The Development of a New Automotive Diagnostic Approach
149
University of Huddersfield Repository Selig, Michael The Development of a New Automotive Diagnostic Approach Original Citation Selig, Michael (2010) The Development of a New Automotive Diagnostic Approach. Masters thesis, University of Huddersfield. This version is available at http://eprints.hud.ac.uk/id/eprint/9669/ The University Repository is a digital collection of the research output of the University, available on Open Access. Copyright and Moral Rights for the items on this site are retained by the individual author and/or other copyright owners. Users may access full items free of charge; copies of full text items generally can be reproduced, displayed or performed and given to third parties in any format or medium for personal research or study, educational or not-for-profit purposes without prior permission or charge, provided: • The authors, title and full bibliographic details is credited in any copy; • A hyperlink and/or URL is included for the original metadata page; and • The content is not changed in any way. For more information, including our policy and submission procedure, please contact the Repository Team at: [email protected]. http://eprints.hud.ac.uk/
-
Upload
khangminh22 -
Category
Documents
-
view
1 -
download
0
Transcript of The Development of a New Automotive Diagnostic Approach

University of Huddersfield Repository
Selig, Michael
The Development of a New Automotive Diagnostic Approach
Original Citation
Selig, Michael (2010) The Development of a New Automotive Diagnostic Approach. Masters thesis, University of Huddersfield.
This version is available at http://eprints.hud.ac.uk/id/eprint/9669/
The University Repository is a digital collection of the research output of theUniversity, available on Open Access. Copyright and Moral Rights for the itemson this site are retained by the individual author and/or other copyright owners.Users may access full items free of charge; copies of full text items generallycan be reproduced, displayed or performed and given to third parties in anyformat or medium for personal research or study, educational or not-for-profitpurposes without prior permission or charge, provided:
• The authors, title and full bibliographic details is credited in any copy;• A hyperlink and/or URL is included for the original metadata page; and• The content is not changed in any way.
For more information, including our policy and submission procedure, pleasecontact the Repository Team at: [email protected].
http://eprints.hud.ac.uk/
The Development of a New Automotive
Diagnostic Approach
Michael Selig
A thesis submitted to the University of Huddersfieldin partial fulfilment of the requirements for the degree Master of Science
The University of Huddersfield in collaboration with theUniversity of Applied Sciences Frankfurt am Main, Germany
August 2010

Masterthesis Automotive Diagnostics
Abstract
This thesis describes the master by research project “The Development of A New
Automotive Diagnostic Approach” and contains the current diagnostic approach, the own
developed idea of a new diagnostic method and the hardware design of a new diagnostic
tool for vehicles.
The messages of the sensors and control units are transmitted over the in-vehicle bus
network and are different depending on the condition of the car. The new diagnostic
approach uses our developed theory, that the bus level changes between faultless and
faulty vehicle condition.
The thesis enables an understanding of the basic principles of automotive electrics, control
systems and the subjacent fault diagnostic principles. To understand these complex
diagnostic principles, the different protocols and standards are described.
A hardware interface to the in-vehicle bus system is shown which can be used for many
different applications, like manipulating/monitoring existing CAN networks, as a
diagnostic tool, creating own control systems or for automotive security experiments. The
main components of the hardware are an Atmel AT90CAN128, the Philips CAN
transceiver PCA82C251, the FTDI FT245BM USB FIFO and the VNC1L USB host
controller. The interface developed in this project gets the same results as an up to date
conference paper published for for IEEE.
Based on the shown in-vehicle bus interface in this thesis an idea of a new control system
for cars is described. The idea is to control the tyre pressure during an automatic vehicle
emergency break. The idea is a reduction of the collision speed and therefore a further
reduction of the stress for the vehicle passengers and the resulting injuries for vehicle
occupants.
Page 2 of 148

Masterthesis Automotive Diagnostics
Copyright statement
i. The author of this thesis (including any appendices and/or schedules to this thesis) owns
any copyright in it (the “Copyright”) and he has given The University of Huddersfield the
right to use such Copyright for any administrative, promotional, educational and/or
teaching purposes.
ii. Copies of this thesis, either in full or in extracts, may be made only in accordance with
the regulations of the University Library. Details of these regulations may be obtained
from the Librarian. This page must form part of any such copies made.
iii. The ownership of any patents, designs, trade marks and any and all other
intellectual property rights except for the Copyright (the “Intellectual Property
Rights”) and any reproductions of copyright works, for example graphs and tables
(“Reproductions”), which may be described in this thesis, may not be owned by
the author and may be owned by third parties. Such Intellectual Property Rights
and Reproductions cannot and must not be made available for use without the prior
written permission of the owner(s) of the relevant Intellectual Property Rights
and/or Reproductions.
Page 3 of 148

Masterthesis Automotive Diagnostics
Acknowledgement
I would like to thank the School of Computing and Engineering at the University of
Huddersfield for enabling this research project to be completed.
I express my gratitude to my supervision team of my research, Dr. John Shi as main-, Prof.
Dr. Karsten Schmidt as co- and Prof. Andrew Ball as second supervisor, who have guided,
helped and supported me throughout the project.
I also gratitude the technical staff in the electrical and automotive lab of the University of
Huddersfield for the support in performing practical tests. The University of Applied
Sciences Coburg for the supply of microcontroller development tools and assembling the
circuit board. The University of Applied Sciences Schweinfurt for the manufacturing of
printed circuit boards.
The work is very enjoyable and I would like to keep on working in the area of automotive
electrics with a special focus on diagnostic and control system. The project supervisors
and I are hoping that we can keep on going with one of the ideas which came up during
the project as described in this thesis.
Page 4 of 148

Masterthesis Automotive Diagnostics
About the Author
Michael Selig studied on the University of Applied Sciences (UAS) of Coburg and
obtained a B.Sc. degree in Automotive Information Technology. Based on an interchange
agreement between the UAS Coburg and the University of Huddersfield, Michael Selig
spent his final year in Huddersfield and obtained a B.Eng. (Hons) in Computer Control
Systems.
His main interests are technical control systems and the communication between the
related components. A special focus lies on control system of vehicles and the
development of embedded systems.
He has industrial experience of programming and debugging automotive control units
gained at the Kübrich Ingenieurgesellschaft, Germany.
Page 5 of 148
Masterthesis Automotive Diagnostics
Table of Contents
Abstract..................................................................................................................................2Copyright statement...............................................................................................................3Acknowledgement.................................................................................................................4About the Author...................................................................................................................5Table of Contents...................................................................................................................6List of Figures........................................................................................................................8List of Tables.......................................................................................................................10Glossary of Terms and Abbreviations..................................................................................11Chapter 1 Introduction.........................................................................................................13
1.1. The history of mechatronic systems in vehicles......................................................131.2. The cross linking of the control units......................................................................18
1.2.1. Terminology of bus systems.............................................................................181.2.2. Cross linking example......................................................................................241.2.3. Classification of bus systems...........................................................................261.2.4. Gateways..........................................................................................................28
1.3. The diagnostic in vehicles........................................................................................29Chapter 2 Aims & Objectives..............................................................................................33Chapter 3 Background of automotive electronics...............................................................35
3.1. The principle of an electronic control unit...............................................................353.1.1. The microcontroller..........................................................................................373.1.2. Memories.........................................................................................................383.1.3. Monitoring system...........................................................................................393.1.4. Generation of sensor data ................................................................................403.1.5. Activating the actuators....................................................................................46
3.2. The CAN bus...........................................................................................................473.2.1. Physical Layer of the CAN bus........................................................................493.2.2. Data Link Layer...............................................................................................523.2.3. Fault detection methods of a faulty communication........................................593.2.4. TTCAN............................................................................................................61
Chapter 4 The Development of a New Diagnostic Approach.............................................624.1. History of diagnostic protocols................................................................................624.2. Current diagnostic approaches.................................................................................64
4.2.1. The K-Line and KWP 2000.............................................................................644.2.2. Unified Diagnostic Services UDS....................................................................764.2.3. The On Board diagnostic OBD........................................................................78
4.3. The new diagnostic approach .................................................................................82Chapter 5 The Development & Design of a Diagnostic Node............................................84
5.1. Hardware development tools...................................................................................845.1.1. The Atmel STK 600.........................................................................................845.1.2. The Atmel JTAGICE mkII...............................................................................85
Page 6 of 148
Masterthesis Automotive Diagnostics
5.1.3. AVR Studio 4....................................................................................................865.1.4. Eagle.................................................................................................................86
5.2. Hardware components.............................................................................................875.2.1. The microcontroller AT90CAN128..................................................................875.2.2. The CAN Transceiver PCA82C251.................................................................895.2.3. The USB FIFO FT245BM...............................................................................915.2.4. The VNC1L and VDIP1...................................................................................925.2.5. LC Display WD-C2704M-1HNN....................................................................95
5.3. Hardware design of the CAN circuit.......................................................................965.3.1. Connecting the AT90CAN128.........................................................................965.3.2. Connecting the FT245BM...............................................................................99
5.4. Hardware design of the new diagnostic device.....................................................105Chapter 6 Experimental Results........................................................................................107
6.1. Results of the CAN circuit.....................................................................................1076.2. Results of the new diagnostic device.....................................................................1136.3. Future work for the hardware development...........................................................116
Chapter 7 Further Investigated Hardware Applications....................................................1177.1. Condition Monitoring of Mechatronic Car Components Using Bus Level Data Flow..............................................................................................................................1177.2. Tyre Pressure Control During a Vehicle Emergency Break...................................118
7.2.1. Introduction....................................................................................................1187.2.2. State of the art................................................................................................1197.2.3. Aims and objectives of the project.................................................................1237.2.4. Realisation of the project idea........................................................................124
7.3. Automotive security analysis.................................................................................125Chapter 8 Conclusion........................................................................................................128Bibliography......................................................................................................................130Appendices .......................................................................................................................134Appendix A: Unified diagnostic services..........................................................................135Appendix B: OBD services...............................................................................................138Appendix C: Range of values............................................................................................139Appendix D: AT90CAN128 pin description.....................................................................140Appendix E: FT245 pin description..................................................................................142Appendix F: VN1CL pin description................................................................................144Appendix G: Automotive security.....................................................................................147
Word count: 26600
Page 7 of 148
Masterthesis Automotive Diagnostics
List of Figures
Figure 1.1: The make up of mechatronics...........................................................................14Figure 1.2: Construction space vs. Number of functions/Time...........................................15Figure 1.3: Information/Energy flow in a mechatronic system...........................................16Figure 1.4: Portion of electronic costs of vehicles..............................................................17Figure 1.5: Full and half duplex mode................................................................................19Figure 1.6: One and two wire bus connection.....................................................................20Figure 1.7: Bus topology.....................................................................................................20Figure 1.8: Ring and star topology......................................................................................21Figure 1.9: NRZ and Manchester coding............................................................................22Figure 1.10: Automotive cross linking................................................................................25Figure 1.11: SAE bus classification.....................................................................................27Figure 1.12: Bus gateway....................................................................................................28Figure 1.13: Decision tree example.....................................................................................32Figure 2.1: Automotive malfunctions in percent between 2005 and 2008..........................33Figure 2.2: Automotive malfunctions in 2009.....................................................................34Figure 3.1: Control unit build up.........................................................................................36Figure 3.2: Additional components of a control unit...........................................................37Figure 3.3: Characteristic of an NTC sensor.......................................................................40Figure 3.4: Wiring of a sensor with the voltage divider rule...............................................41Figure 3.5: ADC interpretation of the voltage area in binary against V/Vref.....................44Figure 3.6: OSI layers..........................................................................................................48Figure 3.7: Wiring of the CAN bus.....................................................................................50Figure 3.8: Nominal potential of the high speed CAN........................................................50Figure 3.9: Nominal potential of the low speed CAN.........................................................51Figure 3.10: Flow diagram of the arbitration process.........................................................52Figure 3.11: Example of the arbitration...............................................................................53Figure 3.12: Structure of a CAN data frame.......................................................................54Figure 3.13: CAN bus error model......................................................................................58Figure 4.1: The development of automotive diagnostic protocols......................................64Figure 4.2: The K-Line topology.........................................................................................65Figure 4.3: The server client structure and the initialisation of a diagnostic session..........66Figure 4.4: KWP 2000 fast initialisation.............................................................................67Figure 4.5: The KWP 2000 5 baud initialisation.................................................................68Figure 4.6: The KWP 2000 data format..............................................................................68Figure 4.7: The KWP 2000 addressing................................................................................69Figure 4.8: Example of a fault entry in the control unit......................................................75Figure 4.9: The UDS application layer................................................................................76Figure 4.10: The OBD connector........................................................................................78Figure 5.1: Atmel STK600..................................................................................................85Figure 5.2: Atmel JTAGICE mkII.......................................................................................85
Page 8 of 148
Masterthesis Automotive Diagnostics
Figure 5.3: AVR Studio screenshot......................................................................................86Figure 5.4: The AT90CAN128 pin layout...........................................................................89Figure 5.5: The CAN transceiver pin layout.......................................................................90Figure 5.6: The FT245 pin layout........................................................................................92Figure 5.7: The VNC1L and VDIP1 pin layout...................................................................95Figure 5.8: The wiring of the crystal...................................................................................97Figure 5.9: Characteristic of the LED forward current vs. forward voltage.......................98Figure 5.10: Wiring of the FT245 to an EEPROM...........................................................100Figure 5.11: Wiring of the bus powered circuit with power control of the FT245............102Figure 5.12: The interface between a microcontroller and the FT245..............................103Figure 5.13: CAN circuit hardware layout........................................................................104Figure 5.14: Diagnostic tool hardware layout...................................................................106Figure 6.1: Data flow of CAN messages...........................................................................107Figure 6.2: Experimental setup CAN circuit.....................................................................108Figure 6.3: CANHACKER settings..................................................................................109Figure 6.4: CANHACKER screenshot..............................................................................110Figure 6.5: CANHACKER filter.......................................................................................110Figure 6.6: NI configuration..............................................................................................111Figure 6.7: NI properties....................................................................................................112Figure 6.8: NI CAN BusMonitor screenshot.....................................................................112Figure 6.9: Data flow between microcontroller, USB flash drive and display..................113Figure 6.10: Interface for the VDIP1 module and the display..........................................114Figure 6.11: Experimental setup for USB flash drive and display....................................115Figure 6.12: USB flahs drive screenshot...........................................................................115Figure 6.13: Data flow in the new diagnostic device........................................................116Figure 7.1: Road deaths in Germany over the last 54 years in thousands.........................119Figure 7.2: The sequence of possible events to reduce traffic deaths and injuries............120Figure 7.3: ContiGuard APIA system................................................................................121
Page 9 of 148
Masterthesis Automotive Diagnostics
List of Tables
Table 3.1: Read hex code and corresponding decimal value...............................................43Table 3.2: A/D converter types............................................................................................45Table 3.3: Automotive actuators..........................................................................................46Table 3.4: Indication of bytes by the data length code........................................................55Table 4.1: Standardisation of diagnostic protocols..............................................................63Table 4.2: Example of error codes.......................................................................................70Table 4.3: Standardised SIDs...............................................................................................71Table 4.4: Diagnostic sessions.............................................................................................72Table 4.5: Request of specific diagnostic sessions..............................................................72Table 4.6: Fault memory access..........................................................................................74Table 4.7: Coding of the trouble codes................................................................................74Table 4.8: Pins of OBD connector.......................................................................................79Table 4.9: Standardisation of the diagnostic communication..............................................79Table 5.1: CAN transceiver PCA82C251 pin description...................................................90Table 5.2: LCD WD-C2704M-1HNN pin description........................................................96
Page 10 of 148

Masterthesis Automotive Diagnostics
Glossary of Terms and Abbreviations
ABC Active Body Control
ABS Anti Lock Braking System
ACC Adaptive Cruise Control
ADAC Allgemeine Deutsche Automobil-Club e.V.
ADC Analogue Digital Converter
AFS Active Front Steering
ALU Arithmetic Logic Unit
ASIC Application Specific Integrated Circuit
CAN Controller Area Network
CARB California Air Resource Board
CRC Cyclic Redundancy Check
CSMA/CA Carrier Sense Multiple Access/ Collision Avoidance
CPU Central Processing Unit
DRAM Dynamic Random Access Memory
DSP Digital Signal Processor
ECU Electronic Control Unit
EEPROM Electrically Erasable Programmable Read Only Memory
EPROM Erasable Programmable Read Only Memory
ESC Electronic Stability Control
EOF End Of Frame
FAT File Allocation Table
FIFO First In First Out
GPL General Public License
IEEE Institute of Electrical and Electronics Engineers
ID Identifier
ISO International Organisation for Standardisation
JTAG Joint Test Action Group
LIN Local Interconnect Network
Page 11 of 148
Masterthesis Automotive Diagnostics
LKAS Lane Keeping Assistance
MIL Malfunction Indicator Lamp
MIPS Mega Instructions Per Second
MOST Media Oriented Systems Transport
MOT Ministry of Transport test
MROM Mask Read Only Memory
NI National Instruments
NTC Negative Temperature Coefficient
OSI Open Systems Interconnection Reference Model
OTP One Time Programmable
PROM Programmable Read Only Memory
PTC Positive Temperature Coefficient
PWM Pulse Width Modulation
RA Remote Address
RAM Random Access Memory
RFI Radio Frequency Identification
RISC Reduced Instruction Set Computer
ROM Read Only Memory
RTC Real Time Counter
SAE Society of Automotive Engineers
SOF Start of Frame
SRAM Static Random Access Memory
SPI Serial Peripheral Interface
TCS Traction Control System
TTCAN Time Triggered CAN
USB Universal Serial Bus
USART Universal Asynchronous Receiver/Transmitter
Page 12 of 148
Masterthesis Automotive Diagnostics
Chapter 1
Introduction
The chapter “Introduction” provides basic information about the entering of mechatronic
systems in vehicles as well as the history of the diagnostic concepts used over the past
years.
1.1. The history of mechatronic systems in vehicles
In the beginning of the 1980s computer technology was introduced in automobiles. That
means the development in the automotive industry changed from the classical field of
mechanical engineering to a new discipline, called mechatronics, (Richter, 2005).
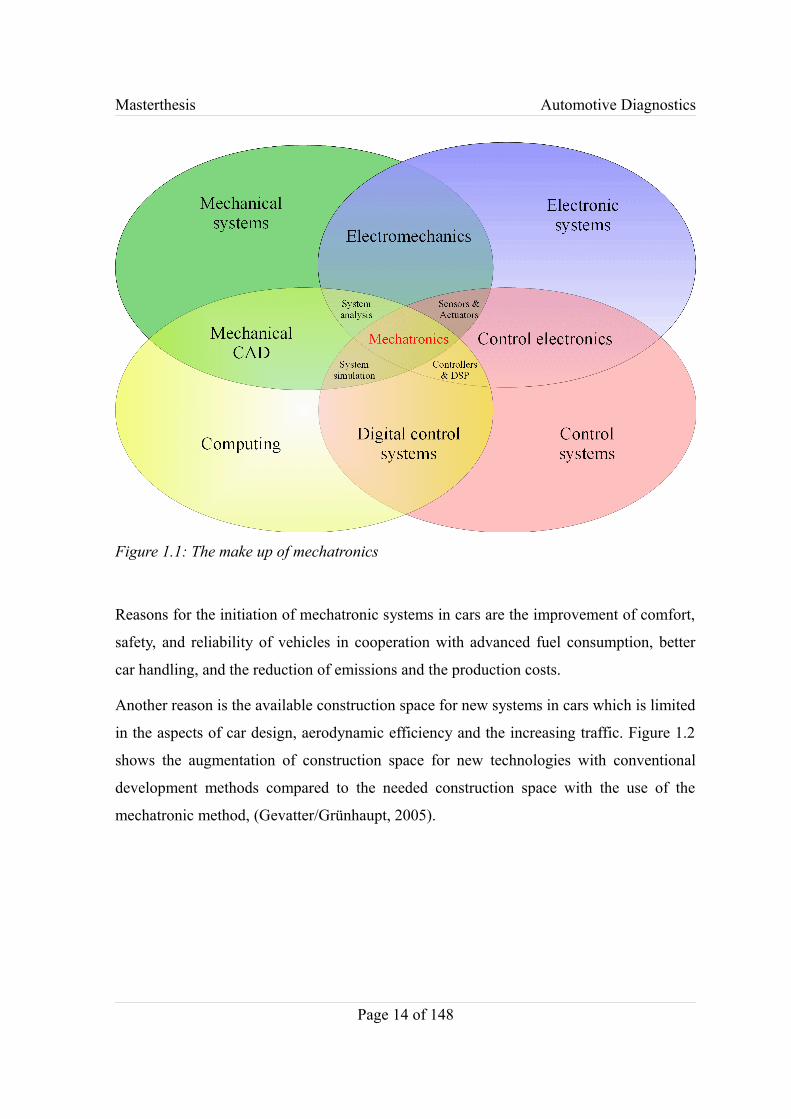
The term mechatronic was firstly used in Japan by the company Yaskawa Electric
Corporation in 1969. Mechatronic means the combination of the mechanical-, electronic-,
control systems and the computer technology. The merging of the different disciplines has
the benefit of synergistic effects in the development of new products. Figure 1.1 illustrates
the structure of the field mechatronics with its different subareas, (North Carolina State
University, 2010), (Brown, 2008).
Page 13 of 148
Masterthesis Automotive Diagnostics
Reasons for the initiation of mechatronic systems in cars are the improvement of comfort,
safety, and reliability of vehicles in cooperation with advanced fuel consumption, better
car handling, and the reduction of emissions and the production costs.
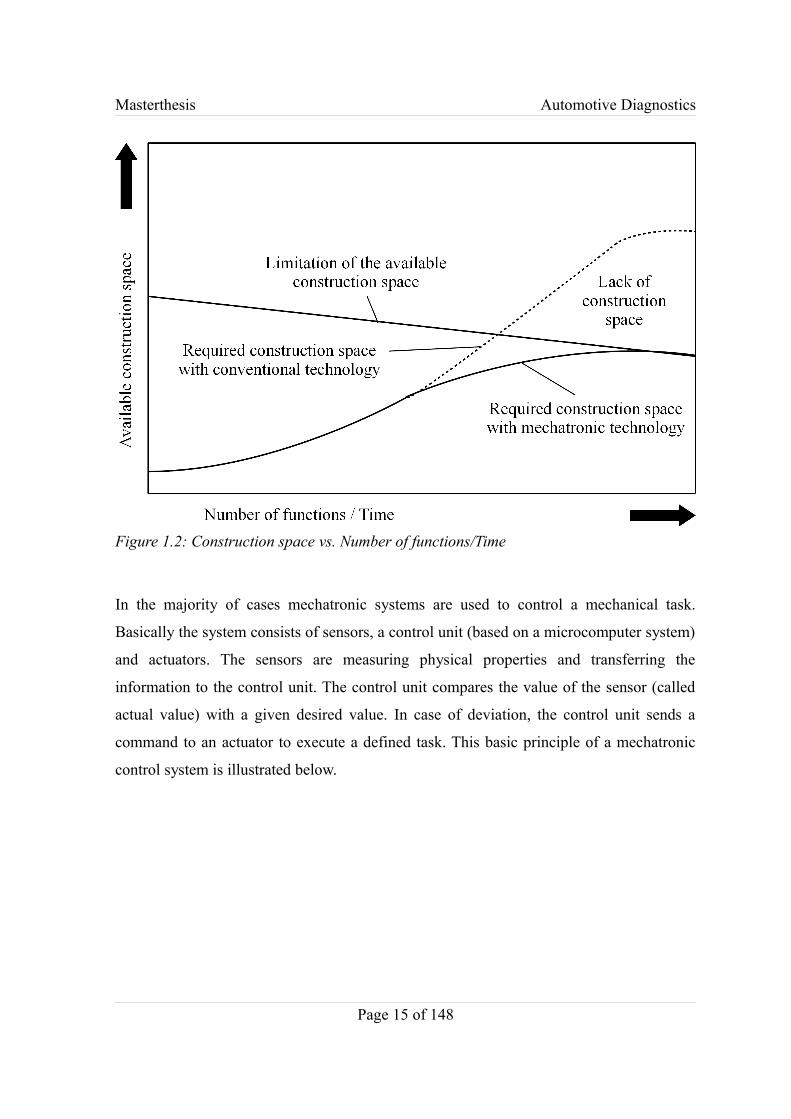
Another reason is the available construction space for new systems in cars which is limited
in the aspects of car design, aerodynamic efficiency and the increasing traffic. Figure 1.2
shows the augmentation of construction space for new technologies with conventional
development methods compared to the needed construction space with the use of the
mechatronic method, (Gevatter/Grünhaupt, 2005).
Page 14 of 148
Figure 1.1: The make up of mechatronics
Masterthesis Automotive Diagnostics
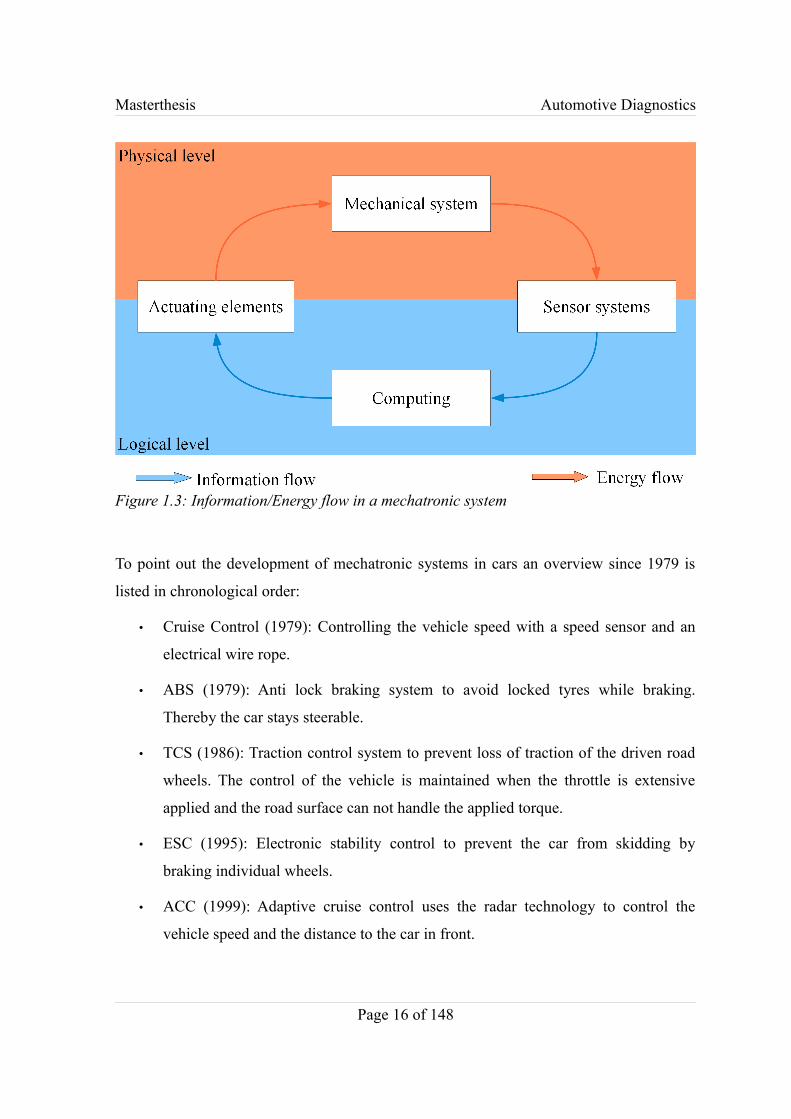
In the majority of cases mechatronic systems are used to control a mechanical task.
Basically the system consists of sensors, a control unit (based on a microcomputer system)
and actuators. The sensors are measuring physical properties and transferring the
information to the control unit. The control unit compares the value of the sensor (called
actual value) with a given desired value. In case of deviation, the control unit sends a
command to an actuator to execute a defined task. This basic principle of a mechatronic
control system is illustrated below.
Page 15 of 148
Figure 1.2: Construction space vs. Number of functions/Time
Masterthesis Automotive Diagnostics
To point out the development of mechatronic systems in cars an overview since 1979 is
listed in chronological order:
• Cruise Control (1979): Controlling the vehicle speed with a speed sensor and an
electrical wire rope.
• ABS (1979): Anti lock braking system to avoid locked tyres while braking.
Thereby the car stays steerable.
• TCS (1986): Traction control system to prevent loss of traction of the driven road
wheels. The control of the vehicle is maintained when the throttle is extensive
applied and the road surface can not handle the applied torque.
• ESC (1995): Electronic stability control to prevent the car from skidding by
braking individual wheels.
• ACC (1999): Adaptive cruise control uses the radar technology to control the
vehicle speed and the distance to the car in front.
Page 16 of 148
Figure 1.3: Information/Energy flow in a mechatronic system
Masterthesis Automotive Diagnostics
• ABC (1999): Active body control means the extension of the suspension with
hydraulic actuators to improve the vehicle rolling behaviour.
• LKAS (2001): Lane keeping assistance warns the driver if the vehicle begins to
move out of its lane.
• AFS(2003): Active front steering balances the steering angle when side wind
occurs or on interventions of the ESC, (Bosch, 2007b).
In current luxury cars (e.g. Mercedes S class, BMW 7 Series, Audi A8) are over 80
electronic control units installed depending on the configuration and the installed equipment,
(Meroth/Tolg, 2008).
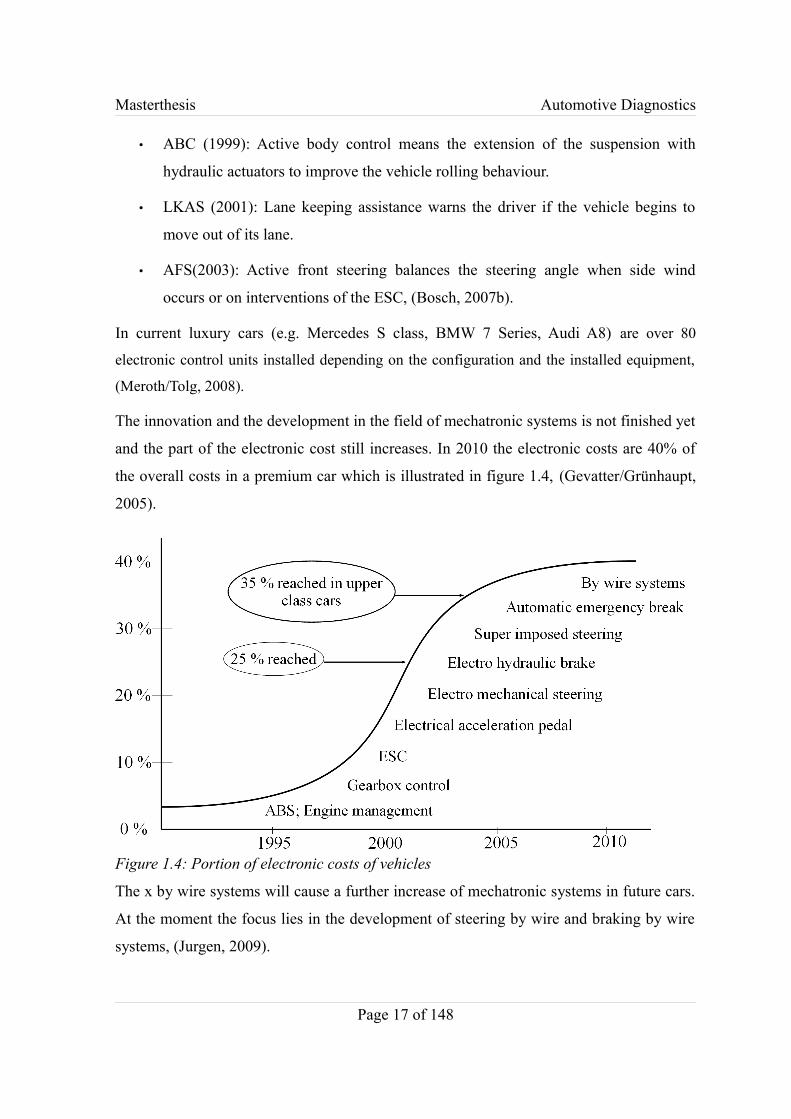
The innovation and the development in the field of mechatronic systems is not finished yet
and the part of the electronic cost still increases. In 2010 the electronic costs are 40% of
the overall costs in a premium car which is illustrated in figure 1.4, (Gevatter/Grünhaupt,
2005).
The x by wire systems will cause a further increase of mechatronic systems in future cars.
At the moment the focus lies in the development of steering by wire and braking by wire
systems, (Jurgen, 2009).
Page 17 of 148
Figure 1.4: Portion of electronic costs of vehicles
Masterthesis Automotive Diagnostics
1.2. The cross linking of the control units
With the initiation of electronic control systems like ABS and engine management in the
beginning of the 1980s it was necessary to create an in-vehicle (onboard) communication
method. The first approach was a point to point connection and the communication is
carried out using analogue or switch signals.
Also a communication between the control units and offboard tools, like diagnostic tools
(used in garages) or tools in the manufacturing process for flashing electronic control units
(ECU), is needed to exchange data. Bosch as a leading company in developing and
producing ECUs published a communication specification which was adopted by many
car manufacturers. The specification is similar to the serial interface RS232 of PCs and
defines the the number of connection wires, the electrical signal level and the bit format of
the signal transmission. Later the specification was standardised in the ISO 9141
specification, (Bosch, 2007a).
With the introduction of the CAN bus in the beginning of the 1990s it was from now on
possible to have a fast onboard data exchange in vehicles. The CAN bus was developed by
Bosch in cooperation with Intel and standardised in the ISO 11898 Road Vehicles –
Controller Area Network and the SAE J1939, (Zimmermann/Schmidgall, 2007).
The different tasks of the control units have opposite requirements like bandwidth,
redundancy, fault tolerance and response time. Therefore various bus protocols are
developed and used in cars like CAN, TTCAN, MOST, byteflight or LIN.
1.2.1. Terminology of bus systems
Cross linking
Commonly the data transmission is executed bitwise and serial. The easiest way is a direct
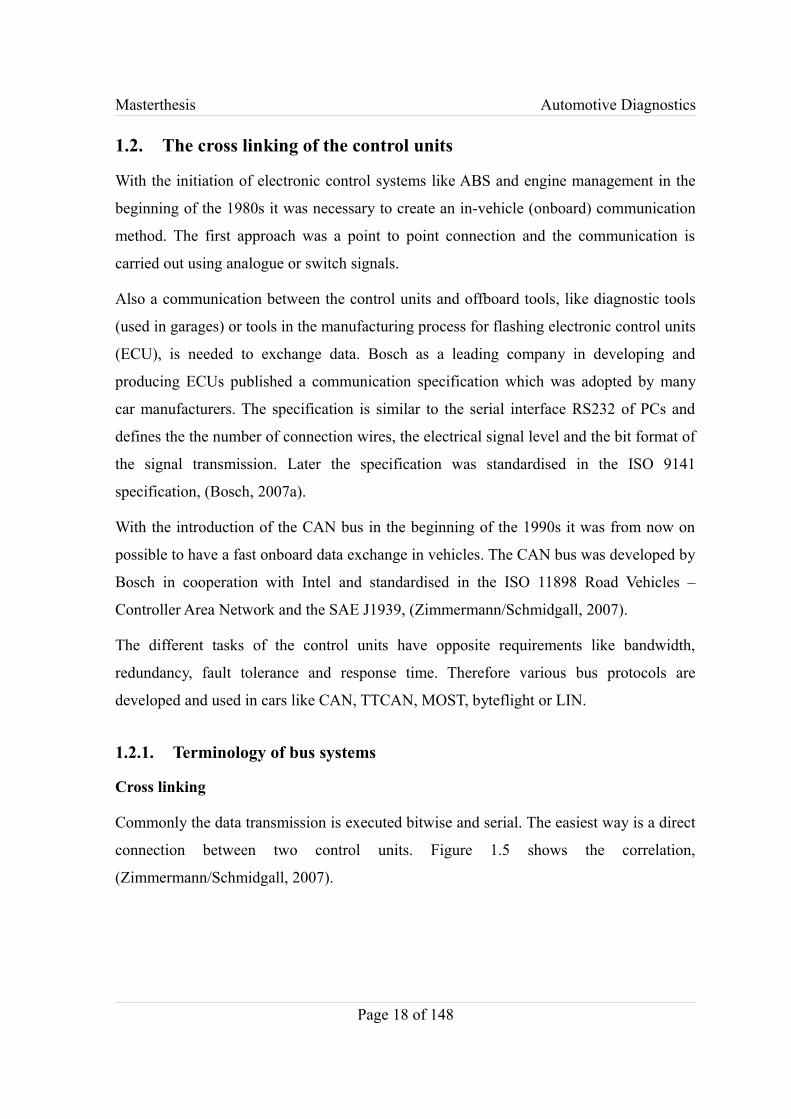
connection between two control units. Figure 1.5 shows the correlation,
(Zimmermann/Schmidgall, 2007).
Page 18 of 148
Masterthesis Automotive Diagnostics
Depending on the use of a shared bidirectional line or a pair of unidirectional lines, the
data transmission takes place in half duplex or in full duplex mode between the control
units.
• Full duplex mode: Sending and receiving data is possible at the same time.
• Half duplex mode: Alternate sending and receiving data of each control unit.
The cross linking is realised either with one wire or two wires, shown in figure 1.6:
One wire connections: Are cheaper in aspects of cost and the signal recirculation takes
place over the car body, which is also the signal earth. This kind of linking is very fragile
in aspects of electromagnetic compatibility. Hence high signal levels and low bit rates are
applied. Often the supply voltage is used as signal level in automotive applications.
Example bus systems using the one wire technology are the LIN bus and the ISO 9141.
Two wire cable: Are often twisted and not as fragile in aspects of electromagnetic
compatibility as one wire cables. This allows higher bit rates and small signal levels.
Figure 1.6 explains the meaning of a signal in a one wire and a two wire linking.
Page 19 of 148
Figure 1.5: Full and half duplex mode

Masterthesis Automotive Diagnostics
Topology, network types and structure
Contrary to the point to point connection of only two ECUs, in a network several numbers
of control units are connected to each other. Therefore different topologies exist. Mainly
used is the bus which is nowadays a synonym for data networks in vehicles.
A bus topology is created when several control units are connected to the same data wires,
shown in figure 1.7. Bus access methods have to control which connected control unit has
the permission to send data. Otherwise collisions are occurring. Bus access methods are
explained later in this chapter.
Page 20 of 148
Figure 1.7: Bus topology
Figure 1.6: One and two wire bus connection
Masterthesis Automotive Diagnostics
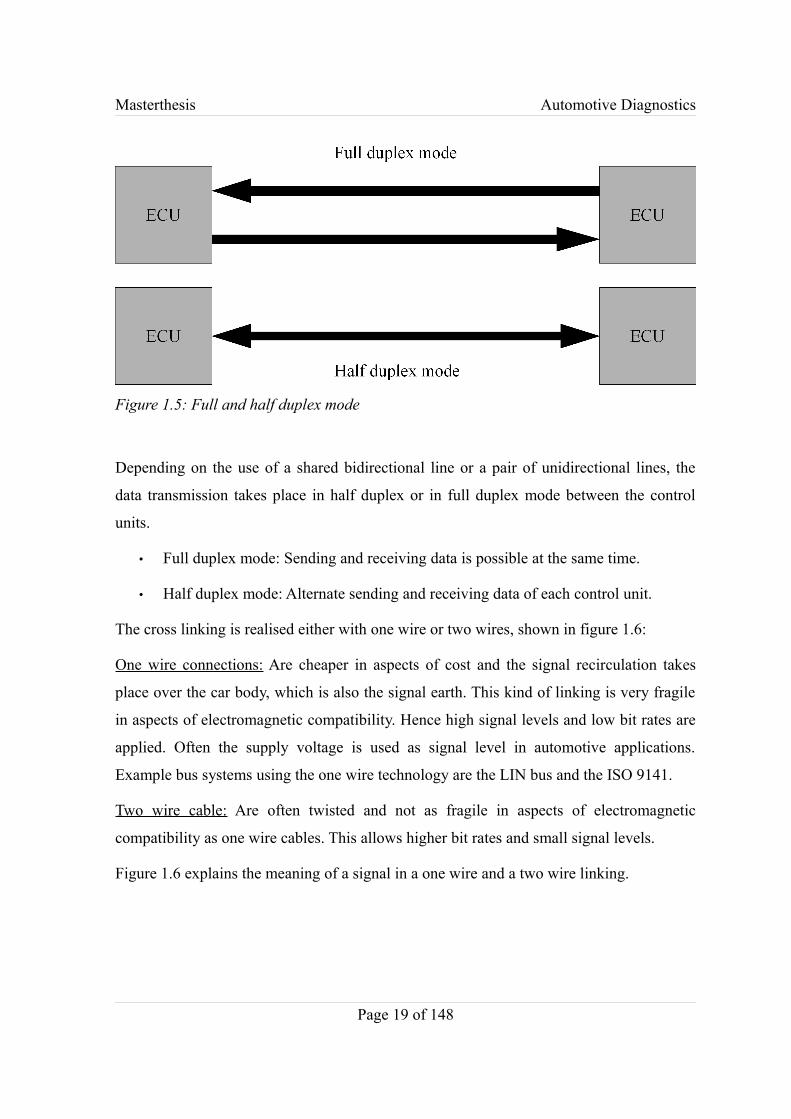
Multimedia networks like MOST use a ring topology. FlexRay supports the star structure
beside the normal bus topology. A broken bus user in the ring topology means a
breakdown of the whole network as well as a broken star node in the star network, which
are the disadvantages of these topologies, (Meroth/Tolg, 2008). Figure 1.8 shows the
structure of the ring and star topology.
Physical Layer
The physical layer is the connection of the control units to a network, which enables the
control units to send and receive data. As medium can be used wires (e.g. copper,
aluminium), wireless technology (e.g. Bluetooth, ZigBee) or optical material (synthetics,
fibre glass) which has a better electromagnetic compatibility. Disadvantages of optical
material are temperature instability, a low tensile strength and the high costs.
Due to the mass production of cars and the high number of control units it is economical
for vehicle and semi conductor manufacturers to integrate the physical layer as transceiver
devices in the layout of the control unit.
Page 21 of 148
Figure 1.8: Ring and star topology
Masterthesis Automotive Diagnostics
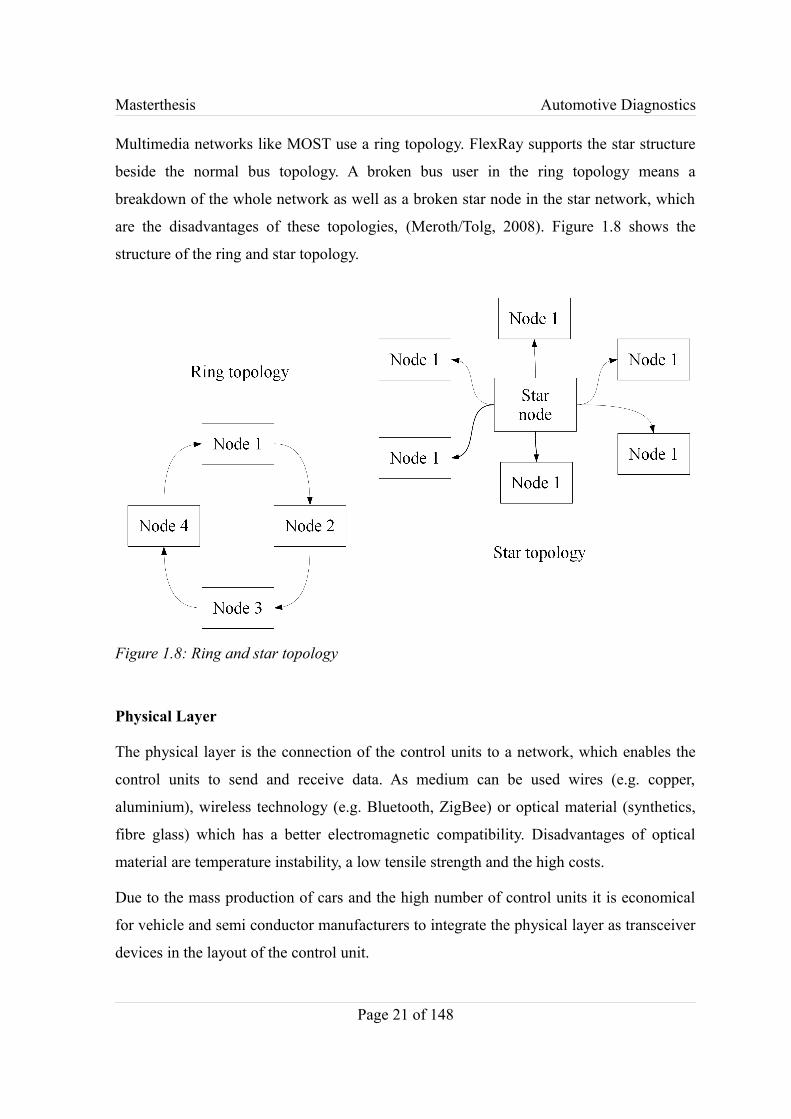
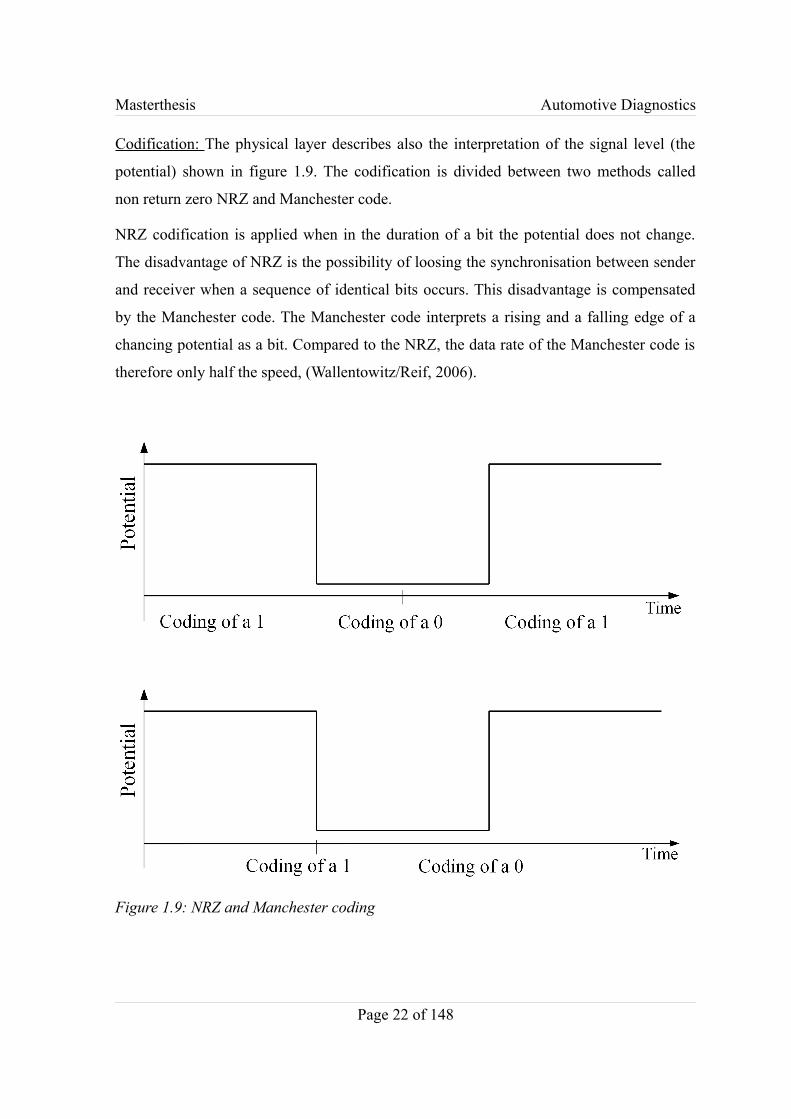
Codification: The physical layer describes also the interpretation of the signal level (the
potential) shown in figure 1.9. The codification is divided between two methods called
non return zero NRZ and Manchester code.
NRZ codification is applied when in the duration of a bit the potential does not change.
The disadvantage of NRZ is the possibility of loosing the synchronisation between sender
and receiver when a sequence of identical bits occurs. This disadvantage is compensated
by the Manchester code. The Manchester code interprets a rising and a falling edge of a
chancing potential as a bit. Compared to the NRZ, the data rate of the Manchester code is
therefore only half the speed, (Wallentowitz/Reif, 2006).
Page 22 of 148
Figure 1.9: NRZ and Manchester coding
Masterthesis Automotive Diagnostics
Data rate
The data rate is the transmission speed of single bits and defines how many bits can be
transmitted in one second. Hence the unit is “bit per second” or derived units like kBit/s or
MBytes/s (1 Byte = 8 Bit, 1kByte = 1024 Byte).
Bus access methods
Master Client and Multi Master model: In the master client model one control unit acts as
master and controls the communication with periodic polling of the connected slaves. An
example network using the master client method is the LIN bus. The master communicates
with the slaves in configured time sequences. This method guarantees a data transmission
in a predicted time. The time between the initialisation of a message by the sender and the
arrival at the receiver is called latency time. Networks with a predictable latency time are
deterministic.
In multi master networks every control unit has the same rights. This method is also called
event triggered. An example of a multi master network is the CAN bus. In reality not
every control unit and every message has equal rights. Hence messages are prioritised
using identifiers. In event triggered networks the latency time is not predictable, therefore
these networks are not deterministic.
Beside the time and event triggered methods systems exist, which combine the advantages
of both earlier described methods. An example is the bus system FlexRay.
In the data communication of an event triggered network with multi master model it is
possible that two control units want to send data at the same time. This method is called
carrier sense multiple access CSMA.
It is differentiated between the CSMA/CD (collision detected) and CSMA/CA (collisions
avoidance) model.
CSMA/CD: This method is not deterministic, because all messages have equal rights and
can have a collision with another message. Hence it can not be guaranteed how long a
message transmission takes. In the case of a very large bus load it is possible that no data
are transmitted due to permanent collisions.
Page 23 of 148

Masterthesis Automotive Diagnostics
CSMA/CA: This method is used in vehicle applications, for example the method is
implemented in the CAN bus. In case of a collision (two sender want to transmit a
message at the same time) the message with the higher priority wins the arbitration
procedure. The priority is implemented in the header of the message. This method
guarantees deterministically for high priority messages.
Synchronicity: To assure an error free communication the receivers must be able to detect
the start and the end of a data frame. It is differentiated between synchronous,
asynchronous and isochronous data communication. Synchronous communication is
performed with a clock signal. In asynchronous communication the data frame is fitted
with start and stop bits.
A further access method is the time division multiple access TDMA. TDMA has a strict
time schedule with time slots for every control unit. Only in this time frame the control
units are allowed to transmit data. Control units which have to send more or high priority
data get more or longer time slots. This communication method is deterministic and
especially suitable for periodical data transmission e.g. measured sensor values in control
loops. But it has disadvantages for seldom, spontaneous or for very urgent messages.
The TDMA method is used by FlexRay and TTCAN. But some control units need an
interface for an asynchronous bus access as well due to the mentioned disadvantages.
Systems with different gaps in the time slots, like the TDMA method, are called
isochronous, (Wallentowitz/Reif, 2006), (Zimmermann/Schmidgall, 2007).
1.2.2. Cross linking example
This part of the thesis describes which bus protocol is used for which automotive cross
linking division as well as the main characteristics of the bus systems. In chapter 3.2 the
CAN protocol is described in more detail, because the research project was focused on this
communication protocol.
In the following a basic cross linking of the vehicle is shown. Of course, it differs of the
characteristic, the manufacturer and the fitted equipments of the car, (Gevatter/Grünhaupt,
2005).
Page 24 of 148

Masterthesis Automotive Diagnostics
The vehicle cross linking is structured in the divisions of powertrain, comfort, multimedia
and manufacturer depending chassis and safety devices.
The communication between the engine and the gearbox, adaptive cruise control, the
electronic control unit and others takes place using the CAN bus. A typical applied data
rate is 500 kBaud. Experience of the manufactures showed that this bandwidth is enough
to control vehicle speed, engine management or safety interventions of the ABS or ESC
system, (Gevatter/Grünhaupt, 2005).
In the comfort area the CAN bus is often used as well, but in a low speed version. That
means the bandwidth is reduced, because comfort systems like the air condition do not
need to be controlled with a fast reaction time. The LIN bus is also used for comfort
application.
Page 25 of 148
Figure 1.10: Automotive cross linking

Masterthesis Automotive Diagnostics
The MOST bus uses an optical high-speed medium to exchange data and is used in the
areas of audio, video, telephone and navigation. These applications need a high bandwidth
due to the high amount of the required data to perform the tasks.
The bus systems byteflight, FlexRay and TTCAN are developed especially for safety
systems. BMW started with Motorola, Elmos and Infineon to develop byteflight which
was basically the first version of FlexRay. The FlexRay bus was created later in a
consortium of the companies BMW, Mercedes Benz, Motorola and Phillips in 2000. In the
years between 2001 and 2004 the companies Bosch, General Motors and Volkswagen
joined the group as well. The byteflight and FlexRay protocol are used to transmit safety
relevant data of the acceleration and pressure sensor, recognition of the used seats in the
car, safety belts systems and data of the electronic system. For the transmission a noise
secure fibre glass wire with a fast response time is used. The data rate is up to 10MBit/s
with a cyclic time of 250 μs. All data messages are available for each connected note at the
same time, similar to the CAN system. But every connected bus user obtains a specific
time to send data called TDMA. This kind of bus access is free of collision and guarantees
hard real time capability. TTCAN has also the ability to perform hard real time tasks but
with the limited data rate of 1Mbit/s. TTCAN was not successful to perform safety
relevant tasks, (Bosch, 2007a).
The interlinking of the different divisions and bus systems is carried out over gateways,
also shown in the figure 1.10, (Gevatter/Grünhaupt, 2005).
1.2.3. Classification of bus systems
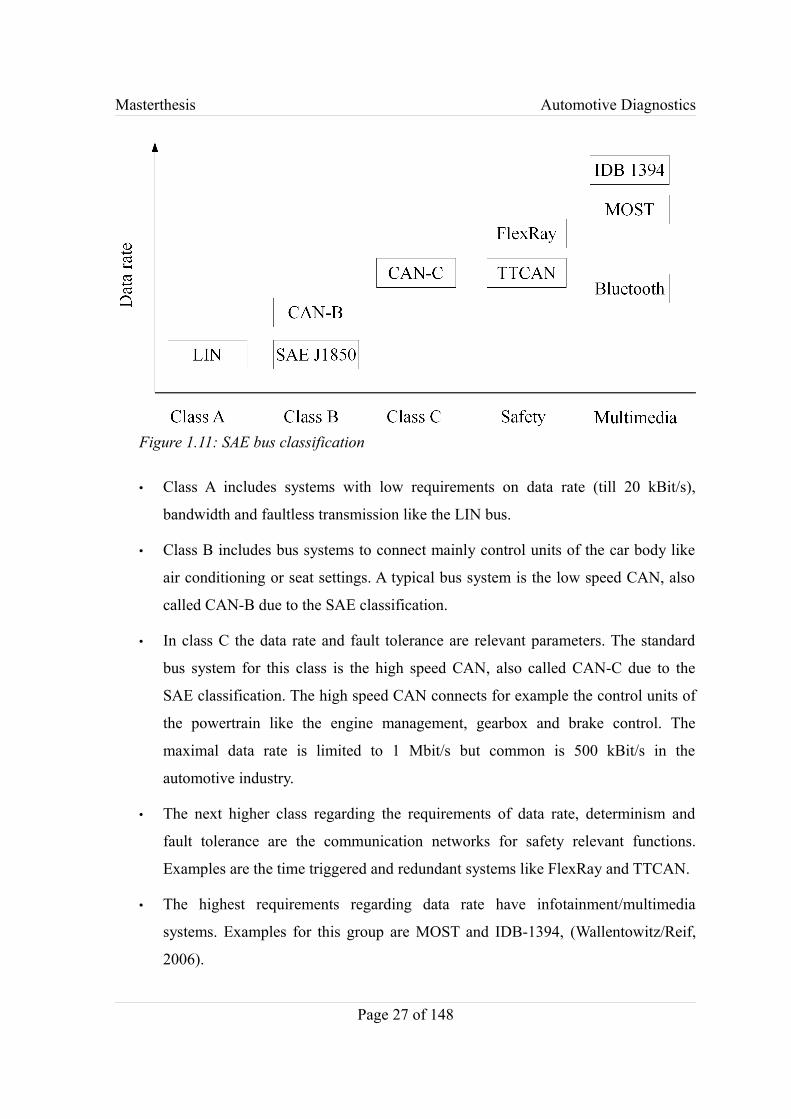
The SAE classifies the different systems for serial data transmission in three classes A, B
and C. But nowadays this classification must be extended with safety relevant and
multimedia systems which are shown in figure 1.11, (Wallentowitz/Reif, 2006).
Page 26 of 148
Masterthesis Automotive Diagnostics
• Class A includes systems with low requirements on data rate (till 20 kBit/s),
bandwidth and faultless transmission like the LIN bus.
• Class B includes bus systems to connect mainly control units of the car body like
air conditioning or seat settings. A typical bus system is the low speed CAN, also
called CAN-B due to the SAE classification.
• In class C the data rate and fault tolerance are relevant parameters. The standard
bus system for this class is the high speed CAN, also called CAN-C due to the
SAE classification. The high speed CAN connects for example the control units of
the powertrain like the engine management, gearbox and brake control. The
maximal data rate is limited to 1 Mbit/s but common is 500 kBit/s in the
automotive industry.
• The next higher class regarding the requirements of data rate, determinism and
fault tolerance are the communication networks for safety relevant functions.
Examples are the time triggered and redundant systems like FlexRay and TTCAN.
• The highest requirements regarding data rate have infotainment/multimedia
systems. Examples for this group are MOST and IDB-1394, (Wallentowitz/Reif,
2006).
Page 27 of 148
Figure 1.11: SAE bus classification
Masterthesis Automotive Diagnostics
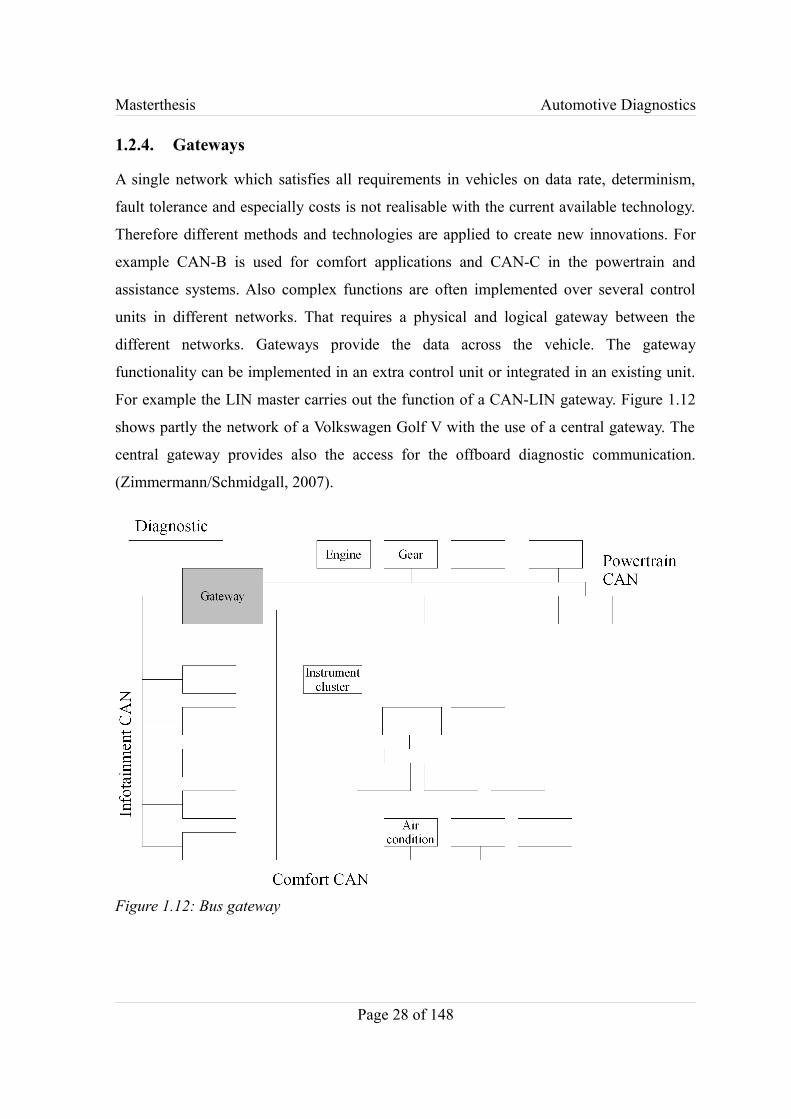
1.2.4. Gateways
A single network which satisfies all requirements in vehicles on data rate, determinism,
fault tolerance and especially costs is not realisable with the current available technology.
Therefore different methods and technologies are applied to create new innovations. For
example CAN-B is used for comfort applications and CAN-C in the powertrain and
assistance systems. Also complex functions are often implemented over several control
units in different networks. That requires a physical and logical gateway between the
different networks. Gateways provide the data across the vehicle. The gateway
functionality can be implemented in an extra control unit or integrated in an existing unit.
For example the LIN master carries out the function of a CAN-LIN gateway. Figure 1.12
shows partly the network of a Volkswagen Golf V with the use of a central gateway. The
central gateway provides also the access for the offboard diagnostic communication.
(Zimmermann/Schmidgall, 2007).
Page 28 of 148
Figure 1.12: Bus gateway
Masterthesis Automotive Diagnostics
1.3. The diagnostic in vehicles
The word diagnosis is Greek and means “apart-split to learn, knowledge” and is basically
known from the medicine side. In medicine the term is used to identify the nature and the
cause of an illness. In the same way the term is used in the automotive sector and the main
aim is to remove the causes of a fault and the resulting symptoms, (Burchfield, 1994).
The diagnosis in the automotive sector exists as long as vehicles were invented, but
changed fundamentally over the past years. In the beginning the diagnosis was carried out
by a visual inspection of the mechanical parts of the car. With entering of electrical
components the diagnostic method changed fundamentally and new tools are required.
The first approach was to use basic measurement tools for example to check the ignition
system where the mechanist had to interpret the test results. But this approach changed
with the entering of electronic systems in a wide range to perform safety and comfort
functions, explained in chapter 1.1. To handle these functions several control units are
needed whereupon single functions/tasks are not implemented in an separate control unit
but rather distributed over different. This fact needs a wiring of the control units explained
in chapter 1.2. and makes the diagnosis complex.
First of all it has to be differentiated between two different approaches, named the onboard
(OBD) and the offboard diagnosis.
On the self diagnosis the control units are permanently checking their own condition and
the condition of the controllers surrounding. This is done either periodically in a program
loop or when a corresponding boundary condition happens, hence when presumably a
problem occurs. A typical example of the self diagnosis is the OBD, initiated by the U.S.
legislative body. The OBD permanently reviews the cars emission information. For that
matter all measured variables must be checked for compliance to specific threshold values.
The threshold values are depending on the specification and the operating condition.
Exceedings of the thresholds will be reported to the driver via a warning lamp in the
dashboard of the car. The malfunction indicator lamp (MIL) in the dashboard helps to
remove the problem quickly. Also the faults are permanently stored in the control unit to
track the problem at a later date. To read the fault message a tester is used, which is an
example for the offboard diagnosis.
Page 29 of 148
Masterthesis Automotive Diagnostics
The offboard diagnosis deals always with reading the trouble information of the vehicle
and the appropriate handling of the fault. The first self diagnostic systems were very easily
implemented using a light (either as an external device or internal warning lamps, like the
ABS warning lamp in the dashboard) and blinking codes as fault indicator to isolate the
fault location. This form of indication simplifies the fault localisation for the mechanist.
More complex systems with many control units, different sensors and actuators require a
more accurate diagnostic option. The approach with the fault isolation is not enough any
more and a better fault description was required. Therefore explicit rules had to be
defined, which symptom creates a fault entry. An example is a too high voltage on the
controller input. The fault entry can be displayed in the test tool with advices of reparation
procedures.
Current systems with a variety of control units are distributed over the entire vehicle and
communicate with each other via different bus systems. The systems are developed by
different manufacturer and have functions distributed over several control units. This
complexity implies high requirements for an accurate diagnosis. A single fault can affect
several different control units caused by the network. This is illustrated in a following
theoretical example:
A control unit detects a sensor error. As a result an error entry is made in the fault memory
through the program for the automatic, frequently review of the sensor. At the same time
several other controllers are depending on the output signal of the affected control unit.
The messages of the affected control unit are no longer transmitted or no longer correct
(implausible values) on the bus and other control units will make an error entry in their
fault memory as well. The offboard diagnostic tool will read to the real error a lot more
trouble code, made by different routines, which neither correlate in time nor content. The
task of the diagnostic tool is to infer from the error messages to the actual fault,
(Wallentowitz/Reif, 2006).
Page 30 of 148
Masterthesis Automotive Diagnostics
Thereby the car manufacturers using expert systems with different methods in the
diagnostic tools to represent the faults:
• Case based systems: Have a fault matrix which describes the context of the fault
and the associated fault solution. The system compares the given case with a
similar possible case in the fault matrix. The concept of affinity is the key problem
of such systems, due to its lack of precision.
• The inferencing rule: Is based on the “if clause” statements and the corresponding
“then clause”. These systems are based on expert rules made of many inference
rules. The system uses the rules to make a conclusion. Every rule is a unit and rules
can be added and deleted without effecting already existing rules. But new rules or
deleted rules have influence of the conclusion. This kind of fault detection is an
advantage compared to the case based method because it is closer to human
reasoning.
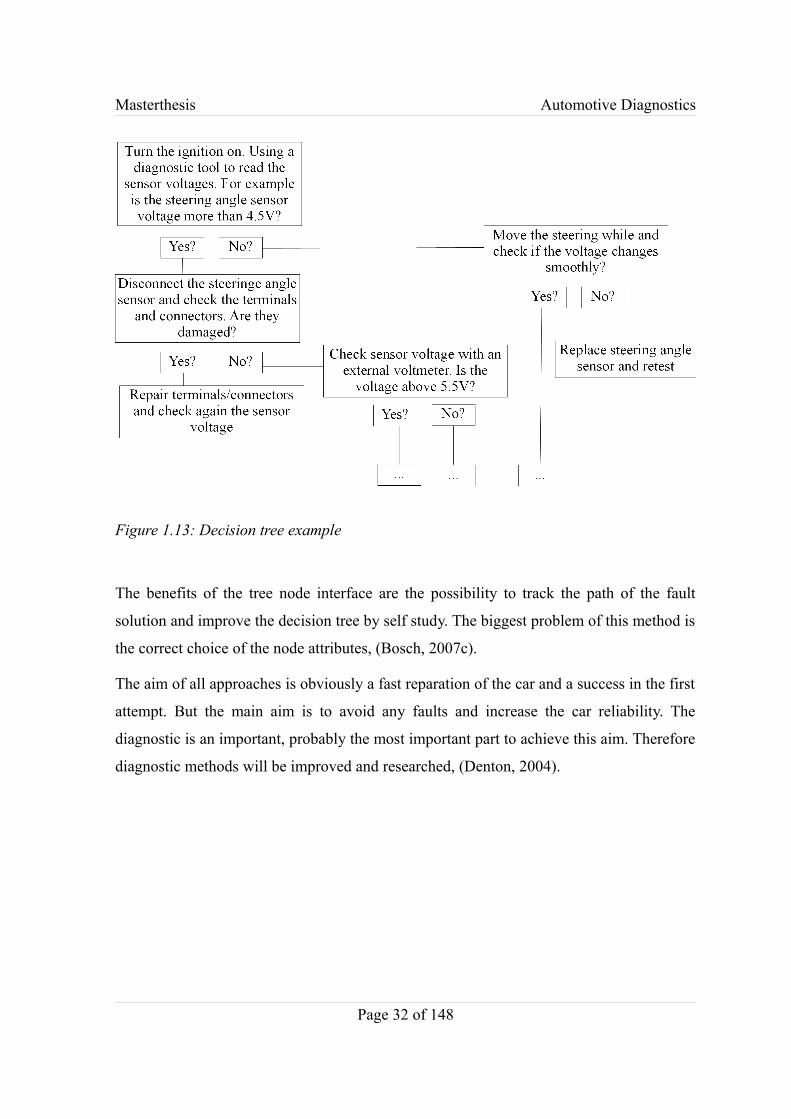
• Tree node interface: This approach receives information from the external world.
The executer of the test provides the required information in form of a decision
tree which is shown in figure 1.13.
Page 31 of 148
Masterthesis Automotive Diagnostics
The benefits of the tree node interface are the possibility to track the path of the fault
solution and improve the decision tree by self study. The biggest problem of this method is
the correct choice of the node attributes, (Bosch, 2007c).
The aim of all approaches is obviously a fast reparation of the car and a success in the first
attempt. But the main aim is to avoid any faults and increase the car reliability. The
diagnostic is an important, probably the most important part to achieve this aim. Therefore
diagnostic methods will be improved and researched, (Denton, 2004).
Page 32 of 148
Figure 1.13: Decision tree example
Masterthesis Automotive Diagnostics
Chapter 2
Aims & Objectives
This chapter describes the aim and objectives of the project “The Development of a New
Automotive Diagnostic Approach”.
Vehicle inspection is an annual test of automobile roadworthiness-, safety- and exhaust
emission aspects undertaken by the MOT in Great Britain. Beside the mechanic condition
the current status of the automotive electronics is checked. This review takes place by
reading the fault memories of the electronic control units in the car.
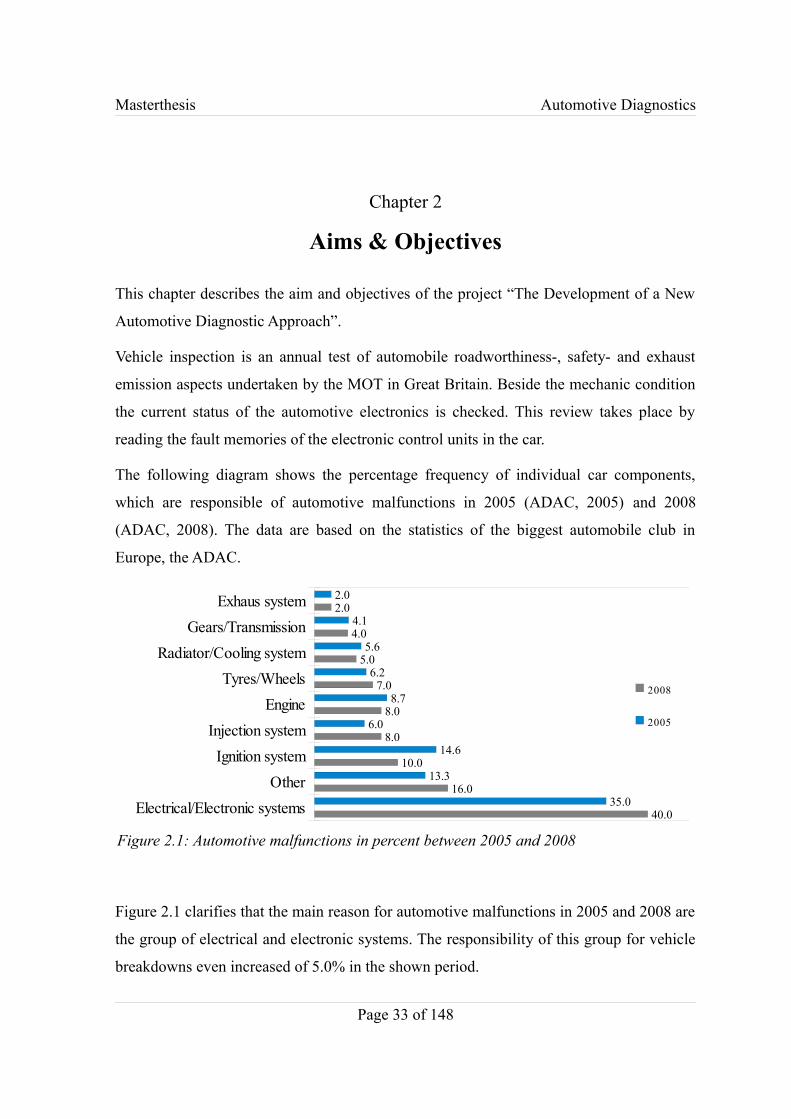
The following diagram shows the percentage frequency of individual car components,
which are responsible of automotive malfunctions in 2005 (ADAC, 2005) and 2008
(ADAC, 2008). The data are based on the statistics of the biggest automobile club in
Europe, the ADAC.
Figure 2.1 clarifies that the main reason for automotive malfunctions in 2005 and 2008 are
the group of electrical and electronic systems. The responsibility of this group for vehicle
breakdowns even increased of 5.0% in the shown period.
Page 33 of 148
Figure 2.1: Automotive malfunctions in percent between 2005 and 2008
Electrical/Electronic systemsOther
Ignition systemInjection system
EngineTyres/Wheels
Radiator/Cooling systemGears/Transmission
Exhaus system
40.0
16.0
10.0
8.0
8.0
7.0
5.0
4.0
2.0
35.0
13.3
14.6
6.0
8.7
6.2
5.6
4.1
2.0
2008 2005
Masterthesis Automotive Diagnostics
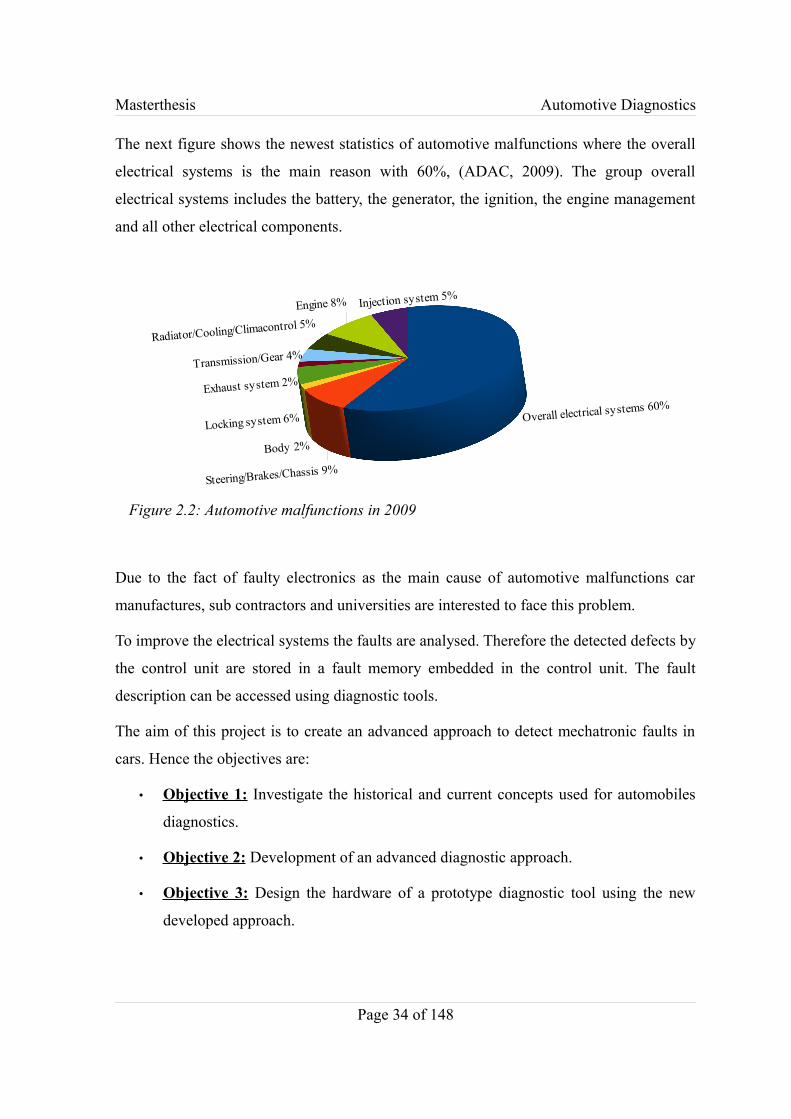
The next figure shows the newest statistics of automotive malfunctions where the overall
electrical systems is the main reason with 60%, (ADAC, 2009). The group overall
electrical systems includes the battery, the generator, the ignition, the engine management
and all other electrical components.
Due to the fact of faulty electronics as the main cause of automotive malfunctions car
manufactures, sub contractors and universities are interested to face this problem.
To improve the electrical systems the faults are analysed. Therefore the detected defects by
the control unit are stored in a fault memory embedded in the control unit. The fault
description can be accessed using diagnostic tools.
The aim of this project is to create an advanced approach to detect mechatronic faults in
cars. Hence the objectives are:
• Objective 1: Investigate the historical and current concepts used for automobiles
diagnostics.
• Objective 2: Development of an advanced diagnostic approach.
• Objective 3: Design the hardware of a prototype diagnostic tool using the new
developed approach.
Page 34 of 148
Figure 2.2: Automotive malfunctions in 2009
Overall electrical systems 60%
Steering/Brakes/Chassis 9%
Body 2%
Locking system 6%
Exhaust system 2%Transmission/Gear 4%
Radiator/Cooling/Climacontrol 5%Engine 8% Injection system 5%

Masterthesis Automotive Diagnostics
Chapter 3
Background of automotive electronics
This chapter discusses the state of the art electronic systems including the CAN bus and
the current diagnostic approach in detail. It clarifies the complexity and problems of the
present diagnostic approach.
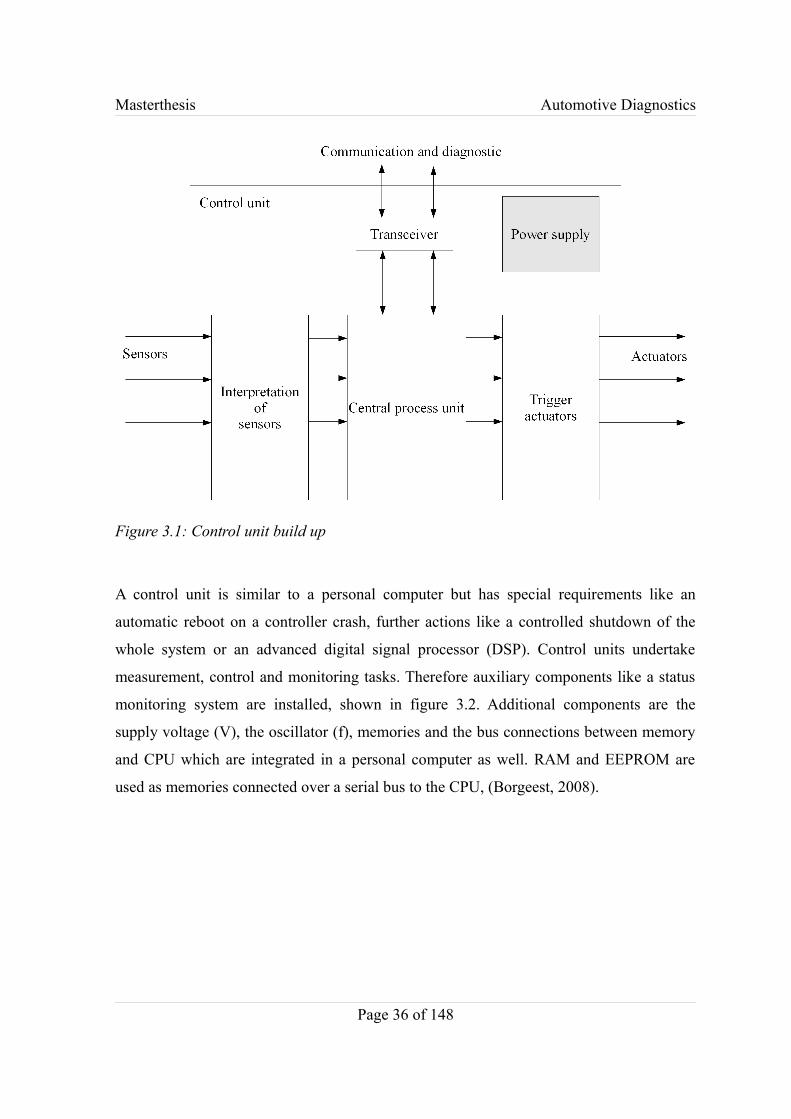
3.1. The principle of an electronic control unit
The tasks of control units in cars are totally differing depending on the function but the
basic design is very similar. The task of a control unit is to process sensor data and
adjusting actuators using a control algorithm. In figure 3.1 the basic structure of a control
unit is shown and the control unit consists of:
• The CPU to process the control algorithm.
• Interface circuits for special sensors and actuators which is tried to standardised
(e.g. using the bus systems CAN/LIN etcetera of the car). But there will be always
sensors and actuators with special requirements on the communication interface.
• A transceiver as communication interface to other control units and service tools.
• A power supply.
Page 35 of 148
Masterthesis Automotive Diagnostics
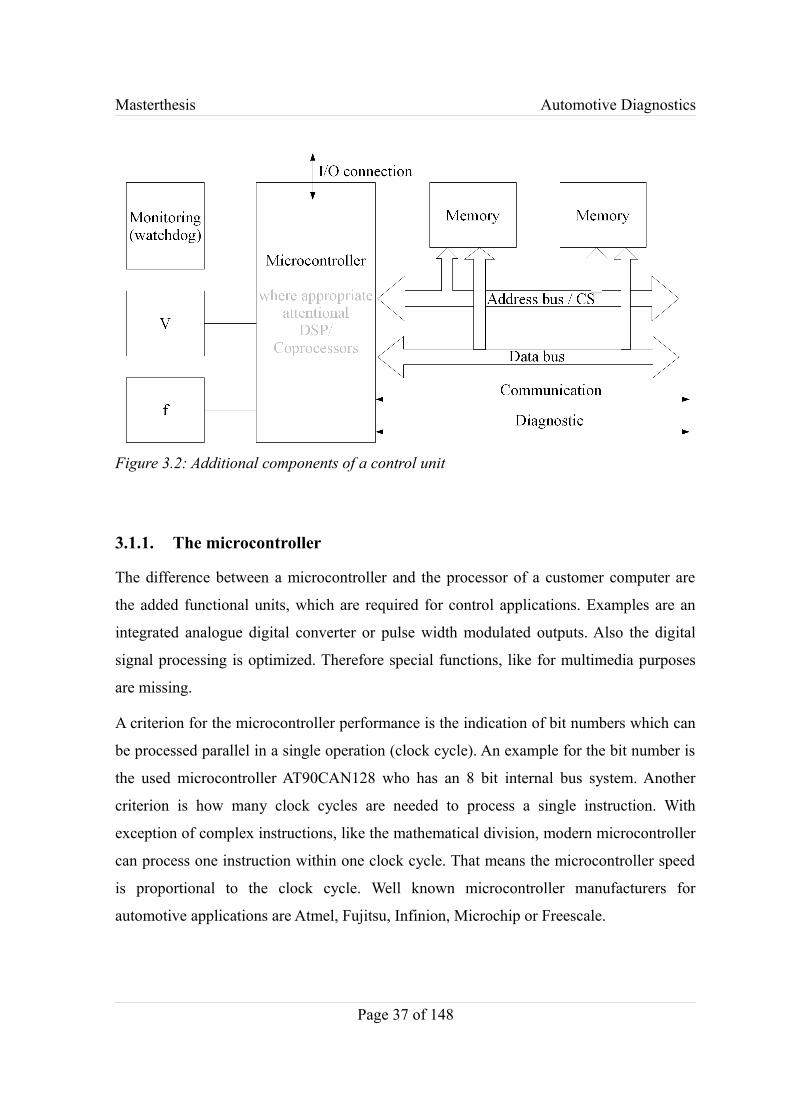
A control unit is similar to a personal computer but has special requirements like an
automatic reboot on a controller crash, further actions like a controlled shutdown of the
whole system or an advanced digital signal processor (DSP). Control units undertake
measurement, control and monitoring tasks. Therefore auxiliary components like a status
monitoring system are installed, shown in figure 3.2. Additional components are the
supply voltage (V), the oscillator (f), memories and the bus connections between memory
and CPU which are integrated in a personal computer as well. RAM and EEPROM are
used as memories connected over a serial bus to the CPU, (Borgeest, 2008).
Page 36 of 148
Figure 3.1: Control unit build up
Masterthesis Automotive Diagnostics
3.1.1. The microcontroller
The difference between a microcontroller and the processor of a customer computer are
the added functional units, which are required for control applications. Examples are an
integrated analogue digital converter or pulse width modulated outputs. Also the digital
signal processing is optimized. Therefore special functions, like for multimedia purposes
are missing.
A criterion for the microcontroller performance is the indication of bit numbers which can
be processed parallel in a single operation (clock cycle). An example for the bit number is
the used microcontroller AT90CAN128 who has an 8 bit internal bus system. Another
criterion is how many clock cycles are needed to process a single instruction. With
exception of complex instructions, like the mathematical division, modern microcontroller
can process one instruction within one clock cycle. That means the microcontroller speed
is proportional to the clock cycle. Well known microcontroller manufacturers for
automotive applications are Atmel, Fujitsu, Infinion, Microchip or Freescale.
Page 37 of 148
Figure 3.2: Additional components of a control unit
Masterthesis Automotive Diagnostics
3.1.2. Memories
Memories are differentiated in volatile and non-volatile memories. Volatile memories
loose the stored data after switching off the supply voltage whilst non-volatile memories
keep the data.
A volatile memory is the random access memory RAM. The RAM is differentiated in
SRAM which stores the data with flip-flops and DRAM which stores the data in little
capacitors. The capacitors capacity is very limited to femto farad on the circuits. That
means the capacitors need to be recharged in a rhythm of milliseconds. Therefore a refresh
controller is needed which is a disadvantage of the DRAM. For this reason the SRAM
technique in microcontroller applications is used.
The software (algorithm) and characteristics are stored in the non-volatile memory.
Therefore personal computers using the hard drive which stores the data magnetically. The
data from the hard drive is loaded into the RAM. A hard drive is not used in an embedded
system due to the size and non shock resistance of a hard drive.
For this reason embedded systems use fixed wires. A fixed connection to ground or supply
voltage represents a logic “0” or “1”. Such a device is called read only memory ROM or
mask ROM. The terminology “mask” has the origin in the integrated circuit fabrication.
Some regions of the chip are masked off during the photolithography process. The MROM
stores the data steady and can not be programmed by the car manufacturers. This method
is only lucrative on a large number of items, due to the high development costs of a
MROM.
Non-volatile memories which are programmed by the car manufacturer are called PROM.
During the programming process microscopical little fuses in the semi conductor are
destroyed to image the stored data. This procedure is irreversible and is called one time
programmable OTP.
But during the development of embedded systems it is helpful to erase the ROM and
reprogram it. Such a device is called EPROM. The programming takes place using
floating gate transistors and a specific voltage. To erase the ROM ultraviolet radiation is
used. Hence EPROMs have a quartz glass window in the microcontroller housing to
Page 38 of 148
Masterthesis Automotive Diagnostics
expose the chip. Unintentional erasing of the ROM can occur by gamma radiation.
Due to the intricateness and tediousness in the erasing process of an EPROM EEPROMs
were developed. The microcontroller has not to be removed from the circuit and can be
reprogrammed with the ISP or ICP interfaces, which is an advantage of the EEPROMs.
EEPROMs with little store capacity are connected over a serial bus and not via the parallel
bus to save costs and circuit space. That is why they are called serial EEPROMs.
EEPROMs with a short programming time are called flash EEPROMs or briefly flash. The
number of programming cycles is limited, (Borgeest, 2008). In the case of the
AT90CAN128 to 10 000 write/erase cycles and therefore the EEPROM should not be used
as a RAM device, (Barrett/Pack, 2008).
3.1.3. Monitoring system
Personal computer users have experience with a crashed computer system. An example is
the freezing of a program or an application. The user can solve the problem by restarting
the computer. But this approach is not applicable for embedded systems and especially not
for safety relevant application in cars.
For this reason the controller is monitored and on occurrence of a failure a special action is
implemented.
The easiest monitoring system is the watchdog. This is a device integrated in the controller
and expects in certain time intervals an explicit signal of the microcontroller. If the
watchdog does not receive the expected signal a fault is interpreted. Complex control units
use application specific integrated circuits (ASICs) or even a second controller just for
monitoring tasks.
The easiest reaction in the case of a fault is a reset. Complex control units use fault
statistics and a stepped reaction. For example breaking the fuel supply or turn off of the
complete system.
Page 39 of 148
Masterthesis Automotive Diagnostics
3.1.4. Generation of sensor data
Every control unit which has integrated sensors, like a hydraulic pressures sensor in the
ABS system, acts as a measurement device. The sensors convert physical values into an
electrical corresponding signal. Sometimes the electrical signal is in a region which is not
useful and the signal must be transformed in another area. Also faulty signals must be
detected and noisy signals should be filtered. Above all the signal must be digitalised to
make it processable for the controller. Mostly the correlation between measured variable
and sensor signal is not linear. That means the conversion factor is not constant and the
controller needs to know the characteristics of the sensors to conclude from the measured
signal to the actual physical value. In the following an abstract of installed sensors in cars
with their applications is given:
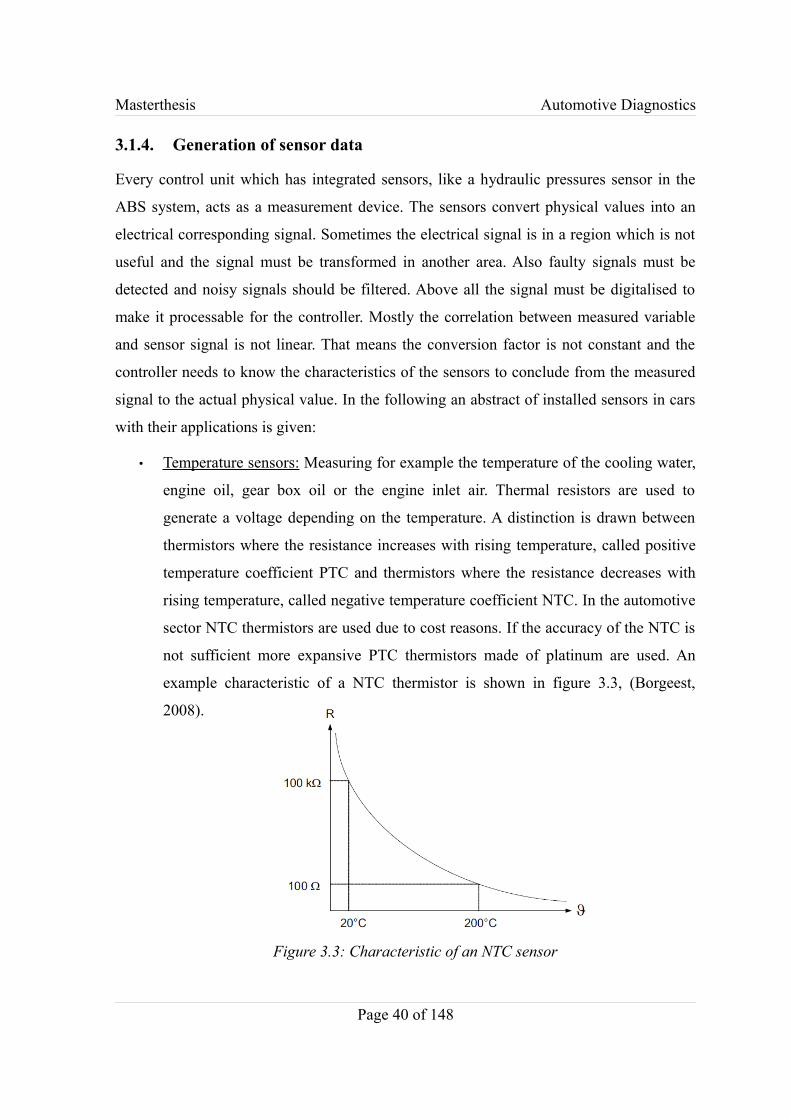
• Temperature sensors: Measuring for example the temperature of the cooling water,
engine oil, gear box oil or the engine inlet air. Thermal resistors are used to
generate a voltage depending on the temperature. A distinction is drawn between
thermistors where the resistance increases with rising temperature, called positive
temperature coefficient PTC and thermistors where the resistance decreases with
rising temperature, called negative temperature coefficient NTC. In the automotive
sector NTC thermistors are used due to cost reasons. If the accuracy of the NTC is
not sufficient more expansive PTC thermistors made of platinum are used. An
example characteristic of a NTC thermistor is shown in figure 3.3, (Borgeest,
2008).
Page 40 of 148
Figure 3.3: Characteristic of an NTC sensor
Masterthesis Automotive Diagnostics
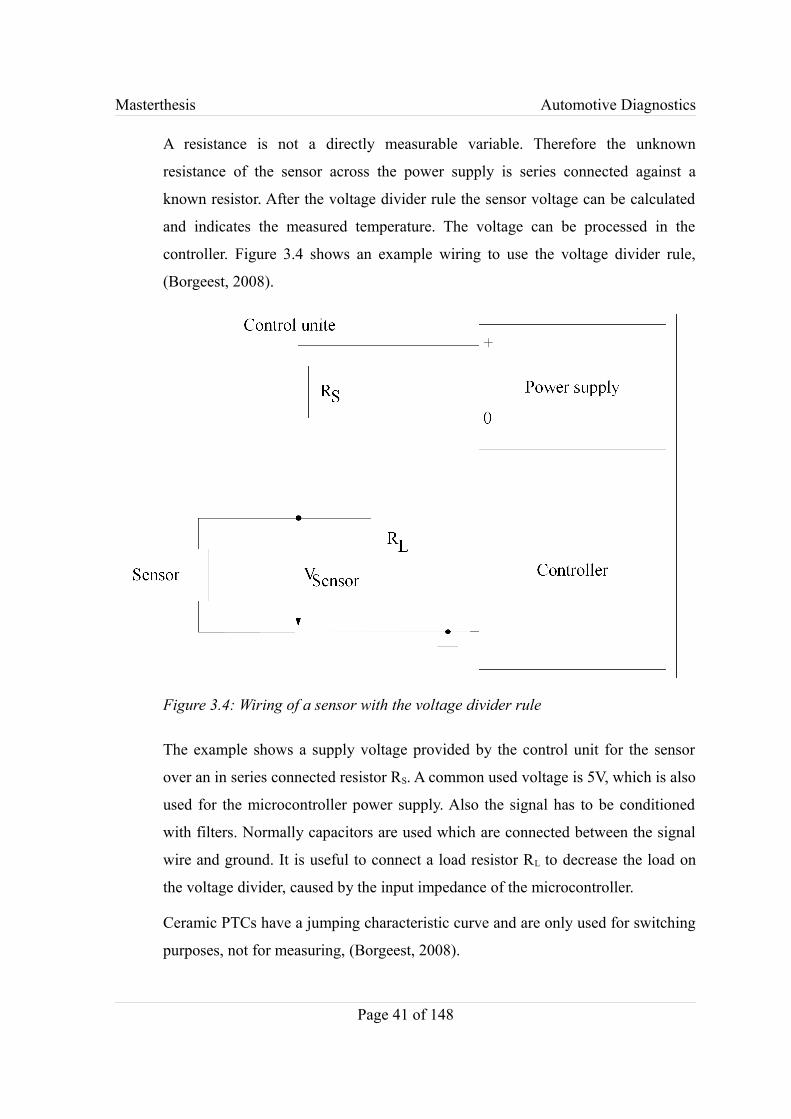
A resistance is not a directly measurable variable. Therefore the unknown
resistance of the sensor across the power supply is series connected against a
known resistor. After the voltage divider rule the sensor voltage can be calculated
and indicates the measured temperature. The voltage can be processed in the
controller. Figure 3.4 shows an example wiring to use the voltage divider rule,
(Borgeest, 2008).
The example shows a supply voltage provided by the control unit for the sensor
over an in series connected resistor RS. A common used voltage is 5V, which is also
used for the microcontroller power supply. Also the signal has to be conditioned
with filters. Normally capacitors are used which are connected between the signal
wire and ground. It is useful to connect a load resistor RL to decrease the load on
the voltage divider, caused by the input impedance of the microcontroller.
Ceramic PTCs have a jumping characteristic curve and are only used for switching
purposes, not for measuring, (Borgeest, 2008).
Page 41 of 148
Figure 3.4: Wiring of a sensor with the voltage divider rule
Masterthesis Automotive Diagnostics
• Distance and angle sensors: Are used to estimate the position of an electrical
actuator. Example applications are the angle of the acceleration pedal or the
steering wheel. For distance, measurement potentiometers are mostly used, where a
flexible wiper moves over a resistive element and grips some voltage, depending
on the position of the polisher. Due to the abrasion, manufacturers passed on to
more expansive contact free sensors. Contact free sensors using magnets, which
are moved over a magnetic field. To detect the distance to another vehicle the radar
technique or optical sensor are used.
• Vehicle speed sensors: Using the wheel speed sensors, which measuring indirectly
the speed. The relative speed to other cars is measured with optical sensors and
radar systems.
• Rotation speed sensors: Are used for example for the engine rpm. The rpm can
only be measured with a magnetic sensors, because optical sensors are prone to
pollution.
• Acceleration sensors: Are used for dynamic stability control systems, crash
detection, anti theft protection and noise vibration harshness (NVH) related
applications. Tilt sensors are measuring the acceleration of the gravity in a special
direction and hence determine the tilt.
• Pressure sensors: Are used for the measurement of the gas pressure like in the
atmospheric, in the turbo charger or in the tyres and also for fluid pressures used in
the fuel injection process or in the braking system. The atmospheric pressure
sensors have to measure a pressure in the area of 1 bar, while sensors for the
injection pressure of the fuel have to measure a pressure till 2000 bar. Typical
sensors consisting of a membrane made of silicium or metal. One side of the
membrane is the measured pressure and on the second side a reference pressures.
The bending of the membrane is measured by the change in the resistance.
• Moisture sensors: Are used to measure the air humidity inside the vehicle to avoid
fogging of the window by heating or drying the air using the air conditioning
system. This kind of sensors consists of capacitors with a porous dielectric which
Page 42 of 148
Masterthesis Automotive Diagnostics
changes the capacity with the absorption of humidity.
• Gas sensors: Are used especially for the exhaust gas treatment. An example is the
oxygen sensor. Also the ventilation is controlled depending on the air quality inside
the car (measuring the CO2) and the fresh air (measuring CO2 exhaust of the car in
front), (Jurgen, 1999), (Turner, 2009).
Analogue Digital conversion
The output voltage of the sensor is the signal input for the microcontroller. The voltage has
a defined range and needs to be converter for further processing. This is the task of the
analogue to digital converter.
The continuous output voltage of the sensor is usually between 0V and 5V. This voltage is
quantised in discrete values which is called quantization. The number of quantization
levels determines the resolution of the system.
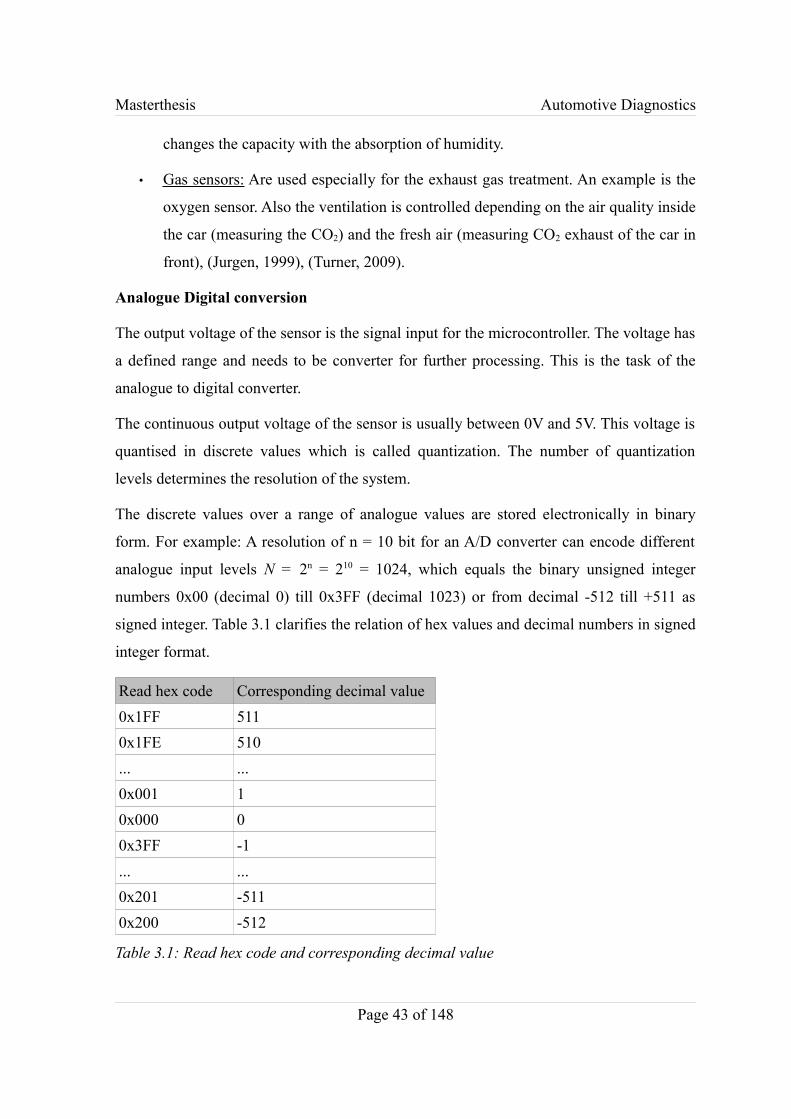
The discrete values over a range of analogue values are stored electronically in binary
form. For example: A resolution of n = 10 bit for an A/D converter can encode different
analogue input levels N = 2n = 210 = 1024, which equals the binary unsigned integer
numbers 0x00 (decimal 0) till 0x3FF (decimal 1023) or from decimal -512 till +511 as
signed integer. Table 3.1 clarifies the relation of hex values and decimal numbers in signed
integer format.
Read hex code Corresponding decimal value0x1FF 5110x1FE 510... ...0x001 10x000 00x3FF -1... ...0x201 -5110x200 -512
Table 3.1: Read hex code and corresponding decimal value
Page 43 of 148
Masterthesis Automotive Diagnostics
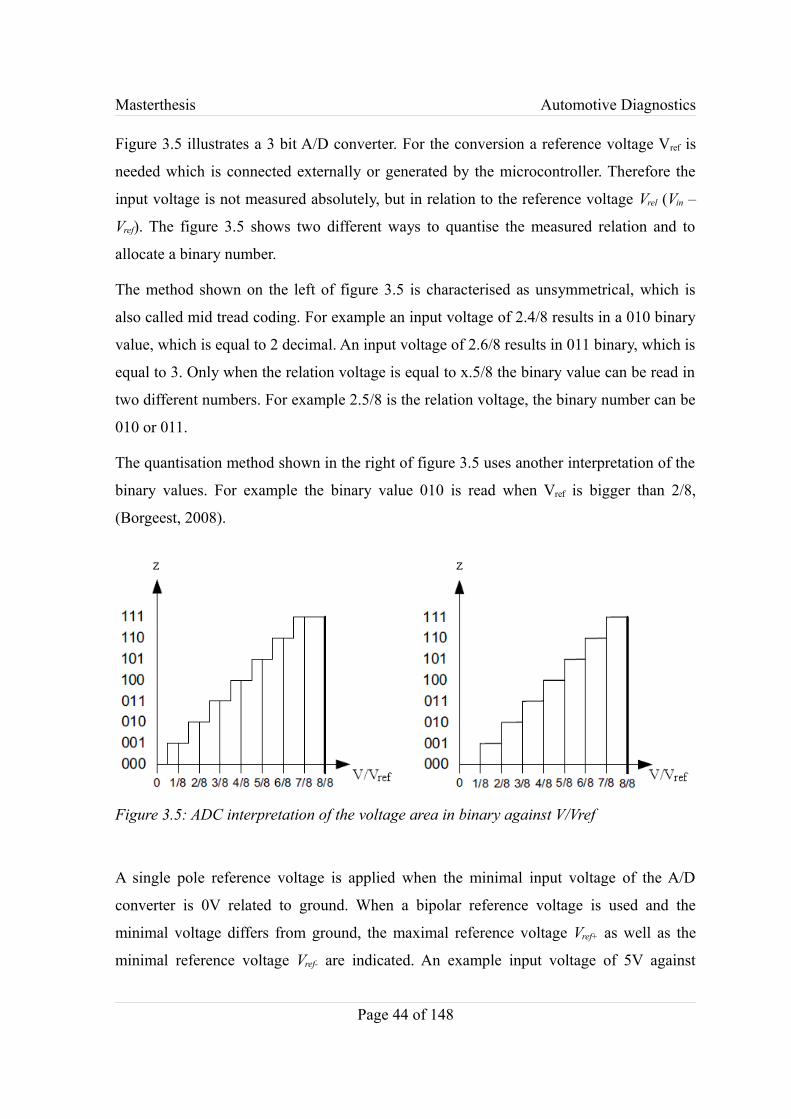
Figure 3.5 illustrates a 3 bit A/D converter. For the conversion a reference voltage Vref is
needed which is connected externally or generated by the microcontroller. Therefore the
input voltage is not measured absolutely, but in relation to the reference voltage Vrel (Vin –
Vref). The figure 3.5 shows two different ways to quantise the measured relation and to
allocate a binary number.
The method shown on the left of figure 3.5 is characterised as unsymmetrical, which is
also called mid tread coding. For example an input voltage of 2.4/8 results in a 010 binary
value, which is equal to 2 decimal. An input voltage of 2.6/8 results in 011 binary, which is
equal to 3. Only when the relation voltage is equal to x.5/8 the binary value can be read in
two different numbers. For example 2.5/8 is the relation voltage, the binary number can be
010 or 011.
The quantisation method shown in the right of figure 3.5 uses another interpretation of the
binary values. For example the binary value 010 is read when Vref is bigger than 2/8,
(Borgeest, 2008).
A single pole reference voltage is applied when the minimal input voltage of the A/D
converter is 0V related to ground. When a bipolar reference voltage is used and the
minimal voltage differs from ground, the maximal reference voltage Vref+ as well as the
minimal reference voltage Vref- are indicated. An example input voltage of 5V against
Page 44 of 148
Figure 3.5: ADC interpretation of the voltage area in binary against V/Vref
Masterthesis Automotive Diagnostics
ground and a resolution of 10 bit results in 1024 quantisation levels. Each level has a
gauge of 4.883 mV. Feeding the minimal reference voltage (ground or Vref-) on the input of
the A/D converter produces a 0 (in binary as well as in decimal). The maximal reference
voltage Vref+ on the input produces a 1023 decimal.
The input voltages and the sampling time are quantised. Commonly a measured value is
sampled at fixed intervals, e.g. 10ms. Alternatively an event triggered sampling is also
possible.
After starting an A/D conversion a specific time, depending on the converter type, is
needed till the correct binary value is created and transmitted to the arithmetic logic unit.
The controller sets a status bit (flag) or executes an interrupt at the end of a conversion.
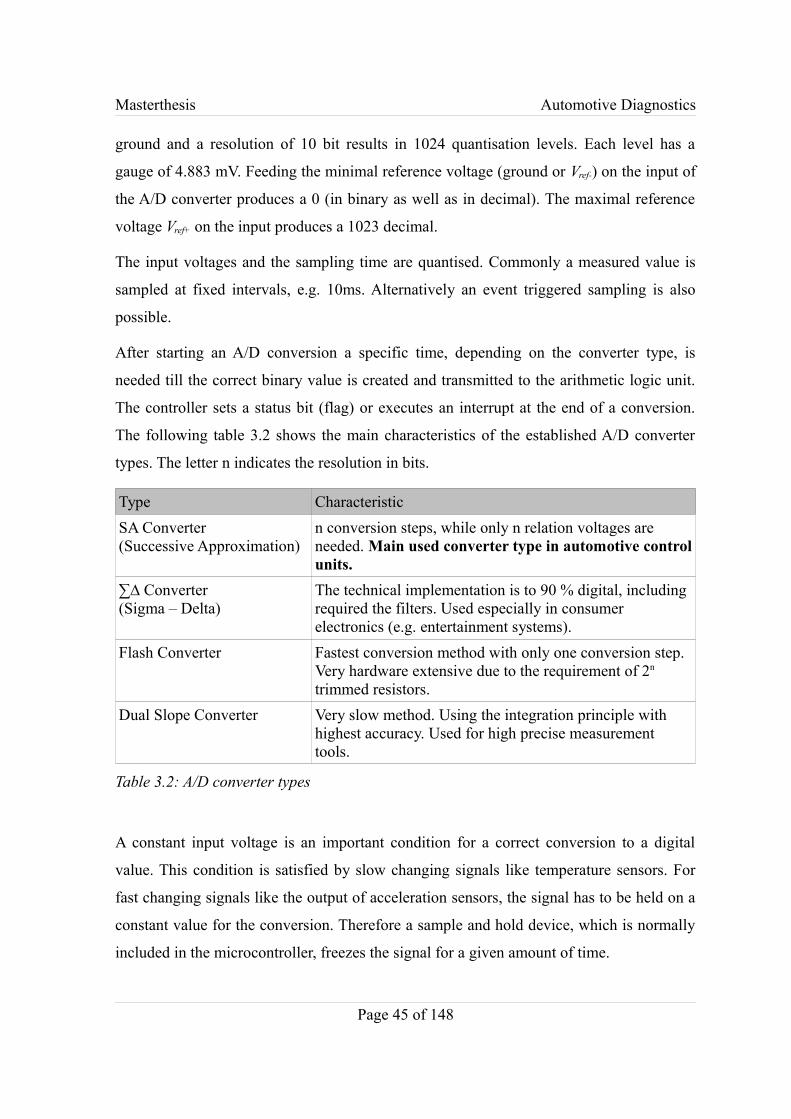
The following table 3.2 shows the main characteristics of the established A/D converter
types. The letter n indicates the resolution in bits.
Type CharacteristicSA Converter(Successive Approximation)
n conversion steps, while only n relation voltages are needed. Main used converter type in automotive control units.
∑∆ Converter(Sigma – Delta)
The technical implementation is to 90 % digital, including required the filters. Used especially in consumer electronics (e.g. entertainment systems).
Flash Converter Fastest conversion method with only one conversion step. Very hardware extensive due to the requirement of 2n
trimmed resistors.Dual Slope Converter Very slow method. Using the integration principle with
highest accuracy. Used for high precise measurement tools.
Table 3.2: A/D converter types
A constant input voltage is an important condition for a correct conversion to a digital
value. This condition is satisfied by slow changing signals like temperature sensors. For
fast changing signals like the output of acceleration sensors, the signal has to be held on a
constant value for the conversion. Therefore a sample and hold device, which is normally
included in the microcontroller, freezes the signal for a given amount of time.
Page 45 of 148
Masterthesis Automotive Diagnostics
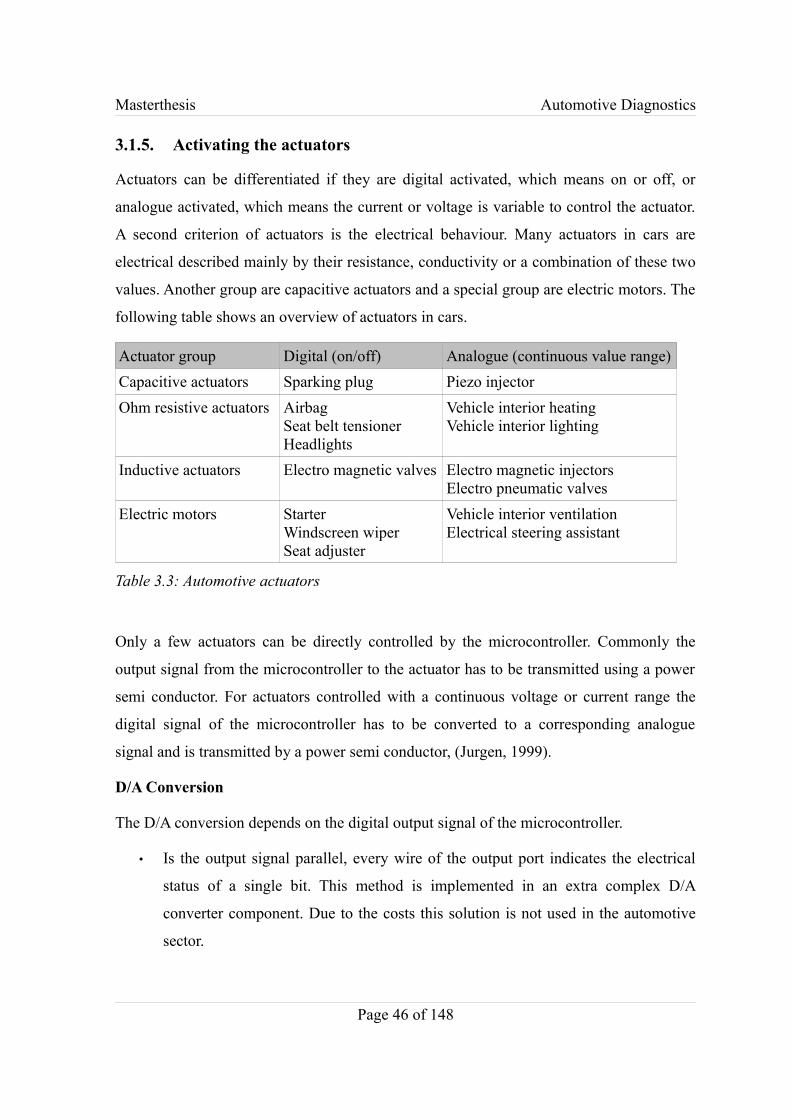
3.1.5. Activating the actuators
Actuators can be differentiated if they are digital activated, which means on or off, or
analogue activated, which means the current or voltage is variable to control the actuator.
A second criterion of actuators is the electrical behaviour. Many actuators in cars are
electrical described mainly by their resistance, conductivity or a combination of these two
values. Another group are capacitive actuators and a special group are electric motors. The
following table shows an overview of actuators in cars.
Actuator group Digital (on/off) Analogue (continuous value range)Capacitive actuators Sparking plug Piezo injectorOhm resistive actuators Airbag
Seat belt tensionerHeadlights
Vehicle interior heatingVehicle interior lighting
Inductive actuators Electro magnetic valves Electro magnetic injectorsElectro pneumatic valves
Electric motors StarterWindscreen wiperSeat adjuster
Vehicle interior ventilationElectrical steering assistant
Table 3.3: Automotive actuators
Only a few actuators can be directly controlled by the microcontroller. Commonly the
output signal from the microcontroller to the actuator has to be transmitted using a power
semi conductor. For actuators controlled with a continuous voltage or current range the
digital signal of the microcontroller has to be converted to a corresponding analogue
signal and is transmitted by a power semi conductor, (Jurgen, 1999).
D/A Conversion
The D/A conversion depends on the digital output signal of the microcontroller.
• Is the output signal parallel, every wire of the output port indicates the electrical
status of a single bit. This method is implemented in an extra complex D/A
converter component. Due to the costs this solution is not used in the automotive
sector.
Page 46 of 148

Masterthesis Automotive Diagnostics
• For a serial output signal no converters are existing. But this method is sometimes
useful for transmitting the signal over the bus system to other control units. For the
D/A conversion the data has to be parallelised.
• The third method is pulse width modulation (PWM). The controller output on one
port is a square wave signal. The signal is divided in for example 255 equal time
periods.
• To represent the number 0, the signal has to be turned off for the whole
period (T = 0).
• To represent the number 255, the signal has to be turned on for the whole
period (T = 1).
• To represent the number 127 for example, the signal has to be turned on for
a sampling period of T = 127/255, which is almost 0.5.
• To represent a number bigger than 255, one period has to be divided in
more then 255 areas.
An advantage of this method is the very easy and cheap conversion of a digital
signal in an analogue signal, (Wallentowitz/Reif, 2006).
3.2. The CAN bus
As described in chapter 1 the CAN bus was developed by Bosch and Intel in 1986. The
first car produced in mass production fitted with the CAN bus was the Mercedes S class in
1992, (Hristu-Varsakelis/Levine, 2005). In 1993 the CAN bus was standardised in the ISO
11898 which consists of five parts:
● Part 1: Data link layer and physical signalling
● Part 2: High speed medium access unit
● Part 3: Low speed, fault tolerant, medium dependent interface
● Part 4: Time triggered communication
● Part 5: High speed medium access unit with low power mode
Page 47 of 148
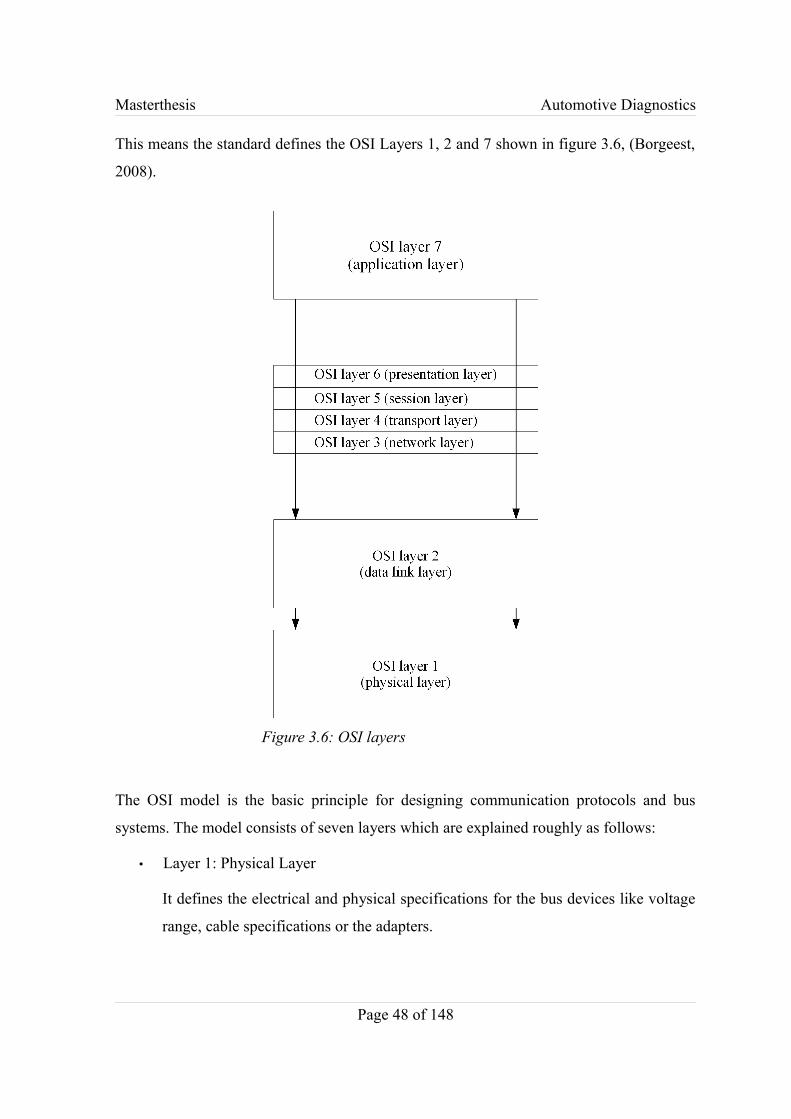
Masterthesis Automotive Diagnostics
This means the standard defines the OSI Layers 1, 2 and 7 shown in figure 3.6, (Borgeest,
2008).
The OSI model is the basic principle for designing communication protocols and bus
systems. The model consists of seven layers which are explained roughly as follows:
• Layer 1: Physical Layer
It defines the electrical and physical specifications for the bus devices like voltage
range, cable specifications or the adapters.
Page 48 of 148
Figure 3.6: OSI layers

Masterthesis Automotive Diagnostics
• Layer 2: Data Link Layer
It is responsible for the communication between adjacent network notes.
• Layer 3: Network Layer
It provides the procedural and functional logic of transferring data sequences from
a source to a destination over several networks.
• Layer 4: Transport Layer
It controls the data flow and is responsible for the end to end connection.
• Layer 5: Session Layer
It provides the communication between different systems.
• Layer 6: Presentation Layer
It presents the data in a system independent format. A second task is the encryption
and decryption of the data.
• Layer 7: Application Layer
It is the access to the network for applications, (Zimmermann, 1980).
3.2.1. Physical Layer of the CAN bus
The physical and the data link layer are available as integrated circuits with the
differentiation of CAN transceivers for high speed and low speed systems. In the
following the circuits of the high speed and low speed CAN transceiver is explained in
more detail.
The figure 3.7 shows the principle structure of a CAN interface. The CAN controller
manages the data stream between the ECU and the CAN bus, (Wallentowitz/Reif, 2006).
Page 49 of 148
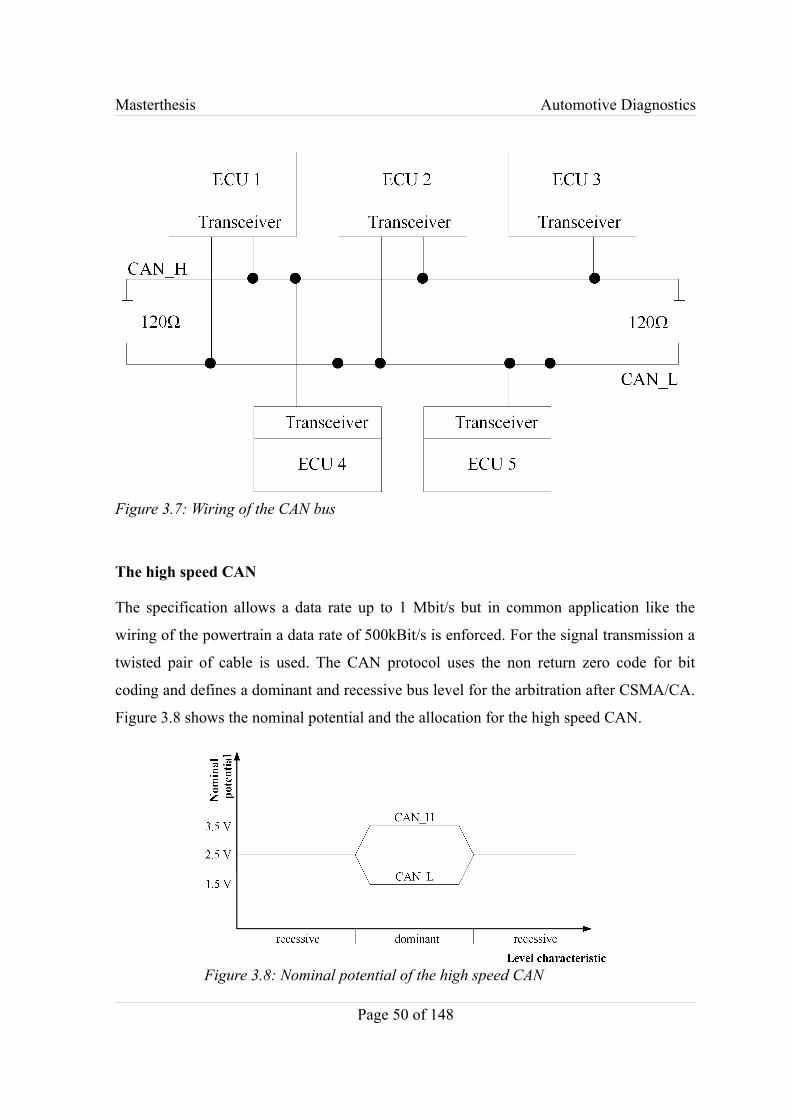
Masterthesis Automotive Diagnostics
The high speed CAN
The specification allows a data rate up to 1 Mbit/s but in common application like the
wiring of the powertrain a data rate of 500kBit/s is enforced. For the signal transmission a
twisted pair of cable is used. The CAN protocol uses the non return zero code for bit
coding and defines a dominant and recessive bus level for the arbitration after CSMA/CA.
Figure 3.8 shows the nominal potential and the allocation for the high speed CAN.
Page 50 of 148
Figure 3.8: Nominal potential of the high speed CAN
Figure 3.7: Wiring of the CAN bus

Masterthesis Automotive Diagnostics
The low speed CAN
The communications between the control units of the comfort system like the air
conditioning or electrical seats are independent from the high speed CAN system. The
data rate is limited to 125kBit/s and is therefore classified as low speed CAN or CAN-B.
The numbers of control units in one low speed CAN network is limited to 32. The lower
data rate enables another fault detection mechanism which means the low speed CAN is
fault tolerant to electrical short circuit and adjournment between the data wires CAN_H
and CAN_L. The figure 3.9 shows the nominal potential of the fault tolerant low speed
CAN. Compared to the high speed CAN in figure 3.8 the difference of potential is much
higher between the dominant and recessive bit. Therefore it is possible to run the low
speed CAN on a single wire. The transceiver is able to detect an adjournment in the data
wires CAN_H or CAN_L, a short circuit between CAN_H and CAN_L, a short circuit
between ground and one of the data wires or a short circuit between supply voltage and the
data wires. In that case the transceiver switches automatically the mode of operation which
means the faulty data wire will be turned off and only the other wire is used for the data
transmission.
Page 51 of 148
Figure 3.9: Nominal potential of the low speed CAN
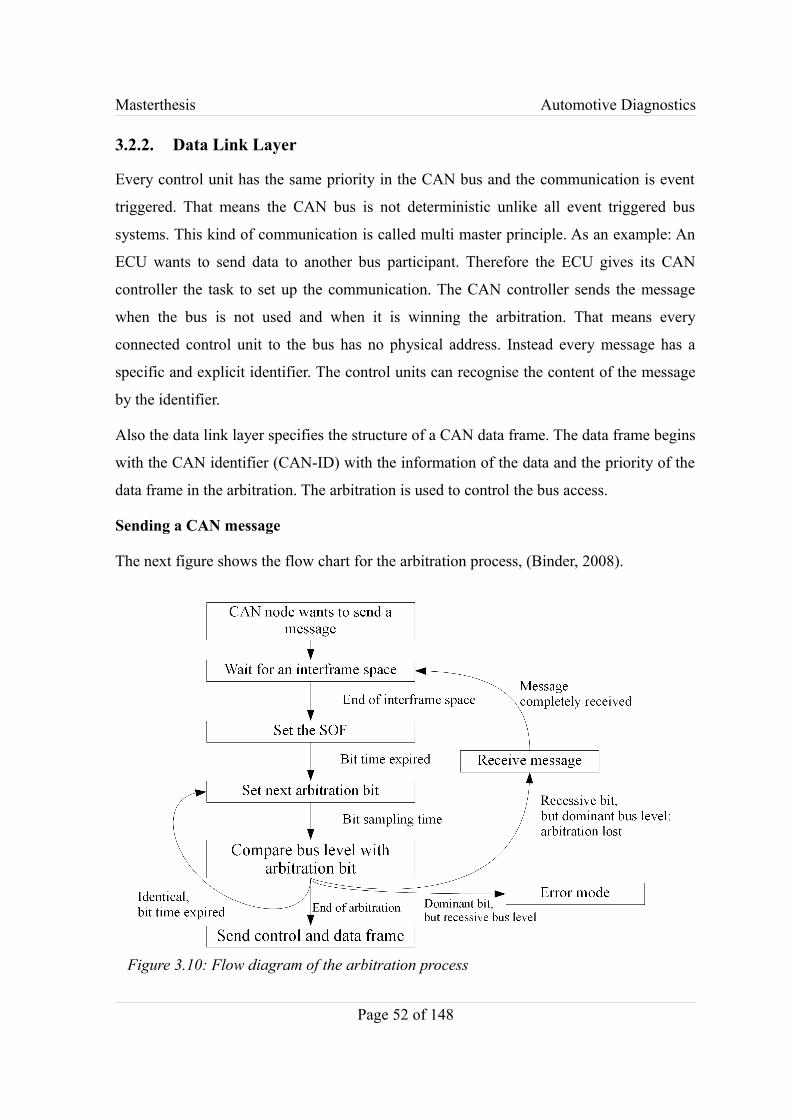
Masterthesis Automotive Diagnostics
3.2.2. Data Link Layer
Every control unit has the same priority in the CAN bus and the communication is event
triggered. That means the CAN bus is not deterministic unlike all event triggered bus
systems. This kind of communication is called multi master principle. As an example: An
ECU wants to send data to another bus participant. Therefore the ECU gives its CAN
controller the task to set up the communication. The CAN controller sends the message
when the bus is not used and when it is winning the arbitration. That means every
connected control unit to the bus has no physical address. Instead every message has a
specific and explicit identifier. The control units can recognise the content of the message
by the identifier.
Also the data link layer specifies the structure of a CAN data frame. The data frame begins
with the CAN identifier (CAN-ID) with the information of the data and the priority of the
data frame in the arbitration. The arbitration is used to control the bus access.
Sending a CAN message
The next figure shows the flow chart for the arbitration process, (Binder, 2008).
Page 52 of 148
Figure 3.10: Flow diagram of the arbitration process
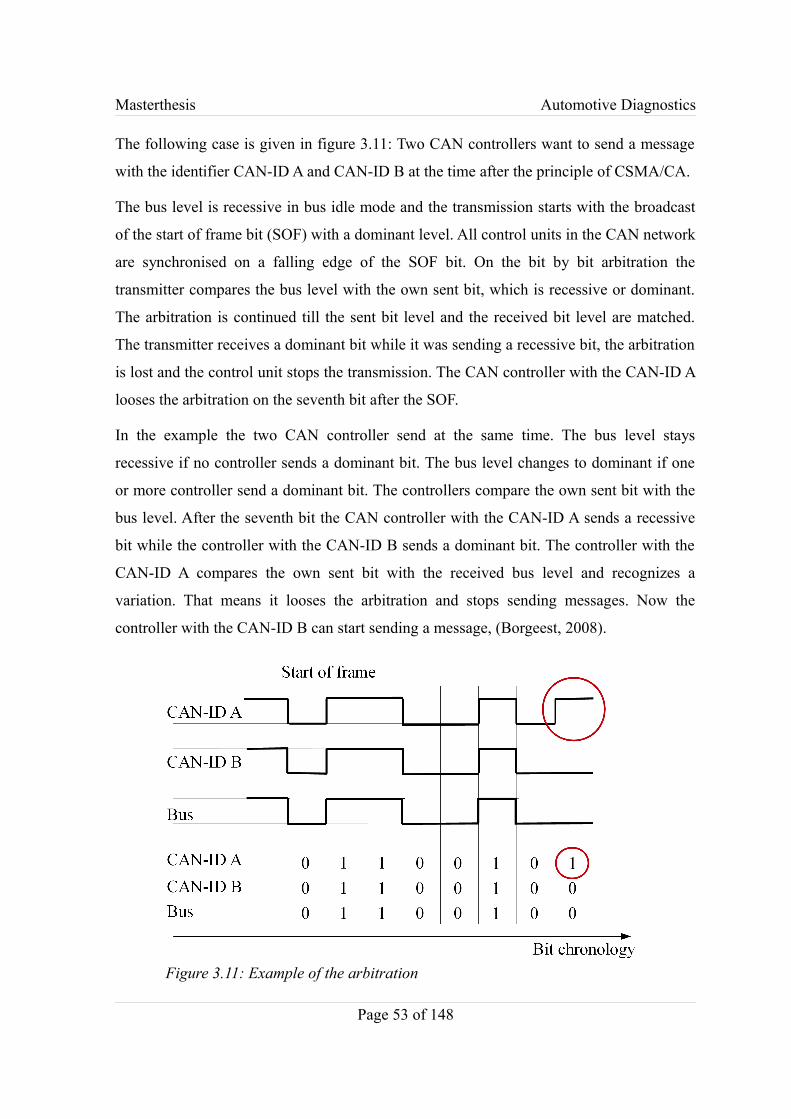
Masterthesis Automotive Diagnostics
The following case is given in figure 3.11: Two CAN controllers want to send a message
with the identifier CAN-ID A and CAN-ID B at the time after the principle of CSMA/CA.
The bus level is recessive in bus idle mode and the transmission starts with the broadcast
of the start of frame bit (SOF) with a dominant level. All control units in the CAN network
are synchronised on a falling edge of the SOF bit. On the bit by bit arbitration the
transmitter compares the bus level with the own sent bit, which is recessive or dominant.
The arbitration is continued till the sent bit level and the received bit level are matched.
The transmitter receives a dominant bit while it was sending a recessive bit, the arbitration
is lost and the control unit stops the transmission. The CAN controller with the CAN-ID A
looses the arbitration on the seventh bit after the SOF.
In the example the two CAN controller send at the same time. The bus level stays
recessive if no controller sends a dominant bit. The bus level changes to dominant if one
or more controller send a dominant bit. The controllers compare the own sent bit with the
bus level. After the seventh bit the CAN controller with the CAN-ID A sends a recessive
bit while the controller with the CAN-ID B sends a dominant bit. The controller with the
CAN-ID A compares the own sent bit with the received bus level and recognizes a
variation. That means it looses the arbitration and stops sending messages. Now the
controller with the CAN-ID B can start sending a message, (Borgeest, 2008).
Page 53 of 148
Figure 3.11: Example of the arbitration
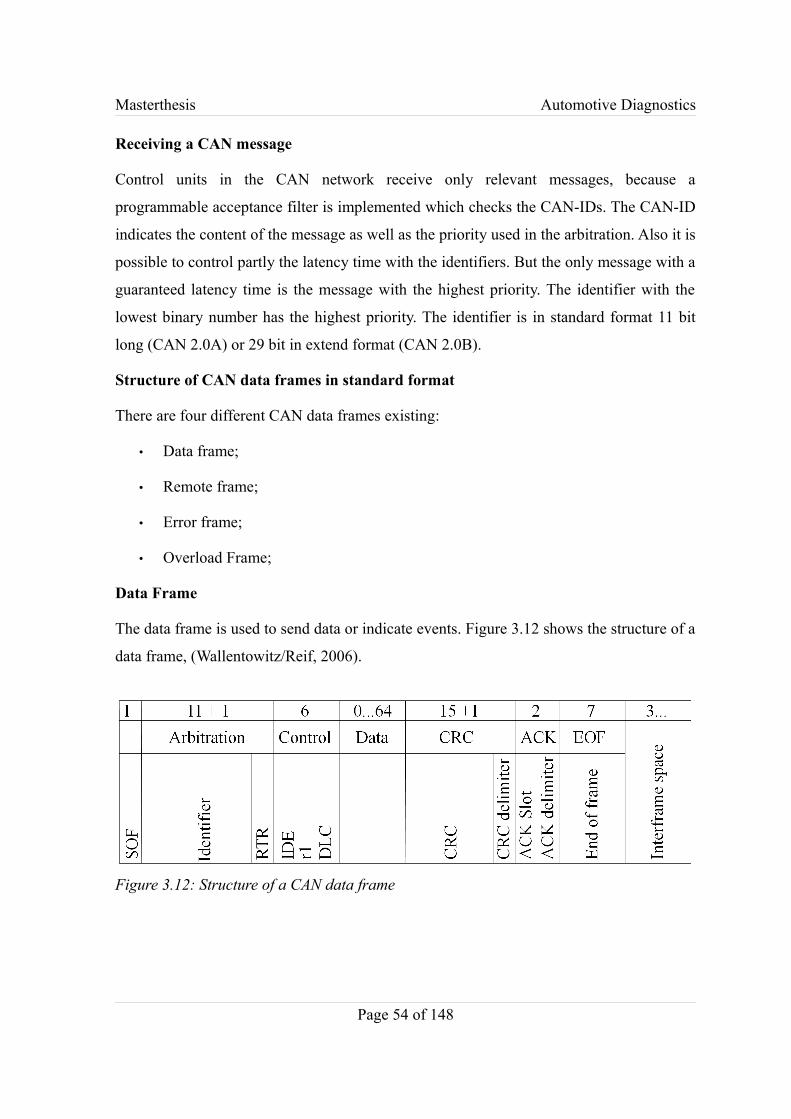
Masterthesis Automotive Diagnostics
Receiving a CAN message
Control units in the CAN network receive only relevant messages, because a
programmable acceptance filter is implemented which checks the CAN-IDs. The CAN-ID
indicates the content of the message as well as the priority used in the arbitration. Also it is
possible to control partly the latency time with the identifiers. But the only message with a
guaranteed latency time is the message with the highest priority. The identifier with the
lowest binary number has the highest priority. The identifier is in standard format 11 bit
long (CAN 2.0A) or 29 bit in extend format (CAN 2.0B).
Structure of CAN data frames in standard format
There are four different CAN data frames existing:
• Data frame;
• Remote frame;
• Error frame;
• Overload Frame;
Data Frame
The data frame is used to send data or indicate events. Figure 3.12 shows the structure of a
data frame, (Wallentowitz/Reif, 2006).
Page 54 of 148
Figure 3.12: Structure of a CAN data frame
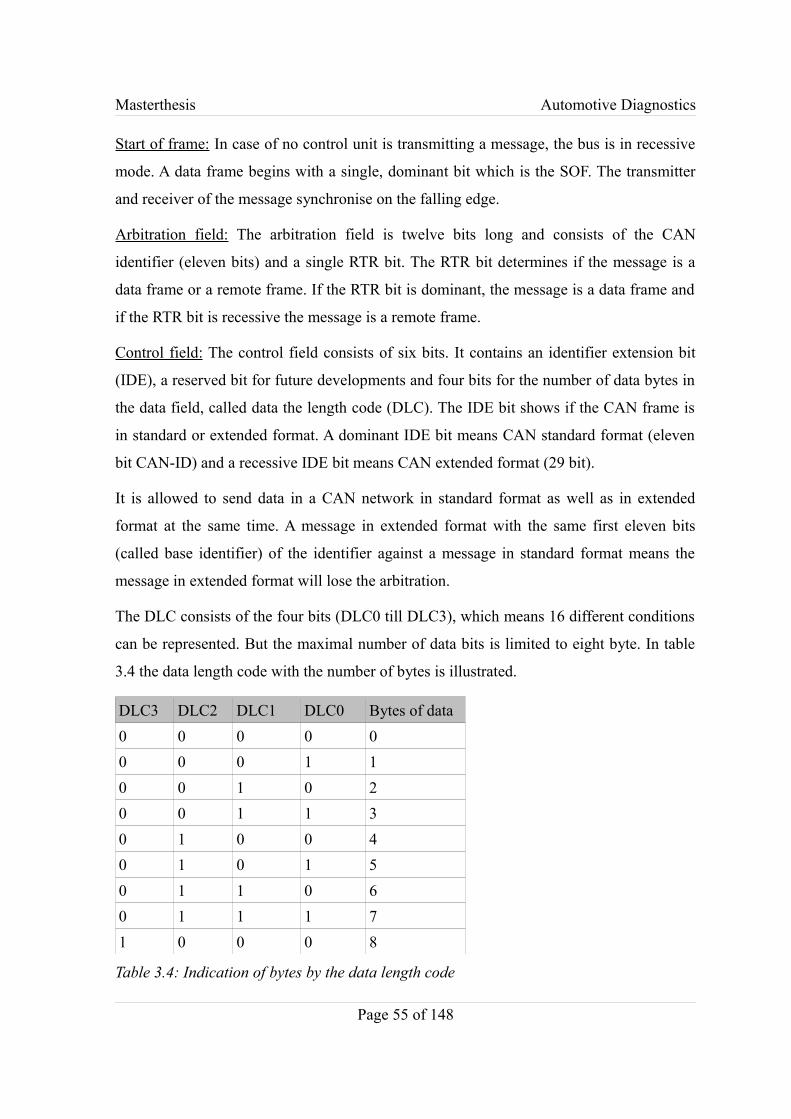
Masterthesis Automotive Diagnostics
Start of frame: In case of no control unit is transmitting a message, the bus is in recessive
mode. A data frame begins with a single, dominant bit which is the SOF. The transmitter
and receiver of the message synchronise on the falling edge.
Arbitration field: The arbitration field is twelve bits long and consists of the CAN
identifier (eleven bits) and a single RTR bit. The RTR bit determines if the message is a
data frame or a remote frame. If the RTR bit is dominant, the message is a data frame and
if the RTR bit is recessive the message is a remote frame.
Control field: The control field consists of six bits. It contains an identifier extension bit
(IDE), a reserved bit for future developments and four bits for the number of data bytes in
the data field, called data the length code (DLC). The IDE bit shows if the CAN frame is
in standard or extended format. A dominant IDE bit means CAN standard format (eleven
bit CAN-ID) and a recessive IDE bit means CAN extended format (29 bit).
It is allowed to send data in a CAN network in standard format as well as in extended
format at the same time. A message in extended format with the same first eleven bits
(called base identifier) of the identifier against a message in standard format means the
message in extended format will lose the arbitration.
The DLC consists of the four bits (DLC0 till DLC3), which means 16 different conditions
can be represented. But the maximal number of data bits is limited to eight byte. In table
3.4 the data length code with the number of bytes is illustrated.
DLC3 DLC2 DLC1 DLC0 Bytes of data0 0 0 0 00 0 0 1 10 0 1 0 20 0 1 1 30 1 0 0 40 1 0 1 50 1 1 0 60 1 1 1 71 0 0 0 8
Table 3.4: Indication of bytes by the data length code
Page 55 of 148
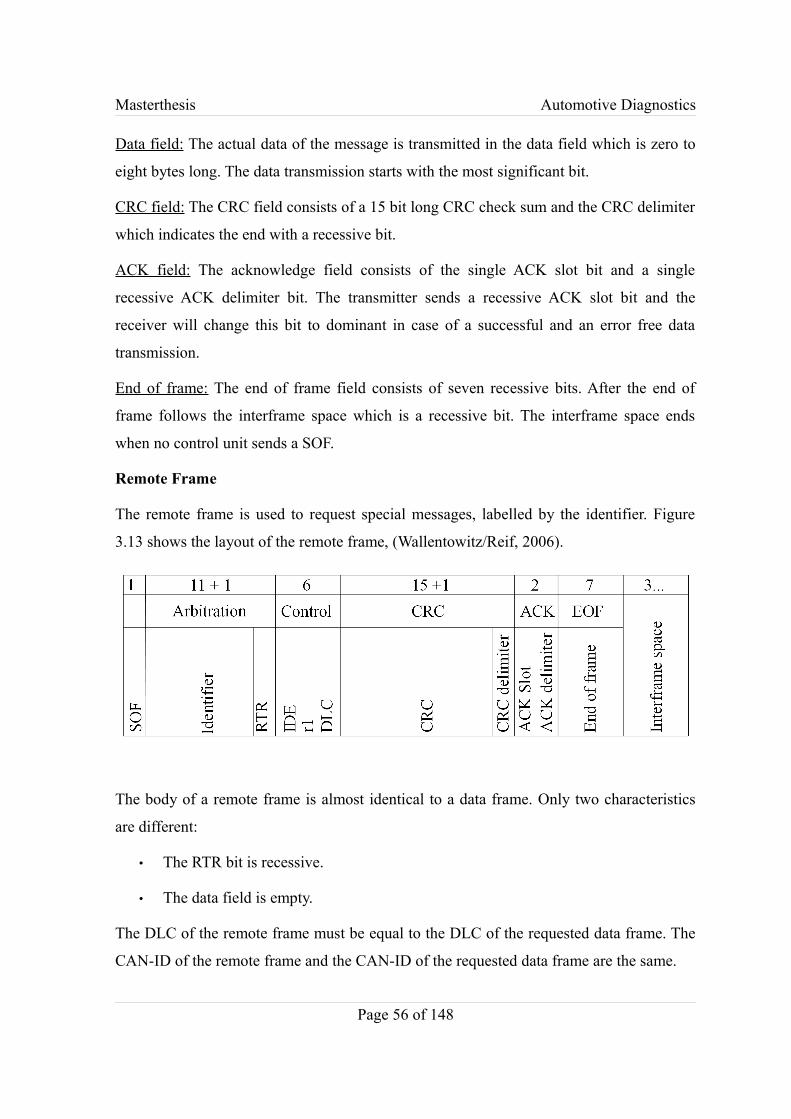
Masterthesis Automotive Diagnostics
Data field: The actual data of the message is transmitted in the data field which is zero to
eight bytes long. The data transmission starts with the most significant bit.
CRC field: The CRC field consists of a 15 bit long CRC check sum and the CRC delimiter
which indicates the end with a recessive bit.
ACK field: The acknowledge field consists of the single ACK slot bit and a single
recessive ACK delimiter bit. The transmitter sends a recessive ACK slot bit and the
receiver will change this bit to dominant in case of a successful and an error free data
transmission.
End of frame: The end of frame field consists of seven recessive bits. After the end of
frame follows the interframe space which is a recessive bit. The interframe space ends
when no control unit sends a SOF.
Remote Frame
The remote frame is used to request special messages, labelled by the identifier. Figure
3.13 shows the layout of the remote frame, (Wallentowitz/Reif, 2006).
The body of a remote frame is almost identical to a data frame. Only two characteristics
are different:
• The RTR bit is recessive.
• The data field is empty.
The DLC of the remote frame must be equal to the DLC of the requested data frame. The
CAN-ID of the remote frame and the CAN-ID of the requested data frame are the same.
Page 56 of 148
Masterthesis Automotive Diagnostics
In case of a control unit with a CAN-ID and a dominant RTR, which means data frame, is
sending a message and a second control unit is sending a message with the same CAN-ID
but with a recessive RTR bit at the same time, which means the control unit with the
dominant RTR is winning the arbitration. This means data frames have a higher priority
than remote frames, which is sensible, because remote frames are requesting data which
can actually be sent by the data source.
Interframe Space
Data and remote frames are separated by the interframe space. The interframe space
consists of an intermission field and an arbitrarily bus idle. The intermission field has three
succeeding, recessive bits. The bus idle has recessive bits as well and arises when no CAN
node is sending a dominant bit. In the intermission field no CAN node is allowed to send a
data or remote frame. With the three bit intermission field, the seven EOF bits and the
recessive ACK delimiter are eleven recessive bits on the bus in a sequence between two
messages. After the sequence the bus is free and can be used for a new transmission
starting with a SOF bit.
Error frame
When a CAN controller detects a disturbance it stops a running data transmission by
sending an error frame. The error frame has an error flag and an eight bit error delimiter.
The error flag has six dominant bits and overwrites all other bits on the bus. Thus breaks
the bit stuffing rule on purpose. The bit stuffing rule is explained later in this thesis,
chapter 3.2.3.
Breaking the bit stuffing rule causes new error flags of other connected control units,
because they are detecting an error on the bus (six dominant bits in a sequence). The
outcome is an overlap of dominant bits on the bus and the length of the error flag varies
between six and twelve bits.
The second field of the error frame is the error delimiter which consists of eight recessive
bits. These bits are sent after the end of the error flag. After the error flag the control unit
sends a single recessive bit and waits till the bus becomes recessive. When the bus is
recessive the control unit sends the last seven recessive bits of the delimiter.
Page 57 of 148
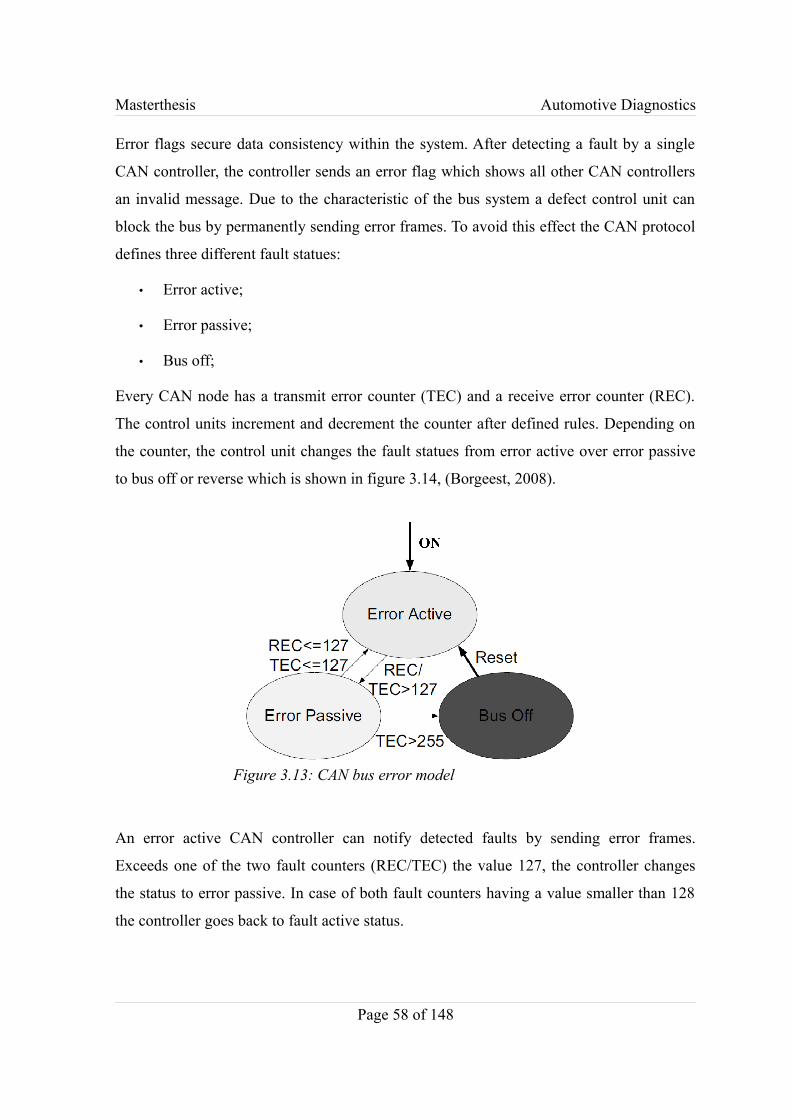
Masterthesis Automotive Diagnostics
Error flags secure data consistency within the system. After detecting a fault by a single
CAN controller, the controller sends an error flag which shows all other CAN controllers
an invalid message. Due to the characteristic of the bus system a defect control unit can
block the bus by permanently sending error frames. To avoid this effect the CAN protocol
defines three different fault statues:
• Error active;
• Error passive;
• Bus off;
Every CAN node has a transmit error counter (TEC) and a receive error counter (REC).
The control units increment and decrement the counter after defined rules. Depending on
the counter, the control unit changes the fault statues from error active over error passive
to bus off or reverse which is shown in figure 3.14, (Borgeest, 2008).
An error active CAN controller can notify detected faults by sending error frames.
Exceeds one of the two fault counters (REC/TEC) the value 127, the controller changes
the status to error passive. In case of both fault counters having a value smaller than 128
the controller goes back to fault active status.
Page 58 of 148
Figure 3.13: CAN bus error model
Masterthesis Automotive Diagnostics
A controller in fault passive status sends a sequence of six recessive bits in case of fault
detection. This means the controller is not able to overwrite messages which are received
error free from other control units.
A CAN controller changes the status from error passive to bus off when the TEC is greater
than 255. In this case the controller is completely decoupled to the bus system. Some
controller can still receive messages in this mode, depending on their implementation.
After a reset all controller are in error active status. Only controllers in bus off status stay
in their mode till they have received successfully 128 x 11 recessive bits. Then they are
allowed to change the status to error active, which secures that no defect controller is
blocking the bus after a reset, (Paret, 2005).
Overload frames
An overload exists when a bus user is not ready for receiving data or when a CAN
controller recognises a dominant bit in the interframe space. A bus user for example can be
busy with processing data and therefore it is not able to receive any more data. Then the
bus user begins to write the first bit of the intermission field and sends an overload frame.
The overload frame has six dominant overload flag bits and the overload delimiter.
The dominant bits of the overload flag are destroying the interframe space format. All
other CAN nodes are expecting no dominant bits in the interframe space and so they send
an overload frame. The outcome is an overload flag overlap. After the transmission of an
overload flag the CAN node waits for an edge of a recessive bit. The edge shows the end
of the overlapped overload flag. Now the CAN controllers send at the same time further
recessive bits on the bus. The outcome is a sequence of eight recessive bits following the
overload flag, which is called the overload delimiter. The overload frame causes no
repeating of previous transmitted data and remote frames.
3.2.3. Fault detection methods of a faulty communication
The transmission of faulty data and remote frames can be stopped during the transmission
process by sending an error frame. This assures data consistency within the system. The
recovery time of the whole bus system after fault detection is quicker than 30 bit times.
Page 59 of 148

Masterthesis Automotive Diagnostics
The time duration for sending a bit depends on the data rate.
The CAN protocol has several different fault detection methods like CRC, message frame
check, acknowledge, monitoring and bit stuffing.
CRC check: Data and remote frames are equipped with a checksum of the sending unit.
The SOF bit, the arbitration field, the control field and the data field are considered as
polynomial. The polynomial is divided by a generator polynomial with a modulo 2
division. The division rest is the CRC sequence. The receivers of the message calculate
themselve a CRC checksum. This checksum is compared with the received checksum. On
a faulty transmission the same CRC sequence occurs.
Message frame check: The length and structure of the frame is analysed during the
message frame check process.
Acknowledge: The receivers of the message writing a dominant bit in the ACK slot which
confirms a successful transmission.
Monitoring: All connected CAN nodes in the bus system are monitoring the bus level. In
case of non conformance of the sent level with the received bus level a bit error occurred.
Bit stuffing: The signal level is constant during an entire bit time by the non return zero
(NRZ) coding. The post synchronisation of the CAN nodes take place after the SOF using
rising and falling edges between different bits. In case of a sequence of identical bits it is
possible to have synchronisation problems without these edges. The transmitter inserts
after five succeeding, identical bits a complementary bit to avoid synchronisation
problems. The complementary bit is called a stuff bit. The stuff bit is also insert even when
already after five succeeding identical bits a stuff bit would follow. The bit stuffing rule is
applied in data and remote frames and begins with the SOF and ends before the CRC
delimiter. For error and overload frames the bit stuffing mechanism is not used. The
receiver of the messages applies the same rule and removes the stuff bits in the data
stream. A bit stuffing error occurs when a receiver detects more then five succeeding,
identical bits in the data stream, (Zimmermann/Schmidgall, 2007).
Page 60 of 148

Masterthesis Automotive Diagnostics
3.2.4. TTCAN
The event triggered communication causes a non predictable high latency time for
messages with low priorities. That happens especially on heavy bus loads and faulty
messages (e.g. through external noise) which means the data transmission must be
repeated fairly often. Thus means the bus is not suitable for real time applications. To
ensure real time ability in an event triggered CAN system 80% of the available bandwidth
must be reserved for peak bus loads. Especially for safety relevant functions the latency
time must be predictable. In all operating modes the transmission of safety relevant
messages with a defined latency time must be secured, as well as on maximal bus load.
The ISO 11898-4 specifies the TTCAN protocol on the session layer of the OSI model to
synchronise the CAN nodes for transmitting messages periodically at defined times.
Safety relevant functions also require an increased fault tolerance (e.g. redundancy) and a
higher data transfer rate. Especially the limited data rate of 1 MBit/s stopped the
integration of TTCAN in cars for safety relevant functions, (Zimmermann/Schmidgall,
2007), (Navet/Simonot-Lion, 2009).
Page 61 of 148
Masterthesis Automotive Diagnostics
Chapter 4
The Development of a New Diagnostic Approach
A control unit consists of three main tasks. The main tasks are to control a process,
provide diagnostic functions and a communication interface. The tasks of controlling a
process and the communication interface is extensively explained in chapter 3.
The diagnostic functions include the self diagnosis of the control unit. In general the
inputs and outputs of the control unit, the control function and the communication
interfaces are monitored. In some cases it is required to check the control loop with
defined conditions.
This chapter describes the communication between a tester and the control unit, which
only can be initiated by the tester. The tester is a diagnostic device which requests
information from the control units or a control unit in function of a gateway. The gateway
control unit acts partly as an onboard tester and provides prefiltered and conditioned
information for the external test device which simplifies the localisation of the fault cause.
4.1. History of diagnostic protocols
In Europe manufactured vehicles use the keyword 2000 protocol KWP 2000 for the
diagnostic communication. In 1989 it was standardised in the ISO 9141 (Road Vehicles –
Diagnostic systems) which defines the electrical properties, the mode of bit transferring
and the communication initialisation process between test device and control unit. During
the initialisation the devices are exchanging the keyword, which defines the used data
protocol. The data protocol and the allowed values for the keyword were not defined in the
specification and therefore several different manufacturer depending solutions are applied
for the connections and connectors.
In the beginnings of the 1990s the California Air Resource Board CARB suggested a
regulation to monitor emission relevant components of the car. Guidelines were made
Page 62 of 148
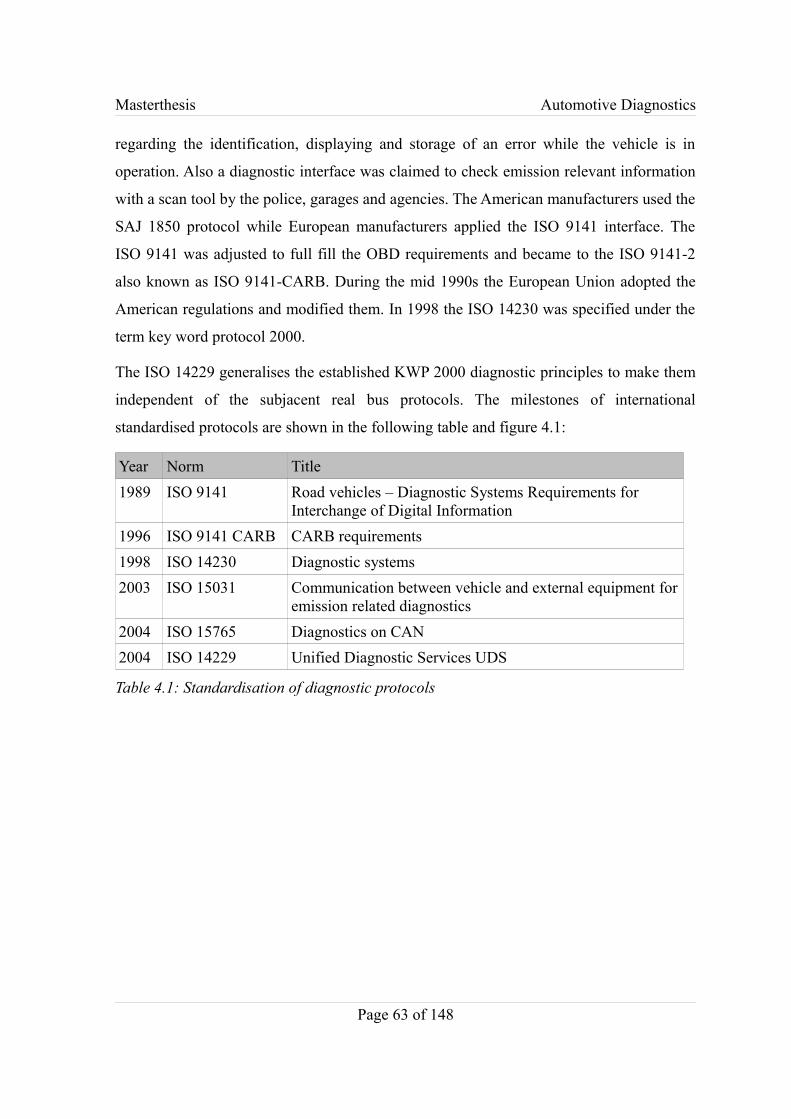
Masterthesis Automotive Diagnostics
regarding the identification, displaying and storage of an error while the vehicle is in
operation. Also a diagnostic interface was claimed to check emission relevant information
with a scan tool by the police, garages and agencies. The American manufacturers used the
SAJ 1850 protocol while European manufacturers applied the ISO 9141 interface. The
ISO 9141 was adjusted to full fill the OBD requirements and became to the ISO 9141-2
also known as ISO 9141-CARB. During the mid 1990s the European Union adopted the
American regulations and modified them. In 1998 the ISO 14230 was specified under the
term key word protocol 2000.
The ISO 14229 generalises the established KWP 2000 diagnostic principles to make them
independent of the subjacent real bus protocols. The milestones of international
standardised protocols are shown in the following table and figure 4.1:
Year Norm Title1989 ISO 9141 Road vehicles – Diagnostic Systems Requirements for
Interchange of Digital Information1996 ISO 9141 CARB CARB requirements1998 ISO 14230 Diagnostic systems2003 ISO 15031 Communication between vehicle and external equipment for
emission related diagnostics2004 ISO 15765 Diagnostics on CAN2004 ISO 14229 Unified Diagnostic Services UDS
Table 4.1: Standardisation of diagnostic protocols
Page 63 of 148
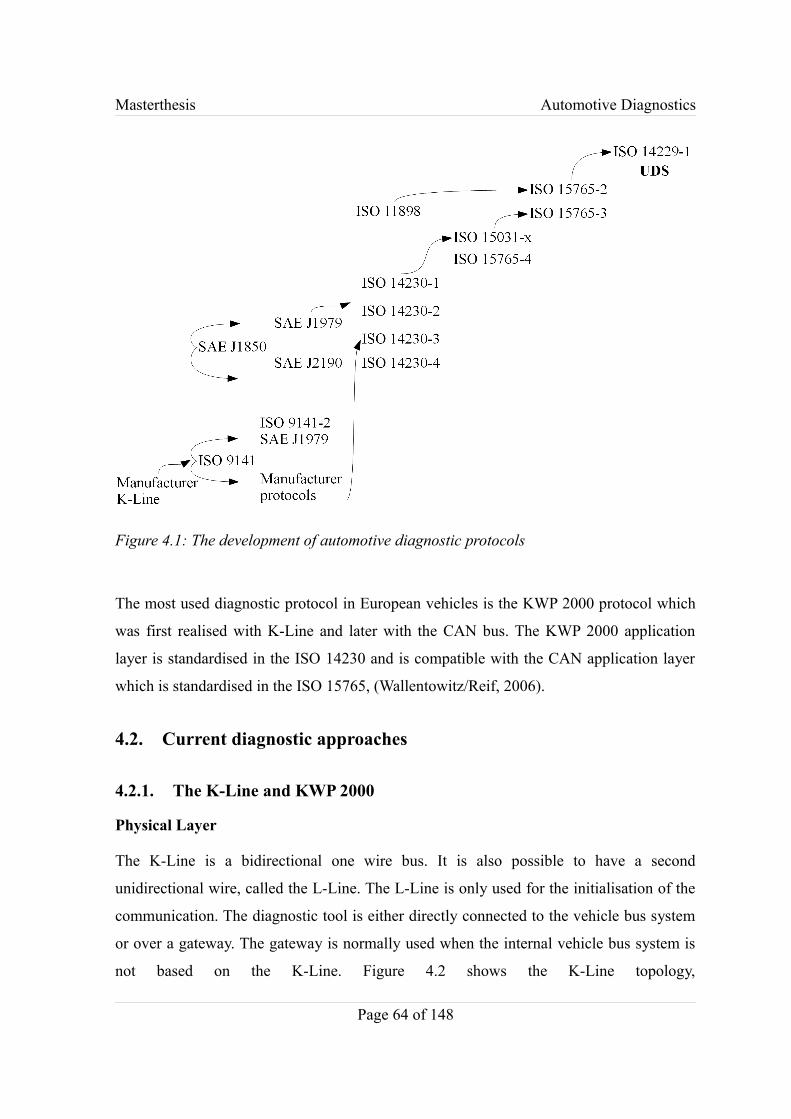
Masterthesis Automotive Diagnostics
The most used diagnostic protocol in European vehicles is the KWP 2000 protocol which
was first realised with K-Line and later with the CAN bus. The KWP 2000 application
layer is standardised in the ISO 14230 and is compatible with the CAN application layer
which is standardised in the ISO 15765, (Wallentowitz/Reif, 2006).
4.2. Current diagnostic approaches
4.2.1. The K-Line and KWP 2000
Physical Layer
The K-Line is a bidirectional one wire bus. It is also possible to have a second
unidirectional wire, called the L-Line. The L-Line is only used for the initialisation of the
communication. The diagnostic tool is either directly connected to the vehicle bus system
or over a gateway. The gateway is normally used when the internal vehicle bus system is
not based on the K-Line. Figure 4.2 shows the K-Line topology,
Page 64 of 148
Figure 4.1: The development of automotive diagnostic protocols

Masterthesis Automotive Diagnostics
(Zimmermann/Schmidgall, 2007).
The bit transmission is UART compatible and is carried out character by character with
one start bit, eight data bits and one stop bit. The baud rate is set by the control unit and is
between 1.2 kbit/s and 10.4 kbit/s. Emission relevant control units must have a fixed baud
rate of 10.4 kbit/s.
Data Link Layer
All the communication is initiated by the testing device with a diagnostic request to the
control unit. The application layer indicates a diagnostic session for the control unit. The
response of the control unit is sent back to the tester. The tester receives the confirmation
over its application layer. The standard defines the control unit as server and the tester as
client. The server client principle and the initiation of the communication is shown in
figure 4.3. The test device is the master in the communication and the control unit the
client (Zimmermann/Schmidgall, 2007).
Page 65 of 148
Figure 4.2: The K-Line topology
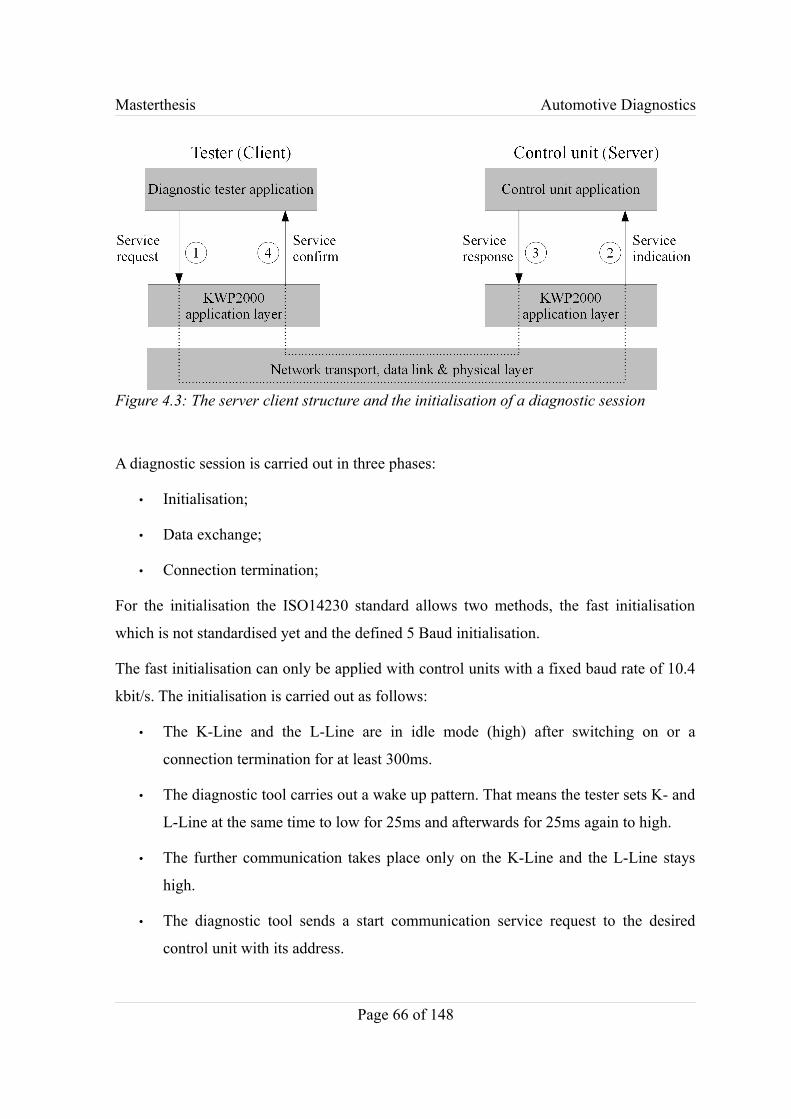
Masterthesis Automotive Diagnostics
A diagnostic session is carried out in three phases:
• Initialisation;
• Data exchange;
• Connection termination;
For the initialisation the ISO14230 standard allows two methods, the fast initialisation
which is not standardised yet and the defined 5 Baud initialisation.
The fast initialisation can only be applied with control units with a fixed baud rate of 10.4
kbit/s. The initialisation is carried out as follows:
• The K-Line and the L-Line are in idle mode (high) after switching on or a
connection termination for at least 300ms.
• The diagnostic tool carries out a wake up pattern. That means the tester sets K- and
L-Line at the same time to low for 25ms and afterwards for 25ms again to high.
• The further communication takes place only on the K-Line and the L-Line stays
high.
• The diagnostic tool sends a start communication service request to the desired
control unit with its address.
Page 66 of 148
Figure 4.3: The server client structure and the initialisation of a diagnostic session
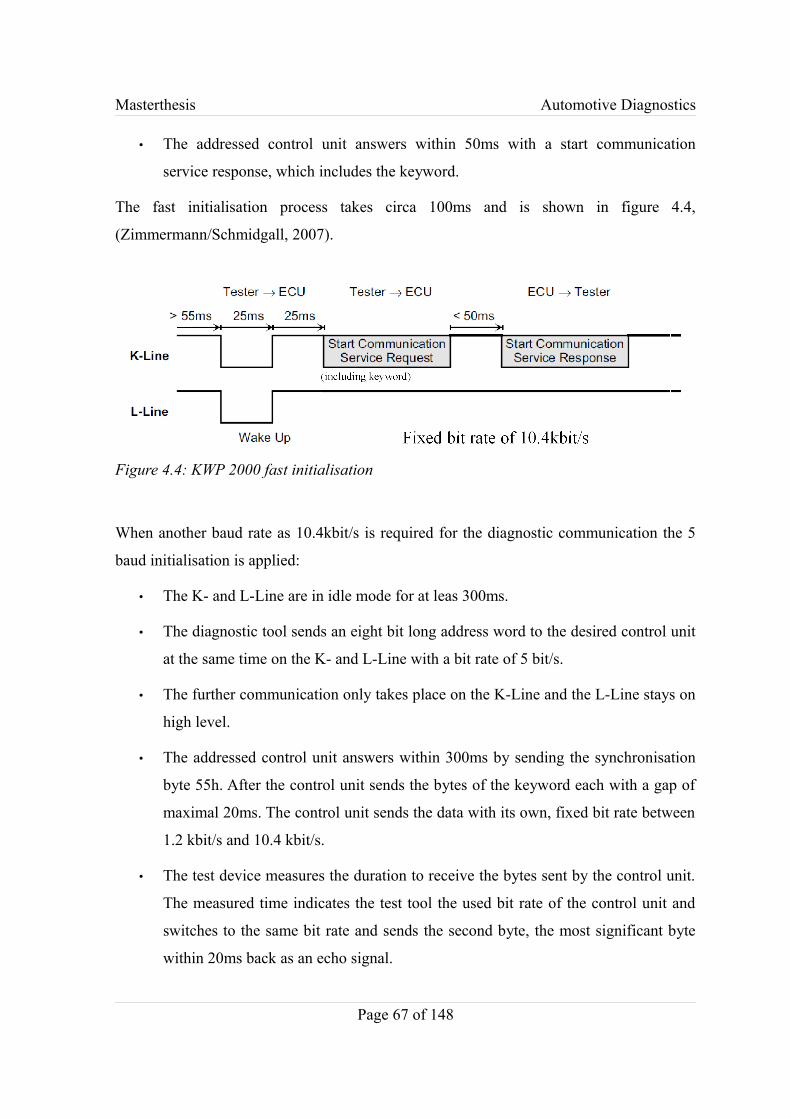
Masterthesis Automotive Diagnostics
• The addressed control unit answers within 50ms with a start communication
service response, which includes the keyword.
The fast initialisation process takes circa 100ms and is shown in figure 4.4,
(Zimmermann/Schmidgall, 2007).
When another baud rate as 10.4kbit/s is required for the diagnostic communication the 5
baud initialisation is applied:
• The K- and L-Line are in idle mode for at leas 300ms.
• The diagnostic tool sends an eight bit long address word to the desired control unit
at the same time on the K- and L-Line with a bit rate of 5 bit/s.
• The further communication only takes place on the K-Line and the L-Line stays on
high level.
• The addressed control unit answers within 300ms by sending the synchronisation
byte 55h. After the control unit sends the bytes of the keyword each with a gap of
maximal 20ms. The control unit sends the data with its own, fixed bit rate between
1.2 kbit/s and 10.4 kbit/s.
• The test device measures the duration to receive the bytes sent by the control unit.
The measured time indicates the test tool the used bit rate of the control unit and
switches to the same bit rate and sends the second byte, the most significant byte
within 20ms back as an echo signal.
Page 67 of 148
Figure 4.4: KWP 2000 fast initialisation
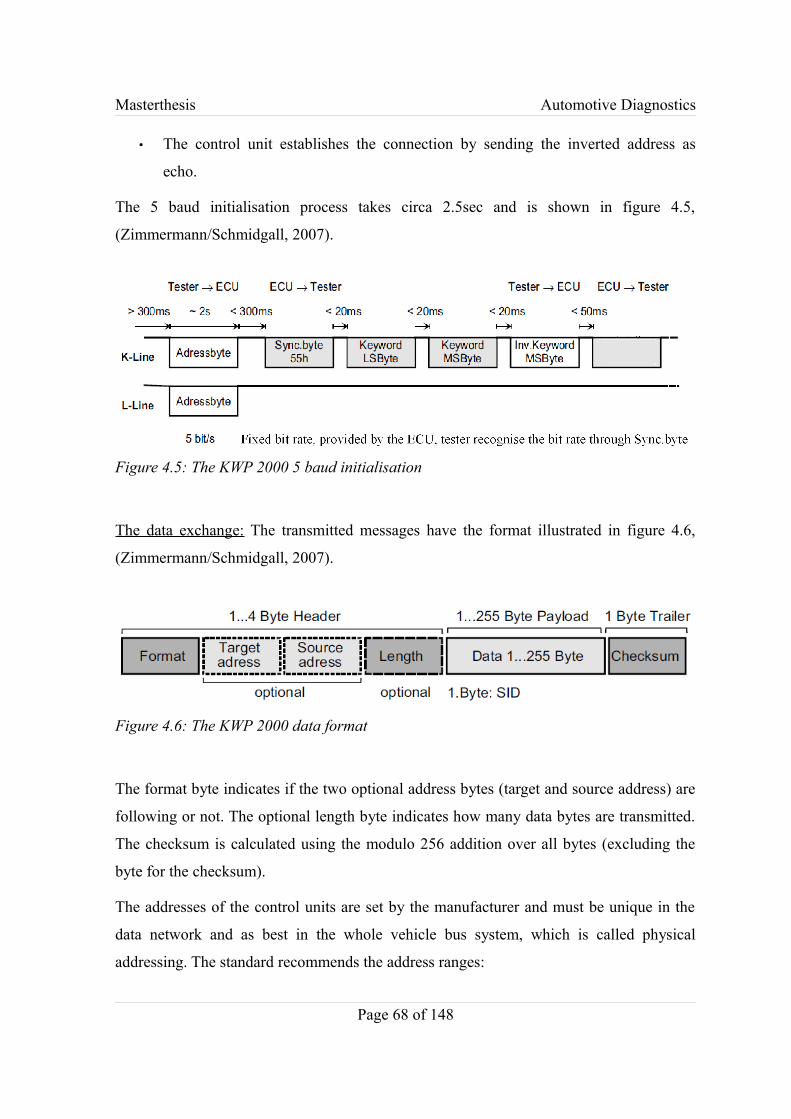
Masterthesis Automotive Diagnostics
• The control unit establishes the connection by sending the inverted address as
echo.
The 5 baud initialisation process takes circa 2.5sec and is shown in figure 4.5,
(Zimmermann/Schmidgall, 2007).
The data exchange: The transmitted messages have the format illustrated in figure 4.6,
(Zimmermann/Schmidgall, 2007).
The format byte indicates if the two optional address bytes (target and source address) are
following or not. The optional length byte indicates how many data bytes are transmitted.
The checksum is calculated using the modulo 256 addition over all bytes (excluding the
byte for the checksum).
The addresses of the control units are set by the manufacturer and must be unique in the
data network and as best in the whole vehicle bus system, which is called physical
addressing. The standard recommends the address ranges:
Page 68 of 148
Figure 4.5: The KWP 2000 5 baud initialisation
Figure 4.6: The KWP 2000 data format
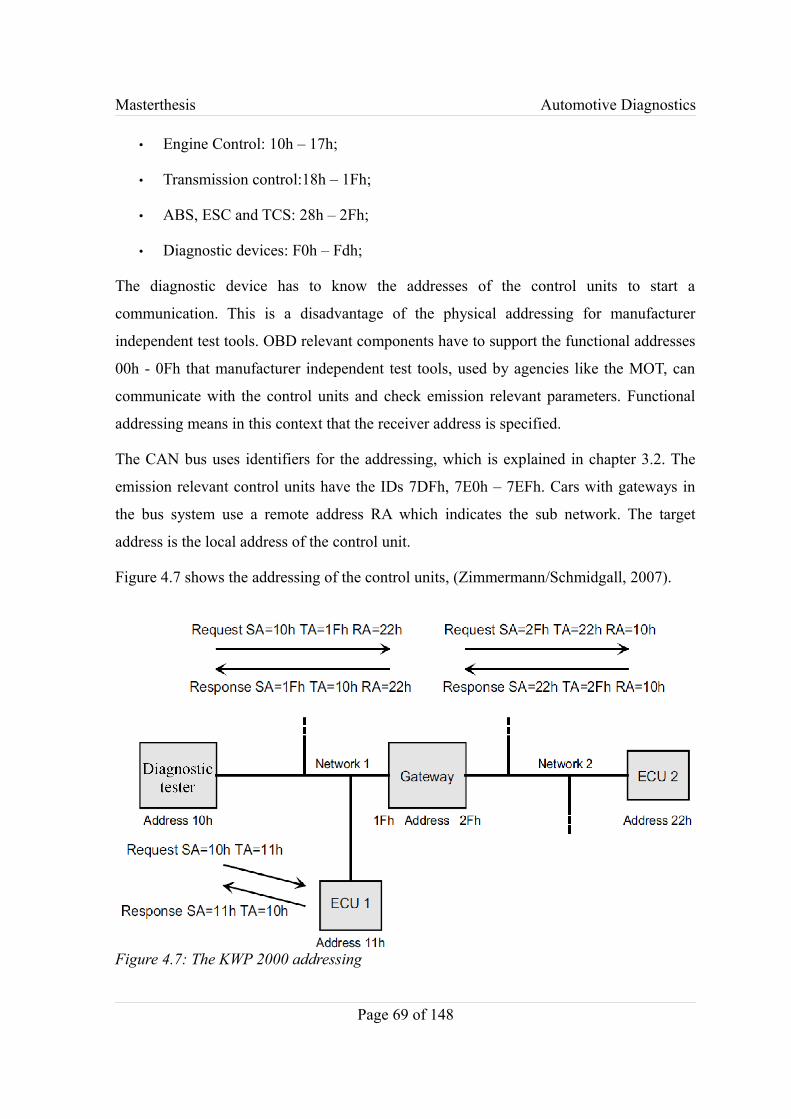
Masterthesis Automotive Diagnostics
• Engine Control: 10h – 17h;
• Transmission control:18h – 1Fh;
• ABS, ESC and TCS: 28h – 2Fh;
• Diagnostic devices: F0h – Fdh;
The diagnostic device has to know the addresses of the control units to start a
communication. This is a disadvantage of the physical addressing for manufacturer
independent test tools. OBD relevant components have to support the functional addresses
00h - 0Fh that manufacturer independent test tools, used by agencies like the MOT, can
communicate with the control units and check emission relevant parameters. Functional
addressing means in this context that the receiver address is specified.
The CAN bus uses identifiers for the addressing, which is explained in chapter 3.2. The
emission relevant control units have the IDs 7DFh, 7E0h – 7EFh. Cars with gateways in
the bus system use a remote address RA which indicates the sub network. The target
address is the local address of the control unit.
Figure 4.7 shows the addressing of the control units, (Zimmermann/Schmidgall, 2007).
Page 69 of 148
Figure 4.7: The KWP 2000 addressing
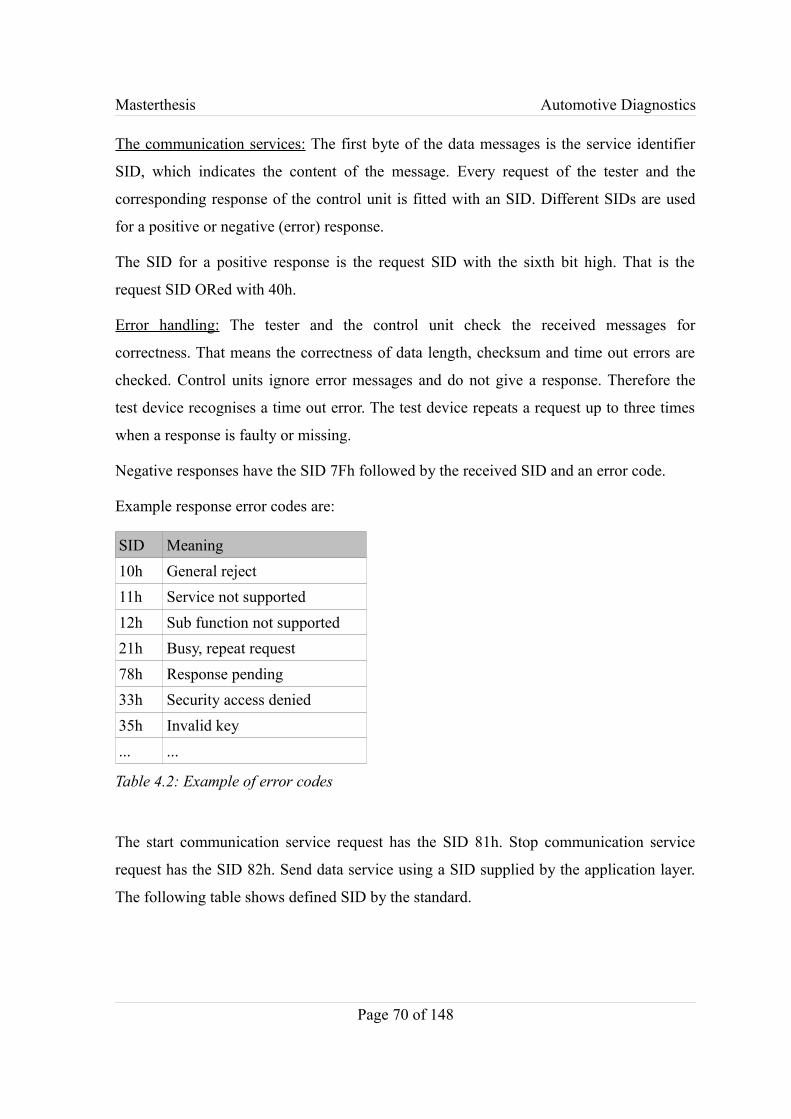
Masterthesis Automotive Diagnostics
The communication services: The first byte of the data messages is the service identifier
SID, which indicates the content of the message. Every request of the tester and the
corresponding response of the control unit is fitted with an SID. Different SIDs are used
for a positive or negative (error) response.
The SID for a positive response is the request SID with the sixth bit high. That is the
request SID ORed with 40h.
Error handling: The tester and the control unit check the received messages for
correctness. That means the correctness of data length, checksum and time out errors are
checked. Control units ignore error messages and do not give a response. Therefore the
test device recognises a time out error. The test device repeats a request up to three times
when a response is faulty or missing.
Negative responses have the SID 7Fh followed by the received SID and an error code.
Example response error codes are:
SID Meaning10h General reject11h Service not supported12h Sub function not supported21h Busy, repeat request78h Response pending33h Security access denied35h Invalid key... ...
Table 4.2: Example of error codes
The start communication service request has the SID 81h. Stop communication service
request has the SID 82h. Send data service using a SID supplied by the application layer.
The following table shows defined SID by the standard.
Page 70 of 148
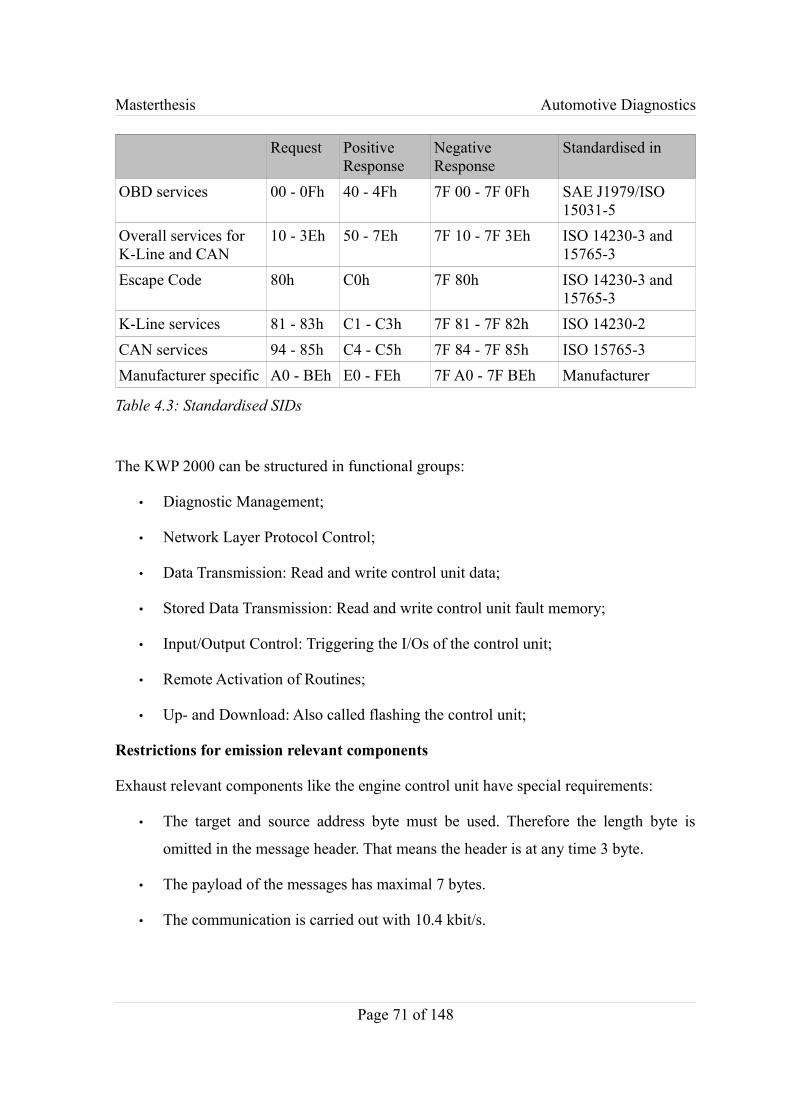
Masterthesis Automotive Diagnostics
Request Positive Response
Negative Response
Standardised in
OBD services 00 - 0Fh 40 - 4Fh 7F 00 - 7F 0Fh SAE J1979/ISO 15031-5
Overall services for K-Line and CAN
10 - 3Eh 50 - 7Eh 7F 10 - 7F 3Eh ISO 14230-3 and 15765-3
Escape Code 80h C0h 7F 80h ISO 14230-3 and 15765-3
K-Line services 81 - 83h C1 - C3h 7F 81 - 7F 82h ISO 14230-2CAN services 94 - 85h C4 - C5h 7F 84 - 7F 85h ISO 15765-3Manufacturer specific A0 - BEh E0 - FEh 7F A0 - 7F BEh Manufacturer
Table 4.3: Standardised SIDs
The KWP 2000 can be structured in functional groups:
• Diagnostic Management;
• Network Layer Protocol Control;
• Data Transmission: Read and write control unit data;
• Stored Data Transmission: Read and write control unit fault memory;
• Input/Output Control: Triggering the I/Os of the control unit;
• Remote Activation of Routines;
• Up- and Download: Also called flashing the control unit;
Restrictions for emission relevant components
Exhaust relevant components like the engine control unit have special requirements:
• The target and source address byte must be used. Therefore the length byte is
omitted in the message header. That means the header is at any time 3 byte.
• The payload of the messages has maximal 7 bytes.
• The communication is carried out with 10.4 kbit/s.
Page 71 of 148
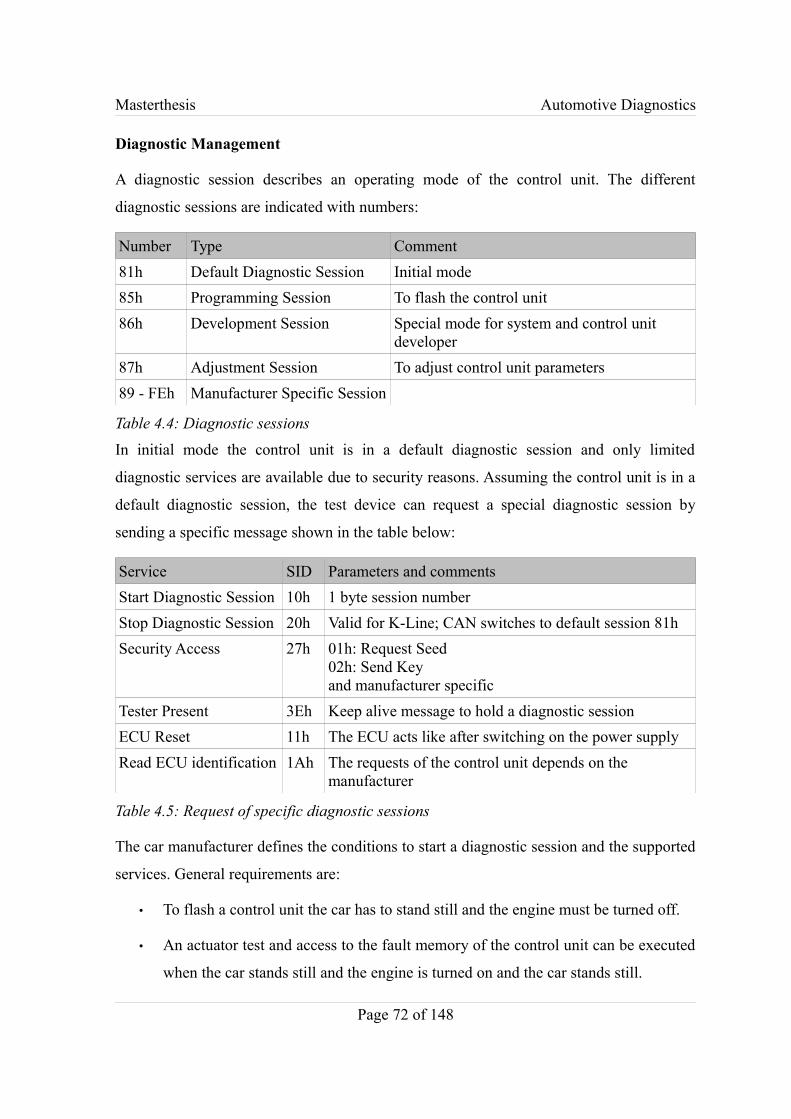
Masterthesis Automotive Diagnostics
Diagnostic Management
A diagnostic session describes an operating mode of the control unit. The different
diagnostic sessions are indicated with numbers:
Number Type Comment81h Default Diagnostic Session Initial mode85h Programming Session To flash the control unit86h Development Session Special mode for system and control unit
developer87h Adjustment Session To adjust control unit parameters89 - FEh Manufacturer Specific Session
Table 4.4: Diagnostic sessionsIn initial mode the control unit is in a default diagnostic session and only limited
diagnostic services are available due to security reasons. Assuming the control unit is in a
default diagnostic session, the test device can request a special diagnostic session by
sending a specific message shown in the table below:
Service SID Parameters and commentsStart Diagnostic Session 10h 1 byte session numberStop Diagnostic Session 20h Valid for K-Line; CAN switches to default session 81hSecurity Access 27h 01h: Request Seed
02h: Send Keyand manufacturer specific
Tester Present 3Eh Keep alive message to hold a diagnostic sessionECU Reset 11h The ECU acts like after switching on the power supplyRead ECU identification 1Ah The requests of the control unit depends on the
manufacturer
Table 4.5: Request of specific diagnostic sessions
The car manufacturer defines the conditions to start a diagnostic session and the supported
services. General requirements are:
• To flash a control unit the car has to stand still and the engine must be turned off.
• An actuator test and access to the fault memory of the control unit can be executed
when the car stands still and the engine is turned on and the car stands still.
Page 72 of 148
Masterthesis Automotive Diagnostics
The diagnostic tool has to identify itself using the seed and key method to unlock the ECU
and getting access to certain diagnostic services. The seed and key method works as
follows. The control unit sends an initialisation data (called seed), which is a random
number to the test device. The test device calculates based on the received number a key
and sends a security access – send key to the control unit. When the key values are equal
the control unit changes the diagnostic mode and sends a positive response. The key and
seed values as well as the calculation algorithm are not specified in the KWP standard.
They are defined by the manufacturers. General diagnostic sessions are carried out with
different keys for car manufacturers, control unit suppliers and authorised garages with
different access levels. The differentiation is carried out with manufacturer specific
security access messages whereby manipulations on the control units are prevented.
A time out mechanism is activated as long as the control unit is in a special diagnostic
session to hold the connection between tester and control unit. The control unit stops a
diagnostic session when it does not receive a message from the tester every five seconds.
Then the control unit goes back to default mode. Therefore the test device sends every
four seconds a tester presents message when no actual diagnostic message is sent to hold
the connection.
A diagnostic session is closed with a stop diagnostic session message or the test device
starts another diagnostic session by sending a start diagnostic session message. In this case
the control unit goes back to the default diagnostic session, because the test device can
have only one active diagnostic session. Using CAN as the physical layer the stop
diagnostic session message should not be used and the session is closed with a start
diagnostic session message (81h).
The read ECU identification message provides information about the manufacturer name,
type, hard- and software version, serial number, data of production and more.
Fault memory
A central part for the current diagnostic concept is the fault memory. The following
commands are used to read and erase the fault memory:
Page 73 of 148
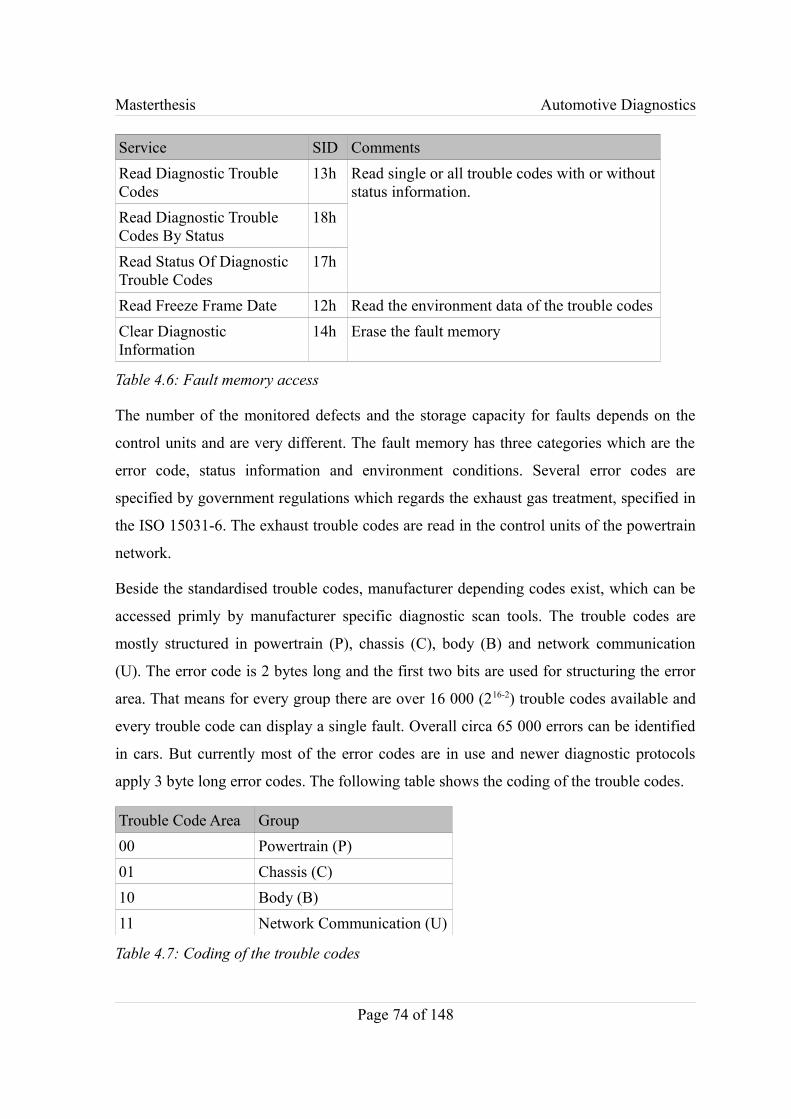
Masterthesis Automotive Diagnostics
Service SID CommentsRead Diagnostic Trouble Codes
13h Read single or all trouble codes with or without status information.
Read Diagnostic Trouble Codes By Status
18h
Read Status Of Diagnostic Trouble Codes
17h
Read Freeze Frame Date 12h Read the environment data of the trouble codesClear Diagnostic Information
14h Erase the fault memory
Table 4.6: Fault memory access
The number of the monitored defects and the storage capacity for faults depends on the
control units and are very different. The fault memory has three categories which are the
error code, status information and environment conditions. Several error codes are
specified by government regulations which regards the exhaust gas treatment, specified in
the ISO 15031-6. The exhaust trouble codes are read in the control units of the powertrain
network.
Beside the standardised trouble codes, manufacturer depending codes exist, which can be
accessed primly by manufacturer specific diagnostic scan tools. The trouble codes are
mostly structured in powertrain (P), chassis (C), body (B) and network communication
(U). The error code is 2 bytes long and the first two bits are used for structuring the error
area. That means for every group there are over 16 000 (216-2) trouble codes available and
every trouble code can display a single fault. Overall circa 65 000 errors can be identified
in cars. But currently most of the error codes are in use and newer diagnostic protocols
apply 3 byte long error codes. The following table shows the coding of the trouble codes.
Trouble Code Area Group00 Powertrain (P)01 Chassis (C)10 Body (B)11 Network Communication (U)
Table 4.7: Coding of the trouble codes
Page 74 of 148
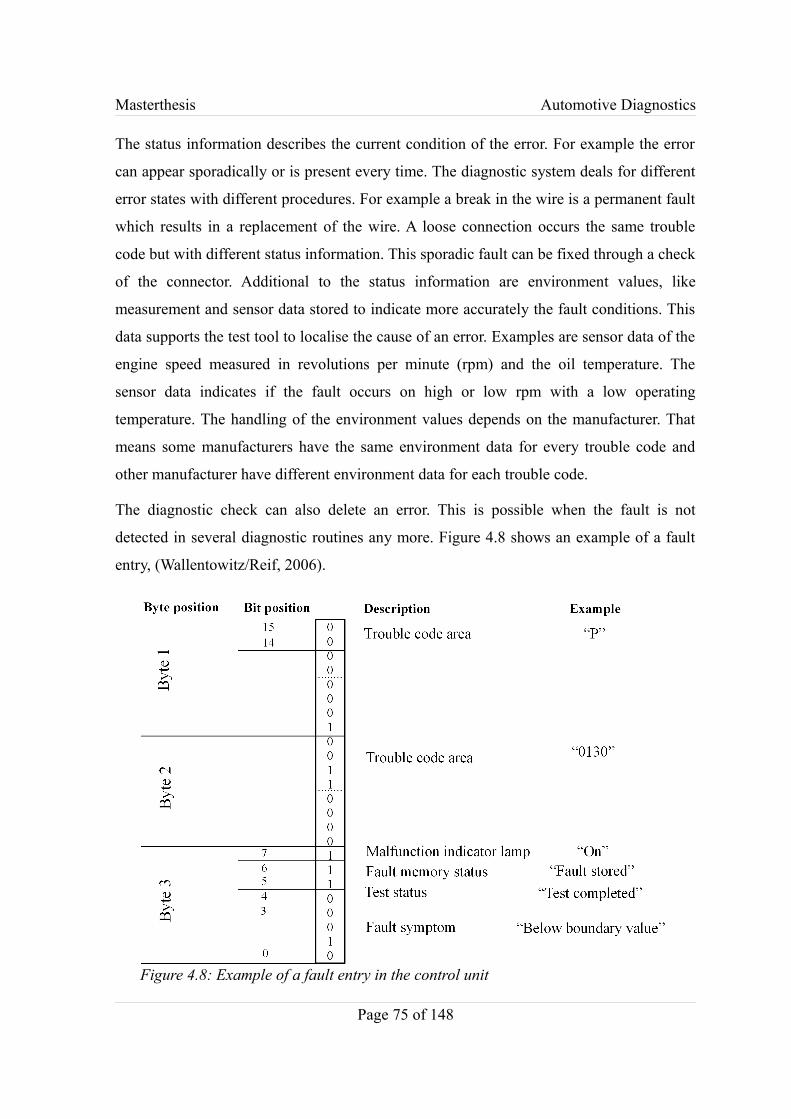
Masterthesis Automotive Diagnostics
The status information describes the current condition of the error. For example the error
can appear sporadically or is present every time. The diagnostic system deals for different
error states with different procedures. For example a break in the wire is a permanent fault
which results in a replacement of the wire. A loose connection occurs the same trouble
code but with different status information. This sporadic fault can be fixed through a check
of the connector. Additional to the status information are environment values, like
measurement and sensor data stored to indicate more accurately the fault conditions. This
data supports the test tool to localise the cause of an error. Examples are sensor data of the
engine speed measured in revolutions per minute (rpm) and the oil temperature. The
sensor data indicates if the fault occurs on high or low rpm with a low operating
temperature. The handling of the environment values depends on the manufacturer. That
means some manufacturers have the same environment data for every trouble code and
other manufacturer have different environment data for each trouble code.
The diagnostic check can also delete an error. This is possible when the fault is not
detected in several diagnostic routines any more. Figure 4.8 shows an example of a fault
entry, (Wallentowitz/Reif, 2006).
Page 75 of 148
Figure 4.8: Example of a fault entry in the control unit
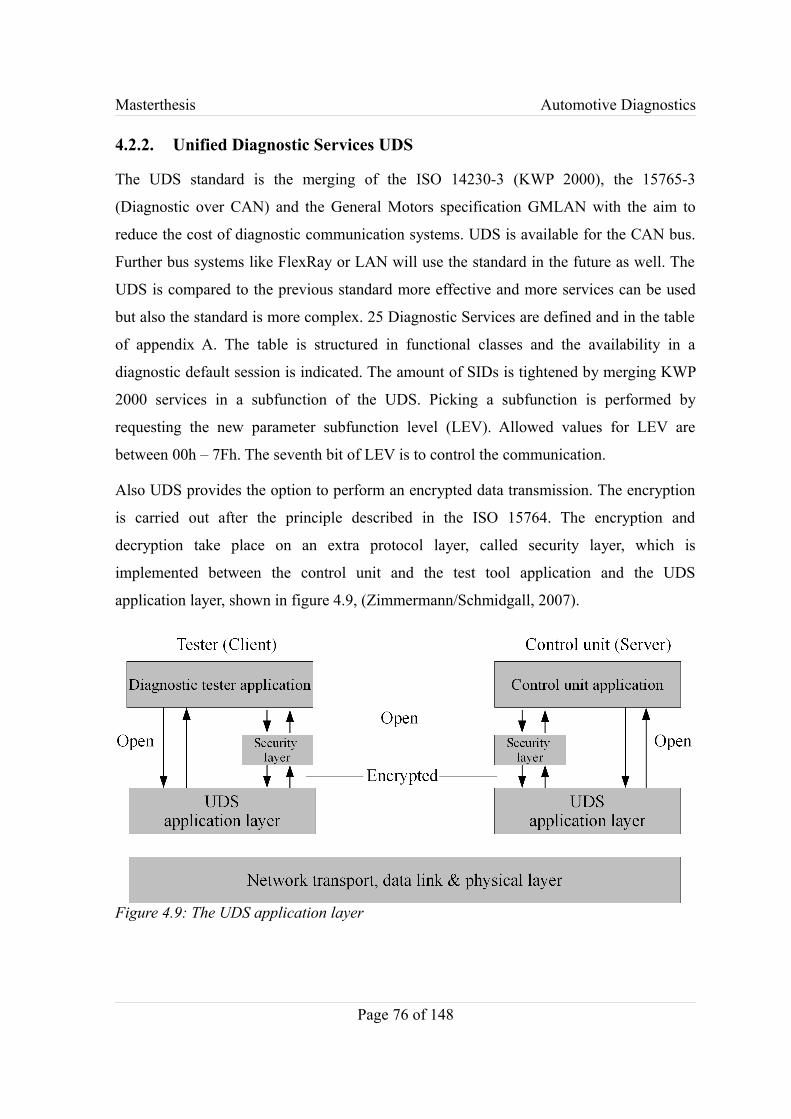
Masterthesis Automotive Diagnostics
4.2.2. Unified Diagnostic Services UDS
The UDS standard is the merging of the ISO 14230-3 (KWP 2000), the 15765-3
(Diagnostic over CAN) and the General Motors specification GMLAN with the aim to
reduce the cost of diagnostic communication systems. UDS is available for the CAN bus.
Further bus systems like FlexRay or LAN will use the standard in the future as well. The
UDS is compared to the previous standard more effective and more services can be used
but also the standard is more complex. 25 Diagnostic Services are defined and in the table
of appendix A. The table is structured in functional classes and the availability in a
diagnostic default session is indicated. The amount of SIDs is tightened by merging KWP
2000 services in a subfunction of the UDS. Picking a subfunction is performed by
requesting the new parameter subfunction level (LEV). Allowed values for LEV are
between 00h – 7Fh. The seventh bit of LEV is to control the communication.
Also UDS provides the option to perform an encrypted data transmission. The encryption
is carried out after the principle described in the ISO 15764. The encryption and
decryption take place on an extra protocol layer, called security layer, which is
implemented between the control unit and the test tool application and the UDS
application layer, shown in figure 4.9, (Zimmermann/Schmidgall, 2007).
Page 76 of 148
Figure 4.9: The UDS application layer
Masterthesis Automotive Diagnostics
A further implementation in UDS is the response on event service. This service allows the
test tool to install an event trigger on the control unit. On triggering an event in the control
unit, it automatically sends a request message to the tester. The process is as follows:
• Installing the event trigger with a trigger condition and a trigger time frame with
the access timing parameter.
• Starting the event service using start response on event.
• Sending requests when an event occurred by the control unit to the tester.
• The event service is stopped after expiration of the trigger time frame or by the test
tool.
• Uninstalling the event service.
Following events can be triggered in the control units:
• On diagnostic trouble code status change.
• On change of data identifier.
• On comparison of values.
Following services can be applied on the event by the control unit:
• Read data by identifier SID = 22h.
• Read diagnostic trouble code information SID = 19h.
• Routine control SID = 31h.
• Input/Output control by identifier SID = 2Fh.
With Read scaling data is now a service available to read the scaling and standard of the
internal controller data. That means to figure out the correlation between the stored value
in hex format and the actual physical value. Therefore the used unit (miles, km/h,
temperature etc.), the scaling factor (offset and rising of the conversion formula) and
number representation (integer, binary coded decimal/or floating point, numbers of bits) is
identified. The conversion formula is:
Physical value=Hex value×risingoffset , (Wallentowitz/Reif, 2006).
Page 77 of 148
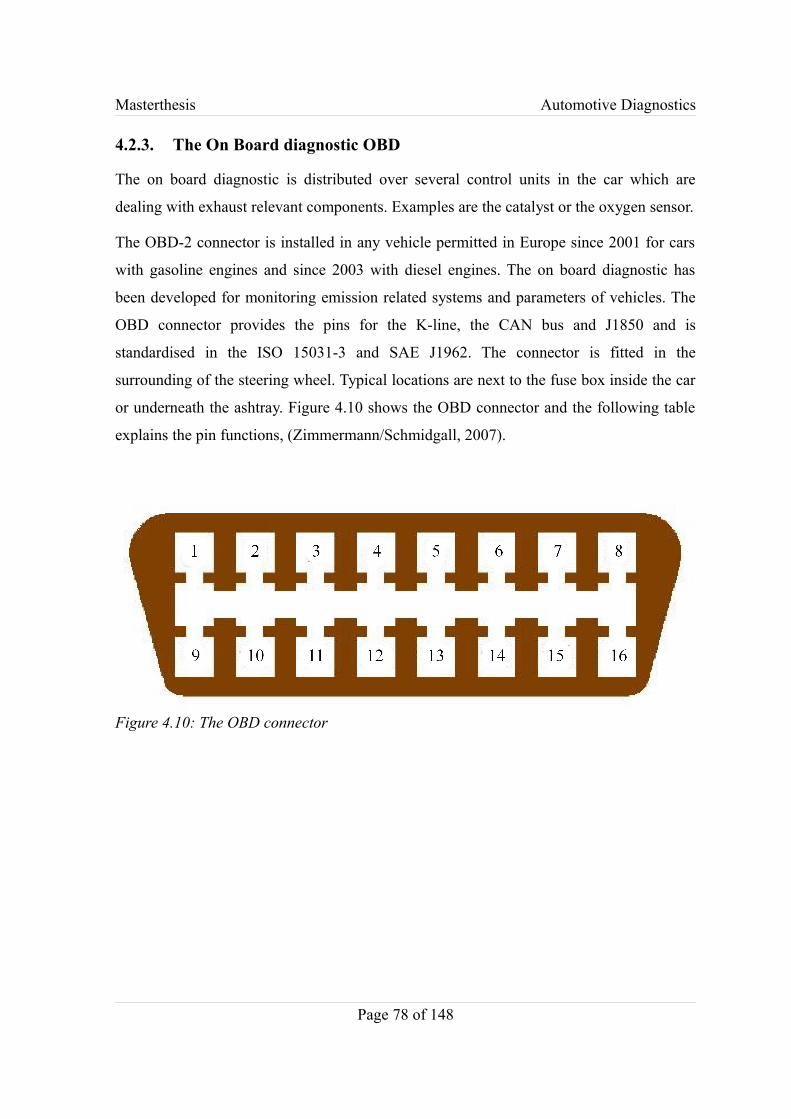
Masterthesis Automotive Diagnostics
4.2.3. The On Board diagnostic OBD
The on board diagnostic is distributed over several control units in the car which are
dealing with exhaust relevant components. Examples are the catalyst or the oxygen sensor.
The OBD-2 connector is installed in any vehicle permitted in Europe since 2001 for cars
with gasoline engines and since 2003 with diesel engines. The on board diagnostic has
been developed for monitoring emission related systems and parameters of vehicles. The
OBD connector provides the pins for the K-line, the CAN bus and J1850 and is
standardised in the ISO 15031-3 and SAE J1962. The connector is fitted in the
surrounding of the steering wheel. Typical locations are next to the fuse box inside the car
or underneath the ashtray. Figure 4.10 shows the OBD connector and the following table
explains the pin functions, (Zimmermann/Schmidgall, 2007).
Page 78 of 148
Figure 4.10: The OBD connector

Masterthesis Automotive Diagnostics
Pin Description1 blank2 J1850 + Bus3 blank4 Chassis Ground5 Signal Ground6 CAN High7 ISO 9141-2 K Line8 blank9 blank10 J1850 - Bus11 blank12 blank13 blank14 CAN Low15 ISO 9141-2 L Line16 Battery voltage
Table 4.8: Pins of OBD connectorThe blank pins can be used by the car manufacturers for own functions.
The communication of the diagnostic data is summarized in the ISO 15031 which is
almost identical to the American SAE standard. The following table gives an overview of
the standardisation.
Topic ISO Standard SAE StandardGeneral Information ISO 15031-1 -Terminology and Abbreviations ISO 15031-2 J1930Connector ISO 15031-3 J1962OBD Scan Tool ISO 15031-4 J1978Diagnostic Service ISO 15031-5 J1979Diagnostic Trouble Codes ISO 15031-6 J2012Data Link Security ISO 15031-7 J2186
Table 4.9: Standardisation of the diagnostic communication
Page 79 of 148
Masterthesis Automotive Diagnostics
The standard also allows the K Line and CAN bus using the KWP 2000 protocol. The
predecessor of the K-Line, the ISO 9141-2 CARB and the SAE J1850 bus are using
PWM. Typically in a car only one bus system for diagnostic applications is supported. The
diagnostic testers are able to deal with every protocol and identify the used bus.
The OBD has following functions:
• Continuous monitoring of exhaust relevant systems (e.g. oxygen sensor).
• Permanent storage of diagnostic trouble code in the fault memory. Examples are
errors in the ignition systems or the status of service intervals.
• Display errors for the driver using the MIL.
• Communication with an external scan tool.
The OBD request/response messages have the KWP 2000 format, described in chapter
4.2.1 and the test tool has to use the functional addressing. The OBD relevant control units
have the functional address 33h and the tester F1h. As mentioned before, more than one
control unit will react on the functional address and the test tool has to expect more then
one response. The tester can differentiate the control units with response messages and the
included explicit physical address.
The messages are maximal seven bytes long including six data bytes and a SID byte. The
first data byte of a request message is to identify parameters (PID), e.g. data values of the
control unit. The table in appendix B shows the OBD services.
Reading the fault memory
In the beginning of a diagnostic session the test tool checks vehicle identification and the
software-/hardware version of the control unit with a Service 09h Request Vehicle
Information. After this MIL status and the number of control units in the car is read using
the SID = 01h and PID = 01h Request Current Power Train Diagnostic Data.
The first byte of the control unit response is the MIL status (bit seven = 1 means the MIL
is turned on) and the remaining seven bits of the first byte show the number of stored
faults.
Page 80 of 148

Masterthesis Automotive Diagnostics
The second byte shows which monitoring functions are implemented in the car:
• Bit 0 = 1: Monitoring system for the ignition;
• Bit 1 = 1: Monitoring system for the injection;
• Bit 2 = 1: Other monitoring systems;
• Bit 4 to 6 shows if the monitoring systems performed a complete test cycle which
means if the monitored data are valid;
The third byte shows which components are monitored:
• Bit 0: Catalyst;
• Bit 1: Catalyst heating;
• Bit 2: Fuel tank ventilation;
• Bit 3: Secondary air system;
• Bit 4: Air condition cooling medium;
• Bit 5: Oxygen sensor;
• Bit 6: Lampda probe heating;
• Bit 7: Exhaust gas recirculation;
The fourth byte shows bit by bit which component was monitored in a complete test cycle.
In the next step the tester reads the OBD relevant trouble code using the Service 03h
Request Emission Related Diagnostic Trouble Codes command. The request of the control
unit contains three 16 bit trouble codes. In the case of no stored trouble codes, the trouble
code is set to 0000h. When more then three faults are stored the control unit sends more
response messages. The tester knows how many responses are sent by the control unit due
to the previous request SID = 01h and PID = 01h.
The tester can request stored environment data to every trouble code. All environment data
are stored in hex format (n = 8 or n = 16 bit) which can be recalculated in the actual
physical value using the formula:
Page 81 of 148
Masterthesis Automotive Diagnostics
Physical value= Decimalvalue2n−1
Maximal value−Minimal valueMinimal value
and the range of values is shown in the appendix C.
The calculation for cooling water is shown in an example:
Stored hexadecimal value: 36h = 54 (decimal)
Calculating the physical value: 54
28−1215 °C−−40 ° C −40 ° C=14 ° C
4.3. The new diagnostic approach
As described in the chapter 4.2 the current approach allows only a small part of diagnostic
services of the control units during normal driving due to security reasons, which is a
disadvantage of the current diagnostic approach. In driving mode reading the fault
memory of the control units is very limited or not possible. Therefore the driver does not
receive detailed error information in case of a defect on the vehicle. It is not possible for
the driver to estimate how serious an error and how secure driving on is,
(Zimmermann/Schmidgall, 2006).
As explained in chapter 4.1. the current diagnostic approach uses single control units to
detect their own faults and the errors of the integrated sensors. But over the past decades
the numbers of control units has constantly increased and new functions are distributed
over several control units of the car, (You/Krage/Jalics, 2005).
In summary the current used diagnostic approach has the following problems and
disadvantages:
• A single fault can affect several different control units caused by the network
explained in chapter 1.3.
• Over the past years several different standards have been used described in chapter
4.1.
• Limited diagnostic services are available while the car is in driving mode
explained in chapter 4.2.
Page 82 of 148
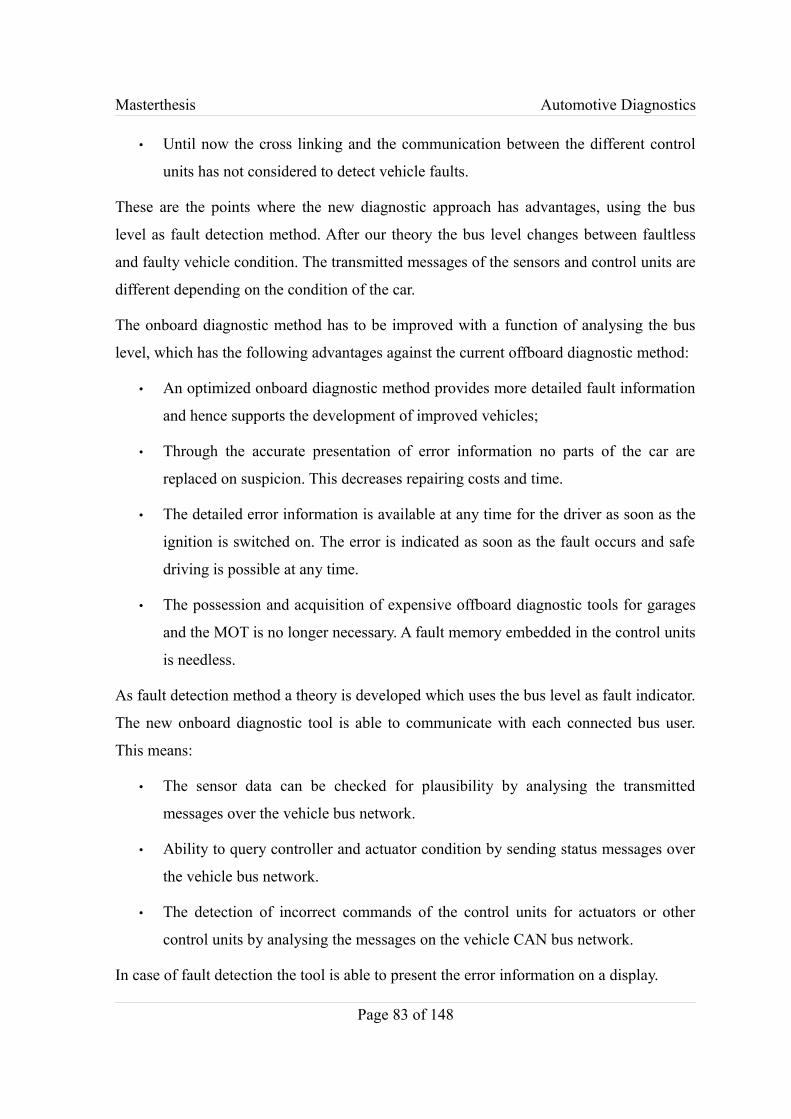
Masterthesis Automotive Diagnostics
• Until now the cross linking and the communication between the different control
units has not considered to detect vehicle faults.
These are the points where the new diagnostic approach has advantages, using the bus
level as fault detection method. After our theory the bus level changes between faultless
and faulty vehicle condition. The transmitted messages of the sensors and control units are
different depending on the condition of the car.
The onboard diagnostic method has to be improved with a function of analysing the bus
level, which has the following advantages against the current offboard diagnostic method:
• An optimized onboard diagnostic method provides more detailed fault information
and hence supports the development of improved vehicles;
• Through the accurate presentation of error information no parts of the car are
replaced on suspicion. This decreases repairing costs and time.
• The detailed error information is available at any time for the driver as soon as the
ignition is switched on. The error is indicated as soon as the fault occurs and safe
driving is possible at any time.
• The possession and acquisition of expensive offboard diagnostic tools for garages
and the MOT is no longer necessary. A fault memory embedded in the control units
is needless.
As fault detection method a theory is developed which uses the bus level as fault indicator.
The new onboard diagnostic tool is able to communicate with each connected bus user.
This means:
• The sensor data can be checked for plausibility by analysing the transmitted
messages over the vehicle bus network.
• Ability to query controller and actuator condition by sending status messages over
the vehicle bus network.
• The detection of incorrect commands of the control units for actuators or other
control units by analysing the messages on the vehicle CAN bus network.
In case of fault detection the tool is able to present the error information on a display.
Page 83 of 148
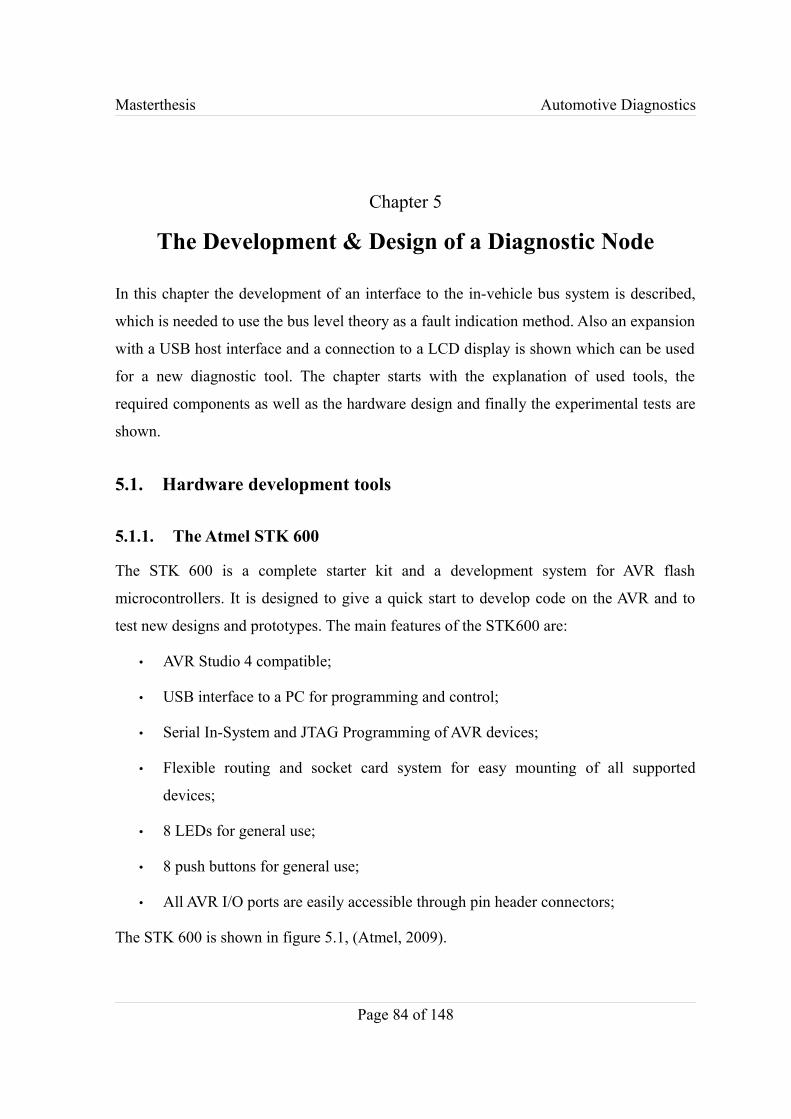
Masterthesis Automotive Diagnostics
Chapter 5
The Development & Design of a Diagnostic Node
In this chapter the development of an interface to the in-vehicle bus system is described,
which is needed to use the bus level theory as a fault indication method. Also an expansion
with a USB host interface and a connection to a LCD display is shown which can be used
for a new diagnostic tool. The chapter starts with the explanation of used tools, the
required components as well as the hardware design and finally the experimental tests are
shown.
5.1. Hardware development tools
5.1.1. The Atmel STK 600
The STK 600 is a complete starter kit and a development system for AVR flash
microcontrollers. It is designed to give a quick start to develop code on the AVR and to
test new designs and prototypes. The main features of the STK600 are:
• AVR Studio 4 compatible;
• USB interface to a PC for programming and control;
• Serial In-System and JTAG Programming of AVR devices;
• Flexible routing and socket card system for easy mounting of all supported
devices;
• 8 LEDs for general use;
• 8 push buttons for general use;
• All AVR I/O ports are easily accessible through pin header connectors;
The STK 600 is shown in figure 5.1, (Atmel, 2009).
Page 84 of 148
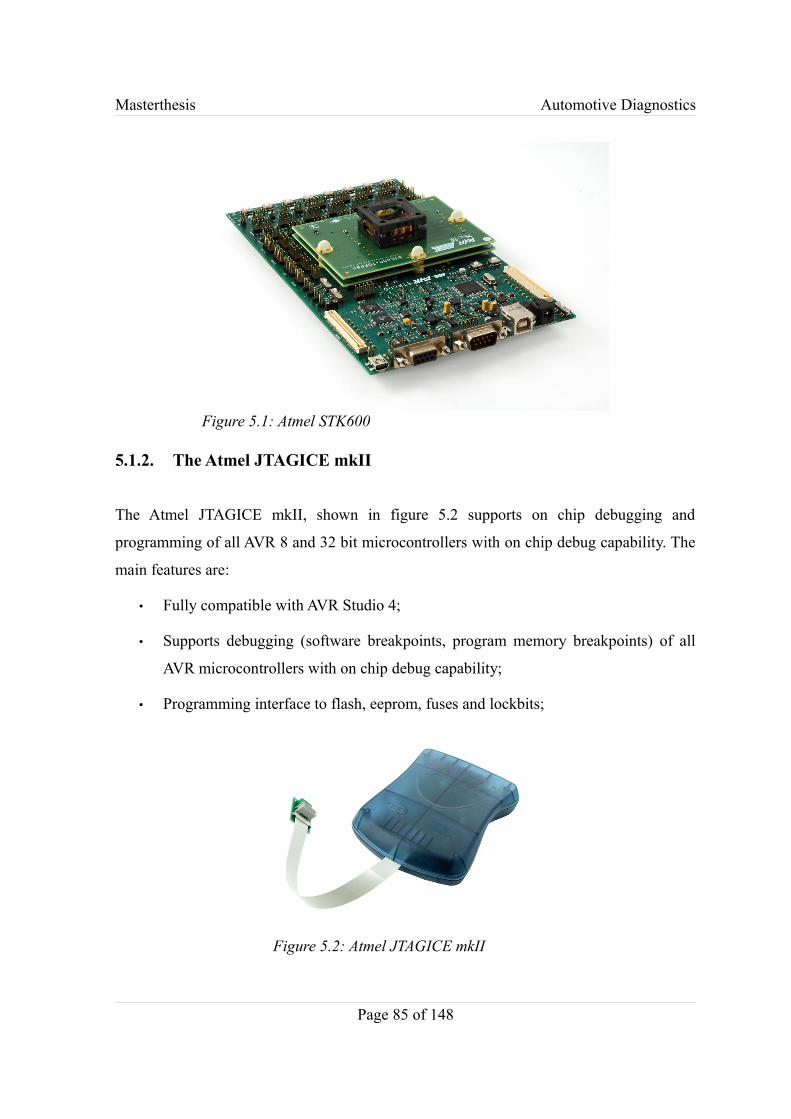
Masterthesis Automotive Diagnostics
5.1.2. The Atmel JTAGICE mkII
The Atmel JTAGICE mkII, shown in figure 5.2 supports on chip debugging and
programming of all AVR 8 and 32 bit microcontrollers with on chip debug capability. The
main features are:
• Fully compatible with AVR Studio 4;
• Supports debugging (software breakpoints, program memory breakpoints) of all
AVR microcontrollers with on chip debug capability;
• Programming interface to flash, eeprom, fuses and lockbits;
Page 85 of 148
Figure 5.1: Atmel STK600
Figure 5.2: Atmel JTAGICE mkII
Masterthesis Automotive Diagnostics
5.1.3. AVR Studio 4
AVR Studio is an integrated development environment (IDE) for writing and debugging
AVR applications in Windows environments. AVR Studio provides a project management
tool, source file editor, simulator, assembler and front-end for C/C++ programming,
emulation and on-chip debugging.
5.1.4. Eagle
Eagle is the short form of Easy Application Graphical Layout Editor and is an easy to use
tool for designing printed circuit boards. The eagle light edition is free for non profit
applications and has the following limitations:
• The usable board area is limited to 100 x 80 mm;
• Limited to two signal layers (top and bottom);
• Only one sheet can be created in the schematic editor;
Page 86 of 148
Figure 5.3: AVR Studio screenshot
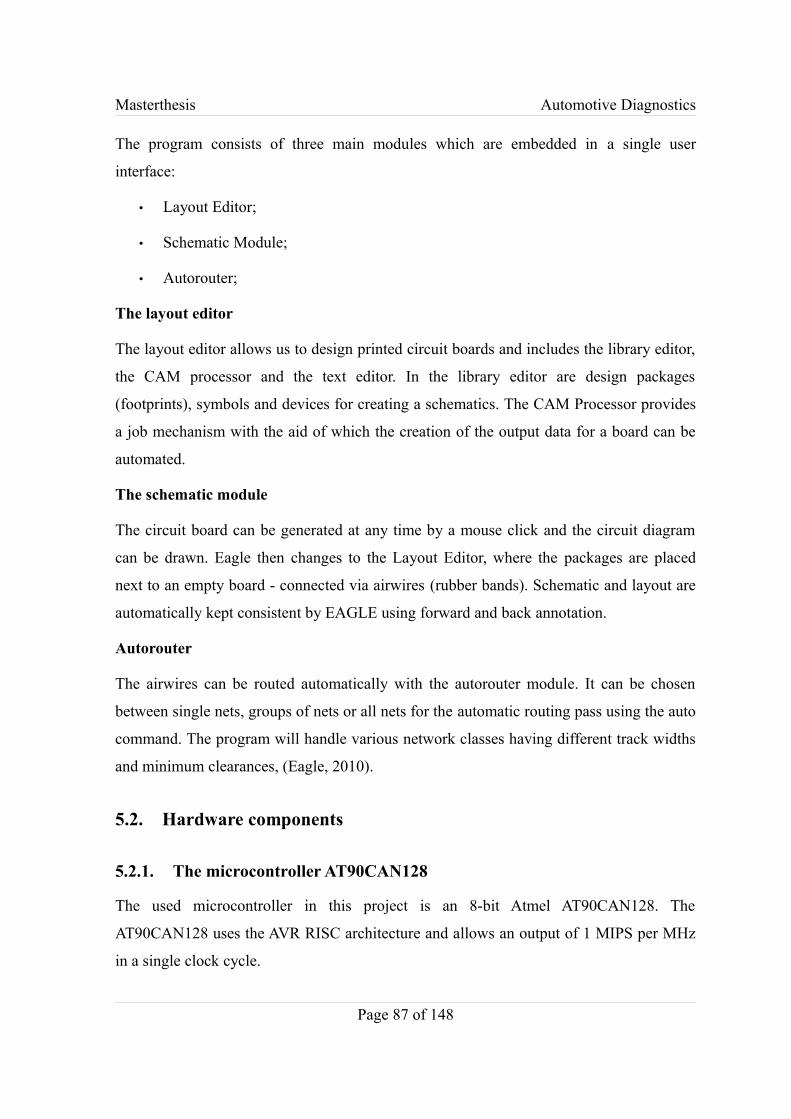
Masterthesis Automotive Diagnostics
The program consists of three main modules which are embedded in a single user
interface:
• Layout Editor;
• Schematic Module;
• Autorouter;
The layout editor
The layout editor allows us to design printed circuit boards and includes the library editor,
the CAM processor and the text editor. In the library editor are design packages
(footprints), symbols and devices for creating a schematics. The CAM Processor provides
a job mechanism with the aid of which the creation of the output data for a board can be
automated.
The schematic module
The circuit board can be generated at any time by a mouse click and the circuit diagram
can be drawn. Eagle then changes to the Layout Editor, where the packages are placed
next to an empty board - connected via airwires (rubber bands). Schematic and layout are
automatically kept consistent by EAGLE using forward and back annotation.
Autorouter
The airwires can be routed automatically with the autorouter module. It can be chosen
between single nets, groups of nets or all nets for the automatic routing pass using the auto
command. The program will handle various network classes having different track widths
and minimum clearances, (Eagle, 2010).
5.2. Hardware components
5.2.1. The microcontroller AT90CAN128
The used microcontroller in this project is an 8-bit Atmel AT90CAN128. The
AT90CAN128 uses the AVR RISC architecture and allows an output of 1 MIPS per MHz
in a single clock cycle.
Page 87 of 148
Masterthesis Automotive Diagnostics
The AVR has 32 general working registers which are directly connected to the Arithmetic
Logic Unit ALU. Therefore the ALU has access to two independent registers and one
single instruction can be executed in one clock cycle which is up to ten times faster than
conventional CISC microcontrollers.
Further features of the AT90CAN128 are:
• 128 kBytes in system programmable flash with read/write capabilities;
• 4 kByte EEPROM;
• 4 kByte SRAM;
• 53 general purposes I/O lines;
• 32 general purposes working registers;
• CAN controller;
• Real Time Counter RTC;
• Four flexible Timer/Counters with compare modes and PWM;
• Two USARTs;
• Two wire serial interface (byte orientated);
• 8 channel 10 bit ADC with differential input stage and programmable gain;
• Programmable Watchdog Timer with internal oscillator;
• A serial peripheral interface SPI;
• Joint test action group JTAG interface after IEEE standard 1149.1;
Figure 5.4 shows the pin configuration of the AT90CAN128 and in appendix D are the pin
functions described, (Atmel, 2008).
Page 88 of 148
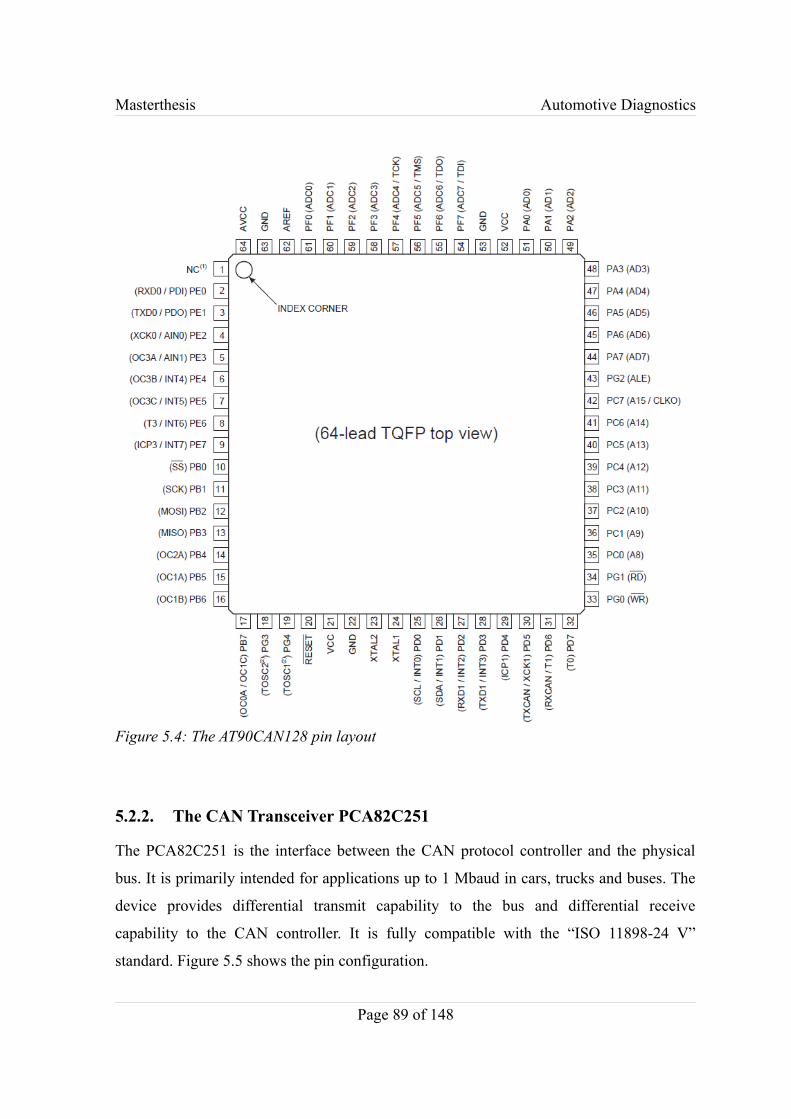
Masterthesis Automotive Diagnostics
5.2.2. The CAN Transceiver PCA82C251
The PCA82C251 is the interface between the CAN protocol controller and the physical
bus. It is primarily intended for applications up to 1 Mbaud in cars, trucks and buses. The
device provides differential transmit capability to the bus and differential receive
capability to the CAN controller. It is fully compatible with the “ISO 11898-24 V”
standard. Figure 5.5 shows the pin configuration.
Page 89 of 148
Figure 5.4: The AT90CAN128 pin layout

Masterthesis Automotive Diagnostics
Pin # Signal Description1 TXD Transmit data input.2 GND Ground.3 VCC Supply voltage.4 RXD Receive data output.5 Vref Reference voltage output.6 CANL CAN low level voltage input/output.7 CANH CAN high level voltage input/output.8 Rs Slope resistor input.
Table 5.1: CAN transceiver PCA82C251 pin description
A current limiting circuit protects the transmitter output stage against short-circuit to
positive and negative battery voltage. Although the power dissipation is increased during
this fault condition, this feature will prevent destruction of the transmitter output stage.
If the junction temperature exceeds a value of approximately 160 °C, the limiting current
of both transmitter outputs is decreased. Because the transmitter is responsible for the
major part of the power dissipation, this will result in reduced power dissipation and hence
a lower chip temperature. All other parts of the IC will remain operating. The thermal
Page 90 of 148
Figure 5.5: The CAN transceiver pin layout
Masterthesis Automotive Diagnostics
protection is particularly needed when a bus line is short-circuited.
The CANH and CANL lines are also protected against electrical transients which may
occur in an automotive environment.
Pin 8 (Rs) allows three different modes of operation to be selected: high-speed, slope
control or standby.
• For high-speed operation, the transmitter output transistors are simply switched on
and off as fast as possible. In this mode, no measures are taken to limit the rise and
fall slope. Use of a shielded cable is recommended to avoid RFI problems. The
high-speed mode is selected by connecting pin 8 to ground.
• The slope control mode allows the use of an unshielded twisted pair or a parallel
pair of wires as bus lines. To reduce RFI, the rise and fall slope should be limited.
The rise and fall slope can be programmed with a resistor connected from pin 8 to
ground. The slope is proportional to the current output at pin 8.
• If a HIGH level is applied to pin 8, the circuit enters a low current standby mode.
In this mode, the transmitter is switched off and the receiver is switched to a low
current. If dominant bits are detected (differential bus voltage >0.9 V), RXD will
be switched to a LOW level. The microcontroller should react to this condition by
switching the transceiver back to normal operation (via pin 8). Because the
receiver is slower in standby mode, the first message will be lost at higher bit rates.
(Philips, 2000)
For the hardware layout the default mode is applied.
5.2.3. The USB FIFO FT245BM
The FT245BM provides a method of transferring data to/from a peripheral and a host PC
at up to one megabyte per second. The FIFO like design gives an interface to any
microcontroller or microprocessor via I/O ports.
By using FTDI’s virtual COM port drivers, the peripheral looks like a standard COM port
to the application software. Commands to set the baud rate are ignored - the device always
Page 91 of 148
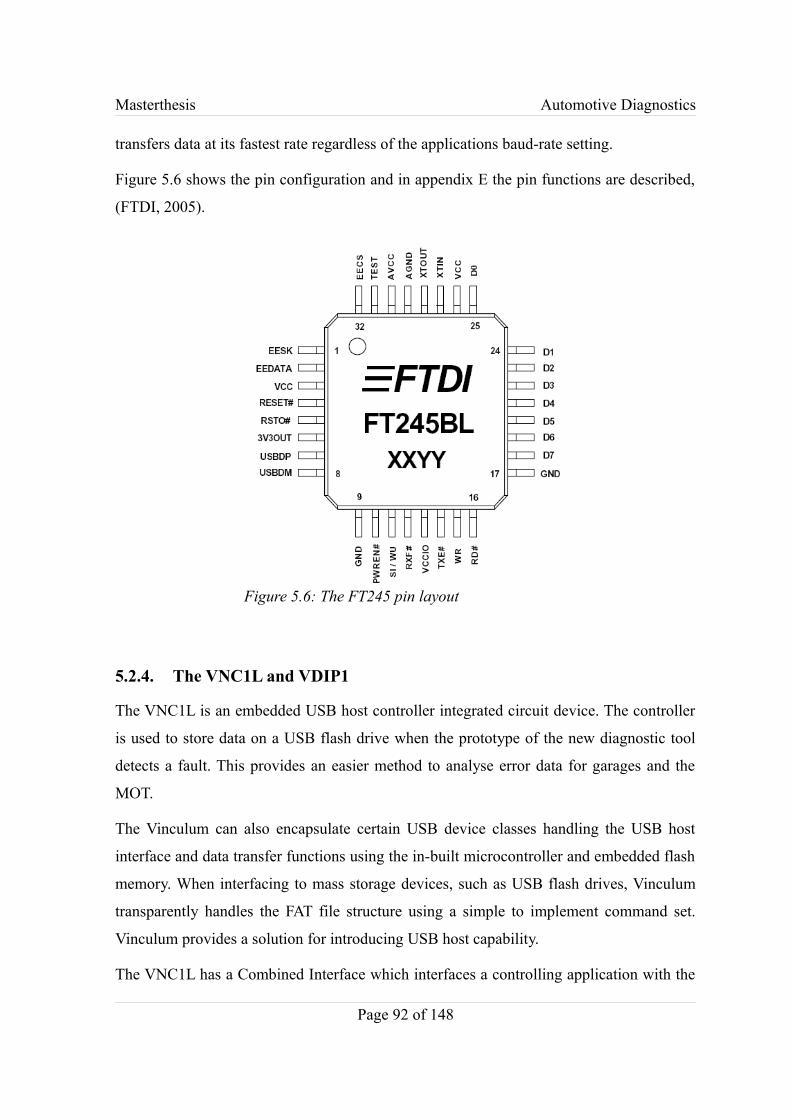
Masterthesis Automotive Diagnostics
transfers data at its fastest rate regardless of the applications baud-rate setting.
Figure 5.6 shows the pin configuration and in appendix E the pin functions are described,
(FTDI, 2005).
5.2.4. The VNC1L and VDIP1
The VNC1L is an embedded USB host controller integrated circuit device. The controller
is used to store data on a USB flash drive when the prototype of the new diagnostic tool
detects a fault. This provides an easier method to analyse error data for garages and the
MOT.
The Vinculum can also encapsulate certain USB device classes handling the USB host
interface and data transfer functions using the in-built microcontroller and embedded flash
memory. When interfacing to mass storage devices, such as USB flash drives, Vinculum
transparently handles the FAT file structure using a simple to implement command set.
Vinculum provides a solution for introducing USB host capability.
The VNC1L has a Combined Interface which interfaces a controlling application with the
Page 92 of 148
Figure 5.6: The FT245 pin layout
Masterthesis Automotive Diagnostics
Command Monitor. The combined interfaces are UART, Parallel FIFO and SPI.
The key features of the VNC1L are:
• Two independent USB host ports;
• 8 or 32-bit microcontroller core;
• 64k embedded flash program memory;
• 4k internal data SRAM;
• 2 x USB 2.0 slow speed or full speed host or slave ports;
• Automatic low or full speed selection;
• UART, SPI and Parallel FIFO interfaces;
• Up to 28 general purpose I/O pins depending on configuration;
• Low power operation (25mA running/2mA standby);
There are currently 6 standard firmware versions available for the VNC1L:
• VDAP Firmware: USB host for single flash disk and general purpose USB
peripherals. Selectable UART, FIFO or SPI interface command monitor.
• VDPS Firmware: USB host for single flash disk and general purpose USB
peripherals. USB slave port connection for connecting to host PC. Selectable
UART, FIFO or SPI interface command monitor.
• VDFC Firmware: USB host for two flash disks, selectable UART, FIFO or SPI
interface command monitor.
• VMSC1 Firmware: USB host for single flash disk and general purpose USB
peripherals. Audio playback command extensions for MP3 decoder integrated
circuits. Selectable UART, FIFO or SPI interface command monitor port.
• VCDC Firmware: USB Host for automatic connection to USB communications
class devices. UART interface command monitor.
• VDIF Firmware: USB host for single flash disk and general purpose USB
peripherals. Selectable UART, FIFO, SPI or USB interface command monitor.
Page 93 of 148
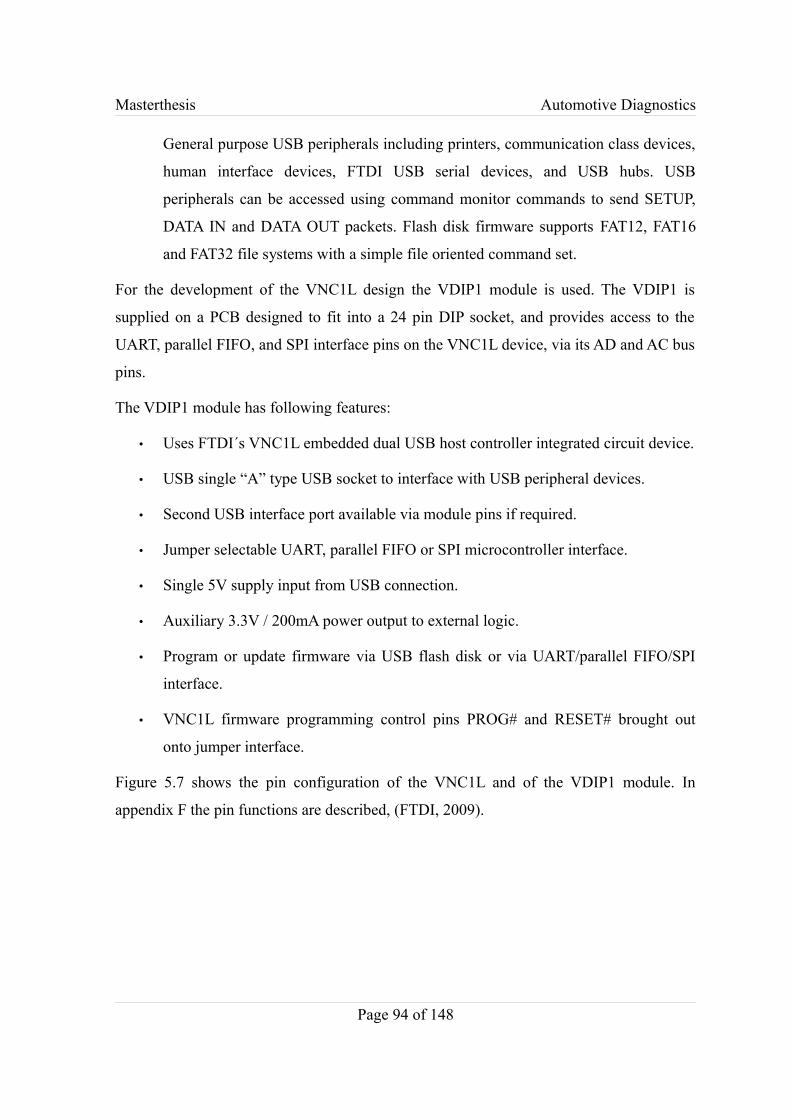
Masterthesis Automotive Diagnostics
General purpose USB peripherals including printers, communication class devices,
human interface devices, FTDI USB serial devices, and USB hubs. USB
peripherals can be accessed using command monitor commands to send SETUP,
DATA IN and DATA OUT packets. Flash disk firmware supports FAT12, FAT16
and FAT32 file systems with a simple file oriented command set.
For the development of the VNC1L design the VDIP1 module is used. The VDIP1 is
supplied on a PCB designed to fit into a 24 pin DIP socket, and provides access to the
UART, parallel FIFO, and SPI interface pins on the VNC1L device, via its AD and AC bus
pins.
The VDIP1 module has following features:
• Uses FTDI´s VNC1L embedded dual USB host controller integrated circuit device.
• USB single “A” type USB socket to interface with USB peripheral devices.
• Second USB interface port available via module pins if required.
• Jumper selectable UART, parallel FIFO or SPI microcontroller interface.
• Single 5V supply input from USB connection.
• Auxiliary 3.3V / 200mA power output to external logic.
• Program or update firmware via USB flash disk or via UART/parallel FIFO/SPI
interface.
• VNC1L firmware programming control pins PROG# and RESET# brought out
onto jumper interface.
Figure 5.7 shows the pin configuration of the VNC1L and of the VDIP1 module. In
appendix F the pin functions are described, (FTDI, 2009).
Page 94 of 148
Masterthesis Automotive Diagnostics
Figure 5.7: The VNC1L and VDIP1 pin layout
5.2.5. LC Display WD-C2704M-1HNN
The LCD WD-C2704M-1HNN is used to indicate the faults as soon as they occur and
provides an example interface of multimedia displays used in cars. The display has the
shown features:
• Four lines x 27 digits text;
• Integrated controller HD44780;
• Two separate controller for the upper and bottom display half;
• Accessed over four or eight bit data bus;
• Supply voltage of 5V/6mA;
Pin layout:
Page 95 of 148
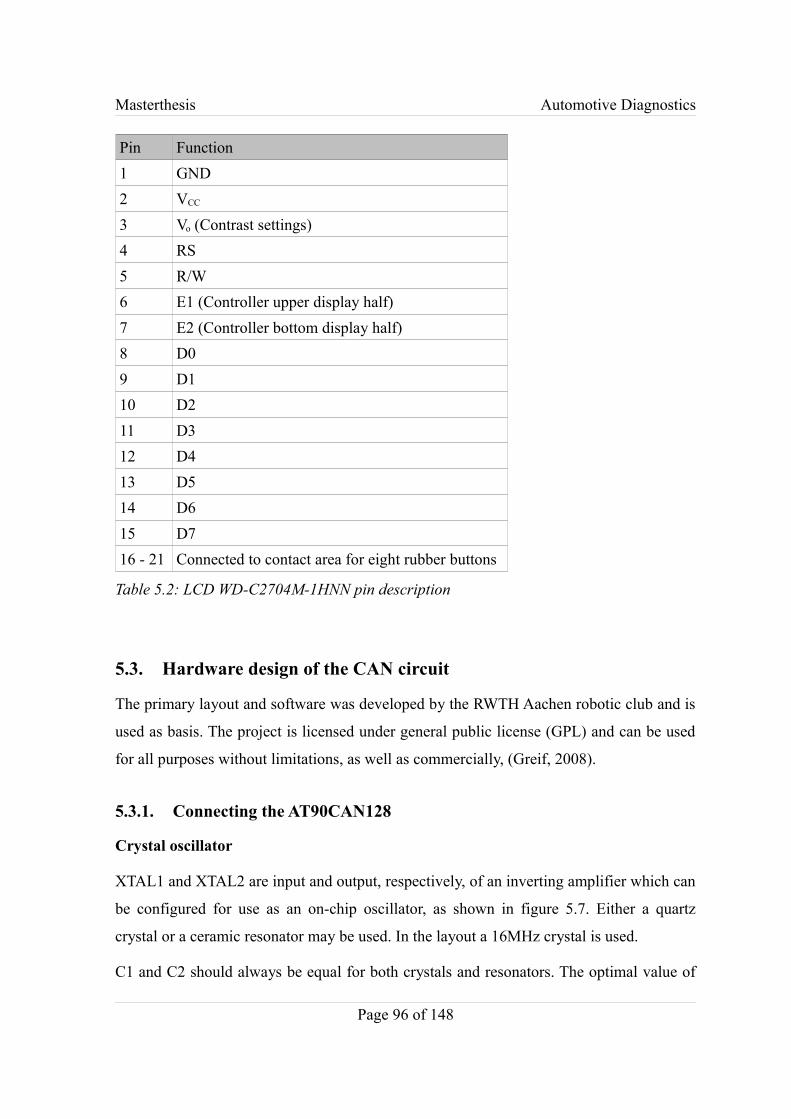
Masterthesis Automotive Diagnostics
Pin Function1 GND2 VCC
3 Vo (Contrast settings)4 RS5 R/W6 E1 (Controller upper display half)7 E2 (Controller bottom display half)8 D09 D110 D211 D312 D413 D514 D615 D716 - 21 Connected to contact area for eight rubber buttons
Table 5.2: LCD WD-C2704M-1HNN pin description
5.3. Hardware design of the CAN circuit
The primary layout and software was developed by the RWTH Aachen robotic club and is
used as basis. The project is licensed under general public license (GPL) and can be used
for all purposes without limitations, as well as commercially, (Greif, 2008).
5.3.1. Connecting the AT90CAN128
Crystal oscillator
XTAL1 and XTAL2 are input and output, respectively, of an inverting amplifier which can
be configured for use as an on-chip oscillator, as shown in figure 5.7. Either a quartz
crystal or a ceramic resonator may be used. In the layout a 16MHz crystal is used.
C1 and C2 should always be equal for both crystals and resonators. The optimal value of
Page 96 of 148

Masterthesis Automotive Diagnostics
the capacitors depends on the crystal or resonator in use, the amount of stray capacitance,
and the electromagnetic noise of the environment. Some initial guidelines for choosing
capacitors for use with crystals are given in the datasheet of the AT90CAN128. The
optimal capacitor value for a 16Mhz crystal is 22pF which is good for many crystals. The
FT245BM uses as 6MHz crystal and the VNC1L a 12MHz crystal. How to connect a
crystal is shown in figure 5.8, (Atmel, 2008).
Reset
The reset pin of the AT90CAN128 is “active low”, which means connecting the pin to
ground is a reset. The microcontroller has a high resistive internal pullup resistor which
pulls the reset pin against VCC. In some cases the resistance of the pullup resistor is not
enough and it is recommended to connect an external pull up resistor between reset pin
and VCC. The typical value is 10 kΩ. Additionally it is recommended to connect a capacitor
between the reset pin and ground. The capacitor ensures that the controller is reset for a
defined period while turning on the supply voltage. While the microcontroller is running
the capacitor ensures that the reset input is not sensitive to spikes and glitches. Therefore
the capacitor should be connected very close to the microcontroller, (Atmel, 2010).
Page 97 of 148
Figure 5.8: The wiring of the crystal
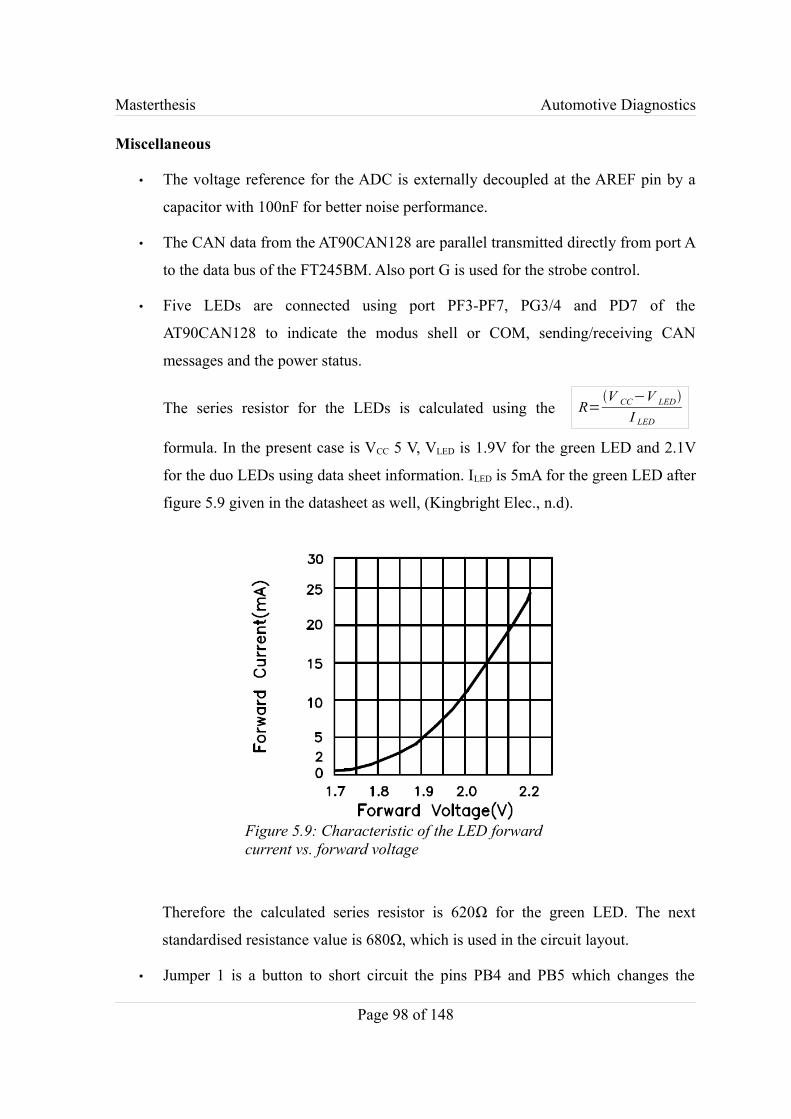
Masterthesis Automotive Diagnostics
Miscellaneous
• The voltage reference for the ADC is externally decoupled at the AREF pin by a
capacitor with 100nF for better noise performance.
• The CAN data from the AT90CAN128 are parallel transmitted directly from port A
to the data bus of the FT245BM. Also port G is used for the strobe control.
• Five LEDs are connected using port PF3-PF7, PG3/4 and PD7 of the
AT90CAN128 to indicate the modus shell or COM, sending/receiving CAN
messages and the power status.
The series resistor for the LEDs is calculated using the R=V CC−V LED
I LED
formula. In the present case is VCC 5 V, VLED is 1.9V for the green LED and 2.1V
for the duo LEDs using data sheet information. ILED is 5mA for the green LED after
figure 5.9 given in the datasheet as well, (Kingbright Elec., n.d).
Therefore the calculated series resistor is 620Ω for the green LED. The next
standardised resistance value is 680Ω, which is used in the circuit layout.
• Jumper 1 is a button to short circuit the pins PB4 and PB5 which changes the
Page 98 of 148
Figure 5.9: Characteristic of the LED forward current vs. forward voltage
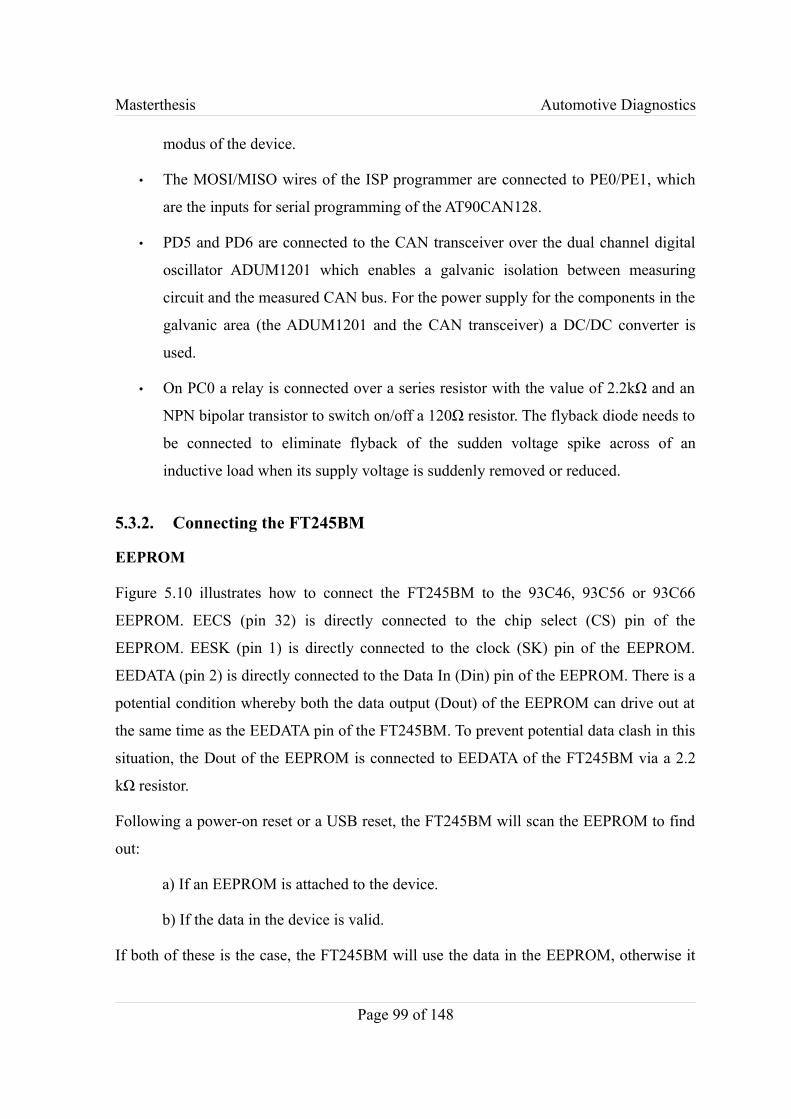
Masterthesis Automotive Diagnostics
modus of the device.
• The MOSI/MISO wires of the ISP programmer are connected to PE0/PE1, which
are the inputs for serial programming of the AT90CAN128.
• PD5 and PD6 are connected to the CAN transceiver over the dual channel digital
oscillator ADUM1201 which enables a galvanic isolation between measuring
circuit and the measured CAN bus. For the power supply for the components in the
galvanic area (the ADUM1201 and the CAN transceiver) a DC/DC converter is
used.
• On PC0 a relay is connected over a series resistor with the value of 2.2kΩ and an
NPN bipolar transistor to switch on/off a 120Ω resistor. The flyback diode needs to
be connected to eliminate flyback of the sudden voltage spike across of an
inductive load when its supply voltage is suddenly removed or reduced.
5.3.2. Connecting the FT245BM
EEPROM
Figure 5.10 illustrates how to connect the FT245BM to the 93C46, 93C56 or 93C66
EEPROM. EECS (pin 32) is directly connected to the chip select (CS) pin of the
EEPROM. EESK (pin 1) is directly connected to the clock (SK) pin of the EEPROM.
EEDATA (pin 2) is directly connected to the Data In (Din) pin of the EEPROM. There is a
potential condition whereby both the data output (Dout) of the EEPROM can drive out at
the same time as the EEDATA pin of the FT245BM. To prevent potential data clash in this
situation, the Dout of the EEPROM is connected to EEDATA of the FT245BM via a 2.2
kΩ resistor.
Following a power-on reset or a USB reset, the FT245BM will scan the EEPROM to find
out:
a) If an EEPROM is attached to the device.
b) If the data in the device is valid.
If both of these is the case, the FT245BM will use the data in the EEPROM, otherwise it
Page 99 of 148
Masterthesis Automotive Diagnostics
will use its built-in default values. When a valid command is issued to the EEPROM from
the FT245BM, the EEPROM will acknowledge the command by pulling its Dout pin low.
In order to check for this condition, it is necessary to pull Dout high using a 10 kΩ resistor.
If the command acknowledge does not happen then EEDATA will be pulled high by the 10
kΩ resistor during this part of the cycle and the device will detect an invalid command or
no EEPROM present, (FTDI, 2005).
Bus powered circuit with power control
Figure 5.11 shows an example of a 5 volt, USB bus powered design using the FT245BM
connected to a 5V microcontroller or other external logic. In this design, the FT245BM
controls the power to the auxiliary circuitry using PWEREN# to shut off power to this
Page 100 of 148
Figure 5.10: Wiring of the FT245 to an EEPROM
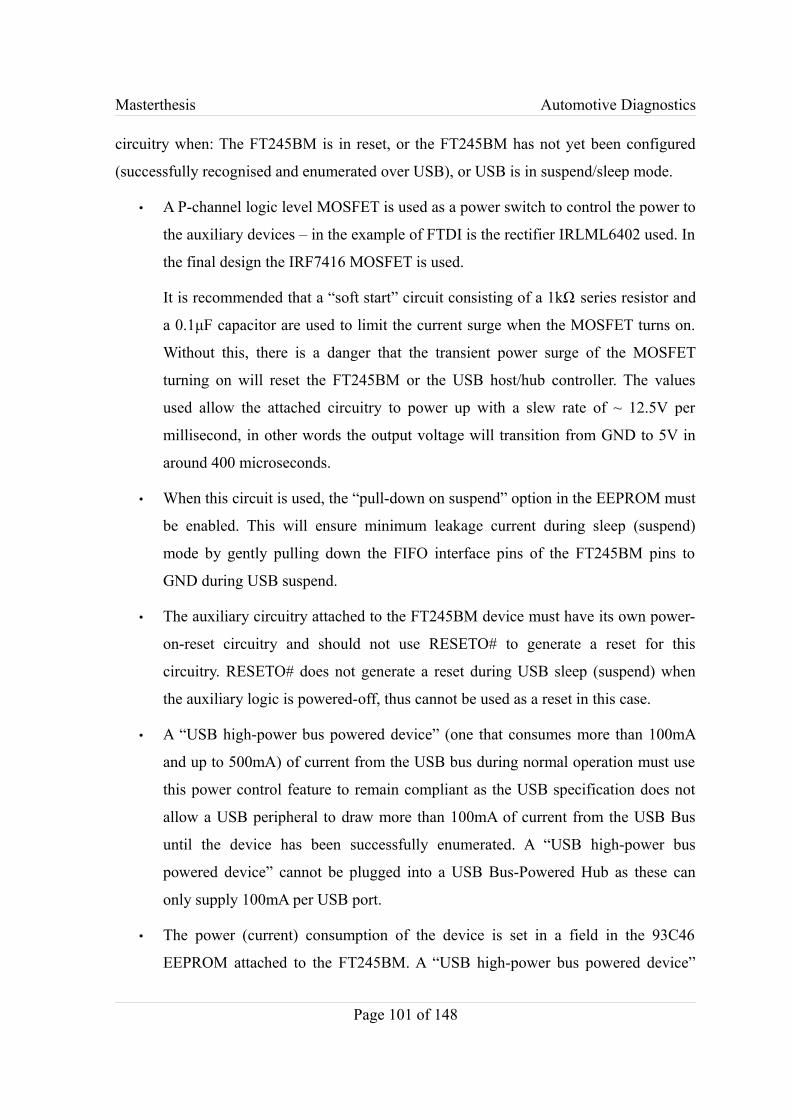
Masterthesis Automotive Diagnostics
circuitry when: The FT245BM is in reset, or the FT245BM has not yet been configured
(successfully recognised and enumerated over USB), or USB is in suspend/sleep mode.
• A P-channel logic level MOSFET is used as a power switch to control the power to
the auxiliary devices – in the example of FTDI is the rectifier IRLML6402 used. In
the final design the IRF7416 MOSFET is used.
It is recommended that a “soft start” circuit consisting of a 1kΩ series resistor and
a 0.1μF capacitor are used to limit the current surge when the MOSFET turns on.
Without this, there is a danger that the transient power surge of the MOSFET
turning on will reset the FT245BM or the USB host/hub controller. The values
used allow the attached circuitry to power up with a slew rate of ~ 12.5V per
millisecond, in other words the output voltage will transition from GND to 5V in
around 400 microseconds.
• When this circuit is used, the “pull-down on suspend” option in the EEPROM must
be enabled. This will ensure minimum leakage current during sleep (suspend)
mode by gently pulling down the FIFO interface pins of the FT245BM pins to
GND during USB suspend.
• The auxiliary circuitry attached to the FT245BM device must have its own power-
on-reset circuitry and should not use RESETO# to generate a reset for this
circuitry. RESETO# does not generate a reset during USB sleep (suspend) when
the auxiliary logic is powered-off, thus cannot be used as a reset in this case.
• A “USB high-power bus powered device” (one that consumes more than 100mA
and up to 500mA) of current from the USB bus during normal operation must use
this power control feature to remain compliant as the USB specification does not
allow a USB peripheral to draw more than 100mA of current from the USB Bus
until the device has been successfully enumerated. A “USB high-power bus
powered device” cannot be plugged into a USB Bus-Powered Hub as these can
only supply 100mA per USB port.
• The power (current) consumption of the device is set in a field in the 93C46
EEPROM attached to the FT245BM. A “USB high-power bus powered device”
Page 101 of 148
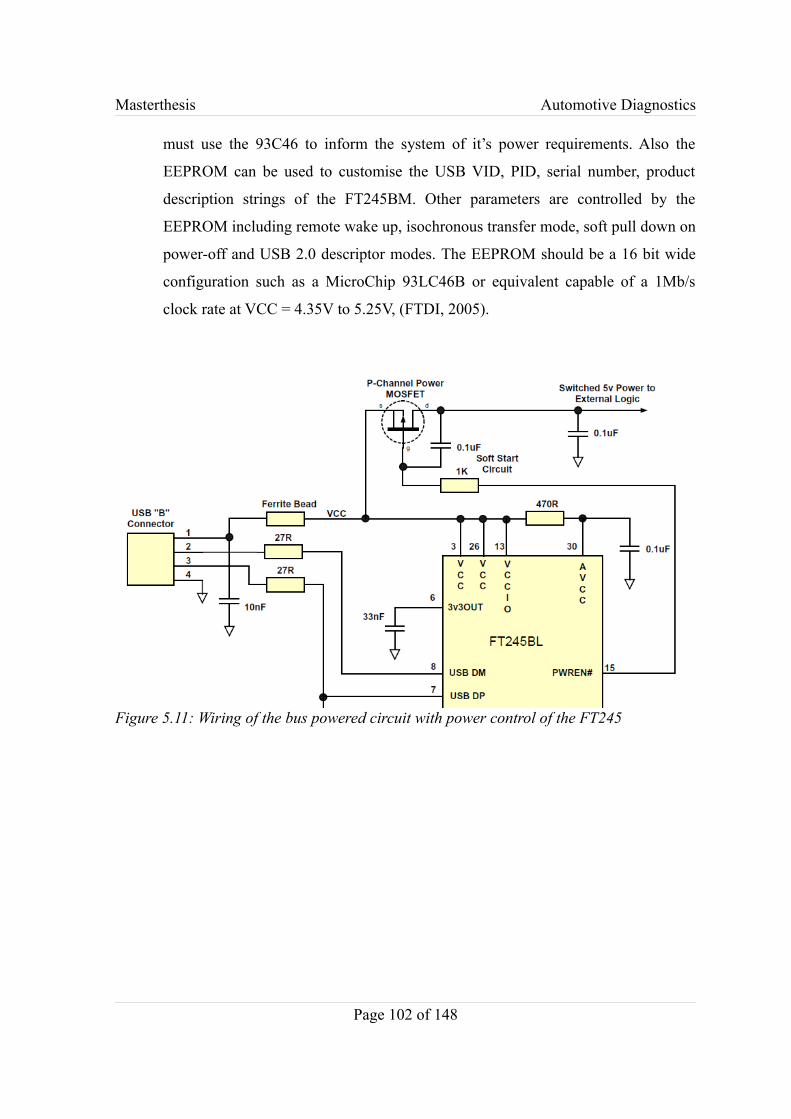
Masterthesis Automotive Diagnostics
must use the 93C46 to inform the system of it’s power requirements. Also the
EEPROM can be used to customise the USB VID, PID, serial number, product
description strings of the FT245BM. Other parameters are controlled by the
EEPROM including remote wake up, isochronous transfer mode, soft pull down on
power-off and USB 2.0 descriptor modes. The EEPROM should be a 16 bit wide
configuration such as a MicroChip 93LC46B or equivalent capable of a 1Mb/s
clock rate at VCC = 4.35V to 5.25V, (FTDI, 2005).
Page 102 of 148
Figure 5.11: Wiring of the bus powered circuit with power control of the FT245
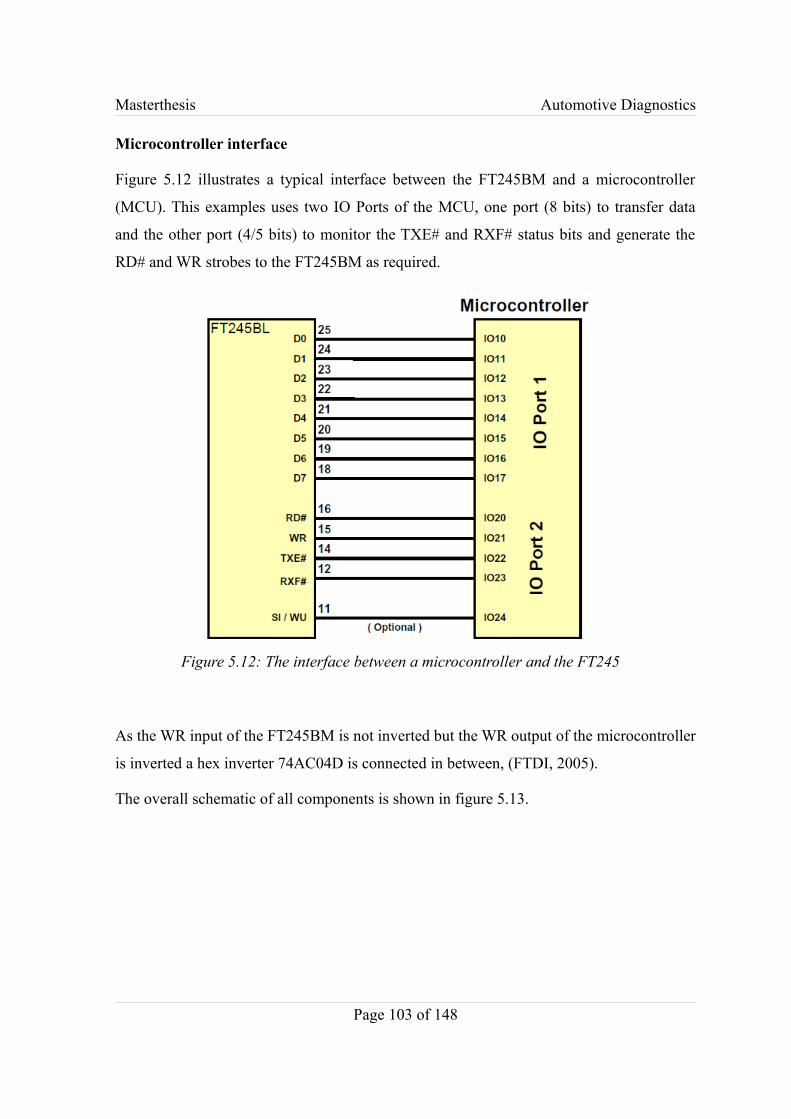
Masterthesis Automotive Diagnostics
Microcontroller interface
Figure 5.12 illustrates a typical interface between the FT245BM and a microcontroller
(MCU). This examples uses two IO Ports of the MCU, one port (8 bits) to transfer data
and the other port (4/5 bits) to monitor the TXE# and RXF# status bits and generate the
RD# and WR strobes to the FT245BM as required.
As the WR input of the FT245BM is not inverted but the WR output of the microcontroller
is inverted a hex inverter 74AC04D is connected in between, (FTDI, 2005).
The overall schematic of all components is shown in figure 5.13.
Page 103 of 148
Figure 5.12: The interface between a microcontroller and the FT245
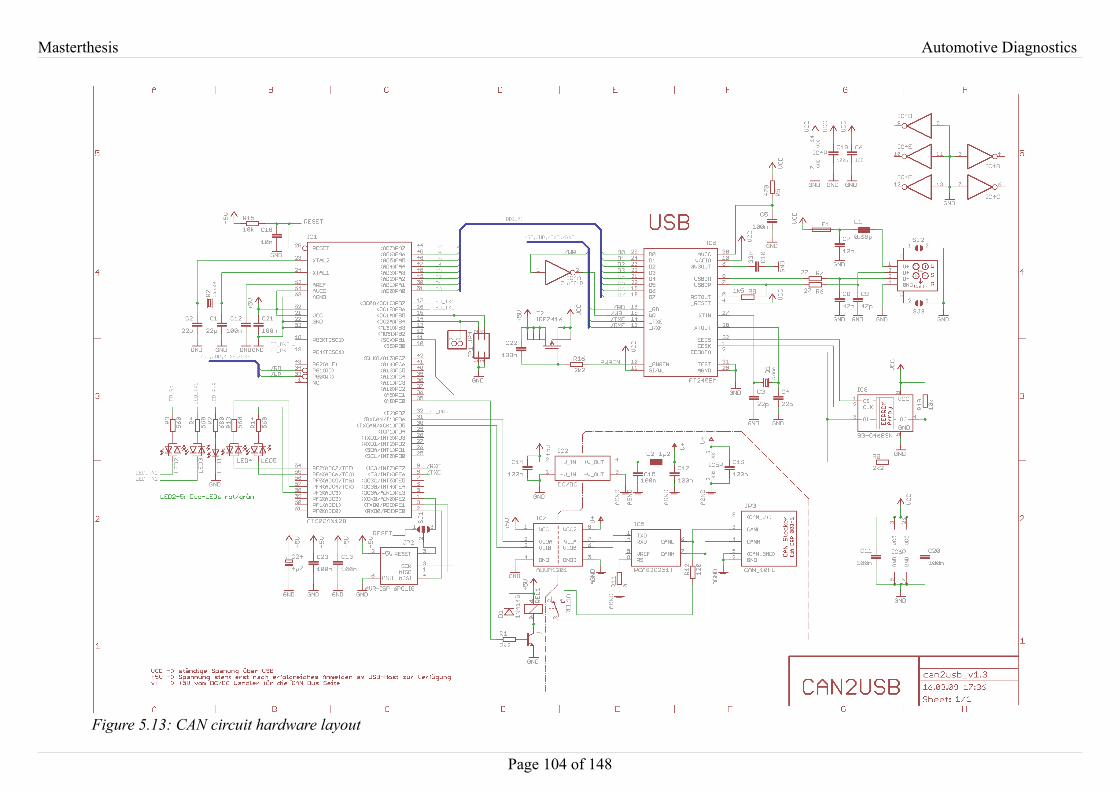
Masterthesis Automotive Diagnostics
Page 104 of 148
Figure 5.13: CAN circuit hardware layout
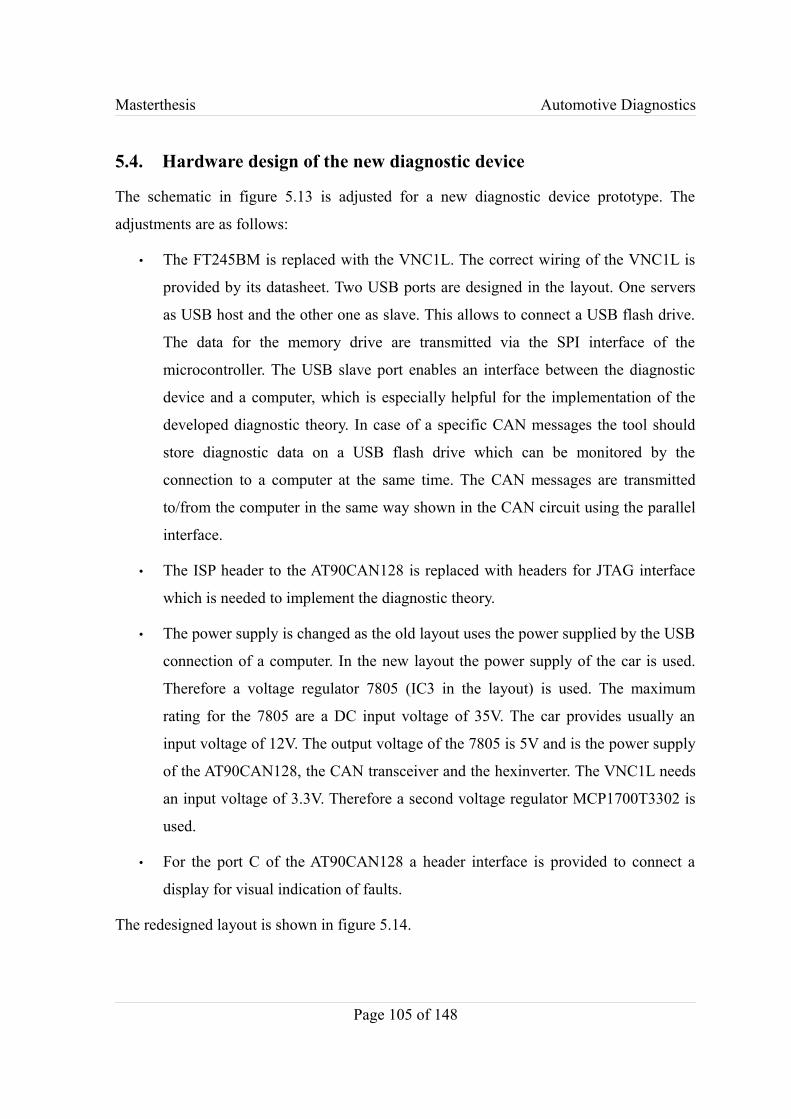
Masterthesis Automotive Diagnostics
5.4. Hardware design of the new diagnostic device
The schematic in figure 5.13 is adjusted for a new diagnostic device prototype. The
adjustments are as follows:
• The FT245BM is replaced with the VNC1L. The correct wiring of the VNC1L is
provided by its datasheet. Two USB ports are designed in the layout. One servers
as USB host and the other one as slave. This allows to connect a USB flash drive.
The data for the memory drive are transmitted via the SPI interface of the
microcontroller. The USB slave port enables an interface between the diagnostic
device and a computer, which is especially helpful for the implementation of the
developed diagnostic theory. In case of a specific CAN messages the tool should
store diagnostic data on a USB flash drive which can be monitored by the
connection to a computer at the same time. The CAN messages are transmitted
to/from the computer in the same way shown in the CAN circuit using the parallel
interface.
• The ISP header to the AT90CAN128 is replaced with headers for JTAG interface
which is needed to implement the diagnostic theory.
• The power supply is changed as the old layout uses the power supplied by the USB
connection of a computer. In the new layout the power supply of the car is used.
Therefore a voltage regulator 7805 (IC3 in the layout) is used. The maximum
rating for the 7805 are a DC input voltage of 35V. The car provides usually an
input voltage of 12V. The output voltage of the 7805 is 5V and is the power supply
of the AT90CAN128, the CAN transceiver and the hexinverter. The VNC1L needs
an input voltage of 3.3V. Therefore a second voltage regulator MCP1700T3302 is
used.
• For the port C of the AT90CAN128 a header interface is provided to connect a
display for visual indication of faults.
The redesigned layout is shown in figure 5.14.
Page 105 of 148
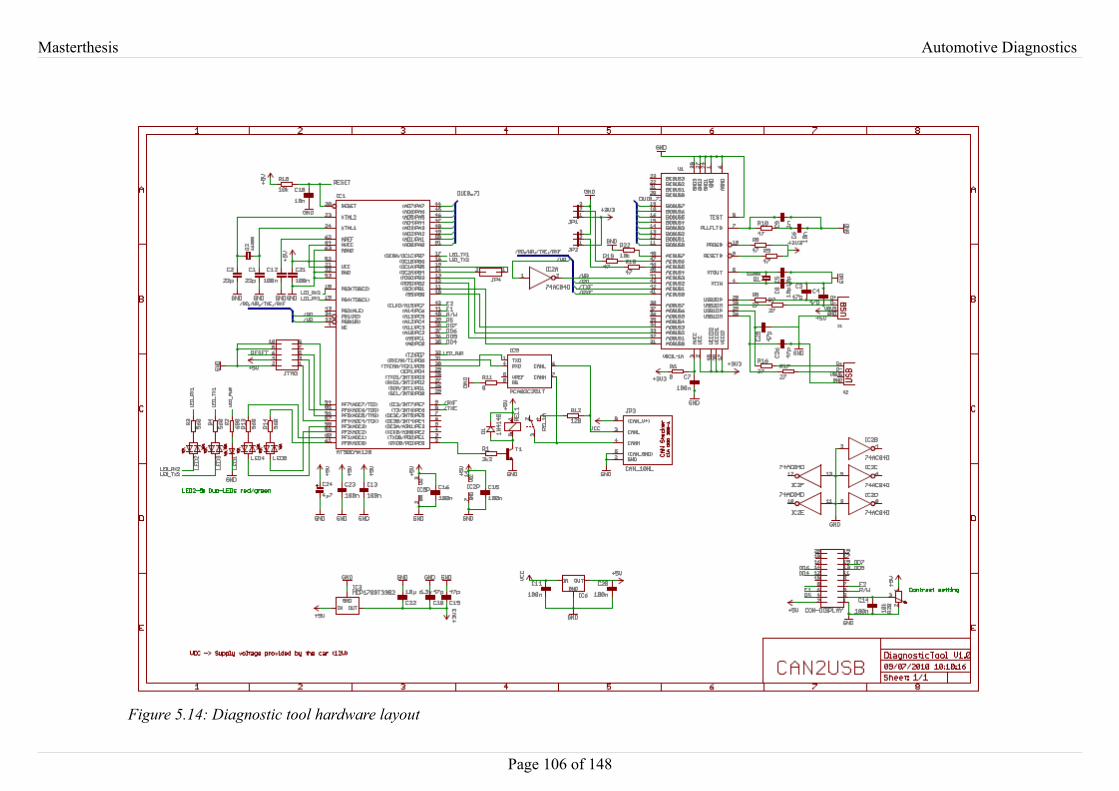
Masterthesis Automotive Diagnostics
Page 106 of 148
Figure 5.14: Diagnostic tool hardware layout
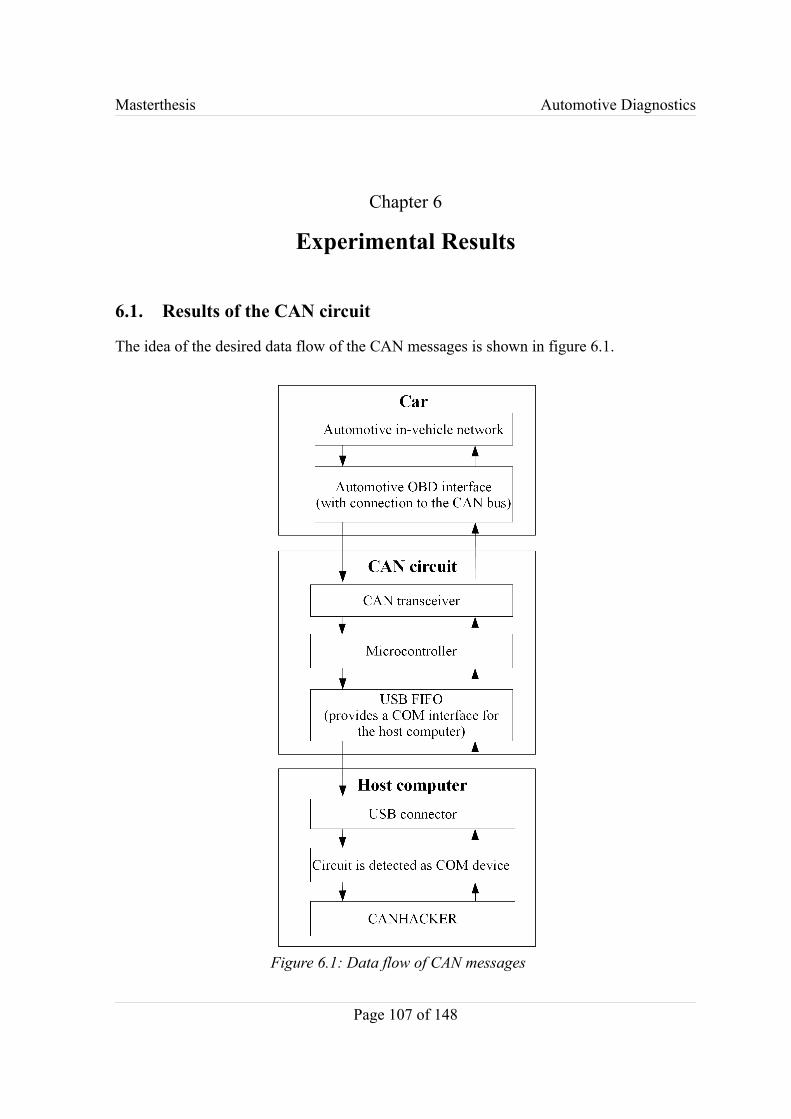
Masterthesis Automotive Diagnostics
Chapter 6
Experimental Results
6.1. Results of the CAN circuit
The idea of the desired data flow of the CAN messages is shown in figure 6.1.
Page 107 of 148
Figure 6.1: Data flow of CAN messages
Masterthesis Automotive Diagnostics
The CAN circuit was connected to a Nissian Primera provided by the University of
Huddersfield automotive lab using the OBD interface. The experimental setup is shown in
figure 6.2.
As CAN monitor software the CANHACKER program was used. The program is free of
costs and has following features:
• Fixed baud rates (10/20/50/100/ 125/250/500/800/1000bps);
• User defined baud rates;
• Identifier filter (Bit mask, single IDs, area of IDs);
• 11 bit identifier and 29 bit identifier;
• Listen only modus;
• Sending CAN messages;
• Automatic repeat of sending CAN messages;
Page 108 of 148
Figure 6.2: Experimental setup CAN circuit
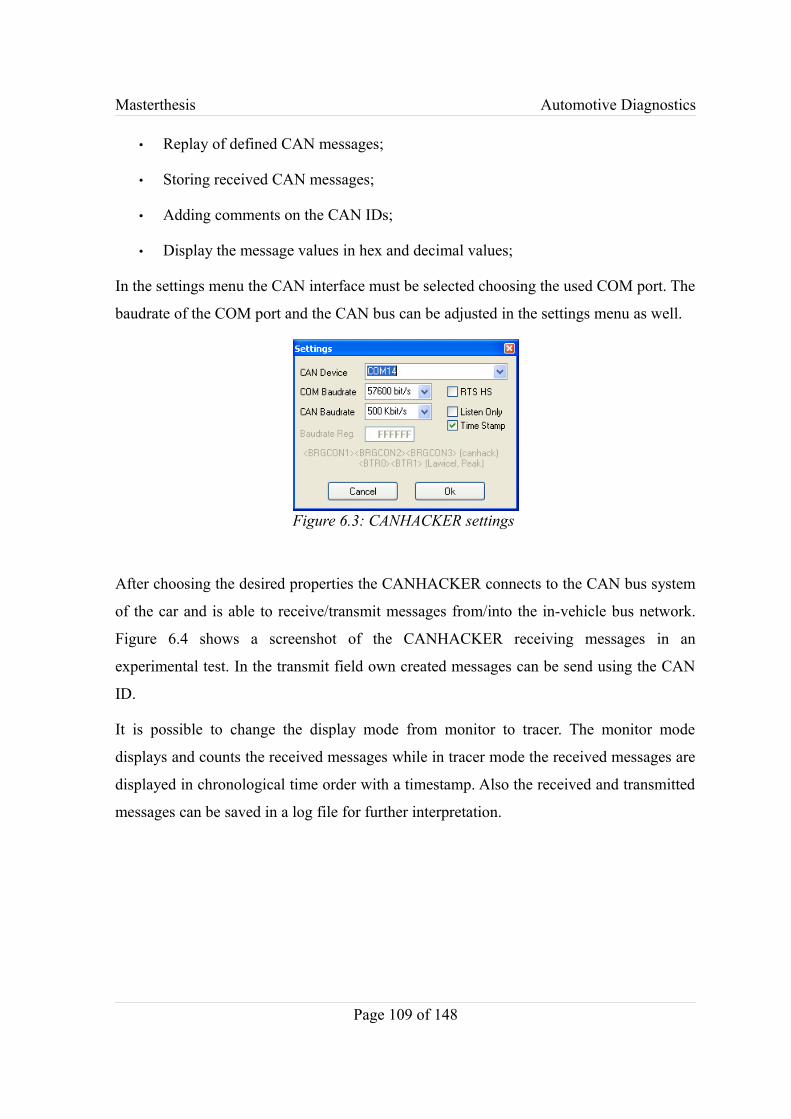
Masterthesis Automotive Diagnostics
• Replay of defined CAN messages;
• Storing received CAN messages;
• Adding comments on the CAN IDs;
• Display the message values in hex and decimal values;
In the settings menu the CAN interface must be selected choosing the used COM port. The
baudrate of the COM port and the CAN bus can be adjusted in the settings menu as well.
After choosing the desired properties the CANHACKER connects to the CAN bus system
of the car and is able to receive/transmit messages from/into the in-vehicle bus network.
Figure 6.4 shows a screenshot of the CANHACKER receiving messages in an
experimental test. In the transmit field own created messages can be send using the CAN
ID.
It is possible to change the display mode from monitor to tracer. The monitor mode
displays and counts the received messages while in tracer mode the received messages are
displayed in chronological time order with a timestamp. Also the received and transmitted
messages can be saved in a log file for further interpretation.
Page 109 of 148
Figure 6.3: CANHACKER settings

Masterthesis Automotive Diagnostics
A further function of the CANHACKER software is the filter shown in figure 6.5. The
filter enables to receive only messages with a desired CAN ID. Applying the settings
shown in the figure 6.5 results in receiving only messages with the CAN ID 215.
Page 110 of 148
Figure 6.5: CANHACKER filter
Figure 6.4: CANHACKER screenshot
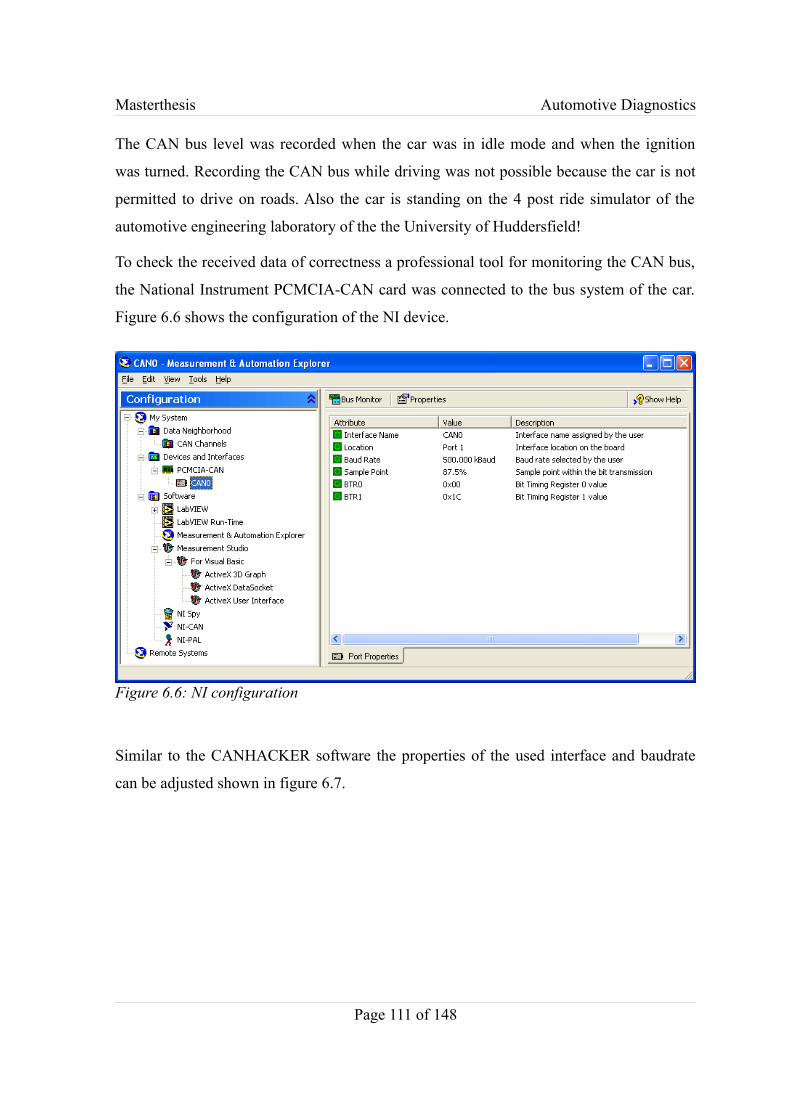
Masterthesis Automotive Diagnostics
The CAN bus level was recorded when the car was in idle mode and when the ignition
was turned. Recording the CAN bus while driving was not possible because the car is not
permitted to drive on roads. Also the car is standing on the 4 post ride simulator of the
automotive engineering laboratory of the the University of Huddersfield!
To check the received data of correctness a professional tool for monitoring the CAN bus,
the National Instrument PCMCIA-CAN card was connected to the bus system of the car.
Figure 6.6 shows the configuration of the NI device.
Similar to the CANHACKER software the properties of the used interface and baudrate
can be adjusted shown in figure 6.7.
Page 111 of 148
Figure 6.6: NI configuration
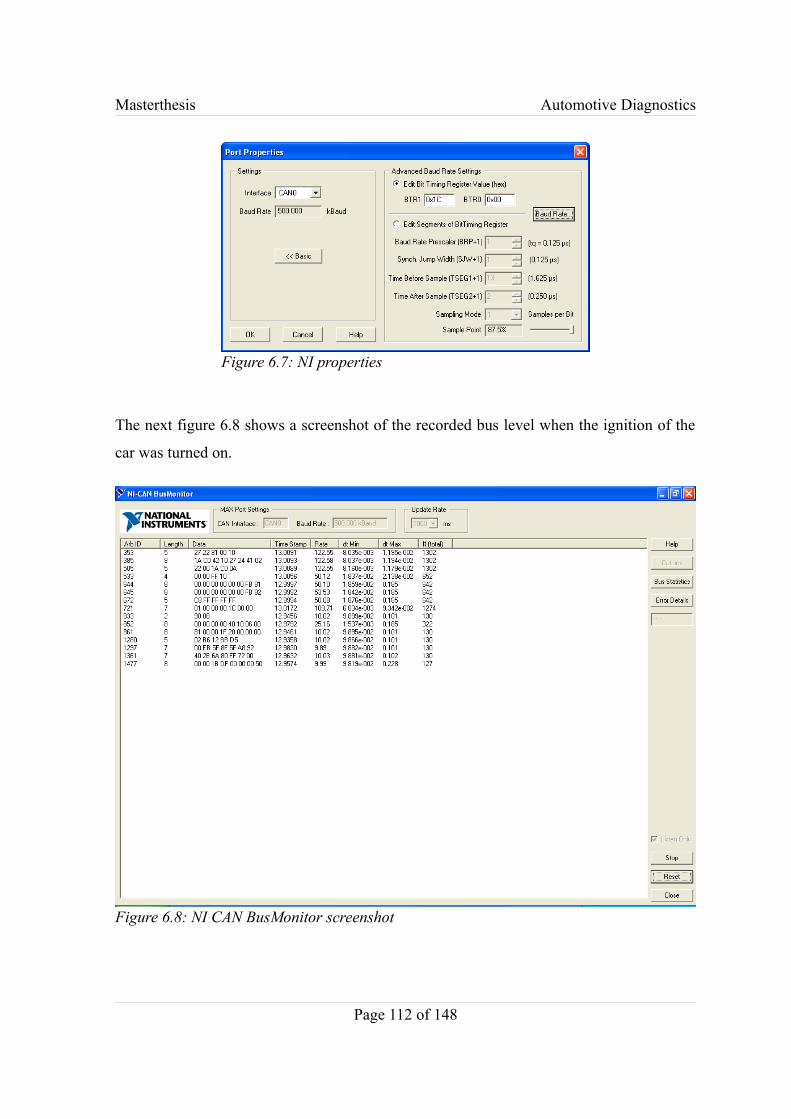
Masterthesis Automotive Diagnostics
The next figure 6.8 shows a screenshot of the recorded bus level when the ignition of the
car was turned on.
Page 112 of 148
Figure 6.7: NI properties
Figure 6.8: NI CAN BusMonitor screenshot
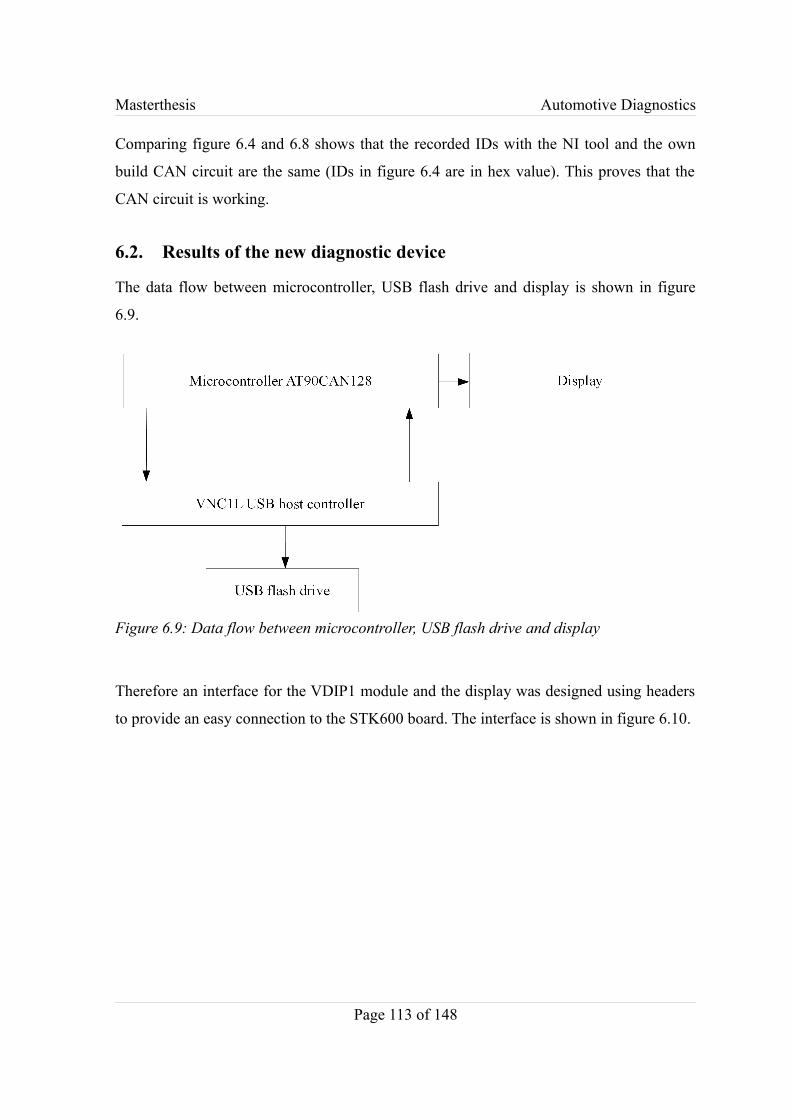
Masterthesis Automotive Diagnostics
Comparing figure 6.4 and 6.8 shows that the recorded IDs with the NI tool and the own
build CAN circuit are the same (IDs in figure 6.4 are in hex value). This proves that the
CAN circuit is working.
6.2. Results of the new diagnostic device
The data flow between microcontroller, USB flash drive and display is shown in figure
6.9.
Therefore an interface for the VDIP1 module and the display was designed using headers
to provide an easy connection to the STK600 board. The interface is shown in figure 6.10.
Page 113 of 148
Figure 6.9: Data flow between microcontroller, USB flash drive and display
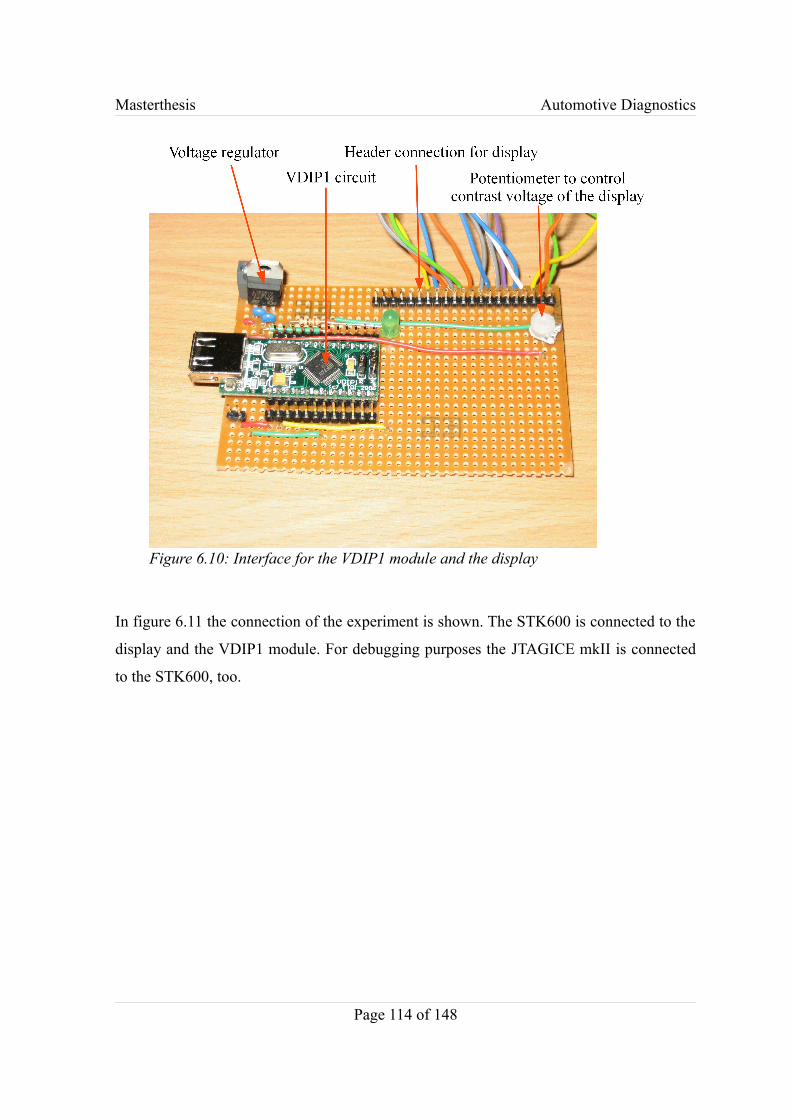
Masterthesis Automotive Diagnostics
In figure 6.11 the connection of the experiment is shown. The STK600 is connected to the
display and the VDIP1 module. For debugging purposes the JTAGICE mkII is connected
to the STK600, too.
Page 114 of 148
Figure 6.10: Interface for the VDIP1 module and the display
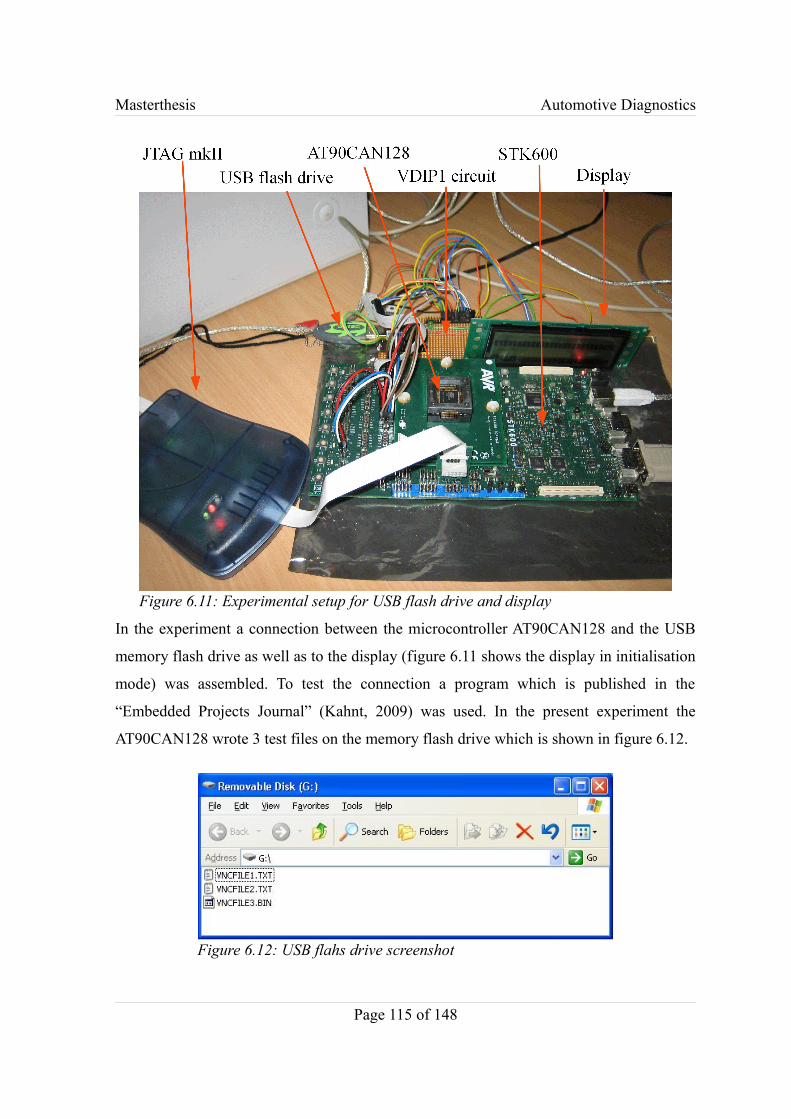
Masterthesis Automotive Diagnostics
In the experiment a connection between the microcontroller AT90CAN128 and the USB
memory flash drive as well as to the display (figure 6.11 shows the display in initialisation
mode) was assembled. To test the connection a program which is published in the
“Embedded Projects Journal” (Kahnt, 2009) was used. In the present experiment the
AT90CAN128 wrote 3 test files on the memory flash drive which is shown in figure 6.12.
Page 115 of 148
Figure 6.11: Experimental setup for USB flash drive and display
Figure 6.12: USB flahs drive screenshot
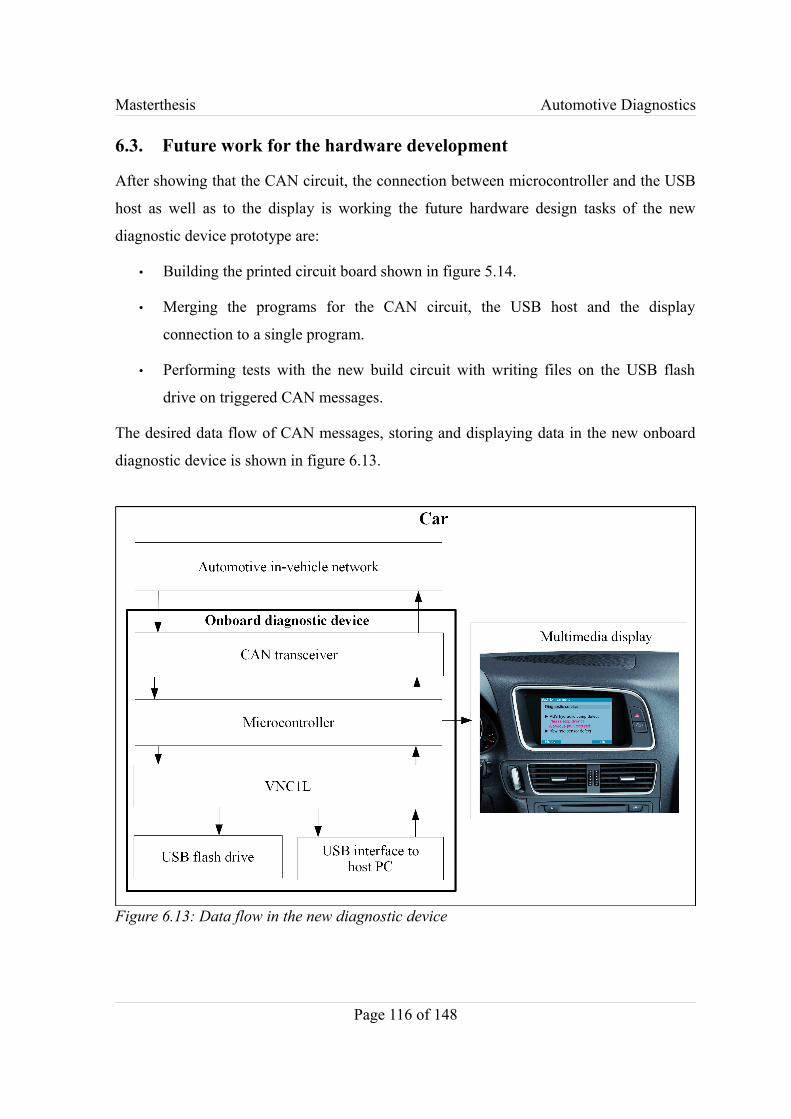
Masterthesis Automotive Diagnostics
6.3. Future work for the hardware development
After showing that the CAN circuit, the connection between microcontroller and the USB
host as well as to the display is working the future hardware design tasks of the new
diagnostic device prototype are:
• Building the printed circuit board shown in figure 5.14.
• Merging the programs for the CAN circuit, the USB host and the display
connection to a single program.
• Performing tests with the new build circuit with writing files on the USB flash
drive on triggered CAN messages.
The desired data flow of CAN messages, storing and displaying data in the new onboard
diagnostic device is shown in figure 6.13.
Page 116 of 148
Figure 6.13: Data flow in the new diagnostic device
Masterthesis Automotive Diagnostics
Chapter 7
Further Investigated Hardware Applications
7.1. Condition Monitoring of Mechatronic Car Components Using BusLevel Data Flow
The project idea “Condition Monitoring of Mechatronic Car Components Using Bus Level
Data Flow” can be realized in the following steps:
Phase 1: Bus level experiments on different vehicles
• Recording the vehicle bus level on healthy car condition.
• Recording the vehicle bus level on faulty car condition.
Phase 2: Data analysis of the recorded bus level
• Interpretation of the bus level using the CAN matrix provided by the project
partners (UAS Coburg, UAS Frankfurt am Main).
• The bus level changes between faultless and faulty condition.
• Merging the fault detection logic as a function of the bus level in error models.
If necessary it is possible to execute a hardware in the loop (HiL) simulation with single
control units to obtain further and possibly more accurate data for the generation of the
error models. Thereby the input signals of the controller are simulated and the output
signals of the controller are fed back to the simulation. Thus allows an exact analyses of
the controller behaviour on appearance of implausible/threshold input values.
Phase 3: Prototype establishment
Based on the error models it is now possible to build a prototype of the new onboard
diagnostic tool. This is done by programming the fault model as functions in the
previously built hardware. The CAN monitor is equipped with an LCD and a USB storage
device to display and store data/messages in case of fault detection.
Page 117 of 148

Masterthesis Automotive Diagnostics
Phase 4: Prototype trail
The project can be completed with test results of the prototype. To validate the prototype
test results a fault memory scanner, e.g. ELM327 can be used to compare diagnostic
trouble code with detected faults of the developed prototype. Now it can be demonstrated
whether it is possible to use the bus level for fault diagnosis or not.
The potential of this project is very high, due to the rapidly growing numbers of electronic
parts in vehicles and the high error rate of such components shown previously in figure 1.2
and figure 1.4.
7.2. Tyre Pressure Control During a Vehicle Emergency Break
7.2.1. Introduction
4.154 people died on German roads in 2009 according to the preliminary data of the
Federal Statistics Office, Germany. That means 7.2 % less people died compared to the
figure of the year before which represents the lowest number since starting the recording
in 1953. For comparison: 1953 the number of traffic deaths was 12.631 by 4.3 million
licensed cars. The number of traffic deaths and licensed cars increased over the following
years and in 1970 the mournful climax was reached with 21.322 traffic deaths and 20.8
million licensed cars. After this year the number of traffic deaths decreased continuously
with little exceptions while the numbers of licensed cars increased. Figure 7.1 shows the
context, (Statistisches Bundesamt Deutschland, 2009).
Page 118 of 148
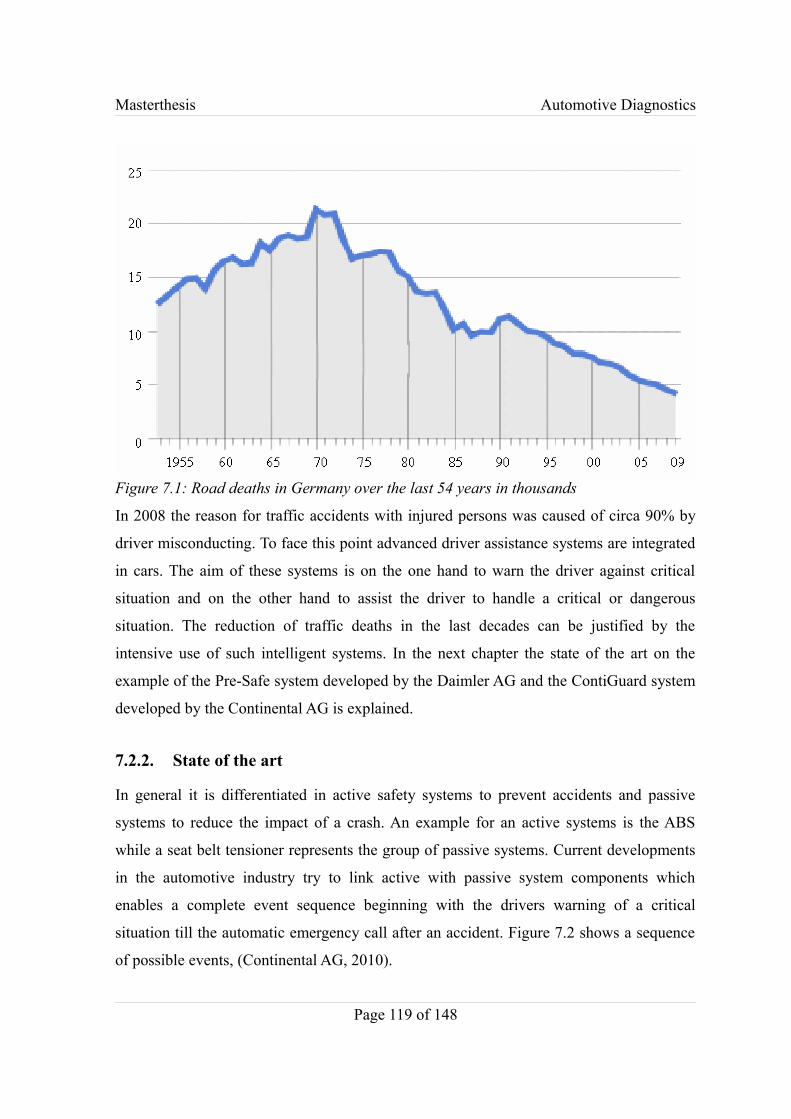
Masterthesis Automotive Diagnostics
In 2008 the reason for traffic accidents with injured persons was caused of circa 90% by
driver misconducting. To face this point advanced driver assistance systems are integrated
in cars. The aim of these systems is on the one hand to warn the driver against critical
situation and on the other hand to assist the driver to handle a critical or dangerous
situation. The reduction of traffic deaths in the last decades can be justified by the
intensive use of such intelligent systems. In the next chapter the state of the art on the
example of the Pre-Safe system developed by the Daimler AG and the ContiGuard system
developed by the Continental AG is explained.
7.2.2. State of the art
In general it is differentiated in active safety systems to prevent accidents and passive
systems to reduce the impact of a crash. An example for an active systems is the ABS
while a seat belt tensioner represents the group of passive systems. Current developments
in the automotive industry try to link active with passive system components which
enables a complete event sequence beginning with the drivers warning of a critical
situation till the automatic emergency call after an accident. Figure 7.2 shows a sequence
of possible events, (Continental AG, 2010).
Page 119 of 148
Figure 7.1: Road deaths in Germany over the last 54 years in thousands
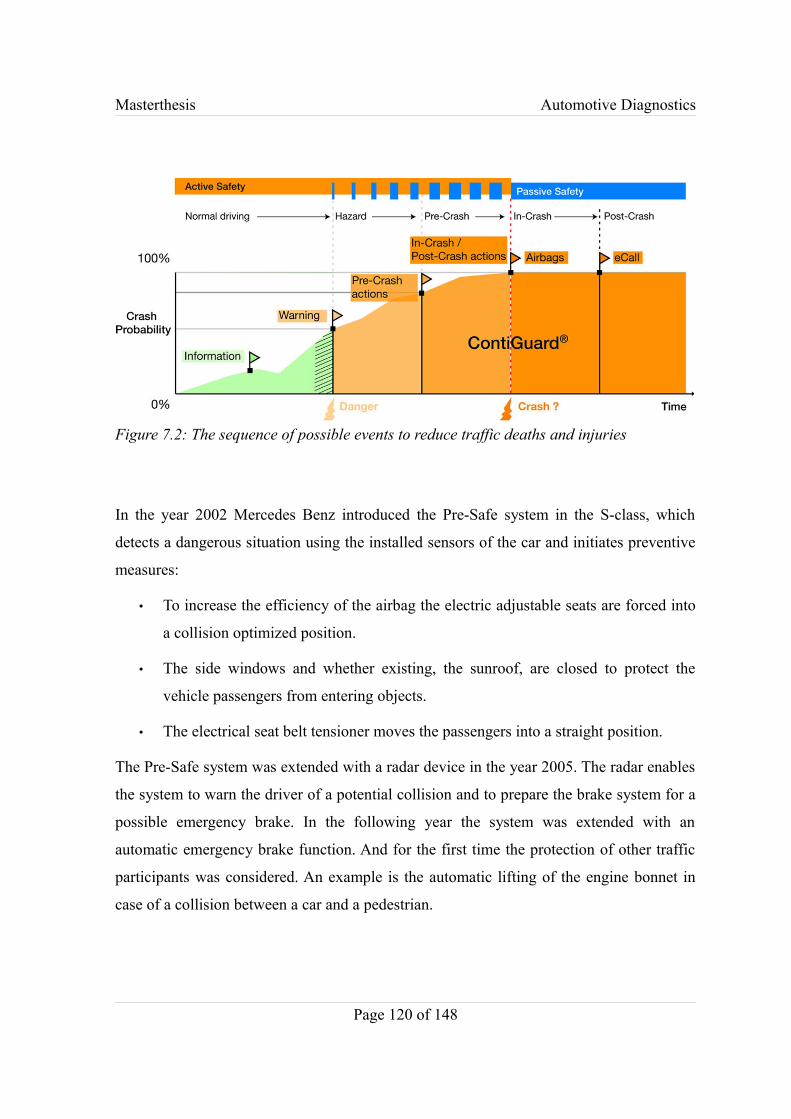
Masterthesis Automotive Diagnostics
In the year 2002 Mercedes Benz introduced the Pre-Safe system in the S-class, which
detects a dangerous situation using the installed sensors of the car and initiates preventive
measures:
• To increase the efficiency of the airbag the electric adjustable seats are forced into
a collision optimized position.
• The side windows and whether existing, the sunroof, are closed to protect the
vehicle passengers from entering objects.
• The electrical seat belt tensioner moves the passengers into a straight position.
The Pre-Safe system was extended with a radar device in the year 2005. The radar enables
the system to warn the driver of a potential collision and to prepare the brake system for a
possible emergency brake. In the following year the system was extended with an
automatic emergency brake function. And for the first time the protection of other traffic
participants was considered. An example is the automatic lifting of the engine bonnet in
case of a collision between a car and a pedestrian.
Page 120 of 148
Figure 7.2: The sequence of possible events to reduce traffic deaths and injuries
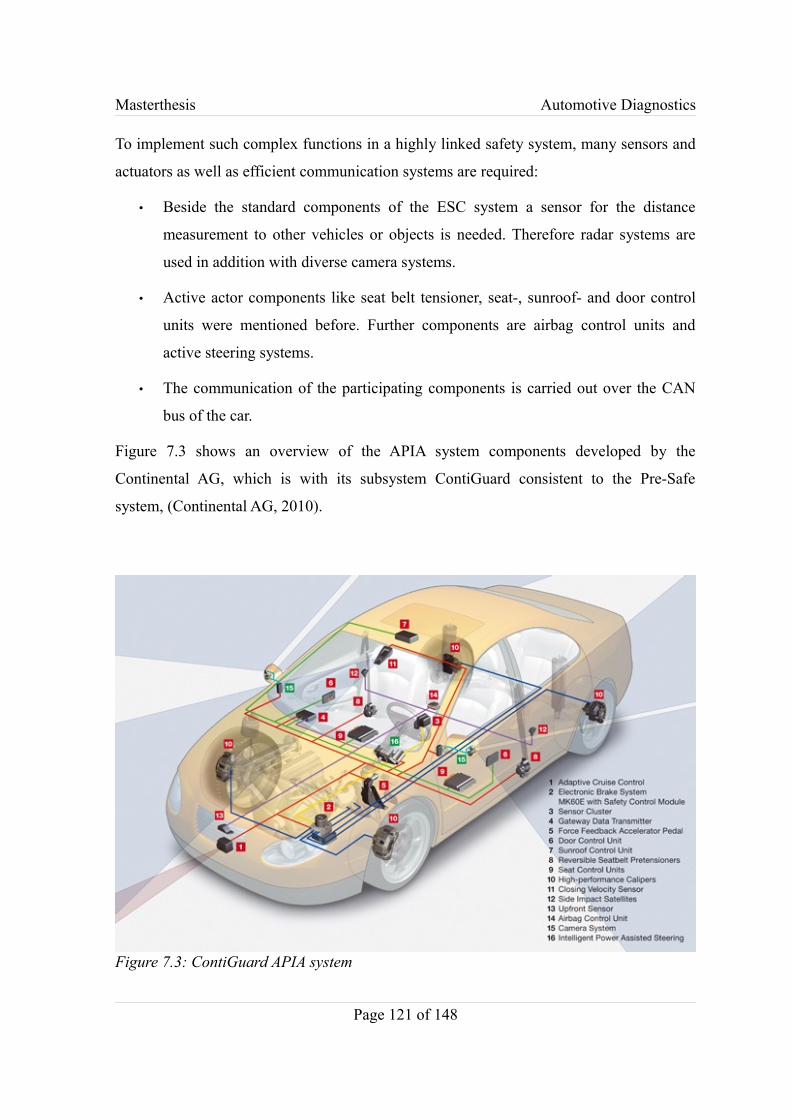
Masterthesis Automotive Diagnostics
To implement such complex functions in a highly linked safety system, many sensors and
actuators as well as efficient communication systems are required:
• Beside the standard components of the ESC system a sensor for the distance
measurement to other vehicles or objects is needed. Therefore radar systems are
used in addition with diverse camera systems.
• Active actor components like seat belt tensioner, seat-, sunroof- and door control
units were mentioned before. Further components are airbag control units and
active steering systems.
• The communication of the participating components is carried out over the CAN
bus of the car.
Figure 7.3 shows an overview of the APIA system components developed by the
Continental AG, which is with its subsystem ContiGuard consistent to the Pre-Safe
system, (Continental AG, 2010).
Page 121 of 148
Figure 7.3: ContiGuard APIA system
Masterthesis Automotive Diagnostics
After detecting a potential collision the system behaves as follows:
• Circa 2.6 seconds before a detected and calculated time of collision, the system
warns the driver via optical and acoustic signals. Furthermore the driver is assisted
as soon as he/she applies the brake according to the situation. The brake assistant
calculates the optimal required braking pressure for the upcoming vehicle brake
and fills the accumulator of the brake system appropriate.
• Circa 1.6 seconds before a potential collision: The driver has the optimal braking
pressure as soon as he/she applies the brakes. The braking application is carried out
with the optimal braking pressure independent of the used pedal force by the
driver. However when the driver is not reacting to the warning signals an automatic
partial braking is executed with a deceleration of up to 0.3 g. That is a deceleration
of circa 3m/s2. Also passive safety systems inside the car are activated like the seat
belt tensioner.
• 0.6 seconds before a potential collision: If the driver is not still reacting on the
warning signals an automatic full braking with maximal braking force is carried
out. This reduces the collision impact and stress for the vehicle passengers. The
ADAC proved in road tests that the collision speed is reduced of 12.5 km/h
achieved through an automatic emergency brake. That means a reduction of the
stress for vehicle passengers of circa 30% for the front passengers and 45% for the
passengers in the rear, (Daimler AG, 2010) .
In summary the systems on the market are marked by high complexity. Figure 7.3 shows
the effort in the area of linked active and passive safety systems to realise the required
functions. The biggest benefit of the linking is the availability of various information,
which are distributed over the whole vehicle. Through monitoring and analysing the data
flow in the car it is possible to use the existing information for implementing new
functions. This approach is the basis of this research project which is explained in the next
chapter.
Page 122 of 148
Masterthesis Automotive Diagnostics
7.2.3. Aims and objectives of the project
The aim of the project “Tyre Pressure Control During a Vehicle Emergency Break” is a
reduction of the collision speed and therefore a further reduction of the stress and the
resulting injuries for vehicle passengers.
The available systems on the market described in the previous chapter shows, that the real
contact point of the braking force, the area of contact between tyre and road surface is
unconsidered. The physical process in the contact area, called tyre contact patch is
extremely complicated and is described by the physical phenomena of rubber friction. The
rubber friction is a combination of adhesive, cohesive and viscous friction as well as
hysteresis. On dry road surface the adhesive friction is dominant. Detailed analyses of this
phenomena shows that the adhesive friction depends mainly on the rubber material, but
also on the contact area size. At this point the rubber friction differs significant from the
friction between two solid objects where the friction is independent of the contact area.
Following the adhesive friction characteristic means increasing the tyre contact patch
reduces the braking distance. Enlarging the tyre contact patch can be achieved by dropping
the tyre pressure.
The aim of the project is the development of a mechatronic control system, which
recognises immediately a near emergency brake by analysing the bus communication of
the car and executes an autonomous systematic dropping of the tyre pressure.
The following components have to be developed:
• An electronic control unit with an interface to the CAN bus.
• A tyre valve, which allows a dynamic dropping of the tyre pressure in case of an
emergency brake.
• A wireless communication interface between the control unit and tyre valve.
The next chapter describes the requirements of the subsystems in detail and explains the
development methods.
Page 123 of 148

Masterthesis Automotive Diagnostics
7.2.4. Realisation of the project idea
To realise a mechatronic system for tyre pressure control in case of an emergency brake
diverse development-, simulation-, test- and assembling tasks must be carried out. The
following informs about the individual subprojects including the tasks in the area of
mechanics and electronics as well as of control engineering and software development.
• Development of the electronic control unit (ECU): This subsystem is the central
unit of the whole system. One task of the ECU is to communicate to other vehicle
components and the analysis of the signals on the CAN bus. The ECU can
conclude an occurrence of an automatic emergency break and controls the tyre
valves as needed. Therefore the control unit needs an interface to the vehicle
communication system and a second wireless interface to communicate with the
actuators on the tyre valves. As basis the developed CAN bus interface on the
AT90CAN128 microcontroller can be used, described in this thesis. The wireless
interface will use the ZigBee standard. The development needs a special focus on
the fail safe of the system. Because systems with autonomous influence on the
vehicle driving dynamics have special requirements by law. In particular the
system needs to be redundant, which means build up with two independent
microcontrollers. The hardware design can be carried out with the program Eagle
which was also used for the development of the CAN monitor.
• Construction of a mechatronic tyre valve: The tyre valve is controlled by the ECU
using a wireless interface and enables to release tyre pressure as much as needed. A
specific challenge is the position of the tyre valve, normally on the tyre outside
which requires a compact and robust design. Furthermore this subsystem needs to
measure the current tyre condition, e.g. the tyre pressure. The mechatronic tyre is
currently under development with integrated sensors and communication
interfaces. As example the European research projects Apollo and FRICTI@N are
to mention. Results of Apollo and FRICTI@N will be considered in this project,
(Apollo, 2005), (FRICTI@N, 2009).
• Development of the control algorithm: For the control software development of the
mechatronic tyre valve modern tools and simulation techniques are used. An
Page 124 of 148
Masterthesis Automotive Diagnostics
industrial standard for the implementation of such complex systems is the rapid
prototyping method with fast real time simulation. Firstly a mathematical-physical
vehicle-tyre-road system has to be modelled. The created model is transformed in a
computer based simulation environment which allows to test different control
strategies with development tools. The achieved control algorithm can be
implemented on real time capable computers per mouse click and controls the
connected hardware. The extensive programming in a high level language like C in
the development- and assembling stage is not required. After finishing the
development the rapid prototyping system enables an autonomous generation of C-
code which can be flashed on the target hardware of the ECU.
7.3. Automotive security analysis
The University of Washington and the University of California San Diego presented the
paper “Experimental Security Analyses of a Modern Automobile” at the IEEE Symposium
on Security and Privacy in Oakland the 19th of May 2010. In the paper the issues of new
potential risks are experimentally evaluated, caused by the implementation of electronic
control units in cars. Furthermore an attack to infiltrate the behaviour of the control unit is
demonstrated.
The experiment was carried out in three principle settings:
• A bench test with the physical extracted hardware (ECUs) from the car.
• A stationary car test on jack stands using the OBD connector to get access to the
internal bus system of the car. As hardware was an Olimex AVR-CAN
development board with an AT90CAN128 used. The software interface
CARSHARK is self developed to receive and send CAN messages in the CAN
network, which is similar to the CANHACKER program described earlier in this
thesis.
• An on road test using a de-commissioned airport runway.
The paper points out that the communication between a tester and the ECU is encrypted
with 16 bits and a hacker can crack the key in seven and a half days. The research team
Page 125 of 148
Masterthesis Automotive Diagnostics
removed the electronic brake control module and decrypted the key in one and a half day
which enables a control unit reflashing for example.
The diagnostic protocol standard prescribes strategies to mitigate risks. But the experiment
showed that not all components are following the specifications:
• A communication between test device and the ECU has to be disabled while the
car is driving.
• A reflashing of the ECU has to be rejected if the engine is running. But this was
possible in the performed experiment. While driving the car the engine control
module and the transmission control module were reflashed.
The attacks were carried out after the following methodology:
• Packet sniffing and target probing to reveal where packets are sent to activate
various components (e.g. turning on the headlights). This approach is helpful to
probe packets during normal driving but is not useful for mapping the interface of
safety critical components.
• Fuzzing sends automatically random created messages in the network to probe the
meaning of CAN messages. Also the car used for the experiment defines a CAN
based service called DeviceControl, which allows test devices to override the
normal output functionality of an ECU. This device is used during the quality
control of the manufacturing process. The DeviceControl functions were
discovered by fuzz testing.
• Reverse engineering was applied to read the ECU code with the ReadMemory
service. A third party debugger was used to understand how the hardware features
are controlled and manipulated by the software with removing or adding new
functions.
The table (appendix G) shows the results of the experiment. The first column shows the
packet which was sent and the result is explained in the next column. Manual override
means if the result of the package can be overridden manually, e.g. pushing the brakes or
by pulling the physical door unlock knob. The “At Speed” column shows if the packet has
Page 126 of 148

Masterthesis Automotive Diagnostics
the same effect when the car is at speed. The column “Need to Unlock” indicates if the
control unit needs to be unlocked with its DeviceControl key to react on the received
message. And the last column shows if this experiment was carried out on a runway as
well, (Koscher K. et al., 2010).
Page 127 of 148
Masterthesis Automotive Diagnostics
Chapter 8
Conclusion
In this research project all objectives are achieved and can be claimed as successful:
Objective 1: Investigation of the historical and current concepts used for automobiles
diagnostics.
Achievement: As shown in the thesis a deep understanding in the areas of automotive
electrical systems, control systems, the cross linking of mechatronic systems and the used
diagnostic concepts is gained. Also the author increased his knowledge in the areas of
microcontroller and hardware development.
Objective 2: Development of an advanced diagnostic approach.
Achievement: A new idea for an advanced diagnostic approach has been developed. The
potential of the idea is high in aspects of realisation, business market and the ability of a
patent. Also the idea can be published for conferences and in journal papers.
Objective 3: Design the hardware of a prototype diagnostic tool using the new developed
approach.
Achievement: An interface to analyse the communication is built and can be used for
different tasks shown in this thesis. The extension with a USB host and a display of the
communication to a new onboard diagnostic tool can be published for conferences and in
journal papers.
Further achievements:
• An idea of a new automotive passive safety system has been developed and can be
carried out in a future project. The new safety system which controls the tyre
pressure during a vehicle emergency brake has big potential to reduce the stress for
vehicle passengers in case of a collision. The market potential can be claimed as
high and the system has to be protected by a patent.
Page 128 of 148

Masterthesis Automotive Diagnostics
• The mentioned automotive security analysis in this thesis shows that the University
of Huddersfield is up to date in the field of automotive electrics and has gained
new knowledge and experience from this research project, allowing the
continuation of further research projects in the field of automotive electronics e.g.
in the fields of diagnostics, control systems and security analysis.
Page 129 of 148
Masterthesis Automotive Diagnostics
Bibliography
ADAC (2005), Automotive Malfunction report 2005, viewed 03.06.2010, www.adac.de
ADAC (2008), Automotive Malfunction report 2008, viewed 03.06.2010, www.adac.de
ADAC (2009), Automotive Malfunction report 2009, viewed 03.06.2010, www.adac.de
Apollo (2005), Intelligent Tyre for Accident-free Traffic, Tampere.
Atmel (2008), Datasheet AT90CAN128, San Jose.
Atmel (2009), AVR Tools User Guide, San Jose.
Atmel (2010), AVR Hardware Design Considerations, San Jose.
Barrett S., Pack D. (2008), Atmel AVR Microcontroller Primer: Programming and
Interfacing, Morgan & Claypool, San Rafael.
Binder E.(2008), Automobilelektronik, Lecture notes, UAS Coburg
Borgeest K. (2008), Elektronik in der Fahrzeugtechnik, 1. Aufl., Vieweg Verlag,
Wiesbaden.
Bosch R. (2007a), Automotive networking, 1st ed., Robert Bosch GmbH, Plochingen.
Bosch R. (2007b), Automotive electrics, 4th ed., Robert Bosch GmbH, Plochingen.
Bosch R. (2007c), Automotive handbook, 7th ed., Robert Bosch GmbH, Plochingen.
Brown A. (2008), Who Owns Mechatronics?, Feature Article, American Society of
Mechanical Engineers
Burchfield R. (1994), The Oxford Dictionary of English Etymology, Oxford University
Page 130 of 148
Masterthesis Automotive Diagnostics
Press, Oxford.
Continental AG (2010), ContiGuard, viewed 12.05.2010, www.conti-online.com
Daimler AG (2010), Tech Centre – Pre Safe brake, viewed 18.05.2010, www.mercedes-
benz.co.uk
Denton T. (2004), Automobile Electrical And Electronic Systems, 3rd ed., Arnold, Oxford.
Eagle (2010), Eagle Manual Version 5, Florida.
FRICTI@N (2009), Final Report, Tampere.
FTDI (2005), Datasheet FT245, Glasgow.
FTDI (2009), Datasheet VNC1L, Glasgow.
Gevatter H.J., Grünhaupt U. (2005), Handbuch der Mess- und Automatisierungstechnik im
Automobil, 2. Aufl., Vieweg Verlag, Wiesbaden.
Greif F. (2008), CAN Debugger, viewed 03.12.2009, www.kreatives-chaos.com
Isermann R. (2006), Fahrdynamik-Regelung, 1. Aufl., Vieweg Verlag, Wiesbaden.
ISO 9141:1989 Road vehicles - Diagnostic systems - Requirements for interchange of
digital information
ISO 14230:1999 Road vehicles - Diagnostic systems - Keyword Protocol 2000
ISO 15031:2001 Road vehicles - Communication between vehicle and external equipment
for emissions-related diagnostics
ISO 11898:2003 Road vehicles - Controller area network (CAN)
ISO 15765:2004 Road vehicles - Diagnostics on Controller Area Networks (CAN)
ISO 14229:2006 Road vehicles - Unified diagnostic services (UDS)
Page 131 of 148
Masterthesis Automotive Diagnostics
Hristu-Varsakelis D., Levine W. (2005), Handbook of Networked and Embedded Control
Systems, Birkhuser, Boston.
Jurgen R. (1999), Automotive Electronics Handbook, 2nd ed., McGraw-Hill, New York.
Jurgen R. (2009), X-By Wire Automotive Systems, SAE International, Warrendale.
Kahnt M. (2009), USB flash drive on a microcontroller, Embedded Projects Journal, Issue
4, pp. 20-22, Augsburg.
Kingbright Elec. (n.d.), Low current LED Lamps, Taiwan.
Koscher K., Czeskis A., Roesner F., Patel S., Kohno T., Checkoway S., McCoy D., Kantor
B., Anderson D., Shacham H., Savage S. (2010), Experimental Security Analysis of a
Modern Automobile, IEEE Symposium on Security and Privacy, Oakland, California.
Meroth A., Tolg B. (2008), Infotainmentsysteme im Kraftfahrzeug, 1. Aufl., Vieweg
Verlag, Wiesbaden.
Navet N., Simonot-Lion F. (2009), Automotive Embedded Systems Handbook, Taylor &
Francis Group, Boca Raton.
North Carolina State University (2010), Mechatronics study program description,
Asheville.
Paret D. (2005), Multiplex networks for embedded systems: CAN, LIN, FlexRay, Safe by
wire..., John Wiley & Sons Ltd, Chichester.
Philips (2000), Datasheet PCA82C251, Eindhoven.
Richter H. (2005), Elektronik und Datenkommunikation im Automobil, Technical Report,
Institute for Informatics, Clausthal University of Technology, Clausthal.
SAE J1850, Class B Data Communications Network Interface (2006)
SAE J1979, E/E Diagnostic Test Modes (2008)
Page 132 of 148
Masterthesis Automotive Diagnostics
SAE J2190, Vehicle E E System Diagnostic Standards Committee (2008)
Statistisches Bundesamt Deutschland (2009), The number of traffic deaths, viewed
09.06.2010, www.destatis.de
Turner J. (2009), Automotive Sensors, 1st ed., Momentum Press, New York.
Wallentowitz H., Reif K. (2006), Handbuch Kraftfahrzeugelektronik, 1. Aufl., Vieweg
Verlag, Wiesbaden.
Winner H., Hakuli S., Wolf G. (2009), Handbuch Fahrerassistenzsysteme, 1. Aufl.,
Vieweg Verlag, Wiesbaden.
You S., Krage M., Jalics L. (2005), Overview of Remote Diagnosis and Maintenance for
Automotive Systems, SAE World Congress , Detroit.
Zimmermann H., IEEE Transactions on Communications, vol. 28, no. 4, April 1980, pp.
425 – 432.
Zimmermann W., Schmidgall R. (2007), Bussysteme in der Fahrzeugtechnik, 2. Aufl.,
Vieweg Verlag, Wiesbaden.
Page 133 of 148

Masterthesis Automotive Diagnostics
Appendices
Page 134 of 148
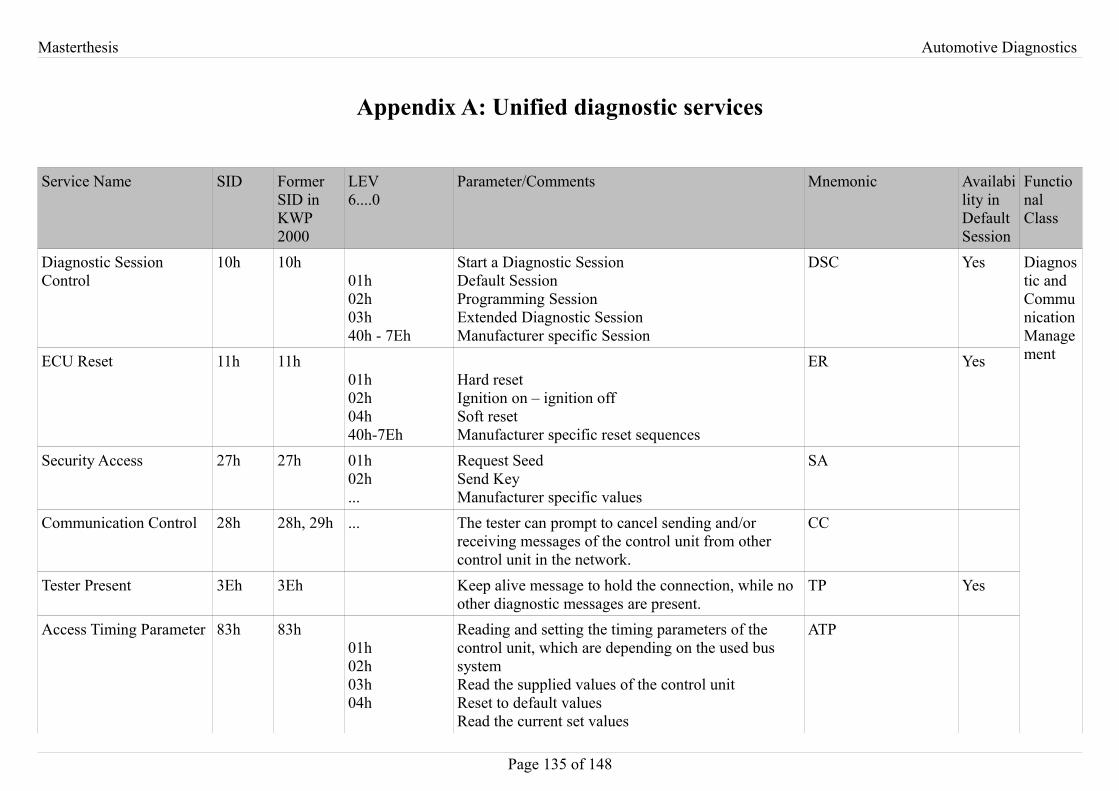
Masterthesis Automotive Diagnostics
Appendix A: Unified diagnostic services
Service Name SID Former SID in KWP 2000
LEV6....0
Parameter/Comments Mnemonic Availability in Default Session
Functional Class
Diagnostic Session Control
10h 10h01h02h03h40h - 7Eh
Start a Diagnostic SessionDefault SessionProgramming SessionExtended Diagnostic SessionManufacturer specific Session
DSC Yes Diagnostic and Communication ManagementECU Reset 11h 11h
01h02h04h40h-7Eh
Hard resetIgnition on – ignition offSoft resetManufacturer specific reset sequences
ER Yes
Security Access 27h 27h 01h02h...
Request SeedSend KeyManufacturer specific values
SA
Communication Control 28h 28h, 29h ... The tester can prompt to cancel sending and/or receiving messages of the control unit from other control unit in the network.
CC
Tester Present 3Eh 3Eh Keep alive message to hold the connection, while no other diagnostic messages are present.
TP Yes
Access Timing Parameter 83h 83h01h02h03h04h
Reading and setting the timing parameters of the control unit, which are depending on the used bus systemRead the supplied values of the control unitReset to default valuesRead the current set values
ATP
Page 135 of 148
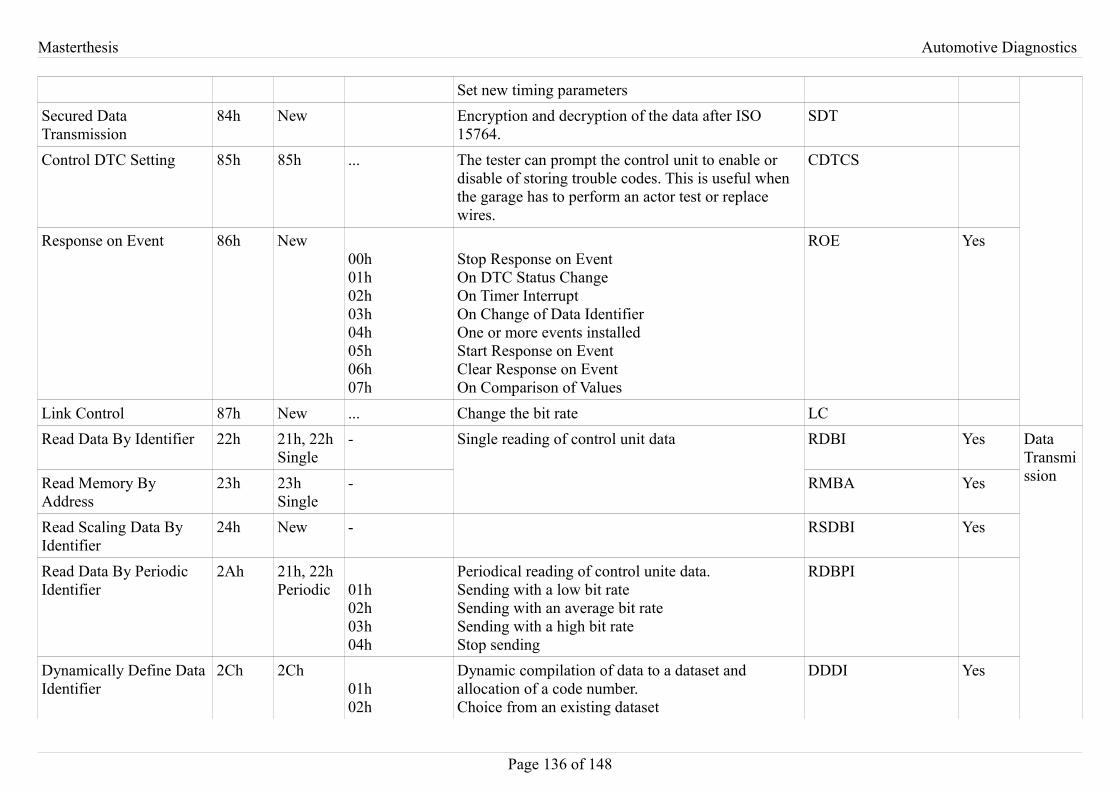
Masterthesis Automotive Diagnostics
Set new timing parametersSecured Data Transmission
84h New Encryption and decryption of the data after ISO 15764.
SDT
Control DTC Setting 85h 85h ... The tester can prompt the control unit to enable or disable of storing trouble codes. This is useful when the garage has to perform an actor test or replace wires.
CDTCS
Response on Event 86h New00h01h02h03h04h05h06h07h
Stop Response on EventOn DTC Status ChangeOn Timer InterruptOn Change of Data IdentifierOne or more events installedStart Response on EventClear Response on EventOn Comparison of Values
ROE Yes
Link Control 87h New ... Change the bit rate LCRead Data By Identifier 22h 21h, 22h
Single- Single reading of control unit data RDBI Yes Data
TransmissionRead Memory By
Address23h 23h
Single- RMBA Yes
Read Scaling Data By Identifier
24h New - RSDBI Yes
Read Data By Periodic Identifier
2Ah 21h, 22hPeriodic 01h
02h03h04h
Periodical reading of control unite data.Sending with a low bit rateSending with an average bit rateSending with a high bit rateStop sending
RDBPI
Dynamically Define Data Identifier
2Ch 2Ch01h02h
Dynamic compilation of data to a dataset and allocation of a code number.Choice from an existing dataset
DDDI Yes
Page 136 of 148
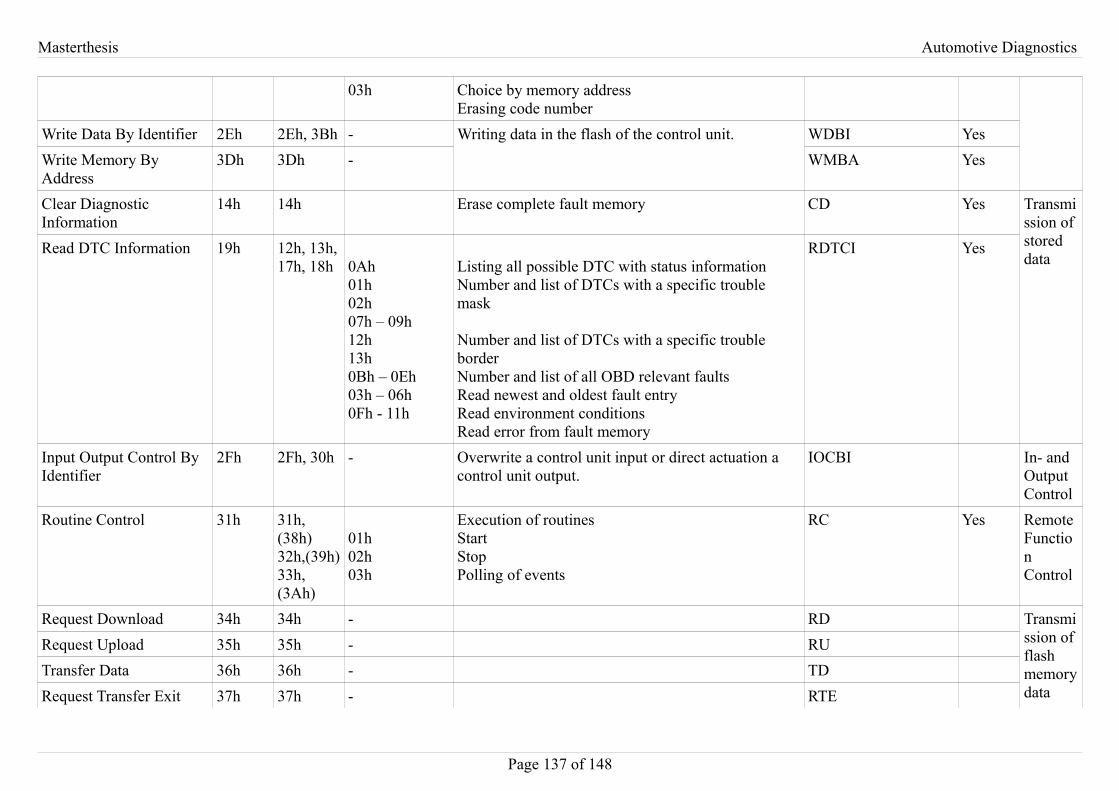
Masterthesis Automotive Diagnostics
03h Choice by memory addressErasing code number
Write Data By Identifier 2Eh 2Eh, 3Bh - Writing data in the flash of the control unit. WDBI YesWrite Memory By Address
3Dh 3Dh - WMBA Yes
Clear Diagnostic Information
14h 14h Erase complete fault memory CD Yes Transmission of stored data
Read DTC Information 19h 12h, 13h, 17h, 18h 0Ah
01h02h07h – 09h12h13h0Bh – 0Eh03h – 06h0Fh - 11h
Listing all possible DTC with status informationNumber and list of DTCs with a specific trouble mask
Number and list of DTCs with a specific trouble borderNumber and list of all OBD relevant faultsRead newest and oldest fault entryRead environment conditionsRead error from fault memory
RDTCI Yes
Input Output Control By Identifier
2Fh 2Fh, 30h - Overwrite a control unit input or direct actuation a control unit output.
IOCBI In- and Output Control
Routine Control 31h 31h, (38h)32h,(39h)33h, (3Ah)
01h02h03h
Execution of routines StartStopPolling of events
RC Yes Remote Function Control
Request Download 34h 34h - RD Transmission of flash memory data
Request Upload 35h 35h - RUTransfer Data 36h 36h - TDRequest Transfer Exit 37h 37h - RTE
Page 137 of 148
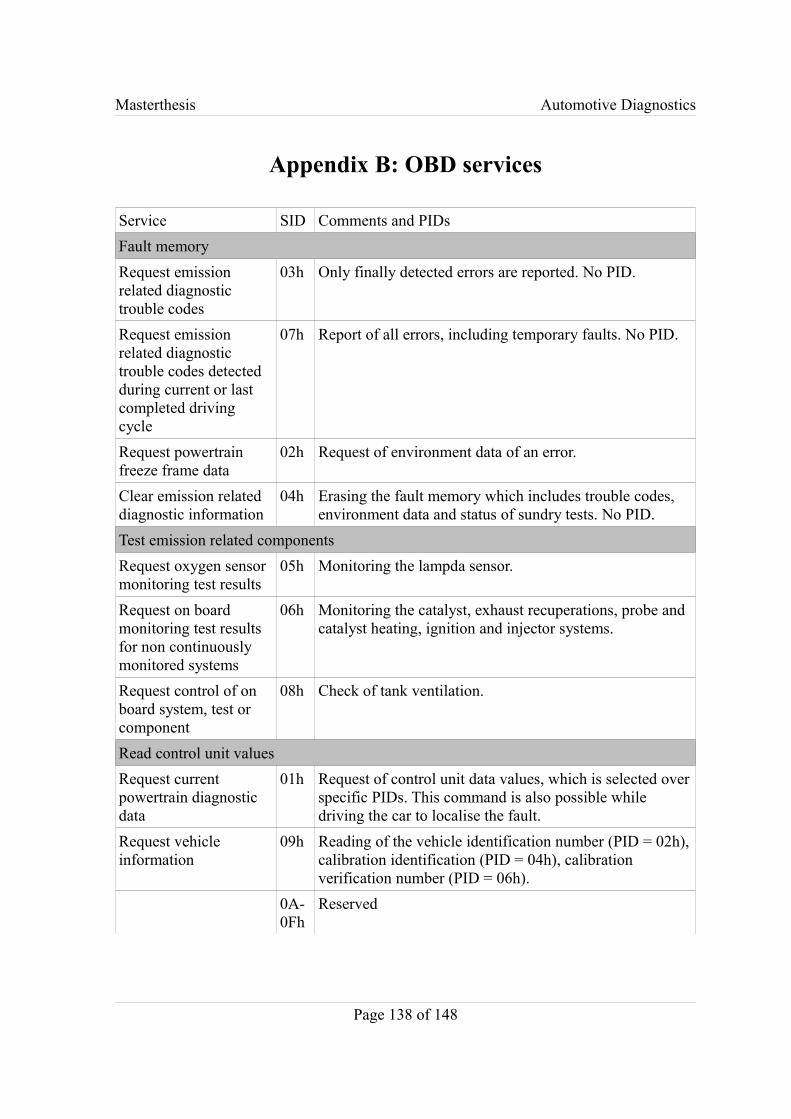
Masterthesis Automotive Diagnostics
Appendix B: OBD services
Service SID Comments and PIDsFault memoryRequest emission related diagnostic trouble codes
03h Only finally detected errors are reported. No PID.
Request emission related diagnostic trouble codes detected during current or last completed driving cycle
07h Report of all errors, including temporary faults. No PID.
Request powertrain freeze frame data
02h Request of environment data of an error.
Clear emission related diagnostic information
04h Erasing the fault memory which includes trouble codes, environment data and status of sundry tests. No PID.
Test emission related componentsRequest oxygen sensor monitoring test results
05h Monitoring the lampda sensor.
Request on board monitoring test results for non continuously monitored systems
06h Monitoring the catalyst, exhaust recuperations, probe and catalyst heating, ignition and injector systems.
Request control of on board system, test or component
08h Check of tank ventilation.
Read control unit valuesRequest current powertrain diagnostic data
01h Request of control unit data values, which is selected over specific PIDs. This command is also possible while driving the car to localise the fault.
Request vehicle information
09h Reading of the vehicle identification number (PID = 02h), calibration identification (PID = 04h), calibration verification number (PID = 06h).
0A- 0Fh
Reserved
Page 138 of 148
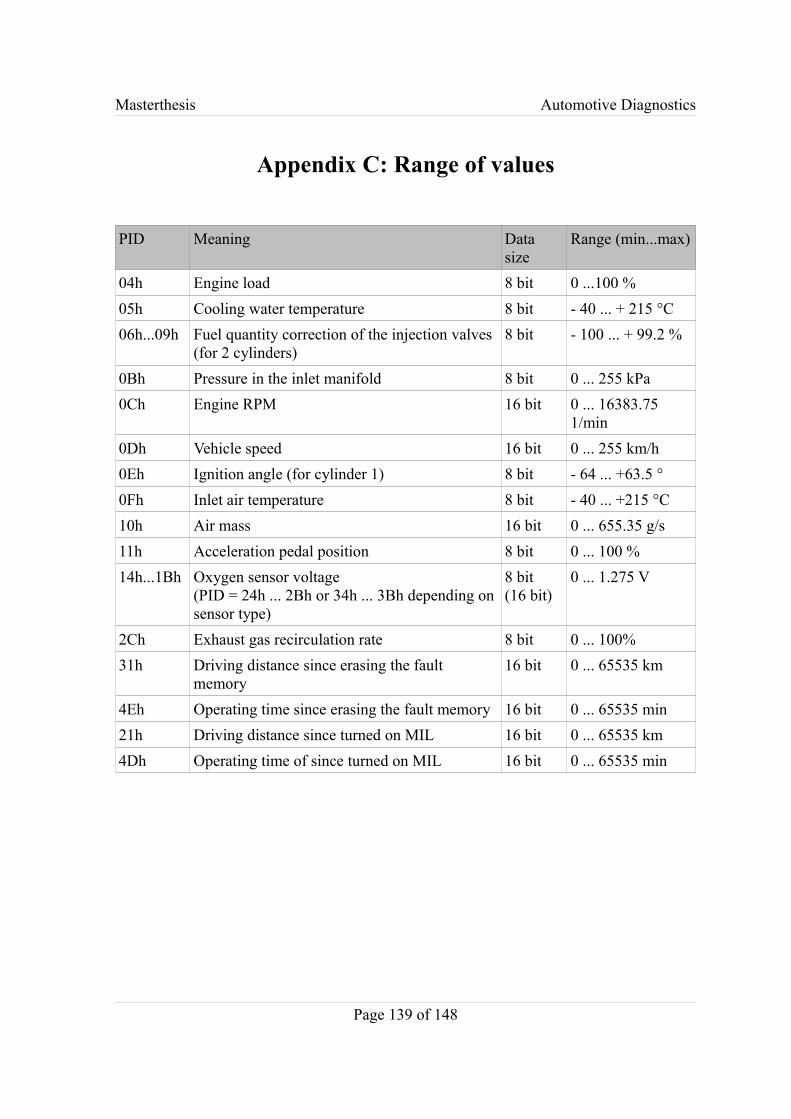
Masterthesis Automotive Diagnostics
Appendix C: Range of values
PID Meaning Data size
Range (min...max)
04h Engine load 8 bit 0 ...100 %05h Cooling water temperature 8 bit - 40 ... + 215 °C06h...09h Fuel quantity correction of the injection valves
(for 2 cylinders)8 bit - 100 ... + 99.2 %
0Bh Pressure in the inlet manifold 8 bit 0 ... 255 kPa0Ch Engine RPM 16 bit 0 ... 16383.75
1/min0Dh Vehicle speed 16 bit 0 ... 255 km/h0Eh Ignition angle (for cylinder 1) 8 bit - 64 ... +63.5 °0Fh Inlet air temperature 8 bit - 40 ... +215 °C10h Air mass 16 bit 0 ... 655.35 g/s11h Acceleration pedal position 8 bit 0 ... 100 %14h...1Bh Oxygen sensor voltage
(PID = 24h ... 2Bh or 34h ... 3Bh depending on sensor type)
8 bit(16 bit)
0 ... 1.275 V
2Ch Exhaust gas recirculation rate 8 bit 0 ... 100% 31h Driving distance since erasing the fault
memory16 bit 0 ... 65535 km
4Eh Operating time since erasing the fault memory 16 bit 0 ... 65535 min21h Driving distance since turned on MIL 16 bit 0 ... 65535 km4Dh Operating time of since turned on MIL 16 bit 0 ... 65535 min
Page 139 of 148
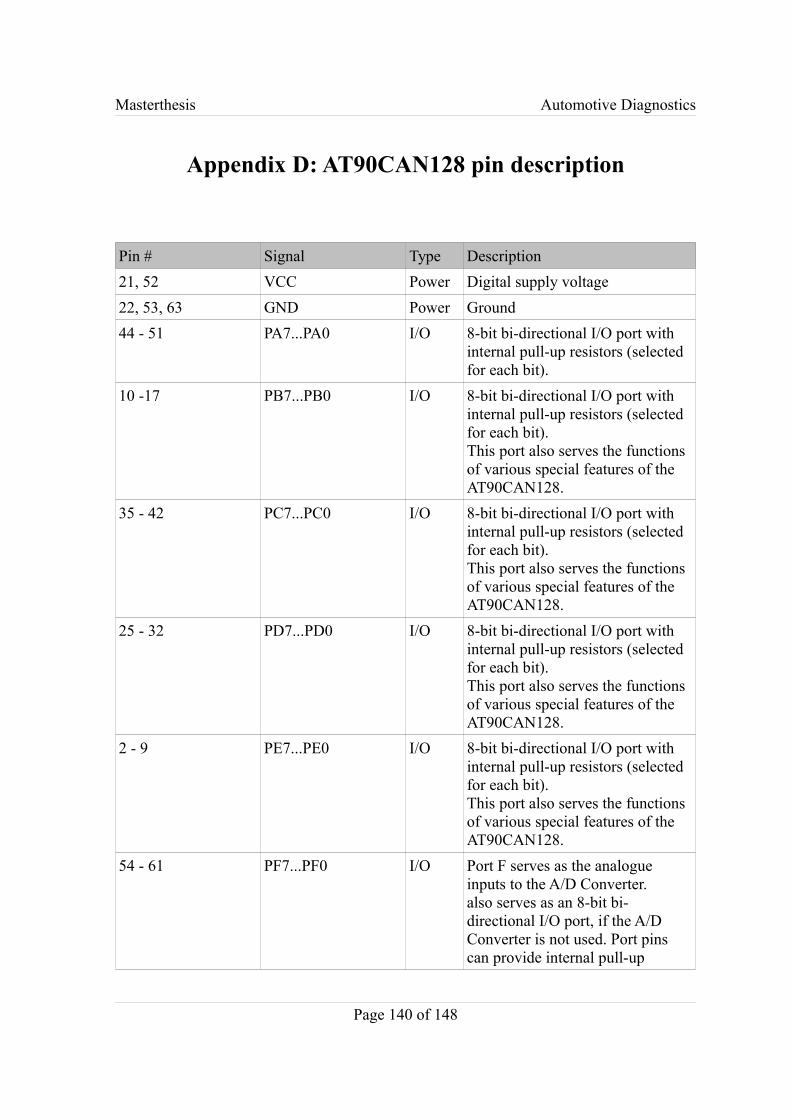
Masterthesis Automotive Diagnostics
Appendix D: AT90CAN128 pin description
Pin # Signal Type Description21, 52 VCC Power Digital supply voltage22, 53, 63 GND Power Ground44 - 51 PA7...PA0 I/O 8-bit bi-directional I/O port with
internal pull-up resistors (selected for each bit).
10 -17 PB7...PB0 I/O 8-bit bi-directional I/O port with internal pull-up resistors (selected for each bit).This port also serves the functions of various special features of the AT90CAN128.
35 - 42 PC7...PC0 I/O 8-bit bi-directional I/O port with internal pull-up resistors (selected for each bit).This port also serves the functions of various special features of the AT90CAN128.
25 - 32 PD7...PD0 I/O 8-bit bi-directional I/O port with internal pull-up resistors (selected for each bit).This port also serves the functions of various special features of the AT90CAN128.
2 - 9 PE7...PE0 I/O 8-bit bi-directional I/O port with internal pull-up resistors (selected for each bit).This port also serves the functions of various special features of the AT90CAN128.
54 - 61 PF7...PF0 I/O Port F serves as the analogue inputs to the A/D Converter.also serves as an 8-bit bi-directional I/O port, if the A/D Converter is not used. Port pinscan provide internal pull-up
Page 140 of 148
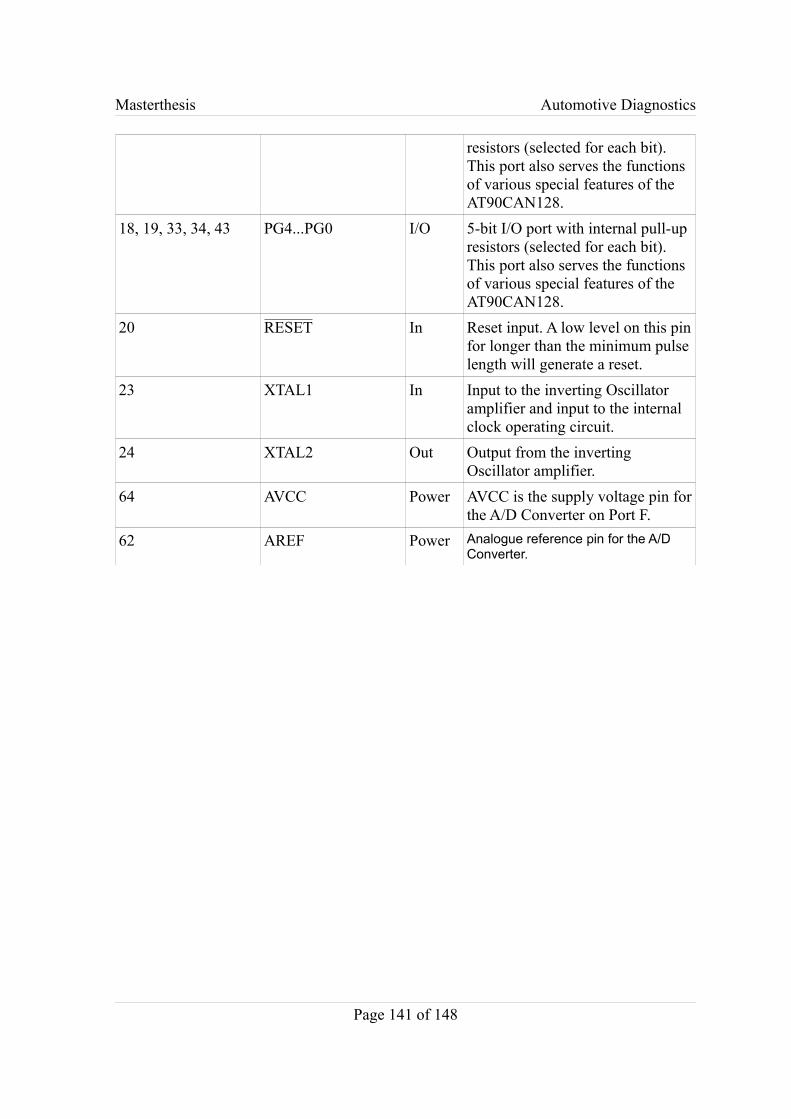
Masterthesis Automotive Diagnostics
resistors (selected for each bit).This port also serves the functions of various special features of the AT90CAN128.
18, 19, 33, 34, 43 PG4...PG0 I/O 5-bit I/O port with internal pull-up resistors (selected for each bit).This port also serves the functions of various special features of the AT90CAN128.
20 RESET In Reset input. A low level on this pin for longer than the minimum pulse length will generate a reset.
23 XTAL1 In Input to the inverting Oscillator amplifier and input to the internal clock operating circuit.
24 XTAL2 Out Output from the inverting Oscillator amplifier.
64 AVCC Power AVCC is the supply voltage pin for the A/D Converter on Port F.
62 AREF Power Analogue reference pin for the A/D Converter.
Page 141 of 148
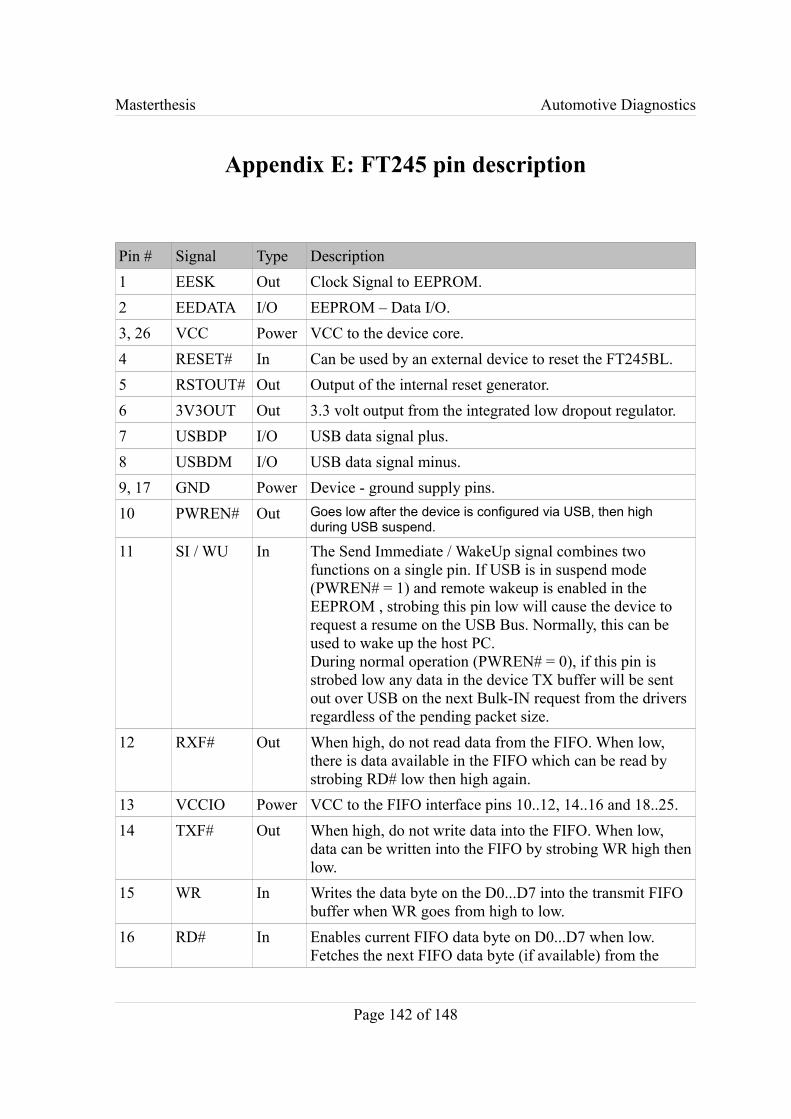
Masterthesis Automotive Diagnostics
Appendix E: FT245 pin description
Pin # Signal Type Description1 EESK Out Clock Signal to EEPROM.2 EEDATA I/O EEPROM – Data I/O.3, 26 VCC Power VCC to the device core.4 RESET# In Can be used by an external device to reset the FT245BL.5 RSTOUT# Out Output of the internal reset generator.6 3V3OUT Out 3.3 volt output from the integrated low dropout regulator.7 USBDP I/O USB data signal plus.8 USBDM I/O USB data signal minus.9, 17 GND Power Device - ground supply pins.10 PWREN# Out Goes low after the device is configured via USB, then high
during USB suspend.
11 SI / WU In The Send Immediate / WakeUp signal combines two functions on a single pin. If USB is in suspend mode (PWREN# = 1) and remote wakeup is enabled in the EEPROM , strobing this pin low will cause the device to request a resume on the USB Bus. Normally, this can be used to wake up the host PC. During normal operation (PWREN# = 0), if this pin is strobed low any data in the device TX buffer will be sent out over USB on the next Bulk-IN request from the drivers regardless of the pending packet size.
12 RXF# Out When high, do not read data from the FIFO. When low, there is data available in the FIFO which can be read by strobing RD# low then high again.
13 VCCIO Power VCC to the FIFO interface pins 10..12, 14..16 and 18..25.14 TXF# Out When high, do not write data into the FIFO. When low,
data can be written into the FIFO by strobing WR high then low.
15 WR In Writes the data byte on the D0...D7 into the transmit FIFO buffer when WR goes from high to low.
16 RD# In Enables current FIFO data byte on D0...D7 when low. Fetches the next FIFO data byte (if available) from the
Page 142 of 148
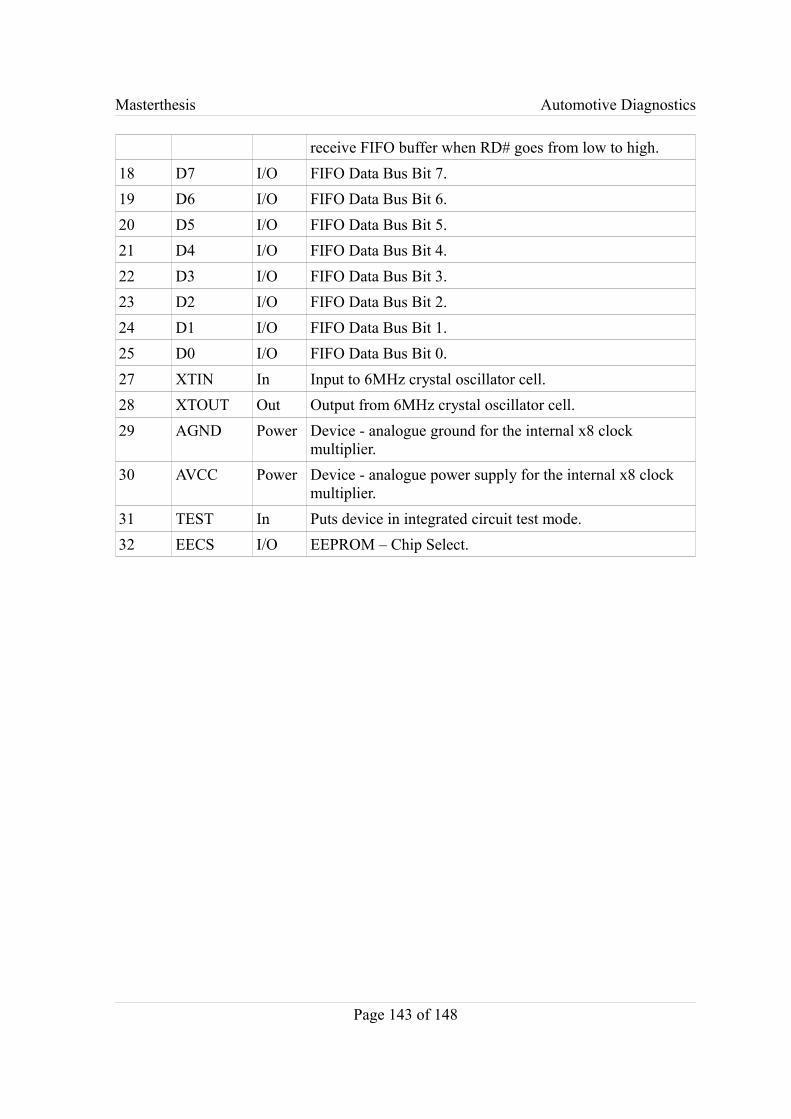
Masterthesis Automotive Diagnostics
receive FIFO buffer when RD# goes from low to high.18 D7 I/O FIFO Data Bus Bit 7.19 D6 I/O FIFO Data Bus Bit 6.20 D5 I/O FIFO Data Bus Bit 5.21 D4 I/O FIFO Data Bus Bit 4.22 D3 I/O FIFO Data Bus Bit 3.23 D2 I/O FIFO Data Bus Bit 2.24 D1 I/O FIFO Data Bus Bit 1.25 D0 I/O FIFO Data Bus Bit 0.27 XTIN In Input to 6MHz crystal oscillator cell.28 XTOUT Out Output from 6MHz crystal oscillator cell.29 AGND Power Device - analogue ground for the internal x8 clock
multiplier.30 AVCC Power Device - analogue power supply for the internal x8 clock
multiplier.31 TEST In Puts device in integrated circuit test mode.32 EECS I/O EEPROM – Chip Select.
Page 143 of 148
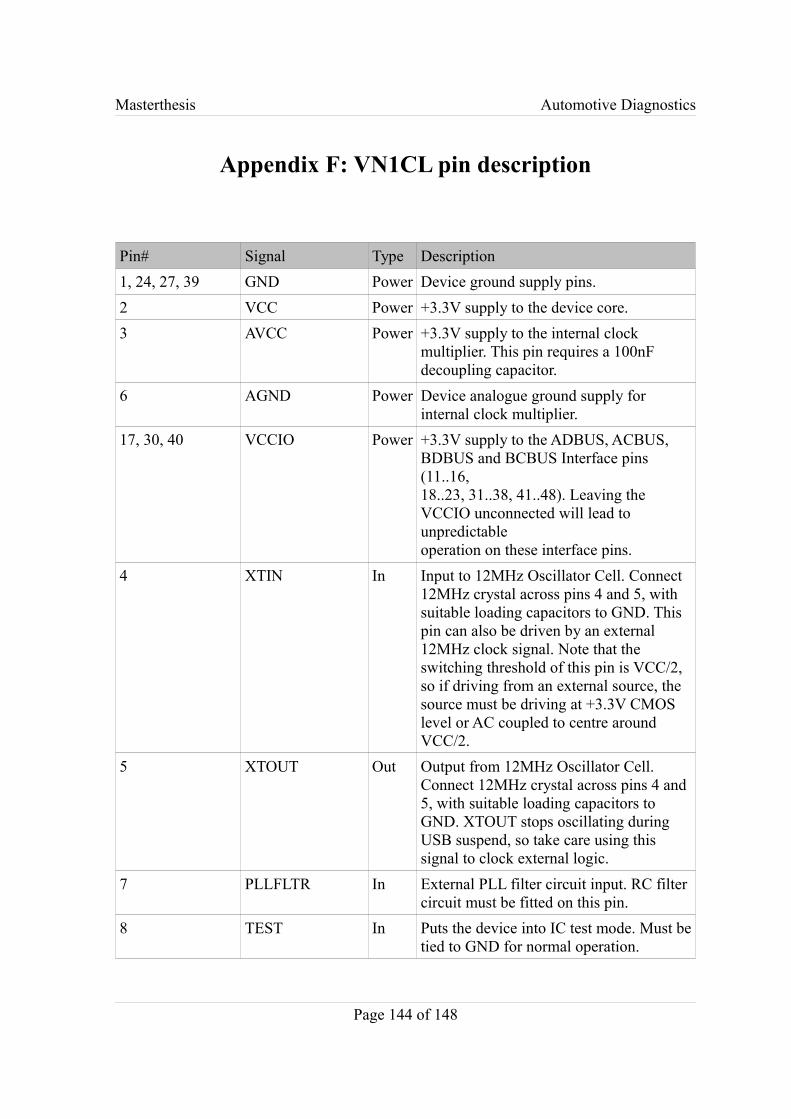
Masterthesis Automotive Diagnostics
Appendix F: VN1CL pin description
Pin# Signal Type Description1, 24, 27, 39 GND Power Device ground supply pins.2 VCC Power +3.3V supply to the device core.3 AVCC Power +3.3V supply to the internal clock
multiplier. This pin requires a 100nF decoupling capacitor.
6 AGND Power Device analogue ground supply for internal clock multiplier.
17, 30, 40 VCCIO Power +3.3V supply to the ADBUS, ACBUS, BDBUS and BCBUS Interface pins (11..16,18..23, 31..38, 41..48). Leaving the VCCIO unconnected will lead to unpredictableoperation on these interface pins.
4 XTIN In Input to 12MHz Oscillator Cell. Connect 12MHz crystal across pins 4 and 5, with suitable loading capacitors to GND. This pin can also be driven by an external 12MHz clock signal. Note that the switching threshold of this pin is VCC/2, so if driving from an external source, the source must be driving at +3.3V CMOS level or AC coupled to centre around VCC/2.
5 XTOUT Out Output from 12MHz Oscillator Cell. Connect 12MHz crystal across pins 4 and 5, with suitable loading capacitors to GND. XTOUT stops oscillating during USB suspend, so take care using this signal to clock external logic.
7 PLLFLTR In External PLL filter circuit input. RC filter circuit must be fitted on this pin.
8 TEST In Puts the device into IC test mode. Must be tied to GND for normal operation.
Page 144 of 148
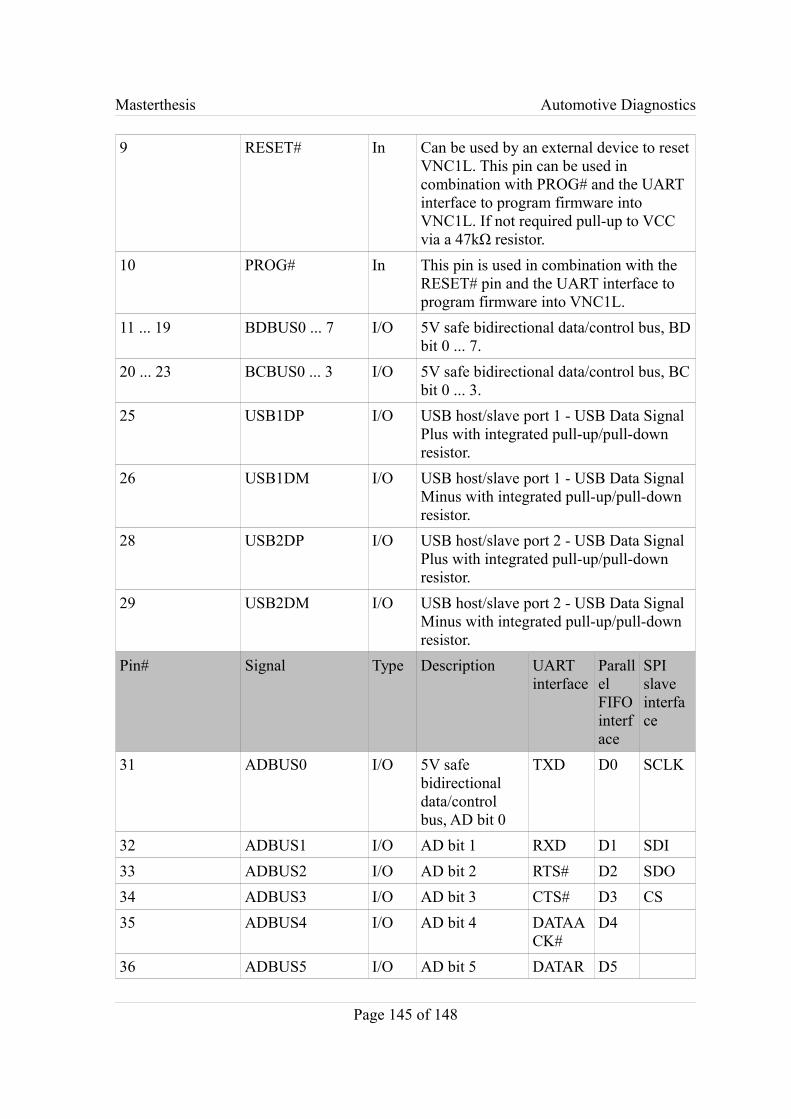
Masterthesis Automotive Diagnostics
9 RESET# In Can be used by an external device to reset VNC1L. This pin can be used in combination with PROG# and the UART interface to program firmware into VNC1L. If not required pull-up to VCC via a 47kΩ resistor.
10 PROG# In This pin is used in combination with the RESET# pin and the UART interface to program firmware into VNC1L.
11 ... 19 BDBUS0 ... 7 I/O 5V safe bidirectional data/control bus, BD bit 0 ... 7.
20 ... 23 BCBUS0 ... 3 I/O 5V safe bidirectional data/control bus, BC bit 0 ... 3.
25 USB1DP I/O USB host/slave port 1 - USB Data Signal Plus with integrated pull-up/pull-down resistor.
26 USB1DM I/O USB host/slave port 1 - USB Data Signal Minus with integrated pull-up/pull-down resistor.
28 USB2DP I/O USB host/slave port 2 - USB Data Signal Plus with integrated pull-up/pull-down resistor.
29 USB2DM I/O USB host/slave port 2 - USB Data Signal Minus with integrated pull-up/pull-down resistor.
Pin# Signal Type Description UART interface
Parallel FIFO interface
SPI slave interface
31 ADBUS0 I/O 5V safe bidirectional data/control bus, AD bit 0
TXD D0 SCLK
32 ADBUS1 I/O AD bit 1 RXD D1 SDI33 ADBUS2 I/O AD bit 2 RTS# D2 SDO34 ADBUS3 I/O AD bit 3 CTS# D3 CS35 ADBUS4 I/O AD bit 4 DATAA
CK#D4
36 ADBUS5 I/O AD bit 5 DATAR D5
Page 145 of 148
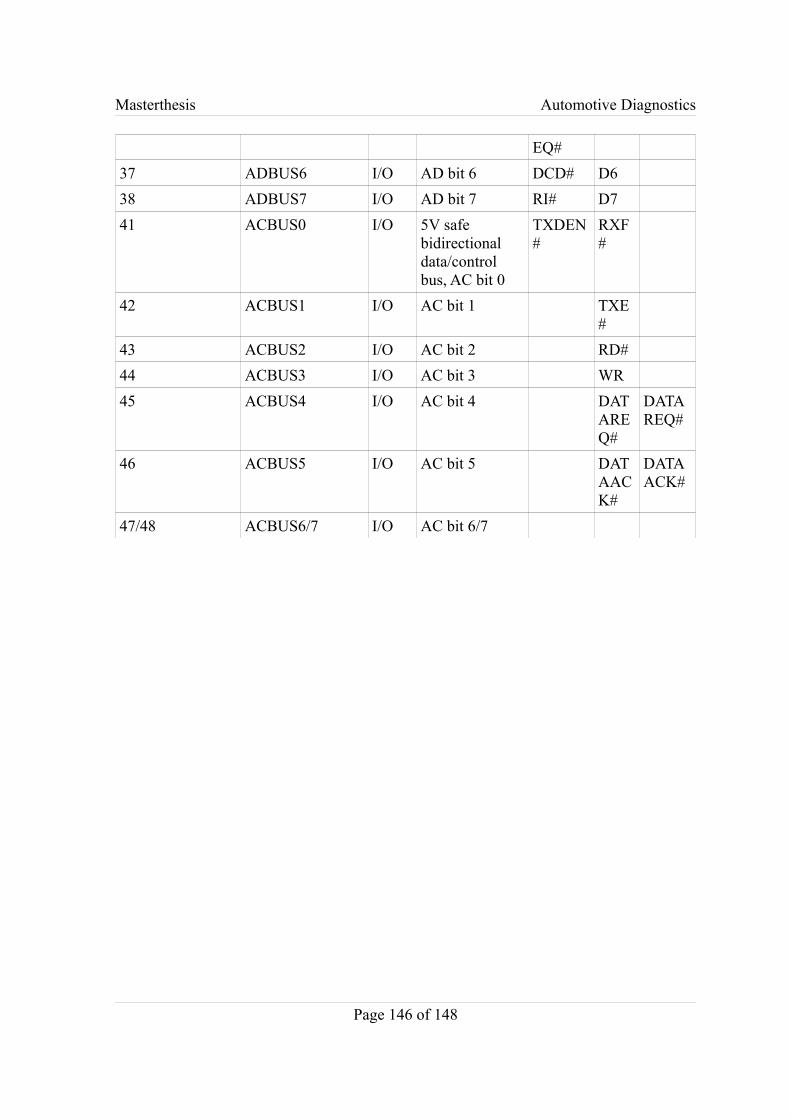
Masterthesis Automotive Diagnostics
EQ#37 ADBUS6 I/O AD bit 6 DCD# D638 ADBUS7 I/O AD bit 7 RI# D741 ACBUS0 I/O 5V safe
bidirectional data/control bus, AC bit 0
TXDEN#
RXF#
42 ACBUS1 I/O AC bit 1 TXE#
43 ACBUS2 I/O AC bit 2 RD#44 ACBUS3 I/O AC bit 3 WR45 ACBUS4 I/O AC bit 4 DAT
AREQ#
DATAREQ#
46 ACBUS5 I/O AC bit 5 DATAACK#
DATAACK#
47/48 ACBUS6/7 I/O AC bit 6/7
Page 146 of 148
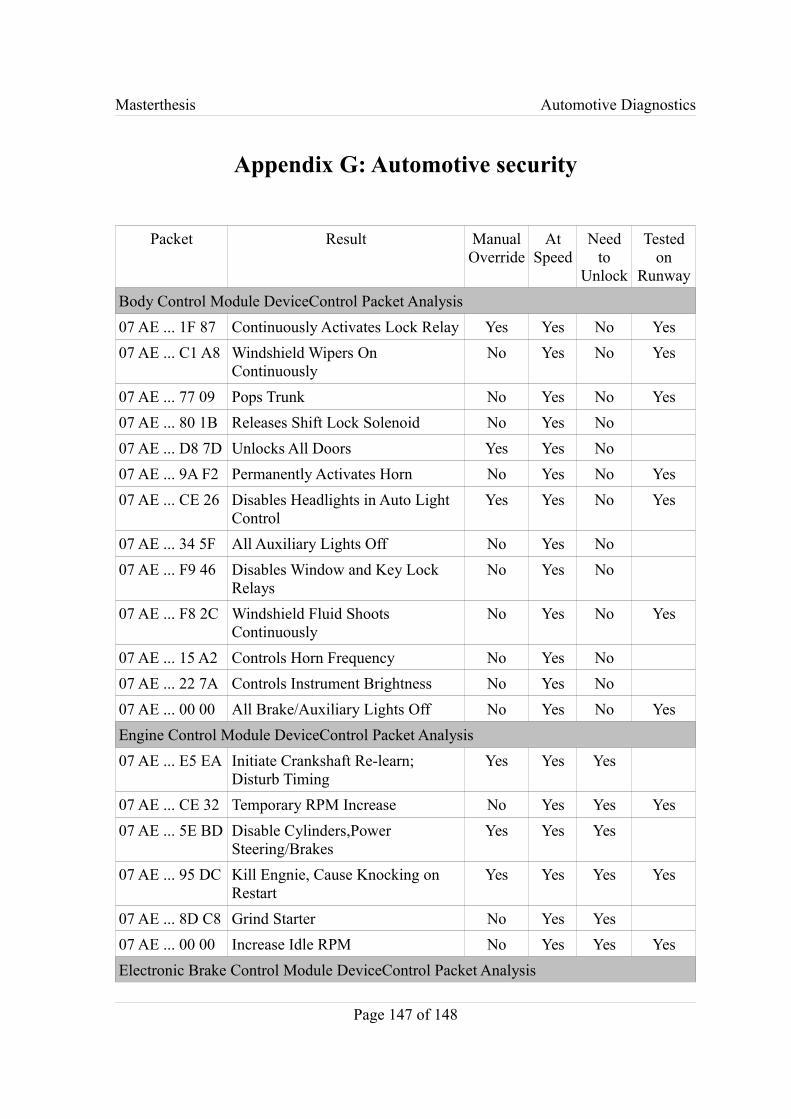
Masterthesis Automotive Diagnostics
Appendix G: Automotive security
Packet Result Manual Override
At Speed
Need to
Unlock
Tested on
RunwayBody Control Module DeviceControl Packet Analysis07 AE ... 1F 87 Continuously Activates Lock Relay Yes Yes No Yes07 AE ... C1 A8 Windshield Wipers On
ContinuouslyNo Yes No Yes
07 AE ... 77 09 Pops Trunk No Yes No Yes07 AE ... 80 1B Releases Shift Lock Solenoid No Yes No07 AE ... D8 7D Unlocks All Doors Yes Yes No07 AE ... 9A F2 Permanently Activates Horn No Yes No Yes07 AE ... CE 26 Disables Headlights in Auto Light
ControlYes Yes No Yes
07 AE ... 34 5F All Auxiliary Lights Off No Yes No07 AE ... F9 46 Disables Window and Key Lock
RelaysNo Yes No
07 AE ... F8 2C Windshield Fluid Shoots Continuously
No Yes No Yes
07 AE ... 15 A2 Controls Horn Frequency No Yes No07 AE ... 22 7A Controls Instrument Brightness No Yes No07 AE ... 00 00 All Brake/Auxiliary Lights Off No Yes No YesEngine Control Module DeviceControl Packet Analysis07 AE ... E5 EA Initiate Crankshaft Re-learn;
Disturb TimingYes Yes Yes
07 AE ... CE 32 Temporary RPM Increase No Yes Yes Yes07 AE ... 5E BD Disable Cylinders,Power
Steering/BrakesYes Yes Yes
07 AE ... 95 DC Kill Engnie, Cause Knocking on Restart
Yes Yes Yes Yes
07 AE ... 8D C8 Grind Starter No Yes Yes07 AE ... 00 00 Increase Idle RPM No Yes Yes YesElectronic Brake Control Module DeviceControl Packet Analysis
Page 147 of 148

Masterthesis Automotive Diagnostics
07 AE ... 25 2B Engages Font Left Brake No Yes Yes Yes07 AE ... 20 88 Engages Font Right Brake/Unlocks
Front LeftNo Yes Yes Yes
07 AE ... 86 07 Unevenly Engages Right Brakes No Yes Yes Yes07 AE ... FF FF Releases Brakes, Prevents Braking No Yes Yes Yes
Page 148 of 148