THE DEVELOPMENT AND VALIDATION OF A MALAYSIAN ...
10
The Eurasia Proceedings of Educational & Social Sciences (EPESS) ISSN: 2587-1730 - This is an Open Access article distributed under the terms of the Creative Commons Attribution-Noncommercial 4.0 Unported License, permitting all non-commercial use, distribution, and reproduction in any medium, provided the original work is properly cited. - Selection and peer-review under responsibility of the Organizing Committee of the conference *Corresponding author: Eng Tek [email protected] © 2016 Published by ISRES Publishing: www.isres.org The Eurasia Proceedings of Educational & Social Sciences (EPESS), 2016 Volume 4, Pages 342-351 ICEMST 2016: International Conference on Education in Mathematics, Science & Technology THE DEVELOPMENT AND VALIDATION OF A MALAYSIAN-BASED BASIC SCIENCE PROCESS SKILLS TEST Eng Tek ONG Sultan Idris Education University Norjuhana MESMEN Bolok National School Sabri MOHD SALLEH Sultan Idris Education University Siti Eshah MOKSHEIN Sultan Idris Education University Nik Azmah NIK YUSUFF Sultan Idris Education University Koon Peng YEAM Khir Johari Secondary School ABSTRACT: This paper reports the development and validation of a test that measures the basic science process skills for upper primary school pupils as stipulated in the Malaysian science curricula. In the instrument development phase, 58 Basic Science Process Skills (BSPS) items were generated according to a set of a priori indicators. These items were vetted by two reviewers to ensure content validity and to establish inter-rater agreement, yielding a Cohen’s Kappa value of 0.877, p = < .001. The BSPS Test was then field tested with a group of 197 upper primary students (aged 10-12) that represents top, average, and bottom sets. The dataset was subjected to item analyses, resulting in a quality 29-item BSPS Test. The BSPS Test has a KR-20 reliability of 0.86, and means for difficulty and discrimination indices of items that measured at 0.61 and 0.49 respectively. This paper ends with a discussion as to how the quality 29-item BSPS Test could be used in the classroom alongside the mandatory science practical assessment, thus providing the concurrent validity. Key words: Basic science process skills, primary science, development, validation, Malaysia. INTRODUCTION The primary school science curriculum in Malaysia has gone through a few waves of reformation, from the Special Project in 1968, Primary School New Curriculum in 1983, Primary School Integrated Curriculum in 1993, to Primary School Standard Curriculum or its Malay equivalent, Kurikulum Standard Sekolah Rendah (KSSR) which took effect in 2011. In terms of pedagogical approach, Primary School Standard Curriculum explicitly states that “science emphasizes inquiry method ... [and] in the inquiry process ... scientific skills and thinking skills are employed” (Curriculum Development Division [CDC], 2012, p. 8) . Accordingly, inquiry method, built on the premise that students learn best through direct experience and through the incorporation of new and existing knowledge, is considered the “primary vehicle for students to develop meaningful understandings of key science concepts as well as learn about the nature and process of science” (Dunkhase, 2003, p 10). Therefore, inquiry teaching honours previous experience and knowledge, making use of multiple ways of knowing and taking on new perspectives when exploring issues, content, and questions. One of the ways of knowing is through investigative work which employs scientific skills. As such, Malaysian teachers are expected to inculcate scientific skills through investigative work. In assessing students’ acquisition
-
Upload
khangminh22 -
Category
Documents
-
view
0 -
download
0
Transcript of THE DEVELOPMENT AND VALIDATION OF A MALAYSIAN ...

The Eurasia Proceedings of Educational & Social Sciences (EPESS)
ISSN: 2587-1730
- This is an Open Access article distributed under the terms of the Creative Commons Attribution-Noncommercial 4.0 Unported License, permitting all non-commercial use, distribution, and reproduction in any medium, provided the original work is properly cited.
- Selection and peer-review under responsibility of the Organizing Committee of the conference
*Corresponding author: Eng Tek [email protected]
© 2016 Published by ISRES Publishing: www.isres.org
The Eurasia Proceedings of Educational & Social Sciences (EPESS), 2016
Volume 4, Pages 342-351
ICEMST 2016: International Conference on Education in Mathematics, Science & Technology
THE DEVELOPMENT AND VALIDATION OF A MALAYSIAN-BASED
BASIC SCIENCE PROCESS SKILLS TEST
Eng Tek ONG
Sultan Idris Education University
Norjuhana MESMEN
Bolok National School
Sabri MOHD SALLEH
Sultan Idris Education University
Siti Eshah MOKSHEIN
Sultan Idris Education University
Nik Azmah NIK YUSUFF
Sultan Idris Education University
Koon Peng YEAM
Khir Johari Secondary School
ABSTRACT: This paper reports the development and validation of a test that measures the basic science
process skills for upper primary school pupils as stipulated in the Malaysian science curricula. In the instrument
development phase, 58 Basic Science Process Skills (BSPS) items were generated according to a set of a priori
indicators. These items were vetted by two reviewers to ensure content validity and to establish inter-rater
agreement, yielding a Cohen’s Kappa value of 0.877, p = < .001. The BSPS Test was then field tested with a
group of 197 upper primary students (aged 10-12) that represents top, average, and bottom sets. The dataset was
subjected to item analyses, resulting in a quality 29-item BSPS Test. The BSPS Test has a KR-20 reliability of
0.86, and means for difficulty and discrimination indices of items that measured at 0.61 and 0.49 respectively.
This paper ends with a discussion as to how the quality 29-item BSPS Test could be used in the classroom
alongside the mandatory science practical assessment, thus providing the concurrent validity.
Key words: Basic science process skills, primary science, development, validation, Malaysia.
INTRODUCTION
The primary school science curriculum in Malaysia has gone through a few waves of reformation, from the
Special Project in 1968, Primary School New Curriculum in 1983, Primary School Integrated Curriculum in
1993, to Primary School Standard Curriculum or its Malay equivalent, Kurikulum Standard Sekolah Rendah
(KSSR) which took effect in 2011. In terms of pedagogical approach, Primary School Standard Curriculum
explicitly states that “science emphasizes inquiry method ... [and] in the inquiry process ... scientific skills and
thinking skills are employed” (Curriculum Development Division [CDC], 2012, p. 8). Accordingly, inquiry
method, built on the premise that students learn best through direct experience and through the incorporation of
new and existing knowledge, is considered the “primary vehicle for students to develop meaningful
understandings of key science concepts as well as learn about the nature and process of science” (Dunkhase,
2003, p 10). Therefore, inquiry teaching honours previous experience and knowledge, making use of multiple
ways of knowing and taking on new perspectives when exploring issues, content, and questions.
One of the ways of knowing is through investigative work which employs scientific skills. As such, Malaysian
teachers are expected to inculcate scientific skills through investigative work. In assessing students’ acquisition

International Conference on Education in Mathematics, Science & Technology (ICEMST), May 19 - 22, 2016 Bodrum/Turkey
343
level of science process skill (SPS) as well science manipulative skills (SMS), practical or hands-on activities
have been designed and used as school-based practical assessment which is termed as Practical Work
Assessment or its Malay equivalent, Penilaian Kerja Amali (PEKA), widely known across the country as an
acronym, PEKA.
The Malaysian Examination Syndicate (or, Lembaga Peperiksaan Malaysia in the Malay Language) stipulates
that PEKA should be “carried out as part of teaching and learning process ... [and that] teachers can assess either
one construct/skill or several constructs/skills to a small group of pupils or the whole class ... at least two times
in each year, from Year 3 to Year 6 ... The highest score for each construct could be taken from either year”
(Malaysian Examination Syndicate, 2008, p.6).
Although a guide on practical work assessment (PEKA) has been provided for by the Malaysian Examination
Syndicate (2008), the effectiveness of implementation of PEKA at school level, nevertheless, is somewhat
problematic as documented in previous research findings which indicated that the implementation of PEKA is
too taxing and unmanageable, too much science content to cover within the limited time frame, uncertainty in
scoring the evidence from the practical work, too many skills to be assessed, insufficient materials and
laboratory instruments to go by during PEKA implementation, the burdens of many other duties, too many
students to assess, students’ negative attitudes towards PEKA implementation, unsure as to how the scoring
rubrics are used, poor support system from the management, and difficulties faced by teachers in selecting and
managing practical activities for PEKA given that there were no pre-determined practical assessment activities
from the Malaysian Examination Syndicate except for the providence of guidelines and scoring criteria (Abdul
Rahim & Saliza, 2008; Filmer & Foh, 1997; Noorasykin, 2002; Siti Aloyah, 2002; Wan Noraine, 2010)
Although the Malaysian Examination Syndicate has introduced the school-based, hands-on PEKA to assess
students’ practical work, such assessment is still subjective in nature as it depends on a teacher’s discernment,
capability, and acumen in assessing practical work based on the identified constructs of science process skills.
Similar problems were faced by American science teachers which prompted Dillashaw and Okey (1980) to
suggest the use of a paper-and-pencil group testing format for measuring process skills competency which they
reckoned “can be administered efficiently and objectively” (p. 602) without requiring expensive resources.
Given the fact that practical work assessment is mandatory, using paper-and-pencil testing could be reckoned as
a supplementary to the practical work assessment. It is irrefutable that assessing and knowing the acquisition
level of SPS among students are important because should they fail to meet an acceptable level, appropriate
remediation is then needed.
As such, there is an urgency to develop and validate a Malaysian-based science process skills inventory which is
able to gauge primary students’ acquisition of science process skills. Such development and validation is of
crucial importance because, from the review of the literature, there was no study done with the aim of
developing an instrument capable of measuring the full range of basic science process skills and suitable for
upper primary students. Accordingly, this study addressed the key question: To what extent does the developed
science process skills instrument has the sufficient validity and reliability?
METHODOLOGY
Research Design and Sampling
This study employed the methodology of test items development which comprised two phases. Phase One was
characterized by the instrument development process (Cohen, Manion, & Morrison, 2007) that involves (a)
identifying the test objective; (b) specifying the content of the test and this entails identifying as well as
describing the science process skills to be tested; (c) forming a test specification table and this includes
delineating the indicators for each of the science process skills and the expected number of items; (d) writing
appropriate test items that match the delineated indicators; and (e) checking items by experts to ensure face
validity and content validity. Phase Two was characterized by psychometric analysis where the developed set of
items was piloted to establish the internal reliability as well as the difficulty and discrimination indices. Items
that have difficulty index within the range of 0.25-0.75 and discrimination index of at least 0.40 would be
accepted, while those that do not meet the required range would be either modified or rejected. The steps taken
in Phase One are described in the Methodology section while the results obtained from item analysis are
described in the Results section.
Phase One: Instrument Development Process

International Conference on Education in Mathematics, Science & Technology (ICEMST), May 19 - 22, 2016 Bodrum/Turkey
344
(a) Identifying the Test Objective
The test objective is to develop a quality instrument in terms of research-appropriate validity, reliability,
difficulty index, and discrimination index to assess the acquisition of a complete range of 7 basic science process
skills as stipulated in the Malaysian science curricula. The instrument should be deemed suitable for upper
primary school students.
(b) Specifying the Content
The 7 basic science process skills were adapted from the Teaching and Learning Module on “Pendekatan Inkuari
Melalui Kemahiran Proses Sains: Tahun 4” (Inquiry Approach through Science Process Skills) (Curriculum
Development Division, 2013). Table 1 summarizes the 7 basic science process skills with their respective
descriptions.
Table 1: Description of Basic Science Process Skills
No Science Process Skill Description
1 Observing Using the sense of hearing, touch, smell, taste and sight to collect information
about an object or a phenomenon.
2 Classifying Using observations to separate or group objects, events or phenomena
according to similar characteristics.
3 Measuring and Using
Numbers
Making quantitative observations using numbers and tools with standardized
units or tools which have been uniformised as reference unit. Measuring makes
observation more accurate.
4 Making Inferences Making a plausible (or reasonable) tentative conclusion which may be correct
or incorrect to explain a certain event or observation.
5 Predicting Making a tentative expectation or outcome of a future event based on
observation and prior knowledge gained through experiences or based on data.
6 Communicating Receive, choose, arrange and present information or ideas in the forms of
writing, oral presentation (speaking), tables, graphs, figures or models.
7 Using Space-Time
Relationship
Describing parameter change such as location, direction, shape, size, volume,
weight and mass with time.
(c) Forming Test Specification Table
As shown in Table 2, the Test Specification Table has 3 major columns, namely science process skill, indicator,
and number of items in the first, second, and third columns respectively. At least 6 items were generated for each
science process skill. Creating more items for each process skill was to ensure that sufficient items remained
after the psychometric analysis of pilot data. Furthermore, Reynolds, Livingston and Wilson (2009) argued that
test measurement features are enhanced with increasing number of items.
Table 2: Test Specification Table for Basic and Integrated Science Process Skills
Science Process
Skill
Indicator Number
of Items
Observing Detect differences and similarities.
12
Identify general characteristics of a group of items.
Identify arrangement and order of occurred phenomena.
Identify the changes occurred.
Focus attention to relevant details from different sources of information.
Make comparison.
Classifying Group something based on common features.
7 Describe common characteristic used in classifying/grouping.
Group something by using various ways based on different criteria (sequentially).
Measuring and
using number
Use numbers to record measurement and phenomenon.
14 Record taken reading.
Make simple calculation.
Calculate and compare the number of items in different groups.
Making
Inferences
Use information from observation to make initial plausible conclusion.
6 Use various possible information from an observation.
Use inference as a tool to determine additional observation.
Predicting Use previous data to predict what might be happening.
6 Use pattern as evidence to make a prediction or expectation.
Determine effect or result which might happen from an action.
International Conference on Education in Mathematics, Science & Technology (ICEMST), May 19 - 22, 2016 Bodrum/Turkey
345
Extrapolate or interpolate to make a prediction
Communicating Write to explain an idea or a thing clearly to others.
7
Use symbol or mathematical equation to convey information about an incident or
phenomenon.
Use writing, diagram, chart, graph, table or ICT to clarify idea or convey
information.
Using time-
space
relationship
Describe position (location) and time.
6
Describe change of direction, feature, object size, volume, weight, mass,
according to time.
Narrate association between distance travelled and time for a moving object.
Determine object location in space and explain the position.
Arrange the occurrence of events chronologically.
Narrate object shape when it is viewed from different positions or reference
points.
Identify variables involved in coming activities.
Carry out activities to test hypothesis by altering manipulated variable.
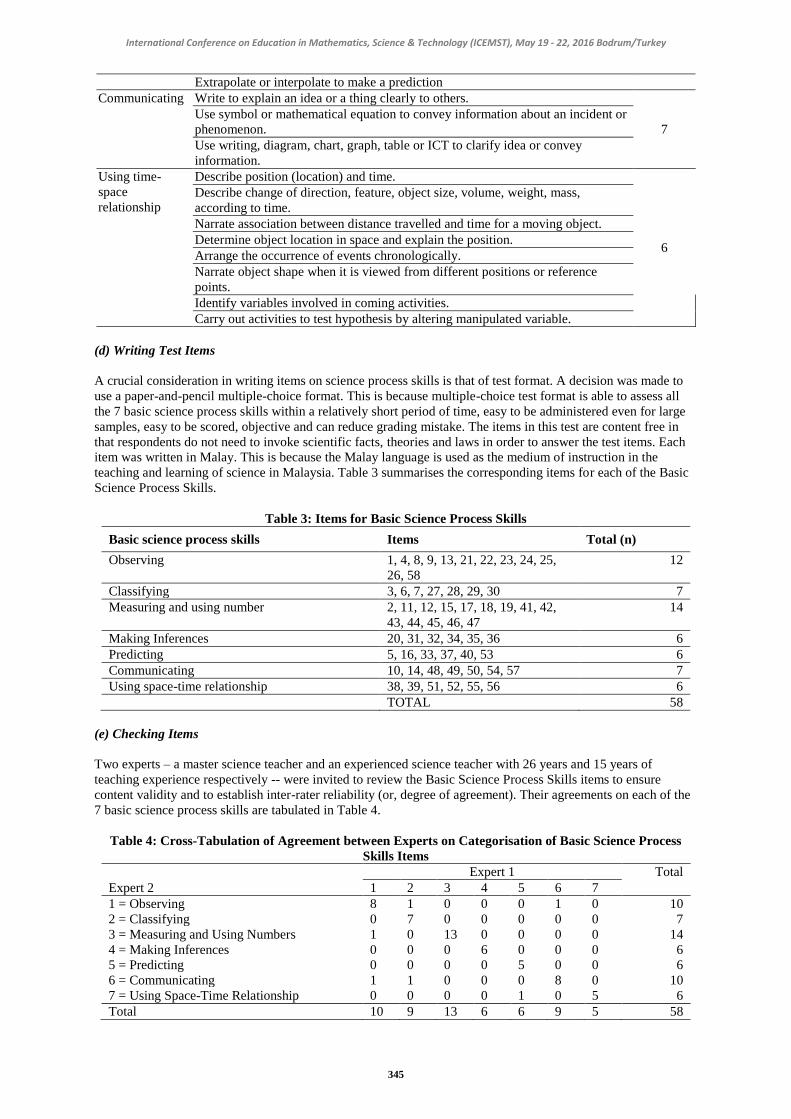
(d) Writing Test Items
A crucial consideration in writing items on science process skills is that of test format. A decision was made to
use a paper-and-pencil multiple-choice format. This is because multiple-choice test format is able to assess all
the 7 basic science process skills within a relatively short period of time, easy to be administered even for large
samples, easy to be scored, objective and can reduce grading mistake. The items in this test are content free in
that respondents do not need to invoke scientific facts, theories and laws in order to answer the test items. Each
item was written in Malay. This is because the Malay language is used as the medium of instruction in the
teaching and learning of science in Malaysia. Table 3 summarises the corresponding items for each of the Basic
Science Process Skills.
Table 3: Items for Basic Science Process Skills
Basic science process skills Items Total (n)
Observing 1, 4, 8, 9, 13, 21, 22, 23, 24, 25,
26, 58
12
Classifying 3, 6, 7, 27, 28, 29, 30 7
Measuring and using number 2, 11, 12, 15, 17, 18, 19, 41, 42,
43, 44, 45, 46, 47
14
Making Inferences 20, 31, 32, 34, 35, 36 6
Predicting 5, 16, 33, 37, 40, 53 6
Communicating 10, 14, 48, 49, 50, 54, 57 7
Using space-time relationship 38, 39, 51, 52, 55, 56 6
TOTAL 58
(e) Checking Items
Two experts – a master science teacher and an experienced science teacher with 26 years and 15 years of
teaching experience respectively -- were invited to review the Basic Science Process Skills items to ensure
content validity and to establish inter-rater reliability (or, degree of agreement). Their agreements on each of the
7 basic science process skills are tabulated in Table 4.
Table 4: Cross-Tabulation of Agreement between Experts on Categorisation of Basic Science Process
Skills Items
Expert 1 Total
Expert 2 1 2 3 4 5 6 7
1 = Observing 8 1 0 0 0 1 0 10
2 = Classifying 0 7 0 0 0 0 0 7
3 = Measuring and Using Numbers 1 0 13 0 0 0 0 14
4 = Making Inferences 0 0 0 6 0 0 0 6
5 = Predicting 0 0 0 0 5 0 0 6
6 = Communicating 1 1 0 0 0 8 0 10
7 = Using Space-Time Relationship 0 0 0 0 1 0 5 6
Total 10 9 13 6 6 9 5 58

International Conference on Education in Mathematics, Science & Technology (ICEMST), May 19 - 22, 2016 Bodrum/Turkey
346
As shown in Table 4, there were 6 items in which both experts differed in their categorisation or labelling of
items. As such, the experts were not in agreement for 6 out of 58 items. Table 5 shows the analysis of inter-rater
agreement in categorisation of Basic Science Process Skills items which yielded a Cohen’s Kappa value of
0.877, p = .000 < .002, which indicates an excellent or outstanding level of agreement between experts (Landis
& Koch, 1977; Cohen, 1960). In other words, after correcting for chance effect, the percentage of agreement
between experts was found to be 87.7%
Table 5: The Measurement of Agreement between Experts in Categorisation of Basic Science Process
Skills Items
Kappa Value N Asymp. Std. Errora Approx. T
b p
.877 58 .047 15.737 .000
a. Not assuming the null hypothesis.
b. Using the asymptotic standard error assuming the null hypothesis.
(f) Pilot Testing
For pilot purposes, the 58-item Basic Science Process Skills Test was administered to a total of 197 upper
primary students drawn from 1 urban and 2 rural primary schools in the state of Perak for duration of one hour
30 minutes. There were 71 (34 males and 37 females) and 126 (53 males and 73 females) students in the
corresponding urban and rural primary schools. The detailed breakdown of the respondents who participated in
the piloting of items in the Basic Science Process Skills Test is given in Table 6.
Table 6: Breakdown of Participants in the Piloting of Basic Science Process Skills Test
Gender
Location Male Female Total
Urban Year 4 10 13 23
Year 5 13 14 27
Year 6 11 10 21
Total 34 37 71
Rural Year 4 16 18 34
Year 5 21 26 47
Year 6 16 29 45
Total 53 73 126
Grand Total 87 110 197
Data Collection Procedures
Prior to the commencement of the study, permission was sought from the Educational Planning and Research
Division (EPRD) of the MoE. Upon gaining the approval from the EPRD, a letter for permission with the
attachment of EPRD approval letter was forwarded to the Perak State Education Department, given that the pilot
study was to be conducted in Perak. Once the approval has been obtained from the Perak State Education
Department, the headmasters of the selected primary schools were approached in person in getting their
approvals to use the upper primary students in their schools as respondents/participants.
In each school, the administration of research instruments was done simultaneously for all the classes under the
supervision of teachers in school time. In administering the instruments, the teachers read the same researcher-
prepared instructional script. In order to ensure high completion rate, teachers were asked to ensure that all the
response sheets were collected at the end of the session.
Data Analysis Procedures
Data collected from the pilot study were subjected to item analyses in which the internal consistency of the
BSPS Test measured by means of Kuder-Richardson-20, the index discrimination, and the difficulty index were
determined. Based on the review of previous literature, it is decided that for this study, (a) a reliability of at least
0.7 is considered acceptable; (b) D33% is adopted as recommended by Liu (2008) to determine the discrimination
indices for each item; (c) items with the difficulty indices of 0.25 – 0.75 are retained, subject to their acceptable
discrimination indices.

International Conference on Education in Mathematics, Science & Technology (ICEMST), May 19 - 22, 2016 Bodrum/Turkey
347
RESULTS
Item analysis was carried out on pilot test data for basic science process skills gathered from 197 Year 4-6
primary students and the results are summarised in Table 7.
Table 7: Results of Item Analysis on Pilot Test Data for Basic Science Process Skills: Distracter Analysis,
Difficulty Index and Discrimination Index
Options (* = answer key) Df=Difficulty Index
D=Discrimination Index
Decision
Item A B C D Non Total Df D
1 15
(7.6)
72*
(36.5)
109
(55.3)
1
(0.5)
0
(0.0)
197
(100%)
0.60 0.31 Modify
2 187*
(94.9)
7
(3.6)
1
(0.5)
2
(1.0)
0
(0.0)
197
(100%)
0.89 0.17 Discard
3 24
(12.2)
149*
(75.6)
19
9.6)
5
(2.5)
0
(0.0)
197
(100%)
0.63 0.40 Retain
4 137
(69.5)
33*
(16.8)
13
(6.6)
14
(7.1)
0
(0.0)
197
(100%)
0.42 0.32 Modify
5 146*
(74.1)
13
(6.6)
29
(14.7)
9
(4.6)
0
(0.0)
197
(100%)
0.67 0.40 Retain
6 32
(16.2)
24
(12.2)
45
(22.8)
96*
(48.7)
0
(0.0)
197
(100%)
0.49 0.29 Modify
7 144*
(73.1)
15
(7.6)
23
(11.7)
14
(7.1)
1
(0.5)
197
(100%)
0.61 0.28 Modify
8 102
(51.8)
21
(10.7)
40
(20.3)
33*
(16.8)
1
(0.5)
197
(100%)
0.17 0.15 Discard
9 14
(7.1)
126*
(64.0)
23
(11.7)
34
(17.3)
0
(0.0)
197
(100%)
0.58 0.32 Modify
10 17
(8.6)
10
(5.1)
142*
(72.1)
27
(13.7)
1
(0.5)
197
(100%)
0.59 0.18 Modify
11 34
(17.3)
22
(11.2)
107*
(45.3)
34
(17.3)
0
(0.0)
197
(100%)
0.54 0.49 Retain
12 9
(4.6)
12
(6.1)
7
(3.6)
169*
(85.8)
0
(0.0)
197
(100%)
0.70 0.29 Modify
13 155*
(78.7)
13
(6.6)
24
(12.2)
5
(2.5)
0
(0.0)
197
(100%)
0.70 0.46 Retain
14 24
(12.2)
39
(19.8)
121*
(61.4)
13
(6.6)
0
(0.0)
197
(100%)
0.52 0.17 Modify
15 11
(5.6)
141*
(71.6)
10
(5.1)
35
(17.8)
0
(0.0)
197
(100%)
0.65 0.22 Modify
16 95*
(48.2)
28
(14.2)
15
(7.6)
58
(29.4)
1
(0.5)
197
(100%)
0.48 0.43 Retain
17 10
(5.1)
77*
(39.1)
19
(9.6)
91
(46.2)
0
(0.0)
197
(100%)
0.45 0.42 Retain
18 33
(16.8)
29
(14.7)
20
(10.2)
115*
(58.4)
0
(0.0)
197
(100%)
0.58 0.66
Retain
19 11
(5.6)
24
(12.2)
153*
(77.7)
8
(4.1)
1
(0.5)
197
(100%)
0.69 0.20 Modify
20 36
(18.3)
19
(9.6)
37
(18.8)
105*
(53.3)
0
(0.0)
197
(100%)
0.53 0.46 Retain
21 12
(6.1)
128*
(65.0)
46
(23.4)
11
(5.6)
0
(0.0)
197
(100%)
0.55 0.17 Modify
22 15
(7.6)
25
(12.7)
67
(34.0)
90*
(45.7)
0
(0.0)
197
(100%)
0.46 0.40 Retain
23 128*
(65.0)
5
(2.5)
27
(13.7)
36
(18.3)
1
(0.5)
197
(100%)
0.61 0.40 Retain
24 40
(20.3)
19
(9.6)
121*
(61.4)
17
(8.6)
0
(0.0)
197
(100%)
0.61 0.51 Retain
25 18
(9.1)
22
(11.2)
77
(39.1)
80*
(40.6)
0
(0.0)
197
(100%)
0.41 0.29 Modify
26 22 113* 28 34 0 197 0.57 0.35 Modify

International Conference on Education in Mathematics, Science & Technology (ICEMST), May 19 - 22, 2016 Bodrum/Turkey
348
Options (* = answer key) Df=Difficulty Index
D=Discrimination Index
Decision
Item A B C D Non Total Df D
(11.2) (57.4) (14.2) (17.3) (0.0) (100%)
27 25
(12.7)
121*
(61.4)
19
(9.6)
30
(15.2)
2
(1.0)
197
(100%)
0.61 0.52 Retain
28 127*
(64.5)
14
(7.1)
27
(13.7)
28
(14.2)
1
(0.5)
197
(100%)
0.64 0.42 Retain
29 17
(8.6)
126*
(64.0)
43
(21.8)
10
(5.1)
1
(0.5)
197
(100%)
0.64 0.43 Retain
30 138*
(70.1)
10
(5.1)
33
(16.8)
15
(7.6)
1
(0.5)
197
(100%)
0.70 0.42 Retain
31 46
(23.4)
20
(10.2)
126*
(64.0)
5
(2.5)
0
(0.0)
197
(100%)
0.64 0.40 Retain
32 18
(9.1)
111
(56.3)
28*
(14.2)
40
(20.3)
0
(0.0)
197
(100%)
0.40 0.05 Modify
33 12
(6.1)
12
(6.1)
140*
(71.1)
31
(15.7)
2
(1.0)
197
(100%)
0.72 0.51 Retain
34 139*
(70.6)
18
(9.1)
26
(13.2)
14
(7.1)
0
(0.0)
197
(100%)
0.65 0.51 Retain
35 37
(18.8)
25
(12.7)
121*
(61.4)
13
(6.6)
1
(0.5)
197
(100%)
0.62 0.57 Retain
36 32
(16.2)
25
(12.7)
119*
(60.4)
21
(10.7)
0
(0.0)
197
(100%)
0.60 0.37 Modify
37 17
(4.6)
91*
(46.2)
70
(35.5)
27
(13.7)
0
(0.0)
197
(100%)
0.46 0.18 Modify
38 10
(5.1)
87*
(44.2)
72
(36.5)
28
(14.2)
0
(0.0)
197
(100%)
0.44 0.38 Modify
39 17
(8.6)
132*
(67.0)
40
(20.3)
8
(4.1)
0
(0.0)
197
(100%)
0.67 0.66 Retain
40 26
(13.2)
72*
(36.5)
34
(17.3)
65
(33.0)
0
(0.0)
197
(100%)
0.37 0.14 Modify
41
4
(2.0)
29
(14.7)
149*
(75.6)
15
(7.6)
0
(0.0)
197
(100%)
0.76 0.46 Retain
42 15
(7.6)
12
(6.1)
149*
(75.6)
21
(10.7)
0
(0.0)
197
(100%)
0.76 0.54 Retain
43 20
(10.2)
43
(21.8)
101*
(51.3)
33
(16.8)
0
(0.0)
197
(100%)
0.51 0.60 Retain
44 12
(6.1)
56
(28.4)
117*
(59.4)
11
(5.6)
1
(0.5)
197
(100%)
0.59 0.52 Retain
45 22
(11.2)
24
(12.2)
132*
(67.0)
19
(9.6)
0
(0.0)
197
(100%)
0.67 0.49 Retain
46 101*
(51.3)
31
(15.7)
40
(20.3)
25
(12.7)
0
(0.0)
197
(100%)
0.51 0.34 Modify
47 53
(26.9)
62
(31.5)
46*
(23.4)
36
(18.3)
0
(0.0)
197
(100%)
0.23 0.02 Discard
48 43
(21.8)
62
(31.5)
70*
(35.5)
22
(11.2)
0
(0.0)
197
(100%)
0.36 -0.06 Discard
49 36
(18.3)
64*
(32.5)
68
(34.5)
29
(14.7)
0
(0.0)
197
(100%)
0.32 0.28 Modify
50 31
(15.7)
45*
(22.8)
87
(44.2)
34
(17.3)
0
(0.0)
197
(100%)
0.23 0.05 Discard
51 30
(15.2)
37*
(18.8)
94
(47.7)
36
(18.3)
0
(0.0)
197
(100%)
0.19 0.03 Discard
52 86*
(43.7)
30
(15.2)
51
(25.9)
30
(15.2)
0
(0.0)
197
(100%)
0.44 0.58 Retain
53 62
(31.5)
42
(21.3)
51*
(25.9)
42
(21.3)
0
(0.0)
197
(100%)
0.26 0.11 Modify
54 54
(27.4)
50
(25.4)
23
(11.7)
70*
(35.5)
0
(0.0)
197
(100%)
0.36 0.29 Modify
55 98* 34 50 15 0 197 0.50 0.49 Retain

International Conference on Education in Mathematics, Science & Technology (ICEMST), May 19 - 22, 2016 Bodrum/Turkey
349
Options (* = answer key) Df=Difficulty Index
D=Discrimination Index
Decision
Item A B C D Non Total Df D
(49.7) (17.3) (25.4) (7.6) (0.0) (100%)
56 11
(5.6)
31
(15.7)
133
(67.5)
22*
(11.2)
0
(0.0)
197
(100%)
0.68 0.55 Retain
57 13
(6.6)
35
(17.8)
32
(16.2)
116*
(58.9)
1
(0.5)
197
(100%)
0.59 0.46 Retain
58 34
(17.3)
121
(61.4)
24*
(12.2)
17
(8.6)
1
(0.5)
197
(100%)
0.25 0.00 Discard
As shown in Table 7, item #2 has a difficulty index of 0.89 (which is more than 0.75) and a discrimination index
of 0.17 (that is lower than 0.20), suggesting that this item is relatively easy and not so powerful in distinguishing
between good and weak students. Hence, it is discarded.
Meanwhile, items #8, #47, #50, and #51 have corresponding difficulty indices of 0.17, 0.23, 0.23, and 0.19 that
are lower than 0.25, suggesting that these items are rather difficult and less than 25% of the participants who
could answer them correctly. Furthermore, all these items have corresponding discrimination indices of 0.15,
0.02, 0.05, and 0.03 which suggest that only a relatively small number of good or top set students are able to
answer them correctly. Given that these four items failed to fulfil the required acceptable range of both the
difficulty index and the discrimination index, a decision was made to discard these items.
Although Item #48 has a difficulty index of 0.36, it has a negative discrimination index of -0.06, indicating that
students who received a lower overall score on basic science process skills chose the correct answer for this item
more often than the students who received a high total score. As such, item #48 is discarded. Item #58 is equally
a bad item even though it has sufficient difficulty index of 0.25 because its discrimination index is 0.00 which
suggests that it is a non-functioning item in differentiating the good and weak students (i.e., the number of
students from the top set chose the correct answers for this item as often as the number of students from the
bottom set). As such, item #58 cannot distinguish students and hence its exclusion.
While the difficulty indices for items #10, #14, #21, #32, #37, #40, and #53 are within the acceptable range of
more than 0.25, their corresponding discrimination indices of 0.18, 0.17, 0.17, 0.05, 0.18, 0.14 and 0.11,
nevertheless, were less than 0.20, indicating the deficiencies of these 7 items in discriminating good students
from the weak students. In other words, these 7 items are poorly functioning item which, according to Ebel
(1979), need to be revised or even be discarded.
Meanwhile, items #6, #7, #12, #15, #19, #25, #49, and #54 have difficulty indices of more than 0.25 with
corresponding discrimination indices of 0.29, 0.28, 0.29,.0.22, 0.20, 0.29, 0.28, and 0.29 that range between 0.2
(inclusive) and 0.3, these eight items are marginal items that need to be revised or modified (Ebel, 1979).
For Items #1, #4, #9, #26, #36, #38, and #46 which have difficulty indices of more than 0.25 with corresponding
discrimination indices of 0.31, 0.32, 0.32, 0.35, 0.37, 0.38 and 0.34 that range from 0.31 (inclusive) and 0.40,
these items are rather good items or reasonably well-functioning items in discriminating between good and weak
students, there are rooms for further improvement (Ebel, 1979).
There are 29 items that have difficulty indices within the acceptable range of 0.25-0.75 and discrimination
indices of at least 0.4 for basic science process skills. These items are quality items in that they are neither too
easy nor too difficult and that they could adequately distinguish between top from bottom set of students.
Accordingly, these 29 items, as shown in Table 8, are retained.
Table 8: Items for Basic Science Process Skills to be Retained, Modified, and Discarded Based on Item
Analyses
Basic Science Process Skills Retain Modify Discard
Observing 13, 22, 23, 24 1, 4, 9, 21, 25, 26 58
Classifying 3, 27, 28, 29, 30 6, 7, 8
Measuring and using numbers 11, 18, 41, 42, 43, 44, 45 2, 12, 15, 19, 46 47
Making inferences 20, 31, 34, 35 32, 36
Predicting 5, 16, 17, 33 37, 40, 53
Communicating 57 10, 14, 49, 54 48, 50
Using time-space relationship 39, 52, 55, 56 38 51
Number of Items 29 23 6
(Note: Three italicized items were subsequently removed, while three underlined items would be revised, piloted
and adopted so as to strike a balance in the number of items across skills)

International Conference on Education in Mathematics, Science & Technology (ICEMST), May 19 - 22, 2016 Bodrum/Turkey
350
DISCUSSION and CONCLUSION
In terms of reliability, the original 58-item basic science process skills test has the Kuder-Richardson Formula 20
(KR-20) coefficient of 0.85, indicating that the internal consistency reliability of the overall test of basic science
process skills was high. This high internal consistency, in turn, indicates that the test was rather homogeneous in
nature. After going through a cycle of selection process, the KR-20 coefficient increased to 0.86 for the 29-
retained-item test on basic science process skills, with the means for difficulty and discrimination indices
measured at 0.61 and 0.49 respectively.
This validated Basic Science Process Skills (BSPS) Test was deemed a quality test in that the items have
difficulty and discrimination indices that fall within the acceptable range for research or testing purposes.
Besides, it is valid and reliable as a basic science process skills test for the use of upper primary students in
Malaysia, particularly amongst the Years 4, 5 and 6.
We do acknowledge the benefits of individual practical work assessment in assessing students’ acquisition of
science process skills although its use is rather time-consuming, “burdensome” (Dillashaw & Okey, 1980,
p.602), and at times problematic (Filmer & Foh, 1997) especially in science classes which are under-resourced
(Onwu & Mozube, 1992; Tobin & Capie, 1982). Nevertheless, if the aim were to gauge students’ acquisition of
each of the basic science process skills in a large scale, say a class of students, within a constraint time-frame, we
strongly encourage and recommend science teachers to use these validated items. Depending on the class time
available, teachers can pick and choose the number of items needed to measure the corresponding selected
number of science process skills. The information obtained from the testing could then be used to make informed
decision as to the appropriate remediation needed so as to address the deficiencies in any aspect of the science
process skills. For teachers who aim to inculcate science process skills amongst students, the results from using
this BSPS Test will help them reflect on the extent to which each basic science process skill has been inculcated
and subsequently, plan the next step forward.
REFERENCES
Abdul Rahim, H., & Saliza, A. (2008). Tahap penguasaan guru dalam melaksanakan pentaksiran kerja amali
(PEKA) sains menengah rendah. [Mastery level of teachers implementing practical work assessment for
lower secondary science]. Paper presented at the National Seminar on Science and Mathematics
Education, 11-12 October 2008, Johor.
Cohen, J. (1960). A coefficient of agreement for nominal scales. Educational and Psychological Measurement,
20(3), 37-46.
Cohen, L., Manion, L., & Morrison, K. (2007). Research methods in education (6th ed.). Great Britain:
Routledge.
Curriculum Development Division [CDC]. (2012). Kurikulum Standard Sekolah Rendah: Dunia Sains dan
Teknologi Tahun 3 (Standard Curriculum for Primary School: Science and Technological World Year 3).
Putrajaya: Ministry of Education Malaysia.
Curriculum Development Division. (2013). Modul Pengajaran dan Pembelajaran: Pendekatan Inkuari Melalui
Kemahiran Proses Sains. Tahun 4. Putrajaya: Ministry of Education Malaysia.
Dillashaw, F. G., & Okey, J. R. (1980). Test of the integrated science process skills for secondary science
students. Science Education, 64(5), 601-608.
Dunkhase, J.A. (2003). The coupled-inquiry cycle: A teacher concerns-based model for effective student inquiry.
Science Educator, 12(1), 10 – 15.
Ebel, R. L. (1979). Essentials of education measurement (3rd
ed.). New Jersey: Prentice-Hall Inc.
Filmer. I, & Foh, S.H. (1997). Penilaian amali sains sekolah rendah: Satu kajian perintis [Assessment of primary
school science practical: An exploratory study]. Jurnal Pendidik dan Pendidikan USM , 15, 33-45.
Liu, F. (2008). Comparison of several popular discrimination indices based on different criteria and their
application in item analysis. (Unpublished master’s thesis). University of Georgia, Athens.
Malaysian Examination Syndicate. (2008). Assessment Guide. Science Practical Work Assessment (PEKA).
Ujian Pencapaian Sekolah Mulai 2008. Putajaya: Ministry of Education Malaysia.
Noorasyikin, K. (2002). Masalah Guru Dalam Pengendalian Penilaian Kerja Amali (PEKA) Biologi Di Daerah
Muar. (Unpublished bachelor’s thesis). Skudai, Universiti Teknologi Malaysia (UTM).
Onwu, G. O. M., & Mozube, B. (1992). Development and validation of a Science Process Skills Test for
secondary science students. Journal of Science Teachers’ Association of Nigeria, 27(2), 37-43.
Reynolds, C.R., Livingston, R.B., & Wilson, V. (2009). Measurement and assessment in education. Columbus,
Ohio: Pearson.
Siti Aloyah, A. (2002) Penilaian Pelaksanaan Program PEKA Biologi. (Unpublished master’s thesis). Universiti
Kebangsaan Malaysia, Bangi, Selangor.
Tobin, K. G., & Capie, W. (1982). Development and validation of a group test of Integrated Science Process
Skills. Journal of Research in Science Teaching, 19(2), 133-141.

International Conference on Education in Mathematics, Science & Technology (ICEMST), May 19 - 22, 2016 Bodrum/Turkey
351
Wan Noraine, W.M.N. (2010). Kesediaan guru dalam melaksanakan PEKA PMR di sekolah menengah Kuala
Trengganu [The readiness of teachers to implement PEKA PMR in Kuala Trengganu secondary schools].
(Unpublished master’s thesis). Universiti Teknologi Malaysia, Skudai, Johor.