Associational Life in the Privatized Public Spaces of Manila ...
The Determinants of Privatised Enterprise Performance in Russia
By: Alan A. Bevan, Saul Estrin, Boris Kuznetsov, Mark E. Schaffer, Manuela Angelucci, Julian Fennema and Giovanni Mangiarotti
William Davidson Working Paper Number 452
June 2001
William Davidson Institute Working Paper 452
The Determinants of Privatised Enterprise Performance
in Russia1
Alan A. Bevan*, Saul Estrin**, Boris Kuznetsov***, Mark E. Schaffer****,
Manuela Angelucci**, Julian Fennema**** and Giovanni Mangiarotti****
*European Bank for Reconstruction and Development
**Centre for New and Emerging Markets, London Business School,
*** Bureau of Economic Analysis, Moscow
****Centre for Economic Reform and Transformation, Heriot-Watt University
First Draft June 2001
1 Financial support of the UK Department for International Development is gratefully acknowledged. The views expressed in the paper are solely those of the authors.
William Davidson Institute Working Paper 452
ABSTRACT
Using data from a large enterprise-level panel designed to address this issue, we account for
enterprise performance in Russia. We link performance to four aspects of the economic
environment: enterprise ownership; corporate governance; market structures and competition;
and financial constraints. We conclude that private ownership and improved performance are not
correlated, though restructuring is positively associated with the competitiveness of the market
environment. These findings on private ownership support those of previous studies, e.g. Earle
and Estrin (1997). Moreover, we find evidence that financially unconstrained firms are better in
their undertaking of restructuring measures then financially constrained firms. Further analysis
suggests that causality runs from restructuring to financial constraint, rather than the reverse.
Finally, our findings indicate strong complementarities between the four factors influencing
improved company performance, confirming the view that these factors need to be considered
jointly.
JEL classification: D21, L10, P31, G34 Keywords: Privatisation, enterprise performance, competition, corporate governance, investment
William Davidson Institute Working Paper 452
NON-TECHNICAL SUMMARY
More than a decade into the transition period, Russia’s economic performance has been
disappointing. Compared to leading countries such as Poland, Hungary and the Czech Republic,
Russia has been lagging in several indicators of reform success - life expectancy, enterprise
restructuring, labour productivity, cumulative GDP growth, and inflation stabilization – despite
undergoing the largest privatisation in history. The standard interpretation, based on initial
evidence, is that while Russian reformers had successfully changed the ownership structure away
from state hands, the emergence and entrenchment of widespread insider privatisation, combined
with the lack of development of capital market institutions to exercise ownership discipline,
meant that privatisation had little impact on either performance or restructuring.
We attempt to shed more light on current understanding of determinants of enterprise
performance by examining a more recent data set and by linking variables that have been
previously treated separately in the literature. First, we use data from the first large scale random
sample conducted in Russia since the mid-1990s on enterprise restructuring. The underlying
assumption is that having been collected 5 years after the end of privatisation and almost a
decade after the beginning of transition, this data will be more reliable in reflecting the impact of
new ownership, incentive and information systems on the performance of companies.
Second, we seek to account for enterprise performance by linking it to four key aspects of
economic environment outlined in contemporary literature: enterprise ownership; governance;
market structures and competition, and financial constraints. Controlling for other factors, we
can identify how variation in these four aspects will lead to variation in performance across the
observed firms.
In general, the findings suggest that restructuring in Russian firms indeed remains modest, and
productivity and investment levels – low. Results of analysis of enterprise performance
determinants, however, do not confirm standard theoretical hypotheses. We conclude that
ownership and performance are not correlated in Russia. It is not evident that outsider ownership
William Davidson Institute Working Paper 452
leads to better performance than insider ownership. Our findings do however suggest a positive
association between restructuring and competitiveness of the market environment in which firms
operate. Moreover, we find evidence of the binding financial constraints that exist for firms of all
types, even though larger firms are better at obtaining short-term credit. Financial constraints
emerge in our study as a fundamental issue for restructuring in Russian enterprises.
There are strong complementarities between these factors. We find that, taken together, domestic
monopoly power, financial constraints and to a limited extent state ownership lead to inferior
company performance across a wide range of measures. Most strikingly, there are clear
interactions between state ownership and market structure. State ownership leads to improved
performance across a number of measures when there is moderate domestic competition or
import competition. However, state ownership reduces performance when there is domestic
monopoly power. Financial constraints also depend on the ownership structure to some extent;
they reduce performance across a variety of measures relative to what would pertain in insider
owned firms.
The results of this work imply that despite the transfer of ownership rights, institutions providing
managerial incentives similar to those existing in western economies have not fully evolved in
Russia. Hence, our research suggests three major policy conclusions. Firstly, as economic
activities of Russian enterprises tend to be restricted to local and regional markets by
administrative barriers, we suggest that the state policy should include additional measures
limiting regional administrative barriers. Secondly, in view of strong tendencies of integration
and cross-ownership in Russian industry, further facilitation of competition is necessary by
lowering barriers to foreign competitors. Finally, to alleviate the problem of financing
investment, we suggest that the government should promote equity financing by establishing
modern corporate governance legislation and practice.
William Davidson Institute Working Paper 452
1
1. Introduction
Successful transition in Russia has always been viewed as one of the most important and
exacting tasks facing post-communist reformers in Central and Eastern Europe, and their
Western advisors. The process of transition was anyway seen to be daunting in relatively more
open and reformed economies like Hungary or Poland (see Blanchard et al (1991), Portes et al
(1993)). The huge scale and long communist traditions of Russia made obstacles to reform
appear almost insurmountable; a view apparently confirmed when the reform process appeared
to founder in the face of the August 1998 crash (see EBRD (1999)). However, reforms in
Russia have included the largest privatisation in history (see Boycko, Shleifer, Vishny (1995)),
which transferred ownership in tens of thousands of companies across the country.
Initial evidence suggested that, while Russian reformers had successfully changed the ownership
structure away from state hands, the emergence and entrenchment of widespread insider
privatisation, combined with the lack of development of capital market institutions to exercise
ownership discipline, meant that privatisation had little impact on either company performance
or restructuring. This finding was deduced in a number of studies during the mid 1990s (e.g.
Earle and Estrin (1997), Estrin and Wright (1999) and has become the standard interpretation in
a number of important surveys (e.g. Nellis (2000), Djankov and Murrell (2000)). The problem
was exacerbated by the low levels of competition in Russia caused by the unfavourable
enterprise size distribution bequeathed by planners, large distances and poor transport
infrastructure, as well as regional policies (see Brown and Earle (2001)).
However, these results were all derived from enterprise surveys undertaken only one or two
years after privatisation (1993 – 1996). This was also the period when firms were seeking to
recover from disorganisation (see Blanchard and Kremer (1997)). Moreover given the long
heritage of communism and planning, they were undertaken too early to deduce definitive
conclusions on the impact of the new ownership, incentive and information systems on the
performance of companies.2 We were therefore motivated to undertake a second large-scale
enterprise survey, based to some extent on the first survey undertaken by the World Bank in
William Davidson Institute Working Paper 452
2
1994 (see Commander, Fan and Schaffer (1996)).3 The survey was undertaken through the
Bureau of Economic Analysis between mid 1998 – 1999, and was carefully constructed to be a
random sample within the population of firms considered. The sample was relatively large – 437
firms – and was confined to six two digit manufacturing industries; to firms employing between
100 and 5000 workers; and to 11 regions within the four main economic zones. Comparison
with Goskomstat data confirms that our sample is reasonably representative of the relevant
national patterns.
Our conceptual framework follows the literature in seeking to link enterprise performance to four
key aspects of the economic environment; ownership; governance; market structures and
competition, and financial constraints. One can conceive of enterprises pre-reform as operating
away from profit maximising equilibrium in two senses. First, levels of output, employment and
perhaps capital would exceed those implied by a profit-maximising rule, because of planners
preference for giganticism (see e.g. Bennett (1989)). Secondly, firms would be operating well
within their production possibility frontiers because of weak managerial incentives. The reform
process represents a number of major changes to the economic environment, leading to
adjustments in output, inputs, prices and total factor productivity. Once sectoral and regional
factors have been controlled for, one can identify the four areas in which variation in the
environment will lead to dispersion in the pattern of behaviour.
The first concerns ownership structure. In principle the propositions here are straightforward –
private ownership will improve monitoring, help to resolve the principal-agent problem which
allows poor managerial performance and sharpen incentives (see Vickers and Yarrow (1995)).
As a result, one would expect privately owned firms to perform better than state owned ones – in
terms of total factor productivity and therefore profitability, unit costs and financial performance.
The situation was not quite so straightforward in Russia however. Privatisation was mainly to
insiders – workers and managers – whose incentives to improve performance were more
2 A point stressed in the papers themselves see e.g. Earle and Estrin (1997); Introduction.
William Davidson Institute Working Paper 452
3
ambiguous (see Earle and Estrin (1996)). Indeed, perhaps the fundamental problem in Russia is
that privatisation yielded effective control over enterprises to managers, who on average faced
dispersed insider (worker) or outsider (investment funds, former workers, banks) owners.
However it did not give them sufficient ownership – typically less than 10% of the total stock
(see Earle and Estrin (1997)). In consequence, the incentives to restructure and improve
profitability were frequently outweighed by those to expropriate the assets for themselves (see
Stiglitz (1999)).
All this implies that one cannot simply compare performance in state and private firms, without
also taking into account carefully the ownership structure – insider or outsider, manager or
worker, dispersed or concentrated. Moreover, ownership itself is not necessarily the key –
control and mechanisms of corporate governance also play a significant part in ensuring private
ownership can deliver improved performance. In the survey, we therefore included very detailed
information on the structure of ownership, as well as its evolution through time, and on systems
for corporate governance, including managerial evaluations of the balance of influences over
major enterprise decisions.
The third major area that can impact on company performance is the competitiveness of the
market environment. In general, even when corporate governance is weak, enterprises can be
forced to improve performance by tough competition in their market. This of course depends in
part on the effectiveness of the bankruptcy threat, and the monopoly rentals available to the firms
(see Nickell (1996)). Several outcomes are feasible. Firms operating in more competitive
environments may face pressures to restructure but be unable to find the revenues to do so, while
their more monopolistic competitors may be able to finance improved performance. At the end
of the day, the direction of the relationship between competitive pressure and company
performance is an empirical question, and one which seems likely to interact with ownership
structure (see Angelucci et al (2001)).
3 There have been other surveys of Russian firms, in the past three years, on a variety of issues including innovation, corruption, and the new-market economy. None have returned to the fundamental theme of the determinants of company performance, based around a large scale random survey.

William Davidson Institute Working Paper 452
4
The role of bankruptcy and the need for funding from profits illustrates our final area of concern
– financial constraints. Much of the previous discussion implicitly assumes that capital is
available at a fixed interest rate at infinitely elastic supply. In practice in Russia this is not true –
capital is scarce and allocated more by rationing than price. These exogonous financial
constraints can of course restrict restructuring and directly influence total factor productivity and
company performance.
In this paper, we use the data from our stratified random sample to look separately at the four
influences on company performance. In the following section, we introduce our methodology
and data set, before considering ownership and corporate governance in the third section.
Competition and performance are addressed in the fourth section and the effects of financial
constraints in the fifth. The sixth section attempts to bring our findings together by drawing a
picture of a “successful” Russian enterprise while conclusions, including interactive effects and
policy findings are contained in the seventh section.
2. Survey Methodology
Our survey was designed to enable the analysis of the relationships between performance,
ownership, corporate governance, restructuring, and finance among privatised Russian
enterprises. The questionnaire was developed between mid-1998 and end-1999. It was tested in
two pilot runs in 1998 and the beginning of 2000 with significant corrections made after the first
pilot and some minor changes after the second one. Following this second pilot, the full survey
was undertaken in the Spring of 2000. We surveyed 437 enterprises which were randomly
sampled from a population list stratified in the manner explained in sub-section 2 below. Given
the focus of this study, and the resultant stratification and sampling criteria, our sample was
never intended to be representative of Russian industry. Nonetheless, sub-section 3 presents a
comparison of the major indicators of our sampled firms with those of the Russian industrial
population in order to give some assessment of our sample biases. Sub-section 4 concludes.
William Davidson Institute Working Paper 452
5
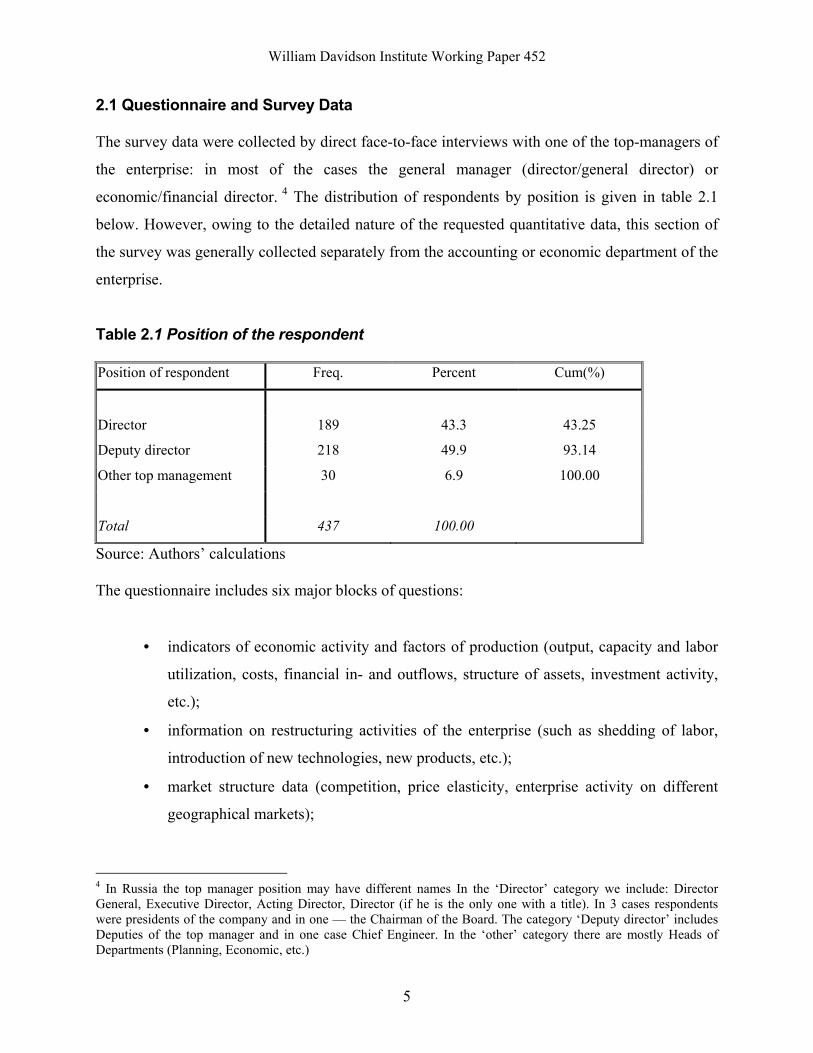
2.1 Questionnaire and Survey Data
The survey data were collected by direct face-to-face interviews with one of the top-managers of
the enterprise: in most of the cases the general manager (director/general director) or
economic/financial director. 4 The distribution of respondents by position is given in table 2.1
below. However, owing to the detailed nature of the requested quantitative data, this section of
the survey was generally collected separately from the accounting or economic department of the
enterprise.
Table 2.1 Position of the respondent
Position of respondent Freq. Percent Cum(%)
Director 189 43.3 43.25
Deputy director 218 49.9 93.14
Other top management 30 6.9 100.00
Total 437 100.00
Source: Authors’ calculations
The questionnaire includes six major blocks of questions:
• indicators of economic activity and factors of production (output, capacity and labor
utilization, costs, financial in- and outflows, structure of assets, investment activity,
etc.);
• information on restructuring activities of the enterprise (such as shedding of labor,
introduction of new technologies, new products, etc.);
• market structure data (competition, price elasticity, enterprise activity on different
geographical markets);
4 In Russia the top manager position may have different names In the ‘Director’ category we include: Director General, Executive Director, Acting Director, Director (if he is the only one with a title). In 3 cases respondents were presidents of the company and in one — the Chairman of the Board. The category ‘Deputy director’ includes Deputies of the top manager and in one case Chief Engineer. In the ‘other’ category there are mostly Heads of Departments (Planning, Economic, etc.)
William Davidson Institute Working Paper 452
6
• ownership and corporate governance data (ownership structure, ownership
concentration, board composition, some information on top-management of the
enterprise);
• data on financial constraints (availability of external financing, state assistance, etc.);
• a block of control variables such as region, industrial code, legal type of enterprise,
date and method of privatization and others.
Where feasible, the data was generally collected for the years 1997-1999: hence the sample
covered both pre- and post-crisis years. The general principle for composing the questionnaire
was to duplicate information regarded as most important; hence e.g., more than one question
(quantitative, rank, qualitative) would be included to permit construction of an indicator for main
characteristics of the firm5.
2.2 Sampling Strategy From the very beginning the results of this survey were not designed to be representative of the
Russian economy nor even of Russian industry. The survey was carried out to enable evaluation
of the adjustment of Russian privatised industrial enterprises to new conditions in the transitional
economy of the late 1990s. This rationale together with the restricted number of enterprises
surveyed (400 enterprises were to be interviewed) led to the sample having some specific
features. Moreover the general population of the firms from which the sample was drawn was
limited to enterprises in certain industries, size, regions, form of ownership and age (date of
establishment of the enterprise). The precise nature of these criteria are explained in detail in the
following sub-sections.
2.2.1 Selection of Industries The sample was confined to the population of firms that belong to manufacturing industries
according to Russian Industrial Classification (OKONH). The following two-digit industries
were selected:
13 - Chemical & Oil-chemical industry;

William Davidson Institute Working Paper 452
7
14 - Machinery building & metal-working industry;
15- Wood & Paper industry;
16 – Stone & Clay (Production of building materials) industry;
17 - Light industry;
18 - Food industry.
It should be noted that the list does not include the Ferrous and Non-Ferrous metal industries.
These were excluded for several reasons. Firstly, as the Russian Industrial Classification does not
separate mining and metal production at the two-digit level, the decision to exclude extractive
industries precluded the inclusion of metal production. Secondly, the concentration of production
in the Ferrous metal industry is extremely high (12 Russian metal plants produce about 90% of
ferrous metal; the Non-Ferrous metal sector concentration is lower but still very high).
Moreover, metal industry enterprises tend to be large, and hence well above our upper size limit
(which is justified below). Consequently it would prove almost impossible to obtain a
statistically valid sample for these industries. In addition, as metal plants are unusually export
oriented (export share of 80-95 percent), any comparisons between them and other firms would
prove rather difficult and uninteresting for our purposes.
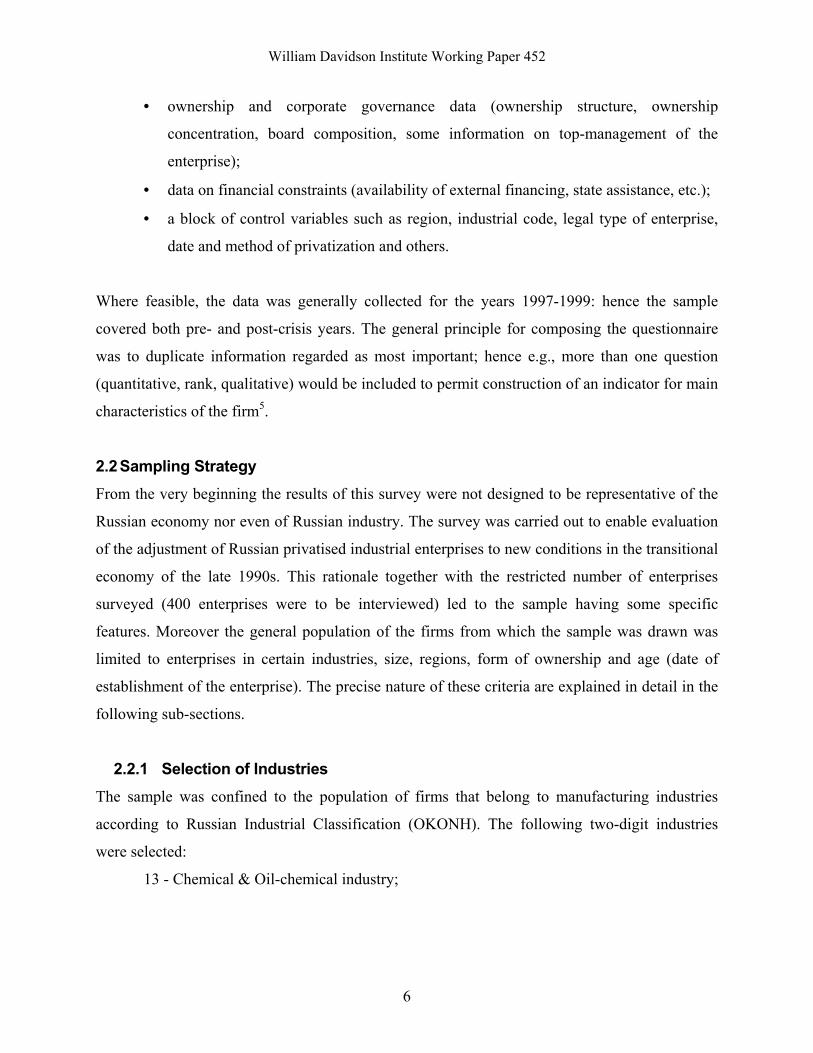
As a result the industrial stratification was chosen such that the sample would be approximately
evenly distributed across our chosen two-digit industries. However, in practice it proved
extremely difficult to meet these quotas for some industries, particularly given the need to
sample privatised enterprises whilst adhering to the size and regional stratification dimensions.
The actual distribution is reported in table 2.2 below, and illustrates that our sample slightly
over-represents the machinery sector relative to the industrial population. Nonetheless, there are
sufficient observations in each industry to control for industry-specific factors.
5 For some questions where pilot surveys showed a low response rate several options were given to respondent. For example, if it was impossible to get information on separate shares for workers and managers the revised instrument included an option to report the cumulative share of insiders.
William Davidson Institute Working Paper 452
8
Table 2.2 Distribution by Industry
Industry Code Observations %
Chemicals 13 56 12.8
Machinery 14 108 24.7
Wood 15 66 15.1
Stone&clay 16 72 16.5
Light 17 72 16.5
Food 18 63 14.4
Total 437 100
Source: Authors’ Calculations
2.2.2 Size Categories To make our surveyed enterprises more comparable, we restricted the size of our sampled firms
to between 100-5000 employees6. Small enterprises with below 100 employees were excluded
because: (a) they work under specific tax and accounting rules that often make them
incomparable with others; (b) although extremely important for market institutions in the long
run — c.f. Poland — they currently account for less that 4 percent of industrial output in Russia,
and (c) the Russian SME sector — which has been extensively surveyed for specific SME
studies by different researchers in recent years — generally necessitates larger, more specific
samples, and was not the focus of this particular study.
The upper size limit of 5000 employees was chosen as there are a small number of such big firms
in most of the industries, and most have unique features that makes them more suitable for case-
studies than for statistical analysis.7 Very large firms in Russia are often located in so called
mono-towns, which leads to a very specific type of behaviour and is reflected in their
performance. Moreover, very big firms tend to not exist in the same economic environment as
6 Employment was selected as a measure of size in accordance with both Russian legislation for separating SMEs and large enterprises, and common practice. 7 See P.Kuznetsov, A.Muraviev ‘Ownership structure and firm performance in Russia's industrial firms’ for an example of a recent econometric approach to the analysis of very big Russian firms (‘blue chips’).
William Davidson Institute Working Paper 452
9
other enterprises, but instead form their own environment to suit their interests: e.g., owing to a
special kind of relationship with authorities, natural monopolies, and so on .8
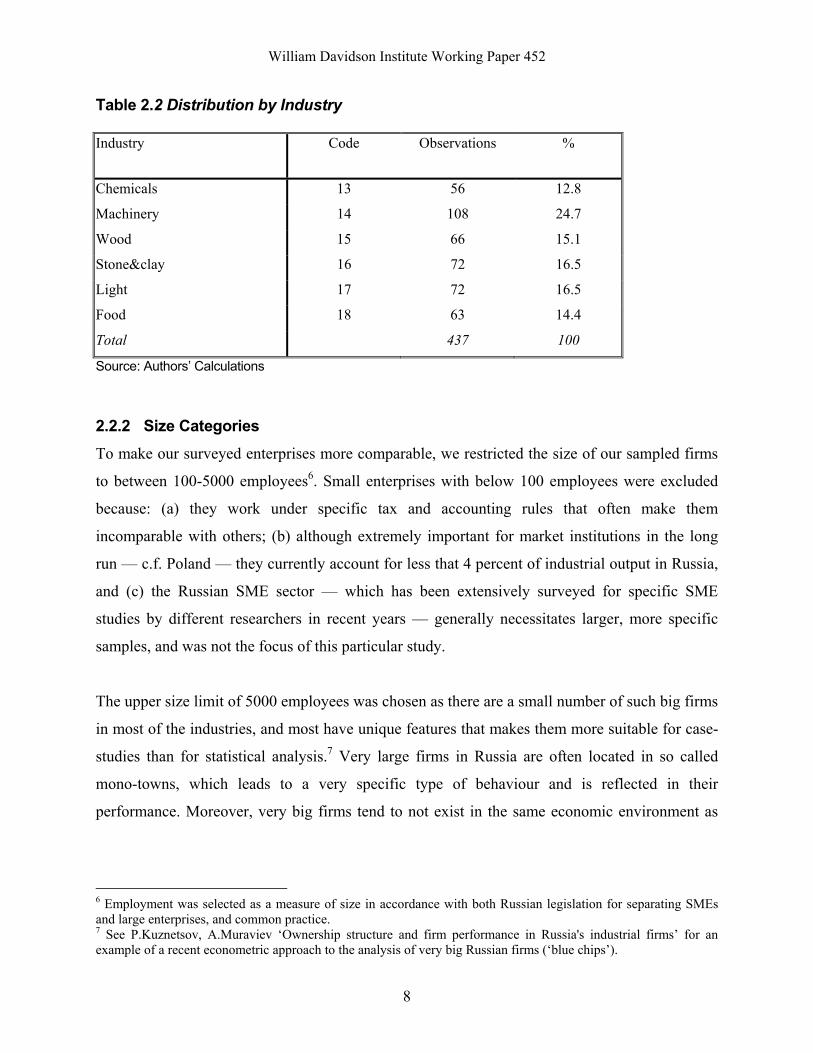
As in the case of the industrial stratification, our aim was to distribute our sample more or less
evenly across three broad size categories: 100-500 employees, 501-1000 employees and 1001-
5000 employees. As table 2.3 below illustrates, this stratification was broadly met by the actual
sample.
Table 2.3 Distribution by Size in 1999
Total 100-500 % 501-1000 % >1000 %
Selected Industries,
observations
437 147 33.6% 139 31.8% 151 34.6%
Average size
(employees)
891 265 703 1820
Source: Authors’ calculations
2.2.3 Selection of Regions Our choice of regions was based on two considerations. The limited number of enterprises to be
sampled was insufficient to get representative sub-samples for all or even the majority of regions
(oblast, kray, republics) of Russia (89 subjects). On the other hand the regional dimension of the
entrepreneurial and investment climates in Russia are acknowledged by most researchers, and
hence the regional dimension should be included in any analysis. The palliative solution chosen
was to select a limited number of regions belonging to four macro-zones: European Russia, the
Volga, the Urals and Siberia. European Russia was represented by two Russian capitals —
Moscow and St-Petersburg — together with their respective oblasts (Moscow oblast and St-
Petersburg oblast); three regions belong to Volga macro-zone — Nizhny Novgorod, Samara,
Volgograd; the Ural macro-zone is also represented by three regions — Chelyabinsk, Perm,
8 The initial list of enterprises from which the sample was drawn was based on the Goskomstat Enterprise Registry data included in ALBA-Y database. The registry includes information for about 30,000 medium and large Russian industrial enterprises, accounting for 65-85 percent of output and employment in the selected industries. Utilising this database enabled us to use historical time series data in the analysis and at the same time did not significantly narrow the population of firms to select from.

William Davidson Institute Working Paper 452
10
Ekaterinburg (Sverdlovskaya oblast), while the Siberia macro-zone included enterprises from
Novosibirsk, Krasnoyarsk and Omsk.
We recognize, however, that our approach does not permit reliable analysis of all regional
specifics. In particular, regional policies can differ significantly within one macro-zone
(Tatarstan, Uliyanovsk and Nizhny Novgorod regions in Volga zone provide good and well
known examples). Nevertheless, in many cases the geographical position itself and the distance
from the centre are likely to be factors contributing to the macro-zone economic environment
and enterprise behavior.
Nonetheless, we did not apply strict regional quotas, having decided that for the purposes of this
study the size and industrial stratifications were the most important criteria. Indeed we initially
aimed to survey in only eight regions across our four macro-zones. One region in each macro-
zone was ‘reserved’ for use if the size and industry quotas could not be met in two regions. This
strategy resulted in some regions (‘reserved’ ones) having a relatively smaller number of
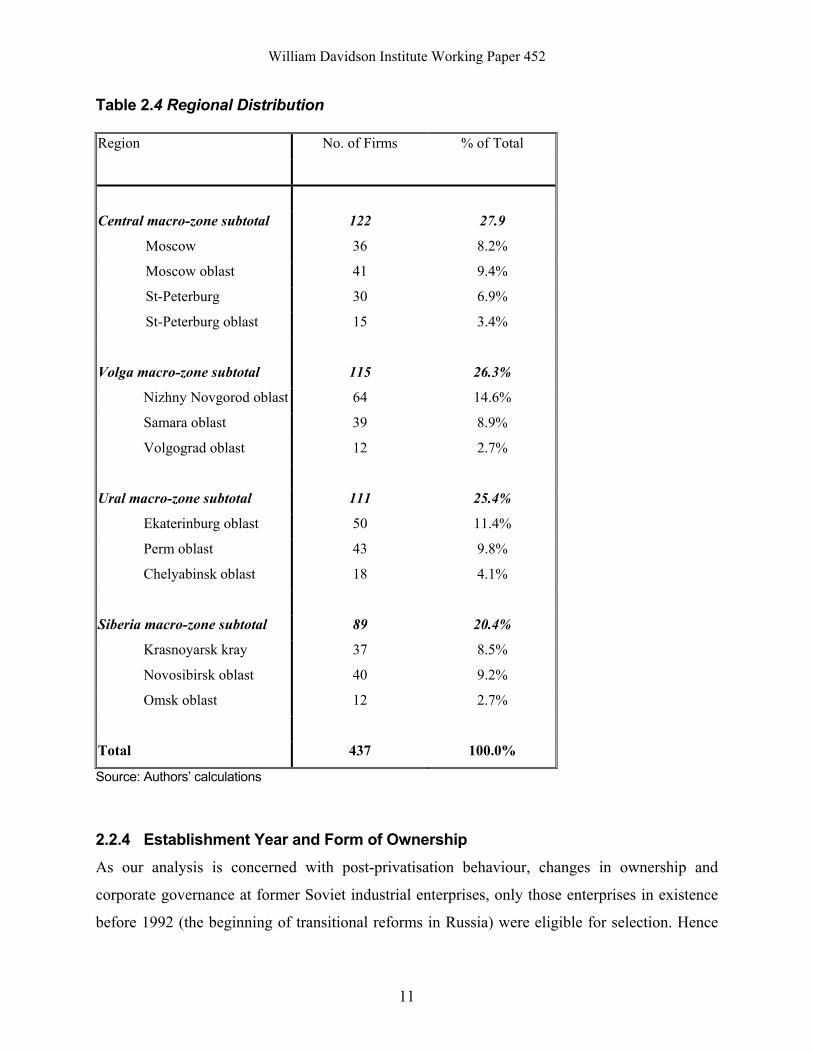
observations. Table 2.4 below shows the regional structure of the sample.
William Davidson Institute Working Paper 452
11
Table 2.4 Regional Distribution
Region No. of Firms % of Total
Central macro-zone subtotal 122 27.9
Moscow 36 8.2%
Moscow oblast 41 9.4%
St-Peterburg 30 6.9%
St-Peterburg oblast 15 3.4%
Volga macro-zone subtotal 115 26.3%
Nizhny Novgorod oblast 64 14.6%
Samara oblast 39 8.9%
Volgograd oblast 12 2.7%
Ural macro-zone subtotal 111 25.4%
Ekaterinburg oblast 50 11.4%
Perm oblast 43 9.8%
Chelyabinsk oblast 18 4.1%
Siberia macro-zone subtotal 89 20.4%
Krasnoyarsk kray 37 8.5%
Novosibirsk oblast 40 9.2%
Omsk oblast 12 2.7%
Total 437 100.0%
Source: Authors’ calculations
2.2.4 Establishment Year and Form of Ownership As our analysis is concerned with post-privatisation behaviour, changes in ownership and
corporate governance at former Soviet industrial enterprises, only those enterprises in existence
before 1992 (the beginning of transitional reforms in Russia) were eligible for selection. Hence
William Davidson Institute Working Paper 452
12
enterprises organized after 1992 as spin-offs of former Soviet ones were excluded. Irrespective
of this choice, the vast majority of de novo firms were excluded as a result of the lower size
restriction which prevented SMEs from entering the sample. Preliminary analysis showed that
the number of big (more than 100 employees) de novo firms in the selected industries and
regions in Russia is so small as to preclude the possibility of obtaining a representative sample of
such enterprises.
Similarly, the focus of our research on the problems and behavioral patterns of privatised
enterprises necessitated the exclusion of fully state-owned enterprises that were never privatised.
At the same time our population included ‘mixed’ state-private joint-stock companies even in
cases where the controlling share of stock belongs to Federal or Regional authorities.
2.3 Does the Sample Represent the Population of Firms? Table 2.5 below compares the results of our sample to the official Goskomstat data for industrial
enterprises. From this it is quite evident that our quotas for industries led to certain selection
biases: some industries with a smaller number of enterprises (Chemicals and Stone & Clay) are
‘over-represented’ relative to others (Machinery Building, Light and Food industries). This is
true not only for the number of enterprises but for employment and sales data as well9. As our
enterprises are on average much larger than those in the total population, the average levels of
employment and sales are naturally much higher.
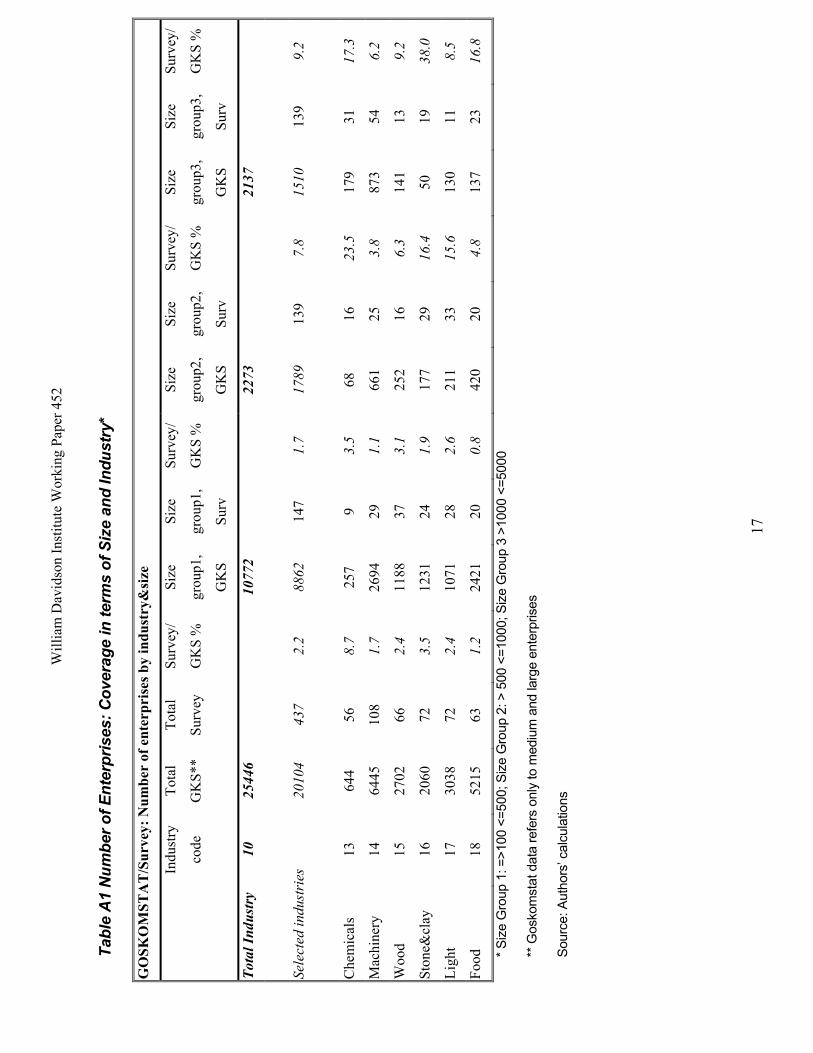
The most important conclusion comes from comparing the sales to employment ratio for our
sample against the population. In general our surveyed enterprises tend to have much higher per
capita sales than Russian industrial firms. There are two possible explanations for this: larger
9 The low values for the percentage of surveyed enterprises in the total population are mostly due to the fact that we are comparing our sample with the total enterprise population including SME. We are using the total number of firms just to be able to compare employment and sales coverage ratio (as sales and employment data by size groups is unavailable. In Table A1 the number of observations in the sample is compared to number of medium and large firms in respective industries which provides a better assessment.

Will
iam
Dav
idso
n In
stitu
te W
orki
ng P
aper
452
13
Tabl
e 2.
5 N
umbe
r of E
nter
pris
es, S
ales
, Em
ploy
men
t: Sa
mpl
e vs
. Gos
kom
stat
Dat
a
N
umbe
r of e
nter
pris
es
Sale
s
(mln
.Rub
)
Num
ber o
f em
ploy
ees
(thos
ands
)
In
dust
ry
tota
l
Surv
ey
%
Indu
stry
tota
l
Surv
ey
%
Indu
stry
tota
l
Surv
ey
%
Che
mic
als
7168
56
0.
8 10
5945
90
53
8.5
858
70
8.2
Mac
hine
ry
5777
6 10
8 0.
2 25
7076
88
29
3.4
4856
12
3 2.
5
Woo
d 20
323
66
0.3
5710
9 30
15
5.3
1034
34
3.
3
Ston
e&cl
ay
9528
72
0.
8 54
945
4189
7.
6 71
3 50
7.
0
Ligh
t 20
784
72
0.3
2352
2 22
38
9.5
888
50
5.6
Food
22
263
63
0.3
1978
48
1226
7 6.
2 13
96
48
3.4
Tota
l 13
7842
43
7 0.
3 69
6445
40
818
5.9
9745
37
5 3.
8
Sour
ce: G
osko
mst
at, A
utho
rs’ c
alcu
latio
ns
William Davidson Institute Working Paper 452
14
enterprises may have higher sales per worker, hence the exclusion of very small firms may have
induced a bias in our average, and/or enterprises in our sample tend to be more productive than
the average Russian firm in the same industry. Analysis of our data set at the aggregate
levelrevealed a positive and highly significant correlation between the sales to employment ratio
and size for all three years of our sample.10 However, more detailed analysis revealed that while
this is true at the aggregate level, it is not true for every industrial sector. Productivity was found
to be highly positively correlated with size in the Food and Wood industries; the correlation was
positive but insignificant in the case of the Chemicals and Machinery sectors, while there was an
insignificant negative correlation in the case of the Stone & Clay and Light industries.
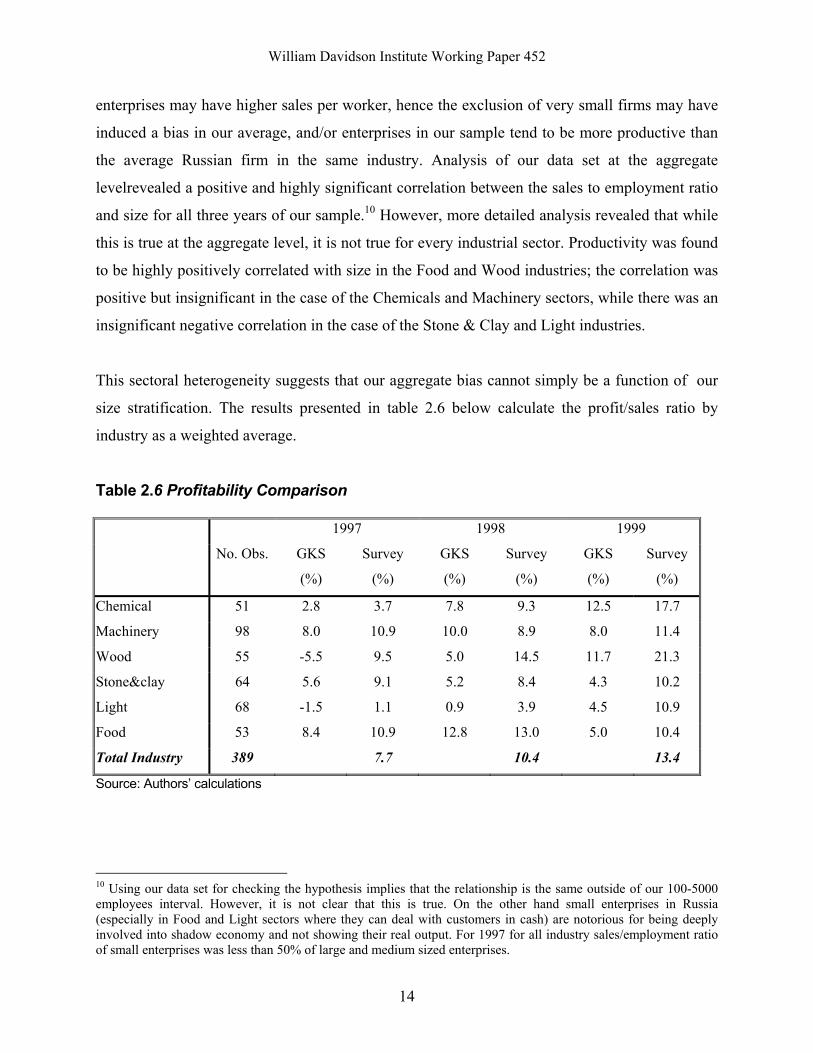
This sectoral heterogeneity suggests that our aggregate bias cannot simply be a function of our
size stratification. The results presented in table 2.6 below calculate the profit/sales ratio by
industry as a weighted average.
Table 2.6 Profitability Comparison
1997 1998 1999
No. Obs. GKS
(%)
Survey
(%)
GKS
(%)
Survey
(%)
GKS
(%)
Survey
(%)
Chemical 51 2.8 3.7 7.8 9.3 12.5 17.7
Machinery 98 8.0 10.9 10.0 8.9 8.0 11.4
Wood 55 -5.5 9.5 5.0 14.5 11.7 21.3
Stone&clay 64 5.6 9.1 5.2 8.4 4.3 10.2
Light 68 -1.5 1.1 0.9 3.9 4.5 10.9
Food 53 8.4 10.9 12.8 13.0 5.0 10.4
Total Industry 389 7.7 10.4 13.4
Source: Authors’ calculations
10 Using our data set for checking the hypothesis implies that the relationship is the same outside of our 100-5000 employees interval. However, it is not clear that this is true. On the other hand small enterprises in Russia (especially in Food and Light sectors where they can deal with customers in cash) are notorious for being deeply involved into shadow economy and not showing their real output. For 1997 for all industry sales/employment ratio of small enterprises was less than 50% of large and medium sized enterprises.
William Davidson Institute Working Paper 452
15
From this it can be seen that our bias is generally in favour of more profitable firms. The most
prominent differences occur in the Wood & Paper and Stone & Clay sectors. However, the
dynamic of the profitability indicator generally corresponds to the national level trend (with the
exception of the Stone & Clay sector). Consequently it would appear that while we chose more
profitable firms than average in the first instance, their performance trends have been
representative of the population.
Nonetheless, transition economies in general, and Russia in particular, are notorious for the poor
quality of enterprise profits data, as a result of extensive tax evasion. Similarly we are aware that
these same biases are likely to appear in our survey data. As the number of observations in
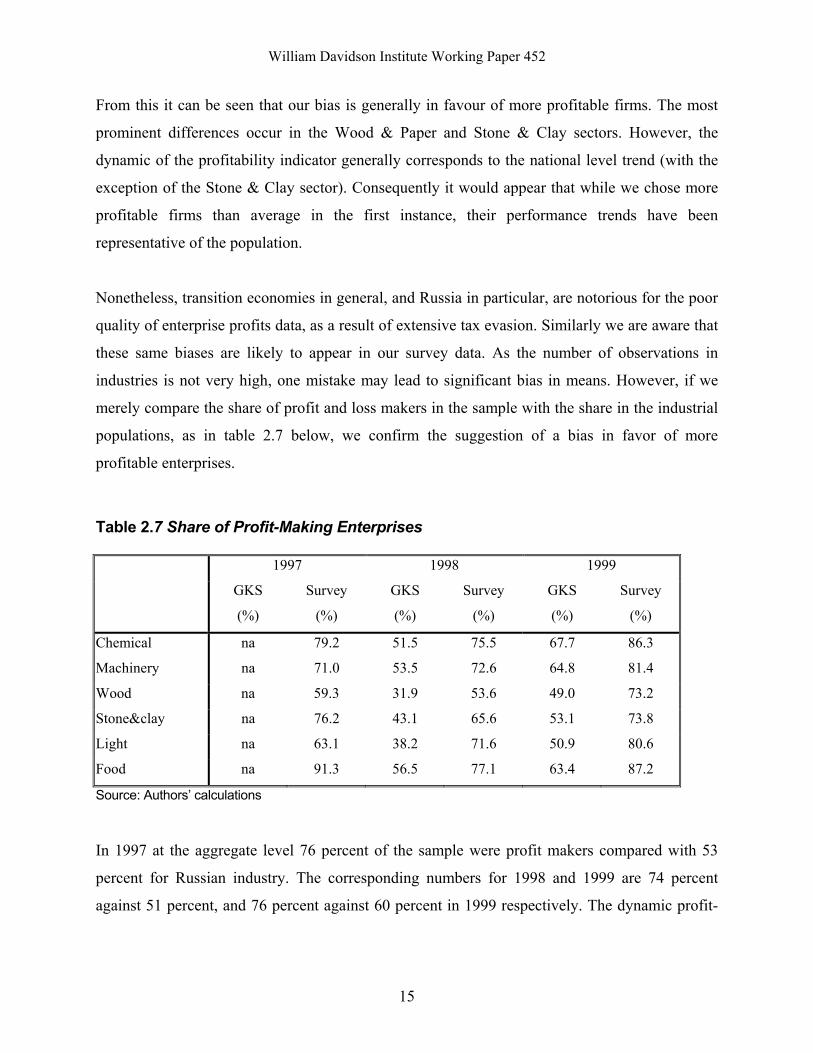
industries is not very high, one mistake may lead to significant bias in means. However, if we
merely compare the share of profit and loss makers in the sample with the share in the industrial
populations, as in table 2.7 below, we confirm the suggestion of a bias in favor of more
profitable enterprises.
Table 2.7 Share of Profit-Making Enterprises
1997 1998 1999
GKS
(%)
Survey
(%)
GKS
(%)
Survey
(%)
GKS
(%)
Survey
(%)
Chemical na 79.2 51.5 75.5 67.7 86.3
Machinery na 71.0 53.5 72.6 64.8 81.4
Wood na 59.3 31.9 53.6 49.0 73.2
Stone&clay na 76.2 43.1 65.6 53.1 73.8
Light na 63.1 38.2 71.6 50.9 80.6
Food na 91.3 56.5 77.1 63.4 87.2
Source: Authors’ calculations
In 1997 at the aggregate level 76 percent of the sample were profit makers compared with 53
percent for Russian industry. The corresponding numbers for 1998 and 1999 are 74 percent
against 51 percent, and 76 percent against 60 percent in 1999 respectively. The dynamic profit-
William Davidson Institute Working Paper 452
16
makers share of the indicator generally corresponds to the national level trend with the exception
of Stone & Clay.
2.4 Conclusions From the above discussion we are able to establish several features of our sample:
• On the average the sample is reasonably evenly distributed across size classes and
industries. In general the time trend in most cases follow national level patterns.
• The regional distribution of the sample is approximately even across our four macro-
zones. However, several regions are underrepresented (Volgograd and Omsk in
particular). Consequently any analysis of regional differences should control for this.
• The average size of the surveyed enterprises is larger than industrial average. This
appears to be a result of the initial selection bias and sampling strategy (size quotas).
• Our sample over-represents better performing enterprises. This can be partially explained
(at least for some industries) by the size structure of sample: bigger enterprises are in
general more productive. Nonetheless, this bias probably is due to the well-known fact
that badly performing enterprises tend to refuse to be surveyed more often than better
performing ones.
• For some industries (Wood & Paper being the most obvious) the sample means and time
trends differ significantly with official Goskomstat data.
Will
iam
Dav
idso
n In
stitu
te W
orki
ng P
aper
452
17
Tabl
e A
1 N
umbe
r of E
nter
pris
es: C
over
age
in te
rms
of S
ize
and
Indu
stry
*
GO
SKO
MST
AT
/Sur
vey:
Num
ber
of e
nter
pris
es b
y in
dust
ry&
size
In
dust
ry
code
Tota
l
GK
S**
Tota
l
Surv
ey
Surv
ey/
GK
S %
Size
grou
p1,
GK
S
Size
grou
p1,
Surv
Surv
ey/
GK
S %
Size
grou
p2,
GK
S
Size
grou
p2,
Surv
Surv
ey/
GK
S %
Size
grou
p3,
GK
S
Size
grou
p3,
Surv
Surv
ey/
GK
S %
Tota
l Ind
ustr
y 10
25
446
1077
2
22
73
2137
Sele
cted
indu
stri
es
2010
4 43
7 2.
2 88
62
147
1.7
1789
13
9 7.
8 15
10
139
9.2
Che
mic
als
13
644
56
8.7
257
9 3.
5 68
16
23
.5
179
31
17.3
Mac
hine
ry
14
6445
10
8 1.
7 26
94
29
1.1
661
25
3.8
873
54
6.2
Woo
d 15
27
02
66
2.4
1188
37
3.
1 25
2 16
6.
3 14
1 13
9.
2
Ston
e&cl
ay
16
2060
72
3.
5 12
31
24
1.9
177
29
16.4
50
19
38
.0
Ligh
t 17
30
38
72
2.4
1071
28
2.
6 21
1 33
15
.6
130
11
8.5
Food
18
52
15
63
1.2
2421
20
0.
8 42
0 20
4.
8 13
7 23
16
.8
* Siz
e G
roup
1: =
>100
<=5
00; S
ize
Gro
up 2
: > 5
00 <
=100
0; S
ize
Gro
up 3
>10
00 <
=500
0
** G
osko
mst
at d
ata
refe
rs o
nly
to m
ediu
m a
nd la
rge
ente
rpris
es
Sour
ce: A
utho
rs’ c
alcu
latio
ns
William Davidson Institute Working Paper 452
18
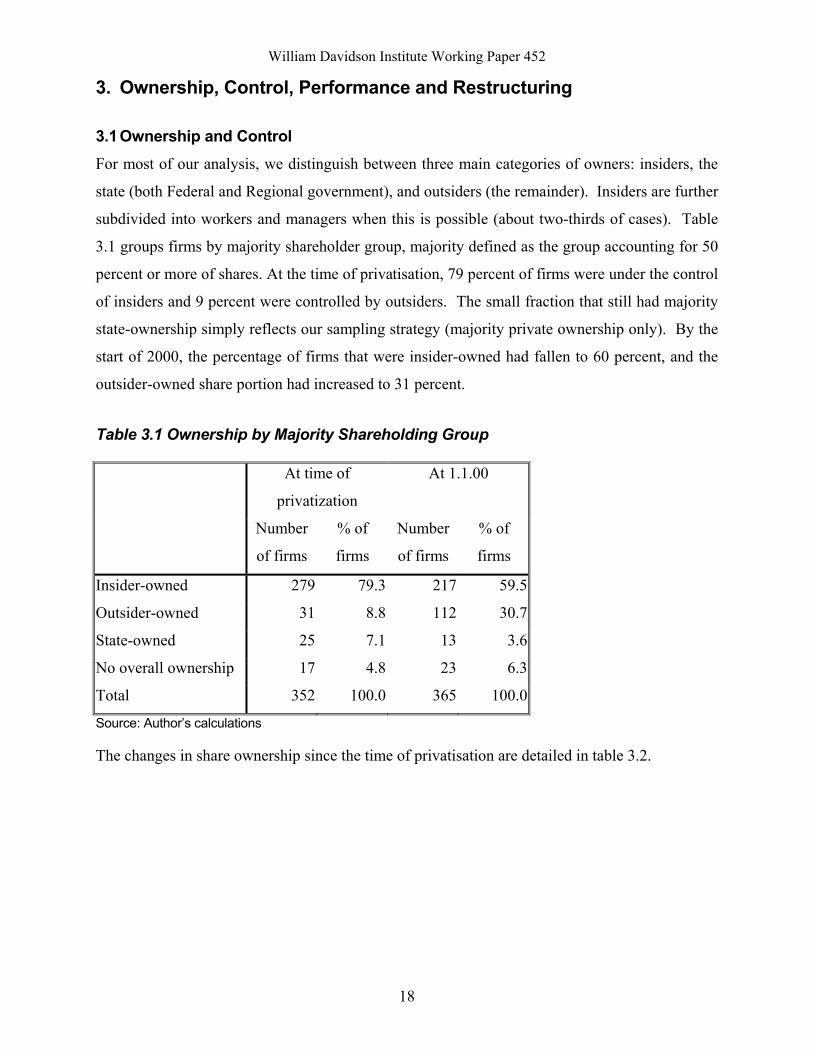
3. Ownership, Control, Performance and Restructuring 3.1 Ownership and Control For most of our analysis, we distinguish between three main categories of owners: insiders, the
state (both Federal and Regional government), and outsiders (the remainder). Insiders are further
subdivided into workers and managers when this is possible (about two-thirds of cases). Table
3.1 groups firms by majority shareholder group, majority defined as the group accounting for 50
percent or more of shares. At the time of privatisation, 79 percent of firms were under the control
of insiders and 9 percent were controlled by outsiders. The small fraction that still had majority
state-ownership simply reflects our sampling strategy (majority private ownership only). By the
start of 2000, the percentage of firms that were insider-owned had fallen to 60 percent, and the
outsider-owned share portion had increased to 31 percent.
Table 3.1 Ownership by Majority Shareholding Group
At time of
privatization
At 1.1.00
Number
of firms
% of
firms
Number
of firms
% of
firms
Insider-owned 279 79.3 217 59.5
Outsider-owned 31 8.8 112 30.7
State-owned 25 7.1 13 3.6
No overall ownership 17 4.8 23 6.3
Total 352 100.0 365 100.0
Source: Author’s calculations
The changes in share ownership since the time of privatisation are detailed in table 3.2.
William Davidson Institute Working Paper 452
19
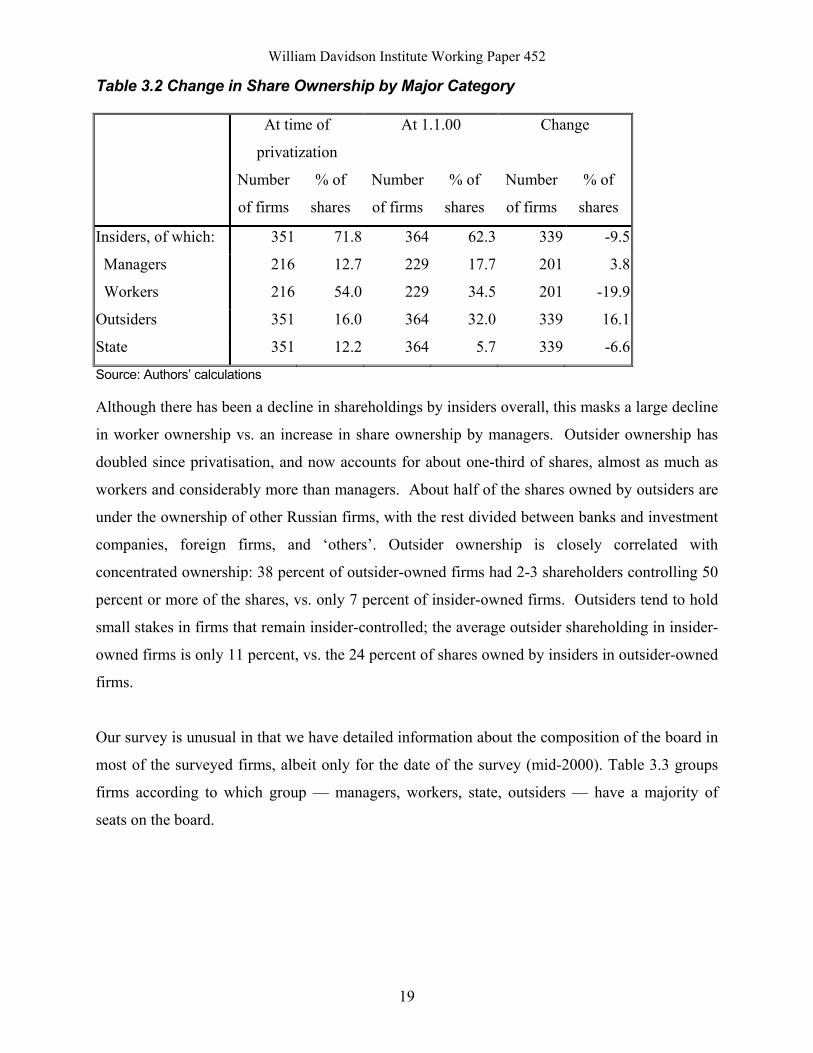
Table 3.2 Change in Share Ownership by Major Category
At time of
privatization
At 1.1.00 Change
Number
of firms
% of
shares
Number
of firms
% of
shares
Number
of firms
% of
shares
Insiders, of which: 351 71.8 364 62.3 339 -9.5
Managers 216 12.7 229 17.7 201 3.8
Workers 216 54.0 229 34.5 201 -19.9
Outsiders 351 16.0 364 32.0 339 16.1
State 351 12.2 364 5.7 339 -6.6
Source: Authors’ calculations
Although there has been a decline in shareholdings by insiders overall, this masks a large decline
in worker ownership vs. an increase in share ownership by managers. Outsider ownership has
doubled since privatisation, and now accounts for about one-third of shares, almost as much as
workers and considerably more than managers. About half of the shares owned by outsiders are
under the ownership of other Russian firms, with the rest divided between banks and investment
companies, foreign firms, and ‘others’. Outsider ownership is closely correlated with
concentrated ownership: 38 percent of outsider-owned firms had 2-3 shareholders controlling 50
percent or more of the shares, vs. only 7 percent of insider-owned firms. Outsiders tend to hold
small stakes in firms that remain insider-controlled; the average outsider shareholding in insider-
owned firms is only 11 percent, vs. the 24 percent of shares owned by insiders in outsider-owned
firms.
Our survey is unusual in that we have detailed information about the composition of the board in
most of the surveyed firms, albeit only for the date of the survey (mid-2000). Table 3.3 groups
firms according to which group — managers, workers, state, outsiders — have a majority of
seats on the board.
William Davidson Institute Working Paper 452
20
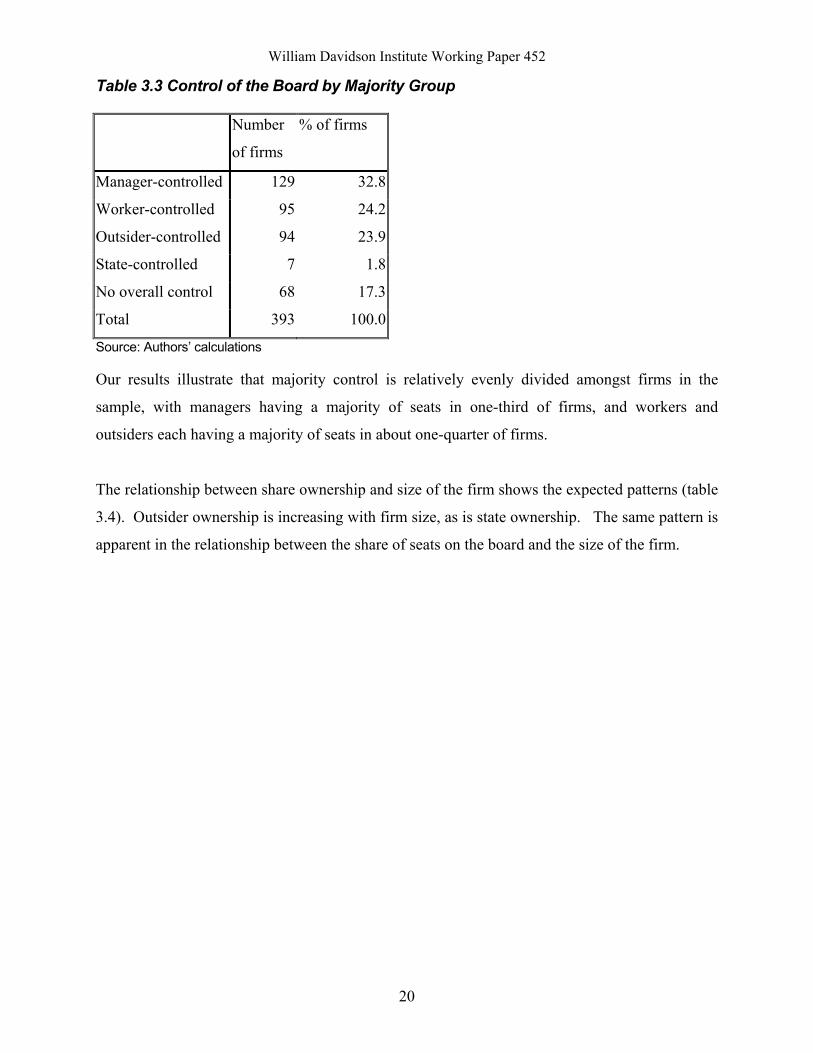
Table 3.3 Control of the Board by Majority Group
Number
of firms
% of firms
Manager-controlled 129 32.8
Worker-controlled 95 24.2
Outsider-controlled 94 23.9
State-controlled 7 1.8
No overall control 68 17.3
Total 393 100.0
Source: Authors’ calculations
Our results illustrate that majority control is relatively evenly divided amongst firms in the
sample, with managers having a majority of seats in one-third of firms, and workers and
outsiders each having a majority of seats in about one-quarter of firms.
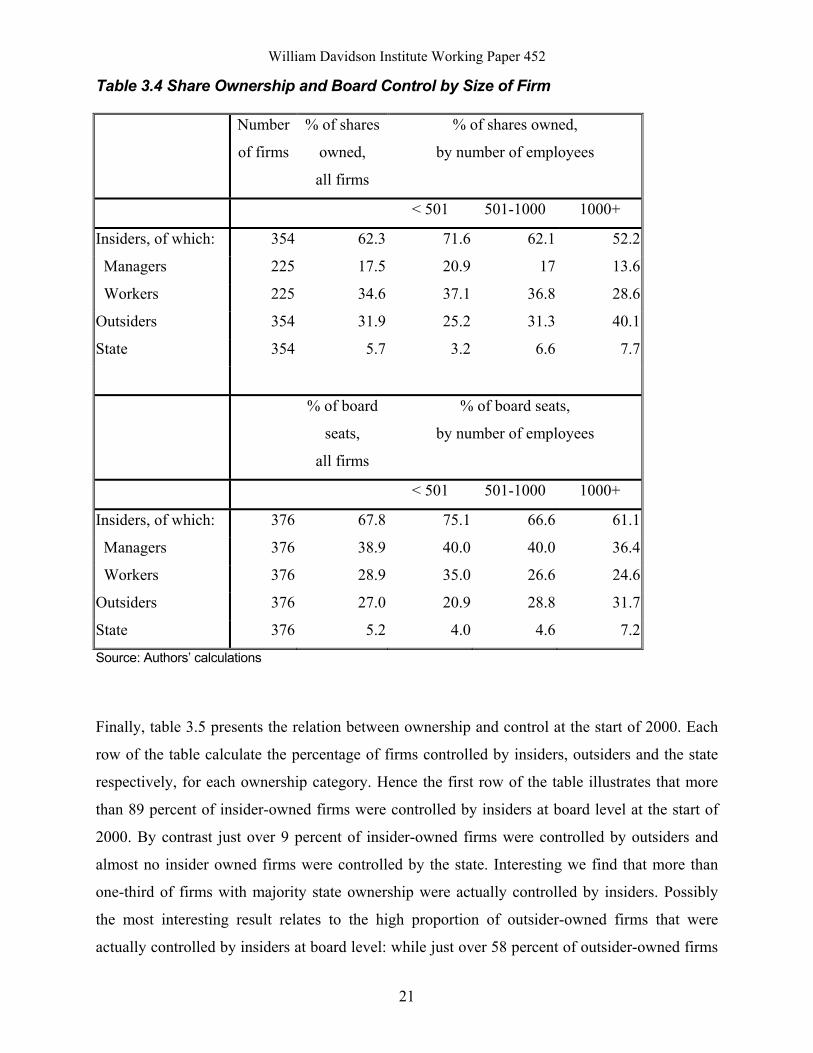
The relationship between share ownership and size of the firm shows the expected patterns (table
3.4). Outsider ownership is increasing with firm size, as is state ownership. The same pattern is
apparent in the relationship between the share of seats on the board and the size of the firm.
William Davidson Institute Working Paper 452
21
Table 3.4 Share Ownership and Board Control by Size of Firm
Number
of firms
% of shares
owned,
all firms
% of shares owned,
by number of employees
< 501 501-1000 1000+
Insiders, of which: 354 62.3 71.6 62.1 52.2
Managers 225 17.5 20.9 17 13.6
Workers 225 34.6 37.1 36.8 28.6
Outsiders 354 31.9 25.2 31.3 40.1
State 354 5.7 3.2 6.6 7.7
% of board
seats,
all firms
% of board seats,
by number of employees
< 501 501-1000 1000+
Insiders, of which: 376 67.8 75.1 66.6 61.1
Managers 376 38.9 40.0 40.0 36.4
Workers 376 28.9 35.0 26.6 24.6
Outsiders 376 27.0 20.9 28.8 31.7
State 376 5.2 4.0 4.6 7.2
Source: Authors’ calculations
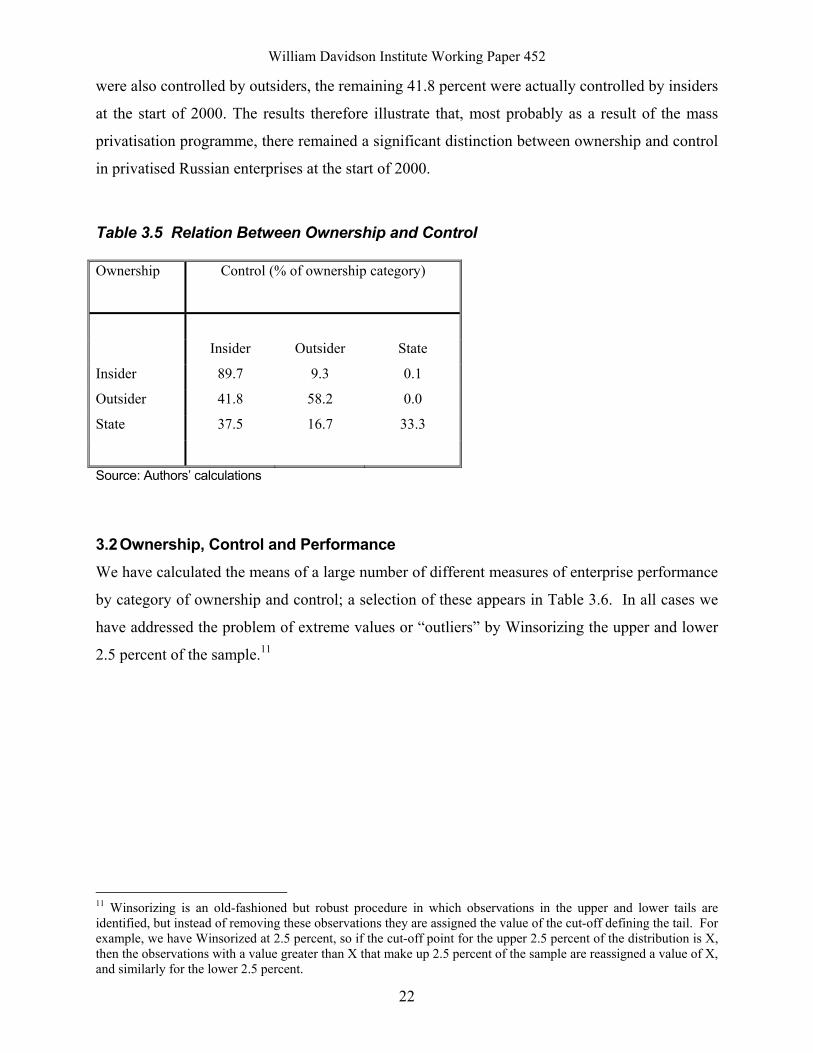
Finally, table 3.5 presents the relation between ownership and control at the start of 2000. Each
row of the table calculate the percentage of firms controlled by insiders, outsiders and the state
respectively, for each ownership category. Hence the first row of the table illustrates that more
than 89 percent of insider-owned firms were controlled by insiders at board level at the start of
2000. By contrast just over 9 percent of insider-owned firms were controlled by outsiders and
almost no insider owned firms were controlled by the state. Interesting we find that more than
one-third of firms with majority state ownership were actually controlled by insiders. Possibly
the most interesting result relates to the high proportion of outsider-owned firms that were
actually controlled by insiders at board level: while just over 58 percent of outsider-owned firms
William Davidson Institute Working Paper 452
22
were also controlled by outsiders, the remaining 41.8 percent were actually controlled by insiders
at the start of 2000. The results therefore illustrate that, most probably as a result of the mass
privatisation programme, there remained a significant distinction between ownership and control
in privatised Russian enterprises at the start of 2000.
Table 3.5 Relation Between Ownership and Control
Ownership Control (% of ownership category)
Insider Outsider State
Insider 89.7 9.3 0.1
Outsider 41.8 58.2 0.0
State 37.5 16.7 33.3
Source: Authors’ calculations
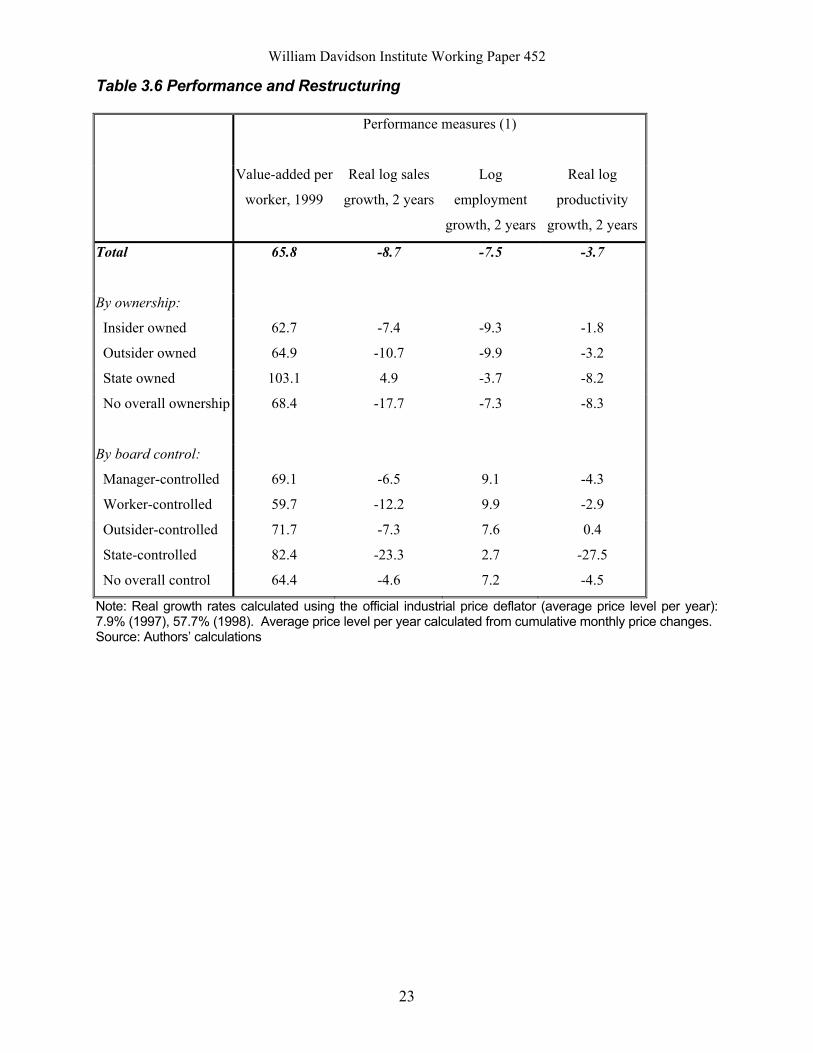
3.2 Ownership, Control and Performance We have calculated the means of a large number of different measures of enterprise performance
by category of ownership and control; a selection of these appears in Table 3.6. In all cases we
have addressed the problem of extreme values or “outliers” by Winsorizing the upper and lower
2.5 percent of the sample.11
11 Winsorizing is an old-fashioned but robust procedure in which observations in the upper and lower tails are identified, but instead of removing these observations they are assigned the value of the cut-off defining the tail. For example, we have Winsorized at 2.5 percent, so if the cut-off point for the upper 2.5 percent of the distribution is X, then the observations with a value greater than X that make up 2.5 percent of the sample are reassigned a value of X, and similarly for the lower 2.5 percent.
William Davidson Institute Working Paper 452
23
Table 3.6 Performance and Restructuring
Performance measures (1)
Value-added per
worker, 1999
Real log sales
growth, 2 years
Log
employment
growth, 2 years
Real log
productivity
growth, 2 years
Total 65.8 -8.7 -7.5 -3.7
By ownership:
Insider owned 62.7 -7.4 -9.3 -1.8
Outsider owned 64.9 -10.7 -9.9 -3.2
State owned 103.1 4.9 -3.7 -8.2
No overall ownership 68.4 -17.7 -7.3 -8.3
By board control:
Manager-controlled 69.1 -6.5 9.1 -4.3
Worker-controlled 59.7 -12.2 9.9 -2.9
Outsider-controlled 71.7 -7.3 7.6 0.4
State-controlled 82.4 -23.3 2.7 -27.5
No overall control 64.4 -4.6 7.2 -4.5
Note: Real growth rates calculated using the official industrial price deflator (average price level per year): 7.9% (1997), 57.7% (1998). Average price level per year calculated from cumulative monthly price changes. Source: Authors’ calculations
William Davidson Institute Working Paper 452
24
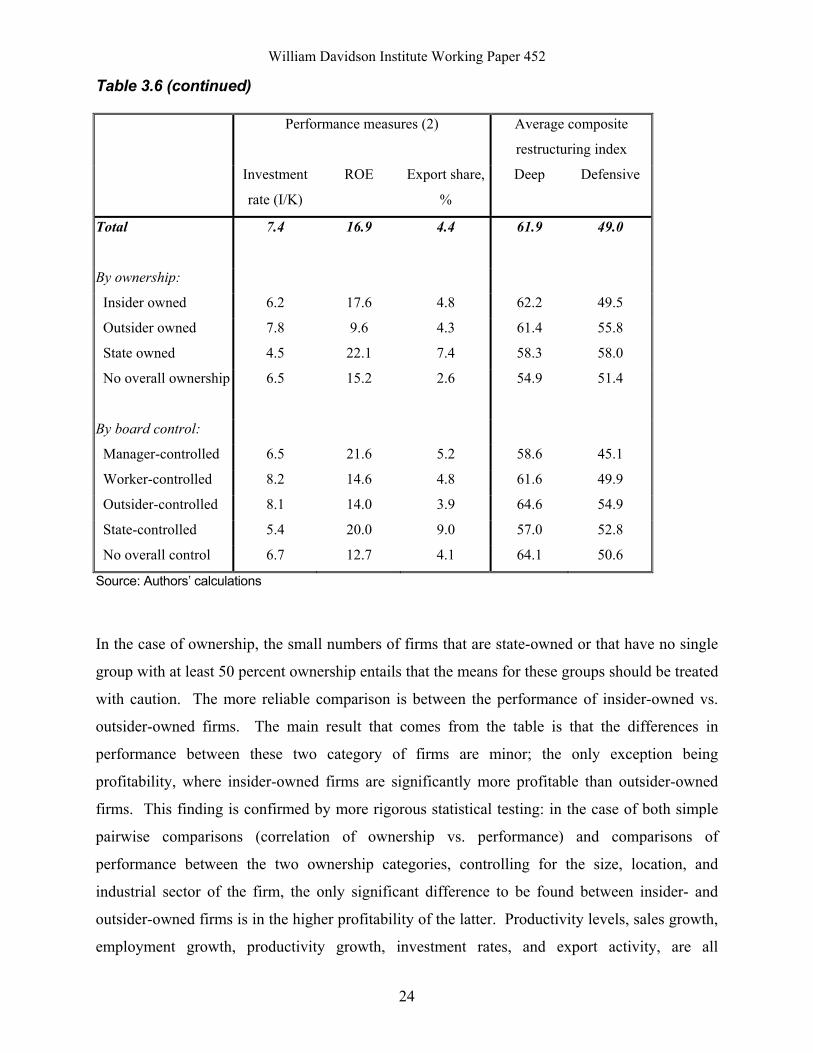
Table 3.6 (continued)
Performance measures (2) Average composite
restructuring index
Investment
rate (I/K)
ROE Export share,
%
Deep Defensive
Total 7.4 16.9 4.4 61.9 49.0
By ownership:
Insider owned 6.2 17.6 4.8 62.2 49.5
Outsider owned 7.8 9.6 4.3 61.4 55.8
State owned 4.5 22.1 7.4 58.3 58.0
No overall ownership 6.5 15.2 2.6 54.9 51.4
By board control:
Manager-controlled 6.5 21.6 5.2 58.6 45.1
Worker-controlled 8.2 14.6 4.8 61.6 49.9
Outsider-controlled 8.1 14.0 3.9 64.6 54.9
State-controlled 5.4 20.0 9.0 57.0 52.8
No overall control 6.7 12.7 4.1 64.1 50.6
Source: Authors’ calculations
In the case of ownership, the small numbers of firms that are state-owned or that have no single
group with at least 50 percent ownership entails that the means for these groups should be treated
with caution. The more reliable comparison is between the performance of insider-owned vs.
outsider-owned firms. The main result that comes from the table is that the differences in
performance between these two category of firms are minor; the only exception being
profitability, where insider-owned firms are significantly more profitable than outsider-owned
firms. This finding is confirmed by more rigorous statistical testing: in the case of both simple
pairwise comparisons (correlation of ownership vs. performance) and comparisons of
performance between the two ownership categories, controlling for the size, location, and
industrial sector of the firm, the only significant difference to be found between insider- and
outsider-owned firms is in the higher profitability of the latter. Productivity levels, sales growth,
employment growth, productivity growth, investment rates, and export activity, are all
William Davidson Institute Working Paper 452
25
statistically indistinguishable between the two groups. Missing data and the relatively small
number of manager-owned firms means we were not able to examine the differences between
these two categories of insider-owned firms.
We were, however, able to look at the differences in performance between manager-controlled,
worker-controlled, and outsider-controlled firms, where control is defined as a majority of seats
on the board. The findings here are essentially the same as for ownership: with the exception of
profitability, there are no significant differences between manager-, worker-, and outsider-
controlled firms in terms of performance, whether or not characteristics of firms are controlled
for (the poorer performance of worker-controlled firms in sales and productivity growth is in fact
not statistically significant, because the cross-sectional variation in these measures is very large).
Profitability, by contrast, is significantly higher in manager-controlled firms, not only compared
to outsider-controlled firms but also compared to worker-controlled firms, and there is no
difference between the latter two groups. This pattern is statistically significant, whether or not
characteristics such as size, industry and location are controlled for. The positive correlation
between profitability and insider ownership/managerial control carries through if we look at the
correlation between the proportion of shares owned/board seats held and profitability. However,
it doesn’t carry through to the subsample of firms for which we have separate manager and
employee ownership, where the correlation loses any statistical significance.
The nature of the causality underlying this correlation between profitability and managerial
control/insider ownership is not clear. The impact of the nature of ownership and control on firm
performance is difficult to separate from the impact of performance on ownership and control.
We looked at, for example, the correlation between high profitability at the time of the survey
and changes in the portions of share ownership belonging to the different groups in question.
High profitability is significantly correlated with an increase in share ownership by managers,
but not with any other changes in ownership shares. We have also found that the significant and
positive correlation between profitability and insider ownership is noticeably reduced if we look
at the correlation between current profitability and insider ownership at the time of privatisation.
Both findings suggest that insiders, and managers in particular, may be increasing their
ownership shares in firms that are, in effect, “worth owning”. Separating this phenomenon from
that in which ownership or control determine performance is left for future work.
William Davidson Institute Working Paper 452
26
3.3 Ownership, Control and Restructuring Restructuring activity is notoriously difficult to measure, but we have attempted to do so
nonetheless. Managers were given a long list of restructuring actions, and asked to categorise
their firm’s restructuring activity up to 1999: (1) engaged in a specific activity in 1997, 1998,
and/or 1999 (separately detailed); (2) didn’t engage in this activity in 1997-99 because it was
done prior to 1997; (3) didn’t engage in it because the firm never needed to do it; (4) didn’t
engage in it but should have. The responses can be combined into summary measures in a
number of ways, but we choose to present here only one measure, based on whether the firm
engaged in the restructuring activity at all in 1997-99. Note that firms that did not restructure are
a heterogeneous set, composed both of firms that say they did not do so for positive reasons (they
didn’t need to or did so already) and of firms that provided a negative reason (they should have
but didn’t)12.
12 We also note that in a subjective question such as this firms responding that they recognised the need to engage in a restructuring measure, but failed to do so, may have positive connotations in that they recognise the need to restructure. Similarly, firms that report that they didn’t need to restructure may have failed to appreciate the need for restructuring activity to be undertaken.
William Davidson Institute Working Paper 452
27
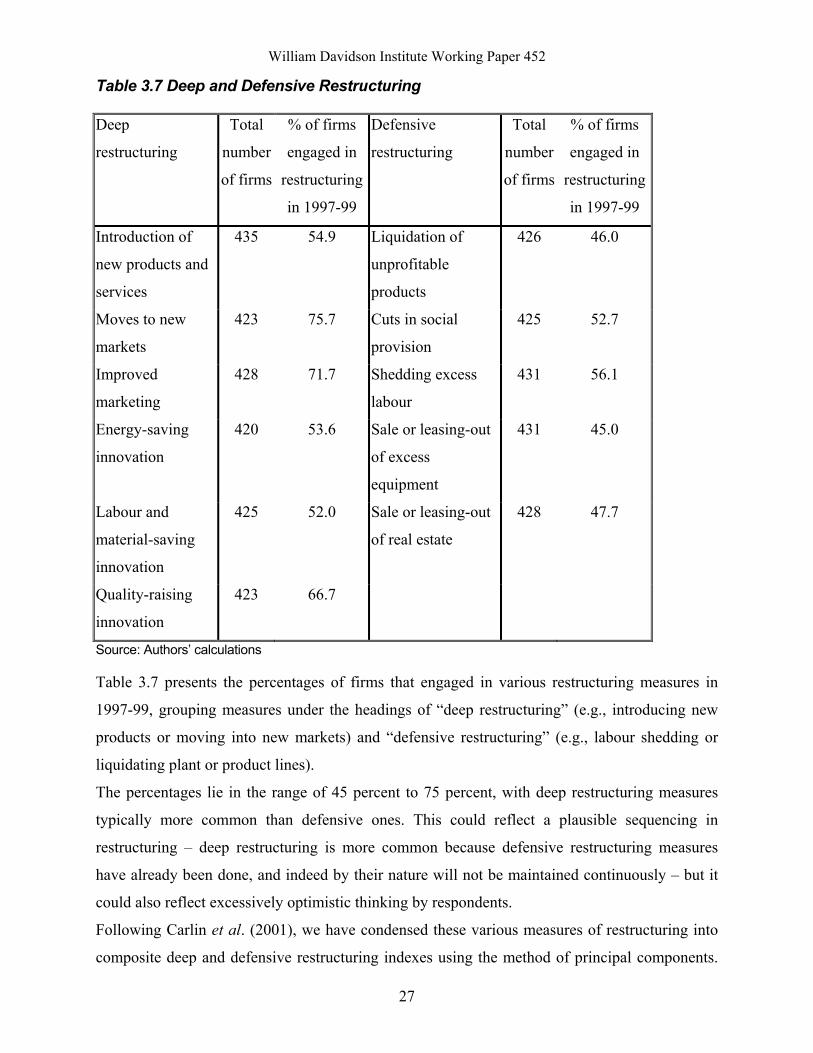
Table 3.7 Deep and Defensive Restructuring
Deep
restructuring
Total
number
of firms
% of firms
engaged in
restructuring
in 1997-99
Defensive
restructuring
Total
number
of firms
% of firms
engaged in
restructuring
in 1997-99
Introduction of
new products and
services
435 54.9 Liquidation of
unprofitable
products
426 46.0
Moves to new
markets
423 75.7 Cuts in social
provision
425 52.7
Improved
marketing
428 71.7 Shedding excess
labour
431 56.1
Energy-saving
innovation
420 53.6 Sale or leasing-out
of excess
equipment
431 45.0
Labour and
material-saving
innovation
425 52.0 Sale or leasing-out
of real estate
428 47.7
Quality-raising
innovation
423 66.7
Source: Authors’ calculations
Table 3.7 presents the percentages of firms that engaged in various restructuring measures in
1997-99, grouping measures under the headings of “deep restructuring” (e.g., introducing new
products or moving into new markets) and “defensive restructuring” (e.g., labour shedding or
liquidating plant or product lines).
The percentages lie in the range of 45 percent to 75 percent, with deep restructuring measures
typically more common than defensive ones. This could reflect a plausible sequencing in
restructuring – deep restructuring is more common because defensive restructuring measures
have already been done, and indeed by their nature will not be maintained continuously – but it
could also reflect excessively optimistic thinking by respondents.
Following Carlin et al. (2001), we have condensed these various measures of restructuring into
composite deep and defensive restructuring indexes using the method of principal components.
William Davidson Institute Working Paper 452
28
In both cases, the eigenvector of the first principal component provides the weights to be applied
to the component restructuring indexes when constructing the composite index. The method also
allows a check on whether a composite index is sensible, i.e., whether it is measuring some
underlying deep or defensive restructuring activity. In the case of the deep restructuring
composite index, the first principal component (out of six) explains fully 38 percent of the
variance in the six deep restructuring indexes; the next most important component explains less
than half that. Similarly, the first principal component for the five defensive restructuring
activities explains 36 percent of the variance.
The last two columns of table 3.6 present the means for the two composite restructuring indexes
by firm ownership and by board control. The indexes are normalised so that the index takes the
value zero if a firm engaged in no restructuring measures in the period 1997-99, and the value
100 if a firm engaged in all possible measures. As was the case with the individual restructuring
measures, deep restructuring is more common than defensive restructuring. The two categories
of restructuring are positively correlated (the simple correlation coefficient is positive and
significant at the 6 percent level). With respect to ownership and control, statistical testing
suggests that firms with outside control of the board are significantly more likely than manager-
controlled firms to engage in either deep or defensive restructuring, with worker-controlled firms
somewhere in between. Ownership group, however, is not significantly correlated with
restructuring activity of either sort.
One aspect of the firm that does differ significantly with ownership and control is the nature of
the manager. Insider-owned firms tend to have general managers who have held their current
post longer (8 years, vs. 5 years for outsider-owned firms) and who have been in the firm longer
(20 years, vs. 15 years for outsider-owned firms). The same applies to insider-controlled firms
(whether manager- or worker-controlled) vs. outsider-controlled firms. This does not appear to
be the result of a greater willingness of outside owners to sack and replace poor managers: the
proportion of insider- and outsider-owned firms with general managers who were appointed as
replacements for someone who was performing poorly was about 50 percent for both categories
of firms. Control of the board, however, is clearly related to managerial turnover: 40 percent of
manager-controlled firms replaced their manager because of poor performance, vs. 48 percent of
worker-controlled firms, and 53 percent of outsider-controlled firms.
William Davidson Institute Working Paper 452
29
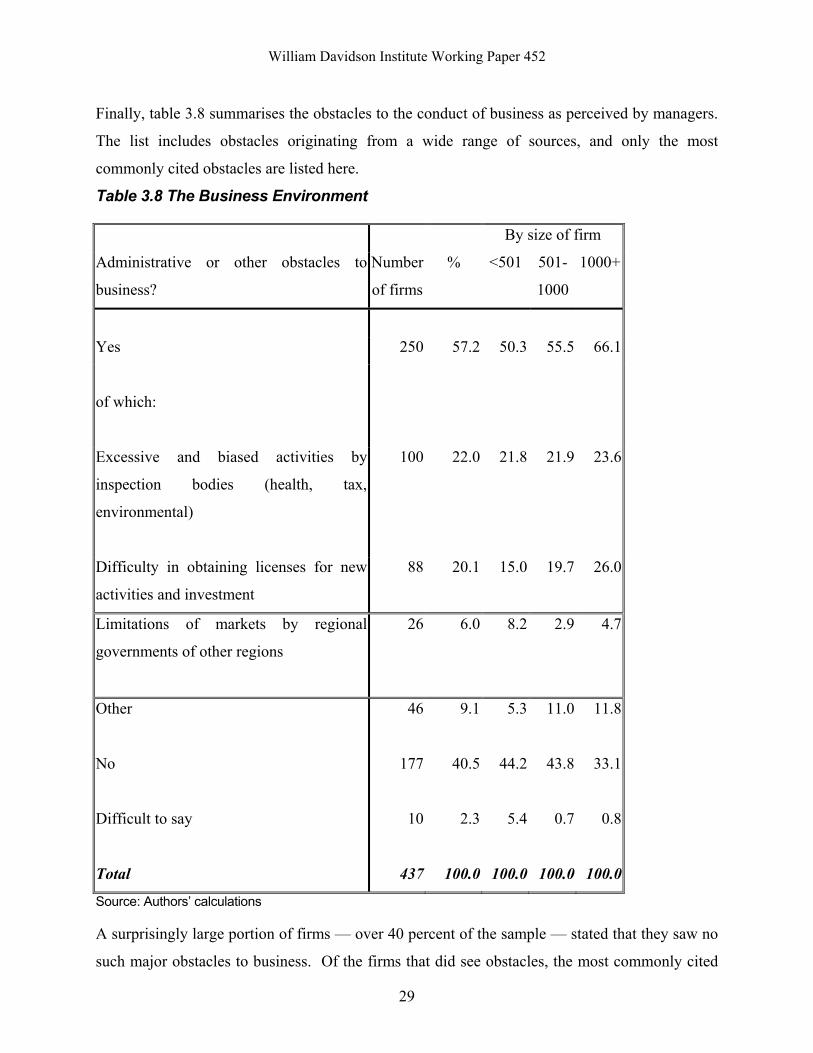
Finally, table 3.8 summarises the obstacles to the conduct of business as perceived by managers.
The list includes obstacles originating from a wide range of sources, and only the most
commonly cited obstacles are listed here.
Table 3.8 The Business Environment
By size of firm
Administrative or other obstacles to
business?
Number
of firms
% <501 501-
1000
1000+
Yes 250 57.2 50.3 55.5 66.1
of which:
Excessive and biased activities by
inspection bodies (health, tax,
environmental)
100 22.0 21.8 21.9 23.6
Difficulty in obtaining licenses for new
activities and investment
88 20.1 15.0 19.7 26.0
Limitations of markets by regional
governments of other regions
26 6.0 8.2 2.9 4.7
Other
46 9.1 5.3 11.0 11.8
No
177 40.5 44.2 43.8 33.1
Difficult to say
10 2.3 5.4 0.7 0.8
Total 437 100.0 100.0 100.0 100.0
Source: Authors’ calculations
A surprisingly large portion of firms — over 40 percent of the sample — stated that they saw no
such major obstacles to business. Of the firms that did see obstacles, the most commonly cited
William Davidson Institute Working Paper 452
30
were excessive and biased activities by government inspection bodies (health, tax,
environmental, etc.), cited as the number one obstacle by 22 percent of firms; difficulties in and
costs of obtaining licenses, cited by 20 percent of firms; and regional protectionism, cited by 6
percent of firms. Surprisingly, or perhaps not, pressure from criminal groups was cited as the
number one problem by only two firms in the entire survey. An interesting feature of the results
in Table 3.8 is that larger firms are more likely than small firms to complain about obstacles to
their business activity.
4. Competition, Performance and Restructuring 4.1 Introduction For most economists, competition is viewed as a fundamental of the market economy, and
therefore is expected to improve enterprise performance. However, modelling to establish this
result is rare and the analysis is often indeterminate in sign, while the empirical evidence, even
for developed market economies, is sparse. For example from a Schumpeterian perspective, less
concentration will reduce rents and increase uncertainty, and this might result in a decrease of R
& D investment, with negative effects on long run performance. On the other hand, the threat
from competition could instead shorten the innovation cycle (Aghion and Carlin, (1996)).
Moreover, firms could be forced to improve efficiency as the struggle for survival becomes
harder. The latter view rests heavily on the ownership and capital market arrangements; soft
budget constraints and the absence of bankruptcy enforcement fundamentally reduce such
competitive processes. The same conceptual ambiguity holds with respect to managers’
behaviour. It is not clear whether they would react to competition by exerting more effort or
would be discouraged by the profit reduction (Willig (1987)). Once again the institutional and
policy environment is significant.
As far as transition economies are concerned, an essential aspect of the economic environment is
the ownership structure of the enterprise. This is because private ownership as well as
competition may provide incentives to pursue a higher efficiency level. Private ownership is
expected to be associated with harder budget constraints and a lower likelihood of government
bailout in case of bankruptcy. Furthermore, privately-owned firms may be more aggressive and
profit oriented than state-owned ones. This raises the issue of substitutability or complementarity
of alternate policy regimes, therefore competition verses privatisation. Competition processes
William Davidson Institute Working Paper 452
31
ultimately refer to the rents generated by the enterprise in its product market, whether domestic
or international. Increasing attention has been paid in recent years to the impact of trade
liberalisation on domestic competitive processes, though, in large regionally dispersed
economies like Russia, non-tariff barriers will always also be significant. The debate on the
impact of alternative ownership forms has in large part focussed on the ways that such firm-
specific rents (as might be available on product markets, whatever their structure) could be
dissipated in the absence of effective capital market disciplines into the managerial utility
function13. At the start of transition, the balance of opinion favoured speedy privatisation, a
mechanism to break the state’s monopoly of ownership and in effect a precondition to improved
performance. More recently, influential analysts such as Joe Stiglitz and Nick Stern have argued
that building a more competitive market structure prior to privatisation might have been
beneficial to performance. These views are consistent with the hypothesis that market
competition and privatisation are substitutes in disciplining firms and generating improved
economic performance. In contrast, the disappointing impact of privatisation on performance in
much of the former Soviet Union, indicates that they may be complements — privatisation only
really works to improve company performance in contexts where product market competition
has limited the scope of firm-specific rents.
The empirical evidence on this matter for Russia is scarce. Earle and Estrin’s analysis (1998)
supports the theory of complementarity between competition and privatisation, although the
significance of the former is low. Brown and Earle (2001) highlight the importance of the
interplay between ownership and concentration. Their analysis, using a 1992-99 panel of Russian
manufacturing enterprises, shows evidence of a firm-level substitution effect between
competition and privatisation.
The theoretical background is therefore too fragmented and ambiguous, and the empirical
evidence too scarce to permit us to derive clear testable hypotheses from a complete model of
firm behaviour vis a vis competition. In our view, the role of competition in enterprise
performance requires more careful thought, and more attention should be devoted to
understanding it as both a static and dynamic process. However, the aim of this paper is simply
to provide an overview of the level and impact of competition in our sample of Russian firms.
13 For example to lower performance, excessive employment and unnecessary cost.
William Davidson Institute Working Paper 452
32
Hence no formal attempt to model the impact of domestic and foreign competition on enterprise
behaviour and performance will be made. Rather, the focus of the present analysis will be a
group of key variables, which are likely to be affected differently by varying degrees of
competition.
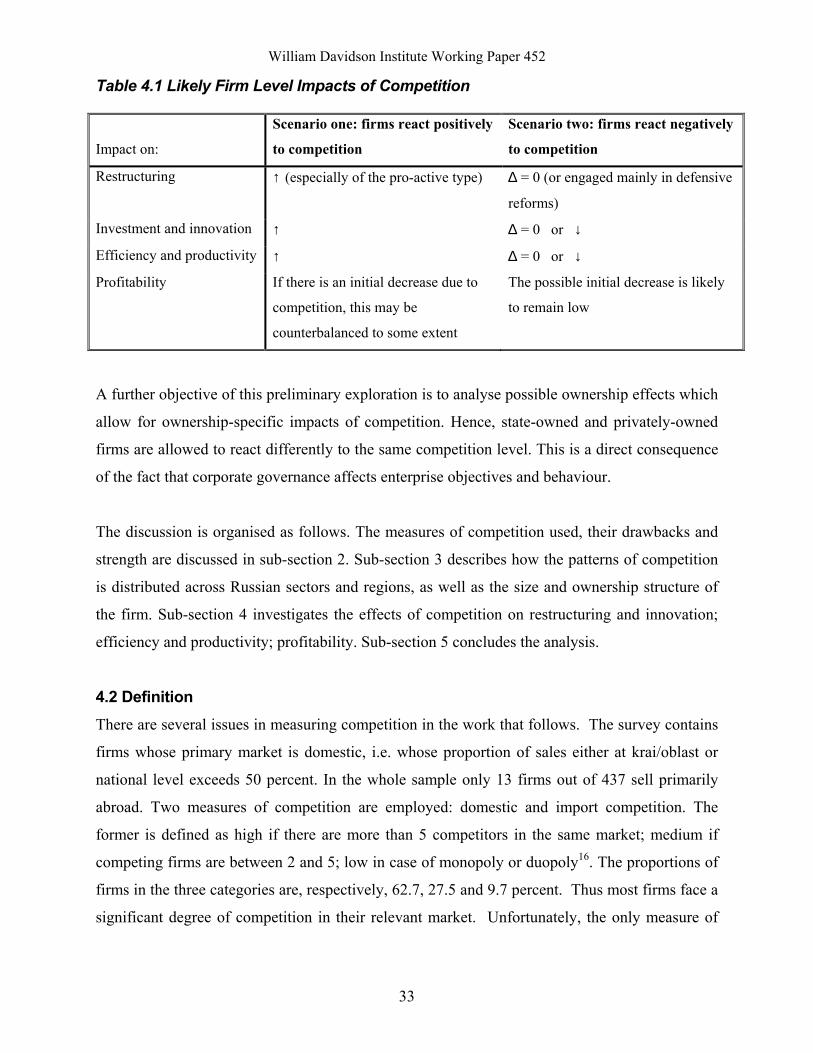
Two possible scenarios are hypothesised. Both of them rest on the assumption that competition
hardens the constraints on firms14. In one case, companies are expected to react to lower
profitability by exerting more effort. Thus they will pursue restructuring and increase innovation
in order to gain in efficiency and become more productive. According to this scenario,
competition will be positively associated with restructuring (especially of the pro-active type),
higher investment and innovation. Restructuring, innovation and investments should lead to
higher efficiency and productivity.
The alternative hypothesis is that enterprises (especially high-cost ones) do not react in a positive
way to the decrease of profitability and of market share implied by tough competition, leading
managerial effort to be reduced. In this case, firms would not engage in restructuring, at least not
of the pro-active type15. No major investment would be undertaken. As a consequence, efficiency
and productivity would not increase. The likely impacts of our key variables are illustrated in
table 4.1.
14 Whether emphasis is given to decreased rents and market power, reduced market share and lower demand or narrower profitability margins does not affect the result of the present exercise. 15 They might still undertake defensive reforms in order to protect their position in the market in the short term without bearing the higher costs of a deep restructuring.
William Davidson Institute Working Paper 452
33
Table 4.1 Likely Firm Level Impacts of Competition
Impact on:
Scenario one: firms react positively
to competition
Scenario two: firms react negatively
to competition
Restructuring ↑ (especially of the pro-active type) ∆ = 0 (or engaged mainly in defensive
reforms)
Investment and innovation ↑ ∆ = 0 or ↓
Efficiency and productivity ↑ ∆ = 0 or ↓
Profitability If there is an initial decrease due to
competition, this may be
counterbalanced to some extent
The possible initial decrease is likely
to remain low
A further objective of this preliminary exploration is to analyse possible ownership effects which
allow for ownership-specific impacts of competition. Hence, state-owned and privately-owned
firms are allowed to react differently to the same competition level. This is a direct consequence
of the fact that corporate governance affects enterprise objectives and behaviour.
The discussion is organised as follows. The measures of competition used, their drawbacks and
strength are discussed in sub-section 2. Sub-section 3 describes how the patterns of competition
is distributed across Russian sectors and regions, as well as the size and ownership structure of
the firm. Sub-section 4 investigates the effects of competition on restructuring and innovation;
efficiency and productivity; profitability. Sub-section 5 concludes the analysis.
4.2 Definition There are several issues in measuring competition in the work that follows. The survey contains
firms whose primary market is domestic, i.e. whose proportion of sales either at krai/oblast or
national level exceeds 50 percent. In the whole sample only 13 firms out of 437 sell primarily
abroad. Two measures of competition are employed: domestic and import competition. The
former is defined as high if there are more than 5 competitors in the same market; medium if
competing firms are between 2 and 5; low in case of monopoly or duopoly16. The proportions of
firms in the three categories are, respectively, 62.7, 27.5 and 9.7 percent. Thus most firms face a
significant degree of competition in their relevant market. Unfortunately, the only measure of
William Davidson Institute Working Paper 452
34
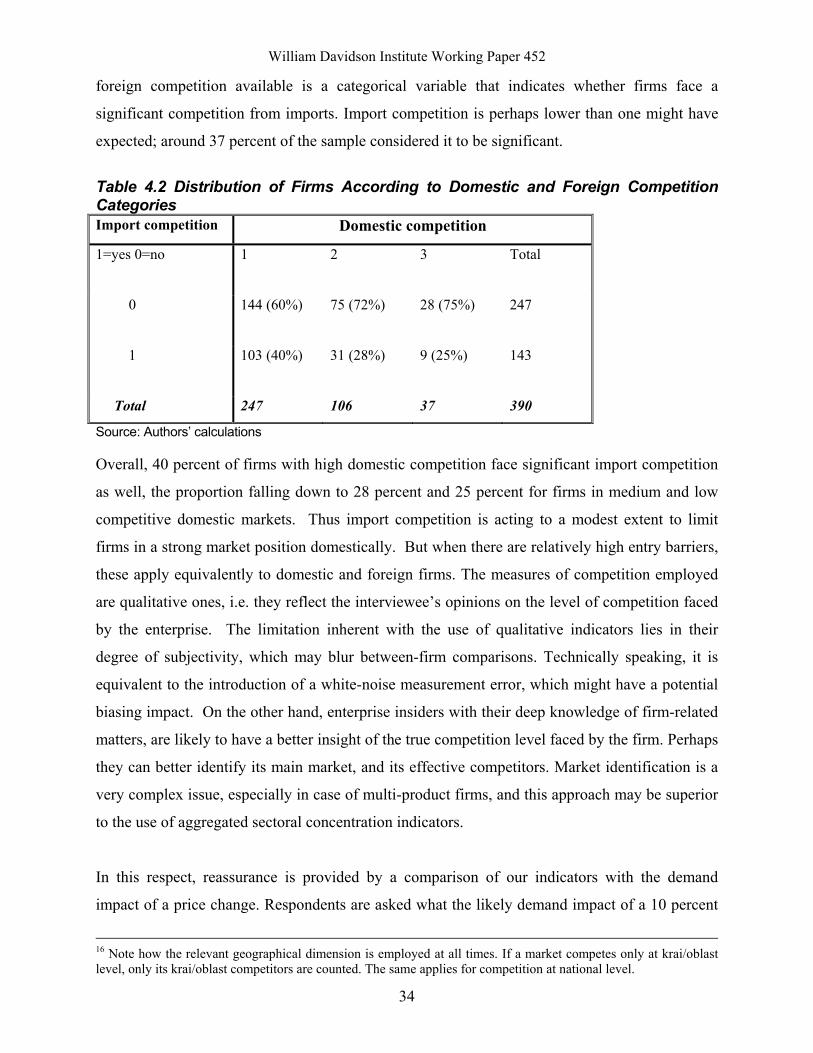
foreign competition available is a categorical variable that indicates whether firms face a
significant competition from imports. Import competition is perhaps lower than one might have
expected; around 37 percent of the sample considered it to be significant.
Table 4.2 Distribution of Firms According to Domestic and Foreign Competition Categories Import competition Domestic competition
1=yes 0=no 1 2 3 Total
0 144 (60%) 75 (72%) 28 (75%) 247
1 103 (40%) 31 (28%) 9 (25%) 143
Total 247 106 37 390
Source: Authors’ calculations
Overall, 40 percent of firms with high domestic competition face significant import competition
as well, the proportion falling down to 28 percent and 25 percent for firms in medium and low
competitive domestic markets. Thus import competition is acting to a modest extent to limit
firms in a strong market position domestically. But when there are relatively high entry barriers,
these apply equivalently to domestic and foreign firms. The measures of competition employed
are qualitative ones, i.e. they reflect the interviewee’s opinions on the level of competition faced
by the enterprise. The limitation inherent with the use of qualitative indicators lies in their
degree of subjectivity, which may blur between-firm comparisons. Technically speaking, it is
equivalent to the introduction of a white-noise measurement error, which might have a potential
biasing impact. On the other hand, enterprise insiders with their deep knowledge of firm-related
matters, are likely to have a better insight of the true competition level faced by the firm. Perhaps
they can better identify its main market, and its effective competitors. Market identification is a
very complex issue, especially in case of multi-product firms, and this approach may be superior
to the use of aggregated sectoral concentration indicators.
In this respect, reassurance is provided by a comparison of our indicators with the demand
impact of a price change. Respondents are asked what the likely demand impact of a 10 percent
16 Note how the relevant geographical dimension is employed at all times. If a market competes only at krai/oblast level, only its krai/oblast competitors are counted. The same applies for competition at national level.
William Davidson Institute Working Paper 452
35
price increase of their major product would be. Overall, the price elasticity of demand evaluation
appears to be consistent with the perceived competition level.
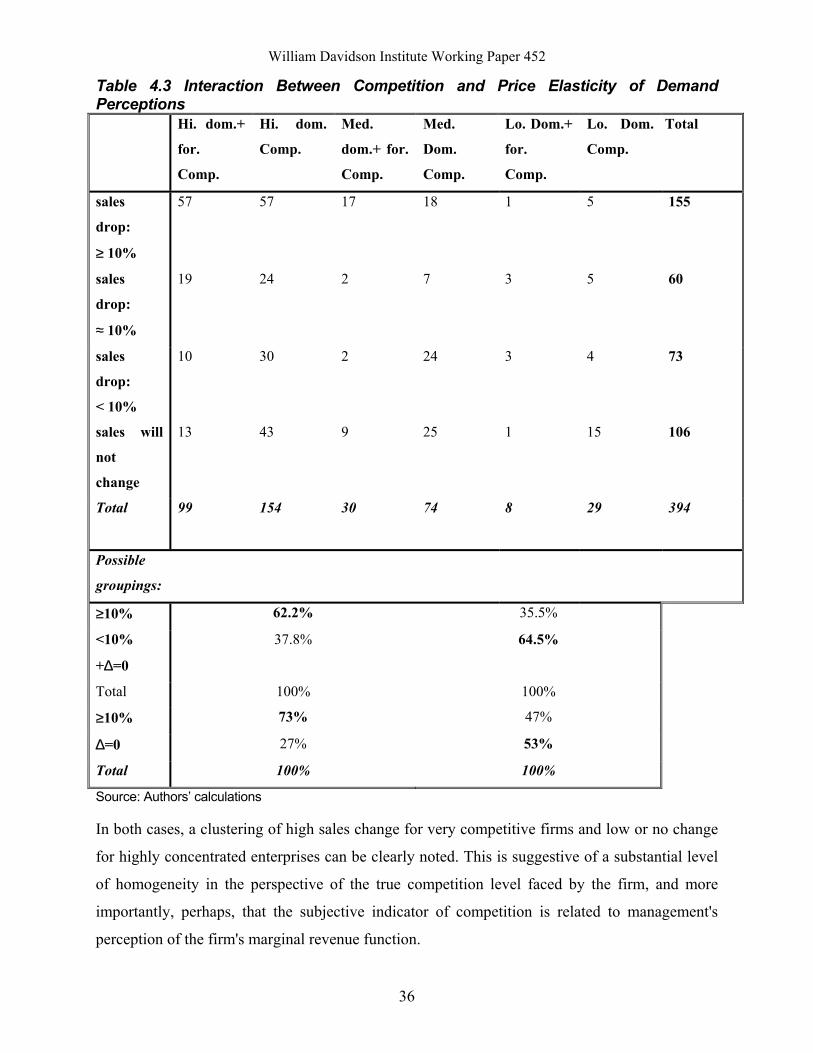
If we group enterprises into two main categories, high and low competition, 62.2 percent of high-
competition firms have a sales drop greater than 10 percent, while the remaining 38.2 percent
will have a price elasticity of demand less than 10 percent or null. The equivalent values for low-
competition enterprises are 35.5 percent and 64.5 percent.
Using a more marked division, we cluster firms around high (≥10 percent) and null elasticity (no
sales change), the proportion for the high-competition group are 73 percent and 27 percent, while
those for the high-concentration one are 47 percent and 53 percent.
William Davidson Institute Working Paper 452
36
Table 4.3 Interaction Between Competition and Price Elasticity of Demand Perceptions Hi. dom.+
for.
Comp.
Hi. dom.
Comp.
Med.
dom.+ for.
Comp.
Med.
Dom.
Comp.
Lo. Dom.+
for.
Comp.
Lo. Dom.
Comp.
Total
sales
drop:
≥ 10%
57 57 17 18 1 5 155
sales
drop:
≈ 10%
19 24 2 7 3 5 60
sales
drop:
< 10%
10 30 2 24 3 4 73
sales will
not
change
13 43 9 25 1 15 106
Total 99 154 30 74 8 29 394
Possible
groupings:
≥10% 62.2% 35.5%
<10%
+∆=0
37.8% 64.5%
Total 100% 100%
≥10% 73% 47%
∆=0 27% 53%
Total 100% 100%
Source: Authors’ calculations
In both cases, a clustering of high sales change for very competitive firms and low or no change
for highly concentrated enterprises can be clearly noted. This is suggestive of a substantial level
of homogeneity in the perspective of the true competition level faced by the firm, and more
importantly, perhaps, that the subjective indicator of competition is related to management's
perception of the firm's marginal revenue function.
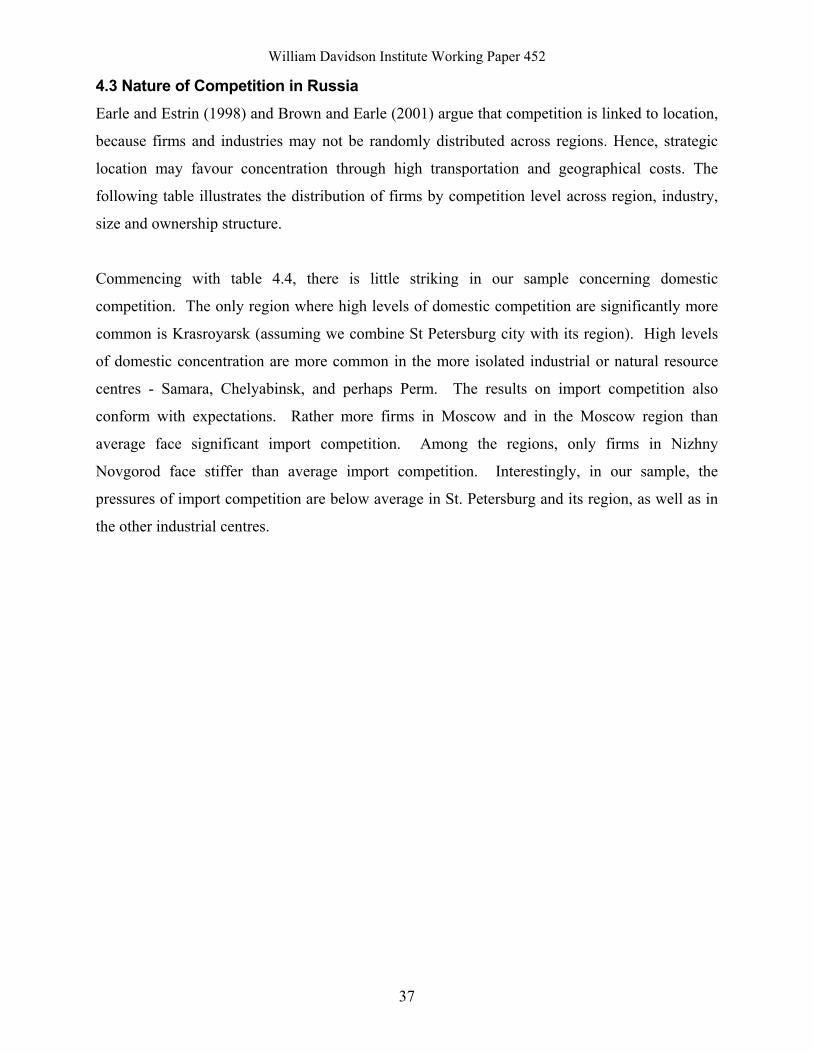
William Davidson Institute Working Paper 452
37
4.3 Nature of Competition in Russia Earle and Estrin (1998) and Brown and Earle (2001) argue that competition is linked to location,
because firms and industries may not be randomly distributed across regions. Hence, strategic
location may favour concentration through high transportation and geographical costs. The
following table illustrates the distribution of firms by competition level across region, industry,
size and ownership structure.
Commencing with table 4.4, there is little striking in our sample concerning domestic
competition. The only region where high levels of domestic competition are significantly more
common is Krasroyarsk (assuming we combine St Petersburg city with its region). High levels
of domestic concentration are more common in the more isolated industrial or natural resource
centres - Samara, Chelyabinsk, and perhaps Perm. The results on import competition also
conform with expectations. Rather more firms in Moscow and in the Moscow region than
average face significant import competition. Among the regions, only firms in Nizhny
Novgorod face stiffer than average import competition. Interestingly, in our sample, the
pressures of import competition are below average in St. Petersburg and its region, as well as in
the other industrial centres.
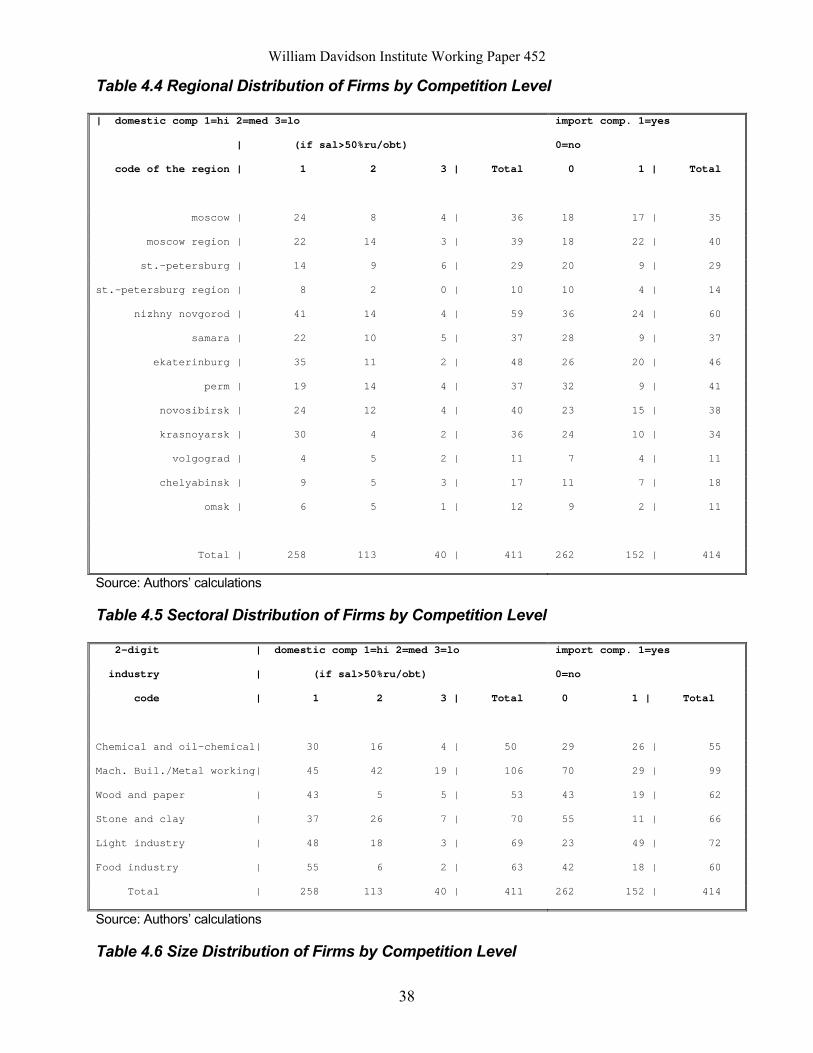
William Davidson Institute Working Paper 452
38
Table 4.4 Regional Distribution of Firms by Competition Level
| domestic comp 1=hi 2=med 3=lo import comp. 1=yes
| (if sal>50%ru/obt) 0=no
code of the region | 1 2 3 | Total 0 1 | Total
moscow | 24 8 4 | 36 18 17 | 35
moscow region | 22 14 3 | 39 18 22 | 40
st.-petersburg | 14 9 6 | 29 20 9 | 29
st.-petersburg region | 8 2 0 | 10 10 4 | 14
nizhny novgorod | 41 14 4 | 59 36 24 | 60
samara | 22 10 5 | 37 28 9 | 37
ekaterinburg | 35 11 2 | 48 26 20 | 46
perm | 19 14 4 | 37 32 9 | 41
novosibirsk | 24 12 4 | 40 23 15 | 38
krasnoyarsk | 30 4 2 | 36 24 10 | 34
volgograd | 4 5 2 | 11 7 4 | 11
chelyabinsk | 9 5 3 | 17 11 7 | 18
omsk | 6 5 1 | 12 9 2 | 11
Total | 258 113 40 | 411 262 152 | 414
Source: Authors’ calculations
Table 4.5 Sectoral Distribution of Firms by Competition Level
2-digit | domestic comp 1=hi 2=med 3=lo import comp. 1=yes
industry | (if sal>50%ru/obt) 0=no
code | 1 2 3 | Total 0 1 | Total
Chemical and oil-chemical| 30 16 4 | 50 29 26 | 55
Mach. Buil./Metal working| 45 42 19 | 106 70 29 | 99
Wood and paper | 43 5 5 | 53 43 19 | 62
Stone and clay | 37 26 7 | 70 55 11 | 66
Light industry | 48 18 3 | 69 23 49 | 72
Food industry | 55 6 2 | 63 42 18 | 60
Total | 258 113 40 | 411 262 152 | 414
Source: Authors’ calculations
Table 4.6 Size Distribution of Firms by Competition Level
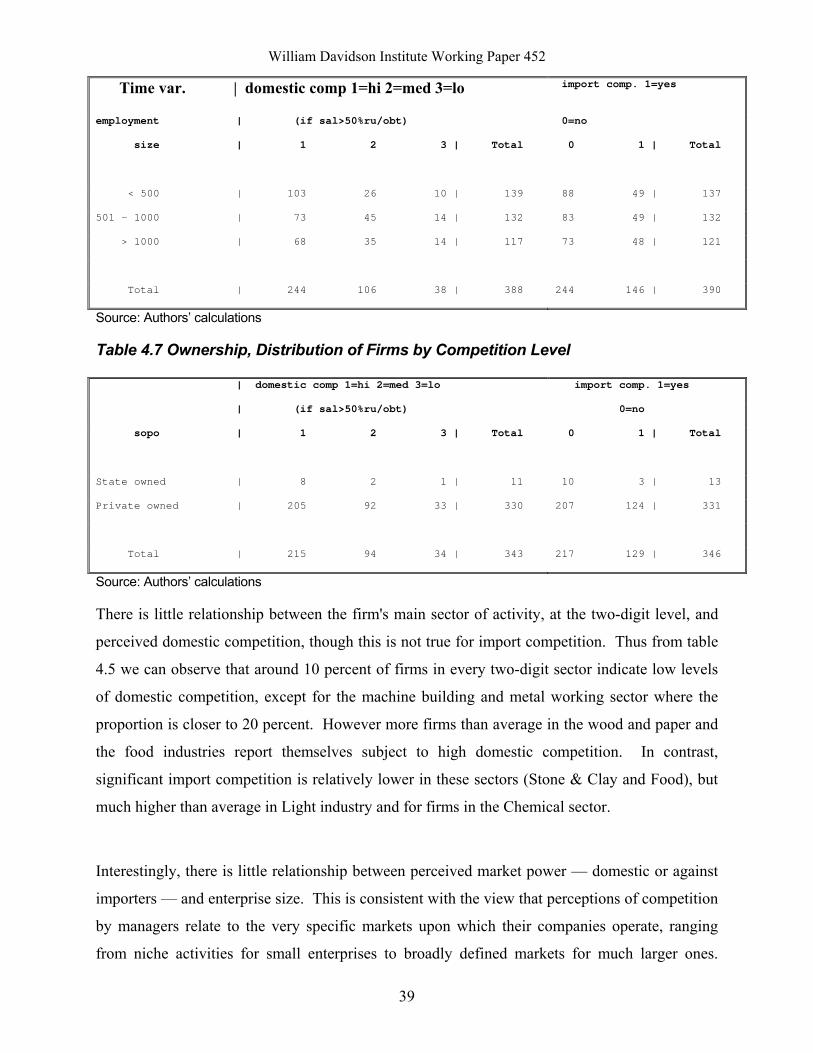
William Davidson Institute Working Paper 452
39
Time var. | domestic comp 1=hi 2=med 3=lo import comp. 1=yes
employment | (if sal>50%ru/obt) 0=no
size | 1 2 3 | Total 0 1 | Total
< 500 | 103 26 10 | 139 88 49 | 137
501 - 1000 | 73 45 14 | 132 83 49 | 132
> 1000 | 68 35 14 | 117 73 48 | 121
Total | 244 106 38 | 388 244 146 | 390
Source: Authors’ calculations
Table 4.7 Ownership, Distribution of Firms by Competition Level
| domestic comp 1=hi 2=med 3=lo import comp. 1=yes
| (if sal>50%ru/obt) 0=no
sopo | 1 2 3 | Total 0 1 | Total
State owned | 8 2 1 | 11 10 3 | 13
Private owned | 205 92 33 | 330 207 124 | 331
Total | 215 94 34 | 343 217 129 | 346
Source: Authors’ calculations
There is little relationship between the firm's main sector of activity, at the two-digit level, and
perceived domestic competition, though this is not true for import competition. Thus from table
4.5 we can observe that around 10 percent of firms in every two-digit sector indicate low levels
of domestic competition, except for the machine building and metal working sector where the
proportion is closer to 20 percent. However more firms than average in the wood and paper and
the food industries report themselves subject to high domestic competition. In contrast,
significant import competition is relatively lower in these sectors (Stone & Clay and Food), but
much higher than average in Light industry and for firms in the Chemical sector.
Interestingly, there is little relationship between perceived market power — domestic or against
importers — and enterprise size. This is consistent with the view that perceptions of competition
by managers relate to the very specific markets upon which their companies operate, ranging
from niche activities for small enterprises to broadly defined markets for much larger ones.
William Davidson Institute Working Paper 452
40
However, it is reassuring to note from table 4.6 that, though the differences are slight among
larger firms (>1000 employees), there is a relatively higher proportion of enterprises facing low
domestic competition and no import competition, while the converse is true for the smallest firm
category (<500 workers).
Finally we turn to ownership distribution. It has been argued that the state will sell ‘the best
firms’ first, which may imply that it would privatise the enterprises with more market power,
domestic or international (see Gupta, Ham and Svejnar (2000), Walsh and Whelan (2000)). Our
sample contains relatively few state owned firms (around 4 percent) but it can be seen in table
4.7 that this small group contains almost no firms in the low competitive category. This is
consistent with the view that the state did privatise firms with significant domestic monopoly
power, though import competition does not appear to have entered the calculations.
4.4 Effects of Competition Competition is likely to affect performance through changes in (1) restructuring and innovation;
(2) efficiency and productivity; (3) profitability. Though arbitrary (because of clear overlapping
and interconnections) we can use the above division into three groups to explore the effect of
competition on Russian firms using a series of key variables. Commencing with restructuring,
we will look at magnitude and consistency of a series of reforms undertaken between 1997 and
1999; at the likelihood of having recently made a major investment in fixed capital; and at the
vintage of capital. As regards productivity and efficiency, the indices used are labour
productivity; value added per worker and proportion of equipment utilisation. Finally, ROE,
EBITD over sales and EBITD over fixed assets17 are the profitability measures employed. Again,
levels and rates of change will be looked at.
4.4.1 Restructuring and Innovation The questionnaire reports information on fifteen possible reforms, asking whether they have
been implemented between 1997 and 1999, and, if not, exploring some possible reasons for it.
In order to obtain synthetic measures, they have been grouped into:
17 Return on equity is defined as 1999 after-tax profits (losses) divided by capital and reserves. EBITD is pre-tax profits (losses).
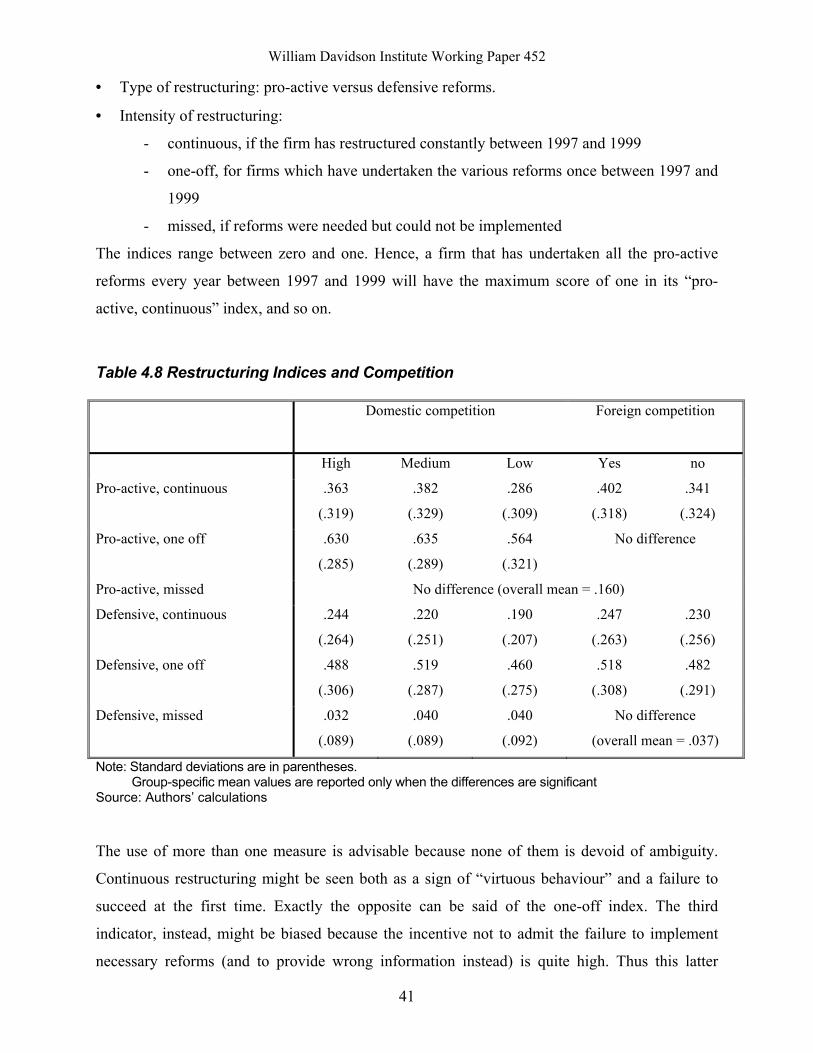
William Davidson Institute Working Paper 452
41
• Type of restructuring: pro-active versus defensive reforms.
• Intensity of restructuring:
- continuous, if the firm has restructured constantly between 1997 and 1999
- one-off, for firms which have undertaken the various reforms once between 1997 and
1999
- missed, if reforms were needed but could not be implemented
The indices range between zero and one. Hence, a firm that has undertaken all the pro-active
reforms every year between 1997 and 1999 will have the maximum score of one in its “pro-
active, continuous” index, and so on.
Table 4.8 Restructuring Indices and Competition
Domestic competition Foreign competition
High Medium Low Yes no
Pro-active, continuous .363
(.319)
.382
(.329)
.286
(.309)
.402
(.318)
.341
(.324)
Pro-active, one off .630
(.285)
.635
(.289)
.564
(.321)
No difference
Pro-active, missed No difference (overall mean = .160)
Defensive, continuous .244
(.264)
.220
(.251)
.190
(.207)
.247
(.263)
.230
(.256)
Defensive, one off .488
(.306)
.519
(.287)
.460
(.275)
.518
(.308)
.482
(.291)
Defensive, missed .032
(.089)
.040
(.089)
.040
(.092)
No difference
(overall mean = .037)
Note: Standard deviations are in parentheses. Group-specific mean values are reported only when the differences are significant Source: Authors’ calculations
The use of more than one measure is advisable because none of them is devoid of ambiguity.
Continuous restructuring might be seen both as a sign of “virtuous behaviour” and a failure to
succeed at the first time. Exactly the opposite can be said of the one-off index. The third
indicator, instead, might be biased because the incentive not to admit the failure to implement
necessary reforms (and to provide wrong information instead) is quite high. Thus this latter
William Davidson Institute Working Paper 452
42
measure might simply be a sub-sample of a larger group of firms, whose interviewees refused to
answer or gave misleading responses18.
First of all, the data suggest that firms engage more in deep rather than defensive reforms. As far
as the latter is concerned, companies have undertaken less than half of the 5 reforms they were
asked about, and less than a quarter of them continuously. The equivalent values for pro-active
reforms are all significantly higher. Firms have undertaken 60 percent of them at least once
between 1997 and 1999, of which more than one half continuously. This first result is indicative
of some widespread attempt to pursue structural changes.
At a more detailed level, there is evidence of a positive association of pro-active restructuring
with competition, both domestic and foreign. Firms in highly and medium competitive domestic
markets restructure more than those in concentrated environments, both intermittently and
continuously. The same applies to firms facing import competition. No significant differences,
instead, have been detected in the last category.
Such results are consistent with the hypothesis that competition is positive for firms, as it forces
them to be more “virtuous”. However, the magnitude of the differentials for companies in low
and highly competitive environments is not very large.
As far as defensive reforms are concerned, it is theoretically unclear whether higher restructuring
in more competitive environments is seen as a failure (because of the necessity of recurring to
emergency measures, so to speak) or as a success (because firms are responsive to signals from
the market).
The data are not clear, either. As regards domestic competition, high-competition firms have
more continuous and less one-off restructuring than medium-competition ones (moreover, the
significance level is very low). The latter group has undertaken more one-off restructuring than
firms in very concentrated markets. Lastly, firms in highly competitive markets have a lower
18 Alternatives that could be chosen by respondents are: reforms were not implemented because there was no need to; reform undertaken before 1997; difficult to answer.
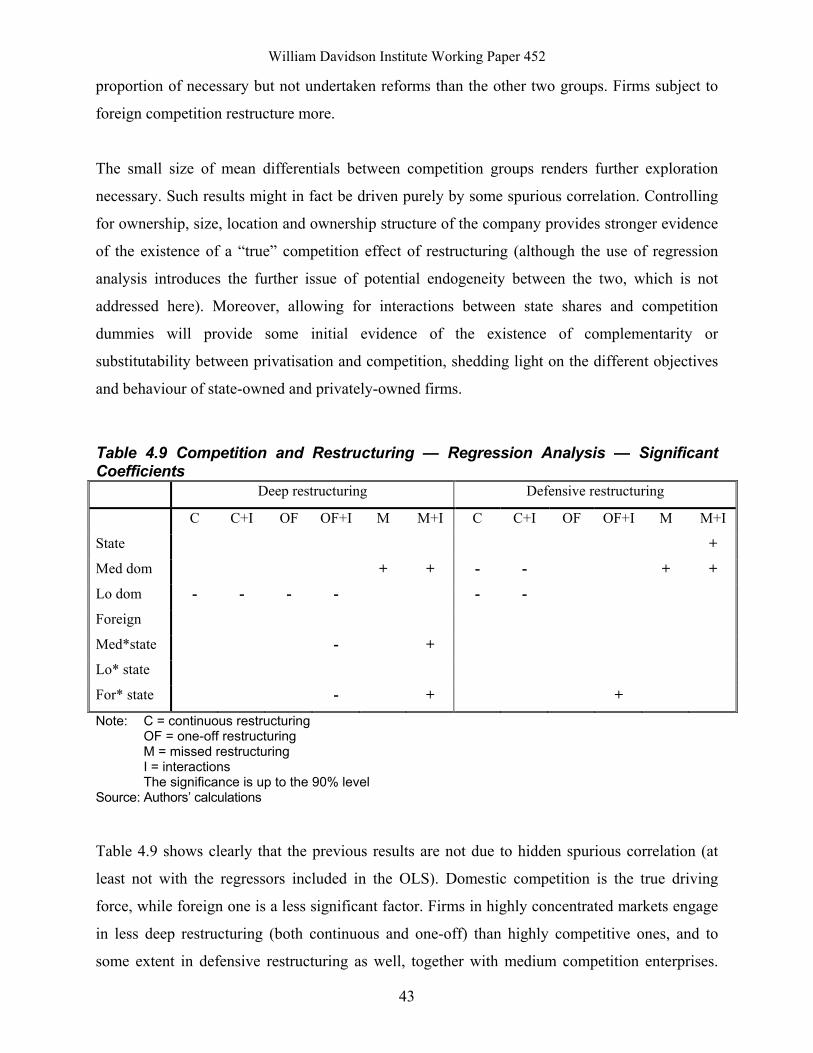
William Davidson Institute Working Paper 452
43
proportion of necessary but not undertaken reforms than the other two groups. Firms subject to
foreign competition restructure more.
The small size of mean differentials between competition groups renders further exploration
necessary. Such results might in fact be driven purely by some spurious correlation. Controlling
for ownership, size, location and ownership structure of the company provides stronger evidence
of the existence of a “true” competition effect of restructuring (although the use of regression
analysis introduces the further issue of potential endogeneity between the two, which is not
addressed here). Moreover, allowing for interactions between state shares and competition
dummies will provide some initial evidence of the existence of complementarity or
substitutability between privatisation and competition, shedding light on the different objectives
and behaviour of state-owned and privately-owned firms.
Table 4.9 Competition and Restructuring — Regression Analysis — Significant Coefficients
Deep restructuring Defensive restructuring
C C+I OF OF+I M M+I C C+I OF OF+I M M+I
State +
Med dom + + - - + +
Lo dom - - - - - -
Foreign
Med*state - +
Lo* state
For* state - + +
Note: C = continuous restructuring OF = one-off restructuring M = missed restructuring I = interactions The significance is up to the 90% level Source: Authors’ calculations
Table 4.9 shows clearly that the previous results are not due to hidden spurious correlation (at
least not with the regressors included in the OLS). Domestic competition is the true driving
force, while foreign one is a less significant factor. Firms in highly concentrated markets engage
in less deep restructuring (both continuous and one-off) than highly competitive ones, and to
some extent in defensive restructuring as well, together with medium competition enterprises.
William Davidson Institute Working Paper 452
44
This latter group has more missed reforms. Defensive restructuring is positively correlated with
state shares. Some significant interaction of ownership with competition occurs, but there is
never any difference in sign between state and private share ownership.
An indirect way to look at the state of restructuring in a firm is to check the proportion of capital
by age category, and control for evidence of a relationship between the undertaking of major
investments in fixed capital and the level of competition faced by the firm.
If competition shortens the innovation cycle, the lower the concentration, the higher the
probability of having recently (since August 1998) undertaken a major investment. A binary
variable coded one if such case is observed is regressed on competition level, controlling for
size, industry, location and ownership structure of firms. Ceteris paribus, firms facing foreign
competition are more likely to have undertaken the investment. Moreover, the interaction of
import competition dummies with the shares owned by the government shows that such
likelihood is higher the larger the privately owned share. Vice versa, within firms subject to
import competition, the higher the proportion owned by the state, the lower the probability of
having undertaken the investment. This result is quite interesting, as it supports the view that
competition affects firms differently according to their ownership structure. Table 4.10 illustrates
the main results.
A further indirect measure of restructuring is the age of firm’s equipment. The proportion of
capital less than 10 years old is regressed on ownership and competition, controlling for size,
location and industry. Although some weak negative association between state-owned shares and
proportion of “new” equipment is detected (higher state-owned shares correlated with lower
proportion of “new” machinery), no competition effect is found.
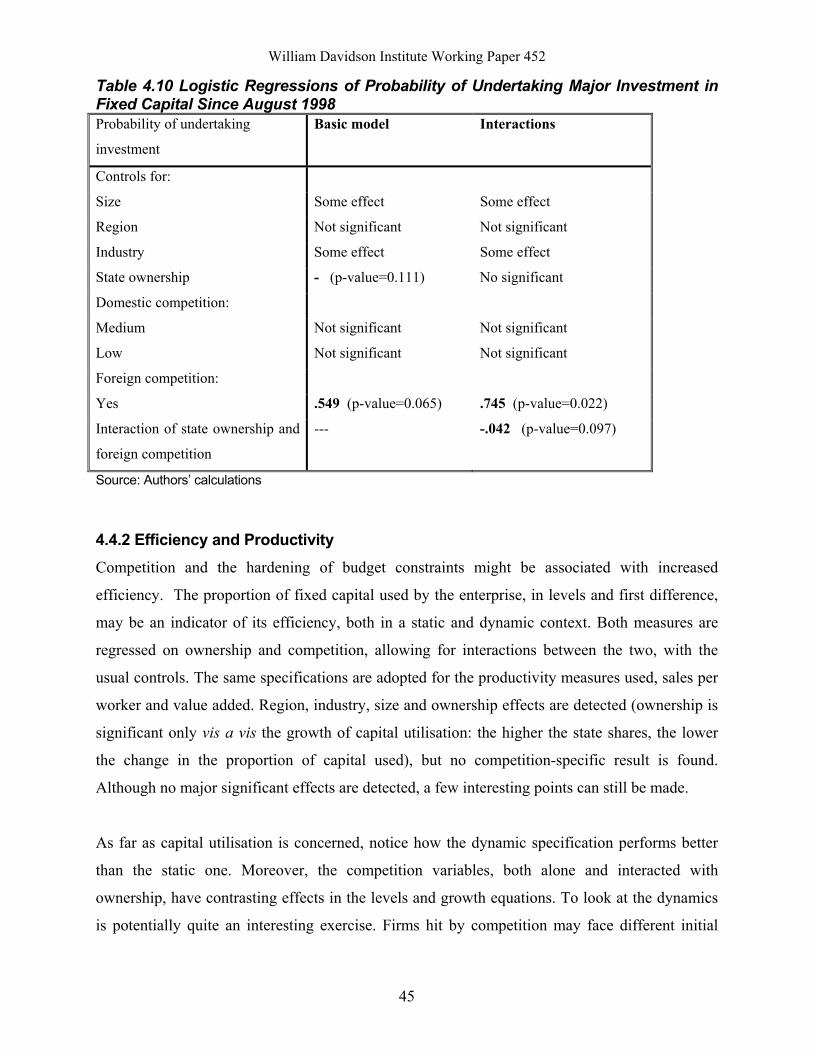
William Davidson Institute Working Paper 452
45
Table 4.10 Logistic Regressions of Probability of Undertaking Major Investment in Fixed Capital Since August 1998 Probability of undertaking
investment
Basic model Interactions
Controls for:
Size Some effect Some effect
Region Not significant Not significant
Industry Some effect Some effect
State ownership - (p-value=0.111) No significant
Domestic competition:
Medium Not significant Not significant
Low Not significant Not significant
Foreign competition:
Yes .549 (p-value=0.065) .745 (p-value=0.022)
Interaction of state ownership and
foreign competition
--- -.042 (p-value=0.097)
Source: Authors’ calculations
4.4.2 Efficiency and Productivity Competition and the hardening of budget constraints might be associated with increased
efficiency. The proportion of fixed capital used by the enterprise, in levels and first difference,
may be an indicator of its efficiency, both in a static and dynamic context. Both measures are
regressed on ownership and competition, allowing for interactions between the two, with the
usual controls. The same specifications are adopted for the productivity measures used, sales per
worker and value added. Region, industry, size and ownership effects are detected (ownership is
significant only vis a vis the growth of capital utilisation: the higher the state shares, the lower
the change in the proportion of capital used), but no competition-specific result is found.
Although no major significant effects are detected, a few interesting points can still be made.
As far as capital utilisation is concerned, notice how the dynamic specification performs better
than the static one. Moreover, the competition variables, both alone and interacted with
ownership, have contrasting effects in the levels and growth equations. To look at the dynamics
is potentially quite an interesting exercise. Firms hit by competition may face different initial
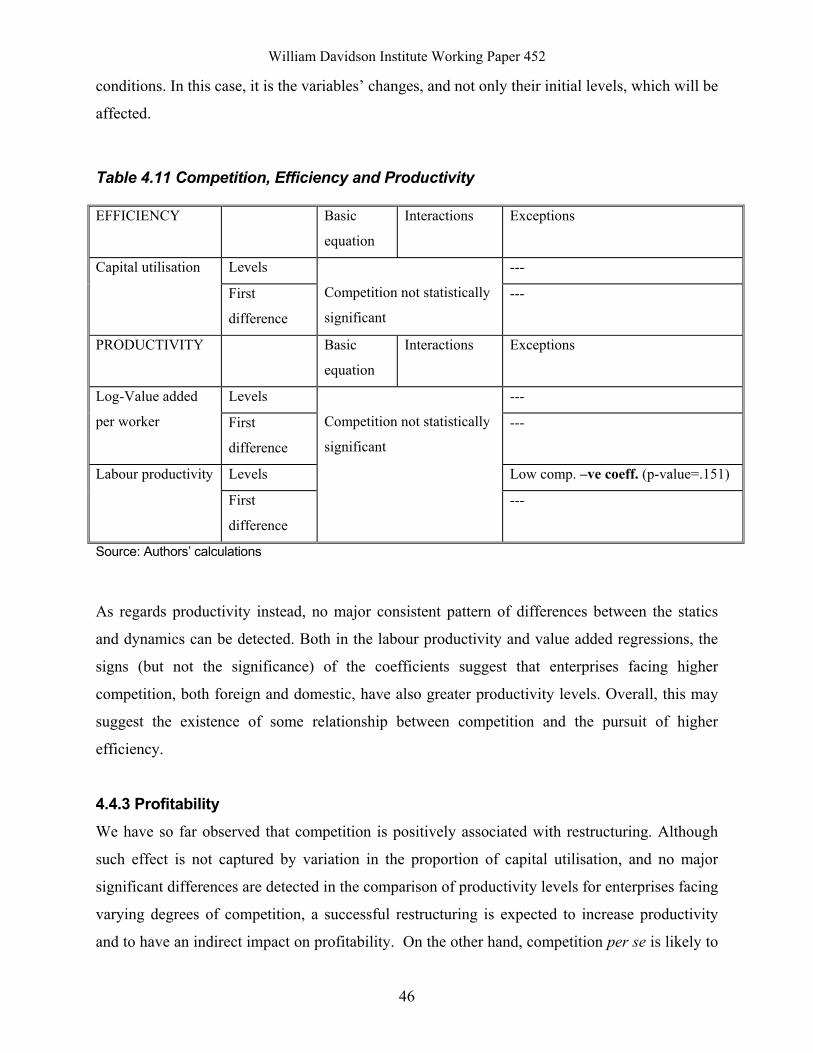
William Davidson Institute Working Paper 452
46
conditions. In this case, it is the variables’ changes, and not only their initial levels, which will be
affected.
Table 4.11 Competition, Efficiency and Productivity
EFFICIENCY Basic
equation
Interactions Exceptions
Levels --- Capital utilisation
First
difference
Competition not statistically
significant
---
PRODUCTIVITY Basic
equation
Interactions Exceptions
Levels --- Log-Value added
per worker First
difference
---
Levels Low comp. –ve coeff. (p-value=.151) Labour productivity
First
difference
Competition not statistically
significant
---
Source: Authors’ calculations
As regards productivity instead, no major consistent pattern of differences between the statics
and dynamics can be detected. Both in the labour productivity and value added regressions, the
signs (but not the significance) of the coefficients suggest that enterprises facing higher
competition, both foreign and domestic, have also greater productivity levels. Overall, this may
suggest the existence of some relationship between competition and the pursuit of higher
efficiency.
4.4.3 Profitability We have so far observed that competition is positively associated with restructuring. Although
such effect is not captured by variation in the proportion of capital utilisation, and no major
significant differences are detected in the comparison of productivity levels for enterprises facing
varying degrees of competition, a successful restructuring is expected to increase productivity
and to have an indirect impact on profitability. On the other hand, competition per se is likely to
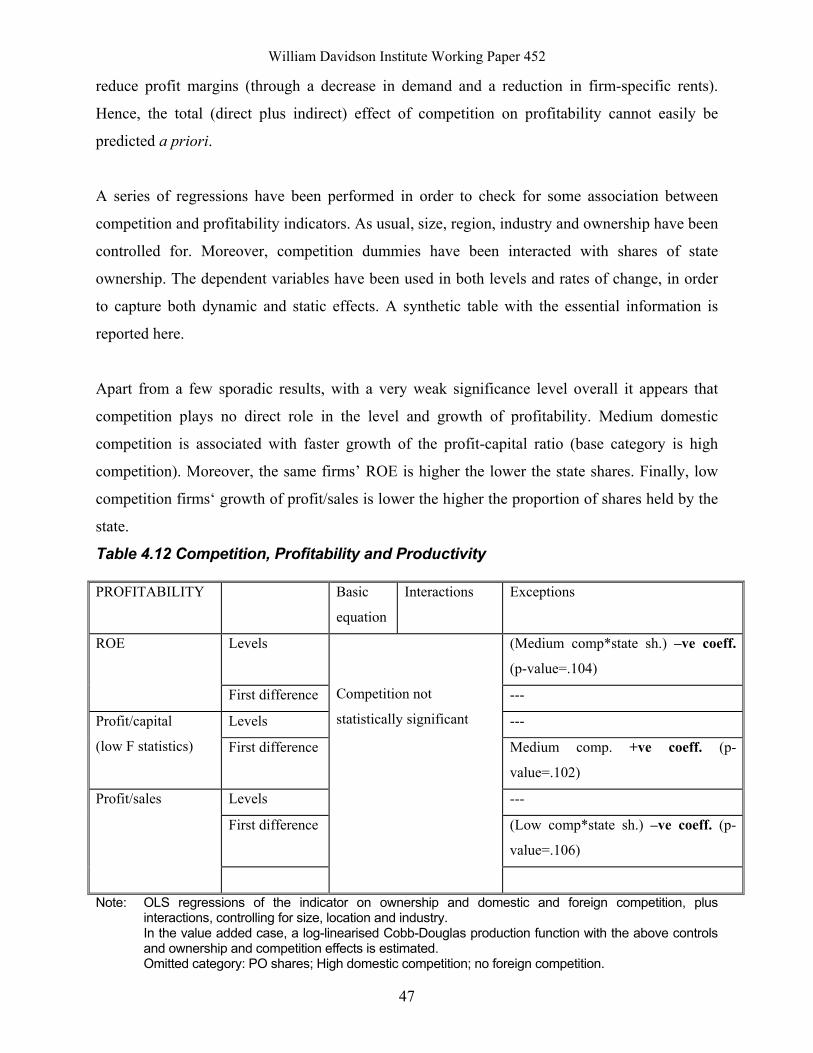
William Davidson Institute Working Paper 452
47
reduce profit margins (through a decrease in demand and a reduction in firm-specific rents).
Hence, the total (direct plus indirect) effect of competition on profitability cannot easily be
predicted a priori.
A series of regressions have been performed in order to check for some association between
competition and profitability indicators. As usual, size, region, industry and ownership have been
controlled for. Moreover, competition dummies have been interacted with shares of state
ownership. The dependent variables have been used in both levels and rates of change, in order
to capture both dynamic and static effects. A synthetic table with the essential information is
reported here.
Apart from a few sporadic results, with a very weak significance level overall it appears that
competition plays no direct role in the level and growth of profitability. Medium domestic
competition is associated with faster growth of the profit-capital ratio (base category is high
competition). Moreover, the same firms’ ROE is higher the lower the state shares. Finally, low
competition firms‘ growth of profit/sales is lower the higher the proportion of shares held by the
state.
Table 4.12 Competition, Profitability and Productivity
PROFITABILITY Basic
equation
Interactions Exceptions
Levels (Medium comp*state sh.) –ve coeff.
(p-value=.104)
ROE
First difference ---
Levels --- Profit/capital
(low F statistics) First difference Medium comp. +ve coeff. (p-
value=.102)
Levels ---
First difference (Low comp*state sh.) –ve coeff. (p-
value=.106)
Profit/sales
Competition not
statistically significant
Note: OLS regressions of the indicator on ownership and domestic and foreign competition, plus interactions, controlling for size, location and industry. In the value added case, a log-linearised Cobb-Douglas production function with the above controls and ownership and competition effects is estimated. Omitted category: PO shares; High domestic competition; no foreign competition.
William Davidson Institute Working Paper 452
48
Source: Authors’ calculations
Results for the EBITD/capital ratio come from too poor a specification to have any relevance.
Comparisons of the overall significance of ownership and competition variables in the remaining
two indices shows no consistency. However, from the scarce significant coefficients we can
observe that the levels and growth of medium and low competition companies is lower
(compared to high competition ones) the higher the proportion of shares owned by the
government. This partial result is in line with the findings of the previous sections, and it
somehow confirms the importance of the interplay between ownership and competition.
4.5 Conclusions Overall, our findings are quite interesting. The major effect of competition is undoubtedly on the
intensity and the type of restructuring. Low domestic competition is associated with less pro-
active reforms, and medium competition with more missed ones. State shareholding is associated
with higher levels of defensive restructuring. Competition is a driving force in terms of capital
investment, too, although on this occasion it is foreign competition that has the major impact.
Altogether, these results suggest that the likely impact of competition on firm behaviour is
consistent with the notion of an increase in effort levels, and the pursuit of efficiency to counter
the decrease in rents. However, using direct measurements of efficiency indicators (vintage of
capital and two different measures of productivity) do not provide additional compelling
evidence. Though the signs of the competition variables are consistent with this scenario- high
productivity being generally associated with high competition (also a weakly significant negative
effect of low domestic competition on the level of labour productivity). The productivity effect
of competition is varied and overall too unclear to be conclusive though again the few (weakly)
significant variables are not inconsistent with arguments of positive efficiency effects.
The really interesting findings, however, are the least explored in the present analysis. Two
points repeatedly emerge from our research. One is the importance of the impact of competition
as a dynamic phenomenon, an issue that clearly deserves much more careful consideration and
modelling at the theoretical level. This is shown not only by the signs of the coefficients in the
William Davidson Institute Working Paper 452
49
various first difference regressions, but primarily by the link between competition and
restructuring, this latter one being itself a dynamic process, rather than a static concept.
The other is the importance of the interplay between corporate governance and competition.
Overall, our investigation suggests that the positive effect of the latter on performance is not a
substitute, but a complement to privatisation. More generally, it indicate how ownership affects
firm behaviour and objectives, and enterprise responses to the same exogenous shocks.
5. Performance, Restructuring and Finance 5.1 Introduction The importance of finance for corporate restructuring and performance is one of the most
consistent conclusions throughout studies of transition. While privatisation has led to the transfer
of ownership from state to private hands, investment in physical capital is fundamental if
enterprises are to restructure in a manner that will enable their long-term viability. Unfortunately
available evidence suggests that enterprises in transition economies have been subjected to acute
financial constraints that have hindered the restructuring process (see e.g., Cornelli, Portes and
Schaffer (1996), Commander, Fan and Schaffer (1996), Bevan, Estrin and Schaffer (1999)).
While the financial markets of the transition front-runners have begun to approach those of
middle income countries, those in the Former Soviet Union (FSU) generally remain thin and do
not constitute an ‘enabling environment’. Although the financial environment in Russia may be
somewhat more developed than in many of the satellite states, it has been severely weakened by
the August 1998 crisis. This has led to a demonetisation of the economy and the emergence of
barter — a phenomenon that has been largely confined to the FSU (see Commander and
Mumssen (1999)).
This section considers the results of our survey that relate finance, restructuring and
performance. We firstly consider the extent to which enterprises are financially constrained and
the forms in which these constraints manifest themselves. Sub-section 3 provides more detail by
considering the extent to which financial constraints differ according to characteristics of the
enterprise such as size, region, area of activity and so on. In order to ease the analysis we then
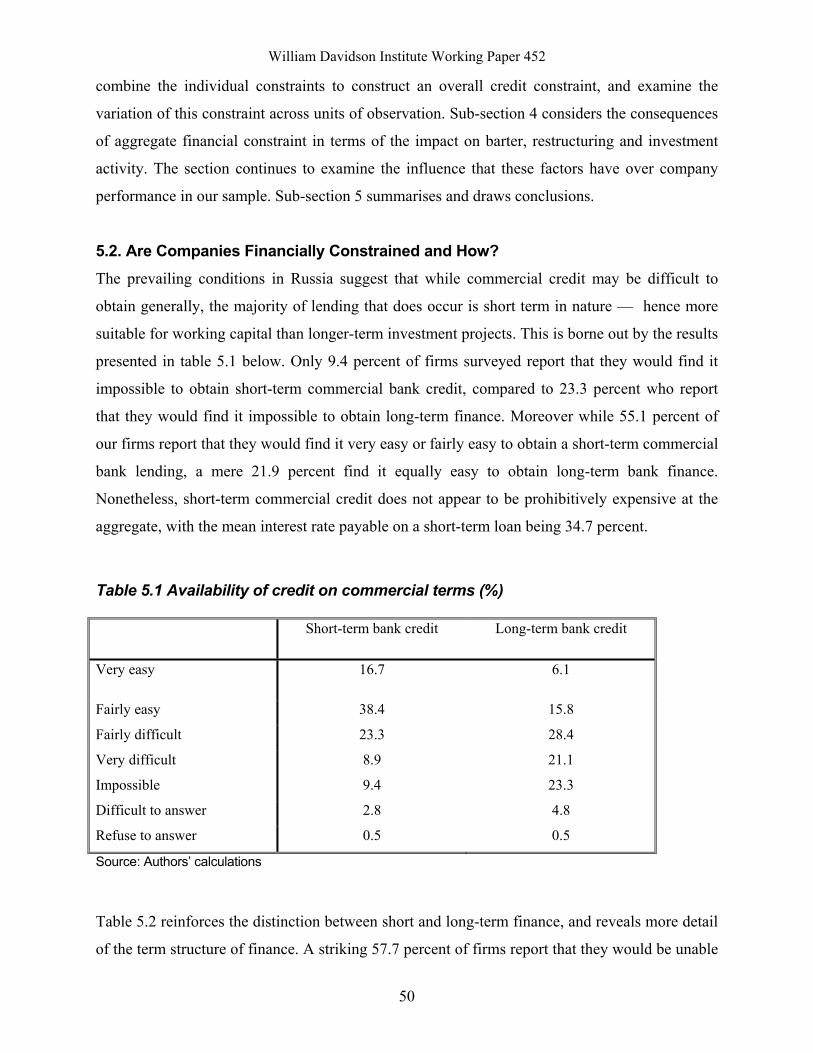
William Davidson Institute Working Paper 452
50
combine the individual constraints to construct an overall credit constraint, and examine the
variation of this constraint across units of observation. Sub-section 4 considers the consequences
of aggregate financial constraint in terms of the impact on barter, restructuring and investment
activity. The section continues to examine the influence that these factors have over company
performance in our sample. Sub-section 5 summarises and draws conclusions.
5.2. Are Companies Financially Constrained and How? The prevailing conditions in Russia suggest that while commercial credit may be difficult to
obtain generally, the majority of lending that does occur is short term in nature — hence more
suitable for working capital than longer-term investment projects. This is borne out by the results
presented in table 5.1 below. Only 9.4 percent of firms surveyed report that they would find it
impossible to obtain short-term commercial bank credit, compared to 23.3 percent who report
that they would find it impossible to obtain long-term finance. Moreover while 55.1 percent of
our firms report that they would find it very easy or fairly easy to obtain a short-term commercial
bank lending, a mere 21.9 percent find it equally easy to obtain long-term bank finance.
Nonetheless, short-term commercial credit does not appear to be prohibitively expensive at the
aggregate, with the mean interest rate payable on a short-term loan being 34.7 percent.
Table 5.1 Availability of credit on commercial terms (%)
Short-term bank credit Long-term bank credit
Very easy 16.7 6.1
Fairly easy 38.4 15.8
Fairly difficult 23.3 28.4
Very difficult 8.9 21.1
Impossible 9.4 23.3
Difficult to answer 2.8 4.8
Refuse to answer 0.5 0.5
Source: Authors’ calculations
Table 5.2 reinforces the distinction between short and long-term finance, and reveals more detail
of the term structure of finance. A striking 57.7 percent of firms report that they would be unable
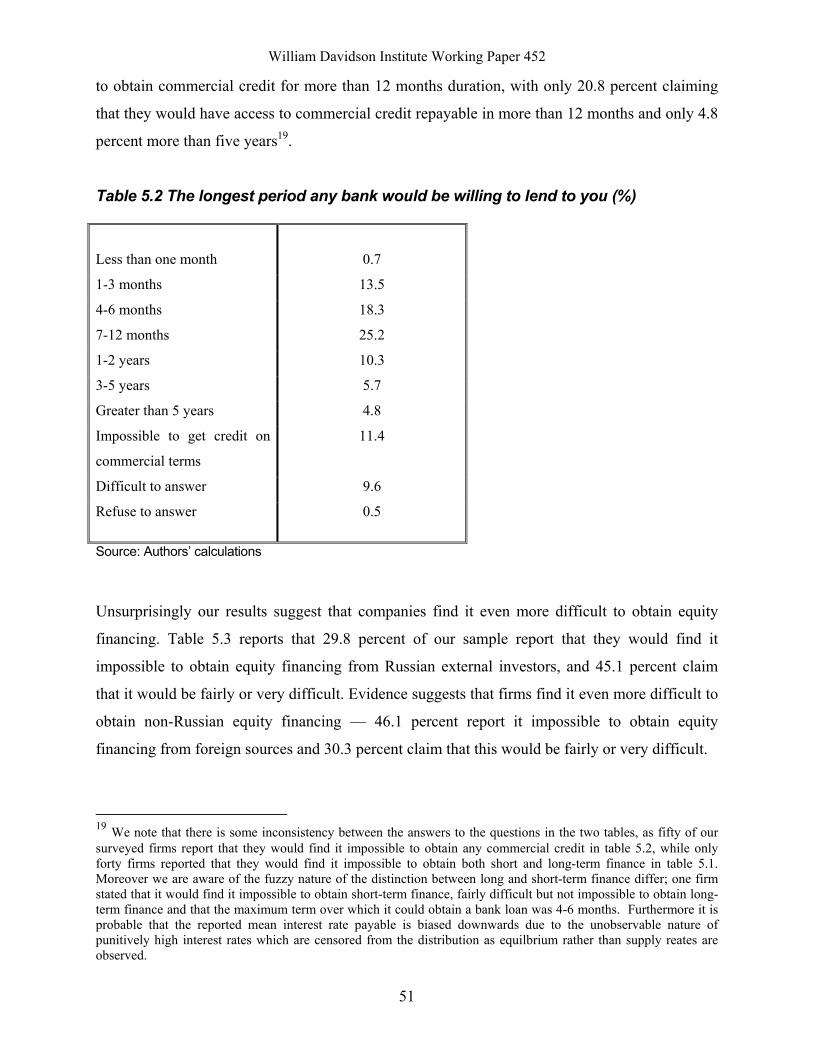
William Davidson Institute Working Paper 452
51
to obtain commercial credit for more than 12 months duration, with only 20.8 percent claiming
that they would have access to commercial credit repayable in more than 12 months and only 4.8
percent more than five years19.
Table 5.2 The longest period any bank would be willing to lend to you (%)
Less than one month
0.7
1-3 months 13.5
4-6 months 18.3
7-12 months 25.2
1-2 years 10.3
3-5 years 5.7
Greater than 5 years 4.8
Impossible to get credit on
commercial terms
11.4
Difficult to answer 9.6
Refuse to answer 0.5
Source: Authors’ calculations
Unsurprisingly our results suggest that companies find it even more difficult to obtain equity
financing. Table 5.3 reports that 29.8 percent of our sample report that they would find it
impossible to obtain equity financing from Russian external investors, and 45.1 percent claim
that it would be fairly or very difficult. Evidence suggests that firms find it even more difficult to
obtain non-Russian equity financing — 46.1 percent report it impossible to obtain equity
financing from foreign sources and 30.3 percent claim that this would be fairly or very difficult.
19 We note that there is some inconsistency between the answers to the questions in the two tables, as fifty of our surveyed firms report that they would find it impossible to obtain any commercial credit in table 5.2, while only forty firms reported that they would find it impossible to obtain both short and long-term finance in table 5.1. Moreover we are aware of the fuzzy nature of the distinction between long and short-term finance differ; one firm stated that it would find it impossible to obtain short-term finance, fairly difficult but not impossible to obtain long-term finance and that the maximum term over which it could obtain a bank loan was 4-6 months. Furthermore it is probable that the reported mean interest rate payable is biased downwards due to the unobservable nature of punitively high interest rates which are censored from the distribution as equilbrium rather than supply reates are observed.
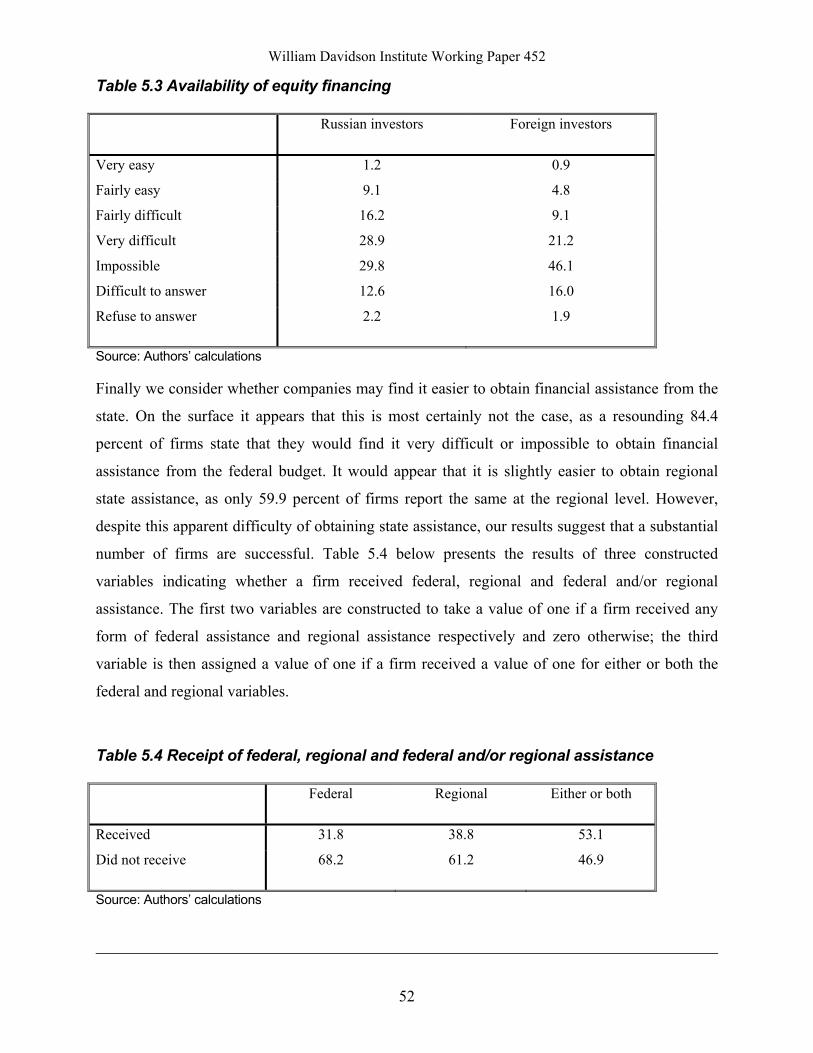
William Davidson Institute Working Paper 452
52
Table 5.3 Availability of equity financing
Russian investors Foreign investors
Very easy 1.2 0.9
Fairly easy 9.1 4.8
Fairly difficult 16.2 9.1
Very difficult 28.9 21.2
Impossible 29.8 46.1
Difficult to answer 12.6 16.0
Refuse to answer 2.2 1.9
Source: Authors’ calculations
Finally we consider whether companies may find it easier to obtain financial assistance from the
state. On the surface it appears that this is most certainly not the case, as a resounding 84.4
percent of firms state that they would find it very difficult or impossible to obtain financial
assistance from the federal budget. It would appear that it is slightly easier to obtain regional
state assistance, as only 59.9 percent of firms report the same at the regional level. However,
despite this apparent difficulty of obtaining state assistance, our results suggest that a substantial
number of firms are successful. Table 5.4 below presents the results of three constructed
variables indicating whether a firm received federal, regional and federal and/or regional
assistance. The first two variables are constructed to take a value of one if a firm received any
form of federal assistance and regional assistance respectively and zero otherwise; the third
variable is then assigned a value of one if a firm received a value of one for either or both the
federal and regional variables.
Table 5.4 Receipt of federal, regional and federal and/or regional assistance
Federal Regional Either or both
Received 31.8 38.8 53.1
Did not receive 68.2 61.2 46.9
Source: Authors’ calculations
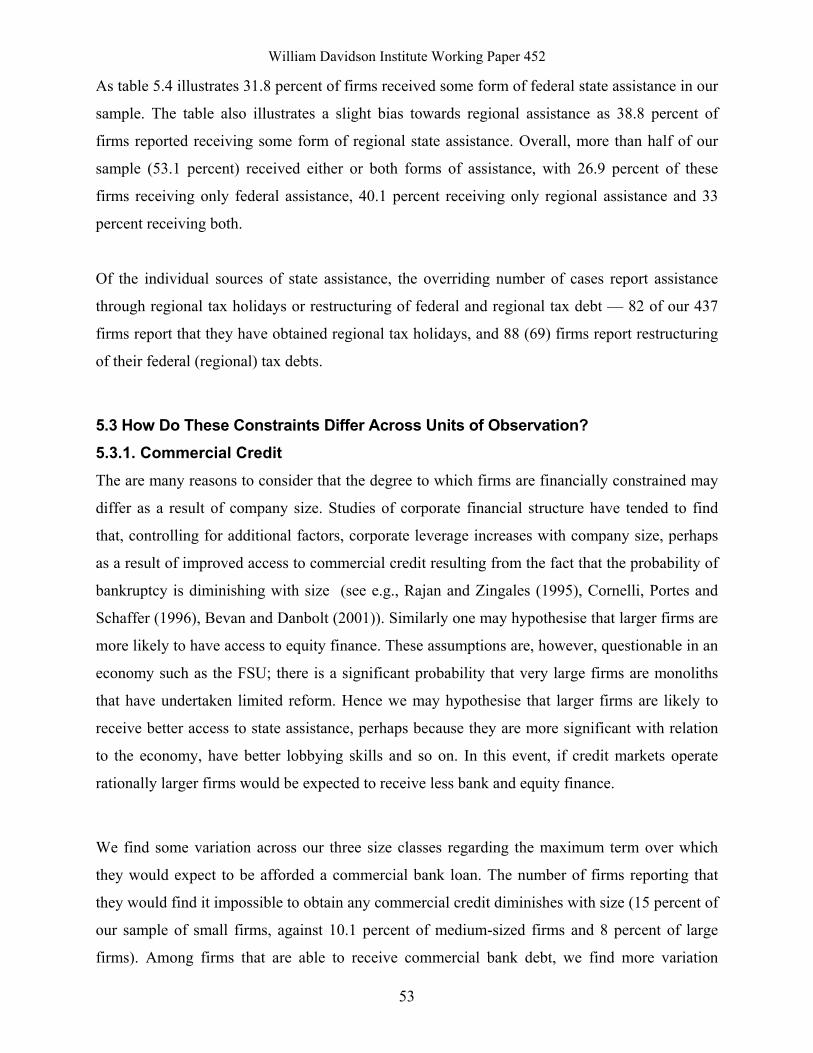
William Davidson Institute Working Paper 452
53
As table 5.4 illustrates 31.8 percent of firms received some form of federal state assistance in our
sample. The table also illustrates a slight bias towards regional assistance as 38.8 percent of
firms reported receiving some form of regional state assistance. Overall, more than half of our
sample (53.1 percent) received either or both forms of assistance, with 26.9 percent of these
firms receiving only federal assistance, 40.1 percent receiving only regional assistance and 33
percent receiving both.
Of the individual sources of state assistance, the overriding number of cases report assistance
through regional tax holidays or restructuring of federal and regional tax debt — 82 of our 437
firms report that they have obtained regional tax holidays, and 88 (69) firms report restructuring
of their federal (regional) tax debts.
5.3 How Do These Constraints Differ Across Units of Observation? 5.3.1. Commercial Credit The are many reasons to consider that the degree to which firms are financially constrained may
differ as a result of company size. Studies of corporate financial structure have tended to find
that, controlling for additional factors, corporate leverage increases with company size, perhaps
as a result of improved access to commercial credit resulting from the fact that the probability of
bankruptcy is diminishing with size (see e.g., Rajan and Zingales (1995), Cornelli, Portes and
Schaffer (1996), Bevan and Danbolt (2001)). Similarly one may hypothesise that larger firms are
more likely to have access to equity finance. These assumptions are, however, questionable in an
economy such as the FSU; there is a significant probability that very large firms are monoliths
that have undertaken limited reform. Hence we may hypothesise that larger firms are likely to
receive better access to state assistance, perhaps because they are more significant with relation
to the economy, have better lobbying skills and so on. In this event, if credit markets operate
rationally larger firms would be expected to receive less bank and equity finance.
We find some variation across our three size classes regarding the maximum term over which
they would expect to be afforded a commercial bank loan. The number of firms reporting that
they would find it impossible to obtain any commercial credit diminishes with size (15 percent of
our sample of small firms, against 10.1 percent of medium-sized firms and 8 percent of large
firms). Among firms that are able to receive commercial bank debt, we find more variation
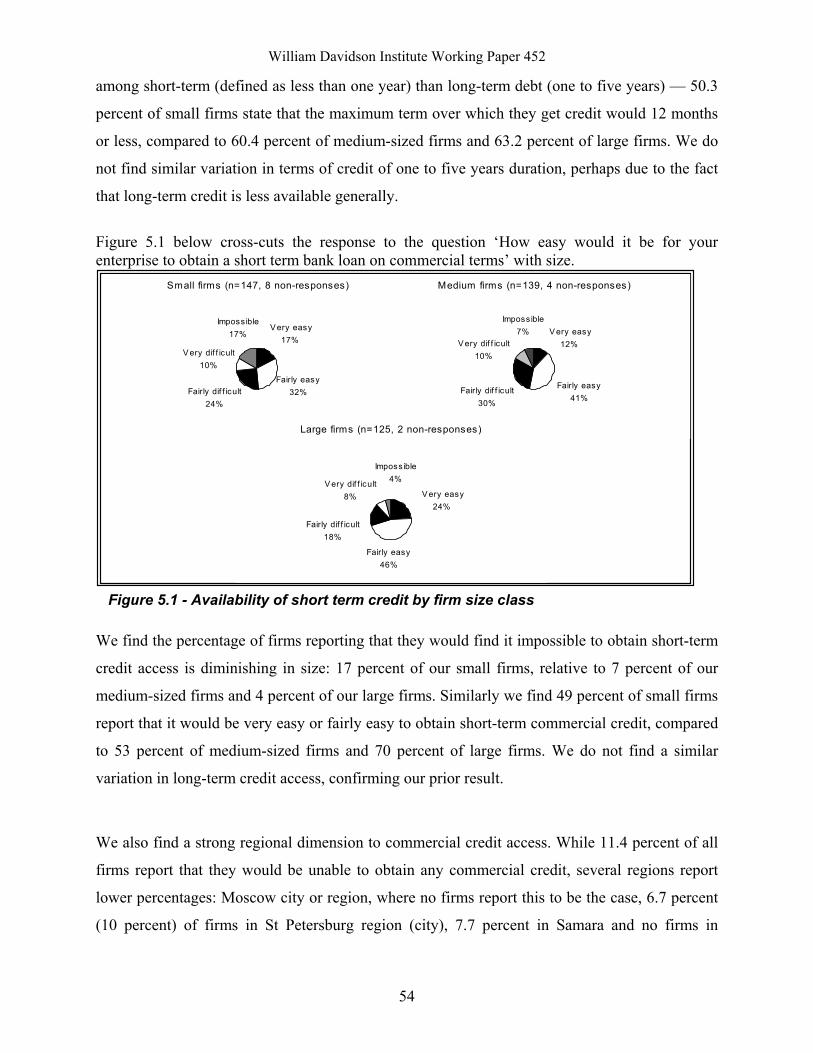
William Davidson Institute Working Paper 452
54
among short-term (defined as less than one year) than long-term debt (one to five years) — 50.3
percent of small firms state that the maximum term over which they get credit would 12 months
or less, compared to 60.4 percent of medium-sized firms and 63.2 percent of large firms. We do
not find similar variation in terms of credit of one to five years duration, perhaps due to the fact
that long-term credit is less available generally.
Figure 5.1 below cross-cuts the response to the question ‘How easy would it be for your enterprise to obtain a short term bank loan on commercial terms’ with size.
Small firms (n=147, 8 non-responses)
V ery easy17%
Fairly easy32%Fairly dif f icult
24%
V ery dif f icult10%
Impossible17%
Medium firms (n=139, 4 non-responses)
Fairly easy41%
Fairly dif f icult30%
V ery dif f icult10%
Impossible7% V ery easy
12%
Large firms (n=125, 2 non-responses)
V ery dif f icult8%
Fairly dif f icult18%
Impossible4%
Fairly easy46%
V ery easy24%
Figure 5.1 - Availability of short term credit by firm size class
We find the percentage of firms reporting that they would find it impossible to obtain short-term
credit access is diminishing in size: 17 percent of our small firms, relative to 7 percent of our
medium-sized firms and 4 percent of our large firms. Similarly we find 49 percent of small firms
report that it would be very easy or fairly easy to obtain short-term commercial credit, compared
to 53 percent of medium-sized firms and 70 percent of large firms. We do not find a similar
variation in long-term credit access, confirming our prior result.
We also find a strong regional dimension to commercial credit access. While 11.4 percent of all
firms report that they would be unable to obtain any commercial credit, several regions report
lower percentages: Moscow city or region, where no firms report this to be the case, 6.7 percent
(10 percent) of firms in St Petersburg region (city), 7.7 percent in Samara and no firms in
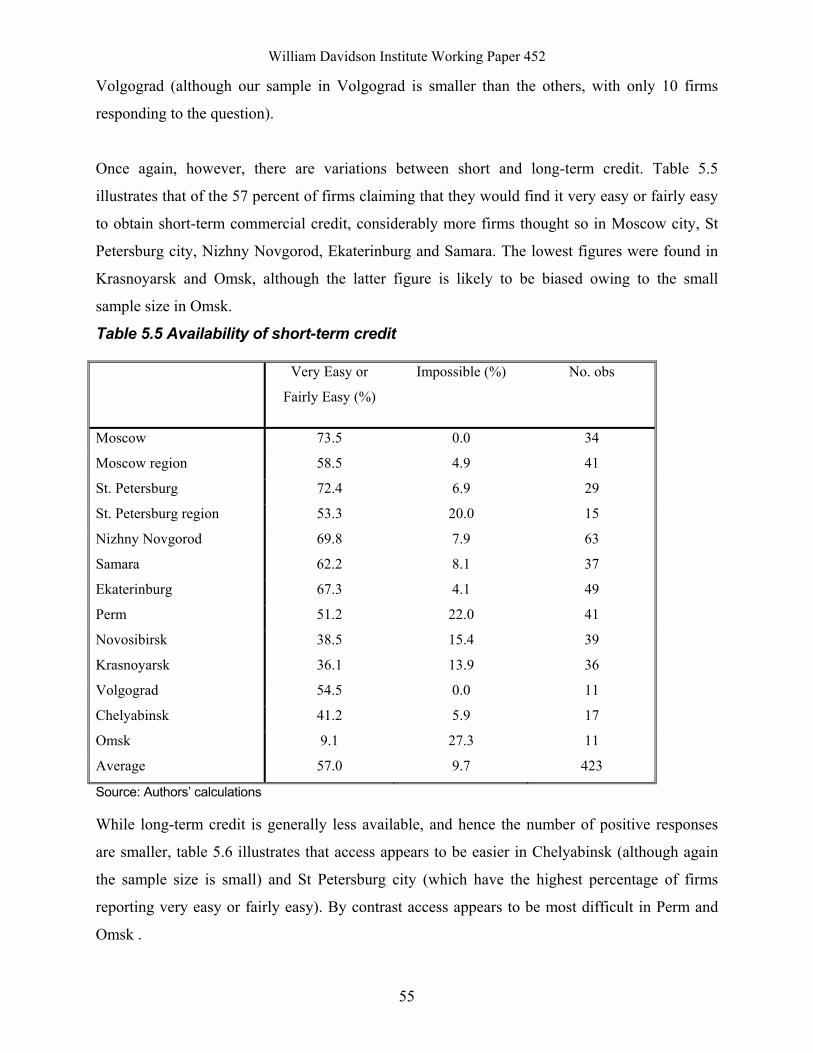
William Davidson Institute Working Paper 452
55
Volgograd (although our sample in Volgograd is smaller than the others, with only 10 firms
responding to the question).
Once again, however, there are variations between short and long-term credit. Table 5.5
illustrates that of the 57 percent of firms claiming that they would find it very easy or fairly easy
to obtain short-term commercial credit, considerably more firms thought so in Moscow city, St
Petersburg city, Nizhny Novgorod, Ekaterinburg and Samara. The lowest figures were found in
Krasnoyarsk and Omsk, although the latter figure is likely to be biased owing to the small
sample size in Omsk.
Table 5.5 Availability of short-term credit
Very Easy or
Fairly Easy (%)
Impossible (%) No. obs
Moscow 73.5 0.0 34
Moscow region 58.5 4.9 41
St. Petersburg 72.4 6.9 29
St. Petersburg region 53.3 20.0 15
Nizhny Novgorod 69.8 7.9 63
Samara 62.2 8.1 37
Ekaterinburg 67.3 4.1 49
Perm 51.2 22.0 41
Novosibirsk 38.5 15.4 39
Krasnoyarsk 36.1 13.9 36
Volgograd 54.5 0.0 11
Chelyabinsk 41.2 5.9 17
Omsk 9.1 27.3 11
Average 57.0 9.7 423
Source: Authors’ calculations
While long-term credit is generally less available, and hence the number of positive responses
are smaller, table 5.6 illustrates that access appears to be easier in Chelyabinsk (although again
the sample size is small) and St Petersburg city (which have the highest percentage of firms
reporting very easy or fairly easy). By contrast access appears to be most difficult in Perm and
Omsk .
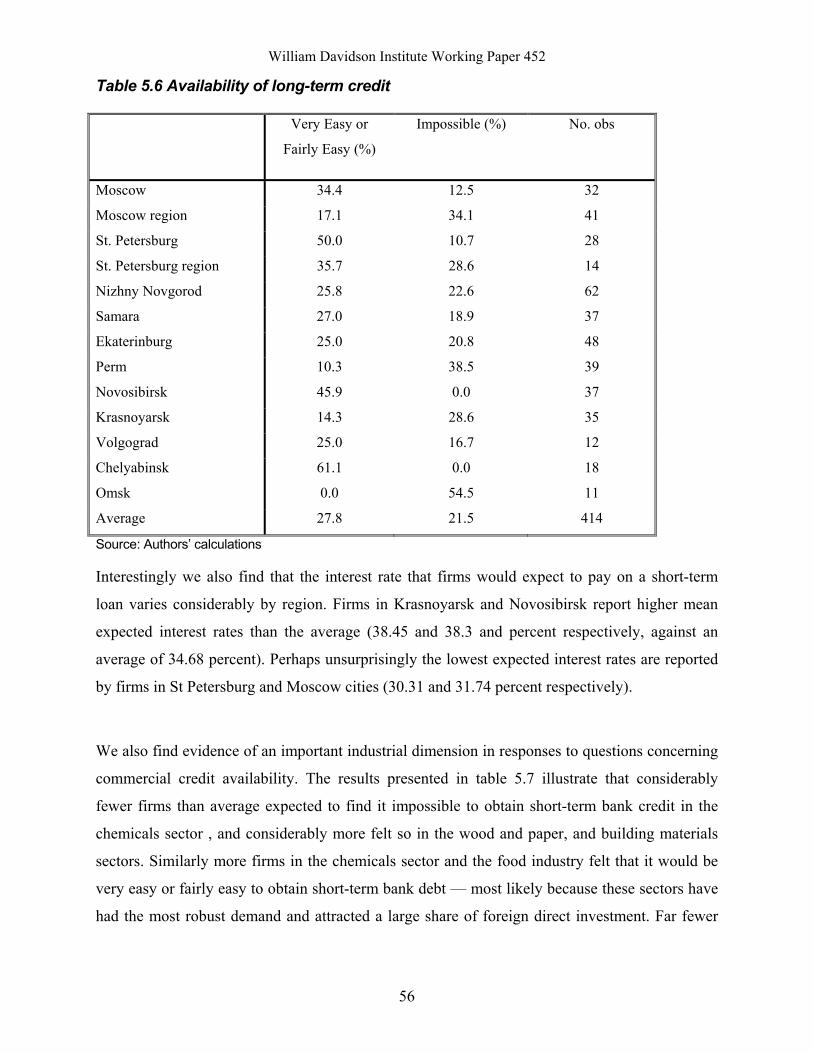
William Davidson Institute Working Paper 452
56
Table 5.6 Availability of long-term credit
Very Easy or
Fairly Easy (%)
Impossible (%) No. obs
Moscow 34.4 12.5 32
Moscow region 17.1 34.1 41
St. Petersburg 50.0 10.7 28
St. Petersburg region 35.7 28.6 14
Nizhny Novgorod 25.8 22.6 62
Samara 27.0 18.9 37
Ekaterinburg 25.0 20.8 48
Perm 10.3 38.5 39
Novosibirsk 45.9 0.0 37
Krasnoyarsk 14.3 28.6 35
Volgograd 25.0 16.7 12
Chelyabinsk 61.1 0.0 18
Omsk 0.0 54.5 11
Average 27.8 21.5 414
Source: Authors’ calculations
Interestingly we also find that the interest rate that firms would expect to pay on a short-term
loan varies considerably by region. Firms in Krasnoyarsk and Novosibirsk report higher mean
expected interest rates than the average (38.45 and 38.3 and percent respectively, against an
average of 34.68 percent). Perhaps unsurprisingly the lowest expected interest rates are reported
by firms in St Petersburg and Moscow cities (30.31 and 31.74 percent respectively).
We also find evidence of an important industrial dimension in responses to questions concerning
commercial credit availability. The results presented in table 5.7 illustrate that considerably
fewer firms than average expected to find it impossible to obtain short-term bank credit in the
chemicals sector , and considerably more felt so in the wood and paper, and building materials
sectors. Similarly more firms in the chemicals sector and the food industry felt that it would be
very easy or fairly easy to obtain short-term bank debt — most likely because these sectors have
had the most robust demand and attracted a large share of foreign direct investment. Far fewer
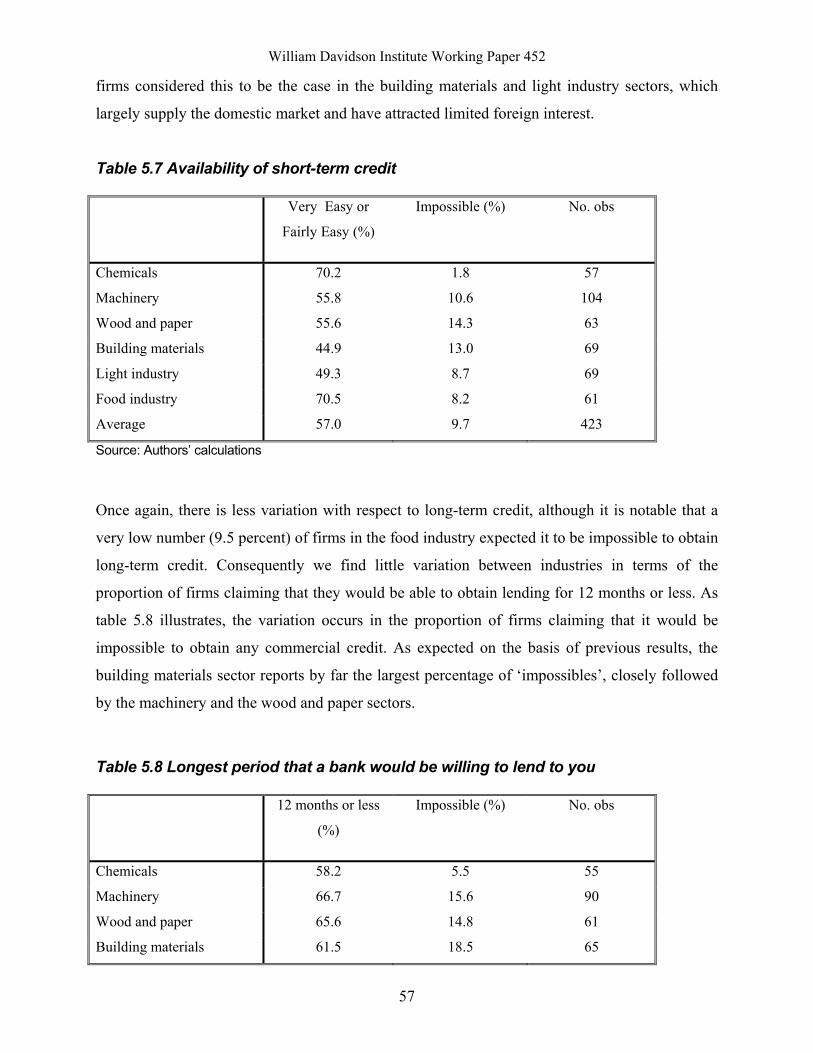
William Davidson Institute Working Paper 452
57
firms considered this to be the case in the building materials and light industry sectors, which
largely supply the domestic market and have attracted limited foreign interest.
Table 5.7 Availability of short-term credit
Very Easy or
Fairly Easy (%)
Impossible (%) No. obs
Chemicals 70.2 1.8 57
Machinery 55.8 10.6 104
Wood and paper 55.6 14.3 63
Building materials 44.9 13.0 69
Light industry 49.3 8.7 69
Food industry 70.5 8.2 61
Average 57.0 9.7 423
Source: Authors’ calculations
Once again, there is less variation with respect to long-term credit, although it is notable that a
very low number (9.5 percent) of firms in the food industry expected it to be impossible to obtain
long-term credit. Consequently we find little variation between industries in terms of the
proportion of firms claiming that they would be able to obtain lending for 12 months or less. As
table 5.8 illustrates, the variation occurs in the proportion of firms claiming that it would be
impossible to obtain any commercial credit. As expected on the basis of previous results, the
building materials sector reports by far the largest percentage of ‘impossibles’, closely followed
by the machinery and the wood and paper sectors.
Table 5.8 Longest period that a bank would be willing to lend to you
12 months or less
(%)
Impossible (%) No. obs
Chemicals 58.2 5.5 55
Machinery 66.7 15.6 90
Wood and paper 65.6 14.8 61
Building materials 61.5 18.5 65
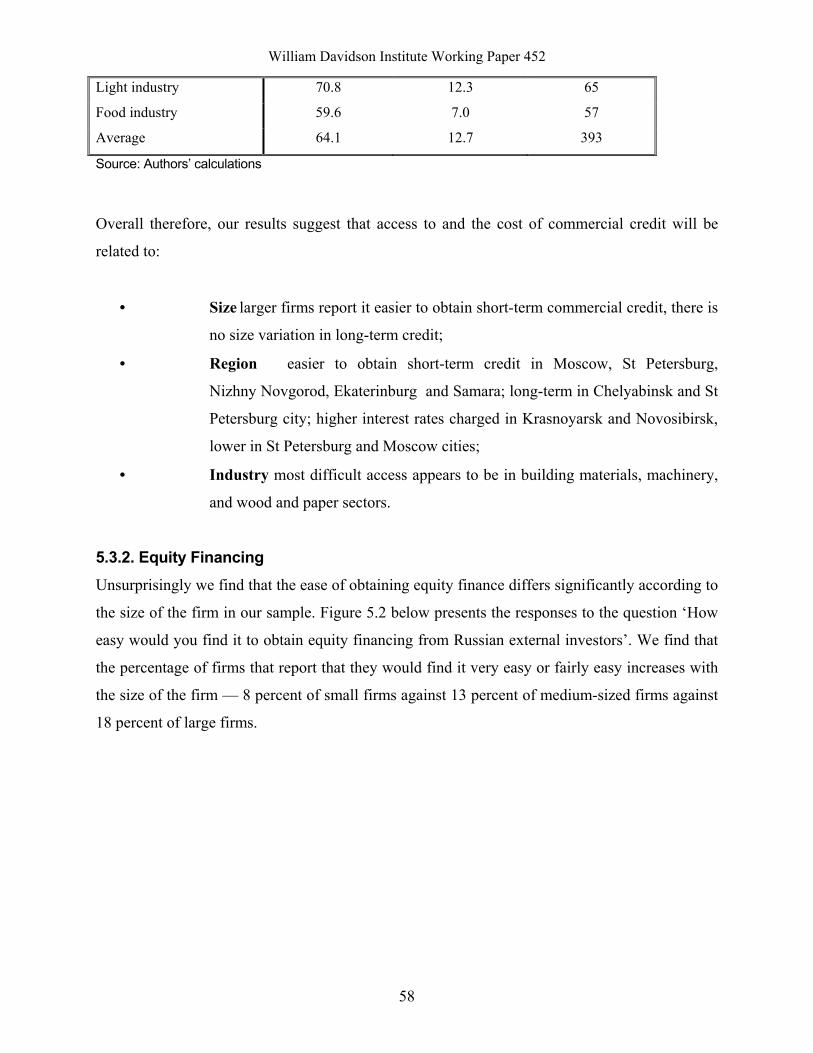
William Davidson Institute Working Paper 452
58
Light industry 70.8 12.3 65
Food industry 59.6 7.0 57
Average 64.1 12.7 393
Source: Authors’ calculations
Overall therefore, our results suggest that access to and the cost of commercial credit will be
related to:
• Size larger firms report it easier to obtain short-term commercial credit, there is
no size variation in long-term credit;
• Region easier to obtain short-term credit in Moscow, St Petersburg,
Nizhny Novgorod, Ekaterinburg and Samara; long-term in Chelyabinsk and St
Petersburg city; higher interest rates charged in Krasnoyarsk and Novosibirsk,
lower in St Petersburg and Moscow cities;
• Industry most difficult access appears to be in building materials, machinery,
and wood and paper sectors.
5.3.2. Equity Financing Unsurprisingly we find that the ease of obtaining equity finance differs significantly according to
the size of the firm in our sample. Figure 5.2 below presents the responses to the question ‘How
easy would you find it to obtain equity financing from Russian external investors’. We find that
the percentage of firms that report that they would find it very easy or fairly easy increases with
the size of the firm — 8 percent of small firms against 13 percent of medium-sized firms against
18 percent of large firms.
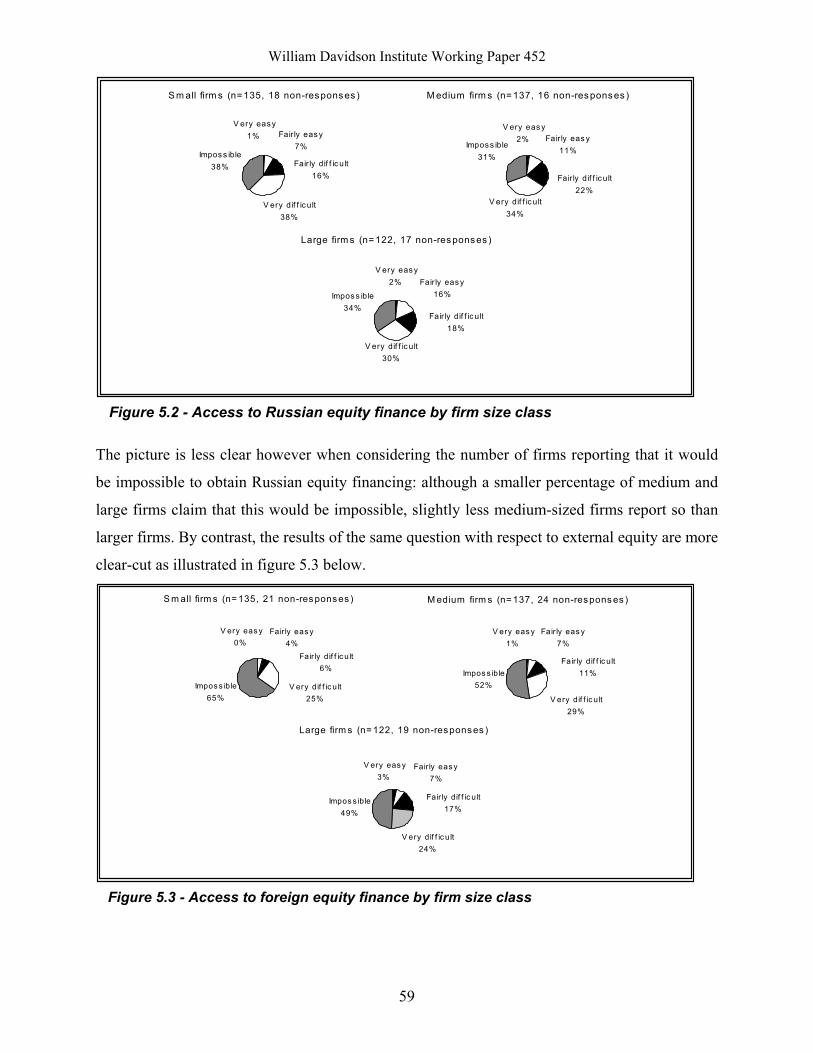
William Davidson Institute Working Paper 452
59
S m all firm s (n=135, 18 non-responses )
Imposs ible38%
V ery dif f icult38%
V ery easy1% Fairly easy
7%
Fair ly dif f icult16%
M edium firm s (n= 137, 16 non-responses )
V ery dif f icult34%
Imposs ible31%
Fair ly eas y11%
Fair ly dif f icult22%
V ery easy2%
Large firm s (n= 122, 17 non-responses )
V ery dif f icult30%
Imposs ible34%
Fair ly dif f icult18%
Fair ly easy16%
V ery easy2%
Figure 5.2 - Access to Russian equity finance by firm size class
The picture is less clear however when considering the number of firms reporting that it would
be impossible to obtain Russian equity financing: although a smaller percentage of medium and
large firms claim that this would be impossible, slightly less medium-sized firms report so than
larger firms. By contrast, the results of the same question with respect to external equity are more
clear-cut as illustrated in figure 5.3 below.
S m all firm s (n= 135, 21 non-res ponses )
Impos s ible65%
Fair ly dif f ic ult6%
Fair ly eas y4%
V ery eas y0%
V ery dif f ic ult25%
M edium firm s (n= 137, 24 non-respons es )
Impos s ible52%
Fair ly eas y7%
V ery dif f ic ult29%
Fair ly dif f ic ult11%
V ery eas y1%
Large firm s (n= 122, 19 non-responses )
Impos s ible49%
Fair ly easy7%
Fair ly dif f ic ult17%
V ery dif f ic ult24%
V ery eas y3%
Figure 5.3 - Access to foreign equity finance by firm size class
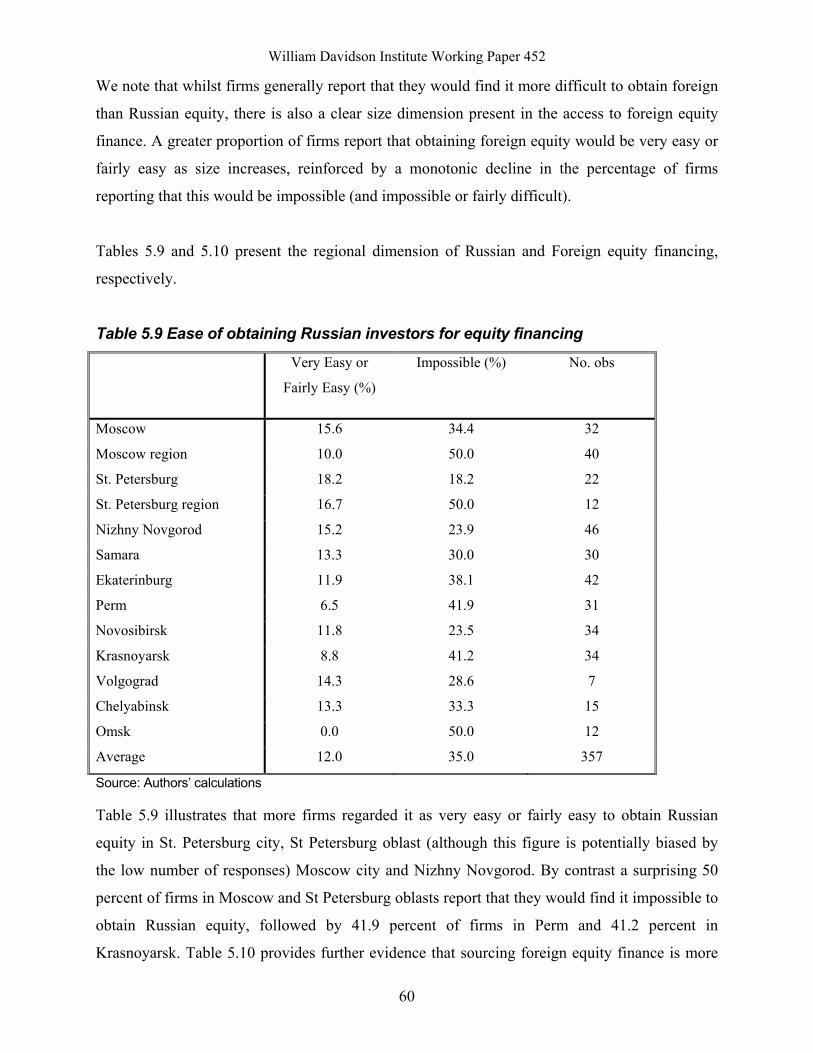
William Davidson Institute Working Paper 452
60
We note that whilst firms generally report that they would find it more difficult to obtain foreign
than Russian equity, there is also a clear size dimension present in the access to foreign equity
finance. A greater proportion of firms report that obtaining foreign equity would be very easy or
fairly easy as size increases, reinforced by a monotonic decline in the percentage of firms
reporting that this would be impossible (and impossible or fairly difficult).
Tables 5.9 and 5.10 present the regional dimension of Russian and Foreign equity financing,
respectively.
Table 5.9 Ease of obtaining Russian investors for equity financing
Very Easy or
Fairly Easy (%)
Impossible (%) No. obs
Moscow 15.6 34.4 32
Moscow region 10.0 50.0 40
St. Petersburg 18.2 18.2 22
St. Petersburg region 16.7 50.0 12
Nizhny Novgorod 15.2 23.9 46
Samara 13.3 30.0 30
Ekaterinburg 11.9 38.1 42
Perm 6.5 41.9 31
Novosibirsk 11.8 23.5 34
Krasnoyarsk 8.8 41.2 34
Volgograd 14.3 28.6 7
Chelyabinsk 13.3 33.3 15
Omsk 0.0 50.0 12
Average 12.0 35.0 357
Source: Authors’ calculations
Table 5.9 illustrates that more firms regarded it as very easy or fairly easy to obtain Russian
equity in St. Petersburg city, St Petersburg oblast (although this figure is potentially biased by
the low number of responses) Moscow city and Nizhny Novgorod. By contrast a surprising 50
percent of firms in Moscow and St Petersburg oblasts report that they would find it impossible to
obtain Russian equity, followed by 41.9 percent of firms in Perm and 41.2 percent in
Krasnoyarsk. Table 5.10 provides further evidence that sourcing foreign equity finance is more
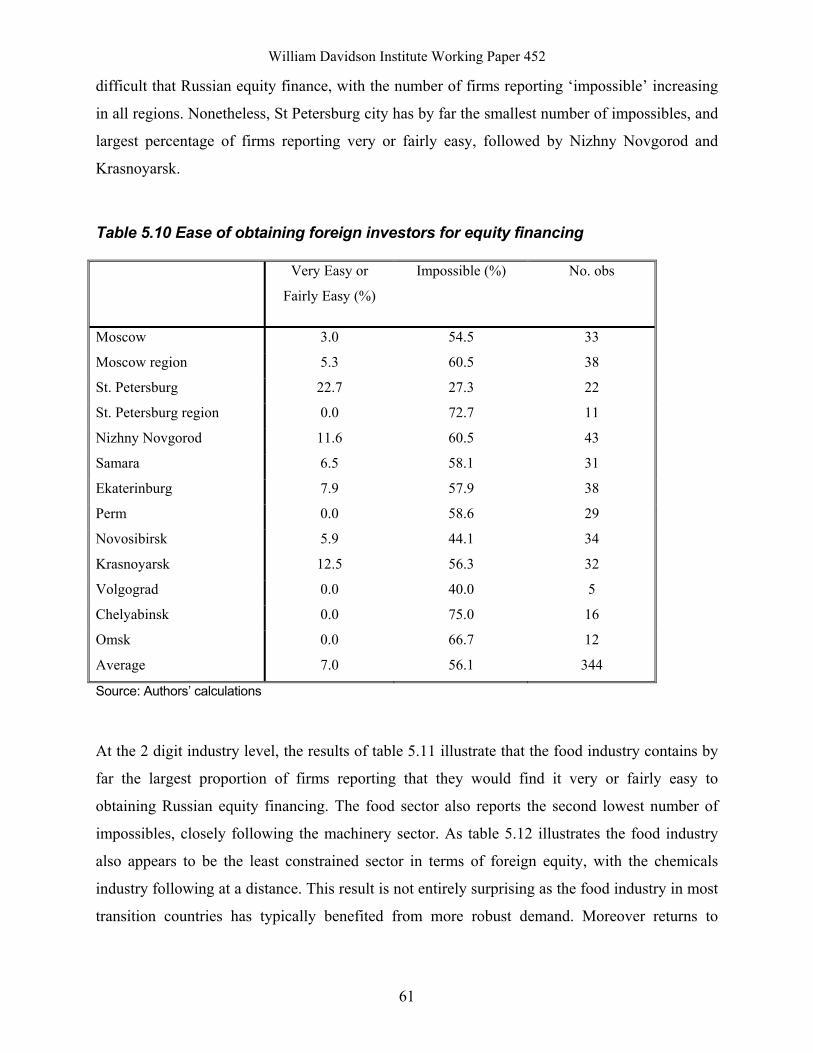
William Davidson Institute Working Paper 452
61
difficult that Russian equity finance, with the number of firms reporting ‘impossible’ increasing
in all regions. Nonetheless, St Petersburg city has by far the smallest number of impossibles, and
largest percentage of firms reporting very or fairly easy, followed by Nizhny Novgorod and
Krasnoyarsk.
Table 5.10 Ease of obtaining foreign investors for equity financing
Very Easy or
Fairly Easy (%)
Impossible (%) No. obs
Moscow 3.0 54.5 33
Moscow region 5.3 60.5 38
St. Petersburg 22.7 27.3 22
St. Petersburg region 0.0 72.7 11
Nizhny Novgorod 11.6 60.5 43
Samara 6.5 58.1 31
Ekaterinburg 7.9 57.9 38
Perm 0.0 58.6 29
Novosibirsk 5.9 44.1 34
Krasnoyarsk 12.5 56.3 32
Volgograd 0.0 40.0 5
Chelyabinsk 0.0 75.0 16
Omsk 0.0 66.7 12
Average 7.0 56.1 344
Source: Authors’ calculations
At the 2 digit industry level, the results of table 5.11 illustrate that the food industry contains by
far the largest proportion of firms reporting that they would find it very or fairly easy to
obtaining Russian equity financing. The food sector also reports the second lowest number of
impossibles, closely following the machinery sector. As table 5.12 illustrates the food industry
also appears to be the least constrained sector in terms of foreign equity, with the chemicals
industry following at a distance. This result is not entirely surprising as the food industry in most
transition countries has typically benefited from more robust demand. Moreover returns to
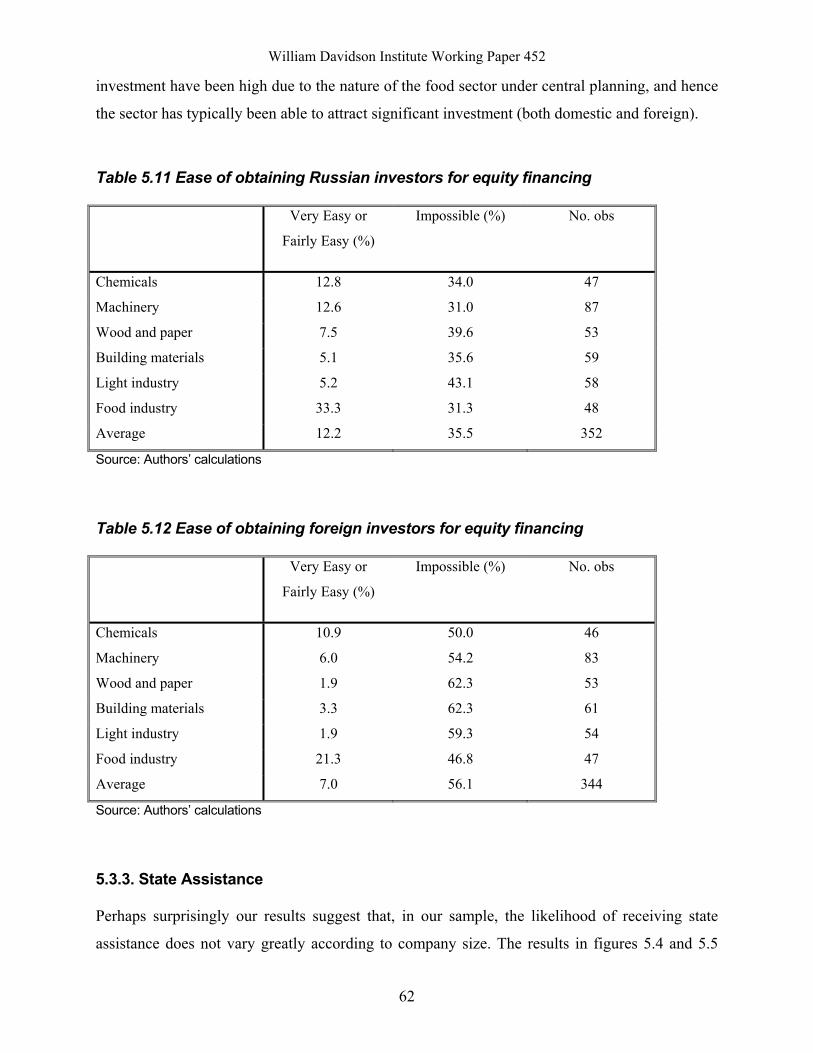
William Davidson Institute Working Paper 452
62
investment have been high due to the nature of the food sector under central planning, and hence
the sector has typically been able to attract significant investment (both domestic and foreign).
Table 5.11 Ease of obtaining Russian investors for equity financing
Very Easy or
Fairly Easy (%)
Impossible (%) No. obs
Chemicals 12.8 34.0 47
Machinery 12.6 31.0 87
Wood and paper 7.5 39.6 53
Building materials 5.1 35.6 59
Light industry 5.2 43.1 58
Food industry 33.3 31.3 48
Average 12.2 35.5 352
Source: Authors’ calculations
Table 5.12 Ease of obtaining foreign investors for equity financing
Very Easy or
Fairly Easy (%)
Impossible (%) No. obs
Chemicals 10.9 50.0 46
Machinery 6.0 54.2 83
Wood and paper 1.9 62.3 53
Building materials 3.3 62.3 61
Light industry 1.9 59.3 54
Food industry 21.3 46.8 47
Average 7.0 56.1 344
Source: Authors’ calculations
5.3.3. State Assistance
Perhaps surprisingly our results suggest that, in our sample, the likelihood of receiving state
assistance does not vary greatly according to company size. The results in figures 5.4 and 5.5
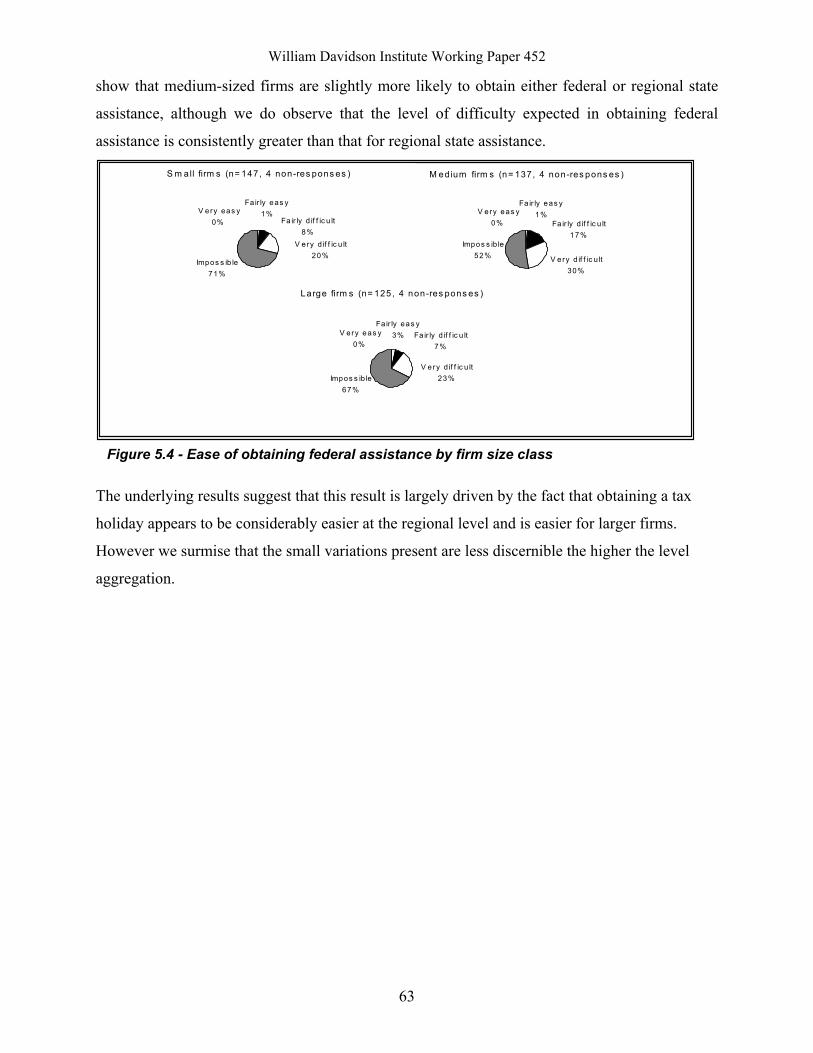
William Davidson Institute Working Paper 452
63
show that medium-sized firms are slightly more likely to obtain either federal or regional state
assistance, although we do observe that the level of difficulty expected in obtaining federal
assistance is consistently greater than that for regional state assistance.
S m all firm s (n= 147, 4 non-res pons es )
Impos s ib le71%
Fa ir ly d if f ic u lt8%
V ery d if f ic u lt20%
V ery eas y0%
Fair ly eas y1%
M edium firm s (n= 137, 4 non-res pons es )
Impos s ib le52%
Fa ir ly eas y1% V ery eas y
0% Fa ir ly d if f ic u lt17%
V ery d if f ic u lt30%
Large firm s (n= 125, 4 non-res pons es )
Impos s ib le67%
Fa ir ly d if f ic u lt7%
V ery d if f ic u lt23%
V ery eas y0%
Fair ly eas y3%
Figure 5.4 - Ease of obtaining federal assistance by firm size class
The underlying results suggest that this result is largely driven by the fact that obtaining a tax
holiday appears to be considerably easier at the regional level and is easier for larger firms.
However we surmise that the small variations present are less discernible the higher the level
aggregation.
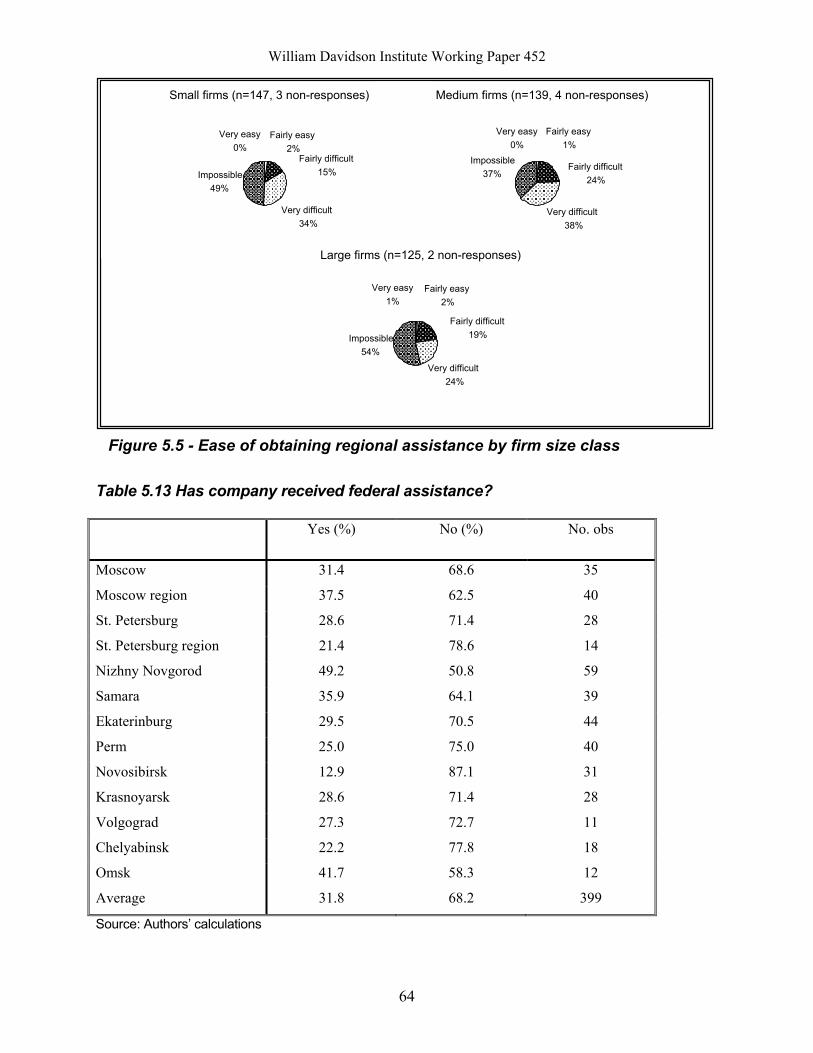
William Davidson Institute Working Paper 452
64
Table 5.13 Has company received federal assistance?
Yes (%) No (%) No. obs
Moscow 31.4 68.6 35
Moscow region 37.5 62.5 40
St. Petersburg 28.6 71.4 28
St. Petersburg region 21.4 78.6 14
Nizhny Novgorod 49.2 50.8 59
Samara 35.9 64.1 39
Ekaterinburg 29.5 70.5 44
Perm 25.0 75.0 40
Novosibirsk 12.9 87.1 31
Krasnoyarsk 28.6 71.4 28
Volgograd 27.3 72.7 11
Chelyabinsk 22.2 77.8 18
Omsk 41.7 58.3 12
Average 31.8 68.2 399
Source: Authors’ calculations
Small firms (n=147, 3 non-responses)
Impossible 49%
Very difficult 34%
Very easy 0%
Fairly difficult 15%
Fairly easy2%
Medium firms (n=139, 4 non-responses)
Very difficult 38%
Impossible37%
Very easy 0%
Fairly easy 1%
Fairly difficult24%
Large firms (n=125, 2 non-responses)
Impossible 54%
Fairly easy2%
Very difficult 24%
Fairly difficult 19%
Very easy 1%
Figure 5.5 - Ease of obtaining regional assistance by firm size class
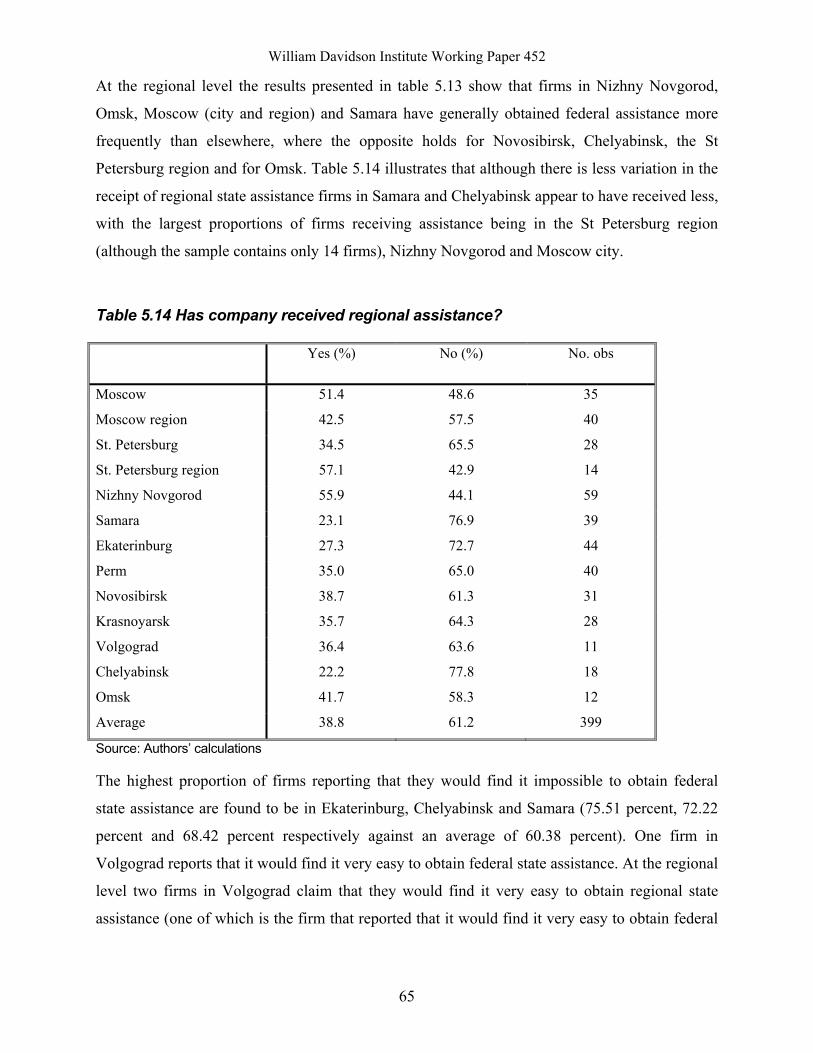
William Davidson Institute Working Paper 452
65
At the regional level the results presented in table 5.13 show that firms in Nizhny Novgorod,
Omsk, Moscow (city and region) and Samara have generally obtained federal assistance more
frequently than elsewhere, where the opposite holds for Novosibirsk, Chelyabinsk, the St
Petersburg region and for Omsk. Table 5.14 illustrates that although there is less variation in the
receipt of regional state assistance firms in Samara and Chelyabinsk appear to have received less,
with the largest proportions of firms receiving assistance being in the St Petersburg region
(although the sample contains only 14 firms), Nizhny Novgorod and Moscow city.
Table 5.14 Has company received regional assistance?
Yes (%) No (%) No. obs
Moscow 51.4 48.6 35
Moscow region 42.5 57.5 40
St. Petersburg 34.5 65.5 28
St. Petersburg region 57.1 42.9 14
Nizhny Novgorod 55.9 44.1 59
Samara 23.1 76.9 39
Ekaterinburg 27.3 72.7 44
Perm 35.0 65.0 40
Novosibirsk 38.7 61.3 31
Krasnoyarsk 35.7 64.3 28
Volgograd 36.4 63.6 11
Chelyabinsk 22.2 77.8 18
Omsk 41.7 58.3 12
Average 38.8 61.2 399
Source: Authors’ calculations
The highest proportion of firms reporting that they would find it impossible to obtain federal
state assistance are found to be in Ekaterinburg, Chelyabinsk and Samara (75.51 percent, 72.22
percent and 68.42 percent respectively against an average of 60.38 percent). One firm in
Volgograd reports that it would find it very easy to obtain federal state assistance. At the regional
level two firms in Volgograd claim that they would find it very easy to obtain regional state
assistance (one of which is the firm that reported that it would find it very easy to obtain federal
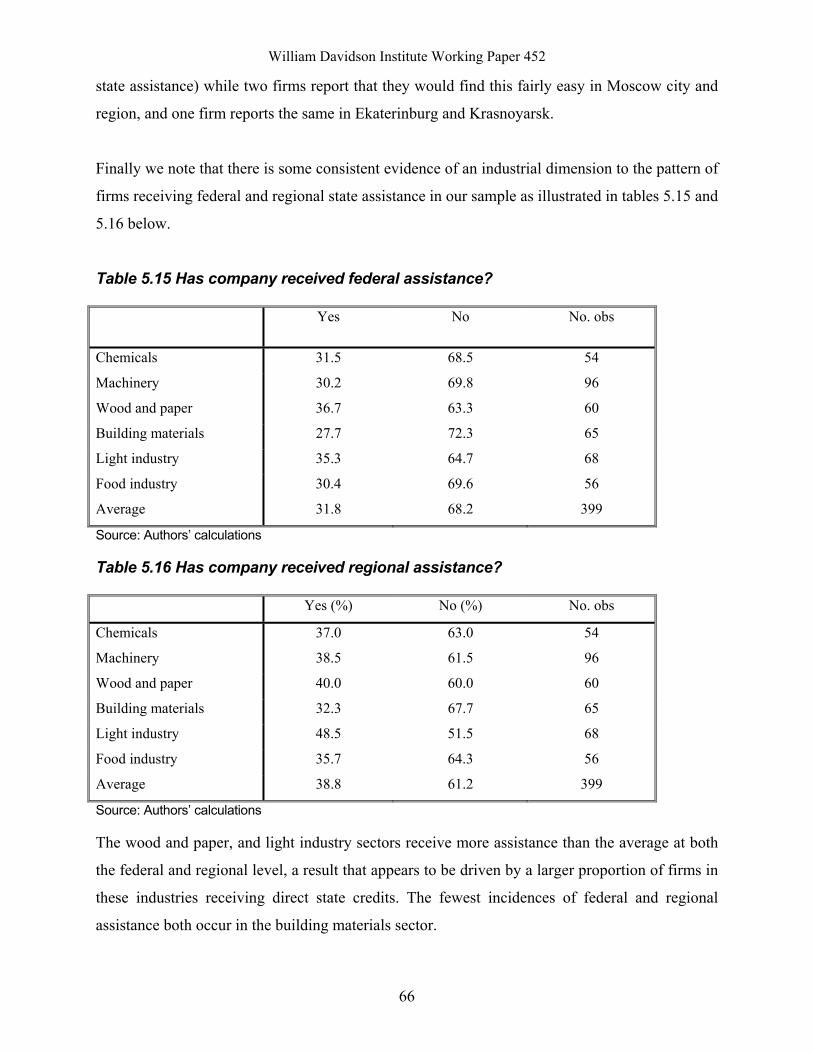
William Davidson Institute Working Paper 452
66
state assistance) while two firms report that they would find this fairly easy in Moscow city and
region, and one firm reports the same in Ekaterinburg and Krasnoyarsk.
Finally we note that there is some consistent evidence of an industrial dimension to the pattern of
firms receiving federal and regional state assistance in our sample as illustrated in tables 5.15 and
5.16 below.
Table 5.15 Has company received federal assistance?
Yes No No. obs
Chemicals 31.5 68.5 54
Machinery 30.2 69.8 96
Wood and paper 36.7 63.3 60
Building materials 27.7 72.3 65
Light industry 35.3 64.7 68
Food industry 30.4 69.6 56
Average 31.8 68.2 399
Source: Authors’ calculations
Table 5.16 Has company received regional assistance?
Yes (%) No (%) No. obs
Chemicals 37.0 63.0 54
Machinery 38.5 61.5 96
Wood and paper 40.0 60.0 60
Building materials 32.3 67.7 65
Light industry 48.5 51.5 68
Food industry 35.7 64.3 56
Average 38.8 61.2 399
Source: Authors’ calculations
The wood and paper, and light industry sectors receive more assistance than the average at both
the federal and regional level, a result that appears to be driven by a larger proportion of firms in
these industries receiving direct state credits. The fewest incidences of federal and regional
assistance both occur in the building materials sector.
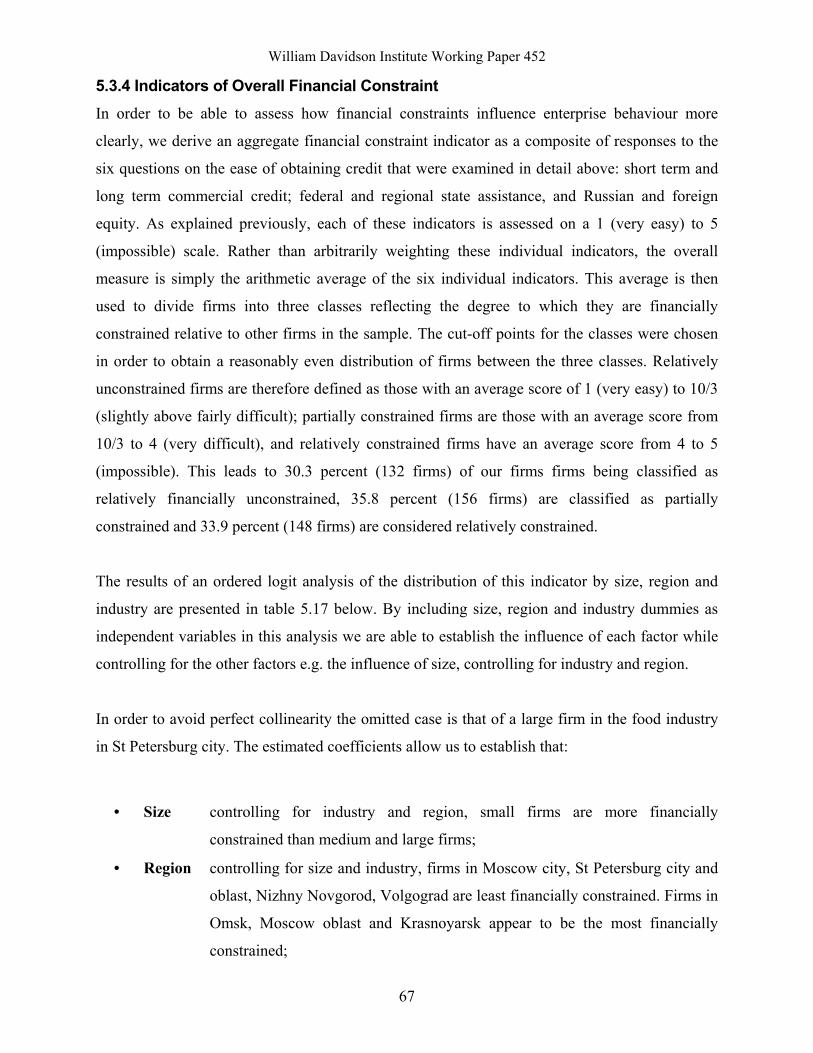
William Davidson Institute Working Paper 452
67
5.3.4 Indicators of Overall Financial Constraint In order to be able to assess how financial constraints influence enterprise behaviour more
clearly, we derive an aggregate financial constraint indicator as a composite of responses to the
six questions on the ease of obtaining credit that were examined in detail above: short term and
long term commercial credit; federal and regional state assistance, and Russian and foreign
equity. As explained previously, each of these indicators is assessed on a 1 (very easy) to 5
(impossible) scale. Rather than arbitrarily weighting these individual indicators, the overall
measure is simply the arithmetic average of the six individual indicators. This average is then
used to divide firms into three classes reflecting the degree to which they are financially
constrained relative to other firms in the sample. The cut-off points for the classes were chosen
in order to obtain a reasonably even distribution of firms between the three classes. Relatively
unconstrained firms are therefore defined as those with an average score of 1 (very easy) to 10/3
(slightly above fairly difficult); partially constrained firms are those with an average score from
10/3 to 4 (very difficult), and relatively constrained firms have an average score from 4 to 5
(impossible). This leads to 30.3 percent (132 firms) of our firms firms being classified as
relatively financially unconstrained, 35.8 percent (156 firms) are classified as partially
constrained and 33.9 percent (148 firms) are considered relatively constrained.
The results of an ordered logit analysis of the distribution of this indicator by size, region and
industry are presented in table 5.17 below. By including size, region and industry dummies as
independent variables in this analysis we are able to establish the influence of each factor while
controlling for the other factors e.g. the influence of size, controlling for industry and region.
In order to avoid perfect collinearity the omitted case is that of a large firm in the food industry
in St Petersburg city. The estimated coefficients allow us to establish that:
• Size controlling for industry and region, small firms are more financially
constrained than medium and large firms;
• Region controlling for size and industry, firms in Moscow city, St Petersburg city and
oblast, Nizhny Novgorod, Volgograd are least financially constrained. Firms in
Omsk, Moscow oblast and Krasnoyarsk appear to be the most financially
constrained;
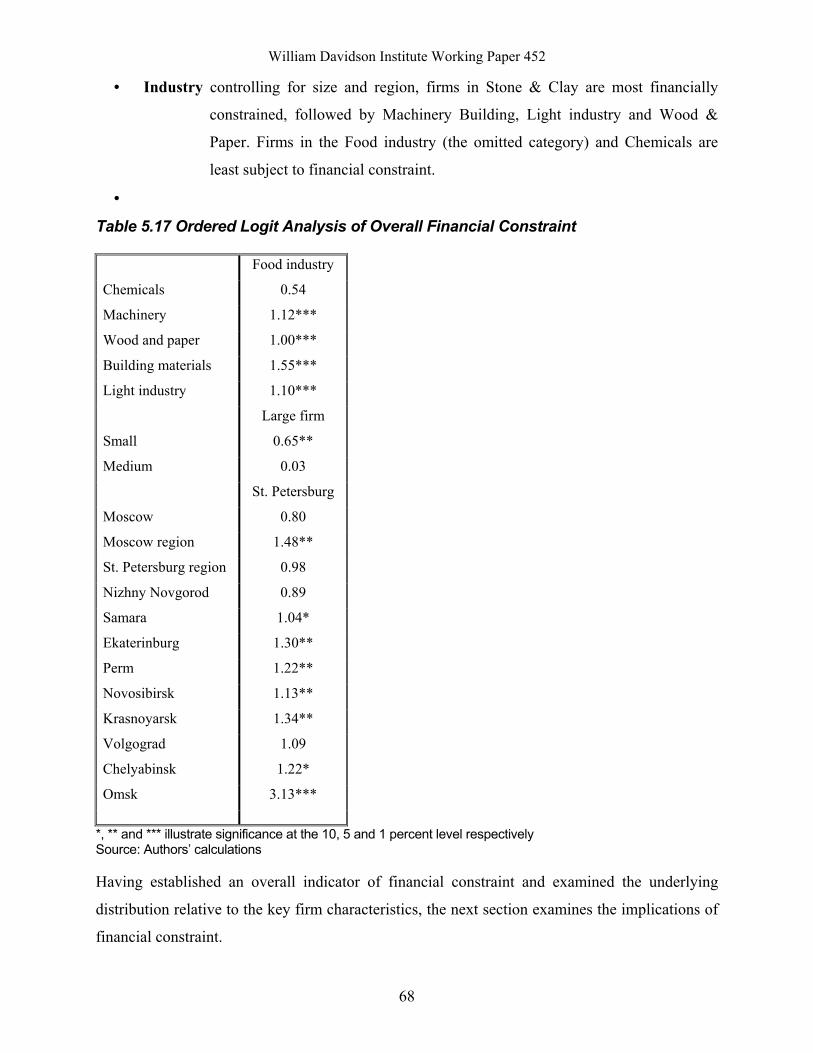
William Davidson Institute Working Paper 452
68
• Industry controlling for size and region, firms in Stone & Clay are most financially
constrained, followed by Machinery Building, Light industry and Wood &
Paper. Firms in the Food industry (the omitted category) and Chemicals are
least subject to financial constraint.
•
Table 5.17 Ordered Logit Analysis of Overall Financial Constraint
Food industry
Chemicals 0.54
Machinery 1.12***
Wood and paper 1.00***
Building materials 1.55***
Light industry 1.10***
Large firm
Small 0.65**
Medium 0.03
St. Petersburg
Moscow 0.80
Moscow region 1.48**
St. Petersburg region 0.98
Nizhny Novgorod 0.89
Samara 1.04*
Ekaterinburg 1.30**
Perm 1.22**
Novosibirsk 1.13**
Krasnoyarsk 1.34**
Volgograd 1.09
Chelyabinsk 1.22*
Omsk 3.13***
*, ** and *** illustrate significance at the 10, 5 and 1 percent level respectively Source: Authors’ calculations Having established an overall indicator of financial constraint and examined the underlying
distribution relative to the key firm characteristics, the next section examines the implications of
financial constraint.
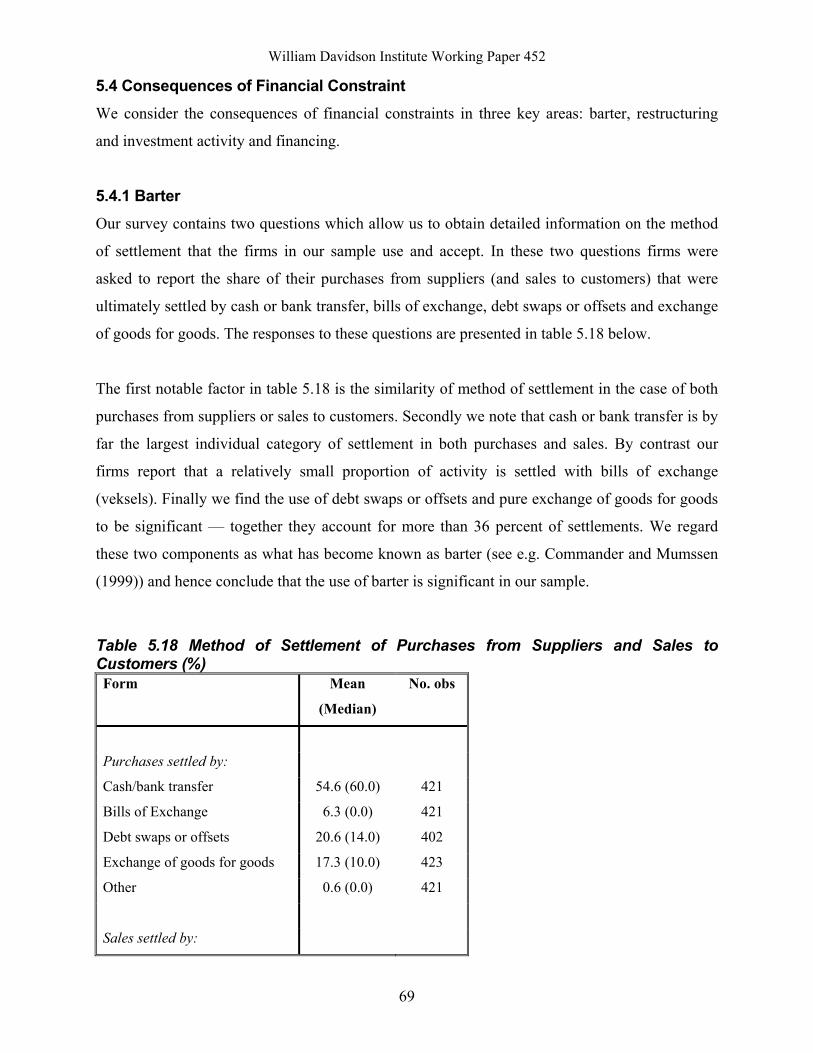
William Davidson Institute Working Paper 452
69
5.4 Consequences of Financial Constraint We consider the consequences of financial constraints in three key areas: barter, restructuring
and investment activity and financing.
5.4.1 Barter Our survey contains two questions which allow us to obtain detailed information on the method
of settlement that the firms in our sample use and accept. In these two questions firms were
asked to report the share of their purchases from suppliers (and sales to customers) that were
ultimately settled by cash or bank transfer, bills of exchange, debt swaps or offsets and exchange
of goods for goods. The responses to these questions are presented in table 5.18 below.
The first notable factor in table 5.18 is the similarity of method of settlement in the case of both
purchases from suppliers or sales to customers. Secondly we note that cash or bank transfer is by
far the largest individual category of settlement in both purchases and sales. By contrast our
firms report that a relatively small proportion of activity is settled with bills of exchange
(veksels). Finally we find the use of debt swaps or offsets and pure exchange of goods for goods
to be significant — together they account for more than 36 percent of settlements. We regard
these two components as what has become known as barter (see e.g. Commander and Mumssen
(1999)) and hence conclude that the use of barter is significant in our sample.
Table 5.18 Method of Settlement of Purchases from Suppliers and Sales to Customers (%) Form Mean
(Median)
No. obs
Purchases settled by:
Cash/bank transfer 54.6 (60.0) 421
Bills of Exchange 6.3 (0.0) 421
Debt swaps or offsets 20.6 (14.0) 402
Exchange of goods for goods 17.3 (10.0) 423
Other 0.6 (0.0) 421
Sales settled by:
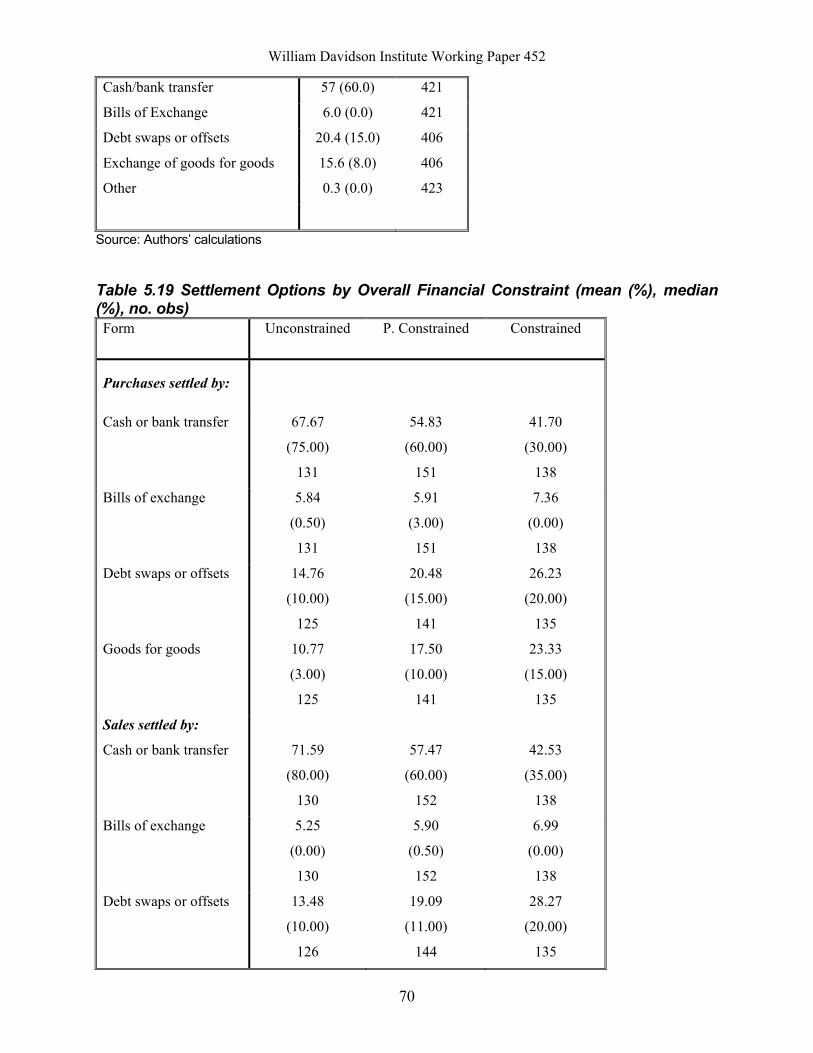
William Davidson Institute Working Paper 452
70
Cash/bank transfer 57 (60.0) 421
Bills of Exchange 6.0 (0.0) 421
Debt swaps or offsets 20.4 (15.0) 406
Exchange of goods for goods 15.6 (8.0) 406
Other 0.3 (0.0) 423
Source: Authors’ calculations
Table 5.19 Settlement Options by Overall Financial Constraint (mean (%), median (%), no. obs) Form Unconstrained P. Constrained Constrained
Purchases settled by:
Cash or bank transfer 67.67
(75.00)
131
54.83
(60.00)
151
41.70
(30.00)
138
Bills of exchange 5.84
(0.50)
131
5.91
(3.00)
151
7.36
(0.00)
138
Debt swaps or offsets 14.76
(10.00)
125
20.48
(15.00)
141
26.23
(20.00)
135
Goods for goods 10.77
(3.00)
125
17.50
(10.00)
141
23.33
(15.00)
135
Sales settled by:
Cash or bank transfer 71.59
(80.00)
130
57.47
(60.00)
152
42.53
(35.00)
138
Bills of exchange 5.25
(0.00)
130
5.90
(0.50)
152
6.99
(0.00)
138
Debt swaps or offsets 13.48
(10.00)
126
19.09
(11.00)
144
28.27
(20.00)
135
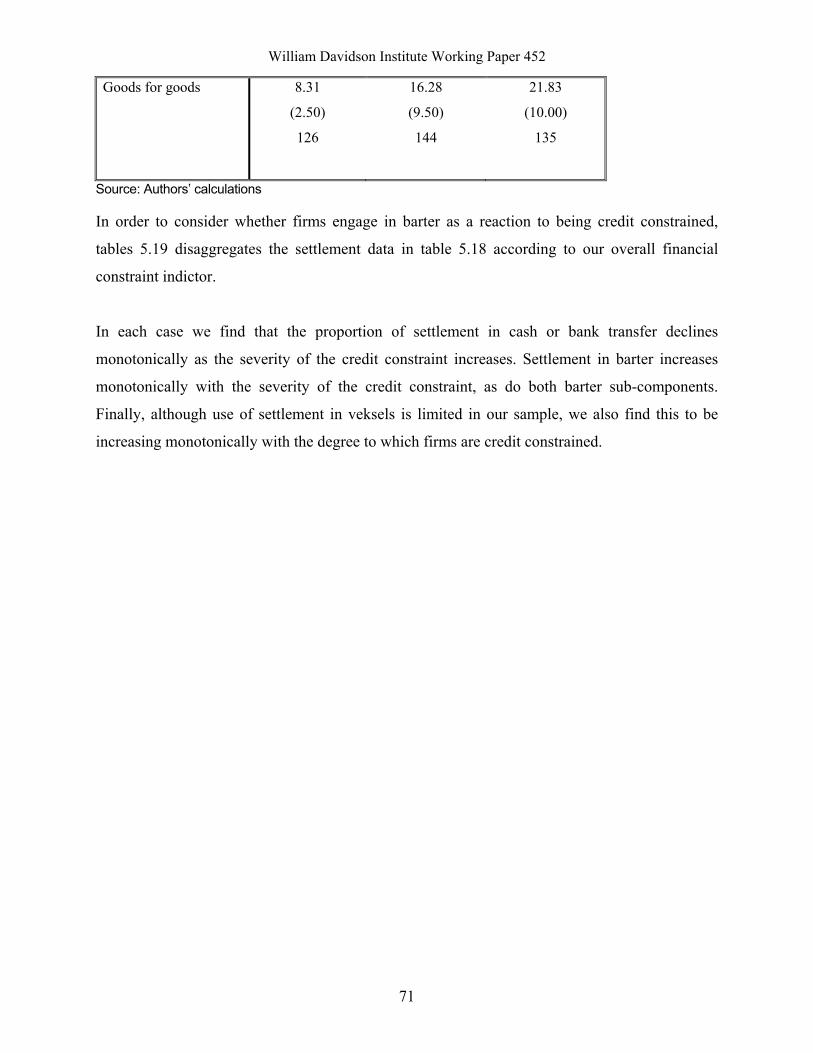
William Davidson Institute Working Paper 452
71
Goods for goods 8.31
(2.50)
126
16.28
(9.50)
144
21.83
(10.00)
135
Source: Authors’ calculations
In order to consider whether firms engage in barter as a reaction to being credit constrained,
tables 5.19 disaggregates the settlement data in table 5.18 according to our overall financial
constraint indictor.
In each case we find that the proportion of settlement in cash or bank transfer declines
monotonically as the severity of the credit constraint increases. Settlement in barter increases
monotonically with the severity of the credit constraint, as do both barter sub-components.
Finally, although use of settlement in veksels is limited in our sample, we also find this to be
increasing monotonically with the degree to which firms are credit constrained.
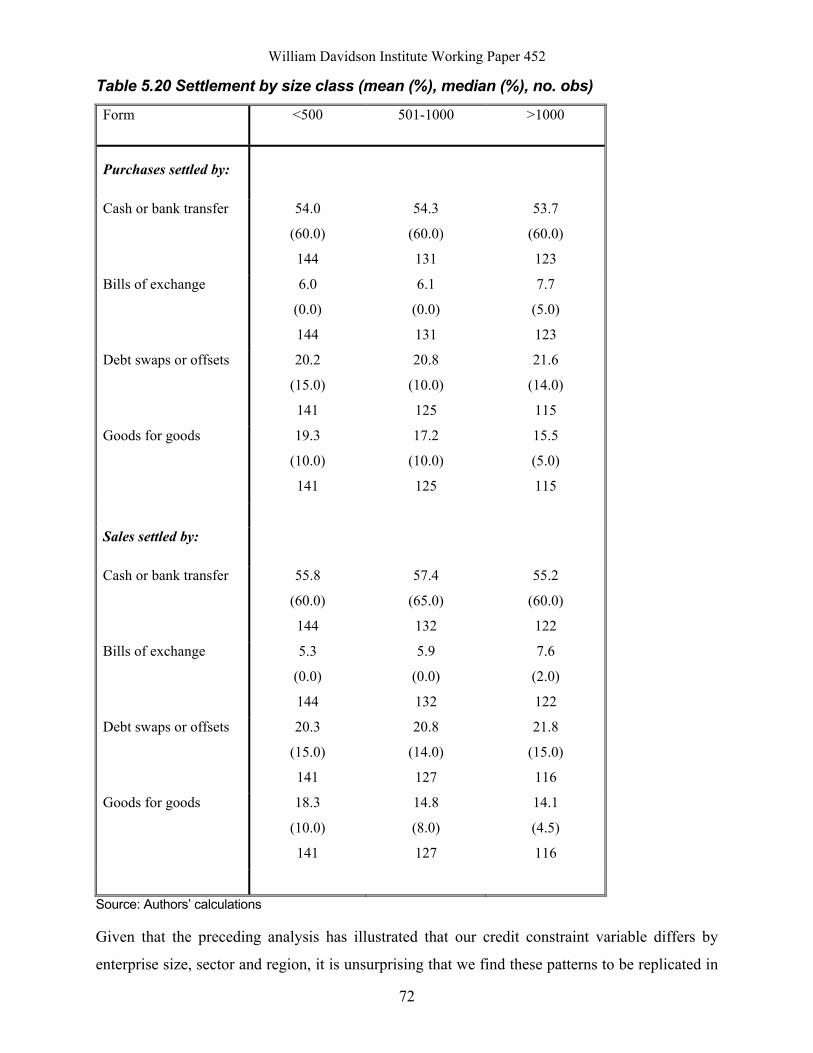
William Davidson Institute Working Paper 452
72
Table 5.20 Settlement by size class (mean (%), median (%), no. obs)
Form <500 501-1000 >1000
Purchases settled by:
Cash or bank transfer 54.0
(60.0)
144
54.3
(60.0)
131
53.7
(60.0)
123
Bills of exchange 6.0
(0.0)
144
6.1
(0.0)
131
7.7
(5.0)
123
Debt swaps or offsets 20.2
(15.0)
141
20.8
(10.0)
125
21.6
(14.0)
115
Goods for goods 19.3
(10.0)
141
17.2
(10.0)
125
15.5
(5.0)
115
Sales settled by:
Cash or bank transfer 55.8
(60.0)
144
57.4
(65.0)
132
55.2
(60.0)
122
Bills of exchange 5.3
(0.0)
144
5.9
(0.0)
132
7.6
(2.0)
122
Debt swaps or offsets 20.3
(15.0)
141
20.8
(14.0)
127
21.8
(15.0)
116
Goods for goods 18.3
(10.0)
141
14.8
(8.0)
127
14.1
(4.5)
116
Source: Authors’ calculations
Given that the preceding analysis has illustrated that our credit constraint variable differs by
enterprise size, sector and region, it is unsurprising that we find these patterns to be replicated in
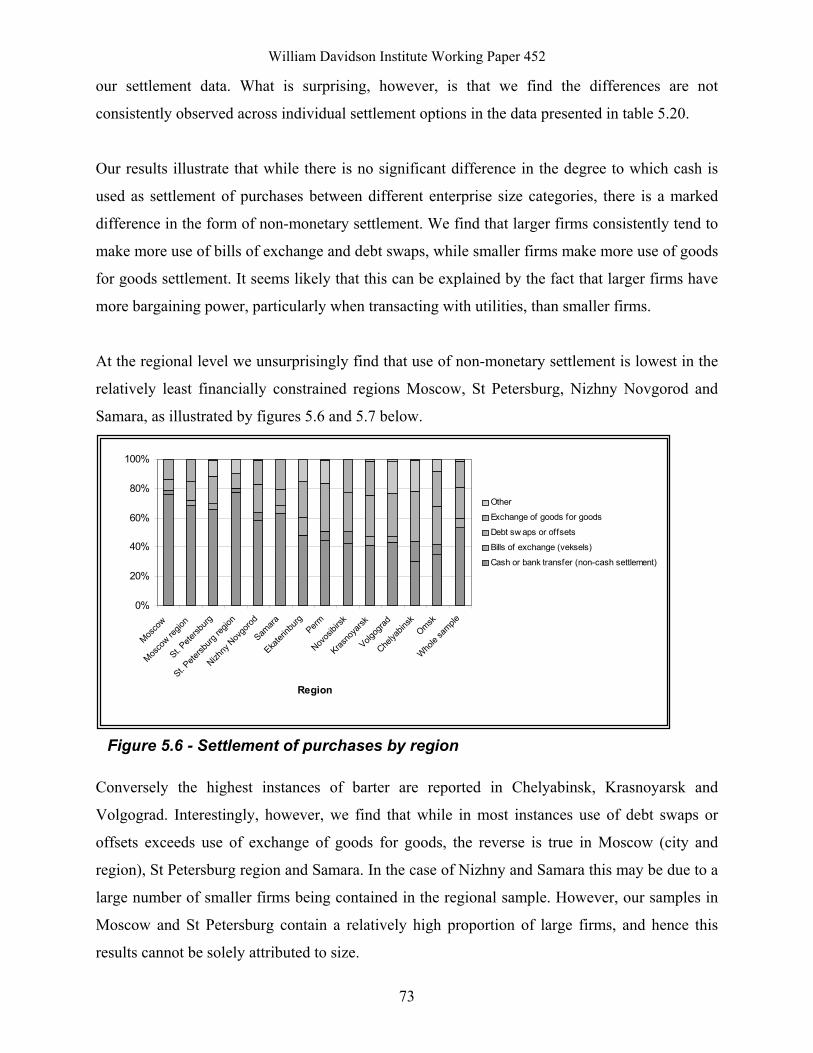
William Davidson Institute Working Paper 452
73
our settlement data. What is surprising, however, is that we find the differences are not
consistently observed across individual settlement options in the data presented in table 5.20.
Our results illustrate that while there is no significant difference in the degree to which cash is
used as settlement of purchases between different enterprise size categories, there is a marked
difference in the form of non-monetary settlement. We find that larger firms consistently tend to
make more use of bills of exchange and debt swaps, while smaller firms make more use of goods
for goods settlement. It seems likely that this can be explained by the fact that larger firms have
more bargaining power, particularly when transacting with utilities, than smaller firms.
At the regional level we unsurprisingly find that use of non-monetary settlement is lowest in the
relatively least financially constrained regions Moscow, St Petersburg, Nizhny Novgorod and
Samara, as illustrated by figures 5.6 and 5.7 below.
0%
20%
40%
60%
80%
100%
Mosco
w
Mosco
w regio
n
St. Pete
rsburg
St. Pete
rsburg
regio
n
Nizhny
Nov
gorod
Samara
Ekater
inburg
Perm
Novos
ibirsk
Krasno
yarsk
Volgog
rad
Chelya
binsk
Omsk
Whole
sample
Region
Other
Exchange of goods for goods
Debt sw aps or offsets
Bills of exchange (veksels)
Cash or bank transfer (non-cash settlement)
Figure 5.6 - Settlement of purchases by region
Conversely the highest instances of barter are reported in Chelyabinsk, Krasnoyarsk and
Volgograd. Interestingly, however, we find that while in most instances use of debt swaps or
offsets exceeds use of exchange of goods for goods, the reverse is true in Moscow (city and
region), St Petersburg region and Samara. In the case of Nizhny and Samara this may be due to a
large number of smaller firms being contained in the regional sample. However, our samples in
Moscow and St Petersburg contain a relatively high proportion of large firms, and hence this
results cannot be solely attributed to size.
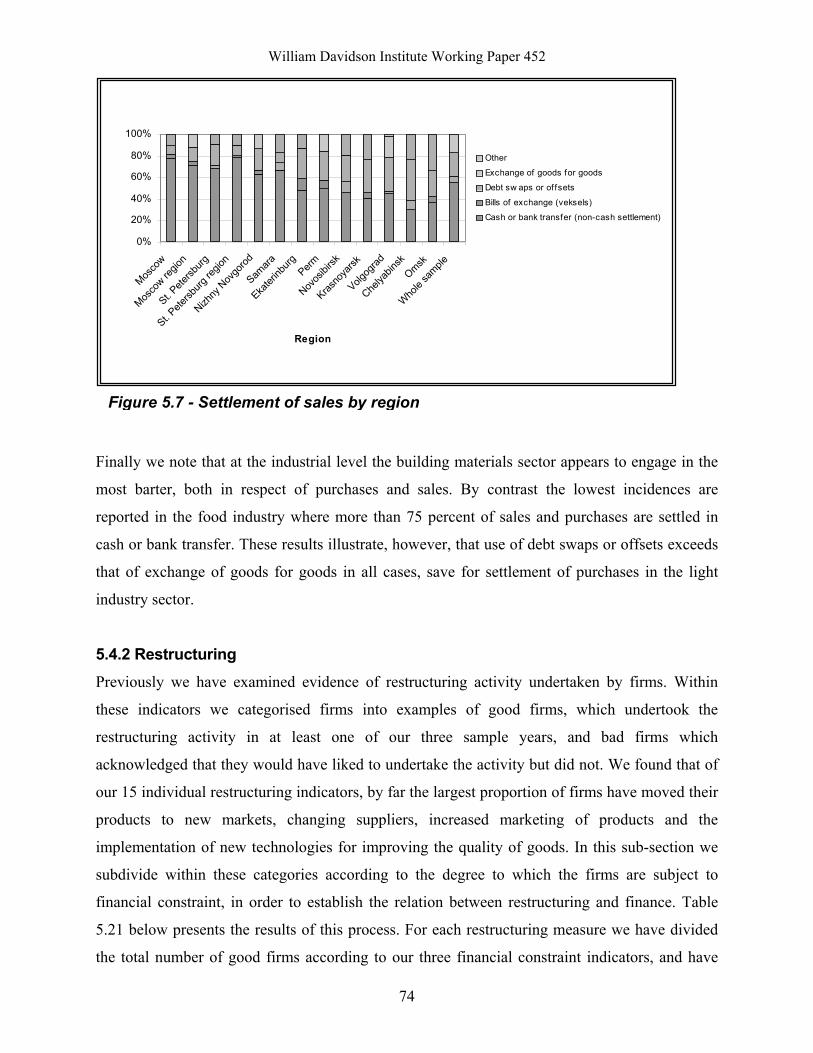
William Davidson Institute Working Paper 452
74
Finally we note that at the industrial level the building materials sector appears to engage in the
most barter, both in respect of purchases and sales. By contrast the lowest incidences are
reported in the food industry where more than 75 percent of sales and purchases are settled in
cash or bank transfer. These results illustrate, however, that use of debt swaps or offsets exceeds
that of exchange of goods for goods in all cases, save for settlement of purchases in the light
industry sector.
5.4.2 Restructuring Previously we have examined evidence of restructuring activity undertaken by firms. Within
these indicators we categorised firms into examples of good firms, which undertook the
restructuring activity in at least one of our three sample years, and bad firms which
acknowledged that they would have liked to undertake the activity but did not. We found that of
our 15 individual restructuring indicators, by far the largest proportion of firms have moved their
products to new markets, changing suppliers, increased marketing of products and the
implementation of new technologies for improving the quality of goods. In this sub-section we
subdivide within these categories according to the degree to which the firms are subject to
financial constraint, in order to establish the relation between restructuring and finance. Table
5.21 below presents the results of this process. For each restructuring measure we have divided
the total number of good firms according to our three financial constraint indicators, and have
0%
20%
40%
60%
80%
100%
Mosco
w
Mosco
w regio
n
St. Pete
rsburg
St. Pete
rsburg
regio
n
Nizhny
Nov
gorod
Samara
Ekater
inburg Perm
Novos
ibirsk
Krasno
yarsk
Volgog
rad
Chelya
binsk
Omsk
Whole
sample
Region
Other
Exchange of goods for goods
Debt sw aps or of fsets
Bills of exchange (veksels)
Cash or bank transfer (non-cash settlement)
Figure 5.7 - Settlement of sales by region

William Davidson Institute Working Paper 452
75
done the same with the total number of bad firms. Therefore, within the row for each type of
restructuring, the sum of the different levels of constraints is 100 percent for each of the groups
of ‘good’ and ‘bad’ firms. At the simplest level we would expect that evidence of a negative
correlation between financial constraint and restructuring would manifest itself in high numbers
of good, unconstrained firms and bad constrained firms.
Interestingly, we find limited evidence to support the notion that unconstrained firms are better
in their undertaking of restructuring measures, where there is insufficient variation to draw
conclusions. However, in the case of firms categorised as ‘bad’, financially constrained firms are
more frequent, especially in activities that would be regarded as defensive restructuring activities
such as labour shedding. Furthermore they appear to be less efficient in adapting to new market
conditions through the launch of new products, a change of suppliers, the sale or lease of land or
the restructuring of debt.
We therefore interpret these findings as suggesting that the causality in these cases runs from
undertaking the restructuring activity to financial constraint, rather than the reverse. Good firms
are not strongly differentiated by financial constraint, hence implying that financial constraint
does not preclude restructuring. By contrast more firms that did not restructure tend to be
financially constrained, hence implying that a failure to restructure seems to lead to financial
constraint.
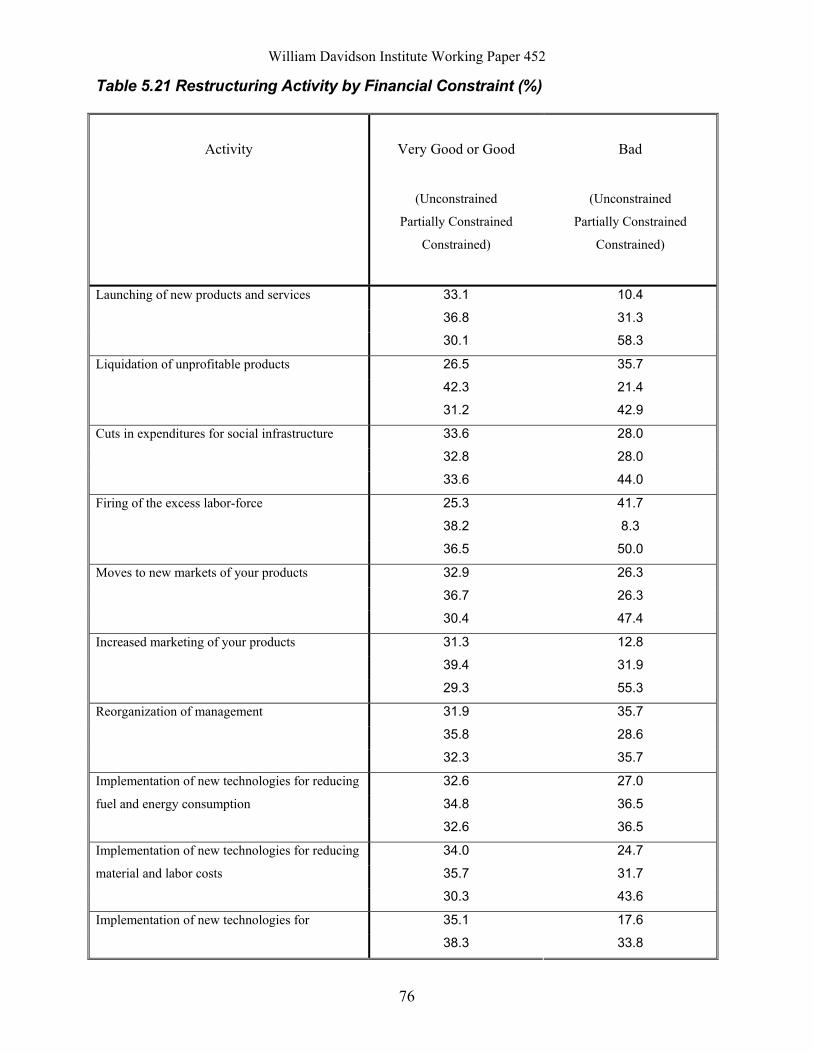
William Davidson Institute Working Paper 452
76
Table 5.21 Restructuring Activity by Financial Constraint (%)
Activity
Very Good or Good
(Unconstrained
Partially Constrained
Constrained)
Bad
(Unconstrained
Partially Constrained
Constrained)
33.1 10.4
36.8 31.3
Launching of new products and services
30.1 58.3
26.5 35.7
42.3 21.4
Liquidation of unprofitable products
31.2 42.9
33.6 28.0
32.8 28.0
Cuts in expenditures for social infrastructure
33.6 44.0
25.3 41.7
38.2 8.3
Firing of the excess labor-force
36.5 50.0
32.9 26.3
36.7 26.3
Moves to new markets of your products
30.4 47.4
31.3 12.8
39.4 31.9
Increased marketing of your products
29.3 55.3
31.9 35.7
35.8 28.6
Reorganization of management
32.3 35.7
32.6 27.0
34.8 36.5
Implementation of new technologies for reducing
fuel and energy consumption
32.6 36.5
34.0 24.7
35.7 31.7
Implementation of new technologies for reducing
material and labor costs
30.3 43.6
35.1 17.6 Implementation of new technologies for
38.3 33.8
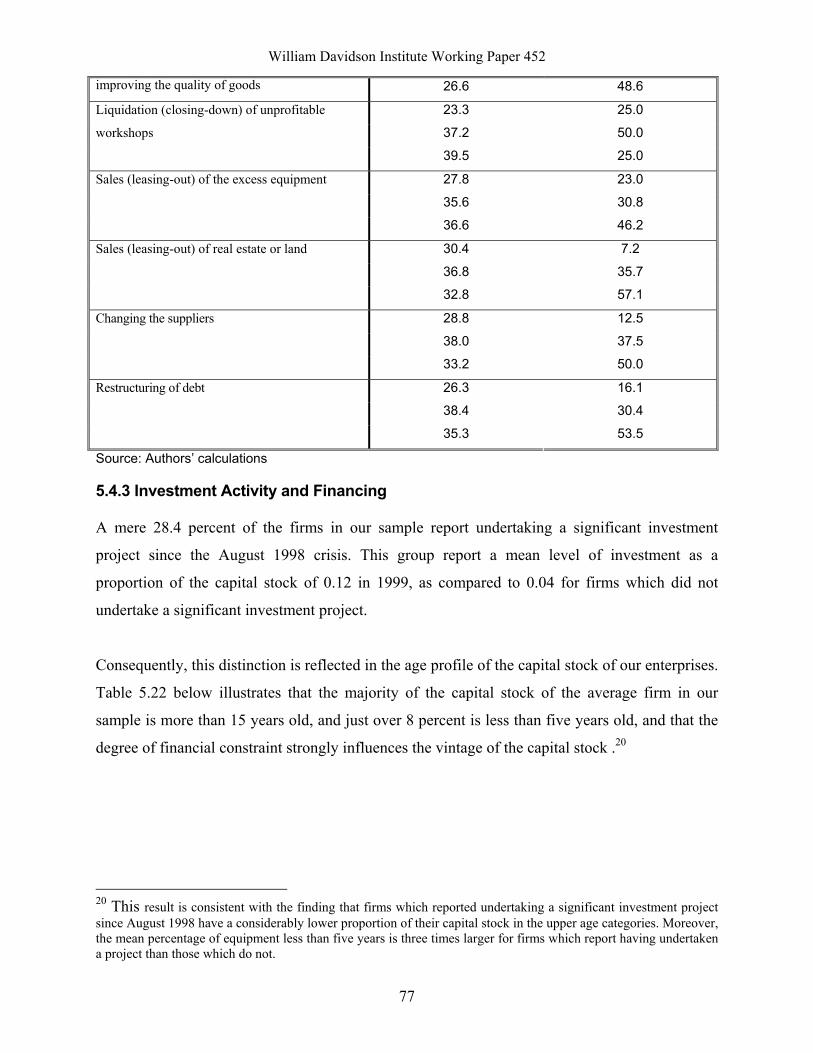
William Davidson Institute Working Paper 452
77
improving the quality of goods 26.6 48.6
23.3 25.0
37.2 50.0
Liquidation (closing-down) of unprofitable
workshops
39.5 25.0
27.8 23.0
35.6 30.8
Sales (leasing-out) of the excess equipment
36.6 46.2
30.4 7.2
36.8 35.7
Sales (leasing-out) of real estate or land
32.8 57.1
28.8 12.5
38.0 37.5
Changing the suppliers
33.2 50.0
26.3 16.1
38.4 30.4
Restructuring of debt
35.3 53.5
Source: Authors’ calculations
5.4.3 Investment Activity and Financing
A mere 28.4 percent of the firms in our sample report undertaking a significant investment
project since the August 1998 crisis. This group report a mean level of investment as a
proportion of the capital stock of 0.12 in 1999, as compared to 0.04 for firms which did not
undertake a significant investment project.
Consequently, this distinction is reflected in the age profile of the capital stock of our enterprises.
Table 5.22 below illustrates that the majority of the capital stock of the average firm in our
sample is more than 15 years old, and just over 8 percent is less than five years old, and that the
degree of financial constraint strongly influences the vintage of the capital stock .20
20 This result is consistent with the finding that firms which reported undertaking a significant investment project since August 1998 have a considerably lower proportion of their capital stock in the upper age categories. Moreover, the mean percentage of equipment less than five years is three times larger for firms which report having undertaken a project than those which do not.
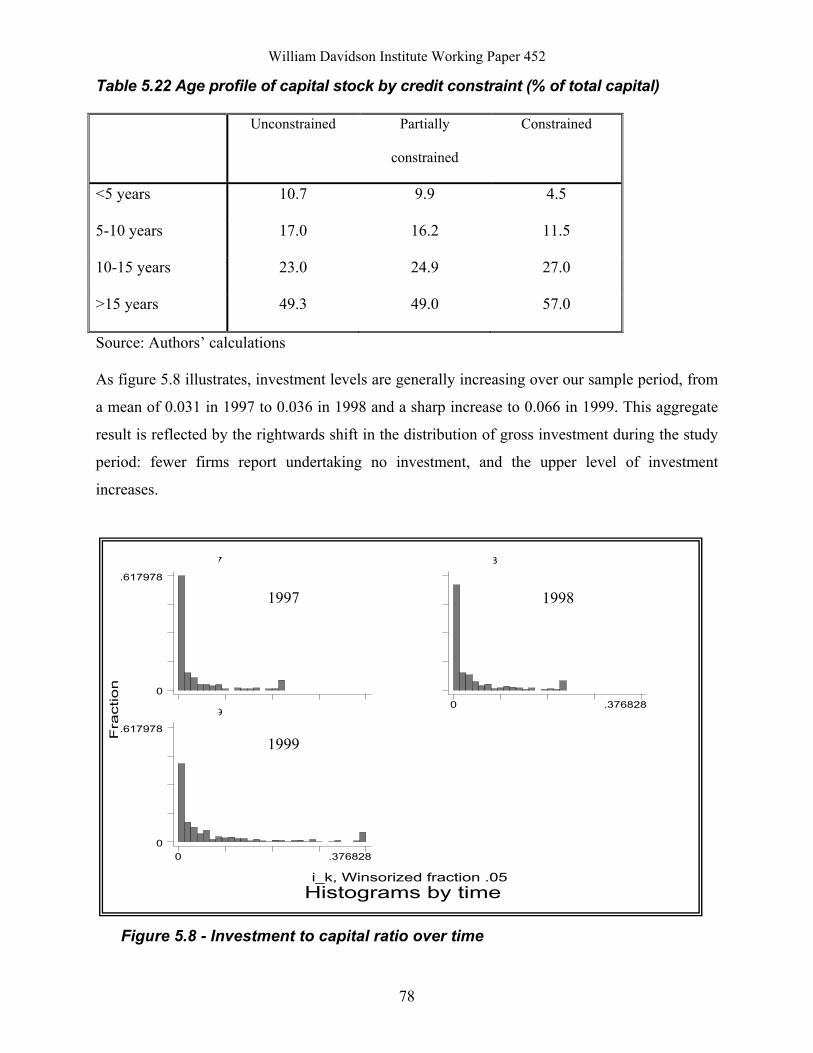
William Davidson Institute Working Paper 452
78
Table 5.22 Age profile of capital stock by credit constraint (% of total capital)
Unconstrained Partially
constrained
Constrained
<5 years 10.7 9.9 4.5
5-10 years 17.0 16.2 11.5
10-15 years 23.0 24.9 27.0
>15 years 49.3 49.0 57.0
Source: Authors’ calculations
As figure 5.8 illustrates, investment levels are generally increasing over our sample period, from
a mean of 0.031 in 1997 to 0.036 in 1998 and a sharp increase to 0.066 in 1999. This aggregate
result is reflected by the rightwards shift in the distribution of gross investment during the study
period: fewer firms report undertaking no investment, and the upper level of investment
increases.
Fra
ctio
n
Histograms by timei_k, Winsorized fraction .05
time==97
0
.617978
time==98
0 .376828time==99
0 .3768280
.617978
Figure 5.8 - Investment to capital ratio over time
1997 1998
1999
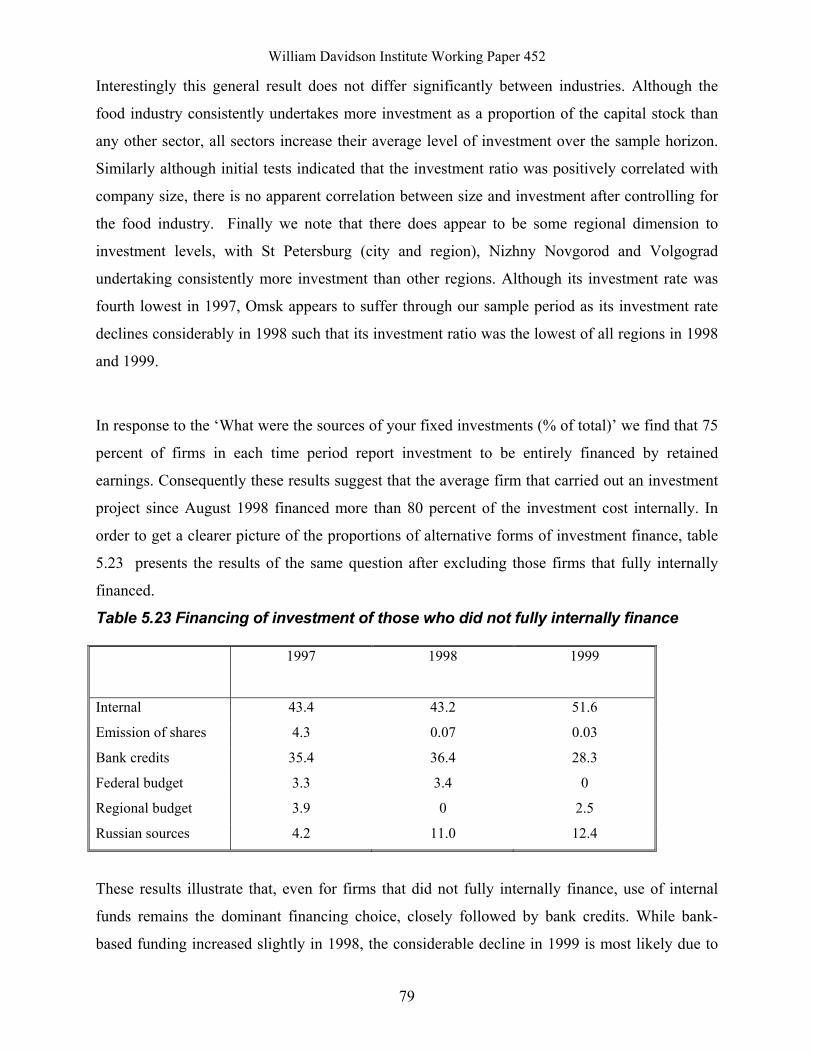
William Davidson Institute Working Paper 452
79
Interestingly this general result does not differ significantly between industries. Although the
food industry consistently undertakes more investment as a proportion of the capital stock than
any other sector, all sectors increase their average level of investment over the sample horizon.
Similarly although initial tests indicated that the investment ratio was positively correlated with
company size, there is no apparent correlation between size and investment after controlling for
the food industry. Finally we note that there does appear to be some regional dimension to
investment levels, with St Petersburg (city and region), Nizhny Novgorod and Volgograd
undertaking consistently more investment than other regions. Although its investment rate was
fourth lowest in 1997, Omsk appears to suffer through our sample period as its investment rate
declines considerably in 1998 such that its investment ratio was the lowest of all regions in 1998
and 1999.
In response to the ‘What were the sources of your fixed investments (% of total)’ we find that 75
percent of firms in each time period report investment to be entirely financed by retained
earnings. Consequently these results suggest that the average firm that carried out an investment
project since August 1998 financed more than 80 percent of the investment cost internally. In
order to get a clearer picture of the proportions of alternative forms of investment finance, table
5.23 presents the results of the same question after excluding those firms that fully internally
financed.
Table 5.23 Financing of investment of those who did not fully internally finance
1997 1998 1999
Internal 43.4 43.2 51.6
Emission of shares 4.3 0.07 0.03
Bank credits 35.4 36.4 28.3
Federal budget 3.3 3.4 0
Regional budget 3.9 0 2.5
Russian sources 4.2 11.0 12.4
These results illustrate that, even for firms that did not fully internally finance, use of internal
funds remains the dominant financing choice, closely followed by bank credits. While bank-
based funding increased slightly in 1998, the considerable decline in 1999 is most likely due to
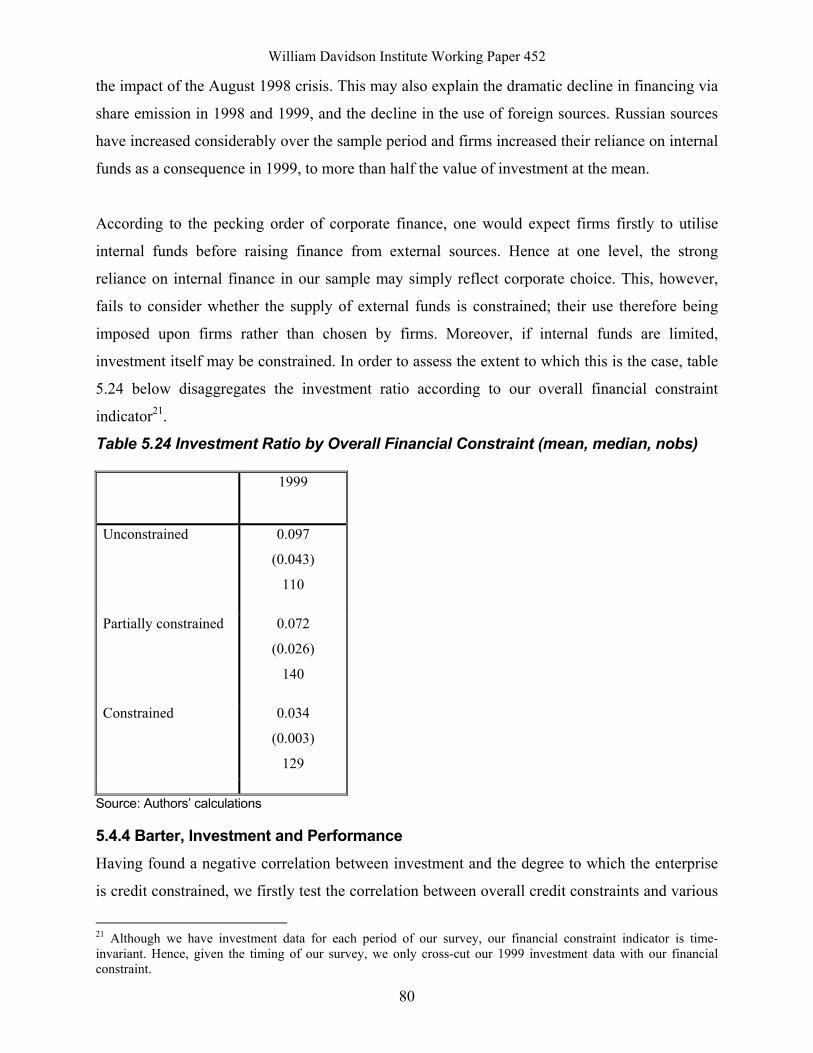
William Davidson Institute Working Paper 452
80
the impact of the August 1998 crisis. This may also explain the dramatic decline in financing via
share emission in 1998 and 1999, and the decline in the use of foreign sources. Russian sources
have increased considerably over the sample period and firms increased their reliance on internal
funds as a consequence in 1999, to more than half the value of investment at the mean.
According to the pecking order of corporate finance, one would expect firms firstly to utilise
internal funds before raising finance from external sources. Hence at one level, the strong
reliance on internal finance in our sample may simply reflect corporate choice. This, however,
fails to consider whether the supply of external funds is constrained; their use therefore being
imposed upon firms rather than chosen by firms. Moreover, if internal funds are limited,
investment itself may be constrained. In order to assess the extent to which this is the case, table
5.24 below disaggregates the investment ratio according to our overall financial constraint
indicator21.
Table 5.24 Investment Ratio by Overall Financial Constraint (mean, median, nobs)
1999
Unconstrained 0.097
(0.043)
110
Partially constrained 0.072
(0.026)
140
Constrained 0.034
(0.003)
129
Source: Authors’ calculations
5.4.4 Barter, Investment and Performance Having found a negative correlation between investment and the degree to which the enterprise
is credit constrained, we firstly test the correlation between overall credit constraints and various
21 Although we have investment data for each period of our survey, our financial constraint indicator is time-invariant. Hence, given the timing of our survey, we only cross-cut our 1999 investment data with our financial constraint.
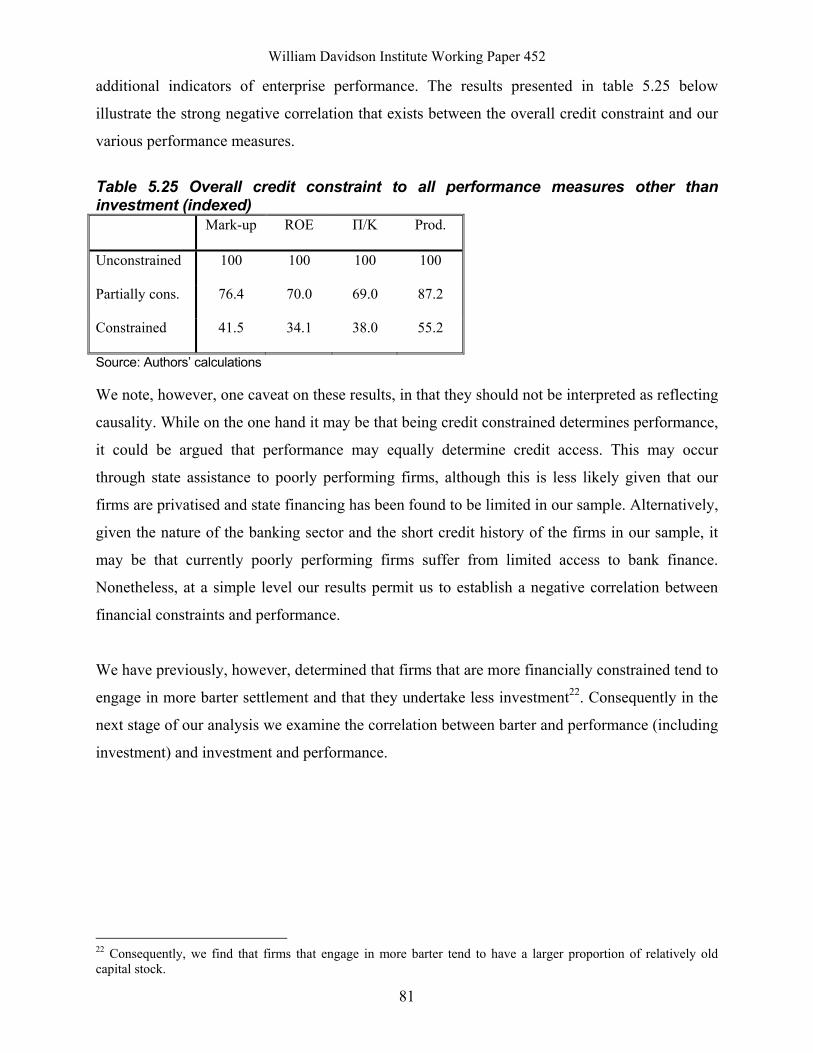
William Davidson Institute Working Paper 452
81
additional indicators of enterprise performance. The results presented in table 5.25 below
illustrate the strong negative correlation that exists between the overall credit constraint and our
various performance measures.
Table 5.25 Overall credit constraint to all performance measures other than investment (indexed) Mark-up ROE Π/K Prod.
Unconstrained 100 100 100 100
Partially cons. 76.4 70.0 69.0 87.2
Constrained 41.5 34.1 38.0 55.2
Source: Authors’ calculations
We note, however, one caveat on these results, in that they should not be interpreted as reflecting
causality. While on the one hand it may be that being credit constrained determines performance,
it could be argued that performance may equally determine credit access. This may occur
through state assistance to poorly performing firms, although this is less likely given that our
firms are privatised and state financing has been found to be limited in our sample. Alternatively,
given the nature of the banking sector and the short credit history of the firms in our sample, it
may be that currently poorly performing firms suffer from limited access to bank finance.
Nonetheless, at a simple level our results permit us to establish a negative correlation between
financial constraints and performance.
We have previously, however, determined that firms that are more financially constrained tend to
engage in more barter settlement and that they undertake less investment22. Consequently in the
next stage of our analysis we examine the correlation between barter and performance (including
investment) and investment and performance.
22 Consequently, we find that firms that engage in more barter tend to have a larger proportion of relatively old capital stock.
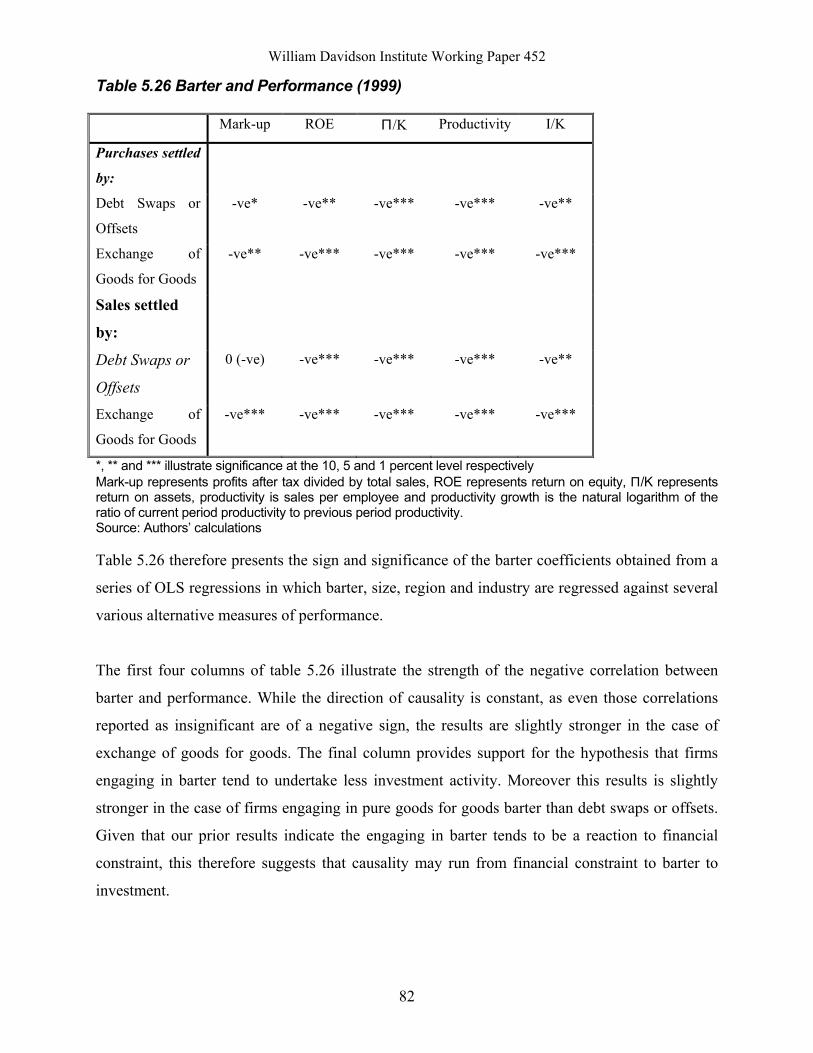
William Davidson Institute Working Paper 452
82
Table 5.26 Barter and Performance (1999)
Mark-up ROE Π/K Productivity I/K
Purchases settled
by:
Debt Swaps or
Offsets
-ve* -ve** -ve*** -ve*** -ve**
Exchange of
Goods for Goods
-ve** -ve*** -ve*** -ve*** -ve***
Sales settled
by:
Debt Swaps or
Offsets
0 (-ve) -ve*** -ve*** -ve*** -ve**
Exchange of
Goods for Goods
-ve*** -ve*** -ve*** -ve*** -ve***
*, ** and *** illustrate significance at the 10, 5 and 1 percent level respectively Mark-up represents profits after tax divided by total sales, ROE represents return on equity, Π/K represents return on assets, productivity is sales per employee and productivity growth is the natural logarithm of the ratio of current period productivity to previous period productivity. Source: Authors’ calculations
Table 5.26 therefore presents the sign and significance of the barter coefficients obtained from a
series of OLS regressions in which barter, size, region and industry are regressed against several
various alternative measures of performance.
The first four columns of table 5.26 illustrate the strength of the negative correlation between
barter and performance. While the direction of causality is constant, as even those correlations
reported as insignificant are of a negative sign, the results are slightly stronger in the case of
exchange of goods for goods. The final column provides support for the hypothesis that firms
engaging in barter tend to undertake less investment activity. Moreover this results is slightly
stronger in the case of firms engaging in pure goods for goods barter than debt swaps or offsets.
Given that our prior results indicate the engaging in barter tends to be a reaction to financial
constraint, this therefore suggests that causality may run from financial constraint to barter to
investment.
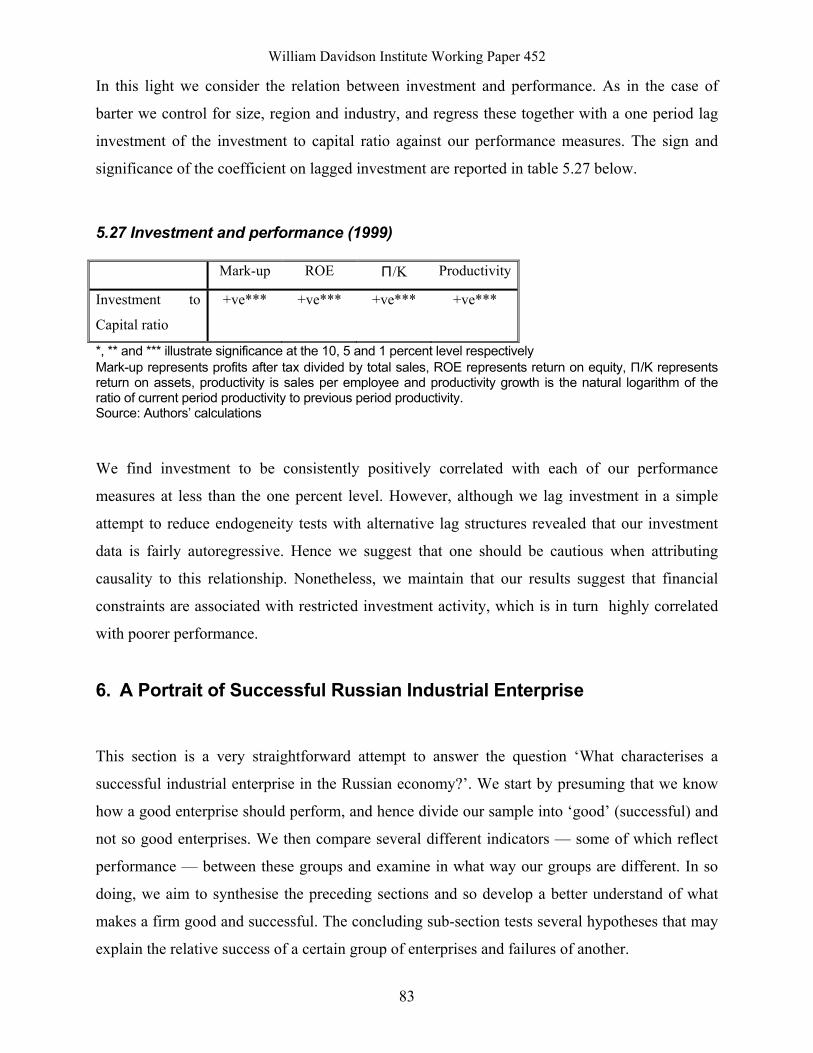
William Davidson Institute Working Paper 452
83
In this light we consider the relation between investment and performance. As in the case of
barter we control for size, region and industry, and regress these together with a one period lag
investment of the investment to capital ratio against our performance measures. The sign and
significance of the coefficient on lagged investment are reported in table 5.27 below.
5.27 Investment and performance (1999)
Mark-up ROE Π/K Productivity
Investment to
Capital ratio
+ve*** +ve*** +ve*** +ve***
*, ** and *** illustrate significance at the 10, 5 and 1 percent level respectively Mark-up represents profits after tax divided by total sales, ROE represents return on equity, Π/K represents return on assets, productivity is sales per employee and productivity growth is the natural logarithm of the ratio of current period productivity to previous period productivity. Source: Authors’ calculations
We find investment to be consistently positively correlated with each of our performance
measures at less than the one percent level. However, although we lag investment in a simple
attempt to reduce endogeneity tests with alternative lag structures revealed that our investment
data is fairly autoregressive. Hence we suggest that one should be cautious when attributing
causality to this relationship. Nonetheless, we maintain that our results suggest that financial
constraints are associated with restricted investment activity, which is in turn highly correlated
with poorer performance.
6. A Portrait of Successful Russian Industrial Enterprise
This section is a very straightforward attempt to answer the question ‘What characterises a
successful industrial enterprise in the Russian economy?’. We start by presuming that we know
how a good enterprise should perform, and hence divide our sample into ‘good’ (successful) and
not so good enterprises. We then compare several different indicators — some of which reflect
performance — between these groups and examine in what way our groups are different. In so
doing, we aim to synthesise the preceding sections and so develop a better understand of what
makes a firm good and successful. The concluding sub-section tests several hypotheses that may
explain the relative success of a certain group of enterprises and failures of another.
William Davidson Institute Working Paper 452
84
6.1 What Constitutes a Successful Industrial Enterprise In Russia? The first step, and probably the most complicated one, is to define what we mean by
‘successful’. We have several options including using flow measures such as profits or stock
measures related to accumulated assets or capital, or controlling for industry specifics — for
example, by measuring relative performance in comparison to industrial averages. However, at
the simplest level we suggest.
Criteria 1. A good enterprise should generate positive value added.
Obviously, this definition of a ‘good’ firm is arbitrary and debatable. However, at least it is
based on a relatively clear-cut concept and does not include a lot of arbitrary threshold
coefficients. Moreover, this criteria was included because there is a great deal of speculation that
Russian industry is populated by enterprises that produce negative value added and only remain
afloat due to soft budget constraints — state direct and indirect subsidies, non-payments, and so
on. Analysis showed that our sample contains very few such enterprises (14 enterprises or 4
percent of the sample in 1997, and no such enterprises in 1998 and 1999). To some extent this
may be due to the aforementioned biases in our sampling, and may also reflect crude
measurement of value added itself, which we calculate as sales minus material costs.
Nonetheless, this criteria was included to ensure that we drop such enterprises from the ‘good’
group.23
Criteria 2. A good enterprise generates positive profits.
While this seems a natural supposition, there are certain factors which cause us to question this
criteria. Firstly, losses may be temporal and due to exogenous factors out of the control of
enterprise. Secondly, hiding profits is a common and a well-known practice for firms in
transition economies — and is not exclusive to firms in transition economies. Hence solid,
productive enterprises may simply show losses and transfer their profits elsewhere. We find that
the first counter-argument can be disregarded (at least for our sample) as 75 percent of our
sampled enterprises managed to generate positive profits even in the 1998 (more than 80 percent
in 1999). By contrast we cannot deal directly with the second argument; instead we propose to
consider a firm to be good only if it is to some extent ‘honest’ and does not hide all generated
profits.
23 Accounting practice sometimes allows enterprises with negative VA to be profitable.

William Davidson Institute Working Paper 452
85
Criteria 3. A good enterprise is always profitable.
A firm may generate positive profits occasionally while being a loss-maker on average. It is
possible to calculate a 3-year average profit measure from our dataset but we do not have
sufficiently reliable deflators to permit us to accurately compare profits from different time
periods. Instead, for the sake of this analysis, we presume that a good firm generates positive
profits for all three years of our sample (1997-1999). This of course may be a significant
constraint if we take into the account that 1998 was a crisis year, and hence an enterprise needed
either a high level of profitability or good management not to post losses during the general
financial chaos. However, in fact a large proportion of firms in our sample meet the requirement:
around 70 percent of our sampled enterprises — 282 out of the 400 enterprises for which we
have data for all three years — meet the criteria, which is almost the same number as the average
profit-makers each year.
We do recognize the fact that we may lose some good firms that posted losses in 1998 as a result
of hard-currency credits that they received in the previous years — for modernization or other
objectives — becoming very expensive due to the devaluation. We interpret such a situation as
indicating that managers/owners of these firms failed to evaluate the associated risks properly
and were insufficiently cautious. Hence whereas in selecting profitable firms we were biased in
favour of ‘honest’ ones, in this case we are conscious of inducing what could be interpreted as a
bias in favour of ‘clever’ firms24.
Criteria 4. A good firm’s output should not be too volatile.
If the management is good and reacts quickly to the changing economic environment, a firm can
be profitable by squeezing the volume of output — and costs. We want our good firm’s
performance to be stable not only in terms of profits but also in terms of output. In principle we
could demand no fall in output in constant prices. That would mean (a) having price indexes for
each enterprise or some proxy — difficult but not unimaginable — and (b) losing a lot of good
firms due to instability in 1998 prices. In order to not be too tough on the enterprises we instead
formulated a soft criteria: ‘a good firm should have no decline in nominal output’. Nonetheless it
24 Actually the check on those firms that were profitable in 1997 but became loss-makers in 1998 showed that most of their performance characteristics (i.e. mark-up, return on equity, etc.) in 1997 were very close to ‘bad’ group means and distinctly different from other groups. Thus, we lost some "good" but unlucky guys but not many.
William Davidson Institute Working Paper 452
86
was surprising that this ‘soft’ requirement appeared to be much harder to meet than requiring the
enterprises to make profits in every year of the sample. Only 48.6 percent — 195 enterprises —
of enterprises met the criteria.
Criteria 5. A good firm thinks about the future and invests into fixed assets.
Despite this tough criteria, finding that 48.6 percent of our firms can be regarded as good seems
a lot, at least for the Russian economy. We therefore introduced the last criteria in order to select
leaders from the good group, to establish a group of what could be called ‘very good’ firms. The
criteria is based on an indicator of the investment activity of the firm. This choice is not an
obvious one, and is somewhat contentious. For instance, a firm may not invest because it has
spare capacity and does not need invest. Alternatively it may not invest into fixed assets every
year, but instead accumulates money for big a investment project and makes financial
investments or purchases other firms’ equity. Moreover, to measure investment activity over
time one should control for prices, etc., and we do not have sufficiently detailed deflators to
permit this.
Instead we simply set a threshold to separate firms on the basis of their investment activity:
namely that total net investment for the three year period — the sum of total investment for the
three years of our sample less the sum of fixed capital depreciation charged to costs in the same
period — should be positive. An obvious reason for choosing this threshold is that it allows us
to separate firms that compensate for the losses of their fixed capital by investing depreciation
money into modernization and/or buying new equipment and facilities.
This is, however, actually a very ‘soft’ constraint for the Russian firms, as the assets of industrial
enterprises — especially installed more than ten years ago — are usually undervalued, and
generally badly measured. Moreover depreciation tends to be smaller than the cost of renewing
capacities lost due to wear-and-tear of equipment. On the other hand, firms with newer and better
equipment — for example, imported recently — would find it harder to meet this requirement
than firms with outdated fixed assets. In our sample 123 enterprise (more than 30 percent of our
sample) had accumulated investments that exceeded accumulated depreciation charges.
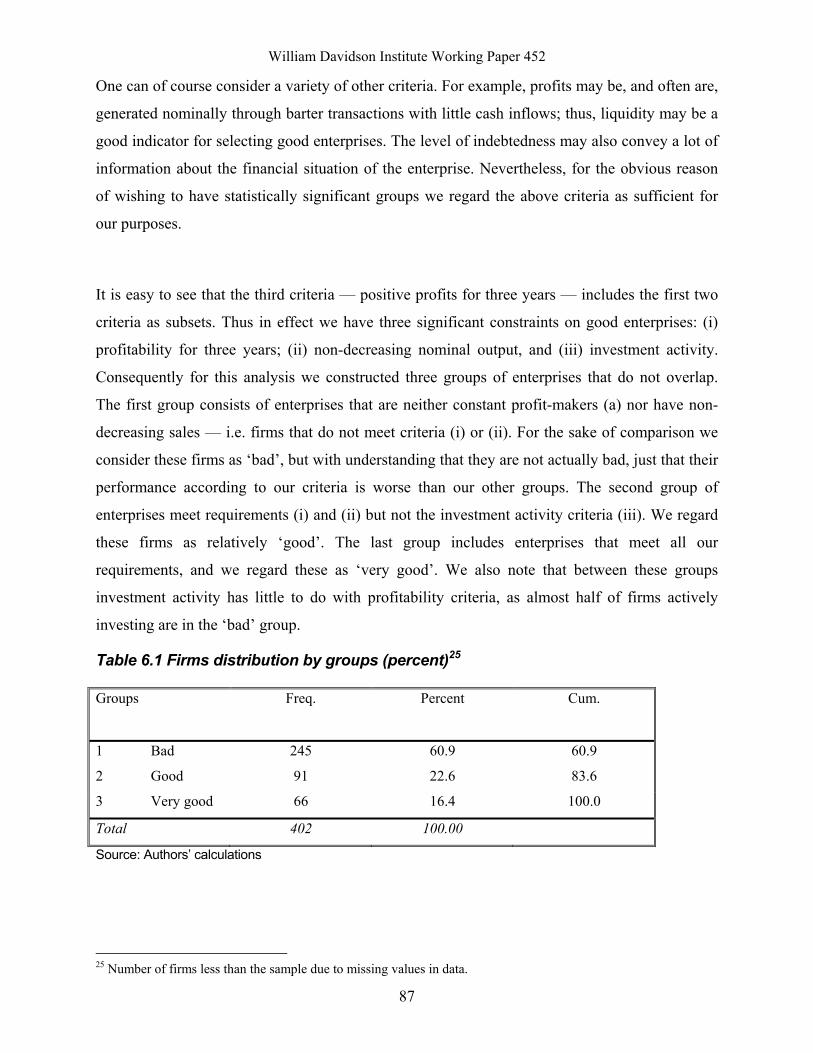
William Davidson Institute Working Paper 452
87
One can of course consider a variety of other criteria. For example, profits may be, and often are,
generated nominally through barter transactions with little cash inflows; thus, liquidity may be a
good indicator for selecting good enterprises. The level of indebtedness may also convey a lot of
information about the financial situation of the enterprise. Nevertheless, for the obvious reason
of wishing to have statistically significant groups we regard the above criteria as sufficient for
our purposes.
It is easy to see that the third criteria — positive profits for three years — includes the first two
criteria as subsets. Thus in effect we have three significant constraints on good enterprises: (i)
profitability for three years; (ii) non-decreasing nominal output, and (iii) investment activity.
Consequently for this analysis we constructed three groups of enterprises that do not overlap.
The first group consists of enterprises that are neither constant profit-makers (a) nor have non-
decreasing sales — i.e. firms that do not meet criteria (i) or (ii). For the sake of comparison we
consider these firms as ‘bad’, but with understanding that they are not actually bad, just that their
performance according to our criteria is worse than our other groups. The second group of
enterprises meet requirements (i) and (ii) but not the investment activity criteria (iii). We regard
these firms as relatively ‘good’. The last group includes enterprises that meet all our
requirements, and we regard these as ‘very good’. We also note that between these groups
investment activity has little to do with profitability criteria, as almost half of firms actively
investing are in the ‘bad’ group.
Table 6.1 Firms distribution by groups (percent)25
Groups Freq. Percent Cum.
1 Bad 245 60.9 60.9
2 Good 91 22.6 83.6
3 Very good 66 16.4 100.0
Total 402 100.00
Source: Authors’ calculations
25 Number of firms less than the sample due to missing values in data.
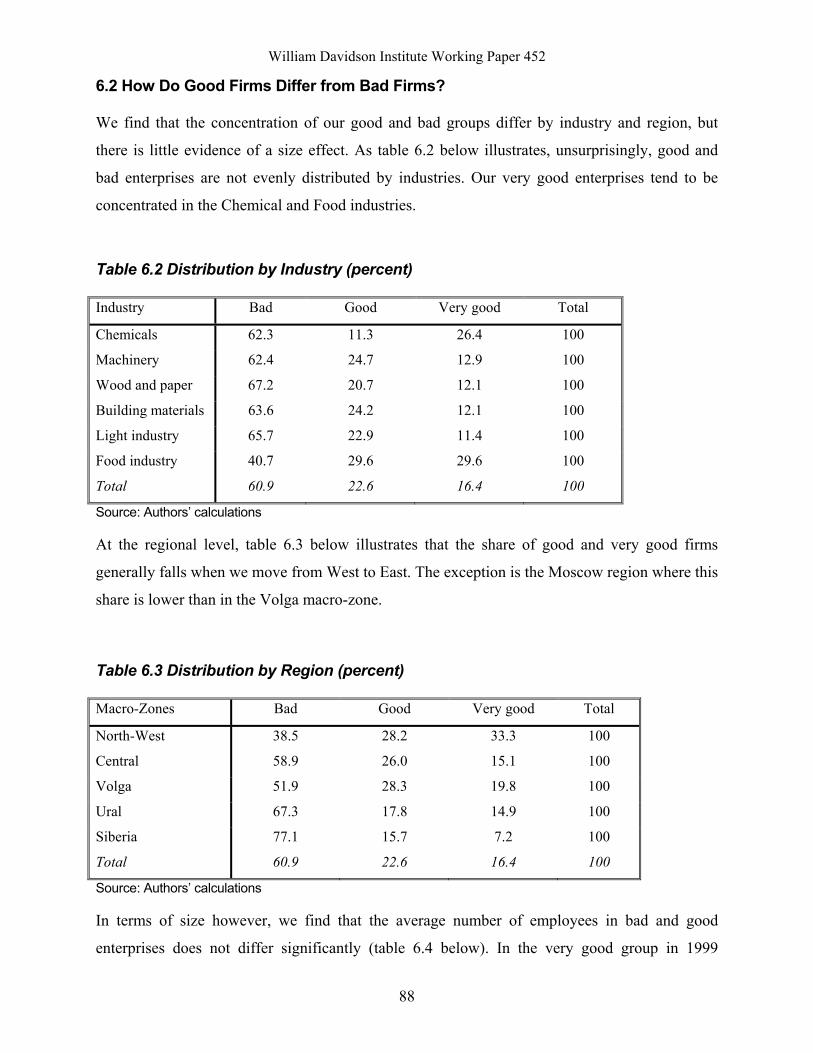
William Davidson Institute Working Paper 452
88
6.2 How Do Good Firms Differ from Bad Firms?
We find that the concentration of our good and bad groups differ by industry and region, but
there is little evidence of a size effect. As table 6.2 below illustrates, unsurprisingly, good and
bad enterprises are not evenly distributed by industries. Our very good enterprises tend to be
concentrated in the Chemical and Food industries.
Table 6.2 Distribution by Industry (percent)
Industry Bad Good Very good Total
Chemicals 62.3 11.3 26.4 100
Machinery 62.4 24.7 12.9 100
Wood and paper 67.2 20.7 12.1 100
Building materials 63.6 24.2 12.1 100
Light industry 65.7 22.9 11.4 100
Food industry 40.7 29.6 29.6 100
Total 60.9 22.6 16.4 100
Source: Authors’ calculations
At the regional level, table 6.3 below illustrates that the share of good and very good firms
generally falls when we move from West to East. The exception is the Moscow region where this
share is lower than in the Volga macro-zone.
Table 6.3 Distribution by Region (percent)
Macro-Zones Bad Good Very good Total
North-West 38.5 28.2 33.3 100
Central 58.9 26.0 15.1 100
Volga 51.9 28.3 19.8 100
Ural 67.3 17.8 14.9 100
Siberia 77.1 15.7 7.2 100
Total 60.9 22.6 16.4 100
Source: Authors’ calculations
In terms of size however, we find that the average number of employees in bad and good
enterprises does not differ significantly (table 6.4 below). In the very good group in 1999
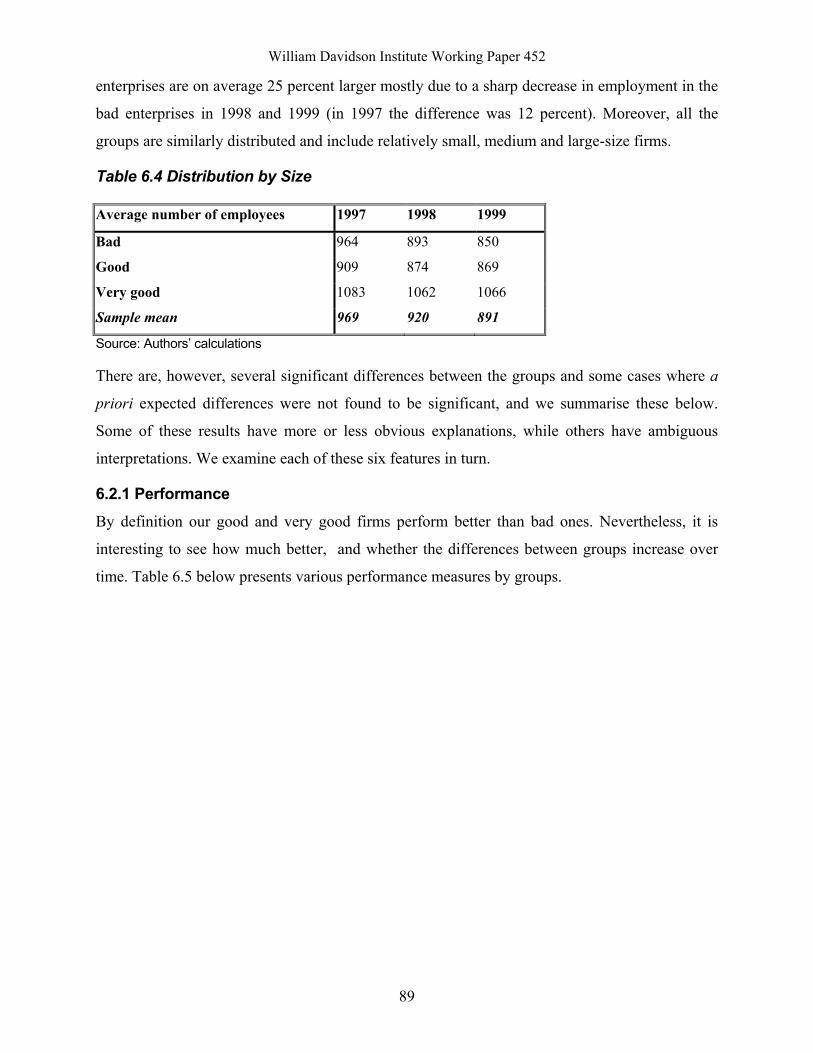
William Davidson Institute Working Paper 452
89
enterprises are on average 25 percent larger mostly due to a sharp decrease in employment in the
bad enterprises in 1998 and 1999 (in 1997 the difference was 12 percent). Moreover, all the
groups are similarly distributed and include relatively small, medium and large-size firms.
Table 6.4 Distribution by Size
Average number of employees 1997 1998 1999
Bad 964 893 850
Good 909 874 869
Very good 1083 1062 1066
Sample mean 969 920 891
Source: Authors’ calculations
There are, however, several significant differences between the groups and some cases where a
priori expected differences were not found to be significant, and we summarise these below.
Some of these results have more or less obvious explanations, while others have ambiguous
interpretations. We examine each of these six features in turn.
6.2.1 Performance By definition our good and very good firms perform better than bad ones. Nevertheless, it is
interesting to see how much better, and whether the differences between groups increase over
time. Table 6.5 below presents various performance measures by groups.
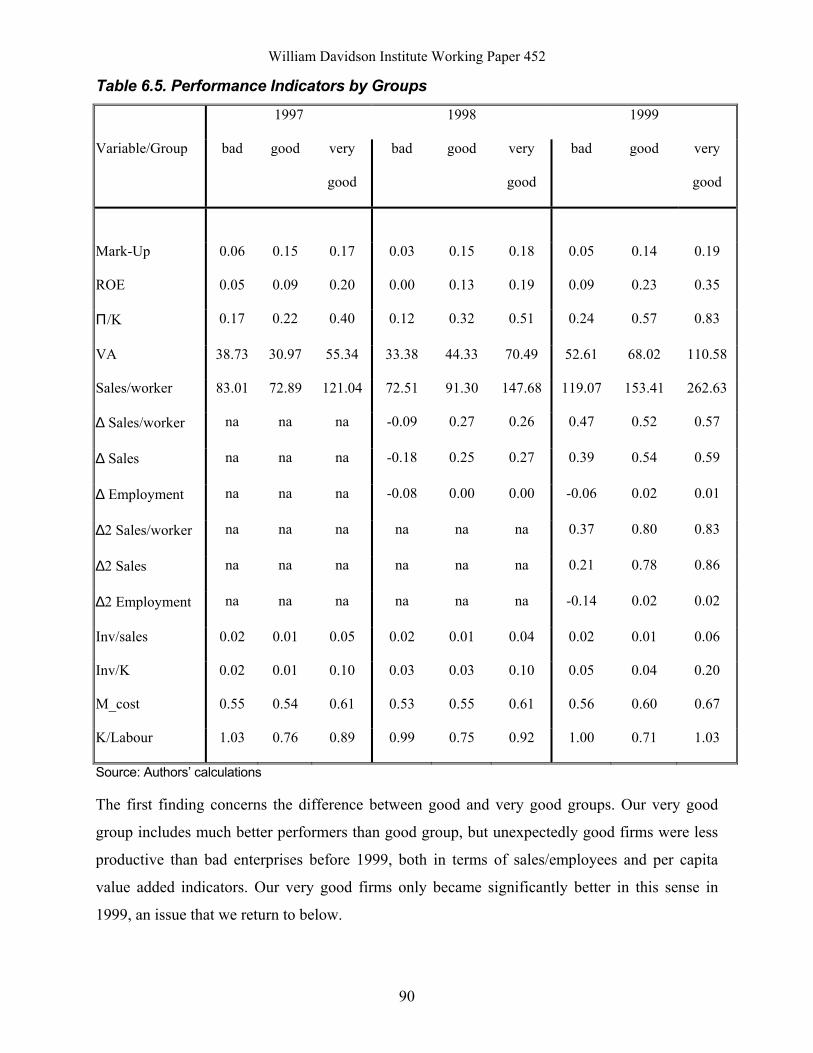
William Davidson Institute Working Paper 452
90
Table 6.5. Performance Indicators by Groups
1997 1998 1999
Variable/Group bad good very
good
bad good very
good
bad good very
good
Mark-Up 0.06 0.15 0.17 0.03 0.15 0.18 0.05 0.14 0.19
ROE 0.05 0.09 0.20 0.00 0.13 0.19 0.09 0.23 0.35
Π/K 0.17 0.22 0.40 0.12 0.32 0.51 0.24 0.57 0.83
VA 38.73 30.97 55.34 33.38 44.33 70.49 52.61 68.02 110.58
Sales/worker 83.01 72.89 121.04 72.51 91.30 147.68 119.07 153.41 262.63
∆ Sales/worker na na na -0.09 0.27 0.26 0.47 0.52 0.57
∆ Sales na na na -0.18 0.25 0.27 0.39 0.54 0.59
∆ Employment na na na -0.08 0.00 0.00 -0.06 0.02 0.01
∆2 Sales/worker na na na na na na 0.37 0.80 0.83
∆2 Sales na na na na na na 0.21 0.78 0.86
∆2 Employment na na na na na na -0.14 0.02 0.02
Inv/sales 0.02 0.01 0.05 0.02 0.01 0.04 0.02 0.01 0.06
Inv/K 0.02 0.01 0.10 0.03 0.03 0.10 0.05 0.04 0.20
M_cost 0.55 0.54 0.61 0.53 0.55 0.61 0.56 0.60 0.67
K/Labour 1.03 0.76 0.89 0.99 0.75 0.92 1.00 0.71 1.03
Source: Authors’ calculations
The first finding concerns the difference between good and very good groups. Our very good
group includes much better performers than good group, but unexpectedly good firms were less
productive than bad enterprises before 1999, both in terms of sales/employees and per capita
value added indicators. Our very good firms only became significantly better in this sense in
1999, an issue that we return to below.

William Davidson Institute Working Paper 452
91
There are, however, several more or less obvious results from the comparison of our three
groups:
• The level of capacity utilization is significantly higher in the good group and even more
so in the very good group;
• The equipment vintage is much better in better groups;
• Better groups have less excess labour. In particular no firm in the very good group has
more that 10 percent of excess labour;
• Better firms pay considerably higher wages and the difference between groups increases
through time;
• The share of exports is higher for better groups. This result is however driven by the fact
that a larger number of firms in the better groups engage in export activity. The average
share of exports among firms engaged in export sales does not differ by groups. In other
words if you are an exporter you have more chances to be good.26
6.2.2 Financing We find that good enterprises receive a significantly higher proportion of revenues from their
customers in money and settle a higher proportion of their purchases from suppliers in money.
Firms in our bad and good groups deal slightly more in surrogates with suppliers than with
customers. The share of barter received from customers is almost identical to that used to settle
purchases from suppliers in very good firms
Rather surprisingly we find that the average interest rate enterprises expect to pay for short-term
bank credit does not differ much by groups (36, 36 and 32 percent for bad, good and very good
firms respectively). On the other hand both short and even more so long-term credits are more
readily available to better performing enterprises. Forty-five percent of bad firms report that they
find it easy or fairly easy to obtain short-term credit, relative to 65 percent of good firms and 75
percent of very good firms; the equivalent proportions long-term credit are 15, 30 and 38 percent
respectively.
26 One more conclusion may be of some interest because it contradicts the common view that being an exporter in Russia makes a firm profitable. The share of exporters in the bad group was 40 percent in 1997, rising to 44 percent in 1999. The good group have a stable share of exporting firms of 51 percent, while the very good group also have a stable share of 57 percent.

William Davidson Institute Working Paper 452
92
Equity financing is almost non existent in all groups but there are certain differences in the level
of optimism: only 3 percent of bad firms believe that it would be easy or fairly easy to sell newly
emitted shares to foreign investors, 9 percent of the good and 11 percent of very good firms are
optimistic. Interestingly, around half of the optimists in the good group believe it to be very easy
whereas no firms in the very good group believe this to be the case. Eight percent of firms in the
first group believe it easy to sell equity to Russian investor, against 10 and 21 percent for good
and very good groups respectively. Again the proportion of ‘radical’ optimists — reporting that
it would be very easy — is much higher among the managers of the good group (50 percent)
against less than 8 percent among the very good group. This fact is worth remembering when we
discuss management.
Finally, we find that levels of debt are naturally lower at better firms when measured relative to
either sales, profits or to capital. At the same time the overdue debt to overall debt ratio while
lower in the second and the third group is still rather high.
6.2.3 Relations with State and State Policy We find that Federal and Regional authorities do not show any biases towards any group. Tax
holidays are more frequently granted to good enterprises (most likely as profit tax holidays
which bad firms can’t have as they are loss-makers by definition). By contrast restructuring of
debt is more usual for bad firms. Direct subsidies are so rare that while 4 percent of bad
enterprise report receiving them relative to 1.5 percent in very good group, the numbers reporting
form too small a sample for definite conclusions.
There appears to be no difference in firms’ expectations of receiving state assistance. Although
our good group is on average very slightly more optimistic about the possibility of getting state
assistance, the difference is insignificant. Sixty percent rate the opportunity of getting assistance
from the Federal authorities as impossible in all groups, while 45 percent in each group report
that they would find it impossible to get assistance from the Regional government.
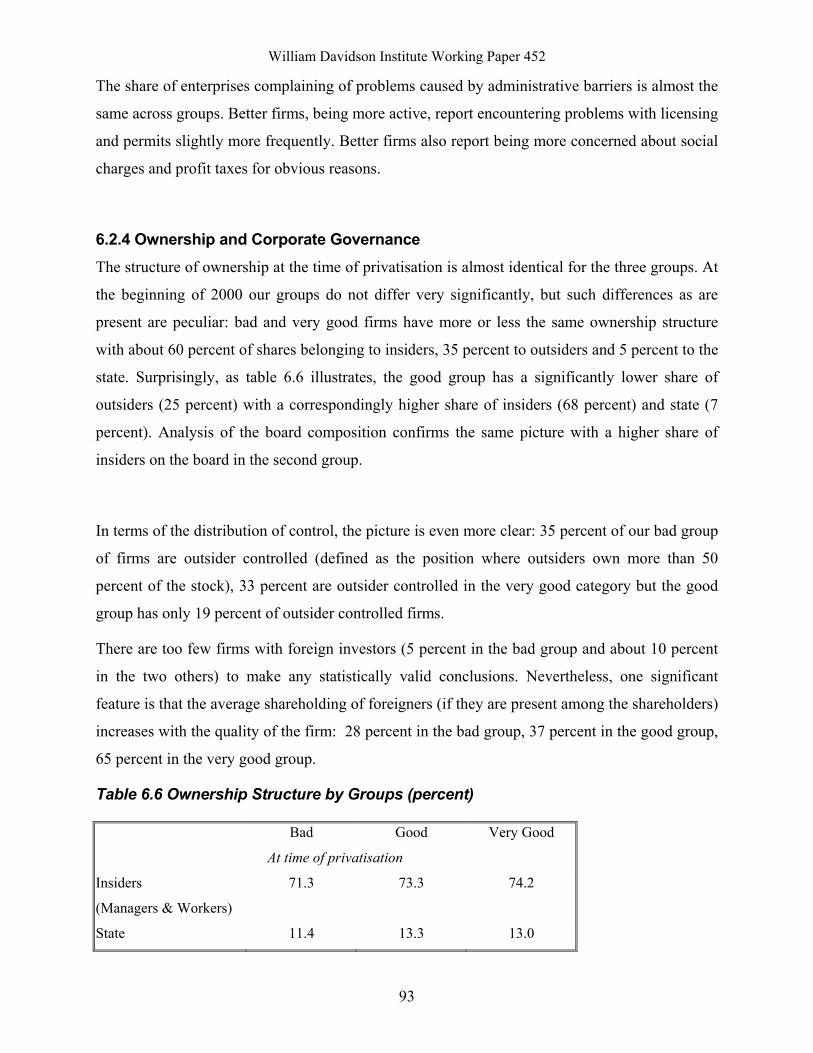
William Davidson Institute Working Paper 452
93
The share of enterprises complaining of problems caused by administrative barriers is almost the
same across groups. Better firms, being more active, report encountering problems with licensing
and permits slightly more frequently. Better firms also report being more concerned about social
charges and profit taxes for obvious reasons.
6.2.4 Ownership and Corporate Governance The structure of ownership at the time of privatisation is almost identical for the three groups. At
the beginning of 2000 our groups do not differ very significantly, but such differences as are
present are peculiar: bad and very good firms have more or less the same ownership structure
with about 60 percent of shares belonging to insiders, 35 percent to outsiders and 5 percent to the
state. Surprisingly, as table 6.6 illustrates, the good group has a significantly lower share of
outsiders (25 percent) with a correspondingly higher share of insiders (68 percent) and state (7
percent). Analysis of the board composition confirms the same picture with a higher share of
insiders on the board in the second group.
In terms of the distribution of control, the picture is even more clear: 35 percent of our bad group
of firms are outsider controlled (defined as the position where outsiders own more than 50
percent of the stock), 33 percent are outsider controlled in the very good category but the good
group has only 19 percent of outsider controlled firms.
There are too few firms with foreign investors (5 percent in the bad group and about 10 percent
in the two others) to make any statistically valid conclusions. Nevertheless, one significant
feature is that the average shareholding of foreigners (if they are present among the shareholders)
increases with the quality of the firm: 28 percent in the bad group, 37 percent in the good group,
65 percent in the very good group.
Table 6.6 Ownership Structure by Groups (percent)
Bad Good Very Good
At time of privatisation
Insiders
(Managers & Workers)
71.3 73.3 74.2
State 11.4 13.3 13.0
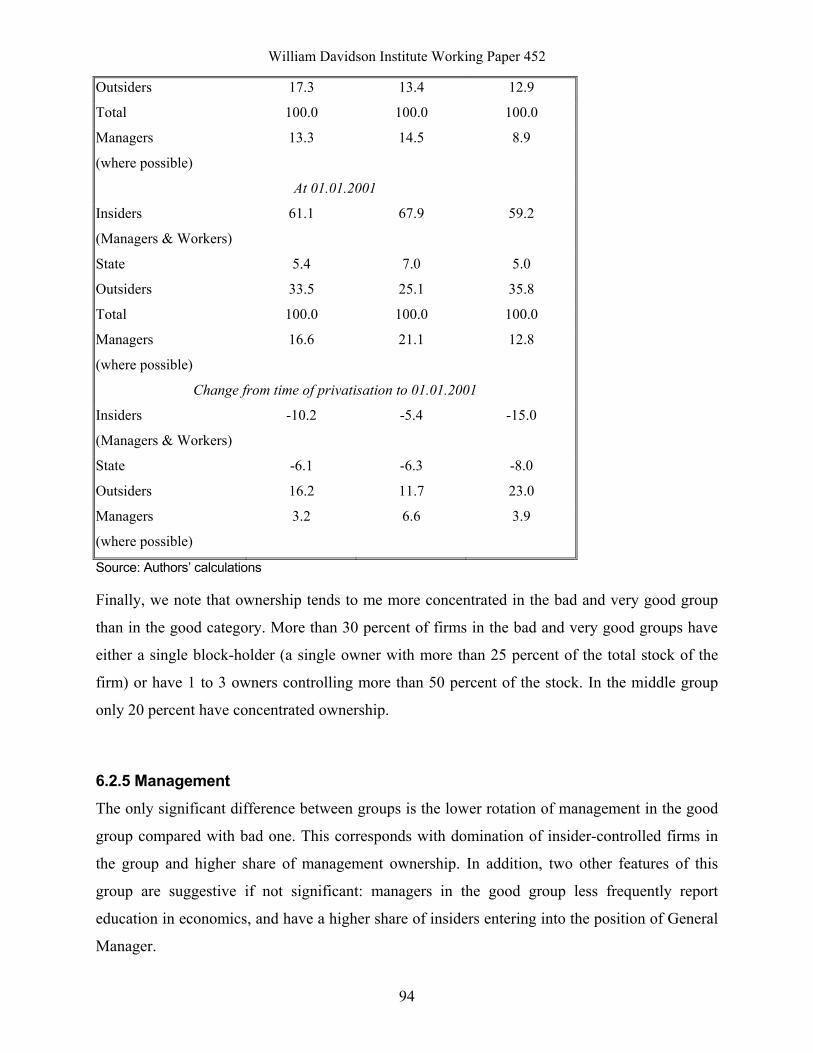
William Davidson Institute Working Paper 452
94
Outsiders 17.3 13.4 12.9
Total 100.0 100.0 100.0
Managers
(where possible)
13.3 14.5 8.9
At 01.01.2001
Insiders
(Managers & Workers)
61.1 67.9 59.2
State 5.4 7.0 5.0
Outsiders 33.5 25.1 35.8
Total 100.0 100.0 100.0
Managers
(where possible)
16.6 21.1 12.8
Change from time of privatisation to 01.01.2001
Insiders
(Managers & Workers)
-10.2 -5.4 -15.0
State -6.1 -6.3 -8.0
Outsiders 16.2 11.7 23.0
Managers
(where possible)
3.2 6.6 3.9
Source: Authors’ calculations
Finally, we note that ownership tends to me more concentrated in the bad and very good group
than in the good category. More than 30 percent of firms in the bad and very good groups have
either a single block-holder (a single owner with more than 25 percent of the total stock of the
firm) or have 1 to 3 owners controlling more than 50 percent of the stock. In the middle group
only 20 percent have concentrated ownership.
6.2.5 Management The only significant difference between groups is the lower rotation of management in the good
group compared with bad one. This corresponds with domination of insider-controlled firms in
the group and higher share of management ownership. In addition, two other features of this
group are suggestive if not significant: managers in the good group less frequently report
education in economics, and have a higher share of insiders entering into the position of General
Manager.
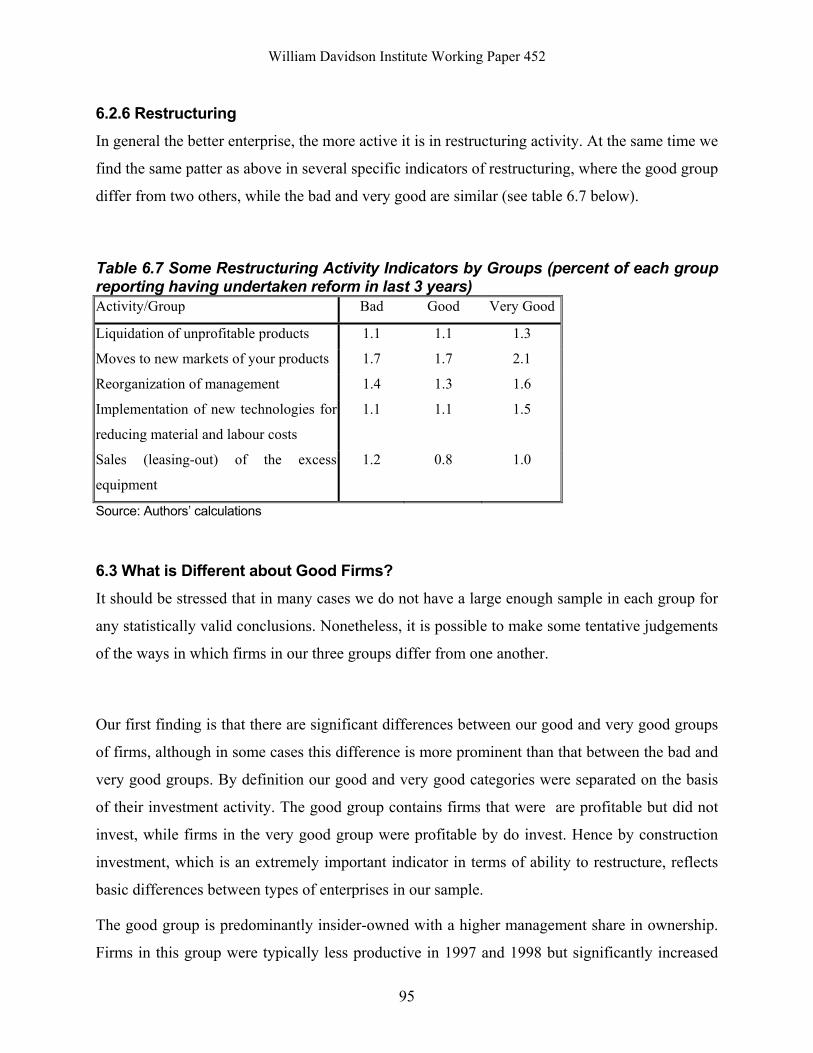
William Davidson Institute Working Paper 452
95
6.2.6 Restructuring In general the better enterprise, the more active it is in restructuring activity. At the same time we
find the same patter as above in several specific indicators of restructuring, where the good group
differ from two others, while the bad and very good are similar (see table 6.7 below).
Table 6.7 Some Restructuring Activity Indicators by Groups (percent of each group reporting having undertaken reform in last 3 years) Activity/Group Bad Good Very Good
Liquidation of unprofitable products 1.1 1.1 1.3
Moves to new markets of your products 1.7 1.7 2.1
Reorganization of management 1.4 1.3 1.6
Implementation of new technologies for
reducing material and labour costs
1.1 1.1 1.5
Sales (leasing-out) of the excess
equipment
1.2 0.8 1.0
Source: Authors’ calculations
6.3 What is Different about Good Firms? It should be stressed that in many cases we do not have a large enough sample in each group for
any statistically valid conclusions. Nonetheless, it is possible to make some tentative judgements
of the ways in which firms in our three groups differ from one another.
Our first finding is that there are significant differences between our good and very good groups
of firms, although in some cases this difference is more prominent than that between the bad and
very good groups. By definition our good and very good categories were separated on the basis
of their investment activity. The good group contains firms that were are profitable but did not
invest, while firms in the very good group were profitable by do invest. Hence by construction
investment, which is an extremely important indicator in terms of ability to restructure, reflects
basic differences between types of enterprises in our sample.
The good group is predominantly insider-owned with a higher management share in ownership.
Firms in this group were typically less productive in 1997 and 1998 but significantly increased

William Davidson Institute Working Paper 452
96
their labour productivity in 1999. The ownership here is less concentrated and while trends are
the same, changes in ownership are slower. Management rotation in this group is also less
intensive that in the two other groups, hence accordingly they are less active in reorganization of
management as a restructuring activity. In terms of other restructuring activity good firms are
also inclined to be less active on their markets (less active in dropping unprofitable products, and
movement to new markets) and less concerned about costs (less implementation of technology
for labour and material cost reduction, less sales of equipment). A lot of other minor details also
contribute to the impression that these firms are quite satisfied with themselves and do not wish
(or do not need) to change much.
6.3.1 What Makes Them Tick?
Hypothesis 1. Good firms were initially good.
One possible explanation for these findings is that simply some firms were lucky enough to find
themselves in a better position at the time of mass privatisation, and kept their advantages
through the 1990s. To check this supposition table 6.8 displays the results of calculations of the
profits (losses) to output ratio for each group of firms using data from Goskomstat. The data does
not display any significant patterns by group until 199527. Consequently we can conclude that
there were no significant difference in initial performance between groups.
We propose two possible factors to explain the difference that emerge from 1995. Firstly, 1995
was the year when financial stabilization in Russia started: inflation fell and the exchange rate
stabilised. Moreover volatility in the structure of prices ended in 1994 — including energy and
natural monopolies tariffs — and hence it may be that the new price structure polarised the
differences between good and bad firms in the new market economy. A second explanation may
be that the differentiation between groups is a product of new owners’ policy and decisions
following the completion of the mass privatisation programme in 1994.
27 The check with return on capital (profits to capital) and cost per ruble of output gives a similar results.

William Davidson Institute Working Paper 452
97
Table 6.8 Retrospective Performance by Groups
Bad Good Very Good
1990 No. Obs. 123 58 36
Proftiabiity 0.14 0.17 0.16
ROE 0.24 0.34 0.29
Cost/sales (%) na na na
1991 No. Obs. 165 69 48
Proftiabiity 0.21 0.23 0.24
ROE 0.62 0.84 0.84
Cost/sales (%) na na na
1992 No. Obs. 197 79 52
Proftiabiity 0.23 0.27 0.27
ROE 0.40 0.56 0.57
Cost/sales (%) 73.43 74.54 71.76
1993 No. Obs. 211 83 56
Proftiabiity 0.23 0.27 0.25
ROE 1.47 2.17 1.86
Cost/sales (%) 75.80 71.27 72.18
1994 No. Obs. 216 80 58
Proftiabiity 0.27 0.26 0.29
ROE 0.26 0.38 0.50
Cost/sales (%) 86.13 79.79 77.06
1995 No. Obs. 235 90 63
Proftiabiity 0.14 0.20 0.23
ROE na na na
Cost/sales (%) 84.95 80.88 77.71
1996 No. Obs. 241 91 66
Proftiabiity 0.02 0.11 0.13
ROE na na na
Cost/sales (%) 100.23 90.43 86.11
Source: Authors’ calculations
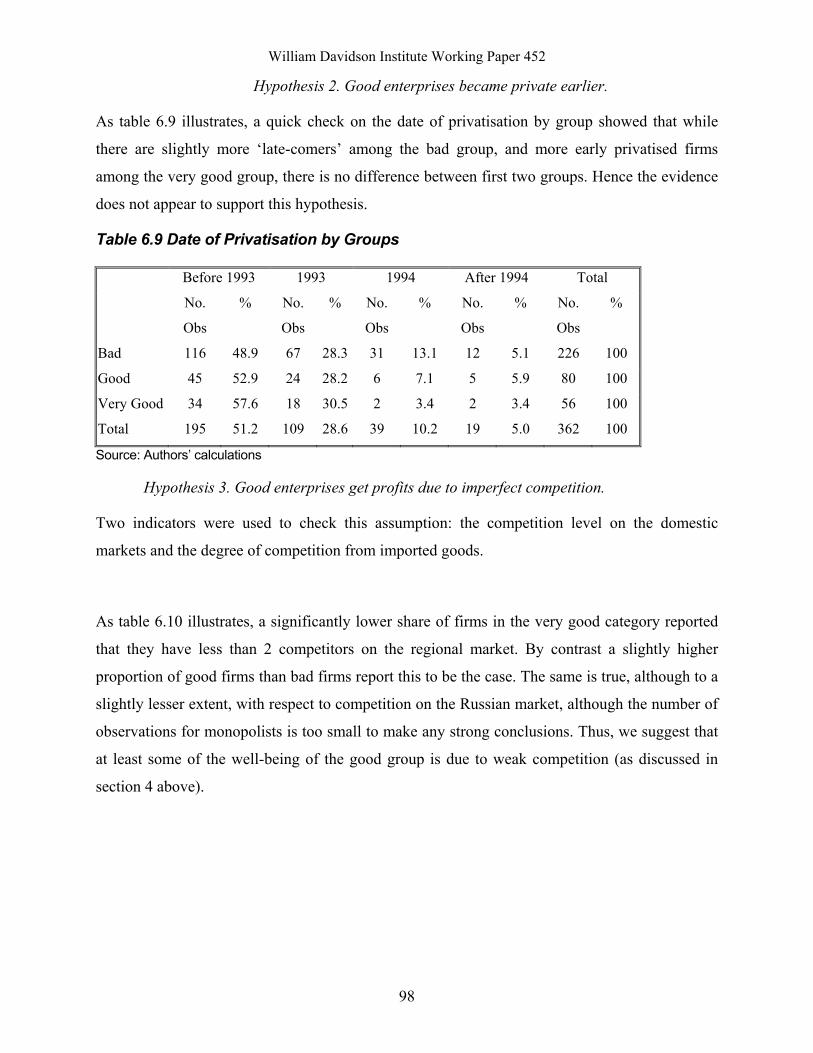
William Davidson Institute Working Paper 452
98
Hypothesis 2. Good enterprises became private earlier.
As table 6.9 illustrates, a quick check on the date of privatisation by group showed that while
there are slightly more ‘late-comers’ among the bad group, and more early privatised firms
among the very good group, there is no difference between first two groups. Hence the evidence
does not appear to support this hypothesis.
Table 6.9 Date of Privatisation by Groups
Before 1993 1993 1994 After 1994 Total
No.
Obs
% No.
Obs
% No.
Obs
% No.
Obs
% No.
Obs
%
Bad 116 48.9 67 28.3 31 13.1 12 5.1 226 100
Good 45 52.9 24 28.2 6 7.1 5 5.9 80 100
Very Good 34 57.6 18 30.5 2 3.4 2 3.4 56 100
Total 195 51.2 109 28.6 39 10.2 19 5.0 362 100
Source: Authors’ calculations
Hypothesis 3. Good enterprises get profits due to imperfect competition.
Two indicators were used to check this assumption: the competition level on the domestic
markets and the degree of competition from imported goods.
As table 6.10 illustrates, a significantly lower share of firms in the very good category reported
that they have less than 2 competitors on the regional market. By contrast a slightly higher
proportion of good firms than bad firms report this to be the case. The same is true, although to a
slightly lesser extent, with respect to competition on the Russian market, although the number of
observations for monopolists is too small to make any strong conclusions. Thus, we suggest that
at least some of the well-being of the good group is due to weak competition (as discussed in
section 4 above).
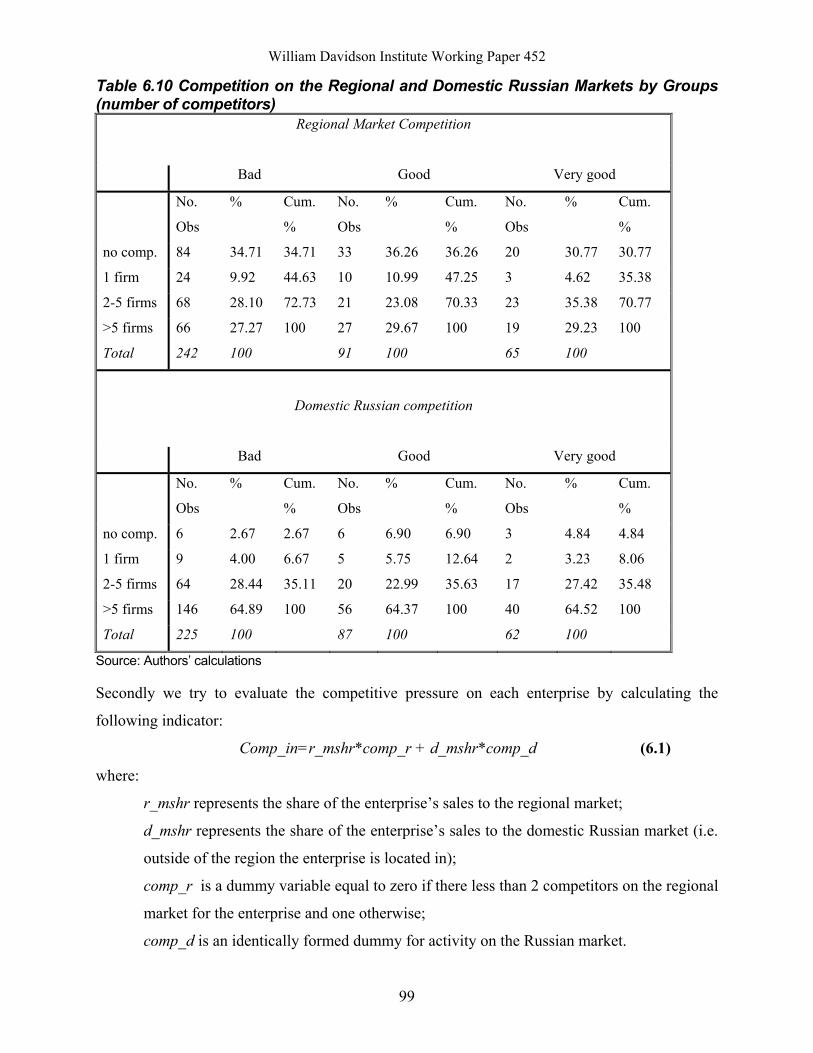
William Davidson Institute Working Paper 452
99
Table 6.10 Competition on the Regional and Domestic Russian Markets by Groups (number of competitors)
Regional Market Competition
Bad Good Very good
No.
Obs
% Cum.
%
No.
Obs
% Cum.
%
No.
Obs
% Cum.
%
no comp. 84 34.71 34.71 33 36.26 36.26 20 30.77 30.77
1 firm 24 9.92 44.63 10 10.99 47.25 3 4.62 35.38
2-5 firms 68 28.10 72.73 21 23.08 70.33 23 35.38 70.77
>5 firms 66 27.27 100 27 29.67 100 19 29.23 100
Total 242 100 91 100 65 100
Domestic Russian competition
Bad Good Very good
No.
Obs
% Cum.
%
No.
Obs
% Cum.
%
No.
Obs
% Cum.
%
no comp. 6 2.67 2.67 6 6.90 6.90 3 4.84 4.84
1 firm 9 4.00 6.67 5 5.75 12.64 2 3.23 8.06
2-5 firms 64 28.44 35.11 20 22.99 35.63 17 27.42 35.48
>5 firms 146 64.89 100 56 64.37 100 40 64.52 100
Total 225 100 87 100 62 100
Source: Authors’ calculations
Secondly we try to evaluate the competitive pressure on each enterprise by calculating the
following indicator:
Comp_in=r_mshr*comp_r + d_mshr*comp_d (6.1) where:
r_mshr represents the share of the enterprise’s sales to the regional market;
d_mshr represents the share of the enterprise’s sales to the domestic Russian market (i.e.
outside of the region the enterprise is located in);
comp_r is a dummy variable equal to zero if there less than 2 competitors on the regional
market for the enterprise and one otherwise;
comp_d is an identically formed dummy for activity on the Russian market.
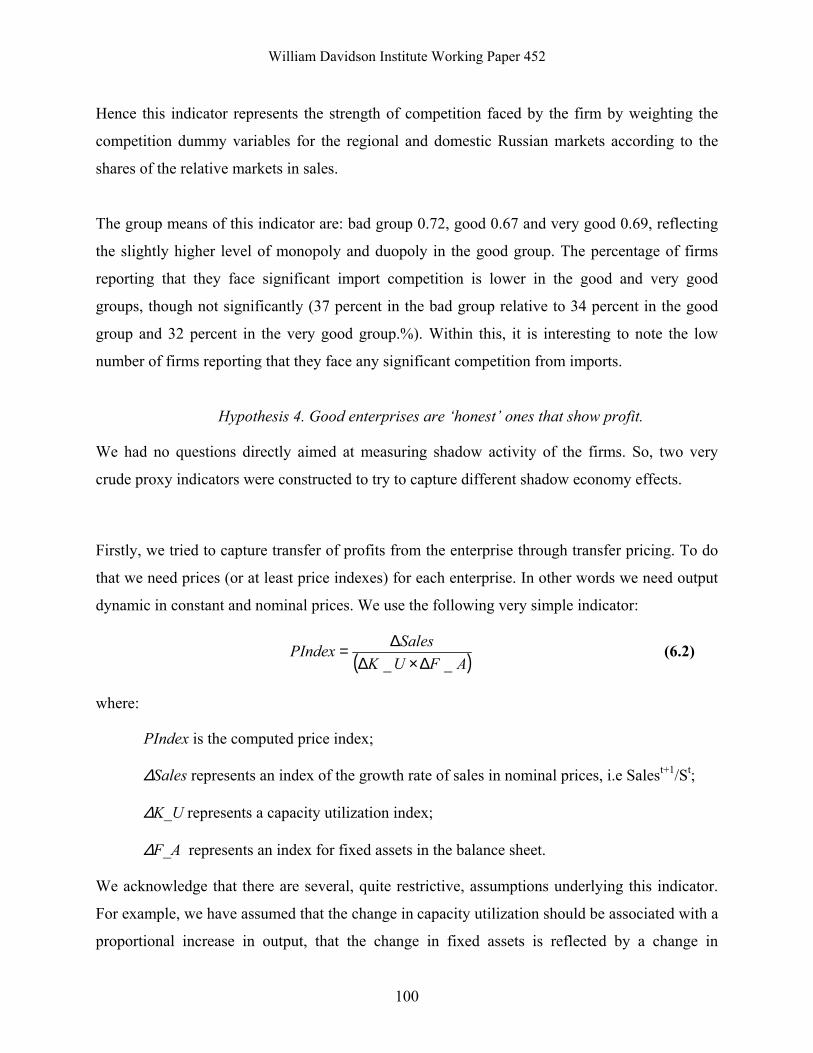
William Davidson Institute Working Paper 452
100
Hence this indicator represents the strength of competition faced by the firm by weighting the
competition dummy variables for the regional and domestic Russian markets according to the
shares of the relative markets in sales.
The group means of this indicator are: bad group 0.72, good 0.67 and very good 0.69, reflecting
the slightly higher level of monopoly and duopoly in the good group. The percentage of firms
reporting that they face significant import competition is lower in the good and very good
groups, though not significantly (37 percent in the bad group relative to 34 percent in the good
group and 32 percent in the very good group.%). Within this, it is interesting to note the low
number of firms reporting that they face any significant competition from imports.
Hypothesis 4. Good enterprises are ‘honest’ ones that show profit.
We had no questions directly aimed at measuring shadow activity of the firms. So, two very
crude proxy indicators were constructed to try to capture different shadow economy effects.
Firstly, we tried to capture transfer of profits from the enterprise through transfer pricing. To do
that we need prices (or at least price indexes) for each enterprise. In other words we need output
dynamic in constant and nominal prices. We use the following very simple indicator:
( )AFUKSalesPIndex
__ ∆×∆∆= (6.2)
where:
PIndex is the computed price index;
∆Sales represents an index of the growth rate of sales in nominal prices, i.e Salest+1/St;
∆K_U represents a capacity utilization index;
∆F_A represents an index for fixed assets in the balance sheet.
We acknowledge that there are several, quite restrictive, assumptions underlying this indicator.
For example, we have assumed that the change in capacity utilization should be associated with a
proportional increase in output, that the change in fixed assets is reflected by a change in
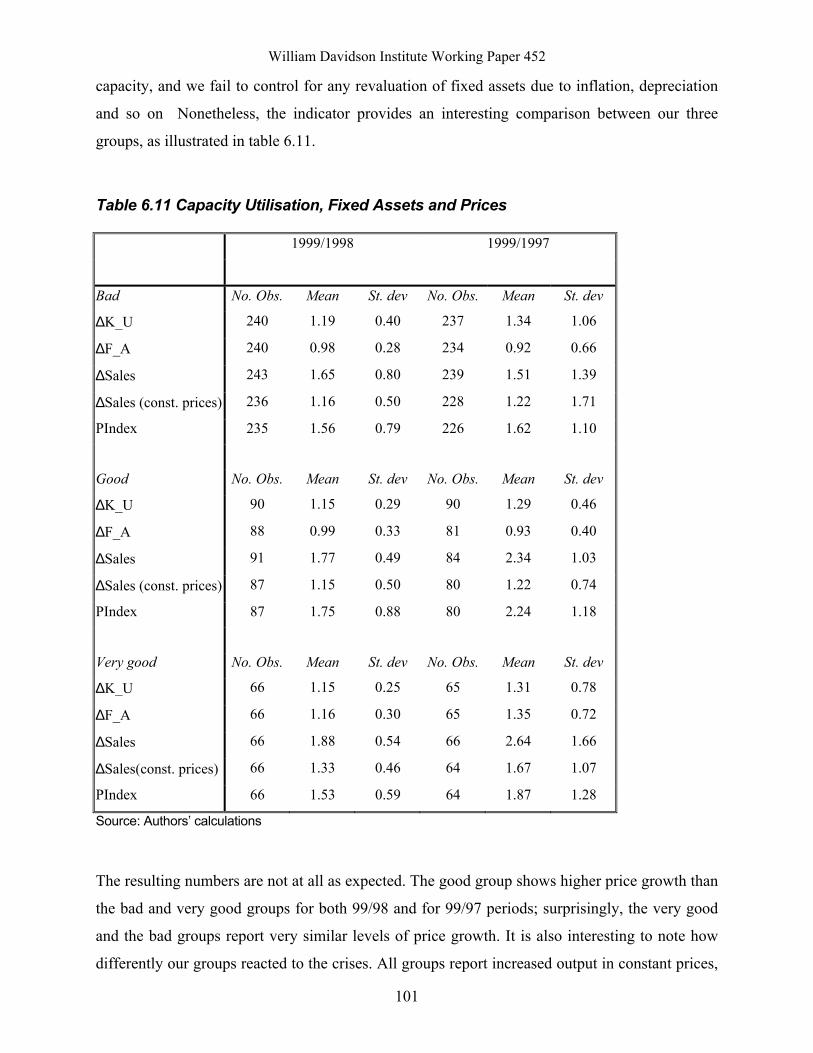
William Davidson Institute Working Paper 452
101
capacity, and we fail to control for any revaluation of fixed assets due to inflation, depreciation
and so on Nonetheless, the indicator provides an interesting comparison between our three
groups, as illustrated in table 6.11.
Table 6.11 Capacity Utilisation, Fixed Assets and Prices
1999/1998 1999/1997
Bad No. Obs. Mean St. dev No. Obs. Mean St. dev
∆K_U 240 1.19 0.40 237 1.34 1.06
∆F_A 240 0.98 0.28 234 0.92 0.66
∆Sales 243 1.65 0.80 239 1.51 1.39
∆Sales (const. prices) 236 1.16 0.50 228 1.22 1.71
PIndex 235 1.56 0.79 226 1.62 1.10
Good No. Obs. Mean St. dev No. Obs. Mean St. dev
∆K_U 90 1.15 0.29 90 1.29 0.46
∆F_A 88 0.99 0.33 81 0.93 0.40
∆Sales 91 1.77 0.49 84 2.34 1.03
∆Sales (const. prices) 87 1.15 0.50 80 1.22 0.74
PIndex 87 1.75 0.88 80 2.24 1.18
Very good No. Obs. Mean St. dev No. Obs. Mean St. dev
∆K_U 66 1.15 0.25 65 1.31 0.78
∆F_A 66 1.16 0.30 65 1.35 0.72
∆Sales 66 1.88 0.54 66 2.64 1.66
∆Sales(const. prices) 66 1.33 0.46 64 1.67 1.07
PIndex 66 1.53 0.59 64 1.87 1.28
Source: Authors’ calculations
The resulting numbers are not at all as expected. The good group shows higher price growth than
the bad and very good groups for both 99/98 and for 99/97 periods; surprisingly, the very good
and the bad groups report very similar levels of price growth. It is also interesting to note how
differently our groups reacted to the crises. All groups report increased output in constant prices,
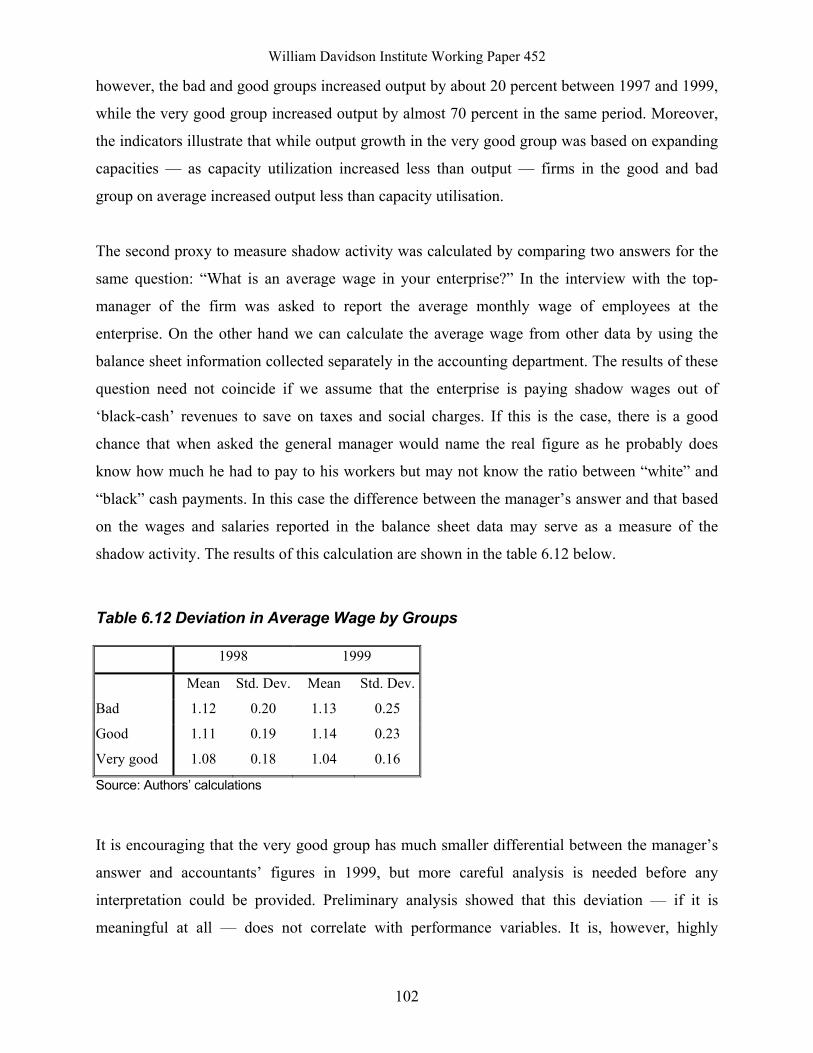
William Davidson Institute Working Paper 452
102
however, the bad and good groups increased output by about 20 percent between 1997 and 1999,
while the very good group increased output by almost 70 percent in the same period. Moreover,
the indicators illustrate that while output growth in the very good group was based on expanding
capacities — as capacity utilization increased less than output — firms in the good and bad
group on average increased output less than capacity utilisation.
The second proxy to measure shadow activity was calculated by comparing two answers for the
same question: “What is an average wage in your enterprise?” In the interview with the top-
manager of the firm was asked to report the average monthly wage of employees at the
enterprise. On the other hand we can calculate the average wage from other data by using the
balance sheet information collected separately in the accounting department. The results of these
question need not coincide if we assume that the enterprise is paying shadow wages out of
‘black-cash’ revenues to save on taxes and social charges. If this is the case, there is a good
chance that when asked the general manager would name the real figure as he probably does
know how much he had to pay to his workers but may not know the ratio between “white” and
“black” cash payments. In this case the difference between the manager’s answer and that based
on the wages and salaries reported in the balance sheet data may serve as a measure of the
shadow activity. The results of this calculation are shown in the table 6.12 below.
Table 6.12 Deviation in Average Wage by Groups
1998 1999
Mean Std. Dev. Mean Std. Dev.
Bad 1.12 0.20 1.13 0.25
Good 1.11 0.19 1.14 0.23
Very good 1.08 0.18 1.04 0.16
Source: Authors’ calculations
It is encouraging that the very good group has much smaller differential between the manager’s
answer and accountants’ figures in 1999, but more careful analysis is needed before any
interpretation could be provided. Preliminary analysis showed that this deviation — if it is
meaningful at all — does not correlate with performance variables. It is, however, highly
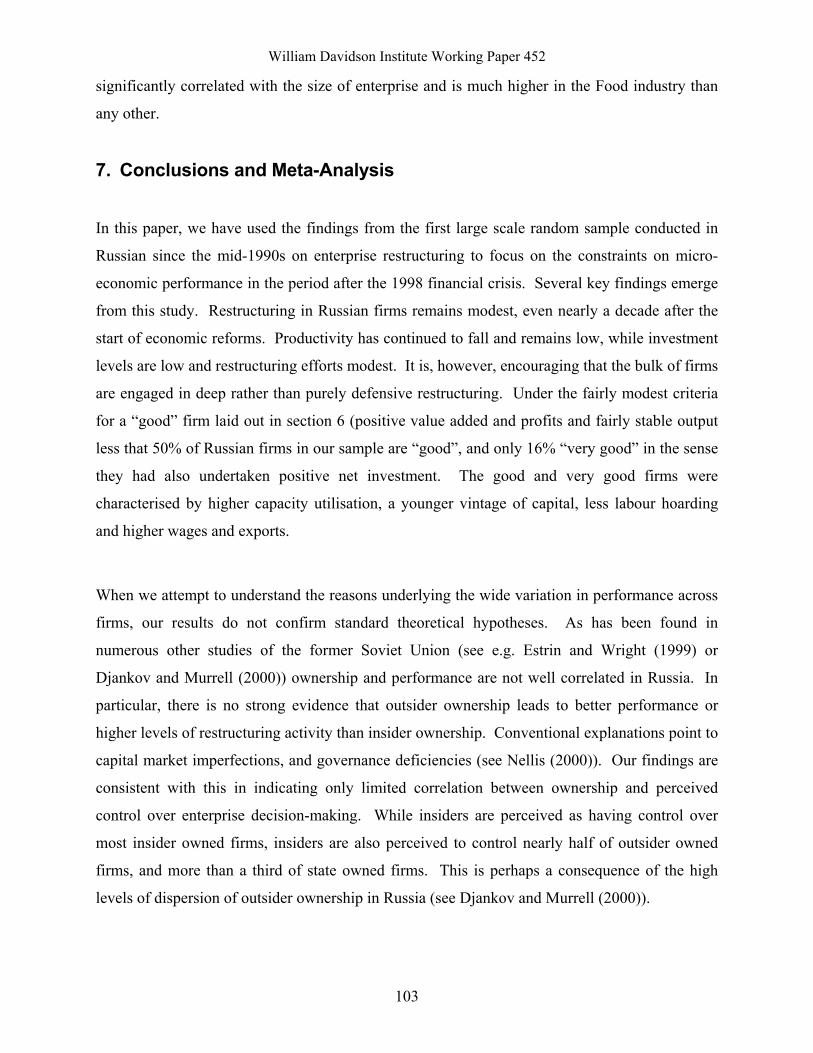
William Davidson Institute Working Paper 452
103
significantly correlated with the size of enterprise and is much higher in the Food industry than
any other.
7. Conclusions and Meta-Analysis
In this paper, we have used the findings from the first large scale random sample conducted in
Russian since the mid-1990s on enterprise restructuring to focus on the constraints on micro-
economic performance in the period after the 1998 financial crisis. Several key findings emerge
from this study. Restructuring in Russian firms remains modest, even nearly a decade after the
start of economic reforms. Productivity has continued to fall and remains low, while investment
levels are low and restructuring efforts modest. It is, however, encouraging that the bulk of firms
are engaged in deep rather than purely defensive restructuring. Under the fairly modest criteria
for a “good” firm laid out in section 6 (positive value added and profits and fairly stable output
less that 50% of Russian firms in our sample are “good”, and only 16% “very good” in the sense
they had also undertaken positive net investment. The good and very good firms were
characterised by higher capacity utilisation, a younger vintage of capital, less labour hoarding
and higher wages and exports.
When we attempt to understand the reasons underlying the wide variation in performance across
firms, our results do not confirm standard theoretical hypotheses. As has been found in
numerous other studies of the former Soviet Union (see e.g. Estrin and Wright (1999) or
Djankov and Murrell (2000)) ownership and performance are not well correlated in Russia. In
particular, there is no strong evidence that outsider ownership leads to better performance or
higher levels of restructuring activity than insider ownership. Conventional explanations point to
capital market imperfections, and governance deficiencies (see Nellis (2000)). Our findings are
consistent with this in indicating only limited correlation between ownership and perceived
control over enterprise decision-making. While insiders are perceived as having control over
most insider owned firms, insiders are also perceived to control nearly half of outsider owned
firms, and more than a third of state owned firms. This is perhaps a consequence of the high
levels of dispersion of outsider ownership in Russia (see Djankov and Murrell (2000)).
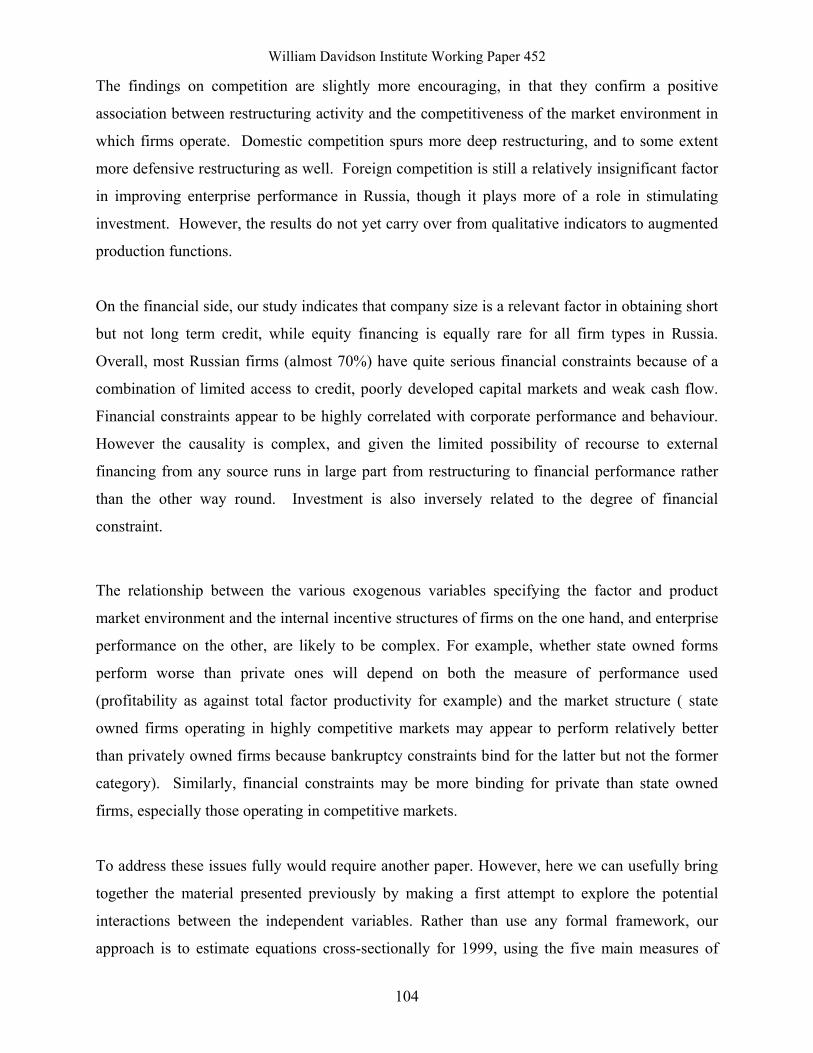
William Davidson Institute Working Paper 452
104
The findings on competition are slightly more encouraging, in that they confirm a positive
association between restructuring activity and the competitiveness of the market environment in
which firms operate. Domestic competition spurs more deep restructuring, and to some extent
more defensive restructuring as well. Foreign competition is still a relatively insignificant factor
in improving enterprise performance in Russia, though it plays more of a role in stimulating
investment. However, the results do not yet carry over from qualitative indicators to augmented
production functions.
On the financial side, our study indicates that company size is a relevant factor in obtaining short
but not long term credit, while equity financing is equally rare for all firm types in Russia.
Overall, most Russian firms (almost 70%) have quite serious financial constraints because of a
combination of limited access to credit, poorly developed capital markets and weak cash flow.
Financial constraints appear to be highly correlated with corporate performance and behaviour.
However the causality is complex, and given the limited possibility of recourse to external
financing from any source runs in large part from restructuring to financial performance rather
than the other way round. Investment is also inversely related to the degree of financial
constraint.
The relationship between the various exogenous variables specifying the factor and product
market environment and the internal incentive structures of firms on the one hand, and enterprise
performance on the other, are likely to be complex. For example, whether state owned forms
perform worse than private ones will depend on both the measure of performance used
(profitability as against total factor productivity for example) and the market structure ( state
owned firms operating in highly competitive markets may appear to perform relatively better
than privately owned firms because bankruptcy constraints bind for the latter but not the former
category). Similarly, financial constraints may be more binding for private than state owned
firms, especially those operating in competitive markets.
To address these issues fully would require another paper. However, here we can usefully bring
together the material presented previously by making a first attempt to explore the potential
interactions between the independent variables. Rather than use any formal framework, our
approach is to estimate equations cross-sectionally for 1999, using the five main measures of
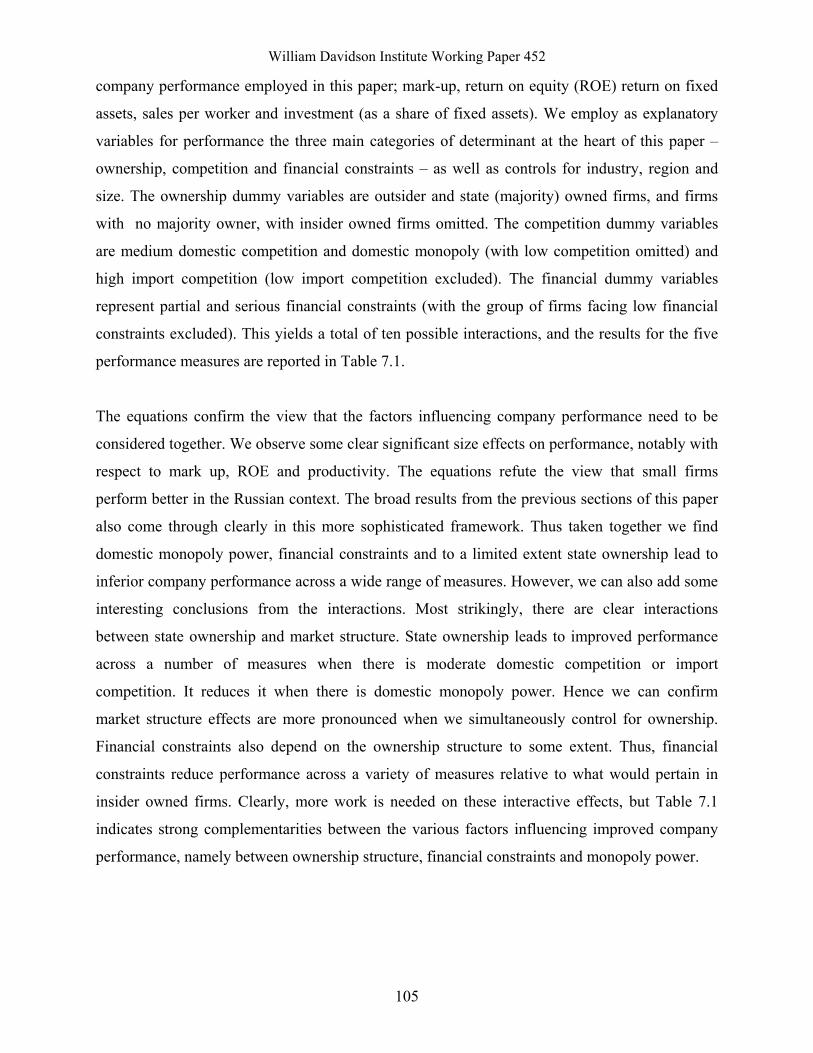
William Davidson Institute Working Paper 452
105
company performance employed in this paper; mark-up, return on equity (ROE) return on fixed
assets, sales per worker and investment (as a share of fixed assets). We employ as explanatory
variables for performance the three main categories of determinant at the heart of this paper –
ownership, competition and financial constraints – as well as controls for industry, region and
size. The ownership dummy variables are outsider and state (majority) owned firms, and firms
with no majority owner, with insider owned firms omitted. The competition dummy variables
are medium domestic competition and domestic monopoly (with low competition omitted) and
high import competition (low import competition excluded). The financial dummy variables
represent partial and serious financial constraints (with the group of firms facing low financial
constraints excluded). This yields a total of ten possible interactions, and the results for the five
performance measures are reported in Table 7.1.
The equations confirm the view that the factors influencing company performance need to be
considered together. We observe some clear significant size effects on performance, notably with
respect to mark up, ROE and productivity. The equations refute the view that small firms
perform better in the Russian context. The broad results from the previous sections of this paper
also come through clearly in this more sophisticated framework. Thus taken together we find
domestic monopoly power, financial constraints and to a limited extent state ownership lead to
inferior company performance across a wide range of measures. However, we can also add some
interesting conclusions from the interactions. Most strikingly, there are clear interactions
between state ownership and market structure. State ownership leads to improved performance
across a number of measures when there is moderate domestic competition or import
competition. It reduces it when there is domestic monopoly power. Hence we can confirm
market structure effects are more pronounced when we simultaneously control for ownership.
Financial constraints also depend on the ownership structure to some extent. Thus, financial
constraints reduce performance across a variety of measures relative to what would pertain in
insider owned firms. Clearly, more work is needed on these interactive effects, but Table 7.1
indicates strong complementarities between the various factors influencing improved company
performance, namely between ownership structure, financial constraints and monopoly power.
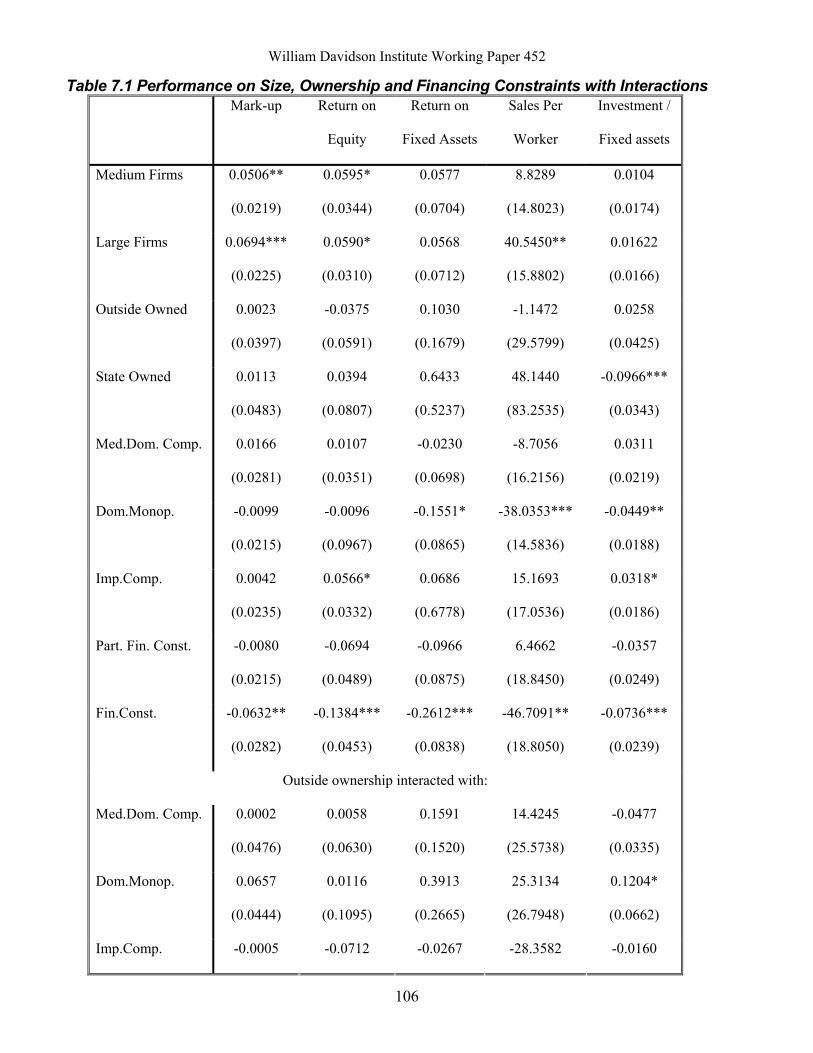
William Davidson Institute Working Paper 452
106
Table 7.1 Performance on Size, Ownership and Financing Constraints with Interactions Mark-up Return on
Equity
Return on
Fixed Assets
Sales Per
Worker
Investment /
Fixed assets
Medium Firms 0.0506**
(0.0219)
0.0595*
(0.0344)
0.0577
(0.0704)
8.8289
(14.8023)
0.0104
(0.0174)
Large Firms 0.0694***
(0.0225)
0.0590*
(0.0310)
0.0568
(0.0712)
40.5450**
(15.8802)
0.01622
(0.0166)
Outside Owned 0.0023
(0.0397)
-0.0375
(0.0591)
0.1030
(0.1679)
-1.1472
(29.5799)
0.0258
(0.0425)
State Owned 0.0113
(0.0483)
0.0394
(0.0807)
0.6433
(0.5237)
48.1440
(83.2535)
-0.0966***
(0.0343)
Med.Dom. Comp. 0.0166
(0.0281)
0.0107
(0.0351)
-0.0230
(0.0698)
-8.7056
(16.2156)
0.0311
(0.0219)
Dom.Monop. -0.0099
(0.0215)
-0.0096
(0.0967)
-0.1551*
(0.0865)
-38.0353***
(14.5836)
-0.0449**
(0.0188)
Imp.Comp. 0.0042
(0.0235)
0.0566*
(0.0332)
0.0686
(0.6778)
15.1693
(17.0536)
0.0318*
(0.0186)
Part. Fin. Const. -0.0080
(0.0215)
-0.0694
(0.0489)
-0.0966
(0.0875)
6.4662
(18.8450)
-0.0357
(0.0249)
Fin.Const. -0.0632**
(0.0282)
-0.1384***
(0.0453)
-0.2612***
(0.0838)
-46.7091**
(18.8050)
-0.0736***
(0.0239)
Outside ownership interacted with:
Med.Dom. Comp. 0.0002
(0.0476)
0.0058
(0.0630)
0.1591
(0.1520)
14.4245
(25.5738)
-0.0477
(0.0335)
Dom.Monop. 0.0657
(0.0444)
0.0116
(0.1095)
0.3913
(0.2665)
25.3134
(26.7948)
0.1204*
(0.0662)
Imp.Comp. -0.0005 -0.0712 -0.0267 -28.3582 -0.0160
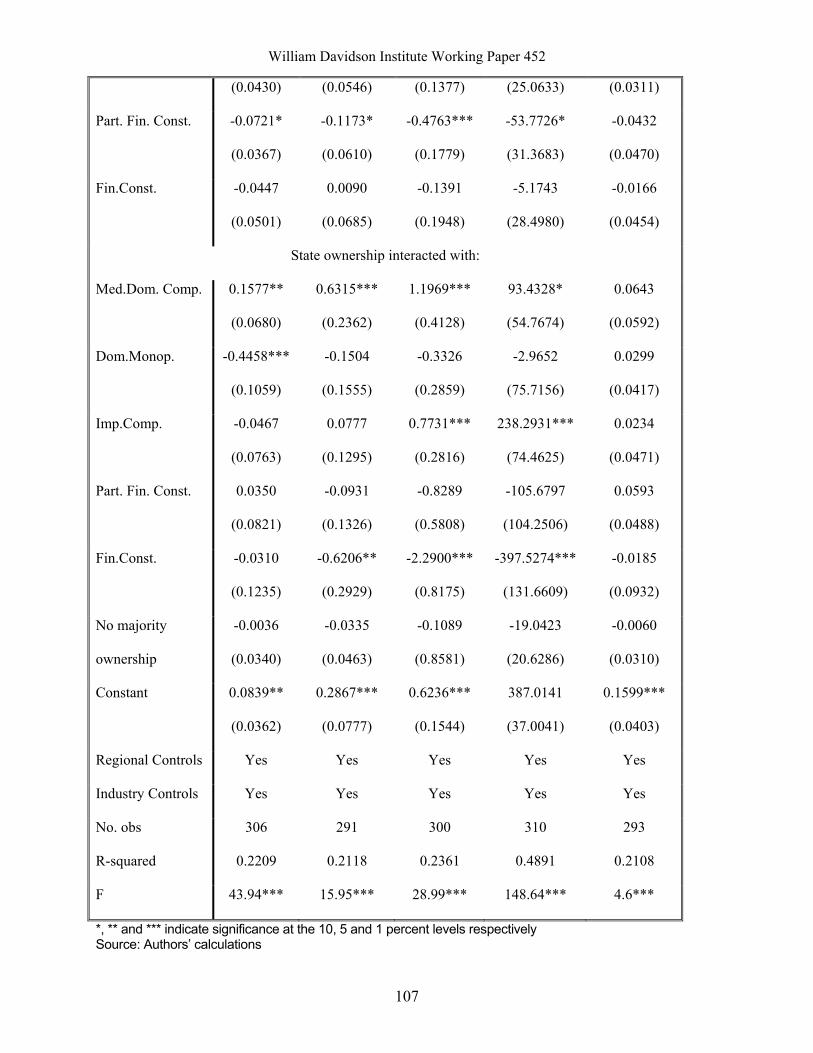
William Davidson Institute Working Paper 452
107
(0.0430) (0.0546) (0.1377) (25.0633) (0.0311)
Part. Fin. Const. -0.0721*
(0.0367)
-0.1173*
(0.0610)
-0.4763***
(0.1779)
-53.7726*
(31.3683)
-0.0432
(0.0470)
Fin.Const. -0.0447
(0.0501)
0.0090
(0.0685)
-0.1391
(0.1948)
-5.1743
(28.4980)
-0.0166
(0.0454)
State ownership interacted with:
Med.Dom. Comp. 0.1577**
(0.0680)
0.6315***
(0.2362)
1.1969***
(0.4128)
93.4328*
(54.7674)
0.0643
(0.0592)
Dom.Monop. -0.4458***
(0.1059)
-0.1504
(0.1555)
-0.3326
(0.2859)
-2.9652
(75.7156)
0.0299
(0.0417)
Imp.Comp. -0.0467
(0.0763)
0.0777
(0.1295)
0.7731***
(0.2816)
238.2931***
(74.4625)
0.0234
(0.0471)
Part. Fin. Const. 0.0350
(0.0821)
-0.0931
(0.1326)
-0.8289
(0.5808)
-105.6797
(104.2506)
0.0593
(0.0488)
Fin.Const. -0.0310
(0.1235)
-0.6206**
(0.2929)
-2.2900***
(0.8175)
-397.5274***
(131.6609)
-0.0185
(0.0932)
No majority
ownership
-0.0036
(0.0340)
-0.0335
(0.0463)
-0.1089
(0.8581)
-19.0423
(20.6286)
-0.0060
(0.0310)
Constant 0.0839**
(0.0362)
0.2867***
(0.0777)
0.6236***
(0.1544)
387.0141
(37.0041)
0.1599***
(0.0403)
Regional Controls Yes Yes Yes Yes Yes
Industry Controls Yes Yes Yes Yes Yes
No. obs 306 291 300 310 293
R-squared 0.2209 0.2118 0.2361 0.4891 0.2108
F 43.94*** 15.95*** 28.99*** 148.64*** 4.6***
*, ** and *** indicate significance at the 10, 5 and 1 percent levels respectively Source: Authors’ calculations

William Davidson Institute Working Paper 452
Overall our research therefore suggests three major policy conclusions. Firstly, this study — in
accordance with other studies — demonstrates that Russian enterprises tend to concentrate their
activity on the local and regional markets. Though the problem of administrative barriers which
limit the ability of enterprises to enter other regional markets is not as acute as might have been
expected, many enterprises — in particular those in the food industry — still complain about
such barriers. In this regard, we suggest that the state should consider additional measures
limiting regional administrative barriers.
Secondly, our results show that further state policy facilitating the development of competition in
the Russian industrial markets is a necessity. It appear to be potentially important to lower non-
economic barriers to import and barriers to entry for foreign firms, in view of strong tendencies
of integration and cross-ownership in Russian industry.
Finally, we have uncovered strong evidence that self-financing of investments is not a feasible
choice for the majority of Russian enterprises due to relatively small profit margins; moreover
the inefficiency of banking sector precludes access to alternative appropriate external funding.
While equity financing could become an alternative in the future, its development will require
more transparent and efficient corporate governance. Currently the average board composition of
our sampled enterprises does not appropriately reflect the ownership structure, and does not
correspond to standards from other countries: employees, especially management and sometimes
regional authorities are over-represented while other groups of stock and stake holders are
underrepresented. Hence we suggest that the Government of Russia should enact policy to

William Davidson Institute Working Paper 452
109
establish modern corporate governance legislation and practice, if it wishes to contribute to the
development of a robust private sector in the Russian Federation.
William Davidson Institute Working Paper 452
110
References
Aghion, Philippe and Wendy Carlin. 1996. “Restructuring Outcomes and the Evolution of Ownership Patterns in Central and Eastern Europe.” Economics of Transition. 4:2, pp. 371-388.
Angelucci, Manuela et al. 2001. “The Effect of Ownership and Competitive Pressure on Firm Performance in Transition Countries: Micro Evidence from Bulgaria, Romania and Poland.” London: Discussion Paper No.2985, Centre for Economic Policy Research.
Bennett, John. 1989. The Economic Theory of Central Planning. Cambridge, Mass.: Blackwell.
Bevan, Alan, Saul Estrin and Mark Schaffer. 1999. “Determinants of Enterprise Performance During Transition.” Edinburgh: Discussion Paper No.99/03, Centre for Economic Reform and Transformation, Herriot-Watt University.
Bevan, Alan and Jo Danbolt. 2001. “On the Determinants and Dynamics of UK Capital Structure.” London: London Business School, mimeo.
Blanchard et al. 1991. Reform in Eastern Europe. Cambridge, Mass.: MIT Press.
Blanchard, Olivier and Michael Kremer. 1997. “Disorganization.” Quarterly Journal of Economics. 112:4, pp.1091-1126.
Boycko, Maxim, Andrei Shleifer and Robert Vishny. 1995. Privatizing Russia. Cambridge, Mass.: MIT Press.
Brown, David and John Earle. 2001. “Privatization, Competition and Reform Strategies: Theory and Evidence from Russian Enterprise Panel Data.” London: Discussion Paper No.2758, Centre for Economic Policy Research.
Carlin, Wendy et al. 2001. “Competition and Enterprise Performance in Transition Economies: Evidence from a Cross-Country Survey.” London: Discussion Paper No.2840, Centre for Economic Policy Research.
Commander, Simon, Qimiao Fan and Mark Schaffer. 1996. Enterprise Restructuring and Economic Policy in Russia. Washington D.C.: World Bank.
Commander, Simon and Christian Mumssen. 1999. “Understanding Barter in Russia.” London: Working Paper No.37, EBRD.
Cornelli, Francesca, Richard Portes and Mark Schaffer. 1996. “The Capital Structure of Firms in Central and Eastern Europe,” in Different Paths to a Market Economy: China and European Economies in Transition. Oliver Bouin, Fabrizio Coricelli and Francoise Lemoine, eds. OECD.
Djankov, Simeon and Peter Murrell. 2000. “Enterprise Restructuring in Transition: A Quantitative Survey,” forthcoming in Journal of Economic Literature.
William Davidson Institute Working Paper 452
111
Earle, John and Saul Estrin. 1996. “Employee Ownership in Transition Economies,” in Corporate Governance in Transition. Roman Frydman, Cheryl Gray and Andrzej Rapaczynski, eds. Budapest: Central European University Press.
Earle, John and Saul Estrin. 1997. “After Voucher Privatization: The Structure of Corporate Ownership in Russian Manufacturing Industry.” London: Discussion Paper No.1736, Centre for Economic Policy Research.
Earle, John and Saul Estrin. 1998. “Privatization, Competition and Budget Constraints: Disciplining Enterprises in Russia.” Stockholm: Working Paper No.128, Stockholm Institute of Transition Economics.
EBRD. 1999. Transition Report, 1999: Ten Years of Transition. London: EBRD.
Estrin, Saul and Mike Wright. 1999. “Corporate Governance in the Former Soviet Union: An Overview.” Journal of Comparative Economics. 27:3, pp.398-421.
Goskomstat data. 1990-1999. Moscow: Goskomstat.
Gupta, Nadini, John Ham and Jan Svejnar. 2000. “Priorities and Sequencing in Privatization: Theory and Evidence from the Czech Republic.” The William Davidson Institute and the University of Michigan Business School, mimeo.
Kuznetsov, P. and Muraviev, A. “Ownership Structure and Firm Performance in Russia's Industrial Firms.” Moscow: Bureau of Economic Analysis, mimeo.
Nellis, John. 2000. “Privatization in Transition Economies: What Happened? What’s Next?” Washington D.C.: World Bank, mimeo.
Nickell, Stephen. 1996. “Competition and Corporate Performance.” Journal of Political Economy. 104:4, pp.724-746.
Portes, Richard, ed. 1993. Economic Transformation in Central Europe: A Progress Report. London: Centre for Economic Policy Research.
Rajan, Raghuram and Luigi Zingales. 1995. “What Do We Know About the Capital Structure? Some Evidence from International Data.” Journal of Finance. 50:5, pp.1421-1460.
Stiglitz, Joseph. 1999. “Whither reform? Ten Years of the Transition.” ABCDE Conference. Washington D.C.: World Bank.
Vickers, John and George Yarrow. 1995. Privatization: An Economic Analysis. Cambridge Mass.: MIT Press.
Walsh, Patrick and Ciara Whelan. 2000. “Firm Performance and the Political Economy of Corporate Governance: Survey Evidence for Bulgaria, Hungary, Slovakia and Slovenia.” Moscow: CEPR/WDI Conference.
Willig, Robert. 1987. “Do Entry Conditions Vary Across Markets? Comments and Discussion.” Brookings Papers on Economic Activity. 3:0, pp. 872-876.

DAVIDSON INSTITUTE WORKING PAPER SERIES - Most Recent Papers The entire Working Paper Series may be downloaded free of charge at: www.wdi.bus.umich.edu
CURRENT AS 4/5/02 Publication Authors Date No. 452: The Determinants of Privatised Enterprise Performance in Russia
Alan A. Bevan, Saul Estrin, Boris Kuznetsov, Mark E. Schaffer, Manuela Angelucci, Julian Fennema and Giovanni Mangiarotti
June 2001
No. 451: Determinants of Financial Distress: What Drives Bankruptcy in a Transition Economy? The Czech Republic Case
Lubomír Lízal Jan. 2002
No. 450: Corporate Governance and the Global Social Void Lee A. Tavis Oct. 2001 No. 449: Financial Architecture and Economic Performance: International Evidence
Solomon Tadesse Aug. 2001
No. 448: Growth Slowdown Under Central Planning: A Model of Poor Incentives
Zuzana Brixiová and Aleš Bulíř Mar. 2002
No. 447: Disentangling Treatment Effects of Polish Active Labor Market Policies: Evidence from Matched Samples
Jochen Kluve, Hartmut Lehmann, and Christoph M. Schmidt
Jan. 2002
No. 446: The Impact of Socialist Imprinting and Search for Knowledge on Resource Change: An Empirical Study of Firms in Lithuania
Aldas Kriauciunas and Prashant Kale
Mar. 2002
No. 445: The Costs, Wealth Effects, and Determinants of International Capital Raising: Evidence from Public Yankee Bonds
Darius P. Miller and John J. Puthenpurackal
Oct. 2001
No. 444: Financial Institutions, Contagious Risks, and Financial Crises Haizhou Huang and Chenggang Xu
Nov. 2001
No. 443: Banks as Catalysts for Industrialization Marco Da Rin and Thomas Hellmann
Oct. 2001
No. 442: Bank-Based or Market-Based Financial Systems: Which is Better?
Ross Levine Feb. 2002
No. 441: Migration and Regional Adjustment and Asymmetric Shocks in Transition Economies
Jan Fidrmuc Feb. 2002
No. 440: Employment and Wages in Enterprises Under Communism and in Transition: Evidence From Central Europe and Russia
Swati Basu, Saul Estrin, and Jan Svejnar
June 2000
No. 439: Small business in Russia: A Case Study of St. Petersburg Alessandro Kihlgren Jan. 2002 No. 438: Foreign Direct Investment as Technology Transferred: Some Panel Evidence from the Transition Economies
Nauro F. Campos and Yuko Kinoshita
Jan. 2002
No. 437: Whistleblowing, MNC’s and Peace Terry Morehead Dworkin Feb. 2002 No. 436: A Note on Measuring the Unofficial Economy in the Former Soviet Republics
Michael Alexeev and William Pyle
Sept. 2001
No. 435: The Ownership School vs. the Management School of State Enterprise Reform: Evidence from China
David D. Li and Changqi Wu Jan. 2002
No. 434: The Effect of Ownership and Competitive Pressure on Firm Performance in Transition Countries: Micro Evidence from Bulgaria, Romania and Poland.
Manuela Angelucci, Saul Estrin, Jozef Konings, and Zbigniew Zolkiewski
Jan. 2002
No. 433: The End of Moderate Inflation in Three Transition Economies? Josef C. Brada and Ali M. Kutan Jan. 2002 No. 432: What Drives the Speed of Job Reallocation During Episodes of Massive Adjustment?
Stepan Jurajda and Katherine Terrell
Jan. 2002
No. 431 Forthcoming in: The Journal of Economic Perspectives, “Competition and Corporate Governance in Transition,” 16(2) Feb. 2002.
Saul Estrin Dec. 2001
No. 430: Corporate Governance in the Cause of Peace: An Environmental Perspective
Don Mayer Jan. 2002
No. 429: Why do Governments Privatize? Loren Brandt, Hongbin Li, and Joanne Roberts
Dec. 2001
No. 428: Testing Russia’s Virtual Economy Vlad Ivanenko Dec. 2001
Copyright © 2022 FDOKUMEN