Radio-Frequency Spectroscopy of a Strongly Interacting Two-Dimensional Fermi Gas
Upload
unibneduportalCategory
view
1download
0
arX
iv:1
011.
1255
v1 [
astr
o-ph
.CO
] 4
Nov
201
0
The Detection of a Population ofSubmillimeter−Bright, Strongly-Lensed Galaxies
Mattia Negrello1∗, R. Hopwood1, G. De Zotti2,3, A. Cooray4, A. Verma5,J. Bock6,7, D. T. Frayer8, M. A. Gurwell9, A. Omont10, R. Neri11,
H. Dannerbauer12, L. L. Leeuw13,14, E. Barton4, J. Cooke4,7, S. Kim4,E. da Cunha15, G. Rodighiero16, P. Cox11, D. G. Bonfield17, M. J. Jarvis17,
S. Serjeant1, R. J. Ivison18,19, S. Dye20, I. Aretxaga21, D. H. Hughes21, E. Ibar18,F. Bertoldi22, I. Valtchanov23, S. Eales20, L. Dunne24, S. P. Driver25,
R. Auld20, S. Buttiglione2, A. Cava26,27, C. A. Grady28,29,D. L. Clements30, A. Dariush20, J. Fritz31, D. Hill 25,
J. B. Hornbeck32, L. Kelvin25, G. Lagache33,34, M. Lopez-Caniego35,J. Gonzalez-Nuevo3, S. Maddox24, E. Pascale20, M. Pohlen20, E. E. Rigby24,
A. Robotham25, C. Simpson36, D. J. B. Smith24, P. Temi37, M. A. Thompson17,B. E. Woodgate38, D. G. York39, J. E. Aguirre40, A. Beelen34, A. Blain7,
A. J. Baker41, M. Birkinshaw42, R. Blundell9, C. M. Bradford6,7, D. Burgarella43,L. Danese3, J. S. Dunlop18, S. Fleuren44, J. Glenn45, A. I. Harris46,J. Kamenetzky45, R. E. Lupu40, R. J. Maddalena8, B. F. Madore47,
P. R. Maloney45, H. Matsuhara48, M. J. Michałowski19, E. J. Murphy49,B. J. Naylor6, H. Nguyen6, C. Popescu50, S. Rawlings5,
D. Rigopoulou5,51, D. Scott52, K. S. Scott40, M. Seibert47, I. Smail53,R. J. Tuffs54, J. D. Vieira7, P. P. van der Werf19,55, J. Zmuidzinas6,7
1Department of Physics and Astronomy, The Open University, Walton Hall, Milton Keynes,MK7 6AA, UK2Istitute Nazionale di Astrofisica (INAF), Osservatorio Astronomico di Padova, Vicolo Osser-vatorio 5, I-35122 Padova, Italy3Scuola Internazionale Superiore di Studi Avanzati (SISSA), Via Bonomea 265, I-34136 Tri-este, Italy4Department of Physics and Astronomy, University of California, Irvine, CA 92697, USA5Oxford Astrophysics, Denys Wilkinson Building, University of Oxford, Keble Road, Oxford,
1

OX1 3RH, uk6Jet Propulsion Laboratory (JPL), Pasadena CA, 91009, USA7California Institute of Technology, Pasadena, CA 91125, USA8National Radio Astronomy Observatory Post Office Box 2, Green Bank, WV 24944, USA9Harvard-Smithsonian Center for Astrophysics, Cambridge,MA 02138, USA10Institut d’Astrophysique de Paris, Universitte Pierre et Marie Curie and CNRS, 98 bis boule-vard Arago, 75014 Paris, France11Institut de Radioastronomie Millimetrique (IRAM), 300 rue de la piscine, 38406 Saint-Martind’Heres, France12Laboratoire Astrophysique, Instrumentation et Modelisation Paris Saclay, Commissariatal’ EnergieAtomique (CEA)/Direction des Sciences de la Matiere (DSM) - CNRS - UniversiteParis Diderot,Institut de recherche sur les lois fondamentales de l’Univers (Irfu)/Service d’Astrophysique,CEA Saclay, Orme des Merisiers, F-91191 Gif-sur-Yvette Cedex, France13 Physics Department, University of Johannesburg, Post Office Box 524, Auckland Park 2006,South Africa14SETI Institute, 515 North Whisman Avenue Mountain View CA, 94043, USA15Department of Physics, University of Crete, 71003 Heraklion, Greece16Dipartimento di Astronomia, Universita di Padova, Vicolo Osservatorio 2, I-35122 Padova,Italy17Centre for Astrophysics Research, Science and Technology Research Institute, University ofHertfordshire, Herts AL10 9AB, UK18UK Astronomy Technology Center, Royal Observatory Edinburgh, Edinburgh, EH9 3HJ, UK19 Scottish Universities Physics Alliance, Institute for Astronomy, University of Edinburgh,Royal Observatory,Edinburgh, EH9 3HJ, UK20School of Physics and Astronomy, Cardiff University, The Parade, Cardiff, CF24 3AA, UK21Instituto Nacional de Astrofısica,Optica y Electronica, Apartado Postal 51 y 216, 72000Puebla, Mexico22Argelander Institut fur Astronomie, Universit Bonn, Auf dem Hugel 71, 53121 Bonn, Ger-many23Herschel Science Centre, European Space Astronomy Centre,European Space Agency (ESA),Post Office Box 78, 28691 Villanueva de la Canada, Madrid, Spain24School of Physics and Astronomy, University of Nottingham,University Park, NottinghamNG7 2RD, UK25Scottish Universities Physics Alliance, School of Physicsand Astronomy, University of St.Andrews, North Haugh, St. Andrews, KY16 9SS, UK26Instituto de Astrofısica de Canarias, C/Vıa Lactea s/n,E-38200 La Laguna, Spain27Departamento de Astrofısica, Universidad de La Laguna (ULL), E-38205 La Laguna, Tener-ife, Spain28Eureka Scientific, 2452 Delmer Street, Suite 100, Oakland CA94602, USA29Goddard Space Flight Center, Code 667, Greenbelt Road, Greenbelt, MD 20771, USA30Astrophysics Group, Physics Department, Blackett Lab, Imperial College London, Prince
2

Consort Road, London SW7 2AZ, UK31Sterrenkundig Observatorium, Universiteit Gent, Krijgslaan 281 S9, B-9000 Gent, Belgium32Department of Physics and Astronomy, University of Louisville, Louisville, KY 40292, USA33Institut d’Astrophysique Spatiale (IAS), Batiment 121, F-91405 Orsay, France34Universite Paris-Sud 11 and CNRS (UMR 8617), 91400 Orsay, France35Instituto de Fisica de Cantabria, Consejo Superior de Investigaciones Cientificas - Universi-dad de Cantabria, Avenue de Los Castros s/n, Santander, 39005, Spain36Astrophysics Research Institute, Liverpool John Moores University Twelve Quays House,Egerton Wharf, Birkenhead, CH41 1LD, UK37Astrophysics Branch, NASA Ames Research Center, Mail Stop 245-6, Moffett Field, CA94035, USA38NASA Goddard Space Flight Center, Code 667, Greenbelt Road,Greenbelt, MD 20771, USA39Department of Astrophysics and The Enrico Fermi Institute,University of Chicago, 5640South Ellis Avenue, Chicago, IL 60637, USA40Department of Physics and Astronomy, University of Pennsylvania, Philadephia, PA 19104,US41Rutgers, the State University of New Jersey, Department of Physics and Astronomy, 136 Frel-inghuysen Road, Piscataway, NJ 08854-8019, USA42HH Wills Physics Laboratory, University of Bristol, Tyndall Avenue, Bristol BS8 1TL, UK43Laboratoire d’Astrophysique de Marseille and Aix-Marseille Universite, UMR6110 CNRS,38 rue F. Joliot-Curie, F-13388 Marseille, France44School of Mathematical Sciences, Queen Mary, University ofLondon, Mile End Road, Lon-don, E1 4NS, UK45University of Colorado, Center for Astrophysics and Space Astronomy, 389-UCB, Boulder,CO 80303, USA46Department of Astronomy, University of Maryland, College Park, MD 20742 USA47Observatories of the Carnegie Institution, 813 Santa Barbara Street, Pasadena, CA 91101,USA48Institute for Space and Astronautical Science, Japan Aerospace Exploration Agency, 3-1-1Yoshinodai, Chuo-ku, Sagamihara 252-5210 Japan49Infrared Processing and Analysis Center, Pasadena, CA 91125, USA50Jeremiah Horrocks Institute, University of Central Lancashire, Preston PR1 2HE, UK51Space Science and Technology Department, Rutherford Appleton Laboratory, Chilton, Did-cot, Oxfordshire OX11 0QX, UK52University of British Colombia, 6224 Agricultural Road, Vancouver, BC V6T 1Z1, Canada53Institute for Computational Cosmology, Durham University, Durham DH1 3LE, UK54Max Planck Institut fuer Kernphysik (MPIK), Saupfercheckweg 1, 69117 Heidelberg, Ger-many55Leiden Observatory, Leiden University, Post Office Box 9513, NL - 2300 RA Leiden, TheNetherlands
3

∗ to whom correspondence should be addressed E-mail: [email protected]
Gravitational lensing is a powerful astrophysical and cosmological probe and
is particularly valuable at submillimeter wavelengths for the study of the sta-
tistical and individual properties of dusty starforming galaxies. However the
identification of gravitational lenses is often time-intensive, involving the sift-
ing of large volumes of imaging or spectroscopic data to find few candidates.
We used early data from the Herschel Astrophysical Terahertz Large Area
Survey to demonstrate that wide-area submillimeter surveys can simply and
easily detect strong gravitational lensing events, with close to 100% efficiency.
When the light from a distant galaxy is deflected by a foreground mass− commonly a mas-
sive elliptical galaxy or galaxy cluster or group− its angular size and brightness are increased,
and multiple images of the same source may form. This phenomenon is commonly known as
gravitational lensing (1) and can be exploited in the study of high-redshift galaxy structures
down to scales difficult (if not impossible) to probe with thelargest telescopes at present (2–4)
and to detect intrinsically faint objects. Surveys conducted at submillimeter wavelengths can
particularly benefit from gravitational lensing because submillimeter telescopes have limited
spatial resolution and consequently high source confusion, which makes it difficult to directly
probe the populations responsible for the bulk of background submillimeter emission (5, 6). In
addition, galaxies detected in blank-field submillimeter surveys generally suffer severe dust ob-
scuration and are therefore challenging to detect and studyat optical and near infra-red (NIR)
wavelengths. By alleviating the photon starvation, gravitational lensing facilitates follow-up ob-
servations of galaxies obscured by dust and in particular the determination of their redshift (7).
Previous submillimeter searches for highly magnified background galaxies have predominantly
targeted galaxy cluster fields (8). In fact, a blind search for submillimeter lensing events re-
4
quires large area because of their rarity, and sub-arcseconds angular resolutions to reveal multi-
ple images of the same background galaxies. Although the first requirement has recently been
fulfilled, thanks to the advent of the South Pole Telescope (SPT) (9) and the Herschel Space
Observatory (Herschel) (10), the second is still the prerogative of ground-based interferometric
facilities, such as the Submillimeter Array (SMA) and the IRAM Plateau de Bure Interferom-
eter (PdBI), which because of their small instantaneous field of view are aimed at follow-up
observations rather than large-area survey campaigns. Nevertheless, several authors (11–14)
have suggested that a simple selection in flux density, rather than surveys for multiply-imaged
sources, can be used to easily and efficiently select samplesof strongly gravitationally-lensed
galaxies in wide-area submillimeter and millimeter surveys. The explanation for this lies in the
steepness of the number counts (the number of galaxies at a given brightness) of dust-obscured
star-forming galaxies, which are usually referred to as submillimeter galaxies (SMGs) (15). Be-
cause of that, even a small number of highly-magnified SMGs can substantially affect the shape
of the bright end of the submillimeter source counts enhancing the number of SMGs seen at
bright flux densities than would be expected on the basis of our knowledge of the un-lensed
SMG population (Fig.1). Furthermore, the frequency of lensing events is relatively high in
the submillimeter (11) because SMGs are typically at high redshift (z >∼ 1) (16), and this
increases the probability that a SMG is in alignment with, and therefore lensed by, a fore-
ground galaxy. Other important contributors to the bright tail of the submillimeter counts are
low-redshift (z ≤ 0.1) spiral and starburst galaxies (17) and higher redshift radio-bright Ac-
tive Galactic Nuclei (AGNs) (18); however both of these are easily identified, and therefore
removed, in relatively shallow optical and radio surveys. Therefore, flux-density limited sub-
millimeter surveys could provide a sample of lens candidates from which contaminants can be
readily removed, leaving a high fraction (close to 100%) of gravitational lens systems (Fig. 1).
Because this selection of lens candidates relies only on theproperties of the background source
5

(its flux density), it can probe a wide range of lens properties (such as redshifts and masses) and
thus provide a valuable sample for studying the elliptical properties of lensing galaxies (19) as
well as investigating the detailed properties of the lensedSMGs.
The submillimeter lens candidate selection at work. Although the approach presented above
may be more efficient and vastly more time-effective than those exploited so far in the radio (20)
or the optical (21,22), at least several tens of square degrees (deg2) of the sky must be observed
in the submillimeter to produce a statistically significantsample of strongly lensed objects
and a minimal contamination from unlensed galaxies. This isbecause the surface density of
lensed submillimeter galaxies is predicted to be lower than∼0.5 deg−2, for flux densities above
100 mJy at 500µm (Fig. 1). Submillimeter surveys conducted before the advent of Herschel
were either limited to small areas of the sky (15, 23), or were severely affected by source con-
fusion due to poor spatial resolution (24). Therefore no previous test of this selection method
has been performed, although the SPT has recently mapped an area of more than 80 deg2 at
millimetre wavelengths (9) and found an “excess” of sources that could be accounted forby a
population of gravitationally-lensed objects.
The Herschel Astrophysical Terahertz Large Area Survey (H-ATLAS) (25) represents the largest-
area submillimeter survey being currently undertaken by Herschel. H-ATLAS uses the Spectral
and Photometric Imaging REceiver (SPIRE) (26, 27) and the Photodetector Array Camera and
Spectrometer (PACS) (28, 29) instruments and, when completed, will cover∼550 deg2 of the
sky from 100 to 500µm. H-ATLAS has been designed to observe areas of the sky with previ-
ously existing multi-wavelength data: Galaxy Evolution Explorer (GALEX) ultra violet (UV)
data, Sloan Digital Sky Survey (SDSS) optical imaging and spectroscopy, NIR data from the UK
Infrared Telescope (UKIRT) Infrared Deep Sky Survey (UKIDSS) Large Area Survey (LAS),
spectra from the Galaxy And Mass Assembly GAMA (30) project, radio imaging data from the
6

Faint Images of the Radio Sky at Twenty-cm (FIRST) survey andthe NRAO Very Large Array
Sky Survey (NVSS). The first 14.4 deg2 of the survey, centred on J2000 RA 09:05:30.0 DEC
00:30:00.0 and covering∼3% of the total area, was observed in November 2009 as part of the
Herschel Science Demonstration Phase (SDP). The results were a catalog of∼6600 sources (31)
with a significance> 5 σ, in at least one SPIRE waveband, where the noise,σ, includes both
instrumental and source confusion noise and corresponds to∼7 to 9 mJy/beam.
The Herschel/SPIRE 500µm channel is favourable for selecting lens candidates, because the
submillimeter source counts steepen at longer wavelengths(24, 32). We used theoretical pre-
dictions (14) to calculate the optimal limiting flux density, above whichit is straightforward
to remove contaminants from the parent sample and maximize the number of strongly lensed
high-redshift galaxies. The surface-density of un-lensedSMGs is predicted to reach zero by
S500 ∼ 100mJy (14) and these objects are only detectable above this thresholdif gravitation-
ally lensed by a foreground galaxy (Fig. 1). The H-ATLAS SDP catalog contains 11 sources
with 500µm flux density above 100 mJy. Ancillary data in the field revealed that six of these
objects are contaminants; four are spiral galaxies with spectroscopic redshifts in the range of
0.01 to 0.05 [see (33) for a detailed analysis of one of these sources], one is an extended Galac-
tic star forming region, and one is a previously known radio−bright AGN (34). Although the
number of these sources are few at bright flux densities, the measured surface densities are con-
sistent with expectations (Fig. 1) (17, 18). Exclusion of these contaminants left the five objects
that form our sample of lens candidates (table S1) (35), identified as ID9, ID11, ID17, ID81 and
ID130.
Unveiling the nature of the lens candidates. For gravitational lensing systems selected at
submillimeter wavelengths, we would expect the lensing galaxy to be seen in optical and/or
NIR images, in which the emission from the lens dominates over the higher redshift background
7
SMG. In line with these expectations, all of the lens candidates have a close counterpart in SDSS
or UKIDSS images (or both). A likelihood ratio analysis (36) showed that the probability of a
random association between these bright submillimeter sources and the close optical/NIR coun-
terparts is less than a few per cent. Therefore the optical and submillimeter emissions must be
physically related, either because they occur within the same object or because of the effects
of gravitational lensing, boosting the flux of the background source and indirectly affecting the
likelihood ratio calculations. The redshift measurementssupport the later scenario. Although
the optical/NIR photometric/spectroscopic redshifts liein the range ofz ∼ 0.3 to 0.9 (table
1 and figs S3 and S4) (35), the redshifts estimated from the submillimeter/millimeter spectral
energy distributions (SED) (table 2) [following the methoddescribed in (37,38)], are distinctly
different (Table 1). The lensed SMG photometric redshifts have been confirmed and made
more precise through the spectroscopic detection, in theseobjects, of carbon monoxide (CO)
rotational line emission which are tracers of molecular gasassocatiated to star forming environ-
ments. Until recently, these kind of detections were difficult to achieve without prior knowledge
of the source redshift, which required extensive optical/NIR/radio follow-up observations. Be-
cause of the development of wide-bandwidth radio spectrometers capable of detecting CO lines
over a wide range of redshifts, it is now possible for blind redshift measurements of SMGs to
be taken without relying on optical or NIR spectroscopy (39, 40). ID81 was observed with the
Z-Spec spectrometer (41, 42) on the California Institute of Technology Submillimeter Obser-
vatory (CSO). The data revealed several CO lines redshiftedinto the frequency range of 187
to 310 GHz; the strongest of these lines has been interpretedas the CO J=7−6 line, with an
estimated redshift ofz = 3.04 (43). This represents the first blind redshift determination by
means of Z-Spec. We followed up this observation with the PdBI and detected CO J=3−2
and CO J=5−4 emission lines, redshifted toz = 3.042, confirming the Z-Spec measured red-
shift (35). We also used the Zpectrometer instrument (44, 45) on the NRAO Robert C. Byrd
8

Green Bank Telescope (GBT) to obtain an independent confirmation of the redshift of ID81
(table 1 and fig. S1) (35, 46) and to measure the redshift of ID130. We detected redshifted CO
J=1−0 emission atz = 2.625 in the spectrum of ID130 (fig. S1) (35, 46)]. This redshift was
confirmed by the PdBI with the observation of CO J=3-2 and CO J=5-4 lines, yielding a redshift
of z = 2.626 (35). The Z-Spec spectrometer observed the remaining three lens candidates (43)
and detected CO lines at redshifts ofz = 1.577 and z = 1.786 for ID9 (fig. S2) (35) and
ID11, respectively, which are higher and inconsistent withthe redshifts derived from the optical
photometry/spectroscopy (Table 1). The Z-Spec CO measurements for ID17 are indicative of
two redshifts; one,z = 0.942, that is in agreement with the optical redshift and a higher one,
z = 2.31, which is indicative of a more distant galaxy.
To determine the morphological type of the foreground galaxies we obtained high resolution
optical images for all five objects with the Keck telescope atg- andi-bands (35). ID9, ID11,
ID81 and ID130 all have optical profiles that are consistent with elliptical galaxies (figs S5 and
S6 and table S4) (35). The interpretation of the results for ID17 is complicatedby the presence
of two partially superimposed galaxies in the optical images (fig. S7) (35), neither exhibiting
the disturbed morphology expected for lensed objects. Thisindicates that ID17 may be a grav-
itational lens system with two foreground lensing masses atsimilar redshifts (z ∼ 0.8 to 0.9)
− possibly a merging system− with some molecular gas responsible for the CO emission de-
tected by Z-Spec atz ∼ 0.9 and confirmed with optical spectroscopy (table 1). A fit to the
UV/optical/NIR SEDs of ID9, ID11, ID81 and ID130 (47), using the models of (48), gives stel-
lar masses in the range of4× 1010 to 15×M⊙ (Table 2) and almost negligible present-day star
formation, which is consistent with elliptical galaxies (fig. 2).
For all five lens systems the background source appears to be undetected in the Keckg- and
i-band images, despite the flux magnification due to lensing. After subtracting the best fit light
profile from each lens we found no structure that could be associated with the background
9

source in the residual images (figs S5 and S6) (35). We derived 3-σ upper limits from the
residual maps (table S4) (35) and corresponding NIR limits from the UKIDSS images. These
upper limits were used to fit the SEDs of the background sources assuming the models of (48),
calibrated to reproduce the UV-to-infrared SEDs of local, purely star-forming ultra luminous
infrared galaxies (ULIRG; 1012 ≤LIR/L⊙ <1013) (49) (fig. 2). A visual extinction (50) ofAV
>2 is required to be consistent with the optical/NIR upper limits (fig. 2 and table 2), confirming
severe dust obscuration in these galaxies along the line-of-sight. Our results indicate that these
submillimeter bright gravitationally lensed galaxies would have been entirely missed by stan-
dard optical methods of selection.
We obtained observations at the SMA for ID81 and ID130 at 880µm, with the aim of detect-
ing the lensed morphology of the background galaxy (35). The SMA images reveal extended
submillimeter emission distributed around the cores of theforeground elliptical galaxies, with
multiple peaks (four main peaks in ID81 and two in ID130), which is consistent with a lensing
interpretation of these structures (Fig. 3). The position of these peaks can be used to directly
constrain the Einstein radius− the radius of the circular region on the sky (the Einstein ring)
into which an extended source would be lensed if a foregroundgalaxy were exactly along the
line of sight of the observer to the source (for a perfectly circular lens). The Einstein radius is a
measure of the projected mass of the lens, so it can be used to derive the total (dark plus lumi-
nous) mass of the galaxy within the Einstein radius (table 2)(35). Another measure of the total
mass of a lens is the line-of-sight stellar velocity dispersion, σv. We have estimatedσv from
the local Faber−Jackson (FJ) relation (51) betweenσv and the rest-frame B-band luminosity
for elliptical galaxies. Assuming passive stellar evolution for the lens galaxies, which is appro-
priate for elliptical galaxies, we have extrapolated theirrest-frame K-band luminosity toz = 0
[using the evolutionary tracks of (52)], and then converted this to B-band luminosity using the
B - K = 4.43 color relation from (53). The result was then applied to the FJ relation from (54).
10

Given a mass model for the lens (35), we can predict the Einstein radius of the galaxy from the
value ofσv expected from the FJ relation and compare it with that directly measured from the
SMA images (Table 2). Although the value of the Einstein radius derived from the line-of-sight
stellar velocity dispersion is affected by large uncertainties (as a result of the scatter in the FJ
relation) it is consistent with the value measured in the SMAimages for both ID81 and ID130.
In order to test whether the properties of the lensing galaxies in our sample are consistent with
those of other known lens ellipticals at similar redshift, we compared the V-band mass-to-light
ratio of the lens galaxy for ID81 and ID130 (Table 2) (35) to those measured in the Sloan Lens
Advanced Camera for Surveys (ACS) (fig. 4) (55), which cover a similar redshift range (z∼0.1
to 0.3). The agreement with the average trend revealed by SLACS confirms that our lens se-
lection method is not biased to lensing ellipticals with atypical luminosities. Moreover, the
location of ID130 in Fig. 4 indicates that our selection method can probe lower masses and
lower luminosity lens galaxies than those sampled by SLACS,thus offering a wider range in
lens properties to be investigated.
The best fit SED to the submillimeter/millimeter photometryfor each of the five background
sources give infrared luminosities LIR ≥∼3×10¹³ L⊙ (Table 2), which would classify these ob-
jects as Hyper Luminous Infra-Red galaxies (HLIRGs; LIR ≥1013 L⊙). However, a correction
for magnification because of lensing will reduce these values by a factor of 10 or greater. For ex-
ample, assuming that the light distribution of the background source is described by a Gaussian
profile with a full width at half maximum (FWHM) of 0.2 arcseconds [which is consistent with
the physical extension of the background galaxy in (4)], the best-fit lens model (fig. S9) (35)
predicts a total amplifications of∼19 and∼6 for ID81 and ID130, respectively. Typical ampli-
fications of 8 to 10 are also suggested by (14), therefore, it is more likely that these sources are
ULIRGs.
These results already provide constraints for models of theformation and evolution of massive
11
galaxies at high redshift. The fact that many (if not all) of the brightest SMGs detected in the H-
ATLAS SDP field are amplified by lensing, implies that un-lensedz > 1 star-forming galaxies
with flux densities more than 100 mJy at 500µm are rare, with≤ 4.6 of them per 14.4 deg−2,
at 99% probability (assuming Poisson statistics). This translates into a 0.32 deg−2 upper limit
on the surface density of these sources. The same limit should translate to the abundance of
HLIRGs with LIR >5×10¹³ L⊙at z < 4, because they would also have 500-µm flux densities
above100mJy, which has possible implications for the role of feedback during the formation
of the most massive galaxies in the universe. By extrapolating our SDP findings to the full
H-ATLAS field, we predict a total sample of more than 100 bright lensed sources, with which
we can further improve this constraint.
References and Notes
1. When multiple images of the same background source are formed, the event is known as
strong gravitational lensing .
2. P. J. Marshall,et al., Astrophys. J.671, 1196 (2007).
3. D. P. Stark,et al., Nature455, 775 (2008).
4. A. M. Swinbank,et al., Nature464, 733 (2010).
5. I. Smail, R. J. Ivison, A. W. Blain,Astrophys. J. L.490, L5+ (1997).
6. A. W. Blain, J. Kneib, R. J. Ivison, I. Smail,Astrophys. J. L.512, L87 (1999).
7. M. Rowan-Robinson,et al., Nature351, 719 (1991).
8. I. Smail, R. J. Ivison, A. W. Blain, J. Kneib,Mon. Not. R. Astron. Soc.331, 495 (2002).
12

9. J. D. Vieira,et al., Astrophys. J.719, 763 (2010).
10. G. L. Pilbratt,et al., Astron. & Astrophys.518, L1+ (2010).
11. A. W. Blain,Mon. Not. R. Astron. Soc.283, 1340 (1996).
12. F. Perrotta, C. Baccigalupi, M. Bartelmann, G. De Zotti,G. L. Granato,Mon. Not. R. Astron.
Soc.329, 445 (2002).
13. F. Perrotta,et al., Mon. Not. R. Astron. Soc.338, 623 (2003).
14. M. Negrello,et al., Mon. Not. R. Astron. Soc.377, 1557 (2007).
15. K. Coppin,et al., Mon. Not. R. Astron. Soc.372, 1621 (2006).
16. S. C. Chapman, A. W. Blain, I. Smail, R. J. Ivison,Astrophys. J.622, 772 (2005).
17. S. Serjeant, D. Harrison,Mon. Not. R. Astron. Soc.356, 192 (2005).
18. G. de Zotti,et al., Astron. & Astrophys.431, 893 (2005).
19. L. V. E. Koopmans, T. Treu, A. S. Bolton, S. Burles, L. A. Moustakas,Astrophys. J.649,
599 (2006).
20. I. W. A. Browne, The Class Collaboration,Gravitational Lensing: Recent Progress and
Future Go, T. G. Brainerd & C. S. Kochanek, ed. (2001), vol. 237 ofAstronomical Society
of the Pacific Conference Series, pp. 15–+.
21. M. Oguri,et al., Astron. J.132, 999 (2006).
22. C. Faure,et al., Astrophys. J. S.176, 19 (2008).
23. A. Weiß,et al., Astrophys. J.707, 1201 (2009).
13

24. M. J. Devlin,et al., Nature458, 737 (2009).
25. S. Eales,et al., Publ. Astron. Soc. Pac.122, 499 (2010).
26. M. J. Griffin,et al., Astron. & Astrophys.518, L3+ (2010).
27. E. Pascale,submitted; preprint available at http://xxx.lanl.gov/abs/astro-ph/1010.5782.
28. A. Poglitsch,et al., Astron. & Astrophys.518, L2+ (2010).
29. E. Ibar,submitted; preprint available at http://xxx.lanl.gov/abs/astro-ph/1009.0262.
30. S. Driver,submitted; preprint available at http://xxx.lanl.gov/abs/astro-ph/1009.0614.
31. E. E. Rigby,submitted; preprint available at http://xxx.lanl.gov/abs/astro-ph/1010.5787.
32. D. L. Clements,et al., Astron. & Astrophys.518, L8+ (2010).
33. M. Baes,et al., Astron. & Astrophys.518, L39+ (2010).
34. J. Gonzalez-Nuevo,et al., Astron. & Astrophys.518, L38+ (2010).
35. Supporting online material (SOM) .
36. D. J. B. Smith,et al., submitted; preprint available at http://xxx.lanl.gov/abs/astro-
ph/1007.5260.
37. D. H. Hughes,et al., Mon. Not. R. Astron. Soc.335, 871 (2002).
38. I. Aretxaga,et al., Mon. Not. R. Astron. Soc.342, 759 (2003).
39. A. Weiß,et al., Astrophys. J. L.705, L45 (2009).
40. E. Daddi,et al., Astrophys. J. L.695, L176 (2009).
14

41. B. J. Naylor,et al., Society of Photo-Optical Instrumentation Engineers (SPIE) Conference
Series, T. G. Phillips & J. Zmuidzinas, ed. (2003), vol. 4855 ofPresented at the Society of
Photo-Optical Instrumentation Engineers (SPIE) Conference, pp. 239–248.
42. C. M. Bradford,et al., Astrophys. J.705, 112 (2009).
43. R. Lupu,submitted; preprint available at http://xxx.lanl.gov/abs/astro-ph/1009.5983.
44. A. I. Harris,et al., From Z-Machines to ALMA: (Sub)Millimeter Spectroscopy of Galaxies,
A. J. Baker, J. Glenn, A. I. Harris, J. G. Mangum, & M. S. Yun , ed. (2007), vol. 375 of
Astronomical Society of the Pacific Conference Series, pp. 82–+.
45. The Zpectrometer frequency coverage allows it to searchfor CO J=1−0 transition over the
redshift range 2.2 to 3.5 simultaneously .
46. D. Frayer,submitted; preprint available at http://xxx.lanl.gov/abs/astro-ph/1009.2194.
47. Only g and i-band photometry can be obtained for each of the two galaxies detected in
ID17. For this reason, we did not attempt any fit to the optical/NIR SED of this H-ATLAS
source .
48. E. da Cunha, S. Charlot, D. Elbaz,Mon. Not. R. Astron. Soc.388, 1595 (2008).
49. E. da Cunha,et al., in press; preprint available at http://xxx.lanl.gov/abs/astro-
ph/1008.2000.
50. The visual extinction parameter,AV , is the difference between the observed V-band mag-
nitude and the intrinsic (dust-free) V-band magnitude of the galaxy .
51. S. M. Faber, R. E. Jackson,Astrophys. J.204, 668 (1976).
15

52. C. J. Willott, S. Rawlings, M. J. Jarvis, K. M. Blundell,Mon. Not. R. Astron. Soc.339, 173
(2003).
53. J. Huang, L. L. Cowie, G. A. Luppino,Astrophys. J.496, 31 (1998).
54. D. H. Gudehus,Astrophys. J.382, 1 (1991).
55. M. W. Auger,et al., Astrophys. J.705, 1099 (2009).
56. Herschel is an ESA space observatory with science instruments provided by European-
led Principal Investigator consortia and with important participation from NASA. US
participants in H-ATLAS acknowledge support from NASA through a contract from
JPL. This work was supported by the Science and Technology Facilities Council (grants
PP/D002400/1 and ST/G002533/1) and studentship SF/F005288/1. We thank Agenzia
Spaziale Italiana for funding through contract No. I/016/07/0 COFIS and ASI/Istituto
Nazionale di Astrofisica agreement I/072/09/0 for the Planck Low Frequency Instrument
(LFI) Activity of Phase E2. Research supported in part by Consejo Nacional de Cien-
cia y Tecnologia (CONACyT) grants 39953-F and 39548-F. The W.M. Keck Observatory
is operated as a scientific partnership among the CaliforniaInstitute of Technology, the
University of California and NASA. The Observatory was madepossible by the gener-
ous financial support of the W.M. Keck Foundation. The Submillimeter Array is a joint
project between the Smithsonian Astrophysical Observatory and the Academia Sinica In-
stitute of Astronomy and Astrophysics and is funded by the Smithsonian Institution and
the Academia Sinica. IRAM is supported by Institut Nationaldes Sciences de l’Univers
(INSU)/CNRS (France), Max Planck Society (MPG) (Germany) and Instituto Geografico
Nacional (Spain). Z-spec was supported by NSF grant AST-0807990 to J. A. and by the
CSO NSF Cooperative Agreement AST-0838261. Support was provided to J. K. by an
NSF Graduate Research Fellowship. Z-spec was constructed under NASA SARA grants
16

NAGS-11911 and NAGS-12788 and an NSF Career grant (AST-0239270) and a Research
Corporation Award (RI0928) to J. G., in collaboration with the JPL, California Institute of
Technology, under a contract with NASA. Construction of andobservations with the Zpec-
trometer have been supported by NSF grants AST-0503946 and AST-0708653. The NRAO
is a facility of the NSF operated under cooperative agreement by Associated Universities.
The optical spectroscopic redshift of ID130 was derived from observations obtained with
the Apache Point Observatory 3.5-meter telescope, which isowned and operated by the
Astrophysical Research Consortium. The optical spectroscopic redshifts of ID9 and ID11
were obtained with the William Herschel Telescope which is operated on the island of La
Palma by the Isaac Newton Group in the Spanish Observatorio del Roque de los Mucha-
chos of the Instituto de Astrofsica de Canarias. For the use of Keck, SMA and CSO, the
authors wish to recognize and acknowledge the very important cultural role and reverence
that the summit of Mauna Kea has always had within the indigenous Hawaiian community.
We are most fortunate to have the opportunity to conduct observations from this mountain .
17

Tables
Table 1: Photometric and spectroscopic redshifts of the fivelens candidates. Spectroscopicredshifts were derived from optical lines for the lens [z(opt)spec ] and from CO lines for the back-ground source [z(CO)
spec ]. Photometric redshifts are based on UV/optical/NIR photometry for the
lens [z(opt)ot ] and H-ATLAS plus SMA and Max-Planck Millimeter Bolometer (MAMBO) pho-tometry for the background source[z
(submillimeter/millimeter)phot ; using the photometric redshift code
of (37,38)]. The quoted errors on the redshifts correspond to a 68% confidence interval.
SDP ID z(opt)phot z
(opt)spec z
(sub−mm/millimeter)phot z
(CO)spec
9 0.679±0.057 − 1.4+0.3−0.4 1.577±0.008(1)
11 0.72±0.16 0.7932±0.0012(2) 1.9+0.4−0.3 1.786±0.005(1)
17 0.77±0.13 0.9435±0.0009(2) 2.0+0.4−0.3 0.942±0.004 & 2.308±0.011(1)
81 0.334±0.016 0.2999±0.0002(3) 2.9+0.2−0.3 3.037±0.010(1)
3.042±0.001(4),(5)
130 0.239±0.021 0.2201±0.002(6) 2.6+0.4−0.2 2.625±0.001(4)
2.6260±0.0003(5)(1) Datum is from CSO/Z-Spec (43)(2) Datum is from the William Herschel Telescope (35)(3) Datum is from SDSS(4) Datum is from GBT/Zpectrometer (46)(5) Datum is from PdBI (35)(6) Datum is from the Apache Point Observatory (35)
18
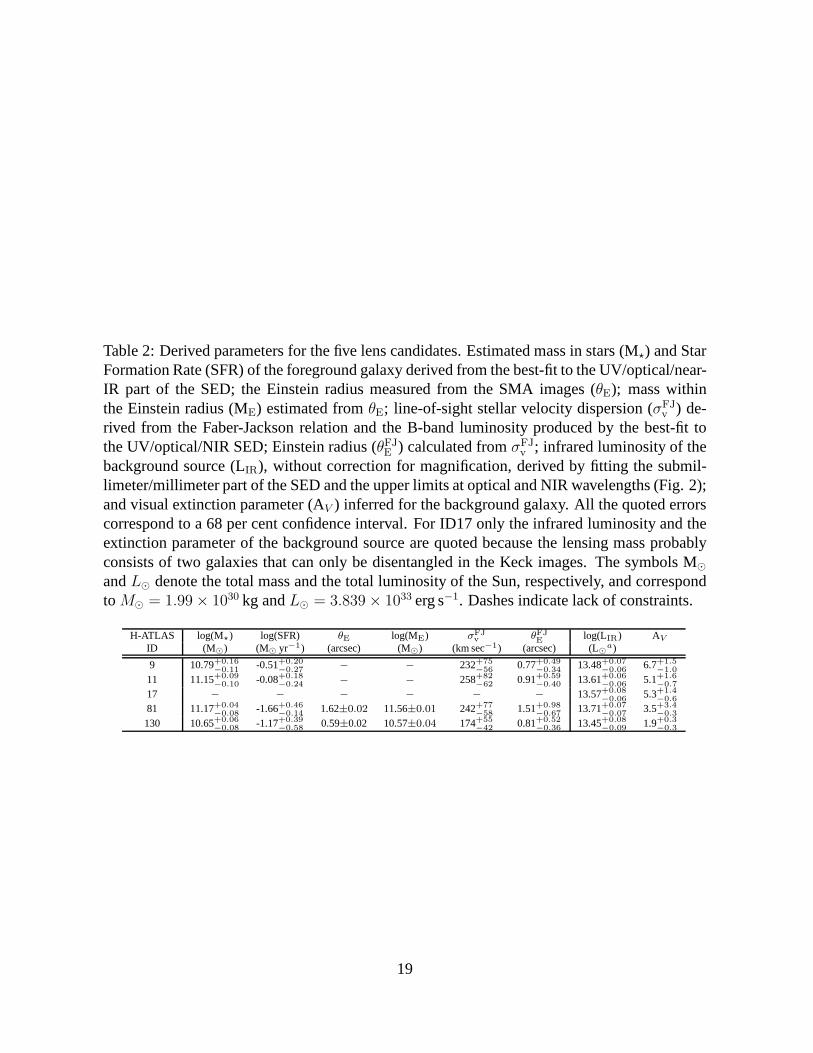
Table 2: Derived parameters for the five lens candidates. Estimated mass in stars (M⋆) and StarFormation Rate (SFR) of the foreground galaxy derived from the best-fit to the UV/optical/near-IR part of the SED; the Einstein radius measured from the SMA images (θE); mass withinthe Einstein radius (ME) estimated fromθE; line-of-sight stellar velocity dispersion (σFJ
v ) de-rived from the Faber-Jackson relation and the B-band luminosity produced by the best-fit tothe UV/optical/NIR SED; Einstein radius (θFJE ) calculated fromσFJ
v ; infrared luminosity of thebackground source (LIR), without correction for magnification, derived by fitting the submil-limeter/millimeter part of the SED and the upper limits at optical and NIR wavelengths (Fig. 2);and visual extinction parameter (AV ) inferred for the background galaxy. All the quoted errorscorrespond to a 68 per cent confidence interval. For ID17 onlythe infrared luminosity and theextinction parameter of the background source are quoted because the lensing mass probablyconsists of two galaxies that can only be disentangled in theKeck images. The symbols M⊙andL⊙ denote the total mass and the total luminosity of the Sun, respectively, and correspondto M⊙ = 1.99× 1030 kg andL⊙ = 3.839× 1033 erg s−1. Dashes indicate lack of constraints.
H-ATLAS log(M⋆) log(SFR) θE log(ME) σFJv θFJ
Elog(LIR) AV
ID (M⊙) (M⊙ yr−1) (arcsec) (M⊙) (km sec−1) (arcsec) (L⊙a)
9 10.79+0.16
−0.11-0.51+0.20
−0.27− − 232+75
−560.77+0.49
−0.3413.48+0.07
−0.066.7+1.5
−1.0
11 11.15+0.09
−0.10-0.08+0.18
−0.24− − 258+82
−620.91+0.59
−0.4013.61+0.06
−0.065.1+1.6
−0.7
17 − − − − − − 13.57+0.08
−0.065.3+1.4
−0.6
81 11.17+0.04
−0.08-1.66+0.46
−0.141.62±0.02 11.56±0.01 242+77
−581.51+0.98
−0.6713.71+0.07
−0.073.5+3.4
−0.3
130 10.65+0.06
−0.08-1.17+0.39
−0.580.59±0.02 10.57±0.04 174+55
−420.81+0.52
−0.3613.45+0.08
−0.091.9+0.3
−0.3
19

Figures
Figure 1: Selection of gravitational lenses at submillimeter wavelengths. The 500µm sourcecounts consist of three different populations (14): high-redshift SMGs; lower redshift late type(starburst plus normal spiral) galaxies; and radio sourcespowered by active galactic nuclei.Strongly lensed SMGs dominate over unlensed SMGs at very bright fluxes where the countof un-lensed SMGs falls off dramatically (yellow shaded region). The data points are fromH-ATLAS (32).
20

Figure 2: Spectra of the gravitational lens candidates. TheUV, optical and NIR data points (bluedots) are fromGALEX, SDSS and UKIDSS LAS, respectively. The submillimeter/millimeterdata points (red dots) are from PACS/Herschel, SPIRE/Herschel, SMA and Max-Planck Mil-limeter Bolometer (MAMBO)/IRAM. Upper limits at PACS/Herschel wavelengths are shownat 3σ. ID130 lies outside the region covered by PACS. The photometric data were fitted usingSED models from (48). The background source, responsible for the submillimeter emission, isa heavily dust obscured star-forming galaxy (red solid curve), whereas the lens galaxy, which isresponsible for the UV/optical and NIR part of the spectrum,is caracterized by passive stellarevolution.
21

Figure 3: Submillimeter and optical follow-up imaging of ID81 and ID130. The SMA imagesof ID81 and ID130 are shown in the top panels, centered on the optical counterpart, and wereobtained by combining the visibility data from very-extended, compact and sub-compact con-figuration observations. The Keck i-band image of ID81 and ID130 are shown in the bottompanels with the SMA contours superimposed (in red). The contours are in steps of -2σ, 2σ,4σ, 6σ, 8σ, 10σ... , with σ = 0.6mJy/beam. The SMA synthesized beam is shown in thebottom-left corner.
22

Figure 4: Relationship between mass and luminosity for the lensing galaxy in ID81 and ID130.The rest-frameV−band luminosity was derived from the best-fit SED to the UV/optical/NIRphotometric data; the mass within the Einstein radius is that measured directly from the SMAimages. The light versus mass relation inferred for ID81 andID130 (red dots) is consistent withthat observed for the SLACS lenses [black dots, from (55) assuming an uncertainty of 0.025dexin their mass estimates].
23
Supporting Online Material
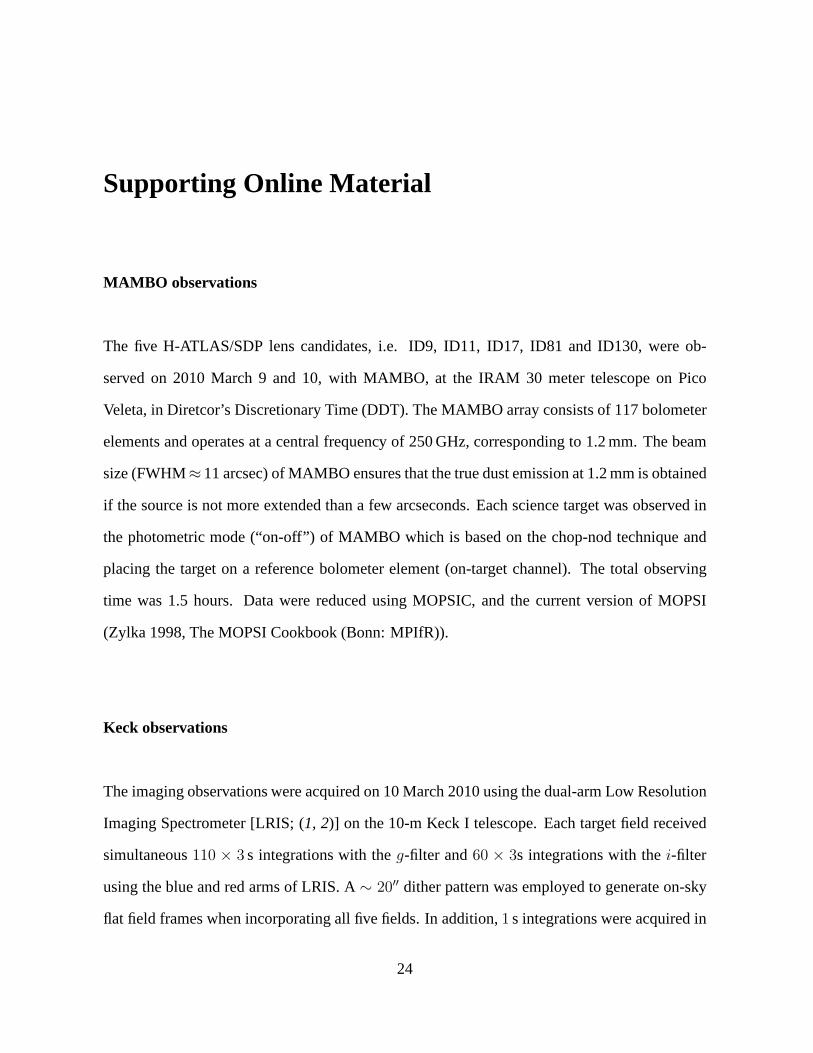
MAMBO observations
The five H-ATLAS/SDP lens candidates, i.e. ID9, ID11, ID17, ID81 and ID130, were ob-
served on 2010 March 9 and 10, with MAMBO, at the IRAM 30 meter telescope on Pico
Veleta, in Diretcor’s Discretionary Time (DDT). The MAMBO array consists of 117 bolometer
elements and operates at a central frequency of 250 GHz, corresponding to 1.2 mm. The beam
size (FWHM≈11 arcsec) of MAMBO ensures that the true dust emission at 1.2mm is obtained
if the source is not more extended than a few arcseconds. Eachscience target was observed in
the photometric mode (“on-off”) of MAMBO which is based on the chop-nod technique and
placing the target on a reference bolometer element (on-target channel). The total observing
time was 1.5 hours. Data were reduced using MOPSIC, and the current version of MOPSI
(Zylka 1998, The MOPSI Cookbook (Bonn: MPIfR)).
Keck observations
The imaging observations were acquired on 10 March 2010 using the dual-arm Low Resolution
Imaging Spectrometer [LRIS; (1, 2)] on the 10-m Keck I telescope. Each target field received
simultaneous110 × 3 s integrations with theg-filter and60 × 3s integrations with thei-filter
using the blue and red arms of LRIS. A∼ 20′′ dither pattern was employed to generate on-sky
flat field frames when incorporating all five fields. In addition,1 s integrations were acquired in
24
theg- andi-filters for photometric calibration of bright stars in eachfield. The seeing FWHM
for the science exposures was∼ 0.8 − 0.9′′. The data were reduced using IDL routines and
combined and analysed using standard IRAF tasks.
SMA observations
Observations of two H-ATLAS/SDP sources, ID81 and ID130, were obtained at 880µm us-
ing the only current high resolution submillimeter facility in the world, the SMA. The SMA is
an interferometer located near the summit of Mauna Kea, Hawaiim and consists of eight 6 m di-
ameter radio telescopes. The two H-ATLAS sources were observed in Director’s Discretionary
Time (from February to May 2010) in three separate configurations, with baselines spanning a
spatial range from 6 to 509 meters, over a total of 4 observingperiods (Table S3).
Target observations from each period were interspersed with observations of calibration sources,
quasars J0909+013 and J0825+031 (phase) and J0730-116 and J0854+201 (amplitude). The
phase calibration targets were typically observed every 7 to 15 minutes, depending upon con-
figuration (a faster cycle was used for the larger configurations).
Calibration of the complex visibility data was performed within the SMA’s MIR package, a
suite of IDL-based routines designed for use with SMA data. The initial opacity correction
was obtained through application of system temperature to the raw visibility data, a standard
practice. Further complex gain corrections, to remove bothatmospheric and instrumental ampli-
tude and phase variations, were measured using the calibration quasars, which appear as point
sources to the interferometer. Calibration of the absoluteflux density scale was performed us-
ing measurements of Titan, whose continuum and line structure is known to within about 5% at
submillimeter/millimeter wavelengths.
25

The resulting calibrated visibility data for each source were combined and imaged within the
NRAO Astronomical Image Processing System (AIPS). Photometry obtained for the SMA im-
ages along with those from PACS, SPIRE, MAMBO are given in table S1.
Plateau de Bure Interferometer observations
The H-ATLAS/SDP sources ID81 and ID130 were observed in the CO J=3-2 and CO J=5-4
lines with the IRAM Plateau de Bure Interferometer (3). Both sources were observed in excel-
lent atmospheric conditions and with the full sensitivity of the six-element array. The observing
frequencies were based on the redshifts provided by the CSO/Z-spec spectrometer. The receiver
bandwidth was adjusted for maximum sensitivity and the observing frequencies centered in the
1 GHz baseband of the narrowband correlator. Observations of ID81 were made on March 22,
2010 for an effective integration time of 22 min and 14 min, respectively, for the CO J=3-2 and
J=5-4 lines. The RF calibration was measured on 3C84, and amplitude and phase calibrations
were made on 0823+033. The J=3-2 and J=5-4 transitions in ID130 were observed on March
26 and April 16, 2010, respectively, for an effective integration time of 74 min and 32 min.
The RF calibration was measured on 3C273, and amplitude and phase calibrations were made
on 0906+015. The absolute flux calibration scales for ID81 and ID130 were established using
as primary calibrator MWC349. Data reduction and calibration were made using the GILDAS
software package in the standard antenna based mode.
Optical spectroscopic observations
26

Optical spectroscopic observations of ID11 and ID17 were made using the ISIS double-arm
spectrograph on the 4.2-m William Herschel Telescope (WHT). The R158B and R158R grat-
ings were used to provide wavelength coverage across the entire optical spectrum, split by
a dichroic at∼5300A. Four 900-second exposures were taken of each source in a standard
‘ABBA’ pattern, nodding the telescope along the slit by 10 arcseconds between the first and
second exposures, and back to the original position betweenthe third and fourth integrations.
This allowed initial sky subtraction to be performed by simply subtracting the ’A’ frames from
the ’B’ frames. Additional sky subtraction was performed bysubtracting the median value of
each row, and then the positive and negative beams were aligned and coadded. Wavelength
calibration was performed using observations of arc lamps taken with the same set-up. A one-
dimensional spectrum was then optimally extracted. The spectra were taken through thin cloud
and therefore no attempt has been made to flux-calibrate them. There was very little signal
in the blue arms and so only the red-arm spectra are presentedhere. The redshifts of the two
sources were determined by cross-correlation with template spectra. All reduction steps were
undertaken using the IRAF package. The resulting spectra are shown in Fig. S3. The spec-
trum of ID11 reveals absorption lines associated to singly ionised calcium Ca H+K (rest-frame
wavelengths: 3968.5A for H-line and 3933.7A for K-line) and the 4000A break feature (rest-
frame wavelength 4000A) at z = 0.793, while the spectrum of ID17 shows the emission from
oxygen doublet [OII]3727 (rest-frame wavelengths 3726-3729A) and the 4000A break feature
at z = 0.944. In both spectra the absorption feature observed at∼ 7600 A is due to the Earth’s
atmosphere.
A 30-minute exposure of ID130 was taken on May 15, 2010, with the Apache Point Observa-
tory’s 3.5-meter telescope and the DIS [Dual Imaging Spectrograph, (4)] long-slit spectrograph
through medium clouds at an average airmass of 1.5. The spectrum was processed by sub-
tracting the detector bias, dividing by a flat-field frame to correct for variable pixel response,
27

performing distortion correction to align the spectrum in the wavelength and spatial directions,
subtracting the sky flux determined from parts of the slit containing no sources, and applying
a wavelength calibration by reference to emission lines from a Helium-Neon-Argon calibration
lamp. Two emission lines in the spectrum (Fig. S4) were identified as [O II]3727 and [Ne
III]3869 (rest-frame wavelengths 3869A) from the ratio of their observed wavelengths. From
the ratio of their observed to emitted wavelengths the redshift of the galaxy was determined to
bez =0.2201±0.002.
28

Modelling with GALFIT
GALFIT (5) is a publicly available two-dimensional non-linear fitting algorithm, which allows
galaxy images to be modelled with one or multiple analyticallight profiles. Each profile is
constrained by a function and a set of parameters. GALFIT convolves the profiles with a user
supplied point spread function, in this case empirical point spread functions constructed using
nearby stars, and then performs a least-squares minimisation. No hard or soft constraints were
applied to the fitting parameters to avoid any prior on the galaxy morphological type. For ID9
and ID11 single Sersic profiles resulted in a reducedχ2 close to 1.0 (see table S4 for the best
fit parameters). ID17 was fitted with two Sersic component, assuming two lensing galaxies.
The resulting Sersic indices were both less than 1 (see tableS4). For ID81 and ID130 two
components were necessary to achieve a satisfactory fit, with a clean residual. The best fits
were obtained using a combination of a compact elliptical Sersic core plus an exponential disk.
No detectable background structure was revealed after subtracting the models, which shows the
background galaxy is below the optical detection limit. Postage stamp images of ID9, ID11,
ID17, ID81 and ID130 are shown in Figs S5 and S6, together withthe corresponding best-fit
models and residuals, while Fig. S7 shows the individual GALFIT components for ID81 and
ID130.
To derive photometric upper limits, we performed random aperture photometry on the i- and
g-band Keck maps, using a 1.5 arcsecond radius. This radius was chosen to correspond with the
structure visible in the SMA images for ID81 and ID130, whichextends to regions with radii
of approximately 1−1.5 arcseconds. The resulting flux distributions were fittedwith Gaussians
and the 3−σ upper limits are presented in Table S4.
29

Mass estimate from lensing
The Einstein radius of a strong galaxy-galaxy gravitational lens system can be measured from
the configuration of multiple lensed images by averaging thedistances of the images from the
center of the lensing galaxy. For two of the H-ATLAS/SDP lenscandidates, ID81 and ID130,
the positions of the lensed images are constrained by high-resolution SMA follow-up imaging.
The lensed images of the background sources appear as peaks in the SMA signal-to-noise ratio
map. Here we have selected those peaks with signal-to-noiseratio above eight, which pro-
vided positions for four images in ID81 and two images in ID130. The error on the Einstein
radius is estimated by taking into account the uncertainties on the position of the individual
peaks. For a point source the rms error on its position is√2σ/SNR (assuming no systematic
astrometry errors and uncorrelated Gaussian noise), whereσ is the Gaussian rms width of the
instrument beam ( = FWHM/2√2ln2), while SNR is the signal-to-noise ratio at the source posi-
tion (6, 7). The SMA synthesised beam (derived by combining observations in VEX, COM and
SUB configurations) has size 0.81′′×0.73′′ for ID81 and 0.78′′×0.72′′ for ID130. Therefore,
in estimating the relative positional uncertainty of the peaks, we have assumed FWHM=0.75′′
and FWHM=0.77′′ for ID81 and ID130, respectively. The absolute positional uncertainty of
the SMA images is estimated by referencing the data to nearbypoint-like sources (quasars) of
known positions and is below 10 milli-arcseconds.
Once the Einstein radius is known, the mass within the Einstein ring can be easily derived as-
suming a Singular Isothermal Sphere (SIS) model (although the result is only little dependent
on the model used) which is characterized by a projected surface density that falls off asθ−1,
whereθ is the angular distance from the center of the mass distribution (8),
ME = M(< θE) = πΣcritθ2E, (1)
30
andΣcrit is thecritical surface density:
Σcrit =c2
4πG
DS
DLDLS. (2)
In the equation above,c is the speed of light,G is the gravitational constant,DL andDS are
the angular diameter distances to the lens and the source, respectively, whileDLS is the angular
diameter distance between the lens and the source. The erroron the mass is obtained by prop-
agating the errors on the Einstein radius and on the spectroscopic/photometric redshifts used to
derived the angular diameter distances. The estimated values ofθE andME are listed in Table 2.
31

Gravitational lensing modeling
A detailed analysis of the lensed structure revealed by the SMA images is beyond the scope
of this paper and is deferred to a forthcoming publication. However, in order to prove that such
a structure is consistent with a lensing event, we have used the publicly available LENSMODEL
software (9) to reproduce the positions of the peaks in the SMA maps. We have assumed a Sin-
gular Isothermal Ellipsoid (SIE) model (8) for the mass distribution of the lens galaxy. The SIE
model consists of concentric and aligned elliptical isodensity contours with axis ratioq. The
circular limit is the SIS model and corresponds toq = 1. The results are shown in Fig. S9. We
have further assumed that the centroid of the mass model coincides with that of the light distri-
bution of the lensing galaxy. The best-fit model for ID130 hasellipticity e = 0.16 and position
angle (measured East of North) ofθ = +75 deg, consistent with the results found for the optical
light-distribution that is dominated by the more compact Sersic profile (Table S4 and Fig. S8).
For ID81, the mass distribution has ellipticitye = 0.24 and position angleθ = −3 deg, which is
not consistent with that measured for the luminous component (Table S4 and Fig. S8). Besides,
the position of the peaks is not well reproduced by the model.This may hint at the effect of an
external shear (which we did not include) due to a nearby cluster (photometrically detected 3.6
arcminutes away), in the direction indicated by the arrow inFig. S9.
We have used the best-fit lens models to approximatively quantify the magnification experi-
enced by a background source described by a Gaussian profile with a Full Width at Half Maxi-
mum (FWHM) in the range 0.1-0.3′′. This extension is consistent with the physical size of the
submillimeter galaxy studied by (10). The inferred magnification is∼18-31 for ID81 and∼5-7
for ID130. An example of lensed image, after convolution with the SMA point spread function,
for the case FWHM=0.2′′ is shown in Fig. S9.
32

Figures
Figure S 1: CO line detections in ID81 and ID130. The figure shows the difference betweenthe spectrum of ID81 and that of ID130, derived from Zpectrometer observations. The relativespectrum is normalized such that the peak line strength of ID81 is equal to 1. In both objectsthe peak is associated with the CO J=1-0 emission line (rest-frame frequency 115.27 GHz).
33

Figure S 2: CO line detections in ID9. The figure shows the spectrum derived from Z-Specobservations. The CO emission lines redshifted into the frequency range probed by Z-Spec cor-respond to transitions J=5-4 (rest-frame frequency 576.3 GHz) and J=6-5 (rest-frame frequency691.5 GHz).
200 220 240 260 280 300Observed Frequency (GHz)
0.00
0.01
0.02
0.03
0.04
0.05
0.06
Flu
x D
en
sity
(Jy
) CO (5−4)
νrest= 576.3 Ghz
CO (6−5)
νrest= 691.5 Ghz
Z−specID9
Figure S 3: Optical spectra of ID11 and ID17 obatined with theWHT.
34

Figure S 4: Optical spectrum of ID130 obtained with the APO telescope. The bottom panel ofthe figure shows the reduced 2-d spectrum in the region of the detected emission lines. The toppanel shows the flux summed in a 5-pixel wide (2 arcsecond) aperture centered on the object,with an arbitrary flux scale because the clouds made wavelength calibration impossible.
35

Figure S 5: Best-fit to the light distribution of the lens galaxy in the gravitational lens systemsID9, ID11 and ID17. The postage stamp images show, from left to right, the keck i-band image,the best-fit light distribution model provided by GALFIT andthe residual map obtained by sub-tracting the best-fit model from the observed light distribution. The map of the residuals showno evident structure, implying that the background source is particularly faint in the optical,despite the magnification due to lensing.
36

Figure S 6: Best-fit to the light distribution of the lens galaxy in the gravitational lens systemsID81 and ID130. The postage stamp images show, from left to right, the keck i-band image,the best-fit light distribution model provided by GALFIT andthe residual map obtained bysubtracting the best-fit model from the observed light distribution. The SMA contours (in red)are overlaid on the optical images (in steps of 6σ, 8σ, 10σ, etc.) to highlight that there isno evident correspondence between the submillimeter and the optical emission in the residualmaps.
37

Figure S 7: Decomposition of the best-fit models of the lens galaxies in ID17, ID81 and ID130.Top: ID17 shows two partially superimposed components, indicative of two distinct lens galax-ies, each described by a relatively shallow Sersic profile.Middle: ID81 has one single lensgalaxy whose light profile is reproduced by the sum of a Sersicprofile and an exponential diskprofile. Bottom: ID130 is similar to ID81, with the light profile being described by the superpo-sition of a compact Sersic profile and an exponential disk profile. In both ID81 and ID130, theSMA contours (in red) are overlaid on the optical images, in steps of 6σ, 8σ, 10σ, etc.
38

Figure S 8: Light profile of the lens galaxy in the gravitational lens systems ID81 and ID130.In both cases the best-fit to the observed light distributionof the lens galaxy is achieved using 2components, i.e. an inner (more compact) Sersic profile and an exponential disk profile. Thesecomponents are shown as a function of the distance from the galaxy center for ID81 (left-handpanel) and ID130 (right-hand panel).
39

Figure S 9: Lens modelling of ID81 and ID130. The LENSMODEL software was used to fit theposition of the peaks in the SMA images. A SIE model was assumed for the mass distributionof the foreground lenses. The image positions used in the fit are indicated by the red dots andcorrespond to the peaks in the SMA images (red contours in steps of 6σ, 8σ, 10σ etc.). Theblue stars are the best-fit positions of the lensed background source, assumed to be point-like.The best-fit position of the lens galaxy and of the backgroundsource are marked by the yellowand the blue dots, respectively. The caustic lines and critical lines of the best-fit lens model areindicated in green and yellow, respectively, while the yellow dashed line shows the major axisof the mass model. The simulated image shows the lensed imageof a background source (afterconvolution with the SMA point spread function and added noise) described by a Gaussianprofile with FWHM= 0.2′′.
40

Tables
Table S 1: Submillimeter/millimeter fluxes for the lens candidates. The official H-ATLASID, according to IAU (International Astronomical Union) convention, is that derived from theposition of the sources in the H-ATLAS SDP catalogue. The quoted errors on theHerschelfluxdensities include statistical errors, confusion noise andan absolute calibration uncertainty of 10per cent for PACS/100µm, 20 per cent for PACS/160µm and 15 per cent for SPIRE. 3σ upperlimits at PACS wavelengths are provided when no detection isachieved at that significance level.Note that ID130 lies just outside the region covered by PACS.Fluxes at 880µm are from theSMA, while those at 1200µm are from the MAMBO array at the Institut de RadioastronomieMillimetrique (IRAM) 30 m telescope.
H-ATLAS ID SDP ID S100 S160 S250 S350 S500 S880 S1200
(mJy) (mJy) (mJy) (mJy) (mJy) (mJy) (mJy)
H-ATLAS J090740.0−004200 9 187±57 416±94 485±73 323±49 175±28 − 7.6±0.8H-ATLAS J091043.1−000321 11 198±55 397±90 442±67 363±55 238±37 − 12.2±1.2H-ATLAS J090302.9−014127 17 78±55 182±56 328±50 308±47 220±34 − 15.3±1.3H-ATLAS J090311.6+003906 81 ≤62 ≤83 129±20 182±28 166±27 76.4±3.8 20.0±0.7H-ATLAS J091305.0−005343 130 − − 105±17 128±20 108±18 39.3±2.3 11.2±1.2
41

Table S 2: UV/optical/NIR photometry for the lens candidates. UV data are from GALEX,optical photometry is from SDSS and NIR data are from UKIDSS [as reprocessed by GAMA;(11)]. Where photometric measurements are not listed it means that the source is not covered atthose wavelengths. The 3-σ upper limits shown within parenthesis for the UKIDSS wavelengthsare obtained from the residual image after the best-fit GALFIT model of the source has beensubtracted off. These limits are used to constrain the SED ofthe background source.
SDP ID 9 11 17 81 130
GALEX FUV (µJy) - - - 0.23±0.18 -GALEX NUV (µJy) - - - 1.9±1.1 -
SDSS u (µJy) 0.24±0.23 0.57±0.59 3.3±1.6 3.9±2.0 1.7±1.7SDSS g (µJy) 1.79±0.43 1.01±0.45 3.9±6.4 24.9±1.1 19.41±0.72SDSS r (µJy) 5.81±0.70 3.94±0.65 7.7±1.0 114.8±2.1 66.1±1.2SDSS i (µJy) 14.9±1.1 11.3±1.0 15.3±1.5 197.7±3.6 108.6±2.0SDSS z (µJy) 27.0±3.7 21.5±4.2 11.8±6.0 278.0±3.6 143.2±6.6
UKIDSS Y (µJy) - - 27.7±9.5(<6.6) 321.3±3.2(<6.3) -UKIDSS J (µJy) - 102.4±9.8(<16) 56±17(<12) 367±11(<9.2) -UKIDSS H (µJy) 73±15(<5.0) 237±17(<14) 107±19(<8.2) 508.1±5.3(<8.5) -UKIDSS K (µJy) 132±24(<6.5) - 108±23(<9.7) 573.7±6.2(<14) -
Table S 3: Technical information on the SMA follow-up observations. This includes: the datethe measurements were taken (Date), the configuration of theantennas (Conf.; VEX=‘very-extended’, SUB=‘sub-compact’, COM=‘compact’), the number of antennas used (Nant.), theprojected baselines lengths (min/mean/max Pr Baselines),the Local Oscillator Frequency (LOFreq.), and the on−source integration time (Int. time).
SDP ID Date Conf. Nant. min/mean/max LO Freq. Int. timePr Baselines (m) (GHz)a (min)
81 25Feb10 VEX 7 69/281/509 340.7 289130 28Feb10 VEX 7 76/289/509 340.7 29881 16Mar10 SUB 5 6/ 17/ 25 340.7 144130 15281 09Apr10 COM 6 9/ 38/ 69 341.6 153130 144
aTotal bandwidth coverage is LO-8 to LO-4 (LSB) and LO+4 to LO+8 (USB) for a total of 8 GHz. The small difference in LOFrequency between compact configuration observations and the subcompact and very extended observations is not important in thiscontext.
42

Table S 4: GALFIT results for the five gravitational lens systems. The 3−σ upper limits givenare for an extended source and derived from the distributionof 1.5 arcsecond radius aperturephotometry of the Keck maps.
H-ATLAS ID profilea χ2ν
b radiusc δd Axis ratio Anglee g-3σ i-3σ(arcsec) deg. (µJy) (µJy)
9 Sersic 1.07 0.85 5.36 0.72 56.76 0.162 0.64111 Sersic 1.03 1.10 2.97 0.65 39.61 0.229 0.44217 Sersic 1.07 0.61 0.54 0.71 63.25 0.202 0.404
Sersic − 1.36 0.91 0.69 12.83 − −81 Sersic 1.13 0.70 2.82 0.78 36.45 0.130 0.202
ExpDisk − 1.20 − 0.72 0.62 − −130 Sersic 1.00 0.32 1.23 0.52 56.82 0.198 0.351
ExpDisk − 1.11 − 0.55 -54.64 − −
aExpDisk = exponential disk profilebReducedχ2
cRadius for Sersic and disk scale length for ExpDiskdSersic indexeAngle measured east of north
43
References and Notes
1. J. B. Oke,et al., Publ. Astron. Soc. Pac.107, 375 (1995).
2. J. K. McCarthy,et al., Society of Photo-Optical Instrumentation Engineers (SPIE) Con-
ference, S. D’Odorico, ed. (1998), vol. 3355, pp. 81-92
3. S. Guilloteau,et al., Astron. & Astrophys.262, 624 (1992)
4. http://www.apo.nmsu.edu/arc35m/Instruments/DIS/
5. C. Y. Peng, L. C. Ho, C. D. Impey, H. Rix,Astron. J.124, 266 (2002)
6. J. J. Condon,Publ. Astron. Soc. Pac.109, 166 (1997)
7. R. J. Ivison,et al., Mon. Not. R. Astron. Soc.380, 199 (2007)
8. R. Kormann, P. Schneider, M. Bartelmann,Astron. & Astrophys.284, 285 (1994)
9. C. R. Keeton,available at http://xxx.lanl.gov/abs/astro-ph/0102340(2001)
10. A. M. Swinbank,et al., Nature464, 733 (2010)
11. D. Hill, et al., available at http://xxx.lanl.gov/abs/astro-ph/1009.0615
44
Copyright © 2022 FDOKUMEN