The Design of Interactive Assessment-Cognitive Schema-based System: An Exploratory Study in...
11
The Design of Interactive Assessment-Cognitive Schema-based System: An Exploratory Study in E-learning Implementation Melvin A. Ballera, [email protected] Omer Masoud Salih, [email protected] Computer Science – Faculty of Science Sirte University – Sirte, Libya ABSTRACT An e-learning website is not sufficient to fully attain the results of online education. There also is a need to align the educational objectives into the design of the assessment to improve and develop cognition, critical thinking and problem-solving skills. Previous studies have explored the potentials of the assessment models but few ventured into their implementation. Others only proposed and introduced conceptual frameworks. The implementation of these proposals, however, revealed that the question type in the assessment phase neglected to align their questionnaire formats into a cognitive schema. At present, the standard multiple-choice question is the most frequently used of the question type of e-learning assessments. However, if this type is the only format adopted by e-learning developers, then the potentially rich and embedded assessment of the computer platform can be will be given up. This paper then focuses on the design of assessment questions, which is created and guided by the hierarchical Bloom cognitive taxonomy and by utilizing rich media formats. Preliminary results conducted for four weeks show a dramatic increase in the academic performance of the students. KEYWORDS Bloom cognitive taxonomy, assessments, e- learning, cognitive, interactive 1 INTRODUCTION Assessment is defined as “a device or procedure used for evaluation by obtaining a sample of a learner’s behavior in a specified domain and scoring this behavior in a standardized process [1]. It constitutes a vital part of web-based learning instruction. Through assessment, educational strategists can determine how effective their lessons are in teaching students the intended facts and skills. To effectively assess students, educational strategists must not simply relegate assessment at the end of the learning process or training. This must be also fully integrated into the process of educating students [2]. Assessment designs can greatly influence the learning of the students. It can also be a tool for data gathering and the results gathered can help teachers decide on the performance of the students [3]. At present, many learning e-learning assessments used the standard multiple-choice questions. However, it can be argued that if e- learning developers adapt only this type of assessment, then the potentially rich and embedded assessment of the computer platform will not be totally utilized [4]. Today, the question type currently dominating many e-learning assessments is the standard multiple-choice question. It is necessary for assessment practices to reflect the combinations of acquired skills and knowledge. The complexity and use of these combinations will enable students to interpret, analyze, evaluate problems and explain their arguments. These assessments, which should be fully integrated into the learning process, provide information about the learner’s progress and support them in selecting appropriate learning tasks. The consistency of the content, methodology, and Proceedings of the International Conference on Computer Science, Computer Engineering, and Education Technologies, Kuala Lumpur, Malaysia, 2014 ISBN: 978-1-941968-02-4 ©2014 SDIWC 40
Transcript of The Design of Interactive Assessment-Cognitive Schema-based System: An Exploratory Study in...
The Design of Interactive Assessment-Cognitive Schema-based System: An Exploratory Study in E-learning Implementation
Melvin A. Ballera, [email protected]
Omer Masoud Salih, [email protected]
Computer Science – Faculty of Science
Sirte University – Sirte, Libya
ABSTRACT
An e-learning website is not sufficient to fully attain
the results of online education. There also is a need
to align the educational objectives into the design of
the assessment to improve and develop cognition,
critical thinking and problem-solving skills.
Previous studies have explored the potentials of the
assessment models but few ventured into their
implementation. Others only proposed and
introduced conceptual frameworks. The
implementation of these proposals, however,
revealed that the question type in the assessment
phase neglected to align their questionnaire formats
into a cognitive schema. At present, the standard
multiple-choice question is the most frequently used
of the question type of e-learning assessments.
However, if this type is the only format adopted by
e-learning developers, then the potentially rich and
embedded assessment of the computer platform can
be will be given up. This paper then focuses on
the design of assessment questions, which is created
and guided by the hierarchical Bloom cognitive
taxonomy and by utilizing rich media formats.
Preliminary results conducted for four weeks show
a dramatic increase in the academic performance of
the students.
KEYWORDS
Bloom cognitive taxonomy, assessments, e-
learning, cognitive, interactive
1 INTRODUCTION
Assessment is defined as “a device or
procedure used for evaluation by obtaining a
sample of a learner’s behavior in a specified
domain and scoring this behavior in a
standardized process [1]. It constitutes a vital
part of web-based learning instruction. Through
assessment, educational strategists can
determine how effective their lessons are in
teaching students the intended facts and skills.
To effectively assess students, educational
strategists must not simply relegate assessment
at the end of the learning process or training.
This must be also fully integrated into the
process of educating students [2]. Assessment
designs can greatly influence the learning of the
students. It can also be a tool for data gathering
and the results gathered can help teachers
decide on the performance of the students [3].
At present, many learning e-learning
assessments used the standard multiple-choice
questions. However, it can be argued that if e-
learning developers adapt only this type of
assessment, then the potentially rich and
embedded assessment of the computer platform
will not be totally utilized [4].
Today, the question type currently dominating
many e-learning assessments is the standard
multiple-choice question. It is necessary for
assessment practices to reflect the combinations
of acquired skills and knowledge. The
complexity and use of these combinations will
enable students to interpret, analyze, evaluate
problems and explain their arguments. These
assessments, which should be fully integrated
into the learning process, provide information
about the learner’s progress and support them
in selecting appropriate learning tasks. The
consistency of the content, methodology, and
Proceedings of the International Conference on Computer Science, Computer Engineering, and Education Technologies, Kuala Lumpur, Malaysia, 2014
ISBN: 978-1-941968-02-4 ©2014 SDIWC 40
the manner of assessment will make teaching
become more effective. Therefore, it is a
worthy undertaking to invest in the design of
performance assessments because assessment
provides multidimensional feedback for
fostering learning [5].
The objective of this paper is to present an
assessment questionnaire format by adapting a
number of the assessment designs which were
investigated and discussed in the related
literature. These designs are redesigned and
realigned into the Bloom Cognitive Theory
Schema and is presented in a more interactive
way to suit the computer science curriculum at
tertiary level. The paper is organized according
to the discussion of related literature,
methodologies, initial findings and lastly, the
conclusion and future works.
2 RELATED LITERATURE
For the alignment of an effective assessment design, three components are investigated in
this section: 1. the search and adaptation of the
existing assessment design that can be useful in
the computer science curriculum; 2. The design
of the assessment according to Bloom
Cognitive Taxonomy schema (manner or way
to present question in accordance to cognitive
prescription) and 3. The incorporation of
simulations interactivity in the assessment
process.
2.1 E-Learning Assessment Questions
There are several ways to make assessment
items innovative and creative. The use of
technological enhancements of sound, graphics,
animation, video or t he i nc o rp o ra t io n o f
media can be utilized also for e-learning
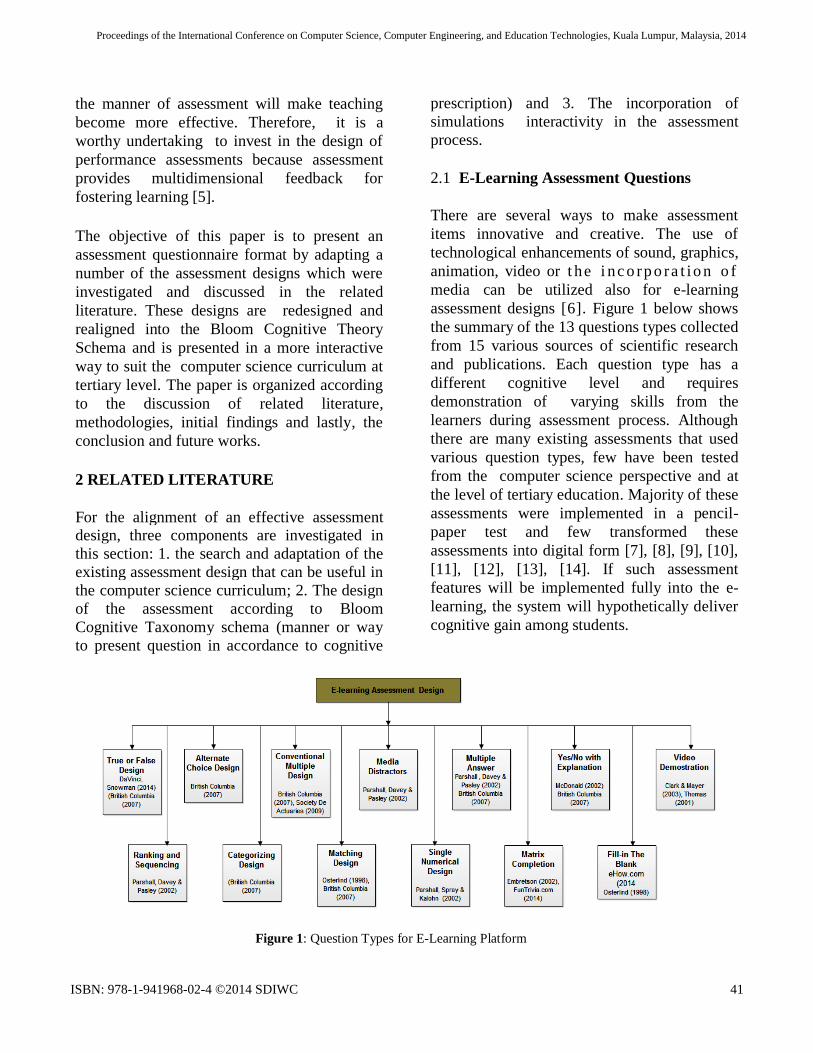
assessment designs [6]. Figure 1 below shows
the summary of the 13 questions types collected
from 15 various sources of scientific research
and publications. Each question type has a
different cognitive level and requires
demonstration of varying skills from the
learners during assessment process. Although
there are many existing assessments that used
various question types, few have been tested
from the computer science perspective and at
the level of tertiary education. Majority of these
assessments were implemented in a pencil-
paper test and few transformed these
assessments into digital form [7], [8], [9], [10],
[11], [12], [13], [14]. If such assessment
features will be implemented fully into the e-
learning, the system will hypothetically deliver
cognitive gain among students.
Figure 1: Question Types for E-Learning Platform
Proceedings of the International Conference on Computer Science, Computer Engineering, and Education Technologies, Kuala Lumpur, Malaysia, 2014
ISBN: 978-1-941968-02-4 ©2014 SDIWC 41

2.2 Bloom Cognitive Schema
The cognitive domain of Bloom involves
knowledge and the development of intellectual
skills, therefore it is necessary to align
assessment according to this schema. This
schema includes recall or recognition of
specific facts, procedural patterns and concepts
that help in the development of intellectual
abilities and skills [15]. There are six major
categories, starting from simplest behavior to
the most complex in this schema. The
categories can be viewed as degrees of
difficulties [16]. Layer one is, “Remembering”
which entails establishing definitions, creating
fact charts, lists or oral activities. Layer two,
“Understanding”, includes producing drawings
or summaries.“ Applying” is layer three, and
models, presentations, interviews or simulations
are applied to new situations. Analyzing” is
layer four which includes “distinguishing”
between the parts creating spreadsheets,
surveys, charts, or diagrams. Evaluating, which
is layer five involves critiquing,
recommending, and reporting. Putting the parts
together in a novel and unique way falls in the
sixth layer which is Creating [17]. At present,
this model becomes a basis in developing e-
learning by transforming its contents,
instructional delivery and most importantly the
assessment. The layers represent the levels of
learning and increasing complexity.
Figure 2 shows the cognitive levels in Bloom’s
original taxonomy, arranged in ascending order.
Each step suggests activities for the specific
level. A list of verbs which are commonly used
to create learning objectives can be found
below each step. When Bloom created this
cognitive schema, he intended to use this in
assessing the expertise in order to develop new
ways in measuring what college students learn.
At present, this model becomes a basis in
developing e-learning by transforming its
contents, instructional delivery and assessment
to suit the learners’ needs. His work contributed
greatly in shifting the focus of educators to
learning from teaching.
Figure 2: Bloom’s Taxonomy Staircase [17]
Proceedings of the International Conference on Computer Science, Computer Engineering, and Education Technologies, Kuala Lumpur, Malaysia, 2014
ISBN: 978-1-941968-02-4 ©2014 SDIWC 42
2.3 Multimedia and Interactivity
Many educators believe that interactive e-
learning assessments allows “learning by
doing”, arouses interest and generates
motivation. Interactivity leads to a more
meaningful learning because students are able
to test their comprehension, learn from their
errors and make sense of what is unpredictable.
It can also improve the students’ knowledge
and performance during the assessment process
[18]. Simulations and modelling tools are the
best examples of complex, meaningful
interactivity in assessments. Such applications
models represents a real or theoretical system,
and allows users to manipulate input variables,
change the system’s behavior and view the
results. With such applications, learners can
construct and receive feedback as a result of
their actions. Inclusion of interactive
simulations in e-learning assessment improves
the quality and outcomes of e-learning.
Simulations and visualization tools make it
possible for students to bridge experience and
abstraction which help to deepen their
understanding of ambiguous or challenging
content [19]. Interactivity, when used in
assessment, is a factor that has the biggest
impact on cognitive learning and is the most
powerful model of instruction [20].
The use of multimedia in assessment such as
graphics refers to the variety of illustrations that
include line drawings, charts, photographs,
motion graphics such as animation and video.
These multimedia can indeed increase learning.
Research shows that graphics improve learning
through cognitive exercises, storing and
retrieving ideas. Mayer claims that a student
who practices on assessment with text and
graphics is claimed to gain an average of 89%
on transfer text as compared to those students
who rely on texts alone [21]. It is also found
out that the integration of text near the visuals
during assessment yielded an average
improvement of 68%. Furthermore, explaining
graphics with audios followed by a question
improved learning t by almost 80%.
Adapting question types from different
researches and re-aligning its questionnaires or
small tests into cognitive model and presenting
it in an interactive and simulative manner can
thus hypothetically guarantee learning.
3 METHODOLOGY
3.1 Respondents
The study is organized within the context of
Design and Analysis of Algorithms class which
is taught at Sirte University, Libya. The entire
data collection and training lasted for 4 weeks
for initial testing. All students are familiar with
the use of electronic materials and had seen the
implementation of the e-learning system and
were given one week familiarization of the
system flow and navigation. During the training,
student were given several examinations
(diagnostic, formative and summative) to
determine their knowledge level of the course.
The passing mark is 75.
Prior to implementation, students were
informed about the research and the task
involved. Students were given time to navigate
the e-learning system so that they would be
familiar and be directly involved in the learning
process. If issues arouse during the learning
process, the researcher provided necessary
assistance in support for blended learning. At
the beginning, participants were given
diagnostic assessments, while at the end of each
lesson, a formative assessment is given. All
students were subjected to summative
assessment at the end of the course training.
Proceedings of the International Conference on Computer Science, Computer Engineering, and Education Technologies, Kuala Lumpur, Malaysia, 2014
ISBN: 978-1-941968-02-4 ©2014 SDIWC 43

3.2 Data Collection
In this study, primary data were collected in
two ways. The first was the experimental
collection where various tables were populated
dynamically, manipulated and extracted to
generate several reports such as examination
results, graphs, frequency of the practice
examination and trials. The second was the
survey which was divided into two parts. The
first part was the measure of the internal
reliability of all the questionnaires stored in the
Item Bank. The second part was the
acceptability of assessment design factors.
Factors that affect the assessment design were
content of the item, the visual design (colors,
balance, readability), accessibility (links,
feedback and explanation facilities), assessment
types (difficulty, bloom level), navigation
(transition of questionnaires, pop-up windows,
reminders), learning support (specific part of
the lesson, additional references) and
interactivity. To measure the internal
consistency of the questionnaires, the Cronbach
alpha was used while z-test was used to
evaluate the acceptability of the assessment
design factors.
Degree of Difficulty
The 13 question types investigated and
presented in the literature were categorized
according to the Cognitive Bloom Taxonomy.
Table 1 shows the question types description
and the degree of difficulty df, for each type in
different assessment formats. In formative
assessment, the df is 1 for reviewing purposes
and practice examination at the end of each
lesson. The df of Bloom Cognitive examination
(diagnostic) on the other hand is also 1, to
measure the cognitive improvements of the
learner which is usually administered every two
weeks of the training.
The df of summative assessment differs
accordingly since it is the most important
performance matrix. As the Bloom category
goes to the bottom of the table, the more
difficult the questions and the deeper the
cognitive development become. Every question
has a level of difficulty, and this level is also
utilized upgrading the students’ performance
matrix. Higher ability is demonstrated when a
student answers harder questions that correctly
answering an easier question. The Remember
category has df 1 while the Understand,
Application, and Analyze categories have a df of
1.5 while Evaluate and Create have df of 2.
Table 1: Questions Types and their Degree of Difficulty (df)
Proceedings of the International Conference on Computer Science, Computer Engineering, and Education Technologies, Kuala Lumpur, Malaysia, 2014
ISBN: 978-1-941968-02-4 ©2014 SDIWC 44
After aligning the colleceted question types as
shown in Table 1, questionnaires underwent
fornatting using the guided cognitive verbs
schema as presented Figure 2 and then the
interactivity and simulation to the question
were added. The use of graphs, videos and
other media formats, and required-response
questions was incorporated in the system. The
Item Bank is currently a repository of different
questions types with varying difficulty level. It
contains 280 questions with explanation
facilities divided among thirteen (13) questions
types and were used to produce the Bloom
Cognitive Taxonomy examination, the random
formative examination and the random
summative examination.
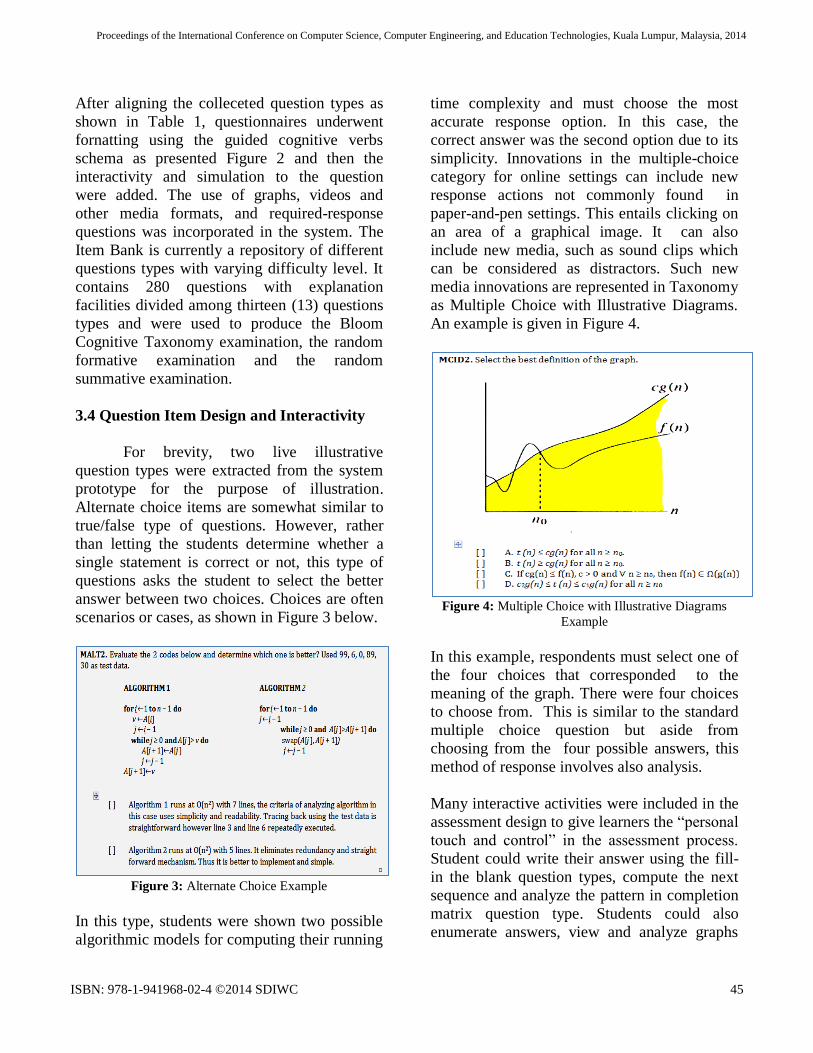
3.4 Question Item Design and Interactivity
For brevity, two live illustrative
question types were extracted from the system
prototype for the purpose of illustration.
Alternate choice items are somewhat similar to
true/false type of questions. However, rather
than letting the students determine whether a
single statement is correct or not, this type of
questions asks the student to select the better
answer between two choices. Choices are often
scenarios or cases, as shown in Figure 3 below.
Figure 3: Alternate Choice Example
In this type, students were shown two possible
algorithmic models for computing their running
time complexity and must choose the most
accurate response option. In this case, the
correct answer was the second option due to its
simplicity. Innovations in the multiple-choice
category for online settings can include new
response actions not commonly found in
paper-and-pen settings. This entails clicking on
an area of a graphical image. It can also
include new media, such as sound clips which
can be considered as distractors. Such new
media innovations are represented in Taxonomy
as Multiple Choice with Illustrative Diagrams.
An example is given in Figure 4.
Figure 4: Multiple Choice with Illustrative Diagrams
Example
In this example, respondents must select one of
the four choices that corresponded to the
meaning of the graph. There were four choices
to choose from. This is similar to the standard
multiple choice question but aside from
choosing from the four possible answers, this
method of response involves also analysis.
Many interactive activities were included in the
assessment design to give learners the “personal
touch and control” in the assessment process.
Student could write their answer using the fill-
in the blank question types, compute the next
sequence and analyze the pattern in completion
matrix question type. Students could also
enumerate answers, view and analyze graphs
Proceedings of the International Conference on Computer Science, Computer Engineering, and Education Technologies, Kuala Lumpur, Malaysia, 2014
ISBN: 978-1-941968-02-4 ©2014 SDIWC 45
and allow feedback. The explanation facilities
could also derive the solution and link
student’s misconception into specific part of the
learning materials. To enhance the learning
process further, videos, and other simulative
process were incorporated into the system to
allow the method of “learning by doing”.
Student could view the algorithm and its
simulative effects given certain inputs and
variables.
4 RESULTS AND DISCUSSION
4.1 Internal Consistency and Z-test Results
Prior to the post survey for students, the survey
forms were presented among the academic staff
to validate the measurement scale and
questionnaires. The Cronbach‘s Alpha
coefficient for internal consistency reliability
test was used for each scale. Cronbach‘s alpha
reliability coefficient normally ranges between
0 and 1. It provides the following rules of
thumb: α ≥ .9 – Excellent, .7 ≤ α < .9 –
Good, .6 ≤ α < .7 – Acceptable, .5 ≤ α < .6 –
Poor and α < .5 – Unacceptable [22]. The
results of Cronbach‘s Alpha coefficients for
each scale are presented in Table 2.
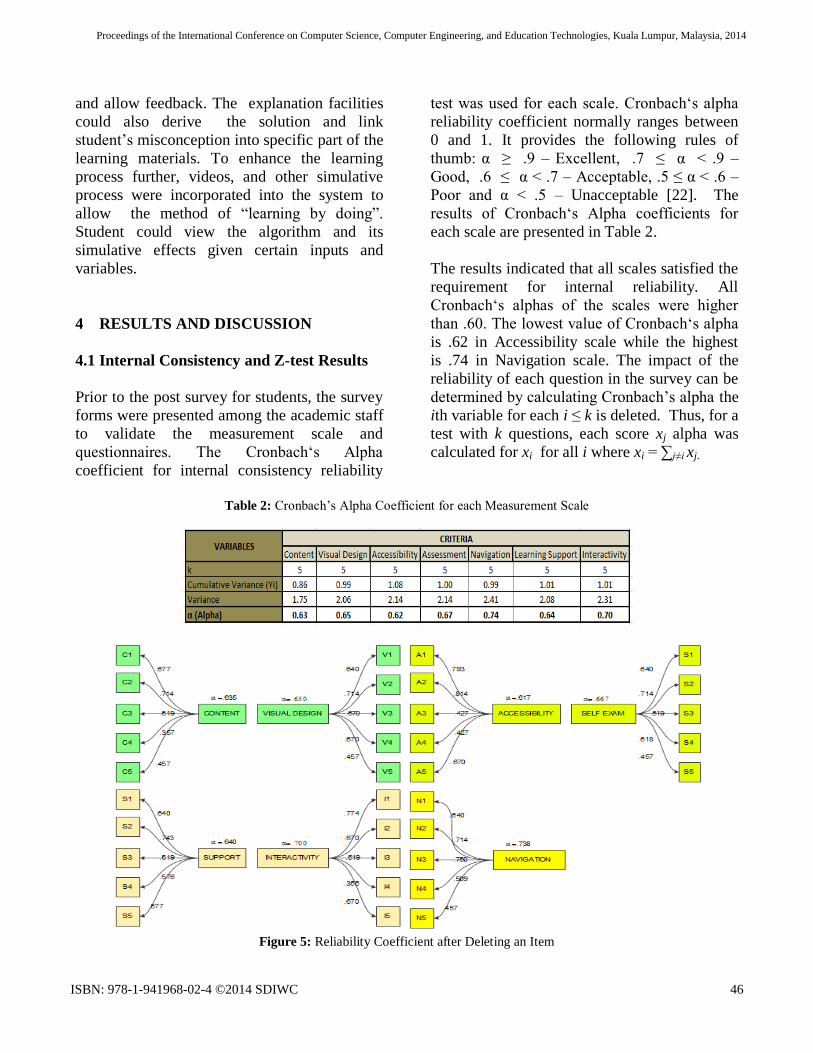
The results indicated that all scales satisfied the
requirement for internal reliability. All
Cronbach‘s alphas of the scales were higher
than .60. The lowest value of Cronbach‘s alpha
is .62 in Accessibility scale while the highest
is .74 in Navigation scale. The impact of the
reliability of each question in the survey can be
determined by calculating Cronbach’s alpha the
ith variable for each i ≤ k is deleted. Thus, for a
test with k questions, each score xj alpha was
calculated for xi for all i where xi = ∑j≠i xj.
Table 2: Cronbach’s Alpha Coefficient for each Measurement Scale
Figure 5: Reliability Coefficient after Deleting an Item
Proceedings of the International Conference on Computer Science, Computer Engineering, and Education Technologies, Kuala Lumpur, Malaysia, 2014
ISBN: 978-1-941968-02-4 ©2014 SDIWC 46
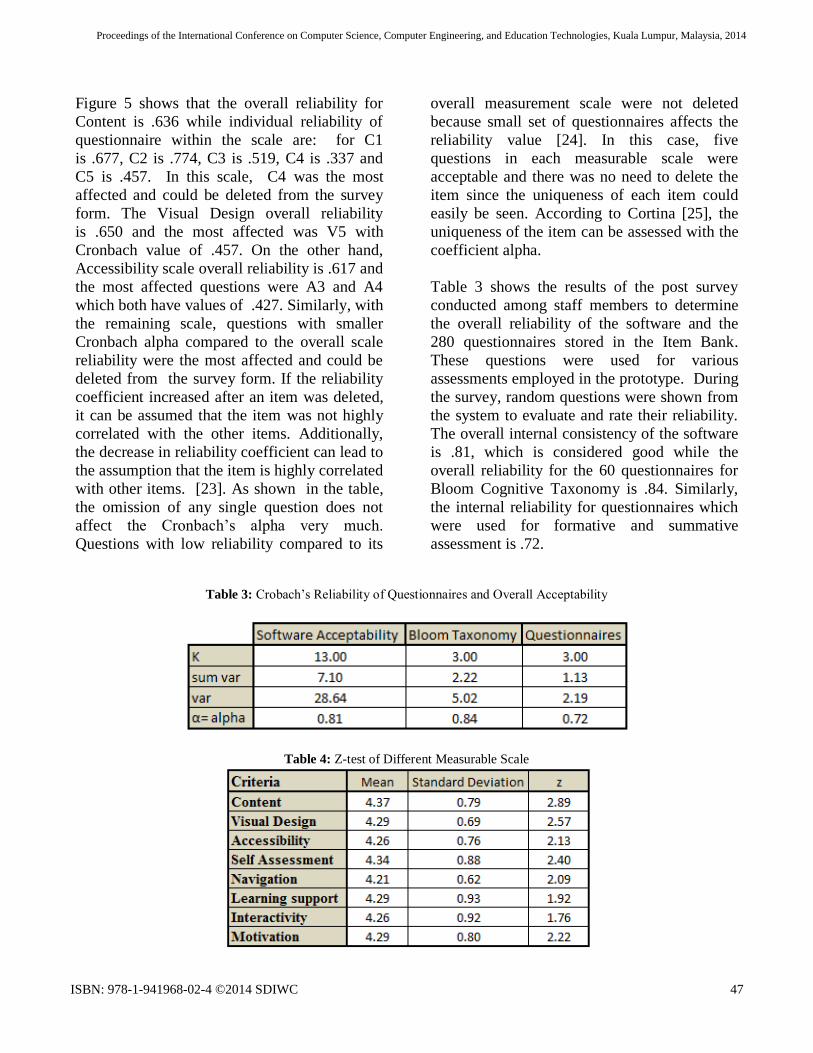
Figure 5 shows that the overall reliability for
Content is .636 while individual reliability of
questionnaire within the scale are: for C1
is .677, C2 is .774, C3 is .519, C4 is .337 and
C5 is .457. In this scale, C4 was the most
affected and could be deleted from the survey
form. The Visual Design overall reliability
is .650 and the most affected was V5 with
Cronbach value of .457. On the other hand,
Accessibility scale overall reliability is .617 and
the most affected questions were A3 and A4
which both have values of .427. Similarly, with
the remaining scale, questions with smaller
Cronbach alpha compared to the overall scale
reliability were the most affected and could be
deleted from the survey form. If the reliability
coefficient increased after an item was deleted,
it can be assumed that the item was not highly
correlated with the other items. Additionally,
the decrease in reliability coefficient can lead to
the assumption that the item is highly correlated
with other items. [23]. As shown in the table,
the omission of any single question does not
affect the Cronbach’s alpha very much.
Questions with low reliability compared to its
overall measurement scale were not deleted
because small set of questionnaires affects the
reliability value [24]. In this case, five
questions in each measurable scale were
acceptable and there was no need to delete the
item since the uniqueness of each item could
easily be seen. According to Cortina [25], the
uniqueness of the item can be assessed with the
coefficient alpha.
Table 3 shows the results of the post survey
conducted among staff members to determine
the overall reliability of the software and the
280 questionnaires stored in the Item Bank.
These questions were used for various
assessments employed in the prototype. During
the survey, random questions were shown from
the system to evaluate and rate their reliability.
The overall internal consistency of the software
is .81, which is considered good while the
overall reliability for the 60 questionnaires for
Bloom Cognitive Taxonomy is .84. Similarly,
the internal reliability for questionnaires which
were used for formative and summative
assessment is .72.
Table 3: Crobach’s Reliability of Questionnaires and Overall Acceptability
Table 4: Z-test of Different Measurable Scale
Proceedings of the International Conference on Computer Science, Computer Engineering, and Education Technologies, Kuala Lumpur, Malaysia, 2014
ISBN: 978-1-941968-02-4 ©2014 SDIWC 47
An important concept in the evaluation of
assessments and questionnaires is the Alpha. It
is required from the assessors and researchers
that they estimate this quantity to add validity
and accuracy to the interpretation of their data.
A low value of alpha can mean a low number
of questions and poor interrelatedness between
items or heterogeneous constructs. For example,
if a low alpha is due to poor correlation
between items, then some items should be
changed or totally eliminated. If an alpha is too
high, it may suggest that some items are
repetitive as they evaluate the same questions
in a different manner [26]. As observed in the
study, the overall alpha is not too high but still
considered highly acceptable at all levels.
Table 4 shows the summary of the perception
of students on the significant level of different
assessments scales. The mean is given with its
standard deviation. The highest mean is 4.37
from the Content scale while the lowest is 4.21
from Navigation scale. The z-values at z:05 =
1:645 makes all the critical values of
measurable scale significant using one-tailed
critical region. The z-values computed are
greater than tabular value at alpha of .05. Based
on Likert scale, the mean of each measurable
variable is higher than the agreeable level
which was successfully correlated by the z-test.
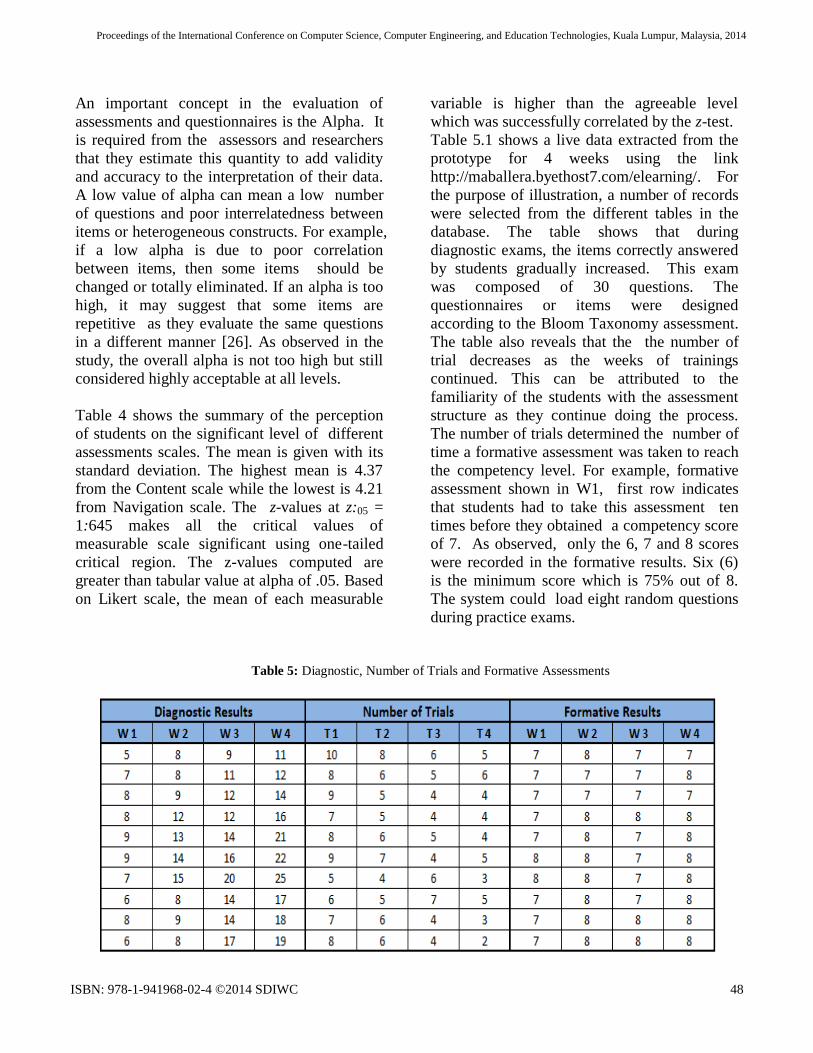
Table 5.1 shows a live data extracted from the
prototype for 4 weeks using the link
http://maballera.byethost7.com/elearning/. For
the purpose of illustration, a number of records
were selected from the different tables in the
database. The table shows that during
diagnostic exams, the items correctly answered
by students gradually increased. This exam
was composed of 30 questions. The
questionnaires or items were designed
according to the Bloom Taxonomy assessment.
The table also reveals that the the number of
trial decreases as the weeks of trainings
continued. This can be attributed to the
familiarity of the students with the assessment
structure as they continue doing the process.
The number of trials determined the number of
time a formative assessment was taken to reach
the competency level. For example, formative
assessment shown in W1, first row indicates
that students had to take this assessment ten
times before they obtained a competency score
of 7. As observed, only the 6, 7 and 8 scores
were recorded in the formative results. Six (6)
is the minimum score which is 75% out of 8.
The system could load eight random questions
during practice exams.
Table 5: Diagnostic, Number of Trials and Formative Assessments
Proceedings of the International Conference on Computer Science, Computer Engineering, and Education Technologies, Kuala Lumpur, Malaysia, 2014
ISBN: 978-1-941968-02-4 ©2014 SDIWC 48
5 CONCLUSION
This paper successfully combined 13 question
types extracted from 14 publications. It also
aligned the 280 questionnaires stored in the
Item Bank according to cognitive schema. The
cognitive schema was composed of different
“verbs” words which served guide in creating
questionnaires that support hierarchical
cognitive development. The questionnaires
were reproduced as part of the e-learning
assessment with added interactivity and
simulations. The questionnaires stored in the
Item bank were measured using internal
reliability test and all were at acceptable level.
The design factors of the assessment level were
statistically significant at all assessment
measurement scale. Based on the preliminary
results of the study, students improved their
academic performance. The number of trials in
taking the practice assessment became less as
the results increased. The success of the initial
testing was attributed to the design of the
assessment which allowed the students to
review and reload the questionnaires several
times thereby making them familiar with the
graded assessment. Being interactive, the item
or the question was linked to the explanation
facilities, specific learning materials and review
module. Although the initial results are quite
convincing and acceptable, a thorough study is
needed to establish the impact of the design in
the diagnostic, formative and summative
assessment.
6 REFERENCES
[1] American Educational Research Association,
American Psychological Association, & National
Council on Measurement in Education.. Standards
for educational and psychological testing.
Washington, DC: American Educational Research
Association. 1999.
[2] M. Birenbaum, M. New insights into learning and
teaching and their implications for assessment. In M.
Segers, F. Dochy, & E. Cascallar (Eds.), Optimising
new modes of assessment: In search of qualities and
standards. Dordrecht, The Netherlands: Kluwer. (pp.
13–36). 2003.
[3] K. Scalise & B. Gifford. Computer-Based
Assessment in E-Learning: A Framework for
Constructing “Intermediate Constraint” Questions
and Tasks for Technology Platforms. Journal of
Technology, Learning, and Assessment, 4(6). 2006.
[4] E. Schreiner.. How to Design Effective Classroom
Assessments. Retrieved July, 22, 2014 from
http://www.ehow.com/how_7408048_design-
classroom-assessments.html
[5] J. Cowan. Designing assessment to enhance student
learning. Retrieved June 10, 2014 from
http://www.heacademy.ac.uk/assets/ps/documents/p
ractice_guides/practice_guides/
[6] C. G. Parshall, T. Davey & P.J. Pashley. Innovative
Item Types for Computerized Testing. In W. Van
der Linden, Glas, C. A. W. (Ed.), Computerized
Adaptive Testing: Theory and Practice. Norwell,
MA: Kluwer Academic Publisher. pp. 129–148,
2000.
[7] C. G. Parshall, J. Spray, J. Kalohn, & T. Davey, T.
Issues in Innovative Item Types. In Practical
Considerations in Computer-Based Testing. New
York: Springer. pp. 70–91, 2002.
[8] S. Embretson. Generating Abstract Reasoning Items
with Cognitive Theory. In S. Irvine, Kyllonen, P.
(Ed.), Item Generation for Test Development.
Mahwah, NJ: Lawrence Erlbaum Associates,
Publishers. pp. 219–250, 2002.
[9] M.E. McDonald. Developing Multiple-Choice Items.
In Systematic Assessment of Learning Outcomes.
pp. 83–120, 2002.
[10] British Columbia. Examination Booklet. Retrieved
July 7, 1014 from
http://www.bced.gov.bc.ca/exams/search/grade11/e
nglish/sample/exam/0708ss_P.pdf
[1] S. J. Osterlind. Constructing Test Items: Multiple-
Choice, Constructed-Response, Performance, and
Other Formats. Norwell, MA: Kluwer Academic
Publisher. 1998.
[12] Society De Actuaries. Construction and Evaluation
of Actuarial Models. Retrieved July 8, 2014 from
Proceedings of the International Conference on Computer Science, Computer Engineering, and Education Technologies, Kuala Lumpur, Malaysia, 2014
ISBN: 978-1-941968-02-4 ©2014 SDIWC 49
http://www.soa.org/files/pdf/edu-2009-fall-exam-c-
questions.pdf
[13] FunTrivia.com. True or False Trivia. Retrieved
August 21, 2014 from
http://www.funtrivia.com/quizzes/general/true_or_f
alse.html
[14] EHow.com.. How to Write a Fill In the Blank
Questions. Retrieved August 21, 2014 from
http://www.ehow.com/how_8233244_write-fill-
blank-questions.html
[15] Bloom, B. Mastery learning. New York: Holt,
Rinehart, & Winston. 1971.
[16] L. W. Anderson, & D. R. Krathwohl. A Taxonomy
for Learning, Teaching, and Assessing: A Revision
of Bloom’s Taxonomy of Educational Objectives.
Allyn & Bacon. Boston, MA (Pearson Education
Group). 2001.
http://epltt.coe.uga.edu/index.php?title=Bloom's_Ta
xonomy
[17] A. Churches. Bloom’s Taxonomy Blooms Digitally.
2008. http://www.techlearning.com/studies-in-ed-
tech/0020/blooms-taxonomy-blooms-
digitally/44988
[18] M. Rosenberg, M. E-Learning: Strategies for
delivering knowledge in the digital. 2000.
[19] R. Thomas.. Interactivity and Simulations. Multi-
verse Solutions Ltd. 2001.
http://www.jelsim.org/resources/whitepaper.pdf.
[20] R. E. Clark. & T. G. Craig. "Research and Theory on
Multimedia Learning Effects." In: M. Giardina (red).
"Interactive Multimedia Learning Environments.
Human factors and technical considerations on
design issues.. NATO ASI Series. s. 19-30. 1992
[21] R. Mayer. The promise of multimedia learning:
using the same instructional design methods across
different media. Learning and Instruction. Vol. 13.
Pp. 125-139. 2003
[22] D. George & P. Mallery,. SPSS for Windows step
by step: A simple guide and reference. 11.0 update
(4th ed.). Boston: Allyn & Bacon. 2003.
[23] C. Zaiontz. Real Statistics Using Excel: Cronbach
Alpha. Retrieved January 21, 2013 from
http://www.real-statistics.com/author/
[24] M. Tavakol & R. Dennick. Making sense of
Cronbach’s alpha. International Journal of Medical
Education. 2011; 2:53-55 Retrieved June 12, 2014
from http://www.ijme.net/archive/2/cronbachs-
alpha.pdf
[25] J. M. Cortina. What is coefficient alpha? An
examination of theory and applications" Journal of
Applied Psychology. pp. 98–104.
http://psychweb.psy.umt.edu/denis/datadecision/fro
nt/cortina_alpha.pdf
[26] D. Streiner. Starting at the beginning: an
introduction to coefficient alpha and internal
consistency. Journal of personality assessment.
80:99-103. 2003.
Proceedings of the International Conference on Computer Science, Computer Engineering, and Education Technologies, Kuala Lumpur, Malaysia, 2014
ISBN: 978-1-941968-02-4 ©2014 SDIWC 50