The Demand for Social Insurance: Does Culture Matter?
40
Electronic copy available at: http://ssrn.com/abstract=1958181 Working Paper No. 41 The Demand for Social Insurance: Does Culture Matter? Beatrix Brügger, Rafael Lalive, Andreas Steinhauer and Josef Zweimüller October 2011 University of Zurich Department of Economics Working Paper Series ISSN 1664-7041 (print) ISSN1664-705X(online)
Transcript of The Demand for Social Insurance: Does Culture Matter?

Electronic copy available at: http://ssrn.com/abstract=1958181
Working Paper No. 41
The Demand for Social Insurance: Does Culture Matter?
Beatrix Brügger, Rafael Lalive, Andreas Steinhauer and Josef Zweimüller
October 2011
University of Zurich
Department of Economics
Working Paper Series
ISSN 1664-7041 (print) ISSN1664-705X(online)
Electronic copy available at: http://ssrn.com/abstract=1958181
The Demand for Social Insurance
Does Culture Matter?∗
Beatrix Brugger, University of Lausanne
Rafael Lalive, University of Lausanne and CEPR
Andreas Steinhauer, University of Zurich
Josef Zweimuller, University of Zurich and CEPR
June 11, 2010
Abstract
Can different social groups develop different demands for social insurance of risks to
health and work? We study this issue across language groups in Switzerland. Language
defines social groups and Swiss language groups are separated by a clear geographic border.
Actual levels of social insurance are identical on either side of the within state segments of
the language border. We can therefore study the role of culture in shaping the demand for
social insurance. Specifically, we contrast at the language border actual voting decisions on
country-wide changes to social insurance programs. Key results indicate substantially higher
support for expansions of social insurance among residents of Latin-speaking (i.e. French,
Italian, or Romansh) border municipalities compared to their German-speaking neighbors in
adjacent municipalities. We consider three possible explanations for this finding: informal
insurance, ideology, and the media. We find that informal insurance does not vary enough to
explain stark differences in social insurance. However, differences in ideology and segmented
media markets are potentially important explanatory factors.
JEL classification: J21, J64, Z10
Keywords: culture, language, preferences for social insurance, spatial regression disconti-
nuity.
∗We would like to thank, without implicating, Sam Bowles, Raj Chetty, Lorenz Goette, Mathias Thoenig,
H. Peyton Young and seminar participants at University of Lausanne for helpful comments on previous ver-
sions of this paper. This project uses data from the Swiss Household Panel (SHP) and we thank Oliver Lipps
for support concerning the interpretation and enrichment of the original SHP data. Research funding from
the Swiss National Science Foundation (Grant No. 100012-120356/1) is gratefully acknowledged. Addresses:
Beatrix Brugger, University of Lausanne, Faculty of Business and Economics, Internef, CH-1015 Lausanne-
Dorigny, [email protected]. Rafael Lalive, University of Lausanne, Faculty of Business and Economics,
CH-1015 Lausanne-Dorigny, [email protected]. Rafael Lalive is also affiliated with CESifo, IFAU, and IZA.
Andreas Steinhauer, University of Zurich, Department of Economics, Muhlebachstrasse 86, CH-8008 Zurich,
[email protected]. Josef Zweimuller, University of Zurich, Department of Economics, Muhlebachstrasse 86,
CH-8008 Zurich, [email protected]. Josef Zweimuller is also affiliated with CESifo, and IZA.

1 Introduction
I have previously remarked that the customs of the people may be considered as one
of the great general causes to which the maintenance of a democratic republic in
the United States is attributable. I here use the word customs with the meaning
which the ancients attached to the word mores; for I apply it not only to manners
properly so called–that is, to what might be termed the habits of the heart–but to the
various notions and opinions current among men and to the mass of those ideas
which constitute their character of mind. (de Tocqueville, 1899, ch.17)
Should a society insure individuals against economic shocks and, if yes, what is the optimal
extent of redistribution associated with government-provided social insurance? These questions
are among the most hotly debated economic policy issues. President Obama’s plan to introduce
universal health insurance in the United States divided the population into two camps. Propo-
nents argue that a society should take responsibility for individuals in need, as market-failures,
discrimination, and poverty exclude socially disadvantaged groups from insurance markets. Op-
ponents (the tea party movement in particular) argue against universal insurance because it
curtails the freedom of choice, undermines individuals’ responsibility for their own fortune and
creates negative incentive effects.
The tension between the active role of governments to mitigate market failures and the
adverse consequences of over-sized governments are at the heart of every discussion about the
proper extent of social insurance provisions. Today, most countries have adopted some form
of re-distributive welfare state programs to mitigate the consequences of economic shocks to
individuals. However, these institutions differ widely across countries and the differences have
been persisting since a long time. While U.S. about 16 % of GDP go to social insurance programs
in the U.S., Sweden spends almost twice as much – 29.4 % – on insuring residents against risks
to work and health (OECD 2005). Since these economies have reached similar levels of economic
development, these stark differences in the role of social insurance suggest that culture plays an
important role to explain the differences in actually implemented institutions.
In this paper, we ask whether social groups develop different demands for social insurance of
risks to health and work. Answering this question is important for at least three reasons. First,
insurance of risks to health and work is key for well-being as both health and work capacity
are key components of human capital. Second, there is tremendous variation in terms of actual
coverage of these two key risks. For instance, health insurance used to be tied to employment
in the US whereas the typical country in the EU offers universal health insurance coverage.
Third, democracies decide on social insurance in a political process. It is therefore central to
understand the determinants of the demand for social insurance among voters.
We first ask whether the demand for redistribution varies among countries that have reached
comparable levels of economic development. The International Social Survey Programme (ISSP)
allows us to answer this question.1 In 1996, the ISSP was particularly interested in measuring
the role of government across its member countries. One survey item referred to the statement
1The ISSP regularly interviews random samples of residents of countries that are members of the survey
programme. Currently, 45 countries participate in the programme including most OECD countries.
1

Government should reduce income differences.
Respondents could indicate whether they disagree strongly, disagree, are indifferent, agree,
or agree strongly with this statement. Across a range of selected member countries Figure 1
reports the share agreeing or agreeing strongly that government should redistribute income.
The figure shows two key results. First, opinions differ enormously across countries on this
issue. In the US only about a third of respondents indicated that government should redis-
tribute. In contrast, in France and Spain between 70 and 80 percent of respondents are in favor
of redistribution by government.2 Second, there is strong within country variation in demand
for redistribution in Germany and Switzerland. Alesina and Fuchs-Schundeln (2007) explain
differences in demand for redistribution by socialist policies. East Germany adopted socialist
policies between 1945 and 1990 whereas West Germany did not. But note that attitudes to-
wards government-redistribution within Switzerland are of an order of magnitude that compares
well to variation across OECD countries. In the Latin (French and Italian)-speaking parts of
Switzerland 68.9 percent of respondents indicate that they favor government redistribution. In
the German-speaking part only 46.0 percent indicate such a preference.
Figure 1: Government should reduce income differences;
World Ranking
0.2
.4.6
.8sh
are
agre
eing
USA
New Z
ealan
d
Austra
lia
Canad
a
SWIS
S−Ger
man
Japa
n
Germ
any−
Wes
t
United
King
dom
Norway
Sweden
Czech
Rep
.
SWIS
S−Lat
in
Irelan
dIta
ly
Hunga
ry
Franc
e
Germ
any−
East
Poland
Spain
Notes: Reported is the share agreeing or strongly agreeing with the
statement.
Source: ISSP 1996.
Figure 1 suggests that there are strong differences in the demand for redistribution across
countries but also across regions within countries. We seek to understand whether the de-
mand for social coverage of risk can vary across social groups ceteris paribus. As cited above,
Alexis de Tocqueville took a clear stand on this question. But to what extent does his con-
jecture hold up to formal empirical testing? We argue that the border between two language
2The clustering of countries corresponds to our expectations. In Anglo-Saxon countries (US, New Zealand,
Australia, and Canada) the demand for redistribution is weak whereas in former communist countries (Poland and
Hungary) and continental/Southern European countries (Italy, France, and Spain) the demand for redistribution
is very strong.Note that these countries all speak languages that are direct descendants of ancient Latin as well.
2

groups in Switzerland – the “Latin-speaking”(i.e. French, Italian, or Romansh) group and the
“German-speaking”group – provides causal evidence on cultural variation in the demand for
social insurance. Latin language groups are minorities within Switzerland, comprising roughly
25 percent of the native Swiss population and entertain strong links with their neighbors Italy
and France speaking the same language. In contrast, the Swiss German language group com-
prises roughly 75 percent of the native Swiss population and entertains much weaker ties to
the large neighbor speaking the same language, Germany. Swiss language areas appear to be
associated with specific cultural traits that create an important cultural gap within the country.3
German Swiss individuals are known for their commitment to work hard, to be punctual, and
to focus on individual responsibility. In contrast, Latin Swiss, historically being the suppressed
minority within the country, tend to rely much more on the role of the state and favor income
redistribution.
In this paper we argue that the cultural diversity within Switzerland together with its par-
ticular political institutions allows us to shed light on the role of culture to explain the demand
for redistributive social insurance. First, the Swiss case allows us to study cultural differences
by comparing the behavior of language groups. A common language is a mechanism that lets
norms and values persist within a group even when there is a geographically close other group
that holds quite different norms and values. The native language that an individual is exposed
to during childhood and adolescence is likely to be an important predictor of the individual’s
values during adulthood to the extent that values are transmitted vertically. Language is central
to any type of social interaction. Language is also central to mixing. Novembre et al. (2008)
find that genetic markers differ more strongly between people living in Latin Swiss areas and
the German Swiss area than within those regions. Hence the native language is also a good
predictor of values to the extent that values are transmitted horizontally. Language serves as a
medium by which attitudes, values, and beliefs are transmitted from one generation to the next.
Language is central to the spreading of beliefs and norms and determines an individual’s social
identity .4 The language barrier is a cultural barrier.5
A second reason why Switzerland is interesting is the fact that language groups are located in
separate regions but these regions are geographically close and have a sharp geographic border.
Within a distance of 5 kilometers, the fraction of Latin-speaking Swiss residents falls from more
than 90 percent to less than 5 percent (and vice versa for German native speakers). Yet there is
no associated change in geography and politics at this language border as the main geographical
border, the Alps, are in East-West direction, while the language border mainly runs in North-
South direction, and large parts of the language border run within Swiss states (cantons). This
is important since most policies in Switzerland are set at the cantonal (rather than the federal)
level. Within-canton contrasts on either side of the border measure to what extent social groups
3The cultural gap is associated with a geographical language border and is called Rostigraben, referring to
Rosti, a popular potato-dish in the German-speaking (but not in the Latin-speaking) part of the country. For an
interesting recent contribution that describes the origins and persistence of this cultural gap, see Bchi (2000).4Trepanier (1991) discusses the forging of the Cajun regional identity in French Louisiana. Aspachs-Bracons
et al. (2007) find that language shapes identity in Spanish regions.5The introductory quote by de Tocqueville (1899) provides an excellent definition of culture. Guiso et al.
(2006) define culture as ...those customary beliefs and values that ethnic, religious, and social groups transmit
fairly unchanged from generation to generation.
3

demand different levels of social insurance even if they face identical levels of actual insurance.
Third, a particularly distinguishing feature of the Swiss society is the high importance of
direct democracy. National referenda are held on a regular basis where citizens vote over all
kinds of issues. Voting results on these national referenda are informative on the regional
distribution of citizens’ attitudes and values. This is because voting results are available on a
community basis and, on average, communities are small and geographically close to each other.
Hence voting results help to understand how cultural differences affect the demand for social
insurance within narrowly defined geographic areas.
From an econometric point of view, our empirical strategy is a spatial regression discontinuity
design. We exploit the fact that the dominant language changes abruptly within a very small
geographic distance. Hence distance to the language border (negative on the German side,
positive on the Latin side) can serve as the running variable. When this variable takes the value
zero, our measure of culture changes discontinuously. The key identifying assumption is that
factors other than culture – that potentially determine the demand for social insurance – do not
change discontinuously at the language border. This assumption is plausible for the segments
of the language border that run through cantons. Cantons have much discretion in setting legal
rules. But the within canton segments allow us to adopt a within canton estimation strategy, i.e.
to add canton fixed effects. This means that observed differences in voting on social insurance
at the language border reflect differences in this demand generated by differences in culture.
Our empirical analysis comes in three parts. First, we document the role of culture for prefer-
ences for social insurance using data from the World Values Survey (WVS) and the International
Social Survey Programme (ISSP). We first show that significant differences between the Latin
Swiss and the German Swiss population in attitudes and norms related to government-provided
social insurance exist. These differences are large also compared with evidence from other coun-
tries. For instance, we find that the Latin-German gap within Switzerland is almost as large as
the gap between Sweden and Canada. Furthermore, these differences turn out to be quite strong
even after controlling in detail for the respondents’ individual characteristics. For instance, the
question “should government reduce income differences”shows a raw Latin-German gap (per-
centage yes Latin minus percentage yes German) of 22.9 percentage points, which remains as
high as 18.9 percentage points after controlling for a variety of community characteristics. We
document that significant differences show up for a variety of other WVS- and ISSP-questions
that are related to government-provided social insurance.
Second, our main empirical analysis is based on community-data from voting behavior in
Swiss national referenda. To concentrate on government-provided social insurance, we consider
national referenda since 1980 in which the Swiss population had to vote on one of the following
issues: (i) old-age insurance; (ii) maternity insurance; (iii) unemployment insurance; and (iv)
health insurance. There were several referenda on these issues. To provide empirical evidence
for a role of culture on the demand for social insurance we look at the gap in voting outcomes
at the language border. We consistently find a significant Latin-German gap in the demand for
government-provided social insurance, that is both quite stable over time and significant across
the various social insurance programmes. Language-group-differences in voting are particularly
striking with respect to old-age insurance and maternity insurance, but they are also sizeable
and significant with respect to unemployment insurance and health insurance.
4

Third, we look for potential channels by which cultural background translates into higher
support for redistributive social insurance on the Latin side of the language border. One straight-
forward channel could be that German-speaking Swiss citizens have stronger social networks
(family ties, friends, club memberships) that provide them informal insurance as a substitute
to formal state-provided insurance. Using data from the Swiss Household Panel we do not find
strong support for weaker social networks in Latin-speaking Switzerland. A second possible
channel are systematic differences in ideology. We find that Latin speakers are less likely to
believe that hard work pays off; and perceive that they enjoy less freedom and control over their
lives than German speakers. Hence our results are consistent with Benabou and Tirole (2006),
who argue that weak beliefs in a ”just world” increases the demand for redistribution and so-
cial insurance. Finally we look at media exposure across langauge regions and find very strong
segmentation of media markets by language regions. This may explain the lack of convergence
in beliefs among social groups that live under similar institutional arrangements. Interestingly,
the pattern of results we find for Switzerland is consistent with de Tocqueville (1899)’s conjec-
ture that culture is a first order explanation for why democracy works so differently in the US
compared to Europe cited in the beginning of the introduction.
Previous papers investigating the role of culture for the support of redistributive policies
are Luttmer and Singhal (2008) and Alesina and Giuliano (2009), who document a strong
impact on immigrants’ preferences for redistribution by the corresponding average preferences
of origin countries that is persistent across generations.6 Alesina and Fuchs-Schundeln (2007)
find that after the German reunification East Germans that lived under a Communist regime
have consistently stronger preferences for redistribution than their West German neighbors and
suggest that indoctrination of pro-state behavior during the Communist regime could have
caused the differences in preferences and that the political regime in place can shape individuals
preferences. Benabou and Tirole (2006) present a model where differences in political ideology
and support for redistribution arises as a results of differences in believes in a ”just world”
where effort pays off. Alesina and Angeletos (2005) present a closely related model along with
empirical results. Alesina and Glaeser (2004) investigate US and European style welfare systems
and argue the belief that “hard work brings success” dominates in the former and “success is a
matter of luck and connections” is more prevalent in the latter which may be due to the high
political influence of trade unions in Europe. Fong (2001) shows empirically that individuals who
prefer more redistribution also think that poverty is caused by circumstances beyond individuals’
control. Algan and Cahuc (2009) argue that cultural differences can explain why some countries
implement different mixes of employment protection and unemployment insurance. Further
related papers are Corneo (2001) who finds that moral values and ideologic principles partly
explain differences in preferences for redistribution in Germany and the US.7
6The literature on the role of culture in economic outcomes derives from a more general discussion of the role of
culture in the evolutionary process. Boyd and Richerson (1985) is the seminal contribution in evolutionary biology
on cultural transmission. See also the more recent work by Bisin and Verdier (2000) who introduce rational choice
into the cultural transmission framework.7Three additional strands of the literature are strongly related. The first strand discusses the role of institutions
in shaping preferences. Bowles (1998); Bowles and Polanıa Reyes (2009) provide surveys of the effects of incentives,
markets, and institutions on preferences. The second strand discusses the role of norms for central economic
decisions. Young and Burke (2001) discuss cropsharing contract choice in Illinois and show that contracts are
5
Our paper contributes to this literature in three different ways. First, it uses a novel empirical
strategy to assess the impact of culture on differences in economic/political outcomes: the spatial
regression discontinuity design. We think that this empirical strategy is quite fruitful in cases
where culture changes within narrowly defined geographic areas. Second, our paper studies
the role of culture for an outcome that has not received a lot of attention so far: support
for government-provided social insurance. While the popularity (and actual implementation)
of these programmes vary widely across countries, not much is known about whether these
differences may be driven by cultural factors. Third, we provide empirical evidence for culture-
effects by exploiting differences across language groups. The example of Switzerland, with its
cultural diversity and particular institutions, provides us with a nice laboratory to assess the
determinants of culture on outcomes.
The remainder of this paper is organized as follows. The next section 2 provides relevant
background on Swiss language regions and social insurance of risks to health and work in Switzer-
land. Section 3 discusses identification and estimation of the effect of being socialized in the
Swiss Latin culture as opposed to being socialized in the Swiss German culture on voting deci-
sions. Section 4 presents and interprets the main results. Section 5 discusses two key competing
explanations of the observed discontinuities in voting, namely informal insurance and ideologies.
Section 6 summarizes the key findings and discusses the most important implications of these
findings.
2 Background
This section offers the key background on Swiss language regions. We also briefly describe the
voting procedure and social insurance that is currently in place in Switzerland. The section then
discusses first key evidence on different attitudes towards the role of government across language
groups.
2.1 Languages in Switzerland
Switzerland has four official languages. The North East of Switzerland speaks Swiss German, the
West speaks French, the South East speaks Italian, and some parts of the East speak Romansh.
According to the population census 2000, 72.5 percent of Swiss citizens speak German, 21.0
percent speak French, 4.3 percent speak Italian, 0.6 percent speak Romansh and 1.6 percent
speak other languages (Ludi and Werlen, 2005).8 The Swiss multilingual situation is supported
surprisingly insensitive to soil quality. They can explain this finding by assuming that producers conform to
contract choice of their neighbors. See also Burke and Young (2010) for an overview of the role of social norms
for economic decisions. See also Clark (2003); Stutzer and Lalive (2004) who discuss the role of social norms in
unemployment. The third strand discusses the role of social capital in shaping political and economic outcomes.
Leonardi et al. (1993) and Putnam (2000) provide descriptive accounts of how measures of participation in local
social life is correlated with political participation and other measures of cooperation such as trust. Durlauf and
Fafchamps (2005a) discuss the role of social capital in economics and the problems associated with measuring its
effects on cooperation, trust, and economic growth.8The numbers in the text refer to the Swiss citizens. Roughly 20 percent of residents are immigrants of which
62.3 percent speak either German, French, Italian or Romansh and 37.7 percent have some other first language.
Romansh is one of the Rhaeto-Romance languages, believed to have descended from the Vulgar Latin variety
6

by its education system. Children learn to speak another “Swiss” language as their second
language.9 The empirical analysis contrasts the regions speaking languages derived from Latin
– French, Italian, Romansh – with the regions speaking German. Figure 2 displays a map of
Switzerland shaded according to the language spoken by a majority of each region’s residents.
Areas with light shading are communities with majority German speaking populations. Areas
with dark shading are those with a majority speaking either French, Italian, or Romansh. Note
that dark lines separate the 26 Swiss cantons, i.e. states.
Figure 2: Majority language, by community
Notes: Language regions in Switzerland by the Swiss population census 2000.
Source: Swiss population census 2000, Federal Statistical Office, Neuchatel. Ge-
ographical data from Swisstopo, Federal Office of Topography.
There are two key features of the Swiss language barrier. First, important parts of the lan-
guage border are no geographical barrier. The language border runs from North to South (the
border between French-speaking and German-speaking regions) whereas the main geographical
barrier, the Alps, are in East-West direction. This fact, together with an efficient (public) trans-
portation system, implies that transport costs within language regions are similar to transport
costs across language regions (conditional on distance). Second, important segments of the lan-
guage border do not coincide with borders between cantons (dark lines). This means that people
living within one of the four multi-lingual cantons but on different sides of the language bor-
der face the same regional set of policies and institutions but they belong to different language
groups.
Historically, Switzerland was founded by the German-speaking cantons Schwyz, Uri and
Nidwalden, located in the center of the country and was successively enlarged by the entrance
of Berne, Zurich, Lucerne and other cities of the German-speaking part. Until the French
spoken by Roman era occupiers of the region, and, as such, is closely related to French, Occitan and North
Italian.9This translates into good command of the languages spoken in other parts of the country. Around 73 % of
the inhabitants of the French speaking regions of Switzerland are able to speak one additional language of the
country. The corresponding number is 92 % for the inhabitants of the Italian speaking regions, and 85 % for the
inhabitants of the German speaking regions (see Werlen (2008)).
7

invasion at the turn of the 19th century large parts of French Switzerland were ruled by the
German-speaking elites of Berne and Fribourg. In 1848, the new constitution with 26 cantons
was established. Four cantons are French-speaking, one is Italian-speaking, three are bilingual
(French / German) cantons (Berne, Valais, and Fribourg), one canton – Graubunden – is officially
trilingual (German, Rhaeto-Romansh, and Italian) and the remaining seventeen are German-
speaking cantons.10
2.2 Social insurance programmes in Switzerland
It is important to understand what social insurance programmes do exist to understand the de-
mand for more social insurance. Switzerland offers mandatory programmes to insure individuals
against major shocks to the two central components of human capital – shocks to health and
shocks to earnings. In our empirical analysis below, we will focus on the following insurance
programmes which characterize most modern welfare states and which are mandatory for all
individuals in Switzerland:
A. Health insurance The Swiss health insurance system is mandatory for all employees. It is
highly regulated and offers the same exhaustive list of basic treatments for everyone. Insurance is
provided by private insurance companies. Insurance premia vary locally. The quality of health
services is very good but also expensive. Switzerland ranks after the US and France among
OECD countries with the highest health expenditures (See, OECD Health Data 2009, OECD
(http://www.oecd.org/health/healthdata).
B. Social Security Swiss old-age social security is characterized by a three-pillar system.
The first pillar is a pay-as-you-go social security system in which individuals pay contributions
during their lifetimes and get benefits as soon as they reach the statutory pension age (65 for
men, 62 for women). The first pillar has a strong redistributive dimension as benefits are capped
but contributions are a tax on labor income. The second pillar is a mandatory funded system.
Employer and employees pay into a pension fund which retirees can access once they reach
the retirement age. Finally, the third pillar are voluntary pension savings accounts which are
tax-deductible.
C. Unemployment insurance The Swiss unemployment insurance system is among the
most generous in OECD countries. Depending on age, it grants up to 2 years of unemployment
benefits and, depending on family circumstances, a replacement rate of 70-80 percent of previous
10Multilingual cantons exist for historical reasons. The current border of the canton of Valais traces the ancient
border of the Roman catholic diocese of Sion. The current border of the cantons Fribourg and Berne traces the
lands acquired by their capitals Fribourg and Berne. The border of the canton of Graubunden traces the borders
of the ancient Roman province of Rhaetia. The language border has been very stable since the 20th century.
Swiss Linguists argue that the 19th century abolishment of dialect in the French speaking part of Switzerland
contributed to stability. The German speaking parts of Switzerland were also keen on abolishing dialects during
the late 19th and early 20th century. During WWII, however, German speaking Swiss differentiated themselves
from Nazi Germany by using dialect. This explains the current situation with the French speaking parts of
Switzerland using standard French whereas German speaking parts of Switzerland still use dialect. See ?? for a
historical account of the language border.
8
income. The system is designed to prevent long-term unemployment by a strong emphasis on
active labor market policies. Individuals are obliged to participate in such programs. Non-
compliance with benefit rules and/or refusal to participate in active labor market policies lead
to benefit sanctions.
D. Maternity insurance Family policies are much less generous in Switzerland than in
many other OECD countries. Before 2005 no mandatory maternity/parental leave system ex-
isted. Since the 1950s several referenda were held about the implementation of such a system
but all referenda failed. The referendum in 2004 was approved by the population. It grants
mothers a 12-week job protection associated with full pay. Large private companies typically
offer supplementary parental leave provisions.
2.3 Demand for redistribution across language regions
Table 1 reports differences across language groups regarding support of redistribution and/or
government-provided social insurance programs using ISSP 1996 and world values survey (WVS)
data for 1996. All results focus on Swiss nationals whose interview language is either German,
French, or Italian so that language serves as a proxy for cultural background.11 Table 1 reports
agreement for each particular item separately in the Latin-speaking and the German-speaking
part part. The second-to-last column reports the raw difference and the last column shows the
coefficient of the Latin dummy in a linear regression that includes education, age, gender, and
canton fixed-effects as control variables.12 Hence the Latin coefficient in the last column of Table
1 reports the within canton difference in support for redistribution and social insurance. Since
individuals within cantons are subject to identical institutional arrangements, this differential
is not driven by differences in policies.
Results suggest that agreement to the statement ”should government reduce income differ-
ences” remains 18 percentage points higher in Latin-speaking Switzerland even when we control
for background characteristics and canton fixed-effects. Very similar patterns emerge with re-
spect to questions whether governments should create and provide jobs; help the unemployed;
and social spending. In all issues, Latin Swiss residents support a more active government
providing more social insurance and redistribution. While the gap differs by survey item, a
significant Latin-gap remains in all cases.
Table 1 also provides evidence of two questions in the World Value Survey concerning the
role of government versus
the role of the individual: (i) Should individuals take more responsibility vs. should gov-
ernment take more responsibility and (ii) Is it justifiable to claim government benefits to which
you are not entitled?. Both questions are answered on a scale from 1 to 10. It turns out that
11We take interview language as a proxy for the native language of the respondent. We have no information
that would allow us to calculate reliability of this proxy. Yet note that survey institutes typically choose interview
language to match native language of the majority of a respondents municipality of residence and – with few
exceptions – municipalities are segregated with respect to language. This suggests that interview language is a
fairly good proxy for native language.12According to the Swiss political scientists Bonoli and Hausermann (2009), education, age, and gender are
thought to be the most important dividing lines in votes on redistribution. Indeed, they find age to be the most
important factor explaining voting patterns in exit polls.
9

Tab
le1:
Survey
QuestionsonAttitudes
Tow
ardsRedistributionin
the
Welfare
State
number
of
share
agree/meanansw
er†
question
survey
respondents
Latin
German
difference
coef.Latin‡
Governmentshou
ld...
(1)
...reduce
incomedifferences
ISSP
2,206
0.689
0.460
0.229
0.178
(0.018)
(0.013)
(0.022)∗∗∗
(0.042)∗∗∗
(2)
...finan
ceprojectsto
create
new
jobs
ISSP
2,229
0.801
0.745
0.056
0.100
(0.015)
(0.011)
(0.019)∗∗∗
(0.036)∗∗∗
(3)
...providejobsto
everyone
ISSP
2,210
0.640
0.507
0.133
0.195
(0.019)
(0.013)
(0.023)∗∗∗
(0.042)∗∗∗
(4)
...providedecentstan
dardof
livingforunem
ployed
ISSP
2,215
0.831
0.653
0.178
0.168
(0.015)
(0.012)
(0.019)∗∗∗
(0.038)∗∗∗
(5)
...spend
moreon
social
services
even
ifthis
meanshigher
taxes
ISSP
1,707
0.451
0.371
0.080
0.090
(0.023)
(0.014)
(0.027)∗∗∗
(0.050)∗
(6)
...keepspendingon
social
services
constan
teven
ifthena-
tion
aldeficit/debtstay
sas
highas
itis
ISSP
1,945
0.654
0.564
0.089
0.076
(0.020)
(0.013)
(0.024)∗∗∗
(0.046)∗
(7)
People
shou
ldtakemorerespon
sibility(1)vs.
Government
shou
ldtakemorerespon
sibility(10)
WVS
1,181
4.003
3.017
0.986
1.895
(0.123)
(0.097)
(0.157)∗∗∗
(0.469)∗∗∗
(8)
Claim
inggov.benefits
towhichyou
arenot
entitled
isnever
justifiab
le(1)vs.
alwaysjustifiab
le(10)
WVS
1,180
3.167
1.701
1.466
1.164
(0.113)
(0.066)
(0.130)∗∗∗
(0.444)∗∗∗
Note
s:Standard
errors
inparentheses.*p<
0.10,**p<
0.05,***p<
0.01.
†Table
entriesare
share
ofresp
onden
tsthatagree(agreeorstrongly
agree)
forquestions1-6
andthemeanresp
onse
inthescale
from
1to
10fortheother
questions(w
eighted).
‡Estim
ate
onLatincoeffi
cien
tin
regressionofmean
answ
er(orshare
agree)
onage,
sex,ed
ucation(low
,med
ium,high)andcantonfixed
effects.Sep
arationinto
languageregionsbyinterview
language,
German
=SwissGerman,Latin=
SwissFrench/Italian.
10

the average government-responsibility score of Latin Swiss respondents is 1.9 points (!) higher
than the score of Swiss-German speakers. The difference is also quite striking in the benefit-
claim score where the Latin-gap is as large as 1.2 points even after controlling for background
characteristics and canton fixed-effects.13 In sum, the evidence of Table 1 is consistent with the
hypothesis of a potentially important impact of culture on the demand for redistributive social
insurance.
3 Identification and Estimation
This section discusses the empirical challenges to identifying the pure effect of being a member
of a language group on the demand for social insurance. The section then discusses the empirical
framework adopted in this paper – a spatial regression discontinuity approach.
3.1 Identification
This paper asks whether different language groups develop different attitudes towards social
insurance, ceteris paribus. This effect lies at the heart of all discussions surrounding culture. It
is useful to introduce notation used in the treatment effects literature to clarify the parameter
of interest (Imbens and Wooldridge, 2009). The Rubin model of potential outcomes consists
of two pieces of information. The first piece of information refers to the treatment D. Let
Di = 1 if individual i is a member of the Swiss Latin language group, and Di = 0 if individual
i is a member of the Swiss German language group.14 We are interested in the effects of group
membership on a set of outcomes Y – attitudes towards the role of government, voting decisions,
beliefs about the payoff to work, etc. Associated with each type of socialization is a potential
voting decision YD, i.e. Y1i is individual i’s decision if i is a member of the Latin speaking
group, and Y0i is individual i’s decision if i is a member of the Swiss German speaking group.
For simplicity, we omit the subscript i henceforth.
The individual causal effect of group membership on voting decisions can now be defined. It
is simply the group membership difference in voting decisions Y1−Y0. The fundamental problem
of causal inference is that this individual effect can not be observed. In the real world, individuals
are either a member of the Latin speaking group or a member of the German speaking group but
not both. This can be seen by characterizing observed voting decisions Y = DY1 + (1 −D)Y0,
i.e. we observe either Y1 for the Latin native or Y0 for the German native.
Can averages of the individual causal effect be identified? For instance, E(Y1 − Y0|D =
1) is the average effect of being a member of the Swiss Latin speaking group for individuals
speaking either French, Italian, or Romansh. This effect could be identified, for instance, if
group membership were randomly assigned. Unfortunately, actual group membership is far
from random. Further, the Swiss Latin speaking regions of Switzerland are located in areas
13Algan and Cahuc (2009) discuss this measure of civic virtue and its link with labor market institutions in
detail.14The treatment effects literature highlights that only those causes that could be experimentally manipulated
can be regarded as proper treatments (Holland, 1986). Being a member of a particular language group is clearly
a treatment that can be manipulated. For instance, children that are adopted by non biological parents are
typically also moving across language borders (Bjorklund et al., 2006).
11
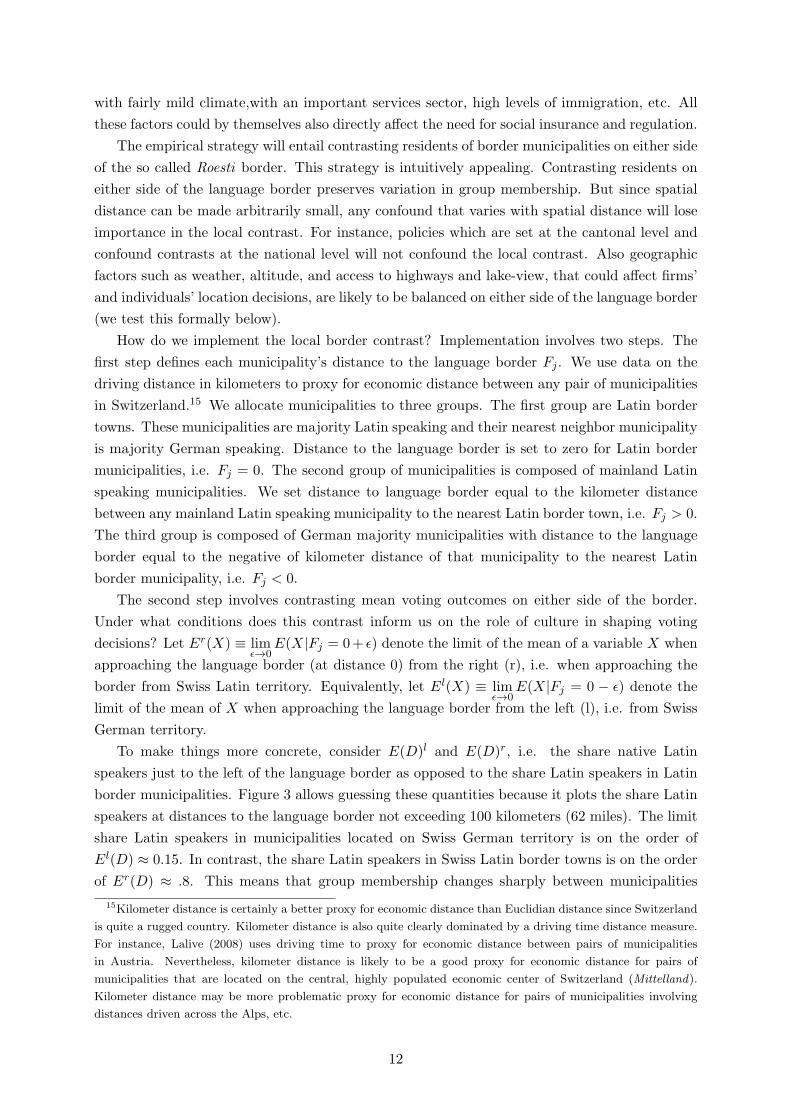
with fairly mild climate,with an important services sector, high levels of immigration, etc. All
these factors could by themselves also directly affect the need for social insurance and regulation.
The empirical strategy will entail contrasting residents of border municipalities on either side
of the so called Roesti border. This strategy is intuitively appealing. Contrasting residents on
either side of the language border preserves variation in group membership. But since spatial
distance can be made arbitrarily small, any confound that varies with spatial distance will lose
importance in the local contrast. For instance, policies which are set at the cantonal level and
confound contrasts at the national level will not confound the local contrast. Also geographic
factors such as weather, altitude, and access to highways and lake-view, that could affect firms’
and individuals’ location decisions, are likely to be balanced on either side of the language border
(we test this formally below).
How do we implement the local border contrast? Implementation involves two steps. The
first step defines each municipality’s distance to the language border Fj . We use data on the
driving distance in kilometers to proxy for economic distance between any pair of municipalities
in Switzerland.15 We allocate municipalities to three groups. The first group are Latin border
towns. These municipalities are majority Latin speaking and their nearest neighbor municipality
is majority German speaking. Distance to the language border is set to zero for Latin border
municipalities, i.e. Fj = 0. The second group of municipalities is composed of mainland Latin
speaking municipalities. We set distance to language border equal to the kilometer distance
between any mainland Latin speaking municipality to the nearest Latin border town, i.e. Fj > 0.
The third group is composed of German majority municipalities with distance to the language
border equal to the negative of kilometer distance of that municipality to the nearest Latin
border municipality, i.e. Fj < 0.
The second step involves contrasting mean voting outcomes on either side of the border.
Under what conditions does this contrast inform us on the role of culture in shaping voting
decisions? Let Er(X) ≡ limϵ→0
E(X|Fj = 0+ ϵ) denote the limit of the mean of a variable X when
approaching the language border (at distance 0) from the right (r), i.e. when approaching the
border from Swiss Latin territory. Equivalently, let El(X) ≡ limϵ→0
E(X|Fj = 0 − ϵ) denote the
limit of the mean of X when approaching the language border from the left (l), i.e. from Swiss
German territory.
To make things more concrete, consider E(D)l and E(D)r, i.e. the share native Latin
speakers just to the left of the language border as opposed to the share Latin speakers in Latin
border municipalities. Figure 3 allows guessing these quantities because it plots the share Latin
speakers at distances to the language border not exceeding 100 kilometers (62 miles). The limit
share Latin speakers in municipalities located on Swiss German territory is on the order of
El(D) ≈ 0.15. In contrast, the share Latin speakers in Swiss Latin border towns is on the order
of Er(D) ≈ .8. This means that group membership changes sharply between municipalities
15Kilometer distance is certainly a better proxy for economic distance than Euclidian distance since Switzerland
is quite a rugged country. Kilometer distance is also quite clearly dominated by a driving time distance measure.
For instance, Lalive (2008) uses driving time to proxy for economic distance between pairs of municipalities
in Austria. Nevertheless, kilometer distance is likely to be a good proxy for economic distance for pairs of
municipalities that are located on the central, highly populated economic center of Switzerland (Mittelland).
Kilometer distance may be more problematic proxy for economic distance for pairs of municipalities involving
distances driven across the Alps, etc.
12
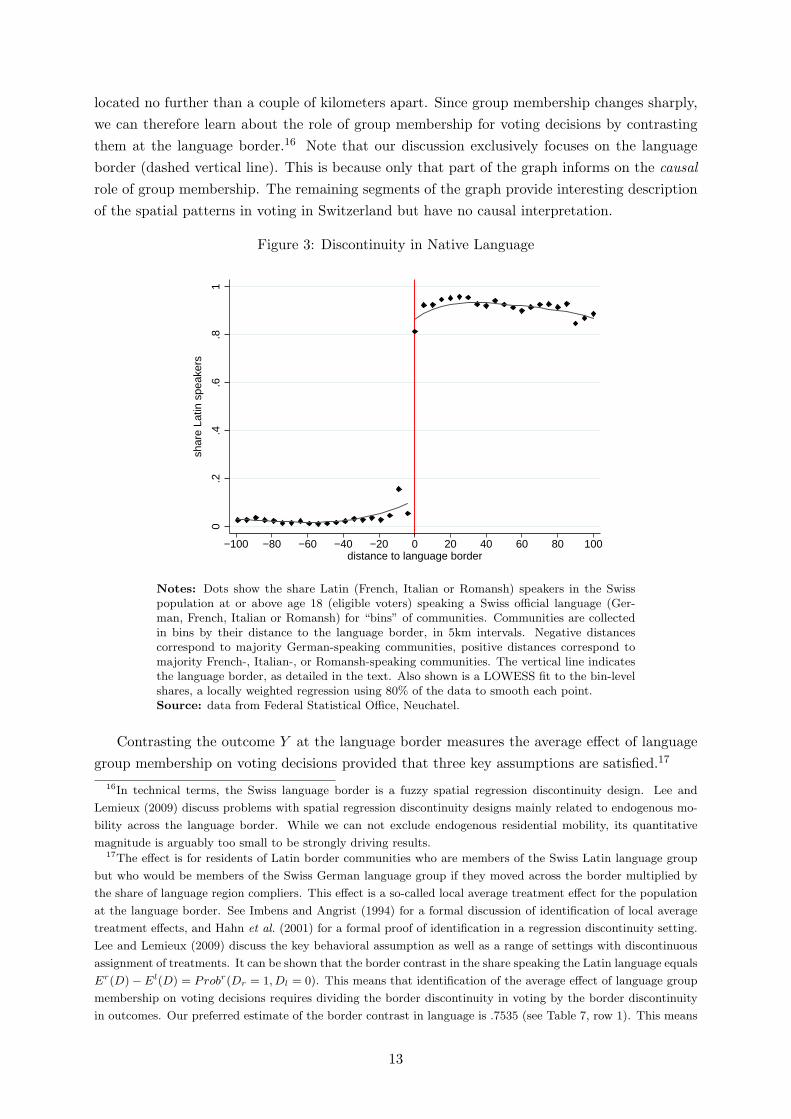
located no further than a couple of kilometers apart. Since group membership changes sharply,
we can therefore learn about the role of group membership for voting decisions by contrasting
them at the language border.16 Note that our discussion exclusively focuses on the language
border (dashed vertical line). This is because only that part of the graph informs on the causal
role of group membership. The remaining segments of the graph provide interesting description
of the spatial patterns in voting in Switzerland but have no causal interpretation.
Figure 3: Discontinuity in Native Language
0.2
.4.6
.81
shar
e La
tin s
peak
ers
−100 −80 −60 −40 −20 0 20 40 60 80 100distance to language border
Notes: Dots show the share Latin (French, Italian or Romansh) speakers in the Swisspopulation at or above age 18 (eligible voters) speaking a Swiss official language (Ger-man, French, Italian or Romansh) for “bins” of communities. Communities are collectedin bins by their distance to the language border, in 5km intervals. Negative distancescorrespond to majority German-speaking communities, positive distances correspond tomajority French-, Italian-, or Romansh-speaking communities. The vertical line indicatesthe language border, as detailed in the text. Also shown is a LOWESS fit to the bin-levelshares, a locally weighted regression using 80% of the data to smooth each point.Source: data from Federal Statistical Office, Neuchatel.
Contrasting the outcome Y at the language border measures the average effect of language
group membership on voting decisions provided that three key assumptions are satisfied.17
16In technical terms, the Swiss language border is a fuzzy spatial regression discontinuity design. Lee and
Lemieux (2009) discuss problems with spatial regression discontinuity designs mainly related to endogenous mo-
bility across the language border. While we can not exclude endogenous residential mobility, its quantitative
magnitude is arguably too small to be strongly driving results.17The effect is for residents of Latin border communities who are members of the Swiss Latin language group
but who would be members of the Swiss German language group if they moved across the border multiplied by
the share of language region compliers. This effect is a so-called local average treatment effect for the population
at the language border. See Imbens and Angrist (1994) for a formal discussion of identification of local average
treatment effects, and Hahn et al. (2001) for a formal proof of identification in a regression discontinuity setting.
Lee and Lemieux (2009) discuss the key behavioral assumption as well as a range of settings with discontinuous
assignment of treatments. It can be shown that the border contrast in the share speaking the Latin language equals
Er(D)−El(D) = Probr(Dr = 1, Dl = 0). This means that identification of the average effect of language group
membership on voting decisions requires dividing the border discontinuity in voting by the border discontinuity
in outcomes. Our preferred estimate of the border contrast in language is .7535 (see Table 7, row 1). This means
13

Er(Y )− El(Y ) = Er(Y1 − Y0|Dr = 1, Dl = 0)Probr(Dr = 1, Dl = 0)
The Appendix discusses the three assumptions along with evidence that is consistent with
these three assumptions. The identification strategy is a fuzzy spatial regression discontinuity
approach (RDD; see Hahn et al. (2001) for a general discussion of sharp and fuzzy RDD).
How can we estimate the average effect of language group membership on voting outcomes?
It can be shown that the border contrast in the share speaking the Latin language equals
Er(D) − El(D) = Probr(Dr = 1, Dl = 0). This means that identification of the average effect
of language group membership on voting decisions requires dividing the border discontinuity in
voting by the border discontinuity in outcomes. Our preferred estimate of the border contrast in
language is .7535 (see Table 7, row 1). This means that the border contrast in voting outcomes
Er(Y )−El(Y ) needs to be inflated by roughly 33 percent (i.e. multiplied by 1.327=1/.7535) to
back out the average effect of language group membership on voting outcomes Er(Y1−Y0|Dr =
1, Dl = 0).
3.2 Estimation
How can the border town contrast be estimated? It is not possible to just focus on the set
of border municipalities. These municipalities would help estimating the mean voting pattern
in Latin border towns Er(Y ) because that is observed. What is not observed, however, is the
counterfactual voting pattern in these municipalities. This counterfactual has to be estimated
using data on Swiss German municipalities located “close”to the language border. We extrap-
olate using linear regression that focuses in all cases on municipalities located no further than
50 kilometers driving distance from the language border, i.e. we set the so-called half-width to
50 kilometers.18 For these municipalities, we estimate the following regression
Yj = αl + δLj + βl1Fj + βl2F2j + βr1Lj · Fj + βr2Lj · F 2
j +X ′jγ + ϵj (1)
The key parameters in this regression are αl and δ.19 To see this, consider E(Yj |Fj = 0, Lj =
1) = αl + δ and E(Yj |Fj = 0, Lj = 0) = αl. This shows that δ estimates the border contrast in
Y , i.e. Er(Y )− El(Y ), and αl measures the mean outcome in Latin border towns if they were
German speaking. The parameters βl1, βl2 measure the spatial trend in voting and other outcome
measures in Swiss German territory, while the parameters βr1, βr2 allow for a completely different
spatial trend in Swiss Latin territory. The data vector Xj contains background information on
the municipalities, and – importantly – a full set of canton dummies. Canton dummies ensure
that the parameter δ is identified by contrasting German and Latin border towns within the
same canton. The parameter vector γ captures the predictive power of background municipality
characteristics. We will use equation (1) as our baseline regression specification to estimate the
border contrast in Y . In all cases, we report standard errors that allow for clustering at the
that the border contrast in voting outcomes Er(Y ) − El(Y ) needs to be inflated by 1.327=1/.7535 to measure
the average effect of language group membership on voting outcomes Er(Y1 − Y0|Dr = 1, Dl = 0).18We adopt an ad-hoc bandwidth because optimal bandwidth choice is complicated. We also report the sensi-
tivity of our results to changes in the bandwidth, adopting, for instance a bandwidth of 25 kilometers. See Imbens
and Kalyanaraman (2009) for a recent discussion of optimal bandwidth choice.19See Lee and Lemieux (2009) for a comprehensive discussion of this regression specification.
14
municipality level when working with individual data and heteroscedasticity robust standard
errors when working with municipality data.20
4 Culture and the Demand for Social Insurance
This section discusses the causal effect of cultural background (as measured by the dominant
language within a community) on the demand for social insurance (as measured by voting
behavior on major reforms to the social insurance system) in Switzerland. In the first part of
this section we give descriptive evidence on major referenda that took place in Switzerland over
the last three decades. We then apply our spatial RDD methodolgy described in the last section
to analyze the causal effect of cultural background on voting behavior.
4.1 Voting on social insurance
National votes and referenda are held on a regular basis on all kinds of issues in Switzerland.
To ask for a referendum, voters collect signatures (50,000 within three months for a referendum
on a government policy, 100,000 for a voter initiative on a new amendment to the constitution)
and the parliament checks if the initiative is consistent with existing laws.21 A national vote is
held on the issue if the parliament agrees on holding it. For most referenda and initiatives a
simple majority rule is applied. International treaties need to be approved by the majority of
the people and the cantons.
These national votes provide a wealth of data on the opinions of Swiss voters with respect to
many different subjects. The voting data is publicly available since 1980. Voting data contain
information on the number of eligible voters, number of votes cast, number of valid votes, and
number of votes in favor (”Yes”) or not (”No”). The data cover each of the roughly 2,700 Swiss
municipalities.
Table 2 provides a list of all votes studied in this paper along with their voter turnout and
results in the two language regions. All these votes are national referenda and intend to change
national law. All voters in Switzerland decide on the same issue.
We start with health insurance because health risks are, arguably, the most broadly relevant
risk to a person’s human capital. Panel A of table 2 contains the results of three votes on health
insurance. The 1994 vote on the introduction of mandatory health insurance constituted a major
change in the health insurance system. It introduced mandatory basic health insurance for all
residents, subsidies for the poor and it abolished the possibility to demand different premia
based on age, preexisting conditions, and gender. The referendum was accepted with a narrow
50.9 percent yes-votes. While Swiss-Germans rejected the referendum with 46 percent yes-votes,
Latin voters strongly supported this referendum. The gap between the two language regions
was almost 20 percentage points. In 2007, a referendum on the introduction of a single public
health insurance company was rejected by the majority of the population. This referendum
proposed a single insurance company for basic health insurance (which is quite comprehensive
20We have also explored clustering standard errors with respect to distance to the language border – our so-
called forcing variable. This type of clustering has been suggested by Card and Lee (2008). Our conclusions are
not affected by a change in the level of clustering.21Note: there is no check if the initiative is consistent with international law, c.f. Minaret initiative in 2009
15

Tab
le2:
SelectedReferendain
Switzerland
yes
(percent)
year
vote
no.†
all
Latin
German
difference
PanelA.Healt
hinsu
rance(expa
nd)
Introductionof
man
datoryhealthinsurance
1994
415
50.89
65.90
45.99
19.91
Onepublichealthinsurance
compan
y2007
528
28.25
43.60
21.40
22.19
Includealternativemedicine
2009
541
65.78
73.72
62.99
10.73
PanelB.Old
ageinsu
rance(expa
nd
/keepstatusquo)
Reductionin
retirementage
1988
352
34.84
47.10
31.19
15.91
Flexible
retirementage
2000
470
45.35
61.42
39.58
21.84
Noincrease
inwom
en’s
retirementage
2000
469
38.77
54.98
32.94
22.04
PanelC.Maternityleave(introduce)
Introductionof
maternityinsurance
1984
323
15.55
21.46
13.65
7.81
Introductionof
maternityinsurance
1999
458
38.45
63.39
31.08
32.31
Introductionof
maternityinsurance
2004
513
54.57
73.84
48.10
25.74
PanelD.Unemploymentinsu
rance(expa
nd
/rest
rict)
Lon
gerpotential
benefitduration
,reductionin
replacementrate
1993
398
67.68
66.33
68.05
−1.72
Reductionof
unem
ploymentbenefits
1997
437
48.03
34.10
52.70
−18.60
Shorterpotential
benefitduration
2002
492
54.56
47.72
56.83
−9.11
Note
s:Thereare
slightva
riationsin
totalturnoutandshare
yes
withresp
ectto
officialstatisticsdueto
omittedvotesfrom
non-residen
tcitizens
votingbyletter.
† Vote
numbersaccordingto
officialSwissreferendum
chronologybytheFed
eralChancellery.
Sourc
e:data
from
Fed
eralStatisticalOffice,Neu
chatel.
16

in Switzerland) and premia based on income and wealth of the insured (instead of equal premia
for everyone). In this vote, the German-Latin gap was even stronger with 22 percentage points
more support for the vote by Swiss Latins. The 2009 vote had as its purpose to include alternative
medicine into the list of treatments that have to be paid by mandatory health insurance. This
expansion of health insurance was accepted by a majority of voters, with much higher support
in the Latin region.
Several important referenda were held also with respect to the second important field of
social insurance, the old-age social security system. Panel B of table 2 shows three referenda
on old age insurance that were rejected by a majority of Swiss voters. In all three votes the
issue was whether to decrease the statutory retirement age of the pay-as-you-go pillar of the
Swiss old age insurance (AHV). This first pillar is in place since 1947 and provides the main
source of income after retirement for low-wage workers. Lowering the eligibility age without a
corresponding (marginally) actuarially fair discount of benefits clearly implies a redistribution of
income from high wage to low wage workers and from young to old age individuals. Even though
all three referenda were turned down at the poll, the Latin-speaking population of Switzerland
would have accepted both referenda in 2000. In all three votes, the Latin-German-gap was as
large as 15 and 22 percentage points.
Panel C. in table 2 depicts voting results on three federal referenda on the introduction
of maternity insurance. Both in 1984 and 1999 introduction was dismissed and Switzerland
introduced maternity insurance not until 2005. The Latin-German-gap is striking in all three
votes but particularly so in 1999 and 2004.22
Unemployment insurance is a national program that was reformed several times since 1980.
Panel D. shows two votes introducing more restrictive rule and one vote that changed rules
on both directions. The main component of the 1993 vote was a reduction in unemployment
benefits. Voters were less aware of the fact that this reform also proposed to extend unem-
ployment benefit duration. In this vote, eventually accepted by the majority, no significant
Latin-German-gap shows up. However, there were large differences in the other two votes, both
of which made the unemployment insurance system less generous. The vote about a reduction
of unemployment benefits in 1997 was turned down; and the vote on shorter benefit durations
in 2002 was accepted. In both votes, the Latin-German-gap was large, 9 percent in the 1997
vote and 19 percent in the 2002 vote.
4.2 The Latin-German gap in demand for social insurance
We start by plotting the relevant outcome variable (percentage yes-votes) with respect to dis-
tance to the language border. Doing so provides a graphical indicator for the presence of a
discontinuous jump in the outcome variable at the language border, i.e. distance zero. To
estimate the border contrast in voting outcomes, we implement equation 1 and report the esti-
mate of the parameter δ. This parameter is identified by a change in majority language within
cantons, holding distance to language border, canton of residence and a wealth of municipality
background characteristics constant. This parameter therefore measures the causal effect of
language group membership on voting decisions at the language border.
22Language regions also differ in terms of the role of women. See Steinhauer (2010) for further details.
17

Figure 4 provides distance-to-border graphs for 15 national referenda on social insurance.
We grouped the votes according to the type of insurance. Panel A in Figure 4 shows three
referenda related to health insurance. The 1994 vote introduced universal mandatory basic
health insurance for all residents, subsidies for the poor and ended the possibility to demand
different premia based on age, preexisting conditions, and gender. There is a strikingly clear
discontinuity in support for the proposal (sub-graph 4A.a.). Whereas this proposition tended
to please barely more than half of the residents of German language border towns, 7 out of
10 Latin border voters tended to voice support for universal social health insurance. In 2007,
voters decided on a proposal to nationalize the health insurance industry. This proposal gathered
support from roughly 3 in 10 voters in German border towns. In contrast, more than 4 out of
10 voters in Latin border towns tended to favor this proposal (sub-graph 4A.b.). In 2009,
the catalogue of covered treatments was to be extended to include alternative medicine. This
proposal was met with approval among 2 out of 3 German border town voters. In contrast,
almost 3 out of 4 Latin border town residents were in favor of extending the catalogue of
covered treatments. Overall, there is a striking discontinuity in the demand for social health
insurance at the Swiss language border.
Panel B in Figure 4 shows three referenda on social security – or old age insurance. All
three votes the issue intended to expand social security by lowering (or keeping constant) the
age of early retirement. In all three cases, there is a clear difference in terms of the proportion of
voters favoring a reduction (or maintaining) the statutory age of retirement. While roughly 3 to
4 out of 10 voters in German speaking border towns support reductions in the early retirement,
the corresponding share attains a level of 5 out of 10 voters supporting lower retirement ages
(sub-graphs 4B.a.-B.c.).
Panel C in Figure 4 depicts voting results on three federal referenda on the introduction
of maternity insurance. Both in 1984 and 1999 introduction was dismissed and Switzerland
introduced maternity insurance not until 2004. The pattern is quite striking, with large discon-
tinuities at the border in 1999 and 2004 (sub-graphs 4C.b. and 4C.c.).23
Panel D in Figure 4 shows three votes on unemployment insurance. The 1993 referendum
entailed both a reduction of the benefit replacement rate from 80 % to 70 % for job seekers
with no dependents, who earned high pre-unemployment incomes, along with an extension of
the potential benefit duration. There is no visible discontinuity in the 1984 voting results on
prolonging potential benefit duration (sub-graph 4E.a.). This is probably due to the fact that
the issue at hand neither clearly extended nor clearly tightened unemployment insurance. In
contrast, both the 1997 and 2002 votes discussed issues related to tightening UI. The 1997 vote
reduced the benefit replacement rate, while the 2002 vote shortened benefit duration. There
are strong discontinuities in support for these two votes. While more than 5 out of 10 German
border voters supported reductions in coverage, fewer than 5 out of 10 Swiss Latin border voters
were in favor of tightening UI (sub-graphs 4E.b. and 4E.c.).
So far, we have looked at only a graphical description of voting at the language border. Do
23Note that Latin and German residents also differ with respect to their view regarding the role of women. For
instance, 23.7 percent of German region residents agree with the ISSP 2002 survey item ”A man’s job is to earn
money; a woman’s job is to look after the home and family.” The corresponding share in Latin regions is 19.4
percent. See Steinhauer (2010) for further discussion of this issue.
18
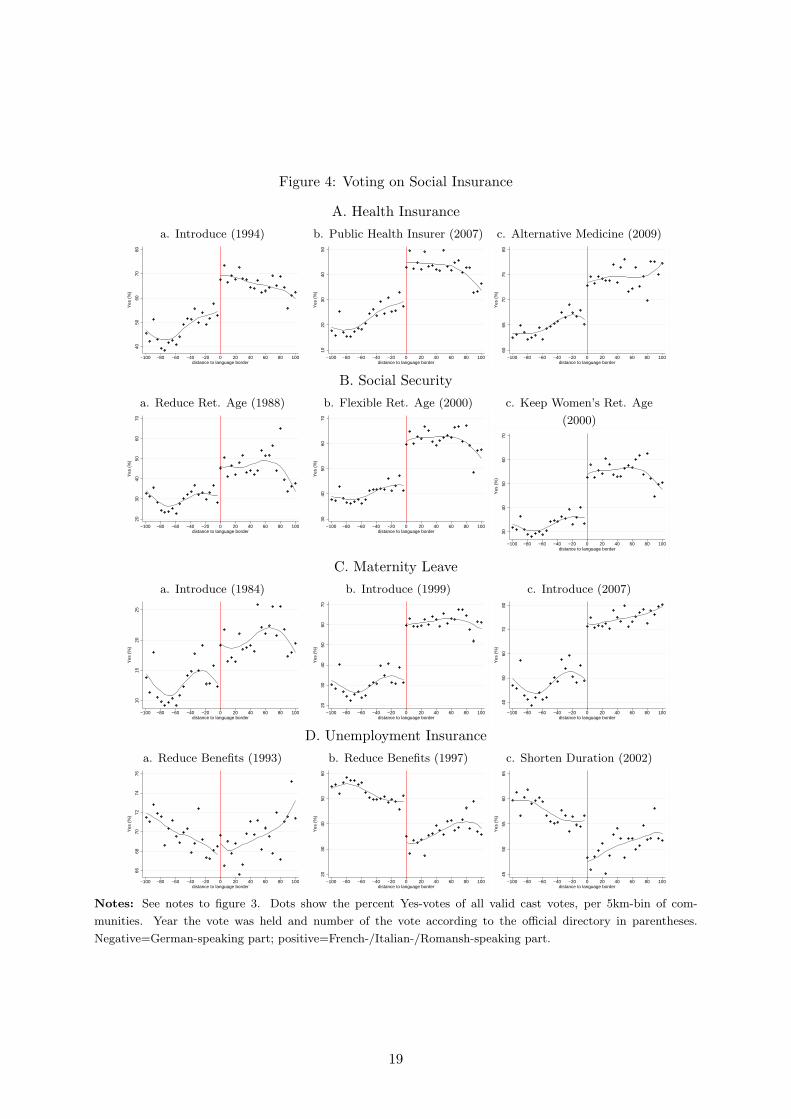
Figure 4: Voting on Social Insurance
A. Health Insurance
a. Introduce (1994)
4050
6070
80
Yes
(%
)
−100 −80 −60 −40 −20 0 20 40 60 80 100distance to language border
b. Public Health Insurer (2007)
1020
3040
50
Yes
(%
)
−100 −80 −60 −40 −20 0 20 40 60 80 100distance to language border
c. Alternative Medicine (2009)
6065
7075
80
Yes
(%
)
−100 −80 −60 −40 −20 0 20 40 60 80 100distance to language border
B. Social Security
a. Reduce Ret. Age (1988)
2030
4050
6070
Yes
(%
)
−100 −80 −60 −40 −20 0 20 40 60 80 100distance to language border
b. Flexible Ret. Age (2000)
3040
5060
70
Yes
(%
)
−100 −80 −60 −40 −20 0 20 40 60 80 100distance to language border
c. Keep Women’s Ret. Age
(2000)
3040
5060
70
Yes
(%
)
−100 −80 −60 −40 −20 0 20 40 60 80 100distance to language border
C. Maternity Leave
a. Introduce (1984)
1015
2025
Yes
(%
)
−100 −80 −60 −40 −20 0 20 40 60 80 100distance to language border
b. Introduce (1999)
2030
4050
6070
Yes
(%
)
−100 −80 −60 −40 −20 0 20 40 60 80 100distance to language border
c. Introduce (2007)
4050
6070
80
Yes
(%
)
−100 −80 −60 −40 −20 0 20 40 60 80 100distance to language border
D. Unemployment Insurance
a. Reduce Benefits (1993)
6668
7072
7476
Yes
(%
)
−100 −80 −60 −40 −20 0 20 40 60 80 100distance to language border
b. Reduce Benefits (1997)
2030
4050
60
Yes
(%
)
−100 −80 −60 −40 −20 0 20 40 60 80 100distance to language border
c. Shorten Duration (2002)
4550
5560
65
Yes
(%
)
−100 −80 −60 −40 −20 0 20 40 60 80 100distance to language border
Notes: See notes to figure 3. Dots show the percent Yes-votes of all valid cast votes, per 5km-bin of com-
munities. Year the vote was held and number of the vote according to the official directory in parentheses.
Negative=German-speaking part; positive=French-/Italian-/Romansh-speaking part.
19

these results withstand the addition of canton dummies and control variables? Table 3 discusses
the causal effects of language group membership on voting outcomes. The table reports a series
of 4 different estimation results. Column (1) discusses the border contrast adopting a 50 km
window around the language border, with a quadratic two sided trend (equation 1 without the
X vector). Column (2) adds canton dummies – shifting to within canton identification – and
municipality background controls (see Tables 7 Panels A and B and 8 Panel C for the full list of
controls). Columns (3) and (4) keep the X vector and assess sensitivity to functional form using
the two approaches recommended by Lee and Lemieux (2009). Column (3) adopts a local linear
approach, i.e. reduces the bandwidth to 25 km and shifts to a linear spatial trend on both sides
of the language border. Column (4) adopts a polynomial approximation approach introducing
third order terms in distance to border.
Panel A in Table 3 provides results on the role of language group membership for the demand
for social health insurance. Row 1 discusses introduction of universal basic coverage in 1994.
Results in column (1) suggest that the Latin German gap in support for universal coverage is
about 7.4 percentage points. Column (2) reports results that include canton dummies (shifting to
within canton identification) and a full set of control variables. Doing so appears to be important
as the estimated Latin German gap shrinks to just barely below 5 percentage points. Columns
(3) and (4) provide sensitivity analysis for column (2). Column (3) discards all municipalities
further than 25 km away from the language border and adopts a linear spatial trend. The
resulting Latin German gap in support for universal health insurance increases somewhat to
6 percentage points. Column (4) assesses sensitivity to misspecified spatial trends by adding
two third order terms in distance to language border (one for each language region) to model
(1) while keeping the original 1177 municipalities located at 50 km distance from the language
border. Results indicate that Latin border municipalities are 4.5 percentage points more in favor
of universal health care than would be expected from their German counterparts. Thus, the
baseline result of a Latin German gap of 4.8 percentage points (column 2) for the 1994 vote do
not appear to be sensitive to misspecified functional form.
Row 2 in Panel A discusses the proposal to nationalize health insurance. The health insurance
market is currently characterized by a large number of private health insurers that are regulated
by the government. The 2007 proposal, elaborated by Pascal Broulis – a politician from the
Latin speaking part of the country – suggested to nationalize the entire industry. Results in
column 2 suggest that Latin border municipalities were 11.9 percentage points more likely to
support this proposal than their German counterparts. This results is, again, not sensitive to
misspecified functional form (columns 3 and 4). Row 3 in Panel A discusses extending the basic
health catalogue to alternative medicine (homeopathy, etc.). Latin border municipalities were
5.1 percentage points more likely to vote for this extension of social insurance than their German
counterparts. Results hold up in column 3 but get insignificant in column 4. Overall, results in
Panel A of Table 3 consistently identify stronger support for universal health insurance in Latin
border towns despite facing identical actual levels of social insurance (section 2).
Panel B in Table 3 discusses changes to the old age pension system. The first vote in 1988
proposes to reduce the statutory retirement age, i.e. an expansion of coverage. Results in column
2 indicate that support for this proposal is 6.2 percentage points higher in Latin border towns
compared to their German counterparts. This result is robust to mis-specification of spatial
20

trends (columns 3 and 4). The second and third vote proposed both to give workers more freedom
to choose when to retire and to keep women’s retirement age at 62 years (instead of gradually
increasing it to match men’s retirement age of 65 years). Both proposals are consistently more
strongly supported in Latin border towns compared to their German counterparts. The Latin
excess support is on the order of 10.3 percent for the proposal to have a flexible system and 9.5
percentage points for the proposal to keep women’s retirement age constant according to our
baseline specification (column 2). Both results hold up to sensitivity analyzes in columns 3 and
4.
Panel C in Table 3 discusses three proposals to introduce maternity leave. The first proposal,
while rejected in 1984, was met with 3.3 percentage points more enthusiasm in the Latin border
community than would be expected from their German counterparts. The second proposal,
while voted rejected in 1999, was met with 9.8 percentage points more enthusiasm in the Latin
border community than would be expected from their German counterparts. The final proposal
who led to the decision to introduce universal paid maternity leave of 12 weeks was, was, yet
again, favored by 9.9 percentage points more voters in the Latin border towns than expected
from the German border community. With the exception of one vote (1984), results hold up to
the sensitivity analyzes in columns 3 and 4.
Panel D in Table 3 discusses three proposals to reform unemployment insurance (UI). The
first proposal in 1993 entailed a reduction of the benefit level, but it also extended unemployment
benefit duration. This proposal was opposed by 3.4 percentage points more voters in Latin
border communities compared to their neighbors in majority German speaking territory. Voters
again decided on a surprise reduction of benefits introduced by the Government in early 1997.24
Unions organized a national referendum on this decision and managed to overturn this surprise
benefit reduction. Interestingly, support for the reduction in benefits was 3.4 percentage points
stronger in German border towns compared to the Latin border society. The third proposal,
voted in 2002, suggested to reduce benefit duration for any job seeker aged 55 years or less.
This clear reduction of UI coverage was opposed by 2.3 percentage points more voters in Latin
border towns compared to their neighbors at the fringes of mainland German speaking territory.
Results hold up to the sensitivity analyzes reported in columns 3 and 4.
In sum, we find strong evidence for higher demand for social insurance and redistribution by
individuals of Latin-speaking communities compared to their neighbors just across the language
border. Thus, results are consistent with a significant role of culture in determining the demand
for social insurance of risks to health and work.
5 Possible explanations
This section discusses three competing explanations of the Latin-German gap in support for
social insurance: informal insurance, beliefs, and the media. Understanding the relevance of
these explanations is key to formulate policy responses.
24Stutzer and Lalive (2004) discuss the political context of this referendum and use this referendum to proxy
for the norm to live off one’s own income.
21
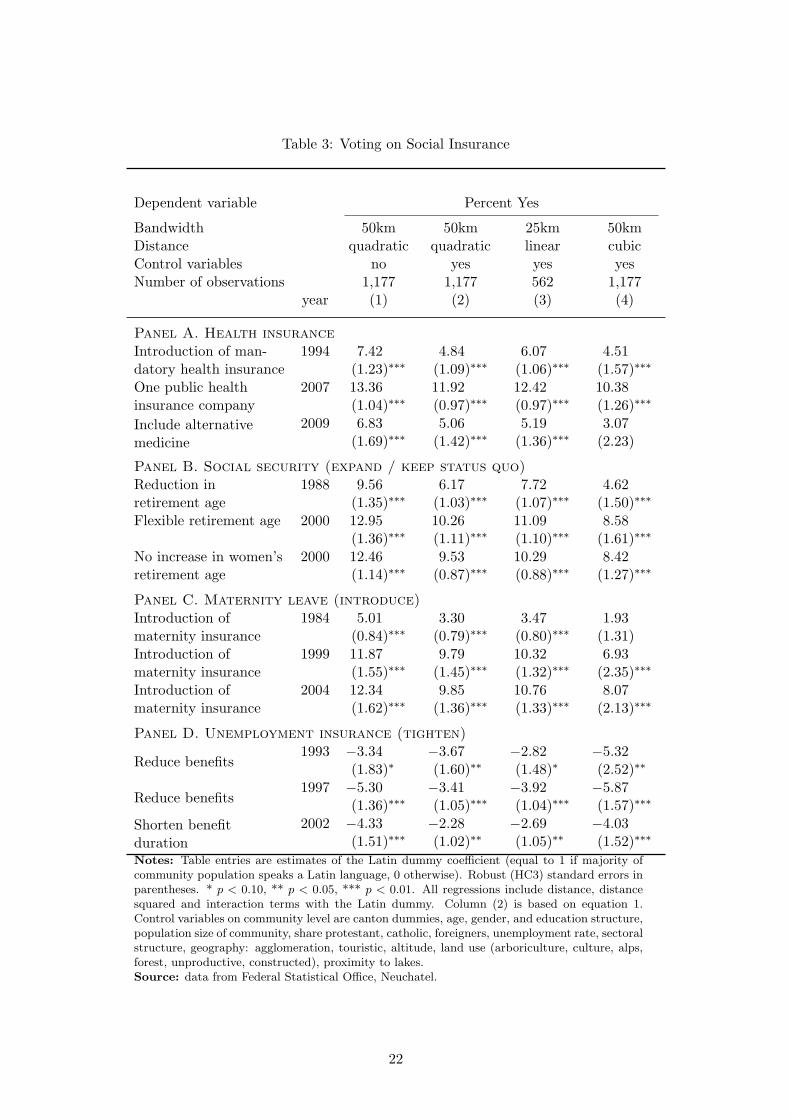
Table 3: Voting on Social Insurance
Dependent variable Percent Yes
Bandwidth 50km 50km 25km 50kmDistance quadratic quadratic linear cubicControl variables no yes yes yesNumber of observations 1,177 1,177 562 1,177
year (1) (2) (3) (4)
Panel A. Health insuranceIntroduction of man-datory health insurance
1994 7.42 4.84 6.07 4.51(1.23)∗∗∗ (1.09)∗∗∗ (1.06)∗∗∗ (1.57)∗∗∗
One public healthinsurance company
2007 13.36 11.92 12.42 10.38(1.04)∗∗∗ (0.97)∗∗∗ (0.97)∗∗∗ (1.26)∗∗∗
Include alternativemedicine
2009 6.83 5.06 5.19 3.07(1.69)∗∗∗ (1.42)∗∗∗ (1.36)∗∗∗ (2.23)
Panel B. Social security (expand / keep status quo)Reduction inretirement age
1988 9.56 6.17 7.72 4.62(1.35)∗∗∗ (1.03)∗∗∗ (1.07)∗∗∗ (1.50)∗∗∗
Flexible retirement age 2000 12.95 10.26 11.09 8.58(1.36)∗∗∗ (1.11)∗∗∗ (1.10)∗∗∗ (1.61)∗∗∗
No increase in women’sretirement age
2000 12.46 9.53 10.29 8.42(1.14)∗∗∗ (0.87)∗∗∗ (0.88)∗∗∗ (1.27)∗∗∗
Panel C. Maternity leave (introduce)Introduction ofmaternity insurance
1984 5.01 3.30 3.47 1.93(0.84)∗∗∗ (0.79)∗∗∗ (0.80)∗∗∗ (1.31)
Introduction ofmaternity insurance
1999 11.87 9.79 10.32 6.93(1.55)∗∗∗ (1.45)∗∗∗ (1.32)∗∗∗ (2.35)∗∗∗
Introduction ofmaternity insurance
2004 12.34 9.85 10.76 8.07(1.62)∗∗∗ (1.36)∗∗∗ (1.33)∗∗∗ (2.13)∗∗∗
Panel D. Unemployment insurance (tighten)
Reduce benefits1993 −3.34 −3.67 −2.82 −5.32
(1.83)∗ (1.60)∗∗ (1.48)∗ (2.52)∗∗
Reduce benefits1997 −5.30 −3.41 −3.92 −5.87
(1.36)∗∗∗ (1.05)∗∗∗ (1.04)∗∗∗ (1.57)∗∗∗
Shorten benefitduration
2002 −4.33 −2.28 −2.69 −4.03(1.51)∗∗∗ (1.02)∗∗ (1.05)∗∗ (1.52)∗∗∗
Notes: Table entries are estimates of the Latin dummy coefficient (equal to 1 if majority ofcommunity population speaks a Latin language, 0 otherwise). Robust (HC3) standard errors inparentheses. * p < 0.10, ** p < 0.05, *** p < 0.01. All regressions include distance, distancesquared and interaction terms with the Latin dummy. Column (2) is based on equation 1.Control variables on community level are canton dummies, age, gender, and education structure,population size of community, share protestant, catholic, foreigners, unemployment rate, sectoralstructure, geography: agglomeration, touristic, altitude, land use (arboriculture, culture, alps,forest, unproductive, constructed), proximity to lakes.Source: data from Federal Statistical Office, Neuchatel.
22

5.1 Informal Insurance
The demand for social insurance and work regulations depends importantly on the availability of
informal insurance, which can be a substitute for publicly provided insurance and redistribution
(Bloch et al., 2008). Informal insurance can either be the family or close friends where insurance
is more strongly based on bilateral links between network members; or insurance groups, where
the group collectively insures the network member. The degree of insurance depends crucially
on norms regarding mutual help. In the present context, it could be that norms with respect
to mutual help might be lower in the Latin region of Switzerland leading to less stable social
networks and less informal insurance. As a result a higher demand for social insurance could
emerge.25
A related argument holds that social capital creates informal insurance. There is no single
definition of social capital. However, Durlauf and Fafchamps (2005b) argue that there are three
underlying main ideas of social capital: (i) it is beneficial for members of a group; (ii) these
benefits arise through shared norms and values, which influence expectations and behavior; and
(iii) these norms and values evolve through informal organizations, such as associations.26
We explore the relevance of informal insurance and social capital exploiting data from the
Swiss Household Panel (SHP).27 Panels a and b of figure 5 look at the number of an individual’s
relatives and friends (strong ties), and the number of an individual’s neighbors and colleagues
(weak ties).28 Since the SHP offers detailed information on individuals’ location of residence,
25Angelucci et al. (2009) present evidence from a quasi-experimental study on transfers within extended family
networks. Studying cash transfers from the state in Mexico, they show that ineligible individuals that are member
of an extended family network do profit more from cash transfers within a village than ineligible individuals that
do not have such a family network. There is a larger literature on risk pooling within ethnic groups and within
families in developing countries. Udry (1994) develops a model of risk sharing within ethnic groups and tests
it with data from Tanzania. He finds substantive but imperfect risk pooling between families. Fafchamps and
Lund (2003) stress the importance of family ties and networks of friends in smoothing income shocks in rural
Philippines. They show that risk pooling is not done on village level but rather within personal networks.26Carter and Castillo (2004) provide evidence on the effect of different social capital in communities in Honduras
in recovering from a hurricane catastrophe. Communities with stronger social norms rebuilt their houses quicker
than communities with lower norms. However, only members of the respective networks profited. Narayan
and Pritchett (1999) proxy in their study about Tanzania social capital as an index containing the number of
club memberships and some characteristics of the respective clubs. They argue that, among others, greater
associational activity is linked to greater sharing of household risk and informal insurance. Putnam (2001)
claims that being member of an association or a club that meet regularly is (besides contact with family, friends,
neighbors,...) a sign of developed social capital. He especially states that a decrease in social capital in the US
over the last years has led to a significant decrease in club memberships.
27The SHP is a yearly conducted panel survey in Switzerland that aims to asses a broad range of questions
linked to living in Switzerland. Among others, it asks about labor market participation, financial situation, social
networks, social participation, and values in different fields. The SHP started in 1999 with a random sample of
5’074 households. In 2004, 2’538 households were added to the original sample because of attrition problems. The
sample was constructed containing only Swiss citizens since birth, because specific Swiss cultural traits that are
transmitted by family and social networks should be strongest for individuals with a Swiss family. Furthermore,
only individuals that have a Swiss mother tongue were kept in the sample, because language is important for
integration to social networks. Finally, only individuals aged 18 or older are investigated, so that our sample can
be compared to the voting age population. This yields a final sample of 8’107 individuals in 5’211 households.
Note however, that not all individuals answer to all questions.28This vocabulary leans on the work of Granovetter (1973) on strong and weak ties. He argues that as well
23

we can apply the spatial regression discontinuity approach. Panels a and b reveal that neither
the number of strong social ties nor the number of weak social ties show large differences at
the language border. Latin Swiss individuals have somewhat stronger family ties but German
Swiss individuals are better connected to neighbors and colleagues (more ”weak social ties”).
The evidence on social networks is mixed.
The SHP also contains information on club membership in eight different kinds of asso-
ciations. Panel c of figure 5 presents evidence on active club memberships in these different
associations. Respondents who live in Latin border municipalities appear to be members of
fewer clubs than their neighbors living in German border municipalities.29 This evidence sug-
gests that a higher demand for social insurance in the Latin side could partly result from lower
social capital.
Figure 5: Social Networks and Social Capital
a. Strong ties
(relatives and friends)
810
1214
1618
Soc
ial N
etw
orks
: Str
ong
Tie
s (n
b of
per
sons
)
−100 −80 −60 −40 −20 0 20 40 60 80 100distance to language border
b. Weak ties
(neighbors and colleagues)
68
1012
1416
1820
Soc
ial N
etw
orks
: Wea
k T
ies
(nb
of p
erso
ns)
−100 −80 −60 −40 −20 0 20 40 60 80 100distance to language border
c. Club membership
(active member)
.4.6
.81
1.2
1.4
1.6
All
activ
e cl
ub m
embe
rshi
ps (
max
is 8
)
−100 −80 −60 −40 −20 0 20 40 60 80 100distance to language border
Notes: negative=German-speaking part; positive=French-/Italian-/Romansh-speaking part.
Strong ties: Sum of number of relatives and number of friends (32’004 valid observations). Weak ties:
Sum of number of neighbors and colleagues (31’360 valid observations). Club membership: Count
number of clubs that a person is an active member in. Maximum number of clubs is eight. (32’259
valid observations).
Source: Swiss Household Panel (1999-2008).
Table 4 provides a detailed econometric analysis of the possible role of social networks and
social capital. Column 1 of Panel A shows that respondents have, on average, 7.4 relatives
and 5.7 close friends. Columns (1) to (4) reports the estimated discontinuity at the language
border. Regressions control for age, education, gender, and an extensive set of municipality
characteristics.30 Using these controls, we find that strong social ties are significantly higher
for Latin speakers. For weak ties, we do not find statistically significative differences among
language groups.
A fact that could confound the analysis in columns (1) to (2) is that unemployment is higher
in Latin regions than in Swiss-German regions. Unemployed individuals might have more need
strong as well as weak ties are important in a sociology to spread information.29One reason among a multitude of others could be that the Latin Swiss appear to follow Groucho Marx’s
suggestion to ”never be a member of a club that accepts me as one of its members” more than the German Swiss.30Permanent population, percentage of protestants and of catholics, percentage foreigners, municipal unemploy-
ment rate, economic sectoral composition, agglomeration, touristy area, altitude of the municipality, lake border,
surface, and land use.
24
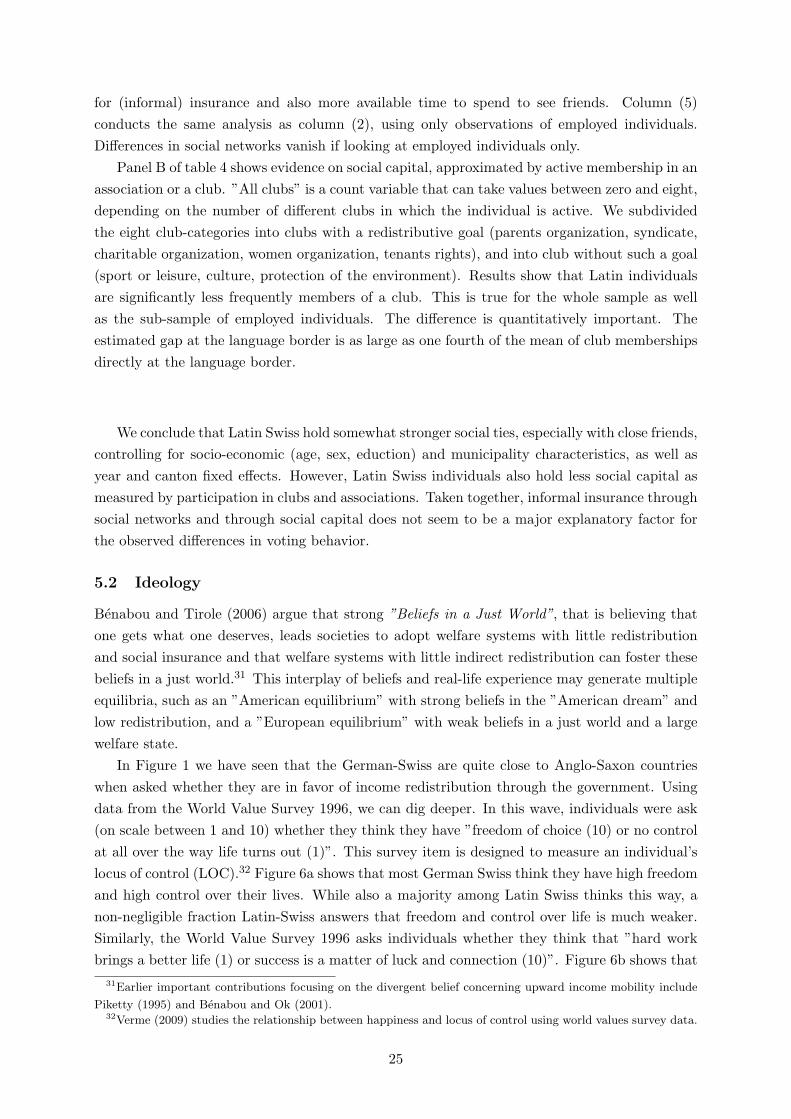
for (informal) insurance and also more available time to spend to see friends. Column (5)
conducts the same analysis as column (2), using only observations of employed individuals.
Differences in social networks vanish if looking at employed individuals only.
Panel B of table 4 shows evidence on social capital, approximated by active membership in an
association or a club. ”All clubs” is a count variable that can take values between zero and eight,
depending on the number of different clubs in which the individual is active. We subdivided
the eight club-categories into clubs with a redistributive goal (parents organization, syndicate,
charitable organization, women organization, tenants rights), and into club without such a goal
(sport or leisure, culture, protection of the environment). Results show that Latin individuals
are significantly less frequently members of a club. This is true for the whole sample as well
as the sub-sample of employed individuals. The difference is quantitatively important. The
estimated gap at the language border is as large as one fourth of the mean of club memberships
directly at the language border.
We conclude that Latin Swiss hold somewhat stronger social ties, especially with close friends,
controlling for socio-economic (age, sex, eduction) and municipality characteristics, as well as
year and canton fixed effects. However, Latin Swiss individuals also hold less social capital as
measured by participation in clubs and associations. Taken together, informal insurance through
social networks and through social capital does not seem to be a major explanatory factor for
the observed differences in voting behavior.
5.2 Ideology
Benabou and Tirole (2006) argue that strong ”Beliefs in a Just World”, that is believing that
one gets what one deserves, leads societies to adopt welfare systems with little redistribution
and social insurance and that welfare systems with little indirect redistribution can foster these
beliefs in a just world.31 This interplay of beliefs and real-life experience may generate multiple
equilibria, such as an ”American equilibrium” with strong beliefs in the ”American dream” and
low redistribution, and a ”European equilibrium” with weak beliefs in a just world and a large
welfare state.
In Figure 1 we have seen that the German-Swiss are quite close to Anglo-Saxon countries
when asked whether they are in favor of income redistribution through the government. Using
data from the World Value Survey 1996, we can dig deeper. In this wave, individuals were ask
(on scale between 1 and 10) whether they think they have ”freedom of choice (10) or no control
at all over the way life turns out (1)”. This survey item is designed to measure an individual’s
locus of control (LOC).32 Figure 6a shows that most German Swiss think they have high freedom
and high control over their lives. While also a majority among Latin Swiss thinks this way, a
non-negligible fraction Latin-Swiss answers that freedom and control over life is much weaker.
Similarly, the World Value Survey 1996 asks individuals whether they think that ”hard work
brings a better life (1) or success is a matter of luck and connection (10)”. Figure 6b shows that
31Earlier important contributions focusing on the divergent belief concerning upward income mobility include
Piketty (1995) and Benabou and Ok (2001).32Verme (2009) studies the relationship between happiness and locus of control using world values survey data.
25

Table 4: Language Border Contrasts in Informal Insurance
Mean (1) (2) (3) (4) (5)Sample All All All All All EmployedBandwidth 50km 50km 50km 25km 50km 50kmDistance no quadratic quadratic linear cubic quadraticControl variables no no yes yes yes yesA. Social NetworksStrong ties (nb persons) 13.10 1.335* 2.305*** 1.487* 1.824* 0.728
(0.107) (0.791) (0.825) (0.783) (1.067) (1.058)Relatives 7.400 0.591 1.216* 0.611 1.096 0.550
(0.0866) (0.623) (0.631) (0.517) (0.728) (0.847)Close friends 5.696 0.744* 1.090** 0.875* 0.728 0.178
(0.0498) (0.414) (0.430) (0.476) (0.621) (0.548)Observations 16’791 16’791 16’791 6’671 16’791 11’532Individuals 3’106 3’106 3’106 1’301 3’106 2’488
Weak ties (nb persons) 10.78 -0.706 0.128 -0.160 -0.505 -1.929(0.121) (1.119) (1.226) (1.400) (1.603) (1.479)
Neighbors 3.347 -0.366 0.238 0.399 -0.428 -0.208(0.0380) (0.329) (0.328) (0.342) (0.527) (0.381)
Colleagues 7.434 -0.340 -0.110 -0.559 -0.0766 -1.720(0.106) (0.986) (1.098) (1.271) (1.365) (1.339)
Observations 16’486 16’486 16’486 6’580 16’486 11’311Individuals 3’101 3’101 3’101 1’295 3’101 2’476B. Social CapitalAll clubs (active members) 0.862 -0.210*** -0.161** -0.178** -0.125 -0.231***
(0.00820) (0.0683) (0.0648) (0.0698) (0.101) (0.0828)Redistributive clubs 0.266 -0.108*** -0.0798** -0.0222 -0.0392 -0.0856*
(0.00449) (0.0360) (0.0368) (0.0389) (0.0546) (0.0443)General clubs 0.596 -0.102** -0.0809* -0.156*** -0.0861 -0.145**
(0.00574) (0.0461) (0.0446) (0.0499) (0.0707) (0.0575)Observations 16’923 16’923 16’923 6’723 16’923 11’579Individuals 3’119 3’119 3’119 1’303 3’119 2’494
Notes: Standard errors in parentheses (clustered by municipality and year). * p < 0.10, ** p < 0.05, ***p < 0.01. Estimate on Latin coefficient in regression of dependent variable on individual characteristics (age,sex, education), municipality characteristics (population, religion, foreigners, unemployment, sectoral structure,agglomeration structure, area usage, area, altitude, lake border), year and cantonal fixed effects. Strong ties: Sumof number of relatives and number of friends. Weak ties: Sum of number of neighbors and colleagues. Sums themembership of the following clubs: local or parents / syndicate / charitable organization / women / tenants rights(redistributive) and sports or leisure / culture / protection of the environment (general) with equal weighting.Separation into language regions by ethnicity, German = Swiss German, Latin = Swiss French/Italian. Source:Swiss Household Panel (1999-2008).
26

a majority of German Swiss thinks that working hard pays off, but this fraction is considerably
smaller among Latin Swiss. In particular, a substantial fraction of Latins think that success is
almost purely driven by luck and connections.
Figure 6: World Values Survey Evidence on Beliefs
a. Freedom of choice and control over
the way your life turns out
0.0
5.1
.15
.2.2
5de
nsity
1 noneat all
2 3 4 5 6 7 8 9 10 a greatdeal
German Latin
b. Success is a matter of hard work vs. success
is a matter of luck and connections
0.0
5.1
.15
.2de
nsity
1 2 3 4 5 6 7 8 9 10
German Latin
Notes: Panel a: 1= non freedom of choice and control over the way my life turns out, 10=a great deal of freedom
of choice and control over the way my life turns out. Panel b: 1=in the long run; hard work usually brings a better
life, 10=hard work does not generally bring success - it is more a matter of luck and connections. Separation into
language regions by interview language.
Source: WVS 1996.
Table 5 reports regression analyzes of these two questions and reproduces these differences
across the language regions when controlling for individual characteristics and canton fixed-
effects.33 Latin-Swiss respondents are significantly less convinced that they have the freedom of
choice and that they can determine the way their life turns out. Taking account for all controls,
the isolated reduction in freedom/control score is 0.56 among the Latin Swiss. The contrast
is even stronger for the question more directly related to the ”belief in a just world”. When
asked whether hard work pays off or whether success is a matter of luck and connection, Latin
Swiss have a luck/connection score that is 1.20 points higher. These results suggest that beliefs
diverge profoundly in a situation with identical actual level of social insurance – clear empirical
evidence of ideology.
Where do these different views and ideology come from? An important argument is that the
Latin Swiss were the minority for centuries, suppressed by the elites of Berne and the aristocracy
of Fribourg. Being a suppressed minority may have contributed to the adoption of values which
are based less strongly on the belief in a ”just world”. In contrast, repeated experience of
suppression is likely to foster the belief that one’s own fortune is more driven by status and
ancestry than the belief that hard work bring success.
Yet there is a key problem with this explanation. In the model discussed by Benabou and
Tirole (2006) there is a feedback mechanism. Actual differences in social insurance coverage
33Regression is a simple tool to understand how membership of a language group shifts the cumulative density
function in Figure 6a and b. Ordered probit analyzes are consistent with the simple regression analysis reported
in Table 5.
27
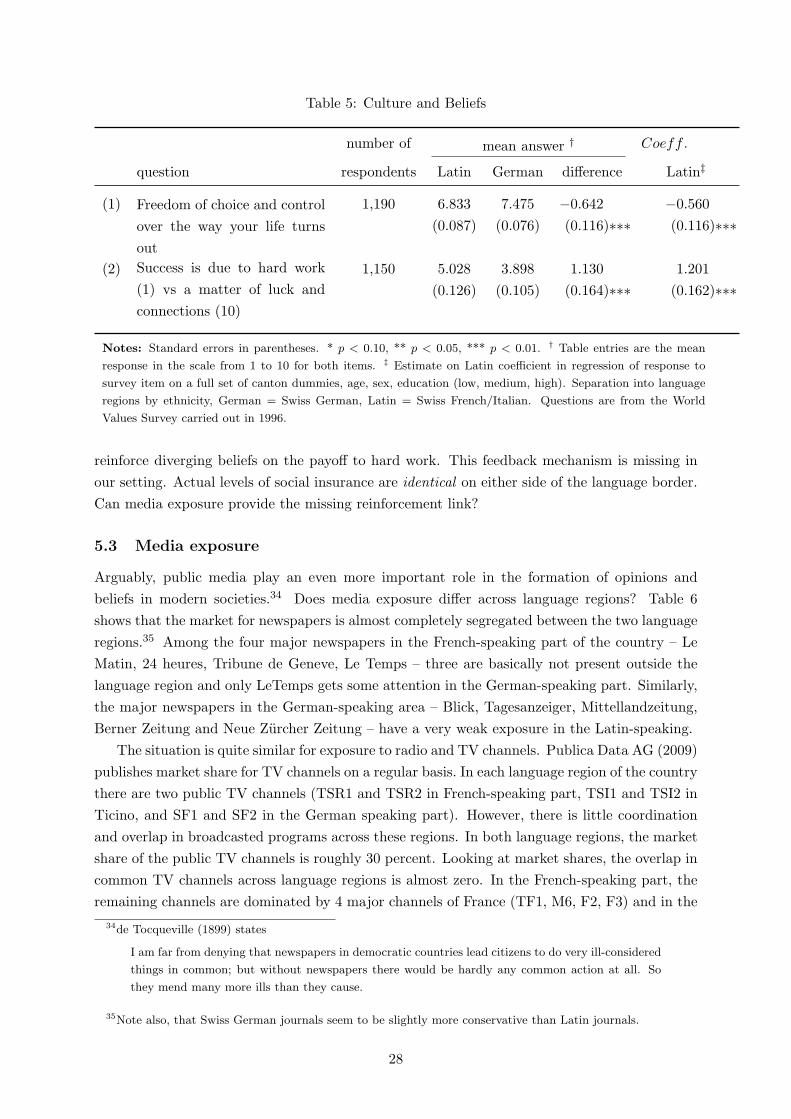
Table 5: Culture and Beliefs
number of mean answer † Coeff.
question respondents Latin German difference Latin‡
(1) Freedom of choice and control
over the way your life turns
out
1,190 6.833 7.475 −0.642 −0.560
(0.087) (0.076) (0.116)∗∗∗ (0.116)∗∗∗
(2) Success is due to hard work
(1) vs a matter of luck and
connections (10)
1,150 5.028 3.898 1.130 1.201
(0.126) (0.105) (0.164)∗∗∗ (0.162)∗∗∗
Notes: Standard errors in parentheses. * p < 0.10, ** p < 0.05, *** p < 0.01. † Table entries are the mean
response in the scale from 1 to 10 for both items. ‡ Estimate on Latin coefficient in regression of response to
survey item on a full set of canton dummies, age, sex, education (low, medium, high). Separation into language
regions by ethnicity, German = Swiss German, Latin = Swiss French/Italian. Questions are from the World
Values Survey carried out in 1996.
reinforce diverging beliefs on the payoff to hard work. This feedback mechanism is missing in
our setting. Actual levels of social insurance are identical on either side of the language border.
Can media exposure provide the missing reinforcement link?
5.3 Media exposure
Arguably, public media play an even more important role in the formation of opinions and
beliefs in modern societies.34 Does media exposure differ across language regions? Table 6
shows that the market for newspapers is almost completely segregated between the two language
regions.35 Among the four major newspapers in the French-speaking part of the country – Le
Matin, 24 heures, Tribune de Geneve, Le Temps – three are basically not present outside the
language region and only LeTemps gets some attention in the German-speaking part. Similarly,
the major newspapers in the German-speaking area – Blick, Tagesanzeiger, Mittellandzeitung,
Berner Zeitung and Neue Zurcher Zeitung – have a very weak exposure in the Latin-speaking.
The situation is quite similar for exposure to radio and TV channels. Publica Data AG (2009)
publishes market share for TV channels on a regular basis. In each language region of the country
there are two public TV channels (TSR1 and TSR2 in French-speaking part, TSI1 and TSI2 in
Ticino, and SF1 and SF2 in the German speaking part). However, there is little coordination
and overlap in broadcasted programs across these regions. In both language regions, the market
share of the public TV channels is roughly 30 percent. Looking at market shares, the overlap in
common TV channels across language regions is almost zero. In the French-speaking part, the
remaining channels are dominated by 4 major channels of France (TF1, M6, F2, F3) and in the
34de Tocqueville (1899) states
I am far from denying that newspapers in democratic countries lead citizens to do very ill-considered
things in common; but without newspapers there would be hardly any common action at all. So
they mend many more ills than they cause.
35Note also, that Swiss German journals seem to be slightly more conservative than Latin journals.
28
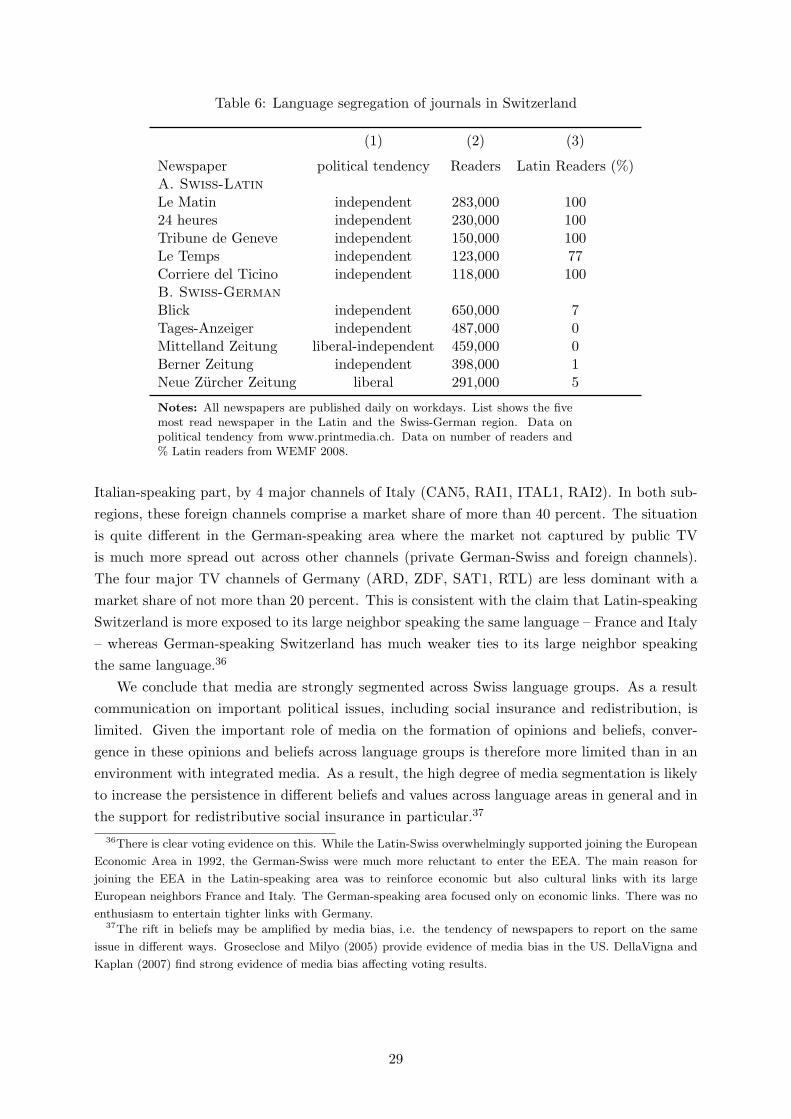
Table 6: Language segregation of journals in Switzerland
(1) (2) (3)
Newspaper political tendency Readers Latin Readers (%)A. Swiss-LatinLe Matin independent 283,000 10024 heures independent 230,000 100Tribune de Geneve independent 150,000 100Le Temps independent 123,000 77Corriere del Ticino independent 118,000 100B. Swiss-GermanBlick independent 650,000 7Tages-Anzeiger independent 487,000 0Mittelland Zeitung liberal-independent 459,000 0Berner Zeitung independent 398,000 1Neue Zurcher Zeitung liberal 291,000 5
Notes: All newspapers are published daily on workdays. List shows the fivemost read newspaper in the Latin and the Swiss-German region. Data onpolitical tendency from www.printmedia.ch. Data on number of readers and% Latin readers from WEMF 2008.
Italian-speaking part, by 4 major channels of Italy (CAN5, RAI1, ITAL1, RAI2). In both sub-
regions, these foreign channels comprise a market share of more than 40 percent. The situation
is quite different in the German-speaking area where the market not captured by public TV
is much more spread out across other channels (private German-Swiss and foreign channels).
The four major TV channels of Germany (ARD, ZDF, SAT1, RTL) are less dominant with a
market share of not more than 20 percent. This is consistent with the claim that Latin-speaking
Switzerland is more exposed to its large neighbor speaking the same language – France and Italy
– whereas German-speaking Switzerland has much weaker ties to its large neighbor speaking
the same language.36
We conclude that media are strongly segmented across Swiss language groups. As a result
communication on important political issues, including social insurance and redistribution, is
limited. Given the important role of media on the formation of opinions and beliefs, conver-
gence in these opinions and beliefs across language groups is therefore more limited than in an
environment with integrated media. As a result, the high degree of media segmentation is likely
to increase the persistence in different beliefs and values across language areas in general and in
the support for redistributive social insurance in particular.37
36There is clear voting evidence on this. While the Latin-Swiss overwhelmingly supported joining the European
Economic Area in 1992, the German-Swiss were much more reluctant to enter the EEA. The main reason for
joining the EEA in the Latin-speaking area was to reinforce economic but also cultural links with its large
European neighbors France and Italy. The German-speaking area focused only on economic links. There was no
enthusiasm to entertain tighter links with Germany.37The rift in beliefs may be amplified by media bias, i.e. the tendency of newspapers to report on the same
issue in different ways. Groseclose and Milyo (2005) provide evidence of media bias in the US. DellaVigna and
Kaplan (2007) find strong evidence of media bias affecting voting results.
29

6 Conclusions
In this paper, we have investigated the role of whether culture has an important impact on
the demand for government-provided social insurance. Government-provided social insurance
programmes are hotly debated in all countries and they use up a large fraction of governments’
budget. Yet the way that these programmes are implemented differs widely across countries. In
this paper we look at Switzerland, a country that is well known for its cultural diversity and
its particular political institutions. We exploit the fact that Switzerland is divided into two
broad cultural groups on the basis of language: the German Swiss, known for their commitment
to work hard, to be punctual, and to focus on individual responsibility; and Latin Swiss, the
historically suppressed minority, who tend to rely much more on the role of the state and favor
income redistribution. Apart from its cultural diversity, Switzerland has a strong tradition of
direct democracy. Voting data from national referenda provide us with a measure of the demand
for social insurance of the various cultural groups.
To isolate an impact of culture from other potential determinants of the demand for social
insurance, we focus on changes in culture within a narrowly defined geographic area. We exploit
the fact that the language border within Switzerland is a clear geographic border. Within a
distance of 5 kilometers, the fraction of Latin-speaking Swiss residents falls from more than 90
percent to less than 5 percent (and vice versa for German native speakers). The border is no
geographical barrier. Moreover, since parts of the language border runs through cantons, and
since we include canton fixed effects, we control for the institutional environment. This allows
us to adopt a spatial regression discontinuity design to separate the impact of culture from the
impact of other potential determinants of the demand for social insurance. Large parts of the
language border runs within Swiss states (cantons). This is important since most policies in
Switzerland are set at the cantonal (rather than the federal) level. Hence local contrasts on
either side of the border measure language-group differences in the demand for social insurance
even if they face identical levels of actual insurance.
We provide empirical evidence on the demand for four social insurance programmes that
cover the most important risks that individuals face over their lifetimes (i) old age insurance,
(ii) maternity insurance, (iii) unemployment insurance and (iv) health insurance. We study a
wide range of voting results from national referenda all of which were related to major changes
(introductions and/reforms) of these social insurance programmes. For referenda related to
(reforms of) old-age insurance and (the introduction of) maternity insurance, our estimates sug-
gest that the demand for social insurance (as measured by voting results) is up to 10 percentage
points higher among the Latin-Swiss population than among the German-Swiss population. We
also find consistently higher (lower) support for more generous (restrictive) unemployment and
health insurance regulations among the Latin-Swiss than among the German-Swiss population.
To shed light on possible reasons for the increased demand for government-provided social in-
surance by the Latin-speaking citizens, we investigated three possible channels: social networks,
ideology, and media exposure. We find that social networks are unlikely to explain the major
part of differences in support for social insurance in Latin-speaking Switzerland. In fact, Latin
speakers have even somewhat closer ties to the family and close friends, but have somewhat
weaker ties to colleagues and are less engaged in clubs. We find evidence that Latin speakers
30

believe less than German speakers that hard work pays off and they feel they have less freedom
and control over their lives. This is consistent with an ideological predisposition that favors
redistribution. A deeper reason for such ideological differences may be historical. Latin Swiss
have been the oppressed minority for centuries and repeated experience of suppression may have
fostered weaker beliefs in a ”just world”. Finally, we have documented the strong segmentation
media markets by language regions. The lack of social communication via media on important
political issues such as the introduction and/or reform of social insurance programs can ex-
plain the lack of convergence in beliefs among social groups that live under similar institutional
arrangements.
Clearly, divergence of collective beliefs does not affect voting outcomes as long as the me-
dian voter is from the same social group. For instance, Swiss national votes are by and large
determined by the collective belief of the dominant majority language group, which is German.
Yet, divergent beliefs may have important efficiency consequences. Pessimism may discourage
labor supply, change health prevention strategies, and affect savings and consumption behav-
ior. Understanding the consequences of divergent beliefs on these economic decisions appears a
worthwhile topic of future research.
References
Alesina, A. and Angeletos, G.-M. (2005). Fairness and Redistribution. American Economic
Review , 95(4), 960–980.
Alesina, A. and Fuchs-Schundeln, N. (2007). Goodbye lenin (or not?): The effect of communism
on people. American Economic Review , 97(4), 1507–1528.
Alesina, A. and Glaeser, E. (2004). Fighting Poverty in the US and Europe. Oxford University
Press.
Alesina, A. F. and Giuliano, P. (2009). Preferences for Redistribution. Working paper 14825,
NBER.
Algan, Y. and Cahuc, P. (2009). Civic Virtue and Labor Market Institutions. American Eco-
nomic Journal: Macroeconomics, 11(1), 111–145.
Angelucci, M., DeGiorgi, G., Rangel, M. A., and Rasul, I. (2009). Family networks and school
enrolment: Evidence from a randomized social experiment. Discussion paper 4497, IZA.
Aspachs-Bracons, O., Clots-Figueras, I., and Masella, P. (2007). Identity and Language Policies.
Working paper no 07-77, Universidad Carlos III de Madrid.
Bchi, C. (2000). Rostigraben. NZZ Press.
Benabou, R. and Ok, E. A. (2001). Social mobility and the demand for redistribution: The
poum hypothesis. Quarterly Journal of Economics, 116(2), 447–487.
Benabou, R. and Tirole, J. (2006). Belief in a just world and redistributive politics. Quarterly
Journal of Economics, 121(2), 699–746.
31

Bisin, A. and Verdier, T. (2000). A model of cultural transmission, voting and political ideology.
European Journal of Political Economy , 16(1), 5–29.
Bjorklund, A., Lindahl, M., and Plug, E. (2006). The origins of intergenerational associations:
Lessons from swedish adoption data. The Quarterly Journal of Economics, 121(3), 999–1028.
Bloch, F., Genicot, G., and Ray, D. (2008). Informal insurance in social networks. Journal of
Economic Theory , 143, 36–58.
Bonoli, G. and Hausermann, S. (2009). New socio-structural conflicts in social policy issues:
evidence from swiss referendum votes. European Societies, 11(2), 211–232.
Bowles, S. (1998). Endogenous Preferences: The Cultural Consequences of Markets and Other
Economic Institutions. Journal of Economic Literature, 26, 75–111.
Bowles, S. and Polanıa Reyes, S. (2009). Economic incentives and social preferences: A
preference-based lucas critique of public policy. Mimeo, Santa Fe Institute and University
of Siena.
Boyd, R. and Richerson, P. J. (1985). Culture and the Evolutionary Process. Chicago: University
of Chicago Press.
Burke, M. A. and Young, H. P. (2010). Social norms. In A. Bisin, J. Benhabib, and M. Jackson,
editors, Handbook of Social Economics, page forthcoming. North Holland: Amsterdam.
Card, D. E. and Lee, D. S. (2008). Regression Discontinuity Inference with Specification Error.
Journal of Econometrics, 142(2), 655–674.
Carter, M. R. and Castillo, M. (2004). Morals, Markets and Mutual Insurance: Using Economic
Experiments to Study Recovery from Hurricane Mitch. Mimeo, University of Wisconsin-
Madison.
Clark, A. E. (2003). Unemployment as a Social Norm: Psychological Evidence from Panel Data.
Journal of Labor Economics, 21(2), 289–322.
Corneo, G. (2001). Inequality and the State: Comparing US and German Preferences. Annales
d’Economie et de Statistique, (63/64), 283–296.
de Tocqueville, A. (1899). Democracy in America. Vol I (translated by Henry Reeve). Colonial
Press, New York.
DellaVigna, S. and Kaplan, E. (2007). The fox news effect: Media bias and voting. Quarterly
Journal of Economics, 122(3), 1187–1234.
Durlauf, S. N. and Fafchamps, M. (2005a). Social capital. In P. Aghion and S. Durlauf, editors,
Handbook of Economic Growth, volume 1 of Handbook of Economic Growth, chapter 26, pages
1639–1699. Elsevier.
Durlauf, S. N. and Fafchamps, M. (2005b). Social Capital. In P. Aghion and S. Durlauf, editors,
Handbook of Economic Growth, pages 1639–1699. Elsevier.
32

Fafchamps, M. and Lund, S. (2003). Risk-sharing networks in rural Philippines. Journal of
Development Economics, 71, 261–287.
Fong, C. M. (2001). Social Preferences, Self-Interest, and the Demand for Redistribution. Journal
of Public Economics, 82(2), 225–246.
Granovetter, M. (1973). The Strength of Weak Ties. American Journal of Sociology , 78, 1360–
1380.
Groseclose, T. and Milyo, J. (2005). A measure of media bias*. Quarterly Journal of Economics,
120(4), 1191–1237.
Guiso, L., Sapienza, P., and Zingales, L. (2006). Does Culture affect Economic Outcomes?
Journal of Economic Perspectives, 20(2), 23–48.
Hahn, J., Todd, P., and van der Klaauw, W. (2001). Identification and Estimation of Treatment
Effects with a Regression-Discontinuity Design. Econometrica, 69(1), 201–209.
Holland, P. W. (1986). Statistics and Causal Inference. Journal of the American Statistical
Association, 81(396), 945–960.
Imbens, G. W. and Angrist, J. D. (1994). Identification and Estimation of Local Average
Treatment Effects. Econometrica, 62(2), 467–475.
Imbens, G. W. and Kalyanaraman, K. (2009). Optimal bandwidth choice for the regression
discontinuity estimator. IZA Discussion Papers 3995, Institute for the Study of Labor (IZA).
Imbens, G. W. and Wooldridge, J. M. (2009). Recent developments in the econometrics of
program evaluation. Journal of Economic Literature, 47(1), 5–86.
Lalive, R. (2008). How do Extended Benefits Affect Unemployment Duration? A Regression
Discontinuity Approach. Journal of Econometrics, 142(2), 785–806.
Lee, D. and Lemieux, T. (2009). Regression discontinuity designs in economics. Working Papers
1118, Princeton University, Department of Economics, Industrial Relations Section.
Leonardi, R., Nannetti, R., and Putnam, R. (1993). Making Democracy Work: Civic Traditions
in Modern Italy . Princeton: Princeton University Press.
Ludi, G. and Werlen, I. (2005). Sprachenlandschaft in der Schweiz, Eidgenossische Volkszahlung
2000. Technical report, Bundesamt fur Statistik, Neuchatel.
Luttmer, E. F. and Singhal, M. (2008). Culture, Context, and the Taste for Redistribution.
Working Paper 14268, NBER.
Narayan, D. and Pritchett, L. (1999). Cents and Sociability: Household Income and Social
Capital in Rural Tanzania. Economic Development and Cultural Change, 47(4), 871–897.
Novembre, J., Johnson, T., Bryc, K., Kutalik, Z., Boyko, A. R., Auton, A., Indap, A., King,
K. S., Bergmann, S., Nelson, M. R., Stephens, M., and Bustamante, C. D. (2008). Genes
mirror geography within Europe. Nature, 456, 98–101.
33

Piketty, T. (1995). Social mobility and redistributive politics. Quarterly Journal of Economics,
110(3), 551–584.
Putnam, R. (2000). Bowling Alone: The Collapse and Revival of American Community . New
York: Simon and Schuster.
Putnam, R. D. (2001). Bowling Alone: The Collapse and Revival of American Community .
Simon & Schuster.
Steinhauer, A. (2010). Labor force participation and working time: How culture affects female
labor supply in switzerland. Mimeo, University of Zurich.
Stutzer, A. and Lalive, R. (2004). The Role of Social Norms in Job Searching and Subjective
Well-Being. Journal of the European Economic Association, 2(4), 696–719.
Trepanier, C. (1991). The cajunization of french louisiana: forging a regional identity. The
Geographic Journal , 157(2), 161–171.
Udry, C. (1994). Risk and Insurance in a Rural Credit Market: An Empirical Investigation in
Northern Nigeria. Review of Economic Studies, 61(3), 495–526.
Verme, P. (2009). Happiness, freedom and control. Journal of Economic Behavior & Organiza-
tion, 71(2), 146–161.
Werlen, I. (2008). Sprachkompetenzen der erwachsenen Bevolkerung in der Schweiz. Technical
report, Swiss National Research Project 56.
Young, H. P. and Burke, M. A. (2001). Competition and custom in economic contracts: A case
study of illinois agriculture. American Economic Review , 91(3), 559–573.
34
Appendix
This appendix discusses the key identifying assumptions and empirical evidence allowing to
assess the validity of these assumptions.
Let Dl denote language group membership of individuals residing in the Swiss German terri-
tory, and Dr is language group membership of individuals residing in the Swiss Latin territory.
This notation serves to introduce four types of individuals.
• Language region compliers with Dr = 1 and Dl = 0. These individuals are members of the
Swiss Latin group if they live in Swiss Latin territory, and members of the Swiss German
group if they live in Swiss German territory.
• Never-Latin speakers with Dr = 0 and Dl = 0. These individuals are members of the
Swiss German language group regardless of their residence.
• Always-Latin speakers with Dr = 1 and Dl = 1. These individuals are members of the
Swiss Latin language group regardless of their residence.
• Language region defiers with Dr = 0 and Dl = 1. These individuals are members of the
Swiss German group if they live in Swiss Latin territory, and members of the Swiss Latin
group if they live in Swiss German territory.
Identification requires three key assumptions.
1. Dr ≥ Dl, i.e. individual language group membership changes monotonically with resi-
dence.
2. The limit shares of the remaining types are identical on either side of the language border,
i.e. Probl(Dr = 1, Dl = 0) = Probr(Dr = 1, Dl = 0) and Probl(Dr = 0, Dl = 0) =
Probr(Dr = 0, Dl = 0) and Probl(Dr = 1, Dl = 1) = Probr(Dr = 1, Dl = 1).
3. The limit mean potential outcomes are balanced for each of these three types, i.e. for
compliers El(Y0|Dr = 1, Dl = 0) = Er(Y0|Dr = 1, Dl = 0) and El(Y1|Dr = 1, Dl = 0) =
Er(Y1|Dr = 1, Dl = 0), for never-takers El(Y0|Dr = 0, Dl = 0) = Er(Y0|Dr = 0, Dl = 0),
for always-takers El(Y1|Dr = 1, Dl = 1) = Er(Y1|Dr = 1, Dl = 1).
Are the three identifying assumptions satisfied? Understanding the first assumption boils
down to understanding language group membership. Residents of language border towns are
members of the Swiss Latin group if they have Swiss Latin speaking parents (vertical trans-
mission of language) or if they chose to adopt one of the three Swiss Latin languages later in
their life (horizontal transmission of language). Vertical transmission is directly consistent with
monotonicity since Swiss Latin parents will be more likely to reside in Swiss Latin territory than
vice versa. Horizontal transmission likely reinforces monotonicity since people tend to adopt the
majority language later in their life.
The second and third assumption boil down to conditional independence of outcome and
potential language group membership at the language border. While conditional independence
35
can not be tested directly, we report the key indirect test (following the suggestions by Lee and
Lemieux (2009)) that consists of checking the balance of covariates at the language border.
Table 7 discusses local contrasts in culture, composition, and geography. The unit of ob-
servation is a municipality. All results are un-weighted. Column (1) reports the mean of a
characteristic in the Latin region, column (2) reports the corresponding mean in the Swiss
German region, column (3) reports the contrast Swiss Latin vs Swiss German municipalities,
column (4) provides an estimate of the local contrast (using regression 1 with each member
of the vector Xj as a dependent variable (and without further municipality controls but with
canton dummies), and column (5) provides an estimate of the local contrast with cubic spatial
trends (allowed to differ on either side of the border).
Panel A in Table 7 contrasts language group membership and religious group membership at
the border. Row 1 shows that across all municipalities, the share Swiss Latin speakers is 87 % in
Swiss Latin municipalities, 3 % in Swiss German municipalities, the difference amounting to 84
percentage points. At the border, the share Swiss Latin speakers increases by anywhere from 70
% (column 5) to 75 % (column 4). This means Language group membership increases strongly.
Rows 2 and 3 indicate that there is a corresponding, but much weaker, change in religious group
membership at the language border. Swiss Latin border towns are characterized by between 11
and 14 percentage points fewer protestants, compensated by a 5 to 12 higher share of catholics
(the remaining and excluded religions making up for the difference). In all our results below
we control for religious group membership to disentangle the role of religious group membership
from language group membership.
Panel B in Table 7 contrasts socio-demographic characteristics of residents at the language
border. All information is from the most recent year 2000 census. Results indicate that the
age structure is perfectly balanced at the language border (rows 1 and 2). There is a slightly
lower share of men living in Swiss Latin border towns (row 3). Swiss Latin border municipal-
ities are also characterized by stronger variance in education. Both the low educated and the
highly educated groups are larger in Swiss Latin municipalities than in Swiss German border
towns (rows 4-6). Municipalities are inhabited by 4800 (Swiss Latin) to 5800 (Swiss German)
residents. Swiss Latin border municipalities are slightly larger (5 to 16 inhabitants more) than
Swiss German border towns (row 7). Swiss Latin border municipalities host a higher share of
immigrants than Swiss German border municipalities (6 to 9 percentage points more; row 8).
Panel C in Table 8 reports differences in geography. The geography controls include informa-
tion on whether a municipality is located in a larger agglomeration, or whether the municipality
is characterized by a large tourism sector. We also measure a municipality’s altitude (in meters
above sea level), access to a lake border, and the use structure of its area. While there are some
significant differences between border towns (especially for the baseline specification in column
4), none of these differences appears to be robust to including cubic terms in spatial distance.
This means that we are not very far from a situation of balanced geographic background of
border municipalities.
36

Table 7: How do Border Towns Compare in Terms of Culture, Composition and Geography?
(1) (2) (3) (4) (5)
Mean Mean Difference Difference DifferenceLatin German All 50km 50km
Distance no no no quadratic cubic
% Latin speaking 87.25 3.239 84.01*** 75.35*** 69.99***[7.336] [3.708] [0.447] [2.775] [4.150]
A. Religion
% protestants 30.27 41.38 -11.10*** -10.89** -14.09*[21.59] [23.35] [1.544] [5.258] [8.297]
% catholics 49.18 41.30 7.881*** 4.583 12.55[24.93] [23.77] [1.712] [6.420] [9.802]
B. Socio-Demographic Composition
Age: 60 plus 0.285 0.267 0.022*** -0.017* -0.017[0.070] [0.054] [0.003] [0.009] [0.013]
Age: 35-59 0.469 0.478 -0.009*** 0.002 0.007[0.053] [0.0.045] [0.002] [0.008] [0.011]
Male 0.483 0.493 -0.011*** -0.010 -0.025*[0.029] [0.022] [0.001] [0.007] [0.013]
Educ. secondary 1 0.488 0.532 -0.044*** 0.004 0.022[0.061] [0.055] [0.002] [0.011] [0.017]
Educ. secondary 2 0.280 0.248 0.032*** -0.041** -0.066**[0.090] [0.077] [0.003] [0.019] [0.030]
Educ. tertiary 0.155 0.144 0.011*** 0.031*** 0.029*[0.072] [0.054] [0.003] [0.012] [0.017]
Population 4,796 5,781 -984.1 5,460* 15,785**[13,229] [16,713] [1,005] [3,283] [7,902]
% foreigners 18.70 13.98 4.727*** 8.775** 5.994[10.53] [8.428] [0.691] [3.480] [5.071]
continued on next page...
37

Table 8: How do Border Towns Compare in Terms of Culture, Composition and Geography? continued
(1) (2) (3) (4) (5)
Mean Mean Difference Difference DifferenceLatin German All 50km 50km
Distance no no no quadratic cubic
C. Geography
Agglomeration 0.558 0.521 0.0374 0.432** 0.165[0.497] [0.500] [0.0347] [0.214] [0.299]
Touristy 0.0498 0.0338 0.0160 -0.0766 0.0513[0.218] [0.181] [0.0144] [0.0808] [0.107]
Altitude (m) 574.6 530.8 43.81*** -159.1 190.2[227.8] [217.5] [15.65] [106.1] [127.2]
% area: arboricultural 4.546 2.825 1.721*** 2.222 -1.109[7.962] [3.199] [0.476] [2.543] [3.152]
% area: agriculture 31.16 41.24 -10.09*** -18.03** -9.035[24.10] [18.03] [1.558] [7.141] [9.762]
% area: alp 6.264 3.190 3.074*** 1.361 5.408[10.55] [8.237] [0.688] [4.090] [4.338]
% area: forest 30.70 30.28 0.417 -4.659 -4.770[20.98] [12.88] [1.310] [6.317] [7.706]
% area: unproductive 5.787 4.722 1.065 1.591 -1.055[11.71] [9.883] [0.778] [3.740] [5.218]
% area: constructed 20.03 16.60 3.433*** 15.35*** 8.828[19.37] [12.29] [1.215] [5.782] [7.290]
Lake border 0.256 0.185 0.0712** -0.0114 -0.138[0.437] [0.388] [0.0294] [0.208] [0.331]
Municipalities 1026 1543 2569 1177 1177
Notes: Columns (1) and (2) standard deviation in parentheses. Columns (3) - (5) robuststandard errors in parentheses. * p < 0.10, ** p < 0.05, *** p < 0.01. Estimate on Latincoefficient in regression of dependent variable on Latin, distance and cantonal fixed effects.German = Swiss German, Latin = Swiss French/Italian. Source: Swiss Household Panel(2000) and Office Federal de la Statistique.
38