The Critical Path Method : its fundamentals - CORE
127
Calhoun: The NPS Institutional Archive Theses and Dissertations Thesis Collection 1965 The Critical Path Method : its fundamentals Mercier, Arthur G. Monterey, California: U.S. Naval Postgraduate School
-
Upload
khangminh22 -
Category
Documents
-
view
4 -
download
0
Transcript of The Critical Path Method : its fundamentals - CORE

Calhoun: The NPS Institutional Archive
Theses and Dissertations Thesis Collection
1965
The Critical Path Method : its fundamentals
Mercier, Arthur G.
Monterey, California: U.S. Naval Postgraduate School


THE CRITICAL PATH METHOD;
ITS FUNDAMENTALS
*****
Arthur G. Mercier
and
Roy S. Nurmally


THE CRITICAL PATH METHOD:
ITS FUNDAMENTALS
by
Arthur G. Mercier
Lieutenant Commander, Supply Corps, United States Navy
and
Roy S. Nunnally
Commander, Supply Corps, United States Navy
Submitted in partial fulfillment ofthe requirements for the degree of
MASTER OF SCIENCEIN
NAVAL MANAGEMENT
United States Naval Postgraduate SchoolMonterey, California
19 6 5
DUDLEY KNOX LIBRARY
NAVAL POSTGRADUATE SCHOOL
MONTEREY CA 93943-5101

/\e.
A.

U. S. lWal Ft^tsra^uate Schoo-M©r*«*sVt California
THE CRITICAL PATH METHOD:
ITS FUNDAMENTALS
by
Arthur G. Mercier
and
Roy S. Nunnally
This work is accepted as fulfilling
the research paper requirements for the degree of
MASTER OF SCIENCE
IN
NAVAL MANAGEMENT
from the
United States Naval Postgraduate School


ABSTRACT
The Critical Path Method is a modern technique for the making and updat-
ing of business decisions in connection with the analyzing, planning, schedul
ing, and monitoring of large and complex projects. The intent of this re-
search paper is to provide a fundamental treatise, written in the language
of the layman, for the use of a businessman or project manager seeking a
management technique of potential use to him.
ii


TABLE OF CONTENTS
CHAPTER Page
I. INTRODUCTION 1
II. HISTORY AND PHILOSOPHY OF CPM 3
III. A SAMPLE DEVELOPMENT OF A PROJECT BY CPM 9
IV. THE MATHEMATICAL BASIS OF CPM AND MANUAL VERSUSCOMPUTER METHODS OF SOLUTION 19
V. THE NETWORK FAMILY OF TECHNIQUES 25
VI. CONCLUSION: ADVANTAGES AND LIMITATIONS OF CPM 36
BIBLIOGRAPHY 40
APPENDIX A . BASIC CRITICAL PATH DEFINITIONS 42
APPENDIX B . PROCEDURAL RULES FOR NETWORK ANALYSIS 43
APPENDIX C. SELECTED CRITICAL PATH COMPUTER PROGRAMS 48
iii


LIST OF FIGURES
FIGURE Page
1. Task listing for sample project 11
2. Network diagram for sample project 12
3. The range of possible cost alternatives in criticalpath scheduling 14
4. Comparative cost table for sample project 15
5. Theoretical minimum-time network diagram forsample project 17
6
.
Network diagram in nodal form 20
7
.
Charnes -Cooper simplex format 20
8. Charaes-Cooper primal-dual equations 21
9. Computer solution to primal-dual equations 22
10. "Factory" guide for the selection of computeror manual methods of project scheduling by CPM 22
11. List of Governmental Agencies that have includedthe use of CPM or PERT in contract specifications 28
iv


CHAPTER I
INTRODUCTION
The Critical Path Method (CPM) , one of a host of related network manage-
ment techniques developed and popularized since 1960, is a modern method for
the making and updating of business decisions in connection with the analyz-
ing, planning, scheduling, and monitoring of large and complex projects.
In the futherance of the management by exception principle, the CPM breaks
a large project down into an ordered sequence of individual tasks. This
permits the singular consideration of the level of contribution of each task
to the overall project completion, thus assisting in a determination of where
in the project to apply limited available resources toward its timely and
efficient completion.i
The intent of this paper is to weave some of the many writings about
CPM into a comprehensive treatise, written in the language of the layman,
for the use of a businessman or project manager seeking a management technique
of potential use to him. The majority of the writings to date on CPM appear
to fall into two general classes - those extolling the successes and virtues
of the technique with little basic factual development or no reference to
its limitations and those so enmeshed in mathematical or descriptive details
that they neglect most practical considerations. This paper hopefully will
provide a middle ground between these two extremes; it will describe the
CPM in the simplest possible language and develop a sample project for illus-
trative purposes; it will cover both the advantages and limitations to be
found in the utilization of CPM in project management; it will briefly des-
cribe the mathematical/linear programming basis of CPM; and it will attempt


to depict the relationship of CPM to the other members of the network family
of techniques.
The authors make no claim to any novel or original contribution to the
network science; they propose only to clarify what has already been written
about CTti to the ultimate benefit of the previously-uninformed businessman
or project manager who may have a legitimate and acute need for an applica-
tion of the technique.


CHAPTER II
HISTORY AND PHILOSOPHY OF CPM
HISTORY
While 1958 can be thought of as the year of initiation of the science of
network analysis the actual beginnings can be traced to the times of Frederick
W. Taylor and Herman Gantt. Their major contribution to scientific production
scheduling methods and an analytical approach to management problems culmin-
ated in the well known bar or Gantt Milestone Chart which portrays the degree
of completion of each individual task in a program. An inherent lack in this
approach, however, is its inability to reflect interrelationships between the
various tasks and constraints as applied to the overall project. By the mid-
1950' s it was recognized that a more revealing and detailed analysis was re-
quired to be effective in the rapidly expanding world of modern business
management
.
In 1958 the duPont Company, in an effort to reduce maintenance and con-
struction costs, assigned a study group to investigate the problem. The
approach settled on by this group was the development of an improved schedul-
ing technique as a means of reducing unproductive downtime and thereby achiev-
ing the desired savings. The results and findings of this group were report-
ed in March 1959.l
Further developments of the technique and the establishment of basic
criteria for the use of the new system resulted from the continued study
conducted by Morgan R. Walker and James E. Kelley, Jr., (In papers presented
2to the 12th International Systems Meeting in October 1959 and to the Eastern
3Joint Computer Conference in December , the methodology of CPM was first pub-
lished). Due to their early efforts and interest Walker and Kelley are


generally recognized as the originators of CPM.
It is interesting to note that during this same period a second research
group was conducting similar studies. Under the auspices of the Navy Depart-
ment's Special Programs Office, efforts to improve the planning and control
system for the development of the Fleet Ballistic Missle Program resulted in
4 5the establishment of the Program Evaluation and Review Technique (PERT). *
There is much similarity between the two methods, the major difference being
that PERT utilizes probabilities and multiple times whereas CPM relies entire-
ly upon a single "best" time estimate.
Subsequently, because the general ground rules and operating criteria
as developed by Walker and Kelley make the technique of CPM applicable to such
a broad range of industries and project oriented situations, numerous later
network analysis applications were developed and reported. A discussion of
some of these approaches will be included in Chapter V.
A recently developed approach by Levy, Thompson, and Weist * provides
a simplified process for the utilization of the CPM analysis, especially when
used in conjunction with computers. Differing slightly from the Kelley-Walker
method, this approach appears to offer the greatest potential for future
adaptations of the CPM technology.
PHILOSOPHY
The basic objective of CPM is the development of a graphical representa-
tion of the complete project plan showing the relationships and interdependen-
ti.es of all activities associated with the project from start to finish. In
CPM terminology (See Appendix A) such a graph is referred to as a network
diagram. Once such a network has been developed it becomes a relatively easy


matter for the manager, rapidly and effectively, to maintain overall control
of the project for which he is responsible.
The major advantages in the use of CPM are as follows:
A disciplined and well-organized planning effort is required.
— The ability to manage by exception becomes an actuality.
Permits the accurate forecasting of resource requirements.
Provides a pictorial view of all interdependencies and interrelationships
among activities in full detail.
Will quickly alert the manager to any possible future problem areas both
in location and effect on the overall project.
— Allows the use of the Monte Carlo system or other simulation methods for
estimating and predicting the results of planned changes.
The net results of CPM, when used properly, will be a project reflect-
ing sound planning and scheduling; improved cooperation and coordination be-
tween production centers will result in an improved contribution to performance;
action to be taken to correct problems can be pinpointed and directed toward
the proper areas rapidly and efficiently; the delineation of responsibilities
and relationships between production centers will result in the availability
of tighter controls; with the entire project developed and displayed on the
network diagram, the scope of the project becomes understandable in its en-
tirety, and oversights and duplications of effort are readily recognized.
The result, therefore, will be a much more realistic and efficient operation.
There are, however, definite limitations to the use of CPM methods.
There must be a clearly definable start and finish to the project. Con-
tinuing programs do not lend themselves to this type of analysis.
— There must be a feasible and achievable objective to be accomplished.


— Each task or activity included in the project must be definable.
The duration or time required for each activity must be estimable, at
least within broad limits.
There must be interdependencies among the activities.
There must be more than one path through the network from start to finish.
These constraints merely reflect the characteristic attributed to CPM
that routine and recurring operations do not adapt themselves to CPM methods.
In the development and use of a CPM analysis, efforts logically and
necessarily divide into three distinct areas. These might well be identified
as the planning, scheduling, and control phases of the method. It should be
noted that one of the primary benefits to this approach is the separation of
the planning and scheduling functions. The influence of the two upon each
other when accomplished concurrently, as in most older management techniques,
frequently results in an inaccurate and less efficient operating plan.
Planning -- The initial undertaking in a CPM analysis is the complete
identification of the project in terms of its component parts. This break-
down ntiay be carried to any degree desired but should be such that complete
control of the operation is insured. Care should be taken not to over compli-
cate the procedure by the inclusion of excessive numbers of applicable activi-
ties. Once such identification is completed, the individual tasks are then
included in the development of the network diagram.
Scheduling -- After the diagram has been constructed each task is then
evaluated in terms of a "best" estimated time span or duration. These times
are then included on the diagram and used during the control phase for the
maintenance of progress checks. During this phase there is also developed
available time-cost trade offs by activity, the equating of time periods in


terms of resource values, for possible future use. At this point the critical
path is then determined. This computation results in the evaluation of the
longest path or paths through the network establishing the estimated comple-
tion time.
Control -- During this period reports and records are maintained to re-
flect an updated status of the project. Decisions concerning the utiliza-
tion of available resources, expenditure of extra efforts to obtain a reduc-
tion in activity times along the critical path, and the recomputation of new
critical paths are made by the manager during this phase. Slippages and
other problems are corrected, using the information generated by the establish-
ed procedures, resulting in the maintenance of proposed time schedules or the
forecasting of new times of completion. It should be remembered, however,
that the main purpose of the CFM analysis is to indicate how a project will
be accomplished and not how it might be.


CHAPTER II FOOTNOTES
m. R. Walker, and J. S. Sayer, "Project Planning and Scheduling," Report6959, E. I. du Pont de Nemours & Company, Inc., Wilmington, Delaware,March 1959.
2Ideas for Management , Papers and Histories presented at the 12th Internation-
al Systems Meeting, Systems and Procedures Association, Edwards Brothers,Inc., Ann Arbor, Michigan, I960, pp 403-411.
3James E. Kelley, Jr., and Morgan R. Walker, "Critical-Path Planning and
Scheduling: An Introduction," Mauchly Associates, Inc., Ambler, Pa.,
1959.
4PERT (Program Evaluation Research Task), Phase I Summary Report, Special
Projects Office, Bureau of Ordnance, Department of the Navy, Washington25, D. C, July 1958.
PERT (Program Evaluation Research Task), Phase II Summary Report, SpecialProjects Office, Bureau of Ordnance, Department of the Navy, Washington25, D. C, September 1958.
f.
F. K. Levy, G. L. Thompson, and J. D. Wiest, "Critical Path Method -
A New Tool for Management," O.N.R. Research Memorandum No. 97, Pitts-burgh 13, Pa., May 25, 1962.
, , and , "Mathematical Basis of the CriticalPath Method," O.N.R. Research Memorandum No. 86, Pittsburgh 13, Pa.,
May 30, 1962.


CHAPTER III
A SAMPLE DEVELOPMENT OF A PROJECT BY CPM
In order for a project to lend itself to the scheduling control of the
Critical Path Method, it must have the following essential characteristics:
(1) the project consists of a well-defined collection of tasks which, when
completed, mark the end of the project; (2) the tasks may be started and
stopped independently of each other, within a given sequence; and (3) the
tatks are ordered, i.e., performed in technological sequence. Basically
then, the Critical Path Method breaks a large project down into an ordered
sequence of individual tasks, i.e., each task is specifically related to
the task or tasks that immediately precede it, the task(s) that immediately
succeed it, and the task(s) that can be accomplished concurrently. The
heart of the technique and the graphic convention normally used in portrayal
of the CPM is a network diagram. The diagram is most valuable as a means of
visually and conceptually relating the complex of tasks in a project to one
another and to overall project requirements; however, it is noted that com-
puter programs are available which permit the necessary calculations to be
2made without reference to any graph or diagram.
3Consider, for purposes of illustration of the method, a simple project
for the manufacture of a machine component which consists of two parts, P
and Q. Each part must be turned on a lathe, and Q must also be polished.
Two types of raw materials, A and B, are needed. Figure 1 is a listing of
the tasks required to complete the project with a best estimate of the time
required for each. Note the addition of two pseudo- tasks "start" and "finish",
Each requires zero time to carry out; "start" is a predecessor to all other
tasks; "finish" is a successor to all other tasks; and both are used for


bookkeeping purposes only.
Figure 2 is the corresponding network diagram for the project. The
method used in depicting this diagram differs in some respects from the
representation used by James E. Kelley,Jr., and Morgan R. Walker. In the
Kelley-Walker format, tasks are shown as arrows, and the arrows are connect-
ed by means of small circles (or nodes) that indicate sequence relationships.
Thus all immediate predecessors of a given job connect to a node at the tail
of the task arrow, and all immediate successor tasks emanate from the node
at the head of the task arrow. In essence, then, a node marks an event -
the completion of all tasks leading into the node. Since these tasks are
the immediate prerequisites for all task arrows leading out of the node,
all must be completed before any succeeding tasks can begin. In order to
accurately portray all predecessor relationships, "dummy" tasks must often be
4added to the network diagram in the Kelley-Walker form. (See Appendix B for
further details of the Kelley-Walker rules.) The method described below is a
composite of what has been used by many later CFM authors; it avoids the
necessity of "dummy" tasks; it is easier to program for a computer; and it
is simpler to explain and apply.
In Figure 2, the number to the far left of each block (early start time)
represents the earliest time the task can be started, and the number to the
immediate right of each block (early finish time) the earliest time it can
be completed. The number to the immediate left of each block (late start
time) represents the latest time the task can be started without delaying
the project, and the number to the far right of each block (late finish time)
the latest time it can be completed without delaying the project. The slack
time for each task is the difference between its late start time and its early
10

-

TASK
a
b
c
d
e
f
gh
IMMEDIATE TIMEDESCRIPTION PREDECESSORS REQUIRED
Start NoneOrder A a 2
Order B a 1
Turn P b,c 2
Turn Q b,c 1
Polish Q e 2
Assembly d,f 1
Finish g
FIGURE 1
TASK LISTING FOR SAMPLE PROJECT
11


0-0 [ b. Order A [2-2
2-2f e. Turn Q {3-3
The key to the notation used for each individual task block is
shown be-low?
i as;: idenoil icationTask time recmireTnsnt Early finish tirr.o-Late f«t#
FIGURE 2
NETWORK DIAGRAM FOR SAMPLE PROJECT
12


start time (or, equivalently, between its late finish time and its early
finish time) and may be thought of as the available freedom or leeway in
scheduling the particular task.
Thus, the critical path, which consists entirely of critical tasks (or
tasks with zero slack), can now be identified as the longest continuum of
tasks through the project (the dotted path, a-b-e-f-g-h, in Figure 2). Any
delay in completion of any one of these tasks will delay completion of the
entire project. At this point in the critical path analysis, all critical
tasks have been identified, and the amount of slack in all the others is
known. In addition, a graphic timetable has been constructed to facilitate
further examination and improvement of task sequences and schedules.
Most projects can be accomplished in a number of ways ranging between
minimum cost (usually accompanied by normal or optimal time) and minimum time
(normally accompanied by maximum cost) . Figure 3 graphically portrays the
range of available alternatives in a typical project. Critical path schedul-
ing permits an educated compromise between these extremes for the most ef-
ficient accomplishment of management goals. Figure 4 is a fictitious cost
table illustrating the cost differences between the normal method of complet-
ing the project (as shown in Figures 1 and 2) and an alternative crash basis
for the previously-developed example.
The original critical path from Figure 2, a-b-e-f-g-h, required 6 time
units. The normal total project cost under these conditions would be $100.00.
From Figure 4, the cheapest way to shorten this path 1 time unit would be to
accomplish Task b on a crash basis at an additional cost of $5.00. Note,
however, that, if this step is taken, path a-c-e-f-g-h also becomes critical,
and any further calculations must now take account of two critical paths.
13


Max.cost
E-<
enOo£-•
owo
Norm.cost
PROJECT TIME
FIGURE 3
THE RANGE CF POSSIBLE COSTALTERNATIVES IN CRITICAL PATH SCHEDULING
14


NORMAL CRASH Additional CostsTask Time Dollars Time Dollars Per Time Unit
Saved
b* 2 $10 1 $15 $5c 1 $10 1 $10 --
d 2 $20 1 $30 $10e* 1 $10 % $15 $10f* 2 $30 1 $60 $30g* 1 $20 % $40 $40
*Denotes a critical task under normal conditions
FIGURE 4
COMPARATIVE COST TABLE FOR SAMPLE PROJECT
15


For example, both these paths could be shortened an additional % time unit
by accomplishing Task e on a crash basis at an additional cost of $5.00.
Continuing these calculations, it can be readily seen that the absolute
minimum time in which the project could be completed would be 3 time units
at a total project cost of $165.00. The network diagram would now appear as
in Figure 5. It is noted that all four paths (a-b-e-f-g-h, a-c-e-f-g-h,
a-b-d-g-h, and a-c-d-g-h) are now critical. Task d could still be shortened
an additional % time unit at a cost of $5.00, but to no theoretical avail in
the scheduling phase, as the overall project time would still require a
total of 3 time units. However, later on during the controlling phase of
the project, it might still prove desirable to take this step if unforeseen
slippages in earlier tasks have occurred.
The preceding example is illustrative of the time savings that can be
realized from reducing the times of selected critical tasks. Of course,
overhead costs have been neglected in this analysis. These fixed costs per
project usually decrease as project time is shortened, and any actual applica-
tion of the CPM would have to take these reductions into account, as well as
such economic factors as the premium prices customers are willing to pay for
the early delivery of end items. Actual results in the employment of CPM
in industry indicate that significant reductions in project time can usually
be realized for less than a 5% increase in total costs.
16

.

0-0 a. Start
0-0
1-1
1 1
1
14-14
b. Order A1
1-1
e.Turn qTTJ-iJ
f. Polish Q1
2h-2h
24-2J
3-3
0-0
0-0 c. Order B1
g. Assembly 3-3
jL
h. Finish 3-3
1-1
;
FIGURE 5
THEORETICAL MINIMUM-TIME NETWORKDIAGRAM FOR SAMPLE PROJECT
17


CHAPTER III FOOTNOTES
F. K. Levy, G. L. Thompson, and J. D. Wiest, "The ABCs of the CriticalPath Method," Harvard Business Review , Vol. 41, No. 5 (Sept/Oct., 1963),
pp. 98-99.
9F. K. Levy, G. L. Thompson, and J. D. Wiest, "Critical Path Method -
A New Tool for Management," Office of Naval Research Memorandum No. 97,May 25, 1962, p. 2.
3Basic example taken from John G. Kemeny and others, Finite Mathematics
with Business Applications (Englewood Cliffs, N. J.: Prentice-Hall, Inc.,
pp. 73-77.
4James E. Kelley, Jr., "Critical Path Planning and Scheduling,"
Operations Research , Vol 9, No. 3 (May-June, 1961), pp. 301-302.
J. S. Sayer, J. E. Kelley, Jr., and Morgan R. Walker, "Critical PathScheduling," Factory , July, 1960, p. 77.
18


CHAPTER IV
THE MATHEMATICAL BASIS OF CPMAND
MANUAL VERSUS COMPUTER METHODS OF SOLUTION
The preceding example, considering a simple project of six tasks, is
illustrative of the simplicity and straight forwardness of the CPM, but what
about a complicated project consisting of 1600 rather than 6 tasks? Obvious-
ly, management must turn to a computer for assistance in such cases if it
can. By the construction of mathematical models of the situation, electronic
computers can be programmed to provide the same information for complicated
projects that a network diagram provides for simpler ones.
The mathematical model upon which the CPM is based is a parametric linear
program, incorporating sequence information, durations, and costs for each
component of the project, and solvable via a primal-dual algorithm. Like
most other CPM theory, the mathematical model was largely developed by J. B.
Kelley, Jr., utilizing both his own discovery of the relationship between para-
2metric programming and the primaldual algorithm and a variation of the Ford-
3Fulkerson flow algorithm. Applying their own works on programming to Kelley's
model,Charnes and Cooper have since developed quite a simple means of setting
up the solution to a critical path problem in a standard primal-dual linear
4programming format. To illustrate the simplicity of the Charnes-Cooper
method, a network diagram in nodal form (Figure 6), a simplex format (Figure
7), the equivalent primal-dual sets of equations (Figure 8), and the computer
solution (Figure 9) for the previously-developed example of Chapter III are
illustrated on following pages.
Once the critical path problem is arranged in the standard linear program-
ming form, there are many computer programs readily available which may be
19


FIGURE 6
NETWORK DIAGRAM IN NODAL FORM
>•"-•• "" '' r
» 2 1
_1
2 1 2 1"rs
01 H1
1
1
0-1b
1-4€
4-5f
5-6g
0-2c
2-3d
3-6g
1-3d
2-4e
1 i
1 -1 1
2 -1 11
11
3 -1 1 -1
4 -1 1 -1
5 -1 1
6 -1 -1 -1
FIGURE 7
CHARNES -COOPER SIMPLEX FORMAT
20


PRIMAL EQUATIONS
Maximize: 2x01 +lx1 , +2x^flx C kflx02*2x23+lx36*2xl3*lx
24
subject to:
x01 +x02= 1
-x01 f x
14 + x13
=
rxQ2 + x23
4 x24
=
- x23
+ xJ6
- x13
-
' -XH+ X45
- X24
=
" x45
f X56
=
- x56 " X
36=-1
and x. .-01J
DUAL EQUATIONS
Minimize: w~ -w6
subject to:'
Wq -W-, ^2
W-, -w4
w4
*1
-w_ ^2
w5
"w6
-1
w -w2
*1
w2
-w3
w3
*2
-w, -16
Wl
-w3
^2
w2
-«4
'
*1
in which the variables are not constrained in sign.
FIGURE g
CHARNES-COCPER PRIMAL-DUAL EQUATIONS
2L


The computer solution to the above primal problem would
appear as: 2xQ1
+x +2x45 +*56 = 6
and to the dual as: Wq -w,- = 6.
Since x in this notation is equivalent to task b in the
notation of Chapter III, x,, to task e, x to task f , and
x , to task g, the solutions indicate that tasks (a)-b-e-
f-g-(h) form the critical path of the network, each of themj
consuming the time of their respective coefficients, for a
total elapsed project time (wq-W/-) of 6 time units.
FIGURE 9
COMPUTER SOLUTION TO PRIMAL-DUAL EQUATIONS
Log/log scale
s* CO
£ 'HlOO•HP COcti «H 1
u o
tJ o
s s ioCO O•O 5:
O -PJ-i OP, C« •
XXo o .U U i 1
£<% 1(
\ \ Use\ \ computer
Manual \^ v\calculation Y£ \
i< i A i \3 2-0- -1A— 100 200' U0O 1(
Number of network events)00
FIGURE 10
"FACTORY" GUIDE FOR THE SELECTION OFCOMPUTER OR MANUAL METHODS OF PROJECT
SCHEDULING BY CPM
22


utilized for its solution. (A list of selected critical path computer pro-
grams for both CPM and PERT is included as Appendix C.) There are numerous
consulting and service firms who will provide these computations on a fee
basis, or a business with a computer can have its own operating personnel
trained in the fundamentals of critical path programming in about a week.
Figure 10, based on actual industry experience, provides a rough guide to the
relative feasibility of using computer or manual network methods in project
scheduling by the CPM.
23


CHAPTER IV FOOTNOTES
James E. Kelley, Jr., "Critical Path Planning and Scheduling: Mathe-matical Basis," Operations Research , Vol. 9, No. 3 (May-June, 1961), p. 296.
2J. E. Kelley, Jr., "Parametric Programming and the Primal-Dual Algorithm,"
Operations Research , Vol. 7 (1959), pp. 327-334.
3L. R. Ford and D. R. Fulkerson, "A Simple Algorithm for Finding Maximal
Network Flows and an Application to the Hitchcock Problem," Canadian Journalof Mathematics , Vol. 9, (1957), pp. 210-218.
4A. Charnes and W. W. Cooper, "A Network Interpretation and a Directed
Subdual Algorithm for Critical Path Scheduling," The Journal of IndustrialEngineering, Vol. 13, No. 4, (July-August, 1962), pp. 213-219.
J. S. Sayer, J. E. Kelley, Jr., and Morgan R. Walker, "Critical PathScheduling," Factory , July, I960, p. 77.
Marvin Flaks and others, "Network Management Techniques," Factory ,
March, 1964, p. 91.
24


CHAPTER V
THE NETWORK FAMILY OF TECHNIQUES
The conduct of business in today's space-age atmosphere requires an ever
more responsive and sophisticated capability in all fields of management. In
the combination of the new concepts of time-cost relationships, critical path
analysis, and improved reporting systems with the earlier Gantt Chart, mile-
stone reporting systems, and network analysis, a versatile aid in the format
of critical path analysis has been provided. The continuously expanding family
of techniques, developed since 1958 and utilizing basic CPM concepts, is an
indication of the potential benefits resulting from the intelligent use of
such methods.
While the greatest emphasis in the development of these techniques has
been provided by the Department of Defense, commercial applications are becom-
ing more common as additional information and published accounts of successful
uses become available. Far-sighted companies, led mainly by the major defense
contractors, are recognizing the values inherent in such an approach. In the
face of decreasing profit margins, scarce resources, and ever mounting develop-
ment and production costs, the savings in valuable time to be realized assumes
an increasing importance. As a result of these adaptations to meet individual
and specific problems, there has been a steady addition to and broadening of
network analysis.
In this chapter will be presented a representative sample of such applica-
tions; first as developed in and for military usage and second as a commercial
by-product for other uses. While such a discussion is not intended to be ex-
haustive it will provide some indication of the wide range of application of
network analysis.
25

•

MILITARY
Faced with ever increasing defense costs and shrinking operating budgets,
the Department of Defense has provided much of the necessary incentive towards
the development of improved techniques in all areas of management. In view
of the present policy of evaluating economic alternatives, to provide the
maximum defense for a given dollar cost, the need for specific and accurate
information is evident. The importance of such information is reflected in
the requirement for the submission of critical path analysis data with sub-
mitted bids on defense contracts. Such information provides the best possible
answers to many pertinent questions concerning and affecting the decision
making process in the selection of the best alternative.
Scarce Resources . The attainment of both feasible and achievable objec-
tives is, in large measure, dependent upon the proper allocation of available
resources. This includes technical abilities, materials, and funds.
Leadtimes. While a program selected may be feasible and achievable,
the time necessary for the development and production of the end product may
be prohibitive.
Predicting and Controlling Costs . In the past, cost overruns to defense
procurements have added greatly to defense spending, especially in the area
of research and development. Because of the huge sums involved there is an
obvious need for the most accurate forecasting of and the closest adherence
to projected costs.
Design Changes and Modifications . Another practice which has added
tremendously to defense costs in the past has been the extensive incorpora-
tion of alterations and modifications to originally contracted equipments.
While such changes are generated rapidly under the present technological
ability of industry, all too frequently such changes, included at additional
26


costs and sometimes resulting in excessive delays, have proven to be neither
necessary nor warranted.
A valuable tool has become available for the use of planners and project
managers with the development of the various critical path analysis techniques.
With these and other tools the projecting and forecasting of future require-
ments and costs on a more realistic and factual basis has resulted in a much
improved decision making process. An indication of the extensive use of
these methods on the part of the military and other government agencies is
given by Figure 11.
The following is a discussion of a selected sample of the various systems
of analysis presently being used. These will give some indication of the
evolutionary nature and constantly expanding and improving science of network
analysis.
PERT (Program Evaluation Review Technique)
Developed during the same period as CPM this system is concerned mainly
with improving the planning associated with research and development. The
nomenclature and methods of PERT are very similar to those used in CPM: the
selection of appropriate activities and events, the development of the net-
work diagram, identification of the critical path, and improved progress re-
porting and control features. PERT, however, unlike CPM, utilizes probability
theory in the scheduling process and develops three applicable times for each
activity: a pessimistic, an optimistic, and a most likely time for completion.
This is a major difference to the single most likely or best time estimate of
CPM.
In addition, the original concept of PERT does not include a capability
for the evaluation of activities in terms of cost as does CPM. As a result,
expediting or speed-ups of projects under this method cannot be priced out in
time-cost trade off fashion.
27


Some Governmental Agencies That Have Included The Use of CPM or PERT in
Contract Specifications.
Department of the Navy:
Bureau of Naval Weapons
Special Projects Office
Bureau of Yards and Docks
Bureau of Ships
Department of the Air Force:
Air Force Systems Command
Ballistic Systems Division
Electronic Systems Division
Department of the Army:
Corps of Engineers
National Aeronautics and Space Admin.
Federal Aviation Agency
General Services Administration
Method Required:
PERT
PERT, cost control
CPM, cost control
CPM and PERT
PERT, cost control
PERT, cost control
PERT
CPM, cost control
CPM, PERT, cost control
CPM
CPM
The above list is only representative and not intended to be exhaustive,
FIGURE 11
28


PERT/COST
A recent development has been the addition of a cost analysis capability
in conjunction with PERT. This newer approach is referred to as PERT/COST.
In addition to the normal PERT information this method provides:
1. Individual activity cost estimates.
2. Contract values and realistic budget information.
3. A more efficient scheduling of available resources.
4. A capability to compare actual and budgeted costs and progress
at any time.
LOB (Line of Balance)
While not a planning and scheduling procedure in the same sense as CPM
and PERT, this method utilizes many identical concepts in the control of
actual production scheduling. The major benefit to be gained is the graphi-
cal display of all production processes included in the project in the form
of an updated status board. In this manner the completion status of the
overall project is quickly determined and slippages and problem areas become
readily apparent.
The primary advantage of the system is its ease of operation. Complex
computers and mathematical formulas are not required. As a control record it
can be maintained with a minimum of effort and is easily understood by all
concerned.
The four major components of the system are: (1) a graph of the pro-
duction and shipping schedules, (2) a time phased plan for production, (3)
a bar chart indicating the status of performance within each control area,
and (4) an understandable legend of the chart. When combined these present
a complete picture of the production schedule and its latest status.
29


The procedure requires the definition of all component activities in-
cluded in the production of an end item, starting with necessary procurement
actions and ending in the shipment of the completed unit. Such steps as
fabrication, testing, assembly, final testing, packing, and shipping are
examples of the possible functions to be included in this technique. With
the inclusion of duration time estimates for each step, it becomes a rela-
tively simple matter to lay out the bar chart in such a manner that comple-
tion times and dates are readily indicated. The determination of event
sequences provides the overall time requirements for the project. By main-
taining up-dated progress and completion information for each activity, the
manager is able to determine the current status of the project. Problem
areas can be spotted early and corrective action taken before the entire
project is affected and delayed.
Additional systems utilizing critical path analysis are:
ABLE (Activity Balance Line Evaluation)
A program status measuring, forecasting, and reporting system.
COMET (Computer Operated Management Evaluation Technique)
Designed for use in planning, scheduling, and monitoring the acquisi-
tion of electronic equipments and systems.
CPA (Cost Planning and Appraisal)
A system to assist equipment managers in developing a more effective
means of managing cost-type contracts by integrating data on cost, time,
and technology.
IMPACT (Integrated Managerial Programming Analysis Control Technique)
Provides progress reporting and program control for Government furnished
material through use of a standardized PERT network and an equipment procure-
ment factor data bank. The system includes milestone reporting, procurement
30

.
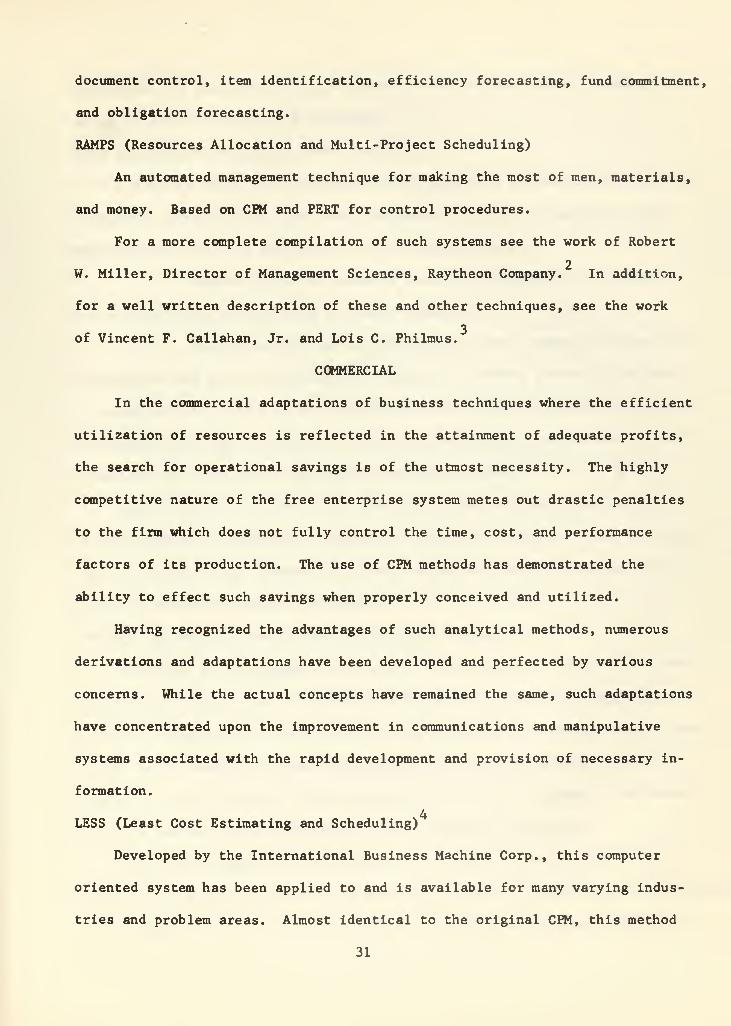
document control, item identification, efficiency forecasting, fund commitment,
and obligation forecasting.
RAMPS (Resources Allocation and Multi-Project Scheduling)
An automated management technique for making the most of men, materials,
and money. Based on CPM and PERT for control procedures.
For a more complete compilation of such systems see the work of Robert
2W. Miller, Director of Management Sciences, Raytheon Company. In addition,
for a well written description of these and other techniques, see the work
3of Vincent F. Callahan, Jr. and Lois C. Philmus.
COMMERCIAL
In the commercial adaptations of business techniques where the efficient
utilization of resources is reflected in the attainment of adequate profits,
the search for operational savings is of the utmost necessity. The highly
competitive nature of the free enterprise system metes out drastic penalties
to the firm which does not fully control the time, cost, and performance
factors of its production. The use of CPM methods has demonstrated the
ability to effect such savings when properly conceived and utilized.
Having recognized the advantages of such analytical methods, numerous
derivations and adaptations have been developed and perfected by various
concerns. While the actual concepts have remained the same, such adaptations
have concentrated upon the improvement in communications and manipulative
systems associated with the rapid development and provision of necessary in-
formation.
4LESS (Least Cost Estimating and Scheduling)
Developed by the International Business Machine Corp., this computer
oriented system has been applied to and is available for many varying indus-
tries and problem areas. Almost identical to the original CPM, this method
31


determines the fastest and most economical means of completing a project using
arrow diagramming (network diagramming)
.
LOCS (Librascope Operations Control System)
A computer based data accumulation and reporting system utilized in the
design and production of electronic equipments. Control of purchasing and
nanufacturing cycles is maintained in the following manner:
1. Punched tapes are prepared whenever a document is initiated
and automatically entered into a central computer.
2. Data collectors at key points within the company correlate such
information and provide pertinent information to control points in the form
of computer print outs. Such information as the start and finish of various
processes, ordering or receipt of material, and shipping information is pro-
vided for the updating of appropriate analysis records.
Used in conjunction with CPM, PERT, or an appropriate variation, the
system provides instantaneous updating of status information. This will be
one of the first such systems to obtain the actual real-time savings neces-
sary to efficient computer operation.
TRACE (Task Reporting and current Evaluation System)
Developed by Ling—Temco—Vought, Inc., this system is utilized for both
military and other uses. The system is compatible with CPM techniques and
provides information in such areas as costs, manpower, and forecasting. Used
mainly as a reporting system, TRACE provides for the rapid maintenance of
control records affecting widely separated and complex programs. The system
utilizes leased lines, transceivers, and centralized computers.
This short summary of the systems in use today is indicative of the in-
creasing acceptance of the CPM technology by industry. While minimal in numbers,
this resume gives positive evidence of the application of these methods to a
32


wide variety of management and control areas. Such acceptance has proven the
validity of the concepts when used under appropriate circumstances. Accounts
of successful applications and generated savings are being reported steadily
in various journals and publications. To the business firm where "time is
money" such savings cannot be ignored.
Factory provides the basic circumstances of two recent applications of
CPM as follows:
Ford Motor Company (Detroit) applied critical path scheduling to
a model changeover at a transmission plant. It cut project time 20%and saved "substantial" money. It was a big job, involving not onlylayout, machine installation, and facility tryout, but purchase of 200pieces of machinery and tooling, 1500 gauges, and 60 types of raw materialand finished parts. Management ran the conventional reporting systemparallel with critical path scheduling, until everyone gained confidencein it.
The East Alton (111.) brass operations of Olin Metals has threemassive projects under way at the same time. The three, which involvetwo outside engineering firms as well as Olin employees, include a newprimary brass mill, expansion and modernization of two finishing millsabout 500 miles apart, and the consolidation of scattered fabricatingdepartments. All three projects maintain their own critical path schedulesand feed information into a central control room at East Alton. Olin hasbeen able to roll with several hard punches in the course of the four yearundertaking, and credits critical path scheduling with enabling it torespond swiftly, on target, and at minimum cost whenever problems showup.
Harvard Business Review provides another:
Du Pont, a pioneer in the application of the CPM to constructionand maintenance projects, was concerned with the amount of downtime formaintenance at its Louisville works, which produces an intermediateproduct in the neoprene process. Analyzing the maintenance scheduleby the CPM, Du Pont engineers were able to cut downtime for maintenancefrom 125 to 93 hours. The CPM pointed to further refinements that wereexpected to reduce total time to 78 hours. As a result, performance of
the plant improved by about one million pounds in 1959, and the inter-mediate was no longer a bottleneck in the neoprene process.
Factory provides, further, cases of successful applications of methods
similar to CPM:
A major castings company used PERT to plan and control the purchase
33

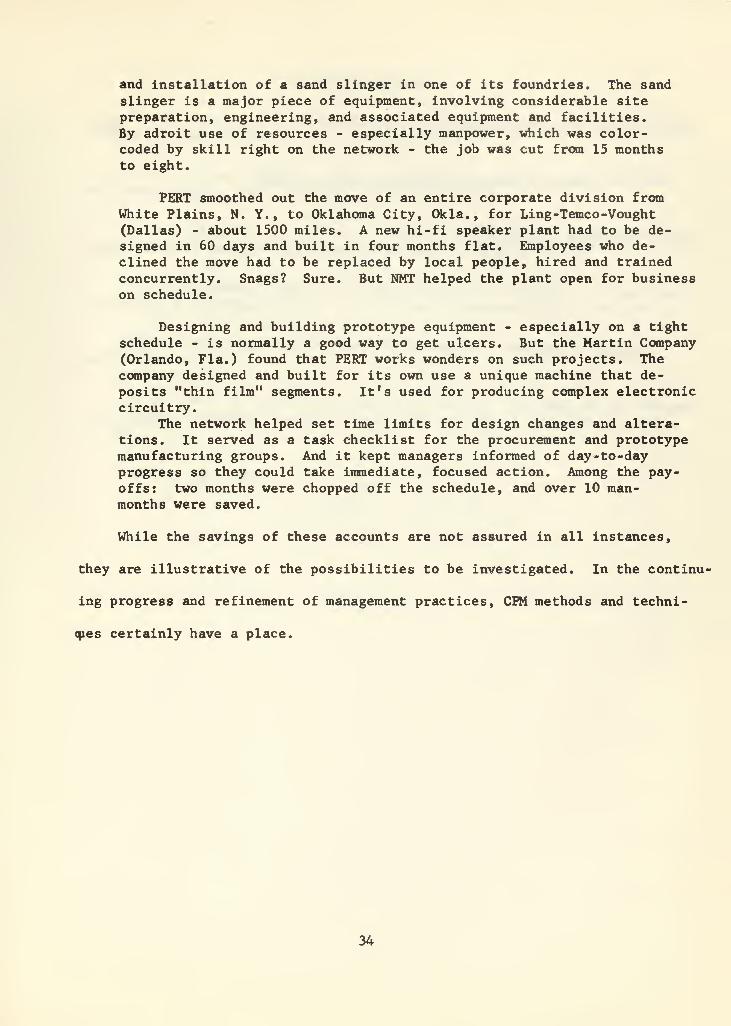
and installation of a sand slinger in one of its foundries. The sandslinger is a major piece of equipment, involving considerable sitepreparation, engineering, and associated equipment and facilities.By adroit use of resources - especially manpower, which was color-coded by skill right on the network - the job was cut from 15 monthsto eight.
PERT smoothed out the move of an entire corporate division fromWhite Plains, N. Y., to Oklahoma City, Okla. , for Ling-Temco-Vought(Dallas) - about 1500 miles. A new hi-fi speaker plant had to be de-signed in 60 days and built in four months flat. Employees who de-clined the move had to be replaced by local people, hired and trainedconcurrently. Snags? Sure. But NMT helped the plant open for businesson schedule.
Designing and building prototype equipment - especially on a tightschedule - is normally a good way to get ulcers. But the Martin Company(Orlando, Fla.) found that PERT works wonders on such projects. Thecompany designed and built for its own use a unique machine that de-
posits "thin film" segments. It's used for producing complex electroniccircuitry.
The network helped set time limits for design changes and altera-tions. It served as a task checklist for the procurement and prototypemanufacturing groups. And it kept managers informed of day-to-dayprogress so they could take immediate, focused action. Among the pay-
offs: two months were chopped off the schedule, and over 10 man-months were saved.
While the savings of these accounts are not assured in all instances,
they are illustrative of the possibilities to be investigated. In the continu-
ing progress and refinement of management practices, CPM methods and techni-
ques certainly have a place.
34


CHAPTER V FOOTNOTES
J. J. Moder, and C. R. Phillips, Project Management with CPM and PERT ,
Reinhold Publishing Corp., New York, 1964, p. 11.
2R. W. Miller, Schedule, Cost, and Profit Control with PERT , McGraw-
Hill Book Company, Inc., New York, 1963, pp 207-215.
3V. F. Callahan, Jr., and L. C. Philmus, Defense/Space Management Hand -
book , Callahan Publications, Washington, D. C, 1963, pp 14-49.
4M. C. Frishberg, "LESS Tells You How Project is Doing," Hydrocarbon
Processing & Petroleum Refiner, Vol. 41, No. 2, February 1962, pp. 130-138.
Marvin Flaks and others, "Network Management Techniques," Factory ,
March 1964, p. 91.
F. K. Levy, G. L. Thompson, and J. D. Wiest, "The ABCs of the CriticalPath Method," Harvard Business Review, Vol. 41, No. 5, (Sept/Oct., 1963),p. 100.
Flaks, loc. cit.
35


CHAPTER VI
CONCLUSIONS ADVANTAGES AND LIMITATIONS OF CPM
The preceding discussion of the CPM should not be construed as a pro-
posal for its application to all large projects as a magical cure-all. In
order for a project to lend itself to the analysis and control of the CPM, it
must have the essential limiting characteristics noted in both Chapters II and
III. These requirements immediately eliminate all open-end projects and con-
tinuous-flow processes, e.g., oil refining, from any analysis by critical
path techniques.
Widely diverse kinds of projects do, however, lend themselves to analysis
by the CPM, as is suggested by the following typical projects to which it
might be applied:
1. The construction of a building.2. Planning and launching a new product.3. Installing and "debugging" a computer system.4. Research and engineering design projects.5. The scheduling of ship construction and repair.6. The manufacture and assembly of a product under job-lot
operations.7. Turnaround maintenance projects in which an entire facility
is shut down, overhauled, and put back into production.
When the project at hand fits the ground rules for application of the CPM
on either a manual or computer basis, the major advantages of its utiliza-
tion appear to boil down to these:
1. It separates the planning and scheduling phases of projectpreparation.
2. It focuses management attention on a critical few of the
total project tasks.
3. It facilitates self-correction in that as errors in task timeestimates are discovered, revised project graphs can be readilyconstructed, manually or by computer.
4. It places a price tag on change, thus enabling the greatesttime savings for the least expenditure of dollars.
36


5. It is a basically simple technique, easy to learn and to
apply, and highly adaptable to a wide variety of projects.
This is not to say that CPM, or for that matter any other network
technique, is handed to management on a silver platter without inherent diffi-
culties and costs. Some of the important disadvantages of CPM are these:
1. It is not flexible in regard to its sequence of events, i.e.,
one network allows one and only one such sequence. In orderto provide for alternative sequences of events, alternate net-works must be prepared and analyzed.
2. The time-cost tradeoff advantage of CPM analysis may, in some
cases, simply not exist. Time and cost can vary independentlyas well as dependently, e.g., a technical breakthrough couldgain time at little or no cost, and the failure of an end itemon the final test stand could wipe out time gains which hadbeen realized at heavy cost.
3. Resources - money, people, skills - are not always flexible,and it may not be possible to shift them to a more criticalevent as might be indicated advisable from project networkanalysis.
4. Managers and operating personnel must be trained in criticalpath fundamentals and operating techniques; and training ef-
fort costs both time and money.
5. Planning with CPM and other network techniques is costly. Somemanagers estimate that network planning is about twice as ex-
pensive as conventional planning approaches. More specifical-ly, Aerojet-General Corporation (Azuza, California) allows 0.5%of the total cost of any project for PERT expense, and FordMotor Company estimates that the cost is about 1% of the totalcost of the first project and 0.5% of later ones conducted bythe same people
.
However, the problems of increased planning costs and the other possible
disadvantages which may accompany the introduction of CPM to a project should
not preclude its use after a careful management determination of its approp-
riateness. Who can estimate the offsetting values of beating a competitor
to market with a new product, of getting a new machine or plant into opera-
tion months ahead of the original schedule, or of improved communication and
faster reaction to production problems? In conclusion, it is sufficient to
37


state that the Critical Path Method is a modern technique of tremendous
potential benefit to a businessman or project manager when intelligently
applied under appropriate circumstances.
38


CHAPTER VI
Marvin Flaks and others, "Network Management Techniques," Factory ,
March, 1964, p. 91.
39


BIBLIOGRAPHY
Astrachan, A. "Better Plans Come from the Study of Anatomy of an EngineeringJob," Business Week , March 21, 1959, pp. 60-66.
Callahan, V. F, , Jr., and L. C. Philmus (editors). Defense/Space ManagementHandbook . Washington: Callahan Publications, 1963.
Charnes, A. , and W. W. Cooper. "A Network Interpretation and a DirectedSub-dual Algorithm for Critical Path Scheduling," Journal of IndustrialEngineering , July-August, 1962, pp. 213-219.
Cosinuke, W. "The Critical Path Method," PERT; A New Management Planningand Control Technique . New York; American Management Association,1962. pp. 147-163.
Department of Defense and National Aeronautics and Space Administration.PERT Cost Systems Design . Washington: Callahan Publications, 1962.
Flaks, M. , and others. "Network Management Techniques ," Factory , March,1964, pp. 87-112.
Ford, L. R. , and D. R. Fulkerson. "A Simple Algorithm for Finding MaximalNetwork Flows and an Application to the Hitchcock Problem," CanadianJournal of Mathematics , Vol. 9 (1957), pp. 210-218.
Holder, J. R. "A Study of Some Statistical and Managerial Procedures forIncreasing the Effectiveness of a Program Evaluation and Review Techni-que." Unpublished Master's thesis, The University of Kansas, 1963.
(Authors Note : This thesis contains an excellent general bibliographyof 712 entries covering both CPM and PERT).
Kelley, J. E., and M. R. Walker. "Critical Path Planning and Scheduling:An Introduction," Proceedings of the Eastern Joint Computer Conference ,
Boston, December 1-3, 1959, pp. 160-173.
Kelley, J. E. "Critical-Path Planning and Scheduling: Mathematical Basis,"Operations Research , Vol. 9, No. 3 (May-June, 1961), pp. 296-320.
Kelley, J. E., Jr., and M. R. Walker. "The Critical Path Method of Planningand Scheduling," Ideas for Management
, papers and histories presented atthe 12th International Systems Meeting, Systems and Procedures Associa-tion. Ann Arbor: Edwards Brothers, Incorporated, 1960, pp. 403-411.
Kemeny, J. G., and others. Finite Mathematics With Business Applications .
Englewood Cliffs, N. J.: Prentice-Hall, 1962.
Levy, F. K. , G. L. Thompson, and J. D. Wiest. "Mathematical Basis of theCritical Path Method," Industrial Scheduling . Englewood Cliffs, N. J.:
Prentice-Hall, 1963.
40


Levy, F. K. , G. L. Thompson, and J. D. Wiest. "The ABCs of the CriticalPath Method," Harvard Business Review , Vol. 41, No. 5 (September-October, 1963), pp. 98-108.
Levy, F. K. , G. L. Thompson, and J. D. Wiest. " Multi-ship, Multi-shopProduction Smoothing Algorithm," Naval Logistics Research Quarterly ,
March 9, 1962.
Martino, R. L. "How Critical-Path Scheduling Works," Canadian ChemicalProcessing, February, 1960.
Miller, Robert W. Schedule , Cost, and Profit Control with PERT . New York;
McGraw-Hill Book Company, 1963.
Moder, J. J., and C. R. Phillips. Project Management with CPM and PERT .
New York: Reinhold Publishing Corporation, 1964.
PERT (Program Evaluation Research Task), Phases I and II Summary Reports,Special Projects Office, Bureau of Ordnance, Department of the Navy,Washington 25, D. C, September, 1958.
Sayer, J. S., J. E. Kelley, and M. R. Walker. "Critical Path Scheduling,"Factory , July, 1960, pp. 74-77.
41


APPENDIX A
BASIC CRITICAL PATH DEFINITIONS
Activity - a project element involving the expenditure of time and otherresources.
Dummy activity - an activity included solely for bookeeping purposes andutilizing no time or resources.
Arrow - the representation of an activity on the network diagram.
CPM - Critical Path Method.
Critical Path - the sequence of activities and events, from start to finish,requiring the maximum time during project completion.
Event - the beginning or completion of an activity or a group of activities.
Float - the amount of time an activity can be delayed without delayingcompletion of the overall project.
Network - a representation of a project in diagrammatic form which displaysall activities and events and their mutual relationships.
Node - a representation of an event on a network diagram.
Path - any series of interconnected activities and events between thestart and finish of a project.
PERT - Program Evaluation and Review Technique.
Resource - any contributing factor necessary for the completion of anactivity within a project.
Slack - the amount of time an activity can be delayed without delaying comple-tion of the overall project.
42


APPENDIX B
PROCEDURAL RULES FOR NETWORK ANALYSIS
In the development of the CPM network diagram there are a number of
basic rules which need be applied. The use of such rules is necessary to
insure a consistency of representation and, in some instances, for mathe-
matical computation. While it is not mandatory to comply completely with
these rules in a manual manipulation of the network, most computer programs
require strict adherence.
ACTIVITY
An activity is a required task to be performed in the completion of the
project under control. Represented normally by an arrow, there must be both
a start and finish to the activity. Other terms sometimes used to designate
such activities are job and task. All refer to the expenditure of both time
and resources.
DUMMY ACTIVITY
The so-called "dummy" activity is one wherein there is a requirement for
neither resources nor time. The primary use of a "dummy" activity is to in-
dicate a sequence or completion relationship between two activities when there
is no specific dependency of one upon the other. This is especially useful
when using a computer. Such activities are represented as dashed arrows or
solid arrows with zero time indicated.
-> " >
43


EVENT
An event is the beginning or ending of any activity and represents a
given point in time. Usually represented as a circle on the diagram the
event is sometimes referred to as a "node" or "connector". When an event
represents a multiple ending of two or more activities it is referred to as
a "merge" event, and when it represents a multiple beginning for two or more
activities as a "burst" event.
O y
merge burst
NETWORK
The network is the graphical representation of all activities and events
included in the overall project. A synonym sometimes used is the "arrow
diagram".
RULES
:
1. No succeeding activity may begin prior to the completion of all
activities which directly precede it.
2. Arrows reflect sequences and precedences only and do not normally
represent time to scale. (In exceptional cases the diagram may be prepared
on a time-scaled basis.)
44


Rules 3, 4, and 5 are required for computer use and are generally
followed in all cases as a matter of form.
3. There must be no duplication of event numbers within a network.
4. Networks must begin with only one starting event (node) and end
with one finish event (node).
5. There may be only one activity directly connecting any two events
(nodes)
.
EXPLANATION OF RULES.
Rules 1. and 2. can be explained by the following diagram:
*®
Before activity G can begin, activities E and F must be completed.
(Rule 1) . There is no intent to indicate that activities E and F are to be
completed simultaneously, since this is not included in Rule 1 and is not a
necessary condition.
In accordance with Rule 2, events 7 and 8 are connected by activity G
only and may not be connected by any other activity.
COMMON ERRORS IN DIAGRAMMING;
Rule 1 is the rule most frequently violated when constructing the net-
work. In the example above, suppose activity G is dependent upon activity
E completely but only upon the first half of activity F. The correct re-
presentation would then be as follows:
—-—>@—*—*®a
45


As can be seen an additional activity and event have been inserted to
correct the mis-representation of complete dependency. This is referred to
as a partial dependency.
A second common error encountered is the formation of a loop. As illus-
trated below, activities H, I, and J are presented such that I is dependent
upon H, J is dependent upon I, and H is dependent upon J. Obviously, a
loop has been formed and an impossible situation exists.
A violation of Rule 3 appears below:
6> *0 >@In using a computer the situation above could not be programmed. It
is necessary, then, when employing computers, that the same event number not be
used more than once. Some programs, in addition, require that each event be
larger than any event preceeding it.
Rule 4 requires that there be only one starting and ending event or
node. Event 1 has been added below in order to join a number of concurrent
first activities in order to conform with this requirement. (tyote the use of
dummy activities with no time or resource requirements to connect the affected
events.)
46


A violation of Rule 5 is illustrated below:
As can be seen there are two activities directly connecting the same
events. To correct this situation a dummy activity and an additional event
may be used.®^^>A second, but less common, method would be to join the two activities
into one. This method is seldom utilized due to the loss of desired detail
within the diagram.
© ILL *z>
47


APPENDIX C
SELECTED CRITICAL PATH COMPUTER PROGRAMS'
Computer Contact for Further
No. Equipment Information on Program Capacity Category and Comments
1 Burroughs 200 Supervisor of Programming
Burroughs Computation Center
Box 843
Paoli, Pennsylvania
2 Burroughs 220 same as above
Control DataG-15
Control Data
G-20
Control Data
G-20
Control Data
1604
GE-225
Honeywell 400
or K00
Honeywell 800
or 1800
10 IBM 650
Control Data Corporation
5030 Arbor Viuo Street
Los Angeles 45, Calif.
same as above
same as above
Mr. Ronald L. Benton
Computer Division
Control Data Corporation
8100 34th Avenue South
Minneapolis 20, Minnesota
Mr. Earnest NussbaumWashington Information Process-
ing Center
General Electric Company7S00 Wisconsin AvenueBcthesda 14, Maryland
500 activities
300 events
400 activities or more,
depending on equip-
ment
863 activities (CPM)431 activities (PKRT)
150 to 2C00+ activi-
ties, depending on
core and tape capacity
same as above
3000 activities
2100 activities
1000 events
Honeywell Klnotronic Data Proi;- 3000 activities
essiiig 2000 events
60 Walnut Street
Wcllcslcy Hills 81, Mass.
same as above unlimited
Mr. F. Backer, Jr. 999 events
IBM Applied Science
2911 Cedar Springs RoadDallas 19, Texas
basic PERT
basic CPM for network system employing
activities on nodes; utilizes calendar dates
and permits random numbering of activities
basic CPM or PERT without calendar dates
or ulphnbotiu description!*; ono output report
"PERT I" is a basic PERT program, with
limited output capability
"PERT II" is a basic PERT program, with
a variety of output 6orts and formats
basic PERT
basic CPM with random numbering of
events; calendar dates; cost optimization;
15 optional sorts; tape file maintenance;
called "Critical Path Method Program"and "Project Monitor and Control Method(PROMOCOM)"
banio PERT
basic PERT; slack computed from inter-
mediate scheduled dates
basic CPM with cost optimization; called
"LESS" program; 650 Program Library
Xo. 10.3.005
Joseph J. Moder and Cecil R. Phillips, PrelectMa nap- em ent with CPM and PFRT (new York: Reinhcld PublishingCorporation, 1964")", pp. 255-260.
48


No,
ComputerEquipment
11 IBM 650 or
1620
12 IBM 704 or
7090
13 IBM KOI
Information on I'ro'jram
Contact jor Further
Mr. H. X. Pork
Systems Analysis Dept.
The Dow Chemical Co.
Frccport, Texas
Mr. F. B. Quackenboss, Head
Operations Research Dept.
General Motors Research Labora-
tories
12 Mile and Mound Roads
Warren, Michigan
TYPHOX Weapon System Analy-
sis Center
Johns Hopkins Univ./APL
8621 Georgia Avenue
Silver Spring, Maryland
Capacity Category and Comments
capacity is problem "manscheduling" addition to LESS program
dependent above allows limitations on avaiiabilitjfcs of
up to 10 skill categories; 650 Program
Library Xo. 10.3.006., 1620 Program Library
Xo. 10.3.013
— basic CPM with cost optimization; 704
Program Library Xo. 11S8GMCP
unlimited several programs for validation and editing
of input data prior to processing on APL/JHU version of XASA PERT "B" program
for IBM 7090
14 IBM 1401
15 IBM 1410
16 IBM 1620
(card)
17 IBM 1620
(tape)
IS
19
IBM 1620
(card or tape)
IBM 7070 and
1401
Mr. Lou Granato
IBM Corporation
631 Cooper Street
Camden 2, Xew Jersey
Mr. Keith WoodcoxIBM Corporation
1371 Pcachtrec St., X.E.Atlanta 9, Georgia
Mr. John C. Patton
IBM Corporation
1220 19th Street, X.W.Washington 6, D. C.
Mr. Bob X. ManningGoodyear Aircraft Corp.
Arizona Division
Litchfield Park, Arizona
Mr. Ray X. Sauer
IBM Corporation
2601 South Main Street
Houston, Texas
Miss Shirley InmanComputer Techniques Dept.
Collins Radio Company
9S5 to 2125 events, de-
pending on core
1000 events, or 3397
events and activities
999 events
Total of 1614 events
and activities for 20Kequipment, 3614 for
40K. and 5614 for 50K
basic CPM
basic CPM but with PERT features of
probability and scheduled dates
PERT and CPM with cost optimization
1620 Program Library Xo. 10.3.006
basic PERT, 1620 Program Library Xo.10.3.009
basic CPM with random event numberingand random activity ordering; 1620 ProgramLibrary Xos. 10.3.011 (card) and 10.3.012
(tape)
basic PERT, with combination activity andevent orientation
49


ComputetA'o. Equipment
Contact jor Further
Information on Program Capacity Category and Comments
20 IBM 7000
21 IBM 7000
23 IBM 7000
23 IBM 7000
24 IBM 7000/94
CommanderU. S. Naval Weapons Lab.Dahlgrcn, Virginia
Attn: Code KPOMr. Walter W. Shirley
015 South Mariposa Ave.Lou Angeles 5, Calif,
PERT Control BoardHq. AFSC (SCCS)Andrews AFBWashington 25, D. C.
Mr. R. W. Hainc, Mgr.Management Information Sys.
Corporate Industrial DynamicsHughes Aircraft CompanyInternational Airport Station
P. 0. Box 90515
Los Angeles 9, Calif.
C-E-I-R, INC.Marketing Information Services
1200 Jefferson Davis Hwy.Arlington, Virginia 22202
13,500 events
1750 to SOOO activities,
depending on equip*
ittcnt
13,000 KdtivUiM in ii«i-
tailcd network
5120 activities in de-
tailed network
approximately 700 ac-
tivities total for 3
projects and 20 re-
sources (it is a func-
tion of the mix of
these parameters)
basic PERT; file establishment and file up-
dating by exception on magnetic tape in-
cluded in the program; activity and event
reports generated
basic CPM with "manschcduling" of up to
00 crafts per network; six crafts per activ-
ity; 7000 Program Library No. 1320R0S0O0
lumic, PHUT widi network uoiukiusation andintegration; activity and/or event orienta-
tion; tape file maintenance; optional treat-
ments of scheduled dates; graphical outputfor selected milestones; called "PERT, III"
basic PERT with cost control ; network con-densation and integration; tape file main-tenance; graphical output for selected mile-
stones; several levels of cost summarization;program is proprietary
basic CPM with resource allocation andmultiproject scheduling; proprietary system,called "RAMPS"; allocates limited resources
to competing activities on the ba&is of. sev-eral management-controlled features includ-
ing float factors, project priorities and delaypenalties; handles varying resource availa-.
bility, shift operations, several accomplish-ment rates, and work efficiencies; producinga work Schedule, resource summary andcost report
25 IBM 7000/04 Mr. X. Leon Montgomeryand Gen. Dy- Secretary UAIDEnamics Elcc- General Dynamics/AstronauticsIronies SC4020 . P. O. Box 106
Mail Zone 591-50
San Diego 12, Calif.
20 IBM 7000/94 Local IBM Branch Office
up to 10C0 activities or
more, depending on
tape capacity
75,000 activities
called "NAP," system accepts PERT net-
work charts via the cathode ray tube com-
puter (SC4020) ; scries of pictures must be
joined together to produce complete net-
work
basic PERT with cost optimization and con-
trol ; up to seven levels of summarization
;
also included arc computer generated net-
works and time, manpower, and cost sum-maries; ^ called "PERT Cost," Lib. No.
7090-CP-OlX
27 IBM 7000/94
2S IBM 7000
(optional use
of IBM 1401)
20 NCIi-30-1 or
NCR-315
NASA Headquarters
Management Information
Systems Division, Office of Admin-istration
Washington 25, D. C.
Douglas Aircraft Co., Inc.
3000 Ocean Park Boulevard
Santa Monica, California
Attn : Aerospace Computing',
A2-2C0
Dr. E. W. Bold
Scientific Programming DPS&SNational Cash Register
Dayton 0, Ohio
71GS activities
40C0 activities per de-
tail network—up to
125 detail networks
and/or 50,000 activi-
ties
5000 activities
has most features of PERT class except
probability; accepts only single time esti-
mate; summarizes by milestones; master
file stored on cards or tape with updating to
file by 1401 ; called "NASA PERT B"
basic features of PERT except probability;
network summarization and skeletonization -
capabilities; graphical output and optional
generation of printed gummed labels for use
in network construction; error check capa-
bility includes optional use . of 1401 pre-
processor edit program ; called "Douglas
PERT MARK IV System" Proprietary
basic PERT
50


CoiiijfUtcr Contact Jor Further
No. Equipment InjormuLion onTrogram Capacity Category and Comments
Philco 2000
31 RECOMP II
f RCA 301
RCA 301
34 RCA 501
35 RCA 501 or
RCA 301
3G UNIVAC 1107
Mr. R. E. Larson
Philco Corporation
Western Computing Center3875 Fabian WayPalo Alto, Calif.
Autonetics, Computers & DataSystems
3370 East Anaheim RoadAnaheim, California
Management Science
Radio Corporation of America
Electronic Data Processing
vision
Cherry Hill, Camden 8, N. J.
same as above.
750 activities basic PERT; called "WCC PERT"
same as above.
same as above.
V. Erskine
UNIVAC Division
Sperry Rand Corp.
Sperry Rand Bldg.
New York 19, New York
703 activities basic CPM ; accepts three time estimates
and multiple initial nodes; several optional
outputs; Program No. 58, "SCHEDULECRITICAL PATH"
16,000 activities basic PERT with several sort options and
9000 events report codes; time unit arbitrary when unit
Di- is available; intermediate schedule dates are
optional for slack computation
24,000 activities basic resource allocation for up to 50 differ-
ent resources, plus aggregate cost analysis;
considers availability of resources by prior-
ity and costs; graphical outputs
2000 activities basic PERT; accepts punched cards, paper
1000 events tape, or magnetic tape
— . called "APEX," a system that integrates
accounting entries with project control re-
porting; provides much of the information
for network cost control
12,000 activities basic PERT with cost control called
12,000 events "UNIVAC 1107 PERT Cost System"; Satis-
fies reporting requirements of DOD/NASA
;
contains network condensation and integra-
tion feature
51


Jhis document has been approved for publicrelease aj ' ' ".' -- :-;^ j g unlimited!.!

1
1"?