The COVID-19 lab score: an accurate dynamic tool to predict ...
9
1 Vol.:(0123456789) Scientific Reports | (2021) 11:9361 | https://doi.org/10.1038/s41598-021-88679-6 www.nature.com/scientificreports The COVID‑19 lab score: an accurate dynamic tool to predict in‑hospital outcomes in COVID‑19 patients Pablo Jose Antunez Muiños 1,3 , Diego López Otero 1,3* , Ignacio J. Amat‑Santos 2 , Javier López País 1,3 , Alvaro Aparisi 2 , Carla E. Cacho Antonio 1,3 , Pablo Catalá 2 , Teba González Ferrero 1,3 , Gonzalo Cabezón 2 , Oscar Otero García 1,3 , José Francisco Gil 2 , Marta Pérez Poza 1,3 , Jordi Candela 2 , Gino Rojas 2 , Víctor Jiménez Ramos 1,3 , Carlos Veras 2 , J. Alberto San Román 2 & José R. González‑Juanatey 1,3 Deterioration is sometimes unexpected in SARS‑CoV2 infection. The aim of our study is to establish laboratory predictors of mortality in COVID‑19 disease which can help to identify high risk patients. All patients admitted to hospital due to Covid‑19 disease were included. Laboratory biomarkers that contributed with significant predictive value for predicting mortality to the clinical model were included. Cut‑off points were established, and finally a risk score was built. 893 patients were included. Median age was 68.2 ± 15.2 years. 87(9.7%) were admitted to Intensive Care Unit (ICU) and 72(8.1%) needed mechanical ventilation support. 171(19.1%) patients died. A Covid‑19 Lab score ranging from 0 to 30 points was calculated on the basis of a multivariate logistic regression model in order to predict mortality with a weighted score that included haemoglobin, erythrocytes, leukocytes, neutrophils, lymphocytes, creatinine, C‑reactive protein, interleukin‑6, procalcitonin, lactate dehydrogenase (LDH), and D‑dimer. Three groups were established. Low mortality risk group under 12 points, 12 to 18 were included as moderate risk, and high risk group were those with 19 or more points. Low risk group as reference, moderate and high patients showed mortality OR 4.75(CI95% 2.60–8.68) and 23.86(CI 95% 13.61–41.84), respectively. C‑statistic was 0–85(0.82–0.88) and Hosmer–Lemeshow p‑value 0.63. Covid‑19 Lab score can very easily predict mortality in patients at any moment during admission secondary to SARS‑CoV2 infection. It is a simple and dynamic score, and it can be very easily replicated. It could help physicians to identify high risk patients to foresee clinical deterioration. In December 2019, an outbreak of a new syndrome emerged in the Chinese province of Hubei. A new betacoro- navirus was described, called SARS-CoV-2 1 . By April 18th, the World Health Organization reported more than 2 million of confirmed cases of COVID-19 disease (Coronavirus Disease 2019), affecting 200 different countries all around the world 2 . Deaths rose to almost 140 thousand people. One of the most encouraging characteristic of Covid-19 disease, is the huge differences in the clinical manifes- tations depending of each patient 3–5 . It is suspected that some of them are paucisymptomatic, or even completely asymptomatic. On the other hand, in some patients SARS-CoV-2 could trigger a big inflammation response, causing a severe disease. Severe Acute Respiratory Syndrome is one of the most common and severe complica- tions, due to its predisposition for the respiratory system, requiring sometimes admission in Intensive Care Units (ICU) or mechanical ventilation and with an elevated death rate 6 . ree different phases are described 7 . First one is the early infection, and secondary there is the pulmonary involvement, causing bilateral infiltrates. Finally, a stage of hyperinflammation is described, affecting extrapulmonary organs and triggering a systemic cytokine storm. Elevated levels of some biomarkers 5 such as Interleukin (IL)-2, -6, -7, TNFα, IFNγ, C-reactive protein, ferritin, D-Dimer, procalcitonin, troponin are described in this severe patients. At this stage, mechani- cal ventilation and admission at ICU are frequently needed, because of hypoxemia, respiratory failure, or even shock secondary to vasoplegia. OPEN 1 Cardiology Department, Hospital Universitario de Santiago de Compostela, Choupana S/N, C.P. 15706, A Coruña, Spain. 2 Cardiology Department, Hospital Clínico Universitario de Valladolid, Valladolid, Spain. 3 CIBERCV, Madrid, Spain. * email: [email protected]
-
Upload
khangminh22 -
Category
Documents
-
view
4 -
download
0
Transcript of The COVID-19 lab score: an accurate dynamic tool to predict ...
1
Vol.:(0123456789)
Scientific Reports | (2021) 11:9361 | https://doi.org/10.1038/s41598-021-88679-6
www.nature.com/scientificreports
The COVID‑19 lab score: an accurate dynamic tool to predict in‑hospital outcomes in COVID‑19 patientsPablo Jose Antunez Muiños1,3, Diego López Otero1,3*, Ignacio J. Amat‑Santos2, Javier López País1,3, Alvaro Aparisi2, Carla E. Cacho Antonio1,3, Pablo Catalá2, Teba González Ferrero1,3, Gonzalo Cabezón2, Oscar Otero García1,3, José Francisco Gil2, Marta Pérez Poza1,3, Jordi Candela2, Gino Rojas2, Víctor Jiménez Ramos1,3, Carlos Veras2, J. Alberto San Román2 & José R. González‑Juanatey1,3
Deterioration is sometimes unexpected in SARS‑CoV2 infection. The aim of our study is to establish laboratory predictors of mortality in COVID‑19 disease which can help to identify high risk patients. All patients admitted to hospital due to Covid‑19 disease were included. Laboratory biomarkers that contributed with significant predictive value for predicting mortality to the clinical model were included. Cut‑off points were established, and finally a risk score was built. 893 patients were included. Median age was 68.2 ± 15.2 years. 87(9.7%) were admitted to Intensive Care Unit (ICU) and 72(8.1%) needed mechanical ventilation support. 171(19.1%) patients died. A Covid‑19 Lab score ranging from 0 to 30 points was calculated on the basis of a multivariate logistic regression model in order to predict mortality with a weighted score that included haemoglobin, erythrocytes, leukocytes, neutrophils, lymphocytes, creatinine, C‑reactive protein, interleukin‑6, procalcitonin, lactate dehydrogenase (LDH), and D‑dimer. Three groups were established. Low mortality risk group under 12 points, 12 to 18 were included as moderate risk, and high risk group were those with 19 or more points. Low risk group as reference, moderate and high patients showed mortality OR 4.75(CI95% 2.60–8.68) and 23.86(CI 95% 13.61–41.84), respectively. C‑statistic was 0–85(0.82–0.88) and Hosmer–Lemeshow p‑value 0.63. Covid‑19 Lab score can very easily predict mortality in patients at any moment during admission secondary to SARS‑CoV2 infection. It is a simple and dynamic score, and it can be very easily replicated. It could help physicians to identify high risk patients to foresee clinical deterioration.
In December 2019, an outbreak of a new syndrome emerged in the Chinese province of Hubei. A new betacoro-navirus was described, called SARS-CoV-21. By April 18th, the World Health Organization reported more than 2 million of confirmed cases of COVID-19 disease (Coronavirus Disease 2019), affecting 200 different countries all around the world2. Deaths rose to almost 140 thousand people.
One of the most encouraging characteristic of Covid-19 disease, is the huge differences in the clinical manifes-tations depending of each patient3–5. It is suspected that some of them are paucisymptomatic, or even completely asymptomatic. On the other hand, in some patients SARS-CoV-2 could trigger a big inflammation response, causing a severe disease. Severe Acute Respiratory Syndrome is one of the most common and severe complica-tions, due to its predisposition for the respiratory system, requiring sometimes admission in Intensive Care Units (ICU) or mechanical ventilation and with an elevated death rate6. Three different phases are described7. First one is the early infection, and secondary there is the pulmonary involvement, causing bilateral infiltrates. Finally, a stage of hyperinflammation is described, affecting extrapulmonary organs and triggering a systemic cytokine storm. Elevated levels of some biomarkers5 such as Interleukin (IL)-2, -6, -7, TNFα, IFNγ, C-reactive protein, ferritin, D-Dimer, procalcitonin, troponin are described in this severe patients. At this stage, mechani-cal ventilation and admission at ICU are frequently needed, because of hypoxemia, respiratory failure, or even shock secondary to vasoplegia.
OPEN
1Cardiology Department, Hospital Universitario de Santiago de Compostela, Choupana S/N, C.P. 15706, A Coruña, Spain. 2Cardiology Department, Hospital Clínico Universitario de Valladolid, Valladolid, Spain. 3CIBERCV, Madrid, Spain. *email: [email protected]
2
Vol:.(1234567890)
Scientific Reports | (2021) 11:9361 | https://doi.org/10.1038/s41598-021-88679-6
www.nature.com/scientificreports/
The aim of the study was to identify high risk patients affected with COVID-19, those with a poor outcome, depending on laboratory biomarkers. Mortality was selected as the primary endpoint of interest. Risk factors and comorbidities such as obesity and diabetes have been described with a poorer outcome8,9. Moreover, a dynamic, objective and very easily score could help physicians to anticipate clinical deterioration. Our goal is to stratify the risk of death for patients with Covid-19 at any moment during the admission, using a very simple and reproducible analytic tool, developed only with laboratory parameters.
MethodsThis is a multicentre, retrospective, observational study performed at three university hospitals from the North-West region of Spain, covering a population of more than one million of inhabitants. In our registry we included all the confirmed cases for SARS-CoV-2 infection from our health areas (n = 1779). Patients were recorded during the first two months since the first case in our areas was diagnosed. For the purpose of this study, we only ana-lysed those patients admitted to hospital with available information about laboratory data (n = 893). Follow-up continued for 3 months. This study was approved by the Ethical Committee of Investigation of Santiago and Lugo (registry code 2020/187) with an approval number UNH-ARA-2020-01, and it fulfils the Declaration of Helsinki of 1975.
We selected laboratory parameters were previously associated with SARS-CoV2 infection in recent literature5,10–14 and with a poorer outcome similar viral severe infections15–18. Moreover, haemoglobin and eryth-rocyte levels, or serum creatinin were evaluated because of their relation with outcomes in severe ill patients, The most deviant from normal results of the laboratory tests for each biomarker during the admission were selected for the score (they were mostly the higher ones, except for the haemoglobin and erythrocytes).
Normal ranges for the different parameters were: procalcitonin < 0.05 ng/mL; Haemoglobin 13.5–17.5 g/dL for men and 12.2–16.1 g/dL for women; erythrocytes 4.5–5.5 per 106/mm3 ; leukocytes 4.09–10.8 per 103/mm3 ; neutrophils 1.7–7.33 per103/mm3 ; creatinine 0.4–1.3 mg/dL for men and 0.4–1.1 mg/dL for women; C-reactive protein 0–0.5 mg/L; interleukin-6 0–5.0 pg/mL; lactate dehydrogenase (LDH) 200–446 UI/L; D-dimer 0–500 ng/mL.
Outcomes. This work is conducted to develop an easily replicable, objective and dynamic score to help phy-sicians to assess the risk of adverse outcomes at any moment during the admission due to COVID-19.
All the information about the clinical evolution and the complications developed was recollected along the admission and continued also when discharged, thanks to remote monitoring. Mortality for any cause during the hospitalization was selected as the main outcome, and was recollected from clinical records. Secondary endpoints were non-cardiovascular outcomes such as ICU admission, necessity of mechanical ventilation or pulmonary embolism. Acute myocardial infarct, heart failure and stroke were established as cardiovascular outcomes.
Data collection. Standardized forms were used for the setting-up of the database, including demographic information, epidemiological data, previous comorbidities and chronic treatments, the clinical data available at the moment when they were admitted to hospital (symptoms, fever and peripheral O2 saturation (SpO2), the results of all laboratory tests done during the admission and the treatment received. All these information was collected from medical records. Laboratory test and clinical decisions were taking according to physician´s cri-teria. Informed consent was obtained for study participation of each patient when admitted to hospital. The data in source documents was confirmed independently by at least two physicians.
Statistical analysis. Continuous variables are presented as mean (SD), whereas discrete variables are pre-sented as percentages. Comparisons between discrete variables were performed using the χ2 test or Fisher exact test as required, and comparisons between continuous variables using the Student t-test (Table 1).
Backward stepwise logistic regression analysis was performed to determine the predictive factors for mortal-ity. Variables that were significantly associated with mortality in the univariate analysis (Supplementary Table 1) were included in the multivariate model (Table 2). The multivariate adjustment was performed according these variables, in addition to biomarkers: age, comorbidities (hypertension, dyslipidemia, diabetes mellitus, peripheral artery disease, heart disease, Chronic Obstructive Pulmonary Disease (COPD)/asthma), days of symptoms, res-piratory insufficiency (defined as PaO2 < 60 mmHg), and in-hospital drugs (antiviral, chloroquine, ceftriaxone, corticosteroids, anticoagulation, antiplatelet). The incremental value of each significant biomarker, when it was added to a clinical base model, was assessed with the change in the c-index (Table 3).
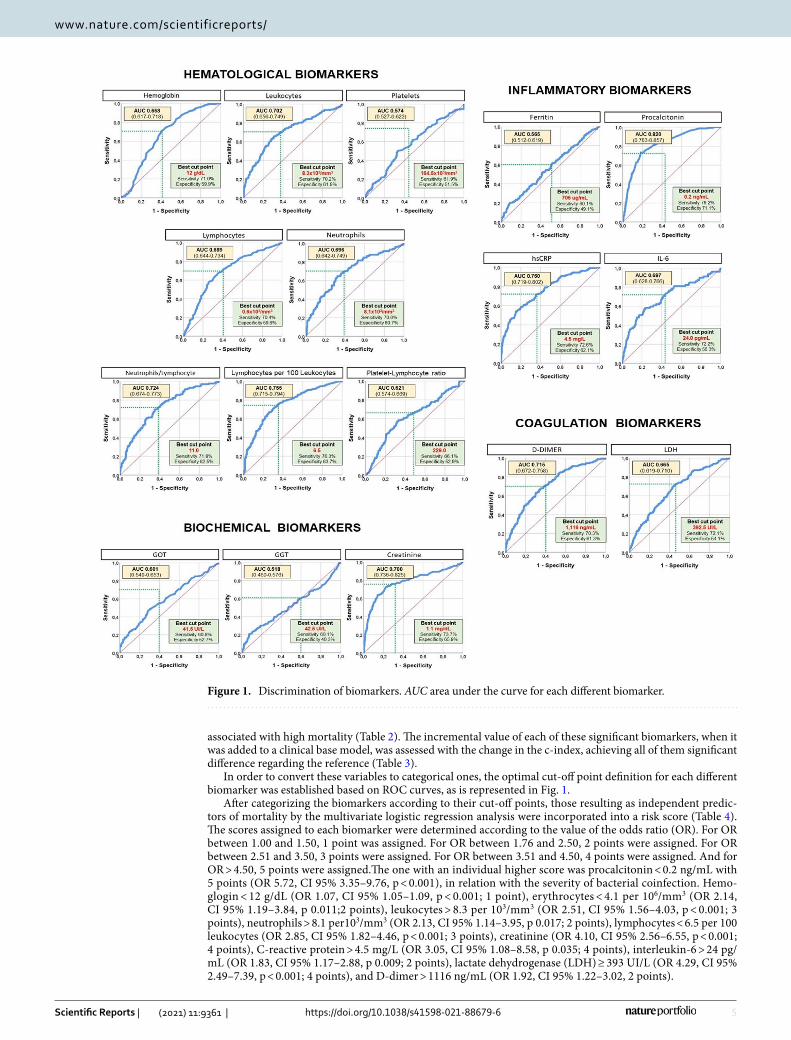
The optimal cut-point definition for different biomarkers was defined based on the receiver operating char-acteristic (ROC) curve, using the Youden index (Fig. 1). Sensitivity and specificity were reported for cut-points.
After categorizing the biomarkers according to their cut-points, those resulting as independent predictors of mortality by the multivariate logistic regression analysis were incorporated into a risk score (Table 4). The scores assigned to each biomarker were determined according to the value of the odds ratio (OR). The predicted probability of death based on the risk score was graphically represented after modelling by fractional polynomials (Fig. 2). The performance of this risk score was tested by assessing its discrimination and calibration capacity (Table 5), for all-cause death. Discrimination was evaluated by calculating the C statistic, and calibration was assessed by the Hosmer–Lemeshow test.
All p values were two-sided and values < 0.05 were considered as significant. All statistical analyses were per-formed using STATA software, version 15.1 (Stata Corp, College Station, Texas, USA), and IBM SPSS software, version 24.0 (IBM, Armonk, New York, USA).
3
Vol.:(0123456789)
Scientific Reports | (2021) 11:9361 | https://doi.org/10.1038/s41598-021-88679-6
www.nature.com/scientificreports/
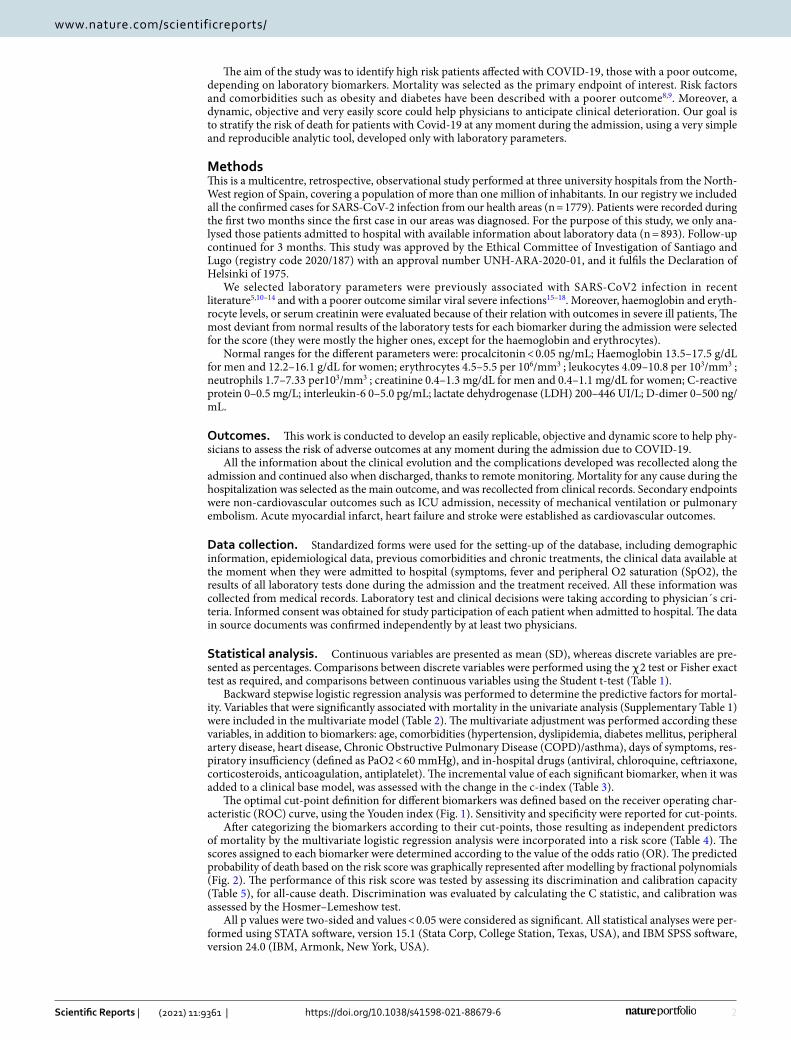
ResultsFrom all cases diagnosed in our health areas (n: 1799), a total of 893 patients were admitted to hospital due to COVID-19. Baseline characteristics are described in Table 1. Median age was 68.2 ± 15.2 years, and 453 were female (50.7%). Considering these 893 patients admitted to hospital, 87 (9.7%) patients were admitted to Inten-sive Care Unit (ICU), 72 cases (8.1%) needed mechanical ventilation support and 171 (19.1%) died. Mean length of hospital stay was 10.6 days, but few patients were not discharged at the end of the follow-up.
Table 1. Baseline characteristics of total population (n = 893). Categorical variables in n (%) and quantitative variables in mean ± standard deviation. LVEF left ventricle ejection fraction.
Baseline characteristic Value
Age 68.2 ± 15.2
Female sex 453 (50.7%)
Obesity 110 (12.3%)
Institutionalized person 15 (1.7%)
Dementia 17 (1.9%)
Dependency 43 (4.8%)
Health worker 13 (1.5%)
Active smoking 40 (4.5%)
Hypertension 444 (49.7%)
Diabetes mellitus 174 (19.5%)
Dyslipidemia 362 (40.5%)
Peripheral artery disease 21 (2.4%)
Heart disease 149 (16.7%)
Ischemic heart disease 75 (8.4%)
Myocardiopathy or depressed LVEF 49 (5.5%)
Valvular heart disease 12 (1.3%)
Atrial fibrillation 20 (2.2%)
Pulmonary disease 55 (6.2%)
COPD or asthma 84 (9.4%)
Prior stroke 19 (2.1%)
Prior cancer 12 (1.3%)
Hypothyroidism 13 (1.5%)
Autoimmune disease 18 (2.0%)
Anticoagulation 201 (11.4%)
Antiplatelet therapy 144 (16.1%)
ACEI/ARB 333 (37.3%)
Antialdosteronic drug 21 (2.4%)
B-blockers 158 (17.7%)
Calcium channel blocker 65 (7.3%)
Diuretic drugs 113 (12.7%)
Statin 294 (32.9%)
Corticosteroid 24 (2.7%)
Inmunosupression 12 (1.3%)
Days of symptoms 7.3 ± 5.1
Fever 562 (62.9%)
Respiratory insufficiency 350 (39.2%)
Antiviral 751 (84.1%)
Chloroquine 772 (86.5%)
Interferon 33 (3.7%)
Tocilizumab 91 (10.2%)
Azithromycin 619 (69.3%))
Ceftriaxone 450 (50.4%)
Corticosteroids 223 (25.0%)
Anticoagulation 347 (38.9%)
Antiplatelets 542 (60.7%)
4
Vol:.(1234567890)
Scientific Reports | (2021) 11:9361 | https://doi.org/10.1038/s41598-021-88679-6
www.nature.com/scientificreports/
In relation with cardiovascular outcomes, heart failure was the most common complication (61cases, 6.8%). Acute myocardial infarction, myocarditis and pericarditis were also described (3 (0.3%); 2 (0.2%); 3 (0.3%), respectively). Pulmonary embolism was diagnosed in 8 patients (0.9%).
Univariate analysis with clinical characteristics and treatment to predict mortality was made (Supplementary Table 1). Those that were found to have significant difference (p < 0.05) (age, comorbidities (hypertension, dys-lipemia, diabetes mellitus, peripheral artery disease, heart disease, COPD/asthma), days of symptoms, respiratory insufficiency, in-hospital drugs (antiviral, chloroquine, ceftriaxone, corticosteroids, anticoagulation, antiplatelet)) were included in the multivariate analysis.
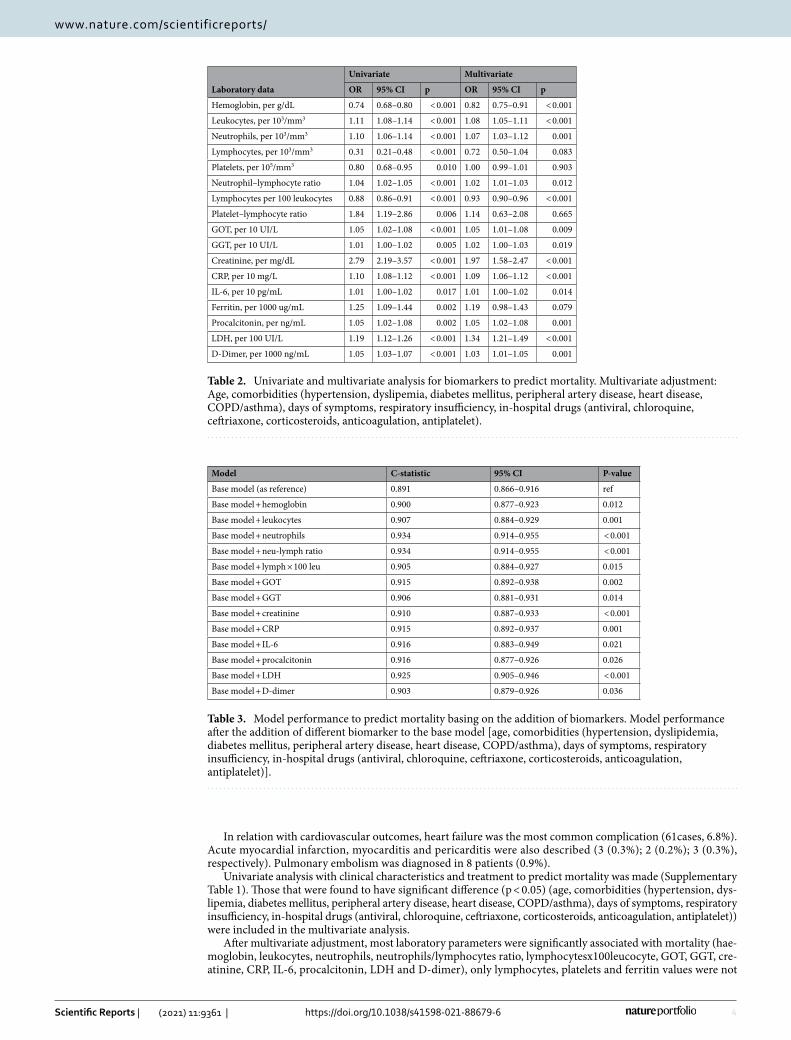
After multivariate adjustment, most laboratory parameters were significantly associated with mortality (hae-moglobin, leukocytes, neutrophils, neutrophils/lymphocytes ratio, lymphocytesx100leucocyte, GOT, GGT, cre-atinine, CRP, IL-6, procalcitonin, LDH and D-dimer), only lymphocytes, platelets and ferritin values were not
Table 2. Univariate and multivariate analysis for biomarkers to predict mortality. Multivariate adjustment: Age, comorbidities (hypertension, dyslipemia, diabetes mellitus, peripheral artery disease, heart disease, COPD/asthma), days of symptoms, respiratory insufficiency, in-hospital drugs (antiviral, chloroquine, ceftriaxone, corticosteroids, anticoagulation, antiplatelet).
Laboratory data
Univariate Multivariate
OR 95% CI p OR 95% CI p
Hemoglobin, per g/dL 0.74 0.68–0.80 < 0.001 0.82 0.75–0.91 < 0.001
Leukocytes, per 103/mm3 1.11 1.08–1.14 < 0.001 1.08 1.05–1.11 < 0.001
Neutrophils, per 103/mm3 1.10 1.06–1.14 < 0.001 1.07 1.03–1.12 0.001
Lymphocytes, per 103/mm3 0.31 0.21–0.48 < 0.001 0.72 0.50–1.04 0.083
Platelets, per 105/mm3 0.80 0.68–0.95 0.010 1.00 0.99–1.01 0.903
Neutrophil–lymphocyte ratio 1.04 1.02–1.05 < 0.001 1.02 1.01–1.03 0.012
Lymphocytes per 100 leukocytes 0.88 0.86–0.91 < 0.001 0.93 0.90–0.96 < 0.001
Platelet–lymphocyte ratio 1.84 1.19–2.86 0.006 1.14 0.63–2.08 0.665
GOT, per 10 UI/L 1.05 1.02–1.08 < 0.001 1.05 1.01–1.08 0.009
GGT, per 10 UI/L 1.01 1.00–1.02 0.005 1.02 1.00–1.03 0.019
Creatinine, per mg/dL 2.79 2.19–3.57 < 0.001 1.97 1.58–2.47 < 0.001
CRP, per 10 mg/L 1.10 1.08–1.12 < 0.001 1.09 1.06–1.12 < 0.001
IL-6, per 10 pg/mL 1.01 1.00–1.02 0.017 1.01 1.00–1.02 0.014
Ferritin, per 1000 ug/mL 1.25 1.09–1.44 0.002 1.19 0.98–1.43 0.079
Procalcitonin, per ng/mL 1.05 1.02–1.08 0.002 1.05 1.02–1.08 0.001
LDH, per 100 UI/L 1.19 1.12–1.26 < 0.001 1.34 1.21–1.49 < 0.001
D-Dimer, per 1000 ng/mL 1.05 1.03–1.07 < 0.001 1.03 1.01–1.05 0.001
Table 3. Model performance to predict mortality basing on the addition of biomarkers. Model performance after the addition of different biomarker to the base model [age, comorbidities (hypertension, dyslipidemia, diabetes mellitus, peripheral artery disease, heart disease, COPD/asthma), days of symptoms, respiratory insufficiency, in-hospital drugs (antiviral, chloroquine, ceftriaxone, corticosteroids, anticoagulation, antiplatelet)].
Model C-statistic 95% CI P-value
Base model (as reference) 0.891 0.866–0.916 ref
Base model + hemoglobin 0.900 0.877–0.923 0.012
Base model + leukocytes 0.907 0.884–0.929 0.001
Base model + neutrophils 0.934 0.914–0.955 < 0.001
Base model + neu-lymph ratio 0.934 0.914–0.955 < 0.001
Base model + lymph × 100 leu 0.905 0.884–0.927 0.015
Base model + GOT 0.915 0.892–0.938 0.002
Base model + GGT 0.906 0.881–0.931 0.014
Base model + creatinine 0.910 0.887–0.933 < 0.001
Base model + CRP 0.915 0.892–0.937 0.001
Base model + IL-6 0.916 0.883–0.949 0.021
Base model + procalcitonin 0.916 0.877–0.926 0.026
Base model + LDH 0.925 0.905–0.946 < 0.001
Base model + D-dimer 0.903 0.879–0.926 0.036
5
Vol.:(0123456789)
Scientific Reports | (2021) 11:9361 | https://doi.org/10.1038/s41598-021-88679-6
www.nature.com/scientificreports/
associated with high mortality (Table 2). The incremental value of each of these significant biomarkers, when it was added to a clinical base model, was assessed with the change in the c-index, achieving all of them significant difference regarding the reference (Table 3).
In order to convert these variables to categorical ones, the optimal cut-off point definition for each different biomarker was established based on ROC curves, as is represented in Fig. 1.
After categorizing the biomarkers according to their cut-off points, those resulting as independent predic-tors of mortality by the multivariate logistic regression analysis were incorporated into a risk score (Table 4). The scores assigned to each biomarker were determined according to the value of the odds ratio (OR). For OR between 1.00 and 1.50, 1 point was assigned. For OR between 1.76 and 2.50, 2 points were assigned. For OR between 2.51 and 3.50, 3 points were assigned. For OR between 3.51 and 4.50, 4 points were assigned. And for OR > 4.50, 5 points were assigned.The one with an individual higher score was procalcitonin < 0.2 ng/mL with 5 points (OR 5.72, CI 95% 3.35–9.76, p < 0.001), in relation with the severity of bacterial coinfection. Hemo-glogin < 12 g/dL (OR 1.07, CI 95% 1.05–1.09, p < 0.001; 1 point), erythrocytes < 4.1 per 106/mm3 (OR 2.14, CI 95% 1.19–3.84, p 0.011;2 points), leukocytes > 8.3 per 103/mm3 (OR 2.51, CI 95% 1.56–4.03, p < 0.001; 3 points), neutrophils > 8.1 per103/mm3 (OR 2.13, CI 95% 1.14–3.95, p 0.017; 2 points), lymphocytes < 6.5 per 100 leukocytes (OR 2.85, CI 95% 1.82–4.46, p < 0.001; 3 points), creatinine (OR 4.10, CI 95% 2.56–6.55, p < 0.001; 4 points), C-reactive protein > 4.5 mg/L (OR 3.05, CI 95% 1.08–8.58, p 0.035; 4 points), interleukin-6 > 24 pg/mL (OR 1.83, CI 95% 1.17–2.88, p 0.009; 2 points), lactate dehydrogenase (LDH) ≥ 393 UI/L (OR 4.29, CI 95% 2.49–7.39, p < 0.001; 4 points), and D-dimer > 1116 ng/mL (OR 1.92, CI 95% 1.22–3.02, 2 points).
Figure 1. Discrimination of biomarkers. AUC area under the curve for each different biomarker.
6
Vol:.(1234567890)
Scientific Reports | (2021) 11:9361 | https://doi.org/10.1038/s41598-021-88679-6
www.nature.com/scientificreports/
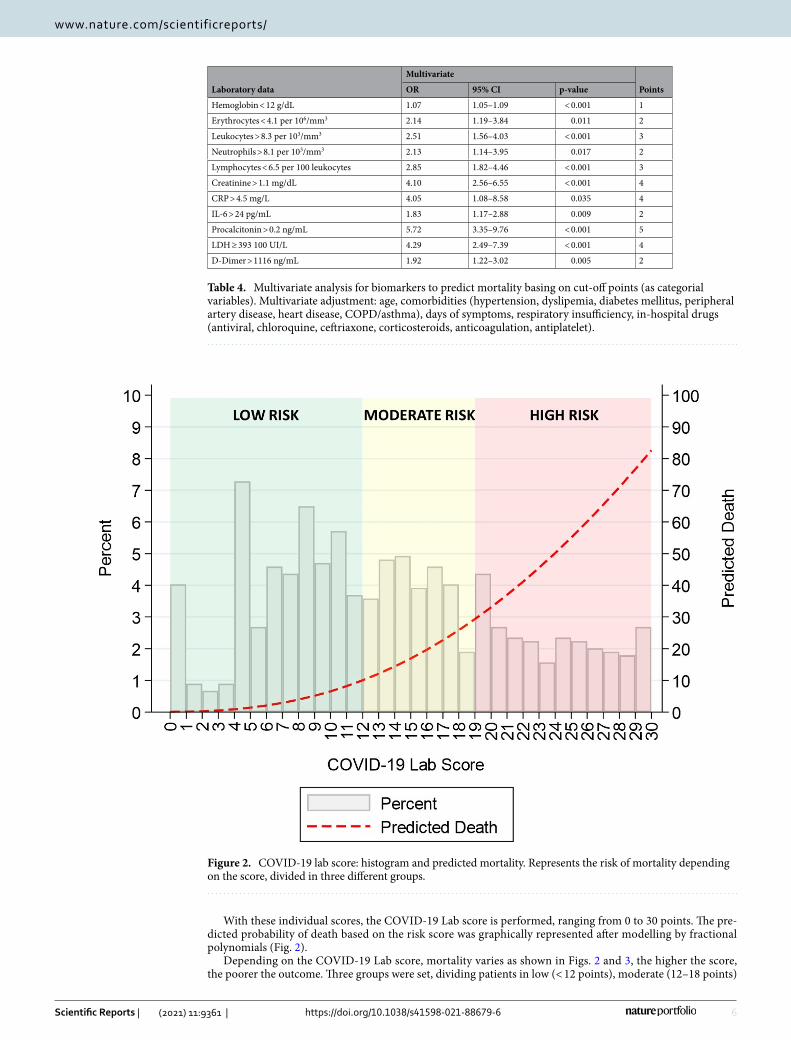
With these individual scores, the COVID-19 Lab score is performed, ranging from 0 to 30 points. The pre-dicted probability of death based on the risk score was graphically represented after modelling by fractional polynomials (Fig. 2).
Depending on the COVID-19 Lab score, mortality varies as shown in Figs. 2 and 3, the higher the score, the poorer the outcome. Three groups were set, dividing patients in low (< 12 points), moderate (12–18 points)
Table 4. Multivariate analysis for biomarkers to predict mortality basing on cut-off points (as categorial variables). Multivariate adjustment: age, comorbidities (hypertension, dyslipemia, diabetes mellitus, peripheral artery disease, heart disease, COPD/asthma), days of symptoms, respiratory insufficiency, in-hospital drugs (antiviral, chloroquine, ceftriaxone, corticosteroids, anticoagulation, antiplatelet).
Laboratory data
Multivariate
PointsOR 95% CI p-value
Hemoglobin < 12 g/dL 1.07 1.05–1.09 < 0.001 1
Erythrocytes < 4.1 per 106/mm3 2.14 1.19–3.84 0.011 2
Leukocytes > 8.3 per 103/mm3 2.51 1.56–4.03 < 0.001 3
Neutrophils > 8.1 per 103/mm3 2.13 1.14–3.95 0.017 2
Lymphocytes < 6.5 per 100 leukocytes 2.85 1.82–4.46 < 0.001 3
Creatinine > 1.1 mg/dL 4.10 2.56–6.55 < 0.001 4
CRP > 4.5 mg/L 4.05 1.08–8.58 0.035 4
IL-6 > 24 pg/mL 1.83 1.17–2.88 0.009 2
Procalcitonin > 0.2 ng/mL 5.72 3.35–9.76 < 0.001 5
LDH ≥ 393 100 UI/L 4.29 2.49–7.39 < 0.001 4
D-Dimer > 1116 ng/mL 1.92 1.22–3.02 0.005 2
Figure 2. COVID-19 lab score: histogram and predicted mortality. Represents the risk of mortality depending on the score, divided in three different groups.
7
Vol.:(0123456789)
Scientific Reports | (2021) 11:9361 | https://doi.org/10.1038/s41598-021-88679-6
www.nature.com/scientificreports/
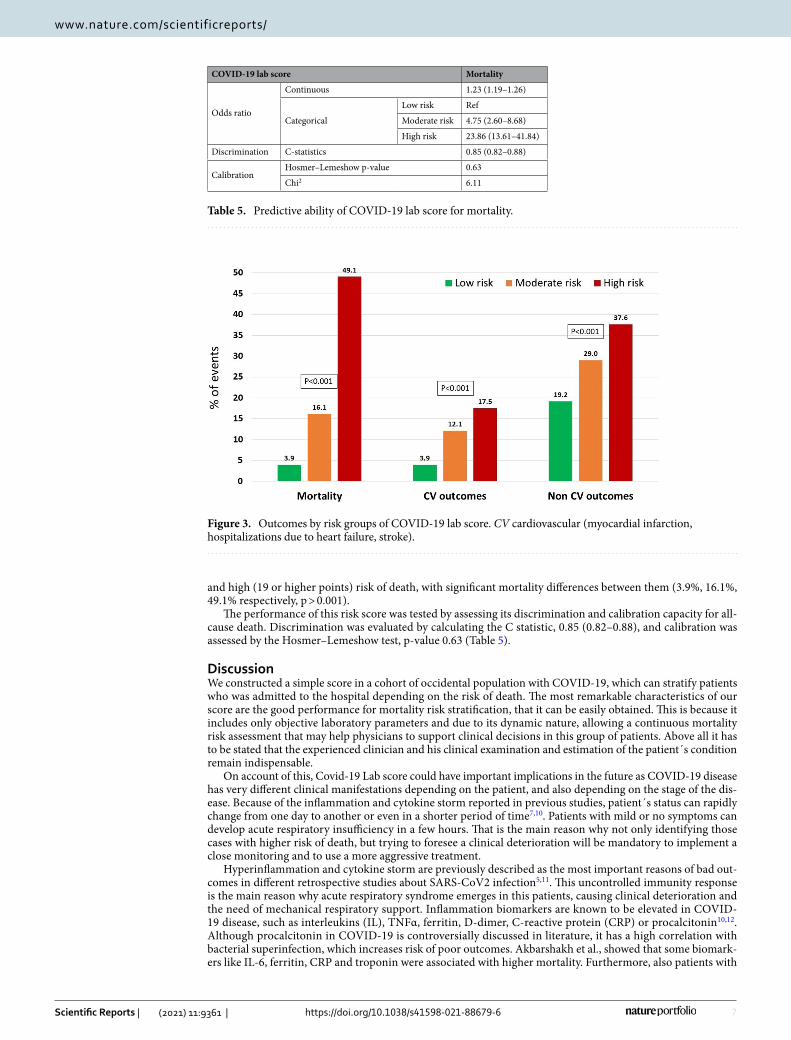
and high (19 or higher points) risk of death, with significant mortality differences between them (3.9%, 16.1%, 49.1% respectively, p > 0.001).
The performance of this risk score was tested by assessing its discrimination and calibration capacity for all-cause death. Discrimination was evaluated by calculating the C statistic, 0.85 (0.82–0.88), and calibration was assessed by the Hosmer–Lemeshow test, p-value 0.63 (Table 5).
DiscussionWe constructed a simple score in a cohort of occidental population with COVID-19, which can stratify patients who was admitted to the hospital depending on the risk of death. The most remarkable characteristics of our score are the good performance for mortality risk stratification, that it can be easily obtained. This is because it includes only objective laboratory parameters and due to its dynamic nature, allowing a continuous mortality risk assessment that may help physicians to support clinical decisions in this group of patients. Above all it has to be stated that the experienced clinician and his clinical examination and estimation of the patient´s condition remain indispensable.
On account of this, Covid-19 Lab score could have important implications in the future as COVID-19 disease has very different clinical manifestations depending on the patient, and also depending on the stage of the dis-ease. Because of the inflammation and cytokine storm reported in previous studies, patient´s status can rapidly change from one day to another or even in a shorter period of time7,10. Patients with mild or no symptoms can develop acute respiratory insufficiency in a few hours. That is the main reason why not only identifying those cases with higher risk of death, but trying to foresee a clinical deterioration will be mandatory to implement a close monitoring and to use a more aggressive treatment.
Hyperinflammation and cytokine storm are previously described as the most important reasons of bad out-comes in different retrospective studies about SARS-CoV2 infection5,11. This uncontrolled immunity response is the main reason why acute respiratory syndrome emerges in this patients, causing clinical deterioration and the need of mechanical respiratory support. Inflammation biomarkers are known to be elevated in COVID-19 disease, such as interleukins (IL), TNFα, ferritin, D-dimer, C-reactive protein (CRP) or procalcitonin10,12. Although procalcitonin in COVID-19 is controversially discussed in literature, it has a high correlation with bacterial superinfection, which increases risk of poor outcomes. Akbarshakh et al., showed that some biomark-ers like IL-6, ferritin, CRP and troponin were associated with higher mortality. Furthermore, also patients with
Table 5. Predictive ability of COVID-19 lab score for mortality.
COVID-19 lab score Mortality
Odds ratio
Continuous 1.23 (1.19–1.26)
Categorical
Low risk Ref
Moderate risk 4.75 (2.60–8.68)
High risk 23.86 (13.61–41.84)
Discrimination C-statistics 0.85 (0.82–0.88)
CalibrationHosmer–Lemeshow p-value 0.63
Chi2 6.11
Figure 3. Outcomes by risk groups of COVID-19 lab score. CV cardiovascular (myocardial infarction, hospitalizations due to heart failure, stroke).
8
Vol:.(1234567890)
Scientific Reports | (2021) 11:9361 | https://doi.org/10.1038/s41598-021-88679-6
www.nature.com/scientificreports/
elevated D-Dimer levels and lymphocytopenia were assessed to have worse outcomes, probably in relation with a procoagulability and immunodeficiency status3,13,14.
It is not the first time these types of biomarkers are evaluated in viral infections. Inflammatory reaction and elevated plasma levels were also describe in other viral infections due to other coronavirus like SARS-CoV and MERS-CoV15–17. Other study conducted by Bautista et al.18 showed that inflammatory biomarkers were associ-ated with higher risk of death in patients with severe acute respiratory syndrome (SARS), secondary to Influenza A H1N1 infection,.
There are also clinical features associated with higher mortality rate in SARS-Cov2 infection. An older age, comorbidities, previous cardiovascular disease, the presence of fever or respiratory insufficiency are associated with poorer outcomes12–14,19.
Others scores like CURB-65 and MuLBTSA were previously assessed for predicting mortality in bacterial and viral pneumonias respectively. Although Lingxi et al.20 proposed this MuLTBSA score for predicting mortality better than CURB6521 in viral pneumonia, it is a static score. This characteristic makes it incapable of showing changes in the risk of death from day to another depending on the progression of the infection and it does not include inflammatory parameters. Furthermore, the main difference with our score is that ours can be replicated very easily only with blood test because all variables are laboratory biomarkers.
Cut-off points for each biomarker were selected depending on the ROC curve in order to achieve the most accurate score. Nevertheless, assuming other cut-off values would change the accuracy of the predicting model.
The clinical manifestations of COVID-19 disease change rapidly in relation with this hyperinflammation reaction, and patients develop acute respiratory insufficiency needing ventilator mechanical support. Having a score like ours, that is not static, it is very simple, and that predicts a hard outcome like mortality will help not only for identifying those patients with high risk of death, but also for anticipating the clinical deterioration. This could be necessary to implement a more aggressive treatment and to keep a close patient monitoring. On the other hand, should be remarked that the experienced clinician and his clinical examination and estimation of the patient´s condition remain indispensable.
Finally, a mobile app that will be available worldwide is being developed to help to calculate quickly the Covid-19 Lab score in order simplify even more the physician’s decisions.
Our study had some limitations. This is a retrospective and observational study, even when this score com-posed of laboratory biomarkers adjusted by other clinical characteristics emerges to predict mortality in COVID-19 disease in an excellent way, other cofounders might be underestimated. Secondly, antiviral treatment was not the same in all patients, because of the lack of evidence of them at the time of the study. Furthermore, follow up is still ongoing, and some complications or events could be missed. Due to the low sample size, the score was derived and validated in the same cohort with the total study population. Despite these limitations, it is a strong study, including all patients admitted to hospital from three different centres, based on objective parameters. Finally, for a more reliable assessment of our score performance, it must be validated in other cohorts of patients from different centres and geographic areas.
ConclusionCovid-19 Lab score is a dynamic simple score only using laboratory biomarkers that can be easily obtained. It can predict in an excellent and dynamic way mortality risk in patients admitted to hospital due to SARS-CoV2 infection in different occasions during the hospital stay. The higher score, the higher mortality risk. Lower hemoglobin o lymphocytes, higher creatitnin levels, higher coagulation and inflammatory biomarkers, were associated with a poorer outcome.
Received: 2 October 2020; Accepted: 17 March 2021
References 1. Zhu, N. et al. A novel coronavirus from patients with pneumonia in China. N. Engl. J. Med. 382, 8 (2019). 2. Situation Report WHO: Confirmados >2M, Mortalidad Global 6,7 Y Europea 8,9, 212 Países/Territorios. https:// www. who. int/ docs/
defau lt- source/ coron aviru se/ situa tion- repor ts/ 20200 417- sitrep- 88- covid- 191b6 cccd9 4f8b4 f2193 77bff 55719 a6ed. pdf? sfvrsn= ebe78 315_6.
3. Chen, N. et al. Epidemiological and clinical characteristics of 99 cases of 2019 novel coronavirus pneumonia in Wuhan, China: A descriptive study. Lancet 395, 507–513 (2020).
4. Guan, W. et al. Clinical characteristics of coronavirus disease 2019 in China. NEJM https:// doi. org/ 10. 1056/ NEJMo a2002 032 (2021).
5. Huang, C. et al. Clinical features of patients infected with 2019 novel coronavirus in Wuhan, China. Lancet 395, 497–506 (2020). 6. Wang, D. et al. Clinical characteristics of 138 hospitalized patients with 2019 novel coronavirus-infected pneumonia in Wuhan,
China. JAMA https:// doi. org/ 10. 1001/ jama. 2020. 1585 (2020). 7. Siddiqi, H. K. & Mehra, M. R. COVID-19 illness in native and immunosuppressed states: A clinical-therapeutic staging proposal.
J. Heart Lung Transplant. https:// doi. org/ 10. 1016/j. healun. 2020. 03. 012 (2020). 8. Hussain, A., Mahawar, K., Xia, Z., Yang, W. & El-Hasani, S. Obesity and mortality of COVID-19. Meta-analysis. Obes. Res. Clin.
Pract. 14(4), 295–300. https:// doi. org/ 10. 1016/j. orcp. 2020. 07. 002 (2020). 9. Singh, A. K., Gupta, R., Gosh, A. & Misra, A. Diabetes in COVID-19: Prevalence, pathophysiology, prognosis and practical con-
siderations. Diabetes Metab. Syndr. 14(4), 303–310. https:// doi. org/ 10. 1016/j. dsx. 2020. 04. 004 (2020). 10. Akhmerov, A. & Marbán, E. COVID-19 and the heart. Circ. Res. 126, 1443–1455 (2020). 11. Mehta, P. et al. COVID-19: Consider cytokine storm syndromes and immunosuppression. Lancet 395, 28 (2020). 12. Ruan, Q., Yang, K., Wang, W., Jiang, L. & Song, J. Clinical predictors of mortality due to COVID-19 based on an analysis of data
of 150 patients from Wuhan, China. Intensive Care Med. https:// doi. org/ 10. 1007/ s00134- 020- 06028-z (2020).
9
Vol.:(0123456789)
Scientific Reports | (2021) 11:9361 | https://doi.org/10.1038/s41598-021-88679-6
www.nature.com/scientificreports/
13. Zhou, F. et al. Clinical course and risk factors for mortality of adult inpatients with COVID-19 in Wuhan, China: A retrospective cohort study. Lancet 395, 1054–1062 (2020).
14. Wang, L., He, W., Xiaomei, Yu., Dalong, Hu. & Bao, M. Coronavirus disease 2019 in elderly patients: Characteristics and prognostic factors based on 4-week follow-up. J. Infect. 80(6), 639–645 (2020).
15. Wong, C. K. et al. Plasma inflammatory cytokines and chemokines in severe acute respiratory syndrome. Clin. Exp. Immunol. 136, 95–103 (2004).
16. Mahallawia, W. H., Khabourad, O. F., Zhangb, Q., Makhdouma, H. M. & Sulimana, B. A. MERS-CoV infection in humans is associated with a pro-inflammatory Th1 and Th17 cytokine profile. Cytokine 104, 8–13 (2018).
17. Kim, E. S. et al. Clinical progression and cytokine profiles of middle east respiratory syndrome coronavirus infection. J. Korean Med. Sci. 31, 1717–1725 (2016).
18. Bautista, E. et al. Angiogenic and inflammatory markers in acute respiratory distress syndrome and renal injury associated to A/H1N1 virus infection. Exp. Mol. Pathol. 94, 486–492 (2013).
19. Onder, G., Rezza, G., Brusaferro, S. Case-fatality rate and characteristics of patients dying in relation to COVID-19 in Italy. JAMA (2020)
20. Lingxi, G. et al. Clinical features predicting mortality risk in patients with viral pneumonia: The MuLBSTA score. Front. Microbiol. 10, 1 (2019).
21. Lim, W. S. et al. Defining community acquired pneumonia severity on presentation to hospital: An international derivation and validation study. Thorax 58, 377–382 (2003).
Author contributionsP.J.A.M. and D.L.O. wrote the main manuscript text and prepared Figs. 1–3 and tables. All authors reviewed the manuscript.
Competing interests The authors declare no competing interests.
Additional informationSupplementary Information The online version contains supplementary material available at https:// doi. org/ 10. 1038/ s41598- 021- 88679-6.
Correspondence and requests for materials should be addressed to D.L.O.
Reprints and permissions information is available at www.nature.com/reprints.
Publisher’s note Springer Nature remains neutral with regard to jurisdictional claims in published maps and institutional affiliations.
Open Access This article is licensed under a Creative Commons Attribution 4.0 International License, which permits use, sharing, adaptation, distribution and reproduction in any medium or
format, as long as you give appropriate credit to the original author(s) and the source, provide a link to the Creative Commons licence, and indicate if changes were made. The images or other third party material in this article are included in the article’s Creative Commons licence, unless indicated otherwise in a credit line to the material. If material is not included in the article’s Creative Commons licence and your intended use is not permitted by statutory regulation or exceeds the permitted use, you will need to obtain permission directly from the copyright holder. To view a copy of this licence, visit http:// creat iveco mmons. org/ licen ses/ by/4. 0/.
© The Author(s) 2021


![Una Limosna [orch] SCORE](https://static.fdokumen.com/doc/165x107/631e9c1925add517740b2033/una-limosna-orch-score.jpg)