The COVID-19 consumption game-changer: evidence from a ...
59
Working Paper Series The COVID-19 consumption game-changer: evidence from a large-scale multi-country survey Alexander Hodbod, Cars Hommes, Stefanie J. Huber, Isabelle Salle Disclaimer: This paper should not be reported as representing the views of the European Central Bank (ECB). The views expressed are those of the authors and do not necessarily reflect those of the ECB. No 2599 / October 2021
-
Upload
khangminh22 -
Category
Documents
-
view
2 -
download
0
Transcript of The COVID-19 consumption game-changer: evidence from a ...

Working Paper Series The COVID-19 consumption game-changer: evidence from a large-scale multi-country survey
Alexander Hodbod, Cars Hommes, Stefanie J. Huber, Isabelle Salle
Disclaimer: This paper should not be reported as representing the views of the European Central Bank (ECB). The views expressed are those of the authors and do not necessarily reflect those of the ECB.
No 2599 / October 2021

Abstract
Prospective economic developments depend on the behavior of consumer spending. A key ques-tion is whether private expenditures recover once social distancing restrictions are lifted or whether the COVID-19 crisis has a sustained impact on consumer confidence, preferences, and, hence, spending. The elongated and profound experience of the COVID-19 crisis may durably affect consumer preferences. We conducted a representative consumer survey in five European countries in summer 2020, after the release of the first wave’s lockdown restrictions, and doc-ument the underlying reasons for households’ reduction in consumption in five key sectors: tourism, hospitality, services, retail, and public transports. We identify a large confidence shock in the Southern European countries and a shift in consumer preferences in the Northern Eu-ropean countries, particularly among high-income earners. We conclude that the COVID-19 experience has altered consumer behavior and that long-term sectoral consumption shifts may occur.
Keywords: COVID-19; household behavior; consumption; expectations; experiences; consumer preferences; economic resilience; sectoral changes; zombification; fiscal policy.
JEL Classifications: D12, D81, D84, E21, E60, E71, G51, H30.
ECB Working Paper Series No 2599 / October 2021 1

Non-technical Summary
This paper seeks to provide insight into how different the post-COVID-19 equilibrium
might be from what preceded it. We are primarily interested in whether the profound
lockdown experience may have altered consumption trends and whether long-term sectoral
consumption shifts are likely to result.
Novel multi-country survey data is used to provide insights on why consumption is
shifting. The sample consists of 7,500 households and represents the general population
in France, Germany, Italy, The Netherlands, and Spain. The data was collected after
the first lockdown experience in July 2020, at a point when those initial restrictions were
completely lifted. This paper identifies the underlying drivers for consumption changes
in five sectors: tourism, hospitality, services, retail, and public transport.
We report five key findings: First, and compared to before the COVID-19 outbreak,
a large proportion of households reports consuming “less than before” or “not at all”,
ranging between a 38 and 66 percent—depending on the sector. Second, the fraction of
households reducing their consumption correlates on aggregate with the severity of the
COVID-19 health crisis, and on an individual level with a personal COVID-experience.
Third, the largest fraction of households that report consuming now “less often than be-
fore” or “not at all” cite the infection risk as the main reason for changing their behavior.
Fourth, the fraction of households reporting to consume certain products and services
now “less than before” because the lockdown experience has permanently altered their
preferences is substantial. Specifically, we observe many households reporting “the real-
ization of not missing it” what they consumed before. “Not missing it” is the second most
prominent reason for consumption reductions in France, Germany, and the Netherlands,
during Summer 2020. Fifth, precautionary saving is a substantial driver for changing
consumption patterns in Spain and Italy. In these countries, increased saving appetite is
the second most important reason for reductions in consumption across almost all prod-
uct categories. In the Northern European countries, the precautionary savings motive is
the third most often cited reason. Sixth, the fraction of households reporting financial
constraints’ as the main reason for reducing consumption is small.
These results provide initial evidence that in response to the COVID-19 experience
consumers may have very different demands. That so many households report “not miss-
ing” what they cut back on during lockdown—even after restrictions are lifted—signals
that permanent changes to consumer demand may be occurring. The fraction of house-
holds reporting the “realization of not missing it anymore” is especially large in the hospi-
tality and services sectors. Within the retail sector, a substantial fraction of households
ECB Working Paper Series No 2599 / October 2021 2

reported shifting their consumption away from high street stores and into online alterna-
tives.
We identify three key policy implications from these findings. First, the results should
be taken into account in the design of fiscal programmes to support businesses through
the pandemic. If it is true that the COVID-19 experience is shifting consumer demand
in large and long-lasting ways, this would imply that the economy itself will need to
shift in order to meet new needs. Some incumbent firms will find that the services or
products that they offer are no longer required in the post-COVID environment. If those
firms cannot adapt to remain relevant for consumers, they could become obsolete. In
this context, fiscal policy should be alert to the risks of extending support too broadly,
and assess firms’ future viability whenever possible. Second, our results suggest that
broad-based policies aiming to restore consumption to pre-pandemic levels by reducing
the pricing of products and services (e.g. VAT cuts) are unlikely to be effective. Financial
constraints are the least reported reason for consumption drops. Instead, fiscal support
should target those households who are particularly hard hit by the crisis. Such support
might be better oriented towards helping displaced workers to retrain and find new jobs.
Third, our results indicate that the objectives of protecting citizens from the virus risk
and preserving economic prosperity do not lead to any trade-offs. Governments should
treat the control of the infection risk as a prerequisite to achieving their objectives of
preserving economic prosperity.
ECB Working Paper Series No 2599 / October 2021 3

1 Introduction
“Recovery is sound only if it does come of itself. For any revival which is
merely due to artificial stimulus leaves part of the work of depressions undone”
Schumpeter (1934)
The COVID-19 pandemic swiftly transformed life as we knew it and plunged the world
into the worst economic downturn since the 1930s (IMF, 2020). Following the onset of the
COVID-19 crisis, governments initially responded with a huge fiscal stimulus, including
a range of generous support packages for firms. The premise of these wholesale support
schemes is that the crisis is facing businesses with a temporary liquidity shock, and that
normal revenues will resume once this difficult period has been bridged. However, as the
extended duration of the crisis is becoming clear, governments are facing critical questions
on how best to design their continuing support to the economy. The longer the crisis lasts,
the higher the likelihood that the post-COVID-19 economy will fundamentally differ from
what preceded it. If consumer preferences have changed in response to the COVID-19
experience, many firms and sectors will become obsolete. Bailing out such firms is likely
to create unsustainable so-called “zombies” and mismatch unemployment in the long run.
This paper seeks to provide insight into how different the post-COVID-19 equilib-
rium might be from what preceded it by using a large scale multi-country survey. We
are primarily interested in whether the profound lockdown experience may have altered
consumption trends and whether long-term sectoral consumption shifts may result. This
question is motivated by recent research in behavioral macroeconomics and finance that
documents robust and permanent experience effects on agents’ preferences, expectations,
and resulting economic behaviors.1 Our study falls within this literature, as it treats the
COVID-19 pandemic as a profound personal experience that could induce durable effects
on consumers’ preferences. To the best of our knowledge, this paper is the first to study
whether and how the personal lockdown experience altered households’ consumption be-
havior.
1The examples in the related literature are numerous. Extrapolative behaviors from local experiencesto aggregate conditions have been widely documented; see, e.g., Andrade et al. (2022). In the same vein,Malmendier and Nagel (2011) show that personal experience of stock returns influences financial expec-tations and long-run investing behavior among households, while Malmendier and Nagel (2016) report onhow recent inflation experience shapes inflation expectations and the resulting lending and borrowing be-haviors of households. Kuchler and Zafar (2019) find that personal experience of unemployment inducespessimistic views about economic outlooks. Growing up under adverse economic conditions has beenfound to permanently alter preferences, be it political preferences and beliefs (Giuliano and Spilimbergo,2014) or job preferences (Cotofan et al., 2022). Overall, the literature shows that personal experiencesof large macroeconomic shocks have the potential to change preferences and behavior permanently.
ECB Working Paper Series No 2599 / October 2021 4

For this purpose, a survey method is needed to provide insights on why consumption
is shifting.2 The sample consists of 7,500 households and is representative for the general
population in France, Germany, Italy, The Netherlands, and Spain. These five countries
represent most of the EU economy but have experienced differing health crisis severities
and lockdown intensities.3
We collected the data after the first lockdown experience in July 2020, at a point
when those initial restrictions were completely lifted, and all surveyed consumption and
travel possibilities were available, as illustrated in Figure 1. Further, the COVID-19
health impact was less salient in July 2020 than at other times during the pandemic,
such as Spring 2020. These two factors (lockdown restrictions lifted, health risk low)
combine to allow one to identify rather cleanly the effect of the lockdown experience on
the post-lockdown consumption choices.4
The survey covers five sectors and activities: tourism (traveling abroad for private
reasons), hospitality (restaurants, bars, and cafes), services (such as hairdressers), retail
(shopping in malls and other stores), and public transport. The survey asks households
how their consumption has changed as a result of the COVID-19 lockdown experience.
Households are specifically asked to state the main reason for their consumption changes.
We focus on five possible drivers of consumption changes: (i) financial constraints, (ii)
worry of infection risk, (iii) a lack of confidence in the future that induces a rise in
precautionary savings, (iv) substitution to online alternatives, or (v) permanent shifts
in taste and preferences arising from the lockdown experience. We focus on these key
reasons, as each would imply a different optimal policy response.
Our focus on households’ self-reported reasoning for the shifts in their consumption
behavior allows us to identify the underlying drivers for consumption changes for each
sector. We thus provide initial evidence on the nature of the COVID-19 demand shock,
and on how durable the reported consumption shifts could turn out in the post-COVID-19
environment. Are we merely experiencing a transitory income shock? A shock to con-
sumer confidence? Or is the COVID-19 experience a game-changer, creating permanent
shifts in consumer preferences?2The revealed preferences approach could provide a more precise quantitative estimate of how con-
sumption aggregates are shifting. However, this paper aims not to predict quantitative consumptionchanges, but instead to identify the underlying drivers and potential persistence of consumption changes.Parker and Souleles (2019) study the difference between reported (survey) data and revealed consump-tion expenditures. This research shows that self-reported data works well in predicting consumptionbehavioral changes, and in estimating population aggregates—which is the goal of this study.
3In 2019, these five countries account for 70% the EU’s GDP; 25% was generated by Germany, followedby France 17% and Italy 13%, ahead of Spain 9% and the Netherlands 6% (Eurostat).
4For instance, the average number of daily COVID-19 related deaths across the whole EU had fallenbelow 100 during July 2020 after a peak above 3,000 in April 2020 (source: Johns Hopkins CSSE).
ECB Working Paper Series No 2599 / October 2021 5
MarchFeb. April
ITATargetedlockdowns
May June
ESPLocal
stay-at-homeadvice
National lockdown:Limit on public transportations, closure ofall non-essential services, strict restriction
of movements
FRA
EU
Stay-at-homeadvice
National reopening:public transp.
and someservices
most services,incl. HORECA
borderswith the
EU
National lockdown:Sharp reduction of public transportations, closureof all non-essential services, strict restriction of
movements
Gradual reopening:some services,
e.g.hairdressers
end ofdomestic
restrictions ofmovements
back-to-normal inpublic transp.,
most services incl.HORECA, end oftravel restrictions
DEU
NDL
Stay-at-homeadvice
Stay-at-
homeadvice
‘Soft’ lockdown:Closure of all non-essential businesses,
reinforced stay-at-home order, reductionof public transp., advice against travel
Canaryislands
mostregions
reopened
back-to-normal in
public transp.
End ofthe stateof alarm
Gradual regional reopening:borderswith the
EU
Gradual reopening:back-to-normal in
public transp.
allnon-essential
services
July 1st:EU borders
open
March 16:guidelines to internal
border controls
10
to
28:
S
U
R
V
E
Y
July
National lockdown:Sharp reduction of public transportations, closure of allnon-essential services, strict restriction of movements
Targeted lockdown:Border closures to non-citizens,closure of non-essential services,
strict restrictions of movements insome regions.
Gradual regional reopening:some
services,e.g. hair-dressers
restaurants and other servicesprogressively throughout the country
EUborders
Source: government response tracker team at Oxford University; https://www.bsg.ox.ac.uk/research/research-projects/covid-19-government-response-tracker, the raw data are retrievedfrom https://raw.githubusercontent.com/OxCGRT/covid-policy-tracker/master/data/OxCGRT_latest_responses.csv
Figure 1: Timing of the adaption and easing of the restrictive COVID-19 related policiesin the countries and sectors included in our survey
More broadly, our paper contributes to the fast-emerging literature studying the effect
of the COVID-19 outbreak on households’ consumption behavior. This related literature
is generally descriptive in nature, quantifying shifting consumption patterns during the
first lockdown in spring 2020—often using financial transaction data5 and, less frequently,
large-scale survey data from households.6 Zwanka and Buff (2021) discuss the potential
channels through which the COVID-19 crisis could generate lasting changes to consump-
tion habits, and conclude by emphasising the need for detailed empirical work.
We add three dimensions to this literature. First, and most importantly, the data
on households’ self-reported reasons for consumption changes allows us to go beyond the
mere description of realized consumption changes. The reasons for consumption drops can
vary across sectors and countries and may be related to households’ health and economic
experiences during the pandemic. Second, the cross-country dimension allows us to link
the survey outcomes to the economic fundamentals and the intensity of the COVID-19
experience. Third, we identify which types of consumers are shifting their consumption5Andersen et al. (2020) for Denmark; Baker et al. (2020) for the US; Bounie et al. (2020) for France;
Carvalho et al. (2020) for Spain; Chronopoulos et al. (2020) for the UK.6For the US, Coibion et al. (2020a) document the impact of lockdown measures on a wide range of
household variables, including consumption patterns. Coibion et al. (2020b) show that public commu-nication amid the COVID-19 crisis had little impact on households’ beliefs and consumption decisions.Guglielminetti and Rondinelli (2021) show how the pandemic impacts on household consumption andsaving patterns in Italy. Using cross-country survey data, Adams-Prassl et al. (2020) find that theCOVID-19 crisis exacerbates inequalities in the UK, US, and German labor market. Piyapromdee andSpittal (2020) report similar findings for the UK.
ECB Working Paper Series No 2599 / October 2021 6

the most, and for what reasons. We need to know why consumption patterns are shifting
and who is shifting them to support policy-makers in devising the optimal design of fiscal
policies.
Our analysis reveals six main findings, each of which has relevant policy implications.
First, and compared to before the COVID-19 outbreak, a large proportion of households
report consuming “less than before” or “not at all”, ranging between 38 and 66 percent—
depending on the consumption category. We observe the largest decline for the tourism
sector: sixty-six percent of households report that they will now travel less abroad for
private reasons. The second-largest drop is found in the public transport sector, with
58 percent of households reporting to use public transport less. The third-largest drop
concerns the hospitality sector, with 55 percent of households reporting a drop in their
appetite to visit restaurants, bars, and cafes.7 A similarly large impact in consumption
demand is observed in the retail sector, with 46 percent of households reporting a drop in
the frequency of their visits to shops, malls, and other physical retail outlets. Services such
as hairdressers see the smallest decline, with thirty-eight percent of households reporting
to use these services less often. It is important to stress that these drops are not due to
lockdown measures, as these restrictions were not in place in July 2020 at the point when
the survey was carried out.
Second, for almost all sectors and countries, the fraction of households reducing their
consumption correlates with the severity of the COVID-19 health crisis. A personal
COVID-19 infection experience explains a substantial part of households’ consumption
reduction, while standard socio-economic household characteristics such as income and
education are not relevant. By contrast, behavioral factors such as personal experiences,
macroeconomic expectations (pessimism), and psychological factors such as fear about
the future matter for households’ change in consumption. This finding confirms that the
COVID-19 crisis may be understood as a profound experience that may, as such, durably
affect behavior, beyond the adverse economic effect.
Third, the largest fraction of households that report consuming now “less often than
before” or “not at all” cite the infection risk as the main reason for changing their behavior.
This result holds for all sectors and countries.
Fourth, the fraction of households reporting to consume less because the lockdown
has changed their preferences is substantial. Specifically, we observe high proportions
of households reporting the “realization of not missing” consuming certain products and7This sector faces the second-largest decline in France, Germany, and Spain; and the third-largest
decline in Italy and The Netherlands. The drop ranges from 66 percent of households visiting restaurantsless often in Spain to 48 percent in France.
ECB Working Paper Series No 2599 / October 2021 7
services that they consumed before the COVID-19 outbreak. Such preference shifts are
particularly apparent in the services and hospitality sectors. For example, the fraction
of households realizing that they do not miss services such as hairdressers amounts to 23
percent in France. Similarly, the fraction of households realizing they do not miss going
to restaurants amounts to 21 percent in Germany. In France and Germany, households
report that—across all sectors—“not missing it” is the second most powerful driver for
households’ reduced consumption in Summer 2020. Similarly, in The Netherlands, the
preference shift is the second most frequently cited reason for reduced consumption in
all but one sector.8 Interestingly, these households are mainly middle-aged, high-income
households and the least likely to have had a personal COVID-19 infection experience.
The fact that mainly high-income households realized through the lockdown experience,
that they do not miss consuming certain things, might reinforce the magnitude of the
change in consumption habits.
Fifth, precautionary saving is a substantial driver for changing consumption patterns
in Spain and to a lesser extent in Italy. In these countries, increased saving appetite is
the second most important reason for reductions in consumption for almost all product
categories. While in Germany, France, and the Netherlands, the saving motive is the
third most popular reason—after the infection risk and the preference shift. Households
citing the precautionary saving motive are mainly young families.
Sixth, the fraction of households reporting “financial constraints” as the main reason
for reducing consumption is small. The fraction of households that cite either “precaution-
ary saving motives” or “changes in preferences” as the key reason for lower consumption
is far greater than the fraction reporting “financial constraints”. This observation is valid
for all countries and sectors. This result surely reflects the unprecedented size of the gov-
ernmental financial support programs that have protected households to a great extent
in all countries during 2020.
The remainder of this paper is organized as follows. Section 2 describes the data
and the survey design. Section 3 summarizes our key findings, Section 4 concludes and
highlights the policy implications of this paper.8In the retail sector, Dutch households’ second primary reason is the substitution for online shopping.
ECB Working Paper Series No 2599 / October 2021 8

2 Survey Design and Data
2.1 Data collection
To investigate households’ consumption behavior during the COVID-19 “dance phase”9,
we conducted a representative survey in five countries: France, Germany, Italy, The
Netherlands, and Spain. The company IPSOS collected the data on our behalf using their
online i-Say panel of consumers (IIS). Panel members are contacted via email or via the
app they have installed on their phone, and are then invited to fill out the questionnaire
in an online environment (device agnostic). The survey was conducted during the period
from July 10th–28th, 2020. The sample size equals 7,501, see Appendix Table A1.
The representativeness of the samples is ensured by setting a non-interlocking quota.
Samples are selected based on (1) the selected background variables and (2) the response
rates which are based on records of respondents’ participation in previous surveys. Tak-
ing into account both the desired representativeness of the sample and response rates,
sampling algorithms design the optimal sample composition.10 The representativeness
of our sample is investigated in detail in Appendix 2, which shows that the samples are
representative for the general population (aged 18 year-old and older) on gender, age,
education, region of residence and—to a lesser extent—on occupation and income (based
on the one-digit ISCO-classification).
2.2 Descriptive Statistics
The survey first collected background information on the households. Data was collected
on households’ socio-economic situation, personal experience with a COVID-19 infection,
concerns related to the COVID-19 crisis, macroeconomic expectations, and levels of trust
and satisfaction with their government. Having answered these background questions,
households were asked questions about their consumption behavior. This section provides
descriptive statistics of the data.9The “hammer” phase refers to the lockdown. The “dance” phase describes times when lockdown
restrictions are entirely lifted—while no effective treatment or vaccine is widely available (i.e., infectionrisk remains). We borrow this terminology from Pueyo (2020), who describes this “hammer and dance”pandemic management from an epidemiological perspective.
10For example, the algorithm would oversample younger respondents if the sample needs to be rep-resentative on age since it is known that younger respondents have lower response rates than olderrespondents.
ECB Working Paper Series No 2599 / October 2021 9
2.2.1 Households’ socio-economic background
For each country, Appendix Tables A2–A4 report descriptive statistics of the socio-
economic characteristics of the sample. Appendix Table A2 documents that the average
respondent is 50 years old and shows the average household size and the distribution
across three education categories (low, middle, high).
Financial Statistics : The distribution of households’ income—yearly total income,
after tax and compulsory deductions, from all sources (per deciles)—is reported in Ap-
pendix Table A4. Column 5 of Appendix Table A3 shows the fraction of households
having the ability to make an unexpected payment of one-month of income. More than
two-thirds of the households have this ability. Interestingly, the variation across countries
is negligible (χ2(4) = 7.71).11
Column 6 of Appendix Table A3 reports households’ perception of how they cope
financially with their current income. The survey question is “Which of these descrip-
tions comes closest to how you feel about your household’s income nowadays?”, with five
answer categories, ranging from 1: “Very difficult on present income and insufficient to
cover all the expenses” to 5= “Living comfortably on present income and able to save”.
The cross-country variation is significant, ranging from 2.6 to 3.5 (χ2(4) = 456∗∗∗). The
average household is coping on current income in most countries. Spanish households are
facing the most financial difficulties, with an average value of 2.6.
Employment statistics : Appendix Table A3 reports the employment statistics. Col-
umn 1 reports the fraction of households in paid work, Column 2 the fraction not being
part of the labor force, and Column 3 the unemployment rate. Column 4 reports the frac-
tion of households having experienced an unemployment spell for more than three months
over the past five years. The fraction of households falling into this category significantly
varies between 13 percent in Germany to 39 percent in Spain (χ2(4) = 341∗∗∗).
2.2.2 Households’ COVID-19 experience, concerns and expectations
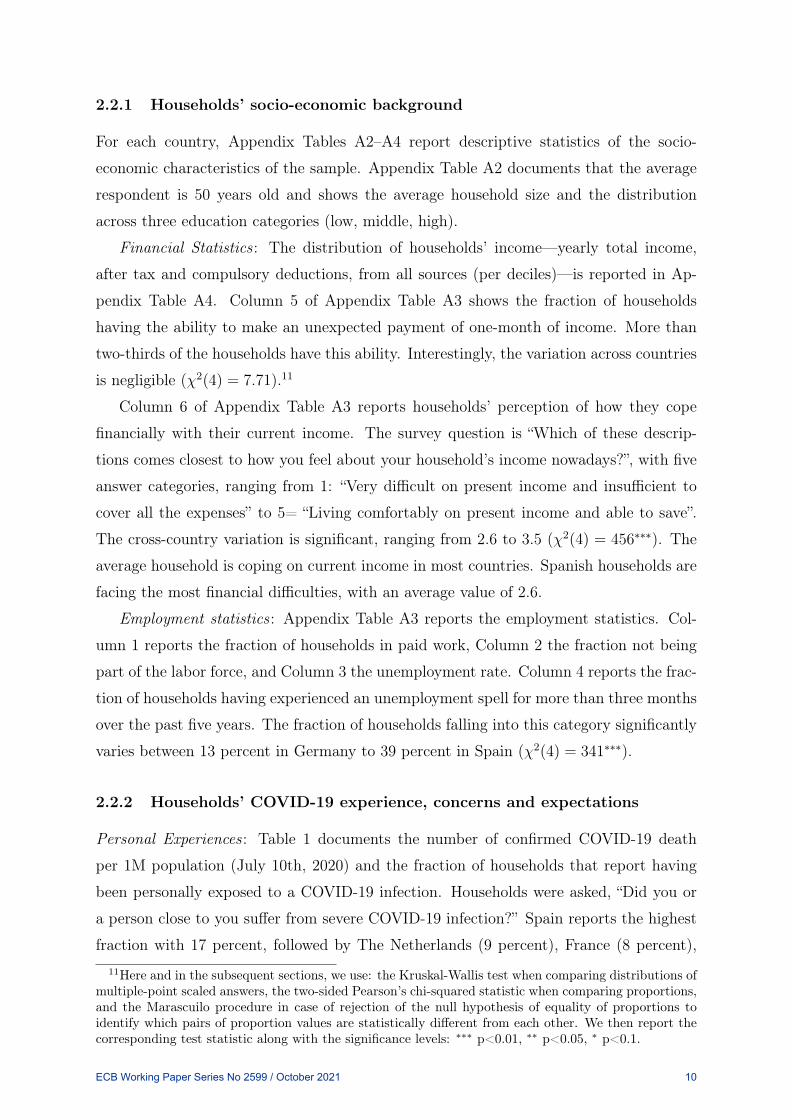
Personal Experiences : Table 1 documents the number of confirmed COVID-19 death
per 1M population (July 10th, 2020) and the fraction of households that report having
been personally exposed to a COVID-19 infection. Households were asked, “Did you or
a person close to you suffer from severe COVID-19 infection?” Spain reports the highest
fraction with 17 percent, followed by The Netherlands (9 percent), France (8 percent),11Here and in the subsequent sections, we use: the Kruskal-Wallis test when comparing distributions of
multiple-point scaled answers, the two-sided Pearson’s chi-squared statistic when comparing proportions,and the Marascuilo procedure in case of rejection of the null hypothesis of equality of proportions toidentify which pairs of proportion values are statistically different from each other. We then report thecorresponding test statistic along with the significance levels: ∗∗∗ p<0.01, ∗∗ p<0.05, ∗ p<0.1.
ECB Working Paper Series No 2599 / October 2021 10
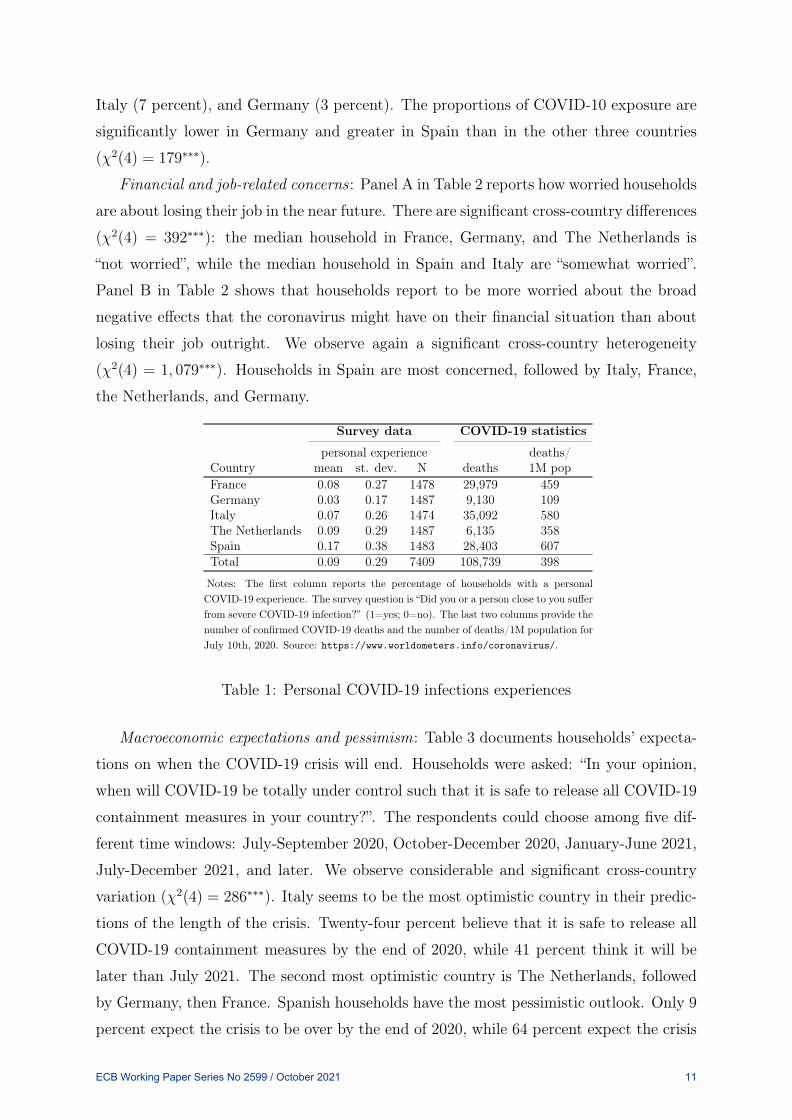
Italy (7 percent), and Germany (3 percent). The proportions of COVID-10 exposure are
significantly lower in Germany and greater in Spain than in the other three countries
(χ2(4) = 179∗∗∗).
Financial and job-related concerns : Panel A in Table 2 reports how worried households
are about losing their job in the near future. There are significant cross-country differences
(χ2(4) = 392∗∗∗): the median household in France, Germany, and The Netherlands is
“not worried”, while the median household in Spain and Italy are “somewhat worried”.
Panel B in Table 2 shows that households report to be more worried about the broad
negative effects that the coronavirus might have on their financial situation than about
losing their job outright. We observe again a significant cross-country heterogeneity
(χ2(4) = 1, 079∗∗∗). Households in Spain are most concerned, followed by Italy, France,
the Netherlands, and Germany.
Survey data COVID-19 statistics
personal experience deaths/Country mean st. dev. N deaths 1M popFrance 0.08 0.27 1478 29,979 459Germany 0.03 0.17 1487 9,130 109Italy 0.07 0.26 1474 35,092 580The Netherlands 0.09 0.29 1487 6,135 358Spain 0.17 0.38 1483 28,403 607Total 0.09 0.29 7409 108,739 398
Notes: The first column reports the percentage of households with a personalCOVID-19 experience. The survey question is “Did you or a person close to you sufferfrom severe COVID-19 infection?” (1=yes; 0=no). The last two columns provide thenumber of confirmed COVID-19 deaths and the number of deaths/1M population forJuly 10th, 2020. Source: https://www.worldometers.info/coronavirus/.
Table 1: Personal COVID-19 infections experiences
Macroeconomic expectations and pessimism: Table 3 documents households’ expecta-
tions on when the COVID-19 crisis will end. Households were asked: “In your opinion,
when will COVID-19 be totally under control such that it is safe to release all COVID-19
containment measures in your country?”. The respondents could choose among five dif-
ferent time windows: July-September 2020, October-December 2020, January-June 2021,
July-December 2021, and later. We observe considerable and significant cross-country
variation (χ2(4) = 286∗∗∗). Italy seems to be the most optimistic country in their predic-
tions of the length of the crisis. Twenty-four percent believe that it is safe to release all
COVID-19 containment measures by the end of 2020, while 41 percent think it will be
later than July 2021. The second most optimistic country is The Netherlands, followed
by Germany, then France. Spanish households have the most pessimistic outlook. Only 9
percent expect the crisis to be over by the end of 2020, while 64 percent expect the crisis
ECB Working Paper Series No 2599 / October 2021 11

Panel A: Job Loss Concerns mean st. dev. p10 p25 p50 p75 p90 NFrance 1.63 0.74 1 1 1 2 3 859Germany 1.49 0.66 1 1 1 2 2 897Italy 1.87 0.77 1 1 2 2 3 886The Netherlands 1.52 0.67 1 1 1 2 2 838Spain 2.04 0.73 1 2 2 3 3 1017Total 1.72 0.75 1 1 2 2 3 4497Panel B: Financial Concerns mean st. dev. p10 p25 p50 p75 p90 NFrance 5.79 2.54 2 4 6 8 9 1460Germany 4.44 2.98 1 2 5 7 8 1459Italy 6.45 2.54 3 5 7 8 10 1457The Netherlands 4.87 2.62 1 3 5 7 8 1463Spain 7.42 2.20 5 6 8 9 10 1458Total 5.79 2.80 1 4 6 8 9 7297
Panel A: The survey question is “How worried are you about losing your job in the near future?” Answeroptions: 1-3. 1= not worried; 2 = somewhat worried; 3 = very worried. Panel B: The survey question is“How concerned are you about the effects that the coronavirus might have for the financial situation yourhousehold?” Answer options: 0-10. 0 (= not at all concerned) to 10 (= extremely concerned).
Table 2: COVID-19 related financial concerns
to last later than July 2021.
France Germany Italy Netherlands SpainPercent Percent Percent Percent Percent
July-September-2020 3.33 4.27 7.47 6.93 2.73October-December 2020 9.13 10.07 16.73 14.13 6.4January-June 2021 28.73 28.67 35.20 34.80 26.98July-December 2021 26.47 26.27 22.87 24.87 34.58Later 32.33 30.73 17.73 19.27 29.31Total 100 100 100 100 100
Notes: The survey question is “In your opinion, when will COVID-19 be totally under controlsuch that it is safe to release all COVID-19 containment measures in your country?”
Table 3: Expectations about the duration of COVID-19 containment measures
Turning to our proxy for pessimism, Table 4 reports households’ predictions about the
unemployment rate before the crisis and their expectations about the current and future
unemployment rates. In all countries, the average household overestimates the pre-crisis
and current unemployment rates compared to the actual figures (source: OECD). This
systematic expectation bias is common in household surveys and may not reflect pes-
simism but rather the misperception of macroeconomic variables. For this reason, in
the sequel, we use the predicted change in the unemployment rate as a proxy for house-
holds’ pessimism. This predicted change at one year ahead directly reflects the expected
macroeconomic impact of the COVID-19 crisis and significantly varies from 5 percentage
points in Germany to 10 in Spain (χ2(4) = 321∗∗∗).
ECB Working Paper Series No 2599 / October 2021 12

Trust and Satisfaction with the Government : Panel A of Table 5 documents house-
holds’ trust level with the prospective government. Households were asked, “Please tell
us how much you personally trust or distrust the (country name) government?”. Gov-
ernments are most trusted in The Netherlands, followed by Germany, Italy, France, and
finally, Spain (χ2(4) = 368∗∗∗). Panel B of Table 5 shows that a similar pattern for the
satisfaction with governments. Households are most satisfied in The Netherlands, fol-
lowed by Germany, Italy, and Spain (χ2(4) = 486∗∗∗). French households are the most
dissatisfied with their government.
France Germany Italy The Netherlands SpainUnemployment ratepoint prediction
before the crisis 14.58 9.55 21.62 11.56 19.67(14.39) (12.06) (17.56) (12.54) (14.11)
now (July 2020) 20.89 14.21 31.39 19.68 20.30(18.57) (15.66) (22.91) (18.28) (20.30)
one-year-ahead 21.82 14.40 30.81 20.37 29.62(19.09) (15.58) (22.80) (18.53) (19.16)
in the next 2-3 years 19.49 13.10 26.48 16.25 24.08(19.37) (15.66) (22. 67) (17.02) (18.41)
Unemployment rateOECD data
July 2019 8.5 3.0 9.7 3.4 14.3July 2020 6.9 4.4 9.7 4.5 15.8
Notes: The first four rows report the (mean) point prediction, standard deviation in parentheses.The survey question is “Please indicate what you think the unemployment rate was or will be inyour country at different points in time.” The last two rows show the realized unemployment rates,measured in numbers of unemployed as % of the labour force (seasonally adjusted). Source: OECD(2020), Unemployment rate (indicator). doi: 10.1787/52570002-en (Accessed on 2020-09-17).
Table 4: Macroeconomic Expectations
Next, we investigate the relationship between personal COVID-19 experiences and
the variables discussed in this section. We measure the average COVID-19 experience
using the two variables presented in Table 1; that is, the self-reported infection rate and
the officially confirmed COVID-19 deaths per 1M population. Table 6 shows meaningful
cross-country correlations. The severity of the COVID-19 experience correlates positively
with the level of worry and fear, pessimism (unemployment increase and the end date of
infection risk), and negatively correlates with trust and satisfaction with the government.
ECB Working Paper Series No 2599 / October 2021 13

Panel A: Trust mean st. dev. p10 p25 p50 p75 p90 NFrance 3.30 1.24 2.00 2.00 3.00 4.00 5.00 1462Germany 2.79 1.19 1.00 2.00 3.00 4.00 5.00 1451Italy 3.22 1.27 2.00 2.00 3.00 4.00 5.00 1454The Netherlands 2.68 1.28 1.00 2.00 2.00 4.00 5.00 1469Spain 3.43 1.43 1.00 2.00 4.00 5.00 5.00 1469Total 3.08 1.32 1.00 2.00 3.00 4.00 5.00 7305Panel B: Satisfaction mean st. dev. p10 p25 p50 p75 p90 NFrance 3.51 1.23 2.00 2.00 4.00 5.00 5.00 1449Germany 2.75 1.28 1.00 2.00 2.00 4.00 5.00 1458Italy 2.96 1.34 1.00 2.00 3.00 4.00 5.00 1445The Netherlands 2.59 1.34 1.00 2.00 2.00 4.00 5.00 1462Spain 3.37 1.43 1.00 2.00 3.00 5.00 5.00 1464Total 3.04 1.37 1.00 2.00 3.00 4.00 5.00 7278
Panel A: The survey question is “Please tell us how much you personally trust or distrust the(country name) government?”. Panel B: The survey question is “How satisfied are you with theway the (country name) government led by (country leader name) is doing its job?” Answercategories: 1= Very much trust, 2= Somewhat trust, 3= Neither trust nor distrust, 4= Somewhatdistrust, 5= Very much distrust. Dropped: 6= I don’t know and 7= I prefer not to answer.
Table 5: Trust and Satisfaction with Government
experience concerns expectations governmentdeaths/ infection job loss financial crisis unempl. trust satis-1M pop rate concern concern end rate faction
Panel A:France 459 0.08 1.63 5.79 3.3 21.82 3.3 3.51Germany 109 0.03 1.49 4.44 2.79 14.4 2.79 2.75Italy 580 0.07 1.87 6.45 3.22 30.81 3.22 2.96The Netherlands 358 0.09 1.52 4.87 2.68 20.37 2.68 2.59Spain 607 0.17 2.04 7.42 3.43 29.62 3.43 3.37Panel B: Cross-Country Correlation with COVID-19 experiencedeaths/1M pop 1 0.73 0.86 0.92 0.80 0.96 0.80 0.58infection rate 0.73 1 0.77 0.81 0.60 0.65 0.60 0.50
Notes: Column 1: number of confirmed COVID-19 deaths/1M population for July 10th, 2020. Source: https://www.worldometers.info/coronavirus/. Column 2, question: “Did you or a person close to you suffer fromsevere COVID-19 infection?” (1=yes; 0=no). Column 3, question: “How worried are you about losing your jobin the near future?” Answer options: 1-3. 1= not worried; 2 = somewhat worried; 3 = very worried. Column 4,question: “How concerned are you about the effects that the coronavirus might have for the financial situationyour household?” Answer options: 0-10. 0 (= not at all concerned) to 10 (= extremely concerned). Column5, question: “In your opinion, when will COVID-19 be totally under control such that it is safe to release allCOVID-19 containment measures in your country?”. Column 6, question: “Please indicate what you think theunemployment rate was or will be in your country in one year from now.” Column 7, question: “Please tell ushow much you personally trust or distrust the (country name) government?”. Column 8, question: “How satisfiedare you with the way the (country name) government led by (country leader name) is doing its job?” Answercategories: 1= Very much trust, 2= Somewhat trust, 3= Neither trust nor distrust, 4= Somewhat distrust, 5=Very much distrust. Dropped categories 6= I don’t know and 7= I prefer not to answer.
Table 6: Cross-Country Correlations with COVID-19 infection and death experience
ECB Working Paper Series No 2599 / October 2021 14

2.2.3 Households’ consumption-specific questions
Households were surveyed about their consumption behavior in five sectors (activities): (i)
public transports (usage), (ii) tourism (traveling abroad for private reasons), (iii) services
(use services such as hairdressers or beauty salons), (iv) hospitality (visiting restaurants,
bars and cafes), and (v) retail (shopping in malls or other stores). We chose these five
sectors because they constitute a large part of total household consumption expenditure
in normal times and because these sectors have been particularly affected by the lockdown
(social-distancing) measures.
For each sector, households are asked whether they are now consuming more, less,
not at all, or the same compared to before the COVID-19 outbreak. We also screen for
households who never consumed pre-pandemic.12
If a household reports a change in consumption behavior, the household is asked to
provide the main reason for the change. Households can select between six main reasons:
(i) “I cannot afford it anymore”, (ii) “I am worried to get infected with COVID-19”,
(iii) “I want to save more”, (iv) “I realized I don’t miss it anymore”, (v) “I buy more
online instead”, and (vi) “other reason”. We interpret the alternatives as (i) financial
constraints due to the COVID-19 income shock, (ii) worry of temporary infection risk,
(iii) precautionary saving motives due to drop in consumer confidence, (iv) lockdown has
altered preferences, and (v) substitution to online consumption.
The next section analyzes for each country and consumption sector, the changes in
household consumption behavior, and the reported primary reason for these changes.
3 Survey results
This section first presents the households’ reported consumption changes for each sector
and country. The change refers to consumption during the dance phase (where restrictions
were lifted) compared to before the COVID-19 outbreak. Second, this section analyzes
the reported consumption changes in light of the demographic and other background
information collected. Finally, this section documents the self-reported main reason for
the change in consumption behavior.12To uncover potential long-lasting consumer preference changes, we framed the survey questions along
the extensive margin, i.e. focusing on whether households plan to engage in particular activities moreor less often than before. This focus on the extensive margin captures well consumption shifts in theservices, hospitality, public transport, and tourism sectors. However, for the retail sector the focus onthe extensive margin may provide a somewhat incomplete picture. Documenting the intensive margin,namely whether a household spends more or less during a visit to a retail store, would be necessaryto comprehensively assess the impact of the COVID-19 lockdown experience on the broad outlook forconsumption demand in the retail sector.
ECB Working Paper Series No 2599 / October 2021 15

3.1 Overview of consumption changes during dance phase
We find that a substantial fraction of households changed their consumption behavior
during the dance phase in all sectors for all countries (compared to before the COVID-19
outbreak). For each country and sector, Appendix Figures A13-A17 provide the percent-
age of households reporting to consume “now more often than before”, “same as before”,
“less often than before”, “not at all”, “never did this before”.
Two clear patterns emerge. First, the share of households reporting a consumption
rise is negligible if not nonexistent. And second, the fraction of households consuming less
is substantial. Depending on the country and sector, the share of households reporting
a consumption drop ranges from 18% to 57%. The share of households reporting a
complete consumption stop ranges from 4% to 31%. Compared to before the COVID-19
outbreak, Figures 2-6 show for each country the fraction of households that reduced their
consumption—conditional on having consumed before.13 Across all sectors, the largest
proportion of households that reduce their consumption is found in Spain and Italy, which
leads us to highlight the first observation:
Observation 1 (Consumption drop). In all sectors, households substantially reduced
their consumption during the dance phase, with the largest drop in Spain and Italy.
These cross-country differences may reflect differences in the severity of the health
crisis: At the time of the survey (July 10th, 2020), Spain had the highest number of con-
firmed COVID-19 death per 1M population, followed by Italy, France, The Netherlands,
and Germany; see Table 1. A higher COVID-19 death rate in a given country seems to
go hand-in-hand with a larger fraction of households that reduce their consumption. The
only exception is France. It is striking to see that France is the country that displays the
lowest fraction of households consuming less in each sector during the dance phase. In the
remainder of this section, we analyze further the cross-country differences in households’
consumption response. However, this finding provides anecdotal evidence for the view
that during a pandemic governments might not face any trade-off in designing policies to
both protect lives and rescue the economy.
Observation 2 (Sectoral variation in the consumption drop). Across all countries, the
tourism sector experienced the largest consumption drop and services the smallest.
The second pattern that stands out is the sectoral variation in the consumption drop.
For the whole sample, we observe the largest decline for the tourism sector: 66 per-13The cross-country differences are statistically significant. We refer to the notes of Figures 2-6 for the
detail of the statistical tests.
ECB Working Paper Series No 2599 / October 2021 16

cent of households say that they will now travel less abroad for private reasons.14 The
second-largest drop is found for the public transport sector, with 58 percent of households
reporting to use this now less. For the whole sample, the third-largest drop concerns the
hospitality sector: 55 percent of households report visiting restaurants, bars, and cafes
less often. Then comes the retail sector: 46 percent of households shop less in malls and
other stores. Services such as hairdressers see the smallest, albeit still substantial, decline
with 38 percent of households reporting to now use these services less.15 16
One caveat to the result that the tourism sector experienced the largest consump-
tion drop is that the measure used for tourism focuses on international travel (‘travel
abroad’) and does not ask explicitly for domestic travel. In 2020, the decline in domestic
tourism was not as drastic as the collapse in international travel. It is therefore possible
that the consumption drop in the tourism sector as a whole may be overestimated in
our data. However, domestic tourism revenues still decreased in all countries surveyed
(source: World Travel and Tourism Council 2020). Hence, there was no perfect substi-
tution between international holiday-making and ‘staycation’ in the five countries under
investigation.
14The vast majority of European households’ pre-pandemic travels took place within Europe (source:Eurostat 2018) and during the time of the survey travel restrictions within the EU had been entirelylifted. However, most governments were still recommending to consider holiday-making in the homecountry, which may partly account for the magnitude of the drop in international tourism.
15For each country: the tourism sector faces the largest decline, ranging from 76 percent of householdstraveling less abroad in Spain to 55 percent in France. The public transport sector faces the second-largest decline in Italy and in The Netherlands and the third-largest decline in Germany, France, andSpain. The drop ranges from 66 percent of households using less public transport in Italy to 44 percentin France. The hospitality sector faces the second-largest decline in France, Germany, and Spain. Andthe third-largest decline in Italy and The Netherlands. The drop ranges from 66 percent of householdsvisiting less often restaurants in Spain to 48 percent in France. For each country, the retail sector facesthe fourth-largest decline, ranging from 52 percent of households shopping less often in malls and otherstores in Spain to 36 percent in France. For each country, the services sector faces the fifth-largest decline,ranging from 47 percent of households using these services less often in Spain to 26 percent in France.
16Cross-sector differences are statistically significant in all countries: χ2(4) = 245∗∗∗ in France, χ2(4) =224∗∗∗ in Germany, χ2(4) = 231∗∗∗ in Italy, χ2(4) = 328∗∗∗ in The Netherlands and χ2(4) = 312∗∗∗ inSpain. All pairwise comparisons are statistically significant at 5%, except the drops in consumption intransport versus hospitality in France, Germany and Spain, in services versus retail in Germany andSpain, in hospitality versus retail in Italy and in transport versus tourism in Italy and The Netherlands.
ECB Working Paper Series No 2599 / October 2021 17

56.08
43.9249.44 50.56
33.68
66.32
36.96
63.04
36.82
63.18
41.94
58.06
020
4060
800
2040
6080
NO YES
NO YES
NO YES
France Germany Italy
The Netherlands Spain Total
Perc
ent
would you use public transports less often?Compared to before the Covid-19 outbreak,
The survey question is: Compared to before the COVID-19 outbreak, howwould you behave? I would use public transports: 1= more often thanbefore; 2= same as before; 3= less often than before; 4= not at all; 5= Inever did this before. Responses =5 are dropped and a dummy is created,which is equal to one for answers in categories 3 or 4, and zero otherwise.The fraction of households that reported “more often” equals 1.6 percent.
Figure 2: Lower usage of public transports (yes/no)
45.1154.89
39.66
60.34
29.45
70.55
35.46
64.54
23.98
76.02
34.37
65.63
020
4060
800
2040
6080
NO YES
NO YES
NO YES
France Germany Italy
The Netherlands Spain Total
Perc
ent
would you travel abroad for private reasons less often?Compared to before the Covid-19 outbreak,
The survey question is: Compared to before the COVID-19 outbreak, howwould you behave? I would travel abroad for private reasons: 1= moreoften than before; 2= same as before; 3= less often than before; 4= not atall; 5= I never did this before. Responses =5 are dropped and a dummyis created, which is equal to one for answer in categories 3 or 4, and zerootherwise. The fraction of households that reported “more often” equals 1.6percent.
Figure 3: Less traveling abroad (yes/no)
ECB Working Paper Series No 2599 / October 2021 18

56.85
43.1549.21 50.79
43.35
56.65
43.2
56.8
34.19
65.81
45.1854.82
020
4060
800
2040
6080
NO YES
NO YES
NO YES
France Germany Italy
The Netherlands Spain Total
Perc
ent
would you visit restaurants, bars, and cafés less often?Compared to before the Covid-19 outbreak,
The survey question is: Compared to before the COVID-19 outbreak, howwould you behave? I would visit restaurants, bars, and cafes: 1= moreoften than before; 2= same as before; 3= less often than before; 4= not atall; 5= I never did this before. Responses =5 are dropped and a dummyis created, which is equal to one for answer in categories 3 or 4, and zerootherwise. The fraction of households that reported “more often” equals 1.7percent.
Figure 4: Less visits to restaurants, bars, and cafes (yes/no)
73.95
26.05
65.52
34.48
54.0945.91
65.48
34.52
52.9647.04
62.09
37.91
020
4060
800
2040
6080
NO YES
NO YES
NO YES
France Germany Italy
The Netherlands Spain Total
Perc
ent
would you use services such as hairdressers or beauty salons less often?Compared to before the Covid-19 outbreak,
The survey question is: Compared to before the COVID-19 outbreak, howwould you behave? I would use services such as hairdressers or beautysalons: 1= more often than before; 2= same as before; 3= less often thanbefore; 4= not at all; 5= I never did this before. Responses =5 are droppedand a dummy is created, which is equal to one for answer in categories 3or 4, and zero otherwise. The fraction of households that reported “moreoften” equals 1.2 percent.
Figure 5: Less usage of services such as hairdressers or beauty salons (yes/no)
ECB Working Paper Series No 2599 / October 2021 19

64.48
35.52
60.39
39.6147.94 52.06
50.78 49.22 47.89 52.11 54.2245.78
020
4060
800
2040
6080
NO YES
NO YES
NO YES
France Germany Italy
The Netherlands Spain Total
Perc
ent
would you shop in malls or other stores less often?Compared to before the Covid-19 outbreak,
The survey question is: Compared to before the COVID-19 outbreak, howwould you behave? I would shop in malls or other stores: 1= more oftenthan before; 2= same as before; 3= less often than before; 4= not at all; 5=I never did this before. Responses =5 are dropped and a dummy is created,which is equal to one for answer in categories 3 or 4, and zero otherwise.The fraction of households that reported “more often” equals 1.6 percent.
Figure 6: Less shopping in malls or other stores (yes/no)
3.2 Consumption changes and households’ characteristics
Next, we investigate households’ characteristics that could explain the reported consump-
tion changes during the dance phase on a individual level. Using the whole data set, we
perform probit estimations of the following specification:
Lessisc = β0 + β1Xi + β2Z̃i + εisc (3.1)
Lessisc denotes the household i’s consumption behavior in sector s surveyed in July 2020,
and who resides in the country c. This indicator is equal to one if household i reports
to consume “less often than before” or “not at all” in sector s (compared to before the
COVID-19 outbreak) and zero otherwise. Xi denotes a vector of standard controls for
household i: we include age, gender, household size, income, employment status, and
the education level.17 Z̃i denotes a vector of additional behavioral controls, which vary
depending on the specification considered: it includes households’ personal experiences,
households’ macroeconomic expectations, and psychological factors such as worry and17These standard controls Xi might also capture changes in current and expected income. Notably, two
major determinants of household consumption, e.g., used in the Keynesian rule-of-thumb consumer modeland the standard New-Keynesian model (Euler Equation). Controlling for exogenous socio-economiccharacteristics, such as age and gender, is essential to capture potential differences in risk aversion anddiscount factors that both influence consumption.
ECB Working Paper Series No 2599 / October 2021 20

fear. The standard errors are clustered at the country level and denoted by εisc.
Socio-economic characteristics First, we present the results of the baseline specifi-
cation (3.1), where we only include the standard socio-economic characteristics Xi that
may affect households’ consumption behavior during a recession. The first column of
Tables 7–11 shows the relevant results for each sector, respectively.
We find that gender is consistently significant: females are more likely to reduce
consumption—this result holds across all sectors. We find that age does not drive changes
in households’ consumption behavior in the hospitality and public transport sectors. How-
ever, we find age to play a significant role in shifting consumption trends in the retail
sector, services sector, and tourism sector. Compared to before the COVID-19 outbreak,
older households are now more likely to travel less often abroad for private reasons than
younger households. In contrast, younger households are more likely to cut their con-
sumption in the hospitality and services sectors. As age is recognized as a major risk
factor associated with more severe health consequences from COVID-19 infections, this
finding is somewhat surprising. One could have expected the opposite effect: the older
the household, the more likely the household will cut non-essential consumption to re-
duce social interactions and, hence, the infection risk. Our results do not support this
narrative, but are in line with recent research on the preception of personal health risks
associated with Covid-19. Bordalo et al. (2020) find that perceived personal health risks
associated with Covid-19 fall sharply with age. The role of age may instead be read in
light of expected future income, where younger individuals may find themselves more
financially insecure than older respondents in the wake of the pandemic.
Turning to the role of income, we find that income is only significant for consumption
changes in two sectors. Higher-income households are more likely to decrease the use of
public transport compared to before the outbreak. For the services sector, we observe
the opposite result. The higher the household income, the less likely that the household
uses services like hairdressers less often. This result echoes those of Baker et al. (2020)
and Carvalho et al. (2020). While these authors find no correlation between income and
changes in consumer behavior during lockdown (i.e., the hammer phase), we report a
limited role of current income for consumption changes during the dance phase. Yet, the
unemployment status increases the probability of having reduced consumption during the
dance phase in the tourism and services sectors, while not being in the labor force makes
the household more likely to consume less in the tourism, hospitality, and public trans-
port sector. Education does not play a large role in explaining changes in consumption
behavior. We consider three education categories (low, middle, high) and find that high
ECB Working Paper Series No 2599 / October 2021 21
educational attainment does not affect the change in consumption behavior. Households
with middle educational attainment are less likely to report consumption changes in the
hospitality and service sectors (compared to the low-educated households). These insights
are summarized by the first finding:
Finding 1 (Consumption drop and socio-economic profile). Gender is the only socio-
economic household characteristic that is consistently and significantly associated with
consumption changes during the dance phase, while income, age, employment status, and
education play a minor role.
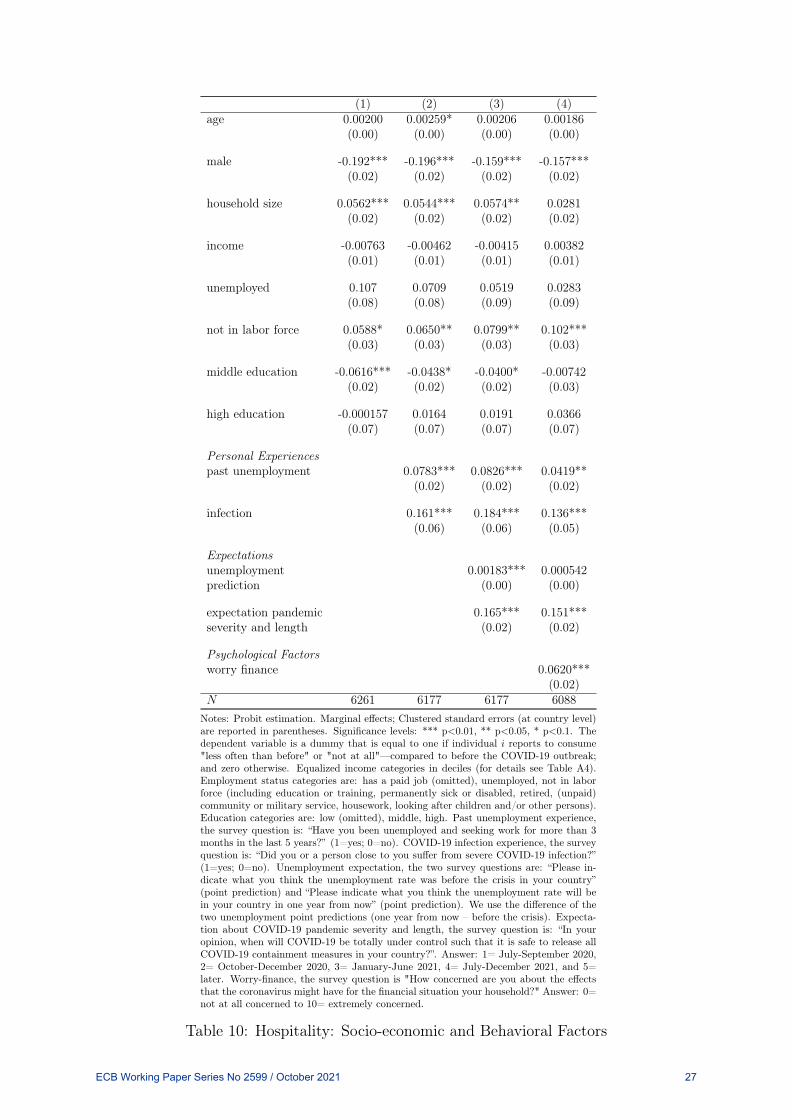
Behavioral factors and expectations Next, we investigate whether households’
consumption changes can be explained by behavioral factors and expectations, such as
households’ personal experiences with a COVID-19 infection and previous unemployment
spells, households’ macroeconomic expectations, and psychological factors such as worry
and fear. We add these behavioral factors sequentially.
First, we add households’ personal experiences. The second column of Tables 7–11
reports the results for each sector, respectively. We find that a personal COVID-19
infection experience (i.e., exposure to a close person that suffered from a severe COVID-
19 infection) makes households more likely to reduce consumption during the dance phase
in the hospitality, services, and retail sectors. In contrast, this experience does not affect
the tourism and public transport sectors. The same result holds for the experience of an
unemployment spell of at least three months in the past five years. In terms of magnitude,
the personal COVID-19 infection experience has roughly twice as large of an impact than
a personal unemployment spell experience.
Next, we add two types of household macroeconomic expectation—inspired by the
traditional expectation channel of standard macroeconomic models. The third column
of Tables 7–10 shows the results for each sector, respectively. Households’ expectations
about the one-year-head change in the unemployment rate compared to the pre-crisis
perception levels are significant for all sectors. The more pessimistic the household (i.e.,
the larger the expected Covid-19 induced increase in unemployment), the more likely
the household reduces consumption in all sectors. Expectation about the pandemic’s
severity and length is the most significant variable for all sectors. The survey question
is: “In your opinion, when will the COVID-19 virus be totally under control such that it
is safe to release all COVID-19 containment measures in your country?”. The later the
expected date, the more likely the household to reduce consumption during the dance
phase compared to before the COVID-19 outbreak.
ECB Working Paper Series No 2599 / October 2021 22

Turning to psychological factors, we add to the regression a variable that captures
households’ worries about the consequences that the COVID-19 pandemic might have on
their financial situation. The last column of Tables 7–11 shows that worries about the
personal financial future is an important explanatory factor for households’ decision to
reduce consumption during the dance phase (compared to before the virus outbreak).18
The effect is highly statistically significant in all sectors. Those insights lead us to the
second finding:
Finding 2 (Consumption drop and behavioral factors). Personal COVID-19 experiences,
pessimistic macroeconomic expectations, and concerns about the future are strongly and
significantly associated with a consumption drop during the dance phase.
Using probit estimations, we find that most standard socio-economic household char-
acteristics (expect gender) do not explain much of the large changes in household con-
sumption behavior. Females (compared to men) are more likely to consume less in all
sectors across all estimation specifications. Findings 1-2 indicate that financial hardship
is not the primary driver for reducing consumption.19 Instead, we find relevant behav-
ioral factors explaining households’ consumption changes such as personal experiences
with a COVID-19 infection and previous unemployment spells, households’ degree of pes-
simism, and psychological factors such as fear about the future. In light of this finding,
the next section explores the self-reported reasons for changing (reducing) consumption
and investigates to what extent the consumption shifts may be transitory or durable.
18Appendix Table A5 shows that worries about the financial future correlate highly with worries aboutfuture job security. Respondents’ job worry correlates with their past unemployment experience andtheir expectations about the unemployment rate. Using job worries instead of financial worries leavesthe main picture unchanged but results in fewer observations.
19This is consistent with households’ reported perception of how they cope financially with their currentincome. We refer to Column 6 of Appendix Table A3.
ECB Working Paper Series No 2599 / October 2021 23

(1) (2) (3) (4)age 0.000583 0.000829 0.000510 0.000565
(0.00) (0.00) (0.00) (0.00)
male -0.167*** -0.163*** -0.116*** -0.112***(0.02) (0.02) (0.02) (0.03)
household size 0.0607** 0.0642** 0.0629** 0.0422(0.02) (0.03) (0.03) (0.03)
income 0.0268*** 0.0288*** 0.0321*** 0.0381***(0.01) (0.01) (0.01) (0.01)
unemployed 0.118 0.112* 0.0857 0.0771(0.09) (0.06) (0.06) (0.07)
not in labor force 0.0563*** 0.0635*** 0.0819*** 0.0955***(0.01) (0.02) (0.02) (0.02)
middle education -0.00149 0.00700 0.0252 0.0441(0.03) (0.04) (0.03) (0.04)
high education -0.0167 -0.00574 0.0214 0.0313(0.07) (0.07) (0.07) (0.07)
Personal Experiencespast unemployment 0.0450 0.0362 0.0106
(0.07) (0.06) (0.06)
infection 0.00414 0.0172 -0.0172(0.06) (0.07) (0.06)
Expectationsunemployment 0.00459*** 0.00372***prediction (0.00) (0.00)
expectation pandemic 0.120*** 0.105***severity and length (0.01) (0.01)
Psychological Factorsworry finance 0.0431***
(0.01)N 5583 5504 5504 5425
Notes: Probit estimation. Marginal effects; Clustered standard errors (at country level)are reported in parentheses. Significance levels: *** p<0.01, ** p<0.05, * p<0.1. Thedependent variable is a dummy that is equal to one if individual i reports to consume"less often than before" or "not at all"—compared to before the COVID-19 outbreak;and zero otherwise. Equalized income categories in deciles (for details see Table A4).Employment status categories are: has a paid job (omitted), unemployed, not in laborforce (including education or training, permanently sick or disabled, retired, (unpaid)community or military service, housework, looking after children and/or other persons).Education categories are: low (omitted), middle, high. Past unemployment experience,the survey question is: “Have you been unemployed and seeking work for more than3 months in the last 5 years?” (1=yes; 0=no). COVID-19 infection experience, thesurvey question is: “Did you or a person close to you suffer from severe COVID-19infection?” (1=yes; 0=no). Unemployment expectation, the two survey questions are:“Please indicate what you think the unemployment rate was before the crisis in yourcountry” (point prediction) and “Please indicate what you think the unemploymentrate will be in your country in one year from now” (point prediction). We use thedifference of the two unemployment point predictions (one year from now – beforethe crisis). Expectation about COVID-19 pandemic severity and length, the surveyquestion is: “In your opinion, when will COVID-19 be totally under control such thatit is safe to release all COVID-19 containment measures in your country?”. Answer:1= July-September 2020, 2= October-December 2020, 3= January-June 2021, 4= July-December 2021, and 5= later. Worry-finance, the survey question is "How concernedare you about the effects that the coronavirus might have for the financial situationyour household?" Answer: 0= not at all concerned to 10= extremely concerned.
Table 7: Public Transports: Socio-economic and Behavioral Factors
ECB Working Paper Series No 2599 / October 2021 24

(1) (2) (3) (4)age 0.00514*** 0.00536*** 0.00478*** 0.00491***
(0.00) (0.00) (0.00) (0.00)
male -0.237*** -0.239*** -0.193*** -0.198***(0.03) (0.03) (0.03) (0.03)
household size 0.0705*** 0.0731*** 0.0742*** 0.0511**(0.02) (0.02) (0.03) (0.02)
income 0.00923 0.00993 0.0119 0.0182(0.01) (0.01) (0.01) (0.01)
unemployed 0.142** 0.142*** 0.114*** 0.0797*(0.07) (0.04) (0.04) (0.04)
not in labor force 0.0865** 0.0978*** 0.117*** 0.139***(0.03) (0.03) (0.03) (0.02)
middle education 0.0346 0.0473 0.0583* 0.0866***(0.04) (0.03) (0.03) (0.03)
high education 0.0249 0.0350 0.0473 0.0650(0.07) (0.07) (0.07) (0.07)
Personal Experiencespast unemployment 0.0261 0.0272 -0.00914
(0.07) (0.07) (0.06)
infection 0.102 0.132** 0.0839(0.07) (0.06) (0.06)
Expectationsunemployment 0.00331*** 0.00226**prediction (0.00) (0.00)
expectation pandemic 0.168*** 0.156***(0.01) (0.01)
Psychological Factorsworry finance 0.0583***
(0.02)N 5570 5495 5495 5423
Notes: Probit estimation. Marginal effects; Clustered standard errors (at country level) arereported in parentheses. Significance levels: *** p<0.01, ** p<0.05, * p<0.1. The depen-dent variable is a dummy that is equal to one if individual i reports to consume "less oftenthan before" or "not at all"—compared to before the COVID-19 outbreak; and zero other-wise. Equalized income categories in deciles (for details see Table A4). Employment statuscategories are: has a paid job (omitted), unemployed, not in labor force (including edu-cation or training, permanently sick or disabled, retired, (unpaid) community or militaryservice, housework, looking after children and/or other persons). Education categories are:low (omitted), middle, high. Past unemployment experience, the survey question is: “Haveyou been unemployed and seeking work for more than 3 months in the last 5 years?” (1=yes;0=no). COVID-19 infection experience, the survey question is: “Did you or a person close toyou suffer from severe COVID-19 infection?” (1=yes; 0=no). Unemployment expectation,the two survey questions are: “Please indicate what you think the unemployment rate wasbefore the crisis in your country” (point prediction) and “Please indicate what you think theunemployment rate will be in your country in one year from now” (point prediction). Weuse the difference of the two unemployment point predictions (one year from now – beforethe crisis). Expectation about COVID-19 pandemic severity and length, the survey questionis: “In your opinion, when will COVID-19 be totally under control such that it is safe to re-lease all COVID-19 containment measures in your country?”. Answer: 1= July-September2020, 2= October-December 2020, 3= January-June 2021, 4= July-December 2021, and 5=later. Worry-finance, the survey question is "How concerned are you about the effects thatthe coronavirus might have for the financial situation your household?" Answer: 0= not atall concerned to 10= extremely concerned.
Table 8: Tourism: Socio-economic and Behavioral Factors
ECB Working Paper Series No 2599 / October 2021 25

(1) (2) (3) (4)age -0.00221** -0.00148 -0.00178 -0.00174
(0.00) (0.00) (0.00) (0.00)
male -0.0978** -0.0943** -0.0420 -0.0400(0.04) (0.05) (0.05) (0.05)
household size 0.117*** 0.117*** 0.114*** 0.0861***(0.01) (0.01) (0.01) (0.02)
income -0.0345*** -0.0322*** -0.0292*** -0.0213***(0.01) (0.01) (0.01) (0.01)
unemployed 0.115* 0.0662 0.0365 0.0334(0.06) (0.05) (0.06) (0.06)
not in labor force -0.0148 -0.00316 0.0147 0.0337(0.02) (0.02) (0.03) (0.03)
middle education -0.120*** -0.0985*** -0.0755** -0.0382(0.03) (0.03) (0.04) (0.04)
high education -0.105 -0.0887 -0.0574 -0.0364(0.07) (0.07) (0.07) (0.06)
Personal Experiencespast unemployment 0.0880*** 0.0737*** 0.0272
(0.03) (0.02) (0.02)
infection 0.138* 0.150* 0.101(0.08) (0.08) (0.08)
Expectationsunemployment 0.00521*** 0.00393***prediction (0.00) (0.00)
expectation pandemic 0.112*** 0.0940***severity and length (0.03) (0.03)
Psychological Factorsworry finance 0.0687***
(0.01)N 6007 5928 5928 5843
Notes: Probit estimation. Marginal effects; Clustered standard errors (at country level)are reported in parentheses. Significance levels: *** p<0.01, ** p<0.05, * p<0.1. The de-pendent variable is a dummy that is equal to one if individual i reports to consume "lessoften than before" or "not at all"—compared to before the COVID-19 outbreak; and zerootherwise. Equalized income categories in deciles (for details see Table A4). Employmentstatus categories are: has a paid job (omitted), unemployed, not in labor force (includ-ing education or training, permanently sick or disabled, retired, (unpaid) community ormilitary service, housework, looking after children and/or other persons). Education cate-gories are: low (omitted), middle, high. Past unemployment experience, the survey ques-tion is: “Have you been unemployed and seeking work for more than 3 months in the last 5years?” (1=yes; 0=no). COVID-19 infection experience, the survey question is: “Did youor a person close to you suffer from severe COVID-19 infection?” (1=yes; 0=no). Unem-ployment expectation, the two survey questions are: “Please indicate what you think theunemployment rate was before the crisis in your country” (point prediction) and “Pleaseindicate what you think the unemployment rate will be in your country in one year fromnow” (point prediction). We use the difference of the two unemployment point predictions(one year from now – before the crisis). Expectation about COVID-19 pandemic severityand length, the survey question is: “In your opinion, when will COVID-19 be totally undercontrol such that it is safe to release all COVID-19 containment measures in your coun-try?”. Answer: 1= July-September 2020, 2= October-December 2020, 3= January-June2021, 4= July-December 2021, and 5= later. Worry-finance, the survey question is "Howconcerned are you about the effects that the coronavirus might have for the financial situ-ation your household?" Answer: 0= not at all concerned to 10= extremely concerned.
Table 9: Services: Socio-economic and Behavioral Factors
ECB Working Paper Series No 2599 / October 2021 26
(1) (2) (3) (4)age 0.00200 0.00259* 0.00206 0.00186
(0.00) (0.00) (0.00) (0.00)
male -0.192*** -0.196*** -0.159*** -0.157***(0.02) (0.02) (0.02) (0.02)
household size 0.0562*** 0.0544*** 0.0574** 0.0281(0.02) (0.02) (0.02) (0.02)
income -0.00763 -0.00462 -0.00415 0.00382(0.01) (0.01) (0.01) (0.01)
unemployed 0.107 0.0709 0.0519 0.0283(0.08) (0.08) (0.09) (0.09)
not in labor force 0.0588* 0.0650** 0.0799** 0.102***(0.03) (0.03) (0.03) (0.03)
middle education -0.0616*** -0.0438* -0.0400* -0.00742(0.02) (0.02) (0.02) (0.03)
high education -0.000157 0.0164 0.0191 0.0366(0.07) (0.07) (0.07) (0.07)
Personal Experiencespast unemployment 0.0783*** 0.0826*** 0.0419**
(0.02) (0.02) (0.02)
infection 0.161*** 0.184*** 0.136***(0.06) (0.06) (0.05)
Expectationsunemployment 0.00183*** 0.000542prediction (0.00) (0.00)
expectation pandemic 0.165*** 0.151***severity and length (0.02) (0.02)
Psychological Factorsworry finance 0.0620***
(0.02)N 6261 6177 6177 6088
Notes: Probit estimation. Marginal effects; Clustered standard errors (at country level)are reported in parentheses. Significance levels: *** p<0.01, ** p<0.05, * p<0.1. Thedependent variable is a dummy that is equal to one if individual i reports to consume"less often than before" or "not at all"—compared to before the COVID-19 outbreak;and zero otherwise. Equalized income categories in deciles (for details see Table A4).Employment status categories are: has a paid job (omitted), unemployed, not in laborforce (including education or training, permanently sick or disabled, retired, (unpaid)community or military service, housework, looking after children and/or other persons).Education categories are: low (omitted), middle, high. Past unemployment experience,the survey question is: “Have you been unemployed and seeking work for more than 3months in the last 5 years?” (1=yes; 0=no). COVID-19 infection experience, the surveyquestion is: “Did you or a person close to you suffer from severe COVID-19 infection?”(1=yes; 0=no). Unemployment expectation, the two survey questions are: “Please in-dicate what you think the unemployment rate was before the crisis in your country”(point prediction) and “Please indicate what you think the unemployment rate will bein your country in one year from now” (point prediction). We use the difference of thetwo unemployment point predictions (one year from now – before the crisis). Expecta-tion about COVID-19 pandemic severity and length, the survey question is: “In youropinion, when will COVID-19 be totally under control such that it is safe to release allCOVID-19 containment measures in your country?”. Answer: 1= July-September 2020,2= October-December 2020, 3= January-June 2021, 4= July-December 2021, and 5=later. Worry-finance, the survey question is "How concerned are you about the effectsthat the coronavirus might have for the financial situation your household?" Answer: 0=not at all concerned to 10= extremely concerned.
Table 10: Hospitality: Socio-economic and Behavioral Factors
ECB Working Paper Series No 2599 / October 2021 27

(1) (2) (3) (4)age -0.00236*** -0.00152** -0.00185** -0.00198**
(0.00) (0.00) (0.00) (0.00)
male -0.275*** -0.277*** -0.241*** -0.244***(0.05) (0.05) (0.05) (0.06)
household size 0.0656*** 0.0641*** 0.0640*** 0.0433***(0.01) (0.01) (0.01) (0.01)
income 0.00525 0.00820 0.0103 0.0174(0.01) (0.01) (0.01) (0.01)
unemployed 0.0224 0.00385 -0.0220 -0.0205(0.05) (0.04) (0.05) (0.05)
not in labor force 0.0203 0.0208 0.0347 0.0568***(0.03) (0.02) (0.02) (0.02)
middle education -0.0576 -0.0376 -0.0244 0.00161(0.06) (0.06) (0.06) (0.06)
high education 0.0458 0.0586 0.0763 0.0896*(0.06) (0.06) (0.06) (0.05)
Personal Experiencespast unemployment 0.0786** 0.0751*** 0.0442*
(0.03) (0.03) (0.02)
infection 0.208*** 0.223*** 0.175**(0.08) (0.08) (0.08)
Expectationsunemployment 0.00303** 0.00181prediction (0.00) (0.00)
expectation pandemic 0.118*** 0.105***severity and length (0.03) (0.03)
Psychological Factorsworry finance 0.0540***
(0.01)N 6374 6290 6290 6200
Notes: Probit estimation. Marginal effects; Clustered standard errors (at country level)are reported in parentheses. Significance levels: *** p<0.01, ** p<0.05, * p<0.1. The de-pendent variable is a dummy that is equal to one if individual i reports to consume "lessoften than before" or "not at all"—compared to before the COVID-19 outbreak; and zerootherwise. Equalized income categories in deciles (for details see Table A4). Employmentstatus categories are: has a paid job (omitted), unemployed, not in labor force (includingeducation or training, permanently sick or disabled, retired, (unpaid) community or mili-tary service, housework, looking after children and/or other persons). Education categoriesare: low (omitted), middle, high. Past unemployment experience, the survey question is:“Have you been unemployed and seeking work for more than 3 months in the last 5 years?”(1=yes; 0=no). COVID-19 infection experience, the survey question is: “Did you or a per-son close to you suffer from severe COVID-19 infection?” (1=yes; 0=no). Unemploymentexpectation, the two survey questions are: “Please indicate what you think the unemploy-ment rate was before the crisis in your country” (point prediction) and “Please indicatewhat you think the unemployment rate will be in your country in one year from now”(point prediction). We use the difference of the two unemployment point predictions (oneyear from now – before the crisis). Expectation about COVID-19 pandemic severity andlength, the survey question is: “In your opinion, when will COVID-19 be totally under con-trol such that it is safe to release all COVID-19 containment measures in your country?”.Answer: 1= July-September 2020, 2= October-December 2020, 3= January-June 2021, 4=July-December 2021, and 5= later. Worry-finance, the survey question is "How concernedare you about the effects that the coronavirus might have for the financial situation yourhousehold?" Answer: 0= not at all concerned to 10= extremely concerned.
Table 11: Retail: Socio-economic and Behavioral Factors
ECB Working Paper Series No 2599 / October 2021 28

3.3 Self-reported reasons for consumption changes
Conditional on having reported consuming “less often than before” or “not at all”, house-
holds were asked: “What is your main reason for doing now less of this activity?”. For
each sector and country, Figures 7-11 provide an overview of the percentage of households
that report as the primary reason (i) financial constraints, (ii) worry of infection risk, (iii)
precautionary saving motives, (iv) lockdown has altered preferences, and (v) substitution
to online consumption.20 Four main observations stand out, leading to four additional
findings.
Finding 3 (Infection risk). The infection risk is the most reported reason for decreasing
consumption (for all countries and sectors).
While the infection risk is the most reported reason for decreasing consumption (across
countries and sectors)21, a substantial fraction of households report what seems to be a
shift in preferences, i.e. households report that they decreased their consumption because
they realized after the lockdown experience that they do not miss it anymore. It is striking
that in France and Germany, the reason “not missing it” is even the second invoked reason
after the infection risk for all sectors. In the Netherlands, we observe the same pattern,
except for the retail sector “shopping in malls or other stores”.22
Households’ consumer preference shifts are substantial but heterogeneous across coun-
tries.23 In all countries, households’ preference shifts are particularly prominent in the
services sector (such as hairdressers), the hospitality industry (i.e., restaurants), and the
retail sector. For example, the fraction of households that realized that they do not miss
services such as hairdressers amounts to 23 percent in France, 19 percent in Germany
and Italy, 14 percent in The Netherlands, and 10 percent in Spain. At the same time,
the fraction of households that realized that they do not miss going to the restaurants20The answer options for the main reason are: “I buy more online instead”; “I realized I don’t miss
it”; “I want to save more”; “I cannot afford it anymore”; “I am worried to get infected with COVID-19”;“Other reason”.
21Aggregating over all countries, the proportions of households reporting each of the five or six reasonsfor reducing consumption are statistically significant different from each other (χ2(4) = 5, 139∗∗∗ fortransport on Fig. 7, χ2(4) = 3, 596∗∗∗ for tourism on Fig. 8, χ2(4) = 1, 061∗∗∗ for services on Fig. 9,χ2(5) = 3, 784∗∗∗ for the hospitality sector on Fig. 10 and χ2(5) = 2, 209∗∗∗ for retail on Fig. 11). Thecross-reason comparisons are all significant except ‘not missing it’ versus ‘saving more’ in the retail andthe hospitality sectors, and ‘not affordable’ versus ‘save more’ in the tourism sector. Significantly morehouseholds report ‘infection risk’ than any other reason for decreasing consumption in all countries andsectors, except for the services sector in France and Italy, and the retail sector in France.
22For the retail sector, Dutch households report as the second main reason a substitution to onlineshopping, followed by the reason “not missing it”.
23Cross-country differences in the fraction of households reporting ‘not missing it’ are significant in allsectors, with χ2(4) = 42∗∗∗ for public transports, χ2(4) = 76∗∗∗ for tourism, χ2(4) = 43∗∗∗ for services,χ2(4) = 58∗∗∗ for the hospitality sector, and χ2(4) = 88∗∗∗ for retail. In each sector, this fraction issignificantly smaller in Spain than in the other countries.
ECB Working Paper Series No 2599 / October 2021 29

amounts to 19 percent in France, 21 percent in Germany, 18 percent in Italy, 15 percent
in The Netherlands, and 9 percent in Spain. 24 These figures lead us to the next finding:
Finding 4 (Change in consumers’ preferences). For all sectors, the fraction of households
that explain their reported consumption drop by a change in preferences is substantial (the
realization of not missing it). It is even the second invoked reason behind the infection
risk in France, Germany, and The Netherlands.
16.197.982 3.991
60.53
11.31 14.48 9.9093.049
55.79
16.77 13.68 13.14.253
59.43
9.54
11.414.467 5.087
54.34
24.69
6.271 7.391 3.024
73.68
9.63 11.83 8.624 3.89
61.26
14.39
020
4060
800
2040
6080
not m
issi
ng it
wan
ting
to s
ave
mor
e
not a
fford
able
infe
ctio
n ris
k
othe
r rea
son
not m
issi
ng it
wan
ting
to s
ave
mor
e
not a
fford
able
infe
ctio
n ris
k
othe
r rea
son
not m
issi
ng it
wan
ting
to s
ave
mor
e
not a
fford
able
infe
ctio
n ris
k
othe
r rea
son
France Germany Italy
The Netherlands Spain Total
Perc
ent
Main reason for using now less public transport:
This survey question is only asked for people who reported “less often thanbefore” or “not at all” in the previous question. The survey question is:“What is your main reason for doing now less of the following activity:Public transport?” 1= I realized I don’t miss it; 2= I want to save more; 3=I cannot afford it anymore; 4= I am worried to get infected with COVID-19;5= Other reason.
Figure 7: Reasons for lower usage of public transports during dance phase
24The fraction of households reporting ‘not missing it’ is significantly larger than the fraction reportingsaving motives or affordability issues (or online alternatives) for the public transport sector in France,Germany, and The Netherlands and the retail sector in France.
ECB Working Paper Series No 2599 / October 2021 30
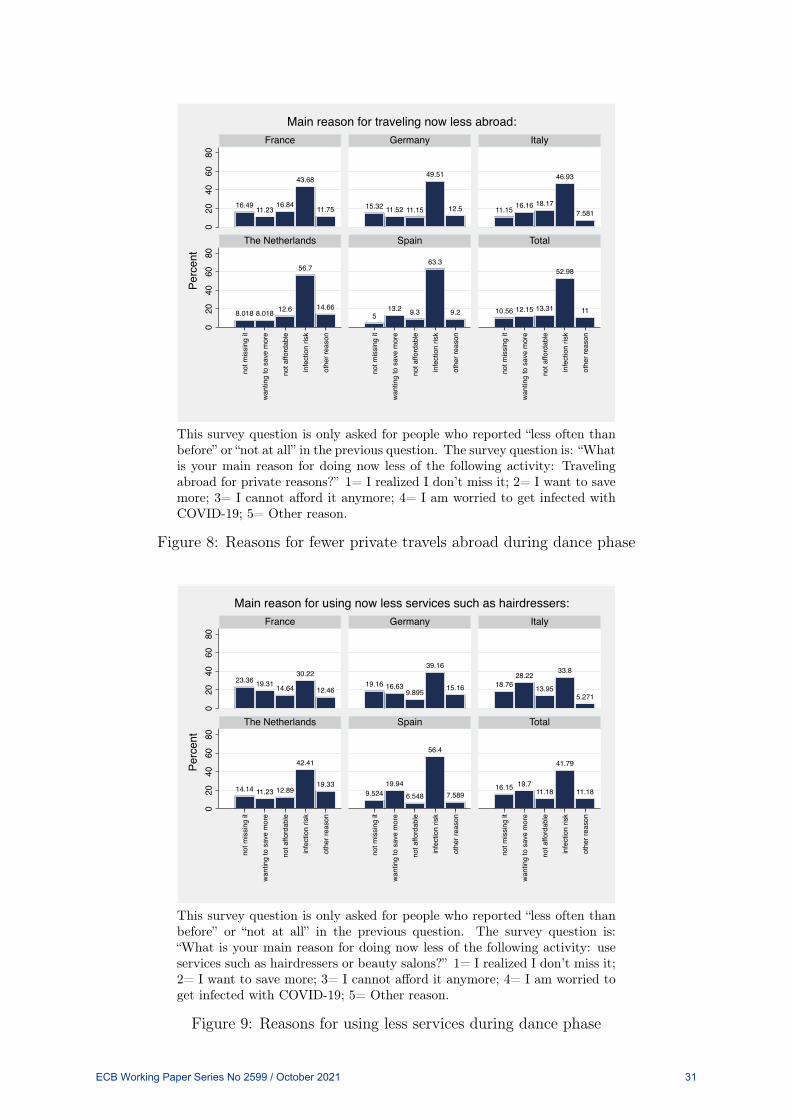
16.49 11.2316.84
43.68
11.75 15.32 11.52 11.15
49.51
12.5 11.15 16.16 18.17
46.93
7.581
8.018 8.018 12.6
56.7
14.665
13.2 9.3
63.3
9.2 10.56 12.15 13.31
52.98
11
020
4060
800
2040
6080
not m
issi
ng it
wan
ting
to s
ave
mor
e
not a
fford
able
infe
ctio
n ris
k
othe
r rea
son
not m
issi
ng it
wan
ting
to s
ave
mor
e
not a
fford
able
infe
ctio
n ris
k
othe
r rea
son
not m
issi
ng it
wan
ting
to s
ave
mor
e
not a
fford
able
infe
ctio
n ris
k
othe
r rea
son
France Germany Italy
The Netherlands Spain Total
Perc
ent
Main reason for traveling now less abroad:
This survey question is only asked for people who reported “less often thanbefore” or “not at all” in the previous question. The survey question is: “Whatis your main reason for doing now less of the following activity: Travelingabroad for private reasons?” 1= I realized I don’t miss it; 2= I want to savemore; 3= I cannot afford it anymore; 4= I am worried to get infected withCOVID-19; 5= Other reason.
Figure 8: Reasons for fewer private travels abroad during dance phase
23.36 19.31 14.64
30.22
12.4619.16 16.63
9.895
39.16
15.16 18.7628.22
13.95
33.8
5.271
14.14 11.23 12.89
42.41
19.339.524
19.946.548
56.4
7.58916.15 19.7
11.18
41.79
11.18
020
4060
800
2040
6080
not m
issi
ng it
wan
ting
to s
ave
mor
e
not a
fford
able
infe
ctio
n ris
k
othe
r rea
son
not m
issi
ng it
wan
ting
to s
ave
mor
e
not a
fford
able
infe
ctio
n ris
k
othe
r rea
son
not m
issi
ng it
wan
ting
to s
ave
mor
e
not a
fford
able
infe
ctio
n ris
k
othe
r rea
son
France Germany Italy
The Netherlands Spain Total
Perc
ent
Main reason for using now less services such as hairdressers:
This survey question is only asked for people who reported “less often thanbefore” or “not at all” in the previous question. The survey question is:“What is your main reason for doing now less of the following activity: useservices such as hairdressers or beauty salons?” 1= I realized I don’t miss it;2= I want to save more; 3= I cannot afford it anymore; 4= I am worried toget infected with COVID-19; 5= Other reason.
Figure 9: Reasons for using less services during dance phase
ECB Working Paper Series No 2599 / October 2021 31

3.041
18.7514.0214.36
42.23
7.6011.359
20.79 16.37.065
43.34
11.141.796
17.7226.11
13.29
36.65
4.431
1.20914.63
8.58512.33
50.42
12.82.7172
8.70916.91
6.66
62.5
4.508 1.51315.5816.57
10.46
47.96
7.917
020
4060
800
2040
6080
buy
mor
e on
line
inst
ead
not m
issi
ng it
wan
ting
to s
ave
mor
e
not a
fford
able
infe
ctio
n ris
k
othe
r rea
son
buy
mor
e on
line
inst
ead
not m
issi
ng it
wan
ting
to s
ave
mor
e
not a
fford
able
infe
ctio
n ris
k
othe
r rea
son
buy
mor
e on
line
inst
ead
not m
issi
ng it
wan
ting
to s
ave
mor
e
not a
fford
able
infe
ctio
n ris
k
othe
r rea
son
France Germany Italy
The Netherlands Spain Total
Perc
ent
Main reason for going now less to restaurants, bars, and cafés:
This survey question is only asked for people who reported “less often thanbefore” or “not at all” in the previous question. The survey question is: “Whatis your main reason for doing now less of the following activity: visitingrestaurants, bars, and cafes?” 1= I plan to buy more online; 2= I realized Idon’t miss it; 3= I want to save more; 4= I cannot afford it anymore; 5= Iam worried to get infected with COVID-19; 6= Other reason.
Figure 10: Reasons for going less to restaurants, bars, and cafes during dance phase
16.7324.61
11.426.299
31.89
9.055 9.02920.95 15.5
4.429
41.91
8.177 11.9315.9525.29
11.54
32.43
2.853
11.4210.7310.047.153
51.03
9.629 10.948.49417.25
5.148
53.8
4.37611.8115.2816.35
7.092
42.94
6.528
020
4060
800
2040
6080
buy
mor
e on
line
inst
ead
not m
issi
ng it
wan
ting
to s
ave
mor
e
not a
fford
able
infe
ctio
n ris
k
othe
r rea
son
buy
mor
e on
line
inst
ead
not m
issi
ng it
wan
ting
to s
ave
mor
e
not a
fford
able
infe
ctio
n ris
k
othe
r rea
son
buy
mor
e on
line
inst
ead
not m
issi
ng it
wan
ting
to s
ave
mor
e
not a
fford
able
infe
ctio
n ris
k
othe
r rea
son
France Germany Italy
The Netherlands Spain Total
Perc
ent
Main reason for shopping now less in malls or other stores:
This survey question is only asked for people who reported “less often thanbefore” or “not at all” in the previous question. The survey question is: “Whatis your main reason for doing now less of the following activity: shopping inmalls and other stores?” 1= I plan to buy more online; 2= I realized I don’tmiss it; 3= I want to save more; 4= I cannot afford it anymore; 5= I amworried to get infected with COVID-19; 6= Other reason.
Figure 11: Reasons for shopping less in malls and other stores during dance phase
ECB Working Paper Series No 2599 / October 2021 32
To the best of our knowledge, this paper is the first to provide evidence on the nature
of the COVID-19 demand shock and on how durable the reported consumption shifts
could turn out in the post-COVID-19 environment. Beyond the question of how much
households are consuming, one must also reflect upon how they are making their pur-
chases. A particularly policy-relevant question is whether the COVID-19 experience may
reinforce the pre-existing trend substituting away from brick and wall stores into online
shopping. This trend is relevant for monetary policy because the online evolution of
shopping habits may influence consumers’ perceptions and expectations of prices.
In our survey, respondents had the opportunity to indicate online alternatives as the
primary reason for reducing consumption in the hospitality and retail sectors. We find
that amongst respondents indicating fewer shopping trips to malls and other stores, a
significant number report that this was due to shopping online instead. The fraction of
households reporting online substitution as the main reason for shopping less in malls
and other stores is highest in France with 16% and lowest in Germany with 9%.25 As
the crisis becomes prolonged, consumers may become further accustomed to this new
way of consumption, which could lead to a long-term shift in the retail sector away from
high-street shops. However, for the hospitality sector, households rarely report “buy more
online instead” to explain their less frequent visits to restaurants, bars, and cafes. The
fraction of households reporting to compensate these visits by delivery services or pick-ups
is negligible and not significantly different across countries, ranging from 3% in France to
0.7% in Spain (χ2(4) = 7.2).
Aside from the main reasons “infection risk” and the “change in preferences”, precau-
tionary saving motives are substantial. A rise in savings is traditionally associated with
pessimistic views about the future economic outlook. This phenomenon reads as a confi-
dence shock that may have a long-lasting impact on demand. For the whole sample, the
fraction of households reporting as the main reason “wanting to save more” to explain
their consumption reduction varies between 8.6% to 19.7%—depending on the sector.
The hospitality and services sectors are the most impacted by precautionary savings,
followed by the retail, tourism, and finally by the public transport sector. We observe
important cross-country variations in the fraction of households reporting as a primary
reason precautionary savings.26 In Spain and Italy, the desire to save more represents the25This cross-country variation is significant (χ2(4) = 16.9∗∗) and cannot be explained by cross-country
differences in the importance of e-commerce in the retail sector. In 2019, the percentage of online sales(of total retail sales) was 15.9% in Germany and 10.9% in France. (sources: Center for Retail Research;Statistica).
26These cross-country differences in the fraction of households reporting saving motive for reducingconsumption are significant in all sectors: χ2 = 45∗∗∗ in the transport sector, χ2 = 47∗∗∗ in the tourismsector, χ2 = 55∗∗∗ in the service sector, χ2 = 58∗∗∗ in the hospitality industry and χ2 = 47∗∗∗ in the retail
ECB Working Paper Series No 2599 / October 2021 33

second most cited main reason for reducing consumption in almost all sectors. While in
France, Germany, and The Netherlands, precautionary saving motives are the third most
cited reason.27 We highlight the following finding:
Finding 5 (Precautionary savings). The fraction of households explaining their consump-
tion drop by a desire to save more is substantial for all sectors. In France, Germany, and
The Netherlands, the saving motive is the third most cited reason (after infection risk and
change in preferences), and the second most popular reason (after the infection risk) in
Italy and Spain.
Financial constraints are the least reported reason for reducing consumption in most
sectors and countries.28 This observation should be understood in light of the unprece-
dented size of governmental fiscal support before and at the time of the survey (July
2020). For the public transport, retail, hospitality, and services sector, the fraction of
households reporting as the main reason for reducing consumption “I cannot afford it
anymore” is significantly smaller than the fraction reporting the infection risk, a shift in
preferences, or precautionary saving motives. The only sector that seems to substantially
lose demand because of households feeling financially constrained is the tourism sector.
However, even for the tourism sector, almost twice as many households report either pre-
cautionary saving motives or the “realization of not missing it” to explain their reduced
travels abroad (compared to those citing financial constraints).
Finding 6 (Financial constraints). Across all sectors and countries, the fraction of house-
holds explaining their consumption drop by financial constraints is small.
Finally, we investigate whether households differ systematically (in terms of socio-
economic characteristics) by their reported reason for consumption reduction. In light
of the pandemic’s asymmetric impact on labor market outcomes (and its resulting dis-
tributional effects), this information is crucial to quantify the COVID-19 demand shock,
besides its persistence. The next section is dedicated to this analysis.
sector. In particular, in the retail and the hospitality sectors, this fraction is significantly higher in Spainthan in any other country. In the transport, tourism and services sectors, this fraction is significantlylower in the Netherlands than in any country.
27Precautionary saving motives are significantly more often reported than a change in consumer pref-erences in the services, hospitality, and retail sectors in Italy and Spain and the tourism sector in Spain.By contrast, in France, Germany, and The Netherlands, the desire to save more is never significantlymore prominent than the reported change in consumer preferences.
28Except for the tourism sector, where the share of households (across all countries) reporting afford-ability constraints is not significantly different from the share reporting precautionary saving motives.However, the share reporting affordability constraints is significantly smaller than the share reportinginfection risk, saving motive, or changing preferences.
ECB Working Paper Series No 2599 / October 2021 34

3.4 Which consumers changed behavior for what reason?
Appendix Tables A9-A10 document for each sector the average socio-economic and behav-
ioral household characteristics for each self-reported reason for decreasing consumption.29
These tables reveal a remarkably stable pattern across the five sectors, with four distinct
household types arising—each corresponding to a different reason for consumption reduc-
tion. This household-level perspective provides further insight regarding the magnitude
of the COVID-19 consumption game-changer.
The first household type is “financially struggling” and is characterized by lower-
income, a lower ability to save, lower educational attainment, a higher likelihood of being
unemployed, and unsatisfied with one’s income level. Women are disproportionately rep-
resented in this category. This result is most striking for the services sector, where 76
percent of the households consuming fewer services due to financial constraints are female.
This result is consistent with the finding that the downturn triggered by the Covid-19
pandemic has created larger employment losses for women than for men (Alon et al.,
2020). Also, this household type is most likely to have had personal Covid-19 experi-
ences and reports the lowest trust in and satisfaction level with the government. Notably,
Ross et al. (2020) find that households that face a contracting budget tend to experience
non-transitional refinement in their consumption preferences, even after normal financial
circumstances are restored. Therefore, if financially struggling households are left unsup-
ported to manage this hardship period, this may tend to reinforce structural changes to
the economy—as this group will be forced to fundamentally re-assess their consumption
priorities, thereby leading to structural behavioral changes.
Implication 1 (Asymmetry of the income shock). The negative income shock induced by
COVID-19 is strikingly asymmetric: low-income households and women are dispropor-
tionately represented among the households reporting affordability issues as the primary
reason for decreasing their consumption.
The second household type are “Young Families”. These larger households are mostly
employed, and are most likely to report precautionary savings motives as the primary
reason for decreasing their consumption. These households are also more likely to be less
satisfied with their income level, despite not reporting the lowest income level.
Implication 2 (Uneven confidence shock). Policies designed to address the COVID-19
confidence shock should primarily target younger and larger households (families).29In this section, we test for group differences pairwise using the nonparametric Wilcoxon-Mann-
Whitney test. Detailed results, including breakdowns per sector, are available upon request. We onlydiscuss systematic differences in household characteristics that are statistically significant at p < 0.05.
ECB Working Paper Series No 2599 / October 2021 35

The third household type is the “Middle-aged and Rich”. This group is more likely
than younger and lower-income households to report long-term changes in their prefer-
ences resulting from the lockdown experience. Individuals within households that report
the “realization of not missing it anymore” as a primary reason for consuming less have
an average age of 50. These households are the least worried about the future and have
the highest level of trust and satisfaction with the government. They are the least likely
to have personally experienced a severe COVID-19 health issue in their group of friends
and family. That these “Middle-aged and Rich” households with higher saving capacities
report this consumer preference shift indicates that the magnitude of the consumer pref-
erence shock may be more substantial than the actual share of these households suggests.
The fourth household type are “Young Rich (Families)”. These households report
substitution away from the high street retail sector and into online alternatives. These
high-income households are mostly in the labor force. This bias towards higher income
can also amplify the preference shock and accelerate the retail market transformation—
away from high-street shops to more e-commerce.
Implication 3 (Preference shock amplifier). The lockdown experience has dispropor-
tionately shifted consumer preference of high-income households. This may amplify the
magnitude of sectoral consumer demand changes and reinforce zombification risk.
4 Conclusions and Policy Implications
This paper provides novel survey-based evidence on the underlying reasons for the shifts in
household consumption following the first COVID-19 lockdown experience. The represen-
tative survey covers five European countries: France, Germany, Italy, The Netherlands,
and Spain. At the time of the survey, July 2020, lockdowns and travel restrictions were
entirely lifted.
We find that there has been a substantial reduction in household consumption in five
sensitive sectors since the onset of COVID-19. Exploiting the cross-country dimension of
the survey, we find that countries that have been heavier hit by the health consequences
of COVID-19 saw in Summer 2020 bigger consumption drops than those that have sur-
vived more unscathed. The infection risk, precautionary saving motives and, perhaps
more surprisingly, a change in consumption habits were the primary reasons for reduced
consumption, while financial constraints were not cited by many respondents. In partic-
ular, we find that the reported drop in consumption strongly and significantly correlates
with past personal unemployment and COVID-19 infection experiences, rather than with
ECB Working Paper Series No 2599 / October 2021 36

the usual socio-economic determinants of consumption.
In summer 2020 and compared to before the COVID-19 outbreak, households report
to have reduced physical shopping, while a significant fraction of these households report
to use online alternatives instead. This crisis might have reinforced and speeded-up
structural changes that were on the way already. Consumers might become used to
online consumption, which could lead to a long-term shift in the retail sector away from
high-street shops to much more e-commerce. In all countries and particularly for the
hospitality and services sectors, a large share of households reported the “realization of
not missing it” as their primary reason for cutting consumption. This finding indicates a
shift in consumer preferences after the first lockdown experience. Hence, our results show
signs that consumption demands in the new-normal after the pandemic will look rather
different to before. We do not know the extent of the game changer yet; but our paper
provides early hints.
These results should be considered as part of the growing and important debate on
zombification. Two potential drivers for zombification in the COVID-19 context are
already widely discussed. First, the ready availability of cheap debt in today’s highly
liquid markets may be acting to impede necessary exits from the market (Jordà et al.,
2020). Second, a geographical mechanism exists (Gathergood et al., 2020)—relating to
the relocation out of city centres and into suburban and rural areas by the new cadre of
home-office-workers. Such shifts of activity could leave many city-centre service providers
facing obsolescence, irrespective of preferences.
Our findings highlight a third possible zombification driver, relating to the long-term
impacts of the profound and protracted COVID-19 experience on consumer preferences.
For this channel to operate, all that is needed is that consumption is partially reallo-
cated. An aggregate long-term drop in consumption is not required, and this is not a
prediction the paper makes. In short, consumers may want very different things after the
pandemic and thus we may never return to the old pre-existing “normal”.30 If this is the
case, then the introduction of health policies such as vaccine roll-outs or health passes
may not be sufficient for pre-pandemic consumption patterns to be restored. In such
circumstances, a substantial number of incumbent firms could face sustained drops in
revenue and profitability in the post-pandemic economy. These considerations may lead
to concerns about the “zombification” of the economy i.e. a situation where public support
programmes and bank lending actions keep unviable firms alive. In other words, the very30 The finding that a significant fraction of households report reducing consumption because of the
realization of not missing it opens the questions of what these households might do with the unspentfunds. Whether they will save the money or use it for debt repayments, education, or different types ofconsumer goods is beyond the scope of this paper and left for future research.
ECB Working Paper Series No 2599 / October 2021 37

broad fiscal support that has been provided to firms during the COVID-19 crisis may have
masked the deteriorating long-term prospects of some firms. If this market exit mech-
anism doesn’t work, then various long-term problems arise—mismatch-unemployment,
inefficient resource allocation, and lower growth.
At this early stage of the pandemic’s life-cycle, one must be careful about making
quick judgements about the long-term viability of firms in receipt of government sup-
port. As argued by Laeven et al. (2020), the pandemic may be simply causing certain
firms and sectors (e.g. tourism) to experience a temporary liquidity squeeze. If those
firms and sectors rebound back to pre-pandemic revenue and profitability levels after the
crisis, then zombification risks will not materialise. However, this bounce-back remains
uncertain—and thus the build-up of debts by companies based in pandemic-hit sectors
remains worthy of close monitoring. Our data shows that the fraction of households re-
porting the “realisation of not missing it anymore” is smallest (10%) in the tourism sector,
althrough this remains substantial.
Our findings complement insights on consumption dynamics drawn from transaction
data; see, inter alia, Bounie et al. (2020) for France and Carvalho et al. (2020) for Spain.
After the severe fall during the lockdown episode of Spring 2020, aggregate consumption
experienced a solid and steady rebound during summer 2020. However, the bounce-back
is heterogeneous across sectors and product types, and especially large for durable goods
such as cars, IT products, and furniture. Bounie et al. (2020) find that certain non-durable
consumption expenditures did not reach pre-crisis (2019) levels (e.g., leisure, hotels, travel
agency, restaurant, transport, clothing). Our survey results on non-durable consumption
patterns provide one possible explanation for these unequal recovering dynamics.
Against this background, analysis by the OECD (Demmou et al., 2021) has evaluated
the potential forthcoming impacts of the COVID-19 crisis on the balance sheet health
of firms of differing sizes and in different sectors since the outbreak. Their simulations
point to a build-up of vulnerabilities of firms becoming distressed. These vulnerabilities
are concentrated in smaller firms, younger firms, and those in sectors that have been
particularly exposed to the impacts of the crisis—e.g. accommodation & food, arts &
entertainment, and travel. This finding is particularly notable when paired with our result
that—especially in the hospitality and services sectors—a large proportion of households
report the “realisation of not missing it anymore” as the primary reason for consuming
now less. These two sectors may be particularly exposed to changes in consumer behavior,
especially amongst smaller and younger firms.
Furthermore, our findings speak to the literature on the role of “pent-up demand”
for economic recoveries. According to Beraja and Wolf (2021), basic consumer theory
ECB Working Paper Series No 2599 / October 2021 38

suggests that pent-up demand effects should be stronger for more durable goods, as
consumers might simply postpone spending on durable goods during a recession. In
contrast, spending on non-durable consumption goods and services, such as hairdressers,
might be simply foregone. This pent-up demand mechanism, together with our finding
that a large fraction of households continue to cut non-durable consumption, suggests that
the recovery path may be long and unevenly experienced across sectors and products.
We draw three policy conclusions from these results. First and foremost, Government
support to businesses should consider the idea that this crisis is not purely a liquidity
shock and that everything might not snap back to normal once it is over. Profound and
elongated experiences, such as the COVID-19 pandemic, have the potential to create new
habits and produce a long-lasting shift in behavior. This paper shows initial evidence that
consumer demand is already changing in ways that may have lasting consequences for
the economy.31 This evidence suggests that the post-COVID 19 economy’s equilibrium
may look substantially different from the one the world left behind in February 2020.
Second, our results suggest that broad-based policies aiming to restore non-durable
consumption to pre-pandemic levels by reducing the pricing of products and services (e.g.,
VAT cuts) are unlikely to be effective. Financial constraints are the least reported reason
for consumption drops. Instead, fiscal support should be laser-like in targeting those
low-educated, low-income households who are particularly hard hit by the crisis. Such
support should be oriented towards helping displaced workers to retrain and find new
jobs.
Third, our results indicate that the objectives of protecting citizens from the virus
risk and preserving economic prosperity may not lead to any trade-offs. During the time
of the survey, lockdowns and travel restrictions were lifted in the countries under in-
vestigation. However, the fraction of households reducing consumption during this time
highly correlates with the number of deaths per 1M population and the personal infec-
tion experience that mostly occurred during the lockdown phase. Also, we find that
standard socio-economic characteristics (except for gender) do not explain the drop in
individual households’ consumption. By contrast, behavioral factors such as macroeco-
nomic expectations (pessimism) and psychological factors such as fears about the future
are significant variables explaining individual households’ drop in consumption. Hence,
governments should treat the control of the infection risk as a prerequisite to achieving
their objective to preserve economic prosperity.31In preliminary support of our survey results, data on household consumption expenditure on goods
in the Fall 2020 with respect to the Fall 2019 show that the recovery in aggregate consumption hidesstriking variations across sectors. While some categories, such as household durables, have stronglyrecovered, some other, such as textile-clothing, keep experiencing a decline; see, e.g. INSEE (2020).
ECB Working Paper Series No 2599 / October 2021 39
Bibliography
Adams-Prassl, A., T. Boneva, M. Golin, and C. Rauh (2020): “Inequality in
the Impact of the Coronavirus Shock: Evidence from Real Time Surveys,” Journal of
Public Economics, 189, 104245.
Alon, T., M. Doepke, J. Olmstead-Rumsey, and M. Tertilt (2020): “This Time
It’s Different: The Role of Women’s Employment in a Pandemic Recession,” Working
Paper 27660, National Bureau of Economic Research.
Andersen, A., E. T. Hansen, N. Johannesen, and A. Sheridan (2020): “Con-
sumer Responses to the COVID-19 Crisis: Evidence from Bank Account Transaction
Data,” Covid Economics: Vetted and Real-time Papers, Issue 7, 93–118.
Andrade, P., O. Coibion, E. Gautier, and Y. Gorodnichenko (2022): “No Firm
is an island? How industry conditions shape firms’ aggregate expectations,” Journal of
Monetary Economics (CRN), forthcoming.
Baker, S. R., R. A. Farrokhnia, S. Meyer, M. Pagel, and C. Yannelis (2020):
“How Does Household Spending Respond to an Epidemic? Consumption during the
2020 COVID-19 Pandemic,” The Review of Asset Pricing Studies, 10, 834–862.
Beraja, M. and C. K. Wolf (2021): “Demand Composition and the Strength of
Recoveries,” MIT mimeo.
Bordalo, P., K. B. Coffman, N. Gennaioli, and A. Shleifer (2020): “Older
People are Less Pessimistic about the Health Risks of Covid-19,” Working Paper 27494,
National Bureau of Economic Research.
Bounie, D., Y. Camara, E. Fize, J. Galbraith, C. Landais, C. Lavest,
T. Pazem, and B. Savatier (2020): “Consumption dynamics in the COVID cri-
sis: Real-time insights from French transaction and bank data,” Covid Economics:
Vetted and Real-time Papers, Issue 59, 1–39.
Carvalho, V., S. Hansen, A. Ortiz, J. Ramon Garcia, T. Rodrigo, S. Ro-
driguez Mora, and J. Ruiz (2020): “Tracking the COVID-19 Crisis with High-
Resolution Transaction Data,” CEPR Discussion Paper 14642, C.E.P.R. Discussion
Papers.
Chronopoulos, D. K., M. Lukas, and J. O. S. Wilson (2020): “Consumer Spend-
ing Responses to the COVID-19 Pandemic: An Assessment of Great Britain,” Available
at SSRN: https://ssrn.com/abstract=3586723.
ECB Working Paper Series No 2599 / October 2021 40
Coibion, O., Y. Gorodnichenko, and M. Weber (2020a): “The Cost of the Covid-
19 Crisis: Lockdowns, Macroeconomic Expectations, and Consumer Spending,” Work-
ing Paper 27141, National Bureau of Economic Research.
——— (2020b): “Does Policy Communication During Covid Work?” Working Paper
27384, National Bureau of Economic Research.
Cotofan, M., L. Cassar, R. Dur, and S. Meier (2022): “Macroeconomic Conditions
When Young Shape Job Preferences for Life,” Review of Economics and Statistics,
forthcoming.
Demmou, L., S. Calligaris, G. Franco, D. Dlugosch, M. A. McGowan, and
S. Sakha (2021): “Insolvency and debt overhang following the COVID-19 outbreak:
Assessment of risks and policy responses,” OECD Economics Department Working
Papers, 1651.
Gathergood, J., F. Gunzinger, B. Guttman-Kenney, E. Quispe-
Torreblanca, and N. Stewart (2020): “Levelling Down and the COVID-19
Lockdowns: Uneven Regional Recovery in UK Consumer Spending,” Available at
SSRN: https://ssrn.com/abstract=3798679.
Giuliano, P. and A. Spilimbergo (2014): “Growing up in a Recession,” The Review
of Economic Studies, 2, 787–817.
Guglielminetti, E. and C. Rondinelli (2021): “Consumption and saving patterns
in Italy during Covid-19,” Bank of Italy, Questioni di Economia e Finanza (Occasional
Papers), n. 620.
IMF (2020): “The Great Lockdown,” World Economic Outlook, (April).
INSEE (2020): “Informations Rapides,” November, No. 304, retrieved from
https://www.insee.fr/en/statistiques/4984641.
Jordà, O., M. Kornejew, M. Schularick, and A. M. Taylor (2020): “Zombies
at large? Corporate debt overhang and the macroeconomy,” Working Paper 2020-36,
Federal Reserve Bank of San Francisco.
Kuchler, T. and B. Zafar (2019): “Personal Experiences and Expectations about
Aggregate Outcomes,” The Journal of Finance, 74, 2491–2542.
Laeven, L., G. Schepens, and I. Schnabel (2020): “Zombification in Europe in
times of pandemic,” VoxEU.org, 11 October.
ECB Working Paper Series No 2599 / October 2021 41

Malmendier, U. and S. Nagel (2011): “Depression Babies: Do Macroeconomic Ex-
periences Affect Risk Taking?” The Quarterly Journal of Economics, 126, 373–416.
——— (2016): “ Learning from Inflation Experiences,” The Quarterly Journal of Eco-
nomics, 131, 53–87.
Parker, J. A. and N. S. Souleles (2019): “Reported Effects versus Revealed-
Preference Estimates: Evidence from the Propensity to Spend Tax Rebates,” American
Economic Review: Insights, 1, 273–90.
Piyapromdee, S. and P. Spittal (2020): “The Income and Consumption Effects of
COVID-19 and the Role of Public Policy,” Fiscal Studies, 41, 805–827.
Pueyo, T. (2020): “Coronavirus: The Hammer and the Dance,” Blog Medium (March
19).
Ross, G. R., M. G. Meloy, and K. A. Carlson (2020): “Preference Refinement
after a Budget Contraction,” Journal of Consumer Research, 47, 412–430.
Schumpeter, J. A. (1934): “Depressions. Can We Learn from Past Experience?” in:
D.V. Brown et al. (eds.) The Economics of the Recovery Program, reprinted in R.V.
Clemence (ed.), Joseph A. Schumpeter. Essays on Entrepreneurs, Innovations, Busi-
ness Cycles and the Evolution of Capitalism, Cambridge 1951, re-published, with a new
Introduction by Richard Swedberg, New Brunswick (U.S.A.) and Oxford (U.K.) 1989:
Transaction Publishers.
Zwanka, R. J. and C. Buff (2021): “COVID-19 Generation: A Conceptual Framework
of the Consumer Behavioral Shifts to Be Caused by the COVID-19 Pandemic,” Journal
of International Consumer Marketing, 33, 58–67.
ECB Working Paper Series No 2599 / October 2021 42

The COVID-19 consumption game–changer:
Evidence from a large-scale multi-country survey
Alexander Hodbod, Cars Hommes, Stefanie J. Huber, Isabelle Salle
Online Appendix
1. Descriptive statistics
2. Representativeness of the data
3. Additional results
1 Descriptive Statistics
Sample SizeFrance 1,500 20 %
Germany 1,500 20 %Italy 1,500 20 %
The Netherlands 1,500 20 %Spain 1,501 20 %Total 7,501 100 %
Table A1: Number of observations by country
ECB Working Paper Series No 2599 / October 2021 43

Country household size education
age male children adults total low middle high(1) (2) (3) (4) (5) (6) (7) (8)
France mean 50.85 0.48 1.43 1.06 2.4 0.25 0.44 0.31st. dev 17.90 0.50 0.78 0.88 1.16 0.43 0.5 0.46N 1500 1500 1176 1500 1500 1500 1500 1500
Germany mean 50.97 0.49 1.37 0.94 2.21 0.2 0.55 0.25st. dev 17.04 0.50 0.76 0.86 1.13 0.40 0.50 0.43N 1500 1496 1106 1500 1500 1500 1500 1500
Italy mean 50.44 0.49 1.44 1.56 2.96 0.41 0.43 0.17st. dev 16.91 0.50 0.75 0.99 1.14 0.49 0.49 0.37N 1500 1499 1380 1500 1500 1500 1500 1500
The mean 50.24 0.50 1.41 1.02 2.33 0.26 0.41 0.32Netherlands st. dev 17.23 0.50 0.85 0.99 1.25 0.44 0.49 0.47
N 1500 1500 1109 1500 1500 1500 1500 1500
Spain mean 48.49 0.49 1.46 1.53 2.96 0.41 0.26 0.34st. dev 15.39 0.50 0.76 0.98 1.15 0.49 0.44 0.47N 1501 1500 1377 1501 1501 1501 1501 1501
Total mean 50.2 0.49 1.42 1.22 2.57 0.31 0.42 0.28st. dev 16.93 0.50 0.78 0.98 1.21 0.46 0.49 0.45N 7501 7495 6148 7501 7501 7501 7501 7501
Notes: Column (1) reports the average age of the household, Column (2) the fraction of male households.Column (3)-(5) report the households’ average number of children younger than 14 years, the average numberof adults, and the average number of people within a household. Columns (6)-(8) report the fraction ofhouseholds having attained low, middle, and high education levels, respectively.
Table A2: Descriptive socio-economic statistics by country I
ECB Working Paper Series No 2599 / October 2021 44

Country employment statistics financial statistics
employment not in unemployment past spell of savings incomelabor force rate unemployment satisfaction
(1) (2) (3) (4) (5) (6)France mean 0.5 0.45 0.06 0.19 0.65 3.16
st. dev 0.5 0.5 0.23 0.39 0.48 1.23N 1443 1443 1443 1481 1351 1469
Germany mean 0.54 0.43 0.03 0.13 0.69 3.3st. dev 0.5 0.49 0.17 0.34 0.46 1.19N 1460 1460 1460 1470 1354 1454
Italy mean 0.4 0.48 0.12 0.3 0.64 2.59st. dev 0.49 0.5 0.32 0.46 0.48 1.04N 1426 1426 1426 1468 1270 1451
The mean 0.47 0.47 0.05 0.19 0.67 3.51Netherlands st. dev 0.5 0.5 0.22 0.4 0.47 1.19
N 1454 1454 1454 1473 1268 1456
Spain mean 0.55 0.32 0.13 0.39 0.64 3.03st. dev 0.5 0.47 0.34 0.49 0.48 1.16N 1464 1464 1464 1471 1295 1455
Total mean 0.49 0.43 0.08 0.24 0.66 3.12st. dev 0.5 0.5 0.27 0.43 0.47 1.2N 7247 7247 7247 7363 6538 7285
Notes: Column (1) reports the fraction of households in paid work, Column (2) the fraction not being part of the labor force, andColumn (3) the fraction being unemployed. Column (4) reports the fraction of households having experienced an unemploymentspell over the past 5 years. The survey question is “Have you been unemployed and seeking work for more than 3 months in thelast 5 years?”. Column (5) reports the fraction of households that have the ability to make an unexpected payment of one-month ofincome. The survey question is “Does your household have savings (excluding the value of your home) worth at least one month ofthe total net income of your household?” (1=yes, 0=no). Column (6) reports households’ perception of how they cope financiallywith their income. The survey question is “Which of these descriptions comes closest to how you feel about your household’s incomenowadays?” The variable is numeric, 5 categories: 1= Very difficult on present income and insufficient to cover all the expenses;2= Difficult on present income; 3= Coping on present income; 4= Living comfortably on present income, but unable to save; 5=Living comfortably on present income and able to save.
Table A3: Descriptive employment and financial statistics by country II
ECB Working Paper Series No 2599 / October 2021 45

Country mean st. dev p10 p25 p50 p75 p90 NFrance 5.44 2.79 1 3 6 8 9 1384Germany 5.60 2.81 1 3 6 8 9 1329Italy 5.83 2.62 2 4 6 8 9 1369The Netherlands 6.08 2.70 2 4 6 8 10 1283Spain 6.03 2.78 2 4 6 9 10 1323Total 5.79 2.75 2 4 6 8 10 6688
Notes: The survey question is “Can you tell us which value describes your household’syearly total income, after tax and compulsory deductions, from all sources?” The re-ported income is then equivalized using the OECD formula on the grounds of familycomposition and compared with the empirical equivalized household income distribu-tion in the given country to attribute the respondent to one of the 10 income deciles.The variable is then numeric, 10 categories. The non-adjusted income brackets are:In France: 1= Less than 13,300 euros; 2= Between 13,301 and 19,800 euros; 3=Between 19,801 and 23,000 euros; 4= Between 23,001 and 26,700 euros; 5= Between26,701 and 30,600 euros; 6= Between 30,601 and 34,900 euros; 7= Between 34,901 and39,200 euros; 8= Between 39,201 and 44,800 euros; 9= Between 44,801 and 54,100 eu-ros; 10= More than 54,100 euros.In Germany: 1= Less than 13,670 euros; 2= Between 13,671 and 18,740 euros; 3=Between 18,741 and 23,360 euros; 4= Between 23,361 and 27,910 euros; 5= Between27,911 and 32,900 euros; 6= Between 32,901 and 38,420 euros; 7= Between 38,421 and45,040 euros; 8= Between 45,041 and 53,680 euros; 9= Between 53,681 and 68,030 eu-ros; 10= More than 68,030 euros.In Italy: 1= Less than 9,000 euros; 2= Between 9,001 and 14,000 euros; 3= Between14,001 and 17,500 euros; 4= Between 17,501 and 21,000 euros; 5= Between 21,001 and25,000 euros; 6= Between 25,001 and 29,500 euros; 7= Between 29,501 and 36,000 eu-ros; 8= Between 36,001 and 43,500 euros; 9= Between 43,501 and 56,000 euros; 10=More than 56,000 euros.In The Netherlands: 1= Less than 13,000 euros; 2= Between 13,001 and 17,000 eu-ros; 3= Between 17,001 and 20,000 euros; 4= Between 20,001 and 24,000 euros; 5=Between 24,001 and 28,000 euros; 6= Between 28,001 and 33,000 euros; 7= Between33,001 and 39,000 euros; 8= Between 39,001 and 46,000 euros; 9= Between 46,001and 58,000 euros; 10= More than 58,000 euros.In Spain: 1= Less than 9,350 euros; 2= Between 9,350 and 12,000 euros; 3= Between12,001 and 15,000 euros; 4= Between 15,001 and 18,000 euros; 5= Between 18,001 and21,600 euros; 6= Between 21,601 and 26,400 euros; 7= Between 26,401 and 30,000 eu-ros; 8= Between 30,001 and 34,200 euros; 9= Between 34,201 and 44,400 euros; 10=More than 44,400 euros.
Table A4: Descriptive household income statistics by country III
ECB Working Paper Series No 2599 / October 2021 46

worry finance worry job past unemployment unemploymentexperience prediction
worry finance 1.0000worry job 0.5538 1.0000past unemployment 0.2159 0.3127 1.0000unemployment prediction 0.2409 0.2548 0.1714 1.0000
Notes: Worry finance is measured by the survey question is “How concerned are you about the effects thatthe coronavirus might have for the financial situation your household?” Answer options: 0-10. 0 (= not at allconcerned) to 10 (= extremely concerned). Worry job is measured by the survey question is “How worried are youabout losing your job in the near future?” Answer options: 1-3. 1= not worried; 2 = somewhat worried; 3 = veryworried. Past unemployment experience measured by the survey question is “Have you been unemployed andseeking work for more than 3 months in the last 5 years?” Answer options: yes/no. Unemployment predictionis measured using the two survey questions “Please indicate what you think the unemployment rate was beforethe crisis in your country” (point prediction) and “Please indicate what you think the unemployment rate willbe in your country in one year from now” (point prediction). We use the difference of the two unemploymentpoint predictions (one year from now – before the crisis).
Table A5: Correlations of explanatory variables
ECB Working Paper Series No 2599 / October 2021 47
2 Representativeness of the data
This section investigates the representativeness of our sample. We have set ‘hard quotas’
for the dimensions of gender, age, education, and region of residence. Appendix Table A6,
A7 and A8 compare the key socio-economic characteristics of the samples to nationally
representative statistics from Eurostat and the OECD. Appendix Table A6 and A7 show
that our sample matches the nationally representative statistics in all five countries when
comparing the gender distribution between men and women, the age distribution, the
distribution on educational attainment, as well as the region of residence.
In addition, occupation and income were set as ‘soft quotas’, which means that there
could be some flexibility, up to 10 p.p., in achieving the required distributions. Appendix
Table A8 shows that the sample distribution is hence roughly comparable to the em-
ployment distribution across occupational groups in the EU (Q3 2020), although some
categories (e.g., "Clerical support workers" and "Service and sales workers" occupations)
are over-represented. However, it is important to note that our response rate for the
occupational employment question was low (missing values: 3,931/7,501), hence the dis-
crepancy. Figure A12 reports on the representativeness of our sample along the income
dimension. In most countries, the high-income category is underrepresented—the under-
coverage of top incomes (the missing rich) is a known issue in the literture of household
finance and often the case in household surveys.
Furthermore, we have also looked into the representativeness of our sample beyond
these five dimensions. When it comes to household size, our sample includes slightly
larger households compared to the national statistics from Eurostat. This observation
holds in all countries. The unemployment rate from Eurostat for June 2020 differs slightly
to the July 2020 unemployment rate prevailing in our sample. One explanation for this
could be the different measurement of the unemployment rate between the sample and
the nationally representative statistics and the difference age spans considered. For the
sample, the unemployment rate measures the fraction of unemployed respondents (aged
18-74). It includes individuals that are actively looking for a job and those who want a job
but who are not actively looking for one. However, Eurostat defines unemployed persons
as persons aged 15 to 74 who are without work, are available to start work within the
next two weeks, and have actively sought employment at some time during the previous
four weeks. The unemployment rate is the number of people unemployed as a percentage
of the labor force. In June 2020, the unemployment rate in the Euro area was 8.0 percent
compared to 8.2 percent for our whole sample in July 2020. (Source: Eurostat; [unertm]).
ECB Working Paper Series No 2599 / October 2021 48
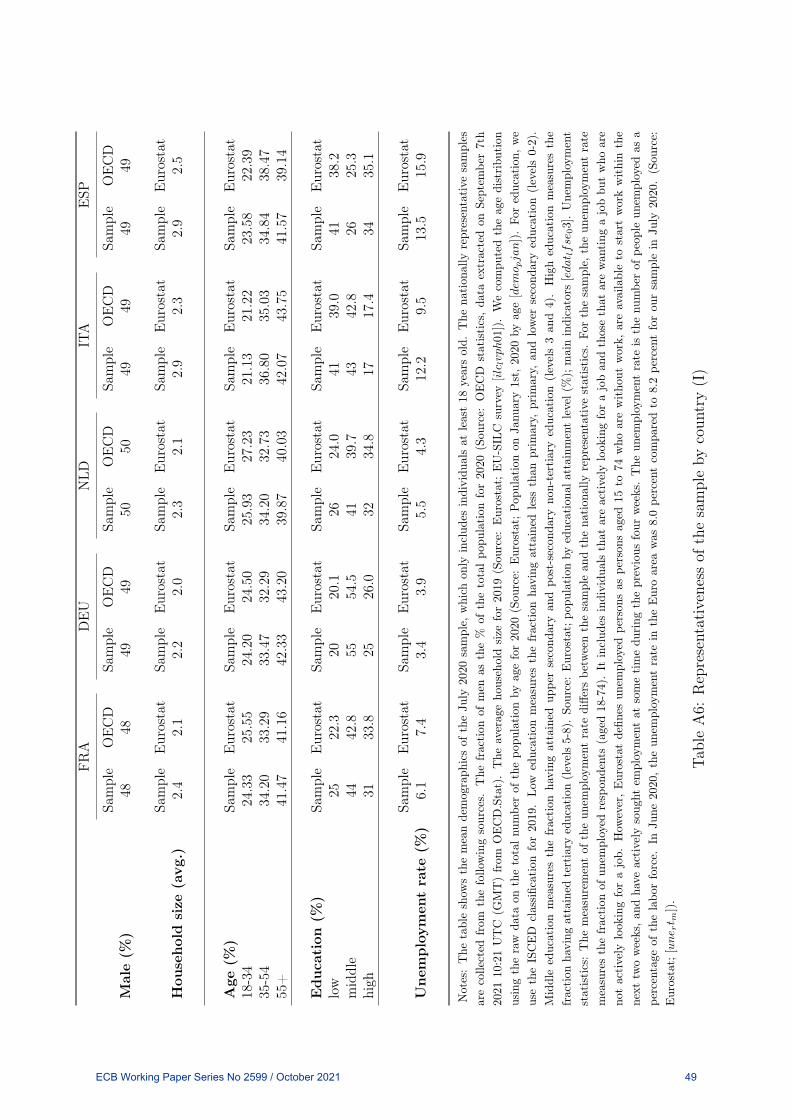
FRA
DEU
NLD
ITA
ESP
Sample
OECD
Sample
OECD
Sample
OECD
Sample
OECD
Sample
OECD
Male(%
)48
4849
4950
5049
4949
49
Sample
Eurostat
Sample
Eurostat
Sample
Eurostat
Sample
Eurostat
Sample
Eurostat
Hou
seholdsize
(avg
.)2.4
2.1
2.2
2.0
2.3
2.1
2.9
2.3
2.9
2.5
Age
(%)
Sample
Eurostat
Sample
Eurostat
Sample
Eurostat
Sample
Eurostat
Sample
Eurostat
18-34
24.33
25.55
24.20
24.50
25.93
27.23
21.13
21.22
23.58
22.39
35-54
34.20
33.29
33.47
32.29
34.20
32.73
36.80
35.03
34.84
38.47
55+
41.47
41.16
42.33
43.20
39.87
40.03
42.07
43.75
41.57
39.14
Education
(%)
Sample
Eurostat
Sample
Eurostat
Sample
Eurostat
Sample
Eurostat
Sample
Eurostat
low
2522.3
2020.1
2624.0
4139.0
4138.2
middle
4442.8
5554.5
4139.7
4342.8
2625.3
high
3133.8
2526.0
3234.8
1717.4
3435.1
Sample
Eurostat
Sample
Eurostat
Sample
Eurostat
Sample
Eurostat
Sample
Eurostat
Unem
ploym
entrate
(%)
6.1
7.4
3.4
3.9
5.5
4.3
12.2
9.5
13.5
15.9
Notes:The
tableshow
sthemeandemograph
icsof
theJu
ly2020
sample,
which
only
includ
esindividu
alsat
least18
yearsold.
The
nation
ally
representative
samples
arecolle
cted
from
thefollo
wingsources.
The
fraction
ofmen
asthe%
ofthetotalpo
pulation
for2020
(Sou
rce:
OECD
statistics,da
taextractedon
Septem
ber7th
2021
10:21UTC
(GMT)from
OECD.Stat).The
averageho
useholdsize
for2019
(Sou
rce:
Eurostat;
EU-SILC
survey
[ilc
lvph01]).Wecompu
tedtheagedistribu
tion
usingtheraw
data
onthetotalnu
mbe
rof
thepo
pulation
byagefor2020
(Sou
rce:
Eurostat;
Pop
ulationon
Janu
ary1st,
2020
byage[dem
o pjan]).Fo
reducation,
we
usetheISCED
classificationfor2019.Lo
weducationmeasuresthefraction
having
attained
less
than
prim
ary,
prim
ary,
andlower
second
aryeducation(levels0-2).
Middleeducationmeasuresthefraction
having
attained
uppe
rsecond
aryan
dpo
st-secon
dary
non-tertiary
education(levels3an
d4).Highed
ucationmeasuresthe
fraction
having
attained
tertiary
education(levels5-8).So
urce:Eurostat;po
pulation
byeducationa
lattainm
entlevel(%);mainindicators
[edat lfse
03].Unemployment
statistics:The
measurementof
theun
employmentrate
diffe
rsbe
tweenthesamplean
dthena
tion
ally
representative
statistics.Fo
rthesample,
theun
employ
mentrate
measuresthefraction
ofun
employed
respon
dents(aged18-74).It
includ
esindividu
alsthat
areactively
look
ingforajoban
dthosethat
arewan
ting
ajobbu
twho
are
notactively
look
ingforajob.
How
ever,Eurostatdefin
esun
employed
person
sas
person
saged
15to
74who
arewitho
utwork,
areavailableto
startworkwithinthe
next
twoweeks,a
ndha
veactively
soug
htem
ploymentat
sometimedu
ring
theprevious
four
weeks.The
unem
ploymentrate
isthenu
mbe
rof
peop
leun
employed
asa
percentage
ofthelabo
rforce.
InJu
ne2020,theun
employmentrate
intheEuroarea
was
8.0pe
rcentcompa
redto
8.2pe
rcentforou
rsamplein
July
2020.(Sou
rce:
Eurostat;[une rt m
]).
TableA6:
Representativen
essof
thesampleby
coun
try(I)
ECB Working Paper Series No 2599 / October 2021 49

FRA
DEU
NLD
ITA
ESP
Sample
Eurostat
Sample
Eurostat
Sample
Eurostat
Sample
Eurostat
Sample
Eurostat
Ilede
Fran
ce18.7
18.2
Bad
en-W
ürttem
berg
13.3
13.3
Noo
rd-N
ederland
10.1
10.1
Nord-Ovest
26.9
26.6
Noroeste
9.3
9.3
BassinParisien
16.8
16.1
Bayern
15.9
15.7
Oost-Nederland
21.2
21.1
Nord-Est
18.5
19.2
Noreste
9.7
9.5
Nord-Pas-de-Calais
6.0
6.1
Berlin
4.3
4.3
West-Nederland
50.1
47.6
Centro
20.1
19.9
Com
unidad
deMad
rid
13.9
13.9
Est
8.3
8.0
Brand
enbu
rg3.0
3.0
Zuid-N
ederland
18.6
21.3
Sud
23.2
23.2
Centro
12.1
11.9
Ouest
13.7
13.2
Bremen
0.8
0.8
Isole
11.3
11.1
Este
29.1
29.1
Sud-Ouest
11.1
10.7
Ham
burg
2.2
2.2
Sur
21.7
21.6
Centre-Est
12.7
11.9
Hessen
7.5
7.5
Can
arias
4.4
4.6
Méditerranée
12.6
12.2
Mecklenbu
rg-V
orpo
mmern
1.9
2.0
Niedersachsen
9.7
0.6
Nordrhein-W
estfalen
21.7
21.7
Rheinland
-Pfalz
5.0
4.9
Saarland
1.3
1.2
Sachsen
4.7
4.8
Sachsen-Anh
alt
2.8
2.7
Schleswig-H
olstein
3.4
3.5
Thü
ring
en2.5
2.6
Notes:The
tableshow
sthedistribu
tion
oftheJu
ly2020
sampleacross
each
NUTS1
region
asidentifiedby
theEU
againsttheem
piricald
istributionof
thegeneralp
opulation(sou
rce:
Eurostat2020).
TableA7:
Representativenessof
thesampleby
coun
try(II)
ECB Working Paper Series No 2599 / October 2021 50
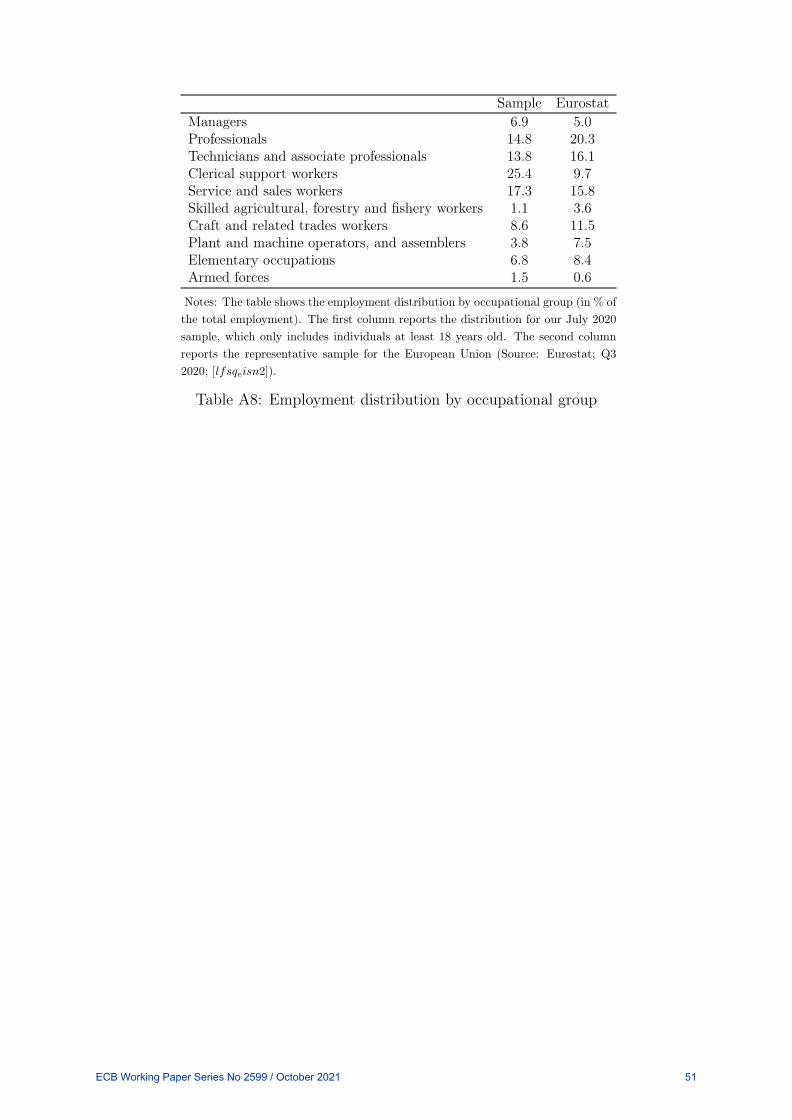
Sample EurostatManagers 6.9 5.0Professionals 14.8 20.3Technicians and associate professionals 13.8 16.1Clerical support workers 25.4 9.7Service and sales workers 17.3 15.8Skilled agricultural, forestry and fishery workers 1.1 3.6Craft and related trades workers 8.6 11.5Plant and machine operators, and assemblers 3.8 7.5Elementary occupations 6.8 8.4Armed forces 1.5 0.6
Notes: The table shows the employment distribution by occupational group (in % ofthe total employment). The first column reports the distribution for our July 2020sample, which only includes individuals at least 18 years old. The second columnreports the representative sample for the European Union (Source: Eurostat; Q32020; [lfsqeisn2]).
Table A8: Employment distribution by occupational group
ECB Working Paper Series No 2599 / October 2021 51

0 10 20 30 40 50
0 10 20 30 40 50 0 10 20 30 40 50
High
Middle
Low
High
Middle
Low
High
Middle
Low
High
Middle
Low
High
Middle
Low
France Germany Italy
The Netherlands Spain
percentage (%)
Notes: The low income category represents the first three deciles, the middle income category gathersthe next four deciles and the high income category the last three deciles. See Table A4 for the deciles percountry. Hence, the empirical distribution of each category in the general population of each country is,respectively, 30, 40 and 30% (Source: OECD equivalized household income distribution on the groundsof family composition; Q3 2020).
Figure A12: Distribution of household income by country
ECB Working Paper Series No 2599 / October 2021 52

3 Additional Results
2.267
37.423.2
7.867
29.27
1.067
42.7330.27
14.53 11.41.467
28.9340.47
19.49.733
2
29.93 31.622.87
13.61.399
33.5845.57
14.464.997 1.64
34.52 34.22
15.82 13.8
020
4060
020
4060
Mor
e of
ten
than
bef
ore
Sam
e as
bef
ore
Less
ofte
n th
an b
efor
e
Not
at a
ll
I nev
er d
id th
is b
efor
e
Mor
e of
ten
than
bef
ore
Sam
e as
bef
ore
Less
ofte
n th
an b
efor
e
Not
at a
ll
I nev
er d
id th
is b
efor
e
Mor
e of
ten
than
bef
ore
Sam
e as
bef
ore
Less
ofte
n th
an b
efor
e
Not
at a
ll
I nev
er d
id th
is b
efor
e
France Germany Italy
The Netherlands Spain Total
Perc
ent
I would use public transportsGraphs by Country
I would use public transportsCompared to before the Covid-19 outbreak, how would you behave?
The survey question is: Compared to before the COVID-19 outbreak, how wouldyou behave? I would use public transports: 1= more often than before; 2= sameas before; 3= less often than before; 4= not at all; 5= I never did this before.
Figure A13: Usage of public transports
ECB Working Paper Series No 2599 / October 2021 53

1.867
30.13 28.27
10.67
29.07
1.467
34.73 29.67 25.4
8.7331.533
24.0737.47
23.8713.07
2.067
30.13 30.2 28.4
9.2.9327
20.25
36.5830.58
11.661.573
27.86 32.4423.78
14.34
020
4060
020
4060
Mor
e of
ten
than
bef
ore
Sam
e as
bef
ore
Less
ofte
n th
an b
efor
e
Not
at a
ll
I nev
er d
id th
is b
efor
e
Mor
e of
ten
than
bef
ore
Sam
e as
bef
ore
Less
ofte
n th
an b
efor
e
Not
at a
ll
I nev
er d
id th
is b
efor
e
Mor
e of
ten
than
bef
ore
Sam
e as
bef
ore
Less
ofte
n th
an b
efor
e
Not
at a
ll
I nev
er d
id th
is b
efor
e
France Germany Italy
The Netherlands Spain Total
Perc
ent
I would travel abroad for private reasonsCompared to before the Covid-19 outbreak, how would you behave?
The survey question is: Compared to before the COVID-19 outbreak, how wouldyou behave? I would travel abroad for private reasons: 1= more often thanbefore; 2= same as before; 3= less often than before; 4= not at all; 5= I neverdid this before. .
Figure A14: Traveling abroad for private reasons
1
51
34.13
5.333 8.5331.533
4638.4
10.673.4 1.867
40.7348.6
7.067 1.733
2.133
39.8 41.2
13.932.933 1.932
31.85
56.9
8.1281.199 1.693
41.87 43.85
9.0253.56
020
4060
020
4060
Mor
e of
ten
than
bef
ore
Sam
e as
bef
ore
Less
ofte
n th
an b
efor
e
Not
at a
ll
I nev
er d
id th
is b
efor
e
Mor
e of
ten
than
bef
ore
Sam
e as
bef
ore
Less
ofte
n th
an b
efor
e
Not
at a
ll
I nev
er d
id th
is b
efor
e
Mor
e of
ten
than
bef
ore
Sam
e as
bef
ore
Less
ofte
n th
an b
efor
e
Not
at a
ll
I nev
er d
id th
is b
efor
e
France Germany Italy
The Netherlands Spain Total
Perc
ent
I would visit restaurants, bars, and cafésCompared to before the Covid-19 outbreak, how would you behave?
The survey question is: Compared to before the COVID-19 outbreak, how wouldyou behave? I would visit restaurants, bars, and cafes: 1= more often thanbefore; 2= same as before; 3= less often than before; 4= not at all; 5= I neverdid this before.
Figure A15: Visiting restaurants, bars, and cafes
ECB Working Paper Series No 2599 / October 2021 54

.7333
61.53
183.933
15.81.267
59.8
25.4
6.733 6.8 1.333
50.2736.07
7.733 4.6
1.533
59.8
24.13
8.2 6.333 1.199
49.536.84
8.195 4.264 1.213
56.18
28.09
6.959 7.559
020
4060
020
4060
Mor
e of
ten
than
bef
ore
Sam
e as
bef
ore
Less
ofte
n th
an b
efor
e
Not
at a
ll
I nev
er d
id th
is b
efor
e
Mor
e of
ten
than
bef
ore
Sam
e as
bef
ore
Less
ofte
n th
an b
efor
e
Not
at a
ll
I nev
er d
id th
is b
efor
e
Mor
e of
ten
than
bef
ore
Sam
e as
bef
ore
Less
ofte
n th
an b
efor
e
Not
at a
ll
I nev
er d
id th
is b
efor
e
France Germany Italy
The Netherlands Spain Total
Perc
ent
I would use services such as hairdressers or beauty salons
Compared to before the Covid-19 outbreak, how would you behave?
The survey question is: Compared to before the COVID-19 outbreak, how wouldyou behave? I would use services such as hairdressers or beauty salons: 1= moreoften than before; 2= same as before; 3= less often than before; 4= not at all;5= I never did this before. Responses =5 are dropped and dummy created.
Figure A16: Usage of services such as hairdressers or beauty salons
1.267
60.2
31.07
2.8 4.667 1.4
58.27
35.2
3.933 1.2 1.733
45.6 45.27
6.133 1.267
2
4842.4
6.067 1.533 1.666
45.9 47.77
3.997 .6662 1.613
51.5940.34
4.586 1.866
020
4060
020
4060
Mor
e of
ten
than
bef
ore
Sam
e as
bef
ore
Less
ofte
n th
an b
efor
e
Not
at a
ll
I nev
er d
id th
is b
efor
e
Mor
e of
ten
than
bef
ore
Sam
e as
bef
ore
Less
ofte
n th
an b
efor
e
Not
at a
ll
I nev
er d
id th
is b
efor
e
Mor
e of
ten
than
bef
ore
Sam
e as
bef
ore
Less
ofte
n th
an b
efor
e
Not
at a
ll
I nev
er d
id th
is b
efor
e
France Germany Italy
The Netherlands Spain Total
Perc
ent
I would shop in malls or other storesCompared to before the Covid-19 outbreak, how would you behave?
The survey question is: Compared to before the COVID-19 outbreak, how wouldyou behave? I would shop in malls or other stores: 1= more often than before;2= same as before; 3= less often than before; 4= not at all; 5= I never did thisbefore.
Figure A17: Shopping in malls or other stores
ECB Working Paper Series No 2599 / October 2021 55

stan
dardstatistics
education
employm
entstatistics
finan
cial
statistics
age
male
hhsize
low
middle
high
emp.
notin
un-
spello
fsaving
sincome
income
Publictran
sports
LFem
p.un
emp.
satisfaction
notmissing
it50
.26
0.53
2.58
0.29
0.45
0.26
0.48
0.43
0.08
0.21
0.67
3.12
5.84
wan
ting
tosave
40.95
0.53
2.94
0.32
0.39
0.28
0.58
0.29
0.13
0.39
0.52
2.65
5.45
notaff
orda
ble
45.34
0.48
2.96
0.46
0.32
0.22
0.4
0.4
0.2
0.43
0.3
2.12
3.84
infectionrisk
51.56
0.46
2.64
0.28
0.4
0.31
0.49
0.44
0.07
0.24
0.72
3.22
6.28
stan
dardstatistics
education
employm
entstatistics
finan
cial
statistics
age
male
hhsize
low
middle
high
emp.
notin
un-
spello
fsaving
sincome
income
Tou
rism
LFem
p.un
emp.
satisfaction
notmissing
it53
.31
0.58
2.52
0.27
0.47
0.25
0.47
0.48
0.05
0.18
0.72
3.28
5.93
wan
ting
tosave
43.34
0.52
2.85
0.29
0.4
0.3
0.62
0.29
0.09
0.32
0.66
2.85
5.78
notaff
orda
ble
48.71
0.45
2.63
0.38
0.42
0.2
0.41
0.45
0.14
0.39
0.39
2.16
4.51
infectionrisk
52.25
0.45
2.6
0.26
0.41
0.33
0.49
0.45
0.06
0.21
0.76
3.39
6.53
stan
dardstatistics
education
employm
entstatistics
finan
cial
statistics
age
male
hhsize
low
middle
high
emp.
notin
un-
spello
fsaving
sincome
income
Services
LFem
p.un
emp.
satisfaction
notmissing
it48
.32
0.49
2.68
0.31
0.45
0.24
0.49
0.44
0.07
0.23
0.68
3.08
5.59
wan
ting
tosave
43.54
0.46
3.01
0.37
0.36
0.28
0.56
0.32
0.11
0.36
0.58
2.64
5.42
notaff
orda
ble
46.82
0.33
2.6
0.4
0.38
0.22
0.38
0.45
0.17
0.41
0.32
2.02
4.2
infectionrisk
51.07
0.44
2.71
0.31
0.39
0.3
0.49
0.43
0.08
0.25
0.7
3.12
6.14
stan
dardstatistics
education
employm
entstatistics
finan
cial
statistics
age
male
hhsize
low
middle
high
emp.
notin
un-
spello
fsaving
sincome
income
Hospitality
LFem
p.un
emp.
satisfaction
notmissing
it51
.97
0.53
2.57
0.29
0.46
0.25
0.46
0.48
0.06
0.19
0.7
3.23
5.82
wan
ting
tosave
44.2
0.46
2.81
0.34
0.39
0.26
0.56
0.34
0.1
0.35
0.59
2.71
5.38
notaff
orda
ble
49.11
0.41
2.63
0.4
0.41
0.19
0.38
0.45
0.17
0.38
0.36
2.09
4.3
infectionrisk
52.36
0.45
2.6
0.29
0.38
0.33
0.48
0.46
0.06
0.22
0.74
3.32
6.29
onlin
ealternatives
40.22
0.48
2.77
0.25
0.42
0.33
0.58
0.32
0.11
0.28
0.56
2.69
5.65
stan
dardstatistics
education
employm
entstatistics
finan
cial
statistics
age
male
hhsize
low
middle
high
emp.
notin
un-
spello
fsaving
sincome
income
Retail
LFem
p.un
emp.
satisfaction
notmissing
it51
.97
0.46
2.58
0.26
0.44
0.3
0.49
0.46
0.05
0.19
0.7
3.19
5.96
wan
ting
tosave
43.07
0.49
2.89
0.33
0.39
0.28
0.56
0.3
0.13
0.35
0.55
2.68
5.52
notaff
orda
ble
46.1
0.36
2.77
0.42
0.37
0.21
0.35
0.46
0.19
0.45
0.32
1.92
4.12
infectionrisk
52.28
0.42
2.57
0.3
0.39
0.31
0.47
0.47
0.06
0.22
0.71
3.27
6.19
buymoreon
line
45.37
0.42
2.84
0.26
0.42
0.32
0.6
0.34
0.06
0.24
0.71
3.12
6.09
TableA9:
Descriptive
socio-econ
omic
householdstatistics
bysector
andby
reason
forconsum
ptionredu
ction
ECB Working Paper Series No 2599 / October 2021 56
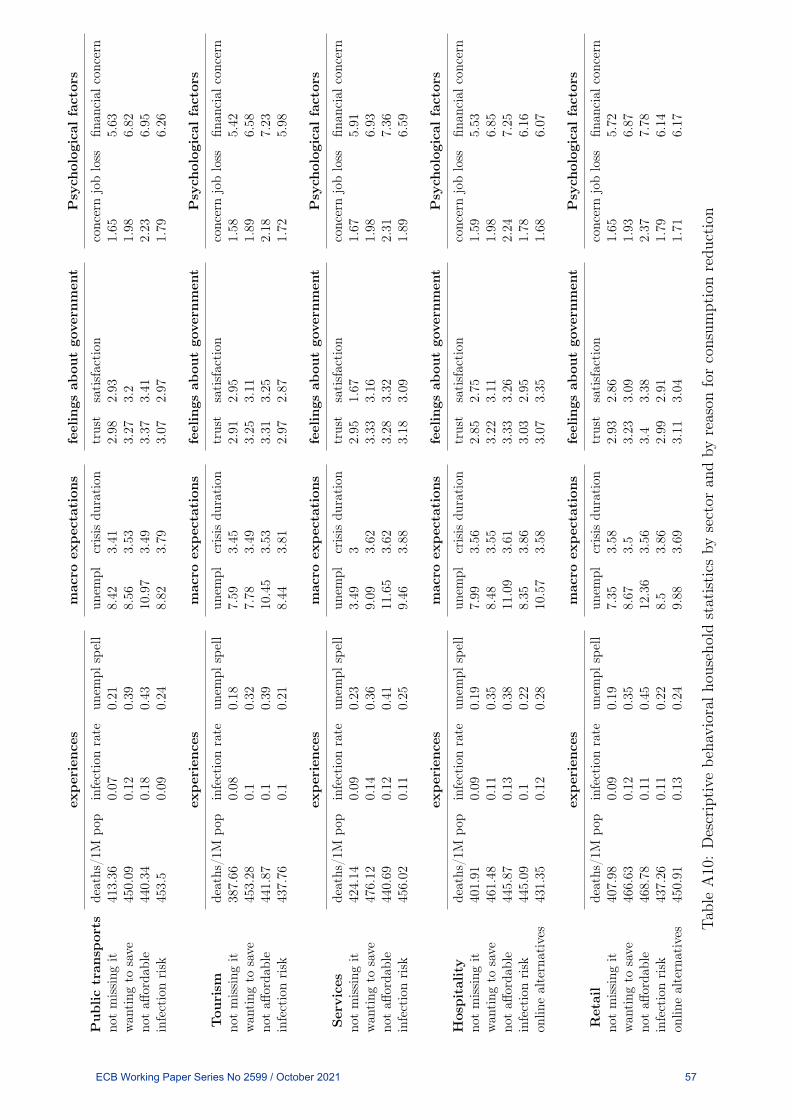
experiences
macro
expectation
sfeelings
abou
tgovernment
Psychological
factors
Publictran
sports
deaths/1
Mpo
pinfectionrate
unem
plspell
unem
plcrisis
duration
trust
satisfaction
concernjobloss
finan
cial
concern
notmissing
it41
3.36
0.07
0.21
8.42
3.41
2.98
2.93
1.65
5.63
wan
ting
tosave
450.09
0.12
0.39
8.56
3.53
3.27
3.2
1.98
6.82
notaff
orda
ble
440.34
0.18
0.43
10.97
3.49
3.37
3.41
2.23
6.95
infectionrisk
453.5
0.09
0.24
8.82
3.79
3.07
2.97
1.79
6.26
experiences
macro
expectation
sfeelings
abou
tgovernment
Psychological
factors
Tou
rism
deaths/1
Mpo
pinfectionrate
unem
plspell
unem
plcrisis
duration
trust
satisfaction
concernjobloss
finan
cial
concern
notmissing
it38
7.66
0.08
0.18
7.59
3.45
2.91
2.95
1.58
5.42
wan
ting
tosave
453.28
0.1
0.32
7.78
3.49
3.25
3.11
1.89
6.58
notaff
orda
ble
441.87
0.1
0.39
10.45
3.53
3.31
3.25
2.18
7.23
infectionrisk
437.76
0.1
0.21
8.44
3.81
2.97
2.87
1.72
5.98
experiences
macro
expectation
sfeelings
abou
tgovernment
Psychological
factors
Services
deaths/1
Mpo
pinfectionrate
unem
plspell
unem
plcrisis
duration
trust
satisfaction
concernjobloss
finan
cial
concern
notmissing
it42
4.14
0.09
0.23
3.49
32.95
1.67
1.67
5.91
wan
ting
tosave
476.12
0.14
0.36
9.09
3.62
3.33
3.16
1.98
6.93
notaff
orda
ble
440.69
0.12
0.41
11.65
3.62
3.28
3.32
2.31
7.36
infectionrisk
456.02
0.11
0.25
9.46
3.88
3.18
3.09
1.89
6.59
experiences
macro
expectation
sfeelings
abou
tgovernment
Psychological
factors
Hospitality
deaths/1
Mpo
pinfectionrate
unem
plspell
unem
plcrisis
duration
trust
satisfaction
concernjobloss
finan
cial
concern
notmissing
it40
1.91
0.09
0.19
7.99
3.56
2.85
2.75
1.59
5.53
wan
ting
tosave
461.48
0.11
0.35
8.48
3.55
3.22
3.11
1.98
6.85
notaff
orda
ble
445.87
0.13
0.38
11.09
3.61
3.33
3.26
2.24
7.25
infectionrisk
445.09
0.1
0.22
8.35
3.86
3.03
2.95
1.78
6.16
onlin
ealternatives
431.35
0.12
0.28
10.57
3.58
3.07
3.35
1.68
6.07
experiences
macro
expectation
sfeelings
abou
tgovernment
Psychological
factors
Retail
deaths/1
Mpo
pinfectionrate
unem
plspell
unem
plcrisis
duration
trust
satisfaction
concernjobloss
finan
cial
concern
notmissing
it40
7.98
0.09
0.19
7.35
3.58
2.93
2.86
1.65
5.72
wan
ting
tosave
466.63
0.12
0.35
8.67
3.5
3.23
3.09
1.93
6.87
notaff
orda
ble
468.78
0.11
0.45
12.36
3.56
3.4
3.38
2.37
7.78
infectionrisk
437.26
0.11
0.22
8.5
3.86
2.99
2.91
1.79
6.14
onlin
ealternatives
450.91
0.13
0.24
9.88
3.69
3.11
3.04
1.71
6.17
TableA10:Descriptive
beha
vioral
householdstatistics
bysector
andby
reason
forconsum
ptionredu
ction
ECB Working Paper Series No 2599 / October 2021 57

Acknowledgements We are indebted to the Amsterdam Centre for European Studies (ACES), Radboud Universiteit Nijmegen, and Gent University for funding this project. We would like to thank participants at the JHU-LSE conference on “Behavioral Economics Experiments & Insights on Covid-19”, the 2021 ZEW Public Finance Conference, the RCEA Future of Growth Conference, the 36th Annual Congress of the European Economic Association (EEA), and at the IAAE 2021 Annual Conference for comments and suggestions. The views and opinions expressed in this article are those of the authors and do not necessarily reflect the view of the Bank of Canada or the European Central Bank. Alexander Hodbod European Central Bank, Frankfurt am Main, Germany; email: [email protected] Cars Hommes Bank of Canada, Ottawa, Canada; University of Amsterdam; Tinbergen Institute, Amsterdam, The Netherlands; email: [email protected] Stefanie J. Huber University of Amsterdam; Tinbergen Institute, Amsterdam, The Netherlands; email: [email protected]. Isabelle Salle Bank of Canada, Ottawa, Canada; University of Amsterdam; Tinbergen Institute, Amsterdam, The Netherlands; email: [email protected]
© European Central Bank, 2021
Postal address 60640 Frankfurt am Main, Germany Telephone +49 69 1344 0 Website www.ecb.europa.eu
All rights reserved. Any reproduction, publication and reprint in the form of a different publication, whether printed or produced electronically, in whole or in part, is permitted only with the explicit written authorisation of the ECB or the authors.
This paper can be downloaded without charge from www.ecb.europa.eu, from the Social Science Research Network electronic library or from RePEc: Research Papers in Economics. Information on all of the papers published in the ECB Working Paper Series can be found on the ECB’s website.
PDF ISBN 978-92-899-4822-7 ISSN 1725-2806 doi: 10.2866/736606 QB-AR-21-090-EN-N