The costs of electricity interruptions in Spain. Are we sending the right signals?
10
The costs of electricity interruptions in Spain. Are we sending the right signals? $ Pedro Linares a , Luis Rey b,n,1 a Universidad Pontificia de Comillas, MR-CBG Harvard Kennedy School and Economics for Energy, Spain b Rede (University of Vigo), Basque Centre for Climate Change (BC3) and Economics for Energy, Doutor Cadaval 2, 36202 Vigo, Spain HIGHLIGHTS We calculate the costs of electricity interruptions in Spain. We find that in 2008 the cost for the Spanish economy of one kWh of electricity not supplied was around €6. The results imply that Spain is underinvesting in short-term energy security. article info Article history: Received 27 June 2012 Accepted 23 May 2013 Available online 29 June 2013 Keywords: Energy security Electricity interruptions Value of lost load abstract One of the objectives of energy security is the uninterrupted physical availability of energy. However, there is limited information about how much is the cost of energy supply interruptions. This information is essential to optimize investment and operating decisions to prevent energy shortages, or, alternatively, to determine the strength of the signals to be sent to the agents so that they may invest accordingly. In this paper, we estimate the economic impact of an electricity interruption in different sectors and regions of Spain. Although there are several caveats in our analysis, we find that in 2008 the cost for the Spanish economy of one kWh of electricity not supplied was above €4 even in a conservative scenario, which is higher than the signals currently being sent as incentives to avoid these interruptions. This might result in an underinvestment in short-term energy security, particularly when we add the usual risk aversion of most consumers. & 2013 Elsevier Ltd. All rights reserved. 1. Introduction Security of supply is considered as an important objective of energy policy in many countries around the world. Together with efficiency and sustainability, the European Union includes security of energy supply as one of the three pillars of its energy policy (European Commission (EC), 2008). In particular, the focus on the security of supply of electricity has increased since the liberalization of the electricity sector in many countries. Theoretically, a liberalized market increases competition and, thus, leads to a more efficient outcome. However, in absence of a proper regulation, electricity suppliers may not have the incentives to ensure a socially optimal security of supply (Rodilla and Batlle, 2010). Batlle et al. (2007) divided the security of electricity supply in three components: A short term level, which refers to the ability of existing generation capacity to meet actual load and support unex- pected disturbances such as electrical short circuits. A medium term level, defined as the ability of the already installed capacity to supply electricity efficiently, and therefore, depends on generation and resource management decisions. A long term level, which refers to the existence of enough available capacity, both installed and/or expected, to meet demand. Arguably, the medium term level is one of the most relevant and common. In the last years many countries have experienced electricity shortfalls due to this reason (some examples are California in 2000 and 2001, Norway in 2002, France and Germany in 2003, South Africa in 2008 and 2009, or most recently, Japan in 2011). The consequences of these outages are particularly important for most societies, very dependent on the availability of electricity, Contents lists available at ScienceDirect journal homepage: www.elsevier.com/locate/enpol Energy Policy 0301-4215/$ - see front matter & 2013 Elsevier Ltd. All rights reserved. http://dx.doi.org/10.1016/j.enpol.2013.05.083 ☆ Financial support from the Spanish Ministry of Economy and Competitiveness (ECO2009-14586-C02-01) is gratefully acknowledged. n Corresponding author. Tel.: +34 944014690x48. E-mail addresses: [email protected], [email protected] (L. Rey). 1 We are also grateful to Alcoa Foundation program on Advancing Sustain- ability Research. The usual disclaimer applies. Energy Policy 61 (2013) 751–760
-
Upload
independent -
Category
Documents
-
view
3 -
download
0
Transcript of The costs of electricity interruptions in Spain. Are we sending the right signals?
Energy Policy 61 (2013) 751–760
Contents lists available at ScienceDirect
Energy Policy
0301-42http://d
☆Fina(ECO20
n CorrE-m1 W
ability R
journal homepage: www.elsevier.com/locate/enpol
The costs of electricity interruptions in Spain. Are we sending the rightsignals?$
Pedro Linares a, Luis Rey b,n,1
a Universidad Pontificia de Comillas, MR-CBG Harvard Kennedy School and Economics for Energy, Spainb Rede (University of Vigo), Basque Centre for Climate Change (BC3) and Economics for Energy, Doutor Cadaval 2, 36202 Vigo, Spain
H I G H L I G H T S
� We calculate the costs of electricity interruptions in Spain.
� We find that in 2008 the cost for the Spanish economy of one kWh of electricity not supplied was around €6.� The results imply that Spain is underinvesting in short-term energy security.a r t i c l e i n f o
Article history:Received 27 June 2012Accepted 23 May 2013Available online 29 June 2013
Keywords:Energy securityElectricity interruptionsValue of lost load
15/$ - see front matter & 2013 Elsevier Ltd. Ax.doi.org/10.1016/j.enpol.2013.05.083
ncial support from the Spanish Ministry of Ec09-14586-C02-01) is gratefully acknowledgedesponding author. Tel.: +34 944014690x48.ail addresses: [email protected], luis.ree are also grateful to Alcoa Foundation proesearch. The usual disclaimer applies.
a b s t r a c t
One of the objectives of energy security is the uninterrupted physical availability of energy. However,there is limited information about how much is the cost of energy supply interruptions. This informationis essential to optimize investment and operating decisions to prevent energy shortages, or, alternatively,to determine the strength of the signals to be sent to the agents so that they may invest accordingly. Inthis paper, we estimate the economic impact of an electricity interruption in different sectors and regionsof Spain. Although there are several caveats in our analysis, we find that in 2008 the cost for the Spanisheconomy of one kWh of electricity not supplied was above €4 even in a conservative scenario, which ishigher than the signals currently being sent as incentives to avoid these interruptions. This might resultin an underinvestment in short-term energy security, particularly when we add the usual risk aversion ofmost consumers.
& 2013 Elsevier Ltd. All rights reserved.
1. Introduction
Security of supply is considered as an important objective ofenergy policy in many countries around the world. Together withefficiency and sustainability, the European Union includes securityof energy supply as one of the three pillars of its energy policy(European Commission (EC), 2008).
In particular, the focus on the security of supply of electricityhas increased since the liberalization of the electricity sector inmany countries. Theoretically, a liberalized market increasescompetition and, thus, leads to a more efficient outcome. However,in absence of a proper regulation, electricity suppliers may nothave the incentives to ensure a socially optimal security of supply
ll rights reserved.
onomy and Competitiveness.
[email protected] (L. Rey).gram on Advancing Sustain-
(Rodilla and Batlle, 2010). Batlle et al. (2007) divided the securityof electricity supply in three components:
�
A short term level, which refers to the ability of existinggeneration capacity to meet actual load and support unex-pected disturbances such as electrical short circuits.�
A medium term level, defined as the ability of the alreadyinstalled capacity to supply electricity efficiently, and therefore,depends on generation and resource management decisions.�
A long term level, which refers to the existence of enoughavailable capacity, both installed and/or expected, to meetdemand.Arguably, the medium term level is one of the most relevantand common. In the last years many countries have experiencedelectricity shortfalls due to this reason (some examples areCalifornia in 2000 and 2001, Norway in 2002, France and Germanyin 2003, South Africa in 2008 and 2009, or most recently, Japanin 2011).
The consequences of these outages are particularly importantfor most societies, very dependent on the availability of electricity,
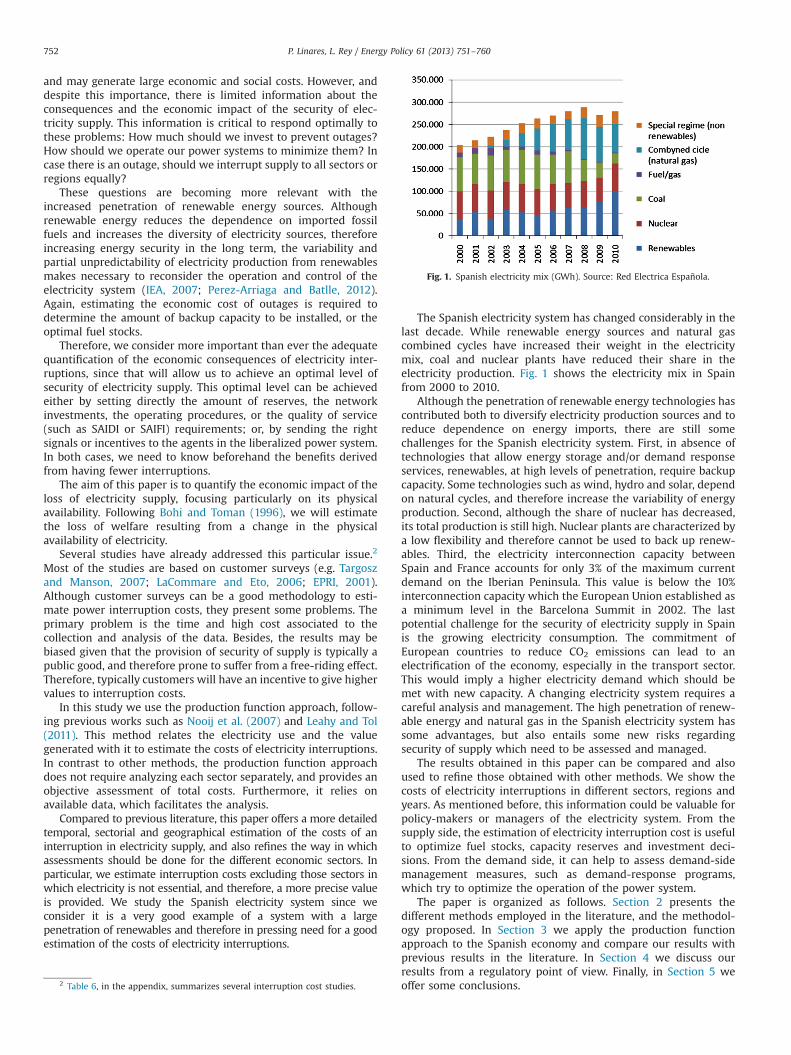
Fig. 1. Spanish electricity mix (GWh). Source: Red Electrica Española.
P. Linares, L. Rey / Energy Policy 61 (2013) 751–760752
and may generate large economic and social costs. However, anddespite this importance, there is limited information about theconsequences and the economic impact of the security of elec-tricity supply. This information is critical to respond optimally tothese problems: How much should we invest to prevent outages?How should we operate our power systems to minimize them? Incase there is an outage, should we interrupt supply to all sectors orregions equally?
These questions are becoming more relevant with theincreased penetration of renewable energy sources. Althoughrenewable energy reduces the dependence on imported fossilfuels and increases the diversity of electricity sources, thereforeincreasing energy security in the long term, the variability andpartial unpredictability of electricity production from renewablesmakes necessary to reconsider the operation and control of theelectricity system (IEA, 2007; Perez-Arriaga and Batlle, 2012).Again, estimating the economic cost of outages is required todetermine the amount of backup capacity to be installed, or theoptimal fuel stocks.
Therefore, we consider more important than ever the adequatequantification of the economic consequences of electricity inter-ruptions, since that will allow us to achieve an optimal level ofsecurity of electricity supply. This optimal level can be achievedeither by setting directly the amount of reserves, the networkinvestments, the operating procedures, or the quality of service(such as SAIDI or SAIFI) requirements; or, by sending the rightsignals or incentives to the agents in the liberalized power system.In both cases, we need to know beforehand the benefits derivedfrom having fewer interruptions.
The aim of this paper is to quantify the economic impact of theloss of electricity supply, focusing particularly on its physicalavailability. Following Bohi and Toman (1996), we will estimatethe loss of welfare resulting from a change in the physicalavailability of electricity.
Several studies have already addressed this particular issue.2
Most of the studies are based on customer surveys (e.g. Targoszand Manson, 2007; LaCommare and Eto, 2006; EPRI, 2001).Although customer surveys can be a good methodology to esti-mate power interruption costs, they present some problems. Theprimary problem is the time and high cost associated to thecollection and analysis of the data. Besides, the results may bebiased given that the provision of security of supply is typically apublic good, and therefore prone to suffer from a free-riding effect.Therefore, typically customers will have an incentive to give highervalues to interruption costs.
In this study we use the production function approach, follow-ing previous works such as Nooij et al. (2007) and Leahy and Tol(2011). This method relates the electricity use and the valuegenerated with it to estimate the costs of electricity interruptions.In contrast to other methods, the production function approachdoes not require analyzing each sector separately, and provides anobjective assessment of total costs. Furthermore, it relies onavailable data, which facilitates the analysis.
Compared to previous literature, this paper offers a more detailedtemporal, sectorial and geographical estimation of the costs of aninterruption in electricity supply, and also refines the way in whichassessments should be done for the different economic sectors. Inparticular, we estimate interruption costs excluding those sectors inwhich electricity is not essential, and therefore, a more precise valueis provided. We study the Spanish electricity system since weconsider it is a very good example of a system with a largepenetration of renewables and therefore in pressing need for a goodestimation of the costs of electricity interruptions.
2 Table 6, in the appendix, summarizes several interruption cost studies.
The Spanish electricity system has changed considerably in thelast decade. While renewable energy sources and natural gascombined cycles have increased their weight in the electricitymix, coal and nuclear plants have reduced their share in theelectricity production. Fig. 1 shows the electricity mix in Spainfrom 2000 to 2010.
Although the penetration of renewable energy technologies hascontributed both to diversify electricity production sources and toreduce dependence on energy imports, there are still somechallenges for the Spanish electricity system. First, in absence oftechnologies that allow energy storage and/or demand responseservices, renewables, at high levels of penetration, require backupcapacity. Some technologies such as wind, hydro and solar, dependon natural cycles, and therefore increase the variability of energyproduction. Second, although the share of nuclear has decreased,its total production is still high. Nuclear plants are characterized bya low flexibility and therefore cannot be used to back up renew-ables. Third, the electricity interconnection capacity betweenSpain and France accounts for only 3% of the maximum currentdemand on the Iberian Peninsula. This value is below the 10%interconnection capacity which the European Union established asa minimum level in the Barcelona Summit in 2002. The lastpotential challenge for the security of electricity supply in Spainis the growing electricity consumption. The commitment ofEuropean countries to reduce CO2 emissions can lead to anelectrification of the economy, especially in the transport sector.This would imply a higher electricity demand which should bemet with new capacity. A changing electricity system requires acareful analysis and management. The high penetration of renew-able energy and natural gas in the Spanish electricity system hassome advantages, but also entails some new risks regardingsecurity of supply which need to be assessed and managed.
The results obtained in this paper can be compared and alsoused to refine those obtained with other methods. We show thecosts of electricity interruptions in different sectors, regions andyears. As mentioned before, this information could be valuable forpolicy-makers or managers of the electricity system. From thesupply side, the estimation of electricity interruption cost is usefulto optimize fuel stocks, capacity reserves and investment deci-sions. From the demand side, it can help to assess demand-sidemanagement measures, such as demand-response programs,which try to optimize the operation of the power system.
The paper is organized as follows. Section 2 presents thedifferent methods employed in the literature, and the methodol-ogy proposed. In Section 3 we apply the production functionapproach to the Spanish economy and compare our results withprevious results in the literature. In Section 4 we discuss ourresults from a regulatory point of view. Finally, in Section 5 weoffer some conclusions.
Table 1The consequences of electricity interruptions.
Direct economic impacts Indirect economic impacts Social impacts
� Loss of production� Restart costs� Equipment damage� Raw material spoilage
� The cost of income being postponed� The financial cost of loss of market share
� Uncomfortable temperature at work/home� Loss of leisure time� Risk to health and safety
P. Linares, L. Rey / Energy Policy 61 (2013) 751–760 753
2. Methodology
The consequences of electricity interruptions can be classifiedin three categories as shown in Table 1 (Targosz and Manson,2007).
An optimal analysis should capture all the impacts. However,the lack of data makes this task very difficult. Each methodologyhas advantages and disadvantages; some methods estimate betterdirect economic impacts, while other methods are able to captureindirect and social impacts. On the other hand, not all electricityinterruptions have the same consequences. Social and indirecteconomic impacts are larger when interruptions are unexpected.Likewise long interruptions have mainly direct economic impacts.Therefore, when analyzing electricity interruptions, it is necessaryto choose the methodology which better captures each impact.
In the literature, there have been different attempts to quantifyelectricity interruption costs. The three most common methods are
�
Customer Surveys: In this method, surveys are employed toobtain information from industrial, commercial and residentialsector customers. The objective is to obtain a direct or indirectvaluation of interruption costs from customers. Directapproaches are employed for those customers with a goodknowledge of interruption consequences (e.g., industrial sectorand other large electrical users). Under some guidance, custo-mers are asked to identify the impacts and evaluate the costsrelated an electricity interruption. When interruption impactsare less tangible and the monetary loss is more difficult toevaluate, indirect evaluation methods are employed (e.g., forthe residential sector). Usually people are asked about theirwillingness to pay (WTP) to avoid interruptions, or their will-ingness to accept (WTA) a compensation for having a highernumber of interruptions. As mentioned before, given thatsecurity of supply can be considered as a public good, con-sumers will tend to overestimate their interruption costs tofree-ride on the system. On the other hand, they can also beinterested in underestimating them if their contribution topaying for the cost of security of supply is higher than theirshare in the costs of an interruption.�
Case studies: Past events, as the blackouts occurred in Californiain 2001 and 2002, can be used to quantify the cost of powerinterruptions. The advantage of this method is that estimationsare based on real events rather than hypothetical scenarios. It iseasier for electricity consumers to provide a more detailed costevaluation when they have experienced an interruption. How-ever, this methodology is limited by the specific characteristicsof the outage studied (e.g., place, time, duration); and it isdifficult to generalize the results.�
3 By definition, the more energy intensive (less value added per energy unit),the lower the impact of an outage. The higher is the flexibility in using electricity orshifting production, the larger will be the overestimation of the impacts. Therefore,higher flexibility in less energy intensive sectors results in higher overestimations.
The production function approach: This method uses the ratio ofan economic measure (e.g., gross domestic product, gross valueadded) and a measure of electricity consumption (e.g., kWh) toestimate interruption costs by sector. The objective is to find thevalue of one unit of electricity, also known as the value of lostload (VoLL). For example, if the gross value added of a sector is€10 million using 1 million kWh of electricity, the cost of a
power interruption would be €10/kWh. Under the productionfunction approach, it is assumed that electricity is essential forproduction, which is not always true. In some sectors, anelectricity interruption does not necessarily imply a productionbreak. Furthermore, production may be postponed or displacedto other locations or time slots. Therefore, this method mayoverestimate electricity interruption costs, particularly if flex-ibility is negatively correlated with energy intensity.3 It is alsoeasy to notice that this measure of VoLL is the inverse of energyintensity, which measures the amount of energy required toproduce a unit of economic output. Therefore, electricity-intensive sectors will by definition show a lower VoLL. But thisdoes not include the dependability of the sector on electricityconsumption, which may also be very relevant for the quanti-fication of the cost of lost load.
The three methods have their advantages and disadvantages.Hence, when analyzing the costs of electricity interruptions, it isimportant to consider the cause and characteristics of the inter-ruption. The production function approach can be appropriate toestimate the costs in electricity shortages as a result of a drought,nuclear crisis, etc., and also for sectors for which electricity supplyis critical and production cannot be shifted. As explained more indetail below, this does not depend directly on the predictability ofthe outage. Customer surveys is a better method to estimate socialand indirect economic impact, and therefore, it should beemployed when analyzing interruptions costs related to poorpower quality and mechanical failures.
In this paper, we use the production function approach toestimate the economic impact of electricity interruptions in Spain.In absence of survey data, this method allows us to use availabledata to estimate interruption costs for any sector. The resultsobtained in this paper could be complemented and refined withthose obtained with other methods.
As in Leahy and Tol (2011) we should remind that, with thismethodology, the exact time and the duration of the outage do notmatter. However, this does not come from the planned orunplanned character of the outage, but rather from the possibilityto shift production or to substitute electricity as an input. Ifproduction cannot be shifted to other moment or electricityconsumption substituted, then it does not matter whether theoutage is planned or not, in all cases it will mean a loss ineconomic production. Of course, unplanned blackouts make itmore difficult to shift production or to have substitutes ready. Butagain, the key element here is flexibility. We address this later bybuilding alternative flexibility scenarios.
The production function approach employs slightly differenttechniques to calculate the costs for firms (and the government)and households. In both cases, the objective is to use available
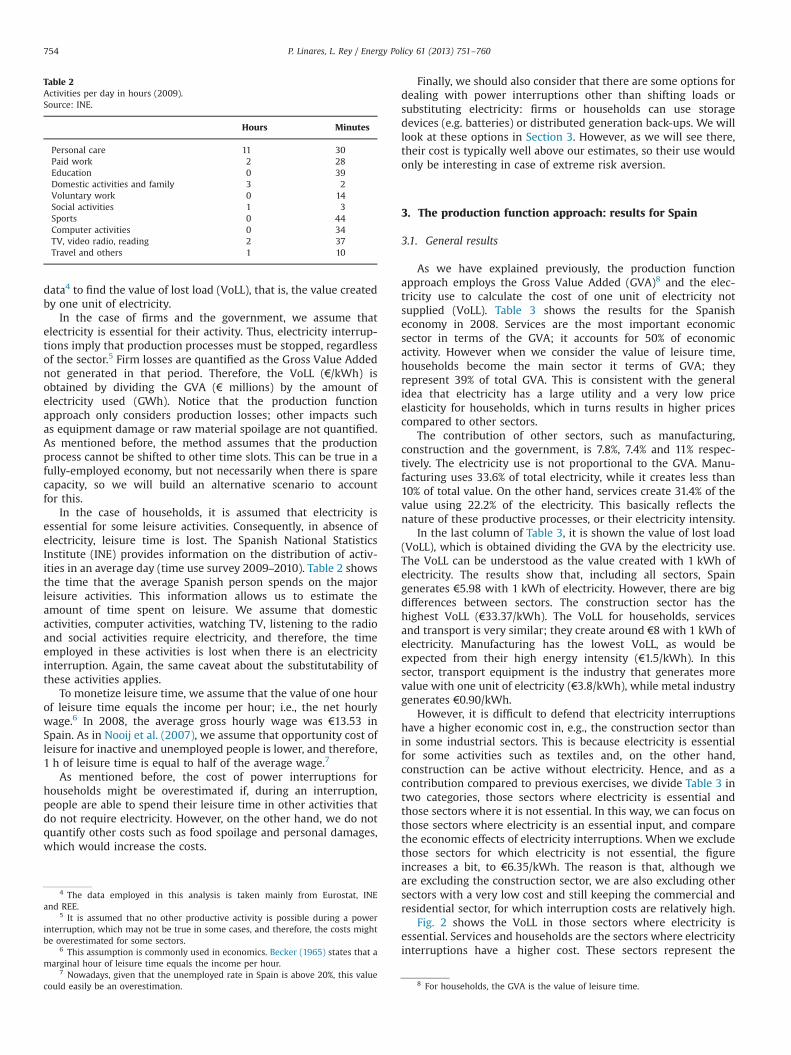
Table 2Activities per day in hours (2009).Source: INE.
Hours Minutes
Personal care 11 30Paid work 2 28Education 0 39Domestic activities and family 3 2Voluntary work 0 14Social activities 1 3Sports 0 44Computer activities 0 34TV, video radio, reading 2 37Travel and others 1 10
P. Linares, L. Rey / Energy Policy 61 (2013) 751–760754
data4 to find the value of lost load (VoLL), that is, the value createdby one unit of electricity.
In the case of firms and the government, we assume thatelectricity is essential for their activity. Thus, electricity interrup-tions imply that production processes must be stopped, regardlessof the sector.5 Firm losses are quantified as the Gross Value Addednot generated in that period. Therefore, the VoLL (€/kWh) isobtained by dividing the GVA (€ millions) by the amount ofelectricity used (GWh). Notice that the production functionapproach only considers production losses; other impacts suchas equipment damage or raw material spoilage are not quantified.As mentioned before, the method assumes that the productionprocess cannot be shifted to other time slots. This can be true in afully-employed economy, but not necessarily when there is sparecapacity, so we will build an alternative scenario to accountfor this.
In the case of households, it is assumed that electricity isessential for some leisure activities. Consequently, in absence ofelectricity, leisure time is lost. The Spanish National StatisticsInstitute (INE) provides information on the distribution of activ-ities in an average day (time use survey 2009–2010). Table 2 showsthe time that the average Spanish person spends on the majorleisure activities. This information allows us to estimate theamount of time spent on leisure. We assume that domesticactivities, computer activities, watching TV, listening to the radioand social activities require electricity, and therefore, the timeemployed in these activities is lost when there is an electricityinterruption. Again, the same caveat about the substitutability ofthese activities applies.
To monetize leisure time, we assume that the value of one hourof leisure time equals the income per hour; i.e., the net hourlywage.6 In 2008, the average gross hourly wage was €13.53 inSpain. As in Nooij et al. (2007), we assume that opportunity cost ofleisure for inactive and unemployed people is lower, and therefore,1 h of leisure time is equal to half of the average wage.7
As mentioned before, the cost of power interruptions forhouseholds might be overestimated if, during an interruption,people are able to spend their leisure time in other activities thatdo not require electricity. However, on the other hand, we do notquantify other costs such as food spoilage and personal damages,which would increase the costs.
4 The data employed in this analysis is taken mainly from Eurostat, INEand REE.
5 It is assumed that no other productive activity is possible during a powerinterruption, which may not be true in some cases, and therefore, the costs mightbe overestimated for some sectors.
6 This assumption is commonly used in economics. Becker (1965) states that amarginal hour of leisure time equals the income per hour.
7 Nowadays, given that the unemployed rate in Spain is above 20%, this valuecould easily be an overestimation.
Finally, we should also consider that there are some options fordealing with power interruptions other than shifting loads orsubstituting electricity: firms or households can use storagedevices (e.g. batteries) or distributed generation back-ups. We willlook at these options in Section 3. However, as we will see there,their cost is typically well above our estimates, so their use wouldonly be interesting in case of extreme risk aversion.
3. The production function approach: results for Spain
3.1. General results
As we have explained previously, the production functionapproach employs the Gross Value Added (GVA)8 and the elec-tricity use to calculate the cost of one unit of electricity notsupplied (VoLL). Table 3 shows the results for the Spanisheconomy in 2008. Services are the most important economicsector in terms of the GVA; it accounts for 50% of economicactivity. However when we consider the value of leisure time,households become the main sector it terms of GVA; theyrepresent 39% of total GVA. This is consistent with the generalidea that electricity has a large utility and a very low priceelasticity for households, which in turns results in higher pricescompared to other sectors.
The contribution of other sectors, such as manufacturing,construction and the government, is 7.8%, 7.4% and 11% respec-tively. The electricity use is not proportional to the GVA. Manu-facturing uses 33.6% of total electricity, while it creates less than10% of total value. On the other hand, services create 31.4% of thevalue using 22.2% of the electricity. This basically reflects thenature of these productive processes, or their electricity intensity.
In the last column of Table 3, it is shown the value of lost load(VoLL), which is obtained dividing the GVA by the electricity use.The VoLL can be understood as the value created with 1 kWh ofelectricity. The results show that, including all sectors, Spaingenerates €5.98 with 1 kWh of electricity. However, there are bigdifferences between sectors. The construction sector has thehighest VoLL (€33.37/kWh). The VoLL for households, servicesand transport is very similar; they create around €8 with 1 kWh ofelectricity. Manufacturing has the lowest VoLL, as would beexpected from their high energy intensity (€1.5/kWh). In thissector, transport equipment is the industry that generates morevalue with one unit of electricity (€3.8/kWh), while metal industrygenerates €0.90/kWh.
However, it is difficult to defend that electricity interruptionshave a higher economic cost in, e.g., the construction sector thanin some industrial sectors. This is because electricity is essentialfor some activities such as textiles and, on the other hand,construction can be active without electricity. Hence, and as acontribution compared to previous exercises, we divide Table 3 intwo categories, those sectors where electricity is essential andthose sectors where it is not essential. In this way, we can focus onthose sectors where electricity is an essential input, and comparethe economic effects of electricity interruptions. When we excludethose sectors for which electricity is not essential, the figureincreases a bit, to €6.35/kWh. The reason is that, although weare excluding the construction sector, we are also excluding othersectors with a very low cost and still keeping the commercial andresidential sector, for which interruption costs are relatively high.
Fig. 2 shows the VoLL in those sectors where electricity isessential. Services and households are the sectors where electricityinterruptions have a higher cost. These sectors represent the
8 For households, the GVA is the value of leisure time.
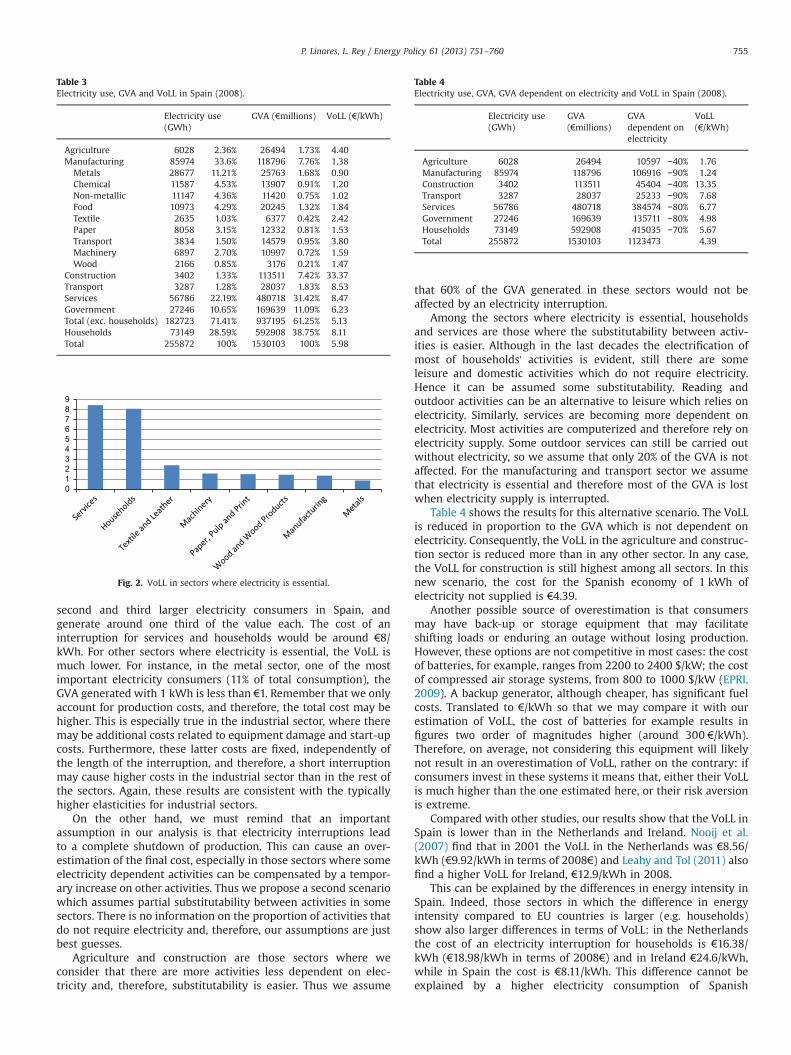
Table 3Electricity use, GVA and VoLL in Spain (2008).
Electricity use(GWh)
GVA (€millions) VoLL (€/kWh)
Agriculture 6028 2.36% 26494 1.73% 4.40Manufacturing 85974 33.6% 118796 7.76% 1.38
Metals 28677 11.21% 25763 1.68% 0.90Chemical 11587 4.53% 13907 0.91% 1.20Non-metallic 11147 4.36% 11420 0.75% 1.02Food 10973 4.29% 20245 1.32% 1.84Textile 2635 1.03% 6377 0.42% 2.42Paper 8058 3.15% 12332 0.81% 1.53Transport 3834 1.50% 14579 0.95% 3.80Machinery 6897 2.70% 10997 0.72% 1.59Wood 2166 0.85% 3176 0.21% 1.47
Construction 3402 1.33% 113511 7.42% 33.37Transport 3287 1.28% 28037 1.83% 8.53Services 56786 22.19% 480718 31.42% 8.47Government 27246 10.65% 169639 11.09% 6.23Total (exc. households) 182723 71.41% 937195 61.25% 5.13Households 73149 28.59% 592908 38.75% 8.11Total 255872 100% 1530103 100% 5.98
0123456789
Fig. 2. VoLL in sectors where electricity is essential.
Table 4Electricity use, GVA, GVA dependent on electricity and VoLL in Spain (2008).
Electricity use(GWh)
GVA(€millions)
GVAdependent onelectricity
VoLL(€/kWh)
Agriculture 6028 26494 10597 −40% 1.76Manufacturing 85974 118796 106916 −90% 1.24Construction 3402 113511 45404 −40% 13.35Transport 3287 28037 25233 −90% 7.68Services 56786 480718 384574 −80% 6.77Government 27246 169639 135711 −80% 4.98Households 73149 592908 415035 −70% 5.67Total 255872 1530103 1123473 4.39
P. Linares, L. Rey / Energy Policy 61 (2013) 751–760 755
second and third larger electricity consumers in Spain, andgenerate around one third of the value each. The cost of aninterruption for services and households would be around €8/kWh. For other sectors where electricity is essential, the VoLL ismuch lower. For instance, in the metal sector, one of the mostimportant electricity consumers (11% of total consumption), theGVA generated with 1 kWh is less than €1. Remember that we onlyaccount for production costs, and therefore, the total cost may behigher. This is especially true in the industrial sector, where theremay be additional costs related to equipment damage and start-upcosts. Furthermore, these latter costs are fixed, independently ofthe length of the interruption, and therefore, a short interruptionmay cause higher costs in the industrial sector than in the rest ofthe sectors. Again, these results are consistent with the typicallyhigher elasticities for industrial sectors.
On the other hand, we must remind that an importantassumption in our analysis is that electricity interruptions leadto a complete shutdown of production. This can cause an over-estimation of the final cost, especially in those sectors where someelectricity dependent activities can be compensated by a tempor-ary increase on other activities. Thus we propose a second scenariowhich assumes partial substitutability between activities in somesectors. There is no information on the proportion of activities thatdo not require electricity and, therefore, our assumptions are justbest guesses.
Agriculture and construction are those sectors where weconsider that there are more activities less dependent on elec-tricity and, therefore, substitutability is easier. Thus we assume
that 60% of the GVA generated in these sectors would not beaffected by an electricity interruption.
Among the sectors where electricity is essential, householdsand services are those where the substitutability between activ-ities is easier. Although in the last decades the electrification ofmost of households' activities is evident, still there are someleisure and domestic activities which do not require electricity.Hence it can be assumed some substitutability. Reading andoutdoor activities can be an alternative to leisure which relies onelectricity. Similarly, services are becoming more dependent onelectricity. Most activities are computerized and therefore rely onelectricity supply. Some outdoor services can still be carried outwithout electricity, so we assume that only 20% of the GVA is notaffected. For the manufacturing and transport sector we assumethat electricity is essential and therefore most of the GVA is lostwhen electricity supply is interrupted.
Table 4 shows the results for this alternative scenario. The VoLLis reduced in proportion to the GVA which is not dependent onelectricity. Consequently, the VoLL in the agriculture and construc-tion sector is reduced more than in any other sector. In any case,the VoLL for construction is still highest among all sectors. In thisnew scenario, the cost for the Spanish economy of 1 kWh ofelectricity not supplied is €4.39.
Another possible source of overestimation is that consumersmay have back-up or storage equipment that may facilitateshifting loads or enduring an outage without losing production.However, these options are not competitive in most cases: the costof batteries, for example, ranges from 2200 to 2400 $/kW; the costof compressed air storage systems, from 800 to 1000 $/kW (EPRI,2009). A backup generator, although cheaper, has significant fuelcosts. Translated to €/kWh so that we may compare it with ourestimation of VoLL, the cost of batteries for example results infigures two order of magnitudes higher (around 300 €/kWh).Therefore, on average, not considering this equipment will likelynot result in an overestimation of VoLL, rather on the contrary: ifconsumers invest in these systems it means that, either their VoLLis much higher than the one estimated here, or their risk aversionis extreme.
Compared with other studies, our results show that the VoLL inSpain is lower than in the Netherlands and Ireland. Nooij et al.(2007) find that in 2001 the VoLL in the Netherlands was €8.56/kWh (€9.92/kWh in terms of 2008€) and Leahy and Tol (2011) alsofind a higher VoLL for Ireland, €12.9/kWh in 2008.
This can be explained by the differences in energy intensity inSpain. Indeed, those sectors in which the difference in energyintensity compared to EU countries is larger (e.g. households)show also larger differences in terms of VoLL: in the Netherlandsthe cost of an electricity interruption for households is €16.38/kWh (€18.98/kWh in terms of 2008€) and in Ireland €24.6/kWh,while in Spain the cost is €8.11/kWh. This difference cannot beexplained by a higher electricity consumption of Spanish
P. Linares, L. Rey / Energy Policy 61 (2013) 751–760756
households9, and therefore, it may be due to a lower average grosswage in Spain, which leads to a lower value of leisure time.10
In turn, differences are not large when we exclude households:in this case, the VoLL in Spain is €5.13, while in the Netherlands is€5.97/kWh (€6.92/kWh in terms of 2008€).
However, most of the studies which estimate the cost of powerinterruptions are based on customer surveys. In surveys, peopleare asked about the cost of an interruption (as a function ofduration). In contrast to the production function approach, inter-ruption costs are usually not expressed in terms of the total energynot supplied (€/kWh), but of the load disconnected (€/kW).Balducci et al. (2002) use survey data collected by the Universityof Saskatchewan in 1992 and 1996 to estimate interruption costsin U.S. They find that in 1996 the average cost of an hourinterruption in U.S. economy was $8.76/kW. The differencesamong sectors are significant. Interruption costs for the transportsector are $16.42/kW per hour, while the cost for households is$0.15/kW. They also estimate the costs for the industrial sector($13.93/kW) and the commercial sector ($12.87/kWh). Billinton(2001) also uses the data collected by the University of Saskatch-ewan to calculate one hour interruption cost for the industrial (C$5.19/kW) commercial (C$32.20/kW) and residential (C$0.31/kW)sectors in Canada.
Surveys have also been used to estimate interruption costs insome European countries. Trengereid (2003) estimate interruptioncosts in Norway both when electricity interruption is notified andwhen it is not. The agricultural, residential and public sectors donot show significant cost differences when the interruption isnotified. On the other hand, the cost for industrial and commercialsector increases around 45% when the interruption is not notified.Bertazzi et al. (2005) estimate electricity interruption costs forItaly. The find that the cost for business sector (industrial, services,agricultural and public sectors) is €21.6/kWh and for households is€10.8/kWh.
As mentioned before, one possible use of these estimateswould be the adequate definition of incentives for quality ofservice (such as SAIDI or SAIFI), such as in Growitsch et al.(2010). Uluski (2007) and Bouhouras et al. (2010) use electricityinterruption costs to assess the benefits of Distribution Automa-tion and Artificial Intelligence Systems in distribution networks,respectively.
The results obtained from surveys differ from those obtainedunder a production function approach in two important aspects.First, the cost of power interruptions for households is higherunder the production function approach, which considers the lossof leisure time as an indicator of this cost. Surveys instead result inhouseholds being among the sectors with lower values. This mightbe explained, following an idea presented earlier, by the significantsubstitutability in household activities: instead of watching tele-vision one can read a book. That is, when activities may be shiftedin time, the production function will overestimate the damage ofan electricity interruption. However, surveys also show weak-nesses in order to estimate power interruption costs in house-holds. People are usually asked about how much they are willingto pay to avoid interruptions. Besides of the biases alreadymentioned, people may underestimate the cost because are notused to electricity interruptions and view electricity supply almostas a social right.11 Indeed, this is consistent with the fact that
9 According to Eurostat, in 2008, the electricity consumption per capita in theresidential sector was 1.61 MWh in Spain, 1.51 MWh in the Netherlands and1.94 MWh in Ireland.
10 In 2001 the average gross wage in the Netherlands was €18.65 (€21.61 interms of 2008€), while in Spain, in 2008, it was €13.53.
11 At least in most developed countries.
people (and policy-makers) try very hard to keep electricity priceslow, in spite of the large utility it provides.
The second important difference between the results of bothmethodologies lies in the electricity interruption cost for theindustrial sector. Surveys show that one hour interruption causessimilar damage (as a function of load disconnected) in thecommercial and the industrial sector. However, the studies whichuse the production function approach find that the cost of 1 kWhnot supplied in the service sector is around 4 times higher than inthe industrial sector. The difference could be explained by the factthat indirect impacts of electricity interruptions are higher in theindustrial sector, and these are not captured with the productionfunction approach. This problem could be partially solved usinginput/output tables, which show the interdependencies betweensectors. The slowdown in industrial activity may affect othersectors which depend on industrial supplies, and therefore, anelectricity interruption in the industry would affect indirectlyother sectors. Another explanation could be that electricity supplyis less critical for services than for the industrial sector, althoughthe latter are more electricity-intensive (and therefore value addedper kWh will be lower). That is, although the value added per kWhin services may be higher, the consequences of an electricityshortfall may be easier to avoid when electricity is not central tothe production/service process.
Despite the differences in the results, both the productionfunction approach and surveys provide useful information topolicy-makers. The production function approach is a goodmethod to account for production losses when they cannot beavoided by shifting production to other time, and also whenelectricity is critical for production. Surveys can be employed tocomplement this information. In some sectors, such as theindustrial one, indirect and social impacts are very important,and thus, surveys can be used to capture these costs.
3.2. Temporal, sectorial and geographical variation of interruptioncosts
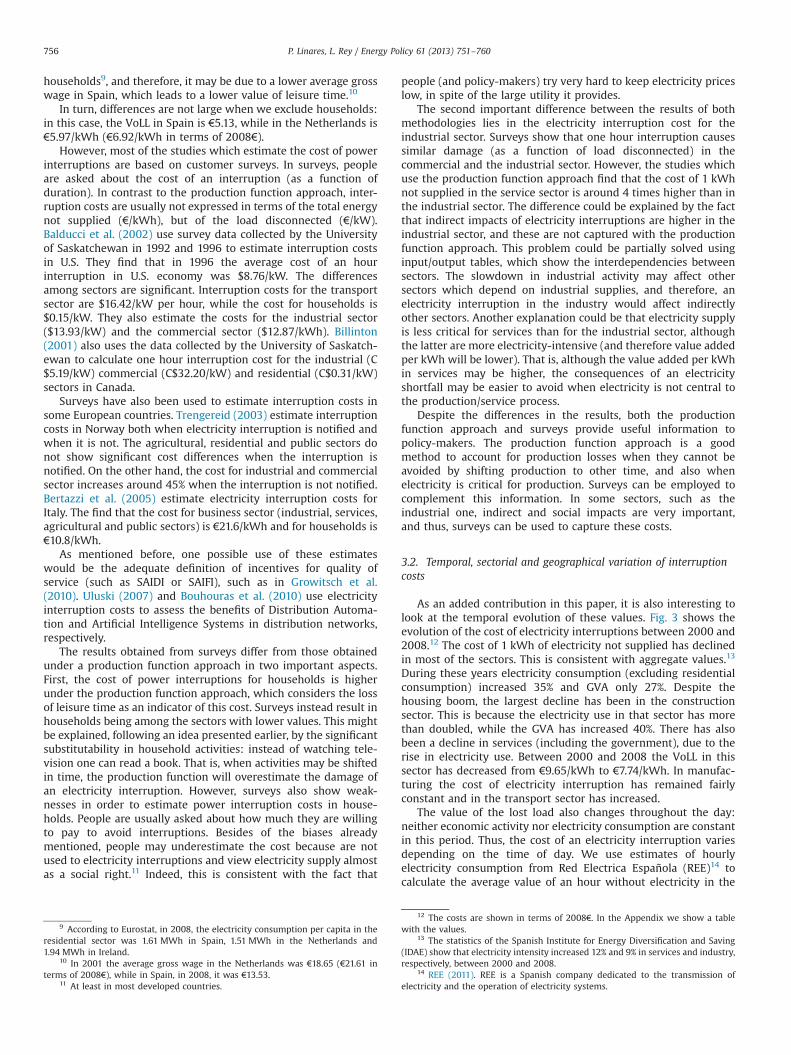
As an added contribution in this paper, it is also interesting tolook at the temporal evolution of these values. Fig. 3 shows theevolution of the cost of electricity interruptions between 2000 and2008.12 The cost of 1 kWh of electricity not supplied has declinedin most of the sectors. This is consistent with aggregate values.13
During these years electricity consumption (excluding residentialconsumption) increased 35% and GVA only 27%. Despite thehousing boom, the largest decline has been in the constructionsector. This is because the electricity use in that sector has morethan doubled, while the GVA has increased 40%. There has alsobeen a decline in services (including the government), due to therise in electricity use. Between 2000 and 2008 the VoLL in thissector has decreased from €9.65/kWh to €7.74/kWh. In manufac-turing the cost of electricity interruption has remained fairlyconstant and in the transport sector has increased.
The value of the lost load also changes throughout the day:neither economic activity nor electricity consumption are constantin this period. Thus, the cost of an electricity interruption variesdepending on the time of day. We use estimates of hourlyelectricity consumption from Red Electrica Española (REE)14 tocalculate the average value of an hour without electricity in the
12 The costs are shown in terms of 2008€. In the Appendix we show a tablewith the values.
13 The statistics of the Spanish Institute for Energy Diversification and Saving(IDAE) show that electricity intensity increased 12% and 9% in services and industry,respectively, between 2000 and 2008.
14 REE (2011). REE is a Spanish company dedicated to the transmission ofelectricity and the operation of electricity systems.
0
5
10
15
20
25
30
35
40
45
2000 2001 2002 2003 2004 2005 2006 2007 2008
Manufacturing
Agriculture
Construction
Transport
Services
Fig. 3. The VoLL between 2000 and 2008 (€/kWh).
Fig. 4. The average value of a lost hour of electricity (€ millions).
Fig. 5. Total VoLL in Spanish regions (€/kWh).
P. Linares, L. Rey / Energy Policy 61 (2013) 751–760 757
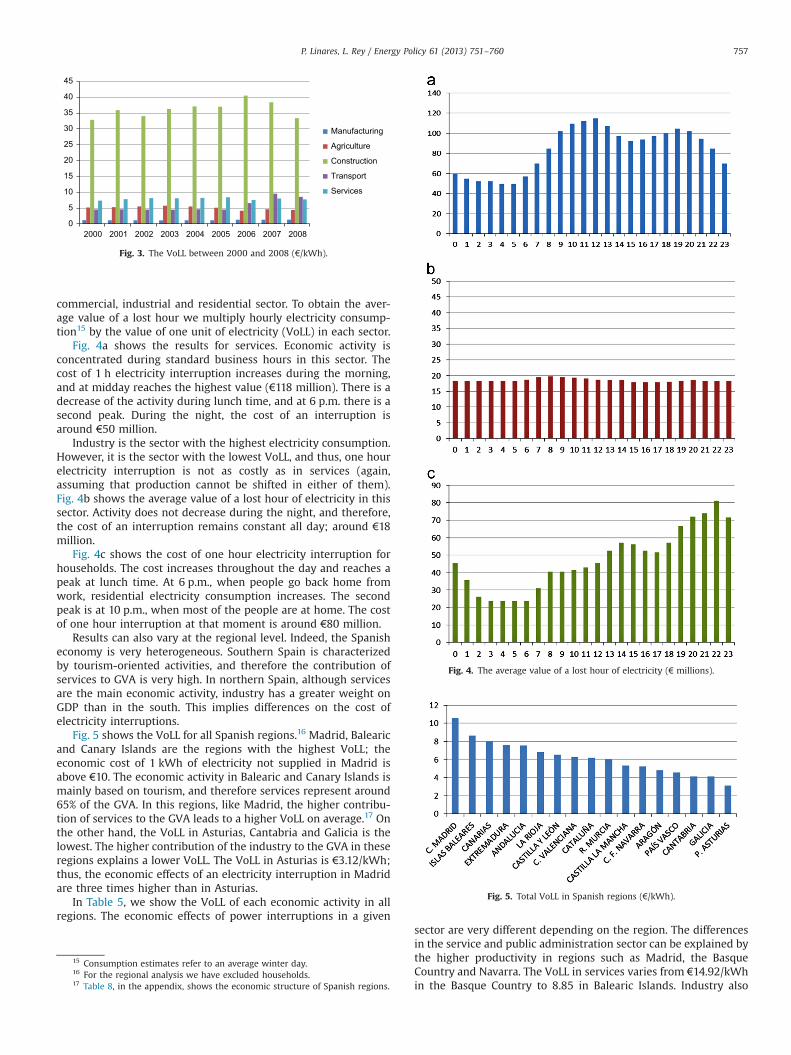
commercial, industrial and residential sector. To obtain the aver-age value of a lost hour we multiply hourly electricity consump-tion15 by the value of one unit of electricity (VoLL) in each sector.
Fig. 4a shows the results for services. Economic activity isconcentrated during standard business hours in this sector. Thecost of 1 h electricity interruption increases during the morning,and at midday reaches the highest value (€118 million). There is adecrease of the activity during lunch time, and at 6 p.m. there is asecond peak. During the night, the cost of an interruption isaround €50 million.
Industry is the sector with the highest electricity consumption.However, it is the sector with the lowest VoLL, and thus, one hourelectricity interruption is not as costly as in services (again,assuming that production cannot be shifted in either of them).Fig. 4b shows the average value of a lost hour of electricity in thissector. Activity does not decrease during the night, and therefore,the cost of an interruption remains constant all day; around €18million.
Fig. 4c shows the cost of one hour electricity interruption forhouseholds. The cost increases throughout the day and reaches apeak at lunch time. At 6 p.m., when people go back home fromwork, residential electricity consumption increases. The secondpeak is at 10 p.m., when most of the people are at home. The costof one hour interruption at that moment is around €80 million.
Results can also vary at the regional level. Indeed, the Spanisheconomy is very heterogeneous. Southern Spain is characterizedby tourism-oriented activities, and therefore the contribution ofservices to GVA is very high. In northern Spain, although servicesare the main economic activity, industry has a greater weight onGDP than in the south. This implies differences on the cost ofelectricity interruptions.
Fig. 5 shows the VoLL for all Spanish regions.16 Madrid, Balearicand Canary Islands are the regions with the highest VoLL; theeconomic cost of 1 kWh of electricity not supplied in Madrid isabove €10. The economic activity in Balearic and Canary Islands ismainly based on tourism, and therefore services represent around65% of the GVA. In this regions, like Madrid, the higher contribu-tion of services to the GVA leads to a higher VoLL on average.17 Onthe other hand, the VoLL in Asturias, Cantabria and Galicia is thelowest. The higher contribution of the industry to the GVA in theseregions explains a lower VoLL. The VoLL in Asturias is €3.12/kWh;thus, the economic effects of an electricity interruption in Madridare three times higher than in Asturias.
In Table 5, we show the VoLL of each economic activity in allregions. The economic effects of power interruptions in a given
15 Consumption estimates refer to an average winter day.16 For the regional analysis we have excluded households.17 Table 8, in the appendix, shows the economic structure of Spanish regions.
sector are very different depending on the region. The differencesin the service and public administration sector can be explained bythe higher productivity in regions such as Madrid, the BasqueCountry and Navarra. The VoLL in services varies from €14.92/kWhin the Basque Country to 8.85 in Balearic Islands. Industry also
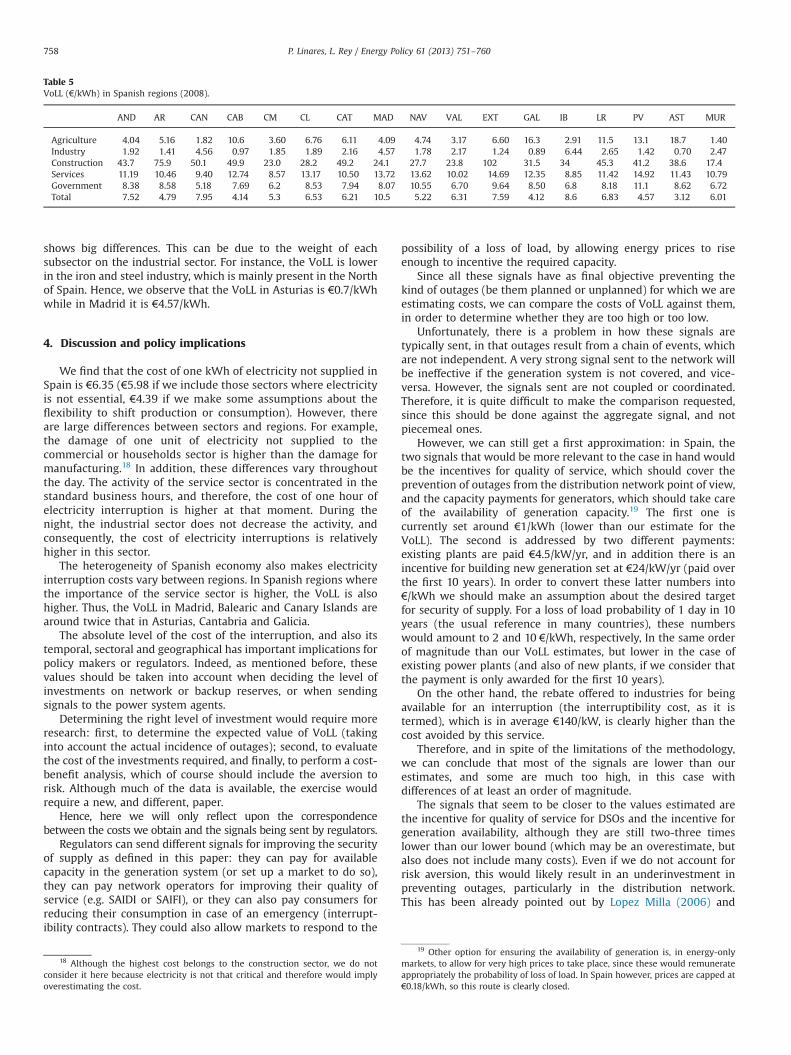
Table 5VoLL (€/kWh) in Spanish regions (2008).
AND AR CAN CAB CM CL CAT MAD NAV VAL EXT GAL IB LR PV AST MUR
Agriculture 4.04 5.16 1.82 10.6 3.60 6.76 6.11 4.09 4.74 3.17 6.60 16.3 2.91 11.5 13.1 18.7 1.40Industry 1.92 1.41 4.56 0.97 1.85 1.89 2.16 4.57 1.78 2.17 1.24 0.89 6.44 2.65 1.42 0.70 2.47Construction 43.7 75.9 50.1 49.9 23.0 28.2 49.2 24.1 27.7 23.8 102 31.5 34 45.3 41.2 38.6 17.4Services 11.19 10.46 9.40 12.74 8.57 13.17 10.50 13.72 13.62 10.02 14.69 12.35 8.85 11.42 14.92 11.43 10.79Government 8.38 8.58 5.18 7.69 6.2 8.53 7.94 8.07 10.55 6.70 9.64 8.50 6.8 8.18 11.1 8.62 6.72Total 7.52 4.79 7.95 4.14 5.3 6.53 6.21 10.5 5.22 6.31 7.59 4.12 8.6 6.83 4.57 3.12 6.01
P. Linares, L. Rey / Energy Policy 61 (2013) 751–760758
shows big differences. This can be due to the weight of eachsubsector on the industrial sector. For instance, the VoLL is lowerin the iron and steel industry, which is mainly present in the Northof Spain. Hence, we observe that the VoLL in Asturias is €0.7/kWhwhile in Madrid it is €4.57/kWh.
4. Discussion and policy implications
We find that the cost of one kWh of electricity not supplied inSpain is €6.35 (€5.98 if we include those sectors where electricityis not essential, €4.39 if we make some assumptions about theflexibility to shift production or consumption). However, thereare large differences between sectors and regions. For example,the damage of one unit of electricity not supplied to thecommercial or households sector is higher than the damage formanufacturing.18 In addition, these differences vary throughoutthe day. The activity of the service sector is concentrated in thestandard business hours, and therefore, the cost of one hour ofelectricity interruption is higher at that moment. During thenight, the industrial sector does not decrease the activity, andconsequently, the cost of electricity interruptions is relativelyhigher in this sector.
The heterogeneity of Spanish economy also makes electricityinterruption costs vary between regions. In Spanish regions wherethe importance of the service sector is higher, the VoLL is alsohigher. Thus, the VoLL in Madrid, Balearic and Canary Islands arearound twice that in Asturias, Cantabria and Galicia.
The absolute level of the cost of the interruption, and also itstemporal, sectoral and geographical has important implications forpolicy makers or regulators. Indeed, as mentioned before, thesevalues should be taken into account when deciding the level ofinvestments on network or backup reserves, or when sendingsignals to the power system agents.
Determining the right level of investment would require moreresearch: first, to determine the expected value of VoLL (takinginto account the actual incidence of outages); second, to evaluatethe cost of the investments required, and finally, to perform a cost-benefit analysis, which of course should include the aversion torisk. Although much of the data is available, the exercise wouldrequire a new, and different, paper.
Hence, here we will only reflect upon the correspondencebetween the costs we obtain and the signals being sent by regulators.
Regulators can send different signals for improving the securityof supply as defined in this paper: they can pay for availablecapacity in the generation system (or set up a market to do so),they can pay network operators for improving their quality ofservice (e.g. SAIDI or SAIFI), or they can also pay consumers forreducing their consumption in case of an emergency (interrupt-ibility contracts). They could also allow markets to respond to the
18 Although the highest cost belongs to the construction sector, we do notconsider it here because electricity is not that critical and therefore would implyoverestimating the cost.
possibility of a loss of load, by allowing energy prices to riseenough to incentive the required capacity.
Since all these signals have as final objective preventing thekind of outages (be them planned or unplanned) for which we areestimating costs, we can compare the costs of VoLL against them,in order to determine whether they are too high or too low.
Unfortunately, there is a problem in how these signals aretypically sent, in that outages result from a chain of events, whichare not independent. A very strong signal sent to the network willbe ineffective if the generation system is not covered, and vice-versa. However, the signals sent are not coupled or coordinated.Therefore, it is quite difficult to make the comparison requested,since this should be done against the aggregate signal, and notpiecemeal ones.
However, we can still get a first approximation: in Spain, thetwo signals that would be more relevant to the case in hand wouldbe the incentives for quality of service, which should cover theprevention of outages from the distribution network point of view,and the capacity payments for generators, which should take careof the availability of generation capacity.19 The first one iscurrently set around €1/kWh (lower than our estimate for theVoLL). The second is addressed by two different payments:existing plants are paid €4.5/kW/yr, and in addition there is anincentive for building new generation set at €24/kW/yr (paid overthe first 10 years). In order to convert these latter numbers into€/kWh we should make an assumption about the desired targetfor security of supply. For a loss of load probability of 1 day in 10years (the usual reference in many countries), these numberswould amount to 2 and 10 €/kWh, respectively, In the same orderof magnitude than our VoLL estimates, but lower in the case ofexisting power plants (and also of new plants, if we consider thatthe payment is only awarded for the first 10 years).
On the other hand, the rebate offered to industries for beingavailable for an interruption (the interruptibility cost, as it istermed), which is in average €140/kW, is clearly higher than thecost avoided by this service.
Therefore, and in spite of the limitations of the methodology,we can conclude that most of the signals are lower than ourestimates, and some are much too high, in this case withdifferences of at least an order of magnitude.
The signals that seem to be closer to the values estimated arethe incentive for quality of service for DSOs and the incentive forgeneration availability, although they are still two-three timeslower than our lower bound (which may be an overestimate, butalso does not include many costs). Even if we do not account forrisk aversion, this would likely result in an underinvestment inpreventing outages, particularly in the distribution network.This has been already pointed out by Lopez Milla (2006) and
19 Other option for ensuring the availability of generation is, in energy-onlymarkets, to allow for very high prices to take place, since these would remunerateappropriately the probability of loss of load. In Spain however, prices are capped at€0.18/kWh, so this route is clearly closed.
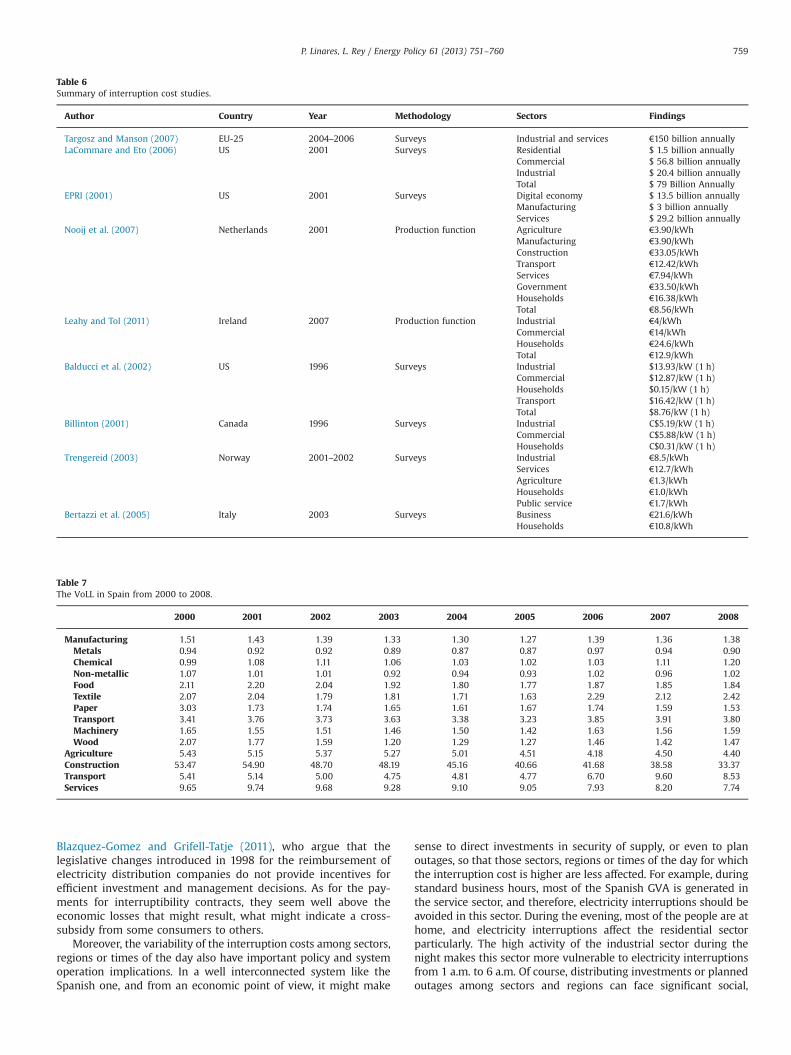
Table 6Summary of interruption cost studies.
Author Country Year Methodology Sectors Findings
Targosz and Manson (2007) EU-25 2004–2006 Surveys Industrial and services €150 billion annuallyLaCommare and Eto (2006) US 2001 Surveys Residential $ 1.5 billion annually
Commercial $ 56.8 billion annuallyIndustrial $ 20.4 billion annuallyTotal $ 79 Billion Annually
EPRI (2001) US 2001 Surveys Digital economy $ 13.5 billion annuallyManufacturing $ 3 billion annuallyServices $ 29.2 billion annually
Nooij et al. (2007) Netherlands 2001 Production function Agriculture €3.90/kWhManufacturing €3.90/kWhConstruction €33.05/kWhTransport €12.42/kWhServices €7.94/kWhGovernment €33.50/kWhHouseholds €16.38/kWhTotal €8.56/kWh
Leahy and Tol (2011) Ireland 2007 Production function Industrial €4/kWhCommercial €14/kWhHouseholds €24.6/kWhTotal €12.9/kWh
Balducci et al. (2002) US 1996 Surveys Industrial $13.93/kW (1 h)Commercial $12.87/kW (1 h)Households $0.15/kW (1 h)Transport $16.42/kW (1 h)Total $8.76/kW (1 h)
Billinton (2001) Canada 1996 Surveys Industrial C$5.19/kW (1 h)Commercial C$5.88/kW (1 h)Households C$0.31/kW (1 h)
Trengereid (2003) Norway 2001–2002 Surveys Industrial €8.5/kWhServices €12.7/kWhAgriculture €1.3/kWhHouseholds €1.0/kWhPublic service €1.7/kWh
Bertazzi et al. (2005) Italy 2003 Surveys Business €21.6/kWhHouseholds €10.8/kWh
Table 7The VoLL in Spain from 2000 to 2008.
2000 2001 2002 2003 2004 2005 2006 2007 2008
Manufacturing 1.51 1.43 1.39 1.33 1.30 1.27 1.39 1.36 1.38Metals 0.94 0.92 0.92 0.89 0.87 0.87 0.97 0.94 0.90Chemical 0.99 1.08 1.11 1.06 1.03 1.02 1.03 1.11 1.20Non-metallic 1.07 1.01 1.01 0.92 0.94 0.93 1.02 0.96 1.02Food 2.11 2.20 2.04 1.92 1.80 1.77 1.87 1.85 1.84Textile 2.07 2.04 1.79 1.81 1.71 1.63 2.29 2.12 2.42Paper 3.03 1.73 1.74 1.65 1.61 1.67 1.74 1.59 1.53Transport 3.41 3.76 3.73 3.63 3.38 3.23 3.85 3.91 3.80Machinery 1.65 1.55 1.51 1.46 1.50 1.42 1.63 1.56 1.59Wood 2.07 1.77 1.59 1.20 1.29 1.27 1.46 1.42 1.47
Agriculture 5.43 5.15 5.37 5.27 5.01 4.51 4.18 4.50 4.40Construction 53.47 54.90 48.70 48.19 45.16 40.66 41.68 38.58 33.37Transport 5.41 5.14 5.00 4.75 4.81 4.77 6.70 9.60 8.53Services 9.65 9.74 9.68 9.28 9.10 9.05 7.93 8.20 7.74
P. Linares, L. Rey / Energy Policy 61 (2013) 751–760 759
Blazquez-Gomez and Grifell-Tatje (2011), who argue that thelegislative changes introduced in 1998 for the reimbursement ofelectricity distribution companies do not provide incentives forefficient investment and management decisions. As for the pay-ments for interruptibility contracts, they seem well above theeconomic losses that might result, what might indicate a cross-subsidy from some consumers to others.
Moreover, the variability of the interruption costs among sectors,regions or times of the day also have important policy and systemoperation implications. In a well interconnected system like theSpanish one, and from an economic point of view, it might make
sense to direct investments in security of supply, or even to planoutages, so that those sectors, regions or times of the day for whichthe interruption cost is higher are less affected. For example, duringstandard business hours, most of the Spanish GVA is generated inthe service sector, and therefore, electricity interruptions should beavoided in this sector. During the evening, most of the people are athome, and electricity interruptions affect the residential sectorparticularly. The high activity of the industrial sector during thenight makes this sector more vulnerable to electricity interruptionsfrom 1 a.m. to 6 a.m. Of course, distributing investments or plannedoutages among sectors and regions can face significant social,
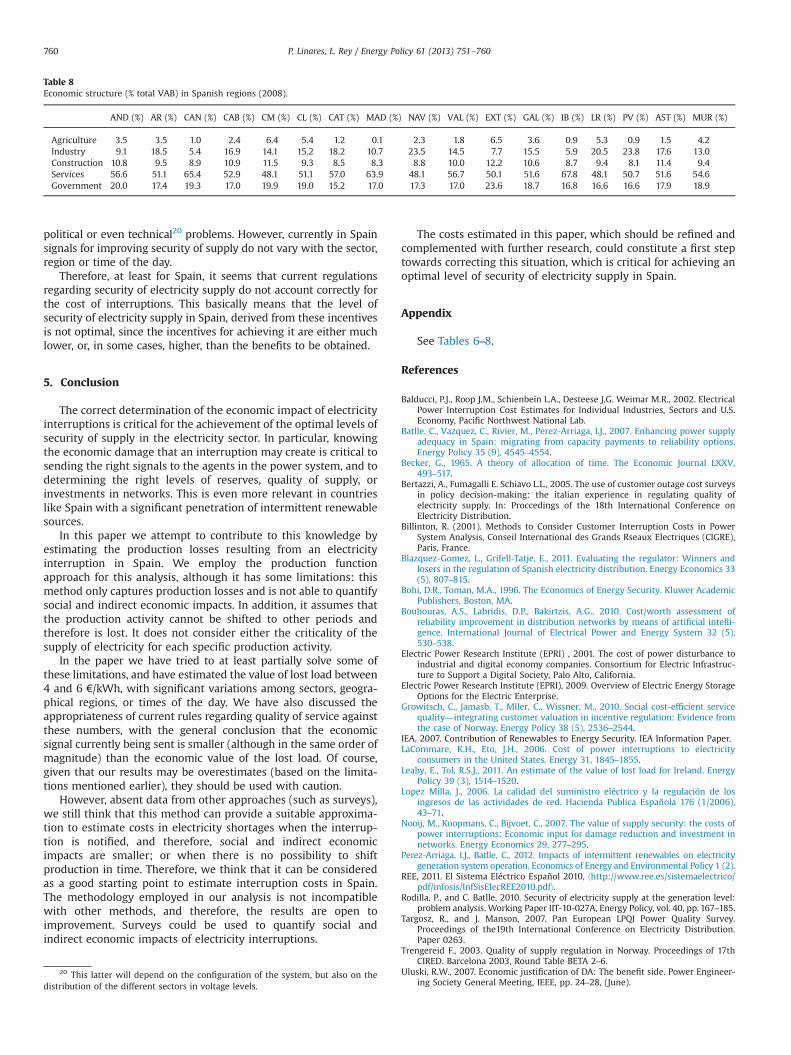
Table 8Economic structure (% total VAB) in Spanish regions (2008).
AND (%) AR (%) CAN (%) CAB (%) CM (%) CL (%) CAT (%) MAD (%) NAV (%) VAL (%) EXT (%) GAL (%) IB (%) LR (%) PV (%) AST (%) MUR (%)
Agriculture 3.5 3.5 1.0 2.4 6.4 5.4 1.2 0.1 2.3 1.8 6.5 3.6 0.9 5.3 0.9 1.5 4.2Industry 9.1 18.5 5.4 16.9 14.1 15.2 18.2 10.7 23.5 14.5 7.7 15.5 5.9 20.5 23.8 17.6 13.0Construction 10.8 9.5 8.9 10.9 11.5 9.3 8.5 8.3 8.8 10.0 12.2 10.6 8.7 9.4 8.1 11.4 9.4Services 56.6 51.1 65.4 52.9 48.1 51.1 57.0 63.9 48.1 56.7 50.1 51.6 67.8 48.1 50.7 51.6 54.6Government 20.0 17.4 19.3 17.0 19.9 19.0 15.2 17.0 17.3 17.0 23.6 18.7 16.8 16.6 16.6 17.9 18.9
P. Linares, L. Rey / Energy Policy 61 (2013) 751–760760
political or even technical20 problems. However, currently in Spainsignals for improving security of supply do not vary with the sector,region or time of the day.
Therefore, at least for Spain, it seems that current regulationsregarding security of electricity supply do not account correctly forthe cost of interruptions. This basically means that the level ofsecurity of electricity supply in Spain, derived from these incentivesis not optimal, since the incentives for achieving it are either muchlower, or, in some cases, higher, than the benefits to be obtained.
5. Conclusion
The correct determination of the economic impact of electricityinterruptions is critical for the achievement of the optimal levels ofsecurity of supply in the electricity sector. In particular, knowingthe economic damage that an interruption may create is critical tosending the right signals to the agents in the power system, and todetermining the right levels of reserves, quality of supply, orinvestments in networks. This is even more relevant in countrieslike Spain with a significant penetration of intermittent renewablesources.
In this paper we attempt to contribute to this knowledge byestimating the production losses resulting from an electricityinterruption in Spain. We employ the production functionapproach for this analysis, although it has some limitations: thismethod only captures production losses and is not able to quantifysocial and indirect economic impacts. In addition, it assumes thatthe production activity cannot be shifted to other periods andtherefore is lost. It does not consider either the criticality of thesupply of electricity for each specific production activity.
In the paper we have tried to at least partially solve some ofthese limitations, and have estimated the value of lost load between4 and 6 €/kWh, with significant variations among sectors, geogra-phical regions, or times of the day. We have also discussed theappropriateness of current rules regarding quality of service againstthese numbers, with the general conclusion that the economicsignal currently being sent is smaller (although in the same order ofmagnitude) than the economic value of the lost load. Of course,given that our results may be overestimates (based on the limita-tions mentioned earlier), they should be used with caution.
However, absent data from other approaches (such as surveys),we still think that this method can provide a suitable approxima-tion to estimate costs in electricity shortages when the interrup-tion is notified, and therefore, social and indirect economicimpacts are smaller; or when there is no possibility to shiftproduction in time. Therefore, we think that it can be consideredas a good starting point to estimate interruption costs in Spain.The methodology employed in our analysis is not incompatiblewith other methods, and therefore, the results are open toimprovement. Surveys could be used to quantify social andindirect economic impacts of electricity interruptions.
20 This latter will depend on the configuration of the system, but also on thedistribution of the different sectors in voltage levels.
The costs estimated in this paper, which should be refined andcomplemented with further research, could constitute a first steptowards correcting this situation, which is critical for achieving anoptimal level of security of electricity supply in Spain.
Appendix
See Tables 6–8.
References
Balducci, P.J., Roop J.M., Schienbein L.A., Desteese J.G. Weimar M.R., 2002. ElectricalPower Interruption Cost Estimates for Individual Industries, Sectors and U.S.Economy, Pacific Northwest National Lab.
Batlle, C., Vazquez, C., Rivier, M., Perez-Arriaga, I.J., 2007. Enhancing power supplyadequacy in Spain: migrating from capacity payments to reliability options.Energy Policy 35 (9), 4545–4554.
Becker, G., 1965. A theory of allocation of time. The Economic Journal LXXV,493–517.
Bertazzi, A., Fumagalli E. Schiavo L.L., 2005. The use of customer outage cost surveysin policy decision-making: the italian experience in regulating quality ofelectricity supply. In: Proccedings of the 18th International Conference onElectricity Distribution.
Billinton, R. (2001). Methods to Consider Customer Interruption Costs in PowerSystem Analysis, Conseil International des Grands Rseaux Electriques (CIGRE),Paris, France.
Blazquez-Gomez, L., Grifell-Tatje, E., 2011. Evaluating the regulator: Winners andlosers in the regulation of Spanish electricity distribution. Energy Economics 33(5), 807–815.
Bohi, D.R., Toman, M.A., 1996. The Economics of Energy Security. Kluwer AcademicPublishers, Boston, MA.
Bouhouras, A.S., Labridis, D.P., Bakirtzis, A.G., 2010. Cost/worth assessment ofreliability improvement in distribution networks by means of artificial intelli-gence. International Journal of Electrical Power and Energy System 32 (5),530–538.
Electric Power Research Institute (EPRI) , 2001. The cost of power disturbance toindustrial and digital economy companies. Consortium for Electric Infrastruc-ture to Support a Digital Society, Palo Alto, California.
Electric Power Research Institute (EPRI), 2009. Overview of Electric Energy StorageOptions for the Electric Enterprise.
Growitsch, C., Jamasb, T., Mller, C., Wissner, M., 2010. Social cost-efficient servicequality—integrating customer valuation in incentive regulation: Evidence fromthe case of Norway. Energy Policy 38 (5), 2536–2544.
IEA, 2007. Contribution of Renewables to Energy Security. IEA Information Paper.LaCommare, K.H., Eto, J.H., 2006. Cost of power interruptions to electricity
consumers in the United States. Energy 31, 1845–1855.Leahy, E., Tol, R.S.J., 2011. An estimate of the value of lost load for Ireland. Energy
Policy 39 (3), 1514–1520.Lopez Milla, J., 2006. La calidad del suministro eléctrico y la regulación de los
ingresos de las actividades de red. Hacienda Publica Española 176 (1/2006),43–71.
Nooij, M., Koopmans, C., Bijvoet, C., 2007. The value of supply security: the costs ofpower interruptions: Economic input for damage reduction and investment innetworks. Energy Economics 29, 277–295.
Perez-Arriaga, I.J., Batlle, C., 2012. Impacts of intermittent renewables on electricitygeneration system operation. Economics of Energy and Environmental Policy 1 (2).
REE, 2011. El Sistema Eléctrico Español 2010, ⟨http://www.ree.es/sistemaelectrico/pdf/infosis/InfSisElecREE2010.pdf⟩.
Rodilla, P., and C. Batlle, 2010. Security of electricity supply at the generation level:problem analysis. Working Paper IIT-10-027A, Energy Policy, vol. 40, pp. 167–185.
Targosz, R., and J. Manson, 2007. Pan European LPQI Power Quality Survey.Proceedings of the19th International Conference on Electricity Distribution.Paper 0263.
Trengereid F., 2003. Quality of supply regulation in Norway. Proceedings of 17thCIRED. Barcelona 2003, Round Table BETA 2–6.
Uluski, R.W., 2007. Economic justification of DA: The benefit side. Power Engineer-ing Society General Meeting, IEEE, pp. 24–28, (June).