![1©(§] - Index of](https://static.fdokumen.com/doc/165x107/631c043176d2a44505035917/1-index-of.jpg)
The copyright © of this thesis belongs to its rightful ... - CORE
404
The copyright © of this thesis belongs to its rightful author and/or other copyright owner. Copies can be accessed and downloaded for non-commercial or learning purposes without any charge and permission. The thesis cannot be reproduced or quoted as a whole without the permission from its rightful owner. No alteration or changes in format is allowed without permission from its rightful owner.
-
Upload
khangminh22 -
Category
Documents
-
view
0 -
download
0
Transcript of The copyright © of this thesis belongs to its rightful ... - CORE

The copyright © of this thesis belongs to its rightful author and/or other copyright
owner. Copies can be accessed and downloaded for non-commercial or learning
purposes without any charge and permission. The thesis cannot be reproduced or
quoted as a whole without the permission from its rightful owner. No alteration or
changes in format is allowed without permission from its rightful owner.
THE RELATIONSHIP BETWEEN SERVICE
MARKETING MIX, SERVICE QUALITY, SERVICE
VALUE AND CUSTOMER SATISFACTION IN
COMMERCIAL CAR PARKING FACILITIES
AHMAD FIAZA ABDUL SHUKOR
DOCTOR OF BUSINESS ADMINISTRATION
UNIVERSITY UTARA MALAYSIA
May 2016

i
THE RELATIONSHIP BETWEEN SERVICE MARKETING MIX, SERVICE
QUALITY, SERVICE VALUE AND CUSTOMER SATISFACTION IN
COMMERCIAL CAR PARKING FACILITIES
By
AHMAD FIAZA ABDUL SHUKOR
TITLE PAGE
Thesis Submitted to
Othman Yeop Abdullah Graduate School of Business,
Universiti Utara Malaysia,
in Partial Fulfillment of the Requirement for the Doctor of Business
Administration

ii
CERTIFICATION OF THESIS

iii

iv
PERMISSION TO USE
In presenting this dissertation paper in partial fulfillment of the requirements for a Post
Graduate degree from the Universiti Utara Malaysia (UUM), I agree that the Library
of this university may make it freely available for inspection. I further agree that
permission for copying this dissertation paper in any manner, in whole or in part, for
scholarly purposes may be granted by my supervisor(s) or in their absence, by the Dean
of Othman Yeop Abdullah Graduate School of Business where I did my dissertation
paper. It is understood that any copying or publication or use of this dissertation paper
parts of it for financial gain shall not be allowed without my written permission. It is
also understood that due recognition shall be given to me and to the UUM in any
scholarly use which may be made of any material in my dissertation paper.
Request for permission to copy or to make other use of materials in this dissertation
paper in whole or in part should be addressed to:
Dean of Othman Yeop Abdullah Graduate School of Business
Universiti Utara Malaysia
06010 UUM Sintok
Kedah Darul Aman

v
ABSTRACT
The role of car park facilities in economic activities, properties market and human life
is imperative. The population growth and vehicle possession in tandem with the rapid
development of building construction to support commercial activities in cities with
scarcity of parking space, have been well identified and have become a major concern
in Malaysia. This phenomenon has raised several issues that affect the satisfaction of
the Malaysian public as users of car park facilities. One of the recommended solutions
was to have excellent parking services but why the Malaysian public is still not
satisfied with how car park facilities are being managed is a puzzle. Based on the
problem statement, this study focused on the relationships between service marketing
mix, service quality, service value, and customer satisfaction of commercial car
parking facilities in Malaysia. The study’s research framework was supported by the
Stimulus-Organism-Response theory. Three of the four main constructs namely
service marketing mix, service quality and service value were conceptualised as
second order construct and assessed via the reflective-formative approach. Customer
satisfaction which acted as a dependent variable was measured reflectively through six
multi items. All the items in the study’s variables were assessed using the 7-point
Likert scale. Data was derived from 182 car park customers who subscribed to monthly
season passes from selected private offices in the Klang Valley. The response rate of
23%, was analysed using the SPSS and the SmartPLS software. This study found that
the priority of mix elements were varied through the non-parametric Friedman Test
and all direct relationships between service marketing mix, service quality, service
value and customer satisfaction were found significant through the PLS-SEM
methodology. Four indirect effect hypotheses to examine the role of service quality
and service value as mediators were accepted as partial mediation. The study findings
were discussed thoroughly and concluded with a discussion on the implications, the
limitation of the study and recommendations for future study.
Keywords: car park facilities, service marketing mix, service quality, service value
and customer satisfaction.

vi
ABSTRAK
Peranan tempat letak kereta di dalam aktiviti ekonomi, pasaran hartanah dan
kehidupan manusia adalah penting. Pertumbuhan penduduk dan pemilikan kenderaan
adalah seiring dengan perkembangan pesat pembinaan bangunan bagi menyokong
aktiviti komersial di bandar-bandar yang kekurangan tempat letak kereta, telah dikenal
pasti dan menjadi kebimbangan utama di Malaysia. Fenomena ini menimbulkan
beberapa isu yang memberi kesan kepada kepuasan dalam kalangan rakyat Malaysia
sebagai pengguna kemudahan tempat letak kereta. Salah satu penyelesaian yang
disyorkan adalah dengan mengadakan perkhidmatan tempat letak kereta yang
cemerlang tetapi mengapa rakyat Malaysia masih tidak berpuas hati dengan cara
kemudahan tempat letak kereta diuruskan menjadi suatu teka-teki. Berdasarkan
pernyataan masalah, kajian ini memberi tumpuan kepada hubungan antara campuran
pemasaran perkhidmatan, kualiti perkhidmatan, nilai perkhidmatan dan kepuasan
pelanggan terhadap kemudahan tempat letak kereta komersial di Malaysia. Rangka
kerja penyelidikan ini disokong oleh teori Rangsangan-Organisma-Respons. Tiga
daripada empat konstruk utama iaitu campuran pemasaran perkhidmatan, kualiti
perkhidmatan dan nilai perkhidmatan dikonsepkan sebagai konstruk peringkat kedua
dan dinilai melalui pendekatan reflektif formatif. Kepuasan pelanggan bertindak
sebagai pemboleh ubah bersandar yang diukur secara reflektif melalui enam item
pelbagai. Semua item di dalam pemboleh ubah kajian dinilai menggunakan skala
Likert 7 mata. Data diperoleh daripada 182 pelanggan tempat letak kereta yang
melanggan pas bulanan bermusim di pejabat swasta terpilih di Lembah Klang. Kadar
maklum balas sebanyak 23%, telah dianalisis menggunakan perisian SPSS dan
SmartPLS. Kajian ini menunjukkan bahawa elemen campuran utama adalah berbeza
melalui Ujian Friedman bukan parametrik dan semua hubungan langsung antara
campuran pemasaran perkhidmatan, kualiti perkhidmatan, nilai perkhidmatan dan
kepuasan pelanggan didapati signifikan melalui kaedah PLS-SEM. Empat hipotesis
kesan tidak langsung untuk mengkaji peranan kualiti perkhidmatan dan nilai
perkhidmatan sebagai perantara, telah diterima sebagai pengantara separa. Dapatan
kajian telah dibincangkan dengan teliti dan diakhiri dengan perbincangan mengenai
implikasi, batasan kajian dan cadangan untuk kajian masa depan.
Kata kunci: kemudahan parkir, campuran perkhidmatan pemasaran, kualiti
perkhidmatan, nilai perkhidmatan dan kepuasan pelanggan.

vii
ACKNOWLEDGEMENT
All praise be to Allah, for His mercy in giving me the health, patience, strength and
courage to complete this study and overcome every challenge in my learning pathway.
I would like to express my special appreciation, respect, deep gratitude and thanks to
my thesis supervisors, Associate Professor Dr. Norlena binti Hasnan and Dr. Jasmani
binti Mohd Yunus who are always there to give their advice, guidance, encouragement
and sharing generous amount of time throughout the process of completing this study.
I deeply appreciate to my wife Sanisah binti Ismail’s endless love for me and my
family for their understanding and support towards my ambition to success in my
study. I would also appreciate to my father, mother and my siblings who always
support and believe in me.
I would like to extend a special thanks to the Management of Metro Parking (M) Sdn.
Bhd. and Amano Malaysia Sdn. Bhd. who gives me an opportunity for me to explore
the issues related to this study and their unconditional support in the success of this
study.
A great appreciation to my study colleague Mr. Choong Yuen Leng who is always
give me his support, ideas and working together to complete our study in Doctor of
Business Administration. Lastly, thanks to those who had given me assistance
throughout my study.
Finally, may Allah bless and reward all of us who had made this work a success and
may it be accepted as our Act of Obedience to Him.

viii
TABLE OF CONTENTS
TABLE OF CONTENTS
TITLE PAGE ................................................................................................................ i
CERTIFICATION OF THESIS ................................................................................... ii
PERMISSION TO USE .............................................................................................. iv
ABSTRACT ................................................................................................................. v
ABSTRAK .................................................................................................................. vi
ACKNOWLEDGEMENT ......................................................................................... vii
TABLE OF CONTENTS .......................................................................................... viii
LIST OF TABLES ..................................................................................................... xv
LIST OF FIGURES ................................................................................................ xviii
LIST OFABBREVIATIONS ..................................................................................... xx
LIST OF APPENDICES ........................................................................................... xxi
CHAPTER ONE .......................................................................................................... 1
INTRODUCTION ....................................................................................................... 1
1.1 Introduction......................................................................................................... 1
1.2 Background of the Study .................................................................................... 2
1.3 Problem Statement .............................................................................................. 7
1.4 Research Questions ........................................................................................... 12
1.5 Research Objectives.......................................................................................... 13
1.6 Significant of the Study .................................................................................... 14
1.7 Scope of the Study ............................................................................................ 17
1.8 Organization of the dissertation ........................................................................ 18
CHAPTER TWO ....................................................................................................... 19
OVERVIEW PARKING FACILITIES AND SERVICES IN MALAYSIA ............ 19
2.1 Introduction....................................................................................................... 19
2.2 Contributing factors to supply and demand for parking facilities .................... 19
2.3 Regulations related to parking facilities ........................................................... 24
2.4 Government initiatives toward parking facilities ............................................. 25
2.5 Parking services ................................................................................................ 26
CHAPTER THREE .................................................................................................... 31
LITERATURE REVIEW........................................................................................... 31
3.1 Introduction....................................................................................................... 31
3.2 Customer satisfaction........................................................................................ 31
3.2.1 Definition of customer satisfaction ....................................................... 33

ix
3.2.2 Concept of customer satisfaction .......................................................... 33
3.2.3 Measurement of customer satisfaction ................................................. 38
3.3 Service marketing mix ...................................................................................... 40
3.3.1 Definition of service marketing mix ..................................................... 41
3.3.2 Concept of service marketing mix ........................................................ 42
3.3.3 Elements of service marketing mix ...................................................... 46
3.3.3.1 Service Product ......................................................................... 47
3.3.3.2 Service Price ............................................................................. 50
3.3.3.3 Service Promotion ..................................................................... 53
3.3.3.4 Service Place ............................................................................. 56
3.3.3.5 Service People ........................................................................... 58
3.3.3.6 Service Physical Evidence ........................................................ 60
3.3.3.7 Service Process ......................................................................... 63
3.3.4 The relationship between service marketing mix elements .................. 66
3.3.5 Service marketing mix and customer satisfaction ................................ 69
3.4 Service quality .................................................................................................. 71
3.4.1 Definition of service quality ................................................................. 73
3.4.2 Concepts of service quality ................................................................... 74
3.4.3 Measuring service quality ..................................................................... 82
3.4.4 The relationship between service quality and customer
satisfaction ............................................................................................ 87
3.4.5 The relationship between service marketing mix and
service quality ....................................................................................... 89
3.4.6 Service quality as mediator between service marketing mix
and customer satisfaction ...................................................................... 93
3.5 Service value ..................................................................................................... 95
3.5.1 Definition of service value .................................................................... 97
3.5.2 Concept of service value ....................................................................... 98
3.5.3 Measurement of service value ............................................................ 104
3.5.4 The relationship between service value and customer
satisfaction .......................................................................................... 108
3.5.5 The relationship between service marketing mix and
service value ....................................................................................... 110
3.5.6 The relationship between service quality and service value ............... 114
3.5.7 Service quality as mediator between service marketing mix
and service value ................................................................................. 117
3.5.8 Service value as mediator between service marketing mix
and customer satisfaction .................................................................... 119

x
3.5.9 Service value as mediator between service quality and
customer satisfaction ........................................................................... 120
3.6 Underpinning theory: Stimulus-Organism-Response ..................................... 122
3.6.1 Relationship of Stimulus-Organism-Response theory with
the present study model ...................................................................... 128
3.7 Summary of chapter ........................................................................................ 131
CHAPTER FOUR .................................................................................................... 133
METHODOLOGY ................................................................................................... 133
4.1 Introduction..................................................................................................... 133
4.2 Research Framework ...................................................................................... 133
4.3 Hypotheses Development ............................................................................... 135
4.3.1 The relationship between elements of service marketing mix ............ 136
4.3.2 The relationship between service marketing mix and
customer satisfaction ........................................................................... 137
4.3.3 The relationship between service marketing mix and
service quality ..................................................................................... 137
4.3.4 The relationship between service marketing mix and
service value ....................................................................................... 138
4.3.5 The relationship between service quality and customer
satisfaction .......................................................................................... 139
4.3.6 The relationship between service quality and service value ............... 140
4.3.7 The relationship between service value and customer
satisfaction .......................................................................................... 141
4.3.8 The mediating role of service quality between service
marketing mix and customer satisfaction ........................................... 142
4.3.9 The mediating role of service quality between service
marketing mix and service value ........................................................ 143
4.3.10 The mediating role of service value between service
marketing mix and customer satisfaction ........................................... 144
4.3.11 The mediating role of service value between service quality
and customer satisfaction .................................................................... 145
4.4 Research Design ............................................................................................. 146
4.4.1 Questionnaires Design ........................................................................ 147
4.5 Operationalisation and measurement of variables .......................................... 149
4.5.1 Service marketing mix as second order construct .............................. 151
4.5.2 Service product ................................................................................... 151
4.5.3 Service price ....................................................................................... 152
4.5.4 Service place ....................................................................................... 153
4.5.5 Service promotion ............................................................................... 153
4.5.6 Service people ..................................................................................... 154

xi
4.5.7 Service process ................................................................................... 155
4.5.8 Service physical evidence ................................................................... 156
4.5.9 Service quality as second order construct ........................................... 156
4.5.10 Tangible dimension ............................................................................. 157
4.5.11 Reliability dimension .......................................................................... 157
4.5.12 Responsiveness dimension ................................................................. 158
4.5.13 Assurance dimension .......................................................................... 159
4.5.14 Empathy dimension ............................................................................ 159
4.5.15 Technical quality dimension ............................................................... 160
4.5.16 Service value as second order construct ............................................. 161
4.5.17 Emotional value dimension ................................................................ 162
4.5.18 Social value dimension ....................................................................... 162
4.5.19 Functional value for quality and performance dimension .................. 163
4.5.20 Functional value for price and value for money dimension ............... 163
4.5.21 Customer satisfaction .......................................................................... 164
4.5.22 Demographic Data .............................................................................. 165
4.6 Data Collection ............................................................................................... 166
4.6.1 Population ........................................................................................... 166
4.6.2 Sampling Frame .................................................................................. 168
4.6.3 Sampling Size ..................................................................................... 171
4.6.4 Sampling technique ............................................................................. 174
4.6.5 Data Collection Procedure .................................................................. 179
4.7 Techniques of Data Analysis ............................................................................. 181
4.7.1 Data Coding ........................................................................................ 182
4.7.2 Data Screening .................................................................................... 182
4.7.2.1 Missing Data ........................................................................... 182
4.7.2.2 Assessment of Outliers............................................................ 183
4.7.2.3 Assessment of Normality ........................................................ 184
4.7.2.4 Linearity and Homoscedasticity.............................................. 185
4.7.2.5 Multicollinearity...................................................................... 186
4.7.3 Descriptive Analysis ........................................................................... 186
4.7.4 Path model estimation ......................................................................... 187
4.7.5 Measurement of model ....................................................................... 188
4.7.6 Hypothesis testing ............................................................................... 190
4.7.6.1 Friedman test ........................................................................... 190
4.7.6.2 Direct effect ............................................................................. 191
4.7.6.3 Indirect effect .......................................................................... 191
xii
4.7.7 Justification using Partial Least Squares (PLS) Technique ................ 194
4.8 Pilot study ....................................................................................................... 197
4.9 Summary of chapter ........................................................................................ 199
CHAPTER FIVE ...................................................................................................... 201
RESULTS AND DISCUSSION .............................................................................. 201
5.1 Introduction..................................................................................................... 201
5.2 Analysis of survey response ........................................................................... 201
5.2.1 Goodness of data ................................................................................. 201
5.2.2 Response rate ...................................................................................... 202
5.2.3 Test for non-response bias .................................................................. 204
5.2.4 Profile of the respondents ................................................................... 206
5.3 Data screening analysis................................................................................... 207
5.3.1 Treatment of missing data ................................................................... 208
5.3.2 Assessment of outliers ........................................................................ 208
5.3.3 Assessment of normality ..................................................................... 209
5.3.4 Assumption of linearity and homoscedasticity ................................... 212
5.4 Evaluation of the model quality ...................................................................... 214
5.4.1 Measurement model ............................................................................ 216
5.4.1.1 Validity test ............................................................................. 216
5.4.1.2 Content validity ....................................................................... 217
5.4.1.3 Construct validity .................................................................... 217
5.4.1.4 Convergent validity ................................................................. 222
5.4.1.5 Discriminant validity............................................................... 224
5.4.1.6 Reliability analysis .................................................................. 225
5.4.1.7 Descriptive analysis ................................................................ 227
5.4.2 Assessment of higher order measurement model ............................... 229
5.4.2.1 Analysis of higher order formative measurement models ...... 231
5.4.3 Assessment of PLS-SEM Structural Model ........................................ 234
5.4.3.1 Analysis of R square (R²) ........................................................ 235
5.4.3.2 Analysis of effect size (f2) ....................................................... 236
5.4.3.3 Blindfolding and predictive relevance (Q2) analysis .............. 238
5.5 Testing of hypotheses ..................................................................................... 239
5.5.1 Result of comparison test of differences ............................................. 240
5.5.1.1 H1: The priority between seven elements in service
marketing mix from customer perspective is varied. .............. 240
5.5.2 Result of direct effect hypotheses ....................................................... 241
5.5.2.1 H2: There is a significant relationship between service
marketing mix and customer satisfaction................................ 242

xiii
5.5.2.2 H3: There is a significant relationship between service
marketing mix and service quality. ......................................... 243
5.5.2.3 H4: There is a significant relationship between service
marketing mix and service value. ........................................... 244
5.5.2.4 H5: There is a significant relationship between service
quality and customer satisfaction. ........................................... 245
5.5.2.5 H6: There is a significant relationship between service
quality and service value. ........................................................ 245
5.5.2.6 H7: There is significant relationship between service
value and customer satisfaction. ............................................. 246
5.5.2.7 Summary of hypotheses testing for direct effects ................... 247
5.5.3 Result of mediating effect hypotheses ................................................ 247
5.5.3.1 H8: Service quality mediates the relationship between
service marketing mix and customer satisfaction. .................. 249
5.5.3.2 H9: Service quality mediates the relationship between
service marketing mix and service value. ............................... 250
5.5.3.3 H10: Service value mediates the relationship between
service marketing mix and customer satisfaction. .................. 251
5.5.3.4 H11: Service value mediates the relationship between
service quality and customer satisfaction. ............................... 252
5.5.3.5 Summary of hypotheses testing for mediation effect .............. 253
5.6 Discussion of research objectives ................................................................... 253
5.6.1 The importance elements of service marketing mix ........................... 254
5.6.2 Direct relationship between service marketing mix and
customer satisfaction ........................................................................... 255
5.6.3 Direct relationship between service marketing mix and
service quality ..................................................................................... 257
5.6.4 Direct relationship between service marketing mix and
service value ....................................................................................... 259
5.6.5 Direct relationship between service quality and customer
satisfaction .......................................................................................... 261
5.6.6 Direct relationship between service quality and service value ........... 263
5.6.7 Direct relationship between service value and customer
satisfaction .......................................................................................... 265
5.6.8 Mediating effect of service quality on the relationship between
service marketing mix and customer satisfaction ............................... 267
5.6.9 Mediating effect of service quality on the relationship between
service marketing mix and service value ............................................ 270
5.6.10 Mediating effect of service value on the relationship between
service marketing mix and customer satisfaction ............................... 272
5.6.11 Mediating effect of service value on the relationship between
service quality and customer satisfaction ........................................... 274

xiv
5.7 Summary of chapter ........................................................................................ 277
CHAPTER 6 ............................................................................................................ 280
CONCLUSION AND RECOMMENDATIONS ..................................................... 280
6.1 Introduction..................................................................................................... 280
6.2 Summary of the study ..................................................................................... 280
6.3 Implications of the study ................................................................................ 283
6.3.1 Managerial and practical implications ................................................ 284
6.3.2 Theoretical implications ..................................................................... 289
6.6 Limitations of the Study ................................................................................. 294
6.8 Recommendations for future research ............................................................ 296
6.9 Conclusion ...................................................................................................... 298
REFERENCES ......................................................................................................... 300
APPENDICES ......................................................................................................... 347
PUBLICATION AND CONFERENCE .................................................................. 378
PARTICIPATION IN GOVERNMENT INITIATIVE ........................................... 380
xv
LIST OF TABLES
Page
Table 1.1 The summary of public complaints on car park
facilities in Malaysia
5
Table 2.1 Accumulative total registered motorcar in Malaysia
2006 – 2013
21
Table 2.2 Formulation for determining a minimum parking bays
allocation
25
Table 2.3 The total number of parking company by states and
years
27
Table 2.4 The characteristic on and off-street parking 29
Table 3.1 Propose to change nomenclatures of 4Ps 44
Table 3.2 The components of service product used in past
studies
49
Table 3.3 The components of service price used in past research
studies
51
Table 3.4 The list of service promotion components in previous
research
55
Table 3.5 The list of service place components in previous
literature
57
Table 3.6 The list of service people components in previous
research
60
Table 3.7 The list of service physical evidence components used
in previous studies
62
Table 3.8 The list of service process components used in
previous studies
65
Table 3.9 The ranking among the elements of service marketing
mix in past studies
68
Table 3.10 The relationship between service marketing mix
elements and customer satisfaction
70
Table 3.11 Definition of SERVQUAL dimensions 77
Table 3.12 Components of SERVQUAL dimensions 83
Table 3.13 The list of hierarchical concept applied in recent years
studies
85
Table 3.14 The list of unidimensional perceived approach applied
in past studies
105
Table 3.15 The list of high order construct and multidimensional
approach applied in past studies
107
Table 3.16 The significant direct relationship between service
value and customer satisfaction
109
Table 3.17 The relationship between service marketing mix
elements and service value
114
Table 3.18 The significant direct relationship between service
quality and service value
115

xvi
LIST OF TABLES
(CONTINUED)
Page
Table 4.1 Measurement scale of service product 152
Table 4.2 Measurement scale of service price 152
Table 4.3 Measurement scale of service place 153
Table 4.4 Measurement scale of service promotion 154
Table 4.5 Measurement scale of service people 155
Table 4.6 Measurement scale of service process 155
Table 4.7 Measurement scale of service physical evidence 156
Table 4.8 Measurement scale of tangible dimension 157
Table 4.9 Measurement scale of reliability dimension 158
Table 4.10 Measurement scale of responsiveness dimension 158
Table 4.11 Measurement scale of assurance dimension 159
Table 4.12 Measurement scale of empathy dimension 160
Table 4.13 Measurement scale of technical quality dimension 160
Table 4.14 Measurement scale of emotional value dimension 162
Table 4.15 Measurement scale of social value dimension 163
Table 4.16 Measurement scale of functional value for quality and
performance dimension
163
Table 4.17 Measurement scale of functional value for price and
value for money dimension
164
Table 4.18 Measurement scale of customer satisfaction 165
Table 4.19 The total breakdown of population, private office
buildings and total space occupied based on
municipals area
170
Table 4.20 The location breakdown of private office buildings
based on municipals area
175
Table 4.21 The breakdown of probability proportionate to size
(PPS) sampling by municipals
177
Table 4.22 The quantity of selected private office buildings by
municipals
179
Table 4.23 Pilot Study results of Cronbach’s Alpha 198
Table 4.24 Summary of hypotheses testing 200

xvii
LIST OF TABLES
(CONTINUED)
Page
Table 5.1 The location, name of private office buildings and
descriptive result of collected questionnaires
203
Table 5.2 Test result of non-response bias 205
Table 5.3 The demographic profile of study’s respondents 206
Table 5.4 Descriptive statistics of mean, standard deviation,
skewness and kurtosis for study variables (n = 182)
211
Table 5.5 Test of homogeneity of variances 214
Table 5.6 Loading and cross loading 219
Table 5.7 Convergent validity and measurement model 223
Table 5.8 Correlations among variables and discriminant
validity
226
Table 5.9 Cronbach’s alpha and composite reliabilities of
variables
227
Table 5.10 Descriptive analysis of the variables (n = 182) 228
Table 5.11 Assessment results of second order construct for
formative and reflective constructs
234
Table 5.12 Effect size of latent constructs 237
Table 5.13 Prediction relevance of the model 239
Table 5.14 Friedman test for variables of service marketing mix 240
Table 5.15 Summary of hypotheses testing results for direct effect 247
Table 5.16 Summary of hypotheses testing for indirect effect 253
Table 5.17 Summary of all hypotheses findings 278

xviii
LIST OF FIGURES
Page
Figure 2.1 Klang Valley Area 23
Figure 2.2 The growth trend of parking companies from 2000 to
2014
27
Figure 3.1 The original concept of McCarthy’s 4Ps 43
Figure 3.2 Grönroos (1984) technical and functional service
quality model
75
Figure 3.3 A hierarchical approach of perceived service quality 81
Figure 3.4 Customer experience framework 90
Figure 3.5 A means-end model relating to price, quality and value 100
Figure 3.6 GLOVAL model 103
Figure 3.7 Structure equation analysis result from Cengiz and
Yayla (2007)
113
Figure 3.8 S-O-R theoretical framework 124
Figure 3.9 Toward reconceptualizing Stimulus-Organism-
Response: A temporally bound two-dimensional
representation
127
Figure 3.10 Extended S-O-R framework 128
Figure 3.11 Connection between extended S-O-R framework and
present study framework
131
Figure 4.1 Research framework 134
Figure 4.2 Structural path model 135
Figure 4.3 Result of sample size for medium effect 173
Figure 4.4 X-Y Plot for medium effect power 173
Figure 5.1 The histogram and normal probability plots 210
Figure 5.2 Normal P-P plot 212
Figure 5.3 Scatter plot diagrams 213
Figure 5.4 Original Research Framework 215
Figure 5.5 Lower order latent variables model using repeated
indicators approach
230
Figure 5.6 Second model for higher order constructs 232
Figure 5.7 Assessment of structural model 236

xix
LIST OF FIGURES
(CONTINUED)
Page
Figure 5.8 Result of path coefficient β and R2 for direct
relationship between SMM and SAT
242
Figure 5.9 Result of path coefficient β and R2 for direct
relationship between SMM and SQ
243
Figure 5.10 Result of path coefficient β and R2 for direct
relationship between SMM and SV
244
Figure 5.11 Result of path coefficient β and R2 for direct
relationship between SQ and SAT
245
Figure 5.12 Result of path coefficient β and R2 for direct
relationship between SQ and SV
246
Figure 5.13 Result of path coefficient β and R2 for direct
relationship between SV and SAT
247
Figure 5.14 Mediation framework 248
Figure 5.15 Result of path coefficient β for SQ mediation effect
between SV and SAT
249
Figure 5.16 Result of path coefficient β for SQ mediation effect
between SMM and SV
250
Figure 5.17 Result of path coefficient β for SV mediation effect
between SMM and SAT
251
Figure 5.18 Result of path coefficient β for SV mediation effect
between SQ and SAT
252

xx
LIST OF ABBREVIATIONS
AVE Average variance extracted
CFA Confirmatory factor analysis
CR Composite reliability
df Degree of freedom
PLS Partial least squares
PPS Probability proportionate to size
SAT Customer satisfaction
SEM Structural equation modeling
S.E. Standard error
s.f. Square feet
Sig. Significant
SMM Service marketing mix
S-O-R Stimulus-Organism-Response
SPSS Statistical Package for Social Sciences
SQ Service quality
SV Service value
VAF Variance accounted for
VIF Variance inflation factor

xxi
LIST OF APPENDICES
Page
Appendix A Measurement of customer satisfaction used in recent
years studies
347
Appendix B Improvement and enhancement of marketing mix
concept (4Ps)
349
Appendix C Definitions of value from customer perspective 351
Appendix D The summary of original measurement scales and
reliability results
353
Appendix E A sample of letter to parking operator for requesting
data of total number of monthly season parking
customers
355
Appendix F Evidence parking allocation ratio to building tenants 356
Appendix G Letter to National Property Information Center
(NAPIC) of Valuation and Property Services
Department
357
Appendix H A list of private building names located in Kuala
Lumpur, Selangor and Putrajaya
359
Appendix I A sample of letter requesting permission for data
collection
369
Appendix J Study Questionnaire 370
Appendix K The results of the D2 (MAH_1 in SPSS) 376
1
CHAPTER ONE
INTRODUCTION
1.1 Introduction
The role of service sector in the world becomes very important to human life and made
the biggest contribution to economic activities (Park & Shin, 2012). In Asia, they had
found that the contribution of service sector over from gross domestic product (GDP)
and employment rate was in upward trend.
The rapid growth of world economic, population and vehicle possession had demands
increment of property development sector together with improvement of transportation
system. There are a lot of attentions had been given by government, authority agencies,
academician, consultants and practitioners on urban planning, transportation system,
road system and technology. But yet the understanding of customer behaviour in
parking facilities and development of parking service is still staying behind.
Today, the role of car parking facilities is more than basic needs of life. A Chairman
of the Board of International Parking Institute, Casey Jones had stressed that parking
is everyone matter (Jones, 2011). Parking space is essential to the use of commercial
properties in most urban areas such as retails, hotels, transportation hubs, hospitals and
offices. These commercial buildings must sufficiently provide parking to their
customers, employees and visitors.

2
Issues related to car parking can be improved by managing parking facilities more
efficiently and effectively (Litman, 2013). A good planning with suitable strategic
decisions and allocation of resources by adapting service marketing mix framework
will enable the company to configure marketing and operational activities for parking
facilities in order to meet customer satisfaction and needs (Goi, 2009).
Correspondingly, European Parking Association (2014) acknowledges that a proper
management of parking facilities will increase the quality and valued by consumers.
Even though services rendered in car parking facilities are recognized as important to
the daily activities of human life and economic, several issues such as congestion,
quality of service, parking fees, security and service standards in car parking facilities
is currently being obstacles to the progress of human life and economic. Thus, studying
in this context will benefits to all stakeholders toward betterment of future.
1.2 Background of the study
Car parking facilities is a part of transportation system, human life and property
development. It has plays pivotal roles to support economic growth and human quality
of life (Qian & Rajagopal, 2013; Litman, 2013; He, Sun, Du, Jinmei, & Das, 2012).
Income and car ownership were recognized as influence factors that affect the demand
for car parking (Spiliopouloua & Antoniou, 2012).
The growth of world vehicle population has been reported above 1,015 billion units in
2010 with increment rate of 3.6% (Sousanis, 2011) and world population had reached
to 7.162 billion with 1.1% growth rate in 2012 (United Nation, 2012). In addition, the

3
International Monetary Fund had reported that Gross Domestic Product at 3.0% in
2013 and expected to continuous growth at 3.6% in 2014 and 2015 (World Economic
Outlook 2014). These growing trends has resulted a great pressure in all aspects such
as urban planning, infrastructure, environmental and supply of resources.
Although building more parking facilities looks necessarily, it has another impacts
such costly to building construction (Amos & Schlossberg, 2014; Litman, 2013;
Shoup, 2005), costly to society (Seibert, 2008), reduce architectural quality and
encourage more vehicles into city which indirectly contribute to environmental issues
(Seibert, 2008; Mukhija & Shoup, 2006) and distorted land value (King & Keenan,
2012). As recommended by Litman (2006), improving parking management is the best
way to satisfy the user demand on parking in many situations.
Therefore, one of solution to overcome the parking problem is to make car park as a
commercial business and impose parking fees to motorist for controlling vehicle
turnover, maintaining car park facilities, generate income to building owner,
encourage entrepreneurship, create jobs and contribute to economic activities. The
common scope of parking services is covers parking revenue collection, parking
management, provide trained and professional car park staffs, provide customer
service, management of traffic flow, deployment of parking equipment and
technology, maintenance of parking facilities and provide safety and security elements
within the parking facilities (Cullen, 2012; Horn, 2011; Phillips, 2011).
In Malaysia, services sector also becomes one of the changing drivers to current
economy as well as to support a demand of domestic-oriented. Malaysia was ranked
4
at eighth in Asia Pacific on the Service Development Index in terms of market
expansion services (Thean, 2012). The contribution of services sector remain the
largest contribution to Malaysian Gross Domestic Product (GDP) with 54.6% in 2012
and 55.2% with increment of 5.9% in 2013 compare to other sectors (Malaysian
Department of Statistics, 2013; Bank Negara Malaysia, 2013).
The Malaysia Prime Minister had launched the Services Sector Blueprint and Logistics
and Trade Facilitation Masterplan which contain the strategic steps to optimise
contribution and growth opportunities of the service sector to the nation's economy
through human development, integration of sectoral governance reform,
internationalization of services and investment incentive management. The Malaysia
government aims services sector will be able to contribute at ratio of fifty eight percent
(58%) to GDP in 2020 where current contribution to GDP in 2014 is recorded at fifty
five percent (55%) with more than eight millions job opportunities in this sector
(“Services Sector Blueprint”, 2015).
However, the above inspiration may have difficulties to achieve due to dissatisfaction
arises among Malaysian public on services rendered in car parking facilities. For
example, the news titled “High rates but poor parking facilities” had appeared at News
Strait Times online on 13 April 2012 (Bahalul, 2012). The news tells a story about
frustration among motorists on the parking fees which does not match up to the
facilities provided, limited parking space, not well maintained and safety issues in the
parking facilities. Other complaints on car parking in Malaysia were appeared in online
media as well and shown in Table 1.1.

5
Table 1.1
The summary of public complaints on car park facilities in Malaysia
No. Parking Issue Writer Publication Date/Month/Year
1 Enforce OKU parking strictly
Bulbir Singh The Star Online 2 May, 2014
2 Touts collecting fees illegally at
parking lot in Kajang
Farah
Fazanna
Zulzaha
The Star Online 26 April, 2014
3 UMMC must resolve its parking
rate issue quickly
Retiree The Star Online 2 January, 2014
4 Private carpark operators in
Petaling Jaya taking advantage of
space shortage
Edward
Rajendra
The Star Online 23 September,
2013
5 Lighting needed at KTM car park
Mantin The Star Online 19 October, 2012
6 Open letter to the Pengarah of HKL Jennifer Free Malaysia
Today
12 October, 2012
7 Adopt Indonesian method to create
space for vehicles
Hussaini
Abdul Karim
News Strait
Times
26 July, 2012
8 Trader is latest car park attack victim
Austin
Camoens
The Star Online 18 July 2012
9 CRIME: Car park owners use
disclaimers
Michael Ng News Strait
Times
28 June, 2012
10 The car park did not get a certificate
of fitness for occupation and poor
design structure
Josephine
Jalleh & Lo
Tern Chern
The Star Online 28 June, 2012
11 What women say about car park
security...
- News Strait
Times
15 June, 2012
12 Going nuts over car prices and
parking fees
Andrew Lo The Star Online 10 June, 2012
13 Women want peace of mind at car
parks
- The Star Online 10 June, 2012
14 Mayor of Ipoh Perak warned illegal
parking attendants of stern action
against them.
- Malay Mail 5 June, 2012
15 Making car parks safer
Edward
Wong
The Star Online 2 June, 2012
16 Feisty marketeer fights off would-be
rapists at mall car park
Regina Lee The Star Online 29 May, 2012
17 Air Asia wants better LCCT car park
security after stewardesses attacked,
molested
Wong Pek
Mei
The Star Online 27 April, 2012
18 High rates but poor parking facilities
Veena
Babulal
News Strait
Times
13 April, 2012
19 Illegal attendants demanding fees
Looi Sue-
Chern
News Strait
Times
30 December,
2011

6
Table 1.1 (Continued)
No. Parking Issue Writer Publication Date/Month/Year
20 Fomca Halls Landmark Decision On
Car Parking
Shk Kam Js Blis 25 April, 2009
21 Parking contractors fired - New Straits
Times
11 July, 2008
22 Traders hit out at rude parking
attendants
- The Star Online 6 August, 2007
Source : Online media
It was understood that car parking facilities gives early impression to motorist on
building standard and it becomes one of essential criteria for commercial value of
properties and also to support business activity at the surrounding area (Cutter &
DeWoody, 2010; Mukhija & Shoup, 2006; Iman, 2006). Motorist frustration on
current transportation system and parking services will cause one of obstacle to the
progress of Government Transformation Programme (GTP) and realization of Vision
2020 as well as achievement of National Key Economic Areas to make Klang Valley
as top twenty liveable metropolis and top twenty in economy growth. Nevertheless,
this scenario indirectly will affects tourism industry in Malaysia where tourism sector
is also one of twelve focuses in National Key Economic Areas.
Thus, the public complaints on parking service and facilities should be addressed
seriously. It become an indicator of performance level assessment, signalling some
problems or failures in internal deficiencies that demand a quick recovery in order to
avoid any negative impact to government, local authorities, property owners and
service organization such as investor encouragement, property value, customer
retention, profitability and image. On other perspective, customer complaints can
provide feedback to organization with the opportunity to solve certain operational
malfunctions, to learn from negative situations and re-establish customer satisfaction
and trust (Filip, 2013). The necessary efforts should be taken in order to improve public

7
satisfaction, customer retention and create profitable relationship as the key to survival
and long-term growth (Eisingerich, Auh, & Merlo, 2014; Ndubisi & Ling, 2005).
1.3 Problem statement
Although it is generally accepted that the excellence parking services reliefs parking
problems and increase satisfaction among motorist (European Parking Association,
2014; Litman, 2013; Health and Safety Executive, 2011; The Institution of Highways
& Transportation, 2005; Mendat & Wogalter, 2003; Shaffer & Anderson, 1983), but
why Malaysian public is still not satisfy on how car park facilities being managed
create puzzle. Response from parking user’s indicates that it is not only parking space
and fees determine their satisfaction but other factors such as parking environment,
security, human interaction, quality and value aspects also becomes their concern. In
short, parking users demand more when they utilize the car parking facilities.
Therefore, the problem being addressed in present study was that car park customers
are not satisfied with the manner in which commercial parking facilities were managed
in Malaysia. Various issues related to car park had occurred in many part of Malaysia,
especially in main cities like Klang Valley where aggressive commercial activities,
high vehicle volume and limited space becomes contribution factors (Rajendra, 2013).
The public feedback on car park facilities and services have been reported in the online
media as listed in Table 1.1. The content of the feedbacks indicate numerous cause-
effect factors that distressing satisfaction among car park users such as high parking
fee, parking attendant attitude, poor maintenance of parking facilities, security issues,
lack of facilities provided in parking area and the choice of parking products.

8
It is notable that the parking problem has been recognized as a long outstanding issue
in the urban cities (Litman, 2013; Doulamis, Protopapadakis, & Lambrinos, 2013;
Qian & Rajagopal, 2013) but studies of customer satisfaction in car park facilities was
very rare and non-conclusive. Past studies claims that there were no comprehensive
evaluation from customer perspective in car park facilities (He at el., 2012; Mendat &
Wogalter, 2003) and mainly concentrate on parking security (Shaffer & Anderson,
1983), parking physical evidence (Mendat & Wogalter, 2003), traffic congestion
(Fosgerau & Palma, 2013), urban planning (Wu, 2011), parking pricing (Manville &
Williams, 2012) and parking technology (Diaconu, Andrei, Puchianu, & Predusca,
2013; Rashid, Musa, Rahman, Farahana, & Farhana, 2012).
Little efforts demonstrated to solve pressing issues on satisfaction among car park
users that will not benefited to car park industry and country in term of economic
development, public health, quality of life and tourism (Redman, Friman, Tommy, &
Hartig, 2013). Therefore, a study on customer satisfaction in car park facilities is a
serious matter and worthy studies that able to aid the stakeholders to understand and
address the issues. Without indepth study, improvement effort to overcome car park
issues becomes tougher and disrupt development progress in services sector,
particularly to car park services as the volume of vechicle and business activities in
city continue to growth rapidly over the time.
Customer satisfaction is a commonsense aspect to measure the success of marketing
achievement in exchange. Attaining high customer satisfaction in car park facilities
becomes a major challenge to car park operators where complaint on parking services

9
is everywhere nowadays. The marketing strategies implemented by the car park
operators seem like not effective enough to address and improve their customer
satisfaction. The marketing strategy such as service marketing mix was designed to
satisfy the customer needs and helps organization to be resilient in a highly competitive
business world (Perreault, Cannon, & McCarthy, 2011). A well designed marketing
stragtegy in parking services that based on customer preferences and needs, able to
allow service provider to form the best alignment of their internal capabilities to be
focused and worth pursuing in business environment.
Addition to this challenge, high leasing and operational cost factors confronted by car
park operators makes the allocation of resources such as capital investment, human
capital and technology investment becomes tougher but yet very important resources
in managing parking facilities. It had demanded that the car park operators to utilize
resources appropriately and wisely toward building a strong foundation in car park
service marketing. However, there is lack of empirical evidence in term of marketing
strategies that support on what are the most influencing mix elements to customer
satisfaction in car park facilities (He at el., 2012; Mendat & Wogalter, 2003). Addition
to this, it has been well accepted that the impact of marketing mixes in creating
excellence service is vary between service context, geographical and culture (Lee et
al., 2014; Chumaidiyah, 2013). Due to this reason, the role of service marketing mix
in car park services is still flaw. Thus, this practical gap creates valuable opportunity
to be investigated and service marketing mix of 7Ps was identified as a suitable model
to be used in this assessment.

10
Even though it is important to understand the foundation of marketing strategies for
car park services, it alone is unable to clarify customer satisfaction adequately without
considering quality and value aspects. Furthermore, the existence of human thinking
phase such as assessment on quality and value before producing responses is
unavoidable and it becomes intermediaries between stimulus factors and response
(Jacoby, 2002). The public complaint as listed in Table 1.1, offer evidences to support
that car park users are so concern about quality and value features provided in car park
facilities and services. Consequently, imbalance treatment between quality and value
to represent customer’s benefits may cause dissatisfaction, distress and disappointment
among car park customers. But unfortunately, most of past studies in the field of
service quality and value focused on other service sectors. Up to now, far too little
attention has been paid to the roles of service quality and service value in creating
satisfaction in car park context. These arises the questions whether those variables has
extensive direct and intervening roles to the satisfaction of car park customers.
Moreover, these relationships have not yet been addressed fully and it deserves for
urgent subject to be studied.
Due to these reasons, present study is interested to investigate relevant variables that
affect customer satisfaction in commercial car parking facilities. After reviewing
comprehensively, variables to be investigated in this study were service marketing mix
elements for assessing marketing and operational efforts done in parking facilities as
first influencer variable, service quality and service value as mediating variables to
customer satisfaction in commercial parking facilities. The chosen variables were
highly believes to be able in explaining contemporary parking issues at commercial
car parking facilities in Malaysian context.

11
However, there is no straightforward research setting for this study. The challenges
encountered in present study is lack of comprehensive study to support and explain the
complexity of the relationships between service marketing mix, service quality,
service value and customer satisfaction in commercial parking facilities. Through
these limitations, five research gaps were identified which are (1) very little known
about the practices of service marketing mix at the commercial parking facilities in
Malaysia including its elements and methodology approach used to support the
marketing mix concept as a mixer of marketing mix elements (Al-Dmour, Al-Zu’bi,
& Kakeesh, 2013; Chumaidiyah, 2013; Sanib, et al., 2013; Yasanallah & Vahid, 2012;
Cengiz & Yayla, 2007); (2) absence of technical quality aspect in SERVQUAL
measurement scale may not able to assess adequately on service quality rendered in
car park facilities (Kang & James, 2004); (3) inconsistent findings on service value
dimensions including it analysis methodology has been inadequately explored (Lin,
Sher, & Shih, 2005); (4) little empirical evidence on the relationships between service
marketing mix, service quality, service value and customer satisfaction and lastly, (5)
lack of empirical studies on the relationship of between service quality, service value
and customer satisfaction model where service marketing mix act as stimulus factor
(Goi, Kalidas, & Zeeshan, 2014).
In summary, the problem statement of present study is surrounded by issues related to
customer satisfaction in commercial car parking facilities. Based on the online news,
it indicates that marketing strategies implemented by car parking operator does not
seem work well to enhance satisfaction of parking users because it disregard on
customer’s concern of service quality and service value in car parking facilities.

12
Additionally, lack of past studies to investigate the above complex issues create urgent
need for a study where attention on car parking facilities becomes important over the
time. Several study gaps were identified that covers the concept, methodology and
relationship in proposed study’s model.
1.4 Research questions
In line with the study background and the problem statement discussed in the
preceding subheadings, the broad research question to which the study attempts to
provide is: What is the influence of service marketing mix, service quality and service
value on customer satisfaction in the commercial parking facilities in Malaysia?
Based on the main research question, this study was guided on the following specific
questions:
a) What are the important elements of service marketing mix in Malaysian
commercial car parking facilities?
b) Does service marketing mix, service quality, service value and customer
satisfaction are influenced by each other directly in Malaysian commercial car
parking facilities?
c) Is there any mediation effect of service quality on the relationship between
service marketing mix and customer satisfaction?
d) Is there any mediation effect of service quality on the relationship between
service marketing mix and service value?
e) Is there any mediation effect of service value on the relationship between service
marketing mix and customer satisfaction?

13
f) Is there any mediation effect of service value on the relationship between service
quality and customer satisfaction?
1.5 Research objectives
Subsequent to the aforementioned research questions, the study was dedicated to
achieve the objectives of present study, as follows:
a) To determine the importance of service marketing mix elements in Malaysian
commercial car parking facilities through customer perspective.
b) To investigate direct relationship between service marketing mix and customer
satisfaction.
c) To investigate direct relationship between service marketing mix and service
quality.
d) To investigate direct relationship between service marketing mix and service
value.
e) To investigate direct relationship between service quality and customer
satisfaction.
f) To investigate direct relationship between service quality and service value.
g) To investigate direct relationship between service value and customer
satisfaction.
h) To examine the mediating effect of service quality on the relationship between
service marketing mix and customer satisfaction.
i) To examine the mediating effect of service quality on the relationship between
service marketing mix and service value.

14
j) To examine the mediating effect of service value on the relationship between
service marketing mix and customer satisfaction.
k) To examine the mediating effect of service value on the relationship between
service quality and customer satisfaction.
1.6 Significant of the study
The findings of this study has significantly contributes to theoretical and practical
aspects where up to the knowledges of researcher, this study can be considered as one
of the Malaysia’s first studies to observe the phenomenon of consumer behavior on
the aspect of service marketing mix, service quality, service value and customer
satisfaction on parking services in the local context.
In term of theory, the findings on service marketing mix practices through 7Ps
elements has contribute to increment number of empirical evidence for application of
service marketing mix concept in service industry especially in parking service
context. Past studies had showed that the application of service marketing mix
elements is doubtful, arguable and impractical in today’s business. The finding of
present study hopes to bridge the gap of current application of service marketing mix.
Moreover, the present study has become first of few studies that treated seven mix
elements to form service marketing mix as high order construct because mostly in the
past studies, elements of service marketing mix were tested as individual variable. The
finding of present study on this aspect had successfully validated and proven to support
the concept of service marketing mix as “mixer of ingredient”.

15
Additional to the above, present study hopes to contributes to the body of knowledge
in service quality through the findings of service quality dimensions in parking
facilities because service quality dimensions vary due to type of service industry and
geographical factor. Furthermore, the finding on the role of technical quality
dimension in service quality may enhance understanding on service quality concept.
This study contributes to theoretical aspect via methodology analysis by validating the
concept of service quality as higher order construct and mediating roles of service
quality.
For methodology aspect, this study had employed PLS-SEM and it application able to
enrich evidence and validation on the research framework especially in Malaysia
context. Moreover, articles in recent years suggest to use PLS-SEM methodology as
analysis technique in future research undertaken towards development of alternative
statistically technique for structural equation modelling (Dijkstra & Henseler, 2015;
Sarstedt, Ringle, Smith, Reams, & Hair, 2014b; Hair, Sarstedt, Pieper, & Ringle,
2012a). In addition, PLS-SEM offers valuable advantages which allow unique
statistical technique to be applied such as formative measurement construct or high
order constructs for multidimensional model. Therefore, present study able to offer
empirical evidences as valuable findings in term of reflective-formative measurement
to the body of knowledge in marketing study and provide an informative platform to
future study in confirming new insight of the constructs available in the proposed
theoretical framework.
From the practical perspectives, the findings of present study able to provide
guidelines to the practitioners such as for 1,504 registered parking operators in

16
Malaysia in 2014 that based on statistic of Suruhanjaya Syarikat Malaysia (Shari,
2015) and owners of parking facilities to gain new insights on the roles of service
marketing mix, service quality and service towards attaining customer satisfaction in
the management of car parking facilities. Moreover, these constructs is very important
to survival of organization as the constructs are linked to customer retention, loyalty
and positive word of mouth. The right application of marketing strategies will enhance
organization performance, reputation, business profitability and competitiveness
advantages in service industry.
This study also able to provide a guideline to local authorities and relevance
government agencies in term of improving existing rules and regulations by focusing
on signified factors revealed in this study. The findings of this study can act as input
for reviewing existing private car park license and specifications in setup car park
facilities. Considering essential features to be incorporated in car park services leads
to high perception on service quality and service value, and subsequently stimulate
greater satisfaction among customer or public. The spread out of this study findings
may encourage better understanding on car park operations and services among public
and perhaps students in transportation, urban planning and architecture faculty would
also gain benefits. Cultivate basic knowledge about car park among public through
conferences and seminars may encourage constructive feedbacks from public as
valuable inputs to government, local authorities and practitioners for further
improvement on car park facilities and it services in future.
In summary, present study able to make valuable contributions to practical and
theoretical perspective through study findings on the relationship between service

17
marketing mix, service quality, service value and customer satisfaction in commercial
car park facilities. This study hopes to provide empirical evidence for further
clarification of the proposed constructs concept and provide practical benefits to the
stakeholders who are concern in car park facilities and services. This study can be a
basis to carry out a future study on parking services in Malaysia or other countries
since there is lack of empirical studies in car park services.
1.7 Scope of the study
The scope of present study is focused on four main streams of literature that cover
service marketing mix, service quality, service value and customer satisfaction. In
regard to service marketing mix, 7Ps elements namely service product, service price,
service promotion, service place, service people, service process and service physical
evidence were used to form the fundamental of service marketing mix construct. Other
construct such as service quality was formed through dimension of tangible, reliability,
responsiveness, assurance, empathy and technical quality. While service value was
formed through emotional value, social value, functional value of quality/performance
and functional value of price/value components. The dependent variable represented
by customer satisfaction consist of six items that covers affective, emotion, fulfillment
of needs, cognitive, disconfirmation and general satisfaction.
The study setting was Malaysian commercial car parking facilities which are available
in the privates office building. The target respondents was the customer who is
subscribing a monthly parking season pass in the selected commercial car parking
facilities within Klang Valley area.
18
1.8 Organization of the dissertation
This dissertation was organized into six chapters. Second chapter provide an overview
of parking facilities and service in Malaysia. A review of the research literature on
service marketing mix, service quality, service value and customer satisfaction was
described in the third chapter. It also discussed the conceptualization of the constructs
and the relationships among them. The fourth chapter describes the research
methodology of the study. It includes the operationalization of the constructs, the
research design, sampling and data collection process. The findings of study generated
by data analysis were provided and discussed in details in the fifth chapter. Finally,
the last chapter had discussed managerial and theoretical implications of this study, as
well as its limitations and recommendation for future research.

19
CHAPTER TWO
OVERVIEW CAR PARKING FACILITIES AND SERVICES IN MALAYSIA
2.1 Introduction
This chapter provides an overview of factors related to parking demand in Malaysia
and Klang Valley such as economy, population, vehicle possession and factors related
to parking supply such as property, buildings and regulations. Moreover, information
and issues related to car parking services was described in this chapter such as
relationship between property owner and customer, characteristics and type of parking.
2.2 Contributing factors to supply and demand for car parking facilities
The land area of Malaysia covers about 330,803 square kilometer that consist of states
in Peninsular Malaysia, namely Johor, Melaka, Negeri Sembilan, Selangor, Pahang,
Perak, Terengganu, Pulau Pinang, Kedah, Kelantan, Perlis and the Federal Territories
covers Kuala Lumpur and Putrajaya. While for East Malaysia at the island of Borneo
consists Sabah and Sarawak and Labuan off Sabah under the Federal Territory.
Malaysian population in 2013 was estimated at 29.7 million with growth of 1.3% (The
Malaysian Economy in Figures 2013) and nominal gross income per capita in 2013 is
RM32,144 with expectation to increase 6.2% in 2014 (Economic Report 2013/2014:
Malaysia's economy). Malaysia is a multi-ethnic country with the main ethnic groups
are Malay, Chinese and Indian.

20
The Malaysian economy in 2013 was 4.7% and a steady growth trend of 4.5%-5.5%
was expected in 2014 (Bank Negara Malaysia Annual Report 2013). Bank Negara in
it outlook report has forecast that the momentum of economy growth will be
contributed through better performance in the external sector and surrounded by
several moderation in domestic demand. The main drivers to the overall economy
growth are expected to be from services and manufacturing sectors. The contribution
of services sector is still remain a main focus in Malaysia and projected to continue it
growth trend on performance and expansion in 2015.
In line with the economy growth, the total new vehicles for passenger and commercial
in 2013 was 655,793 units with increment of 4.5% compare to 2012. Additionally, the
accumulative total for registered motorcar in 2013 is 10,480,977 units and total
registered motor vehicles including motorcycles as at 31st December 2013 was
23,705,794 units (Malaysian Road Transport Department, 2013). Table 2.1 shows the
statistic of accumulative total of registered total motorcar since 2006.
Vast increment of private vehicle ownership and usage in Malaysia was due to
consistent growth of economic, increment of population, improvement of income
levels, friendly financial loan facilities and the availability of made-in-Malaysia cars.
Although Malaysian government encourage citizen to use a public transport, most of
citizen is still want to use motorcar because it able to offers a personal freedom and
impress on person status of life. Other commented that the lack of viable options
especially integrated, accessible and affordable public transport systems causes more
Malaysians to own private vehicles is one of possible factor (Inter Press Service,
2013).

21
Table 2.1
Accumulative total registered motorcar in Malaysia 2006 – 2013
Year Accumulative Total Annual Increment
Total
Annual Increment
%
2006 6,941,996 468,735 7.2%
2007 7,419,643 477,647 6.9%
2008 7,966,525 546,882 7.4%
2009 8,506,080 539,555 6.8%
2010 9,114,920 608,840 7.2%
2011 9,721,447 606,527 6.7%
2012 10,354,678 633,231 6.5%
2013 10,480,977 126,299 1.2%
Source: Ministry of Transportation, Road Transport Department
Major cities in Malaysia like Klang Valley are not exempted from current global
scenario effect. As the capital and commercial heart of the country, Klang Valley
becomes one of main agenda to National Key Economic Area (NKEA) which
represents an essential component in the plan to transform Malaysia into a high-income
nation by 2020. Under one of National Key Economic Area (NKEA), Malaysian
government has a strategic planning to transform Greater Kuala Lumpur/Klang Valley
towards the top twenty most liveable metropolis and top twenty in term of economic
growth (Official Website of Greater Kuala Lumpur/Klang Valley, 2014; Malaysia
Prime Minister’s Department, 2014). The overall aim is to transform the region into a
world-class metropolis that will boast top standards in every area from business
infrastructure to liveability (Malaysia Prime Minister’s Department, 2010).
The range of Klang Valley Region is across approximately 2,843 square kilometres.
This region is consist of ten (10) municipalities which are administered by local
authorities such as Dewan Bandaraya Kuala Lumpur (DBKL) and Perbadanan

22
Putrajaya is under Federal Territory while Majlis Bandaran Shah Alam (MBSA),
Majlis Bandaran Petaling Jaya (MBPJ), Majlis Perbandaran Klang (MPK), Majlis
Perbandaran Kajang (MPKj), Majlis Bandaran Subang Jaya (MBSJ), Majlis
Perbandaran Selayang (MPS), Majlis Perbandaran Ampang Jaya (MPAJ) and Majlis
Perbandaran Sepang is under Selangor state (Malaysia Ministry Of Federal Territories,
2014). The Figure 2.1 shows the district areas covered in Klang Valley.
The total population of Klang Valley is about 7.2 million in 2010 (Malaysia
Department of Statistics, 2011). Federal Territory of Kuala Lumpur has highest
population density with 6,891 persons per kilometer while Putrajaya is 1,478 persons
per square kilometer and Selangor state has 674 persons per square kilometer.
In term of motorcar in Klang Valley, Kuala Lumpur had recorded the highest
accumulative total of registered motorcar which represents 30.4% (3,183,389 units)
and Selangor represent 8.2% (861,360 units) for total accumulative total of registered
motorcar in 2013. According to a study undertaken by Syarikat Prasarana Nasional
Bhd, it was estimated about 2.2 million private vehicles are entering into Klang Valley
daily (The Star, 2006). Apparently, high economy activities, population and the growth
of vehicle in Klang Valley had demanded traffic flow and parking space to be managed
accordingly.

23
Figure 2.1
Klang Valley Area
Source: Ministry of Federal Territories and Urban Wellbeing website
Construction of buildings is also an important indicator to ensure the supply of parking
space is sufficient. It was reported that total number of construction project by end of
2013 is 9,652 with increment of 328 projects compared to 2012. Selangor represent
the highest contribution to construction sector with 25.7% and second highest is 16.1%
from Kuala Lumpur including Wilayah Persekutuan.
While Valuation and Property Services agency under Malaysian Ministry of Finance
has reported that space in commercial building as at 4th quarter of 2013 is 13,951.86
million square meter for 1,417 buildings with 77.8% occupancy for purpose-built
office and 12,390.75 million square meters for 873 complexes with 79.5% occupancy.
Kuala Lumpur, the main provider of office space, accounted for 51.6% (7.206 million
square meters for 353 buildings) share of the national total, recorded 0.7% decrease in

24
its availability rate from 22.5% to 21.8%. At the end of Q4 2013, there were 1.570
million square meters of space available for occupation offered by 235 buildings.
Meanwhile, Selangor, the second biggest contributor of office space in the country,
recorded availability rate of 26.7%, retaining the rate registered in the previous quarter.
At the end of the review quarter, the state had 752,640 square meters (130 buildings)
of office space available in the market.
2.3 Regulations related to car parking facilities
In Malaysia, “Parking” is defined in Road Transport Act 1987 as the bringing of a
motor vehicle to a stationary position and causing it to wait for any purpose other than
that of immediately taking up or setting down persons, goods or luggage. While
“parking place” is defined as a place set apart as a place at which motor vehicles or
any specified class or description of motor vehicles may be parked.
The minimum parking requirement regulation is applied in Malaysia and administered
by local authorities such as City Hall Kuala Lumpur, Majlis Bandaran Subang Jaya,
Majlis Bandaran Petaling Jaya and so forth. For example, Table 2.2 shows the
formulations to determine a minimum parking bays allocation that imposed by City
Hall Kuala Lumpur to a new building construction.
Any operation of commercial parking facilities must first obtain a car park license from
local authority. The car parking operator whether operated in-house by building owner
or outsources to parking companies, has responsibilities to adhered to the requirement
stated in the license conditions. For example, City Hall Kuala Lumpur (also known as

25
DBKL or Dewan Bandaraya Kuala Lumpur) has stated that the responsibilities of
parking operator covers a notification of parking fee and operation hours, parking
security and safety, cleanliness, driving directional signages, parking attendants,
parking bays line marking, parking machine and disable parking bay (DBKL Terms
and Conditions of private car park licensing).
Table 2.2
Formulation for determining a minimum parking bays allocation
No. Type of Commercial Car Parking Lots Motorcycle Parking Lots
1. Office Building/ Shopping
Malls/Terminal/Convention
Centre/Food Court/ Market/
SOHO
Gross Floor Area - 30%
service area / 500 s.f.
Gross Floor Area - 30%
service area / 1,500 s.f.
2. Hypermarket Gross Floor Area - 30%
service area / 215 s.f.
Gross Floor Area - 30%
service area / 1,500 s.f.
3. Hotel 5 Star Gross Floor Area - 40%
service area / 500 s.f.
Gross Floor Area - 40%
service area / 1,500 s.f.
4. Hotel 4 Star and below Gross Floor Area - 35%
service area / 500 s.f.
Gross Floor Area - 35%
service area / 1,500 s.f.
Source: DBKL (2010)
2.4 Government initiatives toward parking facilities
Malaysia government through National Key Economic Area strategic plan intended to
improve transportation system and city congestion by constructing Mass Rapid Transit
(MRT) which currently is in progress (Malaysia Prime Minister’s Department, 2014).
Minister in Prime Minister’s Department, Datuk Seri Idris Jala had introduced “Car
Park League Table” as a challenge to car park operators for improving security in car
park facilities and to be more diligent in ensuring public safety (“Car parks at malls to
be rated”, 2012).

26
Other initiative, the Housing and Local Government Ministry had reported that a
guidelines on requirements for planning construction for car park at business premises
and shopping malls is almost completed and it was aimed to improve existing security
measures in the car park facilities by emphasizing on installation of security system
such as panic button, closed camera television (CCTV), siren, entry and exit of parking
control system (“Guidelines on car park safety soon”, 2012).
While Federal Department of Town and Country Planning Peninsular Malaysia (2011)
had provided a car park planning guidelines that emphasis on car park planning,
design, safety and security towards friendly car park to motorist. However, the service
scope for parking facilities is much broader that include performance of car park
attendant, service process, parking equipment, parking service product and marketing
rather than only parking facilities specifications and general instructions. The existing
guidelines and regulations provided by the government agencies may not sufficient to
educate the parking operators, facilities owners and public. Lacking in term of co-
ordination including enforcement aspect to monitor current parking standards may also
contribute to contemporary issues in parking facilities.
2.5 Car parking services
Car parking services in Malaysia had growth rapidly. A statistical report as provided
by Suruhanjaya Syarikat Malaysia (Shari, 2015) indicates that there are about 1,504
companies has been registered under parking services as at 2014. From 2000 to 2014,
the growth percentage of parking companies is at 126% with average growth of 9%
annually. The highest registered parking companies among the states of Malaysia are
Selangor with 417 companies, followed by Kuala Lumpur with 312 companies and

27
Sarawak with 206 companies. The growth trend of parking companies and the total
number of parking companies by states and years were shown in Figure 2.2 and Table
2.3.
Figure 2.2
The growth trend of parking companies from 2000 to 2014
Source: Shari (2015), Suruhanjaya Syarikat Malaysia
Table 2.3
The total number of parking companies by states and years
Source: Shari (2015), Suruhanjaya Syarikat Malaysia
2000 2001 2002 2003 2004 2005 2006 2007 2008 2009 2010 2011 2012 2013 2014
JOHOR 86 114 90 77 86 115 127 113 144 126 120 127 138 159 164
KEDAH 13 20 10 24 43 32 33 32 51 54 54 23 21 28 31
KELANTAN 10 5 7 7 10 7 5 10 12 8 7 8 11 10 8
MELAKA 15 11 17 12 8 11 13 24 15 19 14 11 16 13 13
NEGERI SEMBILAN 19 22 16 22 13 16 12 12 23 22 14 26 32 28 36
PAHANG 10 18 13 18 14 25 20 27 31 21 22 21 32 30 41
PERAK 25 15 13 17 15 22 29 45 24 22 29 24 25 36 48
PERLIS 2 -- 3 3 6 2 3 4 5 5 2 -- 3 2 6
PULAU PINANG 49 54 63 58 51 72 56 66 72 66 94 66 71 87 92
SABAH 43 33 29 37 53 50 57 56 62 66 49 69 34 62 92
SARAWAK 33 37 43 60 82 62 77 81 86 113 124 111 121 147 206
SELANGOR 175 211 216 247 251 293 275 318 311 263 332 316 322 402 417
TERENGGANU 12 26 32 29 24 8 22 26 27 33 12 10 10 18 26
W.P. LABUAN 4 2 4 6 6 5 5 7 8 11 3 7 3 3 11
W.P. PUTRAJAYA -- -- -- -- -- -- -- 1 -- -- 2 -- 1 -- 1
KUALA LUMPUR 169 197 219 222 235 273 263 257 256 237 273 229 288 286 312
TOTAL 665 765 775 839 897 993 997 1079 1127 1066 1151 1048 1128 1311 1504
YearStates

28
In regard to the model of parking services, three parties normally involved in parking
services that is parking service operator, the parking facility owner and the motorist.
In some situation, the owner of parking facility runs the in-house parking operation. In
general, tripartite relationship among parties are involved in day to day operation of
car park and the complication occurred in this operation relationship is depend to what
extend the owners of parking facility have direct contact of motorist who parked their
vehicle in the parking facility.
Thus, the relationships behind a car park service are complex. The car parks operators
need to provide a service to both the owner and motorists where the objective of service
to each party is vary. Additionally, service for parking facility owner by car park
operator is more on commercial terms such as leasing, profit sharing and monthly
reporting of car park performance. On the other hand, service for motorist who uses
the parking facility is more on service satisfaction that includes parking availability,
security and parking convenience.
Generally, there are two categories of parking that is on-street parking and off-street
parking. For on-street parking facilities, the parking lots are provided at outside of
roadways or along the curbs of street that normally controlled by local authorities. The
parking charges to the users of on-street parking facilities is based on parking duration
using manual ticketing or parking meter installed near to parking lots. The collection
of parking fees is paid to the local authorities and for those user parked exceeding paid
duration will be issued a summon by the enforcement officer of local authority after
checking the parking ticket displayed at vehicle dashboard.

29
While for off-street parking, it normally inside or surrounding buildings and an open
air parking lots. The off-street facilities are often build to accompany the on-street
facilities, as the on-street parking alone fails to cope with the large demand for parking
(Shoup, 2013). In contrary to on-street parking, off-street parking facilities normally
be owned by private companies. Table 2.4 summarizing the characteristic on and off-
street parking.
Table 2.4
The characteristic on and off-street parking
Items On-Street Parking Off-Street Parking
Required Physical
Changes
Parking lots line painting,
installation of signage, parking
meters.
Securing for land, paving, installation
of parking collection system, parking
equipment, and construction of
administrative buildings.
Time for
Development
Require a short time. It takes a long time to finance and
construction of parking facilities
Operational
Arrangement
Inspection and enforcement by
local authority officer or traffic
police.
The operation and enforcement is
operated solely by private entity such
as car park operator.
Targeted Users For short term parking Short term parking for visitors based
on duration parking fee and long term
parking for tenant’s employees using
monthly pass.
Source: adapted from Asia Development Bank, 2008
In regard to parking products for off street parking, there are two types of parking for
motorist, short term and long term parking. Short term parking means the parking user
parked their vehicle based on hourly, per entry or flat rate per day fee. This type of
user is normally a visitor and customer or supplier to building tenants and often called
as casual parkers. When entering the parking facilities, the user is needed to take a
parking ticket for time based pricing model or pay during entry in case of per entry
rate. The user is required to pay parking ticket at auto-pay station or central cashier
30
before collecting their vehicle. In case of non-automated payment system, the user
needs to pay their parking fee to cashier located at exit.
While long term parking means parking user pay the utilization of parking in monthly
basis often called as monthly season parker. This monthly season parking provides
multiple accesses up to twenty four hour in seven days using parking access card,
transponder or monthly sticker. Subject availability of parking lot, the user can apply
whether parking lot to be reserved or non-reserved. Building occupants or employees
of tenant in the building is normally uses this type of parking product.
In summary, the demand of the parking space is derive from economy activities,
population, incomes of population and vehicle possessions. While supply of parking
space is much depend on available of building, building construction, property
development and regulation to determine parking space. However, providing parking
space is costly and become worse if over supply compared to demand for example less
business activities or less public attraction to certain property area.
In delivering parking services, the parking operator must understand the relationship
between the property owner and customer and also the regulations enforced by local
authorities for licensing. In order to provide an excellence parking services, the car
park operator should have a proper planning and strategies that capable to cater short
and long term parking for on-street or off-street parking. The scope of planning to be
considered is to determine the main business activities in the building such as shopping
malls, hotel or office building including deployment of parking systems, pricing
scheme and other service delivery channels.
31
CHAPTER THREE
LITERATURE REVIEW
3.1 Introduction
The purpose of this chapter is to provide a review of the past literature that relates to
present study and to support the body of existing research. The chapter begins with
literature review exploration on customer satisfaction, service marketing mix, service
quality and service value. This chapter also provides literature support on the
mediation role of service quality and service value.
In addition to the above, this chapter had discussed the underpinning theories namely
Stimulus-Organism-Response (S-O-R) theory to explain the theoretical framework
applied in the present study. Moreover, this chapter intended to provide reasonable
explanation to support the hypotheses development based on an intensive review of
the relevance literature.
3.2 Customer satisfaction
Interestingly, customer satisfaction becomes an attractive topic for the past four
decades since 1970s (Parker & Mathews, 2001). The scholars keep continue to explore
the antecedent and consequence of customer satisfaction that able to fit in today’s
business undertaking (Albayrak & Caber, 2015; Athanassopoulos & Iliakopoulos,
2003). Therefore, the role of customer satisfaction still remains a central tendency of
marketing concept for relationship between pre-consumption and post-consumption
(Ameer, 2014). Customer satisfaction was deliberated as the core of success (Siddiqi,

32
2010), business performance, profitability and competitive advantage (Yeung,
Ramasamy, Chen, & Paliwoda, 2013).
Past research has identified customer satisfaction as an antecedent to customer loyalty
(Kursunluoglu, 2014), engross in positive word of mouth and highly possible to form
future purchase intention (Kitapci, Akdogan, & Dortyol, 2014), customer retention
(Edward & Sahadev, 2011), behavioral intention (Wu, 2014) and influences customer
trust (Akamavi, Mohamed, Pellmann, & Xu, 2015) and employee trust (Han & Hyun,
2015). Furthermore, a satisfied customer was found encourage customer involvement
in business process (Eisingerich et al., 2014); influence to brand loyalty (Nam, Ekinci,
& Whyatt, 2011), brand equity and shareholder value (Torres & Tribó, 2011).
Acknowledging the importance to form customer’s satisfaction, past researchers had
identified the determinants of satisfaction for instance such as service quality
(Rajaratnam, Munikrishnan, Sharif, & Nair, 2014), perceived value (Eid & El-Gohary,
2015), physical environment and customer emotion (Ali, 2014), service features and
employee job satisfaction (Pantouvakis & Bouranta, 2013), servicescape (Miles,
Miles, & Cannon, 2012); elements of service marketing mix (Hashemi & Abad, 2013;
Sarker, Amim & Begum, 2012; Cengiz &Yayla, 2007), service employee
competencies (Delcourt, Gremler, Riel, & Birgelen, 2013; Evanschitzky, Sharma, &
Prykop, 2012; Ramasubbu, Mithas, & Krishnan, 2008); technology and service justice
(Wu, 2013).

33
3.2.1 Definition of customer satisfaction
Generally, there were two basic interpretations of satisfaction within the past literature.
First, it was suggested that satisfaction is an evaluation process between a “pre-
consumption expectation” and the “post-consumption perceived performance” by
comparing both aspects. For example, Yi (1990) defined that customer satisfaction is
a collective outcome of perception, evaluation and psychological reaction to the
consumption expectation with a product or services and Kotler (2000) defined
satisfaction as a person’s feelings of pleasure or disappointment resulting from
comparing a product’s or service’s perceived performance or outcome in relation to
his or her expectations.
On second interpretation, satisfaction was interpreted as an outcome of a consumption
activity or experience (Cheng, 2011; Parker & Mathews, 2001). According to Varva
(1997), satisfaction is not a universal occurrence and level of satisfaction among those
whose experiencing a hospitality service were not same. These phenomena could be
explained through different needs fulfillment for customers, purposes and preceding
experiences that stimulus the customer’s expectations. Varva (1997) define
satisfaction as the end-state resulting from the experience of consumption. Another
definition of customer satisfaction as defined by Oliver (1997) was the consumer’s
fulfillment response, the degree to which the level of fulfillment is pleasant or
unpleasant. Oliver’s definition was mostly used in customer satisfaction studies.
3.2.2 Concept of customer satisfaction
The conceptualization of customer satisfaction was explained in various ways to suit
with the context of research undertaking. Applying the right concept of customer

34
satisfaction is important to avoid any distraction of performance result or outcome
from customer target group.
Most of the definitions of customer satisfaction in literature were process based which
involve evaluation process (Ameer, 2014). This category of definition conceptualizes
customer satisfaction as cognitive components by adapting the expectancy
disconfirmation model (McMullan & O’Neill, 2010). In Oliver (1980) study on the
expectancy disconfirmation paradigm of satisfaction theoretical framework, had
viewed that consumers compare post-purchase performance evaluation of products
and services against pre-purchase expectations when judging satisfaction. Oliver
further elaborates that satisfaction was a primary function of standard and perceived
discrepancy experience may occurred at the certain of beginning point.
A state of positive disconfirmation is experienced when perceived performance is
greater than customer’s pre-purchase expectation and the customer could be highly
satisfied or delighted. However, when post-purchase performance decreases below
than customer’s pre-purchase expectation, it will result a negative disconfirmation that
causes the customer feel dissatisfaction (Loureiro, Miranda, & Breazeale, 2014).
Customer satisfaction concept under the process based is reflects to several attribute
judgments related to a particular transaction which known as transaction-specific
satisfaction (Loureiro, et al., 2014; Koufteros, Droge, Heim, Massad, & Vickery,
2014). In Jones and Suh (2000) study, they refer transaction-specific customer
perspective to the consumer’s dissatisfaction and satisfaction with discrete service
encounter.

35
In a transaction-specific satisfaction, customers make an assessment or judgment at a
particular time during service encounter or consumption situation (Koufteros et al.,
2014; Anderson, Fornell, & Lehmann, 1994; Oliver, 1980). The domain of encounter
satisfaction is not the total of experience consumption which may be determined by
other factors such as quality features (Ekinci & Dawes, 2009; Anderson, 1994), service
features, price (Andaleeb & Conway, 2006) and service value (Wu & Liang, 2009;
Fornell, Johnson, Anderson, Cha, & Bryant, 1996).
However, Jones and Suh (2000) commented that the concept of satisfaction that based
on transaction-specific may not be perfectly connected with global satisfaction due to
variation of customer satisfaction level from different service transaction episodes.
They further elaborate that when overall satisfaction is high, consumer do not appear
to let a last encounter experience to determine their repurchase intention. This mean
that when transaction-specific satisfaction is low, repurchase intention is remain high
as long as overall satisfaction is high. This indicates that consumer is willing to give
another chance to service provider to improve on level of service in future.
An alternative perspective, customer satisfaction was conceptualized as an outcome-
oriented approach by focusing on nature of satisfaction instead of cause of satisfaction
(Parker & Mathews, 2001). A study by Oliver (1989) suggests that multiple emotion
factors exist within consumption setting and product or service attributes facilitate
occurrence of satisfaction emotion. In this concept, the performance product or service
is a primary affect to satisfaction level and suggests a better predictor to further
processing such as behavioral intention rather than expectancy-disconfirmation

36
process model as a key to future behavior. Oliver propose four stages of satisfaction
framework that relate to arousal and reinforcement aspect namely “satisfaction as
contentment”, ``satisfaction as surprise'', ``satisfaction as pleasure'' and ``satisfaction
as relief''. In addition to this, other scholars had challenged the domination of
satisfaction cognitive model due to poor performance in predicting future behavior
intention (Koenig-Lewis & Adrian, 2014).
As a part of outcome-oriented approach, customer satisfaction also viewed as an
affective state with positive feeling resulting from an evaluation of the overall
consumption experience (Cronin, Brady, & Hult, 2000). Through this understanding,
past literature has explored the concept of cumulative satisfaction or also known as
overall satisfaction. Oliver (1999) defines overall satisfaction as a cumulative process
across a series of transactions or service encounters. This means that cumulative
satisfaction is represented by function of all previous transaction specific satisfactions.
Past studies had recommended that cumulative satisfaction concept is more consistent
with treatments of customer satisfaction in both economy psychology and welfare
economics (Johnson, Herrmann, & Gustafsson, 2002). Study undertaken by Loureiro
et al. (2014) had confirmed that cumulative perspective is a superior forecaster of
customer loyalty as well as result of previous studies. The important of cumulative
approach is it takes advantage of aggregate series of occasions as well as measures and
provides a reliable performance benchmark for making broad based comparison
(Johnson et al., 2002).

37
From a composite perspective, the satisfaction concept should have both components
of cognitive and affective components in which they are not commonly exclusive
components. Oliver (1993) argue that satisfaction from cognitive perspectives is still
not adequately presented and incorporation of affective components into satisfaction
concept from two affective states namely positive and negative effects in post-
consumption level was suggested. This satisfaction concept was supported by other
scholar such as Koenig-Lewis & Adrian (2014), Olsen (2002), Liljander & Strandvik
(1997) and Dubé-Rioux (1990).
Oliver (1993) further describes that by merging affect disconfirmation and attribute
based satisfaction judgments, satisfaction variance was well explained than
expectancy-disconfirmation paradigm model. However, the affective process was
varied in intensity depending upon the situational, product or service and population
(Yang & Peterson, 2004). Consequence to attribute based satisfaction study, Oliver
defines satisfaction differently with his study in 1980. Oliver (1997) defines
satisfaction as the consumer’s fulfillment response, the degree to which the level of
fulfillment is pleasant or unpleasant.
Following this line of argument, Lin (2003) had concluded that customer satisfaction
was derived from a cognitive and affective assessment by comparing expected and
perceived performance via multiple factors. In addition, Lin (2003) further explains
that if the perceived performance is below than expected outcome, it will causes
dissatisfaction feeling among customers. In contrast, if the perceived performance is
exceeds expectation, customer will feel satisfaction. A study’s finding by Narteh and
Kuada (2014) was supporting Lin’s study.

38
The cumulative satisfaction concept was applied in the present study because it more
suitable with proposed scope of population, more consistent (Johnson et al., 2002),
more superior prediction (Loureiro et al., 2014) and broader scope of satisfaction can
be evaluated through aggregate series of occasions.
3.2.3 Measurement of customer satisfaction
Measuring customer satisfaction is an evaluation process for organization to identify
customer response toward product or services, continuous improvement, added value
to business and prospect for future growth. Selecting a right measurement scale to
customer satisfaction is crucial for accurate result in determining further action or
recovery action.
Generally, there were two famous types of scale applied in the measurement of
customer satisfaction, a single item and multiple items. Some researchers like Shin and
Elliot (2001), used a single item rating scale of four to seven point for measuring
overall satisfaction as simple basis evaluation to reflect “very satisfied” to “very
dissatisfied”. Most of customer satisfaction measurement was developed to simply
evaluate on the global or net satisfaction with post-purchase of product and service
(Shin & Elliot, 2001).
Although single-item scale is simple, this scale does have not less than two
shortcomings. Firstly, the single-item scale provides very limited information and
unable to evaluate density of satisfaction construct separately via different dimensions.
Therefore, the complexity of customer satisfaction cannot be assessed thoroughly
using single-item scale. Secondly, issue related to reliability estimation might be a
39
major concern due to difficulties with a single-item assessment. The only reliability
estimate for single-item measurement was through a test-retest format (Yi, 1989).
Mostly, scholars had recognized that customer satisfaction was a complex construct in
nature and the application of multi-item scales is recommended to be more suitable in
way to provides better understanding about satisfaction from the customer perspective
rather than a single item scale (Gilbert & Veloutsou, 2006). The multi-item approach
will enable satisfaction construct to be measured empirically through levels of scale
reliability which was found impossible to single-item measure. Thus, multi-item
measures are able to explain more broadly on customer satisfaction aspects from which
it may be produced a desired result through valid methodology and measurement
(Nunnally, 1967).
In regard to customer satisfaction measurement approach, there are two approaches
namely transaction specific and cumulative satisfaction approach were still applicable
in recent studies throughout various industry. The objectives of studies will determine
which approaches to be used in studies respectively. However, studies in 2014 and
2015, the scholars are more inclined to use multiple items scale compared to one single
item scale. Multiple items scale has been viewed able to represent various component
of customer satisfaction such as general satisfaction, affective response, cognitive
response, disconfirmation, fulfillment of need and also value. Mostly, a five-point or
seven-point Likert scale had used in recent years studies for examining on how strong
customers disagree and agree with the statement of items. The measurement of
customer satisfaction used in recent years studies were shown in Appendix A.

40
3.3 Service marketing mix
Today, the services sector is growing remarkably in many countries and contributes
significantly to country’s economy, people well-being and life style (Kesavan,
Mascarenhas, Bernacchi, & Panitz, 2014; Kaura, 2013; Lovelock & Writz, 2011).
Modern customers are not only purchase goods but insisting a quality service after
sales or services that able to assist and give a value added to their daily life or business
activities. Lack of concern from manufacturers or service providers in service aspect,
may cause dissatisfaction and complain among customers such as untimely deliveries,
poor attitude or unskilled personnel, inconvenient operation hours, performance below
standard and complexity of procedures (Lovelock & Wright, 2002).
Even though marketing mix concept has been gone through a long debate, scholars
still found the relevancies of marketing mix elements in their studies such as on
banking services (Kushwaha & Agrawal, 2015), customer equity (Lee, Ko, Tikkanen,
Phan, Aiello, Donvito, & Raithel, 2014), customer retention (Chelliah, Kwon,
Annamalah, & Munusamy, 2013), online pharmacies (Su, Li, Hu, & Chen, 2013),
business to business export markets (Helm & Gritsch, 2013), and brand loyalty
(Arokiasamy, 2012). While Sinh (2013) states that the 4Ps marketing mix model
remains the central structure for overcoming problems and strategizing activities in
marketing management although it has weaknesses.
Rafiq and Ahmed (1995) in their study had found that Booms and Bitner (1981)
marketing mix framework which consists additional elements of people, process and
physical evidence and also known as 7Ps, was well accepted by its respondent among
senior academicians, academicians and research students mostly from United States

41
and Europe. The Booms and Bitner’s framework was more comprehensive and the use
of the 4Ps mix was inadequate because not covering other importance areas such as
relationship marketing. This is in line with Vignali and Davies (1994) study that
elements of service should be included in the marketing mix.
The 7Ps of service marketing mix framework is suitable for marketing tools in service
sectors. This framework has been applied in past studies such as Islamic marketing
(Hashim & Hamzah, 2014), brand equity (Aghaei, Vahedi, Kahreh, & Pirooz, 2014;
Al-Dmour et al., 2013), tourism marketing (Seryasat, Salmani, Zamani, Karimian, &
Seryasat, 2014; Champatong, 2014), competitive advantage (Chumaidiyah, 2014),
consumer satisfaction (Charoensettasilp & Wu, 2014; Mucai, Mbaeh, & Noor, 2013),
marketing performance (Chumaidiyah, 2013), hospital services (Sreenivas,
Srinivasarao, & Srinivasa 2013), banking marketing performance (Kaura, 2013) and
restaurant marketing performance (Mishra, 2013; Lin, 2011).
3.3.1 Definition of service marketing mix
The definition for marketing mix is slight different with marketing due to presence of
mix wording. The idea of the mix is the same idea as when mixing a cake (Goi, 2009).
All elements in marketing mix shall work together to achieve customer satisfaction
and needs. The word of “overall” (Baron, Davies, & Swindley, 1991), “blends” (Kotler
& Armstrong, 1989), “co-ordinate” (McCarthy & Perreault, 1987), or “combination”
McCarthy (1964) were used in the definitions to imply the concept of marketing mix.
For example, retail marketing mix was defined by Baron et al. (1991) as those activities
that show similarities to the overall process of marketing, requiring the combination
of individual elements.

42
Other definition of marketing mix is a combination of all of the factors at a marketing
manager’s command to satisfy the target market (McCarthy, 1964). While Kotler and
Armstrong (1989) defined marketing mix as the set of controllable marketing variables
that the firm blends to produce the response it wants in the target market. According
to Rafiq and Ahmed (1995), the marketing mix as defined by Kotler and Armstrong
(1989) was widely accepted and was adapted in present study as operational definition.
3.3.2 Concept of service marketing mix
The marketing mix model has been navigated into marketing thought, research studies
and practice from the time when it was made to known in 1960s. The concept of
marketing mix was used to assist company to configure marketing activities in order
to meet customer satisfaction and needs (Goi, 2009), improve product and service
flexibility (Islam, Yang, Hu, & Hsu, 2013), tools for managerial decision (Birnik &
Bowman, 2007; Lovelock & Wright, 2002) and as part of marketing strategic
development (Palmer, 2004; Perreault & McCarthy, 2002). Although the marketing
mix concept has been challenged greatly, the recent years studies had suggests that the
marketing mix is still relevant to today’s business (Aghaei et al., 2014; Seryasat et al.,
2014; Champatong, 2014; Al-Dmour et al., 2013)
In early stage, Borden had listed out twelve elements of mix for manufacturers namely
product planning, pricing, branding, distribution channels, personal selling,
advertising, promotions, packaging, display, servicing, physical handling, and fact
finding and analysis. Subsequently, McCarthy (1964) had refined Borden‘s (1964)
conceptual thinking further by reducing Borden’s twelve elements into four elements

43
or today known as 4Ps, namely product, price, promotion and place. Subsequently,
marketing mix was defined as a combination of all of the factors at a marketing
manager’s command to satisfy the target market.
Based on the original concept of McCarthy’s 4Ps model as depicted in Figure 3.1, the
model includes five external factors namely cultural and social environment, resources
and objectives of the firm, existing business situation, economic environment, and
political and legal environment that interconnected to mold the 4Ps. At the center of
4Ps model has alphabetic C represent consumer buying behavior which means the
decision for four elements of marketing mix must towards customer satisfaction and
fulfillment of needs.
Figure 3.1
The original concept of McCarthy’s 4Ps
Source: Fitzgerald (2014)
The marketing mix concept emphasize combination of various factors namely product,
price, promotion and place in such a way toward attaining the organizational and
customer objectives (Kotler, 2002). When do a combination, the company must

44
understand the wants and needs of the market customer. In Perreault & McCarthy
(2002) book, they urge that the customer should be the target of all marketing efforts.
Appropriate marketing strategies, plans and effort should be formulated and
implemented accordingly that able to satisfy and meet customer needs. However, the
element of mix may not contribute at same level, but all elements were expected to be
treated as equally important (Perreault & McCarthy, 2002).
However the concept of marketing mix has been critized greatly in term of theoretical
and practical. In Bellmunt and Deltoro (2005) article, they had summarized the
criticism on marketing mix concept based on theoretical and practical application
perspective. Under theoretical point of view, the bases of criticism categorized in three
types which due to (1) over simplification of Borden’s concept; (2) never explained
properties of the classification; and (3) lack of consistency with the marketing concept.
Consequently, several scholars attempt to change nomenclature of marketing mix as
shown in Table 3.1.
The scholars attempt to broaden and introduce new direction of marketing concept by
changing mind set from product orientation to consumer orientation (Staudt & Taylor,
1965; Kelly & Lazer, 1967; Lipson & Darling, 1971; Lauterborn, 1990; Waterschoot
& Bulte, 1992; Dev & Schultz, 2005), more broader scope (Ettenson, Conrado, &
Knowles, 2013: Doyle, 1995: Bruner, 1989) and new marketing concept for modern
business (Yudelson, 1999: Nichols & Woods, 1997).
Table 3.1
Propose to change nomenclatures of 4Ps
Source Element 1 Element 2 Element 3 Element 4 Argument/proposal
McCarthy
(1964) Product Price Promotion Place Marketing mix concept

45
Table 3.1 (Continued)
Source Element 1 Element 2 Element 3 Element 4 Argument/proposal
Staudt &
Taylor (1965)
Product and
service mix
Communications
mix
Distribution
mix
To broaden marketing
concept to consumer
perspective
Kelly & Lazer
(1967)
Product/service mix
(including price)
Communications
mix
Distribution
mix
To broaden marketing
concept consumer
perspective
Lipson &
Darling
(1971)
Product
component
mix
Terms of
sales mix
Communications
mix
Distribution
mix
To broaden marketing
concept consumer
perspective
Kotler (1972) Configuration Valuation Symbolization Facilitation
To broaden marketing
concept that cover not-
for-profit organization
Bruner (1989) Concept Cost Communications Channels
4Ps may not be
adequate to describe the
breadth of marketing
applications and offer
new marketing
conceptualization
Lauterborn
(1990) Consumer Cost Communications Convenience
4Ps is product oriented.
It should be focused on
marketing planning for
customer
Waterschoot
& Bulte
(1992)
Product Mix Price Mix Promotion mix
with 6 type mix
Distribution
mix
4Ps concepts is flaw
and need a better
classification of
marketing mix.
Promotion mix as
communication function
to marketing mix
Doyle (1995) Product Price Communication Distribution
Lack of consumer
interactivity for service
marketing
Nichols &
Woods (1997)
Product
development
&
differentiation
Valuation
and
pricing
Integrated
marketing
communications
Channel and
value chain
management
4Ps are incomplete
framework for the
practice of marketing
today
Yudelson
(1999) Performance Penalty Perception Process
The 4Ps are not the
proper basis of the 21st
century marketing.
Dev &
Schultz
(2005)
Solution Value Information Access
4Ps apply to internal
orientation and suggest
to change to customer
orientation
Ettenson,
Conrado, &
Knowles
(2013)
Solution Value Education Access
4Ps are product focus
strategies and lack of
focus B2B environment
Source: Adapted from Yudelson (1999)
Despite of criticism and weaknesses, the concept of marketing mix still receive a great
attention from marketing scholars. Past studies as shown in Appendix B attempt to
improve or enhance the theoretical and practicality of marketing mix concept that
relevance to marketing context and do not denying the contribution from the marketing
mix concept. Further, past studies also attempt to expand the marketing mix concept

46
from internal orientation such as operational and managerial function to customer
focus based which include customer orientation strategy (Gordon, 2012; English,
2000; Bennett, 1997) and relationship marketing (Grönroos, 1994; Gummesson,
1994). Appendix B also shows the shift of central attention of marketing mix from
managerial perspective to customer perspective especially after Boom and Bitner’s
framework was introduced in 1981.
The Boom and Bitner’s framework can be applied to manufacturing sector which
extended to after sales service and services base like restaurant, airlines, hotel and
banking sector. Several scholars had used 7Ps framework to explore further it
application in service marketing area by adding personalization (Goldsmith, 1999),
publication (Melewar & Saunders, 2000), productivity and quality (Lovelock &
Wright, 2002) and used people instead of participations (Afridi, 2009). These indicates
that the 7Ps of service marketing mix able to be used as a basic tool for the business
organization in twenty first century environment to formulate strategies and operation
tactical towards marketing efforts, customer satisfaction and business performance.
For better understanding, the elements of service marketing mix namely product, price,
promotion, place, people, process and physical evidence were discussed in the
following subheading.
3.3.3 Elements of service marketing mix
The role of service marketing mix has been recognized as important in architecture of
marketing efforts which customer deems is first priority. The service marketing mix
adapted from Booms and Bitner (1981) framework which also known as 7Ps has seven

47
mix elements namely product, price, promotion, place, people, process and physical
evidence.
Studies on service marketing mix had recognized it contribution in present business
environment toward marketing effectiveness and performance (Mucai et al., 2013),
enhancing customer satisfaction through right business decision making
(Charoensettasilp & Wu, 2014), creating positive service value and image (Seryasat et
al., 2014), customer retention (Champatong, 2014) and influencing competitive
advantage (Chumaidiyah, 2014).
3.3.3.1 Service product
Basically, the scope of service product include anything in form of tangible or
intangible that offered by organization to satisfy, fulfill needs and expectation, value-
added, convince and attractive to the customers. In defining a service product,
continuum of the goods and services shall be considered to determine the degrees of
service oriented that need to provide (Palmer, 2011). Generally, service is a
combination of both tangible and intangible components (Lovelock et al., 2011). As
mentioned by Levitt (1981), everybody sells intangibles in the marketplace, no matter
what is produced in the factory.
There were several definitions of service product by past literature. Instantly, Palmer
(2011) defines service product as anything organization offers to potential customers
whether it be tangible or intangible and seek to satisfy customers. Other definition,
service product is the intangible activities and performance designed by interactive

48
process in order to satisfy customer needs and expectations, and convince them, this
process could be done by using tangible products (Al-Dmour et al., 2013).
In Lovelock et al. (2011) book, they explained that the service product consist a core
product that focus to the primary needs of customer and supported by systematic
elements of service that will be able to give a value-added benefit to customers for
using the core product more effectively. It involves a multiple series of processes steps
to operationalize services. They states that the concept of service product consist three
key elements (1) the core service dealing with what is being delivered; (2) auxiliary
service related to value added to services other than the core service; and (3) delivery
process that stress on how the service is delivered. The identification of service product
that fulfill the customer’s needs are important to enable service provider to understand
about their products and services characteristics, components and potential in order to
avoid any waste of resources including effort that due to some attributes may not lead
to customer satisfaction.
Designing concept for service product is challenge to marketing market where one
organization may represent different products or services to cater different group or
customer, at different places and for different occasion or situation (Brechan, 2006).
As shown in Table 3.2, the focus and total of components associate into service product
were varied among service type. Generally, the common components of service
product were product variety, personnel, other services associate in core product, value
for money and quality of product.

49
For parking service, products like monthly season pass reserved and non-reserved and
casual parking is covered under product variety. Application of technology in
managing car parking contributes to operational system efficiency which represent
innovative and technology aspects of service product. Integration of high quality
standard such as certification of ISO9001 and customer service system in service
product will increase confidence and satisfaction among parking users.
Table 3.2
The components of service product used in past studies
No Source Industry
Components of Service Product V
ari
ety
Tim
e/E
ffic
ien
t
En
vir
on
men
t
Per
son
nel
Bra
nd
Qu
ali
ty
Des
ign
Fea
ture
s
Wa
rra
nti
es
Va
lue/
Pri
ce
Ser
vic
es
Info
rma
tio
n
Tec
hn
olo
gy
1 Dominici &
Palumbo (2013) e-Learning x x x x
2 Al-Dmour et al.
(2013)
3 Telco
companies x x x
3 Sanib, et al.
(2013) 4 type of Hotel x x x x
4 Kaura (2013) Banking x x x x
5
Azadi &
Rahimzadeh
(2012)
e-Commerce x x
6 Akroush (2011) 164 Service
organizations x x x x x
7 Lin (2011) 5 fast food
industry x x x x x
8 Lovelock et al.
(2011) General Service x x x x x x x
9 Palmer (2011) General Service x x x x
10 Fuller & Matzler
(2008) Tourism x x x x x
11 Brechan (2006) Transportation x x x x x
12 Yuksel (2004) Shopping x x x x x x x
13
Verma,
Thompson,
Moore & Louviere
(2001)
5 Pizza outlets x x x x x x
14 Teye & Leclerc
(1998) 2 Cruise ships x x x x x
50
3.3.3.2 Service price
Price is one of key concern when customer engaging the services or buying goods.
Pricing interrelated to other service elements and was used to establish positioning in
the market. If the offered price is higher, it may sustainable if its match to the quality
level, brand, accessibility to service, risk, exclusiveness and extra benefits to customer
(Kotler & Amstrong, 2012). While low pricing normally associate with low investment
to quality standard and limited other service features (Palmer, 2011).
The concept of service price had been defined in various meaning by scholars, for
example, service price is to be what is given up or sacrificed to get a product or service
(Zeithaml, 1988); the amount of money that consumers pay to obtain the product
(Chelliah et al., 2013); and the value of items which are needed for the acquisition of
a service product (Al-Dmour et al., 2013).
There were two views for pricing that is from customer perspective and organization
perspective. For customer perspective, they will assess value on what has been trade-
off between the expected benefits to be received and the cost that associate with
customer’s time, effort and money to acquire the service (Zeithaml, 1988). From
organization perspective, price is the only element that able to generate revenue or
sales and profit to the organization (Palmer, 2011).
In order to decide the price to be offered to the customers, the organization have to
really consider influence factors such as what costs to produce product or service, the
amount the customer is willing to pay, the price charged by competitors and the
constraint on pricing that are imposed by authorities or government (Palmer, 2011).

51
Poor implementation on pricing scheme will cause the organization may loss
customers, losses to business, damaging business reputation and affect business
survival (Champatong, 2014).
Through Huber, Herrmann, and Wricke (2001) study, they had found a positive
relationship between variation on satisfaction and willingness of pay. They claims that
the consumer is not homogeneous unite and the product or service can be segmented
to react relatively to the change of satisfaction level which depends on different prices
scheme. If the customer shows a high satisfaction, the organization will able to charge
higher price compare to competitors because the customers is willing to pay and value
maintaining the relationship (Zeithaml, Berry, & Parasuraman, 1996).
Past studies had employed various components of service price in which varies among
industries context. However, pricing factors such as reasonable price, quality,
discount, competitiveness and segmentation were found commonly used in past
research studies for measuring service price from customer perspective. Table 3.3
shows the service price components used in previous research studies.
Table 3.3
The components of service price used in past research studies
No Source Industry
Components of Service Price
Dis
cou
nt
Co
mp
etit
ive
Qu
ali
ty
Ben
efit
s
Rea
son
ab
le
Po
lici
es
All
ow
an
ces
Va
lue
Met
ho
ds
Seg
men
tati
on
1 Noyan & Şimşek (2014) 4 Supermarket x x x
2 Chang & Hsu (2013) Online travel x x x x x
3 Al-Dmour et al. (2013) 3 Telco companies x x x x
4 Kaura (2013) Banking x x x
5 Odunlami (2013) Beverage x x x x x

52
Table 3.3 (Continued)
No Source Industry
Components of Service Price
Dis
cou
nt
Co
mp
etit
ive
Qu
ali
ty
Ben
efit
s
Rea
son
ab
le
Po
lici
es
All
ow
an
ces
Va
lue
Met
ho
ds
Seg
men
tati
on
6 Sreenivas, Srinivasarao, &
Srinivasa (2013) 2 hospitals x x x x x
7 Azadi & Rahimzadeh (2012) e-Commerce x x x
8 Frias-Jamilena, Barrio-Garcia, &
Lopez-Moreno (2012) Tourism x x
9 Akroush (2011) 164 Service
organizations x x x x
10 Martin, Ponder, & Lueg (2009) Retail x x
In parking industry, parking price is very sensitive to the customer. The influence
factors for structuring parking price in commercial building is base to the cost of
property rental, level and scope of service, investment on parking technology including
parking accessories and the demand of parking utilization (Mokonyama, 2011; Seibert,
2008; Shoup, 1997).
While Litman (2008) suggest to apply a convenient parking pricing method that suit
to customer and situations such as (1) several tier for parking rates to maintain optimal
utilization of parking lots: (2) different parking rates structure to cater short-term
parking in main areas and boost longer-term parkers; (3) offer discounted parking rates
that suited to special condition, such as for night parking, weekdays parking in
shopping malls parking and parking on Sunday or Public Holiday; and (4) invest
revenue surplus to increase level of traffic enforcement, security, facility upkeep
marketing efforts and parking technology systems for customer convenient.

53
3.3.3.3 Service promotion
Organization will face a business difficult to success if there is no effective promotion
as communication channel for their service product to customer (Lovelock,
Vandermerwe, Lewis, & Fernie, 2004). Generally, promotion is communication
method from service provider to persuade, educate and interact to the customer for the
benefits of organization such as increase demand, consumption, branding and valuing
services as this confirmed in Chelliah et al. (2013) study.
Several definitions of service promotion from past literature were to educate customer
and upkeep their knowledge by providing various appended sources available (Patil &
Pradhan, 2014) and activities that persuade target customers to try the product
(Chelliah et al., 2013). Present study refers to definition of service promotion provided
by Wickham (2009) states that service promotion as to effectively communicate the
core benefits and differentiated features of the firm's product and services such that the
firm's target customers are aware of their existence, features and locations for
purchase.
Study by Park and Lennon (2009) had confirmed that promotion related to pricing such
as incentive and discounts has important determinant to customer perception in value.
This component able to influence customer through generating a positive perception
of fair price, money saving and motivate customer to make purchase decision
including patronage. In Cengiz and Yayla (2007) study, promotion element had
influenced highly to word of mouth through indirect relationship. Component of
promotion such as consistent promotional activities, quality service features and
creative advertisement play important parts to ensure promotional strategies has

54
effectively deployed. Positive image and feeling among customers is created through
effective promotion and consequently, able to influence customer to response
positively such as loyalty and word of mouth.
For those services that involve high interaction with customer such as hotel, restaurant
and retails chain store, employees of the service provider play an important role as
promotion component to brand reputation, service value, customer satisfaction, loyalty
and word of mouth (Islam et al., 2013; Sanib et al., 2013; Akroush, 2011). The
personnel quality factors like knowledge, servicing skill and attitude as demonstrated
by service employees during service process to customers can be a great service
promotion for reassuring customer to continue subscribe the services and stimuli
customer’s cognitive that he or she had choose the right service.
Reference made to Table 3.4 had showed that the past studies had applied several
components in promotion variable such incentive or discount, public relationship to
create awareness of marketing activities, application of suitable promotion channel to
target customer such as TV, radio, newspapers, magazines, posters, brochures and
websites, information about service products, quality of service personnel and
consistency of promotion activity. Specialty as a component of promotion was found
less used because it is much depends on involvement of technical level require for
particular service like fashion and restaurant. Previous studies also had less emphasis
on subjective norm aspect like pressured or influenced by other people to be a
component in service promotion element.

55
Table 3.4
The list of service promotion components in previous research
No Source Industry
Components of service promotion
Cre
ati
vit
y
Ch
an
nel
Cre
dib
ilit
y
Ince
nti
ves
/
Va
lue
So
cia
l/P
ub
lic
Rel
ati
on
Su
bje
ctiv
e
no
rms
Per
son
nel
Pro
du
cts
Per
form
an
ce
Sp
ecia
lty
Act
ivit
y
1 Lee et al. (2014) 3 Fashion retailers x x x x x
2 Al-Dmour et al.
(2013) 3 Telco companies x x x x x x
3 Sanib, et al. (2013) 4 type of Hotel x x x x
4 Islam, Yang, Hu, &
Hsu (2013) 4 retail stores x x x x
5 Odunlami (2013) Food and beverage x x x x
6 Kaura (2013) Banking x x x x x x x
7 Anitsa, Girard, &
Anitsal (2012) 380 retailers x x x x
8 Akroush (2011) 164 Service
organizations x x x x
9 Park & Lennon
(2009) Online x x x x
10 Sapre & Nagpal
(2009) Media x x x x
11 Ivy (2008) 12 Universities x x x
12 Cengiz & Yayla
(2007)
503 accounting
office x x x
13
Verma, Thompson,
Moore, & Louviere
(2001)
5 Pizza outlets x x x x x x
14 Teye & Leclerc
(1998) 2 Cruise ships x x x x
Promotion is also one of essential element in car parking services as today users expect
a high customer service, service quality and value (European Parking Association,
2014). This concurred by Murphy (2011, Parking), he stated that parking facilities is
important as a “front door” to the business or organization it serves. The experience
during service process must be captured and express the essence of the service brand.
While Shrier (2012) claims that branding in parking makes different and image is
extremely important.
The use of signages within the parking facilities is so important to ensure customer has
adequate information about the parking services. The informative signage placed

56
within the parking facilities is useful to remind customer on safety and security in
relation to customer belongings before leaving their vehicle, the driving access way,
the parking policy, payment facilities and customer service contact (The Institute of
Highways & Transport, 2005; Shaffer & Anderson, 1983). Creatively use of colour
scheme used on the signages and pillars able to attract customer’s attention to read the
message and give a positive perception on how the facility was designed, maintained
and managed (Mendat & Wogalter, 2003).
3.3.3.4 Service place
Product or services must available at the “right” place for ensuring the business’s
objectives successfully achieved. It means making goods or services available at the
right quantities and location as when customers want it (Perreault & McCarthy, 2002).
Service place is vital for business sustainability, competitiveness and marketing
networking as a platform of sales transaction, service delivery and service promotion
between service provider and customers.
Several definitions of service place used in past literature are create value for
customers by making the products available in accessible locations when needed
(Anitsa, Girard, & Anitsal, 2012) and the place where the customers can buy the
product and how the product reaches out to that place (Lin, 2011).The service
promotion defined by Chelliah et al. (2013) as the company activities that make the
product available is referred in this study.
Depending on service nature being offered, the organization must do a planning
suitably and choose the right platform as service place. Lovelock et al. (2011) states
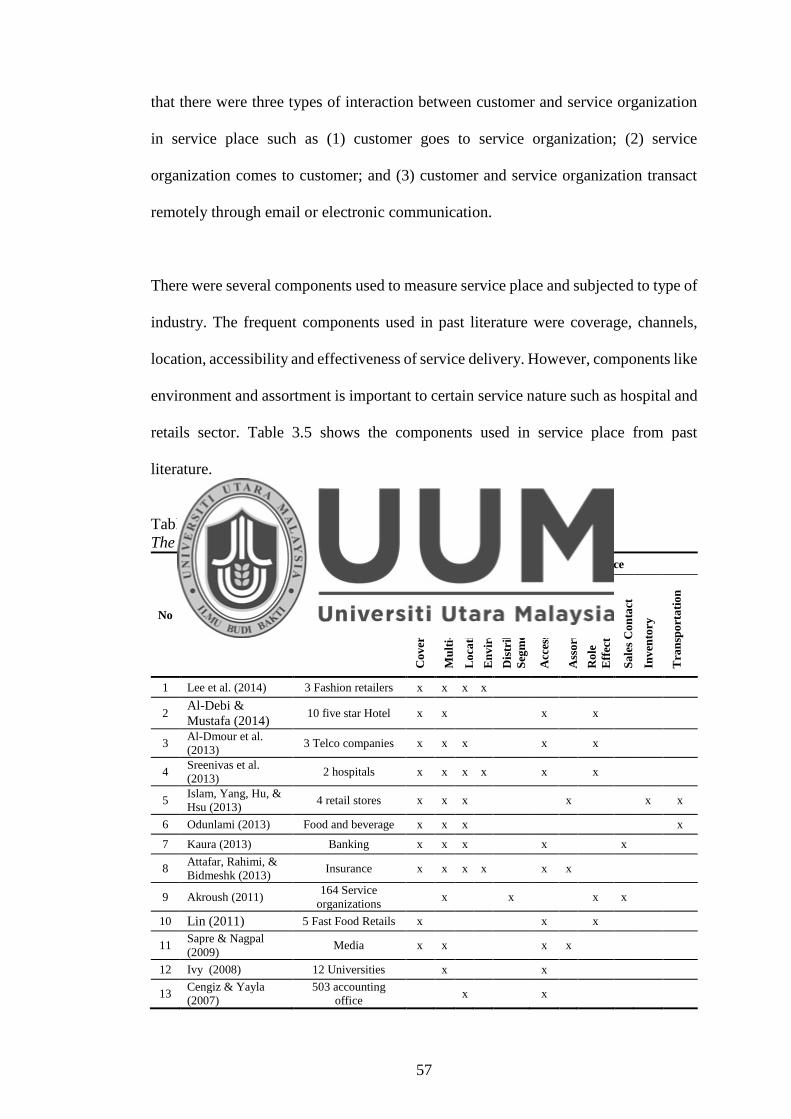
57
that there were three types of interaction between customer and service organization
in service place such as (1) customer goes to service organization; (2) service
organization comes to customer; and (3) customer and service organization transact
remotely through email or electronic communication.
There were several components used to measure service place and subjected to type of
industry. The frequent components used in past literature were coverage, channels,
location, accessibility and effectiveness of service delivery. However, components like
environment and assortment is important to certain service nature such as hospital and
retails sector. Table 3.5 shows the components used in service place from past
literature.
Table 3.5
The list of service place components in previous literature
No Source Industry
Components of service place
Co
ver
ag
e
Mu
lti-
chan
nel
Lo
cati
on
En
vir
on
men
t
Dis
trib
uti
on
Seg
men
tati
on
Acc
essi
bil
ity
Ass
ort
men
t
Ro
le
Eff
ecti
ven
ess
Sa
les
Co
nta
ct
Inv
ento
ry
Tra
nsp
ort
ati
on
1 Lee et al. (2014) 3 Fashion retailers x x x x
2 Al-Debi &
Mustafa (2014) 10 five star Hotel x x x x
3 Al-Dmour et al.
(2013) 3 Telco companies x x x x x
4 Sreenivas et al.
(2013) 2 hospitals x x x x x x
5 Islam, Yang, Hu, &
Hsu (2013) 4 retail stores x x x x x x
6 Odunlami (2013) Food and beverage x x x x
7 Kaura (2013) Banking x x x x x
8 Attafar, Rahimi, &
Bidmeshk (2013) Insurance x x x x x x
9 Akroush (2011) 164 Service
organizations x x x x
10 Lin (2011) 5 Fast Food Retails x x x
11 Sapre & Nagpal
(2009) Media x x x x
12 Ivy (2008) 12 Universities x x
13 Cengiz & Yayla
(2007)
503 accounting
office x x

58
Service place for parking service is utmost important. Without place, the service
cannot be offered and sell. Additionally, parking service is more on tangible in nature
and it expect customer to come to the parking facilities for experiencing the service
delivery at site. However, application for seasonal parking and payment method can
be extended via online payment. Thus, the parking operator should focus more on
parking service rendered in the parking facilities. The European Parking Association
(2014) suggest that the parking facilities should be able to ease traffic flow, served
with high service quality, be a safest place to leave a car and allows more flexibility of
time. Addition to the above, The Institute of Highways and Transport (2005) suggests
that the parking facilities should be sensitive to customer parking needs such as to ease
parking bays for disable drivers, lorry, motorcycle, pedestrian within the facilities and
so forth and also considering on the environment conditions within the facilities and
sufficient signages.
3.3.3.5 Service people
It is undisputed that service employee is often the most important aspect in service
organization in regard of service quality, branding, customer satisfaction and
competitive position. According to Lovelock et al. (2011), service employees is a part
of the service product, represent the organization and often a core part of brand.
People element has been proposed by Judd (1987) as a distinctive element of the
marketing mix. Additionaly, Judd (2003) further proposes that people power be
formalized, institutionalized and managed like other marketing mix elements as a
distinctive element and in determining a marketing strategy. In order to support the
important of people element in service marketing mix, Lin (2011) study in western fast

59
food stores had found that people element affects other element of service marketing
mix. Rafiq and Ahmed (1995) in their study had found that people element as proposed
by Booms and Bitner (1981) is most accepted new element in marketing mix.
Present study refers to definition provided by Al-Dmour et al. (2013). They defined
service people as consist of staff with the required attitude, service knowledge and
relational skills to ensure that the consumers will receive the service for which they
are paying. Other definitions from past literatures were all of the personnel who
demonstrate service and other customers who partake in the service environment
(Anitsa et al., 2012) and to make available a human interface between the consumer
and the products and services that offered by the firm as when its deemed necessary
(Wickham, 2009).
In Lin (2011) study, she suggests that the performance of service should be started
from the source of people. For this reason, as suggested by Palmer (2011), Lovelock
at el. (2011) and Mudie and Pirrie (2006) that service organization should put more
attention on people management to achieve specified service delivery standard and
service quality with right components such as employees planning for right number,
recruitment for right employees, training for right skills and knowledge, motivating
for the team, organization structure for internal process, well designed support systems
and job design. The measurement components for service people mostly used in past
literatures are skills, knowledge, attitude and problem solving. Please refer to Table
3.6.
Although technology of car park was used in many parking facilities, people element
is still needed in parking management and play important factor to influence customer

60
satisfaction and business branding. The interaction between employees and parking
customer is exist during payment of parking ticket during entry or exit, application and
billing of monthly season parking and problem solving such as customer vehicle
having problem, unreadable parking ticket or machine problem and assistance for
direction to building. On other aspect such as appearance of service employees, car
park patrolling and enforcement and traffic control by employee during peak time also
become factors making the customer feel more confidence and secure.
Table 3.6
The list of service people components in previous research
No Source Industry
Components of service people
Cu
sto
mer
feed
ba
ck
Co
-ord
ina
tion
Ma
nag
emen
t
Inv
olv
emen
t
Att
itu
de
Bu
sin
ess
Ob
ject
ive
Va
lue
Sk
ill
&
com
pet
ent
Kn
ow
led
ge
Pro
ble
m s
olv
ing
Res
po
nse
Rea
din
ess
1 Kushwaha &
Agrawal (2015) 15 Indian
banks x x x x
2 Mustafa, Yunus, &
Azman (2014)
Private
Preschool x x
3 Al-Debi & Mustafa
(2014) 10 five star
Hotel x x x x x
4 Al-Dmour et al.
(2013)
3 Telco
companies x x x x x
5 Sreenivas et al. (2013) 2 hospitals x x x x
6 Charoensettasilp &
Wu (2013)
Low cost
airlines x x x
7 Hiransomboon (2012) Tourism x x x x x
8 Akroush (2011) 164 Service
organizations x x x x x x
9 Lin (2011) 5 Fast Food
Retails x x x x x
3.3.3.6 Service physical Evidence
Physical evidence surroundings service delivery is important driver to customer
decision and it gives first impression to the customer about services standard offered
by the organization (Mudie & Pirrie, 2006).
61
According to Bruhn and Georgi (2006), service physical evidence was divided into
three categories that is servicescape, service environment and service material.
Servicescape is a physical location in where service to happen which covers physical
design like machine and furniture, employees tangible attributes such as appearance
including dress and ambiance of servicescape like visual element, aural elements,
olfactory elements and tactile elements. While, service environment covers overall
atmospheric of service location that also include surrounding neighbourhood of
service location, exterior design, quality of service location, cleanliness,
appropriateness of service location and includes material used in performing services
like service encounter handout, ticket, receipt, signage of policy, menu etcetera.
Scholars generally agreed that the definitions of physical evidence were related to
physical location for service interaction and also includes environment, personnel,
equipment, communication material, security and safety. In present study, service
physical evidence is defined as as the environment in which the service is delivered
and any tangible goods that facilitate the performance and communication of the
service (Al-Dmour et al., 2013). While other scholars defined service physical
evidence as relate to the style and appearance of the physical surroundings and other
experiential elements encountered by customers at service delivery sites (Kushwaha
& Agrawal, 2015) and the environment in which the service is delivered with physical
or tangible commodities and where the firm and the customer interact (Sreenivas et
al., 2013).
With reference to the Table 3.7, components used to evaluate physical evidence in
services setting is mostly refer to appearance of equipment or furniture such as modern

62
look, how the equipment is arranged, surrounding environment, quality of equipment,
personnel and signages. Component of physical evidence that related to safety,
security and sensitivity to nature also used to assess physical evidence (Al-Debi &
Mustafa, 2014). In order to ensure physical evidence is assessed correctly, the service
organization must understand the nature of services, customer expectation and the
degree of physical evidence used in their services. For example, to determine whether
the physical evidence is core or supplementary services such as parking bays is core
but direction signages is supplementary services.
Table 3.7
The list of service physical evidence components used in previous studies
No Source Industry
Components of service physical evidence
En
vir
on
men
t
Eq
uip
men
t/F
ur
nit
ure
/Oth
er
Per
son
nel
Ta
ng
ible
pro
du
ct
Sig
na
ges
Mo
der
n L
oo
k
Tec
hn
olo
gy
Arr
an
gem
ent
Sa
fety
&
Sec
uri
ty
Na
ture
Sen
siti
vit
y
1 Kushwaha &
Agrawal (2015) 15 Indian
banks x x
2 Al-Debi &
Mustafa (2014) 10 five star
Hotel x x x x x
3 Al-Dmour et al.
(2013)
3 Telco
companies x x x x
4 Sreenivas et al.
(2013) 2 hospitals x x x x x
5 Kaura (2013) Banking x x x x x
6 Akroush (2011) 164 Service
organizations x x x x
7 Lin (2011) 5 Fast Food
Retails x x x x
8 Sapre & Nagpal
(2009) Media x x
Car parking facilities is a place where the customer will experience the parking
services. Parking lots as a core product provided in the facilities is non-transferable
and customer has to come to the facilities for services. Thus, appropriate allocation of
physical evidence in parking facilities will affect a positive customer experience and
satisfaction during service consumption. In Shaffer and Anderson (1983) study on

63
attractiveness and security of physical features in parking facilities had used nine
factors for evaluation. The attractiveness element in parking facilities includes design,
maintenance, proximity to street, parking lot size and location of parking facilities.
While for security perception in parking facilities covers design, maintenance,
building visibility, lot size, lot use, people, proximity to street and parking location.
Other study, Mendat and Wogalter (2003) uses five factors namely (1) visibility and
compliance; (2) layout and design; (3) safety and crowding; (4) difficulties at access
point; and (5) environment and aesthetics to study on parking facilities in term of
design and maintenance. The British Parking Association (2010) provide guidelines
for parking safety assessment that covers parking lots, pedestrians access, signage,
surveillance that include security equipment, staff presence and patrols and vehicular
access. In studies of Rashid et al. (2012) and Ismail, Reza, rokoni, and Sarkar (2012)
suggests that technology and automation use in parking system such as equipment,
autopay station, parking guidance system and parking central monitoring system able
to enhance parking management in the parking facilities, convenience and more
security control. Application of advance parking management system will improve
parking customer experience and increase positive perception on service quality,
service value and satisfaction.
3.3.3.7 Service process
Service process or the ‘how’ of service delivery can be consumed differently from one
experience to the next is highly influence to consumer’s overall assessment of a service
(Gilmore, 2003). Service delivery is linked to the physical evidence, the management

64
of service delivery, service people and service place elements for performing service
and interaction.
In general, scholars had defined service process in same direction which stress on
procedures, flow of activities and managerial or administrative functions to deliver the
services. Studies by Sreenivas et al. (2013) and Wickham (2009) suggests the inclusion
of customer interaction in the definition of service process. Present study defines
service process as procedures, mechanism and flow of activities by which a service is
acquired (Al-Dmour et al., 2013). Other definitions for service process are the method
and sequence of actions in the service performance (Singh, Chakraborty, & Raju,
2011) and to provide a structured system through which the firm and customer are able
to interact and perform their roles effectively in a market transaction (Wickham, 2009).
In Lovelock and Wright (2007) idea, they suggests that the service process can be
designed effectively by considering several aspects such as involvement of tangibility
or intangibility aspects in service processes, direct receiver of the service process,
service delivered at appropriate time and location, customization or personalization
versus standardization, nature of relationship grounded on customer segmentation,
effort to balance between demand and supply, extent to which integration roles
between facilities, equipment and people in service experience during service process.
There are many components in service delivery process and it can differ widely
between the service industries. Based on past literature as listed in Table 3.8,
components used to assess the service process were mostly refer to convenience to
customer, time consumption to perform services, variety of services, technology,

65
accessibility and personnel. Some scholars like Al-Dmour et al. (2013) and Sapre and
Nagpal (2009) use process component that relate to promise fulfilment, privacy of
customer information, accuracy, problem solving and service policy including terms
and conditions of services for evaluating service delivery process.
Table 3.8
The list of service process components used in previous studies
No Source Industry
Components of service process
Sp
eed
Co
nv
enie
nce
Acc
essi
bil
ity
Qu
ali
ty
Sta
nd
ard
Ser
vic
e/a
fter
sale
s tr
eatm
ent
Ser
vic
e
Per
son
nel
Acc
ura
cy
Pro
mis
e
fulf
ilm
ent
Pri
va
cy
Pro
ble
m s
olv
ing
Ser
vic
e p
oli
cy
Tec
hn
olo
gy
1 Lee et al.
(2014)
3 Fashion
retailers x x x
2
Al-Debi &
Mustafa
(2014)
10 five star
Hotel x x x x
3 Al-Dmour et
al. (2013)
3 Telco
companies x x x x x x
4 Sreenivas et
al. (2013) 2 hospitals x x x
5 Kaura (2013) Banking x x x x
6 Akroush
(2011)
164 Service
organizations x x x x x
7 Lin (2011) 5 Fast Food
Retails x x x x x
8 Sapre &
Nagpal (2009) Media x x x x x
Car parking services can be categorised as service factory because labour intensity and
degree of interaction including customization is low (Mudie & Pirrie, 2006). In
general, parking service is a standard process and the service location is not
changeable. The application of parking technology in services is capable to minimize
dependency on human factor and improve parking services by offering twenty four
hours operation, high accuracy of time and payment, better car park monitoring, online
support for system breakdown and traceable parking transaction.

66
In the environment of automated parking system, casual parking customer only
interacts with parking equipment for ticketing and payment and be guided through
parking signages. The customer will seek for assistance from parking attendant in the
event of equipment breakdown, inquiry for direction due to insufficient of signages or
customer’s vehicle breakdown or damaged. Thus, factors like response time, readiness
to assist and service recovery system is crucial to parking service. However, a monthly
season parking customer will have more experience interacting with parking attendant
compared to casual parking customer because of monthly season parking involve
application process, invoicing, payment and arrangement of reserved parking lot.
Therefore, the essential components of service process in delivery parking service is
convenience, accuracy, accessibility, performance of parking systems, service
employees, process procedures and problem solving.
3.3.4 The relationship between service marketing mix elements
Marketing systems are collections of entities that form coherent groups (Danyi, 2008).
The management of organization must work hand in hand to execute major
responsibilities to recognize the interconnections among the components contain in the
systems. They should have a well understanding on the potential strengthen or
weaknesses through combinations, coordination and integration of business factors
and resources towards achieving the business objective effectively.
A central problem of marketing management is to combine all the marketing elements
and resources into a service marketing mix that will assure the attainment of
organization objectives such as business profit, quantity, corporate image, business
reputation and return on investment by satisfying consumer wants and needs. The

67
marketing mix is the result of blending (Kotler & Armstrong, 1989) and combination
(McCharty, 1964) of all marketing components into integration as a whole at a
particular period of time and must creatively serve.
The relationship between seven elements of service marketing mix has found
interconnected as study undertaken by Lin (2011) in five western fast food chain store
in Taiwan through Decision Making Trial and Evaluation Laboratory (DEMATEL),
Analytic Network Process (ANP) and Simple Additive Weighting (SAW) concluded
that (1) people affect to other six elements of service marketing mix; (2) product affect
all other elements except people; (3) promotion affects price, place, physical evidence
and process; (4) price affects place, physical evidence and process; (5) place affects
physical evidence and process; (6) physical evidence affects only process; and lastly,
process affects by all other elements. Additionally, Lin (2011) suggests that
organization can improve their marketing strategies in business operation by following
the priority ranking of service marketing mix elements.
Chumaidiyah (2013) opines that although the seven elements of the service marketing
mix are equally important and interrelated between the elements, but the impact of
each element is vary between elements and also depends on type of services. Other
scholar, Lee et al. (2014) in their study on the impact of marketing mix (4P) to brand
and customer equity shows that the elements had direct and indirect effect differently
due to culture, geographical location and what outcome variable to be investigated.
The scholar further suggests that the organization should analyse and strategize the
marketing activity carefully because the acceptance among customers is complex and
no straightforward application with another culture or geographical area. In addition

68
to the above, the ranking result of service marketing mix elements from past studies
are provided in Table 3.9 as shown below.
Table 3.9
The ranking among the elements of service marketing mix in past studies
No Source Industry Dependent
variable Country
Element of Service
Marketing Mix
Pro
du
ct
Pri
ce
Pla
ce
Pro
mo
tio
n
Peo
ple
Ph
ysi
cal
Ev
iden
ce
Pro
cess
1
Charoensettasi
lp & Wu
(2014)
Low cost
airlines Satisfaction Thailand 1 6 5 7 2 3 4
2 Champatong,
(2014) Tourism No. of visting Thailand 4 7 5 6 2 3 1
3 Seryasat et al.
(2014) Tourism
Marketing
performance Iran 3 5 6 2 4 7 1
4 Al-Dmour et
al. (2013)
3 Telco
companies Brand equity Jordan 4 2 5 3 6 7 1
5 Sreenivas et
al. (2013)
2 hospitals
(Nurses)
Marketing
performance India 1 7 6 4 2 3 5
6 Chumaidiyah
(2013) 84 Telco
Marketing
performance
Indone-
sia 1 5 6 3 2 7 4
7 Hiransomboon
(2012) Tourism
Buying
decision Thailand 3 7 4 6 1 2 5
8 Yasanallah &
Vahid (2012)
Consumer
Cooperative Status of mix Iran 3 6 5 7 1 2 4
9 Sarker et al.
(2012) Tourism Satisfaction China 1 7 6 4 3 5 2
10 Alipour
(2012) Financial
Increase of
investment Iran 6 4 7 3 5 1 2
11 Lin (2011) 5 Fast Food
Retails
Marketing
performance Taiwan 1 4 3 2 7 5 6
12 Moniri (2011) Financial Increase of
customer Iran 2 4 7 6 1 5 3
13 Alipour &
Darabi (2011) Consultancy
Marketing
audit Iran 1 4 7 6 2 3 5
14 Rafiq &
Ahmed (1995) Education
Marketing
relevancy
UK &
European 1 4 5 3 2 7 6
Average Ranking 1 6 7 5 2 4 3
Through comparison of fourteen studies in service industries as listed in Table 3.9,
averagely product element shows the highest influence ranking, followed by people
element, process element, physical evidence element, promotion element, price and
lastly is place. Table 3.9 also provide evidences to support variation effect of each
service element due to uniqueness for particular service which is depend on service

69
type, culture and location as claimed by Lee et al. (2014) and Chumaidiyah (2013).
Under those circumstances, continuous research study in specific industry, different
culture and location is encouraged to extent the existing knowledge. For example, the
study on the effect of service marketing mix elements in parking services in Malaysia
context will contribute a valuable knowledge since the study on this aspect is
considerable none.
3.3.5 Service marketing mix and customer satisfaction
A proper plan to blend the elements of service marketing mix will effectively increase
the role of the elements to act as stimulus factor to customer satisfaction. On the
contrary, customer will experience dissatisfaction if planning on the mixing elements
is done poorly. This will cause organization losing customers, reputation damaged and
profits reduce.
Most of past studies had investigated the effect of service marketing mix elements on
customer satisfaction through separate elements and this investigation methodology is
not portray clearly to the theme of marketing mix definition and concept. Inconsistent
results derived from past studies between the relationship service marketing mix
elements and customer satisfaction as shown in Table 3.10 lead to argument on (1) the
reputation of marketing mix as powerful tools; (2) lack of understanding on the role of
service marketing mix in service firms due to misconception interpretation; and (3) the
relevance elements of service marketing mix in service context.
In general, the elements of service marketing mix somehow influence to customer
satisfaction but the result is inconsistent. For example, Sarker et al. (2012) found that
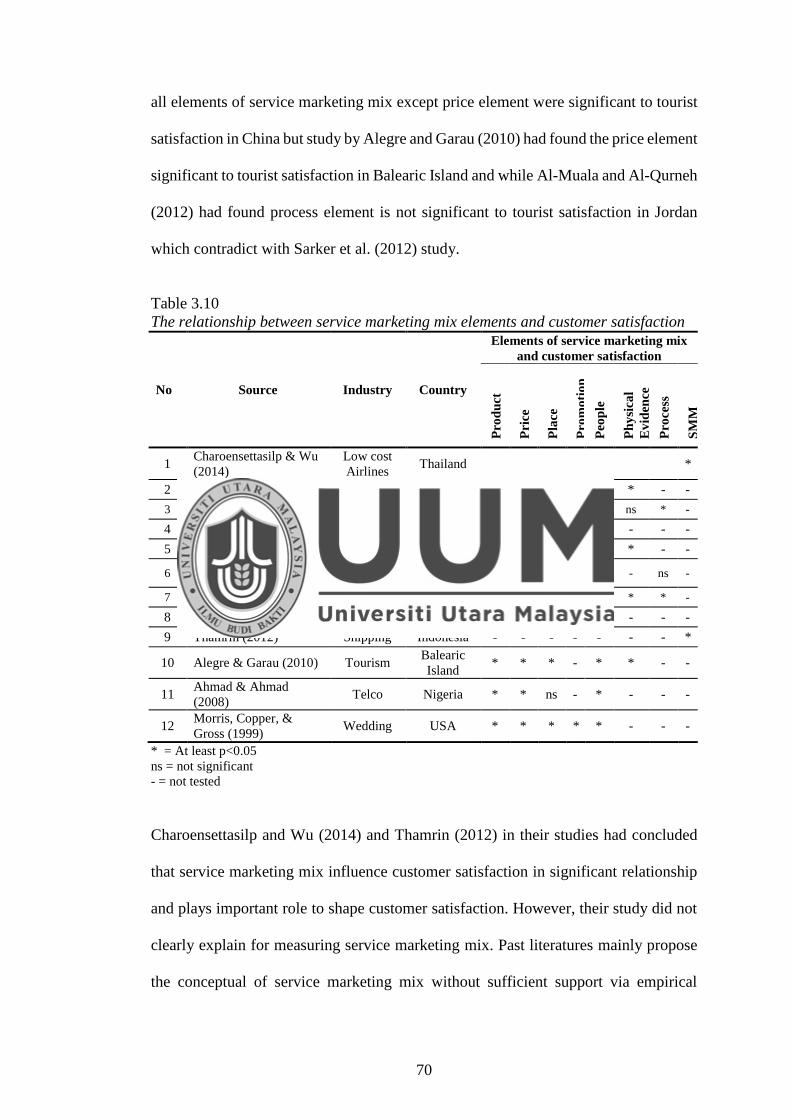
70
all elements of service marketing mix except price element were significant to tourist
satisfaction in China but study by Alegre and Garau (2010) had found the price element
significant to tourist satisfaction in Balearic Island and while Al-Muala and Al-Qurneh
(2012) had found process element is not significant to tourist satisfaction in Jordan
which contradict with Sarker et al. (2012) study.
Table 3.10
The relationship between service marketing mix elements and customer satisfaction
No Source Industry Country
Elements of service marketing mix
and customer satisfaction
Pro
du
ct
Pri
ce
Pla
ce
Pro
mo
tio
n
Peo
ple
Ph
ysi
cal
Ev
iden
ce
Pro
cess
SM
M
1 Charoensettasilp & Wu
(2014)
Low cost
Airlines Thailand *
2 Ali & Amin (2014) Hotel China - - - - - * - -
3 Mucai et al. (2013) Hotel Kenya - - - - ns ns * -
4 Tuan (2012) Academic Vietnam - * - - - - - -
5 Heung & Gu (2012) Restaurant USA - - - - - * - -
6 Al-Muala & Al-Qurneh
(2012) Tourism Jordan * * * - * - ns -
7 Sarker et al. (2012) Tourism China * ns * * * * * -
8 Cengiz & Yayla (2007) Financial Turkey ns ns ns * - - - -
9 Thamrin (2012) Shipping Indonesia - - - - - - - *
10 Alegre & Garau (2010) Tourism Balearic
Island * * * - * * - -
11 Ahmad & Ahmad
(2008) Telco Nigeria * * ns - * - - -
12 Morris, Copper, &
Gross (1999) Wedding USA * * * * * - - -
* = At least p<0.05
ns = not significant
- = not tested
Charoensettasilp and Wu (2014) and Thamrin (2012) in their studies had concluded
that service marketing mix influence customer satisfaction in significant relationship
and plays important role to shape customer satisfaction. However, their study did not
clearly explain for measuring service marketing mix. Past literatures mainly propose
the conceptual of service marketing mix without sufficient support via empirical

71
research. Past studies also were found lacked in emphasizing the role of service
marketing mix to customer satisfaction except for marketing performance, branding
and loyalty as dependent variable.
Furthermore, numerous studies such as Sarker et al. (2012), Al-Muala and Al-Qurneh
(2012) and Alegre et al. (2010) had analyzed the service marketing mix elements
separately by analysing a direct single element to customer satisfaction. This method
of relationship analysis may not in line with the concept of marketing mix as the result
of blending, compounding, combination, package and mixing marketing factors that
serve as a whole at a particular period of time (Danyi, 2008; Jacoby, 2002; Baron et
al., 1991; Kotler & Amstrong, 1989; McCharty, 1964; Borden, 1964).
Imbalance focus and distribution of firm’s resources in developing an effective service
marketing mix may cause business performance is not effective and optimize.
Therefore, this study posits that the service marketing mix is a second order construct
through integration of seven elements of mix to mold the latent construct. By
establishing this construct, present study able to investigate the relationship between
the service marketing mix and customer satisfaction in a right manner as the set of
controllable marketing variables that the firm blends to produce the response it wants
in the target market (Kotler & Amstrong, 1989).
3.4 Service quality
Service quality always be the one of customer attention and played a pivotal roles in
marketing and business service delivery. Organization with high service quality will

72
leads to high customer’s satisfaction (Han & Hyun, 2015; Suki, 2014; Giovanis,
Zondiros, & Tomaras, 2014; Vanniarajan & Gurunathan, 2009; Olorunniwo et al.,
2006), boost an organization’s image (Wu, 2014; Sivakumar & Srinivasan, 2009),
service value (Jo, Lee, & Reisinger, 2014) and positive customer’s behavior such as
re-use intention, recommendation intention and loyalty (Rozita, Zana, Khairulzaman,
& Norlizah, 2014; Kim & Damhorst, 2010). On the contrary, poor service quality will
causes customer to response negative attitude, bad word of mouth and low customer
repurchase (Lovelock & Writz, 2011).
Thus, it is essential to the service organization to understand the requirement of their
customers and able to adjust their services according to the needs of customers
(Vanniarajan & Gurunathan, 2009). Another essential point, Purcărea, Gheorghe, and
Petrescu (2013) suggests that a persistent investigation of the consumer expectations
and perceptions is needed to ensure a long survival of service organization. The right
evaluation of service quality will assist organization’s managers to identify
opportunities, weakness, close the service gaps and organization’s resources will be
precisely distribute where there is necessary need.
As identified by Seth et al. (2005) after reviewing nineteen service quality models in
their study, proposes that the main components towards improvement of service
quality are (1) deep understanding on market and customer focus; (2) highly motivated
staff; (3) precisely comprehend the concepts of service quality and associate factors
affecting the same; (4) possess an effective indicators and customer feedback system;
(5) effectively operationalize system; and (6) efficient implementation of customer
relationship management system. They added that the above aspects should be

73
considered in future research in order to have a valid and reliable feedback of service
quality status for the organization performance.
3.4.1 Definition of service quality
Service quality is commonly defined as a discrepancy between the service expectation
and perceived service that is delivered by the organization and the service performance
by employees (Chang & Wang, 2011).
In early foundation of service quality concept, Grönroos (1984) service quality model
also known as Nordic perspective had identified two dimensions of service quality
namely technical quality that concerned to “what customer gets” and functional quality
related to “how he gets it”. Grönroos’s study define technical quality as “what the
consumer receives as a result of interactions with a service firm” and functional
quality, it defined as “the way in which the technical quality is transferred”. Further,
Grönroos concluded that the technical and functional quality of service built up the
corporate “image” of the company.
Zeithaml (1988) in his study in the mean-end model had defined service quality as
global judgment or attitude relating to the overall excellence or superiority of the
service and this definition also cited again by Parasuraman et al. (1988). Mittal and
Gera (2013) claims that the definition of service quality is given by Zeithaml (1988)
is the most widely accepted by other scholars for studying service quality. This study
use definition provided by Zeithaml (1988).

74
3.4.2 Concepts of service quality
The concept of service quality has been stressed intensively in marketing studies and
academic books since the concept is so important and act as main determination to
customer satisfaction and behaviour (Ziethaml & Bitner, 2003; Lovelock et al., 2002).
However, managing service quality is a challenge because it is subjected to the type of
industries (Wu, 2014), type of service setting (Sandhu & Bala, 2011), customers
segmentation and external factors such as economic, market trends (Seth et al., 2005)
and culture (Ganguli & Roy, 2013). Due to these reasons, Sandhu and Bala (2011)
reported that the service quality was measured in various ways and no agreement
across industries was resulted although numerous attempts and debate to generalize
the measurement of service quality.
Generally, there were two major schools of thought leads the service quality literature
that is the Nordic school is refer to Grönroos’s (1984) two-dimensional model and
American school is refer to Parasuraman et al. (1988) of five dimensional
SERVQUAL model (Karatepe, Yavas, & Babakus, 2005; Caro & Garcia, 2007) and
scholars generally choose one approach of the two schools (Ahmad, Awan, Raouf, &
Sparks, 2009).
The first service quality model was developed by Grönroos (1984) through Nordic
perspective which consists of three dimensions namely technical quality, functional
quality and image. This model was developed based on disconfirmation paradigm of
customer satisfaction that depends of expected service and perceived service (Martínez
& Martínez, 2010).

75
The first dimension namely technical quality was defined as “what” the customer
receives as a result of the interaction with the service provider. According to Grönroos
(2000), technical dimension consists of five components that include employee’s
technical ability, employee’s knowledge, technical solutions, computerized systems
and machine quality. The second dimension that is functional quality was defined as
the way in which the technical quality is transferred in which it represented by seven
components namely behaviour, attitude, accessibility, appearance, customer contact,
internal relationships and service-mindedness. The image as last dimension is refer to
the company’s corporate image through the way of the consumer perceives the firm
after influenced by two dimensions, the technical quality and the functional quality.
According to Kang and James (2004), if the image of the company is perceive
positively by a customer, minor error is tolerable provided that this error is not
recurring. In contrast, a customer will not tolerate for error made by the company if
company’s image perceive negatively. The Grönroos (1984) technical and functional
service quality model was illustrated in Figure 3.2.
Figure 3.2
Grönroos (1984) technical and functional service quality model
Source: Grönroos (1984)

76
Additionally, as shown in Figure 3.2, expected service was fashioned by marketing
activities and external influence such as common practices, ideology, word of mouth,
pricing, locations and promotion factors. On the other hand, perceived service was the
outcomes of consumer’s perception through several dimensions of services which
include technical and functional aspects integrated in service (Martínez & Martínez,
2010). According to Grönroos (2000), the formation of perceived service quality was
not solely due to functional and technical quality dimensions but also from the result
of variation that occurred in between expected and perceived quality should be
considered. Positive perception of service quality will be assessed by the customer if
the service experience was met or above the service expectations (Grönroos, 2007).
Several studies were undertaken to investigate Grönroos’s model. Studies carried out
by Hanzaee and Mirvaisi (2011) in hotel industry in Iran and Kang and James (2004)
in telecommunication in Korea reveals that technical and functional quality contributes
significant relationships to image dimension. Consequently, image dimension has a
significant relationship to service quality perception and the studies also found strong
relationship between service quality perception and customer satisfaction. Result of
both studies confirmed that functional quality had a stronger effect to image compared
to technical quality. In addition, Kang and James (2004) study suggests that
Grönroos’s framework is a more meaningful to represent service quality compared to
the American perspective as its restricted attention on the dimensions of functional
quality only.
Prior to the development of SERVQUAL model, Parasuraman et al. (1985) had
proposed GAP model separated by five gaps that consists of ninety seven items from

77
ten dimensions. After refining and purification process, Parasuraman et al. (1988)
propose five dimensions with twenty two items and named it as SERVQUAL model.
Undoubtedly, SERVQUAL also known as “American perspective” was the most
referred concept and validated scales across variety type of service industries (Ahmad,
Ihtiyar, & Omar, 2014; Mittal & Gera, 2012; Nadiri & Hussain, 2005).
The SERVQUAL model was considered as a multi-dimensional construct consists five
dimension namely tangibility, reliability, responsiveness, assurance and empathy (Cui,
Lewis, & Park, 2003). Parasuraman et al. (1988) contended that despite of the different
nature of the services industry, the assessment of service quality by customer is still
based on same common criterion that stipulated in five dimensions in SERVQUAL
model. The definition of five dimensions of SERVQUAL was defined in Table 3.11.
Table 3.11
Definition of SERVQUAL dimensions
Dimension Definition
Tangible : Physical facilities, equipment and appearance of personnel.
Reliability : Ability to performance the promised service dependably.
Responsiveness : Willingness to help customers and provide prompt service.
Assurance : Knowledge and courtesy of employees and their ability to inspire trust and
confidence.
Empathy : Caring, individualized attention the firm provides its customers.
Source: Parasuraman et al. (1988)
SERVQUAL model is based on disconfirmation paradigm. Parasuraman et al. (1985;
1988) theorized and operationalized SERVQUAL as a gap between consumer
expectations of ‘what they want’ and their perceptions of ‘what they that drives
perception of service quality. In addition, Parasuraman et al. (1988) states that
SERVQUAL dimensions are able to provide overall measurement of service quality.
In their study across four different service industries had found that reliability was a

78
most critical dimension, followed by assurance, responsiveness, tangible and least
important dimension was empathy.
According to Kontogeorgos, Tselempis, and Aggelopoulos (2014), the SERVQUAL
model can be used as a diagnostic instrument to assist public and private organizations
to improve the quality standards by recognizing the strengths and weaknesses for their
service procedures. Subsequently, SERVQUAL model as a base have been replicated,
adapted and developed to several scales for measuring services (Lee, Lee, & Park,
2014; Rajaratnam et al., 2014).
However, the impact of five SERVQUAL’s dimensions to overall service quality was
varied. For example, the result of Yousapronpaiboon (2014) study in higher education
at Thailand indicates that reliability achieved a higher score, followed by empathy,
assurance, responsiveness and tangible. Another study by Ravichandran (2010) in
bank sector at India found that tangibles recorded the highest mean score and followed
by empathy, responsiveness, reliability and lowest mean was assurance dimension.
Moreover, the number of dimensions to explain service quality sometime varies after
factor analysis was carried out. For example, Kontogeorgos et al. (2014) study in
public service in Greek ministry using Principle Component analysis on five
dimensions of SERVQUAL had resulted only three factors which later were named as
customized service, service conditions and tangible. Another scholar, Miranda,
Chamorro, Murillo, and Vega (2012) in their study using partial least square (PLS)
path modelling in healthcare services had derived only four dimensions namely health

79
staff quality attributes, efficiency measures, no health staff quality attributes, and
facilities instead of five SERVQUAL dimensions.
Due to inconsistent of result and dimensions, SERVQUAL model had faced a great
challenge for criticism. However, Parasuraman, Berry, and Zeithaml (1991)
recommended that SERVQUAL scale was not rigid and it should be adapted or
modified accordingly for particular service sectors or different cultures as long as the
integrity of scales is preserved.
Several scholars have been doubtful about whether the five SERVQUAL dimensions
including its components are valid and relevant when assessing service quality in
different service industries (Cronin & Taylor, 1992; Finn & Lamb, 1991; Carman,
1990). Other scholar claim that expectation component in SERVQUAL can be a
misleading indicator and unable to capture the dynamic of changing expectation that
vary from time to time (Erdil & Yıldız, 2011).
Cronin and Taylor (1992) argued that the conceptualization of service quality as a gap
between expectation and performance was inadequate. They opined that expectation
component in the SERVQUAL model can be removed and only use performance
component to evaluate perception of service quality. They proposed SERVPERF scale
as alternative method. Through this methodology, the scale became more efficient
where fifty percent of number of items to be measured was reduced (Jain & Gupta,
2004). Furthermore, validity of SERVPERF as more superior scale compared to
disconfirmation-based SERVQUAL scale was supported by empirical evidence of
Cronin and Taylor (1992) study in four industries namely banks, pest control, dry

80
cleaning and fast food restaurant. The superiority of SERVPERF was supported by
many studies such as Mittal and Gera (2012) in retail banking; Erdil and Yıldız (2011)
in airline industry; Jain and Gupta (2004) in fast food restaurant and Burch, Rogers,
and Underwood (1995) uniform rental service.
Attention to analyse the concept of service quality as hierarchical or high order
construct had gradually increased in past studies where service quality was viewed
more effectively and more meaningful through a global judgment (Clemes, Shu, &
Gan, 2014; Wu & Ko, 2013; Clemes, Cohen, & Wang, 2013; Howat & Assaker, 2013;
Channoi, Clemes, & Dean, 2013; Chen, Lee, Chen, & Huang, 2011; Clemes, Gan, &
Ren, 2011; Caro & Garcia, 2008; Caro & Garcia, 2007; Olorunniwo & Hsu, 2006;
Olorunniwo et al., 2006; Kang, 2006).
Service quality was considered as highly complex in nature (Dhar, 2015) and service
quality was a complex process for service evaluation that may drive from several level
of abstraction (Suuroja, 2003). In reviewing Brady and Cronin (2001) study, service
quality concepts from the Nordic school and the American school models were
integrated into a new hierarchical model. In Brady and Cronin’s model suggests a
service quality model that consists of three dimensions namely interaction quality,
physical environment quality and outcome quality. Each of dimensions in hierarchical
model consists of three sub-dimensions and the cumulative assessment of the sub-
dimensions represents the perception of that particular dimension that leads to the
overall service quality perception. The Brady and Cronin’s conceptual model was
depicted in Figure 3.3 below.

81
Figure 3.3
A hierarchical approach of perceived service quality
Source: Brady & Cronin (2001)
Result revealed by Brady and Cronin (2001) concludes that assessment derived from
combination of interaction, environment quality and outcome quality dimensions
forms customer perception on overall service quality. Further, the hierarchical model
suggested by them was fulfilled the requirement of multilevel conceptualization that
offers a single, comprehensive, supported by strong base of multidimensional
theoretical framework and allows to be analysed on several level of abstraction.
Additional, Brady and Cronin advise the dimension may different due to the service
industry characteristics and remind future study to fully investigate deeper on items
within the dimensions.
The study by Clemes et al. (2014) in mobile communication service in China had
confirmed that hierarchical model as proposed by Brady and Cronin (2001) able to
represent customer’s assessment on overall service quality. In their study, interaction
quality shows the most vital role, followed by physical environmental quality and
outcome quality. They further suggested that service provider to focus on interaction
quality during service delivery stage as this dimension contribute a greatest influence

82
to customers and also to put great effort to improve service quality through well trained
and professional employees.
3.4.3 Measuring service quality
Concern shown by service organization and academician on service quality is always
increasing and interesting as the customer’s needs and expectation are changed over
the time causes service providers to adapt with the current trend of customer’s demand
and lifestyle. Measuring service quality is a complicate task. Ladhari (2008) study had
reviewed thirty studies that posited service quality as a multidimensional construct.
However, the dimensions are not same in respect of number and nature which
subjected to the type of services and the dimensions may vary even within the same
type of service industry. It indicates that the measures applied to appraise service
quality are diverging among customer groups and situations.
Due to these factors, varieties of instruments were developed to measure quality in
specific services industry. For example, SERVQUAL (Parasuraman et al., 1988) for
financial institutions, repair and maintenance company and telecommunication;
SERVPERF (Cronin & Taylor, 1992; 1994) for hotels, clubs and travel agencies;
DINESERV (Stevens, Knutson, & Patton, 1995) for food and beverage
establishments; LODGSERV (Knutson, Stevens, Wullaert, Patton, & Yokoyama,
1990), LODGQUAL (Getty & Thompson, 1994), HOLSERV (Mei, Dean, & White,
1999) for hotels; SERVPERVAL (Petrick, 2002) for airlines; SITEQUAL (Yoo &
Donthu, 2001) for Internet shopping; E-S-QUAL (Parasuraman, Zeithaml, &
Malhotra, 2005) for electronic services; SELEB (Toncar, Reid, Burns, Anderson, &
Nguyen, 2006) for educational services; HISTOQUAL (Frochot & Hughes, 2000) for

83
historic houses; LibQUAL (Cook & Heath, 2001; Thompson, Cook, & Thompson,
2002) for library; ECOSERV (Khan, 2003) for ecotourism; Retail Service Quality
Scale (RSQS) for retail (Dabholkar et al., 1996); Ahmad et al., 2014); e-SERVQUAL
(Zeithaml, Parasuraman, & Malhotra, 2002) for website and CASERV (Wong & Fong,
2012) for casino.
The view of Lin (2010) study had affirmed that SERVQUAL had received the most
attention compared to other instrument of service quality and it also had been
recognized as being the most extensively used instrument for assessing service quality
(Stodnick & Rogers, 2008; Albacete-Sa´ez, Fuentes-Fuentes, & Llore´ns-Montes,
2007; Akbaba, 2006) in service management and marketing literature (Stodnick &
Rogers, 2008). The components represent five dimensions in SERVQUAL were listed
in Table 3.12.
Table 3.12
Components of SERVQUAL dimensions
Dimension Definition Components
Tangibles Physical facilities, equipment and
appearance of personnel.
Equipment, physical facilities and
employee appearance.
Reliability Ability to performance the
promised service dependably.
Promise, problem solving, service
dependable, timing and record
accuracy.
Responsiveness Willingness to help customers and
provide prompt service.
Information to customer, prompt
service, willingness to assist and
spend time.
Assurance Knowledge and courtesy of
employees and their ability to
inspire trust and confidence.
Trust, safe transaction, polite and
adequate support for employee’s
performance.
Empathy Caring, individualized attention the
firm provides its customers.
Attention from firm and employee,
awareness on customer’s needs,
customer’s interest and
convenience operating hours.
Source: Parasuraman et al. (1988)
The SERQUAL model has twenty two (22) items for expected service quality and
twenty two (22) items for perceived service quality (Parasuraman et al., 1988). In Jain
and Gupta (2004) comparative study between SERVQUAL and SERVPERF in fast

84
food restaurant, 7-point Likert scale ranging from “1 = strongly disagree to 7 =
strongly agree” was adapted and was compared to arrive at gap scores.
There were numerous studies propose the assessment of perception should be based
on actual service performance because it was found reliable, valid and able to
overcomes weaknesses in SERVQUAL model (Caro & Garcia, 2007; Welsh & Raven,
2006; Nadiri & Hussain, 2005; Jain & Gupta, 2004). According to Martínez and
Martínez (2010), the service quality that refer to performance-based measurement was
able to achieve excellence result of psychometrically assessment in terms of construct
validity and operational efficacy aspects through its performance indicators and
generate a broader explanation of the variance in an overall assessment of service
quality than SERVQUAL.
Notable hierarchical approach and multidimensional study for measuring service
quality is Brady and Cronin (2001). Their hierarchical model was adapted from
Parasuraman et al. (1988), Rust and Oliver (1994) and Dabholkar et al. (1996) study.
Brady and Cronin (2001) hierarchical model was a third-order factor which
operationalized by combining both the formative and reflective methodology. The
construct of service quality was molded through three main dimensions namely
interaction quality, physical environment quality and outcome quality. Each main
dimension was reflected by sub-dimensions namely attitude, behavior and experience
under interaction quality dimension; ambient conditions, design and social factors
under physical environment quality dimension; and waiting time, tangibles and
valence was under outcome quality dimension that serve as indicators of the main
dimensions. Formative model means that the construct is formed or induced by its

85
measures (Bagozzi, 2011). Thus, operationalization service quality construct as a
formative assessment means that alteration in the dimensions may cause alteration in
the construct of service quality but changes in the indicators of sub-dimensions is
common (Martínez & Martínez, 2010; Diamantopoulos & Siguaw, 2006).
Perceived service quality from SERVQUAL model were also used as hierarchical
construct such as Untachai (2013), Lam, Lee, Ooi, and Phusavat (2012), Chen et al.,
(2012) and Ledden, Kalafatis, and Mathioudakis (2011). Mostly, the nomological
validity on the hierarchical or higher order construct model was confirmed through
structural equation model using analysis of moment structures (AMOS), partial least
square (PLS) or LISREL statistical software. Table 3.13 show the list of hierarchical
concept applied in recent years studies.
Table 3.13
The list of hierarchical concept applied in recent years studies
No Source Research
Context Method
Service Quality
Model Dimensions
1 Wu, Li, & Li
(2014)
Theme Parks,
Taiwan
PLS-SEM
Formative
Adapted from
Brady & Cronin’s
Hierarchical
model
Interaction Quality
Physical environment quality
Outcome quality
Access quality
Overall experiential quality
2 Rajaratnam et
al. (2014)
Rural tourism
destinations in
Malaysia
PLS-SEM
Formative
Adapted from
SERVQUAL
(perceived service
only)
Accessibility & Logistics
Core Tourism Experience
Hygiene
Information
Security
Value for money
Hospitality
3 Wu & Li
(2014)
Historic
Center of
Macau, China
SEM-
AMOS
Reflective
Adapted from
Brady & Cronin’s
Hierarchical
model
Interaction Quality
Physical environment quality
Outcome quality
Access quality
Overall experiential quality
4 Clemes et al.
(2014)
Mobile
communicatio
n service,
China
Structural
Equation
Modeling,
Reflective
Adapted from
Brady & Cronin’s
Hierarchical
model
Interaction Quality
Physical environment quality
Outcome quality
5 Howat &
Assaker, 2013
Outdoor
aquatic centers,
Australia
PLS-SEM
Formative
SERVPERF Core services
Secondary services
Staff
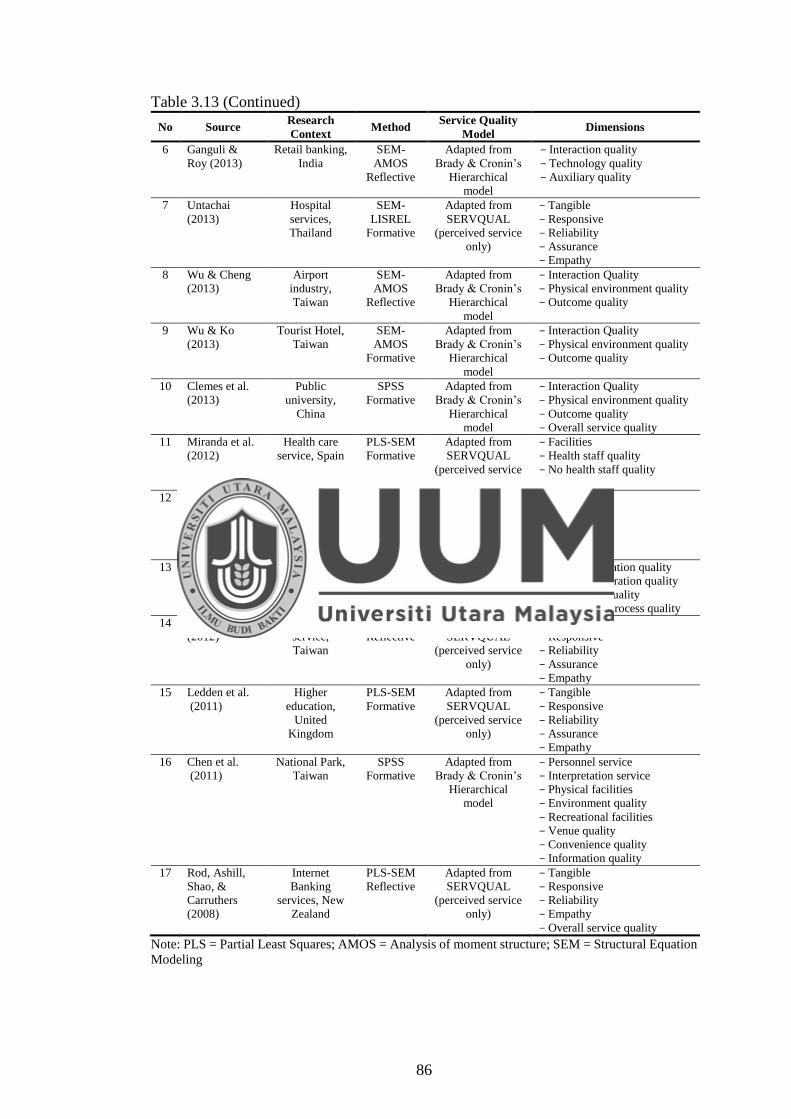
86
Table 3.13 (Continued)
No Source Research
Context Method
Service Quality
Model Dimensions
6 Ganguli &
Roy (2013)
Retail banking,
India
SEM-
AMOS
Reflective
Adapted from
Brady & Cronin’s
Hierarchical
model
Interaction quality
Technology quality
Auxiliary quality
7 Untachai
(2013)
Hospital
services,
Thailand
SEM-
LISREL
Formative
Adapted from
SERVQUAL
(perceived service
only)
Tangible
Responsive
Reliability
Assurance
Empathy
8 Wu & Cheng
(2013)
Airport
industry,
Taiwan
SEM-
AMOS
Reflective
Adapted from
Brady & Cronin’s
Hierarchical
model
Interaction Quality
Physical environment quality
Outcome quality
9 Wu & Ko
(2013)
Tourist Hotel,
Taiwan
SEM-
AMOS
Formative
Adapted from
Brady & Cronin’s
Hierarchical
model
Interaction Quality
Physical environment quality
Outcome quality
10 Clemes et al.
(2013)
Public
university,
China
SPSS
Formative
Adapted from
Brady & Cronin’s
Hierarchical
model
Interaction Quality
Physical environment quality
Outcome quality
Overall service quality
11 Miranda et al.
(2012)
Health care
service, Spain
PLS-SEM
Formative
Adapted from
SERVQUAL
(perceived service
only)
Facilities
Health staff quality
No health staff quality
Efficiency
12 Lam et al.
(2012)
Services
industry,
Malaysia
Structural
Equation
Modeling,
Reflective
Adapted from
SERVQUAL
(perceived service
only)
Tangible
Responsive
Reliability
Assurance
Empathy
13 O’Cass &
Carlson
(2012)
Website sport
consumers
PLS-SEM
Formative
Website service
quality
e-Communication quality
e-System operation quality
e-Aesthetic quality
e-Exchange process quality
14 Chen et al.,
(2012)
Financial
service,
Taiwan
PLS-SEM
Reflective
Adapted from
SERVQUAL
(perceived service
only)
Tangible
Responsive
Reliability
Assurance
Empathy
15 Ledden et al.
(2011)
Higher
education,
United
Kingdom
PLS-SEM
Formative
Adapted from
SERVQUAL
(perceived service
only)
Tangible
Responsive
Reliability
Assurance
Empathy
16 Chen et al.
(2011)
National Park,
Taiwan
SPSS
Formative
Adapted from
Brady & Cronin’s
Hierarchical
model
Personnel service
Interpretation service
Physical facilities
Environment quality
Recreational facilities
Venue quality
Convenience quality
Information quality
17 Rod, Ashill,
Shao, &
Carruthers
(2008)
Internet
Banking
services, New
Zealand
PLS-SEM
Reflective
Adapted from
SERVQUAL
(perceived service
only)
Tangible
Responsive
Reliability
Empathy
Overall service quality
Note: PLS = Partial Least Squares; AMOS = Analysis of moment structure; SEM = Structural Equation
Modeling

87
Based on the above literature review, this study applied only perceived service quality
scale from SERVQUAL. Without underestimate the role of technical quality, this
dimension was included together with another five dimensions of SERVQUAL to
form service quality as second order construct. In car parking services, technical aspect
in determining the smooth of parking operation is essential for ensuring excellent
experience of car parking. Moreover, today’s parking services uses automated parking
system and machines that require a close monitoring and discipline on equipment
maintenance in order to avoid equipment breakdown.
3.4.4 The relationship between service quality and customer satisfaction
An extensive attention in services literature has been given to the connection between
service quality and customer satisfaction (Izogo & Ogba, 2015; Rajaratnam et al.,
2014). Service quality play a crucial role to attain competitive advantage lies in
delivering high service quality that able to effect in customer satisfaction and shaping
positive outcome to the business undertaking such as customer loyalty and reduce
business competitors (Meidutė-Kavaliauskienė, Aranskis, & Litvinenko, 2014).
Some of latest studies have presented consistent evidences on the direct and positive
relationships between service quality and customer satisfaction such as studies carried
out by Han and Hyun (2015), Kashif, Shukran, Rehman, and Sarifuddin (2015), Izogo
and Ogba (2015), Rajaratnam et al. (2014), Hussain, Al-Nasser, and Hussain (2014),
and Giovanis et al. (2014). These findings were in line with past studies such as Spreng
and MacKoy (1996), and Cronin and Taylor (1992).

88
Several scholars examine a direct relationship effect between each dimension of
service quality to customer satisfaction. For instant, quantitative findings by
Munusamy, Chelliah, and Mun (2010) on service quality delivery and its impact of
customer satisfaction in the banking sector in Malaysia revealed that assurance,
empathy, reliability and responsiveness dimension have a relationship but it has no
significant effect on customer satisfaction. Only tangible dimension has positive
relationship and have significant impact on customer satisfaction. The result the
analysis is not in congruent to findings by Kashif et al. (2015) in Malaysia Islamic
banks using PAKSERV which adapted from SERVQUAL scale where tangible,
assurance, sincerity, personalization and formality dimension have significant
relationship with customer satisfaction but not reliability.
Another study finding by Kitapci et al. (2014) in public health care service had found
assurance, empathy and responsiveness dimension have significant relationships with
customer satisfaction but not tangibles and reliability. While Izogo and Ogba (2015)
study had found that all SERVQUAL dimensions was significant to customer
satisfaction and the result proves the instruments applied to measure service quality
was highly reliable and valid. However, inconsistent result of SERVQUAL
dimensions effect to customer satisfaction in past studies may be as a result of the
cultural differences (Izogo & Ogba, 2015).
Due to complexity of service quality abstract, studies applying hierarchical model or
higher order construct of service quality was growth. For example, Rajaratnam et al.
(2014) study in rural tourism destination in Malaysia had used seven dimension of
service quality namely accessibility and logistics, core tourism experience, hygiene,

89
information, security, value for money and hospitality via formative approach using
structural equation model methodology were found significant relationship to forming
service quality as second order construct. The findings of their study show that that
service quality was significant to tourist satisfaction and indicates service quality was
a direct antecedent to customer satisfaction. Additionally, they confirmed that service
quality is a multidimensional construct. While Clemes et al. (2014) study in mobile
communication services in China had adapted service quality hierarchical model as
proposed by Brady and Cronin (2001).
From the above literature, although there were several approaches for measuring a
service quality such as multi-dimensions of service quality, unidimensional of service
quality and hierarchical model of service quality, service quality is still remain as a
significant construct to customer satisfaction. This is due to the nature of service
quality and customer satisfaction relationship was seen as linear which is showing a
high service quality performance may result to high response of customer satisfaction.
3.4.5 The relationship between service marketing mix and service quality
The service marketing mix consist various pivotal elements of service marketing
programme which need to be considered in order to ensure an effective planning and
successful implementation of the marketing operation that able to reach customer’s
need and expectation (Aghaei et a., 2014; Kaura, 2013). The elements of mix such as
product, price, place, promotion, people, physical evidence and process is consider as
internal factors that can be controlled and determined by the service firms.

90
The focal point of definition for service marketing mix is to satisfy customer needs
and wants (Kushwaha & Argawal, 2015). While service quality centralized to
fulfillment of needs and demand of customer and also the certainty of delivery to
balance customer’s expectation. According to Kotler (2000), Lovelock and
Gummesson (2004), and Kotler and Kevin (2009), service quality shall begin from the
consumer needs and ended on consumer perception. In that matter, the elements of
service marketing mix are referred for evaluating the excellence of service quality from
customer perspective. Through that basis, the relationship between service marketing
mix and service quality is connected. This relationship was also supported by
Nasution, Sembada, Miliani, Resti, and Prawono (2014) where they had illustrated the
relationship between service marketing mix and service quality in their Customer
Experience Framework as showed in Figure 3.4 where the customer experience
journey is started from the innermost layer outwards. The framework tells that the
customer experience is similar with a journey where the perception and responses will
be accumulated at every contact point between customer and service provider.
Figure 3.4
Customer experience framework.
Source: Nasution et al. (2014)

91
For example, the service firm provides a platform for customer to choose the offered
service based on their needs and expectation, experience it and evaluate the service
after consuming the service. If the service quality that they consumed is below their
expectation, then the consumer will lose interest on such service provider and vice
versa. Therefore, it is crucial for service firms to deploy right mixes that able to
produce a high service quality standards incorporated in the services features. The
same also goes to Grönroos’s concept a way back in 1984. In Grönroos (1984)
functional and technical quality model, states that marketing mix activities such as
promotion, pricing and selling place can be applied as a promises to influence the
expectation of customer. He suggests that resources and marketing activities under
control and outside the immediate of control of the firm must be recognized to ensure
sufficient impact to service quality.
Conversely, there were a little studies to investigate the relationship between service
marketing mix and service quality or stimulus factors to service quality judgment. A
study conducted by Islam et al. (2013) to examine the relationship between marketing
mix, service quality and customer loyalty in retail chain stores at Taiwan, argue that
marketing mix elements such as product, price, promotion and place can be exploited
for improving service quality in aspect of tangibility, reliability, responsiveness,
assurance and empathy. They explained that place element of marketing mix is
possible to enlarge tangibility dimension of service quality by way of better
representing the physical facilities, tools and equipment for customer service, product
supports reliability and empathy. While promotion strengthens responsiveness
dimension due to provided preference service and information to customers. The
finding of their study shows that service quality was influenced by marketing mix

92
significantly with twenty seven percent variations. However, their study did not
explain on how marketing mix and service quality has been analysed for example
whether in formative, reflective or unidimensional. Furthermore, application of
marketing mix scale instead of service marketing mix for the context of retail chain
stores may not enough to explain the effect to service quality due to absence of people,
physical evidence and process element.
Other study carried out by Cengiz and Yayla (2007) in accounting office services in
Turkey had found that only product element of marketing mix has significant effect to
perceived quality but not for other elements such as price, promotion and place.
However, they did not discuss their findings between these variables in their article.
Conceptualize marketing mix as separate elements to be tested to the other variable is
inconsistent with the definition of marketing mix concept as mixer of ingredient
(Borden, 1964), combination of all (McCharty, 1964) or as a “package” (Jacoby, 2002)
which may not be able to fully explain the role of marketing mix.
While, other studies on service marketing mix and service quality is fragmented. Past
studies only investigate one or partial elements of service marketing to service quality.
For instant, Baker, Parasuraman, Grewal, and Voss (2002) in card-and-gift stores
environment in United States used the people and physical evidence elements like
store’s design and ambient factor to represent stores environment. The people and
stores design were found significant to interpersonal service quality perception and
merchandise quality perception but not ambient factor.

93
A study of Dhar (2015) in tourist hotel had found that benefits of training for
employees as a part of people element has direct relationship to service quality and
mediated by organizational commitment. The important of people element as a part of
marketing activities to quality perspective is supported by Al-alak (2013) study in
Malaysian banking sector. In relation to process element, study of Janipha, Ahmad,
and Ismail (2015) had found that purchasing process makes significant contribution to
quality of firm’s resource, customer’s financial and conditions of final product.
Based on the above literature, it had showed that there were limited and inexclusive
studies to explain the relationship between service marketing mix and service quality.
However, the conceptual of both constructs was closely related and several studies
support the existence of relationship but yet not comprehensive. This study attempted
to close the gap.
3.4.6 Service quality as mediator between service marketing mix and customer
satisfaction
Service quality always becomes a central subject in marketing literature and can be
considered as a door to another perception and responses such as service value and
customer satisfaction. The above literature review discuss the findings and possibilities
of two interconnected relationships between service marketing mix to service quality
as well as between service quality to customer satisfaction.
However, past studies conceptualize service quality construct as mediator is limited
and these theoretical interlinkages between service marketing mix, service quality and
customer satisfaction is still remain as a gap in the service context. Past studies (Chen

94
et al., 2012; Wu, Li, & Li, 2014; Rajaratnam et al., 2014) frequently considered service
quality scales as stimulus factors like SERVQUAL and hierarchical models to measure
customer satisfaction where the dimensions and indicators of quality is refer to the
elements of service marketing mix for example product features, technology and
quality from product element, employee knowledge and adaption of service culture is
a part of people element, environmental aspect is refer to place and physical evidence
element and reliable transaction and operation hours is referred to process element.
Although service quality is important, it alone is may not enough to ensure
competitiveness of firm’s business (Islam et al., 2013).
Service marketing mix also plays important roles to influence customer satisfaction.
For example, Al-Muala and Al-Qurneh (2012) and Sarker at el. (2012) study had
supported significant relationship between elements of service marketing mix and
customer satisfaction. Although limited studies on the relationship between service
marketing mix and service quality, there were several studies (Islam et al., 2013;
Cengiz & Yayla, 2007) reveals significant relationship between the service marketing
mix elements and service quality that offer study prospects in future study.
A structural equation model study by Islam et al. (2013) in four retails stores in Taiwan,
had found that mediation effect of service quality between marketing mix and
customer loyalty. They had applied Baron and Kenny’s (1986) three-path regression
analysis and SOBEL test for a difference in coefficients testing the indirect effect for
significant differences from zero. The role of service quality as mediating variable was
also supported by Andrade, Lima, Pereira, Fornara, and Bonaiuto (2013). Their study
findings derived from structural equation modelling methodology had showed that the

95
relationship between objective environmental and outpatient patient’s satisfaction was
mediated by perception of physical environment quality but not for inpatient
respondents.
The above literature shows the mediation role of service quality is still remains flaw
and fragile due to lack of studies conceptualizing service quality as mediation
construct. Therefore, it would be interesting to know whether marketing mix has an
indirect influence on customer satisfaction through existence of service quality as
mediating variable between these constructs. The present study argue that the service
marketing mix provide a service platform as stimulus factor to customer for evaluating
quality factors that later cause customer response on satisfaction after having
experience and consumption of services. In short, service quality depends on a
marketing mix which eventually reflected in the customer satisfaction.
3.5 Service value
All about value creation comes from services (Lovelock et al., 2011; Bruhn & Georgi,
2006). Customers are clever enough to consider and determine any benefits obtained
before deciding to use a service. This situation urged the company to provide a
valuable service to the customer’s view of points for competitive advantages,
profitable and business growth.
In line with the growing acceptance of service value, the idea of “value creation”
become as an essential measures in consumer behavior such as customer satisfaction
and behavioral intentions (Eid & El-Gohary, 2015; Jo et al., 2014), building customer
96
relationship that leading to business growth and profitable (Chahal & Kumari, 2012)
and a key aspect in the management of business strategic (Lovelock et al., 2011). This
means that offering higher value to the customers will enable organization to (1)
strengthen profit and sustain competitive advantage through incorporation of
important strategic direction (Huber, Herrmann, & Morgan, 2001; Lapierre, Filiatrault,
& Charles, 1999); (2) easy it managers in the resources allocation planning that
connected to service design and delivery phase (Cronin, Brady, Brand, Hightower, &
Shemwell, 1997); and (3) improve systems of service encounters that drive to positive
result from customer (Cronin et al., 2000).
Despite of wide attention and studies were carried out in the past, several issues
associated to the fundamental concern of service value is still remain unclear. With
reference to Boksberger and Melsen (2011), Sánchez-Fernández and Iniesta-Bonillo
(2007), and Lin, Sher, and Shih (2005) studies, unsolved issues pertaining to service
value is covering (1) there is lack of compromise in respects to the definition and the
concept. Consequently, service value construct always been wrongly applied in the
social sciences and specifically in the services marketing studies (Khalifa, 2004); (2)
no consensus between scholars about the definitions and concepts causes the results of
the empirical measure are inconsistent and uncoordinated causes the subject has been
criticized; and (3) the relationship between service value to other construct such as
service quality and customer satisfaction has been debated controversially.
As issues related to the value is yet to reach an agreement on the generalization,
continuous study of this construct is needed in order to narrow down the knowledge
gap as this study is attempt to investigate the service value including it connections to

97
other constructs. In Sánchez-Fernández and Iniesta-Bonillo (2007) study, they opines
that service value is based on situational and context-dependent. Due to this nature of
value, the assessment judgment on the value is a function of the changing standards.
These standards are likely to vary according to the settings, locality, culture and time
in which the evaluation of value was held.
3.5.1 Definition of service value
Past literature indicates that several issues related to the fundamental concern in
construct service value was still remains unresolved which include lack of consensus
and inconclusive for the definition of service value (Ledden et al., 2011; Boksberger
& Melsen, 2011; Khalifa, 2004). This make a task to define service value becomes a
challenge due to complexity of value concepts and should not simply use in any
research study in order to evade any misused or overused of service value concepts
(Khalifa, 2004).
Researchers applied various terms to describe the service value construct, although the
terms were mostly referred to the same concept (Woodruff, 1997). According to
Woodall (2003), eighteen different names were found for the value consumers that
arise from interaction of purchasing and consuming the product. Further, Woodall
added that the most ordinarily term used in marketing literature include ‘customer
value’ (Anderson & Narus, 1998; Dodds, 1999; Holbrook, 1996; Woodruff, 1997),
‘perceived value’ (Liljander & Strandvick, 1992; Patterson & Spreng, 1997), and
‘value’ (Berry & Yadav, 1996; de Ruyter, Wetzels, Lemmink, & Mattson, 1997;
Ostrom & Iacobucci, 1995).

98
Less frequent terms used were ‘consumption value’ (Sheth, Newman, & Gross, 1991),
‘value for the customer’ (Reichheld, 1996) ‘value for customers’ (Treacy & Wiersema,
1993), ‘customer perceived value’ (Grönroos, 1997), ‘consumer value’ (Holbrook,
1999), ‘perceived customer value’ (Lai, 1995), ‘buyer value’ (Slater & Narver, 1994)
‘service value’ (Bolton & Drew, 1991), ‘subjective expected value’ (Bolton, 1998),
‘perceived value for money’ (Sweeney, Soutar, & Johnson, 1999), ‘net customer
value’ (Butz & Goodstein, 1996), ‘perceived service value’ (LeBlanc & Nguyen,
1999), ‘consumer surplus’ (Anderson, 1995) and ‘expected value’ (Huber et al, 1997).
There was variation of value definitions from customer perspective that had been used
in the past literature as shown in APPENDIX C. Definition of service value as defined
by Zeithaml (1988) will be used in present study. Service value was defined as a
consumer’s overall assessment of the utility of a product based on perceptions of what
is received and what is given.
3.5.2 Concept of service value
The debates on the concepts of value are still ongoing as scholars disagree with several
points in constructing the concepts of value that able to provide a better understanding
to industry setting, business situation and customer segmentation. Sánchez, Callarisa,
Rodriguez, and Moliner (2006) had reviewed several past literatures and commented
that value was an abstract construct and it depends on type of customers, cultures
context and period of times. This indicates service value as a dynamic variable that
include experienced before buying, during buying stage, at the time consumption and
after consumption.

99
Generally, there were two major approaches to the conceptualization of service value
which was unidimensional approach and multi-dimensional approach. On the first
approach, the concept of service value is refer to unidimensional approach which have
two parts as a construct, one of benefits received by customer in term of economic
scale, quality, brand, social and relationship; and another of perceived sacrifices made
by the customer in two aspects such as monetary and non-monetary, for example price,
time, effort, risk and convenience (Boksberger & Melsen, 2011; Sánchez et al., 2006).
According to Sánchez-Fernández and Iniesta-Bonillo (2007), the most popular
conceptualizations of value in past literature is treating ‘value’ as a cognitive trade-off
between benefits and sacrifices where ‘value’ was defined in terms of performance
(quality) and price as functional nature. The study of value has been dominated using
unidimensional approach and most of the research in the field has focused on
economic-based consumer utilitarianism to explain the service value.
Subsequently, Dodds et al. (1991) study which based on Monroe’s (1979) conceptual
model, perception of value was interpreted as cognitive trade-off between perceptions
of quality and sacrifice and consequently, they had found that external factors such as
product price, product brand name and store name affect the perceptions of product
quality and value. This founding value conception was referred to the consumer
economic theory and the utility concept.
Correspondingly, Zeithaml (1988) study who adapted the Dodds and Monroe (1985)
model frame, suggested that the construct should be comprehend as a trade-off
between benefits and sacrifices in which consumers conclude benefits by global
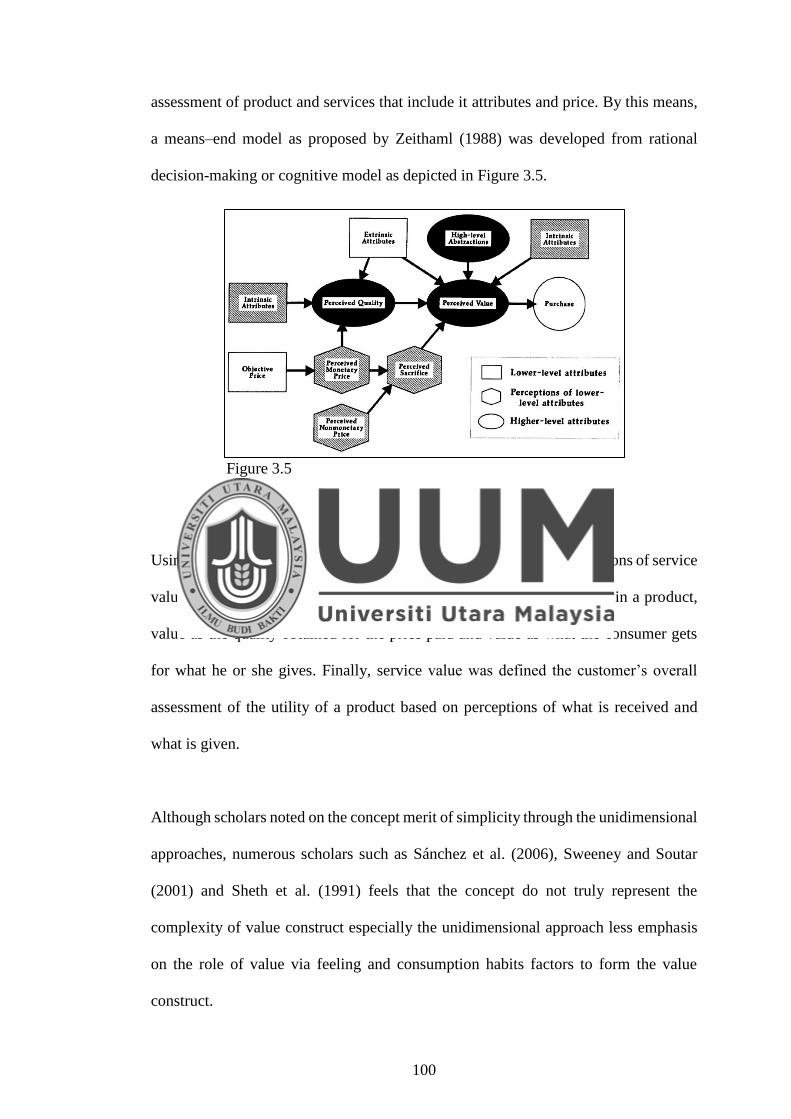
100
assessment of product and services that include it attributes and price. By this means,
a means–end model as proposed by Zeithaml (1988) was developed from rational
decision-making or cognitive model as depicted in Figure 3.5.
Figure 3.5
A means-end model relating to price, quality and value
Source: Zeithaml (1988)
Using the means-end theory, Zeithaml (1988) had identified four dimensions of service
value that is value as low price, value as whatever the consumer wants in a product,
value as the quality obtained for the price paid and value as what the consumer gets
for what he or she gives. Finally, service value was defined the customer’s overall
assessment of the utility of a product based on perceptions of what is received and
what is given.
Although scholars noted on the concept merit of simplicity through the unidimensional
approaches, numerous scholars such as Sánchez et al. (2006), Sweeney and Soutar
(2001) and Sheth et al. (1991) feels that the concept do not truly represent the
complexity of value construct especially the unidimensional approach less emphasis
on the role of value via feeling and consumption habits factors to form the value
construct.

101
The second approach for service value was understood as a multi-dimensional
construct with consideration the role of functional and the affective component to
formulate a holistic representation for a complexity of service value. The functional
component is represented by the rational and economic valuations of individuals
whereas the quality of the product and service is also part of this dimension. In other
component, the affective dimension is alienated into an emotional dimension that
involves feeling or internal emotion and a social impact of the purchase represent the
social dimension. In the same path, several scholars had embraced a multi-dimensional
approach, for example like Sheth et al. (1991), de Ruyter et al. (1997), Sweeney and
Soutar (2001) and Sánchez et al., (2006).
Notable study by Sheth et al. (1991) had identified up to five dimensions for their value
conceptual model namely social, emotional, functional, conditional and epistemic.
Sheth et al. (1991) claimed that a decision made by consumer may be derived partly
or all of the five consumption values. These five types of value had been found able to
influence in different ways of consumption value on why consumer decide to purchase
or not to purchase or to consume or not to consume for a particular product, select one
type of product over another and select one brand over another.
Other scholar in similar opinion, de Ruyter et al. (1997) had proposed a more holistic
concept to value, which consisted integration of affective and cognitive response
components such as value for money. As conceptualized by de Ruyter et al. (1997),
service value was constructed from three dimensions namely emotional, functional and
logical. The emotional dimension represents the affective assessment at the moment

102
of service encounter, the functional dimension represents pragmatic aspects of the
service scene and lastly, the quality of service and the price explain the logical
dimension that shape consumer’s logical thinking on value for money. Service
performance at every process stages can be assessed in respects of the above
dimensions.
In subsequent study, Sweeney and Soutar (2001) value model exclude the epistemic
and conditional dimensions as suggested by Sheth et al. (1991). Consequently, the five
dimensions were reduced and altered to four dimensions namely functional value for
quality and performance such as quality perception and output of the product or
service, adaptability and practicality of product; functional value for price and value
for money; social value and emotional value represents intangible aspects exist within
the relationship. The scale of measurement developed by Sweeney and Soutar was
named as PERVAL.
In same line with multi-dimensional concept, Sánchez et al. (2006) had examined the
presence of cognitive and affective dimensions concerning to installation, personnel
and product in travel services agency. They had found that cognitive elements such as
quality and price play a central role. While, affective element such as emotional
components in value construct play also pivotal role in both satisfaction and loyalty
because affective components are concentrated on the internal feelings caused by the
experience of purchase and consumption and as a result from the consumer’s social
environment. Their study supports the experiential understanding as proposed by
Holbrook (1996) and confirms the multi-dimensional construct of service value as
proposed by Sweeney and Soutar (2001) which was based on the conceptualization of

103
value initiated by Sheth et al. (1991). With existence of affective component, Sánchez
et al. (2006) suggests that value perceived by customer was not only on product but
also on sales outlet of travel agency.
Subsequently, Sánchez et al. (2006) had established a measurement scale of post-
purchase service value that consists of twenty four (24) items and named it as
GLOVAL. Six dimensions of service value were proposed to be incorporated in
GLOVAL model. Total of four dimensions link to functional value such as functional
value of the establishment, functional value of the service purchased for quality and
performance, functional value of the contact personnel and functional value for price.
Another two dimensions were related to the affective dimension of service value that
represented by emotional value and social value. Sánchez et al. (2006) treated the
service value as second order construct thorough a formative approach. Figure 3.6
shows the GLOVAL model.
Figure 3.6
GOLVAL model
Source: Sánchez et al. (2006)

104
3.5.3 Measurement of service value
Generally, service value was measured through unidimensional and multidimensional
constructs (Chahal & Kumari, 2012; Sánchez-Fernández & Iniesta-Bonillo (2007).
The unidimensional construct was mostly used in past studies but the conceptual of
service value as multidimensional construct of service value has become increasingly
important in recent years studies (Gallarza & Saura, 2006).
The unidimensional construct adopts a utilitarian perspective and identifies benefits in
term quality and ratio of sacrifice in term of price, time and distance (de Ruyter et al.
(1997). However, Ruiz, Gremler, Washburn, and Carrión (2008), Al-Sabbahy, Ekinci,
and Riley (2004) and Oh (1999) had commented that the use of a single item scale
would not capture dimensions of this construct adequately as a single dimension is
likely resulting a limitation of understanding of service value construct which is also
include its antecedents and consequences.
Acknowledged on the limitations of single scale measurement, multi-items
measurement of value was introduced and growing. Several scholars interested in
exploring composite nature of value have adopted conventional value typologies for
example Petrick and Backman (2002) use seven items from Grewal, Krishnan, Baker,
and Borin (1998) scale of transaction versus acquisition value of twelve items
measurement where they found both factors related to service value especially
transaction value shows majority of explained variance. Another example, Bajs (2015)
use two items represented by acquisition value and trade-off of total cost components
to measure service value which had significantly influenced by destination appearance,
emotional factors, quality and monetary aspects. Different findings in Howat and

105
Assaker (2013) study, they use two items that related to value for money questions to
measure service value where perceived quality had very strong influence to service
value. Several past studies which had applied the unidimensional approach were listed
in Table 3.14.
Table 3.14
The list of unidimensional service value approach applied in past studies
No Source Research
Context Method Concept
Component of service value
(Number of item/s)
1 Bajs (2015) Tourism Reflective Benefit and
Sacrifice
Acquisition value (1)
Trade-off with total costs (1)
2 Sabiote-Ortiz, Frías-
Jamilena &
Castañeda-García
(2014)
Tourism Reflective Service value Value for money (2)
Overall perceived value (1)
3 Howat & Assaker
(2013)
Aquatic
Centers
Reflective Service value Value for money (2)
4 Gallarza, et al.
(2013)
Tourism Reflective Service value Value for money (2)
Overall perceived value (1)
5 Ryu, Han & Kim
(2008)
Restaurant Reflective Service value Value for money (2)
Overall perceived value (1)
6 Petrick & Backman
(2002)
Golf
Travelers
Reflective Service value Value for money (1)
Acquisition value (4)
Transaction value (3)
7 Kashyap & Bojanic
(2000)
Tourism Single item Service value Overall value (1)
8 Martensen,
Grønholdt,
Eskildsen &
Kristensen (1999)
Education Reflective Benefit and
Sacrifice
Future goals (1)
Effort (1)
9 Oh (1999) Hotel Single item Service value Overall value (1)
10 Murphy & Pritchard
(1997)
Transportati
on
Single item Service value Value for money (1)
11 Webb & Jagun
(1997)
Higher
Education
Reflective Benefit and
Sacrifice
Acquisition value (1)
Transaction value (1)
However, due to the complexity of value construct, broaden views of service value
construct were adopted through multidimensional perspective that covers experiential,
cognitive and also affective aspects (Moliner, Sánchez, Rodríguez, & Callarisa, 2007).
The notable study findings of Sheth et al. (1991), multidimensional approach of service
value has been established that made up from five dimensions as elaborated in
preceding sub-heading. Instrument scales such as PERVAL (Sweeney, Soutar, &
Johnson, 1996; Sweeney & Soutar, 2001) and GLOVAL (Sánchez-Fernández &
Iniesta-Bonillo, 2007) were referred to multidimensional approach for service value

106
concept. The PERVAL scale was grounded on the theory proposed by Sheth et al.
(1991) and it has four dimensions categorized under functional, social and emotional
value compared to five dimensions originally developed by Sheth et al. (1991).
Numerous scholars such as Bolton and Drew (1991), Lin et al. (2005) and Ruiz et al.
(2008) adhere to the view that service value should be conceptualized and
operationalized as a high-order construct. A study of Ledden et al. (2007) had found
that service value will have a greater explanatory capacity when the construct is
conceptualized as higher order. The abstraction of the value concept is not clearly
defined in multidimensional models and it is not harmonized with the definition
concept. The weaknesses in multidimensional models fail to take account of overall
value that causes the models unable to reflect prudently to the right trade-off
experience of “give versus get”.
As proposed by Zeithaml (1988) in his trade-off model, a higher-order construct using
formative approach to mold service value should be applied in future research. This is
in line with Ruiz et al. (2008) recommendation that the formative approach of service
value was found superior than a reflective approach of value and appears generalizable
across various settings. The operationalization of service value through formative
approach at higher-order construct must have several dimensions for an intensive
understanding of the construct. The several past studies which had conceptualize
service value as high order construct and multidimensional model were listed in Table
3.15.

107
Table 3.15
The list of high order construct and multidimensional approach applied in past studies
No Source Research
Context Method Concept
Component of service
value (Number of
item/s)
1 Eid & El-Gohary
(2014)
Muslim tourist
package
Formative Muslim Tourist
Perceived Value
Cognitive,
Affective and
Islamic value
Quality (4)
Price (4)
Emotional (4)
Social (4)
Physical attribute (4)
Non-physical
attribute (4)
2 Chen (2013) Agriculture farms 3rd order
Reflective-
formative-
formative
Perceived value
formed by
benefits and
sacrifices
Product benefits (3)
Emotional benefit (3)
Social benefit (3)
Inconvenience (3)
Risk (2)
3 Williams &
Soutar (2009)
Tourism Reflective
Analyzed via
individual
dimension
PERVAL Value for money (4)
Novelty value (4)
Functional Value (4)
Emotional Value (4)
Social Value (4)
4 Ruiz et al.
(2008)
3 group service
industries customized,
personalized
semi-customized,
nonpersonalized standardized
services
2nd order
Reflective-
Formative
Service value
Index
Service quality (4)
Service equity (4)
Confidence benefits (5)
Sacrifice (1)
5 Turel, Serenko
& Bontis (2007)
Usage of SMS 2nd order
Reflective-
Formative
PERVAL Quality (4)
Emotional value (5)
Value-for-money (4)
Social value (4)
6 Sánchez, et al.
(2006)
Tourism 2nd order
Reflective-
Formative
GLOVAL
Overall
perceived value
of a
purchase
Establishment (4)
Personnel (4)
Product(4)
Price (3)
Emotional value (5)
Social value (4)
7 Lin et al. (2005). Online shopping 2nd order
Reflective-
reflective
Reflective-
formative
Give-versus-get Monetary sacrifice (2)
Web site design (5)
Fulfillment/reliability (3)
Security/privacy (3)
Customer service (3)
8 Ulaga & Eggert
(2005)
Manufacturing
suppliers
3rd order
Reflective-
formative-
formative
Benefits and
Sacrifices
Relationship
value B2B
Product (3)
Service (2)
Know-how (3)
Time-to-market (2)
Social (3)
Process costs (2)
Price (1)
9 Lages &
Fernandes
(2005)
Telecommunicati
ons service
2nd order
Reflective
SERPVAL
Service personal
values
Peaceful life (4)
Social recognition (5)
Social integration (3)
10 Petrick &
Backman (2002)
Golf travelers Reflective
Analyzed via
individual
dimension
Acquisition
and transaction
value
Acquisition value (3)
Transaction value (4)
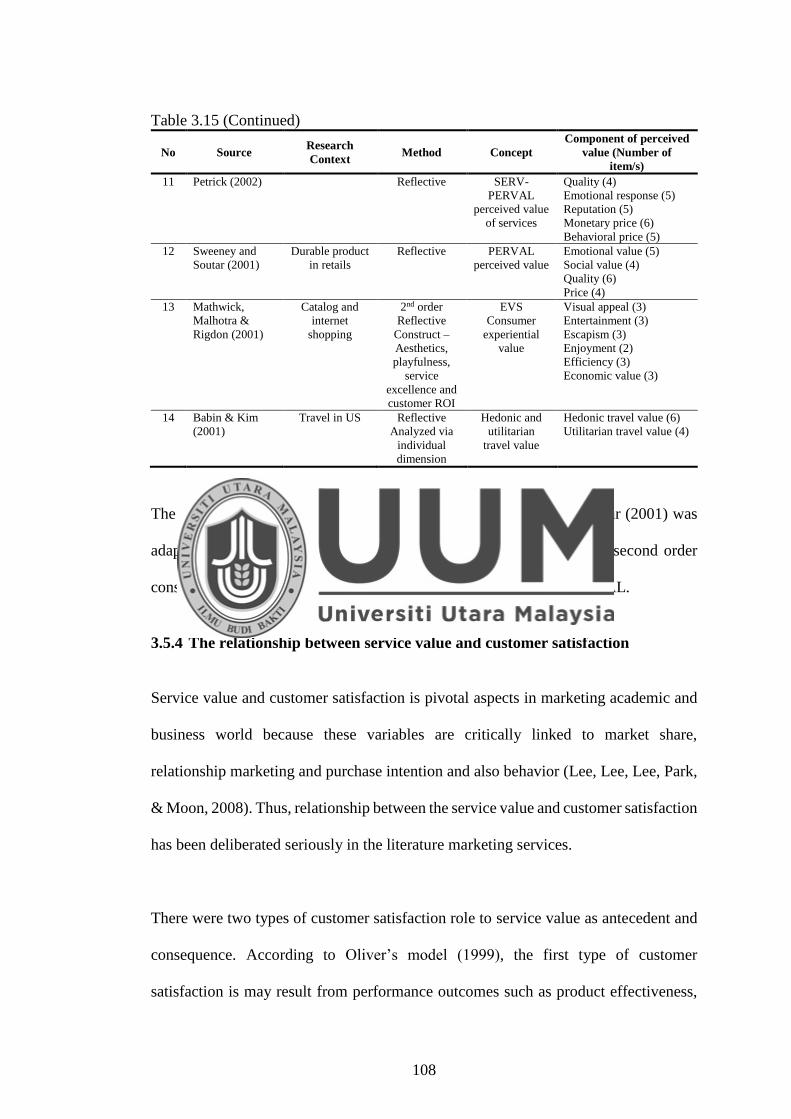
108
Table 3.15 (Continued)
No Source Research
Context Method Concept
Component of perceived
value (Number of
item/s)
11 Petrick (2002) Reflective SERV-
PERVAL
perceived value
of services
Quality (4)
Emotional response (5)
Reputation (5)
Monetary price (6)
Behavioral price (5)
12 Sweeney and
Soutar (2001)
Durable product
in retails
Reflective PERVAL
perceived value
Emotional value (5)
Social value (4)
Quality (6)
Price (4)
13 Mathwick,
Malhotra &
Rigdon (2001)
Catalog and
internet
shopping
2nd order
Reflective
Construct –
Aesthetics,
playfulness,
service
excellence and
customer ROI
EVS
Consumer
experiential
value
Visual appeal (3)
Entertainment (3)
Escapism (3)
Enjoyment (2)
Efficiency (3)
Economic value (3)
14 Babin & Kim
(2001)
Travel in US Reflective
Analyzed via
individual
dimension
Hedonic and
utilitarian
travel value
Hedonic travel value (6)
Utilitarian travel value (4)
The measurement scales of PERVAL developed by Sweeney and Soutar (2001) was
adapted in present study. Additionally, service value was assessed as second order
construct through formative measurement of four dimensions of PERVAL.
3.5.4 The relationship between service value and customer satisfaction
Service value and customer satisfaction is pivotal aspects in marketing academic and
business world because these variables are critically linked to market share,
relationship marketing and purchase intention and also behavior (Lee, Lee, Lee, Park,
& Moon, 2008). Thus, relationship between the service value and customer satisfaction
has been deliberated seriously in the literature marketing services.
There were two types of customer satisfaction role to service value as antecedent and
consequence. According to Oliver’s model (1999), the first type of customer
satisfaction is may result from performance outcomes such as product effectiveness,

109
service quality or cost-based value such as low price. The second type of satisfaction
is termed value-added satisfaction which suggesting that satisfaction is derived from
customer service value. In the event of customer is dissatisfy it will resulting in a
negative impact to customer service value. In Chang and Hsu (2013) study confirmed
that the value based satisfaction is the result from a cognitive comparison process
where cognitive evaluation taking place before the affective response occurred.
For present study, the first type of customer satisfaction was referred that focus on
customer satisfaction is consequence from service value where providing value to
customers continuously will highly satisfy customers (Schiffman & Kanuk, 2004).
Generally, the direct relationship of service value has been accepted as a reliable
predictor of customer satisfaction in past studies in various service industries and
consistent from past and present studies (Eid & El-Gohary, 2015; Walsh, Shiu, &
Hassan, 2014; Gallarza et al., 2013; Ryu, Lee, & Kim, 2012). The list of the significant
relationship between service value and customer satisfaction in past studies were
enlisted in Table 3.16.
Table 3.16
The significant direct relationship between service value and customer satisfaction
No Source Research
Context Method Value concept
Variance
Explained (R2)
1 Eid & El-Gohary
(2015)
Muslim
tourist in UK,
Egypt and
UAE
Reflective
6 dimensions were
tested individually
SEM-AMOS
Muslim Consumer
Perceived Value
multi-dimensional
Traditional
Quality;
Value for money,
Emotional, Social
Islamic
Physical &
Non-physical
attribute
0.64
Only non-physical
Attribute was
found not
significant to
satisfaction
2 Walsh et al.
(2014)
Furniture
stores in US
and UK
Reflective
4 dimensions were
tested individually
SEM-AMOS
PERVAL
Multi-dimensional
0.52 to 0.55
All dimensions are
significant

110
Table 3.16 (Continued)
No Source Research
Context Method Value concept
Variance
Explained (R2)
3 Wu (2014) Gaming in
China, Macau
Reflective
SPSS
Overall value and
value for money
Multi-items
0.84
For perceived
value, image but
service quality is
not significant
4 Chen (2013) Agriculture
farms in
China
3rd order
Reflective-
formative-formative
SEM-PLS
Perceived value
formed by benefits
and sacrifices
0.26
5 Howat &
Assaker (2013)
Outdoor
aquatic
centres in
Australia
Reflective
SEM-PLS
2 items value for
money
0.29
for perceived
quality and value
6 Ryu et al.(2012) Chinese
restaurant in
US
Reflective
SEM-AMOS
Multi-items
Benefits and
sacrifices
n.a.
7 Williams &
Soutar (2009)
Adventure
tourism in
Australia
Reflective
Analyzed via
individual
dimension
SEM approach
PERVAL
Multi-dimensional
0.62
8 Lin et al. (2005). Online
shopping in
Taiwan
2nd order
Formative model
Reflective model
Unidimensional
model
SEM-AMOS
Give-versus-get n.a.
All models is
significant
9 Lages &
Fernandes
(2005)
Telecommuni
cations
service in
Portugal
2nd order
Reflective
SEM-LISREL
SERPVAL
Peaceful life
Social recognition
Social integration
0.16 to 0.19
10 Cronin, Brady,
& Hult (2000)
6 service
industries in
US
Reflective
SEM-LISREL
4 model tested
Used 2 items –
overall value 1
items and get and
give 1 items
0.42 to 0.44
Also found
significant SAT
SV in Value
model
11 Patterson &
Spreng (1997)
B2B
3
consultancy
firms in
Australia
Single item
measurement for
value
SEM-LISREL
Unidimensional
single item
n.a.
Strong impact
value to
satisfaction
* n.a. = not applicable
3.5.5 The relationship between service marketing mix and service value
Service marketing mix and service value has been recognized as important as aspects
that able to preserve or boost the organization’s product or services toward
competitiveness (Gallego, Rubalcaba, & Hipp, 2013), increase customer loyalty,
branding (Tridhoskul, 2014) and profitability (Puustinen, Maas, & Karjaluoto, 2013).

111
The service marketing mix as a basic tools that used by organization to plan, strategize
and later, to operationalize all marketing effort. In this regard, all elements of service
marketing mix such as service product, price, place, promotion, people, process and
physical evidence should work together that able to influence customer in valuing the
services. A systematic review study by Birnik and Bowman (2007) claims that
marketing mix and value chain integration were orthogonal. Thus, they suggests that
future research should combines marketing mix research into the integration of value
chain for better understanding on the relationship between customer experience and
operational delivery.
Additional support to the above suggestion, Gallego et al. (2013) views that activities
highly recognized in value chain includes (1) inbound logistics such activities
concerned with receiving and storing externally sourced materials; (2) operations such
as activities related to the production of goods and services; (3) outbound logistics
such as activities concerned with distributing the final product: (4) other support that
relate to the management of human resource and (5) innovative such as technology,
organizational, strategic, operations and commercial as value added in product or
services. Excellence delivery of service marketing mix will offer a good consumption
experience and boost a positive feeling to the customer as emotional things is part of
value dimension.
Through theoretical perspective, Chang et al. (2011) and Jacoby (2002) in stimuli-
organism-response (S-O-R) paradigm suggests that external stimuli factor lead to
internal states of individual to think and evaluate. According to Bagozzi (1986), when
consumer behavior is depicted as an S-O-R system, the stimuli is external to the person

112
and consist of both marketing mix variables and other environmental inputs. In line
with this theory, service marketing mix elements is a part of external stimuli such as
products, brands, logos, ads, packages, prices, stores and store environments (Jacoby,
2002). While value is included in the organism stage which act as cognitive system
such as thinking and evaluation. Structural equation measurement study by Goi,
Kalidas, and Zeeshan (2014) in the international and local retailers of coffee-house had
found that stimulus factors had influenced to organism and responses significantly.
Thus, this paradigm support that the elements of service marketing mix is link and able
to affect the customer judgment on service value.
Very little was known about the relationship between service marketing mix as a whole
construct or it elements and service value. Among empirical studies had been
conducted is Cengiz and Yayla (2007). They claimed that no empirical studies has
been conducted to analyze the relationship between marketing mix, service quality,
service value, customer satisfaction, customer loyalty and word of mouth. Based on
their study in accounting services setting through structural equation measurement
method, they had found only price and place element is significant to service value
while product and promotion element is not as shown in Figure 3.7. Their study also
found that several insignificant relationships between marketing mix elements with
other variables like service quality and customer satisfaction. Therefore, Cengiz and
Yayla (2007) demand a further investigate among these variables in other service
context and region.
Other studies like Ye, Li, Wang, and Law (2014) for quality perspective in hotel setting
in China had found that location, cleanliness and employee’s service were significant

113
to service value. Price had more significant effects on service value but through
negative relationship.
Figure 3.7
Structure equation analysis result
Source: Cengiz and Yayla (2007)
In contrary, a study of Ryu et al. (2012) in Chinese restaurant in USA had found quality
of physical environment and service were not significant with customer service value
but quality of food which represent product element had found significant relationship
to customer service value.
In effort to provide more findings of past studies, Table 3.17 showed the relationship
between service marketing mix elements and service value where the results was
generally inconsistent. Therefore, the relationship is not yet clearly or completely
understood and the investigation on the relationship between service marketing mix
and service value has received very little attention in literature.

114
Table 3.17
The relationship between service marketing mix elements and service value
No Source Industry Country
Elements of service marketing mix
and service value
Pro
du
ct
Pri
ce
Pla
ce
Pro
mo
tio
n
Peo
ple
Ph
ysi
cal
Ev
iden
ce
Pro
cess
SM
M
1 Ye, Li, Wang &
Law (2014) Hotel
Beijing,
China - -* * - * * - -
2 Ryu et al. (2012) Chinese
Restaurant USA * - - - ns ns - -
3 Thamrin (2012) Shipping Indonesia - - - - - - - ns
4 Kwun (2011) Campus
Foodservice USA * - - - * ns - -
5 Park & Lennon
(2009) Fashion USA ns - - * - - - -
6 Ladhari &
Morales (2008) Library Canada - - * - * - * -
7 Cengiz & Yayla
(2007)
Accounting
service Turkey ns * * ns - - - -
8 Oh (1999) Hotel USA - -* - - - - - -
* = At least p<0.05
-* = negative relationship at least p<0.05
ns = not significant
- = not tested
3.5.6 The relationship between service quality and service value
No doubt that service quality and service value had long been of interest to marketing
researchers. The service quality concept was defined as the customer's assessment of
the overall excellence or superiority of the service (Zeithaml, 1988). While Cronin and
Taylor (1994) conceptualize the service quality that reflected to the performance based
evaluation of service quality perception during a service encounter. In Bolton and
Drew (1991) article, they had defined perceived service quality was consisted of
components though performance, expectation and disconfirmation. The functional
quality such as responsive, reliability, empathy and assurance and technical quality
such as tangible become main drivers to customer in assessing the worthiness of

115
buying product or engaging the services in term of price, effort, emotion, relationship
and social. The customer will enjoy the high quality performance, speed of service
delivery, convenience and friendly services through superiority of service given by
provider as an important impact for customer comparing what he/she get compare to
what he/she give.
Therefore, service quality play important role in determining service value. Result
from Cronin et al. (2000) study shows that perception of quality had defined largely
on service value where it emphasize greatly on quality rather than cost linked with its
exchange transaction. Other scholar, Shukla (2010) report the past studies such as
Andreassen and Lindestad (1998) and Dodds et al. (1991) including more recent
studies as shown in Table 3.18 had consistently found similar results that customer’s
evaluation of perceived service value was depends directly on customer’s evaluation
of perceived service quality. Ledden, et al. (2011) acknowledged that several scholars
like Gallarza and Saura (2006), Ruiz et al. (2008), Sánchez-Fernández and Iniesta-
Bonillo (2009) and Walsh et al. (2014) had treated quality as a dimension of the get
component of value. Furthermore, Sweeney, Soutar, and Johnson (1999) have
emphasized that the role of service value was vital part in decision making process and
perceived service quality was a main antecedent variable of service value.
Table 3.18
The significant direct relationship between service quality and service value
No Source Research
Context Method
Service Quality
Concept Value concept R2
1 Wu (2014) Gaming in
China,
Macau
Reflective
SPSS
Overall service
quality
Overall value and value
for money
Multi-items
0.59
2 Jo et al.
(2014)
Tea Guest
House,
Korea
Reflective
SEM
2 dimension of
service quality
Staff*
Facility*
2 dimension of
perceived value
Functional
Emotional
0.49
0.71

116
Table 3.18 (Continued)
No Source Research
Context Method
Service Quality
Concept Value concept R2
3 Howat &
Assaker
(2013)
Outdoor
aquatic
centres in
Australia
Formative
for service
quality
SEM-PLS
2nd order of
service quality
formed by 4
dimensions
Unidimensional2 items
value for money
0.43
4 Gallarza,
et al.
(2013)
Travelling
in Spanish
Reflective
SEM-PLS
Unidimensional
Service quality of
9 items
Unidimensional 3 items
derived from overall
perceived value,
sacrifice and benefit
n.a.
5 Ghalandari
(2013)
Hypermar
kets in
Iran
Reflective
SEM-
LISREL
Unidimensional
Perceived service
quality of 4 items
Unidimensional
perceived value of 4
items
n.a.
6 Ryu et
al.(2012)
Chinese
restaurant
in US
Reflective
SEM-
AMOS
Physical
environment
quality n.s.
Food quality*
Service quality n.s.
Unidimensional
Multi-items
Benefits and sacrifices
n.a.
Only food
quality was
significant
to perceived
value
7 Swaid &
Wigand
(2012)
Online-
focused
shopping
in US
Reflective
SEM-
AMOS
Overall service
quality
Unidimensional
Perceived value of 4
items
n.a.
8 Ledden, et
al, (2011)
Higher
education
in UK
Reflective
and
formative
PLSGRAP
H
2nd order Service
quality formed by
SERVQUAL
dimensions
Functional*
Epistemic*
Social-others*
Social-students*
Emotional*
Image*
Money*
Time n.s.
0.23 – 0.27
0.34 – 0.54
0.19 – 0.21
0.60 – 0.61
0.11 – 0.28
0.31 – 0.33
0.19 – 0.43
0.03
9 Kim &
Damhorst
(2010)
Apparel
Internet
shopping
Reflective
SEM-
AMOS
Unidimensional
Perceived service
quality of 3 items
and
Perceived apparel
quality of 3 items
Unidimensional
Perceived value of 5
items
Low
treatment =
0.35
Low
treatment =
0.47
10 Kuo, Wu,
& Deng
(2009)
Mobile
value-
added
Reflective
SEM-
LISREL
SERVPERF
Customer service
and system
reliability*
Navigation and
visual design*
Content quality*
Connection
speed*
Unidimensional
Perceived value of 3
items
0.46
11 Lee, Lee,
Lee, Park,
& Moon
(2008)
Hotels 3,
4 and 5
star
Reflective
SPSS
SERVPERF
Tangibles*
Reliability*
Responsiveness *
Assurance n.s.
Empathy*
Unidimensional
Perceived value of 6
items
0.58, 0.53,
0.55
Empathy*
all hotel
grades and
assurance
not
significant
in all hotel
grades. Mix
result for
other quality
dimensions

117
Table 3.18 (Continued)
No Source Research
Context Method
Service Quality
Concept Value concept R2
12 Cronin et
al. (2000)
6 service
industries
in US
Reflective
SEM-
LISREL
Unidimensional
of 10 items
4 model tested
Used 2 items – overall
value 1 items and get
and give 1 items
n.a.
significant
in all
industries
* significant
n.a. = not applicable
n.s. = not significant
3.5.7 Service quality as mediator between service marketing mix and service
value
Service marketing mix, service quality and service value is important variables exist
between service provider and customer. Service marketing mix helps organization to
strategize and operationalize the services to be offered to customers (Aghaei et al.,
2014; Kaura, 2013). This can be considered as first contact stage to customers. After
customers are attracted and subsequently subscribe the services, customer will make
an assessment quality of the service that had been experienced. Service people,
process, physical evidence, service product and communication were related to
dimension of service quality including technical quality (Janipha et al., 2015; Al-alak,
2013; Baker et al., 2002).
At another stage, customer will make a judgment whether the service subscribed by
the customer is worthy or otherwise which this stage can be called as service value
judgment. Quality and performance of services is a part of service value dimensions
(Walsh et al., 2014; Sánchez-Fernández & Iniesta-Bonillo, 2009; Ruiz et al., 2008;
Gallarza & Saura, 2006; Sweeney et al., 1999).

118
In Nasution et al. (2014) article, they had conceptualized the relationship between
service marketing mix, service quality and service value in their Customer Experience
Framework. They propose that service marketing mix as a stimulus starter of customer
journey and customer will accumulate experience and also response at every contact
point. At the next stage, stimulus interacts with customer and the process toward
customer response derived from customer experience will be occurred such as
cognitive process which involve assessment of service quality and service value. In
this regard, service quality is antecedent to service value (Sabiote-Ortiz, Frias-
Jamilena, & Castaneda-Garcia, 2014; Voima, Heinonen, & Strandvik, 2010). The
interlinked between stimulus and cognitive as role of organism was also supported by
S-O-R theory as explained Goi et al. (2014) and Jacoby (2002).
The investigation on service quality as mediator between service marketing mix and
service value has been given less attention from past studies. In study of Cengiz and
Yayla (2007) in accounting services, it was found that product mix has a direct
relationship to service quality and it was found significant in direct relationship to
service value. Additionally, product mix has indirect relationship to service value
through service quality. However, no further explanation on this relationship in their
study. A study of Thamrin (2012) in ship passenger’s satisfaction had found that
service marketing and service quality simultaneously influence service value. Further,
he concludes that service marketing mix and service quality can be jointly affects
customer satisfaction where service value had a direct relationship to customer
satisfaction.

119
As mentioned above, there were limited empirical studies to investigate these
relationships. Due to this reason, it is valuable for present study to continue
investigating on this relationship.
3.5.8 Service value as mediator between service marketing mix and customer
satisfaction
Integration of service value in the relationship between service marketing mix and
customer satisfaction will contribute to a more variance explains in satisfaction
construct. Past studies had affirmed that service value was an antecedent to customer
satisfaction (Prebensen, Woo, & Uysal, 2013; Gallarza et al., 2013; Ghalandari, 2013;
Chen, Liu, Sheu, & Yang, 2012; Hume & Mort, 2010).
The relationship between service marketing mix and service value is interconnected.
The elements of service marketing mix such as product, price, promotion, place,
people, process and physical evidence become a stimuli factor to consumption value.
Sheth et al. (1991) further explain that functional value may derive from characteristic
of attributes like looks, features, reliability, durability and price which relates to
product, price, process and physical evidence element. The decision to choose type of
product or service may represent a symbolic status or visible consumption value that
explained by social value dimension.
In order to stimulate positive judgment of service value, service provider must
comprehend the mix of service marketing elements. The elements of service marketing
mix must be seen as one package to the customer where deficiency in any one element
may cause failure (Kellerman, Gordon, & Hekmat, 1995). However, the

120
implementation of service marketing mix is depends on service provider’s resources,
market conditions and fluctuation of customer needs (Goi, 2009). Thus, the strategy
decision on the elements of mix should be made after considering the impact of other
mix elements that aligned to satisfy the customer needs.
The findings from Kwun (2011) study reveal that food quality and menu variety
represent product element has been partially mediated by service value for female
consumers. The items of service quality in Kwun’s study represent the people element
which had found completely mediated by service value. While for male consumers,
service value only partially mediate food quality and customer satisfaction.
The role of service value as mediating variable between service marketing mix and
customer satisfaction was not fully investigated in the past. It would be interesting to
find out the mediating role of service value as contribution to knowledge in present
study.
3.5.9 Service value as mediator between service quality and customer satisfaction
The role of service value is crucial within the service provider and customer
relationship. Moreover, the role of service value is considerable as unique where this
variable can serve the relationship as mediator (Cronin et al., 2000) and moderator
(Caruana, Money, & Berthon, 2000). Thus, it is vital to have a better understanding on
the role of service value.
Service value has been empirically known as a mediating variable in the relationship
between service quality and customer satisfaction (Chen et al., 2012; Lee et al., 2008).

121
A study conducted by Brady, Robertson, and Cronin (2001) and Cronin et al. (2000)
suggests that the cognitively oriented service quality and service value appraisal was
antecedent to customer satisfaction assessment. Based on literature review studied by
Chen et al. (2012), service value serves more influential predictor than service quality
in service assessment. Empirically, the study findings by Kuo et al. (2009) affirms that
the total effects of post-purchase intention were highly contribute from service value,
followed by service quality and customer satisfaction. It was concluded that delivering
a higher service value will increase a positive behavioral intention and word of mouth
among customers.
A study using structural equation model carried out by Hume and Mort (2010) in
performing arts setting in Australia reveals core service quality to customer
satisfaction and repurchase intention has been fully mediated by service value but not
peripheral service quality and appraisal emotion. They suggests that managers should
focus on core service quality as key factor such show or act in performing arts to
determine repurchase intention. Their study also found that the core service quality,
peripheral service quality and appraisal emotion had a direct relationship to service
value but not for customer satisfaction and service value was significant to customer
satisfaction. Therefore, the complex mediation role involved by service value should
warrants for further research.
Another evidence for the mediation role of service value is Kwun (2011) study. His
study in campus foodservice had found that mediation role of service value was varied
between gender. For female consumers, the relationship between service quality and
customer satisfaction was entirely mediated by service value. While food quality,

122
menu has been partially mediated by service value. On contrary, only food quality was
mediated by service value for male consumers. The result indicates that assessment
made by male and female consumers on campus foodservice attributes offer mixed
trade-off benefits on service value and provide different effects on satisfaction and
consumer attitude.
Result from Kwun (2011), Kuo et al. (2009) and Cronin et al. (2000) study indicates
that service quality, service value and customer satisfaction can collectively contribute
to a large effect on post-purchase intention and perception of customer service.
Further, they suggest analysis on the integration of these variables shall be carried out
simultaneously through multivariate analytic approach.
The above literature reviews had supported the role of service value as mediating
variable between the relationship of service quality and customer satisfaction. Due to
the service type and location factors may uncertain the finding of the relationship,
continuous investigation on this relationship will contribute to existing knowledge.
Since the study on this relationship has been overlooked in parking service specifically
in Malaysia context, the question is remain. Therefore, it would be valuable to present
study to find answer on this relationship to fill the existing gap.
3.6 Underpinning theory: Stimulus-Organism-Response
The expression Stimulus-Organism-Response (S-O-R) was firstly introduced by
Robert S. Woodworth in 1921 (Hergenhahn & Henley, 2014). Woodworth disagree
with environment adjustment was only restricted to the stimuli-response (S-R)
relationship. He claimed that psychologists has left out the role of brain mechanism

123
and then emphasize the important of organism in S-O-R relationship. Woodworth used
the term of mechanism which was refers to the way organism interacts with the
environment in order to satisfy a need. The internal condition of the organism activates
the organism behavior and the organism will be become inactive unless it was
activated through present of a need or drive (Hergenhahn & Henley, 2014).
The S-O-R model contain of three stages namely, stimulus, organism and response.
Stimulus is refer to all those factors that have impact to individual internal states and
stimulates the individual (Eroglu, Machleit, & Davis, 2001). According to Belk
(1975), he explains that “all those factors” represents five categories of situational
characteristics namely physical surrounding, social surrounding, temporal perspective,
tasks definition and antecedent states. Bagozzi (1986) describes that in situation where
consumer behavior was following a sequence of S-O-R system, the stimuli factors are
external to the individual and marketing mix elements such as product, price,
advertisement, brand and other surrounding setting are part of stimuli factors (Chang
et al., 2011). While, Jacoby (2002) argue that stimulus was best known as a “package”
of many that often interrelating and competing stimuli.
Organism refers to human internal processes that represented by emotional and
cognitive systems including prior experience also known as “long-term memory”
(Jacoby, 2002). The structure of organism is intervenes process between stimuli
external to the individual and the final outcome, reactions or responses emitted which
consist of perceptual, physiological, feeling and thinking activities (Bagozzi, 1986) for
example past experience, knowledge, beliefs, emotional, service value (Jacoby, 2002)
and perceived service quality (Wang, Hernandez, & Minor, 2010; Kim & Moon,

124
2009). Lastly, response stage in the S-O-R framework embodies the ending results and
the final judgements of consumers, which can be favorable or unfavorable behaviors
(Sherman, Mathur, & Smith 1997; Donovan & Rossiter, 1982). Jacoby (2002) refers
response as those responses that was externally detectable include verbal, non-verbal
and behavioural responses such as word of mouth, usage, purchase and revisit.
However, Jacoby (2002) also states that responses such as intention, satisfaction,
beliefs and attitude were not visible to an outsider which also known as internal
response.
The theoretical framework of S-O-R was present in Figure 3.8. The S-O-R framework
explains that the stimulus encourage the variation of effect or response depending on
the state of the organism as a mediator which in turn causes approach as positive
response or avoidance as seen as negative response. The organism mediates the
relationship between the stimulus and the response factor.
Figure 3.8
S-O-R theoretical framework
Source: Adapted from Chang et al. (2011)
In the similar thought, Mehrabian and Russell (1974) model had applied the S-O-R
framework in their environmental psychology study. Later, Donovan and Rossiter
(1982) had adopted Mehrabian and Russell (1974) model and introduce it into
marketing context. The model postulates that environmental stimuli (S) pointer to an
emotional reaction as internal part of organism (O) that drives consumer’s behavioral
STIMULI (S)
Example: marketing mix
variables such as product, price, advertisement, brand and other
environmental inputs
ORGANISM (O)
Example: past experience,
knowledge, beliefs, emotional, perceived value and perceived
service quality
RESPONSE (R)
Example: word of mouth, usage,
purchase and revisit intention. For internal response such as
satisfaction, beliefs and attitude
125
response (R). Further to this model, emotion states was used to represent organism
mechanism where pleasure, arousal, and dominance dimensions were conceptualized
in emotion construct. Past studies had adopted Mehrabian and Russell’s model to
investigate the relationship of environmental stimuli as a predictor of emotional states
and emotional as a predictor of consumer behaviours in several industries such as
retailing (Goi et al., 2014; Kim & Lennon, 2013; Vieira, 2013; Chang, Eckman, &
Yan, 2011) and restaurants (Hyun & Kang, 2014; Jang & Namkung, 2009; Liu & Jang,
2009).
However, several scholars in view that the Mehrabian and Russell’s model has been
limited to environmental aspect as stimuli and may not adequately to represent the
consumer’s behaviour response. For example, Goi et al. (2014) study finds that beside
environmental elements, the value based on price paid by customer play a significant
role in stimulus construct. Another finding by Goi et al. (2014), the impact of stimulus
to the response was higher compared to the impact of organism to response. This
indicates that the environmental factor may not sufficient to appeal customer to visit a
store and customer’s response occurred is not only accordance to the cue of S-O-R
model but also need to consider incorporation of stimuli as a predictor of response.
Another scholar Hyun and Kang (2014) finds that environment and non-environmental
factors such as price, product quality and service quality were found significant to
emotion aspect as more holistic approach to investigate the relationship between
emotional and customer behavioural response. In same result with Goi et al. (2014)
study, Jang and Namkung (2009) suggests that stimuli aspects should be examined in
broaden contact to organism and response despite the sequence of S-O-R. Their

126
suggestion also parallel with Hyun and Kang (2014) study where stimuli factors should
not only limited to environment factor and to consider other elements such as product
and service quality.
In Jacoby (2002) article, he propose a reconceptualization of S-O-R framework. He
argues that the S-O-R framework was based on linear relations or logically relationship
phenomena which suggest a sequential of SOR process. The framework may not
be able to fit with dynamic process which influenced by multitude phenomena, the
constructs and relationships especially when the phenomena is non-linear and not
necessarily logical. He further claims that existing framework may cause difficulties
to categorize due to lack of clarification on a particular phenomenon under stimulus,
organism and response such as factor of ethnic, religious, social class, reference group
and other social influences, beliefs, attitudes, intentions and satisfaction.
Thus, Jacoby (2002) proposes the comprehensive relationship framework between S-
O-R as shown in Figure 3.9. The diagram shows seven sectors of psychological
systems that is sector 1 represent “Encountered Environment” as experienced by
individual at a particular moment which includes marketing mix, communication and
other impinging factors; sector 2 represent “Automatic Processing” involve
unconsciously process incoming stimuli or internally activated stimuli or both; sector
3 represent “Experiential Storehouse” related to the individual's emotive and cognitive
systems, including all retained prior experience; sector 4 represent “Consciousness”
consists mental responses of the moment of which the individual is consciously aware;
sector 5 represent “Nontrace Stimulus-Response Events” are automatic and leave no
psychological trace of their occurrence; sector 6 represent “Internal Responses”
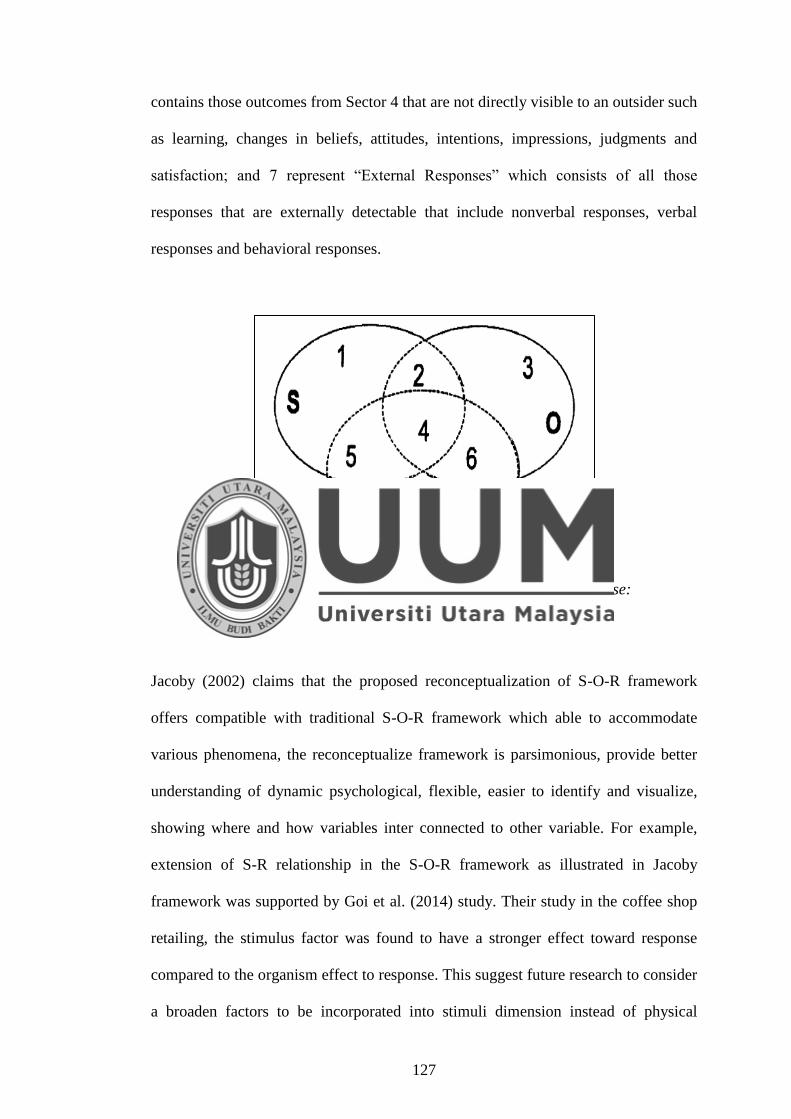
127
contains those outcomes from Sector 4 that are not directly visible to an outsider such
as learning, changes in beliefs, attitudes, intentions, impressions, judgments and
satisfaction; and 7 represent “External Responses” which consists of all those
responses that are externally detectable that include nonverbal responses, verbal
responses and behavioral responses.
Figure 3.9
Toward reconceptualizing Stimulus-Organism-Response:
A temporally bound two-dimensional representation
Source: Jacoby (2002)
Jacoby (2002) claims that the proposed reconceptualization of S-O-R framework
offers compatible with traditional S-O-R framework which able to accommodate
various phenomena, the reconceptualize framework is parsimonious, provide better
understanding of dynamic psychological, flexible, easier to identify and visualize,
showing where and how variables inter connected to other variable. For example,
extension of S-R relationship in the S-O-R framework as illustrated in Jacoby
framework was supported by Goi et al. (2014) study. Their study in the coffee shop
retailing, the stimulus factor was found to have a stronger effect toward response
compared to the organism effect to response. This suggest future research to consider
a broaden factors to be incorporated into stimuli dimension instead of physical

128
environment dependable and further suggest to develop a better instrument to clarify
organism dimensions. The extended S-O-R framework adapted in Goi et al. (2014)
study was illustrated in Figure 3.10.
Figure 3.10
Extended S-O-R framework
Source: adapted from Goi et al. (2014)
3.6.1 Relationship of Stimulus-Organism-Response theory with the present study
model
One of the fundamental theories used in explaining on consumer behaviour perspective
is stimulus-organism-response (S-O-R) framework. The S-O-R framework adapted
from Mehrabian and Russel (1974) was mostly referred by scholars to investigate
consumer behavior in regard of environmental effects especially in retailing and
hospitality industry (Jani & Han, 2015). However, environmental variable as stimulus
factor, emotional variable as organism factor and the sequence path of SOR is no
longer exclusive to S-O-R framework. Since the framework offer more room to be
further explored, several studies had attempted to include more variables in the S-O-R
framework such as product attributes and price (Lee & Yun, 2015), human and value
elements (Goi et al., 2014), personality factors (Jani & Han, 2015), reputation and
quality elements (Kim & Lennon, 2013), technology and ambient conditions (Hossain,
Stimulus (S) Response (R)
Organism (O)

129
Kim, Lee, & Kim, 2012), human elements (Liu & Jang, 2009) and hedonic and
utilitarian value (Peng & Kim, 2014) for stimuli stage. While for organism stage,
service value (Lee & Yun, 2015), perceived service quality (Wang, Hernandez, &
Minor, 2010; Kim & Moon, 2009) and perceived risk (Kim & Lennon, 2013; Lee,
Kim, & Fiore, 2010) were used in the past studies instead of limited to emotional aspect
only because emotion was co-exist with cognitive systems to produce satisfaction
(Oliver, 1997).
Present study adopting the extended S-O-R framework that proposed by Goi et al.
(2014) with variables that goes beyond traditional S-O-R framework (Mehrabian &
Russel, 1974). Furthermore, the extended S-O-R framework will be integrated with
7Ps of service marketing mix (Booms & Bitner, 1981) and PERVAL framework
(Sweeney & Soutar, 2001) as this study attempt to contribute knowledge in broaden
knowledge in the S-O-R theoretical framework.
According to Bagozzi (1986) and Jacoby (2002), the elements of marketing mix are
one of example of external stimuli to the person’s internal organism and stimuli
components should serve a “package” of many is seem compatible with the definition
of marketing mix concept as “combination of all of the factors …” (McCharty, 1964)
and “the set of controllable marketing variables that the firm blends …” (Kotler &
Amstrong, 1989). Thus, seven elements of service marketing mix namely service
product, service price, service place, service promotion, service people, service
process and service physical evidence from Booms and Bitner’s framework was
adapted to operationalize service marketing mix as a higher order construct.

130
Cognitive system is a part of human organism system beside emotional factor.
Cognitive from the view of Mey (2003) was broad and diverse range of psychological
approaches which emphasizes the configurations and progressions within the
individual’s mind that are claim to perform the paramount role in behavior such as
reading, speech, problem solving and thinking. In brief, cognitive can be viewed as
decision making process at individual level like evaluation and judgment (Kim &
Moon, 2009).
In contrast to S-O-R framework (Mehrabian & Russel, 1974), organism stage in this
study’s research framework was represented by service quality and service value
instead of emotional factor whereas the definition of both variables concept involve
the “global judgment” and “overall assessment” (Zeithaml, 1985; 1988). The present
study focus the cognitive aspect in organism stage as Lee and Yun (2015) study found
that consumers were more likely to engage in cognitive judgments than emotionally,
driven evaluations of buying organic food. Without underestimating the role of
emotional, this study adapted PERVAL instruments where emotional value is a part of
PERVAL dimensions.
In this present study does not include visible behavioural such as word of mouth,
purchase or repurchase in response stage in order to avoid too complexity of study’s
research framework. This study is interested to investigate the role of customer
satisfaction as post purchase evaluation and internal response to embody the response
stage.
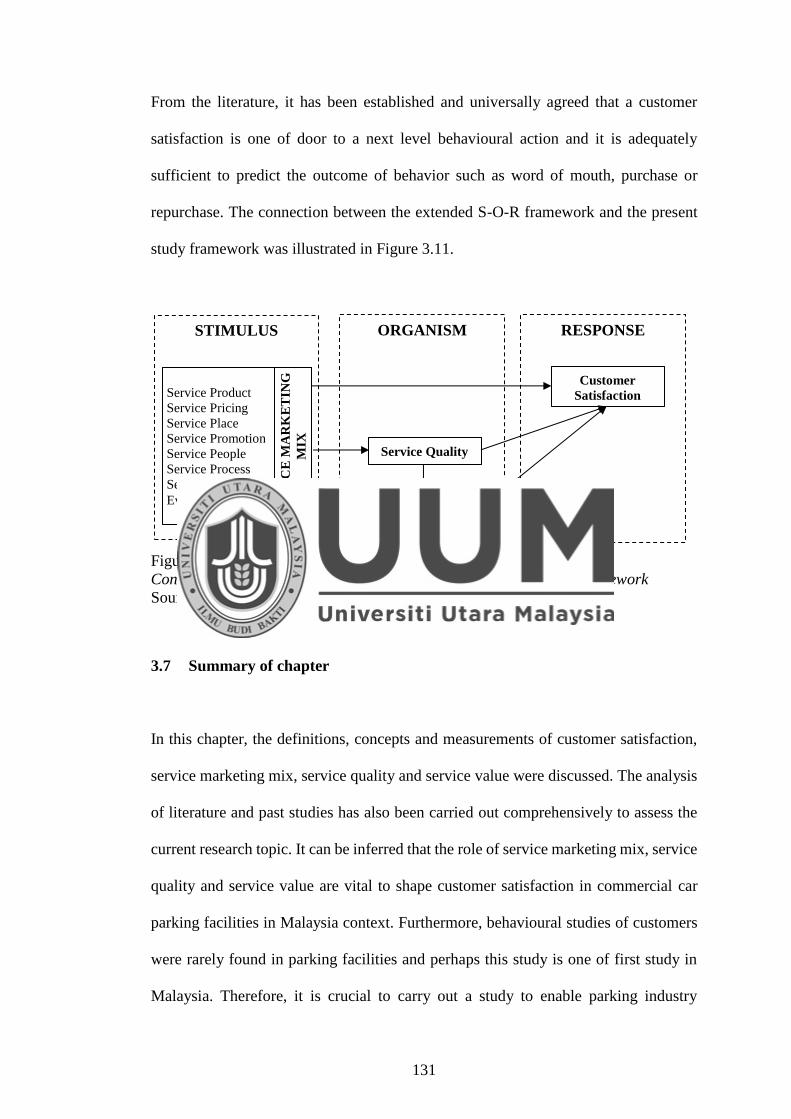
131
From the literature, it has been established and universally agreed that a customer
satisfaction is one of door to a next level behavioural action and it is adequately
sufficient to predict the outcome of behavior such as word of mouth, purchase or
repurchase. The connection between the extended S-O-R framework and the present
study framework was illustrated in Figure 3.11.
Figure 3.11
Connection between extended S-O-R framework and present study framework
Source: Adapted from Goi et al. (2014)
3.7 Summary of chapter
In this chapter, the definitions, concepts and measurements of customer satisfaction,
service marketing mix, service quality and service value were discussed. The analysis
of literature and past studies has also been carried out comprehensively to assess the
current research topic. It can be inferred that the role of service marketing mix, service
quality and service value are vital to shape customer satisfaction in commercial car
parking facilities in Malaysia context. Furthermore, behavioural studies of customers
were rarely found in parking facilities and perhaps this study is one of first study in
Malaysia. Therefore, it is crucial to carry out a study to enable parking industry
Service Product
Service Pricing
Service Place
Service Promotion
Service People
Service Process
Service Physical
Evidence
SE
RV
ICE
MA
RK
ET
ING
MIX
Service Quality
Service Value
Customer
Satisfaction
STIMULUS ORGANISM RESPONSE

132
practitioners, local authorities, government, academician and also public to understand
the demand for car parking facilities standard, to find the ways to increase customer
satisfaction and allow the policy makers to design the strategies framework for
improving public satisfaction on car parking facilities.

133
CHAPTER FOUR
METHODOLOGY
4.1 Introduction
This chapter provides a description on how the research was carried out and the
methodology employed to test the hypotheses. The chapter was divided into eight
sections. The first section begins with an introduction of research design. The second
section elaborates the sampling design. The third section discusses the development of
instrument. The fourth section presents the instrument of the study. The fifth and sixth
sections discuss the data screening and data analysis methods. The seventh section
highlights the mediation analysis method. The eight section was related to a pilot
study. Lastly, the chapter ends with a summary.
4.2 Research framework
A theoretical framework is the application of a theory or contains interrelated of
concepts to guide researchers, determine what things to be measured and offer
clarification of an occasion or shed some light on a particular phenomenon or research
problem (Imenda, 2014; Borgatti, 1999).
In present study, the research framework is adapted from Stimulus-Organism-
Response paradigm theory. In essence, this study’s goal was to investigate the
interrelationship between constructs namely service marketing mix, service quality,
service value and customer satisfaction. The context of this study was behavior
phenomenon concerning customer satisfaction in commercial car park facilities where

134
the starting point for the research framework is service marketing mix formed by seven
elements that stimulate organism and response stage. Organism stage was acted as
mediation which contained service quality construct that formed by five dimensions
and service value construct was formed by four dimensions. While, response stage
acted as an outcome was represented by customer satisfaction. The research
framework for relationship between the constructs was depicted in Figure 4.1.
Figure 4.1
Research framework
For better understanding for whole research framework, Figure 4.2 shows the
structural path model that show the relationship between items, dimensions and it
constructs. This structural model illustrate on how items and dimensions acted as low
order construct were connected to form a higher order construct. In short, application
of reflective-formative concept was used to form service marketing mix, service
quality and service value as latent variable. While, customer satisfaction construct was
measured through a reflective concept.

135
Figure 4.2
Structural path model
Once the research framework had been structured, then testable hypotheses could be
developed to investigate whether the theory formulated was valid or not (Sekaran,
2003). Therefore, based on literature review and the aforementioned research
framework, eleven hypotheses represented by H1 to H11 had been proposed. The
hypotheses were developed to support the relationship between the constructs as
discussed in the following subheading.
4.3 Hypotheses development
The hypotheses of the present study were formulated based on the research framework
as shown in Figure 4.1 above and extended S-O-R theory. The formulation of
hypotheses were expected to be true and responded to the stated objectives of study.

136
The items included in the present study’s questionnaires were corresponded to all
hypotheses.
The present study postulates the dependent variable of customer satisfaction is
influenced by service marketing mix, service quality and service value. These three
independent variables are important predictor to customer satisfaction in parking
facilities since problems experience by parking customer is always surrounded to these
variables. Additionally, this study also hypothesized the indirect relationship through
service quality and service value as mediating variable. Thus, present study had
formulated eleven hypotheses to be investigated and the development of hypotheses
was discussed in the following subheading.
4.3.1 The relationship between elements of service marketing mix
According to Chumaidiyah (2013), the seven elements of the service marketing mix
namely service product, service price, service place, service promotion, service people,
service process and service physical evidence are equally important and interrelated
between the elements, but the impact of each element is vary between elements and it
also depends on type of services. Similarly, Lee et al. (2014) claims that variation
effect of each service element due to uniqueness for particular service is depend on
service type, culture and location. Therefore, it is important for organization to
prioritize ranking of service marketing mix elements in their services for improvement
of business operation (Lin, 2011). Thus, in view of the above findings, the hypothesis
can be proposed as follows:
Hypothesis 1 (H1) : The priority between seven elements in service
marketing mix from customer perspective is varied.

137
4.3.2 The relationship between service marketing mix and customer satisfaction
Corroboratively, Goi (2009) acknowledges that marketing mix was an influential
concept to simplify the ways marketing tasks to be managed and permits the
segregation of marketing efforts towards fulfilment of customer needs and satisfaction.
This statement was supported by study findings of Sarker et al. (2012) in tourism
context where six elements of service marketing mix except service price were found
significant to customer satisfaction. Similarly, study by Alegre and Garau (2010) also
in tourism had found that the relationship between five elements of service marketing
mix namely service product, service price, service place, service people and service
physical evidence and customer satisfaction were significant. In other word,
implementation of service marketing mix would influence customer satisfaction.
However, the role of service marketing mix as one construct is still ambiguous and not
clearly explained by past studies such as Charoensettasilp and Wu (2014) and Thamrin
(2012). This is a gap that needs to be investigated in present study. Therefore, second
hypothesis for present study is proposed below:
Hypothesis 2 (H2) : There is a significant relationship between service
marketing mix and customer satisfaction.
4.3.3 The relationship between service marketing mix and service quality
The conceptual relationship between service marketing mix and service quality is
interconnected. Islam et al. (2013) argue that marketing mix elements can be exploited
for improving service quality. This also supported by S-O-R theory where people after
receiving certain stimulus will tend to think and judge in their organism system.
138
A study of Al-Dmour et al. (2013) in mobile telecom services using SPSS had
demonstrated all elements of service marketing except distribution element were
significantly related to service quality. Other study, Islam et al. (2013) in retail store
setting had found service quality was influenced by marketing mix significantly with
twenty seven percent (27%) variations. Other studies had found significant
relationship to service quality through individual element of service marketing mix,
for example Cengiz and Yayla (2007) for service product, Baker et al. (2002) for
people and physical evidence, Dhar (2015) for people element and Janipha et al. (2015)
for process element. The empirical evidence on the relationship between these
constructs was flawed because most of analysis in prior studies on service marketing
mix were based on individual elements and present study attempt to narrow this gap
by conceptualizing service marketing mix as higher order construct through formation
of seven mix elements. Based on the above discussion, the following hypothesis was
proposed:
Hypothesis 3 (H3) : There is a significant relationship between service
marketing mix and service quality.
4.3.4 The relationship between service marketing mix and service value
Through theoretical perspective of stimuli-organism-response paradigm, external
stimuli factor lead to internal states of individual to think and evaluate (Chang et al.,
2011; Jacoby, 2002). Study by Goi et al. (2014) conquered that stimulus factors had
influenced to organism significantly. This means stimulus factor like service
marketing mix able to influence people mind to do a judgment on service value.

139
Past studies on this relationship were piece meal. In study findings of Cengiz and
Yayla (2007), service price and service place were found significant to service value.
In other study, Ye et al. (2014) findings indicate location, cleanliness as part of
physical evidence and employee’s service were significant to service value. While Ryu
et al. (2012) found that quality of food which represent product element had a
significant relationship to customer service value in Chinese restaurant in USA. The
relationship between service marketing mix and service value is still not well
established or completely understood due to little attention in past literature.
Further investigation on this relationship makes a valuable finding to fulfill the
identified study gap. Moreover, the application of formative approach in service
marketing and service value enhanced the value of study’s contribution. Based on
promising conceptual idea and several past studies, the present study proposes the
following hypothesis:
Hypothesis 4 (H4) : There is a significant relationship between service
marketing mix and service value.
4.3.5 The relationship between service quality and customer satisfaction
Service quality as antecedent to customer satisfaction has been long investigated
(Izogo & Ogba, 2015; Rajaratnam et al., 2014) and consistent findings on direct
relationship between service quality and customer satisfaction is well proven in past
studies Han and Hyun (2015), Kashif et al. (2015), Izogo and Ogba (2015); Rajaratnam
et al. (2014), Hussain et al. (2014), and Giovanis et al. (2014).

140
Even though most empirical evidences had showed significant role of service quality
to customer satisfaction, further investigation on this relationship shall be continue and
not to be taken lightly especially in unexplored services setting like car parking
services because in several studies, service quality were found insignificant to
satisfaction such as Wu (2014), and Wong and Fong (2010) in gaming industry and
Hume and Mort (2010) in arts performance. The degree of car parking services is
higher on physical aspect than human interaction. Unlike with most past studies, the
formation of service quality in this study consists five dimensions of SERVQUAL
with extension of technical quality dimension which may impact to customer
satisfaction differently. In order to fulfill existing gap in parking services in Malaysia
context, present study proposes the following hypothesis:
Hypothesis 5 (H5) : There is a significant relationship between service
quality and customer satisfaction.
4.3.6 The relationship between service quality and service value
The relationship between service quality and service value had been studied
intensively in the past and still becomes one of main interest in recent studies. The
findings result on this relationship had been consistently proven where the evaluation
of perceived service value was depends directly on customer’s evaluation of perceived
service quality (Wu, 2014; Jo et al., 2014; Howat & Assaker, 2013; Gallarza et al.,
2013; Ghalandari, 2013).

141
Further study on this relationship in different context such as car parking services
enriches the existing knowledge. Thus, based on the above discussion, the hypothesis
for this relationship was proposed as follows:
Hypothesis 6 (H6) : There is a significant relationship between service
quality and service value.
4.3.7 The relationship between service value and customer satisfaction
The relationship between the service value and customer satisfaction has been
deliberated seriously in the literature marketing services. Many of studies on this
relationship claims that service value is antecedent to customer satisfaction and was
found significantly influence to customer satisfaction (Eid & El-Gohary, 2015; Walsh
et al., 2014; Wu, 2014; Chen, 2013; Howat & Assaker, 2013; Ryu et al., 2012;
Williams & Soutar, 2009; McDougall & Levesque, 2000; Andreassen & Lindestad,
1998; Patterson & Spreng, 1997).
Acknowledged on the past findings on significant relationship for these two construct
but is not limited the present study to continue investigation in this relationship. The
findings of present study in the car parking services context may contribute to the
existing knowledge in respect of this relationship. Based on the above discussion, the
seventh hypothesis was proposed as follows:
Hypothesis 7 (H7) : There is significant relationship between service value
and customer satisfaction.

142
4.3.8 The mediating role of service quality between service marketing mix and
customer satisfaction
Service marketing mix is at the beginning stage as stimulus factor for customer to
evaluate the degree of service quality rendered by service provider in human organism
system. High service quality will drive high satisfaction to the customers as internal
response. In short, service quality depends on a marketing mix which eventually
reflected in the customer satisfaction. This flow is in line with S-O-R theory (Goi et
al., 2014; Jacoby, 2002).
However, only a few studies had conceptualized service quality as mediator variable
and these inter-linkages relationship between service marketing mix, service quality
and customer satisfaction is still remain as a gap in the service context. The role of
service quality as mediating variable was also supported by Andrade et al. (2013).
Their structural equation model study reveals that physical environment quality
mediates the relationship between objective environmental and outpatient patient’s
satisfaction.
Another structural equation model study by Islam et al. (2013) in four retails stores in
Taiwan, had found that mediation effect of service quality between marketing mix and
customer loyalty. Although the dependent variable in Islam et al. (2013) study is
customer loyalty, this study propose that the mediation effect of service quality
between marketing mix and customer satisfaction should be same like Islam et al.
(2013) study since customer satisfaction is consistently become an antecedent to
customer loyalty.
143
As mentioned above, the relationship between service marketing mix, service quality
and customer satisfaction is still ambiguous and need to be investigated. Therefore,
present study attempt to find an answer on the said relationship by proposing the eighth
hypothesis as follows:
Hypothesis 8 (H8) : Service quality mediates the relationship between
service marketing mix and customer satisfaction.
4.3.9 The mediating role of service quality between service marketing mix and
service value
In study of Cengiz and Yayla (2007) in accounting services, it was found that product
mix has a insignificant direct relationship to perceived value but it was found
significant through indirect relationship of service quality to service value. While in
ship passenger’s satisfaction study, Thamrin (2012) had found that service marketing
mix and service quality simultaneously influence service value. The above result
indicates that the impact of service marketing mix will exist on service value after
assessment of service quality. Although there were limited evidences to support
service quality as a mediator, but based on theoretical perspective of the S-O-R model,
the cognitive part in human organism can be represented by evaluation of service
quality and also service value. Within cognitive stage in customer mind, quality will
be assessed first then followed by judgement of value where quality always became
important aspect to service value (Wu, 2014; Jo et al., 2014; Howat & Assaker, 2013).
Therefore, the ninth hypothesis in this study was suggested as follows:
Hypothesis 9 (H9) : Service quality mediates the relationship between
service marketing mix and service value.

144
4.3.10 The mediating role of service value between service marketing mix and
customer satisfaction
The right mixture of service marketing mix creates effective operational elements of
mix as stimulus factor toward service value and customer satisfaction. Integration of
service value in the relationship between service marketing mix and customer
satisfaction will contribute to a more variance explains in satisfaction construct. Past
studies had affirmed that service value was an antecedent to customer satisfaction
(Prebensen, Woo, & Uysal, 2013; Gallarza et al., 2013; Ghalandari, 2013; Chen et al.,
2012; Hume & Mort, 2010).
As stated in previous paragraph, past studies had investigated separately the elements
of service marketing mix in which this study claims that analyzing the elements of
service marketing mix individually to dependent variable is not consistent with
marketing mix concepts (Jacoby, 2002; Kellerman, Gordon, & Hekmat, 1995). The
findings on the role of service marketing mix to service value and customer satisfaction
was fragmented. However, a few study had found mediating role of service value
between elements of service marketing mix and customer satisfaction. For instance,
Kwun (2011) study had found that food quality and menu variety represent product
element of mix has been partially mediated by service value for female consumer’s
satisfaction. While, the items of service quality in Kwun’s study which was contained
the element of service people had found completely mediated by service value to
customer satisfaction.

145
The relationship between service marketing mix, service value as mediating variable
and customer satisfaction is worth to investigate since existing empirical still lack to
explain the relationship. Thus, present study postulates the tenth hypothesis as follows:
Hypothesis 10 (H10) : Service value mediates the relationship between service
marketing mix and customer satisfaction.
4.3.11 The mediating role of service value between service quality and customer
satisfaction
Service value has been empirically known as a mediating variable in the relationship
between service quality and customer satisfaction (Chen et al., 2012; Lee et al., 2008).
Understanding of the role of service value is crucial to business and it relationship
between service provider and customer. Service value is considerable as unique where
this variable can serve the relationship as mediator variable (Cronin et al., 2000) and
moderator variable (Caruana et al., 2000).
Study by Hume and Mort (2010) in performing arts setting in Australia reveals core
service quality to customer satisfaction has been fully mediated by service value.
Similar to Kwun (2011) study in campus foodservice had revealed that service quality
effect on satisfaction was mediated completely by service value. Supported by the
empirical evidence, eleventh hypothesis in this study was proposed as follows:
Hypothesis 11 (H11) : Service value mediates the relationship between service
quality and customer satisfaction.

146
4.4 Research design
The research will need to be designed in such a way that the researcher is able to justify
his research (Jonker & Pennink, 2010). The research design must clearly explain the
different steps to be taken during a research program to reach the objective of a
particular research (Sahu, 2013; Creswell, 2009).
Generally, there were three research approaches were deployed by the researcher in
order to find an answer for their research questions that is quantitative, qualitative and
mixed method research (Creswell, 2009). Correspondingly, Sahu (2013) states that a
quantitative research is a kind of research in which systematic investigations having
quantitative property and phenomenon are considered where this research approach
allow researcher to measure or quantify phenomena and analyze them numerically.
There were two options available in regard of the time horizons. The first option is a
longitudinal study and the second one is a cross-sectional study. The longitudinal study
is suitable when the researchers aim to seek how things vary over time, which requires
data to be collected from the same sample units at multiple points in time (Sahu, 2013;
Beins & McCharty, 2012). On the other hand, in cross-sectional study, the data for
independent variables and dependent variables data is collected and measured at the
same point of time (Bhattacherjee, 2012).
The research approach used in this study was the cross-sectional and quantitative
approach due to the fact that the research aims to discover the relationships among the
proposed constructs in commercial parking facilities in Malaysia context.

147
4.4.1 Questionnaires design
According to Slattery, Voelker, Nussenbaum, Rich, Paniello, and Neely (2011),
surveys and questionnaires are powerful research tools to create meaningful data
through correct construction, implementation, and management of research tools.
Questionnaires refer to a specific tool, also known as an instrument for gathering
information through series of questions and are usually self-administered.
In order to ensure that the adaptations of the questionnaires is done appropriately, the
set of study’s questionnaires had been reviewed by two experienced academicians in
related field and two experts in car park service industry with more than twenty year
experience as a part of content validity. The purpose of this reviewed is to ensure the
universe of content items are valid to represent the study’s variables, make sense and
relevant to study’s context that able to communicate clearly and avoid
misinterpretation among respondents (Slattery et al., 2011; Lietz, 2010).
In next process, pretest on the draft of survey questionnaire was conducted. Pretest is
a preliminary assessment of the measurement instrument in order to recognise any
possible difficulties or ambiguity that may encounter the potential respondents in
research field setting when filling out questionnaire (Bhattacherjee, 2012). Thus,
before final draft of questionnaires released, seven respondents were selected
randomly to answer the draft of survey questionnaire. Subsequent to this pretest, the
respondents commented that questionnaires in English language was understandable,
the meaning for each question was not overlapping, the questionnaires quite long and
lastly, most of respondents suggest the use of Arial font instead of Times New Roman
for better reading. All of their comments and suggestions regarding the clarity,

148
wording, relevance and consistencies of the questions were considered to be
incorporated into the final draft of survey questionnaire.
Additionally, negatively worded question method was adapted in this study as this type
of question was expected to minimize tendency to mechanically respond to one end of
the scale. Further, Sekaran (2003) suggested that a good questionnaire should include
both positively and negatively worded questions. Based on this reason, three
negatively worded questions were included in the final questionnaire of this study and
were highlighted in bold with (r) sign.
In this study, a self-administered questionnaire was employed to serve as a data
collection instrument. The design of questionnaires for present study was divided into
three parts as follows:
a) Part I is to measures customer’s perception on the elements of service
marketing mix, service quality, service value and assessment of customer
satisfaction towards parking services in commercial parking facilities.
b) Part II is for respondent to indicate any comments or suggestions for
betterment of parking services including its facilities.
c) Part III for demographic information of the respondents that include
gender, age, education, occupation level, a closed question confirming
respondent as customer of monthly season parking, a closed question

149
confirming the payment of monthly season parking and lastly, usage
experience.
The respondent’s demographic questions was placed at the end of questionnaire rather
than at beginning stage in order to avoid any negative feeling among the respondents
when answering questions related to personal information (Lietz, 2010).
4.5 Operationalisation and measurement of variables
The operational definition is the translation process of changing an abstraction of
theoretical construct into a concept, so that it can be characterized and measured
through tangible indicators can be seen in the empirical reality (Jonker & Pennink,
2010; Beins & McCharty, 2012; Saunders, Lewis, & Thornhill (2009). An operational
definition of a certain variable describes how variables are defined and measured
within the framework of a research study (Sahu, 2013).
In order to operationalize the proposed variables under the scope of research
framework, the measurement scales are need to be specified in the development of
questionnaires stage. The questionnaires scales of respective variables in present study
were adapted from several published studies that had been validated to be reliable.
Modifications were made in the wording of the items of questionnaires in order to meet
the consistency among variables.
The total number of items used in the present study was eighty three (83) items. The
questionnaire consists of eighteen measurement scales that includes (1) seven scales
represented by service product, service price, service place, service promotion, service

150
people, service process and service physical evidence to form service marketing; (2)
service quality was formed through six scales that is tangible, reliability,
responsiveness, assurance, empathy and technical quality; (3) service value was
molded through four scales by emotional value, social value, functional value for
performance and quality, and functional value for price and value for money; and
lastly, (4) multiple items scale were used to measure dependent variable of customer
satisfaction. The sources for original measurement scales and reliability results were
summarized and shown in Appendix D.
The seven-point Likert scale ranging from 1 = “strongly disagree” to 7 = “strongly
agree” was used in present study for all items of service marketing mix, service quality
and service value and customer satisfaction. The respondents were asked to circle the
response from among the list provided that best reflects their perceptions. For example,
in Section A, the respondents were asked to circle at the number of their choice that
best reflects on his or her perception using a seven-point Likert scale towards the
perception of service product: “The car park operator provides a variety of parking
services”. The target respondent was customer who is subscribe to a monthly season
parking in private office buildings and the respondents were expected to understand
the questionnaire in English language.
Moving forward, the operational definition and measurement of each constructs and
variables used in present study were described in the following subheading.

151
4.5.1 Service marketing mix as second order construct
Service marketing mix refers as the set of controllable marketing variables that the
firm blends to produce the response it wants in the target market (Kotler & Armstrong,
1989). The construct was measured through formation of seven elements of mix
adapted from Booms and Bitner’s framework namely service product, service price,
service place, service promotion, service people, service process and service physical
evidence. Service marketing mix in present study was treated as second higher order
construct with multidimensional variables.
The advantages in applying second order construct was broader construct offer better
prediction of criteria, more parsimonious to examine the source construct rather than
the individual indicators and latent variable can be analyzed using structural equation
model (Johnson, Rosen, & Chang, 2011). The operational definition and it
measurement scales for service marketing mix were discussed in following
subheading.
4.5.2 Service product
In this study, service product refers to the intangible activities and performance
designed by interactive process in order to satisfy customer needs and expectations
(Al-Dmour et al., 2013). The measurement scale for service product was adapted and
modified from Al-Dmour et al. (2013) for two items, Bradley (2001) for three items
and Akroush (2011) for one item. In total, service product element consisted of six
items which represent component of product variety, quality, performance,
technology, brand and customer service. The past reliability results for these

152
questionnaires were at range 0.88 to 0.94. The measurement scale for service product
was presented in Table 4.1.
Table 4.1
Measurement scale of service product
Index Item Component Source
PRD1 The car park operator offers a variety of parking
services.
Variety Al-Dmour et al.
(2013)
PRD2 The car park operator has a high quality standard. Quality Bradley (2001)
PRD3 The car park operator provides highly effective
parking system.
Performance Bradley (2001)
PRD4 The car park operator is highly innovative in its
parking services.
Technology Bradley (2001)
PRD5 The car park operator has distinctive brand in a
market.
Brand Al-Dmour et al.
(2013)
PRD6 The car park operator has high standard of
customer service.
Customer
service
Akroush (2011)
4.5.3 Service price
Service price was defined as the value of items which are needed for the acquisition of
a service product (Al-Dmour et al., 2013). In order to operationalise service price, the
measurement scale has five items that adapted and modified from three items of Al-
Dmour et al. (2013), one items of Martin et al. (2009) study and one item from Akroush
(2011) as presented in table 4.2. Several components were incorporated to represent
service price namely fairness, quality, competitiveness, segmentation and policy. The
reliability results of past studies for these questionnaires were at range 0.83 to 0.97.
Table 4.2
Measurement scale of service price
Index Item Component Source
PRC7 The car park operator offers options in parking
fees structure.
Fairness Al-Dmour et al.
(2013)
PRC8 The offered parking fees are suitable to the level
of quality.
Quality Al-Dmour et al.
(2013)
PRC9 The offered parking fees are based on prices in
the marketplace.
Competitive Al-Dmour et al.
(2013)
PRC10 The car park operator provides parking fees for
different customer categories.
Segmentation Akroush (2011)
PRC11 The car park operator provides a good payment
terms and policies.
Policy Martin et al.
(2009)

153
4.5.4 Service place
Service place refers to the company activities that make the service product available
(Chelliah et al., 2013). The scale to assess service place consisted of five items which
was adapted and modified from one items of Sreenivas et al. (2013), two items from
Al-Dmour et al. (2013) study and two of Bradley (2001) study to measure service place
using reflective approach. The component integrated in service place was
environment, location, channel and accessibility. The reliability result from the past
study was 0.94. Table 4.3 present seven items to measure service place.
Table 4.3
Measurement scale of service place
Index Item Component Source
PLC12 The car park operator creates convenience parking
place.
Location Sreenivas et al.
(2013)
PLC13 The parking facility is always well organized. Environment Al-Dmour et al.
(2013)
PLC14 The car park operator always ensures enough
parking lots for customers.
Accessibility Bradley (2001)
PLC15 The car park operator provides sufficient channels
for parking payment.
Channel Al-Dmour et al.
(2013)
PLC16 The car park operator provides a highly safe and
secure parking place.
Environment Bradley (2001)
4.5.5 Service promotion
Service promotion was defined as to effectively communicate the core benefits and
differentiated features of the firm's product and services such that the firm's target
customers are aware of their existence, features, and location(s) for purchase
(Wickham, 2009). The service promotion scale was measured reflectively by six items
which was adapted and modified from three items of Bradley (2001) study, one item
of Al-Dmour et al. (2013) study, Akroush and Al-Dmour (2006) study and Yoo,
Donthu, and Lee (2000) respectively as shown in Table 4.4. The integration of

154
components to explain service promotion variable were creatively, method,
information, brand, safety and customer service. The reliability results from the past
studies were at range 0.87 to 0.94.
Table 4.4
Measurement scale of service promotion
Index Item Component Source
PRM17 The car park operator promotes the parking
services creatively.
Creativity Bradley (2001)
PRM18 The parking promotion method creates a positive
image.
Method Akroush and Al-
Dmour (2006)
PRM19 The car park operator communicates parking
services clearly.
Information Bradley (2001)
PRM20 The car park operator promotes parking brand
extensively.
Brand Yoo et al. (2000)
PRM21 The car park operator promotes parking safety and
security intensively.
Safety Al-Dmour et al.
(2013)
PRM22 The car park operator promotes customer service
intensively.
Customer
service
Bradley (2001)
4.5.6 Service people
In present study, service people was defined as consist of staff with the required
attitude, service knowledge and relational skills that supported by necessary working
systems in order to ensure the consumers will receive the service for which they are
paying (Al-Dmour et al., 2013). The service people scale in this study was measured
reflectively by six indicators which was adapted and modified from one indicator of
Bradley (2001) study, three indicators from Akroush and Al-Dmour (2006) study and
two items from He, Lee, and Lai (2011) study. While, components cohesive in the
service people were innovation, skills, readiness, staff, managerial support and work
structure. The reliability results from the past studies were at range 0.72 to 0.89. The
items to measure service people were presented in Table 4.5.

155
Table 4.5
Measurement scale of service people
Index Item Component Source
PEP23 The car park operator manages this parking facility
professionally.
Innovation Bradley (2001)
PEP24 The car park operator trains their staffs for high
service performance.
Skills Akroush and Al-
Dmour (2006)
PEP25 The car park operator always provides adequate
staffs to operate parking facility.
Readiness Akroush and Al-
Dmour (2006)
PEP26 The car park operator recruits right personnel to
operate parking facility.
Staff Akroush and Al-
Dmour (2006)
PEP27 The car park operator provides effective working
facilities to supports their staffs.
Managerial
Support
He et al. (2011)
PEP28 The car park operator has a systematic working
structure.
Work
structure
He et al. (2011)
4.5.7 Service process
Service process refers to procedures, mechanism and flow of activities by which a
service is acquired (Al-Dmour et al., 2013). The components of systematic,
technology, interaction, complexity and efficiency were used to explain service
process. The measurement scale used to operationalise service process was adapted
and modified from three items of Akroush and Al-Dmour (2006) study and two items
from Sreenivas et al. (2013) study. The reliability result from past study was 0.78.
Table 4.6 shows the five items to measure service process.
Table 4.6
Measurement scale of service process
Index Item Component Source
PRO29 The car park operator has a systematic service
process.
Systematic Akroush and Al-
Dmour (2006)
PRO30 The car park operator use advance information
technology (IT) for service processing.
Technology Akroush and Al-
Dmour (2006)
PRO31 The car park operator has a qualified staffs to serve. Interaction Akroush and Al-
Dmour (2006)
PRO32 The car park operator provides friendly procedures
for season parking processes.
Complexity Sreenivas et al.
(2013)
PRO33 The car park operator has a very efficient system to
process season parking.
Efficiency Sreenivas et al.
(2013)

156
4.5.8 Service physical evidence
Service physical evidence refers to the environment in which the service is delivered
and any tangible goods that facilitate the performance and communication of the
service (Al-Dmour et al., 2013). The components embodied in the service physical
evidence were staff, design, maintenance, atmosphere and adequacy. The service
physical evidence was measured through reflective approach. The measurement for
service physical evidence was derived from four items of Akroush and Al-Dmour
(2006) study and one item from Chen (2011) study. The reliability results from past
studies were at range 0.78 to 0.86. The items to measure service physical evidence was
presented in Table 4.7.
Table 4.7
Measurement scale of service physical evidence
Index Item Component Source
PHY34 The car park operator applies a professional look to
their staff’s attire.
Staff Akroush and Al-
Dmour (2006)
PHY35 The design of parking facilities creates a positive
impression.
Design Akroush and Al-
Dmour (2006)
PHY36 Parking equipment and other related facilities are
always maintained.
Maintenance Akroush and Al-
Dmour (2006)
PHY37 The parking atmosphere is clean and comfort. Atmosphere Akroush and Al-
Dmour (2006)
PHY38 The car park operator provides very useful signages. Adequacy Chen (2011)
4.5.9 Service quality as second order construct
In next construct, service quality was defined as a consumer’s judgment about a
product’s overall excellence (Zeithaml, 1988). In present study, service quality was
conceptualized as higher order construct through formation of six dimensions namely
tangible, reliability, responsiveness, assurance, empathy and technical quality
dimension. The measurement of service quality construct through formative approach
was consistent with past studies such as Rajaratnam et al. (2014), Untachai (2013),
Miranda et al. (2012), Martínez and Martínez (2010) and Olorunniwo et al. (2006). It

157
was recommended that the formative approach supports the conceptual definition of
service quality as a consumer’s judgment about a product’s overall excellence
(Zeithaml, 1988). The operational definition and measurement scale for service
quality’s dimension were stated in subsequent subheading.
4.5.10 Tangible dimension
Tangible refers as physical facilities, equipment and appearance of personnel
(Parasuraman et al., 1988). The tangible dimension was measured reflectively by four
items which was adapted and modified from Parasuraman et al. for perceived scale of
SERVQUAL. While, components contained in the tangible dimension is equipment,
physical facilities, staff and appearance. The reliability from Parasuraman et al. study
for this dimension is 0.72. The items to measure tangible dimension were presented in
Table 4.8.
Table 4.8
Measurement scale of tangible dimension
Index Item Component Source
TAN39 This parking facility has up to date equipment and
facilities.
Equipment Parasuraman et
al. (1988)
TAN40 This parking facility is visually appealing. Physical
facilities
Parasuraman et
al. (1988)
TAN41 The car park staffs are well dressed and appear neat. Staff Parasuraman et
al. (1988)
TAN42 The appearance of this parking facility reflects to the
type of parking being served.
Appearance Parasuraman et
al. (1988)
4.5.11 Reliability dimension
Reliability was defined an ability to performance the promised service dependably
(Parasuraman et al., 1988). The components of reliability dimension were represented
by promises, problem solving, dependable, time and accuracy. The reliability
dimension was measured reflectively by five items which was adapted and modified

158
from Parasuraman et al., SERVQUAL scale. The reliability result from Parasuraman
et al. study for this dimension was 0.83. The items to measure reliability dimension
were presented in Table 4.9.
Table 4.9
Measurement scale of reliability dimension
Index Item Component Source
REL43 The car park operator provides a service as
promised.
Promises Parasuraman et
al. (1988)
REL44 When I have problems, the car park operator is
sympathetic and reassuring.
Problem
solving
Parasuraman et
al. (1988)
REL45 The car park operator is dependable. Dependable Parasuraman et
al. (1988)
REL46 The car park operator provides parking services at
appointed time.
Time Parasuraman et
al. (1988)
REL47 The car park operator keeps its record accurately. Accuracy Parasuraman et
al. (1988)
4.5.12 Responsiveness dimension
Responsiveness refers to willingness to help customers and provide prompt service
(Parasuraman et al., 1988). The responsiveness dimension in this study was measured
reflectively by four items which is adapted and modified from perceived scale of
SERVQUAL. The components of responsiveness dimension were integrated from
information, promptness and attitude. The reliability result from Parasuraman et al.
study for this dimension was 0.82. The items to measure responsiveness dimension
were presented in Table 4.10.
Table 4.10
Measurement scale of responsiveness dimension
Index Item Component Source
RES48 The car park operator does not tell me exactly
when services will be performed. (r)
Information Parasuraman et
al. (1988)
RES49 The car park staffs give a prompt service to me. Promptness Parasuraman et
al. (1988)
RES50 The car park staffs always willing to help me. Attitude Parasuraman et
al. (1988)
RES51 The car park staffs always have time to respond to
my requests promptly.
Promptness Parasuraman et
al. (1988)
(r) = negatively worded
159
4.5.13 Assurance dimension
Assurance was defined as knowledge and courtesy of employees and their ability to
inspire trust and confidence (Parasuraman et al., 1988). The assurance dimension was
measured reflectively by four items which were adapted and modified from perceived
scale of SERVQUAL. The components of assurance dimension were jointly explained
by credibility, safety, attitude and readiness. The reliability result from Parasuraman
et al. study for this dimension was 0.81. The items to operationalize assurance
dimension were presented in Table 4.11.
Table 4.11
Measurement scale of assurance dimension
Index Item Component Source
ASS52 The car park staffs can be trusted. Credibility Parasuraman et
al. (1988)
ASS53 I feel safe in all payment transactions for my
season parking.
Safety Parasuraman et
al. (1988)
ASS54 The car park staffs are polite to me. Attitude Parasuraman et
al. (1988)
ASS55 The car park staffs have the knowledge to answer
my questions.
Readiness Parasuraman et
al. (1988)
4.5.14 Empathy dimension
Empathy refers to caring, individualized attention the firm provides its customers
(Parasuraman et al., 1988). The empathy dimension was measured reflectively by five
items which is adapted and modified from perceived scale of SERVQUAL. The
components consisted in empathy dimension were attention, fulfilment of needs,
interest and convenience. The reliability result from Parasuraman et al. study for this
dimension was 0.86. The items to operationalise assurance dimension were presented
in Table 4.12.

160
Table 4.12
Measurement scale of empathy dimension
Index Item Component Source
EMP56 The car park operator does not give me individual
attention as a season parking customer. (r)
Attention Parasuraman et
al. (1988)
EMP57 The car park staffs give a personal attention to me. Attention Parasuraman et
al. (1988)
EMP58 The car park staffs understand on my needs. Fulfilment Parasuraman et
al. (1988)
EMP59 The car park staffs keep my interest at heart. Interest Parasuraman et
al. (1988)
EMP60 Parking facilities has convenient operating hours. Convenience Parasuraman et
al. (1988)
(r) = negatively worded
4.5.15 Technical quality dimension
Technical quality was defined as what the consumer receives as a result of interactions
with a service firm (Grönroos, 1984). In order to explain technical quality dimension,
the component of assurance, effectiveness, efficiency, standard and safety were jointly
operationalize the said dimension. Thus, the technical quality dimension in this study
was assessed reflectively by five items which were adapted and modified from two
items of Kang and James (2004) study, two items of Brady and Cronin (2001) study
and one item of Rajaratnam et al. (2014). The reliability results of past studies for these
items were at range from 0.78 to 0.90. The items to assess technical quality dimension
were represented in Table 4.13.
Table 4.13
Measurement scale of technical quality dimension
Index Item Component Source
TEC61 I always complete the parking process
(InParkOut) successfully.
Assurance Kang and James
(2004)
TEC62 There is no equipment breakdown during my entry
and exit.
Effectiveness Kang and James
(2004)
TEC63 Process time (InParkOut) for my car parking is
very acceptable.
Efficiency Brady and
Cronin (2001)
TEC64 This car park facility has high specification of
parking standard.
Standard Brady and
Cronin (2001)
TEC65 This car park facility complies with high safety and
security requirement.
Safety Rajaratnam et al.
(2014)

161
4.5.16 Service value as second order construct
Another construct in research framework, service value refers a consumer’s overall
assessment of the utility of a product based on perceptions of what is received and
what is given Zeithaml (1988). In order to operationalise service value, present study
used a short scale of PERVAL from nineteen items in original scale was developed by
Sweeney and Soutar (2001) had been reduced to twelve items as suggested by Walsh
et al. (2014). The findings of Walsh et al. study had found that twelve items scale
provide a robust result of PERVAL original scale and it has better psychometric
properties. They further suggest that twelve items scale of PERVAL should be a
preferable choice to researchers and practitioner.
Additionally, this study conceptualise service value as higher order construct that
formatively assessed by emotion value, social value, function value for quality and
performance and functional value for price and value for money. This approach was
consistent with the conceptual definition that defined service value as a consumer’s
overall assessment of the utility of a product based on perceptions of what is received
and what is given (Zeithaml, 1988). Additionally, the approach was in line with
numerous studies such as Eid and El-Gohary (2014), Chen (2013), Turel, Serenko, and
Bontis (2007) and Sánchez et al. (2006).
In subsequent subheading, operational definition and measurement scales for all
dimensions under service value construct were discussed.

162
4.5.17 Emotional value dimension
Emotional value was defined as the utility derived from the feelings or affective states
that a product generates (Sweeney & Soutar, 2001). The component of emotional value
was derived from affective aspect. The dimension was operationalised reflectively via
three items which were adapted and modified from Sweeney and Soutar (2001) and
Walsh et al. (2014) for short scale of PERVAL. The reliability result from Sweeney
and Soutar’s study for this dimension was 0.94. The items to measure emotional value
dimension were presented in Table 4.14.
Table 4.14
Measurement scale of emotional value dimension
Index Item Component Source
EMO66 Using season parking in this parking facility
makes me happy.
Affective Sweeney and
Soutar (2001)
EMO67 This season parking service makes me want to use
it.
Affective Sweeney and
Soutar (2001)
EMO68 Using season parking would make me feel
comfort.
Affective Sweeney and
Soutar (2001)
4.5.18 Social value dimension
Social value refers to the utility derived from the product’s ability to enhance social
self-concept (Sweeney & Soutar, 2001). The component of social value was from self-
concept aspect. The scale for social value dimension was measured reflectively by
three items which were adapted and modified from Sweeney and Soutar (2001) and
Walsh et al. (2014) for short scale of PERVAL. The reliability result from Sweeney
and Soutar’s study for this dimension was 0.82. The items to assess emotional value
dimension were presented in Table 4.15.

163
Table 4.15
Measurement scale of social value dimension
Index Item Component Source
SOC69 Using season parking service gives me acceptable
feeling.
Self-concept Sweeney and
Soutar (2001)
SOC70 Using season parking service had improved the
way I am perceived by other people.
Self-concept Sweeney and
Soutar (2001)
SOC71 Using season parking service gives me a good
impression by other people.
Self-concept Sweeney and
Soutar (2001)
4.5.19 Functional value for quality and performance dimension
The functional value for quality and performance refers to the utility derived from the
perceived quality and expected performance of the product (Sweeney & Soutar, 2001).
The components of this functional value were represented by consistency,
performance and tangible aspect. The scale of functional value for quality and
performance dimension was measured reflectively by three items which were adapted
and modified from Sweeney and Soutar (2001) and Walsh et al. (2014) for short scale
of PERVAL. The reliability result from Sweeney and Soutar’s study for this dimension
was 0.91. The items to evaluate emotional value dimension were presented in Table
4.16.
Table 4.16
Measurement scale of functional value for quality and performance dimension
Index Item Component Source
FQP72 The car park operator does not perform consistent
quality of parking services. (r)
Consistency Sweeney and
Soutar (2001)
FQP73 The standard of quality performance is acceptable
to me.
Performance Sweeney and
Soutar (2001)
FQP74 The design and setting of parking
facility/equipment is well made.
Tangible Sweeney and
Soutar (2001)
(r) = negatively worded
4.5.20 Functional value for price and value for money dimension
The function value for price and value for money was defined as the utility derived
from the product due to the reduction of its perceived short term and longer term costs
164
(Sweeney & Soutar, 2001). The components embodied in this functional value were
fairness, value and utility aspect. The scale of functional value for price and value for
money dimension was assessed reflectively by three items which were adapted and
modified from Sweeney and Soutar (2001) and Walsh et al. (2014) for short scale of
PERVAL. The reliability result from Sweeney and Soutar’s study for this dimension
was 0.80. The items to assess emotional value dimension were presented in Table 4.17.
Table 4.17
Measurement scale of functional value for price and value for money dimension
Index Item Component Source
FPV75 My season parking fee is reasonably priced. Fairness Sweeney and
Soutar (2001)
FPV76 Season parking offers me a value for money. Value Sweeney and
Soutar (2001)
FPV78 Season parking is a good product for the price. Utility Sweeney and
Soutar (2001)
4.5.21 Customer satisfaction
The last main construct in this study was customer satisfaction. The operational
definition of customer satisfaction refers to a consumer’s fulfillment response
following the consumption experience, the degree to which the level of fulfillment is
pleasant or unpleasant (Olorunniwo, Hsu, & Udo, 2006, Oliver, 1997). Under this
definition, customer satisfaction was operationalised in broader meaning that consisted
six components namely general satisfaction, affective, need fulfillment,
disconfirmation, cognitive and emotion.
Furthermore, the customer satisfaction was conceptualized as a cumulative satisfaction
that represented by the functions of all previous transaction specific satisfactions
(Oliver, 1999). The construct of customer satisfaction in this study was measured
reflectively through multi-items. The items used in measuring the construct was

165
adopted from Eisingerich et al. (2014) for three items, Terpstra and Verbeeten (2014)
for two items and one item from Suki (2014). The reliability results from the past
studies were at range 0.74 to 0.91. The items for operationalising customer satisfaction
were presented in table 4.18.
Table 4.18
Measurement scale of customer satisfaction
Index Item Component Source
SAT78 I had a pleasant experience with the car park
operator.
Affective Eisingerich et al.
(2014)
SAT79 I have a more positive attitude towards the car park
operator.
Emotion Suki (2014)
SAT80 The car park operator meets all my requirements
for a parking.
Fulfilment of
needs
Terpstra and
Verbeeten (2014)
SAT81 Compared to other car park operator, I am very
satisfied with the car park operator.
Cognitive Eisingerich et al.
(2014)
SAT82 The parking services provided to me is met my
expectations.
Disconfirmat
ion
Terpstra and
Verbeeten (2014)
SAT83 Overall, my experience with the car park operator
is very satisfied.
General
satisfaction
Eisingerich et al.
(2014)
4.5.22 Demographic data
The respondents were requested to name building of parking facilities and five
demographic variables that include gender, age, highest educational qualification,
position of the respondents, confirmation as customer of monthly season parking,
entity who pay a monthly season parking and usage experience. The demographic
variables were measured by applying categorical scale. The questions related to
demographic variables were placed at the end of the questionnaire. According to Lietz
(2010), placing demographic questions at the end of the questionnaire is intended to
avoid negative feeling because it concerns provision of personal information.
Gender was asked on a dichotomous scale of male and female. The respondent was
required to indicate their age range by choosing one of five categories of age range. In

166
next scale, five categories of educational qualification were developed to measure
highest level of education for the respondents. A dichotomous scale was used to
measure employment position level of the respondent: (a) non-executive; (b)
executive; (c) managerial; (d) director/Chief Executive Officer (CEO); and (e)
business owner/self-employed.
In order to validate the respondent is a customer of monthly season parking, question
to confirm the status was provided. The respondent was also required to answer about
payment of monthly season parking as this study intended to confirm commercial
element incorporated between the relationship between respondent and service
provider. Finally, five categories were used to measure respondent’s usage experience
of monthly season parking in the same parking facilities.
4.6 Data collection
As explained by Sahu (2013), quantitative research like present study is depends on
the collection of data, the accuracy of data collection questionnaires and the
consistency and efficiency of the data. Therefore, this subheading section consists of
description about population, sampling frame, sampling size, sampling technique and
data collection procedure that gives overall view on how data to be collected for this
study. The details of data collection were explained in the subsequent subheading.
4.6.1 Population
Population was defined as the full universe of people or things from which the sample
is selected (Greener, 2008) or a collection or totality of well-defined objects (Sahu,
2013). In the present study, general population of the study comprised all the

167
individual car park customers who are subscribed to a monthly season parking in
commercial car park facilities which were operated at the private office buildings in
Klang Valley. The monthly parking subscriber are choosen because they are familiar
with many aspects of parking services and allows more variables to be investigated.
However, car parking facilities provided at shopping malls, hospitals, hotels,
transportation hubs and government offices were excluded because it cater more on
casual parking customers which offers limited scope of investigation.
In fact, the population of customers of monthly season parking in Malaysia
commercial parking facilities in private office buildings is fairly similar because it was
provided to tenants, tenant’s employees and opened to visitors of building. Even
though, the car park customers use diverse parking facilities, they are basically receive
similar service of parking product across different states in Malaysia and the sample
was derived from this population was relatively homogeneous. However, due to a very
large population of car park customers in Malaysia, collecting data from entire
population is impractical, costly and timely (Hair, Black, Babin, & Anderson, 2014).
Klang Valley city was selected as the sampling area to be covered by the present study.
The Klang Valley covered by ten municipalities located at Kuala Lumpur and Selangor
states including Putrajaya which was one of the most commercially advanced cities in
Malaysia. According to the “The Klang Valley” (2013), Klang Valley has seven
million and two hundred thousand (7.2 million) people are one of fastest growing
metropolitan cities in the region. It was expected that Klang Valley as a capital of
Malaysia will becoming one of the most vibrant, modern and cosmopolitan cities
among the emerging South-East Asian countries.

168
The scope of present study was limited to Klang Valley metropolis because of the
attentiveness of commercial activities, which resulted in the presence of a large
number of commercial buildings and car parking facilities in the city. Additionally,
government strategies through National Key Economic Area aim Klang Valley to be
a liveable city in 2020, attracts many type of people from diverse backgrounds such as
religions, ethnic, education and citizenship.
Due to homogenous population of car park customers, the generalization of population
can be measured via sampling random process to represent the population of interest
(Tabachnick & Fidell, 2013). Additionally, Saunders et al. (2009) comments that using
sampling method, it makes possible a higher overall accuracy than a census because
the researcher can collect information from the samples in more detailed based on
smaller cases.
4.6.2 Sampling frame
Obtaining a sampling frame is very important but must ensure the sampling is
complete and accurate with latest information (Saunders et al., 2009). Therefore, an
ideal sampling frame for the respondents of the study was to acquire a complete list of
all respondents in the target population which is the exact number and respondent
details of the customers subscribe for monthly season parking at private office building
in Klang Valley.
In first attempt to get the number of monthly season parking customers in Klang
Valley, requisition letter with University Utara Malaysia letterhead has been emailed

169
and posted to ten (10) car park operators in Klang Valley such as Metro Parking (M)
Sdn. Bhd., AP Parking Managers Sdn. Bhd., First City Parking Sdn. Bhd., Godell
Parking Sdn. Bhd., Imej Parking Sdn. Bhd., Major Parking Sdn. Bhd., Park Rite Sdn.
Bhd., SCP Parking Sdn. Bhd., Wilson Parking Sdn. Bhd. and Secure Parking
Corporation Sdn. Bhd. A sample of letter to parking operator for requesting data of
total number of monthly season parking customers was attached in Appendix E.
Unfortunately, none of the car park operators had replied to the request except for
Metro Parking (M) Sdn. Bhd. which has 11,079 customers subscribing monthly season
parking as at 31st December 2014 from thirty one car parks in Klang Valley. The total
number of monthly season parking customers provided by Metro Parking (M) Sdn.
Bhd. was inadequate to represent target population entirely and it also seems not
suitable for population due to total number of customer was derived from mix type of
car park buildings such as offices, hospitals, shopping malls and airports.
Acknowledged to the fact that getting an ideal sampling frame is highly complex and
might not available accurately, in next attempt, the present study had obtained
information pertaining the total number of private buildings including it occupancies
size which is recorded in the property stock report for Q1 2014 published by the
Valuation and Property Services Department of Malaysian Ministry of Finance.
In order to determine a population of monthly season parking customers, the total size
of occupied space shall be divided by ratio of parking allocation for occupied space.
Generally, parking allocation to building tenants is based on ratio one parking bay for
1,000 square feet (Rahim & Co). The evidence to support this practice was attached in

170
Appendix F. The number of registered private office buildings was obtained from the
Valuation and Property Services Department (2015) website. The total breakdown
population, private office buildings and total space occupied based on municipals area
is shown in Table 4.19.
The estimated total customers who are subscribe to the monthly season parking in
private office building in Klang Valley was based on the ratio of one parking bay for
1,000 square feet of total occupied space. From the calculation, it was estimated eighty
five thousand nine hundred and sixty seven (85,967) customers who are subscribe to
the monthly season parking in Klang Valley. The highest percentage of monthly
season parking customers was at DBKL area which represents 72.6% and followed by
MBPJ area which represents 12.8%.
Table 4.19
The total breakdown of population, private office buildings and total space occupied
based on municipals area
No. Municipals in Klang Valley
Number
of
Buildings
Total Space
Occupied
s.f.
Season parking
Allocation Ratio:
1:1000 s.f.
Population
Ratio (%)
1 Dewan Bandaraya Kuala
Lumpur (DBKL)
353 62,428,646 62,429 72.6%
2 Perbadanan Putrajaya 7 1,261,143 1,261 1.5%
3 Majlis Bandaran Shah Alam
(MBSA)
24 3,069,781 3,070 3.6%
4 Majlis Bandaran Petaling
Jaya (MBPJ)
75 11,023,945 11,024 12.8%
5 Majlis Perbandaran Klang
(MPK)
17 1,508,627 1,509 1.8%
6 Majlis Perbandaran Kajang
(MPKj)
6 243,630 244 0.3%
7 Majlis Bandaran Subang Jaya
(MBSJ)
20 2,571,251 2,571 3.0%
8 Majlis Perbandaran Selayang
(MPS)
4 239,400 239 0.3%
9 Majlis Perbandaran Ampang
Jaya (MPAJ)
2 309,516 310 0.4%
10 Majlis Perbandaran Sepang 32 3,311,216 3,311 3.9%
540 85,967,155 85,967 100.0%
Source: Commercial Property Stock Table Q1 2014, Valuation and Property Services
Department
Note: s.f. = square feet

171
4.6.3 Sampling size
According to Sahu (2013), it is critical aspect for researcher to determine whether the
sample size is adequate to provide sufficient accuracy to base decisions on the findings
with confidence. With an adequate of sample size, the margin of error is decrease
(Saunders et al., 2009), able to achieve anticipate statistical effect (Tabachnick &
Fidell, 2013), the shape of the distribution approaches normality and variability can be
standardized (Beins & McCarthy, 2012) and sufficient to generalization of population
interest (Sahu, 2013; Sekaran, 2003).
There are several recommendation and methods to determine optimal sample size.
Therefore, it is essential for present study to choose the most appropriate method to
fix sample size. Scholars like Tabachnick and Fidell (2013) and Field (2009) had
suggested that sample size of at least 300 samples or more would generally generate a
stable result in factor analysis. A study by MacCallum, Widaman, Zhang, and Hong
(1999) suggests that the sample size from 200 to 400 samples able to achieve good
recovery of population factors in the sample. According to Comrey and Lee (1992) as
cited by MacCallum et al. (1999), had suggested a rough rating scale for adequate
sample sizes in factor analysis such as 100 is poor, 200 is fair, 300 is good, 500 is very
good, 1,000 or more = excellent. Further, Comrey and Lee urged researchers to obtain
samples of 500 or more observations whenever possible in factor analytic studies.
On the other hand, Hair, Hult, Ringle, and Sarstedt (2014) stated that the rule of thumb
for a minimum sample size should be ten times the maximum number of arrowheads
pointing at a latent variable anywhere in the PLS path model as general guidelines.
Based on the rule of thumb of ten times, the structural path as shown in Figure 4.2 has
172
seventeen three arrowheads pointing at latent variables which indicate that a minimum
sample size required is 170 samples or more. However, Field (2009) and Maccallum
et al. (1999) claims that the rule of thumb was not valid and oversimplified.
Another method to determine sample size is through statistical power test. High
efficiency in parameter estimation and relationship significant can be gained from
greater statistical power (Hair et al., 2014a). According to McCrum-Gardner (2010),
statistical power is the probability of rejecting the null hypothesis when the alternative
hypothesis is true. Statistical power can assist to calculate a correct balance of sample
size in order to avoid underpowered due to too less sample size or overpowered too
large sample size.
Therefore, in determining a sample size for this study, power of a test approach is one
of feasible option. Through the G*Power 3.1.9.2 software, sample size will be
calculated after user determined values for effect size of population (ƒ2), expected
significance level (α), the intended statistical power (1-β), and total number of
predictors consist in the study model and enter the values into software for
computation (Faul, Erdfelder, Lang, & Buchner, 2007). In present study framework,
total number of predictor is seventeen variables were used for calculating the sample
size. The standard values as recommended by Cohen (1977) used to calculate the
sample size for this study was (1) effect size of population (f2= 0.15); (2) level of
significance alpha (α= 0.05); (3) expected power of statistical (1-β = 0.95); and (4)
total number of seventeen predictors as shown in Figure 4.2. The result of sample size
for medium effect and X-Y Plot for medium effect power analysis through G*Power
3.1.9.2 computation software is showed in Figure 4.3 and Figure 4.4.

173
As appeared in Figures 4.3 and 4.4, results of the statistical power test shown that 208
sample sizes was sufficient for present study via a multiple regression. The results also
indicate the statistical power for identifying effect sizes for present study is set at a
recommended value of 0.95 (Cohen, 1977). Thus, it was decided that the total sample
size for this study was 208 samples.
Figure 4.3
Result of sample size for medium effect
Figure 4.4
X-Y Plot for medium effect power

174
4.6.4 Sampling technique
Generally, the sampling method can be divided into two categories that are probability
sampling and nonprobability sampling. In this study, the method of probability
sampling was selected. The probability sampling technique was selected due to the
fact that the findings based on this type of sampling technique can be generalized to
the target population with a level of confidence and the representativeness of the
sample is of importance in the interest of wider generalizability (Sekaran & Bugie,
2010).
The multi-stage cluster sampling procedure is one of sampling technique under
probability sampling (Sahu, 2013; Bhattacherjee, 2012; Saunders et al., 2009; Cohen,
Manion, & Morrison, 2007). The multi-stage cluster sampling procedure was applied
in present study to achieve maximum representative of population in Klang Valley.
This decision was taken after considering the nature of the study population was
estimated at 85,967 customers, which appears quite complex and might not be well
represented by a straightforward sampling technique.
According to Sahu (2013), cluster sampling is useful when data to be collected directly
to population is not feasible, listing of population units is not available and resource
constrain. Considering the fact that the population of this research was large, multi-
stage cluster sampling was regarded as appropriate for fair representation and for the
subsequent generalisation of the findings (Cohen et al., 2007). Such a design involves
the initial sampling of groups of elements, known as clusters followed by the selection
of elements within each selected cluster.

175
The part of the multi-stage procedure is involve stratified sample, cluster sampling,
and finally, systematic random sampling methods as suggested by Sahu (2013), Cohen
et al., (2007) and Sekaran (2003). In first stage, from thirteen states of Malaysia, this
study choose Klang Valley area as sampling frame due to this area is most active in
term of economic activities, variety of population characteristic and highly demand for
parking facilities. In second stage, the scope of study was narrow down to commercial
parking facilities in private office buildings. The list of number of private office
building including locations of building and building space occupation were obtained
from the property stock report for first quarter of 2014 (Malaysia Ministry of Finance,
2014). Subsequently in third stage, the locations of private building are divided into
ten municipals under Klang Valley area, see Table 4.20. Based on this, the stratified
random sampling method was applied to select geographical area of private building
into ten clusters based on municipals within Klang Valley that in line with the scope
of present study.
Table 4.20
The location breakdown of private office buildings based on municipals area
No. Municipal Area
Number
of
Buildings
Total
Space
Occupied
s.f.
Season
parking
allocation
ratio:
1:1000 s.f.
Population
Ratio (%)
1 Dewan
Bandaraya Kuala
Lumpur (DBKL)
KLCC/Golden
Triangle
89 21,195,926 21,196 25%
Central Business
District
89 11,866,662 11,867 14%
Within City
Centre
106 18,376,449 18,376 21%
Suburban 69 10,989,608 10,990 13%
2 Perbadanan
Putrajaya
Putrajaya 7 1,261,143 1,261 1%
3 Majlis Bandaran
Shah Alam
(MBSA)
Shah Alam 24 3,069,781 3,070 4%

176
Table 4.20 (Continued)
No. Municipal Area
Number
of
Buildings
Total
Space
Occupied
s.f.
Season
parking
allocation
ratio:
1:1000 s.f.
Population
Ratio (%)
4 Majlis Bandaran
Petaling Jaya
(MBPJ)
Petaling Jaya 59 8,528,214 8,528 10%
Bandar Utama 2 848,196 848 1%
Kelana Jaya 14 1,647,535 1,648 2%
5 Majlis
Perbandaran
Klang (MPK)
Klang 17 1,508,627 1,509 2%
6 Majlis
Perbandaran
Kajang (MPKj)
Kajang/Cheras/
Bangi
6 243,630 244 0%
7 Majlis Bandaran
Subang Jaya
(MBSJ)
Subang Jaya 11 1,063,905 1,064 1%
Sunway City 2 243,921 244 0%
Seri Kembangan/
Sungai Besi
5 748,382 748 1%
Puchong 2 515,042 515 1%
8 Majlis
Perbandaran
Selayang (MPS)
Selayang 0 - - 0%
Kuala Selangor 2 41,979 42 0%
Gombak 2 197,421 197 0%
9 Majlis
Perbandaran
Ampang Jaya
(MPAJ)
Ampang 2 309,516 310 0%
10 Majlis
Perbandaran
Sepang
Sepang 32 3,311,216 3,311 4%
Total 540 85,967,155 85,967 100%
Source: Commercial Property Stock Table Q1 2014, Valuation and Property Services
Department
Note: s.f. = square feet
Based on the property stock report for Q1 2014 (Malaysia Ministry of Finance, 2014),
there were 540 private office buildings located at Klang Valley which were registered
in the Valuation and Property Services Department. A letter as shown in Appendix G
was sent to the National Property Information Center (NAPIC) of Valuation and
Property Services Department and then, a list of private building names located in
Kuala Lumpur, Selangor and Putrajaya as attached in Appendix H. In forth stage, the
names of private building was referred for systematic sampling procedure.
177
Based on the sample size as discussed in preceding subheading, the total customer
population of the selected clusters was 85,967 and the total required sample size was
208 samples. In order to reduce sample size error and minimize non-response issue,
the sample size was increased to nearly four times based on twenty percentage (20%)
of response rate estimation and rounded up to 800. Correspondingly, Baruch and
Holtom (2008) study on response rate which derived from 1,607 publications that
covers more than 100,000 organizations and 400,000 individual respondents indicates
that the lowest response rate for paper base survey and service sector was 19.7% and
19.6% respectively. Comparatively, response rate achieved in study by Wahid and
Mahmood (2013) in Malaysian commercial banks was only 18.7%.
Furthermore, due to differences in the size of customer base on the selected clusters,
probability proportionate to size (PPS) sampling was adopted to ensure that the overall
selection is able to represent the total population and also to provide an equal chance
of selection for each element (Sekaran, 2003). The probability proportionate to size
for each municipal area was shown in Table 4.21.
Table 4.21
The breakdown of Probability Proportionate to Size (PPS) sampling by municipals
No. Municipal Number of
Buildings
Population
estimation
Population
Ratio (%)
Proportionate
to size (PPS)
1 Dewan Bandaraya Kuala
Lumpur (DBKL)
353 62,429 72.6% 581
2 Perbadanan Putrajaya 7 1,261 1.5% 12
3 Majlis Bandaran Shah Alam
(MBSA)
24 3,070 3.6% 29
4 Majlis Bandaran Petaling
Jaya (MBPJ)
75 11,024 12.8% 103

178
Table 4.21 (Continued)
No. Municipal Number of
Buildings
Population
estimation
Population
Ratio (%)
Proportionate
to size (PPS)
5 Majlis Perbandaran Klang
(MPK)
17 1,509 1.8% 14
6 Majlis Perbandaran Kajang
(MPKj)
6 244 0.3% 2
7 Majlis Bandaran Subang Jaya
(MBSJ)
20 2,571 3.0% 24
8 Majlis Perbandaran Selayang
(MPS)
4 239 0.3% 2
9 Majlis Perbandaran Ampang
Jaya (MPAJ)
2 310 0.4% 3
10 Majlis Perbandaran Sepang 32 3,311 3.9% 31
Total 540 85,967 100% 800
Source: Commercial Property Stock Table Q1 2014, Valuation and Property Services
Department
Note: s.f. = square feet
The present study aims at least forty questionnaires to be distributed to the target
customers for particular private office buildings and twenty private office buildings
were selected through systematic sampling in order to ensure eight hundred (800)
questionnaires are distributed. Therefore, the number of proportionate population size
for each municipal was divided by forty questionnaires to get twenty private buildings.
In order to ensure the samples of population have fair opportunity to be represented,
every 20th private buildings was selected from the list provided by the National
Property Information Center (NAPIC) of Valuation and Property Services Department
to participate in this survey. Table 4.22 shows the quantity of private office building
to be selected for each municipal.

179
Table 4.22
The quantity of selected private office buildings by municipals
No. Municipal Number of
Buildings
Proportionate
to size (PPS)
Number of
Building to
be selected
1 Dewan Bandaraya Kuala Lumpur (DBKL) 353 581 15
2 Perbadanan Putrajaya 7 12 0
3 Majlis Bandaran Shah Alam (MBSA) 24 29 1
4 Majlis Bandaran Petaling Jaya (MBPJ) 75 103 3
5 Majlis Perbandaran Klang (MPK) 17 14 0
6 Majlis Perbandaran Kajang (MPKj) 6 2 0
7 Majlis Bandaran Subang Jaya (MBSJ) 20 24 0
8 Majlis Perbandaran Selayang (MPS) 4 2 0
9 Majlis Perbandaran Ampang Jaya (MPAJ) 2 3 0
10 Majlis Perbandaran Sepang 32 31 1
Total 540 800 20
Source: Commercial Property Stock Table Q1 2014, Valuation and Property Services
Department
Note: 40 set of questionnaires to be distributed to each selected building
Formula: PPS / 40 (Example: 581 / 40 ≈ 15)
In the event of the private office building has less than fifty parking lots, free parking,
manual car park operation, selected building is in poor conditions or permission to do
survey is not granted, then the next private building will be chosen. This is to ensure
sample to be collected is fairly represented, unbiased and normal conditions. Less
parking lots, manual car park operation or poor building conditions increase biasness
on respondent perception that tends to choose negative perception. Municipals
territories were considered as distinct clusters because parking facilities among the
cluster is heterogeneous and diverse in nature (Cohen et al., 2007; Singh, 2007). At
the same time, the way of parking service rendered within the customers is
homogenous (Sahu, 2013).
4.6.5 Data collection procedure
This study used primary data. Thus, a self-administered approach through cross-
sectional study design was applied for the present study and multi-stage cluster
sampling technique was adapted for selecting the car parking facilities in Klang Valley
180
before distributing at least forty questionnaires to the potential respondents in each
selected private office building.
Cross-sectional study consist of data collection for a specify study that conducted in
one time only or at one point in time to meet the objectives of study (Cavana, Delahaye,
& Sekaran, 2001). Cross- sectional method survey was selected for this study in order
avoids deviation of study’s objectives where association with long-time survey period
can be characterized as longitudinal research (Sekaran & Bougie, 2010).
The building management was contacted through telephone call or walk in to inform
that their building has been selected for this study and followed by the University’s
official letter pertaining to the research study as shown in Appendix I. This is to ensure
personnel who are responsible for building management had acknowledged a presence
of researcher and research activity. This is also to avoid any misunderstanding of
information being collected in their building. After consent was obtained from the
building management, study questionnaires were distributed to car park customers
who are subscribed to monthly season parking and politely request them to collaborate
in study survey.
The distribution method for questionnaire to the potential respondents was done in one
of the two ways, directly by hand to respondent and through the office administrator
or staff who is incharge at particular car park facilities. In order to avoid
misunderstanding, researcher wearing uniform with Universiti Utara Malaysia logo
and introduce as doctoral student of the said university. As office administrator or car
park staff cover many potential respondents, one piece of cloth called “Shawl” was

181
given to them upon handed over bundle of questionnaires together with envelopes.
Instance completion of survey questionnaire is most welcome. In case of respondents
unable to complete the questionnaire instantly, the researcher will back to collect the
completed questionnaire or otherwise, the respondent use postal to delivery back the
questionnaire using provided envelope or scan the completed questionnaire and email
to researcher email address or take photo of completed questionnaire and posted it to
researcher’s Whatapps. The data collection activities were conducted within August
2015 until end of September 2015 after obtained consent from proposal defense
committee.
4.7 Techniques of data analysis
Methods of data analysis applied in this study were from combinations of both
descriptive and inferential statistics. According to Singh (2007), descriptive statistics
are used to describe, summarize or explain a given set of data, whereas inferential
statistics use statistics computed from a sample to infer about the population concerned
by making inferences from the samples about the populations from which they have
been drawn.
In general, data analysis is to produce statistical results in table or figures that enable
researcher to interpret and conclude the research questions, hypotheses and the broader
meaning of the results (Creswell, 2012; Sekaran, 2003). According to Sekaran (2000),
data analysis involves several steps such as coding the responses, screening the data
and selecting the appropriate data analysis strategy.
182
In present study, descriptive statistics was computed through Statistical Package Social
Science or SPSS version 21.0. While the reliability testing, validity testing and
hypotheses testing were analyzed using SmartPLS version 2.0 M3 through partial least
square structural equation modelling or in short PLS-SEM approach.
4.7.1 Data coding
Data coding is the process transforming data into numeric format (Bhattacherjee,
2012). After collecting the data from respondents, coding exercise on the data is
required in order to store data systematically (Zikmund, 2003) and enable statistical
software to group or combine to form additional variables (Saunders et al., 2009).
4.7.2 Data screening
After data has been coded and key in the SPSS statistical software, data screening is
need to be carried out to ensure the analysis result is not affected by poor characteristic
of the data such as missing data, outliers and violation of assumptions (Hair et al.,
2014b). Hence, data screening is important and it involves a number of steps as shown
in the following steps of analysis.
4.7.2.1 Missing data
Missing data is information not available or not complete for a subject or case about
whom other information is available. Missing data occurred when a respondent fails
to answer one or more questions in a survey (Hair et al., 2014b).
Missing data can be treated in several ways (Hair et al., 2014a; Singh, 2007; Sekaran,
2003). For example, Singh (2007) suggests several treatment to handle missing data

183
such complete case analysis (list-wise deletion), available case methods (pair-wise
deletion) and filling in the missing values with estimated scores (imputation). Hair et
al. (2014a) recommend that in case of missing value for a specific questionnaire is
more than fifteen percent, then all responses for the questionnaire should be removed.
4.7.2.2 Assessment of outliers
The next step after treating the missing responses is examining outliers. Hair et al.
(2014a) define outlier is an extreme response to a particular question or extreme
responses to all questions. Another definition, Beins and McCarthy (2012) defines
outlier as a value that is highly disparate from the larger data set.
There are reasons that cause outliers such as incorrect data entry. The other reason is
that observations within the intended population are extreme in their combination of
values across the variables (Hair et al., 2006). The impact of outliers should be
assessed through practical and substantive consideration that in line within the context
of the analysis (Hair et al. (2014b).
Multivariate detection applied a Mahalanobis D2 measurement where this method
measure each observation’s distance in multidimensional space from the mean center
of all observations, providing a single value for each observation no matter how many
variables are considered. Each case was evaluated using the chi-square distribution
with an alpha level of 0.001 and the degree of freedom of the number of items. The
score was compared to Chi-square X 2 value. If Mahalanobis D2 > Chi-square X 2 then
that case was considered as an outlier and can be considered to deleted from the dataset
(Hair et al., 2006).

184
Additionally, Hair et al. (2014a) also reminds to researcher to examine suspicious
responses pattern such as straight lining when a respondent marks the same response
for a high proportion of the questions. For example in seven Likert-point scale, a
respondent only select number 4 or 1 or 7 only and it should be removed from data set.
In this situation, it was interpreted that the respondent was not reading the questions
closely or simply was marking answers to complete and exit the survey as quickly as
possible.
4.7.2.3 Assessment of normality
Although PLS-SEM is apply a nonparametric statistical method which does not
demand strictly normality of data distribution, it was stressed that it is essential to
ensure that the distribution of data are not extremely distant from normality baseline
in order to avoid a problematic in the computing the significant of parameters.
Correspondingly, Hair et al. (2014a) states that extreme non-normal data increase
standard errors value that resulted from bootstrapping procedure and consequently,
reduce the likelihood of some relationships will be gauged as significant.
Normality test is used to evaluate whether the data are normally distributed or not. If
the variation of the data is sufficiently large, all resulting statistical tests are invalid
(Hair et al., 2010). For most analyses to work correctly, the data should follow a normal
distribution. If normality exists, even in conditions that do not necessitate normality,
it will make a stronger assessment (Hair et al., 2010). Subsequent to outlier tests, an
assessment of normality will be performed. In order to detect extreme normality issue,
statistical results such a skewness and kurtosis.

185
Skewness assesses the distribution of responses for a variable stretches toward the right
or left tail of the distribution and Kurtosis is to measure “peakedness” or “flatness” of
distribution compared to the normal distribution (Hair, Black, Barry, & Anderson,
2010). The result of skewness and kurtosis should be closed to zero to be considered
as a normal distribution. For general guidelines as provided by Hair et al. (2014a),
recommend the range of skewness is greater than + 1 or lower than -1 to indicates a
substantially skewed distribution. For kurtosis, if range is greater than +1, the
distribution is too peaked and if less than -1 shows a distribution that is too flat.
Data transformation is needed if the variable has an undesirable characteristic, such as
non-normality. A transformation such as taking the logarithm or the square root of
variable creates a transformed variable that is more suited to portraying the
relationship. Transformation may be applied to either dependent or independent
variables or both (Hair et al., 2006).
4.7.2.4 Linearity and homoscedasticity
The reason for testing linearity is because the concept of relationship is based on
linearity. Non linearity will affect the predictive accuracy of the model and the validity
of the estimated coefficients during regression analysis between dependent and
independent variables relationship (Hair et al., 2014b). According to Mooi and Sarstedt
(2011), linearity can be check by producing a scatter plot to represent the relationship
of independent variable against dependent variable. The straight line shows in scatter
plot indicates a linear relationship exists.

186
According to Saunders et al. (2009), they defines homoscedasticity as the extent to
which the data values for the dependent and independent variables have equal
variances. Homoscedasticity is used to describe the distribution of data points around
the line of best fit and signifies that the data points are equally distributed around the
line of best fit. This is because the regression line is a straight line where the line is
described as the line of best fit as it reduces the variance of all distances from the line
(Singh, 2007). Opposite to homoscedasticity, if unequal variances exist as known as
heteroscedasticity, data transformation method should be applied to correct breach of
statistical assumption and to improve the relationship between variables or increasing
sample size for 200 cases or more (Hair et al., 2014b).
4.7.2.5 Multicollinearity
Multicollinearity is related to the highly correlation among independent variables
when the result shows .90 and above (Pallant, 2011). Multicollinearity associates
statistical problems like Β coefficient values are less trustworthy, limit the size of R
and difficult to assess the individual importance of a predictor (Field, 2009).
Using SPSS software, multicollinearity can be detected through tolerance and variance
inflation factor (VIF) in collinearity diagnostic results. According to Pallant (2011),
the possibility of multicollinearity exist if a Tolerance value is small less than 0.10 and
VIF value more than 10.
4.7.3 Descriptive analysis
The objective of the descriptive analysis is to change the raw data into the form that is
easy for the researcher to understand and interpret (Zikmund, 2003). The descriptive
187
statistics can be divided into two types: frequency distributions, and measures of
central tendencies and dispersion (Cavana et al., 2001). The frequency distributions
are presented in the form of frequency and percentages for the nominal scale and
ordinal scale of the respondents’ profiles such as demographic data.
Meanwhile, the measure of central tendencies and dispersion explains the nature of
data in terms of minimum, maximum, means, standard deviations, and variance for the
interval scale of the measured variables.
4.7.4 Path model estimation
SmartPLS was used in this study and apply the PLS-SEM algorithm to calculate the
path model estimation. This algorithm uses the empirical data for the indicators and
iteratively determines the construct scores, the path coefficients, indicator loadings and
weights, and the R2 values. These score results are treated as perfect alternatives for
the indicator variables in the measurement models and use all the variance to explain
the endogenous constructs (Hair et al., 2014a).
Before apply the PLS-SEM algorithm, several parameter settings are needed to be
specified such as selecting the structural model weighting scheme, the data metric,
initial values to run the PLS-SEM algorithm, the stop criterion and the maximum
number of iterations. The report results from SmartPLS enable the researcher to check
and to evaluate the initial results for the outer weights, outer loadings, structural model
path coefficients, and R2 values (Hair et al., 2014a).

188
4.7.5 Measurement of model
Assessment of measurement models for reflective approach includes composite
reliability to evaluate internal consistency also known as composite reliability,
individual indicator reliability and average variance extracted (AVE) to evaluate
convergent validity.
Generally, the composite reliability values interpreted in the same way as Cronbach's
alpha. Acceptable composite reliability values in exploratory research are 0.60 to 0.
70. While in more advance research, values between 0. 70 and 0.90 can be regarded as
satisfactory. Values above 0.90 (and definitely> 0.95) are not desirable because they
indicate that all the indicator variables are measuring the same phenomenon and are
therefore unlikely to be a valid measure of the construct (Hair et al., 2014a).
Validity is the extent to which a scale or set of measures accurately represents the
concept of interest. Beside content validity as mentioned in preceding subheading,
discriminant validity and convergent reliability is other form of validity which
measures empirically by the correlation between theoretically defined sets of variables
(Hair et al., 2014b).
Convergent validity assesses the degree to which two measures of the same concept
are correlated. High correlations indicate the scale is captured in the intended concept.
A common rule of thumb is that the standardized outer loadings should be at range of
0.708 or higher that equal to fifty percent (50%) for latent variable is explained
substantially. Acceptable value of 0.70 is usually referred as the value is considered
close enough to 0.708. The scale indicators with outer loadings between 0.40 and 0.70

189
should be considered for removal (Hair et al., 2014a). A common measure to establish
convergent validity on the construct level is the average variance extracted (AVE)
which also known as the communality of a construct. The value for AVE should at
range 0.50 or higher to indicate the construct have been explains for more than half of
the indicator’s variance (Hair et al., 2014a).
Discriminant validity is the extent to which a construct is truly distinct from other
constructs by empirical standards. Discriminant validity suggests that the
characteristic of construct is unique and different with other constructs in the model.
Cross loading result for each indicator will be used to assess discriminant validity and
the value of outer loading on the specify construct should be higher than all loadings
on other constructs (Hair et al., 2014a).
Another assessment method for discriminant validity, the Fornell-Larcker criterion is
referred to compares the square root of the AVE values with the latent variable
correlations. The square root of each construct's AVE should be higher than correlation
loading in any other construct (Hair et al., 2014a).
Present study conceptualizes service marketing mix, service quality and service value
as second order construct through formative measurement approach. However, Hair et
al. (2014a) highlights that there are two issues need to be examined which are
collinearity among indicators for redundancy of indicator’s information and
significance and relevance of the formative indicators. The suggested tolerance and
VIF standard to measures collinearity is higher than 0.20 and lower than 0.50. For
assessing significance and relevance of the formative indicators, outer weight as

190
resulted from multiple regressions should be referred. The value of outer weight can
be obtained after applying a bootstrapping procedure at 5000 subsamples to assess
significant of indicators is run. Additionally, Hair et al. (2014a) recommend that if
weight of indicators is found not significant but the outer loading is more than 0.50,
the indicator should generally be retained and if both measurement are not significant
including no strong empirical support to retain the indicator, removal of such indicator
from the model is recommended.
4.7.6 Hypothesis testing
Hypothesis testing is a claim about a statistic characterizing a population (Mooi &
Sarstedt, 2011). The present study was intended to test the priority between elements
in service marketing mix for hypothesis number one (H1), the direct effect of six
hypotheses (H2, H3, H4, H5, H6 & H7) and indirect effect of four hypotheses (H8,
H9, H10 & H11) as stated in earlier heading in this chapter.
4.7.6.1 Friedman test
Friedman test from SPSS statistical software was be used to answer H1. This testing
method also known as Friedman two-way analysis of variance is a non-parametric tests
that uses the ranks of the data rather than raw values to calculate the statistic. The
Friedman statistic test is refers to a chi-square distribution with k–1 degrees of
freedom, where k is the number of repeated measures. As a guideline for this test, the
distributions of mean ranks are not the same across repeated measures if the statistic
result shows significance value less than 0.05 (Corder & Foreman, 2009; Singh, 2007).
Several studies such as Yasanallah and Vahid (2012); Alipour (2012); Alipour and

191
Darabi (2011), and Moniri (2011) had applied the Friedman test to prioritize and rank
the elements of service marketing mix in their studies.
4.7.6.2 Direct effect
According to Hair et al. (2014a), direct effect is a single arrow connecting to
relationship between two constructs. In other words, a direct effect is the effect
variables have on one another in a direct relationship.
In present study research framework, there were six direct effects has been tested in
six hypotheses indexed as H2, H3, H4, H5 and H6 and H7. The PLS-SEM algorithm
with bootstrapping procedure of 5,000 subsamples iteration to analysed relationships
among the constructs. The strength of path coefficients was interpreted through how
close path coefficients value to +1 that represent strong positive relationships or vice
versa for negative values.
The standard error is produced by means of bootstrapping procedure where it allows t
value to be computed. The critical values for two tailed tests as hypothesized in present
study are 1.96 for significance level of 5% and 2.57 for significance level of 1%. The
significance level of 5% is commonly referred in marketing research (Hair et al.,
2014a). This means that if t value is more than 1.96, it supports the hypothesis path. In
contrary, the hypothesis path is not supported and rejected if t value is less than 1.96.
4.7.6.3 Indirect effect
Indirect effect is referred to mediation effect. According to Hair et al. (2014a), a
significant mediator variable may to some extent absorb a cause-effect relationship.

192
The presence of mediating variable in the research model enables researchers to have
better understanding on the broader scope of relationships between dependent and
predictor constructs through appropriate methodology.
A mediating effect is existed when a third variable or construct intervenes between
two other related constructs. There are four hypotheses to be tested for mediating effect
where service quality and service value are conceptualized as mediating variable in
present research framework. According to Frazier, Tix, and Barron (2004) who use
Baron and Kenny (1986) mediating conceptual model, states there are four steps in
establishing that a variable mediates the relationship between predictor variable (also
called independent variable) and dependent variable (dependent variable):
a) there is a significant on direct relationship (see path c) between the predictor and
dependent;
b) the predictor is significantly related to the mediator variable (see path a);
c) to show that the mediator is significantly related to dependent (see path b); and
d) the strength of the relation between predictor and dependent is significantly
reduced when the mediator is added in the model (compare path c and path c’ in
Figure 5.14).
However, Hair et al. (2014a) suggest the researchers to use mediating test methodology
as proposed by Preacher and Hayes (2004; 2008) and bootstrap the sampling
distribution of the indirect effect which it was found works well for a simple and
multiple mediator models. Accordingly, Hayes (2009) argues that mediating effect can
exist although the relationship between predictor variable and dependent variable is
not significant. It was claimed as contemporary thinking for testing indirect effects.

193
Hayes (2009) also claims that bootstrapping procedure is more powerful than SOBEL
test because bootstrapping do not make assumption based on normality of sampling
distribution, able to provide size or significant of the indirect effect and the best Type
I error control. Hair et al. (2014a) further recommend that application of PLS-SEM is
perfectly suited to test mediating effect as proposed by Preacher and Hayes and
bootstrapping procedure. However, Hair et al. (2014a) recommend that the direct path
from predictor to dependent variable should be significant when mediating variable is
not presence. This condition makes the mediator analysis is easier to understand and
interpret. Therefore, this study followed a mediating testing approach as suggested by
Preacher and Hayes (2004; 2008) and Hair et al. (2014a).
As postulated by Hair et al. (2014a), Variance Accounted For (VAF) determines the
size of the indirect effect in relation to the total effect, i.e. direct effect + indirect effect.
If the VAF value is below 20%, there is no mediating effect, as opposed to the VAF
value of above 20% but less than 80%, it shall indicate the existence of partial
mediating effect. The VAF value above 80% shall indicate full mediating effect.
Therefore, this study followed a mediating testing approach as suggested by Preacher
and Hayes (2004; 2008) and Hair et al. (2014a).
The R2 values represent the amount of explained variance of the endogenous constructs
in the structural model. A well-developed path model able to explains endogenous
constructs through adequate high R2 values. As a guideline, R2 values of 0.25, 0.50,
and 0.75 for target constructs are considered as weak, medium, and substantial,
respectively (Hair et al., 2014a).

194
In addition to the above paragraph, Hair et al. (2014a) suggests that Stone-Geisser's Q2
should be carried out in addition to evaluate R2 for criterion of predictive accuracy.
The PLS Blindfolding procedure was used to obtain Q2 to demonstrates that the model
has adequate predictive relevance required to highlight the data points in the
measurement model of the reflective endogenous. The number of the observations
used in the model estimation is divided by any omission distance number from 5 to 10,
which shall not result into an integer. According to Hair et al. (2014a), 0.75 indicates
substantial predictive relevance power, whereas 0.50 indicates moderate predictive
relevance power and 0.25 indicates weak predictive relevance power. The Q2 can be
calculated using cross-validated redundancy and cross-validated communality
approaches.
Another result as addition to evaluate R2 is f2 effect size. The f2 effect size is a measure
used to assess the relative impact of a predictor construct on an endogenous construct.
The f2 effect size enables researcher to analyze how much a predictor construct
contributes to the R2 value of a target construct in the structural model. Results of 0.02,
0.15, and 0.35 are interpreted as small, medium, and large f2 effect sizes, respectively.
4.7.7 Justification using Partial Least Squares (PLS) technique
PLS-SEM technique is called a second generation structural equation modelling
(Wold, 1982) and nonparametric in nature approach (Hair et al., 2014a). The PLS
technique is works well with structural equation models that represent a series of
cause-and-effect relationships and latent variables (Hair et al., 2014a). PLS-SEM is a
technique that based on an iterative approach for maximizing the explained variance
of endogenous constructs (Hair, Sarstedt, Hopkins, & Kuppelwieser, 2014). The PLS

195
SEM approach is enables researcher to test advanced model such as moderator,
hierarchical components model, nonlinear relationship and flexible to reflective or
formative measurement (Sarstedt et al., 2014b).
The application of PLS-SEM technique in present study was based on the following
justifications. Firstly, structural equations models via partial least square have been
demonstrated to be superior models that perform estimations better than regressions
for assessing mediation (Preacher & Hayes, 2004). Empirical study results had showed
that statistical report for total effect of the sum of direct and indirect effects between
two constructs and measurement error provides more deeper and accurate estimates of
mediating effects through bootstrapping procedure (Hair et al., 2012b). Therefore,
application of PLS-SEM in the present was crucial because four hypotheses indexed
as H8, H9, H10 and H11 is related to mediation testing.
Secondly, PLS-SEM is increasing in popularity because it application capable to
handle non-normal data usually occurred in social science studies and able to compute
highly complex model such as many constructs, structural models, many indicators
hierarchical relationship and formative measured constructs of which gaining attention
in recent years studies (Sarstedt et al., 2014b; Hair et al., 2014c). There were eighty
three (83) indicators, application of reflective-formative measurement for three
constructs, hierarchical relationship for three constructs and four mediation
relationship conceptualized in present research framework. Based on literature, it was
expected that PLS-SEM able to handle, explore, predict and compute all hypothesized
relationship in present study.

196
Thirdly, conditions of relationship between a latent variable and its measures can be
modelled either formative or reflective through PLS-SEM compared to CB-SEM such
as AMOS is typically for reflective measurement only (Sarstedt, Ringle, & Hair, 2014)
and measurements of formative outer model are applicable under certain conditions
(Hair et al., 2012a). According to Hair et al. (2014a) and Hair et al. (2014c), PLS-
SEM has a major advantage and capability to apply formative measures in research
model framework. Additionally, a formative measured constructs are useful for studies
that aim at explaining and predicting dependent constructs. Through the advantages as
offered by PLS-SEM, three latent constructs in this study namely service marketing
mix, service quality and service value were molded through formative measures from
its dimensions respectively.
Fourthly, Hair, Ringle, and Sarstedt (2013) claim that hierarchical components models
or higher order models are relatively easy to use in PLS-SEM. The hierarchical
components models concept allows research model to be more theoretical parsimony,
lessen model complexity and can prevent confounding effects in multidimensional
model structures such as multicollinearity (Hair et al., 2014c). The PLS-SEM is also
capable to testing on several layers of constructs but usually involve second order
constructs that contain two layers of components (Hair et al., 2014a). While Becker,
Klein, and Wetzels (2012) suggests that PLS-SEM should be used to investigate in
future research for the estimate hierarchical latent variable models when highly
complex models such as mediation or moderation variables are included in research
model. Therefore, the characteristic of research framework in present study which
contained three second order constructs namely service marketing mix, service quality
and service value suggested that PLS-SEM was an appropriate technique to be used in

197
this study. Furthermore, application of PLS-SEM to test hierarchical components
applied in this study enhanced the existing knowledge as suggested by Becker et al.,
(2012).
Lastly, although this study follow Hair et al., (2014a) advise to check status of
excessive abnormality among collected data at the beginning analysis stage, in this
case SPSS was used; the application of PLS-SEM in this study had further confirmed
there are no issue on data normality and the statistical power of analysis was
considered as accurate and true. This is line with statement made by Hair et al. (2014a),
Hair et al. (2014c), Hair et al. (2013), and Becker et al. (2012). They comments that
PLS-SEM does not necessarily require data to be normal and handles non-normal data
issue relatively well. In contrast, CB-SEM requires data to be normal and more
stringent on data characteristic (Hair et al., 2012b). Additionally, it was reported that
most data collected for social science studies are tend to have normality problem (Hair
et al., 2014c). Therefore, the use of PLS-SEM in this study was proposed.
4.8 Pilot study
Pilot study is essential process in research undertaking in order to establish the
reliability and validity of an instrument such as appropriateness of observations
categories, improvement on questionnaire and scales, accuracy, understandable,
effectively operationalize towards study objectives (Bhattacherjee, 2012; Cresswell,
2009; Cohen et al., 2007).

198
Therefore, this study had conducted a pilot study before the final questionnaire as
shown in Appendix J was distributed to respondents. A pilot study was conducted
through a convenience sampling to thirty two (32) customers who are subscribed for
monthly season parking in one private office building named Chase Perdana at
Damansara Heights, Kuala Lumpur.
At the next stage, all collected data was analyzed for the Cronbach’s Alpha in order to
check the internal reliability of consistency of the intended measurement and SPSS
software was used for this purpose. For the scales guideline, acceptable Cronbach
Alpha value for in exploratory research are 0.60 to 0.70 and more advance research is
between 0.70 and 0.90 (Hair et al., 2014a). Further, they reminded that values above
0.90 or more extreme value of above 0.95 demonstrate the indicators measure a same
scenario and it is not desirable. The result of pilot study was shown in Table 4.23.
Table 4.23
Pilot Study results of Cronbach’s Alpha
Construct Variable No. of
Indicators Cronbach’s Alpha
Service Marketing Mix (SMM)
Service product 6 0.939
Service price 5 0.905
Service place 5 0.871
Service promotion 6 0.904
Service people 6 0.957
Service process 5 0.908
Service physical evidence 5 0.910
Service Quality (SQ)
Tangible 4 0.872
Reliability 5 0.954
Responsiveness 4 0.931
Assurance 4 0.979
Empathy 5 0.934
Technical quality 5 0.930

199
Table 4.23 (Continue)
Construct Variable No. of
Indicators Cronbach’s Alpha
Service Value (SV)
Emotional value 3 0.730
Social value 3 0.961
Quality/performance 3 0.948
Price/value for money 3 0.872
Customer Satisfaction (SAT) Customer satisfaction 6 0.917
Total items 83
4.9 Summary of chapter
The research methodology for this study has been discussed in this chapter. It contain
a proposed the research framework and hypotheses of the study. The subsequent
heading outlined the questionnaire design which concerned with measurement of
variables. This chapter also discussed the methods and strategy of data collection such
as population of the study, sampling frame, sample size, sampling technique, data
collection procedure to rationale for the research design.
Additionally, more technical description under data analysis technique had discussed
the method and type of data analysis techniques to be applied in this study include it
justification adopting such technique. Finally, this chapter has explained the rationale
and the process involved for pilot study. The result of Cronbach’s Alpha for each
variable that derived from collected data of pilot study was presented in this study. For
ease reference, the link between research questions, research objectives and
hypotheses testing was summarized in Table 4.24.

200
Table 4.24
Summary of hypotheses testing
No. Research questions Research objectives Index Hypotheses Analysis
technique
1. What are the important elements of service
marketing mix in Malaysian commercial
parking facilities?
To determine the importance of service
marketing mix elements in Malaysian
commercial parking facilities through customer
perspective.
H1 The priority between seven elements in service
marketing mix from customer perspective is
varied.
Friedman
test
2. Does service marketing mix, service quality,
service value and customer satisfaction are
influenced by each other directly in Malaysian
commercial car parking facilities?
To investigate direct relationship between
service marketing mix and customer
satisfaction.
H2 There is a significant relationship between service
marketing mix and customer satisfaction.
PLS-SEM
regression
To investigate direct relationship between
service marketing mix and service quality.
H3 There is a significant relationship between service
marketing mix and service quality.
PLS-SEM
regression To investigate direct relationship between
service marketing mix and service value.
H4 There is a significant relationship between service
marketing mix and service value.
PLS-SEM
regression To investigate direct relationship between
service quality and customer satisfaction.
H5 There is a significant relationship between service
quality and customer satisfaction.
PLS-SEM
regression To investigate direct relationship between
service quality and service value.
H6 There is a significant relationship between service
quality and service value.
PLS-SEM
regression To investigate direct relationship between
service value and customer satisfaction.
H7 There is significant relationship between service
value and customer satisfaction.
PLS-SEM
regression
3. Is there any mediation effect of service quality
on the relationship between service marketing
mix and customer satisfaction?
To examine the mediating effect of service
quality on the relationship between service
marketing mix and customer satisfaction.
H8 Service quality mediates the relationship between
service marketing mix and customer satisfaction.
PLS-SEM
Hierarchical
4. Is there any mediation effect of service quality
on the relationship between service marketing
mix and service value?
To examine the mediating effect of service
quality on the relationship between service
marketing mix and service value.
H9 Service quality mediates the relationship between
service marketing mix and service value.
PLS-SEM
Hierarchical
5. Is there any mediation effect of service value
on the relationship between service marketing
mix and customer satisfaction?
To examine the mediating effect of service
value on the relationship between service
marketing mix and customer satisfaction.
H10 Service value mediates the relationship between
service marketing mix and customer satisfaction.
PLS-SEM
Hierarchical
6. Is there any mediation effect of service value
on the relationship between service quality and
customer satisfaction?
To examine the mediating effect of service
value on the relationship between service
quality and customer satisfaction.
H11 Service value mediates the relationship between
service quality and customer satisfaction.
PLS-SEM
Hierarchical

201
CHAPTER FIVE
RESULTS AND DISCUSSION
5.1 Introduction
This chapter shows the result of data analysis and discussion on the results outcome.
Firstly, this chapter reports the response rate from the field. Secondly, this chapter
analyzes results of normality analysis and multicollinearity through SPSS for seven
elements of service marketing mix, six dimensions of service quality, four dimensions
of service value and satisfaction variable. In next step, PLS-SEM approach was used
to analyze the measurement model through construct validity and reliability analysis
of measures used. In subsequence heading, this chapter analyzes the structural model
for relationships between service marketing mix, service quality, service value and
customer satisfaction constructs. Lastly, the results for hypotheses were shown and
discussed.
5.2 Analysis of survey response
In this section, the result of collection data and demographic data were analyzed and
presented. This section focuses on the goodness of data, response rate, test for non-
bias response and profile of respondents.
5.2.1 Goodness of data
As mentioned in Chapter 4, the primary data of this study was collected through an
instrument in the form of a questionnaire. It aimed 800 car park customers who were

202
subscribed to monthly season parking pass in the private office buildings located
within Klang Valley of Malaysia as shown in Table 4.22 of Chapter 4. The data
collection was conducted over a period of two months, from August 2015 to the end
of September 2015. Prior to performing the data analysis, data from thirty two
respondents for pilot study were excluded and three negatively worded items were
recoded into a positive form. From a total of 800 questionnaires distributed, only 182
questionnaires were usable.
5.2.2 Response rate
Based on stratified sampling and proportionate to size method, present study had
distributed 800 questionnaires to twenty private office buildings within Klang Valley
where 40 questionnaires were allocated to each buildings. Out of twenty private office
buildings, fifteen buildings are located within DBKL territory, three buildings are
located at MBPJ territory, one building is located at MBSA territory and another one
building is located in Majlis Perbandaran Sepang (MPSg) territory.
The selected respondents were among parking customers who are subscribing a
monthly season pass at the selected buildings. From 800 questionnaires, a total of 211
questionnaires were returned. However, a total of 182 questionnaires were finally
retained for analysis and this represent response rate of 23%.
Specifically, a total of twenty eight responses were excluded from the analysis due to
three major reasons. First, a total of thirteen questionnaires were excluded from
analysis for the incompleteness. Secondly, a total of nine questionnaires were excluded
because the respondents marks the same response which also known as “straight

203
lining”. Thirdly, a total of six questionnaires were excluded due to the respondents are
not a customer of monthly season parking. The location, name of private office
buildings and descriptive result of collected questionnaires were listed in Table 5.1.
Table 5.1
The location, name of private office buildings and descriptive result of collected
questionnaires
Municipal Name of Private Office
Building
Questionnaire
Distributed Returned Rejected Usable
DBKL BGN GETAH ASLI 40 8 3 5
DBKL WISMA MBSB 40 8 6 2
DBKL WISMA TUNE 40 11 11
DBKL BGN MALAYSIA RE 40 11 11
DBKL WISMA CHASE PERDANA 40 17 3 14
DBKL PNB DARBY PARK 40 4 4
DBKL MENARA JCORP 40 6 6
DBKL MENARA 238 40 14 14
DBKL WISMA MILLENIUM 40 11 3 8
DBKL WISMA UOA II 40 8 8
DBKL WISMA MPL 40 7 7
DBKL WISMA KFC 40 12 1 11
DBKL MENARA UNI ASIA 40 4 4
DBKL G TOWER 40 8 3 5
DBKL WISMA SEJARAH 40 4 4
MBPJ 8TRIUM 40 14 4 10
MBPJ OASIS SQUARE 40 17 17
MBPJ PREMBA SQUARE 40 6 1 4
MBSA WISMA PKPS 40 15 2 13
MPSg ENTERPISE 3 40 26 2 24
Total of Frequency 800 211 28 182
Rate Percentage 100% 27% 4% 23%
Although the usable questionnaires for this study was slightly below from the desired
sample size of 208 as suggested by G Power method, the variance of samples constitute
a broad range of customer characteristics through different location in Klang Valley.
Furthermore, 182 usable questionnaires is more than required sample size based on
rule of thumb which equivalent to ten times of number of independent variables in the
study (Hair et al., 2014a). As this study constitute of seventeen independent variables,
170 sample sizes is adequate for analysis. The application of PLS-SEM in present

204
study for analysis methodology requires a minimal range of 30 to 100 responses only
(Chin & Newsted, 1999). Thus, a total of 182 respondents for this study are greatly
adequate for analysis.
5.2.3 Test for non-response bias
According to Mooi and Sarstedt (2011), respondents who reply later are theoretically
more similar to non-respondents characteristics and recommend Armstrong and
Overton procedure should be followed. This argument is the late respondent probably
would not have responded if not followed up upon. Non-response bias is a critical
concern for this study and a non-response bias test was carried out with the late
respondents being used as proxy for non-respondents. In respect of this
recommendation, independent sample test using the Levene's Test for Equality of
Variances has been employed to see whether the early and late respondent groups show
any differences. If significant value is greater 0.05, it means no significant differences
between the two groups.
In order to accomplish this purpose, first group of ninety eight usable questionnaires
which were returned in the month of August 2015 was considered as early respondents
and second group of eighty four usable questionnaires received in September 2015 was
considered as late respondents. Results from the Independent Samples T-Test are
shown in Table 5.2 below. The result reveals no statistically significant differences at
the 0.05 level for any of the characteristics of the two group namely early respondents
and late respondents. Based on the result, present study assumes that non-response bias
was not a critical concern for this study.

205
Table 5.2
Test result of non-response bias
Variable
Levene's Test for
Equality of Variances
t-test for Equality
of Means
N Mean F Sig. Sig. (2-tailed)
PRD Early 98 3.838 .194 .660
.891
Late 84 3.859 .891
PRC Early 98 4.032 .032 .858
.582
Late 84 3.948 .581
PLC Early 98 4.029 .008 .931
.732
Late 84 4.081 .732
PRM Early 98 3.816 .179 .673
.658
Late 84 3.755 .658
PEP Early 98 3.968 .164 .686
.810
Late 84 4.002 .809
PRO Early 98 4.028 .060 .806
.884
Late 84 4.049 .885
PHY Early 98 4.067 .895 .345
.673
Late 84 4.005 .670
TAN Early 98 3.939 .103 .748
.814
Late 84 3.971 .814
REL Early 98 4.116 .001 .979
.845
Late 84 4.144 .846
RES Early 98 4.219 3.698 .056
.856
Late 84 4.246 .860
ASS Early 98 4.337 .258 .612
.244
Late 84 4.519 .248
EMP Early 98 3.976 .019 .889
.837
Late 84 3.947 .838
TEC Early 98 4.288 .149 .700
.138
Late 84 4.075 .138
EMO Early 98 4.469 .238 .626
.444
Late 84 4.344 .448
SOC Early 98 4.299 .072 .788
.766
Late 84 4.254 .767
FQP Early 98 4.237 .253 .616
.540
Late 84 4.156 .544
FPV Early 98 4.192 2.640 .106
.620
Late 84 4.114 .625
SAT Early 98 4.296 .772 .381
.408
Late 84 4.178 .415
*p < 0.05
Note: PRD = service product; PRC = service price; PLC = service place; PRM = service
promotion; PEP = service people; PRO = service process; PHY = service physical; QTAN =
tangible, QREL = reliability; RES = responsiveness; QASS = assurance; QEMP = empathy;
QTEC = technical; VEMO = emotion; VSOC = social; VFQP = functional quality &
performance; VFPV = functional price & value; SAT = customer satisfaction.

206
5.2.4 Profile of the respondents
Using the descriptive analysis in SPSS, this sub-heading presents the profile of the
study’s respondents and eight items were provided. Firstly, the respondents were
required to name the car park building that they currently been used. Then, followed
by six groups of the respondents’ characteristics namely gender, age, highest
education, level of position, payment of season parking and period of service
engagement. One control question in item number six (6) was provided to make
distinction between customer and non-customer of season parking. The details of
demographic profiles of the respondents were summarized in Table 5.3.
Table 5.3
The demographic profile of study’s respondents
Demographic Characteristic Frequency Percent (%)
Gender Male 77 42.3
Female 105 57.7
Age
> 21 3 1.6
21 - 30 57 31.3
31 - 40 86 47.3
41 - 50 30 16.5
> 50 6 3.3
Highest Education
Cert 27 14.8
Diploma 42 23.1
Degree 97 53.3
Master 15 8.2
Doctoral 1 0.5
Position
Non-Exec 49 26.9
Exec 92 50.5
Managerial 34 18.7
Top Mgmt 7 3.8
Payment
My Own 76 41.8
My Company 76 41.8
My Own + Company 29 15.9
Other Party 1 0.5
Usage duration
>= 1 year 46 25.3
1 <= 2 years 53 29.1
2 <= 3 years 48 26.4
3 <= 4 years 18 9.9
More than 4 years 17 9.3

207
Table 5.3 shows there were 182 respondents in total. The percentage of respondents
among female indicates slightly higher than male respondents which represent 57.7%
and 42.3% respectively. The majority respondent’s age participated in this study
comes from 31 – 40 years old (47.3%) and followed by respondent’s age between 21
– 30 years old (31.3%). Generally, the respondents of this study were among well
education. The respondents with bachelor degree had recorded the highest
participation in this study with 53.3% and followed by diploma holder respondents
with 23.1%. In term of position level, the respondents among executive level was the
highest with 50.5% and followed by respondent among non-executive position with
26.9%. Majority of respondents pay a monthly season parking pass through their own
money or their company which represent 41.8% for each category. While another
15.9% respondents pays their monthly season parking pass proportionately with their
company and only one respondent pay the season pass by other company. Frequency
analysis of the respondent’s on service usage duration indicates respondents with 1 <=
2 years was the highest group represent to this study at 29.1% and followed by the
respondents with 2 <= 3 years at 26.1% and respondents with less or equal to 1 year
service usage duration at 25.0%.
5.3 Data screening analysis
Among the fundamental steps in any study is to assess the study’s data prior to analyse
the effect of research framework on the particular phenomenon and thus, data
screening was necessary. The essential for doing data screening process was stressed
in research methodology books because the erroneous and poor quality of data
distribution may distort analysis techniques and results (Tabachnick & Fidell, 2013;
Pallant, 2011; Kline, 2011) Although PLS-SEM was used in this study to evaluate the

208
model quality such as measurement model, structural model and the hypotheses
testing, which has less sensitive about data normality, data screening was still
employed so that the nature of the distribution of the data could be known. The main
purpose of these screening procedures is to detect and decide what to do with any
extreme data encountered. In this procedure, detection and treatment of missing data,
outliers, normality, linear relationship and test of homoscedasticity, were run.
5.3.1 Treatment of missing data
Missing data due to wrong entry or no response to particular item in the data group
should be analysed and detected. The effects of missing data in analysis may affect
analysis assumption and necessary steps were took to avoid their existence. On receipt
of the completed questionnaire, all items in the questionnaires were checked
thoroughly to ensure that all the questions were appropriately answered. Once,
research data was entered completely into SPSS software, descriptive statistics on data
was run to detect whether or not there was missing data. The descriptive result
indicates there was no missing value in the questionnaires. However, there were 28
rejected questionnaires due to incompleteness, straight lining response and outside
target respondent, which were subsequently excluded from further analysis.
5.3.2 Assessment of outliers
Next step of data screening is the evaluation and treatment of outliers in order to detect
extreme value that might have a negative impact on the statistical assumption. Outlier
cases typically have an unusually high or low value, a variable or a unique combination
of values across several variables which makes the observation stand out from the

209
remaining. Hence, multivariate analysis using Mahalanobis Distance is mostly used to
identify and treat the outliers cases accordingly (Tabachnick & Fidell, 2013).
As suggested by Tabachnick and Fidell (2013), Mahalanobis Distance (D2) was used
to identify and deal with multivariate outlying cases. The Mahalanobis procedure in
the SPSS was run and the scores were compared to the table of Chi-square. Given that
83 items were used, representing the degree of freedom in the X2 table with p < 0.001,
so the criterion value was 128.57 (Tabachnick & Fidell, 2013). This explains that any
case with a D2 of 128.57 and above is considered as a multivariate outlier and the
respondent should be excluded in further analysis.
After Mahalanobis test was run, the highest value of D2 was 128.18. Fortunely, no
cases were found to be 128.57 and above and therefore, a total of 182 samples for
further analysis were remained. The results of the D2 (MAH_1 in SPSS) was sorted by
largest values at the top of the list in which was presented in Appendix K.
5.3.3 Assessment of normality
Normality assessment is to describe a symmetrical bell-shaped curve, which has the
utmost frequency of scores in the central with smaller frequencies towards the
extremes (Pallant, 2011). In order to assess the normality, five measures were used in
present study to measure and assess the spread of data distribution that was histogram
with it normal probability plot, standard deviation, mean, skewness and kurtosis.
The assumption of normality about the data distribution of continuous variable scores
along normal curve was illustrated in histogram. Figure 5.1 present the histogram and

210
normal probability plots. As shown, all bars were closed to normal curve, meaning that
normality assumptions were not violated (Pallant, 2011).
Figure 5.1
The histogram and normal probability plots
Standard deviation is described as a measure of the way the data are spread. It is the
average distance of the data distribution from the mean. It presents the degree of
variation from the mean, with a low value of standard deviation indicating data that is
neighboring to the mean and high value of standard deviation indicating the
distribution of data is beyond a range of values.
While for skewness and kurtosis, Kline (2011) suggested that when a skewness index
is acceptable when value is less than 3.0 and the kurtosis index are recommended to
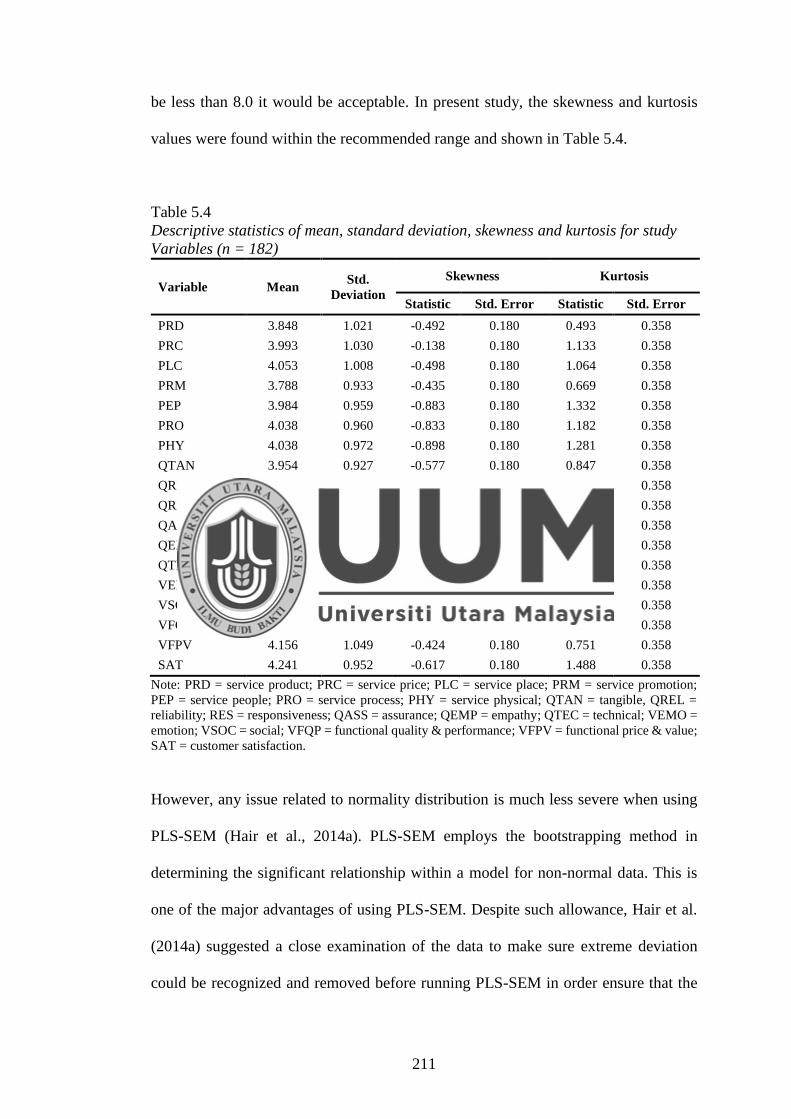
211
be less than 8.0 it would be acceptable. In present study, the skewness and kurtosis
values were found within the recommended range and shown in Table 5.4.
Table 5.4
Descriptive statistics of mean, standard deviation, skewness and kurtosis for study
Variables (n = 182)
Variable Mean Std.
Deviation
Skewness Kurtosis
Statistic Std. Error Statistic Std. Error
PRD 3.848 1.021 -0.492 0.180 0.493 0.358
PRC 3.993 1.030 -0.138 0.180 1.133 0.358
PLC 4.053 1.008 -0.498 0.180 1.064 0.358
PRM 3.788 0.933 -0.435 0.180 0.669 0.358
PEP 3.984 0.959 -0.883 0.180 1.332 0.358
PRO 4.038 0.960 -0.833 0.180 1.182 0.358
PHY 4.038 0.972 -0.898 0.180 1.281 0.358
QTAN 3.954 0.927 -0.577 0.180 0.847 0.358
QREL 4.129 0.950 -0.674 0.180 1.023 0.358
QRES 4.231 1.018 -0.469 0.180 1.029 0.358
QASS 4.421 1.044 -0.376 0.180 0.610 0.358
QEMP 3.963 0.949 -0.497 0.180 1.489 0.358
QTEC 4.190 0.967 -0.536 0.180 0.879 0.358
VEMO 4.411 1.090 -0.194 0.180 0.707 0.358
VSOC 4.278 1.024 -0.476 0.180 1.161 0.358
VFQP 4.200 0.890 -0.685 0.180 1.418 0.358
VFPV 4.156 1.049 -0.424 0.180 0.751 0.358
SAT 4.241 0.952 -0.617 0.180 1.488 0.358
Note: PRD = service product; PRC = service price; PLC = service place; PRM = service promotion;
PEP = service people; PRO = service process; PHY = service physical; QTAN = tangible, QREL =
reliability; RES = responsiveness; QASS = assurance; QEMP = empathy; QTEC = technical; VEMO =
emotion; VSOC = social; VFQP = functional quality & performance; VFPV = functional price & value;
SAT = customer satisfaction.
However, any issue related to normality distribution is much less severe when using
PLS-SEM (Hair et al., 2014a). PLS-SEM employs the bootstrapping method in
determining the significant relationship within a model for non-normal data. This is
one of the major advantages of using PLS-SEM. Despite such allowance, Hair et al.
(2014a) suggested a close examination of the data to make sure extreme deviation
could be recognized and removed before running PLS-SEM in order ensure that the

212
quality of the data does not compromise the outcome of the study. Fortunately, upon
scrutiny of five measures of normality assessment, no indication of extreme non
normal data was found and further analysis using the existing data set was decided.
5.3.4 Assumption of linearity and homoscedasticity
The scatterplot analysis was used to examine non-linearity of certain variables, as
recommended by Tabachnick and Fidell (2013). In the initial assumption, linearity was
evaluated by analyzing the residuals and plots of partial regression. The linearity result
displayed via normal P-P plot was presented in Figure 5.2. It can be inferred that non-
linearity was not an issue in the study data.
Figure 5.2
Normal P-P plot

213
While for homoscedasticity, it refers to the assumption that the variance of residual is
homogeneous across level of predicted values. Homoscedasticity facilitates analysis
because most methods are based on the assumption of equal variance. This assumption
is also known as the assumption of independence of error. If the dispersion of the
residual is unequal across levels of predicted values, then the relationship is said to be
heteroscedastic. Homoscedasticity is assessed by using graphical analysis through a
scatterplot in which the standardized residuals are plotted against the standardized
predicted values (Tabachnick & Fidell, 2013). The condition of homoscedasticity is
said to be met if the plot is scattered across the scatterplot with no distinctive pattern.
The result of graphical analysis using scatterplot to assess the assumption of
homoscedasticity was depicted in Figure 5.3.
Figure 5.3
Scatter plot diagrams

214
Furthermore, Levene’s Test for homogeneity of variances as showed in Table 5.5
indicates that value for significant was greater than 0.05 which was not violated the
assumption of homogeneity of variance. Thus, the data was assumed to have fulfilled
the assumption of homoscedasticity.
Table 5.5
Test of Homogeneity of Variances
Variable Levene
Statistic df1 df2 Sig.
PRD .123 1.000 180.000 .726
PRC .097 1.000 180.000 .756
PLC .526 1.000 180.000 .469
PRM .817 1.000 180.000 .367
PEP .000 1.000 180.000 .984
PRO .001 1.000 180.000 .974
PHY .400 1.000 180.000 .528
QTAN .150 1.000 180.000 .699
QREL .792 1.000 180.000 .375
QRES .412 1.000 180.000 .522
QASS .065 1.000 180.000 .800
QEMP .119 1.000 180.000 .731
QTEC .112 1.000 180.000 .738
VEMO .000 1.000 180.000 .989
VSOC .675 1.000 180.000 .412
VFQP .139 1.000 180.000 .710
VFPV .218 1.000 180.000 .641
SAT .006 1.000 180.000 .941
Note: PRD = service product; PRC = service price; PLC = service place; PRM = service promotion;
PEP = service people; PRO = service process; PHY = service physical; QTAN = tangible, QREL =
reliability; RES = responsiveness; QASS = assurance; QEMP = empathy; QTEC = technical; VEMO =
emotion; VSOC = social; VFQP = functional quality & performance; VFPV = functional price & value;
SAT = customer satisfaction.
5.4 Evaluation of the model quality
The present study uses SmartPLS, version 2.0 M3 software to perform data analysis
as this software is widely used to perform PLS-SEM method in marketing research
(Hair et al., 2012b). A PLS-SEM path model is analyzed and interpreted in two stages
namely measurement model and structural model (Hair et al., 2014a). First, the
measurement model also known as outer model is tested to ensure its validity and
reliability between constructs and indicators. Measurement properties of multi-item

215
constructs, including convergent validity, discriminant validity and reliability, were
examined by conducting confirmatory factor analysis (CFA). Multicollinearity testing
was also a part of measurement model for formative measurement adapted in second
order construct. Second, the structural model is also known as inner model was
analyzed relationship between constructs by means of R square (R2), effect size (f 2)
and predictive relevance of the model (Q2). Bootstrapping of 5,000 subsamples
iteration as recommended by Hair et al. (2014a) was used to test the study hypothesis.
The original study model contained 83 reflective measurement items for 18 variables
(latent variables) that covers 17 independent variables, three latent constructs at second
order construct and one dependent variable which constitute 11 hypotheses for
relationships between them and supported by extended S-O-R theory as illustrated in
Figure 5.4.
Figure 5.4
Original Research Framework
Source: Researcher

216
5.4.1 Measurement model
The first step in PLS-SEM path modeling is to validate the measurement model used
in this study. This initial step is to determine how well the indicators load on the
theoretically defined constructs. Examining the outer model ensures that the survey
items measure the constructs they are designed to measure, thus ensuring that the
survey instrument is reliable. In order to determine individual item reliabilities, this
study looked at each of their loadings to the respective variables.
For this part, confirmatory factor analysis (CFA) was conducted to assess the validity
of the measurement model. In using CFA, the number of factors within each set of
variables was predetermined and those with high loadings were determined before
computation of the results. For the purpose of testing goodness of measure, the two
main criteria used are validity and reliability. Validity is meant to test how well the
instruments used in the research measure the intended concept.
5.4.1.1 Validity test
Validity means the evaluation’s correctness, whether the theoretical and practical
meanings are the real manifestation of the fundamental concept to be evaluated or not
(Neuman, 2003). Three types of validity analysis which is content validity, construct
validity that covers convergent validity, discriminant validity and criterion validity that
include reliability analysis.

217
5.4.1.2 Content validity
In brief, content validity is related to a measure of adequate coverage of a topic under
study (Sahu, 2013). Therefore, the questionnaire was pretested and pilot tested to
validate it content prior to distribution of the survey. Only English language was used
in the questionnaire.
The method for the pilot test was described in Chapter 4 where two lecturers with
doctoral degree and two personnel from senior management level with more than 20
year experience in parking management were engaged to ensure the appropriateness
and clarity of each question. In order to check whether respondents understand the
questionnaires, eight respondents were selected to respond to the questionnaires and
their comments were collected to further improvement. As a result, wording in three
survey questions for number 11, 64 and 67 were amended and included in the final
questionnaire.
5.4.1.3 Construct validity
Construct validity is concerned with measurement accurately measures the underlying
concept that it supposed to be measured (Beins & McCarthy, 2012). This can be
achieved by assessing convergent and discriminant validity by looking at the
respective loadings and cross loadings. According to Hair et al. (2014a), indicator
loadings should be higher than 0.70. Based on the above recommendations, this study
used a cut-off value for factor loadings at 0.70 as being significant.
Accordingly, three items were removed from further analysis because item PRC10
(0.647) was lower than 0.70 and loading from other constructs are higher than item

218
QRES48 (0.703) and QEMP56 (0.708). The items coded as QRES48 (0.703) and
QEMP56 (0.708) are negatively worded item and lack of consciousness from
respondents on these type of item were suspected to cause low loading result in their
construct respectively. After removal these items, all the remaining items that
measured a particular construct loaded highly on that construct and loaded lower on
the other constructs, thus confirming construct validity of present study. Table 5.6
shows the cross loading result.

219
Table 5.6
Loading and cross loading
Items PEP PHY PLC PRC PRD PRM PRO QASS QEMP QREL QRES QTAN QTEC VEMO VFPV VFQP VSOC SAT
PEP23 0.871 0.736 0.691 0.619 0.689 0.782 0.725 0.634 0.735 0.711 0.608 0.738 0.655 0.520 0.533 0.669 0.633 0.689
PEP25 0.881 0.741 0.651 0.604 0.627 0.716 0.697 0.641 0.686 0.698 0.593 0.752 0.579 0.527 0.562 0.602 0.626 0.632
PEP26 0.870 0.687 0.672 0.603 0.627 0.680 0.769 0.687 0.674 0.735 0.660 0.685 0.600 0.492 0.519 0.622 0.534 0.687
PEP27 0.865 0.703 0.640 0.609 0.659 0.662 0.724 0.642 0.634 0.690 0.584 0.743 0.619 0.477 0.570 0.577 0.579 0.672
PEP28 0.898 0.749 0.674 0.594 0.609 0.672 0.748 0.703 0.703 0.733 0.633 0.748 0.694 0.501 0.583 0.613 0.601 0.678
PHY35 0.771 0.901 0.657 0.588 0.673 0.685 0.671 0.639 0.642 0.676 0.557 0.751 0.678 0.544 0.498 0.663 0.638 0.648
PHY36 0.777 0.880 0.623 0.516 0.598 0.653 0.654 0.623 0.681 0.662 0.540 0.688 0.644 0.450 0.491 0.617 0.583 0.660
PHY37 0.669 0.862 0.628 0.504 0.554 0.575 0.519 0.541 0.555 0.579 0.486 0.660 0.557 0.476 0.479 0.555 0.564 0.599
PHY38 0.669 0.865 0.627 0.552 0.614 0.589 0.590 0.468 0.551 0.597 0.450 0.687 0.601 0.455 0.492 0.544 0.585 0.570
PLC12 0.569 0.582 0.854 0.664 0.665 0.560 0.542 0.530 0.512 0.552 0.504 0.570 0.542 0.537 0.547 0.639 0.597 0.620
PLC13 0.666 0.653 0.864 0.635 0.720 0.631 0.638 0.562 0.594 0.614 0.518 0.664 0.568 0.587 0.557 0.617 0.628 0.659
PLC14 0.663 0.619 0.857 0.669 0.662 0.563 0.635 0.582 0.632 0.639 0.555 0.659 0.624 0.553 0.616 0.638 0.594 0.687
PLC15 0.669 0.596 0.836 0.588 0.673 0.669 0.649 0.575 0.581 0.599 0.562 0.604 0.498 0.473 0.470 0.570 0.562 0.612
PLC16 0.596 0.562 0.758 0.594 0.590 0.618 0.474 0.509 0.529 0.534 0.491 0.549 0.460 0.461 0.445 0.510 0.517 0.533
PRC11 0.669 0.547 0.688 0.879 0.713 0.652 0.605 0.533 0.594 0.581 0.563 0.629 0.526 0.508 0.570 0.601 0.571 0.648
PRC7 0.614 0.570 0.609 0.850 0.694 0.616 0.520 0.471 0.494 0.554 0.454 0.593 0.504 0.437 0.579 0.524 0.501 0.548
PRC8 0.566 0.527 0.699 0.898 0.691 0.586 0.542 0.472 0.521 0.562 0.504 0.607 0.557 0.512 0.601 0.608 0.556 0.585
PRC9 0.515 0.469 0.592 0.806 0.614 0.509 0.458 0.452 0.520 0.488 0.453 0.510 0.487 0.503 0.607 0.519 0.518 0.583
PRD1 0.536 0.528 0.598 0.607 0.797 0.566 0.488 0.449 0.538 0.548 0.461 0.554 0.483 0.381 0.427 0.425 0.490 0.439
PRD2 0.641 0.646 0.693 0.679 0.890 0.661 0.619 0.522 0.586 0.583 0.494 0.653 0.563 0.490 0.501 0.593 0.565 0.610
PRD3 0.691 0.646 0.706 0.680 0.895 0.689 0.659 0.526 0.565 0.640 0.542 0.697 0.615 0.545 0.490 0.586 0.600 0.619
PRD4 0.590 0.580 0.686 0.638 0.873 0.705 0.596 0.441 0.496 0.563 0.465 0.631 0.499 0.401 0.436 0.524 0.524 0.519
PRD5 0.617 0.552 0.666 0.735 0.840 0.655 0.581 0.524 0.554 0.624 0.532 0.653 0.497 0.479 0.539 0.528 0.557 0.586
PRD6 0.706 0.648 0.755 0.752 0.884 0.717 0.700 0.647 0.630 0.679 0.647 0.710 0.610 0.527 0.583 0.635 0.624 0.668
PRM17 0.656 0.569 0.585 0.616 0.674 0.834 0.612 0.477 0.589 0.580 0.526 0.592 0.497 0.392 0.430 0.512 0.506 0.530
PRM18 0.658 0.566 0.588 0.539 0.666 0.849 0.649 0.477 0.564 0.588 0.524 0.623 0.527 0.480 0.469 0.557 0.564 0.533
PRM19 0.669 0.587 0.631 0.617 0.674 0.870 0.595 0.570 0.514 0.590 0.535 0.596 0.529 0.466 0.507 0.560 0.543 0.582
PRM20 0.638 0.562 0.595 0.535 0.639 0.840 0.584 0.436 0.521 0.520 0.459 0.635 0.493 0.388 0.446 0.506 0.502 0.533
PRM21 0.710 0.683 0.664 0.597 0.658 0.862 0.641 0.519 0.527 0.575 0.524 0.640 0.559 0.508 0.517 0.576 0.642 0.592
PRM22 0.788 0.703 0.683 0.648 0.670 0.895 0.711 0.625 0.665 0.670 0.622 0.670 0.624 0.502 0.538 0.648 0.614 0.682

220
Table 5.6 (Continued)
Items PEP PHY PLC PRC PRD PRM PRO QASS QEMP QREL QRES QTAN QTEC VEMO VFPV VFQP VSOC SAT
PRO30 0.671 0.541 0.510 0.471 0.556 0.599 0.824 0.502 0.599 0.616 0.549 0.618 0.518 0.353 0.422 0.421 0.462 0.514
PRO31 0.763 0.665 0.597 0.522 0.619 0.636 0.870 0.689 0.691 0.702 0.648 0.662 0.592 0.441 0.451 0.545 0.505 0.609
PRO32 0.778 0.666 0.697 0.617 0.684 0.673 0.904 0.707 0.727 0.771 0.704 0.705 0.688 0.544 0.632 0.646 0.580 0.726
PRO33 0.681 0.536 0.637 0.537 0.585 0.649 0.870 0.631 0.637 0.700 0.588 0.601 0.615 0.533 0.528 0.569 0.541 0.591
QASS52 0.693 0.595 0.639 0.508 0.562 0.574 0.697 0.875 0.697 0.722 0.766 0.610 0.612 0.507 0.547 0.653 0.607 0.685
QASS53 0.634 0.517 0.575 0.528 0.529 0.478 0.663 0.888 0.684 0.743 0.717 0.625 0.654 0.552 0.561 0.645 0.590 0.675
QASS54 0.680 0.604 0.569 0.461 0.491 0.529 0.641 0.927 0.710 0.760 0.753 0.602 0.644 0.548 0.534 0.648 0.594 0.675
QASS55 0.684 0.605 0.580 0.512 0.572 0.580 0.619 0.878 0.652 0.749 0.708 0.632 0.661 0.546 0.554 0.670 0.645 0.710
QEMP57 0.626 0.582 0.537 0.517 0.511 0.563 0.605 0.611 0.866 0.649 0.627 0.610 0.588 0.451 0.496 0.586 0.528 0.628
QEMP58 0.752 0.644 0.659 0.578 0.639 0.638 0.737 0.738 0.916 0.766 0.721 0.666 0.685 0.528 0.583 0.656 0.597 0.735
QEMP59 0.654 0.579 0.592 0.527 0.569 0.573 0.654 0.601 0.890 0.642 0.659 0.604 0.575 0.527 0.558 0.561 0.585 0.635
QEMP60 0.686 0.607 0.585 0.532 0.540 0.513 0.668 0.712 0.809 0.730 0.604 0.683 0.714 0.580 0.571 0.618 0.603 0.672
QREL43 0.747 0.640 0.615 0.556 0.638 0.552 0.726 0.726 0.724 0.864 0.688 0.753 0.673 0.485 0.618 0.609 0.565 0.703
QREL44 0.709 0.642 0.618 0.525 0.613 0.606 0.725 0.734 0.700 0.887 0.739 0.685 0.683 0.505 0.537 0.615 0.556 0.680
QREL45 0.689 0.609 0.632 0.563 0.605 0.591 0.703 0.755 0.706 0.897 0.712 0.697 0.659 0.536 0.623 0.628 0.605 0.655
QREL46 0.708 0.611 0.638 0.594 0.630 0.625 0.692 0.712 0.686 0.887 0.703 0.696 0.683 0.584 0.638 0.682 0.624 0.691
QREL47 0.723 0.658 0.598 0.567 0.609 0.642 0.701 0.736 0.717 0.861 0.685 0.689 0.688 0.517 0.611 0.672 0.579 0.650
QRES49 0.648 0.517 0.560 0.588 0.535 0.578 0.655 0.726 0.705 0.766 0.911 0.604 0.603 0.492 0.572 0.644 0.558 0.669
QRES50 0.618 0.504 0.566 0.490 0.545 0.542 0.645 0.774 0.668 0.716 0.945 0.576 0.585 0.534 0.541 0.603 0.583 0.662
QRES51 0.698 0.602 0.637 0.536 0.622 0.618 0.716 0.808 0.729 0.762 0.944 0.640 0.636 0.579 0.571 0.646 0.653 0.731
QTAN39 0.696 0.659 0.616 0.680 0.708 0.694 0.602 0.504 0.556 0.617 0.489 0.867 0.644 0.548 0.568 0.614 0.635 0.596
QTAN40 0.734 0.725 0.661 0.646 0.666 0.696 0.613 0.567 0.592 0.692 0.544 0.872 0.673 0.527 0.604 0.625 0.646 0.634
QTAN41 0.740 0.702 0.696 0.569 0.663 0.611 0.657 0.658 0.710 0.728 0.573 0.858 0.640 0.514 0.516 0.660 0.581 0.656
QTAN42 0.676 0.624 0.518 0.443 0.541 0.494 0.671 0.617 0.648 0.685 0.605 0.813 0.631 0.585 0.592 0.599 0.600 0.624
QTEC61 0.527 0.491 0.508 0.459 0.454 0.401 0.540 0.597 0.579 0.606 0.506 0.590 0.779 0.631 0.507 0.582 0.574 0.565
QTEC62 0.435 0.420 0.423 0.316 0.353 0.439 0.449 0.430 0.476 0.475 0.402 0.478 0.739 0.430 0.407 0.477 0.497 0.471
QTEC63 0.524 0.495 0.451 0.445 0.454 0.458 0.547 0.609 0.607 0.623 0.565 0.572 0.841 0.568 0.505 0.553 0.567 0.600
QTEC64 0.709 0.734 0.576 0.594 0.631 0.625 0.656 0.632 0.671 0.710 0.562 0.729 0.860 0.522 0.604 0.716 0.630 0.718
QTEC65 0.679 0.690 0.640 0.592 0.631 0.602 0.617 0.627 0.641 0.679 0.588 0.678 0.831 0.535 0.582 0.689 0.607 0.716

221
Table 5.6 (Continued)
Items PEP PHY PLC PRC PRD PRM PRO QASS QEMP QREL QRES QTAN QTEC VEMO VFPV VFQP VSOC SAT
VEMO66 0.532 0.519 0.599 0.529 0.510 0.503 0.517 0.563 0.563 0.565 0.534 0.598 0.639 0.945 0.595 0.627 0.802 0.678
VEMO67 0.523 0.457 0.567 0.516 0.477 0.498 0.509 0.514 0.525 0.527 0.530 0.573 0.591 0.951 0.648 0.609 0.802 0.661
VEMO68 0.567 0.575 0.605 0.564 0.560 0.504 0.508 0.625 0.608 0.596 0.558 0.629 0.646 0.931 0.671 0.677 0.847 0.737
VFPV75 0.560 0.486 0.548 0.657 0.533 0.556 0.558 0.574 0.574 0.626 0.568 0.594 0.602 0.611 0.924 0.630 0.653 0.719
VFPV76 0.604 0.542 0.612 0.655 0.542 0.508 0.524 0.575 0.600 0.647 0.552 0.635 0.582 0.621 0.950 0.687 0.685 0.710
VFPV77 0.603 0.538 0.613 0.609 0.541 0.525 0.573 0.576 0.609 0.657 0.568 0.642 0.635 0.667 0.931 0.699 0.682 0.710
VFQP72 0.547 0.495 0.604 0.531 0.583 0.568 0.516 0.631 0.559 0.653 0.605 0.617 0.592 0.595 0.588 0.808 0.644 0.688
VFQP73 0.595 0.602 0.569 0.563 0.484 0.500 0.528 0.614 0.593 0.579 0.548 0.580 0.630 0.550 0.593 0.872 0.621 0.707
VFQP74 0.668 0.653 0.664 0.598 0.579 0.616 0.588 0.645 0.643 0.647 0.591 0.690 0.712 0.601 0.671 0.897 0.688 0.757
VSOC69 0.606 0.611 0.651 0.573 0.573 0.560 0.530 0.607 0.574 0.586 0.578 0.647 0.663 0.899 0.677 0.682 0.911 0.714
VSOC70 0.647 0.630 0.626 0.564 0.616 0.633 0.583 0.656 0.627 0.644 0.605 0.677 0.673 0.798 0.646 0.708 0.950 0.740
VSOC71 0.629 0.638 0.651 0.596 0.616 0.630 0.562 0.630 0.647 0.617 0.597 0.676 0.637 0.705 0.675 0.713 0.911 0.761
XSAT78 0.726 0.632 0.711 0.663 0.620 0.619 0.645 0.722 0.736 0.709 0.697 0.674 0.697 0.614 0.694 0.770 0.664 0.906
XSAT79 0.704 0.644 0.637 0.607 0.592 0.599 0.630 0.696 0.695 0.685 0.637 0.688 0.729 0.611 0.716 0.752 0.700 0.904
XSAT80 0.674 0.637 0.652 0.610 0.592 0.578 0.631 0.693 0.713 0.694 0.672 0.657 0.708 0.664 0.669 0.770 0.717 0.911
XSAT81 0.681 0.640 0.687 0.619 0.607 0.635 0.653 0.708 0.695 0.704 0.694 0.670 0.694 0.745 0.688 0.799 0.768 0.935
XSAT82 0.709 0.666 0.710 0.623 0.639 0.623 0.635 0.673 0.679 0.676 0.647 0.690 0.672 0.675 0.720 0.734 0.746 0.911
XSAT83 0.698 0.651 0.691 0.646 0.609 0.628 0.679 0.718 0.695 0.737 0.687 0.658 0.691 0.711 0.685 0.748 0.772 0.907
Note: PRD = service product; PRC = service price; PLC = service place; PRM = service promotion; PEP = service people; PRO = service process; PHY = service physical;
QTAN = tangible, QREL = reliability; RES = responsiveness; QASS = assurance; QEMP = empathy; QTEC = technical; VEMO = emotion; VSOC = social; VFQP = functional
performance & quality; VFPV = functional price & value; SAT = customer satisfaction.

222
5.4.1.4 Convergent validity
According to Hair et al. (2014b), convergent validity is to assess the degree to which
two measures of the same concept are correlated. They further suggest that researchers
utilize the factor loadings, composite reliability (CR) and average variance extracted
(AVE) to assess convergence validity.
All the items loadings should be over the recommended value of 0.70 (Hair et al.,
2014a). In addition, composite reliability values reflect the level to which the construct
indicators reveal the latent variable and they should be greater than 0.70, as
recommended by prior researchers (Hair et al., 2014a). In this study, all the composite
reliability values ranged from 0.895 to 0.968, as shown in Table 5.7, indicating good
internal consistency reliability.
On a final note, the average variance extracted (AVE) measures the variance captured
by the indicators relative to measurement error and loading value higher than 0.50 was
recommended to justify the use of the construct (Hair et al., 2014a). In this study, the
AVEs ranged from 0.658 to 0.888, which were all within the recommended range as
presented in Table 5.7. Therefore, the entire latent variables fulfilled the threshold
value and were considered to have met the standard recommended for convergent
validity.

223
Table 5.7
Convergent validity and measurement model
Variable Item Loading
Average
Variance
Extracted (AVE)
Composite
Reliability (CR)
Service people (PEP)
PEP23 0.871
0.769 0.943
PEP25 0.881
PEP26 0.870
PEP27 0.865
PEP28 0.898
Service physical (PHY)
PHY35 0.901
0.769 0.930 PHY36 0.880
PHY37 0.862
PHY38 0.865
Service place (PLC)
PLC12 0.854
0.697 0.920
PLC13 0.864
PLC14 0.857
PLC15 0.836
PLC16 0.758
Service price (PRC)
PRC11 0.879
0.738 0.918 PRC7 0.850
PRC8 0.898
PRC9 0.806
Service product (PRD)
PRD1 0.797
0.746 0.946
PRD2 0.890
PRD3 0.895
PRD4 0.873
PRD5 0.840
PRD6 0.884
Service promotion (PRM)
PRM17 0.834
0.737 0.944
PRM18 0.849
PRM19 0.870
PRM20 0.840
PRM21 0.862
PRM22 0.895
Service process (PRO)
PRO30 0.824
0.752 0.924 PRO31 0.870
PRO32 0.904
PRO33 0.870
Assurance (QASS)
QASS52 0.875
0.796 0.940 QASS53 0.888
QASS54 0.927
QASS55 0.878
Empathy (QEMP)
QEMP57 0.866
0.759 0.926 QEMP58 0.916
QEMP59 0.890
QEMP60 0.809
Reliability (QREL)
QREL43 0.864
0.773 0.945
QREL44 0.887
QREL45 0.897
QREL46 0.887
QREL47 0.861
Responsiveness (QRES)
QRES49 0.911
0.871 0.953 QRES50 0.945
QRES51 0.944

224
Table 5.7 (Continued)
Variable Item Loading
Average
Variance
Extracted (AVE)
Composite
Reliability (CR)
Tangible (QTAN)
QTAN39 0.867
0.727 0.914 QTAN40 0.872
QTAN41 0.858
QTAN42 0.813
Technical (QTEC)
QTEC61 0.779
0.658 0.906
QTEC62 0.739
QTEC63 0.841
QTEC64 0.860
QTEC65 0.831
Emotion (VEMO)
VEMO66 0.945
0.888 0.960 VEMO67 0.951
VEMO68 0.931
Functional price & value
(VFPV)
VFPV75 0.924
0.874 0.954 VFPV76 0.950
VFPV77 0.931
Functional quality &
performance (VFQP)
VFQP72 0.808
0.739 0.895 VFQP73 0.872
VFQP74 0.897
Social (VSOC)
VSOC69 0.911
0.854 0.946 VSOC70 0.950
VSOC71 0.911
Customer satisfaction (SAT)
XSAT78 0.906
0.832 0.968
XSAT79 0.904
XSAT80 0.911
XSAT81 0.935
XSAT82 0.911
XSAT83 0.907
5.4.1.5 Discriminant validity
Discriminant validity of the measures is the degree to which items differentiate among
constructs or measure distinct concepts. In this regard, Hair et al. (2014a) explained
that discriminant validity stipulates each latent construct’s average variance extracted
(AVE) should be higher than the highest squared correlation of other latent construct
as recommended by Fornell–Larcker’s (1981) criterion and the item’s loadings should
be greater than all its cross loadings.
225
In the present study, first round analysis of discriminant validity had detected a loading
for variable coded as PRO (0.880) was higher than AVE of PEP variable (0.870) and
correlation loading between variable coded as QTAN (0.826) was close to AVE of
PHY (0.848). The questionnaire items contain in PEP, PRO, PHY and QTAN were
reviewed in order to detect any similar meaning among items. After reviewing process,
three items indexed as PEP24, PRO29 and PHY34 were considered to have same
meaning with other items and these three items were removed from next analysis
process. Accordingly, correlation matrix and AVE for each variable had complied
Fornell and Larcker’s (1981) criterion as depicted in Table 5.8 and consequently
confirmed discriminant validity.
5.4.1.6 Reliability analysis
Cronbach’s alpha coefficient was utilized in the present study along with composite
reliability values to examine the inter-item consistency of the measurement items. The
Cronbach’s alpha and composite reliability (CR) values should be higher than 0.70
(Hair et al., 2014a). With respect to Cronbach’s Alpha and composite reliability value,
George and Mallery (2003) pointed out that the reliability which is higher than 0.9 is
regarded as excellent, higher than 0.8 is fine, higher than 0.7 is adequate, higher than
0.6 is doubtful, and lower than 0.5 is substandard.
Table 5.9 presents the values of Cronbach’s alpha and CR of all constructs. It was
evident that all reliability values were higher than the recommended value of 0.70.
Hence, construct reliability was confirmed.

226
Table 5.8
Correlations among variables and discriminant validity
Variable AVE PEP PHY PLC PRC PRD PRM PRO QASS QEMP QREL QRES QTAN QTEC SQ SSM SV VEMO VFPV VFQP VSOC XSAT
PEP 0.769 0.877
PHY 0.769 0.825 0.877
PLC 0.697 0.759 0.723 0.835
PRC 0.738 0.691 0.617 0.755 0.859
PRD 0.746 0.733 0.697 0.795 0.791 0.864
PRM 0.737 0.802 0.715 0.729 0.691 0.773 0.858
PRO 0.752 0.835 0.697 0.707 0.621 0.707 0.738 0.867
QASS 0.796 0.754 0.650 0.662 0.563 0.603 0.605 0.734 0.892
QEMP 0.759 0.783 0.695 0.684 0.620 0.651 0.658 0.767 0.769 0.871
QREL 0.773 0.813 0.719 0.705 0.638 0.704 0.686 0.807 0.833 0.804 0.879
QRES 0.871 0.702 0.581 0.631 0.577 0.609 0.621 0.721 0.825 0.752 0.802 0.933
QTAN 0.727 0.836 0.796 0.732 0.683 0.755 0.730 0.747 0.691 0.738 0.801 0.651 0.853
QTEC 0.658 0.718 0.709 0.646 0.604 0.633 0.629 0.699 0.720 0.739 0.770 0.652 0.759 0.811
SQ 0.604 0.862 0.777 0.759 0.688 0.740 0.734 0.837 0.904 0.895 0.943 0.866 0.867 0.872 FORMATIVE
SSM 0.578 0.919 0.853 0.888 0.833 0.899 0.895 0.859 0.741 0.787 0.823 0.721 0.857 0.751 0.875 FORMATIVE
SV 0.674 0.719 0.686 0.742 0.706 0.672 0.670 0.659 0.732 0.723 0.745 0.693 0.768 0.772 0.828 0.787 FORMATIVE
VEMO 0.888 0.574 0.550 0.627 0.570 0.548 0.533 0.543 0.603 0.601 0.598 0.574 0.638 0.664 0.686 0.639 0.904 0.942
VFPV 0.874 0.631 0.559 0.633 0.684 0.576 0.566 0.590 0.615 0.636 0.688 0.602 0.668 0.649 0.723 0.684 0.870 0.678 0.935
VFQP 0.739 0.704 0.680 0.714 0.657 0.639 0.654 0.634 0.733 0.697 0.729 0.676 0.733 0.752 0.808 0.759 0.872 0.678 0.720 0.860
VSOC 0.854 0.679 0.677 0.695 0.625 0.651 0.657 0.604 0.682 0.665 0.666 0.642 0.721 0.712 0.763 0.745 0.938 0.868 0.721 0.758 0.924
SAT 0.832 0.766 0.707 0.747 0.688 0.669 0.673 0.708 0.769 0.769 0.769 0.737 0.738 0.766 0.849 0.803 0.871 0.735 0.762 0.836 0.798 0.912
Note: AVE = average variance extracted; PRD = service product; PRC = service price; PLC = service place; PRM = service promotion; PEP = service people; PRO = service
process; PHY = service physical; QTAN = tangible, QREL = reliability; RES = responsiveness; QASS = assurance; QEMP = empathy; QTEC = technical; VEMO = emotion;
VSOC = social; VFQP = functional quality & performance; VFPV = functional price & value; SAT = customer satisfaction.

227
Table 5.9
Cronbach’s Alpha and Composite Reliabilities of constructs
Variable Number of
Items
Composite
Reliability
Cronbachs
Alpha
PEP 5 0.943 0.925
PHY 4 0.930 0.900
PLC 5 0.920 0.890
PRC 4 0.918 0.881
PRD 6 0.946 0.932
PRM 6 0.944 0.928
PRO 4 0.924 0.890
QASS 4 0.940 0.915
QEMP 4 0.926 0.893
QREL 5 0.945 0.927
QRES 3 0.953 0.926
QTAN 4 0.914 0.875
QTEC 5 0.906 0.870
VEMO 3 0.960 0.937
VFPV 3 0.954 0.928
VFQP 3 0.895 0.822
VSOC 3 0.946 0.915
XSAT 6 0.968 0.960
Total Number of Items 77
Note: PRD = service product; PRC = service price; PLC = service place; PRM = service promotion;
PEP = service people; PRO = service process; PHY = service physical; QTAN = tangible, QREL =
reliability; RES = responsiveness; QASS = assurance; QEMP = empathy; QTEC = technical; VEMO =
emotion; VSOC = social; VFQP = functional quality & performance; VFPV = functional price & value;
SAT = customer satisfaction.
5.4.1.7 Descriptive analysis
A descriptive analysis was then conducted to describe the general customer perception
of service marketing mix, service quality, service value and customer satisfaction in
commercial car parking facilities in Malaysia context. As can be seen in Table 5.10,
the mean, standard deviation, maximum and minimum of the constructs were reported.
For ease of interpretation of the seven point Likert scale, the current study used five
equal sized categories as follows: scores less than 2.20 [6/5 + lowest value (1)] were
considered low; scores of 5.80 [highest value (7) - 6/5] high and those in between
considered as moderate scores.

228
Table 5.10
Descriptive analysis of the variables (n = 182)
Variable Mean Std.
Deviation Minimum Maximum
PRD 3.848 1.021 1.145 6.660
PRC 3.993 1.030 1.000 7.000
PLC 4.053 1.008 1.000 6.797
PRM 3.788 0.933 1.000 6.000
PEP 3.984 0.959 1.000 6.000
PRO 4.038 0.960 1.000 6.000
PHY 4.038 0.972 1.000 6.000
QTAN 3.954 0.927 1.000 6.000
QREL 4.129 0.950 1.000 6.613
QRES 4.231 1.018 1.000 7.000
QASS 4.421 1.044 1.000 6.746
QEMP 3.963 0.949 1.000 7.000
QTEC 4.190 0.967 1.000 6.440
VEMO 4.411 1.090 1.000 7.000
VSOC 4.278 1.024 1.000 7.000
VFQP 4.200 0.890 1.000 6.025
VFPV 4.156 1.049 1.000 7.000
SAT 4.241 0.952 1.000 7.000
Note: PRD = service product; PRC = service price; PLC = service place; PRM = service promotion;
PEP = service people; PRO = service process; PHY = service physical; QTAN = tangible, QREL =
reliability; RES = responsiveness; QASS = assurance; QEMP = empathy; QTEC = technical; VEMO =
emotion; VSOC = social; VFQP = functional quality & performance; VFPV = functional price & value;
SAT = customer satisfaction.
Table 5.10 shows that the minimum and maximum values for each construct were 1.00
and 7.00 respectively which equivalent to the minimum and maximum levels in the
Likert scale used in this study. In addition, the data revealed that assurance dimension
of service quality had the maximum mean value of 4.421 with the second highest
standard deviation of 1.044. In contrary, service promotion of service marketing mix
had the minimum mean value of 3.788 with the third lowest standard deviation of
0.933.
In general, these results indicated that the respondents tended to exhibit moderate
levels response on all measured variables with range lowest score of 3.788 for PRM

229
to highest mean score of 4.421 for QASS. While SAT as dependent variable obtained
mean score of 4.241. These mean scores can be interpreted that customer response on
satisfaction was stand at non-stable level where the responses for contributing factors
were unable to push higher satisfaction level among seasonal parking customers. The
mean scores for the variables of service marketing mix obtained slightly lower score
compare variables for service quality and service value. More effort emphasize to the
improvement of service marketing mix initiatives as a input to parking service may
lead to better score results of service quality, service value and customer satisfaction.
5.4.2 Assessment of higher order measurement model
Present study has three constructs to be conceptualized and assessed as formative
second-order construct namely service marketing mix (SMM), service quality (SQ)
and service value (SV). This assessment to tests whether the scores of first-order
constructs synchronized harmoniously onto their respective second-order constructs.
Thus, the assessment on higher order measurement model requires steps to measure
lower order latent variables and subsequently, higher order construct.
According to Becker et al. (2012), three approaches were used to measure higher order
construct that is (1) repeated indicator approach, (2) two-stage approach and hybrid
approach. In present study, repeated indicators approach was used to assess lower
order latent variables as this approach was usually used by researchers (Hair el al.,
2014a). In first stage, three measurement models namely SMM, SQ and SV were
estimated separately using the repeated indicators approach as illustrated in Figure 5.5
and the second-order factor was measured by all the lower order factors where
indicators are repeated measures in the analysis (Hair et al., 2014a; Becker et al., 2012).

230
Unstandardised variable latent scores to represent the lower order variables were
referred and saved during this stage of the analysis through path weighting scheme
algorithm in the PLS-SEM analysis. Then, these scores were copied into the PLS-SEM
data file for further analysis.
Figure 5.5
Lower order latent variables model using repeated indicators approach
Source: adapted from Becker et al. (2012)
In second stage, these scores were used to represent lower order variables as indicators
for second order constructs in the structural model. This approach is most commonly
utilised (Becker et al., 2012; Wilson, 2011) and was chosen in this study. The diagram
for second order construct can be sighted in Figure 5.6.
The next subheading presents formative measurement of higher order for three
constructs namely SMM, SQ and SV including SAT as reflective dependent variable
construct. This process was used to validate the assessed higher order constructs are
reliable, valid and distinctive between constructs.

231
5.4.2.1 Analysis of higher order formative measurement models
In order to analyze higher order construct, it is important to provide information
pertaining to selected modelling approach and reports for constructs properties
(Becker et al., 2012). Furthermore, they suggest that analysis report for formative
model should be included indicator outer weights, significance of outer weights and
multicollinearity of indicators.
As mentioned earlier, present study select reflective-formative modelling approach
that suit with the assessed constructs. At higher order construct level, three constructs
namely SMM, SQ and SV were measured through formative model where seven
variables coded as PRD, PRC, PLC, PRM, PEP, PRO and PHY were conceptualized
to form SMM construct, six variables coded as QTAN, QREL, QRES, QASS, QEMP
and QTEC were conceptualized to frame SQ construct and four variables coded as
VEMO, VSOC, VFPQ and VFPV were conceptualized to mold SV construct. The
second model for higher order construct was depicted in Figure 5.6.
The unstandardized latent variable scores for lower order variables were obtained
during analysis for lower order measurement models using path algorithm weighting
scheme and 5,000 bootstrapped subsample iterations. These unstandardized latent
variable scores were used to represent lower order variables and acted as indicators to
their respective constructs. The structural model for second order constructs as shown
in Figure 5.6, were regressed in the same method.

232
Figure 5.6
Second model for higher order construct Note: PRD = service product; PRC = service price; PLC = service place; PRM = service promotion;
PEP = service people; PRO = service process; PHY = service physical; QTAN = tangible, QREL =
reliability; RES = responsiveness; QASS = assurance; QEMP = empathy; QTEC = technical; VEMO =
emotion; VSOC = social; VFQP = functional quality & performance; VFPV = functional price & value;
SMM = service marketing mix; SQ = service quality; SV = service value; SAT = customer satisfaction.
Another important point need to assess in formative measurement is collinearity.
Assessment of collinearity among formative indicators can present significant
problems because the weights linking the formative indicators with the construct can
become unstable and nonsignificant. Furthermore, formative indicators have no
individual measurement error terms (Hair et al., 2014a). Due to seriousness of
collinearity issues, Kock and Lynn (2012) had strongly recommended that analysis
suggesting strong predictor criterion associations be considered for full collinearity
tests among all constructs in order to avoid any distortion by vertical and lateral
collinearity. It was recommended that VIFs be lower than 5 and a more relaxed
criterion is that they be lower than 10 (Hair et al., 2014a; Kock, 2014). The assessment
results of second order constructs were presented in Table 5.11.

233
According to Hair et al. (2014a), outer weight is the result of a multiple regression
between the latent variable scores as the formative independent variables and
dependent variable. It becomes one of essential benchmark for estimating the
contribution of a formative measurement. Based on Table 5.11, all outer weights of
formative variables were found significant except for outer weights of four variables
coded as PRD (-0.039), PRM (0.011), QRES (0.044) and VEMO (0.053) were found
not significant. However, as suggested by Hair et al. (2014a), nonsignificant outer
weights shall not necessarily be read as poor quality of measurement model but it
should also refer to absolute contribution of variables such as significant of outer
loading and it construct conceptualization as suggested by past research or theory.
Following Hair et al. (2014a) advises, outer loading for the four variables were found
significant despite of nonsignificant of their outer weights and removal of these
variables may affect interpretation of their constructs respectively. Moreover, there
were no serious collinearity issues on these variables and all VIF results for all
formative variables were within acceptable value. Therefore, present study decided to
retain nonsignificant outer weights and considered all model of formative constructs
has met the assessment criterion, thus assessment of structural model was granted.
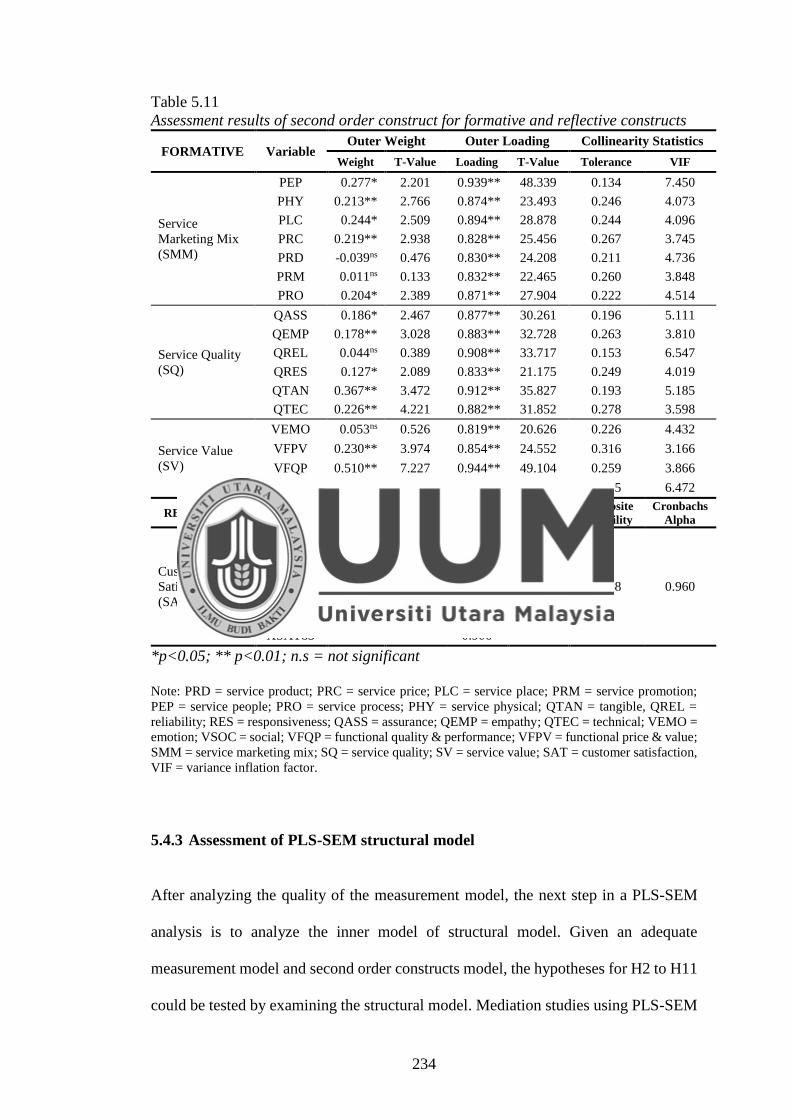
234
Table 5.11
Assessment results of second order construct for formative and reflective constructs
FORMATIVE Variable Outer Weight Outer Loading Collinearity Statistics
Weight T-Value Loading T-Value Tolerance VIF
Service
Marketing Mix
(SMM)
PEP 0.277* 2.201 0.939** 48.339 0.134 7.450
PHY 0.213** 2.766 0.874** 23.493 0.246 4.073
PLC 0.244* 2.509 0.894** 28.878 0.244 4.096
PRC 0.219** 2.938 0.828** 25.456 0.267 3.745
PRD -0.039ns 0.476 0.830** 24.208 0.211 4.736
PRM 0.011ns 0.133 0.832** 22.465 0.260 3.848
PRO 0.204* 2.389 0.871** 27.904 0.222 4.514
Service Quality
(SQ)
QASS 0.186* 2.467 0.877** 30.261 0.196 5.111
QEMP 0.178** 3.028 0.883** 32.728 0.263 3.810
QREL 0.044ns 0.389 0.908** 33.717 0.153 6.547
QRES 0.127* 2.089 0.833** 21.175 0.249 4.019
QTAN 0.367** 3.472 0.912** 35.827 0.193 5.185
QTEC 0.226** 4.221 0.882** 31.852 0.278 3.598
Service Value
(SV)
VEMO 0.053ns 0.526 0.819** 20.626 0.226 4.432
VFPV 0.230** 3.974 0.854** 24.552 0.316 3.166
VFQP 0.510** 7.227 0.944** 49.104 0.259 3.866
VSOC 0.307** 2.792 0.905** 33.956 0.155 6.472
REFLECTIVE Item Outer
Loading AVE
Composite
Reliability
Cronbachs
Alpha
Customer
Satisfaction
(SAT)
XSAT78 0.906
0.832 0.968 0.960
XSAT79 0.905
XSAT80 0.911
XSAT81 0.935
XSAT82 0.911
XSAT83 0.906
*p<0.05; ** p<0.01; n.s = not significant
Note: PRD = service product; PRC = service price; PLC = service place; PRM = service promotion;
PEP = service people; PRO = service process; PHY = service physical; QTAN = tangible, QREL =
reliability; RES = responsiveness; QASS = assurance; QEMP = empathy; QTEC = technical; VEMO =
emotion; VSOC = social; VFQP = functional quality & performance; VFPV = functional price & value;
SMM = service marketing mix; SQ = service quality; SV = service value; SAT = customer satisfaction,
VIF = variance inflation factor.
5.4.3 Assessment of PLS-SEM structural model
After analyzing the quality of the measurement model, the next step in a PLS-SEM
analysis is to analyze the inner model of structural model. Given an adequate
measurement model and second order constructs model, the hypotheses for H2 to H11
could be tested by examining the structural model. Mediation studies using PLS-SEM

235
consist of several alternative approaches and for the purpose of this research, the
present study chose the bootstrapping approach. The research framework for this
structural model consisted of four main constructs that are service marketing mix
(SMM), service quality (SQ), service value (SV) and customer satisfaction (CS).
After running the PLS-SEM with path weighting scheme algorithm, estimates were
obtained for the structural model relationship through path coefficients which
represented the hypothesized relationship among the constructs. The results of
structural model such as R Square (R²), Effect Size (f2), Blindfolding and Predictive
Relevance (Q2) were presented in the next subheadings.
5.4.3.1 Analysis of R square (R²)
According to Hair et al. (2014a), the primary assessment criterion of the structural
model by PLS-SEM is the R² measures and to determine the significance level of the
path coefficients. The reason is because the objective of the prediction-oriented PLS-
SEM approach is to explain the variance of endogenous latent variable and reasonably
high R² value should be obtained. A rule of thumb in marketing research studies, R²
values of 0.75, 0.50, or 0.25 for endogenous latent variables in the structural model
can be represented as substantial, moderate, or weak, respectively.
Accordingly, the obtained R² value can be used to interpret the quality of the structural
model which indicates the explanatory variance by the exogenous variables contained
in the endogenous variable. Assessment results displayed in Figure 5.7, it can be
explained that firstly, the R² of SQ was 0.811 where 81.1% variance was explained by
SMM which considerable as substantial. Secondly, the R² was found to be 0.748 for

236
SV, indicating that SMM and SQ can account for 74.8% of the variance in the SV,
which was very close to substantial level. Lastly, the R² value of SAT was 0.819 and
it was at substantial range. It suggests that 81.9% of the variance in extent of SAT can
be explained by SMM, SQ and SV.
Figure 5.7
Assessment of structural model
For comparison purpose, when the formative directions of SMM, SQ and SV were
inverted to reflective directions, the R2 value of SQ, SV and SAT had reduced to 0.775,
0.713 and 0.817 respectively. The understanding from this comparison was that the
contribution of components representing SMM, SQ and SV had performed better in
the way of formative instead of reflective measurement. Hence, the formative
approach used to measure SMM, SQ and SV were the right choice.
5.4.3.2 Analysis of effect size (f2)
Complementary to R² results, it was recommended to determine the f2 effect sizes of
specific latent variables impact upon the dependent variables through the change in R²

237
when particular exogenous construct excluded in the model (Hair et al., 2014a). The f2
effect size was manually compute using formula; f2 = (R² included - R² excluded) / (1
- R² included). As recommended by Cohen (1988), the scale of f2 effect sizes that based
on 0.02, 0.15 and 0.35 were used to interpret small, medium and large effect sizes of
the predictive variables, respectively.
Table 5.12 shows SMM, SQ and SV had varied effect size on SAT. SMM has very
small effect size of SMM on SAT with f2 of 0.017. Other constructs, SQ has small
effect size of 0.044 on SAT but SV has large effect size of 0.486 on SAT. While, result
of effect size on SV, SMM and SAT represent small effect size on SV with value of
0.028 and 0.020 respectively. The f2 value from SV to SAT was large but reduce to
small effect when the path direction from SAT to SV. This result had confirmed that
the effect of SV will be more meaningful when the path direction was from SV to SAT.
However, SQ has medium effect size of 0.282 on SV. Lastly, analysis on effect size
towards SQ, indicates no effect size from SV and SAT on SQ due to their value scores
below zero.
Table 5.12
Effect size of latent constructs
Endogenous Exogenous Included Excluded f 2 Effect size rating
SAT SMM 0.819 0.816 0.017 Very small SQ 0.819 0.811 0.044 Small SV 0.819 0.731 0.486 Large
SV SMM 0.748 0.741 0.028 Small SQ 0.748 0.677 0.282 Medium SAT 0.748 0.743 0.020 Small
SQ SMM 0.811 N/A N/A N/A SV 0.811 0.828 -0.090 N/A SAT 0.811 0.824 -0.069 N/A
Note: SMM = service marketing mix; SQ = service quality; SV = service value; SAT = customer
satisfaction.

238
5.4.3.3 Blindfolding and predictive relevance (Q2) analysis
In addition to assessing the structural model quality by seeing the R² values and effect
sizes, another assessment of structural model is blindfolding. It contains procedure to
generate the cross-validated communality and cross-validated redundancy. Based on
the recommendation of Hair et al. (2014a) and Hair et al. (2012), cross-validated
redundancy is perfectly fit the PLS-SEM approach because it was assessed by the PLS-
SEM estimates for the structural model and the measurement models to predict
eliminated data point.
The Q² was calculated to indicate how well predictive relevance to the model (Hair et
al., 2014a). According to Valerie (2012), Stone-Geisser’s test was calculated by the
following formula: Q²=1-SSE/SSO. In order to obtain Q² through blindfolding
procedure, Hair et al. (2014a) recommended that the number of cases in the data must
not be a multiple integer number of the omission distance (D) otherwise the
blindfolding procedure produces inaccurate results and D value should be selected
between 5 and 10. Therefore, this study used 9 as a value for D to obtain cross-
validated redundancy measures for each dependent variable.
Further, Hair et al. (2014a) states that if the cross-redundancy value is more than zero,
the model will have predictive quality; or else the predictive relevance of the model
cannot be concluded. Table 5.13 displays that the value of cross validated redundancy
obtained for SAT, SQ and SV were found to be 0.675, 0.624 and 0.566, respectively.
These results confirmed that the model has adequate prediction relevance for the
constructs.

239
Table 5.13
Prediction relevance of the model
Total SSO SSE 1-SSE/SSO
SAT 1092.0000 354.6405 0.6752
SQ 1092.0000 410.2499 0.6243
SV 728.0000 316.2812 0.5655
Note: SQ = service quality; SV = service value; SAT = customer satisfaction.
5.5 Testing of hypotheses
The final step of analysis was to test the hypotheses. In first hypothesis testing coded
as H1, nonparametric test namely Friedman Test in SPSS was used to compare
differences among tested variables of SMM and next hypotheses from H2 to H11 were
tested using SmartPLS 2.0 3M by applying PLS-SEM algorithm and bootstrapping
procedure with 5,000 subsample iterations (Hair et al., 2014a). Although path
coefficients are very important in PLS-SEM analysis, Hair et al. (2011) confirmed that
when paths are non-significant or reveal signs that are against the hypothesized
direction, the prior hypothesis should be rejected. On the other hand, significant paths
showing the hypothesized direction support the proposed causal relationship
empirically.
Moreover, the critical t-values for a two-tailed test are 1.96 with a significance level
of 5% and 2.58 with a significance level of 1%. Along this vein, the present study
choose to set 5,000 re-sampling with a replacement number from the bootstrap cases
equal to the original number of samples, that is 182 for this study, in order to produce
standard errors and obtain t-statistics. The analysis results to be presented in next
subheading includes hypotheses testing for nonparametric test of differences for H1

240
and for other hypotheses includes path coefficient, the bootstrapping results and effect
size with variance accounted for (VAF) result for mediation analysis.
5.5.1 Result of comparison test of differences
Friedman test was used in this study to answer H1 hypothesis. This test was applied to
compare differences between tested variables coded as PRD, PRC, PLC, PRM, PEP,
PRO and PHY and rank the said variables in order to identify which component in
service marketing mix has better situation than other components. The results and
discussion are presented in the following subheading.
5.5.1.1 H1: The priority between seven elements in service marketing mix
from customer perspective is varied.
As shown in the Table 5.14, p-value was 0.000 indicate there was significant
differences in rating of seven variables namely PRD, PRC, PLC, PRM, PEP, PRO and
PHY. Further, the result reveals that PRO has the highest mean rank of 4.41 and PRM
has the lowest mean rank of 3.26. It was concluded that null hypothesis was rejected
at the significance level of 5%. Thus, the assumption of hypothesis regarding the
variation of the tested variables in ranking is hereby accepted.
Table 5.14
Friedman test for variables of service marketing mix
Rank Variable of
SMM Mean Rank
1 PRO 4.41
2 PLC 4.32
3 PHY 4.23
4 PRC 4.11
5 PEP 4.07
6 PRD 3.60
7 PRM 3.26

241
Table 5.14 (Continued)
Samples size Chi-Square df Asymp. Sig. Test result
182 44.597 6 .000* Reject the null hypothesis.
Null Hypothesis: The priority of PRD, PRC, PLC, PRM, PEP, PRO and PHY are the same.
*p < 0.05
PRD = service product; PRC = service price; PLC = service place; PRM = service promotion; PEP =
service people; PRO = service process; PHY = service physical; SMM = service marketing mix
5.5.2 Result of direct effect hypotheses
In this subheading, analysis on the direct effects hypotheses between latent constructs
has been made through PLS-SEM algorithm and bootstrapping of 5,000 subsamples
iterations. The direct effect hypotheses are the hypotheses that predict direct
connection to a latent construct with another as indicated by an arrow. Present study
has six direct effect hypotheses coded as H2, H3, H4, H5, H6 and H7 for testing.
In testing the hypotheses, the path standardised estimate or beta (β), standard errors
(S.E.), t-value and probability value were used and thus, presented in a parenthesis and
also in diagram (Hair et al., 2014a). Suggestion by Chin (2010), the β value of
standardized paths should be around 0.20 but more ideally, the value has to be above
0.30 to be considered as meaningful. While, Cohen (1988) categorized standard path
coefficients having absolute values of lower than 0.10 considered as small effect,
values of 0.30 as having a medium effect and values greater than 0.50 as having large
effects. In order to make hypothesis findings more interesting, R2 value was included
to recognize to what extend the variance in endogenous explained by exogenous. For
rule of thumb as suggested by Hair et al. (2014a), R² values of 0.75, 0.50 or 0.25 for
endogenous latent variables be described as substantial, moderate or weak,
respectively. In the subsequent headings, six direct effect hypotheses of the study are
discussed.

242
5.5.2.1 H2: There is a significant relationship between service marketing
mix and customer satisfaction.
Results from SmartPLS output showing that this hypothesis is accepted. The result
indicates that the path coefficient from SMM to SAT was statistically significant with
a very strong standardised estimate and obtained high t-value for more than 2.58 (β=
0.823, S.E.=0.031, t = 27.127, p < 0.01).
Figure 5.8
Result of path coefficient β and R2 for direct relationship between SMM and SAT
As SMM was conceptualized as formative measures as illustrated in Figure 5.8, only
PLC and PRC variables were contributed significantly to form SMM that has makes a
significant relationship to SAT. While t-value result for PEP was very close to
significant value of 1.96 and it considered as significant. But the rest of variables had
contributed to small effect in formatting SMM that does not reach a significant level.
While variance explained by SMM in SAT was reached to R2 = 0.677 as it evidently
stated in Figure 5.8.

243
5.5.2.2 H3: There is a significant relationship between service marketing
mix and service quality.
The result for this hypothesis was the strongest compared to other direct effect
hypothesis’s result. The result generated by SmartPLS had showed that there was a
significant association between SMM and SQ (β= 0.920, S.E. = 0.014, t = 63.767, p <
0.01). Both β value and the t > 2.58 are high and substantial enough to have the
strongest relationship than other direct relationship in the study. Additionally, R2 for
variance in SQ was substantially explained at 0.847. Thus, the third hypothesis was
confirmed and accepted.
The path coefficient β for variables which are forming SMM was showed in Figure
5.9. The result shows that PEP, PHY and PRO committed to play significant role in
forming SMM that make a significant relationship with SQ. The other variables in
SMM were contributed to a small effect in forming SMM to this relationship.
Figure 5.9
Result of path coefficient β and R2 for direct relationship between SMM and SQ

244
5.5.2.3 H4: There is a significant relationship between service marketing
mix and service value.
The fourth hypothesis which postulates a significant relationship SMM and SV was
equally accepted. This was based on the PLS algorithm and bootstrapping procedure
which shows SMM was significantly associated (β= 0.825, S.E.0.030, t = 27.674, p <
0.01) to SV. The β value was large and the t > 2.58 was higher than the threshold. The
R2 value obtained in SV was moderately explained by SMM at value of 0.681.
Additionally, the path coefficient β result shows in Figure 5.10 indicates that PHY,
PLC and PRC had associated significantly to mold SMM constructs that made the
relationship to SV was large and significant. Other variables like PEP, PRD, PRM and
PRO had no significant effect to form SMM and only contribute to small effect in this
relationship.
Figure 5.10
Result of path coefficient β and R2 for direct relationship between SMM and SV

245
5.5.2.4 H5: There is a significant relationship between service quality and
customer satisfaction.
The fifth hypothesis that predicts a significant association between SQ and SAT was
confirmed and accepted. The regression result generated by SmartPLS had showed
that there was a significant connection between SQ and SAT (β= 0.854, S.E. = 0.028,
t = 30.330, p < 0.01). The β value and the t > 2.58 were relatively high. Another
statistical finding is the R2 for SAT was to be 0.730 which was close to substantial
level of variance accounted through SQ.
Based on Figure 5.11, all variables under SQ except QREL and QTAN were found
significantly represent SQ construct. The outer weights of 0.294 and t = 3.943 for
QTEC had reached the highest value compared to other variables in SQ. This indicates
QTEC was most essential component in forming service quality in car parking services
context.
Figure 5.11
Result of path coefficient β and R2 for direct relationship between SQ and SAT
5.5.2.5 H6: There is a significant relationship between service quality and
service value.
The relationship between SQ and SV in past studies was not a new thing in marketing
research and they always associated. Same with present study, SQ was found

246
significantly associated with SV (β= 0.863, S.E.= 0.028, t = 30.488, p < 0.001) and R2
value of 0.745 was found substantial in explaining SV as shown in Figure 5.12. Hence,
sixth hypothesis of this study was confirmed and accepted. For a more fruitful finding,
SQ variables coded as QASS, QTAN and QTEC had significant characteristics in
molding SQ construct that cause significant relationship between SQ and SV.
Figure 5.12
Result of path coefficient β and R2 for direct relationship between SQ and SV
5.5.2.6 H7: There is significant relationship between service value and
customer satisfaction.
Lastly for direct hypothesis, H7 postulates a significant relationship between SV and
SAT where past studies commonly support this relationship. In the same fashion, the
relationship between these constructs was also found significant (β= 0.886, S.E.=
0.021, t = 40.566, p < 0.001) in car park service context. Addition to this, R2 in SAT
was found to be 0.786 and substantially explained by SV.
All components of SV except VEMO were play essential roles in shaping SV construct
and consequently revealed the major role of quality performance (VFQP) of SV in
building relationship with SAT. The VEMO which represent emotion in service value
play a less meaning in car park service context. This result can be sighted in Figure
5.13.

247
Figure 5.13
Result of path coefficient β and R2 for direct relationship between SV and SAT
5.5.2.7 Summary of hypotheses testing for direct effects
All findings of direct hypotheses were confirmed in preceding subheadings and
summarized in Table 5.15.
Table 5.15
Summary of hypotheses testing results for direct effect
Hypotheses Path Path
Coefficient S.E. t-value R2 Decision
H2 SMM SAT 0.823 0.031 27.127** 0.677 Accepted
H3 SMM SQ 0.920 0.014 63.767** 0.847 Accepted
H4 SMM SV 0.825 0.030 27.674** 0.681 Accepted
H5 SQ SAT 0.854 0.028 30.330** 0.730 Accepted
H6 SQ SV 0.863 0.028 30.488** 0.745 Accepted
H7 SV SAT 0.886 0.021 40.566** 0.786 Accepted
Note: *t-values > 1.96 (p < 0.05); **t-values > 2.58 (p < 0.01)
SMM = service marketing mix; SQ = service quality; SV = service value; SAT = customer satisfaction;
S.E. = standard error
5.5.3 Result of mediating effect hypotheses
In this subheading, the effect of service quality (SQ) and service value (SV) as
mediators has been hypothesized through four hypotheses coded as H8, H9, H10 and
H11 and were analysed separately using simple mediation model. In assessing the
mediating effect which also called as indirect effect, testing methodology as proposed
by Preacher and Hayes (2004; 2008) and recommendation from Hair et al. (2014a) was
referred to quantify the indirect effects between predictor variable and dependent

248
variable. Furthermore, the result of indirect effect generated by bootstrapping method
was applied as this method was recommended by Hayes (2009) to be more powerful
than SOBEL test. Without underestimating Baron and Kenny (1986) method for
assessing mediation effect, the path coefficient and significant level for direct path
without mediator variable was also counted as this was advised by Hair et al. (2014a)
for a better result interpretation. For illustration, the path model for direct effect and
indirect effect as mediating variable is shown in Figure 5.14.
Figure 5.14
Mediation framework
Model A illustrate a direct effect also known as total effect. Model B illustrate a
simple mediating model. M is hypothesized as mediator variable between X and
Y
Source: Hayes (2009)
Finally, result of mediation effect was determined using the variance accounted for
(VAF) scale as it was recommended by Hair et al. (2014a) and Shrout and Bolger
(2002) where VAF greater than 80%, it can be considered as full mediation, VAF more
than 20% but less than 80% can be considered as partial mediation, while VAF less

249
than 20% indicates no mediation. The next subheading presents the findings of
mediation effects of four hypotheses.
5.5.3.1 H8: Service quality mediates the relationship between service
marketing mix and customer satisfaction.
This hypothesis postulate the service quality (SQ) has mediation effect between
service marketing mix (SMM) and customer satisfaction (SAT). Firstly, direct path
between SMM and SAT was assessed and result shows path coefficient beta (β) =
0.823 and significant at level p < 0.01. After regression and bootstrapping procedure
was run collectively with SMM, SAT and SQ as mediator variable, the size of indirect
effect of SQ was 0.546 and attained statistically significant at t = 4.332 (p < 0.01) after
divided by standard error (S.E.) value = 0.126. The direct path coefficient between
SMM and SAT was reduced to β = 0.271 but still a significant path at level p < 0.01.
VAF was calculated by dividing β of indirect effect and total effect size which has
derived to a total percentage value of 67%. Thus, it verified that SQ was a mediator
between SMM and SAT through partial mediation and it denoted the hypothesis H8
was accepted. Figure 5.15 shows coefficient β for each path.
Figure 5.15
Result of path coefficient β for SQ mediation effect between SV and SAT

250
5.5.3.2 H9: Service quality mediates the relationship between service
marketing mix and service value.
The next indirect effect hypothesis claims that SQ has mediation effect toward the
relationship between SMM and service value (SV). The path coefficient for direct
effect between SMM and SV was 0.825 and statistical significant at p < 0.01.
Mediating variable of SQ was inserted and result revealed that SQ has occurred a
significant indirect effect size of 0.602 at t = 4.399 (p < 0.01). However, direct path
coefficient β was reduced from 0.825 to 0.213 as shown in Figure 5.16 and no longer
significant path. In order to validate the level of mediation, VAF percentage of 74%
was obtained and fall under partial mediation category. Based on this result, SQ has
mediation effect on the relationship between SMM and SV by partial mediation.
Therefore, the finding was confirmed and hypothesis as stated in H9 was hereby
accepted.
Figure 5.16
Result of path coefficient β for SQ mediation effect between SMM and SV

251
5.5.3.3 H10: Service value mediates the relationship between service
marketing mix and customer satisfaction.
This subheading demonstrates results of the mediating effect of SV on the relationship
between SMM and SAT. Direct effect without mediating variable for SMM and SAT
was supported by hypothesis H2 where the path coefficient β = 0.823 and
demonstrated a high significant value. After SV was included as mediator and the
triangle path was run simultaneously and then, the direct path β reduced to 0.286 but
still has a significant path as shown in Figure 5.17. While for indirect effect, the effect
size of 0.536 was obtained significantly at t = 7.999 (p < 0.01) and this result supported
the existence of mediation effect. In order to determine the level of mediation effect,
VAF value of 65% was obtained and this result classified as partial mediation. Hence,
H10 hypothesis was validated and accepted that SV has mediation effect on the
relationship between SMM and SAT.
Figure 5.17
Result of path coefficient β for SV mediation effect between SMM and SAT

252
5.5.3.4 H11: Service value mediates the relationship between service quality
and customer satisfaction.
Final indirect effect hypothesis predicts that SV has mediation effect on relationship
between SQ and SAT. The role of SV as mediator between these two variables has
been proved numerously in past studies. Same in present study, SQ has significant
direct effect to SAT with path coefficient β = 0.854. After mediating variable was
inserted for regression, indirect effect of SV was obtained by multiplying path a and
path b (a*b) to reach effect size of 0.506 and statistically significant with t = 6.370 (p
< 0.01). For direct effect between SQ and SAT, the path coefficient β was reduced to
0.346 but still has a significant effect as showed in Figure 5.18. In the next analysis,
VAF was measured to determine the mediation level and result of 59% was obtained
to indicate SV has partial mediation effect on the relationship between SQ and SAT.
Therefore, H11 hypothesis has been confirmed and accepted.
Figure 5.18
Result of path coefficient β for SV mediation effect between SQ and SAT
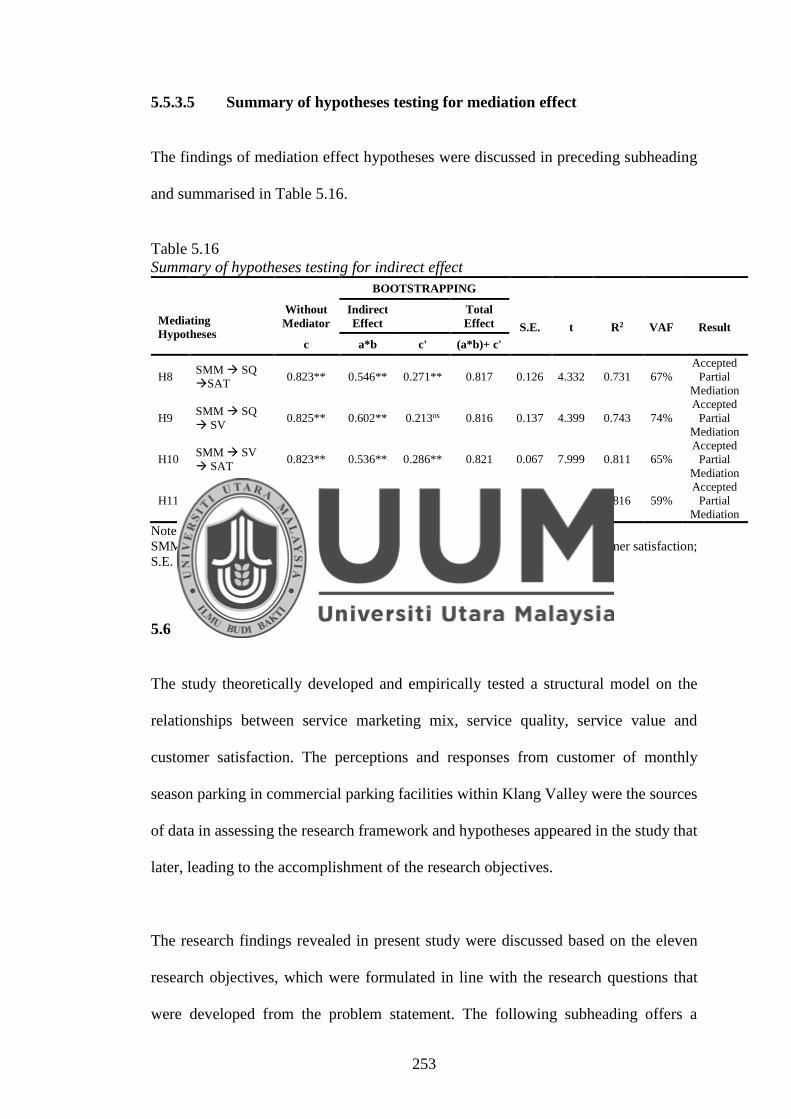
253
5.5.3.5 Summary of hypotheses testing for mediation effect
The findings of mediation effect hypotheses were discussed in preceding subheading
and summarised in Table 5.16.
Table 5.16
Summary of hypotheses testing for indirect effect BOOTSTRAPPING
Mediating
Hypotheses
Without
Mediator
Indirect
Effect Total
Effect S.E. t R2 VAF Result
c a*b c' (a*b)+ c'
H8 SMM SQ
SAT 0.823** 0.546** 0.271** 0.817 0.126 4.332 0.731 67%
Accepted
Partial
Mediation
H9 SMM SQ
SV 0.825** 0.602** 0.213ns 0.816 0.137 4.399 0.743 74%
Accepted
Partial
Mediation
H10 SMM SV
SAT 0.823** 0.536** 0.286** 0.821 0.067 7.999 0.811 65%
Accepted
Partial
Mediation
H11 SQ SV
SAT 0.854** 0.506** 0.346** 0.852 0.079 6.370 0.816 59%
Accepted
Partial
Mediation
Note: *t-values > 1.96 (p < 0.05); **t-values > 2.58 (p < 0.01)
SMM = service marketing mix; SQ = service quality; SV = service value; SAT = customer satisfaction;
S.E. = standard error; VAF = variance accounted for, t = t-value; R2 = R square
5.6 Discussion of research objectives
The study theoretically developed and empirically tested a structural model on the
relationships between service marketing mix, service quality, service value and
customer satisfaction. The perceptions and responses from customer of monthly
season parking in commercial parking facilities within Klang Valley were the sources
of data in assessing the research framework and hypotheses appeared in the study that
later, leading to the accomplishment of the research objectives.
The research findings revealed in present study were discussed based on the eleven
research objectives, which were formulated in line with the research questions that
were developed from the problem statement. The following subheading offers a

254
thorough discussion on the results of each research objective in relation to study
findings and existing literature reviews.
5.6.1 The importance elements of service marketing mix
The first objective of this study was to determine the important elements of service
marketing mix via customer perceptions in commercial parking facilities in Malaysia.
In order to response to this research objective, hypothesis coded as H1 was formulated
to claim the priority elements of service marketing mix namely service product, service
price, service place, service promotion, service people, service process and service
physical evidence are non-similar in commercial parking facility. The non-parametric
Friedman test of SPSS software was used to analyse the variables and result obtained
indicate that there was a significant differences between variables, hence, null
hypothesis claiming the same variance between variables was rejected. Further,
Friedman test result had provided the list of mean ranking where the highest ranking
was service process, followed by service place, service physical, service price, service
people, service product and service promotion. This result is essential to car park
service practitioners where based on current response, the car park customers prefer
friendly service process, good management of parking place, provide attractive,
comfort, maintainable physical and useful signages under service physical and
formulate service price accordance to marketplace, reasonable pricing, attractive
pricing structure and policies. Moreover, these result able to assist the practitioners to
restrategize their focus and deploying the right resources to enhance the level of
services in car park facilities. The practitioner has to put more efforts to improve
service people, service product and service promotion. For example, the role of service
people is commonly highly rated in other services as evidently shown in Table 3.9 but

255
not in car park services which falls under fifth rank. The practitioner should provide a
systematic training to their car park staffs to enhance their knowledge and servicing
skills and do recruitment selection or placement of staff correctly.
Additionally, the result of this hypothesis is consistent with past studies such as
Charoensettasilp and Wu (2014) in Thailand low cost airlines, Champatong, (2014) in
Thailand tourism, Seryasat et al. (2014) in Iran tourism marketing performance and
Al-Dmour et al. (2013) in Jordan brand equity study. Interestingly, service place
becomes second highest ranking instead of low ranking as shown in Table 3.9. Mean
rank for service product in car park facilities falls second lowest and service promotion
got the lowest mean ranking which is far contradict to ranking in other services as
presented in Table 3.9. This means that services provided in the commercial car park
facilities has a unique characteristic compared to other services where managing
services in car park facilities is rarely known among community. Lastly, service
product and service promotion always work together in various business sector but
present study obtained opposite result for car parking services. The lack of promotion
effort on parking products, parking system technology, customer service and service
brand could be possible reasons to drag low ranking scores for service product in
Malaysia.
5.6.2 Direct relationship between service marketing mix and customer
satisfaction
This research objective is to investigate a direct relationship between service
marketing mix and customer satisfaction with respect to the provision of commercial
car park facilities in Malaysia. Hence, hypothesis two was developed to find an answer
on this research objective and tested using PLS-SEM path output regression. This

256
study argues the importance of service marketing mix to be operationalised as second
order construct where seven elements of service marketing should be performed
simultaneously and measured formatively. The idea of service marketing mix should
be performed as higher order construct has been long established but rarely adapted in
past studies. Another essential point, customer satisfaction in present study was
constructed from reflection of six components namely affective, fulfillment of needs,
cognitive, disconfirmation, emotion and overall satisfaction to comprehend the
complexity of human responses in consumer behavior, which was also rarely adapted
in past studies. Both constructs were validated systematically and contribute to
meaningful findings.
For attaining this research objective, the empirical finding suggests that there was a
significant relationship between service marketing mix and customer satisfaction
where variance in customer satisfaction was moderately explained by 67.7%. This
highlights the important of service marketing mix as one of main contributory factor
in simulating satisfaction response among customers in car park services context. This
finding also in line with the concept definition of service marketing mix adapted in
present study in which service marketing mix was pointed to create the response it
wants in the target market (Kotler & Armstrong, 1989). The significant result on the
relationship between service marketing mix and customer satisfaction was consistent
with past studies such as Charoensettasilp and Wu (2014) in Thailand low cost airlines,
Sarker et al. (2012) in China tourism and Thamrin (2012) in Indonesian ship
passengers’ satisfaction. As mentioned in preceding paragraph, the concept and
methodology adapted in the said studies may not similar with present study and thus,
it considered as partially support.

257
More deeper explanation on this finding, the elements of service marketing mix
namely service place, service price and service people were demonstrated significant
part in forming service marketing mix that creates a significant relationship to
customer satisfaction. This finding indicates that Malaysian car park customers is
conservative where they prefers the car parking place is enough to park, convenience,
safe, secure and provide sufficient channel for parking payment for them to pay a
competitive parking fees such as price commensurate with marketplace prices and
quality. They also prefer the right car park staff adequately available and professional
serve as when as they intend to seek an assistance. In short, the Malaysian car park
customers expect a smooth car parking process that chargeable with a reasonable price
and have a right staffs when they looking for assistance. The non-significant results
demonstrated by on other elements of service marketing mix does not means that
service product, service promotion, service process and service physical evidence are
not important. These elements had influenced to service marketing mix but with less
impact. The possible reason to this result was car parking service in aspect of product,
promotion, process and physical evidence have not yet attained expectation of
customer that lead to satisfaction and it indicates that the room for improvement
toward these aspects is large. Moving forward, the practitioners had to review back
their marketing and operational strategises toward improvement of non-significant mix
elements.
5.6.3 Direct relationship between service marketing mix and service quality
Investigating the relationship between service marketing mix and service quality was
another key objective of this research. In order to realize this research objective,

258
hypothesis three was formulated to predict existence of significant relationship
between service marketing mix and service quality in Malaysia commercial parking
facilities and this was verified by PLS-SEM algorithm and bootstrapping output.
Based on analysis result, it can be seen that relationship between service marketing
mix and service quality was significant with the highest path coefficient compared to
other direct hypotheses results. The variance in service quality was explained
substantially by 84.7% of service marketing mix. Hence, the hypothesis was confirmed
and accepted. This finding was consistent with Islam et al. (2013) study in Taiwan
retail chain stores but their study was based on four elements of marketing only instead
of seven elements in present study. There were very limited evidences on this
relationship in past studies and present study has successfully established a distinct
construct between service marketing mix and service quality variable. The finding of
this relationship could able to fill gap in academic knowledge.
According to Islam et al. (2013), enhancing marketing efforts for customers through
the aspects of marketing mix can be established to succeed customer needs in relation
to service quality. Similarly, present study also emphasizes the important of the
performance of service marketing mix as an input to the endogenous variable such as
service quality. This finding explain that the relationship between service marketing
mix and service quality was a linear relationship when performance of service
marketing mix is high, the assessment on service quality by customer will be better or
another way round. Managing elements of service marketing mix is crucial that
demand service practitioner to be always alert on designing and strategizing their
marketing including operations that able to meet quality criteria expected by customers
which is ultimately reflected to service value and customer satisfaction. Addition to
259
this finding, the primary causes that treats mixes of service marketing was extensively
associated to service quality is service people, service process and service physical
where they were reacted actively in molding service marketing mix for service quality
assessment. Customer of Malaysian car park facilities favors the right and qualified
staffs to serve them, look professional in duty, friendly procedure, efficient system for
processing and impressive car park environment. Other elements of service marketing
mix have demonstrated less impact in term of service quality perspective in car park
facilities.
5.6.4 Direct relationship between service marketing mix and service value
The fourth research objective of present study is to investigate direct relationship
between service marketing mix and service value in commercial parking facilities in
Malaysia. In order to predict significant relationship between the two constructs,
hypothesis coded as H4 was formulated and PLS-SEM algorithm regression method
was applied. The analysis result of this hypothesis had found a significant relationship
between service marketing mix and service value. As mentioned in the literature
review, there were very limited studies between service marketing mix and service
value to compare. Several studies had tested the direct relationship between marketing
mix elements to service value but analysed individually, partly, using different variable
name or analysis methodology was not clearly defined such as Ye et al. (2014), Ryu
et al. (2012) Thamrin (2012) and Cengiz and Yayla (2007). Despite of this, two studies
was considerable suitable to support the above finding that is Ye et al. (2014) found
significant relationship between price, location, comfort, cleanliness and customer
service on service value in China hotel tourism and Cengiz and Yayla (2007) study
indicates price and place has significant relationship with service value but not product
260
and promotion in Turkey accounting services. However, the finding was strongly
backing on the idea and concept as suggested by Nasution et al. (2014) and Gallego et
al. (2013) where they advised companies would need to move to a differentiation based
on customer experience and reorganization of operations to support organizational
innovation as evolution of strategies in order to provide added value and value
creation.
Another important statistical finding was that the explanatory variance contributed by
service marketing mix existed in service value was stood at moderate level of 68.1%.
It is apparent that service marketing mix was one of essential factor explaining service
value for more than 50%. Further, statistical result indicates that service price, service
place and service physical evidence had a strong significant path coefficient that form
the service marketing mix to have a significant relationship with service value. This
result was not far differ from Ye et al. (2014) and Cengiz and Yayla (2007) study. The
price element cannot be separated in explaining service value. The European Parking
Association (2014) suggests that pricing of parking spaces usage should be based on
value such as attraction, safe and convenient aspect. Following suggestion by
European Parking Association (2014), the responses from Malaysia car park customers
implies that they are favors when parking fees are equitable with marketplace, options
of fees available, commensurate with level of quality and reasonable payment policies.
While service place and physical evidence aspects was always interrelated and vital to
the foundation of parking services. Malaysian car park customers had demonstrated
that they desire parking place should have features such as parking convenience,
sufficient parking lots, adequate channel for payment, well organized, safe and secure.
Additionally, they are also prefers useful parking signages, clean and maintained

261
parking structure in term of physical evidence aspect. This findings was consistent
with recommendation made by European Parking Association (2014), British Parking
Association (2010), The Institution of Highways & Transportation (2005), Mendat and
Wogalter (2003), and Shaffer and Anderson (1983). Generally, the above findings
were makes sense and practical to explain on car park consumer behaviour in Malaysia
as these aspects are commonly associated to the dissatisfaction of car park customer.
Furthermore, better understanding can be gained from the above results. It indicates
that the mixes of service marketing except for physical evidence had reacted
differently between service quality and service value construct. These results, therefore
remind the practitioner to advance their understanding on the customer needs in
formulating quality and valuable services as they are usually incorporate these aspects
in their company’s vision and mission.
5.6.5 Direct relationship between service quality and customer satisfaction
The impact of service quality on customer satisfaction was another research objective
in present study. Henceforth, the fifth hypothesis that apprehended this relationship
was tested using PLS-SEM path coefficient analysis and subsequently, the hypothesis
was accepted based on the statistical result. The outcome of analysis, as expected,
revealed that service quality had influenced significantly to customer satisfaction.
Equally important finding, R2 indicates technical quality, empathy, assurance and
responsiveness except tangible and reliability dimensions, makeup the considerable
substantial variance of 73% for customer satisfaction, while only 27% was
unobserved. This study demonstrated results which corroborate the findings of several
other recent years studies, such as Han and Hyun (2015), Kashif et al. (2015), Izogo

262
and Ogba (2015); Rajaratnam et al. (2014), Hussain et al. (2014), and Giovanis et al.
(2014). The present study coincide with the views of Meidutė-Kavaliauskienė et al.
(2014) whose emphasize the fundamental role of service quality to achieve
competitive advantage through performing high level of quality features that highly
potential to influence in customer satisfaction and produce positive outcomes to the
business undertaking such as customer loyalty, repatronage and reduce business
competitors. This may explain why car park customers demand outstanding quality
features to be incorporated in car park services. Performance of service quality
determines the level of satisfaction, for instance, excellence quality will increase
customer satisfaction but when poor quality demonstrated, customer will be
dissatisfied.
The strength of the relationship between service quality and customer satisfaction in
this study was strongly explained by four dimensions that is technical quality,
empathy, assurance and responsiveness as these factors is in line with
recommendations by (European Parking Association (2014), Litman (2013); Health
and Safety Executive (2011) and The Institution of Highways & Transportation
(2005). For example, technical quality dimension had scored the highest outer weights
output and the possible explanation is efficient process of car parking without
interruption, compliance with safety and security standard and high specification of
parking standard are preferable by customers. But surprisingly, tangible and reliability
dimension of service quality serves little impact on customer satisfaction. This surprise
output may be due to present conditions of tangible aspect in Malaysian car park
facilities such as condition of parking equipment, parking set up and presentable dress
of car park staffs does not achieve customer expectation and furthermore, negative

263
perception of customer on how service provider keep their service promises and
managing parking payment had affected perception on service reliability. Thus, it
suggested that the practitioner to find the possible directions to improve tangible and
reliability aspect in parking services. Instantly, there are several possible solutions
could be considered such as installation of automated parking system and online
parking payment for monthly season customers (The Institution of Highways &
Transportation, 2005).
5.6.6 Direct relationship between service quality and service value
Another essential research objective set in present study was to investigate a direct
relationship between service quality and service value. In order to achieve this
objective, hypothesis six was articulated to envisage a significant interconnection
between these two constructs via calculation of PLS-SEM algorithm and 5,000
bootstrapping iteration subsamples. It also found that variance explaining the service
value was almost reaching a substantial level of R2 value with 74.5% and the rest
variance of 25.5% was unobserved. Numerous studies have similar finding to support
the relationship such as Wu (2014) in China gaming sector, Jo et al. (2014) in South
Korean restaurant, Howat and Assaker (2013) in Australia aquatic centres, Gallarza,
et al. (2013) in Spanish tourism and Ghalandari (2013) in Iran hypermarket. This
findings indicates that higher level of service quality generate higher perception of
service value among car park customers in Malaysia.
Quality aspect is one of major component in framing service value. Service quality
was developed that relate to the concern on perception of overall superiority of service
where the consumer will do evaluation on the service experience by them whether its

264
meet the expectation of what and how they wants. In the event that the quality criteria
are met, the customer will feel they had received a worthy service which will lead them
to judge a positive outcome of service value. This was supported by Cronin et al.
(2000) study where they had found that perception of quality had explained
substantially on service value where it emphasize largely on quality rather than cost in
exchange transaction.
Although this study found the relationship between service quality and service value
was significant and almost substantial, car park customers only indicate moderate
responses to service quality in commercial car park facilities. Several possible causes
to explain this scenario may due to less Malaysian car park operator practicing quality
management system in their services, inadequate training to their car park staffs and
limited resources to comply with high quality criterion.
In formatting service quality in car park services, present study found that technical
quality dimension had contributed significantly to service quality construct with
highest outer weights score, then followed by tangible and assurance dimension. The
result of technical quality aspect indicate a fundamental objective of customer to use
car park services that is customers want a place to park their cars where this car park
gives them a convenience and safe experience to access, park and exit smoothly
(European Parking Association, 2014; British Parking Association, 2010). By
attaining this main objective, customer will value the service and feel worthy to pay.
Additionally, tangible and assurance aspects have to be strategized and coordinated in
such ways that capable to drives higher performance of service quality. Other
dimension such as reliability, responsiveness and empathy play small roles in signify

265
relationship to service value. Not to undermine insignificant dimensions, the car park
operations have to review their direction and resources to improve reliability,
responsiveness and empathy aspects. The deployment of technology savvy in parking
system and customer interaction technology will be several solutions for service
improvement such as installing automated parking system and placing customer
relationship management system especially for monthly season parking toward more
efficient and effective services.
Interestingly, treatment from attributes of service quality to service value and customer
satisfaction in car park service is varied. For service value, dimension of technical
quality, tangible and assurance were found significant. While for customer
satisfaction, dimension of technical quality, empathy, assurance and responsiveness
were found significant. Through comparison, it shows that technical quality and
assurance becomes common dimensions in explaining service value and customer
satisfaction. This findings highlights the complexity in managing service quality and
this scenario indicates the measurement of service quality is subject to many conditions
such as the type of industries (Wu, 2014), type of service setting (Sandhu & Bala,
2011), customers segmentation and external factors (Seth et al., 2005) and culture
(Ganguli & Roy, 2013). Hence, the practitioner must identify customer needs, choose
right direction and do quality assessment periodically in order to achieve the business
missions successfully.
5.6.7 Direct relationship between service value and customer satisfaction
The last research objective for direct relationship was touch on service value and
customer satisfaction. In order to accomplish this objective, seventh hypothesis was

266
expressed to predict a significant effect on the relationship between service value and
customer satisfaction and tested using PLS-SEM regression. The statistical result
shows that service value had significantly influenced customer satisfaction and the
variance substantially explained at 78.6% in customer satisfaction, the second highest
R2 value for direct effect testing. Numerous studies such as Eid and El-Gohary (2015)
in Muslim tourism, Walsh et al. (2014) in furniture stores in United States and United
Kingdom, Wu (2014) in China gaming industry, Chen (2013) in China agriculture farm
and Howat and Assaker (2013) in Australia aquatic centreshad agreed that service
value has a significant effect on customer satisfaction. One way to interpret this finding
is that the higher levels of value attributes incorporated to car park service, the more
likely it is to have a favourable customer satisfaction on car park services.
The concept of service value is broad that covers assessment of perception on product
or service utilization in respect of what is received and what is given and it also include
social and emotion aspect. Better understanding on what and how value will be
evaluated by customers is essential. Service value is a part of cognitive process where
customer will do comparison and rationale their consumption between benefits and
sacrifices before any responses such as satisfaction existed (Chang & Hsu, 2013). The
positive perception of service value is important for producing customer satisfaction
in achieving successful car park services and this is being increasingly recognized by
the practitioner and academic community as well.
Addition to the finding, four dimensions namely emotion value, social value,
functional value for quality and performance, and functional value for price and value
were applied in framing service value that makes significant influence to customer

267
satisfaction. However, only three dimensions were found contribute greatly to service
value that was functional value for quality and performance, social value and
functional value for price and value. In regard of functional value for quality and
performance, it was highlighted in customer response that they are favors to consistent
of quality performance and well-made of parking facilities. Other components in
service value preferable by car park customers are reasonable parking fees, thumb up
parking services and exclusiveness features of monthly season pass holders that gives
positive impression by others to the pass holder (Litman, 2013).
Unfortunately, emotion aspect was unable to demonstrate significant contribution to
service value. Possible reason for this finding is due to limited parking lots in office
buildings that give customer no other choice to park their vehicle. This situation creates
inconvenient where customers of non-reserved parking have to scrambling to get their
parking place. On the hand, allocations for reserve parking are controlled and
expensive. As a result, car park customer feels unhappy, force to use and inconvenient.
The service providers have to find practical solutions for overcoming the situation, for
example provide designated area for all season parkers, install parking lots indicator
system and establish a customer database system for better monitoring in order to
avoid over selling situation (Litman, 2013).
5.6.8 Mediating effect of service quality on the relationship between service
marketing mix and customer satisfaction
The eight research objective is pertaining to the role of service quality as mediating
variable. This objective intended to examine mediating effect of service quality on the
relationship between service marketing mix and customer satisfaction. Subsequently,
hypothesis eight that founded through simple mediation model was developed to

268
predict a significant mediating effect of service quality on the relationship between
service marketing mix and customer satisfaction. The hypothesis was analysed using
PLS-SEM algorithm regression and bootstrapping method through 5,000 subsamples
iteration. The result of regression analysis was interpreted by the way of Preacher and
Hayes (2004; 2008) approach and applied partly of mediation assessment of Baron and
Kenny (1986) method as proposed by Hair et al. (2014a). Based on the mediation result
presented in this study, service quality has partially mediated on the relationship
between service marketing mix and customer satisfaction. The size of indirect effect
was calculated to obtain variance accounted for (VAF) of 67% that falls under partial
mediation (Hair et al., 2014a). Although the direct path coefficient was reduced
between service marketing mix and customer satisfaction, the significant path was still
existed.
As already pointed out in the literature chapter, very few studies were conducted
whereby service quality was placed as a mediating factor in the past studies (Islam et
al., 2013). There was no previous study to support exactly on this finding but partial
supported by Islam et al. (2013) study where they had found service quality fully
mediate between marketing mix and customer loyalty, and Andrade et al. (2013) study
had found that physical environment quality mediates the relationship between
objective environmental and outpatient patient’s satisfaction. The present finding
could contribute to a new knowledge in academic area.
The roles of service marketing mix and service quality in creating satisfaction among
customers was validated and recognized in present and past studies. The partial
mediation effect of service quality between service marketing mix and customer

269
satisfaction was crucial to generate customer satisfaction in which it turns to lead a
better service performance. The important of service quality in this simple mediation
model was sustained as the present finding shown the variance accounted in explaining
customer satisfaction to have increased to 73.1% in spite of 67.7% variance only if no
existence of service quality. A likely explanation to this finding was besides
performing mixes of service marketing, customers will be more satisfied when quality
of services featuring in all car park services which in later stage, it will gives
worthiness feeling to customers and leads to positive response. Evaluating on quality
is naturally inherit in human cognitive process and cannot be separated (Islam et al.,
2013). Thus, enhancing quality level in services is very essential especially on aspect
of tangible, technical quality, assurance and empathy as its empirically supported and
without it, all efforts in execution of service marketing mix becomes meaningless and
unsustainable.
Furthermore, service marketing mix has been validated having a strong significant
effect on customer satisfaction and the connection was still significant although service
quality had absorbed certain level of cause-effect between two constructs relationship.
It was found that all elements of service marketing mix except service product and
service promotion play active roles to serve service quality and customer satisfaction.
This means that the significant findings demonstrated in mediation model was due to
coordination of service process, service people, service physical evidence and service
place elements as important input factors that stimuli customer’s cognitive process and
responses (Goi et al. (2014). Correspondingly, Jacoby (2002) holds that association
between stimulus and response are sound automatic and not involve mind to trace of
their occurrence. For example, providing a right painting colour on car park wall,

270
having enough brightness within car park area or enough width of driving access will
impact instantly on pleasure experience of customer that lead to satisfaction (Shaffer
& Anderson, 1983). Therefore, selecting, initiating and implementing the right
directions in enhancing mixes of service marketing and service quality are key
determinant for success to achieve customer satisfaction and turn it into long term
business competitive advantage.
5.6.9 Mediating effect of service quality on the relationship between service
marketing mix and service value
Next research objective of present study was related to the role of service quality as
mediating variable between service marketing mix and service value. This study
objective presented here was accomplished by testing hypothesis nine that predict a
significant mediating effect of service quality on the relationship between service
marketing mix and service value using PLS-SEM algorithm regression and
bootstrapping method through 5,000 subsamples iteration in this simple mediation
model. The Preacher and Hayes (2004; 2008) mediation approach and partial Baron
and Kenny (1986) mediation methodology as proposed by Hair et al. (2014a) was
applied in this hypothesis testing.
Recap to earlier findings, service marketing mix has a significant direct relationship to
service quality and service value with substantial values. When three constructs were
regressed together where service quality serve as mediator in simple mediation model,
variance explained in service value was increased from 68.1% to almost to substantial
R2 value of 74.3% and significant direct path coefficient between service marketing
mix and service value becomes insignificant. Based on Baron and Kenny (1986)
mediation methodology, this result can be considered as full mediation but in order to

271
preserve consistency on mediation report, service quality was mediated partially
between service marketing and service value according to VAF formula as
recommended by Hair et al. (2014a). The size of indirect effect was calculated and
VAF value was stood at 67%. As mentioned in literature review, previous published
studies on the relationship service marketing mix to service quality and service value
was very limited because most of studies tended to focus on influence of marketing
mix elements individually instead of conceptualise service marketing mix as higher
construct. For consideration, the nearest findings in past studies fractionally support
the present study finding was Cengiz and Yayla (2007) study in accounting services
where they found that only product mix has indirect relationship to service value
through service quality and Thamrin (2012) study about ship passenger’s satisfaction
had found that service marketing mix and service quality simultaneously effect service
value. The academic knowledge on this relationship could be strengthen through this
study finding.
The finding describes that quality attributes serve as service benefits that contained in
mixes of service marketing was turn out to be sensitive aspect and deeply evaluated
by car park customers before the judgement of value level was made. This can be
supported by the public complaint listed in Table 1.1 specifically online news titled
“High rates but poor parking facilities” published by News Strait Times (Bahalul,
2012). Almost all aspects of service marketing were insisted to have quality attributes.
This is in line with the spirit of marketing mix concept that concern on marketing and
operation factors in satisfying customer’s need and wants (Kotler & Armstrong, 1989;
McCarthy, 1964). On the other hand, service quality gives practical and technical
benefits that customers can be obtained after utilization of service product. High

272
performance of quality coexistent in services will ensure car park customers enjoy the
efficiency of vehicle parking processes, comfortable on car park environment, safety
and security features assured and customer care is well preserved (European Parking
Association, 2014). This statement was supported by the present findings where
functional value of quality and performance in service value was recorded as strongest
outer weights value that similar to Walsh et al. (2014) study, then followed by
functional value for price and value, and social value. Car park service in Malaysia is
still in impotent to boost emotion value among their customers. Perhaps, by reviewing
mixes of service marketing and service quality aspects is one of optimist steps to
improve customer’s emotion aspect when utilize the car park services.
5.6.10 Mediating effect of service value on the relationship between service
marketing mix and customer satisfaction
The tenth objective of present study was to examine the mediation effect of service
quality between service marketing mix and customer satisfaction. The hypothesis ten
was formulated to analyse prediction of a significant indirect effect of service value
between service marketing mix and customer satisfaction using similar analysis
method as stated in preceding subheading.
The finding for tenth hypothesis confirms that service marketing mix and customer
satisfaction was partially mediated by service value. The statistical result shows that
R2 value of customer satisfaction was enlarged extensively from 67.7% to 81.1% with
presence of service value. Another statistical result, VAF of 65% was significantly
counted to represent indirect effect size which holds to partial mediation category.
Therefore, it was decided that service value had partially mediated between service
marketing mix and customer satisfaction. This finding was partially corroborates with

273
Kwun (2011) study who found the food quality and menu variety represent product
mix partially mediated by service value for female consumer’s satisfaction. Due to
very limited empirical study on this mediation framework, present finding grants a
new knowledge to academic community.
The above finding can be interpreted that higher customer satisfaction can be created
over augmentation of value features in services by means of offering the right mixes
of service marketing, in case of this study, its suggest only service place, service price
and service physical evidence. Again, this comes back to the primary objective of
customers to park their vehicle in car park facilities. The possible causes to this finding
is Malaysian car park customer wants the car park facilities that convenience, well
organized, enough parking lots, safe, sufficient payment channels, reasonable price
structure with good payment policies and impressive and useful car park physical set
up. In appropriate situation, Litman (2013) suggest various types of financial
incentives could be offered to car park user such as to provide discounted or
preferential parking for rideshare, a group purchases discounted and discounted price
for tandem parking. In addition, quality performance subscale of service value shown
the highest impact on the construct then followed by price, value and social factors
that impetus by the marketing mixes. Although, service value mediates on customer
satisfaction, service marketing mix still has a significant direct effect on customer
satisfaction. In the present states, it was noted that three marketing mixes namely
service place, service price and service physical evidence has capability to induce
customer satisfaction directly especially in cognitive and overall satisfaction
component of satisfaction. Being competitive to other car park provider and being
good in many aspects of marketing mixes are vital because empirical result suggest
274
car park customers tend to compare services between car park facilities and evaluate
many parts of service feature.
Surprisingly, current states of service people, service process, service product and
service promotion in Malaysian car park services was not showed a significant
contribution to serve service value and customer satisfaction. These weaknesses can
be evident clearly through public complaint listed in Table 1.1. Taken serious measures
to improve weaknesses in people, process, product and promotion aspects will
appreciate another impact to service value and satisfaction that sustaining service
excellence for being more strength and profitable in car park operations.
5.6.11 Mediating effect of service value on the relationship between service
quality and customer satisfaction
The last research objective discussed here was related to service value as mediator
between service quality and customer satisfaction relationship. In spirit to end the last
objective of this study, hypothesis eleven was established to explain findings obtained
from PLS-SEM algorithm and bootstrapping of 5,000 subsamples repetition output.
Methodology employed to interpret mediation result was analyzed in the same way as
the preceding hypothesis.
The finding of last hypothesis had validated and confirmed that service quality and
customer satisfaction was partially mediated by service value. With existence of
service value as mediator between service quality and customer satisfaction, R2 value
was increased from 74.5% to 81.6% for variance power explained in customer
satisfaction. The size of indirect effect for service value was calculated manually to
get significant VAF value of 59% and this result had recognized service value has a

275
partial mediation effect between service quality and customer satisfaction. Studies on
the role of service value as mediator is not a new subject in the past. Numerous studies
had offered same findings on mediation effect of service value such as Chen et al.
(2012) in Taiwan financial services, Kwun (2011) in food services, Hume and Mort
(2010) in Australian art performance, Lee et al., (2008) in hotel services, Brady et al.
(2001) in American and Ecuadorian fast-food services and Cronin et al. (2000) in
service environments.
The most convincing reason for service value being a partial mediation effect between
service quality and customer satisfaction in Malaysian car park setting is because
service quality has a strong significant direct effect on service value and customer
satisfaction. Customer constantly seek for quality in the services that they had been
engaged and always being a pivotal parts in marketing and business service delivery.
Establishment with high service quality will leads to high service value (Jo et al., 2014)
and customer’s satisfaction (Han & Hyun, 2015; Suki, 2014; Giovanis, Zondiros, &
Tomaras, 2014) and attracting another opportunity to boost an organization’s image
(Wu, 2014; Sivakumar & Srinivasan, 2009), encourage positive behaviour such as re-
use intention, positive word of mouth and loyalty (Rozita, Zana, Khairulzaman, &
Norlizah, 2014; Kim & Damhorst, 2010). In contrast, poor serving of quality causes
business strength damaged due to negative response attitude, bad word of mouth and
low customer repurchase (Lovelock & Writz, 2011). In short, garbage in will be
garbage out (Hair et al., 2014a).
In car park setting, this study shows that all dimensions of service quality except
reliability dimension had worked together intensively to serve value and satisfaction,

276
specifically on technical aspect. Equally important finding to this study, it was noted
that the measurement of service quality in car park services is better through
combination of functional and technical factor instead of functional aspect alone as
suggested by Kang and James (2004). For record, technical quality dimension had
repeatedly attained the strongest impact in hypotheses testing. Hence, better
understanding on the requirement of car park customers in term of functional and
technical through persistent evaluation on quality is suggested for the service providers
to be able to fulfill customer needs and ensure long survival of business (Purcărea et
al., 2013; Vanniarajan & Gurunathan, 2009).
As a quality performance reach an acceptable level, car park customers will do
assessment of advantage versus disadvantages after being engaged in the service. As
high quality in car park services is preferable by customers, perception of value will
becomes positive and minor defect encountered by customer during service
consumption will be disregarded. This evident clearly in present study where quality
performance factors in service value continued to obtain the strongest impact score,
then followed by price, value and social factors although several aspects were found
weak in service quality and service marketing mix. This finding was parallel with
Cronin et al. (2000) study. Therefore, it was suggested that car park operator should
focus and encourage any initiative to improve quality in car park services from time to
time towards delivering high value to their customer that leading to customer
satisfaction. For example, car park operator should ensure a proper maintenance of
equipment to avoid any inconvenient experience, increase safety level such as
adequate brightness, provide sufficient Closed Circuit Television (CCTV) units, do
security patrol within car park area and use up dated car park technology such as

277
parking guidance systems to monitor availability of parking space, automated
payment, provide medium or long range season pass reader (Litman, 2013; Mendat &
Wogalter, 2003; Shaffer & Anderson, 1983). For value-added service, possible
initiatives such as cashless parking payment, car wash service, mini retail outlet or
valet service can be considered to boost a valuable sensation among car park users and
should ensure the customer aware about valuable features. High worthiness feeling of
customers after service utilization will makes a particular service unique that could
strengthen the business competitiveness through high satisfaction level. This statement
was supported by present study findings where service comparison by customer
represent cognitive had achieved the strongest loading than other components in
satisfaction construct. Additionally, this study’s findings consistent with Cronin et al.
(2000) study where they had found that satisfaction was largely explained by service
quality and service value, and further conclude that cognitive evaluations precede
emotional responses. Their work also proves that jointly efforts to improve quality,
value and satisfaction as a means of refining customer service perceptions. Addition
to suggestion, the present study also highlight the needs of managers to decide the right
strategies, embedded clear direction among staffs and to do frequent monitoring to
ensure excellence performance on delivery of value to their customers (Chen et al.,
2012).
5.7 Summary of chapter
This chapter provides overview on the study’s findings and discussion. It has presented
findings on the response rate, profile of respondents and the statistical results. In
general, descriptive statistics indicates that the perception of respondents was at
moderate level for service marketing mix, service quality, service value and

278
satisfaction at commercial private office building in Malaysia. This chapter has offered
result of Friedman Test using SPSS and output of PLS-SEM analysis that was obtained
from evaluation of the measurement model, second order model assessment, structural
model and hypotheses testing.
Generally, all constructs namely service marketing mix, service quality, service value
and satisfaction had a significant direct effect between them. Accordingly, mediation
analyses were carried out using PLS-SEM bootstrapping methodology to determine
the mediating effect of service quality and service value on customer satisfaction. The
statistical outputs had confirmed the existence of partial mediation and consequently,
all mediation hypotheses were accepted. Based on these results, eleven hypotheses of
this study has been accepted and summarized in Table 5.17. Furthermore, eleven
research objectives and it findings were discussed in same chapter including results
comparison to prior studies.
Table 5.17
Summary of all hypotheses findings
Hypothesis
code Hypothesis Decision
H1 The priority between seven elements in service marketing
mix from customer perspective is varied
Accepted
H2 There is a significant relationship between service marketing
mix and customer satisfaction
Accepted
H3 There is a significant relationship between service marketing
mix and service quality
Accepted
H4 There is a significant relationship between service marketing
mix and service value
Accepted
H5 There is a significant relationship between service quality and
customer satisfaction
Accepted
H6 There is a significant relationship between service quality and
service value
Accepted
H7 There is significant relationship between service value and
customer satisfaction
Accepted

279
Table 5.17 (Continued)
Hypothesis
code Hypothesis Decision
H8 Service quality mediates the relationship between service
marketing mix and customer satisfaction
Accepted
as partial mediation
H9 Service quality mediates the relationship between service
marketing mix and service value
Accepted
as partial mediation
H10 Service value mediates the relationship between service
marketing mix and customer satisfaction
Accepted
as partial mediation
H11 Service value mediates the relationship between service
quality and customer satisfaction
Accepted
as partial mediation

280
CHAPTER 6
CONCLUSION AND RECOMMENDATIONS
6.1 Introduction
This is a final chapter of study that summarizing the study and key findings, discuss it
implications to the managerial and theoretical perspectives. It also presents limitations
of the study and recommends for future research avenues. Finally, this chapter
summarizes and concludes the study.
6.2 Summary of the study
This study addresses the problem that related to customer satisfaction issues about on
how commercial car park facilities were served in Malaysia. Based on complaints
reported in online media news, numerous factors had causes dissatisfaction among car
park customers such as high parking fee, parking attendant attitude, poor maintenance
of parking facilities, security issues, lack of facilities provided in parking area and so
forth. It can be acclaimed that present car park services rendered in car park facilities
was still unable to generate high level of satisfaction among users which was deemed
as essential ingredient to business performance, competitiveness and sustainability.
The phenomenon and factors that contribute to the demand and needs of proper
parking services were introduced step by step in Chapter 1 with support of relevance
reference and statistics.

281
As a result of the above, the model of service marketing mix which contains aspect of
service product, service price, service place, service promotion, service people, service
process and service physical evidence was found relevance to describe the role of car
park operators in serving car park facilities. However, explaining customer satisfaction
issues through service marketing mix alone was too high expectation. Lack of quality
attributes and imbalance service value offered in car park services has been identified
to be another influence factors on customer satisfaction. Hence, the broad question
arises in this study was about the role of service marketing mix, service quality and
service value as causal relationship and mediation effect on customer satisfaction.
Therefore, the aim of this study was to investigate the relationships between service
marketing mix, service quality, service value and customer satisfaction in commercial
car park facilities in Malaysia.
Founded from the problem statement and subsequently supported by relevant
literatures, this study aims to achieve eleven research objectives where one of research
objective was to determine the priority of service marketing mix elements, six research
objectives to investigate direct relationships and four objectives concern on mediation
effects.
Since a car park service is something unfamiliar topic to public and non-practitioner,
Chapter 2 was provided to present an overview of parking services in Malaysia. It
continues with comprehensive literature review on service marketing mix, service
quality, service value and customer satisfaction in Chapter 3. The essence of literature
reviews was presented to support this study and several study gaps due to fragmented
studies and lack of empirical studies for particular concepts and relationships were

282
highlighted. Addition to Chapter 3, under underpinning theory subheading, the
application of Stimulus-Organism-Response (S-O-R) theory in the study’s research
framework was explained and discussed.
In light of the objectives of the study and the discussions that were provided in Chapter
1 and Chapter 3, the research framework was formulated in Chapter 4. As argued in
Chapter 4, the framework was theoretically built that based on the extended Stimulus-
Organism-Response (S-O-R) in relation to service marketing mix, service quality,
service value and customer satisfaction. The service marketing mix was measured
formatively by seven lower order latent variables, service quality was also measured
formatively by five SERVQUAL dimension plus technical dimension, service value
was also measured formatively by four lower order latent variables and customer
satisfaction was measured reflectively by six components. Additionally, Chapter 4
contained eleven hypotheses to accomplish eleven research objectives that include
measurement of each variable and research methodology. In order to achieve the
objectives of the study, the hypotheses were divided into three group that is one
hypothesis on priority of service marketing mix variables was tested, six hypotheses
related to investigate direct effect between service marketing mix, service quality,
service value and customer satisfaction, and last group contained four hypotheses to
examine on indirect effect of service quality and service value on customer
satisfaction.
In Chapter 5, it presents statistical findings and offers discussion of eleven research
objectives that based on the results of tested hypotheses. This study hopes that all
findings obtained are able to provide valuable contributions to academic knowledge,

283
practitioners and government in issues pertaining to car park facilities in Malaysia. In
order to test eleven hypotheses of the study, SPSS version 21.0 and SmartPLS version
2.0 M3 statistical software were used. The nonparametric Friedman test using SPSS
was used to test first hypothesis and the rest of hypotheses were tested using PLS-SEM
algorithm regression with bootstrapping procedure of 5,000 subsamples iterations. The
input of the analysis was based on 182 usable responses with response rate of 23% that
collected from twenty private office buildings in Klang Valley.
The results of analysis demonstrates that the priorities of service marketing mix
variables were not similar was accepted and mean ranking among variables were
detected. While, the six direct effect hypotheses on the relationships between service
marketing mix, service quality, service value and customer satisfaction were
confirmed and accepted. The mediation test for another four hypotheses on the roles
of indirect effect of service quality and service value were found to have mediation
effects and all mediation hypotheses were accepted as partial mediation. The summary
of hypotheses result can be seen in Table 5.17. In subsequent subheading in Chapter
5, comprehensive discussions on eleven research objectives were presented.
6.3 Implications of the study
Present study spreads the understanding of consumer behavioural studies in term of
customer satisfaction in car park facilities particularly in Malaysia and the overall
parking industry in general. As mentioned in Chapter 1, services sector plays pivotal
contributor to country’s economy specifically in Malaysia and part of this sector,
services in car park facilities becomes so important to commercial activities,
284
transportation sector and quality of life. In short, the role of car park facilities is more
than basic needs of life. Thus, it is imperative to fulfil the requirements and
expectations of customers in multifarious backgrounds. This study is an early effort in
investigating the satisfaction of car park customers in Malaysia including their
contributing factors namely service marketing mix, service quality and service value.
The implication of this study in terms of practical and theoretical standpoints was
discussed in the following subheading.
6.3.1 Managerial and practical implications
This subheading highlight a number of managerial implications extracted from the
study’s findings. As stated out in earlier chapters, there was a need to comprehend
what establishes service marketing mix as a first stage contact to customers and how
it relates service quality and service value to stimulate satisfaction responses among
car park customers. Inappropriate selection of marketing strategies, insufficient
deployment resources for implementation and lack of operation control may cause the
desired output unable to achieve and create wastage to the company’s resources. Thus,
it is of utmost important for managers to identify the right mixes of service marketing
as this study confirmed that the variables contained in service marketing was varied
and perform with multifarious impact toward service quality, service value and
customer satisfaction.
Present study had showed that service marketing mix has a significant direct effect to
service quality, service value and customer satisfaction but it elements respond
differently. In this study, mixes of service people, service physical evidence and
service process plays a vital role in service marketing mix that fashion customer’s

285
perception on service quality in car park services. While to create high value
perception in car park services, the result indicates that service physical evidence,
service place and service price have emerged as key instrument to service marketing
mix in producing value worthiness feeling in service consumption. Conversely, the
mixes of service place, service price and service people demonstrates critical role in
generating satisfaction among car park customers.
Under those circumstances, the results of this study acted as proof that the elements of
service marketing mix are interchangeable that depends on what aspect to be assessed.
This evidence was also commensurate with several past studies such as Chumaidiyah
(2013) study claimed that elements of service marketing mix are interrelated with
equally important but gives different impact to particular services. Another study by
Lin (2011) recommended that business entity can improve their marketing strategies
in service operation by following the priority ranking of service marketing mix
elements. Therefore, it demands manager to recognize deeply on the service features
preferred by their customers and choose right marketing mixes to be incorporated
inside their service operations toward attaining high service performance that gives
extra mileage to business competitiveness and sustainability.
Offering services without traits of quality and value will be meaningless. Withal,
human thinking of quality and value cannot be separated while consuming the services.
Thus, quality and value aspects are important in second level to encourage satisfaction
responses. Evidence in this study suggests that service quality with it dimensions
namely tangible, technical quality and assurance had performed important
fundamental in developing value perception and all dimensions of service quality
except reliability and tangible reacted significantly in obtaining satisfaction among car

286
park customer. The European Parking Association (2014) suggests that the value needs
to be mirrored by quality of service of the parking product. While all components of
service value except emotion, perform the most potent in shaping satisfaction
responses. Additionally, service quality and service value partake the role of service
marketing mix in generating customer satisfaction.
Therefore, managers are advised not to take lightly on quality and value aspects in
their service product. On the contrary, satisfaction and performance for service
consumption will be poor. In Cronin et al. (2000) study concludes that service quality,
service value and satisfaction worked collectively in performing next behavioural.
Under this circumstance, it was recommended for managers to do periodically
assessment on customer perceptions where the input from assessment will helps
manager to acknowledge the customer preferences and review features in service for
further improvement. Furthermore, car park operators should consider adopting
customer friendly measures and market driven in order to assess underlying
information about the expectations and needs of the customers. Assessment by
customer on service performance and how customer satisfaction is expressed are the
essential ingredients to the development of marketing programmes. Evidence of this
study shows that satisfaction was stimulated mainly by cognitive component in term
of service comparison with other and followed by overall satisfaction assessment. Due
to this reason, adapting quality management system such as ISO9001 or total quality
management is one of the ways to aid car park services in performing better and more
sustainability as present car park operators are lacking in this aspect. Equally
important, result of this study had recognized essential role of technical quality
dimension to service value and customer satisfaction. It was interpreted that managers
287
are required to ensure a good maintenance practices such as preventive and corrective
systems in car park services as customer expect no disruption when they are going in
to park their vehicle and exit with safely and conveniently. This is their primary
objective in consuming the car park services and maximum customer satisfaction can
be obtained if this objective is preserved. The most valued parking spaces are usually
those most convenient and closest to the main destination (European Parking
Association, 2014).
In third stage, customer satisfaction is seen as a consequence of received service,
service quality and service value. Therefore, managing customer satisfaction is truthly
important as past studies had recognized customer satisfaction still perform a central
tendency of marketing strategies and management guidelines that lead to business
success, high service performance, profitability, competitive advantage, customer
retention, behavioural intention and trust (Akamavi et al., 2015; Ameer, 2014; Kitapci
et al., 2014; Wu, 2014; Yeung et al., 2013).
In managing customer satisfaction, the managers are advised to measure periodically
and identify which features and benefits in service that priority to their customers. As
satisfaction is one of outcome from service consumptions, the managers are required
to identify important features from the beginning stage to the end of service
consumptions and track customer responses systematically. Developing a
consumption system approach is one of the ways where managers are able to monitor
the process flow, alert to any changes of customer behavior and respond to them. It
enables managers to focus on the most important predictors of performance while
providing inputs in designing marketing programs that effectively adapt to customers.

288
Furthermore, the car park staffs should be made known clearly on organization
inspiration in serving their customers by establishing effective communication flow,
cultivating customer service culture and provide knowledge on service product
through periodical internal meeting and training programmes.
The implication of this study is not limited to practitioners only but the outcomes of
this study also can be referred by the related ministries or agencies of Malaysian
government such as Ministry of Federal Territories, Performance Management &
Delivery Unit (PEMANDU), DBKL and other local authorities. The Malaysian
government through Government Transformation Programme and Greater Kuala
Lumpur/Klang Valley stresses on the improvement of urban public transportation. One
of enlisted initiatives is to enhancing parking control and management by reviewing
on and off-street parking rates in the Kuala Lumpur city centre for a more competitive
rate and the strengthening of parking enforcement within the central business district.
Therefore, the findings of this study provide detail information pertaining to which
components need to be focused in order to enhance public perception on quality and
value in parking services that reach public satisfaction. It was suggested that grading
scheme for car park facilities that reflect to parking rates. Example, for those car park
facilities intend to charge high parking rates must comply with high parking
specification. In contrast, those car park facilities with basic parking specification will
only allow to charge parking rate at certain range.
Lastly, the Department of Skills Development of Ministry of Human Resource can use
the findings of this study for their guidelines to develop National Occupational Skills
Standard (NOSS) for parking operation and services in which the syllabus of the skills

289
for NOSS level 3 is almost approved by Ministry. The input from this study can help
the respective department to improve the skills syllabus in next revision and adapt it
for the development of NOSS level 4 and 5 of parking operation and services. By
having the systematic syllabus for skills development in parking operation and
services; the practitioners, school leavers and also public would have opportunities to
learn and practice the right way in delivering parking services in car park facilities.
6.3.2 Theoretical implications
The foundation of research framework was based on StimulusOrganismResponse
(S-O-R) theory that views external factors to stimulate internal individual states for
generating responses. It also postulates that external factors such as service marketing
mix interact with human organism such as quality and value assessment that drive
human response such satisfaction to represent internal response. Accordingly, eleven
hypotheses were formulated from the research framework of present study that offers
essential empirical evidence as a part of contribution to current academic knowledge.
Firstly, this study contributes to the literature by establishing the relationships between
the three sectors of Stimulus, Organism and Response in S-O-R model in commercial
car park facilities in Malaysia. This relationship was tested through four mediating
hypotheses where stimulus represented by service marketing mix, organism embodied
by service quality and service value, and response proxy through customer satisfaction.
All results for the four hypotheses were confirmed and accepted as partial mediation.
An implication of this result is the possibility that besides organism act as intermediary
between stimulus and response as proposed by original S-O-R model, stimulus also
can interact directly to response with presence of organism. The evidence of this study

290
suggests that although some stimulus roles were taken over by organism before
producing response, there were some option of stimulus can still influence directly to
response. In brief, some elements of service marketing need to go via cognitive process
like quality and value assessment before response appeared and some elements gives
immediate reflection on satisfaction among customers.
On the contrary, the findings were found against the original S-O-R model as
recommended by Robert S. Woodworth (Hergenhahn & Henley, 2014) and Mehrabian
and Russell (1974) model but in line with the concept of S-O-R model proposed by
Jacoby (2002) and support the extended S-O-R model as empirically tested by Goi et
al. (2014). Furthermore, psychologist Alexander Bain in voluntary behavior subject
(Hergenhahn & Henley, 2014) suggests that some behavior can simply act
spontaneously guided only by its desire and the sight of the object. On the basis of this
theory, it may explain the reason of why stimulus can still influence significantly in
response with presence of organism process.
Secondly, it were claims that the effect of marketing mix is vary based on the type of
services (Al-Dmour et al. , 2013; Yasanallah & Vahid, 2012; Cengiz & Yayla, 2007),
culture (Dong & Siu, 2013) and geographical area (Chumaidiyah, 2013; Sanib et al.,
2013). The finding of present study was in agreement with past studies where the
means ranking analysis in first hypothesis was not same with the ranking results of
past studies shown in Table 3.9. Thus, it demands a thorough evaluation on mixes of
service marketing that applicable to particular services.

291
In further findings, the 7P model proposed by Booms and Bitner (1981) as cited by
Rafiq and Ahmed (1995) was found suitable to represent marketing elements contain
in service specifically in commercial car park services instead of 4P model proposed
by McCarthy (1964). The present finding also found that seven elements of service
marketing mix namely service product, service price, service place, service promotion,
service people, service process and service physical evidence were coordinated well
through reflective approach at lower order latent variable and acted meaningfully to
form service marketing mix as second order construct using formative approach.
Therefore, the finding of this part of the study was seem to be consistent with the word
of “mixer of ingredient” (Borden, 1964) and the word “blend” by Kotler and
Armstrong (1989) contained in the conceptual definition of marketing mix. This
reflective-formative approach to assess and conceptualise service marketing mix as
higher order is one of first study ever conduct.
Thirdly, it was contended that application of SERVQUAL with five dimensions may
cause inadequacy of quality evaluation in services without presence of technical
quality dimension. For this reason, Kang and James (2004) suggests that the presence
of technical quality dimension makes stronger effect between service quality and
customer satisfaction. In agreement with Kang and James (2004), technical quality
dimension acted as additional dimension to SERVQUAL model in this study had
performed excellence result by obtaining the highest scores compared to other quality
dimensions. Consequently, service quality worked best not only to customer
satisfaction but also to service value. Incorporation of technical quality dimension in
SERVQUAL makes quality criterion more practical and produce better explanation
variance.

292
Fourthly, there was little consensus among scholars in regards to the definition and the
concept of service value (Chen, 2013; Boksberger & Melsen, 2011). Service value has
been operationalized in several ways such as unidimensional (Grewal, Monroe, &
Krishnan, 1998), multi-dimensional (Eid & El-Gohary, 2015; Sánchez-Fernández &
Iniesta-Bonillo, 2007) and higher order construct (Lin, Sher, & Shih, 2005). It was
claimed by Lin et al. (2005) that the service value conceptualize as higher order via
formative approach able to obtain greater effects than other approaches.
Present study adapted PERVAL model from Sweeney and Soutar (2001) using short
scale of PERVAL as proposed by Walsh et al. (2014) because short scale has better
psychometric properties. The PERVAL scales were assessed reflectively in first order
and formatively in second order to mold service value as this approached
recommended by Sánchez et al. (2006). The result from present study indicates
reflective-formative method to assess service value at second order construct was
obtained high path coefficient β of 0.886 at p < 0.01 for relationship between service
value and customer satisfaction. Moreover, when first order variable becomes
indicator to service value formatively, the outer weights and significant effect of items
able to indicate which components were most active. In this case, quality and
performance dimension had obtained the highest score then followed by social value,
price and value and the lowest score was emotional value as evidently shown in Figure
5.12. Therefore, the study’s finding corroborates the ideas of Lin et al. (2005) who
suggested that formative measure of service value able to obtain large impact and
provide additional information on how first order variable acted within second order
293
construct. The valuable findings on service value in this study have fulfilled the future
research recommendation by Lin et al. (2005).
Fifthly, past studies had extensively used the relationship between service quality,
service value and customer satisfaction model for the impact and outcome of behavior
such as intention and actual behavior of customer (Ameer, 2014) but always neglecting
the presence of stimulus factor. Absence of stimulus factor in the research model may
contradict with the StimulusOrganismResponse (S-O-R) theory where the theory
had suggested stimulus can influence organism that evoke person response (Goi et al.,
2014). Moreover, past studies frequently limit the scope of stimulus to physical
environment or quality attributes only and use emotion to represent organism stage as
mediating factor (Vieira, 2013; Chang et al., 2011; Jang & Namkung, 2009). The
limited scope may not able to explain behavioral response adequately. Moreover, such
relationship was not been tested in the commercial parking facilities setting
particularly in Malaysia.
Therefore, this study fulfill the academic gaps by confirming the relationship of
stimulus to other factors. In this case, stimulus represented by service marketing mix
which was founded by seven elements, was found to have significant relationships to
service quality, service value and customer satisfaction in great impact. The finding of
this study also reveals the construct of service marketing mix, service quality and
service value was established distinctively to explain causal relationship to customer
satisfaction that supported by results of discriminant validity, convergent validity and
multicollinearity assessment. Furthermore, this study had used service quality and
service value as mediating construct between service marketing mix and customer
294
satisfaction instead of emotion which was commonly applied in Mehrabian and Russel
(1974) model of S-O-R. As mentioned in the literature review chapter, there were very
rare studies that focus on these mediation relationships. Thus, this study offers valuable
findings that confirm service quality and service value were acted as mediator between
service marketing mix and customer satisfaction through partial mediation.
Lastly, the relationships diagrammatically illustrated in research framework that
consists of service marketing mix, service quality, service value and customer
satisfaction had not been tested in the commercial parking facilities setting specifically
in Malaysia. The information and findings contained in present study provide new
contribution to academic knowledge by adding one more research input pertaining to
consumer behavior in service context.
6.6 Limitations of the study
Although the results of the current study have shed light on several important issues,
study’s limitations to certain extend should be considered when interpreting the results.
On the other hand, these limitations offer some opportunities for future studies to
consider in order gaining further knowledge. Firstly, this study focuses on customer
satisfaction to represent the internal response of individual as the outcome of behavior.
Of course, customer satisfaction is not the end of business objective. Numerous of past
studies had verified that customer satisfaction is one of antecedent to the other outcome
such as intention behavior, loyalty, patronage, word of mouth. Thus, this study
outcome was limited to internal response only.
295
The second limitation is that besides direct relationships, this study had focused on the
mediation effect of service quality and service value. There are a few other moderating
variables that could possibly influence customer satisfaction, such as respondent
demographics, experience and the type of parking product, for instant, season parkers,
causal parkers and valet customers.
Thirdly, this study faced difficulties in finding enough empirical studies in the context
of car park services that involves variables used in the study. Moreover, past studies
gave less attention on the relationships between service marketing mix to service
quality, service value and also customer satisfaction including the mediation effect of
service quality and service value between service marketing mix and customer
satisfaction causes limited empirical evidence to support the findings of study.
Fourthly, the mediation testing was based on simple mediation model only for
accomplishing the respective research objectives. This study was not formulates
hypothesis testing for multi-mediation effects which can be seen in the research
framework. Future research to investigate multi-mediation effects that based on the
study’s research framework would beneficial to academic.
The fifth limitation was related to respondents. The respondents for this study were
among monthly season parking customers from twenty private office buildings within
Klang Valley area. Although, it was stated that Klang Valley is a most advance and
rapid growth of economic activities area, it may not be representative of all car park
customers in Malaysian in term of satisfaction because there are other cities are also
aggressive in economic activities such as Johor Bahru in the south, Penang and Ipoh

296
in the north and Kuantan in the east coast of Peninsular Malaysia. Lastly, difficulty in
getting high rate of responses is considered as one of the major methodological
limitations faced in this study. Factors contribute to this limitation may derive from
many items in questionnaires, appropriateness of method to distribute questionnaires
and time consumption to encourage collection of complete questionnaire.
6.8 Recommendations for future research
This study offers opportunities for future research where the findings and limitations
of the study becomes a basis of recommendations. Future research may explore more
comprehensively in several areas as discussed in this subheading. Firstly, customer
satisfaction as dependent variable may not adequate to explain consumer behavior as
customer satisfaction was recognized as antecedent to other behavioural and linked to
external measures (Morgeson III, Sharma, & Hult, 2015). Thus, adding more
constructs such as intention and actual behavior would give academic mileages due to
complexity of consumer behavior that may vary accordance to diverse influence
factors. Equally important, although the result of explaining variance in customer
satisfaction from service marketing mix, service quality and service value was 81.9%,
considerably high, another 18.1% could be explained by other possible variables that
influence satisfaction. Future studies should consider what other potential factors that
can influence customer satisfaction.
Secondly, although this study has been developed based on
StimulusOrganismResponse model in the Malaysian commercial parking
facilities that used service quality and service value as intermediary variables, there
are still unknown in commercial car park setting whether presence of moderating

297
variables could influence the StimulusOrganismResponse model. Therefore, it is
suggested that future research should investigate the moderating influence such as
customer age and gender in present study’s model.
Thirdly, past studies always focused on individual components to endogenous
variables creates high complex model and sometime bring confusion interpreting the
variable concept. Using low order and high order measurement as applied in this study
makes research model simpler and support the concept of variables. Application of
formative assessment at higher order level able to generate high impact on endogenous
variables and statistical power of each indicator that form the higher order construct
can be identified. However, the concept of low and high order constructs or
hierarchical order construct in past studies was not widely used. Therefore, it is highly
recommended that future studies to use low and high order construct and formative
assessment that commensurate with proposed concept.
Fourthly, as indicated in the study’s limitations heading, even though the concept of
marketing mix has been made known since year 1964, there is fragmented and limited
studies to investigate the role of service marketing mix as a whole that linked to other
constructs such as service quality, service value and customer satisfaction.
Additionally, this study also found that there is lack of studies to investigate on the
mediating role of service quality and service value between service marketing mix and
customer satisfaction. Hence, it would bring benefit to the academic knowledge when
the said relationships are further investigated in future studies.

298
Lastly, it is recommended that the sample size could be increased in future studies for
more comprehensive result by the way of taking samples from diverse geographical
areas across Malaysia states and other countries that may include diversity of cultures
and social structures. It is also suggested that the type of respondent should be
expanded to other category of car park user such as casual parking users and valet
customers for generalization of study outcome. Moreover, the respondents for present
study were selected among private office buildings and respondents input from
difference type of buildings such as hotel, shopping malls, transportation hubs and
theme parks. Therefore, replicating and extending this study in other regions and
countries and other services would test the applicability of the present findings.
Additionally, it would provide a basis for further validation of the research framework
formulated in this study to understand the variations of customer behaviour.
6.9 Conclusion
First and foremost, the purpose of the study is to investigate the influence factors on
customer satisfaction in Malaysian commercial parking facilities. The descriptive
result of the study suggests that the level of customer satisfaction on service in car park
facilities is still at moderate level. This means that the perception of car park customers
on service marketing mix, service quality and service value at medium level.
The structural assessment for research framework indicates that the model has
adequate prediction relevance for the constructs though blindfolding procedure in
PLS-SEM method. Briefly, the study’s results reveal that the impact of service
marketing mix was different. While for direct effect, the relationships between service
marketing mix, service quality, service value and customer satisfaction were found

299
significant with reasonably high statistical results. This shows that service marketing
mix, service quality and service value are effective factors for customer satisfaction.
In subsequent analysis, service quality and service value had demonstrated partial
mediation effects. In summary, eleven hypotheses formulated from research
framework were found accepted. Thus, the research objectives of the study were
accomplished.
The findings of the study were discussed and suggest the managers to incorporate
workable strategies in car park services in terms of mixes of service marketing, quality
and value in order to grant positive responses of satisfaction among car park customers.
Periodically assessment on customer feedback on services may aid service provider to
improve their car park service and able to track any changes on behavior trends that
act as input for further enhance of car park services.
Several limitations in the study were recognized which offers opportunities in future
research. It was suggested that future studies to include intention behavior, actual
behavior, other antecedent factor and moderator variable in the study model. It is also
suggested that application of low and high order construct concept in future studies.
Further validation of the study’s findings was encouraged by expanding the sample
size, type of buildings, geographical area and other services sector.

300
REFERENCES
Abdullah, K., Kamis, N. H., Farahiyah, N., Azahar, N., Shariff, S. F., & Musa, Z. C.
(2012). Optimization of the Parking Spaces: A Case Study of Dataran Mawar,
UiTM Shah Alam. IEEE Colloquium on Humanities, Science & Engineering
Research, 684-687.
Action against illegal parking attendants (2012, June 5). Malay Mail. Retrieved from
http://www.mmail.com.my/story/action-against-illegal-parking-attendants
Afridi, F. K. (2009). Extended Services Marketing Mix and Emergence of Additional
Marketing Ps. Journal of Managerial Sciences, III(1), 139-143.
Aghaei, M., Vahedi, E., Kahreh, M. S., & Pirooz, M. (2014). An examination of the
relationship between services marketing mix and brand equity dimensions.
Procedia - Social and Behavioral Sciences, 109, 865-869. DOI:
10.1016/j.sbspro.2013.12.555
Ahmad, A., & Ahmad, H. (2008). Marketing mix drivers of clients satisfaction in
technology-enabled service: study of Nigerian GSM subscribers.
Communications of the IBIMA, 1, 84-90.
Ahmad, F. S., Ihtiyar, A., & Omar, R. (2014). A comparative study on service quality
in the grocery retailing: evidence from Malaysia and Turkey. Procedia - Social
and Behavioral Sciences, 109, 763-767. DOI: 10.1016/j.sbspro.2013.12.541
Ahmad, N., Awan, M. U., Raouf, A., & Sparks, L. (2009). Development of a service
quality scale for pharmaceutical supply chains. International Journal of
Pharmaceutical and Healthcare Marketing, 3(1), 26-45. DOI:
10.1108/17506120910948494
Akamavi, K., Mohamed, E., Pellmann, K., & Xu, Y. (2014). Key determinants of
passenger loyalty in the low-cost airline business. Tourism Management, 46,
528-545. DOI: 10.1016/j.tourman.2014.07.010
Akbaba, A. (2006). Measuring service quality in the hotel industry: a study in a
business hotel in Turkey. Hospitality Management, 25, 170–192.
DOI:10.1016/j.ijhm.2005.08.006
Akroush, M. N., (2011). The 7Ps classification of the services marketing mix revisited:
an empirical assessment of their generalisability, applicability and effect on
performance - evidence from Jordan’s services organisations. Jordan Journal
of Business Administration, 7(1), 116-147.
Albacete-Sa´ez, C., Fuentes-Fuentes, M. M., & Llore´ns-Montes, F. J. (2007). Service
quality measurement in rural accommodation. Annals of Tourism Research,
34(1), 45–65.

301
Albayrak, T., & Caber, M. (2015). Prioritisation of the hotel attributes according to
their influence on satisfaction: a comparison of two techniques. Tourism
Management, 46, 43-50. DOI: 10.1016/j.tourman.2014.06.009
Alegre J., & Garau J. (2010). Tourist satisfaction and dissatisfaction. Annals Tourism
Research, 37(1), 52-73. DOI:10.1016/j.annals.2009.07.001
Ali, F., & Amin, M. (2014). The influence of physical environment on emotions,
customer satisfaction and behavioural intentions in Chinese resort hotel
industry. J. Global Business Advancement, 7(3), 249-266.
Alipour, M. (2012). A new educational marketing mix: the 7Ps for private school
marketing in Iran. Research Journal of Applied Sciences, Engineering and
Technology, 4, 4314–4319. DOI: 10.1016/j.sbspro.2012.09.200
Alipour, M., & Darabi, E. (2011). The Role Of Service Marketing Mix And Its Impact
On Marketing Audit In Engineering And Technical Service Corporations.
Global Journal of Management and Business Research, 11(6), 69-77.
Al-alak, B. A. (2013). Impact of marketing activities on relationship quality in the
Malaysian banking sector. Journal of Retailing and Consumer Services, 1-10.
DOI: 10.1016/j.jretconser.2013.07.001
Al-Debi, H. A., & Mustafa, A. (2014). The impact of services marketing mix 7P's in
competitive advantage to five stars hotel - case study Amman, Jordan. The
Clute Institute International Academic Conference. 39-48.
Al-Dmour, H., Al-Zu’bi, Z.M.F., & Kakeesh, D. (2013). The effect of services
marketing mix elements on customer-based brand equity: an empirical study
on mobile telecom service recipients in Jordan. International Journal of
Business and Management, 8(11), 13-26.
Al-Eisa, A. S., & Alhemoud, A. M. (2009). Using a multiple-attribute approach for
measuring customer satisfaction with retail banking services in Kuwait.
International Journal of Bank Marketing, 27(4), 294-314. DOI:
10.1108/02652320910968368
Al-Muala, A., & Al-Qurneh, M. (2012). Assessing the relationship between marketing
mix and loyalty through tourists satisfaction in Jordan curative tourism.
American Academic & Scholarly Research Journal, 4(2).
Al-Sabbahy, H., Ekinci, Y., & Riley M. (2004). An investigation of perceived value
dimensions: implications for hospitality research. Journal of Travel Research,
42(3), 226-234.
Ameer, I. (2014). Satisfaction-A behavioral perspective on consumer: review,
criticism and contribution. International Journal of Research Studies in
Management, 3(1), 75-82. DOI: 10.5861/ijrsm.2013.406

302
Amos, D., & Schlossberg, M. (2014). The parking mismatch phenomena: excessive
residential parking and what to do about it. Transportation Research Board
Annual Conference. 1-15. Retrieved from http://docs.trb.org/prp/14-1815.pdf
Andaleeb, T. W., & Conway, M. (2006). Customer satisfaction in the restaurant
industry: An examination of the transaction-specific model. Journal of Services
Marketing, 20(1), 3-11. DOI: 10.1108/08876040610646536
Anderson, E. W. (1994). Cross-category variation in customer satisfaction and
retention. Marketing Letters, 5(1), 19-30.
Anderson, E. W. (1995). An economic approach to understanding how customer
satisfaction affects buyer perceptions of value. Proceedings of the AMA Winter
Educators Conference, 6, 102-107.
Anderson, E. W., Fornell, C., & Lehmann, D. R. (1994). Customer satisfaction, market
share, and profitability: Findings from Sweden. Journal of Marketing, 58(3),
53–66.
Anderson, J. C., & Narus, A. (1998). Business marketing: understand what customers
value. Harvard Business Review (Nov-Dec), 53-65.
Andrade, C. C., Lima, M. L., Pereira, C. R., Fornara, F., & Bonaiuto, M. (2013).
Inpatients’ and outpatients’ satisfaction: The mediating role of perceived
quality of physical and social environment. Health & Place, 21, 122-132. DOI:
10.1016/j.healthplace.2013.01.013
Andreassen, T., & Lindestad, B. (1998). Customer loyalty and complex services: the
impact of corporation image on quality, customer satisfaction and loyalty for
customers with varying degrees of service expertise. International Journal of
Service Industry Management, 9(1), 7-23.
Anitsa, I., Girard, T., & Anitsal, M M. (2012). An application of services marketing
mix framework: how do retailers communicate information on their sales
receipts? Business Studies Journal, 4(2), 77-90.
Arokiasamy, A. R. A. (2012). The effect of marketing mix and customer perception
on brand loyalty. Journal of Business and Management, 4(2), 1-11.
Asia Development Bank (2008). Guidelines for parking measures: policy and options.
Retrieved from http://sti-india-uttoolkit.adb.org/mod4/se2/ 002_2.html
Athanassopoulos, A. D., & Iliakopoulos, A. (2003). Modeling customer satisfaction in
telecommunications: assessing the effects of multiple transaction points on the
perceived overall performance of the provider. Production and Operations
Management, 12(2), 224-245.

303
Azadi, S., & Rahimzadeh, E. (2012). Developing marketing strategy for electronic
business by using Mccarthy’s four marketing mix model and Porter’s five
competitive forces. Emerging Markets Journal, 2, 47-58. DOI
10.5195/emaj.2012.25
Babin, B. J., & Kim, K. (2001). International Students' Travel Behavior. Journal of
Travel & Tourism Marketing, 10(1), 93-106, DOI: 10.1300/J073v10n01_06
Babulal, V. (2012, April 13). High rates but poor parking facilities. News Strait Times.
Retrieved from http://www2.nst.com.my/streets/central/high-rates-but-poor-
parking-facilities-1.73554
Bagozzi, R. P. (1986). Principles of marketing management. Chicago: Science
Research Associates.
Bagozzi, R. P. (2011). Measurement and Meaning in Information Systems and
Organizational Research: Methodological and Philosophical Foundations. MIS
Quarterly, 35(2), 261-292.
Bajs, I. P. (2015). Tourist perceived value, relationship to satisfaction, and behavioral
intentions: the example of the Croatian tourist destination Dubrovnik. Journal
of Travel Research, 54(1), 122-134.
Baker, J., Parasuraman, A., Grewal, D., & Voss, G. B. (2002). The influence of
multiple store environment cues on perceived merchandise value and patronage
intentions. Journal of Marketing, 66(2), 120-141.
Bank Negara Malaysia, Annual report 2013, Outlook and policy in 2014. Retrieved
from http://www.bnm.gov.my/files/publication/ar/en/2013/ar2013_book.pdf
Baron, R. M., & Kenny, D. A. (1986). The moderator–mediator variable distinction in
social psychological research: Conceptual, strategic, and statistical
considerations. Journal of Personality and Social Psychology, 51, 1173–1182.
Baron, S., Davies, B.J., & Swindley, D., Dictionary of Retailing. Macmillan, London,
1991.
Barter, P. A. (2012). Off-street parking policy surprises in Asian cities. Cities,
29(2012), 23–31. DOI:10.1016/j.cities.2011.06.007
Baruch, Y., & Holtom, B.C. (2008). Survey response rate levels and trends in
organizational research. Human Relations, 61(8), 1139–1160. DOI:
10.1177/0018726708094863
Becker, J. M., Klein, K., & Wetzels, M., (2012). Hierarchical latent variable models
in PLS-SEM: guidelines for using reflective-formative type models. Long
Range Planning, 45 (5/6), 359-394. DOI: 10.1016/j.lrp.2012.10.001
Beckwith, H. (2001). The Invisible Touch - The Four Keys of Modern Marketing.
Texere Publishing.

304
Beins, B. C., & McCarthy, M. A. (2012). Research Methods and Statistics. USA, New
Jersey: Pearson Education.
Belk, R. W. (1975). Situational variables and consumer behavior. Journal of
Consumer Research, 2(3), 157-164.
Bellmunt, T. V., & Deltoro, M. F. (2005). The rise and fall of the marketing mix. The
evolution of and debate surrounding the concept. Esic Market, 399-424.
Bennett, A. R. (1997). The five Vs - a buyer's perspective of the marketing mix.
Marketing Intelligence & Planning, 15(3), 151-156.
Berry, D. (1990, December 24). Marketing mix for the ‘90s adds an S and 2Cs to 4Ps.
Marketing News, American Marketing Association.
Berry, L. L., & Yadav, M. S. (1996). Capture and communicate value in the pricing of
services. Sloan Management Review, 41-51.
Bhattacherjee, A. (2012) Social Science Research: Principles, Methods, and Practice
(2nd ed.). Textbooks Collection. Book 3. http://scholarcommons.usf.edu/
oa_textbooks/3
Biemer, P.P., & Lyberg, L. E. (2003), introduction to survey quality: Wiley series in
survey methodology. Hoboken: Wiley.
Birnik, A., & Bowman, C. (2007). Marketing mix standardization in multinational
corporations: A review of the evidence. International Journal of Management
Reviews, 9, 303-324. DOI: 10.1111/j.1468-2370.2007.00213.x
Blackwell, S. A., Szeinbach, S. L., Barnes, J. H., Garner, D. W., & Bush, V. (1999).
The antecedents of customer loyalty. An empirical investigation of the role of
personal and situational aspects on repurchase decisions. Journal of Service
Research, 1(4), 362-375.
Boksberger, P. E., & Melsen, L. (2011). Perceived value: a critical examination of
definitions, concepts and measures for the service industry. Journal of Services
Marketing, 25(3), 229-240. DOI: 10.1108/08876041111129209
Bolton, R. N. (1998). A dynamic model of the customer’s relationship with a
continuous service provider: the role of satisfaction. Marketing Science, 17(1),
45-65.
Bolton, R. N., & Drew, J. H. (1991). A multi-stage model of customer’s assessments
of service, quality and value. Journal of Consumer Research, 17, 375-384.
Booms, B. H., & Bitner, M. J., 1981. Marketing strategies and organization structures
for service firms. In Donnelly, J. H., & George, W. R., (eds). Marketing of
Services. Chicago: American Marketing Association.

305
Borden, N. H. (1964), “The concept of the marketing mix”, Journal of Advertising
Research, 4(2), 2-7.
Boulding, W., Kalra, A., Staelin, R., & Zeithaml, V. A. (1993). Adynamic process
model of service quality: from expectation to behaviournal intention. Journal
of Marketing Research, 30, 7-27.
Brady, M. K., & Cronin, J. J. (2001). Some new thoughts on conceptualizing perceived
service quality: a hierarchical approach. Journal of Marketing, 65 (3), 34–49.
Brady, M. K., Robertson, C. J. & Cronin, J. J. (2001). Managing behavioural intentions
in diverse cultural environments: an investigation of service quality, service
value and satisfaction for American and Ecuadorian fast-food customers.
Journal of International Management, 7(2), 129-149.
Brechan, I. (2006). The different effect of primary and secondary product attributes on
customer satisfaction. Journal of Economic Psychology, 27, 441-458.
DOI:10.1016/j.joep.2005.10.003
British Parking Association (2010). Park Mark® Safer Parking. West Sussex: Author.
Bruhn, M., & Georgi, D. (2006). Services marketing: managing the service value
chain. England, Essex: Pearson Education Limited.
Bruner, G. C., II. (1989). The marketing mix: a retrospective and evaluation. Journal
of Marketing Education, 10, 29-33.
Burch, E., Rogers, H.P., & Underwood, J. (1995). Exploring SERVPERF: an empirical
investigation of the importance-performance, service quality relationship in the
uniform rental industry. 1-13. Retrieved from
http://sbaer.uca.edu/docs/proceedings11/95ama.121.htm
Butz, H. E., Jr., & Goodstein. L. D. (1996). Measuring customer value: gaining the
strategic advantage. Organisational Dynamics, 24, 63-77.
Camoens, A. (2012, July 18). Trader is latest car park attack victim. The Star Online.
Retrieved from http://thestar.com.my/news/story.asp?file=/2012/7/18/nation/
11682700&sec=nation
Car parks at malls to be rated (2012, September 25). The Star Online. Retrieved from
http://thestar.com.my/news/story.asp?file=/2012/9/25/nation/12046733&sec=
nation
Car parking (2011). Health and Safety Executive. Retrieved from http://
www.hse.gov.uk/pubns/wpt09.pdf.
Carman, J. (1990). Consumer perceptions of service quality: an assessment of the
SERVQUAL dimensions. Journal of Retailing, 66(1), 33-55.

306
Caro, L. M., & Garcia, J. A. M. (2007). Measuring perceived service quality in urgent
transport service. Journal of Retailing and Consumer Services, 14(1), 60–72.
DOI:10.1016/j.jretconser.2006.04.001
Caro, L. M., & Garcia, J. A. M. (2008). Developing a multi-dimensional and
hierarchical service qualtiy model for the travel agency industry. Tourism
Management, 29, 706-720. DOI:10.1016/j.tourman.2007.07.014
Caruana, A., Money, A. H., & Berthon P. R. (2000). Service quality and satisfaction –
the moderating role of value. European Journal of Marketing, 34(11/12), 1338-
1352.
Cavana, R., Delahaye, B. L., & Sekaran, U. (2001). Applied business research:
qualitative and quantitative methods. Singapore: Markono Print Media Ltd.
Cengiz, E., & Yayla, H. E. (2007). The effect of marketing mix on positive word of
mouth communication: evidence from accounting offices in Turkey. Innovative
Marketing, 3(4), 74-86.
Chahal, H., & Kumari, N. (2012). Consumer perceived value: the development of a
multiple item scale in hospitals in the Indian context. International Journal of
Pharmaceutical and Healthcare Marketing, 6(2), 167-190. DOI
10.1108/17506121211243086
Chakraborty, S., & Sengupta, K. (2013). An exploratory study on determinants of
customer satisfaction of leading mobile network providers – case of Kolkata,
India. Journal of Advances in Management Research, 10(2), 279-298. DOI:
10.1108/JAMR-11-2012-0049
Champatong, S. O. (2014). Visitors’ attitude towards the service marketing mix and
frequency of visits to Bangpu recreation centre, Thailand. International
Journal of Social, Management, Economics and Business Engineering, 8(6),
1996-1999.
Chang, H. J., Eckman, M., & Yan, R. N. (2011). Application of the Stimulus-
Organism-Response model to the retail environment: the role of hedonic
motivation in impulse buying behaviour. The International Review of Retail,
Distribution and Consumer Research, 21(3), 233-249, DOI:
10.1080/09593969.2011.578798
Chang, C., & Hsu, Y. S. (2013). Assessing the effect of perceived value, service quality
and customer satisfaction in the online travel industry. Business and
Management Review, 3(3), 14-23.
Chang, H. H., & Wang, H. W. (2011). The moderating effect of customer perceived
value on online shopping behaviour. Online Information Review, 35(3), 333-
359. DOI: 10.1108/14684521111151414
307
Channoi, R., Clemes, M. D., & Dean, D. (2013). A comprehensive hierarchical model
of resort hotel stays in Thailand: an empirical analysis. International Business
Research Conference, 1-13.
Charoensettasilp, S., & Wu, C. (2013). Attitude and needs of Thai people in selecting
domestic low-cost airlines. American Journal of Industrial and Business
Management, 3, 178-184. DOI: 10.4236/ajibm.2013.32023
Charoensettasilp, S., & Wu, C. (2014). Thai consumers’ satisfaction after receiving
services from Thailand's newest low-cost airline. Applied Mechanics and
Materials, 505(506), 767-777. DOI:10.4028/www.scientific.net/AMM.505-
506.767
Chelliah, S., Kwon, C. K., Annamalah, S., & Munusamy, J. (2013). Does marketing
mix still relevant? A study on herbal coffee in Malaysia. International Journal
of Management and Innovation, 5(1), 31-46.
Chen, C. N., & Ting, S. C. (2002). A study using the grey system theory to evaluate
the importance of various service quality factors. International Journal of
Quality & Reliability Management, 19(7), 838-861. DOI:
10.1108/02656710210434775
Chen, H. G., Liu, J. Y. C., Sheu, T. S., & Yang, M. H. (2012). The impact of financial
services quality and fairness on customer satisfaction. Managing Service
Quality, 22(4), 399-421. DOI 10.1108/09604521211253496
Chen, C. M., Lee, H. T., Chen, S. H., & Huang, T. H. (2011). Tourist behavioral
intentions in relation to service quality and customer satisfaction in Kinmen
National Park, Taiwan. International Journal of Tourism Research, 13, 416-
432. DOI: 10.1002/jtr.810
Chen, W. (2013). Perceived value in community supported agriculture (CSA): A
preliminary conceptualization, measurement, and nomological validity. British
Food Journal, 115(10), 1428-1453. DOI: 10.1108/BFJ-01-2011-0013
Chen, Z., & Dubinsky, A. J. (2003). A conceptual model of perceived customer value
in e-commerce: a preliminary investigation. Psychology & Marketing, 20(4),
323-347.
Cheng, S. I. (2011). Comparisons of competing models between attitudinal loyalty and
behavioral loyalty. International Journal of Business and Social Science,
2(10), 149-166.
Chin, W.W. (2010). How to write up and report PLS analyses. In Vincenzo Esposito
Vinzi, Wynne W. Chin, Jörg Henseler, and Huiwen Wang. (eds.), Handbook
of Partial Least Squares, Springer Handbooks of Computational Statistics,
655-690. Berlin, Germany: Springer. DOI 10.1007/978-3-540-32827-8 29

308
Christopher, M., Payne, A., & Ballantyne, D. (1991), Relationship Marketing.
Bringing Quality. Customer Service and Marketing Together. Oxford:
Butterworth-Heinemann
Chou, S. W., & Chiang, C. H. (2013). Understanding the formation of software-as-a-
service (SaaS) satisfaction from the perspective of service quality. Decision
Support Systems, 56, 148-155. DOI: 10.1016/j.dss.2013.05.013
Chumaidiyah, E. (2013). Marketing mix strategy in increasing marketing performance
in Indonesia telecommunication services companies. International Conference
of Information and Communication Technology, IEEE, 433-438.
Chumaidiyah, E. (2014). The marketing mix strategy in influence to the competitive
advantage. International Conference on Industrial Engineering and
Operations Management, 818-826.
City Hall Kuala Lumpur, Licensing & Petty Traders Management Department, Syarat-
syarat pelesenan tempat letak kereta persendirian.
Claffey, E. (2006). Out with the old and in with the new…. traditional strategy
formulation is no longer apt for the digital age. University of Dublin.
Clemes, M. D., Cohen, D. A., & Wang, Y. (2013). Understanding Chinese university
students' experiences: an empirical analysis. Asia Pacific Journal of Marketing
and Logistics, 25, 391-427. DOI: 10.1108/APJML-07-2012-0068
Clemes, M. D., Gan, C., & Ren, M. (2011). Synthesizing the effects of service quality,
value and customer satisfaction on behavioral intentions in the motel industry:
An empirical analysis. Journal of Hospitality & Tourism Research, 35(4), 530-
568. DOI: 10.1177/1096348010382239
Clemes, M. D., Shu, X., & Gan, C. (2014). Mobile communications: a comprehensive
hierarchical modelling approach. Asia Pacific Journal of Marketing and
Logistics, 26(1), 114-146. DOI: 10.1108/APJML-04-2013-0040
Corder, G. W., & Foreman, D. I. (2009). Nonparametric statistics for non-
statisticians: a step-by-step approach. Hoboken, New Jersey: John Wiley &
Sons.
Cohen, J. (1977). Statistical power analysis for the behavioral sciences. USA, New
York: Academic Press.
Cohen, J. (1988). Statistical power analysis for the behavioral sciences. Hillsdale, NJ:
Lawrence Erlbaum Associates.
Cohen, L., Manion, L., & Morrison, K. (2007). Research Methods in Education (6th
ed.). Oxon, UK: Routledge
Comrey, A., & Lee, H., (1992). A first course in factor analysis (2nd ed.). Hillsdale,
NJ: Lawrence Erlbaum Associations.

309
Constantinides, E. (2002). The 4S web-marketing mix model, e-commerce research
and applications. Electronic Commerce Research and Applications, 1, 57-76.
Constantinides, E. (2006). The marketing mix revisited: towards the 21st century
marketing. Journal of Marketing Management, 22, 407-438.
Cook, C., & Thompson, B. (2001). Psychometric properties of scores from the web-
based LibQUAL + study of perceptions of library service quality. Library
Trends, 49(4), 585-604.
Creswell, J. W. (2009). Research design: Qualitative, quantitative, and mixed methods
approaches (3rd ed.). California, USA: Sage Publications Ltd.
Creswell, J. W. (2012). Educational research: planning, conducting, and evaluating
quantitative and qualitative research (4th ed.). Boston, USA: Pearson
Education
Cronin, J. J., Jr., Brady, M., Brand, R. R., Hightower, R., Jr., & Shemwell, D. J. (1997).
A cross-sectional test of the effect and conceptualization of service value.
Journal of Services Marketing, 11(6), 175-218.
Cronin, J. J., Jr., & Taylor, S. A. (1992). Measuring service quality: A reexamination
and extension. Journal of Marketing, 56, 55-68.
Cronin, J. J., Jr., & Taylor, S.A. (1994). SERVPERF versus SERVQUAL: Reconciling
performance-based and perception- minus-expectations measurement of
service quality. Journal of Marketing, 58(1), 125–131.
Cronin, J. J., Jr., Brady, M. K., & Hult, G. T. M. (2000). Assessing the effects of
quality, value, and customer satisfaction on consumer behavioral intentions in
service environments. Journal of Retailing, 76(2), 193-218.
Cui, C. C., Lewis, B. R., & Park, W. (2003). Service quality measurement in the
banking sector in South Korea. International Journal of Bank Marketing,
24(1), 191-201. DOI: 10.1108/02652320310479187
Cullen, C. (2012, June). Best practices in parking management: How to provide
superior service to owners and customers. Parking, 52(5), 18-20.
Cutter, B., & DeWoody, A. (2010). Parking externalities in commercial real estate.
Real Estate Economics, 38(2), 197–223.
Dabholkar, P., Thorpe, D., & Rentz, J. (1996). A measure of service quality for retail
stores: scale development and validation. Journal of the Academy of Marketing
Science, 24 (1), 3-16.
Danyi, S. (2008). Services marketing. Jaipur, India: Oxford Book company.

310
DBKL (2010). Garis Panduan Keperluan Tempat Letak Kereta Dan Tempat Letak
Motosikal Di Wilayah Persekutuan Kuala Lumpur. Retrieved from
http://jprb.dbkl.gov.my/GarisPanduan
de Ruyter, K., Wetzels, M., Lemmink, J., & Mattson, J. (1997). The dynamics of the
service delivery process: a value-based approach. International Journal of
Research in Marketing, 14(3), 231-243.
Delcourt, C., Gremler, D. D., Riel, A. C.R. V., & Birgelen, M. V. (2012). Effects of
perceived employee emotional competence on customer satisfaction and
loyalty: the mediating role of rapport. Journal of Service Management, 24(1),
5-24. DOI: 10.1108/09564231311304161
Dev, C.S., & Schultz, D.E. (2005). Simply SIVA. Marketing Management, 14(2), 36–
41.
Dhar, R. L. (2015). Service quality and the training of employees: the mediating role
of organizational commitment. Tourism Management, 46, 419-430. DOI:
10.1016/j.tourman.2014.08.001
Diaconu, E., Andrei, H., Puchianu, D., & Predusca, G. (2013). Advanced software
system for optimization of car parking services in urban area. The 8th
international symposium on advanced topics in electrical engineering, IEEE.
Diamantopoulos, A., & Siguaw, J. (2006). Formative versus reflective indicators in
organizational measure development: a comparison and empirical illustration,
British Journal of Management, 17(4), 263-282.
Dijkstra, T. K., & Henseler, J. (2015). Consistent and asymptotically normal PLS
estimators for linear structural equations. Computational Statistics and Data
Analysis, 81, 10-23. DOI: 10.1016/j.csda.2014.07.008
Dodds, W. B. (1999). Managing customer value. Mid-American Journal of Business,
14(1), 13-22.
Dodds, W. B., & Monroe, K. B. (1985). The effect of brand and price information on
subjetive product evaluations. Advances in Consumer Research, 12(1), 85–90.
Dodds, W. B., Monroe, K. B., & Grewal, D. (1991). The effect of price, brand and
store information on buyers product evaluations. Journal of Marketing
Research, 28, 307-12.
Dominici, G., & Palumbo, F. (2013). How to build an e-learning product: factors for
student/customer satisfaction. Business Horizons, 56, 87-96. DOI:
10.1016/j.bushor.2012.09.011
Dong, P., & Noel Yee-Man Siub, N. Y. M. (2013). Servicescape elements, customer
predispositions and service experience: The case of theme park visitors.
Tourism Management, 36, 541-551. DOI: 10.1016/j.tourman.2012.09.004

311
Donovan, R. J., & Rossiter, J. R. (1982). Store atmosphere: an environmental
psychology approach. Journal of Retailing, 58(1), 34–57.
Doulamis, N., Protopapadakis, E., & Lambrinos, L. (2013). Improving Service Quality
for Parking Lot Users Using Intelligent Parking Reservation Policies. 27th
International Conference on Advanced Information Networking and
Applications Workshops, IEEE computer society, 1392-1397. DOI
10.1109/WAINA.2013.219
Doyle, P. (1995). Marketing in the new millennium. European Journal of Marketing,
29(13), 23-41. DOI: 10.1108/03090569510147712
Dube-Rioux, L. (1990). The Power of Affective Reports in Predicting Satisfaction
Judgments. Advances in Consumer Research, 17, 571-576.
Edward, M., & Sahadev, S. (2011). Role of switching costs in the service quality,
perceived value, customer satisfaction and customer retention linkage. Asia
Pacific Journal of Marketing and Logistics, 23(3), 327-345. DOI
10.1108/13555851111143240
Eid, R., & El-gohary, H. (2015). The role of Islamic religiosity on the relationship
between perceived value and tourist satisfaction. Tourism Management, 46,
477-488. DOI: 10.1016/j.tourman.2014.08.003
Eisingerich, A. B., Auh, S., & Merlo, O. (2014). Acta non verba? The role of customer
participation and word of mouth in the relationship between service firms'
customer satisfaction and sales performance. Journal of Service Research,
17(1), 40-53. DOI: 10.1177/1094670513490836
Ekinci, Y., & Dawes, P. L. (2009). Consumer perceptions of frontline service
employee personality traits, interaction quality, and consumer satisfaction. The
Service Industries Journal, 107(125), 503-521. DOI:
10.1080/02642060802283113
English, J. (2000). The four "P"s of marketing are dead. Marketing Health Services,
20(2), 20-23.
Erdil, S. T., & Yıldız, O. (2011). Measuring service quality and a comparative analysis
in the passenger carriage of airline industry. Procedia Social and Behavioral
Sciences, 24, 1232-1242. DOI:10.1016/j.sbspro.2011.09.117
Eroglu, S. A., Machleit, K. A., & Davis, L. M. (2001). Atmospheric qualities of online
retailing: a conceptual model and implications. Journal of Business Research,
54, 177–184.
Etemad-Sajadi, R., & Rizzuto, D. (2013). The antecedents of consumer satisfaction
and loyalty in fast food industry: a cross-national comparison between Chinese
and Swiss consumers. International Journal of Quality and Reliability
Management, 30(7), 780-798. DOI: 10.1108/IJQRM-May-2012-0069

312
ETP Annual Report 2013. Greater Kuala Lumpur/Klang Valley. Retrieved from
http://etp.pemandu.gov.my/../ETP2013_ENG_full_version.pdf
Ettenson, R., Conrado, E., & Knowles, J. (2013). Rethinking the 4P's. Harvard
Business Review. Retrieved from http://hbr.org/2013/01/rethinking-the-4-
ps/ar/1
European Parking Association (2014). Key messages from the parking sector.
Retrieved from http://www.europeanparking.eu/cms/Media/EPA_key-
messages_2014.pdf.
Evanschitzky, H., Sharma, A., & Prykop, C. (2012). The role of the sales employee in
securing customer satisfaction. European Journal of Marketing. 46(3/4), 489-
508. DOI 10.1108/03090561211202576
Fatima, J. K., & Razzaque. M. A. (2013). Roles of customer involvement in rapport
and satisfaction. Asia Pacific Journal of Marketing and Logistics, 25(3), 452-
471.
Faul, F., Erdfelder, E., Lang, A. G., & Buchner, A. (2007). G*Power 3: a flexible
statistical power analysis program for the social, behavioral, and biomedical
sciences. Behavior Research Methods, 39, 175-191.
Federal Department of Town and Country Planning Peninsular Malaysia. Tempat
Letak Kenderaan Garis Panduan Perancangan (2011). Retrieved from
http://www.townplan.gov.my/download/GPTLK.pdf
Field, A. (2009). Discovering statistics using SPSS (3rd ed.). London, England: SAGE
Publications.
Filip, A. (2013). Complaint management: A customer satisfaction learning process.
Procedia - Social and Behavioral Sciences, 93, 271-275. DOI:
10.1016/j.sbspro.2013.09.188
Finn, D. W., & Lamb, C. W. (1991). An evaluation of the SERVQUAL scales in a
retailing setting. Advances in Consumer Research, 18, 483-490.
Fitzgerald, J. (2014). CPR for the 4Ps: breathing new life into the marketing mix.
International Academy of Business and Economics, 1-16.
Fornell, C., & J. Cha (1994). Partial least squares. In: R. P. Bagozzi (ed.). Advanced
methods of marketing research, 52–78.
Fornell, C., Johnson, M. D., Anderson, E. W., Cha, J., & Bryant, B. E. (1996). The
American customer satisfaction index: nature, purpose, and findings. Journal
of Marketing, 60(4), 7-18. DOI: 10.2307/1251898
Fosgerau, M., & Palma, A. D. (2013). The dynamics of urban traffic congestion and
the price of parking. Journal of Public Economics, 105, 106–115. DOI:
10.1016/j.jpubeco.2013.06.008

313
Frazier, P. A., Tix, A. P., & Barron, K. E. (2004). Testing moderator and mediator
effects in counseling psychology research. Journal of Counseling Psychology,
51, 115–134.
Frias-Jamilena, D. M., Barrio-Garcia, S. D., & Lopez-Moreno, L. (2012).
Determinants of satisfaction with holidays and hospitality in rural tourism in
Spain: The moderating effect of tourists’ previous experience. Cornell
Hospitality Quarterly, 54(3), 294-307. DOI: 10.1177/1938965512466587
Frochot, I., & Hughes, H. (2000). HISTOQUAL: The development of a historic houses
assessment scale. Tourism Management, 21, 157-167.
Füller, J., & Matzler, K. (2008). Customer delight and market segmentation: an
application of the three-factor theory of customer satisfaction on life style
groups. Tourism Management, 29, 116-126.
DOI:10.1016/j.tourman.2007.03.021
Gagliardi, D. T. (2001). 4Ps not dead; just add fifth one. Marketing News, 12.
Gallarza, M. G., & Saura, I. G. (2006). Value dimensions, perceived value, satisfaction
and loyalty: an investigation of university students’ travel behavior. Tourism
Management, 27(3), 437-452.
Gallarza, M. G., Saura, I. G., & Moreno, F. A. (2013). The quality-value-satisfaction-
loyalty chain: Relationships and impacts. Tourism Review, 68(1), 3-20. DOI
10.1108/16605371311310048
Gallego, J., Rubalcaba, L., & Hipp, C. (2013). Services and organisational innovation:
the right mix for value creation. Management Decision, 51(6), 1117-1134. DOI
10.1108/MD-11-2012-0446
Ganguli, S., & Roy, S. K. (2013). Conceptualisation of service quality for hybrid
services: a hierarchical approach. Total Quality Management, 24(10), 1202–
1218. DOI: 10.1080/14783363.2013.814293
George, D., & Mallery, P. (2003). SPSS for Windows step by step: A simple guide and
reference. 11.0 update (4th ed.). Boston, USA: Allyn & Bacon.
Getty, J. M., & Thompson, N. K. (1994). The relationship between quality,
satisfaction, and recommending behaviour in lodging decisions. Journal of
Hospitality and Leisure Marketing, 2, 3-22.
Ghalandari, K. (2013). The effect of service quality on customer perceived value and
customer satisfaction as factors influencing creation of word of mouth
communications in Iran. J. Basic. Appl. Sci. Res., 3(4), 305-312.
Gilbert, G.R., & Veloutsou, C. (2006). A cross-industry comparison of customer
satisfaction. The Journal of Services Marketing, 20(5), 298-307. DOI:
10.1108/08876040610679918

314
Gilmore, A. (2003). Services, marketing and management. London: Sage Publications.
Goi, C. L. (2009). A Review of Marketing Mix: 4Ps or More? International Journal
of Marketing Studies, 1(1), 2-15.
Goi, M. T., Kalidas, V., & Zeeshan, M. (2014). Comparison of Stimulus-Organism-
Response Framework between International and Local Retailer. Procedia -
Social and Behavioral Sciences, 130, 461-468. DOI:
10.1016/j.sbspro.2014.04.054
Goldsmith, R.E., (1999). The personalised marketplace: beyond the 4Ps. Marketing
Intelligence & Planning, 17(4), 178-185.
Gordon, R. (2012). Re-thinking and re-tooling the social marketing mix. Australasian
Marketing Journal, 20, 122-126. DOI:10.1016/j.ausmj.2011.10.005
Giovanis, A. N., Zondiros, D., & Tomaras, P. (2014). The antecedents of customer
loyalty for broadband services: The role of service quality, emotional
satisfaction and corporate image. Procedia - Social and Behavioral Sciences,
148, 236-244. DOI: 10.1016/j.sbspro.2014.07.039
Greener, S. (2008). Business Research Methods. Retrieved from
http://dlx.bookzz.org/genesis/605000/282db92ed082212de026c2b5f230ea69/
_as/[Dr._Sue_Greener]_Business_Research_Methods(BookZZ.org).pdf
Grewal, D., Krishnan, R., Baker, J., & Borin, N. (1998). The effect of store name,
brand name and price discounts on consumers’ evaluations and purchase
intentions. Journal of Retailing, 74 (3), 331-352.
Grewal, D., Monroe, K. B., & Krishnan, R. (1998). The effects of price-comparison
advertising on buyers' perceptions of acquisition value, transaction value, and
behavioral intentions. Journal of Marketing, 62, 46-59.
Grove, S. J., Fisk, R.P., & John, J. (2000). Service as Theatre, Guidelines and
Implications. Handbook of services Marketing and Management, Sage
Publications Inc., 25.
Grönroos, C. (1984). A service quality model and its marketing implications.
European Journal of Marketing, 18 (4), 36-44.
Grönroos, C. (1994). From marketing mix to relationship marketing - towards a
paradigm shift in marketing. Management Decision, 32(2), 4-20.
Grönroos, C. (1997). Value-driven relational marketing: from products to resources
and competencies. Journal of Marketing Management, 13, 407-419.
Grönroos, C. (2000). Service management and marketing. Chichester: Wiley.

315
Grönroos, C. (2007). Service management and marketing: customer management in
service competition (3rd ed.). Chichester: Wiley.
Guidelines on car park safety soon (2012, October 23). The Star Online. Retrieved
from http://thestar.com.my/news/story.asp?file=/2012/7/10/nation/ 11632883
&sec= nation
Gummesson, E. (1994). Making relationship marketing operational. International
Journal of Service Industry Management, 5(5), 5-20.
Gummesson, E. (1997). Relationship marketing as a paradigm shift: some conclusions
from the 30R approach. Management Decision, 35(4), 267-272.
Ha, Y. W., & Park, M. C. (2013). Antecedents of Customer Satisfaction and Customer
Loyalty for Emerging Devices in the Initial Market of Korea: An Equity
Framework. Psychology and Marketing, 30(8), 676-689. DOI:
10.1002/mar.20637
Hair, J. F., Jr., Black, W. C., Babin, H. J., & Anderson, R. E. (2010). Multivariate data
analysis (7th ed.). New Jersey, USA: Prentice Hall.
Hair, J. F., Jr., Black, W. C., Babin, B. J., & Anderson R. E. (2014b). Multivariate
Data Analysis (7th ed.). Essex, England: Pearson Education Limited.
Hair, J. F., Hult, G. T. M., Ringle, C. M., & Sarstedt, M. (2014a). A primer on partial
least squares structural equation modeling (PLS-SEM). Thousand Oaks, CA:
Sage.
Hair, J. F., Jr., Ringle, C. M., & Sarstedt, M. (2013). Partial least squares structural
equation modeling: rigorous applications, better results and higher acceptance.
Long Range Planning, 46(1-2), 1-12. DOI: 10.1016/j.lrp.2013.01.001
Hair, J. F., Jr., Sarstedt, M., Hopkins, L., & Kuppelwieser, V. G. (2014c). Partial least
squares structural equation modeling (PLS-SEM): an emerging tool in business
research. European Business Review, 26(2), 106-121. DOI: 10.1108/EBR-10-
2013-0128
Hair, J. F., Jr., Sarstedt, M., Pieper, T., Ringle, C.M., (2012a). The use of partial least
squares structural equation modeling in strategic management research: a
review of past practices and recommendations for future applications. Long
Range Planning, 45, 320-340. DOI: 10.1016/j.lrp.2012.09.008
Hair, J. F., Jr., Sarstedt, M., Ringle, C. M., & Mena, J. A. (2012b). An assessment of
the use of partial least squares structural equation modeling in marketing
research. J. of the Acad. Mark. Sci. 40, 414–433. DOI: 10.1007/s11747-011-
0261-6
Hagman, O. (2006). Morning Queues and Parking Problems. On the Broken Promises
of the Automobile, Mobilities, 1(1), 63-74. DOI: 10.1080/17450100500489247

316
Han, H., & Hyun, S. S. (2015). Customer retention in the medical tourism industry:
Impact of quality, satisfaction, trust, and price reasonableness. Tourism
Management, 46, 20-29. DOI: 10.1016/j.tourman.2014.06.003
Hanzaee, K. H., & Mirvaisi, M. (2011). Implementing Gronroos Service Quality
Model: The Role of Image and Service Quality Perception on Customer
Satisfaction in the Iran Hotel Industry. Journal of Basic and Applied Scientific
Research, 1(11), 2482-2487.
Haphazard parking in Klang Valley (2014, February 24). New Straits Times. Retrieved
from http://www2.nst.com.my/streets/central/haphazard-parking-in-klang-
valley-1.491276
Hashemi, S. A. S., & Abad, M. H. M. (2012). Analysis and evaluation of affecting
factors to attract customers at Maskanbank branches in Ardabil province.
Arabian Journal of Business and Management Review (Nigerian Chapter),
1(6), 25-31.
Hashim, N., & Hamzah, M. I. (2014). 7P's: a literature review of Islamic marketing
and contemporary marketing mix. Procedia - Social and Behavioral Sciences,
130, 155-159. DOI: 10.1016/j.sbspro.2014.04.019
Hassan, L. F. A., Jusoh, W. J. W., & Hamid, Z. (2014). Determinant of customer
loyalty in Malaysian takaful industry. Procedia - Social and Behavioral
Sciences, 130, 362-370. DOI: 10.1016/j.sbspro.2014.04.043
Hayes, A. F. (2009). Beyond Baron and Kenny: statistical mediation analysis in the
new millennium. Communication Monographs, 76(4), 408-420. DOI:
10.1080/03637750903310360
He, Y., Sun, X., Du, L., Jinmei, R., & Das, S. (2012). Level of Service for Parking
Facilities. International IEEE Conference on Intelligent Transportation
Systems, 1161-1165.
Helkkula, A., & Kelleher, C. (2010). Circularity of customer service experience and
customer perceived value. Journal of Customer Behaviour, 9(1), 37-53.
Helm, R., & Gritsch, S. (2013). Examining the influence of uncertainty on marketing
mix strategy elements in emerging business to business export-markets.
International Business Review, 1-11. DOI: 10.1016/j.ibusrev.2013.06.007
Hergenhahn, B.R., & Henley, T.B. (2014). An introduction to the history of psychology
(7th ed.). CA, USA: Cengage Learning
Heung, V. C. S., & Gu, T. (2012). Influence of restaurant atmospherics on patron
satisfaction and behavioral intentions. International Journal of Hospitality
Management, 31, 1167-1177. DOI:10.1016/j.ijhm.2012.02.004
317
Hiransomboon, K. (2012). Marketing mix affecting accommodation service buying
decisions of backpacker tourist traveling at inner Rattanakosin Island in
Bangkok, Thailand. Procedia Economics and Finance, 3, 276-283. DOI:
10.1016/S2212-5671(12)00152-9
Holbrook, M. B. (1996). Special session summary: customer value - a framework for
analysis and research. Advances in Consumer Research, 23, 138-142.
Holbrook, M. B., (Ed) (1999). Consumer value: a framework for analysis and
research. New York: Routledge.
Horn, J.V. (2011, October). Operators… solve all your parking problem. Parking
Today, 16(10), 32-33.
Hosany, S., & Prayag, G. (2013). Patterns of tourists' emotional responses, satisfaction,
and intention to recommend. Journal of Business Research, 66, 730-737. DOI:
10.1016/j.jbusres.2011.09.011
Hossain, M. D., Kim, J. K., Lee, J. Y., & Kim, K. J. (2012). Impacts of cognitive media
attributes and motivation on IPTV adoption: exploring the moderating effects
of agricultural information. Information Development, 28(4), 300–315. DOI:
10.1177/0266666912446496
Howat, G., & Assaker, G. (2013). The hierarchical effects of perceived quality on
perceived value, satisfaction, and loyalty: empirical results from public,
outdoor aquatic centres in Australia. Sport Management Review, 16, 268-284.
DOI: 10.1016/j.smr.2012.10.001
Høst, V., & Knie-Andersen, M. (2004). Modeling customer satisfaction in mortgage
credit companies. The International Journal of Bank Marketing, 22(1), 26-42.
DOI: 10.1108/02652320410514915
Huber, F., Herrmann, A., & Morgan, R.E. (2001). Gaining competitive advantage
through customer value oriented management. The Journal of Consumer
Marketing, 18(1), 41-53.
Huber, F., Herrmann, A., & Wricke, M. (2001). Customer satisfaction as an antecedent
of price acceptance: results of an empirical study. Journal of Product & Brand
Management, 10(3), 160-169.
Huber, J., Lynch, J., Corfman, K., Feldman, J., Holbrook, M. B., Lehmann, D.,
Munier, B., Schkade, D., & Simonson, I. (1997). Thinking about values in
prospect and retrospect: maximising experienced utility. Marketing Letters,
8(3), 323-334.
Hume, M., & Mort, G. S. (2010). The consequence of appraisal emotion, service
quality, perceived value and customer satisfaction on repurchase intent in the
performing arts. Journal of Services Marketing, 24, 180–182. DOI
10.1108/08876041011031136

318
Hussain, R., Al-Nasser, A., & Hussain, Y. K. (2014). Service quality and customer
satisfaction of a UAE-based airline: An empirical investigation, Journal of Air
Transport Management, 1-9. DOI: 10.1016/j.jairtraman.2014.10.001
Hyun, S. S., & Kang, J. (2014). A better investment in luxury restaurants:
Environmental or non-environmental cues? International Journal of
Hospitality Management, 39, 57-70. DOI: 10.1016/j.ijhm.2014.02.003
Ihtiyar, A., Ahmad, F. S., & Baroto, M. B. (2013). Impact of intercultural competence
on service reliability and customer satisfaction in the grocery retailing.
Procedia - Social and Behavioral Sciences, 99, 373-381. DOI:
10.1016/j.sbspro.2013.10.505
Iman, A. H. H. M. (2006). Applying shared-parking turn-time (SPaTT) model and
geographic information system in the supply and demand analysis of parking
space. Malaysian Journal of Real Estate, 1(2), 57-76.
International Monetary Fund, World economic outlook - Recovery Strengthens,
Remains Uneven (2014, April). Washington: International Monetary Fund.
Retrieved from http://www.imf.org/external/pubs/ft/weo/2014/01/pdf/text.pdf
Islam, M., Yang, Y. F., Hu, Y. J., & Hsu, C. S. (2013). Marketing mix, service quality
and loyalty—in perspective of customer-centric view of balanced scorecard
approach. Accounting, Accountability & Performance, 18(1), 1-18.
Ismail, M.F., Reza, M.O., rokoni, A.A., & Sarkar, M.A.R. (2012). Design and
development of an advanced vehicle parking system. IEEE/OSA/IAPR
International Conference on Informatics, Electronics & Vision, 458-463.
Izogo, E. E., & Ogba, I. E. (2015). Service quality, customer satisfaction and loyalty
in automobile repair services sector. International Journal of Quality &
Reliability Management, 32(3), 1-24. DOI: 10.1108/IJQRM-05-2013-0075
Ivy, J. (2008). A new higher education marketing mix: the 7Ps for MBA marketing.
International Journal of Educational Management, 22(4), 288-299.
Jacoby, J. (2002). Stimulus-organism-response reconsidered: An evolutionary step in
modeling (consumer) behavior. Journal of Consumer Psychology, 12(1), 51-
57.
Jahanzeb, S., Fatima, T., & Butt, M. M. (2011). How service quality influences brand
equity: The dual mediating role of perceived value and corporate credibility.
International Journal of Bank Marketing, 31(2), 126-141. DOI
10.1108/02652321311298735
Jalleh, J., & Chern, L. T. (2012, June 28). The car park did not get a certificate of
fitness for occupation and poor design structure. The Star Online.

319
Jani, D., & Han, H. (2015). Influence of environmental stimuli on hotel customer
emotional loyalty response: testing the moderating effect of the big five
personality factors. International Journal of Hospitality Management, 44, 48–
57. DOI: 10.1016/j.ijhm.2014.10.006
Janipha, N. A. I., Ahmad, N., & Ismail, F. (2015). Clients’ involvement in purchasing
process for quality construction environment. Procedia - Social and
Behavioral Sciences, 168, 30-40. DOI: 10.1016/j.sbspro.2014.10.207
Jain, S. K., & Gupta, G. (2004). Measuring service quality: SERVQUAL vs.
SERVPERF scales. Vikalpa, 29(2), 25-37.
Jan, A. (2012). Services marketing theory revisited: an empirical investigation into
financial services marketing. Journal of Business and Management. 4(4), 36-
45.
Jang, S. S., & Namkung, Y. (2009). Perceived quality, emotions, and behavioral
intentions: application of an extended Mehrabian–Russell model to restaurants. Journal of Business Research, 62, 451-460. DOI:10.1016/j.jbusres.2008.01.038
Jayanti, R. K., & Ghosh, A. K. (1996). Service value determination: an integrative
perspective. Journal of Hospitality and Leisure Marketing, 34(4), 5-25.
Jennifer (2012, October 12). Open letter to the Pengarah of HKL. Free Malaysia
Today. Retrieved from http://www.freemalaysiatoday.com/category/opinion/
2012/10/12/ open-letter-to-the-pengarah-of-hkl
Jo, W., Lee, C. K., & Reisinger, Y. (2014). Behavioral intentions of international
visitors to the Korean hanok guest houses: quality, value and satisfaction.
Annals of Tourism Research, 47, 77–95. DOI: 10.1016/j.annals.2014.05.009
Johnson, A. A. (1986). Adding more P’s to the pod or 12 essential elements of
marketing. Marketing News, 11 April, 2
Johnson, M. D., Herrmann, A., & Gustafsson, A. (2002). Comparing customer
satisfaction across industries and countries. Journal of Economic Psychology,
23(6), 749-769.
Jones, C. (2011, October). Casey Jones talks parking. Parking Today, 16(10), 8-9.
Jones, M. A., & Suh, J. (2000). Transaction-specific satisfaction and overall satis-
faction: An empirical analysis. Journal of Services Marketing, 14(2), 147- 159.
DOI: 10.1108/08876040010371555
Jonker, J., & Pennink, B. (2010). The Essence of Research Methodology. Verlag Berlin
Heidelberg: Springer. DOI 10.1007/978-3-540-71659-4

320
Js, S. K. (2009, April 25). Fomca hails landmark decision on car parking. Blis.
Retrieved from http://blis2.bernama.com.eserv.uum.edu.my/mainHome
Bypass.do
Judd, V. C. (1987). Differentiate With the 5th P: People. Industrial Marketing
Management, 16, 241-247.
Judd, V. C. (2003). Achieving a Customer Orientation using people-power, the 5th P.
European Journal of Marketing, 37(10), 1301-1313.
Jung, H. S., & Yoon, H. H. (2013). Do employees’ satisfied customers respond with
an satisfactory relationship? The effects of employees’ satisfaction on
customers’ satisfaction and loyalty in a family restaurant. International Journal
of Hospitality Management, 34, 1-8. DOI: 10.1016/j.ijhm.2013.02.003
Kalaian, S. A. (2011). Research design. Encyclopedia of survey research methods.
SAGE Publication.
Kang, G.D. (2006). The hierarchical structure of service quality: integration of
technical and functional quality. Managing Service Quality, 16, 37-50. DOI:
10.1108/09604520610639955
Kang, G. D., & James, J. J. (2004). Service quality dimensions: an examination of
Grönroos’s service quality model. Journal of Managing Service Quality, 14(4),
266-277. DOI: 10.1108/09604520410546806
Khalifa, A.S. (2004). Customer value: a review of recent literature and an integrative
configuration. Management Decision, 42(5/6), 645–666.
Karatepe, O. M., Yavas, U., & Babakus, E. (2005). Measuring service quality of banks:
scale development and validation. Journal of Retailing and Consumer Services,
12, 373–383. DOI:10.1016/j.jretconser.2005.01.001
Karim, H. A. (2012, July 26). Adopt Indonesian method to create space for vehicles.
News Strait Times. Retrieved from http://www2.nst.com.my/nation/extras/ car-
parks-adopt-indonesian-method-to-create-space-for-vehicles-1.112937
Kashyap, R., & Bojanic, D. (2000). A structural analysis of value, quality and price
perceptions of business and leisure travellers. Journal of Travel Research,
39(1), 45-51. DOI: 10.1177/004728750003900106
Kashif, M., Shukran, S. S. W., Rehman, M. A., & Sarifuddin, S. (2014). Customer
satisfaction and loyalty in Malaysian Islamic banks: a PAKSERV
investigation. International Journal of Bank Marketing, 33(1), 23-40 DOI:
10.1108/IJBM-08-2013-0084
Kaura, V. (2013). Service Marketing Mix with Special Reference to Indian Banking.
Pacific Business Review International. 6(5), 53-57.

321
Kellerman, B. J., Gordon, P. J., & Hekmat, F. (1995). Product and pricing courses are
underrepresented in undergraduate marketing curricula. Journal of Product &
Brand Management, 4(1), 18–25.
Kelly, E. J., & Lazer, W. (1967). Managerial marketing (3rd ed). Homewood, IL:
Irwin.
Kerin, R. A., Hanley, S. W., & and Rudelius, W. (2011). Marketing (10th ed.). New
York, USA: McGeaw Hill Irwin.
Kesavan, R., Mascarenhas, O., Bernacchi, M., & Panitz, E. (2014). Marketing services
globally: a fourfold typology. Services Marketing Quarterly, 35(3), 187-205.
DOI: 10.1080/15332969.2014.916123
Khan, M. (2003). ECOSERV: ecotourists quality expectations. Annals of Tourism
Research, 30(1), 109-124.
Kim, J., & Damhorst, M. L. (2010). Effects of level of internet retailer's service quality
on perceived apparel quality, perceived service quality, perceived value,
satisfaction, and behavioral intentions toward an internet retailer. Clothing &
Textiles Research Journal, 28(1), 56-73. DOI: 10.1177/0887302X08329647
Kim, J., & Lennon, S. J. (2013). Effects of reputation and website quality on online
consumers' emotion, perceived risk and purchase intention. Journal of
Research in Interactive Marketing. 7(1), 33–56. DOI
10.1108/17505931311316734
Kim, W. G., & Moon, Y. J. (2009). Customers’ cognitive, emotional, and actionable
response to the servicescape: a test of the moderating effect of the restaurant
type. International Journal of Hospitality Management, 28, 144–156.
DOI:10.1016/j.ijhm.2008.06.010
King, D.A., & Keenan, J.M. (2012). Understanding the role of parking lots for urban
redevelopment: interim uses or permanent presence? Cure, 1-18. Retrieved
from http://citeseerx.ist.psu.edu/viewdoc/download?doi=10.1.1.489.2787&
rep=rep1&type=pdf
Kitapci, O., Akdogan, C., & Dortyol, I. T. (2014). The impact of service quality
dimensions on patient satisfaction, repurchase intentions and word-of-mouth
communication in the public healthcare industry. Procedia - Social and
Behavioral Sciences, 148, 161-169. DOI: 10.1016/j.sbspro.2014.07.030
Knutson, B., Stevens, P., Wullaert, C., Patton, M., & Yokoyama, F. (1990),
LODGSERV: a service quality index for the lodging industry. Hospitality
Research Journal, 14(2), 227-84.
Kock, N. (2014). Advanced mediating effects tests, multi-group analyses, and
measurement model assessments in PLS-based SEM. International Journal of
e-Collaboration, 10(1), 1-13.

322
Kock, N., & Lynn, G. S. (2012). Lateral collinearity and misleading results in
Variance-Based SEM: an illustration and recommendations. Journal of the
Association for Information Systems, 13(7), 546-580.
Koenig-Lewis, N., & Palmer, A. (2014). The effects of anticipatory emotions on
service satisfaction and behavioral intention. Journal of Services Marketing,
28(6), 1-39. DOI: 10.1108/JSM-09-2013-0244
Kontogeorgos, A., Tselempis, D., & Aggelopoulos, S. (2014). Measuring service
quality of the Greek Ministry of Agriculture. Measuring Business Excellence
18(4), 54-64. DOI: 10.1108/MBE-05-2013-0030
Kotabe, M., & Helsen, K. (2014). Global Marketing Management (6th ed.). Hoboken,
NJ: John Wiley & Sons
Kotler, P. (1972). Marketing management: Analysis, planning and control. Englewood
Cliffs, NJ: Prentice Hall.
Kotler, P. (1984). Marketing management: analysis, planning, and control (5th ed.).
Englewood Cliffs, NJ: Prentice-Hall.
Kotler, P. (2000). Marketing Management (10th ed.). India, New Delhi: Prentice Hall
Kotler, P. (2002). Marketing management millenium edition (10th ed.). Prentice-Hall,
America: Boston.
Kotler, P., & Armstrong, G. (1989). Principles of Marketing (4th ed.). Englewood
Cliffs, N.J.: Prentice-Hall.
Kotler, P., & Armstrong, G. (2012). Principles of Marketing (14th ed.). USA, New
Jersey: Pearson Hall.
Kotler, P., Armstrong, G., Wong, V., & Saunders, J. (2008). Principles of marketing:
fifth European edition. Harlow: Pearson.
Koufteros, X., Droge, C., Heim, G., Massad, N., & Vickery, S. K. (2014). Encounter
Satisfaction in E-tailing: Are the Relationships of Order Fulfillment Service
Quality with its Antecedents and Consequences Moderated by Historical
Satisfaction? Decision Sciences, 45(1), 5-48. DOI: 10.1111/deci.12056
Kuo, Y. F., Wu, C. M., & Deng, W. J. (2009). The relationships among service quality,
perceived value, customer satisfaction, and post-purchase intention in mobile
value-added services. Computers in Human Behavior, 25, 887-896.
Kursunluoglu, E. (2014). Shopping centre customer service: creating customer
satisfaction and loyalty. Marketing Intelligence & Planning, 32(4), 528-548.
DOI: 10.1108/MIP-11-2012-0134

323
Kushwaha, G. S., & Agrawal, S. R. (2015). An Indian customer surrounding 7P׳s of
service marketing. Journal of Retailing and Consumer Services, 22, 85-95.
DOI: 10.1016/j.jretconser.2014.10.006
Kwun, D. J. W. (2011). Effects of campus foodservice attributes on perceived value,
satisfaction, and consumer attitude: a gender-difference approach.
International Journal of Hospitality Management, 30(2), 252-261.
DOI:10.1016/j.ijhm.2010.09.001
Ladhari, R. (2008). Alternative measures of service quality: a review. Managing
Service Quality, 18 (1), 65-86. DOI: 10.1108/09604520810842849
Ladhari, R., & Morales, M. (2008). Perceived service quality, perceived value and
recommendation: A study among Canadian public library users. Library
Management, 29(4/5), 352-366. DOI: 10.1108/01435120810869129
Lai, A. W. (1995). Consumer values, product benefits and customer value: a
consumption behaviour approach. In Advances in Consumer Research (Eds.),
Kardes, F. R., & Sijan, M., Association for Consumer Research, 381-383.
Lages, L. F., & Fernandes, J. C. (2005). The SERVPAL scale: a multi-item instrument
for measuring service personal values. Journal of Business Research, 58, 1562-
1572.
Lam, S.Y., Lee, V.H., Ooi, K.B., & Phusavat, K. (2012). A structural equation model
of TQM, market orientation and service quality: evidence from a developing
nation. Managing Service Quality: An International Journal, 22(3), 281-309.
DOI: 10.1108/09604521211230996
Lancaster, G., & Massingham, L. (2011). Essentials of marketing management.
Routledge. USA: New York, Canada: Oxon
Lapierre, J., Filiatrault, P., & Charles, J. C. (1999). Value strategy rather than quality
strategy: a case of business-to-business professional services. Journal of
Business Research, 45, 235–246.
Lauterborn, B. (1990). New marketing litany: Four Ps Passé: C-words take over.
Advertising Age, 61(41), 26-28.
LeBlanc, G., & Nguyen, N. (1999). Listening to the customer’s voice: examining
perceived service value among business college students. The International
Journal of Educational Management, 13(4), 187-198.
Ledden, L., Kalafatis, S. P., & Mathioudakis, A. (2011). The idiosyncratic behaviour
of service quality, value, satisfaction, and intention to recommend in higher
education: an empirical examination. Journal of Marketing Management, 27,
1232-1260. DOI: 10.1080/0267257X.2011.611117

324
Ledden, L., Kalafatis, S. P., & Samouel, P. (2007). The relationship between personal
values and perceived value of education. Journal of Business Research, 60,
965- 974.
LeDoux, L. (1991). Is preservation the fifth 'P' or just another microenvironmental
factor? In Challenges of New Decade in Marketing Education, (Eds)
McKinnon, G. F. & Kelley, C. A., Western Marketing Educators' Association,
82-86.
Lee, C. H., Ko, E., Tikkanen, H., Phan, M. C. T., Aiello, G., Donvito, R., & Raithel,
S. (2014). Marketing mix and customer equity of SPA brands: cross-cultural
perspectives. Journal of Business Research, 67, 2155-2163. DOI:
10.1016/j.jbusres.2014.04.025
Lee, H. H., Kim, J. & Fiore, A. M. (2015). Affective and cognitive online shopping
experience: effects of image interactivity technology and experimenting with
appearance. Clothing & Textiles Research Journal, 28(2), 140-154. DOI:
10.1177/0887302X09341586
Lee, H. J., & Yun, Z. S. (2015). Consumers’ perceptions of organic food attributes and
cognitive and affective attitudes as determinants of their purchase intentions
toward organic food. Food Quality and Preference, 39, 259–267. DOI:
10.1016/j.foodqual.2014.06.002
Lee, J. S., Lee, C. K., & Park, C. K. (2014). Developing and validating a
multidimensional quality scale for mega-events. International Journal of
Hospitality Management, 43, 121-131. DOI: /10.1016/j.ijhm.2014.09.003
Lee, R. (2012, May 29). Feisty marketeer fights off would be rapists at mall car park.
The Star Online. Retrieved from http://thestar.com.my/news/story.asp?
file=/2012/5/29/nation/20120529180624&sec=nation
Lee, Y. K., Lee, Y., Lee, K. A., Park, D. H., & Moon, H. (2004). Exploring the role of
service value in the relationship between service quality and customer
satisfaction. International Journal of Hospitality & Tourism Administration,
5(1), 67-86. DOI: 10.1300/J149v05n01_04
Levitt, T. (1981). Marketing Intangible Products and Product Intangibles. Harvard
Business Review, May-June, 94-102.
Liehr, P., & Smith, M. J. (1999). Middle range theory: spinning research and practice
to create knowledge for the new millennium. Advances in Nursing Science,
21(4), 81-91.
Lietz, P. (2010). Research into questionnaire design: a summary of the literature.
International Journal of Market Research, 52(2), 249-272. DOI:
10.2501/S147078530920120X

325
Liljander, V., & Strandvik, T. (1992). Different types of customer service expectations
in relation to perceived value. Proceedings of the Annual Conference –
European Marketing Academy, 21(2), 1351-1354.
Liljander, V., & Strandvik, T. (1997). Emotions in service satisfaction. International
Journal of Service Industry Management, 8(2), 148-169.
Lin, C. C. (2003). A critical appraisal of customer satisfaction and e-commerce.
Managerial Auditing Journal, 18(3), 202–212. DOI:
10.1108/02686900310469952
Lin, C. H., Sher, P. J., & Shih, H. Y. (2005). Past progress and future directions in
conceptualizing customer perceived value. International Journal of Service
Industry Management, 16(4), 318-336. DOI: 10.1108/09564230510613988
Lin, S. M. (2011). Marketing mix (7P) and performance assessment of western fast
food industry in Taiwan: An application by associating DEMATEL and ANP.
African Journal of Business Management, 5(26), 10634-10644. DOI:
10.5897/AJBM11.894
Lipson, H. A., & Darling, J. R. (1971). Introduction to marketing: an administrative
approach. John Wiley, America: New York.
Litman, T. (2006). Parking Management: Strategies, Evaluation and Planning.
Victoria Transport Policy Institute, 1-60. Retrieved from http://www.
cleanairinstitute.org/cops/bd/file/gdt/62-parking-managementLitman.pdf
Litman, T. (2008). Parking Management Best Practices. ITE Journal on the web,
September, 69-73.
Litman, T. (2013). Parking management: strategies, evaluation and planning.
Transportation Research Board 2007 Annual Meeting, Victoria Transport
Policy Institute, 1-30. Retrieved from http://www.vtpi.org/park_man.pdf.
Liu, Y., & Jang, S. (2009). Perception of Chinese restaurants in the U.S.: what affects
customer satisfaction and behavioral intentions? International Journal of
Hospitality Management, 28(3), 338–348. DOI:10.1016/j.ijhm.2009.01.002
Lo, A. (2012, June 10). Going nuts over car prices and parking fees. The Star Online.
Retrieved from http://thestar.com.my/news/story.asp?file=/2012/6/10/
sarawak/11451038&sec=sarawak
Looi, S. C. (2011, December 30). Illegal attendants demanding fees. News Strait
Times. Retrieved from http://www2.nst.com.my/nation/illegal-attendants-
demanding-fees-1.25479
Loureiro, S. M. C., Miranda, J. F., & Breazeale, M. (2014). Who needs delight? The
greater impact of value, trust and satisfaction in utilitarian, frequent-use retail.
Journal of Service Management, 25(1), 101-124. DOI: 10.1108/JOSM-06-
2012-0106

326
Lovelock, C. H., Patterson, P. G., & Wirtz, J. (2011). Services marketing: an Asia-
Pacific and Australian perspective (5th ed.). NSW, Australia: Pearson
Education.
Lovelock, C. H., Vandermerwe,S., Lewis, B., & Fernie, S. (2004). Services marketing.
Great Britain, UK: Prentice Hall.
Lovelock, C. H., & Wright, L. (2002). Principles of service marketing and
management (2nd ed.). New Jersey, USA: Inc. Upper Saddler River.
Lovelock, C. H., & Wright, L. (2007). Principles of Service Marketing and
Management (5th ed.). Englewood Cliffs NJ: Pearson.
Lovelock, C. H., & Writz, J. (2011). Services marleting, people, technology, strategy
(7th ed.). New Jersey, USA: Prentice Hall.
Low, S. P., & Kok, H. M. (1997). Formulating a strategic marketing mix for quantity
surveyors. Marketing Intelligence & Planning, 15(6), 273-280.
MacCallum, R. C., Widaman, K. F., Zhang, S., & Hong, S. (1999). Sample size in
factor analysis. Psychological Methods, 4, 84-99.
Magrath, A. J. (1986). When marketing services 4Ps are not enough. Journal of
Business, 29(3), 44-50.
Malaysia Department of Statistics (2011). Population Distribution and Basic
Demographic Characteristic Report 2010, Retrieved from
http://www.statistics.gov.my/portal/index.php?option=com_content&view=ar
ticle&id=1215%3Apopulation-distribution-and-basic-demographic-
characteristic-report-population-and-housing-census-malaysia-2010
Malaysia Department of Statistics, 2013. Gross domestic product at current prices -
quarterly 2011-2013. Retrieved from http://www.statistics.gov.my/index.php
?r=column/ctwoByCat&parent_id=80&menu_id=YmJrMEFKT0p0WUIxbDl
1bzZydW9JQT09
Malaysia Ministry of Federal Territories, Official Website of Greater Kuala Lumpur
/Klang Valley (2014). Retrieved from http://app.kwpkb.gov.my/greaterklkv/
Malaysia Ministry of Finance, Department of Valuation and Property Services.
National Property Information Centre (2014). Property Stock Report:
Commercial Property Stock Table Q1 2014. Retrieved from
http://napic.jpph.gov.my/portal/ en/web/guest/main-page?
Malaysia Ministry of Finance, Economic Report 2013/2014: Malaysia's economy.
Retrieved from http://www.treasury.gov.my/index.php?option=com_content
&view=article&id=2735:economic-report-2013-2014&catid=262&lang=en&
Itemid=2478

327
Malaysia Prime Minister’s Department, Performance Management and Delivery Unit
(PEMANDU), Economic Transformation Programme: A Roadmap For
Malaysia (2010). Retrieved from http://www2.moh.gov.my/images/gallery
/ETP/Ringkasan% 20Eksekutif%20ETP.pdf
Malaysia Prime Minister's Department, Economic Planning Unit, The Malaysian
Economy in Figures 2013. Retrieved from http://www.epu.gov.my/
documents/10124/2257e64f-b08d-41b7-bed0-b6e6498c38a3.
Malaysia Prime Minister’s Department, Performance Management and Delivery Unit
(PEMANDU, 2012). ETP Annual Report 2011. Retrieved from http://etp.
pemandu.gov.my/upload/ETP%202011%20AR.pdf
Malaysia Prime Minister’s Department, Performance Management and Delivery Unit
(PEMANDU, 2014). ETP Annual Report 2013: Greater Kuala Lumpur/Klang
Valley. 22-41. Retrieved from https://www.pmo.gov.my/
dokumenattached/NTP-Report-2013/ETP_2013_ENG.pdf
Malaysia Road Transport Department, Total motor vehicles by type and state,
Malaysia, until 31st December 2013. Retrieved from http://www.mot.gov.my
/my/Statistics/Land/2013%204%20%20SUKU%20IV%202013/Jadual%201.
2.pdf
Mantin (2012, October 19). Lighting needed at KTM car park. The Star Online.
Retrieved from http://thestar.com.my/news/story.asp?file=/2012/10/19/focus
/12195293&sec=focus
Marcu, M., & Gherman, C. (2010). The efficiency of promotional instruments related
to the product life cycle stages. Annals of the University of Petroşani,
Economics, 10(1), 169-176.
Martensen, A., Grønholdt, L., Eskildsen, J., & Kristensen, K. (1999). Measuring
student oriented quality in higher education: application of the ECSI
methodology. Proceedings from the TQM for Higher Education conference.
Higher Education institutions and the issue of total quality, Verona, 371-383.
Martin, W. C., Ponder, N., & Lueg, J. E. (2012). Price fairness perceptions and
customer loyalty in a retail context. Journal of Business Research, 62, 588-593.
DOI:10.1016/j.jbusres.2008.05.017
Martínez, J. A., & Martínez, L. (2010). Some insights on conceptualizing and
measuring service quality. Journal of Retailing and Consumer Services, 17, 29-
42. DOI:10.1016/j.jretconser.2009.09.002
Mathwick, C., Malhotra, N., & Rigdon, E. (2001). Experiential value:
conceptualization, measurement and application in the catalog and Internet
shopping environment. Journal of Retailing. 77(1), 39–56.
McCarthy, E. J. (1964). Basic marketing: a managerial approach (2nd ed.). Irwin.

328
McCarthy, E. J., & Perreault, W. D., Jr., (1987). Basic marketing: a global managerial
approach. Irwin.
Mccrum-gardner, E. (2010). Sample size and power calculations made simple.
International Journal of Therapy and Rehabilitation, 17(1), 10-14.
McMullan, R., & O'Neill, M. (2010). Towards a valid and reliable measure of visitor
satisfaction. Journal of Vacation Marketing, 16(1), 29-44. DOI:
10.1177/1356766709356141
Mehrabian A., & Russell, J. A. (1974). An approach to environmental psychology.
Cambridge, MA: MIT Press.
Mei, A. W. O., Dean, A. M., & White, C. J. (1999). Analyzing service quality in the
hospitality industry. Managing Service Quality, 9(2), 136-43. DOI:
10.1108/09604529910257920
Mei, W. P. (2012, April 27). Air Asia wants better LCCT car park security after
stewardesses attacked, molested. The Star Online. Retrieved from
http://thestar.com.my/news/story.asp?file=/2012/4/27/nation/2012042712545
1&sec=nation
Meidutė-Kavaliauskienė, I., Aranskis, A., & Litvinenko, M. (2014). Consumer
satisfaction with the quality of logistics services. Procedia - Social and
Behavioral Sciences, 110, 330-340. DOI: 10.1016/j.sbspro.2013.12.877
Melewar, T. C., & Saunders, J. (2000). Global corporate visual identity systems: using
an extended marketing mix. European Journal of Marketing, 34(5/6), 538-
550.
Mendat, C. C., & Wogalter, M. S. (2003). Perceptions of Parking Facilities: Factors to
Consider in Design and Maintenance. Proceedings of the Human Factors and
Ergonomics Society Annual Meeting 2003, 47, 918-921. DOI:
10.1177/154193120304700617
Meng, F., Tepanon, Y., & Uysal, M. (2008). Measuring tourist satisfaction by attribute
and motivation: the case of a nature-based resort. Journal of Vacation
Marketing, 14(1), 41-56. DOI: 10.1177/1356766707084218
Mey, H. R. A. D. (2003). Two psychologies: cognitive versus contingency-oriented.
Sage Publications. 13(5), 695–709. DOI: 10.1177/09593543030135010
Manville, M., & Williams, J. A. (2012). The price doesn’t matter if you don’t have to
pay: legal exemptions and market-priced parking. Journal of Planning
Education and Research, 32(3), 289-304. DOI: 10.1177/0739456X11432472
Miles, P., Miles, G., & Cannon, A. (2012). Linking servicescape to customer
satisfaction: exploring the role of competitive strategy. International Journal of
Operations & Production Management, 32(7), 772-795. DOI:
10.1108/01443571211250077

329
Mindak, W. A., & Fine, S. (1981). A fifth ‘P’: public relations”. In Donnely, J.H. &
George, W.R. (Eds), Marketing of Services, American Marketing Association,
Chicago, IL, pp. 71-73.
Miranda, F. J., Chamorro, A., Murillo, L. R., & Vega, J. (2012). Primary health care
services quality in Spain: A formative measurement approach using PLS path
modeling. International Journal of Quality and Service Sciences, 4, 387-398.
DOI: 10.1108/17566691211288368
Mittal, S., & Gera, R. (2012). Relationship between service quality dimensions and
behavioural intentions: an SEM study of public sector retail banking customers
in India. Journal of Services Research, 12(2), 147-171.
Mishra, L. (2013). A critical analysis of the effectiveness of 7P’s marketing and service
marketing. International Journal of Innovative Research and Studies. 2(12),
723-736.
Mokonyama, M. (2011). Just how much is fair to pay for parking? Civil Engineering,
56-59.
Moliner, M. A., Sánchez, J., Rodríguez, R. M., & Callarisa, L. (2007). Relationship
quality with a travel agency: the influence of the post-purchase perceived value
of a tourism package. Tourism and Hospitality Research, 7 (3-4), 194-211.
Moniri, S. M. (2011). Studying the impact of service marketing mix on increasing of
Agricultural banks’ costumers. Advances in Environmental Biology, 5(13),
3959-3966.
Monroe, K. B. (1979). Pricing: making profitable decisions. New York: McGraw-Hill.
Monroe, K. B. (1990). Pricing: making profitable decisions. New York: McGraw-Hill.
Mooi, E. A., & Sarstedt, M. (2011). A concise guide to market research: The process,
data, and methods using IBM SPSS Statistics. Berlin: Springer.
Morgeson III, F.V., Sharma, P.N., & Hult, G.T.M. (2015). Cross-national differences
in consumer satisfaction: mobile services in emerging and developed markets.
Journal of International Marketing, 23(2), 1-24.
Morris, M. L., Cooper, C., & Gross, K. H. (1999). Marketing factors influencing the
overall satisfaction of marriage education participants. Family Relations, 48(3),
251-261.
Mucai, G. P., Mbaeh, E. K., & Noor, A. I. (2013). Extended marketing mix and
customer’s satisfaction in classified non-star hotels in Meru Municipality
Kenya. International Review of Management and Business Research, 2(3),
691-696.
330
Mudie, P., & Pirrie, A. (2006). Services marketing management (3rd. Ed.). Burlington,
MA: Butterworth-Heinemann, Elsevier.
Mukhija, V. & Shoup, D. (2006). Quantity versus Quality in Off-Street Parking
Requirements. Journal of the American Planning Association, 72(3), 296-308.
Munusamy, J., Chelliah, S., & Mun, H. W. (2010). Service quality delivery and its
impact on customer satisfaction in the banking sector in Malaysia.
International Journal of Innovation, Management and Technology, 1(4), 398-
404.
Murphy, P. (2011, July/August). Easy in, easy out. Parking, 51(6), 28-30.
Murphy, P. E., & Pritchard, M. (1997). Destination price-value perceptions: an
examination of origin and seasonal influences. Journal of Travel Research,
35(3), 16-22.
Mustafa, L. M., Yunus, N. K. Y., & Azman, M. N.A. (2014). An Overview of Private
Preschool in Malaysia: Marketing Strategies and Challenges. Procedia - Social
and Behavioral Sciences, 130, 105-113. DOI: 10.1016/j.sbspro.2014.04.013
Nadiri, H., & Hussain, K. (2005). Perceptions of SQ in North Cyprus hotels.
International Journal of Contemporary Hospitality Management, 17, 469-480.
DOI: 10.1108/09596110510612112
Nam, J., Ekinci, Y., & Whyatt, G. (2014). Brand equity, brand loyalty and consumer
satisfaction. Annals of Tourism Research, 38(3), 1009-1030. DOI:
10.1016/j.annals.2011.01.015
Narteh, B., & Kuada, J. (2014). Customer Satisfaction with Retail Banking Services
in Ghana. Thunderbird International Business Review, 1-19. DOI:
10.1002/tie.21626
National Economic Advisory Council, New Economic Model for Malaysia 2010.
Malaysia, Putrajaya: Percetakan Nasional Malaysia Berhad. Retrieved from
https://www.pmo.gov.my/dokumenattached/NEM_Concluding_Part.pdf
Nasution, R. A., Sembada, A. Y., Miliani, L., Resti, N. D., & Prawono, D. A. (2014).
The customer experience framework as baseline for strategy and
implementation in services marketing. Procedia - Social and Behavioral
Sciences, 148, 254-261. DOI: 10.1016/j.sbspro.2014.07.041
Ndubisi, N. O., & Ling, T. Y. (2005). Complaint behaviour of Malaysian consumers.
Management Research News, 29(1/2), 65-76. DOI
10.1108/01409170610645457
Netto, A. (2012, November 4). MALAYSIA: Govt Urged to Rethink Transport Policy.
Inter Press Service. Retrieved from http://www.ipsnews.net/2001/09/
malaysia-govt-urged-to-rethink-transport-policy

331
Neuman, W. L. (2003). Social research methods: Qualitative and quantitative
approaches (5th ed.). Boston, USA: Pearson Education.
Nichols, W. G., & Woods, M. B. (1997). Marketing: relationships, quality, value. New
York, USA: Worth.
Nickels, W. G., & Jolson M. A. (1976). “Packaging – the fifth P in the marketing mix.
Advanced Management Journal, Winter, 13-21.
Ng, M. (2012, June 28). CRIME: Car park owners use disclaimers. News Strait Times.
Retrieved from http://www.nst.com.my/opinion/letters-to-the-editor/crime-
car-park-owners-use-disclaimers-1.99199
Noyan, F., & Şimşek, G. G. (2014). The antecedents of customer loyalty. Procedia -
Social and Behavioral Sciences, 109, 1220-1224. DOI:
10.1016/j.sbspro.2013.12.615
Nunnally, J.C. (1967). Psychometric Theory. New York, NY: McGraw-Hill.
O'Cass, A., & Carlson, J. (2012). An empirical assessment of consumers' evaluations
of web site service quality: conceptualizing and testing a formative model.
Journal of Services Marketing, 26(6), 419-434. DOI:
10.1108/08876041211257909
Odunlami, I. B. (2013). Effects of factor analysis on the questionnaire of strategic
marketing mix on organisational objectives of food and beverage industry.
European Journal of Business and Management, 5(18), 47-58.
Official Website of Greater Kuala Lumpur/Klang Valley. Ministry of Federal
Territories. Retrieved from http://app.kwpkb.gov.my/greaterklkv
Oh, H. (1999). Service quality, customer satisfaction and customer value: an holistic
perspective. International Journal of Hospitality Management, 18, 67-82.
Ohmae, K. (1982). The mind of the strategist: The art of Japanese business. New York,
NY: McGraw-Hill Inc
Oliver, R. L. (1980). A cognitive model of the antecedents and consequences of
satisfaction decision. Journal of Marketing Research, 17(11), 460-469. DOI:
10.2307/3150499
Oliver, R. L. (1989). Processing of the satisfaction response in consumption: a
suggested framework and research propositions. Journal of Consumer
Satisfaction, Dissatisfaction and Complaining Behavior, 2, 1-16.
Oliver, R. L. (1993). Cognitive, affective, and attribute bases of the satisfaction
response. Journal of Consumer Research, 20(3), 418-430.
Oliver, R. L. (1997). Satisfaction: a behavioural perspective on the consumer. New
York, USA: McGraw Hill.

332
Oliver, R. L. (1999). Whence customer loyalty? Journal of Marketing, 63, 33-44.
Olorunniwo, F., Hsu, M. K., & Udo, G. J. (2006). Service quality, customer
satisfaction, and behavioural intentions in the service factory. Journal of
Services Marketing, 20 (1), 59–72.
Olorunniwo, F., & Hsu, M. K. (2006). A typology Analysis of Service Quality,
Customer Satisfaction and behaviournal Intention in Mass Service. Managing
Service Quality, 16 (2), 106-123. DOI 10.1108/09604520610650600
Olsen, S. O. (2002). Comparative evaluation and the relationship between quality,
satisfaction, and repurchase loyalty. Journal of the Academy of Marketing
Science, 30 (3), 240-249.
Ostrom, A., & Iacobucci, D. (1995). Consumer trade-offs and the evaluation of
services. Journal of Marketing, 59, 17-28.
Pallant, J. (2011). A step by step guide to data analysis using SPSS (4th ed.). Australia:
Allen & Unwin.
Palmer, A. (2004). Introduction to marketing: theory and practice. Oxford University
Press.
Palmer, A. (2011). Principles of Services Marketing (6th ed.). New York, USA:
McGraw Hill.
Pantouvakis, A., & Bouranta, N. (2013). The interrelationship between service
features, job satisfaction and customer satisfaction: evidence from the transport
sector. The TQM Journal, 25(2), 186-201. DOI: 10.1108/17542731311299618
Parasuraman, A., Zeithaml, V. A., & Berry, L. L. (1985). A conceptual model of
service quality and its implications for future research. Journal of Marketing,
49, 41-50.
Parasuraman, A., Zeithaml, V. A., & Berry, L. L. (1988). SERVQUAL: a multiple
item scale for measuring consumer perceptions of service quality. Journal of
Retailing, 64(1), 14-40.
Parasuraman, A., Berry, L.L., & Zeithaml, V.A. (1991), Refinement and reassessment
of the SERVQUAL scale. Journal of Retailing, 67(4), 420-450.
Parasuraman, A., Zeithaml, V. A., & Malhotra, A. (2005). E-S-Qual: a multiple-item
scale for assessing electronic service quality. Journal of Service Research, 7(3),
213-233.
Park, D., & Shin, K. (2012). The Service Sector in Asia: Is It an Engine of Growth?
(ADB Economics Working Paper Series No. 322). Retrieved from Asian
Development Bank website: http://www.adb.org/sites/default/files/
publication/30092/economics-wp322.pdf
333
Park, M., & Lennon, S. J. (2009). Brand name and promotion in online shopping
contexts. Journal of Fashion Marketing and Management, 13(2), 149-160.
DOI 10.1108/13612020910957680
Parker, C., & Mathews, B. P. (2001). Customer satisfaction: contrasting academic and
consumers’ interpretations. Marketing Intelligence & Planning, 19(1), 38-44.
DOI: 10.1108/02634500110363790
Parking contractors fired (2008, July 11). News Straits Times. Retrieved from
http://blis2.bernama.com.eserv.uum.edu.my/mainHomeBypass.do
Parking management & strategies (2005, July). The Institution of highways &
Transportation. Retrieved from http://www.britishparking.co.uk/write/
Documents/Library/Parking_Management_and_Strategies-_IHT.pdf
Patil, S. K., & Pradhan, P. (2014). Library promotion practices and marketing of
library services: a role of library professionals. Procedia - Social and
Behavioral Sciences, 133, 249-254. DOI: 10.1016/j.sbspro.2014.04.191
Patterson, P. G., & Spreng, R. A. (1997). Modeling the relationship between perceived
value, satisfaction and repurchase intentions in a business-to-business, services
context: an empirical examination. International Journal of Service Industry
Management, 8(5), 414-434.
Peng, C., & Kim, Y. G. (2014). Application of the Stimuli-Organism-Response (S-O-
R) framework to online shopping behaviour. Journal of Internet Commerce,
13(3-4), 159-176. DOI: 10.1080/15332861.2014.944437
Perreault, W. D., Jr., & McCarthy, E. J. (2002). Basic marketing: a global−managerial
approach (14th ed.). New York, USA: McGraw Hill Irwin.
Perreault, W. D., Jr., Cannon, J. P., & McCarthy, E. J. (2011). Basic marketing: a
marketing strategy planning approach (18th ed.). New York, USA: McGraw
Hill Irwin.
Petrick, J. F. (2002). Development of a multi-dimensional scale for measuring the
perceived value of a service. Journal of Leisure Research, 34(2), 119–134.
Petrick J. F., & Backman S. J. (2002). An examination of the construct of perceived
value for the prediction of golf travellers’ intention to revisit. Journal of Travel
Research, 41, 38–45.
Phillips, K. (2011, September). Safety and Security: 7 Steps to increase parking lot
safety. Parking, 51(7), 42.
Preacher, K. J., & Hayes, A. F. (2004). SPSS and SAS procedures for estimating
indirect effects in simple mediation models. Behavior Research Methods,
Instruments, and Computers, 36, 717–731.

334
Preacher, K. J., & Hayes, A. F. (2008). Asymptotic and resampling strategies for
assessing and comparing indirect effects in multiple mediator models.
Behavior Research Methods, 40, 879–891.
Prebensen, N., Woo, E., Chen, J., & Uysal, M. (2013). Motivation and involvement as
antecedents of the perceived value of the destination experience. Journal of
Travel Research, 52(2), 253-264.
Purcărea, V. L., Gheorghe, I. R., & Petrescu, C. M. (2013). The assessment of
perceived service quality of public health care services in Romania using the
SERVQUAL scale. Procedia Economics and Finance, 6, 573-585. DOI:
10.1016/S2212-5671(13)00175-5
Putting the best route forward (2006, September 24). The Star Online. Retrieved from
http://www.thestar.com.my/story/?file=%2f2006%2f9%2f24%2ffocus
%2f15517780&sec=focus
Puustinen, P., Maas, P., & Karjaluoto, H. (2013). Development and validation of the
perceived investment value (PIV) scale. Journal of Economic Psychology, 36,
41-54. DOI: 10.1016/j.joep.2013.02.009
Pynnönen, M., Ritala, P., & Hallikas, J. (2011). The new meaning of customer value:
A systemic perspective. Journal of Business Strategy, 32(1), 51-57. DOI:
10.1108/02756661111100328
Qian, Z., & Rajagopal, R. (2013). Optimal Parking Pricing in General Networks with
Provision of Occupancy Information. Procedia - Social and Behavioral
Sciences, 80, 779-805.
Rafiq, M., & Ahmed, P.K. (1995). Using the 7Ps as a generic marketing mix: an
exploratory survey of UK and European marketing academics. Marketing
Intelligence & Planning, 13(9), 4-15.
Rajaratnam, S. D., Munikrishnan, U. T., Sharif, S. P., & Nair, V. (2014). Service
quality and previous experience as a moderator in determining tourists’
satisfaction with rural tourism destinations in Malaysia: a partial least squares
approach. Procedia - Social and Behavioral Sciences, 144, 203-211. DOI:
10.1016/j.sbspro.2014.07.288
Rajendra, E. (2013, September 23). Private car park operators in Petaling Jaya taking
advantage of space shortage. The Star Online. Retrieved from
http://www.thestar.com.my/News/Community/2013/09/23/No-control-over-
parking-rates-Private-carpark-operators-in-PJ-taking-advantage-of-space-
shortage
Rahim & Co. Menara IGB Lingkaran Syed Putra, Mid Valley City 59200 Kuala
Lumpur. Retrieved from http://rahim-co.com/properties/Menara%20IGB.pdf

335
Ramasubbu, N., Mithas, S., & Krishnan, M.S. (2008). High tech, high touch: The
effect of employee skills and customer heterogeneity on customer satisfaction
with enterprise system support services. Decision Support Systems, 44, 509-
523. DOI:10.1016/j.dss.2007.06.005
Ravichandran, K. (2010). Influence of service quality on customer satisfaction
application of SERVQUAL model. International Journal of Business and
Management, 5(4), 117-124.
Rashid, M. M., Musa, A., Rahman, M. A., Farahana, N., & Farhana, A. (2012).
Automatic parking management system and parking fee collection based on
number plate recognition. International Journal of Machine Learning and
Computing, 2(2), 93-98.
Ravald, A., & Grönroos, C., (1996). The value concept and relationship marketing.
European Journal of Marketing, 30(2), 19-30.
Redman, L., Friman, M., Tommy, G., & Hartig, T. (2013). Quality attributes of public
transport that attract car users: a research review. Transport Policy, 25, 119–
127. DOI:10.1016/j.tranpol.2012.11.005
Recovery Strengthens, Remains Uneven (2014, April). World economic outlook.
International monetary fund. Retrieved from
Reichheld, F. F. (1996). The loyalty effect. Boston, Mass: Harvard Business School
Press.
Retiree (2014, January 2). UMMC must resolve its parking rate issue quickly. The Star
Online. Retrieved from http://www.thestar.com.my/Opinion/Letters/
2014/01/02/UMMC-must-resolve-its-parking-rate-issue-quickly/
Road Transport Act, Act 333 § 2 (1987).
Robins, F. (1991). Four Ps or Four Cs or Four Ps and Four Cs. Paper Presented at
MEG Conference.
Rod, M., Ashill, N. J., Shao, J., & Carruthers, J. (2008). An examination of the
relationship between service quality dimensions, overall internet banking
service quality and customer satisfaction: a New Zealand study. Marketing
Intelligence & Planning, 27(1), 103-126. DOI 10.1108/02634500910928344
Rozita, A. L., Nor Zana, A. A., Khairulzaman, H., & Norlizah, A. H. (2014). Impact
of sport complex services towards costumer behaviour in Terengganu.
Procedia - Social and Behavioral Sciences, 153, 410-418. DOI:
10.1016/j.sbspro.2014.10.074
Ruiz, D., Gremler, D., Washburn, J., & Carrión, G. (2008). Service value revisited:
specifying a higher-order, formative measure. Journal of Business Research
61, 1278-1291.

336
Rust, R. T., & Oliver, R. L. (1994). Service quality: insights and managerial
implications fromthe frontier. In: Rust, R.T., & Oliver, R.L. (Eds.), service
quality: new directions in theory and practice. Thousand Oaks, CA: Sage, pp.
1–19.
Ryu, K.; Han, H., & Kim, T. H. (2008). The relationships among overall quick-causal
restaurant image, perceived value, customer satisfaction, and behavioural
intentions. International Journal of Hospitality Management, 27 (3), 459-469.
DOI: 10.1016/j.ijhm.2007.11.001
Ryu, K., Lee, H., & Kim, W. (2012). The influence of the quality of the physical
environment, food, and service on restaurant image, customer perceived value,
customer satisfaction, and behavioral intentions. International Journal of
Contemporary Hospitality Management, 24(2), 200–223.
Sabiote-Ortiz, C. M., Frias-Jamilena, D. M., & Castaneda-Garcia, J. A. (2014). Overall
perceived value of a tourism service delivered via different media: a cross-
cultural perspective. Journal of Travel Research, (May), 1-18. DOI:
10.1177/0047287514535844
Sahu, P. K. (2013). Research Methodology: A Guide for Researchers in Agricultural
Science, Social Science and Other Related Fields. India: Springer. DOI
10.1007/978-81-322-1020-7_4
Sanib, N. I. R., Aziz, Y. A., Samdin, Z., & Rahim, K. A. (2013). Comparison of
Marketing Mix Dimensions between Local and International Hotel Customers
in Malaysia. Int. Journal of Economics and Management, 7(2), 297-313.
Sánchez-Fernández, R., & Iniesta-Bonillo, M.A. (2007). The concept of perceived
value: A systematic review of research. Marketing Theory, 7(4), 427-451. DOI:
10.1177/1470593107083165
Sánchez, J., Callarisa, l., Rodriguez, R. M., & Moliner, M. A. (2006). Perceived value
of the purchase of a tourism product. Tourism Management, 27, 394-409.
DOI:10.1016/j.tourman.2004.11.007
Sandhu, H. S., & Bala, N. (2011). Customers’ perception towards service quality of
life insurance corporation of India: a factor analytic approach. International
Journal of Business and Social Science, 2(18), 219–231.
Sapre, A., & Nagpal, A. (2009). Viewer relationship management in Indian news
channels: an analysis using 7Ps framework. The Icfai University Journal of
Marketing Management, VIII(1), 39-47.
Sarker, M. A. H., Aimin, W., & Begum, S. (2012). Investigating the impact of
marketing mix elements on tourists satisfaction: An empirical study on East
Lake. European Journal of Business and Management, 4(7), 273-282.

337
Sarstedt, M., Ringle, C. M., & Hair, J. F. (2014). PLS-SEM: Looking Back and
Moving Forward. Long Range Planning, 47, 132-137. DOI:
10.1016/j.lrp.2014.02.008
Sarstedt, M., Ringle, C. M., Henseler, J., & Hair, J. F. (2014a). On the Emancipation
of PLS-SEM: A Commentary on Rigdon (2012). Long Range Planning, 47,
154-160. DOI: 10.1016/j.lrp.2014.02.007
Sarstedt, M., Ringle, C., Smith, D., Reams, R., & Hair, J. (2014b). Partial least squares
structural equation modeling (PLS-SEM): A useful tool for family business
researchers. Journal of Family Business Strategy, 5, 105-115. DOI:
10.1016/j.jfbs.2014.01.002
Saunders, M., Lewis, P., & Thornhill, A. (2009). Research methods for business
students (5th ed.). Essex, England: Pearson Education Limited.
Schultz, D.E. (2001). Marketers: Bid Farewell to Strategy Based on old 4Ps. Marketing
News, 35(2), 7.
Secure Parking (2012). 10 Design Points for a Good Car Park. boomgate, 7(3), 1-4.
Seibert, C. (2008). There’s no such thing as a free parking space. Policy, 23 (2), 7-13.
Sekaran, U. (2003). Research methods for business: a skill building approach (4th ed.).
New York, USA: John Wiley and Sons.
Sekaran, U., & Bougie, R. (2010). Research Methods for Business: A Skill Building
Approach (5th ed.). USA: John Wiley and Sons.
Services Sector Blueprint A Strategic Move To Increase Productivity (2015, March).
Bernama. Retrieved from http://www.bernama.com/bernama/v8/sp/
newssports.php?id=1117452
Seryasat, M. R., Salmani, M., Zamani, H., Karimian, T., & Seryasat, H. R. (2014).
Analysis of factors affecting tourism marketing rural marketing mix model
(P7) case study: district Baraghan. Advances in Environmental Biology, 8(6),
1810-1819.
Seth, N., Deshmukh, S. G., & Vrat, P. (2005). Service quality models: a review.
International Journal of Quality & Reliability Management, 22(9), 913-949.
DOI 10.1108/02656710510625211
Shaffer, G. S., & Anderson L. M. (1983). Perceptions of the security and attractiveness
of urban parking lots. Journal of Environmental Psychology, 5, 311-323.
Shari, M. H. (2015, April 1). Re: FW: e-CBID: ROC - application forms {electronic
mailing list message]. Retrieved from [email protected],
https://blu184.mail.live.com/?tid=cmSL-lCibY5BGU-tidZ2YpFA2&fid=
flsearch&srch=1&skws=fazrul%40ssm. com.my&sdr=4&satt=0

338
Sherman, E., Mathur, A., & Smith, R. B. (1997). Store environment and consumer
purchase behaviour: mediating role of consumer emotions. Psychology &
Marketing, 14(4), 361–378.
Sheth, J. N., Newman, B. I., & Gross, B. L. (1991). Why we buy what we buy: a theory
of consumption values. Journal of Business Research, 22, 159-170.
Shrier K. (2012, October). The parking spots takes branding to a new level. Parking
Today, 17(10), 44-45.
Shin, D. and Elliott, K. (2001). Measuring customers’ overall satisfaction: a multi-
attributes assessment. Services Marketing Quarterly, 22(1), 3-20. DOI:
10.1300/J396v22n01_02
Singh, B. (2014, May 2). Enforce OKU parking strictly. The Star Online. Retrieved
from http://www.thestar.com.my/Opinion/Letters/2014/05/02/Enforce-OKU-
parking-strictly/
Singh, K. (2007). Quantitative social research methods. India, New Delhi: Sage
Publications.
Singh, M. P., Chakraborty, A., & Raju, A. (2011). Contemporary issues in marketing
of life insurance services in India. International Journal of Multidisciplinary
Research, 1(7), 47-61.
Sinh, N. H. (2013). The fall of the marketing mix: a paradigm shift needed?
International Integration, 12(22), 83-88.
Sirohi, N., Mclaughlin, E. W., & Wittink, D. R. (1998). A model of consumer
perceptions and store loyalty intentions for a supermarket retailer. Journal of
Retailing, 74(2), 223-245.
Sivakumar, C. P., & Srinivasan, P. T. (2009). Involvement as moderator of the
relationship between service quality and behavioural outcomes of hospital
consumers. Asia Pacific Business Review, 5(4), 98-107. DOI:
10.1177/097324700900500408
Shoup, D. C. (1997). The high cost of free parking. Journal of Planning Education
and Research, 7, 3-20.
Shoup, D. (2013). On-Street parking management v. Off-Street parking requirements.
Access, 42, 38-40.
Shukla, P. (2010). Effects of perceived sacrifice, quality, value, and satisfaction on
behavioral intentions in the service environment. Services Marketing
Quarterly, 31(4), 466-484. DOI: 10.1080/15332969.2010.510730
Slater, S. F., & Narver, J. C. (1994). Market orientation, customer value, and superior
performance. Business Horizons, 37, 22-28.

339
Slattery, E.L., Voelker, C.C.J., Nussenbaum, B., Rich, J.T., Paniello, R.C. & Neely,
J.G. (2011). A Practical Guide to Surveys and Questionnaires.
Otolaryngology–Head and Neck Surgery, 144(6), 831 –837. DOI:
10.1177/0194599811399724
Sousanis, J. (2011, August 15). World Vehicle Population Tops 1 Billion Units.
WardsAuto. Retrieved from http://wardsauto.com/ar/world_vehicle_
population _110815
Spiliopouloua, C., & Antoniou, C. (2012). Analysis of illegal parking behavior in
Greece. Procedia - Social and Behavioral Sciences, 48(2012), 1622-1631.
DOI: 10.1016/j.sbspro.2012.06.1137
Spreng, R. A., Dixon, A. L., & Olshavsky, R. W. (1993). The impact of perceived
value on consumer satisfaction. Journal of Consumer Satisfaction,
Dissatisfaction and Complaining Behavior, 6, 50-55.
Spreng, R. A., & MacKoy, R. D. (1996). An empirical investigation of a model of
perceived service quality and satisfaction. Journal of Retailing, 72(2), 201-214.
Sreenivas, T., Srinivasarao, B., & Srinivasa, R. U. (2013). An analysis on marketing
mix in hospitals. Advances In Management, 6(2), 46-56.
Staudt, T. A., & Taylor, D. A, (1965), Marketing. A managerial approach. Homewood,
IL, Irwin.
Steiner, T., & Gleave, S. D. (2002). Improving the quality of city centre parking: will
the consumer pay? Parking focus – Cambridge case study, tec, 175-179.
Stevens, P., Knutson, B., & Patton, M. (1995). DINESERV: A tool for measuring
service quality in restaurants. Cornell Hotel and Restaurant Administration
Quarterly, 36(2), 56-60.
Stodnick, M., & Rogers, P. (2008). Using SERVQUAL to measure the quality of the
classroom experiance. Decision Sciences Journal of Innovative Education,
6(1), 115–132. DOI: 10.1111/j.1540-4609.2007.00162.x
Su, L., Li, T., Hu, Y., & Chen, J. (2013). Factor analysis on marketing mix of online
pharmacies − Based on the online pharmacies in China. Journal of Medical
Marketing: Device, Diagnostic and Pharmaceutical Marketing, 13(2), 93-101.
DOI: 10.1177/1745790413488778
Suki, N. M. (2014). Passenger satisfaction with airline service quality in Malaysia: A
structural equation modeling approach. Research in Transportation Business
& Management, 10, 26-32. DOI: 10.1016/j.rtbm.2014.04.001
Sun, Q., Zhu, S., Wang, H., & Liu, B. (2008). Research on public parking lots planning
based on traffic demand management. Published in IEEE, 1532-1535.

340
Sureshchandar, G. S., Rajendran, C., & Anantharaman, R. N. (2002). The relationship
between service quality and customer satisfaction: a factor specific approach.
Journal of Services Marketing, 16(4), 363-379.
Suuroja, M. (2003). Service quality – main conceptualizations and critique. University
of Tartu. Retrieved from http://www.mtk.ut.ee/sites/default/files/
mtk/toimetised/febawb23.pdf
Swaid, S. I., & Wigand, R. T. (2012). The effect of perceived site-to-store service
quality on perceived value and loyalty intentions in multichannel retailing.
International Journal of Management, 29(3/2), 301-313.
Sweeney, J., & Soutar, G. N. (2001). Consumer perceived value: the development of
a multiple-item scale. Journal of Retailing, 77(2), 203-222.
Sweeney, J. C., Soutar, G. N., & Johnson, L. W. (1996). Are satisfaction and
dissonance the same construct? a preliminary analysis. Journal of Consumer
Satisfaction, Dissatisfaction and Complaining Behavior, 9, 138-143.
Sweeney, J. C., Soutar, G. N., & Johnson, L. W. (1999). The role of perceived risk in
the quality-value relationship: a study in a retail environment. Journal of
Retailing, 75 (1), 77-105.
Tabachnick, B. G., & Fidell, L. S. (2013). Using Multivariate Statistics (6th ed.). USA:
Pearson Education.
Tellis, G. J. (1986). Beyond the many faces of price: an integration of pricing
strategies. Journal of Marketing, 50, 146-50.
Terpstra, M., & Verbeeten, F. H. M. (2014). Customer satisfaction: Cost driver or
value driver? Empirical evidence from the financial services industry.
European Management Journal, 32, 499-508. DOI:
10.1016/j.emj.2013.07.001
Teye, V. B., & Leclerc, D. (1998). Product and service delivery satisfaction among
North American cruise passengers. Tourism Manage. 19 (2), 153-160.
Thamrin H. M. (2012). The role of service marketing mix and ship service quality
towards perceived value and its impact to ship passenger’s satisfaction in
Indonesia. Global Journal of Management and Business Research, 12(3), 97-
101.
Thean, J. M. (2012). M'sia ranks 8th for service sophistication in Asia Pacific. The
Edge. Retrieved from http://www.theedgemalaysia.com/highlights/223400-
msia-ranks-8th-for-service-sophistication-in-asiapacific.html
Traders hit out at rude parking attendants (2007, August 6). The Star Online. Retrieved
from http://thestar.com.my/news/story.asp?file=/2007/8/6/north/18507771&
sec=north

341
The Star. Putting the best route forward. Article on press dated 24 September 2006.
The Star Online. Car parks at malls to be rated. Retrieved from
http://thestar.com.my/news/story.asp?file=/2012/9/25/nation/12046733&sec=
nation
Thompson, B., Cook, C., & Thompson, R. L. (2002). Reliability and structure
LibQUAL + TM scores: measuring perceived library service quality. Libraries
and the Academy, 2(1), 3-12.
Tiexina, C., Miaomiao, T., & Ze, M. (2012). The Model of Parking Demand Forecast
for the Urban CCD. Energy Procedia, 16(2012), 1393–1400.
doi:10.1016/j.egypro.2012.01.221
Toncar, M. F., Jane S. R., David J. B., Cynthia E. A., & Hieu P. N. (2006). Uniform
Assessment of the Benefits of Service Learning: The Development, Evaluation
and Implementation of the SELEB Scale,” Journal of Marketing Theory and
Practice, 14 (Summer), 233-248.
Torres, A., & Tribó, J. A. (2011). Customer satisfaction and brand equity. Journal of
Business Research, 64, 1089-1096. DOI:10.1016/j.jbusres.2010.12.001
Traynor, K. (1985). Research deserves status as Marketing’s fifth “P”. Marketing
News, 19(7), 12.
Treacy, M., & Wiersema, F. (1993). Customer intimacy and other value disciplines.
Harvard business review, Jan-Feb, 84-93.
Tridhoskul, P. (2014). Customers’ perception towards the service marketing mix and
frequency of use of Mercedes Benz. International Journal of Social,
Management, Economics and Business Engineering, 8(6), 1945–1947.
Trout, J. (1969). Positioning” is a game people play in today’s me-too market place.
Industrial Marketing, 5(6), 51–55.
Tuan, N.M., (2012). Effects of service quality and price fairness on student
satisfaction. International Journal of Business and Social Science, 3(19), 132-
150.
Turel, O., Serenko, A., & Bontis, N. (2007). User acceptance of wireless short
messaging services: deconstructing perceived value. Information &
Management, 44(1), 63-73.
Ulaga, W., & Eggert, A. (2005). Relationship value in business markets: the construct
and its dimensions. Journal of Business-to-Business Marketing, 12(1), 73-99.
DOI: 10.1300/J033v12n01_04
United Nations (2012). World population 2012. Retrieved from http://www.
unpopulation.org

342
Untachai, S. (2013). Modeling service quality in hospital as a second order factor,
Thailand. Procedia - Social and Behavioral Sciences, 88, 118-133. DOI:
10.1016/j.sbspro.2013.08.487
Vanniarajan, T., & Gurunathan, P. (2009). Evaluation of linkage between service
quality, customer satisfaction and repurchase intentions: An application of
SEM. Asia-Pacific Business Review, 5(4), 108-118. DOI:
10.1177/097324700900500409
Vavra, T.G. (1997). Improving your measurement of customer satisfaction: A guide to
creating, conducting, analyzing, and reporting customer satisfaction
measurement programs, ASQC Quality Press, Milwaukee.
Vieira, V. A. (2013). Stimuli–organism-response framework: a meta-analytic review
in the store environment. Journal of Business Research, 66, 1420–1426.
DOI:10.1016/j.jbusres.2012.05.009
Vignali, C., & Davies, B. J. (1994). The marketing mix redefined and mapped -
Introducing the MIXMAP model. Management Decision, 32(8), 11-16.
Verma, R., Thompson, G. M., Moore, W. L., & Louviere, J. J. (2001). Effective design
of products/services: an approach based on integration of marketing and
operations management decisions. Decision Sciences, 32(1), 165-193.
Voima, P., Heinonen, K., & Strandvik, T. (2010). Exploring customer value
formation: a customer dominant logic perspective. Finland Helsinki: Hanken
School of Economics.
Yang, Z., & Peterson, R. T. (2004). Customer perceived value, satisfaction, and
loyalty: the role of switching costs. Psychology & Marketing, 21(10), 799-822.
DOI: 10.1002/mar.20030
Yasanallah, P., & Vahid, B. (2012). Studying the status of marketing mix (7Ps) in
consumer cooperatives at ilam province from members’ perspectives.
American Journal of Industrial and Business Management, 2, 194-199.
DOI:10.4236/ajibm.2012.24025
Yass, A. A., Yasin, N. M., Alam, G. M., & Zaidan, B. B. (2010). SSME architecture
design in reserving parking problems in Malaysia. African Journal of Business
Management, 4(18), 1-13.
Ye, Q., Li, H., Wang, Z., & Law, R. (2014). The influence of hotel price on perceived
service quality and value in e-tourism: an empirical investigation based on
online traveler reviews. Journal of Hospitality & Tourism Research, 38(1), 23-
39. DOI: 10.1177/1096348012442540
Yeung, M. C. H., Ramasamy, B., Chen, J., & Paliwoda, S. (2013). Customer
satisfaction and consumer expenditure in selected European countries. Intern.
J. of Research in Marketing, 30, 406-416. DOI:
10.1016/j.ijresmar.2013.06.001

343
Yi, Y. (1989). A critical review of consumer satisfaction. University of Michigan.
Yi, Y. (1990). A critical review of consumer satisfaction. In V.A. Zeithaml (Ed.),
Review of marketing 1990 Chicago: American Marketing Association.
Yi, Y. (1993). The determinants of consumer satisfaction: the moderating role of
ambiguity. Advances in Consumer Research, 20(1), 502-506.
Yoo, B., & Donthu, N. (2001). Developing a scale to measure the perceived quality of
an Internet shopping site (SITEQUAL). Quarterly Journal of Electronic
Commerce, 2(1), 31-46.
Yousapronpaiboon, K. (2014). SERVQUAL: measuring higher education service
quality in Thailand. Procedia - Social and Behavioral Sciences, 116, 1088-
1095. DOI: 10.1016/j.sbspro.2014.01.350
Yudelson, J. (1999). Adapting McCarthy’s four P’s for the twenty-first century.
Journal of Marketing Education, 21(1), 60-67. DOI:
10.1177/0273475399211008
Wahid, R.A., & Mahmood, R. (2013). Relationship of intellectual capital dimensions
and performance of banks in Malaysia: an exploratory study. International
Journal of Business and Social Science, 4(15), 151-159.
Walsh, G., Shiu, E., & Hassan, L. M. (2014). Replicating, validating, and reducing the
length of the consumer perceived value scale. Journal of Business Research,
67, 260-267. DOI: 10.1016/j.jbusres.2013.05.012
Wang, F., Head, M., & Archer, N. (2000). A relationship-building model for the web
retail marketplace. Internet Research: Electronic Networking Applications and
Policy, 10(5), 374-384.
Wang, Y. J., Hernandez, M. D., & Minor, M. S. (2010). Web aesthetics effects on
perceived online service quality and satisfaction in an e-tail environment: the
moderating role of purchase task. Journal of Business Research, 63, 935–942.
Wang, Z., & Zhou, W. (2010). Current Situation and Improvement Strategy for
Campus Parking in China. 2010 International Conference on Intelligent
Computation Technology and Automation, Published in IEEE computer
society, 1075-1078. DOI 10.1109/ICICTA.2010.214
Waterschoot W. V., & Bulte, C. V. D. (1992). The 4P classification of the marketing
mix revisited. Journal of Marketing, 56, 83-93.
What women say about car park security... (2012, June 15). News Strait Times.
Retrieved from http://www.nst.com.my/streets/central/what-women-say-
about-car-park-security-1.94808

344
Webb, D., & Jagun, A. (1997). Customer care, customer satisfaction, value, loyalty
and complaining behavior: validation in a UK university setting. Journal of
Consumer Satisfaction, Dissatisfaction and Complaining Behavior, 10, 139-
151.
Welsh, D., & Raven, P. (2006) 'Family Business in the Middle East: an exploratory
study of retail management in Kuwait and Lebanon. Family Business Review,
19(1), 29-48.
Wickham, M. (2009). Thana-marketing strategy: Exploring the bps that dare not speak
their name. International Journal of Business Strategy, 9(1), 194-201.
Williams, P., & Soutar, G. N. (2009). Value, satisfaction and behavioural intentions in
an adventure tourism context. Annals of Tourism Research, 36(3), 413-438.
Wilson, B. (2011). An investigation into three consumer constructs: explaining the
nature of relations influencing brand relationship quality (Doctoral
Dissertation). Retrieved from http://www.researchgate.net/publication/
256369736
Wind, Y. (1986). Models for marketing planning and decision making. In Buell, V.P.
(Ed.), Handbook of Modern Marketing, New York, NY: McGraw-Hill.
Wold, H. (1982). Soft modelling: the basic design and some extensions. In K.G.
Jöreskog and H. Wold (Eds.), Systems Under Indirect Observation, Part II,
Amsterdam: North-Holland Publishing.
Women want peace of mind at car parks (2012, June 10). The Star Online. Retrieved
from http://thestar.com.my/news/story.asp?file=/2012/6/10/nation/11452495
&sec=nation
Wong, E. (2012, June 2). Making car parks safer. The Star Online. Retrieved from
http://thestar.com.my/news/story.asp?file=/2012/6/2/focus/11403147&sec=fo
cus
Wong, I. A., & Fong, V. H. I. (2012). Development and validation of the casino service
quality scale: CASERV. Int. J. Hosp. Manage. 31(1), 209–217. DOI:
10.1016/j.ijhm.2011.04.005
Wong, I. A., & Fong, V. H. I. (2010). Examining casino service quality in the Asian
Las Vegas: an alternative approach, Journal of Hospitality Marketing &
Management, 19(8), 842-865. DOI: 10.1080/19368623.2010.514553
Woodall, T., (2003). Conceptualising “Value for the customer”: an attributional,
structural and dispositional analysis. Academy of Marketing Science Review,
12, 1-41.
Woodruff, R. B. (1997). Customer value: the next source of competitive advantage.
Journal of the Academy of Marketing Sciences, 25, 139-53.
345
Wreiner, T., Mårtensson, I., Olof Arnell, O., Gonzalez, N., Holmlid, S., & Segelström,
F. (2009). Exploring service blueprints for multiple actors: a case study of car
parking services. Nordic Conference on Service Design and Service
Innovation, 1-11.
Wu, H. C., & Cheng, C. C. (2013). A hierarchical model of service quality in the airline
industry. Journal of Hospitality and Tourism Management, 20, 13-22. DOI:
10.1016/j.jhtm.2013.05.001
Wu, C. H. J., & Liang, R. D. (2009). Effect of experiential value on customer
satisfaction with service encounters in luxury-hotel restaurants. International
Journal of Hospitality Management, 28(4), 586-593.
DOI:10.1016/j.ijhm.2009.03.008
Wu, H. C. (2014). The effects of customer satisfaction, perceived value, corporate
image and service quality on behavioral intentions in gaming establishments.
Asia Pacific Journal of Marketing and Logistics, 26(4), 540-565. DOI:
10.1108/APJML-03-2014-0049
Wu, H. C., & Ko, Y. J. (2013). Assessment of Service Quality in the Hotel Industry.
Journal of Quality Assurance in Hospitality & Tourism, 14(3), 218-244. DOI:
10.1080/1528008X.2013.802557
Wu, I. L. (2013). The antecedents of customer satisfaction and its link to complaint
intentions in online shopping: An integration of justice, technology, and trust.
International Journal of Information Management, 33, 166-176. DOI:
10.1016/j.ijinfomgt.2012.09.001
Wu, H. C., Li, M. Y., & Li, T. (2014). A study of experiential quality, experiential
value, experiential satisfaction, theme park image, and revisit intention.
Journal of Hospitality & Tourism Research, 20(10), 1-48. DOI:
10.1177/1096348014563396
Wu, H. C., & Li, T. (2014). A study of experiential quality, perceived value, heritage
image, experiential satisfaction, and behavioral intentions for heritage tourists.
Journal of Hospitality & Tourism Research, 20(10), 1-41. DOI:
10.1177/1096348014525638
Wu, Y., (2011). Analysis of Present Status and Prediction of Future Demand on
Parking in the Central Area of Medium and Small City: Vehicle Parking
Investigation and Analysis in Changping. Published in IEEE, No. 978-1-4244-
9171-1, 57 – 60.
Zeithaml, V. A. (1988). Consumer perceptions of price, quality and value: a means-
end model and synthesis of evidence. Journal of Marketing, 52 (3), 2-22.
Zeithaml, V. A., Berry, L. L., & Parasuraman, A. (1996). The behavioral consequences
of service quality. Journal of Marketing, 60, 31-46.

346
Zeithaml, V. A., Parasuraman, A., & Berry, L. L. (1990). Delivering quality service.
New York: The Free Press.
Zeithaml, V. A., Parasuraman, A., & Malhotra, A. (2002). Service quality delivery
through websites: a critical review of extant knowledge. Journal of the
Academy of Marketing Science, 30(4), 362-75.
Zikmund, W.G. (2003). Business Research Methods (7th ed.). Ohio, USA: Thompson
South-Western.
Zulzaha, F. F. (2014, April 26). Touts collecting fees illegally at parking lot in Kajang.
The Star Online. Retrieved from http://www.thestar.com.my/
News/Community/2014/04/26/Touts-collecting-fees-illegally-at-parking
lotin-Kajang

347
APPENDICES
APPENDIX A
Measurement of customer satisfaction used in recent studies
No. Authors Industry Approach Item/s Scales Components
1 Albayrak & Caber (2015) Hotel Transaction 1 1: strongly disagree, 5: strongly agree General satisfaction
2 Han & Hyun (2015) Medical Tourism Cumulative 3 1 : Extremely disagree, 7: Extremely agree General satisfaction, affective and cognitive
3 Akamavi et al. (2015) Airlines Transaction 4 1: strongly disagree, 5: strongly agree Cognitive and affect-based
4 Eid & El-gohary (2015) Tourism Transaction 4 1: strongly disagree, 5: strongly agree Emotion, performance, cognitive
5 Noyan & Şimşek (2014) Shopping Transaction 7 1: completely disagree, 10: completely agree General satisfaction, affective, value,
disconfirmation, cognitive and need fulfillment
6 Hassan, Jusoh & Hamid
(2014)
Insurance Cumulative 5 1: strongly disagree, 7: strongly agree General satisfaction, affective, disconfirmation
and cognitive
7 Eisingerich et al. (2014) Financial services Cumulative 3 1: strongly disagree, 7: strongly agree General satisfaction, affective and cognitive
8 Loureiro, et al. (2014) Shopping Transaction 3 1: strongly disagree, 10: strongly agree Cognitive and affect-based
9 Giovanis et al. (2014) Telecommunication Transaction 3 1: strongly disagree, 7: strongly agree Emotion
10 Suki (2014) Airlines Transaction 3 1: strongly disagree, 5: strongly agree Emotion, performance, cognitive
11 Wu (2014) Casino Transaction 3 1: strongly disagree, 7: strongly agree General satisfaction, affective and cognitive
12 Ali (2014) Hotel Transaction 4 1: strongly disagree, 5: strongly agree Cognitive and affect-based
13 Koufteros et al., 2014 Web purchase Cumulative 8 1: strongly disagree, 7: strongly agree General satisfaction, affective, disconfirmation,
cognitive and need fulfillment
14 Koufteros et al., 2014 Web purchase Transaction 9 1: strongly disagree, 7: strongly agree General satisfaction, affective, disconfirmation,
cognitive and need fulfillment
15 Terpstra &Verbeeten (2014) Financial services Cumulative 9 1: totally disagree, 4: totally agree General satisfaction, affective, disconfirmation,
cognitive and need fulfillment

348
APPENDIX A (Continued)
No. Authors Industry Approach Item/s Scales Components
16 Chakraborty & Sengupta
(2013)
Telecommunication Cumulative 1 1: strongly disagree, 7: strongly agree General satisfaction
17 Chou & Chiang (2013) Software Cumulative 1 (1) Very dissatisfied/very satisfied; (2) Very
displeased/very pleased; (3) Very
frustrated/very contented; (4) Absolutely
terrible/absolutely delighted.
Cognitive and affect-based
18 Fatima & Razzaque (2013) Banking Cumulative 1 1: strongly disagree, 5: strongly agree General satisfaction
19 Howat & Assaker (2013) Public Aquatic Cumulative 2 1: displeased, 7: pleased General satisfaction and affective
20 Etemad-Sajadi & Rizzuto
(2013)
Restaurant Cumulative 3 1: strongly disagree, 5: strongly agree General satisfaction and affective
21 Gallarza, et al. (2013) Tourism Transaction 3 1: very low, 5: very high Affective, cognitive and need fulfillment
22 Hosany & Prayag (2013) Tourism Transaction 3 1: extremely dissatisfied, 6: extremely
satisfied; 1: terrible, 6: delighted; 1: much
worse than expected, 6: much better than
expected; 1: strongly disagree, 6: strongly
agree
General satisfaction, affective and
disconfirmation
23 Jung & Yoon (2013) Restaurant Transaction 4 1: strongly disagree, 7: strongly agree General satisfaction, affective and
disconfirmation
24 Hsu (2013) Web purchase Transaction 3 1: strongly disagree, 5: strongly agree General satisfaction, affective and cognitive
25 Ha & Park (2013) Technology Cumulative 4 1: strongly disagree, 7: strongly agree General satisfaction, affective and cognitive
26 Ihtiyar, Ahmad & Baroto
(2013)
Retail outlet Cumulative 4 1: very low, 7: very high Performance

349
APPENDIX B
Improvement and enhancement of marketing mix concept (4Ps)
Source Additional element and changes to 4Ps concept
Perspective
Concern
Ma
na
ger
ial
Cu
sto
mer
Su
pp
lier
Trout (1969) Add Positioning x Consumer perception
Nickels & Jolson
(1976) Add Packaging x Packaging
Mindak & Fine
(1981) Add Public relations x External relationship
Booms & Bitner
(1981) Add Participants, Physical Evidence and Process x
Service delivery and
performance
Ohmae (1982) Add Customers, Competitors and Corporation x Competitiveness Strategy
Kotler (1984) Add Political Power and Public Relations x External factors
Traynor (1985) Add Probe x Marketing research
Johnson (1986) Add Purpose, Probe, Perceive, Perform, Predict,
Plan, People and Professional x Marketing functions
MaGrath (1986) Personnel, physical facilities and process
management x Services marketing
Tellis (1986) Proposed new pricing strategies, x Pricing strategies
Wind (1986)
Add Positioning, Portfolio of Market Segments,
Portfolio by Product Segment and Distribution,
Portfolio of Countries by Mode of Entry, Political
Marketing Tools, Public Relations and Public
Affairs and The Marketing Program
x Business strategy decision
Judd (1987) Add People x Differentiation in industrial
marketing
Zeithaml (1988) Proposed new strategies for understanding
consumer buying behavior x Price, quality and value
Berry (1990) Add Service, Customer Sensitivity and Customer
Convenience x
Service delivery and
performance
Christopher, Payne
and Ballantyne
(1991)
Add People, processes, and customer service x Relationship marketing
Robins (1991) Add Customers, Competitors, Company and
Capabilities x Customer orientation
LeDoux (1991) Add Preservation x Environmental
Waterschoot &
Bulte (1992) Add Communication mix divided into Mass mix,
Personal mix and Publicity Mix x
Customer awareness,
knowledge and motivation
towards product mix
Doyle (1995) Add Services and Staff x Service delivery
Grönroos (1994) Acknowledged relationship marketing and
retention is unique x Relationship marketing
Gummesson (1994)
Acknowledged that relationship (and retention)
marketing is unique, but proposed no additions or
changes to the 4Ps x x Relationship marketing
Bennett (1997)
Proposed the 5Vs that relate to the customer
Value, Viability, Variety, Volume, and Virtue,
but no actual additions or changes to the 4Ps. x Strategic customer focus
Gummesson (1997) Propose 30Rs related to relationship x x Relationship marketing

350
APPENDIX B (Continued)
Source Additional element and changes to 4Ps concept
Perspective
Concern
Ma
na
ger
ial
Cu
sto
mer
Su
pp
lier
Parasuraman (1998)
Suggest marketing must be personalized with
emphasis on customer service, teamwork, quality,
and excellence x Customer service
Yudelson (1999) Add Partners x Value-creating
exchange activity
Goldsmith (1999)
Called extended marketing mix as Personnel,
Physical Assets, and Procedures. Add
Personalization to 7Ps x
Customer Service and World
Wide Web
Melewar &
Saunders (2000) Add Publication to 7Ps x Brand communication
English (2000) Replace or augment with 4Rs: Relevance,
Response, Relationships and Results x
Customer relationship and
Marketing strategies
Grove, Fisk, & John
(2000) Add Actors, Audience, Setting, Performance x Customer service
Wang, Head &
Archer (2000)
Suggest marketing mix for relationship, retail,
and web marketing must consider Database,
Interaction, Network x
Relationship marketing via
World Wide Web
Schultz (2001) Proposed that the mix should consider the triad of
marketer, employee, and customer x Service delivery
Gagliardi (2001) Add Profit x Profitable orientation
Beckwith (2001) Replace and/or augment with: Price, Brand,
Packaging and Relationships x Service marketing
Constantinides
(2002)
Replace or augment with 4Ss: Scope: Strategy,
analysis, customers, objectives, Site: Web site
experience, Synergy: Integration with other
departments, System: Technology administration
x E-Marketing project
Lovelock & Wright
(2002) Add Productivity and Quality into 7Ps framework x
Valued added to service
marketing
Claffey (2006)
Described the five attributes of e- marketing
namely pervasive communications, mobility,
ubiquity, context, and personalization x E-marketing
Afridi (2009)
Adopted Booms & Bitner’s 7Ps, but called
extended elements as People, Physical Evidence,
and Process. x Service marketing
Marcu & Gherman
(2010)
Proposed new promotion strategies based on
product life cycle stages x
Product life cycle and
promotion
Gordon (2012)
Replace or augment with: Consumer as center
point shaped by Cost, Channels/Strategies,
Circumstances, Process,
Organization/Competition
x Consumer orientation strategy
Azadi &
Rahimzadeh (2012)
Combine the 4Ps with Porter’s (1979) five
competitive forces x External factors
Amerland (2013) Change to Purpose, Presence, Proximity and
Partnerships x
Social marketing via valuing
customer

351
APPENDIX C
Definitions of value from customer perspective
No. Source Term of
value
Context/
Approach Definition
1 Ledden, et al.
(2011)
Consumer
perceived
value
B2C
Experiential
A personal, comparative judgment of a consumer’s
preferred object formed through his/her experience of
interacting with that object.
2 Chang & Wang
(2011)
Perceived
value
B2C
Benefit and
sacrifice
As a consumer’s perception of the net benefits gained
based on the trade-off between relevant benefits and
sacrifices derived from the online shopping process,
which is an objective evaluation from personal
cognition.
3 Pynnönen,
Ritala, &
Hallikas (2011)
Customer
value
B2C
Attribute
The systemic customer value reflects the value
delivered to the customer is dependent on more than
one attribute and possibly on more than one firm.
4 Kim &
Damhorst (2010)
Perceived
value
B2C
Benefit and
sacrifice
A consumer’s subjective overall evaluation of the
benefits and sacrifices of both the product and
shopping experience, including emotional, monetary,
time, convenience and merchandise assortment values
derived from apparel shopping at the retailer site.
5 Helkkula &
Kelleher
(2010)
Customer
perceived
value
B2C
Experiential
Is a holistic phenomenon, which is subjective, event
specific, personal, and individually and socially
constructed
6 Grönroos, 2008 Value for
customers
B2C
Experiential
Means that after they have been assisted by a self-
service process (cooking a meal or withdrawing cash
from an ATM) or a full-service process (eating out at
a restaurant or withdrawing cash over the counter in a
bank) they are or feel better off than before
7 Woodall (2003) Value for
the
customer
B2C
Benefit and
sacrifice
Any demand-side, personal perception of advantage
arising out of a customer’s association with an
organisation’s offering and can occur as reduction in
sacrifice; presence of benefit (perceived as either
attributes or outcomes); the resultant of any weighted
combination of sacrifice and benefit (determined and
expressed either rationally or intuitively); or an
aggregation, over time, of any or all of these.
8 Chen &
Dubinsky
(2003)
Customer
perceived
value
B2C
Benefit and
sacrifice
A consumer’s perception of the net benefits gained in
exchange for the costs incurred in obtaining the
desired benefits
9 Holbrook (2002) Consumer
value
B2C
Experiential
As interactive relativistic preference experience
10 Eggert & Ulaga
(2002)
Customer
perceived
value
B2B
Benefit and
sacrifice
Trade-off between benefits and sacrifices perceived by
customers in a seller’s offering.
11 Slater & Narver
(2000)
Customer
value
B2C
Benefit and
sacrifice
As a trade-off between the benefit of consuming
products/ services and the disadvantage (or sacrifice)
involved.
12 Lapierre (2000) Customer
perceived
value
B2B
Benefit and
sacrifice
The difference between the benefits and the sacrifices
perceived by customers in terms of their expectations
such as needs and wants.
13 Lovelock (2000) B2C
Benefit and
sacrifice
A trade-off between perceived benefits and perceived
costs.

352
APPENDIX C (Continued)
No. Source Term of
value
Context/
Approach Definition
14 Sirohi,
McLaughlin &
Wittink (1998)
Perceived
value
B2C
Benefit and
sacrifice
What you [consumer] get for what you pay.
15 Woodruff
(1997)
Customer
value
B2C
Means-end
A customer’s perceived preference for and
evaluation of those product attributes, attribute
performances, and consequences arising from use
that facilitate (or block) achieving the customer’s
goal and purposes in use situations.
16 Woodruff &
Gardial
(1996)
Customer
value
B2C
Means-end
A customer’s perceived perception of what they
want to happen in a specific use situation, with the
help of a product and service ordering, in order to
accomplish a desired purpose or goal.
17 Butz &
Goodstein
(1996)
Customer
value
B2C
Benefit and
sacrifice
The emotional blond established between a customer
and a producer after the customer had used a salient
product or service produced by that supplier and
found the product to provide an added value.
18 Ravald &
Grönroos (1996)
Customer
perceived
value
B2C
Benefit and
sacrifice
Trade-off between benefits and sacrifices perceived
by customers in a seller’s offering. (Episode and
relationship value).
19 Jayanti & Ghosh
(1996)
Perceived
service value
B2C
Benefit and
sacrifice
As a direct consequence of perceived quality as well
as of price-based transaction and acquisition utilities.
20 Spreng, Dixon
& Olshavsky
(1993)
Expected
perceived
value
B2C
Benefit and
sacrifice
A consumer’s anticipation about the outcome of
purchasing a product or service based on future
benefits and sacrifices.
21 Sheth, Newman
& Gross (1991)
Consumption
value
B2C
Buy or not
buy (use or
not use)
The five values influencing market choice behaviour
are functional value, social value, emotional value,
epistemic value and conditional value.
22 Dodds et al.
(1991)
Perceived
value
B2C
Benefit and
sacrifice
As a trade-off between perceived quality and
perceived psychological as well as monetary
sacrifice.
23 Monroe (1990) Perceived
value
B2C
Benefit and
sacrifice
A tradeoff between the quality or benefits they
perceive in the product relative to the sacrifice they
perceive by paying the price.
24 Zeithaml (1988) Perceived
value
B2C
Means-end
A consumer’s overall assessment of the utility of a
product based on perceptions of what is received and
what is given.

353
APPENDIX D
The summary of original measurement scales and reliability results ORIGINAL ADAPTED
No. Variable Measurement
scales
Number
of items Scales Reliability
Number of
items
1 Service product Al-Dmour et al.
(2013)
5 1 = strongly disagree
and 5= strongly agree
0.94 2
Bradley (2001) 6 10 point scales from
inferior performance to
superior performance
N.A. 3
Akroush (2011) 5 N.A. 0.88 1
2 Service price Martin et al.
(2009)
3 1 = strongly disagree
and 7 = strongly agree
0.97 1
Al-Dmour et al.
(2013)
4 1 = strongly disagree
and 5= strongly agree
0.94 3
Akroush (2011) 3 N.A. 0.83 1
3 Service place Sreenivas et al.
(2013)
7 1 = strongly disagree
and 5= strongly agree
N.A. 1
Al-Dmour et al.
(2013)
6 1 = strongly disagree
and 5= strongly agree
0.94 2
Bradley (2001) 6 10 point scales from
inferior performance to
superior performance
N.A. 2
4 Service
promotion
Bradley (2001) 5 10 point scales from
inferior performance to
superior performance
N.A. 3
Al-Dmour et al.
(2013)
6 1 = strongly disagree
and 5= strongly agree
0.94 1
Yoo, Donthu, and
Lee (2000)
3 1 = strongly disagree
and 5= strongly agree
0.87 1
Akroush and Al-
Dmour (2006)
7 1 = strongly disagree
and 5= strongly agree
0.87 1
5 Service people Bradley (2001) 5 10 point scales from
inferior performance to
superior performance
N.A. 1
Akroush and Al-
Dmour (2006)
7 1 = strongly disagree
and 5= strongly agree
0.89 3
He, Lee, and Lai
(2011)
4 (Managerial
support)
1 = strongly disagree
and 7 = strongly agree
0.75 1
He, Lee, and Lai
(2011)
4 (Work
facilitation) 1 = strongly disagree
and 7 = strongly agree
0.72 1
6 Service process Akroush and Al-
Dmour (2006)
6 1 = strongly disagree
and 5= strongly agree
0.78 3
Sreenivas et al.
(2013)
6 1 = strongly disagree
and 5= strongly agree
N.A. 2
7 Service physical
evidence
Akroush and Al-
Dmour (2006)
5 1 = strongly disagree
and 5= strongly agree
0.78 4
Chen (2011) 3 1 = very unimportant
and 5= very important
0.86 1
8 Tangible Parasuraman et al.
(1988)
4 1 = strongly disagree
and 7 = strongly agree
0.72 4
9 Reliability Parasuraman et al.
(1988)
5 1 = strongly disagree
and 7 = strongly agree
0.83 5
10 Responsiveness Parasuraman et al.
(1988)
4 1 = strongly disagree
and 7 = strongly agree
0.82 4
11 Assurance Parasuraman et al.
(1988)
4 1 = strongly disagree
and 7 = strongly agree
0.81 4
12 Empathy Parasuraman et al.
(1988)
5 1 = strongly disagree
and 7 = strongly agree
0.86 5

354
APPENDIX D (Continued) ORIGINAL ADAPTED
No. Variable Measurement
scales
Number
of items Scales Reliability
Number of
items
13 Technical Kang and James
(2004)
3 1 = strongly disagree
and 7 = strongly agree
0.78 2
Brady and Cronin
(2001)
2 (Outcome
quality)
1 = strongly disagree
and 7 = strongly agree
0.90 1
Brady and Cronin
(2001)
3 (Waiting
time)
1 = strongly disagree
and 7 = strongly agree
0.82 1
Rajaratnam et al.
(2014)
3 N.A. N.A. 1
14 Emotional value Sweeney and
Soutar (2001)
5 1 = strongly disagree
and 7 = strongly agree
0.94 3
15 Social value Sweeney and
Soutar (2001)
4 1 = strongly disagree
and 7 = strongly agree
0.82 3
16 Performance &
Quality value
Sweeney and
Soutar (2001)
6 1 = strongly disagree
and 7 = strongly agree
0.91 3
17 Price & value
for money
Sweeney and
Soutar (2001)
4 1 = strongly disagree
and 7 = strongly agree
0.80 3
18 Customer
satisfaction
Eisingerich et al.
(2014)
3 1 = strongly disagree
and 7 = strongly agree
0.87 3
Terpstra and
Verbeeten (2014)
9 0 = totally disagree to 4
= totally agree
0.91 2
Suki (2014) 3 1= strongly disagree to
5= strongly agree
0.74 1

355
APPENDIX E
A sample of letter to parking operator for requesting data of total number of monthly season
parking customers

356
APPENDIX F
Evidence parking allocation ratio to building tenants

357
APPENDIX G
Letter to National Property Information Center (NAPIC) of Valuation and Property Services
Department

358
APPENDIX G (Continued)

359
APPENDIX H
A list of private building names located in Kuala Lumpur, Selangor and Putrajaya
LIST OF PRIVATE OFFICE BUILDING - KLANG VALLEY
No MUNICIPAL NAMA BANGUNAN1 DBKL KLCC TWIN TOWER
2 DBKL KOMPLEKS PEJABAT DAMANSARA
3 DBKL G TOWER
4 DBKL MENARA TELEKOM
5 DBKL NORTH & SOUTH GARDEN MIDVALLEY
6 DBKL SUNWAY TOWER 2
7 DBKL TAMBAHAN SURIA KLCC (KLCC TOWER 3)
8 DBKL THE INTERMARK
9 DBKL MENARA BINJAI
10 DBKL MENARA UOA BANGSAR
11 DBKL MENARA CITIBANK
12 DBKL MENARA FELDA
13 DBKL MENARA AIA
14 DBKL PLAZA SENTRAL
15 DBKL STANDARD CHARTERED BANK
16 DBKL MENARA SAFUAN
17 DBKL Wisma Mont Kiara
18 DBKL DATARAN MAYBANK ( MAYBANK LIFE ASSURANCE)
19 DBKL 3 Towers, Jalan Ampang
20 DBKL BANGUNAN GETAH ASLI
21 DBKL VISTA TOWER
22 DBKL THE INTERMARK
23 DBKL WISMA SMI
24 DBKL MENARA PRESTIGE
25 DBKL MENARA MAXIS
26 DBKL KL SENTRAL PARK (Platinum Sentral)
27 DBKL MENARA PUBLIC BANK
28 DBKL GRAND SEASONS AVENUE
29 DBKL THE ICON
30 DBKL WISMA AIG
31 DBKL BANGUNAN PUBLIC FINANCE
32 DBKL TM ANNEXE 1 & 2
33 DBKL WISMA PARADISE
34 DBKL MEGAN AVENUE II
35 DBKL CENTREPOINT NORTH & SOUTH @ MID VALLEY CITY
36 DBKL MENARA PJD
37 DBKL EXCHANGE SQUARE & ANNEXE
38 DBKL ETIQA TWINS
39 DBKL MENARA EXXONMOBIL
40 DBKL WISMA MBSB
41 DBKL DUA SENTRAL
42 DBKL WISMA GENTING & ANNEXE
43 DBKL PLAZA MBF
44 DBKL MENARA GREAT EASTERN
45 DBKL WISMA ZEELAN BANDAR TUN RAZAK
46 DBKL MENARA PNB
47 DBKL MENARA HLA
48 DBKL DATARAN KEWANGAN DARUL TAKAFUL
49 DBKL BANGUNAN MING & ANNEXE
50 DBKL SEMUA HOUSE
51 DBKL MENARA CELCOM
52 DBKL PLAZA MONT KIARA
53 DBKL WISMA SELANGOR DREDGING
54 DBKL MENARA KECK SENG
55 DBKL BANGUNAN BANK NEGARA
56 DBKL PLAZA SENTRAL
57 DBKL MENARA FABER

360
APPENDIX H (Continued)
58 DBKL RHB CENTRE (Tower 1,2 & 3)
59 DBKL BANGUNAN AMBANK GROUP
60 DBKL WISMA TUNE
61 DBKL MENARA SEE HOY CHAN
62 DBKL WISMA DANG WANGI
63 DBKL 1 SENTRAL
64 DBKL MENARA TA ONE
65 DBKL MENARA YAYASAN TUN RAZAK
66 DBKL HP TOWERS
67 DBKL MENARA BANK ISLAM
68 DBKL WISMA CENTRAL
69 DBKL MENARA UBN
70 DBKL SOUTHGATE
71 DBKL 100 PUTRA PALACE
72 DBKL MENARA TAN & TAN
73 DBKL KOMPLEKS CAMPBELL
74 DBKL MENARA STANDARD CHARTERED
75 DBKL WISMA ALLIANZ
76 DBKL WISMA UOA DAMANSARA II
77 DBKL MENARA UEM
78 DBKL QUILL 7
79 DBKL PLAZA SEE HOY CHAN
80 DBKL BANGUNAN MALAYSIAN RE
81 DBKL MENARA DION
82 DBKL MENARA IMC
83 DBKL BANGUNAN IBU PEJABAT TABUNG HAJI
84 DBKL FIRST NATIONWIDE
85 DBKL PLAZA PUDU
86 DBKL MIDA
87 DBKL MENARA ZURICH
88 DBKL PLAZA DAMANSARA BLOK A
89 DBKL TH SELBORN
90 DBKL MENARA WORLDWIDE
91 DBKL BANGUNAN HONG LEONG
92 DBKL WISMA GOLDHILL
93 DBKL BANGUNAN BANGKOK BANK
94 DBKL MENARA WELD
95 DBKL MENARA PGRM
96 DBKL CHULAN TOWER
97 DBKL MENARA PERKESO
98 DBKL BANGUNAN MAYBANK
99 DBKL SSM
100 DBKL WISMA CHASE PERDANA
101 DBKL KOMPLEKS ANTARABANGSA
102 DBKL WISMA HANG SAM
103 DBKL MENARA KENCANA PETROLEUM
104 DBKL KENANGA INTERNATIONAL
105 DBKL WISMA DAMANSARA
106 DBKL WISMA HONG LEONG
107 DBKL BANGUNAN TUNAS UTAMA
108 DBKL BANGUNAN MAS
109 DBKL BANGUNAN LUEN HENG
110 DBKL WISMA TELEKOM
111 DBKL Sentral Vista @ Brickfields
112 DBKL BANGUNAN AMDB
113 DBKL MEGAN AVENUE I
114 DBKL MENARA KH
115 DBKL WISMA ROHAS PERKASA
116 DBKL MENARA ATLAN
117 DBKL UOA CENTRE
118 DBKL KOMPLEKS PUSAT ISLAM

361
APPENDIX H (Continued)
119 DBKL Menara YNH, Jalan Sultan Ismail
120 DBKL PNB DARBY PARK
121 DBKL MENARA TOKIO MARINE LIFE
122 DBKL DEWAN BAHASA DAN PUSTAKA
123 DBKL MENARA BRDB
124 DBKL PLAZA OSK
125 DBKL BANGUNAN PLAZA PENGKALAN
126 DBKL MEGAN AVENUE I
127 DBKL MENARA BOUSTEAD
128 DBKL BANGUNAN AMODA
129 DBKL WISMA KAH MOTOR
130 DBKL BANGUNAN BALAI FELDA
131 DBKL WISMA UOA
132 DBKL WISMA PERKESO
133 DBKL WISMA KWSG
134 DBKL ORIENTAL BANK
135 DBKL WISMA JERNEH
136 DBKL BANGUNAN LEE YAN LIAN
137 DBKL MENARA IGB & ANNEXE BLOCK
138 DBKL KOMPLEK PEJABAT BUKIT DAMANSARA
139 DBKL PLAZA PERMATA
140 DBKL MENARA JCORP
141 DBKL MENARA PARK
142 DBKL BANGUNAN MENARA AFFIN
143 DBKL BANGUNAN SHELL
144 DBKL WISMA INAI
145 DBKL PLAZA YTL
146 DBKL SURUHANJAYA SEKURITI
147 DBKL PLAZA CENTRAL
148 DBKL BANGUNAN SOUTHERN BANK
149 DBKL MENARA PERAK
150 DBKL WISMA HUA JIANG
151 DBKL BGN BANK SIMPANAN NASIONAL
152 DBKL BANGUNAN PUBLIC BANK
153 DBKL PLAZA VADS
154 DBKL MENARA CHAN
155 DBKL SIGNATURE OFFICES
156 DBKL MENARA ING
157 DBKL WISMA NG GOON HAN
158 DBKL WISMA MCA
159 DBKL PLAZA SENTRAL
160 DBKL MENARA 238
161 DBKL MEGAN AVENUE II
162 DBKL BANGUNAN AMANAH CAPITAL
163 DBKL MENARA HAW PAR
164 DBKL WISMA YAKIN
165 DBKL MENARA PANGLOBAL
166 DBKL BANGUNAN UOB
167 DBKL WISMA MARAN
168 DBKL MENARA BUMIPUTRA
169 DBKL MENARA MANULIFE
170 DBKL PLAZA PANTAI
171 DBKL SIGNATURE OFFICES
172 DBKL MUTIARA BANGSAR
173 DBKL KOMPLEKS MUTIARA
174 DBKL WISMA MIRAMA
175 DBKL BANGUNAN BANK RAKYAT
176 DBKL WISMA PUBLIC BANK
177 DBKL Wisma UOA Pantai
178 DBKL WISMA LEE RUBBER
179 DBKL WISMA TAS

362
APPENDIX H (Continued)
180 DBKL WISMA MILLENIUM
181 DBKL MENARA PRUDENTIAL
182 DBKL BANGUNAN PERKIM
183 DBKL BANGUNAN DATO' ZAINAL
184 DBKL WISMA E & CHOO
185 DBKL BANGUNAN MOCCIS
186 DBKL DIJAYA PLAZA
187 DBKL PLAZA MONT KIARA
188 DBKL WISMA AMBANK
189 DBKL MEGAN AVENUE I
190 DBKL SOUTHERN BANK
191 DBKL SIGNATURE OFFICES
192 DBKL SPPK SETIA 1
193 DBKL PLAZA MONT KIARA
194 DBKL MENARA MBF
195 DBKL BANGUNAN AMANAH RAYA
196 DBKL WISMA TNB
197 DBKL WISMA LIM FOO YONG
198 DBKL MEGAN AVENUE I
199 DBKL BANGUNAN YAYASAN SELANGOR_KG BARU
200 DBKL WISMA UOA II
201 DBKL WISMA TUN SAMBANTHAN
202 DBKL MENARA CAPSQUARE
203 DBKL MENARA GENESIS
204 DBKL BANGUNAN RISDA & ANNEXE
205 DBKL PLAZA SENTUL
206 DBKL MEGAN AVENUE I
207 DBKL MENARA TAIPAN
208 DBKL PLAZA AMPANG CITY
209 DBKL MENARA MULTI PURPOSE
210 DBKL WISMA BERNAMA
211 DBKL BANGUNAN PAK PENG
212 DBKL MENARA DATO' ONN (PWTC)
213 DBKL MENARA AIK HUA
214 DBKL PLAZA BUKIT BINTANG
215 DBKL WISMA FELCRA BHD
216 DBKL BANGUNAN LTAT
217 DBKL PLAZA PANTAI
218 DBKL MENARA UNCANG EMAS
219 DBKL PLAZA PANTAI
220 DBKL WISMA MPL
221 DBKL SPPK SETIA 2
222 DBKL MENARA AA
223 DBKL WISMA DAYAPI
224 DBKL BANGUNAN IBUPEJABAT TNB
225 DBKL MENARA NAZA
226 DBKL WISMA COSWAY
227 DBKL PLAZA MONT KIARA
228 DBKL WISMA CHINESE CHAMBER
229 DBKL BANGUNAN MIDF
230 DBKL PLAZA MCB
231 DBKL MENARA UTAMA
232 DBKL WISMA CHAR YONG
233 DBKL BANGUNAN KWSP
234 DBKL MEGAN AVENUE II
235 DBKL PLAZA MONT KIARA
236 DBKL BANGUNAN YAYASAN SELANGOR
237 DBKL MENARA OLYMPIA
238 DBKL BANGUNAN YEE SENG
239 DBKL MENARA BUMIPUTRA COMMERCE
240 DBKL WISMA KFC

363
APPENDIX H (Continued)
241 DBKL WISMA SIME DARBY
242 DBKL BANGUNAN KUWASA
243 DBKL MENARA RAJA LAUT
244 DBKL MENARA TUN RAZAK
245 DBKL WISMA NUSANTARA
246 DBKL MENARA KAUSAR
247 DBKL MENARA TUN ISMAIL MOHAMED ALI
248 DBKL WISMA AVENUE SECURITIES
249 DBKL PLAZA SUNGAI MAS
250 DBKL BANGUNAN LPPKN
251 DBKL PLAZA IMBI
252 DBKL WISMA HELP
253 DBKL WISMA EQUITY
254 DBKL WISMA BUMIRAYA
255 DBKL BANGUNAN PRESIDENT HOUSE
256 DBKL THE AMPWALK
257 DBKL PLAZA ATRIUM
258 DBKL MENARA UOB
259 DBKL WISMA THARKARDAS
260 DBKL MENARA UNI ASIA
261 DBKL KWONG YIK BANK
262 DBKL WISMA SHACHDEV
263 DBKL MENARA JALINAN
264 DBKL WISMA HRDF
265 DBKL BANGUNAN SONG PENG SENG
266 DBKL MENARA CMY
267 DBKL WISMA RAJA MUDA
268 DBKL RHB JALAN SILANG
269 DBKL WISMA SHL
270 DBKL MENARA TSH
271 DBKL UNI ASIA LIFE ASSURANCE BERHAD
272 DBKL WISMA PAHLAWAN
273 DBKL PLAZA DWITASIK
274 DBKL WISMA VOLKSWAGON
275 DBKL WISMA IBI
276 DBKL WISMA LEOPAD
277 DBKL WISMA ANTAH
278 DBKL WISMA DATO' DAGANG
279 DBKL WISMA GUTHRIE
280 DBKL G POWER
281 DBKL BANGUNAN ITTAR
282 DBKL WISMA YPR
283 DBKL AMBANK GROUP LEADERSHIP CENTRE
284 DBKL BANGUNAN SYED KECHIK FOUNDATION
285 DBKL DAMANSARA SQUARE
286 DBKL PLAZA KL
287 DBKL BANGUNAN CIMB
288 DBKL KOMPLEKS DAYABUMI
289 DBKL MENARA TH PERDANA
290 DBKL BANGUNAN KOPERASI POLIS
291 DBKL WISMA BUDIMAN
292 DBKL WISMA BOUSTEAD
293 DBKL MENARA MAJU PERDANA
294 DBKL BANGUNAN MIC
295 DBKL WISMA FU YUEN
296 DBKL WISMA SCA
297 DBKL MENARA BANK PEMBANGUNAN
298 DBKL WISMA KLIH
299 DBKL MENARA SME BANK
300 DBKL WISMA SEJARAH
301 DBKL BANGUNAN MOFAZ

364
APPENDIX H (Continued)
302 DBKL BANGUNAN FABER IMPERIAL COURT
303 DBKL BANGUNAN EXIM BANK
304 DBKL WISMA KEBUDAYAAN SGM
305 DBKL BANGUNAN MAYBANK JALAN.T.A.R
306 DBKL BANGUNAN MCOBA
307 DBKL KOMPLEKS SELANGOR
308 DBKL WISMA HAVELA THAKARDAS
309 DBKL BANGUNAN MEDAN MARA
310 DBKL WISMA SIAH BROTHERS
311 DBKL BANGUNAN MAYBANK JALAN BANDAR
312 DBKL BANGUNAN DARUZZAKAH
313 DBKL KOMPLEKS PERTAMA
314 DBKL WISMA AWAL
315 DBKL WISMA BANDAR
316 DBKL BANGUNAN AMAL ASSURANCE 338
317 DBKL WISMA HARWANT
318 DBKL BANGUNAN BANK UTAMA
319 DBKL BANGUNAN BAITULMAL W.P
320 DBKL WISMA BATU
321 DBKL WISMA LAL DOSHI
322 DBKL BANGUNAN MMA
323 DBKL WISMA PRIMA
324 DBKL MENARA MAYBANK
325 DBKL MENARA OCBC
326 DBKL MENARA UAB
327 DBKL BANGUNAN CAHAYA SURIA
328 DBKL WISMA KRAFTANGAN
329 DBKL HERITAGE HOUSE
330 DBKL BANGUNAN KURNIA
331 DBKL PLAZA BERJAYA
332 DBKL WISMA TAN KIM SAN
333 DBKL WISMA HAMZAH-KWONG HING
334 DBKL BANGUNAN MBSB, LEBUH AMPANG
335 DBKL BANGUNAN HSBC (LEBOH AMPANG)
336 DBKL BANGUNAN SHAMELIN HOLDINGS
337 DBKL WISMA ABDUL RAZAK
338 DBKL BANGUNAN BALAI ISLAM
339 DBKL BANGUNAN HSBC (LEBOH PASAR)
340 DBKL BANGUNAN TABUNG HAJI
341 DBKL BANGUNAN PUSTAKA ANTARA
342 DBKL MENARA PATRIOT ( BPMB)
343 DBKL THE STRAITS TRADING BUILDING
344 DBKL BANGUNAN MAYBAN FINANCE
345 DBKL MENARA KEMBAR BANK RAKYAT
346 DBKL MENARA HAP SENG
347 DBKL MENARA SHELL
348 DBKL IBU PEJABAT CIMB (LOT A)
349 DBKL OVAL TOWER TTDI
350 DBKL HAMPSHIRE PLACE OFFICE
351 DBKL MENARA DARUSSALAM
352 DBKL MENARA GLOMAC
353 DBKL WISMA PERINTIS
354 DBKL BUSANA MENARA MARA
355 DBKL MENARA GLOMAC
356 DBKL 1 Sentrum (ganti asal Nu Sentral)
357 DBKL ONE RESIDENCY
358 DBKL THE HORIZON BANGSAR SOUTH
359 DBKL The Horizon I, Bangsar South
360 DBKL NU Tower
361 DBKL Plaza 138
362 DBKL Wisma Kim Seah

365
APPENDIX H (Continued)
363 DBKL Wisma Naza
364 DBKL Menara Hap Seng 2
365 DBKL Ikon Connaught Suite Pejabat
366 DBKL Menara LGB
367 DBKL MENARA ILHAM BARU
368 DBKL Menara Naza
369 DBKL Tower 4, Bandar Wawasan
370 DBKL Menara Centara, Jn Tuanku Abd Rahman
371 DBKL Crest , Jalan Sultan Ismail
372 DBKL Plaza Rakyat
373 DBKL Menara Trillion
374 DBKL Lot B- Q sentral , KL Sentral
375 DBKL Menara MBMR
376 DBKL Vida Bukit Ceylon
377 DBKL KL Gateway
378 DBKL Menara Bangkok Bank @Berjaya
379 DBKL Summer Suites
380 DBKL Bangunan SPPK,Jln Dungun
381 DBKL Wangsa 118
382 DBKL Eco City Office Tower
383 DBKL Arcoris
384 DBKL Commerce One Klang Lama
385 DBKL Zeta Park Office
386 DBKL Vertical Suites @ Bangsar South
387 DBKL Tabung Haji
388 DBKL V Office Sunway Velocity Phase 1A, Cheras
389 DBKL Designer Office, Sunway Velocity Phase 3C1, Cheras
390 PPJ Menara PJH (Plot 2C2)
391 PPJ Menara PRISMA (Pelaburan Hartanah Berhad) (Formerly Known as Bangunan PjH)
392 PPJ Menara Tulus (PT.12070 (PLOT 3C6)
393 PPJ Menara Ikhlas (Formerly known as Boulevard Plaza (Plot 3C7 / PT 12069)
394 PPJ Galleria PJH (Formerly known as Bangunan Komersil (PT.12287) (PLOT 4C11)
395 PPJ Kompleks Danau Point
396 PPJ Menara Everly (blok pejabat (Plot PZ10)-bersebelahan The Everly Putrajaya Hotel
397 PPJ PT 12071 (PLOT 3C5) Mayland Square
398 PPJ Kompleks Pentadbiran Islam
399 PPJ Menara Platinum PT 7555 (Plot 2C14)
400 PPJ Menara pejabat di atas Plot Z1-Z4
401 PPJ Bangunan Pejabat di atas Lot 7546 (Plot 2C5)
402 MBPJ Wisma IJM Annexe
403 MBPJ Damansara Business Park Block B
404 MBPJ Plaza Sri Setia
405 MBPJ Wisma KSCH
406 MBPJ KWSP , Damansara Fairway 1
407 MBPJ Wisma Perkeso
408 MBPJ PJ5 SOHO
409 MBPJ Jaya 33
410 MBPJ Bangunan Fairway 3
411 MBPJ Wisma MCIS Zurich
412 MBPJ Wisma IJM
413 MBPJ Menara Yayasan Selangor
414 MBPJ PacketHub (Formerly Known as Bgn SPPS)
415 MBPJ Quattro West (Formerly Known as Nestle House)
416 MBPJ Menara UAC
417 MBPJ KWSP Jalan Gasing
418 MBPJ Menara Choy Fook On
419 MBPJ Menara Mudajaya
420 MBPJ Menara KLK (Menara Batu Kawan)
421 MBPJ 8Trium @ Sri Damansara (Tower 1)
422 MBPJ Menara TSR
423 MBPJ Kompleks Kemajuan

366
APPENDIX H (Continued)
424 MBPJ Bangunan Pan Global
425 MBPJ Damansara Uptown 3(B) - Bangunan Tabung Haji
426 MBPJ Persoft Tower (Formerly known as Menara Luxor)
427 MBPJ Menara Mutiara Majestic
428 MBPJ Menara OBYU (Formerly Known as Point 92)
429 MBPJ Menara Amfirst (Formely kown as Menara Merais)
430 MBPJ Amcorp Tower A
431 MBPJ Menara Star
432 MBPJ Jaya 33
433 MBPJ Damansara Uptown 2(D)
434 MBPJ Menara Lien Hoe
435 MBPJ PJ City
436 MBPJ Menara Gamuda (PJ Trade Centre Tower D, Formerly 437 MBPJ Menara Bata (PJ Trade Centre Tower B)
438 MBPJ Menara Mustapha Kamal (PJ Trade Centre Tower A)
439 MBPJ Damansara Uptown 1( C )
440 MBPJ Menara PKNS
441 MBPJ Oasis Square
442 MBPJ Quill Building 9
443 MBPJ Plaza 33 Hyperoffice
444 MBPJ Damansara Uptown 5(A)
445 MBPJ Empire Damansara
446 MBPJ Menara CP
447 MBPJ PJ Exchange (PJX)
448 MBPJ PJ8
449 MBPJ Dataran Prima
450 MBPJ Surian Tower (Menara Surian)
451 MBPJ Bangunan VSQ
452 MBPJ Phileo Damansara 11
453 MBPJ Damansara Intan
454 MBPJ Leisure Commerce Square
455 MBPJ Phileo Damansara 1
456 MBPJ 3 Alliance (Formerly kown as Wisma Projass)
457 MBPJ Annex to Menara Sg. Way
458 MBPJ Menara Sg. Way
459 MBPJ Sri Pentas TV3
460 MBPJ 1 First Avenue
461 MBPJ Peremba Square
462 MBPJ Wisma King Koil
463 MBPJ Glomac Business Centre-Block B
464 MBPJ Kelana Business Centre-Block B
465 MBPJ Kelana Centre Point-Block D
466 MBPJ Wisma Prosper (Formerly Known as Kelana Centre 467 MBPJ Wisma PNS (Formerly known as Kelana Centre Point-468 MBPJ Kelana Park View
469 MBPJ Wisma Amfirst (Formerly kown as Brem Tower)
470 MBPJ Kelana Centre Point-Block A
471 MBSA Bgn OPA
472 MBSA Menara PPNS (Formerly known as Wisma LPP)
473 MBSA Menara UMNO/UBSA
474 MBSA Umno Building
475 MBSA Menara Maybank
476 MBSA Menara Affin
477 MBSA Wisma Rozali (Formerly known as Wisma Maritim)
478 MBSA Worldwide Business Park Block 4
479 MBSA Wisma Sunway (Formerly known as Wisma Sunwaymas 480 MBSA Wisma DRB-Hicom
481 MBSA Sirim 4-Storey
482 MBSA Menara MRCB (Formerly known as Selbourne Tower A)483 MBSA PKNS Complex
484 MBSA Plaza Masalam

367
APPENDIX H (Continued)
485 MBSA Plaza Perangsang
486 MBSA Sirim 14-Storey
487 MBSA Kompleks PKNS, IKS
488 MBSA Wisma PKPS
489 MBSJ Menara Mesiniaga
490 MBSJ Wisma Subang Jaya
491 MBSJ Wisma TNB (Formerly known as Wisma UEP)
492 MBSJ Menara Summit
493 MBSJ Heitech Village (Formerly known: Wisma Integrated)
494 MBSJ Subang Square (Corporate Tower)
495 MBSJ Empire Tower Subang
496 MBSJ Wisma Consplant 1
497 MBSJ First Subang
498 MBSJ Puchong Financial Corporate Centre or PFCC (Formerly 499 MBSJ IOI Business Park
500 MPAJ Wisma Dirgahayu
501 MPAJ Menara Maxisegar
502 MPK Mais Complex
503 MPK Wisma Southern
504 MPK Tabung Haji Building
505 MPK NTS Building
506 MPK Wisma TLT
507 MPK Menara Westport
508 MPK Menara Acmar
509 MPK Westport Business Centre
510 MPK Crown House (Crystal Crown Pearl Harbour)
511 MPK Casa Klang
512 MPK BBT One The Towers
513 MPK Intan Millenium Square (Menara ING-Block A)
514 MPK Prima Klang Avenue
515 MPK Prima Klang Avenue
516 MPK BBT One The Towers
517 MPK First Tower Klang (Plaza Metro Klang)
518 MPK Garden Business Centre (Menara A & M)
519 MPK Centro
520 MPKj Mines 2
521 MPKj Wisma SSP
522 MPKj South City Block B
523 MPKj The Mines Waterfront Business Park
524 MPKj Sapura @ Mines
525 MPKj Wisma Sim Tee Ming
526 MPKj Kompleks Kota Kajang
527 MPKj Kompleks PKNS
528 MPKj Wisma Metro Kajang
529 MPKj Wisma Wan Asia Corporation
530 MPKj Menara Apex
531 MPS Bangunan Philomath
532 MPS BANGUNAN MTD GROUP
533 MPSg Prima 5
534 MPSg City Command Centre
535 MPSg Prima 1
536 MPSg SME 3 Building (Komplek KWDI)
537 MPSg Prima 6
538 MPSg Century Square
539 MPSg K. Workers Development Centre (KWDI) Phase 2
540 MPSg Prima 2
541 MPSg Enterprise Building Two
542 MPSg Prima 7
543 MPSg Prima 8
544 MPSg Enterprise One
545 MPSg SME Technopreneur Centre 1

368
APPENDIX H (Continued)
546 MPSg IOI Square
547 MPSg Ericsson
548 MPSg SME Technopreneur Centre 2
549 MPSg Dell Global Business Centre
550 MPSg MKN Embassy (Cyberview 12)
551 MPSg Mahindra Satyam Global Solution Centre
552 MPSg Enterprise Three
553 MPSg MKN Embassy (Cyberview 13)
554 MPSg Wisma Mustapha Kamal@Cyberjaya
555 MPSg Hewlett Peckard Global IT (HP)
556 MBPJ Wisma Peladang

369
APPENDIX I
A sample of letter requesting permission for data collection

370
APPENDIX J
Study Questionnaire
SURVEY OF PARKING SERVICES AND FACILITIES
Dear Sir/Madam,
1. Firstly, we congratulate you as you have been chosen to be one of our valuable
respondents in doctoral survey study.
2. This survey questionnaire is part of an academic research study.
3. This study investigates your perception and satisfaction that based on your true
experience and feeling while using parking services and facility in this building.
4. There is no right or wrong answer.
5. All information given in this questionnaire will be kept strictly confidential.
6. If you are customer for a monthly season parking in this building, then you may
proceed to complete the survey with truly and honestly.
7. If you have any enquiries, you may contact AHMAD FIAZA ABDUL SHUKOR at 017-
2037333 or [email protected], a doctoral candidate in area of Business
Administration at the Universiti Utara Malaysia, Kuala Lumpur.
8. Immediate return of the completed survey is greatly welcome. Otherwise, En. Ahmad
Fiaza or his representative will be back to pick-up the questionnaires in the enclosed
envelop within 3 days. Alternatively, you can scan or take photo on the completed
questionnaire and email to [email protected] or SMS/Whatsapp to 017-
2037333.
9. Supervisors for this study are Associate Professor Dr. Norlena Hasnan and Dr.
Jasmani Mohd Yunus. Both of them are academicians from Universiti Utara Malaysia,
Kuala Lumpur and can be contacted at 03-2610 3000.
Lastly, we would like to express sincere appreciation and thank you for your cooperation.

371
There are three parts in this survey. Part I : Respondent perception of service marketing mix, service quality, service value and
customer satisfaction. Part II : Respondent comments and suggestions. Part III : Respondent demographic information.
PART I : RESPONDENT PERCEPTION Please read the following statements and circle the number that most accurately reflects your perception on each statement.
SCALE
Strongly disagree
Middle
Strongly agree
1 2 3 4 5 6 7
No. Question Please circle your answer
1 The car park operator offers a variety of parking services.
1 2 3 4 5 6 7
2 The car park operator has a high quality standard. 1 2 3 4 5 6 7
3 The car park operator provides highly effective parking system.
1 2 3 4 5 6 7
4 The car park operator is highly innovative in its parking services.
1 2 3 4 5 6 7
5 The car park operator has distinctive brand in a market. 1 2 3 4 5 6 7
6 The car park operator has high standard of customer service.
1 2 3 4 5 6 7
7 The car park operator offers options in parking fees structure.
1 2 3 4 5 6 7
8 The offered parking fees are suitable to the level of quality.
1 2 3 4 5 6 7
9 The offered parking fees are based on prices in the marketplace.
1 2 3 4 5 6 7
10 The car park operator provides parking fees for different customer categories.
1 2 3 4 5 6 7
11 The car park operator provides a good payment terms and policies.
1 2 3 4 5 6 7
12 The car park operator creates convenience parking place.
1 2 3 4 5 6 7
13 The parking facility is always well organized. 1 2 3 4 5 6 7
14 The car park operator always ensures enough parking lots for customers.
1 2 3 4 5 6 7
15 The car park operator provides sufficient channels for parking payment.
1 2 3 4 5 6 7
16 The car park operator provides a highly safe and secure parking place.
1 2 3 4 5 6 7

372
SCALE
Strongly disagree
Middle
Strongly agree
1 2 3 4 5 6 7
No. Question Please circle your answer
17 The car park operator promotes the parking services creatively.
1 2 3 4 5 6 7
18 The parking promotion method creates a positive image.
1 2 3 4 5 6 7
19 The car park operator communicates parking services clearly.
1 2 3 4 5 6 7
20 The car park operator promotes parking brand extensively.
1 2 3 4 5 6 7
21 The car park operator promotes parking safety and security intensively.
1 2 3 4 5 6 7
22 The car park operator promotes customer service intensively.
1 2 3 4 5 6 7
23 The car park operator manages this parking facility professionally.
1 2 3 4 5 6 7
24 The car park operator trains their staffs for high service performance.
1 2 3 4 5 6 7
25 The car park operator always provides adequate staffs to operate parking facility.
1 2 3 4 5 6 7
26 The car park operator recruits right personnel to operate parking facility.
1 2 3 4 5 6 7
27 The car park operator provides effective working facilities to supports their staffs.
1 2 3 4 5 6 7
28 The car park operator has a systematic working structure.
1 2 3 4 5 6 7
29 The car park operator has a systematic service process.
1 2 3 4 5 6 7
30 The car park operator use advance information technology (IT) for service processing.
1 2 3 4 5 6 7
31 The car park operator has a qualified staffs to serve. 1 2 3 4 5 6 7
32 The car park operator provides friendly procedures for season parking processes.
1 2 3 4 5 6 7
33 The car park operator has a very efficient system to process season parking.
1 2 3 4 5 6 7
34 The car park operator applies a professional look to their staff’s attire.
1 2 3 4 5 6 7
35 The design of parking facilities creates a positive impression.
1 2 3 4 5 6 7
36 Parking equipment and other related facilities are always maintained.
1 2 3 4 5 6 7
37 The parking atmosphere is clean and comfort. 1 2 3 4 5 6 7
38 The car park operator provides very useful signages. 1 2 3 4 5 6 7

373
SCALE
Strongly disagree
Middle
Strongly agree
1 2 3 4 5 6 7
No. Question Please circle your answer
39 This parking facility has up to date equipment and facilities.
1 2 3 4 5 6 7
40 This parking facility is visually appealing. 1 2 3 4 5 6 7
41 The car park staffs are well dressed and appear neat. 1 2 3 4 5 6 7
42 The appearance of this parking facility reflects to the type of parking being served.
1 2 3 4 5 6 7
43 The car park operator provides a service as promised. 1 2 3 4 5 6 7
44 When I have problems, the car park operator is sympathetic and reassuring.
1 2 3 4 5 6 7
45 The car park operator is dependable. 1 2 3 4 5 6 7
46 The car park operator provides parking services at appointed time.
1 2 3 4 5 6 7
47 The car park operator keeps its record accurately. 1 2 3 4 5 6 7
48 The car park operator does not tell me exactly when services will be performed. (r)
1 2 3 4 5 6 7
49 The car park staffs give a prompt service to me. 1 2 3 4 5 6 7
50 The car park staffs always willing to help me. 1 2 3 4 5 6 7
51 The car park staffs always have time to respond to my requests promptly.
1 2 3 4 5 6 7
52 The car park staffs can be trusted. 1 2 3 4 5 6 7
53 I feel safe in all payment transactions for my season parking.
1 2 3 4 5 6 7
54 The car park staffs are polite to me. 1 2 3 4 5 6 7
55 The car park staffs have the knowledge to answer my questions.
1 2 3 4 5 6 7
56 The car park operator does not give me individual attention as a season parking customer. (r)
1 2 3 4 5 6 7
57 The car park staffs give a personal attention to me. 1 2 3 4 5 6 7
58 The car park staffs understand on my needs. 1 2 3 4 5 6 7
59 The car park staffs keep my interest at heart. 1 2 3 4 5 6 7
60 Parking facilities has convenient operating hours. 1 2 3 4 5 6 7
61 I always complete the parking process (InParkOut) successfully.
1 2 3 4 5 6 7
62 There is no equipment breakdown during my entry and exit.
1 2 3 4 5 6 7
63 Process time (InParkOut) for my car parking is very acceptable.
1 2 3 4 5 6 7
64 This car park facility has high specification of parking standard.
1 2 3 4 5 6 7
65 This car park facility complies with high safety and security requirement.
1 2 3 4 5 6 7
**(r) = reversed
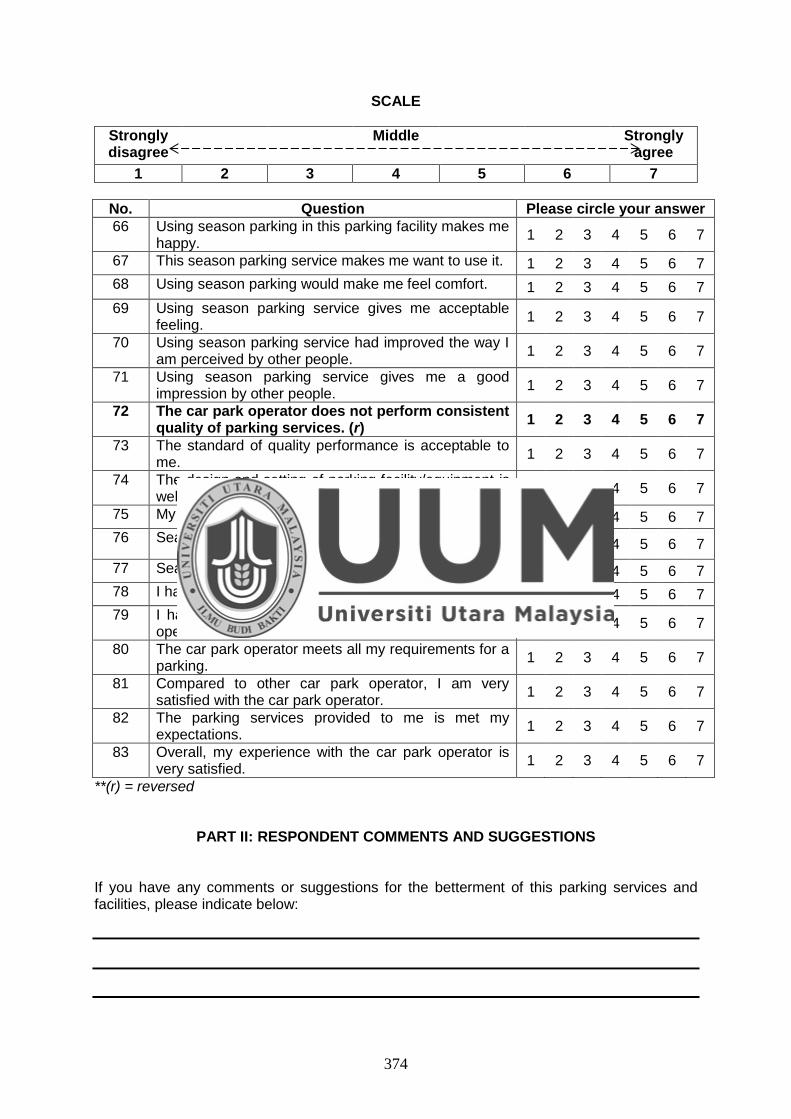
374
SCALE
Strongly disagree
Middle
Strongly agree
1 2 3 4 5 6 7
No. Question Please circle your answer
66 Using season parking in this parking facility makes me happy.
1 2 3 4 5 6 7
67 This season parking service makes me want to use it. 1 2 3 4 5 6 7
68 Using season parking would make me feel comfort. 1 2 3 4 5 6 7
69 Using season parking service gives me acceptable feeling.
1 2 3 4 5 6 7
70 Using season parking service had improved the way I am perceived by other people.
1 2 3 4 5 6 7
71 Using season parking service gives me a good impression by other people.
1 2 3 4 5 6 7
72 The car park operator does not perform consistent quality of parking services. (r)
1 2 3 4 5 6 7
73 The standard of quality performance is acceptable to me.
1 2 3 4 5 6 7
74 The design and setting of parking facility/equipment is well made.
1 2 3 4 5 6 7
75 My season parking fee is reasonably priced. 1 2 3 4 5 6 7
76 Season parking offers me a value for money. 1 2 3 4 5 6 7
77 Season parking is a good product for the price. 1 2 3 4 5 6 7
78 I had a pleasant experience with the car park operator. 1 2 3 4 5 6 7
79 I have a more positive attitude towards the car park operator.
1 2 3 4 5 6 7
80 The car park operator meets all my requirements for a parking.
1 2 3 4 5 6 7
81 Compared to other car park operator, I am very satisfied with the car park operator.
1 2 3 4 5 6 7
82 The parking services provided to me is met my expectations.
1 2 3 4 5 6 7
83 Overall, my experience with the car park operator is very satisfied.
1 2 3 4 5 6 7
**(r) = reversed
PART II: RESPONDENT COMMENTS AND SUGGESTIONS If you have any comments or suggestions for the betterment of this parking services and facilities, please indicate below:

375
PART III : RESPONDENT DEMOGRAPHIC INFORMATION The following information will be used for statistical analysis only. The information will be kept strictly confidential.
Please tick one ( ) to fill in the appropriate box.
1. Name of Building : ______________________________
2. Gender : Male Female
3. Age : 20 or below 21 - 30 31 - 40
41 - 50 Above 50
4. Highest education : Certificate Diploma Degree
Master Doctoral
5. Position level : Non-Executive Executive Managerial
Director/CEO/ Business owner/self-employed
Top Management
6. Are you using the season pass parking in this parking facility?
Yes No
7. Who pay your monthly season parking fee?
My own My company My own and
Company
Other party/people No body, it is complimentary
8. How long have you been using this parking facility?
1 year or less More than 1 – 2 years More than 2 – 3 years
More than 3 – 4 years More than 4 years
~ THANK YOU ~

376
APPENDIX K
The results of the D2 (MAH_1 in SPSS)
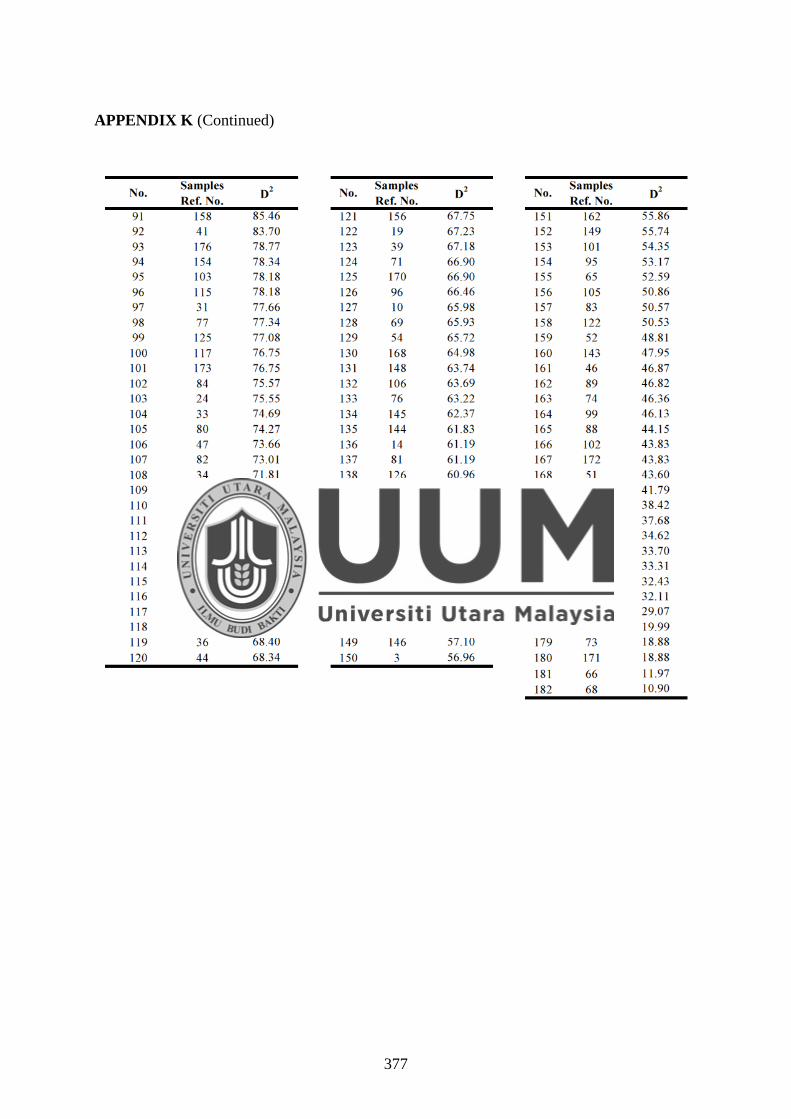
377
APPENDIX K (Continued)

378
PUBLICATION AND CONFERENCE
Shukor, A.F.A., Hasnan, N., & Yunus, J. M. (2016). The effects of service marketing mix on
the customer satisfaction in commercial car parking facilities. Presented in the 1st
International Conference on Management and Communication (ICMC) 2016, 20-21
August 2016, Universiti Utara Malaysia, UUM Kuala Lumpur.
Shukor, A.F.A., Samiran, M., Saleh, H., & Hasnan, N. (2015). The relationship between service
quality, customer satisfaction and customer external complaints intentions in commercial
parking facilities in Klang Valley, Malaysia. International Journal of Science,
Environment and Technology, 4(3), 595 – 615.
Shukor, A.F.A., & Samiran, M. (2014). The relationship between service quality, customer
satisfaction and customer external complaints intentions in commercial parking facilities
in Klang Valley, Malaysia. Presented in the 1st National Conference on Management and
Communication (NCMC) 2014, 15-16 November 2014, Universiti Utara Malaysia, UUM
Kuala Lumpur. Awarded Best Paper Award.

379
380
PARTICIPATION IN GOVERNMENT INITIATIVE
Appointment as Expert Panel for National Occupational Skills Standard (NOSS) for
Department of Skills Development, Ministry of Human Resource in Parking Facility Operation
Level 1-3 dated 9 May 2015.

381


![© . { i] LIBRARY' x-;,. ,,.',: '](https://static.fdokumen.com/doc/165x107/631ddf7e3969c5af13079fb2/-i-library-x-.jpg)

