
The Comparative Reactivity Method? a ... - Archive ouverte HAL
43
HAL Id: hal-00303218 https://hal.archives-ouvertes.fr/hal-00303218 Submitted on 19 Dec 2007 HAL is a multi-disciplinary open access archive for the deposit and dissemination of sci- entific research documents, whether they are pub- lished or not. The documents may come from teaching and research institutions in France or abroad, or from public or private research centers. L’archive ouverte pluridisciplinaire HAL, est destinée au dépôt et à la diffusion de documents scientifiques de niveau recherche, publiés ou non, émanant des établissements d’enseignement et de recherche français ou étrangers, des laboratoires publics ou privés. The Comparative Reactivity Method ? a new tool to measure total OH reactivity in ambient air V. Sinha, J. Williams, J. N. Crowley, J. Lelieveld To cite this version: V. Sinha, J. Williams, J. N. Crowley, J. Lelieveld. The Comparative Reactivity Method ? a new tool to measure total OH reactivity in ambient air. Atmospheric Chemistry and Physics Discussions, European Geosciences Union, 2007, 7 (6), pp.18179-18220. hal-00303218
-
Upload
khangminh22 -
Category
Documents
-
view
1 -
download
0
Transcript of The Comparative Reactivity Method? a ... - Archive ouverte HAL
HAL Id: hal-00303218https://hal.archives-ouvertes.fr/hal-00303218
Submitted on 19 Dec 2007
HAL is a multi-disciplinary open accessarchive for the deposit and dissemination of sci-entific research documents, whether they are pub-lished or not. The documents may come fromteaching and research institutions in France orabroad, or from public or private research centers.
L’archive ouverte pluridisciplinaire HAL, estdestinée au dépôt et à la diffusion de documentsscientifiques de niveau recherche, publiés ou non,émanant des établissements d’enseignement et derecherche français ou étrangers, des laboratoirespublics ou privés.
The Comparative Reactivity Method ? a new tool tomeasure total OH reactivity in ambient air
V. Sinha, J. Williams, J. N. Crowley, J. Lelieveld
To cite this version:V. Sinha, J. Williams, J. N. Crowley, J. Lelieveld. The Comparative Reactivity Method ? a newtool to measure total OH reactivity in ambient air. Atmospheric Chemistry and Physics Discussions,European Geosciences Union, 2007, 7 (6), pp.18179-18220. �hal-00303218�
ACPD
7, 18179–18220, 2007
CRM – a new tool to
measure atmospheric
OH reactivity
V. Sinha et al.
Title Page
Abstract Introduction
Conclusions References
Tables Figures
◭ ◮
◭ ◮
Back Close
Full Screen / Esc
Printer-friendly Version
Interactive Discussion
EGU
Atmos. Chem. Phys. Discuss., 7, 18179–18220, 2007
www.atmos-chem-phys-discuss.net/7/18179/2007/
© Author(s) 2007. This work is licensed
under a Creative Commons License.
AtmosphericChemistry
and PhysicsDiscussions
The Comparative Reactivity Method – a
new tool to measure total OH reactivity in
ambient air
V. Sinha, J. Williams, J. N. Crowley, and J. Lelieveld
Max Planck Institute for Chemistry, J. J. Becher Weg 27, 55128 Mainz, Germany
Received: 13 November 2007 – Accepted: 13 November 2007 – Published: 19 December
2007
Correspondence to: J. Williams ([email protected])
18179
ACPD
7, 18179–18220, 2007
CRM – a new tool to
measure atmospheric
OH reactivity
V. Sinha et al.
Title Page
Abstract Introduction
Conclusions References
Tables Figures
◭ ◮
◭ ◮
Back Close
Full Screen / Esc
Printer-friendly Version
Interactive Discussion
EGU
Abstract
Hydroxyl (OH) radicals play a vital role in maintaining the oxidizing capacity of the
atmosphere. To understand variations in OH radicals both source and sink terms must
be understood. Currently the overall sink term, or the total atmospheric reactivity to
OH, is poorly constrained. Here, we present a new on-line method to directly measure5
the total OH reactivity (i.e. total loss rate of OH radicals) in a sampled air mass. In
this method, a reactive molecule (X), not normally present in air, is passed through a
glass reactor and its concentration is monitored with a suitable detector. OH radicals
are then introduced in the glass reactor at a constant rate to react with X, first in the
presence of zero air and then in the presence of ambient air containing VOCs and10
other OH reactive species. Comparing the amount of X exiting the reactor with and
without the ambient air allows the air reactivity to be determined. In our existing set
up, X is pyrrole and the detector used is a proton transfer reaction mass spectrometer.
The present dynamic range for ambient air reactivity is about 6 to 300 s−1
. The system
has been tested and calibrated with different single and mixed hydrocarbon standards15
showing excellent linearity and accountability with the reactivity of the standards. Field
tests in the tropical rainforest of Suriname (∼53 s−1
) and the urban atmosphere of
Mainz (∼10 s−1
) Germany, show the promise of the new method and indicate that a
significant fraction of OH reactive species in the tropical forests is likely missed by
current measurements. Suggestions for improvements to the technique and future20
applications are discussed.
1 Introduction
Every year, approximately 1.3 billion tonnes of natural and anthropogenic gases are
emitted into the troposphere. Photochemical reactions, initiated by the hydroxyl radical
(OH), oxidize many of these emitted primary atmospheric pollutants such as carbon25
monoxide (CO), sulphur dioxide (SO2), nitrogen oxides (NOx=NO and NO2) and VOCs
18180
ACPD
7, 18179–18220, 2007
CRM – a new tool to
measure atmospheric
OH reactivity
V. Sinha et al.
Title Page
Abstract Introduction
Conclusions References
Tables Figures
◭ ◮
◭ ◮
Back Close
Full Screen / Esc
Printer-friendly Version
Interactive Discussion
EGU
(Volatile Organic Compounds) into forms, which are more readily removed from the
atmosphere by deposition or formation of aerosol. Ultimately, if a carbon compound
remains in the gas phase it will be oxidised in radical reaction chains to CO2 and wa-
ter, which is vital for maintaining the self cleansing capacity of the atmosphere (Heard
and Pilling, 2003; Lelieveld et al., 2004). In order to ascertain how well we understand5
these OH initiated photochemical processes, measured ambient OH radical concen-
trations from field studies are often compared with OH radical concentrations predicted
by photochemical models (e.g. Poppe et al., 1994; Hofzumahaus et al., 1996; Carslaw
et al., 2002; Holland et al., 2003; Martinez et al., 2003; Olson et al., 2004; Ren et al.,
2005; Ren et al., 2006; Smith et al., 2006).10
The accuracy of photochemical models depends to a large extent on how well the
OH sources, OH sinks and associated chemical mechanisms are represented. For ex-
ample, if the model predicts significantly higher OH concentrations than the measured
OH concentrations, it could be due to an overestimation of the OH sources and/or an
underestimation of the OH sinks. Currently, the source term is better understood and15
more readily quantified than the sink. While the source involves a limited number of
reactants and rate coefficients that can be determined using available instruments, the
sink is dependent on a multitude of species, all of which compete for the available OH.
An accurate sink term can constrain models and thus clarify the possible reasons for
discrepancies between models and measurements. Atmospheric OH is produced pri-20
marily by the photolysis of O3 with solar UV (λ≤320 nm) radiation followed by reaction
of the excited oxygen atoms (O1D) with water vapour,
O3 + hν → O2 + O(1D) (R1)
O(1D) + H2O → 2OH (R2)
The reactions of OH radicals with VOCs in the atmosphere can be summarized by the25
following four generalized reactions. In the first step, OH attacks a hydrocarbon in the
presence of O2,
RH + OH + O2 → RO2 + H2O (R3)
18181
ACPD
7, 18179–18220, 2007
CRM – a new tool to
measure atmospheric
OH reactivity
V. Sinha et al.
Title Page
Abstract Introduction
Conclusions References
Tables Figures
◭ ◮
◭ ◮
Back Close
Full Screen / Esc
Printer-friendly Version
Interactive Discussion
EGU
to produce water and an alkyl peroxy radical, where R = any organic moiety.
Next, the alkyl peroxy radical may react with NO when present,
RO2 + NO → RO + NO2 (R4)
to produce an alkoxy radical that reacts with O2,
RO + O2 → carbonyls + HO2 (R5)5
This step produces a carbonyl and HO2. Alternatively, the alkyl peroxy radicals, RO2
and HO2, may also react with each other,
RO2 + R′O2 → peroxides,alcohols, carbonyls + O2 (R6)
resulting in the production of peroxides, alcohols and carbonyls, which may dissolve
into the liquid phase and precipitate out of the atmosphere or further react with OH.10
Both R and R′can be any organic moiety.
Reaction (3) represents a major sink term of OH radicals in the atmosphere, namely
reaction with the generic hydrocarbon RH. Often, the overall sink term is estimated by
calculating OH loss frequencies (product of concentration and rate coefficient) for all
individually measured species and summing them. Thus, the OH reaction frequency15
(also termed OH reactivity) of a chemical is given by
OH reaction frequency of reactant X (s−1)=k(X+OH)[X] (1)
where k(X+OH) is the rate coefficient for the reaction of X with OH.
However, it is not certain whether all relevant OH reactive species are measured
by the suite of measurement techniques deployed in current field studies. Roberts et20
al. (1998) and Maris et al. (2003) determined the total carbon budget of ambient VOCs,
but while this information is useful for understanding what fraction of the carbon bud-
get remains unidentified by VOC measurements, it lacks the critical information about
how reactive the missing carbon might be for chemical reactions in the atmosphere
(e.g. 10 ppbC of isoprene is not equivalent to 10 ppbC of methane for OH reactivity).25
18182
ACPD
7, 18179–18220, 2007
CRM – a new tool to
measure atmospheric
OH reactivity
V. Sinha et al.
Title Page
Abstract Introduction
Conclusions References
Tables Figures
◭ ◮
◭ ◮
Back Close
Full Screen / Esc
Printer-friendly Version
Interactive Discussion
EGU
Lewis et al. (2000) identified more than 500 reactive VOCs in urban air using compre-
hensive gas chromatography and concluded that a large number of VOCs, particularly
those with more than 6 carbon atoms and especially aromatics, are not resolved in the
more commonly employed single column gas chromatography measurements. More
recently, Goldstein et al. (2004) and Holzinger et al. (2005) reported the presence of5
unknown reactive biogenic compounds (up to 30 times the emission of total monoter-
penes observed in the forest canopy on a molar basis), from a pine forest in California.
Direct OH reactivity measurement techniques circumvent the daunting task of measur-
ing all the OH reactive species individually, in order to obtain the total OH reactivity
(sink) and can even serve as a diagnostic tool for missing reactivity due to possibly10
unmeasured reactive species (Di Carlo et al., 2004). Additionally, OH production rates
can also be estimated by simultaneous measurements of total OH reactivity and OH
concentrations, assuming the steady state of OH using
d OH
d t= POH − k [OH] = 0 (2)
where POH and k represent the OH production rate and its measured first-order de-15
cay constant, respectively. Finally, information about the lifetime of OH is also easily
obtained by taking the reciprocal of the measured OH reactivity.
In the last decade, new instruments capable of directly measuring the OH reactivity of
ambient air have been developed (Kovacs and Brune, 2001; Sadanaga et al., 2004b).
With some variations, all of them employ laser induced fluorescence (LIF) to monitor20
the loss rate (decay) of OH radicals in a reactor in the presence of ambient air. While
these measurement systems have provided new insights on the OH reactivity budget,
their cost, complexity and large size are deterrents to their widespread deployment for
field studies. Thus, other techniques capable of measuring the total OH reactivity of
ambient air that are more economical and portable than the existing LIF based method,25
would be a valuable addition to current atmospheric measurements.
In this study, we present a new method for direct online measurements of the to-
tal OH reactivity of ambient air. This method can be easily integrated with commonly
18183
ACPD
7, 18179–18220, 2007
CRM – a new tool to
measure atmospheric
OH reactivity
V. Sinha et al.
Title Page
Abstract Introduction
Conclusions References
Tables Figures
◭ ◮
◭ ◮
Back Close
Full Screen / Esc
Printer-friendly Version
Interactive Discussion
EGU
employed in-situ analytical techniques such as gas chromatography and chemical ion-
ization mass spectrometry at modest additional costs. Presented below is a detailed
description of the general concept, the reactor design, the method validation and cal-
ibration, choice of reagent (in this case pyrrole; C4H5N) and the detector system em-
ployed (in this case a proton transfer reaction mass spectrometer). First field results5
from the tropical rainforest in Suriname and the urban atmosphere of Mainz, Germany,
are shown and potential interferences from NO and relative humidity are investigated.
Finally an outlook for future applications of the new method is given.
2 Methodology
2.1 Concept of Comparative Reactivity Method (CRM)10
Figure 1 illustrates the general concept schematically. A reactive molecule (X), not
normally present in air, is introduced into a glass reactor and its concentration C1 is
monitored with a suitable detector, in the air exiting the reactor. After some time when
C1 is well determined, synthetically generated OH radicals (OH<[X]) are introduced
into the reactor at a constant rate to react with X. This causes C1, the monitored con-15
centration of X, to decrease to C2, as X reacts with the OH radicals. The decrease in
the monitored concentration of X (from C1 to C2) also gives the initial concentration of
the OH radicals, as all the OH is completely titrated by X. Next, an air sample contain-
ing reactive species is introduced into the glass reactor. The various species present
in ambient air then compete with X for the available OH radicals, so that the concen-20
tration of X in the air exiting the reactor increases to C3. Comparing the amount of X
exiting the reactor without (C2) and with the ambient air (C3) allows the introduced air
sample’s OH reactivity to be determined in a quantitative manner, provided the system
is suitably calibrated. Some general criteria that the reagent molecule X must satisfy
are:25
1) it reacts with OH at a suitable rate so as to compete with reactive species in
18184

ACPD
7, 18179–18220, 2007
CRM – a new tool to
measure atmospheric
OH reactivity
V. Sinha et al.
Title Page
Abstract Introduction
Conclusions References
Tables Figures
◭ ◮
◭ ◮
Back Close
Full Screen / Esc
Printer-friendly Version
Interactive Discussion
EGU
ambient air;
2) the rate coefficient for reaction with OH should be well established;
3) it must be volatile (to make into a good bottled standard);
4) it must have the necessary physical and chemical properties for easy and ac-
curate detection (without interferences) using a suitable detector (e.g. the proton5
affinity of X should be greater than water to be detectable by a PTR-MS);
5) it should not be present in ambient air (under normal circumstances) as this can
complicate the analysis. In the present version of the CRM developed in Mainz,
the reagent molecule X is pyrrole (C4H5N) and the detector is a PTR-MS.
2.2 Determining OH Reactivity: Derivation of the basic equation for CRM10
Based on competitive kinetics, an expression may be derived for the total OH reactivity
of the analysed air sample (denoted by Rair) in terms of the measured pyrrole signals
C1, C2 and C3 (shown in Fig. 1).
Consider the loss of OH in a two component reactive mixture consisting of pyrrole
and air, the equations describing the loss of OH are:15
OH + pyrrole → products (R7)
OH + air → products (R8)
leading to the rate expression
− δOH/dt = kp[OH][Pyrrole] + kOH+air[OH][air] (3)
where kp is the rate coefficient for reaction of OH with pyrrole and kOH+air is the ef-20
fective rate coefficient of all reactive components in the air sample and [air] is their
summed concentration. As [pyrrole] is >OH the first order loss rate coefficients of OH
18185

ACPD
7, 18179–18220, 2007
CRM – a new tool to
measure atmospheric
OH reactivity
V. Sinha et al.
Title Page
Abstract Introduction
Conclusions References
Tables Figures
◭ ◮
◭ ◮
Back Close
Full Screen / Esc
Printer-friendly Version
Interactive Discussion
EGU
in its reactions with pyrrole and air are given approximately by Rp=kp [Pyrrole] and
Rair=kair[air], respectively, resulting in a total loss rate coefficient of Rp+Rair. If all OH
is lost in reaction with pyrrole and air, the change in pyrrole concentration (C1-C3) is
approximately given by
(C1 − C3) =Rp
Rp + Rair
· OH (4)5
As discussed previously, the OH concentration is given by the loss of pyrrole in the
absence of air (C1-C2), so that:
(C1 − C3) =Rp
Rp + Rair
· (C1 − C2) (5)
rearranging we get
Rair =
{
(C1 − C2)
(C1 − C3)− 1
}
· Rp (6)10
and, equating [pyrrole] to C1,
Rair =
{
(C1 − C2)
(C1 − C3)− 1
}
· kpC1 (7)
which is numerically equivalent to
Rair =(C3 − C2)
(C1 − C3)· kpC1 (8)
C1, C2 and C3 have the units of molecules cm−3
and kp has the unit of cm3
15
molecule−1
s−1
, so that the unit for Rair is s−1
. It should be noted that Eq. (8) assumes
that mixing within the reactor does not favour reaction of X with OH compared with
the reaction of ambient air with OH or vice versa. It also assumes that throughout its
reactive lifetime the OH is partitioned to the pyrrole and air reactants according to their
18186
ACPD
7, 18179–18220, 2007
CRM – a new tool to
measure atmospheric
OH reactivity
V. Sinha et al.
Title Page
Abstract Introduction
Conclusions References
Tables Figures
◭ ◮
◭ ◮
Back Close
Full Screen / Esc
Printer-friendly Version
Interactive Discussion
EGU
initially available concentrations, i.e. the reaction takes place under pseudo-first order
conditions. We examine the effect of this assumption in Sect. 4.1 when we present the
results of some numerical simulations of the reactor.
3 Experimental
The simple set up consists of a small glass reactor (where pyrrole and ambient5
air/standards mix and react with OH radicals), a PTR-MS which detects pyrrole in the
air exiting the reactor and a set of mass flow controllers along with two gas bottles
(nitrogen and zero air).
3.1 Glass reactor
Figure 2 shows a diagram of the glass reactor used along with its inlets and outlets10
labelled as arms A, B, C, D and E. The length and volume of the glass reactor are
approximately 14 cm and 94 cm3, respectively. The typical flow rate inside the reactor
is approximately 260 ml min−1
.
Gas phase pyrrole (Westfalen A.G., stated uncertainty 5 %; 10µmol mol−1
) is mixed
with zero air (Synthetic air, Westfalen A.G., 99.999% purity, <0.5µmol mol−1
THC) and15
introduced through inlet A at a constant flow. Its concentration is monitored in the air
exiting the reactor (outlet D) with a PTR-MS. Inlet B consists of a pen ray spectral
mercury vapour lamp (L.O.T Oriel GmbH & Co. KG), over which humidified nitrogen
/ nitrogen (Westfalen A.G., 99.9999% purity) is passed at a constant flow rate. The
humidification is accomplished by bubbling gaseous nitrogen through water, which is20
maintained at room temperature (298 K). When the lamp is switched on, OH radicals
are produced due to photolysis of the water vapour (at λ=184.9 nm) present in the hu-
midified nitrogen. The lamp is 5 cm long and the maximum time the OH radicals spend
in arm B before they emerge into the glass reactor, is 0.6 s. This method of producing
OH radicals has been used extensively in gas phase kinetic studies, including calibra-25
18187
ACPD
7, 18179–18220, 2007
CRM – a new tool to
measure atmospheric
OH reactivity
V. Sinha et al.
Title Page
Abstract Introduction
Conclusions References
Tables Figures
◭ ◮
◭ ◮
Back Close
Full Screen / Esc
Printer-friendly Version
Interactive Discussion
EGU
tion of OH measurement instruments, and for more details the reader is referred to
Heard and Pilling (2003) and references therein.
The tapered arm E is a Wood’s horn which minimizes reflection of the mercury lamp
down the reactor and hence photochemical reactions along the length of the glass re-
actor. Outlet C is connected to an exhaust pump (Model NO22AV.18, KNF Neuberger,5
Germany) that draws out the excess air from the main flow. The total incoming flow
rate (A + B) is circa 260 ml min−1
, slightly more (∼5 ml min−1
) than the combined flow
through the exhaust pump (arm C) and the PTR-MS. To prevent an over-pressure from
building up within the reactor, and to ensure that the pressure in the reactor is always at-
mospheric pressure (760 Torr), one of the lines linked to arm A (with a T-shaped Teflon10
joint) is kept open-ended at all times. The pressure and temperature inside the reac-
tor are also monitored using a digital pressure manometer (Model 13 AN, Greisinger
Elektronik, Germany) and a temperature probe connected to the line exiting arm C. A
total of four mass flow controllers (MKS Instruments, Deutschland GmbH) are used to
maintain constant flows in arm A (one each for pyrrole and zero air), arm B (one for15
nitrogen) and arm C (for the exhaust pump). All the gas carrier lines leading into and
from the reactor are plumbed using short (<1 m) 1/4 inch (0.635 cm) (outer diameter
(o.d.)) and 1/8 inch (0.3175 cm) (o.d.) Teflon tubing.
To sample ambient air for reactivity, the zero air is switched off and an equivalent
amount (130–150 ml min−1
) of ambient air is pumped in, using a Teflon VOC sam-20
pling pump (Laboport N86-KN18; at arm A). This causes dilution of the ambient air
within the reactor, and the dilution factor has to be taken into account when determin-
ing the total OH reactivity of the introduced ambient air. It is worth mentioning that
the ambient air is not subject to any gas chromatography column, preconcentration
step or laser excitation and its reactivity is directly converted into a modulation of the25
pyrrole signal so that any potential losses of VOCs and/or associated artefacts are min-
imised. Typical pyrrole and OH radical mixing ratios (the signal C1-C2 in Fig. 1) in the
set up are ∼120 nmol mol−1
(∼3.23×10¹²
molecules cm−3
) and up to 100 nmol mol−1
(∼2.69×10¹²
molecules cm3), respectively.
18188
ACPD
7, 18179–18220, 2007
CRM – a new tool to
measure atmospheric
OH reactivity
V. Sinha et al.
Title Page
Abstract Introduction
Conclusions References
Tables Figures
◭ ◮
◭ ◮
Back Close
Full Screen / Esc
Printer-friendly Version
Interactive Discussion
EGU
3.2 PTR-MS: the detector
The mixing ratio of pyrrole in the air exiting the glass reactor through arm D was mon-
itored using a proton transfer reaction mass spectrometer (PTR-MS), a device used
extensively over the last decade to measure ambient VOCs (Lindinger et al., 1998a;
de Gouw and Warneke, 2007). Within the instrument, organic species with a proton5
affinity greater than water are chemically ionised by proton transfer with H3O+
ions
and the products are detected using a quadrupole mass spectrometer (Lindinger et
al., 1998b). The entire inlet system of the PTR-MS including switching valves is made
of Teflon. Details about the operation of the PTR-MS used here, including its mass
identifications, its sensitivity and detection limits for masses other than pyrrole (C4H5N)10
are given elsewhere (Williams et al., 2001; Salisbury et al., 2003; Sinha et al., 2007a).
Pyrrole is detectable by the PTR-MS since its proton affinity (209.2 kcal mol−1
) is higher
than that of water (165.2 kcal mol−1
) and the signal is observed without fragmentation
at mass 68 (C4H5NH+
). There are no known species in ambient air that could interfere
at mass 68 within the PTR-MS, and experience from field campaigns has shown this15
mass to be stable. It is advantageous that mass 68 is an even mass (pyrrole has a
nitrogen atom), since most organic compounds detectable by PTR-MS (e.g. methanol,
acetone, acetaldehyde and isoprene) are detected after protonation at odd masses.
Pyrrole is not normally present in ambient air, and has only been observed in emission
plumes from specific energy production processes such as coal gasification and shale20
and coal-based oil production (Sickles et al., 1977).
Calibrations performed with custom prepared pyrrole standards from Westfalen
A.G. show that the protonated ion of pyrrole (m/z=68) does not fragment within the
instrument and high mixing ratios of up to circa 250 nmol mol−1
do not significantly de-
crease the signal of the H3O+
reagent ions. Furthermore, no significant humidity effect25
has been observed at the pyrrole signal (mass 68). The linearity of the pyrrole signal
is excellent (r=0.99 between the investigated range of 0.5 to 250 nmol mol−1
) and the
total uncertainty in the measured pyrrole signal is estimated to be 11%. This includes a
18189

ACPD
7, 18179–18220, 2007
CRM – a new tool to
measure atmospheric
OH reactivity
V. Sinha et al.
Title Page
Abstract Introduction
Conclusions References
Tables Figures
◭ ◮
◭ ◮
Back Close
Full Screen / Esc
Printer-friendly Version
Interactive Discussion
EGU
5% accuracy error inherent in the pyrrole gas standard and a 2σ precision error of 6%,
while measuring pyrrole at 25 nmol mol−1
(the typical baseline value, C2, Fig. 1). As a
detector for the CRM technique, the PTR-MS offers the added advantage of tracking
humidity changes in the air exiting the glass reactor (more details in Sect. 4.2.3), by
monitoring masses 37 (cluster ion H3O+·H2O) and 55 (cluster ion H3O
+·(H2O)2), which5
can be used as proxies for water vapour in the air sampled by the PTR-MS. Further
details of this approach are available in Ammann et al. (2006).
4 Results
4.1 Calibrations and method validation
Several tests with single and mixed hydrocarbon standards were performed to ascer-10
tain whether the comparative reactivity method can reliably quantify samples of known
OH reactivity. Figure 3 shows an example plot of the measured reactivity data ver-
sus the reactivity introduced using a standard. A propane gas standard (Westfalen
A.G.; 33µmol mol−1
; stated uncertainty 4%) was introduced at different concentra-
tions through the same line that is used to introduce ambient air into the glass reactor.15
The PTR-MS is blind to propane since the proton affinity of propane is less than that
of water. The occasions when propane was introduced are indicated by shaded ar-
eas. As can be seen in Fig. 3, the baseline value (corresponding to C2 in Fig. 1) of
pyrrole is ∼25 nmol mol−1
and after every modulation (increase in signal correspond-
ing to C3 in Fig. 1) with propane concentrations of 1203 nmol mol−1
, 769 nmol mol−1
20
and 465 nmol mol−1
, respectively, the pyrrole signal reproducibly returns to its baseline
value (from C3 to C2), within the instrumental precision error of ∼6%. This shows that
the modulation (from C2 to C3) occurs due to the competition between propane and
pyrrole for the available OH radicals. The evaluated rate coefficient for the reaction
of propane with OH is (1.1±0.2) × 10−12
cm3
molecule−1
s−1
(Atkinson et al., 2007).25
Using equation (1), the reactivities due to the propane amounts shown in Fig. 3, were
18190
ACPD
7, 18179–18220, 2007
CRM – a new tool to
measure atmospheric
OH reactivity
V. Sinha et al.
Title Page
Abstract Introduction
Conclusions References
Tables Figures
◭ ◮
◭ ◮
Back Close
Full Screen / Esc
Printer-friendly Version
Interactive Discussion
EGU
calculated to be ∼35.3 s−1
, 22.5 s−1
and 13.6 s−1
, respectively. The breaks in the data
plot in Fig. 3 correspond to periods where the instrumental background was measured.
The background signal is collected by passing the sampled air over a Pt catalyst kept at
350◦C to oxidize all the organics. This enables correction for the noise at the measured
masses and results in more accurate quantification.5
Figure 4 shows the reactivity measured with the CRM (vertical axis) plotted against
the reactivity introduced into the glass reactor (horizontal axis) due to several standards
in different experiments. In addition to propane, a 19 component hydrocarbon mixture
was used as a reactivity standard. The 19 component hydrocarbon mixture is a com-
mercial gas standard (Apel-Riemer Environmental Inc.) and contains numerous com-10
pounds spanning four orders of magnitude in OH reaction rates. These are methanol,
acetone, acetaldehyde, hexanal, trans-2-hexenal, methyl ethyl ketone, methyl vinyl ke-
tone, acetonitrile, isoprene, alpha pinene, toluene, benzene, 1,3-dimethyl benzene,
2-methyl furan, 2-pentanone, 1,3,5-trimethyl benzene, 1,2,4,5- tetramethyl benzene,
cis-2-butene dimethyl sulphide and dimethyl disulphide. Akin to propane, the reactiv-15
ity due to the standards is calculated using Eq. (1) and using rate coefficients taken
from the latest IUPAC recommendations on gas kinetic data evaluation for atmospheric
chemistry (Atkinson et al., 2007).
For 1,2,4,5- tetra methyl benzene, no data was available and so its OH rate coef-
ficient was assumed to be 1×10⁻¹¹
cm3
molecule−1
s−1
(similar to rate coefficients of20
∼1.3×10⁻¹¹
cm3
molecule−1
s−1
for 1,3-dimethyl benzene and 1,4-dimethyl benzene
and 3×10⁻¹¹
cm3
molecule−1
s−1
for 1,3,5-trimethyl benzene). For the 19-component
hydrocarbon standard’s data shown in Fig. 4, the hydrocarbon concentrations intro-
duced were ∼7 nmol mol−1
and 16 nmol mol−1
, which are notably higher than the gen-
eral abundance levels of these VOCs in the atmosphere. The horizontal error bars in25
Figure 4 represent the total uncertainty in the reactivity of the standards, which includes
the uncertainties in the VOC + OH-rate coefficient (typically ∼15–20%), the accuracy of
the standard (∼5%) and the flow fluctuations (∼10%). The measured reactivity (plotted
on the vertical axis in Fig. 4) is obtained by interpolating the measured baseline (corre-
18191
ACPD
7, 18179–18220, 2007
CRM – a new tool to
measure atmospheric
OH reactivity
V. Sinha et al.
Title Page
Abstract Introduction
Conclusions References
Tables Figures
◭ ◮
◭ ◮
Back Close
Full Screen / Esc
Printer-friendly Version
Interactive Discussion
EGU
sponding to C2 in Fig. 4) and applying Equation 8 to the measured pyrrole signals C1,
C2 and C3.
The vertical error bars (∼20%) in Fig. 4 represent the total uncertainty in the mea-
sured OH reactivity and include the uncertainty in the pyrrole + OH rate coefficient
(1.20±0.16) ×10−10
cm3
molecule−1
s−1
, flow fluctuations of the mass flow controllers5
(∼10%), uncertainty in the pyrrole standard (5%) and instrumental precision error
(∼6%). Overall, it can be seen from Fig. 4 that the CRM measurements show excellent
linearity (r=0.99) and good accountability (slope of measured reactivity versus reactiv-
ity due to standard = 1.08±0.04) for the reactivity of up to ∼196 s−1
due to propane as
well as the 19-component hydrocarbon standard. This means that the dynamic range10
for the reactivity of ambient air (typically diluted in the glass reactor by a factor 1.7–2)
would be about 6 to 300 s−1
. The intercept of the line in Fig. 4 is negative (a=−3.3)
which indicates that at low reactivity ranges of <6 s−1
the existing method lacks sensi-
tivity.
Indeed, at low reactivity significant systematic errors can be induced by use of the an-15
alytical expression (Eq. 8) which is strictly appropriate only if pseudo-first order condi-
tions exist (i.e. [pyrrole] >> [OH]). Under the experimental conditions here a significant
depletion of pyrrole was however necessary in order to make accurate measurement
of C2 feasible. In fact, even under near pseudo first order conditions ([Pyrrole]/[OH]
ratio = 10), for sample air having 5 s−1
OH reactivity and OH radical concentration in20
the set up of ∼2.7×10¹¹
molecules cm−3
, one would have to measure a modulation of
0.2 nmol mol−1
on a baseline (C2) pyrrole signal of 1µmol mol−1
, which is not possible
with a PTR-MS. Only the initial flux of OH to either pyrrole or air is adequately described
by Eq. (8), but the integrated flux to both reactants (i.e. over the entire reaction time
for OH) may deviate from this if the two pools of reactants (i.e. pyrrole versus air) are25
depleted at different rates. In order to investigate this, simple numerical simulations
(Curtis et al.,1988) were carried out in which an initial concentration of OH (2.7×10¹²
molecules cm−3
) was allowed to react firstly with pyrrole only and then with pyrrole and
a hydrocarbon with a rate coefficient of 2×10⁻¹³
at different concentrations, to give OH
18192
ACPD
7, 18179–18220, 2007
CRM – a new tool to
measure atmospheric
OH reactivity
V. Sinha et al.
Title Page
Abstract Introduction
Conclusions References
Tables Figures
◭ ◮
◭ ◮
Back Close
Full Screen / Esc
Printer-friendly Version
Interactive Discussion
EGU
reactivity between 5 and 150 s−1
. Considering the dilution factor for ambient air in the
set up, this would correspond to a reactivity range of about 8 to 300 s−1
for ambient air
sampling.
The results are summarised in Fig. 5 which plots the reactivity, Reqn, obtained by
applying Eq. (8) to the numerical simulations of the pyrrole concentration (C2 and C3)5
after OH had reacted to zero, versus the true reactivity, Rtrue (derived from kRH. [RH];
Eq. 1). Two scenarios were considered, one approaching pseudo-first order conditions
with [pyrrole]/[OH]=10 and the second one with [pyrrole] / [OH] = 1.22. The simulations
for near-pseudo-first order conditions (see Fig. 5) provide confirmation of the analytical
expression used and return a slope of 1.05. Note that the relationship between Reqn10
and Rtrue is however not perfectly linear, with a maximum deviation of 6%. For the
case where [pyrrole]/[OH]=1.22 (also shown in Fig. 5), which is more relevant for the
experiments described here, we obtain the following fitting function:
Reqn = 3.16 × R0.84true
− 2.55 (9)
This shows that using Eq. (8) under the conditions of [pyrrole]/[OH]=1.22, may cause15
the measurements to overestimate the OH reactivity of the analyzed air sample, es-
pecially at lower ranges of OH reactivity. Also, in the real experiment this curvature
would not have been observed (e.g. Fig. 4). Nevertheless, as the [pyrrole]/[OH] ratio is
known from the experiments (C1/C1-C2), this simple analysis does enable a correction
factor to be derived for the measured data. For conditions typical of the present set20
of experiments, the correction factor is easily obtained by plotting Rtrue versus Reqn as
shown in Fig. 6, and we obtain the following correction factor:
Rtrue = 0.26R1.19eqn + 1.2 (10)
Applying Eq. (10) to the measured reactivity data in the calibration plot of Fig. 4, we
obtain a line with a slope of 0.79±0.03 (as shown in Figure 7). From Fig. 7, it is again25
obvious that the OH reactivity measured by the CRM accounts for the introduced air
sample’s OH reactivity, within the overall uncertainty of the measurement (20%). For
18193
ACPD
7, 18179–18220, 2007
CRM – a new tool to
measure atmospheric
OH reactivity
V. Sinha et al.
Title Page
Abstract Introduction
Conclusions References
Tables Figures
◭ ◮
◭ ◮
Back Close
Full Screen / Esc
Printer-friendly Version
Interactive Discussion
EGU
all measured OH reactivity data shown hereafter, the correction factor (Eq. 10), has
already been applied.
4.2 Investigation of possible interferences
Three main potential interferences have been identified while operating the compar-
ative reactivity method in its present configuration. These are: photolysis of pyrrole;5
recycling of OH at high NO due to the NO+ HO2 reaction; and drastic changes in the
relative humidity within the set-up when ambient air is sampled. A detailed discussion
of each is presented in the following sub-sections.
4.2.1 Photolysis of pyrrole
The pen ray mercury lamp (L.O.T Oriel GmbH & Co. KG), used for producing OH rad-10
icals by photolysis of water vapour at 184.9 nm, also has emission lines at 253.6 nm,
312.5 nm, 365 nm and 435.8 nm. Pyrrole absorbs at some of these wavelengths (Bavia
et al., 1976; Cronin et al., 2004) and its photolysis can potentially complicate the re-
activity assessment. Switching on the lamp inside the set-up without bubbling the
nitrogen through water (so that no OH radicals are generated) gives the decrease in15
pyrrole (from C0 to C1) due to photolysis alone.
In every session of CRM measurements, the C1 value is obtained experimentally
and so the initial amount of pyrrole (corresponding to C1), which is available for reac-
tion with OH, is known accurately. Using C1 instead of C0 is valid provided that the
photolytic loss of pyrrole is not significantly influenced by addition of water vapour. As20
H2O does not absorb strongly at the 254.6 nm Hg line, which is mainly responsible for
pyrrole photolysis, this is a reasonable assumption. Photolysis of pyrrole in our set-up
(can be up to 25%) is a significant interference if it is not taken into account. However,
by measuring and hence knowing its contribution to the observed decrease in the pyr-
role signal, when the lamp is switched on in the presence of moist N2 for OH production25
ensures that this interference is adequately quantified and hence has negligible influ-
18194
ACPD
7, 18179–18220, 2007
CRM – a new tool to
measure atmospheric
OH reactivity
V. Sinha et al.
Title Page
Abstract Introduction
Conclusions References
Tables Figures
◭ ◮
◭ ◮
Back Close
Full Screen / Esc
Printer-friendly Version
Interactive Discussion
EGU
ence on the measurements. This is also borne out by the good agreement obtained
using reactivity standards as mentioned earlier.
4.2.2 Recycling of OH due to HO2 + NO
The pen-ray mercury lamp produces OH radicals by the photolysis of water vapour at
atmospheric pressure in the following manner5
H2O184.9 nm−→ OH + H (R9)
While the above step is performed only in a flow of N2, zero air containing oxygen
(O2) enters the glass reactor through arm A (see Fig. 2), so that HO2 is also rapidly
produced within the glass reactor by the following reaction:
H + O2 + M −→ HO2 + M (R10)10
If NO is present in the sampled ambient air, it can recycle OH radicals:
NO + HO2k =8.8×10
−12
−→ OH + NO2 (R11)
Figure 8 shows the measured OH reactivity (vertical axis; open green markers)
for different amounts of NO (horizontal axis) while sampling air containing propane
(∼16.5 s−1
of reactivity; 558 nmol mol−1
propane). Note that even at such high values of15
propane in the introduced air sample (∼16.5 s−1
of reactivity; 558 nmol mol−1
propane),
the measured OH reactivity is not affected significantly (that is, the change is within
the measurement uncertainty) for added NO concentrations of up to ∼3.5 nmol mol−1
.
Above 5 nmol mol−1
of NO, however, the change in the measured OH reactivity due to
reaction with the recycled OH was non-linear and caused significant interference in the20
CRM measurements, so that the entire modulation (C3-C2) was suppressed (data not
plotted in Fig. 8). The numerical simulation for the same value of introduced reactivity
(16.5 s−1
) is also shown in Fig. 8 (the closed green markers) and are in good agreement
with the profile of the measurements (open green markers) up to ∼3.5 nmol mol−1
. This
18195
ACPD
7, 18179–18220, 2007
CRM – a new tool to
measure atmospheric
OH reactivity
V. Sinha et al.
Title Page
Abstract Introduction
Conclusions References
Tables Figures
◭ ◮
◭ ◮
Back Close
Full Screen / Esc
Printer-friendly Version
Interactive Discussion
EGU
numerical simulation included the complete propane degradation mechanism (to end
products CO2 and H2O) (Atkinson et al., 2007) and, by neglecting reactions of RO2
with themselves or with HO2, represents the worst case scenario in which the rate of
reaction of HO2 with NO is optimized. Beyond 3.5 nmol mol−1
of NO, while the simula-
tion also shows more suppression in the measured OH reactivity, the scale of change is5
not the same as that observed for the measurements (measured OH reactivity tends to
zero at 10 nmol mol−1
of NO in the experiments while the simulation shows only ∼70%
change, from 16.5 s−1
to 5 s−1
; Fig. 8). Further simulations at 12 s−1
(red markers in
Fig. 8) and 50 s−1
(purple markers in Fig. 8) of OH reactivity confirm the same trend of
underestimation of measured OH reactivity at NO >5 nmol mol−1
.10
4.2.3 Humidity difference between zero air and ambient air
If the zero air used in lieu of ambient air to determine the pyrrole baseline signal (cor-
responding to C2 in Fig. 1) differs substantially in humidity from that of the sampled
ambient air, then the amount of OH radicals generated within the glass reactor might
change, causing artefacts in the measured C2 and C3 pyrrole signals. When the zero15
air is drier than the ambient air entering the glass reactor, more OH radicals may be
produced while sampling/ modulating with ambient air due to photolysis of the “extra”
water vapour present in the sampled ambient air. As a result, there can be a suppres-
sion of the measured pyrrole signal (C3) causing the measurements to underestimate
the actual reactivity. Conversely, if the zero air is wetter than the sampled ambient air,20
less OH radicals may be available for reaction with pyrrole during the sampling of am-
bient air, leading to an enhancement of the measured pyrrole signal (C3) and resulting
in measurements that may overestimate the actual OH reactivity.
To ascertain how significant this interference might be, the zero air flowing into the
set-up was humidified to different degrees by mixing varying amounts of wet and dry25
zero air prior to its introduction into the glass reactor through arm A (see Fig. 2). Then,
the variation in the pyrrole baseline (signal C2 in Fig. 1) was monitored for different de-
grees of humidified zero air. The humidity of the glass reactor air is tracked using mass
18196
ACPD
7, 18179–18220, 2007
CRM – a new tool to
measure atmospheric
OH reactivity
V. Sinha et al.
Title Page
Abstract Introduction
Conclusions References
Tables Figures
◭ ◮
◭ ◮
Back Close
Full Screen / Esc
Printer-friendly Version
Interactive Discussion
EGU
55 (cluster ion H3O+
(H2O)2), with the PTR-MS, similar to the approach of Ammann
et al. (2006). Figure 9 shows the results, with the increase in the pyrrole signal (verti-
cal axis) plotted against the corresponding decrease in humidity (horizontal axis). It is
evident that repeating the experiment on different occasions which involved reassem-
bling the whole set up and slightly different flows (see data for 14 August, 2005 and 265
October, 2006 in Fig. 9) produces a consistent trend line.
The data in the top left hand corner of Fig. 9 were obtained under the extreme con-
dition of measuring the change in the pyrrole signal (C2) while using saturated zero
air (∼90%) and dry zero air, taken directly from the bottle. Figure 9 also shows that
for changes in mass 55 (humidity tracer) of up to ∼20 000 counts per second (cps)10
the change in the pyrrole signal is <1 nmol mol−1
, which is within the precision error
of the PTR-MS. Therefore, while conducting ambient air reactivity measurements, the
diluting zero air is humidified to lie within the 20 000 cps range of the mass 55 signal
observed for ambient air. So, while drastic changes in humidity can cause a significant
interference, care is taken to match the mixing gases close to the ambient humidity and15
thereby significant interferences are avoided.
4.3 Field deployment and first CRM results of ambient air OH reactivity
To test the capability and performance of the technique under markedly different ambi-
ent conditions, measurements were conducted first in the urban atmosphere of Mainz,
Germany, and then in the tropical rainforest air of Suriname in August and October20
2005, respectively.
4.3.1 Total OH reactivity of Mainz air: urban environment
Figure 10 shows the diel OH reactivity profile for Mainz air, measured with the CRM
technique from 18–20 August 2005. Ambient air was sampled outside our laboratory
(49◦59
′N, 8
◦14
′E) at the Max Planck Institute for Chemistry in Mainz, circa 8 m above25
the ground. Just outside the laboratory there is an undergrowth of bushes and plants.
18197
ACPD
7, 18179–18220, 2007
CRM – a new tool to
measure atmospheric
OH reactivity
V. Sinha et al.
Title Page
Abstract Introduction
Conclusions References
Tables Figures
◭ ◮
◭ ◮
Back Close
Full Screen / Esc
Printer-friendly Version
Interactive Discussion
EGU
The sampled ambient air was introduced directly into the CRM glass reactor using
∼12 m long, 1/2 inch (o.d.) Teflon tubing, using a VOC sampling pump (Laboport N86-
KN18). The inlet residence time for the ambient air was <20 s and the measurement
frequency was 0.025 Hz. During the measurements, NO in Mainz air was typically
less than 1.5 nmol mol−1
(Landesamt fur Umwelt, Wasserwirtschaft und Gewerbeau-5
sicht Rheinland-Pfalz). The average value of the total OH reactivity of Mainz air was
∼10.4 s−1
. OH reactivity was observed to be highest during the afternoon (13:00 LT),
reaching peak values of ∼18±4 s−1
, while lowest values (∼6±3 s−1
) were observed
early in the morning between 02:00 to 04:00 LT.
4.3.2 Total OH reactivity of Suriname rainforest air: forest environment10
Figure 11 shows OH reactivity measurements of rainforest air at the peak of diel emis-
sions. The measurements were taken in the nature reserve of Brownsberg (4◦56
′N,
55◦10
′W, 512 m a.s.l.) in Suriname, within the canopy at about 35 m above the ground.
Details about the sampling methodology along with the site description are given else-
where (Sinha et al., 2007b; Williams et al., 2007). Ambient forest air reactivity was15
measured for almost 2 h on 6 October 2005 before the PTR-MS broke down. Ear-
lier, from 2 to 5 October 2005, the PTR-MS was used to measure ambient air directly
(without reactivity measurements) to determine diel emission profiles for VOCs such
as acetone (mass 59), acetaldehyde (mass 45), isoprene (mass 69) and the isoprene
oxidation products, methyl vinyl ketone and methacrolein (detected collectively at mass20
71). The calculated diel reactivity profile derived from the ambient air PTR-MS mea-
surements of these species is shown on the right vertical axis of Fig. 11. The CRM
reactivity measurements shown in Fig. 11 were taken when forest air seemed to have
maximum OH reactivity, as they coincide with the peak of diel forest emissions. The
average of all the OH reactivity measurements (∼2 h of data) was circa 53 s−1
, with a25
peak OH reactivity of approximately 72±18 s−1
.
18198
ACPD
7, 18179–18220, 2007
CRM – a new tool to
measure atmospheric
OH reactivity
V. Sinha et al.
Title Page
Abstract Introduction
Conclusions References
Tables Figures
◭ ◮
◭ ◮
Back Close
Full Screen / Esc
Printer-friendly Version
Interactive Discussion
EGU
5 Discussion
The results shown here demonstrate that a new and promising online technique capa-
ble of directly measuring the total OH reactivity of ambient air has been developed. Us-
ing pyrrole and a PTR-MS, as the reagent molecule and detector, respectively, the dy-
namic range of the technique in its existing configuration is about 6 to 300 s−1
for ambi-5
ent air. At C1, C2 and C3 values of 120 nmol mol−1
, 20 nmol mol−1
and 1.5 nmol mol−1
,
respectively, the measured reactivity using Eq. (8) is ∼5.9 s−1
. Applying the correction
factor in Eq. (10) this corresponds to true reactivity of ∼3.3 s−1
and allowing for the
dilution factor of 1.7 within the set up, this implies ∼6 s−1
of reactivity for the sampled
ambient air. The overall uncertainty of the measurements is typically around 25%. At10
lower ambient air reactivities (<circa 8 s−1
), the uncertainty can be up to ±50%. This is
sensitive enough to constrain the OH reactivity (OH sink) and test for missing OH reac-
tants during field campaigns (when OH reactivity >8 s−1
). The technique performs well
with propane and mixed hydrocarbon standards and accounts for the introduced reac-
tivity within the measurement uncertainty. While the slope of the trend line derived from15
the calibration experiments (Fig. 4) tended to slightly overestimate the true reactivity
by circa 8%, the trend line obtained by applying a model correction factor to the same
data (Fig. 7), tended to underestimate the true reactivity by circa 20%. Note however
that both the simulation and the experiments lie within 20% of the true reactivity due to
the different standards.20
While major potential interferences have been investigated in Sect. 4.3, other minor
interferences have also been considered. Ambient air VOCs which absorb in the UV
region may undergo photolysis within the set up. However, the fact that the calibra-
tion line due to the 19 component hydrocarbon standard (containing VOCs such as
acetaldehyde, hexanal and aromatics and methyl vinyl ketone, which absorb UV light25
and are introduced at concentrations of 7 to 17 nmol mol−1
), falls on the same trend
line as that of propane (see Fig. 4), suggests that this is not a significant effect. To test
for secondary chemistry along the reaction length, and the sensitivity to slight change
18199
ACPD
7, 18179–18220, 2007
CRM – a new tool to
measure atmospheric
OH reactivity
V. Sinha et al.
Title Page
Abstract Introduction
Conclusions References
Tables Figures
◭ ◮
◭ ◮
Back Close
Full Screen / Esc
Printer-friendly Version
Interactive Discussion
EGU
of flows (∼20 ml min−1
) the PTR-MS probe (inlet D of the glass reactor; Fig. 2) was
placed at different points along the length of the glass reactor. However, no noticeable
change in the measured pyrrole signal was observed. This simple test is also applied
in the field, while sampling ambient air to investigate the influence of secondary chem-
istry within the glass reactor. It is also worth mentioning that the lifetime of OH radicals5
within the glass reactor set up is always <4 ms.
Ozone is also produced within the glass reactor by photolysis of O2 due to the
184.9 nm lamp emission line. Moreover the ratio of O3/OH in our glass reactor set
up is similar to that found in ambient air (103). However, the ozone (produced at
µmol mol−1
level) hardly affects the pyrrole signal since the pyrrole + O3 reaction10
rate (kO3+pyrrole=1.57×10⁻¹⁷
cm3
molecule−1
s−1
(Atkinson et al., 1984) is several or-
ders of magnitude slower than the reaction rate with OH radicals. When terpenes and
sesquiterpenes are present in ambient air, they can react with O3 within the glass reac-
tor and recycle OH (Paulson et al., 1999; Hasson et al., 2003). Also, some RO2 reac-
tions with HO2 may also generate OH (Hasson et al., 2004), again potentially affecting15
the reactivity measurement. Note however, that the recycled OH due to ozonolysis of
these reactive alkenes and the Hasson reactions within the glass reactor is negligible
compared to the high OH radical concentrations (∼2.15×10¹²
molecules cm−3
) gen-
erated in-situ by photolysis of water vapour at 184.9 nm and O3 photolysis at 254 nm,
which also produces OH by the O(1D) + H2O reaction. For the same reason, the20
CRM method may actually perform better under such ambient air conditions (of highly
reactive terpenes in ambient air) than the LIF based method. This is because the re-
generated OH radicals may mask the actual OH decay rate within the LIF instrument’s
flow reactor and cause an underestimation of the actual measured decay rate and OH
reactivity.25
The NO sensitivity studies have shown that in the existing configuration of CRM
high NO in sampled air causes interference. We found significant interference at
NO>5 nmol mol−1
for propane at ∼16.5 s−1
reactivity, and numerical simulations for
50 s−1
of OH reactivity in the set up (corresponding to 100 s−1
of OH reactivity for
18200
ACPD
7, 18179–18220, 2007
CRM – a new tool to
measure atmospheric
OH reactivity
V. Sinha et al.
Title Page
Abstract Introduction
Conclusions References
Tables Figures
◭ ◮
◭ ◮
Back Close
Full Screen / Esc
Printer-friendly Version
Interactive Discussion
EGU
ambient air due to the dilution factor of 2) also indicate that the interference is not
significant for NO<5 nmol mol−1
. In this respect, it would be useful and interesting to
compare the CRM technique with the LIF based reactivity measurement technique to
test for systematic offsets between the two analytical approaches. Under our experi-
mental conditions, it is likely that high NO (>5 nmol mol−1
) in ambient air might cause5
the measurements to underestimate the actual reactivity. Thus, low NOx environments
such as tropical forests (NO<20 pmol mol−1
, e.g. Brownsberg) and pristine marine en-
vironments appear to be ideal sites for the deployment of the existing CRM instrument.
Further modifications to improve the sensitivity, precision and automation of the in-
strument and to minimize/remove interferences can proceed now that the first validation10
is complete. For example, a mercury pen-lamp equipped with an interference filter to
transmit only the 184.9 nm line, would significantly reduce photolysis related interfer-
ences. OH sources that are not HO2 sources exist and may help in improving the
current system (e.g. photolysis of H2O2, F + H2O, photolysis of N2O followed by the
reaction of O1D with water). The existing sampling strategy for introducing ambient air15
into the glass reactor, which uses a VOC sampling Teflon pump (Laboport N86-KN18),
could also be modified so that the ambient air enters the set-up directly without going
through a pump. This would help to minimize the loss of sticky reactive VOCs, which
may contribute significantly to OH reactivity. While we have used the reagent and de-
tector system of pyrrole and a PTR-MS, respectively, in principle it should be possible to20
apply the Comparative Reactivity Concept to other suitable reagent molecules (e.g. la-
beled isotopes of isoprene) and detectors (e.g. fast GC-MS systems). Other reagent
molecules, which have a smaller rate coefficient than that of pyrrole with OH may also
afford better sensitivity at lower ranges of ambient air OH reactivity.
The instrument has been successfully deployed in the field to measure the total OH25
reactivity of ambient air in the contrasting environments of Mainz (urban), Germany
and Brownsberg (rainforest air), Suriname. The measurements indicated that at the
peak of diel emissions, Suriname forest air was 4 times more reactive than the urban
air of Mainz (72 s−1
compared to 18 s−1
). The total OH reactivity measurements for
18201
ACPD
7, 18179–18220, 2007
CRM – a new tool to
measure atmospheric
OH reactivity
V. Sinha et al.
Title Page
Abstract Introduction
Conclusions References
Tables Figures
◭ ◮
◭ ◮
Back Close
Full Screen / Esc
Printer-friendly Version
Interactive Discussion
EGU
Mainz air lie well within the range of total OH reactivity measurements reported in
literature for urban air sites. Table 1 presents a summary of ambient air OH reactivity
measurements from urban and forest sites. Kovacs et al. (2003) reported ambient
air OH reactivity values of 11–19 s−1
at Nashville, TN, USA. In the same campaign,
a comparison of the measured OH reactivity and the calculated reactivity due to the5
measured reactants (70 VOCs), showed that on average, the measured OH reactivity
was 1.45 times higher (Martinez et al., 2003). Using laser induced fluorescence based
techniques, maximum OH reactivity values of 50 s−1
in New York City (Fig. 8 in Ren et
al., 2003), 85 s−1
in suburban Tokyo (Sadanaga et al., 2004a; Sadanaga et al., 2005;
Yoshino et al., 2006), and 200 s−1
in Mexico city (Fig. 9 in Shirley et al., 2006) have10
been observed.
To our knowledge, the ambient air OH reactivity measurements from Brownsberg are
the first total OH reactivity measurements from a tropical rainforest site, an ecosystem
that is known for strong biogenic emissions (Karl et al., 2004; Goldstein and Galbally,
2007). Di Carlo et al. (2004) observed missing OH reactivity in a mixed transition forest15
consisting of northern hardwood, aspen and white pine in north Michigan. Our limited
OH reactivity measurements from Brownsberg also indicate that a significant fraction
of important OH reactive compounds are likely missed in conventional measurements
at forest sites (see Fig. 11), since isoprene, isoprene oxidation products, acetone and
acetaldehyde make up only ∼35% of the measured sink). In future studies, it will be20
interesting to measure a more comprehensive suite of VOCs and other OH-reactive
species such as NO2 and SO2, together with direct OH reactivity measurements to
better understand the budget of OH sinks. Rate constants for the reaction of OH with
almost all measured ambient VOCs are known. By summing up the calculated reactiv-
ity due to all the measured VOCs (i.e. summation of VOC concentration times its rate25
coefficient) and comparing it with the direct OH reactivity measurement, one can addi-
tionally examine the reactive carbon budget and assess to what extent the individually
measured VOCs account for the total OH reactivity.
18202

ACPD
7, 18179–18220, 2007
CRM – a new tool to
measure atmospheric
OH reactivity
V. Sinha et al.
Title Page
Abstract Introduction
Conclusions References
Tables Figures
◭ ◮
◭ ◮
Back Close
Full Screen / Esc
Printer-friendly Version
Interactive Discussion
EGU
6 Conclusions
This study has shown that the Comparative Reactivity Method (CRM) can be applied
for measurements of the total OH reactivity of ambient air. Applying the CRM concept
to the reagent and detector system of pyrrole and a PTR-MS, respectively, a new on-
line measurement technique with a dynamic range of about 6 to 300 s−1
for ambient5
air and accuracy of ±25% has been developed. Sensitivity studies (involving changing
parameters) have been carried out, and high NO (>5 nmol mol−1
) in ambient air has
been identified as the major interference. Therefore low NOx environments such as re-
mote forest sites and marine environments are ideal for deploying the new instrument,
and improvements in the existing set up are needed for conducting measurements10
in strongly NOx polluted environments. Moderately polluted Mainz air measurements
(NO ≤1.5 nmol mol−1
) are consistent with OH reactivity measurements reported previ-
ously for urban air. Our measurements from the tropical rainforest (for which no other
data exists) indicate that a significant fraction of OH reactive species is missed in cur-
rent measurements. Further OH reactivity measurements, combining comprehensive15
measurements of VOCs and other OH reactive species are needed to clarify whether
sinks are currently underestimated in forest environments and to constrain the budget
of reactive VOCs.
Finally, several measurement groups routinely employ proton transfer reaction mass
spectrometers and gas chromatography detectors for measuring VOCs in ambient air,20
during field campaigns. It would be relatively easy and economical to integrate a glass
reactor and employ the CRM based technique proposed in this study with these de-
tectors for direct quantification of the OH sink, using either pyrrole or another suitable
molecule. One of the future objectives will also be to compare the newly developed
CRM based instrument with the existing more comprehensive laser induced fluores-25
cence (LIF) based reactivity measurement technique, to test for systematic offsets be-
tween the two analytical approaches. Hopefully, this study will stimulate further efforts
in the application of the Comparative Reactivity Method for ambient air OH reactivity
18203
ACPD
7, 18179–18220, 2007
CRM – a new tool to
measure atmospheric
OH reactivity
V. Sinha et al.
Title Page
Abstract Introduction
Conclusions References
Tables Figures
◭ ◮
◭ ◮
Back Close
Full Screen / Esc
Printer-friendly Version
Interactive Discussion
EGU
measurements.
Acknowledgements. Special thanks to S. Jung for helping with her expertise in glass blowing
and furnishing the requested myriad glassware and reactors, sometimes even at very short
notice. K. Simon is appreciated for expediting delivery of the custom ordered hydrocarbon
standards. V. Sinha acknowledges the financial support rendered by the Max Planck Society.5
Last but certainly not the least, we thank all the members of the ORSUM group, in particular
T. Kluepfel and T. Custer who have facilitated the successful accomplishment of this work.
References
Ammann, C., Brunner, A., Spirig, C., and Neftel, A.: Technical note: Water vapour concentration
and flux measurements with PTR-MS, Atmos. Chem. Phys., 6, 4643–4651, 2006,10
http://www.atmos-chem-phys.net/6/4643/2006/.
Atkinson, R., Aschmann, S. M., Winer, A. M., and Carter, W. P. L., Rate Constants for the
Gas-Phase Reactions of OH Radicals and O3 with Pyrrole at 295+/-1k and Atmospheric-
Pressure, Atmos. Environ., 18, 2105–2107, 1984.
Atkinson, R., Baulch, D. L., Cox, R. A., Crowley, J. N., Hampson, R. F., Hynes, R. G., Jenkin, M.15
E., Kerr, J. A., Rossi, M. J. and Troe, J. “IUPAC Subcommittee for gas kinetic data evaluation,
Evaluated kinetic data, http://www.iupac-kinetic.ch.cam.ac.uk/, 2007
Bavia, M., Bertinelli, F., Taliani, C., and Zauli, C.: Electronic-Spectrum of Pyrrole in Vapor and
Crystal, Mol. Phys., 31, 479–489, 1976.
Carslaw, N., Creasey, D. J., Heard, D. E., Jacobs, P. J., Lee, J. D., Lewis, A. C., McQuaid, J. B.,20
Pilling, M. J., Bauguitte, S., Penkett, S. A., Monks, P. S., and Salisbury, G.: Eastern Atlantic
Spring Experiment 1997 (EASE97) – 2. Comparisons of model concentrations of OH, HO2,
and RO2 with measurements, J. Geophys. Res.-Atmos., 107, 2002.
Cronin, B., Nix, M. G. D., Qadiri, R. H., and Ashfold, M. N. R.: High resolution photofragment
translational spectroscopy studies of the near ultraviolet photolysis of pyrrole, Phys. Chem.25
Chem. Phys., 6, 5031–5041, 2004.
Curtis, A. R. and Sweetenham, W. P.: Facsimile/Chekmat Users Manual, AERE Report R-
12805, Her Majesty’s Stationary Office, England.
de Gouw, J. and Warneke, C.: Measurements of volatile organic compounds in the earths
18204
ACPD
7, 18179–18220, 2007
CRM – a new tool to
measure atmospheric
OH reactivity
V. Sinha et al.
Title Page
Abstract Introduction
Conclusions References
Tables Figures
◭ ◮
◭ ◮
Back Close
Full Screen / Esc
Printer-friendly Version
Interactive Discussion
EGU
atmosphere using proton-transfer-reaction mass spectrometry, Mass Spectrom. Rev., 26,
223–257, 2007.
Di Carlo, P., Brune, W. H., Martinez, M., Harder, H., Lesher, R., Ren, X. R., Thornberry, T.,
Carroll, M. A., Young, V., Shepson, P. B., Riemer, D., Apel, E., and Campbell, C.: Missing OH
reactivity in a forest: Evidence for unknown reactive biogenic VOCs, Science, 304, 722–725,5
2004.
Goldstein, A. H., McKay, M., Kurpius, M. R., Schade, G. W., Lee, A., Holzinger, R.,
and Rasmussen, R. A.: Forest thinning experiment confirms ozone deposition to forest
canopy is dominated by reaction with biogenic VOCs, Geophys. Res. Lett., 31, L22106,
doi:10.1029/2004GL021259, 2004.10
Goldstein, A. H. and Galbally, I. E.: Known and unexplored organic constituents in the earth’s
atmosphere, Environ. Sci. Technol., 41, 1514–1521, 2007.
Hasson, A. S., Chung, M. Y., Kuwata, K. T., Converse, A. D., Krohn, D., and Paulson, S. E.:
Reaction of Criegee intermediates with water vapor - An additional source of OH radicals in
alkene ozonolysis?, J. Phys. Chem. A, 107, 6176–6182, 2003.15
Hasson, A. S., Tyndall, G. S., and Orlando, J. J.: A product yield study of the reaction of
HO2 radicals with ethyl peroxy (C2H5O2), acetyl peroxy (CH3C(O)O-2), and acetonyl peroxy
(CH3C(O)CH2O2) radicals, J. Phys. Chem. A, 108, 5979–5989, 2004.
Heard, D. E. and Pilling, M. J.: Measurement of OH and HO2 in the troposphere, Chem. Rev.,
103, 5163–5198, 2003.20
Hofzumahaus, A., Aschmutat, U., Hessling, M., Holland, F., and Ehhalt, D. H.: The measure-
ment of tropospheric OH radicals by laser-induced fluorescence spectroscopy during the
POPCORN field campaign, Geophys. Res. Lett., 23, 2541–2544, 1996.
Holland, F., Hofzumahaus, A., Schafer, R., Kraus, A., and Patz, H. W.: Measurements of OH
and HO2 radical concentrations and photolysis frequencies during BERLIOZ, J. Geophys.25
Res.-Atmos., 108(D4), 8246, doi:10.1029/2001JD001393, 2003.
Holzinger, R., Lee, A., Paw, K. T., and Goldstein, A. H.: Observations of oxidation products
above a forest imply biogenic emissions of very reactive compounds, Atmos. Chem. Phys.,
5, 67–75, 2005,
http://www.atmos-chem-phys.net/5/67/2005/.30
Jeanneret, F., Kirchner, F., Clappier, A., van den Bergh, H., and Calpini, B.: Total VOC reac-
tivity in the planetary boundary layer 1. Estimation by a pump and probe OH experiment, J.
Geophys. Res.-Atmos., 106, 3083–3093, 2001.
18205
ACPD
7, 18179–18220, 2007
CRM – a new tool to
measure atmospheric
OH reactivity
V. Sinha et al.
Title Page
Abstract Introduction
Conclusions References
Tables Figures
◭ ◮
◭ ◮
Back Close
Full Screen / Esc
Printer-friendly Version
Interactive Discussion
EGU
Karl, T., Potosnak, M., Guenther, A., Clark, D., Walker, J., Herrick, J. D., and Geron, C.: Ex-
change processes of volatile organic compounds above a tropical rain forest: Implications
for modeling tropospheric chemistry above dense vegetation, J. Geophys. Res.-Atmos., 109,
D18306, doi:10.1029/2004JD004738, 2004.
Kovacs, T. A. and Brune, W. H.: Total OH loss rate measurement: J. Atmos. Chem., 39, 105–5
122, 2001.
Kovacs, T. A., Brune, W. H., Harder, H., Martinez, M., Simpas, J. B., Frost, G. J., Williams, E.,
Jobson, T., Stroud, C., Young, V., Fried, A., and Wert, B.: Direct measurements of urban OH
reactivity during Nashville SOS in summer 1999, J. Environ. Monit., 5, 68–74, 2003.
Lelieveld, J., Dentener, F. J., Peters, W., and Krol, M. C.: On the role of hydroxyl radicals in the10
self-cleansing capacity of the troposphere, Atmos. Chem. Phys., 4, 2337–2344, 2004,
http://www.atmos-chem-phys.net/4/2337/2004/.
Lewis, A. C., Carslaw, N., Marriott, P. J., Kinghorn, R. M., Morrison, P., Lee, A. L., Bartle, K. D.,
and Pilling, M. J.: A larger pool of ozone-forming carbon compounds in urban atmospheres,
Nature, 405, 778–781, 2000.15
Lindinger, W., Hansel, A., and Jordan, A.: On-line monitoring of volatile organic compounds
at pptv levels by means of proton-transfer-reaction mass spectrometry (PTR-MS) – Medical
applications, food control and environmental research, Int. J. Mass Spectrom., 173, 191–241,
1998a.
Lindinger, W., Hansel, A., and Jordan, A.: Proton-transfer-reaction mass spectrometry (PTR-20
MS): on-line monitoring of volatile organic compounds at pptv levels, Chem. Soc. Rev., 27,
347–354, 1998b.
Maris, C., Chung, M. Y., Lueb, R., Krischke, U., Meller, R., Fox, M. J., and Paulson, S. E.: De-
velopment of instrumentation for simultaneous analysis of total non-methane organic carbon
and volatile organic compounds in ambient air, Atmos. Environ., 37, S149–S158, 2003.25
Martinez, M., Harder, H., Kovacs, T. A., et al.: OH and HO2 concentrations, sources, and
loss rates during the Southern Oxidants Study in Nashville, Tennessee, summer 1999, J.
Geophys. Res.-Atmos., 108(D19), 4617, doi:10.1029/2003JD003551, 2003.
Olson, J. R., Crawford, J. H., Chen, G., et al.: Testing fast photochemical theory during TRACE-
P based on measurements of OH, HO2, and CH2O, J. Geophys. Res.-Atmos., 109, D15S10,30
doi:10.1029/2003JD004278, 2004.
Paulson, S. E., Chung, M. Y., and Hasson, A. S., OH radical formation from the gas-phase reac-
tion of ozone with terminal alkenes and the relationship between structure and mechanism:
18206
ACPD
7, 18179–18220, 2007
CRM – a new tool to
measure atmospheric
OH reactivity
V. Sinha et al.
Title Page
Abstract Introduction
Conclusions References
Tables Figures
◭ ◮
◭ ◮
Back Close
Full Screen / Esc
Printer-friendly Version
Interactive Discussion
EGU
J. Phys. Chem. A, 103, 8125-8138, 1999.
Poppe, D., Zimmermann, J., Bauer, R., et al.: Comparison Of Measured Oh Concentrations
With Model-Calculations: J. Geophys. Res.-Atmos., 99, 16 633–16 642, 1994.
Ren, X. R., Brune, W. H., Cantrell, C. A., Edwards, G. D., Shirley, T., Metcalf, A. R., and
Lesher, R. L.: Hydroxyl and peroxy radical chemistry in a rural area of Central Pennsylvania:5
Observations and model comparisons, J. Atmos. Chem., 52, 231–257, 2005.
Ren, X. R., Brune, W. H., Oliger, A., Metcalf, A. R., Simpas, J. B., Shirley, T., Schwab, J. J.,
Bai, C. H., Roychowdhury, U., Li, Y. Q., Cai, C. X., Demerjian, K. L., He, Y., Zhou, X. L.,
Gao, H. L., and Hou, J.: OH, HO2, and OH reactivity during the PMTACS-NY Whiteface
Mountain 2002 campaign: Observations and model comparison, J. Geophys. Res.-Atmos.,10
111, D10S03, doi:10.1029/2005JD006126, 2006.
Ren, X. R., Harder, H., Martinez, M., Lesher, R. L., Oliger, A., Shirley, T., Adams, J., Simpas, J.
B., and Brune, W. H.: HOx concentrations and OH reactivity observations in New York City
during PMTACS-NY2001, Atmos. Environ., 37, 3627–3637, 2003.
Roberts, J. M., Bertman, S. B., Jobson, T., Niki, H., and Tanner, R.: Measurement of total15
nonmethane organic carbon (C-y): Development and application at Chebogue Point, Nova
Scotia, during the 1993 North Atlantic Regional Experiment campaign, J. Geophys. Res.-
Atmos., 103, 13 581–13 592, 1998.
Sadanaga, Y., Yoshino, A., Kato, S., and Kajii, Y.: Measurements of OH reactivity and photo-
chemical ozone production in the urban atmosphere, Environ. Sci. Technol., 39, 8847–8852,20
2005.
Sadanaga, Y., Yoshino, A., Kato, S., Yoshioka, A., Watanabe, K., Miyakawa, Y., Hayashi, I.,
Ichikawa, M., Matsumoto, J., Nishiyama, A., Akiyama, N., Kanaya, Y., and Kajii, Y.: The
importance of NO2 and volatile organic compounds in the urban air from the viewpoint of the
OH reactivity, Geophys. Res. Lett., 31, D10S03, doi:10.1029/2005JD006126, 2004a.25
Sadanaga, Y., Yoshino, A., Watanabe, K., Yoshioka, A., Wakazono, Y., Kanaya, Y., and Kajii,
Y.: Development of a measurement system of OH reactivity in the atmosphere by using a
laser-induced pump and probe technique, Rev. Sci. Instrum., 75, 2648–2655, 2004b.
Salisbury, G., Williams, J., Holzinger, R., Gros, V., Mihalopoulos, N., Vrekoussis, M., Sarda-
Esteve, R., Berresheim, H., von Kuhlmann, R., Lawrence, M., and Lelieveld, J.: Ground-30
based PTR-MS measurements of reactive organic compounds during the MINOS campaign
in Crete, July–August 2001, Atmos. Chem. Phys., 3, 925–940, 2003,
http://www.atmos-chem-phys.net/3/925/2003/.
18207
ACPD
7, 18179–18220, 2007
CRM – a new tool to
measure atmospheric
OH reactivity
V. Sinha et al.
Title Page
Abstract Introduction
Conclusions References
Tables Figures
◭ ◮
◭ ◮
Back Close
Full Screen / Esc
Printer-friendly Version
Interactive Discussion
EGU
Shirley, T. R., Brune, W. H., Ren, X., Mao, J., Lesher, R., Cardenas, B., Volkamer, R., Molina,
L. T., Molina, M. J., Lamb, B., Velasco, E., Jobson, T., and Alexander, M.: Atmospheric
oxidation in the Mexico City Metropolitan Area (MCMA) during April 2003, Atmos. Chem.
Phys., 6, 2753–2765, 2006,
http://www.atmos-chem-phys.net/6/2753/2006/.5
Sickles, J. E., Eaton, W. C., Ripperton, L. A., and Wright, R.S., US Environmental Protection
Agency, EPA-60017-77-104, 1977.
Sinha, V., Williams, J., Meyerhofer, M., Riebesell, U., Paulino, A. I., and Larsen, A.: Air-sea
fluxes of methanol, acetone, acetaldehyde, isoprene and DMS from a Norwegian fjord fol-
lowing a phytoplankton bloom in a mesocosm experiment, Atmos. Chem. Phys., 7, 739–755,10
2007a.
Sinha, V., Williams, J., Crutzen P., and Lelieveld J.: Methane emissions from boreal and tropical
forest ecosystems derived from in-situ measurements, Atmos. Chem. Phys. Discuss., 7,
14 011–14 039, 2007b.
Smith, S. C., Lee, J. D., Bloss, W. J., Johnson, G. P., Ingham, T., and Heard, D. E.: Concentra-15
tions of OH and HO2 radicals during NAMBLEX: measurements and steady state analysis,
Atmos. Chem. Phys., 6, 1435–1453, 2006,
http://www.atmos-chem-phys.net/6/1435/2006/.
Williams, J., Poschl, U., Crutzen, P. J., Hansel, A., Holzinger, R., Warneke, C., Lindinger, W.,
and Lelieveld, J.: An atmospheric chemistry interpretation of mass scans obtained from a20
proton transfer mass spectrometer flown over the tropical rainforest of Surinam, J. Atmos.
Chem., 38, 133–166, 2001.
Williams, J., Yassaa, N., Bartenbach, S., and Lelieveld, J.: Mirror image hydrocarbons from
Tropical and Boreal forests, Atmos. Chem. Phys., 7, 973–980, 2007,
http://www.atmos-chem-phys.net/7/973/2007/.25
Yoshino, A., Sadanaga, Y., Watanabe, K., Kato, S., Miyakawa, Y., Matsumoto, J., and Kajii, Y.:
Measurement of total OH reactivity by laser-induced pump and probe technique – compre-
hensive observations in the urban atmosphere of Tokyo, Atmos. Environ., 40, 7869–7881,
2006.
18208
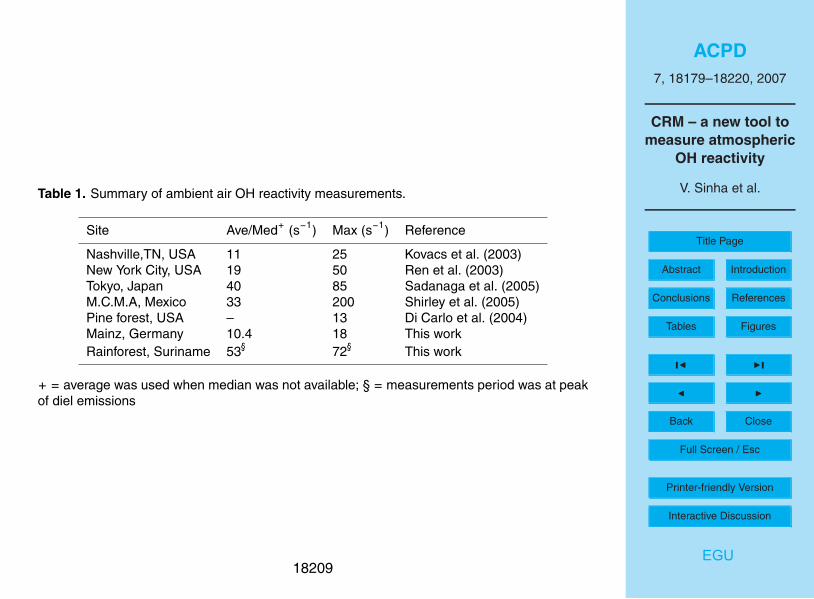
ACPD
7, 18179–18220, 2007
CRM – a new tool to
measure atmospheric
OH reactivity
V. Sinha et al.
Title Page
Abstract Introduction
Conclusions References
Tables Figures
◭ ◮
◭ ◮
Back Close
Full Screen / Esc
Printer-friendly Version
Interactive Discussion
EGU
Table 1. Summary of ambient air OH reactivity measurements.
Site Ave/Med+
(s−1
) Max (s−1
) Reference
Nashville,TN, USA 11 25 Kovacs et al. (2003)
New York City, USA 19 50 Ren et al. (2003)
Tokyo, Japan 40 85 Sadanaga et al. (2005)
M.C.M.A, Mexico 33 200 Shirley et al. (2005)
Pine forest, USA – 13 Di Carlo et al. (2004)
Mainz, Germany 10.4 18 This work
Rainforest, Suriname 53§
72§
This work
+ = average was used when median was not available; § = measurements period was at peak
of diel emissions
18209
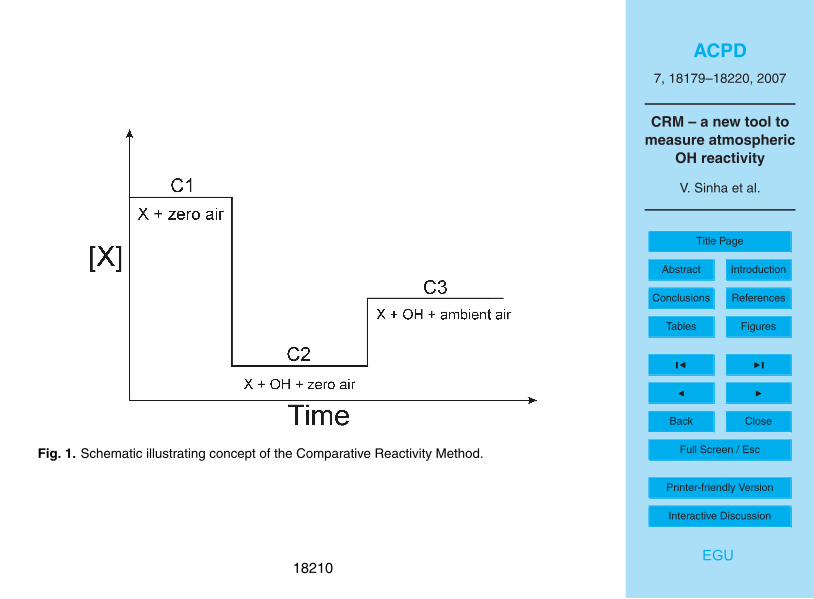
ACPD
7, 18179–18220, 2007
CRM – a new tool to
measure atmospheric
OH reactivity
V. Sinha et al.
Title Page
Abstract Introduction
Conclusions References
Tables Figures
◭ ◮
◭ ◮
Back Close
Full Screen / Esc
Printer-friendly Version
Interactive Discussion
EGU
Fig. 1. Schematic illustrating concept of the Comparative Reactivity Method.
18210
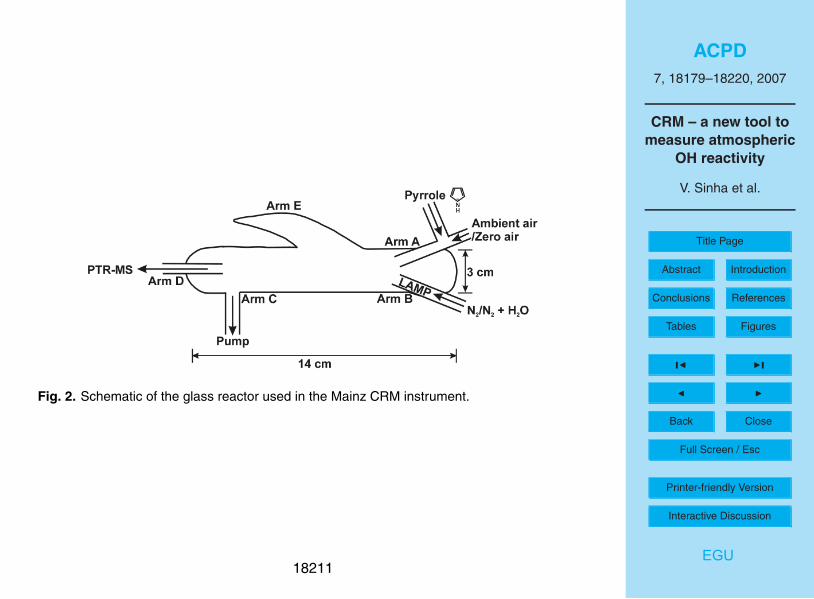
ACPD
7, 18179–18220, 2007
CRM – a new tool to
measure atmospheric
OH reactivity
V. Sinha et al.
Title Page
Abstract Introduction
Conclusions References
Tables Figures
◭ ◮
◭ ◮
Back Close
Full Screen / Esc
Printer-friendly Version
Interactive Discussion
EGU
Fig. 2. Schematic of the glass reactor used in the Mainz CRM instrument.
18211

ACPD
7, 18179–18220, 2007
CRM – a new tool to
measure atmospheric
OH reactivity
V. Sinha et al.
Title Page
Abstract Introduction
Conclusions References
Tables Figures
◭ ◮
◭ ◮
Back Close
Full Screen / Esc
Printer-friendly Version
Interactive Discussion
EGU
Fig. 3. Example plot showing raw reactivity data and modulations with propane.
18212
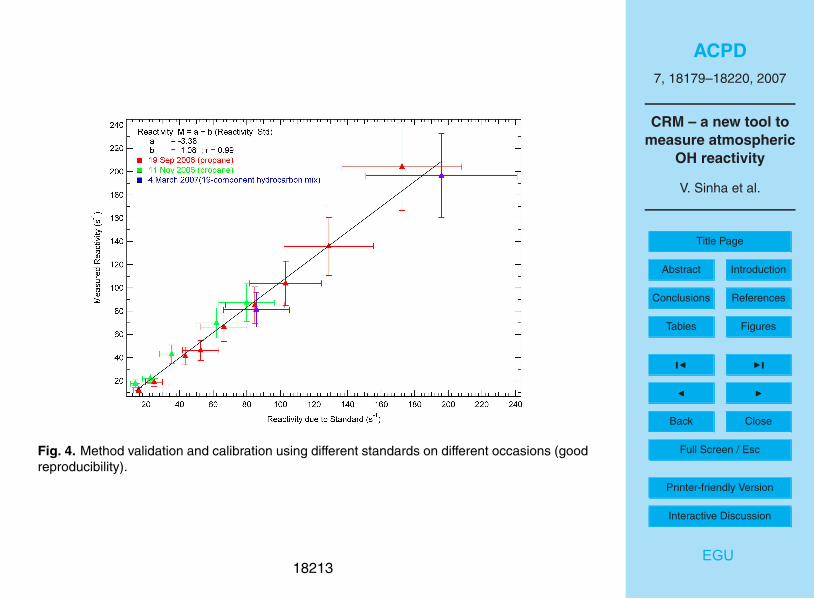
ACPD
7, 18179–18220, 2007
CRM – a new tool to
measure atmospheric
OH reactivity
V. Sinha et al.
Title Page
Abstract Introduction
Conclusions References
Tables Figures
◭ ◮
◭ ◮
Back Close
Full Screen / Esc
Printer-friendly Version
Interactive Discussion
EGU
Fig. 4. Method validation and calibration using different standards on different occasions (good
reproducibility).
18213

ACPD
7, 18179–18220, 2007
CRM – a new tool to
measure atmospheric
OH reactivity
V. Sinha et al.
Title Page
Abstract Introduction
Conclusions References
Tables Figures
◭ ◮
◭ ◮
Back Close
Full Screen / Esc
Printer-friendly Version
Interactive Discussion
EGU
Fig. 5. Plots showing relation between Reqn and Rtrue for numerical simulations at [pyrrole]/[OH]
ratios of 10 (purple markers) and 1.22 (green markers).
18214
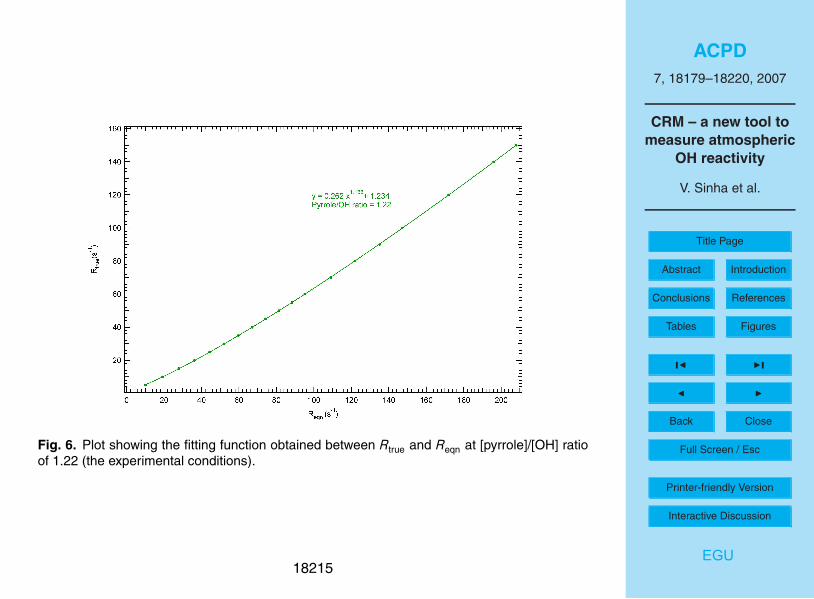
ACPD
7, 18179–18220, 2007
CRM – a new tool to
measure atmospheric
OH reactivity
V. Sinha et al.
Title Page
Abstract Introduction
Conclusions References
Tables Figures
◭ ◮
◭ ◮
Back Close
Full Screen / Esc
Printer-friendly Version
Interactive Discussion
EGU
Fig. 6. Plot showing the fitting function obtained between Rtrue and Reqn at [pyrrole]/[OH] ratio
of 1.22 (the experimental conditions).
18215
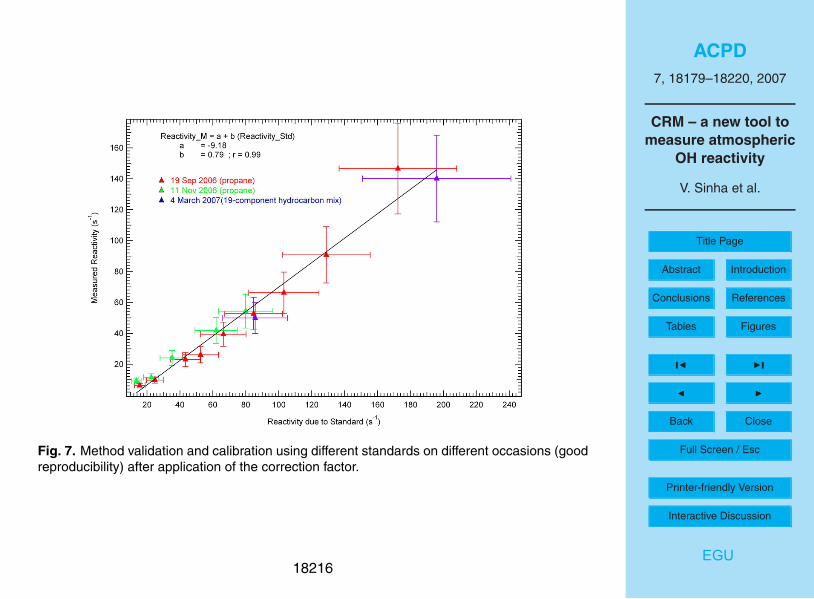
ACPD
7, 18179–18220, 2007
CRM – a new tool to
measure atmospheric
OH reactivity
V. Sinha et al.
Title Page
Abstract Introduction
Conclusions References
Tables Figures
◭ ◮
◭ ◮
Back Close
Full Screen / Esc
Printer-friendly Version
Interactive Discussion
EGU
Fig. 7. Method validation and calibration using different standards on different occasions (good
reproducibility) after application of the correction factor.
18216

ACPD
7, 18179–18220, 2007
CRM – a new tool to
measure atmospheric
OH reactivity
V. Sinha et al.
Title Page
Abstract Introduction
Conclusions References
Tables Figures
◭ ◮
◭ ◮
Back Close
Full Screen / Esc
Printer-friendly Version
Interactive Discussion
EGU
Fig. 8. Results of the experimental (open green markers) and numerical (closed markers: red,
green and purple) NO sensitivity study to determine its impact on the CRM measurements.
18217
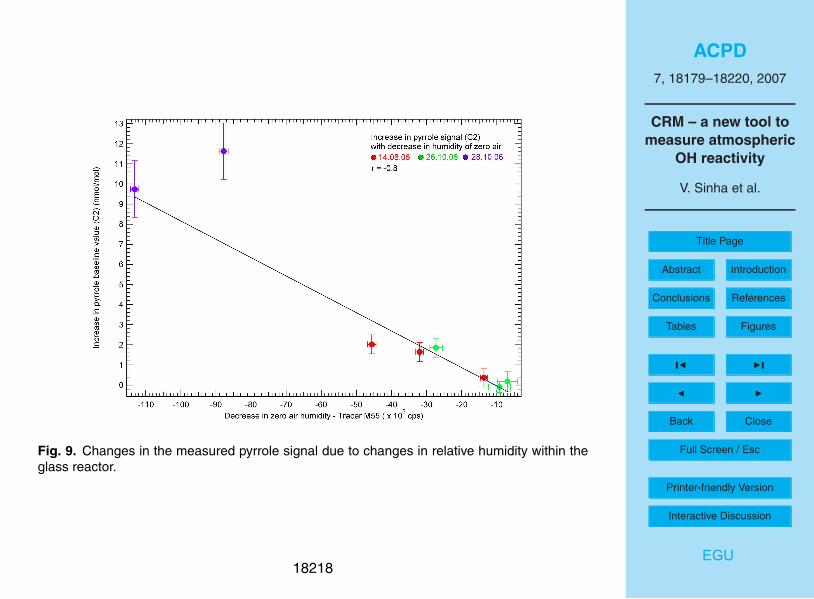
ACPD
7, 18179–18220, 2007
CRM – a new tool to
measure atmospheric
OH reactivity
V. Sinha et al.
Title Page
Abstract Introduction
Conclusions References
Tables Figures
◭ ◮
◭ ◮
Back Close
Full Screen / Esc
Printer-friendly Version
Interactive Discussion
EGU
Fig. 9. Changes in the measured pyrrole signal due to changes in relative humidity within the
glass reactor.
18218
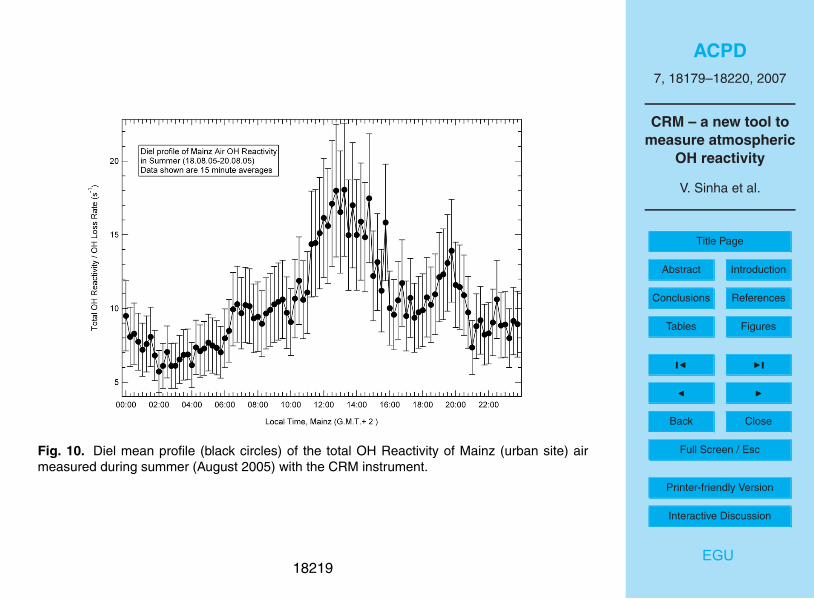
ACPD
7, 18179–18220, 2007
CRM – a new tool to
measure atmospheric
OH reactivity
V. Sinha et al.
Title Page
Abstract Introduction
Conclusions References
Tables Figures
◭ ◮
◭ ◮
Back Close
Full Screen / Esc
Printer-friendly Version
Interactive Discussion
EGU
Fig. 10. Diel mean profile (black circles) of the total OH Reactivity of Mainz (urban site) air
measured during summer (August 2005) with the CRM instrument.
18219
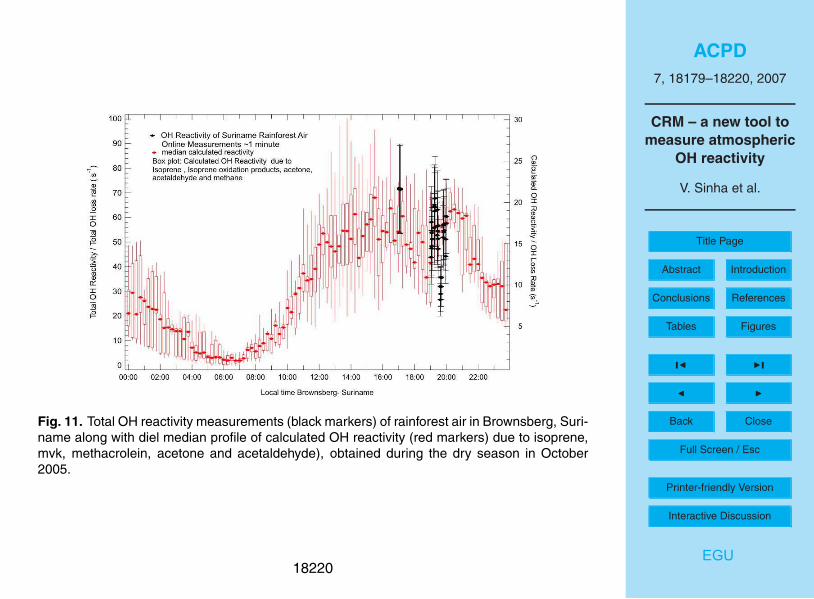
ACPD
7, 18179–18220, 2007
CRM – a new tool to
measure atmospheric
OH reactivity
V. Sinha et al.
Title Page
Abstract Introduction
Conclusions References
Tables Figures
◭ ◮
◭ ◮
Back Close
Full Screen / Esc
Printer-friendly Version
Interactive Discussion
EGU
Fig. 11. Total OH reactivity measurements (black markers) of rainforest air in Brownsberg, Suri-
name along with diel median profile of calculated OH reactivity (red markers) due to isoprene,
mvk, methacrolein, acetone and acetaldehyde), obtained during the dry season in October
2005.
18220