The City Of Greenville South Carolina - Greenville, SC
192
The City Of Greenville South Carolina Comprehensive Annual Financial Report For The Year Ended June 30, 2015
-
Upload
khangminh22 -
Category
Documents
-
view
0 -
download
0
Transcript of The City Of Greenville South Carolina - Greenville, SC
The City Of Greenville South Carolina
Comprehensive Annual Financial Report For The Year Ended June 30, 2015

CITY OF GREENVILLE, SOUTH CAROLINA
COMPREHENSIVE ANNUAL FINANCIAL REPORT With Reports Required According to OMB Circular A-133
YEAR ENDED JUNE 30, 2015
Prepared by the City’s Office of Management and Budget
Kai D. Nelson, Director
Karen K. Crawford, Comptroller

CITY OF GREENVILLE, SOUTH CAROLINA
TABLE OF CONTENTS
YEAR ENDED JUNE 30, 2015
Page Number
Transmittal Letter 1
Listing of Principal Officials 5
Organizational Chart 6
Certificate of Achievement for Excellence in Financial Reporting 7
Independent Auditor's Report 9
Management's Discussion and Analysis 11
Basic Financial Statements:
Government-Wide Financial Statements:
Statement of Net Position 26
Statement of Activities 27
Fund Financial Statements:
Balance Sheet - Governmental Funds 28
Reconciliation of the Governmental Funds Balance Sheet to the Statement of Net Position 29
Statement of Revenues, Expenditures, and Changes in Fund Balances - Governmental Funds 30
Reconciliation of the Governmental Funds Statement of Revenues, Expenditures, and Changes inFund Balances to the Statement of Activities 31
Statement of Net Position - Proprietary Funds 32
Statement of Revenues, Expenses, and Changes in Fund Net Position - Proprietary Funds 34
Statement of Cash Flows - Proprietary Funds 36
Statement of Net Position - Fiduciary Fund Types 38
Statement of Changes in Fiduciary Net Position - Fiduciary Fund - Pension Trust 39
Notes to the Financial Statements 40
Required Supplementary Information:
Budgetary Comparison Schedule:
Schedule of Revenues, Expenditures, and Changes in Fund Balance - Budgets and Actual - General Fund 88
Pension Plan Schedules:
Schedule of the City's Proportionate Share of the Net Pension Liability - South Carolina Retirement System 89
Schedule of the City's Contributions - South Carolina Retirement System 90
Schedule of the City's Proportionate Share of the Net Pension Liability - Police Officers Retirement System 91
(Continued)
INTRODUCTORY SECTION
FINANCIAL SECTION
i
CITY OF GREENVILLE, SOUTH CAROLINA
TABLE OF CONTENTS
YEAR ENDED JUNE 30, 2015
Page Number
Required Supplementary Information (Continued):
Pension Plan Schedules (Continued):
Schedule of the City's Contributions - Police Officers Retirement System 92
City of Greenville Firemen's Pension Fund - Schedule of Changes in the Net Pension Liability and Related Ratios 93
City of Greenville Firemen's Pension Fund - Schedule of Contributions 94
City of Greenville Firemen's Pension Fund - Schedule of Investment Returns 96
Other Postemployment Benefit Schedules:
Other Postemployment Benefit Plan - Defined Benefit Healthcare Plan - Schedules of Employer Contributions and Funding Status 98
General Fund
Schedule of Revenues, Expenditures, and Changes in Fund Balance - Revised Budget and Actual 100
Other Governmental Funds
Combining Balance Sheet - Other Governmental Funds 108
Combining Schedule of Revenues, Expenditures, and Changes in Fund Balances - Other Governmental Funds 109
Special Revenue Funds
Combining Balance Sheet - All Special Revenue Funds 110
Combining Schedule of Revenues, Expenditures, and Changes in Fund Balances -All Special Revenue Funds 114
Schedule of Revenues, Expenditures, and Changes in Fund Balances -Special Revenue Funds - HOME Program - Revised Budget and Actual 118
Schedule of Revenues, Expenditures, and Changes in Fund Balances -Special Revenue Funds - HOPWA - Revised Budget and Actual 119
Schedule of Revenues, Expenditures, and Changes in Fund Balances -Special Revenue Funds - Community Development - Revised Budget and Actual 120
Schedule of Revenues, Expenditures, and Changes in Fund Balances -Special Revenue Funds - Local Hospitality Tax - Revised Budget and Actual 121
Schedule of Revenues, Expenditures, and Changes in Fund Balances -Special Revenue Funds - Sunday Alcohol Permits - Revised Budget and Actual 122
Schedule of Revenues, Expenditures, and Changes in Fund Balances -Special Revenue Funds - Admissions Tax - Revised Budget and Actual 123
Schedule of Revenues, Expenditures, and Changes in Fund Balances -Special Revenue Funds - State Accommodations Tax - Revised Budget and Actual 124
Schedule of Revenues, Expenditures, and Changes in Fund Balances -Special Revenue Funds - Victim Assistance - Revised Budget and Actual 125
(Continued)
FINANCIAL SECTION (CONTINUED)
Supplementary Information:
ii
CITY OF GREENVILLE, SOUTH CAROLINA
TABLE OF CONTENTS
YEAR ENDED JUNE 30, 2015
Page Number
Special Revenue Funds (Continued)
Schedule of Revenues, Expenditures, and Changes in Fund Balances -Special Revenue Funds - Local Accommodations Tax - Revised Budget and Actual 126
Schedule of Revenues, Expenditures, and Changes in Fund Balances -Special Revenue Funds - Utility Undergrounding - Revised Budget and Actual 127
Debt Service Funds
Combining Balance Sheet - All Debt Service Funds 128
Combining Schedule of Revenues, Expenditures, and Changes in Fund Balances -All Debt Service Funds 129
Schedule of Revenues, Expenditures, and Changes in Fund Balances -Debt Service Funds - Downtown Infrastructure District - Revised Budget and Actual 130
Schedule of Revenues, Expenditures, and Changes in Fund Balances -Debt Service Funds - Westend Tax Increment District - Revised Budget and Actual 131
Schedule of Revenues, Expenditures, and Changes in Fund Balances -Debt Service Funds - Viola Street Tax Increment District - Revised Budget and Actual 132
Nonmajor Proprietary (Enterprise) Funds
Combining Statement of Net Position - Nonmajor Proprietary (Enterprise) Funds 133
Combining Statement of Revenues, Expenses, and Changes in Fund Net Position -Nonmajor Proprietary (Enterprise) Funds 134
Combining Statement of Cash Flows - Nonmajor Proprietary (Enterprise) Funds 135
Fiduciary Funds
Statement of Changes in Assets and Liabilities -Fiduciary Fund - Agency - Greenville Local Development Corporation 136
Internal Service Funds
Combining Statement of Net Position - All Internal Service Funds 137
Combining Statement of Revenues, Expenses, and Changes in Fund Net Position - All Internal Service Funds 138
Combining Statement of Cash Flows - All Internal Service Funds 139
Schedule of Court Fines, Assessments, and Surcharges 140
Financial Trends Information
Net Position by Component - Last Ten Fiscal Years - Accrual Basis Table 1 142
Changes in Net Position - Last Ten Fiscal Years - Accrual Basis Table 2 144
(Continued)
FINANCIAL SECTION (CONTINUED)
Supplementary Information (Continued):
STATISTICAL SECTION (UNAUDITED)
iii
CITY OF GREENVILLE, SOUTH CAROLINA
TABLE OF CONTENTS
YEAR ENDED JUNE 30, 2015
Page NumberFinancial Trends Information (Continued)
Governmental Activities Tax Revenues by Source - Last Ten Fiscal Years - Accrual Basis Table 3 147
Fund Balances of Governmental Funds - Last Ten Fiscal Years - Modified Accrual Basis Table 4 148
Changes in Fund Balances of Governmental Funds - Last Ten Fiscal Years - Modified Accrual Basis Table 5 150
General Governmental Tax Revenues by Source - Last Ten Fiscal Years - Modified Accrual Basis Table 6 153
Revenue Capacity Information
Assessed Value and Estimated Actual Value of Taxable Property - Last Ten Fiscal Years Table 7 154
Property Tax Rates Direct and Overlapping Governments - Last Ten Fiscal Years Table 8 156
Principal Property Taxpayers - Current Year and Nine Years Ago Table 9 158
Property Tax Levies and Collections - Last Ten Fiscal Years Table 10 159
Debt Capacity Information
Ratios of Outstanding Debt by Type - Last Ten Fiscal Years Table 11 160
Ratios of General Bonded Debt Outstanding - Last Ten Fiscal Years Table 12 162
Direct and Overlapping Governmental Activities Debt - Current Year Table 13 163
Legal Debt Margin Information - Last Ten Fiscal Years Table 14 164
Pledge Revenue Coverage - Last Ten Fiscal Years Table 15 166
Demographic and Economic Information
Demographic and Economic Statistics - Last Ten Fiscal Years Table 16 168
Principal Employers - Current Year Table 17 169
Operating Information
Full-Time Equivalent City Government Employees by Function - Last Ten Fiscal Years Table 18 170
Operating Indicators by Function - Last Ten Fiscal Years Table 19 171
Capital Asset Statistics by Function - Last Ten Fiscal Years Table 20 172
Schedule of Expenditures of Federal Awards 174
Notes to the Schedule of Expenditures of Federal Awards 176
Independent Auditor's Report - Report on Internal Control Over Financial Reporting and on Compliance and OtherMatters Based on an Audit of Financial Statements Performed in Accordance with Government Auditing Standards 177
Independent Auditor's Report - Report on Compliance for Each Major Federal Program and Report on Internal Control Over Compliance as Required by OMB Circular A-133 179
Schedule of Findings and Questioned Costs 181
Summary of Prior Audit Findings 183
COMPLIANCE SECTION
STATISTICAL SECTION (UNAUDITED) (CONTINUED)
iv
Office of Management & Budget
November 9, 2015 The Honorable Knox H. White Members of City Council City of Greenville, South Carolina Dear Mayor White and City Council Members: State law requires that all general-purpose local governments, at the close of each fiscal year, publish a complete set of financial statements presented in conformity with accounting principles generally accepted in the United States of America and audited in accordance with generally accepted auditing standards by a firm of licensed certified public accountants. Pursuant to that requirement, we hereby issue the Comprehensive Annual Financial Report (“CAFR”) of the City of Greenville, South Carolina (“City”) for the year ended June 30, 2015. This report consists of management’s representations concerning the finances of the City. Consequently, management assumes full responsibility for the completeness and reliability of all of the information presented in this report. To provide a reasonable basis for making these representations, management of the City has established a comprehensive internal control framework that is designed both to protect the government’s assets from loss, theft, or misuse and to compile sufficient reliable information for the preparation of the City’s financial statements in conformity with generally accepted accounting principles (“GAAP”). Because the cost of internal controls should not outweigh their benefits, the City’s comprehensive framework of internal controls has been designed to provide reasonable rather than absolute assurance that the financial statements are free from material misstatement. As management, we assert that, to the best of our knowledge and belief, this financial report is complete and reliable in all material respects. The City’s financial statements have been audited by Greene, Finney and Horton, L.L.P., a firm of licensed public accountants. The goal of the independent audit was to provide reasonable assurance that the financial statements of the City for the fiscal year ending June 30, 2015 are free of material misstatement. The independent audit involved examining, on a test basis, evidence supporting the amounts and disclosures in the financial statements; assessing the accounting principles used and significant estimates made by management; and evaluating the overall financial statement presentation. The independent auditor concluded, based upon the audit, that there was a reasonable basis for rendering an unmodified opinion that the City’s financial statements for the fiscal year ended June 30, 2015 are fairly presented in conformity with GAAP. The independent auditor’s report is presented in the Financial Section of this report. The independent audit of the financial statements of the City was part of a broader, federally mandated “Single Audit” designed to meet the special needs of federal grantor agencies. The standards governing Single Audit engagements require the independent auditor to report not only on the fair presentation of the financial statements but also on the audited government’s internal controls and compliance with legal requirements, with special emphasis on internal controls and legal requirements involving the administration of federal awards. These reports are presented in the Compliance Section of the CAFR. GAAP requires that management provide a narrative introduction, overview, and analysis to accompany the financial statements in the form of Management’s Discussion and Analysis (“MD&A”). This letter of transmittal is designed to complement MD&A and should be read in conjunction with it. The City’s MD&A can be found in the Financial Section of the CAFR.
1
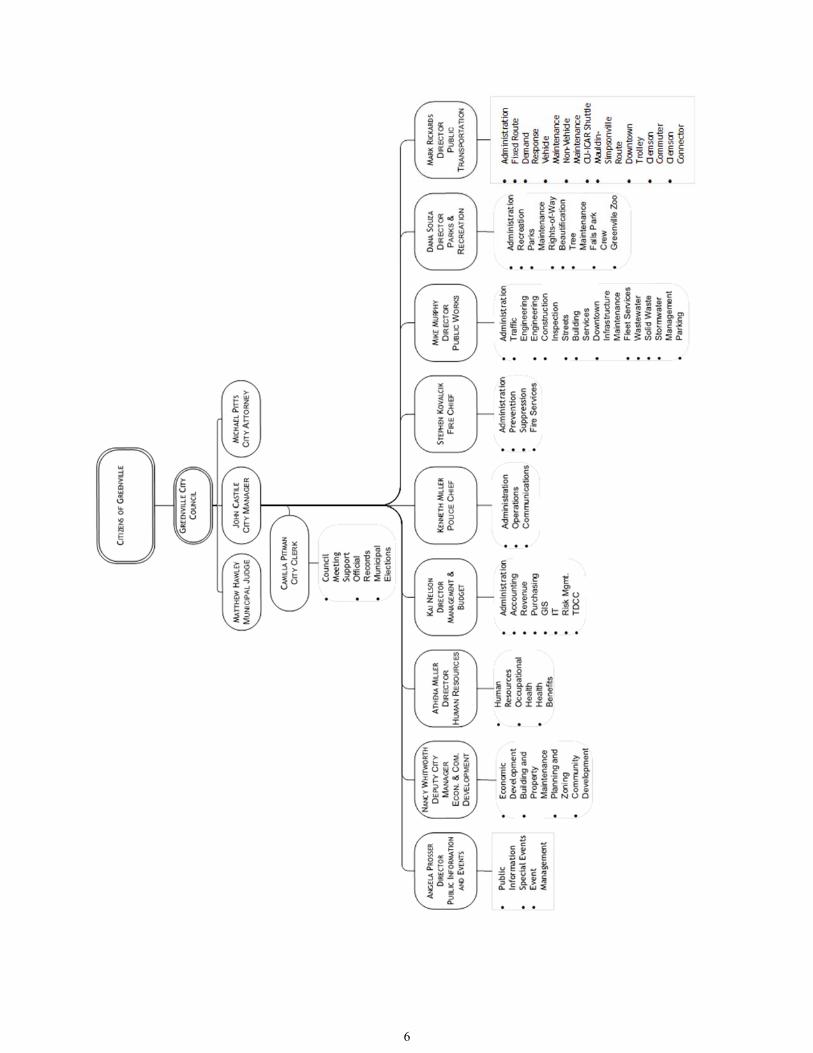
Community Profile The City is located in the Upstate Region of South Carolina and is the sixth largest city in the state with an estimated population of 62,252. The City was originally incorporated in the year 1831 and was known at that time as the Village of Greenville. In the year 1869, the Village of Greenville altered and amended its Charter and was then known as the City. On August 10, 1976, the City adopted the Council-Manager form of government pursuant to the Home Rule Act of 1975. Today, the City is located in the Greenville-Anderson-Mauldin MSA and has become part of the economic hub of the southern portion of the Piedmont Plateau. The area of the City is 28.92 square miles. Although limited in its ability to expand due to South Carolina’s restrictive annexation laws, the City draws on a population of over 1,100,000 within a 30-mile radius of its location including the upstate region of the state. The area is consistently cited as one of the fastest growing urban regions in the country. The City’s climate, natural assets, and economic diversity have combined to reinforce the City’s role as a regional center for both the state of South Carolina and the southeastern region of the United States. The City is recognized as one of the Southeast’s most progressive local governments and has amassed a notable record of success. It is characterized by active involvement in support of economic development, provision of high quality services, fiscal conservatism, and a pro-business attitude. City Government The current governing body was elected on a partisan basis and is comprised of a mayor elected at-large and six council members, two of whom are elected at-large and four of whom are elected from their respective districts. As contained in Section 2-32 of the Code of Ordinances of the City, the City Council shall fix the policies of City government, and the City Manager shall execute and administer such policies. Section 2-194 of the Code of Ordinances provides the City Manager with the necessary authority to appoint administrative employees. Eleven department heads currently report to the City Manager and are responsible for the following functions: Police, Fire, Economic and Community Development, Parks and Recreation, Public Works, Office of Management and Budget, Human Resources, Public Transportation, Municipal Court, Legal, and Public Information and Events. The City operates and maintains various programs which are funded from City revenues, as reflected in its annual budget for fiscal year 2014-2015, and provides a full range of services contemplated by statute. These services include the public safety (police, fire and central communications); sanitation and environmental health enforcement; recreational activities and cultural events; planning; and zoning and community services. The City of Greenville Public Facilities Corporation (the “Corporation”) is a blended component unit of the City. The Corporation is a governmental entity organized pursuant to Section 115 of the Internal Revenue Code of 1986, as amended. The Corporation was created for the specific purpose of operating exclusively for the benefit of, to perform the functions of, and to carry out the purposes for holding title, owning, leasing, constructing, acquiring and operating land, buildings and equipment, and facilities functionally related thereto and to perform any other lawful purpose related to the furtherance of the governmental powers of the City that is not inconsistent with the Corporation’s non-profit status; provided, that all property owned and leased by the Corporation shall be used for a valid public purpose. Blended component units, although legally separate entities, are in substance part of the government’s operations; therefore, data from this Corporation has been combined with data from the primary government because the Corporation exclusively benefits the City. In addition, the City owns and operates eight enterprise funds as of June 30, 2015, consisting of the Stormwater Utility, Wastewater, Parking, TD Convention Center, Zoo, Transit, Solid Waste and Event Management funds. The City has the following related organizations: Greenville Water System, Donaldson Development Commission, Greenville Airport Commission, Greenville Hospital Board of Trustees, Greenville Housing Authority, Greenville Housing Futures, Inc., and the Greenville Transit Authority.
2
Budget Process The budget process begins in January of each year for the forthcoming fiscal year which runs from July 1 to June 30. The Office of Management and Budget (“OMB”) projects fixed operating costs, vehicle replacement, and salary and fringe benefits costs for currently budgeted staffing and service levels. Departments develop objectives, performance measures, and funding requests for new services. This information is assimilated by OMB in February and is weighed against current financial conditions. In January and February, OMB projects revenues for all funds based on current tax rates and fee structures. Certain growth assumptions are made based on analysis of local and regional economic trends. In March and April, the City Manager meets with department heads to review funding requests, prioritize program needs, and establish consensus on objectives and performance measures. Based on the most recent revenue estimates available, funding requests are modified according to prioritized service levels. A preliminary budget document is then prepared and submitted to City Council by May 1. City Council may deliberate on the preliminary budget during the month of May and into early June. By the middle to the end of June, City Council adopts an Appropriation Ordinance for all funds following formal readings. The City Council must approve the budget by July 1 prior to any expenditures being made in the new fiscal year. Within each fund, the City Manager has the authority to transfer appropriated funds within any of the designated expenditure categories. The City Manager also has the authority to transfer appropriated funds across departmental accounts for salary adjustments and staff reorganization. Per Ordinance, the City Manager is required to notify City Council of any transfer in excess of $25,000 between projects or departments. Transfers outside the scope given to the City Manager may be executed upon a resolution approved by a majority of City Council. Factors Affecting Financial Condition Local Economy The City is uniquely positioned in the heart of a growing region of South Carolina. The City is the central city of the County and accounts for approximately 12.9% of the County’s total population. Additionally, the City serves as the hub of the Greenville-Spartanburg-Anderson Combined Statistical Area, which includes Greenville, Spartanburg, Anderson, Pickens, Oconee, Greenwood, Laurens, Cherokee, Union and Abbeville counties. During 2015, the City recorded almost $8.5 billion dollars in gross business sales, and building permit valuations equaled approximately $635 million. The total valuation increased by 71% from the previous year. These changes reflect a significant turn in the economy with increased activity. The City continues to promote the downtown by taking an active role in marketing and sponsoring a full range of cultural and recreational activities including more than 100 weekly and recurring outdoor events and concerts. During this fiscal year, Greenville has received the Playful City USA Community award and Falls Park was named Silver Medalist for 2015 Rudy Bruner Award for Urban Excellence. Downtown Greenville is the preeminent business center of the Upstate, accounting for over one-third of the total office space in the Greenville Spartanburg metropolitan area, with over 3 million square feet. Long-Term Financial Planning City staff has prepared a Five-Year Financial Forecast based largely on the revenues and expenditures the City has experienced in prior years and growth that can reasonably be anticipated in the near future. It is limited by incorporating only those events which City staff has a reasonable expectation of occurring in future years. Therefore, major changes in the regional economy (both positive and negative), statutory changes, or other unforeseen events can fundamentally change the dynamics affecting the forecast. As a result, the forecast is a living document that is subject to change based on the information that is currently available. It is meant to be a planning tool and does not commit City Council to action in future years. The City also prepares a Capital Improvement Program (“CIP”) which is a five-year fiscal planning instrument that is used to identify needed capital projects and to coordinate the financing and timing of those projects. The capital improvement budget is adopted annually, encompassing appropriations for the projects scheduled for the first year of the plan, and authorizing any bond issues necessary to fund the improvements. The next four years are considered planning years and are subject to appropriation in the following years. Projects included in the CIP represent major facility construction, infrastructure renovations, and economic development projects. The CIP document is available from the City’s Office of Management and Budget.
3
4
david
Text Box
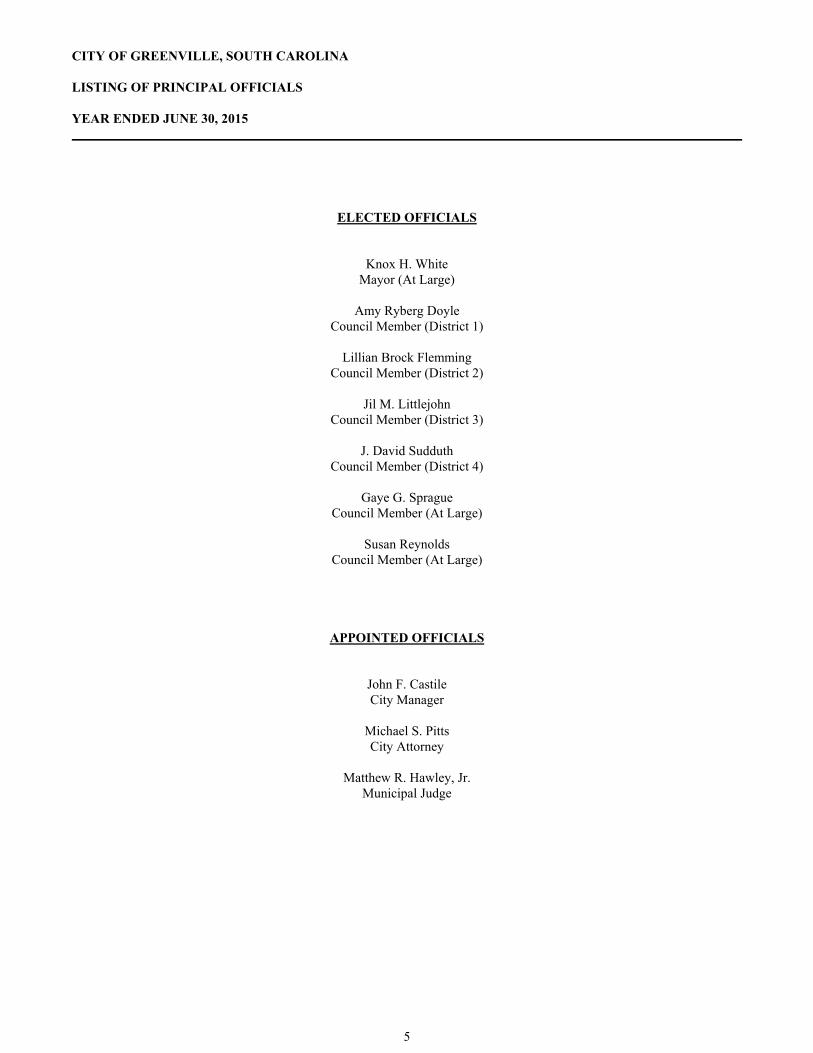
CITY OF GREENVILLE, SOUTH CAROLINA LISTING OF PRINCIPAL OFFICIALS YEAR ENDED JUNE 30, 2015
ELECTED OFFICIALS
Knox H. White Mayor (At Large)
Amy Ryberg Doyle
Council Member (District 1)
Lillian Brock Flemming Council Member (District 2)
Jil M. Littlejohn
Council Member (District 3)
J. David Sudduth Council Member (District 4)
Gaye G. Sprague
Council Member (At Large)
Susan Reynolds Council Member (At Large)
APPOINTED OFFICIALS
John F. Castile City Manager
Michael S. Pitts City Attorney
Matthew R. Hawley, Jr.
Municipal Judge
5
6
Government Finance Officers Association
Certificate of Achievement
for Excellence in Financial Reporting
Presented to
City of Greenville
South Carolina
For its Comprehensive Annual Financial Report
for the Fiscal Year Ended
June 30, 2014
Executive Director/CEO
7

City of Greenville, South Carolina
8
www.gfhllp.com Greenville Mauldin Mount Pleasant
(864) 451-7381 (864) 232-5204 (843) 735-5805
INDEPENDENT AUDITOR’S REPORT The Honorable Mayor and Members of City Council City of Greenville, South Carolina Report on the Financial Statements We have audited the accompanying financial statements of the governmental activities, the business-type activities, each major fund, and the aggregate remaining fund information of City of Greenville, South Carolina (the “City”), as of and for the year ended June 30, 2015, and the related notes to the financial statements, which collectively comprise the City’s basic financial statements as listed in the table of contents. Management’s Responsibility for the Financial Statements Management is responsible for the preparation and fair presentation of these financial statements in accordance with accounting principles generally accepted in the United States of America; this includes the design, implementation, and maintenance of internal control relevant to the preparation and fair presentation of financial statements that are free from material misstatement, whether due to fraud or error. Auditor’s Responsibility Our responsibility is to express opinions on these financial statements based on our audit. We conducted our audit in accordance with auditing standards generally accepted in the United States of America and the standards applicable to financial audits contained in Government Auditing Standards, issued by the Comptroller General of the United States. Those standards require that we plan and perform the audit to obtain reasonable assurance about whether the financial statements are free from material misstatement. An audit involves performing procedures to obtain audit evidence about the amounts and disclosures in the financial statements. The procedures selected depend on the auditor’s judgment, including the assessment of the risks of material misstatement of the financial statements, whether due to fraud or error. In making those risk assessments, the auditor considers internal control relevant to the entity’s preparation and fair presentation of the financial statements in order to design audit procedures that are appropriate in the circumstances, but not for the purpose of expressing an opinion on the effectiveness of the entity’s internal control. Accordingly, we express no such opinion. An audit also includes evaluating the appropriateness of accounting policies used and the reasonableness of significant accounting estimates made by management, as well as evaluating the overall presentation of the financial statements. We believe that the audit evidence we have obtained is sufficient and appropriate to provide a basis for our audit opinions. Opinions In our opinion, the financial statements referred to above present fairly, in all material respects, the respective financial position of the governmental activities, the business-type activities, each major fund, and the aggregate remaining fund information of the City of Greenville, South Carolina, as of June 30, 2015, and the respective changes in financial position and, where applicable, cash flows thereof for the year then ended in accordance with accounting principles generally accepted in the United States of America. Correction of Error As described in the infrastructure reimbursement agreement section of Note III.E to the financial statements, in 2015 the City discovered that it had not properly recorded the value of land and improvements and related long-term obligations related to the Verdae Development. These items were corrected when they were discovered. Our opinion is not modified with respect to these matters.
9
Change in Accounting Principle
As discussed in Note I.B to the financial statements, in 2015 the City adopted the provisions of Governmental Accounting Standards Board Statement No. 68 “Accounting and Financial Reporting for Pensions – an amendment of GASB Statement No. 27” and Governmental Accounting Standards Board Statement No. 71 “Pension Transition for Contributions Made Subsequent to the Measurement Date – an amendment of GASB Statement No. 68”. Our opinion is not modified with respect to these matters.
Other Matters
Required Supplementary Information
Accounting principles generally accepted in the United States of America require that management’s discussion and analysis, the budgetary comparison schedule, the pension plan schedules, and the other postemployment benefit plan schedules, as listed in the table of contents, be presented to supplement the basic financial statements. Such information, although not a part of the basic financial statements, is required by the Governmental Accounting Standards Board who considers it to be an essential part of financial reporting for placing the basic financial statements in an appropriate operational, economic, or historical context. We have applied certain limited procedures to the required supplementary information in accordance with auditing standards generally accepted in the United States of America, which consisted of inquiries of management about the methods of preparing the information and comparing the information for consistency with management’s responses to our inquiries, the basic financial statements, and other knowledge we obtained during our audit of the basic financial statements. We do not express an opinion or provide any assurance on the information because the limited procedures do not provide us with sufficient evidence to express an opinion or provide any assurance.
Supplementary and Other Information
Our audit was conducted for the purpose of forming opinions on the financial statements that collectively comprise the City’s basic financial statements. The introductory section, supplementary information, statistical section, and the schedule of expenditures of federal awards, as required by the U.S. Office of Management and Budget Circular A-133, Audits of States, Local Governments, and Non-Profit Organizations, as listed in the table of contents, are presented for purposes of additional analysis and are not a required part of the basic financial statements.
The supplementary information and the schedule of expenditures of federal awards are the responsibility of management and were derived from and relates directly to the underlying accounting and other records used to prepare the basic financial statements. Such information has been subjected to the auditing procedures applied in the audit of the basic financial statements and certain additional procedures, including comparing and reconciling such information directly to the underlying accounting and other records used to prepare the basic financial statements or to the basic financial statements themselves, and other additional procedures in accordance with auditing standards generally accepted in the United States of America. In our opinion, the supplementary information and the schedule of expenditures of federal awards are fairly stated, in all material respects, in relation to the basic financial statements as a whole.
The introductory section and the statistical section have not been subjected to the auditing procedures applied in the audit of the basic financial statements, and accordingly, we do not express an opinion or provide any assurance on them.
Other Reporting Required by Government Auditing Standards
In accordance with Government Auditing Standards, we have also issued our report dated November 9, 2015 on our consideration of the City’s internal control over financial reporting and on our tests of its compliance with certain provisions of laws, regulations, contracts, and grant agreements and other matters. The purpose of that report is to describe the scope of our testing of internal control over financial reporting and compliance and the results of that testing, and not to provide an opinion on internal control over financial reporting or on compliance. That report is an integral part of an audit performed in accordance with Government Auditing Standards in considering the City’s internal control over financial reporting and compliance.
Greene, Finney & Horton, LLP Mauldin, South Carolina November 9, 2015
10
CITY OF GREENVILLE, SOUTH CAROLINA MANAGEMENT’S DISCUSSION AND ANALYSIS YEAR ENDED JUNE 30, 2015 As management of the City of Greenville (the City), we offer readers of the City’s financial statements this narrative overview and analysis of the financial activities of the City for the fiscal year ended June 30, 2015 (“FY 2015” or “2015”) compared to the fiscal year ended June 30, 2014 (“FY 2014” or “2014”). We encourage readers to consider the information presented here in conjunction with additional information that we have furnished in our letter of transmittal, which can be found on pages as listed in the table of contents. FINANCIAL HIGHLIGHTS
The assets and deferred outflows of resources of the City exceeded its liabilities and deferred inflows of resources at the close of the current year by $223,398,913 (net position). Unrestricted net position was a deficit of $25,182,074 primarily due to implementing Governmental Accounting Standard Board (“GASB”) Statement No. 68, “Accounting and Financial Reporting for Pensions – an amendment of GASB Statement No. 27” (“GASB #68”) and GASB Statement No. 71 “Pension Transition for Contributions Made Subsequent to the Measurement Date – an amendment of GASB Statement No. 68” (“GASB #71”) in 2015. See discussion below for more details.
The City’s total net position increased by $31,027,465 (an increase of $6,929,090 from business type activities and an increase of $24,098,375 from governmental activities), as total revenues of $142,539,034 exceeded total expenses of $111,511,569. The year over year change in total net position in the governmental activities is attributable to the increase in tax millage, other tax collections, business licenses and permits, capital grants and contributions and no transfers out of bond proceeds for construction of a parking facility in the current year. The year over year reduction in net position for business-type activities reflects no transfer of bond proceeds for the construction of a parking facility as reported in the prior year.
As of the close of the current year, the City’s governmental funds reported combined ending fund balances of $65,279,749, an increase of $12,436,897 in comparison with the prior year. Approximately 37% of this total amount, or $24,300,751, is available for spending at the government’s discretion (unassigned fund balance).
Unassigned fund balance for the General Fund was $24,322,751 at June 30, 2015, or 33% of total General Fund expenditures and transfers out for the year ended June 30, 2015. This balance exceeded the City’s minimum fund balance amount of $15,250,950 under the City’s policy of 20% of the next year’s appropriations by $9,071,801.
The City’s total capital assets were $308,973,789 at the close of the fiscal year, increasing by $26,201,523 (9.3%) during the current year, due to additions of $39,694,968 and restated beginning balances of $5,517,591, offset by depreciation expense and net disposals of $13,493,445.
The City’s total bonded debt was $84,351,000 at the close of the current year, decreasing by $4,516,000 (5.1%) during the current fiscal year. This decrease is due to principal payments of $8,846,000, partially offset by the issuance of $4,330,000 in new wastewater revenue bond debt.
The City’s general obligation bond ratings for Standard & Poor’s, Fitch and Moody’s are AAA, AAA and Aa1, respectively.
The City implemented GASB #68 and GASB #71 (collectively “Statements”) in 2015. These Statements require the City to recognize a net pension liability, deferred outflows of resources, and deferred inflows of resources for the City of Greenville Firemen’s Pension Plan (“City Pension Plan”), single-employer plan, and for their participation in the South Carolina Retirement System and South Carolina Police Officers Retirement System (“State Retirement Plans”), cost-sharing multiple-employer defined benefit pension plans, on financial statements prepared on the economic resources measurement focus and accrual basis of accounting (i.e., the Statement of Net Position) and present more extensive note disclosures. The adoption of these Statements had no impact on the City’s governmental fund financial statements, which continue to report expenditures in the amount of the contractually required contributions, as required by the City’s code of ordinances for the City’s Pension Plan and by the South Carolina Public Employee Benefit Authority (“PEBA”) who administers the State Retirement Plans. However, the adoption has resulted in the restatement of the City’s net position as of July 1, 2014 for its government-wide and proprietary funds financial statements to reflect the reporting of net pension liabilities and deferred outflows of resources for each of its qualified plans in accordance with the provisions of these Statements. Net position of the City’s government-wide financial statements as of July 1, 2014 was decreased in total by $74,703,299 consisting of $59,663,871 for governmental activities and $15,039,428 for business-type activities, to reflect the cumulative change in accounting principle related to the adoption of these Statements. The City’s enterprise funds also reflected a decrease in net position of $15,039,428 related to the adoption of these Statements. See Note IV.B in the notes to the financial statements for more information regarding the City’s retirement plans.
11
CITY OF GREENVILLE, SOUTH CAROLINA MANAGEMENT’S DISCUSSION AND ANALYSIS YEAR ENDED JUNE 30, 2015 OVERVIEW OF THE FINANCIAL STATEMENTS This discussion and analysis is intended to serve as an introduction to the City of Greenville’s financial statements. The City’s financial statements comprise three components: 1) government-wide financial statements, 2) fund financial statements, and 3) notes to the financial statements. The financial statements present two different views of the City’s finances through the use of government-wide statements and fund financial statements. In addition to the financial statements, this report contains required and supplementary information that will enhance the reader’s understanding of the financial condition of the City of Greenville. Government-Wide Financial Statements The financial statements include two kinds of statements that present different views of the City’s finances. The government-wide financial statements are designed to provide readers with a broad overview of the City of Greenville’s finances in a manner similar to a private-sector business. The statement of net position presents information on all of the City’s assets, deferred outflows of resources, liabilities, and deferred inflows of resources, with the differences between these items reported as net position. Over time, increases or decreases in net position may serve as a useful indicator of whether the financial position of the City is improving or deteriorating. The statement of activities presents information showing how the City’s net position changed during the most recent fiscal year. All changes in net position are reported as soon as the underlying event giving rise to the change occurs, regardless of the timing of related cash flows. Thus, revenues and expenses are reported in this statement for some items that will only result in cash flows in future fiscal periods (e.g., uncollected taxes and earned but unused vacation leave). The government-wide statements are divided into two categories: 1) governmental activities; and 2) business-type activities. The governmental activities include most of the City’s basic services such as public safety, parks and recreation, economic and community development, street maintenance and legislative and administrative. Property taxes, business licenses and permits, and state and federal grants finance most of these activities. The business-type activities are those that are financed in whole or in part by fees charged to external parties for goods and services. These include the Stormwater Utility, Wastewater, Parking, TD Convention Center, Zoo, Transit, Solid Waste and Event Management operations of the City of Greenville. The government-wide financial statements can be found as listed in the table of contents. Fund Financial Statements The fund financial statements provide a more detailed look at the City’s most significant activities. A fund is a grouping of related accounts that is used to maintain control over resources that have been segregated for specific activities or objectives. The City, like all other governmental entities in South Carolina, uses fund accounting to ensure and demonstrate compliance with finance-related legal requirements, such as the General Statutes or the City’s budget ordinance. All of the funds of the City can be divided into three categories: governmental funds, proprietary funds, and fiduciary funds. Governmental Funds – Governmental funds are used to account for essentially the same functions reported as governmental activities in the government-wide financial statements. However, unlike the government-wide financial statements, governmental fund financial statements focus on near-term inflows and outflows of spendable resources, as well as on balances of spendable resources available at the end of the fiscal year. Such information may be useful in evaluating a government’s near-term financing requirements. Most of the City’s basic services are accounted for in governmental funds. Governmental funds are reported using an accounting method called modified accrual accounting which provides a short-term spending focus. As a result, the governmental fund financial statements give the reader a detailed short-term view that helps him or her determine if there are more or less financial resources available to finance the City’s programs. The relationship between governmental activities (reported in the statement of net position and the statement of activities) and governmental funds is described in reconciliations as listed in the table of contents.
12
CITY OF GREENVILLE, SOUTH CAROLINA MANAGEMENT’S DISCUSSION AND ANALYSIS YEAR ENDED JUNE 30, 2015 OVERVIEW OF THE FINANCIAL STATEMENTS (CONTINUED) Fund Financial Statements (Continued) The City maintains 25 individual governmental funds. Information is presented separately in the governmental funds balance sheet and in the governmental funds statement of revenue, expenditures, and changes in fund balances for the General Fund and the Capital Projects Fund, both of which are considered to be major funds. Data from the other 23 governmental funds are combined into aggregated presentations, including one for the special revenue funds and one for the debt service funds. Individual fund data for each of these nonmajor governmental funds is provided in the form of combining statements elsewhere in this report. The governmental fund financial statements can be found as listed in the table of contents. Proprietary Funds – The City of Greenville maintains two different types of proprietary funds. Enterprise Funds are used to report the same functions presented as business-type activities in the government-wide financial statements. The City uses enterprise funds to account for its Stormwater Utility, Wastewater, Parking, and TD Convention Center operations, which are considered to be major funds. The Zoo, Transit, Solid Waste and Event Management operations are considered to be nonmajor funds. Data from the nonmajor enterprise funds are combined into aggregated presentations; individual fund data for the nonmajor enterprise funds is provided in the form of combining statements elsewhere in this report. Internal Service Funds are used to accumulate and allocate costs internally among the City’s various functions. The City’s Health Benefits, Risk Management and Fleet programs are accounted for in internal service funds. Because these functions predominately benefit governmental rather than business-type activities, the internal service funds have been included within the governmental activities in the government-wide financial statements. The proprietary fund financial statements can be found as listed in the table of contents. Fiduciary Funds – Fiduciary funds are used to account for resources held for the benefit of parties outside the government. Fiduciary funds are not reflected in the government-wide financial statement because the resources of those funds are not available to support the City’s own programs. Trust Funds are used to account for resources received and held by the City as a trustee. The Pension Trust Fund is used to account for the City of Greenville Firemen’s Pension Plan. Agency Funds are used to account for assets the City holds on behalf of others. Assets of the Greenville Local Development Corporation, a non-profit corporation, are accounted for in an agency fund. Additional information related to the agency fund can be found in Note I.B in the Notes to the Financial Statements. The fiduciary funds can be found as listed in the table of contents. Notes to the Financial Statements – The notes provide additional information that is essential to a full understanding of the data provided in the government-wide and fund financial statements. The notes to the financial statements can be found as listed in the table of contents. Other Information – In addition to the financial statements and accompanying notes, this report also presents certain required supplementary information. The City adopts an annual budget for its General Fund, as required by General Statutes. The City presents a budgetary comparison statement for the General Fund to demonstrate compliance with this budget. In addition, the City presents required schedules for the City pension plans and it’s Other Post Employment Benefit Plan – Defined Benefit Healthcare Plan. Required supplementary information can be found as listed in the table of contents.
Supplementary information, including nonmajor governmental and enterprise funds, fiduciary funds, internal service funds and the schedule of court fines, assessments and surcharges are presented immediately following the required supplementary information. These schedules can be found as listed in the table of contents. Budgetary comparison schedules have been provided for all of the debt service funds and for certain special revenue funds to demonstrate compliance with the annual budget. These schedules can be found as listed in the table of contents.
13
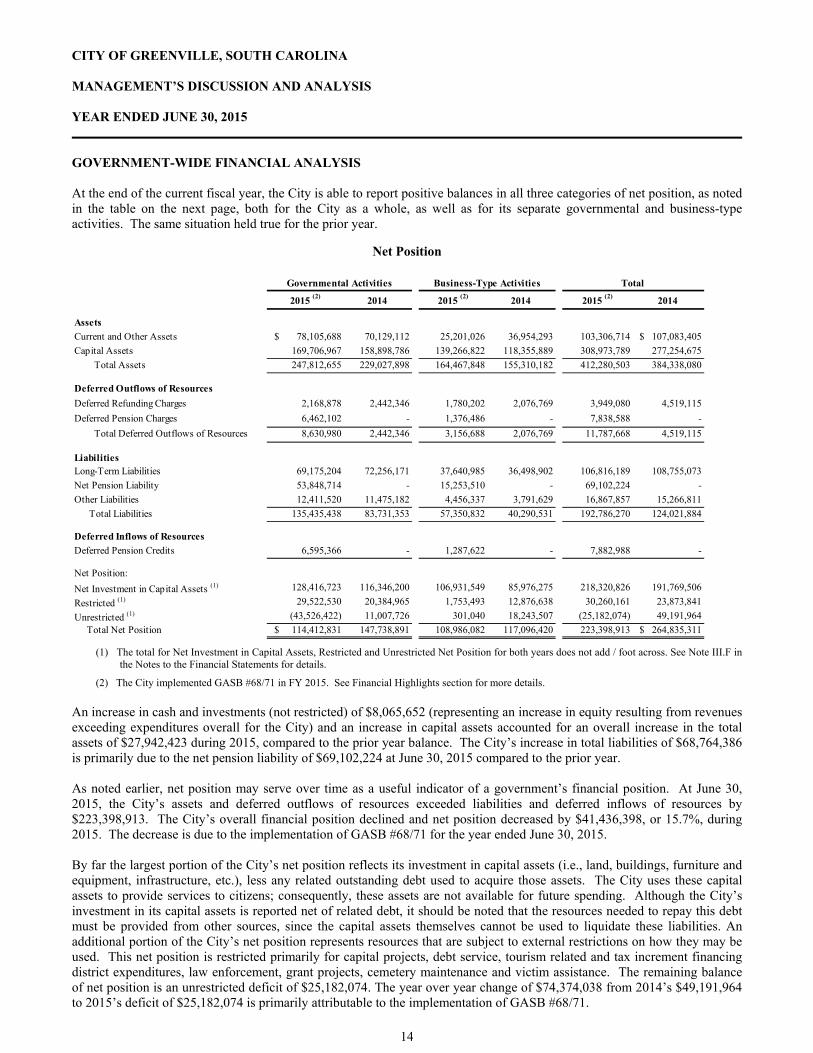
CITY OF GREENVILLE, SOUTH CAROLINA MANAGEMENT’S DISCUSSION AND ANALYSIS YEAR ENDED JUNE 30, 2015 GOVERNMENT-WIDE FINANCIAL ANALYSIS At the end of the current fiscal year, the City is able to report positive balances in all three categories of net position, as noted in the table on the next page, both for the City as a whole, as well as for its separate governmental and business-type activities. The same situation held true for the prior year.
Net Position
2015 (2)
2014 2015 (2)
2014 2015 (2)
2014
Assets
Current and Other Assets $ 78,105,688 70,129,112 25,201,026 36,954,293 103,306,714 $ 107,083,405
Capital Assets 169,706,967 158,898,786 139,266,822 118,355,889 308,973,789 277,254,675
Total Assets 247,812,655 229,027,898 164,467,848 155,310,182 412,280,503 384,338,080
Deferred Outflows of Resources
Deferred Refunding Charges 2,168,878 2,442,346 1,780,202 2,076,769 3,949,080 4,519,115
Deferred Pension Charges 6,462,102 - 1,376,486 - 7,838,588 -
Total Deferred Outflows of Resources 8,630,980 2,442,346 3,156,688 2,076,769 11,787,668 4,519,115
LiabilitiesLong-Term Liabilities 69,175,204 72,256,171 37,640,985 36,498,902 106,816,189 108,755,073
Net Pension Liability 53,848,714 - 15,253,510 - 69,102,224 -
Other Liabilities 12,411,520 11,475,182 4,456,337 3,791,629 16,867,857 15,266,811
Total Liabilities 135,435,438 83,731,353 57,350,832 40,290,531 192,786,270 124,021,884
Deferred Inflows of Resources
Deferred Pension Credits 6,595,366 - 1,287,622 - 7,882,988 -
Net Position:
Net Investment in Capital Assets (1) 128,416,723 116,346,200 106,931,549 85,976,275 218,320,826 191,769,506
Restricted (1) 29,522,530 20,384,965 1,753,493 12,876,638 30,260,161 23,873,841
Unrestricted (1) (43,526,422) 11,007,726 301,040 18,243,507 (25,182,074) 49,191,964
Total Net Position $ 114,412,831 147,738,891 108,986,082 117,096,420 223,398,913 $ 264,835,311
Governmental Activities Business-Type Activities Total
(1) The total for Net Investment in Capital Assets, Restricted and Unrestricted Net Position for both years does not add / foot across. See Note III.F in
the Notes to the Financial Statements for details.
(2) The City implemented GASB #68/71 in FY 2015. See Financial Highlights section for more details.
An increase in cash and investments (not restricted) of $8,065,652 (representing an increase in equity resulting from revenues exceeding expenditures overall for the City) and an increase in capital assets accounted for an overall increase in the total assets of $27,942,423 during 2015, compared to the prior year balance. The City’s increase in total liabilities of $68,764,386 is primarily due to the net pension liability of $69,102,224 at June 30, 2015 compared to the prior year. As noted earlier, net position may serve over time as a useful indicator of a government’s financial position. At June 30, 2015, the City’s assets and deferred outflows of resources exceeded liabilities and deferred inflows of resources by $223,398,913. The City’s overall financial position declined and net position decreased by $41,436,398, or 15.7%, during 2015. The decrease is due to the implementation of GASB #68/71 for the year ended June 30, 2015. By far the largest portion of the City’s net position reflects its investment in capital assets (i.e., land, buildings, furniture and equipment, infrastructure, etc.), less any related outstanding debt used to acquire those assets. The City uses these capital assets to provide services to citizens; consequently, these assets are not available for future spending. Although the City’s investment in its capital assets is reported net of related debt, it should be noted that the resources needed to repay this debt must be provided from other sources, since the capital assets themselves cannot be used to liquidate these liabilities. An additional portion of the City’s net position represents resources that are subject to external restrictions on how they may be used. This net position is restricted primarily for capital projects, debt service, tourism related and tax increment financing district expenditures, law enforcement, grant projects, cemetery maintenance and victim assistance. The remaining balance of net position is an unrestricted deficit of $25,182,074. The year over year change of $74,374,038 from 2014’s $49,191,964 to 2015’s deficit of $25,182,074 is primarily attributable to the implementation of GASB #68/71.
14
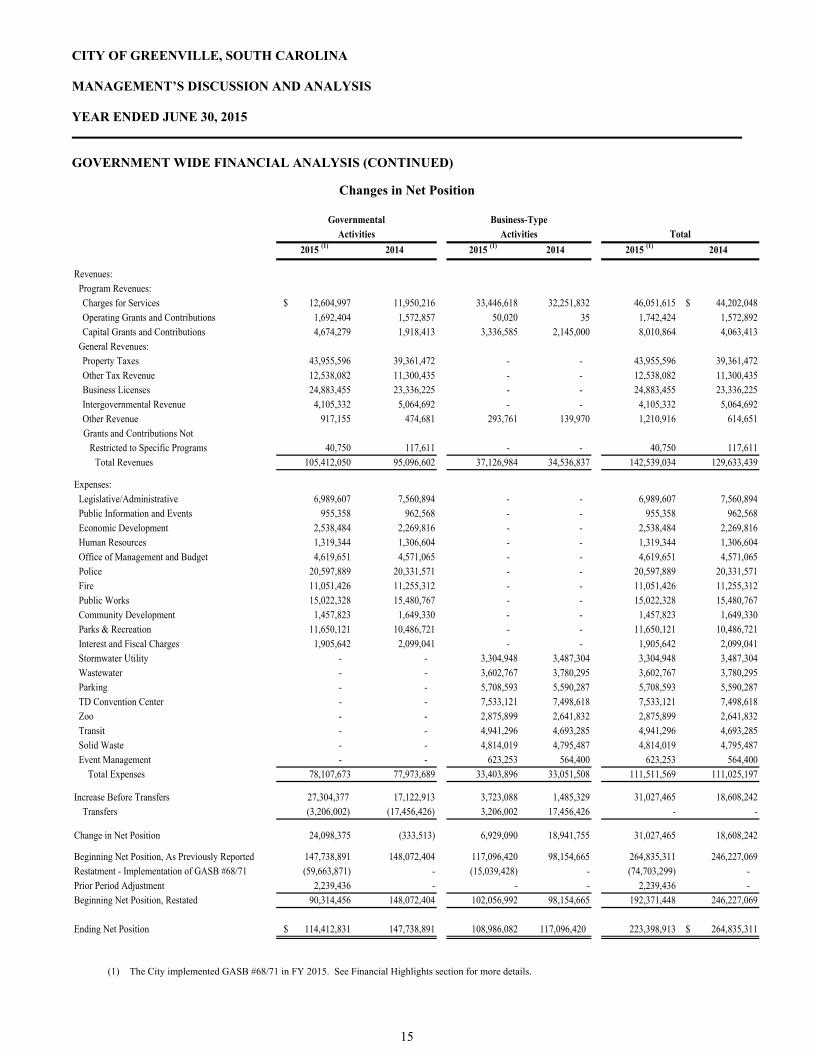
CITY OF GREENVILLE, SOUTH CAROLINA MANAGEMENT’S DISCUSSION AND ANALYSIS YEAR ENDED JUNE 30, 2015 GOVERNMENT WIDE FINANCIAL ANALYSIS (CONTINUED)
Changes in Net Position
2015 (1) 2014 2015 (1) 2014 2015 (1) 2014
Revenues:
Program Revenues:Charges for Services $ 12,604,997 11,950,216 33,446,618 32,251,832 46,051,615 $ 44,202,048
Operating Grants and Contributions 1,692,404 1,572,857 50,020 35 1,742,424 1,572,892 Capital Grants and Contributions 4,674,279 1,918,413 3,336,585 2,145,000 8,010,864 4,063,413
General Revenues: Property Taxes 43,955,596 39,361,472 - - 43,955,596 39,361,472
Other Tax Revenue 12,538,082 11,300,435 - - 12,538,082 11,300,435 Business Licenses 24,883,455 23,336,225 - - 24,883,455 23,336,225
Intergovernmental Revenue 4,105,332 5,064,692 - - 4,105,332 5,064,692 Other Revenue 917,155 474,681 293,761 139,970 1,210,916 614,651
Grants and Contributions Not Restricted to Specific Programs 40,750 117,611 - - 40,750 117,611
Total Revenues 105,412,050 95,096,602 37,126,984 34,536,837 142,539,034 129,633,439
Expenses:
Legislative/Administrative 6,989,607 7,560,894 - - 6,989,607 7,560,894 Public Information and Events 955,358 962,568 - - 955,358 962,568
Economic Development 2,538,484 2,269,816 - - 2,538,484 2,269,816 Human Resources 1,319,344 1,306,604 - - 1,319,344 1,306,604
Office of Management and Budget 4,619,651 4,571,065 - - 4,619,651 4,571,065 Police 20,597,889 20,331,571 - - 20,597,889 20,331,571
Fire 11,051,426 11,255,312 - - 11,051,426 11,255,312 Public Works 15,022,328 15,480,767 - - 15,022,328 15,480,767
Community Development 1,457,823 1,649,330 - - 1,457,823 1,649,330 Parks & Recreation 11,650,121 10,486,721 - - 11,650,121 10,486,721
Interest and Fiscal Charges 1,905,642 2,099,041 - - 1,905,642 2,099,041 Stormwater Utility - - 3,304,948 3,487,304 3,304,948 3,487,304
Wastewater - - 3,602,767 3,780,295 3,602,767 3,780,295 Parking - - 5,708,593 5,590,287 5,708,593 5,590,287
TD Convention Center - - 7,533,121 7,498,618 7,533,121 7,498,618 Zoo - - 2,875,899 2,641,832 2,875,899 2,641,832
Transit - - 4,941,296 4,693,285 4,941,296 4,693,285 Solid Waste - - 4,814,019 4,795,487 4,814,019 4,795,487
Event Management - - 623,253 564,400 623,253 564,400 Total Expenses 78,107,673 77,973,689 33,403,896 33,051,508 111,511,569 111,025,197
Increase Before Transfers 27,304,377 17,122,913 3,723,088 1,485,329 31,027,465 18,608,242
Transfers (3,206,002) (17,456,426) 3,206,002 17,456,426 - -
Change in Net Position 24,098,375 (333,513) 6,929,090 18,941,755 31,027,465 18,608,242
Beginning Net Position, As Previously Reported 147,738,891 148,072,404 117,096,420 98,154,665 264,835,311 246,227,069 Restatment - Implementation of GASB #68/71 (59,663,871) - (15,039,428) - (74,703,299) -
Prior Period Adjustment 2,239,436 - - - 2,239,436 - Beginning Net Position, Restated 90,314,456 148,072,404 102,056,992 98,154,665 192,371,448 246,227,069
Ending Net Position $ 114,412,831 147,738,891 108,986,082 117,096,420 223,398,913 $ 264,835,311
TotalGovernmental Business-Type
Activities Activities
(1) The City implemented GASB #68/71 in FY 2015. See Financial Highlights section for more details.
15

CITY OF GREENVILLE, SOUTH CAROLINA MANAGEMENT’S DISCUSSION AND ANALYSIS YEAR ENDED JUNE 30, 2015 GOVERNMENT-WIDE FINANCIAL ANALYSIS (CONTINUED) Total government-wide revenues of $142,539,034 were derived primarily from property and other taxes (39.6%), business licenses (17.5%), and charges for services (32.3%). Revenues increased $12.9 million or 10.0% from the prior year. The total government-wide expenses of all programs were $111,511,569, reflecting an increase of $0.5 million (0.4%) over the prior year. The expenses cover a range of services with public safety (police and fire) representing 28.5% and public works (general public works, stormwater utility, wastewater, parking and solid waste) representing 29.1%. Governmental Activities:
As shown in the chart, property taxes (41.7%) continue to be the major source of revenues for governmental activities with business licenses the second highest (23.6%). These two revenue sources account for 65.3% of the total governmental revenue. Governmental expenses increased by $133,984 (0.2%) from $77,973,689 to $78,107,673 during the current year. This increase is due primarily to personnel and benefit cost increases offset by position vacancies during the current year. As in prior years, the police function continues to be the largest expense with 26.4% of the total expenses in the current year compared to 26.1% in the prior year.
Overall, governmental activities increased the City’s net position by $24,098,375, compared to a $333,513 decrease for the prior year. The change from the prior year is due primarily to a decrease in transfers related to bond proceeds in connection with the construction of the Project One parking facility to business-type activities of $14,250,424 in the current year combined with higher property tax collections of $4,594,124 and additional operating and capital grant revenue of $2,875,413. Also, the City recognized $4,674,279 in capital grants and contributions in the current year, compared to $1,918,413 in the prior year with a majority of the 2015 capital grants and contributions attributable to donated land.
This chart highlights the expenses and program revenues of the City’s governmental programs. The financial support provided by property taxes, business license and other general revenue sources not restricted to specific programs do not specifically match the costs by function. In addition, permit revenues collected in the Legislative/Administrative function provide additional revenue to cover the costs of other functions, such as Police and Fire.
16
downimi
Line
downimi
Line
downimi
Line
downimi
Line
downimi
Line
CITY OF GREENVILLE, SOUTH CAROLINA MANAGEMENT’S DISCUSSION AND ANALYSIS YEAR ENDED JUNE 30, 2015 GOVERNMENT-WIDE FINANCIAL ANALYSIS (CONTINUED) Governmental Activities (Continued): In addition to property and other taxes, the total cost of services of $78.1 million was supported by $12.6 million in charges for services and for those who directly benefited from the programs and $6.4 million was provided by other governments and organizations for specific programs. Business-Type Activities:
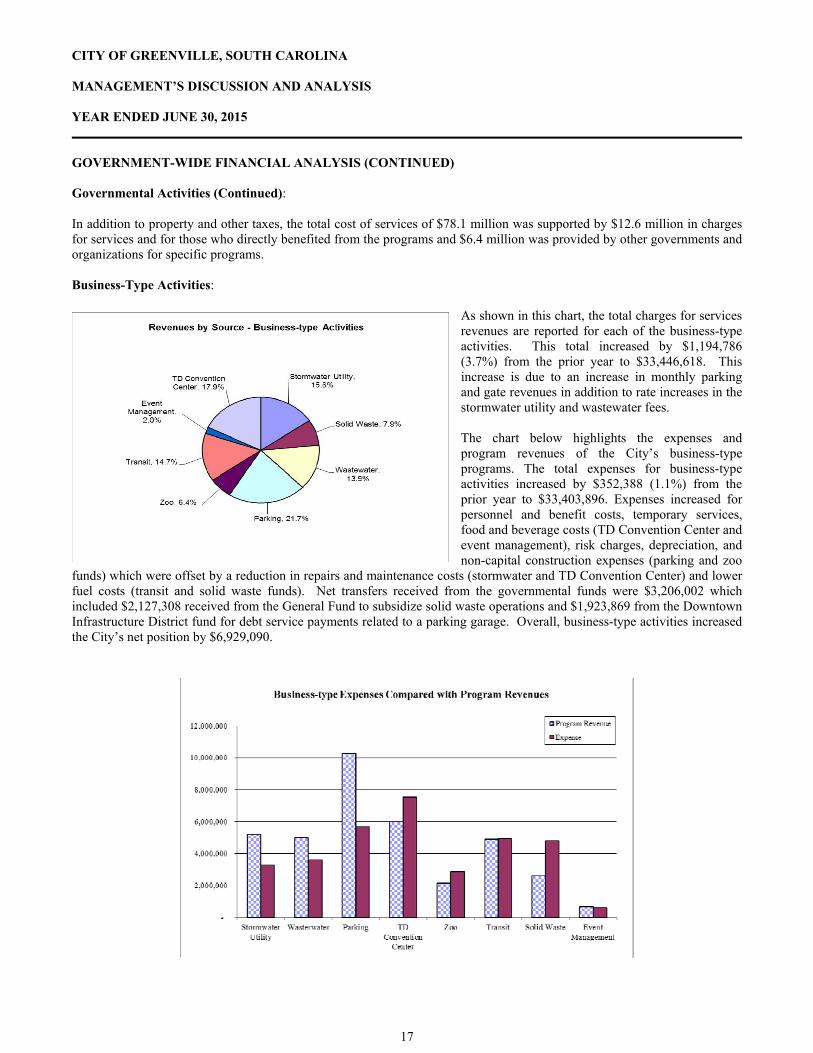
As shown in this chart, the total charges for services revenues are reported for each of the business-type activities. This total increased by $1,194,786 (3.7%) from the prior year to $33,446,618. This increase is due to an increase in monthly parking and gate revenues in addition to rate increases in the stormwater utility and wastewater fees. The chart below highlights the expenses and program revenues of the City’s business-type programs. The total expenses for business-type activities increased by $352,388 (1.1%) from the prior year to $33,403,896. Expenses increased for personnel and benefit costs, temporary services, food and beverage costs (TD Convention Center and event management), risk charges, depreciation, and non-capital construction expenses (parking and zoo
funds) which were offset by a reduction in repairs and maintenance costs (stormwater and TD Convention Center) and lower fuel costs (transit and solid waste funds). Net transfers received from the governmental funds were $3,206,002 which included $2,127,308 received from the General Fund to subsidize solid waste operations and $1,923,869 from the Downtown Infrastructure District fund for debt service payments related to a parking garage. Overall, business-type activities increased the City’s net position by $6,929,090.
17
downimi
Line
downimi
Line
downimi
Line
downimi
Line
downimi
Line
downimi
Line
CITY OF GREENVILLE, SOUTH CAROLINA MANAGEMENT’S DISCUSSION AND ANALYSIS YEAR ENDED JUNE 30, 2015 GOVERNMENT-WIDE FINANCIAL ANALYSIS (CONTINUED) The City of Greenville’s enterprise fund highlights from the fiscal year are below. The Stormwater Utility Enterprise Fund is used to account for the City's stormwater operations. There was an overall
increase in operating revenues of $85,000 due to a 1.6% rate increase and a nominal increase in the impervious surface billings in the City. Operating expenses were $198,000 lower due to a reduction in professional and temporary services, repairs and maintenance costs and offset by an increase in personnel and benefit costs, risk charges and depreciation. Transfers to other funds for capital projects and administrative services totaled $334,000. This fund experienced an increase in net position of approximately $1,724,000 in 2015, compared to $1,276,000 in 2014.
The Wastewater Enterprise Fund is used to account for the City's wastewater operations. There was a $332,000 increase
in operating revenues from the prior year due to a 5% rate increase for the current year. Operating expenses were $254,000 lower due to a reduction in non-capital construction expenses in the current year, offset by increases in personnel and benefit costs, risk charges, and depreciation expense. In addition, capital grants of $356,000, and transfers from other funds of $417,000 were used for capital additions. This fund experienced an increase in net position of approximately $1,543,000 in 2015 compared to $1,317,000 in 2014.
The Parking Enterprise Fund is used to account for the City's parking operations. There was an increase in operating revenues of $602,000 due to an increase in the average number of monthly parkers, special event, gate, and hotel guest parking revenue, and parking fines. Operating expenses increased by $196,000 due to personnel and benefit costs, bank charges, non-capital construction expenses and depreciation expense. This fund received a transfer of $1,924,000 from the Downtown Infrastructure District Fund for the purpose of providing resources to transfer out $1,512,000 to the Greenville Public Facilities Corporation, a Special Revenue fund, for acquisition payments in connection with the construction of the Project One parking facility. A capital land contribution of $2,980,000 for the Riverplace IIB parking facility is also reflected in the statements. This fund experienced an increase in net position of $4,269,000 in 2015, compared to $16,919,000 in 2014. The 2014 increase reflected the transfer of resources from the Greenville Public Facilities Corporation in the amount of $11,830,000 to construct the Project One facility.
The TD Convention Center Enterprise Fund is used to account for the operations at the TD Convention Center. There was an increase in operating revenues of $160,000 due to an increase in event rentals, food and beverage, and ancillary revenues. There was also an increase in operating expenses of $58,000 during the current year related to an increase in professional services, incentive fees, advertising expenses, food and beverage costs and depreciation expense offset by a reduction in salaries and benefit costs and repairs and maintenance. This fund experienced a decrease in net position of approximately $354,000 in 2015, compared to a decrease of $492,000 in 2014.
The Zoo Enterprise Fund is used to account for the operations of the Greenville Zoo. There was a decrease in operating
revenues of $119,000 due to a reduction in admissions, concession sales and memberships. Operating expenses increased by $234,000 due to non-capital construction expenses. The fund experienced a decrease in net position of $342,000 in 2015, compared to an increase of $10,000 in 2014.
The Transit Enterprise Fund is used to account for the City’s costs in managing the operations of the Greenville Transit
Authority (“GTA”). Due to the nature of the intergovernmental agreement with the GTA, the City’s revenues relate to the total expenses paid on behalf of GTA. There was an increase in operating expenses of $248,000. The increase relates to a full year of the Clemson commuter and connector routes, the assumption of trolley service by GTA in August 2014, increases in temporary personnel services, and parts costs offset by a decrease in fuel costs. This fund experienced a decrease in net position of $23,000 in 2015, compared to an increase of $1,000 in 2014.
The Solid Waste Enterprise Fund is used to account for the City's solid waste operations. There was a decrease in
operating revenue from the prior year of $167,000 due to the elimination of commercial trash collections for a full year. There was an increase in the total operating expenses for the fund of $19,000 during the current year related to an increase in temporary services and risk charges offset by decreases in fuel, parts costs and depreciation. As previously noted, this fund is heavily subsidized by the General Fund, with a total of $2,127,000 transferred to cover operating losses. The subsidy transfer from the General Fund was $1,877,000 in the prior year. This fund experienced an increase in net position of $62,000 in 2015, compared to a decrease of $120,000 in 2014.
18

CITY OF GREENVILLE, SOUTH CAROLINA MANAGEMENT’S DISCUSSION AND ANALYSIS YEAR ENDED JUNE 30, 2015 GOVERNMENT-WIDE FINANCIAL ANALYSIS (CONTINUED)
The Event Management Enterprise Fund is used to account for the City’s event management operations. There was an
increase in operating revenue from the prior year of $77,000 due to an increase in sponsorship, concession, vendor and contract revenues. There was an increase in operating expenses of $59,000 in salary and benefits and food and beverage costs offset by a reduction in revenue sharing expenses. This fund experienced an increase in net position of $49,000 in 2015, compared to $31,000 in 2014.
FINANCIAL ANALYSIS OF THE CITY’S FUNDS As noted earlier, the City of Greenville uses fund accounting to ensure and demonstrate compliance with finance-related legal requirements. Governmental Funds: The focus of the City’s governmental funds is to provide information on near-term inflows, outflows, and balances of spendable resources. Such information is useful in assessing the City’s financing requirements. Specifically, unassigned fund balance can be a useful measure of a government’s net resources available for spending at the end of the fiscal year. At June 30, 2015, the City’s governmental funds reported combined ending fund balances of $65,279,749, an increase of $12,436,897 in comparison with the prior year. Fund balances consist of the following:
$11.0 million restricted for capital projects and $7.0 million committed for capital projects $5.2 million restricted for tourism related expenditures $3.3 million restricted for debt service $8.4 million restricted for TIF Districts’ expenditures $1.1 million restricted for grant projects $0.5 million restricted for law enforcement $0.2 million restricted for other purposes $1.4 million committed for utility undergrounding $0.2 million committed for other purposes $2.6 million assigned for future year’s expenditures and various other purposes $24.3 million is unassigned
General Fund Revenues The General Fund is the principal fund that accounts for the daily operations of the City. Total revenues for 2015 were $71,823,589, an 8.5% increase from the previous year. Taxes, business licenses, permits and franchise fees make up approximately 95.3% of all General Fund revenues. As with most municipalities in the State of South Carolina, the City is dependent on property taxes to pay for many of the services provided to its citizens. The current millage rate for property taxes is 89.4 mils. The assessed value is 4% of market value for residential property, 6% for commercial property, 10.5% for industrial property, 10.5% for personal property and 6% for motor vehicles. Property tax collections increased by 11.0% from the prior year and accounted for 46.5% of total General Fund revenue for the year ended June 30, 2015, with $33,406,281 recognized. The increase of $3,317,757 from the prior year resulted from a 4.0 increase in millage combined with an increase in the collection rate for real, commercial and automobile property taxes. The City received $33,455,857 in revenues from business licenses, permits, and franchise fees, a 7.2% increase from the previous fiscal year. The increase in business licenses and permits from the prior year reflects significant gains in the insurance, retail, service and contractor business licenses. Also revenue gains in building permits and smaller growth in the wholesale and hotel categories. In addition, fines and forfeitures were slightly higher than the prior year.
19
CITY OF GREENVILLE, SOUTH CAROLINA MANAGEMENT’S DISCUSSION AND ANALYSIS YEAR ENDED JUNE 30, 2015 FINANCIAL ANALYSIS OF THE CITY’S FUNDS (CONTINUED) General Fund Expenditures General Fund expenditures for 2015 totaled $64,430,133, a 0.3% increase over the prior year. Key elements of this change are as follows:
Required employer contributions to the South Carolina Public Employee Benefit Authority (“PEBA”), formerly the South Carolina Retirement System increased 0.3% from the prior year to 10.75% of salaries paid in 2015. The police officer rate increased 0.6% from the prior year to 13.0% of salaries paid.
A 3.0% compensation pool for merit adjustments for employees, offset by salary savings from position vacancies
Reduced capital outlay spending of $1,827,406 from the prior year; contributing to the decrease were two fire pumper vehicles purchased in 2014.
Together, the Police, Fire and Public Works departments accounted for approximately 60.8% of all General Fund expenditures. Actual expenditures for these departments, excluding capital outlay, were $19,338,779 - Police, $11,462,266 - Fire, and $8,359,849 - Public Works. The remaining 39.2% of General Fund expenditures resulted from Parks and Recreation - $6,893,573, Legislative/Administrative - $5,691,936, Office of Management and Budget - $4,472,633, Capital Outlay - $1,691,395, Economic Development - $2,498,925, Debt Service - $1,784,725, Human Resources - $1,311,908, and Public Information and Events - $924,144.
General Fund Balance The General Fund is the chief operating fund of the City of Greenville. Total fund balance in the General Fund increased by $3,131,313, from $23,751,082 at June 30, 2014 to $26,882,395 at June 30, 2015. The unassigned fund balance increased by $4,240,626, from $20,082,125 to $24,322,751. Unassigned fund balance represents 33% of total General Fund expenditures and transfers out for the year. The remaining portion of fund balance includes amounts assigned for future year expenditures and for various purposes totaling $2,559,644. Capital Projects Fund Revenues The Capital Projects Fund is a major fund that accounts for the financial resources expended for the acquisition or construction of major capital facilities and improvements (other than those accounted for by the Proprietary Funds). Revenues are derived primarily from the issuance of bonds along with grants, intergovernmental revenues, investment earnings, and transfers in from other funds. Projects are funded at the beginning of the project with expenditures being made over the life of the project. The Capital Projects Fund received funding during the current year of $11,274,392, which included transfers from other funds (net) of $10,982,734. Capital Projects Fund Expenditures Capital Projects Fund expenditures for the current year totaled $7,065,227. Various projects this year included downtown development projects of $1,600,000, parks and recreation facilities and trail improvements of $1,917,000, road and sidewalk construction of $1,027,000, technology and camera projects of $1,195,000, fire station improvements of $601,000 and streetscape improvements of $580,000. At June 30, 2015, the Capital Projects fund balance was $18,015,915, which was an increase of $4,209,165 from the prior year. Special Revenue Fund Operations The Special Revenue Funds are used to account for the proceeds of designated specific revenue sources that are restricted by law or administrative actions to expenditures for specified purposes. The following activities are recorded in Special Revenue Funds: HOME Program, Neighborhood Stabilization, Rental Rehabilitation, HOPWA, Revolving Housing, Community Development, Local Hospitality Tax, Sunday Alcohol Permits, Admission Tax, State Accommodations Tax, Law Enforcement, Miscellaneous Grants, Victim Assistance, Local Accommodations Tax, Utility Undergrounding, Recreation Incentive, Tree Foundation, Donation Fund, and the Greenville Public Facilities Corporation.
20
CITY OF GREENVILLE, SOUTH CAROLINA MANAGEMENT’S DISCUSSION AND ANALYSIS YEAR ENDED JUNE 30, 2015 FINANCIAL ANALYSIS OF THE CITY’S FUNDS (CONTINUED) Special Revenue Fund Revenues The combined Special Revenue fund revenues for 2015 were $19,170,550, a 9.4% increase from the previous fiscal year. Increases in local hospitality, state and local accommodations taxes, HOPWA grant proceeds, miscellaneous grants, victim assistance and utility undergrounding fees totaling $1,996,000 were offset by a decrease of $343,000 in the following funds:
Admission tax fund revenues were $13,000 less than the prior year due to the expiration for admission taxes at the Bon Secours Wellness Arena.
HUD grant proceeds for the Home and Community Development funds were $35,000 and $148,000, respectively, less than the prior year.
Law enforcement fund revenues were $137,000 less than the prior year due to a reduction in the seized funds cases in fiscal 2015.
Sunday Alcohol permit fees were $10,000 less than the prior year.
The City received $12,538,082 in revenue from tourism related taxes, an 11.0% increase from the previous year. The remaining Special Revenue Funds’ combined revenue sources were grants of $2,491,649; intergovernmental revenue of $1,883,565; license, permits, and franchise fees of $1,423,568; fees, charges and rentals of $139,213; and investment earnings and other revenues of $694,473. Special Revenue Fund Expenditures Special Revenue Fund expenditures for 2015 totaled $12,083,074, a 15.7% increase over the previous year. The increase relates to the scheduled debt service payments during 2015 and an increase in State and Local Accommodation Tax expenditures due to the increased revenues offset by reduced grant related expenditures. Together, Public Works, Community Development and Parks and Recreation accounted for approximately 60.2% of all Special Revenue Fund expenditures. Public Works expenditures for 2015 were $1,308,186, Community Development expenditures were $1,454,631, and Parks and Recreation expenditures amounted to $4,507,792. The remaining 39.8% of the combined Special Revenue Funds expenditures came from the areas of Debt Service - $3,867,884, Police - $215,407, Fire - $85,059, Capital Outlay - $592,575, and Other Expenditures - $51,540. Debt Service Funds The Debt Service Funds are used to account for servicing debt payments on the City’s tax increment revenue bonds. Revenue for the tax increment bond payments are derived from incremental property tax collections. The City of Greenville has three Debt Service Funds used to account for the retirement of principal and interest on tax increment revenue bonds:
Downtown Infrastructure Fund for infrastructure improvements in the Central Business District.
Westend Tax Increment Fund for various improvements in the Westend Redevelopment area.
Viola Street Tax Increment Fund for infrastructure in the Viola Street neighborhood. Tax increment revenues for the Debt Service funds for 2015 were $10,523,620, compared to $9,364,018 for the prior year. Property tax increment collections accounted for 99.6% of the revenues, which were higher than the prior year due to an increase in the City and School District millage rates for tax year 2014 and an increase in the increment districts’ taxable assessed values. Total Debt Service Fund expenditures were $3,067,642, compared to $3,085,771 for the prior year. The decrease is due to the debt repayment scheduled payments for 2015. Principal and interest payments on the City’s debt accounted for 98.1% of the total expenditures.
21
CITY OF GREENVILLE, SOUTH CAROLINA MANAGEMENT’S DISCUSSION AND ANALYSIS YEAR ENDED JUNE 30, 2015 FINANCIAL ANALYSIS OF THE CITY’S FUNDS (CONTINUED) Enterprise Funds: The City of Greenville’s enterprise funds provide the same type of information found in the government-wide statements, but in more detail.
Unrestricted net position at the end of the current year for the City’s enterprise funds were as follows: Stormwater Utility - $7,412,270, Wastewater- $567,293, Parking – ($1,155,589), TD Convention Center - $883,606, Zoo – ($663,441), Transit - ($3,977,673), Solid Waste – ($2,442,472), and Event Management – ($322,954). Total unrestricted net position for all enterprise funds was $301,040 at June 30, 2015, a decrease of $17,942,467 over the prior year of $18,243,507 due primarily to the implementation of GASB #68/71 in 2015. Other factors concerning the operations of these funds have already been addressed in the discussion of the City’s business-type activities. General Fund Budgetary Highlights Differences between the General Fund original budget and the final amended budget relate to prior year encumbrances of $612,000 and appropriations to fund a settlement with Gantt Fire and Sewer Districts of $480,000, replacement of the Woodland Way Bridge due to storm damage of $360,000, and other changes totaling $102,000. Any unexpended encumbrances remaining after the conclusion of the fiscal year will be re-appropriated in the next fiscal year in accordance with the approved Budget Ordinance. The total revenue received in 2015 was $71.8 million or $5.6 million more than the revised budget of $66.2 million. Property taxes were $1.9 million more than budget as collections for automobiles and commercial property taxes increased. Business licenses and permit revenues were $3.4 million more than the budget due to higher than anticipated collections in insurance, retail, service and contractor business licenses. All other revenues exceeded budget in total by $0.4 million. The total expenditures were $64.4 million or $2.0 million less than the budget of $66.4 million. The City’s actual expenditures were lower than budget due to the following reasons:
Salary savings in personnel expenditures, including temporary personnel service, of almost $935,000 (2.0%). This variance is due to a combination of an average annual 5.7% vacancy rate for General Fund positions, use of temporary personnel services to fill vacancies, and an average 3% merit increase implemented in October.
Lower operating expenditures for all departments totaling almost $690,000, including $168,000 for a cancelled sidewalk grinding contract and $188,000 in reduced contributions to South Carolina Other Retirement Benefits Employer Trust (“SC ORBET”).
Delayed capital outlay purchases of $345,000 which will be reflected as unexpended encumbrances re-appropriated
in the next fiscal year. CAPITAL ASSET AND DEBT ADMINISTRATION Capital Assets The City’s investment in capital assets for its governmental and business–type activities was $308,973,789 (net of accumulated depreciation) at June 30, 2015. During 2015, the City recognized approximately $6,340,000 in land and improvements contributed by other parties. The City’s assets include land, buildings and improvements, furniture and equipment, infrastructure, vehicles and construction in progress.
22
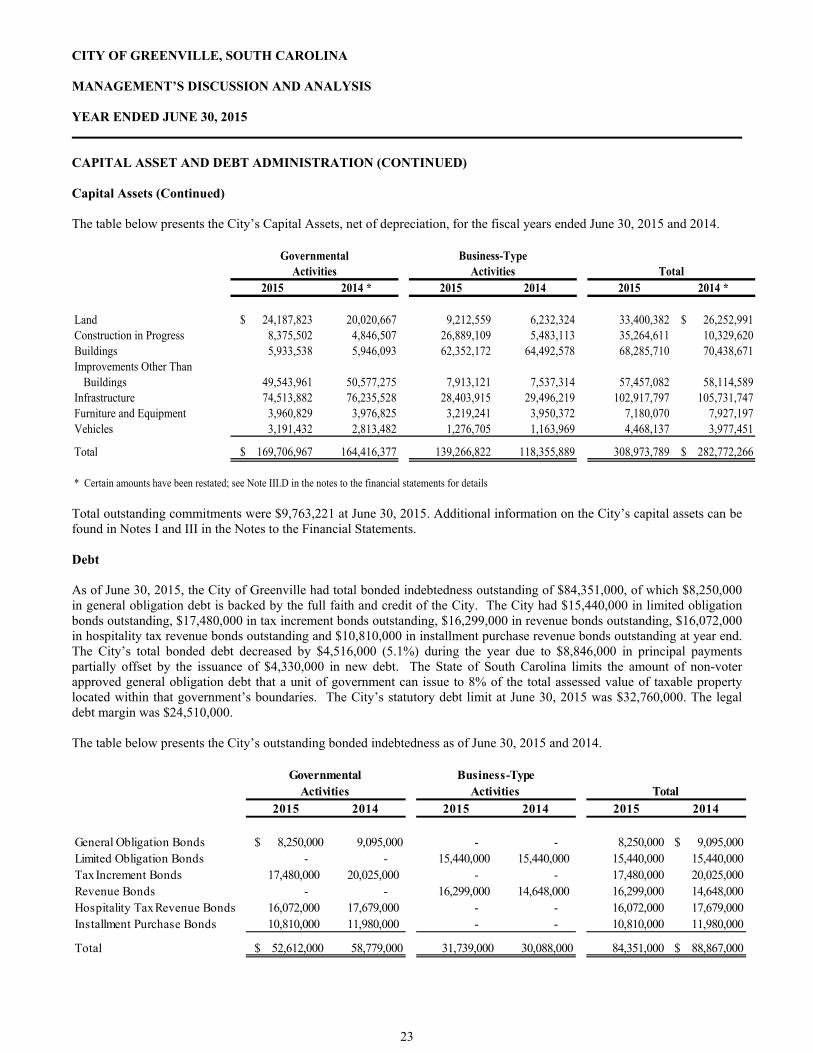
CITY OF GREENVILLE, SOUTH CAROLINA MANAGEMENT’S DISCUSSION AND ANALYSIS YEAR ENDED JUNE 30, 2015 CAPITAL ASSET AND DEBT ADMINISTRATION (CONTINUED) Capital Assets (Continued) The table below presents the City’s Capital Assets, net of depreciation, for the fiscal years ended June 30, 2015 and 2014.
2015 2014 * 2015 2014 2015 2014 *
Land $ 24,187,823 20,020,667 9,212,559 6,232,324 33,400,382 $ 26,252,991 Construction in Progress 8,375,502 4,846,507 26,889,109 5,483,113 35,264,611 10,329,620 Buildings 5,933,538 5,946,093 62,352,172 64,492,578 68,285,710 70,438,671 Improvements Other Than
Buildings 49,543,961 50,577,275 7,913,121 7,537,314 57,457,082 58,114,589 Infrastructure 74,513,882 76,235,528 28,403,915 29,496,219 102,917,797 105,731,747 Furniture and Equipment 3,960,829 3,976,825 3,219,241 3,950,372 7,180,070 7,927,197 Vehicles 3,191,432 2,813,482 1,276,705 1,163,969 4,468,137 3,977,451
Total $ 169,706,967 164,416,377 139,266,822 118,355,889 308,973,789 $ 282,772,266
* Certain amounts have been restated; see Note III.D in the notes to the financial statements for details
Governmental Business-TypeActivities Activities Total
Total outstanding commitments were $9,763,221 at June 30, 2015. Additional information on the City’s capital assets can be found in Notes I and III in the Notes to the Financial Statements. Debt As of June 30, 2015, the City of Greenville had total bonded indebtedness outstanding of $84,351,000, of which $8,250,000 in general obligation debt is backed by the full faith and credit of the City. The City had $15,440,000 in limited obligation bonds outstanding, $17,480,000 in tax increment bonds outstanding, $16,299,000 in revenue bonds outstanding, $16,072,000 in hospitality tax revenue bonds outstanding and $10,810,000 in installment purchase revenue bonds outstanding at year end. The City’s total bonded debt decreased by $4,516,000 (5.1%) during the year due to $8,846,000 in principal payments partially offset by the issuance of $4,330,000 in new debt. The State of South Carolina limits the amount of non-voter approved general obligation debt that a unit of government can issue to 8% of the total assessed value of taxable property located within that government’s boundaries. The City’s statutory debt limit at June 30, 2015 was $32,760,000. The legal debt margin was $24,510,000. The table below presents the City’s outstanding bonded indebtedness as of June 30, 2015 and 2014.
2015 2014 2015 2014 2015 2014
General Obligation Bonds $ 8,250,000 9,095,000 - - 8,250,000 $ 9,095,000 Limited Obligation Bonds - - 15,440,000 15,440,000 15,440,000 15,440,000 Tax Increment Bonds 17,480,000 20,025,000 - - 17,480,000 20,025,000 Revenue Bonds - - 16,299,000 14,648,000 16,299,000 14,648,000 Hospitality Tax Revenue Bonds 16,072,000 17,679,000 - - 16,072,000 17,679,000 Installment Purchase Bonds 10,810,000 11,980,000 - - 10,810,000 11,980,000
Total $ 52,612,000 58,779,000 31,739,000 30,088,000 84,351,000 $ 88,867,000
Governmental Business-TypeActivities Activities Total
23

CITY OF GREENVILLE, SOUTH CAROLINA MANAGEMENT’S DISCUSSION AND ANALYSIS YEAR ENDED JUNE 30, 2015 CAPITAL ASSET AND DEBT ADMINISTRATION (CONTINUED) Debt (Continued) The City issued its Series 2015 Wastewater Revenue Bonds in the amount of $4,330,000 to provide resources for financing a portion of the costs of rehabilitating portions of the wastewater system related to inflow and infiltration issues and providing increased sewer line capacity to allow future development within several basins throughout the City. The City also had $3,115,048 in an outstanding Qualified Energy Conservation note payable, $1,737,873 in other outstanding notes payable, $1,608,166 in an outstanding South Carolina Water Quality Revolving Fund loan, and $7,471,987 in outstanding infrastructure reimbursement agreement obligations as of June 30, 2015. Additional information regarding the City’s long-term debt can be found in Note III in the Notes to the Financial Statements. NEXT YEAR’S BUDGETS AND RATES The fiscal 2016 adopted budget for all funds is $168,407,751, including a General Fund budget of $76,254,750. This represents an overall budgetary increase of 7.7% and a General Fund increase of 2.2% over the adopted FY 2015 operating budget. The budget emphasizes the continuing investment in people, infrastructure and equipment, making targeted investments through economic development and productivity improvements, and reserving financial capacity for signature projects so that once the City has the required data and analysis, it has a financial path forward for their execution. The General Fund millage rate for fiscal 2016 is 89.4 mills, representing no change from prior year. The County will reassess property in fiscal 2016 and the rollback millage rate will be 85.3 mills. The budget includes an appropriation of fund balance of $1,999,420, which is reflected as assigned as of June 30, 2015, to balance the fiscal 2016 budget. Key elements that factored into the preparation of next year’s budget are listed below:
Property tax revenues are expected to increase by 4.8% over the amount estimated for fiscal 2015 which reflects improving real property assessments and projected FY2014-15 receipts.
License and permits are projected to be up 5.9% due to the continuing recovering of the economy.
The monthly solid waste fee rates for fiscal 2016 will increase $2.00 per month to $15.50 per month. The stormwater and wastewater rates will increase 1.6% and 5%, respectively, from the fiscal 2015 rates.
The budget provides for a 3% compensation pool for a merit adjustment for employees.
The budget also implements several City Council directives of reinvesting in vehicles and equipment replacements of $5,190,485, fire station renovations of $3,343,153 and infrastructure of $19,351,392 and some other targeted investments, including $410,000 in an information technology improvement program.
ECONOMIC FACTORS
The unemployment rate for Greenville County is currently 6.1%, which is an increase from the rate of 5.8% a year ago. This compares favorably to the state’s average unemployment rate of 6.6% and the national average of 5.3%.
The office occupancy rate in the Central Business District is 87.9%, down 1.3% from the past year. Almost $8.5 billion was recorded in gross business sales for 2014-2015, and the building permit valuation was
$634.7 million, an increase of 71% over the prior year of $371.5 million.
REQUESTS FOR INFORMATION This report is designed to provide an overview of the City’s finances for those with an interest in this area. Questions concerning any of the information found in this report or requests for additional information should be directed to the Office of Management and Budget, City of Greenville, P.O. Box 2207, Greenville, South Carolina, 29602.
24
BASIC FINANCIAL STATEMENTS
25
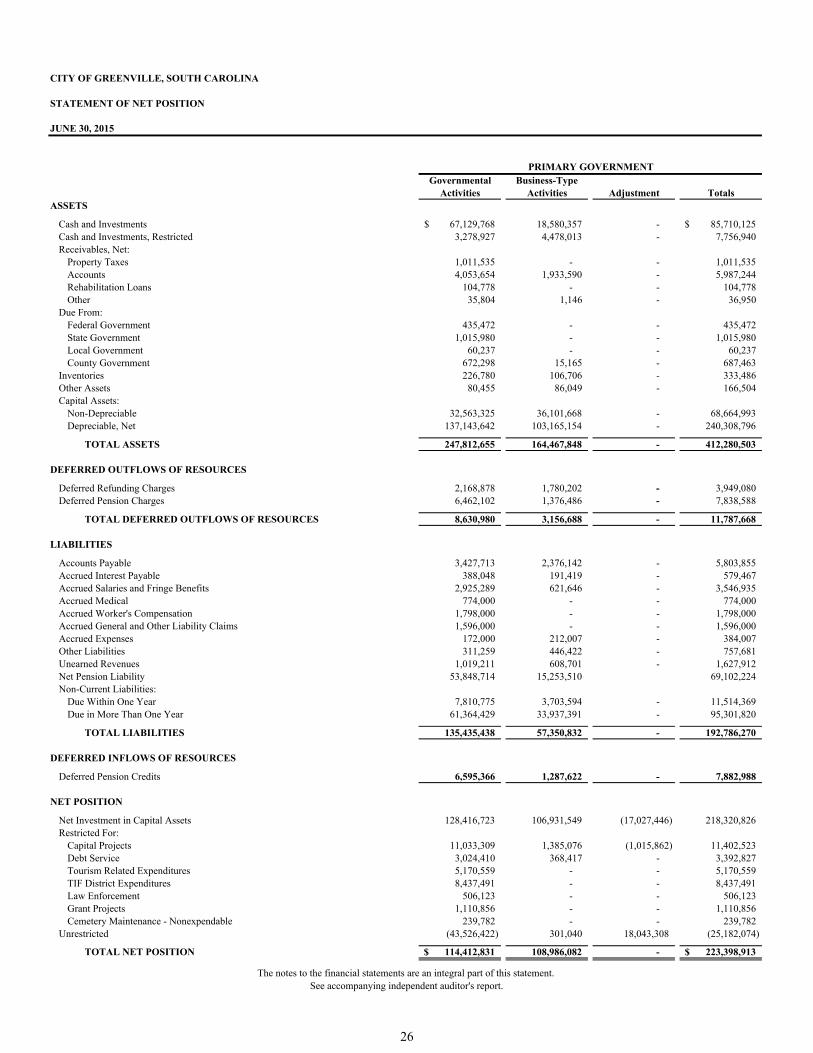
CITY OF GREENVILLE, SOUTH CAROLINA
STATEMENT OF NET POSITION
JUNE 30, 2015
Governmental Business-TypeActivities Activities Adjustment Totals
ASSETS
Cash and Investments 67,129,768$ 18,580,357 - 85,710,125$ Cash and Investments, Restricted 3,278,927 4,478,013 - 7,756,940 Receivables, Net:
Property Taxes 1,011,535 - - 1,011,535 Accounts 4,053,654 1,933,590 - 5,987,244 Rehabilitation Loans 104,778 - - 104,778 Other 35,804 1,146 - 36,950
Due From:Federal Government 435,472 - - 435,472 State Government 1,015,980 - - 1,015,980 Local Government 60,237 - - 60,237 County Government 672,298 15,165 - 687,463
Inventories 226,780 106,706 - 333,486 Other Assets 80,455 86,049 - 166,504 Capital Assets:
Non-Depreciable 32,563,325 36,101,668 - 68,664,993 Depreciable, Net 137,143,642 103,165,154 - 240,308,796
TOTAL ASSETS 247,812,655 164,467,848 - 412,280,503
DEFERRED OUTFLOWS OF RESOURCES
Deferred Refunding Charges 2,168,878 1,780,202 - 3,949,080 Deferred Pension Charges 6,462,102 1,376,486 - 7,838,588
TOTAL DEFERRED OUTFLOWS OF RESOURCES 8,630,980 3,156,688 - 11,787,668
LIABILITIES
Accounts Payable 3,427,713 2,376,142 - 5,803,855 Accrued Interest Payable 388,048 191,419 - 579,467 Accrued Salaries and Fringe Benefits 2,925,289 621,646 - 3,546,935 Accrued Medical 774,000 - - 774,000 Accrued Worker's Compensation 1,798,000 - - 1,798,000 Accrued General and Other Liability Claims 1,596,000 - - 1,596,000 Accrued Expenses 172,000 212,007 - 384,007 Other Liabilities 311,259 446,422 - 757,681 Unearned Revenues 1,019,211 608,701 - 1,627,912 Net Pension Liability 53,848,714 15,253,510 69,102,224 Non-Current Liabilities:
Due Within One Year 7,810,775 3,703,594 - 11,514,369 Due in More Than One Year 61,364,429 33,937,391 - 95,301,820
TOTAL LIABILITIES 135,435,438 57,350,832 - 192,786,270
DEFERRED INFLOWS OF RESOURCES
Deferred Pension Credits 6,595,366 1,287,622 - 7,882,988
NET POSITION
Net Investment in Capital Assets 128,416,723 106,931,549 (17,027,446) 218,320,826 Restricted For:
Capital Projects 11,033,309 1,385,076 (1,015,862) 11,402,523 Debt Service 3,024,410 368,417 - 3,392,827 Tourism Related Expenditures 5,170,559 - - 5,170,559 TIF District Expenditures 8,437,491 - - 8,437,491 Law Enforcement 506,123 - - 506,123 Grant Projects 1,110,856 - - 1,110,856 Cemetery Maintenance - Nonexpendable 239,782 - - 239,782
Unrestricted (43,526,422) 301,040 18,043,308 (25,182,074)
TOTAL NET POSITION 114,412,831$ 108,986,082 - 223,398,913$
PRIMARY GOVERNMENT
The notes to the financial statements are an integral part of this statement. See accompanying independent auditor's report.
26
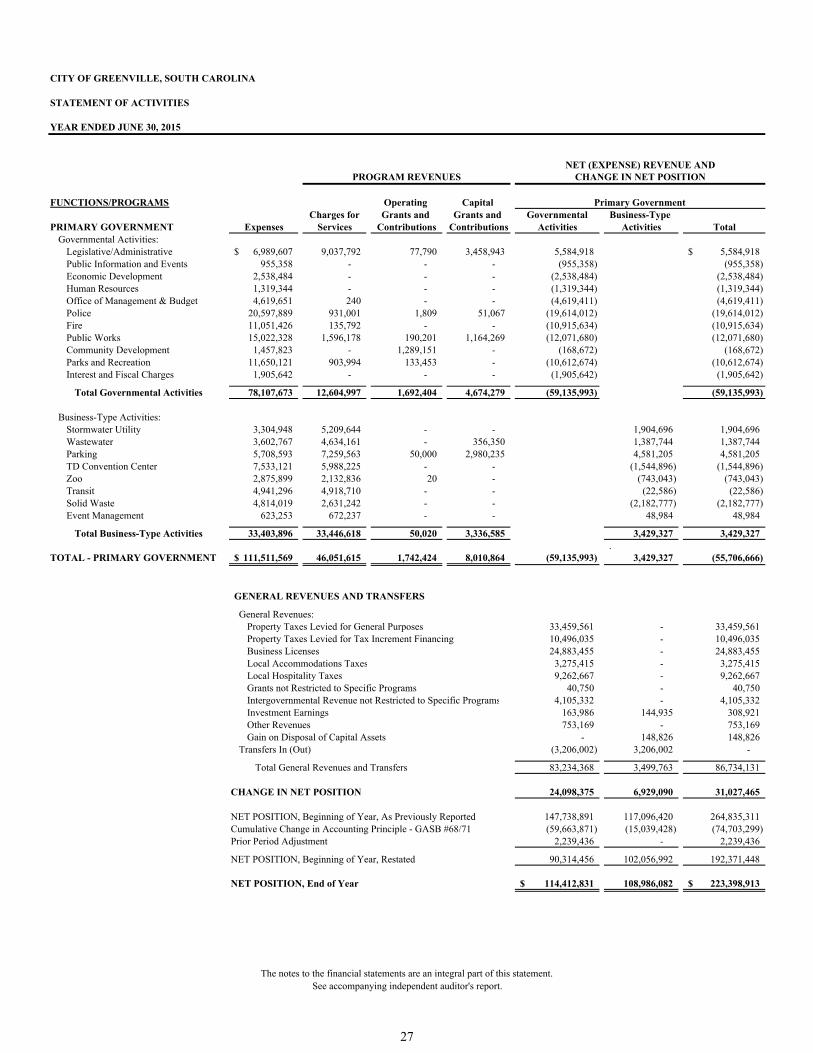
CITY OF GREENVILLE, SOUTH CAROLINA
STATEMENT OF ACTIVITIES
YEAR ENDED JUNE 30, 2015
FUNCTIONS/PROGRAMS Operating Capital Charges for Grants and Grants and Governmental Business-Type
PRIMARY GOVERNMENT Expenses Services Contributions Contributions Activities Activities TotalGovernmental Activities:
Legislative/Administrative 6,989,607$ 9,037,792 77,790 3,458,943 5,584,918 5,584,918$ Public Information and Events 955,358 - - - (955,358) (955,358) Economic Development 2,538,484 - - - (2,538,484) (2,538,484) Human Resources 1,319,344 - - - (1,319,344) (1,319,344) Office of Management & Budget 4,619,651 240 - - (4,619,411) (4,619,411) Police 20,597,889 931,001 1,809 51,067 (19,614,012) (19,614,012) Fire 11,051,426 135,792 - - (10,915,634) (10,915,634) Public Works 15,022,328 1,596,178 190,201 1,164,269 (12,071,680) (12,071,680) Community Development 1,457,823 - 1,289,151 - (168,672) (168,672) Parks and Recreation 11,650,121 903,994 133,453 - (10,612,674) (10,612,674) Interest and Fiscal Charges 1,905,642 - - - (1,905,642) (1,905,642)
Total Governmental Activities 78,107,673 12,604,997 1,692,404 4,674,279 (59,135,993) (59,135,993)
Business-Type Activities:Stormwater Utility 3,304,948 5,209,644 - - 1,904,696 1,904,696 Wastewater 3,602,767 4,634,161 - 356,350 1,387,744 1,387,744 Parking 5,708,593 7,259,563 50,000 2,980,235 4,581,205 4,581,205 TD Convention Center 7,533,121 5,988,225 - - (1,544,896) (1,544,896) Zoo 2,875,899 2,132,836 20 - (743,043) (743,043) Transit 4,941,296 4,918,710 - - (22,586) (22,586) Solid Waste 4,814,019 2,631,242 - - (2,182,777) (2,182,777) Event Management 623,253 672,237 - - 48,984 48,984
Total Business-Type Activities 33,403,896 33,446,618 50,020 3,336,585 3,429,327 3,429,327 .
TOTAL - PRIMARY GOVERNMENT 111,511,569$ 46,051,615 1,742,424 8,010,864 (59,135,993) 3,429,327 (55,706,666)
GENERAL REVENUES AND TRANSFERS
General Revenues:Property Taxes Levied for General Purposes 33,459,561 - 33,459,561 Property Taxes Levied for Tax Increment Financing 10,496,035 - 10,496,035 Business Licenses 24,883,455 - 24,883,455 Local Accommodations Taxes 3,275,415 - 3,275,415 Local Hospitality Taxes 9,262,667 - 9,262,667 Grants not Restricted to Specific Programs 40,750 - 40,750 Intergovernmental Revenue not Restricted to Specific Programs 4,105,332 - 4,105,332 Investment Earnings 163,986 144,935 308,921 Other Revenues 753,169 - 753,169 Gain on Disposal of Capital Assets - 148,826 148,826
Transfers In (Out) (3,206,002) 3,206,002 -
Total General Revenues and Transfers 83,234,368 3,499,763 86,734,131
CHANGE IN NET POSITION 24,098,375 6,929,090 31,027,465
NET POSITION, Beginning of Year, As Previously Reported 147,738,891 117,096,420 264,835,311 Cumulative Change in Accounting Principle - GASB #68/71 (59,663,871) (15,039,428) (74,703,299) Prior Period Adjustment 2,239,436 - 2,239,436
NET POSITION, Beginning of Year, Restated 90,314,456 102,056,992 192,371,448
NET POSITION, End of Year 114,412,831$ 108,986,082 223,398,913$
Primary Government
NET (EXPENSE) REVENUE ANDPROGRAM REVENUES CHANGE IN NET POSITION
The notes to the financial statements are an integral part of this statement. See accompanying independent auditor's report.
27
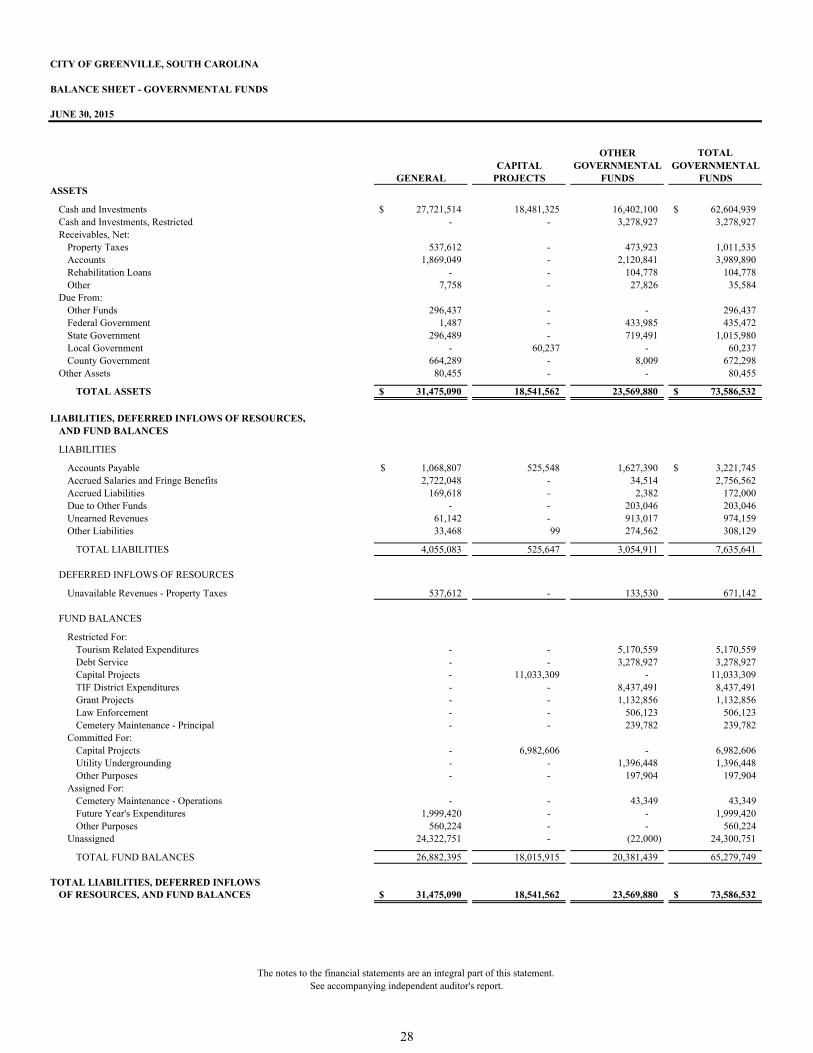
OTHER TOTALCAPITAL GOVERNMENTAL GOVERNMENTAL
GENERAL PROJECTS FUNDS FUNDSASSETS
Cash and Investments 27,721,514$ 18,481,325 16,402,100 62,604,939$ Cash and Investments, Restricted - - 3,278,927 3,278,927 Receivables, Net:
Property Taxes 537,612 - 473,923 1,011,535 Accounts 1,869,049 - 2,120,841 3,989,890 Rehabilitation Loans - - 104,778 104,778 Other 7,758 - 27,826 35,584
Due From:Other Funds 296,437 - - 296,437 Federal Government 1,487 - 433,985 435,472 State Government 296,489 - 719,491 1,015,980 Local Government - 60,237 - 60,237 County Government 664,289 - 8,009 672,298
Other Assets 80,455 - - 80,455
TOTAL ASSETS 31,475,090$ 18,541,562 23,569,880 73,586,532$
LIABILITIES, DEFERRED INFLOWS OF RESOURCES,AND FUND BALANCES
LIABILITIES
Accounts Payable 1,068,807$ 525,548 1,627,390 3,221,745$ Accrued Salaries and Fringe Benefits 2,722,048 - 34,514 2,756,562 Accrued Liabilities 169,618 - 2,382 172,000 Due to Other Funds - - 203,046 203,046 Unearned Revenues 61,142 - 913,017 974,159 Other Liabilities 33,468 99 274,562 308,129
TOTAL LIABILITIES 4,055,083 525,647 3,054,911 7,635,641
DEFERRED INFLOWS OF RESOURCES
Unavailable Revenues - Property Taxes 537,612 - 133,530 671,142
FUND BALANCES
Restricted For:Tourism Related Expenditures - - 5,170,559 5,170,559 Debt Service - - 3,278,927 3,278,927 Capital Projects - 11,033,309 - 11,033,309 TIF District Expenditures - - 8,437,491 8,437,491 Grant Projects - - 1,132,856 1,132,856 Law Enforcement - - 506,123 506,123 Cemetery Maintenance - Principal - - 239,782 239,782
Committed For:Capital Projects - 6,982,606 - 6,982,606 Utility Undergrounding - - 1,396,448 1,396,448 Other Purposes - - 197,904 197,904
Assigned For:Cemetery Maintenance - Operations - - 43,349 43,349 Future Year's Expenditures 1,999,420 - - 1,999,420 Other Purposes 560,224 - - 560,224
Unassigned 24,322,751 - (22,000) 24,300,751
TOTAL FUND BALANCES 26,882,395 18,015,915 20,381,439 65,279,749
TOTAL LIABILITIES, DEFERRED INFLOWSOF RESOURCES, AND FUND BALANCES 31,475,090$ 18,541,562 23,569,880 73,586,532$
CITY OF GREENVILLE, SOUTH CAROLINA
BALANCE SHEET - GOVERNMENTAL FUNDS
JUNE 30, 2015
The notes to the financial statements are an integral part of this statement. See accompanying independent auditor's report.
28
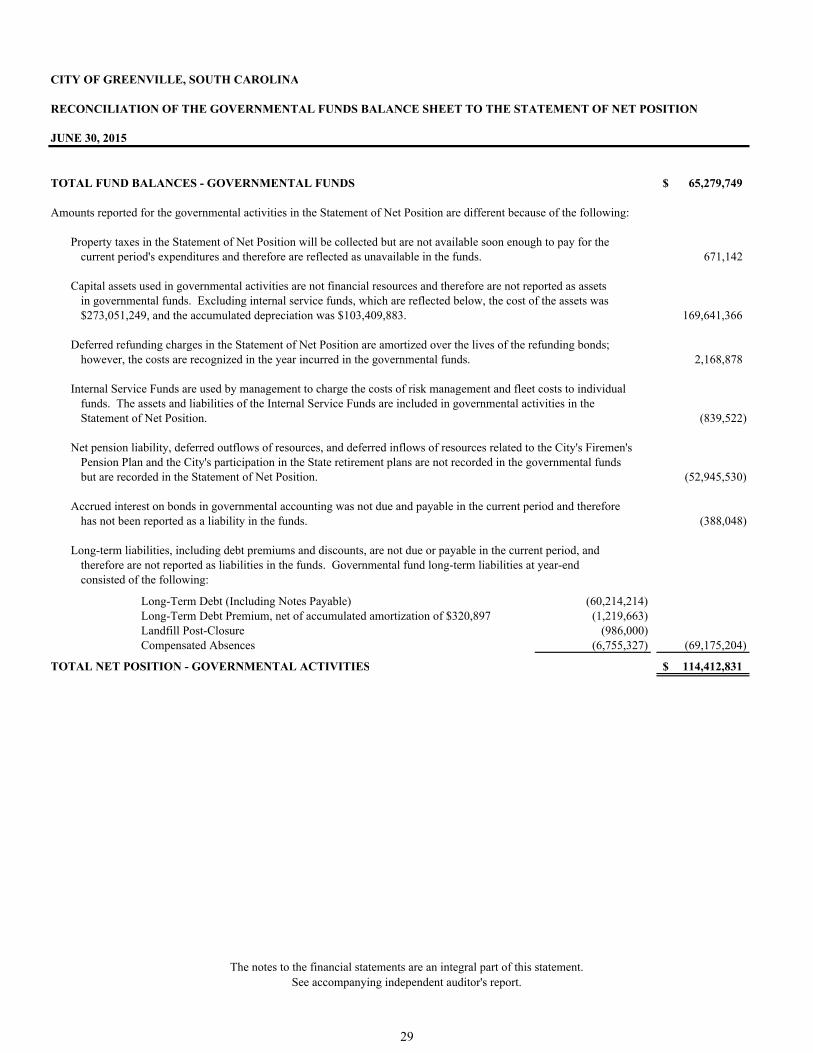
CITY OF GREENVILLE, SOUTH CAROLINA
RECONCILIATION OF THE GOVERNMENTAL FUNDS BALANCE SHEET TO THE STATEMENT OF NET POSITION
JUNE 30, 2015
TOTAL FUND BALANCES - GOVERNMENTAL FUNDS 65,279,749$
Amounts reported for the governmental activities in the Statement of Net Position are different because of the following:
Property taxes in the Statement of Net Position will be collected but are not available soon enough to pay for thecurrent period's expenditures and therefore are reflected as unavailable in the funds. 671,142
Capital assets used in governmental activities are not financial resources and therefore are not reported as assetsin governmental funds. Excluding internal service funds, which are reflected below, the cost of the assets was$273,051,249, and the accumulated depreciation was $103,409,883. 169,641,366
Deferred refunding charges in the Statement of Net Position are amortized over the lives of the refunding bonds; however, the costs are recognized in the year incurred in the governmental funds. 2,168,878
Internal Service Funds are used by management to charge the costs of risk management and fleet costs to individualfunds. The assets and liabilities of the Internal Service Funds are included in governmental activities in the Statement of Net Position. (839,522)
Net pension liability, deferred outflows of resources, and deferred inflows of resources related to the City's Firemen'sPension Plan and the City's participation in the State retirement plans are not recorded in the governmental fundsbut are recorded in the Statement of Net Position. (52,945,530)
Accrued interest on bonds in governmental accounting was not due and payable in the current period and thereforehas not been reported as a liability in the funds. (388,048)
Long-term liabilities, including debt premiums and discounts, are not due or payable in the current period, andtherefore are not reported as liabilities in the funds. Governmental fund long-term liabilities at year-endconsisted of the following:
Long-Term Debt (Including Notes Payable) (60,214,214) Long-Term Debt Premium, net of accumulated amortization of $320,897 (1,219,663) Landfill Post-Closure (986,000) Compensated Absences (6,755,327) (69,175,204)
TOTAL NET POSITION - GOVERNMENTAL ACTIVITIES 114,412,831$
The notes to the financial statements are an integral part of this statement. See accompanying independent auditor's report.
29
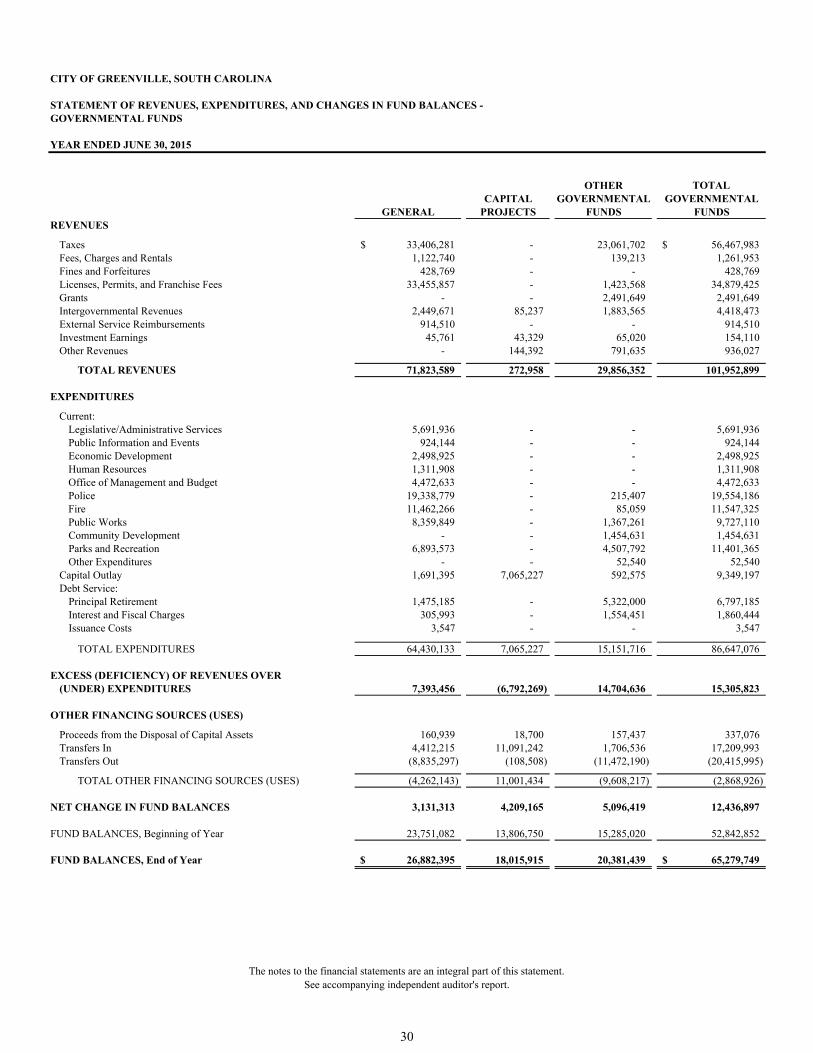
CITY OF GREENVILLE, SOUTH CAROLINA
STATEMENT OF REVENUES, EXPENDITURES, AND CHANGES IN FUND BALANCES -GOVERNMENTAL FUNDS
YEAR ENDED JUNE 30, 2015
OTHER TOTALCAPITAL GOVERNMENTAL GOVERNMENTAL
GENERAL PROJECTS FUNDS FUNDSREVENUES
Taxes 33,406,281$ - 23,061,702 56,467,983$ Fees, Charges and Rentals 1,122,740 - 139,213 1,261,953 Fines and Forfeitures 428,769 - - 428,769 Licenses, Permits, and Franchise Fees 33,455,857 - 1,423,568 34,879,425 Grants - - 2,491,649 2,491,649 Intergovernmental Revenues 2,449,671 85,237 1,883,565 4,418,473 External Service Reimbursements 914,510 - - 914,510 Investment Earnings 45,761 43,329 65,020 154,110 Other Revenues - 144,392 791,635 936,027
TOTAL REVENUES 71,823,589 272,958 29,856,352 101,952,899
EXPENDITURES
Current:Legislative/Administrative Services 5,691,936 - - 5,691,936 Public Information and Events 924,144 - - 924,144 Economic Development 2,498,925 - - 2,498,925 Human Resources 1,311,908 - - 1,311,908 Office of Management and Budget 4,472,633 - - 4,472,633 Police 19,338,779 - 215,407 19,554,186 Fire 11,462,266 - 85,059 11,547,325 Public Works 8,359,849 - 1,367,261 9,727,110 Community Development - - 1,454,631 1,454,631 Parks and Recreation 6,893,573 - 4,507,792 11,401,365 Other Expenditures - - 52,540 52,540
Capital Outlay 1,691,395 7,065,227 592,575 9,349,197 Debt Service:
Principal Retirement 1,475,185 - 5,322,000 6,797,185 Interest and Fiscal Charges 305,993 - 1,554,451 1,860,444 Issuance Costs 3,547 - - 3,547
TOTAL EXPENDITURES 64,430,133 7,065,227 15,151,716 86,647,076
EXCESS (DEFICIENCY) OF REVENUES OVER (UNDER) EXPENDITURES 7,393,456 (6,792,269) 14,704,636 15,305,823
OTHER FINANCING SOURCES (USES)
Proceeds from the Disposal of Capital Assets 160,939 18,700 157,437 337,076 Transfers In 4,412,215 11,091,242 1,706,536 17,209,993 Transfers Out (8,835,297) (108,508) (11,472,190) (20,415,995)
TOTAL OTHER FINANCING SOURCES (USES) (4,262,143) 11,001,434 (9,608,217) (2,868,926)
NET CHANGE IN FUND BALANCES 3,131,313 4,209,165 5,096,419 12,436,897
FUND BALANCES, Beginning of Year 23,751,082 13,806,750 15,285,020 52,842,852
FUND BALANCES, End of Year 26,882,395$ 18,015,915 20,381,439 65,279,749$
The notes to the financial statements are an integral part of this statement. See accompanying independent auditor's report.
30
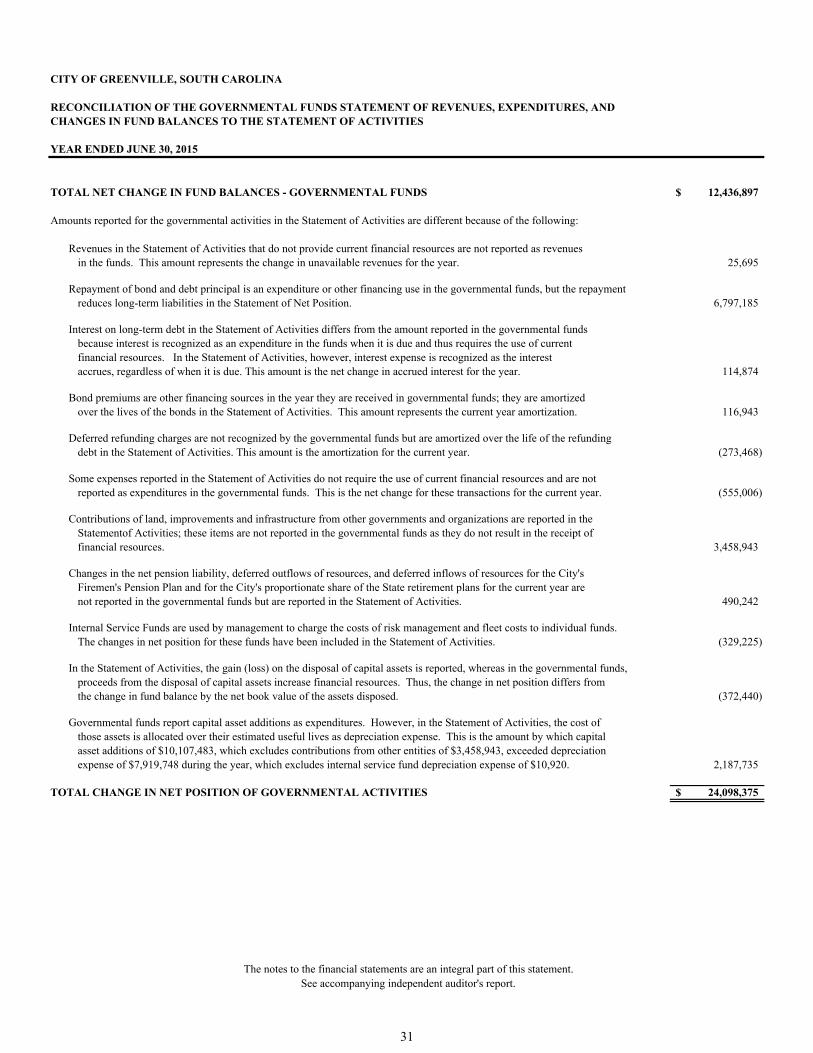
CITY OF GREENVILLE, SOUTH CAROLINA
RECONCILIATION OF THE GOVERNMENTAL FUNDS STATEMENT OF REVENUES, EXPENDITURES, ANDCHANGES IN FUND BALANCES TO THE STATEMENT OF ACTIVITIES
YEAR ENDED JUNE 30, 2015
TOTAL NET CHANGE IN FUND BALANCES - GOVERNMENTAL FUNDS 12,436,897$
Amounts reported for the governmental activities in the Statement of Activities are different because of the following:
Revenues in the Statement of Activities that do not provide current financial resources are not reported as revenuesin the funds. This amount represents the change in unavailable revenues for the year. 25,695
Repayment of bond and debt principal is an expenditure or other financing use in the governmental funds, but the repaymentreduces long-term liabilities in the Statement of Net Position. 6,797,185
Interest on long-term debt in the Statement of Activities differs from the amount reported in the governmental fundsbecause interest is recognized as an expenditure in the funds when it is due and thus requires the use of currentfinancial resources. In the Statement of Activities, however, interest expense is recognized as the interest accrues, regardless of when it is due. This amount is the net change in accrued interest for the year. 114,874
Bond premiums are other financing sources in the year they are received in governmental funds; they are amortizedover the lives of the bonds in the Statement of Activities. This amount represents the current year amortization. 116,943
Deferred refunding charges are not recognized by the governmental funds but are amortized over the life of the refundingdebt in the Statement of Activities. This amount is the amortization for the current year. (273,468)
Some expenses reported in the Statement of Activities do not require the use of current financial resources and are notreported as expenditures in the governmental funds. This is the net change for these transactions for the current year. (555,006)
Contributions of land, improvements and infrastructure from other governments and organizations are reported in the Statementof Activities; these items are not reported in the governmental funds as they do not result in the receipt of financial resources. 3,458,943
Changes in the net pension liability, deferred outflows of resources, and deferred inflows of resources for the City'sFiremen's Pension Plan and for the City's proportionate share of the State retirement plans for the current year are not reported in the governmental funds but are reported in the Statement of Activities. 490,242
Internal Service Funds are used by management to charge the costs of risk management and fleet costs to individual funds. The changes in net position for these funds have been included in the Statement of Activities. (329,225)
In the Statement of Activities, the gain (loss) on the disposal of capital assets is reported, whereas in the governmental funds,proceeds from the disposal of capital assets increase financial resources. Thus, the change in net position differs from the change in fund balance by the net book value of the assets disposed. (372,440)
Governmental funds report capital asset additions as expenditures. However, in the Statement of Activities, the cost ofthose assets is allocated over their estimated useful lives as depreciation expense. This is the amount by which capitalasset additions of $10,107,483, which excludes contributions from other entities of $3,458,943, exceeded depreciation expense of $7,919,748 during the year, which excludes internal service fund depreciation expense of $10,920. 2,187,735
TOTAL CHANGE IN NET POSITION OF GOVERNMENTAL ACTIVITIES 24,098,375$
The notes to the financial statements are an integral part of this statement. See accompanying independent auditor's report.
31
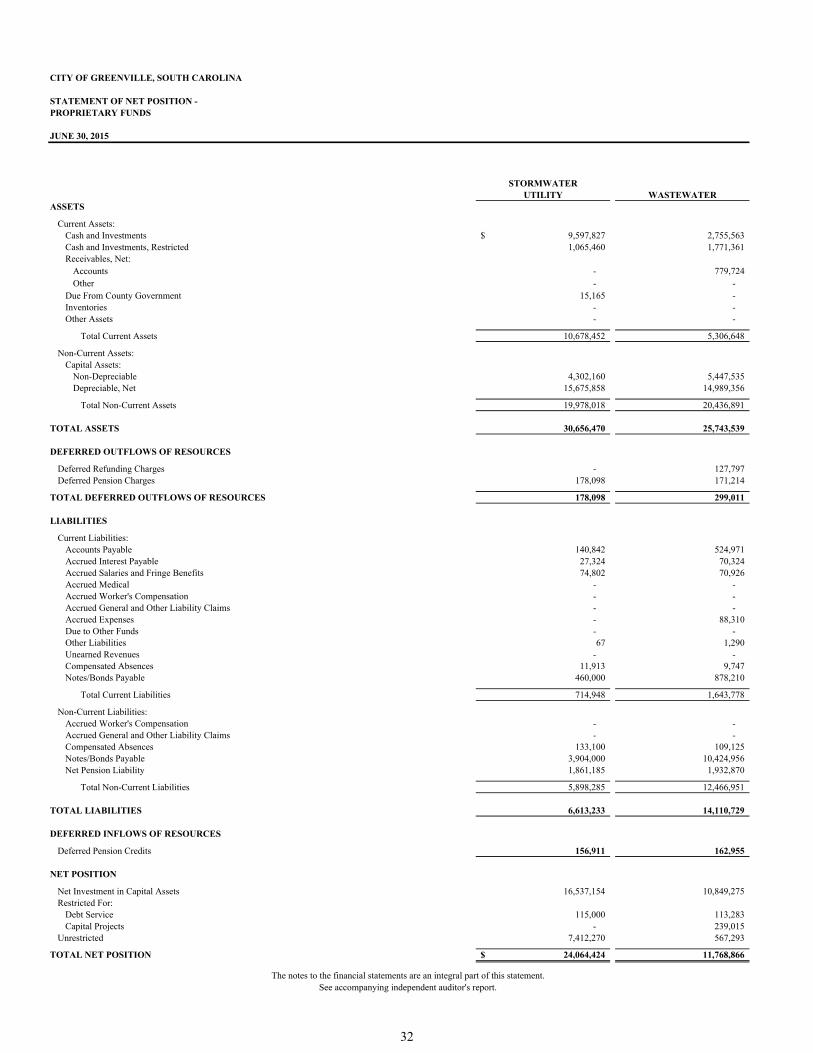
CITY OF GREENVILLE, SOUTH CAROLINA
STATEMENT OF NET POSITION -PROPRIETARY FUNDS
JUNE 30, 2015
STORMWATERUTILITY WASTEWATER
ASSETS
Current Assets:Cash and Investments 9,597,827$ 2,755,563 Cash and Investments, Restricted 1,065,460 1,771,361 Receivables, Net:
Accounts - 779,724 Other - -
Due From County Government 15,165 - Inventories - - Other Assets - -
Total Current Assets 10,678,452 5,306,648
Non-Current Assets:Capital Assets:
Non-Depreciable 4,302,160 5,447,535 Depreciable, Net 15,675,858 14,989,356
Total Non-Current Assets 19,978,018 20,436,891
TOTAL ASSETS 30,656,470 25,743,539
DEFERRED OUTFLOWS OF RESOURCES
Deferred Refunding Charges - 127,797 Deferred Pension Charges 178,098 171,214
TOTAL DEFERRED OUTFLOWS OF RESOURCES 178,098 299,011
LIABILITIES
Current Liabilities:Accounts Payable 140,842 524,971 Accrued Interest Payable 27,324 70,324 Accrued Salaries and Fringe Benefits 74,802 70,926 Accrued Medical - - Accrued Worker's Compensation - - Accrued General and Other Liability Claims - - Accrued Expenses - 88,310 Due to Other Funds - - Other Liabilities 67 1,290 Unearned Revenues - - Compensated Absences 11,913 9,747 Notes/Bonds Payable 460,000 878,210
Total Current Liabilities 714,948 1,643,778
Non-Current Liabilities:Accrued Worker's Compensation - - Accrued General and Other Liability Claims - - Compensated Absences 133,100 109,125 Notes/Bonds Payable 3,904,000 10,424,956 Net Pension Liability 1,861,185 1,932,870
Total Non-Current Liabilities 5,898,285 12,466,951
TOTAL LIABILITIES 6,613,233 14,110,729
DEFERRED INFLOWS OF RESOURCES
Deferred Pension Credits 156,911 162,955
NET POSITION
Net Investment in Capital Assets 16,537,154 10,849,275 Restricted For:
Debt Service 115,000 113,283 Capital Projects - 239,015
Unrestricted 7,412,270 567,293
TOTAL NET POSITION 24,064,424$ 11,768,866
The notes to the financial statements are an integral part of this statement. See accompanying independent auditor's report.
32

TD NONMAJOR TOTAL TOTAL CONVENTION ENTERPRISE ENTERPRISE INTERNAL
PARKING CENTER FUNDS FUNDS SERVICE FUNDS
1,754,585 1,523,707 2,948,675 18,580,357 4,524,829$ 1,641,192 - - 4,478,013 -
159,507 268,980 725,379 1,933,590 63,764 1,093 - 53 1,146 220
- - - 15,165 - - 69,913 36,793 106,706 226,780 - 78,549 7,500 86,049 -
3,556,377 1,941,149 3,718,400 25,201,026 4,815,593
26,251,687 50,634 49,652 36,101,668 - 43,537,974 24,943,055 4,018,911 103,165,154 65,601
69,789,661 24,993,689 4,068,563 139,266,822 65,601
73,346,038 26,934,838 7,786,963 164,467,848 4,881,194
1,652,405 - - 1,780,202 - 152,729 - 874,445 1,376,486 102,032
1,805,134 - 874,445 3,156,688 102,032
1,216,137 269,308 224,884 2,376,142 205,968 69,148 24,169 454 191,419 - 69,734 50,265 355,919 621,646 168,727
- - - - 774,000 - - - - 1,205,289 - - - - 1,069,878
123,507 - 190 212,007 - - - - - 93,391
5,284 432,021 7,760 446,422 3,130 313,696 151,581 143,424 608,701 45,052
8,247 - 53,399 83,306 - 1,826,718 451,830 3,530 3,620,288 -
3,632,471 1,379,174 789,560 8,159,931 3,565,435
- - - - 592,711 - - - - 526,122
92,127 - 596,963 931,315 - 16,890,255 1,734,815 52,050 33,006,076 - 1,670,024 - 9,789,431 15,253,510 1,049,961
18,652,406 1,734,815 10,438,444 49,190,901 2,168,794
22,284,877 3,113,989 11,228,004 57,350,832 5,734,229
140,795 - 826,961 1,287,622 88,519
52,725,093 22,807,044 4,012,983 106,931,549 65,601
140,134 - - 368,417 - 1,015,862 130,199 - 1,385,076 -
(1,155,589) 883,606 (7,406,540) 301,040 (905,123)
52,725,500 23,820,849 (3,393,557) 108,986,082 (839,522)$
33
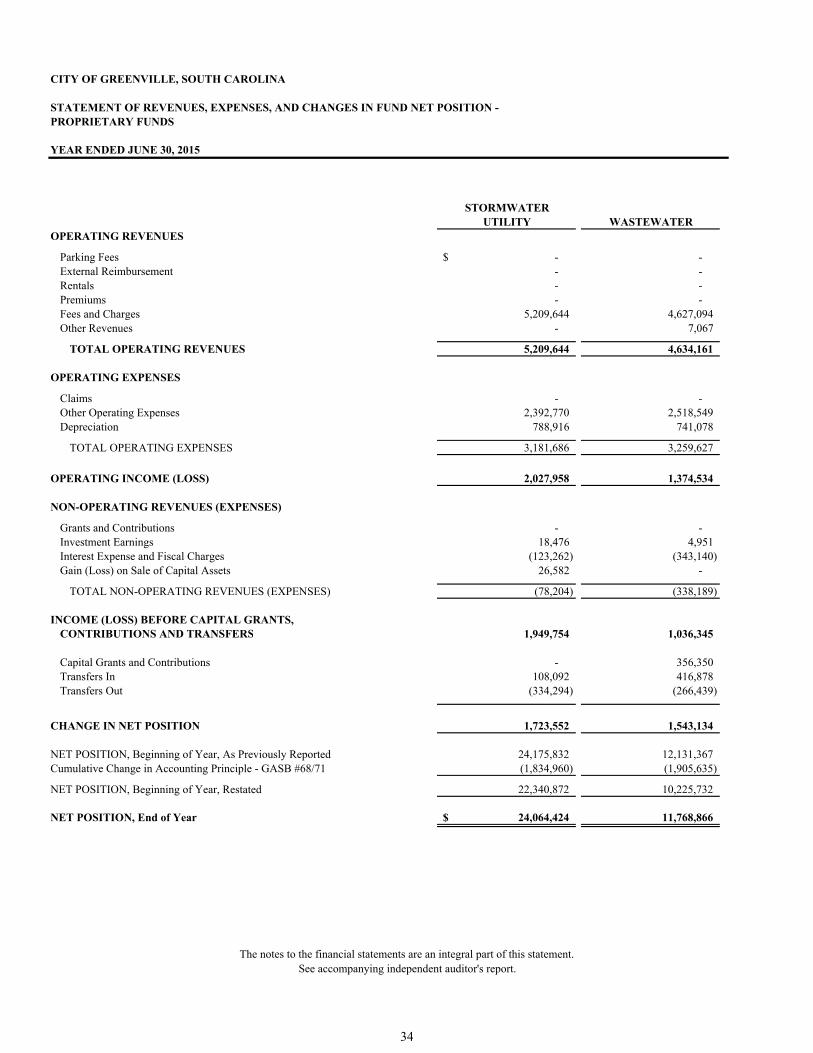
CITY OF GREENVILLE, SOUTH CAROLINA
STATEMENT OF REVENUES, EXPENSES, AND CHANGES IN FUND NET POSITION - PROPRIETARY FUNDS
YEAR ENDED JUNE 30, 2015
STORMWATERUTILITY WASTEWATER
OPERATING REVENUES
Parking Fees -$ - External Reimbursement - - Rentals - - Premiums - - Fees and Charges 5,209,644 4,627,094 Other Revenues - 7,067
TOTAL OPERATING REVENUES 5,209,644 4,634,161
OPERATING EXPENSES
Claims - - Other Operating Expenses 2,392,770 2,518,549 Depreciation 788,916 741,078
TOTAL OPERATING EXPENSES 3,181,686 3,259,627
OPERATING INCOME (LOSS) 2,027,958 1,374,534
NON-OPERATING REVENUES (EXPENSES)
Grants and Contributions - - Investment Earnings 18,476 4,951 Interest Expense and Fiscal Charges (123,262) (343,140) Gain (Loss) on Sale of Capital Assets 26,582 -
TOTAL NON-OPERATING REVENUES (EXPENSES) (78,204) (338,189)
INCOME (LOSS) BEFORE CAPITAL GRANTS,CONTRIBUTIONS AND TRANSFERS 1,949,754 1,036,345
Capital Grants and Contributions - 356,350 Transfers In 108,092 416,878 Transfers Out (334,294) (266,439)
CHANGE IN NET POSITION 1,723,552 1,543,134
NET POSITION, Beginning of Year, As Previously Reported 24,175,832 12,131,367 Cumulative Change in Accounting Principle - GASB #68/71 (1,834,960) (1,905,635)
NET POSITION, Beginning of Year, Restated 22,340,872 10,225,732
NET POSITION, End of Year 24,064,424$ 11,768,866
The notes to the financial statements are an integral part of this statement. See accompanying independent auditor's report.
34
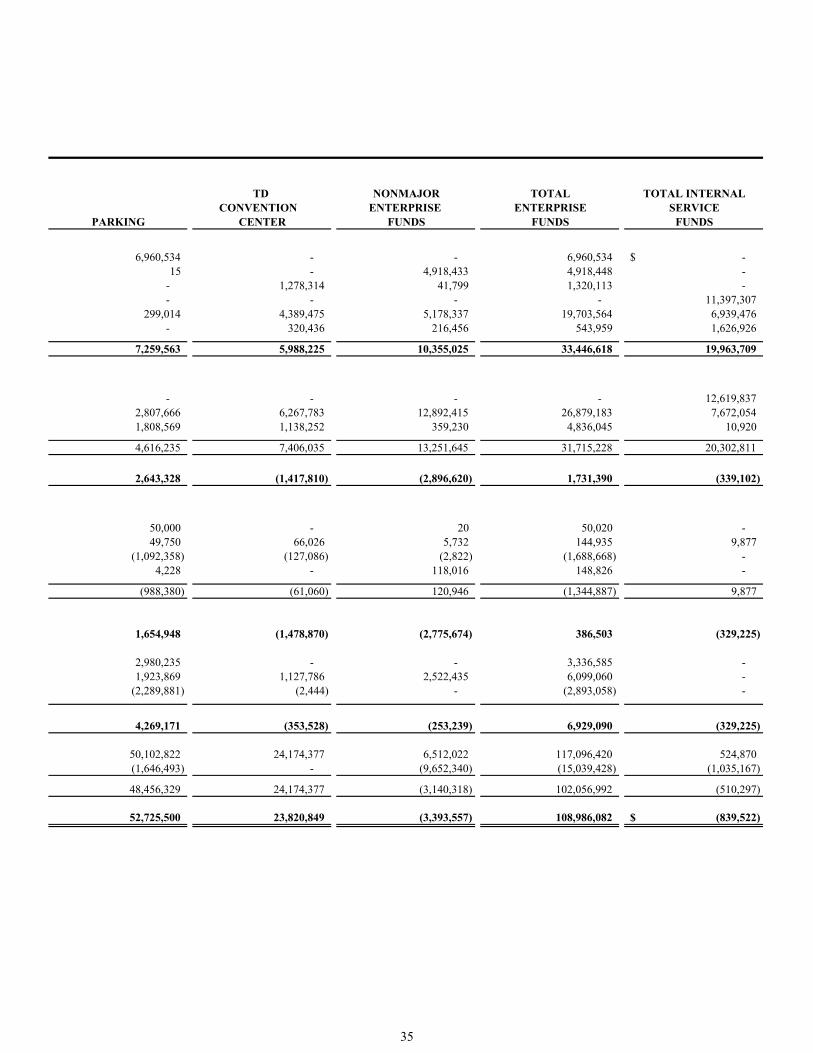
TD NONMAJOR TOTAL TOTAL INTERNALCONVENTION ENTERPRISE ENTERPRISE SERVICE
PARKING CENTER FUNDS FUNDS FUNDS
6,960,534 - - 6,960,534 -$ 15 - 4,918,433 4,918,448 -
- 1,278,314 41,799 1,320,113 - - - - - 11,397,307
299,014 4,389,475 5,178,337 19,703,564 6,939,476 - 320,436 216,456 543,959 1,626,926
7,259,563 5,988,225 10,355,025 33,446,618 19,963,709
- - - - 12,619,837 2,807,666 6,267,783 12,892,415 26,879,183 7,672,054 1,808,569 1,138,252 359,230 4,836,045 10,920
4,616,235 7,406,035 13,251,645 31,715,228 20,302,811
2,643,328 (1,417,810) (2,896,620) 1,731,390 (339,102)
50,000 - 20 50,020 - 49,750 66,026 5,732 144,935 9,877
(1,092,358) (127,086) (2,822) (1,688,668) - 4,228 - 118,016 148,826 -
(988,380) (61,060) 120,946 (1,344,887) 9,877
1,654,948 (1,478,870) (2,775,674) 386,503 (329,225)
2,980,235 - - 3,336,585 - 1,923,869 1,127,786 2,522,435 6,099,060 -
(2,289,881) (2,444) - (2,893,058) -
4,269,171 (353,528) (253,239) 6,929,090 (329,225)
50,102,822 24,174,377 6,512,022 117,096,420 524,870 (1,646,493) - (9,652,340) (15,039,428) (1,035,167)
48,456,329 24,174,377 (3,140,318) 102,056,992 (510,297)
52,725,500 23,820,849 (3,393,557) 108,986,082 (839,522)$
35
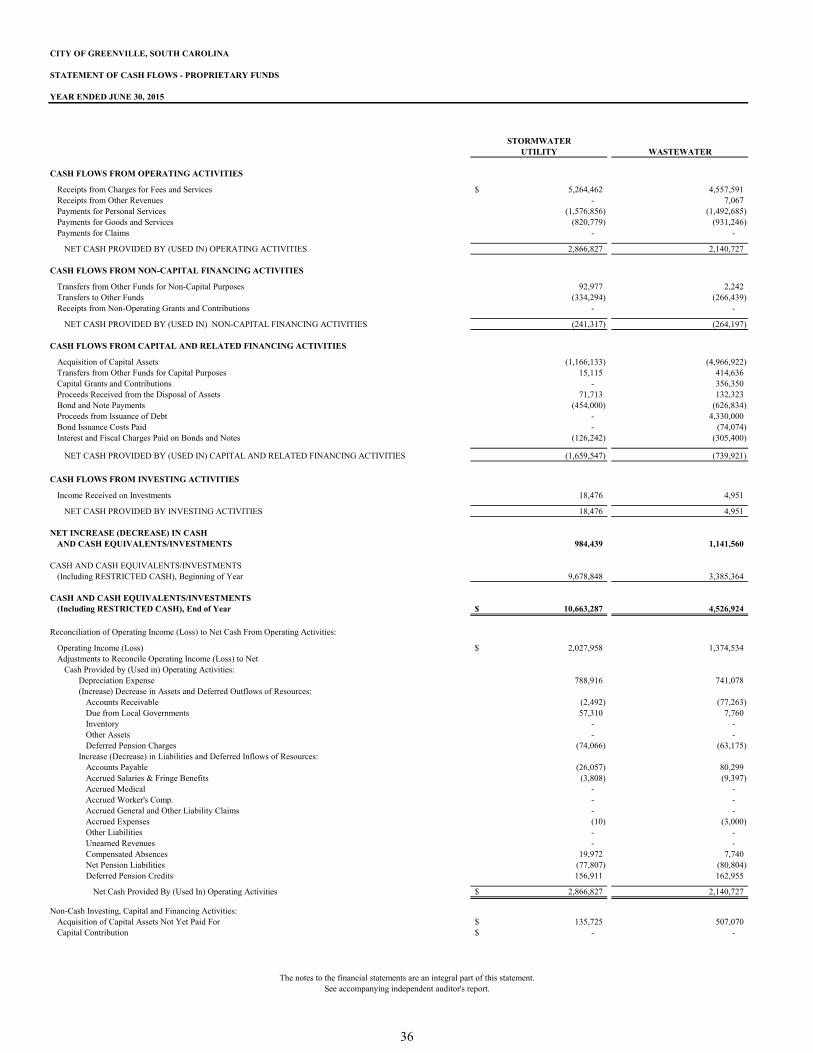
CITY OF GREENVILLE, SOUTH CAROLINA
STATEMENT OF CASH FLOWS - PROPRIETARY FUNDS
YEAR ENDED JUNE 30, 2015
STORMWATERUTILITY WASTEWATER
CASH FLOWS FROM OPERATING ACTIVITIES
Receipts from Charges for Fees and Services 5,264,462$ 4,557,591 Receipts from Other Revenues - 7,067 Payments for Personal Services (1,576,856) (1,492,685) Payments for Goods and Services (820,779) (931,246) Payments for Claims - -
NET CASH PROVIDED BY (USED IN) OPERATING ACTIVITIES 2,866,827 2,140,727
CASH FLOWS FROM NON-CAPITAL FINANCING ACTIVITIES
Transfers from Other Funds for Non-Capital Purposes 92,977 2,242 Transfers to Other Funds (334,294) (266,439) Receipts from Non-Operating Grants and Contributions - -
NET CASH PROVIDED BY (USED IN) NON-CAPITAL FINANCING ACTIVITIES (241,317) (264,197)
CASH FLOWS FROM CAPITAL AND RELATED FINANCING ACTIVITIES
Acquisition of Capital Assets (1,166,133) (4,966,922) Transfers from Other Funds for Capital Purposes 15,115 414,636 Capital Grants and Contributions - 356,350 Proceeds Received from the Disposal of Assets 71,713 132,323 Bond and Note Payments (454,000) (626,834) Proceeds from Issuance of Debt - 4,330,000 Bond Issuance Costs Paid - (74,074) Interest and Fiscal Charges Paid on Bonds and Notes (126,242) (305,400)
NET CASH PROVIDED BY (USED IN) CAPITAL AND RELATED FINANCING ACTIVITIES (1,659,547) (739,921)
CASH FLOWS FROM INVESTING ACTIVITIES
Income Received on Investments 18,476 4,951
NET CASH PROVIDED BY INVESTING ACTIVITIES 18,476 4,951
NET INCREASE (DECREASE) IN CASH AND CASH EQUIVALENTS/INVESTMENTS 984,439 1,141,560
CASH AND CASH EQUIVALENTS/INVESTMENTS (Including RESTRICTED CASH), Beginning of Year 9,678,848 3,385,364
CASH AND CASH EQUIVALENTS/INVESTMENTS(Including RESTRICTED CASH), End of Year 10,663,287$ 4,526,924
Reconciliation of Operating Income (Loss) to Net Cash From Operating Activities:
Operating Income (Loss) 2,027,958$ 1,374,534 Adjustments to Reconcile Operating Income (Loss) to Net
Cash Provided by (Used in) Operating Activities:Depreciation Expense 788,916 741,078 (Increase) Decrease in Assets and Deferred Outflows of Resources:
Accounts Receivable (2,492) (77,263) Due from Local Governments 57,310 7,760 Inventory - - Other Assets - - Deferred Pension Charges (74,066) (63,175)
Increase (Decrease) in Liabilities and Deferred Inflows of Resources:Accounts Payable (26,057) 80,299 Accrued Salaries & Fringe Benefits (3,808) (9,397) Accrued Medical - - Accrued Worker's Comp. - - Accrued General and Other Liability Claims - - Accrued Expenses (10) (3,000) Other Liabilities - - Unearned Revenues - - Compensated Absences 19,972 7,740 Net Pension Liabilities (77,807) (80,804) Deferred Pension Credits 156,911 162,955
Net Cash Provided By (Used In) Operating Activities 2,866,827$ 2,140,727
Non-Cash Investing, Capital and Financing Activities: Acquisition of Capital Assets Not Yet Paid For 135,725$ 507,070 Capital Contribution -$ -
The notes to the financial statements are an integral part of this statement. See accompanying independent auditor's report.
36
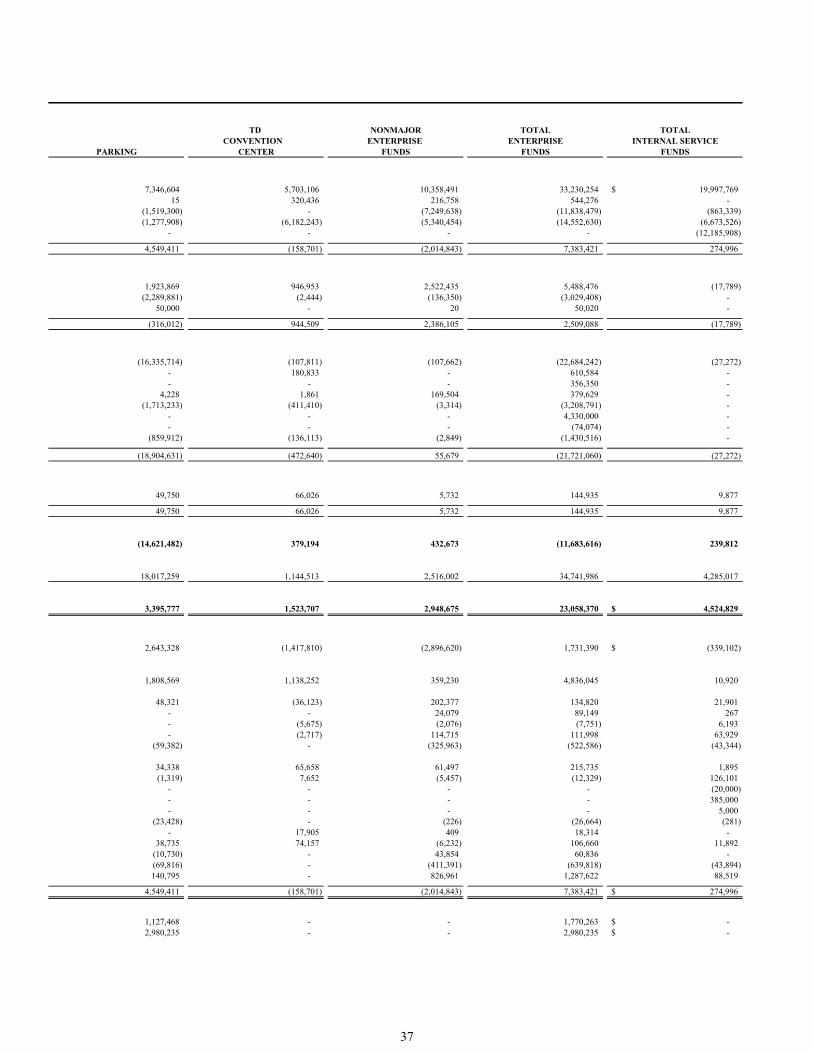
TD NONMAJOR TOTAL TOTALCONVENTION ENTERPRISE ENTERPRISE INTERNAL SERVICE
PARKING CENTER FUNDS FUNDS FUNDS
7,346,604 5,703,106 10,358,491 33,230,254 19,997,769$ 15 320,436 216,758 544,276 -
(1,519,300) - (7,249,638) (11,838,479) (863,339) (1,277,908) (6,182,243) (5,340,454) (14,552,630) (6,673,526)
- - - - (12,185,908)
4,549,411 (158,701) (2,014,843) 7,383,421 274,996
1,923,869 946,953 2,522,435 5,488,476 (17,789) (2,289,881) (2,444) (136,350) (3,029,408) -
50,000 - 20 50,020 -
(316,012) 944,509 2,386,105 2,509,088 (17,789)
(16,335,714) (107,811) (107,662) (22,684,242) (27,272) - 180,833 - 610,584 - - - - 356,350 -
4,228 1,861 169,504 379,629 - (1,713,233) (411,410) (3,314) (3,208,791) -
- - - 4,330,000 - - - - (74,074) -
(859,912) (136,113) (2,849) (1,430,516) -
(18,904,631) (472,640) 55,679 (21,721,060) (27,272)
49,750 66,026 5,732 144,935 9,877
49,750 66,026 5,732 144,935 9,877
(14,621,482) 379,194 432,673 (11,683,616) 239,812
18,017,259 1,144,513 2,516,002 34,741,986 4,285,017
3,395,777 1,523,707 2,948,675 23,058,370 4,524,829$
2,643,328 (1,417,810) (2,896,620) 1,731,390 (339,102)$
1,808,569 1,138,252 359,230 4,836,045 10,920
48,321 (36,123) 202,377 134,820 21,901 - - 24,079 89,149 267 - (5,675) (2,076) (7,751) 6,193 - (2,717) 114,715 111,998 63,929
(59,382) - (325,963) (522,586) (43,344)
34,338 65,658 61,497 215,735 1,895 (1,319) 7,652 (5,457) (12,329) 126,101
- - - - (20,000) - - - - 385,000 - - - - 5,000
(23,428) - (226) (26,664) (281) - 17,905 409 18,314 -
38,735 74,157 (6,232) 106,660 11,892 (10,730) - 43,854 60,836 - (69,816) - (411,391) (639,818) (43,894) 140,795 - 826,961 1,287,622 88,519
4,549,411 (158,701) (2,014,843) 7,383,421 274,996$
1,127,468 - - 1,770,263 -$ 2,980,235 - - 2,980,235 -$
37
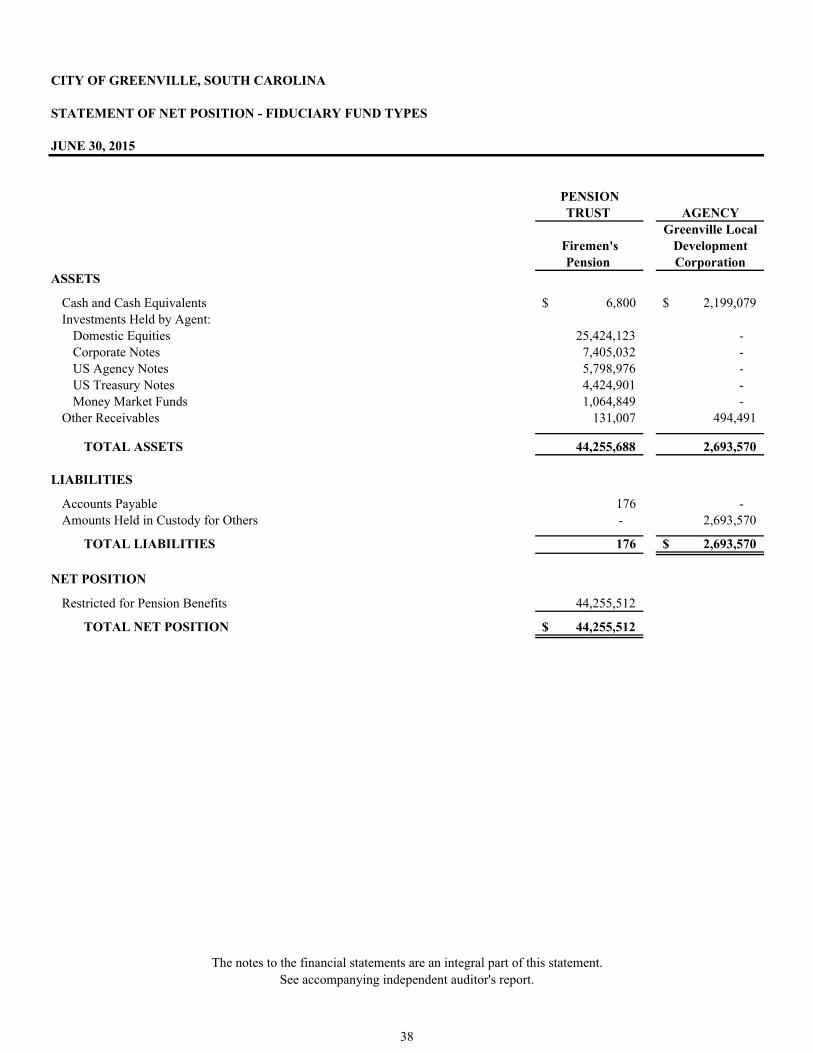
CITY OF GREENVILLE, SOUTH CAROLINA
STATEMENT OF NET POSITION - FIDUCIARY FUND TYPES
JUNE 30, 2015
PENSIONTRUST AGENCY
Greenville LocalFiremen's DevelopmentPension Corporation
ASSETS
Cash and Cash Equivalents 6,800$ 2,199,079$ Investments Held by Agent:
Domestic Equities 25,424,123 - Corporate Notes 7,405,032 - US Agency Notes 5,798,976 - US Treasury Notes 4,424,901 - Money Market Funds 1,064,849 -
Other Receivables 131,007 494,491
TOTAL ASSETS 44,255,688 2,693,570
LIABILITIES
Accounts Payable 176 - Amounts Held in Custody for Others - 2,693,570
TOTAL LIABILITIES 176 2,693,570$
NET POSITION
Restricted for Pension Benefits 44,255,512
TOTAL NET POSITION 44,255,512$
The notes to the financial statements are an integral part of this statement. See accompanying independent auditor's report.
38
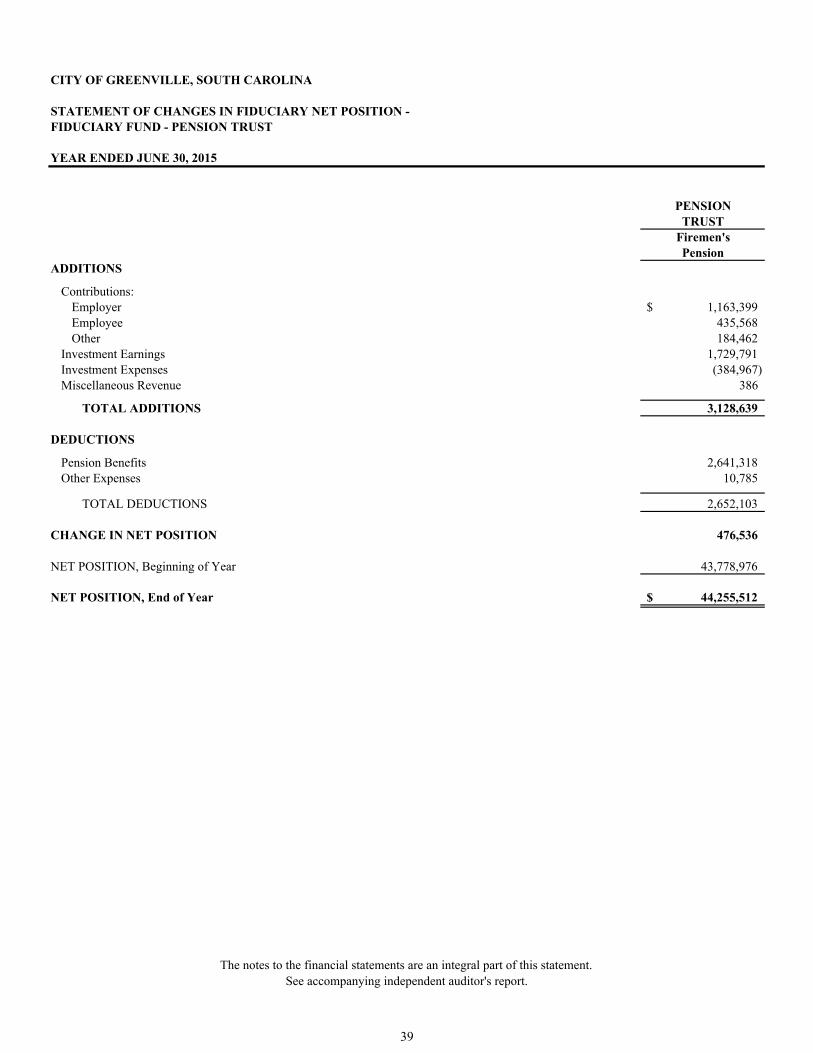
CITY OF GREENVILLE, SOUTH CAROLINA
STATEMENT OF CHANGES IN FIDUCIARY NET POSITION -FIDUCIARY FUND - PENSION TRUST
YEAR ENDED JUNE 30, 2015
PENSIONTRUST
Firemen'sPension
ADDITIONS
Contributions:Employer 1,163,399$ Employee 435,568 Other 184,462
Investment Earnings 1,729,791 Investment Expenses (384,967) Miscellaneous Revenue 386
TOTAL ADDITIONS 3,128,639
DEDUCTIONS
Pension Benefits 2,641,318 Other Expenses 10,785
TOTAL DEDUCTIONS 2,652,103
CHANGE IN NET POSITION 476,536
NET POSITION, Beginning of Year 43,778,976
NET POSITION, End of Year 44,255,512$
The notes to the financial statements are an integral part of this statement. See accompanying independent auditor's report.
39
CITY OF GREENVILLE, SOUTH CAROLINA NOTES TO THE FINANCIAL STATEMENTS YEAR ENDED JUNE 30, 2015 The City of Greenville, South Carolina (the “City”) embraces an area of 28.92 square miles. Incorporated in 1831, the City has grown into a cultural, educational, recreational, and transportation center for the Upstate of South Carolina. It serves 62,252 city residents and 478,752 residents in Greenville County. The governing body of the City is a Council-Manager form of government. The mayor and six members of council (the “Council”) establish policy for the City. Administrative functions are directed by the City Manager. I. SUMMARY OF SIGNIFICANT ACCOUNTING POLICIES A. The Reporting Entity
The financial statements of the City have been prepared in conformity with accounting principles generally accepted in the United States of America (“GAAP”), as applied to governmental units. The Governmental Accounting Standards Board (“GASB”) is the accepted standard-setting body for establishing governmental accounting and financial reporting principles. The more significant of the City’s accounting policies are described below. As required by GAAP, the financial statements must present the City’s financial information with any of its component units. The primary criterion for determining inclusion or exclusion of a legally separate entity (component unit) is financial accountability, which is presumed to exist if the City both appoints a voting majority of the entity’s governing body, and either 1) the City is able to impose its will on the entity or, 2) there is a potential for the entity to provide specific financial benefits to, or impose specific financial burdens on the City. If either or both of the foregoing conditions are not met, the entity could still be considered a component unit if it is fiscally dependent on the City and there is a potential that the entity could either provide specific financial benefits to, or to impose specific financial burdens on the City. In order to be considered fiscally independent, an entity must have the authority to do all of the following: (a) determine its budget without the City having the authority to approve or modify that budget; (b) levy taxes or set rates or charges without approval by the City; and (c) issue bonded debt without approval by the City. An entity has a financial benefit or burden relationship with the City if, for example, any one of the following conditions exists: (a) the City is legally entitled to or can otherwise access the entity’s resources, (b) the City is legally obligated or has otherwise assumed the obligation to finance the deficits or, or provide financial support to, the entity, or (c) the City is obligated in some manner for the debt of the entity. Finally, an entity could be a component unit even if it met all the conditions described above if excluding it would cause the City’s financial statements to be misleading. Blended component units, although legally separate entities, are in substance, part of the government's operations and data from these units are combined with data of the primary government in the fund financial statements. Discretely presented component units, on the other hand, are reported in a separate column in the government-wide financial statements to emphasize they are legally separate from the City. Based on the criteria above, the City has one blended component unit; the City does not have any discretely presented component units. Blended Component Unit The City of Greenville Public Facilities Corporation: The City of Greenville Public Facilities Corporation (the “Corporation”) is a blended component unit of the City. The Corporation is a governmental entity organized pursuant to Section 115 of the Internal Revenue Code of 1986, as amended. The Corporation was created for the specific purpose of operating exclusively for the benefit of the City, to perform the functions of, and to carry out the purposes for holding title, owning, leasing, constructing, acquiring and operating land, buildings and equipment, and facilities functionally related thereto and to perform any other lawful purpose related to the furtherance of the governmental powers of the City that is not inconsistent with the Corporation’s non-profit status; provided, that all property owned and leased by the Corporation shall be used for a valid public purpose. The Corporation has four board members, consisting of the City Mayor, Mayor Pro Tempore, City Manager, and the Director of the Office of Management and Budget (“OMB”). The City accounts for and reports the operations of the Corporation in the Greenville Public Facilities Corporation Special Revenue Fund. Separate financial statements for the Corporation are not issued.
40
CITY OF GREENVILLE, SOUTH CAROLINA NOTES TO THE FINANCIAL STATEMENTS YEAR ENDED JUNE 30, 2015 I. SUMMARY OF SIGNIFICANT ACCOUNTING POLICIES (CONTINUED) A. The Reporting Entity (Continued)
Blended Component Unit (Continued) The Corporation issued $11,980,000 in Taxable Installment Purchase Revenue Bond Series 2013 (“IPRB 2013”) in December 2013 to finance the construction of a parking garage and related improvements and renovations. The IPRB 2013 were issued pursuant to an Indenture Agreement with a bank and evidence proportionate interests of the owners in certain payments to be made by the City under the terms of a Base Lease Agreement and a Municipal Facilities Purchase & Occupancy Agreement (the “Agreements”) between the City and the Corporation dated December 1, 2013. Under the terms of these Agreements, the City will pay to the bank the required principal and interest payments as required by the Indenture Agreement. These payments constitute a current expenditure of the City and are not construed to be a debt of the City in contravention of any applicable constitutional or statutory limitations or requirements concerning the creating of indebtedness by the City, nor shall anything contained herein constitute a pledge of the general tax revenues, funds, moneys or credit of the City. The City intends to make all required payments when due; the City would forfeit possession of the parking garage and related improvements and renovations for the remainder of the term of the Agreements if it did not make the required payments. As security for and the source of payment of the IPRB 2013, the Corporation has assigned to the bank all of its right, title and interest in and to the Agreements, except for the right to receive reimbursement against claims and payments of its fees and expenses as defined in the Agreements.
This IPRB 2013 is not a debt of the City; however, as the Corporation is blended with the operations of the City, the debt of the Corporation is included with the City’s other obligations as required by GAAP.
Related Organizations
The City Council has the responsibility, according to South Carolina law, for concurring with the Greenville Water System’s issuance of bonded debt. It has been determined that the concurrence is ministerial and therefore does not make the Greenville Water System fiscally dependent upon the City. In addition to the Greenville Water System, the Council also has the responsibility for appointing a limited number of board members to the organizations listed below. These appointments do not represent a majority or controlling interest in their boards.
SCTAC Board of Directors Greenville Airport Commission Greenville Hospital Board of Trustees Greenville Housing Futures, Inc. Convention and Visitors Bureau Greenville Transit Authority
The City’s responsibility does not extend beyond making these appointments, with the exception of the SCTAC Board of Directors and the Greenville Airport Commission. For these two organizations, the Council has the responsibility for approving grants that are awarded. This approval is ministerial and does not make these two organizations fiscally dependent upon the City. None of the above organizations has significant financial relationships with the City, with the exception of the Greenville Transit Authority. The City entered into an agreement with the Greenville Transit Authority to manage the operations of this entity effective March 31, 2008, and the City established a new enterprise fund during 2008 to account for its activities related to this agreement. This agreement has since been extended through 2018. Therefore, none of these organizations are considered to be component units. Major Operations
The City’s major operations include police and fire protection, parks and recreation, economic and community development, public works and general administrative services. In addition, the City operates eight enterprise funds, consisting of Stormwater Utility, Wastewater, Parking, TD Convention Center, Zoo, Transit, Solid Waste, and Event Management.
41
CITY OF GREENVILLE, SOUTH CAROLINA NOTES TO THE FINANCIAL STATEMENTS YEAR ENDED JUNE 30, 2015 I. SUMMARY OF SIGNIFICANT ACCOUNTING POLICIES (CONTINUED)
B. Measurement Focus, Basis of Accounting, and Basis of Presentation
The government-wide financial statements (i.e., the Statement of Net Position and the Statement of Activities) report information on all of the non-fiduciary activities of the City (the “Primary Government”). The effect of interfund activity has been removed from these statements.
Governmental activities, which normally are supported by taxes and intergovernmental revenues, are reported separately from business-type activities, which rely, to a significant extent, on fees and charges for support. The Statement of Activities demonstrates the degree to which the direct expenses of a given function or segment are offset by program revenues. Direct expenses are those that are clearly identifiable with a specific function or segment. Program revenues include 1) charges to customers or applicants who purchase, use, or directly benefit from goods, services or privileges provided by a given function or segment and 2) grants and contributions that are restricted to meeting the operational or capital requirements of a particular function or segment. Taxes and other items not properly included among program revenues are reported instead as general revenues. The comparison of direct expenses with program revenues identifies the extent to which each business segment or governmental function is self-financing or draws from the general revenues of the City.
The government-wide financial statements are reported using the economic resources measurement focus and the accrual basis of accounting, as are the Proprietary Fund and Fiduciary Fund financial statements. Revenues are recorded when earned and expenses are recorded when a liability is incurred, regardless of the timing of related cash flows. Non-exchange transactions, in which the City gives or receives value without directly receiving or giving equal value in exchange, includes property taxes, grants and donations. Property taxes are recognized as revenues in the year for which they are levied. Grants and similar items are recognized as revenues as soon as all eligibility requirements imposed by the provider have been met. The government-wide statements are prepared using a different measurement focus from the manner in which governmental fund financial statements are prepared (see further detail below). Governmental fund financial statements, therefore, include reconciliations with brief explanations to better identify the relationship between the government-wide statements and the statements for governmental funds. Governmental fund financial statements are reported using the current financial resources measurement focus and the modified accrual basis of accounting. Revenues are recognized as soon as they are both measurable and available. Revenues are considered to be available when they are collectible within the current period or soon enough thereafter to pay liabilities of the current period. Property taxes, intergovernmental revenues, franchise taxes, licenses, and interest associated with the current fiscal period are all considered to be measurable and susceptible to accrual and so have been recognized as revenues of the current fiscal period. For this purpose, the government considers property taxes to be available if they are collected within 30 days of the end of the current fiscal period. A 60-day availability period is generally used for revenue recognition for all other governmental fund revenue with the exception of certain expenditure driven grants for which a one-year availability period is used. Expenditures generally are recorded when a liability is incurred, as under accrual accounting. However, debt service expenditures, as well as expenditures related to compensated absences and claims and judgments, are recorded only when payments are due. General capital asset acquisitions are reported as expenditures in governmental funds. Proceeds of general long-term debt and acquisitions under capital leases are reported as other financing sources. Fund financial statements report detailed information about the City. The focus of governmental and enterprise fund financial statements is on major funds rather than reporting funds by type. Each major fund is presented in a separate column. Non-major funds are aggregated and presented in a single column. Fiduciary funds are reported by fund type.
42
CITY OF GREENVILLE, SOUTH CAROLINA NOTES TO THE FINANCIAL STATEMENTS YEAR ENDED JUNE 30, 2015 I. SUMMARY OF SIGNIFICANT ACCOUNTING POLICIES (CONTINUED) B. Measurement Focus, Basis of Accounting, and Basis of Presentation (Continued)
The accounts of the government are organized and operated on the basis of funds. A fund is an independent fiscal and accounting entity with a self-balancing set of accounts. Fund accounting segregates funds according to their intended purpose and is used to aid management in demonstrating compliance with finance-related legal and contractual provisions. The minimum number of funds maintained is consistent with legal and managerial requirements. The following major funds and fund types are used by the City.
Governmental fund types are those through which most governmental functions of the City are financed. The City's expendable financial resources and related assets and liabilities (except for those accounted for in the Proprietary Funds and Fiduciary Funds) are accounted for through governmental funds. Governmental funds are accounted for using the current financial resources measurement focus and the modified accrual basis of accounting. The City’s major and non-major governmental fund types are as follows:
The General Fund, a major fund and a budgeted fund, is the general operating fund of the City and accounts for all revenues and expenditures of the City, except those required to be accounted for in another fund. All general tax revenues and other receipts that (a) are not allocated by law or contractual agreement to other funds or (b) that have not been restricted, committed, or assigned to other funds are accounted for in the General Fund. General operating expenditures, capital improvement costs, and general debt service that are not paid through other funds are paid from the General Fund. The Capital Projects Fund, a major fund is used to account for and report financial resources that are restricted, committed, or assigned for expenditures of capital outlay related to the acquisition or construction of major capital facilities (other than those financed by the Proprietary Funds). These funds are also used to carry on specified ongoing major improvement projects or major equipment acquisitions usually spanning more than one fiscal year. The Special Revenue Funds, non-major funds, are used to account for and report the proceeds of specific revenue sources (that are expected to continue to comprise a substantial portion of the inflows of the fund) that are restricted, committed or assigned to expenditures for specified purposes other than debt service in the City’s Tax Increment Districts or capital projects. The City has the following Special Revenue Funds:
HOME Program Law Enforcement Neighborhood Stabilization Miscellaneous Grants
Rental Rehabilitation Victim Assistance HOPWA Local Accommodations Tax
Revolving Housing Utility Undergrounding Community Development Recreation Incentive Local Hospitality Tax Tree Foundation
Sunday Alcohol Permits Donation Admission Tax Greenville Public Facilities Corporation State Accommodations Tax
The Debt Service Funds, non-major funds, are used to account for the accumulation of financial resources that are restricted, committed, or assigned for the payment of long-term debt principal, interest, and related costs for the City’s Tax Increment Districts. The City has the following Debt Service Funds:
Downtown Infrastructure District Westend Tax Increment District Viola Street Tax Increment District
43
CITY OF GREENVILLE, SOUTH CAROLINA NOTES TO THE FINANCIAL STATEMENTS YEAR ENDED JUNE 30, 2015 I. SUMMARY OF SIGNIFICANT ACCOUNTING POLICIES (CONTINUED) B. Measurement Focus, Basis of Accounting, and Basis of Presentation (Continued)
The Permanent Fund, a non-major fund is used to account for the resources received and held by the City as a trustee under a non-expendable trust agreement for restricted purposes. Two cemeteries are accounted for in this fund.
Proprietary Fund Types are accounted for based on the flow of economic resources measurement focus and use the accrual basis of accounting. Under this method, revenues are recorded when earned and expenses are recorded at the time liabilities are incurred.
Proprietary funds distinguish operating revenues and expenses from non-operating items. Operating revenues and expenses generally result from providing services and producing and delivering goods in connection with a proprietary fund’s principal ongoing operations. The principal operating revenues of enterprise funds are primarily charges for services and fees. Operating expenses for enterprise funds include the expense for providing goods and services, administrative expenses, maintenance, and depreciation of capital assets. All revenues and expenses not meeting this definition are reported as non-operating revenues and expenses. Proprietary Fund types include the following funds:
Enterprise Funds are used to account for operations (a) that are financed and operated in a manner similar to private business enterprises - where the intent of the governing body is that the costs (expenses, including depreciation) of providing goods or services to the general public on a continuing basis be financed or recovered primarily through user charges; or (b) where the governing body has decided that periodic determination of revenues earned, expenses incurred, and/or net income is appropriate for capital maintenance, public policy, management control, accountability, or other purposes. The City has the following Enterprise Funds:
The Stormwater Utility Fund, a major fund, is used to account for the City’s stormwater drainage operations.
The Wastewater Fund, a major fund, is used to account for the City’s wastewater line maintenance operations.
The Parking Fund, a major fund, is used to account for the City’s parking operations. The TD Convention Center Fund, a major fund, is used to account for the operations at the TD Convention Center. The Zoo Fund, a nonmajor fund, is used to account for the operations of the Greenville Zoo. The Transit Fund, a nonmajor fund, is used to account for the transit services that the City provides to the Greenville Transit Authority.
The Solid Waste Fund, a nonmajor fund, is used to account for the City’s solid waste operations. The Event Management Fund, a nonmajor fund, is used to account for the City’s event management operations.
Internal Service Funds are used to account for the financing of goods or services provided by one department or agency to other departments or agencies of the City, or to other governments, on a cost-reimbursement basis. The City has the following Internal Service Funds:
The Health Benefits Fund is used to account for the costs of health, dental and benefit services provided to employees and retirees of the City. This fund was established in fiscal year 2014.
44
CITY OF GREENVILLE, SOUTH CAROLINA NOTES TO THE FINANCIAL STATEMENTS YEAR ENDED JUNE 30, 2015 I. SUMMARY OF SIGNIFICANT ACCOUNTING POLICIES (CONTINUED) B. Measurement Focus, Basis of Accounting, and Basis of Presentation (Continued)
The Risk Management Fund is used to account for the cost of workers’ compensation, general liability and property damages. The Fleet Fund is used to account for the cost of managing and maintaining the City’s fleet of vehicles and rolling stock and mobile communications.
For the government-wide statements, the doubling up effect of internal service activity has been eliminated. Remaining financial activities that are not eliminated are reported in the governmental activities column of the government-wide statements.
Fiduciary Fund Types include the Pension Trust Fund and the Agency Fund. These funds are used to account for assets held by the City in a trustee capacity for individuals, other governments, and/or other funds. The Pension Trust Fund is accounted for in essentially the same manner as Proprietary Funds and is used to account for the City of Greenville Firemen’s Pension Fund, which is the City’s single-employer defined benefit retirement plan for its regular fire department employees. The Agency Fund is generally used to account for cash and other miscellaneous assets that the City holds on behalf of others. The City is responsible for certain assets of the Greenville Local Development Corporation, a non-profit organization. The Agency Fund is custodial in nature and does not present results of operations. Significant New Accounting Standards Adopted – Change in Accounting Principle The City implemented GASB Statement No. 68 “Accounting and Financial Reporting for Pensions – an amendment of GASB Statement No. 27” (“GASB #68”) and GASB Statement No. 71 “Pension Transition for Contributions Made Subsequent to the Measurement Date – an amendment of GASB Statement No. 68” (“GASB #71” and collectively “Statements”) for the year ended June 30, 2015. The primary objective of these Statements is to improve accounting and financial reporting by state and local governments for pensions. In addition, state and local governments who participate in single-employer or cost-sharing multiple employer plans are now required to recognize a net pension liability for their single-employer plan or their proportionate share of the net pension liability of cost-sharing multiple employer plans. It is GASB’s intention that these Statements will provide citizens and other users of the financial statements with a clearer picture of the size and nature of the City’s financial obligations to current and former employees for past services rendered. In particular, these Statements require the City to recognize a net pension liability, deferred outflows of resources, and deferred inflows of resources for the City of Greenville Firemen’s Pension Plan (“City Pension Plan”), a single-employer plan, and for the City’s participation in the South Carolina Retirement System and South Carolina Police Officers Retirement System (“State Retirement Plans”), cost-sharing multiple-employer defined benefit pension plans, on financial statements prepared on the economic resources measurement focus and accrual basis of accounting (i.e., the Statement of Net Position) and present more extensive note disclosures. The adoption of these Statements had no impact on the City’s governmental fund financial statements, which continue to report expenditures in the amount of the contractually required contributions, as required by the City’s code of ordinances for the City Pension Plan and by the South Carolina Public Employee Benefit Authority (“PEBA”) who administers the State Retirement Plans. However, the adoption has resulted in the restatement of the City’s net position as of July 1, 2014 for its government-wide and proprietary funds financial statements to reflect the reporting of net pension liabilities and deferred outflows of resources for each of its qualified plans in accordance with the provisions of these Statements. Net position of the City’s government-wide financial statements as of July 1, 2014 was decreased in total by approximately $74,703,000, consisting of approximately $59,664,000 for governmental activities and $15,039,000 for business-type activities, to reflect the cumulative change in accounting principle related to the adoption of these Statements. The City’s enterprise funds also reflected a decrease of approximately $15,039,000 related to the adoption of these Statements. The total impact related to the State Retirement Plans was approximately $61,708,000; the impact related to the City Pension Plan was approximately $12,995,000. See Note IV.B for more information regarding the City’s retirement plans.
45
CITY OF GREENVILLE, SOUTH CAROLINA NOTES TO THE FINANCIAL STATEMENTS YEAR ENDED JUNE 30, 2015 I. SUMMARY OF SIGNIFICANT ACCOUNTING POLICIES (CONTINUED) C. Assets, Liabilities, Deferred Outflows / Inflows of Resources, and Equity
1. Cash, Cash Equivalents, and Investments Cash and Cash Equivalents For purposes of the statements of cash flows for the Enterprise Funds and Internal Service Funds, the City considers all highly liquid investments (including restricted assets) with original maturities of three months or less to be cash equivalents. Investments The City’s investment policy is designed to operate within existing statutes (which are identical for all funds, fund types and component units within the State of South Carolina) that authorize the City to invest in the following:
(a) Obligations of the United States and its agencies, the principal and interest of which is fully guaranteed by
the United States;
(b) Obligations issued by the Federal Financing Bank, Federal Farm Credit Bank, the Bank of Cooperatives, the Federal Intermediate Credit Bank, the Federal Land Banks, the Federal Home Loan Banks, the Federal Home Loan Mortgage Corporation, the Federal National Mortgage Association, the Government National Mortgage Association, the Federal Housing Administration, and the Farmers Home Administration, if, at the time of investment, the obligor has a long-term, unenhanced, unsecured debt rating in one of the top two ratings categories, without regard to a refinement or gradation of rating category by numerical modifier or otherwise, issued by at least two nationally recognized credit rating organizations;
(c) (i) General obligations of the State of South Carolina or any of its political units; or (ii) revenue obligations
of the State of South Carolina or its political units, if at the time of investment, the obligor has a long-term, unenhanced, unsecured debt rating in one of the top two ratings categories, without regard to a refinement or gradation of rating category by numerical modifier or otherwise, issued by at least two nationally recognized credit rating organizations.
(d) Savings and Loan Associations to the extent that the same are insured by an agency of the Federal
Government; (e) Certificates of deposit where the certificates are collaterally secured by securities of the type described in (a)
and (b) above held by a third party as escrow agent or custodian, of a market value not less than the amount of the certificates of deposit so secured, including interest; provided, however, such collateral shall not be required to the extent the same are insured by an agency of the federal government;
(f) Repurchase agreements when collateralized by securities as set forth in this section; and
(g) No load open-end or closed-end management type investment companies or investment trusts registered
under the Investment Company Act of 1940, as amended, where the investment is made by a bank or trust company or savings and loan association or other financial institution when acting as trustee or agent for a bond or other debt issue of that local government unit, political subdivision, or county treasurer if the particular portfolio of the investment company or investment trust in which the investment is made (i) is limited to obligations described in items (a), (b), (c), and (f) of this subsection, and (ii) has among its objectives the attempt to maintain a constant net asset value of one dollar a share and to that end, value its assets by the amortized cost method.
46
CITY OF GREENVILLE, SOUTH CAROLINA NOTES TO THE FINANCIAL STATEMENTS YEAR ENDED JUNE 30, 2015 I. SUMMARY OF SIGNIFICANT ACCOUNTING POLICIES (CONTINUED) C. Assets, Liabilities, Deferred Outflows / Inflows of Resources, and Equity (Continued)
1. Cash, Cash Equivalents, and Investments (Continued) Investments (Continued) The City’s cash investment objectives are preservation of capital, liquidity, and yield. To assist in achieving these objectives, the City maintains a cash and investment pool that is available for use by other funds. Investment earnings are allocated based on average cash balances. The City reports its cash and investments at fair value which is normally determined by quoted market prices. The City currently or in the past year has used the following investments:
South Carolina Local Government Investment Pool (“LGIP” or “Pool”) investments are invested with the South Carolina State Treasurer’s Office, which established the South Carolina Pool pursuant to Section 6-6-10 of the South Carolina Code. The Pool is an investment trust fund, in which public monies in excess of current needs, which are under the custody of any city treasurer or any governing body of a political subdivision of the State, may be deposited. The Pool is a 2a 7-like pool which is not registered with the Securities and Exchange Commission (“SEC”) as an investment company, but has a policy that it will operate in a manner consistent with the SEC’s Rule 2a 7 of the Investment Company Act of 1940. In accordance with GASB Statement No. 31, “Accounting and Financial Reporting for Certain Investments and for External Investment Pools”, investments are carried at fair value determined annually based upon quoted market prices. The total fair value of the Pool is apportioned to the entities with funds invested on an equal basis for each share owned, which are acquired at a cost of $1.00. Financial statements for the Pool may be obtained by writing the Office of State Treasurer, Local Government Investment Pool, P.O. Box 11778, Columbia, SC 29211-1960.
Money market mutual funds are generally open-ended funds that invest in short term debt securities (including obligations of the United States and related agencies) that generally have a weighted average maturity of 60 days or less and do not invest more than 5% in any one issuer, except for government securities and repurchase agreements.
US securities are generally treasury notes, treasury bonds, treasury bills, and related securities which are debt obligations of the U.S. government (lending money to the federal government for a specified period of time). These debt obligations are backed by the “full faith and credit” of the government, and thus by its ability to raise tax revenues and print currency, U.S. Treasury securities are considered the safest of all investments.
Agency securities are securities that are generally backed by mortgage loans, and due to their creation from particular corporations that are sponsored by the U.S. government, they enjoy credit protection based on either an implicit or explicit guarantee from the U.S. Government.
2. Restricted Assets
The City established certain accounts for assets restricted for specific purposes, typically by outside parties or legal agreement. Certain bond indentures require the establishment of (i) maximum annual principal and interest payments, unless a surety bond was provided; (ii) the next succeeding principal and accrued interest payment; and (iii) bond proceeds to be used for construction purposes as required in the bond agreement. 3. Receivables and Payables
During the course of its operations, the City has numerous transactions occurring between funds. These transactions include expenditures and transfers of resources to provide services, construct assets, and service debt. The accompanying financial statements generally reflect such transactions as transfers. Subsidies are also recorded as transfers. City management determines the classification of amounts recorded as subsidies or advances.
47
CITY OF GREENVILLE, SOUTH CAROLINA NOTES TO THE FINANCIAL STATEMENTS YEAR ENDED JUNE 30, 2015 I. SUMMARY OF SIGNIFICANT ACCOUNTING POLICIES (CONTINUED) C. Assets, Liabilities, Deferred Outflows / Inflows of Resources, and Equity (Continued)
3. Receivables and Payables (Continued)
To the extent that certain transactions between funds had not been paid or received as of year end, balances of interfund amounts or payables have been recorded. Internal service funds are used to record charges to all City departments as operating revenue. All City funds record these payments to the internal service funds as operating expenditures or expenses.
All trade and property taxes receivable are shown net of an allowance for uncollectible amounts. Trade receivables are comprised of amounts due from entities and individuals for a variety of types of fees, charges and services, including franchise fees, hospitality taxes, solid waste, wastewater, parking and other fees and charges.
4. Inventories and Prepaids Inventories are valued at cost (first-in, first-out). Inventories consist of expendable supplies held for consumption and are recorded as an expense at the time individual inventory items are consumed. Prepaid items are generally accounted for under the purchase method (expensed when paid). If material, prepaid insurance is accounted for using the consumption method (expensed over the periods expected to benefit from the initial payment). 5. Capital Assets General capital assets are those assets not specifically related to activities reported in the Proprietary Funds. These assets generally result from expenditures in the governmental funds. These assets are reported in the governmental activities column of the Government-Wide Statement of Net Position, but are not reported in the fund financial statements. Capital assets utilized by the Proprietary Funds are reported both in the business-type activities column of the Government-Wide Statement of Net Position and in the respective fund financial statements.
All capital assets are valued at historical cost or estimated historical cost, if actual historical cost is not available. Donated capital assets generally are valued at their estimated fair market value on the date donated. Public domain (“infrastructure”) general capital assets acquired prior to July 1, 2002, consist of the road network (roads, bridges, curbs and gutters, streets, sidewalks, drainage systems, lighting systems) and stormwater and wastewater system assets that were acquired or that received substantial improvements subsequent to July 1, 1980. These assets are reported at estimated historical cost using deflated replacement cost. The cost of normal maintenance and repairs that do not add to the value of the asset or materially extend assets’ lives are not capitalized. The City maintains a minimum capitalization threshold of $5,000 for all capital assets other than those associated with infrastructure. The City’s minimum capitalization threshold for infrastructure assets is $100,000. Capital assets are depreciated using the straight-line method over the following estimated useful lives:
Governmental Activities andDescription Business-Type Activities
Buildings 10-45 yearsImprovements Other Than Buildings 20-30 yearsInfrastructure 30-50 yearsFurniture and Equipment 7-20 yearsVehicles 6 years
48
CITY OF GREENVILLE, SOUTH CAROLINA NOTES TO THE FINANCIAL STATEMENTS YEAR ENDED JUNE 30, 2015 I. SUMMARY OF SIGNIFICANT ACCOUNTING POLICIES (CONTINUED) C. Assets, Liabilities, Deferred Outflows / Inflows of Resources, and Equity (Continued)
6. Compensated Absences The City’s general leave policy allows the accumulation of leave between 13 and 28 days annually, based upon length of service, up to a maximum of 90 days. Employees terminating or retiring are paid for accumulated general leave based on their hourly rate of pay earned at the time of termination or retirement. The entire compensated absence liability and expense is reported in the government-wide financial statements. The portion applicable to the Proprietary Funds is also recorded in the Proprietary Fund financial statements. The governmental funds will also recognize a liability for compensated absences only if they have matured, for example, as a result of employee resignation or retirement prior to fiscal year end, if they are material.
7. Accrued Liabilities and Long-Term Obligations
All accrued liabilities and long-term obligations are reported in the government-wide financial statements. The portion applicable to the proprietary funds is also recorded in the proprietary fund financial statements. All current payables and accrued liabilities from governmental funds are reported in the governmental fund financial statements. An estimate for health and dental, workers’ compensation, general liability and property damage claims that have been incurred prior to year end but were unreported at that time is also reflected in the governmental fund financial statements. These estimates are based upon the City’s claim history, claims processed following the close of year end, and other industry factors. In the government-wide financial statements and the proprietary fund financial statements, long-term debt and other long-term obligations are reported as liabilities on the Statement of Net Position. Bond premiums and discounts, if material, are deferred and amortized over the life of the bonds using the straight-line method that approximates the effective interest method. Amortization of premiums and discounts are included in interest expense. Bonds payable are reported net of the applicable bond premiums and discounts. Issuance costs, whether or not withheld from the actual debt proceeds received, are reported as expenses. In the fund financial statements, governmental fund types recognize bond premiums and discounts, as well as bond issuance costs, during the current period. The face amount of debt issued is reported as other financing sources. Premiums received on debt issuances are reported as other financing sources, while discounts on debt issuances are reported as other financing uses. Issuance costs are reported as expenditures. 8. Landfill Post-Closure Care Costs Federal and state laws required the City to place a final cover on its landfill site at Mauldin Road and to perform certain maintenance and monitoring functions at the site for thirty years after closure. In September 2001, the South Carolina Department of Health and Environmental Control inspected the construction of the final cover of the City’s landfill and considered the landfill closed and ready for post-closure maintenance at that time. The post-closure care costs, estimated at $58,000 annually for approximately 17 more years, will be paid through appropriations from the General Fund operating budget. These estimates are subject to changes due to inflation or deflation, technology or changes in applicable laws or regulations. The remaining estimated post-closure care costs are included in long-term obligations in the governmental activities column of the government-wide financial statements.
49
CITY OF GREENVILLE, SOUTH CAROLINA NOTES TO THE FINANCIAL STATEMENTS YEAR ENDED JUNE 30, 2015 I. SUMMARY OF SIGNIFICANT ACCOUNTING POLICIES (CONTINUED)
C. Assets, Liabilities, Deferred Outflows / Inflows of Resources, and Equity (Continued) 9. Deferred Outflows/Inflows of Resources In addition to assets, the Statement of Net Position and the Balance Sheet will sometimes report a separate section for deferred outflows of resources. This separate financial statement element, deferred outflows of resources, represents a consumption of net position that applies to a future period(s) and so will not be recognized as an outflow of resources (expense/expenditure) until then. The City currently has two types of deferred outflows of resources: (1) The City reports deferred refunding charges in its Statements of Net Position. If material, deferred refunding charges, which is the difference between the reacquisition price and the net carrying amount of the defeased debt, are deferred and amortized over the life of the refunding bonds, which has the same maturity as the bonds that were refunded. Amortization of deferred refunding charges is included in interest expense. (2) The City also reports deferred pension charges in its Statements of Net Position in connection with the City Pension Plan and the City’s participation in the State Retirement Plans. These deferred pension charges are either (a) recognized in the subsequent period as a reduction of the net pension liability (which includes pension contributions made after the measurement date) or (b) amortized in a systematic and rational method as pension expense in future periods in accordance with GAAP. In addition to liabilities, the Statement of Net Position and the Balance Sheet will sometimes report a separate section for deferred inflows of resources. This separate financial statement element, deferred inflows of resources, represents an acquisition of net position that applies to a future period(s) and so will not be recognized as an inflow of resources (revenue) until that time. The City currently has two types of deferred inflows of resources: (1) The City reports unavailable revenue only in the governmental funds balance sheet; it is deferred and recognized as an inflow of resources (revenues) in the period the amounts become available. (2) The City also reports deferred pension credits in its Statements of Net Position in connection with the City Pension Plan and their participation in the State Retirement Plans. These deferred pension credits are amortized in a systematic and rational method and recognized as a reduction of pension expense in future periods in accordance with GAAP. 10. Fund Balance In accordance with GAAP, the City classifies its governmental fund balances as follows:
Nonspendable – includes amounts that inherently cannot be spent either because they are not in spendable form (i.e., prepaids, inventories, long-term portions of loans receivable, etc.) or because of legal or contractual requirements (i.e., principal on an endowment, etc.).
Restricted – includes amounts that are constrained by specific purposes which are externally imposed by (a) other governments through laws and regulations, (b) grantors or contributions through agreements, (c) creditors through debt covenants or other contracts, or (d) imposed by law through constitutional provisions or enabling legislation.
Committed – includes amounts that are constrained for specific purposes that are internally imposed by the government through formal action (an ordinance) made by the City Council, which is the highest level of decision-making authority, before the end of the reporting period. Those committed amounts cannot be used for any other purpose unless the government removes or changes the specified use by taking the same type of action it employed to previously commit those amounts.
Assigned – includes amounts that are intended to be used for specific purposes that are neither considered restricted nor committed; in addition, such assignments are made before the report issuance date. City Council Resolution No. 2011-25 formally granted the City Manager or his designee the authority to make assignments of fund balance for the City. The City Manager has not identified who his designee is at this time. The General Fund includes assigned fund balance of approximately $1,999,000 for the use of fund balance in the fiscal year 2016 budget approved by the City Council.
50
CITY OF GREENVILLE, SOUTH CAROLINA NOTES TO THE FINANCIAL STATEMENTS YEAR ENDED JUNE 30, 2015 I. SUMMARY OF SIGNIFICANT ACCOUNTING POLICIES (CONTINUED)
C. Assets, Liabilities, Deferred Outflows / Inflows of Resources, and Equity (Continued)
10. Fund Balance (Continued) Unassigned – includes amounts that do not qualify to be accounted for and reported in any of the other fund balance categories. This classification represents the amount of fund balance that has not been assigned to other funds and that has not been restricted, committed, or assigned to specific purposes within the General Fund. The General Fund should be the only fund that reports a positive unassigned fund balance amount. In other governmental funds, if expenditures incurred for specific purposes exceeded the amounts that are restricted, committed, or assigned to those purposes, it may be necessary to report a negative unassigned fund balance.
The City generally uses restricted amounts first when both restricted and unrestricted (committed, assigned, and unassigned) fund balance is available unless there are legal documents, contracts, or agreements that prohibit doing such. Additionally, the City generally would first use committed, then assigned, and lastly unassigned amounts of unrestricted fund balance when expenditures are made. The City’s Council has formally adopted a minimum fund balance policy that requires 20% of the next year’s General Fund appropriations be available as unassigned fund balance. The minimum fund balance amount that is available under the policy is approximately $15,251,000 as of June 30, 2015, which represents 20% of the original budget for the General Fund for fiscal year 2016.
11. Net Position
Net position represents the difference between assets and deferred outflows of resources and liabilities and deferred inflows of resources in the Statement of Net Position. Net position is classified as net investment in capital assets; restricted; and unrestricted. Net investment in capital assets consists of capital assets, net of accumulated depreciation, reduced by the outstanding balances of any borrowings used for the acquisition, construction or improvement of those assets. Outstanding debt which has not been spent is included in the same net position component as the unspent proceeds. Net position is reported as restricted when there are limitations imposed on their use either through enabling legislation or through external restrictions imposed by creditors, grantors, contributors, or laws or regulations of other governments. 12. Pensions In government-wide financial statements, pensions are required to be recognized and disclosed using the accrual basis of accounting (see Note IV.B and the required supplementary information immediately following the notes to the financial statements for more information), regardless of the amount recognized as pension expenditures on the modified accrual basis of accounting. The City recognizes a net pension liability for each qualified pension plan in which it participates, which represents the excess of the total pension liability over the fiduciary net position of the qualified pension plan, or the City’s proportionate share thereof in the case of a cost-sharing multiple-employer plan, measured as of the City’s fiscal year-end. Changes in the net pension liability during the period are recorded as pension expense, or as deferred outflows or inflows of resources depending on the nature of the change, in the period incurred. Those changes in net pension liability that are recorded as deferred outflows or inflows of resources that arise from changes in actuarial assumptions or other inputs and differences between expected or actual experience are amortized over the weighted average remaining service life of all participants in the respective qualified pension plan and recorded as a component of pension expense beginning with the period in which they are incurred. Projected earnings on qualified pension plan investments are recognized as a component of pension expense. Differences between projected and actual investment earnings are reported as deferred outflows or inflows of resources and amortized as a component of pension expense on a closed basis over a five-year period beginning with the period in which the difference occurred.
51
CITY OF GREENVILLE, SOUTH CAROLINA NOTES TO THE FINANCIAL STATEMENTS YEAR ENDED JUNE 30, 2015 I. SUMMARY OF SIGNIFICANT ACCOUNTING POLICIES (CONTINUED)
C. Assets, Liabilities, Deferred Outflows / Inflows of Resources, and Equity (Continued) 13. Other Postemployment Benefits Other Postemployment Benefits (“OPEB”) cost for retiree healthcare and similar, non-pension retiree benefits, is required to be measured and disclosed using the accrual basis of accounting (see Note IV.C and the required supplementary information immediately following the notes to the financial statements), regardless of the amount recognized as OPEB expense on the modified accrual basis of accounting. Annual OPEB cost is equal to the annual required contributions to the OPEB Plan, calculated in accordance with GASB Statement No. 45. 14. Accounting Estimates
The preparation of financial statements in conformity with accounting principles generally accepted in the United States of America requires management to make estimates and assumptions. Those estimates and assumptions affect the reported amounts of assets and deferred outflows of resources and liabilities and deferred inflows of resources and disclosure of these balances as of the date of the financial statements. In addition, they affect the reported amounts of revenues and expenditures/expenses during the reporting period. Actual results could differ
15. Comparative Data
Comparative data (i.e. presentation of prior year totals by fund type) has not been presented in each of the statements since their inclusion would make the statements unduly complex and difficult to read.
II. STEWARDSHIP, COMPLIANCE, AND ACCOUNTABILITY – BUDGETARY INFORMATION
The City utilizes the following procedures in establishing the budgetary data reflected in the financial statements:
Budgets are adopted on the modified accrual basis. During the months of January and February, the City’s Administration Division of the Office of Management and Budget, with other department input, develops a preliminary budget model for operational and capital expenditures, and develops revenue projections as a proposed means of financing the proposed expenditures. The Director of the Office of Management and Budget and the City Manager refine the budget model, develop objectives and update trends related to service efforts and accomplishments during the month of March. During April and May, the proposed budget is presented by the City Manager to City Council. The budget includes proposed expenditures and the means for financing them. Public meetings are conducted to obtain taxpayer comments. A target date in June is set for legal enactment of the budget through passage of an ordinance. The ordinance sets the limit at the fund level, for which expenditures may not exceed appropriations. After two readings of the budget, the City Council legally adopts the budget through the passage of the ordinance. After the City completes the formal budget process, the City prepares and issues the budget report. Budget accountability rests primarily with the operating departments of the City. In accomplishing the programs and objectives for which the budget was authorized, department directors are responsible for ensuring that their respective expenditures do not exceed the prescribed funding levels.
For each assigned account, the department is obligated to stay within budget by each major expenditure category of personnel, operating and capital. The department director has the authority to transfer funds among the divisions. The City Manager has the authority to transfer funds within departments and across departmental accounts. Such transfers are entered on the City’s records. All unused expenditure appropriations lapse at year-end. Encumbrances are re-appropriated on a yearly basis and are reflected as an increase in the budgeted expenditures in the next year.
52
CITY OF GREENVILLE, SOUTH CAROLINA NOTES TO THE FINANCIAL STATEMENTS YEAR ENDED JUNE 30, 2015 II. STEWARDSHIP, COMPLIANCE, AND ACCOUNTABILITY – BUDGETARY INFORMATION (CONTINUED)
The City Council annually adopts an operating budget ordinance for all governmental funds of the City, except for the following Special Revenue Funds: Rental Rehabilitation, Neighborhood Stabilization, Revolving Housing, Law Enforcement, Miscellaneous Grants, Recreation Incentive, Tree Foundation, Donation, and Greenville Public Facilities Corporation (blended component unit). There is also no operating budget adopted for the Capital Projects Fund, as funds are budgeted on a total project basis. During the year, approximately $612,000 in unexpended commitments and contracts in the General Fund from appropriations in fiscal year 2014 were carried forward to fiscal year 2015.
III. DETAILED NOTES ON ALL FUNDS AND ACTIVITIES
A. Deposits and Investments
Deposits
Custodial Credit Risk for Deposits: Custodial credit risk for deposits is the risk that, in the event of a bank failure, the City’s deposits might not be recovered. The City does not have a deposit policy for custodial credit risk but follows the investment policy statutes of the State of South Carolina. As of June 30, 2015, none of the City’s bank balances of approximately $52,395,000, which had a carrying value of approximately $51,347,000, were exposed to custodial credit risk.
Investments
As of June 30, 2015, the City had the following investments:
Investment Type Fair Value
South Carolina Pooled Investment Fund 38,000,495$
U.S. Securities 154,108
Agency Securities 1,659,554
Money Market Mutual Funds 4,511,368
Total 44,325,525$
Interest Rate Risk: The City’s investment policy is to mitigate interest rate risk and ensure the preservation of capital in the overall portfolio. The policy does not place a limit on its investment maturities to help manage the City’s exposure to fair value losses from increasing interest rates. Investments in securities in agencies related to the U.S. Government earn interest at a stated fixed rate and are normally held until maturity when the full principal and interest amount is paid to the City. All of the City’s investments had maturities of less than one year as of June 30, 2015.
Credit Risk for Investments: The City’s investment policy requires that the portfolio consist largely of securities with active secondary or resale markets. In addition, a portion of the portfolio may be placed in the South Carolina Pooled Investment Fund. This fund is unrated. Investments in U.S. Securities are considered to have no credit risk. The investments in Agency Securities include the following: (1) Federal Home Loan Mortgage Corp Discount Notes and (2) Federal National Mortgage Association Discount Notes; these securities are rated A-1+ by Standard & Poor’s and P-1 by Moody’s Investors Service. The investments in money market mutual funds are in the First American Government Obligations Fund, the First American Treasury Obligation Fund, the Fidelity Institutional Money Market Government Fund, and the Federated Government Obligation Fund; these funds are rated AAAm by Standard & Poor’s and Aaa-mf by Moody’s Investors Service.
53
CITY OF GREENVILLE, SOUTH CAROLINA NOTES TO THE FINANCIAL STATEMENTS YEAR ENDED JUNE 30, 2015 III. DETAILED NOTES ON ALL FUNDS AND ACTIVITIES (CONTINUED)
A. Deposits and Investments (Continued)
Investments (Continued)
Custodial Credit Risk for Investments: Custodial credit risk for investments is the risk that, in the event of a bank failure, the government will not be able to recover the value of its investments or collateral securities that are in the possession of an outside party. The City’s investment policy requires that securities be held by a third party custodian in the name of the City. As of June 30, 2015, none of the City’s security investments was exposed to custodial credit risk. Concentration of Credit Risk for Investments: The City’s investment policy places no limit on the amount it may invest in any one issuer. Investments issued or explicitly guaranteed by the U.S government and investments in mutual funds and external investment pools are excluded from this disclosure requirement. No other investments exceeded 5% of the total as of June 30, 2015.
Reconciliation to the Financial Statements A reconciliation of cash and investments (excluding the Pension Trust Fund) as shown in the statement of net positions is as follows:
Description Amount
Carrying Amount of Deposits 51,347,419$ Fair Value of Investments 44,325,525
Total Deposits and Investments 95,672,944$
Statement of Net Position:Cash and Investments 85,710,125$ Cash and Investments, Restricted 7,756,940
Statement of Fiduciary Net Position:Cash and Cash Equivalents 2,205,879
Total Cash and Investments 95,672,944$
Pension Trust Cash, Cash Equivalents, and Investments The City of Greenville Firemen’s Pension Fund (the “Trust”) portfolio at June 30, 2015 is as shown in the following table. The Trust reports its investments at fair value, which is normally determined by quoted market prices.
Investment Type Fair Value Less than 1 Yr 1 to 2 Yrs 2 to 3 Yrs Over 3 Yrs
Domestic Equities 25,424,123$ N/A N/A N/A $ N/A
Corporate Notes 7,405,032 204,583 656,172 2,020,671 4,523,606
U.S. Agency Notes 5,798,976 919,249 527,855 357,680 3,994,192
U.S. Treasury Notes 4,424,901 453,851 402,296 626,041 2,942,713
Money Market Funds 1,064,849 1,064,849 - - -
Total 44,117,881$ 2,642,532 1,586,323 3,004,392 11,460,511$
Investment Maturities (in Years)
54
CITY OF GREENVILLE, SOUTH CAROLINA NOTES TO THE FINANCIAL STATEMENTS YEAR ENDED JUNE 30, 2015 III. DETAILED NOTES ON ALL FUNDS AND ACTIVITIES (CONTINUED)
A. Deposits and Investments (Continued)
Pension Trust Cash, Cash Equivalents, and Investments (Continued) Investment Policy: The investment policy for the Trust requires that the overall asset investment allocation mix for the Trust to be at least 40% invested in fixed income type investments. In addition, it requires that the asset allocation for the fixed income portfolio (40% requirement) to be within the following ranges: Minimum % Maximum %
Cash and Cash Equivalents 0% 90% Fixed Income 10% 100%
Interest Rate Risk: The Trust considers capital preservation to be of paramount importance, while prudent risk taking is considered justifiable. The Trust’s investment horizon is viewed as long term with limits of six months or less for investments in money market funds or in other fixed income securities. The duration target is 5 years with lower and upper bounds of 3 years and 10 years, respectively. Corporate bonds may not have a maturity date longer than 12 years from the date of purchase.
Credit Risk for Pension Trust Investments: The Trust’s investment policy for credit risk requires that investments in corporate bonds have an average credit quality of “A” or better as defined by Moody’s and Standard & Poors. Even if the average is maintained, Trust policy requires that less than 5% of the total portfolio may possess a lower credit rating than that outlined above. The following table lists the credit ratings of debt instruments held in the Trust’s portfolio:
Credit RatingsType of Investment Moody and S&P Amount
U.S. Government and Related Agency Notes A or higher 9,368,607$ U.S. Government and Related Agency Notes Unrated 855,270 Corporate Notes A or higher 6,418,838 Corporate Notes B 986,194$
Custodial Credit Risk for Pension Trust Investments: Custodial credit risk for investments is the risk that, in the event of a bank failure, the government will not be able to recover the value of its investments that are in the possession of an outside party. The Trust’s investment policy requires that securities be held by a third party custodian in the name of the Trust. As of June 30, 2015, none of the Trust’s security investments was exposed to custodial credit risk.
Concentration of Credit Risk for Pension Trust Investments: The Trust investment policy limits the amount of the total portfolio that may be invested in any one corporate issuer to 5%. There were no investments in any one corporate issuer that exceeded 5% of the total portfolio at June 30, 2015. Investments issued or explicitly guaranteed by the U.S. Government and investments in mutual funds are excluded from this disclosure requirement. Rate of Return: For the year ended June 30, 2015, the annual money-weighted rate of return on pension plan investments, net of pension plan investment expense, was 3.1%. The money-weighted rate of return expresses investment performance, net of investment expense, adjusted for the changing amounts actually invested.
55
CITY OF GREENVILLE, SOUTH CAROLINA NOTES TO THE FINANCIAL STATEMENTS YEAR ENDED JUNE 30, 2015 III. DETAILED NOTES ON ALL FUNDS AND ACTIVITIES (CONTINUED)
B. Property Taxes and Other Receivables
The City’s 2014 property taxes were levied on November 15, 2014, and were due beginning on this date based on the assessed valuation as of January 1, 2014. Property taxes were considered late on January 16, 2015. Motor vehicle property tax is levied and collected on a portion of taxable vehicles monthly. Penalties and charges are assessed if taxes are not paid by the following dates:
January 16 through February 1 - 3% penalty for tax dueFebruary 2 through March 16 - 10% penalty for tax dueMarch 17 - Lien Date - 15% penalty for tax due plus $15 for a delinquent execution Unpaid Taxes After One Year - Property is sold by the County Tax Collector at the annual tax
sale held the first Monday in December.
Assessed values are established by the Greenville County Tax Assessor and the South Carolina Department of Revenue and were approximately $400 million for the 2014 levy year. The City’s operating tax rate is currently 89.4 mills. City property taxes are billed and collected by Greenville County under a joint billing and collection agreement. Amounts received by Greenville County but not yet remitted to the City at year end are included in Due from County Government on the Statement of Net Position and the combining balance sheet. Property taxes receivable consisted of the following at June 30, 2015:
Property Taxes Receivable General Fund Debt Service Fund Totals
Current and Prior Year Taxes Receivable 2,299,316$ 566,496 2,865,812$ Allowance for Uncollectible Taxes (1,761,704) (92,573) (1,854,277)
Net Taxes Receivable 537,612$ 473,923 1,011,535$
Accounts receivable in the governmental funds and the enterprise funds totaling approximately $3,990,000 and $1,934,000, respectively, are recorded net of allowances for uncollectible amounts of approximately $45,000 and $42,000, respectively.
C. Interfund Receivables and Payables
Interfund balances at June 30, 2015, consisted of the following individual fund receivables and payables:
Fund Receivables Payables
General Fund 296,437$ -$
Fleet Internal Service Fund - 93,391
Special Revenue Funds:HOPWA - 73,786 Community Development - 79,674 State Accommodations Tax - 33,451 Local Accommodations Tax - 16,135
Totals 296,437$ 296,437$
The HOPWA, Community Development, State Accommodations Tax, Local Accommodations Tax, and Fleet payables were a result of amounts paid by the General Fund on behalf of these other funds. All of these amounts are expected to be paid within one year.
56
CITY OF GREENVILLE, SOUTH CAROLINA NOTES TO THE FINANCIAL STATEMENTS YEAR ENDED JUNE 30, 2015 III. DETAILED NOTES ON ALL FUNDS AND ACTIVITIES (CONTINUED) D. Capital Assets
During fiscal 2015, the City discovered that it had not recorded certain land and net improvements other than buildings located near Verdae Boulevard that were conveyed by a developer several years ago totaling approximately $5,517,000. The City has corrected this by adjusting beginning Capital Assets for Governmental Activities – see Note III.E Infrastructure Reimbursement Agreement for more details. The beginning amounts below have been restated to reflect these corrections. Capital asset activity for the City’s governmental activities for the year ended June 30, 2015, was as follows:
RestatedBeginning Ending Balance Increases Decreases Transfers Balance
Governmental Activities:
Capital Assets, Not Being Depreciated:Land 20,020,667$ 4,167,156 - - 24,187,823$ Construction In Progress 4,846,507 6,184,306 - (2,655,311) 8,375,502
Total Capital Assets, Not Being Depreciated 24,867,174 10,351,462 - (2,655,311) 32,563,325
Capital Assets, Being Depreciated:Buildings 15,717,548 - (342,834) 540,596 15,915,310 Improvements Other Than Buildings 61,232,451 - (150,540) 1,566,230 62,648,141 Infrastructure 135,528,609 1,055,273 - 548,485 137,132,367 Furniture and Equipment 11,408,973 827,308 (2,630,624) - 9,605,657 Vehicles 16,274,917 1,359,654 (1,837,998) (17,846) 15,778,727
Total Capital Assets Being Depreciated 240,162,498 3,242,235 (4,961,996) 2,637,465 241,080,202
Less: Accumulated Depreciation for:Buildings 9,771,455 328,842 (118,525) - 9,981,772 Improvements Other Than Buildings 10,655,176 2,579,349 (130,345) - 13,104,180 Infrastructure 59,293,081 3,325,404 - - 62,618,485 Furniture and Equipment 7,432,148 777,197 (2,564,517) - 5,644,828 Vehicles 13,461,435 919,876 (1,776,170) (17,846) 12,587,295
Total Accumulated Depreciation 100,613,295 7,930,668 (4,589,557) (17,846) 103,936,560
Total Capital Assets, Being Depreciated, Net 139,549,203 (4,688,433) (372,439) 2,655,311 137,143,642
Governmental Activities Capital Assets, Net 164,416,377$ 5,663,029 (372,439) - 169,706,967$
During 2015, the City’s governmental activities recognized approximately $3,459,000 in land contributed by the South Carolina Department of Transportation and other entities. The City has several ongoing construction projects as of June 30, 2015, for renovations and other construction projects. Total remaining commitments on these contracts for both governmental activities and business-type activities were approximately $9,763,000 at June 30, 2015.
57
CITY OF GREENVILLE, SOUTH CAROLINA NOTES TO THE FINANCIAL STATEMENTS YEAR ENDED JUNE 30, 2015 III. DETAILED NOTES ON ALL FUNDS AND ACTIVITIES (CONTINUED) D. Capital Assets (Continued)
Depreciation expense for the City’s governmental activities was charged to the following functions/programs as follows:
Functions/Programs Amount
Governmental Activities:Legislative/Administrative 2,363,571$ Office of Management and Budget 330,326 Police 686,560 Fire 627,694 Public Works 3,541,004 Parks and Recreation 381,513
Total Depreciation Expense - Governmental Activities 7,930,668$
Capital asset activity for the City’s business-type activities for the year ended June 30, 2015, was as follows:
Beginning Ending Balance Increases Decreases Transfers Balance
Business-Type Activities:
Capital Assets, Not Being DepreciatedLand 6,232,324$ 2,980,235 - - 9,212,559$ Construction in Progress 5,483,113 22,129,832 - (723,836) 26,889,109
Total Capital Assets, Not Being Depreciated 11,715,437 25,110,067 - (723,836) 36,101,668
Capital Assets, Being DepreciatedBuildings 91,423,422 - (42,299) - 91,381,123 Improvements Other Than Buildings 8,914,085 46,678 - 723,836 9,684,599 Infrastructure 42,574,605 - - - 42,574,605 Furniture and Equipment 10,218,771 538,598 (511,511) - 10,245,858 Vehicles 5,036,425 405,928 (648,459) 17,846 4,811,740
Total Capital Assets, Being Depreciated 158,167,308 991,204 (1,202,269) 741,682 158,697,925
Less: Accumulated Depreciation for:Buildings 26,930,844 2,128,170 (30,063) - 29,028,951 Improvements Other Than Buildings 1,376,771 394,707 - - 1,771,478 Infrastructure 13,078,386 1,092,304 - - 14,170,690 Furniture and Equipment 6,268,399 1,125,997 (367,779) - 7,026,617 Vehicles 3,872,456 94,867 (450,134) 17,846 3,535,035
Total Accumulated Depreciation 51,526,856 4,836,045 (847,976) 17,846 55,532,771
Total Capital Assets, Being Depreciated, Net 106,640,452 (3,844,841) (354,293) 723,836 103,165,154
Business-Type Activites Capital Assets, Net 118,355,889$ 21,265,226 (354,293) - 139,266,822$
During 2015, the City’s business-type activities recognized approximately $2,980,000 in land contributed by a developer.
58
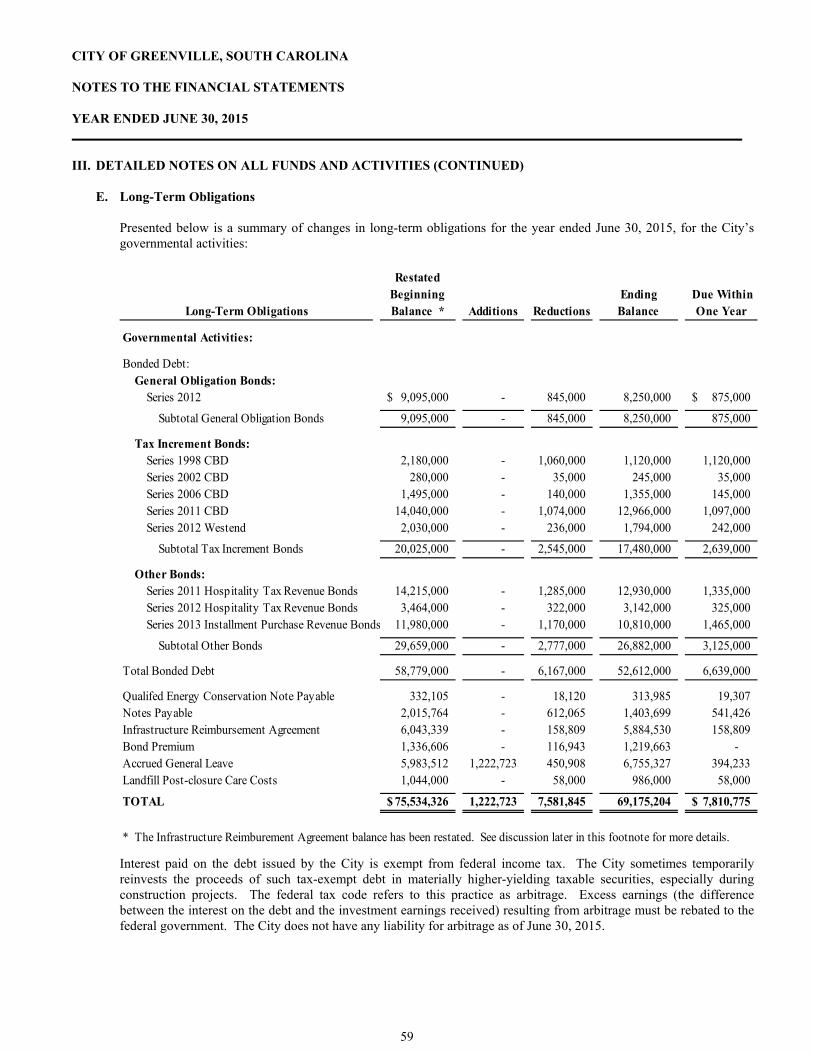
CITY OF GREENVILLE, SOUTH CAROLINA NOTES TO THE FINANCIAL STATEMENTS YEAR ENDED JUNE 30, 2015 III. DETAILED NOTES ON ALL FUNDS AND ACTIVITIES (CONTINUED) E. Long-Term Obligations
Presented below is a summary of changes in long-term obligations for the year ended June 30, 2015, for the City’s governmental activities:
Long-Term Obligations
Restated Beginning Balance * Additions Reductions
Ending Balance
Due Within One Year
Governmental Activities:
Bonded Debt:General Obligation Bonds:
Series 2012 9,095,000$ - 845,000 8,250,000 875,000$
Subtotal General Obligation Bonds 9,095,000 - 845,000 8,250,000 875,000
Tax Increment Bonds:Series 1998 CBD 2,180,000 - 1,060,000 1,120,000 1,120,000 Series 2002 CBD 280,000 - 35,000 245,000 35,000 Series 2006 CBD 1,495,000 - 140,000 1,355,000 145,000 Series 2011 CBD 14,040,000 - 1,074,000 12,966,000 1,097,000 Series 2012 Westend 2,030,000 - 236,000 1,794,000 242,000
Subtotal Tax Increment Bonds 20,025,000 - 2,545,000 17,480,000 2,639,000
Other Bonds:Series 2011 Hospitality Tax Revenue Bonds 14,215,000 - 1,285,000 12,930,000 1,335,000 Series 2012 Hospitality Tax Revenue Bonds 3,464,000 - 322,000 3,142,000 325,000 Series 2013 Installment Purchase Revenue Bonds 11,980,000 - 1,170,000 10,810,000 1,465,000
Subtotal Other Bonds 29,659,000 - 2,777,000 26,882,000 3,125,000
Total Bonded Debt 58,779,000 - 6,167,000 52,612,000 6,639,000
Qualifed Energy Conservation Note Payable 332,105 - 18,120 313,985 19,307 Notes Payable 2,015,764 - 612,065 1,403,699 541,426 Infrastructure Reimbursement Agreement 6,043,339 - 158,809 5,884,530 158,809 Bond Premium 1,336,606 - 116,943 1,219,663 - Accrued General Leave 5,983,512 1,222,723 450,908 6,755,327 394,233 Landfill Post-closure Care Costs 1,044,000 - 58,000 986,000 58,000
TOTAL 75,534,326$ 1,222,723 7,581,845 69,175,204 7,810,775$
* The Infrastructure Reimburement Agreement balance has been restated. See discussion later in this footnote for more details.
Interest paid on the debt issued by the City is exempt from federal income tax. The City sometimes temporarily reinvests the proceeds of such tax-exempt debt in materially higher-yielding taxable securities, especially during construction projects. The federal tax code refers to this practice as arbitrage. Excess earnings (the difference between the interest on the debt and the investment earnings received) resulting from arbitrage must be rebated to the federal government. The City does not have any liability for arbitrage as of June 30, 2015.
59
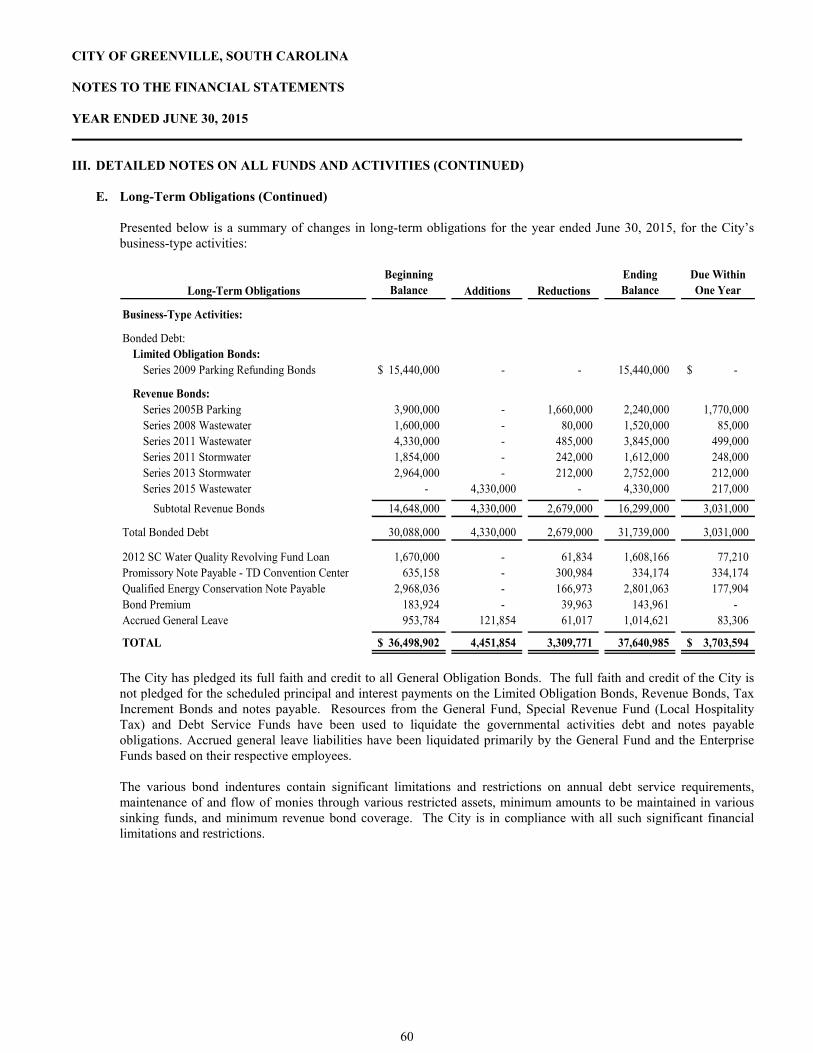
CITY OF GREENVILLE, SOUTH CAROLINA NOTES TO THE FINANCIAL STATEMENTS YEAR ENDED JUNE 30, 2015 III. DETAILED NOTES ON ALL FUNDS AND ACTIVITIES (CONTINUED) E. Long-Term Obligations (Continued)
Presented below is a summary of changes in long-term obligations for the year ended June 30, 2015, for the City’s business-type activities:
Long-Term ObligationsBeginning Balance Additions Reductions
Ending Balance
Due Within One Year
Business-Type Activities:
Bonded Debt:Limited Obligation Bonds:
Series 2009 Parking Refunding Bonds 15,440,000$ - - 15,440,000 -$
Revenue Bonds:Series 2005B Parking 3,900,000 - 1,660,000 2,240,000 1,770,000 Series 2008 Wastewater 1,600,000 - 80,000 1,520,000 85,000 Series 2011 Wastewater 4,330,000 - 485,000 3,845,000 499,000 Series 2011 Stormwater 1,854,000 - 242,000 1,612,000 248,000 Series 2013 Stormwater 2,964,000 - 212,000 2,752,000 212,000 Series 2015 Wastewater - 4,330,000 - 4,330,000 217,000
Subtotal Revenue Bonds 14,648,000 4,330,000 2,679,000 16,299,000 3,031,000
Total Bonded Debt 30,088,000 4,330,000 2,679,000 31,739,000 3,031,000
2012 SC Water Quality Revolving Fund Loan 1,670,000 - 61,834 1,608,166 77,210 Promissory Note Payable - TD Convention Center 635,158 - 300,984 334,174 334,174 Qualified Energy Conservation Note Payable 2,968,036 - 166,973 2,801,063 177,904 Bond Premium 183,924 - 39,963 143,961 - Accrued General Leave 953,784 121,854 61,017 1,014,621 83,306
TOTAL 36,498,902$ 4,451,854 3,309,771 37,640,985 3,703,594$
The City has pledged its full faith and credit to all General Obligation Bonds. The full faith and credit of the City is not pledged for the scheduled principal and interest payments on the Limited Obligation Bonds, Revenue Bonds, Tax Increment Bonds and notes payable. Resources from the General Fund, Special Revenue Fund (Local Hospitality Tax) and Debt Service Funds have been used to liquidate the governmental activities debt and notes payable obligations. Accrued general leave liabilities have been liquidated primarily by the General Fund and the Enterprise Funds based on their respective employees. The various bond indentures contain significant limitations and restrictions on annual debt service requirements, maintenance of and flow of monies through various restricted assets, minimum amounts to be maintained in various sinking funds, and minimum revenue bond coverage. The City is in compliance with all such significant financial limitations and restrictions.
60
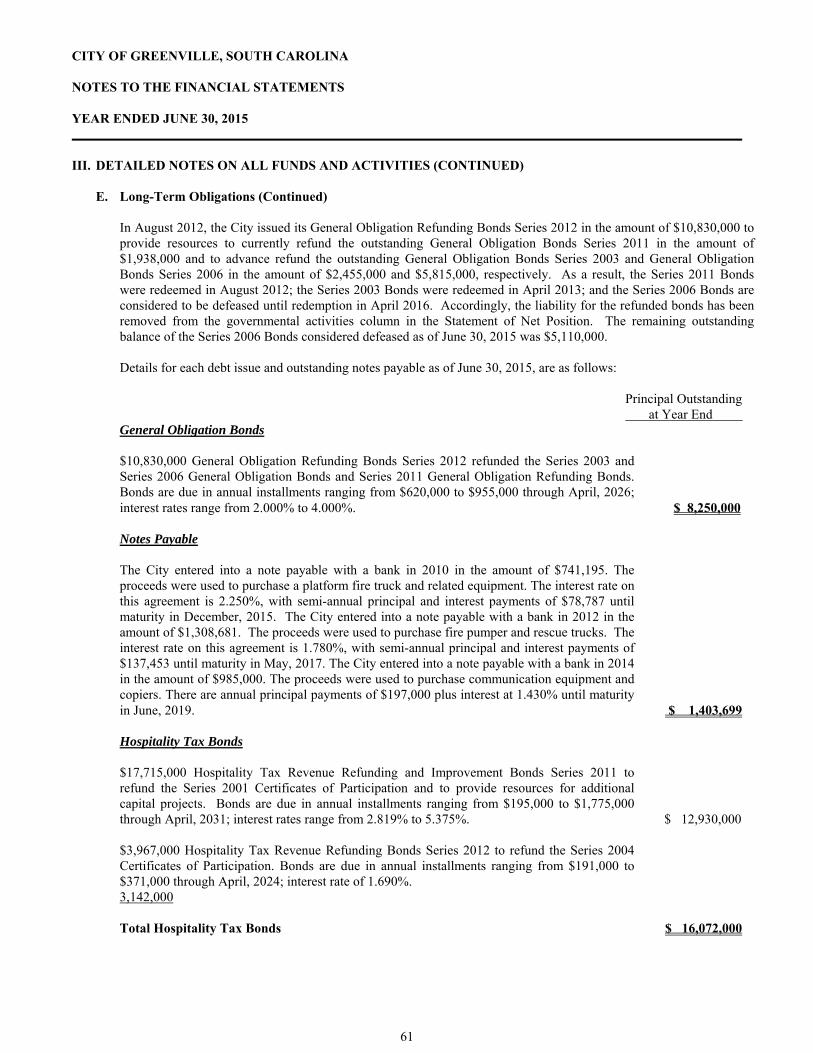
CITY OF GREENVILLE, SOUTH CAROLINA NOTES TO THE FINANCIAL STATEMENTS YEAR ENDED JUNE 30, 2015 III. DETAILED NOTES ON ALL FUNDS AND ACTIVITIES (CONTINUED)
E. Long-Term Obligations (Continued)
In August 2012, the City issued its General Obligation Refunding Bonds Series 2012 in the amount of $10,830,000 to provide resources to currently refund the outstanding General Obligation Bonds Series 2011 in the amount of $1,938,000 and to advance refund the outstanding General Obligation Bonds Series 2003 and General Obligation Bonds Series 2006 in the amount of $2,455,000 and $5,815,000, respectively. As a result, the Series 2011 Bonds were redeemed in August 2012; the Series 2003 Bonds were redeemed in April 2013; and the Series 2006 Bonds are considered to be defeased until redemption in April 2016. Accordingly, the liability for the refunded bonds has been removed from the governmental activities column in the Statement of Net Position. The remaining outstanding balance of the Series 2006 Bonds considered defeased as of June 30, 2015 was $5,110,000. Details for each debt issue and outstanding notes payable as of June 30, 2015, are as follows:
Principal Outstanding at Year End General Obligation Bonds $10,830,000 General Obligation Refunding Bonds Series 2012 refunded the Series 2003 and Series 2006 General Obligation Bonds and Series 2011 General Obligation Refunding Bonds. Bonds are due in annual installments ranging from $620,000 to $955,000 through April, 2026; interest rates range from 2.000% to 4.000%. $ 8,250,000
Notes Payable The City entered into a note payable with a bank in 2010 in the amount of $741,195. The proceeds were used to purchase a platform fire truck and related equipment. The interest rate on this agreement is 2.250%, with semi-annual principal and interest payments of $78,787 until maturity in December, 2015. The City entered into a note payable with a bank in 2012 in the amount of $1,308,681. The proceeds were used to purchase fire pumper and rescue trucks. The interest rate on this agreement is 1.780%, with semi-annual principal and interest payments of $137,453 until maturity in May, 2017. The City entered into a note payable with a bank in 2014 in the amount of $985,000. The proceeds were used to purchase communication equipment and copiers. There are annual principal payments of $197,000 plus interest at 1.430% until maturity in June, 2019. $ 1,403,699
Hospitality Tax Bonds $17,715,000 Hospitality Tax Revenue Refunding and Improvement Bonds Series 2011 to refund the Series 2001 Certificates of Participation and to provide resources for additional capital projects. Bonds are due in annual installments ranging from $195,000 to $1,775,000 through April, 2031; interest rates range from 2.819% to 5.375%. $ 12,930,000 $3,967,000 Hospitality Tax Revenue Refunding Bonds Series 2012 to refund the Series 2004 Certificates of Participation. Bonds are due in annual installments ranging from $191,000 to $371,000 through April, 2024; interest rate of 1.690%. 3,142,000 Total Hospitality Tax Bonds $ 16,072,000
61
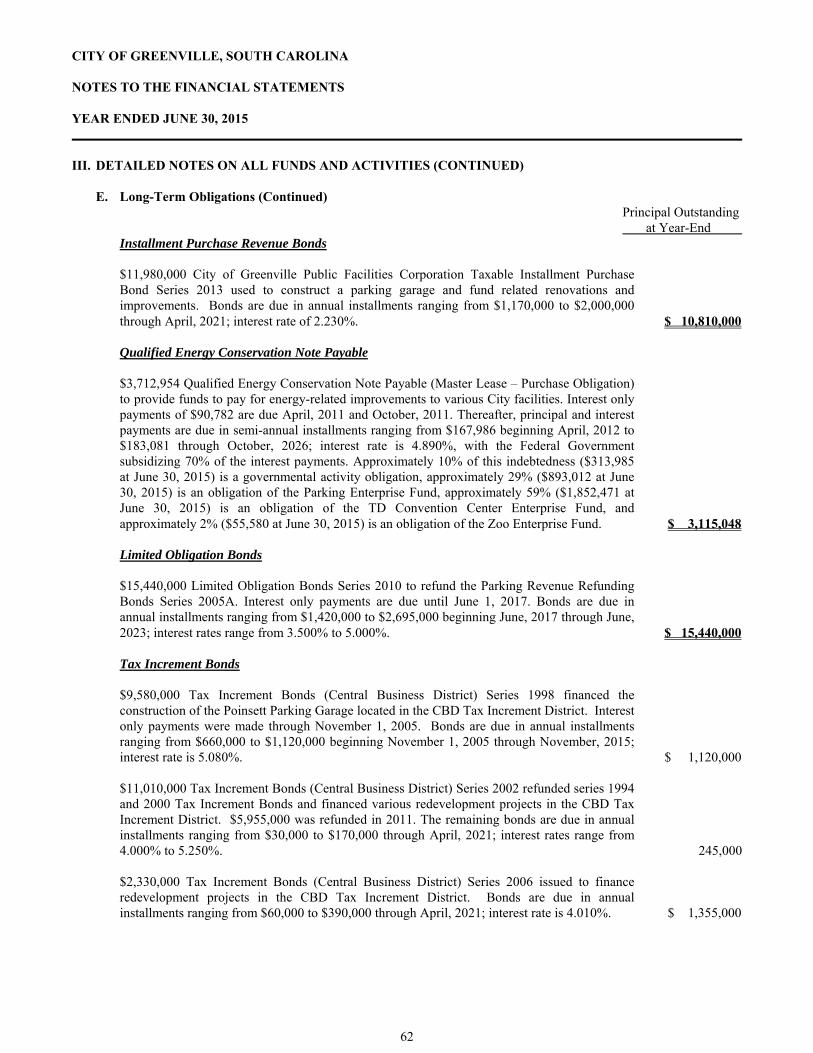
CITY OF GREENVILLE, SOUTH CAROLINA NOTES TO THE FINANCIAL STATEMENTS YEAR ENDED JUNE 30, 2015 III. DETAILED NOTES ON ALL FUNDS AND ACTIVITIES (CONTINUED) E. Long-Term Obligations (Continued)
Principal Outstanding at Year-End
Installment Purchase Revenue Bonds $11,980,000 City of Greenville Public Facilities Corporation Taxable Installment Purchase Bond Series 2013 used to construct a parking garage and fund related renovations and improvements. Bonds are due in annual installments ranging from $1,170,000 to $2,000,000 through April, 2021; interest rate of 2.230%. $ 10,810,000
Qualified Energy Conservation Note Payable $3,712,954 Qualified Energy Conservation Note Payable (Master Lease – Purchase Obligation) to provide funds to pay for energy-related improvements to various City facilities. Interest only payments of $90,782 are due April, 2011 and October, 2011. Thereafter, principal and interest payments are due in semi-annual installments ranging from $167,986 beginning April, 2012 to $183,081 through October, 2026; interest rate is 4.890%, with the Federal Government subsidizing 70% of the interest payments. Approximately 10% of this indebtedness ($313,985 at June 30, 2015) is a governmental activity obligation, approximately 29% ($893,012 at June 30, 2015) is an obligation of the Parking Enterprise Fund, approximately 59% ($1,852,471 at June 30, 2015) is an obligation of the TD Convention Center Enterprise Fund, and approximately 2% ($55,580 at June 30, 2015) is an obligation of the Zoo Enterprise Fund. $ 3,115,048
Limited Obligation Bonds $15,440,000 Limited Obligation Bonds Series 2010 to refund the Parking Revenue Refunding Bonds Series 2005A. Interest only payments are due until June 1, 2017. Bonds are due in annual installments ranging from $1,420,000 to $2,695,000 beginning June, 2017 through June, 2023; interest rates range from 3.500% to 5.000%. $ 15,440,000
Tax Increment Bonds $9,580,000 Tax Increment Bonds (Central Business District) Series 1998 financed the construction of the Poinsett Parking Garage located in the CBD Tax Increment District. Interest only payments were made through November 1, 2005. Bonds are due in annual installments ranging from $660,000 to $1,120,000 beginning November 1, 2005 through November, 2015; interest rate is 5.080%. $ 1,120,000
$11,010,000 Tax Increment Bonds (Central Business District) Series 2002 refunded series 1994 and 2000 Tax Increment Bonds and financed various redevelopment projects in the CBD Tax Increment District. $5,955,000 was refunded in 2011. The remaining bonds are due in annual installments ranging from $30,000 to $170,000 through April, 2021; interest rates range from 4.000% to 5.250%. 245,000
$2,330,000 Tax Increment Bonds (Central Business District) Series 2006 issued to finance redevelopment projects in the CBD Tax Increment District. Bonds are due in annual installments ranging from $60,000 to $390,000 through April, 2021; interest rate is 4.010%. $ 1,355,000
62

CITY OF GREENVILLE, SOUTH CAROLINA NOTES TO THE FINANCIAL STATEMENTS YEAR ENDED JUNE 30, 2015 III. DETAILED NOTES ON ALL FUNDS AND ACTIVITIES (CONTINUED)
E. Long-Term Obligations (Continued)
Principal Outstanding at Year End Tax Increment Bonds (Continued) $15,986,000 Tax Increment Refunding Bond (Central Business District) Series 2011 issued to refund most of the Tax Increment Bonds Series 2002 and Series 2003. Bonds are due in annual installments ranging from $129,000 to $2,483,000 through April, 2021; interest rate is 2.270%. $ 12,966,000
$2,507,000 Tax Increment Refunding Bond (Westend District) Series 2012 issued to refund the Tax Increment Bonds Series 2003. Bonds are due in annual installments ranging from $234,000 to $271,000 through April, 2022; interest rate is 1.470%. 1,794,000 Total Tax Increment Bonds $ 17,480,000
Promissory Note Payable In January 2007, the City entered into an agreement with Carolina First Corporation (“Carolina First”), in which Carolina First agreed to pay the City a total of $3,001,527 over a ten year period for “naming rights” for the Palmetto Expo Center. Accordingly, the name was changed to Carolina First Center. In May 2007, the City entered into a note payable agreement with Carolina First, receiving $2,043,130, which was the net present value of the total payments to be received for the naming rights. This indebtedness has a term of nine years and matures in January 2016; it corresponds to the annual payments to be received for the naming rights. It will be repaid in annual installments ranging from $260,000 to $355,828, which includes interest at an effective rate of 6.48%. The annual payments are equal to the amounts to be received from Carolina First for the naming rights. TD Bank assumed the naming rights sponsorship with its acquisition of Carolina First, and the name was changed to TD Convention Center in July 2011. $ 334,174 South Carolina Water Quality Revolving Fund Loan $1,811,773 South Carolina Water Quality Revolving Fund Loan - 2012 to finance the Haynie Sirrine Collection System Rehabilitation. The Loan is payable from revenues derived by the City from the operations of the wastewater system. Bonds are due in quarterly installments of $31,192, which includes principal and interest at 2.250%, through July, 2032. $ 1,608,166 Revenue Bonds $15,370,000 Revenue Refunding Bonds Series 2005B refunded and defeased Series 1996, Series 1997, Series 1997A and Series 2002 Revenue Bonds; the original bonds were used to fund parking facilities. Bonds are payable from revenues derived by the City from the operations of parking facilities. Bonds are due in annual installments ranging from $350,000 to $1,770,000 through June, 2017; interest rates range from 2.600% to 5.000%. $ 2,240,000
$1,990,000 Revenue Bonds Series 2008 provided resources for improvements to the wastewater system. Bonds are payable from revenues derived by the City from the operations of the wastewater system. Serial bonds are due in annual installments ranging from $55,000 to $155,000 through April, 2028; interest rate is 3.570%. $ 1,520,000
63
CITY OF GREENVILLE, SOUTH CAROLINA NOTES TO THE FINANCIAL STATEMENTS YEAR ENDED JUNE 30, 2015 III. DETAILED NOTES ON ALL FUNDS AND ACTIVITIES (CONTINUED)
E. Long-Term Obligations (Continued)
Principal Outstanding at Year End Revenue Bonds (Continued) $5,612,000 Revenue Refunding Bonds Series 2011 to refund the Sewer Revenue Bonds Series 1999 and to partially refund the Sewer Revenue Bonds Series 2002; the original bonds were used to fund improvements to the wastewater system. Bonds are payable from revenues derived by the City from the operations of the wastewater system. Bonds are due in annual installments ranging from $164,000 to $587,000 through April, 2024; interest rate is 3.185%. $ 3,845,000 $2,576,000 Revenue Refunding Bonds Series 2011 to refund the Stormwater Revenue Bonds Series 2001; the original bonds were used to fund improvements to the stormwater system. Bonds are payable from revenues derived by the City from the operations of the stormwater system. Bonds are due in annual installments ranging from $38,000 to $289,000 through April, 2021; interest rate is 2.973%. 1,612,000 $3,100,000 Revenue Bonds Series 2013 provided resources for (i) reimbursing the City for the cost of acquiring land to be used by the stormwater system; (ii) defraying the cost of the acquisition, construction, installation, renovation and equipping of various capital improvements for the stormwater system and (iii) paying costs of issuance of the Series 2013 Bond. Bonds are payable from revenues derived by the City from the operations of the stormwater system. Bonds are due in annual installments ranging from $136,000 to $212,000 through June, 2028; interest rate is 2.230%. 2,752,000 $4,330,000 Revenue Bonds Series 2015 provided resources for the purposes of financing a portion of the costs of (i) rehabilitating portions of the System related to inflow and infiltration issues and providing increased sewer line capacity to allow future development within several basins throughout the City and (ii) paying Costs of Issuance of such Series 2015 Bond. Bonds are payable from revenues derived by the City from the operations of the wastewater system. Bonds are due in annual installments ranging from $216,000 to $217,000 through April, 2035; interest rate is 2.060%. 4,330,000
Total Revenue Bonds $ 16,299,000
Infrastructure Reimbursement Agreement During 2008, the City entered into a memorandum of understanding with a developer to provide a portion of the funding for the restructuring and development of infrastructure of approximately 1,250 acres located near Verdae Boulevard. Once the improvements have been completed and transferred over to the City, then the City will begin reimbursing the developer on an annual basis for each improvement up to 25% of the annual ad valorem taxes in the area in excess of the ad valorem taxes on those same properties based on taxable values in 2007 prior to the improvements. The reimbursements will continue to be paid until the actual improvement costs have been reimbursed in full or 20 years, with an option for five additional one-year extensions. The memorandum of understanding is subject to annual appropriation and is non-binding to a future City Council. During 2011, the developer conveyed the Hollingsworth Legacy Park to the City. During 2015 the City discovered that the developer had also conveyed Legacy Park Road and Rocky Slope Road to the City in 2009, including the rights of way for these two roads. The value of these two roads and rights of way had not been recorded by the City prior to fiscal 2015. The City corrected this error by increasing the balance of capital assets for governmental activities as of the beginning of fiscal 2015 by approximately $5,517,000, which is net of accumulated depreciation, for the improvements and rights of way that had been conveyed to the City in prior years. 64
CITY OF GREENVILLE, SOUTH CAROLINA NOTES TO THE FINANCIAL STATEMENTS YEAR ENDED JUNE 30, 2015 III. DETAILED NOTES ON ALL FUNDS (CONTINUED)
E. Long-Term Obligations (Continued) Infrastructure Reimbursement Agreement (Continued) The City also determined that it had understated long-term obligations for governmental activities related to this agreement as of the beginning of fiscal 2015 by approximately $3,278,000, which is the total estimated value of the improvements conveyed to and as accepted by the City. Per the memorandum of understanding, the City will not be reimbursing the developer for the value of the rights of way. The net effect of these adjustments was an increase to the beginning net investment in capital assets component of net position for governmental activities by approximately $2,239,000. These corrections had no impact to the City’s governmental funds, operations or cash flows.
The City has reimbursed the developer a total of approximately $549,000 under the terms of this agreement as of June 30, 2015. The outstanding balance on this non-interest bearing agreement as of June 30, 2015 was approximately $5,885,000, which includes approximately $159,000 that management estimates will be reimbursed to the developer during 2016. Debt Service Requirements to Maturity
Following is a summary of debt service requirements to maturity for the City’s outstanding bonds and notes payable.
Year Ended June 30, Principal Interest Totals
Governmental Activities2016 7,199,733$ 1,580,369 8,780,102$ 2017 7,576,825 1,396,358 8,973,183 2018 7,546,811 1,184,476 8,731,287 2019 7,623,131 968,105 8,591,236 2020 7,552,566 757,270 8,309,836
2021-2025 14,595,707 1,294,193 15,889,900 2026-2030 1,949,911 290,709 2,240,620
2031 285,000 15,323 300,323
Totals 54,329,684$ 7,486,803 61,816,487$
Business-Type Activities2016 3,620,288$ 1,299,446 4,919,734$ 2017 3,452,340 1,171,309 4,623,649 2018 3,612,733 1,055,065 4,667,798 2019 3,779,730 915,465 4,695,195 2020 3,958,823 779,300 4,738,123
2021-2025 13,613,334 1,765,223 15,378,557 2026-2030 3,118,470 319,382 3,437,852 2031-2033 1,326,685 73,735 1,400,420
Totals 36,482,403$ 7,378,925 43,861,328$
Debt
65
CITY OF GREENVILLE, SOUTH CAROLINA NOTES TO THE FINANCIAL STATEMENTS YEAR ENDED JUNE 30, 2015 III. DETAILED NOTES ON ALL FUNDS (CONTINUED)
F. Net Investment in Capital Assets During the year ended June 30, 2014, the City issued its Series 2013 City of Greenville Public Facilities Corporation
Taxable Installment Purchase Revenue Bond (the “IPRB”) in the amount of $11,980,000 and transferred the proceeds to its Parking Enterprise Fund to fund a new parking garage and related improvements. The IPRB is reported in the government-wide financial statements’ governmental activities as it will be repaid by governmental activities (Greenville Public Facilities Corporation Special Revenue Fund). The assets, both unexpended debt proceeds and construction in progress, are reported in the business-type activities. In addition, in prior years the City used a portion of the proceeds from its Series 2012 Hospitality Tax Bond and its Series 2011 Hospitality Tax Bond (see Note III.E) to refund debt that was originally used for the purchase of the TD Convention Center and various improvements at this facility. This indebtedness is being repaid by governmental activities (Local Hospitality Tax Special Revenue Fund). Accordingly, approximately $18,043,000 of the outstanding balance of these three bonds at June 30, 2015 is included in the calculation of the governmental activities’ unrestricted net position in the Statement of Net Position, but the net book value of these improvements and the unexpended debt proceeds from the IPRB (net of construction invoices payable and retainage related to expenditures on this project) are included in the business-type activities’ net investment in capital assets and restricted for capital projects. Consequently, the City is including these amounts in an Adjustment column on the Statement of Net Position in order to reflect the correct amount for the City’s total net position components.
G. Transfers In and Out
Transfers are used to (1) move revenues to finance various programs and capital projects that the government must account for in other funds in accordance with budgetary authorizations, including amounts provided as subsidies or matching funds for various grant programs, (2) move recurring budgeted transfers from various funds to the general fund for administrative services, and (3) move revenues to pay for debt service. Transfers in for governmental funds for the year ended June 30, 2015 consisted of the following:
Capital Other TotalGeneral Projects Governmental Governmental
Transfers Out: Fund Fund Funds Funds
Governmental Funds:
General Fund -$ 6,629,927 22,024 6,651,951$ Capital Projects Fund - - 108,508 108,508 Other Governmental Funds 3,521,246 4,061,315 13,096 7,595,657
Total Governental Funds 3,521,246$ 10,691,242 143,628 14,356,116$
Proprietary Funds:
Stormwater Utility Fund 332,052$ - - 332,052$ Wastewater Fund 229,500 - - 229,500 Parking Fund 329,417 400,000 1,560,464 2,289,881 Nonmajor Enterprise Funds - - 2,444 2,444
Total Proprietary Funds 890,969$ 400,000 1,562,908 2,853,877$
Transfers In - Governmental Funds
66
CITY OF GREENVILLE, SOUTH CAROLINA NOTES TO THE FINANCIAL STATEMENTS YEAR ENDED JUNE 30, 2015 III. DETAILED NOTES ON ALL FUNDS (CONTINUED)
G. Transfers In and Out (Continued)
Transfers in for proprietary funds for the year ended June 30, 2015 consisted of the following:
NonmajorTD Convention Enterprise Total
Stormwater Wastewater Parking Center and Internal ProprietaryTransfers Out: Fund Fund Fund Fund Service Funds Funds
Governmental Funds:
General Fund 56,038$ - - - 2,127,308 2,183,346$ Other Governmental Funds 15,115 414,636 1,923,869 1,127,786 395,127 3,876,533
Total Governental Funds 71,153$ 414,636 1,923,869 1,127,786 2,522,435 6,059,879$
Proprietary Funds:
Stormwater Utility Fund -$ 2,242 - - - 2,242$ Wastewater Fund 36,939 - - - - 36,939
Total Proprietary Funds 36,939$ 2,242 - - - 39,181$
Transfers In - Proprietary Funds
IV. OTHER INFORMATION A. Risk Management
The City is exposed to various risks related to torts, theft of, damage to and destruction of assets, errors, omissions, injuries to employees, and natural disaster. The City carries insurance for these risks of loss, including workers’ compensation and employee health and dental insurance.
The City has a health benefits internal service fund for health, dental and benefit services (reestablished in 2014); the City also has a risk management internal service fund for workers’ compensation, general liability, and property damage. These funds are responsible for collecting premiums from departments and employees and for paying claims. Claims are handled by third-party administrators for a fee. These plans include stop-loss provisions which are adjusted annually. Settlements for the last three fiscal years have not exceeded insurance coverage. An estimate for health and dental, workers’ compensation, general liability, and property damage claims that were incurred on or before June 30, 2015 but were unreported at that time has been accrued in the appropriate Internal Service Fund. These estimates are based upon the City’s claims history, claims processed following the close of year end, and other industry factors. The City estimates that approximately $774,000 of the health and dental claims and $2,275,000 of the workers’ compensation and general and other liability claims will be paid within one year.
67
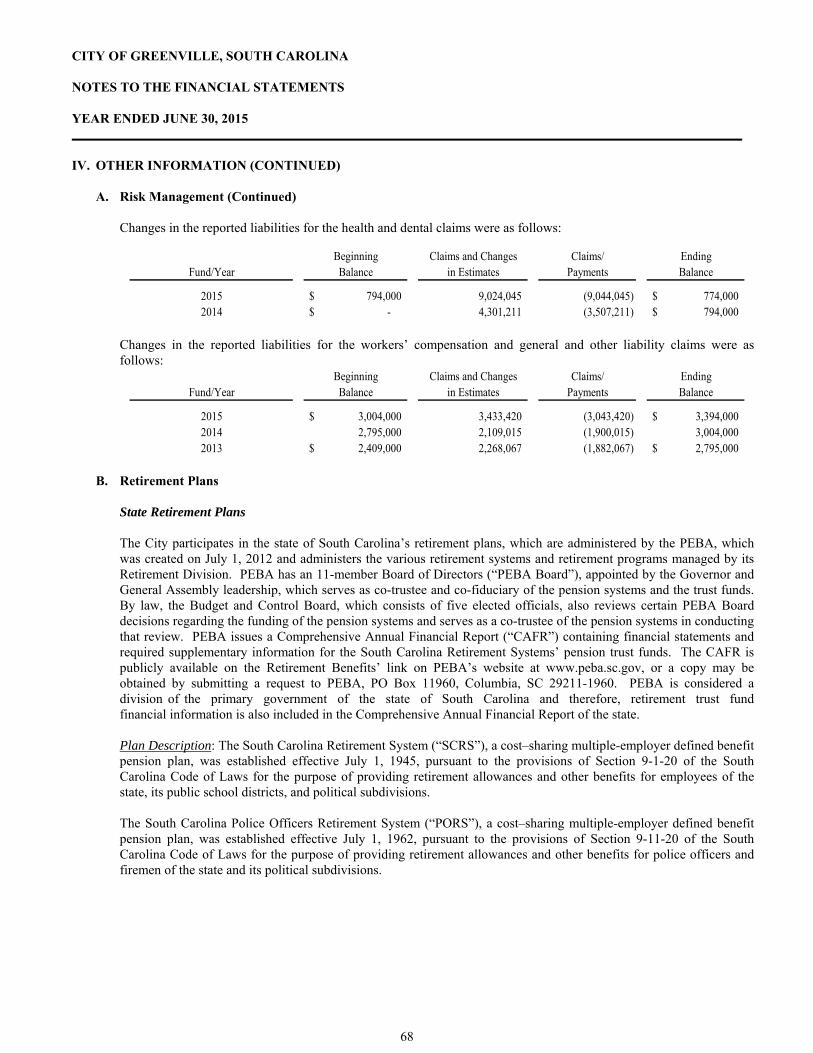
CITY OF GREENVILLE, SOUTH CAROLINA NOTES TO THE FINANCIAL STATEMENTS YEAR ENDED JUNE 30, 2015 IV. OTHER INFORMATION (CONTINUED) A. Risk Management (Continued)
Changes in the reported liabilities for the health and dental claims were as follows:
Beginning Claims and Changes Claims/ EndingFund/Year Balance in Estimates Payments Balance
2015 794,000$ 9,024,045 (9,044,045) 774,000$ 2014 -$ 4,301,211 (3,507,211) 794,000$
Changes in the reported liabilities for the workers’ compensation and general and other liability claims were as follows:
Beginning Claims and Changes Claims/ EndingFund/Year Balance in Estimates Payments Balance
2015 3,004,000$ 3,433,420 (3,043,420) 3,394,000$ 2014 2,795,000 2,109,015 (1,900,015) 3,004,000 2013 2,409,000$ 2,268,067 (1,882,067) 2,795,000$
B. Retirement Plans
State Retirement Plans The City participates in the state of South Carolina’s retirement plans, which are administered by the PEBA, which was created on July 1, 2012 and administers the various retirement systems and retirement programs managed by its Retirement Division. PEBA has an 11-member Board of Directors (“PEBA Board”), appointed by the Governor and General Assembly leadership, which serves as co-trustee and co-fiduciary of the pension systems and the trust funds. By law, the Budget and Control Board, which consists of five elected officials, also reviews certain PEBA Board decisions regarding the funding of the pension systems and serves as a co-trustee of the pension systems in conducting that review. PEBA issues a Comprehensive Annual Financial Report (“CAFR”) containing financial statements and required supplementary information for the South Carolina Retirement Systems’ pension trust funds. The CAFR is publicly available on the Retirement Benefits’ link on PEBA’s website at www.peba.sc.gov, or a copy may be obtained by submitting a request to PEBA, PO Box 11960, Columbia, SC 29211-1960. PEBA is considered a division of the primary government of the state of South Carolina and therefore, retirement trust fund financial information is also included in the Comprehensive Annual Financial Report of the state. Plan Description: The South Carolina Retirement System (“SCRS”), a cost–sharing multiple-employer defined benefit pension plan, was established effective July 1, 1945, pursuant to the provisions of Section 9-1-20 of the South Carolina Code of Laws for the purpose of providing retirement allowances and other benefits for employees of the state, its public school districts, and political subdivisions. The South Carolina Police Officers Retirement System (“PORS”), a cost–sharing multiple-employer defined benefit pension plan, was established effective July 1, 1962, pursuant to the provisions of Section 9-11-20 of the South Carolina Code of Laws for the purpose of providing retirement allowances and other benefits for police officers and firemen of the state and its political subdivisions.
68
CITY OF GREENVILLE, SOUTH CAROLINA NOTES TO THE FINANCIAL STATEMENTS YEAR ENDED JUNE 30, 2015 IV. OTHER INFORMATION (CONTINUED)
B. Retirement Plans (Continued)
State Retirement Plans (Continued) Plan Membership: Membership requirements are prescribed in Title 9 of the South Carolina Code of Laws. A brief summary of the requirements under each system is presented below.
SCRS - Generally, all employees of covered employers are required to participate in and contribute to the system as a condition of employment. This plan covers general employees and teachers and individuals newly elected to the South Carolina General Assembly beginning with the November 2012 general election. An employee member of the system with an effective date of membership prior to July 1, 2012, is a Class Two member. An employee member of the system with an effective date of membership on or after July 1, 2012, is a Class Three member.
PORS - To be eligible for PORS membership, an employee must be required by the terms of his employment,
by election or appointment, to preserve public order, protect life and property, and detect crimes in the state; to prevent and control property destruction by fire; or to serve as a peace officer employed by the Department of Corrections, the Department of Juvenile Justice, or the Department of Mental Health. Probate judges and coroners may elect membership in PORS. Magistrates are required to participate in PORS for service as a magistrate. PORS members, other than magistrates and probate judges, must also earn at least $2,000 per year and devote at least 1,600 hours per year to this work, unless exempted by statute. An employee member of the system with an effective date of membership prior to July 1, 2012, is a Class Two member. An employee member of the system with an effective date of membership on or after July 1, 2012, is a Class Three member.
Plan Benefits: Benefit terms are prescribed in Title 9 of the South Carolina Code of Laws. PEBA does not have the authority to establish or amend benefit terms without a legislative change in the code of laws. Key elements of the benefit calculation include the benefit multiplier, years of service, and average final compensation. A brief summary of benefit terms for each system is presented below.
SCRS - A Class Two member who has separated from service with at least five or more years of earned service is eligible for a monthly pension at age 65 or with 28 years credited service regardless of age. A member may elect early retirement with reduced pension benefits payable at age 55 with 25 years of service credit. A Class Three member who has separated from service with at least eight or more years of earned service is eligible for a monthly pension upon satisfying the Rule of 90 requirement that the total of the member’s age and the member’s creditable service equals at least 90 years. Both Class Two and Class Three members are eligible to receive a reduced deferred annuity at age 60 if they satisfy the five- or eight-year earned service requirement, respectively. An incidental death benefit is also available to beneficiaries of active and retired members of employers who participate in the death benefit program. The annual retirement allowance of eligible retirees or their surviving annuitants is increased by the lesser of one percent or five hundred dollars every July 1. Only those annuitants in receipt of a benefit on July 1 of the preceding year are eligible to receive the increase. Members who retire under the early retirement provisions at age 55 with 25 years of service are not eligible for the benefit adjustment until the second July 1 after reaching age 60 or the second July 1 after the date they would have had 28 years of service credit had they not retired.
69
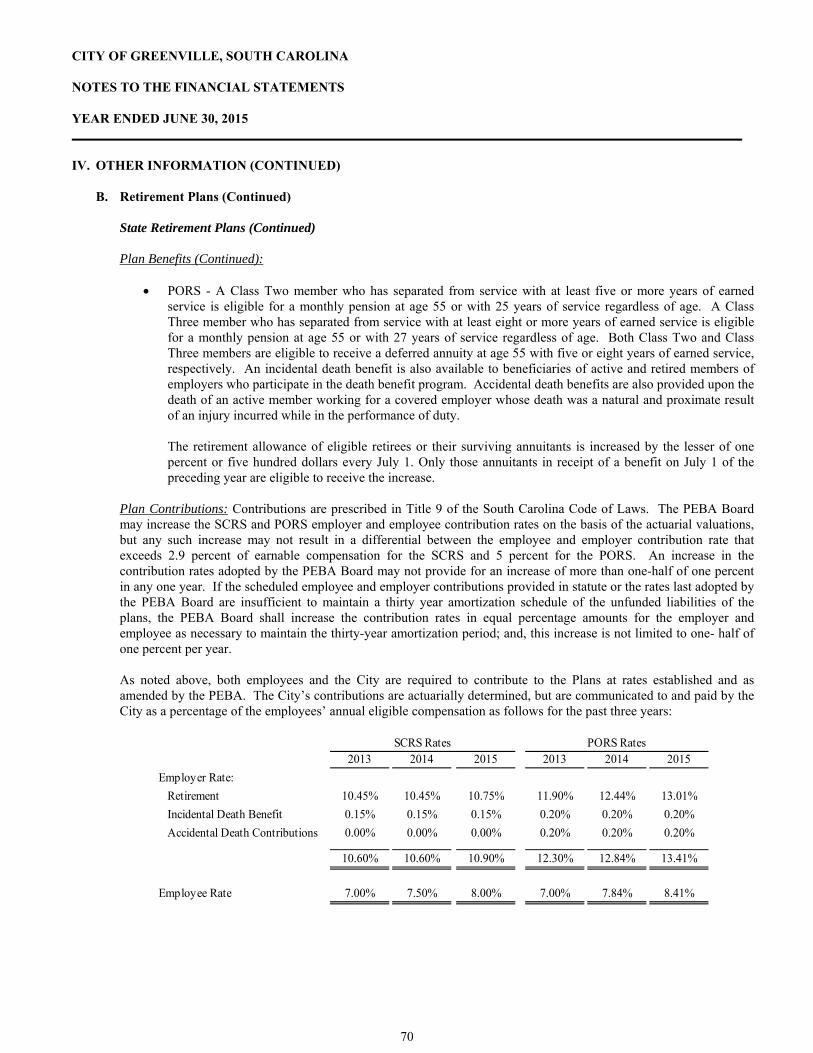
CITY OF GREENVILLE, SOUTH CAROLINA NOTES TO THE FINANCIAL STATEMENTS YEAR ENDED JUNE 30, 2015 IV. OTHER INFORMATION (CONTINUED)
B. Retirement Plans (Continued)
State Retirement Plans (Continued) Plan Benefits (Continued):
PORS - A Class Two member who has separated from service with at least five or more years of earned
service is eligible for a monthly pension at age 55 or with 25 years of service regardless of age. A Class Three member who has separated from service with at least eight or more years of earned service is eligible for a monthly pension at age 55 or with 27 years of service regardless of age. Both Class Two and Class Three members are eligible to receive a deferred annuity at age 55 with five or eight years of earned service, respectively. An incidental death benefit is also available to beneficiaries of active and retired members of employers who participate in the death benefit program. Accidental death benefits are also provided upon the death of an active member working for a covered employer whose death was a natural and proximate result of an injury incurred while in the performance of duty. The retirement allowance of eligible retirees or their surviving annuitants is increased by the lesser of one percent or five hundred dollars every July 1. Only those annuitants in receipt of a benefit on July 1 of the preceding year are eligible to receive the increase.
Plan Contributions: Contributions are prescribed in Title 9 of the South Carolina Code of Laws. The PEBA Board may increase the SCRS and PORS employer and employee contribution rates on the basis of the actuarial valuations, but any such increase may not result in a differential between the employee and employer contribution rate that exceeds 2.9 percent of earnable compensation for the SCRS and 5 percent for the PORS. An increase in the contribution rates adopted by the PEBA Board may not provide for an increase of more than one-half of one percent in any one year. If the scheduled employee and employer contributions provided in statute or the rates last adopted by the PEBA Board are insufficient to maintain a thirty year amortization schedule of the unfunded liabilities of the plans, the PEBA Board shall increase the contribution rates in equal percentage amounts for the employer and employee as necessary to maintain the thirty-year amortization period; and, this increase is not limited to one- half of one percent per year. As noted above, both employees and the City are required to contribute to the Plans at rates established and as amended by the PEBA. The City’s contributions are actuarially determined, but are communicated to and paid by the City as a percentage of the employees’ annual eligible compensation as follows for the past three years:
2013 2014 2015 2013 2014 2015
Employer Rate:
Retirement 10.45% 10.45% 10.75% 11.90% 12.44% 13.01%
Incidental Death Benefit 0.15% 0.15% 0.15% 0.20% 0.20% 0.20%
Accidental Death Contributions 0.00% 0.00% 0.00% 0.20% 0.20% 0.20%
10.60% 10.60% 10.90% 12.30% 12.84% 13.41%
Employee Rate 7.00% 7.50% 8.00% 7.00% 7.84% 8.41%
SCRS Rates PORS Rates
70
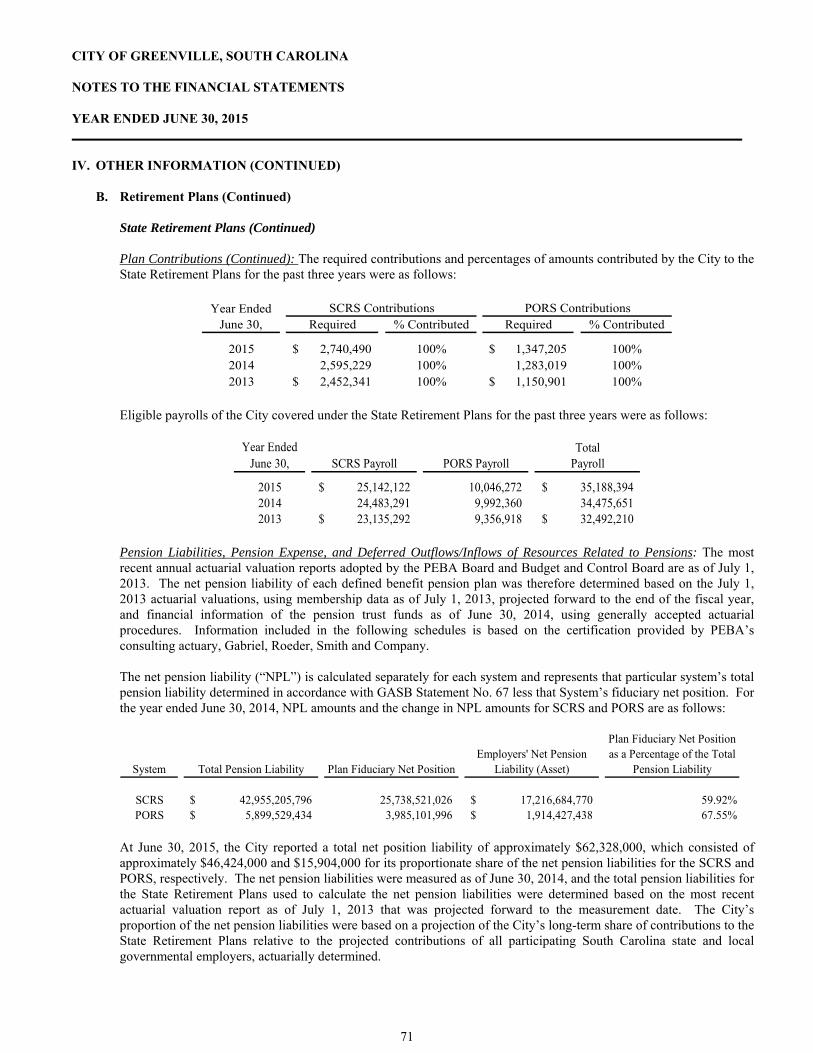
CITY OF GREENVILLE, SOUTH CAROLINA NOTES TO THE FINANCIAL STATEMENTS YEAR ENDED JUNE 30, 2015 IV. OTHER INFORMATION (CONTINUED)
B. Retirement Plans (Continued)
State Retirement Plans (Continued) Plan Contributions (Continued): The required contributions and percentages of amounts contributed by the City to the State Retirement Plans for the past three years were as follows:
Required % Contributed Required % Contributed
2015 2,740,490$ 100% 1,347,205$ 100%2014 2,595,229 100% 1,283,019 100%2013 2,452,341$ 100% 1,150,901$ 100%
SCRS Contributions PORS ContributionsYear Ended June 30,
Eligible payrolls of the City covered under the State Retirement Plans for the past three years were as follows:
TotalSCRS Payroll PORS Payroll Payroll
2015 25,142,122$ 10,046,272 35,188,394$ 2014 24,483,291 9,992,360 34,475,651 2013 23,135,292$ 9,356,918 32,492,210$
Year Ended June 30,
Pension Liabilities, Pension Expense, and Deferred Outflows/Inflows of Resources Related to Pensions: The most recent annual actuarial valuation reports adopted by the PEBA Board and Budget and Control Board are as of July 1, 2013. The net pension liability of each defined benefit pension plan was therefore determined based on the July 1, 2013 actuarial valuations, using membership data as of July 1, 2013, projected forward to the end of the fiscal year, and financial information of the pension trust funds as of June 30, 2014, using generally accepted actuarial procedures. Information included in the following schedules is based on the certification provided by PEBA’s consulting actuary, Gabriel, Roeder, Smith and Company. The net pension liability (“NPL”) is calculated separately for each system and represents that particular system’s total pension liability determined in accordance with GASB Statement No. 67 less that System’s fiduciary net position. For the year ended June 30, 2014, NPL amounts and the change in NPL amounts for SCRS and PORS are as follows:
System Total Pension Liability Plan Fiduciary Net PositionEmployers' Net Pension
Liability (Asset)
Plan Fiduciary Net Position as a Percentage of the Total
Pension Liability
SCRS 42,955,205,796$ 25,738,521,026 17,216,684,770$ 59.92%PORS 5,899,529,434$ 3,985,101,996 1,914,427,438$ 67.55%
At June 30, 2015, the City reported a total net position liability of approximately $62,328,000, which consisted of approximately $46,424,000 and $15,904,000 for its proportionate share of the net pension liabilities for the SCRS and PORS, respectively. The net pension liabilities were measured as of June 30, 2014, and the total pension liabilities for the State Retirement Plans used to calculate the net pension liabilities were determined based on the most recent actuarial valuation report as of July 1, 2013 that was projected forward to the measurement date. The City’s proportion of the net pension liabilities were based on a projection of the City’s long-term share of contributions to the State Retirement Plans relative to the projected contributions of all participating South Carolina state and local governmental employers, actuarially determined.
71
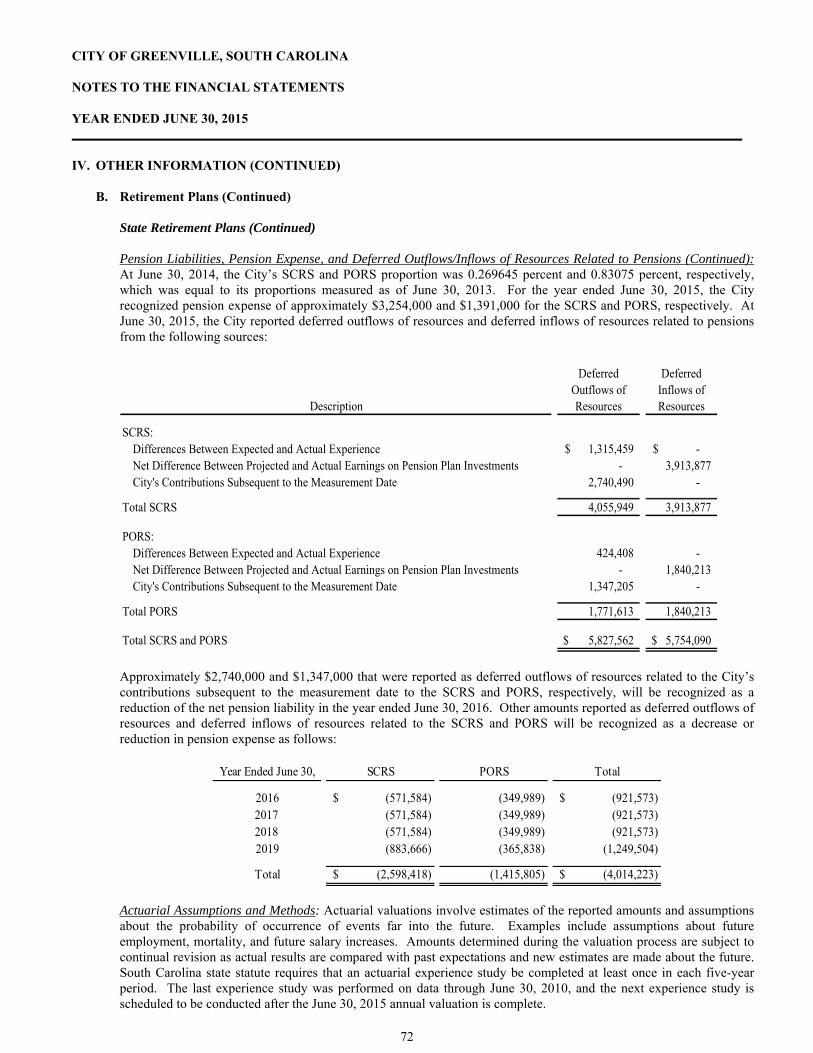
CITY OF GREENVILLE, SOUTH CAROLINA NOTES TO THE FINANCIAL STATEMENTS YEAR ENDED JUNE 30, 2015 IV. OTHER INFORMATION (CONTINUED)
B. Retirement Plans (Continued)
State Retirement Plans (Continued) Pension Liabilities, Pension Expense, and Deferred Outflows/Inflows of Resources Related to Pensions (Continued): At June 30, 2014, the City’s SCRS and PORS proportion was 0.269645 percent and 0.83075 percent, respectively, which was equal to its proportions measured as of June 30, 2013. For the year ended June 30, 2015, the City recognized pension expense of approximately $3,254,000 and $1,391,000 for the SCRS and PORS, respectively. At June 30, 2015, the City reported deferred outflows of resources and deferred inflows of resources related to pensions from the following sources:
Description
SCRS:Differences Between Expected and Actual Experience 1,315,459$ -$ Net Difference Between Projected and Actual Earnings on Pension Plan Investments - 3,913,877 City's Contributions Subsequent to the Measurement Date 2,740,490 -
Total SCRS 4,055,949 3,913,877
PORS:Differences Between Expected and Actual Experience 424,408 - Net Difference Between Projected and Actual Earnings on Pension Plan Investments - 1,840,213 City's Contributions Subsequent to the Measurement Date 1,347,205 -
Total PORS 1,771,613 1,840,213
Total SCRS and PORS 5,827,562$ 5,754,090$
Deferred Outflows of Resources
Deferred Inflows of Resources
Approximately $2,740,000 and $1,347,000 that were reported as deferred outflows of resources related to the City’s contributions subsequent to the measurement date to the SCRS and PORS, respectively, will be recognized as a reduction of the net pension liability in the year ended June 30, 2016. Other amounts reported as deferred outflows of resources and deferred inflows of resources related to the SCRS and PORS will be recognized as a decrease or reduction in pension expense as follows:
Year Ended June 30, SCRS PORS Total
2016 (571,584)$ (349,989) (921,573)$ 2017 (571,584) (349,989) (921,573) 2018 (571,584) (349,989) (921,573) 2019 (883,666) (365,838) (1,249,504)
Total (2,598,418)$ (1,415,805) (4,014,223)$
Actuarial Assumptions and Methods: Actuarial valuations involve estimates of the reported amounts and assumptions about the probability of occurrence of events far into the future. Examples include assumptions about future employment, mortality, and future salary increases. Amounts determined during the valuation process are subject to continual revision as actual results are compared with past expectations and new estimates are made about the future. South Carolina state statute requires that an actuarial experience study be completed at least once in each five-year period. The last experience study was performed on data through June 30, 2010, and the next experience study is scheduled to be conducted after the June 30, 2015 annual valuation is complete.
72
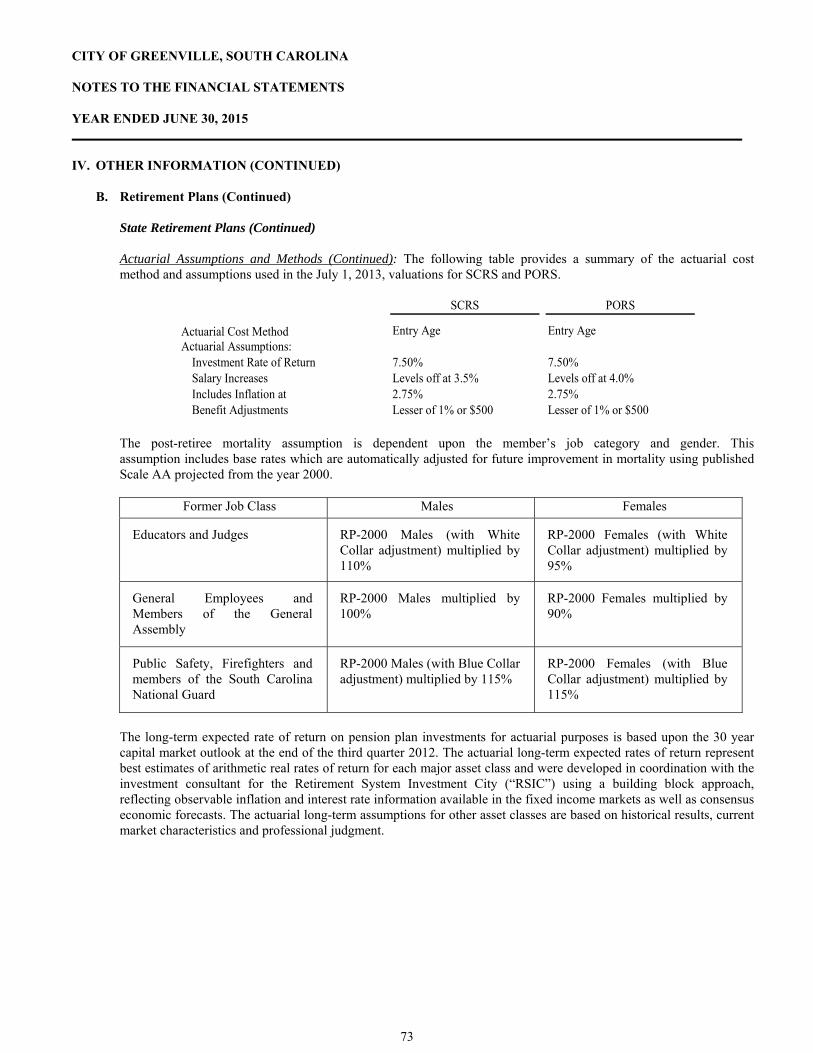
CITY OF GREENVILLE, SOUTH CAROLINA NOTES TO THE FINANCIAL STATEMENTS YEAR ENDED JUNE 30, 2015 IV. OTHER INFORMATION (CONTINUED)
B. Retirement Plans (Continued)
State Retirement Plans (Continued) Actuarial Assumptions and Methods (Continued): The following table provides a summary of the actuarial cost method and assumptions used in the July 1, 2013, valuations for SCRS and PORS.
SCRS PORS
Actuarial Cost Method Entry Age Entry AgeActuarial Assumptions:
Investment Rate of Return 7.50% 7.50%Salary Increases Levels off at 3.5% Levels off at 4.0%Includes Inflation at 2.75% 2.75%Benefit Adjustments Lesser of 1% or $500 Lesser of 1% or $500
The post-retiree mortality assumption is dependent upon the member’s job category and gender. This assumption includes base rates which are automatically adjusted for future improvement in mortality using published Scale AA projected from the year 2000.
Former Job Class Males Females
Educators and Judges RP-2000 Males (with White Collar adjustment) multiplied by 110%
RP-2000 Females (with White Collar adjustment) multiplied by 95%
General Employees and Members of the General Assembly
RP-2000 Males multiplied by 100%
RP-2000 Females multiplied by 90%
Public Safety, Firefighters and members of the South Carolina National Guard
RP-2000 Males (with Blue Collar adjustment) multiplied by 115%
RP-2000 Females (with Blue Collar adjustment) multiplied by 115%
The long-term expected rate of return on pension plan investments for actuarial purposes is based upon the 30 year capital market outlook at the end of the third quarter 2012. The actuarial long-term expected rates of return represent best estimates of arithmetic real rates of return for each major asset class and were developed in coordination with the investment consultant for the Retirement System Investment City (“RSIC”) using a building block approach, reflecting observable inflation and interest rate information available in the fixed income markets as well as consensus economic forecasts. The actuarial long-term assumptions for other asset classes are based on historical results, current market characteristics and professional judgment.
73
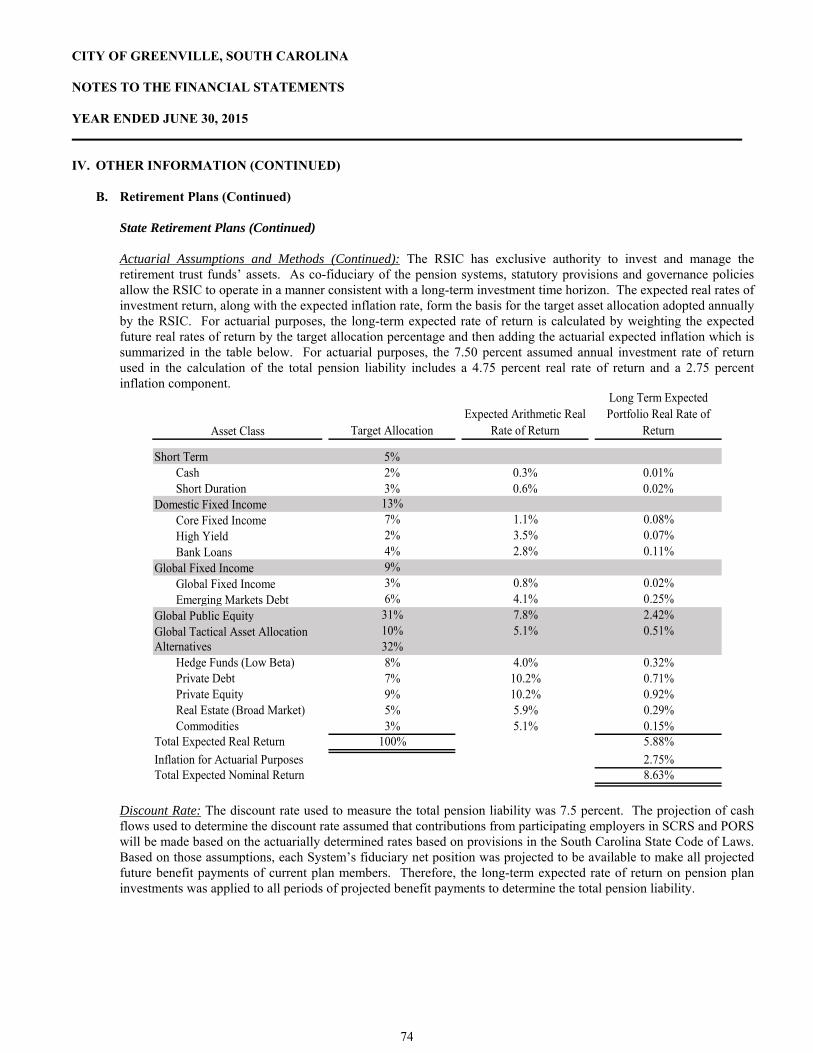
CITY OF GREENVILLE, SOUTH CAROLINA NOTES TO THE FINANCIAL STATEMENTS YEAR ENDED JUNE 30, 2015 IV. OTHER INFORMATION (CONTINUED)
B. Retirement Plans (Continued)
State Retirement Plans (Continued) Actuarial Assumptions and Methods (Continued): The RSIC has exclusive authority to invest and manage the retirement trust funds’ assets. As co-fiduciary of the pension systems, statutory provisions and governance policies allow the RSIC to operate in a manner consistent with a long-term investment time horizon. The expected real rates of investment return, along with the expected inflation rate, form the basis for the target asset allocation adopted annually by the RSIC. For actuarial purposes, the long-term expected rate of return is calculated by weighting the expected future real rates of return by the target allocation percentage and then adding the actuarial expected inflation which is summarized in the table below. For actuarial purposes, the 7.50 percent assumed annual investment rate of return used in the calculation of the total pension liability includes a 4.75 percent real rate of return and a 2.75 percent inflation component.
Asset Class Target AllocationExpected Arithmetic Real
Rate of Return
Long Term Expected Portfolio Real Rate of
Return
Short Term 5%Cash 2% 0.3% 0.01%Short Duration 3% 0.6% 0.02%
Domestic Fixed Income 13%Core Fixed Income 7% 1.1% 0.08%High Yield 2% 3.5% 0.07%Bank Loans 4% 2.8% 0.11%
Global Fixed Income 9%Global Fixed Income 3% 0.8% 0.02%Emerging Markets Debt 6% 4.1% 0.25%
Global Public Equity 31% 7.8% 2.42%Global Tactical Asset Allocation 10% 5.1% 0.51%Alternatives 32%
Hedge Funds (Low Beta) 8% 4.0% 0.32%Private Debt 7% 10.2% 0.71%Private Equity 9% 10.2% 0.92%Real Estate (Broad Market) 5% 5.9% 0.29%Commodities 3% 5.1% 0.15%
Total Expected Real Return 100% 5.88%
Inflation for Actuarial Purposes 2.75%Total Expected Nominal Return 8.63%
Discount Rate: The discount rate used to measure the total pension liability was 7.5 percent. The projection of cash flows used to determine the discount rate assumed that contributions from participating employers in SCRS and PORS will be made based on the actuarially determined rates based on provisions in the South Carolina State Code of Laws. Based on those assumptions, each System’s fiduciary net position was projected to be available to make all projected future benefit payments of current plan members. Therefore, the long-term expected rate of return on pension plan investments was applied to all periods of projected benefit payments to determine the total pension liability.
74
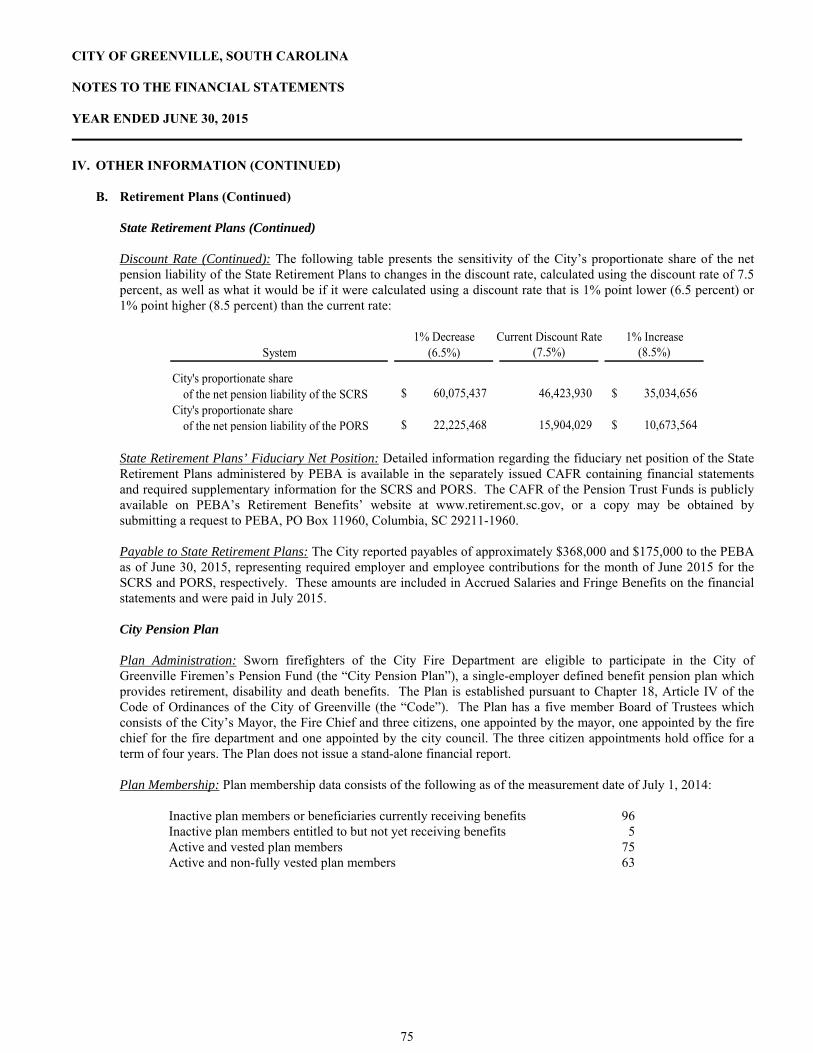
CITY OF GREENVILLE, SOUTH CAROLINA NOTES TO THE FINANCIAL STATEMENTS YEAR ENDED JUNE 30, 2015 IV. OTHER INFORMATION (CONTINUED)
B. Retirement Plans (Continued)
State Retirement Plans (Continued) Discount Rate (Continued): The following table presents the sensitivity of the City’s proportionate share of the net pension liability of the State Retirement Plans to changes in the discount rate, calculated using the discount rate of 7.5 percent, as well as what it would be if it were calculated using a discount rate that is 1% point lower (6.5 percent) or 1% point higher (8.5 percent) than the current rate:
1% Decrease Current Discount Rate 1% IncreaseSystem (6.5%) (7.5%) (8.5%)
City's proportionate share of the net pension liability of the SCRS 60,075,437$ 46,423,930 35,034,656$
City's proportionate share of the net pension liability of the PORS 22,225,468$ 15,904,029 10,673,564$
State Retirement Plans’ Fiduciary Net Position: Detailed information regarding the fiduciary net position of the State Retirement Plans administered by PEBA is available in the separately issued CAFR containing financial statements and required supplementary information for the SCRS and PORS. The CAFR of the Pension Trust Funds is publicly available on PEBA’s Retirement Benefits’ website at www.retirement.sc.gov, or a copy may be obtained by submitting a request to PEBA, PO Box 11960, Columbia, SC 29211-1960. Payable to State Retirement Plans: The City reported payables of approximately $368,000 and $175,000 to the PEBA as of June 30, 2015, representing required employer and employee contributions for the month of June 2015 for the SCRS and PORS, respectively. These amounts are included in Accrued Salaries and Fringe Benefits on the financial statements and were paid in July 2015. City Pension Plan
Plan Administration: Sworn firefighters of the City Fire Department are eligible to participate in the City of Greenville Firemen’s Pension Fund (the “City Pension Plan”), a single-employer defined benefit pension plan which provides retirement, disability and death benefits. The Plan is established pursuant to Chapter 18, Article IV of the Code of Ordinances of the City of Greenville (the “Code”). The Plan has a five member Board of Trustees which consists of the City’s Mayor, the Fire Chief and three citizens, one appointed by the mayor, one appointed by the fire chief for the fire department and one appointed by the city council. The three citizen appointments hold office for a term of four years. The Plan does not issue a stand-alone financial report. Plan Membership: Plan membership data consists of the following as of the measurement date of July 1, 2014:
Inactive plan members or beneficiaries currently receiving benefits 96 Inactive plan members entitled to but not yet receiving benefits 5 Active and vested plan members 75 Active and non-fully vested plan members 63
75
CITY OF GREENVILLE, SOUTH CAROLINA NOTES TO THE FINANCIAL STATEMENTS YEAR ENDED JUNE 30, 2015 IV. OTHER INFORMATION (CONTINUED)
B. Retirement Plans (Continued)
City Pension Plan (Continued)
Benefits Provided: City Fire Department sworn firefighters who retire at or after age 55 with at least 25 years of service are provided benefits equal to 50% of monthly compensation. An additional 2% is provided for each year of service exceeding 25 years but not more than 35 years. An adjustment of up to 6% of the percentage of the benefit is added to the benefit calculation to reflect accrued general leave time. In accordance with the Code, as amended, the City contributes 15.425% and the employee contributes 5.775% of the employee’s salary. The Plan also provides for death and disability benefits as established through adopted Plan provisions. Administrative costs are financed through investment earnings and other contributions. The City prepares the pension checks for the Plan at no cost to the Plan. The benefits are established pursuant to the Code and benefits may not be amended or modified by the Board of Trustees. The Board of Trustees is not authorized to provide for benefit changes, including automatic cost-of-living adjustments and ad hoc postemployment benefit changes, including ad hoc cost-of-living adjustments.
Financial Reporting and Basis of Accounting: The Plan implemented GASB Statement No. 67 (“GASB #67”) in 2014. GASB #67 replaces the requirements of GASB Statements No. 25 and No. 50 as they relate to pension plans that are administered through trusts or equivalent arrangements. GASB #67 establishes standards of financial reporting for plans that issue separate financial reports and also those plans whose financial information is included solely in the financial report of another government as a pension trust fund. GASB #67 specifies the required approach to measuring the pension liability of employers and non-employer contributing entities for benefits provided through the pension plan. The Plan’s financial statements are prepared using the accrual basis of accounting. Plan member contributions are recognized in the period in which the contributions are due. Employer contributions benefit payments, and refunds are all recognized when due and payable.
Investments: The Plan’s policy in regard to the allocation of invested assets, interest rate risk, credit risk, custodial credit risk, investment concentrations, and rate of return is disclosed in Note III.A. Contribution Requirements and Contributions Made: Contributions to the Plan for 2015 of $1,163,399 for the employer and $435,568 for the employees were made in accordance with the Code, which requires a City contribution of 15.425% of covered salaries and an employee contribution of 5.775%. Additional contributions of $184,848 from other entities were also received. Actuarial Assumptions and Methods: The most recent annual actuarial valuation report is as of July 1, 2014. The total pension liability was determined using the actuarial assumptions in the table below, applied to all periods included in the measurement. Updated procedures were used to roll forward the total pension liability to the pension plan’s fiscal year-end of June 30, 2015 from the actuarial assumptions used in the July 1, 2014 valuation. The information is based on the certification provided by the City’s consulting actuary, Stanley, Hunt, Dupree & Rhine, a division of BB&T Insurance Services, Inc.
76
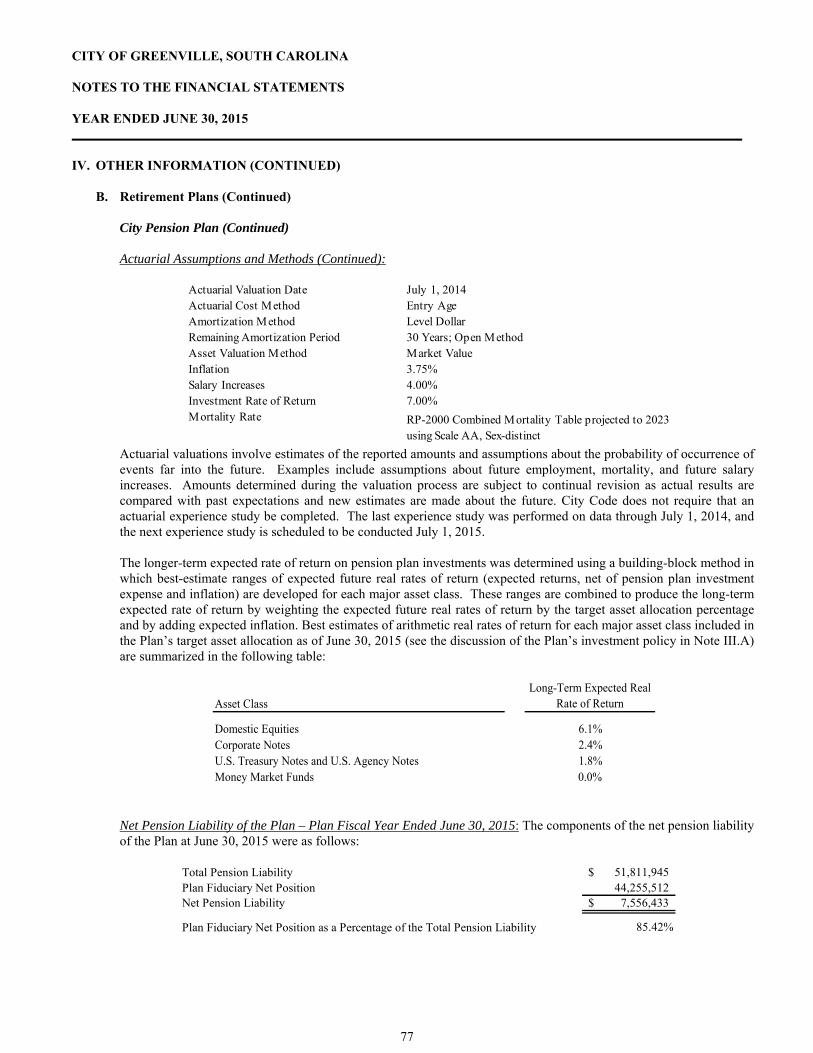
CITY OF GREENVILLE, SOUTH CAROLINA NOTES TO THE FINANCIAL STATEMENTS YEAR ENDED JUNE 30, 2015 IV. OTHER INFORMATION (CONTINUED)
B. Retirement Plans (Continued)
City Pension Plan (Continued)
Actuarial Assumptions and Methods (Continued):
Actuarial Valuation Date July 1, 2014Actuarial Cost Method Entry AgeAmortization Method Level DollarRemaining Amortization Period 30 Years; Open MethodAsset Valuation Method Market ValueInflation 3.75%Salary Increases 4.00%Investment Rate of Return 7.00%Mortality Rate RP-2000 Combined Mortality Table projected to 2023
using Scale AA, Sex-distinct Actuarial valuations involve estimates of the reported amounts and assumptions about the probability of occurrence of events far into the future. Examples include assumptions about future employment, mortality, and future salary increases. Amounts determined during the valuation process are subject to continual revision as actual results are compared with past expectations and new estimates are made about the future. City Code does not require that an actuarial experience study be completed. The last experience study was performed on data through July 1, 2014, and the next experience study is scheduled to be conducted July 1, 2015. The longer-term expected rate of return on pension plan investments was determined using a building-block method in which best-estimate ranges of expected future real rates of return (expected returns, net of pension plan investment expense and inflation) are developed for each major asset class. These ranges are combined to produce the long-term expected rate of return by weighting the expected future real rates of return by the target asset allocation percentage and by adding expected inflation. Best estimates of arithmetic real rates of return for each major asset class included in the Plan’s target asset allocation as of June 30, 2015 (see the discussion of the Plan’s investment policy in Note III.A) are summarized in the following table:
Asset ClassLong-Term Expected Real
Rate of Return
Domestic Equities 6.1%Corporate Notes 2.4%U.S. Treasury Notes and U.S. Agency Notes 1.8%Money Market Funds 0.0%
Net Pension Liability of the Plan – Plan Fiscal Year Ended June 30, 2015: The components of the net pension liability of the Plan at June 30, 2015 were as follows:
Total Pension Liability 51,811,945$ Plan Fiduciary Net Position 44,255,512 Net Pension Liability 7,556,433$
Plan Fiduciary Net Position as a Percentage of the Total Pension Liability 85.42%
77
CITY OF GREENVILLE, SOUTH CAROLINA NOTES TO THE FINANCIAL STATEMENTS YEAR ENDED JUNE 30, 2015 IV. OTHER INFORMATION (CONTINUED)
B. Retirement Plans (Continued)
City Pension Plan (Continued) Discount Rate: The discount rate used to measure the total pension liability was 7.0 percent. The projection of cash flows used to determine the discount rate assumed that employee and employer contributions will be made at the current contribution rates; no contributions from other sources are assumed. Based on these assumptions, the Plan’s fiduciary net position was projected to be available to make all projected future benefit payments of current plan members. Therefore, the long-term expected rate of return on Plan investments was applied to all periods of projected benefit payments to determine the total pension liability.
Sensitivity of the Net Pension Liability as of Plan Fiscal Year End to Changes in the Discount Rate: The following presents the net pension liability of the Plan as of June 30, 2015, calculated using the discount rate of 7.0 percent, as well as what the Plan’s net pension liability would be if it were calculated using a discount rate that is 1-percentage-point lower (6.0 percent) or 1-percentage-point higher (8.0 percent) than the current rate:
1% Decrease (6.0%)
Current Discount Rate
(7.0%)1% Increase
(8.0%)
Plan's Net Pension Liability 14,048,040$ 7,556,433 2,112,114$
City Recognition of Pension Liabilities, Pension Expense, and Deferred Outflows/Inflows of Resources Related to Pensions: As allowed by GASB #68, the City is reporting on its government-wide financial statements its net pension liabilities and related deferred outflows and inflows of resources using information from the City Pension Plan measured as of June 30, 2014. The City Pension Plan’s Total Pension Liability as of June 30, 2014 was $50,553,241, less Plan Fiduciary Net Position of $43,778,976, resulting in a Net Pension Liability of $6,774,265 at June 30, 2014. Accordingly, as of June 30, 2015, the City reported a total net position liability of approximately $6,774,000 for the year ended June 30, 2015, the City recognized pension expense of approximately $664,000. At June 30, 2015, the City reported deferred outflows of resources and deferred inflows of resources related to the City Pension Plan from the following sources:
Description
City Pension Plan:Differences Between Expected and Actual Experience 847,627$ -$ Net Difference Between Projected and Actual Earnings on Pension Plan Investments - 2,128,898 City's Contributions Subsequent to the Measurement Date 1,163,399 -
Total City Pension Plan 2,011,026$ 2,128,898$
Deferred Outflows of Resources
Deferred Inflows of Resources
78
CITY OF GREENVILLE, SOUTH CAROLINA NOTES TO THE FINANCIAL STATEMENTS YEAR ENDED JUNE 30, 2015 IV. OTHER INFORMATION (CONTINUED)
B. Retirement Plans (Continued)
City Pension Plan (Continued) City Recognition of Pension Liabilities, Pension Expense, and Deferred Outflows/Inflows of Resources Related to Pensions (Continued): Approximately $1,163,000 that was reported as deferred outflows of resources as of June 30, 2015 related to the City’s contributions to the City Pension Plan subsequent to the measurement date of June 30, 2014 will be recognized as a reduction of the net pension liability in the year ended June 30, 2016. Other amounts reported as deferred outflows of resources and deferred inflows of resources will be recognized as an increase (decrease) in pension expense as follows:
Year Ended June 30, City Pension Plan
2016 (362,699)$ 2017 (362,699) 2018 (362,699) 2019 (362,701) 2020 169,527
Total (1,281,271)$
C. Other Postemployment Benefits
Plan Description: The City sponsors a single-employer medical insurance subsidy benefit plan (the “OPEB Plan”) that provides payments on behalf of eligible retirees to be used toward the purchase of subsidization or medical insurance provided under the City’s group plan. Employees become eligible when the employee qualifies for the SCRS or PORS and has a minimum age of 60 (age 55 for public safety) with 20 years of service with the City or have a minimum of 28 years of service with the City. Information regarding SCRS and PORS eligibility may be found in the Comprehensive Annual Financial Report as identified in Note IV.B. The OPEB Plan may be changed by City Council at its discretion; the benefit and contribution requirements of the City and plan members are established and amended by City Council. These contributions are neither guaranteed nor mandatory. City Council has retained the right to unilaterally modify its payments toward retiree health care benefits at any time. As of July 1, 2013, the last measurement date, there were 1,090 covered participants; 203 members are retirees receiving benefits and 887 are active participants. The OPEB Plan is affiliated with the South Carolina Other Retirement Benefits Employer Trust (“SCORBET”), an agent multiple-employer irrevocable trust administered by the Municipal Association of South Carolina (“MASC”). Each participating employer is responsible for determining the appropriate amount of contributions to remit to the trust. SCORBET issues a publicly available financial report that includes audited financial statements and required supplementary information for the OPEB Plan. A copy of the report may be obtained by writing to: Financial Manager - Risk Management Services, Municipal Association of South Carolina, P.O. Box 12109, Columbia, South Carolina 29211.
Funding Policy: Prior to January 1, 2009, the City explicitly provided the cost of coverage to retirees prior to and after age 65 and spouses of retirees prior to age 65 covering 75% of the total premium. On January 1, 2009, the City changed the plan to cover only current and future retirees under age 65; spousal coverage will no longer be subsidized. In addition, the amount paid by the City for retirees under age 65 has been set at fixed amounts.
79

CITY OF GREENVILLE, SOUTH CAROLINA NOTES TO THE FINANCIAL STATEMENTS YEAR ENDED JUNE 30, 2015 IV. OTHER INFORMATION (CONTINUED) C. Other Postemployment Benefits (Continued)
Funding Policy (Continued): The amount of the benefit will be reviewed periodically and may be adjusted by the City Manager subject to the availability of funds. Additionally, the City will provide a fixed dollar subsidy to eligible retirees who retired on or before December 31, 2008, after becoming eligible for Medicare to be used towards the retiree’s Medicare Supplemental Plan and prescription drug coverage. Prior to January 1, 2009, the City contributed from $257.11 to $838.96 monthly depending on coverage election per retiree. After January 1, 2009, the City contributed from $289.50 to $321.07 monthly depending on the coverage election per retiree under age 65. For retirees over age 65, the monthly contribution per retiree varied by age from $100 to $175.
The City’s annual other postemployment benefits (“OPEB”) cost (expense) is calculated based on the annual required contribution (“ARC”) of the employer, an amount actuarially determined in accordance with the parameters of GASB Statement No. 45. The ARC represents a level of funding that, if paid on an ongoing basis, is projected to cover normal cost each year and amortize any unfunded actuarial liabilities (or funding excess) over a period not to exceed 30 years. The current ARC rate is based on a level percent of payroll increasing annually at 2.75% and is 2.27% of covered payroll. Actuarial Methods and Assumptions: Actuarial valuations of an ongoing plan involve estimates of the value of reported amounts and assumptions about the probability of occurrence of events far into the future. Examples include assumptions about future employment, mortality, and the healthcare cost trend. Amounts determined regarding the funded status of the OPEB Plan and the annual required contributions of the employer are subject to continual revision as actual results are compared with past expectations and new estimates are made about the future. The schedule of funding progress is presented as required supplementary information following the notes to the financial statements. Projections of benefits for financial reporting purposes are based on the substantive OPEB Plan (the plan as understood by the employer and the plan members) and include the types of benefits provided at the time of each valuation and the historical pattern of sharing of benefit costs between the employer and plan members to that point. The actuarial methods and assumptions used include techniques that are designed to reduce the effects of short-term volatility in actuarial accrued liabilities and the actuarial value of assets, consistent with the long-term perspective of the calculations. The asset valuation method used is market value. The SCORBET trust’s actuarial consultants intend to use a smoothing method over a 5 year period with an assumed investment rate of return of 5.0%. The OPEB Plan’s UAAL is being amortized as a level percent of pay on an open basis. The remaining amortization period at June 30, 2015 was 30 years. The following changes have been made in the valuation performed as of July 1, 2013 compared to the valuation performed as of July1, 2011: (1) Changes in PORS and SCRS eligibility conditions for members hired on or after July 1, 2012; (2) Claims costs have been updated; (3) Change in medical trend, discount rate and inflation assumption; and (4) Change in actuarial assumptions to reflect the new decrements set forth in the 2011 Experience Study for the SCRS and PORS pension plans.
80
CITY OF GREENVILLE, SOUTH CAROLINA NOTES TO THE FINANCIAL STATEMENTS YEAR ENDED JUNE 30, 2015 IV. OTHER INFORMATION (CONTINUED) C. Other Postemployment Benefits (Continued)
Actuarial Methods and Assumptions (Continued): The following table summarizes the key actuarial assumptions and cost method: Actuarial Valuation Date: July 1, 2013
Actuarial Cost Method: Projected Unit Credit
Amortization Method: Level Percent of Pay, Open
Amortization Period: 30 Years
Actuarial Assumptions:Investment Rate of Return: 5.0% annual return, net of both investment and non-actuarial administrative expenses
(includes inflation at .75%)Health Cost Trend: 8.5% to 5.0% in 0.5% annual steps
Payroll Growth 2.75% per yearCoverage Elections: 90% of eligible retirees will elect coverage and 30% of those will elect to cover their
spouseActive Participant Marriage Assumption 100% of all active employees are assumed to be married with female spouses assumed to
be 3 years younger (SCRS), 100% of all active employees are assumed to be marriedwith female spouses assumed to be 4 years younger (PORS), and 75% of all activemembers are assumed to be married with female spouses assumed to be 3 years younger(Firemen's Pension)
Mortality Table: UP-94 (PORS) and RP 2000 (SCRS and Firemen's Pension) Annual OPEB Costs and Rollforward of Net OPEB Obligation: The annual OPEB cost (expense) and the progression of the net OPEB obligation in the OPEB Plan for the most recent plan year (fiscal year 2015) was as follows:
1. Net OPEB Obligation (Asset), Beginning of the Plan Year -$ 2. One Year's Interest on the Net Pension Obligation - 3. Annual Required Contribution (Normal Cost Plus Any Amortization Payments) 870,505 4. Adjustment to Annual Required Contribution -
5. Annual Pension Cost: (2)+(3)+(4) 870,505 6. Contributions Made for the Plan Year 870,505
7. Increase (Decrease) in Net Pension Obligation (Asset): (5)-(6) -
8. Net Pension Obligation (Asset), End of the Plan Year: (1)+(7) -$
Schedule of Employer Contributions: Contributions for 2015 are comprised solely of payments made by the City for covered participants’ explicit subsidized benefits. There is no implicit subsidized benefits as the City is self-funded for its health and dental insurance.
81
CITY OF GREENVILLE, SOUTH CAROLINA NOTES TO THE FINANCIAL STATEMENTS YEAR ENDED JUNE 30, 2015 IV. OTHER INFORMATION (CONTINUED) C. Other Postemployment Benefits (Continued)
Schedule of Employer Contributions (Continued): Annual OPEB cost, annual OPEB cost contributed, percentage of annual OPEB cost contributed to the OPEB Plan, and the net OPEB obligation (asset) for the past three years were as follows:
Applicable to Fiscal Year Ending Annual OPEB Cost
Annual OPEB Cost Contributed
Percentage of Annual OPEB Cost Contributed
Net OPEB Obligation (Asset)
June 30, 2015 870,505$ 870,505 100.00% -$ June 30, 2014 1,016,832 1,016,832 100.00% - June 30, 2013 987,459$ 987,459 100.00% -$
Schedule of Employer Contributions
Schedule of Funding Progress: This schedule will provide trend information about whether the actuarial values of OPEB Plan assets are increasing or decreasing over time relative to the actuarial accrued liabilities for benefits. The schedule of funding progress for the OPEB Plan is as follows:
Actuarial Valuation
Actuarial Value of Assets
Actuarial Accrued
Liability (AAL)Unfunded AAL
(UAAL) Funded Ratio Covered Payroll
UAAL as a Percentage of
Covered PayrollDate (a) (b) (b-a) (a/b) ( c ) ((b-a)/c)
July 1, 2013 472,272$ 10,953,985 10,481,713 4.31% 38,260,885$ 27.40%July 1, 2011 211,899 11,847,438 11,635,539 1.79% 31,688,914 36.72%July 1, 2009 -$ 9,535,600 9,535,600 0.00% 33,480,200$ 28.48%
Schedule of Funding Progress
D. Commitments and Contingencies
The City receives financial assistance from numerous federal, state, and local governmental agencies in the form of grants. Disbursements of funds received under these programs generally require compliance with the terms and conditions specified in the grant agreements. The disbursements are also subject to audit by the grantor agencies. Any disallowed claims resulting from such audits could become a liability of the General Fund or other applicable funds. However, in the opinion of management, any such disallowed claims will not have a material effect on the financial condition of the City at June 30, 2015.
Greenville Transit Authority: Effective March 31, 2008, the City entered into an agreement with the Greenville Transit Authority (“GTA”) to manage the operations of this entity. This arrangement is intended to provide a reduction in transit operational costs through economies of scale by merging transit administration, support services and operations with other City services. The expenses incurred by the City in providing these services are charged to the GTA at the City’s cost. The initial term of the agreement ended June 30, 2008. The City and GTA executed a new agreement with a term through June 30, 2013, which included an option to renew for an additional five years. In July 2013, the City and GTA executed a new agreement, effective July 1, 2013 and continuing through June 30, 2018. All expenditures incurred by the City and charged to the GTA through June 30, 2015 have been reimbursed by the GTA as of the date of the issuance of these financial statements.
82
CITY OF GREENVILLE, SOUTH CAROLINA NOTES TO THE FINANCIAL STATEMENTS YEAR ENDED JUNE 30, 2015 IV. OTHER INFORMATION (CONTINUED)
D. Commitments and Contingencies (Continued) Greenville Transit Authority (Continued): At June 30, 2014, the GTA had a negative unrestricted net position of $115,028 primarily attributable to the forfeiture of capital grants in connection with the demolition of a GTA owned building that was not fully depreciated. The City has no contractual obligation to fund any negative unrestricted net position of the GTA. The City anticipates the negative unrestricted net position of the GTA to improve from favorable operating activities as well as the sale of real property.
Reedy Square Project: In June 2010, the City approved a resolution of intent to provide up to $3.5 million in financial support to the Reedy Square project, contingent upon the attainment of eighty-five percent of the overall fund raising goals of the project from private sector contributions. Financial support for the project will be provided from Local Accommodations Taxes that are in excess of the debt service requirements on the Greenville Arena District debt that was issued to finance the construction of the arena. The City’s intent is to issue debt that will be repaid from the excess Local Accommodations Taxes. No City action has been taken at the close of the fiscal year as the established fundraising goals have not been attained to date. Project One: On July 22, 2013, City Council authorized the execution of an agreement with a developer for development of approximately 1.28 acres located on the northwest corner of the intersection of West Washington Street and Richardson Street in the City’s central business district. Pursuant to the terms of the agreement, the developer will demolish certain existing improvements and construct or cause to be constructed on a portion of the land a hotel expected to have approximately 125 rooms in air space parcels above a City parking facility and no less than 35,000 square feet comprised of retail shops, office, and residential space. The agreement provides for the developer to design and construct the City parking facility (the “Project One”) containing approximately 470 spaces with the City purchasing the parking facility in an amount not to exceed $11,500,000. The City will own, operate and manage the parking facility. On December 18, 2013, the City of Greenville Public Facilities Corporation (the “Corporation”) issued its $11,980,000 Taxable Installment Purchase Revenue Bond, Series 2013 (the “Series 2013 Bond”) pursuant to an Indenture dated December 1, 2013, between the Corporation and TD Bank, N.A. The Corporation simultaneously entered into a Municipal Facilities Purchase and Occupancy Agreement (the “Facilities Agreement”) dated as of December 1, 2013, with the City, pursuant to which the Corporation agreed with respect to the parking facility to make certain improvements on the real property which the City will purchase under the provisions of the Facilities Agreement and the City will be entitled to occupy the parking facility upon completion. The proceeds of the Series 2013 Bond, net of issuance cost, were transferred from the Greenville Public Facilities Corporation Special Revenue Fund to the Parking Enterprise Fund during fiscal year 2014. The parking facility is expected to open in the fall of 2015. At June 30, 2015, approximately $10,814,690 had been expended on the parking facility. Unexpended Series 2013 Bond proceeds totaled approximately $1,432,000 at June 30, 2015. The City anticipates refunding the Series 2013 Bond in the fall of 2015 with its Taxable Installment Purchase Revenue Bond, Series 2015 (the “Series 2015 Bond”). See Subsequent Events for a more complete discussion of the Series 2015 Bond. RiverPlace 2B Project: On January 13, 2014, City Council authorized the execution of an agreement with a developer for development (the “RiverPlace 2B Project”) of approximately 2.1 acres located in the City’s downtown at the intersection of Hammond and River Streets, with frontage along the Reedy River. Pursuant to the terms of the agreement, the developer will construct or cause to be constructed on a portion of the land (a) a parking facility containing approximately 266 spaces, (b) two public plazas to be located above the parking facility (hereinafter, (a) and (b) when addressed collectively are referenced as “Public Improvements”, (c) a hotel expected to have approximately 150 rooms above portions of the Public Improvements, (d) a retail building along the river walk of approximately 6,000 sq. ft., (e) a residential structure containing approximately 30,000 sq. ft. of residential space above portions of the Public Improvements, and (f) a future mixed use development. The agreement provides for the developer to design and construct the Public Improvements with the City purchasing the Public Improvements in an amount not to exceed $12,600,000. The City will own, operate, maintain and manage the Public Improvements.
83
CITY OF GREENVILLE, SOUTH CAROLINA NOTES TO THE FINANCIAL STATEMENTS YEAR ENDED JUNE 30, 2015 IV. OTHER INFORMATION (CONTINUED)
D. Commitments and Contingencies (Continued) RiverPlace 2B Project (Continued): At June 30, 2015, the Parking Enterprise Fund contains an appropriation of $10,562,000 for the parking facility comprised of special revenue and debt service funds fund balance, unrestricted net position of the Parking Enterprise Fund and proceeds of a future debt financing in the amount of $6,260,000. The accounting and financial reporting activity associated with the two public plazas is reflected in the Capital Projects Fund with a budget of $2,390,000 and funding provided by a transfer from a debt service fund. At June 30, 2015, approximately $8,098,808 and $1,030,975 had been expended on the parking facility and public plazas, respectively. The City anticipates restructuring the financing of this garage. See Subsequent Events for a more complete discussion. Greenville Zoo Commitment: On April 14, 2014, the City approved a resolution of intent to provide up to $3 million in financial support from tourism related funds over the period 2014-2019 for implementation of the first phase, estimated at $12-$15 million, of the Greenville Zoo Master Plan. The Friends of the Greenville Zoo, a non-profit corporation organized under the laws of South Carolina created for the primary purpose of cooperating with and raising funds to support the Greenville Zoo, has embarked on a fundraising campaign with the goal of obtaining $9-$12 million in private and grant contributions representing about 75-80 percent of the first phase costs. At June 30, 2015, the City has not appropriated any tourism related funds related to this commitment. The fiscal year 2015-16 Zoo Enterprise Fund adopted budget contains a $1 million appropriation from unrestricted net position. The remaining $2 million City financial commitment will occur in fiscal years 2016-17 and 2017-18 from Hospitality Special Revenue Fund. The financial balances and activity of the Friends of the Greenville Zoo are not material for the City to include them as a discretely presented component unit at this time. Greenlink Greenway Commitment: On January 12, 2015, City Council approved a resolution to support Greenville County’s plans to construct the Greenlink Greenway by stating its intent to provide $2.5 million in funds to construct the Greenlink Greenway contingent upon pedestrian bridges being constructed over Laurens Road, Haywood Road and Verdae Boulevard as part of a County project. City funding will be provided once Greenville County has executed a contract to construct the trail, provided Greenville County has contracted for construction of the project on or before December 31, 2016. The fiscal year 2015 Capital Improvement Program provided $1 million of financial support with the fiscal year 2016 Capital Improvement Program providing the balance of the commitment in the amount of $1.5 million. Additionally, on May 18, 2015, the City Council affirmed its $2.5 million match commitment for the Greenlink Greenway operational and maintenance commitment toward a regional multimodal transportation network in connection with a federal TIGER VII grant application. Encumbrances – The City had total encumbrances outstanding of approximately $11,081,000 at June 30, 2015, which consisted of the following:
General Fund – $560,000 Capital Projects Fund – $3,878,000 Other Governmental Funds – $407,000 Stormwater Utility Fund - $856,000 Wastewater Fund - $1,142,000 Parking Fund - $3,982,000 Solid Waste Fund - $172,000 Other Proprietary Funds - $84,000
E. Conduit Debt
The Greenville Water System (the “GWS”) issued several revenue and/or refunding bonds in the name of the City. At June 30, 2015, the outstanding balances on these bonds totaled $83,195,000. The bonds are payable solely from the gross revenues derived from the operation of the GWS after first paying operation and maintenance of the GWS. The bonds are secured by a statutory lien upon the GWS granted by the bond ordinances. The City is not obligated in any manner for repayment of the bonds. Accordingly, the bonds are not reported as liabilities in the accompanying financial statements.
84
CITY OF GREENVILLE, SOUTH CAROLINA NOTES TO THE FINANCIAL STATEMENTS YEAR ENDED JUNE 30, 2015 IV. OTHER INFORMATION (CONTINUED)
F. Litigation
In January, 2015, the City received notice from the Greenville County School District and the County of Greenville that a dispute existed concerning the City’s three (3) tax increment financing (“TIF”) districts. The dispute centers on the City’s use of TIF revenues to pay eligible project costs directly, rather than through debt issuance, as well as the funding estimates provided in the City’s TIF plans, as amended. The City denies any liability. The City and the School District reached an agreement which included a full release of all claims and a prospective TIF revenue sharing arrangement. See Subsequent Events Footnote for a more complete discussion of the settlement. The City is optimistic that it will reach an agreement with the County of Greenville on no less favorable terms in the near future. In 2007, the City revoked the business license for a motel due to the excessive number of police calls to the establishment. Litigation followed and after a series of procedural rulings at the trial and appellate court levels, the South Carolina Court of Appeals held the City acted properly in revoking the business license, thereby ending the case. During the pendency of the litigation focused on the business license revocation, the owner brought a second suit for damages against the City in the Circuit Court where he alleged he lost his home, his business and the property which was foreclosed upon by the bank. The owner sought actual and punitive damages, along with attorneys’ fees and costs. The aforementioned Court of Appeals ruling renders the viability of the claims asserted in the second lawsuit questionable. Further, the Plaintiff has dismissed the second case under Rule 40(j) of the South Carolina Rules of Civil Procedure which requires a litigant to restore the case with one year or it is forever barred. The City denies liability to the plaintiff and intends to vigorously defend the case should Plaintiff elect to restore it.
The City is routinely the subject of litigation by a variety of plaintiffs. Although the outcome of these other claims is not presently determinable, it is the opinion of the City’s management and attorney that resolution of these matters, either individually or in the aggregate, will not have a material adverse effect on the financial condition of the City.
G. Related Party Transactions
The City uses Haynsworth Sinkler Boyd, PA as its bond counsel. The Mayor is a partner in this firm. The City paid approximately $49,000 to this firm during the year ended June 30, 2015 for services rendered in connection with various bond issues.
Effective July 1, 2010, the City entered into an agreement with Talent Management Solutions (“TMS”) to provide temporary employment services to the City, including temporary personnel for the Transit Fund. This agreement was for one year, with successive one year terms. The owner and president of TMS is a member of the Board of Directors for the GTA. The City paid approximately $889,000 to TMS for these services during the year ended June 30, 2015.
H. Deficit Balances in Non-major Funds
The Special Revenue – HOPWA Fund had a deficit fund balance of $22,000 at June 30, 2015. The Transit, Solid Waste, and Event Management Enterprise Funds had deficit net positions of approximately $3,978,000, $1,495,000 and $323,000, respectively, due to the implementation of GASB #68/71 in the year ended June 30, 2015.
I. Subsequent Events
On July 13, 2015, the City Council approved a Development Agreement with Broad Street Office, LLC for the EP Campus. The redevelopment of the property situated on the northeast corner of the intersection of East Broad Street and Falls Street in the City’s Central Business District will be completed by Broad Street Office, LLC, (the “Developer”), or its affiliate which owns or controls those certain parcels of land with improvements thereon. The Developer intends to construct and develop a mixed use development known as the EP Campus. The EP Campus will consist of the renovated SunTrust Building, renovated office buildings, a five story mixed use building, a future mixed use development, a new parking facility, and the redesign and beautification of areas located under the Church Street Bridge.
85

CITY OF GREENVILLE, SOUTH CAROLINA NOTES TO THE FINANCIAL STATEMENTS YEAR ENDED JUNE 30, 2015 IV. OTHER INFORMATION (CONTINUED)
I. Subsequent Events (Continued) Under the terms of the Development Agreement, the City will acquire the land at approximately $690,000 and pay the costs of constructing the parking garage estimated at $9,300,000 with approximately 630 parking spaces. The City’s total investment is approximately $10 million which will be financed through the issuance of its Taxable Installment Purchase Revenue Bond, Series 2015 (the “Series 2015 Bond”) in the fall of 2015. On November 9, 2015, City Council adopted an ordinance relating to the issuance of the City of Greenville Public Facilities Corporation Taxable Installment Purchase Revenue Bonds, Series 2015, in an amount not to exceed $22,000,000. The Series 2015 Bonds are being issued for the purpose of (1) financing the costs of acquiring, constructing, renovating and equipping the EP parking facility; (2) refunding the $11,980,000 City of Greenville Public Facilities Corporation Taxable Installment Purchase Revenue Bonds, Series 2013 which was issued to finance the costs of acquiring, constructing, renovating and equipping the Project One parking facility; and (3) paying the costs of issuance of the Series 2015 Bonds. On October 26, 2015, City Council approved first reading of a budget ordinance relating to the Project One, RiverPlace 2B and EP parking garages. The budget ordinance appropriates $8 million from the Tax Increment District Debt Service Fund fund balances and $806,000 from the Parking Fund and applies the amounts to the RiverPlace 2B garage and public plazas, thus eliminating the need to issue $6,260,000 in debt proceeds originally contemplated for the RiverPlace 2B project, and provides for an equity contribution to the refunding component of the Series 2015 Bonds.
On September 22, 2015, the City and the School District of Greenville County (the “School District”) entered into an intergovernmental agreement concerning the allocation of tax increment financing (the “TIF”) revenues. These revenues are reflected in the City’s financial statements as debt service funds – Downtown Infrastructure District (the “CBD”), Westend Tax Increment District (the “West End”) and Viola Street Tax Increment District (the “Viola”). Under the terms of the agreement, Viola will terminate effective June 30, 2016, and the West End and CBD district plans will terminate concurrently on September 8, 2021. The City will retain all fund balances reflected in the debt service funds as of June 30, 2015, as well as all revenues collected through June 30, 2016, in the Viola district. Beginning July 1, 2015, the City shall pay the School District 53.3% of Net TIF Revenues with respect to the CBD and West End Districts. Net TIF Revenues is defined as the gross collections of tax increment revenues for the CBD and West End in each fiscal year (as determined by the County Treasurer), less the payments of principal and interest due in accordance with the outstanding tax increment bonds in such fiscal year, including, but not limited to, the final City debt service payments due in fiscal year 2022. Commencing July 1, 2015, the City shall, in addition to $310,000 in revenue attributable to Viola in fiscal year 2016, retain $4,787,500 from the School District share of Net TIF Revenues associated with the CBD and West End. The City will retain all of the School District share of Net TIF Revenue until the $4,787,500 has been attained, at which point the School District share of Net TIF Revenues (or remaining portion thereof with respect to the fiscal year in which the $4,787,500 is attained) shall be remitted by the City to the School District for each remaining fiscal year covered by the agreement. The City will distribute the School District share of the Net TIF Revenues to the School District on or before February 1 each year with a “true up” performed on or before October 1 of each year following the February distribution where the School District would receive from the City the difference between said February distribution and the audited collections for the corresponding fiscal year.
Current Net TIF Revenues total about $7.5 million annually with the City expending the funds on public improvements described in the redevelopment plans. The City anticipates that funding for public improvements will be reduced to $2 million annually due to the intergovernmental agreement with the School District described above and the County agreement cited in the litigation footnote.
86
REQUIRED SUPPLEMENTARY INFORMATON
87
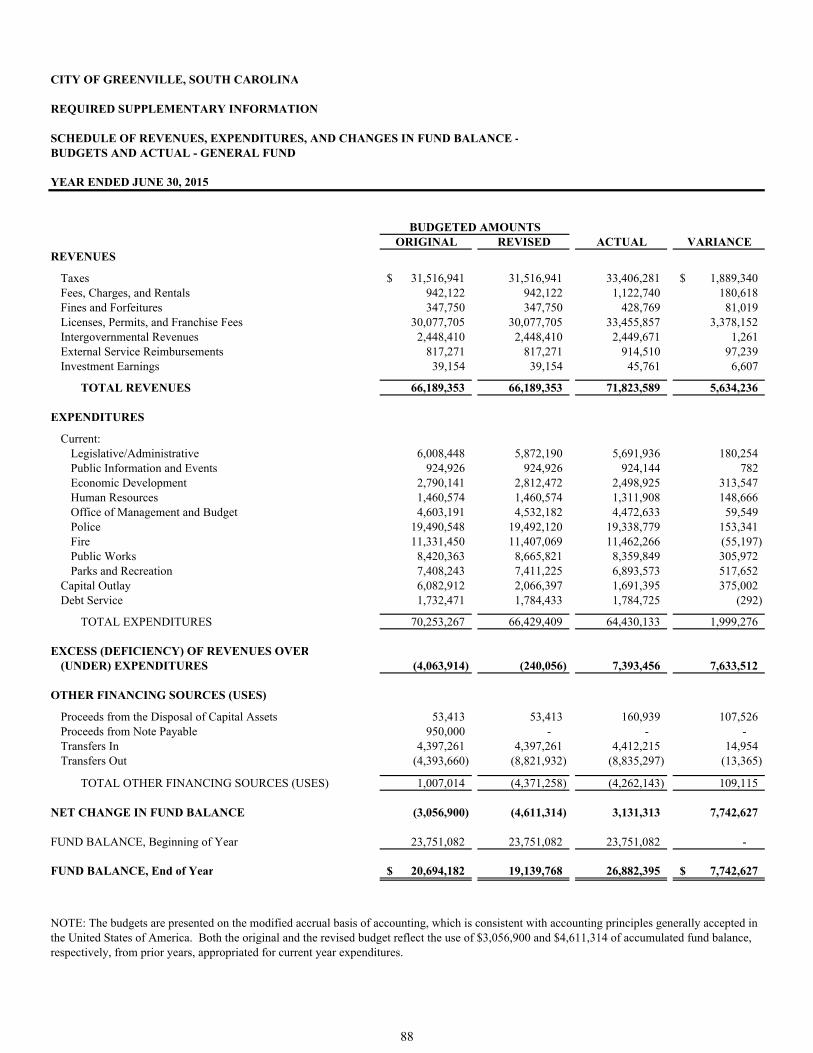
CITY OF GREENVILLE, SOUTH CAROLINA
REQUIRED SUPPLEMENTARY INFORMATION
SCHEDULE OF REVENUES, EXPENDITURES, AND CHANGES IN FUND BALANCE -BUDGETS AND ACTUAL - GENERAL FUND
YEAR ENDED JUNE 30, 2015
ORIGINAL REVISED ACTUAL VARIANCEREVENUES
Taxes 31,516,941$ 31,516,941 33,406,281 1,889,340$ Fees, Charges, and Rentals 942,122 942,122 1,122,740 180,618 Fines and Forfeitures 347,750 347,750 428,769 81,019 Licenses, Permits, and Franchise Fees 30,077,705 30,077,705 33,455,857 3,378,152 Intergovernmental Revenues 2,448,410 2,448,410 2,449,671 1,261 External Service Reimbursements 817,271 817,271 914,510 97,239 Investment Earnings 39,154 39,154 45,761 6,607
TOTAL REVENUES 66,189,353 66,189,353 71,823,589 5,634,236
EXPENDITURES
Current:Legislative/Administrative 6,008,448 5,872,190 5,691,936 180,254 Public Information and Events 924,926 924,926 924,144 782 Economic Development 2,790,141 2,812,472 2,498,925 313,547 Human Resources 1,460,574 1,460,574 1,311,908 148,666 Office of Management and Budget 4,603,191 4,532,182 4,472,633 59,549 Police 19,490,548 19,492,120 19,338,779 153,341 Fire 11,331,450 11,407,069 11,462,266 (55,197) Public Works 8,420,363 8,665,821 8,359,849 305,972 Parks and Recreation 7,408,243 7,411,225 6,893,573 517,652
Capital Outlay 6,082,912 2,066,397 1,691,395 375,002 Debt Service 1,732,471 1,784,433 1,784,725 (292)
TOTAL EXPENDITURES 70,253,267 66,429,409 64,430,133 1,999,276
EXCESS (DEFICIENCY) OF REVENUES OVER(UNDER) EXPENDITURES (4,063,914) (240,056) 7,393,456 7,633,512
OTHER FINANCING SOURCES (USES)
Proceeds from the Disposal of Capital Assets 53,413 53,413 160,939 107,526 Proceeds from Note Payable 950,000 - - - Transfers In 4,397,261 4,397,261 4,412,215 14,954 Transfers Out (4,393,660) (8,821,932) (8,835,297) (13,365)
TOTAL OTHER FINANCING SOURCES (USES) 1,007,014 (4,371,258) (4,262,143) 109,115
NET CHANGE IN FUND BALANCE (3,056,900) (4,611,314) 3,131,313 7,742,627
FUND BALANCE, Beginning of Year 23,751,082 23,751,082 23,751,082 -
FUND BALANCE, End of Year 20,694,182$ 19,139,768 26,882,395 7,742,627$
NOTE: The budgets are presented on the modified accrual basis of accounting, which is consistent with accounting principles generally accepted inthe United States of America. Both the original and the revised budget reflect the use of $3,056,900 and $4,611,314 of accumulated fund balance, respectively, from prior years, appropriated for current year expenditures.
BUDGETED AMOUNTS
88
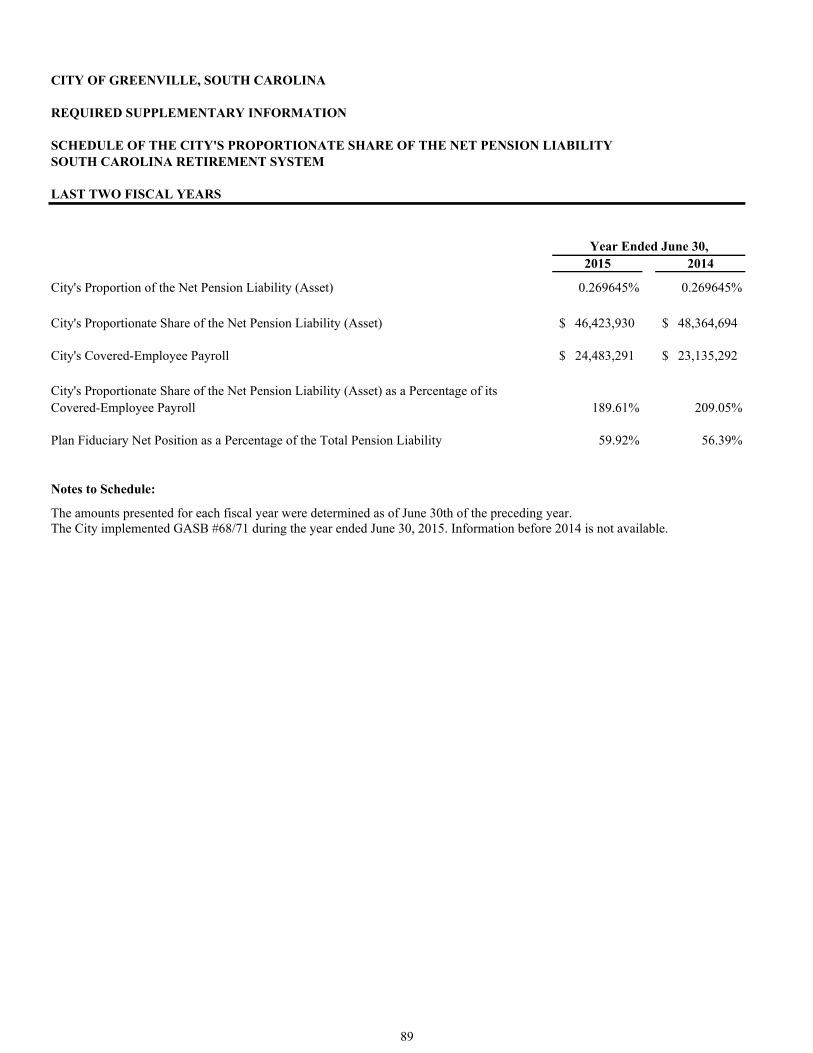
CITY OF GREENVILLE, SOUTH CAROLINA
REQUIRED SUPPLEMENTARY INFORMATION
SCHEDULE OF THE CITY'S PROPORTIONATE SHARE OF THE NET PENSION LIABILITYSOUTH CAROLINA RETIREMENT SYSTEM
LAST TWO FISCAL YEARS
2015 2014
City's Proportion of the Net Pension Liability (Asset) 0.269645% 0.269645%
City's Proportionate Share of the Net Pension Liability (Asset) 46,423,930$ 48,364,694$
City's Covered-Employee Payroll 24,483,291$ 23,135,292$
City's Proportionate Share of the Net Pension Liability (Asset) as a Percentage of its Covered-Employee Payroll 189.61% 209.05%
Plan Fiduciary Net Position as a Percentage of the Total Pension Liability 59.92% 56.39%
Notes to Schedule:
The amounts presented for each fiscal year were determined as of June 30th of the preceding year.The City implemented GASB #68/71 during the year ended June 30, 2015. Information before 2014 is not available.
Year Ended June 30,
89
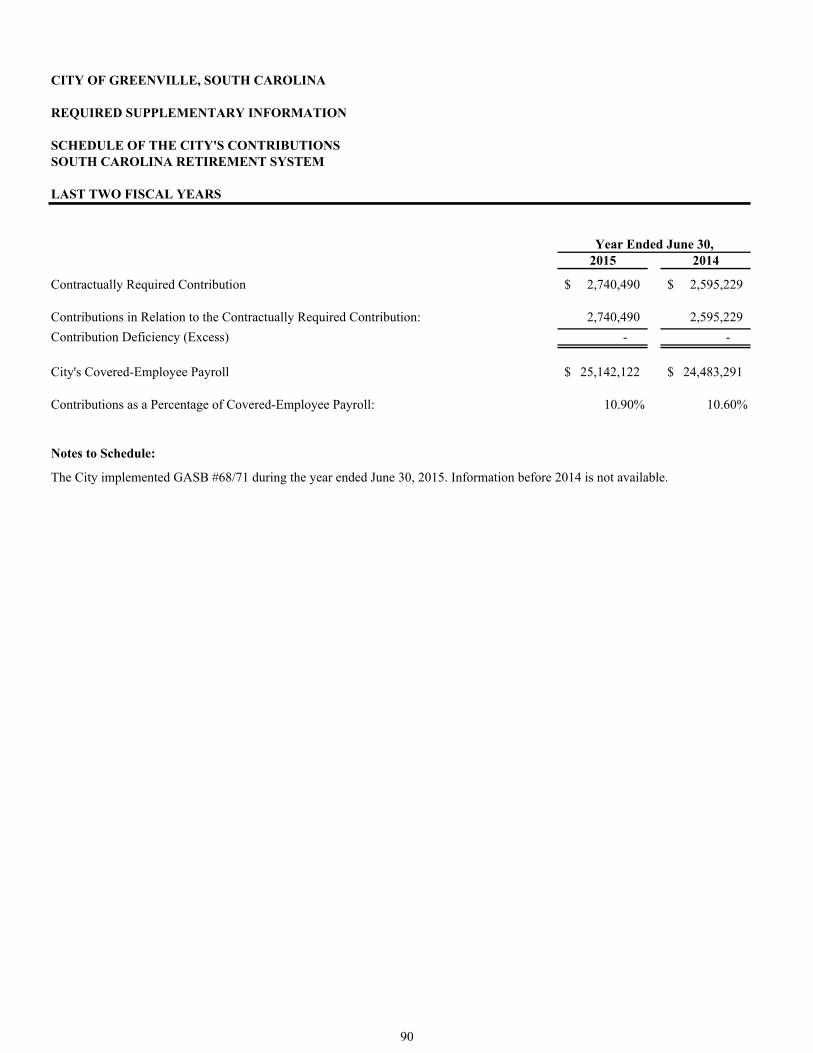
CITY OF GREENVILLE, SOUTH CAROLINA
REQUIRED SUPPLEMENTARY INFORMATION
SCHEDULE OF THE CITY'S CONTRIBUTIONSSOUTH CAROLINA RETIREMENT SYSTEM
LAST TWO FISCAL YEARS
2015 2014
Contractually Required Contribution 2,740,490$ 2,595,229$
Contributions in Relation to the Contractually Required Contribution: 2,740,490 2,595,229
Contribution Deficiency (Excess) - -
City's Covered-Employee Payroll 25,142,122$ 24,483,291$
Contributions as a Percentage of Covered-Employee Payroll: 10.90% 10.60%
Notes to Schedule:
The City implemented GASB #68/71 during the year ended June 30, 2015. Information before 2014 is not available.
Year Ended June 30,
90

CITY OF GREENVILLE, SOUTH CAROLINA
REQUIRED SUPPLEMENTARY INFORMATION
SCHEDULE OF THE CITY'S PROPORTIONATE SHARE OF THE NET PENSION LIABILITYPOLICE OFFICERS RETIREMENT SYSTEM
LAST TWO FISCAL YEARS
2015 2014
City's Proportion of the Net Pension Liability (Asset) 0.83075% 0.83075%
City's Proportionate Share of the Net Pension Liability (Asset) 15,904,029$ 17,221,136$
City's Covered-Employee Payroll 9,992,360$ 9,356,918$
City's Proportionate Share of the Net Pension Liability (Asset) as a Percentage of its Covered-Employee Payroll 159.16% 184.05%
Plan Fiduciary Net Position as a Percentage of the Total Pension Liability 67.55% 62.98%
Notes to Schedule:
The amounts presented for each fiscal year were determined as of June 30th of the preceding year.The City implemented GASB #68/71 during the year ended June 30, 2015. Information before 2014 is not available.
Year Ended June 30,
91
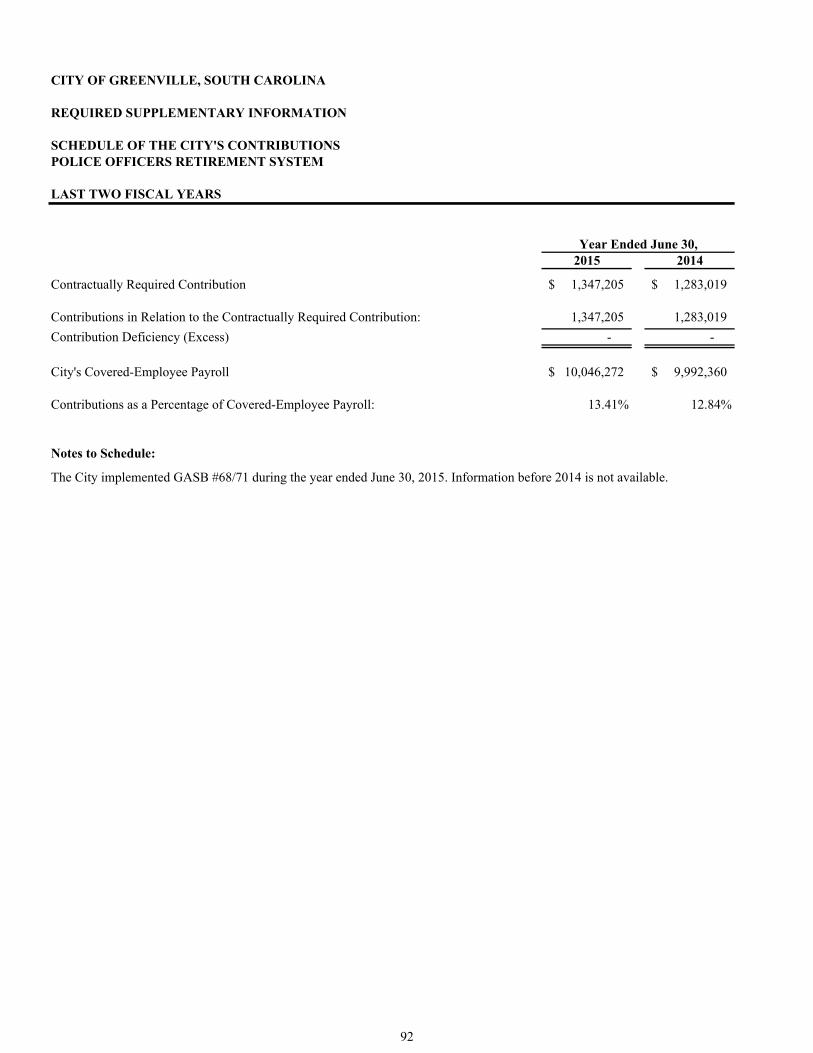
CITY OF GREENVILLE, SOUTH CAROLINA
REQUIRED SUPPLEMENTARY INFORMATION
SCHEDULE OF THE CITY'S CONTRIBUTIONSPOLICE OFFICERS RETIREMENT SYSTEM
LAST TWO FISCAL YEARS
2015 2014
Contractually Required Contribution 1,347,205$ 1,283,019$
Contributions in Relation to the Contractually Required Contribution: 1,347,205 1,283,019
Contribution Deficiency (Excess) - -
City's Covered-Employee Payroll 10,046,272$ 9,992,360$
Contributions as a Percentage of Covered-Employee Payroll: 13.41% 12.84%
Notes to Schedule:
The City implemented GASB #68/71 during the year ended June 30, 2015. Information before 2014 is not available.
Year Ended June 30,
92
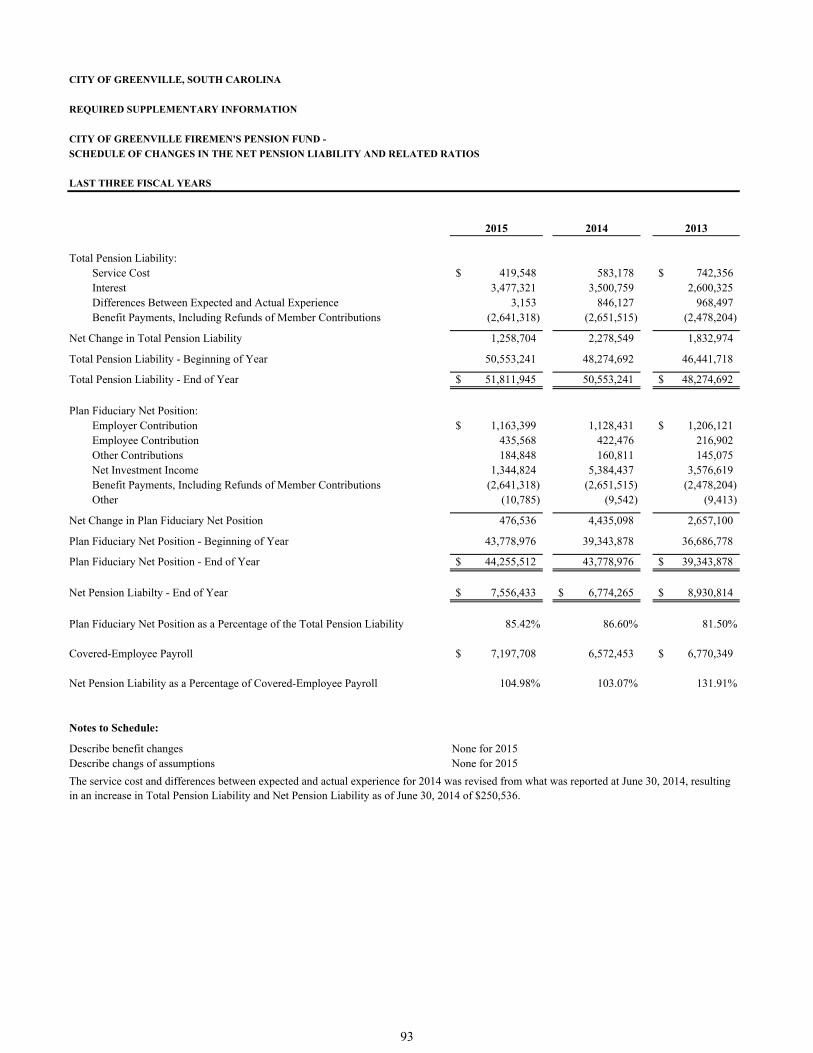
CITY OF GREENVILLE, SOUTH CAROLINA
REQUIRED SUPPLEMENTARY INFORMATION
CITY OF GREENVILLE FIREMEN'S PENSION FUND -
SCHEDULE OF CHANGES IN THE NET PENSION LIABILITY AND RELATED RATIOS
LAST THREE FISCAL YEARS
2015 2014 2013
Total Pension Liability:Service Cost 419,548$ 583,178 742,356$ Interest 3,477,321 3,500,759 2,600,325 Differences Between Expected and Actual Experience 3,153 846,127 968,497 Benefit Payments, Including Refunds of Member Contributions (2,641,318) (2,651,515) (2,478,204)
Net Change in Total Pension Liability 1,258,704 2,278,549 1,832,974
Total Pension Liability - Beginning of Year 50,553,241 48,274,692 46,441,718
Total Pension Liability - End of Year 51,811,945$ 50,553,241 48,274,692$
Plan Fiduciary Net Position:Employer Contribution 1,163,399$ 1,128,431 1,206,121$ Employee Contribution 435,568 422,476 216,902 Other Contributions 184,848 160,811 145,075 Net Investment Income 1,344,824 5,384,437 3,576,619 Benefit Payments, Including Refunds of Member Contributions (2,641,318) (2,651,515) (2,478,204) Other (10,785) (9,542) (9,413)
Net Change in Plan Fiduciary Net Position 476,536 4,435,098 2,657,100
Plan Fiduciary Net Position - Beginning of Year 43,778,976 39,343,878 36,686,778
Plan Fiduciary Net Position - End of Year 44,255,512$ 43,778,976 39,343,878$
Net Pension Liabilty - End of Year 7,556,433$ 6,774,265$ 8,930,814$
Plan Fiduciary Net Position as a Percentage of the Total Pension Liability 85.42% 86.60% 81.50%
Covered-Employee Payroll 7,197,708$ 6,572,453 6,770,349$
Net Pension Liability as a Percentage of Covered-Employee Payroll 104.98% 103.07% 131.91%
Notes to Schedule:
Describe benefit changes None for 2015Describe changs of assumptions None for 2015
The service cost and differences between expected and actual experience for 2014 was revised from what was reported at June 30, 2014, resulting in an increase in Total Pension Liability and Net Pension Liability as of June 30, 2014 of $250,536.
93
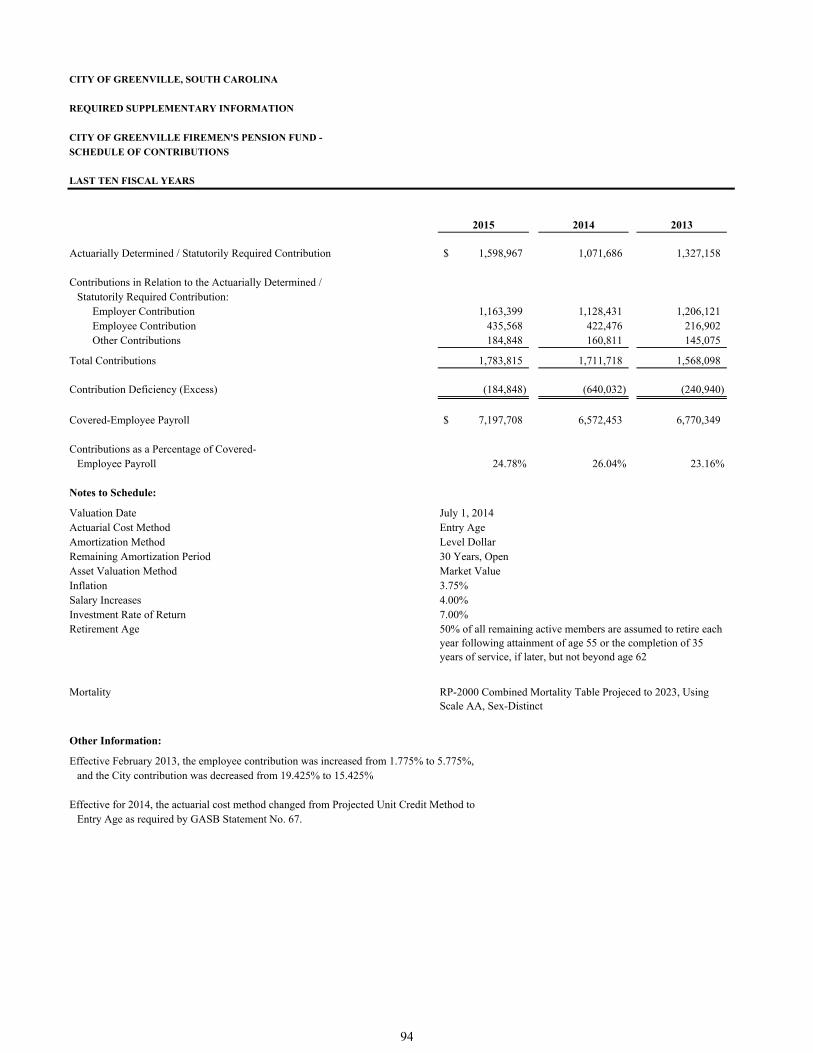
CITY OF GREENVILLE, SOUTH CAROLINA
REQUIRED SUPPLEMENTARY INFORMATION
CITY OF GREENVILLE FIREMEN'S PENSION FUND -
SCHEDULE OF CONTRIBUTIONS
LAST TEN FISCAL YEARS
2015 2014 2013
Actuarially Determined / Statutorily Required Contribution 1,598,967$ 1,071,686 1,327,158
Contributions in Relation to the Actuarially Determined /Statutorily Required Contribution:
Employer Contribution 1,163,399 1,128,431 1,206,121 Employee Contribution 435,568 422,476 216,902 Other Contributions 184,848 160,811 145,075
Total Contributions 1,783,815 1,711,718 1,568,098
Contribution Deficiency (Excess) (184,848) (640,032) (240,940)
Covered-Employee Payroll 7,197,708$ 6,572,453 6,770,349
Contributions as a Percentage of Covered-Employee Payroll 24.78% 26.04% 23.16%
Notes to Schedule:
Valuation Date July 1, 2014Actuarial Cost Method Entry AgeAmortization Method Level DollarRemaining Amortization Period 30 Years, OpenAsset Valuation Method Market ValueInflation 3.75%Salary Increases 4.00%Investment Rate of Return 7.00%Retirement Age
Mortality
Other Information:
Effective February 2013, the employee contribution was increased from 1.775% to 5.775%,and the City contribution was decreased from 19.425% to 15.425%
Effective for 2014, the actuarial cost method changed from Projected Unit Credit Method toEntry Age as required by GASB Statement No. 67.
50% of all remaining active members are assumed to retire each year following attainment of age 55 or the completion of 35 years of service, if later, but not beyond age 62
RP-2000 Combined Mortality Table Projeced to 2023, Using Scale AA, Sex-Distinct
94
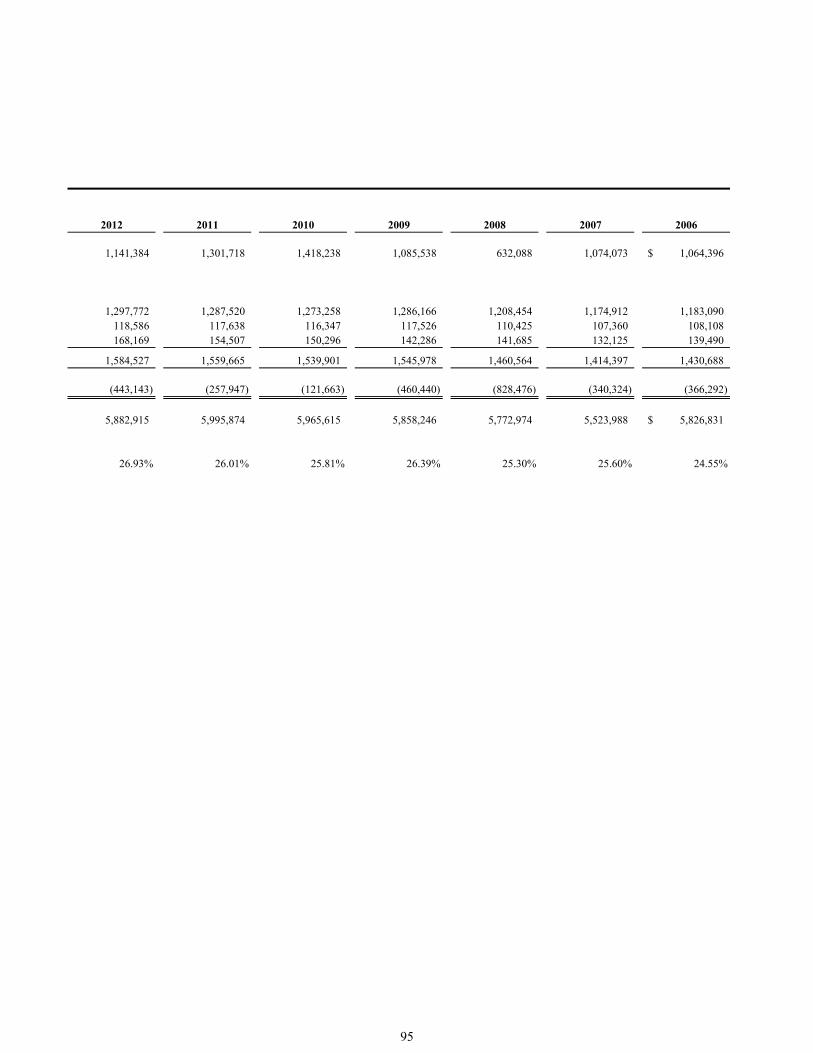
2012 2011 2010 2009 2008 2007 2006
1,141,384 1,301,718 1,418,238 1,085,538 632,088 1,074,073 1,064,396$
1,297,772 1,287,520 1,273,258 1,286,166 1,208,454 1,174,912 1,183,090 118,586 117,638 116,347 117,526 110,425 107,360 108,108 168,169 154,507 150,296 142,286 141,685 132,125 139,490
1,584,527 1,559,665 1,539,901 1,545,978 1,460,564 1,414,397 1,430,688
(443,143) (257,947) (121,663) (460,440) (828,476) (340,324) (366,292)
5,882,915 5,995,874 5,965,615 5,858,246 5,772,974 5,523,988 5,826,831$
26.93% 26.01% 25.81% 26.39% 25.30% 25.60% 24.55%
95
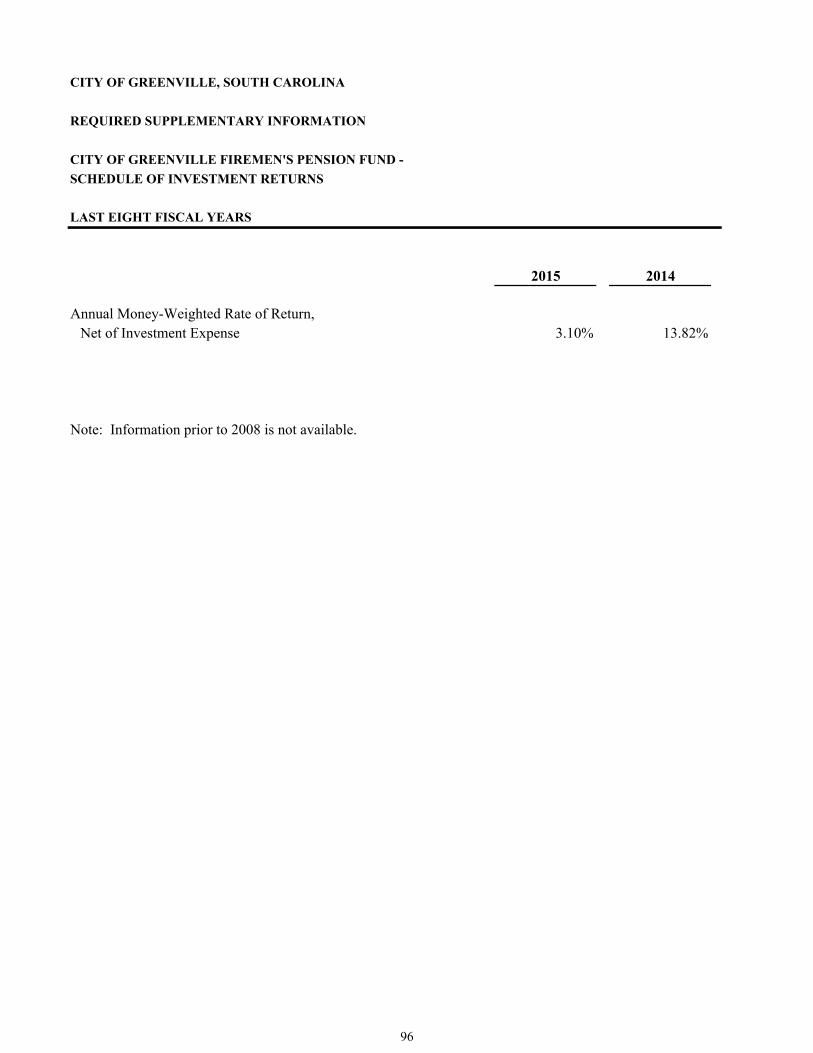
CITY OF GREENVILLE, SOUTH CAROLINA
REQUIRED SUPPLEMENTARY INFORMATION
CITY OF GREENVILLE FIREMEN'S PENSION FUND -
SCHEDULE OF INVESTMENT RETURNS
LAST EIGHT FISCAL YEARS
2015 2014
Annual Money-Weighted Rate of Return,Net of Investment Expense 3.10% 13.82%
Note: Information prior to 2008 is not available.
96

2013 2012 2011 2010 2009 2008
9.94% 2.60% 18.67% 11.00% -13.00% -2.10%
97
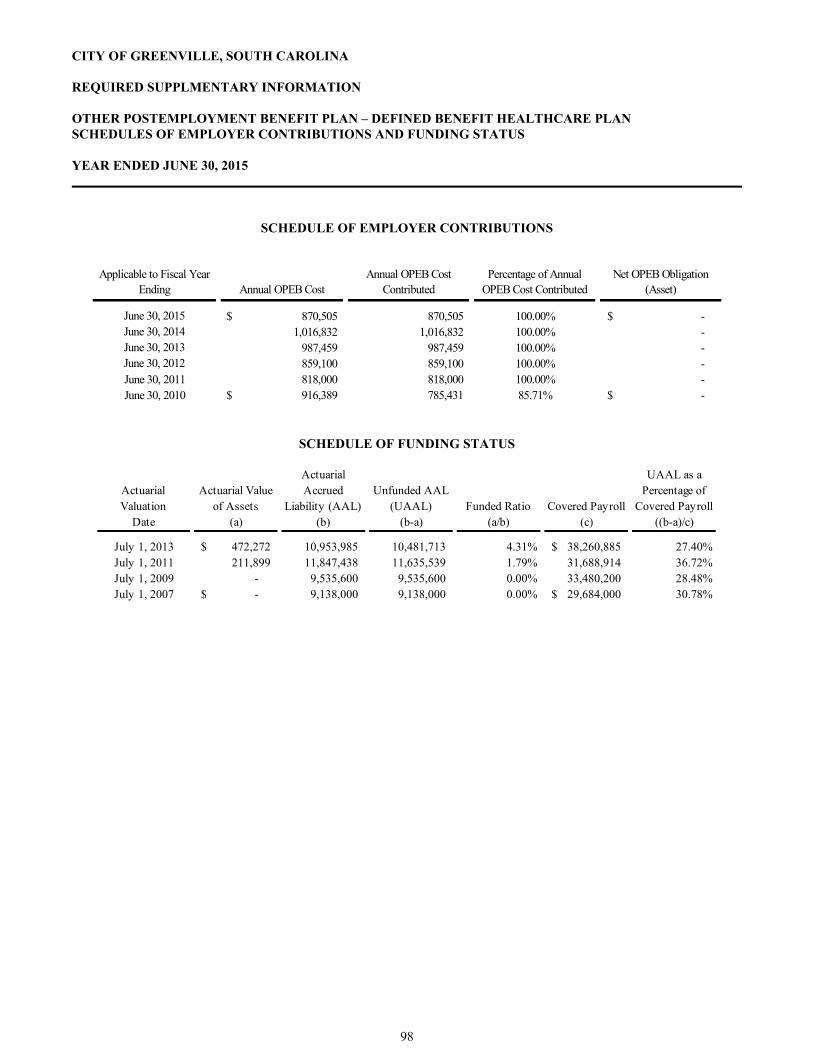
CITY OF GREENVILLE, SOUTH CAROLINA REQUIRED SUPPLMENTARY INFORMATION OTHER POSTEMPLOYMENT BENEFIT PLAN – DEFINED BENEFIT HEALTHCARE PLAN SCHEDULES OF EMPLOYER CONTRIBUTIONS AND FUNDING STATUS YEAR ENDED JUNE 30, 2015
SCHEDULE OF EMPLOYER CONTRIBUTIONS
Applicable to Fiscal Year Ending Annual OPEB Cost
Annual OPEB Cost Contributed
Percentage of Annual OPEB Cost Contributed
Net OPEB Obligation (Asset)
June 30, 2015 870,505$ 870,505 100.00% -$ June 30, 2014 1,016,832 1,016,832 100.00% - June 30, 2013 987,459 987,459 100.00% - June 30, 2012 859,100 859,100 100.00% - June 30, 2011 818,000 818,000 100.00% - June 30, 2010 916,389$ 785,431 85.71% -$
SCHEDULE OF FUNDING STATUS
Actuarial Valuation
Actuarial Value of Assets
Actuarial Accrued
Liability (AAL)Unfunded AAL
(UAAL) Funded Ratio Covered Payroll
UAAL as a Percentage of
Covered PayrollDate (a) (b) (b-a) (a/b) (c) ((b-a)/c)
July 1, 2013 472,272$ 10,953,985 10,481,713 4.31% 38,260,885$ 27.40%July 1, 2011 211,899 11,847,438 11,635,539 1.79% 31,688,914 36.72%July 1, 2009 - 9,535,600 9,535,600 0.00% 33,480,200 28.48%July 1, 2007 -$ 9,138,000 9,138,000 0.00% 29,684,000$ 30.78%
98
SUPPLEMENTARY INFORMATON
99
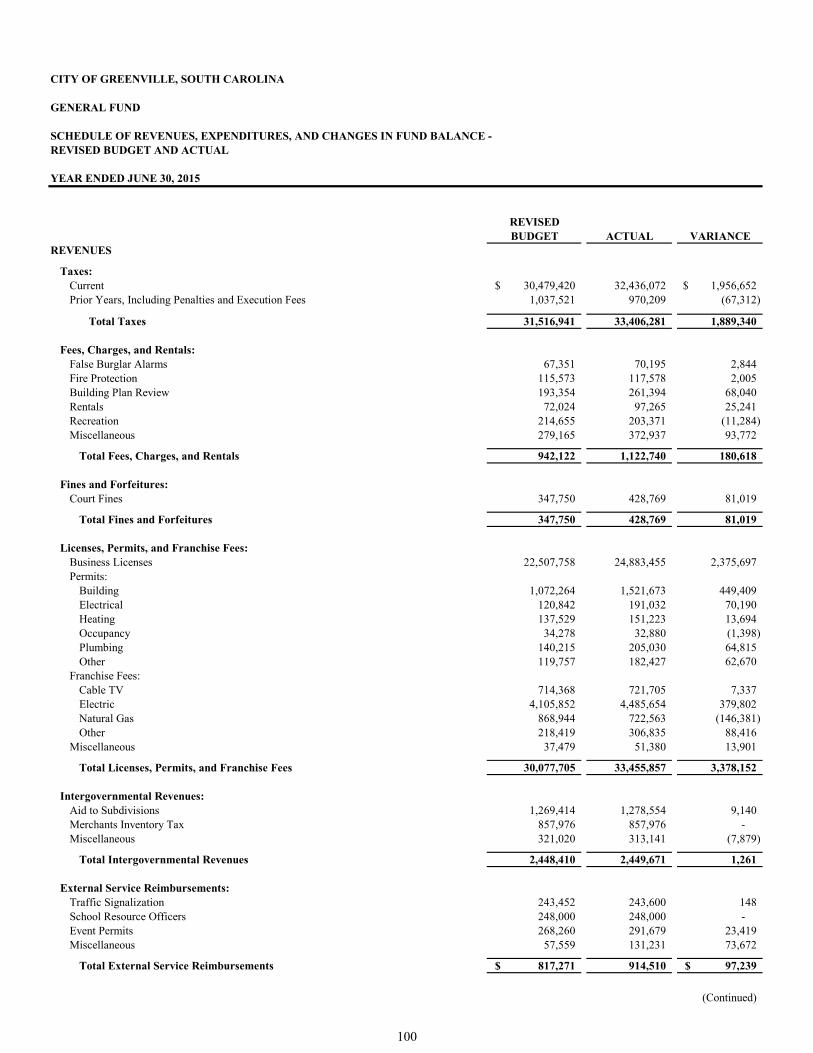
CITY OF GREENVILLE, SOUTH CAROLINA
GENERAL FUND
SCHEDULE OF REVENUES, EXPENDITURES, AND CHANGES IN FUND BALANCE - REVISED BUDGET AND ACTUAL
REVISEDBUDGET ACTUAL VARIANCE
REVENUES
Taxes:Current 30,479,420$ 32,436,072 1,956,652$ Prior Years, Including Penalties and Execution Fees 1,037,521 970,209 (67,312)
Total Taxes 31,516,941 33,406,281 1,889,340
Fees, Charges, and Rentals:False Burglar Alarms 67,351 70,195 2,844 Fire Protection 115,573 117,578 2,005 Building Plan Review 193,354 261,394 68,040 Rentals 72,024 97,265 25,241 Recreation 214,655 203,371 (11,284) Miscellaneous 279,165 372,937 93,772
Total Fees, Charges, and Rentals 942,122 1,122,740 180,618
Fines and Forfeitures:Court Fines 347,750 428,769 81,019
Total Fines and Forfeitures 347,750 428,769 81,019
Licenses, Permits, and Franchise Fees:Business Licenses 22,507,758 24,883,455 2,375,697 Permits:
Building 1,072,264 1,521,673 449,409 Electrical 120,842 191,032 70,190 Heating 137,529 151,223 13,694 Occupancy 34,278 32,880 (1,398) Plumbing 140,215 205,030 64,815 Other 119,757 182,427 62,670
Franchise Fees:Cable TV 714,368 721,705 7,337 Electric 4,105,852 4,485,654 379,802 Natural Gas 868,944 722,563 (146,381) Other 218,419 306,835 88,416
Miscellaneous 37,479 51,380 13,901
Total Licenses, Permits, and Franchise Fees 30,077,705 33,455,857 3,378,152
Intergovernmental Revenues:Aid to Subdivisions 1,269,414 1,278,554 9,140 Merchants Inventory Tax 857,976 857,976 - Miscellaneous 321,020 313,141 (7,879)
Total Intergovernmental Revenues 2,448,410 2,449,671 1,261
External Service Reimbursements:Traffic Signalization 243,452 243,600 148 School Resource Officers 248,000 248,000 - Event Permits 268,260 291,679 23,419 Miscellaneous 57,559 131,231 73,672
Total External Service Reimbursements 817,271$ 914,510 97,239$
(Continued)
YEAR ENDED JUNE 30, 2015
100
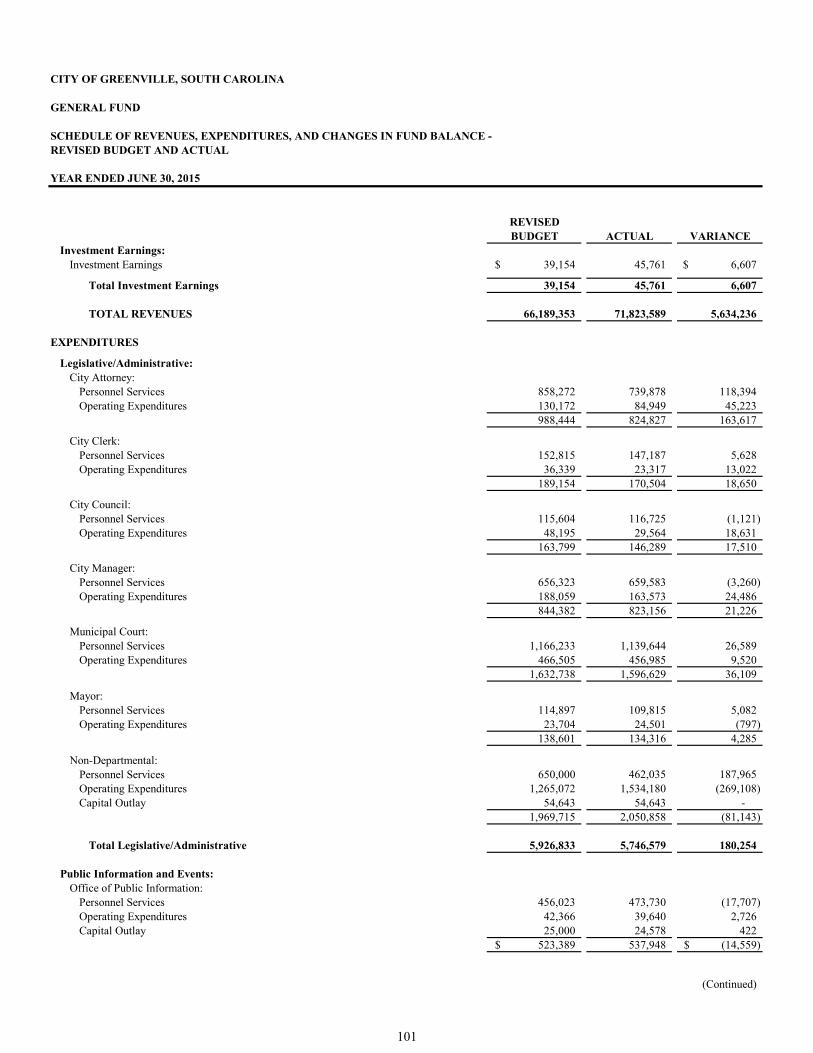
CITY OF GREENVILLE, SOUTH CAROLINA
GENERAL FUND
SCHEDULE OF REVENUES, EXPENDITURES, AND CHANGES IN FUND BALANCE - REVISED BUDGET AND ACTUAL
REVISEDBUDGET ACTUAL VARIANCE
YEAR ENDED JUNE 30, 2015
Investment Earnings:Investment Earnings 39,154$ 45,761 6,607$
Total Investment Earnings 39,154 45,761 6,607
TOTAL REVENUES 66,189,353 71,823,589 5,634,236
EXPENDITURES
Legislative/Administrative:City Attorney:
Personnel Services 858,272 739,878 118,394 Operating Expenditures 130,172 84,949 45,223
988,444 824,827 163,617
City Clerk:Personnel Services 152,815 147,187 5,628 Operating Expenditures 36,339 23,317 13,022
189,154 170,504 18,650
City Council:Personnel Services 115,604 116,725 (1,121) Operating Expenditures 48,195 29,564 18,631
163,799 146,289 17,510
City Manager:Personnel Services 656,323 659,583 (3,260) Operating Expenditures 188,059 163,573 24,486
844,382 823,156 21,226
Municipal Court:Personnel Services 1,166,233 1,139,644 26,589 Operating Expenditures 466,505 456,985 9,520
1,632,738 1,596,629 36,109
Mayor:Personnel Services 114,897 109,815 5,082 Operating Expenditures 23,704 24,501 (797)
138,601 134,316 4,285
Non-Departmental:Personnel Services 650,000 462,035 187,965 Operating Expenditures 1,265,072 1,534,180 (269,108) Capital Outlay 54,643 54,643 -
1,969,715 2,050,858 (81,143)
Total Legislative/Administrative 5,926,833 5,746,579 180,254
Public Information and Events:Office of Public Information:
Personnel Services 456,023 473,730 (17,707) Operating Expenditures 42,366 39,640 2,726 Capital Outlay 25,000 24,578 422
523,389$ 537,948 (14,559)$
(Continued)
101
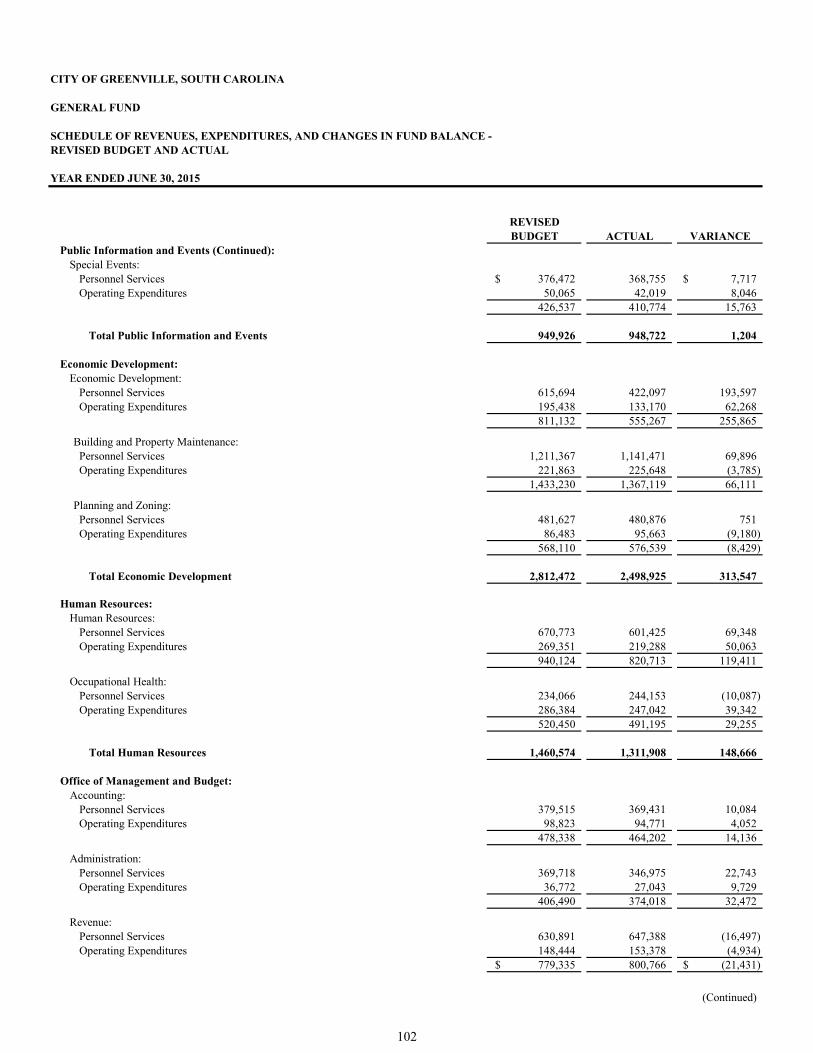
CITY OF GREENVILLE, SOUTH CAROLINA
GENERAL FUND
SCHEDULE OF REVENUES, EXPENDITURES, AND CHANGES IN FUND BALANCE - REVISED BUDGET AND ACTUAL
REVISEDBUDGET ACTUAL VARIANCE
YEAR ENDED JUNE 30, 2015
Public Information and Events (Continued):Special Events:
Personnel Services 376,472$ 368,755 7,717$ Operating Expenditures 50,065 42,019 8,046
426,537 410,774 15,763
Total Public Information and Events 949,926 948,722 1,204
Economic Development: Economic Development:
Personnel Services 615,694 422,097 193,597 Operating Expenditures 195,438 133,170 62,268
811,132 555,267 255,865
Building and Property Maintenance:Personnel Services 1,211,367 1,141,471 69,896 Operating Expenditures 221,863 225,648 (3,785)
1,433,230 1,367,119 66,111
Planning and Zoning:Personnel Services 481,627 480,876 751 Operating Expenditures 86,483 95,663 (9,180)
568,110 576,539 (8,429)
Total Economic Development 2,812,472 2,498,925 313,547
Human Resources: Human Resources:
Personnel Services 670,773 601,425 69,348 Operating Expenditures 269,351 219,288 50,063
940,124 820,713 119,411
Occupational Health:Personnel Services 234,066 244,153 (10,087) Operating Expenditures 286,384 247,042 39,342
520,450 491,195 29,255
Total Human Resources 1,460,574 1,311,908 148,666
Office of Management and Budget:Accounting:
Personnel Services 379,515 369,431 10,084 Operating Expenditures 98,823 94,771 4,052
478,338 464,202 14,136
Administration:Personnel Services 369,718 346,975 22,743 Operating Expenditures 36,772 27,043 9,729
406,490 374,018 32,472
Revenue:Personnel Services 630,891 647,388 (16,497) Operating Expenditures 148,444 153,378 (4,934)
779,335$ 800,766 (21,431)$
(Continued)
102
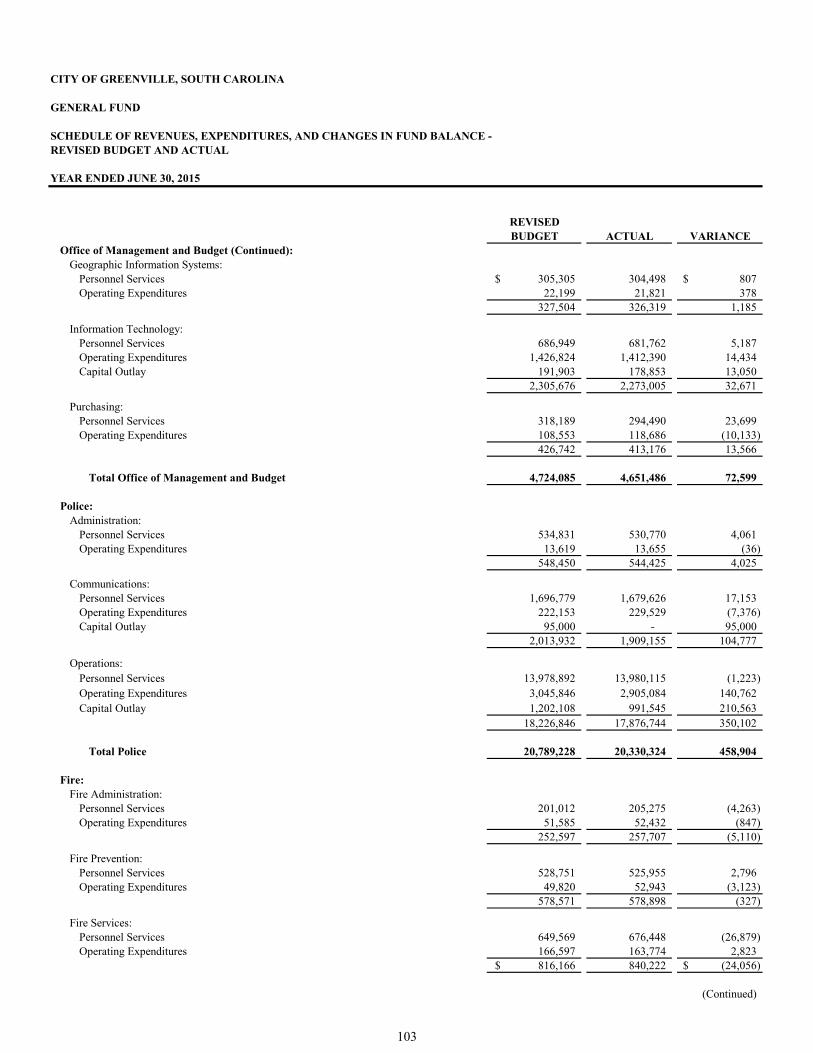
CITY OF GREENVILLE, SOUTH CAROLINA
GENERAL FUND
SCHEDULE OF REVENUES, EXPENDITURES, AND CHANGES IN FUND BALANCE - REVISED BUDGET AND ACTUAL
REVISEDBUDGET ACTUAL VARIANCE
YEAR ENDED JUNE 30, 2015
Office of Management and Budget (Continued):Geographic Information Systems:
Personnel Services 305,305$ 304,498 807$ Operating Expenditures 22,199 21,821 378
327,504 326,319 1,185
Information Technology:Personnel Services 686,949 681,762 5,187 Operating Expenditures 1,426,824 1,412,390 14,434 Capital Outlay 191,903 178,853 13,050
2,305,676 2,273,005 32,671
Purchasing:Personnel Services 318,189 294,490 23,699 Operating Expenditures 108,553 118,686 (10,133)
426,742 413,176 13,566
Total Office of Management and Budget 4,724,085 4,651,486 72,599
Police:Administration:
Personnel Services 534,831 530,770 4,061 Operating Expenditures 13,619 13,655 (36)
548,450 544,425 4,025
Communications:Personnel Services 1,696,779 1,679,626 17,153 Operating Expenditures 222,153 229,529 (7,376) Capital Outlay 95,000 - 95,000
2,013,932 1,909,155 104,777
Operations:Personnel Services 13,978,892 13,980,115 (1,223) Operating Expenditures 3,045,846 2,905,084 140,762 Capital Outlay 1,202,108 991,545 210,563
18,226,846 17,876,744 350,102
Total Police 20,789,228 20,330,324 458,904
Fire:Fire Administration:
Personnel Services 201,012 205,275 (4,263) Operating Expenditures 51,585 52,432 (847)
252,597 257,707 (5,110)
Fire Prevention:Personnel Services 528,751 525,955 2,796 Operating Expenditures 49,820 52,943 (3,123)
578,571 578,898 (327)
Fire Services:Personnel Services 649,569 676,448 (26,879) Operating Expenditures 166,597 163,774 2,823
816,166$ 840,222 (24,056)$
(Continued)
103
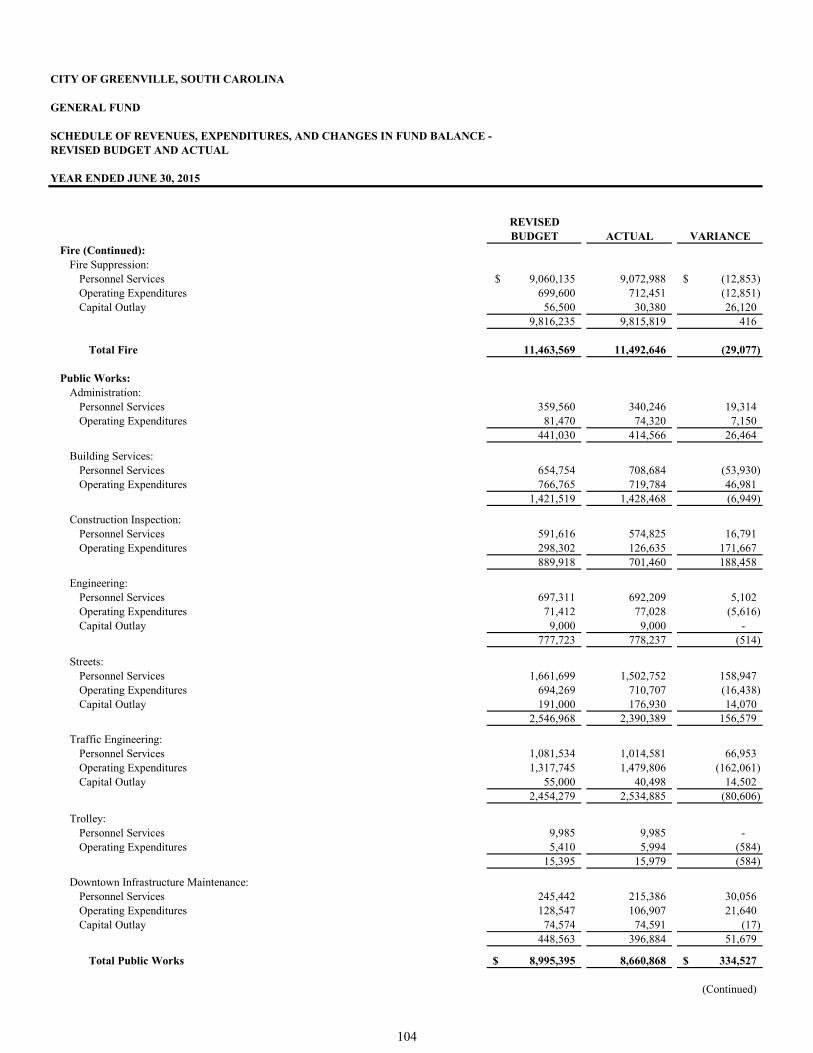
CITY OF GREENVILLE, SOUTH CAROLINA
GENERAL FUND
SCHEDULE OF REVENUES, EXPENDITURES, AND CHANGES IN FUND BALANCE - REVISED BUDGET AND ACTUAL
REVISEDBUDGET ACTUAL VARIANCE
YEAR ENDED JUNE 30, 2015
Fire (Continued):Fire Suppression:
Personnel Services 9,060,135$ 9,072,988 (12,853)$ Operating Expenditures 699,600 712,451 (12,851) Capital Outlay 56,500 30,380 26,120
9,816,235 9,815,819 416
Total Fire 11,463,569 11,492,646 (29,077)
Public Works:Administration:
Personnel Services 359,560 340,246 19,314 Operating Expenditures 81,470 74,320 7,150
441,030 414,566 26,464
Building Services:Personnel Services 654,754 708,684 (53,930) Operating Expenditures 766,765 719,784 46,981
1,421,519 1,428,468 (6,949)
Construction Inspection:Personnel Services 591,616 574,825 16,791 Operating Expenditures 298,302 126,635 171,667
889,918 701,460 188,458
Engineering:Personnel Services 697,311 692,209 5,102 Operating Expenditures 71,412 77,028 (5,616) Capital Outlay 9,000 9,000 -
777,723 778,237 (514)
Streets:Personnel Services 1,661,699 1,502,752 158,947 Operating Expenditures 694,269 710,707 (16,438) Capital Outlay 191,000 176,930 14,070
2,546,968 2,390,389 156,579
Traffic Engineering:Personnel Services 1,081,534 1,014,581 66,953 Operating Expenditures 1,317,745 1,479,806 (162,061) Capital Outlay 55,000 40,498 14,502
2,454,279 2,534,885 (80,606)
Trolley:Personnel Services 9,985 9,985 - Operating Expenditures 5,410 5,994 (584)
15,395 15,979 (584)
Downtown Infrastructure Maintenance:Personnel Services 245,442 215,386 30,056 Operating Expenditures 128,547 106,907 21,640 Capital Outlay 74,574 74,591 (17)
448,563 396,884 51,679
Total Public Works 8,995,395$ 8,660,868 334,527$
(Continued)
104
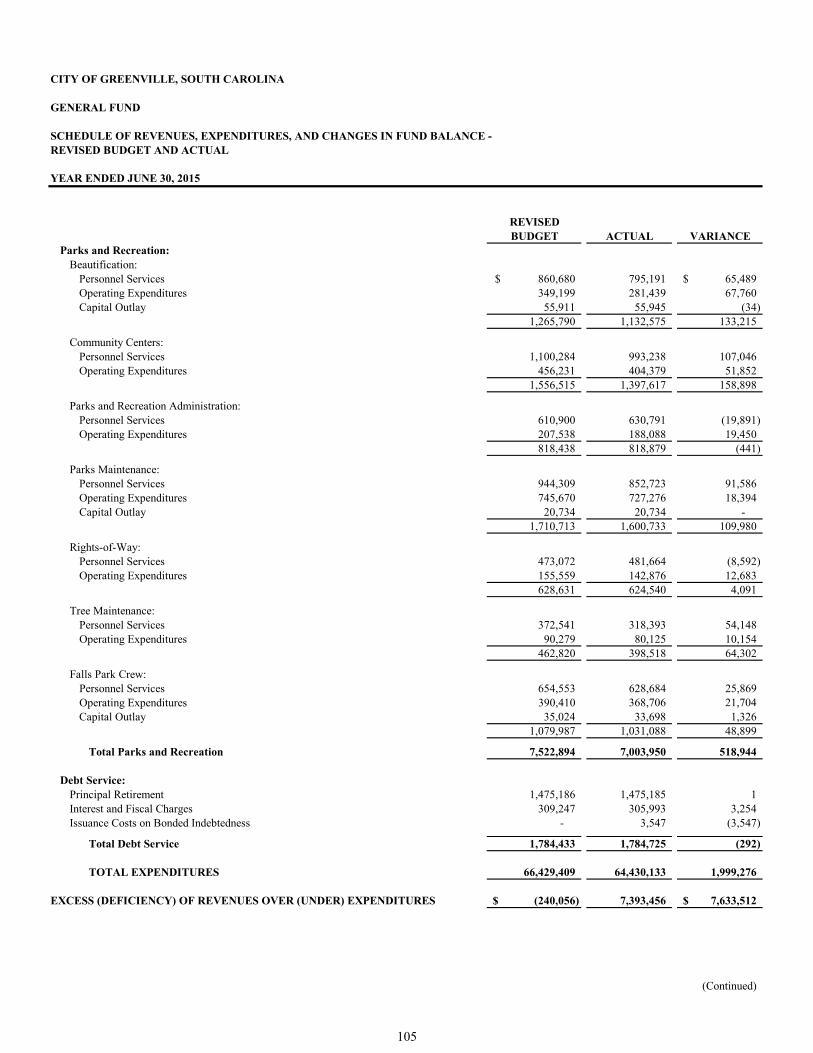
CITY OF GREENVILLE, SOUTH CAROLINA
GENERAL FUND
SCHEDULE OF REVENUES, EXPENDITURES, AND CHANGES IN FUND BALANCE - REVISED BUDGET AND ACTUAL
REVISEDBUDGET ACTUAL VARIANCE
YEAR ENDED JUNE 30, 2015
Parks and Recreation:Beautification:
Personnel Services 860,680$ 795,191 65,489$ Operating Expenditures 349,199 281,439 67,760 Capital Outlay 55,911 55,945 (34)
1,265,790 1,132,575 133,215
Community Centers:Personnel Services 1,100,284 993,238 107,046 Operating Expenditures 456,231 404,379 51,852
1,556,515 1,397,617 158,898
Parks and Recreation Administration:Personnel Services 610,900 630,791 (19,891) Operating Expenditures 207,538 188,088 19,450
818,438 818,879 (441)
Parks Maintenance:Personnel Services 944,309 852,723 91,586 Operating Expenditures 745,670 727,276 18,394 Capital Outlay 20,734 20,734 -
1,710,713 1,600,733 109,980
Rights-of-Way:Personnel Services 473,072 481,664 (8,592) Operating Expenditures 155,559 142,876 12,683
628,631 624,540 4,091
Tree Maintenance:Personnel Services 372,541 318,393 54,148 Operating Expenditures 90,279 80,125 10,154
462,820 398,518 64,302
Falls Park Crew:Personnel Services 654,553 628,684 25,869 Operating Expenditures 390,410 368,706 21,704 Capital Outlay 35,024 33,698 1,326
1,079,987 1,031,088 48,899
Total Parks and Recreation 7,522,894 7,003,950 518,944
Debt Service:Principal Retirement 1,475,186 1,475,185 1 Interest and Fiscal Charges 309,247 305,993 3,254 Issuance Costs on Bonded Indebtedness - 3,547 (3,547)
Total Debt Service 1,784,433 1,784,725 (292)
TOTAL EXPENDITURES 66,429,409 64,430,133 1,999,276
EXCESS (DEFICIENCY) OF REVENUES OVER (UNDER) EXPENDITURES (240,056)$ 7,393,456 7,633,512$
(Continued)
105
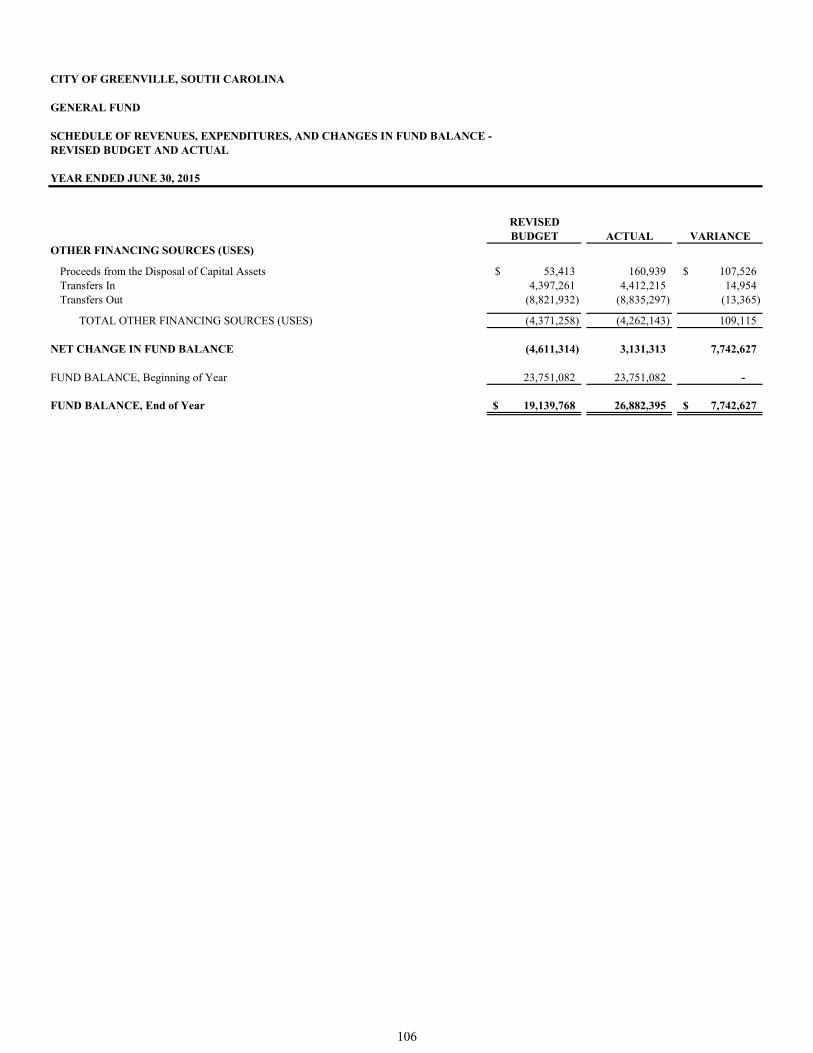
CITY OF GREENVILLE, SOUTH CAROLINA
GENERAL FUND
SCHEDULE OF REVENUES, EXPENDITURES, AND CHANGES IN FUND BALANCE - REVISED BUDGET AND ACTUAL
REVISEDBUDGET ACTUAL VARIANCE
YEAR ENDED JUNE 30, 2015
OTHER FINANCING SOURCES (USES)
Proceeds from the Disposal of Capital Assets 53,413$ 160,939 107,526$ Transfers In 4,397,261 4,412,215 14,954 Transfers Out (8,821,932) (8,835,297) (13,365)
TOTAL OTHER FINANCING SOURCES (USES) (4,371,258) (4,262,143) 109,115
NET CHANGE IN FUND BALANCE (4,611,314) 3,131,313 7,742,627
FUND BALANCE, Beginning of Year 23,751,082 23,751,082 -
FUND BALANCE, End of Year 19,139,768$ 26,882,395 7,742,627$
106

City of Greenville, South Carolina
107
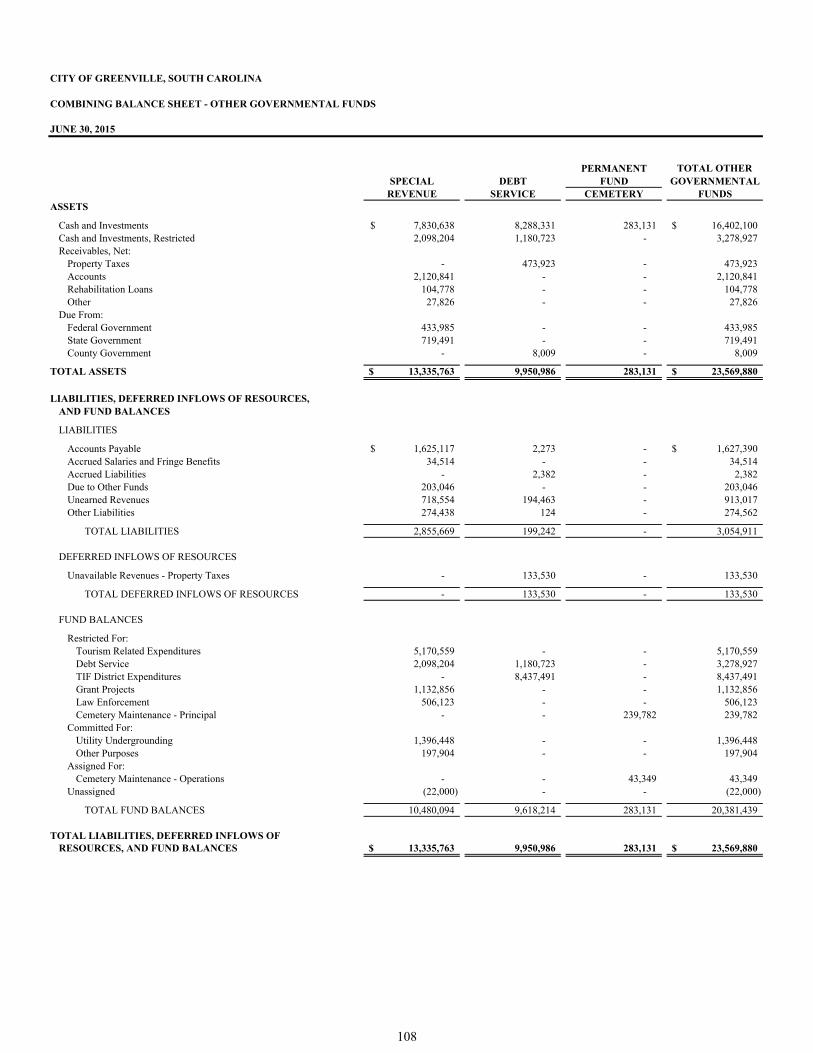
CITY OF GREENVILLE, SOUTH CAROLINA
COMBINING BALANCE SHEET - OTHER GOVERNMENTAL FUNDS
JUNE 30, 2015
PERMANENT TOTAL OTHERSPECIAL DEBT FUND GOVERNMENTAL
REVENUE SERVICE CEMETERY FUNDSASSETS
Cash and Investments 7,830,638$ 8,288,331 283,131 16,402,100$ Cash and Investments, Restricted 2,098,204 1,180,723 - 3,278,927 Receivables, Net:
Property Taxes - 473,923 - 473,923 Accounts 2,120,841 - - 2,120,841 Rehabilitation Loans 104,778 - - 104,778 Other 27,826 - - 27,826
Due From:Federal Government 433,985 - - 433,985 State Government 719,491 - - 719,491 County Government - 8,009 - 8,009
TOTAL ASSETS 13,335,763$ 9,950,986 283,131 23,569,880$
LIABILITIES, DEFERRED INFLOWS OF RESOURCES,AND FUND BALANCES
LIABILITIES
Accounts Payable 1,625,117$ 2,273 - 1,627,390$ Accrued Salaries and Fringe Benefits 34,514 - - 34,514 Accrued Liabilities - 2,382 - 2,382 Due to Other Funds 203,046 - - 203,046 Unearned Revenues 718,554 194,463 - 913,017 Other Liabilities 274,438 124 - 274,562
TOTAL LIABILITIES 2,855,669 199,242 - 3,054,911
DEFERRED INFLOWS OF RESOURCES
Unavailable Revenues - Property Taxes - 133,530 - 133,530
TOTAL DEFERRED INFLOWS OF RESOURCES - 133,530 - 133,530
FUND BALANCES
Restricted For:Tourism Related Expenditures 5,170,559 - - 5,170,559 Debt Service 2,098,204 1,180,723 - 3,278,927 TIF District Expenditures - 8,437,491 - 8,437,491 Grant Projects 1,132,856 - - 1,132,856 Law Enforcement 506,123 - - 506,123 Cemetery Maintenance - Principal - - 239,782 239,782
Committed For:Utility Undergrounding 1,396,448 - - 1,396,448 Other Purposes 197,904 - - 197,904
Assigned For:Cemetery Maintenance - Operations - - 43,349 43,349
Unassigned (22,000) - - (22,000)
TOTAL FUND BALANCES 10,480,094 9,618,214 283,131 20,381,439
TOTAL LIABILITIES, DEFERRED INFLOWS OFRESOURCES, AND FUND BALANCES 13,335,763$ 9,950,986 283,131 23,569,880$
108
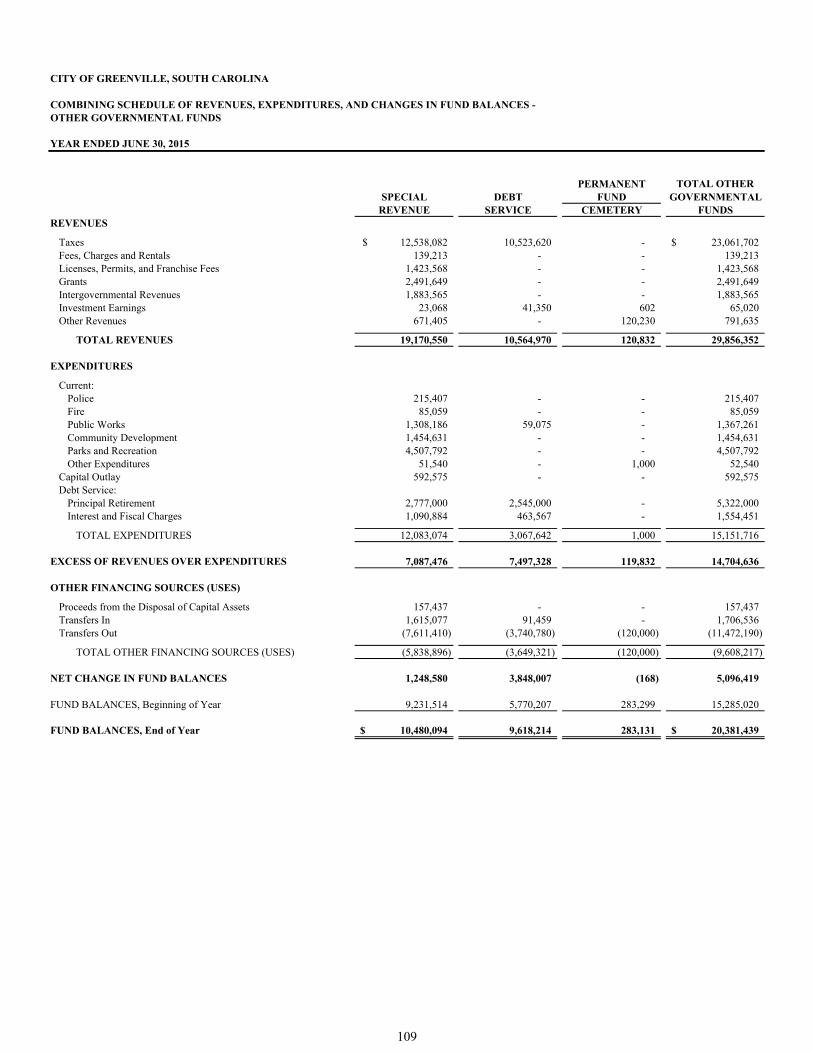
CITY OF GREENVILLE, SOUTH CAROLINA
COMBINING SCHEDULE OF REVENUES, EXPENDITURES, AND CHANGES IN FUND BALANCES -OTHER GOVERNMENTAL FUNDS
YEAR ENDED JUNE 30, 2015
PERMANENT TOTAL OTHERSPECIAL DEBT FUND GOVERNMENTAL
REVENUE SERVICE CEMETERY FUNDSREVENUES
Taxes 12,538,082$ 10,523,620 - 23,061,702$ Fees, Charges and Rentals 139,213 - - 139,213 Licenses, Permits, and Franchise Fees 1,423,568 - - 1,423,568 Grants 2,491,649 - - 2,491,649 Intergovernmental Revenues 1,883,565 - - 1,883,565 Investment Earnings 23,068 41,350 602 65,020 Other Revenues 671,405 - 120,230 791,635
TOTAL REVENUES 19,170,550 10,564,970 120,832 29,856,352
EXPENDITURES
Current:Police 215,407 - - 215,407 Fire 85,059 - - 85,059 Public Works 1,308,186 59,075 - 1,367,261 Community Development 1,454,631 - - 1,454,631 Parks and Recreation 4,507,792 - - 4,507,792 Other Expenditures 51,540 - 1,000 52,540
Capital Outlay 592,575 - - 592,575 Debt Service:
Principal Retirement 2,777,000 2,545,000 - 5,322,000 Interest and Fiscal Charges 1,090,884 463,567 - 1,554,451
TOTAL EXPENDITURES 12,083,074 3,067,642 1,000 15,151,716
EXCESS OF REVENUES OVER EXPENDITURES 7,087,476 7,497,328 119,832 14,704,636
OTHER FINANCING SOURCES (USES)
Proceeds from the Disposal of Capital Assets 157,437 - - 157,437 Transfers In 1,615,077 91,459 - 1,706,536 Transfers Out (7,611,410) (3,740,780) (120,000) (11,472,190)
TOTAL OTHER FINANCING SOURCES (USES) (5,838,896) (3,649,321) (120,000) (9,608,217)
NET CHANGE IN FUND BALANCES 1,248,580 3,848,007 (168) 5,096,419
FUND BALANCES, Beginning of Year 9,231,514 5,770,207 283,299 15,285,020
FUND BALANCES, End of Year 10,480,094$ 9,618,214 283,131 20,381,439$
109

CITY OF GREENVILLE, SOUTH CAROLINA
COMBINING BALANCE SHEET - ALL SPECIAL REVENUE FUNDS
HOME Neighborhood RentalProgram Stabilization Rehabilitation
Fund Fund Fund
ASSETS
Cash and Investments 69,864$ 3,945 77,727 Cash and Investments, Restricted - - - Receivables, Net:
Accounts - - - Rehabilitation Loans - - 43,146 Other - - -
Due From:Federal 18,421 - - State - - -
TOTAL ASSETS 88,285$ 3,945 120,873
LIABILITIES AND FUND BALANCES
LIABILITIES
Accounts Payable -$ - - Accrued Salaries and Fringe Benefits 1,158 - - Due to Other Funds - - - Unearned Revenues - - - Other Liabilities 1,375 - -
TOTAL LIABILITIES 2,533 - -
FUND BALANCES
Restricted For:Tourism Related Expenditures - - - Debt Service - - - Grant Projects 85,752 3,945 120,873 Law Enforcement - - -
Committed For:Utility Undergrounding - - - Other Purposes - - -
Unassigned - - -
TOTAL FUND BALANCES 85,752 3,945 120,873
TOTAL LIABILITIES AND FUND BALANCES 88,285$ 3,945 120,873
JUNE 30, 2015
110
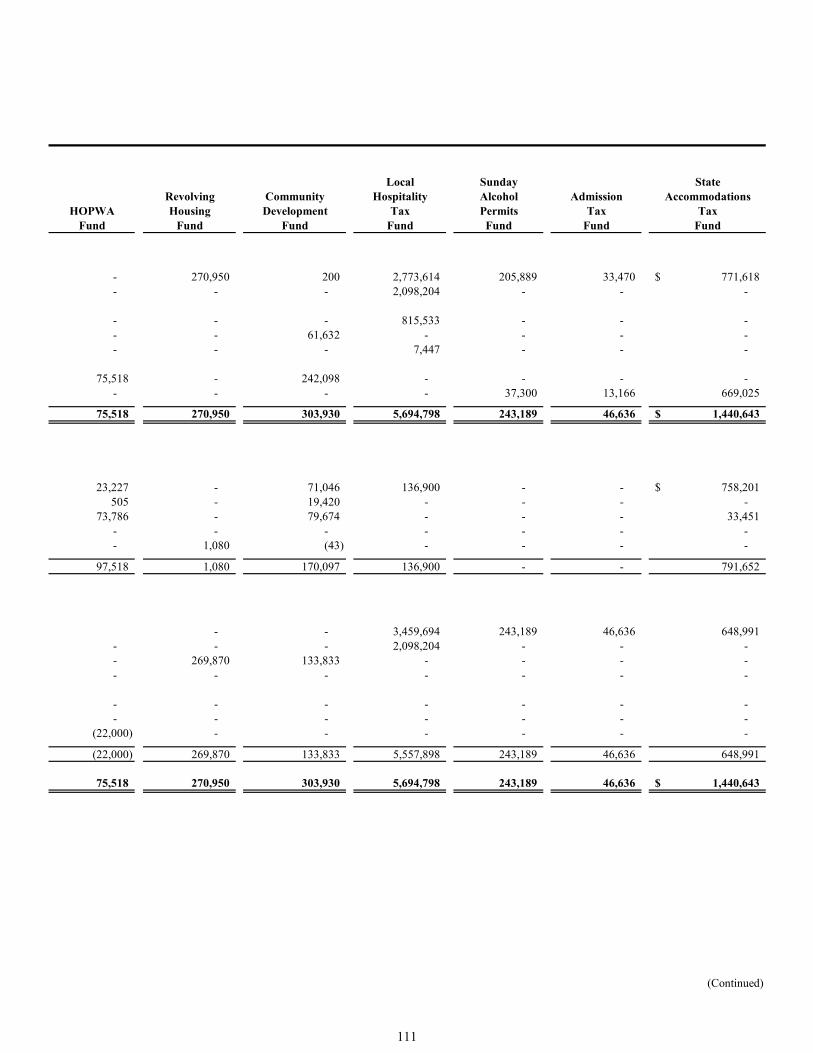
Local Sunday StateRevolving Community Hospitality Alcohol Admission Accommodations
HOPWA Housing Development Tax Permits Tax TaxFund Fund Fund Fund Fund Fund Fund
- 270,950 200 2,773,614 205,889 33,470 771,618$ - - - 2,098,204 - - -
- - - 815,533 - - - - - 61,632 - - - - - - - 7,447 - - -
75,518 - 242,098 - - - - - - - - 37,300 13,166 669,025
75,518 270,950 303,930 5,694,798 243,189 46,636 1,440,643$
23,227 - 71,046 136,900 - - 758,201$ 505 - 19,420 - - - -
73,786 - 79,674 - - - 33,451 - - - - - - - - 1,080 (43) - - - -
97,518 1,080 170,097 136,900 - - 791,652
- - 3,459,694 243,189 46,636 648,991 - - - 2,098,204 - - - - 269,870 133,833 - - - - - - - - - - -
- - - - - - - - - - - - - -
(22,000) - - - - - -
(22,000) 269,870 133,833 5,557,898 243,189 46,636 648,991
75,518 270,950 303,930 5,694,798 243,189 46,636 1,440,643$
(Continued)
111
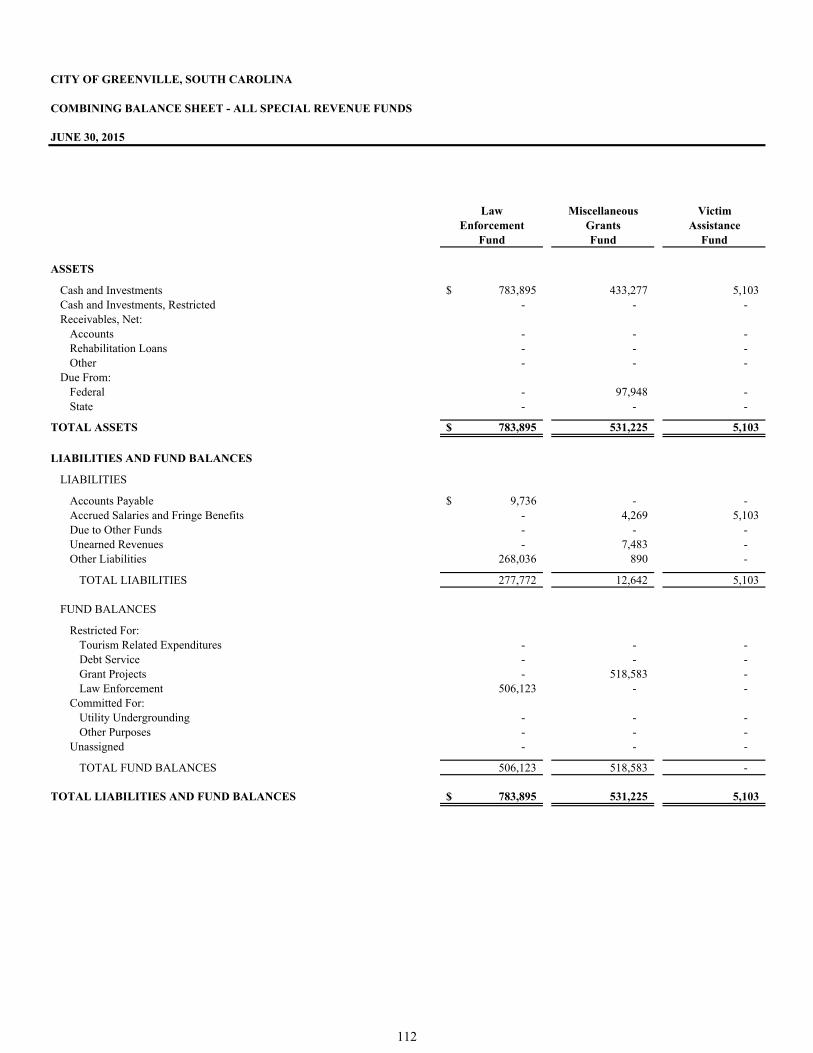
CITY OF GREENVILLE, SOUTH CAROLINA
COMBINING BALANCE SHEET - ALL SPECIAL REVENUE FUNDS
Law Miscellaneous VictimEnforcement Grants Assistance
Fund Fund Fund
ASSETS
Cash and Investments 783,895$ 433,277 5,103 Cash and Investments, Restricted - - - Receivables, Net:
Accounts - - - Rehabilitation Loans - - - Other - - -
Due From:Federal - 97,948 - State - - -
TOTAL ASSETS 783,895$ 531,225 5,103
LIABILITIES AND FUND BALANCES
LIABILITIES
Accounts Payable 9,736$ - - Accrued Salaries and Fringe Benefits - 4,269 5,103 Due to Other Funds - - - Unearned Revenues - 7,483 - Other Liabilities 268,036 890 -
TOTAL LIABILITIES 277,772 12,642 5,103
FUND BALANCES
Restricted For:Tourism Related Expenditures - - - Debt Service - - - Grant Projects - 518,583 - Law Enforcement 506,123 - -
Committed For:Utility Undergrounding - - - Other Purposes - - -
Unassigned - - -
TOTAL FUND BALANCES 506,123 518,583 -
TOTAL LIABILITIES AND FUND BALANCES 783,895$ 531,225 5,103
JUNE 30, 2015
112
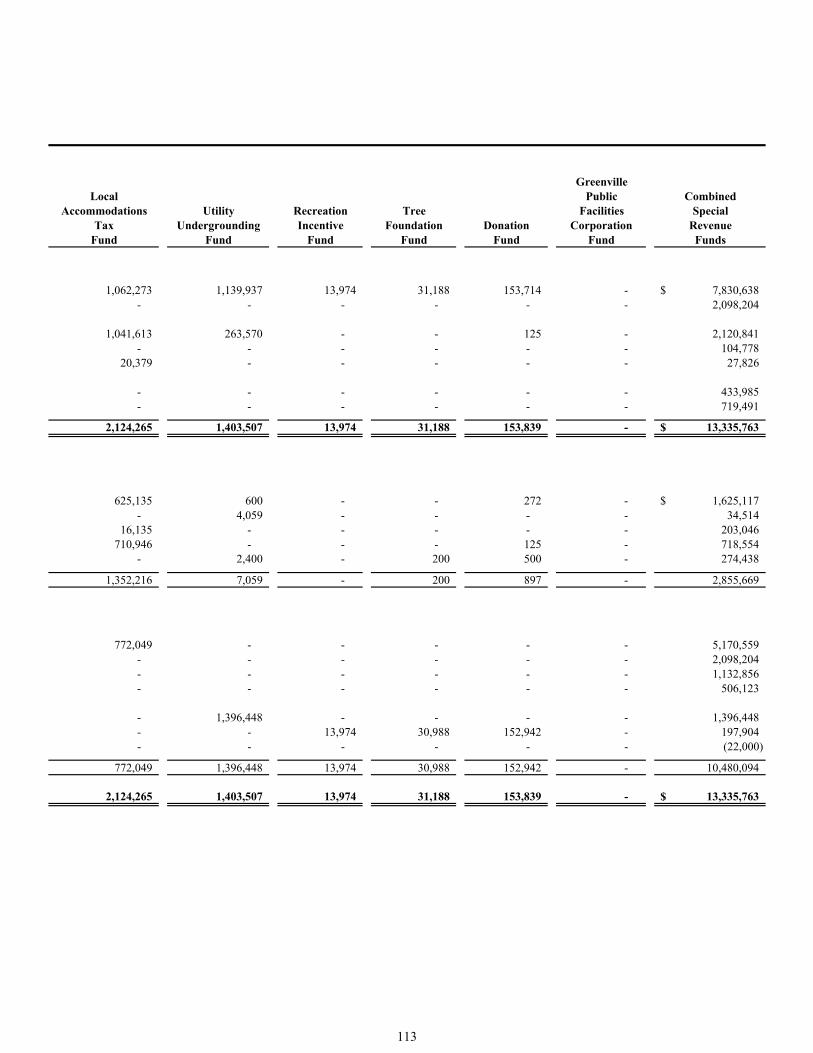
GreenvilleLocal Public Combined
Accommodations Utility Recreation Tree Facilities SpecialTax Undergrounding Incentive Foundation Donation Corporation Revenue
Fund Fund Fund Fund Fund Fund Funds
1,062,273 1,139,937 13,974 31,188 153,714 - 7,830,638$ - - - - - - 2,098,204
1,041,613 263,570 - - 125 - 2,120,841 - - - - - - 104,778
20,379 - - - - - 27,826
- - - - - - 433,985 - - - - - - 719,491
2,124,265 1,403,507 13,974 31,188 153,839 - 13,335,763$
625,135 600 - - 272 - 1,625,117$ - 4,059 - - - - 34,514
16,135 - - - - - 203,046 710,946 - - - 125 - 718,554
- 2,400 - 200 500 - 274,438
1,352,216 7,059 - 200 897 - 2,855,669
772,049 - - - - - 5,170,559 - - - - - - 2,098,204 - - - - - - 1,132,856 - - - - - - 506,123
- 1,396,448 - - - - 1,396,448 - - 13,974 30,988 152,942 - 197,904 - - - - - - (22,000)
772,049 1,396,448 13,974 30,988 152,942 - 10,480,094
2,124,265 1,403,507 13,974 31,188 153,839 - 13,335,763$
113
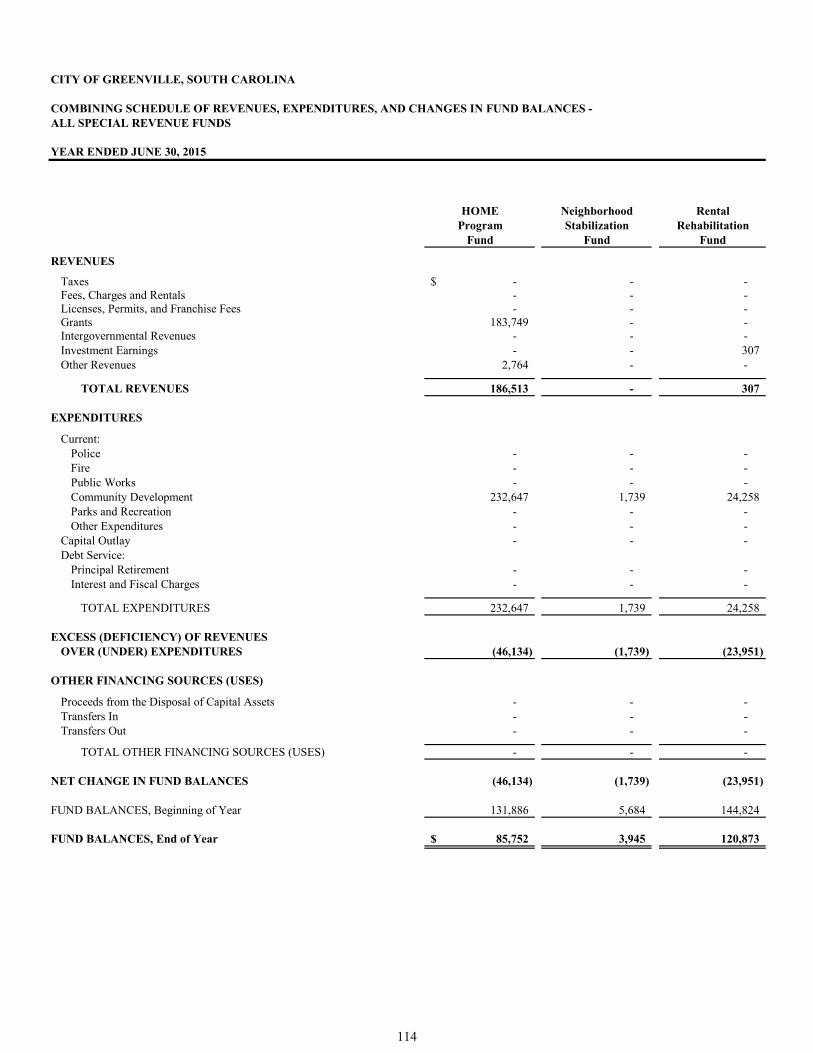
CITY OF GREENVILLE, SOUTH CAROLINA
COMBINING SCHEDULE OF REVENUES, EXPENDITURES, AND CHANGES IN FUND BALANCES - ALL SPECIAL REVENUE FUNDS
YEAR ENDED JUNE 30, 2015
HOME Neighborhood RentalProgram Stabilization Rehabilitation
Fund Fund Fund
REVENUES
Taxes -$ - - Fees, Charges and Rentals - - - Licenses, Permits, and Franchise Fees - - - Grants 183,749 - - Intergovernmental Revenues - - - Investment Earnings - - 307 Other Revenues 2,764 - -
TOTAL REVENUES 186,513 - 307
EXPENDITURES
Current:Police - - - Fire - - - Public Works - - - Community Development 232,647 1,739 24,258 Parks and Recreation - - - Other Expenditures - - -
Capital Outlay - - - Debt Service:
Principal Retirement - - - Interest and Fiscal Charges - - -
TOTAL EXPENDITURES 232,647 1,739 24,258
EXCESS (DEFICIENCY) OF REVENUESOVER (UNDER) EXPENDITURES (46,134) (1,739) (23,951)
OTHER FINANCING SOURCES (USES)
Proceeds from the Disposal of Capital Assets - - - Transfers In - - - Transfers Out - - -
TOTAL OTHER FINANCING SOURCES (USES) - - -
NET CHANGE IN FUND BALANCES (46,134) (1,739) (23,951)
FUND BALANCES, Beginning of Year 131,886 5,684 144,824
FUND BALANCES, End of Year 85,752$ 3,945 120,873
114
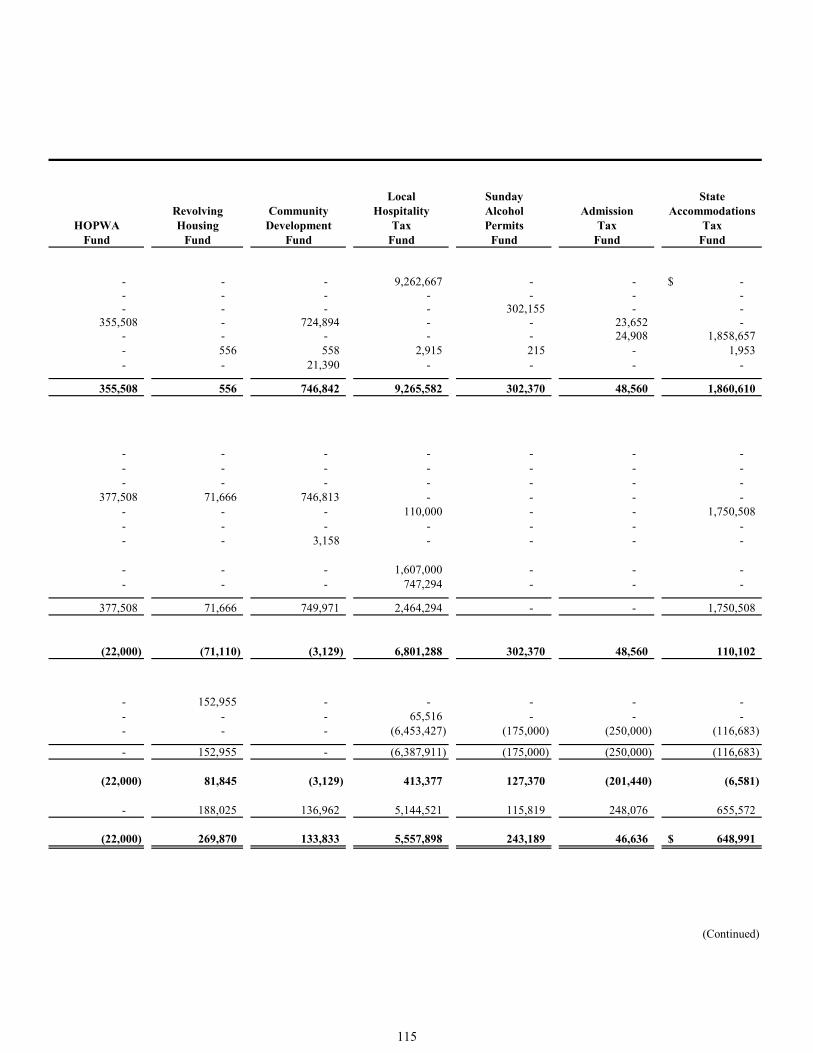
Local Sunday StateRevolving Community Hospitality Alcohol Admission Accommodations
HOPWA Housing Development Tax Permits Tax TaxFund Fund Fund Fund Fund Fund Fund
- - - 9,262,667 - - -$ - - - - - - - - - - - 302,155 - -
355,508 - 724,894 - - 23,652 - - - - - - 24,908 1,858,657 - 556 558 2,915 215 - 1,953 - - 21,390 - - - -
355,508 556 746,842 9,265,582 302,370 48,560 1,860,610
- - - - - - - - - - - - - - - - - - - - -
377,508 71,666 746,813 - - - - - - - 110,000 - - 1,750,508 - - - - - - - - - 3,158 - - - -
- - - 1,607,000 - - - - - - 747,294 - - -
377,508 71,666 749,971 2,464,294 - - 1,750,508
(22,000) (71,110) (3,129) 6,801,288 302,370 48,560 110,102
- 152,955 - - - - - - - - 65,516 - - - - - - (6,453,427) (175,000) (250,000) (116,683)
- 152,955 - (6,387,911) (175,000) (250,000) (116,683)
(22,000) 81,845 (3,129) 413,377 127,370 (201,440) (6,581)
- 188,025 136,962 5,144,521 115,819 248,076 655,572
(22,000) 269,870 133,833 5,557,898 243,189 46,636 648,991$
(Continued)
115
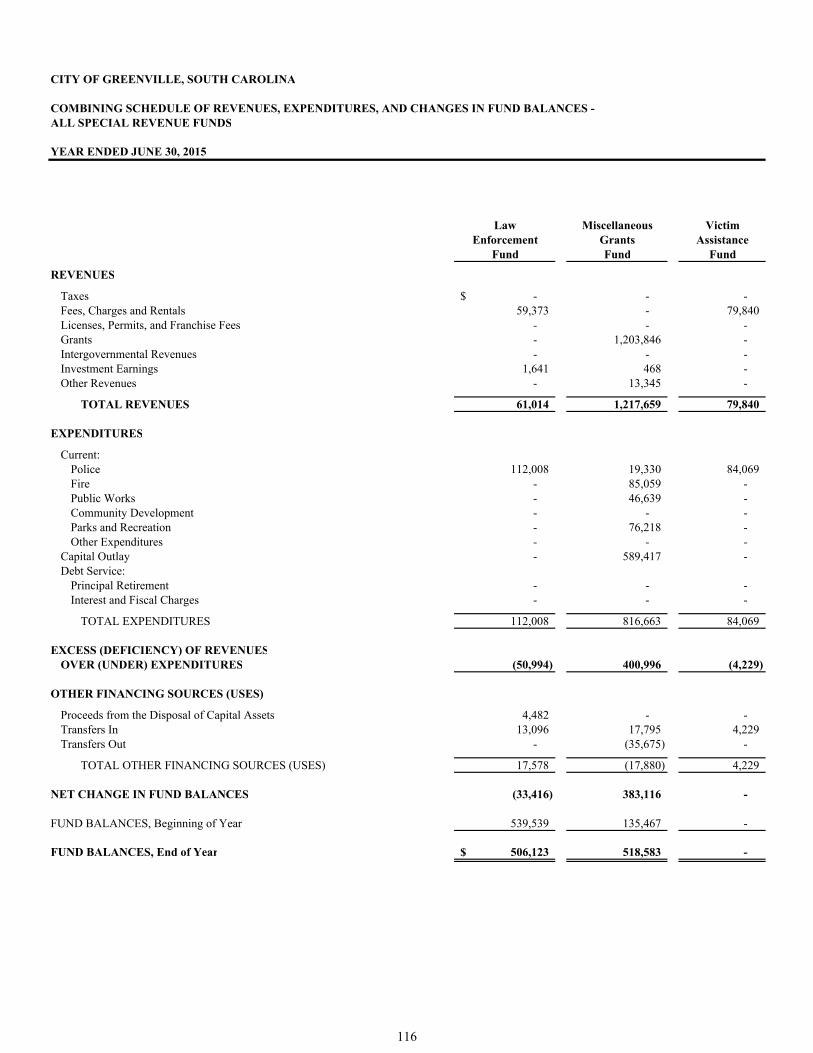
CITY OF GREENVILLE, SOUTH CAROLINA
COMBINING SCHEDULE OF REVENUES, EXPENDITURES, AND CHANGES IN FUND BALANCES - ALL SPECIAL REVENUE FUNDS
YEAR ENDED JUNE 30, 2015
Law Miscellaneous VictimEnforcement Grants Assistance
Fund Fund Fund
REVENUES
Taxes -$ - - Fees, Charges and Rentals 59,373 - 79,840 Licenses, Permits, and Franchise Fees - - - Grants - 1,203,846 - Intergovernmental Revenues - - - Investment Earnings 1,641 468 - Other Revenues - 13,345 -
TOTAL REVENUES 61,014 1,217,659 79,840
EXPENDITURES
Current:Police 112,008 19,330 84,069 Fire - 85,059 - Public Works - 46,639 - Community Development - - - Parks and Recreation - 76,218 - Other Expenditures - - -
Capital Outlay - 589,417 - Debt Service:
Principal Retirement - - - Interest and Fiscal Charges - - -
TOTAL EXPENDITURES 112,008 816,663 84,069
EXCESS (DEFICIENCY) OF REVENUESOVER (UNDER) EXPENDITURES (50,994) 400,996 (4,229)
OTHER FINANCING SOURCES (USES)
Proceeds from the Disposal of Capital Assets 4,482 - - Transfers In 13,096 17,795 4,229 Transfers Out - (35,675) -
TOTAL OTHER FINANCING SOURCES (USES) 17,578 (17,880) 4,229
NET CHANGE IN FUND BALANCES (33,416) 383,116 -
FUND BALANCES, Beginning of Year 539,539 135,467 -
FUND BALANCES, End of Year 506,123$ 518,583 -
116
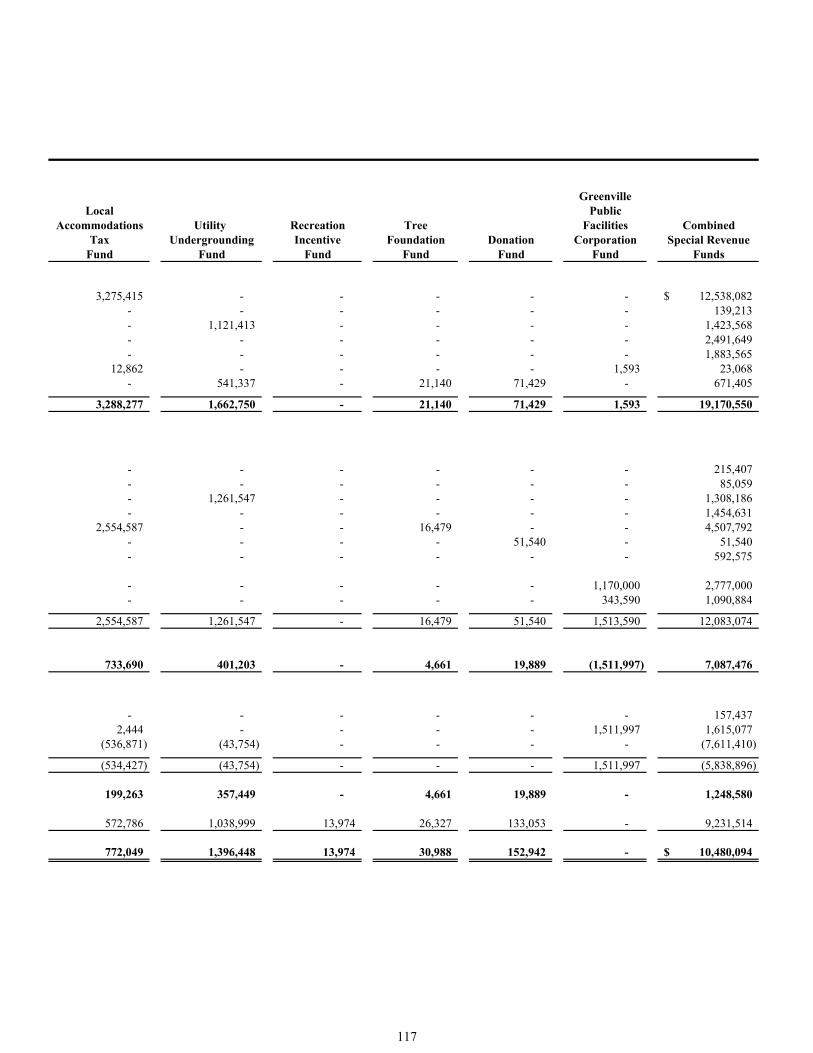
GreenvilleLocal Public
Accommodations Utility Recreation Tree Facilities CombinedTax Undergrounding Incentive Foundation Donation Corporation Special Revenue
Fund Fund Fund Fund Fund Fund Funds
3,275,415 - - - - - 12,538,082$ - - - - - - 139,213 - 1,121,413 - - - - 1,423,568 - - - - - - 2,491,649 - - - - - - 1,883,565
12,862 - - - - 1,593 23,068 - 541,337 - 21,140 71,429 - 671,405
3,288,277 1,662,750 - 21,140 71,429 1,593 19,170,550
- - - - - - 215,407 - - - - - - 85,059 - 1,261,547 - - - - 1,308,186 - - - - - - 1,454,631
2,554,587 - - 16,479 - - 4,507,792 - - - - 51,540 - 51,540 - - - - - - 592,575
- - - - - 1,170,000 2,777,000 - - - - - 343,590 1,090,884
2,554,587 1,261,547 - 16,479 51,540 1,513,590 12,083,074
733,690 401,203 - 4,661 19,889 (1,511,997) 7,087,476
- - - - - - 157,437 2,444 - - - - 1,511,997 1,615,077
(536,871) (43,754) - - - - (7,611,410)
(534,427) (43,754) - - - 1,511,997 (5,838,896)
199,263 357,449 - 4,661 19,889 - 1,248,580
572,786 1,038,999 13,974 26,327 133,053 - 9,231,514
772,049 1,396,448 13,974 30,988 152,942 - 10,480,094$
117
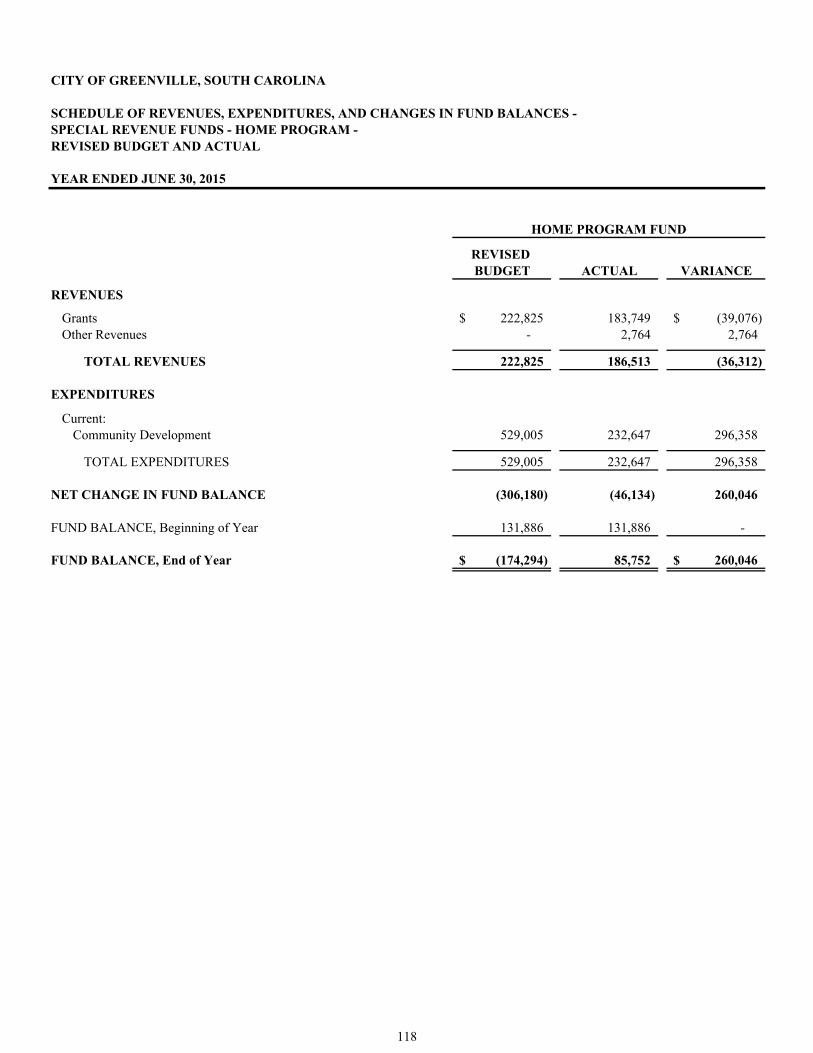
CITY OF GREENVILLE, SOUTH CAROLINA
SCHEDULE OF REVENUES, EXPENDITURES, AND CHANGES IN FUND BALANCES - SPECIAL REVENUE FUNDS - HOME PROGRAM -REVISED BUDGET AND ACTUAL
YEAR ENDED JUNE 30, 2015
REVISED BUDGET ACTUAL VARIANCE
REVENUES
Grants 222,825$ 183,749 (39,076)$ Other Revenues - 2,764 2,764
TOTAL REVENUES 222,825 186,513 (36,312)
EXPENDITURES
Current:Community Development 529,005 232,647 296,358
TOTAL EXPENDITURES 529,005 232,647 296,358
NET CHANGE IN FUND BALANCE (306,180) (46,134) 260,046
FUND BALANCE, Beginning of Year 131,886 131,886 -
FUND BALANCE, End of Year (174,294)$ 85,752 260,046$
HOME PROGRAM FUND
118
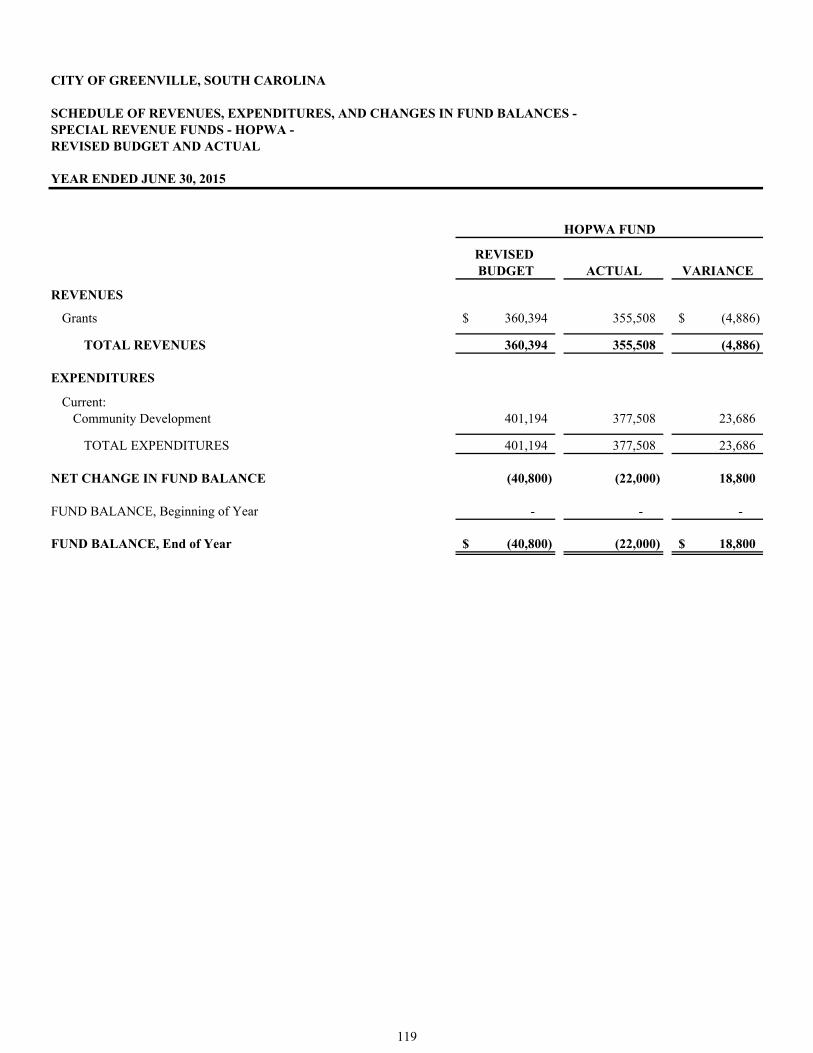
CITY OF GREENVILLE, SOUTH CAROLINA
SCHEDULE OF REVENUES, EXPENDITURES, AND CHANGES IN FUND BALANCES - SPECIAL REVENUE FUNDS - HOPWA -REVISED BUDGET AND ACTUAL
YEAR ENDED JUNE 30, 2015
REVISED BUDGET ACTUAL VARIANCE
REVENUES
Grants 360,394$ 355,508 (4,886)$
TOTAL REVENUES 360,394 355,508 (4,886)
EXPENDITURES
Current:Community Development 401,194 377,508 23,686
TOTAL EXPENDITURES 401,194 377,508 23,686
NET CHANGE IN FUND BALANCE (40,800) (22,000) 18,800
FUND BALANCE, Beginning of Year - - -
FUND BALANCE, End of Year (40,800)$ (22,000) 18,800$
HOPWA FUND
119
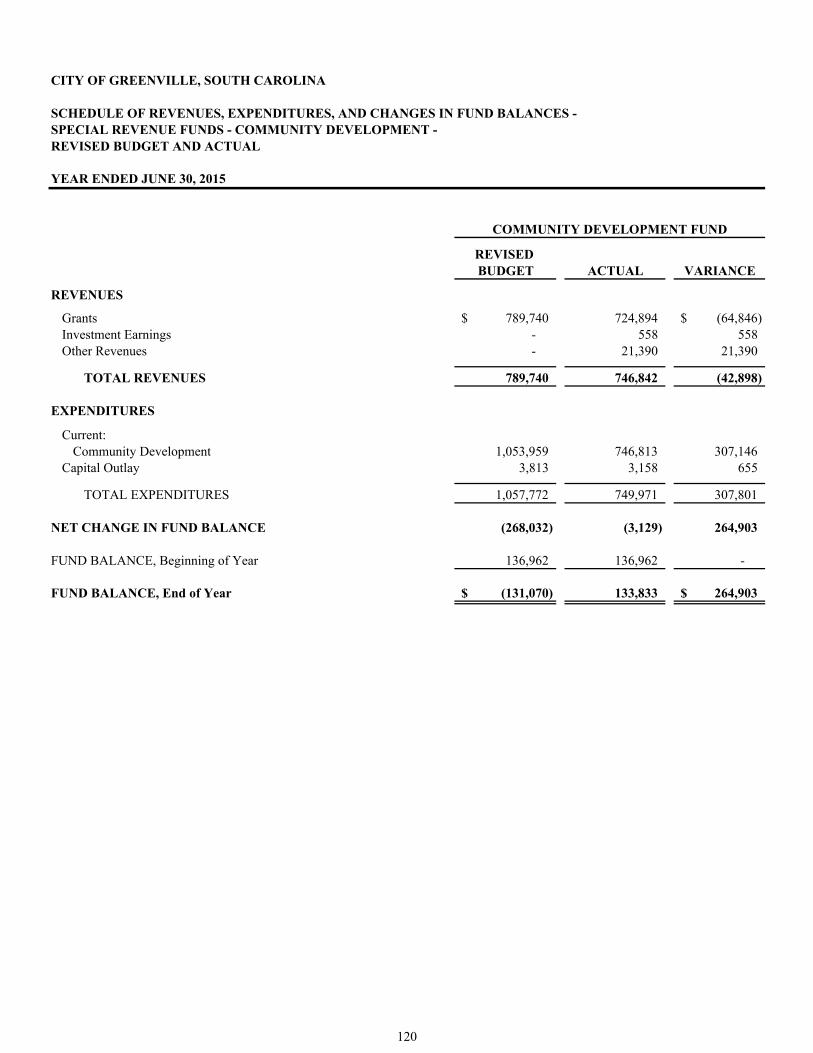
CITY OF GREENVILLE, SOUTH CAROLINA
SCHEDULE OF REVENUES, EXPENDITURES, AND CHANGES IN FUND BALANCES - SPECIAL REVENUE FUNDS - COMMUNITY DEVELOPMENT -REVISED BUDGET AND ACTUAL
YEAR ENDED JUNE 30, 2015
REVISED BUDGET ACTUAL VARIANCE
REVENUES
Grants 789,740$ 724,894 (64,846)$ Investment Earnings - 558 558 Other Revenues - 21,390 21,390
TOTAL REVENUES 789,740 746,842 (42,898)
EXPENDITURES
Current:Community Development 1,053,959 746,813 307,146
Capital Outlay 3,813 3,158 655
TOTAL EXPENDITURES 1,057,772 749,971 307,801
NET CHANGE IN FUND BALANCE (268,032) (3,129) 264,903
FUND BALANCE, Beginning of Year 136,962 136,962 -
FUND BALANCE, End of Year (131,070)$ 133,833 264,903$
COMMUNITY DEVELOPMENT FUND
120
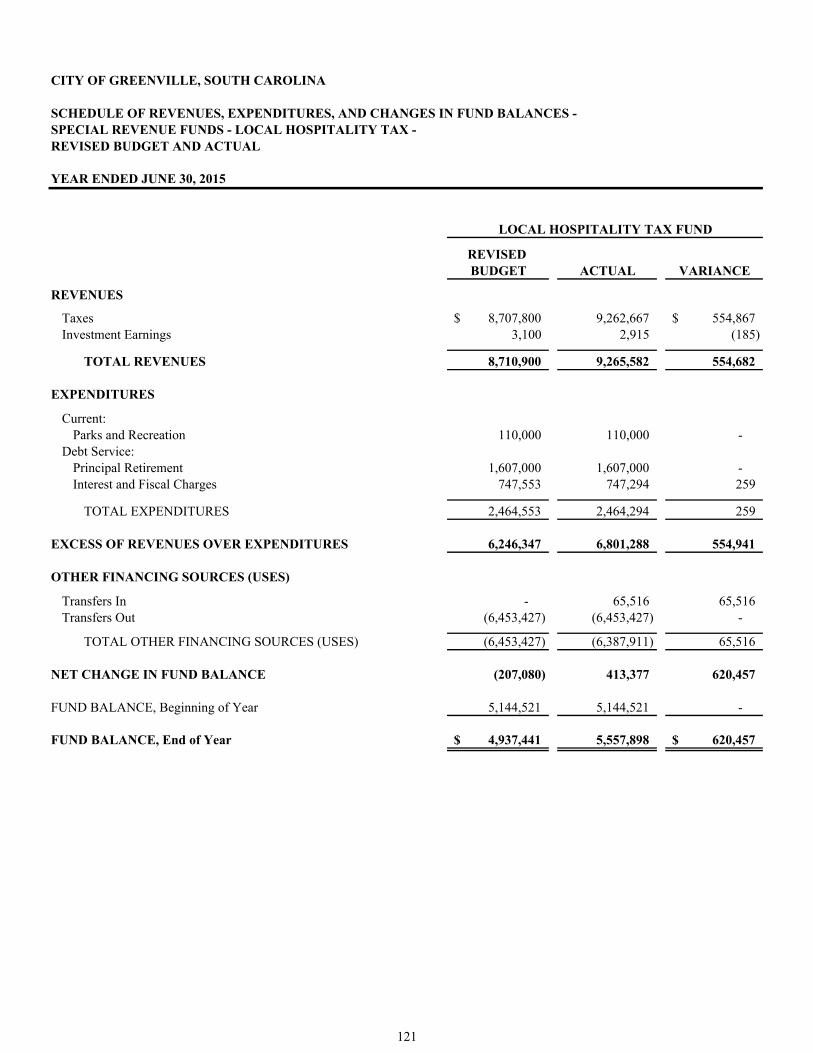
CITY OF GREENVILLE, SOUTH CAROLINA
SCHEDULE OF REVENUES, EXPENDITURES, AND CHANGES IN FUND BALANCES - SPECIAL REVENUE FUNDS - LOCAL HOSPITALITY TAX -REVISED BUDGET AND ACTUAL
YEAR ENDED JUNE 30, 2015
REVISED BUDGET ACTUAL VARIANCE
REVENUES
Taxes 8,707,800$ 9,262,667 554,867$ Investment Earnings 3,100 2,915 (185)
TOTAL REVENUES 8,710,900 9,265,582 554,682
EXPENDITURES
Current:Parks and Recreation 110,000 110,000 -
Debt Service:Principal Retirement 1,607,000 1,607,000 - Interest and Fiscal Charges 747,553 747,294 259
TOTAL EXPENDITURES 2,464,553 2,464,294 259
EXCESS OF REVENUES OVER EXPENDITURES 6,246,347 6,801,288 554,941
OTHER FINANCING SOURCES (USES)
Transfers In - 65,516 65,516 Transfers Out (6,453,427) (6,453,427) -
TOTAL OTHER FINANCING SOURCES (USES) (6,453,427) (6,387,911) 65,516
NET CHANGE IN FUND BALANCE (207,080) 413,377 620,457
FUND BALANCE, Beginning of Year 5,144,521 5,144,521 -
FUND BALANCE, End of Year 4,937,441$ 5,557,898 620,457$
LOCAL HOSPITALITY TAX FUND
121
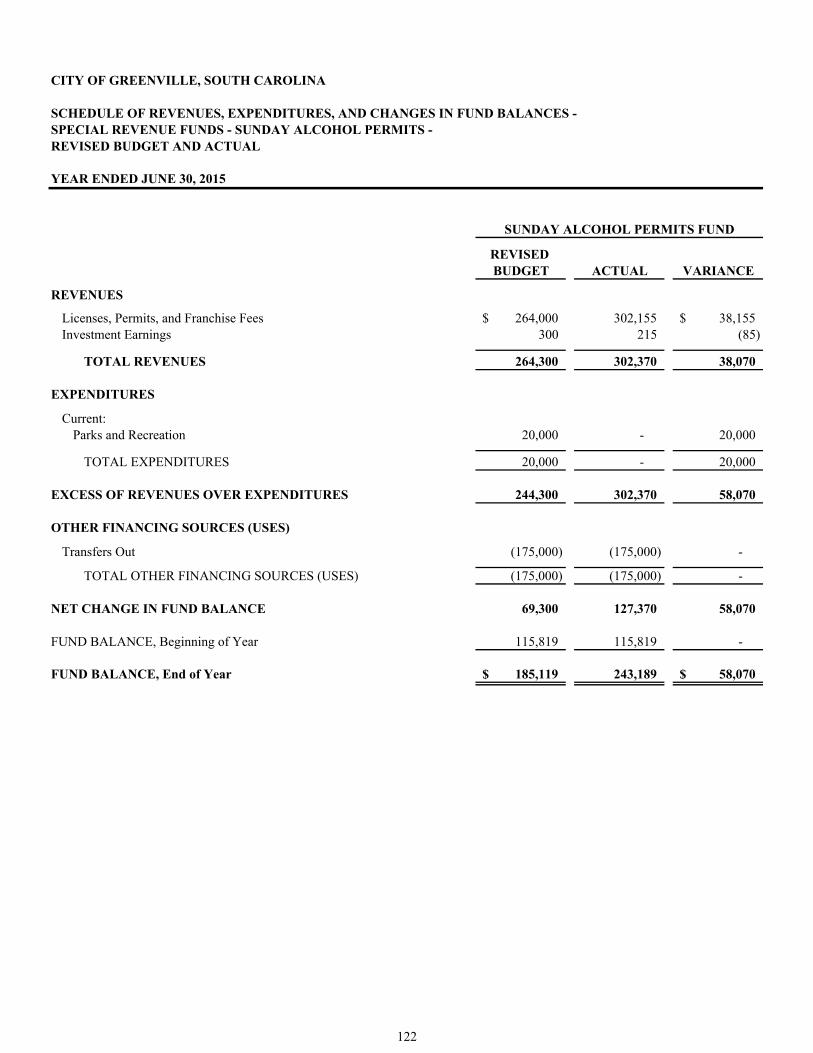
CITY OF GREENVILLE, SOUTH CAROLINA
SCHEDULE OF REVENUES, EXPENDITURES, AND CHANGES IN FUND BALANCES - SPECIAL REVENUE FUNDS - SUNDAY ALCOHOL PERMITS -REVISED BUDGET AND ACTUAL
YEAR ENDED JUNE 30, 2015
REVISED BUDGET ACTUAL VARIANCE
REVENUES
Licenses, Permits, and Franchise Fees 264,000$ 302,155 38,155$ Investment Earnings 300 215 (85)
TOTAL REVENUES 264,300 302,370 38,070
EXPENDITURES
Current:Parks and Recreation 20,000 - 20,000
TOTAL EXPENDITURES 20,000 - 20,000
EXCESS OF REVENUES OVER EXPENDITURES 244,300 302,370 58,070
OTHER FINANCING SOURCES (USES)
Transfers Out (175,000) (175,000) -
TOTAL OTHER FINANCING SOURCES (USES) (175,000) (175,000) -
NET CHANGE IN FUND BALANCE 69,300 127,370 58,070
FUND BALANCE, Beginning of Year 115,819 115,819 -
FUND BALANCE, End of Year 185,119$ 243,189 58,070$
SUNDAY ALCOHOL PERMITS FUND
122
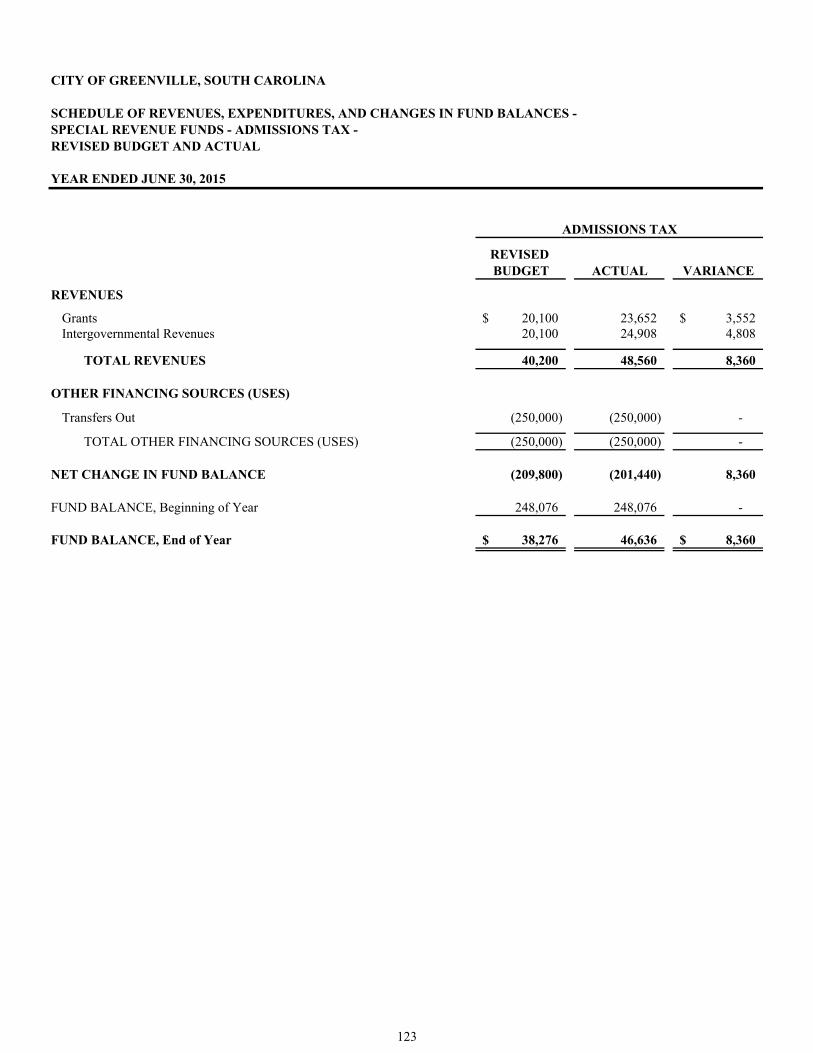
CITY OF GREENVILLE, SOUTH CAROLINA
SCHEDULE OF REVENUES, EXPENDITURES, AND CHANGES IN FUND BALANCES - SPECIAL REVENUE FUNDS - ADMISSIONS TAX -REVISED BUDGET AND ACTUAL
YEAR ENDED JUNE 30, 2015
REVISED BUDGET ACTUAL VARIANCE
REVENUES
Grants 20,100$ 23,652 3,552$ Intergovernmental Revenues 20,100 24,908 4,808
TOTAL REVENUES 40,200 48,560 8,360
OTHER FINANCING SOURCES (USES)
Transfers Out (250,000) (250,000) -
TOTAL OTHER FINANCING SOURCES (USES) (250,000) (250,000) -
NET CHANGE IN FUND BALANCE (209,800) (201,440) 8,360
FUND BALANCE, Beginning of Year 248,076 248,076 -
FUND BALANCE, End of Year 38,276$ 46,636 8,360$
ADMISSIONS TAX
123

CITY OF GREENVILLE, SOUTH CAROLINA
SCHEDULE OF REVENUES, EXPENDITURES, AND CHANGES IN FUND BALANCES - SPECIAL REVENUE FUNDS - STATE ACCOMMODATIONS TAX -REVISED BUDGET AND ACTUAL
YEAR ENDED JUNE 30, 2015
REVISED BUDGET ACTUAL VARIANCE
REVENUES
Intergovernmental Revenues 1,821,000$ 1,858,657 37,657$ Investment Earnings - 1,953 1,953
TOTAL REVENUES 1,821,000 1,860,610 39,610
EXPENDITURES
Current:Parks and Recreation 1,788,800 1,750,508 38,292
TOTAL EXPENDITURES 1,788,800 1,750,508 38,292
EXCESS OF REVENUES OVER EXPENDITURES 32,200 110,102 77,902
OTHER FINANCING SOURCES (USES)
Transfers Out (114,800) (116,683) (1,883)
TOTAL OTHER FINANCING SOURCES (USES) (114,800) (116,683) (1,883)
NET CHANGE IN FUND BALANCE (82,600) (6,581) 76,019
FUND BALANCE, Beginning of Year 655,572 655,572 -
FUND BALANCE, End of Year 572,972$ 648,991 76,019$
STATE ACCOMMODATIONS TAX FUND
124
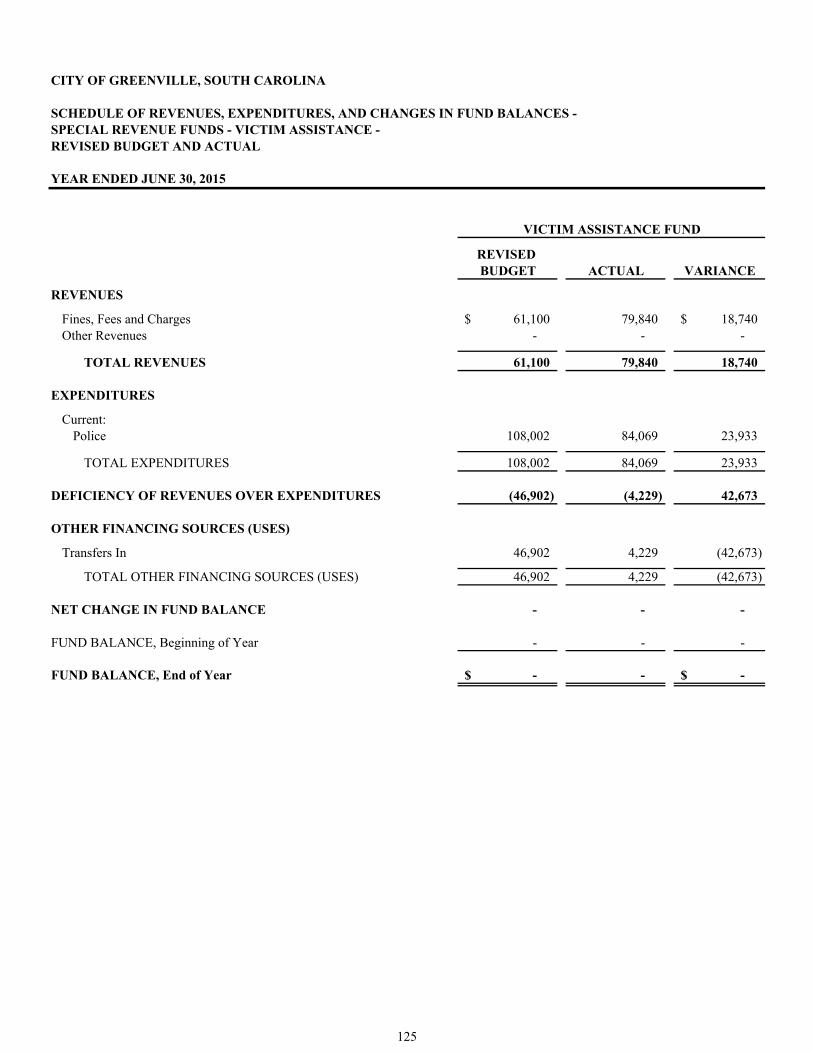
CITY OF GREENVILLE, SOUTH CAROLINA
SCHEDULE OF REVENUES, EXPENDITURES, AND CHANGES IN FUND BALANCES - SPECIAL REVENUE FUNDS - VICTIM ASSISTANCE -REVISED BUDGET AND ACTUAL
YEAR ENDED JUNE 30, 2015
REVISED BUDGET ACTUAL VARIANCE
REVENUES
Fines, Fees and Charges 61,100$ 79,840 18,740$ Other Revenues - - -
TOTAL REVENUES 61,100 79,840 18,740
EXPENDITURES
Current:Police 108,002 84,069 23,933
TOTAL EXPENDITURES 108,002 84,069 23,933
DEFICIENCY OF REVENUES OVER EXPENDITURES (46,902) (4,229) 42,673
OTHER FINANCING SOURCES (USES)
Transfers In 46,902 4,229 (42,673)
TOTAL OTHER FINANCING SOURCES (USES) 46,902 4,229 (42,673)
NET CHANGE IN FUND BALANCE - - - FUND BALANCE, Beginning of Year - - -
FUND BALANCE, End of Year -$ - -$
VICTIM ASSISTANCE FUND
125
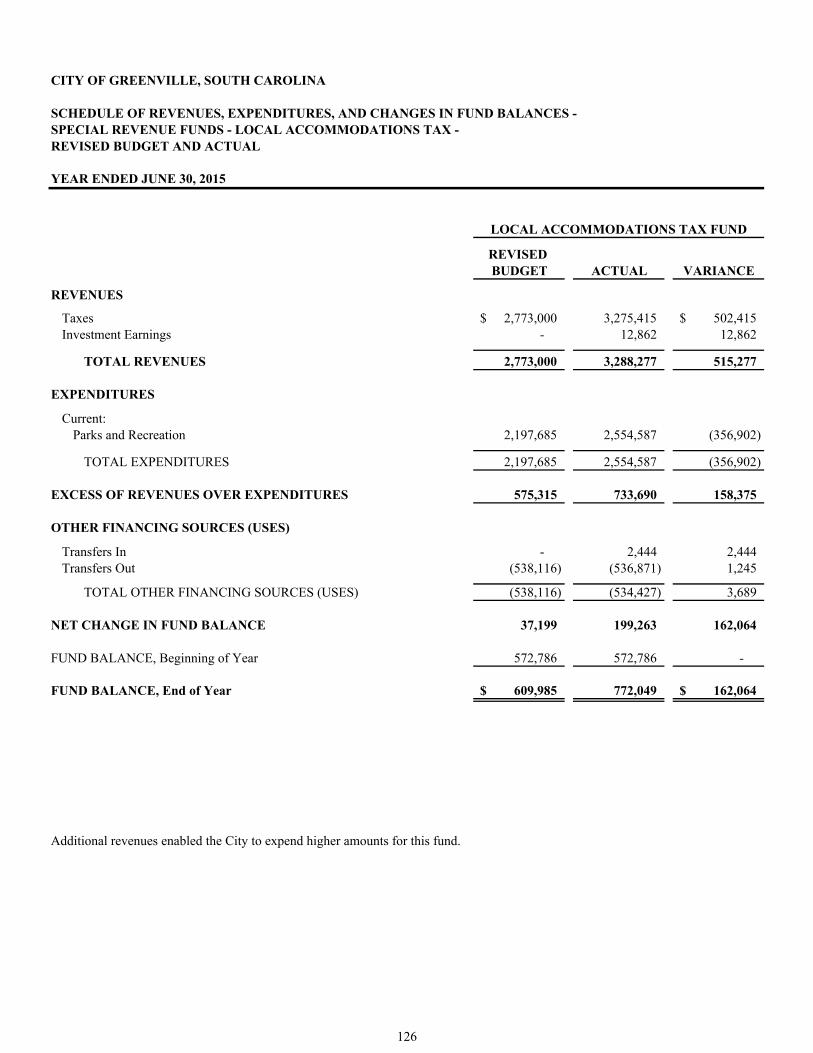
CITY OF GREENVILLE, SOUTH CAROLINA
SCHEDULE OF REVENUES, EXPENDITURES, AND CHANGES IN FUND BALANCES - SPECIAL REVENUE FUNDS - LOCAL ACCOMMODATIONS TAX -REVISED BUDGET AND ACTUAL
YEAR ENDED JUNE 30, 2015
REVISED BUDGET ACTUAL VARIANCE
REVENUES
Taxes 2,773,000$ 3,275,415 502,415$ Investment Earnings - 12,862 12,862
TOTAL REVENUES 2,773,000 3,288,277 515,277
EXPENDITURES
Current:Parks and Recreation 2,197,685 2,554,587 (356,902)
TOTAL EXPENDITURES 2,197,685 2,554,587 (356,902)
EXCESS OF REVENUES OVER EXPENDITURES 575,315 733,690 158,375
OTHER FINANCING SOURCES (USES)
Transfers In - 2,444 2,444 Transfers Out (538,116) (536,871) 1,245
TOTAL OTHER FINANCING SOURCES (USES) (538,116) (534,427) 3,689
NET CHANGE IN FUND BALANCE 37,199 199,263 162,064
FUND BALANCE, Beginning of Year 572,786 572,786 -
FUND BALANCE, End of Year 609,985$ 772,049 162,064$
Additional revenues enabled the City to expend higher amounts for this fund.
LOCAL ACCOMMODATIONS TAX FUND
126

CITY OF GREENVILLE, SOUTH CAROLINA
SCHEDULE OF REVENUES, EXPENDITURES, AND CHANGES IN FUND BALANCES - SPECIAL REVENUE FUNDS - UTILITY UNDERGROUNDING -REVISED BUDGET AND ACTUAL
YEAR ENDED JUNE 30, 2015
REVISED BUDGET ACTUAL VARIANCE
REVENUES
Licenses, Permits, and Franchise Fees 1,026,463$ 1,121,413 94,950$ Other Revenues 482,270 541,337 59,067
TOTAL REVENUES 1,508,733 1,662,750 154,017
EXPENDITURES
Current:Public Works 2,012,543 1,261,547 750,996
TOTAL EXPENDITURES 2,012,543 1,261,547 750,996
DEFICIENCY OF REVENUES OVER EXPENDITURES (503,810) 401,203 905,013
OTHER FINANCING SOURCES (USES)
Transfers Out (43,754) (43,754) -
TOTAL OTHER FINANCING SOURCES (USES) (43,754) (43,754) -
NET CHANGE IN FUND BALANCE (547,564) 357,449 905,013
FUND BALANCE, Beginning of Year 1,038,999 1,038,999 -
FUND BALANCE, End of Year 491,435$ 1,396,448 905,013$
UTILITY UNDERGROUNDING FUND
127

COMBINING BALANCE SHEET - ALL DEBT SERVICE FUNDS
WESTEND VIOLA STREETDOWNTOWN TAX TAX COMBINED
INFRASTRUCTURE INCREMENT INCREMENT DEBT SERVICEDISTRICT DISTRICT DISTRICT FUNDS
ASSETS
Cash and Investments 3,185,503$ 4,213,874 888,954 8,288,331$ Cash and Investments, Restricted 1,180,723 - - 1,180,723 Receivables, Net:
Property Taxes 287,758 122,907 63,258 473,923 Due from County Government 4,440 587 2,982 8,009
TOTAL ASSETS 4,658,424$ 4,337,368 955,194 9,950,986$
LIABILITIES, DEFERRED INFLOWS OF RESOURCES,AND FUND BALANCES
LIABILITIES
Accounts Payable 2,273$ - - 2,273$ Accrued Liabilities - - 2,382 2,382 Unearned Revenues 194,463 - - 194,463 Other Liabilities 124 - - 124
TOTAL LIABILITIES 196,860 - 2,382 199,242
DEFERRED INFLOWS OF RESOURCES
Unavailable Revenues - Property Taxes 69,756 53,864 9,910 133,530
TOTAL DEFERRED INFLOWS OF RESOURCES 69,756 53,864 9,910 133,530
FUND BALANCES
Restricted For Debt Service 1,180,723 - - 1,180,723 Restricted For TIF District Expenditures 3,211,085 4,283,504 942,902 8,437,491
TOTAL FUND BALANCES 4,391,808 4,283,504 942,902 9,618,214
TOTAL LIABILITIES, DEFERRED INFLOWS OFRESOURCES, AND FUND BALANCES 4,658,424$ 4,337,368 955,194 9,950,986$
CITY OF GREENVILLE, SOUTH CAROLINA
JUNE 30, 2015
128
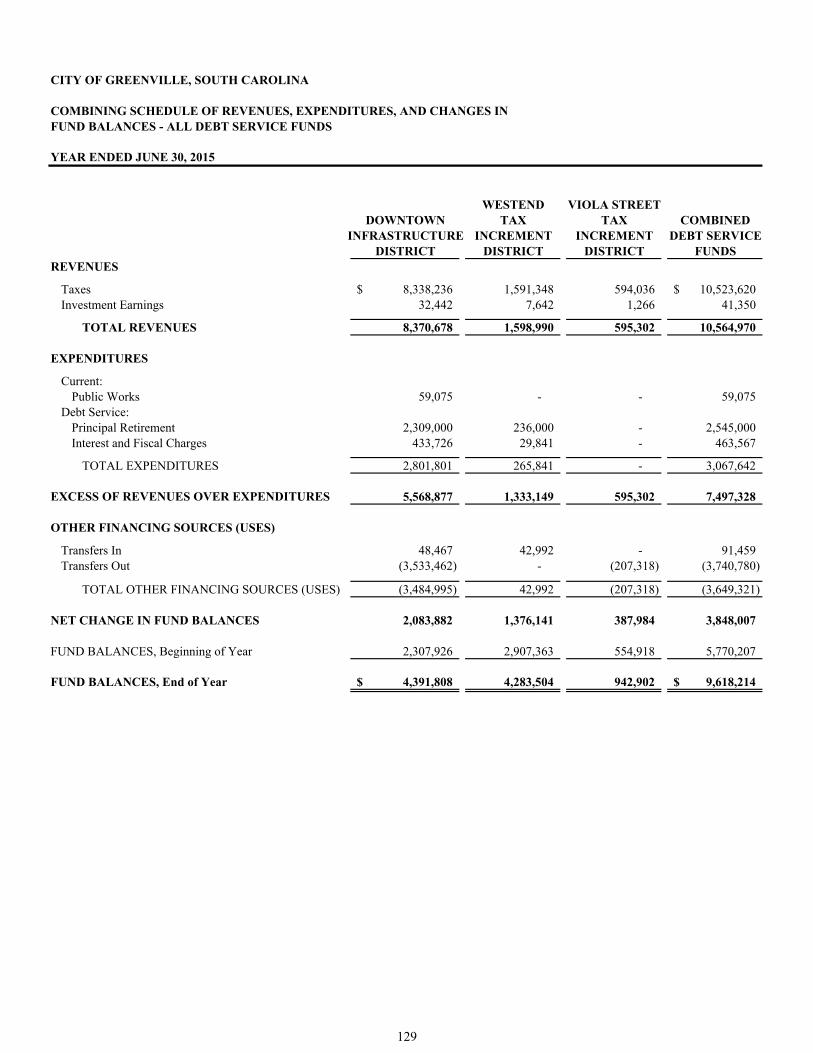
CITY OF GREENVILLE, SOUTH CAROLINA
COMBINING SCHEDULE OF REVENUES, EXPENDITURES, AND CHANGES INFUND BALANCES - ALL DEBT SERVICE FUNDS
YEAR ENDED JUNE 30, 2015
WESTEND VIOLA STREETDOWNTOWN TAX TAX COMBINED
INFRASTRUCTURE INCREMENT INCREMENT DEBT SERVICEDISTRICT DISTRICT DISTRICT FUNDS
REVENUES
Taxes 8,338,236$ 1,591,348 594,036 10,523,620$ Investment Earnings 32,442 7,642 1,266 41,350
TOTAL REVENUES 8,370,678 1,598,990 595,302 10,564,970
EXPENDITURES
Current:Public Works 59,075 - - 59,075
Debt Service:Principal Retirement 2,309,000 236,000 - 2,545,000 Interest and Fiscal Charges 433,726 29,841 - 463,567
TOTAL EXPENDITURES 2,801,801 265,841 - 3,067,642
EXCESS OF REVENUES OVER EXPENDITURES 5,568,877 1,333,149 595,302 7,497,328
OTHER FINANCING SOURCES (USES)
Transfers In 48,467 42,992 - 91,459 Transfers Out (3,533,462) - (207,318) (3,740,780)
TOTAL OTHER FINANCING SOURCES (USES) (3,484,995) 42,992 (207,318) (3,649,321)
NET CHANGE IN FUND BALANCES 2,083,882 1,376,141 387,984 3,848,007
FUND BALANCES, Beginning of Year 2,307,926 2,907,363 554,918 5,770,207
FUND BALANCES, End of Year 4,391,808$ 4,283,504 942,902 9,618,214$
129
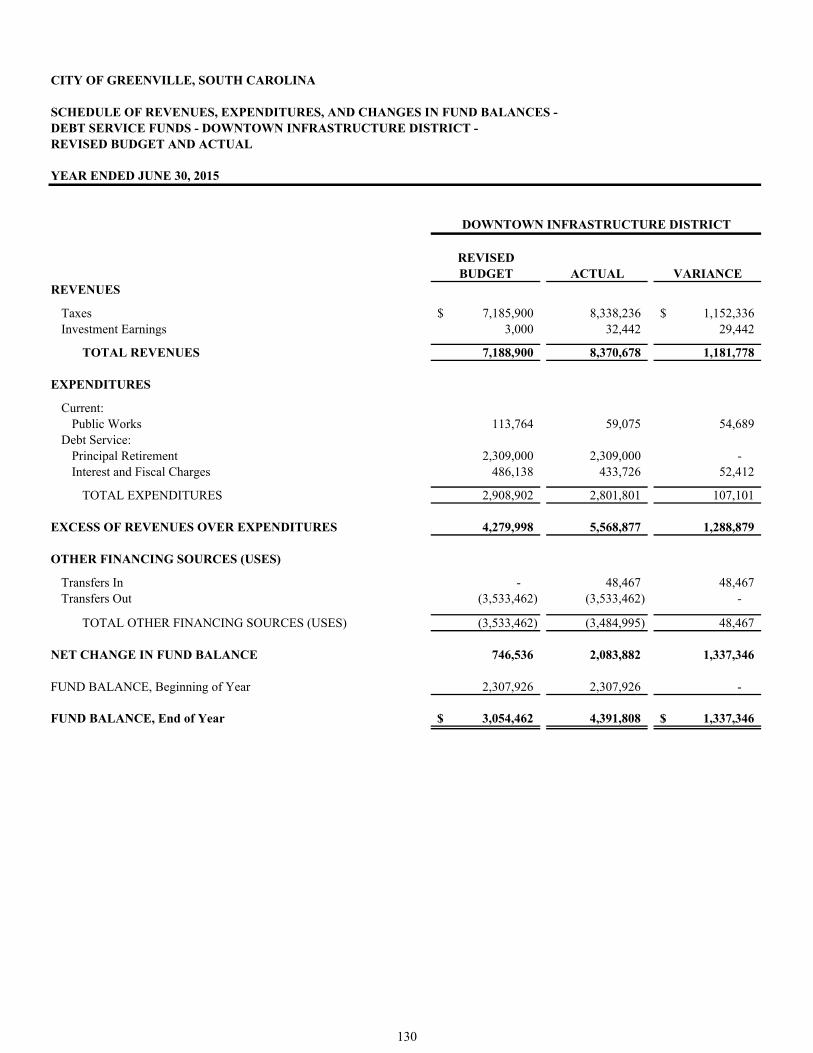
CITY OF GREENVILLE, SOUTH CAROLINA
SCHEDULE OF REVENUES, EXPENDITURES, AND CHANGES IN FUND BALANCES -DEBT SERVICE FUNDS - DOWNTOWN INFRASTRUCTURE DISTRICT -REVISED BUDGET AND ACTUAL
YEAR ENDED JUNE 30, 2015
REVISEDBUDGET ACTUAL VARIANCE
REVENUES
Taxes 7,185,900$ 8,338,236 1,152,336$ Investment Earnings 3,000 32,442 29,442
TOTAL REVENUES 7,188,900 8,370,678 1,181,778
EXPENDITURES
Current:Public Works 113,764 59,075 54,689
Debt Service:Principal Retirement 2,309,000 2,309,000 - Interest and Fiscal Charges 486,138 433,726 52,412
TOTAL EXPENDITURES 2,908,902 2,801,801 107,101
EXCESS OF REVENUES OVER EXPENDITURES 4,279,998 5,568,877 1,288,879
OTHER FINANCING SOURCES (USES)
Transfers In - 48,467 48,467 Transfers Out (3,533,462) (3,533,462) -
TOTAL OTHER FINANCING SOURCES (USES) (3,533,462) (3,484,995) 48,467
NET CHANGE IN FUND BALANCE 746,536 2,083,882 1,337,346
FUND BALANCE, Beginning of Year 2,307,926 2,307,926 -
FUND BALANCE, End of Year 3,054,462$ 4,391,808 1,337,346$
DOWNTOWN INFRASTRUCTURE DISTRICT
130
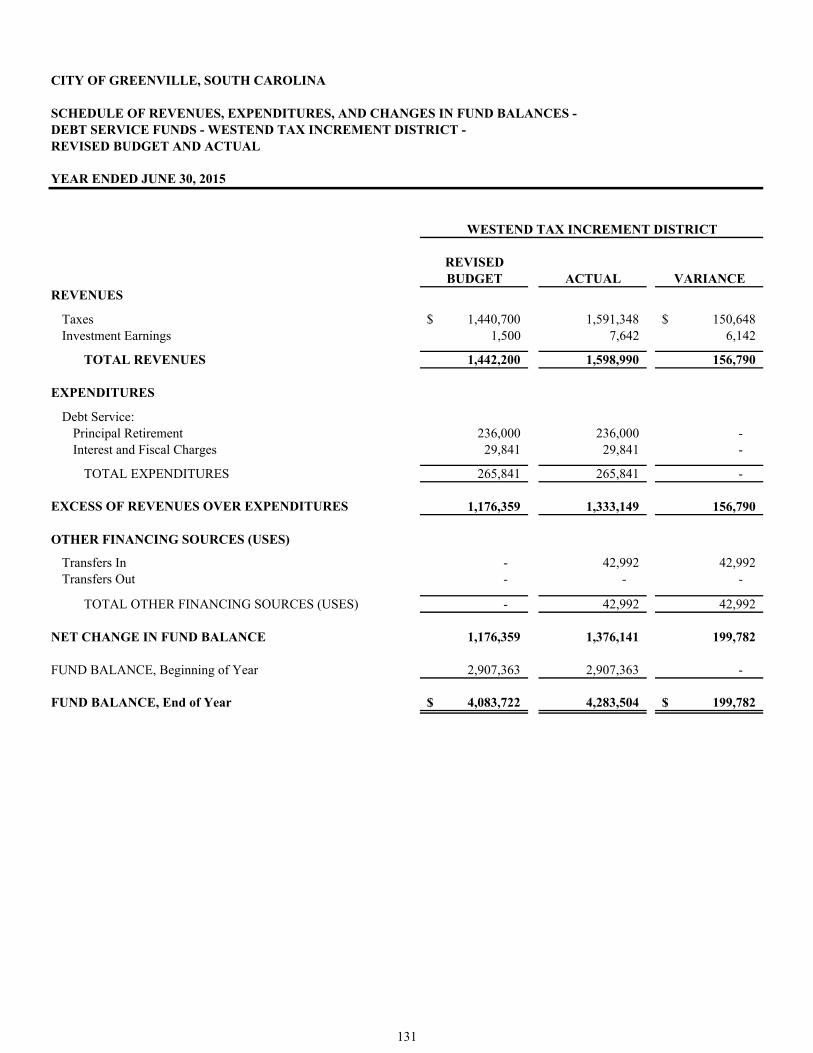
CITY OF GREENVILLE, SOUTH CAROLINA
SCHEDULE OF REVENUES, EXPENDITURES, AND CHANGES IN FUND BALANCES -DEBT SERVICE FUNDS - WESTEND TAX INCREMENT DISTRICT -REVISED BUDGET AND ACTUAL
YEAR ENDED JUNE 30, 2015
REVISEDBUDGET ACTUAL VARIANCE
REVENUES
Taxes 1,440,700$ 1,591,348 150,648$ Investment Earnings 1,500 7,642 6,142
TOTAL REVENUES 1,442,200 1,598,990 156,790
EXPENDITURES
Debt Service:Principal Retirement 236,000 236,000 - Interest and Fiscal Charges 29,841 29,841 -
TOTAL EXPENDITURES 265,841 265,841 -
EXCESS OF REVENUES OVER EXPENDITURES 1,176,359 1,333,149 156,790
OTHER FINANCING SOURCES (USES)
Transfers In - 42,992 42,992 Transfers Out - - -
TOTAL OTHER FINANCING SOURCES (USES) - 42,992 42,992
NET CHANGE IN FUND BALANCE 1,176,359 1,376,141 199,782
FUND BALANCE, Beginning of Year 2,907,363 2,907,363 -
FUND BALANCE, End of Year 4,083,722$ 4,283,504 199,782$
WESTEND TAX INCREMENT DISTRICT
131
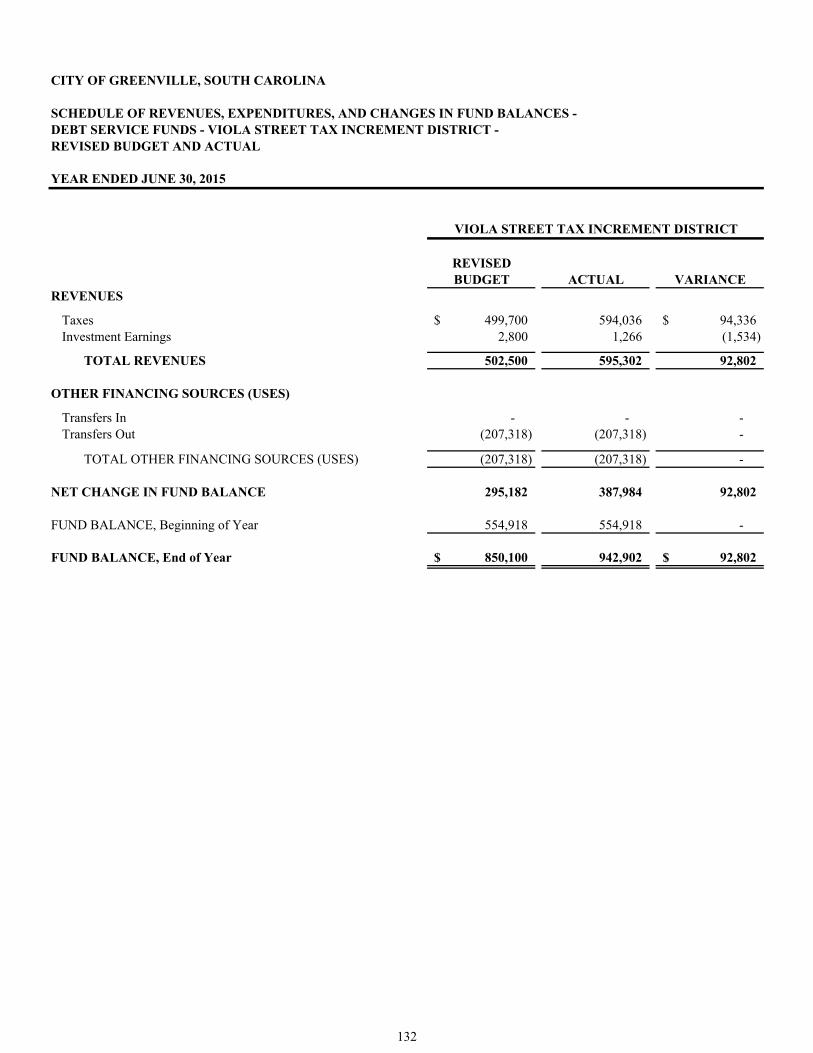
CITY OF GREENVILLE, SOUTH CAROLINA
SCHEDULE OF REVENUES, EXPENDITURES, AND CHANGES IN FUND BALANCES -DEBT SERVICE FUNDS - VIOLA STREET TAX INCREMENT DISTRICT -REVISED BUDGET AND ACTUAL
YEAR ENDED JUNE 30, 2015
REVISEDBUDGET ACTUAL VARIANCE
REVENUES
Taxes 499,700$ 594,036 94,336$ Investment Earnings 2,800 1,266 (1,534)
TOTAL REVENUES 502,500 595,302 92,802
OTHER FINANCING SOURCES (USES)
Transfers In - - - Transfers Out (207,318) (207,318) -
TOTAL OTHER FINANCING SOURCES (USES) (207,318) (207,318) -
NET CHANGE IN FUND BALANCE 295,182 387,984 92,802
FUND BALANCE, Beginning of Year 554,918 554,918 -
FUND BALANCE, End of Year 850,100$ 942,902 92,802$
VIOLA STREET TAX INCREMENT DISTRICT
132
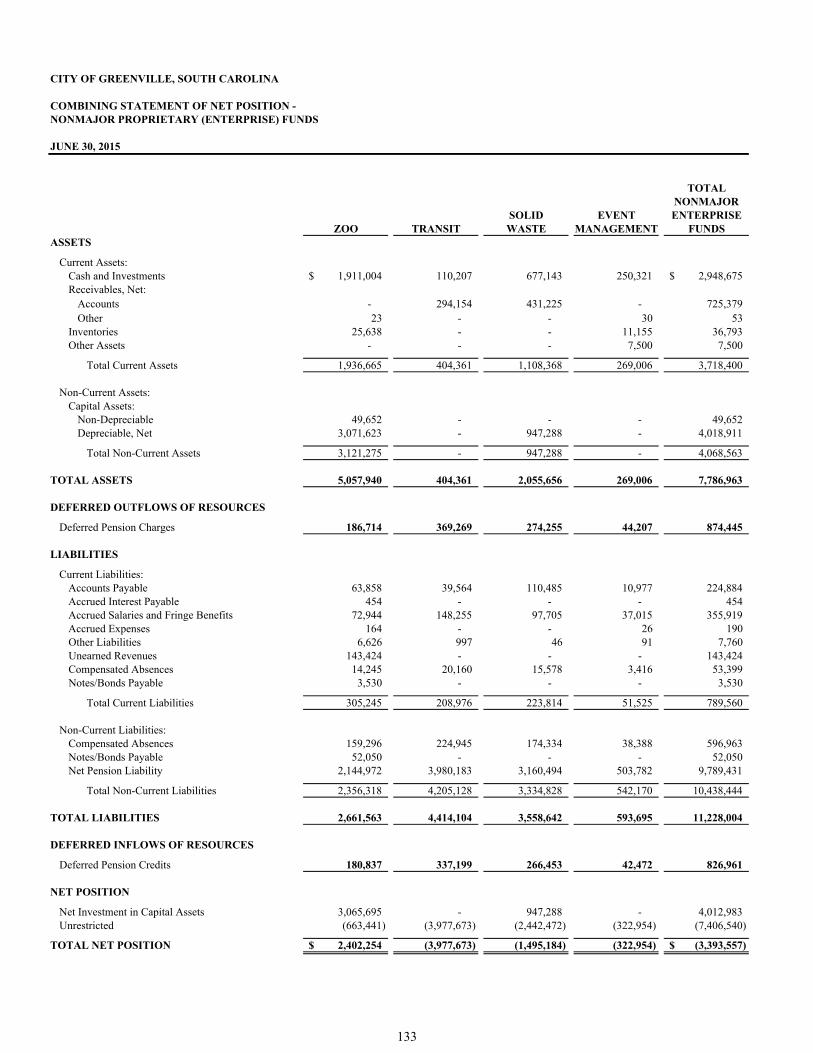
CITY OF GREENVILLE, SOUTH CAROLINA
COMBINING STATEMENT OF NET POSITION -NONMAJOR PROPRIETARY (ENTERPRISE) FUNDS
JUNE 30, 2015
TOTALNONMAJOR
SOLID EVENT ENTERPRISEZOO TRANSIT WASTE MANAGEMENT FUNDS
ASSETS
Current Assets:Cash and Investments 1,911,004$ 110,207 677,143 250,321 2,948,675$ Receivables, Net:
Accounts - 294,154 431,225 - 725,379 Other 23 - - 30 53
Inventories 25,638 - - 11,155 36,793 Other Assets - - - 7,500 7,500
Total Current Assets 1,936,665 404,361 1,108,368 269,006 3,718,400
Non-Current Assets:Capital Assets:
Non-Depreciable 49,652 - - - 49,652 Depreciable, Net 3,071,623 - 947,288 - 4,018,911
Total Non-Current Assets 3,121,275 - 947,288 - 4,068,563
TOTAL ASSETS 5,057,940 404,361 2,055,656 269,006 7,786,963
DEFERRED OUTFLOWS OF RESOURCES
Deferred Pension Charges 186,714 369,269 274,255 44,207 874,445
LIABILITIES
Current Liabilities:Accounts Payable 63,858 39,564 110,485 10,977 224,884 Accrued Interest Payable 454 - - - 454 Accrued Salaries and Fringe Benefits 72,944 148,255 97,705 37,015 355,919 Accrued Expenses 164 - - 26 190 Other Liabilities 6,626 997 46 91 7,760 Unearned Revenues 143,424 - - - 143,424 Compensated Absences 14,245 20,160 15,578 3,416 53,399 Notes/Bonds Payable 3,530 - - - 3,530
Total Current Liabilities 305,245 208,976 223,814 51,525 789,560
Non-Current Liabilities:Compensated Absences 159,296 224,945 174,334 38,388 596,963 Notes/Bonds Payable 52,050 - - - 52,050 Net Pension Liability 2,144,972 3,980,183 3,160,494 503,782 9,789,431
Total Non-Current Liabilities 2,356,318 4,205,128 3,334,828 542,170 10,438,444
TOTAL LIABILITIES 2,661,563 4,414,104 3,558,642 593,695 11,228,004
DEFERRED INFLOWS OF RESOURCES
Deferred Pension Credits 180,837 337,199 266,453 42,472 826,961
NET POSITION
Net Investment in Capital Assets 3,065,695 - 947,288 - 4,012,983 Unrestricted (663,441) (3,977,673) (2,442,472) (322,954) (7,406,540)
TOTAL NET POSITION 2,402,254$ (3,977,673) (1,495,184) (322,954) (3,393,557)$
133
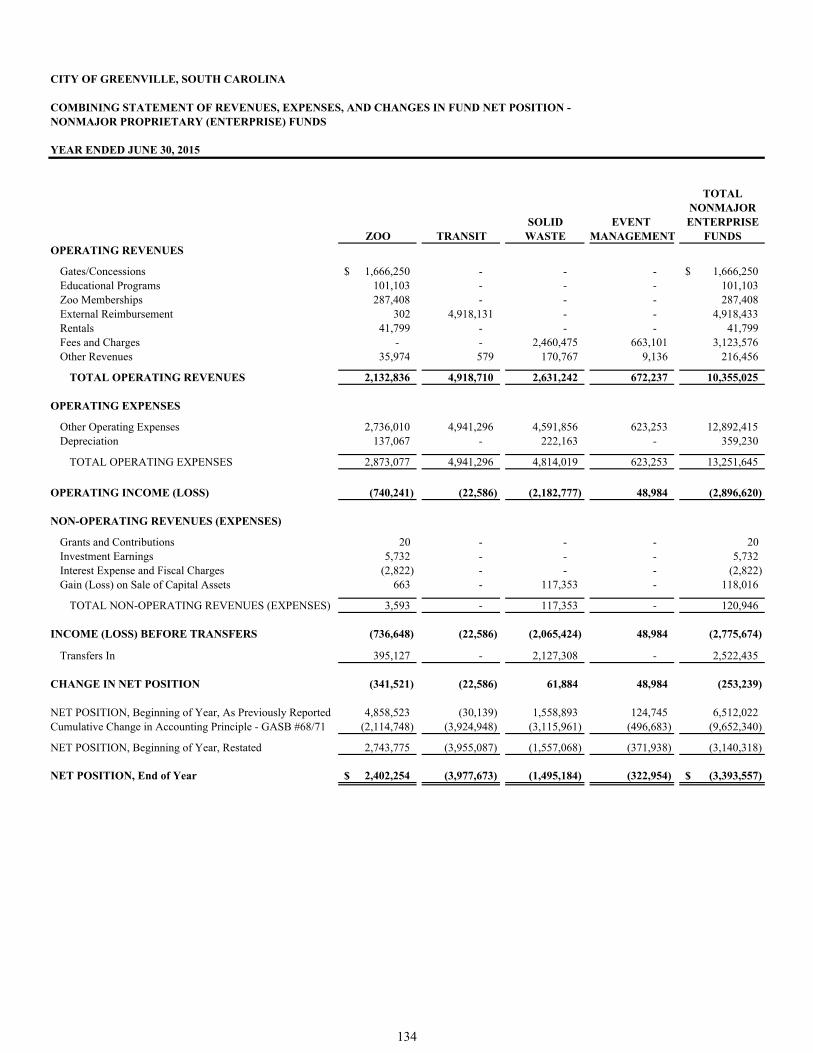
CITY OF GREENVILLE, SOUTH CAROLINA
COMBINING STATEMENT OF REVENUES, EXPENSES, AND CHANGES IN FUND NET POSITION - NONMAJOR PROPRIETARY (ENTERPRISE) FUNDS
YEAR ENDED JUNE 30, 2015
TOTALNONMAJOR
SOLID EVENT ENTERPRISEZOO TRANSIT WASTE MANAGEMENT FUNDS
OPERATING REVENUES
Gates/Concessions 1,666,250$ - - - 1,666,250$ Educational Programs 101,103 - - - 101,103 Zoo Memberships 287,408 - - - 287,408 External Reimbursement 302 4,918,131 - - 4,918,433 Rentals 41,799 - - - 41,799 Fees and Charges - - 2,460,475 663,101 3,123,576 Other Revenues 35,974 579 170,767 9,136 216,456
TOTAL OPERATING REVENUES 2,132,836 4,918,710 2,631,242 672,237 10,355,025
OPERATING EXPENSES
Other Operating Expenses 2,736,010 4,941,296 4,591,856 623,253 12,892,415 Depreciation 137,067 - 222,163 - 359,230
TOTAL OPERATING EXPENSES 2,873,077 4,941,296 4,814,019 623,253 13,251,645
OPERATING INCOME (LOSS) (740,241) (22,586) (2,182,777) 48,984 (2,896,620)
NON-OPERATING REVENUES (EXPENSES)
Grants and Contributions 20 - - - 20 Investment Earnings 5,732 - - - 5,732 Interest Expense and Fiscal Charges (2,822) - - - (2,822) Gain (Loss) on Sale of Capital Assets 663 - 117,353 - 118,016
TOTAL NON-OPERATING REVENUES (EXPENSES) 3,593 - 117,353 - 120,946
INCOME (LOSS) BEFORE TRANSFERS (736,648) (22,586) (2,065,424) 48,984 (2,775,674)
Transfers In 395,127 - 2,127,308 - 2,522,435
CHANGE IN NET POSITION (341,521) (22,586) 61,884 48,984 (253,239)
NET POSITION, Beginning of Year, As Previously Reported 4,858,523 (30,139) 1,558,893 124,745 6,512,022 Cumulative Change in Accounting Principle - GASB #68/71 (2,114,748) (3,924,948) (3,115,961) (496,683) (9,652,340)
NET POSITION, Beginning of Year, Restated 2,743,775 (3,955,087) (1,557,068) (371,938) (3,140,318)
NET POSITION, End of Year 2,402,254$ (3,977,673) (1,495,184) (322,954) (3,393,557)$
134
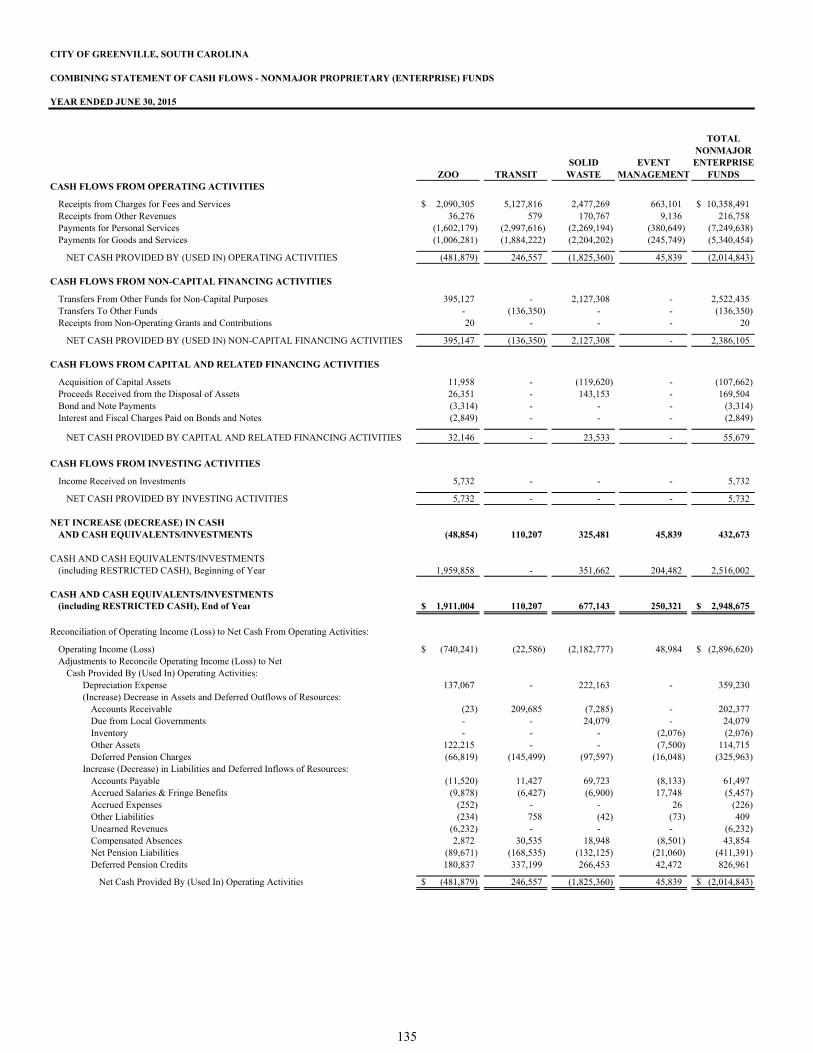
CITY OF GREENVILLE, SOUTH CAROLINA
COMBINING STATEMENT OF CASH FLOWS - NONMAJOR PROPRIETARY (ENTERPRISE) FUNDS
YEAR ENDED JUNE 30, 2015
TOTALNONMAJOR
SOLID EVENT ENTERPRISEZOO TRANSIT WASTE MANAGEMENT FUNDS
CASH FLOWS FROM OPERATING ACTIVITIES
Receipts from Charges for Fees and Services 2,090,305$ 5,127,816 2,477,269 663,101 10,358,491$ Receipts from Other Revenues 36,276 579 170,767 9,136 216,758 Payments for Personal Services (1,602,179) (2,997,616) (2,269,194) (380,649) (7,249,638) Payments for Goods and Services (1,006,281) (1,884,222) (2,204,202) (245,749) (5,340,454)
NET CASH PROVIDED BY (USED IN) OPERATING ACTIVITIES (481,879) 246,557 (1,825,360) 45,839 (2,014,843)
CASH FLOWS FROM NON-CAPITAL FINANCING ACTIVITIES
Transfers From Other Funds for Non-Capital Purposes 395,127 - 2,127,308 - 2,522,435 Transfers To Other Funds - (136,350) - - (136,350) Receipts from Non-Operating Grants and Contributions 20 - - - 20
NET CASH PROVIDED BY (USED IN) NON-CAPITAL FINANCING ACTIVITIES 395,147 (136,350) 2,127,308 - 2,386,105
CASH FLOWS FROM CAPITAL AND RELATED FINANCING ACTIVITIES
Acquisition of Capital Assets 11,958 - (119,620) - (107,662) Proceeds Received from the Disposal of Assets 26,351 - 143,153 - 169,504 Bond and Note Payments (3,314) - - - (3,314) Interest and Fiscal Charges Paid on Bonds and Notes (2,849) - - - (2,849)
NET CASH PROVIDED BY CAPITAL AND RELATED FINANCING ACTIVITIES 32,146 - 23,533 - 55,679
CASH FLOWS FROM INVESTING ACTIVITIES
Income Received on Investments 5,732 - - - 5,732
NET CASH PROVIDED BY INVESTING ACTIVITIES 5,732 - - - 5,732
NET INCREASE (DECREASE) IN CASH AND CASH EQUIVALENTS/INVESTMENTS (48,854) 110,207 325,481 45,839 432,673
CASH AND CASH EQUIVALENTS/INVESTMENTS (including RESTRICTED CASH), Beginning of Year 1,959,858 - 351,662 204,482 2,516,002
CASH AND CASH EQUIVALENTS/INVESTMENTS(including RESTRICTED CASH), End of Year 1,911,004$ 110,207 677,143 250,321 2,948,675$
Reconciliation of Operating Income (Loss) to Net Cash From Operating Activities:
Operating Income (Loss) (740,241)$ (22,586) (2,182,777) 48,984 (2,896,620)$ Adjustments to Reconcile Operating Income (Loss) to Net
Cash Provided By (Used In) Operating Activities:Depreciation Expense 137,067 - 222,163 - 359,230 (Increase) Decrease in Assets and Deferred Outflows of Resources:
Accounts Receivable (23) 209,685 (7,285) - 202,377 Due from Local Governments - - 24,079 - 24,079 Inventory - - - (2,076) (2,076) Other Assets 122,215 - - (7,500) 114,715 Deferred Pension Charges (66,819) (145,499) (97,597) (16,048) (325,963)
Increase (Decrease) in Liabilities and Deferred Inflows of Resources:Accounts Payable (11,520) 11,427 69,723 (8,133) 61,497 Accrued Salaries & Fringe Benefits (9,878) (6,427) (6,900) 17,748 (5,457) Accrued Expenses (252) - - 26 (226) Other Liabilities (234) 758 (42) (73) 409 Unearned Revenues (6,232) - - - (6,232) Compensated Absences 2,872 30,535 18,948 (8,501) 43,854 Net Pension Liabilities (89,671) (168,535) (132,125) (21,060) (411,391) Deferred Pension Credits 180,837 337,199 266,453 42,472 826,961
Net Cash Provided By (Used In) Operating Activities (481,879)$ 246,557 (1,825,360) 45,839 (2,014,843)$
135
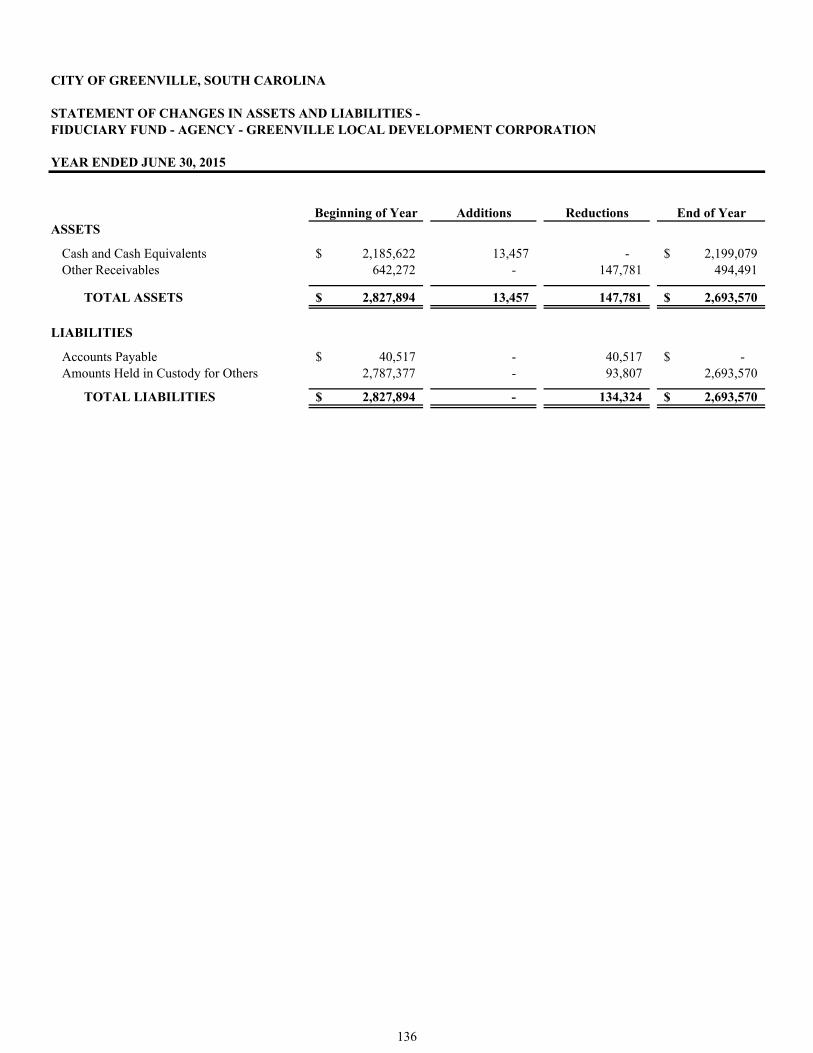
CITY OF GREENVILLE, SOUTH CAROLINA
STATEMENT OF CHANGES IN ASSETS AND LIABILITIES -FIDUCIARY FUND - AGENCY - GREENVILLE LOCAL DEVELOPMENT CORPORATION
Beginning of Year Additions Reductions End of YearASSETS
Cash and Cash Equivalents 2,185,622$ 13,457 - 2,199,079$ Other Receivables 642,272 - 147,781 494,491
TOTAL ASSETS 2,827,894$ 13,457 147,781 2,693,570$
LIABILITIES
Accounts Payable 40,517$ - 40,517 -$ Amounts Held in Custody for Others 2,787,377 - 93,807 2,693,570
TOTAL LIABILITIES 2,827,894$ - 134,324 2,693,570$
YEAR ENDED JUNE 30, 2015
136
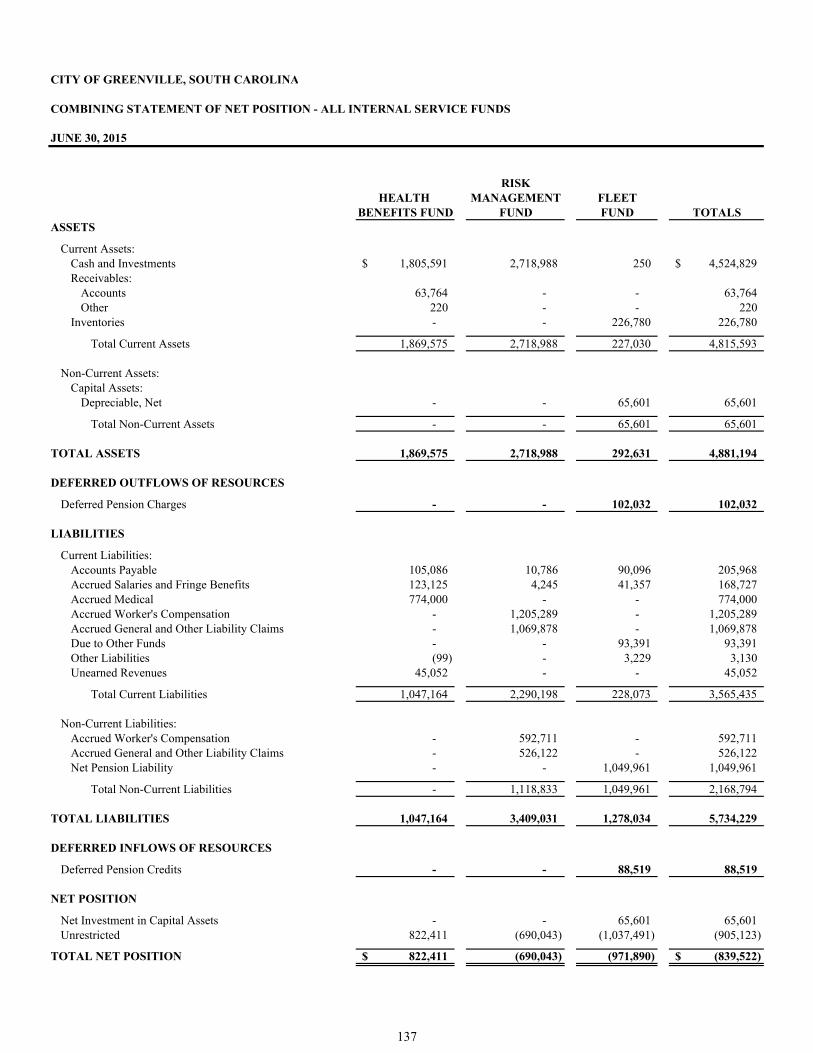
CITY OF GREENVILLE, SOUTH CAROLINA
COMBINING STATEMENT OF NET POSITION - ALL INTERNAL SERVICE FUNDS
JUNE 30, 2015
RISKHEALTH MANAGEMENT FLEET
BENEFITS FUND FUND FUND TOTALSASSETS
Current Assets:Cash and Investments 1,805,591$ 2,718,988 250 4,524,829$ Receivables:
Accounts 63,764 - - 63,764 Other 220 - - 220
Inventories - - 226,780 226,780
Total Current Assets 1,869,575 2,718,988 227,030 4,815,593
Non-Current Assets:Capital Assets:
Depreciable, Net - - 65,601 65,601
Total Non-Current Assets - - 65,601 65,601
TOTAL ASSETS 1,869,575 2,718,988 292,631 4,881,194
DEFERRED OUTFLOWS OF RESOURCES
Deferred Pension Charges - - 102,032 102,032
LIABILITIES
Current Liabilities:Accounts Payable 105,086 10,786 90,096 205,968 Accrued Salaries and Fringe Benefits 123,125 4,245 41,357 168,727 Accrued Medical 774,000 - - 774,000 Accrued Worker's Compensation - 1,205,289 - 1,205,289 Accrued General and Other Liability Claims - 1,069,878 - 1,069,878 Due to Other Funds - - 93,391 93,391 Other Liabilities (99) - 3,229 3,130 Unearned Revenues 45,052 - - 45,052
Total Current Liabilities 1,047,164 2,290,198 228,073 3,565,435
Non-Current Liabilities:Accrued Worker's Compensation - 592,711 - 592,711 Accrued General and Other Liability Claims - 526,122 - 526,122 Net Pension Liability - - 1,049,961 1,049,961
Total Non-Current Liabilities - 1,118,833 1,049,961 2,168,794
TOTAL LIABILITIES 1,047,164 3,409,031 1,278,034 5,734,229
DEFERRED INFLOWS OF RESOURCES
Deferred Pension Credits - - 88,519 88,519
NET POSITION
Net Investment in Capital Assets - - 65,601 65,601 Unrestricted 822,411 (690,043) (1,037,491) (905,123)
TOTAL NET POSITION 822,411$ (690,043) (971,890) (839,522)$
137
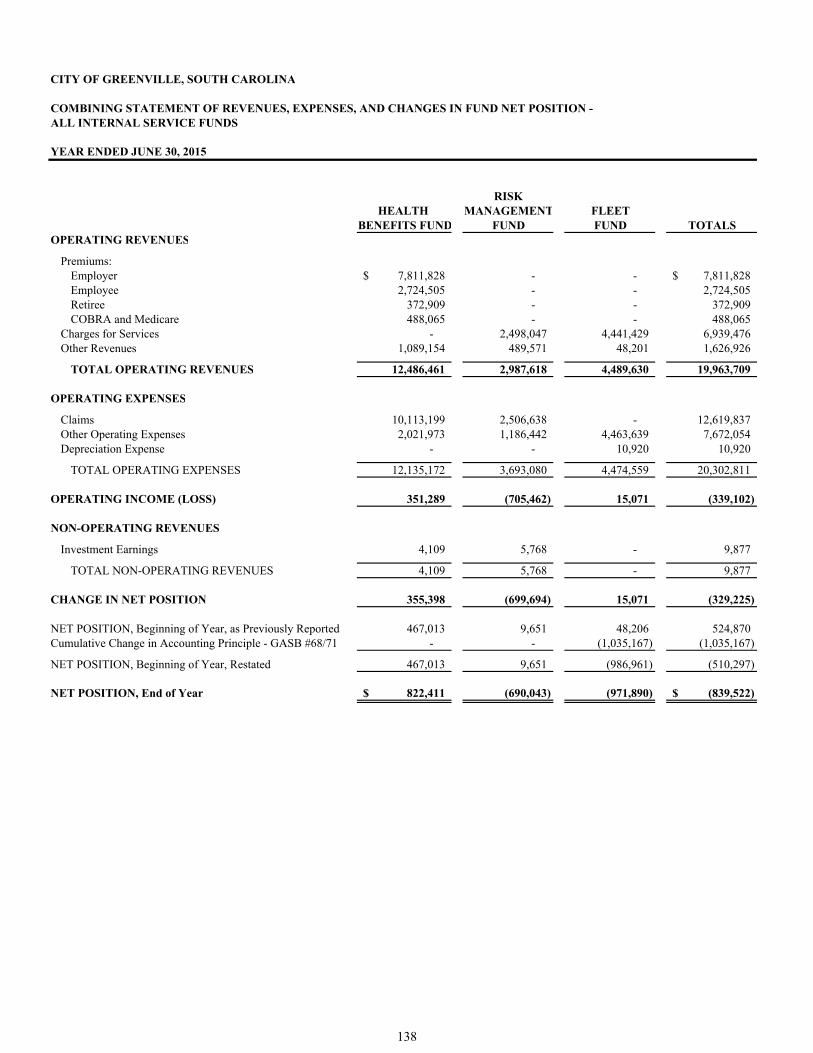
RISKHEALTH MANAGEMENT FLEET
BENEFITS FUND FUND FUND TOTALSOPERATING REVENUES
Premiums:Employer 7,811,828$ - - 7,811,828$ Employee 2,724,505 - - 2,724,505 Retiree 372,909 - - 372,909 COBRA and Medicare 488,065 - - 488,065
Charges for Services - 2,498,047 4,441,429 6,939,476 Other Revenues 1,089,154 489,571 48,201 1,626,926
TOTAL OPERATING REVENUES 12,486,461 2,987,618 4,489,630 19,963,709
OPERATING EXPENSES
Claims 10,113,199 2,506,638 - 12,619,837 Other Operating Expenses 2,021,973 1,186,442 4,463,639 7,672,054 Depreciation Expense - - 10,920 10,920
TOTAL OPERATING EXPENSES 12,135,172 3,693,080 4,474,559 20,302,811
OPERATING INCOME (LOSS) 351,289 (705,462) 15,071 (339,102)
NON-OPERATING REVENUES
Investment Earnings 4,109 5,768 - 9,877
TOTAL NON-OPERATING REVENUES 4,109 5,768 - 9,877
CHANGE IN NET POSITION 355,398 (699,694) 15,071 (329,225)
NET POSITION, Beginning of Year, as Previously Reported 467,013 9,651 48,206 524,870 Cumulative Change in Accounting Principle - GASB #68/71 - - (1,035,167) (1,035,167)
NET POSITION, Beginning of Year, Restated 467,013 9,651 (986,961) (510,297)
NET POSITION, End of Year 822,411$ (690,043) (971,890) (839,522)$
CITY OF GREENVILLE, SOUTH CAROLINA
COMBINING STATEMENT OF REVENUES, EXPENSES, AND CHANGES IN FUND NET POSITION - ALL INTERNAL SERVICE FUNDS
YEAR ENDED JUNE 30, 2015
138
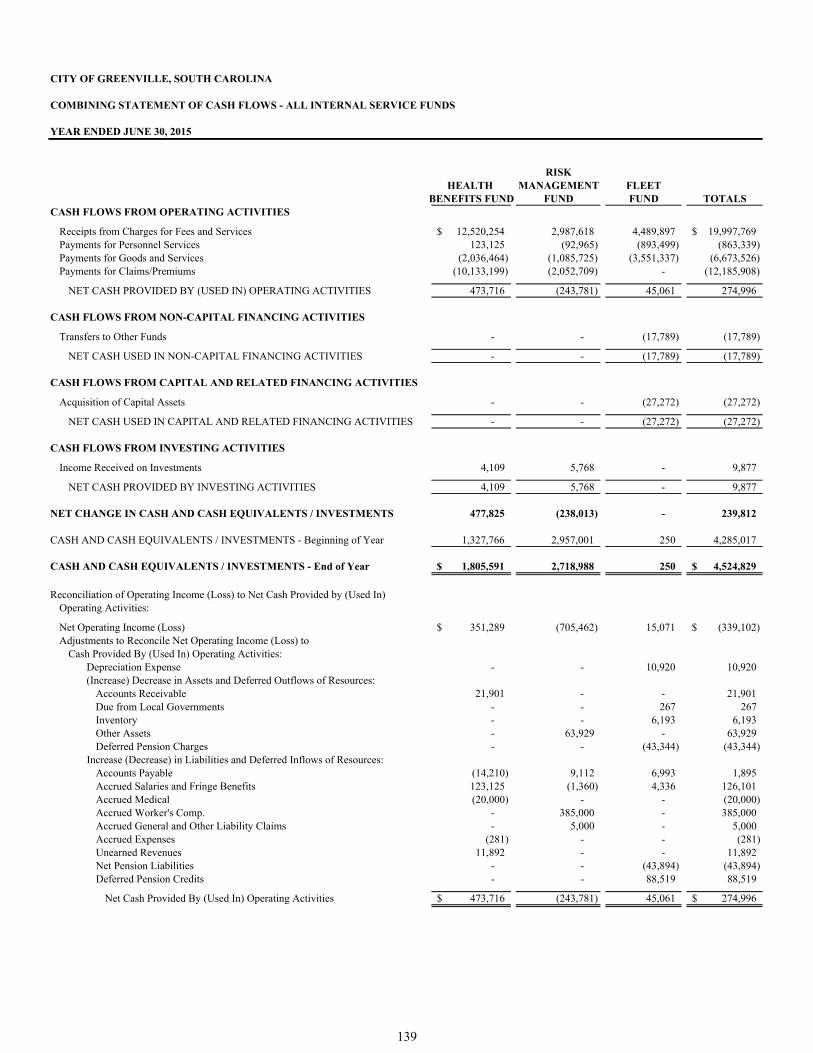
RISKHEALTH MANAGEMENT FLEET
BENEFITS FUND FUND FUND TOTALSCASH FLOWS FROM OPERATING ACTIVITIES
Receipts from Charges for Fees and Services 12,520,254$ 2,987,618 4,489,897 19,997,769$ Payments for Personnel Services 123,125 (92,965) (893,499) (863,339) Payments for Goods and Services (2,036,464) (1,085,725) (3,551,337) (6,673,526) Payments for Claims/Premiums (10,133,199) (2,052,709) - (12,185,908)
NET CASH PROVIDED BY (USED IN) OPERATING ACTIVITIES 473,716 (243,781) 45,061 274,996
CASH FLOWS FROM NON-CAPITAL FINANCING ACTIVITIES
Transfers to Other Funds - - (17,789) (17,789)
NET CASH USED IN NON-CAPITAL FINANCING ACTIVITIES - - (17,789) (17,789)
CASH FLOWS FROM CAPITAL AND RELATED FINANCING ACTIVITIES
Acquisition of Capital Assets - - (27,272) (27,272)
NET CASH USED IN CAPITAL AND RELATED FINANCING ACTIVITIES - - (27,272) (27,272)
CASH FLOWS FROM INVESTING ACTIVITIES
Income Received on Investments 4,109 5,768 - 9,877
NET CASH PROVIDED BY INVESTING ACTIVITIES 4,109 5,768 - 9,877
NET CHANGE IN CASH AND CASH EQUIVALENTS / INVESTMENTS 477,825 (238,013) - 239,812
CASH AND CASH EQUIVALENTS / INVESTMENTS - Beginning of Year 1,327,766 2,957,001 250 4,285,017
CASH AND CASH EQUIVALENTS / INVESTMENTS - End of Year 1,805,591$ 2,718,988 250 4,524,829$
Reconciliation of Operating Income (Loss) to Net Cash Provided by (Used In) Operating Activities:
Net Operating Income (Loss) 351,289$ (705,462) 15,071 (339,102)$ Adjustments to Reconcile Net Operating Income (Loss) to
Cash Provided By (Used In) Operating Activities:Depreciation Expense - - 10,920 10,920 (Increase) Decrease in Assets and Deferred Outflows of Resources:
Accounts Receivable 21,901 - - 21,901 Due from Local Governments - - 267 267 Inventory - - 6,193 6,193 Other Assets - 63,929 - 63,929 Deferred Pension Charges - - (43,344) (43,344)
Increase (Decrease) in Liabilities and Deferred Inflows of Resources:Accounts Payable (14,210) 9,112 6,993 1,895 Accrued Salaries and Fringe Benefits 123,125 (1,360) 4,336 126,101 Accrued Medical (20,000) - - (20,000) Accrued Worker's Comp. - 385,000 - 385,000 Accrued General and Other Liability Claims - 5,000 - 5,000 Accrued Expenses (281) - - (281) Unearned Revenues 11,892 - - 11,892 Net Pension Liabilities - - (43,894) (43,894) Deferred Pension Credits - - 88,519 88,519
Net Cash Provided By (Used In) Operating Activities 473,716$ (243,781) 45,061 274,996$
CITY OF GREENVILLE, SOUTH CAROLINA
YEAR ENDED JUNE 30, 2015
COMBINING STATEMENT OF CASH FLOWS - ALL INTERNAL SERVICE FUNDS
139
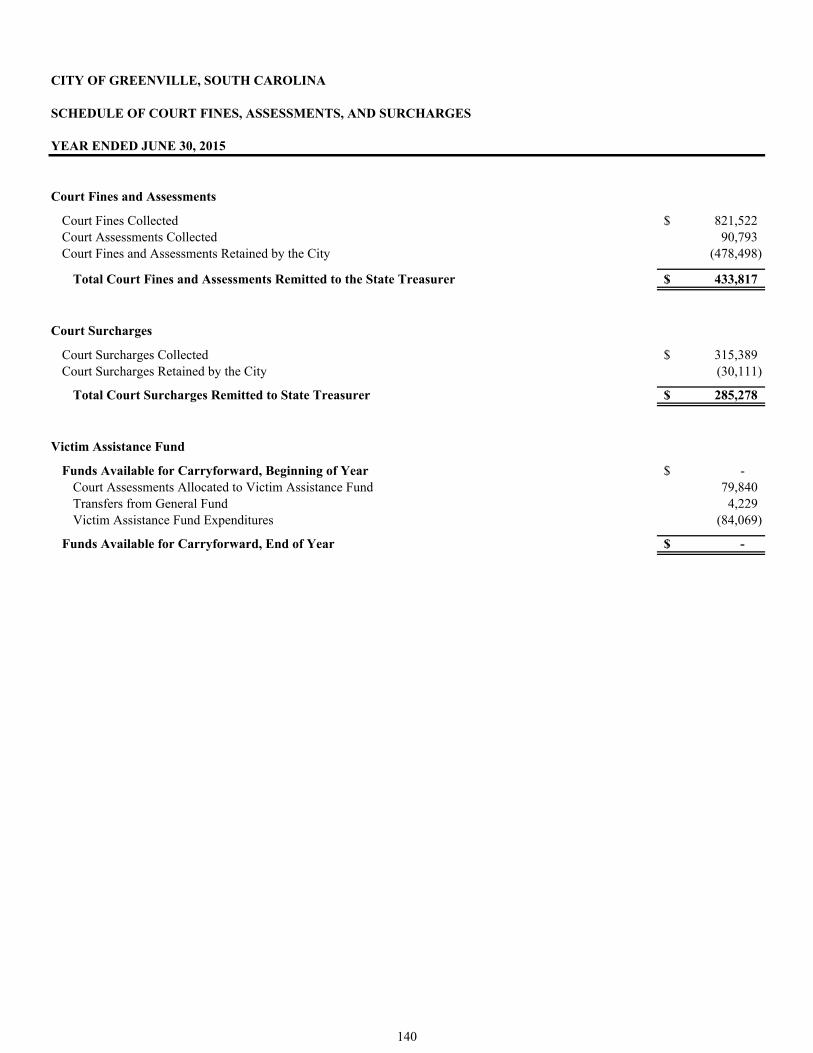
SCHEDULE OF COURT FINES, ASSESSMENTS, AND SURCHARGES
Court Fines and Assessments
Court Fines Collected 821,522$ Court Assessments Collected 90,793 Court Fines and Assessments Retained by the City (478,498)
Total Court Fines and Assessments Remitted to the State Treasurer 433,817$
Court Surcharges
Court Surcharges Collected 315,389$ Court Surcharges Retained by the City (30,111)
Total Court Surcharges Remitted to State Treasurer 285,278$
Victim Assistance Fund
Funds Available for Carryforward, Beginning of Year -$ Court Assessments Allocated to Victim Assistance Fund 79,840 Transfers from General Fund 4,229 Victim Assistance Fund Expenditures (84,069)
Funds Available for Carryforward, End of Year -$
CITY OF GREENVILLE, SOUTH CAROLINA
YEAR ENDED JUNE 30, 2015
140
STATISTICAL SECTION This part of the City of Greenville’s comprehensive annual financial report presents detailed information as a context for understanding what the information in the financial statements, note disclosures, and required supplementary information says about the City’s overall financial health. Contents Page Financial Trends 142
These schedules contain trend information to help the reader understand how the City’s financial performance and well-being have changed over time.
Revenue Capacity 154
These schedules contain information to help the reader assess the City’s most significant local revenue source, the property tax.
Debt Capacity 160
These schedules present information to help the reader assess the affordability of the City’s current levels of outstanding debt and the City’s ability to issue additional debt in the future.
Demographic and Economic Information 168
These schedules offer demographic and economic indicators to help the reader understand the environment within the City’s financial activities take place.
Operating Information 170
These schedules contain service and infrastructure data to help the reader understand how the information in the City’s financial report related to the services the City provides and the activities it performs.
Sources: Unless otherwise noted, the information in these schedules is derived from the comprehensive annual financial reports for the relevant year.
141
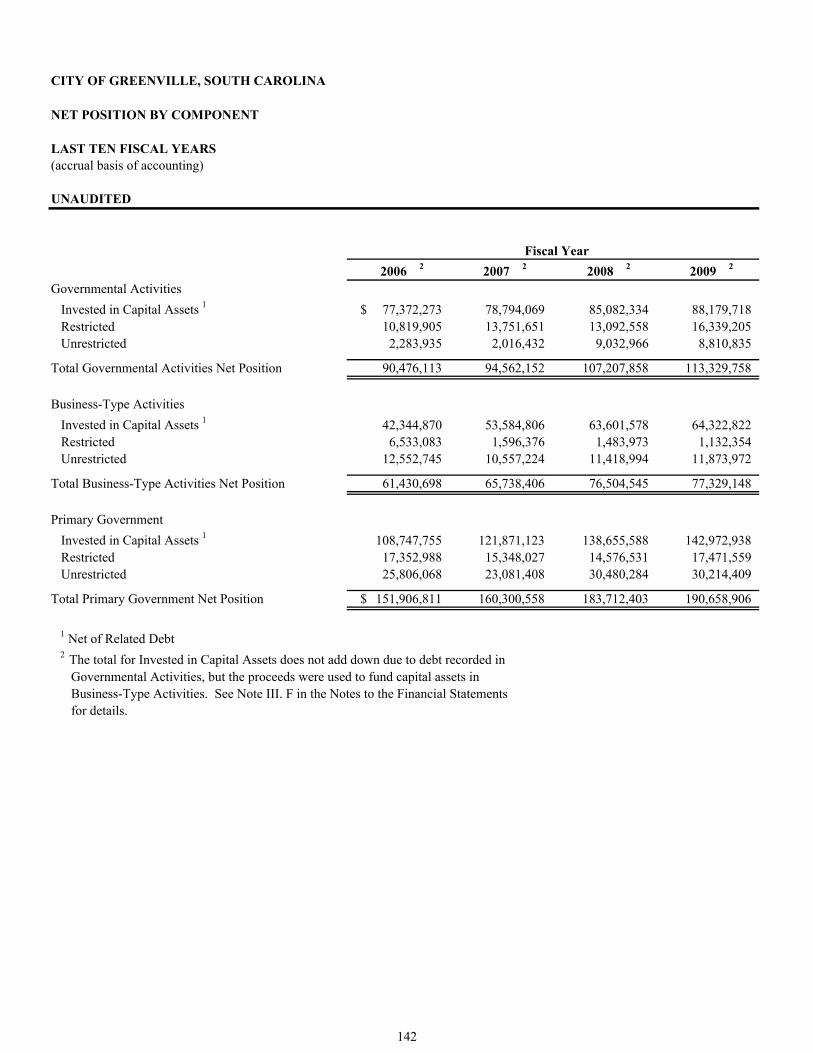
CITY OF GREENVILLE, SOUTH CAROLINA
NET POSITION BY COMPONENT
LAST TEN FISCAL YEARS(accrual basis of accounting)
UNAUDITED
2006 2 2007 2 2008 2 2009 2
Governmental Activities
Invested in Capital Assets 1 77,372,273$ 78,794,069 85,082,334 88,179,718 Restricted 10,819,905 13,751,651 13,092,558 16,339,205 Unrestricted 2,283,935 2,016,432 9,032,966 8,810,835
Total Governmental Activities Net Position 90,476,113 94,562,152 107,207,858 113,329,758
Business-Type Activities
Invested in Capital Assets 1 42,344,870 53,584,806 63,601,578 64,322,822 Restricted 6,533,083 1,596,376 1,483,973 1,132,354 Unrestricted 12,552,745 10,557,224 11,418,994 11,873,972
Total Business-Type Activities Net Position 61,430,698 65,738,406 76,504,545 77,329,148
Primary Government
Invested in Capital Assets 1 108,747,755 121,871,123 138,655,588 142,972,938 Restricted 17,352,988 15,348,027 14,576,531 17,471,559 Unrestricted 25,806,068 23,081,408 30,480,284 30,214,409
Total Primary Government Net Position 151,906,811$ 160,300,558 183,712,403 190,658,906
1 Net of Related Debt2 The total for Invested in Capital Assets does not add down due to debt recorded in
Governmental Activities, but the proceeds were used to fund capital assets inBusiness-Type Activities. See Note III. F in the Notes to the Financial Statementsfor details.
Fiscal Year
142
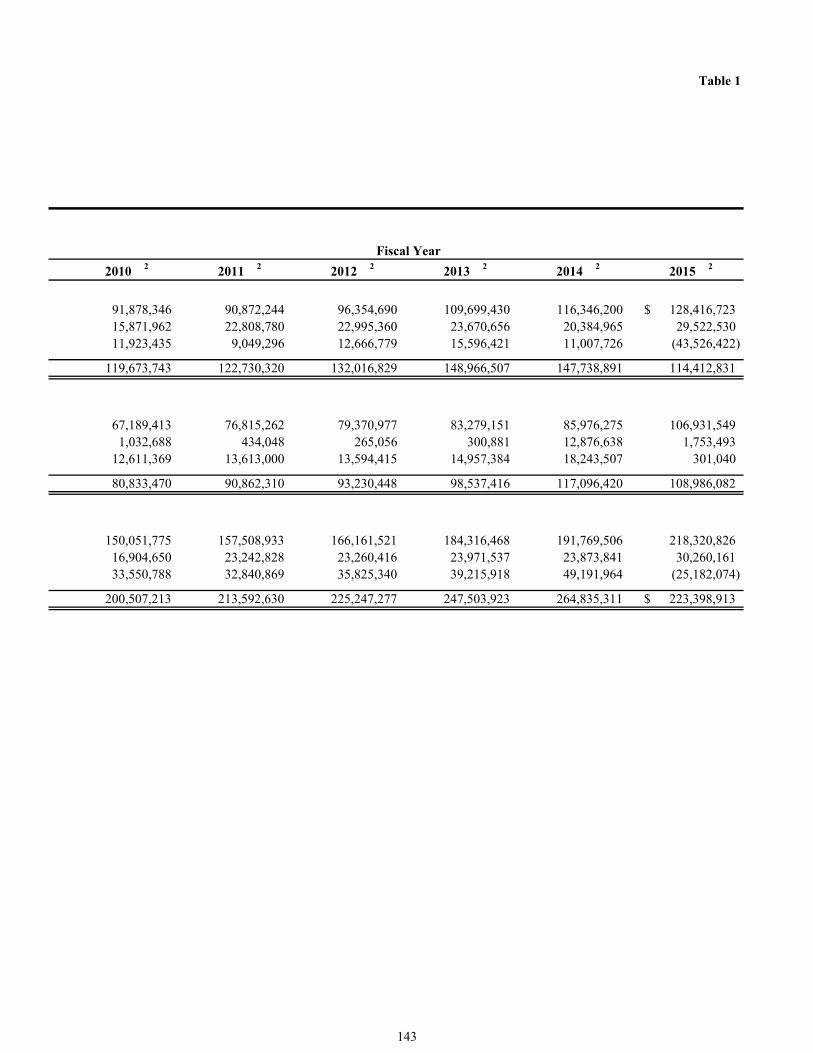
Table 1
2010 2 2011 2 2012 2 2013 2 2014 2 2015 2
91,878,346 90,872,244 96,354,690 109,699,430 116,346,200 128,416,723$ 15,871,962 22,808,780 22,995,360 23,670,656 20,384,965 29,522,530 11,923,435 9,049,296 12,666,779 15,596,421 11,007,726 (43,526,422)
119,673,743 122,730,320 132,016,829 148,966,507 147,738,891 114,412,831
67,189,413 76,815,262 79,370,977 83,279,151 85,976,275 106,931,549 1,032,688 434,048 265,056 300,881 12,876,638 1,753,493
12,611,369 13,613,000 13,594,415 14,957,384 18,243,507 301,040
80,833,470 90,862,310 93,230,448 98,537,416 117,096,420 108,986,082
150,051,775 157,508,933 166,161,521 184,316,468 191,769,506 218,320,826 16,904,650 23,242,828 23,260,416 23,971,537 23,873,841 30,260,161 33,550,788 32,840,869 35,825,340 39,215,918 49,191,964 (25,182,074)
200,507,213 213,592,630 225,247,277 247,503,923 264,835,311 223,398,913$
Fiscal Year
143
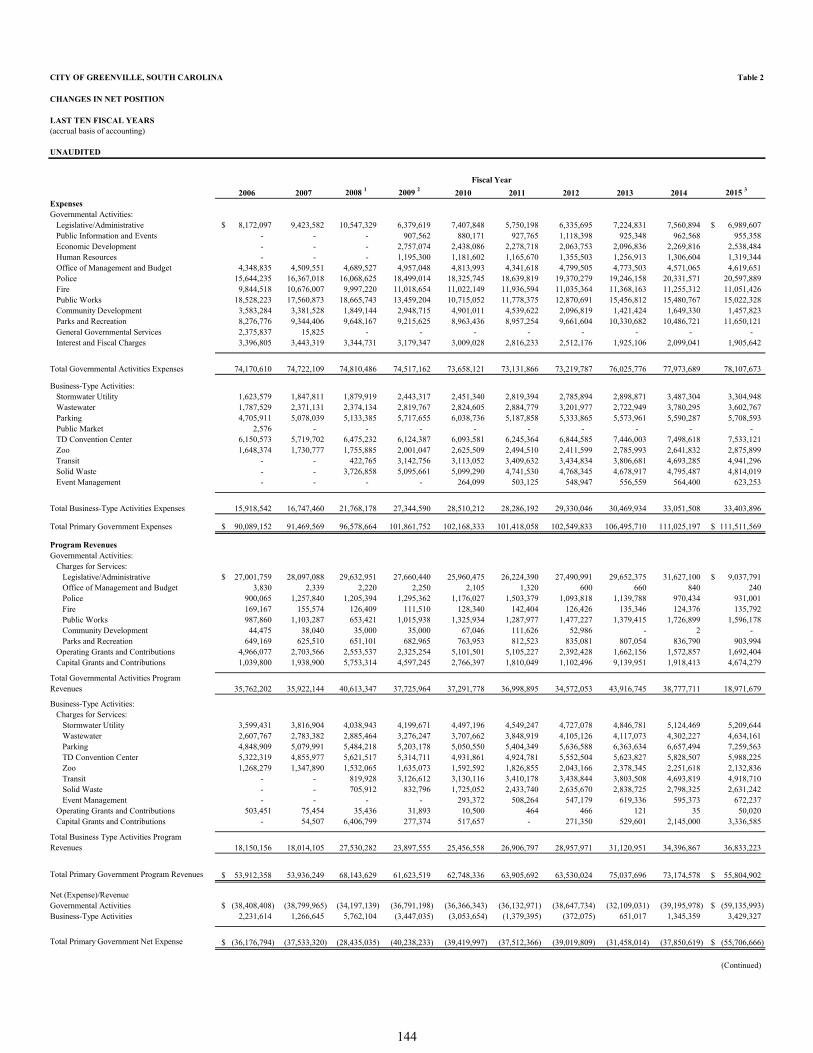
CITY OF GREENVILLE, SOUTH CAROLINA Table 2
CHANGES IN NET POSITION
LAST TEN FISCAL YEARS(accrual basis of accounting)
UNAUDITED
2006 2007 2008 1 2009 2 2010 2011 2012 2013 2014 2015 3
ExpensesGovernmental Activities:
Legislative/Administrative 8,172,097$ 9,423,582 10,547,329 6,379,619 7,407,848 5,750,198 6,335,695 7,224,831 7,560,894 6,989,607$ Public Information and Events - - - 907,562 880,171 927,765 1,118,398 925,348 962,568 955,358 Economic Development - - - 2,757,074 2,438,086 2,278,718 2,063,753 2,096,836 2,269,816 2,538,484 Human Resources - - - 1,195,300 1,181,602 1,165,670 1,355,503 1,256,913 1,306,604 1,319,344 Office of Management and Budget 4,348,835 4,509,551 4,689,527 4,957,048 4,813,993 4,341,618 4,799,505 4,773,503 4,571,065 4,619,651 Police 15,644,235 16,367,018 16,068,625 18,499,014 18,325,745 18,639,819 19,370,279 19,246,158 20,331,571 20,597,889 Fire 9,844,518 10,676,007 9,997,220 11,018,654 11,022,149 11,936,594 11,035,364 11,368,163 11,255,312 11,051,426 Public Works 18,528,223 17,560,873 18,665,743 13,459,204 10,715,052 11,778,375 12,870,691 15,456,812 15,480,767 15,022,328 Community Development 3,583,284 3,381,528 1,849,144 2,948,715 4,901,011 4,539,622 2,096,819 1,421,424 1,649,330 1,457,823 Parks and Recreation 8,276,776 9,344,406 9,648,167 9,215,625 8,963,436 8,957,254 9,661,604 10,330,682 10,486,721 11,650,121 General Governmental Services 2,375,837 15,825 - - - - - - - - Interest and Fiscal Charges 3,396,805 3,443,319 3,344,731 3,179,347 3,009,028 2,816,233 2,512,176 1,925,106 2,099,041 1,905,642
Total Governmental Activities Expenses 74,170,610 74,722,109 74,810,486 74,517,162 73,658,121 73,131,866 73,219,787 76,025,776 77,973,689 78,107,673
Business-Type Activities:Stormwater Utility 1,623,579 1,847,811 1,879,919 2,443,317 2,451,340 2,819,394 2,785,894 2,898,871 3,487,304 3,304,948 Wastewater 1,787,529 2,371,131 2,374,134 2,819,767 2,824,605 2,884,779 3,201,977 2,722,949 3,780,295 3,602,767 Parking 4,705,911 5,078,039 5,133,385 5,717,655 6,038,736 5,187,858 5,333,865 5,573,961 5,590,287 5,708,593 Public Market 2,576 - - - - - - - - - TD Convention Center 6,150,573 5,719,702 6,475,232 6,124,387 6,093,581 6,245,364 6,844,585 7,446,003 7,498,618 7,533,121 Zoo 1,648,374 1,730,777 1,755,885 2,001,047 2,625,509 2,494,510 2,411,599 2,785,993 2,641,832 2,875,899 Transit - - 422,765 3,142,756 3,113,052 3,409,632 3,434,834 3,806,681 4,693,285 4,941,296 Solid Waste - - 3,726,858 5,095,661 5,099,290 4,741,530 4,768,345 4,678,917 4,795,487 4,814,019 Event Management - - - - 264,099 503,125 548,947 556,559 564,400 623,253
Total Business-Type Activities Expenses 15,918,542 16,747,460 21,768,178 27,344,590 28,510,212 28,286,192 29,330,046 30,469,934 33,051,508 33,403,896
Total Primary Government Expenses 90,089,152$ 91,469,569 96,578,664 101,861,752 102,168,333 101,418,058 102,549,833 106,495,710 111,025,197 111,511,569$
Program RevenuesGovernmental Activities:
Charges for Services:Legislative/Administrative 27,001,759$ 28,097,088 29,632,951 27,660,440 25,960,475 26,224,390 27,490,991 29,652,375 31,627,100 9,037,791$ Office of Management and Budget 3,830 2,339 2,220 2,250 2,105 1,320 600 660 840 240 Police 900,065 1,257,840 1,205,394 1,295,362 1,176,027 1,503,379 1,093,818 1,139,788 970,434 931,001 Fire 169,167 155,574 126,409 111,510 128,340 142,404 126,426 135,346 124,376 135,792 Public Works 987,860 1,103,287 653,421 1,015,938 1,325,934 1,287,977 1,477,227 1,379,415 1,726,899 1,596,178 Community Development 44,475 38,040 35,000 35,000 67,046 111,626 52,986 - 2 - Parks and Recreation 649,169 625,510 651,101 682,965 763,953 812,523 835,081 807,054 836,790 903,994
Operating Grants and Contributions 4,966,077 2,703,566 2,553,537 2,325,254 5,101,501 5,105,227 2,392,428 1,662,156 1,572,857 1,692,404 Capital Grants and Contributions 1,039,800 1,938,900 5,753,314 4,597,245 2,766,397 1,810,049 1,102,496 9,139,951 1,918,413 4,674,279
Total Governmental Activities Program Revenues 35,762,202 35,922,144 40,613,347 37,725,964 37,291,778 36,998,895 34,572,053 43,916,745 38,777,711 18,971,679
Business-Type Activities:Charges for Services:
Stormwater Utility 3,599,431 3,816,904 4,038,943 4,199,671 4,497,196 4,549,247 4,727,078 4,846,781 5,124,469 5,209,644 Wastewater 2,607,767 2,783,382 2,885,464 3,276,247 3,707,662 3,848,919 4,105,126 4,117,073 4,302,227 4,634,161 Parking 4,848,909 5,079,991 5,484,218 5,203,178 5,050,550 5,404,349 5,636,588 6,363,634 6,657,494 7,259,563 TD Convention Center 5,322,319 4,855,977 5,621,517 5,314,711 4,931,861 4,924,781 5,552,504 5,623,827 5,828,507 5,988,225 Zoo 1,268,279 1,347,890 1,532,065 1,635,073 1,592,592 1,826,855 2,043,166 2,378,345 2,251,618 2,132,836 Transit - - 819,928 3,126,612 3,130,116 3,410,178 3,438,844 3,803,508 4,693,819 4,918,710 Solid Waste - - 705,912 832,796 1,725,052 2,433,740 2,635,670 2,838,725 2,798,325 2,631,242 Event Management - - - - 293,372 508,264 547,179 619,336 595,373 672,237
Operating Grants and Contributions 503,451 75,454 35,436 31,893 10,500 464 466 121 35 50,020 Capital Grants and Contributions - 54,507 6,406,799 277,374 517,657 - 271,350 529,601 2,145,000 3,336,585
Total Business Type Activities Program Revenues 18,150,156 18,014,105 27,530,282 23,897,555 25,456,558 26,906,797 28,957,971 31,120,951 34,396,867 36,833,223
Total Primary Government Program Revenues 53,912,358$ 53,936,249 68,143,629 61,623,519 62,748,336 63,905,692 63,530,024 75,037,696 73,174,578 55,804,902$
Net (Expense)/RevenueGovernmental Activities (38,408,408)$ (38,799,965) (34,197,139) (36,791,198) (36,366,343) (36,132,971) (38,647,734) (32,109,031) (39,195,978) (59,135,993)$ Business-Type Activities 2,231,614 1,266,645 5,762,104 (3,447,035) (3,053,654) (1,379,395) (372,075) 651,017 1,345,359 3,429,327
Total Primary Government Net Expense (36,176,794)$ (37,533,320) (28,435,035) (40,238,233) (39,419,997) (37,512,366) (39,019,809) (31,458,014) (37,850,619) (55,706,666)$
(Continued)
Fiscal Year
144

CITY OF GREENVILLE, SOUTH CAROLINA Table 2
CHANGES IN NET POSITION
LAST TEN FISCAL YEARS(accrual basis of accounting)
UNAUDITED
2006 2007 2008 1 2009 2 2010 2011 2012 2013 2014 2015 3Fiscal Year
General Revenues and Other Changes In Net PositionGovernmental Activities
Taxes: Property Taxes 27,558,040$ 29,625,954 32,422,757 34,140,109 35,868,813 36,688,793 36,244,428 38,299,957 39,361,472 43,955,596$ Business Licenses 20,163,985 21,278,479 21,882,486 20,926,361 19,236,024 19,556,858 20,379,764 21,910,320 23,336,225 24,883,455 Accommodation Taxes 1,540,648 1,733,869 1,978,470 1,700,510 1,711,207 2,021,929 2,254,208 2,396,132 2,802,321 3,275,415 Hospitality Taxes 5,187,368 5,677,947 6,023,631 6,167,633 6,079,146 6,592,900 7,102,557 7,843,173 8,498,114 9,262,667
Grants not restricted to Specific Programs 78,767 461,711 279,901 124,825 528,518 184,274 464,572 179,181 117,611 40,750 Intergovernmental Revenue 5,250,372 4,254,726 4,799,376 4,396,854 3,558,005 3,465,966 4,180,328 4,123,687 5,064,692 4,105,332 Investment Earnings 1,544,845 1,990,800 1,495,973 546,275 309,141 207,969 177,870 485,659 104,622 163,986 Other Revenues 1,320,529 109,950 969,440 92,881 48,503 192,553 90,856 65,283 237,087 753,169 Gain on Disposal of Capital Asset - 1,116,862 3,292,303 - - 1,111,941 - 176,487 132,972 - Transfers 214,741 (2,085,815) (3,171,854) (4,255,989) (5,393,005) (6,010,975) (2,580,576) (4,510,850) (17,456,426) (3,206,002)
Total Governmental Activities 62,859,295 64,164,483 69,972,483 63,839,459 61,946,352 64,012,208 68,314,007 70,969,029 62,198,690 83,234,368
Business-Type ActivitiesInvestment Earnings 710,380 955,248 585,029 197,952 83,981 130,822 158,297 145,101 139,970 144,935 Transfers (214,741) 2,085,815 3,171,854 4,255,989 5,393,005 6,010,975 2,580,576 4,510,850 17,456,426 3,206,002 Gain on Disposal of Capital Asset - - - - 10,518 636 1,340 - - 148,826
Total Business-Types Activities 495,639 3,041,063 3,756,883 4,453,941 5,487,504 6,142,433 2,740,213 4,655,951 17,596,396 3,499,763
Total Primary Government 63,354,934$ 67,205,546 73,729,366 68,293,400 67,433,856 70,154,641 71,054,220 75,624,980 79,795,086 86,734,131$
Change In Net PositionGovernmental Activities 4,286,902$ 25,364,518 35,775,344 27,048,261 25,580,009 27,879,237 29,666,273 16,949,678 (333,513) 24,098,375$ Governmental Prior Period Adjustments 3,678,148 - - - - - - - - 2,239,436 Governmental Implementation Adjustments - - - - - - - - (894,103) (59,663,871) Business-Type Activities 2,727,253 4,307,708 9,518,987 1,006,906 2,433,850 4,763,038 2,368,138 5,306,968 18,941,755 6,929,090 Business-Type Prior Period Adjustments 528,401 - - (182,303) 1,070,472 - - - - -
Business-Type Implementation Adjustments - - - - - - - - (382,751) (15,039,428)
Total Primary Government 11,220,704$ 29,672,226 45,294,331 27,872,864 29,084,331 32,642,275 32,034,411 22,256,646 17,331,388 (41,436,398)$
1 The City added two enterprise funds during fiscal year end 2008. The Transit fund reflects the operations of a new function beginning in 2008. The Solid Waste fund was accounted for in the General fund prior to 2008; no reclassifications were made for this table.
2 The City accounted for Public Information and Events, Economic Development, and Human Resources in the Legislative/Administrative function in 2008 and prior years; no reclassification was made for this table.
3 The City implemented GASB #68/71 in the year ended June 30, 2015.
145
City of Greenville, South Carolina
146
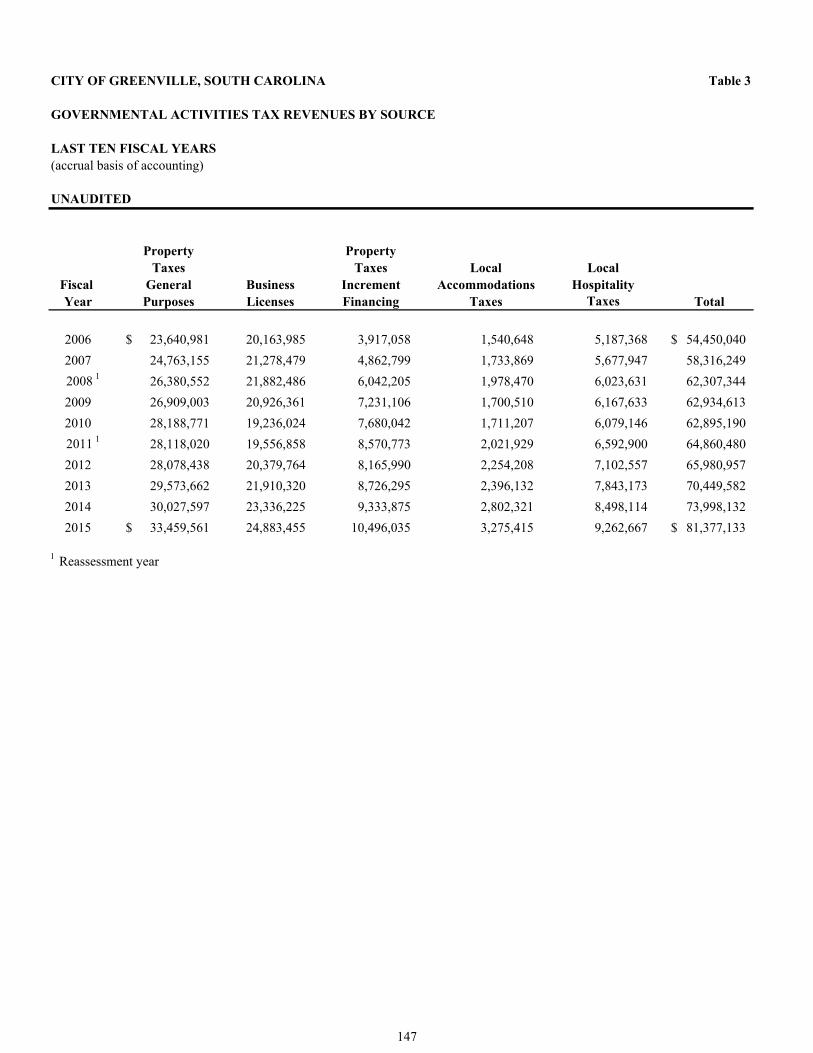
CITY OF GREENVILLE, SOUTH CAROLINA Table 3
GOVERNMENTAL ACTIVITIES TAX REVENUES BY SOURCE
LAST TEN FISCAL YEARS(accrual basis of accounting)
UNAUDITED
Property Property Taxes Taxes Local Local
Fiscal General Business Increment Accommodations HospitalityYear Purposes Licenses Financing Taxes Taxes Total
2006 23,640,981$ 20,163,985 3,917,058 1,540,648 5,187,368 54,450,040$
2007 24,763,155 21,278,479 4,862,799 1,733,869 5,677,947 58,316,249
2008 1 26,380,552 21,882,486 6,042,205 1,978,470 6,023,631 62,307,344
2009 26,909,003 20,926,361 7,231,106 1,700,510 6,167,633 62,934,613
2010 28,188,771 19,236,024 7,680,042 1,711,207 6,079,146 62,895,190
2011 1 28,118,020 19,556,858 8,570,773 2,021,929 6,592,900 64,860,480
2012 28,078,438 20,379,764 8,165,990 2,254,208 7,102,557 65,980,957
2013 29,573,662 21,910,320 8,726,295 2,396,132 7,843,173 70,449,582
2014 30,027,597 23,336,225 9,333,875 2,802,321 8,498,114 73,998,132
2015 33,459,561$ 24,883,455 10,496,035 3,275,415 9,262,667 81,377,133$
1 Reassessment year
147
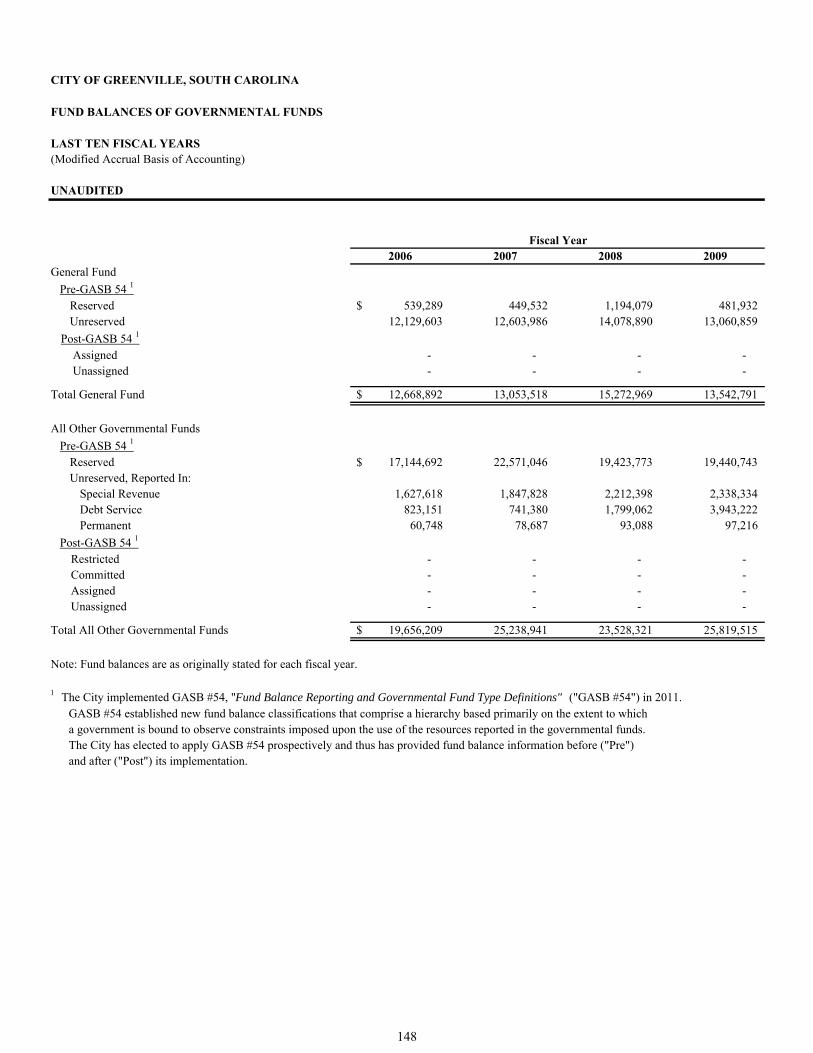
CITY OF GREENVILLE, SOUTH CAROLINA
FUND BALANCES OF GOVERNMENTAL FUNDS
LAST TEN FISCAL YEARS(Modified Accrual Basis of Accounting)
UNAUDITED
2006 2007 2008 2009General Fund
Pre-GASB 54 1
Reserved 539,289$ 449,532 1,194,079 481,932 Unreserved 12,129,603 12,603,986 14,078,890 13,060,859
Post-GASB 54 1
Assigned - - - - Unassigned - - - -
Total General Fund 12,668,892$ 13,053,518 15,272,969 13,542,791
All Other Governmental Funds
Pre-GASB 54 1
Reserved 17,144,692$ 22,571,046 19,423,773 19,440,743 Unreserved, Reported In:
Special Revenue 1,627,618 1,847,828 2,212,398 2,338,334 Debt Service 823,151 741,380 1,799,062 3,943,222 Permanent 60,748 78,687 93,088 97,216
Post-GASB 54 1
Restricted - - - - Committed - - - - Assigned - - - - Unassigned - - - -
Total All Other Governmental Funds 19,656,209$ 25,238,941 23,528,321 25,819,515
Note: Fund balances are as originally stated for each fiscal year.
1 The City implemented GASB #54, "Fund Balance Reporting and Governmental Fund Type Definitions" ("GASB #54") in 2011. GASB #54 established new fund balance classifications that comprise a hierarchy based primarily on the extent to which a government is bound to observe constraints imposed upon the use of the resources reported in the governmental funds. The City has elected to apply GASB #54 prospectively and thus has provided fund balance information before ("Pre") and after ("Post") its implementation.
Fiscal Year
148
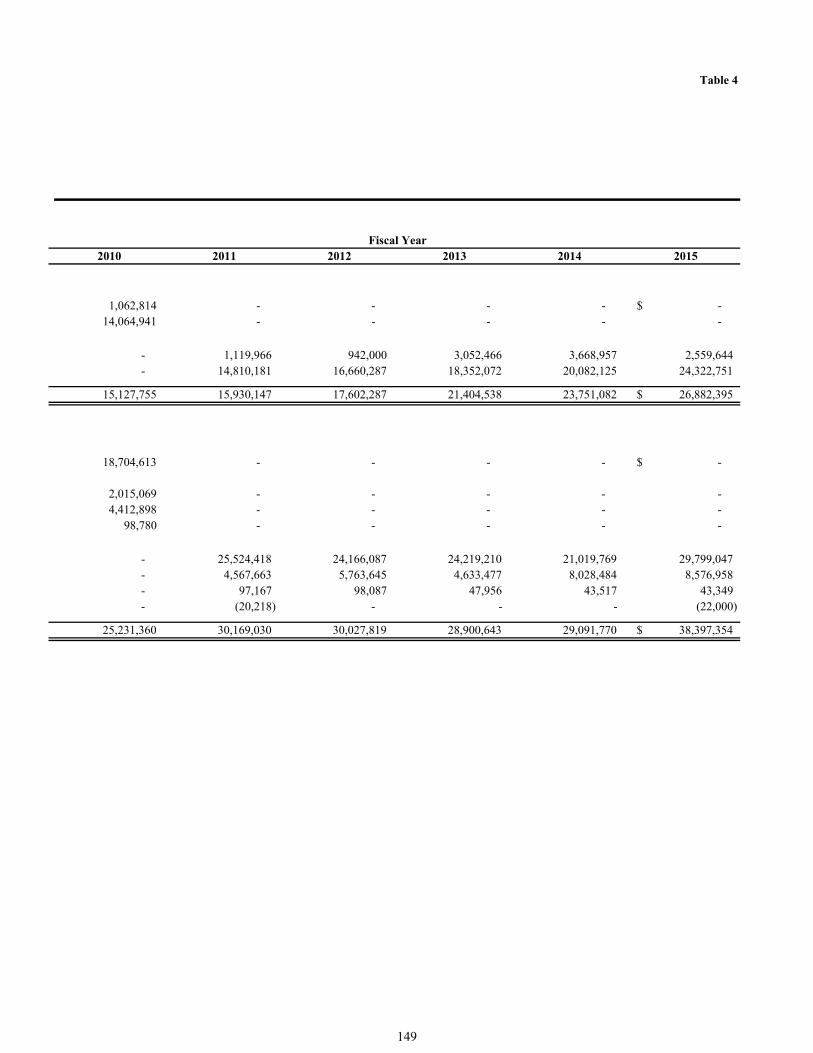
Table 4
2010 2011 2012 2013 2014 2015
1,062,814 - - - - -$ 14,064,941 - - - - -
- 1,119,966 942,000 3,052,466 3,668,957 2,559,644 - 14,810,181 16,660,287 18,352,072 20,082,125 24,322,751
15,127,755 15,930,147 17,602,287 21,404,538 23,751,082 26,882,395$
18,704,613 - - - - -$
2,015,069 - - - - - 4,412,898 - - - - -
98,780 - - - - -
- 25,524,418 24,166,087 24,219,210 21,019,769 29,799,047 - 4,567,663 5,763,645 4,633,477 8,028,484 8,576,958 - 97,167 98,087 47,956 43,517 43,349 - (20,218) - - - (22,000)
25,231,360 30,169,030 30,027,819 28,900,643 29,091,770 38,397,354$
Fiscal Year
149

CITY OF GREENVILLE, SOUTH CAROLINA
CHANGES IN FUND BALANCES OF GOVERNMENTAL FUNDS
LAST TEN FISCAL YEARS(modified accrual basis of accounting)
UNAUDITED
2006 2007 2008 2009 1
RevenuesTaxes 34,327,678$ 37,041,227 40,284,263 41,981,931 Fees, Charges and Rentals 1,646,205 1,950,897 1,254,777 1,266,353Fines and Forfeitures 584,422 550,035 661,803 493,076Licenses, Permits, and Franchise Fees 26,450,297 27,628,227 29,138,813 28,038,503Grants 5,757,207 4,399,339 8,236,731 2,879,080Intergovernmental Revenues 5,653,648 4,650,583 5,184,436 4,748,167External Service Reimbursements 955,087 1,034,959 1,181,063 942,467Investment Earnings 1,439,595 1,813,046 1,405,362 520,341Other Revenues 154,369 534,489 1,004,440 222,880
Total Revenues 76,968,508 79,602,802 88,351,688 81,092,798
ExpendituresLegislative/Administrative Services 7,943,695 8,551,991 9,623,717 5,591,435Public Information and Events - - - 908,961Economic Development - - - 2,760,465Human Resources - - - 1,196,220Office of Management and Budget 3,891,723 3,880,551 4,223,215 4,717,039Police 14,481,717 15,147,009 15,247,296 17,814,958Fire 9,149,021 9,385,231 9,982,791 10,599,574Public Works 13,433,553 13,621,216 11,883,084 8,354,193Community Development 3,527,123 3,120,277 2,398,282 1,976,099Parks and Recreation 7,843,805 8,816,787 9,254,355 8,811,025General Governmental Services 2,249,435 15,825 - - Other Expenditures 44,780 77,268 8,565 24,124Capital Outlay 22,509,033 8,348,841 18,082,779 6,109,977Debt Service:
Principal 4,210,698 4,428,963 4,213,888 4,415,768Interest and Fiscal Charges 3,285,571 3,390,538 3,330,831 3,172,170Issuance Costs and Other Charges 93,651 72,933 - -
Payments to Refunded Debt Escrow Agent - - - -
Total Expenditures 92,663,805 78,857,430 88,248,803 76,452,008
Excess of Revenues Over (Under) Expenditures (15,695,297) 745,372 102,885 4,640,790
Other Financing Sources (Uses)Proceeds from Disposal of Capital Assets 1,294,652 1,127,096 3,380,396 176,216 Issuance of Bond Indebtedness 2,330,000 6,070,000 - - Premiums (Discounts) on Issuance of Debt - 57,456.00 - - Payments to Refunded Debt Escrow Agent - - - - Insurance Proceeds from Casualty 272,660 - - - Proceeds from Notes Payable - - 197,404 - Transfers In 9,414,782 7,492,765 8,498,483 7,506,597Transfers Out (9,338,615) (9,525,331) (11,670,337) (11,762,587)
Total Other Financing Sources (Uses) 3,973,479 5,221,986 405,946 (4,079,774)
Net Change in Fund Balance (11,721,818)$ 5,967,358 508,831 561,016
Debt Service as Percentage of Noncapital Expenditures 10.42% 10.85% 10.05% 10.52%
1 The City accounted for Public Information and Events, Economic Development, and Human Resources in the Legislative/Administrative function in 2008 and prior years; no reclassification was made for this table.
Fiscal Year
150
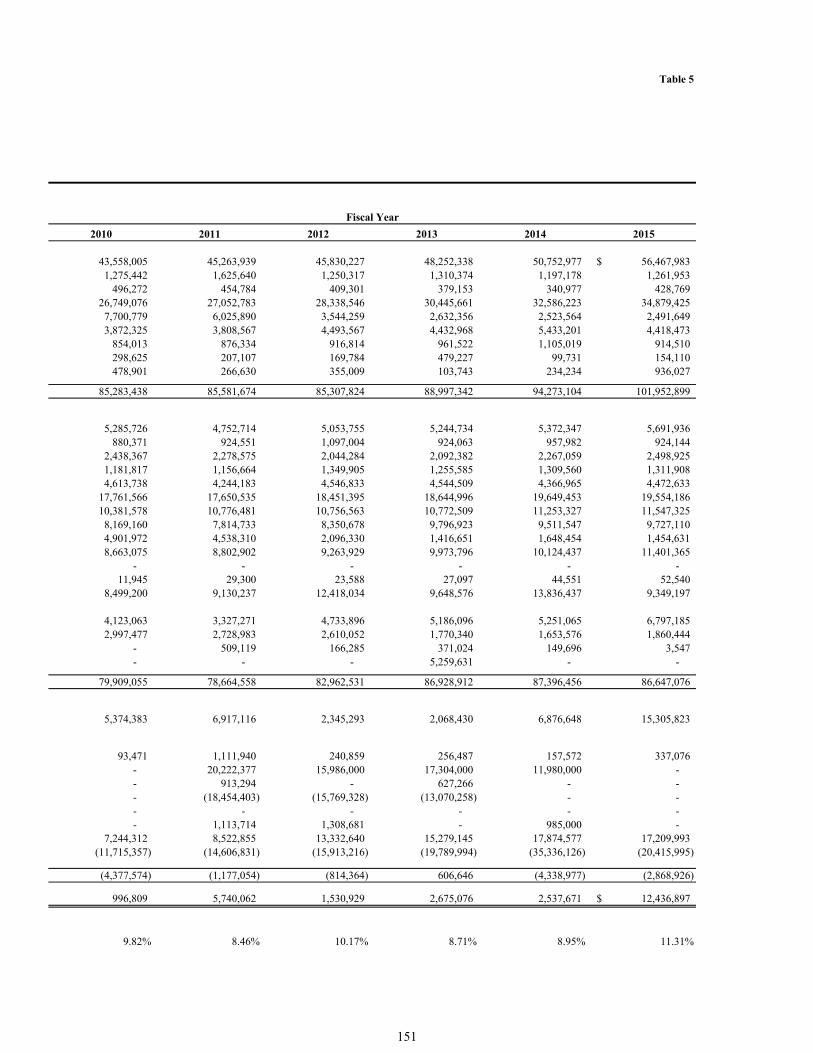
Table 5
2010 2011 2012 2013 2014 2015
43,558,005 45,263,939 45,830,227 48,252,338 50,752,977 56,467,983$ 1,275,442 1,625,640 1,250,317 1,310,374 1,197,178 1,261,953
496,272 454,784 409,301 379,153 340,977 428,769 26,749,076 27,052,783 28,338,546 30,445,661 32,586,223 34,879,425 7,700,779 6,025,890 3,544,259 2,632,356 2,523,564 2,491,649 3,872,325 3,808,567 4,493,567 4,432,968 5,433,201 4,418,473
854,013 876,334 916,814 961,522 1,105,019 914,510 298,625 207,107 169,784 479,227 99,731 154,110 478,901 266,630 355,009 103,743 234,234 936,027
85,283,438 85,581,674 85,307,824 88,997,342 94,273,104 101,952,899
5,285,726 4,752,714 5,053,755 5,244,734 5,372,347 5,691,936 880,371 924,551 1,097,004 924,063 957,982 924,144
2,438,367 2,278,575 2,044,284 2,092,382 2,267,059 2,498,925 1,181,817 1,156,664 1,349,905 1,255,585 1,309,560 1,311,908 4,613,738 4,244,183 4,546,833 4,544,509 4,366,965 4,472,633
17,761,566 17,650,535 18,451,395 18,644,996 19,649,453 19,554,186 10,381,578 10,776,481 10,756,563 10,772,509 11,253,327 11,547,325 8,169,160 7,814,733 8,350,678 9,796,923 9,511,547 9,727,110 4,901,972 4,538,310 2,096,330 1,416,651 1,648,454 1,454,631 8,663,075 8,802,902 9,263,929 9,973,796 10,124,437 11,401,365
- - - - - - 11,945 29,300 23,588 27,097 44,551 52,540
8,499,200 9,130,237 12,418,034 9,648,576 13,836,437 9,349,197
4,123,063 3,327,271 4,733,896 5,186,096 5,251,065 6,797,185 2,997,477 2,728,983 2,610,052 1,770,340 1,653,576 1,860,444
- 509,119 166,285 371,024 149,696 3,547 - - - 5,259,631 - -
79,909,055 78,664,558 82,962,531 86,928,912 87,396,456 86,647,076
5,374,383 6,917,116 2,345,293 2,068,430 6,876,648 15,305,823
93,471 1,111,940 240,859 256,487 157,572 337,076 - 20,222,377 15,986,000 17,304,000 11,980,000 - - 913,294 - 627,266 - - - (18,454,403) (15,769,328) (13,070,258) - - - - - - - - - 1,113,714 1,308,681 - 985,000 -
7,244,312 8,522,855 13,332,640 15,279,145 17,874,577 17,209,993 (11,715,357) (14,606,831) (15,913,216) (19,789,994) (35,336,126) (20,415,995)
(4,377,574) (1,177,054) (814,364) 606,646 (4,338,977) (2,868,926)
996,809 5,740,062 1,530,929 2,675,076 2,537,671 12,436,897$
9.82% 8.46% 10.17% 8.71% 8.95% 11.31%
Fiscal Year
151

City of Greenville, South Carolina
152
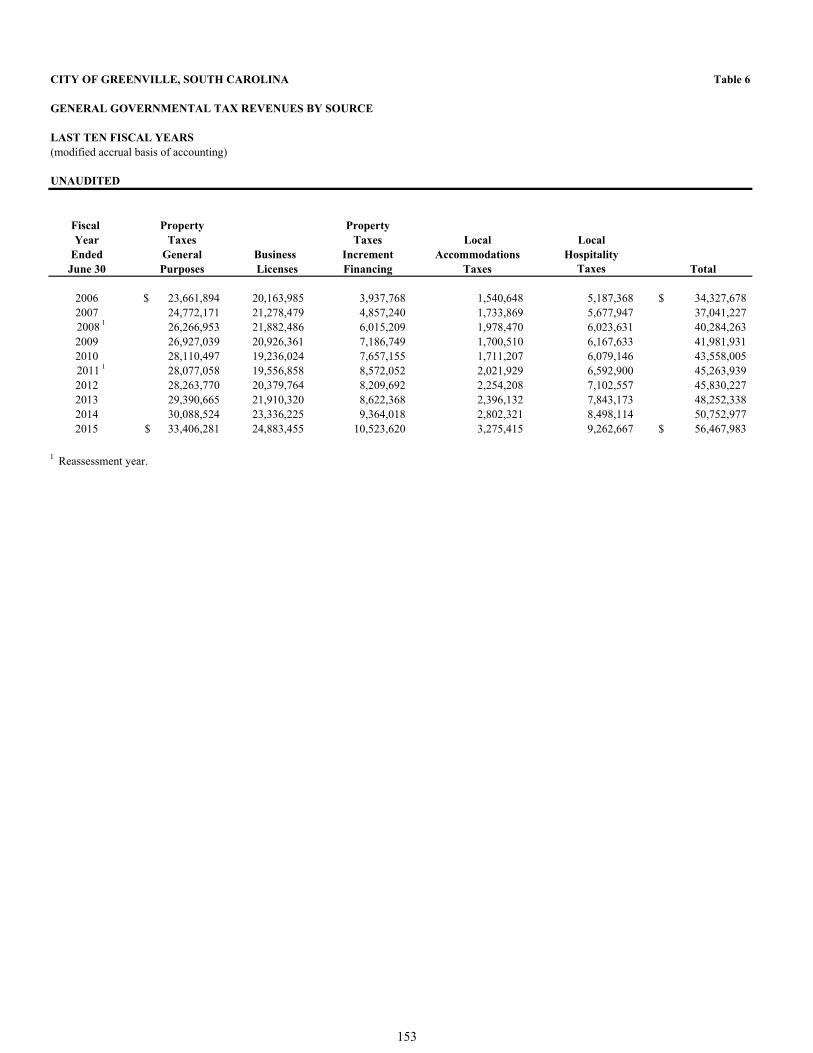
CITY OF GREENVILLE, SOUTH CAROLINA Table 6
GENERAL GOVERNMENTAL TAX REVENUES BY SOURCE
LAST TEN FISCAL YEARS(modified accrual basis of accounting)
UNAUDITED
Fiscal Property PropertyYear Taxes Taxes Local Local
Ended General Business Increment Accommodations HospitalityJune 30 Purposes Licenses Financing Taxes Taxes Total
2006 23,661,894$ 20,163,985 3,937,768 1,540,648 5,187,368 34,327,678$ 2007 24,772,171 21,278,479 4,857,240 1,733,869 5,677,947 37,041,227
2008 1 26,266,953 21,882,486 6,015,209 1,978,470 6,023,631 40,284,263 2009 26,927,039 20,926,361 7,186,749 1,700,510 6,167,633 41,981,931 2010 28,110,497 19,236,024 7,657,155 1,711,207 6,079,146 43,558,005
2011 1 28,077,058 19,556,858 8,572,052 2,021,929 6,592,900 45,263,939 2012 28,263,770 20,379,764 8,209,692 2,254,208 7,102,557 45,830,227 2013 29,390,665 21,910,320 8,622,368 2,396,132 7,843,173 48,252,338 2014 30,088,524 23,336,225 9,364,018 2,802,321 8,498,114 50,752,977 2015 33,406,281$ 24,883,455 10,523,620 3,275,415 9,262,667 56,467,983$
1 Reassessment year.
153
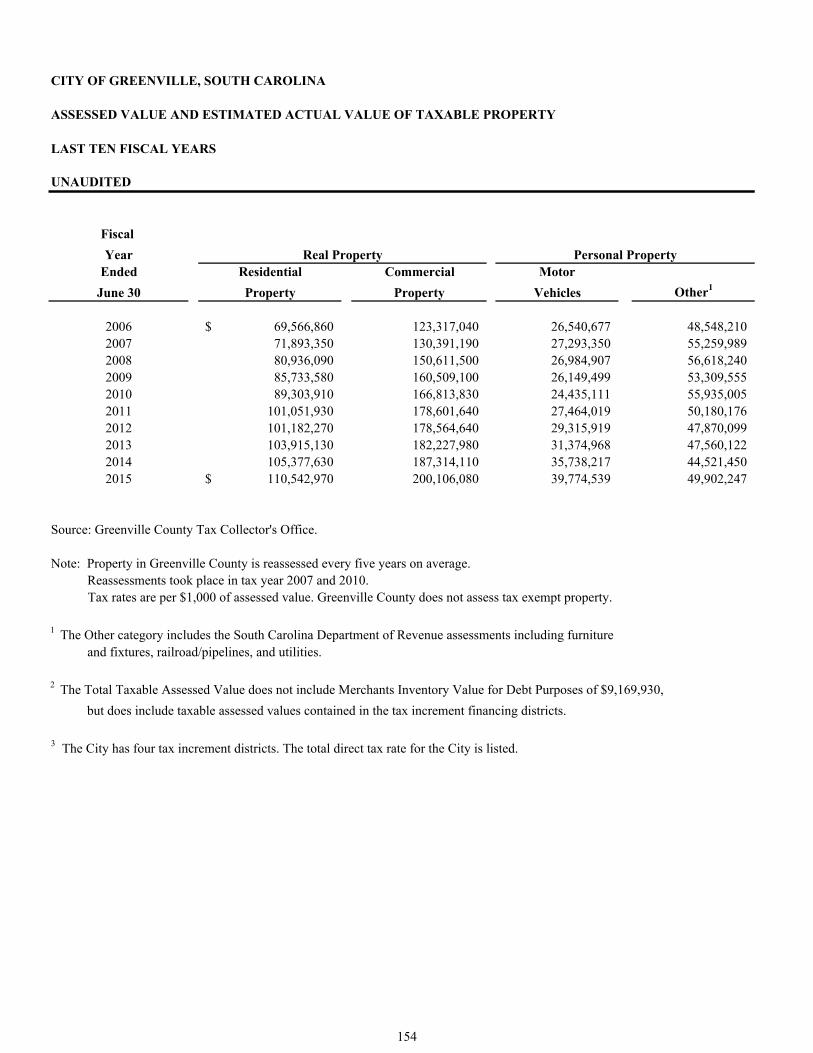
CITY OF GREENVILLE, SOUTH CAROLINA
ASSESSED VALUE AND ESTIMATED ACTUAL VALUE OF TAXABLE PROPERTY
LAST TEN FISCAL YEARS
UNAUDITED
Fiscal
YearEnded Residential Commercial Motor
June 30 Property Property Vehicles Other1
2006 69,566,860$ 123,317,040 26,540,677 48,548,210 2007 71,893,350 130,391,190 27,293,350 55,259,989 2008 80,936,090 150,611,500 26,984,907 56,618,240 2009 85,733,580 160,509,100 26,149,499 53,309,555 2010 89,303,910 166,813,830 24,435,111 55,935,005 2011 101,051,930 178,601,640 27,464,019 50,180,176 2012 101,182,270 178,564,640 29,315,919 47,870,099 2013 103,915,130 182,227,980 31,374,968 47,560,122 2014 105,377,630 187,314,110 35,738,217 44,521,450 2015 110,542,970$ 200,106,080 39,774,539 49,902,247
Source: Greenville County Tax Collector's Office.
Note: Property in Greenville County is reassessed every five years on average. Reassessments took place in tax year 2007 and 2010.
Tax rates are per $1,000 of assessed value. Greenville County does not assess tax exempt property.
1 The Other category includes the South Carolina Department of Revenue assessments including furniture and fixtures, railroad/pipelines, and utilities.
2 The Total Taxable Assessed Value does not include Merchants Inventory Value for Debt Purposes of $9,169,930, but does include taxable assessed values contained in the tax increment financing districts.
3 The City has four tax increment districts. The total direct tax rate for the City is listed.
Real Property Personal Property
154
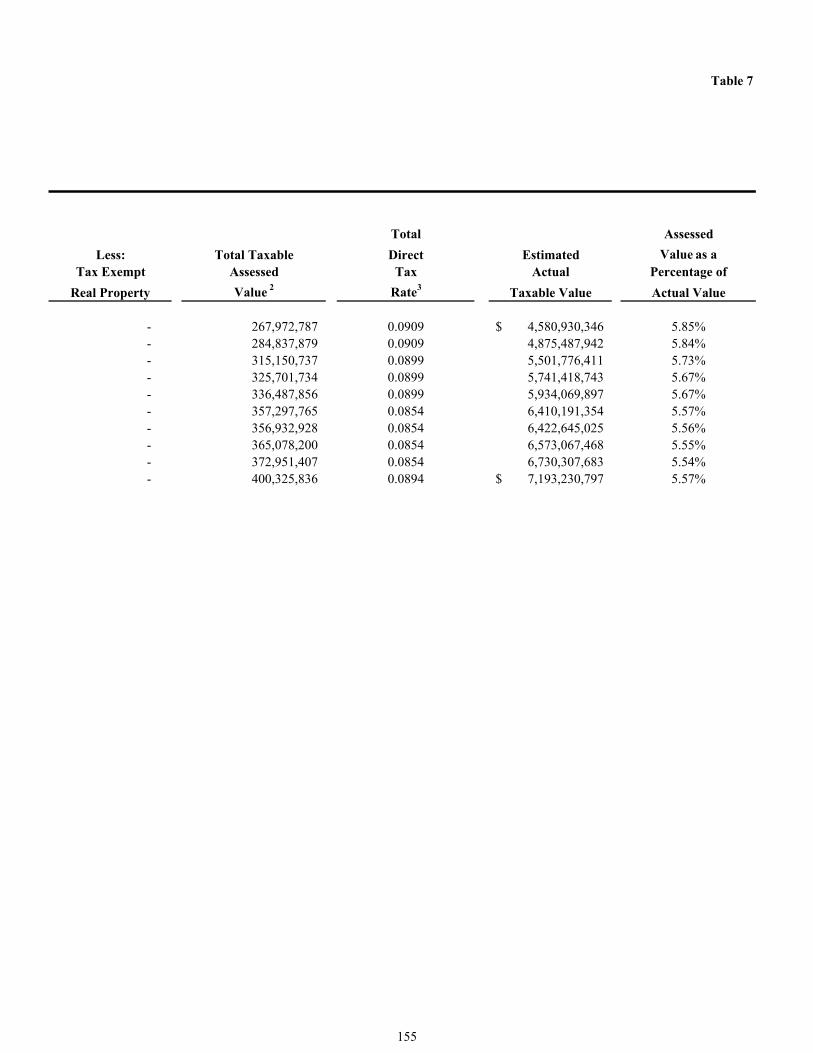
Table 7
Total Assessed
Less: Total Taxable Direct Estimated Value as a Tax Exempt Assessed Tax Actual Percentage of
Real Property Value 2 Rate3 Taxable Value Actual Value
- 267,972,787 0.0909 4,580,930,346$ 5.85%- 284,837,879 0.0909 4,875,487,942 5.84%- 315,150,737 0.0899 5,501,776,411 5.73%- 325,701,734 0.0899 5,741,418,743 5.67%- 336,487,856 0.0899 5,934,069,897 5.67%- 357,297,765 0.0854 6,410,191,354 5.57%- 356,932,928 0.0854 6,422,645,025 5.56%- 365,078,200 0.0854 6,573,067,468 5.55%- 372,951,407 0.0854 6,730,307,683 5.54%- 400,325,836 0.0894 7,193,230,797$ 5.57%
155
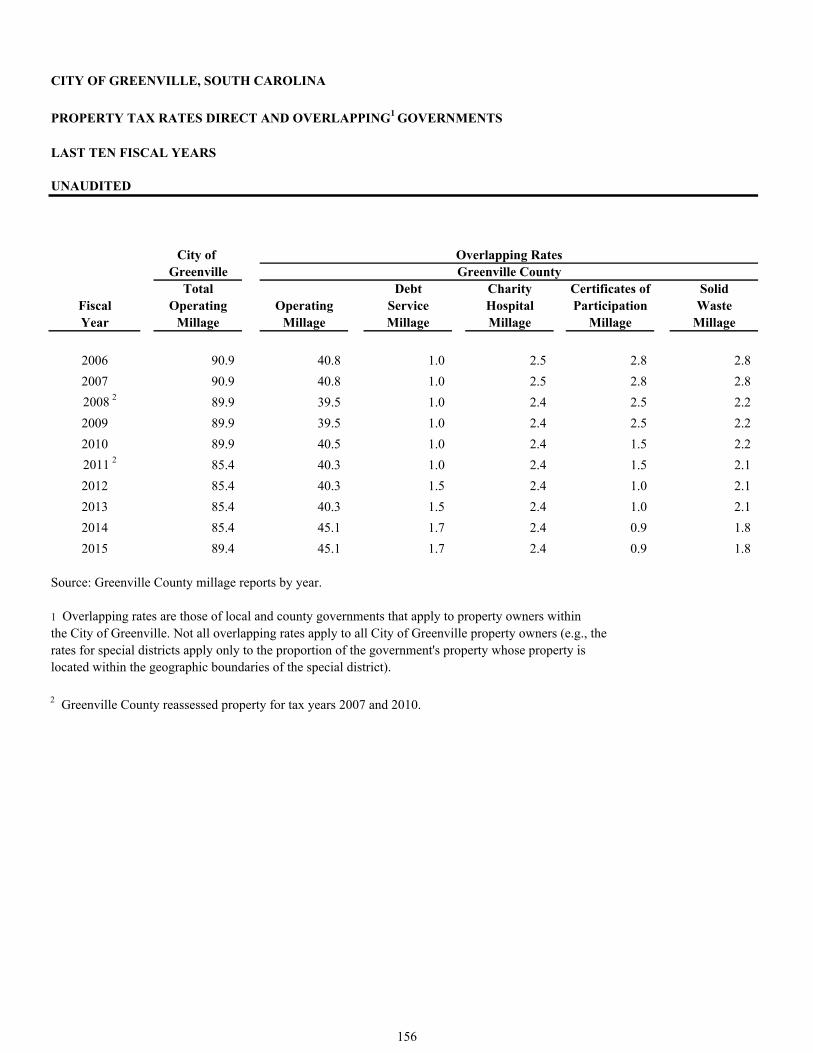
CITY OF GREENVILLE, SOUTH CAROLINA
PROPERTY TAX RATES DIRECT AND OVERLAPPING1 GOVERNMENTS
LAST TEN FISCAL YEARS
UNAUDITED
City of Greenville
Total Debt Charity Certificates of SolidFiscal Operating Operating Service Hospital Participation WasteYear Millage Millage Millage Millage Millage Millage
2006 90.9 40.8 1.0 2.5 2.8 2.8
2007 90.9 40.8 1.0 2.5 2.8 2.8
2008 2 89.9 39.5 1.0 2.4 2.5 2.2
2009 89.9 39.5 1.0 2.4 2.5 2.2
2010 89.9 40.5 1.0 2.4 1.5 2.2
2011 2 85.4 40.3 1.0 2.4 1.5 2.1
2012 85.4 40.3 1.5 2.4 1.0 2.1
2013 85.4 40.3 1.5 2.4 1.0 2.1
2014 85.4 45.1 1.7 2.4 0.9 1.8
2015 89.4 45.1 1.7 2.4 0.9 1.8
Source: Greenville County millage reports by year.
1 Overlapping rates are those of local and county governments that apply to property owners withinthe City of Greenville. Not all overlapping rates apply to all City of Greenville property owners (e.g., therates for special districts apply only to the proportion of the government's property whose property islocated within the geographic boundaries of the special district).
2 Greenville County reassessed property for tax years 2007 and 2010.
Overlapping RatesGreenville County
156
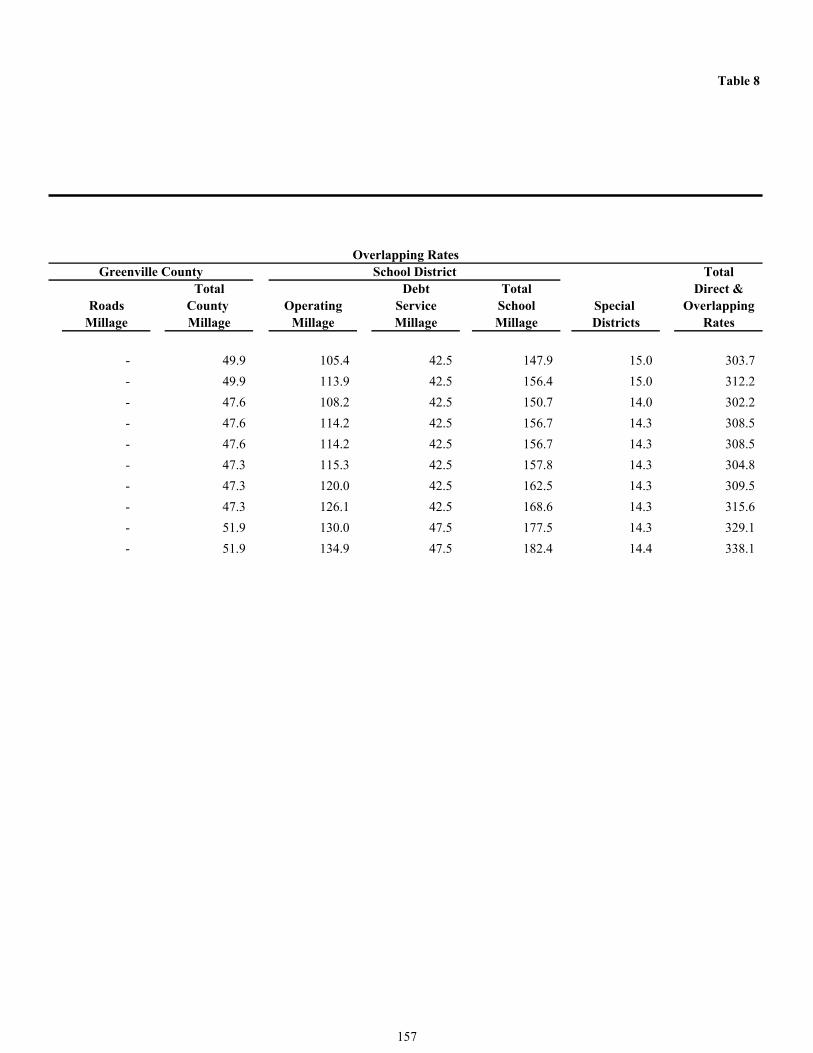
Table 8
Total Total Debt Total Direct &
Roads County Operating Service School Special OverlappingMillage Millage Millage Millage Millage Districts Rates
- 49.9 105.4 42.5 147.9 15.0 303.7
- 49.9 113.9 42.5 156.4 15.0 312.2
- 47.6 108.2 42.5 150.7 14.0 302.2
- 47.6 114.2 42.5 156.7 14.3 308.5
- 47.6 114.2 42.5 156.7 14.3 308.5
- 47.3 115.3 42.5 157.8 14.3 304.8
- 47.3 120.0 42.5 162.5 14.3 309.5
- 47.3 126.1 42.5 168.6 14.3 315.6
- 51.9 130.0 47.5 177.5 14.3 329.1
- 51.9 134.9 47.5 182.4 14.4 338.1
Overlapping RatesGreenville County School District
157
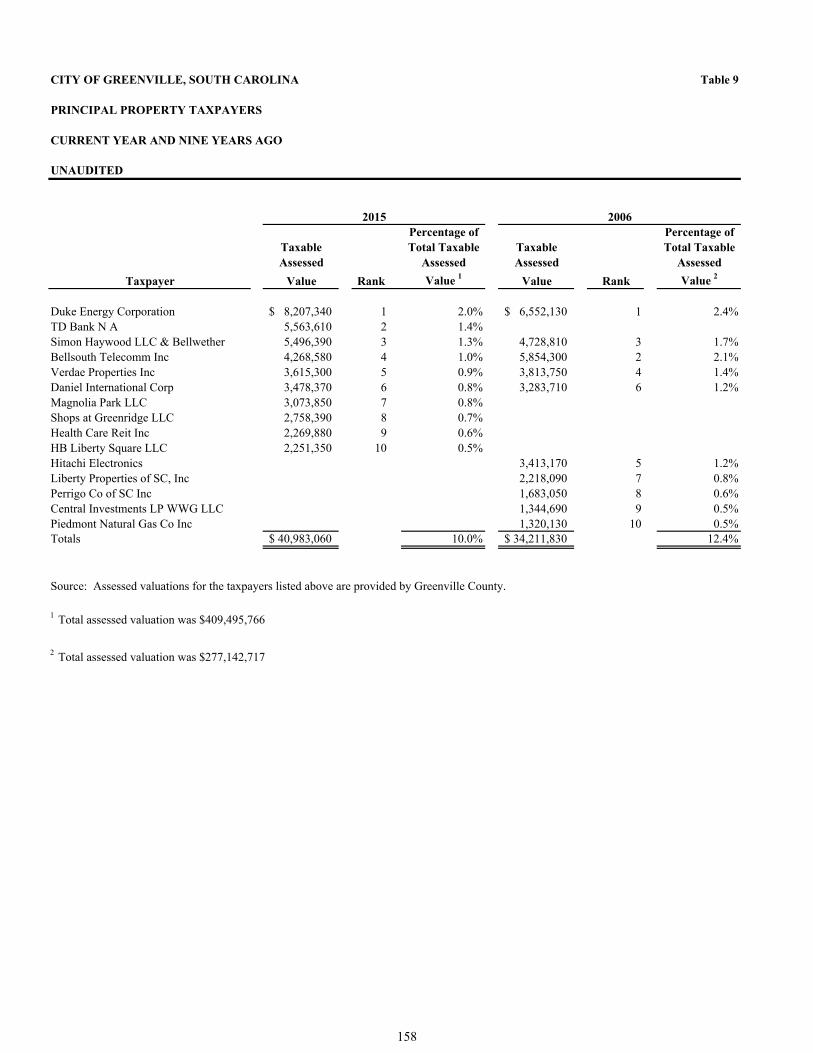
CITY OF GREENVILLE, SOUTH CAROLINA Table 9
UNAUDITED
Percentage of Percentage ofTaxable Total Taxable Taxable Total Taxable
Assessed Assessed Assessed Assessed
Taxpayer Value Rank Value 1 Value Rank Value 2
Duke Energy Corporation 8,207,340$ 1 2.0% 6,552,130$ 1 2.4%TD Bank N A 5,563,610 2 1.4%Simon Haywood LLC & Bellwether 5,496,390 3 1.3% 4,728,810 3 1.7%Bellsouth Telecomm Inc 4,268,580 4 1.0% 5,854,300 2 2.1%Verdae Properties Inc 3,615,300 5 0.9% 3,813,750 4 1.4%Daniel International Corp 3,478,370 6 0.8% 3,283,710 6 1.2%Magnolia Park LLC 3,073,850 7 0.8%Shops at Greenridge LLC 2,758,390 8 0.7%Health Care Reit Inc 2,269,880 9 0.6%HB Liberty Square LLC 2,251,350 10 0.5%Hitachi Electronics 3,413,170 5 1.2%Liberty Properties of SC, Inc 2,218,090 7 0.8%Perrigo Co of SC Inc 1,683,050 8 0.6%Central Investments LP WWG LLC 1,344,690 9 0.5%Piedmont Natural Gas Co Inc 1,320,130 10 0.5%Totals 40,983,060$ 10.0% 34,211,830$ 12.4%
Source: Assessed valuations for the taxpayers listed above are provided by Greenville County.
1 Total assessed valuation was $409,495,766
2 Total assessed valuation was $277,142,717
20062015
PRINCIPAL PROPERTY TAXPAYERS
CURRENT YEAR AND NINE YEARS AGO
158
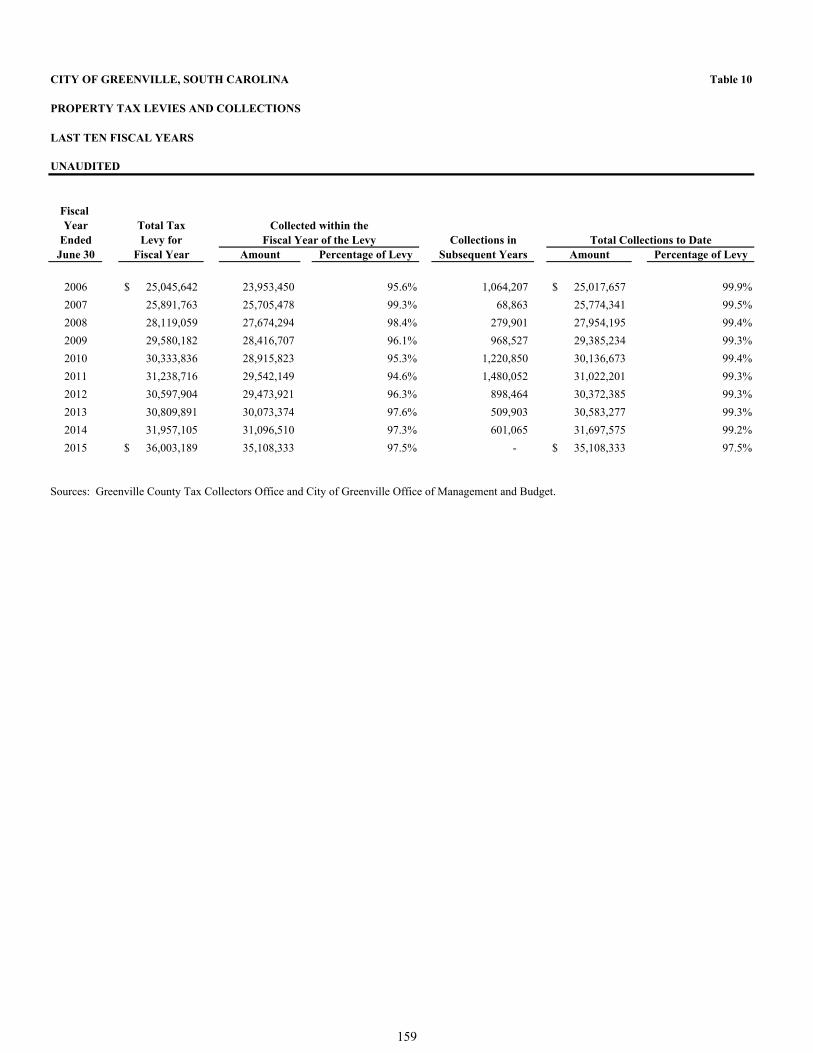
CITY OF GREENVILLE, SOUTH CAROLINA Table 10
PROPERTY TAX LEVIES AND COLLECTIONS
LAST TEN FISCAL YEARS
UNAUDITED
Fiscal Year Total Tax
Ended Levy for Collections inJune 30 Fiscal Year Amount Percentage of Levy Subsequent Years Amount Percentage of Levy
2006 25,045,642$ 23,953,450 95.6% 1,064,207 25,017,657$ 99.9%
2007 25,891,763 25,705,478 99.3% 68,863 25,774,341 99.5%
2008 28,119,059 27,674,294 98.4% 279,901 27,954,195 99.4%
2009 29,580,182 28,416,707 96.1% 968,527 29,385,234 99.3%
2010 30,333,836 28,915,823 95.3% 1,220,850 30,136,673 99.4%
2011 31,238,716 29,542,149 94.6% 1,480,052 31,022,201 99.3%
2012 30,597,904 29,473,921 96.3% 898,464 30,372,385 99.3%
2013 30,809,891 30,073,374 97.6% 509,903 30,583,277 99.3%
2014 31,957,105 31,096,510 97.3% 601,065 31,697,575 99.2%
2015 36,003,189$ 35,108,333 97.5% - 35,108,333$ 97.5%
Sources: Greenville County Tax Collectors Office and City of Greenville Office of Management and Budget.
Collected within theFiscal Year of the Levy Total Collections to Date
159
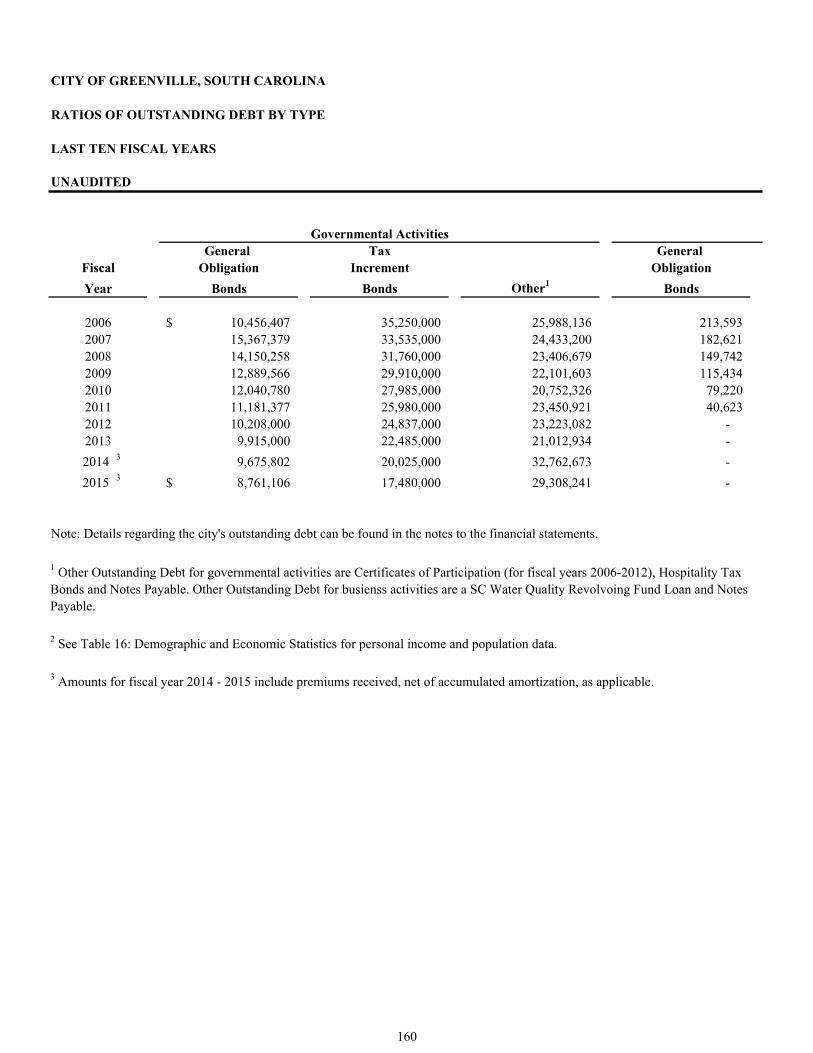
CITY OF GREENVILLE, SOUTH CAROLINA
RATIOS OF OUTSTANDING DEBT BY TYPE
LAST TEN FISCAL YEARS
UNAUDITED
General Tax General Fiscal Obligation Increment Obligation
Year Bonds Bonds Other1 Bonds
2006 10,456,407$ 35,250,000 25,988,136 213,593 2007 15,367,379 33,535,000 24,433,200 182,621 2008 14,150,258 31,760,000 23,406,679 149,742 2009 12,889,566 29,910,000 22,101,603 115,434 2010 12,040,780 27,985,000 20,752,326 79,220 2011 11,181,377 25,980,000 23,450,921 40,623 2012 10,208,000 24,837,000 23,223,082 - 2013 9,915,000 22,485,000 21,012,934 -
2014 3 9,675,802 20,025,000 32,762,673 -
2015 3 8,761,106$ 17,480,000 29,308,241 -
Note: Details regarding the city's outstanding debt can be found in the notes to the financial statements.
2 See Table 16: Demographic and Economic Statistics for personal income and population data.
3 Amounts for fiscal year 2014 - 2015 include premiums received, net of accumulated amortization, as applicable.
Governmental Activities
1 Other Outstanding Debt for governmental activities are Certificates of Participation (for fiscal years 2006-2012), Hospitality Tax Bonds and Notes Payable. Other Outstanding Debt for busienss activities are a SC Water Quality Revolvoing Fund Loan and Notes Payable.
160
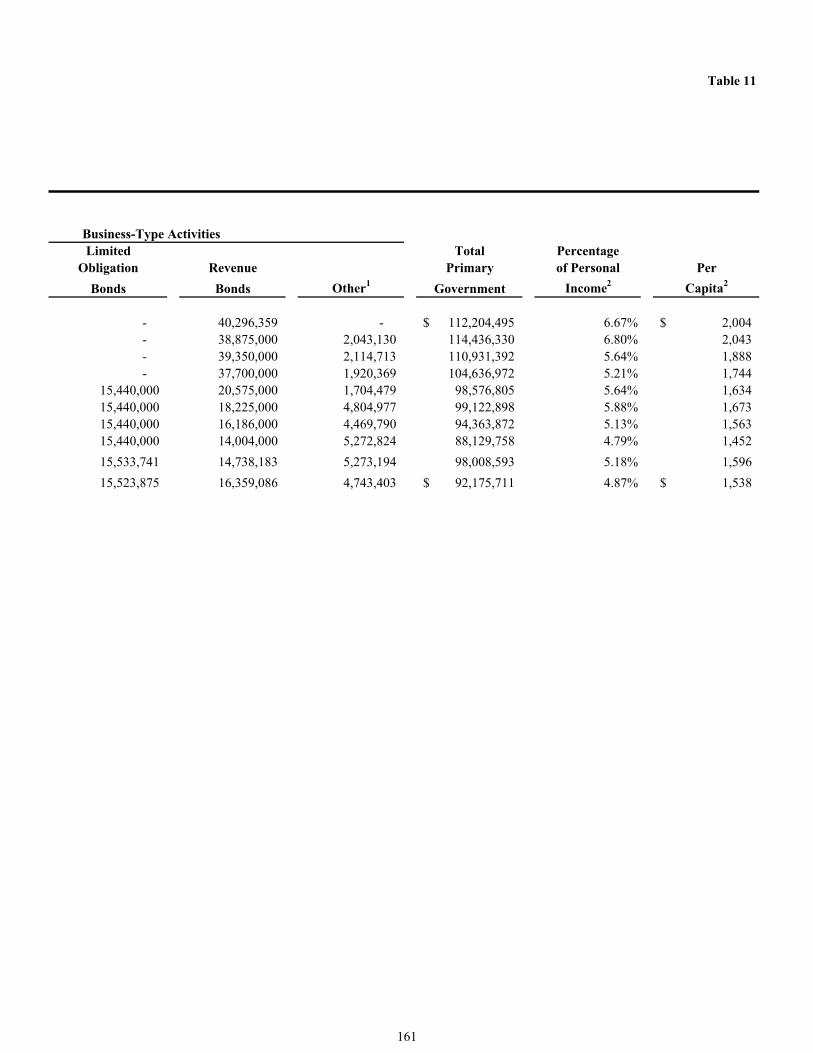
Table 11
Limited Total PercentageObligation Revenue Primary of Personal Per
Bonds Bonds Other1 Government Income2 Capita2
- 40,296,359 - 112,204,495$ 6.67% 2,004$ - 38,875,000 2,043,130 114,436,330 6.80% 2,043 - 39,350,000 2,114,713 110,931,392 5.64% 1,888 - 37,700,000 1,920,369 104,636,972 5.21% 1,744
15,440,000 20,575,000 1,704,479 98,576,805 5.64% 1,634 15,440,000 18,225,000 4,804,977 99,122,898 5.88% 1,673 15,440,000 16,186,000 4,469,790 94,363,872 5.13% 1,563 15,440,000 14,004,000 5,272,824 88,129,758 4.79% 1,452
15,533,741 14,738,183 5,273,194 98,008,593 5.18% 1,596
15,523,875 16,359,086 4,743,403 92,175,711$ 4.87% 1,538$
Business-Type Activities
161
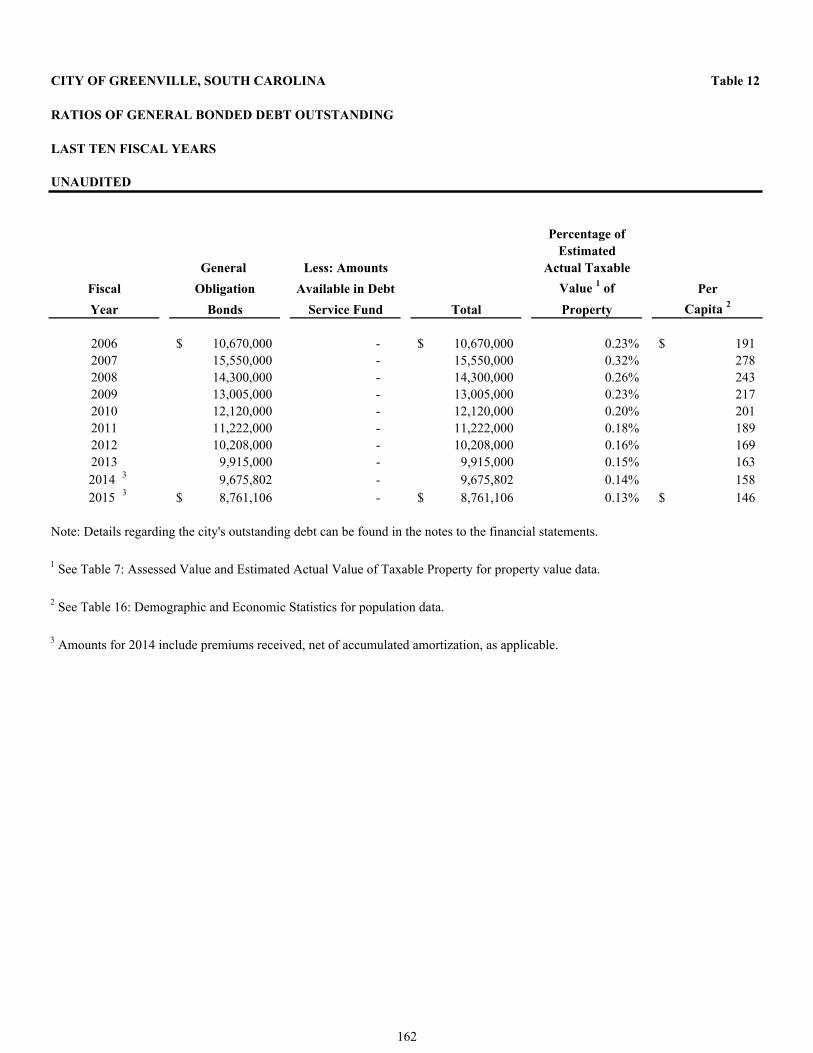
CITY OF GREENVILLE, SOUTH CAROLINA Table 12
RATIOS OF GENERAL BONDED DEBT OUTSTANDING
LAST TEN FISCAL YEARS
UNAUDITED
Percentage ofEstimated
General Less: Amounts Actual Taxable
Fiscal Obligation Available in Debt Value 1 of Per
Year Bonds Service Fund Total Property Capita 2
2006 10,670,000$ - 10,670,000$ 0.23% 191$ 2007 15,550,000 - 15,550,000 0.32% 278 2008 14,300,000 - 14,300,000 0.26% 243 2009 13,005,000 - 13,005,000 0.23% 217 2010 12,120,000 - 12,120,000 0.20% 201 2011 11,222,000 - 11,222,000 0.18% 189 2012 10,208,000 - 10,208,000 0.16% 169 2013 9,915,000 - 9,915,000 0.15% 163
2014 3 9,675,802 - 9,675,802 0.14% 158 2015 3 8,761,106$ - 8,761,106$ 0.13% 146$
Note: Details regarding the city's outstanding debt can be found in the notes to the financial statements.
1 See Table 7: Assessed Value and Estimated Actual Value of Taxable Property for property value data.
2 See Table 16: Demographic and Economic Statistics for population data.
3 Amounts for 2014 include premiums received, net of accumulated amortization, as applicable.
162
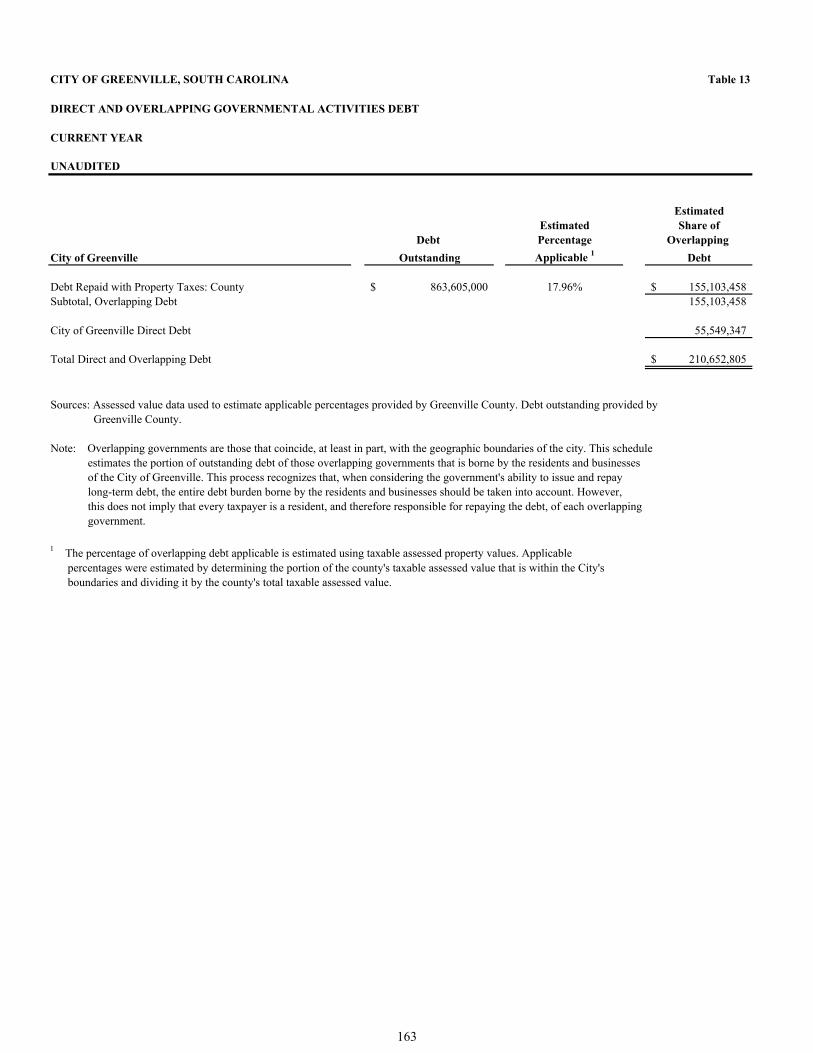
CITY OF GREENVILLE, SOUTH CAROLINA Table 13
DIRECT AND OVERLAPPING GOVERNMENTAL ACTIVITIES DEBT
CURRENT YEAR
UNAUDITED
EstimatedEstimated Share of
Debt Percentage Overlapping
City of Greenville Outstanding Applicable 1 Debt
Debt Repaid with Property Taxes: County 863,605,000$ 17.96% 155,103,458$ Subtotal, Overlapping Debt 155,103,458
City of Greenville Direct Debt 55,549,347
Total Direct and Overlapping Debt 210,652,805$
Note: Overlapping governments are those that coincide, at least in part, with the geographic boundaries of the city. This schedule estimates the portion of outstanding debt of those overlapping governments that is borne by the residents and businesses of the City of Greenville. This process recognizes that, when considering the government's ability to issue and repay long-term debt, the entire debt burden borne by the residents and businesses should be taken into account. However, this does not imply that every taxpayer is a resident, and therefore responsible for repaying the debt, of each overlapping government.
1 The percentage of overlapping debt applicable is estimated using taxable assessed property values. Applicablepercentages were estimated by determining the portion of the county's taxable assessed value that is within the City'sboundaries and dividing it by the county's total taxable assessed value.
Sources: Assessed value data used to estimate applicable percentages provided by Greenville County. Debt outstanding provided by Greenville County.
163
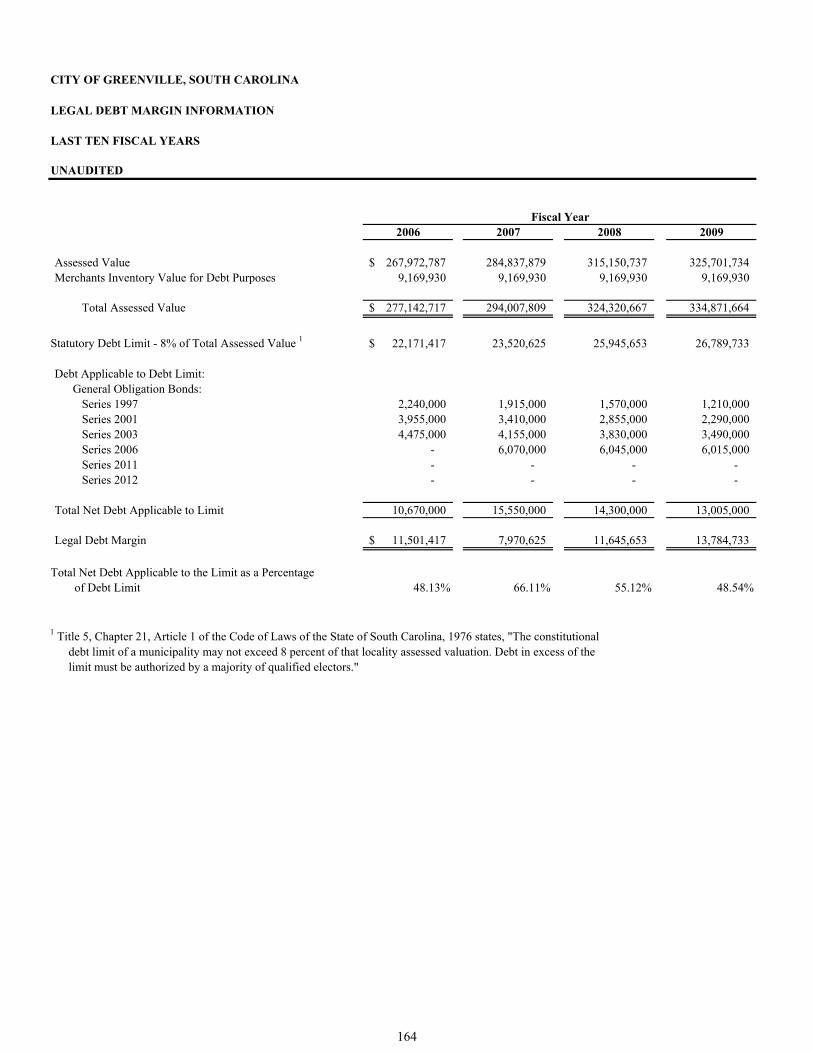
CITY OF GREENVILLE, SOUTH CAROLINA
LEGAL DEBT MARGIN INFORMATION
LAST TEN FISCAL YEARS
UNAUDITED
2006 2007 2008 2009
Assessed Value 267,972,787$ 284,837,879 315,150,737 325,701,734 Merchants Inventory Value for Debt Purposes 9,169,930 9,169,930 9,169,930 9,169,930
Total Assessed Value 277,142,717$ 294,007,809 324,320,667 334,871,664
Statutory Debt Limit - 8% of Total Assessed Value 1 22,171,417$ 23,520,625 25,945,653 26,789,733
Debt Applicable to Debt Limit:General Obligation Bonds:
Series 1997 2,240,000 1,915,000 1,570,000 1,210,000 Series 2001 3,955,000 3,410,000 2,855,000 2,290,000 Series 2003 4,475,000 4,155,000 3,830,000 3,490,000 Series 2006 - 6,070,000 6,045,000 6,015,000 Series 2011 - - - - Series 2012 - - - -
Total Net Debt Applicable to Limit 10,670,000 15,550,000 14,300,000 13,005,000
Legal Debt Margin 11,501,417$ 7,970,625 11,645,653 13,784,733
Total Net Debt Applicable to the Limit as a Percentage of Debt Limit 48.13% 66.11% 55.12% 48.54%
1 Title 5, Chapter 21, Article 1 of the Code of Laws of the State of South Carolina, 1976 states, "The constitutional debt limit of a municipality may not exceed 8 percent of that locality assessed valuation. Debt in excess of the limit must be authorized by a majority of qualified electors."
Fiscal Year
164
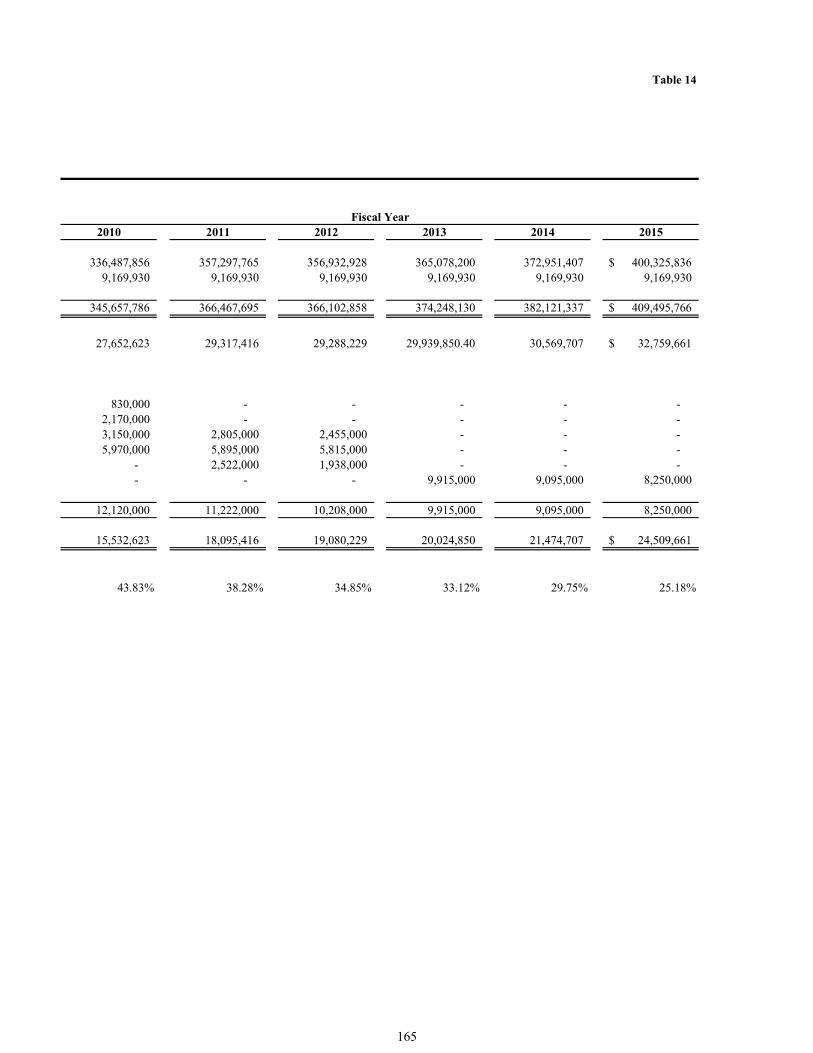
Table 14
2010 2011 2012 2013 2014 2015
336,487,856 357,297,765 356,932,928 365,078,200 372,951,407 400,325,836$ 9,169,930 9,169,930 9,169,930 9,169,930 9,169,930 9,169,930
345,657,786 366,467,695 366,102,858 374,248,130 382,121,337 409,495,766$
27,652,623 29,317,416 29,288,229 29,939,850.40 30,569,707 32,759,661$
830,000 - - - - - 2,170,000 - - - - - 3,150,000 2,805,000 2,455,000 - - - 5,970,000 5,895,000 5,815,000 - - -
- 2,522,000 1,938,000 - - - - - - 9,915,000 9,095,000 8,250,000
12,120,000 11,222,000 10,208,000 9,915,000 9,095,000 8,250,000
15,532,623 18,095,416 19,080,229 20,024,850 21,474,707 24,509,661$
43.83% 38.28% 34.85% 33.12% 29.75% 25.18%
Fiscal Year
165

CITY OF GREENVILLE, SOUTH CAROLINA Table 15
PLEDGE REVENUE COVERAGE
LAST TEN FISCAL YEARS
UNAUDITED
Coverage CoverageLess Net With Without
Fiscal Net Current Available Pension Pension Year Revenues Expenses Revenue Principal Interest Costs Costs
Sewer Revenue Bonds 1
2006 2,750,085$ 1,825,750 924,335 305,000 389,074$ n/a 1.332007 2,972,563 1,835,733 1,136,830 315,000 376,929 n/a 1.642008 2,959,195 1,798,670 1,160,525 330,000 363,204 n/a 1.672009 3,310,456 2,006,869 1,303,587 395,000 415,233 n/a 1.612010 3,727,870 2,144,836 1,583,034 420,000 401,553 n/a 1.932011 3,866,916 2,381,191 1,485,725 525,000 285,196 n/a 1.832012 4,108,870 2,657,309 1,451,561 504,000 216,231 n/a 2.022013 4,122,760 2,177,364 1,945,396 584,079 262,953 n/a 2.302014 4,305,806 3,105,655 1,200,151 620,694 255,561 n/a 1.372015 4,639,112$ 2,754,476 1,884,636 626,834 224,900$ 2.21 2.23
Stormwater Revenue Bonds 2
2006 3,949,593$ 1,591,590 2,358,003 160,000 178,545$ n/a 6.972007 4,260,294 1,772,868 2,487,426 165,000 172,845 n/a 7.362008 4,284,125 1,689,344 2,594,781 170,000 167,170 n/a 7.702009 4,288,044 2,154,586 2,133,458 175,000 160,795 n/a 6.352010 4,542,714 2,071,951 2,470,763 180,000 152,170 n/a 7.442011 4,584,037 2,472,700 2,111,337 228,000 154,854 n/a 5.512012 4,747,188 2,490,193 2,256,995 220,000 75,455 n/a 7.642013 4,859,419 2,539,374 2,320,045 228,000 68,914 n/a 7.812014 5,134,789 2,979,926 2,154,863 372,000 89,596 n/a 4.672015 5,228,120$ 2,729,848 2,498,272 454,000 121,217$ 4.34 4.35
2005B Parking Revenue Bonds 3
2006 4,804,252$ 1,989,955 2,814,297 560,000 835,766$ n/a 2.022007 4,978,629 2,252,726 2,725,903 830,000 835,766 n/a 1.642008 5,414,666 2,254,819 3,159,847 955,000 835,766 n/a 1.762009 4,958,152 2,578,684 2,379,468 1,080,000 835,766 n/a 1.242010 4,759,022 2,484,884 2,274,138 1,155,000 735,295 n/a 1.202011 5,062,672 2,436,060 2,626,612 1,240,000 616,411 n/a 1.412012 5,286,796 2,432,917 2,853,879 1,315,000 590,782 n/a 1.502013 6,025,807 2,656,054 3,369,753 1,430,000 171,347 n/a 2.102014 6,393,859 2,784,478 3,609,381 1,545,000 232,350 n/a 2.032015 7,010,299$ 2,908,610 4,101,689 1,660,000 155,100$ 2.26 2.27
(Continued)
Debt Service
166
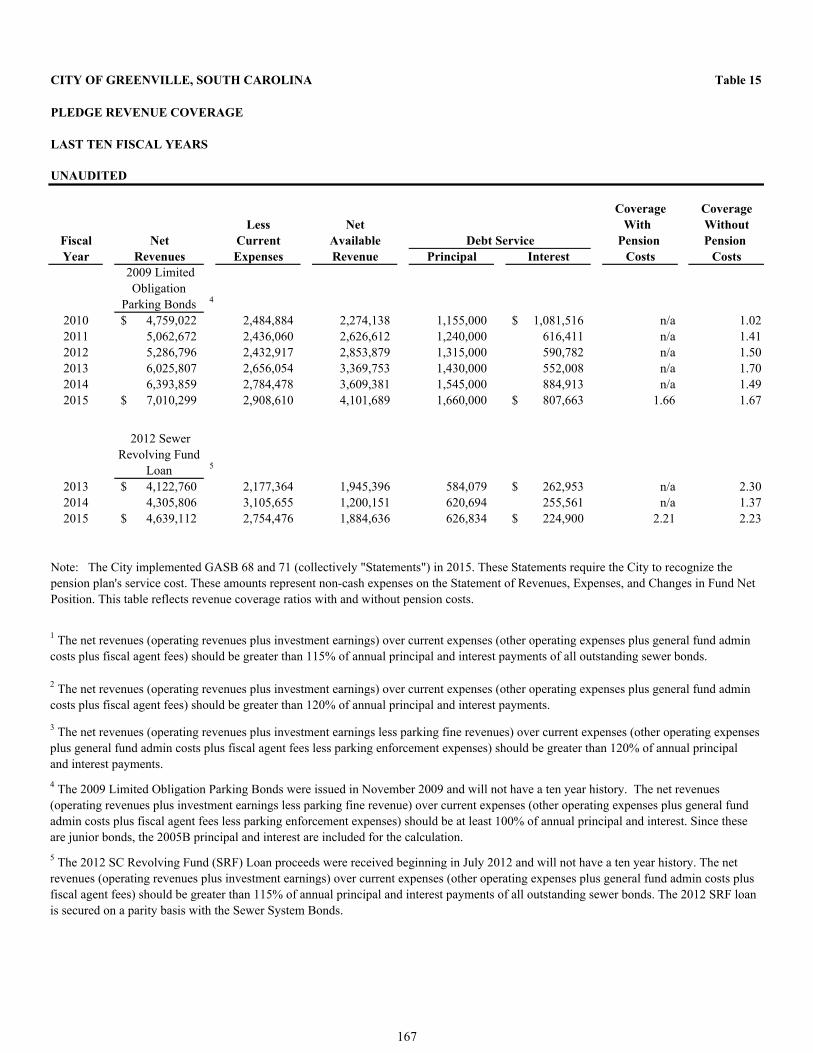
CITY OF GREENVILLE, SOUTH CAROLINA Table 15
PLEDGE REVENUE COVERAGE
LAST TEN FISCAL YEARS
UNAUDITED
Coverage CoverageLess Net With Without
Fiscal Net Current Available Pension Pension Year Revenues Expenses Revenue Principal Interest Costs Costs
Debt Service
2009 Limited Obligation
Parking Bonds 4
2010 4,759,022$ 2,484,884 2,274,138 1,155,000 1,081,516$ n/a 1.022011 5,062,672 2,436,060 2,626,612 1,240,000 616,411 n/a 1.412012 5,286,796 2,432,917 2,853,879 1,315,000 590,782 n/a 1.502013 6,025,807 2,656,054 3,369,753 1,430,000 552,008 n/a 1.702014 6,393,859 2,784,478 3,609,381 1,545,000 884,913 n/a 1.492015 7,010,299$ 2,908,610 4,101,689 1,660,000 807,663$ 1.66 1.67
2012 Sewer Revolving Fund
Loan 5
2013 4,122,760$ 2,177,364 1,945,396 584,079 262,953$ n/a 2.302014 4,305,806 3,105,655 1,200,151 620,694 255,561 n/a 1.372015 4,639,112$ 2,754,476 1,884,636 626,834 224,900$ 2.21 2.23
3 The net revenues (operating revenues plus investment earnings less parking fine revenues) over current expenses (other operating expenses plus general fund admin costs plus fiscal agent fees less parking enforcement expenses) should be greater than 120% of annual principal and interest payments.
4 The 2009 Limited Obligation Parking Bonds were issued in November 2009 and will not have a ten year history. The net revenues (operating revenues plus investment earnings less parking fine revenue) over current expenses (other operating expenses plus general fund admin costs plus fiscal agent fees less parking enforcement expenses) should be at least 100% of annual principal and interest. Since these are junior bonds, the 2005B principal and interest are included for the calculation.
5 The 2012 SC Revolving Fund (SRF) Loan proceeds were received beginning in July 2012 and will not have a ten year history. The net revenues (operating revenues plus investment earnings) over current expenses (other operating expenses plus general fund admin costs plus fiscal agent fees) should be greater than 115% of annual principal and interest payments of all outstanding sewer bonds. The 2012 SRF loan is secured on a parity basis with the Sewer System Bonds.
1 The net revenues (operating revenues plus investment earnings) over current expenses (other operating expenses plus general fund admin costs plus fiscal agent fees) should be greater than 115% of annual principal and interest payments of all outstanding sewer bonds.
2 The net revenues (operating revenues plus investment earnings) over current expenses (other operating expenses plus general fund admin costs plus fiscal agent fees) should be greater than 120% of annual principal and interest payments.
Note: The City implemented GASB 68 and 71 (collectively "Statements") in 2015. These Statements require the City to recognize the pension plan's service cost. These amounts represent non-cash expenses on the Statement of Revenues, Expenses, and Changes in Fund Net Position. This table reflects revenue coverage ratios with and without pension costs.
167
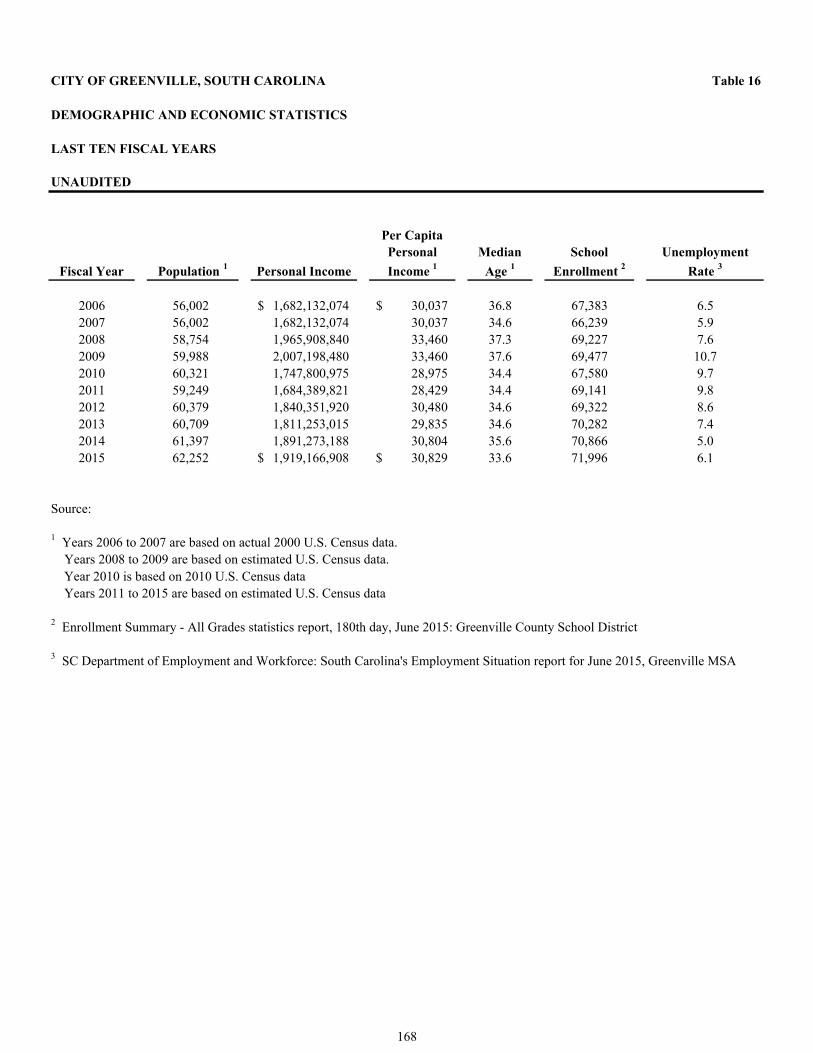
CITY OF GREENVILLE, SOUTH CAROLINA Table 16
DEMOGRAPHIC AND ECONOMIC STATISTICS
LAST TEN FISCAL YEARS
UNAUDITED
Fiscal Year Population 1 Personal Income
Per Capita Personal
Income 1
Median
Age 1School
Enrollment 2
Unemployment
Rate 3
2006 56,002 1,682,132,074$ 30,037$ 36.8 67,383 6.52007 56,002 1,682,132,074 30,037 34.6 66,239 5.92008 58,754 1,965,908,840 33,460 37.3 69,227 7.62009 59,988 2,007,198,480 33,460 37.6 69,477 10.72010 60,321 1,747,800,975 28,975 34.4 67,580 9.72011 59,249 1,684,389,821 28,429 34.4 69,141 9.82012 60,379 1,840,351,920 30,480 34.6 69,322 8.62013 60,709 1,811,253,015 29,835 34.6 70,282 7.42014 61,397 1,891,273,188 30,804 35.6 70,866 5.02015 62,252 1,919,166,908$ 30,829$ 33.6 71,996 6.1
1 Years 2006 to 2007 are based on actual 2000 U.S. Census data. Years 2008 to 2009 are based on estimated U.S. Census data. Year 2010 is based on 2010 U.S. Census data Years 2011 to 2015 are based on estimated U.S. Census data
Source:
3 SC Department of Employment and Workforce: South Carolina's Employment Situation report for June 2015, Greenville MSA
2 Enrollment Summary - All Grades statistics report, 180th day, June 2015: Greenville County School District
168

CITY OF GREENVILLE, SOUTH CAROLINA Table 17
PRINCIPAL EMPLOYERS
CURRENT YEAR
UNAUDITED
Employer Employees 1 Rank
Percentage of Total
City Employment 2
12,770 1 11.16%
2,260 2 1.97%
1,771 3 1.55%
1,428 4 1.25%
1,400 5 1.22%
963 6 0.84%
953 7 0.83%
948 8 0.83%
750 9 0.66%
Greenville Health System
Fluor Corporation
Greenville County Government School District of Greenville County Greenville Technical College
City of Greenville
Windstream Communications
Bob Jones University
TD Bank
BB&T 500 10 0.44%
Total 23,743 20.75%
Note: 2005 information is not available
1 Greenville Area Development
2 114,445 total workers were reported living in Greenville, SC, per Table 3, Commuter-Adjusted Daytime Population Population and Employment -Residence Ratios: 2010, published by the U.S. Census Bureau.
2015
Source:
169
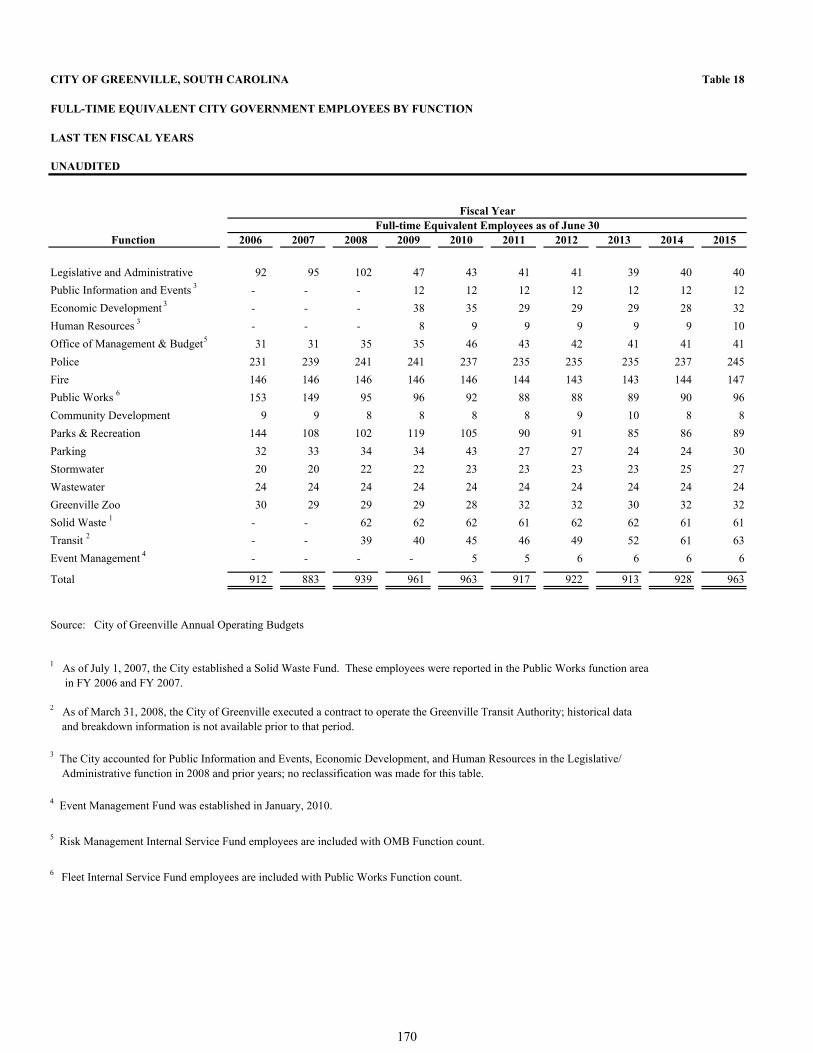
CITY OF GREENVILLE, SOUTH CAROLINA Table 18
FULL-TIME EQUIVALENT CITY GOVERNMENT EMPLOYEES BY FUNCTION
Function 2006 2007 2008 2009 2010 2011 2012 2013 2014 2015
Legislative and Administrative 92 95 102 47 43 41 41 39 40 40
Public Information and Events 3 - - - 12 12 12 12 12 12 12
Economic Development 3 - - - 38 35 29 29 29 28 32
Human Resources 3 - - - 8 9 9 9 9 9 10
Office of Management & Budget 5 31 31 35 35 46 43 42 41 41 41
Police 231 239 241 241 237 235 235 235 237 245
Fire 146 146 146 146 146 144 143 143 144 147
Public Works 6 153 149 95 96 92 88 88 89 90 96
Community Development 9 9 8 8 8 8 9 10 8 8
Parks & Recreation 144 108 102 119 105 90 91 85 86 89
Parking 32 33 34 34 43 27 27 24 24 30
Stormwater 20 20 22 22 23 23 23 23 25 27
Wastewater 24 24 24 24 24 24 24 24 24 24
Greenville Zoo 30 29 29 29 28 32 32 30 32 32
Solid Waste 1 - - 62 62 62 61 62 62 61 61
Transit 2 - - 39 40 45 46 49 52 61 63
Event Management 4 - - - - 5 5 6 6 6 6
Total 912 883 939 961 963 917 922 913 928 963
Source: City of Greenville Annual Operating Budgets
1 As of July 1, 2007, the City established a Solid Waste Fund. These employees were reported in the Public Works function area in FY 2006 and FY 2007.
2 As of March 31, 2008, the City of Greenville executed a contract to operate the Greenville Transit Authority; historical data and breakdown information is not available prior to that period.
3 The City accounted for Public Information and Events, Economic Development, and Human Resources in the Legislative/ Administrative function in 2008 and prior years; no reclassification was made for this table.
4 Event Management Fund was established in January, 2010.
5 Risk Management Internal Service Fund employees are included with OMB Function count.
6 Fleet Internal Service Fund employees are included with Public Works Function count.
Fiscal YearFull-time Equivalent Employees as of June 30
LAST TEN FISCAL YEARS
UNAUDITED
170
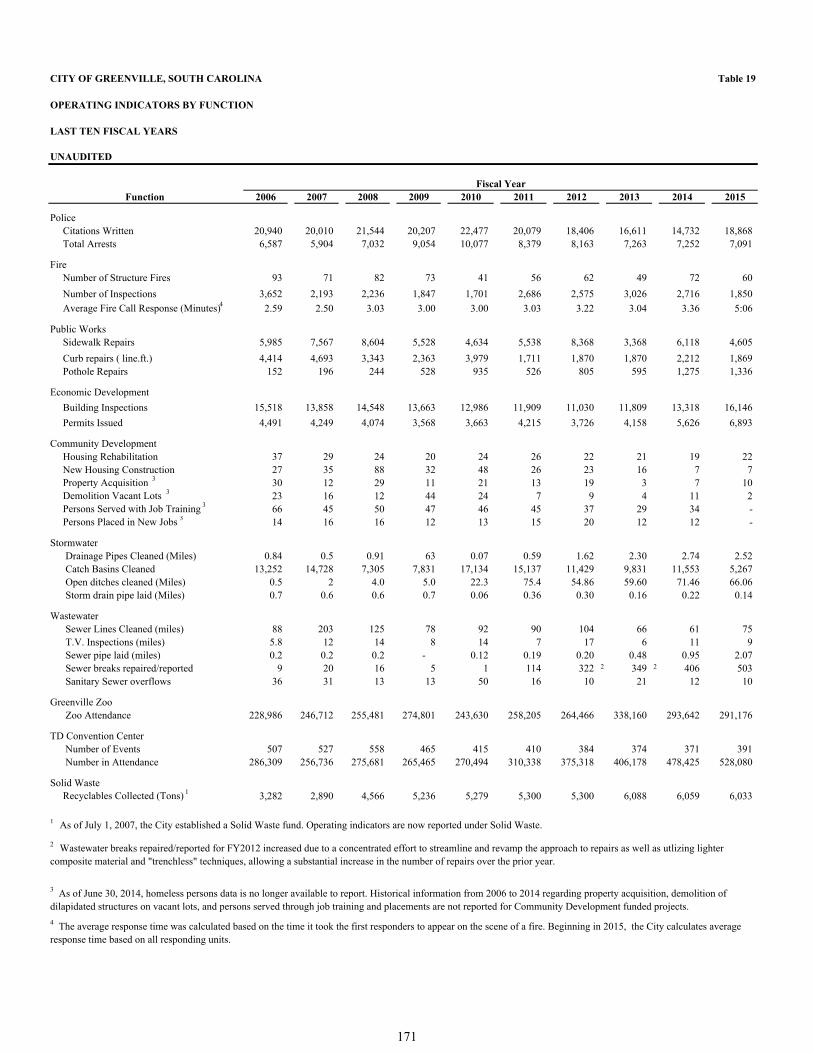
CITY OF GREENVILLE, SOUTH CAROLINA Table 19
OPERATING INDICATORS BY FUNCTION
LAST TEN FISCAL YEARS
UNAUDITED
Function 2006 2007 2008 2009 2010 2011 2012 2013 2014 2015 Police Citations Written 20,940 20,010 21,544 20,207 22,477 20,079 18,406 16,611 14,732 18,868 Total Arrests 6,587 5,904 7,032 9,054 10,077 8,379 8,163 7,263 7,252 7,091
Fire Number of Structure Fires 93 71 82 73 41 56 62 49 72 60
Number of Inspections 3,652 2,193 2,236 1,847 1,701 2,686 2,575 3,026 2,716 1,850
Average Fire Call Response (Minutes)4 2.59 2.50 3.03 3.00 3.00 3.03 3.22 3.04 3.36 5:06
Public Works Sidewalk Repairs 5,985 7,567 8,604 5,528 4,634 5,538 8,368 3,368 6,118 4,605
Curb repairs ( line.ft.) 4,414 4,693 3,343 2,363 3,979 1,711 1,870 1,870 2,212 1,869 Pothole Repairs 152 196 244 528 935 526 805 595 1,275 1,336
Economic Development
Building Inspections 15,518 13,858 14,548 13,663 12,986 11,909 11,030 11,809 13,318 16,146
Permits Issued 4,491 4,249 4,074 3,568 3,663 4,215 3,726 4,158 5,626 6,893
Community Development Housing Rehabilitation 37 29 24 20 24 26 22 21 19 22 New Housing Construction 27 35 88 32 48 26 23 16 7 7 Property Acquisition 3 30 12 29 11 21 13 19 3 7 10 Demolition Vacant Lots 3 23 16 12 44 24 7 9 4 11 2 Persons Served with Job Training 3 66 45 50 47 46 45 37 29 34 - Persons Placed in New Jobs 3 14 16 16 12 13 15 20 12 12 -
Stormwater Drainage Pipes Cleaned (Miles) 0.84 0.5 0.91 63 0.07 0.59 1.62 2.30 2.74 2.52 Catch Basins Cleaned 13,252 14,728 7,305 7,831 17,134 15,137 11,429 9,831 11,553 5,267 Open ditches cleaned (Miles) 0.5 2 4.0 5.0 22.3 75.4 54.86 59.60 71.46 66.06 Storm drain pipe laid (Miles) 0.7 0.6 0.6 0.7 0.06 0.36 0.30 0.16 0.22 0.14
Wastewater Sewer Lines Cleaned (miles) 88 203 125 78 92 90 104 66 61 75 T.V. Inspections (miles) 5.8 12 14 8 14 7 17 6 11 9 Sewer pipe laid (miles) 0.2 0.2 0.2 - 0.12 0.19 0.20 0.48 0.95 2.07 Sewer breaks repaired/reported 9 20 16 5 1 114 322 2 349 2 406 503 Sanitary Sewer overflows 36 31 13 13 50 16 10 21 12 10
Greenville Zoo Zoo Attendance 228,986 246,712 255,481 274,801 243,630 258,205 264,466 338,160 293,642 291,176
TD Convention Center Number of Events 507 527 558 465 415 410 384 374 371 391 Number in Attendance 286,309 256,736 275,681 265,465 270,494 310,338 375,318 406,178 478,425 528,080
Solid Waste Recyclables Collected (Tons) 1 3,282 2,890 4,566 5,236 5,279 5,300 5,300 6,088 6,059 6,033
1 As of July 1, 2007, the City established a Solid Waste fund. Operating indicators are now reported under Solid Waste.
Fiscal Year
4 The average response time was calculated based on the time it took the first responders to appear on the scene of a fire. Beginning in 2015, the City calculates average response time based on all responding units.
3 As of June 30, 2014, homeless persons data is no longer available to report. Historical information from 2006 to 2014 regarding property acquisition, demolition of dilapidated structures on vacant lots, and persons served through job training and placements are not reported for Community Development funded projects.
2 Wastewater breaks repaired/reported for FY2012 increased due to a concentrated effort to streamline and revamp the approach to repairs as well as utlizing lighter composite material and "trenchless" techniques, allowing a substantial increase in the number of repairs over the prior year.
171
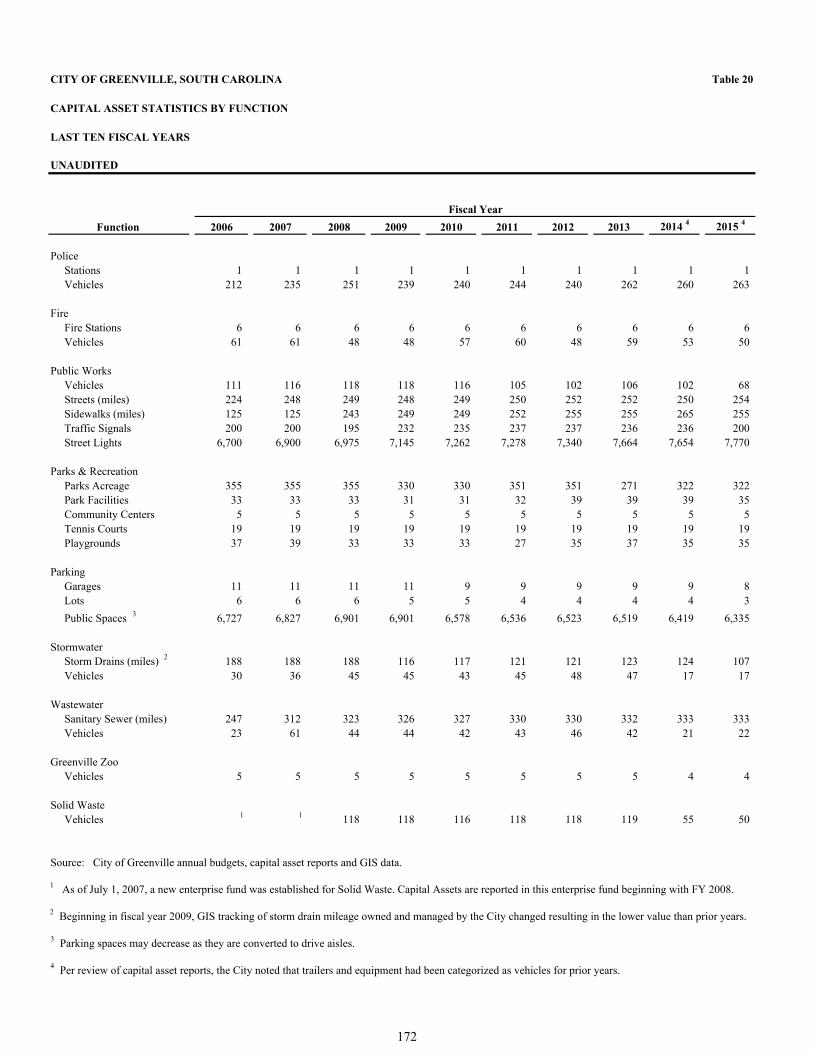
CITY OF GREENVILLE, SOUTH CAROLINA Table 20
CAPITAL ASSET STATISTICS BY FUNCTION
LAST TEN FISCAL YEARS
UNAUDITED
Function 2006 2007 2008 2009 2010 2011 2012 2013 2014 4 2015 4
Police Stations 1 1 1 1 1 1 1 1 1 1 Vehicles 212 235 251 239 240 244 240 262 260 263
Fire Fire Stations 6 6 6 6 6 6 6 6 6 6 Vehicles 61 61 48 48 57 60 48 59 53 50
Public Works Vehicles 111 116 118 118 116 105 102 106 102 68 Streets (miles) 224 248 249 248 249 250 252 252 250 254 Sidewalks (miles) 125 125 243 249 249 252 255 255 265 255 Traffic Signals 200 200 195 232 235 237 237 236 236 200 Street Lights 6,700 6,900 6,975 7,145 7,262 7,278 7,340 7,664 7,654 7,770
Parks & Recreation Parks Acreage 355 355 355 330 330 351 351 271 322 322 Park Facilities 33 33 33 31 31 32 39 39 39 35 Community Centers 5 5 5 5 5 5 5 5 5 5 Tennis Courts 19 19 19 19 19 19 19 19 19 19 Playgrounds 37 39 33 33 33 27 35 37 35 35
Parking Garages 11 11 11 11 9 9 9 9 9 8 Lots 6 6 6 5 5 4 4 4 4 3
Public Spaces 3 6,727 6,827 6,901 6,901 6,578 6,536 6,523 6,519 6,419 6,335
Stormwater Storm Drains (miles) 2 188 188 188 116 117 121 121 123 124 107 Vehicles 30 36 45 45 43 45 48 47 17 17
Wastewater Sanitary Sewer (miles) 247 312 323 326 327 330 330 332 333 333 Vehicles 23 61 44 44 42 43 46 42 21 22
Greenville Zoo Vehicles 5 5 5 5 5 5 5 5 4 4
Solid Waste Vehicles 1 1 118 118 116 118 118 119 55 50
Source: City of Greenville annual budgets, capital asset reports and GIS data.
1 As of July 1, 2007, a new enterprise fund was established for Solid Waste. Capital Assets are reported in this enterprise fund beginning with FY 2008.
2 Beginning in fiscal year 2009, GIS tracking of storm drain mileage owned and managed by the City changed resulting in the lower value than prior years. 3 Parking spaces may decrease as they are converted to drive aisles.
4 Per review of capital asset reports, the City noted that trailers and equipment had been categorized as vehicles for prior years.
Fiscal Year
172
COMPLIANCE SECTION
173
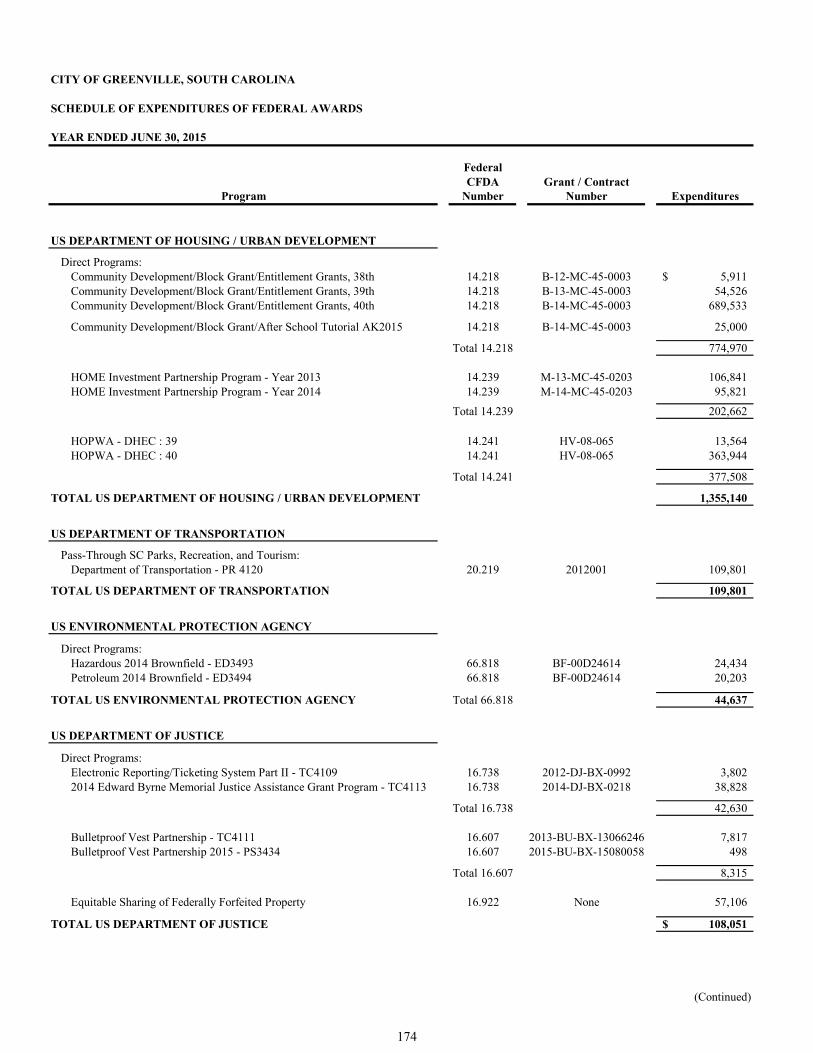
CITY OF GREENVILLE, SOUTH CAROLINA
SCHEDULE OF EXPENDITURES OF FEDERAL AWARDS
YEAR ENDED JUNE 30, 2015
FederalCFDA Grant / Contract
Program Number Number Expenditures
US DEPARTMENT OF HOUSING / URBAN DEVELOPMENT
Direct Programs:Community Development/Block Grant/Entitlement Grants, 38th 14.218 B-12-MC-45-0003 5,911$ Community Development/Block Grant/Entitlement Grants, 39th 14.218 B-13-MC-45-0003 54,526 Community Development/Block Grant/Entitlement Grants, 40th 14.218 B-14-MC-45-0003 689,533
Community Development/Block Grant/After School Tutorial AK2015 14.218 B-14-MC-45-0003 25,000
Total 14.218 774,970
HOME Investment Partnership Program - Year 2013 14.239 M-13-MC-45-0203 106,841 HOME Investment Partnership Program - Year 2014 14.239 M-14-MC-45-0203 95,821
Total 14.239 202,662
HOPWA - DHEC : 39 14.241 HV-08-065 13,564 HOPWA - DHEC : 40 14.241 HV-08-065 363,944
Total 14.241 377,508
TOTAL US DEPARTMENT OF HOUSING / URBAN DEVELOPMENT 1,355,140
US DEPARTMENT OF TRANSPORTATION
Pass-Through SC Parks, Recreation, and Tourism:Department of Transportation - PR 4120 20.219 2012001 109,801
TOTAL US DEPARTMENT OF TRANSPORTATION 109,801
US ENVIRONMENTAL PROTECTION AGENCY
Direct Programs:Hazardous 2014 Brownfield - ED3493 66.818 BF-00D24614 24,434 Petroleum 2014 Brownfield - ED3494 66.818 BF-00D24614 20,203
TOTAL US ENVIRONMENTAL PROTECTION AGENCY Total 66.818 44,637
US DEPARTMENT OF JUSTICE
Direct Programs:Electronic Reporting/Ticketing System Part II - TC4109 16.738 2012-DJ-BX-0992 3,802 2014 Edward Byrne Memorial Justice Assistance Grant Program - TC4113 16.738 2014-DJ-BX-0218 38,828
Total 16.738 42,630
Bulletproof Vest Partnership - TC4111 16.607 2013-BU-BX-13066246 7,817 Bulletproof Vest Partnership 2015 - PS3434 16.607 2015-BU-BX-15080058 498
Total 16.607 8,315
Equitable Sharing of Federally Forfeited Property 16.922 None 57,106
TOTAL US DEPARTMENT OF JUSTICE 108,051$
(Continued)
174

CITY OF GREENVILLE, SOUTH CAROLINA
SCHEDULE OF EXPENDITURES OF FEDERAL AWARDS
YEAR ENDED JUNE 30, 2015
FederalCFDA Grant / Contract
Program Number Number Expenditures
US DEPARTMENT OF HOMELAND SECURITY
Direct Programs:Assistance to Firefighters Grant - PS3431 97.044 EMW-2013-FP-00411 31,123$
Upstate Regional WMD/HazMat Team Enhancements - PS3426 97.067 13SHSP18 37,044 Upstate Regional Collapse Search & Rescue Team Enhancements - PS3427 97.067 13SHSP24 24,931 Upstate Regional Collapse Search & Rescue Team Enhancements - PS3432 97.067 13SHSP32 45,370
Total 97.067 107,345
TOTAL US DEPARTMENT OF HOMELAND SECURITY 138,468
GRAND TOTALS 1,756,097$
175
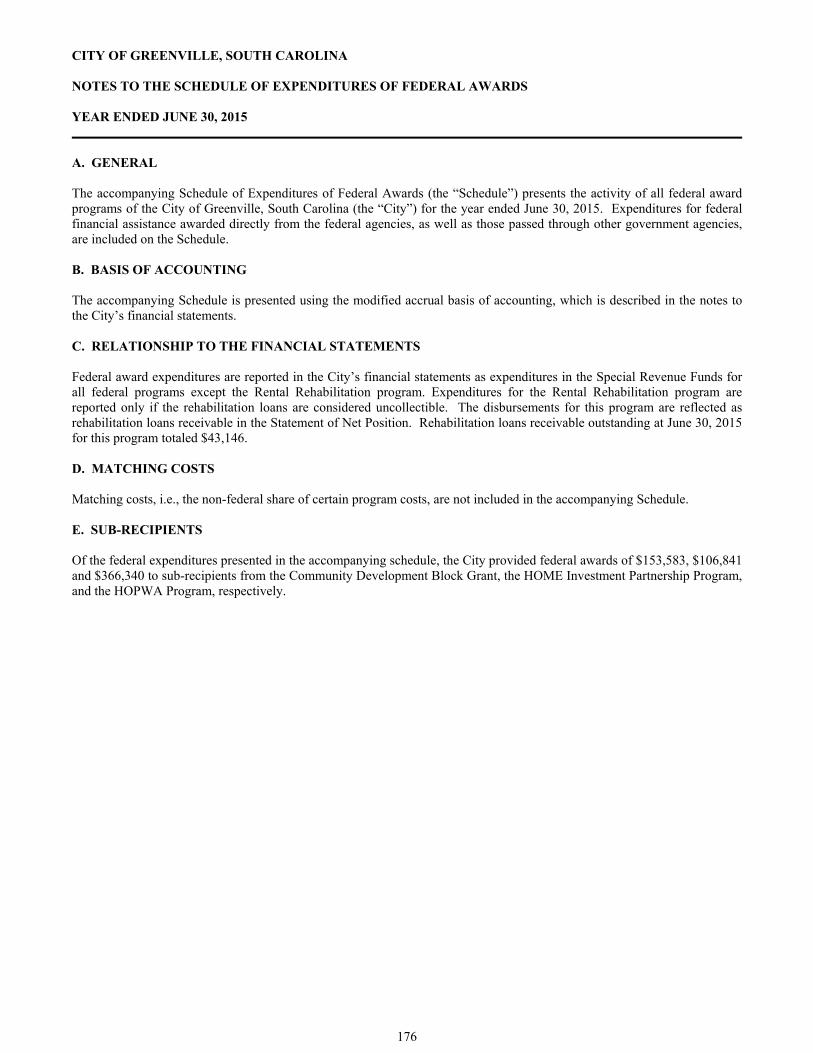
CITY OF GREENVILLE, SOUTH CAROLINA NOTES TO THE SCHEDULE OF EXPENDITURES OF FEDERAL AWARDS YEAR ENDED JUNE 30, 2015 A. GENERAL The accompanying Schedule of Expenditures of Federal Awards (the “Schedule”) presents the activity of all federal award programs of the City of Greenville, South Carolina (the “City”) for the year ended June 30, 2015. Expenditures for federal financial assistance awarded directly from the federal agencies, as well as those passed through other government agencies, are included on the Schedule. B. BASIS OF ACCOUNTING The accompanying Schedule is presented using the modified accrual basis of accounting, which is described in the notes to the City’s financial statements. C. RELATIONSHIP TO THE FINANCIAL STATEMENTS Federal award expenditures are reported in the City’s financial statements as expenditures in the Special Revenue Funds for all federal programs except the Rental Rehabilitation program. Expenditures for the Rental Rehabilitation program are reported only if the rehabilitation loans are considered uncollectible. The disbursements for this program are reflected as rehabilitation loans receivable in the Statement of Net Position. Rehabilitation loans receivable outstanding at June 30, 2015 for this program totaled $43,146. D. MATCHING COSTS Matching costs, i.e., the non-federal share of certain program costs, are not included in the accompanying Schedule. E. SUB-RECIPIENTS Of the federal expenditures presented in the accompanying schedule, the City provided federal awards of $153,583, $106,841 and $366,340 to sub-recipients from the Community Development Block Grant, the HOME Investment Partnership Program, and the HOPWA Program, respectively.
176
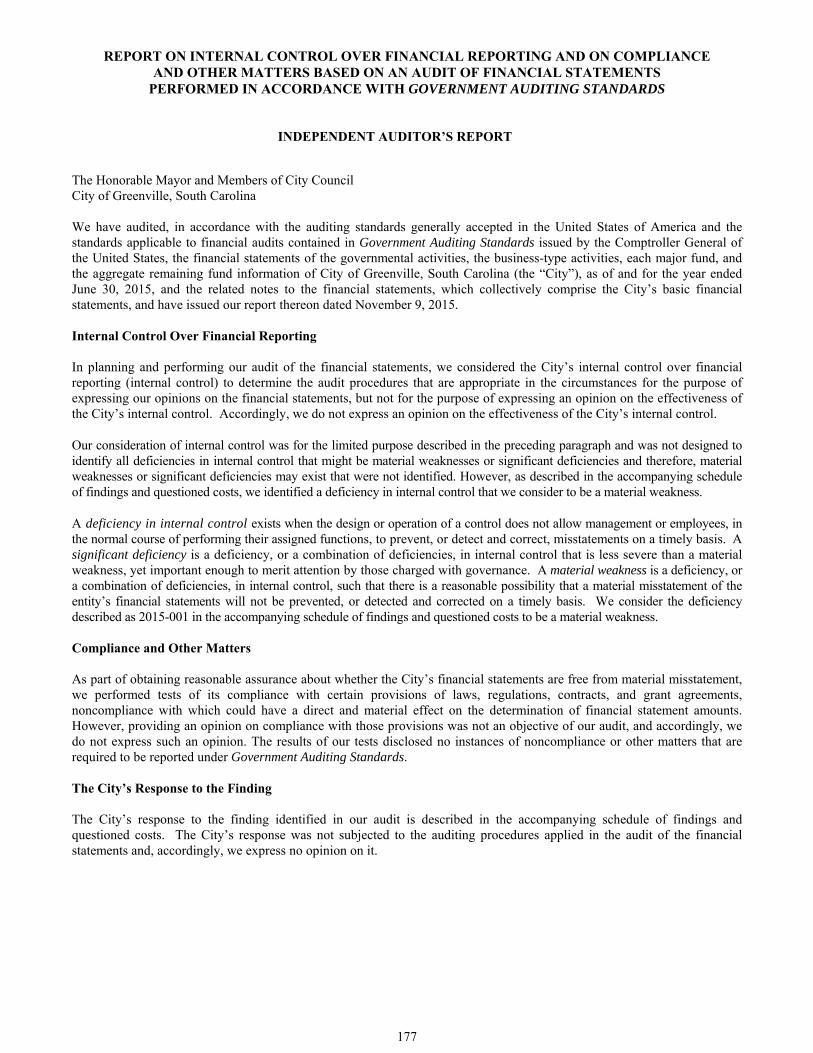
REPORT ON INTERNAL CONTROL OVER FINANCIAL REPORTING AND ON COMPLIANCE AND OTHER MATTERS BASED ON AN AUDIT OF FINANCIAL STATEMENTS
PERFORMED IN ACCORDANCE WITH GOVERNMENT AUDITING STANDARDS
INDEPENDENT AUDITOR’S REPORT
The Honorable Mayor and Members of City Council City of Greenville, South Carolina
We have audited, in accordance with the auditing standards generally accepted in the United States of America and the standards applicable to financial audits contained in Government Auditing Standards issued by the Comptroller General of the United States, the financial statements of the governmental activities, the business-type activities, each major fund, and the aggregate remaining fund information of City of Greenville, South Carolina (the “City”), as of and for the year ended June 30, 2015, and the related notes to the financial statements, which collectively comprise the City’s basic financial statements, and have issued our report thereon dated November 9, 2015.
Internal Control Over Financial Reporting
In planning and performing our audit of the financial statements, we considered the City’s internal control over financial reporting (internal control) to determine the audit procedures that are appropriate in the circumstances for the purpose of expressing our opinions on the financial statements, but not for the purpose of expressing an opinion on the effectiveness of the City’s internal control. Accordingly, we do not express an opinion on the effectiveness of the City’s internal control.
Our consideration of internal control was for the limited purpose described in the preceding paragraph and was not designed to identify all deficiencies in internal control that might be material weaknesses or significant deficiencies and therefore, material weaknesses or significant deficiencies may exist that were not identified. However, as described in the accompanying schedule of findings and questioned costs, we identified a deficiency in internal control that we consider to be a material weakness.
A deficiency in internal control exists when the design or operation of a control does not allow management or employees, in the normal course of performing their assigned functions, to prevent, or detect and correct, misstatements on a timely basis. A significant deficiency is a deficiency, or a combination of deficiencies, in internal control that is less severe than a material weakness, yet important enough to merit attention by those charged with governance. A material weakness is a deficiency, or a combination of deficiencies, in internal control, such that there is a reasonable possibility that a material misstatement of the entity’s financial statements will not be prevented, or detected and corrected on a timely basis. We consider the deficiency described as 2015-001 in the accompanying schedule of findings and questioned costs to be a material weakness.
Compliance and Other Matters
As part of obtaining reasonable assurance about whether the City’s financial statements are free from material misstatement, we performed tests of its compliance with certain provisions of laws, regulations, contracts, and grant agreements, noncompliance with which could have a direct and material effect on the determination of financial statement amounts. However, providing an opinion on compliance with those provisions was not an objective of our audit, and accordingly, we do not express such an opinion. The results of our tests disclosed no instances of noncompliance or other matters that are required to be reported under Government Auditing Standards.
The City’s Response to the Finding
The City’s response to the finding identified in our audit is described in the accompanying schedule of findings and questioned costs. The City’s response was not subjected to the auditing procedures applied in the audit of the financial statements and, accordingly, we express no opinion on it.
177
Purpose of this Report
The purpose of this report is solely to describe the scope of our testing of internal control and compliance and the results of that testing, and not to provide an opinion on the effectiveness of the entity’s internal control or on compliance. This report is an integral part of an audit performed in accordance with Government Auditing Standards in considering the entity’s internal control and compliance. Accordingly, this communication is not suitable for any other purpose.
Greene, Finney & Horton, LLP Mauldin, South Carolina November 9, 2015
178

REPORT ON COMPLIANCE FOR EACH MAJOR FEDERAL PROGRAM AND REPORT ON INTERNAL CONTROL OVER COMPLIANCE AS REQUIRED BY OMB CIRCULAR A-133
INDEPENDENT AUDITOR’S REPORT
The Honorable Mayor and Members of City Council City of Greenville, South Carolina Report on Compliance for Each Major Federal Program We have audited the City of Greenville’s (the “City”) compliance with the types of compliance requirements described in the OMB Circular A-133 Compliance Supplement that could have a direct and material effect on each of the City’s major federal programs for the year ended June 30, 2015. The City’s major federal programs are identified in the summary of auditor’s results section of the accompanying schedule of findings and questioned costs. Management’s Responsibility Management is responsible for compliance with the requirements of laws, regulations, contracts, and grants applicable to its federal programs. Auditor’s Responsibility Our responsibility is to express an opinion on compliance for each of the City’s major federal programs based on our audit of the types of compliance requirements referred to above. We conducted our audit of compliance in accordance with auditing standards generally accepted in the United States of America; the standards applicable to financial audits contained in Government Auditing Standards, issued by the Comptroller General of the United States; and OMB Circular A-133, Audits of States, Local Governments, and Non-Profit Organizations. Those standards and OMB Circular A-133 require that we plan and perform the audit to obtain reasonable assurance about whether noncompliance with the types of compliance requirements referred to above that could have a direct and material effect on a major federal program occurred. An audit includes examining, on a test basis, evidence about the City’s compliance with those requirements and performing such other procedures as we considered necessary in the circumstances. We believe that our audit provides a reasonable basis for our opinion on compliance for each major federal program. However, our audit does not provide a legal determination of the City’s compliance. Opinion on Each Major Federal Program In our opinion, the City complied, in all material respects, with the types of compliance requirements referred to above that could have a direct and material effect on each of its major federal programs for the year ended June 30, 2015.
Report on Internal Control Over Compliance
Management of the City is responsible for establishing and maintaining effective internal control over compliance with the types of compliance requirements referred to above. In planning and performing our audit of compliance, we considered the City’s internal control over compliance with the types of requirements that could have a direct and material effect on each major federal program to determine the auditing procedures that are appropriate in the circumstances for the purpose of expressing an opinion on compliance for each major federal program and to test and report on internal control over compliance in accordance with OMB Circular A-133, but not for the purpose of expressing an opinion on the effectiveness of internal control over compliance. Accordingly, we do not express an opinion on the effectiveness of the City’s internal control over compliance. A deficiency in internal control over compliance exists when the design or operation of a control over compliance does not allow management or employees, in the normal course of performing their assigned functions, to prevent, or detect and correct, noncompliance with a type of compliance requirement of a federal program on a timely basis. A material weakness in internal control over compliance is a deficiency, or combination of deficiencies, in internal control over compliance, such that there is a reasonable possibility that material noncompliance with a type of compliance requirement of a federal program will not be prevented, or detected and corrected, on a timely basis. A significant deficiency in internal control over compliance is a deficiency, or a combination of deficiencies, in internal control over compliance with a type of compliance requirement of a federal program that is less severe than a material weakness in internal control over compliance, yet important enough to merit attention by those charged with governance.
179
Our consideration of internal control over compliance was for the limited purpose described in the first paragraph of this section and was not designed to identify all deficiencies in internal control over compliance that might be material weaknesses or significant deficiencies. We did not identify any deficiencies in internal control over compliance that we consider to be material weaknesses. However, material weaknesses may exist that have not been identified.
The purpose of this report on internal control over compliance is solely to describe the scope of our testing of internal control over compliance and the results of that testing based on the requirements of OMB Circular A-133. Accordingly, this report is not suitable for any other purpose.
Greene, Finney & Horton, LLP Mauldin, South Carolina November 9, 2015
180
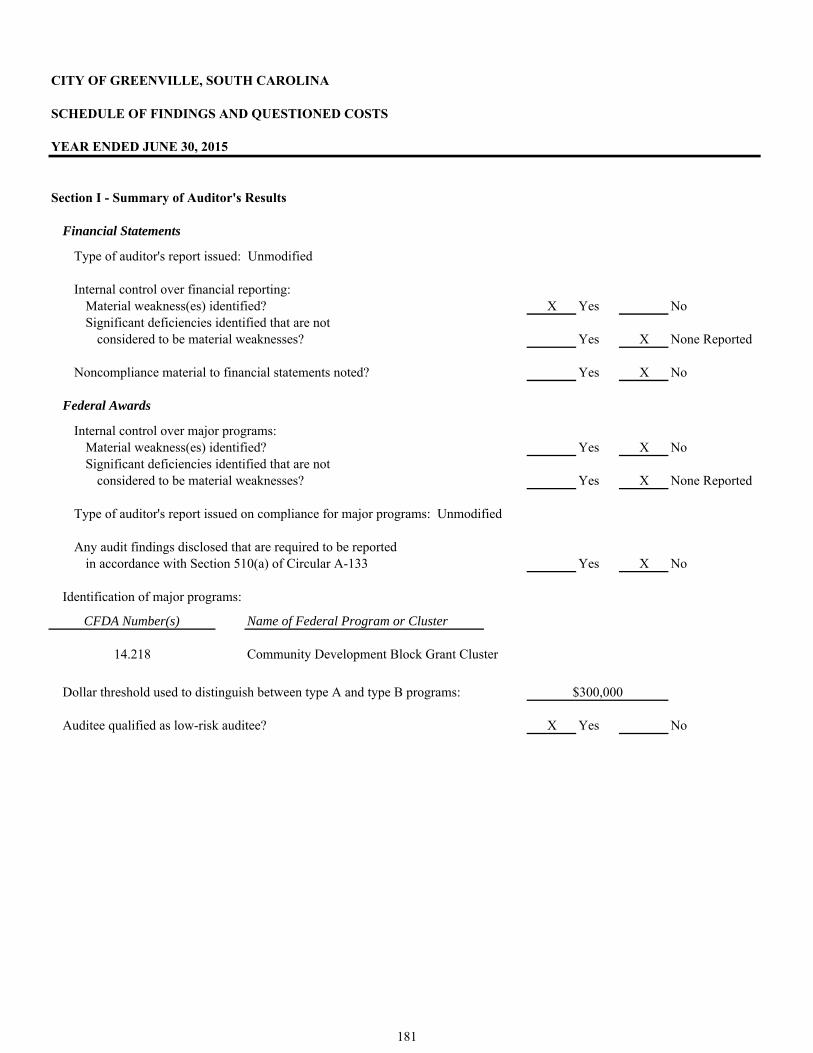
Financial Statements
Type of auditor's report issued: Unmodified
Internal control over financial reporting:Material weakness(es) identified? X Yes NoSignificant deficiencies identified that are not
considered to be material weaknesses? Yes X None Reported
Noncompliance material to financial statements noted? Yes X No
Federal Awards
Internal control over major programs:Material weakness(es) identified? Yes X NoSignificant deficiencies identified that are not
considered to be material weaknesses? Yes X None Reported
Type of auditor's report issued on compliance for major programs: Unmodified
Any audit findings disclosed that are required to be reportedin accordance with Section 510(a) of Circular A-133 Yes X No
Identification of major programs:
CFDA Number(s) Name of Federal Program or Cluster
14.218 Community Development Block Grant Cluster
Dollar threshold used to distinguish between type A and type B programs:
Auditee qualified as low-risk auditee? X Yes No
$300,000
CITY OF GREENVILLE, SOUTH CAROLINA
SCHEDULE OF FINDINGS AND QUESTIONED COSTS
YEAR ENDED JUNE 30, 2015
Section I - Summary of Auditor's Results
181
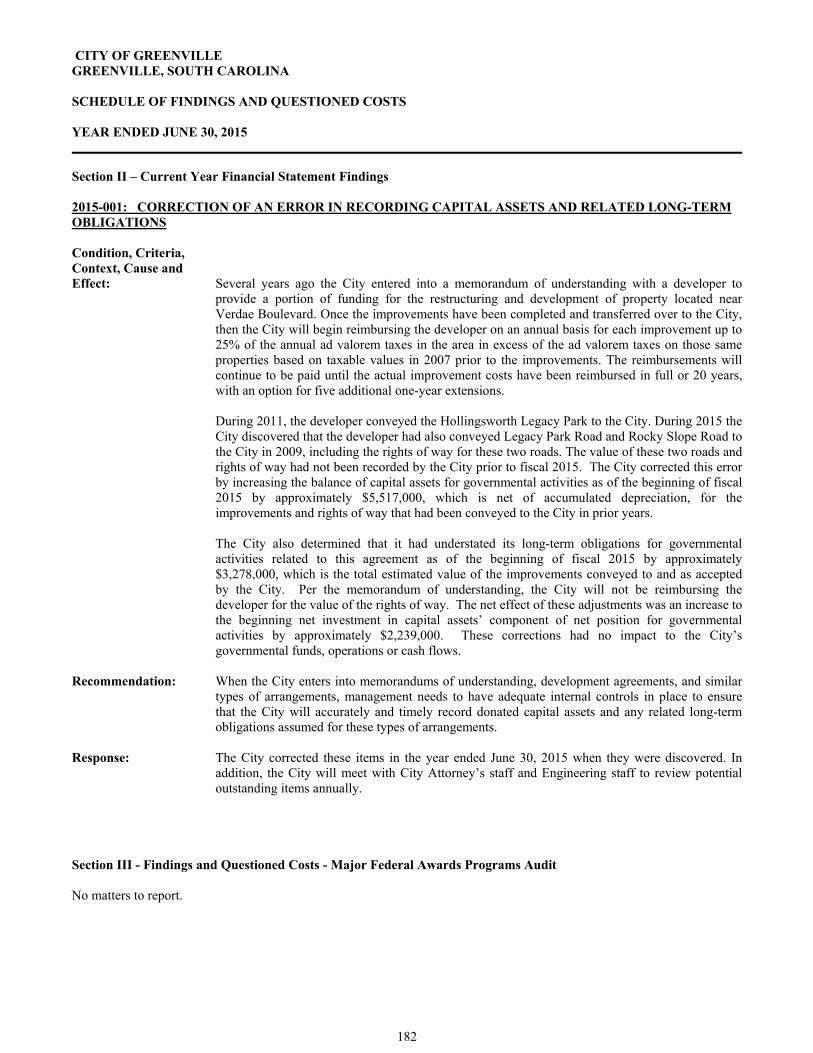
CITY OF GREENVILLE GREENVILLE, SOUTH CAROLINA
SCHEDULE OF FINDINGS AND QUESTIONED COSTS
YEAR ENDED JUNE 30, 2015 Section II – Current Year Financial Statement Findings 2015-001: CORRECTION OF AN ERROR IN RECORDING CAPITAL ASSETS AND RELATED LONG-TERM OBLIGATIONS Condition, Criteria, Context, Cause and Effect: Several years ago the City entered into a memorandum of understanding with a developer to
provide a portion of funding for the restructuring and development of property located near Verdae Boulevard. Once the improvements have been completed and transferred over to the City, then the City will begin reimbursing the developer on an annual basis for each improvement up to 25% of the annual ad valorem taxes in the area in excess of the ad valorem taxes on those same properties based on taxable values in 2007 prior to the improvements. The reimbursements will continue to be paid until the actual improvement costs have been reimbursed in full or 20 years, with an option for five additional one-year extensions.
During 2011, the developer conveyed the Hollingsworth Legacy Park to the City. During 2015 the City discovered that the developer had also conveyed Legacy Park Road and Rocky Slope Road to the City in 2009, including the rights of way for these two roads. The value of these two roads and rights of way had not been recorded by the City prior to fiscal 2015. The City corrected this error by increasing the balance of capital assets for governmental activities as of the beginning of fiscal 2015 by approximately $5,517,000, which is net of accumulated depreciation, for the improvements and rights of way that had been conveyed to the City in prior years.
The City also determined that it had understated its long-term obligations for governmental activities related to this agreement as of the beginning of fiscal 2015 by approximately $3,278,000, which is the total estimated value of the improvements conveyed to and as accepted by the City. Per the memorandum of understanding, the City will not be reimbursing the developer for the value of the rights of way. The net effect of these adjustments was an increase to the beginning net investment in capital assets’ component of net position for governmental activities by approximately $2,239,000. These corrections had no impact to the City’s governmental funds, operations or cash flows.
Recommendation: When the City enters into memorandums of understanding, development agreements, and similar
types of arrangements, management needs to have adequate internal controls in place to ensure that the City will accurately and timely record donated capital assets and any related long-term obligations assumed for these types of arrangements.
Response: The City corrected these items in the year ended June 30, 2015 when they were discovered. In
addition, the City will meet with City Attorney’s staff and Engineering staff to review potential outstanding items annually.
Section III - Findings and Questioned Costs - Major Federal Awards Programs Audit No matters to report.
182

CITY OF GREENVILLE, SOUTH CAROLINA
SUMMARY OF PRIOR AUDIT FINDINGS
YEAR ENDED JUNE 30, 2015 There were no federal award audit findings in the prior year.
183

City of Greenville, South Carolina
184