the case of vehicle sales companies in ethiopia - St. Mary's ...
92
ST. MARY’S UNIVERSITY SCHOOL OF GRADUATE STUDIES MBA PROGRAM EFFECTIVENES OF SALES DISTRIBUTION CHANNELS ON SALES PERFORMANCE: THE CASE OF VEHICLE SALES COMPANIES IN ETHIOPIA By: Getahun Kebede E-mail: [email protected] Mobile: 0943 929292 A Thesis Submitted to the School of Graduate Studies of St. Marry University in Partial Fulfillment of the Requirements for the Award of the Degree of Master of Business Administration December, 2020 Addis Ababa, Ethiopia
-
Upload
khangminh22 -
Category
Documents
-
view
0 -
download
0
Transcript of the case of vehicle sales companies in ethiopia - St. Mary's ...

ST. MARY’S UNIVERSITY SCHOOL OF GRADUATE STUDIES
MBA PROGRAM
EFFECTIVENES OF SALES DISTRIBUTION CHANNELS
ON SALES PERFORMANCE:
THE CASE OF VEHICLE SALES COMPANIES IN
ETHIOPIA
By:
Getahun Kebede
E-mail: [email protected]
Mobile: 0943 929292
A Thesis Submitted to the School of Graduate Studies of St.
Marry University in Partial Fulfillment of the Requirements
for the Award of the Degree of Master of Business
Administration
December, 2020 Addis Ababa, Ethiopia

II
ST. MARY’S UNIVERSITY
SCHOOL OF GRADUATE STUDIES
MBA PROGRAM
EFFECTIVENES OF SALES DISTRIBUTION CHANNELS
ON SALES PERFORMANCE:
THE CASE OF VEHICLE SALES COMPANIES IN
ETHIOPIA
By
Getahun Kebede
A Thesis Submitted to the School of Graduate Studies of St.
Mary’s University in Partial Fulfillment of the Requirements
for the Award of the Degree of Master of Business
Administration
Advisor: Temesgen Belayneh, (Ph.D.)
December, 2020 Addis Ababa, Ethiopia

III
ST. MARY’S UNIVERSITY
SCHOOL OF GRADUATE STUDIES
MBA PROGRAM
A Thesis Submitted to the School of Graduate Studies of St.
Mary’s University in Partial Fulfillment of the Requirements
for the Award of the Degree of Master of Business
Administration
By Getahun Kebede
Name and signature of members of the examining board
Dr. Temesgen Belayneh, (Asst. Professor)
Dean, Graduate studies Signature & Date
Dr. Temesgen Belayneh, (Asst. Professor)
Advisor Signature & Date
Dr.Wondimeneh Mammo (Assist. Professor)
External Examiner Signature & Date
Dr. Shoa Jemal (Assistant Professor)
Internal Examiner Signature & Date

IV
CERTIFICATE
This is to certify that the thesis entitles “Effectiveness of Salles Distribution Channels on
Sales Performance: The Case of Vehicle Sales Companies in Ethiopia” submitted to St.
Mary’s University for the award of the Degree of Master of Business Administration is a
record of bonafide research work carried out by Mr. Getahun Kebede, under the guidance
and supervision of Temesgen Belayneh (PhD), Dean Graduate Studies.
Therefore, we hereby declare that no part of this thesis has been submitted to any other
university or institutions for the award of any degree or diploma.
Adviser’s Name Date Signature
Temesgen Belayneh (PhD),

V
DECLARATION
I hereby declare that this thesis entitled “Effectiveness of Salles Distribution Channels on
Sales Performance: The Case of Vehicle Sales Companies in Ethiopia” has been carried
out by Getahun Kebede under the guidance and supervision of Temesgen Belayneh (PhD),
Dean Graduate Studies.
The thesis is original and has not been submitted for the award of any degree or diploma
to any university or institutions.
Researcher’s Name Date Signature
Getahun Kebede

vi
TABLE OF CONTENTS
LIST OF TABLES………………………………………..……..…………………..….ix
LIST OF FIGURES…………………………......………………..………………….….x
ABBREVIATIONS………………………………………………..………………….xii
ACKNOWLEDGMENT…………………………………..……….…….…………..xiii
ABSTACT…………………………………………………………..……..………..…xv
CHAPTER ONE - INTRODUCTION……….………………………….......................1
1.1 Research background.…………………………….……………………….….….....1
1.2 Problem statement………………….………………………………..……….…..…2
1.3 Basic research questions ………………….……..………….………………….…...3
1.4 Objectives or research………………………………………………………….…...3
1.5 Scope of study……………………………………………………………….……...4
1.6 Significance of the study…………………………………………………..………..4
1.7 Limitation of the study……………………………………….………………….….5
1.8 Organization of the paper……………………………………………………….…..6
CHAPTER TWO - LITRATURE REVIEW………………………………………......8
2.1 Review of Theories and Concepts……………………..………………………..….8
2.1.1 Channel Design…………………………..……………………………………..8
2.1.2 Channel Administration………………………………………..……………...11
2.1.3 Channel Management Technologies………………………………………..…13
2.1.4 Sales performance……………………………..………………………………16
2.2 Theoretical Framework………………………………..…………………….….…20
2.2.1 Effect of Channel Design on sales performance………………………………..20
2.2.2 Effect of Channel Administration on sales performance………..…………….21
2.2.3 Effect of Channel Management Technologies on sales performance…………..21
2.3 Empirical Review………………..……………..………….………..….…..……..22
2.4 Research Gap…………………………….…………………………....…..……...25
2.5 Conceptual Review & Hypothesis…………………………….…………..………26

vii
CHAPTER THREE - METHODOLOGY…………………………..….………….…29
3.1 Description of the study..………………………………..…………...……..…......29
3.2 Research design and approach…………………………………..………………..29
3.3 Study population and sample……….………………………………..…….…….29
3.3.1 Sample design……………………………………………………….….……..29
3.3.2 Target population…………………………………………………….………. 29
3.3.3 Sampling frame…………………………………………………….………….31
3.3.4 Sampling unit……………………………………………………….…………31
3.3.5 Sampling technique and procedure…………………………………….……...31
3.3.5.1 Sampling technique………………………………….…………………..31
3.3.5.2 Sampling procedure……………………………….…………………….31
3.3.6 Sample size……………………………………….……………………………32
3.3.7 Data source and type………………………………………….……………….32
3.3.8 Data collection procedure…………………………………..………………….33
3.3.9 Data collection instruments…………………………………..………………..33
3.4 Variables of the study……………………………………………………….….…34
3.5 Validity and Reliability………………………..……….………………….………35
3.6 Data Analysis………….……………………………..………..………..…………36
3.6.1 Descriptive analysis………………………………………………………..…..36
3.6.2 Inferential statistics………………..……………………………..……………37
3.7 Research Ethics…………..……………………………….…………………...…...37
CHAPTER FOUR - DATA PRESENTATION, ANALYSIS AND
INTERPRETATION…………………………………….………………………..…...39
4.1 Questionary distributed and returned.………………………………….…..……..39
4.2 Demographic characteristics of the respondents……………..……………………40
4.2.1 Gender analysis of the respondents…….….…….….…… ………..…………41
4.2.2 Job Position of the respondents…………………………….………..…..….….41
4.2.3 Education level of the respondents………………………………….………...41

viii
4.2.4 Experience of the respondents………………………………………...……....42
4.3 Analysis of car channels effectiveness……………………………...……....…...42
4.3.1 Analysis of channel design…………………………………………………….43
4.3.2 Analysis of channel administration……………………………………………44
4.3.3 Analysis of channel management technology…………………………….……46
4.3.4 Analysis of sales performance implication……………………………….……47
4.4 Correlation Analysis…………………………..……………………………..…...49
4.5 Regression analysis…………………………………………..……………….…..51
4.5.1 Diagnostic Analysis…………………………………………..………………52
4.5.1.1 Multicollinearity test …..…………………………….……………..…..52
4.5.1.2 Normality test……………………………………………………………53
4.5.2 Regression results……………………………………………………………..55
4.6 Hypothesis Testing………………………………………….……………………58
4.7 Discussion & Findings……………………………………………….....................60
CHAPTER FIVE – FINDINGS, RECOMMENDATIONS AND CONCLUSION...63
5.1 Major research findings………….……………………….……………………...63
5.2 Conclusion…………………………..……………………………………….…..64
5.3 Recommendation………………………………..…………...………………..…65
5.4 Summary…………………………………………………………………………67
REFERENCES………………………….………..….…………..…….………….…...66

ix
APPENDIX
Appendix I: Questioner………………………………………………………………..71
Appendix II: Determining sample size for a finite population…………………………76
Appendix III: List of major car sales companies.………………………………………77

x
LIST OF TABLES
Table1: Population…………..……..................................................................................30
Table 2: Sample size……………………………………………..…………….……......32
Table 3: Reliability of variables……………………………………….…….…………..35
Table 4: Mean score ranges and description………………………………….………….37
Table 5: Summary of questionary distributed and returned……………….…………….40
Table 6: Demographic characteristics of the respondents…….………………….…….40
Table 7: Description statics of reaction on channel design………..…………………….43
Table 8: Descriptive statics of reaction on channel administration……………..……......44
Table 9: Descriptive statics of reaction on management technology….…………….......46
Table 10: Descriptive for different performance attributes.………….…………………47
Table 11: Correlation analysis….……………………………………..…..…………….50
Table 12: Multicollinearity table……………………………………….………………..52
Table 13: Test of Normality table……………………………..…….…………………..54
Table 14: Regression results………………………………………….…………..….….55
Table 15: ANOVA table……………………………………………………….……......57
Table 16: Regression table………………………………………………………………58
Table 17: Summary of the research hypothesis…………………………………………59

xi
LIST OF FIGURES
Figure 1: Proposed model of Research Hypothesis...........................................................27
Figure 2: Q-Q Plot…………………………………………………………….…………55

xii
ABBREVIATIONS
AA: Automotive Association
AMCE: Automotive Company of Ethiopia
CA: Channel Administration
CD: Channel Design
CKD: Complete knock down
CMT: Channel Management Technology
CP: Channel Performance
CPFR: Collaborative Planning Forecasting and Replenishment
EBG: Equatorial Business Group
EDI: Electronic Data Interchange
ICT: Information & Communication Technology
MOENCO: Motor Engineering company of Ethiopia
PDA: Personal Digital Assistance
POS: Point of Sale
SKD: Semi knock down
SSTs: Self Service Technology
RTA: Roads Transport Authority
VMCM: Vendor Managed Category Management
VMI: Vendor Management Inventory

xiii
AKNOWLEDGEMENT
This study took a lot of my time and effort; my office colleagues understood me and
showed me kindness, generosity and understanding, to which I owe a lot of thanks and
love expressed on this page.
My gratitude goes to my wife, Muluberhan Gizaw, for her diligence and assistance to the
partial completion of this work, which will always be remembered as she has been very
helpful and has supported me in giving me much time in taking care of our kids at this
difficult time of COVID 19.
I hope in assistance of my family, colleagues and the company, I will put much of my
effort to read lots of research papers, interview different people to finalize my research on
the issue and paves the way to next researcher who might make further research on the
agenda.

XIV
Abstract
The study sought to assess the effectiveness of channels on the sales performance of car
sales companies in Ethiopia. The study was guided by the following specific objectives:
To show in what way and the extent in which, distribution channel effectiveness affects
the sales volume of the company, and to point out the significant factors influencing the
distribution channel efficiency in Ethiopia. A distribution channel consists of the set of
people and companies involved in the transfer of title to a product as the product moves
from distributers to final customers or users. Diverse distribution channels exist today, A
company wants a distribution channel that not only meets customers’ needs but also
provides an edge on competition, and for the purpose of this study, an organized approach
is required which comprises of three decisions: (i) specifying the design of distribution
(ii) accessing the channel administration (iii) determining the technology use by channels.
The study focused on the company executives, staff of marketing department, sales
executives, distribution channels owners, and customers of some organizations from
selected in Addis Ababa. The study adopted a descriptive survey design. Purposive
judgmental proportion technique was carried out to arrive at a representative sample for
the study and 113 willing were found to participate in the study and taken as a target for
the sample size. The researcher used primary source of data which was obtained through
a semi-structured questionnaire. The data was analyzed using the Statistical Package for
Social Science (SPSS) version 23 and the t-Test statistical tool was employed to test the
significance between the observed variables and the underlying construct. The findings
revealed that the design and administration of channels of distribution, affects sales of
product, and the technology use by sales companies and channel has no much effect on
the sales volume of vehicles. Based on the underlying assumption, the following were
recommended for the study; that the channel members should have good working
procedures, management and administration to carry efficient marketing and sales of
vehicles.
Key Words: Channel design, Channel administration, Channel management technologies.

XIII
1
CHAPTER ONE
INTRODUCTION
1.1 Research Background
Ethiopia, being one of the African countries, above all requires continuous development
in agriculture, manufacturing, and service sectors. In accomplishing the development on
these sectors, the role of infrastructure is vital. The developments of the infrastructure in
turn highly depend on the availability of various types vehicles (Cars, pickups, trucks,
etc...), construction machineries, industrial machineries, agricultural equipment,
technology and educated human resources.
In Ethiopia, road transport is the major means of passengers and freight. In 2015, Ethiopia
had 110,414 km of roads (14,354 km paved and 96,060 unpaved) as against
659KM railways and 17 airports with paved runways”, (2019 World Fact Book of the
United States Central Intelligence Agency, 2015). Still a low percentage of the
population has access roads.
Automotive importing companies in Ethiopia are importing different types of vehicles to
the country’s vehicle market. Few of them have established assembly plant by importing
components based on SKD, and CKD. The study doing so, a predictive study on the
effectiveness of the distribution & sales channels to clearly see the demand supply gap
and satisfaction of both parties’ sales companies, and intermediaries. This project
mainly prepares to reveal the effectiveness and impact of the vehicles sales channel being
implemented by different car assembles and importing companies on their sales
performance.
In Ethiopia some of these car assembly companies sell their products through one
dedicated intermediary, and some of them direct to end users. However, most of them
prefer to sell thorough many distributers, dealers, or intermediaries. The reason of
preferring distribution through channel by the company is better access to the market and

2
sharing responsibility of aftersales to the distributers or retailers. These intermediaries
perform a variety of functions constitute a marketing channel, that is also referred to a
trade channel or distribution channel and dealers. Especially the case of three wheelers
tra-cycle which are highly demanded in areas of growing cities and rural areas, the sales
channels involve many intermediaries.
At present there are eighteen well established and long experience companies those
are: MOENCO, Belay Ab Motors, AMCE, Nyala Motors, Ries Engineering, Marathon
Motors, Paul Ries & Sons, Lifan Motors, Seferian Co., Ethio lakes, Orbis Automotive
Trading, Horra Trading, Equatorial Business Group, Ethio Nippon, Gaky Engineering,
Ultimate Motors, Mesfin Engineering, TVS Motors, and Tamrin. Most of these
companies use different channels based on the company’s interest. Many of these
companies especially the recent once are exerting their full potential to penetrate the
market through formulating different distribution strategies and widening their destination
to different regions.
For any company’s product to sell, how to avail the product to the customers can be as
crucial as strategic issue as that of manufacturing the product itself (Ahn, Duenyas and
Zhang, 2002). The writers added that Multi-channel product distributions shall for this
study refer to situations where on top of the traditional intermediaries (whole sellers,
resellers, distributor, retailers etc), the manufacturer purposely nominates other
intermediaries’ strategies in order to control the market. Despite the importance of channel
intermediaries: knowing the accurate effect on the sales volume is inconclusive and poorly
understood. So, it’s the researcher’s opinion that it’s important to study an assessment of
the relationship between distribution practice and sales volume in case of cars in Ethiopia
and to understand on how distribution is currently implemented and functioning for the
companies in the Ethiopian market context.
Most of ideas concerning channel design, management, and administration issues are
underlying a theory that predict the effectiveness of the channels for the success of vehicle
companies based on some factors. Hence, this proposal is to review the distribution
efficiency impact on vehicle sales and builds a framework analysis to be tested by studies
in Ethiopia.

3
1.2 Problem Statement
Distribution channels are one of the major sales outlets for business operation and
effectiveness of companies, which are decisive for those goods manufacturing firms.
Channels normally have contract agreement for distribution of goods, and efficient
product presentation and carry-out aftersales service in their areas for mutual benefit. As
experience shows most of the sales out lets are not preforming well or doesn’t operate as
per their commitment with the parent or manufacturing company. Those intermediaries
may also concentrate with other own business of interest.
Despite a strong commitment between the vehicles sales or assembly companies and the
distribution channel, there is misunderstanding of one another and that affects their mutual
goals and operation. The situation isn’t able to promote the parent company’s
products in an efficient way, and the channels are also not well administered or not
devoting their full time to do up to their commitment. Research or assessment should be
carried out to determine the situations behind the effectiveness of distribution channel
of vehicles in Ethiopia to assess the issues and find the situations and propose best
possible solution that let both the intermediaries and the company would have better
understanding each other and communicate and work out efficiently.
1.3 Basic Research Questions
What is the effect of channel design on the sales performance of vehicles in
Ethiopia?
What is the relationship between channel administration and sales
performance of vehicles in Ethiopia?
What is the effect of channel management technologies on the sales
performance of vehicles in Ethiopia?

4
1.4 Objectives of Research
General objective
The general objective of this study is to assess the effectiveness of distribution channels
and evaluate their effect on the sales performance of organizations, taking the case of
automotive assembly and sales companies in Ethiopia.
Specific objective
To examine the effect of channel design on the sales performance of vehicles in
Ethiopia.
To determine the relationship between channel administration and the sales
performance of vehicles in Ethiopia.
To evaluate the effect of channel management technologies on the sales performance
of vehicles in Ethiopia.
1.5 Scope of the Study
Subject Scope
The study concentrates on the effectiveness of some variables for vehicle distribution
channel which are distribution channel design, channel administration, and channel
technologies used by channel intermediaries and the vehicle sales companies in Ethiopia.
Geographical Scope
The study is conducted in Addis Ababa among employees of car assembly and sales
companies, sales channels, and organizational customers.
Time Scope
This study considers, sales & marketing channels, and the sales performance trend
of car sales companies from 2015 to 2020 GC.
1.6 Significance of study
The findings of the research can be used by any automotive companies to gain an
insight into distribution strategy in the current market environment of the car industry

5
for its contribution to distribution system effectiveness. Companies can do better by using
the study as refence as to how factors that contribute for the effectiveness of the company
and use for their reference in achieving better sales performance.
There aren’t much work/study carried out on channel of distribution on cars industry in
Ethiopia, so the study adds up and provide a rational elaboration and detail understanding
of different distribution system operation. Moreover, the study highlights potential areas
for future research and fills the gap that identified on the literature review.
The researcher beliefs that he acquires more knowledge and experience on the study
research; and can also use the study as a format or an outline of the thesis to follow for
any other research works.
1.7 Limitation of study
The scope of this paper is to study an assessment of the effectiveness of distribution
channel and sales volume in the case of car sales in Ethiopia. The study considers only
the car sector; and the data of other industry are not be included and focus only on car
sales, which have an experience of local competitive environment. Beside this,
factors influencing the distribution channel system and the extent of distribution channel
affecting the sales volume, were the most to be analyzed and evaluated to assess the
mentioned research topic.
The following limitations were encountered during the study and strategies:
The worldwide COVID-19 pandemic issue was the main hinderance that let the
researcher to get more and accurate data. Most of the respondents weren’t happy
to receive the hard copies from the researcher instead want to make it in telephone,
or using digital media; and that let the researcher to be strict on data collection.
Briefing and convincing the issue details in person to respondents somehow
wasn’t easy.
Respondents withholding information due to fear of being victimized, however,
the researcher convinced the respondents that the information would be kept

6
confidential. This is true especially with organizational customers, which are not
open on all data that may raise issue against them.
Unwillingness of respondents to fill questionnaires. The researcher remained in
constant contact with the respondents and made sure reminders are sent to them
to fill the questionnaires.
Respondents having a view of not obtaining any direct benefit from the research
results. However, the researcher convinced the respondents to spare some time to
answer the questions, and further explained that the recommendations of the
research would be presented to concerned for the benefit of the companies and
employees.
The study was conducted and limited on few vehicle sales companies, channels,
and organizational customers taking sample from relevant population that sited in
Addis Ababa. Even if the sampling techniques have its own limitations the
researcher made use of scientific method of sample size determination to become
more accurate on the conclusion.
1.8 Organization of the paper
The research paper used an assessment of the vehicles sales distribution practice in
Ethiopia in Addis Ababa and organized in to five chapters.
The first chapter is introduction part in which the paper discussed the reasons why this
research is necessary; the research questions that are needed to be answered, scope of
the study, and limitation of the study.
The second chapter literature review discusses in depth previous close or related theories,
review theoretically and empirically, show research gap, forward conceptual review
and hypothesis for the topic of the effect of distribution channel in general, and on sales
volume of cars.

7
Chapter three which is the third part of the paper is dedicated to methodology, research
design, Population of the study and sampling and sampling procedure of the research
under study. In order to help the analysis and interpretation the researcher used The
Statistical Package for Social Sciences (SPSS) software.
Chapter four of the paper is all about data interpretation and analysis. Which is
interpretation of the data collected using the statistical software mentioned above. In that
chapter detailed data analysis carried out to support the last chapter which is
recommendation and conclusion.
The final chapter is summary, conclusion and interpretation based on the analysis
performed on the fourth chapter of the paper. The conclusion and recommendation solely
base on the data collected, analyzed, and interpreted on in the previous chapters.
The paper also includes reference papers listed at the end of the paper which enable
readers grasp further information on the research topic and other related topics

8
CHAPTER TWO
LITERATURE REVIEW
The chapter has four sections namely, theoretical review, empirical review, research gap,
and conceptual review & hypothesis. In the theoretical review the researcher obtains
information from different sources and sorted under main themes and theories, highlighting
agreements and disagreements among the authors and identifying the unanswered questions,
gaps or outlook of the researcher. In the empirical review the researcher review Empirical
evidence refers to evidence verifiable by observation or experience, thus, the research
studies with conclusions based on empirical evidence. The Theoretical framework consists
of the theories or issues in which the research study is embedded, while the
conceptual framework describes the aspects selected from the theoretical framework
to become the basis of research enquiry.
2.1 Review of Theories and concepts
2.1.1 Channel Design
A firm can set-up different channels it requires. Channels are classified by the number of
intermediaries between producer and consumer (Kotler, Keller & Burton, 2009).
Designing a marketing channel calls for analyzing customer needs, establishing channel
objectives, and identifying and evaluating the major channel alternatives (Kotler,
Keller & Burton, 2009). In designing the marketing channels, the marketer must
understand the output levels desired by the target customers. Channels produce five
service outputs, these include; Lot size - the number of units purchase on/in one occasion,
Waiting time - the average time customers of that channel wait for receipt of the
goods, Spatial convenience - the degree to which the marketing channel makes it easy
for customers to purchase the product, Product variety - the assortment breadth provided
by the marketing channel; normally customers prefer greater assortment because more
choices increase the chance of finding what they need and lastly, Service backup - the

9
add-on services (e.g credit, delivery, etc) provided by the channel (da Silva, 2008).
According to da Silva (2008), channel objectives should be stated in terms of targeted
service output levels. Channel objectives vary with product characteristics. The
company’s channel objectives are influenced by; nature of the product, company
characteristics, characteristics of intermediaries, competitors’ channel and
environmental factors. Nature of the product, e.g. perishable products require more
d i r e c t marketing to avoid delays and too much handling (Kotler, Keller &
Burton, 2009). Company characteristics, e.g.the company’s size and financial situation
determine which functions it can handle, how many channels it can use, which
transportation can be used.
Characteristics of intermediaries, intermediaries differ in their abilities to handle
promotions, customer contact, storage and credit e.g. the company’s own sales force
is more intense in selling. Competitors’ channel, some companies may prefer to
compete in or near the same outlets that carry competitors’ products, some may not (e.g.
Daily Monitor newspaper wants to locate near the New Vision newspaper).
Environmental factors, economic conditions and legal constraints affect channel design
decisions e.g. in a depressed economy, producers want to distribute their goods in the
most economical way, using shorter channels (Kotler, Keller & Burton, 2009).
After the channel objectives have been determined, the company should identify its major
channel alternatives in terms of; (1) types of intermediaries, (2) the number of
intermediaries needed, and (3) the terms and responsibilities of each channel member
(Kansal, 2011). The firms need to identify the different types of available intermediaries
to carry on its channel work. Intermediaries are individuals or businesses that make it
possible for the product to make it from the manufacturer to the end user, essentially
facilitating the sales process (Kumar & Venkatesan, 2005). There are four basic types of
channel intermediaries, which include: agent, wholesalers, distributors and retailers. An
Agent is an independent individual or company whose main function is to act as the
primary selling arm of the producer and represent the producer to users. Agents take
possession of products but do not actually own them (Kansal, 2011). Agents usually make
profits from commissions or fees paid for the services they provide to the producer and
10
users. Wholesalers are independently owned firms that take title to the merchandise they
handle. The wholesalers own the products they sell. Wholesalers purchase product in bulk
and store it until they can resell it. Wholesalers generally sell the products they have
purchased to other intermediaries, usually retailers, for a profit. Distributors are similar
to wholesalers, but with one key difference. Wholesalers will carry a variety of
competing products, for instance Pepsi and Coke products, whereas distributors only carry
complementary product lines, either Pepsi or Coke products. Distributors will take title to
products and store them until they are sold. A retailer takes title to, or purchases products
from other market intermediaries. Retailers can be independently owned and operated on
a small scale or they can be part of a large chain. The retailer will sell the products it
has purchased directly to the end user for a profit (Kansal, 2011).
After major intermediaries have been identified, the company should decide on the
number of intermediaries to use. Three strategies available are; Exclusive distribution,
Intensive distribution and Selective distribution (Kotler, Keller & Burton, 2009).
Exclusive distribution involves a limited number of intermediaries with an exclusive
dealing arrangement where the resellers agree not to carry competing brands. This
strategy is appropriate for specialty products which are expensive, infrequently bought
and require service or info to fit them to buyers’ needs, such as Rolex watches, Mercedes-
Benz and Rolls Royce vehicles (Kotler, Keller & Burton, 2009). In Selective distribution
only selected available outlets in an area are chosen to distribute a product. The company
does not have to dissipate its efforts over too many outlets, it enables the producer to gain
adequate market coverage with more control and less cost than intensive distribution
(Kotler, Keller & Burton, 2009). Kotler, Keller & Burton (2009) add that it is
appropriate for shopping of products, which consumers are willing to spend more
time visiting in several retail outlets to compare prices, designs, styles, and other features
of these products. Intensive distribution is the use of all available outlets to distribute a
product. It is suitable for convenience products such as soft drinks, bread, candy,
newspapers, etc. because they have high replacement rate and require almost no service
(Kotler, Keller & Burton, 2009). Multiple channels (i.e. convenience stores, service
stations, supermarkets, discount stores) are used to sell these products. Each channel
options should be checked against; Economic, Control and Adaptive criteria. Vibhash &

11
Lakshmi (2008) explain that under; a) Economic criteria, a company compares the likely
sales, costs and profitability of different channel alternatives; b) Control criteria,
the company must also consider control issues since using intermediaries usually means
giving them some control over the marketing of the product, and some intermediaries take
more control than others, and finally c) Adaptive criteria, the company must apply
adaptive criteria because channels often involve long term commitments, yet the
company wants to keep the channel flexible so that it can adapt to environmental
changes. A channel involving long term commitments should be greatly superior on
economic and control grounds (Vibhash & Lakshmi, 2028) After the number of
intermediaries needed have been identified, the terms and responsibilities of each channel
member should be set (Kansal, 2011). Each channel member must be treated respectfully
and given the opportunity to be profitable. The main elements are; 1) Price policy – price
list, schedule of discount and allowances, 2) Conditions of sale – payment terms and
producers ‘guarantees, 3) Distributors territorial rights – distributors’ territories and the
terms under which the producer will enfranchise other distributors, and 4) Mutual services
and responsibilities- particularly in franchised and exclusively-agency channels. The
franchiser provides promotional support, training, record keeping system, etc. (Kansal,
2011).
2.1.2 Channel Administration
Like other areas of business, distribution channels require careful administration as
superior channel management policies and strategies help a firm attain a differential
advantage but concomitantly are difficult to duplicate (Shusterman, 2013).
Distribution and Marketing channel management refers to the process of analyzing,
planning, organizing, and controlling a firm’s marketing channels (Coughlan et al., 2005).
As discussed in numerous articles and textbooks, it comprises seven decision areas: (1)
formulating channel strategy, (2) designing marketing channels, (3) selecting channel
members, (4) motivating channel members, (5) coordinating channel strategy with
channel members, (6) assessing channel member performance, and (7) managing channel
conflict (Mehta et al 2000). Hutt & Speh (2013) emphasize that the primary roles of

12
channel administration are; selection of channel members and motivating channel
members.
The process of selecting channel members / intermediaries is an ongoing process due to
the fact that they tend to leave the channel from time to time, basing on different
circumstances: market's changes, problem within their businesses, etc. (Hutt & Speh,
2013). Thus the process of choosing intermediaries should be very well managed in order
not to reduce the cost of search to the minimum (Coughlan et al., 2005). The most
important step to be made in order to fulfill the goal is to secure good intermediaries. The
list of probable intermediaries can be reduced to a few by getting the information about
the candidates from different sources: current partners, salespeople, potential and actual
clients or through databases and professional communities (Coughlan et al., 2005).
Nevertheless, it should be remembered that the process of choosing the intermediaries is
not a one-way street at all, thus the company should bother about its reputation if it wants
to have the opportunity to choose the best intermediaries (Kumar & Venkatesan,
2005). After the channel members / intermediaries have been selected, they should be
maintained by motivating them. If the company wants to build strong and beneficial
relationships within its marketing channels, the company's strategies should be tied up to
the capabilities and aims of its distributors, representatives and suppliers, (Hutt & Speh
2013), They added company's managers should constantly remind themselves that the
intermediaries are independent and profit-oriented and thus as soon as they are not
satisfied with the current state of affairs, they will leave the marketing channel.
The motivation of the channel members starts with the realization that every relationship
within the channel is a partnership (Kumar & Venkatesan, 2005). The communication
can be improved by product training, recognition programs, consultations with the
manufacturer's representatives and informational meetings where the plans and strategies
will be discussed in detail. The goal of joining the plans and strategy should be prioritized
(Kumar & Venkatesan, 2005). Additionally, in order to enhance the performance of the
channel, the manufacturer has to improve the information flow among channel’s
participants (Hutt & Speh, 2013). This can be made by setting periodical council’s
meetings among the representatives whose aim will be to review distribution policies,

13
provide advice on marketing strategy and supply industry intelligence (Hutt & Speh,
2013). Motivation of channel intermediaries can also be enhanced by setting good
commission policies since the main aim of the marketing channel's participants is to get
profits (Coughlan etal., 2005). Lastly, manufacturers have to build trust between and
among intermediaries. To be competitive, business marketers have to build effective
networks and collaborations within channels, and successful cooperation exists only when
the partners trust each other (Hutt & Speh, 2013).
2.1.3 Channel Management Technologies
Technological innovations facilitate the integration of structures, physical flows, and
information within the same distribution channel (Tummala et al., 2006). Information and
Communications Technologies (ICTs) are the main platforms on which inter and intra-
firm channel management processes have been built (Closs & Xu 2000; Porter 2001).
ICTs refer to technologies that people use to share, distribute and gather information, and
to communicate, through computers and computer networks (ESCAP,2001).
Technological innovations improve the productivity of physical and information flows
by improving the transportation network and logistics management. Some of the
technologies used in marketing channels include; Electronic Data Interchange (EDI),
Vendor Management Inventory (VMI), Collaborative Planning Forecasting and
Replenishment (CPFR), Vendor Managed Category Management (VMCM) and Self-
Service Technologies (SSTs)/ Point Of Sales (POS) technologies (Kaipia &
Tanskanen, 2003; Musso, 2012). The EDI is the basic infrastructure for coordinating
logistic processes among channel partners that has been defined as “tools which permit
the automatic exchange of data between remote applications in situations where
these belong to different organizations (Martinez & Polo-Redondo, 2001). The
principal attraction that EDI has for companies in marketing channels lies in the large
number of references that are exchanged. For large retailers, as well as wholesalers,
EDI means a big saving because they work with a large number of suppliers (and/or
customers) with a great quantity of references, and this means having to handle a vast
amount of documents of different types. The EDI has been promoted because it
eliminates the extremely burdensome task of reentering, collation and storing of all

14
this data. Four groups of variables have influence in the spread of EDI: Network
Factors, Innovation Factors, Intra- Organizational Factors, and Inter-Organizational
Factors (Martinez & Polo-Redondo 2001).
Channel management technologies are also very important in joint management of
supplying activities, through techniques such as Vendor Management Inventory
(VMI) (Kaipia & Tanskanen 2003). Supplying activities include assortment decisions,
activities for reducing stock-outs, and the use of indicators to control and improve joint
processes. In VMI, the supplier is able to smooth the peaks and valleys in the flow
of goods, and therefore to keep smaller buffers of capacity and inventory (Kaipia &
Tanskanen 2003). Buyers need not monitor the supplier performance by the service level
provided by the supplier to the buyer. Successful VMI implementations in retailing can
be found in the apparel industry. However, VMI has not gained large acceptance in
the grocery supply chain.
The Collaborative Planning Forecasting and Replenishment (CPFR) and Vendor
Managed Category Management (VMCM) technologies are used at a higher level of
collaboration in marketing channels. The CPFR is used for jointly making sales
forecasts and procurement schemes and includes all activities that pertain to the
management of assortments such as promotions and the introduction of new
products. VMCM technologies are used for retail demand fulfilment. It combines the
ideas of VMI, Category Management and Outsourcing (Kaipia & Tanskanen 2003).
An additional front of technological innovation in vertical relationships between
firms in the marketing channels is that of the management of supplies via the Internet
(Risso 2009). Electronic business technological innovations impact the operational design
of a channel system by increasing the degree to which the tasks and resources of members
need to be integrated. In particular, the proper utilization of software requires the
integration of channel operations in terms of greater formalization, standardization, and
centralization (Bello et. al. 2002). The most important fronts of technological innovation
in the relationships with the final consumer are checkout technologies, electronic and
mobile payment systems, distance selling (mainly on-line sales), and Self-Service
Technologies (SSTs) such as vending machines and multimedia kiosks. Checkout or Point

15
of sales (POS) technologies are applied to locations where a retail transaction occurs. The
benefits of POS technology are in the possibility to better manage inventory by
combining sales data with the amount and cost of the purchases. This enables the firm to
analyze the profitability of individual products and manage inventory more accurately
and quickly (Bergen et al. 2008). Related to POS-scanner technologies are electronic and
mobile payment systems. Mobile payments are payments for goods, services, and bills
with a mobile device (such as a mobile phone, smart-phone, or personal digital assistant
(PDA) by taking advantage of wireless and other communication technologies (Dahlberg
et al. 2008). Mobile payment systems are suitable for proximity and micro-
payments hence are a great opportunity for mobile payments to reduce the number
of small purchases paid with cash (Ondrus & Pigneur 2006).
Other forms of innovation in relationships with final customers are detectable in telephone
and on-line selling. The main innovation potential in distance selling, however,
comes from online sales, as part of e-commerce. Online shopping remains a small
fraction of retail sales despite the well-known benefits of electronic commerce to
consumers, including lower prices (Brynjolfsson and Smith 2000), greater selection and
availability (Ghose et al. 2006), and greater convenience by eliminating travel costs and
enabling purchases irrespective of geographic location. There are many reasons for
consumers’ slow adoption of online shopping habits, such as: inspecting non-digital
products is often difficult, shipping can be slow and expensive, and returning of products
can be challenging (Forman, Ghose and Goldfarb 2009). That is, there appears to be a set
of fixed disutility costs of buying online. These costs vary across products and
retailers, and in some markets have created significant hurdles to the continued diffusion
of electronic commerce.
The last face of technological innovation in dealing with the final consumer is that
of Self- service technologies (SSTs), based on interacting technologies, like vending
machines and multimedia kiosks. With consumers wanting quick and convenient access to
competitively priced products, the vending industry has seen a great deal of growth over
the last twenty years. Vending machines are continually updating with the latest
technologies, as well as the variety of products that are being sold. One of the newest

16
vending innovations is telemetry. Machines equipped with telemetry can transmit sales
and inventory data to a route truck so that the driver knows exactly what products to
bring in for restocking. Or the data can be transmitted to remote headquarters for use in
scheduling a route stop, detecting component failure or verifying collection information
(Courty and Pagliero 2008). Multimedia kiosks sometimes described as interactive kiosks
or public access kiosks are computer workstations that are designed to provide public
access to digital information and e-transactions. In retailing and other business
environments such as travel, entertainment, advertising, property marketing and
building, information kiosks are being used to provide information and services directly
to customers. Kiosks are typically located in a store, or in a shopping center or mall, or
in other public environments such as railway stations, motorway service stations and
airports (Rowley and Slack, 2003). In this study the researcher will assess the adequacy of
technologies being used in the marketing channels of vehicle sales in Ethiopia.
2.1.4 Sales Performance
The term sales refer to transactions between two parties where the buyer receives
goods (tangible or intangible), services /or assets in exchange for money (Hutt &
Speh, 2013). According to Dean (2015), no matter what industry, every manufacturer /
supplier must improve sales performance, reduce the cost of selling, and ensure their
survival. By analyzing sales performance, managers can make changes so as to
optimize sales going forward (Farris et al., 2010). According to literature, sales
performance is a combination of sales effectiveness - the ability of a company’s sales
professionals to “win” at each stage of the customer’s buying process, and ultimately earn
the business on the right terms and in the right timeframe and sales efficiency - the speed
at which each task in the sales process is performed (Farris et al., 2010; Treace, 2012;
Rogers, 2014; Dean, 2015). Farris et al (2010) posits that sales effectiveness is not just a
sales function issue; it’s a company issue, as it requires deep collaboration between
sales and marketing to understand what’s working and not working, and continuous
improvement of the knowledge, messages, skills, and strategies that sales people apply
as they work sales opportunities. On the side of sales efficiency, companies need
to examine their sales process for weaknesses so as to maintain favorable speeds at

17
which each task in the sales process is performed (Treace, 2012). For example, if
intermediaries are spending too much time on some tasks, the company might automate
those tasks so as to allow sales representatives to spend more time selling (Treace,
2012).
According to Cournoyer (2014), marketing channels allow partner representatives
in the best possible position to sell. Cournoyer suggests tips to consider to in
optimizing sales performance (Cournoyer, 2014); 1) Provide resources that
communicate your message, create a common sales toolkit for partners so that
you’re doing everything possible to enable them to communicate your value
proposition and accelerate sales growth; 2) Modularize your packaging for each
stage of the buying process. Packaging stock into smaller, more manageable ‘chunks’
or ‘bits’ makes moving of stock more practical for channel partners at the time and
place they choose; 3) Keep the lines of communication frequent and open. Alexander
(2013) advises that the producer should call each of channel partners on a regular basis
so as to offer any assistance that may be needed; 4) Get on board with social media.
According to Offenberger (2011) it is important to network with channel partners
through social networks like Facebook, LinkedIn, Twitter and others. Social networks
enable more authentic, personal and regular interactions leading to positive
partner interactions and more partner sales (Offenberger, 2011); and 5) Measure the
relationship early and often. James (2011) explains that there are two reasons to
measure. First, the key to the channel relationship is trust, which means that you need to
be flexible in making adjustments that improve performance. That's only possible if
you know what's happening. Second, when a channel partner is not performing (i.e.
consuming more resources than the revenue they create), you need to know quickly so
that you can either fix the problem or cut the partner from your programs.
Understanding the theory behind creating and maintaining these marketing and sales
channels gives some control over how the marketplace can be approached and how quickly
products can move to customers (Vibhash & Lakshmi, 2008). The theory behind
distribution and marketing channels also enables sellers to learn how to time their
marketing so that they do not offer products that haven't arrived in the customers' areas

18
yet (Bucklin, 1966; Gaski, 1984; da Silva, 2008). Channels can be defined as the set of
external organizations that a firm uses to achieve its distribution objectives (Mehta,
Rosenbloom & Anderson, 2000). Essentially, a channel is the route, path, or conduit
through which products or things of value flow, as they move from the manufacturer to
the ultimate user of the product (Metha et al., 2000). Actors in the marketing channels
include agents, wholesalers, and retailers. By performing a variety of distribution tasks,
marketing channels play a significant role in the flow of products from producers to
consumers and on company profitability (Coughlan et al., 2005). Like other areas of
business, channels require careful administration, as superior channel management
policies and strategies help a firm attain a differential advantage. Marketing channel
management refers to the process of analyzing, planning, organizing, and controlling a
firm’s sales & marketing channels (Stern et al 1996).
As discussed in numerous articles and textbooks, it comprises seven decision areas: (1)
formulating channel strategy, (2) designing marketing channels, (3) selecting channel
members, (4) motivating channel members, (5) coordinating channel strategy with
channel members, (6) assessing channel member performance and (7) managing channel
conflict (Rosenbloom 1987; Rosenbloom 1999). All seven areas are critical to superior
market performance and long-term customer loyalty (Mehta et al 2000). Manufacturers
differ on how they distribute their products to the consumer, with some preferring shorter
channels and others longer channels depending on the context of the buyers. Some of
them distribute intensively (using a lot of intermediaries) or exclusively (directly to
the consumer) (Vibhash & Lakshmi, 2008). Stern & El-Ansary (1982) and Pelton
et al, (2001) affirm that a channels are not simply preferred; there are some issues like
the middlemen, traditional channel patterns, product characteristics, company finances,
competitive strategies, and customer dispersion question. It is the same idea of
Mcvey (1960) who stated that channel networks were not perfectly formulated
under the control of one type of organization and that an organization, encounters
few options preferring the channels for its products. The author added that the choice
of a channel is not open to any firm unless it has various freedom of action in issues of
marketing policy. According to this approach, the company has a various constrictions
like limited choice of types of middlemen, customers and locations of trading areas.

19
Some logistics authors wrote that the channel preference is a cost and financial decision
(Lambert 1981; Bowersox 1969). Otherwise Lilien et al. (1992) say that the channel
choice decision is not only an economic decision but is also dependent on the control
aspects of channels and their adaptability. Several theories have been forwarder to show
/ predict marketing channel dynamics and their management.
These include but are not limited to; Coalition theory, Bargaining theory, Theory of
power and conflict in marketing channels and Theory of distribution channels. The
Coalition theory explains that weaker (smaller) channel members are prone to dominance
by more powerful channel entities (Harvey, 1975). Channel members may band together
in an attempt to decrease conflict among themselves or to protect themselves against more
dominant power figures in the channel of distribution. This theory indicates that with
increased power, marketing flows are controlled and therefore goal attainment (sales
performance in this case) is more likely to occur (Harvey, 1975). The Bargaining theory
states that a critical factor in channel relationships between manufacturers and retailers
is the relative bargaining power of both parties (Iyer & Villas-Boas, 2003). Bargaining
the terms of trade in a marketing channel consists of a manufacturer that produces the
product and a retail intermediary that takes a market action (e.g., setting the retail price)
and sells the product to the consumer market. Relationships between manufacturers and
their retailers often hinge on the importance of negotiation and its effects on each party’s
share of the pie, as well as on channel coordination parties (Iyer & Villas-Boas, 2003).
Lastly, the theory of distribution channels states that each company in the channel must
charge enough to pay expenses and leave a profit (Bucklin, 1966). According to
this theory, knowing where you are in the channel helps you understand your costs
and mark-up needs. If you are near the end of the channel, you will pay the most for a
product, because it has been marked up on its way to you. If you're near the beginning,
you may be expected to charge what are commonly called wholesale prices, because
your buyers understand you incur less expense at the start of a channel (Bucklin, 1966).

20
2.2 Theoretical Framework
2.2.1 Effect of channel design on sales performance
For companies planned for growth, one of the biggest tasks is making sales more efficient
and productive (Palmatier et al., 2008). When a company’s sales channels realize their
full potential, they don’t only boost revenue and share but also create a high-
performance organization pulling together for breakthrough financial results (Palmatier
et al., 2008). Kotler et al (2009) forwarded that for a company to design channels that can
guarantee good sales, the company must analyze customer needs, establish channel
objectives, and identify and evaluate the major channel alternatives (Kotler, Keller &
Burton, 2009). Excellent progress has been made in our understanding of how firms may
effectively design and manage their channels of distribution (Frazier and Lassar 1996;
Vinhas et al., 2010).
Literature has also indicated that producers have to develop strong, long-
term relationships with their channel partners since these affect firm performance, and
sales performance in particular (e.g., Anderson and Weitz 1992; Heide and John
1992; Morgan and Hunt 1994). Moreover, the channel partners provide the route, path, or
conduit through which products or things of value flow, as they move from the producer
to the ultimate user of the product (Metha et al., 2000). Today’s distribution channel
systems are increasingly complex. Producers often serve end-user markets through
multichannel systems where diverse channel types (e.g., telemarketing, sales force, and
e-commerce operations) and/or diverse entities (e.g., the manufacturer and different
independent firms) are involved in the performance of the main distribution functions
to optimize sales (Vinhas et al., 2010). The complexities in the marketing channels
(especially for newspapers in Uganda) provides a research opportunity on how to
design marketing channels that can enable the producer to utilize different channel types
to create customer value and maximize sales.

21
2.2.2 Effect of channel administration on sales performance
Emphasize that most manufacturers, success or failure is determined by how
effectively and efficiently their products are sold through their marketing channel
members (Behan & Lamoureux, 2015). In an era of increased emphasis on customer
relationship management and hybrid marketing channels, there has been growing concern
regarding how channel relationships are managed (Mehta, Dubinsky & Anderson, 2002).
The prominence of channel management is premised on the fact that marketing
channel partners play a significant role in the flow of products from producers to
consumers and on company profitability (Kotler et al., 2009). Channel management
affects sales performance by helping to protect brand value, allowing vendors to sell their
products at a premium, while enabling the channel to up-sell the proper services
and support offerings that meet the customer’s needs (Behan & Lamoureux,2015).
Channel management can also control price reductions, which can slow price erosion. In
addition, it can extend a vendor’s visibility over products and services through the
channel to prevent diversion and the risk of gray marketing, where products are
leaked or diverted outside of the authorized channel. Strong channel management
helps create and maintain customer loyalty while strengthening the channel partner
relationship by protecting the investment in the vendors’ products and the partners’ post-
sales service and support (Behan & Lamoureux, 2015). Behan & Lamoureux (2015)
mention the KPMG’s proprietary Channel Management Model that outlines the steps in
the channel life cycle that vendors can use to strengthen channel relationships,
enhance value, reduce gray and counterfeit marketing, and ultimately enhance
sales revenues and margins. Four key steps to effective channel management include:
a) Channel strategies and programs, b) Partner onboarding, 3) Transactions reporting and
incentives and 4) monitoring (Behan & Lamoureux, 2015).
2.2.3 Effect of Channel management technologies on sales performance
In the last ten years or so, ICT has become an important tool in company processes, in
goods and service supplied to the market letting system and organizational change
projects and in the modification of business models (Balocco, Ghezzi, Rangone & Toletti,

22
2012). Professionals who have contact with customers are now "touching" with
technology. Every day, sales, marketing, and even customer service giving positions are
becoming increasingly concentrated on technology (Vilaseca-Requena, Torrent-Sellens
& Jiménez-Zarco, 2007). Technological innovations facilitate the integration of
structures, physical flows, and information within the same distribution channel
(Tummala et al., 2006). Information technology and telecommunications technologies
are the main platforms on which inter and intra-firm channel management processes for
have been built (Closs & Xu 2000; Porter 2001). ICT use has brought about a
fundamental transformation in the marketing function and distribution channels have
been one of the main beneficiaries. Some of the technologies used in
marketing channels include; Electronic Data Interchange (EDI), Vendor Management
Inventory (VMI), Collaborative Planning Forecasting and Replenishment (CPFR),
Vendor Managed Category Management (VMCM) and Self-Service Technologies
(SSTs)/ Point Of Sales (POS) technologies (Kaipia & Tanskanen, 2003; Musso,
2012). These results suggest that ICT could offer companies a competitive advantage,
allowing them to differentiate themselves in the marketplace. In addition, as Pine et al.
(1995) and Prasad et al. (2001) suggest, ICT endow marketing with an extraordinary
capability to target specific groups of individuals with precision, and enable mass
customization and one-to-one strategies by adapting communications and other elements
of the marketing mix to consumer segments.
2.3 Empirical Review
Certain previous researchers have devoted deal of attention to the relationship of supply
chain management practices and certain aspects of organizational performance from
different perspective/dimensions of overall supply chain. Some of these researches’
findings are discussed as follow:
Fengyi. Wu, and Yuehhua. Lee (2009) in their study investigation channel power
and satisfaction in a marketing channel. His study adopted case study design in
Guangzhou province-china. It was found out that the competition faced by business
organizations is no longer mere inter-firm competition, but also inter-channel competition

23
caused by adapting to industry globalization. Considering this trend, this study found out
that there was a correlation between distribution channel power customer commitment
and satisfaction. The results provide non-coercive power had a positive and significant
impact on the channel firms’ communication and commitment, as well as the supplier
communication and commitment had a positive and significant impact on the economic
satisfaction and non- economic satisfaction of channel firms.
Daugherty (2009) in her study titled “reverse logistics in the automobile aftermarket
industry. The study employed case study design whereby 321 respondents participated
in the study data collection was done through the questionnaires and interviews. The
results indicated that trust exists when one party has confidence in an exchange partner’s
reliability and integrity. Trust involves an expectation held by an individual that another
can be relied on. The existence of trust is particularly important with respect to buyer-
seller exchange relationships. Buyer-seller relationships are almost always unequal; one
party has more power, better positioning, and/or more resources. Because of the
unevenness of power, the other party is likely to feel vulnerable unless trust is present. As
such, trust is the mutual confidence that no party to an exchange will exploit another’s
vulnerabilities. It was shown that downstream channel partners that trust suppliers
exhibit higher levels of cooperation and exert more effort on the part of the supplier.
Channel partners that trust suppliers also tend to be more committed to and intend to stay
in the relationship. Trust is viewed as a highly effective means of fostering cooperation
across all types of inter-organizational relationships. Thus, trust in their customers
appears important for suppliers who want to reap maximum benefits from the exchange
relationship.
Atafar et al, (2011) in their study “Assessing the Effectiveness of Distribution Channel in
Isfahan Zamzam Company in their research, they gathered data by interviewing the top
marketing managers who have high experiences in marketing; finally, the variables in the
research assumptions been used to incorporate flow table model for measuring the
Effectiveness Distribution Channel in Isfahan Zamzam Co. The study revealed that
Zamzam distribution channel was successful in product transportation, gathering market
information was effective in payment procedures, but distribution channel of this

24
company is not been effective in trade promotion programs and communication with
retailers and wholesalers.
McFarland (2001) in his study “the marketing position of industrial distribution”; the article
discussed the position of industrial distributors in channels of distribution. The study was
conducted in Johannesburg, South Africa, interviews and questionnaires were employed
as methods of data collection. The result indicated that, doing business with industrial
distributors is more cost effective than doing business with sales branches, sales offices
and agents. The author notes that when compared to alternative agencies, the gross margin
required by industrial distributors is similar. Also it was noted that industrial distributors
are better qualified than alternative agencies to offer services such as emergency
deliveries, credit clearance and knowledge of sources of supply for buyers.
David (2005) in his study “Distribution Keiretsu, Foreign Direct Investment, and Import
Penetration in Japan” based in directed marketing channel known in Japan as distribution
keiretsu are more likely than others to be headed by a primary wholesaler that is vertically
integrated with the manufacturer, which for foreign manufacturers entails their
directly investing in Japan-based wholesale subsidiaries. Briefly stated, vertical
integration better aligns the non-contractible wholesaler effort levels with the
manufacturer's profit, but necessarily forgoes the inherent advantage of an independent
wholesaler at market-widening efforts. This establishes a trade-off bearing on the decision
to vertically integrate.
The reviewed literature has shown that essentially, marketing channels are routes, paths,
or conduits through which products or things of value flow, as they move from the
manufacturer to the ultimate user of the product (Metha et al., 2000). Marketing
channels are mainly comprised of four basic types of marketing intermediaries, which
include: agent, wholesalers, distributors and retailers (Vibhash & Lakshmi, 2008). When
designing channels, producers should consider five service outputs, these include; the
number of units purchased on/in one occasion, the average time customers of that channel
wait for receipt of the goods, the degree to which the marketing channel makes it easy
for customers to purchase the product, product variety, the add- on services (e.g.
credit, delivery, etc) provided by the channel (da Silva, 2008). Like other areas of

25
business marketing channels require careful administration, as superior channel
management policies and strategies help a firm attain a differential advantage
(Shusterman, 2013). When administering effective marketing channels, producers should
consider a) Channel strategies and programs, b) Partner onboarding, 3) Transactions
reporting and incentives and 4) monitoring (Behan & Lamoureux, 2015). Lastly, the other
aspect of marketing channels reviewed is technological innovations which facilitate the
integration of structures, physical flows, and information within the same distribution
channel (Tummala et al., 2006).
2.4 Research Gap
In most cases direct sales, one of the channel models, is e-sales, which is contributing
much in the case of the literatures; but the cases of Ethiopia, the researcher believes that
due to various reasons like the telecom and internet technology has not well developed
these days, or for the coming few years. That can be seen as a time gap between the
literature and what happens in Ethiopia.
There is a theoretical Gap, and the issue of the car sales distribution has not been well
covered in literature of earlier study carried for the case of Ethiopia. Many studies on
distribution channel were conducted in various places of different culture, political and
economic systems, therefore, it is important to conduct another study in order to
understand the performance trend especially on sales of car in Ethiopia.
The other gap is most of the literatures discussed as if that they do not consider product
shortage in supply of products, however, the car import or assembly in Ethiopia is limited
due to the foreign currency shortage; and selling of products may not strictly adhere to
one of the channels. Most of the time there is a fluctuation of demand that couldn’t be
fulfilled only by the availability of vehicles.
The other theoretical gap is with Mr. Fengi, Wu which put that inter-channel competition
as positive effect for the company performance, however, the researcher believes that
inter-channel competition in small degree is necessary, but may affect the performance in
creating a negative contraction and conflict of interest between channels.

26
The other theoretical gap is with Mr. Mc Farland, who put industrial distributers are mor
qualified than alternative agencies. Industrial distributors are normally few in numbers
and deal with lot of industries which have different design aspects, and industrial
distributers may not be qualify with all effect of industries. However, the vehicle channel
deal only on vehicles which are not very different with each other in design, and it is easier
to qualify them.
There is time gap that the studies indicate that all technological including IT is well
adapted situation, however the IT technology of the researcher’s country is far behind to
implement the IT technologies in companies and channels.
2.5 Conceptual Review & Hypothesis
The conceptual framework is developed after review of related literature on the study
variables and summarized as research propositions. A channel design affects sales of its
product (Obaji, 2011). The channel control and administration have an impact on
company performance in aspects of sales growth, profitability and effectiveness (Bello &
Gilliland, 1997). Cooperation and coordination among channel members are vital and
required so that the channel will operate efficiently and all channel members will achieve
their goals in-terms of sales growth and profitability (Lynn & Robert, 1996). The
researcher chose these variables due to the fact that these are some of the most important
variables that affect distribution channel effectiveness of companies. The researcher also
proposes hypotheses about how factors of channel distribution effectiveness affect
company sales performance summarized as follows and represented as a model in Fig. 2

27
Figure 2: Conceptual framework
Source: Variables adopted with modifications from Iyer & Villas-Boas, 2003
The aim of this research is to investigate the relationship between channel design (CD),
channel administration (CA), and channel management technology (CMT) with company
sales performance (CP). The variables are taken from different papers discussed in the
literatures taking into consideration the availability of data. The regression model of this
study is estimated in the following form: CP = 𝛽0 + 𝛽1 CD + 𝛽2 CA + 𝛽3 CMT + 𝜀
Source: Developed for the research based on the literature review and the hypothesized
connections presented in the conceptual framework the following three hypotheses were
tested:
H0: Channel design has no effect on company sales performance.
H1: Channel design has positive effect on company sales performance.
H0: Channel administration has no effect on company sales performance.
H1: Channel administration has positive effect on company sales performance.

28
H0: Channel management technologies has no effect on company sales performance.
H1: Channel management technologies has positive effect on company sales performance.
From the literature reviewed, it is very clear that there is insufficient information about
vehicle sales channel and how they are managed especially in Ethiopia. In this study
the researcher endeavors to investigate how distribution channel design, administration,
and the technologies used by channel intermediaries affect sales performance
of vehicles in Ethiopia.

29
CHAPTER THREE
METHODOLOGY
3.1 Description of the study The main research objective of this study was to identify the factors which are affecting
the logistics performance from the perspective of logistics service providers, specifically,
freight forwarders and transit service providers who are engaged/ licensed to provide
import and export services to their customers.
For any organization it could be manufacturing, agriculture, government/non-government
service, whatsoever, needs the service of logistics for movement and storage of goods,
finance and information from the point of origin to the points of consumptions in an
efficient and effective manner to satisfy the needs of the customer or user in forward and
reverse moves as defined by councils of logistics management (CSCMP, 2018).
Therefore, the study focused on logistics performance of Ethiopian logistics service
providers.
3.2 Research Design and approach Cross-sectional study type of research was applied to assess the factors affecting Logistic
performance. Also, descriptive research design was used to describe independent and
dependent variables and it is a scientific method of carrying out a systematic or formal
inquiry in which data is collected and analyzed in order to describe the current conditions
concerning the specific field problems at hand.
The study used probability method for selecting the sample in which each in relation to
the study is included. Used simple random sampling method to conduct the probability
method. Also, the researchers applied a research strategy which is survey to collect the
intended data through structured questionnaire.

30
Accordingly, the study used close ended questionnaires to meet research objectives. The
data was analyzed using Statistic Package for Social Sciences (SPSS) through descriptive
analysis techniques. The result was also analyzed using tables.
3.3 Population and sample
3.3.1 Sample Design
The study adopted five sampling steps of as indicated by (Malhotra et al., 2006); these
steps are closely interrelated and relevant to all aspects of the research. Those are
identified target population, determine the sampling frame, select sampling techniques,
determine the sample size and execute the sampling process.
3.3.2 Target Population The aggregate population of the study was the total logistics service providers/ freight
forwarders and transit service providers operating in Ethiopia and also who are engaged
in import and export activities while licensed and registered by EMAA (Ethiopian
Maritime Affairs Authority) to conduct the logistics service in the country including
customs clearing agents. According to EMAA, then, there are more than 251 service
providers who are active and registered to render the logistics service and customs
clearing by combination of all activities or just some of the logistical activities.
Table 1: Population
Population category Population,
Numbers
Company executives 18
Sales Executives and
Supervisors 72
Distributers/Channels 85
Organizational & Public
Customers 35
Total 210

31
3.3.3 Sampling frame The sample frame of the study was operations units of the sales and marketing functions of
companies who are responsible for leading and managing the day to day sales activities
of all parties vehicle companies, channels, and customers, who the researcher believe
to get the required information to address the research question. Accordingly, these
targets were addressed by structured questionnaire.
3.3.4. Sampling unit According to (Kothari, 2004) the researcher has to decide one or more of sampling that
he has to select for his study. The sampling unit of this study was the respondents of the
companies, channels, and organizational customers.
3.3.5 Sampling techniques and procedure
3.3.5.1 Sampling techniques
Purposive sampling was used to select executives, sales executives, and distributers
or channels; and organizational customers were selected from public organizations, who
are convenient for the researcher. Purposive is a non- probability sampling
technique that enable the researcher to select respondents based on who has the required
information; that is key informants (Sekaran, 2003). A single-stage sampling procedure
is one in which the researcher has access to names in the population and can sample the
people (or other elements) directly. Based on this the researcher nominated the sample
and put names for his sampling technique.
3.3.5.2 Procedure
The researcher seek authorization from sales companies and relevant authorities before
collecting data, and presented an introduction letter from the University indicating that
the study is purely for academic purposes. The researcher calls every person recognized
for interview and inform the purpose and get convenient time appointment and place for
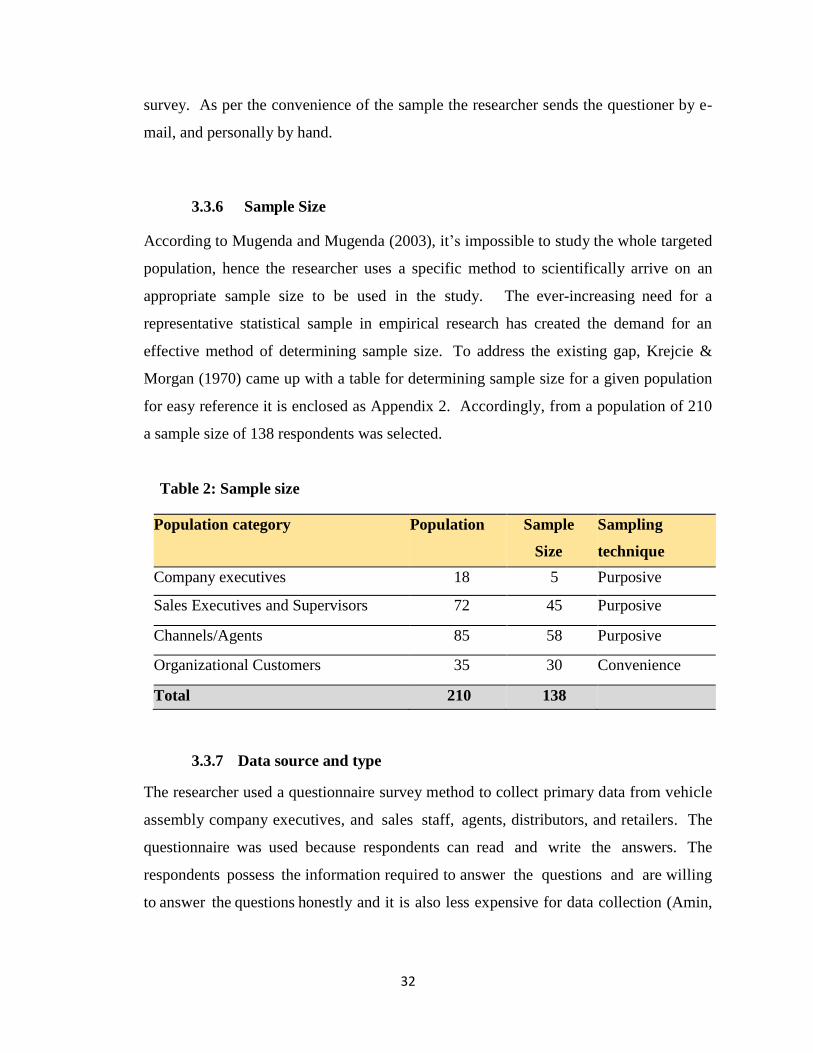
32
survey. As per the convenience of the sample the researcher sends the questioner by e-
mail, and personally by hand.
3.3.6 Sample Size According to Mugenda and Mugenda (2003), it’s impossible to study the whole targeted
population, hence the researcher uses a specific method to scientifically arrive on an
appropriate sample size to be used in the study. The ever-increasing need for a
representative statistical sample in empirical research has created the demand for an
effective method of determining sample size. To address the existing gap, Krejcie &
Morgan (1970) came up with a table for determining sample size for a given population
for easy reference it is enclosed as Appendix 2. Accordingly, from a population of 210
a sample size of 138 respondents was selected.
Table 2: Sample size
Population category Population
Sample Size
Sampling technique
Company executives 18 5 Purposive
Sales Executives and Supervisors 72 45 Purposive
Channels/Agents 85 58 Purposive
Organizational Customers 35 30 Convenience
Total 210 138
3.3.7 Data source and type The researcher used a questionnaire survey method to collect primary data from vehicle
assembly company executives, and sales staff, agents, distributors, and retailers. The
questionnaire was used because respondents can read and write the answers. The
respondents possess the information required to answer the questions and are willing
to answer the questions honestly and it is also less expensive for data collection (Amin,

33
2005). The respondents record their answers within closely defined alternatives on a
Likert scale.
Both primary and secondary data were used in this research.
Primary Data:. The primary data was collected using questionnaire as a method of data
collection.
Secondary Data: Since secondary data is also as important as the primary data, the
researcher collected essential data from secondary sources. The Company’s data about the
number of customers, number of branches, etc. were taken from few company's annual
report. Other secondary sources of data also include, research papers, internet sources, and
articles from different magazines.
3.3.8. Data collection procedure In research, there are numerous methods, and procedures to be applied such as Historical
Method, Experimental Method, Survey Method, Descriptive Method and Case study
Method. Out of these methods, the descriptive method was selected which is believed to
be the most appropriate to the study under investigation. Therefore, the research used
questionnaire as a major data collection tool.
3.3.9 Data collection instrument
A questionnaire was used to collect quantitative data from the respondents. A
questionnaire is a written set of questions that were used to obtain information about the
study objectives from the selected respondents (Amin, 2005). A questionnaire was used,
because it helps to investigate motives and feelings in Likert scaling (Creswell, 1994).
The questionnaire has closed-ended questions divided into sections that represent the
different variables of the study.
The variables measured by operationally defining concepts. For instance, the
questionnaire designed to ask responses about how sales channel design, administration
and the technologies used by channel intermediaries affect sales performance

34
of vehicles of the company. The variables operationalized into measurable elements to
enable the development of an index of the concept. A five-p oi nt Likert scale {(5)
strongly agree, (4) agree, (3) not sure (2) disagree, (1) strongly disagree} were used to
measure both the independent and dependent variables.
3.4 Variables of the study The objective of the study is to identify the effectiveness of channels on car sales performance.
Therefore, the study consists of dependent and independent variables. Channel design,
channels administration and channel management technology are the major
independent variable of the study. The dependent variable, sales performance, was
evaluated by three specific independent variables: channel design, channel administration
and channel management technology.
Channel design is the first independent variable which is expressed as a function of ten
questioners, which includes dimensions of the business sectors, selection of channels,
tasks and constraints of the sector. It is to evaluate the effectiveness of the channel design
in having good cooperation and with the company for mutual busines relationship.
The second independent variable is channel administration which is expressed as a
function of sales cycle duration, selection of members and motivating members or
channels. It is to evaluate channels effectiveness with ten independent dimensional
questions that were used to measure the variable importance to the sales performance.
The third independent variable of the study is channel management technology. It is
to evaluate the CMT though questions of tracking of orders, assisting of clients,
customer feedback and customer management system in investigating it though
questions that was responded by the respondents. The variable is expressed as function
of ten dimensions of questions which was evaluated by the respondents.
Company sales performance is the dependent variable with was analyzed by the above
three independent variables. The variable had nineteen question which were evaluated

35
by the respondents. Customer satisfaction, turn over and profitability are the most
outcome of effectiveness.
3.5 Validity and Reliability
A reliability test is used to assess consistency in measurement items (Cerri, 2012).
Cronbach‘s alpha is used to measure the internal consistency of the measurement items.
Higher Alpha coefficients indicate higher scale reliability. Specifically, Nunnally as cited
in Eze et al., (2008) suggests that scales with 0.60 Alpha coefficients and above are
considered acceptable As shown in the table below, Scale Reliability Cronbach Alphas
coefficients for effectiveness variables range from 0.755 to 0.809. The scale of channel
administration and channel management technology developed in this study also
demonstrates high internal consistency, with a Cronbach coefficient of 0.809 and 0.811
respectively. And the overall Cronbach alpha coefficient for expected-scale items is
0.778. Therefore, the expected scales used in this study demonstrate high reliability
Table 3: Reliability of Variables
Variables Cronbach's Alpha
Coefficients N of Items
Channel Design 0.795 9
Channel Administration 0.809 9
Channel Management
technology 0.811 10
Sales Performance 0.755 9
Reliability of total Scale 0.778 37
Source: Own Computation of Data Survey (2020)
Validity refers to the extent of which a test measures what we actually wish to measure
(Blumberg et al., 2005). The questionnaire was produced from other research paper by
Boontharika Banjongjit (2010), and adapted by the researcher based on the purpose of the
research. Pilot testing allows assessing the questioner ‘s validity and the likely reliability
of the data (Ranjit, 2011). It also enables the researcher to know whether the design of
data collection instruments is successful in meeting the research objectives and in
obtaining meaningful responses. Therefore, pilot test was conducted and this validation
36
was made to get some evidence on whether the content of the items was relevant in helping
to answer the research questions as well as to check the clarity of the questions.
3.6 Data Analysis The data collected is edited, coded and later analyzed using SPSS computer program. The
first-hand data was entered into Ms. Excel and exported to SPSS package. Quantitative
data presented in form of descriptive statistics using mean and standard deviations for
each of the variables used in the study. Correlation and regression technique used to
measure the relationships between the variables of the study. The correlation technique
based on Pearson’s coefficient (+ or – to show the direction of the relationship between
the variables) and significance tested at 95% confidence levels based on two tailed
correlation and significant more than or equals to 0.05. A positive correlation indicates
a direct positive relationship between the variables while a negative correlation indicates
an inverse relationship between the two variables. The regression analysis checks the
adjusted R2 values and significance values to determine the magnitude of the influence
of the independent variables on the dependent variable (Amin, 2005).
3.6.1 Descriptive Statistics
The descriptive part of the statistical procedures includes frequency, mean score values,
and standard deviation. Frequencies, and percentage are used to describe some
important demographic characteristics so as to describe the appropriateness of
respondents in relation to this study.
Mean score values have been used to compare the levels effectiveness of channels on
sales performance. For this purpose, the mean score comparison technique that was
adopted by (Zaidotal & Bagheri, 2009, pp. 338-346) was employed. For a five-point
Likert scale, according to Zaidotal and Bagheri, mean score values of are classified into
three levels of ranges. Table 4 presents the mean score ranges and their level of
description.

37
Table 4: Mean score ranges & descriptions
Mean score Level of description
<3.34 Low
3.4-3.79 Moderate
>3.80 High
Source: (Zaidotal & Bagheri, 2009)
3.6.2 Inferential statistics
In this study inferential statistics has been used for different purposes. One of the purposes
of survey study is to draw conclusion about the population based on sample information.
This study based on 113 sample respondents, draws conclusion on respondents. This
conclusion requires to test whether the sample mean is acceptable to represent the
population mean. Moreover, inferential statistics has been employed to make some
necessary tests to check beforehand whether the data is fit for multiple linear regression
analysis.
Finally, this has been conducted regression analysis to determine how well the
independent variable have accounted for the variance in their respective variables.
3.7 Research Ethics
The application of moral standard to research. Moral standards are principles that reflect
beliefs about what is ethical and what is unethical. More simply, they can be thought of
as rules distinguishing right from wrong First and foremost, the researcher has an
obligation to respect the rights, needs, values, and desires of the informant(s). Participant
observation invades the life of the informant (Spradley, 1980) and sensitive information
is frequently revealed. This is of concern in this study where the informant’s position and
institution are highly visible. The below actions were taken by the researcher to protect
the informant’s rights:
The research objectives prepared verbally and in writing so that they be
understood by the participants,
The informant was informed of all data collection devices and activities,

38
The informant’s rights, interests and wishes considered first when choices are
made regarding reporting the data,
The researcher protects research participants from any harm that may related to
information collection,
The researcher refrain from data cooking/manipulation,
The researcher confidentially shares results,
Participant’s rights to privacy; especially phone call & observational studies,
The researcher had to protect the respondents and himself from the world wide
pandemic, Covid-19, by using necessary protective materials, and obey the
regulation put by the Ministry of Health.

39
CHAPTER FOUR
DATA PRESENTATION, ANALYSIS AND INTERPRETATION
This chapter contains the presentation and interpretation of data collected. Primarily the
data was collected through questionnaires and from secondary sources and these were
discussed mainly using descriptive and inferential statistics. The data collected through
questionnaire were summarized and analyzed using statistical software called Statistical
Package for social science (SPSS). Most of the measurement items were measured in a
five-point Likert-scale types ranging from 1- strongly disagree to 5- Strongly agree.
The analysis of the study was structured and conducted to answer questions by
addressing the objectives of the research. Therefore, the main concern of this chapter is
to analyze and present the data collected on effectiveness of the car sales channels in
Ethiopia.
The reliability and validity test, descriptive statistics of all the variables used in this study
and the results of hypothesis testing i.e. the estimated parameters of the regression
equation, their significance, the connection between the independent variables and
dependent variable according to the sign and the value of the parameters for the regression
model are presented and discussed in detail.
4.1 Questionary Distributed and Returned
The researcher distributed one hundred thirty-eight questionaries, and received one
hundred nineteen. In order to make the collected data suitable for the analysis, all
questionnaires were checked for completeness. All returned incomplete questionnaires
were considered as errors and removed from the survey data and the return rate was 82 %.
The collected data were 5 from company Executives, 40 from Sales Executives, 44 from

40
distributers or channels and 24 from organizational customers. Totally 113 questionnaires
were found to be valid and used for the final analysis.
Table 5 : Summary of questionary distributed and returned
Description Number of
respondents
Respondents in
Percentage
(%)
Questionnaires distributed 138 100%
Questionnaires returned 119 86%
Questionnaires not returned 19 14%
Questionnaires returned but 6 4.35%
Disregarded
Questionnaires used for analysis 113 82%
Source* Own Survey, 2018
4.2 Demographic characteristic of the respondents
It is necessary to analyze the demographic profile of the respondents to validate reliability
of the data collected. Accordingly, the respondents were asked to respond to their
education level, year of experience, and rank in their organizations. The information
processed by SPSS were summarized as follows. So this section presents the respondent
profiles result from 113 questionnaire.
Table:6 Demographic characteristics of the respondents
Variable Category Frequency Percent
Gender
Male 91 81%
Female 22 19%
Total 113 100%
Education
Level
BSC 35 31%
MBA 9 8%
CD 31 27%
Primary 11 10%
None 7 6%
HS 20 18%
Total 113 100%
Years of
Experience
0-5 4 4%
6-10 22 19%
11-15 39 35%

41
16-20 24 21%
21-25 18 16%
26 and
above 6 5%
Total 113 100%
Position
category
CEO 5 4%
Sales
Executives 35 31%
Customer 30 27%
channel 43 38%
Total 113 100%
Source* Own Survey, 2018
4.2.1 Gender analysis of the respondents
The study sought to find out the gender of the respondents. Table 4 shows that 81% of the
respondents interviewed were male while 19% were female. The researcher believes that
the male vs female ratio of the respondents for the research considered both genders in
considering the female enrolment in the Ethiopian situation.
4.2.3 Education level of the respondents
As summarized in the table 6 above, majority of the respondents (47%) were qualified in
first degree, (19%) respondents qualified in college Diploma, 4% were qualified in high
school, and 8% and 7% were qualified in primary school and masters degree respectively.
This is an indication that the majorities of the respondents have bachelor degree which
enables them to provide more reliable information for this study and enable the
respondents to have idea of the objective of the study. The education level of the
respondents is from all level of education and understanding, that helped the researcher to
get adequate and relevant information for the data collection.
4.2.3 Work experience of the respondents
The table 6 depicts the experience of respondents in target business area. Respondents
experience is critical to obtain a wise and objective response. The majority of the
respondents were worked in the sector for 11 to 15 years, comprising 35% (n=39) of the
total participants. Twenty-four (24) respondents i.e. 21 % have been within the sector for
16-20, twenty-two (22) respondents i.e.19% have been 6-10 have been in the sector, and

42
twenty-four (24) respondents have been in the sector for twenty-one and above years. The
respondents have different experience due to their vary experience, thus it helped the
researcher to get reliable and all-round feed back on the enquiry of the questioner.
4.2.4 Job position of the respondents
Participant are from vehicle sales companies, channels & organizational customers. job
position is the variable which was considered in the study mainly from sales companies.
The researcher included the job position in the study to see whether the study included
participants from different level. Different level of respondents help to feed complete
information which the researcher was looking for.
The result from table 6, indicated that the majority of the respondents 38% (n=43) were
channels (people from distributers, or dealers), 31% (n=35) were Sales Executives &
Supervisors, and 27% (n=30) were organizational customers, and 4% (n=5) were company
Executives. In terms of the respondent’s position in the sector, the majority of the
respondents were channels or distributers assigned by the companies. Consequently, the
respondents were appropriate to collect data about channel effectiveness for sales
performance, because they were in a suitable and critical and related position. Besides,
the study was incorporated participants from all levels to see their diversified perceptions
towards the subject matter.
4.3 Analysis of car sales channel effectiveness in Ethiopia
The descriptive statistics that is intended to give general descriptions about the data (both
dependent and independent variables) is presented below. The total number of
observations for each variable was 113. Accordingly, frequency, mean and standard
deviation values of each variable was used so as to show the overall trend of the data.
This section tries to find out the outlook level of the parties on the channels operation
with regards to satisfaction with one another for the sake of the sales performance of
companies. The respondents value judgments were computed using statistical tools such
as mean and standard deviation. The mean indicates the sample group averagely agrees
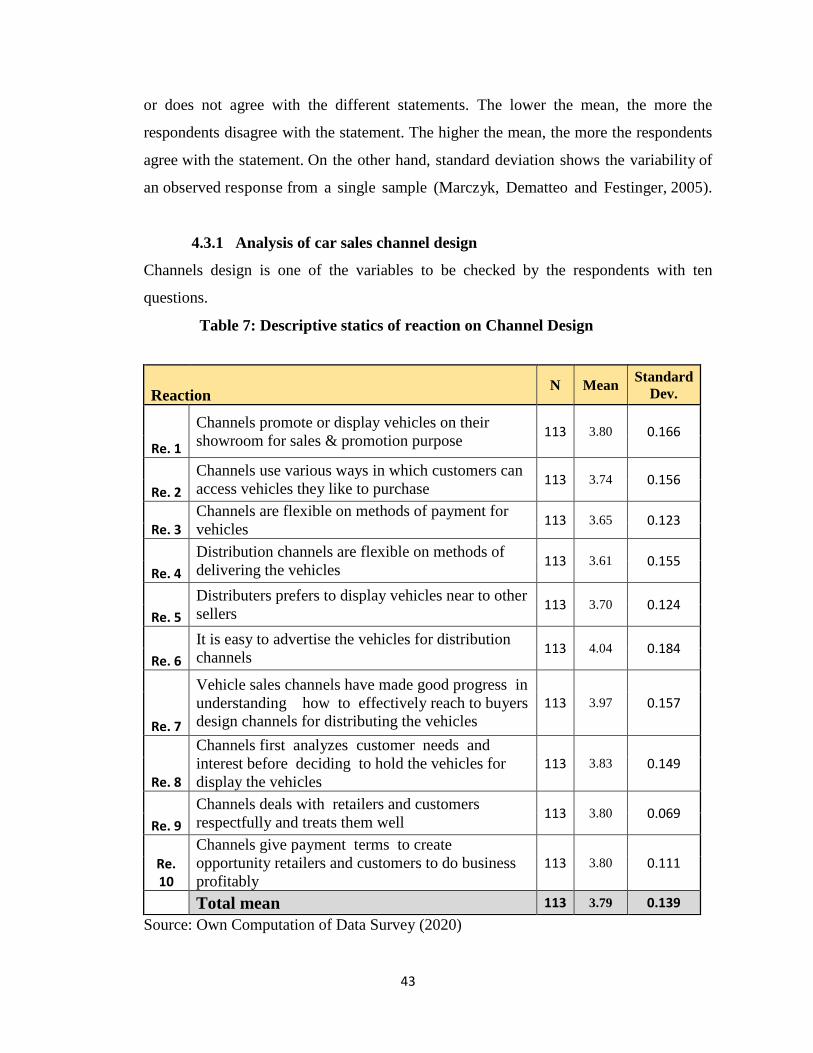
43
or does not agree with the different statements. The lower the mean, the more the
respondents disagree with the statement. The higher the mean, the more the respondents
agree with the statement. On the other hand, standard deviation shows the variability of
an observed response from a single sample (Marczyk, Dematteo and Festinger, 2005).
4.3.1 Analysis of car sales channel design
Channels design is one of the variables to be checked by the respondents with ten
questions.
Table 7: Descriptive statics of reaction on Channel Design
Reaction N Mean
Standard
Dev.
Re. 1
Channels promote or display vehicles on their
showroom for sales & promotion purpose 113 3.80 0.166
Re. 2
Channels use various ways in which customers can
access vehicles they like to purchase 113 3.74 0.156
Re. 3 Channels are flexible on methods of payment for
vehicles 113 3.65 0.123
Re. 4
Distribution channels are flexible on methods of
delivering the vehicles 113 3.61 0.155
Re. 5
Distributers prefers to display vehicles near to other
sellers 113 3.70 0.124
Re. 6
It is easy to advertise the vehicles for distribution
channels 113 4.04 0.184
Re. 7
Vehicle sales channels have made good progress in
understanding how to effectively reach to buyers
design channels for distributing the vehicles
113 3.97 0.157
Re. 8
Channels first analyzes customer needs and
interest before deciding to hold the vehicles for
display the vehicles
113 3.83 0.149
Re. 9
Channels deals with retailers and customers
respectfully and treats them well 113 3.80 0.069
Re. 10
Channels give payment terms to create
opportunity retailers and customers to do business
profitably
113 3.80 0.111
Total mean 113 3.79 0.139
Source: Own Computation of Data Survey (2020)

44
The above table 7 descriptive statistics clearly depicts the corresponding arithmetic
mean of every construct totals (total of every individual categorical construct).
The reaction of all respondents has a mean score o f greater than 3. The easiness of
advertisement by the distribution channel has the highest mean score, 4.04, and the
distribution channels flexibility is the smallest mean score, 3.61, but which still high.
The channels have made progress in understanding how to reach buyers has also the
second high mean score, 3.97.
The main objectives of the channels in display vehicles appropriately for promotion
and payment flexibility have also favorable mean score. In other words, in the
current study indicates from the respondents of the channel design increases and
boosts the business taks and overall performance of the channels and the
companies.
On the subject of channel design, it can be seen from the above table indicates the
majority of the respondents with a mean >3.80 and agree that the job channel design
contribute much to the business of car sales companies.
For the channel design considering objective, selection, tasks and constraints of the
channels the above table shows the respondents are agreement with a total mean of
3.79.
4.3.2 Analysis of car sales channel administration
Table 8: Descriptive statics of reaction on Channel Administration
Reaction N Mean
Standard
Dev.
Re. 1
Vehicle sales companies has good commission
policies in Ethiopia 113 3.60 0.069
Re. 2
There should be good communication between the
vehicles sales companies and their channels 113 3.69 0.119
Re. 3
Vehicle sales companies should frequently train
their channel on customer management 113 3.70 0.097
Re. 4 113 3.78 0.138
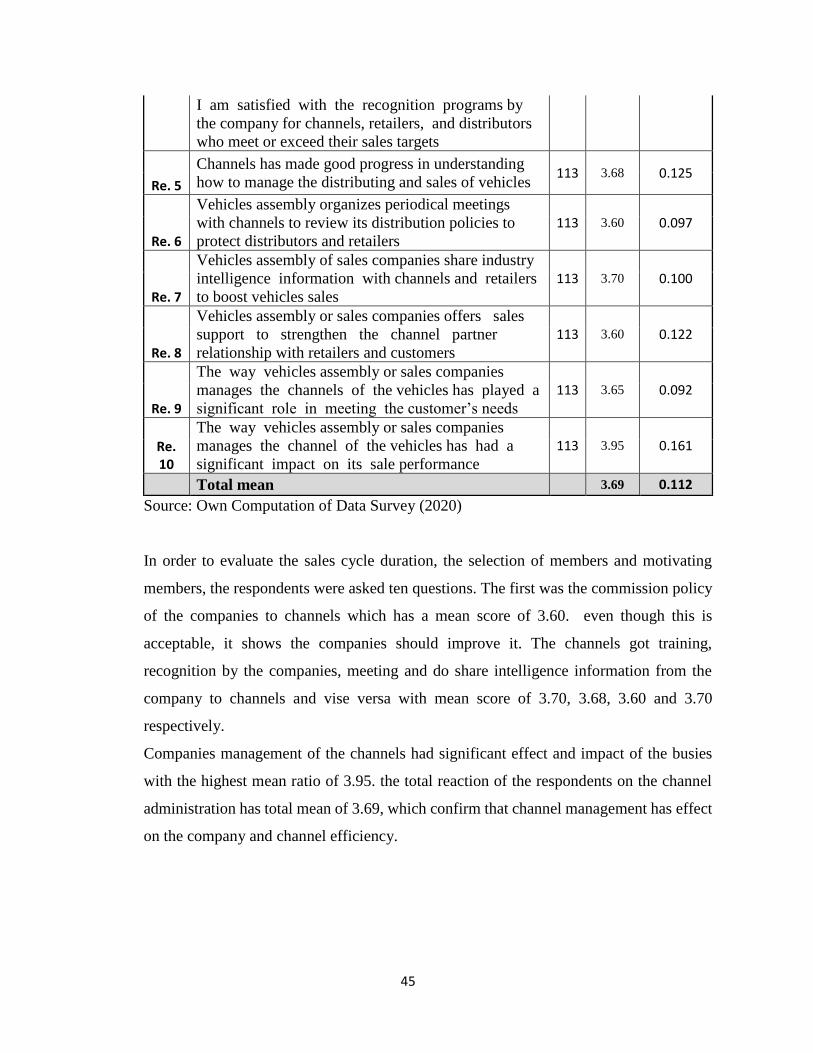
45
I am satisfied with the recognition programs by
the company for channels, retailers, and distributors
who meet or exceed their sales targets
Re. 5
Channels has made good progress in understanding
how to manage the distributing and sales of vehicles 113 3.68 0.125
Re. 6
Vehicles assembly organizes periodical meetings
with channels to review its distribution policies to
protect distributors and retailers
113 3.60 0.097
Re. 7
Vehicles assembly of sales companies share industry
intelligence information with channels and retailers
to boost vehicles sales
113 3.70 0.100
Re. 8
Vehicles assembly or sales companies offers sales
support to strengthen the channel partner
relationship with retailers and customers
113 3.60 0.122
Re. 9
The way vehicles assembly or sales companies
manages the channels of the vehicles has played a
significant role in meeting the customer’s needs
113 3.65 0.092
Re. 10
The way vehicles assembly or sales companies
manages the channel of the vehicles has had a
significant impact on its sale performance
113 3.95 0.161
Total mean 3.69 0.112
Source: Own Computation of Data Survey (2020)
In order to evaluate the sales cycle duration, the selection of members and motivating
members, the respondents were asked ten questions. The first was the commission policy
of the companies to channels which has a mean score of 3.60. even though this is
acceptable, it shows the companies should improve it. The channels got training,
recognition by the companies, meeting and do share intelligence information from the
company to channels and vise versa with mean score of 3.70, 3.68, 3.60 and 3.70
respectively.
Companies management of the channels had significant effect and impact of the busies
with the highest mean ratio of 3.95. the total reaction of the respondents on the channel
administration has total mean of 3.69, which confirm that channel management has effect
on the company and channel efficiency.

46
4.3.3 Analysis of Channel management technology
Table 9: Descriptive statics of reaction on Channel Management Technology
Reaction N Mean
Standard
Dev.
Re. 1
Channels have been provided with technologies to
enable them share, distribute and gather sales
information with customers of their retailers
113 3.56 0.127
Re. 2
Technologies have improved the communication
among channels, and retailers to customers 113 3.72 0.151
Re. 3
Some staff of channels, and retailers have not fully
embraced use of communication technologies to
facilitate sells of vehicles
113 3.60 0.149
Re. 4
Technologies have improved information flow
among Vehicles assembly sales companies’ staff,
and channels
113 4.00 0.214
Re. 5
Technologies have helped to manage inventory
more accurately and quickly reducing stock-outs at
channels hence improving sales
113 3.80 0.210
Re. 6
The IT innovations have increased integration of
vehicles assembly or sales companies and channel
tasks which has improved the cost of selling the
vehicles
113 3.59 0.125
Re. 7
Channels use different public service giving areas
to promote and sell its vehicles 113 3.51 0.104
Re. 8
Channels or distributers use IT to promote and
distribute its vehicles 113 3.51 0.114
Re. 9
The sales technologies used by companies enable
it to analyze the profitability of the vehicles 113 3.70 0.139
Re. 10
Distribution channels optimizes sales by using
social media (Telegram, Twitter, Facebook,
YouTube, etc.) to show the features of vehicles
113 3.68 0.136
Total mean 113 3.67 0.147
Source: Own Computation of Data Survey (2020)
In order to monitor agents, tracking sales, marketing automation and customer
management the respondents were asked ten questions. One of the questions which the
respondents were asked was “technology has improved information flow among parties”,
and the mean was 4.00 which the highest score. Technologies help and manage of
inventory has a mean score of 3.80 which is high.
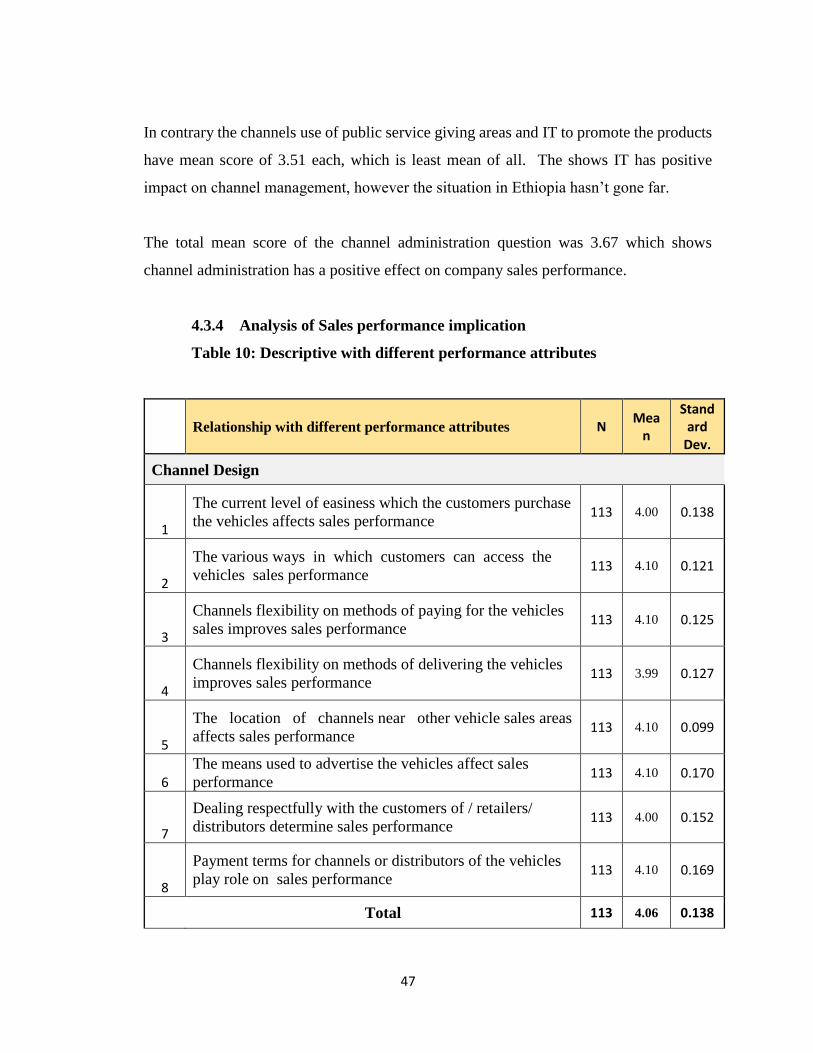
47
In contrary the channels use of public service giving areas and IT to promote the products
have mean score of 3.51 each, which is least mean of all. The shows IT has positive
impact on channel management, however the situation in Ethiopia hasn’t gone far.
The total mean score of the channel administration question was 3.67 which shows
channel administration has a positive effect on company sales performance.
4.3.4 Analysis of Sales performance implication
Table 10: Descriptive with different performance attributes
Relationship with different performance attributes N
Mean
Standard
Dev.
Channel Design
1
The current level of easiness which the customers purchase
the vehicles affects sales performance 113 4.00 0.138
2
The various ways in which customers can access the
vehicles sales performance 113 4.10 0.121
3
Channels flexibility on methods of paying for the vehicles
sales improves sales performance 113 4.10 0.125
4
Channels flexibility on methods of delivering the vehicles
improves sales performance 113 3.99 0.127
5
The location of channels near other vehicle sales areas
affects sales performance 113 4.10 0.099
6 The means used to advertise the vehicles affect sales
performance 113 4.10 0.170
7
Dealing respectfully with the customers of / retailers/
distributors determine sales performance 113 4.00 0.152
8
Payment terms for channels or distributors of the vehicles
play role on sales performance 113 4.10 0.169
Total 113 4.06 0.138

48
Channel Administration
9
Vehicles assembly or sales companies commission policies
led to high affect sales performance 113 4.20 0.143
10
The good communication between the companies, and
channels and retailers affect sales performance 113 3.90 0.120
11
Vehicles assembly or sales companies frequently train
channels, retailers, on customer management to improve
sales performance
113 3.80 0.133
12
Recognizing channels, retailers and distributors who meet
or exceed their sales targets affects sales performance 113 4.00 0.113
13
Vehicle companies sharing vehicles industry intelligence
information with channels, retailers / distributors boosts
sales performance
113 3.60 0.117
14
Sales support offered by companies to strengthen the
channel partner relationship with customers has led to
improvements in sales performance
113 3.80 0.144
Total 113 3.88 0.128
Channel Management Technologies
15
Technologies used by staff of companies to share,
distribute and gather sales information sales performance 113 3.90 0.104
16
Technologies have enabled channels staff, and retailers
to easily reach customers which has improved sales
performance
113 3.80 0.127
17
Technologies have helped to manage inventory
more accurately and quickly reducing stock-outs at
vehicles assembly or sales companies, channels and
retailers hence improving sales performance
113 3.70 0.140
18
The electronic business technological innovations
have increased integration of vehicles assembly or sales
companies and channels tasks which has improved sales
performance
113 3.80 0.122
19
Using social media (telegram, Twitter, Facebook,
YouTube, etc.) to show stories and success of the vehicles
brand sales performance
113 3.80 0.111
Total 113 3.80 0.121
Source: Own Computation of Data Survey (2020)

49
The research questionnaire designed using 5 point likert scale to collect appropriate
responses, in relation to this the respondents indicated the extent they agree with the
statements by choosing: 5- Strongly Agree, 3-Neutral, 2-Disagree and 1-Strongly
Disagree. Based on the response of the respondents. mean computed on the above table
4.12 mean (M) score of 0-1.50 means that the respondents strongly disagree, between
1.5 to 2.50 means they disagree 2.50 to 3.50 means the respondents were neutral, 3.50
to 4.50 means they agree and a mean above 4.50 means the respondents strongly agreed.
The table 10 shows that the channel design attributes on sales performance has
eight questions and the average mean score 4.06, thus all respondents have agreed
that all attributes have effect on the sales performance of vehicles.
The channel admiration attributes has six questions that the respondents were
replied with an average mean score of 3.88, which shows that the channel
administration attributes have effect on the volume of car sales,
The table also shows that the management attributes have five questions which the
average mean score is 3.80 which shows that the channel management has effect
on the volume of car sales in Ethiopia.
Based on the findings on Table 10, majority of sales performance scores an average of
3.80; this implies that the sales performance is highly related to the independent
variables. As is seen on the table 10, channel design, channel administration, and
channel management technology has high effect to low effect respectively.
4.4 Correlation Analysis
The correlation coefficient represents the relatedness of two variables, and how well the
value of one can be used to predict the value of the other. The correlation coefficient r
ranges between -1 and +1. A positive r values indicates that as one variable increase so
does the other, and an r of +1 indicates that knowing the value of one variable allows
perfect indication of the other. A negative r value indicates that as one variable increases
the other variable decreases, and an r of -1 indicates that knowing the value of one variable

50
allows perfect prediction of the other. A correlation coefficient of 0 indicates no
relationship between the variables
This study employs the correlation analysis, which investigates the strength of
relationships between the studied variables. Pearson correlation analysis is used to provide
evidence of convergent validity. Correlations are perhaps the most basic and most useful
measure of association between two or more variables (Marczyk, Dematteo & Festinger,
2005). General guidelines correlations of .10 to .30 are small/weak, correlations of .30 to
.70 are moderate, correlations of .70 to .90 are large/strong, and correlations of .90 to 1.00
are very large. In order to determine the most influencing factor for predicting company
performance relationship between all variables was determined through correlation
analysis before proceeding to regression analysis.
As per Table 11 below, the coefficients show that two of the independent variable channel
design and channel administration are correlated with week positive correlation
coefficient of .224; channel design and Channel management technology are correlated
with very low positive correlation coefficient of .187 which is weak; however, channel
administration and channel management technology are very- very week which is .051.
The table shows that all independent variables are statistically correlated in small or weak
level with each other.
Table 11: Correlation analysis
CD CA CMT SP
Channel
Design
Pearson
Correlation 1 .224 .187 .352
Sig. (2-
tailed) .009 .024 .000
N 113 113 113 113
Channel
Administration
Pearson
Correlation 1 .051 .269**
Sig. (2-
tailed) .295 .002
N 113 113 113 113

51
Source: Own Computation of Data Survey (2020)
Regarding the relationship between the independent variables, the table below clearly
shows that channel design and channel administration statistically significant correlation
with each other with a significance level of p<0.05, the increase in one put positive
influence on the other. The correlation between channel management technology and
channel performance is not significantly significant with p>0.05. The very week
correlation corresponds to a very low relationship between the channel technologies and
company sales performance.
4.5 Regression Analysis
The aim of this research is to examine effect of channel effectiveness on company sales
performance, by investigating the relationship between the determinants factors Channel
design (CD), Channel administration (CA), and Channel management technology (CMT),
with company sales performance (CP) of vehicles sales companies in Ethiopia. The
variables are taken from different papers discussed in the literatures taking into
consideration the availability of data. A multiple linear regression model was used to
determine the relative impact of each independent variable in explaining the influence on
company sale performance. The model of multiple regression of the variables include β0,
β1, β2,… βn and regression coefficients was developed and conducted in the following
form:
CP = 𝛽0 + 𝛽1 CD + 𝛽2 CA + 𝛽3 CMT
Source: Developed for the research
Channel M.
Technology
Pearson
Correlation 1 .025
Sig. (2-
tailed) .395
N 113 113 113 113
Sales
Performance
Pearson
Correlation 1
Sig. (2-
tailed)
N 113 113 113 113

52
4.5.1 Diagnostic Analysis
Before run a multiple regression, analysis diagnostic checking whether multi collinearity
occurs, and the data are normally distributed.
4.5.1.1 Multicollinearity Test
According to Brooks (2008), Multicollinearity occurs when some or all of the independent
variables are highly correlated with one another. If the multicollinearity occurs, the
regression model is unable to tell which independent variables are influencing the
dependent variable. The consequences of multicollinearity are large variances, wider
confidence interval, insignificant t ratio, and high R2 but few significant t ratio. There is
no one unique method to detect the multicollinearity problem, it only has some rules of
thumb, which are high R2 but few significant t ratio, high pair wise correlation coefficient,
and Variance Inflation Factor (VIF) or Tolerance. This study used VIF or Tolerance
method to test the presence of multicollinearity problem in a regression model.
According to Burns and Bush (2003), the VIF is a single number, and a rule of thumb is
that as long as the VIF is less than 10, multicollinearity is not a concern. With a VIF of
greater than 10 associated with any independent variable in the multiple regression
equation, it is prudent to remove that variable from consideration or to otherwise
reconstitute the set of independent variables.
Table 12: Multi collinearity table
Variable T Sig, Collonari statics
Tolerance VIF
Channel Design 3.621 .000 .910 1.098
Channel Administration 2.853 .005 .943 1.060
Channel Management
Technologies -.514 .609 .964 1.037
Source: Own Computation of Data Survey (2020)

53
The value for VIF starts at 1 and has no upper limit. A general rule of thumb a value of 1
indicates there is no correlation, a value between 1 and 5 indicates moderate correlation,
between a given predictor variable and other predictor variables in the model, but this is
often not severe enough to require attention, and a value greater than 5 indicates
potentially severe correlation between a given predictor variable and other predictor
variables in the model. In this case, the coefficient estimates and p-values in the regression
output are likely unreliable.
The p-value for channel design, and channel administration are statistically significant at
the 0.05 level. The researcher can trust this finding, because multicollinearity is within
acceptable levels for the channel design and channel administration. The p-value for
channel management technology is not statistically significant. However,
multicollinearity is high for the variable; so its tests of significance are suspect. Despite
the non-significant test results, the researcher cannot say with confidence that channel
management technology is poor predictors of test score.
The multi collinearity Table-12 of the study above indicates that the value of VIF of all
independent variables is well below 5. The VIF values for each of the predictor variables
channel design, channel administration and channel management technology are 1.098,
1.060, and 1.037, respectively which are moderate correlation and is often not severe
enough to require attention. Generally, it indicates that multicollinearity will not be a
problem in the regression model of the study.
4.5.1.2 Normality Test
An assessment of the normality of data is a prerequisite for many statistical tests because
normal data is an underlying assumption in parametric testing. There are two main methods
of assessing normality: graphically and numerically. The researcher is interested in the
Tests of Normality table and the Normal Q-Q Plots, which the numerical and graphical
methods to test for the normality of data, respectively.

54
Shapiro-Wilk Test
Table 13: Test of Normality table
Kolmogorov-Smirnov Shapiro-Wilk
Statistic df Sig. Statistic df Sig.
Sales Performance .085 113 .045 .978 113 .064
Source: Own Computation of Data Survey (2020)
The above table presents the results from two well-known tests of normality, namely the
Kolmogorov-Smirnov Test and the Shapiro-Wilk Test. The Shapiro-Wilk Test is more
appropriate for small sample sizes (< 50 samples), but can also handle sample sizes as large
as 2000. For this reason, the researcher used the Shapiro-Wilk test as our numerical means
of assessing normality.
If the Sig. value of the Shapiro-Wilk Test, is greater than 0.05, the data is normal. If it is
below 0.05, the data significantly deviate from a normal distribution. As the table shows
the Sig. value is 0.64 which is greater than the 0.05, the sales performance, dependent
variable is normally distributed.
Normal Q-Q Plot
In order to determine normality graphically, we can use the output of a normal Q-Q Plot.
If the data are normally distributed, the data points will be close to the diagonal line. If the
data points stray from the line in an obvious non-linear fashion, the data are not normally
distributed.

55
Figure 2: Normal Q-Q Plot
The same data from the same individuals are now also being analyzed to produce a Normal
Q-Q Plot as below. From this graph, the researcher concluded that the data appears to be
normally distributed as it follows the diagonal line closely and does not appear to have a
non-linear pattern. It is safe in assuming that the data is normally distributed. This means
that at least one of the criteria for parametric statistical testing is satisfied.
4.5.2 Regression Results
The regression model below presents how much of the variance in the measure of
company performance is explained by the underlying variables or predicators of channel
effectiveness (the model).
Table 14: Model Summary
Model R R Square Adjusted
R Square
Std. Error of
the Estimate
Durbin-
Watson
1 .450a 0.203 0.181 0.22994 1.671
Source: Own Computation of Data Survey (2020)

56
The R-squared of the study is .203, which means that 20.3% of the total variation of
company sales performance is explained by the total variation of channel effectiveness
determinants channel design, channel administration, and channel management
technology. Whereas, the adjusted R-squared is .181, which means that 18% of the total
variation of company sales performance is explained by the total variation of channel
design, channel administration, and channel management technology, by taking into
account the number of independent variables and sample size. Although, the remaining
79.7% and 82% of the change is explained by other factors which are not included in this
study model. Both the R-squared and the Adjusted R square values in this study are found
to be sufficient enough to infer that the fitted regression line is very close to all of the data
points taken together (has more explanatory power). R Square is just greater than 20%
which is still enough for reliable conclusions for such data (Cameron Trivedi, 2009; Hsiao,
2007, and Nyamsogoro, 2010). Compared to coefficient of determination or R, Adjusted
R-square is more reliable in measuring a regression model‘s goodness of fit. The main
disadvantage of using coefficient of determination or R-square is more to do with bias of
number of independent variables included into the model, which implies that the more
independent variable added into the model, the more R-square increasing. Worst of all,
this condition does not take into consideration whether independent variable included is
significant or insignificant influencing dependent variable. Meanwhile, that situation were
not applied in the case of using adjusted R-square ((Marczyk, Dematteo, & Festinger,
2005).
The ANOVA
The hypotheses of interest in an ANOVA are as follows:
H0: μ1 = μ2 = μ3 ... = μk
H1: Means are not all equal.
where k = the number of independent comparison groups.

57
μ1, μ, μ3, and μ4 are population data of four groups, Executives, Sales executives,
Channels, and customers respectively which were considered as four groups for
ANOVA test.
In the research, the hypotheses are:
H0: μ1 = μ2 = μ3 = μ4
H1: The means are not all equal.
Table 15: ANOVA table
Sum of
Squares Df
Mean
Square F Sig.
Between Groups .360 3 .489 8.251 .044
Within Groups 6.877 109 .063
Total 7.237 112
Source: Own Computation of Data Survey (2020)
The ANOVA table shows the overall significance/acceptability of the model from a
statistical perspective. As the significance value of F statistics shows a value of 8.251 and
p- value (.044), which is fairly less than p<.05, the model is significant. Therefore, the
researcher refutes the null hypothesis, and the result lends to the hypothesis that there is a
statistically significant difference in the group mean and associated p-value on the data of
effectiveness of sales performance.
According to Table 16 below, the regression standardized coefficients for the three
independent variables, i.e. channel design, channel administration, and channel
management technology are 0.325, 0.251, and -0.045 respectively. Their significance
levels are 0.000, 0.005, and 0.609 respectively. The significant values of channel design,
and channel administration are less than 0.05; it indicates that there is significant
relationship between them and the company sales performance. And these determinant
factors which are perceived to be important in predicting company performance. Since the
significance values of the channel management technology is greater than 0.05 there is no
significant influence in predicting company performance. That is also shows that the

58
channel management technology has small negative influence on the company sales
performance.
Table 16: Regression table
Source: Own Computation of Data Survey (2020)
The developed regression model:
SP = 2.852 + 0.325CD + 0.251CA +(- 0.045CMT)
4.6 Hypothesis Testing
The following section demonstrates the impact of each explanatory variable on
company.
Standardized
Coefficients
BStd.
ErrorBeta
Toleranc
eVIF
(Constant) 2.852 0.298 9.575 0
Channel
design0.152 0.042 0.325 3.621 0 0.91 1.098
Channel
Administratio
n
0.172 0.06 0.251 2.853 0.005 0.943 1.06
Channel
Management
technology
-0.03 0.058 -0.045 -0.514 0.609 0.964 1.037
1
a. Dependent Variable:
Coefficientsa
Model
Unstandardized
CoefficientsT Sig.
Collinearity
Statistics

59
Table 17: Summary of the Research Hypotheses
Hypothesis Result Reason
Ho: Channel design has no
effect on sales performance
Ho: Reject β = 0.321, p<0.05
H1: Accept
Ho: Channel administration has
no effect on sales performance
Ho: Reject β =0.251, p<0.05
H1: Accept
Ho: Channel management
technologies has no effect on
sales performance
Ho: Fail to reject
β =-0.045, p>0.05
H1: Reject
Source: own computation of Data Survey (2020)
Hypothesis testing of the relationship between channel design (CD) and company sales
performance:
HO: Channel design has no significance effect on company sales performance.
Conclusion: According to the regression table result beta is 0.325 and is significant (0.000)
at 95%. The significance level is below the cut-off value we have set (0.05), we reject the
null hypothesis and accept the alternative hypothesis. An increase by 1% of channel design
will result in 0.325% increase on company sales performance, holding other variables
constant.
Hypothesis testing of the relationship between channel administration (CA) and company
sales performance:
HO: Channel administration has no significant effect on company sales performance.
Conclusion: According to the regression table result beta value is 0.251 and is significant
(0.005) at 95%. The significance level is below the cut-off value we have set (0.05), we
reject the null hypothesis and accept the alternative hypothesis. An increase by 1% of
channel administration will result in 0.251% increase on company sales performance,
holding other variables constant.
Hypothesis testing of the relationship between channel management technology (CMT)
and company sales performance:

60
HO: Channel Management Technologies has no significant effect on company
performance.
Conclusion: According to the regression table result beta value is -0.045, and p is 0.609.
The significance level is above the cut-off value, (0.05), and that the researcher fails to
reject the null hypothesis and cannot accept the alternative hypothesis. In short, the
researcher cannot accept the null hypothesis, but only find evidence against it.
4.7 Discussions on Findings
The study was designed and carried out to examine the effectiveness of channel on
company sales performance. As discussed on the introduction part of this study, most of
the Ethiopian car sales companies use different sales channel to distribute the products to
different parts of the country.
This paper has particularly tried to see three factors that have effects on firm sales
performance as proposed by and adopted from the works of Pieterson, 2009.
The regression model was significant and thus reliable for making conclusions and
recommendations (F=8.251; Sig. = 0.044). The most significant predictor of company
sales performance was channel design (Beta= 0.325, t= 3.621, Sig. = 0.000) followed by
channel administration (Beta= 0.251, t= 2.853, Sig. = 0.005). Channel management
technology was found to be an insignificant predictor of company sales performance.
The findings revealed that channel design, and channel administration were strong
predictors of company sales performance whereas channel management technology is
found to be an insignificant predictor of company performance. The research‘s finding
has partial similarity with that of another research Brandenburger & Nalebuff, (1996)
Frazier & Lassar (1996) in that channel design has significant effect on company
performance.
The Channel control or administration result is consistent with Anderson, Lodish, & Weitz
(1987) and Bello & Gilliland (1997) in that of channel control and administration improve
sales of the company. Coelho & Easingwood (2003) positive significant association
between channel cooperation and administration company performance is that Co-

61
operation between partners can help improve the competitiveness of the chain and the
interaction between firms. However, this research result is consistent Morgan and Hunt
(1994), Smith & Barclay (1997) and Bucklin & Sengupta (1993). The results indicate that
even though channel cooperation and administration have a positive impact on company
performance, it is not very crucial.
The unexpected negative but small coefficient of the channel management technology
might happen due to the channels which are in regional cities weren’t satisfied due to the
low network coverage of the country, that may change in future when the network and
digital put in to a better state. The improper management of technology and the presence
of low levels of competition in the channel system may originate positive outcomes on
the channel management technology.
The regression analysis of the current study also showed that there are other factors other
than the ones found to be significant by this study. This is because the adjusted R-square
comes out to be 18.1% implying that the rest 82.9% of company performance is to be
determined by other factors (i.e. other than the ones that come significant in the current
study). This is true in that other researches on the area have come up with many other
factors that influence company sales performance. The conclusion by Matthew, Samuel,
and Patrick (2012) showed that factors like transportation optimization, delivery service
improvement, channel pricing, trading partner collaboration and regulatory compliance as
other means of improving effectiveness of channels and sales performance.
The hypotheses raised at the beginning of the study were also addressed in the analysis.
The researcher accepted two of the hypotheses, Channel design and channel admiration;
and failed to reject one of the null hypotheses Channel management technology. The
findings of the t-test results also showed that the independent factors affecting company
performance have differences among the group of respondents.
The research findings showed that the influence of channel design and channel
administration on the sales performance of vehicle sales companies in Ethiopia are
moderate, positive and significant. The companies apply appropriate channels of
distribution relative to current market trends, basing the distribution channels on the need
to target great value for customers and the use of distribution channel with aim of

62
minimizing cost of distributions. It is, therefore, recommended that the distribution
channel differentiation should be customer/market driven. This would ensure that firm
products and services are accessible at the convenience of their customer thereby
preventing them from incurring extra costs. Lastly, the management of companies should
recognize that out of others channel design and management strategies are ideal strategies
to remain competitive in the industry.

63
CHAPTER- 5
SUMMARY OF FINDINGS, AND RECOMMENDATIONS
This chapter aims to review the findings of the research and conclude the findings with
regard to the objectives of the study to examine the effectiveness of the distribution system
on company sales performance. Recommendation that focuses on how the problem
identified could be addressed was and further research work for future recommended was
included in this chapter. Limitations during study were also included at the end of this
chapter.
5.1. Major Research Findings
The main objective of this study as put at the first chapter of the study is to examine the
effect of channels effectiveness company sales performance of the vehicle sales
companies in Ethiopia by investigating the relationship between the determinant factors
of channel design, Channel administration, and Channel management technology with
company sales performance.
Following the literature review and the results from the empirical research, a number of
conclusions and implications based thereon can be drawn. This section will list the major
findings from the study, draw a conclusion from each finding and provide the implication
of the finding.
a) Major finding 1
From the correlation analysis, the factors (independent variables); channel design, channel
administration, and channel management technology were found out to be correlated with
company sales performance (i.e. dependent variable).
All these three variables are correlated to each other that the impact of the one has some
impact on the other. These are some of the factors or variables that affect the company
sales performance, there are also other factors which are not covered by the researcher but
related to these variables.

64
b) Major finding 2
From the regression analysis, it‘s observed that only two factors (i.e. channel design and
channel administration) out of the three studied independent variables come out to
significantly affect company sales performance. When put in the order of significance
from high to low, channel design, and channel administration affect company
performance.
c) Major finding 3
From hypothesis test it‘s observed that channel management technology has a negative
effect on the company sales performance.
This can be concluded that the IT development of the country is infant stage and the
channels may haven’t started to utilize it and its resources properly.
5.2. Conclusion
Distribution channel means “the chain of business or intermediaries through which a good
or service passes until it reaches the end consumer”. A distribution channel can includes
wholesalers, retailer, distributer and even the internet. Channels are broken in to direct
and indirect forms, with a “direct” channel allowing the consumer to buy the good from
manufacturer, and an “indirect” channel allowing the consumer to buy the good from a
wholesaler. from the project I can conclude that a distribution channel is important factor
for sales of product in a better way as long as its has good channel design and channel
administration. So, every company should maintain a good distribution channel. A
company distribution channels directly affects every other marketing decision. Company
sales force communication decision depends on how much motivation and support its
channel partners need. A company develops or acquires certain new product and may
depend on how well those products fit the capability of its channel members
In general, the study looked at the relationships between the determinant factors of
effectiveness channel design, Channel administration, Channel management technology
on Company sales performance in vehicle sales companies in Ethiopia. From the findings,

65
the relationships between channel design and channel administration with company sales
performance were found to be positive and significant whereas, channel management
technology was insignificant. It also examined the variance in company sales performance
that is explained by the independent variables of channel design and channel
administration. Channel management technology was found to be insignificant predictors
of company sales performance. Channel design was the most significant predictor. The
independent variables combined together accounted for only 20% variance in company
sales performance in the vehicles sales companies in Ethiopia. Other factors affecting
company sales performance is 80%.
5.3. Recommendations
Basing on the results of this study, recommendations are made that can help to improve
performance of vehicle sales companies in Ethiopia. These recommendations do not
solely apply to one company, but to most organizations that are committed to improving
sales performance and company sales performance through effectiveness of the factors of
Channel design, channel control, administration and Channel management technology. In
light of the research findings, the following possible recommendations are forwarded:
From the findings, the regression analysis revealed that the model could only explain
20% in variance of the company performance of vehicle sales companies. The
researcher recommends that a study be carried out comprising of other variables which
were not part of the model to try and predict the company sales performance.
According to the findings, channel design was found to be the major predictor of
company sales performance. In a channel administration has also positive effect on
performance. Once channels have more communication, commitment, and cooperation
with the company, their satisfaction will be increased and also will prefer to
continuously work with the sales companies. In addition, a number of channel
management and administration issues must be addressed. These are the selection,
motivation, training and evaluation of channels members and managing conflict
between company and channel members.

66
According to the findings, relationships between the study variables in sales companies
need to put a lot of attention on the significant relationships between the study
variables on company sales performance as a means of improving the performance of
the company.
According to the findings, channel administration was found to be the second major
predictor of company sales performance of vehicles companies. In today‘s business
world an increased channel management and its network have become an important
source of success and competitive advantage. Vehicle assembly and sales companies’
success cannot be reached from own effort alone; having a good partner in distribution
is very important. Though the company takes great care about choosing the right
distributors or channels.
Due to the increasing importance of the company channel relationship, channel
distribution strategies in supporting and boosting firm sales performance in manufacturing
and distribution sectors, further empirical research works could be carried out to
determine:
Channel design, Channel administration, and Channel management technology
predicted 20% of the variance in company sales performance. Further studies should
establish what other factors explain the variance in company sales performance of
vehicle sales companies in Ethiopia.
The impact of channel management technology on firm’s performance.
Further case studies aimed at other related industries may be useful. Extensions for
managing companies and channel relationship also warrant firm performance.
Companies should consider different situation and carry-out study how to sale their
product or car to the market before select and decide on their channel.
Companies and channels should work closely together to fill the gap between them, and
utilize the IT facilities for good performance and mutual benefits.

67
5.4 Summary
The primary objective of the study was to determine the effectiveness of car sales
distribution in Ethiopia.
Based on the conclusions, implications and recommendations derived from the study,
discussed in Chapter 5, it can therefore be concluded that the results from this study
contribute to the body of knowledge on channels selection, channels motivation, selection,
motivation, marketing theory, consumer decision-making theory (with specific emphasis
on the channels operation, and administration theory) and knowledge and skills of the car
sales in Ethiopia.
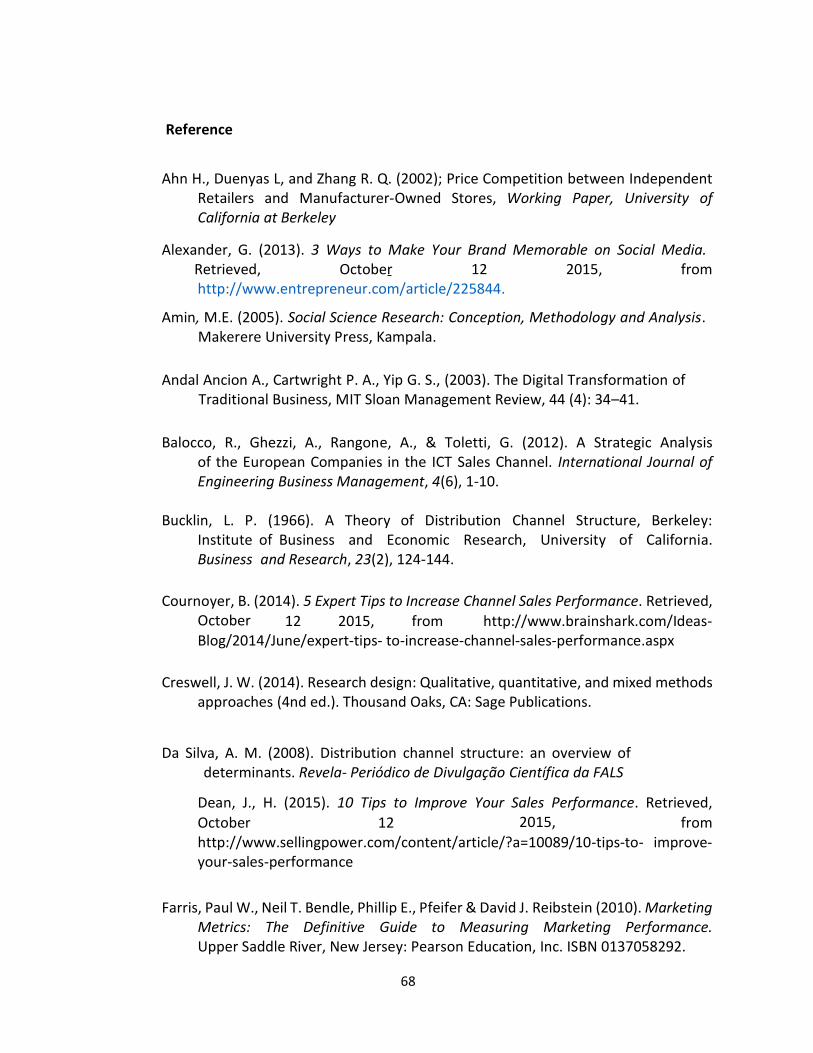
68
Reference
Ahn H., Duenyas L, and Zhang R. Q. (2002); Price Competition between Independent Retailers and Manufacturer-Owned Stores, Working Paper, University of California at Berkeley
Alexander, G. (2013). 3 Ways to Make Your Brand Memorable on Social Media. Retrieved, October 12 2015, from
http://www.entrepreneur.com/article/225844.
Amin, M.E. (2005). Social Science Research: Conception, Methodology and Analysis. Makerere University Press, Kampala.
Andal Ancion A., Cartwright P. A., Yip G. S., (2003). The Digital Transformation of Traditional Business, MIT Sloan Management Review, 44 (4): 34–41.
Balocco, R., Ghezzi, A., Rangone, A., & Toletti, G. (2012). A Strategic Analysis
of the European Companies in the ICT Sales Channel. International Journal of Engineering Business Management, 4(6), 1-10.
Bucklin, L. P. (1966). A Theory of Distribution Channel Structure, Berkeley:
Institute of Business and Economic Research, University of California. Business and Research, 23(2), 124-144.
Cournoyer, B. (2014). 5 Expert Tips to Increase Channel Sales Performance. Retrieved,
October 12 2015, from http://www.brainshark.com/Ideas-Blog/2014/June/expert-tips- to-increase-channel-sales-performance.aspx
Creswell, J. W. (2014). Research design: Qualitative, quantitative, and mixed methods approaches (4nd ed.). Thousand Oaks, CA: Sage Publications.
Da Silva, A. M. (2008). Distribution channel structure: an overview of determinants. Revela- Periódico de Divulgação Científica da FALS
Dean, J., H. (2015). 10 Tips to Improve Your Sales Performance. Retrieved,
October 12 2015, from http://www.sellingpower.com/content/article/?a=10089/10-tips-to- improve-your-sales-performance
Farris, Paul W., Neil T. Bendle, Phillip E., Pfeifer & David J. Reibstein (2010). Marketing Metrics: The Definitive Guide to Measuring Marketing Performance. Upper Saddle River, New Jersey: Pearson Education, Inc. ISBN 0137058292.

69
Gaski, J. F. (1984). The theory of power and conflict in channels of distribution. Journal of Marketing, 9-29.
Harvey, M. G. (1975). Coalition theory and channels of distribution: an
alternative power strategy. International Journal of Physical Distribution, 5(3), 148-156.
Hutt Michael, D., & Speh Thomas, W. (2013). Business marketing management-
B2B. 11.Painos. Canada: South-western, Cengage Learning, 444. Iyer, G., & Villas-Boas, J. M. (2003). A bargaining theory of distribution channels. Journal of Marketing Research, 40(1), 80-100.
James, G. (2011). How Can I Motivate My Channel Sales Partners? Retrieved, October 11
2015, from http://www.cbsnews.com/news/how-can-i-motivate-my-channel-partners/
Katungi, Justus (2015). Newspaper circulation report to the new NMG CEO [PowerPoint slides]. Retrieved from Monitor Publications Limited (MPL) library.
Kotler, Keller & Burton (2009). Marketing Management, Pearson Education
Australia: Frenchs Forest
Krejcie, Robert V. and Morgan, Daryle W. (1970). Determining Sample Size for Research Activities, Educational and Psychological Measurement.
Treace, J. (2012). 5 Simple Ways to Increase Sales. Retrieved, October 12
2015, from http://www.inc.com/john-treace/sales-management-simple-ways-to-increase- sales.html.
Tumwine, S., Omagor, C. & Agaba, G. (2014). Newspaper copy sales and the
performance of the print media in Uganda. International Journal of Management and Business Studies, Vol. 4 (2), pp. 138-150.
Uganda Radio Network (May 13, 2011). Walk To Work. Journalists Slap A Ban On Government Activities Ove rAttacks. http://ugandaradionetwork.com/a/ story.php?s=33664

70
Van Bruggen, G. H., Kacker, M., & Nieuwlaat, C. (2005). The impact of channel function performance on buyer–seller relationships in marketing channels. International Journal of Research in Marketing, 22(2), 141-158.
Vibhash, G. and Lakshmi N. (2008). Sales and Distribution Management in Newspaper Industry. Retrieved, October 12 2015, from
http://www.indianmba.com/Occasional_Papers/OP185/op185.html
Vilaseca-Requena, J., Torrent-Sellens, J., & Jiménez-Zarco, A. I. (2007). ICT use
in marketing as innovation success factor: Enhancing cooperation in new product development processes. European Journal of Innovation Management, 10(2), 268-288.
Vinhas, A. S., Chatterjee, S., Dutta, S., Fein, A., Lajos, J., Neslin, S., & Wang, Q. (2010). Channel design, coordination, and performance: Future research directions. Marketing Letters, 21(3), 223-237.

71
Appendix I: QUESTIONARY
QUESTIONNAIRE
Dear
Respond
ent,
My name is Getahun Kebede. I am conducting research on the effectiveness of distribution channels on the vehicles sales performance for the case of Ethiopia. There are different aspects regarding the distribution channels of the vehicles in respect of which I would like to get your opinion. I kindly request you to spare some time and fill this questionnaire so that I can accomplish this task. I will keep this data confidential and use it strictly for academic purposes only. The questions require filling in short answers or ticking () the most appropriate options. I am grateful for your assistance.
PART I: BACKGROUND INFORMATION Gender of respondent
Male Female
Age of respondent
25-30 years
31-35 years
36-40 years
41-45 years
46 years and above
Level of education
None Primary H/S complete College Diploma 1st or 2nd Degree Phd
Primary
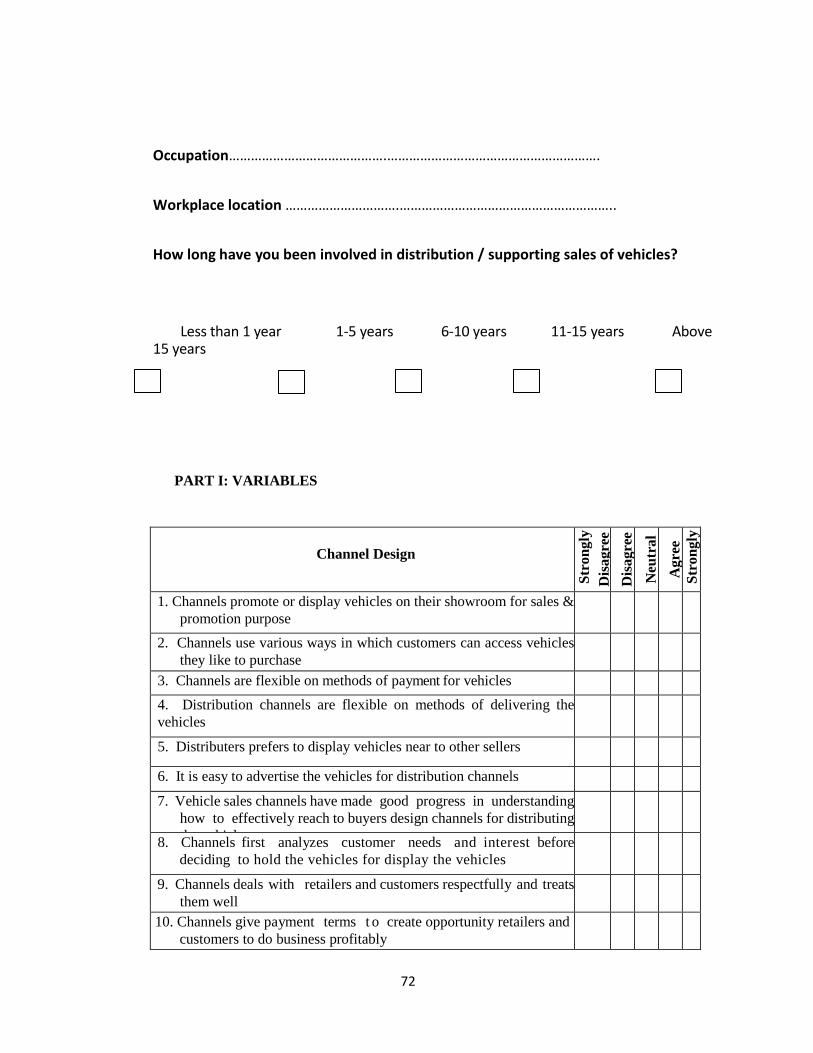
72
Occupation…………………………………….………………………………………………….
Workplace location ………………………….…………………………………………………..
How long have you been involved in distribution / supporting sales of vehicles?
Less than 1 year 1-5 years 6-10 years 11-15 years Above 15 years
PART I: VARIABLES
Channel Design
Str
on
gly
Dis
agre
e
Dis
agre
e
Neu
tral
A
gre
e
Str
on
gly
Ag
ree
1. Channels promote or display vehicles on their showroom for sales &
promotion purpose
2. Channels use various ways in which customers can access vehicles
they like to purchase
likewspaper
3. Channels are flexible on methods of payment for vehicles
4. Distribution channels are flexible on methods of delivering the
vehicles
vehicles
5. Distributers prefers to display vehicles near to other sellers
6. It is easy to advertise the vehicles for distribution channels
7. Vehicle sales channels have made good progress in understanding
how to effectively reach to buyers design channels for distributing
the vehicles
8. Channels first analyzes customer needs and interest before
deciding to hold the vehicles for display the vehicles
9. Channels deals with retailers and customers respectfully and treats
them well
10. Channels give payment terms t o create opportunity retailers and
customers to do business profitably

73
Channel Administration
Str
on
gly
Dis
agre
e D
isa
gre
e
Neu
tra
l
Ag
ree
Str
on
gly
Ag
ree
1. Vehicle sales companies have good commission policies in
Ethiopia
2. There is good communication between the vehicles sales companies
and their channels
3. Vehicle sales companies frequently train their channel on
customer management
4. I am satisfied with the recognition programs by the company
for channels, retailers, and distributors who meet or exceed their
sales targets
5. Channels have made good progress in understanding how to
manage the distributing and sales of vehicles
6. Vehicle companies organize periodical meetings with channels to
review its distribution policies to protect distributors and retailers
7. Vehicle companies share industry intelligence information with
channels and retailers to boost vehicles sales
8. Vehicles companies offer sales support to strengthen the
channel partner relationship with retailers and customers
9. The way companies manage the channels of the vehicles has
played a significant role in meeting the customer’s needs
10. The way companies manage the channel of the vehicles has
had a significant impact on its sale performance
Channel Management Technologies
Str
on
gly
Dis
agre
e
Dis
agre
e
Neu
tra
l
Ag
ree
S
tro
ng
ly
Ag
ree
1. Channels have been provided with technologies to enable them
share, distribute and gather sales information with customers of
their retailers
2. Technologies have improved the communication among
channels, and retailers to customers

74
3. Some staff of channels, and retailers have not fully embraced use
of
communication technologies to facilitate sells of vehicles
4. Technologies have improved information flow among Vehicles
assembly sales companies’ staff, and channels
5. Technologies have helped to manage inventory more accurately and
quickly reducing stock-outs at channels hence improving sales
6. The IT innovations have increased integration of vehicles
assembly or sales companies and channel tasks which has improved
the cost of selling the vehicles
7. Channels use different public service giving areas to promote and
sell its vehicles
8. Channels or distributers use IT to promote and distribute its vehicles
9. The sales technologies used by companies enable it to analyze
the profitability of the vehicles
10. Distribution channels optimizes sales by using social media
(Telegram, Twitter, Facebook, YouTube, etc.) to show the features
of vehicles
Influence of Channel Design on performance
Channel Design
Str
on
gly
Dis
agre
e
Dis
agre
e
Neu
tral
Agre
e
Str
on
gly
Agre
e
1
The current level of easiness which the customers
purchase the vehicles affects sales performance
2
The various ways in which customers can access the
vehicles sales performance
3
Channels flexibility on methods of paying for the
vehicles sales improves sales performance
4
Channels flexibility on methods of delivering the
vehicles improves sales performance
5
The location of channels near other vehicle sales
areas affects sales performance
6
The means used to advertise the vehicles affect sales
performance
7
Dealing respectfully with the customers of / retailers/
distributors determine sales performance

75
8
Payment terms for channels or distributors of the
vehicles play role on sales performance
Channel Administration
9
Vehicles assembly or sales companies commission
policies led to high affect sales performance
10
The good communication between the companies, and
channels and retailers affect sales performance
11
Vehicles assembly or sales companies frequently trains
channels, retailers, on customer management to improve
sales performance
12
Recognizing channels, retailers and distributors who
meet or exceed their sales targets affects sales
performance
13
Vehicle companies sharing vehicles industry
intelligence information with channels, retailers /
distributors boosts sales performance
14
Sales support offered by companies to strengthen the
channel partner relationship with customers has led to
improvements in sales performance
Channel Management Technologies
15
Technologies used by staff of companies to share,
distribute and gather sales information sales
performance
16
Technologies have enabled channels staff, and
retailers to easily reach customers which has improved
sales performance
17
Technologies have helped to manage inventory
more accurately and quickly reducing stock-outs at
vehicles assembly or sales companies, channels and
retailers hence improving sales performance
18
The electronic business technological innovations
have increased integration of vehicles assembly or
sales companies and channels tasks which has improved
sales performance
19
Using social media (telegram, Twitter, Facebook,
YouTube, etc.) to show stories and success of the
vehicles brand sales performance

76
Appendix II: Determining sample Size for a finite Population
Determining sample Size for a finite Population
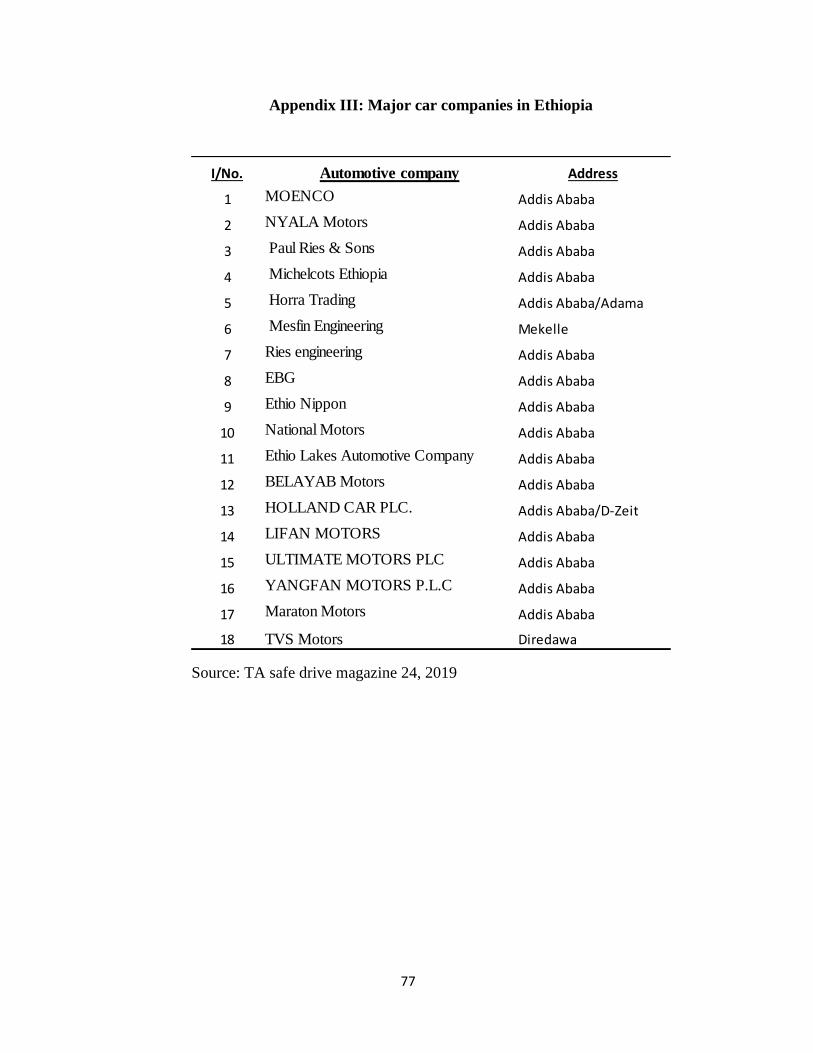
77
Appendix III: Major car companies in Ethiopia
Source: TA safe drive magazine 24, 2019
I/No. Automotive company Address
1 MOENCO Addis Ababa
2 NYALA Motors Addis Ababa
3 Paul Ries & Sons Addis Ababa
4 Michelcots Ethiopia Addis Ababa
5 Horra Trading Addis Ababa/Adama
6 Mesfin Engineering Mekelle
7 Ries engineering Addis Ababa
8 EBG Addis Ababa
9 Ethio Nippon Addis Ababa
10 National Motors Addis Ababa
11 Ethio Lakes Automotive Company Addis Ababa
12 BELAYAB Motors Addis Ababa
13 HOLLAND CAR PLC. Addis Ababa/D-Zeit
14 LIFAN MOTORS Addis Ababa
15 ULTIMATE MOTORS PLC Addis Ababa
16 YANGFAN MOTORS P.L.C Addis Ababa
17 Maraton Motors Addis Ababa
18 TVS Motors Diredawa