THE CASE OF OFFICE DEVELOPMENT IN TORONTO
273
THE CONDITIONS FOR CAPITAL INVESTMENT IN THE REAL ESTATE SECTOR: THE CASE OF OFFICE DEVELOPMENT IN TORONTO lgal Chamey A thesis subrnitted in conformity with the requirements for the degree of Doctor of Philosophy Graduate Department of Geography University of Toronto O Copyright by lgal Chamey 2000
-
Upload
khangminh22 -
Category
Documents
-
view
0 -
download
0
Transcript of THE CASE OF OFFICE DEVELOPMENT IN TORONTO
THE CONDITIONS FOR CAPITAL INVESTMENT IN
THE REAL ESTATE SECTOR:
THE CASE OF OFFICE DEVELOPMENT IN TORONTO
lgal Chamey
A thesis subrnitted in conformity with the requirements for the degree of Doctor of Philosophy Graduate Department of Geography
University of Toronto
O Copyright by lgal Chamey 2000

National Library 1+1 of Canada Bibiiotheque nationale du Canada
Acquisitions and Acquisitions et Bi bliograp hic Services services bibliographiques
395 Wellington Street 395, Ne W m Onawa ON K I A ôN4 OcrawaON K 1 A W Canada canada
The author has granted a non- exclusive licence aliowing the National Lïbrary of Canada to reproduce, loan, distribute or seU copies of this thesis in microform, paper or electronic formats.
n ie author retains ownership of the copyright in this thesis. Neither the thesis nor substantial extracts from it may be printed or otherwise reproduced without the author's permission.
L'auteur a accordé une licence non exclusive permettant a la Bibliothèque nationale du Canada de reproduire, prêter, distribuer ou vendre des copies de cette thèse sous la forme de microfiche/nlm, de reproduction sur papier ou sur format électronique.
L'auteur conserve la propriété du droit d'auteur qui protège cette thèse. Ni la thèse ni des extraits substantiels de celle-ci ne doivent être imprimés ou autrement reproduits sans son autorisation.
A b s t r a c t
THE CONDITIONS FOR CAPITAL INVESTMENT IN
THE REAL ESTATE SECTOR:
THE CASE OF OFFICE DEVELOPMENT IN TORONTO
Doctor of Philosophy 2000
lgal Chamey
Graduate Department of Geography University of Toronto
This study presens an examination of office development in Canada and speclically in the Toronto
metropolitan region in the post-WWII era. The major purpose of this inquiiy is to document and analyze
the spatial patterns of office development produced by real estate devetopers in conjunction with
financial agents. The changing real estate sector in Canada during the last f i i yean provides the
backdrop for this research.
The major argument put forward emphasizes spatial limits that shape the geographic scope of office
development. The heterogeneity of space prompts the production and maintenance of distinctive
surfaces over which office development takes place. The idea of capital switching between circuits of
accumulation is expanded to include switching practices within the real estate sector. This notion is
introduced throug h the concept of 'three dimensions of capital switching'.
In the office development process, one of the major agents is the real estate developer. Developers
perforrn two basic spatial tasks: they 'lock' capital into specific places by engaging in the development
of office buildings, and they either continue to operate in customary locations or switch their operational

preferences between different places. W i i respect to spatial fields of operations, a distinction between
two spatial scales is made.
Uneven conditions experienced by different cities are a major stimulus for variable spatial practices
experienced by developers. Wi i in the Canadian urban system, large developers prefer to invest in
specific top-tier cities, particubrly Toronto and Calgary and to a lesser extent in Montreal and
Vancouver. The preferences of developers indicate that office development is spatially selective and
based on specific regional and local conditions.
At the intra-metropolitan level, uneven conditions resut in a distinct spatial division of labour among the
developers of office buildings. Office development in the Toronto area illustrates the ability of
developers to pursue development in paiücular settings. Their practices result from compatibility with
particular environments and with specific societal arrangements. This in tum produces and reproduces
territories that are conceptualized as office development districts.
iii

Acknowledgements
In sober-mined retrospect, when I arrived in Toronto in August 1996,l did not fully realize the scale and
scope of punuing the Ph.D. quest. In punuing this enonous task, I was very fortunate to have
tremendous help and constant caring and nourishing without which t could not have managed. I was
fortunate to have an outstanding supewisor and a very supportive committee that enabled me to
complete this project in four-years. I was also able to take full advantage of the excellent living
environrnent and educational facilities in the City of Toronto, and the resources of the University of
Toronto.
I am deeply grateful to my Ph.D. supervisor. Professor Gunter Gad, for his support.
professional guidance, and his generous nature. His caring and mindful attendance were essential for
the completion of this project. Gunter has been professional anchor and friend throughout my Ph.0.
program and I feel fortunate to have been able to work with him.
I would also like to thank my PhD. committee memben, Professor Lany Boume, Professor
Robert Lewis and Professor Susan Ruddick, for their interest, suggestims, and constructive
cornments. Their input and support are deeply appreciated. Professor Ted Relph provided direction in
the earlier stages on this dissedation for which I am grateful. I owe particular thanks to Professor Anne
Haila of the University of Helsinki for acting as extemal examiner, and for her very strong interest in my
research. Also, I have thanks to Professor Pierre Filion of the University of Waterloo for agreeing to be
on the final examination committee.
I would like to thank the Department of Geography at the University of Toronto that hosted me
for four years and provided me with scholarships and teaching opportunities. Also, I am thankful for the
staff that rnake this department such a pleasant place to study in. In particular, I am grateful to
Marianne Ishibashi and Donna Jeynes for their willingness to help and their good spirit.
I would like to thank the people who agreed to be interviewed for this research and shared with
me their thoughts and ideas, and to Mark Knowles and Dean April of Royal LePage Commercial Inc.
for their assistance in the process of data collection.
Finally, I would like to thank Professor Amiram Gonen of the Department of Geography at the
Hebrew University of Jerusalem who encouraged me to widen my horizons and pursue a Ph.D.
program abroad, and for his ongoing interest in the progress of my research. Professor Bryan Massam
of York University provided me with moral support in rny first two years in Toronto. Most of all, I would
like to thank my family for al1 of the support they have provided over the years.

Table of Contents
Abst ract
Acknowledgements
Table of Contents
List of Tables
List of Figures
INTRODUCTION
THEORlZlNG OFFICE DEVELOPMENT
Principal Approaches 1 .l. 1 Neo-classical approaches 1 .1.2 Political economy approaches 1 .1.3 Institutional approaches
Components of the Real Estate Development Process 1.2.1 Building cycles and their spatial aspects 1 -2.2 Financial institutions and real estate development 1 -2.3 The state and real estate development 1.2.4 Real estate developers
Steps Toward a Theory of Office Development 1 -3.1 The intrinsic dynamic of real estate capital 1.3.2 The 'three dimensions of capital switching' 1.3.3 Reciprocal relations: Real estate and other capitals
A Provisional Framework
xiii

2 RESEARCHING OFFICE DEVELOPMENT IN TORONTO: CONTEXT, APPROACH, METHODS, AND DATA
Context: The Conditions for Office Development in Toronto 2.1 .1 Population and employment growth 2.1.2 Municipal organization 2.1.3 The planning system 2.1.4 Taxation 2.1.5 General development issues 2.1.6 Office users in the Census Metropolitan Area 2.1.7 The scope for office development
The Research Process and the Use of Realist Method
Data of lnterest and Data Collection 2.3.1 Extensive data 2.3.2 Intensive research
THE CHANGING CANADIAN REAL ESTATE SECTOR
The Trajectory of Commercial Real Estate Companies in Canada 3.1 -1 Office development in the first half of the twentieth
century 3.1.2 The formative era of modem developers:
Entrepreneurial skills and 'extemal' capital 3.1.3 The golden era of office development: Expansion and
the establishment of real estate powerhouses 3.1.4 The institutionalization of the real estate sector and
the emergence of new entrepreneurs
Canadian-Based Real Estate Companies and Office Development in the United States
Office Development and Foreign lnveston in Canada
ldentifying Primary Office Developers and Owners in the Toronto Area
Unpacking Real Estate Developers

4 FlNANClNG OFFICE DEVELOPMENT AND THE ROLE OF FIN ANCIAL INSTlTUllONS 99
The Configuration of the Canadian Financial System and the Financial Arrangements in the Real Estate Sector 101
Sources of Financing Office Development: The Developer's Perspective 1 06 4.2.1 Olympia & York: Social networks, ingenuity and the
provision of financing 1 08 4.2.2 Corporate sire and real estate financing 110
Financial lnstitutions as Investors in Office Buildings and as Developers 112 4.3.1 Banks and office development 114 4.3.2 Life insurance companies and office development 118
The Spatial Practices of Office Development and Ownership by Financial Institutions 122 4.4.1 Banks 123 4.4.2 Life insurance companies 126
The Spatial Limitations of Real Estate Capital 130
Financing and Financial Institutions: Concluding Remarks 1 33
THE THREE DIMENSIONS OF CAPITAL SWITCHING: LARGE CANADIAN REAL ESTATE COMPANIES AT THE NATIONAL SCALE 136
Switching Between Modes of Operation 138
Switching Between Property Types 140
Switching Between Locations at the National Scale 144 5.3.1 The geography of office building cycles in Canada 145 5.3.2 Office building cycles in Toronto and Calgary 150

Three Dimensions of Capital Switching and Building Cycles: Two Case Studies 5.4.1 The Trizec Corporation 5.4.2 Cadillac Fairview Corporation
Capital Switching and Real Estate Companies
FROM KING AND BAY TO MEADOWVALE: TORONTO'S OFFICE BUILDINGS AND OFFICE D
Preliminaries: Office Building lnventory and Spatial Frame of Reference
Toronto's Office Stock: A Synopsis
Office Districts in Toronto 6.3.1 The Financial District 6.3.2 Downtown and Midtown 6.3.3 Suburban Downtowns 6.3.4 Office Parks
Sequential Cycles of lnvestment within the Metropolitan Realm
The Changing Character of Toronto's Office Stock
THE SPATIAL PRACTICES OF OFFICE DEVELOPMENT COMPANIES AND OFFICE DEVELOPMENT DISTRICTS IN TORONTO
Spatial Selectivity among Real Estate Companies in Toronto 7.1 .1 Cadillac Fairview Corporation 7.1.2 lnducon Development Corporation
Office Development Districts
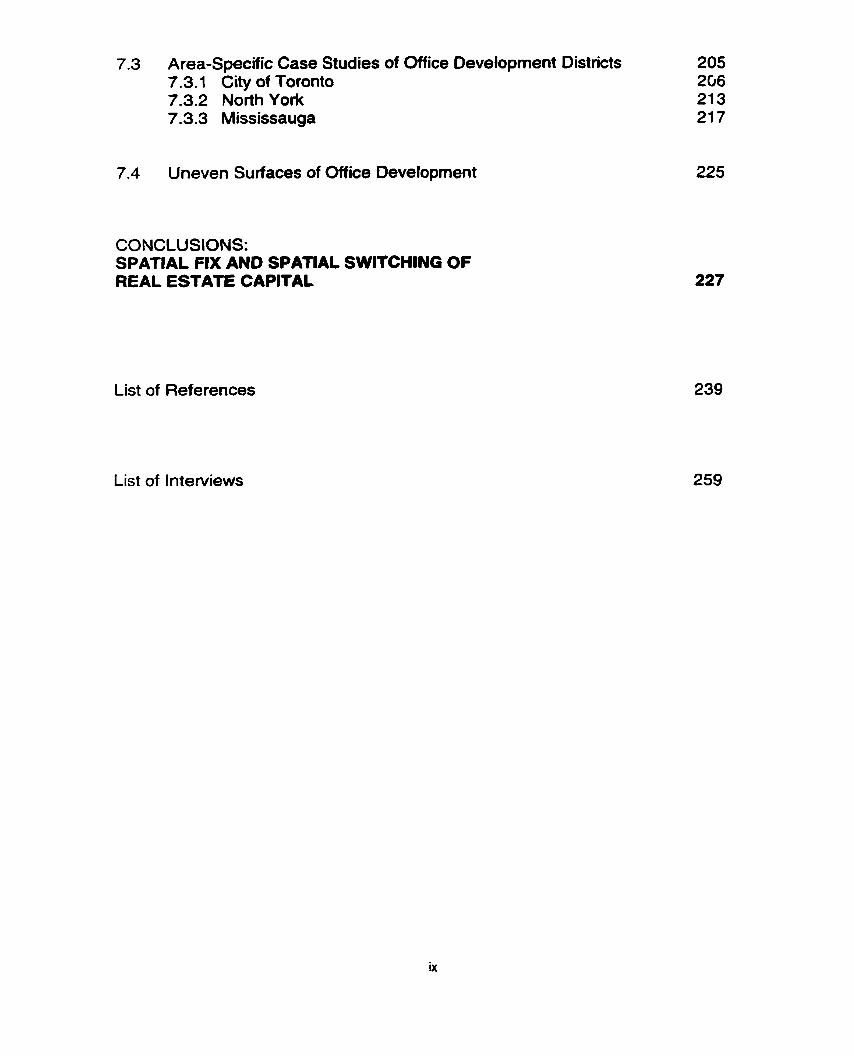
7.3 Area-Specific Case Studies of Office Development Districts 205 7.3.1 City of Toronto 206 7.3.2 North York 21 3 7.3.3 Mississauga 217
7.4 Uneven Surfaces of Office Development 225
CONCLUSIONS: SPATIAL F1X AND SPATIAL SWlf CHlNG OF REAL ESTATE CAPITAL
List of References
List of Interviews

Table
Type of data available on office building permits and office floor-space
List of interviews
Major themes and questions in interviews
The weight of the real estate sector in the Canadian econorny, selected years, 1 966-96
The largest (publicly held) Canadian-based owners of real estate assets, selected years, 1971 -99
A profile of the largest Canadian-based reai estate companies in their initial phases
The largest real estate investment trusts in Canada, 1999
Office portfolios of Canadian-based real estate companies in Canada and the U.S., selected yean, 1976-99
The largest owners of office space in the Toronto area, selected years, 1971 -99
Debt-to-equity ratio, al1 industries and real estate, selected years, 1971 -96
Banks involvement in the development and ownership of their head offices in Toronto
lnvestment of Canadian life insurance companies in real estate and mortgages, selected years, 1950-98
Bank of Nova Scotia and office developrnent joint ventures
ClBC Development Corporation and Royal Bank's owned office portfolio, 1 998, 1 999
Major developments by Canada's largest life insurance companies (for income-producing purposes), late 1970s to early 1990s
Office buildings developed by Manulife Financial for income-producing purposes, 1960s ta 1980s
x
Paae
60
66
67
71
73
76
83
85
94
1 O?
115
119
1 24
1 25
128
129

Table
Spatial distribution of Manulife Financial real estate portfolio, selected years, 1960-99
Major switching practices of selected large real estate companies (by property type)
The largest owners of office space by the location of their Canadian office portfolio, selected years, 1975-99
The growth of office space in Toronto and Calgary, selected years, 1978-99
The Canadian office portfolio of Trizec, selected years, 1968-99
The Canadian office portfolio of Cadillac Fairview, selected years, 1 968-99
A typology of office districts in the Toronto CMA
The growth of office space inventory in the Toronto CMA. selected years, 1954-99
Additions of new office space in the Toronto CMA, selected yean, 1954-99
Average size of newly constructed office buildings in the Toronto CMA, 1 954-99
Average densities of office buildings in Metropolitan Toronto, 1991
Physical characteristics of office buildings in selected districts in the Toronto CMA, 1999 179
The inventory of office space in Toronto's Financial District, selected yean, 1961 -99 181
The inventory of office space in the Suburban Downtowns, selected years, 1976-99 1 84
The inventory of office space in Office Parks in the Toronto CMA, selected years, 1 971 -99 186
Additions of new office space along the Don Valley corridor, selected years, 1 961 -99 190
Paae
133
Table
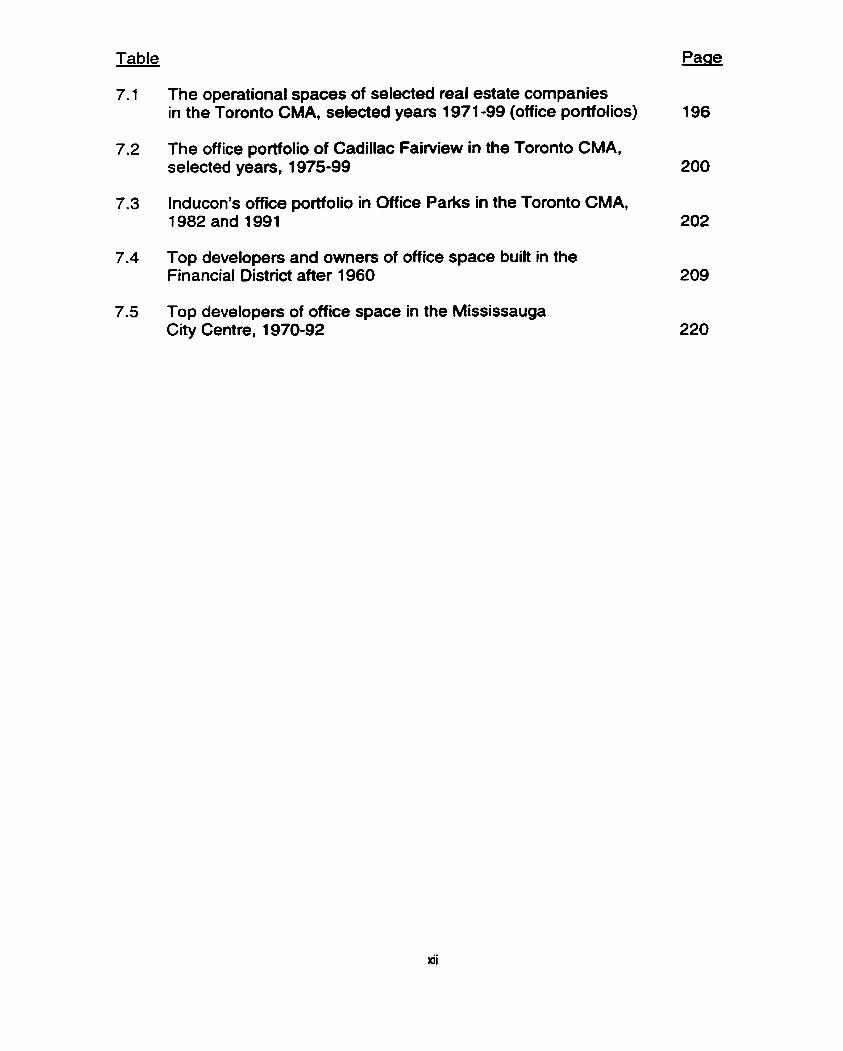
7.1 The operational spaces of selected mal estate companies in the Toronto CMA, selected years 1 97 1 -99 (office portfolios) 196
7.2 The office portfolio of Cadillac Fairview in the Toronto CMA, selected years, 1975-99 200
7.3 Inducon's office portfolio in Office Parks in the Toronto CMA, 1 982 and 1991 202
7.4 Top developers and owners of office space built in the Financial District after 1960 209
7.5 Top developers of office space in the Mississauga City Centre, 1 970-92
List of Figures
Paae
Downtown and north-south corridor office devetopers in the Toronto CMA
Suburban office developers in the Toronto CMA
Toronto Census Metropolitan Area
Connections between financial capital and real estate developers
The three dimensions of capital switching in Canada
Value of office building pennits in Canada, 1961-99
Value of office building perrnits in Ontario and Quebec, 1961 -99
Value of office building permits in British Columbia and Alberta, 1 961 -99
Net New supply of office space in Toronto and Calgary. 1969-99
Major office concentrations in the Toronto Census Metropolitan Area
By the end of the twentieth century, office buildings had become the most prominent structures in many
of the large rnetropolitan areas of the world. Office buildings are part of the iconography of the
metropolis: the Empire State and Chrysler Buildings in New York, the Sean Tower in Chicago, the
Transarnerica Building in S2n Francisco, or the Fint Canadian Place and the Toronto-Dominion Centre
in Toronto. A Toronto-based development company, Olympia 8 York, and its office mega-project,
Canary Wharf in London, England, provided the greatest spectacle of real estate promotion and
subsequent collapse in the M decade of the twentieth century. However, skyscrapen and mega-
projects like Canaiy Wharf are high profile elernents that mask a vast amount of less conspicuous and
rarely publicized office developrnent.
Office development has been uneven in space and time. There have been several cycles of
office development in the twentieth century, bu? in ternis of magnitude, the boom of the 1980s was
unprecedented. In some cities, such as Houston, Texas, more office floor-space was built in this one
decade than in the preceding f i yean. Although the 1980s boom drew a lot of attention to global
cities (Sassen, 1991, 1994) and to office development in cities like London (e.g., Diarnond, 1991;
Zukin, 1 992; Fainstein, 1994; Pryke, 1994a) and New York (Zukin, 1992; Fainstein, 1994), there have
been many other cities where office development was prominent and attracted the attention of
researchers. For instance, the booms in office development in Houston (Feagin, 1987, 1988), Dublin
(MacLaran, 1 993, 1996), Nottingham (Btyson, 1990, 1997), Melbourne (Beny, 1994), or Auckland
(Moricz and Muiphy, 1997) and the research they generated can be rnentioned. However, across
regions and urban systems and within large cities, office devebpment has been uneven.
In order to understand uneven temporal and spatial development of the urban fabric in general,
and office development in paiticular, many researchen have drawn on Harvey's (1982,1985) theory of
capital switching between pnmary and secondary circuits of capital accumulation, and his notion of
capital switching between places (Beauregard, 1991, 1994; Haila, 1991 ; Pryke, 1994a, 1994b).
However, the notion of time scale under investigation is essential in the analysis of the built
environment. Harvey's research on capital accumulation focused on long-terni history; however, other
scholars such as Feagin (1 987) and Beauregard (1 991, 1994) were interested in shorter periods and
as a result conclusions about switching practices are different from these proposed by Harvey.
Harvey's conceptualizations have also implicated finance capital in the process of the
production of the urban fabric, and as suggested by Warf (1994, p. 325) 'Yinance capital is not some
passive actor in the construction of hndscapes, but an adive participant wilh a bgic of its ownn. Some
limited research has punued this avenue as far as offce development is concemed (Feagin, 1987).
Othen have not oniy considered the role of finance capital as an intennediaiy, but also as a direct
participant in office development as financial institutions becarne developers and owners of office
buildings (Des Rosiers, 1 984; MacLaran, 1 986; Lindahl, 1 997). It has also been suggested that the role
of financial institutions as lenden-usen and as ownen-uses might converge, and these institutions
force their locational preferences on office development patterns (Piyke. 1994a. 1994b; LUieri et al..
2000). Another strand of research has argued îhat real estate devebpers have ernerged as large-scale
companies. and become multinational corporations with far-flung projects (Beauregard. 1989; Feagin
and Parker, 1990; Sudjic, 1992; Knox, 1993, Logan, 1993; Olds, 1995; Beauregard and Haila, 1997).
However, the literature on the uneven development of the urban fabric is not as straightforward as this
paragraph may indicate.
The notion advocated by Zukin (1992) and Knox (1993) that real estate developen have global
reach that enables them to engage in development across regions with-in one country and beyond, and
that real estate capital has limitless scope is somewhat extrente and should be questioned. Urban
space is neither flat nor featureless. It has a highly articulated and changeable surface (Harvey, 2000).
Institutions and sets of individuals are grounded in local settings. They respond to these specific
settings and reproduce them, thereby contributing to the pennanently uneven structure of urban space.
Indeed. several authon have argued that office development takes place in very specific historic and
geographic settings as a result of the juxtaposition of specific requirements (Pryke, 1991, 1994a,
1 994b; Beauregard, 1 993; Ball, 1994; Leitner, 1994).
Office developrnent in Canada
The configuration of the real estate development sector in Canada is an outcome of two parallel
processes. At the macro scale, historical shifts in strategies of accumulation have resuhed in a number
of changes. Entrepreneurial developen were the prominent agents of change at the fint phase of the
development of the Canadian commercial real estate sector; largexale development companies
shaped office development in a later stage, and rnost recently, financial institutions became the most
important agents in the real estate sector. In the short nin and in ternis of ongoing process, real estate
companies aiming to grow or to stay afloat have employed capital and spatial switching practices.
There have been several office development cycles at the national level in the last f i i years,
and major urban areas were affected differently by them. Office developen have taken advantage of
these cycles and have produced an extraordinary amount of office space in Canada's largest cities.
Two cities stand out in tems of office development booms: Calgary in the late 1970s, and Toronto in
the 1980s. Toronto is Canada's largest urban area mth by far the largest office floor-space inventoiy
(145 million square feet in 1999 or 40 percent of the national office stock), and Calgary has the third
largest office stock (42 million square feet in 1999). Toronto experienced consistent rates of growth in
office space Mi le Calgary had abrupt cycles of office development. To put the 1980s boom in
perspective: in each post-WWII decade, office fbor-space doubled in Toronto. Between 1981 and
1991, this doubling meant an increase from about 74 to 142 million square feet of floor-space, which is
almost the inventory of Montreal (the city with the second hrgest o f tm inventory, 80 million square feet
in 1999) and about the combined 1999 inventoiy of office space in Vancouver, Edmonton, Halifax and
Winnipeg (68 million square feet). On the other hand. Calgary's history shows an impressive boom in a
very short penod: office space more #an tripled between 1978 and 1982 (from 8 to 28 million square
feet).
Office development within the Toronto metropolitan region has been highly uneven. The towers
of the socalled Financial District are a relatively minor part of a highly articulated landsape of office
buildings and office districts. These districts include several distinct inner city areas, suburban
downtowns, and a variety of office paiks. These districts are diierentiated by the age and size of office
buildings, by development densities, and also by the physical, economic, and social fabric in which
office buildings are embedded. Canadian and especially Toronto-based companies developed almost
al1 of Toronto's office space.
Within the Toronto region, most real estate companies have very specific fields of operation.
Figures 1 and 2 show the different operational spaces of selected development companies in the
Toronto Census Metropolitan Area (CMA, Statistics Canada definition of a metropolitan region).
Cadillac Fairview and Olympia 8 York, two of the largest real estate companies in Canada. operated
mainly in downtown Toronto. Marathon and Bramalea, smaller real estate companies, operated along
Toronto's traditional North-South high-income sector. Other developers, such as Inducon, Menkes,
Orlando, and Shipp, operated only in selected suburban municipalities. The broad picture of office
development in Canada suggests that office development is not only uneven, but also carried out by
agents with highly focused geographic preferences. Developen operate in highly specific locations.
Knowledge of particular places and local opportunities encourage developers to be very selective.
The major issue to be addressed in this study is the relationship between the conditions of
developrnent. and the response to these conditions by specific types of agents who produce the built
environment, especially office buildings and office districts.


Office development in the cities of the Canadian uban system, particulaily within the Toronto Census
Metropolitan Area between 1950 and 2000, is the arena to be investigated. The following paragraphs
outline briefly the major thesis, the approach, the specific research methods used, and the types of
data collected. A final paragraph outlines the organizaton of the thesis.
Thesis
The core of the thesis maintains that office development is spatially uneven, because capital requires
spatial unevenness to create oppominiaes for future aaumulation, and because the practice of
development faces important spatial barriers. F i e components of the thesis contribute to distinct sub-
arguments. Together, they describe the pradice of office development and support the core thesis.
1. Capital switching between primary and secondary circuits of capital accumulation is difficuk to track.
and it may be a phenomenon that is l e u important than some authois suggest. Instead, my focus is on
the real estate sector which has an 'intnnsic dynamic' (Haila. 1991). This intnnsic dynarnic can be
conceptualized as the Yhree dimensions of capital switching' within the real estate sector. This
switching can occur between modes of operation, property types, and locations.
2. The built environment consists of physically discemible structures and the parcels of land they stand
on. These real estate properties are by definition immobile and represent capital investment in concrete
and fixed assets. However, capital is also elusive and nomadic; the 'globalkation hypothesis' with
regard to real estate development relies on this guality (Berry and Huxley, 1992; Olds, 1995). The
development, and the ownenhip, of real estate properties has become increasingly 'delocalized' and
may be detennined by forces beyond the city's boundaries (Savitch, 1995; Beauregard and Haila,
1997; Baum and Liiieri, 1998, 1999). There seems to bel therefore, a paradox or an inherent
contradiction between immobile properties and mobile capital. This contradiction can be reconciled by
scrutinizing the reciprocal relationship between the abstract nature of capital and its concrete
manifestation. On the abstract level, capital is intangible, a restless element of the global financial
markets. Nevertheless, capital invested in real estate assets has to be fixed in definite places, at least
for a limited period of time, thus fumishing capital concemed with office development with a spatial
specificity.
3. Real estate investment, and especially real estate development. is fundamentally a local business.
This 'local dependence' (Cox and Mair, 1988. 1989) means that real estate development has to build

on local knowledge and local conditions. Unifom and perfect knowledge across space is unlikely to be
attained, thus, developen have to decide where they want to put their development efforts. To be well
inforrned and obtain valuable information, developers need to be well connected in their operational
environment. Developers with spatially diverse interests have to familiame thernsehres in the local
arenas in which they invest. This also implies that they negotiate with a variety of local interests,
including specific local govemrnents.
4. Real estate development, including office development, is cyclical. In the case of office development,
cycles are not identical across regions or across the Canadian urban system. Spatial differences in
building cycles encourage soma developen to take advantage of opportunities that are created by
uneven conditions.
5. Finance capital is essential for real estate development, and especially for office developrnent. The
relatively large amounts of rnoney needed, the longevity of office buildings, and the gradua1 strearn of
revenues require that office developen bonow heavily. While flows of money may be flexible in theory,
they tend to be spatially concentrated in practice. Like the developer, the financial institution needs to
know the specific urban conditions in order to assess nsk and avoid undue exposure.
Approach, methods, and data
The approach adopted in this research rests on the political economy perspective. This approach
explains social and economic processes through the investigation of structural conditions, which
include the state and financial institutions as major components in the urban developrnent process. A
political economy approach does not necessarily exclude the juxtaposition of structure and agency.
The acknowledgement of structure and agency is essential in order to explain a process, which is
highly influenced by individuals interpreting structural and local conditions. The theoretical contribution
of this thesis is pnrnarily through ce-conceptualizing and re-interpreting the nexus between structure
and agency in the particular sphere of real estate development.
The realist method as developed by Sayer (1984) is used as a critical tool in this research. This
methodology assigns the agent a critical role in reproducing structure, and it combines necessary and
contingent conditions in expiainhg events. The multiplicity of events, mechanisms, and structures,
provides a useful framework for the anaiysis of real estate and office development.
Office development is not strongly theorized. Harvey provides a general frarnework for the
analysis of the built environment, but in his level of abstraction he under-emphasizes the specific

charaderistics of each part of the buiit environment and the agents that reproduce the structure in
which new rounds of development take place. At the m e time, day-today concepts like 'developer'
are only vaguely defined. One way to analyze real estate development is through 'structures of building
provision' (Ball, 1986). This method of anaiysis suggests that each development is the end result of a
variety of social agents and mediating institutions. To be able to interpret office development as a
particular segment in the buin environment means that exact definitions of the process and the agents
are necessary. Sayer suggests that in a world that is stratified and differentiated, complex relationships
need to be 'unpacked'.
The realist approach emphasizes exact definitions of concepts and wams against the notion of
'chaotic conceptions', in which objects are grouped into categories that have little or no intemal logic or
structural interaction. The idea of using exact definitions is crucial in the realm of office development.
since the dynamic nature of this sector and the fact that in the process of development, a number of
different agents are involved. These agents are ditficuit to categorke, because the functions they
perfonn and the roles they play can be combined in different ways at different times. Hence, to
understand office development, the use of well-defined concepts and the unpacking of everyday ternis
are necessary to provide a sense of clanty.
The term 'real estate developer', commonly used by joumalists, real estate industry
professionals, govemment agencies, and academics, is a 'chaotic concept'. Academic writing
considers the real estate developer as a key agent in the development process, but does not offer a
consistent definition. The developer is sometimes conceived as the catalyst of development. This agent
initiates, coordinates, manages and brings the development from the stage of concept to the point of
completion (Marriott, 1967). Harvey (1985) uses the tenn 'speculativedeveloper, based on the idea
that a developer sells land or makes improvements to land for speculative purposes only. This notion of
the developer also fails to capture the corn plex functions performed by this type of agent.
Within the development process four major types of agents are active: developers, land
owners, financial institutions, and construction companies (Barras, 1979b). These roles can be
embedded in one organization. For example, a developer may be the land owner and the construction
company; a financial institution may assume the role of a lender, land owner, or developer. Pratt (1994)
suggests that the view of the propecty developer as a unitary category is misleading: 'there are a
variety of forms that the 'developet may take. The exact speclication of the developer will depend
upon a whole range of contingent conditions and so cannot be identified a priory' (p. 203).
In this thesis I use the term 'real estate company' to descnbe an organization that engages in
various functions that are related to real estate development and investment, primarily development,
redevelopment, and ownenhip of real estate properties. The terni 'developer' is used when the major
activÏÏ of a real estate company is development. Development is improvement to land either through
the production of new properties or the redevelopment of existing buildings. A major, but not exclusive,
role of real estate companies is to develop real estate assets. However, real estate companies do not
develop office buildings or other structures a l the time, but they also engage in other operations. Real
estate companies may engage in 'ownenhip' and 'trading' of real estate properties, but not necessanly
in developrnent. The term 'real estate sector' is used to situate real estate development within a broad
range of economic activity. It is a faidy loose terni, which coincides with that branch of the economy
designated in the Canadian Standard Industrial Classification as 'Real Estate Developers and
Operaton'. In addition to the traditional real estate mmpanies, financial institutions may assume the
role of developer for a short or long period of time, and may peiform the role as ownea of office
buildings. Since their main role, however, is not real estate development or ownenhip, the term
'financial institution' will be used as a distinct category.
The causal connections, as suggested by the realist approach, can only be discovered through
intensive research. In the real estate sector in general and in office development in particular extensive
data is limited. This, and the fact that there are very few real estate companies whose major business
is office developrnent, makes the use of intensive research very important. Research presented here
relies heavily on data and information that were obtained through a multi-faceted collection process.
Consequently, this thesis is primarily qualitative research based on insights gained through careful
examination of a multitude of sources including newspapers, trade joumals, official company reports
and company brochures. Information was obtained through semi-structured interviews with prominent
participants in, and observes of, the commercial part of the real estate industry in Canada. Extensive
data on building permits at different spatial scales and a comprehensive office building inventory for the
Toronto Census Metropolitan Area were obtained.
Thesis organization
Chaoter One provides a set of theoretical considerations, synthesizes major components of different
approaches analyzing real estate, and re-conceptualizes office development by focusing on real estate
companies. Three major approaches to real estate development are discussed: neoclassical, political
economy, and institutional. From these approaches, selected components that are considered as
cornentones for understanding off'ke development are chosen. The major part of this chapter consists
of an analysis and synthesis of secondary Merature.

Cha~ter Two outlines the condiions for offm development in Toronto. In order to establish a
Toronto case study of office development, the physical, economic, and politml conditions will be
addressed. stressing the crucial position of municipal organization. This chapter also provides the
methodological framework. Realist methods are explained and related to the study of real estate
development. In the last section of this chapter, the type of data and sources utilized are described in
detail.
Cha~ter Three provides a broad historical account of the modem commercial real estate
development industry in Canada. Focusing primariiy on the publicly heid real estate companies, which
are abo the most spatially divenified companies, this chapter sketches the dynamics of this sector in
Canada. This chapter also establishes a plaîform for the interpretation of the practices of office
developen in the Toronto area by identifying major developen. This identification procedure highlights
the role of local, Toronto-based, companies that have their main field of operation in the Toronto area.
Cha~ter Four addresses the role of finance capital and financial institutions in financing office
development. In this chapter both the perspectives of real estate companies and financial institutions
regarding real estate financing are considered. Financial institutions often undeaake office
development for investment purposes and perform the same functions as real estate companies. This
role, together with their spatial practices in the field of offie development and ownenhip, is a key
cornponent of this chapter. Finally, I present some preliminary observations and thoughts on the role
played by transborder capital flows in real estate development.
Cha~ter Fihm investigates the practices of real estate companies using the conceptuaiization of
'three dimensions of capital switching' within the Canadian urban system. The investigation of the
practices of real estate companies is positioned in the context of building cycles. Office building cycles
at different scales and locations have spatially discrete patterns. I argue that office-building cycles
shape the fields of operation of real estate companies at the scale of the Canadian urban system. The
next two chapten move from the national to the metropolitan scale. The empirical findings of the case
study of the Toronto Census Metropolitan Area are presented in chapten Six and Seven.
Cha~ter Six documents the development of the office building inventory in Toronto in the last
fifty years. Contrary to a common perception based on the high visibility of a limited number of high-rise
office buildings in Toronto's Financial District, the stock of office buildings is far more heterogeneous. It
ranges from a large number of srnall and mid-size buildings to a limited number of large-scale
structures. In ternis of spatial patterns, office buildings are grouped into office districts. These office
districts provide a variety of operational fields for specialized office developen.

Cha~ter Seven articulates the argument of spatial selectN'i of office developen within the
Toronto Census Metropditan Ares. The distinctive spatial operations of developen support the
argument that real estate capital is highly specifc and embedded in particular spaces. The concept of
'office development district' is introduced; these districts sct as the spatial containers for different
developen and at the same time are prduced and reproduced by real estate companies.

CHAPTER ONE
THEORlZlNG OFFICE DEVELOPMENT
It is the purpose of this chapter to extract from the broader literature on real estate development and
from specific writings on office development principal arguments, which help to understand office
development across urbm systems and parkulariy within metropolitan areas.
The structure of this chapter is as follows: first, principal literatures or approaches will be
discussed. The neoclassical, the pollical economy, and the institutional approaches each contribute to
the understanding of office development. There is considerable scope in synthesizing insights from
these three approaches. The second part of this chapter focuses on distinct sub-processes or
components of the real estate development process. These components are building cycles, the
involvement of finance capital, the role of real estate companies, the role of the state, and issues which
are related to the specific settings of real estate development within metropolitan areas. A third part of
this chapter reconceptualizes office development by putting real estate development companies into a
central position.
1.1 Principal Approaches Research on real estate development has relied on quite different approaches. The neoclassical
approach with its focus on the demand-supply aspects of real estate development dominated until
about 1970. Beginning in the late 1960s and the early l9ïOs, another set of approaches emerged and
was employed to analyze real estate development. Scholars, drawing upon the writings of Man,
became interested in the logic of capitalist accumulation as a major factor dominating the production of
real estate properties. The forces of capitalisrn and its monolithic nature were unpacked in the 1980s
by political econorny analyses and institutional approaches. From a thematic point of view, most of the
early research was concemed with housing and less with commercial or office development. Starting in
the 1980s, a growing proportion of research was focused on commercial real estate development,
including retail, industrial, and office development.
1 -1.1 Neo-classical approaches
Researchers relying on neoclassical approaches have studied office development or 'office markets' by
focusing on market forces. Neo-classical approaches used the demand-supply equilibrium concept in
attempts to explain how office markets work (Fisher, 1992; DiPasquale and Wheaton, 1992; Clapp,
1993; 1992; Mills, 1995). Atternpts have been made to explain economk mechanisms, primanly price
adjustments, that shape office markets (Rosen, 1984; Hekmm, 1985; Shilling et al., 1987; Keogh,
1994; Henneberry, 1999). Vacancy rates, for example, reflect the balance between demand and
supply. and demand is detennined by macro-economk conditions, such as business cycles.
Considerable arnount of research has been oriented toward modeling o f f i i building cydes (Barras,
1983.1987.1994; Barras and Ferguson, 1985,1987; Wheaton, 1987; McGough and Tsolacos, 1997).
Another research Stream mthin the neoclassical conceptual framework has been exploring the benefiis
of portfolio diversification based on different propeity types and multiple locations (Hartzell et al., 1987;
Eichhok et al., 1995; Hoesti et A., 1997; Hamelink et al., 2000).
According to the neoclassical perspective. in a market economy, exchange takes place on the
basis of prices determined by the interaction of supply and demand. In the case of real estate, rent is
the price a tenant pays for occupying a paiücular space. The interaction of demand for real estate and
the supply of rental propeflies detemine the level of rentals. Price is detemined by demand. and
supply follows, rather than influences demand (Harvey, 1987). The real estate development pmcess is
therefore demand-driven. Agents engaging in the development process are assumed to act in unison,
collectively providing development at the right time, and reacting automaticalty to the structure of
demand (Boume, 1976). The model implies the existence of a perfect market and the rapid elimination
of any price differences. Both consumers and producen seek to maximire utility and profiiability, and in
doing so they are unhampered by social. legal, or local constraints. However, recenüy some writers of
the neoçlassical school have stressed the role of supply in structuring property markets (D'Arcy and
Keogh, 1997; Nanthakumaran and Watkins, 2000).
As Lichfield and Darin-Drabkin (1980) note, real estate developers operate on a profit-
maximizing basis by considering alternative projects, and selecting among them on the basis of
maximum profiiabiltty per unit of investrnent. Apait from rationality and profa maximization, there are
severa! other assumptions incorporated in the demand-supply model. One such concept. perfect
cornpetition, relies on a simplification of real estate markets by assuming that products are
homogeneous, that there are large numbers of buyers and seilers, and that actors have perfect
information.
However, authon relying on neoclassical frameworks, have increasingly recognized urban
specificity as a major condition shaping supply of and dernand for land and property. As Bakhin et al.
(1988) observe, the property market is very imperfect. In practice, the property market is not one
market but is divided into a number of sub-markets. Property itself is not homogenous and divisible into
small and uniform units, but is instead heterogeneous and comprises different sles, each with their
own characteristics Sites with different characteristics give rise to differential rents (Coakley, 1994;
Rabianski and Cheng, 1997). In the simple case of a monocentric city, an integrated land market
shapes the pattern of land use resulting from the interaction of land prices and location bids by the
different sectors of the economy (Alonso, 1960). This bidding process leads to the emergence of
districts, for exarnple, a financial district, a legal district, or a residential district (Archer and Ling, 1997).
Land prices decrease consistently from the city's centre, because they reflect the value of accessibility
which is maximized in the Central Business District. The land market described by Alonso (1 960) has a
single continuous price gradient because it is integrated. Recently, this spatial integration has been
questioned. The distinction between downtown and suburban districts within the metropolitan area and
the idea of the 'polycentric city' (Ladd and Wheaton, 1991 ; Berry and Kim, 1993) indicate that in fact
the land market is segmented for a variety of reasons. Evidence of multiple price gradients, mostly
unaffected by proximity to downtown suggests that the market is not differentiated with respect to any
single location, but that the market is segmented within the rnetropolitan area (Clapp et al., 1992; Hoch
and Waddell, 1993; Hanink, 1997; Rabianski and Cheng, 1 997).
According to the neoclassical approach, the intensity of real estate development is shaped by
the land value gradient or a series of land value gradients. Transportation lines, which converge at one
location, give rise to what has been referred to as the 'peak land value intersection (PLVI). As a result
of maximum accessibility, land values at the PLV1 are the highest in the city. Demand for space results
in soaring land costs, which reflect the potential value of the land if built upon to the maximum
allowable extent (Ford, 1994). In these locations, the cost of land is the major component in office or
other real estate development. Capital is substituted for land as large amounts of capital are invested in
the erection of more intensive land uses to compensate for high land values (Baume, 1967). In this
case, large-scale office buildings are predominant as a resuH of financial calcu!ations emphasizing
maximum retum on investment (Willis, 1995).
The assumptions regarding a perfectly functioning market have been heavily criticized. Harvey
(1973) argued that land prices in the CBD do not depend on locational advantage, because land
owners want to achieve high rents. Similady, Ball (1985) suggested that large-scale financial
institutions develop office buildings in high-priced locations in the city centre to minimize the risk of
premature obsolescence. The property market is ubiquitous, and there is no formal organized
marketplace, central agency, or instlution, where prices are quoted and publicly witnessed. tnstead of
a large number of buyen and seller's, there are relatively few with sufficient finance to invest; therefore,
financial institutions and property nvesbnent companies dominate the pmperty market. In some cases,
there is no freedom of entry into the real estate market as would be expected under perfect market
conditions (Markusen and Scheffman, 1977; Kostin et al., 1989), and as monopoly or oligopoly power
occur, the geographic division of the market leads to imperfect cornpetition. Another criticism of
neoclassical modek argues that maximizing pmfiiability may not be the prime objective of either the
space user or the real estate developer. Also, changes in income and business conditions and the
difficulties in obtaining up-todate knowledge may prevent the punuit of maximum profits (Momson,
1992). Criticism based on empirical observation about office development indicates that the high cost
of land is not necessarily the reason for large-scale buildings. Feagin (1988) argues that despite the
fact that land costs are only a small fraction of the total development costs, high-rise office buildings
were erected in downtown Houston.
Although it may be generally the case that land values and building densities are strongly
related, the question of how land value surfaces are produced is not adequately addressed by the
neoclassical approaches. Accessibility depends on both the articulation of the publicly produced
transportation system and the spatial patterns of customers or input sources. These spatial pattems
are long-lasting, and their expianations require a form of historical analysis that the subscfibers to the
neoclassical approaches would rather stay away from.
Contrary to the tenets of some of the neoclassical approaches, the supply of buildings is
relatively inelastic, and the changes in the building stock and location are slow due to the durability of
buildings and the small proportion of real property of any type coming ont0 the market at any one time
(D'Arcy and Keogh, 1997). The property market is, therefore, in a constant state of disequilibrium. The
actors who supply the market also do not necessarily respond to demand as assumed in the simple
demand-supply relationship. Various factors, such as taxation, national interest rates, and govemment
policy and subsidies, determine the framework of supply. Real estate developers do not constitute a
homogeneous entity, but rather they make up a group of multiple agents with dÏfferent interests
(Beauregard, 1993; Pratt, 1994). Finally, development often occun speculatively, only remotely related
to actual demand. Development booms may be related to the sharp expansion of money supply, as
was the case in the 1920s (Willis, l995), and more recently in the 1980s (Ball, 1994; Fainstein, 1994).
A recent. and a useful, strand in neoclassical research is the application of portfolio theory. The
use of portfolio theory in real estate analysis has emphasized the position of real estate assets as
distinct financial vehicles that can be switched between products and places (Miles and McCue. 1984;
Coakley, 1994; Hoesli et al., 1997). The reasons for capital switching are emerging opportunities, which
corne about through a change in existing conditions, such as different retums on capital. Different
investment vehicles, different property types, and different locations, possess different rates of retum.
The purpose of this type of analysis is to detenine the optimal resource allocation within a company's
investment portfolio. To combat the perils of unceilainty, diversifikation strategies, including different
property types and different locations, are proposed. In this avenue of research an important topic is
the investigation of the benef i of divenifikation at a number of geographic scales. Corporate Cnancial
interests consider spatial diversifkation as an instrument that is mainly designed to optimize risk-return
relationships (minimizing risk while maximizing retum) of real estate portfolios.
lnveston have sought to divenify according to property type andlor according to geographical
area. The logic of diversification baseci on property type lies in the belief that retums to each type are
determined by different economic 'driven' (retail performance is diiven by consumer expenditure. office
retums by growth of seMce employment. and industrial performance by manufacturing production).
While there are common factors (like GNP growth and interest rates), it is assurned that these different
'divers' do not coincide across different regions, and hence spatial diversification is beneficial.
However, the usefulness of the region as a unit of analysis has been the subject of much debate
(Hoesli et al., 1997; Hamelink et al., 2000). Within portfolio theory, switching strategies between
different property types have been considered as more beneficial than spatial diversification. Spatial
diversification has been more problematic to conceptualize, since it depends on a number of scales
and a multitude of definitions of regions. In general, analyses based on metropolitan statistical areas in
the U.S. suggest that the largest urban areas are the favoured locations for real estate investrnent.
However, the market is segmented: institutional investors prefer to invest in the largest urban areas
while private investors have more dispersed geographical patterns (Shilton and Stanley, 1996; Lindahl,
1 997).
Overall, the principal shorkoming of the neoclassical approach is the absence of the public
sector as a major participant in the real estate developrnent process (although the role of institutionai
structure was addressed by some researches, for example, Bal et al. 1998). Real estate development
is not driven entirely by market forces and an orderly function of real estate markets involves
govemrnent participation. Also, neoclassical approaches emphasize the strong relationship between
building intensity and land values. However, land value surfaces are modulated by accessibility, which
is collectively produced through investment in infrastructure and through the interdependence of many
land uses. There are also many exceptions. For example, high land values predominate in the inner
city. but high-rise buildings do not materialize because of many factors. including social struggle over
the built environment. There are interesting ideas embedded in portfolio theory. Real estate assets are
seen as tradable assets that shift between property types and locations. In later conceptualizations I
will draw strongly on this concept.
1.1.2 Political economy approaches
Harvey's work (1 978, 1982, 1985) on circuits of capital and the role of investment in the production of
the built environment has provided the theoretical framework for a political economy approach, which
focuses on the suppiy of capital as the driving force of real estate development. Harvey's initial
argument suggests that in the long nin, in the absence of profitable investments in the primary
(manufacturing) circuit of capital accumulation, capital will flow into the secondary circuit, where capital
is deployed in the production of the built environment.
Hanrey's contribution to understanding real estate development has been important in other
respects. Harvey acknowledges the important role of the state in facilitating real estate development.
Both the private sector and the state are part of the capitalist system. The different levels of the state
(federal, intermediate, and local) provide the conditions of the continuous process of real estate
production. At the local level, govemment regulation is needed in order for the speculator-developer to
function (Hatvey, 1985, pp. 68-69).
f i a ~ e y discusses the nature of uneven spatial development of the buift environment at
different spatial scales, impiying that uneven development is an essential condition for capital
circulation in capitalist economies (Harvey, 1985, pp. 19-20, 155-64). In addition, his idea of capital
switching paves the way for the notion of spatial switching. Haivey acknowledges that capital can flow
from one place to another (Harvey, 1985, p. 13). These switching practices, between circuits/sectors
and places are crucial practices of real estate companies as will be demonstrated in later sections.
Other researchen did not substantiate Harvey's argument conceming capital switching between
circuits of capital accumulation. After research on the sources for real estate investment in Houston in
the 1970s and l98Os, Feagin (1 987, 1988) suggests that "financial institutions, both those inside Texas
and those outside, channeled much surplus capital from a variety of sources into Houston real estaten
(1 987, pp. 182-83). Beauregard (1 991, 1994) argues that primary-circuit capital may seek other outlets
than the built environment. However, in spite of the difficuity of establishing a clear link between
industrial and real estate capital in the short nin, Harvey's ideas remain influential in establishing an
office development theory (see section 1.3).
The recognition of the real estate sector as an independent or nearly independent sector of the
econorny, which requires its own analysis, has led to an emerging research agenda within the political
economy approach (Feagin, 1987; Haila, 1991 ; Beauregard, 1994; Fainstein, 1994; Leitner, 1994). In a
preliminary outline. Haila (1 991) argues that the real estate sector has an 'intrinsic dynamic' rather than
being extemally driven by the switching of capital between different circuits of accumulation. This
dynamic shapes investrnent patterns in real estate assets, and is based on the intemal characteristics
of real estate pmperties, narnely tradabiiii, divisibili, and mobili. Real estate assets are tradable;
they are bought and sold in the market. like other types of financial assets (Harvey, 1982). Although
properties cannot be traded in small units in the same way as stocks (Coakley, 1994), they can be
divided into large units because the ownenhip of properties can be shared by a number of
investordpartners. In addition, the real estate sector is segmented into commercial and residential sub-
sectors, and into distinctive property types, such as office, industrial, and retaü (Beauregard, 1994). It is
further segmented spatialty. Some &ers acknowledge that the real estate sector is hrgely a 'local'
business, ahough some components of this sector are beyond the local realm (Logan, 1993; Bryson.
1997). Other theonsts suggest that real estate properties have becorne increasingly 'delocalized',
because some aspects of the real estate sector (architecture, reaf estate ownership) are shaped by
'global' forces (Sassen, 1991 ; Knox, 1993; Savitch, 1995; Beauregard and Haila, 1997). The complex
spatial configuration of real estate investment is further segmented as a resuit of the spatial divergence
of building cycles and the fact that at the level of urban systems different cities experience different
building cycles (Leitner, 1 994).
Within the political economy approach, Marxist authors emphasize issues of land ownership
and rent as core elements in their framework of explaining the production of the built environment
(Harvey, 1 982, 1985; Haila, 1988, 1990, 1991). lnstead of the assumption buik into neoçlassical land
use rnodels, Marxist interpretations suggest th+ possibility of power in the han& of few land owners.
(The existence of several kinds of land owners with distinct interests and modes of behaviour is
recognized by Massey and Catalane, 1978.) In addition, it is suggested that land has a monopolistic
character. Hanrey argued that there are monopoly prîvileges inherent in any fomi of private property in
landn (1 985, p. 102) and Logan and Molotch (1987, p. 23) have wnsidered land markets as 'inherently
monopolistic'. This enables land owners to manipulate or control the land market by charging monopoly
rent.
The major critique of the political economy approach revoives around its high degree of
generaiization and abstraction. More specifically, the relations between the general conception of the
structunng dynamics of the development process and the specific interests and strategies of individual
agents remain to be established. Much more attention needs to be given to the ways individual f i n s
and agents interrelate, and how various economic and political factors. which govern their strategies,
are incorporated into a structure-agency framework (Healey and Barrett, 1990). Also. the impossibility
of documenting some assertions such as flows from the pnrnary to secondary circuit (Feagin, 1987;
Beauregard, 1991; 1994) has attracted criticism (Ball, 1994). Also, there is little research on the role of
transnational flows cf capital in real estate development (Logan, 1993). Regarding the idea of land
rnonopoly, the fact of concentrated ovmenhip in real estate does not automatically mean that a
condition of monopoly is attained; monopoly might only occur in locarued and isolated situations
(Houghton, 1 993; Fainstein. 1 994).
1.1.3 Institutional approaches
Advocates of institutional approaches argue that it is essential to understand the institutionai foms.
relationships, and practices of the real esMe sector. The starting point s the institutional articulation of
the real estate sector and the patterns of netwoiks and relationships between agents. This results in an
institutional rnap of the development industry (Healey. 1992b). As Healey and Banett (1990, p. 93)
argue:
Wuch more attention needs to be given to the way individual fims and agents intenelate in the negotiation of
parkular development projects and how, through these transactions, land and properly 'markets' are constituted
and built environment invesbnent decisians madeg.
Healey (1 992a) and Momson (1 992) have provided expositions on institutional approaches to the reaJ
estate industry. They argue that the focus of institutional approaches is pnmarily on identifying the type
and composition of agents involved in the real estate development process and revealing the interests
and strategies they adopt. The nature of the relationships which occur between acton, their actual
roles, and the relative influence they enjoy in the negotiation of particular projects are analyzed in tum.
Healey (1992a) presents an institutionai modei of the real estate development process that
takes into account the complexw of the events and agencies involved in the process, and the diventty
of forms the process rnay take under different conditions. At the theoretical level 'the critical issue here
is to make the connection with the social relations expressed in the prevailing mode of production,
mode of regulation, and ideology of society within which development is being undertaken" (Healey,
1992a, p. 37).
Various authors have constmcted models about how the actors interact and how the
development process operates. Drewett (1973) presents the simplest model with the focus on the
developer. Arnbrose (1986) suggests a more complex model. There are three sets of agents in
Ambrose's model: the finance industry, the state, and the construction industry. All three sets interact in
the process of creating the built environment (Ambrose, 1986). Apart from depicting the development
process, various researchers have written about the development process in ternis of the stages
developers go through from initiating a scheme to its completion (Drewett, 1973; Cadman and Austin-
Crowe, 1983; Ratcliie and Stubbs. 1996). Many of these stages and issues, such as finance, classes
of developen, or landowners and real estate agents, within the development process have been
elaborated on in depth by other researchen (Cadman and Au&-Crowe, 1983; McNamara, 1985;
Ambrose, 1 986).
These works focus on agents and differ from the neoclassical and Manist approaches in
being concemed with the details of how the davalopment process takes place, rather than makng
generalizations and engaging in abstractions. Agents are not treated as homogeneous entities, but are
clearly differentiated (O'Malley, 1989; Morrison, 1992). Institutional scholan have noted how
developen interact with other intemediaries within the development process. How developers interact
with the state was the focus of several studies undertaken by researchers of the institutional school
(Am brose and Collenutt, 1 975; Lonmer, 1 978; Ambmse, 1 986; Healey, 1 998a). The extensive attention
given to the state is in contrast to the neoclassical literature, which ignores or downplays the role of the
state in the supply-demand model, or the Manist literature, which regards the state as a mediator of
capital flows between the primary and secondary circuits without providing analyses of its exact role.
Institutional analyses have been criticized because they place too much emphasis on the
actors and their interactions. They have also been cnticized for being too descriptive and for not
adequately focusing upon structural factors which govem the behaviour of agents. The descriptive
nature of some of the institutional analyses and the lack of attention to the economic and political
conditions which constrain the actors in question, present major limits to their analytical ability.
Structural factors have to be embedded in institutional analyses, since they affect the provision of real
estate assets (Morrison, 1992).
1.2 Components of the Real Estate Development Process The real estate development process is shaped by various forces, and involves severai types of
agents. Different elements in the approaches discussed in the previous section contnbute to the
knowledge of this process. In this section I merge conceptualizations derived from various approaches.
These concepts are fhen used in an attempt to construct a theory of office development, which will be
presented in section 1.3.
Four major elements are considered as pivotai in the literature on the real estate development
process. (Capital switching was addressed before and will be included later in the conceptualization of
the real estate sector.) These are building cycles, financing arrangements, the role of the state, and the
role of real estate developers. Building cycles are the cumulative reflection of numerous actions that
produce real estate properties. The differentiation of building cycles by property type and location is
addressed, and macroeconomic forces shaping the development process are considered. As is
demonstrated in this section, real estate development cannot proceed without substantial financing that
is outside the realm of the Company that develops a parthlar propeity. As a result, real estate
development depends on the availabiiii of financing. The state, at its various levels, is an essential
part of the development process, since development occun in existing settings that are regulated by
the state. In addition. development is place-specific and developen need to interact with the state level
that is relevant. Finally, the indMduals or organizations that initiate, execute and manage the process
are real estate developers. Their pivotai role as the shapen of the built environment has been
recognized in the literature.
1.2.1 Building cycles and their spatial aspects
Construction activity and investment in the built environment are subject to cyclical patterns known as
building cycles. Building cycles play a major role in neoclassical and in Marxist approaches in
explaining urban development. Kuznets (1 930, 1958) first identified long investment or building cycles
with a period of up to twenty-fie yean, and Hoyt (1933) documented the cyclical pattern of land prices
in Chicago. Harvey's analysis of real estate development in the United States and Britain suggested
that investment in real estate depended on the cyclical nature of the economies of these two countries
(Hawey, 1985).
Building cycles encompass a multitude of components that have to be separated. First,
building cycles are a 'family of property cycles' (Barras, 1994). These cycles Vary in length from long
cycles of 20-ta-30-year periods, to cycles spanning 9 to 10 years, and short cycles of 4 to 5-year
duration (Barras and Ferguson, 1985; Barras, 1994). Second, instead of treating the built environment
as a homogeneous product (Harvey, 1978), real estate products should be differentiated. Within the
real estate sphere each product has a different cycle, which is especially apparent when residential and
commercial development are compared (Ball, 1994; Barras. 1994; Beauregard, 1994; Keogh, 1994).
Within the commercial sector an additional disaggregation is possible, namely between office, retail
and industrial sub-secton. This is required, because different 'drives' propel each sub-sector (for
example, office development is driven by the growth in office-based ernployrnent, Hoesli et al.. 1997).
Building cycles are also shaped by govemment regulation. best exemplified by zoning bylaws.
Govemments tend to enforce restrictive regulations during downtums, and introduce more liberal
regulation during the uptums in building cycles. In an article titled 'The politics of real estate cycles',
Weiss (1991) suggests that govemments intewene in the real estate sector during diierent phases of
the real estate cycles as a resuk of pressure from the large-scale real estate companies. During boom
tirnes, the status quo is prefened, while in downtum periods, the big developers advocate govemment
intervention. Weiss explains the passing of zoning bylaws in Los Angeles and New York in the eariy
twentietb century as the aftermath of a real estate downtum. He also attributes tax policies to buildings
cycles, suggesting, for instance, that the 1981 U.S. tax ad, which offered financial incentives for
developrnent, passed during the depths of a severe recession. Willis (1995) argues that govemment
regulation woiks in tandem with building cycles. Height restrictions on buildings in Chicago in the late
nineteenth and eariy twentieth centuries were shaped by the appropriate phase (boom or slump) in the
building cycle.
Office development has received a great deal of attention in the research on building cycles.
Neoclassical economists attempted to model office-building cycles by examining demand and supply
factors (Barras, 1983; Wheaton, 1987; Downs, 1993). To a large extent, the neoclassical analyses
have failed to discem spatial variations of building cycles by suggesting a synchrony of subnational
building cycles (regional and local) with national cycles as part of the notion of equilibrium (Easterlin,
1968; Gottlieb, 1976). A few studies explored the uneven spatial manifestations of building cycles
(Leitner, 1994; Henneberry, 1999) suggesting, 'the particular cycles in each c w occurred in somewhat
different times and reflected different local conditionsn (Wilfis, 1995, p. 169).
Building cycles are not unifom geographically and have long endurance. The notion that
building cycles should be considered in accordance with the geographic sale under investigation is
increasingly recognized as an essential element in building cycle analysis, since local conditions affect
the outcome of building cycles in different cities (Leitner, 1994). In examining office construction cycles
in downtown areas of major U.S. cities, Leitner (1994) illustrates how local circumstances interact with
wider financial and political trends to produce unique outcomes. Despite the trend toward convergence
in the timing of office construction cycles between different cities, individual cities continue to show
differences in the ways they are affected by and participate in national and international trends.
Changes, such as econornic restruduring, growing demand for office space, the relative attractiveness
of commercial real estate, and govemment regulations have differential effects on urban property
markets. Cities experience different development cycles in t e n s of timing, length and volume, and in
ways that reflect the specific conditions in these localities and their changing position within the larger
urban system (Leitner, 1994).
Henneberry (1999) provides a different interpretation of building cycles. He argues that
property investment has become dislocated from user requirements, and that building cycles are not
shaped by local conditions but rather by the preferences and decisions of major financial investors. In
contrast to the political economy approach advocated by Leitner, he suggests a neotlassical approach

to explain spatial variations of building cycles at the regional level. Based on Keogh's (1 994) analysis,
the propeity market is depicted as a set of three interrelated components: the user market, the
investment market, and the development market. Each is a trading arena where the interaction of
demand and supply determines the price. Changes in use values (rents) or in required rates of retum
on property investment (yields) produce rapid changes in investment (capital) values. Developen who
monitor the market on a regular basis will respond to these changes by increasing or decreasing
development activii. Spatial differentiation is oniy a marginal component in this analysis (Keogh,
1994). According to Hennebeny, the timing of regional office building cycles is determined by the
property price mechanism; in other words, the interplay between rents, yields and capital values. Each
market has its own building stock, vacancy rates, and demand; thus rents minor the local economy.
Rents and yields have locally ernbedded components. As a result, the manifestation of spatial
differences is echoed through the property price mechanism. This argument cancels out the need to
look at specific conditions, since the development is mediated through the property price mechanism.
The explanation of spatial differences on the basis of the price mechanism is insufficient,
because it does not reveal the origin of these cycles and why such differences persist. To explain
building cycles at the regional or the metropolitan level, general economic conditions as well as
conditions specific to the metropolitan areas in question have to be addressed. By combining these
sets of considerations inter-metropolitan variations can be explained.
Building cycles provide a general framework for the analysis of office development The
argument that building cycles Vary across space contributes to the explanation of uneven office
development. Also, spatially diverse building cycles indicate that there is a role for the local arena in
shaping office development. The specific local conditions have to be revealed in order to understand
the uneven investment in office buildings across urban systems and within specific metropolitan areas.
1.2.2 Financial institutions and real estate development
Early Marxiçt writing on urban development has reasoned that real estate development is a 'by-product'
of the capitalist production system (Lamarche, 1976). According to Lamarche, there is a specialized
type of capital, 'property capital', whose sole function is to produce properties in order to increase the
overall efficiency of the capitalist system. This definition puts an emphasis on pmperty as 'servant' to
capital and not as a separate sphere of capital accumulation.
These eariier conceptualizations were supeneded by Harvey's work on conceptualizing the
flows of capital within the capitalist system. According to Harvey's general theory, capital invested in
real estate originates mainly through industrial production. As a result of crises of overaccumulation in
the 'productive' sectar of the economy, capital will flow into other circuits lodting for profitaMe
investments. Harvey adds that through the mediation of financial institutions surplus capital
accurnulating in manufaduring is channeled into the real estate sector (Harvey, IW8, 1982, 1985).
However, Harvey does not elaborate on the role of financial institutions as mediaton; financial
mediaton are perceived as instiîutions whose purpose is to channel capital in ways that wouM buttress
the smooth functioning of the capitalist economy. Harvey, like &en from otfter viewpoints, also points
out some of the specific characteristics of real estate development. These characteristics include high
cost, longevity, a long tirne to collect revenue, and the possibility of putting up propeity as collateral.
Therefore, long-terni financing is required and possible. Harvey's influential writing has stimulated
ernpirical work on the financial sources used for investment in the built environment (Feagin, 1987;
Beauregard, 1991, 1994; discussed in section 1.1.2).
The financing aspects of office development were extensively explored in the United Kingdom.
Barras (1979a. 1979b) and Catalano and Barras (1980) examined office development in the United
Kingdom, particularly in London and Manchester. Based on this work, Barras (1979b, p. 50) attempts to
distinguish between different fomis or practices of capital, which involves four different kinds of agents
or fractions of capital:
o commercial capital (the real estate development company);
0 financial capital (funding institutions);
O landed capital (land ownen); and
o industrial capital (the constniction company).
In his model, Barras, contraiy to Harvey, ignores the role of the primaiy circuit, and treats industrial
capital as primarily related to construction companies. No empirical work was done on the flows of
capitals that eventually find their way into real estate development. Feagin (1987, 1988) is aware of the
different fractions that constitute finance capital. Following Harvey's idea of capital switching, he claims
that capital invested in real estate assets is the result of companies divedng profis into real estate
using the mediation of finance capital. In the case of real estate investment in Houston, Texas, he
argues that different types of finance capital were involved: "The pnmary source was finance capital,
including commercial banks, insurance companies, investment trusts, and mortgage companies"
(Feagin, 1987, 182). However, Feagin's interpretation of the role of financial institutions in the real
estate development process is limited to their mediating role, channeling funds from various sectors
into real estate, ignoring their role as ownenimreston in real estate assets.
Other studies in the U.K. suggest that smaller developers have different financial arrangements
than large developen. Large real estate companies depend on the 'global institutional investment
market' and are able to tap the capital markets, while small developers depend on the conventional
bank loan (Bryson, 1997; Lizieri et al., 2000). AIso, different requirements of financial institutions are
driving specific spatial investment practices. The long-time horizon of life insurance companies and
pension funds operating in the City of London result in reinforcing existing spatial configurations. These
institutions impose their requirements on real estate companies. Banks, on the other hand, hold
essentially short-terni commitments, thus they do not tie real estate investment to particular spaces,
allowing real estate developen greater spatial flexibility (Pryke, 1994a).
Several other studies have distinguished between major types of funding institutions, such as
banks, Me insurance companies and pension funds, and their role in the real estate sector (MacLaran
et al., 1985; OIMalley, 1989; Feagin and Parker, 1990; Logan, 1993). However, different fractions of
finance capital involved in the real estate development process and their role in 'active' investrnent
(ownership or development of properties for income purposes) remains a largely understudied topic.
There are some important exceptions (for example, Des Rosiers, 1984; Pryke, 1994b; Lindahl, 1997).
These studies distinguish between different financial institutions and their role in real estate
development. Des Rosiers examines life insurance companies and pension funds; Pryke analyzes
financial institutions; and Lindahl looks at institutional investon, foreign investon, and real estate
investment trusts (REITs). lnstead of the idea of a generic capital market driving real estate investment,
it has been suggested by Cindahl (1997) that real estate capital Ss comprised of multitudes of players,
each with complex motivations and constraints" (p. 189). These motivations combined with extemal
constraints shape the spatial practices of financial institutions (Pryke, 1994a; Lindahl, 1997).
Rather than tiying to determine the aggregate flows of capital, a different approach to
explaining financing mechanisms or financial instruments is used by writen close to real estate
investment and development practices (Urban Land Institute, 1998). When considering the financial
sources of real estate investment, the distinction between debt and equity should be made. Generally,
debt financing is either short terni or long term, and is used to finance development when the lender
has no equity interest in the property. Equity investment, on the other hand, represents a stake in a
specific project or in a real estate Company (see details in Chapter Four).
1.2.3 The state and real estate development
In general, there are three strands of literature about the importance of the state in real estate
development. First, there is Harvey's insistence that involvement in real estate development is used by
the state as a means to stabilize the capital accumulation process and thereby the capitalist system.
Second, there is a literature which emphasizes the interest of the local state in local growth through
real estate development. The literature on 'growth coalitions' foms an important part of this argument.
Third, a number of theorists emphasize an inevitable structural necessity of state invoivement in urban
development. The following paragraphs address the argument about shoring up capital accumulation
very briefly. and then deak at length with the local state and local growth, and with the local state and
its necessary involvernent in real estate development.
Shonn~ UP c a ~ i t a l accumulation
The state supports the capitalist system through the support of real estate development and different
levels of government have different but important roles in faciliating and creating urban real estate
development (Dear and Clark, 1981; Roweis and Scott, 1981). Harvey (1985, pp. 202-1 1) argues that
post-WWII Kenynesian suburbanization was state-backed, debt-financed consumption to solve under-
consumption problems. After the trauma of the 1930s Depression. the state intenrened with expansive
fiscal and monetary policies. National govemments laid down mies for real estate development through
planning legislation. taxation measures, provision of infrastructure, and planning regulation, and by
granting exemptions of al1 kinds. Govemment participation has occurred even in an environment where
laissez-faire is the core ideology. For instance, in Houston, Texas, a city lacking zoning bylaws,
govemments provided massive infusion of funds into transportation infrastructure. which stimulated
suburbanization. In addition, because of liberal depreciation allowances in the U.S. tax code, much
office construction was carried out not only to make profits from leasing or selling office space, but also
to Save substantial amounts in federal taxes (Feagin, 1984, 1988; Leitner, 1994; Shilling, 1997). In
Ireland, the Urban Renewal Act and Finance Act of 1986 created designated areas for property
developrnent. As a result, a large proportion of office construction in the late 1980s and early 1990 in
Dublin was in the areas that received tax incentives (Maclaran, 1993; 1996).
Growth coalitions
For local governments, real estate development in general and commercial development in particular is
synonymous with economic growth (Rast, 1999). Commercial real estate development seems
beneficial to local municipalities for a number of reasons. First, it increases the local tax base, since
commercial uses (office, industrial and retail) pay taxes more than residential uses per unit of built
area, while not utilizing social services. since the basic necessity for commercial uses is transportation
infrastructure. Hence, commercial uses are major contributon to local revenues. Taxes paid by
commercial uses allow local govemments to provide municipal services wiaiout substantially increasing
residential taxes. Second, it is argued that there is a direct link between real estate development and
employment growth. Real estate development creates jobs directiy in the construction process, through
employment in the built premises (offices, shopping centres and industrial buildings), and by
contributing to a multiplier effect. Recentiy, but also in the past, job creation has k e n considered as
one of the major responsibilities of local municipalities. Third, real estate investment creates tangible
evidence of economic growth (Leher, 1990). A new building or a new shopping centre is a material
proof of a dynamic environment, and can be used as parameters to indicate economic growth.
Shopping centres or office buildings are being used as symbols of economic growth, and are used to
portray rnunicipalities as 'successful' and growing locales; hence they help in attracting fumer
investment. Fourth, no growth (stagnation) or slow growth means relative decline in comparison to
other places. At times of devolution and downloading of responsibilities to the municipal level, growth is
perceived as an imperatîve instrument necessary to keep the quality of life from detenorating. ln this
context, local municipalities often attempt to lure investrnent by providing various incentives for
potential investon (Kantor and Savitch, 1993). Fnially, growth is punued, since local decision-maken
and real estate developers often believe in similar ideas and share common social networks. This
nexus facilitates and enhances cooperation, and promotes the extraction of reciprocal gains accruing
from real estate investment. For example, a case study of Croydon (a subuib of London) suggests a
convergence of goals between the city council, the professional team of planners, and the local
business elite, since al1 have similar interests (Saunders, 1979).
Studies by Molotch (1976, 1993), Mollenkopf (1983) and Logan and Molotch (1 987) have
solidified the theory of growth coalitions (local governments and private enterprises) as promoters of
real estate development. Their main thesis argues that local politics in the United States have revohred
around land development dominated by pro-growth coalitions, in which real estate interests cany out a
major rote. Real estate developers interact with local government as part of their business routine.
They need building permb, zoning changes and infrastructure development. As noted by Molotch
(1 993, p. 32) "each such interaction influences implementation procedures, sets precedents for how
things are done, establishes relations between officiais and citizens, and alten spatial relations and the
social conditions the built environment imposes: Others have argued that 'the principal effect of growai
coalitions is to bend the policy priorities of localities toward developmental, rather than redistributional,
goalsn (Logan et al., 1997, p. 605). A related concept, 'spatial coalition', emphasizes shared social
places as generators for solidification of alliances. A spatial coalition is 'an alliance which draws
support from a variety of social classes, and which seeks to prornote what it defines as the interests of
the area in questionn (Pichance, 1985, pp. 121-22). The precise demands of such coalitions vaiy, but
generally they include the growth of the area. The rise of urban entrepreneurialism aaording to Leitner
(1990, 1994). has increased the quanûly of commercial real estate in the United States. Federal
policies (tax incentives) and aconornic restnicturing have urged uhan govemments to invest and
subsidize large-sale real estate projeds. The basic purpose of these public subsidies, mainly provided
in central cities, was to attract private investrnent to the deterbrating downtown areas, and to convert
disinvestment environments into highprofile settings. In an attempt to redevelop their downtowns and
compete with other cities, local govemments have raised capital to subsidize private commercial real
estate projects. The effect was an increased availability of capital, which in turn encouraged real estate
development (Leitner, 1990). The result in many cases was the construction of edifices, especially
office buildings, that wen much larger than the actual demand for office space. In the late 1980s, this
type of boosterisrn resulted in a fierce competition among cities and increased real estate speculation,
tuming many projects into 'white elephants', which experienced record-breaking vacancy rates.
In Canada, city politics are also about property and the enhancement of urban land values
(Collier, 1974; Gutstein, 1975; Lorimer, 1978; Sancton, 1983). In the late 1960s and early 1970s, some
authon proposed that city councils played the game according to developen' rules by being over-
enthusiastic to fulfill the devekpen' requests (Caulfeld, 1974; Collier, 1974; Gutstein, 1975; Lorimer,
1978). However, unlike the United States, Canadian municipal politics are more regulated and
constrained by provincial-level legislation and monitoring. The locus of pro-growth policy is often the
province, rather than the local municipality. In ternis of planning issues, cities are subject to extensive
provincial review. Therefore, Canadian cities are not in the same position as their U.S. counterparts in
their ability to stimulate and direct growth (Garber and Imbroscio, 1996).
Critique of the growth coalition theory is directed at two major points. First, govemments are
not necessarily pro-growth al1 the tirne. Some govemments seek containment of further development
(Kantor and Savitch, 1993). and anti-growth movements are also visible (Clark and Goetz, 1994). A
number of attempts to curb development often triggered an interventionist public policy aiming to steer
investment decisions as illustrated by London, San Francisco and Toronto. London pioneered a policy
of encouraging office decentralization and banning commercial development. Constant efforts were
made by the central govemment to divert further office development away from the South East of
England. Beginning after the Second Wodd War, the idea of decentralization of activities from the
South East has been a high pnority on the national agenda and a ban on office development in London
becarne a public policy in the mid-1960s (Scott, 1996). In San Francisco, a series of growthcontrol
inliatives set a lirnit for a city-wide growth on al1 commercial buildings and on the height of buildings
since the early 1980s (Ford, 1994; Leitner, 1994). In Toronto, the Central Area Plan, introduced in the
mid-1970s by a newly elected 'reform' council, attempted to liml office development in the tore area. In
addition, local govemments (the City of Toronto and Metropolitan Toronto) promoted the idea of
decentralking development to the surrounding municipalioes (Gad, 1979; Frisken, 1988). In the cases
of San Francisco and Toronto, active citizens groups advocated containment and put this idea on the
municipal agenda. In addition, the coherence of growth coalitions has to be addressed. The degree of
coherence is one of the variables that influence the ebility of growth coalitions to detemine their
development agenda. Some cities have busii?ess communities with an extremely high degree of
coherence, whereas in other cities the business community is less organized and citizen groups are
more influential (Leitner, 1990).
Structural im~era t i ves
There are structural conditions that reguire the involvement of the state in real estate development. The
political economy approach in urban studies has emphasized the role of the state in facilitating land
development (Scott, 1980; Feagin, 1984; Harvey, 1985; Berry and Huxley, 1992) and the role of the
state as an entrepreneur that initiates and controls land development (Haila, 1999a. 1999b). State
intewention is considered a bocial imperative imposed by the selfsestnictive logic of capitalist society
as it is mediated through urban space" (Scott, 1980, p. 170). Harvey (1985) argues that the state
supports and provides the mechanisms that enable the developers to realize their monopoly rents and
Vithout a certain minimum of govemmental regulation ... the speculator-developer could not perfonn
the vital function of promoter, coordinator and stabilizer of land-use changew (p. 68).
Govemrnents are necessary for providing order in the market and enforcing the rules.
Municipal governments are involved in protecting rights of way and property values, they mediate
between conflicting public interests, and they engage in infrastructure provision and provide municipal
services. These roles of municipal govemrnents are essential for real estate development. The notion
of growth coalitions is a contingent manifestation of a necessary condition, since market forces cannot
effectively and efficiently perform without municipal functions.
One of the major roles of the political sphere in shaping real estate development is through
settirig the ground rules in the form of zoning regulations. Govemment regulation manifested through
land-use planning affects real estate development (Roweis and Scott, 1981). Conventional arguments
suggest that zoning bylaws are used to restrict the built environment from the chaos created by real
estate development companies. However, restrictive zoning bylaws are also used to protect real estate
companies from the dire results of economic downtums, and are often advocated by the real estate
companies themsehres. In late nineteenth century and eariy twentieth century Chicago, the height limit
on buildings moved up and down several times in response to pressures from the real estate industry.
The height restrictions passed in 1893 in Chicago and the 1916 New York zoning bylaw were enacted
in the first phase of a real estate recession. Conversely, in the early 1 9 2 0 ~ ~ when the Chicago office
market experienced high demand and low vacancies, the city passed a new bylaw that allowed higher
buildings (Willis, 1995).
Weiss (1987, 1991) explains that the nse of large-scale residential developen in the first half of
the twentieth century in the United States was a result of community builden using the state to displace
smaller speculative builden. Major builden worked with plannen to secure land use planning and
regulation. Together they encouraged highquality development, which became an impassable bamer
for small developen. Generally, large real estate development companies are more favourable toward
public policy initiatives than their small-scale colleagues. Big real estate companies are better equipped
to shape legislation and regulation for their o m ends; consequently they are more likely to play
influential roles in the policyrnaking process Weiss, 1991).
Urban s~ec i f i c i tv and real estate deveîo~ers
Real estate development is not a private venture. As suggested in the previous section, real estate
development inevitabiy requires the cooperation of private and public agents. The production of real
estate involves individual parcels of land, knowledge of the specific market (supply/demand), and
familiarity with the regulatory environment. Therefore, real estate development is mainly a 'local
business'. Recently, it has been widely acknowledged that property markets are more segmented and
differentiated than had been assumed in earlier period (Clapp et al., 1992; Hanink, 1997; Rabianski
and Cheng, 1 997; Healey, 1 998a; Wolverton et al., 1 998; Hamelink et al., 2000). In this type of venture,
the real estate production process is embedded in local conditions (Wilson, 1991). In situ networks are
indispensable for this process to take place.
The importance of place and local conditions has preoccupied the urban literature in an era
when global forces seem to be dominant, especially in industrial production and financial services.
However, in the era of globalization, place also has been recognized as an important ingredient in
economic performance as the specific conditions in localities have contributed to competitive
advantages (Harvey, 1989; Amin and Thrift, 1992; Swyngedouw, 1992). The local 'institutional
thickness', according to Amin and Thrift, has a decisive influence on economic development as place
appean to become of critical importance to f i n s (Amin and Thrift, 1995). This position was stressed by
Healey (1998b). who argued that Sn a world where integrated place-bounded relationships are pulled
out of their localities, 'disembodied' and refashioned by multiple forces which mould them in different
directions. the qualities of place seem to become more, not less, significant" (p. 1531). With regard to

the real estate sector, global, national and regional economic forces rnay produce distinct spatial
patterns of investment However, there appear to be strong links between the real estate sector and
local economic conditions (Turok, 1992; Healey, 1994; Leitner, 1994; Ball and Wood, 1996; Hamelink
et al., 2000).
Urban specbity is even more impoltant in the real estate sector than in finance and industrial
production, since it is concemed with investrnents which have a dimension of immobility. Beyond the
distinct economic conditions, other localty embedded factors shape real estate investment. Real estate
development is articulated differently at various places and times: The exact articulation of the practice
of real estate development is contingent upon which acton are invoived and how they are organized,
as well as the particular historical and spatial contexï (Pratt, 1994, p. 204). In this context, the idea of
'local dependence' advocated by Cox and Mair (1988, 1989) is of importance. Cox and Mair define
'local dependence' as 'a relation to locality that results from the relative spatial immobility of some
social relations, perhaps related to fixed investments in the buiit environment or to the particulaiization
of social relationsn (Cox and Mair, 1989, p. 142). To succeed in real estate development, deveiope~
have to be embedded in local power centres, and have to rely on positive experiences with local
professionals (planners) and decision-makers (politicians). These relations are indispensable to
businesses which depend entirely on local conditions. Many if not most other businesses are less
spatially fixed. To facilitate the real estate development process, operational spaces have to be
detemined and defended. The formation of these spatial relations is time consuming and expensive.
As a result, the importance of iocal dependence intensifies. Cox and Mair's idea of local dependence is
mainly related to localities or municipalities. However, urban specificity depends on a particular
geographical scafe; hence local dependence is possible at the intra-municipal as well as at the inter-
municipal level.
The involvement of real estate companies in local politics in order to enhance their own private
businesses has been widely acknowledged. First, investigative joumalism tends to fonis on and over-
emphasize the scandalous and illegal aspects of this nexus. Here real estate developen are depicted
as capitalist villains appropriating public money for their own gains. A similar line of reasoning was also
pursued by the advocates of the 'conspiracy approach', which culminated in the 1970s in Britain and
Canada, and to lesser extent in the Unes States. These authon insinuated that the relationship
between local govemments and private businesses is 'cooperative'; this cooperation enhances
accumulated profits of private cornpanies. The state. represented by local municipalities, was pomayed
as a coconspirator who destroyed the 'good' (usually old) urban fabric and restnictured the built
environment for the gain of the developers (Barker et al., 1 S73; Caulfield, 1974; Collier, 1974; Ambrose
and Colenutt, 1 975; Gutstein, 1 975; Lonmer, 1 978).
However, devebper-government relations need to be seen as a necessary element in the
production of buiit commodities that are essential to the suivival of the capitalist mode of production.
Without close-ties, common social networks, shared beliefs, and common goals, real estate
development is unlikely to occur at the sa le and scope experienced by major cities. Govemrnents are
an integral part of the smooth functioning of real estate production; they hold the 'keys' that enable
developrnent. In the same way that capital is considered the raw material of development, govemment
regulation is a 'manual' attached to each devekpment. The essence of these relations is not
embedded in persona1 misderneanon, but deeply established in the daily practices and the structure of
relations in a profit-maximiring culure which needs a 'cooperative mode' to make real estate a
profitable business. Moreover, it is important to bear in mind that these practices do not reflect only the
developers' interests. There is a twoway rebtionship. Govemments strive to promote their own
objectives and they 'use' real estate as a major vehicle to accomplish their goals, namely advance their
political agenda.
1.2.4 Real estate developers
Literature on the real estate sector identifies the real estate developer as a pivotal agent in the
deveIo prnent process:
The developer is like an impresario. He is a cataiyst, the man in the middle who creates nothing himself, maybe
has a vague vision, and causes others to create things. His raw material is land and his aim is to take land and
improve it with bricks and mortar so that it becornes more useful to somebody else and thus more valuabte to himn
(Mamott, 1967, p. 24).
'In fact, of the groups invoived in urban deveiopment, developers, since they are lead agents in this process, are
the most important" (Beauregard, 1989, p. 262).
Thr property developer, not the planner or the architect ... is primariiy responsible for the cunent incarnation of
the western cRy" (Sudjic, 1992, p. 34).
Marriott (1967) was one of the first authon to emphasize the role of the developer in the real estate
development process. lnstead of focusing on the demand side or on abstract forces that shape
development of the built environment, he focuses on the developer, the provider of real estate
properties, as the key agent in the development process. The focus of the politi i l economy approach

on the importance of the supply side in real estate development is at the abstract level, reducing agents
to objects that are manipulated by structural forces (Harvey, 1985). However, some agents are
powerful enough to influence the production of the buiit environment (Logan and Molotch, 1 987: Feagin
and Parker, 1990; Wilson, 1991) and, therefore, real estate cbmpanies should receive attention. In an
interpretation of the 1980s building cycle Beauregard (1 994, p. 730) suggests:
%il of this [the digagement of mal estate ban actMty from a demand-induced base] means that city building is
l e s and les responsive to human need and more and more driven by entrepreneurial fervor".
Necessav components in the framework of capital switching are the facilitators, the agents who
engage in capital switching practices, and who have a significant role in shaping supply. Rather han
scrutinizing structural factors as abstract forces, the recognition of agents as being the medium for the
reproduction of structure is essential. Macroeconomic and political events create the conditions and set
the stage for building cycles, but agents are the catalysts that take advantage of these conditions to
mold place-and time-specific products (Mamott, 1967; Lorimer, 1978; Feagin and Parker, 1990).
Structural and agent-based approaches are complementary interpretations, since interactions between
economic conditions and agents' calculations explain the production of built space (Pryke, 1994a). As
suggested by Healey and Banett (1990, p. 90) '. . . extemal pressures are reflected and affected by the
way individual agents determine their strategies and conduct their relationships as they deal with
specific projects and issues, and as they consider their future stream of activiiies". In addition, agents
establish and nourish channels of capital flows. These channels will remain intact, particularly if a
critical threshold is surpassed, and they will attract capital for fumer investment (Edgington, 1 995;
Lindahl, 1997).
One of the major agents in the real estate development process is the entrepreneur or the
developer that initiates and coordinates the development process. The developer is considered not
only a passive actor in the real estate development process, but also a proactive agent who makes
things happen (Mamott, 1967; Chamberlain, 1972; Logan and Molotch, 1987; Haila, 1991). For
example, according to Sudjic (1 992) and Fainstein (1 994), Olympia 8 York Developments, the largest
Canadian-based real estate Company in the late 1980s, was a major cataiyst for the development of
the Battery Park City (World Financial Center) in New York and the Canary Wharf project in London.
Other agents, such as local governments, financial institutions, and real estate broken are extremely
important, but the developer embodies the act of development and the developer's practices 'fuse' the
reciprocal relationships between structural conditions and the agency's perceptions (Whitehead, 1987;
Fainstein, 1994; Lindahl, 1997).
This does not mean that the real estate developer is the sole force of speailative development,
but the developer's ability to exploit specifn conditions, such as easy credit and optimism of the funding
institutions, makes the developer the agent who practices and implements development. The
speculative developen are market promoters, coordinaton and stabilizen, and are "integnl and
essential to the workings of the capitalist economy" (Harvey, 1985, p. 68). This position of the
developer as an opportunity hunter is crucial in taking advantage of dierent phases during building
cycles and different cycles across properties and places.
Logan and Molotch (1987) and Haila (1991) have constructed a typology of the real estate
agents involved in the real estate development process. Their typdogy distinguishes between two
'poles' of development agents: casual and structural. The casual developer is a passive player in the
real estate market and the profid helshe receives rests on accidentally owning the land or property at
the right place at the right time. The developer's passiveness is reflected in the fact that the future
building is designed for a specific client. The structural developer, on the other hand, is a pmactive
player who predicts development trends and gambles on predictions. The real estate developer, who
uses mostly bonowed capital to execute development, is not an entirely rational calculating agent;
often decisions are based on guesses and faith in future conditions (Feagin, 1987; Fainstein, 1994;
Haila, 1999a). In some cases, this type of speculative developer even attempts to manipulate the
market for hisher own purpose (Haila, 1991).
Des Rosiers (1984) outlines four major functions perforrned by a developer. First, helshe is a
coordinator who assumes diverse operations such as negotiating land purchase, obtaining planning
permissions, assembling a development team, taking major decisions regarding planning and
construction, and leasing or selling the new property. The second fundion is assessing risk. In a
volatile environment, the complex development process has to be offset by being able to assess the
market. The developer is also a maket 'insider' who has market knowledge. Accurate knowledge,
which is generated through an information network, is pivotal for the developer's power. Finally, the
developer is responsible for the acquisition of development funds from extemal sources (Des Rosiers,
1 984, pp. 599-600).
The behaviour of developen changes according to the phases of the building cycle. Whitehead
(1 987, 1996) suggests four phases in the real estate development cycle: recovery, expansion,
stagnation and collapse. As the cycle progresses from market recovery to collapse, the role of the
developer diminishes and spatiat behaviour changes. At the recovery phase, the developer is the
spatial trailblazer, as opportunities are perceived when there is no clear picture of the future (O'Donnetl,
1989). As the recovery tums into expansion and the market becomes crowded, some developers leave

the specific market to look for 'greener pastures' that offer higher potential pmf i . At the stagnation
phase, the financiers, who strive to salvage their investment, take the reins from the developers
(Whitehead, 1996).
The developer is able to identify opportunities by conceivhg an original project and creative
financing. During real estate uptums, new entrants enter the development business, because secuiing
financing is easier and investors are willing to take greater risks (Ball, 1994). However, 1 is not only
reading the market well that assists developers, but al- the exploitation of oppominities created by
policy incentives (Harvey, 1985; Momson, 1992; Kennedy-Skipton, 1993). For example, in Glasgow,
the concentration of office devekpment in the city centre is the direct resuit of a sequence of office
policies and plans. These plans are essentially centralist and also protectionist policies, whereby major
office developments are to remain in the central area and are not be located outside 1. These policies
reinforce the tendency of the real estate cornpanies to concentrate their interests in the city centre
(Momson, 1992). Moreover, since the 1980s, real estate devekpers have shared with local
govemments the values of enhancing economic performance. Real estate is no longer considered as a
parasitic business and real estate companies have become more invoived in the planning process,
achieving more room for speculative maneuvers (Haila, 1991).
The components discussed in this section (1.2) situate agents, which are considered having an
important role within the structural framework they operate in. This notion is put forward by Wilson
(1 991, p. 41 1):
'Powerful individuals are authos of their own woilds and not simply respondent. in a predetemiined world. Their
actions, however, are influenced by prevailing ideologies, roles, and production of relations. This social
inheritance provides the context within Aich humm actions operate. Local restnicturing influences are therefore
bonded to structural forces".
Building cycles, financing arrangements, and the roles of different levels of the state reflect the major
structural conditions that affect the actions of real estate companies. Building cycles provide the
macroeconomic conditions in which individual real estate companies work. Financing is also a
structural condition as different types of sources and arrangements are possible. All levels of the state
are necessary for the smooth functioning of real estate production. Each component contributes to the
formation of a framework that enables to interpret and explain the development of space. This
framework is sketched in the next section.
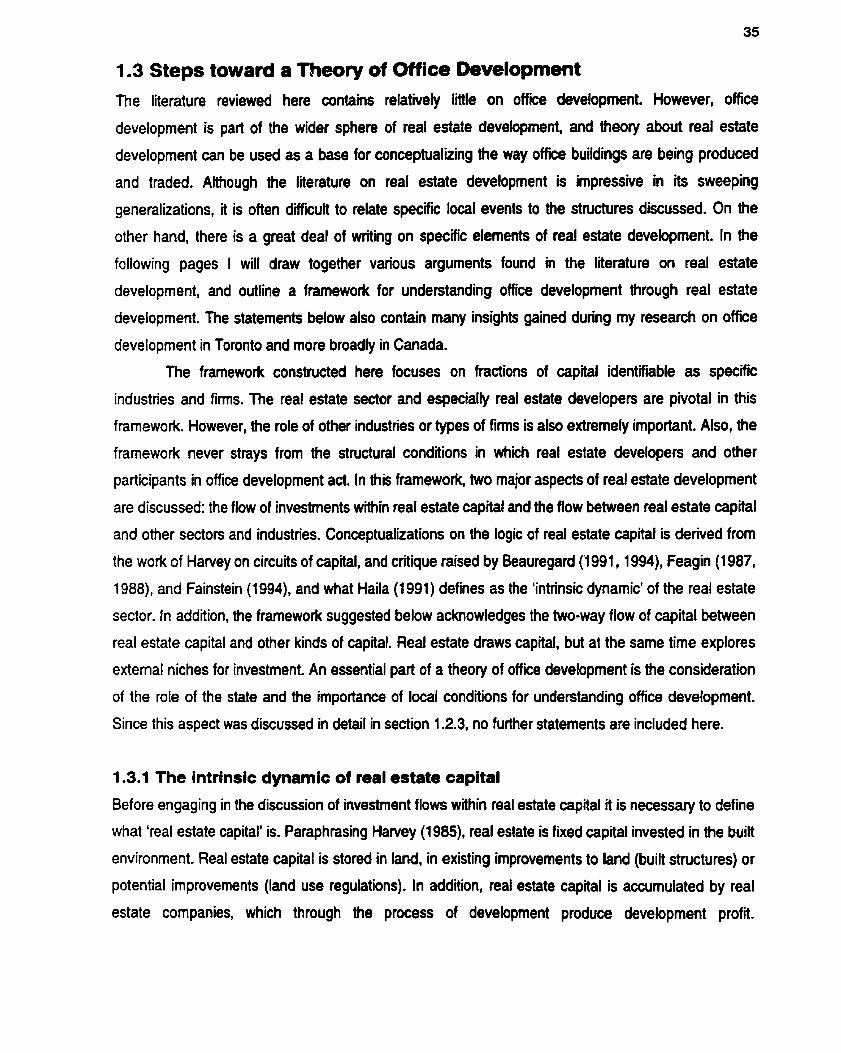
1.3 Steps toward a Theory of Office Development The literature reviewed here contains relatively I l e on office development. However, office
development is pait of the wider sphere of real estate development, and theoiy about real estate
development can be used as a base for conceptualking the way office buildings are being produced
and traded. Although the literature on real estate development is impressive in its sweeping
generalizations, it is often diffiiult to relate specific local events to the structures discussed. On the
other hand, there is a great deal of wnting on specific elements of real estate development. In the
following pages I will draw together various arguments found in the literature on real estate
developrnent, and outline a framework for understanding office development through real estate
development. The statements below also contain many insights gained during my research on office
development in Toronto and more broadly in Canada.
The framework constnicted here focuses on fractions of capital identifiable as specific
industries and fims. The real estate sector and especially real estate developers are pivotal in this
framework. However, the role of other industries or types of fimis is also extremely important. Also, the
framework never strays from the structural conditions in which real estate developers and other
participants in office development ad. In this framework, two major aspects of real estate development
are discussed: the flow of investrnents within real estate capital and the flow between real estate capital
and other secton and industries. Conceptualizations on the logic of real estate capital is derived from
the work of Harvey on circuits of capital, and critique raised by Beauregard (1 991, 1994), Feagin (1 987,
1988), and Fainstein (1994), and what Haila (1 991) defines as the 'intrinsic dynamic' of the real estate
sector. In addition, the frarnework suggested below acknowledges the two-way flow of capital between
real estate capital and other kinds of capital. Real estate draws capital, but at the same time explores
extemal niches for investment. An essential part of a theory of office development is the consideration
of the role of the state and the importance of local conditions for understanding office development.
Since this aspect was discussed in detail in section 1.2.3, no further statements are included here.
1.3.1 The intrinsic dynamic of real estate capital
Before engaging in the discussion of investment flows within real estate capital it is necessary to define
what 'real estate capital' is. Paraphrasing Harvey (1 985), real estate is fixed capital invested in the buitt
environment. Real estate capital is stored in land, in existing improvements to land (built structures) or
potential improvements (land use regulations). In addition, real estate capital is accumulated by real
estate companies, which through the process of development produce development profi.
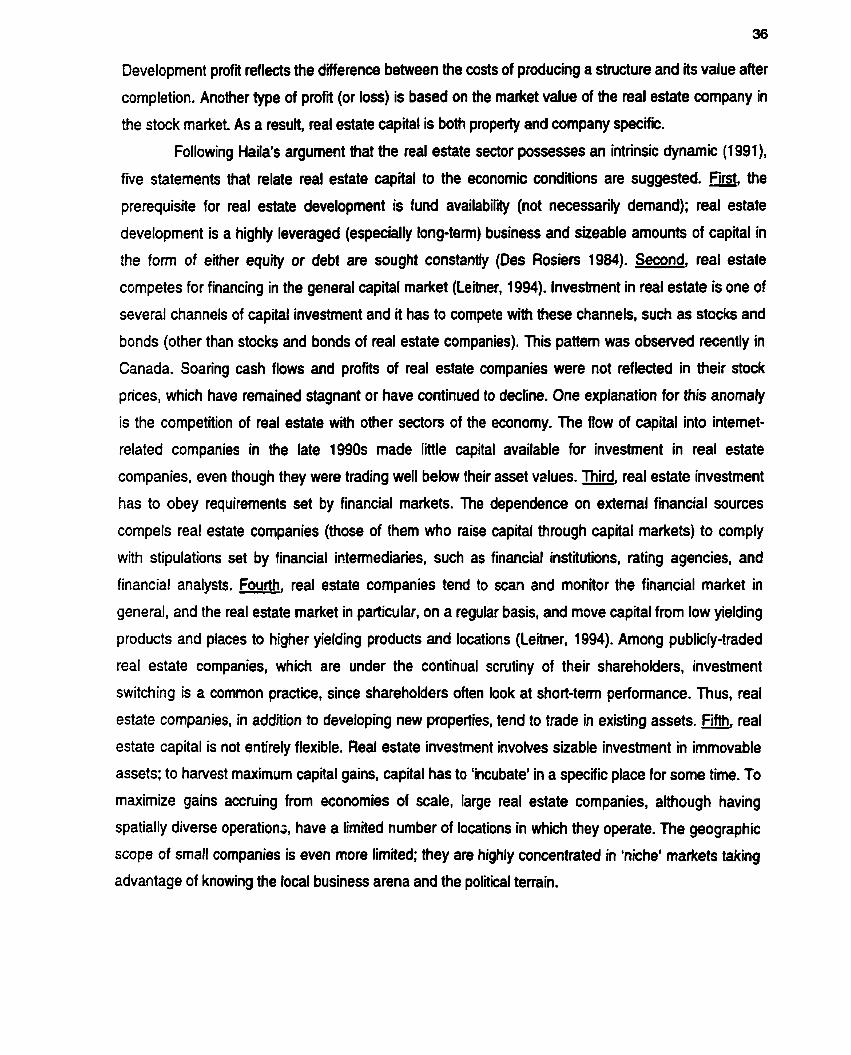
Development profi reflects the diierence between the costs of producing a structure and its value after
completion. Another type of profi (or los) is based on the market value of the real estate company in
the stock market. As a resutt, real estate capital is both property and Company specific.
Following Haila's argument that the real estate sector possesses an intrinsic dynamic (1 991).
f i e statements that relate real estate capital to the economic conditions are suggested. First, the
prerequisite for real astate development is fund availabilii (not necessarily demand); real estate
development is a highiy leveraged (especially long-terni) business and sizeable amounts of capital in
the form of either eguity or debt are sought constantiy (Des Rosiers 1984). Second, real estate
cornpetes for financing in the general capital market (Leitner, 1994). lnvestment in real estate is one of
several channels of capital investment and it has to compete with these channels, such as stocks and
bonds (other than stocks and bonds of real estate cornpanies). This pattern was obsenred recently in
Canada. Soanng cash flows and profis of real estate companies were not reflected in their stock
prices, which have remained stagnant or have continued to decline. One expknation for this anomaly
is the competition of real estate with other sectors of the economy. The flow of capital into intemet-
related companies in the late 1990s made little capital available for investment in real estate
companies. even though they were trading well below their asset vslues. Third, real estate investment
has to obey requirements set by financial markets. The dependence on extemal financial sources
compels real estate companies (those of them who raise capital through capital markets) to comply
with stipulations set by financial ifitermediaries, such as financial institutions, rating agencies, and
financial analysts. Fourth, real estate cornpanies tend to scan and monitor the financial market in
general, and the real estate market in particular, on a regular basis, and rnove capital from low yielding
products and places to higher yielding products and locations (Leitner, 1994). Among publicly-traded
real estate companies, which are under the continual scrutiny of their shareholders, investment
switching is a cornmon practice, since shareholders often look at short-terni performance. Thus, real
estate companies, in addition to developing new properties, tend to trade in existing assets. Flh, real
estate capital is not entirely flexible. Real estate investment involves sizable investment in immovable
assets; to harvest maximum capital gains, capital has to 'incubate' in a specific place for some time. To
maximize gains accruing from economies of scale, large real estate companies, although having
spatially diverse operation;, have a limited number of locations in which they operate. The geographic
scope of small companies is even more limited; they are highly concentrated in 'niche' markets taking
advantage of knowing the local business arena and the political terrain.
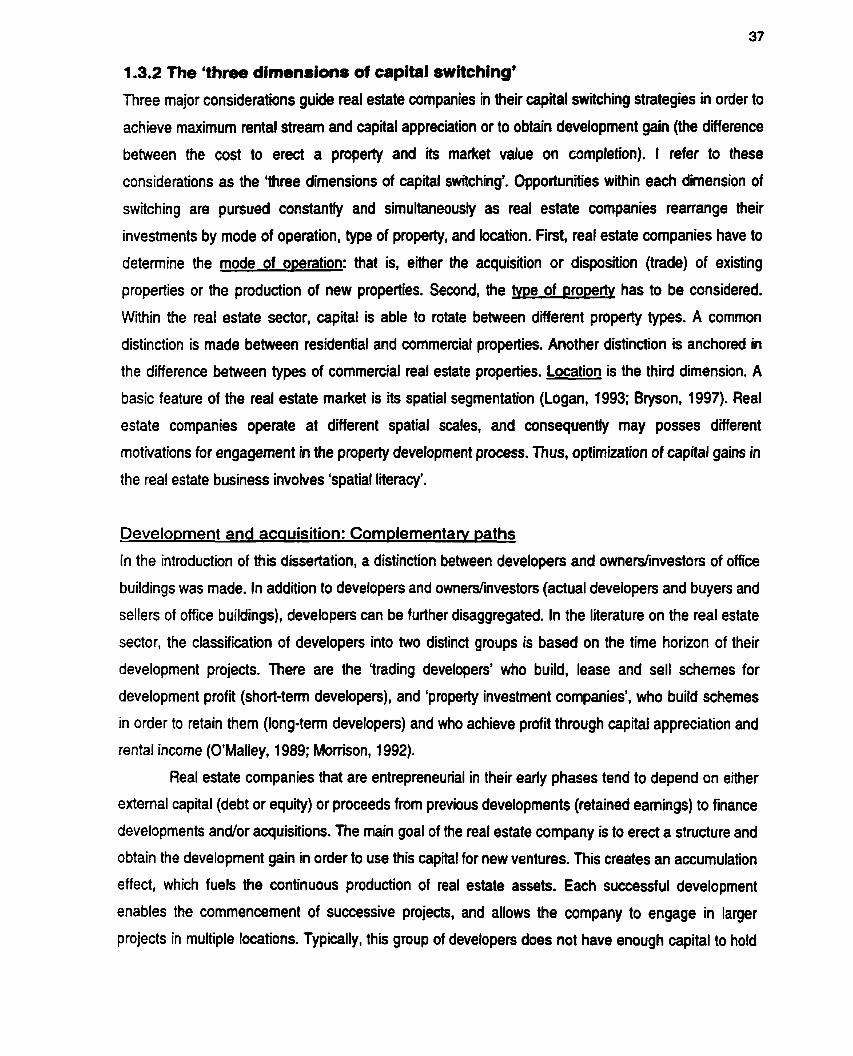
1.3.2 The Yhree dimensions of capital switching'
Three major considerations guide real estate companies in their capital switching strategies in order to
achieve maximum rental Stream and capital appreciation or to obtain development gain (the difference
between the cost to erect a property and its market value on completion). I refer to these
considerations as the Wree dimensions of capital switching'. Oppoilunities within each dimension of
switch ing are punued constantly and simultaneously as real estate companies reanange their
investments by mode of operation, type of propeity, and location. First, real estate cornpanies have to
detenine the mode of operation: that is, either the acquisition or disposition (trade) of existing
properties or the production of new propeities. Second, the twe of ~ r o ~ e r t y has to be considered.
Within the reai estate sector, capital is able to rotate between different property types. A cornmon
distinction is made between residentiaf and commercial properties. Another distinction is anchored in
the difference between types of commercial real estate properties. Location is the third dimension. A
basic feature of the real estate market is its spatial segmentation (Logan, 1993; Blyson, 1997). Real
estate companies operate at different spatial scales, and consequently may posses different
motivations for engagement in the property developrnent pracess. Thus, optimization of capital gains in
the real estate business involves 'spatial literacy'.
Deveto~ment and acquisition: Complementarv ~a ths
In the introduction of this dissertation, a distinction between developers and ownershnvestors of office
buildings was made. In addition to developers and ownerslinvestors (actual developers and buyers and
sellers of office buildings), developers can be further disaggregated. In the literature on the real estate
sector, the classification of developers into two distinct groups is based on the time horizon of their
development projects. There are the 'trading developers' who build, lease and seIl schemes for
development profi (short-term developers), and 'property investment companies', who build schemes
in order to retain thern (long-ten developen) and who achieve profi through capital appreciation and
rental incorne (O'Malley, 1989; Momson, 1992).
Real estate companies that are entrepreneurhl in their early phases tend to depend on either
extemal capital (debt or equity) or proceeds from previous developments (retained eamings) to finance
developments andfor acquisitions. The main goal of the real estate Company is to erect a structure and
obtain the development gain in order to use this capital for new ventures. This creates an accumulation
effect. which fuels the continuous production of real estate assets. Each successful development
enables the commencement of successive projects. and allows the company to engage in larger
projects in multiple locations. Typically, this group of developen does not have enough capital to hold

these assets for a long period; therefore, these projects are sold after completion to their respective
tenants or to other investors. On the other hand, real estate companies with the backing of large
corporations are able to pursue larger scale developments and retain the ownership of the pmpeiües
they develop.
Nonetheless, the distinction between two modes of operation, development and acquisition,
has significant implications for the conceptualization of the real estate sector. Drawing on Manist
thinking and using the concepts of 'surplus value' and 'ckculation of capital', a distinction between
development and acquisition of real estate assets is punued. Surplus value, according to Harvey
(1973), "is that part of the total value of production which is left over after constant capital (which
includes the means of production, raw materials and instruments for labour) and variable capital (labour
power) have been accounted for" (p. 224). The production of a new property invohres three major
components that may increase or decrease the value of a property. Fint, the traditional surplus value
embodied in a building is created through labour, either labouren invoived in the construction process
or other professionals, such as architects, engineen, plannen and consultants. Second, negotiation
gains, such as re-zoning or increasing denstty, are obtained through bargaining with the local
govemment. Finally, market gains (or losses), which involve the appreciation (or depreciation) of the
market value of buildings over time. These three components reflect the development profit.
Retained profits from each development enable the developer to continue in the process of
development and acquisition and, consequently, to accumulate capital. In addition, if the property is
retained as an 'incorne-producing' property, the developer is able to extract rents on a regular basis.
On the other hand, acquisition is more likely to create a different kind of value, 'exchange value'.
Harvey (1982) argues that capital exists as a commodity fom when it is frozen in a finished product.
But since capital is a 'value in motion', it must be continuously transfoned into money capital. The
difference between market prices at different points in time creates the 'exchange value'. This is
attributed to appreciation in value over time, often a result of extemal-to-the-property conditions, such
as inflation and escalating rental rates (rather than direct capital investment executed by the property
owner).
The developrnent and the acquisition/dispositÎon of real estate properties are two sides of the
same coin; real estate companies execute both strategies as they restructure their holdings. In generai,
during uptums of the building cycle, cornpanies prefer development over acquisition. For example, in
the office market, as demand for space rises, vacancy rates diminish and rental rates escalate. At the
same time, the rate of transactions in existing office properties is minimal. Consequently, development
is pursued. As the market hits recession, the extent of development is reduced and during severe

rccessions development is almost abandoned. Many real estate companies and ownen of properties
expenence financial diffïnuloes as vacancy rates soar and rental rates plunge. As a result, these
companies are not able to service theif debt. Hence, selected pmperties are put on the market for sale,
and acquisition/disposition becornes the dominant practice in the office sector.
Product selection: The arowina s~ecialization within the real estate sector
Properties that are developed or acquired by an organization for the purpose of its own use are usually
considered stable and outside capital switching practices. However, exchange-value properties a n
acquired or developed for the purpose of generating an income strearn thmugh the collection of rent;
real estate companies hold these propeities for income-producing purposes. lntemal characteristics of
income-producing properties determine their rnaiket value and attainable rental rates. Generally, newer
buildings command higher rents than older buildings; older buildings need major capital investments to
bring them to the rental levels of the newer buildings. Large-scale projects are relatively scarce
commodities, attracting premier tenants and commanding high rents. Therefore, they are considered
lucrative long-terni investrnents. On the other hand, smaller buildings are considered to be
opportunities for a quick profit. Since there are more small properties available than larger ones.
smaller properties are easier to trade and are regarded as short-term investments.
, Real estate companies tend to rotate capital within their portfolios by upgrading their holdings.
This practice involves the construction of new buildings and shifting tenants from their old prernises to
the newer buildings. Some office space users retain long-ten relationships with their space providers
(the real estate companies). These close relationships enable real estate developers to build a new
building knowing that they will be able to convince tenants to move to the new development. The
shuffling of tenants is either a result of the tenant's growing space needs that cannot be
accommodated within their old office premises or a resuit of inducements made by the developer.
These practices enable real estate companies to retain development gains and at the same time
increase the rental stream, since newer buildings command higher rents than older ones. In addition,
real estate companies prefer to own highquality properties. The highest quality properties in the office-
building sector are class 'A' buildings. Over the long run, class-A office buildings experience lower
vacancy rates, and are therefore more resistant to slumps in rental income than lower quality buildings.
Hence, these high-quality properties are either retained through developrnent or acquired.
Within the real estate sector, capital is able to rotate between different property categories. The
most common distinction is made between residential and commercial properties. Residential
properties include land development and different kinds of housing, such as single detached houses,

apartment buildings or condominiums. Industrial buildings, shopping centres, hotels and office buildings
are the prime categories within the commercial sub-sector. Capital is often shifted to commercial
development since it is considered more lucrative by virtue of dealing with corporate tenants rather
than individual renters. In addition, corporate tenants are not subject to rent control regulation (Feagin
and Parker, 1990). Developers who acquire the expertise, capital and ties to local 'power centres'
(politicai and business), are able to tackle more complex land uses, such as major shopping centres
and multi use developments. Furthemiore, as a result of concentration and the creation of large-scale
conglomerates, the average scale of development has increased significantty (Knox, 1993). Some
large-scale projects acquire distinctive characteristics that make them unique and prestigious, and the
scarcity of these types of properües inflates their values, making them highly desirable among real
estate companies.
Location
The differences between places govem the financial performance of seemingly similar real estate
assets. At the national scale, real estate companies maintain their spatial presence in selected cities
(markets) across a country by maintaining a continued presence. They use regional offices, which
anchor their presence, and nourish alliances with locally influential agents. On the other hand, local real
estate companies are likely to be spatially conservative, having a higher level of dependence on weli-
defined territories. For small real estate companies, 'local dependence', resulting from the relative
spatial immobility of social relations (Cox and Mair, 1988) is far more important than for large
companies. The limited operational territory of small companies is also a result of limited equity and a
finite leverage capacrty (Bryson, 1997; Lizieri et al., 2000). This is specially the case with modem office
buildings; the high cost and the complexity of large-scale office buildings (necessw for parking
structures, expensive electrical, plumbing, mechanical and security systems) usually limit these
buildings to the core of large urban areas. The focus of large real estate companies on downtown office
concentrations in large rnetropolitan areas is further enhanced by the availability of data on these
markets in relation to smaller cities or suburban areas (Lizieri et al., 2000). Only the well-financed and
well-established developers can undertake these types of projects. These factors segment the spatial
reach of real estate capital.
The renowned real estate mantra 'location, location, location' appears to play a primary role
when considenng capital switching. A basic feature of the real estate sector is its spatial segmentation
(Logan, 1993; Bryson, 1997). Real estate companies operate at different spatial scales and
consequently may posses different motivations for engagement in the property development process.
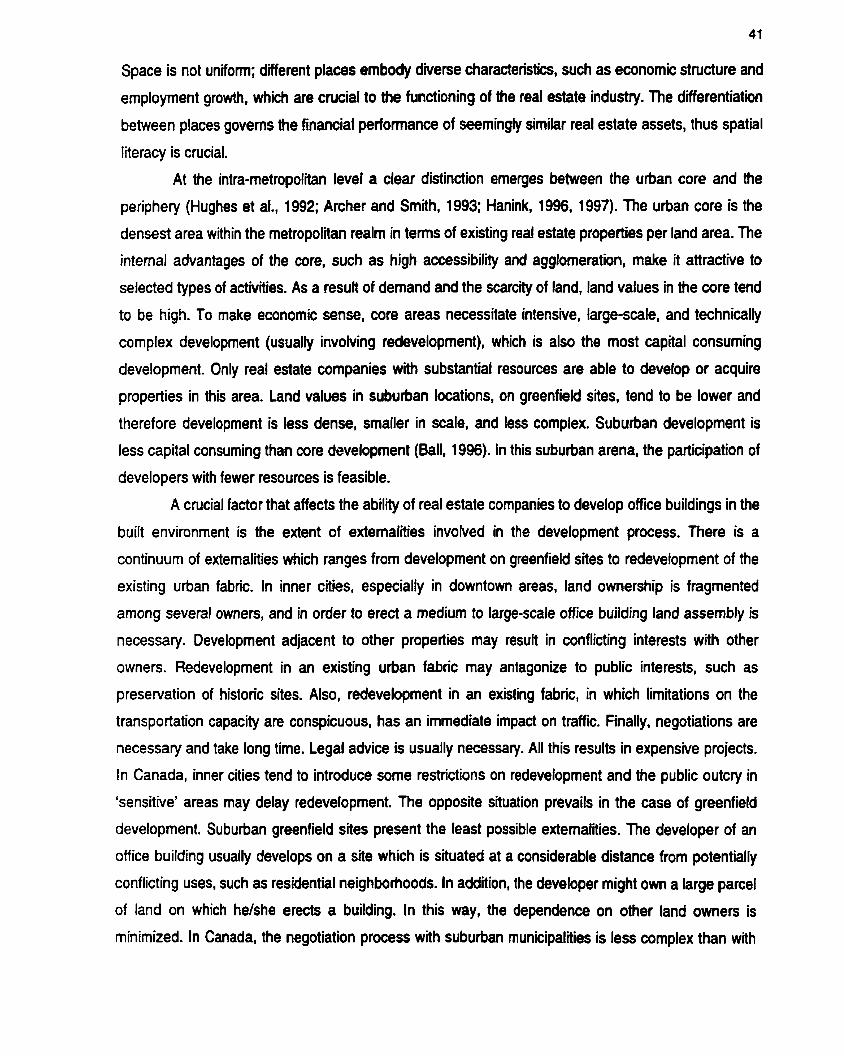
Space is not uniforni; different places embody diverse characteristh, such as economic structure and
employment growth, which are crucial to the functioning of the real estate industry. The differentiation
between places govems the financial performance of seemingly similar real estate assets, thus spatial
Iiteracy is crucial.
At the intra-rnetropolitan level a clear distinction emerges between the urban core and the
periphery (Hughes et al., 1992; Archer and Smith, 1993; Hanink, 1996, 1997). The urban core is the
densest area within the metropolitan realm in ternis of existing real estate properties per land area. The
intemal advantages of the core, such as high accessibiliîy and agglomeration, make it attractive to
selected types of activities. As a result of demand and the scarcity of land, land values in the core tend
to be high. To make economic sense, core areas necessitate intensive, large-scale, and technically
complex development (usually invohring redevelopment), which is also the most capital consuming
development. Only real estate companies with substantial resources are able to develop or acquire
properties in this area. Land values in suburban locations, on greenfield sites, tend to be lower and
therefore development is less dense, smaller in scale, and less complex. Suburban development is
less capital consuming than core development (Ball, 1996). ln this suburban arena, the participation of
developers with fewer resources is feasible.
A crucial factor that affects the ability of real estate companies ta develop office buildings in the
built environment is the extent of extemalities invoived in the developrnent process. There is a
continuum of extemalities which ranges from development on greenfield sites to redevelopment of the
existing urban fabric. In inner cities, especially in downtown areas, land ownership is fragmented
among several owners, and in order to erect a medium to large-scale office building land assembly is
necessary. Development adjacent to other properties may result in conflicting interests with other
owners. Redevelopment in an existing urban fabric rnay antagonize to public interests, such as
preservation of historic sites. Also, redevelopment in an existing fabric, in which limitations on the
transportation capacity are conspicuous, has an immediate impact on traffic. Finally, negotiations are
necessary and take long tirne. Legal advice is usually necessary. All this results in expensive projects.
In Canada, inner cities tend to introduce soma restrictions on redevelopment and the public outcry in
'sensitive' areas may delay redevelopment. The opposite situation prevails in the case of greenfield
development. Suburban greenfield sites present the least possible extemalities. The developer of an
office building usually develops on a site which is situated at a considerable distance from potentially
conflicting uses, such as residential neighborhoods. In addition, the developer might own a large parce1
of land on which helshe erects a building. In this way, the dependence on other land owners is
minimized. In Canada, the negotiation process with suburban municipalities is less complex than with

inner cities. Suburban developers are embedded in the municipaliies in which they operate; they are
part of the community and well recognized as contributors to the success of these localities.
1.3.3 Reciprocal relations: Real estate and other capitals
Haivey's arguments that capital switches between the primary and the secondary circuits provide
important insights into the practices of fractions of capital. The production of real estate capital is
possible through two major processes. First, real estate developen with minimal initial capital
(entrepreneurial developen) use retained eamings combined with small leverage to punue real estate
development. This type of development involves the construction of rektively small properties, in which
the developers usually do not retain ownenhip interest. They use their labour qualifications (vision and
expertise) to accumulate capital. The second type of real estate capital is produced through the direct
involvement of financial, industrial or mercantile capitals. This condition results in a real estate
Company that is backed by large capital (financial, industrial, or mercantile). The backing of extemal
capital facilitates further leverage and enables much iarger developments.
Although it is often difficult to document and determine the sources of capital used for real
estate development, obseivations on the practices of Canadian real estate companies provide
evidence for the invohrernent of different fractions of capital in real astate development. The history of
the real estate sector in Canada shows that finance, industrial and mercantile capitals were stimulators
and financiers of real estate development at various times. All these capitals used leverage to finance
real estate development; the extent of these capitals' invohrernent in real estate is difficult to measure,
but it would be reasonable to suggest that without initial capital onginating in the financial, industrial
and mercantile spheres, subsequent leverage would not have been possible.
In his formulations on circuits of capital, Harvey argues that investment in the built environment
that preceded each of the global crises of the 1930s and the 1970s was as a kind of lastditch hope for
finding productive uses for rapidly overaccumulating capital" (1985, p. 20). For Harvey, investment in
the built environment is a one-way flow of capital. Fainstein (1 994) criticizes this notion of circuits. She
argues that Hanrey's 'use of the tenn 'circuit' indicates that once capital moves into this realm [real
estate] it will stay there" (p. 222). But, capital invested in real estate assets is not 'locked' in, rather it is
stored in these assets and it can be used to generate investment in other sectors. Since the idea of
capital switching between the primary and secondary circuits failed to produce 'hard' evidence in the
short run (Feagin, 1987; Beauregard, 1991, 1994), 1 is suggested that the behaviour of real estate
does not counter the movements in other parts of the economy, rather patterns of real estate
investment directly correspond to situations in the economy in general.
Real estate properties c m be used as collateral for bormwing and since the capital invested in
these properties is mostly bonowed, real estate properties are extremely leveraged instruments. This
leverage can be fumer extended to investments in other secton of the economy. Real estate
companies bonow large sums of capital for development, and are able to establish multiple lines of
credit that provide them large leverage. They are able to invest in secton extemal to real estate by
using leverage on top of leverage. Bonowing money is made possible based on the assets of real
estate companies that most of their cost was financed through debt. This leverage exemplifies what
Harvey calls 'fictitious capital', capital that is financed through credit and debt (Harvey, 1982). As a
result, Harvey considen real estate as an absorbent rather than a generator of capital. Fainstein
(19941, on the other hand, argues that real estate development creates value. The increase in land
value resulting from development, changes unproductive spaces into productive ones, hence
development is not fictitious. These two contradictory approaches can be reconciled. Although mal
estate capital is produced through debt instruments, the final outcome is not fictitious since it facilitates
the continuous process of production. This juncture with 'real' production may resuft in some real estate
companies switching some of their capital into the 'productive' secton of the economy.
Often large real estate companies merge their real estate capital with investments in other
sectors and the distinction between these types of capital is bluned. In these instances loans obtained
by a real estate company may not be assigned to specific purposes but the general purposes punued
by the real estate company. As companies grow in size bey are able to obtain larger loans which may
be directed to various purposes; this allows them to diversify into fields not related to real estate. These
financing practices result in capital crossing the 'boundaries' of real estate capital. This move is
facilitated since capital is considered as a pure financial asset (Harvey, 1982, 1985; Haila, 1988, 1990).
Urban land has been increasingly treated as pure financial asset; this means that instead of focusing
on its use value, developers and owners of real estate assets treat it as another financial asset that can
be bought and sold according to its market value (Harvey, 1985). As a financial asset, real estate
capital does not have to cling to real estate assets, but can explore other alternatives. This feature of
tradability may result in flipping capital from primary to secondary circuit and vice versa. These
practices are related to temporal position of real estate capital. During recession, real estate companies
prefer to invest in non-real estate assets. to hedge against negative affects experienced by the real
estate sector.
The increasing embeddeness of real estate within other sectors of the economy has facilitated
the conditions for real estate capital to seek the most efficient niches within and outside its domain.
These conditions necessitate complex calculations that have to be considered by real estate

companies. One set of cakulations involves situating investrnent within the 'three dimensions of capital
switching'. Figuring what is the best available mix of considerations is a continuous task perfomed by
real estate companies. Second. capital is switching back and forth to and from real estate. Fractions of
capital that are not real estate related engage in investrnent in real estate and occasionally, real estate
capital is seeking outlets outside its 'traditional' scope. Several aspects of these complex calculations
are addressed in this dissertation.
1.4 A Provisional Framework In this chapter, I have attempted to reanange supply-side components as shaping the production of
real estate properties into an analytical framework. This type of analysis draws on combining structural
requirements and actions performed by prominent agents. A number of elements are emphasized in
this framework. First, the uneven surface of structural conditions, which is a fundamental requirement
for the reproduction of the capitalist system, is responsible for variabilii in the development of real
estate properties. Second, this uneven surface is mediated by institutional intervention and public
arrangements perfomed by the various layers of the state. The state is an imperative elernent in this
system. Finally, the vehicle for the implementation of the development process, the agent that cames
out this endeavour, is the private real estate Company.
This chapter clarifies how the structural conditions of real estate deveiopment are reflected in
the daily operations and practices of real estate companies. The real estate company translates
various processes and signals into concrete buiit products. This type of compnay is an investment
channel that gathen information and expertise to deploy capital in real estate in selected products and
in selected locations. The focus on the real estate company and its operational procedures enables the
integration of a conceptual process into concrete manifestations and back to abstract levels.
CHAPTER TWO
RESEARCHING OFFICE DEVELOPMENT IN TORONTO: CONTEXT,
APPROACH, METHODS, AND DATA
This chapter has three components. First, as asserted in the previous chapter' real estate development
is highly dependent on specifii urban settngs. Therefore, the conditions and the specific context for
office development in Toronto during the last fiie decades are outlined. The second section presents
the research approach and methodology chosen. Research procedures rely strongly on 'realist' method
and techniques. The last section disuisses data sources and data collection.
2.1 Context: The Conditions for Office Development in Toronto Toronto, as Canada's largest metropolitan area and its foremost business centre, presents an excellent
opportunity for the study of office development. The size and the cornplexity of Toronto's urban area
and the generally high rates of population and employrnent growth prevailing for the last f i e decades
have provided ample scope for divenity with respect to office development. These features of growth
were complemented by institutional arrangements and planning interventions that have influenced
development in the Toronto metropolitan area since 1950 (Filion, 2000). Office development has been
a major component of growth in the Toronto metropolitan area. Nevertheless, office development was
not uniform across the urban region, as some districts were much more sought out than othen.
In order to situate office development in the Toronto context, several important features of the
urban region have to be described. First, it should be stated that the Toronto area grew strongly in the
last fifty yean. Secondly, it should be pointed out that the Toronto urban area is politically fragrnented
and that planning and urban development have taken place in a politically fragmented region with
particular socio-political cuitures. Finally, as Canada's most important business centre, Toronto has
experienced high rates of employment growth in a variety of activiiies that are office space usen.
The Toronto urban area in this study is the Toronto Census Metropolitan Area (CMA) as
defined by Statistics Canada. The Toronto CMA includes the former Metropolitan Toronto (as of
January 1998, the City of Toronto) and 21 local or 'area' municipalities sunounding Metropolitan
Toronto (Figure 2.1). Akhough a more recent definition of the urban area includes a larger territory,
Greater Toronto Area (GTA), I use the CMA, since most office development in the Toronto area has
been limited to the Census Metropolitan Area.

2.1.1 Population and employment growth
Growth, as one of the prime factors to trigger and sustain urban development, has been one of
Toronto's main features. When the municipality of Metropolitan Toronto (commonly refened to as
Metro) was created in 1953, the population of the area was approximately 1.2 million, slightly more
than half of which were living in the City of Toronto. The boundaries of the Metropolitan municipality
enclosed 622 square kilometers, essentially coinciding with the 1951 boundaries of the Census
Metropolitan Area (CMA). Unlike the f ied boundaries of Metropolitan Toronto, the CMA boundaries
were moved outward over time to encompass the rapid growth and geographic spread of Toronto's
population. In the early 1990s, the CMA boundaries encompassed several sunounding 'regional' and
'area' or local municipalities beyond the Metro boundaries: arnong others Markhm and Richmond Hill
in York Region, Mississauga and Brampton in Peel Region, Oakville in Halton Region and Pickering in
Durham Region (Figure 2.1).
By 1991, the CMA boundaries contained 5,580 square kilometers and 3.9 million people. A
wider definition of the Toronto region, which includes the former Metropolitan Toronto and additional
four regional municipalities, was adopted in the 1990s. The so-called Greater Toronto Area (GTA)
encompasses a larger territory than the CMA boundaries and had a population of 4.2 million in 1991. In
1996, the CMA had a population of 4.4 million and the GTA had a population of 4.7 million. Pnor to
1976 the Toronto CMA was the second-largest metropolitan area in Canada after Montreal. Since the
rnid-1970s, Toronto has become the largest CMA in Canada. Over the last four decades, most of the
population growth has occuned outside the City of Toronto, fint in suburban municipalities within
Metropolitan Toronto and then in the outer or CMA suburbs. Over the last quarter century most of
population growth was in the four regional municipalities sunounding Metropolitan Toronto (Frisken et
ai., 1997).
Parailel to population growth, empIoyment has expanded considerably between 1951 and
1991 from about 527,000 to 2 million jobs. While job growth occuned in al1 three parts of the CMA (the
City of Toronto, Metro subuhs, and outer suburbs), it was more vigorous outside than inside Metro,
resulting in considerable employment deconcentration. For example, in spite of absolute increase in
employment, the share of the City of Toronto in al1 CMA jobs declined sharply from 48 percent to 31
percent between 1971 and 1991; the share of jobs located in the outer suburbs more than doubled,
from 17 percent to 35.5 percent (Gad. 1979; Frisken et al.. 1997). However, employrnent growth has
not been as smooth as population growth. A number of recessions in the late 1950s, mid-1970s, and
early 1980s were accompanied by stagnation or decline in employrnent. A protracted recession in the
early 1990s led to very severe losses of employment. with a recovery visible only in the late 1990s.

Figure 2.1 : Toronto Census Metroplitan A m

In total, substantial population and employment growth since 1951 have set Toronto apart from
many other cities in North America and Europe. For the Toronto area as a whole the challenge has
been to manage growih rather than to attract it. Concerted efforts by the metropolitan and regional
govemments to attract population or employment were largely absent over most of the last f i e
decades.
2.1.2 Municipal organization
Wiihin the Toronto area three tien of govemment manage services and municipal issues. First, the
Province of Ontario has a crucial role in municipal Me. The Province has the power to change and
restructure local municipalities, and it has used this power repeatedly to amalgamate a number of
municipalities into larger entities. The amalgamation of the six municipalities foning Metropolitan
Toronto into the new City of Toronto in 1998 is the most recent manifestation of this power. The Ontario
Planning Act sets out the conditions for uhan development and stipulates provincial govemment
'approval' of 'official plans'. Through the Ontario Municipal Board (OMB), which is the highest tribunal
to rule on planning related decisions, municipalities are subject to extensive developrnent review. In
addition, the province has an important role in transportation issues. For example, in the case of
Toronto, it has had, until recently, the overall responsibility for the major expressways, for the
commuter rail and bus senrice (known as the GO system), and it played a significant role in subsidizing
both capital investment and the operations of Toronto's transit system. However, since 1998, the
Province has ceased ta fund transit and some expressways in the Toronto area (Filion, 2000).
Toronto's reputation as an urban success story is often finked to the formation of the
Municipality of Metropolitan Toronto in 1953. This regional rnunicipality was a two-tier federation of 13
(later six) municipalities, partially govemed by an 'upper tier' rnetropolitan council. Metro's original
mandate was to provide physical infrastructure (water supply, trunk sewer facilities, arterial roads) to
suburban districts experiencing rapid growth, and to relieve the central city, the City of Toronto, of its
housing problems. Later it resurned responsibility for policing, public school finance, and social
services. Metro's responsibility for sorne expressways, roads, and transit, together with its power to
redistribute taxes, were crucial for office developrnent. Metro was in charge of managing the arterial
roads, certain expressways, and it also supplied, through the Toronto Transl Commission, an
integrated system of subway, bus and streetcar services (Scott, 1980; Frisken et al., 1997; Filion,
2000). Although the local municipalities collected taxes, the needs of Metro were levied against them,
and debenture financing for Metro fiself and al1 the lower-tier municipalities was placed in Metro hands
(Lemon, 1985). At the local level, the 13 (later six) metropolitan rnunkipalities controlled the local
roads, provided senrices that were not provided by Metro, and formulated their own land use plans.
Outside Metropolitan Toronto, four regional govemments (Durham, York, Peel and Halton)
were established in the 1970s. These govemments were given limited responsibilities in comparison to
Metro. The antagonism of outer suburbs towards al1 foms of metropolitan govemment caused the
provincial govemment to shy away from a new metropolitan administration (Filion, 2000). Within these
regional governrnents, local municipalities function in relative independence of each other, united only
as members of two-tier regional structures, in which the upper-tier regional councils have relatively few
powers de jure (Frisken et al., 1997). De facto powers are even smaller, since regional councils are
strongly influenced by the coalitions of councillors and mayon elected at the level of the 'area' or lower
level rnunicipalities.
2.1 -3 The planning system
In Ontario, each municipality has to prepare an official plan. An official plan is a public statement which
defines basic goals, objectives and directions for the physical dwelopment of a municipality. It is
prepared and 'adopted' by the municipality and gets its final 'approval' from the Province. In the case of
two-tier municipal govemments, the Ontario Planning Act stipulates that the plans of the Municipality of
Metropolitan Toronto and the regional municipalities take precedent over the plans of the 'area' or
lower level rnunicipalities. Subdivision approval at the regional level and land use controls (zoning
bylaws) at the lower level are other features of the planning system under the Ontario Planning Act.
These stipulations reflect notions of the rational-comprehensive planning model. In planning practice,
however, there is very lime topdown planning. In most cases, the lower level municipalities had official
plans in place before the formation of the two-tier system of municipal govemment. Also, because of
the considerable weight of the lower level municipalities, regional plans can only be made with the
cooperation of these lower level municipalities. As Lemon (1 996, p. 252,263-66) has pointed out, large
scale or comprehensive planning has been largely rejected in Ontario in general, and in Toronto in
particular. This does not, however, negate a very strong role of the state, both provincial and municipal,
in urban matten. Lemon (1996, p. 263) characterizes this strong public involvement in urban affain as
'management' rather than planning.
Apart from passing enabling legislation in the form of the Planning Act, the Province of Ontario
has a critical role in the Ontario planning system. Official plans of area (lower level) and regional
rnunicipalities must be submitted to the provincial Ministry of Municipal Affairs and Housing for final
approval. Although the Ministry interferes to some extent in 'planning', the more frequent and more
important interference comes through the Ontario Municipal Board (OMB). This body of appointed
'judges' is a quasi-judicial provincial agency with various responsibilities for oveneeing municipal
affairs. The OMB is the final tribunal on planning issues, and it can overtum decisions made by
rnunicipalities. (OMB nilings could be appealed to the Ontario Cabinet until a revision of the Planning
Act in 1 983.)
2.1.4 Taxation
One of the fundamentai powers of municipalities is their ability to collect property taxes. These taxes
are used to provide a wide range of municipal services. From the beginning, Metropolitan Toronto
raised rnoney for operathig costs and debt repayment by levying charges on mernber municipalities
based on the size of their assessments. This way, assessrnent-rich municipalities paid more per capita
than poorer municipalities. The redistribution of property tax helped to prevent inter-municipal
disparities in the quality of services and allowed the poorer municipalities to have a higher standard of
local services than their own tax base would have made possible. The City of Toronto had the highest
total assessment per capita, and it has also experienced an increase in that assessment relative to
other municipalities. This meant that the City of Toronto had always paid a larger share (relative to
population) of Metro costs than any other Metro municipality. This issue has contributed to a debate
about the redistribution of property taxes within Metro. Because of the financial strength of the City of
Toronto, based on its substantial business district, the City of Toronto has drawn a much larger share
of its revenues frorn taxes on non-residential properties than other Metro municipalities. The high non-
residential tax base allowed the City of Toronto to spend more on local services than other Metro
municipalities, without taxing residents at a higher rate (Frisken et al., 1997; Todd, 1998). Although
both residents and businesses pay property taxes, residents, not businesses vote, therefore making
local govemments geared toward encouraging more non-residential development as an important
source of tax income.
The rnunicipalities outside of Metropolitan Toronto have stniggled with the same problems that
had been faced by the rapidly growing Metro suburbs in the 1940s and 1950s: high expenditure for
basic infrastructure. Property taxes for residential uses in the municipalities outside Metropolitan
Toronto are, therefore, higher than in the Ctty of Toronto. On the other hand, taxes for industrial and
commercial properties are relatively low in order to attract businesses, and provide a 'balanced'
assessment base. In eariier decades, the stniggle over attracting businesses has largely concemed
industrial enterprises. In the 1980s and 1 %Os, however, competition for the non-residential tax base
has shifted to a considerable degree to office developrnent.
2.1 -5 General development issues
As a resuk of being a high growth region wiai a two-tier govemment, well-estabiished and well-defined
growth coalitions in Toronto were less pronounced than in regions experiencing lower growth and
lacking rnetropolitan govemments. The two-tier govemment (metropolii and local) contributed to the
fragmentation and the weakening of growth coalitions. The role of the Metropolitan govemment in
redistnbuting benefis across the metropolitan area is in contrast to the role of growth coalitions seeking
local development (Logan et al., 1997). Nevertheless, in the Toronto area, various coalitions have
emerged at the local municipality level.
The Metropolitan govemment provided a physical infrastructure for urban expansion. and in its
eariy days it opened up large subuhan tracts for private residential and industrial development. The
City of Toronto got help with housing, especially high-rise public housing that was accommodated in
Metro suburbs. The provincial government supported this policy indirectiy by placing restrictions on
development based on the availability of infrastructure (Frisken et al., 1997).
Over time, Metro's planning goals shifted. Beginning in the 1 9 7 0 ~ ~ more emphasis was placed
on a multinodal urban structure in conjunction with the policies promoted by Metro suburbs and the
City of Toronto. Metro suburbs advocated office decentralization in order to attract more office
development to the suburbs; concunently, the City of Toronto attempted to control and 'deconcentrate'
office development. By the late 1980s, Metropolitan Toronto faced considerable competition for office
development and off ice-based employment from several of the outer CMA municipalities. A major study
was conducted by the Metropolitan Planning Department. and subsequently the 1994 Official Plan for
Metropolitan Toronto relaxed the rules for office location in former industrial areas. This responded to
demand for more convenient accessibility by car and more liberal parking facilities. In the 1990s. the
conflict over commercial developrnent and employrnent locations had shifted to differential business
taxes between Metropolitan Toronto and the outer suburbs. In this case, the various municipal
govemrnents in Metropolitan Toronto combined voices with the Metropolitan Toronto Board of Trade to
urge a reduction in property tax differentials.
The City of Toronto. as the core municipality or central city was clearly prodevelopment until
the late 1960s. It encouraged both high-density residential and commercial development in Toronto's
central area. In this effoit the City was assisted by the Downtown Redevelopment Advisory Council. in
which large downtown employers and land owners played a major role. The rise of the 'reform'
rnovement in the late 1960s and early 1970s. and the election of a 'refon' council in 1972. changed
the development environment. In the 1970s. and especially for a limited period in the mid-1970~~ the
planning agenda of the CRy of Toronto focused on restrictive measures. The Central Area Plan
('adopted' by city council in 1976 and 'approved' by the Ontario Cabinet in 1979) was the strongest
move by the Cty of Toronto to shape the downtown area (see section 7.3.1). This plan attempted to
contain development by reducing densities in the Central Area. Office development was severely
affected by downzoning (Frisken, 1988; Gad, 1999). The emerging planning strategy heM that the
further development of new office space in the Central Area should be limited in relation to the capacity
of transportation facilities that already existed or had been committed pnor to the plan. According to the
plan, growth in future office employment was to be managed by deconcentration and the establishment
of suburban city centres (Frisken, 1988). In the 1990s, the 'downtown' coalition which includes various
large firrns (banks and retailen), media and politically connected law firms, has been organized around
the Toronto Board of Trade. This coalition pushed for the amalgamation of municipalities in
Metropolitan Toronto in order to gain tax reductions (Todd, 1998). However, as will be shown later,
implernentation of restrictive coalitions varied according to economic circumstances. It can be argued
that a coalition of residents' groups and some business interests put emphasis of the quality of growth
rather than stopping growth.
Outside the Cdy of Toronto, distinct alignments between municipal govemments and large-
scale developers were noticeable during the era of rapid expansion in the 1950s. In large-sale
expansion projects, the cooperation of a municipality is essential. In the eady 1950s, one of the leading
entrepreneurs in Canada, E.P. Taylor, commenced the development of the first large-scale suburban
subdivision in Canada in the Don Mills area of Toronto's suburb of North York. In this case the
municipality and developer shared an interest in developrnent and the rnunicipality involvement
became "nothing more than a passive rubber stampn (Sewell, 1993, p. 95).
The development of Downtown North York (later North York City Centre) exemplifies the role
of different levels of govemments as promoten of development. Until the late 1970s, the Metro
Bcrough of North York had no highly visible centre. The extension of the south-north Yonge Street
subway line to Sheppard Avenue and the desire of the municipality to create its own city centre were in
conformity with the deconcentration policy adopted by Metropolitan Toronto (Matthew, 1989;
Municipality of Metropolitan Toronto, 1989). In the initial phases of development in the 1970s, office
development depended heavily on the initiatives of municipal and federal govemments to build and
occupy major office structures. One of the first office buildings in the future North York City Centre was
the North York Board of Education (1970). It was followed by the North York City Hall and the largest
office building in North York at that time, which was occupied by the Department of Public Works of the
Government of Canada. In the 1980s, local developers and developers with vested interests in the
area, became highly invohred in the development of the City Centre and together with North York's
high-profile mayor (Mel Lastman) pushed for development. (A more detailed account of the public and
private agents creating North York's City Centre will be provided in section 7.3.2.)
Outside Metropolitan Toronto, development has been strongly promoted by large private real
estate developers. The case of Mississauga City Centre is an outstanding example. The idea of
developing a city centre in Mississauga was initiated by the largest landowner in Mississauga in the
1960s and 1970s (Lorimer, 1978). Bruce McLaughlin, who had assembled a large land bank, had the
ambition to build the centre of the new Town of Mississauga (a number of municipalities were
combined in 1967 to fom the Town of Mississauga). When McLaughlin appeared before the
Mississauga t o m council to present his plans for the City Centre in 1969, the town council was
extremely supportive. However, with the election of a 'reforrn' council in 1973, Mclaughlin had to wait
until the re-election of a prodevelopment council in 1976 for his plan of the City Centre to be adopted
(a detailed account will follow in section 7.3.3).
Development issues, especially those related to office development, in other municipalities
have been less visible. However, the practice of favouring industrial and commercial development in
order to increase the assessment base seems to have been penrasive over the last couple of decades.
The general liberal zoning for 'industrial areas' is an indication of the attempts to increase the real
estate tax base and revenues.
Growth coalitions are, thus, at work in a selective fashion, and they are time and space specific
as the Toronto urban region experienced different phases of growth promotion and growth
management.
2.1.6 Office users in the Census Metropolitan Area
The time period 1950 to 1990 witnessed an enonnous growth of the kinds of jobs which are housed in
office buildings. All sectors of the economy contributed to the growth of office-based employment. By
the mid-1990s, about one third of al1 employrnent in Metropolitan Toronto was classified as 'office
employment' by Metropolitan Toronto Planning Department (Metropolitan Tomnto Planning
Department, unpublished tables). Several authon, especially Gad (1 985, 1991 a), have commented on
the vast array or great divenity of office space usen.
There is a large number of office establishments in the metropolitan region. In the central part
of the City of Toronto alone there were more than 4.800 establishments in 1971 (Gad, 1979, p. 293)
and in Metropolitan Tomnto there were about 32,000 in 1988 (Gad, 1991a. p. 436). These office
establishments range from very small ones (1-3 employees) to very large ones with several thousand
employees. The size distribution is highly skewed toward smaller establishments. Large establishments

with more than thousand employees are relatively rare and are largely confined to public sector, utility,
and bank and insurance company off ie establishments. Since around 1970, a process of 'back office'
formation has resulted in the spatial fragmentation of the larger head and regional offices (Huang,
1989). There were also signifiint changes in labour force composition, which, together with an
increasing geographic spread of the places of residence of the labour force, led to new kinds of
geographies of office location. Since the 1950s, both female labour force participation and professional-
managenal jobs have increased stmngly (Huang, 1989). These two trends together led to a
considerable increase in the percentage of female managerial-professional employees in the Central
Area (Huang, 1989) and the decentrakation of some offices or parts of offices taking advantage of a
relatively flexible female labour force supply in the outer residential areas (Huang, 1989; Gad, 1991 a,
pp. 43841; Gad and Matthew, 2000).
In Toronto, the processes of central district specialization and suburbanization have created
different types of office clusters (Gad, 1985). Highorder financial services, media, and some business
services (law fimis, accounting and management consuking fimis) remain relatively central, h i l e other
types of office space users have dispened across the metropolitan region. Gad (1 985, 1991a) argues
that there are three kinds of suburban offices: small offices that serve largely localized suburban
markets, offices that exploit the suburban advantage of high accessibility by car (for example,
manufacturing company head and sales offices, engineering consultants), and back offices and similar
offices that take advantage of the flexible female labour force in the suburbs.
Gad suggests that 'the various spatial patterns of industries, establishment size, status,
occupations, and other aspects, such as gender of employees or commuter patterns, combine to
produce quite distinct office nodes in the Toronto area. It is tempting to see an intra-urban set of
regions emergingn (Gad, 1991a. p. 441). Other authors support this notion of a diversity of office nodes
in the Toronto area. Matthew (1992, 1993a, 1993b) argues that within the suburban realm each centre
or concentration has developed a measure of specialization.
2.1.7 The scope for office development
This brief portrait of the post-Worid War II Toronto region indicates the enormous scope for office
development over several decades. Strong growth of Toronto's economy coupled with growing
diversification is reflected in a huge variety of office establishments. Thus, demand for office space of
different kind has been very strong. In the context of a growing urban region, office establishments
have spread across many different types of locations. This spatial spread was supported by a public
growth management system, which provided a wide range of infrastructure for urban development.
However, within this general framework, municipalities with different interests and growth dynamics
provided ample opportunity for different niches of office development. It is quite apparent that municipal
fragmentation and other spatially differentiated conditions made it possible for office developers to
exploit these niche markets.
Finally, it should be pointed out that oppominities for office development are also accornpanied
by constraints. The physical and social conditions for office development Vary greatly. Aithough Toronto
is not an old city, there are substantial areas of nineteenth century development. Redeveloprnent of an
earlier fabric, even if it consists of offices that have already replaced earlier commercial and residential
buildings, has increasingly faced resistance. Traffic generation is resisted too, especially by older elite
and new professional classes in inner city neighborhoods. Extemalities are also highly visible in and
around some of the new 'suburban downtowns'. Replacement of older buildings and the impact of new
developments on surrounding single-family residential neighborhoods have led to many conflicts. In the
outer suburbs, on the other hand, land use conflicts, especially involving office development. are less
frequent. Development in large greenfield industrial or business parks or socalled 'employment areas'
is well isolated; hence, conflicts between residential groups and office development are almost
un known .
2.2 The Research Process and the Use of Realist Method In ternis of approach, that is questions raised, assumptions made, and the broad theoretical
framework, the reseamh presented in this thesis is grounded in the political economy tradition. The
rnethods of research are grounded in the 'realist' framework explicated by a geographer, Andrew Sayer
(1 984). Pratt (1 994) was one of the few researchers to use the realist approach in the analysis of real
estate development. This section outlines why this paiticular approach and this method are appropriate
for research on office development in the time period 1950-2000 in the particular setting of Toronto.
Urban development is well theorized within the political economy approach. This approach
draws attention to structural conditions within capitalist economies and societies. It also draws attention
to the role of the state in urban development. Unless a strictly Marxist structural version is adopted, the
role of the local state in urban development is problematized. Also, the approach perrnb the
investigation of the relationship between structure and agency. The outline of the political economy
approach and its particular relevance and application in this study have been provided in section 1.1.2.
In the following paragraphs, I will briefly outline why realist method is appropriate for this
research project. It is not my intent to review this method, but to outline its basic features and to
demonstrate why it is particularly suitable for research on office development in the case of the Toronto
study.
Realist methodl as developed by Andrew Sayer (Sayer, 1984, 1987; see also Cloke et al.,
1991), is founded on a critical response to posiovism. Sayer rejeds the notion that the workl is made
up of discrete events that can be measured as specific phenomena. Instead, he suggests that it is a
stratified and differentiated worid of complex relationships that need to be 'unpacked'. Realist method
emphasizes exact definitions of concepts. It wams against 'chaotic conception', in which objects are
grouped into categories that have little or no intemal logic or structural interaction. The 'setvice sector'
is mentioned as an example of a 'chaotic conception' (Cloke et al., 1991). Pratt (1994, pp. 207-8)
argues that an industrial estate is a chaotic conception, and as such it is not appropriate to develop an
autonomous theory of industrial estates. Rather, he claims Tt was considered more appropriate to
identify the processes and mechanisms that give nse to the 'eventl of an industrial astate, and to
explain their development in the specific places and times with recourse to the structures of provision
and the contingent conditions pertaining therew.
Chaotic conceptions are visible in research on office development. ûffice development is a
particular component of the 'real estate sectot, which has its own characteristics separate from other
real estate activities. Grouping office development with residential or even retail development resuits in
oversirnplification of office development. For example, office buildings have different usen, location
characteristics and agents invoived than in retail facilities. Also. the common terni 'developer', which is
attached to companies invohred in office development, fails to differentiate between agents that are
involved in devefoprnent and other related functions such as investment and ownership.
A number of dualities govem the realist approach. First, the distinction between necessary
causai powers and contingent conditions is introduced. The notion of contingent conditions argues that
the existence of two objects does not necessarily indicate some kind of relationship between the two
objects. In order to identify causal power a relationship has to be in place. This relationship is the
necessary condition. An example, used by Sayer to illustrate this relationship, is the relation of landlord
and tenant. The existence of one necessarily presupposes the other (Sayer, 1984, p. 82). The
identification of this type of relationship enabies exposing causality because the necessary condition
already exists. The second distinction is between the abstract and the concrete. The realist approach
considers the empirical study of contingent relations as concrete research. Concrete research is
required in order to discover the actual contingent relations under which the causal mechanisms are
triggered. Abstract or theoretical concepts are used to unravel the necessary conditions by abstracting
from concrete objects. According to Sayer, concrete research permits the abstraction of necessary

relations. Embedded in his conception s the notion that the relationship between abstract and concrete
is reciprocal and dynamic, as both interact and modify each other. In the beginning, the
conceptualizations of concrete objects are likely to be superficial, and in order to understand their
diverse determinations they need to be abstracted first. When each of the abstracted aspects has been
exarnined, it is possible to combine the abstractions to form concepts which grasp the concrete nature
of their objects (Sayer, 1984, p. 81). Finally, structure and agency are addressed. The realist approach
considers structure and agency as embedded in the context of necessary and contingent. Structure is
generally identified with We necessary, while agency is the generator of contingent conditions.
However, the causal powen of structures will not always be realized and not al1 contingencies are
simply a matter of human agency (Cloke et al., 1991).
Sayer (1984, pp. 219-28) also distinguishes between 'intensive' and 'extensive' research. In
intensive research the primary questions concem how causal processes work out in a particular case
or a small number of cases. Extensive research is concemed with discovering some of the common
properties of the population as a Mole. In this study, I examine a specific field within the real estate
sector, office development, and the major question is how o f f i i development comes about in the
spatial practices of selected large and medium-sized real estate developen operating in the Toronto
metropolitan area. This is reseanh of contingent relations geared to discover the conditions under
which the causal mechanisms are triggered. The role of agents is investigated by studying their
practices. An investigation of a limited number of cases requires particuhr techniques. These include
qualitative methods, semi-stnictured interviews, and a strong reliance on regular documentation of the
subject matter. These techniques permit the detailed study of the individual finn in its causal context,
and, in tum, this enables the researcher to establish the connections between the necessary and the contingent. Land has a necessary role for the creation of capital gains through the construction of
various structures. However, the creation of capital gains does not occur at al1 tirnes in al1 places, but
rather in particular instances (exemplified by building cycles) and in specific places (sometimes in
downtown and often in suburban settings). This argument is advocated by Fainstein (1 994) suggesting
that in relation to real estate development Virtually al1 values exist in combinations and are increased
or lowered, based on the context in which they are used" (p. 223). Certain causal powen are argued to
exist necessarily by the virtue of the characteristics and fom of the objects that posses them, but it is
contingent whether these causal powen are released or activated. In the case of real estate
development, it depends on numerous factors, such as a particular type of demand, zoning regulations,
access to capital, and a 'spark' of an entrepreneuriai developer, wbether a building materialires in a
certain place.
Extensive research, on the other hand, would deal with office development in a different
manner. It would ask whether there are general characteristics and patterns to be discovered over the
whole population, and adopt techniques, such as large-scale forrnal questionnaire suiveys and
descriptive and inferential statistical analysis, to uncover reguhrities. Evidently, then, in this case
pattern and regularity are possible indicaton of causality. For the purpose of the study of office
development, extensive research is unsuitable for a nurnber of reasons. First, what constitutes a
developer is a fair question, and since a developer assumes a number of roles, the categoiy
'developer' is problematic. Second, there is no formal account of the total population of office
developers. Third, the process of devebpment is complicated because it involves a large number of
different types of agents and hence cannot be separated from contingent conditions. Finally, there are
a few large real estate companies operating as office developers, which are also publicly held.
Extensive research on a small population of two or three-dozen companies does not make rnuch
sense.
However, rnethods and procedures used in extensive research are employed as well. Attempts
are made to use extensive data as much as possible. Building permit data for Canada and b provinces
and data on investment of financial institutions in real estate are used. Also, comprehensive data on
the office building stock in Toronto is used. Some of these extensive sources are analyzed in order to
discover regularities or relationships.
Intensive and extensive procedures differ also in the type of account produced. In intensive
research, the groups to be researched should be such that the members of the group relate to each
other either structurally or causally, thus permitting interpretation of causality through an examination of
actual connections. This is vitally important in the case of the real estate sector, which is highly
heterogeneous. In the case of real estate development, the examination of relations between
developers and financiers and between developers and local municipalities makes it possible to distill
the causal conditions that trigger, facilitate and enhance office development. In extensive research, the
groups employed are taxonornic, i.e. those that share formal attributes, but do not necessarily connect
or interact with each other. The account produced would describe 'representative' generalizations
which lack explanatory possibilities.
However, both research procedures have inherent weaknesses. Extensive research is a
weaker explanatory tool as this type of research lacks sensitivity to detail and it has a limited
explanatory power with regard to the identification of causal mechanisms by stressing general patterns.
The main weakness of intensive research methods is the lack of representativeness. It may, therefore,
be susceptible to the problems of over-extension of concrete research (Cloke et al., 1991). As a result,
both approaches are used in this thesis, although the emphasis is on intensive research.
2.3 Data of lnterest and Data Collection The general question about how office buildings were produced in Toronto over the last half century
requires answen to specific questions and the manhaling of specifk data. The following questions
regarding the agents, the office stock, govemment policies, and financing practices are at the core of
this study:
Who are the agents responsible for office development in the Toronto Census Metropolitan Area,
and what are their spatial practices?
How do agents responsible for office development act within the framework of the 'three
dimensions of capital switching'?
How has Toronto's office stock developed since 1950?
What are the different types of relationships between govemments and developers?
What are the financing practices of real estate developen and what is the role of financial
institutions in office developrnent?
Given the political economy approach, including the theorkation of office development, and the realist
methodology chosen, the data required and the methods of data collection are as follows. Extensive
data on real estate companies and office development is relatively scarce in published form. This type
of information cannot be found in census data or specific annual surveys such as on manufacturing
(Statistics Canada series on Manufacturing Industries of Canada). No cornprehensive industry
directories like the Canada Legal Directory or the Canadian Law List or the National List of Advertisers
are available. Unlike in the case of sorne sectors in the economy, the total size of the real estate sector
is questionable (see section 3.1). Further, it is a highiy cornpetitive sector. This sector indudes
numerous small, privately held companies that do not reveal their real estate holdings or other
business characteristics. As a result. a combination of information sources has to be used to identq
real estate companies involved in office development.
2.3.1 Extensive data
Office develo~ment and office buildinas
Two kinds of data sources are used here: building pemits and office floor-space (Table 2.1). In
Canada. no agency collects data on office buildings or building completions at the national or the
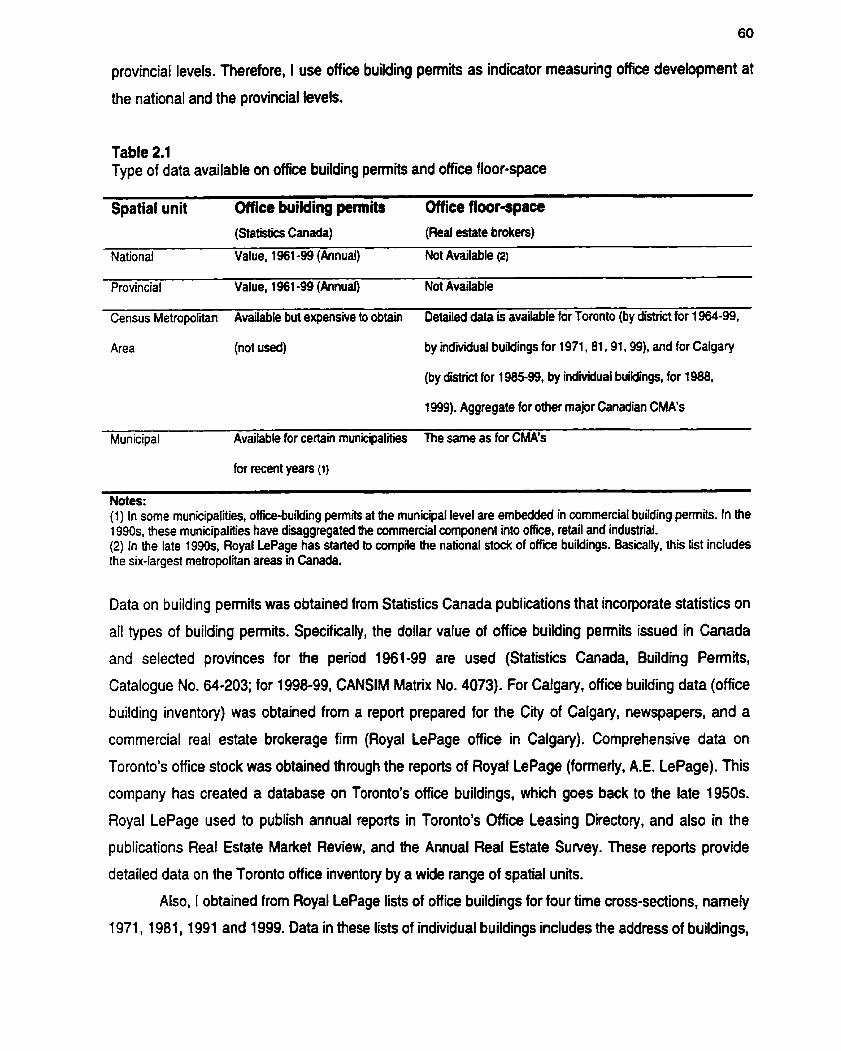
provincial levels. Therefore, I use office building permits as indicator measuring office development at
the national and the provincial levels.
Table 2.1 Type of data available on office building permits and office floor-space
Spatial unit Office building permits Office floor-space (Statistics Canada) (Red estate brokers)
National Value, 1961 -99 (Annual) Not Available (2)
Provincial Value, 1961 -99 (Annual) Not Available
Census Metropoiiîan Available but expensive to obtain Detailed data is available for Toronto (by district for 1964-99,
Area (not used) by individual buildings for 1971, 81,91,99), and for Calgary
(by dirçtrict for 1985-99, by indi iual buildings, for 1988,
1999). Aggregate for other major Canadian CMA's
Municipal Available for certain municiialibjes The same as for CMA's
for recent years (1)
Notes: (1) In some municipaiiies, offibuilding pemits at the municipal level are embedded in commercial building pemits. In the 1990s, these municipalities have disaggregated the commercial cornponent into office, retail and industrial. (2) In the late 1 990s, Royal Le Page has started to compile the national stock of office buildings. Basically, this list includes the six-largest metropditan areas in Canada.
Data on building penits was obtained from Statistics Canada publications that incorporate statistics on
al1 types of building pemits. Specifically, the dollar value of office building penits issued in Canada
and selected provinces for the period 1961-99 are used (Statistics Canada, Building Penits,
Catalogue No. 64-203; for 1998-99. CANSIM Matrix No. 4073). For Calgary, office building data (office
building inventory) was obtained from a report prepared for the City of Calgary, newspapers, and a
commercial real estate brokerage finn (Royal LePage office in Calgary). Comprehensive data on
Toronto's office stock was obtained through the reports of Royal LePage (fonerly, A.E. LePage). This
Company has created a database on Toronto's office buildings. which goes back to the late 1950s.
Royal LePage used to publish annual reports in Toronto's Office Leasing Directory, and also in the
publications Real Estate Market Review, and the Annual Real Estate Suivey. These reports provide
detailed data on the Toronto office inventory by a wide range of spatial units.
Also, I obtained from Royal LePage lists of office buildings for four time cross-sections, namely
1971, 1 981, 1991 and 1999. Data in these lists of individual buildings includes the address of buildings,

the year of construction, and office floor-space in each building. The 1999 list includes also nurnber of
floors in each building. By using this data I was able to reconstruct Toronto's office inventory in four
cross-section years and changes over the decades: l971-8l, 1982-92, 1993-99; these periods of
eleven years correspond approximately to building cycles.
Two problems arise with this type of data: the definitions are vague, for example, what
constitutes office space, and some degree of inconsistency of the measurement of floor-space. Other
data sources were used to venfy the accuracy of the Royal LePage data. For example, several
municipalities have their own databases on office buildings (1 used data from North York and
Mississauga). However, these data sources are themsefves incomplete, because municipalities rnay
include only a sample of the largest office buildings (North York) or do not include buildings exclusively
occupied by the owner or a single tenant (Mississauga). In addition, they often use outside sources,
which rely on surveys by real estate brokers.
Real estate companies
Extensive data on real estate cornpanies and especially on those engaged in office development is
scarce. Statistics Canada produces aggregate statistics on 'real estate operaton and developers'
based on the Standard lndustnal Classification (Statistics Canada, Canadian Standard Industrial
Classification for Companies and Enterprises, 1980, Catalogue No. 12-570E). This category includes a
wide range of cornpanies that are related to real estate. These cornpanies are engaged in:
a land development and construction of residential and non-residential buildings;
acquisition, assembly, subdivision and servicing of land;
ownership and operation of buildings.
Real estate associations provide only general and partial data. One of the prominent real estate
associations, the Canadian lnstitute of Public Real Estate Companies (CIPREC), published annual
reports on its members between 1970 and 1996-7. These reports mainly include the publicly traded
cornpanies, which are also the largest. A major problem with Statistics Canada data and the data of
CIPREC are that they do not differentiate between the types of real estate companies. All real estate
companies, large and small, commercial and residential, developers and traders, are included in the
general category of real estate companies.

Financial institutions and mal estate investment
Real estate assets of financial institutions, mainly banks and life insurance companies, are measured
through mortgages and direct investment in real estate properties. A study by Des Rosiers (1984) is a
rich source for information on mal estate investment by life insurance companies and pension funds in
Canada in the 1950-1 980 period. Aggregate data for this thesis on life insurance companies is attained
from the Canadian Health and Liie Insurance Association. This source breaks down the assets of
insurance companies into their major components and provides historical data. In addition, reports of
the Superintendent on Financial Institutions provide similar data but at the individual Company level.
Finally, more recent annual reports (the second haif of the 1990s) of individual life insurance
companies provide a breakdown of mortgages and real estate investments by product type (residential,
industrial, retail, and office), and occasionally location (city or downtownlsuburbs).
2.3.2 Intensive research
Real estate campanies
No documentation of the history of commercial real estate in Canada as a whole exists at the moment.
Documentation put together for this thesis is based on knowledge gained through intensive research on
the rea! estate sector. Specifically, it is based on a few books published on urban development and
related issues scrutinizing Canadian real estate developers in the 1960s and the 1970s. However, the
more recent boom experienced by the real estate development sector in the 1980s did not trigger
intensive inquiry with the exception of several books on the Reichmann family, the owners of Olympia
& York. Accordingly, additional sources had to be used. These include media files, biographies. and
annual reports of real estate companies. Media files consist of an abundant number of newspaper
clippings primarily from the Globe & Mail, Financial Post, the Toronto Star, and the Mississauga
Business Times, and from trade joumals, such as Canadian Building and BuiMng Managemenf.
Approximately 1500 newspaper items from 1969 to 2000 were used. These items were of unequal
weight. Many were advertisements or simple press releases indicating the start of a building. Others
were features on developers: still othen were on municipal policies conceming office development.
The major articles used are listed in the bibliography under the heading 'Newspaper and Magazine
Articles'. I was able to use an extensive collection of newspaper clippings on urban development
assembled by Professor Gunter Gad, Department of Geography, University of Toronto over the time
period 1969 to 1998. From the middle of 1998 onward my own clipping files have covered office
development in Canada.

A major and valuable source used extensively throughout this research consists of the annual
reports of publicly traded real estate companies. Between 1970 and 1999, the largest real estate
companies in Canada, except Olympia & York, were at some stage of their corporate existence publicly
listed companies. The number of public companies varied over this time pend between ten and
twenty. Although public companies represent a small segment of the total number of real estate
companies in Canada, their signifimce is greater than their number. Publicly listed companies are the
largest in tems of assets, in diversification of the products they deliver, and in their national and
international spatial scope. The largest real estate companies are the 'powerful land-interested acton'
(Feagin, 1982; Feagin and Parker, 1990) and they have more impact on office development than
smaller companies. (Also, almost any information on private companies is limited and difficuit to corne
by. Collecting systematic andlor in-depth data is almost impossible). The annual reports include two
components that are of major significance to this dissertation. First, they provide the real estate
portfolio owned by a specific company, and second, they elaborate on the cornpanies' decisions and
explain their actions and their understanding of the business environment. In total, I examined annual
reports of approximately fifteen companies for each year of the time span in which these companies
were publicly listed. A few companies have reports for the last thirty years. For example, Trizec
Corporation was a publicly listed company since its incorporation in 1960; 1 was able to review the thiity
annual reports of this company issued between 1969 and 1999. Other companies were public for
shorter periods, such as Cadillac Fairview (1975-87 and 1997-99) and Oxford Development
Corporation (1975-79 and from 1987 onward). For private companies, data was obtained through
collection of newspaper articles and advertisements, professional joumals, company brochures,
corporate web sites, and face-to-face interviews.
Identification of office develo~ers
To substantiate the argument that multiple office developen have particuhr spaces in which they
operate, the identification of as many office developers as possible in the Toronto area was needed.
This was one of the most challenging tasks, since there is no single source that has this type of
information. The task was further complicated as a result of the large number of office buildings
constructed in the last thirty yeais. ln 1999, there were more than 1200 office buildings in the Toronto
metropolitan area; in comparison, in 1969 there were only 350 office buildings. Many buildings have
passed on to new owners and it is very cornplicated to identify the original developer. A large nurnber
of sources was needed to accomplish the identification of office developen and to match them to
particular buildings (details in section 3.4).

Financial institutions and office development
Most of the sources on the involvement of banks and life insurance companies in real estate financing
and development do not differentiate between types of real estate assets (residential, industnal, office
and retail) or whether buildings were developed or acquired by these companies. Annual reports,
except for providing aggregate figures of mortgage and real estate investment, also do not indicate the
type and location of these investments. Only since the late 1990s have annual reports of selected Me
insurance companies differentiated the mortgages by real estate product (residential, retail, industrial or
office) and provided information segmented by property type on the real estate portfolios owned by
these companies. These companies are the largest Me insurance companies and the most actively
involved in commercial real estate. They include Manulife Financial, Sun Lie, Great-West Life, and
Canada Life. ln addition, 1 collected items (newspaper articles, advertisements) on the involvement of
financial institutions in real estate investment. One life insurance company, which was the most active
in real estate development over much of the 1970s and 1980s, Manulife Financial, is examined in
detail. I obtained data on this company through access to intemal reports and interviews with company
executives. Data on Manulife Financial includes the company's detailed real estate portfolio broken
down into office, retail, industrial, and residential assets. In addition, the office portfolio is differentiated
by location, including information on individual office buildings in Canadian cities. For banks,
information is based on a nurnber of sources. Unlike annual reports of life insurance companies, which
provide some information on their real estate exposure, the annual reports of banks are structured in
such a way that real estate is embedded in other business segments. A variable degree of information
was obtained on three Canadian banks. The Canadian Imperial Bank of Commerce (CIBC) real estate
subsidiary, ClBC Development Corporation, which was active in real estate between the late 1980s
and the late 1990s. published a number of intemal reports. The publicity regarding the sale of the Royal
Bank real estate portfolio in late 1999 provided the extent of the bank's ownenhip of office buildings.
Finally, through the archives of the Bank of Nova Scotia, the bank's Staff Magazine. and annual
reports, information on its involvement in real estate was collected.
Municipal c~overnments and office deve lo~ment
Information on municipal niles was gained through the examination of official plans. Official plans
express the policies and intent of municipalities regarding their physical development. Selected official
plans in the Toronto metropolitan area were scrutinized (City of Toronto, North York and Mississauga).
These plans provide the platform for development which is then translated into specific zoning bylaws.

Based on statements in these offiiial documents the policies that directly or indirectly shape office
developrnent were exarnined.
Municipal practices are diverse and flexible. Practices are more diicult to assess than policy
documents sucb as 'OffÏÏal Plans'. During the process of prepanng an official plan revision,
submissions to the council by different individuals and organizations are made. These submissions
reflect the concerns of interest groups. In this study, submissions to the North York City Council
regarding the amendment of the city's office policy are examined. Staff Reports (professional opinions
of the planning deparbnents in municipalities) on planning issues and reports by hired consultants are
another source of information. Finaliy, articles in the Globe & Mail. the Toronto Star, and the
Mississauga Business Times on issues such as land use rezoning, amendments to official plans, and
the interaction behveen developers and municipalities are used.
Interviews
Interviews as dialogues with industry insiders are an important strategy in economic and social
geography (Schoenberger, 1991; Clark, 1998; Cochrane, 1998: McDowell, 1998). Schoenberger (1 991,
p. 188) notes the contribution of inteiviews to the understanding of corporate strategies:
The richness of detail and historïcal complexity that can be derived from an intewiew-based approach alkws one
to reconstnrct a coherent representation of how and why particuiar phenomena came to be. In this sense, the
method can greatly ampli and complement information derived from more conventional approachesn.
Case studies and individuai observations offer the opportunity to reflect upon stylized facts or
conventional interpretations of economic and social change. Although 'sacrificing' to some extent
representativeness and statistical generalization, this type of insight is valuable, especially in the
compact and highly interconnected real estate sector. One important element of this sector is informal
knowledge networks that facilitate obtaining information through intensive social networks. This is
reinforced by the fact that it is a highly compact sector in terms of the number of major players
functioning as the pivots in the real estate development field.
The total population of the publicly held real estate companies that have been engaged in
commercial real estate developrnent in Canada, and specifically in office development, is small. I have
interviewed the former and present senior executives of most large Canadian real estate companies. In
addition, interviews with smaller players, such as privately held and foreign companies, were
conducted. Financial institutions involved in real estate were also interviewed. Interviews with a
brokerage firm and a real estate consultant were designed to provide additional insights.

Most of the interviews were ananged by telephone. The majority of the chosen executives
expressed their willingness to engage in a short interview (30 minutes). The large and publicly traded
cornpanies were the most cwperatnre, whereas privately-held companies tended to be more secretive
and less willing to participate in interviews. Initial interviews generated personal introductions to
executives in other companies. The interviews were mostly with senior executives, from the chief
executive officer or president of a company to vice presidents. In several companies, interviews with
leasing directon were conducted. In total I have conducted 29 interviews (Table 2.2). In the end of the
reference section, a detailed list of interviewed persons and interview dates is provided.
Table 2.2 List of interviews
Type of Number of Number of
company companies interviews
Pubticly listed 7 15
Privately held 3 4
Foreign 1 1
Life insurance 1 4
Banks 2 2
Brokerage firrn 1 1
Consultant 1 1
Advisor 1 1
Total 18 29
The interviews were camed out between May 1999 and April 2000, with the majority of interviews
undertaken between May and July 1999. Most of the executives interviewed had muitiple experience in
different real estate companies. In other words, they held positions in more than one real estate
company throughout their professional career. Furaier, some switched positions between the public
(local govemments) and the private sector, for example, from a position in a municipal planning
department to a position in a real estate company. These muliple employment positions are

advantageous to my research for two reasons. First, although I interviewad a Iimited number of
executives, their multiple expenence provides hsights that are beyond their cuvent position or the last
position that they held. Second, this enables them to reflact on the industry from a broader point of
view. In addition to completing information on the corporate histoiy, the major themes in the interviews
included the following areas: corporate criteria for locational decisions regarding development at
different spatial scales at different times, the critena for engagement in different types of property
development and investment, the sources of financing, and the importance of specifc municipal
settings (Table 2.3).
Table 2.3 Major themes and questions in interviews
Theme Specific questions Locational decisions How did the company choose specific sites?
What is the dierence between downtown and suburban devebpment?
What is the importance of creating 'presence' in a particular location?
What are the motives for diversification at the national or international levels?
How did the company's spatial strategy change over time?
Types of real estate investments What are the reasons for devebping offie buildings?
M a t causes the shifting of investment between different types of properties?
M a t are the criteria for development and what are the criteria for acquisition?
Did the company develop speculative buildings or did it custom-built?
M a t are strategic assets and properties that draw on changing opportunities?
Financing What were the Company's major sources of financing?
How did financing affect the type and scale of development?
Ooes oie company have permanent financial partners?
M a t criteria are ernployed by financial institutions for the provision of loans?
Urban setting How does the company 'know' where to develop?
M a t are the advantages of staying in the same place?
What is the role of the local municipality in the process of office development?
Prior to undertaking interviews, extensive research on office development was conducted. It allowed
questions to be formulated in the language used in the real estate sector. In addition, each interview
was preceded by extensive research undertaken on the specific company or companies under
investigation. For each organization in question, a specific schedule was tailored by drawing upon
background research on that specific organization. This familiarity and knowledge assisted in
establishing credibility and allowed dealing with specifn issues. Interviews were open-ended, with
questions prepared in advance; however, I was responsive to issues raised during the interviews and
often changed the questions according to the direction the interview was taking.
The interviews have provided a set of rich infornation and helpful ideas for this research. In
general, the interviewees were quite straightforward about strategies, relationships with municipal
govemrnents, and financing. However, since I underplayed the importance of financing in the eady
stages of this research, I was able to attain less information than ! hop& to get. Also, when I touched
upon this issue, it was often diffiiult for the penons interviewed to remember the specifcs of financing
arrangements. Otherwise, most of the interviewees had a good recollection of events, and since some
of them are not currently in the forefront of the business they were veiy open. Interviews with former
executives tended to be long (about an hour) and, therefore, encompassed a larger number of issues.
Some problerns arose with the currently active persons due to time limits (about 30 minutes) and their
reservations regarding current information. Interviews with private companies were the most
problematic since they attempted not to reveal detaik, and I felt that they were holding back
information.
AI1 interviews were typed in their entire length and cornpletely transcribed. Each interview produced
between 3 and 4 pages of typewritten notes.
CHAPTER THREE
THE CHANGING CANADIAN REAL ESTATE SECTOR
The changing nature of the Canadian real estate sector in the twentieth century has received little
attention. There have been only a few studies which include the history of real estate developers in the
first half of the centuty (Gad and Holdsworth. 1984, 1987a, 1987b). h i l e research in the 1960s and
1970s had been, to a large extent, aimed at exposing the 'conspiracy' surrounding real estate
development (Collier, 1974; Gutstein, 1975; LorÎmer, 1978). A major part of the more recent knowledge
on real estate developers is based on the exceptional case of Olympia & York (Sudjic, 1992; Crilley,
1993; Fainstein, 1994; Ghosh et al., 1994).
This chapter explores the development of the Canadian real estate sector, the role of
Canadian developers outside Canada, and the role of foreign developers in Toronto. The real estate
sector in Canada in general and the sub-sector engaged in offm development in particular has
changed drarnatically over the last half a century. Changes at the industry level, such as sire, propeity
type, and modes of operations are complemented by changes in the spatial arenas of operations.
This chapter is made up of four sections. The first section outlines the four major phases of the
real estate sector's history through the examination of the major real estate companies in Canada.
Since Canadian-based real estate companies have been very active in the United States, section two
provides a concise account of these companies' operations in office development in the United States.
Foreign real estate companies also formed subsidiaries in Canada and were invoived in the real estate
sector; this aspect is discussed in section three. Finally, as this study focuses on Toronto's office
development, section four identifies the major real estate companies that have been active in office
development in the Toronto metropolitan area. The chapter concludes with an attempt to use
knowledge generated frorn documenting the history of the real estate sector to sketch a typology of the
diverse and changing character of real estate companies.
3.1 The Trajectory of Commercial Real Estate Companies in
Canada During the twentieth century. and particulaily in the last forty years, the Canadian real estate sector has
grown in scale and scope and has experienced a senes of important changes. Before World War II,
financial institutions and large usen of space camed out most office development. During the two
decades after the War, the vast majonty of the contemporary brgest commercial real estate companies
in Canada were established. During the next phase, between the eariy-1970s to the late-1980s,
Canadian real estate companies consolidated and divenified, and becarne sorne of the largest real
estate companies in Notth America. Finally, during the 1990s, the sector has restnrctured as some of
the largest real estate companies disappeared and institutional investors have taken a commanding
position.
Before sketching the history of the real estate sector in Canada, its relative weight in the
Canadian economy needs to be addressed. Detemining the overall size of the real estate sector is
problematic for a nurnber of reasons. First, do you measure the sector by the value cf the real estate
properties or by the assets of the real estate companies? Do you include land in this calculation or only
the value of the built structures? Miron (2000, p. 156) estimates the size of the real estate sector in
Canada by using the total value of land assets and the value of the built structures (residential and non-
residential). Based on his calculation, in 1997real estate assets amounted ?or 28 percent of al1 assets
(which range from property to saving accounts to equity stocks) in Canada. Using this method, in the
penod of 1966 to 1991 the share of the real estate sector was even higher: between 32 to 35 percent
(Table 3.1).
Second, focusing on the non-residential component of the real estate sector would result in a smaller
share of the real estate sector in the economy. Considering business (not including govemment) gross
investment in the fom of construction of new buildings and additions, repairs and renovations of
existent buildings (not including land) as a percentage of the GDP brings the share of the real estate
sector down to 4 to 8 percent in the period 1966-1996. Finally, if we want to focus on real estate
companies, which companies are to be included in this sector? Statistics Canada uses the Standard
Industrial Classification (SIC) to define 'real estate operators and developers'. This is a very expansive
definition, since it includes companies that are not directly related to real estate development and
ownership. As a resuk, a large number of fitms are included in this category. For example, in 1971
there were over 26,000 fimis defined as 'real estate operators and developers', and in 1986, 55,000
firrns. Also, large owners of real estate assets such as, life insurance companies and pension funds are
not included in this definition. Using the definition of operators and developers results in the real estate
sector accounting for 5 to 8 percent of the assets of al1 companies in Canada between 1966 and 1996
(Table 3.1).
To provide estimations on the relative role of the real estate sector, Statistics Canada suiveys
are used: National Balance Sheet Accounts (Catalogue No. l3-214), Corporation Financial Statistics
(Catalogue No. 61-207, later Financial Statistics for Enterprises, Catalogue No. 61-219) and National
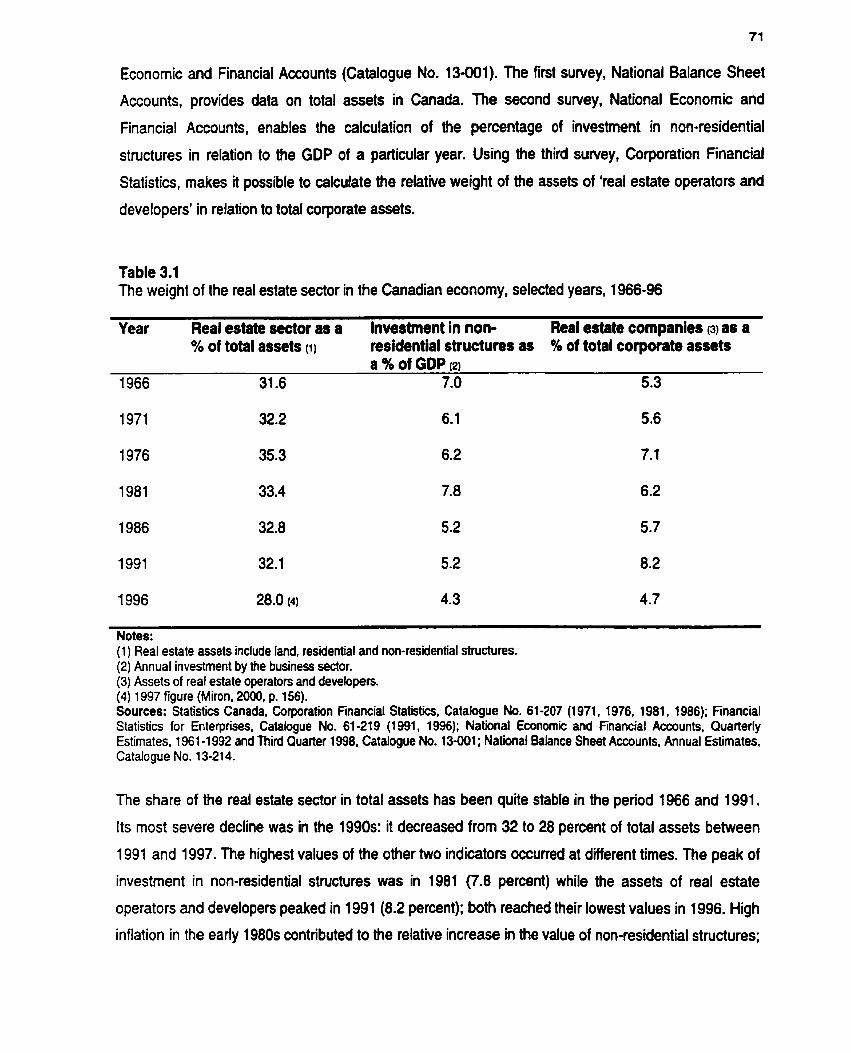
Economic and Financial Accounts (Catalogue No. 13-001). The first sunrey, National Balance Sheet
Accounts, provides data on total assets in Canada. The second survey, National Economic and
Financial Accounts, enables the calculation of the percentage of investrnent in non-residential
structures in relation to the GDP of a paiticular year. Using the third survey, Corporation Financial
Statistics, makes it possible to calculate the relative weight of the assets of 'real estate operaton and
developers' in relation to total corporate assets.
Table 3.1 The weight of the real estate sector in the Canadian economy, selected years, 1966-96
Year Real estate sector as a Invertment in non- Real estate cornpanier (3) as a % of total assets (1) residential structures as % of total coiparate assets
a % of GDP (2)
1966 31.6 7.0 5.3
Notes: (1) Real estate assets include land, residential and non-residential structures. (2) Annual investrnent by the business sector. (3) Assets of real estate operators and developers. (4) 1997 figure (Miron, 2000, p. 156). Sources: Statistics Canada, Corporation Financiat Statisticç, Catalogue No. 61 -207 (1 971, fW6, 1981, 1986); Financial Statistics for Enterprises, Catalogue No. 61 -21 9 (1 991, 1996); National Ewnomic and Financial Accounts, Quarterfy Estimates, 1961 -1992 and Third Quarter 1998, Catalogue No. 13-01; National Balance Sheet Accounts, Annual Estimates, Catalogue No. 13-214.
The share of the real estate sector in total assets has been quite stable in the period 1966 and 1991.
Its most severe decline was in the 1990s: it decreased from 32 to 28 percent of total assets between
1991 and 1997. The highest values of the other two indicaton occuned at different times. The peak of
investment in non-residential structures was in 1981 (7.8 percent) while the assets of real estate
operaton and developen peaked in 1991 (8.2 percent); both reached their lowest values in 1996. High
inflation in the earîy 1980s contributed to the relative increase in the value of non-residential structures;
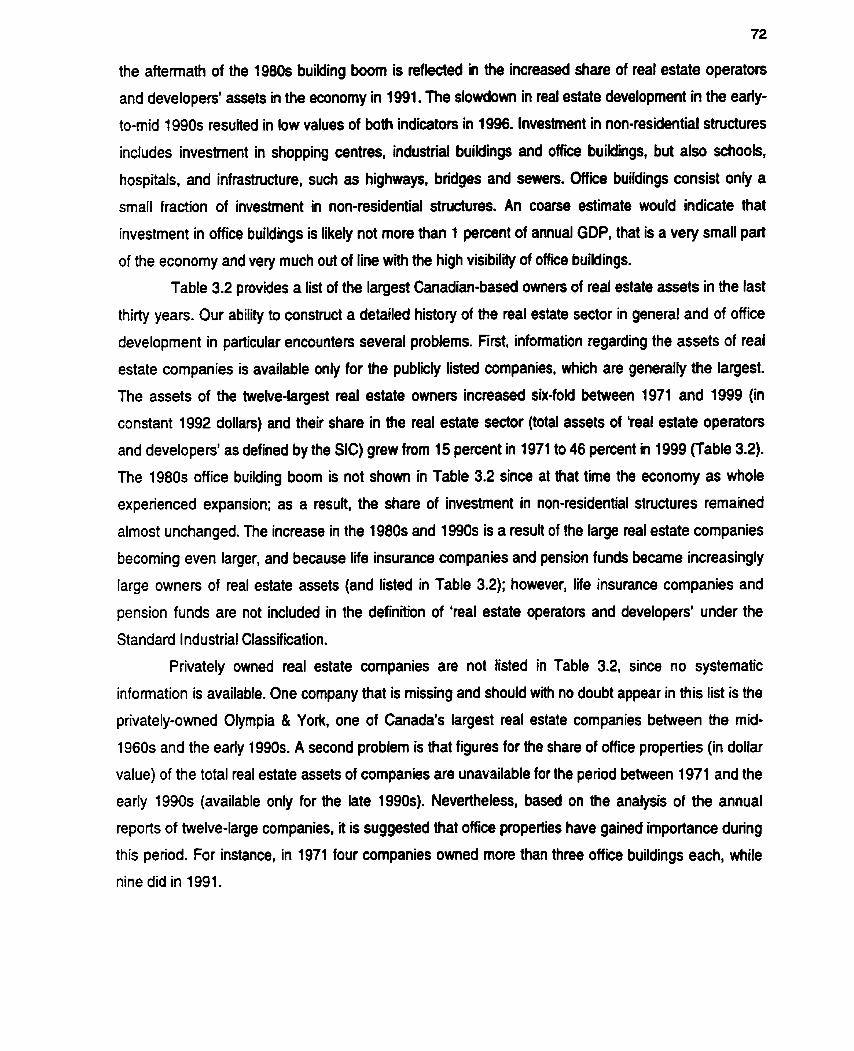
the aftermath of the 1980s building boom is reflected in the increased share of real estate operaton
and developen' assets in the economy in 1991. The slowdown in real estate development in the eady-
to-mid 1990s resuited in low values of both indicators in 1996. lnvestrnent in non-residential structures
includes investrnent in shopping centres, industrial buildings and office buildings, but also schools,
hospitals, and infrastructure, such as highways, bridges and sewen. Office buildings consist only a
small fraction of investment in non-residential structures. An coarse estimate would indicate that
investment in office buildings is likely not more than 1 percent of annual GDP, that is a very small pait
of the economy and very much out of line with the high visibility of office buildings.
Table 3.2 provides a list of the largest Canadian-based ownen of real estate assets in the last
thirty yean. Our ability to construct a detailed history of the real estate sector in general and of office
development in particular encounten several problems. First, information regarding the assets of real
estate companies is available only for the publicly listed companies, which are generally the largest.
The assets of the twehre-largest real estate ownen increased six-fold between 1971 and 1999 (in
constant 1992 dollars) and their share in the real estate sector (total assets of 'real estate operaton
and developen' as defined by the SIC) grew from 15 percent in 1971 to 46 percent in 1999 (Table 3.2).
The 1980s office building boom is not shown in Table 3.2 since at that time the economy as whole
experienced expansion; as a resuit, the share of investment in non-residential structures remained
almost unchanged. The increase in the 1 980s and 1 990s is a result of the large real estate companies
becoming even larger, and because life insurance companies and pension funds became increasingly
large owners of real estate assets (and listed in Table 3.2); however, life insurance companies and
pension funds are not included in the definition of 'real estate operators and developers' under the
Standard Industrial Classification.
Privately owned real estate companies are not listed in Table 3.2, since no systematic
information is available. One Company that is missing and should with no doubt appear in this list is the
privately-owned Olympia & York, one of Canada's largest real estate companies between the mid-
1960s and the early 1990s. A second problem is that figures for the share of office properties (in dollar
value) of the total real estate assets of companies are unavaiiable for the period between 1971 and the
early 1990s (available only for the late 1990s). Nevertheless, based on the analysis of the annual
reports of twehre-large companies, it is suggested that office properties have gained importance during
this period. For instance, in 1971 four companies owned more than three office buildings each, while
nine did in 1991.
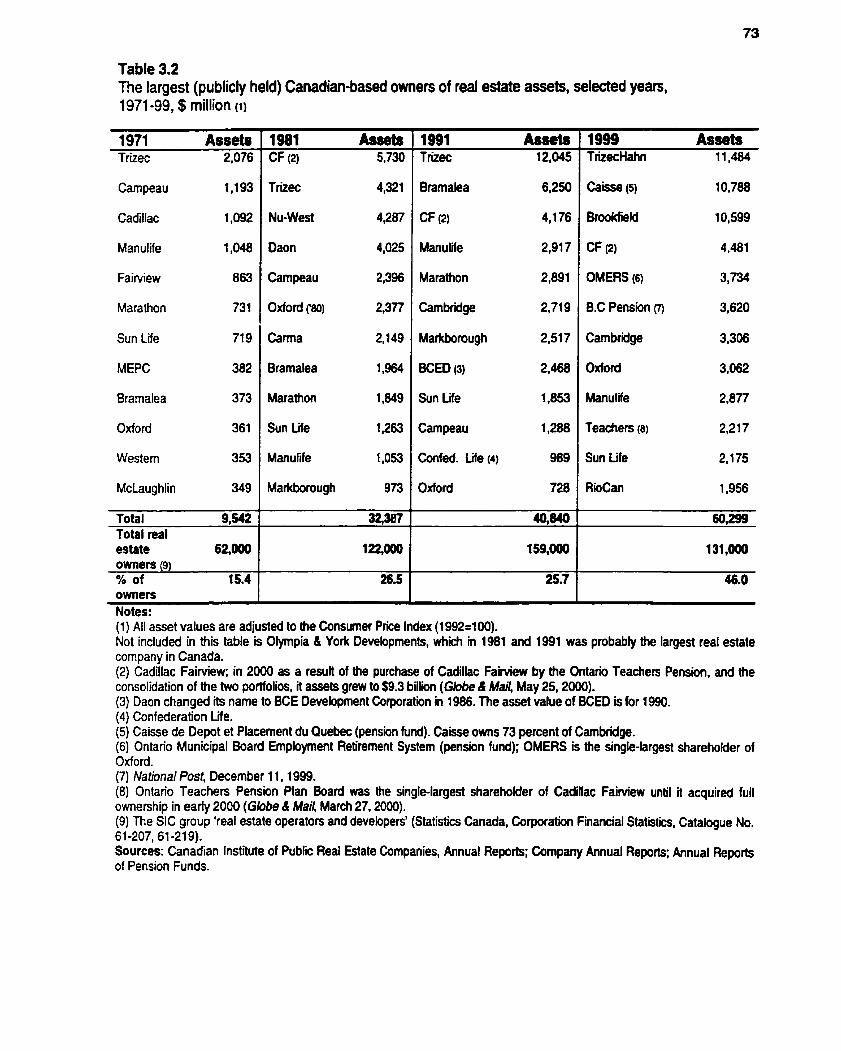
Table 3.2 The largest (publiciy held) Canadianbased ownen of real estate assets, selected yean. 1971 -99, $ million (1)
Cadillac 1,092
Manulife 1,048
Marathon 731
Sun Lie 71 9
MEPC 382
Bramalea 373
Oxford 36 1
Western 353
McLaughlin 349
Total 9,542 Total real estate 62,000 owners (9) % of 15.4 owners
Trizec 4,321
Nu-West 4,287
Daon 4,025
Campeau 2,396
Oxford @O) 2,377
Carrna 2,149
Brarnalea 1,964
Marathon 1,849
Sun Life 1,263
Manuliie 1,053
Markborough 973
Bramalea
CF (2)
Manulife
Marathon
Cam bridge
Markborough
BCED (3)
Sun Life
Campeau
Confed. Life (4)
Oxford
Caisse (5)
Brooùîield
OMERS (6)
B.C Pension (7)
Cam bridge
Oxford
Manulife
Teachers (0)
Sun Life
Riocan
Notes: (1 ) AI1 asset values are adjusteci to the Consumer Price Index (1 992=lOO). Not included in this table is Olympia 8 York Developments, which in 1981 and 1991 was probably the largest real estate Company in Canada. (2) Cadillac F a i ~ e w ; in 2000 as a result of the purchase of Cadillac FaiMew by the Ontario Tea&ers Pension, and the consolidation of the two portfolios, it assets grew to $9.3 billion (Globe & Mail, May 25,2000). (3) Daon changed its name 10 BCE Devebpment Corporation in 1986. The asset value of BCED is for 1990. (4) Confederation Life. (5) Caisse de Depot et Placement du Quebec (pension fund). Caisse owns 73 percent of Cambridge. (6) Ontario Municipal b a r d Employrnent Retirement System (pension fund); OMERS is the single-largest shareholder of Oxford. (7) National Posf, December 1 1,1999. (8) Ontario Teachers Pension Plan Board was the single-largest shareholder of Cadillac Fairview until it acquired full ownership in early 2000 (Globe & Mail, Match 27,2000). (9) The SIC group 'reaf estate operators and developers' (Statiçtics Canada, Corporation Financial Statistics, Catalogue No. 61 -2O7,61-219). Sources: Canadian lnstitute of Public Real Estate Companies, Annual Reports; Company Annual Reports; Annual Reports of Pension Funds.

In Table 3.2 the same hrge real estate companies appear throughout the 1971 to 1991 period, but
there are a few newcomen and othen disappear between 1971 and 1981. However, the most
significant change was in the 1990s. when for the fint time four of the largest owners of real estate
assets were pension funds. In addition, in this thirty-year period, two life insurance companies were
among the largest ownen of real estate properties. Real estate assets owned by publicly held real
estate companies are for incorne-producing purposes. The vast majonty of real estate assets owned by
pension funds, and the majonty of real estate assets owned by life insurance companies are also for
income generating purposes. Banks are not listed, since their major real estate properties are for their
own use rather than for incorne purposes. Banks rent out space in their head office buildings. but their
total real estate portfolios are generally not investment driven.
3.1.1 Office development in the first half of the twentieth century
Even though there has been relatively little research on office development in Canada in the first half of
the twentieth century, it is possible to discem some characteristics of the businesses engaging in office
development (Gad and Holdsworth, 1984, 1987a. 1987b; Gad and Matthew, 2000). Gad and
Holdsworth (1987a. 1987b) examined office buildings and their occupants in Toronto's old office
district, which was, until the second half of the hventieth century, the prirnary office district in Toronto
(approximately 98 percent of Toronto's office space in 1951). Erecting office buildings solely for
investment purposes (incarne-producing properties) constituted a small segment of the real estate
development sector before the Second World War. Until that time, owner-occupiers, such as banks and
life insurance companies, devebped office buildings, which were usually multiple-occupancy buildings.
Building owners occupied variable portions of the floor-space while excess space was leased to
various kinds of office-type tenants (Gad and Holdsworth, 1987b). This practice was developed to
seive as an additional income for the company's main business, not as the chief source of revenues.
Building owners could justify occupying an expensive site by building at a high density, renting out
space, and collecting revenues. Real estate companies developing office buildings for primarily
investment purposes were active to some extent by erecting small-to-medium size, multiple tenant
buildings.
In the 1920s and to lesser extent in the 1930s, other developers/owners emerged, especially
newspaper and utility companies. Also noticeable were speculative office developers, whose buildings
did not cary developerlowner or anchor tenant company labels. In their first phase in the late 1910s
and early 1920s. the company Yolles and Rotenberg (known later as YBR) built theatres on a contract
basis, and then diversified into industriaüwarehouse loft buildings. In the 1920s. they branched out into

developing speculative office buildings at the expanding western edge of Toronto's office district, in an
area that was then rnainly occupied by factories and warehouses.
3.1.2 The formative era of modem developers: Entrepreneurial skills and
'external' capital
During a single decade, between the mid-1950s and the mid-1960s, most of the large Canadian real
estate developrnent companies were fonned. Usually, these companies staited as developen of single
projects, either residential or commercial, targeting specific tedories. The role of financial institutions
as developen diminished as real estate development companies gradually became the dominant
providen of commercial space. Also, during this period, some of the largest local developen in the
Toronto area were created.
The emergence of large and divenified real estate companies in Canada is a postwar era
phenomenon. Most of Britain's largest property cornpanies were founded immediately after WWll
(Scott, 1996). MEPC (Metropolitan Estate and Property Corporation) and Hammenon Property
Investment and Development Corporation, two companies to 'invade' the Canadian real estate market
in the 1950s and the 1960s, were a product of this process. Similady, in the United States, the largest
divenified real estate companies were formed or developed out of rapid expansion after the War.
Examples include Webb & Knapp (associated with the fint commercial mega-developer, William
Zeckendorf), Trammel Crow (established in 1948)' and G. Hines lnterests (1 957).
In Canada, the emergence of large and divenified commercial real estate companies staited a
decade later. All the cunent diversified real estate companies invokred in the commercial real estate
sector were fonned between the mid-1950s to the mid-1960s. Although some have disappeared,
restructured or rnerged with other companies since, their core identity can be traced to this period. The
large Canadian real estate companies that were founded in ths 1945-1965 period are listed in Table
3.3.
Two major types of real estate development companies were established in this phase:
entrepreneurial-based companies and spin-otfs from large non-real estate corporations. Companies
based on a combination of entrepreneurial skills and 'trial and error' practice usually started with a
single project (residential or commercial) and as a resutt of their successes, the founders went on to
develop other real estate projects. This type includes a few of Canada's prominent companies:
Campeau Corporation, Cadillac Development Corporation, Oxford Development Corporation, and
Olympia 8 York Developments. The initial lack of capital forced this type of Company to punue a
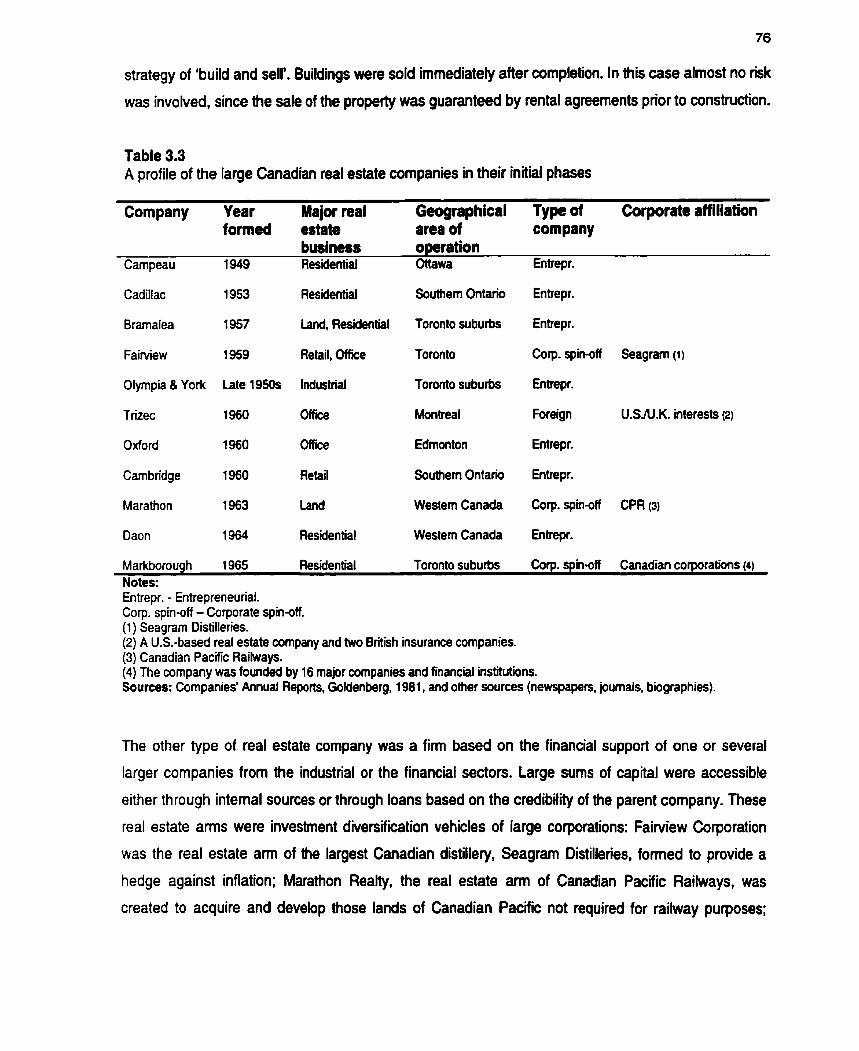
strategy of 'build and seli'. Buildings were sold immediately after completion. In this case almost no risk
was invohred, since the sale of the pmperty was guaranteed by rental agreements prior to construction.
Table 3.3 A profile of the large Canadian real estate companies in their initial phases
Company Year Major real Geographical Type of Corporate affiliation forrned estate area of company
business operation Campeau 1 949 Residential Ottawa Entrepr.
Cadillac 1 953 Residential Southem Ontario Entrepr.
Brarnalea 1 957 Land, Resideritial Toronto suburbs Entrepr.
Faim-ew 1959 Retail, CMice Toronto Corp. spinoff Seagram (1)
Olympia 8 York Late 1950s Industrial Toronto suburbs Entrepr.
Trizec 1960 Office Montreal Foreign U.SN.K. interests (2)
Oxford 1960 Office Edmonton Entrepr.
Cambridge 1960 Retail Southem Ontario Entrepr.
Marathon 1 963 Land Westem Canada COQ. spm-off CPR (3)
Daon 1 964 Residential Western Canada Entrepr.
Markborough 1965 Residential Toronto suburbs Corp. spinoff Canadian corporations (4)
Notes: Entrepr. - Entrepreneurial. Corp. spin-off - Corporate spinoff. (1) Seagram Distilleries. (2) A U.S.-based real estate company and two British insurance companies. (3) Canadian Pacific Railways. (4) The company was founded by 16 major cornpanies and financial institutions. Sources: Companies' Annual Reports, Goldenberg, 1981, and other sources (newspapers, joumals, biographies).
The other type of real estate Company was a fim based on the financial support of one or several
larger companies from the industnal or the financial sectors. Large sums of capital were accessible
either through intemal sources or through loans based on the credibility of the parent company. These
real estate amis were investrnent diversification vehicles of large corporations: Fairview Corporation
nas the real estate am of the largest Canadian distillery, Seagrarn Distilleries. fonned to provide a
hedge against inflation; Marathon Realty, the real estate ami of Canadian Pacific Railways, was
created to acquire and develop those lands of Canadian Pacific not required for railway purposes;
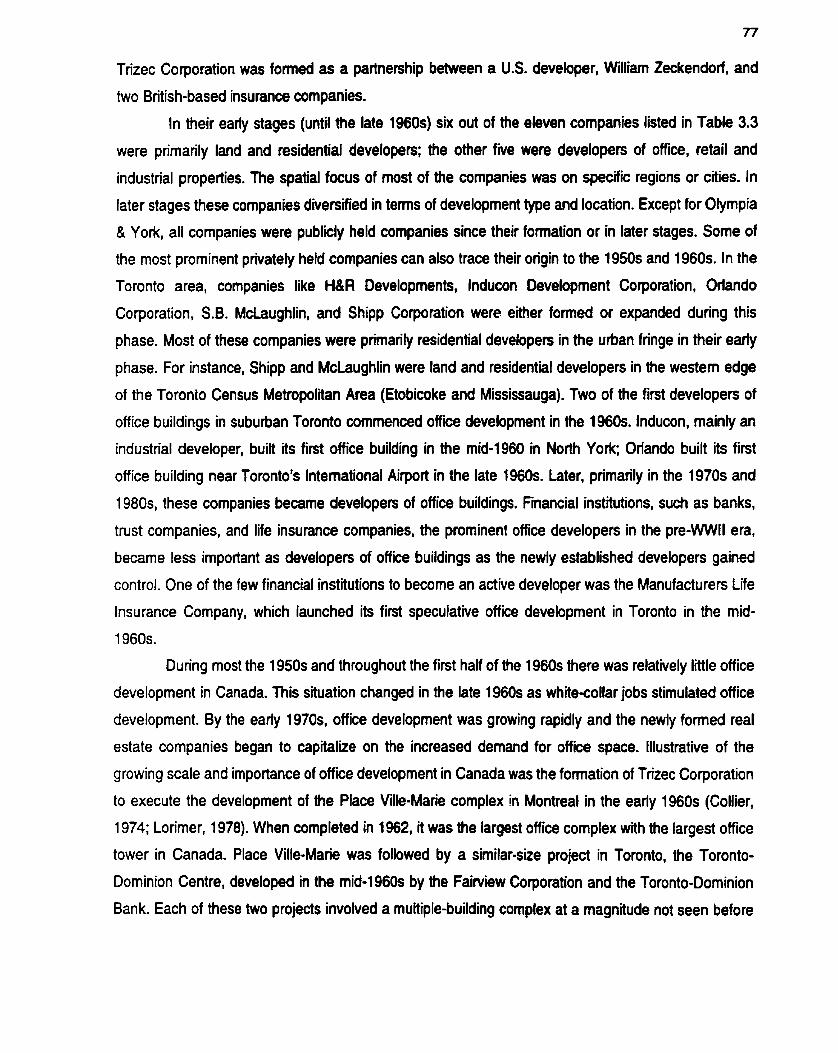
Trizec Corporation was formed as a partnenhip between a U.S. developer, William Zeckendorf, and
two British-based insurance companies.
In their early stages (until the late 1960s) six out of the eleven companies listed in Table 3.3
were primarily land and residential developen; the other five were developen of office, retail and
industrial properties. The spatial focus of most of the companies was on specific regions or cities. In
later stages these companies dive~ified in ternis of development type and location. Except for Olympia
& York, al1 companies were publicly held companies since their formation or in later stages. Some of
the most prominent privately held companies can also trace their origin to the 1950s and 1960s. In the
Toronto area, companies like H&R Devebpments, Inducon Development Corporation, Orlando
Corporation, S.B. McLaughlin, and Shipp Corporation were either fomed or expanded during this
phase. Most of these companies were primarily residential developen in the urban fringe in their eady
phase. For instance, Shipp and Mcbughlin were land and residential developen in the western edge
of the Toronto Census Metropolitan Area (Etobicoke and Mississauga). Two of the fint developen of
office buildings in suburban Toronto commenced office development in the 1960s. Inducon, mainly an
industrial developer, built its first office building in the mid-1960 in North York; Orlando built its fint
office building near Toronto's International Airport in the late 1960s. Later, primarily in the 1970s and
1 9 8 0 ~ ~ these companies became developers of office buildings. Financial institutions, such as banks,
trust companies, and life insurance companies, the prominent office developers in the pre-WWII ara,
became less important as developers of office buildings as the newiy established developers gained
control. One of the few financial institutions to becorne an active developer was the Manufacturers Life
lnsurance Company, which launched its first speculative office development in Toronto in the mid-
1960s.
During most the 1950s and throughout the first haH of the 1960s there was relatively little office
development in Canada. This situation changed in the late 1960s as white-collar jobs stimulated office
developrnent. By the early 1970s, office development was growing rapidly and the newly forrned real
estate companies began to capitalize on the increased demand for office space. lllustrative of the
growing scale and importance of office development in Canada was the formation of Trizec Corporation
to execute the development of the Place Ville-Marie complex in Montreal in the early 1960s (Collier,
1974; Lorimer, 1978). When completed in 1962, it was the largest office complex with the largest office
tower in Canada. Place Ville-Marie was followed by a similar-size project in Tomnto, the Toronto-
Dominion Centre, developed in the mid-1960s by the Fairview Corporation and the Toronto-Dominion
Bank. Each of these two projects involved a mulple-building complex at a magnitude not seen before

in Canada and two companies that henceforth belonged to the set of the largest Canadian real estate
development corporations.
3.1.3 The golden era of office development: Expansion and the establishment
of real estate powerhouses
In the 1970s and 1980s a new phase o m n e d in the structure of the commercial real estate industry in
Canada. This phase was characterized by rnergers and acquisitions and by the changing character and
volume of foreign investment. In addition, companies increasingly emphasized commercial
development and divenified spatially across Canada and into the United States. Unlike the previous
round of office development, which was strongly related to increasing demand for office space, the
1980s office building boom and to lasser extent the 1970s boom, were related to supply-side
considerations. In the midst of the glut of office space in the eady 1980s in Calgary, for example, real
estate companies continued the development process. In the late 1980s, when the construction of
office buildings reached unprecedented heights in Toronto, some developers still pursued
development. This occurrence supports the argument raised by several authors (Beauregard, 1994;
Fainstein, 1994; Downs, 1998) that office development was fueled by available financial capital that
was searching for profitable investments.
On the eve of the 1980s boom, Canadian-controlled companies had secured their dominant
position in real estate developrnent. In 1981, in contrast to the 1970s, al1 real estate companies were
rnainly developen or owners of commercial portfolios (shopping centres, industrial buildings, office
buildings and mixed-use complexes). Residential properties constituted a diminishing segment of their
total real estate portfolios as some prominent real estate companies disposed of their residential
assets. ln the eariy 1980s, push-pull factors downgraded the position of land and residential properties
for real estate companies. High inflation, and consequently high interest rates, made holding large
unproductive land banks an unrewarding channel of investment. In addition. the highly regulated
tenant-landlord relationships and signs of an expanding economy encouraged companies to shift
corn pletely into commercial development. As a result, leading real estate companies li ke Cadillac
Fairview, Campeau, and Daon disposed of their land and residential holdings in the earfy-to-mid 1980s.
Mergers and acquisitions within the real estate sector enabled the consolidation of the real
estate industry and the creation of large companies. In this process it allowed them to gain dominance
in multiple markets across Canada. Trizec's growth strategy invohred acquiring smaller companies and
using their assets and market dominance to penetrate new markets. In 1970-1, the acquisition of two
real estate companies allowed Trizec to establish a presence in western Canada, particularly in

Calgary and Vancouver. The Oxford Development Group adopted a smilar strategy. In the late 1970s,
in an acquisition spree in Canada and the United States, Oxford bought several companies, including
Y&R Properties, one of the largest office development companies in Toronto. The prime component of
the consolidation process in the real estate sector was the 1974 merger of Cadillac and Fainriew into
Cadillac Fairview Corporation. This merger created Canada's largest public real estate Company. The
merger movement was associated with increasing Canadian control of real estate and a decline in
foreign control of Canadian real estate. During this phase, Canadian developen also expanded their
operations into the United States and by the late 1980s more than half of their office portfolio was south
of the border (section 3.2).
Sirnilar to their practices in the first half of the twentieth century, financial institutions,
particularly banks and life insurance companies, resmerged as important developers of office
buildings. Banks were invohred as developen, joint venture partnen or investon in the construction of
their head office buildings, or even through the establishment of a real estate subsidiary (CIBC
Development Corporation, the real estate subsidiary of the Canadian Imperia1 Bank of Commerce). In
the 1 980s, life insurance companies joined the boom in office development by becoming developen of
buildings, primarily for income-producing purposes, across Canada (see Chapter Four). In addition,
private cornpanies thriving rnainly in the suburban areas of Toronto became an important component of
the office developrnent sector. Developers that were until the 1970s primarily residential and industrial
developers diversified into office development. Suburban real estate developers founded in the 1950s
and the 1960s as developers of industrial areas began erecting office buildings in the suburbs. lnducon
Development Corporation and Orlando Corporation continued to develop office buildings in the Toronto
area in the 1970s and especially in the 1980; by the late 1980s lnducon becarne the largest office
developer in suburban Toronto and one of the largest developers in the Toronto CMA. Further, real
estate companies that were mainly engaged in residential development diversified into office
developrnent. McLaughlin, the largest landowner in Mississauga and the developer of the Mississauga
City Centre. built his first office building in 1970. Shipp, another developer with a residential origin,
began the developrnent of a three-building office complex in Etobicoke in the early 1980s.
3.1.4 The institutionalkation of the real estate sector and the emergence of
new entrepreneurs
The deep recession in the real estate market of the early 1990s resulted in a major restnicluring of the
real estate sector. This invohred the demise of some of the largest Canadian developers, such as
Olympia & York, the reconfiguration of other companies, such as Trizec, and the stronger participation
of pension funds in real estate as major investors in real estate assets and real estate companies. Also,
new playen, focused on the reuse of older buildings, appeared on the scene.
In Uie early-to-mid 19Ws, the office market in Canada experienced its worst slump ever: the
value (in constant dollars) of o f f i building pennits issued in 1995 were at the same level as in 1970
(Statistics Canada, Building Pennits, Catalogue No. 64-203). Most of the prominent real estate
companies of the previous three decades experienced various levels of difficulties. Soaring and
unprecedented office vacancy rates in the Canadian cities in the early 1990s caused low rents (even
negative net rents, since the owner of an unoccupied building has to pay for operation costs like hydro
and taxes). Real estate companies were not able to senrice their debts. As a resu, real estate
companies either restnictured their office portfolios by disposing of properties in order to reduce debt,
took new partnen as major shareholden, or went bankrupt. The most spectacular resut of the slurnp
was the collapse of Olympia & York in 1992; however, many other companies followed including
Bramalea Limited, Campeau Corporation, Marathon Realty, and lnducon Development Corporation. On
the other hand, beginning in the eady 1990s and gaining momenturn throughout that decade, pension
funds became major ownen of office properties and of publicly listed real estate companies. especially
as life insurance companies and banks reduced their real estate investrnents.
At the present time, the two largest Canadian-based real estate companies constihite
elaborate 'reincamations' of former organizations. Brookfield Properties Corporation is the product of
the restructuring of the real estate holdings of the EdperBrascan Group, a conglomerate with holdings
in industrial, resource and financial companies. The Group has been involved in real estate since the
mid-1970s, when it acquired control of Trizec Corporation (until then a foreign-owned company). In
1994, EdperBrascan sold its ownership interest in Trizec to Horsham, a holding company of Bamck
Gold (Canada's largest gold mining company). Also, in the late 1980s, the EdperBrascan Group
acquired BCE Development Corporation (BCED). In the eariy 1990s, the restnicturing has led to the
consolidation of the portfolios of BCE Development Corporation and the major properties held by
Olympia 8 York Developments (including the World Financial Center in Manhattan), under the roof of
Brookfield. TrizecHahn Corporation is the reincarnation of Trizec (formed in 1960) reinforced by an
infusion of capital from Bamck Gold in the mid-1990s. The majority of the current real estate assets of
both companies, Brookfield and T rizecHahn, is in the United States; in 1999,56 percent of Brookfield's
and 78 percent of TrizecHahn's office portfolios were in the United States (Annual Reports, both
companies). In mid-2000 TrizecHahn sold the rnajority of its Canadian office portfolio, making its U.S.
office portfolio and to a lesser extent, its European portfolio, the company's entire office holdings
(TrizecHahn Corporation, Press Release, June 8,2000).

Since the mid-1990s. several financial institutions have reduced their exposure to real estate.
whereas other investon have become the prime force in the commercial real estate sector. Following
the 1990s slump, life insurance companies began to consider real estate developrnent and investment
as a highly risky business. The real estate portfolio of Manulife Financial, the most active life insurance
Company in office development (in the 1990s. over 80 percent of its real estate pomolio was comprised
of office buildings). reduced its real estate assets from ten percent of the company's invested assets in
1992 to six percent in 1997 (Manulife Financial, Annual Reports). Similady, while London Life had 12
percent of its investments in real estate in 1992. the Company had reduced its real estate exposure to
three percent by 1998 (Dominion Bond Rating Service, 1999). Banks followed this trend by considering
real estate as noncore assets. Consequenüy, in the kte 1990s. two of the major Canadian banks
(Royal Bank and CIBC) sold their non-branch office buildings and one (Bank of Nova Scotia) sold part
of ils real estate assets.
Two main institutional investon became dominant forces in the real estate sector. Athough
being involved in real estate in the 1970s and 1980s. pension funds had become the most important
investors in real estate at the end of the 1990s. Pension funds :ook advantage of the growing
availabiltty of properties as real estate developen became stranded by the devaluation of their
properties and as their cash flow dropped. Wiih their long-temi perspective, little need to get into debt.
and real estate considered as an efficient hedge against inflation. pension funds were extremely active
in the acquislion of commercial real estate properties. By the end of the 1990s. the pension funds were
described by the Globe & Mailas the 'big kids on the block' (Globe & Mail. November 14,1998).
Pension funds not only acquired already existing office buildings (and shopping centres) but
also invested in publicly traded real estate companies. In the 1990s, the Ontario Teachen Pension
Plan Board became the single largest shareholder in Cadillac Fairview with a 22 percent equity stake;
in December 1999. it acquired the remaining 78 percent and became the Company's sole owner
(National Post, December 2. 1999). The Ontario Municipal Employees Retirement System (OMERS)
became the single largest shareholder in Oxford Properties Group in 1998; OMERS participated in the
acquisition of the Royal Bank portfolio in 1999. Quebec's largest pension fund, the Caisse de depot et
placement du Quebec, acquired a 73 percent equity stake in Cambridge Shopping Centres (one of the
largest shopping centre developers) and a 48 percent stake in Bentall Corporation (Globe & Mail,
December 3. 1999). By 1999, pension funds were prominent ownen of both real estate properties and real estate companies in Canada. Canada's four largest public pension funds were among the twelve
largest owners of real estate properties (Table 3.2). In the late 1990s. pension funds through their
association with real estate management companies began to engage in office development. Penreal

Capital Management, a manager of real estate investrnents for a gmup of pension funds, is the
developer of the new 800,000 square feet office complex for the Royal Bank in Mississauga, and
OMERS as a partner of Oxford Properties Group, is active in the development of an office building in
Calgary. Unlike large pension funds that have their own real estate ans, mid-sized pension funds use
segregated funds that are managed by Me insurance companies or professional management
cornpanies in order to invest in real estate properties. One such management Company is QWL Realty,
a wholly-owned subsidiary of Great-West Lie Assurance Company. GWL Realty owns and manages
real estate assets on behalf of 150 mid-sized and small pension funds; its major segregated fund had
over $1 billion of managed real estate assets (National Post, April 16, 1999).
Another emerging force in the Canadian real estate sector since the eariy 1990s have been
real estate investment trusts (REITs). A RElT is a mutual fund form of ownership of pooled capital that
provides smali investon with the opportunity to invest in and own real estate assets. If RElTs meet
certain requirements, they can pass realized gains through to shareholden and take tax deductions for
the distributions, thus avoiding a double tax (Urban Land Institute, 1998). Typically. a RElT is fonned
by a Company that owns or manages real estate properties. RElTs purchase existing properties and
occasionally they are invoked in development. The RElT issues a security, called a 'unit', which can be
bought and sold by investors. Each unit entitles the owner to a proportion of the net annual revenue
from the RElT properties (Miron, 2000).
In Canada, the relative recovery of the real estate market in the second half of the 1990s and
the abundant supply of properties for sale prompted the formation of real estate inveçtment trusts. The
number of RElTs grew from f i e in 1996 to twelve in 1997 (f iancial Post, January 3, 1998). In terrns of
asset size. RElTs are much smaller than the largest real estate cornpanies; for instance, RioCan, the
largest RElT in Canada, has $2.2 billion in assets in 1999 dollars (the equivalent of 2 billion in 1992
dollars), which ranks it only at the twelfth place among the largest Canadian ownen of real estate
assets (Table 3.2).
RElTs are not developen, their main objective is to acquire and manage real estate assets.
Generally, RElTs tend to specialize in one type of na1 estate (Table 3.4). Most of Riocan's properties,
for example. are retail propeities, while Canadian Hotel lncome Properties (CHIP) specializes in hotels,
and RESREIT in apartment buildings. Some REITs, like Morguard, H&R and Summit have more
diversified holdings.
In the late 1990s, a shortage of quality properties for sale. high property prices, and the desire
to maintain the appreciation of the unit value, encouraged some RElTs to enter the development arena
by financing the construction of shopping centres and office buildings. As suggested by the chief

executive officer of the H&R REIT: Ytls going to become imperative to get into development to stay in
businessn (Financial Post, June 6, 1998). H&R, which has the largest o f f i portfolio among RElTs
(over three million square feet of office space), has provided financing for the development of an office
cornplex for Bell Mobility in Mississauga and for a new head office for TransCanada Pipelines (TCPL)
in downtown Calgary (H&R REIT, 1998 Annual Report). Not oniy is this one of the largest
developrnents since the earfy 1990s (aknost one million square feet), it is also the first large-sale
office development financed by a REIT. H&R REIT was created in 1996 by acquiring rnost of the real
estate holdings of the privateiy-held real estate Company H&R Developments (Globe & Mail, December
5, 1996). The developer of the TCPL building is HIR Developments h i l e the REIT provides
construction financing and has an option to purchase the building upon completion at cost (HBR REIT,
1999 Annual Report).
Table 3.4 The largest real estate invertment trusts in Canada. 1999
RElT Year fomed Assets Principle property types owned ($ million)
RioCan 1994 2,161 Retail
Legacy 1997 1,066 Hotels
H8R 1996 941 Office, industrial, retail
Summit 1996 923 Retail, industrial, office
Morguard 1 997 838 Retail, o f f~e , industrial
CPL 1 997 7?4 Nursing facifies
CRElT 1993 730 Retail, industrial, office
CHlP 1 997 606 Hoteis
RESREIT 1998 489 Apartment buildings
Royal Host 1997 385 Hotels and resorts
Cominar 1998 294 Industrial, office, retail
Source: Real Estate lnvestment Trusts, Annual Reports.
Midst the institutionalkation of commercial real estate in Canada new kinds of entrepreneurial forces
have re-emerged. However, since these new kinds of entrepreneurs have not erected standard office
modemist office towen, they have not received much attention in reseaich on and writing about office

developrnent. The companies in question are small and are primanly engaged in the re-use of older
commercial-industrial buildings located at the fringes of the downtom office districts. These companies
take advantage of demand for 'alternativep o f f i space generated by professional businesses, such as
architects, graphic designers, cornputer software and multimedia fimis. These types of businesses
reject the traditional office tower-type of space and prefer old buildings in which mechanical systems
are upgraded but architectural features kept almost unchanged. This phenomenon is visible in the
areas west and east of Toronto's downtown and in Vancouver (see sections 6.4 and section 7.3.1).
The developers of such buildings include small companies (often owned by architects) buying
one or two old industnal or general commercial buildings and refurbishing them as office buildings. The
only Company of this type that can be considered as medium-size is Allied Canadian Corporation,
which owns approximately one million square feet of office space on the fringes of Toronto's downtown.
Allied acquired 17 commercial-industriaI loft buildings in 1998 and is in the process of 'upgrading' these
buildings to office standards. The financing for Allied Canadian 7s coming from. ..a Toronto money
manager that directs about $500 million in assets for weaithy individuais" (Globe & Mail. October, 15,
1998). Otherwise, information on the size and scope of this type of devebper remains unknown at this
stage.
3.2 Canadian-Based Real Estate Companies and Office Development in the
United States
Until the rnid-1970s. Canadian-based real estate development companies developed office buildings
mainly in Canada. Starting in the mid-1970~~ most of the large Canadian-based real estate
development cornpanies (and also medium-sized companies) began to purchase andlor develop office
buildings in the United States (Goldenberg, 1981; Feagin and Parker, 1990). An analysis of the
geographic distribution of their office portfolios shows that in the decade between 1976 and 1987 the
focal point of the Canadian companies shifted dramatically from Canada to the United States. In 1976
approximately 90 percent of their office portfolio was in Canada and the remaining in the United States;
a decade later, in 1987. only 48 percent was in Canada and 52 percent in the U.S. (Table 3.5). By the
1990s. although the share of U.S. assets for al1 Canadian companies together has rernained almost
unchanged. only two large Canadian-based real estate development companies. TrizecHahn and
Brookfield. had a substantial share of their office properties in the United States. This is in stark
contrast to the mid-1980s. when almost al1 of the hrgest Canadian companies owned office propecties
in the United States.
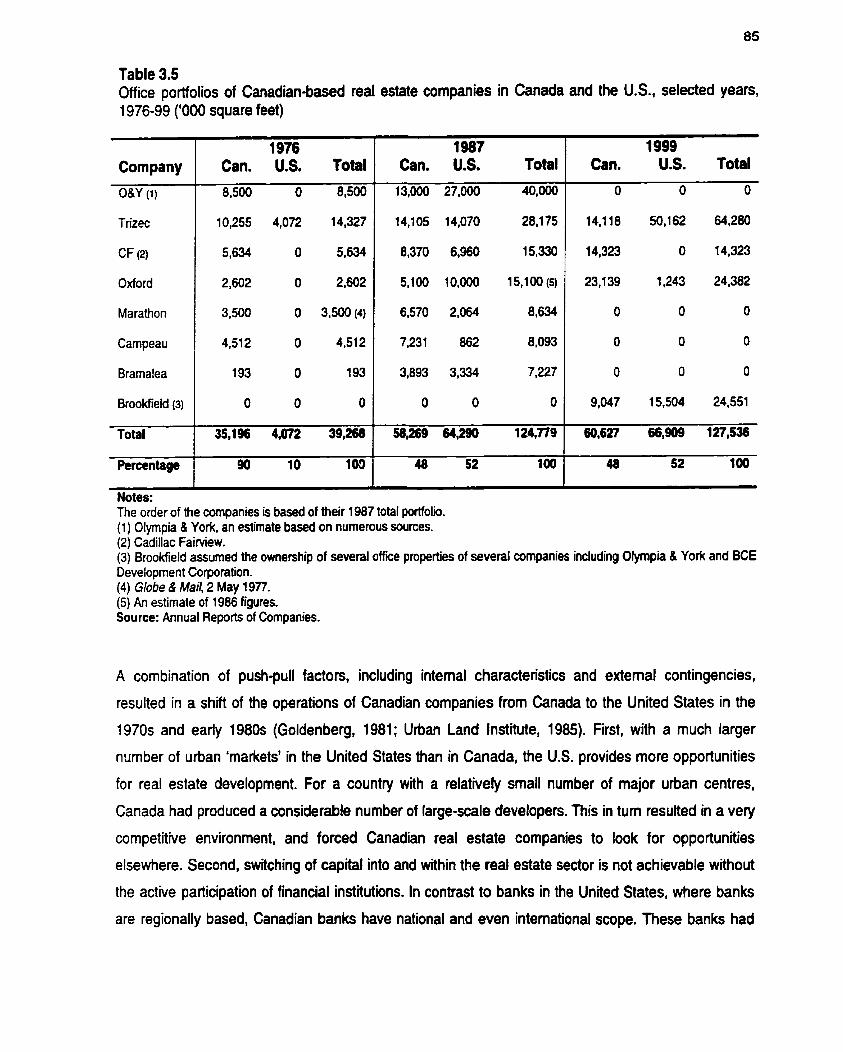
Table 3.5 Office po~ol ios of Canadian-based real estate companies in Canada and the U.S., selected yean, 1976-99 ('000 square feet)
Company
08Y (1)
Trizec
CF (2)
Oxford
Marathon
Campeau
Bramalea
Brookfield (3)
Total
Percentage
Notes:
197 6 Can. U.S. Total 8,500 O 8,500
10,255 4,072 14,327
5,634 O 5,634
2,602 O 2,602
3,500 O 3,500(4)
4.51 2 O 4,512
193 O 193
O O O
The order of the companies is based of their 1987 total portfolio. ( 1 ) Olympia 8 York, an estimate based on numerous sources. (2) Cadillac Fa i~ew. (3) Brookfield assumed the omership of several office properties of several companies including Oiympia 8 York and BCE Development Corporation. (4) Globe & Mail, 2 May 1977. (5) An estimate of 1986 figures. Source: Annual Reports of Companies.
1987 Can. U.S. Total
13,000 27,000 40,000
14,1 05 14,070 28,175
8,370 6,960 15,330
5,100 10,000 15,100(5)
6,570 2,064 8,634
7,231 862 8,093
3,893 3,334 7,227
O O O
A combination of push-pull factors, including intemal characteristics and extemai contingencies,
resulted in a shift of the operations of Canadian companies from Canada to the United States in the
1970s and eariy 1980s (Goldenberg, 1981; Urban Land Institute, 1985). First, with a much larger
nurnber of urban 'markets' in the United States than in Canada, the U.S. provides more opportunities
for real estate development. For a country with a relatively small number of major urban centres,
Canada had produced a considerable number of large-scale developers. This in tum resulted in a very
competitive environment, and forced Canadian real estate companies to look for opportunities
elsewhere. Second, switching of capital into and within the real estate sector is not achievable without
the active participation of financial institutions. In contrast to banks in the United States, where banks
1999 Can. U.S. Total
O O O
14,118 50,162 64,280
14,323 O 14,323
23,139 1,243 24,382
O O O
O O O
O O O
9,047 15,504 24,551
are regionally based, Canadian banks have national and even international scope. These banks had
previous expenence of lending money to Canadian developen either through debt financing or thmugh
joint ventures. The branches of Canadian banks in the United States participated in ananging financing
for the development of office buildings and the expansion of Canadian-based developers into the
United States. Third, in many U.S. cities, planning regufations were bss rigorous than in Canada, and the previous experience of Canadian-based real estate companies in dealing with local rnunicipalities
and the complex process of development in Canada schooled them in the mechanism of local
planning. Fourth, unlike Canadian municipales, U.S. local authorities were able to attmct developen
by offering different types of incentives. The rise of urban entrepreneurialism (Leitner, 1990, 1994) and
the competition between municipalities f ~ r investment combined with the attempt to redevelop their
declining downtown areas has resuited in generous incentives to lure experienced Canadian-based
real estate developen. Finally, specific conditions in the United States made investment in real estate
attractive. Cornpetitive prices in the U.S. followed by a real estate decline in the mid-1970s made
expansion in the U.S. a sensible strategy (Goldenberg, 1981).
The investrnents of Canadian-based real estate companies in office buildings were mainly in
the fastest growing regions, namely Southern and Western United States. California and Texas were
the prime investment arenas. The principal cities for investment in office buildings were the major
centres within the oil and gas corridor, Houston, Dallas and Denver. Other cities in the Sunbelt, such as
Los Angeles and Atlanta, were also preferred investment arenas. The DallasFort Worth area illustrates
the role of Canadian-based companies. At the peak of the office building boom in 1989, three of the
largest Canadian companies, Cadillac Fairview, Bramalea, and Olympia 8 York, owned approximately
eight million square feet of office space in the Dallas-Fort Worth area. Wfih the exception of Olympia &
York. Canadian-based real estate developen have not invested in Manhattan, the hrgest office market
in the US. This market was at the brink of collapse in the mid-1970s as a result of the city's financial
malaise. In 19ï7, however, Olympia 8 York made a deal dubbed the 'deal of the century' (Foster,
1993) by buying nine office buildings in Manhattan for $350 million (U.S.). By 1981 the value of these
buildings had tnpled to $1 billion (Goldenberg, 1981) and by the late 1980s Olympia & York had
developed its largest real estate project in Manhattan, Battery Park City (including the World Financial
Center). At that tirne, the New York office portfolio of 08Y contained more than 24 millions square feet
of office space.
Following the 1990s real estate slump, rnost Canadian-based real estate companies have
totally withdrawn from the U.S. office market. A highly cornpetitive office market in the U.S. has
prompted Oxford to refocus on Canada as early as the mid-1980s, and as a result of restnicturing,
Cadillac Faiwiew was left only with its Canadian office portfolio by the mid-1990s. Other companies,
such as Olympia & York, Campeau, Bramaela, and Marathon went banknipt and other companies
absorbed their portfolios. A few companies have continued to focus on the United States. The majonty
of the office porifolio of the two largest Canadian-based real estate companies (TrizecHahn
Corporation and Brookfield Pmpeities) is in the US. This phenornenon indicates a differentiation
between companies. Bargain prices of high quality office buildings in the U S . have attracted
developers that were able to channel capital from other segments of the real estate sector into the
ownership of office buildings. TrizecHahn sold its entire U.S. shopping centre portfolio in 1998 and
shifted the proceedings to the acquisition of office buildings, mainly in the U.S. The collapse of their
Canadian counterparts in the early 1990s has provided the rneans for Brookfield Properties to becorne
the owner of one of the most prestigious office complexes in Manhattan, the World Financial Centre,
fomerly owned by Olympia 8 York.
3.3 Office Oevelopment and Foreign lnvestors in Canada In Canada, very little is known about foreign investment in the real estate sector in general and in office
development in particular. A few case studies provide limited insights into this arena. In this thesis,
findings on foreign investrnent in office development are based, to a large extent, on the absence,
rather than evidence on the presence of this type of investment. Intensive study of the office
development sector in Toronto has only revealed limited foreign participation in office development
projects.
Foreign involvement in office development in Canada predated the expansion of Canadian
developers into the United States. The first foreign real estate developers, mostfy British-based, to
enter Canada anived in the 1950s and 1960s and their operations included development of office
properties as well as the purchase of existing buildings and land. The withdrawal of most of these
companies in the mid-1970s resulted in a void of foreign investment until the late 1980s and early
1990s, when most of the new foreign real estate investon became buyen of troubled propeities.
In the 1960s and 1970s. British-owned companies were the most dominant foreign operators in
real estate in Canada. These companies included Trizec, MEPC, Bramalea, Rank. Abbey Glen,
Hamrnerson and Slough Estates. Foreign control took two forms. One was the London-based holding
company, which concentrated on ownership of income-producing pmperties. The other f o n was the
development company, which specialized in buying land and developing residential and commercial
pro perties. A num ber of foreignswned companies, in particular MEPC, Bramalea, Trizec, and
Hammenon were the most active firms in Canada in the last thirty years. The first foreign real estate

company to launch a Canadian operation was the British-based MEPC in 1954. By the 1970s, MEPC
Canadian Properties was one of the largest commercial real estate companies in Canada (in 1971 it
ranked seventh largest among public real estate companies) with properties (office, industrial and
retail) in most major cities across Canada. The company was a developer and an owner of real estate
properties as indicated by the president of MEPC '8asically we are an investment
company ... sometimes the investment market is diy and we have to build, but we prefer buyingn
(Building Development, December 1971, p. 14). The forerunner of Bramalea was fomed in 1957 in
order to change a rural area near the town of Brampton into the area known as Bramalea. In the late
1950s. a British syndicate bought the company (Bayton) and changed its name to Bramalea. Bramalea
was mainly a residential developer up to the mid-1970s. when Canadian entrepreneurs acquired the
company. In 1960, Trizec was formed to serve as a vehicle for the development of Place Ville-Marie in
Montreal. This singlepurpose company combined US. (William Zeckendoif, an American real estate
mogul) and British capital (Eagle Star Insurance). Trizec went on to develop other commercial
properties across Canada and in 1971 it ranked as the top publicly held real estate Company in Canada
in ternis of assets. Hammenon Canada, a subsidiary of Hammenon (U.K.) began its Canadian
operations in 1969. Hammerson focused on two Canadian cities, Toronto and Calgary. Its largest
project in Canada was the Bow Valley Square in Calgary. (Hammenon had also developed and
acquired office buildings in Vancouver.) In the mid-1980s, Hammerson bought the entire real estate
portfolio of a large Canadian developer (SB. McLaughlin). This portfolio consisted of a regional
shopping centre, a number of office buildings, and large land holdings, primanly in the suburban
municipality of Mississauga. This purchase made Hammenon the largest landowner in Mississauga.
f o some extent, other foreign investors and developers have been active in office
development. Two German-based companies, York-Hannover and Polaris, developed office buildings
mainly in Mississauga (Milner, 1991), and in other cities in Canada. In the early 1 9 9 0 ~ ~ York-Hannover,
together with a NorthYoik-based developer were planning an ambitious office complex in downtown
Toronto, but as a result of the 1990s recession it did not rnaterialize (Financial Post, October 7, 1992).
ln the 1990s, German investon bought a number of office buildings in Toronto's suburbs from troubled
Canadian developers (Financial Post, April 21, 1993). For example, they acquired an office building
from the largest office developer in suburban Toronto that went bankrupt (Inducon), and another office
building in North York City Centre from another developer (Bramalea). The only building developed by
a German investor in Toronto's Financial District was a relatively small building (100,000 square feet);
another building was in the Financial District renovated by German investon in the mid-1990s (Globe &
Mail, July 11, 1995).
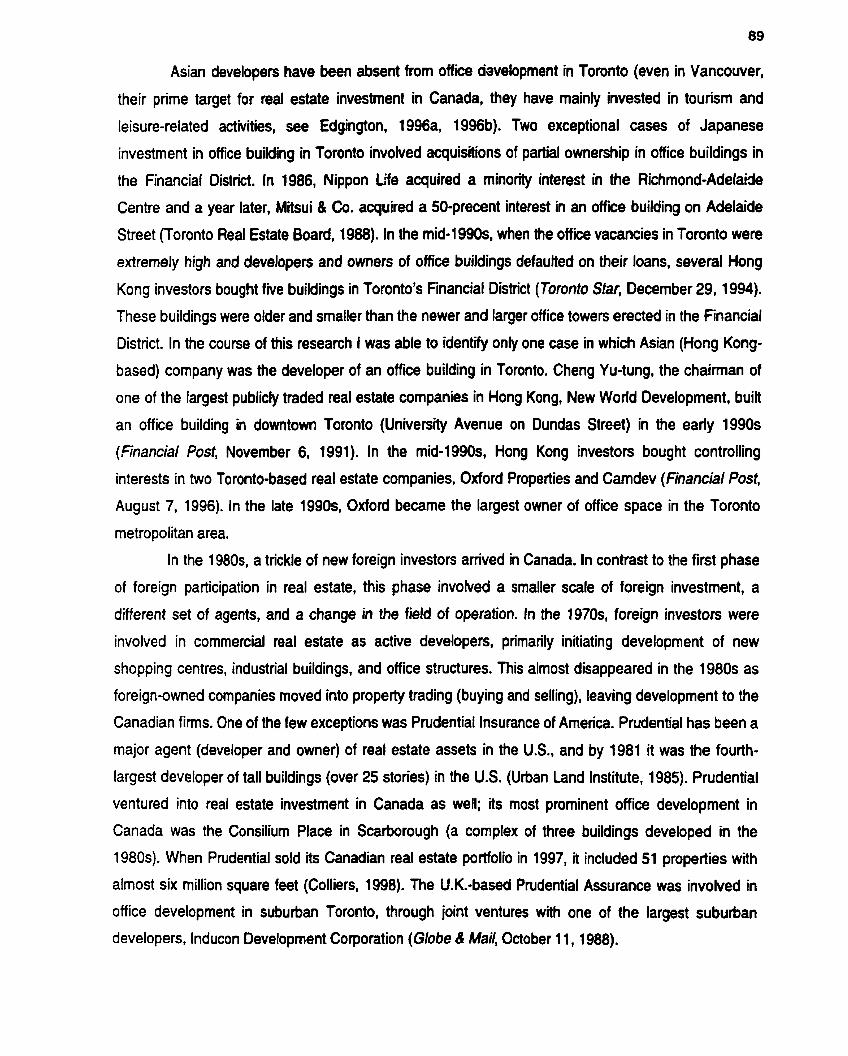
Asian developers have been absent from office asvelopment in Toronto (even in Vancouver,
their prime target for real estate investment in Canada, they have mainly invested in tourism and
leisure-related activities, see Edgington, 1996a, 1996b). Two exceptional cases of Japanese
investment in office building in Toronto invohred aquisitions of partial ownership in office buildings in
the Financiaf District. In 1986, Nippon Me acquired a minonty interest in the Richmond-Adelaide
Centre and a year later, Mitsui 8 Co. acguired a 50-precent interest in an offne building on Adelaide
Street (Toronto Real Estate Board, 1988). In the mid-1990s, when the office vacancies in Toronto were
extrernely high and developers and ownen of office buildings defaulted on their loans, several Hong
Kong investors bought f i e buildings in Toronto's Financial District (Toronto Star, Decernber 29. 1994).
These buildings were older and smaller than the newer and larger office towers erected in the Financial
District. In the course of this research f was able to identify only one case in which Asian (Hong Kong-
based) Company was the developer of an office building in Toronto. Cheng Yu-tung, the chaiman of
one of the largest publicly traded real estate companies in Hong Kong, New Worid Devetopment, buiit
an office building in downtown Toronto (University Avenue on Dundas Street) in the eariy 1990s
(Financial Post, November 6, 1991). In the mid-1990s, Hong Kong investon bought controlling
interests in two Toronto-based real estate companies, Oxford Pmperties and Camdev (FManciaI Post,
August 7, 1996). In the late 1990s, Oxford became the hrgest owner of office space in the Toronto
metropolitan area.
In the 1980s, a trickle of new foreign investors arrived in Canada. In contrast to the first phase
of foreign participation in real estate, this phase invohred a smaller sale of foreign investment, a
different set of agents, and a change in the field of operation. In the 1970s, foreign investors were
involved in commercial real estate as active developers, primarily initiating developrnent of new
shopping centres, industrial buildings, and office structures. This almost disappeared in the 1980s as
foreign-owned companies moved into propeity trading (buying and selling), leaving development to the
Canadian fimis. One of the few exceptions was Prudential Insurance of Amerka. Prudential has been a
major agent (developer and owner) of real estate assets in the U.S., and by 1981 it was the fourth-
largest developer of tall buildings (over 25 stories) in the U.S. (Urban Land Institute, 1985). Prudential
ventured into real estate investment in Canada as well; its most pmminent office developrnent in
Canada was the Consilium Place in Scarborough (a complex of three buildings developed in the
1980s). When Prudential sold its Canadian real estate pomolio in 1997, it included 51 properties with
almost six rniflion square feet (Colliers, 1998). The U.K.-based Prudential Assurance was involved in
office development in suburban Toronto, through joint ventures with one of the largest suburban
developers, lnducon Development Corporation (Globe 8 Mail. October 1 1, 1 988).
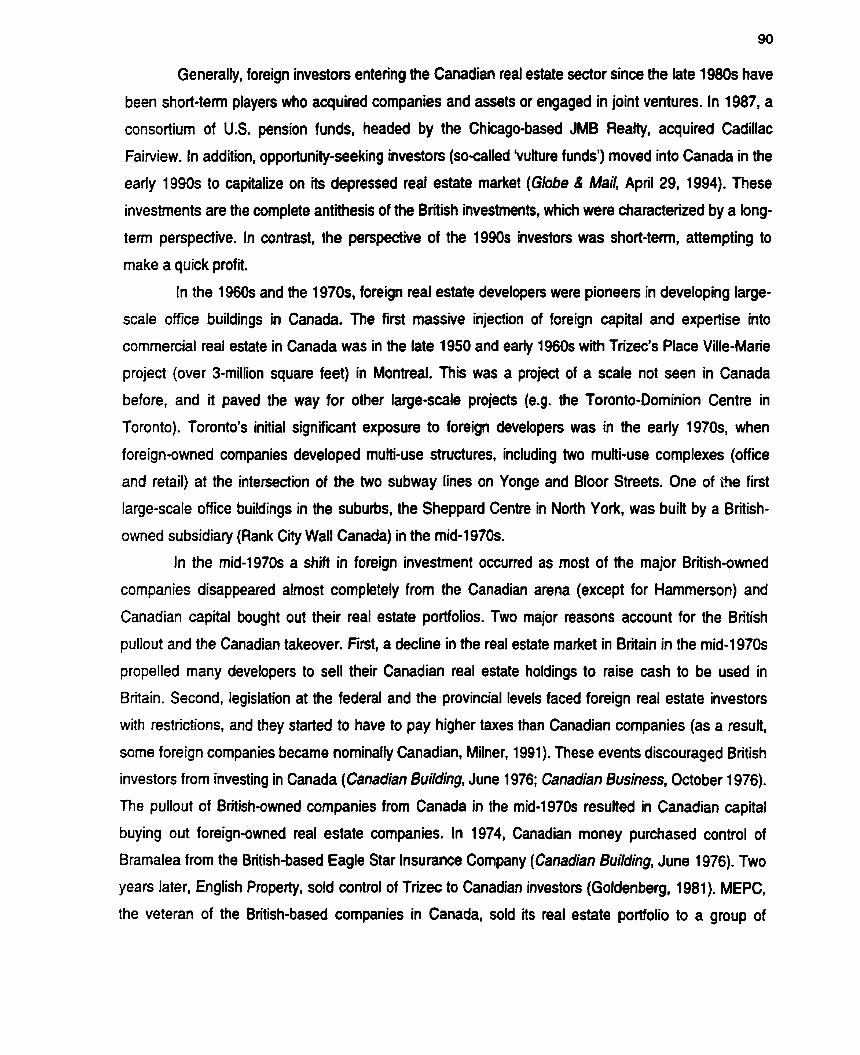
Generally, foreign investors entering the Canadian real estate sector since the late 1980s have
been short-terni playen who acquired companies and assets or engaged in joint ventures. In 1987, a
consortium of U.S. pension funds, headed by the Chicago-based JMB Realty, acquired Cadillac
Fairview. ln addlon, opportunity-seeking investon (socalled 'vulture funds') moved into Canada in the
eariy 1990s to capitalize on its depressed real estate market (Globe & Mail, April 29, 1994). These
investments are the complete antithesis of the British investrnents, which were characterized by a long-
term perspective. In contrast, the perspective of the 1990s investon was short-terrn, attempting to
make a quick profit.
In the 1960s and the 1970s, foreign real estate developers were pioneen in developing large-
scale office buildings in Canada. The first massive injection of foreign capital and expertise into
commercial real estate in Canada was in the late 1950 and eariy 1960s with Trizec's Place Ville-Marie
project (over Smillion square feet) in Montreal. This was a project of a scale not seen in Canada
before, and it paved the way for other large-sale projects (e.g. the Toronto-Dominion Centre in
Toronto). Toronto's initial signifiant exposure to foreign developen was in the early 1970s, when
foreign-owned companies developed mutti-use structures, including two multi-use complexes (office
and retail) at the intersection of the two subway lines on Yonge and Bloor Streets. One of the first
large-scale office buildings in the suburbs, the Sheppard Centre in North York, was built by a British-
owned subsidiary (Rank City Wall Canada) in the mid-1970s.
In the mid-1970s a shift in foreign investment occurred as most of the major British-owned
companies disappeared almost completely from the Canadian arena (except for Hammerson) and
Canadian capital bought out their real estate portfolios. Two major reasons account for the British
pullout and the Canadian takeover. First, a decline in the real estate market in Britain in the mid-1970s
propelled many developers to seIl their Canadian real estate holdings to raise cash to be used in
Britain. Second, legislation at the federal and the provincial levels faced foreign real estate investors
with restrictions, and they started to have to pay higher taxes than Canadian companies (as a result,
some foreign companies becarne nominally Canadian, Milner, 1991). These events discouraged British
investors from investing in Canada (Canadian Buildingl June 1976; Canadian Business, October 1976).
The pullout of British-owned companies from Canada in the mid-1970s resulted in Canadian capital
buying out foreign-owned real estate companies. In 1974, Canadian money purchased control of
Bramalea from the British-based Eagle Star lnsurance Company (Canadian BuiMing, June 1976). Two
years later. English Property, sotd control of Trizec to Canadian investors (Goldenberg, 1981). MEPC,
the veteran of the British-based companies in Canada, sold its real estate portfolio to a group of

Canadian pension funds in 1977. In the kte 19Ws, the last big British-owned real estate Company,
Hammenon Canada, sold its offkehetail portfolio to a Canadian pension fund.
Two reasons may explain why foreign real estate companies were not involved in development
and ownenhip of office buildings at a large sale during the development boom of the 1980s. First, the
Canadian market became crowded and highly cornpetitive as additional companies joined the
development arena. The well-established, wellorganized, and closely-knit set of Canadian companies
overshadowed foreign companies (Kostin et al., 1989). This included the strong link between major
Canadian banks, life insurance companies and the largest real estate companies. Second, foreign
investment was also constrained because of the scarcity of suitable office properties for sale (Milner,
1991 ; Edgington, 1998). It has been argued that Japanese investrnent in North America showed veiy
little interest in Canadian cities, including Toronto and Vancouver (Edgington, 1996a. 1996b).
Japanese investon considered Canadian cities as second or third lier 'world class' cities, falling behind
cities like New York and Los Angeles (Edgington, 1998). In addition, domestic and other international
real estate markets were booming, so Canadian pmperty was only one of many investrnent
possibilities. 00th Asian and European investon were interested in Toronto's Financial District.
However, bamen to entry into this district, limited their involvement to buying smaller and older office
buildings; they were not able to purchase almost any large office building in the Financial District and
focused their efforts on the subuhs.
In general, there was little office development by foreign real estate companies after early
British expertise, entrepreneurship, and capital left Canada; the major f o n of foreign participation in
the 1980s and the 1990s was pnrnarily trade in office buildings.
3.4 ldentifying Primary Office Developers and Owners in the
Toronto Area The final purpose of this chapter is to identify the developers who are responsible for creating and
owning Toronto's stock of office buildings. So far this chapter has examined the real estate sector in
Canada at the national level. However, as argued in Chapter One, specific conditions are important in
shaping real estate development in any given location, and each crty has its local developen in
addition to developers that operate on a wider regional or national basis. By examining the Toronto
case, the role of national and local developers is demonstrated. For this purpose, identifying major
office developers in the Toronto is needed.

92
Several problems arise when attempting to identify the developen of office buildings in
Toronto. First, a considerable number of developen were entrepreneurs whose single office building
constitutes their sole office development. Since it was a one-of-kind development. other Yootprints' are
missing, and the ability to identw developen based on one building is extremely difficult. Second. most
of the developen were privatelyswned companies, which did not have to release information about
their ventures. Therefore, information was voluntariiy released, and is found mainly through extensive
scrutiny of media coverage (newspapen, professional magazines, and advertisements). Third, tracking
d o m the original developer of tradable commodities (real estate assets) is difficult, since office
buildings usually change hands. Finally, while one Company envisions an office development, it is
occasionally implemented by another. Adding to this problem of associating projects with respective
developers is the fact that ownership and partial ownership of real estate properties are common
practices. In these cases it is unclear whom to attribute the venture to: the initiator or the implementing
agent?
Compiling an inventory of Toronto's office buildings built between 1950 and 1999 preceded the
identification process. Using Royal LePage surveys of a l office buildings in the Toronto CMA, an office
inventory for Toronto was constructed. Office buildings, according to Royal LePage, include al1 office
space in buildings containing more than 20,000 square feet of net rentable area, most of which are
used for office facilities. The following sources were used to match office buildings to their respective
developers:
Annual reports of public real estate companies;
Advertisements in publications of real estate brokerage companies (e.g., Royal Lefage, Colliers);
Real estate professional newspapen and magazines (Real Estate News, Canadian
Builder/Building, Building Development, Building Management);
Real estate information supplien (Toronto Office Guide, lnsite Real Estate Information Systems);
News pape n (Globe & Mail, Financial Post, Financial Times);
Local newspapen and magazines including both articles and advertisements (Toronto Star,
Mississauga Business m e s , Mississauga Business Report Magazine);
City planning reports and office inventory surveys (Toronto, North York, and Mississauga);
Annual reports of the Canadian lnstitute of Public Real Estate Companies;
Popular literature on the real estate industry (for example, the history of the largest Canadian real
estate companies by Goldenberg, 1981, and the extensive documentation of the Olympia & York
story: 'Master Builders', 'Towers of Debt', and 'Too Big to Fail')

4 Printed matters and brochures of real estate companies;
4 Web sites of real estate companies; and
a Personal communication (intenriews).
1 was able to match approximately 400 buildings out of a total of 1200 buildings to respective
developerdowners. The resuit of the identification proces is presented in Table 3.6. It was impossible
to determine whether the owner was the developer of the specific building in some cases; hence, this
table shows both developen and owners of office buildings. In addition to the presence of nationally
diversified and well-established developers, such as Cadillac Fairview and Olympia 8 York, several
locally based developers like Inducon, Menkes, and Orhndo make up the second tier of developen.
Until the eariy 1970s. office space was being rapidiy added to the office stock by only a handful
of developen who owned considerable office portfolios. Most companies actually developed the office
buildings that they owned. Four companies stand out as the hrgest developen of office space in
Toronto before 1971. Wiih the major o f f i i cornplex, the Toronto-Dominion Centre, the largest was
Fairview. The most experienced developer of office space in Toronto (active since in the 1920~ )~ Y&R
Properties, had a major stake in office development. The operational space of both Fairview and Y&R
was in Toronto's 'old office district', the area south of Queen Street (in 1976 designated as the
Financial District). Olympia & York, which was in the midst of office development of its Flemingdon
Park property in North York and the eariy phases of development in Toronto's downtown, was ranked
third. The fourth of the largest companies was Manufactures L ie (later known as Manuiiie Financial), a
life insurance Company with an active role in office development. Other developers were significantly
srnaller in ternis of number and size of buildings they developed.
Between 1971 and 1981, Toronto's office space doubled, and o f f i i development was diffused
among a larger nurnber of developers. In 1981, Cadillac Fairview and Olympia 8 York remained by far
the largest developen in Toronto. However, several additional companies became significant players in
this sector. In the late 1970s Oxford Development Corporation acquired Y8R Properties to become the
third largest owner of office buildings in Toronto, while Trizec and Marathon Realty entered the Toronto
market. Several residential developers, such as Bramalea Limited, Menkes Developments, and the
Shipp Corporation ventured into office development during the l98Os, while other suburban developers
diversified their operations from industrial to office development (Inducon and Orlando).
During the 1980s. Toronto experienced its most signifiant growth of office space in absolute
terrns. The cornpletion of approximately 70 million square feet of office floor-space between 1981 and
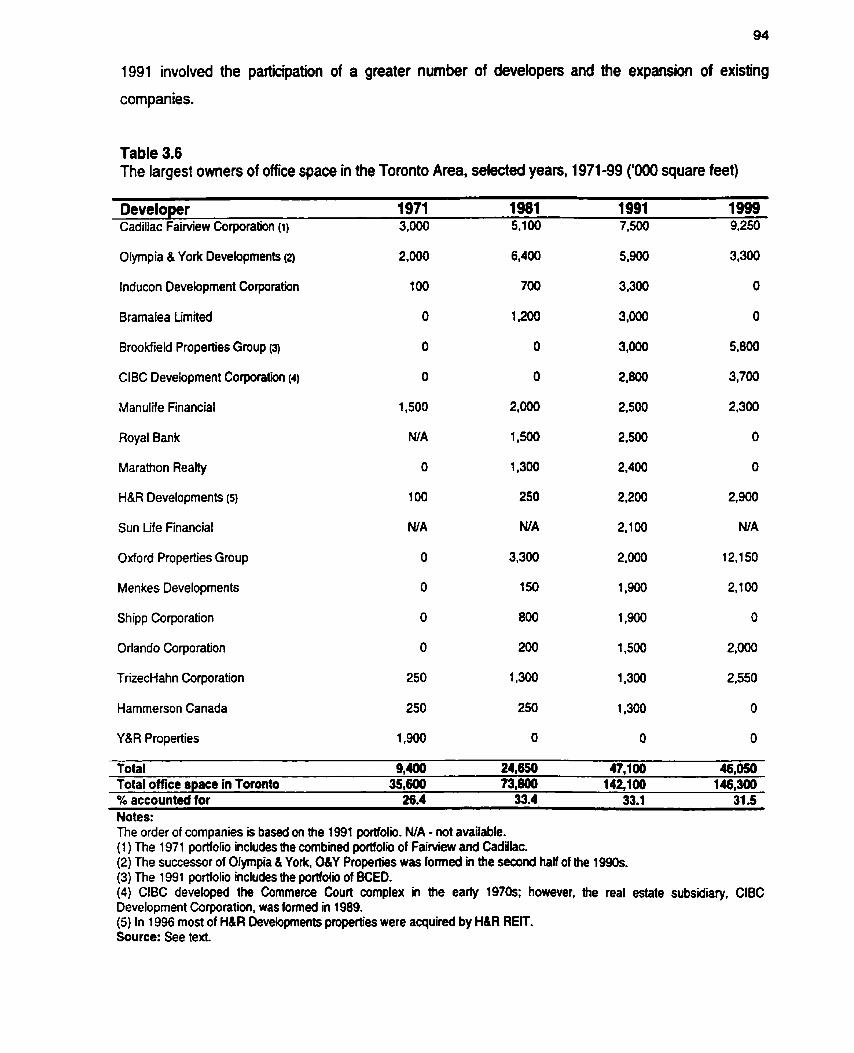
1991 involved the participation of a greater number of developers and the expansion of existing
companies.
Table 3.6 The largest ownen of office space in the Toronto Area, selected years. 1971-99 ('000 square feet)
Developer 1 971 1981 1991 1999 CadiHac F a i ~ k w Corporation (1) 3,000 5,100 7,500 9,250
Olympia & York Developments (2)
lnducon Oevebpment Corporation
Bramalea Lirnited
Brookfield Properties Group (3)
ClBC Deveiopment Corporation (4)
Manulife Financial
Royal Bank
Marattion Reaity
H&R Developments (5)
Sun Life Financial
Oxford Properties Group
Menkes Developments
Shipp Corporation
Orlando Corporation
TrizecHahn Corporation
Harnrnerson Canada
Y&R Properties
Total 9,100 24,650 47,100 16,050 Total office space in Toronto 35,600 73,800 142,100 146,300 % accounted for 26.4 33.4 33.1 31.5 Notes: The order of companies is based on the 1991 portfolio. N/A - not available. (1 ) The 1971 portfolio includes the combineci portfolio of F a i ~ e w and Cadillac. (2) The successor of Olympia 8 York, O&Y Properties was formed in the second haif of the 1990s. (3) The 1991 portfolio includes the portfolio of BCED. (4) ClBC developed the Commerce Court compfex in the early 1970s; however, the real estate subsidiary, ClBC Development Corporation, was formed in 1989. (5) In 1996 most of H&R Developments properties were acquired by H&R REIT. Source: See text.

In 1991, the top position was still occupied by Cadillac Faiwiew and Olympia & Yoik, but they were
followed by a senes of signifiant medium-sued developen. Bramalea and Marathon, for example, as
well as sorne suburban-based cornpanies (Inducon, W R Developments, Menkes, Shipp, and
Orlando), ernerged as important developen in the 1980s.
Over the course of the 1990s, however, there was a shift back to the concentration of office
property ownenhip into a small number of hands owing to either bankniptcy or the selling of portfolios.
Firms such as Olympia & York, Inducon, and Bramalea disappeared after the early 1990s, and the
portfolios of Marathon, the Royal Bank, and Shipp were sold to other companies. Cunently, the largest
owner of office space in Toronto is pnrnarily a buyer of office properties. Oxford Properties Group
developed only 5 percent of the office space it owned in 1999 in the Toronto metropolitan area: the
major part of Oxford's office portfolio was acquired in massive waves of purchases executed mainly in
the 1996-99 penod. Brookfield Properties acquired control of BCED after the collapse of the real estate
market in the early 1990s, and as a resuit inherited its portfolio, which includes one of the largest office
complexes in Toronto, BCE Place. In addition, it acquired control of selected properties owned by
Olympia 8 York. Among the top-tier companies, Cadillac FaiMew remained thé only owner of office
space who had actually developed the rnajority of its holdings. Among the financial institutions,
Manulife Financial has been the major developer of office space in Toronto. Privately owned
developers, such as Menkes and Orlando were able to survive the 1990s collapse and continued to
hold and develop office properties through the late 1990s.
3.5 Unpacking Real Estate Developers Some general insights regarding real estate developers can be drawn based on the descriptive
staternents made above. The conclusions of this chapter are interpreted at two levels: defining
developers, and frarning their changing characteristics Unpacking the term 'real estate deveioper' is
the first task. Real estate development and investment is a complex business venture consisting of a
multitude of arrangements and practices. lnstead of understanding real estate developen as
perfoming only one function, their role shouM be broken down into major componentç, which can be
situated along an 'investment continuum'. The major factor underiying the construction of this
continuum is the degree of nsk exposure. This role is divided into four core functions ranging from the
Ieast exposed to the most risk-exposed ventures. The four functions are as follows.
a At one end of the continuum, at its least risky side, stands the develomr for a fee ('Manager'). This
type of developer has the least risk involved in a real estate development, since the

investor/owner/user a m g e s the financing for the projec?, and the developer has no equity in the
property. Generally, the developer has almost no capital at stake because the investor will pay the
development fee no matter whether the project is successful cr not (fully or partially leased). This is
the case when the developer for a fee is short of cash, and does not have sufficient capital to
invest in the project, or when shehe is chosen to act as manager in the development process
which was already conceived by another organbation.
Real estate companies tend to perform a number of functions simultaneously. For example, Y&R
was the developer for fee for the Royal Bank Plaza in Toronto's Financial District, and Cadillac
Fairview was the developer of the CBC complex in downtown Toronto and the head office of
Hewlett-Packard in Mississauga.
O Investors in real estate companies ('lnvestorsl) are more exposed to nsk than developers for a fee,
because they have equity invested in these companies. The prime incentive to invest in real estate
companies is to receive dividends that are based on the company's performance, usually
influenced by cash flow and the market performance of the company (its stock value). The capital
gains of this group depend on the performance of the entire real estate portfolio of a specific real
estate company. Since publicly listed real estate companies have divenified po~olios, the risk is
usually spread across a multitude of properties and locations. In a depressed real estate market,
when the value of the company's shares is less than its total real estate porffolio, it is often more
profiiable to buy company shares instead of real estate properties (individual or packaged). The
price of a building is based on its appraised value, whereas buying shares is based on the market
capitalization. which in the case of a depressed real estate market might not reflect the full value of
the companyls assets. Cornpanies that fit this category of investors include primarily pension funds
and life insurance companies.
O Buven of existina ~rooerties ('Buyers') incur more risk because their equity is tied to a particuhr
property or several properties. Buyen of real estate properties expect to gain through the cash flow
generated by the respective propetlies: the income Stream which is based on the property's rental
rates. Since real estate assets are divisible in terms of ownership, the ownenhip of buildings can
be divided between a few investors. The larger the ownership interest, the higher the risk, but in
tum, the potential retum is also higher. Buyers that acquire fully leased properties with creditworthy
tenants are subject to less risk than buyers of partially leased buildings.
Most of the real estate companies are both buyers and developen of real estate properties at the
same tirne. At certain times they prefer to buy and in other penods they develop. In the 1990s.
when almost no development was undenvay, companies engaged in buying and selling office

buildinçs. The most prominent and aggressive buyer of office buildings in Toronto in the 1990s was
Oxford Properties Group, which increased ih office floor-space in Toronto seven-fold between
1995 and 1999. In mid-2000, the brgest Quebec pension fund acquired from Trizeciiahn the
largest office complex in Montreal (Place Ville Marie).
a The most risk-exposed group of investors is the ownerdevelo~ers ('Developers'). This type of
Company, similar to 'investoa' and 'buyen', retains equity in properties, but in addition, it has to
incur the nsk of not leasing in full the property that is under construction. The major incentive for
developen to engage in development is to obtain the development profit, which is the difference
between the initial outlays for a project and its value upon cornpletion. A property that is under
construction experiences the highest degree of risk Wii in this category, speculative developen,
developers that launch a project with no tenants committed for at least portions of the property, are
exposed to the highest degree of risk. This risk can be reduced through some pre-leasing, that is,
leasing parts of the property before construction starts (a common requirement of the lending
institutions). Uncertainty enhances risk, but at the same time increases potential gains if the
property is fully leased. By taking partnen, co-developen have partial ownership of properties,
therefore, risk is proportional to their ownership interest. Soiedevelopers have the ownership
majonty in a property, thus they are subject to the rnajority of risk related to the property or
properties under construction.
During the 1970s and the 1980s, when Toronto experienced a constant process of office
development, most of the real estate companies were acting as developers. To name a few, they
included Olympia & York, Cadillac Fairview, Marathon, lnducon and Menkes.
The last type of developer epitomkes the traditional developer. The real estate developer gathers
together the necessary resources for and orchestrates a particular type of development in order to
satisfy an existing or anticipated demand for a specific type of property. Hekhe acquires sites for
developrnents, organizes building plans, obtains finance, acquires planning permission, arranges
construction, and the leasing or sale of the property (O'Malley, 1989). An organization can perfom one
or more of these functions at the same time, or switch between these roles. The type of risk can Vary
between different projects; in one development the organization can act as the project manager.
whereas in another venture the organization assumes the role of ownerdeveloper.
Another level of generalization concerne the intemal development of real estate companies.
The intemal development of real estate cornpanies is strongly related to their prior experience. Most
office developers can trace their beginnings to the construction of nlatively small, less complex
projects. Through the experience in the production of residential or industriallwarehouse projects, an
organization diversifies, expands, and begins to tackle more complex land uses which consume
considerable financial resources and invoives higher levels of expertise. The emergence of most real
estate development companies specializing in office development is aîtributed to reaching a level of
'fully developed' companies. O K i development of a considerable sale is an advanced type of real
estate production, and only highly experienced and well-financed organizations can be in this business
on a regular basis.
The office devekpment sector is intertwined and embedded in the more broadly defined
operations of real estate devekpment companies, which include development and
acquisitionldisposition, and other products, such as industrial, retail and residential assets. Specifically,
the development and ownenhip of office space becarne a major segment of assets of the publicly held
companies. Office development has also contributed a growing share to the portfolios of privately held
companies as they divenified into office development. In Canada, Canadian-based real estate
cornpanies have been the major developen and ownen of office space, whereas the role of foreign
companies has been relatively marginal. A general tendency of the office development sector over the
last forty yean has been a gradua1 transformation from entrepreneurial-based companies to large real
estate corporations and finally to a sector thît is now increasingly dominated by large institutional
investors.
Over this time period, and especially between the early 1970s to the late 1980s, Canadian-
based companies have emerged as sizeable organizations operating across Canada, as well as at the
international arena, mainly in the United States. Large real estate companies expanded their spatial
extent from being relatively local companies operating in selected markets, to companies that cover
major urban centres across Canada, and selected centres in the United States. Nonetheless, their
spatial operations were channeled ta selected urban centres.
Within the local scale, the large Canadian-wide office developen are also the largest
developen in the Toronto area. However, in Toronto, a substantial amount of office space has been
developed or owned by local real estate companies. These companies have different operational
spaces within the Toronto arena than the large developers (as suggested in the Introduction; see
Figure 1 and 2). Financing office development is examined in Chapter Four, and a scnitiny of the
spatial practices of real estate companies is analyzed in detail in chapters Five and Seven.
CHAPTER FOUR
FlNANClNG OFFICE DEVELOPMENT AND THE
ROLE OF FINANCIAL INSTITUTiONS
"Developers will develop as much as lenders will lend"
(A reai estate industry observer)
"Financial institutions are more important in this business [real estate] than in any other business"
(A real estate industry observer)
Financiat capital, through the specific financial institutions, such as banks and life insurance
companies, plays a crucial role in real estate development in general and office development in
particular. The literature discussed previously (section 1.2.2) has drawn attention to crucial connections
between real estate development and the financial sector. It is quite clear that developers rely on
extemal financing, and it is also clear that finance capital is showing different faces since it can act as
lender, engage directly in real estate development, or engage in the purchase and sale of developed
office properties.
The broad connections between real estate development and the financial sector visible in a
variety of countries can also be observed in Canada. Based on the literature and specific research on
Canada, a general pattern of relationships between financial institutions and real estate developers can
be constructed (Figure 4.1). Developers' equity or debt is raised from various sources (financial
institutions, other extemal sources andlor capital markets).
On the other hand, financial institutions can either be indirect participants by providing debt
capital through different instruments, or be developers andlor owners of properties. Financial
institutions can becorne property ownen by buying properties (or acquiring them through the default of
bonowers), by joining developers on a joint venture basis, or by becoming developers themselves.
This chapter will focus on the specific articulation of these connections in Canada. Part of the
set of relationships is spatially differentiated, especially visible at the national level, but also at the local
level. Less clear are the spatial patterns of financial flows at the international scale. Further, the
principal relationships and their spatial manifestations tend to change over time.
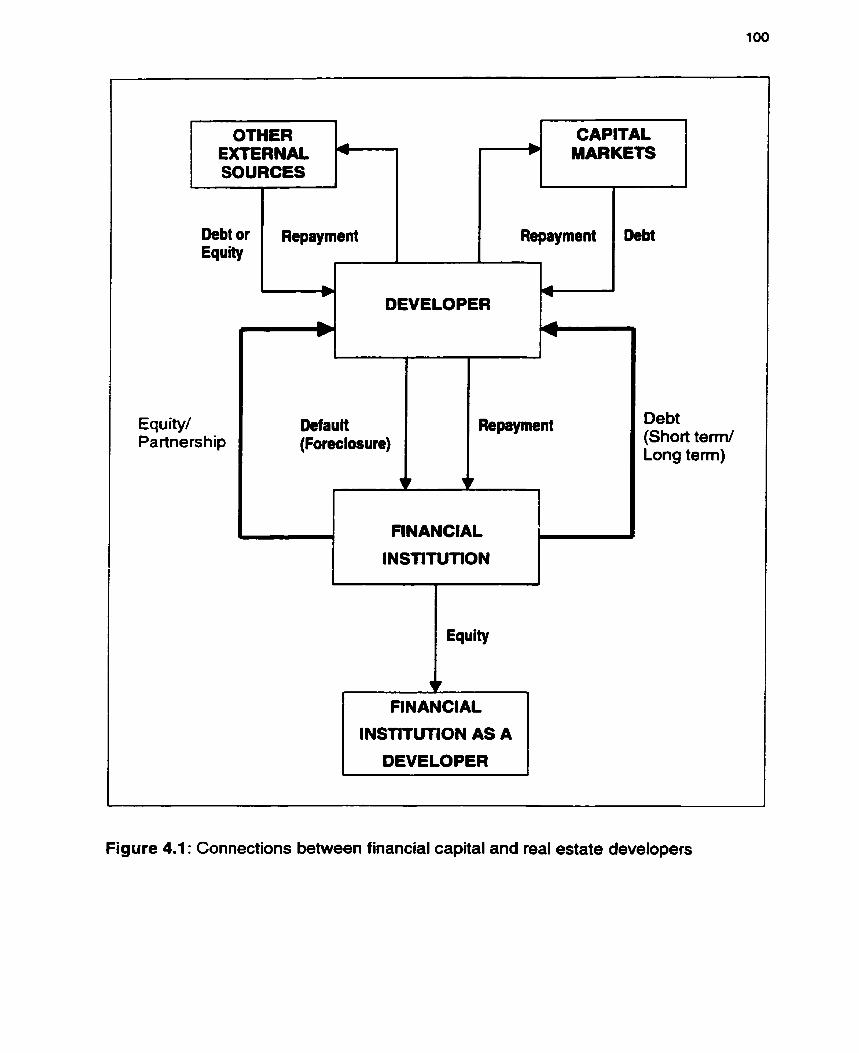
OTHER 1 EXïERNAL MARKETS
Equity/ Partnership
Repayment Debt
DEVELOPER
Defauit (Foreclosure)
Repayment
FINANCIAL
INSTlTUlION
Equity
FINANCIAL
INSTITUTION AS A 1 1 DEVELOPER 1
Debt (Short terni/ Long term)
Figure 4.1 : Connections between financial capital and real estate developers

There are f i e parts to this chapter. First, an overview of the relationships between the Canadian
financial system and the real estate sector are sketched. The particular financial structure in Canada
shapes the type and sape of involvernent of financial institutions in real estate. Second, an outline of
financing office development from the perspective of the office developer is provided; that is, an
attempt will be made to show what sources of financing developen draw on. The third section provides
an analysis of the financial institutions, primarily banks and life insurance companies, explaining their
various types of participation in office development. The spatial practices of financial institutions are
discussed in section four. Finally, a preliminary sketch of the role of international capital in real estate
developrnent is presented.
4.1 The Configuration of the Canadian Financial System and the
Financial Arrangements in the Real Estate Sector As real estate developments increased in site, complexity and cost, and as new financial instruments
emerged, financial arrangements have become a more critical element in real estate development (and
in the trading of real estate assets). The finite amount of equity owned by real estate companies, the
desire to share the nsk embodied in development, and the eagemess to invest in multiple projects, has
contributed to the growing dependence on financial sources from outside the real estate Company. For
this reason, it is important to understand the structure of the financial system which real estate
development draw on.
Until recently, the Canadian financial systern had operated under a regulatory regime defined
by the 'four pillars'. Each core function of the financial system, with its own financial institutions and
regulatory authority, constituted a 'pillar'. Chartered banks, trust companies, insurance companies, and
investment dealers operated under rules that defined their activaies nanowly and allowed no overlap.
Chartered banks, for exampte, could accept short-term deposits and provide business loans. The
securities industry participated in transactions of secondary equities and underwrote new stock issues.
Trust companies managed estates and trust funds and provided mortgage financing. Insurance
companies sold insurance policies. With every review of the Bank Act (between 1954 and 19971,
cornpetition was encouraged and demarcation lines between 'pillars' have became increasingly bluned
as individual financial institutions extended the range of seivices they were allowed to provide (Dobilas,
1996; Majury, 1999).
Within this framework, each of the components of the financial system has a unique role with
respect to real estate development Trusts companies have been primarily engaged in the provision of

residential mortgages, although, occasionally, they have been invoived in commercial development (for
example, Canada Trust provided a rnortgage for First Canadian Place). lnvestment dealers, including
financial analysts, have a different role. F int they act as stock traders and underwnten, and enable
raising capital for real estate companies and real estate projects. In addition, financial analysts that are
part of the investment firms provide recommendations and analyses of the performance of publicly
traded companies. Fimis like Memll Lynch, ClBC Wood Gundy, RBC Dominion Securities, and Nesbitt
Burns monitor, on a regutar basis, the performance of publicly traded real estate companies and make
recommendations regarding the performance and outlook of these companies. The most important
institutions of the Canadian financial system for the commercial real estate sector, however, are banks
and iife insurance cornpanies.
Financina new deveio~ment
Very little has been written in Canada about the principal methods of real estate development financing
by banks and insurance companies. However, there are some useful discussions on practices in the
United States (Knigrnan and Furiong, 1993; Downs, 1998; Urban Land Institute, 1998) and the United
Kingdom (Pryke, 1994a); these are used as starting points. M e n considering the financial sources of
real estate investment, the distinction between debt and equity is important. Generally, debt financing is
either through short-terni loans (construction loans) or through long-temi loans (in the real estate
industry the term is 'permanent loan'). In the case of debt financing, the lender has no interest in the
property. Equity investment on the other hand, represents a stake in a specific project or in a real
estate Company. Debt and equity investors differ in the amount of risk they accept. Consequently, they
require different levels of retum. Debt investors generally are more risk averse; they are less willing to
invest in risky projects. Lenden usually provide the majonty of financing for completed developments
that have creditworthy tenants secured by long-term leases. W i rental income streams in place,
backed by financially sound tenants, such properties have a iow-risk profile. Equity investors invest in
riskier projects, or in risky portions of projects, but they require a higher rate of retum on these
investments. The interests of the equity investors are subordinate to the clairns that lenders have on
the venture's assets; therefore, the outstanding debt on the project will be always paid in full before
equity investon receive any retum on their investment. mus, equity investment in a real estate project
is much riskier than debt investment. When the property performs poorly, equity investors are in the
riskiest position. But when it performs well, they receive benefiis in the form of cash flow generated by
the project, property value appreciation, and tax advantages.
Historicalty, the primary sources of long-terni debt financing (permanent loans) for office
development have been life insurance companies and pension funds, with commercial banks playing a
limited role. Life insurance companies tend to provide long-ten mortgages (15-30 years) on leased
buildings in order to match their long-terni liabilities. Much of the principal balance is amortized during
the life of the mortgage. Life insurance companies are able to invest large sums of capital in long-tem
mortgages, because their cash flow is contïnuous and predictable. They receive a constant flow of
funds from premium payments, and can accurately predict their future outlays from actuarial tables
(Krugman and Furiong, 1993; Urban Land Institute, 1998).
Commercial banks traditionally have been the primary source of construction financing. Banks
have avoided long-term real estate mortgages, because the matunty of such loans has not matched
the short-term duration of their primary liabilities. Large portions of banks' deposits take the form of
demand deposits payable on the demand of the depositor. Hence, bank funds must be more liquid than
those of other financial intermediaries, and they have concentrated their investment in construction
funding, which also has a relatively short-terni matunty (Krugman and Furiong, 1993; Urban Land
Institute, 1998). Traditionally, banks have refused to make a construction loan on a new project unless
the borrower proved it had a long-terni mortgage cornmitment that would take the bank out of the deal
when construction was completed. In their eagemess to get business, especially in the 1980s,
however, banks began making construction loans without takeouts (long-term financing) in place,
extending the duration of construction loans into periods nomally associated with long-term mortgages
(Downs, 1998).
Developers usually arrange the permanent financing before they seek a construction loan.
When a permanent financing commitrnent is in place it is much easier to obtain a construction loan.
Thus, a takeout cornmitment impraves the construction lendets risk position. The interest rates on
construction loans are typically higher than on permanent loans, giving the developer an incentive to
replace the construction loan as soon as possible. In addition, in the case of bank short-term loans, the
bank might ask for the repayment of its loans at any given time, or the disposal of the propeity, while
long-terni financing is protected for the developer, as long as principal and interest are paid. This
division of labour between financial institutions resub in different financial arrangements conceming
development and investment in office buildings.
The financina of acquisitions
Apart h m banks and life insurance companies, pension funds have assumed an increasing role in real
estate financing. As noted in Des Rosiers' study (1984) on the participation of Canadian life insurance
companies and pension funds in the real estate sector, real estate investrnent represented a small
fraction of only about one percent of their assets until the late 1970s. However, Des Rosiers also
obseived the phenomenal growth in real estate investment by pension funds in the late 1970s and
early 1980s. Basicaily, there are two ways pension funds can invest in real estate: for their own
account or through pooled funds (most of the pooled real estate vehicles in Canada started in the eady
1 980s). Pooled funds (segregated funds) are investrnent vehicles organized by life insurance
companies or financial managers. Pension funds buy shares or blocks and the prmeds are invested
in real astate (Canadian Buiiding, October 1985). Generally medium and small pension funds either do
not have the expertise needed for engagement in real estate ownenhip or they are simply too small to
acquire properties and prefer to share ownership of properties. These pension funds use segregated
funds that acquire assets for the account of a pool of investors in order to invest in real estate.
Beginning in the eady 1990s. the large pension funds have been the most active financial
institutions in the real estate sector. In 1989, OMERS (Ontario Municipal Employees Retirement
System) formed a real estate subsidiary, OMERS Reaity, and began to acquire pmperties across
Canada (Canadian Business, November 1996). After the early 1990s real estate recession, many
pension funds took advantage of depressed prices of the shares of public real estate companies,
expecting thern to increase in value. In Ontario, legislation allowed pension funds to invest in riskier
assets such as stocks, bonds and real estate (Globe & Mail, October 1, 1991). This made it possible for
one of Canada's largest pension funds, the Ontario Teachen Pension Plan Board, to acquire a 22
percent interest in the Cadillac Faiwiew Corporation, the third largest public real estate company in
Canada. Other pension funds also acquired equity stakes in major real estate companies. The largest
Canadian pension fund, Caisse de depot et placement du Quebec, acquired a 73 percent equity stake
in of one of the largest shopping centre owners, Cambridge Shopping Centres, and 48 percent of a
Vancouver-based commercial development company, the Bentall Corporation. OMERS has become
the largest single shareholder of Oxford Properties Group (Globe & Mail, December 3, 1999).
Life insurance companies and banks, apart from acting as financial intermediaries (i.e. lenders)
also act as investors in and developers of office buildings. The most active financial institutions in this
respect are life insurance companies. Until the 1970s, life insurance companies in the U.K. largely
pursued the traditional form of investment in real estate, fixed interest mortgages. These were and still
are considered to give a guaranteed retum while not invohring the institution directly in real estate
development. However, realizing potential gains of real estate investrnent, life insurance companies
have shifted more of their assets to direct investment and devekpment (Barras, 1979b). In Canada,
until the 1970s, life insurance companies were mainly debt providen. Beginning in the late 1970s and

gaining momentum in the 1 9 8 0 ~ ~ life insurance cornpanies realized that real estate development
companies were making large profis; as a result they engaged in direct investment through equity
investment in office buildings and in acting as devekpers (Financiai mes, October 31, 1983).
The participation in equity investment can be d ided into ownenhip of assets, joint venture
development, and development solely by Cnancial institutions. In the first phase of their involvement in
the real estate sector, institutions, primarily life insurance companies, tended to acquire partial or full
interest in existing office properties. This is the least risky business, because the building is cornpleted
and the level of occupancy is known. In this case, financial institutions profit from the rental income of
these properties and their appreciation. The next step is teaming up with an experienced real estate
developer. Joining developen in this case is a prudent move, since real estate development involves
expertise that most financial institutions lacked. Under this arrangement financial institutions and
developers shared the risk of development, and in addition to sharing the rental stream and capital
appreciation, they profited from the development gain (the diffennce between the cost to build the
project and its value after completion). The most extreme move as far as financial institutions are
concemed, is to becorne sole developer. This practice is limited to a small number of large financial
institutions; this is the riskiest business, but also potentially the most rewarding. In this case, financial
institutions can collect the whole development gain, and be in full control of the development.
The last route of acquiring office properties to be discussed is the route of foreclosure. When
bonowers fail to service their debt and default on their mortgages, lenden are entitled to foreclose the
propeity that was used as collateral. This is typically the case when rents are low and vacancy rates
are high, and it is typically the lender's last resort of claiming hisher loan. Lenden are reluctant to start
foreclosure proceedings that can take a long time and eventually become a liability on their balance
sheet. By foreclosing properties, financial institutions become unwillingly property owners. Generally,
institutions hold foreclosed properties for the short-terni, disposing them as soon as possible. This was
the situation during the real estate recession of the early-to-mid 1990s. The value of foreclosed
properties held by Sun L ie Assurance Company (one of Canada's largest life insurance cornpanies)
doubled between 1993 and 1995 from $42 to $83 million. However, in 1997 it declined to $46 million
and by 1999 to $24 million, as a large part of these properties was sold (Sun Life Assurance Company,
various Annual Reports).
In observed practice, most of the equity invested in real estate by life insurance companies is
through the acquisition of full or partial ownenhip of completed projects. Life insurance companies take
ownership position in existing properties and not in properties under construction. The risk invotved in
such a property, especially speculative development, and the need to potentially incur short-term or
long-term losses, is too risky for these companies. Only a few of the brgest companies have become
active playen in the area of direct development, either through joint ventures of by being sole
developers.
4.2 Sources of Financing Office Development: The Developer's
Perspective Information on the financial sources used for office development by real estate investon that are also
financial institutions is difficult to come by. The cornpetitive nature of real estate development and the
fact that the paiticipants do no! have to report on their ventures makes the sources of finance highly
confidential. As indicated in the previous financing is divided into two types: agurty and debt.
The focus of the real estate literature is on debt financing, and the general nile is that banks provide
short-ten financing and life insurance cornpanies provide long-tem mortgages. In tens of debt, very
little is known about the specifii of loans to real estate companies as a whole. Equity financing, in
which investors acquire interest in office buildings, is also hrgely undocumented. To explore the issue
of financing, information on a number of companies is used here. These examples include evidence
from a variety of newspaper aiticles, annual reports, and interviews conducted in the course of my
research. These observations do not provide a comprehensive account. Nevertheless, together with
insights gained from international literature on office development financing, they provide important
insights into this highly secretive part of real estate developrnent.
The high dependence of the real estate sector on boirowed capital is reflected in a cornpanson
of real estate companies al1 other companies. In Canada, real estate companies (as defined by
Statistics Canada, see section 3.1) employ higher ratios of leverage than al1 industries as a gmup. The
debt-to-equity ratio is used to illustrate this dependency. The debt-to-equity ratio is the ratio of total
liabilities to total equity. The higher the ratio the higher dependency on debt. While al1 industries had an
average ratio of three, real estate companies had a ratio that ranged between four and almost six
(Table 4.1).
The case of Olympia & York is often used to illustrate the divene and multinational resources
available for real estate cornpanies; however, large sale and spatially diverse developers and smaller
and local developen use different sources of financing. As argued by Bryson (1997), the financial
requirements which large and smaller developen have to accommodate are different; h i l e large-scale
developers need to obey the requirements set by capital markets, local developen need to satisfy only
the cost of conventional bank loans.

Table 4.1 Debt-to-equity ratio, al1 industries and real estate, setected years. 1971-96
Year All industries Real Estate
Sources: Statistics Canada, Corporation Financial Statistics, Catalogue No. 61 -207; Financial Statistics for Enterprises, Catalogue No. 61 -21 9.
Smaller developen engage in less capital-intensive ventures, thus using less complicated and more
tradlional sources of financing; large-scale developers, on the other hand, have to combine several
sources and satisfy the conditions attached to these types of funding. In the same vain, Des Rosiers1
study (1984) on Canadian life insurance companies and pension funds suggests high dependency of
developen on these institutional investon. In this case, the granting of funds was heavily dependent
upon meeting rental requirements and profitability thresholds set by life insurance companies and
pension funds (Des Rosiers, 1984, p. 667).
Des Rosiers (1 984) undertook the most comprehensive study on financial institutions and their
real estate investment in Canada. He showed that the majority of the corporate funds of real estate
companies in the period of 1968 to 1981 came from external sources (this pattern continues to
dominate in later periods too). Using a sample of 31 real estate companies of different sires, he
concluded that external funds constituted between 75 and 88 percent of the corporate funds. About haIf
of the total funds were deriied from long-term debt and approximately 20 percent from short-terni debt.
The prominent external sources of long-tenn finance were mortgage loans from life insurance
companies and pension funds. This research is the first of its kind providing empirical evidence
regarding financing of real estate in Canada. However, Des Rosiers grouped together different types of
real estate companies, hence it is not possible to separate residential developers from commercial
developers. Although making a distinction between different types of developen according to the risk
associated with investrnent, he does not use this distinction to demonstrate how it affects the reliance
on different financial sources. In addition, he suggests that preferential links' between developen and
lenders detemine financial parlnenhips (p. 662). but he does not develop this argument. In order to
discover these preferential links, selected practices are studied in this research.
4.2.1 Olympia & York: Social networks, ingenuity and the provision of
financing
Olympia & York (O&Y) grew from a small company into a real estate giant; parallel to this development,
its sources of financing changed. After the company's colbpse in 1992, a window of opportunity for
understanding the practices of real estate financing was open, because information of the financing
arrangements of the world's largest developer were revealed. These sources include court documents
of the bankruptcy proceedings, reports on the unprecedented debt of O&Y that caused massive losses
for almost ail major Canadian banks (and foreign banks as well), and the public fascination of the rise
and fall of this real estate empire.
However, to understand the financial practices of Olympia & York we have to go back to the
cornpany's early days. In its eariy stage in the 1960s. O&Y was a developer of warehouses and
industrial structures in the Toronto suburbs. At that time, the practice of OBY was to develop and then
seIl the buildings to speclic usen. Since most of the buildings were small, no major financial
arrangements were needed. In its first large-scale real estate development, the purchase of 600 acres
(Flemingdon Park in the Borough of North York) in the mid-1960s, O&Y had to bonow the full amount
of capital to finance this project. Half of the amount came from the Bank of Nova Scotia, which was one
of the lenders to the banknipt U.S. developer, who was the previous orner of this site, and the other
half came from the Oelbaums, a Toronto family prominent in the development business (Foster, 1986,
p. 1 9; Stewart, 1993, p. 43).
Like every developer, Olympia & York financed its office buildings with a short-terrn loan
obtained from a bank and then refinanced its office buildings through a long-tem mortgage obtained
from a I le insurance company. In the 1960s, a dramatic change in financing took place as O&Y started
to use a new technique of mortgage bonds. A small Toronto investment dealer, specializing in bond
financing, pioneered a technique that enabled Olympia 8 York's to cut financing costs by accessing the
bond market, which until that period, had been almost the exclusive domain of top-rated govemments
and corporate credits. The innovation of this method was the 'net net lease', which obligated the tenant
not only to pay rent, but also cover al1 operating costs. Under this type of lease, the only financial
exposure was that a tenant would go broke and be unable to live up to its lease obligations. But if the
tenant was a govemment agency or a triple-A corporation, the risk of default was slim. This investment

dealer was able to convince several institutional investors that there was no real difference between
buying bonds floated by an established company or buying first-mortgage bonds issued by a developer
and backed by the a 'net net lease'. This instrument was advantageous from two points. First, it
allowed developen to borrow at a substantially lower interest rate Vian with conventional long terni
financing. Second, it extended their leverage by enabling hem to obtain loans of as much as 100
percent of the appraised value of the building, instead of a maximum of 75 percent to which insurance
companies were limited by law (Bianco, 1997).
Using first mortgage bonds, Olympia & York financed some of its office buildings in Canada.
The case of the Shell Data Centre built by O&Y in Flerningdon Park in the mid-1960s is used to
illustrate this point. O&Y was able to persuade Shell to pay above market reds by granting the
company an option to buy its building at a price that declined to zero over the twenty-fie year duration
of the lease. The value of the Shell Canada lease was $3.3 million, while the cost of the building was
$2.5 million. By issuing $3.3 million in first-mortgage bonds, O&Y was able to pay off highcost
construction loans with cheaper debt and have an excess of $800,000 (Bianco, 1997).
For the purchase of the Star Building, part of the site of the future Fint Canadian Place, 0 8 Y
forrned a joint venture with a financial institution, North American Life. The construction financing of
O&Y's largest office development in Toronto, First Canadian Place, was partly financed through
retained eamings from other projects and from a consortium of Canadian banks led by the Canadian
lmperial Bank of Commerce. The long-ten mortgage for the project was issued by Canada Trust
(Stewart, 1 993; Bianco, 1997).
In later stages, OBY relied primarily on bank loans. public debt and commercial paper, usually
at rates available only to highquality corporate bonowen (Globe & Mail, March 26, 1992). O&Y was
one of a handful of real estate companies that were able to seIl commercial paper by using its
properties as collateral. In 1984, O&Y first issued short-terni debt to finance part of its inventory of
office buildings. O&Y launched a program of 30 to 90-day commercial paper notes to finance some of
its U.S. properties, because it believed that interest rates would decline. When O&Y collapsed, the list
of borrowers included major foreign and Canadian banks. The list of Canadian lenders included the
Canadian lmperial Bank of Commerce (CIBC), Royal Bank, the Bank of Nova Scotia, the Bank of
Montreal, the National Bank, and Canada Trust. Together they held about $2.5 billion (U.S.) in O&Y
debt (Globe 8 Mail, March 26, 1992).
The notion that access to large pools of capital by real estate developers is restricted and
highly confined to selected real estate companies is illustrated by the case of Olympia & York. Access
to capital is facilitated through an extensive social network obtained thmugh a variety of accumulated
encounten. In their first large project, the acquisition of Flemingdon Park, the Reichmann's, the ownen
of OBY, a Toronto-based family, used a connection with another prominent Toronto family. In the case
of the purchase of the Star Building, Paul Reichmann had previous connections to one of the senior
executives of North American Lie. Among Canadian banks, Olympia & York had established long
lasting and very strong ties with the Canadian Imperia1 Bank of Commerce. 08Y began dealing with
ClBC in 1956 and eventually, in 1986, Paul Reichmann was invited to join the ClBC board (Foster,
1993). Even after ClBC endured a giant loss as a result of the collapse of O&Y in 1992, ClBC was
willing to provide b successor, 0 8 Y Properties, with over $ 2 0 million to reclah the ownenhip of the
First Bank Tower in the First Canadian Place office complex (Globe 8 Mail, August 6, 1999).
4.2.2 Corporate size and real estate financing
Information on many of the financial sources used by a wide range of real estate companies was
revealed in the eariy 1990s. At that tirne, many of the real estate companies went through major
financial difficulties, which resulted in court deliberations and the diffusion of information to the media.
However, the financial sources for small and medium-sized companies are less well known. Since
smaller and medium-size companies are usually privately held, knowledge about their financing
practices is largely inferential. Some examples and fragments of knowledge about the sources of
financing can be provided here. The North York-based developer Cammst Development Corporation
lost control of its major office building to Sun Lie in 1994 as a result of missing several mortgage
payments. (The total mortgage obligations amounted to $60 million). Sun Life owned the majonty on
the mortgage of this project. In addition, the Toronto-Dominion Bank had a mortgage on another office
building developed by Camrost (Financial Post, March 8, 1994). A similar case is provided by the
affairs of the York-Trillium Development Group. This North York-based developer used mortgage funds
from Confederation Life and Canada Trust for the acquisition of the land for the York-Mills Centre in
North York (Globe 8 Mail, July 30, 1991). The bankruptcy of one of the largest suburban developers in
Toronto, lnducon Development Corporation. in 1992, also provides soma indication of the sources of
financing used by a mid-sized Company. According to couit documents, lnducon owed money to a
large number of creditors, including many of the largest banks and life insurance companies. The
largest creditor was the Royal Bank; the second largest was Confederation Life (Globe & Mail, March
31, 1992). Although Inducon's financial sources invohred the largest financial institutions, the scale of
its debt is quite different frorn that of the large developers. While Cadillac Fairview's total debt was $7.5
billion and Bramalea's debt was $4.9 billion, Inducon's debt was 'only' $175 million (Globe 8 Mail,
March 31,1992; Decernber 23,1992; December 31, 1994).

Real estate devekpen of different sizes tend b use different financing modes. In the eady
stages of a developer's life cycle entrepreneuriafdevelopers are short of capital; they do not have
substantial retained eamings from previous developments, and hence they engage in the build-and-seIl
practice. According to this practice, the developer builds a building for an investor or the user of the
office building for a fee. In this case the development is done on a ground lease held by the owner or
the investor, and hence it does not require significant capital outlay by the developer. The Oxford
Development Group in its eady stages provides an excellent example. The founder of Oxford. Donald
Love, had conducted business with the local manager at the Royal Bank in Edmonton. The bank
manager inforrned Love that the bank was looking for new premises in Edmonton. Love went to see the
bank executive in charge of premises, and as a result Oxford developed a series of Royal Bank
buildings across Canada. During the mid-to-late 1960s, Oxford also developed office buildings for the
Bank of Montreal and the Canadian Imperia1 Bank of Commerce (Goldenberg, 1981; an interview with
the founder of Oxford). The pattern was vety simple; Oxford would lease the land from the bank, build
the building and lease the prernises back to the bank. Oxford also ananged financing for these
projects, but it was quite simple, since the bank could guarantee the debt.
For a developer that is an a m of a major corporation and is seeking 10 retain the property,
financing is possible through the parent company or through a joint venture partner. Because of the
financial strength of the parent company, Cemp (a vehicle to manage the fortune of the Bronfman
family gained through whiskey distilling), Fairview was able to arrange short-term bank financing for the
development stage of its office buildings. In a later stage, Fairview sold its mortgage bonds, which were
based on the value of the tenants' leases (Building Management, February 1966). The joint venture
between Fairview and the Toronto-Dominion Bank in the Toronto-Dominion Centre was facilitated
through a public offering of long-terni notes guaranteed by the Toronto-Dominion Bank and Fairview. A
major advantage of a bank being involved in office development was that the bank would guarantee the
long-terni debt or provide the deficiency agreement on the debt. When a bank puts a guarantee on
debt, it ranks equally with deposits, which means that the company does not have to file a prospectus,
which takes a long time (intenriew with a former president of Cadillac Fairview).
Large companies also use a variety of sources (see the case of Olympia & York). Court
documents from 1994, when Cadillac Faitview was seeking court protection, revealed that the largest
Canadian life insurance cornpanies were Cadillac Fairview's major mortgage pmviders, these included
Sun Life, Manulife. Canada Lie, Great-West Life, Mutual Lie, and the US.-based Prudential lnsurance
Company (Globe 8 Mail, December 31, 1994). It is of interest here that fiie of the life insurance
companies providing mortgages to Cadillac Fairview were Canadian companies, and it is also

important to mention that only foreign Company included, Prudential Insurance, had a substantial
underwriting business when the mortgages were provided.
The high degree of concentration within the Canadian financial system, in which f i e banks and
about a dozen large life insurance companies control short and long-term financing, and the limited
number of large developen results in close-knit netwoiks between financial institutions and developen.
This notion was suggested in the case of Toronto's Financial District. A report prepared by the New
York-based financial services firm Salomon Brothers in 1989, asserted that %uildings in the financial
core are owned for the most part by a closeiy knit group of well capitalized developen and banks"
(Kostin et al., 1989, p. 16). As indicated in this section and as will be argued in later sections, banks
and developers and 1;fe insurance companies and developen, have established and maintained long-
term relations and partnerships.
With regards to the spatial practices of office development financing, the absence of data on
this theme limits the abiltty to provide conclusive arguments. However, preliminary findings suggest that
the financial sources for office development in Canada are mainiy domestic. In the case of debt
financing, the requirement set by the financial institution to match assets and liabilities by spatial units
(in Canada, by provinces or regions) limits flows between regions and certainly between countries. The
share of direct real estate investrnent in total assets of financial institutions is quite small; consequently,
the need of the financial institutions to import capital from outside a distinct political jurisdiction that
regulates its financial institutions is limited. In addition, currency risks (lending in US. dollars and
receiving cash flow in Canadian dollars), and taxes imposed on capital movements limit the extent of
the free flow of capital across international boundaries (see section 4.5).
4.3 Financial Institutions as lnvestors in Office Buildings and as
Developers Office buildings have been one of the preferred properties for investment and development by financial
institutions. Financial institutions have three major incentives to engage in office development. From
the point of view of being office space users, these institutions are large employers. Thus, acting as
developers of their own premises makes sense from an econornic perspective. Second, since financiaI
institutions occupy a variable share of their head-office and regional office complexes, development
might generate additional revenues through leasing space to tenants. Other authors have put more
ernphasis on the symbolism of large office buildings. Owneahip of their prestigious office buildings
seived also as an image promoter for financial institutions (Domosh, 1988, 1992, 1996).
Financial institutions have historicaliy been developen andlor ownen of office buildings. Banks
and life insurance companies in Canada were invohred as either ownen or to lesser extent as
developen of their head and regional offices. These financial institutions occupied only a portion of the
total office floor-space, and rented out space to tenants (Gad and Holdsworth. 1987b). During the post-
WWll era offices grew tremendously in sire, and financial institutions realized that office development
could be profitable. As a result, starting in the 1960s and culminating in the 1 WOs, financial institutions
became strongly invohred in office development.
By erecting a building that was identified with the corporation, a material embodiment was
created; this physical monument acted as a symbol of corporate presence in a specific location (Relph,
1987; Feagin, 1988; Zukin, 1991). This function was especially irnpoitant for financial institutions which
attempted to paint themsehres as sound and safe corporations. Dornosh (1988, 1992) suggests that
one of the reasons for the construction of skyscrapers in Manhattan in the late nineteenth and eady
twentieth centuries was symbolism. This was especially the case with life insurance companies. These
companies needed to justify their excess proffis and lack of any apparent material product. By
constructing impressive office buildings, they were able to present to the public a civic-minded
corporate identity, and their buildings were the material manifestation of that identtty.
Beyond the symbolic significance of buildings, there is a functional purpose. In Canada, a
country with an integrated financial system, the scope of major banks and life insurance companies is
national; therefore, there is also the need for regional offices in major metropolitan areas. Regional
offices in a oumber of cities require physical presence. and this in tum results in demand for office
buildings.
The involvement of financial institutions in office development included three major ways. The
first method was hiring a real estate company with an expertise to deal with large-scale office
development. In this case the financial institution kept the full ownenhip in the project. The definition of
'developer' in this case is broad. Most financial institutions lacked the expertise needed for the
development process, expertise which has been acquired by developers (such as dealing with land
assembly and planning regulations), hence they preferred to hire experienced developers to act on
their behalf as project managers. However, in this case the institution might be considered the
developer in the sense that it decided on the type of development, the location, and it retained the full
ownership of the project; the professional developer was merely a hired expert with no stake in the
development.
The second method was partnering with a real estate company for development. In this case,
the real estate company developed the project and assumed partial ownenhip. Especially in the 1970s

and 1980s. financial institutions often fonned joint ventures with establkhed real estate developen; if
successful, these partnenhips might have lasted for a long period of tirne. In the case of joint ventures,
developers and institutions shared the ownership of the pmjects developed. The combination of access
to capital via the financial institution and the expertise of an established developer enabled the
development of large-scale projects.
Finally, the financial institution can became a semi-integrated real estate Company. Financial
institutions could act as a semi-integrated real estate developen by having a real estate development
department; these institutions tended to outsource certain professional functions to hired experts
(engineers, architects, planners and leasing broken). This was the exceptional case for financial
institutions participation in the real estate sector. On the participation spectnim in the real estate
development industty, the 'developer' position indicates the highest degree of invohrernent and risk
(see section 3.6). Generally, financial institutions which are more consewative organizations than real
estate cornpanies, abstain from this direct form of invohrement. Real estate development requires
knowledge and expertise that is not central to the business of these institutions.
There are two sections in the discussion on financial institutions, one deals with banks and the
other examines Me insurance companies.
4.3.1 Banks and office development
Historically, banks have been large usen of office space. especially of large-sca!e downtown buildings.
Partly as a resul? of their need for space and partly because the inclination to generate additional profits
(and to guarantee space for future expansion), banks engaged in the development of large buildings,
using a variable portion of the total office space they developed.
Between the 1960s and the 1980s, al1 the big-fie Canadian banks were invohred either as sole
developers, joint venture partnen, or as partial ownen in the construction of their head office
complexes in Toronto (a similar pattern was evident in their regional offices in Canada, see section
4.4.1). The cases of the Royal Bank (sole owner employing developer for fee) and the Toronto-
Dominion Bank (joint venture, partial ownenhip) were illustrated earlier. In addition, the Canadian
Imperia1 Bank of Commerce was the sole developer and owner of its head office cornplex, the Bank of
Nova Scotia used a developer as joint venture partner and retained partial ownenhip, and the Bank of
Montreal had 25 percent eguity in the ownership of its head office (Table 4.2).

Table 4.2 Banks involvement in the development and ownership of their head offices in Toronto
Bank Role in development Owmship at the time of
development
Toronto-Dominion Partnenhip with Cadillac Fairview Paitnership 50150
Cl BC Developer Owns 1 M) percent
Bank of Montreal lnvestor Minority interest (25 percent)
Royal Bank Hired a developer Owns 100 percent
Bank of Nova Scotia Partnership with Campeau Minonty interest - .
Source: Various sources.
The development of the Royal Bank Plaza in Toronto, the de facto head office of the Royal Bank (de
jure, the head office is in Montreal), illustrates the nature of relationship between a bank and a hired
developer. In 1972, afîer meeting with a number of major developers, the bank appointed the Toronto-
based Y&R Propeities (one of the well-established office developen in Toronto) to act as its agent and
developrnent manager for the construction of the Royal Bank Plaza in Toronto's Financial District. The
cornplexity of development prompted the bank to assemble a project team, in which Y&R had a pivotal
role. In this case, as pointed out by one of the bank's officiais, the distinction between the developer
and the owner was made: '...the developer would lend his expertise to a prospective owner for a fee.
Up to this time, the developer usually held direct interest in the project and developed it on this basisn
(Canadian Building, September 1975). For the purpose of rnanaging the Royal Bank Plaza, the Bank
formed its wholly-owned subsidiary, Globe Realty Management in 1974. The role of Y&R was
especially important as the mediator and the negotiator with Toronto City Hall. The Royal Bank with its
head office in Montreal at the time was a newcorner in Toronto's Financial District (Although the bank
had office buildings in the area before, they were not at the size of a large-scale project). The bank
used the expertise of a real estate brokerage fim to assemble the land, and being inexperienced in
handling development; the bank needed an expert that was able to deal with this large-sale project. In
this way, the bank rnaximized the potential benefis gained through knowing the 'niles of the gamet.
An exarnple for another type of relationship is the long-terni connection between the Toronto-
Dominion Bank (TD) and Fairview (later Cadillac Fairview). In the early 1960s after the merger of the
Dominion Bank and the Bank of Toronto, the TD contemplated the idea of developing a new head

office building in Toronto. The City of Toronto urged the bank to consider a development of a whole
downtown complex instead of only a head o f f i building (Collier, 1974). As a result, Me bank teamed
up with Fairview to develop the largest office complex in Canada, the Toronto-Dominion Centre ( f i e
buildings and over 4 million square feet of office space). In this case an equal partnenhip was fomed,
where the bank owned 50 percent of the project and the developer owned the other half. The initial
connection between the TD bank and Fairview was faciiitated through the mediation of a prominent
Toronto investment dealer. The bank executives were impressed with the quality of development
demonstrated by the development company as well as the company's expertise; moreover, the
financial credentials of the developen (their association with the Bronfman family) helped to forge this
partnenhip (intewiew with a former president of Cadillac Fairview). In this case it is clear that the bank
wanted to build a large project that would be an income producing property because only a small
portion of the Toronto-Dominion Centre senres as the bank's head office, h i l e the vast majonty of
office space was rented to various tenants.
The only Canadian bank that had aspirations to become an integrated real estate developer
was the Canadian lmperial Bank of Commerce (CIBC). In the late 1980s, the Bank attempted to cash
in on the real estate upswing by establishing a real estate subsidiary, ClBC Development Corporation.
The creation of a real estate a m was an attempt to change its traditional rote in real estate from a
lender to a major owner and potentially a developer. The Bank announced the formation of its real
estate subsidiary at the peak of the real estate cycle in 1989 (Toronto Star, January 11, 1989). The
original purpose of the subsidiaiy was to manage the Bank's existing real estate podfolio and
eventually expand into real estate development. According to a ClBC executive, the Bank's properties
contributed an insignificant share to its profils; by establishing the subsidiary, the Bank aimed to
rationalize its assets and generate more profits from its real estate portfolio (Globe & Mail, January 11,
1989). The mandate of ClBC Development Corporation was threefold (CIBC Development Corporation,
intemal documents):
o Maximize the value of selected bank properties by creative redevelopment and on-going
management;
o Build a portfolio of prime office and mixed-use income properties through acquisition, development
and joint ventures; and
o Capitalire on synergies between the corporation's expertise and the comprehensive activities of
the bank for long-terni returns.
By the late 1 990s, ClBC Development Corporation was a full secvice real estate company employing
more than 400 people and performing the major functions of a real estate development Company:

leasing, investrnent and development, property management, and corporate real estate (CIBC
Development Corporation, intemal documents). In 1990, a year after the subsidiary was fonned, it
outbid the two largest real estate companies in Canada, Olympia 8 York and Cadillac FaiMew, to build
a proposed Ontario Hydro headquarters complex in Oowntown North York. CIBC Development
Corporation planned to finance, develop, own and manage the 24million square feet, three-tower
office complex (Toronto Star, March 10, 1990; Globe 6 Mail, August 26, 1991); however, the real
estate meltdown in the early 1990s caused the project to be mothballed and eventually abandoned. In
the late 1990s, the ClBC Devekpment Corporation developed a few small office and industrial
buildings in Mississauga and Brampton. The company's main business was real estate leasing,
property management, and acquisitions of real estate assets. Development never took off as planned.
The latest phase regarding the role of banks in both office development and ownenhip signak
a dramatic tumaround is visible in the 1990s. The banks dissociated themseives from the ownership of
big office buildings, and they definitely, at least in the foreseeabk future, abandoned the development
business. In the late 1990s, three major Canadian banks disposed of most of their real estate assets as
part of their strategy to re-deploy assets in the banks' core businesses. The banks considered real
estate as a non-core business in an era of growing competition and specialization. It was suggested
that electronic banking is replacing buildings and real estate investment. A vice-president of the Royal
Bank admitted, 'Ecommerce will be one of the uses of money we make from a [real estate] sale"
(National Post, July 31, 1999). In September 1999, the Royal Bank sold its entire office portfoiio to a
consortium of Oxford Properties Group, OMERS and GE Capital (Toronto Star, September 23, 1999).
The Bank of Nova Scotia sold properties that were not used by the bank. The bank's senior vice-
president of real estate indicated that *we [the bank] do not belong in the real estate business per se.
We are not developen. What we are is an institution that uses real estaten (Globe & Mail, June 17,
1999). The most recent move was by CIBC. In August 1999, ClBC put its real estate division on sale;
by December of 1999, seven premier office complexes were sold to a British Columbia pension fund
(Globe & Mail, August 13, 1999, December 1 1, 1999). When a bank needs a new facility (office or
office-like building), it prefers to have a design-built building for a long lease period put up and owned
by a real estate Company. The new Royal Bank office complex (800,000 square feet) in Mississauga
illustrates this point. The Bank used a developer, Penreal Capital Management (a manager of pension
fund real estate assets), to develop its new two-tower office project The bank leases the building,
which is owned by pension funds.
4.3.2 Life insurance companies and office development
The life and trust companies and pension funds will control the development industry in the
next decaden (Senior Vice-President. Reaity Advisory Group. Toronto-Dominion Bank, Globe &
Mail, September 21,1982).
The changing role of IL insurance companies in the real estate sector matches the position and the
character of development cycles. Barras (1979b) suggested that successive development cycles in
London since the early 1950s modified the structure of the real estate sector and the nature of the
relationship between developers and financial institutions. In the late 1950s and early 1960s, bridge
financing from banks was in short supply and real estate companies were forced to tum to life
insurance companies. These institutions began to appreciate the retums from properiy ownership
during the 1960s. and by the 1970s, life insurance companies were in a commanding position with
regard to nearly al1 aspects of real estate investment and development. Financial institutions engaged
in active development as joint schemes became a common funding arrangement; as a result,
development profit and rental income were shared between the developer and the funding institution
(Barras, 1979b). In Ireland, 'institutional' investon (life nisurance companies and pension funds) also
becarne involved in the process of development, in some cases using developers but reducing the
developer's role to the status of a project manager working for a fee. or by establishing their own
development departments (MacLaran, 1986).
In Canada, the involvement of life insurance companies in real estate ownership and mortgage
provision increased markedly between 1950 and 1980: from approximately 20 to more than 40 percent
of invested assets (Table 4.3). In the 1950s. most life insurance companies had either no real estate at
al1 or had no more than one percent of their total assets in property. which was probably their head
office building and some regional office buildings. By 1960, the situation had already evolved toward
greater involvement of larger life insurance companies in property investment, although the process
was still in its eaily stage. It gathered Pace during the 1960s and the 1970s (Des Rosiers, 1984). In
1980, several large companies had invested significant amounts of capital in real estate. Two of the
larges? companies, Manufacturen Life and Sun Life, had more than eight percent of their funds in real
estate assets (excluding mortgages). When real estate development was growing at a rapid pace, the
average share of real estate in the assets of life insurance companies increased from four percent in
1980 to 5.1 percent in 1990 (Canadian Life and Health lnsurance Association, 1998). However,
paradoxically, the peak (6.3 percent) of the share of real estate investments of assets of Me insurance
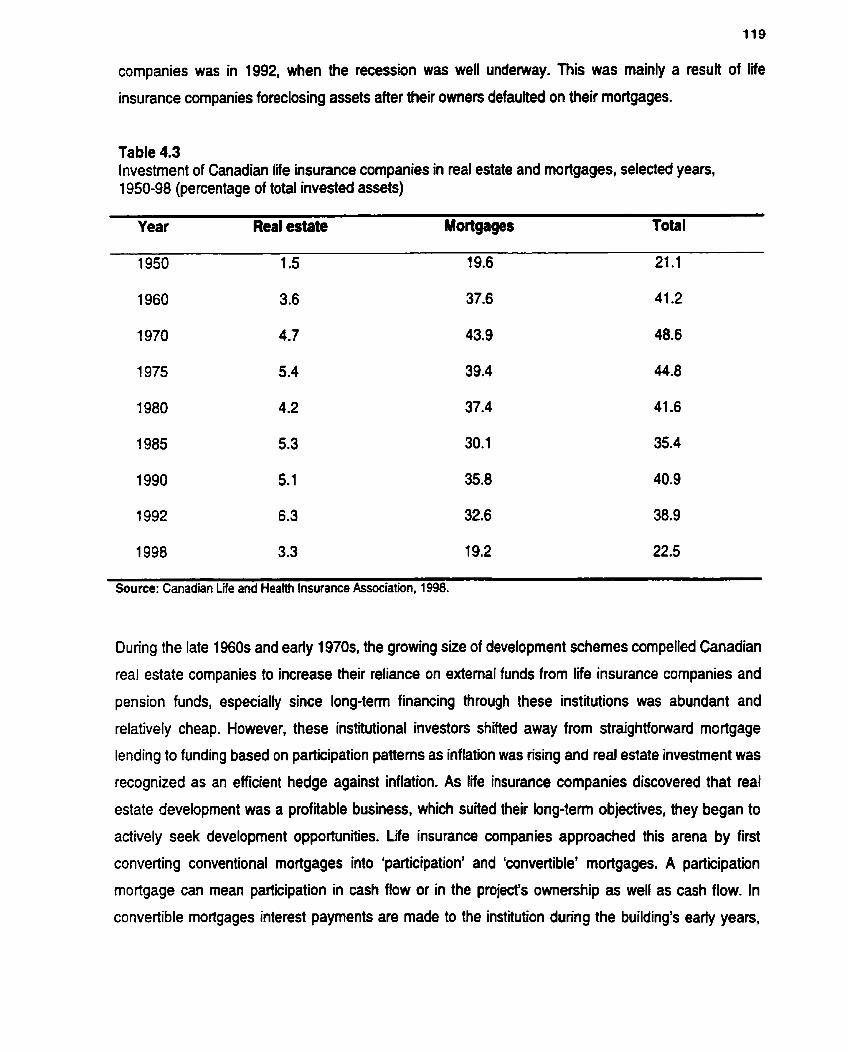
companies was in 1992, when the recession was well underway. This was mainly a resutt of life
insurance companies foreclosing assets after their ownen defaulted on their mortgages.
Table 4.3 lnvestrnent of Canadian life insurance companies in real estate and mortgages, setected yean, 1950-98 (percentage of total invested assets)
Year Real estate Mortgages Total
1998 3.3 19.2 22.5
Source: Canadian Life and Health Insurance Association, 1 998.
During the late 1960s and eariy 1970s. the growing sire of development schemes compelled Canadian
real estate companies to increase their reliance on extemal funds from life insurance companies and
pension funds, especially since long-terni financing through these institutions was abundant and
relatively cheap. However, these institutional investors shifted away from straightforward mortgage
lending to funding based on participation patterns as inflation was nsing and real estate investment was
recognized as an efficient hedge against inflation. As life insurance companies discovered that real
estate development was a profitable business, which suited their long-term objectives, they began to
actively seek development opportunities. Life insurance companies approached this arena by first
converting conventional mortgages into 'participation' and 'convertible' mortgages. A participation
rnortgage can mean participation in cash flow or in the project's ownership as well as cash flow. In
convertible mortgages interest payments are made to the institution during the building's early yean,
then the ternis are switched to give the lender an equity positicn, or even an option to buy out the
developer (Financial Post, October 24, 1981). The role of life insurance companies in real estate
operations increased steadily as îhese companies moved from indirect and passive to increasingly
direct and active involvement. This transition led Goldenberg (1981) and Des Rosiers (1987) to
conclude that the control of the real estate sector was shifting away from entrepreneurial capital (real
estate companies) to agents of finance capital (Me insurance companies and pension funds).
Until the early 1980s, the steadily increasing involvement of life insurance companies in real
estate investments was largely through the acquisition of existing properties, but during the 1980s. life
insurance companies began to play an active role in development. The growing attraction of office
development, especially the promise of development gain retained from the development of new
properties, prompted a growing competition between real estate developen and financial institutions.
Life insurance companies either initiated developments, made developers joint venture partners, or
conditioned funding by obtaining a partial ownership in a project. The clearcut distinctions between
developers (real estate companies) and financiers (life insurance companies) began to blur as life
insurance companies expanded their real estate operations (Des Rosiers, 1987).
The move of life insurance companies from debt financing towards direct investrnent (most
pronounced in the 1970s and 1980s) signaled the relative lessening of their role as financial
intennediary and their increased role as active investors. Empirical evidence covering a thirty-year
period (1950-1980) provided by Des Rosiers (1984) support the argument that the involvement of life
insurance companies in direct real estate investment (either through property ownership or
developrnent) had increased dunng this period. In the postwar era, these companies shifted a larger
portion of their investments into real estate and decreased their share of mortgage lending (Des
Rosiers, 1 984).
Most of the largest Me insurance companies in Canada became involved in commercial
development, particularly in office development during the 1980s. Life insurance companies entered
into the arena of developrnent as a result of the continuous expansion of the real estate market, and
their eagemess to exploit opportunities; in addition, the scarcity of propeities for sale also prompted
their involvernent in development. The upswing in the real estate cycle in the earîy-to-late 1980s
enhanced the attraction of real estate investment for life insurance companies. Companies with no
previous experience in real estate development began to initiate developments. For example, North
Arnencan Life initiated a large office development in North York in partnership with Xerox, and Canada
Life teamed up with ClBC in a joint venture to develop an office building in Hamilton (North Arnerican
Life and Canada Life, Annual Reports).

When life insurance companies engage in office development, they usually do it jointly with
real estate developen. These relations are further cemented into long-terni financial partnerçhips
between real estate companies and life insurance companies. In these cases, life insurance companies
provide the developers with either debt or equity financing, or both. Great-West Lie Assurance
Company had a long-term relationship with the Oxford Development Group. Between 1963 and 1979,
Great-West was a majcr equity and debt provider for Oxford's real estate projects along with
Confederation Life and Canada Trust (Goldenberg, 1981). Great-West provided part of the financing for
development of new office buildings as well as acquisition of individual properties, real estate portfolios,
and real estate companies. Another long-terni relationship was cemented between Mutual Life of
Canada and the Shipp Corporation. These two cornpanies have been partnen since the mid-1960s in
residential and commercial real estate development at the western edge of the Toronto rnetropolitan
area (mainly in Etobicoke and Mississauga).
The life insurance company that has been highly exposed to real estate investment is Manulife
Financial (previously Manufacturers Life). Its share of invested assets in real estate had grown from 4-5
percent in the mid-1960s to almost 15 percent (then, the maximum allowed by law) in 1974. In the late
1980s and eady 1990s its share was at 9-10 percent and dropped to 6 percent in the aftenath of the
real estate recesçion in the mid-to-late 1990s as the Company decided to reduce its real estate
exposure (Manulife Financial, Annual Reports). Up to the mid-1950s Manulife's participation in real
estate was primarily through debt financing (mortgages). Beginning in the mid-1950s. the company had
increased its involvement in equity investment. In the mid-1960s the wmpany decided to invest in real
estate through direct development, making it a unique enterprise among life lnsurance companies in
North Arnerica. It became active in office development as an integrated developer without adopting
specialized developers as partners (Manulife Financial, intemal documents).
The activities of life insurance companies have been highly regulated by rules of the
Governrnent of Canada. These rules outline the type and proportion of investments allowed to life
insurance cornpanies. In the 1970s. the limit on life insurance companies' investment in real estate was
15 percent of a company's total assets. During the 1980s boom, life insurance companies lobbied the
federal govemment to permit them to devote up ta 25 percent of their assets to real estate, and the
industry's association, the Canadian Life and Health Insurmce Association, suggested that the 15
percent limit %il! prove confining to some companies in a vey few yearsn (financial Times, October
31, 1983). In the most recent round of govemment regulation, which came into effect in 1992, no fixed
limits on real estate investment were imposed but rather a 'prudent' approach was suggested for
adoption by the life insurance companies. Under this revised legislation the board of directors of each
life insu rance company is responsible for 'prudent' investrnent decisions. This revision came Mer
insurance companies experienced the high-risk aspects of real estate investrnent and development; as
a result, the share of their real estate declined from 6.3 percent to 3.3 percent of their assets rather
than rising to above 15 percent (Canadian Life and Health Insurance Association. 1998).
During real estate slumps, life insurance companies have been parlaying their real estate
expertise into investor advisory services. Sun Lie and Great-West Lie are two examples of companies
who shifted their focus from purchasing properties for their own account to providing services, such as
real estate management, to outside investon (Financial Post, June 29. 1992). When there are signs of
recovery, some venture into development Although GWL Realty Advison, the wholly-owned real
estate a m of Great West Cie, had no prior experience in development, the company commenced its
first office project in 1998 (Finsncial Post, January 29, 1998). Favourable conditions in suburban office
markets with low vacancy rates provided the platforrn for suburban office development in Toronto,
Calgary and Edmonton. The company's ability to act as a developer is further enhanced by the fact that
a number of its key executives have experience in real estate development. For exarnple, both the
company's president and its senior vicegresident were with Trizec Corporation, one vice president was
with Cadillac Fairview, and another vice president was with a commercial real estate brokerage firm
(GWL Realty Advisors, 1997 Pomolio Review).
4.4 The Spatial Practices ot Office Development and Ownership by
Financial Institutions Real estate investments of financiai institutions have distinct spatial patterns. These patterns are based
on the fact that these institutions are major users of office space and capitalize on real estate being an
income-producing asset. Barras (1979a) in a study of office development in the United Kingdom,
suggested that large and medium-sized life insurance companies and pension funds had a clear
preference for London and the South-East markets. This spatial pattern was grounded in the strategy
and the time horizon adopted by these investors. Martin and Minns (1995) suggest in relation to
pension funds that the concentration of economic power in and around London transfers wealth
disproportionately to the South East of England. They attributs this core-periphery tendency to
institutional requirements for Iiquidity that discourages long-term investrnent in regions outside the
South-East. Henneberry (1999) attributes the sequential pattems in the 1980s office boom, with
London leading the boom and other regions peaking later, to the preferences and decisions of major
institutional investors.
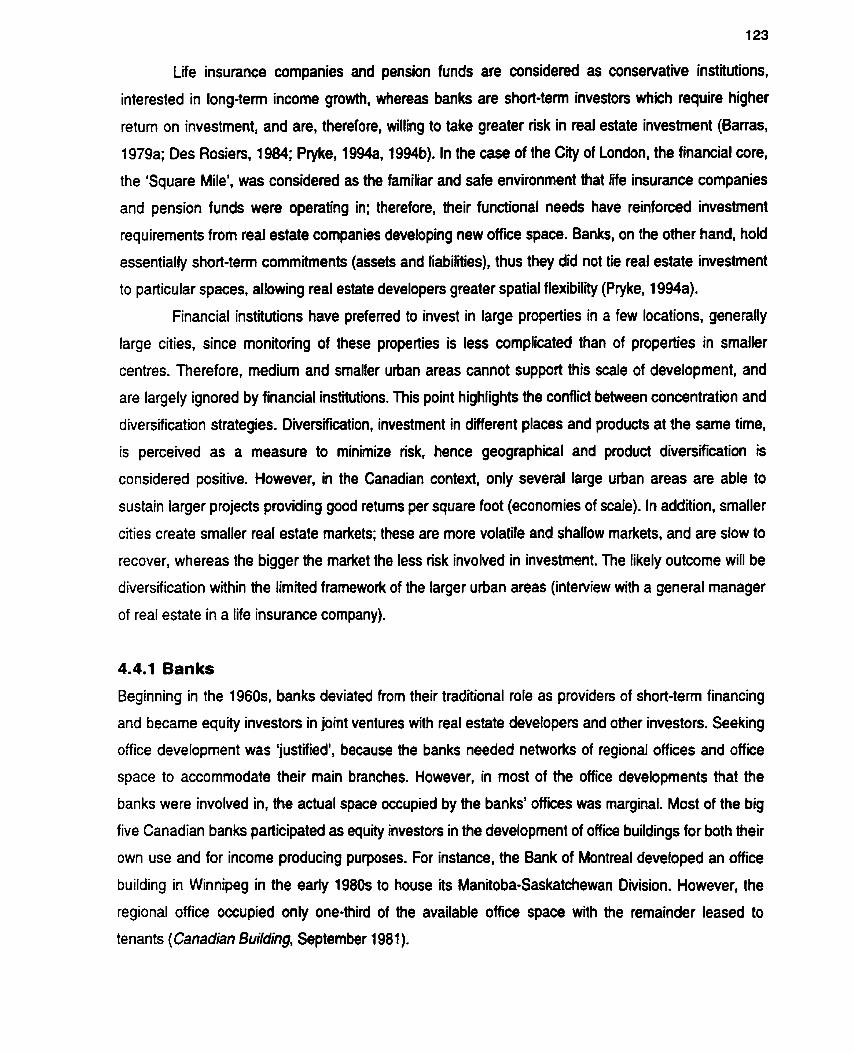
Liie insurance companies and pension funds are considered as consenrative institutions.
interested in long-ten income growth, whereas banks are short-terni investors which require higher
retum on investment, and are, therefore, willing to take greater risk in real estate investment (Banas,
1979a; Des Rosiers, 1984; Pryke, 1994a. 1994b). In the case of the City of London, the financial core,
the 'Square Mile', was considered as the familiar and safe environment that life insurance companies
and pension funds were operating in; therefore, their functionai needs have reinforced investrnent
requirements from real estate companies developing new office space. Banks, on the other hand. hold
essentially short-terni commitments (assets and liabilities). thus they did not tie real estate investment
to particular spaces, allowing real estate developers greater spatial flexibility (Pryke. 1994a).
Financial institutions have preferred to invest in large propetties in a few locations, generaily
large cities, since monitoring of these properties is less complicated than of properties in smaller
centres. Therefore, medium and smaller urban areas cannot support this scale of development, and
are largely ignored by financial institutions. This point highlights the conflict between concentration and
diversification strategies. Diversification. investment in different places and products at the same time.
is perceived as a measure to minimize risk, hence geographical and product diversification is
considered positive. However, in the Canadian context, only several large urban areas are able to
sustain larger projects providing good retums per square foot (economies of scale). In addition, smaller
cities create smaller real estate markets; these are more volatile and shallow markets, and are slow to
recover, whereas the bigger the market the less risk involved in investrnent. The likely outcome will be
diversification within the limited frarnework of the larger urban areas (interview with a general manager
of real estate in a life insurance company).
4.4.1 Banks
Beginning in the 1960s. banks deviated from their traditional role as providers of short-term financing
and became equity investors in joint ventures with real estate developers and other investors. Seeking
office development was 'justified', because the banks needed networks of regional offices and office
space to accommodate their main branches. However, in most of the office developments that the
banks were involved in, the actual space occupied by the banks' offices was marginal. Most of the big
five Canadian banks participated as equq investon in the development of office buildings for both their
own use and for income producing purposes. For instance, the Bank of Montreal developed an office
building in Winnipeg in the early 1980s to house its Manitoba-Saskatchewan Division. However, the
regional office occupied only one-third of the available office space with the remainder leased to
tenants (Canadian Building, September 1981).

One of the most active Canadian banks in office development was the Bank of Nova Scotia. In
the 1970s and 1980s, the bank sought joint ventures in office development projects for the purpose of
income-producing propeities. The bank was active in almost al1 of the hrgest cities across Canada
(Table 4.4).
Table 4.4 Bank of Nova Scotia and office development joint ventures
City Period Project Size Partner (square feet)
Vancouver Eariy-to-mid 1970s Vancouver Centre 400,000 Fmous Players, Birks
Calgary Mid-1 970s Scotia Centre 600,000 Trüec
Edmonton Eariy-to-mid 1 980s Scotia Place 550,000 National Trust, pension funds
Winnipeg Late 1970s-early 1980s Winnipeg Square 600,OoO TNec
Toronto Mid-to-late 1980s Scotia Plaza 1,500,000 Campeau
Montreal Late 1 980s-early 1990s Tour BNE 300,OOO Monit ( h l developer)
St. John Mid-1 970s-late-1 970s Brunswick Centre ~,~ Trizec and other partners
Sources: Scotiabanker (Bank of Nova Scotia Staff Magazine); Tritec Corporation, Annual Reports.
In al1 the office buildings in which the bank was a joint venture partner, it occupied the lesser part of the
available office space. The reason for these joint-venture developments was to acquire equrty interest
and to take advantage of the benefis embodied in real estate assets. Table 4.4 also shows the long-
terni relationship between the bank and Trizec (three buildings were built as joint ventures). In addition,
the Bank of Nova Scotia was a minonty holder of the Canadian Company (Carena Properties) that
purchased Trizec Corporation (the Trizec case is discussed in section 5.4.1) from its British owners in
1976 (Goldenberg, 1981).
The portfolio of ClBC Development Corporation, the real estate subsidiary CIBC, illustrates
similar type of practices as the Company was geared toward investment in real estate for income-
producing purposes. The spatial practices presented by CIBC Development Corporation reflect a
preference to Canada's f i e largest rnetropolitan areas. These areas accounted for more than 97
percent of the company's office portfolio; in particular, this portfolio is favourably disposed towards the
Toronto area: over 54 percent of the total portfolio was concentrated in this metropolitan area (Table
4.5).

Table 4.5 ClBC Development Corporation and Royal Bank's owned office portfolio, l998,l999
Metropolitan area
--
Toronto
Calgary
Edmonton
Montreal
Vancouver
Hamilton
Ottawa
Winnipeg
London
Halifax
Regina
Other
Total
ClBC ûevelopment Corporation (1)
Office space % of total portfolio (WC square feet)
3,729 54.5
1,124 16.4
750 11.0
71 6 10.5
341 5.0
180 2.6
O O
O O
O O
O O
O O
O O
6,8«) 100.0
Royal Bank
M c e sprte % of total portfolio (üûû square feet)
2,721 55.9
47 1 .O
1 44 2.9
1 46 3.0
1 98 4.1
O O
401 8.2
21 7 4.4
180 3.7
1 74 3.6
112 2.3
531 (3) 10.9
4,871 100.0
Notes: (1 ) 1998 figures. (2) 1999 figures. (3) These includes cities with properties of l e s than 100,000 square feet eah: Thunder Bay, Saint John, Brandon, Moose Jaw, Saskatoon, Lethbridge, Prince George, Kamloops, New Westminster, Victoria, and Guelph. Sources: ClBC Development Corporation, Property Portfolio; Oxford Properties Group, written communication.
The office portfolio of the Royal Bank presents a different spatial pattern with a wider dispersion across
Canadian cities (Table 4.5). Except for a similar large portion of the Royal Bank's portfolio in Toronto
(almost 56 percent of the bank's total portfolio), the spatial patterns of the Royal Bank are different from
those of the Bank of Nova Scotia and CIBC. The high-profile of Toronto in the portfolios of al1 three
banks is a result of the banks having their head office complexes in Toronto. Commerce Court (2
million square feet), Royal Bank Plaza (1.5 million square feet) and Scotia Plaza (1.5 million square
feet) are located in Toronto's Financial District. Apart from that, each bank has different spatial
practices. ClBC Development Corporation is a specialized real estate f im that owns major bank
premises, and rnulti-tenant office buildings that are owned for revenue purposes and are leased to
various tenants. In 1997 the company acquired four office buildings in the Mississauga City Centre
(800,000 square feet). ClBC was not a major tenant in any of these buildings (interestingly, the Royal
Bank is one of the major tenants in two of the four buildings). In Calgary, the company co-owned one of

Calgary's largest office buildings, Gulf Canada Square (1.1 million square feet); in this building ClBC
was not a major tenant (CIBC Development Corporation, 1999). The Bank of Nova Scotia, although not
as aggressive as ClBC in punuing o f f a development, was invoived as a parbier in office
development, primady in major Canadian cities (Table 4.4).
The Royal Bank portfolio, on the other hand, consists mainly of office buildings in which the
bank is a major tenant. The portfolio consists of a large number of small buildings; out of the bank's 33
buildings, 21 are less than 100,000 square feet (in comparison, the ClBC portfolio includes only four
small buildings out of a portfolio of 18 buildings). The Royal Bank portfolio is much more dispened than
the ClBC or the Bank of Nova Scotia office podfolio. Approximately two-thirds of the Royal Bank
portfolio is in f i e of aie largest metropolitan areas (Toronto, Montreal, Vancouver, Calgary and
Edmonton), whereas a majonty of the Bank of Nova Scotia portfolio is these metropolitan areas, and in
virtually al1 of ClBC Development Corporation portfolio is in these metropolitan areas.
The reason for the 'discrepancy' beîween these office portfolios is a result of the different
approaches toward real estate adopted by the banks. ClBC decided, in the late 1980s, to become an
active player in the real estate sector, mainly through management of the bank's premises, and
ownership of real estate assets for income-generating purposes. Real estate was perceived as an
under-perfoning asset and the bank aimed to maximire the value of its properties. Thus, the
company's focus was on prime properties that generate high rents and high retums. These are large
properties located in the largest Canadian metropolitan areas. The Bank of Nova Scotia punued office
development in the 1970s and 1980s when office development was in high demand. The bank
attempted to take advantage of these favourable conditions and becorne a partner in real estate
projects. The Royal Bank acted mainly as a user of office space, owning properties that are needed for
the bank's functions. Hence, the bank had a large number of srnall-size buildings in a variety of cities
across Canada. The bank's portfolio consisted of buildings in small cities such as Thunder Bay,
Brandon, Moose Jaw, and Kamloops; in al1 of these cities, the bank owned small buildings, each less
than 50,000 square feet in size. This represents a spatial pattern of ownership of office buildings that
matches the bank's spatial functional configuration. Although having similar functional needs, Cl0C and
Royal Bank considered real estate in different ways; while Cl0C attempted to become active in real
estate development, the Royal Bank regarded its office buildings mainly for use purposes.
4.4.2 Life insurance companies
The financial strategy of life insurance companies is to match assets and liabilities; in this process they
also attempt to match their assets and liabilities spatially. In cases where the Company does not have
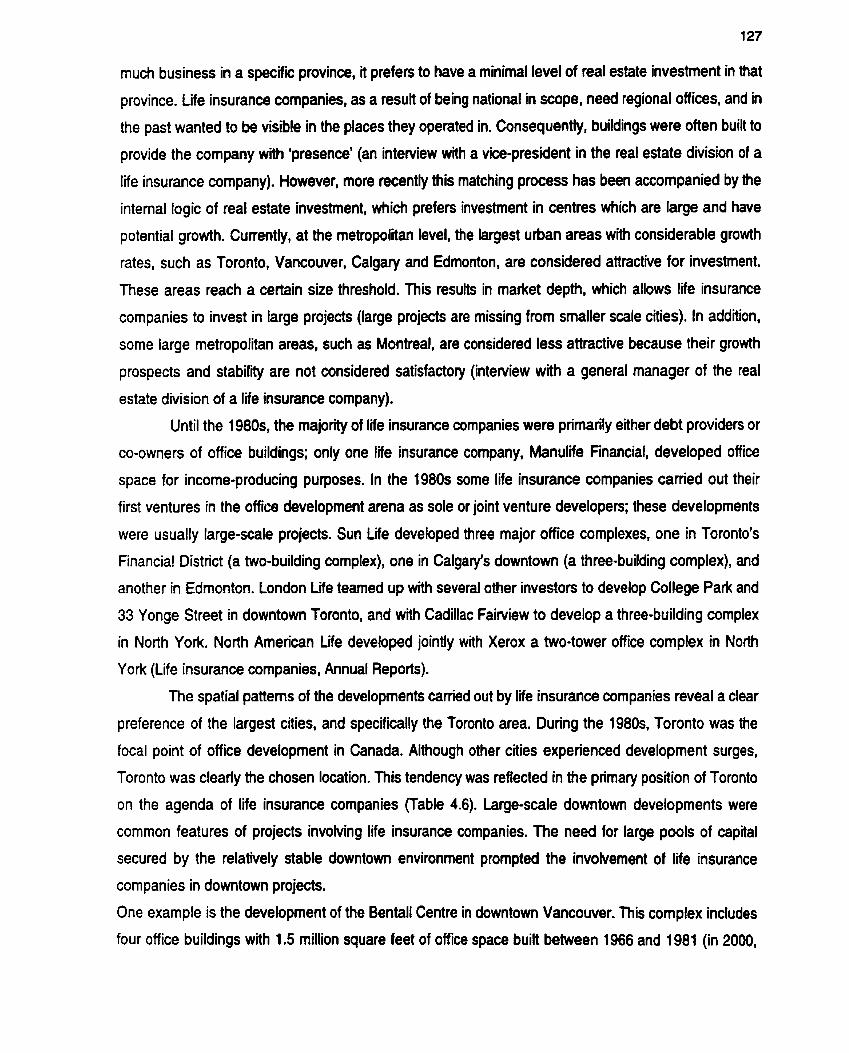
much business in a specific province, it prefen to have a minimal level of real estate investment in that
province. L ie insurance companies, as a result of being national in scope, need regional offices, and in
the past wanted to be visible in the places they operated in. Consequently, buildings were often built to
provide the company with 'presence' (an interview with a vicegresident in the real estate division of a
life insurance company). However, more recentiy this matching process has been accompanied by the
intemal logic of real estate investment, which prefen investment in centres which are large and have
potential growth. Currently, at the metropolitan level, the largest urban areas with considerable growth
rates, such as Toronto, Vancouver, Calgaiy and Edmonton, are considered attractive for investment.
These areas reach a certain size threshold. This results in market depth, which allows life insurance
cornpanies to invest in large projects (large projects are missing from smaller scale cities). In addition,
some large metropolitan areas, such as Montreal, are considered less attractive because their growth
prospects and stabildy are not considered satisfactory (interview with a general manager of the real
estate division of a Iife insurance company).
Until the 1980s, the majonty of life insurance companies were primarily either debt providers or
CO-owners of office buildings; only one life insurance company, Manulife Financial, developed office
space for income-producing purposes. In the 1980s some life insurance companies canied out their
first ventures in the office development arena as sole or joint venture developers; these developments
were usually large-scale projects. Sun Lie developed three major office complexes, one in Toronto's
Financial District (a two-building complex), one in Calgary's downtown (a three-building cornplex), and
another in Edmonton. London Life teamed up with several otber investars ta develop College Park and
33 Yonge Street in downtown Toronto, and with Cadillac FaiMew to develop a three-building complex
in North York. North American Life developed jointly with Xerox a two-tower office complex in North
York (Me insurance companies, Annual Reports).
The spatial patterns of the developments carried out by Iife insurance companies reveal a clear
preference of the largest cities, and specifically the Toronto area. Dunng the 1980s, Toronto was the
focal point of office development in Canada. Although other cities experienced development surges,
Toronto was clearly the chosen location. This tendency was reflected in the primary position of Toronto
on the agenda of life insurance companies (Table 4.6). Large-scale downtown developments were
common features of projects invohring life insurance companies. The need for large pools of capital
secured by the relatively stable downtown environment prompted the involvement of life insurance
cornpanies in downtown projects.
One exarnple is the development of the Bentall Centre in downtown Vancouver. This complex includes
four office buildings with 1.5 million square feet of office space buiit between 1966 and 1981 (in 2000,
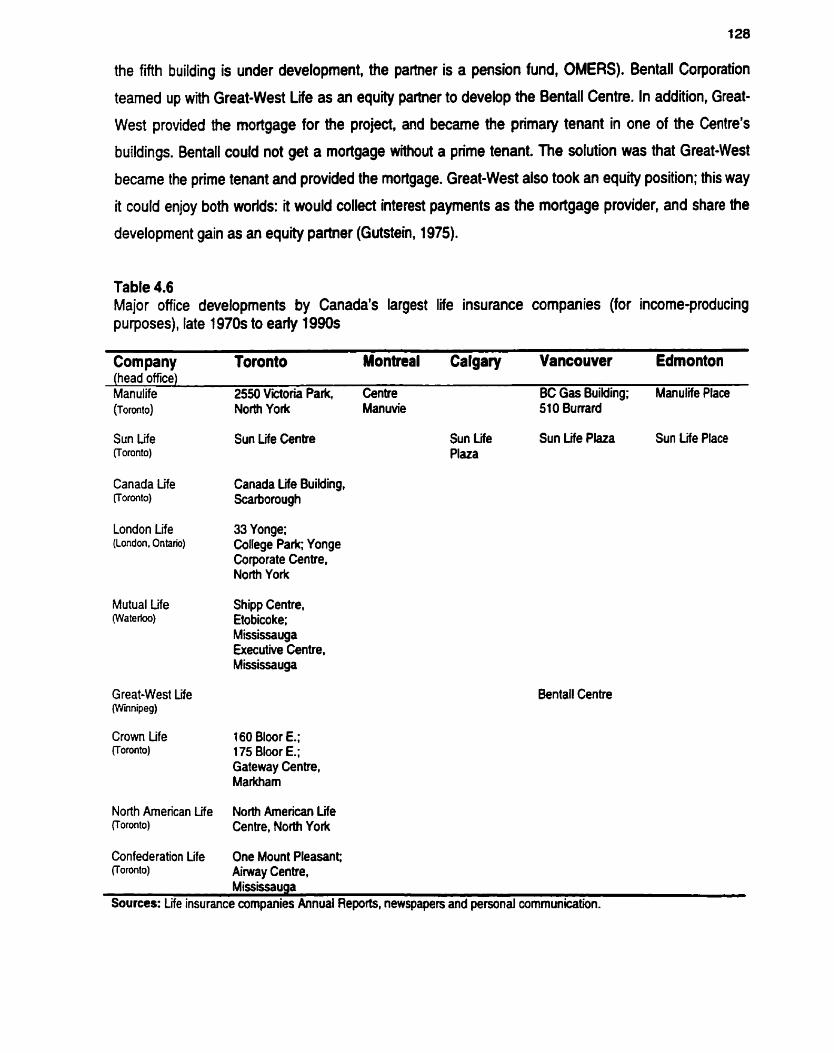
the fiih building is under development, the partner is a pension fund, OMERS). Bentall Corporation
teamed up with Great-West Life as an equity paitner to develop the Bentall Centre. In addlon, Great-
West provided the mortgage for the project, and becarne the primaiy tenant in one of the Centre's
buildings. Bentall could not get a mortgage without a prime tenant. The solution was that Great-West
became the prime tenant and provided the mortgage. Great-West also took an equity position; this way
it could enjoy both worids: it would collect interest payrnents as the moitgage provider, and share the
development gain as an equity partner (Gutstein, 1975).
Table 4.6 Major office developmenh by Canada's largest life insurance companies (for income-producing purposes), late 1970s to early f 990s
Company Toronto Montmal Calgary Vancouver Edmonton . .
(head office) Manulife 2550 Victoria Park, Centre BC Gas Building; Manulife Place ( T O ~ O ) North York Manuvie 51 O Bunard
Sun Life Sun Life Centre (Toronto)
Canada Me Canada Life Building, (Toronto) Scarborough
London Life 33 Yonge; (London. On tario) Cdege Park; Yonge
Corporate Centre, North York
Mutual Life Shipp Centre, (Waterioo) Etobico ke;
Mississauga Executive Centre, Mississauga
Crown Life (Toronto)
160 Bloor E.; 175 Bloor E.; Gateway Centre, Markham
North Arnerican Life North Arneiican Life (Toronto) Centre, North York
Confederation Life One Mount Pleasant; (foronto) Airway Centre,
Sun Life Sun Life Plaza Sun Life Place Plaza
Bentall Centre
Mississauga Sources: Lie insurance companies Annuai Reports, newspapers and personal communication.
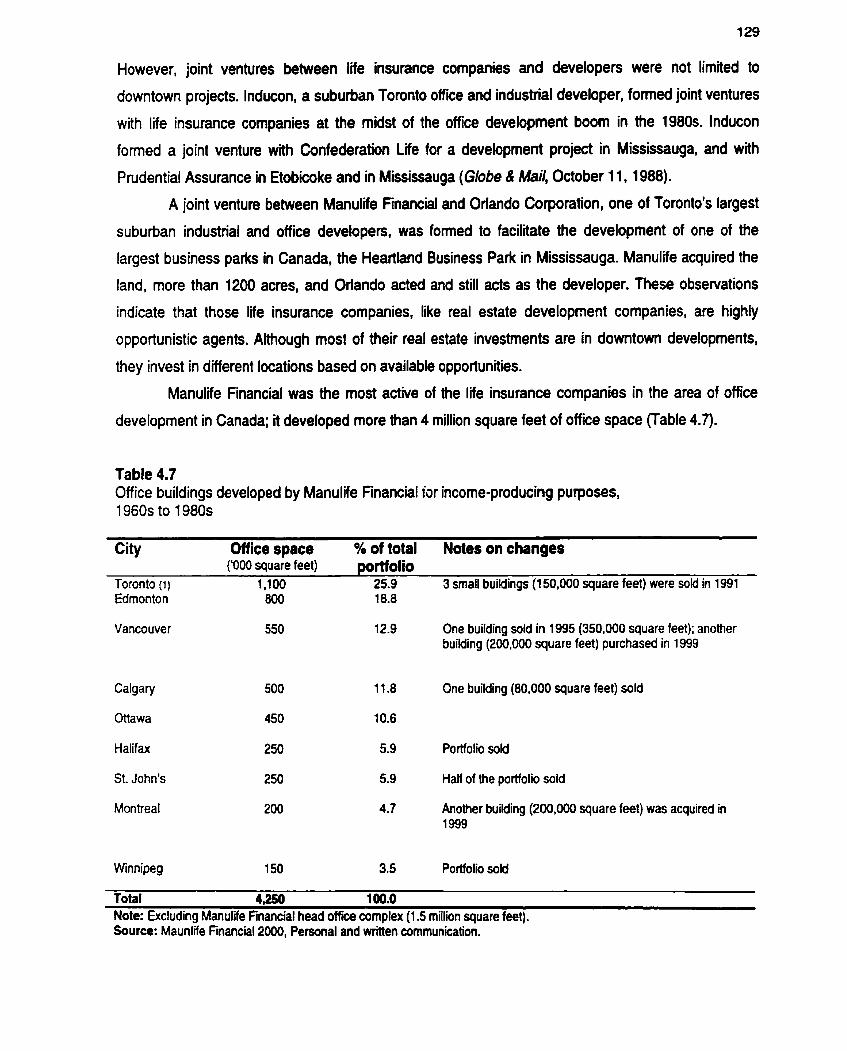
However, joint ventures between life insurance companies and developen were not limited to
downtown projech. Inducon, a suburbiui Toronto office and industhal developer, formed joint ventures
with life insurance companies at the midst of the office development boom in the 1980s. lnducon
fomed a joint venture with Confederation Life for a development project in Mississauga, and with
Prudential Assurance in Etobicoke and in Mississauga (Globe & Mail, October 11, 1988).
A joint venture between Manulife Financial and Orlando Corporation, one of Toronto's largest
suburban industrial and office developers, was formed to facilitate the development of one of the
largest business paks in Canada, the Heartland Business Park in Mississauga. Manulife acquired the
land, more than 1200 acres, and Oriando acted and still acts as the developer. These observations
indicate that those life insurance companies, like real estate development companies, are highly
opportunistic agents. Although most of their real estate investments are in downtown developments,
they invest in different locations based on available opportunities.
Manulife Financial was the most active of the Me insurance companies in the area of office
development in Canada; it developed more than 4 million square feet of office space (Table 4.7).
Table 4.7 Office buildings developed by Manulife Financial h r income-producing purposes, 1960s to 1980s
City Office space % of total Notes on changes ('000 square feet) portfolio
Toronto (1) 1,100 25.9 3 small buildings (1 50,000 square feet) were sold in 1991 Edmonton 800 18.8
Vancouver 12.9 One building çold in 1995 (350,000 square feet); another building (200,000 square feet) purchased in 1999
Calgary 500 11.8 One building (80,000 square feet) sold
Ottawa 450 10.6
Halifax 250 5.9 Portfolio sold
St. John's 250 5.9 Half of the portfolio sold
Montreal 4.7 Another building (200,000 square feet) was acquired in 1999
Winnipeg 150 3.5 Portfolio sold
Total 4,250 100.0 Note: Excluding Manulife Financial head office complex (1.5 million square feet). Source: Maun l ie Financial 2000, Personal and wntten communication.

The first office building developed by Manulife in 1965 (50,000 square feet) was in Toronto; it was
followed by an office building in Calgary, completed in 1967 (276,000 square feet), and another office
building in Toronto was completed in 1969. In the 1970s, Manulife constructed office buildings in
Toronto, Calgary, Ottawa and Winnipeg. The most prominent development was the Manulife Centre in
Midtown Toronto (Bloor/Bay), a mixed-use complex of residential, office and retail uses. During the
1980s and the eady 1990s. contrary to Me actions of other life insurance companies, Manulife's
developrnent focus shifted fiom Toronto to other cities. Manulife built office buildings in Vancouver,
Calgary, Ottawa, Halifax, Edmonton, Montreal, and St. John's. The development of Manulife Place in
Edmonton was the single largest office building developed by Manulife in Canada.
As in the case of other real estate companies and life insurance companies, this was an
attempt to capitalize on the expanding economy of Alberta in the late 1970s and early 1980s. During
the 1980s. Manulife developed a total of 2 million square feet of office space across Canada. In
addition, the company developed office buildings in the U.S., primarily in Washington DC, Los Angeles,
Chicago, and San Diego and shifted its main focus to the United States (see next section).
Following the severe recession in the early 1 9 9 0 ~ ~ Manulife decided to seIl a significant portion
of its real estate holdings. The risky nature of real estate has prornpted this move as the concentration
in real estate %as higher than we [Manulife] would like compared to the industv (Manulife Financial,
senior vice-president, Globe & Mail, April 3, 1995). The assets that Manulife sold were the smaller
office buildings in the medium-sized and smaller cities (Winnipeg, Halifax and St. John's), and smaller
buildings in the largest 'markets' (Toronto and Calgary).
Wiihin the metropolitan areas, Manulife investments in office buildings are favourably disposed
toward downtown areas. In the 1980s, the oversupply of office space in suburban markets propelled
Manulife to concentrate on 'prime' downtown opporlunities in cities with stable and divenified
economies' (Manulife Financial, 1989 Annual Report). Statistics on the value of the company's office
buildings indicate that in the 1990s (1992-99), downtown office buildings constituted on average more
than 80 percent of the value of the total office buildings in Canada owned by Manulife (Manulife
Financial, intemal company reports).
4.5 The Spatial Limitations of Real Estate Capital In conformity with the notion that the spatial reach of capital is almost without limits, Olympia 8 York is
often used as the archetypal development company employing global capital (Logan, 1993; Ghosh et
al., 1994). However, even in the case of O&Y, close links were obsenred between the places in which
capital was invested and places where the lenden were kcated. In other words, Canadian lenden
were primarily exposed to Canadian real estate properties; U.S. and Japanese lenders were
collateralized mainly by US. assets; and European banks were mainly exposed to the Canary Wharf
project (Ghosh et al., 1994, p. 11). Moreover, Olympia 8 York is an exceptional case. Most Canadian
developers acquire thek funding from domestic sources. Based on a number of case studies, it is
reasonable to suggest that Canadian banks and Canadian life insurance companies are the major
providers of debt and equity financing for office development in Canada.
Information on foreign investment is partial. However, insights gained through a careful
examination of published material and interviews with industry insiders make it reasonable to suggest
that the role of foreign capital in Canadian office development has been limited. The notion that most of
capital invested in Canadian real estate is domestic was also supported by a senior executive of a life
insurance company:
The major sources of capital are quite provincial, they [financial inçtihitions] want to lend money in the place that
they know. There is not a b t of desire of a U.S. lender to come to Canada and leam the laws of Canada, and
leam about the real estate market. When you do it, you tend to lose money. Capital tends to stick close to home.
In Canada, the role of foreign capital is very marginal. Most of the debt in this market is controlled by life
companies, pension companies and the banks" (an in te~ew wia, a VicePresident of Canadian mortgages at one
of Canada's largest life insurance cornpanies).
Preliminary findings suggest that the provision of foreign capital as debt financing for office
development projects in Canada has been moderate in size. An interview with the executive vice-
president of a major Canadian bank revealed that there are great risks in using foreign capital for real
estate development. The fact that the cash flow of an office building in Canada is in Canadian dollars
makes lending in any foreign cunency susceptible for exchange rate fluctuations. Although information
of debt financing is partial, the absence of information on significant foreign financing may suggest that
it is unusual in the case of office development. Among the largest office buildings developed in Canada
in general and in Toronto in particular, the only reported foreign capital (debt financing) was used in the
case of Place Ville Marie in Montreal, where financing was obtained from Metmpolitan Lie and Eagle
Star, a British insurance company, around 1960 (Zeckendorf, 1970, p. 179).
On the other hand, foreign direct investment for the acquisition of real estate assets and to
lesser extent the development of new structures seems to be more prevalent than foreign debt
financing. The reason for this might be that direct investment is more visible. and therefore easier to
detect than debt financing. In order to develop office buildings, foreign investors prefer joint ventures
with Canadian developers. Prudential lnsurance of America, the co-developer of the Consilium Place in
Scarborough, had a haIf interest in this project; a Toronto-based developer, Equity Development
Group, owned the other haL The Prudential Assurance Company of the United Kingdom was a partner
of lnducon in office development in Etobicoke and Mississauga (Globe & Mail, July 28, 1983; Financial
Post, September 19, f 990).
The extent of foreign participation in office development in Canada has been marginal and was
mainly through the acquisition of office buildings. Edgington (1996a, 1996b) found that among
Japanese investon in Canadian real estate, investment in office buildings between 1985 and 1992 was
scant, and it was through the acquisition of existing office buildings. In total. Japanese investon
acquired six office buildings in Canada (three in Vancouver and three in Toronto), while their main
investment was in hotels and resorts in western Canada (Edgington, 1996b. p. 26). Even when foreign
developers engage in office development in Canada. it does not necessarily mean that they utilize
foreign capital; often they may use Canadian financing.
The mortgage for the York Centre (known later as Aetna Centre) located on King and York
Streets at the heart of Toronto's Financial District (developed by Olympia & York) was provided by the
U.S.-based Prudential Insurance Company of America (Globe & Mail, January 1, 1993). However,
since Prudential lnsurance had large Canadian operations and collected prernium incomes in Canada,
it is quite possible that the mortgage funds acquired by Olympia & York were Canadian funds.
Hammerson Canada, one of the major foreign developers in Canada, used foreign capital as
construction bans (short-term financing), while long-term financing was raised in Canada (interview
witb a former president of Hammerson Canada).
In addition to Canadian real estate companies operating outside Canada. primarily in the U.S.
(see section 3.2), Canadian financial institutions were involved and still are in real estate investment in
the United States. In the boom years of the 1980s, Canadian banks provided financing for selected
office development projects in the U.S., and in the 1990s, several Canadian pension funds purchased
real estate properties in the U.S. However, the rnost active financial institutions in this field have been
life insurance companies.
Canadian life insurance companies do not limit their investments to Canadian assets, and their
real estate investments are not an exception. Des Rosiers study (1984) shows that between 1960 and
1980 the share of real estate investment by Canada's largest life insurance companies in Canadian
real estate decreased from 91 to 68 percent of their real estate investments. Data on the geographic
distribution of real estate investments is scarce for the period between 1980 to the mid-1990s;
however, detailed data on one Company, Manulife Financial, is available (Table 4.8).
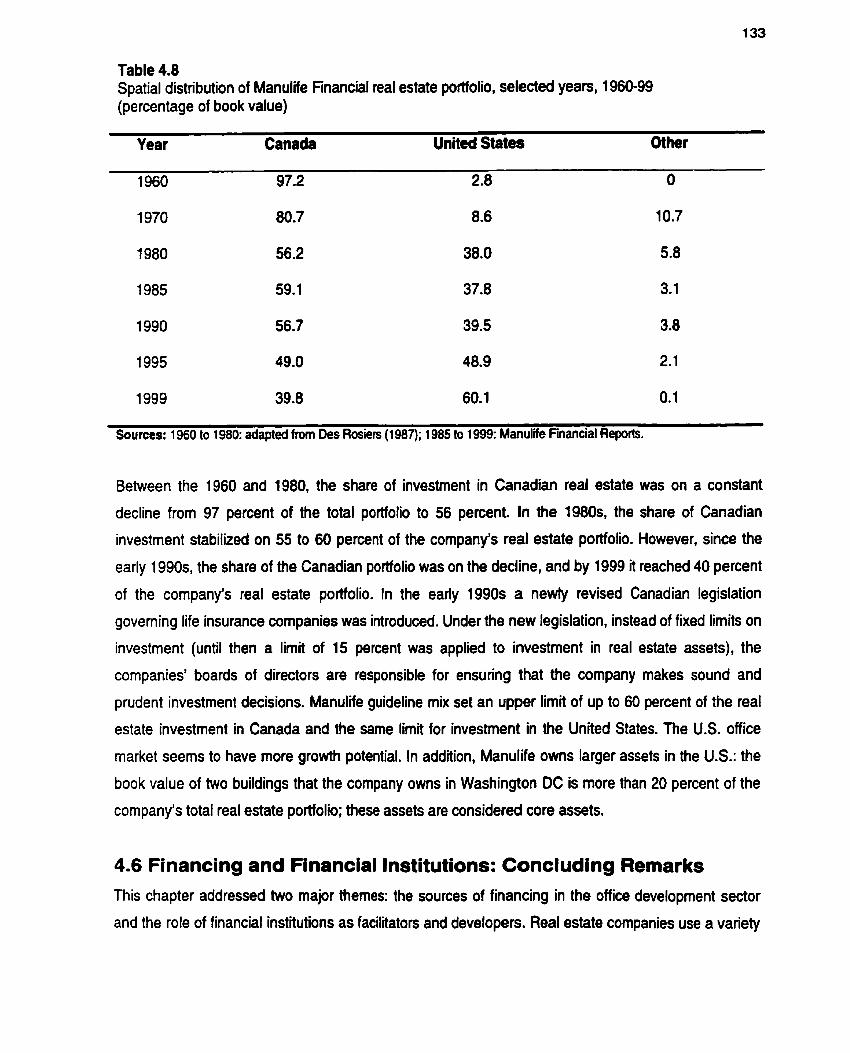
Table 4.8 Spatial distribution of Manulife Financial real estate portfolio, selected years, 1960-99 (percentage of book value)
Year Canada United States Other
1999 39.8 60.1 O. 1
Sources: 1960 to 1980: adapted from Des Rosiers (1 987); 1985 to 1999: Manuiife Fuiancial Reports.
Between the 1960 and 1980, the share of investment in Canadian real estate was on a constant
decline from 97 percent of the total portfolio to 56 percent. In the 1980s, the share of Canadian
investment stabilized on 55 to 60 percent of the company's real estate portfolio. However, since the
early 1 990s' the share of the Canadian portfolio was on the decline, and by 1999 it reached 40 percent
of the company's real estate portfolio. In the early 1990s a newly revised Canadian legislation
goveming life insurance companies was introduced. Under the new legislation, instead of fixed limits on
investment (until then a lima of 15 percent was applied to investrnent in real estate assets), the
companies' boards of directors are responsible for ensuring that the company makes sound and
prudent investment decisions. Manulife guideline mix set an upper limit of up to 60 percent of the real
estate investment in Canada and the same limit for investment in the United States. The U.S. office
market seems to have more growth potential. In addition, Manulife owns larger assets in the US.: the
book value of two buildings that the company owns in Washington DC is more than 20 percent of the
company's total real estate portfolio; these assets are considered core assets.
4.6 Financing and Financial Institutions: Concluding Remarks This chapter addressed two major themes: the sources of financing in the office development sector
and the role of financial institutions as facilitators and developers. Real estate cornpanies use a vanety
of financial sources in their office development ventures, but three sources stand out as the most
impodant ones: banks as the providen of short terni financing, life insurance companies, and pension
funds as facilitaton of long term financing. A portion of large real estate companies is able to tap
capital markets. Large cornparies are able to raise capital at magnitudes that enable participation in
large-sire projects and a large number of projects.
The participation of financial institutions in the real estate sector has two principal dimensions.
First, these institutions control large pools of capital collected from various sources, such as deposits
and premiums that are placed in their domains. This empowers them to direct investrnent into and out
of different investment channels, including real estate. The flexibility of their investments depends on
their ability to match assets and liabilities both fiscally and spatially. Institutions that control long-temi
assets tend to be more involved in real estate than institutions with short-terni assets. In the case of
short-term financing, the role of institutions is mainly to mediate the flow of capital between secton,
products and locations, ensuring the smooth flow of capital. Generally, financial institutions prefer to
lend money for office development in areas that they perceive as established office districts. However,
economic conditions and the position of the building cycle have a signifiant impact on lending
practices. In times when the real estate market experiences growth, location is perceived as a less
important issue; in this case capital is looking for opportunities without setting clear-cut spatial
limitations. Development could proceed without tenants that are committed to the project. When the
market is 'soft' financial institutions tend to be more careful, and would finance development in projects
with substantial pre-leasing.
Very little is known about the connection between financial institutions as debt providen and
real estate companies; however, more information is available on their role as equity investon or as
developers on their own account. Over the last few decades, financial institutions became increasingly
involved in real estate investment as stakeholders in real estate assets andor real estate companies.
This direct involvement is beyond their traditional role as financial intemediaries. Ownenhip of
propetties and companies, and investment in the developrnent of real estate assets, is feasible as a
result of the process of profit accumulation. Parts of these profits have been directed to real estate
investment. Owned real estate assets by Iife insurance companies (and pension funds) place them as
prominent investors in commercial real estate assets (see section 3.1.4).
The geography of real estate investment by banks and life insurance companies indicates that
their spatial practices are quite similar to those of the largest real estate companies (see Chapter Five).
In terrns of office development, these institutions focus on the largest urban centres, specifically on the
Toronto region. Recently, office buildings owned by life insurance companies located in the smaller

markets were sold to local investors, whereas life insurance campanies shifted their focus exclusively
to the major metmpolitan areas that have deep (large) markets and have better prospects of growth. At
the rnetropolitan scale, banks and life insurance companies prefer either to acquire or deveiop (with
partnen) large office buildings, typically located downtown. Hidorically, downtown locations have
provided a more secure investment. Financial institutions being risk-averse (contrary to developers who
are more likely to be risk takers) perceived downtown as a less volatile environment and as a long-term
iniestrnent (in addition, they are users of space in these locations). When suburban ventures were
initiated, they were based on opportunlies; since they are smaller in sire and less costly, they are more
tradable, and hence considered as short-tenn investments.
Although suggestions in the literature of the growing invoivement of fonign investors in local
real estate markets, this study has found littk evidence to support this argument. In the Canadian case
in general and more specificaliy in Toronto, the impact of foreign investors and foreign real estate
companies is quite modest. This finding and the strength of the Canadian real estate companies (ses
Chapter Three) support the rationale of focusing on Canadian cornpanies; this issue is addressed in
the next chapter.
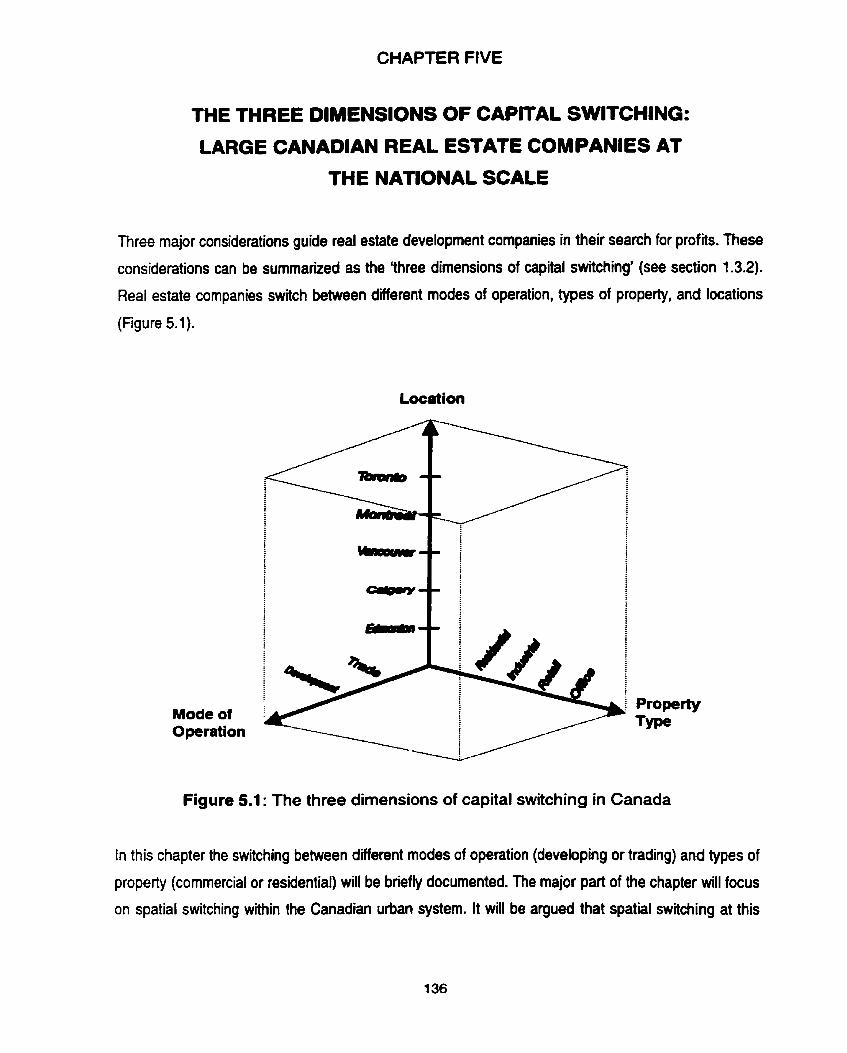
CHAPTER FIVE
THE THREE DIMENSIONS OF CAPITAL SWITCHING:
LARGE CANADIAN REAL ESTATE COMPANIES AT
THE NATIONAL SCALE
Three major considerations guide real estate development companies in their search for profits. These
considerations can be summarized as the Yhree dimensions of capital switching' (see section 1.3.2).
Real estate companies switch between different modes of operation, types of property, and locations
(Figure 5.1).
Location
Figure 5.1 : The three dimensions of capital switching in Canada
In this chapter the switching between different modes of operation (developing or trading) and types of
property (commercial or residential) will be briefly documented. The major part of the chapter will focus
on spatial switching within the Canadian urban system. It will be argued that spatial switching at this
scale is strongly related to building cycles. Thus, a major part of this chapter will explore building cycles
in Canada at the national and provincial scales. Toronto and Calgary will be examined in detail,
because they have gradually become the cities prefened by Canada's hrge real estate companies.
Large real estate companies play a major role in switching of investrnent in office buildings beîween
different cities. Also, more data is available on these large companies than on the smaller and the
purely local ones (see section 2.3.2). The practices of the largest Canadian-based real estate
companies are the focus of the following analysis. The largest real estate companies are also the most
powerful ones (Spurr, 1976; Lorimer, 1978; Feagin, 1982; Weiss, 1987; Beauregard, 1989; Feagin and
Parker, 1990). It was argued that the real estate sedor, in general, is becoming more concentrated and
centralized (Knox, 1993; Logan 1993). Evidence of this concentration has been clearly show in the
case of Canada (see section 3.1). Accordingly it is useful to scmtinize the largest real estate
cornpanies. Because of these two reasons, two publbly held companies, Trizec and Cadilhc Fairview,
will be used as case studies in order to explore spatial switching from the perspective of these
important agents.
The description of capital switching at the national or urban systems scale would ideally draw
on extensive or systematic data regarding office development measured in ternis of capital outlays,
building construction, or floor-space completed. This kind of systematic data is barely available (see
section 2.3.1). As a resuit, a combination of sources and substitute indicators are used.
Statistics Canada provides time series (1 961 -1 999) of the dollar value of office building permits
at the national and provincial levels (data at the municipal level is available upon request, although
expensive). The annual crude dollar value was then adjusted to the price index of business investment
in non-residential structures. Building permit data has two major deficiencies: not ail permits result in
immediate construction (Wheaton, 1987; Leitner, 1994), and some buildings do not get put up at ail.
However, the magnitudes of building penits and completions are "very similar, so most penits are in
fact cornpleted" (Wheaton, 1987, p. 284). Moreover, building pemits constitute a sensitive
'seismograph' of changes. Soon after there are signals of a downtum in demand, the value of building
pemits tends to diminish, while completions continue to be high; this is a result of the time iag between
the approval of the building permit to completion of construction (approximately a two-year period, in
sorne cases the time lag is much larger) that typifies office development. Since no official statistics on
building completions exist, permits are the only data source for estimating national and provincial
cycles.
Data on office space completions for specific urban centres is available from real estate
brokers who monitor the office market. The data for this study was obtained from Royal LePage
Commercial Inc. Two metropolitan areas were scnitnized in detail, Toronto and Calgary. Data for the
Toronto Census Metropolitan Area (CMA) and for Calgary from the late 1960s was obtained (1 969-99).
Between 1969 and 1978, Calgary data includes only the new supply for the downtown area, because
until the late 1970s almost al1 office construction in Calgary was there. After 1979, data on new suppfy
of office space is for the Ci of Calgary.
Data on the developen and ownen of office buildings is available primarily for the large real
estate companies (for Toronto, in comparison to Calgary, more information on local developen was
attained in the field research). Although this data is biased toward the large companies, it provides an
indication on the nature of office development since these companies account for a considerable part
of office floor-space in rnost large Canadian cities. Data sources for identifying office developen are
detailed in section 2.3.2 and section 3.4.
5.1 Switching Between Modes of Operation Real estate development companies that are entrepreneurial in their eariy phases tend to depend on
either extemal capital (debt or equity) or proceeds from previous developments (retained eamings) to
finance developments andlor acquisitions. Typically, this group of developers does not have enough
capital to hold these assets for a long period; therefore, these projeds are sold after completion to their
respective tenants or to other investon. If this type of developer is able to accumulate sufficient capital,
helshe is capable of retaining properties for the long term. Each successful development enables the
commencement of successive projects and allows the company to engage in larger projects in multiple
locations. The main goal of this type of real estate company is to build a structure and obtain the
development gain in order to use this capital for new ventures. A different type of a start-up real estate
company is a Company that has the backing of large corporations. This position permits this type of
Company to punue larger scale developments and retain the ownenhip of the properties developed
(see section 3.1.2).
For larger companies, development and the acquisition/disposition of real estate properties are
two çides of the same coin; real estate companies execute both strategies as they restructure their
holdings. In general, during uptums of the building cycle, companies prefer development over
acquisition. For example, in the office market, as demand for space rises, vacancy rates diminish and
rentai rates escalate. At the same time, the rate of transactions in existing office properties is minimal.
Consequently, development is pursued. As the market hits recession, the extent of development is
reduced. During severe recessions development is almost abandoned. Many real estate companies
and owners of properties experience financial difficutties as vacancy rates soar and rental rates plunge.
As a result, these companies are not able to sewice their debt. Hence, selected properties are put on
the market for sale, and acquisitioddisposition becomes the dominant practice in the office sector.
Two major Canadian-based real estate companies, Oxford Propecties Group, the Mth-largest
Canadian real estate company with $3.4 billion in assets in 1999 (al1 figures are in Canadian dollars),
and Cadillac Fairview Corporation, the third-largest wwi almost $5 billion, exemplify the modes of
operation used by different companies in different phases of the corporate life cycle. Oxford was
formed in 1960 as an entrepreneurial construction company in Edmonton, Alberta. In its first four years,
Oxford developed properties (rnainly office buildings) for sale, based on agreements that it concluded
prior to construction. In this early period, Oxford used the development profits of each project to initiate
its next development Later, it teamed with institutional investors (two life insurance companies and a
trust company) and this association provided the leverage needed for the development of larger sale
office buildings in multiple locations (Oxford Property Group, personal communication; Goldenberg,
1981).
The access to capital via association with powerful partners enables the pursuit of above-
average projects in ternis of complexity and size. This type of company holds certain properties for long
periods of time and uses them as collateral for future loans, and at the sarne time, as income-producing
properties. The Fairview Corporation, founded in the late 1950s, one of the predecessors of Cadillac
Fairview, was able to pursue the development of large-scale projects as a result of the backing by
'industrial capital' (in this case, the Montreal-based Seagram Distilleries). Moreover, Fairview used
partners to finance and hold its large-scale developments. Its most notable development projects were
joint ventures with powerful corporations. The Toronto-Dominion Centre in Toronto (the largest office
complex in Canada, with more than 4 million square feet) was a partnership with the Toronto-Dominion
Bank (one of the five largest Canadian banks). In two additional complexes, the Pacific Centre in
Vancouver and the Eaton Centre in Toronto, Cadillac Faiwiew teamed up with the Toronto-Dominion
Bank and what was then one of Canada's largest retailers, the T. Eaton Company (Cadillac Fairview
Corporation, various Annual Reports; Goldenberg, 1981).
Until the mid-1980s, Oxford had a balanced two-track strategy. It had developed office
buildings across Canada and in the United States, and at the same time bought and sold existing
properties. In the late 1970s, Oxford acquired one of Toronto's largest office developen, YBR
Propeities, and a large office portfolio in the U.S. By the mid-1980s, before the collapse of the office
market, Oxford had disposed of its entire U.S. portfolio as well as selected office buildings in Toronto,
including its interest in the development of one of the largest office complexes in Toronto's Financial
District, BCE Place (2.5 million square feet). Since the mid-199ûs, due to the continuous slump in the
real estate market, the injection of new capital into Oxford, and the presence of new partnen, Oxford
has adopted an aggressive acquisition strategy. In 1995, Oxford's total office portfolio was 7 million
square feet and the Company's assets were $430 million (Oxford Properties Group, 1995 Annual
Report). By 1999, Oxford's office portfolio had more than tripled to 24 million square feet and its asseh
had increased eight-fold to $3.4 billion (Oxford Properties Group, 1999 Annual Report). Unlike
Oxford's, Cadillac Fairview's focus in the 1970s and 1980s was on development; during this period,
Cadillac Fairview developed office buildings; the acquisition of existing buildings was a less important
component in the Company's strategy. However, during the period when the office market was
depressed in the 1990s. Cadillac Fairview, as did al1 other Canadian-based real estate companies,
shifted its mode of operation from development to acquisition and disposition (Cadillac Fairview
Corporation, 1 997, 1 998 Annual Repo~s).
Real estate companies engage sirnultaneously in the development and trade of office
buildings. The balance between development and trade depends of the position of the building cycle at
that tirne and the financial strength of the real estate company. Different phases in the building cycle
generate distinct responses by real estate companies and the financial strength which depends on the
stage in the life cycle of the real estate company and its business partners, determine the configuration
of the company's mode of operation.
5.2 Switching Between Property Types Major shifts between property types as executed by selected large real estate companies are
presented in Table 5.1. Wihin the real estate sector, the development of residential properties in the
1960s and 1970s constituted a substantial share of the activities of many diversified (engaged in
residential and commercial development) real estate companies in Canada.
Some of the major real estate companies trace their origins to residential development.
Cadillac Developrnent Corporation was mainly a residential developer until the merger with Fairview in
1974; Campeau Corporation started its real estate business as a home-builder and was prirnarily a
residential developer until the late 1970s; and Bramalea, originally a residential developer, expanded
into commercial real estate in the early 1980s (Annual Reports of these cornpanies). However,
beginning in the early 1980s. residential development was perceived as pmblematic among divenified
real estate development companies. Residential developrnent. particularly apartment buildings, meant
potential friction with muitiple tenants in a highly regulated environment. In contrast, commercial
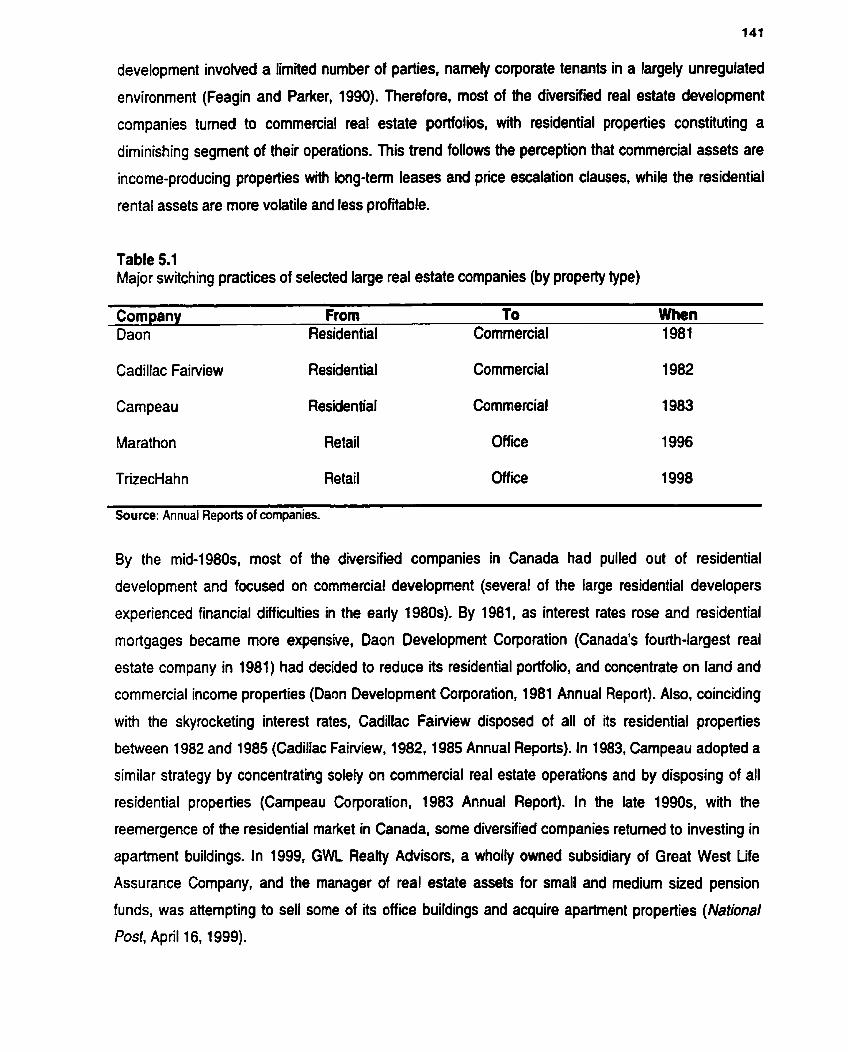
developrnent invotved a limited number of parties, namely corporate tenants in a largely unregulated
environment (Feagin and Parker, 1990). Therefore, most of the divenifed real estate development
companies tumed to commercial real estate portfolios, with residential propecties constituting a
diminishing segment of their operations. This trend follows the perception that commercial assets are
incorne-producing propeities with long-terni leases and price escalation clauses, while the residential
rental assets are more volatile and less profitable.
Table 5.1 Major switching practices of selected large real estate companies (by property type)
Company From To When Daon Residentiat Commercial 1981
Cadillac Fairview Residential Commercial 1982
Campeau Residential Commercial 1 983
Marathon Retail Office 1 996
TrizecHahn Retail Office 1998
Source: Annuai Reports of companies.
By the mid-1980s, most of the divenified cornpanies in Canada had pulled out of residential
development and focused on commercial development (several of the large residential developers
experienced financial difficulties in the early 1980s). By 1981, as interest rates rose and residential
mortgages becarne more expensive, Daon Developrnent Corporation (Canada's fourai-largest real
estate cornpany in 1981) had decided to reduce its residential portfolio, and concentrate on land and
commercial income properties (Dam Development Corporation, 1981 Annual Report). Also, coinciding
with the skyrocketing interest rates, Cadillac Fairview disposed of al1 of its residential properties
between 1982 and 1985 (Cadillac Fairview, 1982,1985 Annual Reports). In 1983, Campeau adopted a
similar strategy by concentrating solely on commercial real estate operations and by disposing of al1
residential propeities (Campeau Corporation, 1983 Annual Report). In the late 1 9 9 0 ~ ~ with the
reemergence of the residential market in Canada, some diversified companies retumed to investing in
apartment buildings. In 1999, GWL Realty Advison, a wholly owned subsidiary of Great West Life
Assurance Company, and the manager of real estate assets for small and medium sized pension
funds, was attempting to sel1 some of its office buildings and acquire apartment properties (National
Posi, April 16, 1999).
Capital switching practices are not confined to shifting properties between the residential and
the commercial realms; capital redeployrnent is likely to occur within the commercial domain too. In
1998, the Canadian-based real estate Company TrizecHahn Corporation sold its entire U.S. retail
portfolio for $2.6-billion (U.S.) and re-deployed the proceedings in office properties (20 million square
feet in the U.S. and six million in Canada), expecting to increase significantly its return on eguity.
TrizecHahn's strategy was '... to rotate your capital to seIl out of lower-growth assets and buy into
hig her-growth ones" (TrizecHahn Corporation, 1 998 Annual Report, p. 5). TrizecHahn initially tried to
maximize the revenue stream from its shopping centre portfolio. However, as slow growth in retail sales
and ever-increasing competition among retailen made it difficutt to generate above-average retums,
TrizecHahn decided to sel1 its entire retail portfolio (TrizecHahn Corporation, 1998 Annual Report). The
concurrent buying of office buildings was also advantageous for tax reasons. Under U.S. tax law,
TrizecHahn had to reinvest those proceeds in the U.S. or pay capital gains taxes (Globe & Mail,
September 4, 1998). This financial 'juggling' illustrates the tradability of real estate properties and the
benefits that accrue from capital switching and tax laws. In eady 2000, TrizecHahn revealed a plan for
another round of restructuring. The depressed Canadian real estate stock prices and its own
depressed share price (TrizecHahn's stock pnce was trading at a 45 percent discount to the company's
net asset value) were considered as the prime incentive for an anticipated sweeping restructuring. In
June 2000 TrizecHahn sold the majority of its Canadian office portfolio (1 1 million square feet) totaling
$1.7 billion. The proceeds will be used to buy the Company's shares, and to invest in technology
ventures (TrizecHahn Corporation, Press Release, June 8,2000).
Another type of capital switching occurs not strictly between types of properties but between
properties of different age. Real estate companies tend to rotate capital within their portfolios by
upgrading their holdings. This practice invoives the construction of new buildings and shifting tenants
frorn their old premises to the newer buildings. Some office space users retain long-terni relationships
with their space providers (the real estate companies). These close relationships enable real estate
developers to build a new building knowing that they will be able to relocate tenants to the new
develapment. This practice is either a nsuit of the tenant's growing space needs that cannot be
accommodated within their old office premises or a result of inducements made by the developer. This
practice enables real estate companies to retain development gains and at the same time increase the
rental stream, since newer buildings command higher rents than older ones. In addition, real estate
companies prefer to own highquality pmperties. The highest quality properlies in the office-building
sector are class 'A' buildings. Over the long fun, cbssA office buildings experience lower vacancy
rates, and are therefore more resistant to slumps in rental income than lower quality buildings. Hence,
these highqualw properties are obtained eîther through development or acquisition.
Despite its recent transformation in the mid-1990~~ Cadillac Fairview retained ownenhip of its
flagship projects: the Pacific Centre in Vancouver and both the Toronto-Dominion Centre and the Eaton
Centre in Toronto. These constiMed its core portfolio. At the same time, Cadillac Fairview disposed of
most of its srnaller, older, and freestanding office buildings (Cadillac Fairview Corporation, vanous
Annual Reports). However, seiected office buildings, usually large-scale, are upgraded through
continuous investment. Although the fint tower of the Toronto-Dominion Centre was completed in
1967, it is still classlied as class-A building as a result of renovations made by the ownen (Cadillac
Fairview and the Toronto-Dominion Bank). This process of upgrading the Toronto-Dominion Centre has
been pursued to keep tenants from moving to newer buildings in Toronto's Financial District. The
importance of flagship properties was shown in one of the largest real estate transactions in Canada. In
the second haff of 1999, the Royal Bank of Canada sold its real estate portfolio as a package. This
included the Bank's head office building in Toronto and a large number of small-to medium-sized
buildings spread across Canada. fhe main attraction to acguire the whole package was the Bank's
'gold-towered' head office complex in Toronto's Financial District. The capital value of the head office
cornplex was over one-han of the total package, and it is 'one of Toronto's most distinctive office
towers, instantly recognizable on the city's skyline" (Toronto Star, Septernber 23, 1999, D4). This
distinctiveness was padayed into higher rents and capital gains. Also in 1999, 08Y Properties
Corporation purchased the remaining 70 percent interest of the company's flagship, First Canadian
Place (before it owned 30 percent interest). This purchase was made possible in part as a result of the
disposition of interest in a smaller North York office building. O&Y acquired 51 percent interest in the
North York office building in 1997; the Company raised the building's occupancy and increased retum
on investment. Two years later, in 1999, it realized the gains and reinvested the proceeds in First
Canadian Place (OBY Properties Corporation, 2000 Annual Report).
The largest and the most distinctive office buildings are assets that real estate cornpanies
prefer to keep. These companies dispose of propeities that they consider noncore, meaning that they
produce less retum on capital and focus of the larger buildings which have better financial prospects.
This philosophy is summarized in the strategy of 08Y Properties Corporation: "enhance value, realize
capital appreciation and then redeploy the capital into new growth-oriented investrnent opportunities"
(O&Y Properties Corporation, 2000 Annual Report, p. 27).

5.3 Switching Between Locations at the National Scale The spatial configuration of o f f i porîfolios controlled by Canada's largest real estate companies
during the last 25 years shows a continuous supremacy of the top-level cities of the Canadian urban
systern (Table 5.2). However, within the set of top-level cities, major shifts ocwrred over this 25-year
time period.
Table 5.2 The largest owners of office space by the location of their Canadian office portfolio, selected yean, 1975-99 (percentage)
Year Toronto Calgary Montreal Vancouver Edmonton Ottawa Topsix share
. . -- - . .
Notes: In 1999, the largest Canadian-based owners of ofiice buildings owned about 100 million square feet of office space. The largest real estate companies by their Canadian office portfolio: In 1975: Trizec Corporation, Olympia 8 York Developments, Cadillac F a i ~ e w Corporation. Oxford Developrnent Group, Campeau Corporation, Manufacture6 Life, Marathon Reatty, MEPC, and YBR Properties. In 1982: Trizec, Olympia 8 York, Cadillac Faiwiew, Oxford, Campeau, Marathon, Manufactures Life, Daon Development Corporation, Bramalea Limited, and Hammerson Canada. In 1989: Trizec, Olympia 8 York, Cadillac Fainriew, Oxford, Campeau, Marathun, Bramalea, Manufacturers Life, Hammerson, BCED Development Corporation. In 1999: TrizecHahn Corporation, Cadillac Fainiew, Oxford Properties Group, Brwkfield Properties Corporation, O&Y Properties, ClBC Development Corporation, Manulife Financial, BentaIl Corporation, H&R REIT, Canadian Real Estate lnvestment Fund No. t (GWL Reaity Advisors), and Dundee Realty Corporation. Sources: Real estate companies' Annual Reports. For Olympia 8 York Goldenberg, 1981; biographies and varbus newspaper articles.
In 1975, the two large concentrations of office portfolios controlled by the largest companies were in
Toronto and Montreal; almost 57 percent of the office portfolio was in these two Census Metropolitan
Areas. By 1982, Calgary and Edmonton's share had more than doubled from 11 percent of the
portfolios of the large real estate companies in 1975 to 25 percent (Table 5.2). Correspondingly, the
share of Toronto and Montreal had decreased to 47 percent of the companies' portfolios, with Montreal
showing a particulariy steep drop in its share. After 1982, Calgary's share has remained at a constant
level, while Toronto's share has increased substantially. During the mid-to-late 1 980s, substantial office
development occurred in Toronto; between 1982 and 1989 Toronto's share had increased from 35 to

almost 43 percent of the companies' portfolios, while the shares of other cities, except for Edmonton,
had decreased. Economic growth and massive office construction in Toronto in the 1980s, and a
gradua1 econornic recovery in the second hatf of the 1990s have reinforced its position as the most
attractive location for the largest real estate companies. Toronto's share has continued to increase and
by 1999, almost 46 percent of the largest companies' portfolios were in Toronto. Ottawa's share has
decreased sharply in the 1990s (as a resuit of the demise of two of the largest real estate companies
with substantial office holdings in Ottawa, Olympia & York Developments and Campeau Corporation)
while the shares of other cities have remained relatively stable.
The analysis of the office portfolios of the largest real estate companies shows that their
strategies are a result of surfacing opportunities during the different local building cycles and the
strategy by real estate companies to create a critical mass in selected locations. Successful real estate
developers are able to identify and take advantage of these opportunities by shifting some of their
resources to the fast-growing regions, without ignoring their well-established investment nodes.
Locations that present unsatisfactory performance (relatively low retum on capital) are susceptible to
withdrawal or reduction of their share in the large real estate companies' portfolios. This leads to the
channeling of resources to places that are expected to produce high growth rates and higher retum on
capital than slower growing places. Nevertheless, where a channel is initiated and a critical threshold is
reached, existing investment acts as a magnet attracting fuither investrnent, perpetuating the
attractiveness of that setting (capital attracts capital, a process articulated in cumulative causation
theory, see Myrdal, 1957; Clark et al., 1986). Thus, when a Company establishes a 'presence' in a city
it is bound to stay in that location even if circumstances change, for example, a downtum in the building
cycle. Therefore real estate companies juggle between seizing expected opportunities by moving
elsewhere, and taking full advantage of present conditions by staying in their farniliar environments.
Buildinq cycles reflect structural conditions which are in fact the sum of cumulative actions of space
users and providers. They are used as a heuristic device that might exptain the switching practices of
real estate cornpanies.
5.3.1 The geography of office building cycles in Canada
Research on the geography of office building cycles in Canada is practically non-existent; however,
inspiration can be drawn from other studies. Leitner's study (1994) on office building cycles in major
U.S. rnetropolitan areas indicates spatial divergence between cities. Henneberryls investigation of
British cycles (1 999) suggests spatial convergence between different regions. Except for using different
time frames, different spatial scales and different financial indicators, the basic distinction between the
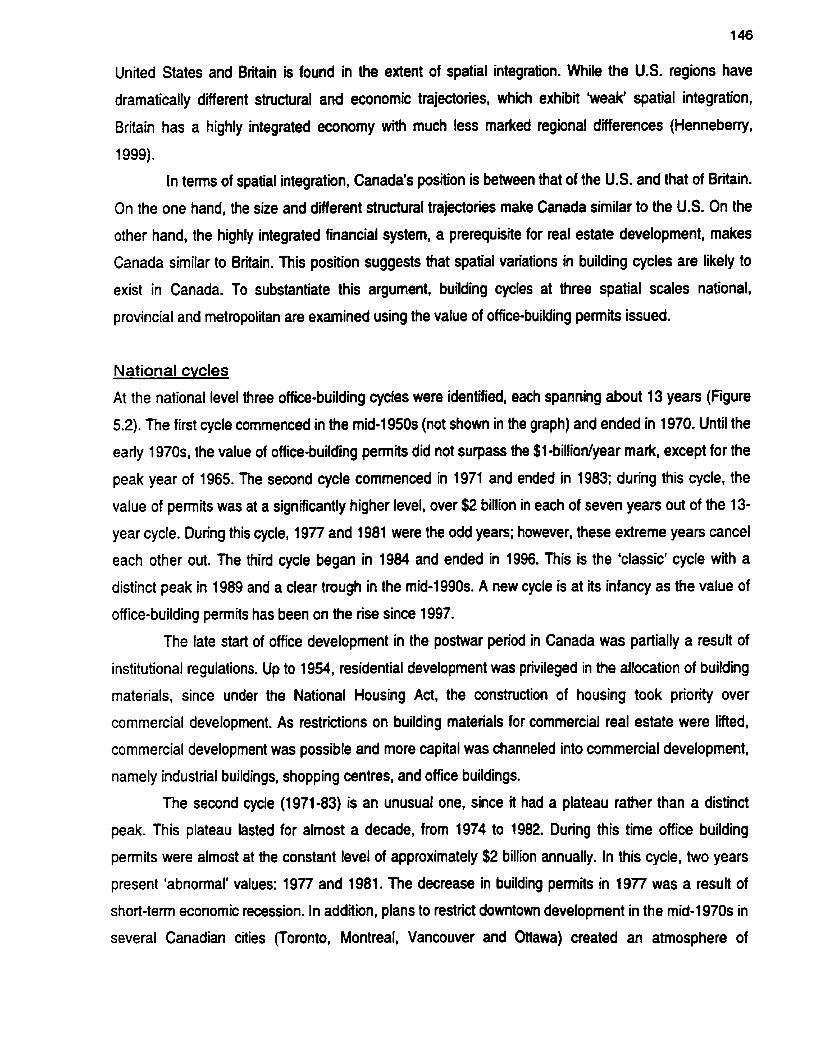
United States and Britain is found in the extent of spatial integration. While the U.S. regions have
dramatically different structural and economic trajectories, which exhibit 'weak' spatial integration,
Britain has a highly htegrated economy with much less marked regional differences (Hennebeny,
1999).
In ternis of spatial integration, Canada's position is between that of the U.S. and that of Britain.
On the one hand, the size and different structural trajectories rnake Canada similar to the U.S. On the
other hand, the highly integrated financial system, a prerequisite for real estate development, makes
Canada similar to Britain. This position suggests that spatial variations in building cycles are likely to
exist in Canada. To substantiate this argument, building cycles at three spatial scales national,
provincial and metropolitan are examined using the value of office-building pemits issued.
National cycles
At the national level three office-building cycles were identified, each spanning about 13 years (Figure
5.2). The first cycle commenced in the rnid-1950s (not shown in the graph) and ended in 1970. Until the
early 1970s, the value of office-building penits did not surpass the $1-billiodyear mark, except for the
peak year of 1965. The second cycle commenced in 1971 and ended in 1983; during this cycle. the
value of penits was at a significantly higher level, over $2 billion in each of seven years out of the 13-
year cycle. During this cycle, 1977 and 1981 were the odd yean; however, these extreme years cancel
each other out. The third cycle began in 1984 and ended in 1996. This is the 'classic' cycle with a
distinct peak in 1989 and a clear trough in the mid-1990s. A new cycle is at its infancy as the value of
office-building pemits has been on the rise since 1997.
The late stait of office development in the postwar period in Canada was partially a result of
institutional regulations. Up to 1954, residential development was privileged in the allocation of building
materials, since under the National Housing Act, the construction of housing took priority over
cornmerciai development. As restrictions on building materials for commercial real estate were lifted,
commercial development was possible and more capital was channeled into c~mmercial development,
namely industrial buildings, shopping centres, and office buildings.
The second cycle (1971-83) is an unusual one, since it had a plateau rather than a distinct
peak. This plateau lasted for almost a decade, from 1974 to 1982. During this time office building
perrnits were almost at the constant level of approximately $2 billion annually. In this cycle, two years
present 'abnormal' values: 1977 and 1981. The decrease in building perrnits in 1977 was a result of
short-terni econornic recession. In addition, plans ta restrict downtown developrnent in the mid-1970s in
several Canadian cities (Toronto, Montreal, Vancouver and Ottawa) created an atmosphere of

uncertainty among real estate companies (Canadian Buildng, August, 1974; August. 1976). The
increase in office building pennits in 1981 paralleled the oil and gas boom in Albeila, resulang in an
unprecedented volume of building pemits in that province. In general, the rapid growth of producer
services jobs (FIRE and business services) during the 1970s, which are housed primarily in office
buildings, had encouraged the development of office space. Between 1971 and 1981 employment in
producer services had increased by 91 percent; at the same time, total employment in Canada
increased by less than 47 percent (Coffey, l996a). In addition, in the 1970s, the Canadian commercial
real estate industry had been consolidated, and Canadian-based real estate companies expanded their
operations at home and abroad (Goldenberg, 1981; see section 3.1.3).
Figure 5.2 Value of Office ~uilding Permits in Canada (constant dollars)
Soum: StabQtics Canada. B u W i pennik, Catalogue No. 64-203; for 1998-99. Statistics Canada. CANSIM Matrix No. 4073.
The third cycle (1984-96) reflects most clearly the expansion and contraction of the economy. Until the
late 1980s, the Canadian economy was expanding; employment in producer services increased by
more than 40 percent in the 1980s; in cornparison, total employrnent increased by less than 20 percent
(Coffey, 1996a). A severe economic recession in the early 1990s coupled with an oveaupply of office
space corning to the market (a resutt of speculative development), had resulted in the near collapse of
office development by the mid-1990s. In 1996, the bottom year of this cycle, the dollar value of office-
building pemits in Canada was at the sarne level as thirty yeaa earlier. Since 1997 office development
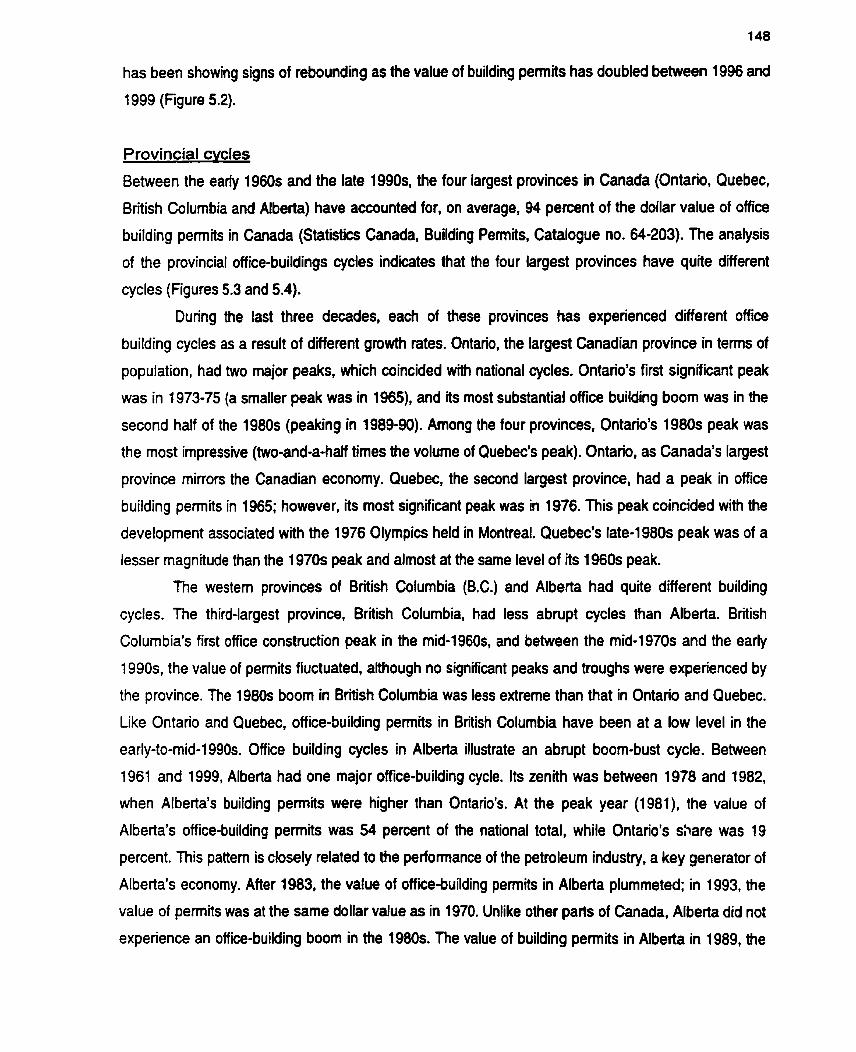
has been showing signs of rebounding as the value of building permits has doubled between 1996 and
1999 (Figure 5.2).
Provincial cvcles
Between the eariy 1960s and the late 1990s1 the four largest provinces in Canada (Ontario, Quebec,
British Columbia and Alberta) have accounted for, on average, 94 percent of the dollar value of office
building pemits in Canada (Statistics Canada, Building Permits, Catalogue no. 64-203). The analysis
of the provincial officobuildings cycles indicates that the four largest provinces have quite different
cycles (Figures 5.3 and 5.4).
During the last three decades. each of these provinces has expenenced different office
building cycles as a result of different growth rates. Ontario, the largest Canadian province in terms of
population, had two major peaks, which coincided with national cycles. Ontario's first significant peak
was in 1973-75 (a smaller peak was in 1965), and its most substantial office building boom was in the
second half of the 1980s (peaking in 1989-90). Among the four provinces. Ontario's 1980s peak was
the most impressive (two-and-a-half times the volume of Quebec's peak). Ontario. as Canada's largest
province mirron the Canadian econorny. Quebec, the second largest province, had a peak in office
building pemits in 1965; however, its most significant peak was in 1976. This peak coincided with the
development associated with the 1976 Olympics held in Montreal. Quebec's late-1980s peak was of a
lesser magnitude than the 1970s peak and almost at the same level of its 1960s peak.
The western provinces of British Columbia (B.C.) and Alberta had quite different building
cycles. The third-largest province, British Columbia, had less abrupt cycles than Alberta. British
Columbia's first office construction peak in the mid-1960s, and between the mid-1970s and the early
1990s, the value of permits fluctuated, atthough no significant peaks and troughs were experienced by
the province. The 1980s boom in British Columbia was less extreme than that in Ontario and Quebec.
Like Ontario and Quebec, office-building permits in British Columbia have been at a low level in the
early-to-mid-1990s. Office building cycles in Alberta illustrate an abrupt boom-bust cycle. Between
1961 and 1999, Alberta had one major office-building cycle. Its zenith was between 1978 and 1982,
when Alberta's building permits were higher than Ontario's. At the peak year (1981), the value of
Alberta's office-building permits was 54 percent of the national total, while Ontario's share was 19
percent. This pattern is closely related to the performance of the petroleum industry, a key generator of
Alberta's economy. After 1983, the value of office-building permits in Alberta plummeted; in 1993, the
value of permits was at the same dollar value as in 1970. Unlike other parts of Canada, Alberta did not
experience an off ice-building boom in the 1980s. The value of building permits in Alberta in 1989, the
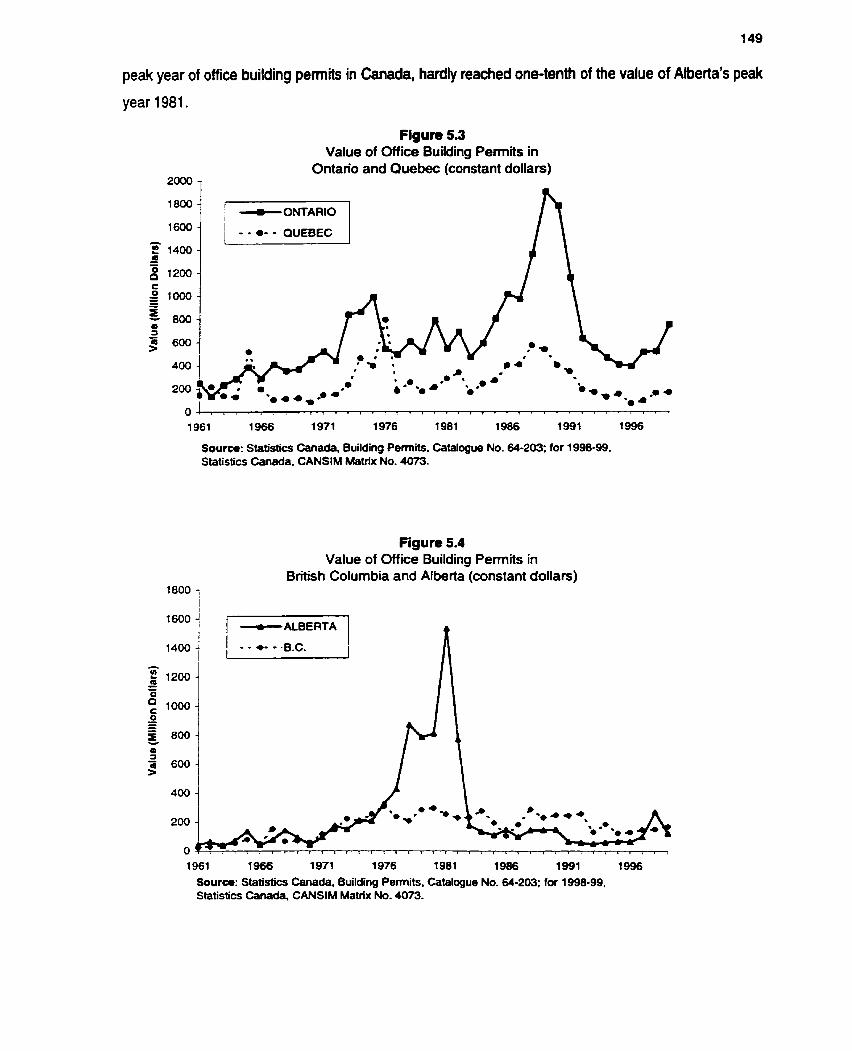
peak year of office building pemits in Canada, hardly reached one-tenth of the value of Alberta's peak
year 1 981 .
Figure 5.3 Value of Office Building Permits in
Ontario and Quebec (constant dollars)
O N T A R I O
- - *- - QUEBEC
Source: Statistics Canada, Building Permits, Catalogue No. 64-203; for 1998-99. Statistics Canada, CANSIM Matrix No. 4073.
Figure 5.4 Value of Office Building Permits in
BrÏtish Columbia and Alberta (constant dollars)
1961 1966 1971 1976 1981 1986 1991 1 9% Sourœ: Statisücs Canada. Building Permits. Catalogue No. 64-203; for 1998-99, Statistics Canada, CANSIM Matrix No. 4073.

The cunent building cycle, the fouith cycle, which commenced in 1997, is still a rather suggestive one.
There are indications that a new cycle might be undemiay in al1 provinces. Ontario and Quebec are
experiencing their highest increase in offiie building permits in companson to the 1996 trough; British
Columbia is on a steady expansion route since 1995, and Alberta had a sharp increase in 1998
followed by a fall in 1999.
Office building cycles experienced by these four provinces suggest that different 'engines'
shape the Canadian economy at its regional scale and as resuit convergence and divergence pattems
are discemible. Two major metropolitan areas, Toronto and Calgary, epitornize these patterns.
5.3.2 Office building cycles in Toronto and Calgary
Different provincial cycles are demonstrated by distinct inter-metropolitan cycles. As suggested by
Leitner (1994), individual clies are affected by and partmpate in national building cycles because
"...location, that is, site and situation, charactenstics, remains an important factor in influencing the
construction activity" (p. 799). The manageability and the complexity of the office development sector
and the national scope of the large real estate companies make the Canadian case an excellent
candidate for research. The examination of two cities (Toronto and Calgary) in isolation from the
broader Canadian context, assuming that these cities are the onfy alternatives the large real estate
companies consider, might be misleading. When the large na1 estate companies search for
opportunities they scrutinize the Canadian arena as a whole, and since the mid-1970s. the US. market
has been incorporated into their considerations. However, even for these companies space is not
limitless and initial investment in a specific market attracts further investment to that market. In this
case Toronto and Calgary were already major investrnent arenas for the two real estate companies
discussed in this study, Trizec Corporation and Cadillac FaiMew Corporation, before the
commencement of the 1970s and 1 980s building cycles. In addition, during the 1 970s and the 1980s
large real estate companies had a clear preference towards investment in office buildings in Toronto
and Calgary (Table 5.2). This, and the fact that obtaining deep knowledge of al1 major Canadian cities
is beyond the scope of this study, makes these two cities the subject of this inquiry.
An analysis based on the additions of office space in Toronto and Calgary since the late 1960s
suggests three distinct pattems of office development (Figure 5.5). During the first decade, 1969-78,
there was a big difference in absolute tenns between Toronto and Calgary. While Toronto had
additions rneasured in millions of square feet, Calgary's additions were measured in hundreds of
thousands for most of this penod. Ako, their cyclical pattems seern to be opposite; for example, while
Toronto experienced a boom in 1971 -72, Calgary additions were at low levels. For a short time in the
151
late 1970s and eariy 1980s (1 979-82). both cSes exhibited similar patterns and the magnitude of office
construction was almost at par; during 1980-82, Calgary had more additions of ofiice space than
Toronto. However, between 1983 and 1992, the building patterns of Toronto and Calgary had diverged.
Toronto had experienced continuous growth in office space and a major expansion between 1985 and
1991. On the other hand, Calgary's office development was on a minute scale throughout the 1980s,
except for an addition of three large-scale office buildings in 1988 (Financial Post, September 20,
Figure 5.5 Net New Supply of Office Space in Toronto and Calgary
-2000 i Note: For Toronto. net new supply for the CMA~ for Calgary, new supply for the downtown area (1 969-1 978) and for the city (1979-1 999). Source: Royal LePage, Toronto Office Leasing Directory, various years; Royal LePage, Unpublished data. Urban Life Consultants (1 979) Location of Office Employrnent in Calgary.
This analysis shows that Calgary's building cycles are very abrupt, reaching their unprecedented peak
during the early 1980s when in a four-year period its office stock increased more than threefold, later
experiencing only modest growth (Table 5.3). The growth of office space in Toronto was less dramatic,
although between 1981 and 1991 its office inventory had almost doubled. Beginning in the early 1990s,
Toronto has joined Calgaty in experiencing a long period of stagnation (Toronto even experienced an
absolute decline in office stock, see Figure 5.5). In the late 1990s, particularly in 1998-99, both markets
have been showing signs of recovery. In Calgary a number of major office buildings are expected to be

completed in 2000-1 (Globe & Mail, August 3, 1999). In Toronto, construction is also on the horizon
and is proceeding at a faidy rapid pace in several suburban municipalities (Daily Commercial News,
October 1, 1 999).
Table 5.3 The growth of office space in Toronto and Calgary, selected yean, 1978-99 ('000 square feet)
Year Office space Growth of office Offie space Growth of office space (1 97W00) space (1 978=100)
1978 60,352 100.0 8,400 100.0
Sources: Royal LePage, Toronto Office Leasing Directory, various years; Royal LePage, unpublished data; Financial Times, October 25,1982, p. Ag.
Toronto and Calgary are major destinations for investment in office buildings in Canada. Toronto's size
and econornic divers* and Calgary's economic vibrancy and spectacular growth have prompted the
perception amongst real estate companies that these two cities are attractive places for real estate
investrnent. Toronto is the prime location of the largest companies in Canada; measured by total assets
in 1989, alrnost 48 percent of the Canadian headquarters of financial corporations and 44 percent of
non-financial corporations (service, manufacturing, and resource) were in Toronto (Semple, 1 996). This
figure is much higher than Toronto's share in Canada's total service sector employrnent (1 6 percent) or
its share in producer service employment, of 26 percent of Canada's total (Coffey, 1996b). Toronto's
prime role in the Canadian economy is also demonstrated by the fact that in 1998, 193 out of the
largest 500 Canadian corporations had their headquarten in the Toronto metropolitan area (Financial
Post Magazine, 1999).
Calgary's growth has been more cyclical; the predominance of the oil and gas sectors has
fumished Calgary with a high profile status among real estate investon. However, this dependency has
also made Calgary highly susceptible to the fluctuations of oil and gas prices. The extreme

dependence on the energy sector is reflected in the fact that between 70 to 80 percent of the office
space is leased to energy-related fimis, either oil and gas companies or engineering and gas services
companies (National Post, Febniary 10, 1999; Globe & Mail,, August 3, 1999). Like its counterpart in
the U.S. Energy Comdor, Houston, Texas (Feagin, 1987), Calgary has experienced exbeme boom and
bust in office construction cycles. This cyclical nature is directly linked to the volatile character of an oil-
based economy.
Buildinas cycles and office d e v e i o ~ e r s in Toronto
The most recent boom in office development in Canada, during the 1980s, was unique in the history of
office development in Canada. First, the absolute magnitude of developrnent was unprecedented.
Second, unlike in previous cycles, this boom-bust cycle was the most extreme, ffling into the classical
model of buildings cycles. Finally, information on this cycle and the developen that took part in it are
more accessible. In this boom, Toronto attracted developen that had no history of constructing office
buildings in Toronto. Real estate companies of al1 sizes had seized the opportunity of the
unprecedented boom, ranging from small and medium-sized companies to large companies. Minto
Developrnents, one of the largest homebuilders in Ottawa, completed its sole office development in
downtown Toronto in 1989. This move fitted the Company's decision to divenify away from its Ottawa
base (Financial Post, July 17, 1989); in addition, it was clearly supported by the growth of Toronto's
office market in that period. The Centennial Group of Cornpanies, a Halifax-based real estate company,
was active only in Atlantic Canada until the rnid 1980s. In the mid 1980s, the company diversified into
Toronto by building a suite-hotel and an office building, both in Toronto's Financial District (Canadian
Building, 1 988, 1 989).
In the mid-to-late 1980s, real estate cbmpanies specializing in particular regions re-allocated
their resources making holdings in Toronto a significant portion of their portfolios. Unti! the mid-1980s.
the ovemhelming majonty of Campeau's office buildings was in the Ottawa area (in 1984. almost 80
percent of its Canadian portfolio); no major development was outside Ottawa. By 1989, 56 percent of
its portfolio was in Ottawa and 30 percent in Toronto (the remainder was in Montreal, Vancouver and
Edmonton). During the 1980s, Campeau's strategy was to explore potential growth markets:
"Strategically, the Corporation has sought to attain a more dominant position in selected growth
markets rather than competing in centres all across the nationw (Carnpeau Corporation, 1980 Annual
Report, p. 3). In accordance with this strategy it expanded into two major Canadian cities: Toronto and
Vancouver (Campeau Corporation, 1982, 1988 Annual Reports). The commencement of its most
ambitious project, Scotia Plata (part of the head office complex of the Bank of Nova Scotia; the Bank
was also the joint venture partner in this project) in Toronto's Financial District in the mid-1980s.
upgraded Campeau to the league of the Iargest real estate companies. It progressed fmm a residential
developer to niche developer (mainly engaged in the construction of office buildings for the federal
govemment) and to a divenified real estate corporation. Until1981, Daon Development Corporation (in
1985 acquired by Bell Canada Enterprises and with its name changed to BCE Development
Corporation, or BCED) was active mainiy in Western Canada and the U.S. (Daon Development
Corporation, 1981 Annual Report). By the mid-1980s, BCED had identified Toronto as the only market
in Canada for office buildings (Globe & Mail, Febniary 22, 1986). The choice of Toronto as the best
Canadian office market by BCED resulted in the commencement of its largest office development in
Toronto. In 1984, BCED and Oxford Development Gmup announced a joint venture to develop BCE
Place in Toronto, a 2.5-million square feet office complex (Globe 6 Mail, March 13, 1986). In 1986,
Oxford sold its share in the BCE development site to BCED (BCE Place was completed in 1992). In
addition to the interest in downtown Toronto, BCED had purchased a site in the Mississauga City
Centre in 1985 for long-term deveiopment of one million square feet of office space after outbidding the
Cadiliac Fairview Corporation (Globe 8 Mail, October 3, 1985).
At the same time, foreign investon had partially redeployed their capital within the Canadian
urban system by shifting their interests from other Canadian cities to Toronto. The fint office
development of Hammerson (Canada) was in Calgary in the late 1960s. By 1982 Hammerson had
completed a four-building compkx in Calgary (Bow Valley Square) and was ready to go ahead with
another tower. The design for the fiih tower cornrnenced in late 1981, but as a result of the 1982
recession, development was put on hold. However, h i l e postponing the development of the f i ih tower
in Calgary, Hammerson had completed an office building in Toronto in 1983 (Hammerson's first office
building in Toronto was redeveloped in 1971). Hammerson's involvement in the Toronto area
continued in 1984. when it acquired a large property portfolio in Mississauga, which included 180 acres
of land, four office buildings and a sizable shopping centre (Square One).
During the 1990s real estate slump, companies largely abandoned office development,
disposed of their noncore properties, and focused on their most valuable assets. Marathon Reaîty, the
real estate am of Canadian Paclic Railways, has tumed itseif into a Company that focused on
downtown office buildings in the early 1990s (Globe di Mail, March 4, 1996). Behveen 1993 and 1996,
Marathon was in suivival mode seiling shopping centres, office buildings, and land to reduce its debt.
The transformation has left Marathon with 4.8 million square feet of office space in 1995, about one-
half of its portfolio size in the peak year, 1993 (Marathon Realty, 1993, 1995 Annual Reports). The

result was a set of highquality, large-sale office buildings located in Toronto, Montreal and
Vancouver.
Buildina cycles and office develo~ers in Calaaw
Calgary has the largest office inventory in Westem Canada; in 1999 it had 42 million square feet, 7
million more than Vancouver (35 million) and twice as much as Edmonton, which had the second
largest office inventory in Alberta (Royal LePage, 1999). Most of Calgary's office stock was built during
the econornic boom (oil and gas driven) of the late 1970s and the early 1980s. Between 1978 and
1982, the golden era of real estate development in Alberta, Calgary's office stock experienced a
phenomenal growth. The growth was so immense that in 1981, the peak year in Calgary's office
building boom, the value of office building permits was the second largest in North America, exceeded
only by New York (Whitehead, 1987). The overwhelming confidence in Calgary's pmspenty was
illustrated in the planning of a 75-story office building in the early 1980s (Trade and Commerce, August
1981). This building, scheduled for a 1984 completion, was the 'victim' of the early 1980s recession
that hit Calgary in 1982.
During its burst of growth, a total of 22.5 million square feet of new office space was added to
Calgary's inventory, more than tripling its 1978 inventory (Royal LePage, unpublished data). In
cornparison, between 1986 and 1991 (the peak of the office building boom in Canada) only 3 million
square feet were added to Calgary's office stock (Royal LePage, unpublished data); this figure
represents merely 10 percent of its 1985 inventory. At the same time 47 million square feet were added
in Toronto, representing 51 percent of Toronto's 1985 inventory (Royal LePage, Toronto Office Leasing
Directory, 1984, 1992). Calgary did not fully recover from its early-1980s bust of office construction.
Notwithstanding this, confidence in Calgary's economy was renewed in the second half of the 1990s as
the construction of a number of large-scale office buildings has awarded Calgary the tale 'Western
Canada's head office capital' as it has the second-highest (or third-highest, after Toronto and
Montreal) number of head offices in Canada (Globe & Mail, August 3, 1999). Despite attempts at
economic diversification, Calgary's volatihty is still based on being a predominantly an oil-based city;
this is best illustrated by the insight of a Calgary real estate broker: 'ln Calgary, the mood seems to
change week by week, according to oil pricesw (Globe & Mail, August 3, 1999).
Real estate developers navigate their operations by switching capital in accordance with 'hot
spots' created during building cycles. Like Houston in the 1980s (Feagin, 1987), Calgary was the
Canadian 'hot spot' in the late 1970s and eariy 1980s as many developers flocked to that city. Calgary
reinforced its position as the energy capital of Canada as many oil and gas companies accompanied by
ancillary service companies expanded their operations in Calgary (Royal LePage, Toronto Office
Leasing Directory, Fall 1979). In this booming economy, companies based in western Canada, foreign
companies, and the largest Canadian-based companies expanded or pioneered office development in
Calgary.
Due to the dominance of the energy sector in Calgary, a common feature of office
development was joint ventures between real estate companies and oil and gas companies. In this
arrangement, oil companies hold full or partial ownenhip of the office buildings. Partnenhips such as
Daon and Chevron, Trizec and Husky Oil, and Canada Square and Gulf Canada, resulted in joint
developments. Furthemore, oil and gas cornpanies were the prime tenants in these buildings. In the
Toron fo-Dominion Square, the main tenants were Dome Petroleum and Home Oil; in the Calgary Place
tower, Mobil Oil Canada and Canadian Superior Oil were the main tenants; in the FMh and Fifth tower,
Texaco Canada and C.D.C Oil and Gas were the major tenants (Oxford Development Group; Trizec
Corporation, Annual Reports, various years).
Concunently, foreign companies expanded their investments in Calgary. Hammenon
(Canada) commenced its enteprise in Calgary in the late 1960s completing two out of four buildings in
their Bow Valley Square complex before the late-1970s boom (1972 and 1975) and two additional
buildings in the midst of the boom (1980 and 1982). Another British-based company, Rank City Wall,
cornpleted a medium-site office building in Calgary in 1977 (at the same period, it was also active in
office development in the Toronto area). In addition, the largest office complex in Calgary (the twin-
tower Petro-Canada Centre, 1.6 million square feet) was developed in the early 1980s by the
partnership between a major oil company, Petro-Canada, and a foreign investor (ARCI).
ln the late 1970s, major Canadian-based real estate companies have either expanded their
operations in Calgary, such as Marathon Realty, the real estate a m of Canadian Pacific Railways, or
entered Calgary for the first time. The prime example of a new entrant to the Calgary market that
'coincided' with the building boom was Olympia & York Developments (O&Y). Until the mid-1970s,
0 8 Y major areas of operation in Canada were Toronto and Ottawa. Following the shortage of office
space in Calgary and a favourable potential for growth, 08Y funneled capital to this prornising territory.
However, OBY was able to target Calgaiy as a result of previous relations with a major oil company.
The previous relationship between O&Y ana Shell Canada through the construction of Shell's data
centre in suburban Toronto in the 1960s (see section 4.2.1) paved the way for the development of the
Shell Centre in Calgary in 1977. The next project of O&Y, the Esso Plaza (1.5 million square feet), was
completed in 1981 (OBY completed another building in Calgary in 1988). Other companies that did not
have previous expenence in Calgary followed this move: Cadillac Fairview, Campeau, and Sun Liie
Assurance Company. Sun Life's three-building complex (over one million square feet, completed
between 1981 and 1984) was one of the largest-ever developments taken by a life insurance Company
in Canada. When the recession hit Calgary in March 1982, many projects were either canceled or put
on hold. By late 1982, as the racession deepened, the construction of 22 buildings (with a total of 17
million square feet) at different development phases was either delayed or canceled (Calgary HeaM,
October 5, 1982).
Although very few office development projects were commenced during the slump in office
development in the 1980s. large real estate companies remained in Calgary, and in the late 1980s they
renewed their interest in the city. In the late 1980s, Oxford. TNec and Olympia & York completed office
buildings in Calgary (Financial Post, March 2, 1987). However, when the market had continued to
expenence stagnation in the late 1980s and the fint haif of the 1990s. several companies like Cadillac
Fairview and Hammenon sold their office buildings in Calgary.
Until the early 1970s. large Canadian office developen were active in vety defined and limited
territones, confined mainly to the two largest centres, Toronto and Montreal. These included Olympia 8
York, Cadillac Fairview, and Trizec. As a resuk, before the boom of the late 1970s and early 1980s,
only local and regional developen operated in Calgary. Following the boom, most of the large
Canadian real estate companies launched operations in Calgary. In Toronto, most of the large
developen were present before the 1970s. In both cities, large companies developed the largest office
buildings, and once they reached a certain threshold, these cornpanies have maintained their presence
in these cities.
5.4 Three Dimensions of Capital Switching and Building Cycles:
Two Case Studies To demonstrate the interaction between building cycles and developersl practices, two firms will be
examined in detail. The two companies under investigation, the Trizec Corporation and Cadillac
Fairview Developrnent Corporation, illustrate the shifting practices of real estate companies resulting
from the different metropolitan building cycles experienced by Toronto and Calgary. The investigation
also shows the particular paths adopted by these companies. Trizec and Cadillac FaiMew have been
two of the largest Canadian public real estate companies during the last three decades. In 1999, the
total assets of TrizecHahn Corporation (the successor of Trizec) were $12 billion, and the assets of the
Cadillac FaiMew were almost $5 billion. Both companies have had divenified commercial propeity
podfolios (shopping centres, office buildings, and multi-use complexes) situated in various cities across
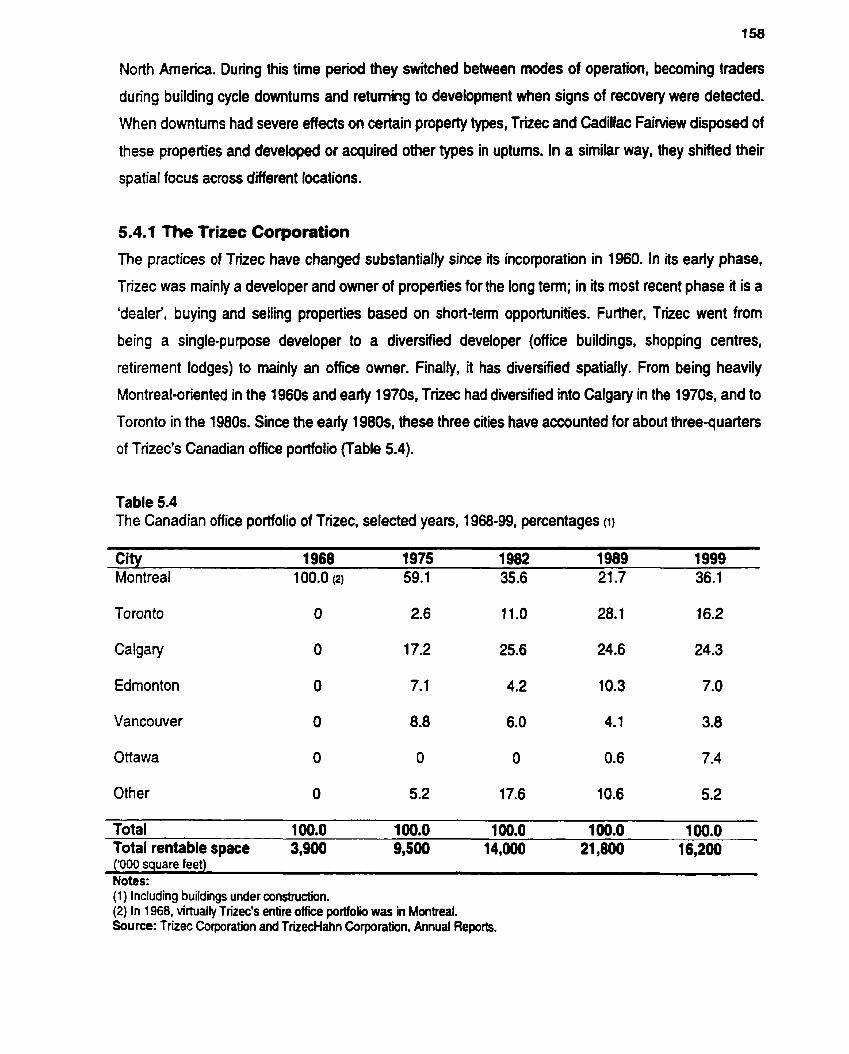
North Arnerica. During this time period they switched between modes of operation, becoming traders
during building cycle downtums and retuming to development when signs of recovery were detected.
When downtums had severe effects on certain property types, Trizec and Cadillac F a i ~ e w disposed of
these properties and developed or acquired other types in uptums. In a similar way, aiey shifted their
spatial focus across different locations.
5.4.1 The Trizec Corporation
The practices of Trizec have changed substantially since its incorporation in 1960. In its early phase,
Trizec was mainly a developer and owner of propeities for the long terrn; in its most recent phase it is a
'dealer', buying and selling properties based on short-ten opportunities. Further, Trizec went from
being a single-purpose developer to a diversified developer (office buildings, shopping centres,
retirement lodges) to mainly an office owner. Finally. it has divenified spatially. From being heavily
Montrealsriented in the 1960s and early 1970s. Trizec had diversified into Calgary in the 1 WOs, and to
Toronto in the 1980s. Since the eariy 1980s, these three cities have accounted for about threequarten
of Trizec's Canadian office portfolio (Table 5.4).
Table 5.4 The Canadian office portfolio of Trizec, selected yean, 1968-99, percentages (1)
City 1968 1975 1982 1989 1999 Montreal 100.0 (2) 59.1 35.6 21.7 36.1
Toronto O 2.6 11.0 28.1 16.2
Calgary O 17.2 25.6 24.6 24.3
Edmonton O 7.1 4.2 10.3 7.0
Vancouver O 8.8 6.0 4.1 3.8
Ottawa O O O 0.6 7.4
Other O 5.2 17.6 10.6 5.2
Total 100.0 100.0 100.0 100.0 100.0 Total rentable space 3,900 9,500 14,000 21,800 16,200 ('000 square feet) Notes: (1) lncluding buildings under construction. (2) In 1968, viitually Trizec's entire office portfolio was in Montreal. Source: Trizec Corporation and TrizecHahn Corporation, Annual Reports.

Until the late-1960s, Trizec had office buildings only in Montreal, epitomized by its flagship complex,
Place Ville-Marie (3 million square feet of office space). The Montreal portfolio was essentially its entire
portfolio (Trizec Corporation, 1968 Annual Report). Following the purchase in 1970-71 of two real
estate companies with major holdings in Western Canada, its scope had expanded to include Calgary,
Edmonton and Vancouver (Trizec Corporation, 1970 Annual Report). However, until 1978, Montreal
propetties continued to hold more than one-half of Trizec's Canadian office portfolio (Trizec
Corporation, 1978, 1979 Annual Reports). Coinciding with the beginning of Calgary's real estate boom
in the mid-1 970s, the booming of Alberta's oil and gas sector and the decline of Montreal as a financial
centre, Trizec raised its stakes in Calgary. In 1976. Trizec's ownenhip changed and the Company
moved of its executive office to Calgary and in 1980 al1 head office operations were consolidated there
(Goldenberg, 1981). During Calgary's boom period (late 1970s to eady 1980s). Trkec had completed
three office buildings in Calgary. These three projects increased Trizec's office poiffolio in Calgary from
1.6 million square feet in 1975 to 3.8 million in 1983 (Trizec Corporation, various Annual Reports). The
high dependence on the energy sector was demonstrated by the fact that in al1 three buildings the
major tenants were oil and gas companies, and in one of the three projects an oil Company was a
partner.
Calgary's focal position in the Company's strategy and the confidence in its future was best
expressed in the President's message in the 1981 Annual Report: We believe Calgary will continue to
be the focal point of real estate development in Canada during the next f i e yean" (Trizec Corporation,
1981 Annual Report, p. 4). This confidence was also expressed in launching Trizec's largest-ever
project in Calgaiy, Banken Hall. in 1980. The completion of this two-tower complex (1.8 million square
feet) was expected in 1984. However, the recession of 1982 put this development on hold (Calgary
Herald, October 21, 1982). The groundbreaking for the first tower was in late 1986 (completed in 1989).
after vacancy rates of class-A buildings in the core had dropped below the 10 percent mark. The
construction of the second tower started in 1998 (completed in June 2000) as vacancy rates of class-A
office buildings in Calgary's core have dropped to almost an all-time low of 1.4 percent in 1997
(Financial Post, June 5,1998; Royal LePage, unpublished data).
Until the late 1 9 7 0 ~ ~ Toronto's office market was of secondary importance to Trizec. In 1971,
Trizec developed its first office building in Toronto, a medium size building on the periphery of
Toronto's Financial District. In the late 1 970s, Trizec, with a Toronto-based developer as a partner, had
initiated the construction of the first phase of a f -3-million square feet project in Toronto's downtown,
the Atrium On Bay (first phase completed in 1981, second phase in 1984). Realizing in the early 1980s
that Calgary was experiencing a severe slurnp, and since the Company thought further diversification

was needed, Trizec had tumed to Toronto. Consequently, Trizec's stake in Toronto's market rose
substantially from 11 percent of its Canadian office portfolio in 1982 to 28 percent in 1989 (Table 5.4).
During the mid-19805. Trizec focused its office development effoits on major financial centres
in North America. Toronto, along with New York and Los Angeles, was considered such a centre.
Trizec identified these cities as "markets offering long-terni potential due to their strong financial
service-based economies and their consistent record of overall growth' (Trizec Corporation, 1986
Annual Report, p. 13). The importance of Toronto as an office development node was recognized
through the establishment of a regional office in Toronto in 1984; until then the Eastern Canada
regional office was in Montreal and Toronto only had a small office in charge of shopping centre
planning (Trizec Corporation, 1984 Annual Report). More importantly, in 1984, Trizec invested in the
Toronto- based real estate Company Brarnalea Limited (Trizec Corporation, 1 984, 1 988 Annual Report).
One of the major assets of Bramalea was its Toronto portfolio, in particular, the substantial
office portfolio. In 1983 over one-haif of Bramalea's Canadian office floor-space was in Toronto and a
number of projects were at the planning stage (Bramalea, 1982, 1984 Annual Reports). Trizec, which
had a very small portfolio in Toronto, wanted to capitalire on Toronto's fastexpanding office market.
Trizec's incremental increase in Bramalea ownenhip between 1984 and 1988 reflects its growing
interest in Toronto. In 1984 Trizec acquired 31 percent ownenhip interest in Bramalea, it increased its
share to 65 percent in 1986, and to 70 percent in 1988 (Trizec Corporation, various Annual Reports). In
1987, Trizec launched its 'crown-jewel' development in Toronto, a 57-story building, the Bay-Adelaide
Centre, Iocated at the heart of the Financial District. When construction started in late 1989, Toronto's
office market was already beyond its peak. Vacancy rates of class-A office buildings (the type of
buildings that the Bay-Adelaide had to compete against) in Toronto's Financial District increased from
3.1 percent in 1987 to 7.8 percent in 1989 and to more than 17 percent in 1993 (Royal LePage,
Toronto O f ice Leasing Directory, various yean). As a resuit, the Bay-Adelaide Centre, consisting of an
underground parking garage and partial elevator core, was rnothballed indefinitely (Globe 8 Mail,
August 19, 1 993).
In the late 1990s, the Canadian office market has show some indications of recovery,
including lower vacancy rates, higher rental rates, and higher absorption rates. Consequently, the
interest of the T ;izecHahn Corporation (under new owners since 1994 and a new name since 1996) in
Toronto and Calgary rebounded. In 1998, the vacancy rates of class-A office buildings in Toronto's
Financial District and in Calgary's Core were 5.1 and 2.6 percent respectively, down frorn 20.3 and
17.2 percent in 1992-93 (Royal LePage, Canadian Office Guide, 1999; Royal LePage, 1993, 1999).
The second phase of Calgary's Banken Hall (800,000 square feet) was completed recently, however,
Toronto's Bay-Adelaide Centre is still on hold, since no anchor tenants have been found so far.
In addition to spatial switching of capital, particularly between its largest Canadian office nodes
in Canada, Montreal, Calgary and Toronto, Trizec maintained holding its largest pmperties in these
cities. Despite slower growth rates in Montreal than in Toronto and Calgary, Place Ville Marie was an
indispensable piece of property in Trizec's portfolio. To a large extent, the existence of this Ylagship'
property has established a threshold in Montreal that is not easily relinquished. Place Ville Marie and its
'satellite' projects in Montreal have produced Trizec's core portfolio that has lasted since the company's
incorporation regardless of the position of building cycles or Montreal's overall growth potential. These
one-of-a-kind projects are virtually non-tradable. In Toronto, on the other hand, Trizec did not have an
'anchor' property, hence the Company acted as an opportunistic entrepreneur, cashing in on the
expanding market. Following this rationale, when Toronto's market collapsed in the eariy 1990s, the
Company disposed of most of its properties. In the case of Calgary, off ie development was highîy
sensitive to local building cycles, but unlike in Toronto, a severe and long downtum did not prevent
Trizec from keeping rnost of its buildings during the lengthy recession. Similar to Montreal, Trizec had
reached a critical mass (defined by real estate companies as 'presence') in Calgary with some high-
profile properties; its high stakes and the prospects or recovery from the oil crisis encouraged Trizec to
keep its presence in Calgary.
Like many other real estate companies, Trizec was engaged in simultaneous operations of
development and trading of properlies. Until the early 1990s. Trizec was both a developer and trader of
office buildings, with the development elernent accounting for the majonty of its operations. ûffice
markets experienced periods of up and downs, and in these cyclical conditions, Trizec navigated by
developing buildings when markets had growth prospects and hatted development when markets
experienced recession periods. Development in the booming years in Calgary, while halting the
development of Bankers Hall and the Bay-Adelaide Centre during the downtum of building cycles are
exarnples of these practices. Downtum periods are characterized by dispositions of noncore
properties. In 1991 Trizec had 6.2 million square feet of rentable space in office buildings in Toronto.
Following the eariy 1990s downtum it disposed of it holdings in Bramalea Limited, and in 1992 it had
only 1.7 million square feet of space in Toronto (Trizec Corporation, 1991, 1 992 Annual Report). At the
same time, its office portfolio in Calgary remained intact, suggesting that Calgary's prospects at that
time were better than Toronto's, and Trizec's presence in Calgary was much more important than in
Toronto. TrizecHahn, the successor corporation to Trizec, also engaged in switching between propecty
types as in 1998, when it disposed of its entire U.S. retail portfolio and, wiUi the proceedings, bought
office buildings (see section 5.1.2)
Investments of real estate companies are not limited to real astate properties. Consequently, in
2000, TrizecHahn acquired control of a telecommunications company. This is part of its recent
philosophy of divenifying into the high-tech sector and divesting al1 of its office buildings in Canada
(Globe & Mail, March 28, 2000). Finally, in June 2000 TrizecHahn sold the majority of its Canadian
office portfolio, except for the Bay-Adelaide site in Toronto.
5.4.2 Cadillac Fairview Corporation
Cadillac Faiiview is the result of an amalgamation of a commercial developer (Fairview) and a
residential developer (Cadillac) in 1974. The Fairview Corporation was a developer of shopping centres
and office buildings, white the focus of Me Cadillac Development Corporation was on apartment
buildings. After the merger, the company disposed of its residential properties and focused on
commercial development, and became, for the most part, a developer of properties and to a fesser
extent a buyer and seller of real estate holdings.
Until the amalgamation, Faiwiew's interests in office development were in Toronto (although
the capital originated partially from Montreal-based Seagram Distilleries). In 1973, Fairview had 76
percent of its office space in Toronto (Fairview Corporation 1973 Annual Report). After the
amalgamation, Cadillac Fairview diversified into other Canadian cities: Edmonton, Halifax, Winnipeg
and Calgary, but the rnajonty of its Canadian office portfolio remained in Toronto (Table 5.5).
The Toronto-Dominion Centre, Cadillac Faiwiew's 'flagship' complex in Toronto, illustrates the
practices that have been shaped by the combination of building cycles and local conditions. The first
office building in this five-building complex was completed in 1967 (the f i h tower was completed in
1992 bringing the total office space in the complex to more than 4 million square feet). The scale of the
first tower, 1.3 million square feet, signaled a breakthrough in office development in Toronto. In 1966,
the year before the first tower was completed, the total office space in Toronto's downtown core was
only 9.2 million square feet (A.E. LePage, Office Space Market Suwey Metropolitan Toronto, 1966).
In the mid-1960s, it was a big risk to build this size of building; however, until that time,
Toronto's office market had not experienced any major slump, but had been on a continuous path of
growth. Fuither, the plan to develop this project was promoted by the City of Toronto as part of its
efforts to enhance downtown redeveloprnent. The City encouraged Faiwiew not just to develop a
building but to build a large-scale complex (Collier, 1974). In the eariy 1960s, the Toronto-Dominion
Bank was looking for a new head office, and the partnenhip with a development company having the

backing of a major corporation (Seagram Distilleries) seemed perfect. The combination of a cash-rich
real estate developer, a tenant with clout, and the support of the local govemment facilitated the
commencement of the largest office building at that time (the Toronto-Dominion Centre is jointly owned
by Cadillac Faiwiew and the Toronto-Dominion Bank).
Table 5.5 The Canadian office portfolio of Cadillac Fairview, selected years, 1968-99, percentages (1)
City 1968 (2) 1975 1982 1987 1999 Toronto 85.0 72.7 71.9 70.8 65.1
Ottawa-Hu Il O 10.8 O O 5.5
Vancouver O 9.8 13.8 14.6 10.7
Montreal 15.0 6.7 O 4.8 3.5
Edmonton O O 5.4 3.7 6.8
Calgary O O 8.9 6.1 6.4
Other O O O O 2.0
Total 100.0 100.0 100.0 100.0 100.0 Total office space 1,800 7,000 7,100 10,500 14,300 ('000 square feet) Notes: (1) Including buildings under construction. The 1 968 portfolio is of the F a i ~ e w C~rporation. Source: Cadillac Fa i~ew Corporation, Annual Reports; Fainhew Corporation, 1973 Annual Report.
The next two buildings in the Toronto-Dominion Centre were completed during the period of almost
uninterrupted growth of office space in Toronto (late 1960s and eariy 1970s). Plans for the fourth tower
were presented as early as 1973, parallel to the construction of the third tower (Globe & Mail, June 7,
1973). However, a short-term recession, the anti-development atmosphere at Toronto City Hall and the
construction of competing towers, such as First Canadian Place (2 million square feet) and the Royal
Bank Plaza (1.1 million square feet) in 1975-6, put the construction on hold. In this case, the ability of a
developer to analyze the situation and take a 'calculated risk' by initiating development at the right time
indicates the importance of the developei's judgement. A decade later, in 1983, despite an ovenupply
of office space in Toronto, Cadillac Faiwiew decided to go ahead with the fourth tower. Due to the eariy
1980s slump, construction costs were lower, and although substantial leasing was not accomplished
and long-terni financing was not ananged, Cadillac FaiMew decided to build the fourth tower (Globe 8
Mail, September 23, 1983). In fact, the completion of the fourth tower in 1985 coincided with the uptum
of the offce market and it was 95 percent leased before occupancy commenced (Cadillac Fairview
Corporation, 1985 Annual Report). The account of the fmh tower illustrates Wong' judgement by the
developer. The construction of the fifth tower commenced in 1988, at the peak of the building cycle.
Consequently, when the building was completed in 1992, leasing was stumbling as an enonnous
oversupply of office space was delivered into Toronto's office market.
Cadillac Fairview did not close its eyes to opportunities outside of Toronto. When Alberta's
economy seemed buoyant in the late 1970s, Cadillac Fairview rushed into this territory of prornising
grouvth. Until the mid-1970s, Cadillac Fairview did not have any office building in Alberta. Faiwiew
already owned an office building site in Calgary in the eariy 1970s. However, the Company's position at
that time was that it %il1 commence development of an office building ... as soon as market conditions
warrant'' (Fairview Corporation, 1973 Annual Report, p. 15). Beginning in the mid-1970s the company
was pursuing development opportunities in Calgary (Cadillac Fairview Corporation, 1976 Annual
Report), and between 1977 and 1980 Cadillac Fairview completed îwo buildings in Edmonton and two
in Calgary. In 1980. the company identified a strong demand in Calgary and decided to acquire
additional sites for development (Cadillac Fairview Corporation, 1980 Annual Report). At the peak of
Alberta's building cycle in 1981, Cadillac Fairview had approximately 14 percent of its office poitfolio in
Edmonton and Calgary combined, compared with no office space in 1976 (Cadillac Fairview
Corporation, 1976-1 981 Annual Reports). In the eady 1980s. Cadillac Fairview was planning to pursue
large-scale office development in Calgary, but the 1982 recession stopped any further development
(Guirnond and Sinclair, 1984).
In the second half of the 1980s, as Toronto's market was experiencing an explosive growth,
Cadillac Fairview refocused its development efforts to Toronto while disposing of its office b~ildings in
Calgary (Cadillac Faiwiew Corporation, 1987, 1998 Annual Reports). However, in the late 1990s. the
Calgary office market has shown signs of rebounding, and Cadillac Fairview has renewed its interest in
Calgary by acquinng two office buildings in Calgary (Calgary Herald, February 10, 1998).
Cadillac Fairview's long term focus on Toronto and its limited interest in Calgary implies that it
has a two-track strategy. On the one hand, the concentration on the Toronto market indicates that
Toronto has been a structural (long ten ) investment for the company. On the other hand, investment
in Calgary and Edmonton was considered an opportun@ resulting from unique local cycles. In Toronto,
Cadillac Fairview has reached a threshold that makes it one of the primary landlords in the Financial
District and in the surrounding Downtown area. This cluster strategy has generated operational

synergies resulting from economies of sa le and greater tenant fiexibility. Cadillac Fairview was a late
entrant to Calgary and as such it has not been able to create a 'presence' of the same magnitude as it
has in its home territory.
Besides spatial switching, Cadi!lac Fairview practiced switching between modes of operation
and between property types. Although being primarily a developer and a long-term holder of properties,
it was involved in buying and selling of buildings. Parallel to the development of office buildings in
Toronto in the late 1960s and early 1970s, Cadillac Fairview acquired two office buildings in Montreal.
On the other hand, FaiMew's first office buildings developed in Toronto in the eariy 1960s were sold in
1981 -82. The disposition of these buildings was at the time when office development was in recession.
In the early 1980s Cadillac Faiwiew also switched its property composition by disposing of its
residential portfolio (see section 5.1.2).
5.5 Capital Switching and Real Estate Companies The practices of real estate cornpanies cannot be analyzed without examining pivotal conditions related
to the real estate sector. A major structural component influencing the considerations of real estate
companies, office building cycles, and in tum the practices of these companies were addressed in this
chapter.
The conclusions of this analysis are at three levels. The fint conclusion confimis the notion
that building cycles are place-specific: different spatial scales and locations experience different office-
building cycles. Therefore the practices of real estate companies are likely to be influenced by these
cycles. By trying to capitalize on distinct building cycles, some real estate companies shift a major
portion of their investments to fast-growing areas (high profit potential), and often reduce or relinquish
their investments in other areas. However, this type of Company continues to focus on the core
investment arenas despite the fact that other areas might experience faster growth.
The limited degree of spatial integration between Canadian regions generates a variety of
building cycles at different spatial scales and places. Each of the two spatial scales investigated, the
national and provincial, has its particular cycles; within the provincial scale, variations between
provinces have a tendency to penist for the long tem. Ontario and Quebec present quite similar
patterns of office-building cycles (although the magnitude is different); British Columbia has a few
similarities with the patterns experienced by the two large eastem provinces, while Alberta exhibits a
unique pattern. This dissimilanty is partially echoed at the metropolitan level as the office building
cycles of Toronto and Calgary converged during the late 1970s and diverged during the 1980s.
Spatial and temporal unevenness are not a short-terni phenomenon eventualiy leading to a
spatial equilibnum. Examining a time series of almost four decades of o f f i building cycles in Canada
at the national, provincial and inter-metmpolitan levels suggests that uneven pattems of real estate
investment are a petmanent phenomenon embedded in urban development. The tact that temporal and
spatial switching of capital is both sequential and simuftaneous, depending upon the scale at which
one focuses and the time period of the analysis" (Beauregard, 1993, p. 59), leads to permanent spatial
disequilibrium.
Contrary to a common perception that large cities as a group attract real estate investment,
this chapter shows that within the top-tier cities in Canada some attract more real estate investrnent by
large real estate companies that other cities in this tier. Toronto and Calgary have been prime
destinations for the largest developen and owners of office buildings. Montreal and Vancouver, on the
other hand, attracted far less investrnent by the large Canadian real estate companies. Since even the
largest real estate companies cannot stretch their operations to include al1 large cities, they tend to
focus on a few preferred locations. The preference of particular cities is determined by a variety of
reasons. These include factors extemal to the Company, such as economic growth, facilitating
environment, and type of demand, and intemal factors like financial strength, local market knowledge,
and path dependency.
This embedded inequality is fuither enhanced and solidified by agents as they shape the
spatial switchinglfix of capital. Because there are multiple agents with different interests that act as
intermediaries, capital does not switch from one location to another simply by following the patterns of
building cycles. The logic of these agents is shaped and influenced by macro conditions. but the
preconditions embedded in each organization play a major role in this process. The establishment of
'local presence' (reaching a critical threshold) in specific locations prompts continuous capital funneling
to these 'designated' places. Concurrently, switching oawn between properties at a particular location
(for exarnple, between retail and office buildings or between newer and oMer properties in the same
city), and between properties that did not reach a critical threshold in a specific market, and hence are
more likely to include tradable praperties. The cases of Trizec and Cadillac Fairview illustrate this
argument. Both companies have an anchor investment in specific locations: Trizec has Place Ville
Marie in Montreal and several large buildings in Calgary; Cadillac Fairview has the Toronto-Dominion
Centre and the Eaton Centre in Toronto. This firmly established local presence and the ownership of
one-of-a-kind assets, restrict the movement of their investrnents. Even when Montreal and Calgaiy
experienced stormy periods, Trizec has continued to hold these proparties. This indicates that reaching

a certain level of investment transforms real estate into a form that is perceived as fixed by a Company
for a long period of the.

CHAPTER SIX
FROM KING AND BAY TO MEADOWVALE:
TORONTO'S OFFICE BUILDINGS AND OFFICE DISTRICTS
The urban silhouette with its soaring skyscrapen next to the CN Tower contributes to the image of
Toronto at home and abroad. But large office buildings at King and Bay are the proverbial tip of the
iceberg. There are only eight office buildings with 40 to 72 floon and only another fourteen with 30 to
39 floors. The vast rnajonty of the more than 1200 office buildings in the Toronto Census Metropolitan
Area (CMA) are relatively unassuming buildings. Although they do not receive much attention, they are
extremely important. They provide accommodation for tens of thousands of businesses and hundreds
of thousands of employees. All office buildings together accounted for about 36 percent of employment
in Metropoiitan Toronto in 1996 (Metropofitan Toronto Planning Department, unpublished tables) and
for about 25 percent of employment in the CMA. The smaller office buildings are treasured by and
fought over by municipalities that value their contribution to the municipal tax base. The spread of office
buildings acrcss municipal boundaries and the different forces and denslies of these various buildings
have been more and more contentious among planners and municipal politicians.
In this chapter I describe the characteristics and locations of Toronto's office buildings. The
core of this account is data avaibble on individual buildings provided for this study by Royal LePage, a
Toronto-based real estate bmkerage finn. The chapter includes a section on 'preliminaries', which
deals with the definition of office buildings, the scope of the data, and the basic spatial units chosen for
aggregating individual buildings. The two major sections of this chapter focus on documenting the
changing inventory of office space in Toronto and provide evidence for the notion of office districts.
Toronto's office stock has accrued over several phases, each with different conditions for development
and different physical resuits in the fom of buildings. Although office buildings are scattered across
many locations, there are distinct nodes or districts noticeable. The description of these office districts
is important, because they are the fields of operation for different kinds of developers. The final section
illustrates spatial switching of capital within the realm of the largest office parks in the Toronto CMA.
6.1 Preliminaries: Office Building lnventory and the Spatial Frame
of Reference There is no explicit definaon of what constitutes an office building. The undedying notion, used by real
estate businesses as well as urban planners, is of a building, which does not house rnachinery other
than that sitting on desks. This machinery is used for the manipulation of words and data. This
excludes buildings used for storing goods or for conventional residential purposes. Universities,
churches and places where people stay overnight (hotels) are also excluded from the definition of office
buildings. However, a theoretically-based definition of office buildings is missing. Typically, in most
databases dealing with office buildings the definition of an office building is considered self-evident and
any explanation considered redundant. Largely for practical reasons, the customs of the agencies
providing data are accepted here.
Data on office buildinas
There are no official data on office buildings. Leitner (1994) acknowledges this problem in her research
on office building cycies in major downtown areas in the United States. As a resut, she used data
maintained by commercial real estate broken. Municipalities within the Toronto CMA do not have any
systematic data on office buildings which would provide a good picture of the office stock.
Municipalities rarely define office space or collect data on office buildings. In planning documents,
office space is usually embedded in the larger category of commercial or mixed uses. Also,
municipalities rely on private consultants, who in tum rely on data from real estate brokers. Since there
is no official enumeration or suivey of office buildings in the Toronto metropolitan region, data collected
by real estate brokerage firms, especially Royal LePage, and Colliers are used here. Royal LePage
defines office buildings as "office space in buildings having as their prime funclion the provision of
office facilitiesn (Royal LePage, 1982). No additional explanation is provided regarding the criteria used
to determine what office space is. Nevertheless, Royal LePage is the only source that has compiled
and rnaintained an outstanding set of data on the office building history of Toronto since the eady
1960s.
In order for a building to be included in the Royal LePage inventory, it has to have at least
20,000 square feet of net rentable office area, which is the floor-space that can be rented to and used
by tenants. Over the years, surveys became more detailed in ternis of information provided, and Royal
LePage changed the number and the boundaries of the districts for which it published data to reflect
temporal shifts in office development. In 1977, it added the City of Mississauga to the surveys, and in
subsequent years the boundaries of the suweyed area were further stretched out to include the
expanding metropoiiian area.
Data from commercial real estate agents have to be handled with care. Royal LePage data has
certain characteristics Al1 office buildings with more than 20,000 square feet were recorded. A typical
20,000 square feet building is a four-storey building of about 50x100 feet floorplates. Office space
above stores or in shopping plazas is not included. Royal LePage surveys categorize buildings by
market classifications designated as A, B, and C. These distinctions roughly parallel quality and p r ia
levels for office space which directly competes for the same tenants in the sarne district. The Royal
LePage survey includes both 'cornpetitive' and 'noncompetitive' buildings. Cornpetitive space is
cornprked of multi-tenant buildings with office space offered for lease in the short term. Non-
cornpetitive buildings are occupied by building ownen or by long-terni core tenants; these buildings
include govemment office buildings. Most other real estate brokers do not include noncompetitive
buildings since they are not considered a part of the leasing market they are interested in. Floor-space
data in Royal LePage surveys is about net rentable floor-space; this excludes walls. elevator cores,
and areas that are not included in the rent. This is different from municipal practices, which are used for
density (floor space index) calculations. Density calculations use gros floor-space, thus, there can be
differences between space recorded in municipal documents and Royal LePage tabulations.
Royal LePage data is far from complete or consistent. Often it is difficult to detenine the exact
function of the spaces recorded. Built space can function both as office and industrial space, and
drawing the line is difficuk. This problern of definition becornes more acute in the newer types of
buildings that are by definition 'hybrid' or 'flex' buildings combining several functions, or in which
functions change over tirne; therefore, making clearcut definitions is often inadequate. In addition,
'questionable' buildings are often included in Royal LePage data as office buildings, such as the
Ontario parfiament buildings, which are to a large extent an assembly space rather than office space.
On the other hand, buildings converted from wholesale and manufacturing to office use are often not
included in the Royal LePage surveys.
Spatial units of analvsis: Office districts
The availability of data on individual office buildings for 1971, 1981, 1991, and 1999 facilitates the
construction of spatial units (Table 6.1). Figure 6.1 provides the essential reference map. For the
analysis of this chapter I divided the inner city into the Financial District, Downtown (excluding the
Financial District), and Midtown (which includes office clusters around major subway stations at Yonge
and Bloor, Yonge and St. Clair, and Yonge and Eglinton).
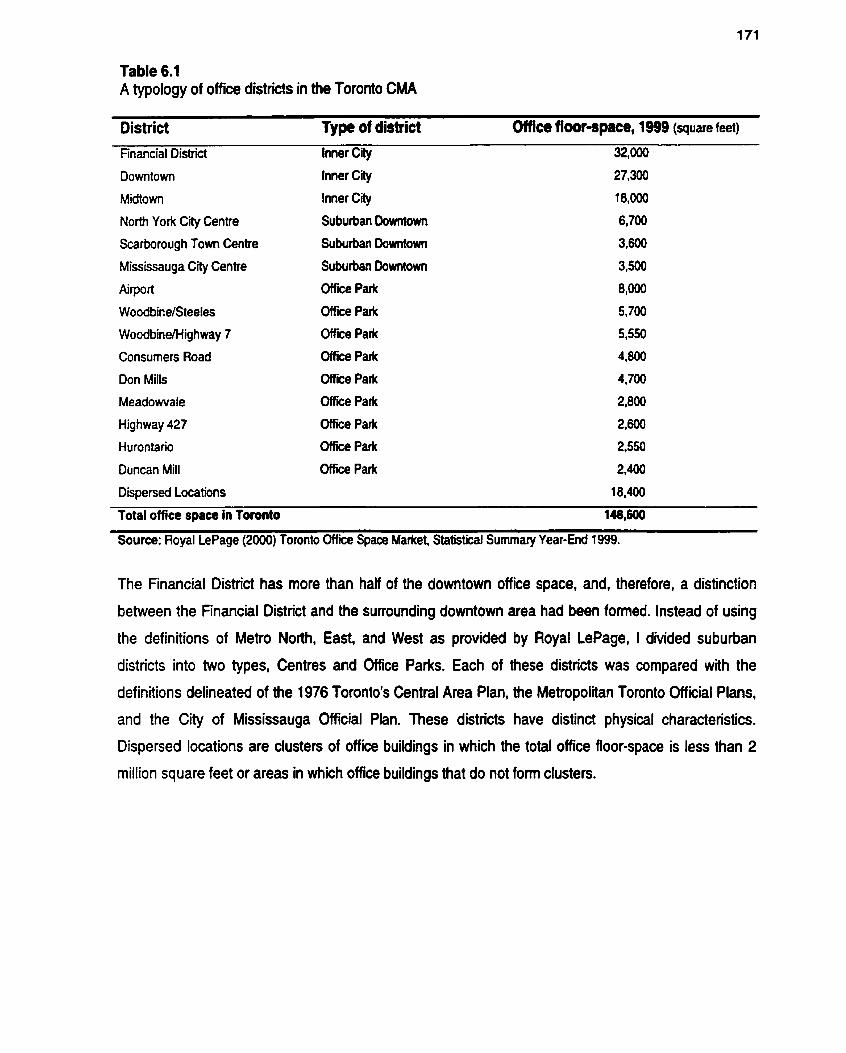
Table 6.1 A typology of office districts in the Toronto CMA
District Type of district Office flooispece, 1999 (square feet)
Financial District lnner City 32,000
Downtown lnner Ciîy 27,300
Midtown lnner City 18,000
North York City Centre Suburban Downtom 6,700
Scahrough Town Centre Suburban Downtown 3,600
Mississauga City Centre Suburban Downtown 3,500
Airport ûf f i i Park 8,000
WoodbinelSteeles OKce Park 5,700
Woodbinekiighway 7 Office Park 5,550
Consumers Road Office Park 4,800
Don MiIls Office Park 4,700
Meadowvale O f f i Park 2,800
Highway 427 ûffiie Park 2,600
Hurontano Office Park 2,550
Duncan Mill ûffice Park 2,400
Dispersed Lacations 18,400
Total office spacc in Toronto 148,600
Source: Royal LePage (2000) Toronto Offce Space Market, Statistical Summary Year-End 1999.
The Financial District has more than half of the downtown office space, and, therefore, a distinction
between the Financial District and the surrounding downtown area had been fonned. lnstead of using
the definitions of Metro Noith, East, and West as provided by Royal LePage, I divided suburban
districts into two types, Centres and Office Parks. Each of these districts was compared with the
definitions delineated of the 1976 Toronto's Central Area Plan, the Metropolitan Toronto Official Plans,
and the City of Mississauga Official Plan. These districts have distinct physicaf characteristics.
Dispersed locations are clusten of office buildings in which the total office floor-space is less than 2
million square feet or areas in which office buildings that do not fonn clusten.

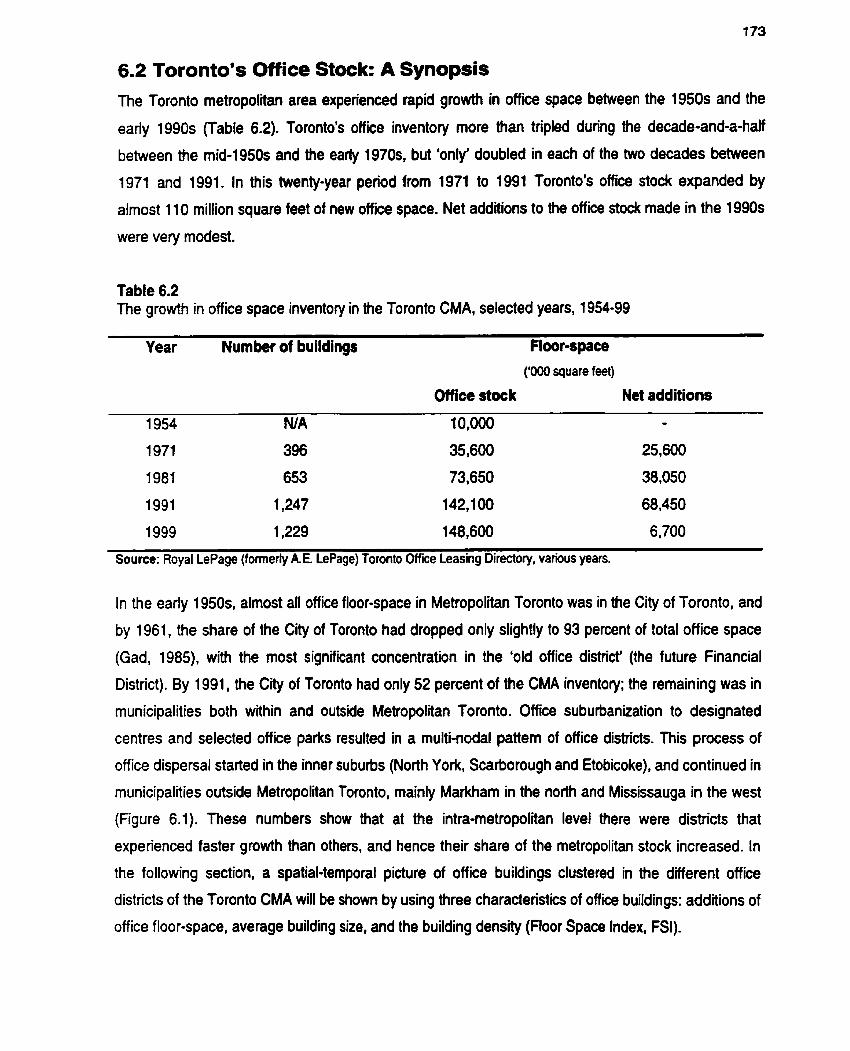
6.2 Toronto's Office Stock: A Synopsis The Toronto metropolitan area experienced rapid growth in office space between the 1950s and the
early 1990s (Table 6.2). Toronto's office inventory more than Mpled during the decade-and-a-half
between the mid-1950s and the eaily 1970s, but 'only' doubled in each of the two decades between
1971 and 1991. In this twenty-year period from 1971 to 1991 Toronto's offÏce stock expanded by
almost 1 10 million square feet of new o f f i space. Net additions to the office stock made in the 1990s
were very modest.
Table 6.2 The growth in office space inventory in the Toronto CMA, selected yean, 1954-99
Year Number of buildings Floor-space ('000 square feet)
Office stock Net additions
1954 NIA 10,000 -
1999 1,229 148,600 6,700
Source: Royal LePage (formeriy AE. LePage) Toronto Office Leasing Directory, various years.
In the early 1950s, alrnost al1 office floor-space in Metropolitan Toronto was in the City of Toronto, and
by 1961, the share of the City of Toronto had dropped only slightly to 93 percent of total office space
(Gad, 1985), with the most significant concentration in the 'old office district (the future Financial
District). By 1991, the City of Toronto had only 52 percent of the CMA inventory; the remaining was in
municipalities both within and outside Metropolitan Toronto. Office suburbanization to designated
centres and selected office parks resuited in a multi-nodal pattern of office districts. This process of
office dispersal started in the inner suburbs (North York, Scarborough and Etobicoke), and continued in
municipalities outside Metropolitan Toronto, mainly Markham in the nodh and Mississauga in the west
(Figure 6.1). These numbers show that at the intra-metropolitan level there were districts that
experienced faster growth than others, and hence their share of the metropolitan stock increased. In
the following section, a spatial-temporal picture of office buildings clustered in the different office
districts of the Toronto CMA will be shown by using three characteristics of office buildings: additions of
office floor-space, average building site, and the building density (Floor Space Index, FSI).

New office space
In the time period under scrutiny (1954-99), 1135 office buildings of at least 20,000 square feet each
were built in the Toronto CMA. The information is based on Royal LePage surveys of individual o f f i
buildings in the Toronto Census Metropolitan Area at four points in time: 1971, 1981, 1991 and 1999.
These sunreys include the year in which each building was built and the total office space of each
building. This enabled the constnicüon of data that would correspond to office building cycles. Rather
than strictly limiting data to a tan-year frame, longer or shorter periods were employed according to the
hythms of net additions of office space. Table 6.3 summarizes these findings.
Table 6.3 Additions of new offie space in the Toronto CMA, selected years, 1954-99 ('000 square feet)
District 1954-70 197141 1982-92 1993-99 Total additions
Financial District 7,500 10,000 11,000 100 28,600
Downtown (1) 4,050 6,200 1 0,800 1,550 22,600
Mid t o m 6,800 6,850 4,100 100 17,850
Office Park 3,700 10,400 22,900 3,000 40,000
Suburban Downtowns NIA 3,850 9,400 500 13,750
Dispsrsed Locations 1,600 6,000 &O00 450 16,050
Total 23,650 43,300 86,200 5,700 138,850 - - -
Notes: Since this table is based on individual building data, there are several discrepancies between tfiis data and the annual publications of Royal LePage. (1) Downtown excludes the Financial District. NIA - between 1954 and 1970 a negligible amount of office space was buiit in suburban downtowns. Sources: A.€. LePage (1971) Toronto, Office Space Sunrey; AE. LePage (1980) Toronto, Office Space Sunrey; Royal LePage (1 991) Toronto, Market Survey Report: Royal LePage (2000) Toronto Office Space Market, Statistical Summary, Year-End 1990.
During these four and a half decades, the spatial patterns of office development have changed
drarnaticalfy. The earlier pattern of downtown and midtown orientation was transfomed to an almost
even distribution of office space between the core and the suburban realm. Most of the City's office
space was and still is contained within the Central Area (as defined by the 1976 Official Plan), which
includes the Financial District, Downtown and Midtown. In 1971, 82 percent of Toronto's office space
was within the City; in 1981 it decreased to 66 percent, and in 1991 only 52 percent of Toronto's CMA
office floor-space was within the City boundanes. This situation has remained unchanged in 1999
(Royal Le Page, various suweys).

During the 1980s cycle (exîended from 1 982 to 1992. buildings completed in 1991-92 were a
product of the late 1980s development cycle) more office space was added to the Toronto area than in
any previous decade. In the 1 9 8 0 ~ ~ more than 66 million square feet were added, representing 50
percent of al1 postwar additions (Table 6.3). In the 1970s (1971-81), 32 percent of the postwar office-
building additions were made, 14 percent in the 1954-70 period, and during 1993-99, only 4 percent of
the postwar stock was added. If conversion to other uses and demolition are taken into account, the net
addition is less than 4 percent during the 1993-99 period.
In the 1954-7û period virtually al1 addlions of office buildings were in the City of Toronto; the
Financial District was the prime beneficiary of office development (41 percent of the new space). The
1970s were the defining decade in which the dominance staited to shift from the Financial District to
the office parks, and by the 1980s construction outside Toronto's Central Area exceeded that within the
Central Area. In the 1970s, the share of the Financial District and office parks in offce development
was equal; in the 1980s. 34 percent of the additions were in office parks while only 17 percent were in
the Financial District. In the 1990s (1993-99) more than one-half of the additions in Toronto were in
office parks. (Their share rises as the 1990s proceed, and by the late 1990s virtually al1 construction of
office space was in office parks.) This shift paralleled population growth patterns; suburban
rnunicipalities, initially those within Metro Toronto and later municipalities outside Metro experienced far
greater growth rates than the City of Toronto. However, this shift to office parks abo contradicts
planning policies of Metmpolitan Toronto, which attempt to channel office development into suburban
downtowns rather than to office parks.
Buildinci size
Despite the massive office development in Toronto during the 1980s, the largest office buildings, on
average, constructed in Toronto in the postwar era were built in the 1970s (Table 6.4). Until the late
1960s, only the City of Toronto (the combination of the Financial District, Downtown and Midtown) had
a substantial office inventory; within these boundaries the largest office district was the Financial
District, and on average it had the hrgest office buildings. In the 1970s (1971-81). the average size of
office buildings constructed increased considerably; it more than doubled in the Financial District, and
doubled in the Downtown. The largest office buildings by far are found in the Financial District. The
average building constructed in the Financial District in the 1970s had more than 500.000 square feet
of office space, while the average in the Downtown district, the district with the second largest office
buildings, was only 200,000 square feet. With the expansion of the suburban realm in the 1980s, the

average building constructed in the suburban downtowns has surpassed the average office building
size in the Downtown district (223,000 venus 192.000 square feet).
Table 6.4 Average size of newly constructed office buildings in the Toronto CMA, 1954-99 ('000 square feet)
District 1954-70 197141 1 982-92 1993-99 Average financial District 227 502 422 WA 357
Downtown (1) 101 200 1 92 N A 169
Midtown 89 140 111 NIA 1 09
Suburban Downtowns NIA 1 67 223 NIA 205
Office Parks 71 92 89 99 89
Dispersed Locations 44 77 69 NIA 68
Average 90 1 38 1 24 129 1 22
Notes: (1 ) Downtown excludes the Fmancial District N A - between 1954 and 1970 a negligible amount of space was buiit in suburban downtowns; in 1993-99 oniy 14 office buildings were buiiî in the CMA (except office paris), îherefore the average size for each district was not calculated. Source: Same as Table 6.3.
Buildings in office parks and in dispersed locations retain the smallest office buildings (smaller than
100,000 square feet), and their average sue has remained almost unchanged throughout the 1971 -99
period. During the 1980s (1982-92), the average building size had dropped in al1 districts except in the
suburban downtowns (an increase of 30 percent). The decline in average size was most noticeable in
the Financial District and in Midtown; in these two districts it dropped by more than 15 percent.
Densitv
Density is analped b ÿ using a sample of 300 office buildings completed between 1951 and 1 991 in
Metropolitan Toronto (Metropolitan Toronto, 1993). In the City of Toronto buildings with over 100,000
square feet of office space in which office space constitutes more than 50 percent of the total floor-
space were included. Buildings with more than 50,000 square feet were utilized in the case of the
suburban municipalities within Metropolitan Toronto.
As expected, the highest densities are recorded in the Financial District, followed by the
densities in the Downtown and Midtown districts. Outside the old City of Toronto densities were
significantly lower (Table 6.5). The average density in the Financial District was 13.6 times the lot; high
densities were recorded also in the Downtown and in Midtown (9.3 and 7.5 respectively). Densities in
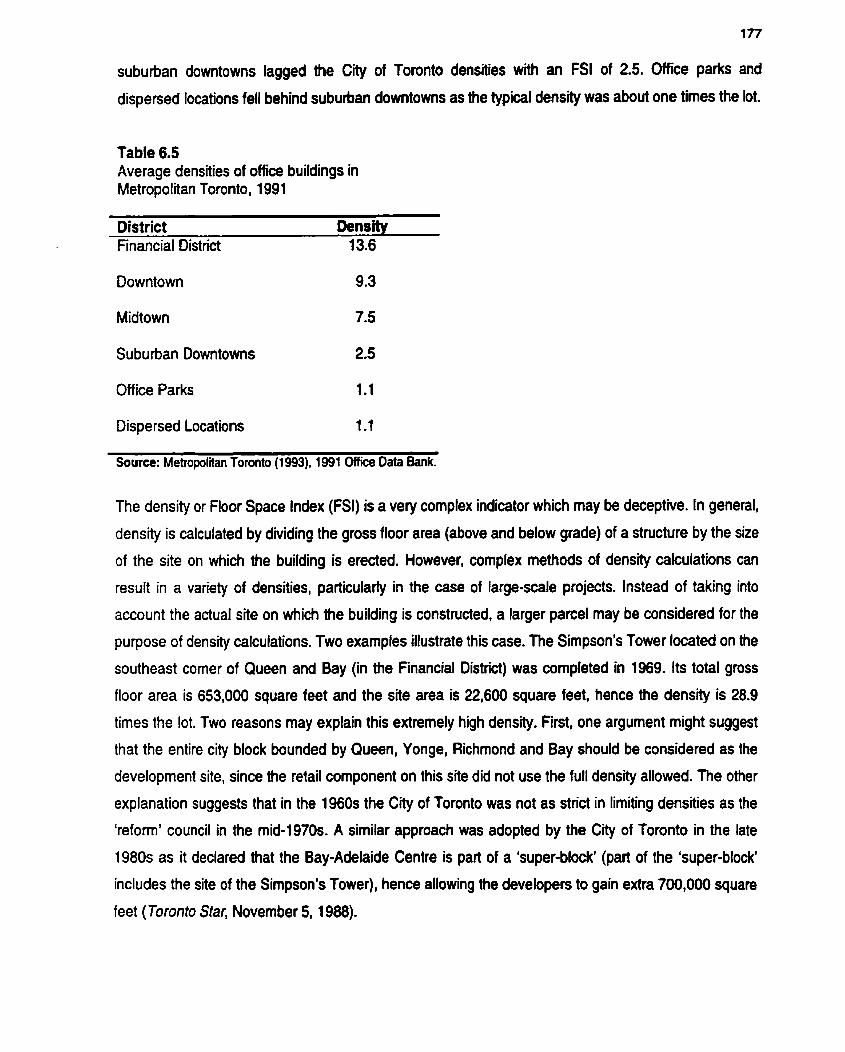
suburban downtowns lagged the City of Toronto denslies with an FSI of 2.5. Office parks and
dispersed locations fell behind suburban downtowns as the typical density was about one times the lot.
Table 6.5 Average densities of office buildings in Metropolitan Toronto, 1991
District Density Financial District 13.6
Downtown 9.3
Midtown 7.5
Suburban Downtowns 2.5
Office Park 1.1
Dispersed Locations 1.1
Source: Metropolitan Toronto (1 993), 1991 Office Data Bank
The density or Floor Space Index (FSI) is a very complex indicator which may be deceptive. In general,
density is calculated by dividing the gross floor area (above and below grade) of a structure by the size
of the site on which the building is erected. However, complex methods of density calculations can
result in a variety of densities, particuhdy in the case of large-scale projects. lnstead of taking into
account the actual site on which the building is constructed, a larger parcel may be considered for the
purpose of density calculations. Two examples illustrate this case. The Simpson's Tower located on the
southeast corner of Queen and Bay (in the Financial District) was completed in 1969. Its total gros
floor area is 653,000 square feet and the site area is 22,600 square feet, hence the density is 28.9
tirnes the lot. Two reasons rnay explain this extremely high density. First, one argument might suggest
that the entire city block bounded by Queen, Yonge, Richmond and Bay should be considered as the
developrnent site, since the retail component on this site did not use the full density allowed. The other
explanation suggests that in the 1960s the City of Toronto was not as strict in limiting densities as the
'reform' council in the mid-1970s. A similar approach was adopted by the City of Toronto in the late
1980s as it declared that the Bay-Adelaide Centre is pait of a 'super-bbck' (par! of the 'super-block'
includes the site of the Simpson's Tower), hence allowing the developers to gain extra 700,000 square
feet (Toronto Star, November 5, 1988).

The second example is the Scotia Plaza building, which was completed in 1989. The approval of this
project was made public, especially after a rival bank, the Toronto-Dominion objected to the 'excessive'
density of the Scotia Plaza project (see Chapter Seven). According to the highiy publicized debate, the
densrty of the Scotia Plaza was 16 times the lot. However, the adual FSI is much higher. The total floor
area is 2,300,000 square feet and the lot sue is 97,000 square feet, therefore the density is 23.7 times
the lot coverage. Again, dsnsity depends of site definitions.
6.3 Office districts in Toronto Office buildings in the Toronto Metropolitan Area are not evenly dispersed but strongly clustered in
srnall areas, largely delineated through planning instruments such as 'Official Plans' and zoning
bylaws. These territories are identified here as office districts on the basis of principal location,
characteristics of buildings, and planning history. The ofiice districts are presented in Table 6.1. Before
the districts are descnbed in detail, a systematic comparison of selected districts based on building
characteristics is provided in order to illustrate the systematic variety of the offke buildings fabric (Table
6.6).
The spatial configuration of office clusten and their intemal characteristics illustrate a diverse
office inventory in terrns of the size, height, and the age of office buildings. Examination of f i e
exemplary districts reveals core-periphery gradients based on these building characteristics (Table
6.6). The further away a district is from the core, the smaller, lower and newer are the buildings. The
composition of the office building stock in the Financial District, which is also the oldest office district,
points out that it has by far the largest office buildings in ternis of floor-space (more than 300,000
square feet), in terms of height (more than 25 stories) and also the largest share of 'older' buildings.
The Midtown district has fewer large-scale buildings, few high-rise buildings, and a
considerable number of 'old' office structures (built before 1970). Office buildings in the largest
suburban downtown, Downtown NoRh York, are newer and larger than buildings in the Midtown
Toronto. However, buildings over 25 stories are absent from Downtown North York. The dominant
features in the Consumers Road district, one of the oldest office parks, are low-rise buildings (73
percent with fewer than 1 1 stories), almost no buildings of more than 300,000 square feet, and very few
buildings that were built before 1970. The features of office parks are magnified in the newest office
park in the Toronto CMA, the WoodbineMighway 7 district. All office buildings in this office park are
Iess than 300,000 square feet in site, fewer than 1 1-stories high, and there are no buildings that were
built before 1970 (the first buildings were built in the mid-1980s).

Table 6.6 Physical characteristics of office buildings in selected districts in the Toronto CMA, 1999
Building characteristics
No. of buildings
Buildings with less than 100,000 square feet
Buildings with more than 200,000 square feet
Buildings of less îhan 1 1- stories
Buildings of more than 25- stories
Buildings completed before 1970 Source: Royal LePage (1999
Financial District
No. % 105 100
33 31
32 30
23 22
25 24
57 54
Unpublished da
Midtown
No. % 150 100
98 65
16 11
106 71
3 2
67 45
on individual 01
Downtown North York No. % 29 100
8 28
11 38
12 41
O O
2 7
ce buildings in ti
Consumers Road
No. % 33 100
6 18
Toronto CMA.
Wwdbind Highway 7
No. % 69 100
Office building characteristics Vary strongly from district to district as has been shown. There are other
differences. The interna1 street and circulation systern in the Financial District includes fragmented
parcels that had to be assembled for the development of large office buildings. The Consumers Road
or the WoodbineRlighway 7 districts comprise of large parcels of land separated by roads and
expressways. lnner city districts, including Downtown North York, have mixed land uses, which include
mainly residential, retail, institutional and offce uses; office parks are clusters of office and industrial
buildings. Each district has different kinds of boundaries. Expressways and arterial roads enclose some
districts (office parks), whereas other are bounded by residential neighborhoods and institutional
complexes (Midtown, Downtown North York). Also each district has a particular location in the
network's of the public transit and road infrastructure. The Financial District is transit oriented, Midtown
is partially transit oriented (located along the Yonge subway line). Office parks are totally automobile
oriented and their designation as office parks or their emergence as office parks is attributed to being
highly accessible by automobile. Description and understanding of these districts is important, because
office districts are the resuit of rounds of earlier development and they provide the conditions for new
rounds of office development, stagnation or abandonment.
6.3.1 The Financial District
The territory currently designated in Official Plans as the Financial District is the prime office area of the
Toronto region in t a n s of scale, quality of office space, and rental rates. In this district, the fint
purpose-buiit office structures in Toronto were buiit in the late 1850s in the area east of Yonge Street
around the jundure of Adelaide and Toronto Streets (Gad and Holdsworth, 1984). Until the 1960% this
area was the general office district in the City of Toronto. Although banks, trust and insurance
companies became the r o s t prominent establishments in this district, other types of office
establishments were also part of the general office district (Gad and Holdsworth, 1984; Gad, 1999).
The commencement of the Toronto-Dominion Centre in the mid-1960s ushered in a new phase
of office development in the general office district. A pro-growüi urban regime, using permissive
planning regulation, encouraged large-sale urban redevelopment in the City of Toronto. City officiais
welcomed the participation of corporations in redeveloping the downtown area. In the case of the
Toronto-Dominion Centre, the director of the City of Toronto Planning Board urged the president of the
Toronto-Dominion Bank to consider a downtown cornplex instead of just a head office building (Collier,
1974). In the 1970s some of the largest office buildings in the Financial District were built (Commerce
Court, First Canadian Place and Royal Bank Plata).
In the 1976 Central Area Plan the area was officially designated as the 'Financial District'.
Following the Central Area Plan, development restrictions were imposed, and densities in the Financial
District were lowered from an FSI of 12 to an FSI of 8 (Caulfield, 1974; Gad, 1999). However, by that
tirne, many of the largest office complexes were already built, under construction, or approved. The
oversu pply of office space in the mid-1970s cou pled with municipal 'resistance' to office development
had resulted in a relatively modest delivery of new space in the late 1970s and early 1980s.
Notwithstanding this, downzoning did not prevent the construction of large-scale developments, and by
the mid-1980s when the real estate market was 'hot', two of the largest office complexes in the current
Financial District were built. They had much higher densities than allowed in the 1976 Official Plan and
zoning bylaw. The Scotia PIaza (FSI of 16) and the BCE Place (FSI of 12) were approved in the mid-
1980s (Toronto Star, June 29, 1984; Globe & Mail, December 15, 1987). The average density of the
medium and large office buildings completed before the 1976 Official Plan and after the plan are about
the same average with an FSI of 13.5. Much of the post-1976 plan densities are due to pemitted and
bargained bonuses granted to office projects as a iesult of historical preservation and the provision of
public benefiis such as assisted public housing and daycare facilities.
In the 1990s, the Financial District was considered Canada's most densely developed urban
area (Gad, 1991 b). This district has the largest office buildings in Toronto in tenns of floor-space and
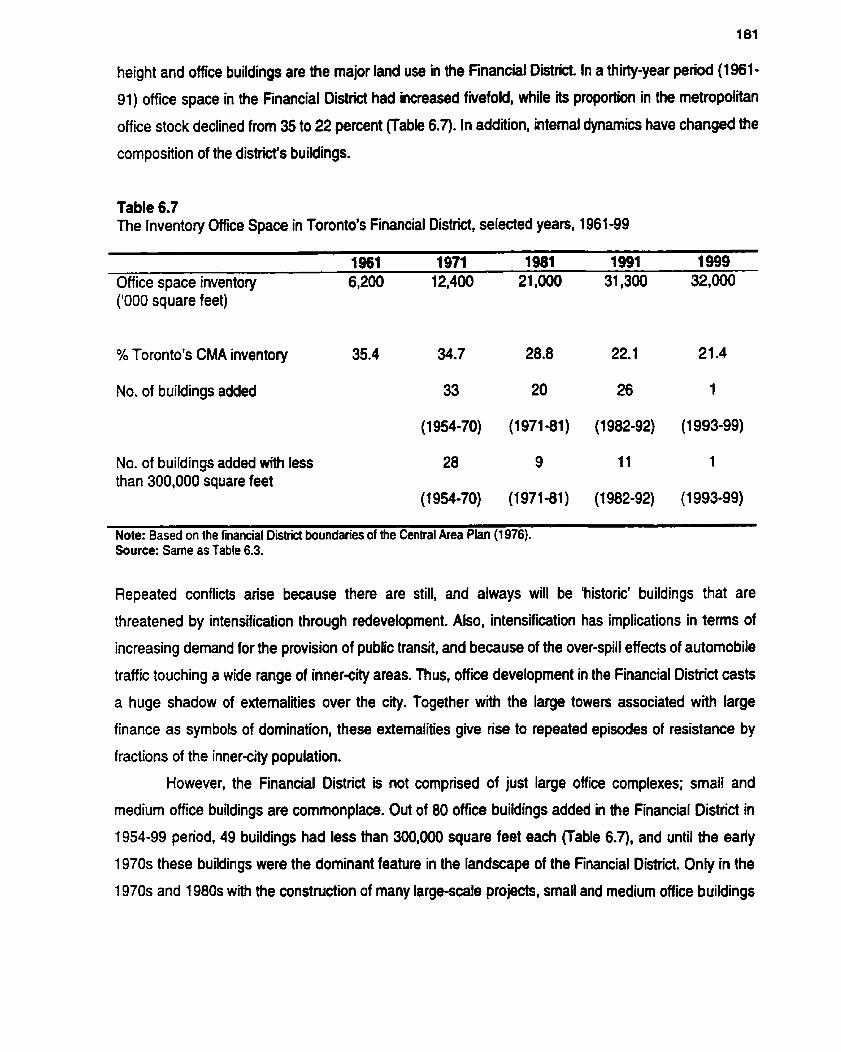
height and office buildings are the major land use in the Financial District. In a thiiiy-year period (1 961 - 9 1 ) office space in the Financial District had increased fiiefold, while its proportion in the metropolitan
office stock declined from 35 to 22 percent (Table 6.7). In addition, intemal dynamics have changed the
composition of the district's buildings.
Table 6.7 The lnventory Office Space in Toronto's Financial District, selected yean, 1961 -99
1961 1971 1981 1991 1999 Office space inventory 6,200 12,400 21,000 31,300 32,000 ('000 siuare feet) -
% Toronto's CMA inventory
No. of buildings added 33 20 26 1
No. of buildings added with less than 300,000 square feet
Note: Based on the financial D i boundaries of the Central Area Plan (1 976). Source: Same as Tabfe 6.3.
Repeated conflicts anse because there are still, and always will be 'historic' buildings that are
threatened by intenslication through redevebpment. Also, intensification has implications in tenns of
increasing demand for the provision of public transit, and because of the over-spill effects of automobile
traffic touching a wide range of inner-city areas. Thus, office development in the Financial District casts
a huge shadow of extemalities over the city. Together with the large towen associated with large
finance as symbols of domination, these extemalities give rise to repeated episodes of resistance by
fractions of the inner-city population.
However, the Financial District is not comprised of just large office complexes; srnall and
medium office buildings are cornmonplace. Out of 80 office buiidings added in the Financial District in
1954-99 period, 49 buildings had less than 300.000 square feet each (Table 6.7). and until the eariy
1970s these buildings were the dominant feature in the landscape of the Financial District. Only in the
1970s and 1980s with the construction of many large-sale projects, small and medium office buildings

have become less signifkant, and their share of the districYs office space has plunged from 66 percent
in 1971 to 30 percent in 1991.
6.3.2 Downtown and Midtown
Downtown is used here to describe an area that includes second largest concentration of office floor-
space in the CMA. The Downtown district encircles the Financial District, with the largest part located
north of the Financial District. This district includes retail, institutional and residential uses as well as
office buildings. Royal Le Page d ides Downtown into f i e concentrations: North, South, East. West
and King West. The eastem sector of Downtown as well as King West includes some of the oldest
office stock, and is also the smallest in ternis of office space. The areas of Downtown North and
Downtown West have the largest office inventories in Downtown.
In the Downtown area, office development expanded substantially from the 1950s to the
1980s. As land for redevelopment in the Financial District became scarce and municipal regulation
tighter, office development moved to the areas sunounding the Financial District. In the 1970s and the
1980, the area north of the Financial District and south of Bloor Street (Downtown North according to
Royal LePage definitions) experienced massive growth, and in the 1980s the area immediately west
and south of the Financial District added considerable volume of office space.
Midtown is a combination of three distinct clusters, Bloor Street, St. Clair Avenue, and Eglinton
Avenue at the intersections of Yonge Street. These areas are located around major subway stations
along the Yonge subway line, and their genesis as office districts is a consequence of the opening of
the Yonge line in the mid-1950s. Prior to the opening of the Yonge subway line in 1954, no significant
office clusters were to be found in the Midtown District. The subway and municipal encouragement
through zoning induced office construction around the major subway stations in the Midtown area
(Lemon, 1985). Throughout the decade following the opening of the Yooge subway line (1 954-65), 45
percent of new office construction in Metropolitan Toronto was in the Midtown district.
Midtown Toronto continued to experience considerable growth from the mid-1960s to the mid-
1970s. In the 1969 ûfficial Plan, two of the three clusten in the Midtown area were designated to
function as 'commercial districts', thus removing them from the liberal growth framework prevailing in
the Central Area. Since the mid-1970s, office development in these areas has slowed down as a result
of neighborhood pmtest, followed by restrictions on parking space permitted in and around new office
buildings. As a result, Midtown was the only district in the Toronto CMA that gained l e s office space in
the 1981 -91 decade than in each of the preceding decades (Table 6.3).
Both Downtown and Midtown districts are areas with offices, institutional, and older residential
uses that have been subject to gentrification. Consequently, any office development that is associated
with disturbing the existing building fabric and its reuse has been problematic and very few large o f f i
buildings wewe added in these districts after the mid-1970s.
6.3.3 Suburban Downtowns
By the end of the 1990s. there were three distinct office districts which deserve the label 'suburban
downtown'. These suburban downtowns are in the former Metropolitan municipalities of North York and
Scarborough, and a third one is in the City of Mississauga. These downtowns or subcentres were
created through both public planning measures and the initiatives of private developen. They are
defined and delineated in Official Plans and roning bylaws, and they are promoted by local
municipalities, and in the case of Nom York and Scarborough also by Metropolitaii Toro~to. In these
subcentres, office buildings are confined to reasonably small areas (at least at suburban sales of
cornpactness), and in the 1990s each of these centres accommodated more than 3 million square feet
of office space.
The development of suburban downtowns in the Toronto area is a relatively new phenomenon
(Hartshom and Muller, 1989; Relph, 1991). Until the early 1970s, no such downtowns existed.
However, since the mid-1970s, and especially in the 1980s, the suburban municipalities surrounding
the City of Toronto expanded rapidly, and their downtowns grew conespondingly (Table 6.8). This
transformation resulted from several factors, most notably suburban population and employment
growth, centrifuga1 forces pushing office development away from the City of Toronto. the
deconcentration of office employrnent encouraged by the Metropolitan Toronto govemment, and the
desire of suburbsn municipalities to attract developrnent in order to expand their tax base and in order
to gain visibility and recognition. The importance of suburban downtowns for their respective local
governments is reflected in the off icial designation: Mississauga City Centre, Downtown North York and
later North York City Centre, and Scarbomugh Town Centre.
The 1980s were the 'golden decade' of office development in the suburban downtowns. In
1976, total office floor-space in the three downtowns was 1.35 million square feet; it increased to 4
million in 1981, and more than tripled by 1991 to 12.7 million square feet (Table 6.8). Conespondingly,
their share of Toronto's office stock increased from 2.5 percent in 1976 to 9 percent in 1991. In the
1990s, growth in suburban downtowns literally came to a hait. There were no new office buildings
completed. (Although several office buildings were completed in the early 1990s in North York City
Centre and Mississauga City Centre, they were part of the 1980s boom).
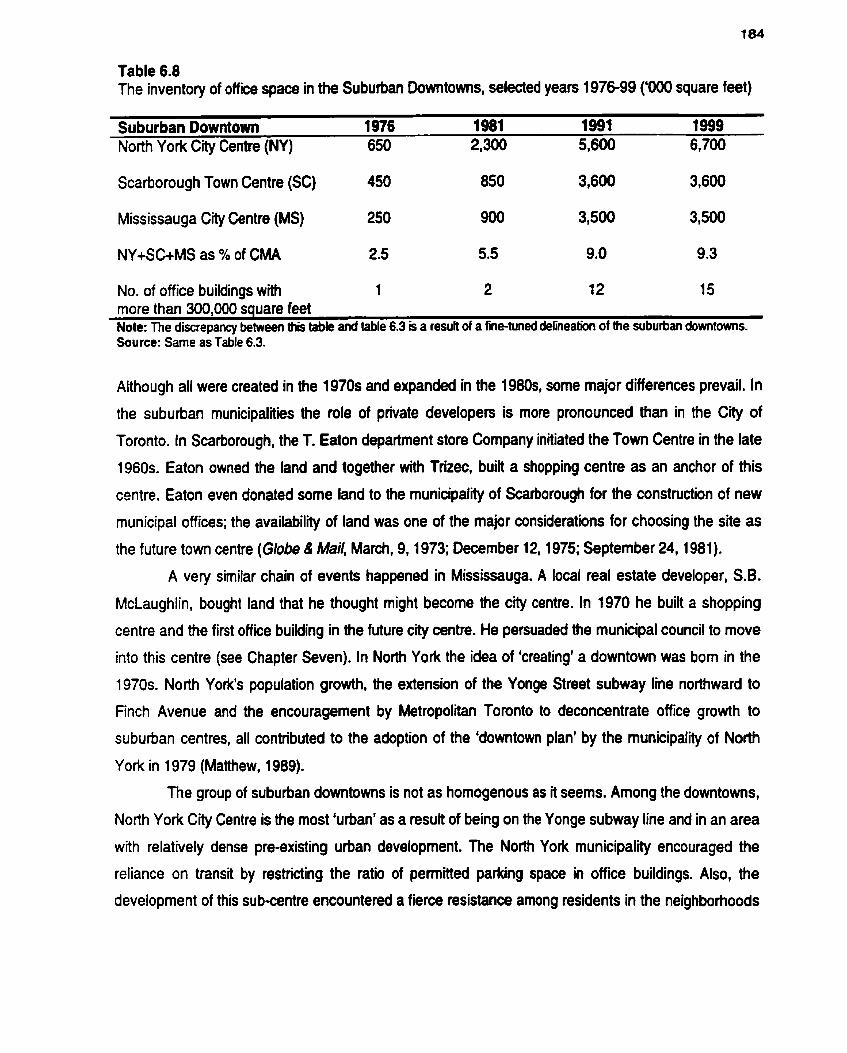
Table 6.8 The inventory of office space in tha Suburban Downtowns, selected years 1976-99 ('000 square feet)
Suburban Downtown 1 976 1981 1991 1999 North York Crty Centre (NY) 650 2,300 5,600 6,700
Scarborough Town Centre (SC) 450 850 3,600 3,600
Mississauga City Centre (MS) 250 900 3,500 3,500
NY+SC+MS as % of CMA 2.5 5.5 9.0 9.3
No. of office buildings with 1 2 12 15 more than 300,000 square feet Note: The discrepancv between th& table and table 6.3 is a resuft of a fine-tuned delineation of ttie suburban downtowns. Source: Same as s able 6.3.
Aithough al1 were created in the 1970s and expanded in the 1 9 8 0 ~ ~ some major differences prevail. In
the suburban municipalities the role of private developea is more pronounced than in the City of
Toronto. In Scarborough, the T. Eaton department store Company initiated the Town Centre in the late
1960s. Eaton owned the land and together with Trizec, built a shopping centre as an anchor of this
csntre. Eaton even donated some land to the municipality of Scarborough for the construction of new
municipal offices; the availability of land was one of the major considerations for choosing the site as
the future t o m centre (Globe & Mail, Mach, 9, 1973; December 12,1975; September 24, 1981).
A very sirnilar chain of events happened in Mississauga. A local real estate developer, S.B.
McLaughlin, bought land that he thought might become the city centre. In 1970 he built a shopping
centre and the first office building in the future crty centre. He persuaded the municipal council to move
into this centre (see Chapter Seven). In North York the idea of 'creating' a downtown was bom in the
1970s. North York's population growth, the extension of the Yonge Street subway Ine northward to
Finch Avenue and the encouragement by Metropolitan Toronto to deconcentrate office growth to
suburban centres, al1 contributed to the adoption of the 'downtown plan' by the municipality of North
York in 1 979 (Matthew, 1989).
The group of suburban downtowns is not as homogenous as it seems. Among the downtowns,
North York City Centre is the most 'urban' as a resuit of being on the Yonge subway line and in an area
with relatively dense pre-existing urban development. The Nomi York municipality encouraged the
reliance on transit by restricting the ratio of permitted parking space in office buildings. Also, the
developrnent of this subcentre encountered a fierce resistance arnong residents in the neighborhoods
adjacent to the City Centre. The subcentres in Scarborough and Mississauga were developed on
greenfield sites, thus local conflicîs were hardly a major issue.
In addition, the size. height and densw of office buildings Vary between these subcentres.
North York City Centre has the largest office buildings (10 buildings with over 300,000 square feet
each, Scarborough has f ie, and Mississauga has only one). The North York City Centre stands out
with seven buildings of 20-24 floon. In the Mississauga City Centre and the Scarborough Town Centre,
the maximum building height is 18 floon.
6.3.4 Office Parks
The nine recognizable office parks in the Toronto CMA contained more than 2 million square feet of
office space in 1999. The major attractions of office parks are related to space and accessibility
(Daniels, 1974). The availability and relatively low cost of greenfield sites enables on-site parking and
customized-design buildings. In the Toronto area, office parks are a feature of the post-WWII era. and
therefore strict regulations and preferences regarding land use separation are applied. The office parks
exclude any residential uses (apart from hotels) and usually have veiy distinct boundaries such as
expressways, railway tracks, or ravines. which act as barrien between various types of offices and
residential neighborhoods. Hence, conflicts with residents as interest groups are viltually unknown.
Most Toronto office parks were developed in areas initially designated as industrial areas
(Pivo, 1993). Two major comdors of office park development dominate the Toronto area: the Don
Valley comdor and the Highway 401 comdor in the vicinity of the Airport (Figure 6.1). In the case of the
Don Valley corridor, the north-south Don Valley Parkway (DVP) and its extension northward (Highway
404), and the major east-west comdor, Highway 401. have provided high accessibility to Toronto's
central area and to the metropolitan region as a whole. In the airport area, Toronto's International
Airport and sunounding web of highways (401. 403. 427, and recently 407) have enhanced the
attractiveness of the Airport district for office development.
The Don Valley Parkway is the backbone of the strongest concentration of office parks in
Toronto. Beginning in the mid-1960s. the development of the Eglinton-Don Mills area (Flemingdon
Park) created Canada's first suburban office park that ran along the proposed north-south expressway.
ln the late 1960s. after the completion of the Don Valley Parkway another mixed-use park further north
of Flemingdon Park was developed (Matthew, 1989). The Consumes Road district, situated around
the intersection of Highway 401 and the DVP, signaled the future trend of office development. In the
1980s and 1990s, office clusten at Woodbine and Steeles and Woodbine and Highway 7 were
developed. By the early 1990s, these nodes became the largest office parks in the Don Valley comdor
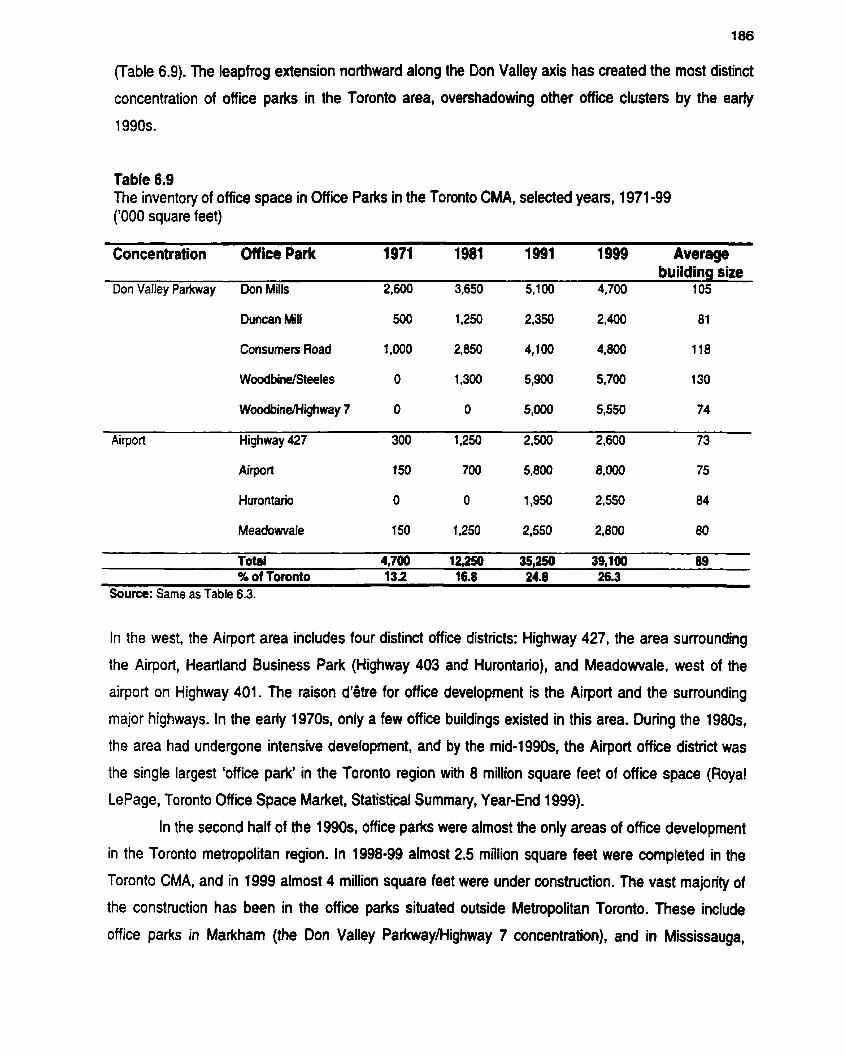
(Table 6.9). The leapfrog extension northward along the Don Valley axis has created the most distinct
concentration of office parks in the Toronto area, ovenhadowing other office clusten by the earîy
Table 6.9 The inventory of office space in Office Parks in the Toronto CMA, selected yean, 1971-99 ('000 square feet)
Concentration ûffice Park 1971 1981 1991 1999 Average building size
Don Valley Parkway Don Mills 2,600 3,650 5,100 4,700 1 OS
Duncan Mill 500 1 250 2,350 2,400 8 1
Consumers Road 1,000 2,850 4,100 4,800 118
WoodbineISteeles O 1,300 5,900 5,700 130
Woodbine/Highway 7 O O 5,000 5,550 74
Airport Highway 427 300 1,250 2,500 2,600 73
Airport 150 700 5,800 8,000 75
Hurontario
Meadowvale
Total 4.700 12250 35.250 39.1ûû 89 - -,-- - . - -
% of Toronto 13.2 168 24.8 26.3 Source: Same as Table 6.3.
In the west, the Airport area includes four distinct office districts: Highway 427, the area surrounding
the Airport, Heartland Business Park (Highway 403 and Hurontario), and Meadowvale, west of the
airport on Highway 401. The raison d'être for office development is the Airport and the surrounding
major highways. In the eariy 1970s, only a few office buildings existed in this area. Dunng the 1980s.
the area had undergone intensive development, and by the mid-1990s. the Aiport office district was
the single largest 'office park' in the Toronto region with 8 million square feet of office space (Royal
LePage, Toronto Office Space Market, Statistical Summary, Year-End 1999).
In the second half of the 1990s. office parks were almost the only areas of office development
in the Toronto metropolitan region. In 1998-99 almost 2.5 million square feet were completed in the
Toronto CMA, and in 1999 almost 4 million square feet were under construction. The vast majonty of
the construction has been in the office parks situated outside Metropolitan Toronto. These include
office parks in Markham (the Don Valley ParkwayNighway 7 concentration), and in Mississauga,
primarily in the Airport, Heaitland, and Meadowvale districts (Royal LePage, Toronto Office Space
Market, Statistical Summary, Year-End 1999).
Tbere are some variations in the character of office parks. For instance, the average building
size in most office paiks is between 70,000 and 85,000 square feet; however, in the Consumen Road
and Woodbine/Steeles districts, the average building has between 120.000 and 130,000 square feet of
office space (Tab!e 6.9). Office parks, although having on average the smallest building size among
office districts in Toronto, contain also some large-scale o f f i buildings. Although the presence of
large-scale buildings in office parks is not new, there has been a trend toward larger office buildings in
the last decade. In the late 1960s, three buildings, each over 300,000 square feet (the IBM building. the
23-storey Foresten House and the Bell Canada Data Centre), were buiit in the Don Mills district. In the
late 1980s, two buildings of more than 300,000 square feet were developed in the Consumen Road
office park, each 17-storeys high. In the WoodbineISteeles office park, three low-rise buildings (two
buildings in an IBM cornplex of 900,000 and 700,000 square feet, and the Bank of Montreal Data
Centre 400,000 square feet) were added between the mid-1980s and the early 1990s. Beginning in the
late 1990s, major office buildings have been erected in the western office districts: a 500,000 square
feet (12-storey) building in the Heartland district (completed in 1999). and a twin-tower Roysl Bank
edifice (800,000 square feet) in the Meadowvale district is under construction. In the Woodbine/Steeles
distict, a building for Call-Net (650,000 square feet) is under construction in 2000 (Royal LePage,
Toronto Office Space Market, Statistical Summary, Year-End 1999).
Office parks are well separated from residential areas, and negative over-spills from office
parks have not surfaced. However, conflicts do arise between office park proponents and others. Since
office parks contain industrial and warehousing uses, intemal conflicts adse over roads and parking
facilities. The interests of truck users (industrial and warehouses owners) and passenger car users
(office tenants) freguently clash. Also, office buildings seem to accrue in mixed industriaVoffice parks
over time and at a certain stage higher capacity passenger transpoitation facilities (more roads or
public transit) may be required. This becomes a problern for municipal govemments, who want to
promote suburban downtowns, which are easier to serve with public transit facilities than are office
parks. To a large extent, office parks were developed in spite of the attempts of Metropolitan Toronto
to restrict this type of development. The 1981 Metropolitan Officia1 Plan stated that no new office
centres should be buiit; however. the 1991 Official Plan designated a number of suburban clusters for
office development in order to reduce the flight of development to the outer suburbs of the CMA.
6.4 Sequential Cycles of Investment within the Metropditan Realm Switching of investment between different o f f i i districts is a newly emerging phenomenon in the
Toronto CMA. Some districts gain substantial amounts of o f f i space, h i l e other districts experience
relative decline, stagnation, or even abandonment. This is part of the cyclical process of investment
within the urban realm. Some places becorne attractive for investment, while othen experience
disinvestment. Neoclassical interpretations consider uneven spatial development as a ternporary
phenomenon. Over time as geographical expansion reaches its limits, the system should move into
equilibrium and the performance of different locations should converge (Richardson, 1969; Watkins,
1980). Hence, capital moves fmm high cost areas (in tenns of land and building cost) to low cost
locations. On the other hand, another perspective views dis-equilibrium a typical phenomenon as
locations that gain initial advantage continue to build on their edge while these disadvantaged fall
behind (Myrdal, 1957; Clark et at., 1986). Capital flows, according to the Manist theory. move from
locations with low profit potential to high profi potential (Clark, 1980; Harvey, 1982,1985; Smith, 1984);
however, this uneven spatial configuration is a long-term phenomenon. Further, spatially uneven
development is an essential ekment of growth in capitalist economies (Broweît, 1984). When new
areas of growth are exploited to the point where profi rates fall, capital flows to previously undeveloped
areas (Beauregard, 1993).
Office development in the 1990s in Toronto illustrates sequentia! and simultaneous nature of
spatial investment and disinvestment in office buildings. In the fint haf of the 1990s, when almost no
office developmen! was punued in the City of Toronto, its total office flwr-space declined in absolute
terrns. This decline can be attributed to the absence of new constriction and the deletion of office space
through convenions and demolitions. As a result of historically high vacancy rates, negative net rents
and the demand for residential space, office buildings were converted to residential buildings. The
trend to convert vacant or almost vacant office buildings to residential space began in 1993 when the
City of Toronto eased rules restricting such convenions (Real Estate News, Febniary 17, 1995). In
early 1995, sixteen conversion projects were underway or in the approval process, representing 1.4
million square feet of office space (Royal LePage, 1995). Most of the conversions were restricted to
older buildings either in Downtown or Midtown. One of the areas that suffered the most from
convenions was the Yonge-Eglinton area, one of the three nodes constituting the Midtown district.
According to the report by Royal LePage, 6.5 percent of the area's office inventory was either
converted or proposed to be converted (Royal LePage, 1995). The City and local ratepayen
discouraged office development in this area (see section 6.3.2).
Parallel to convenions of office buildings in certain parts of the City of Toronto, reinvestrnent in
the conversion of manufacturing and wholesale buildings into office space occurred in other areas.
Under the Centra! Area Plan, the area West of Toronto's Financial District was zoned for industrial use.
Pressures from the development industty resulted in bylaws that permit commercial development and
extensive office development in a sub-area of the industrial district just west of the Financial DistrÏct. In
the 1980sl both new space (2 million square feet) and renovated space was put on the market in this
area. The City was detennined to keep offie development out of the garment district (further west of
the Financial District) in order to maintain industrial jobs downtown (Metropolitan Toronto Business
Journal, July-August 1985). In the mid 1990s. however, the gannent district, also known as the King-
Spadina district, was opened by the City for further office redevelopment (together with the area east of
the Financial District, King Parliament) and was designated as a reinvestment area. These areas were
'de-zoned' allowing any use consistent with density and simple compatibility guidelines (Globe & Mail,
April 29, 2000). The re-use of older warehouses and manufacturing facilities located in the urban core
for office uses is evident in other cities, such as Vancouver (Hutton, 1998) and Chicago (Rast, 1999).
Until then the buiit fabric of this district consisted of mainly buildings that were buitt in the 1900-1930
period, usually 5-6 stories (but also a few of 10 stories), which were multi-purpose 'loft' buildings used
for Iight rnanufacturing and wholesale. As the barriers to the reuse of these spaces opened, buildings in
this district were converted to fit the needs of the 'new economy' such as architects, publishers, fashion
designers, software developers, new media companies, or digital content developers. These types of
companies, which employ professionak of various kinds, opt for new types of spaces which have
'character' and histocy, and they are dissatisfied with the traditional office buildings. The prefened
buildings have architectural attributes such as interior post and beam construction, exposed intenor
brick, windows on al1 sides, and hardwood floors (Daily Commercial News, October 20, 1998). As a
result of this process, a considerable number of buildings in this district were retrofiied by upgrading
mechanical systems and information systems. How far this process has gone is not quantifiable at the
moment. There seems to be some resistance to acknowledge these buildings as office buildings.
The case of office development along the Don Valley comdor provides illustrative evidence of
sequential and simultaneous investment and disinvestment practices. Office development in the area
staited midway between the Gardiner Expressway (the expressway that mns along Toronto's
waterfront) and Highway 401 along the Don Valley corridor. As the noithem sections of rnetropolitan
Toronto were experiencing rapid population growth and as eadier office parks 'aged', office parks along
the Don Valley Parkway leaped northward. Older office districts in the south lost their attractions.
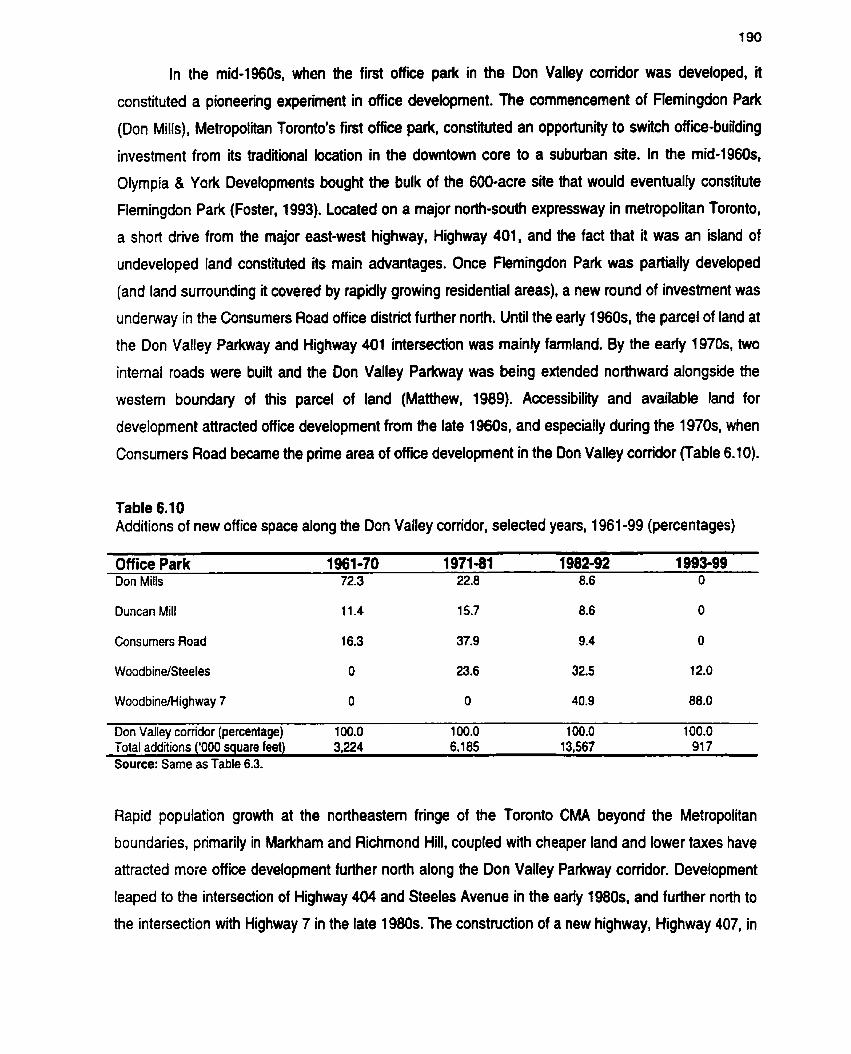
In the mid-1960s, when the fint office paik in the Don Valley comdor was developed, it
constituted a pioneering experiment in office devekpment. The commencement of flemingdon Park
(Don Mills), Metropolitan Toronto's first office park, constituted an opportunity to switch offce-building
investment from its traditional location in the downtown core to a sububan site. In the mid-1960s,
Olympia & York Developments bought the bulk of the 600-acre site that would eventually constitute
Flemingdon Park (Foster, 1993). Located on a major north-south expressway in metropolitan Toronto,
a short drive from the major east-west highway. Highway 401, and the fact that it was an island of
undeveloped land consthted Ïts main advantages. Once flemingdon Park was partially developed
(and land surrounding it covered by rapidly growing residential areas), a new round of investment was
undenvay in the Consumers Road office district further north. Until the eady 1960s, the parcel of land at
the Don Valley Parkway and Highway 401 intersection was rnainly familand. By the earfy 1 9 7 0 ~ ~ two
intemal roads were built and the Don Valley Parkway was being extended northward alongside the
western boundary of this parcel of land (Matlhew, 1989). Accessibility and available land for
development attracted office development from the late 1960s. and especially during the 1970s. when
Consumers Road became the prime area of office development in the Don Valley corridor (Table 6.10).
Table 6.10 Additions of new office space along the Don Valley comdor, selected yean, 1961 -99 (percentages)
Office Park 1961-70 197141 1982-92 1993-99 Don Mills 72.3 22.8 8.6 O
Duncan Mill 11.4 15.7 8.6 O
Consumers Road 16.3 37.9 9.4 O
Don Valley corridor (percentage) 100.0 100.0 100.0 100.0 Total additions ('000 square feet) 3,224 6,185 13,567 91 7 Source: Same as Table 6.3.
Rapid population growth at the northeastem fnnge of the Toronto CMA beyond the Metropolitan
boundaries, prirnarily in Markham and Richmond Hill, coupled with cheaper land and lower taxes have
attracted more office development further north along the Don Valley Parkway corridor. Devefopment
leaped to the intersection of Highway 404 and Steeles Avenue in the eariy 1980s. and further north to
the intersection with Highway 7 in the late 1980s. The construction of a new highway, Highway 407, in
the mid-1990s has contributed to the further attraction of the WoodbineMighway 7 o f f i i cluster, which
became by the late 1990s a major office development cluster in the Don Valley comdor (Table 6.1 0). In
the 1980s (1 982-92), the role of the older office parks as attractive investment arenas for new office
developrnent has diminished Mi le othen have been experiencing continuous growth. In the 1980s1 73
percent of new office development was in the newest office parks, Woodbine/Steeles and
WoodbineMighway 7. In the 1990s (1993-99) al1 new office development along the Don Valley corridor
was in these two office parks.
In the 1990s, older office clusters such as Don Mills. Duncan Mill and Consumers Road have
been experiencing relative stagnation and several office buildings in these districts were rernoved from
the inventory as they were converted into residential and other uses, or office buildings were
demolished and the parcels of land they stood on rernain vacant. On the other hand. office
development was funneled into the newest office parks, as these clusten have become the favourite
locations of office development In 1998-99, as the office market moves from depression to moderate
growth, the major areas experiencing office development have been selected o f f i i parks. The most
recently developed office park in the Don Valley corridor, WoodbineMighway 7 together with the offce
districts in the Airport Complex (Airpoit, Heartland, and Meadowvals) have accounted for 88 percent of
new office construction in the Toronto CMA in 1998-99 (more than 2 million square feet). Office
buildings under construction in 1999 in these areas accounted for 93 percent of the floor-space of the
office buildings under construction in the Toronto region (Royal LePage, Toronto Office Space Market,
Statistical Summary, Year-End 1999).
6.5 The Changing Character of Toronto's Office Stock The stock of office buildings and the office districts they are part of shows a great degree of variability
across rnetropolitan space and across time. Between the 1950s and the 1990s, the landscape of
offices has changed from being concentrated in a small downtown area with relatively small buildings
to a multi-nodal pattern with buildings of rnany sizes.
Office buildings have increased greatly in size over time in the Financial District. the Downtown
district and in the suburban downtowns. Even office parks have witnessed the construction of buildings
with larger amounts of space. However, paralfel to the construction of large buildings, small office
structures have prevailed in office paiks. The 1990s saw a turn in ternis of office buildings constructed
or re-modeled: large towen with multiple occupancy ('speculative space') have given way to smaller
customized buildings for single occupancy. Al1 of the 1990s large-scale buildings in office parks are
custom-built for single occupancy. Along with convenions of office buildings to other uses, a
phenomenon discemible prirnarily in the 1990s, built structures were recycled as offce buildings.
These 'new spaces' located in old industrial districts, such as the King-Spadina district, may be mula-
tenant buildings, but these multi-tenant buildings are reused spaces of srnall-to-medium size industrial
and multi-purpose buildings.
The character of off= districts is also subject to change. Since the 196Cs, office clusten with
large buildings in tight spaces have competed with the low-density spaces of office parks. In the 1990s'
however, high-density clusten stopped growing, while office space was added in office parks and in old
industrial areas. However, not al1 office parks continued to add new office space; some experienced
stagnation and even absolute decline in office floor-space. Older office parks were 'abandoned' in
favour of newer office paiks. As a resuît, the oldest office park in the Toronto area, the Don Mills district
(earlier known as Flemingdon paik) has seen an absolute decrease in the office building inventory in
the 1990s through demolitions and through conversion to residential and non-office uses. At the same
time, the districts of WoodbineMighway 7 and the Airpoit sustained a strong growth of office
deveIopment.
The uneven distribution of real estate investrnent in office buildings is a necessary condition in
the production of real estate in capitalist economies based on the intemal characteristics of the growing
economic sectors. Wihin the suburban sphere, investment migrates between locations according to
availability of greenfield sites (in conjunction with accessibility). lnvestment in suburban locations in
which development becomes complicated experience declining profiiability and their share in
development diminishes in favour of inexpensive undeveloped land. This allows the continuation of low
densities, although larger office buildings may be erected. In the 1990s. strong demand, driven mainly
by the fast-growing high-tech sector (with a preference for office park development), the proximity to
large suburban labour pools, and further advances in telecommunications have reinforced office
development in the suburban locations that were able to deliver high accessibility and availability of
land. However, these 'preferences' are also accompanied by structural conditions in the older office
districts, where an intriate land use network and residents' opposition gives rise to barriers. Capital
that seeks to minimize resistance is encouraged to look for more favourable locations.
The variety of office districts in the Toronto area, each with specific characteristjcs, provides
real estate companies diverse areas of operation in which each Company cari possibly fit. The
compatibility or the division of labour between real estate companies wiaiin the Toronto area in the
subject of the next chapter.

CHAPTER SEVEN
THE SPATiAL PRACTICES OF OFFICE DEVELOPMENT
COMPANIES AND OFFICE DEVELOPMENT DISTRICTS IN
TORONTO
In the previous chapter I have shown the physical characteristics of different office districts in Toronto.
In the introduction and in a preliminary way in Chapter Three, I have argued that developen (and
investors/owners) operate within specific territories within the urban region. In this chapter further
evidence conceming the spatial selectivity of developers and owners of office buildings will be
fumished. The major concem of this chapter, however, will be bringing together the physical
characteristics of office districts, the municipal actions that shape these districts, and the actions of
developers which also create and reproduce these districts. The combination of ph ysical characteristics
and the actions of key agents creates the basis for the concept 'office development district'. Although
the literature on urban development recognizes the importance of specific sub-areas or 'sub-markets'
within large urban areas, the concept of office development district has not been articulated in this
literature.
The notion that real estate development is highiy dependent on specific conditions has been
suggested throughout this dissertation and in nurnerous studies (for exarnple, Leitner, 1994; Pryke,
1 994a; Bryson, 1997). Other researchers (Knox, 1993; Logan, 1993; Beauregard and Haila, 1997)
stress the tension between local and global real estate markets, but even these studies acknowledge
the significant role of local conditions in shaping real estate developrnent. Studies on office markets
indicate that within a particular metropolitan area office markets are subject to further spatial
segmentation (Clapp et al., 1992; Hanink, 1997; Rabianski and Cheng, 1997; Wolverton et al.. 1998).
This segmentation is not Iimited to the traditional notion of downtown versus the suburbs. lt has been
increasingly acknowledged that there are a variety of commercial property sub-markets as is shown by
Healey's (1 998a) recent statement that 'it is now clear that land and property development markets are
now much more segmented and differentiated than had been assumed in earlier penods" (p. 221).
This segmentation is a resut of several factors. First, it is a consequence of a segmented
demand; different types of usen generate differences in demand in t e n s of building size and location
(Gad, 1985,1991 a; Matthew, 1993b; Pivo. 1993). However, the suggestion that demand of office usen
dictates the supply of space has been challenged, since the development process is relatively lengthy

and there is a time h g between the indication of specifii demand and actual product delivery to the
market (D'Arcy and Keogh, 1997). At particular times, especially in expansion pariods, a considerable
part of office developrnent is speculative (iniliated with no commitment from future tenants). Therefore,
the perceptions and preferences of the producers of offne space are pivotal in determining the
characteristics of office development.
Second, space, both institutional and physical, is highly fragmented and specialized. Municipal
zoning regulations define the type and location of certain types of development. Physical
characteristics, like accessibility and availability of land, which are often intertwined, propel different
kinds of office development. Govemments and real estate companies do not operate in isolation but
rather tend to cooperate. As suggested by Logan and Molotch (1987) and Haila (1991), some real
estate companies attempt to manipulate development and for this purpose govemments are needed.
This in turn results in diverse and cornpetitive office development 'markets' in which a substantial
number of developers operate. In the segmented urban structure of rnetropolitan areas, there are
spatial opportunities that allow different real estate companies to find their niches or operational
s paces.
Although the literature on urban development in general and on office development in
particular is replete with references to the influence of developers, I have argued before that there are
structural necessities that bring developers and municipal govemments together. This calls for an
empirical investigation to establish in which particular circumstances and in which patticular events or
episodes real estate developers gel away with good or inappropriate 'deals'.
What follows is detailed information on the spatial selectivity arnong office deveiopers in
Toronto. Employing systematic data that is largely based on the largest office deveiopen in the Toronto
area and a patchwork of data on some of the smaller developers, the spatial configuration of their
operations is descnbed. TWO cornpanies with distinct spatial practices are examined in detail. In the
second section, I pmvide propositions about the concept 'office developrnent district'. These districts
embody the notion of a localized and segmented office development process and its particular physical
manifestations. The third and major section is about case studies of important types of office
development districts in the City of Toronto. and the suburban cities of North York and Mississauga.
7.1 Spatial Selectivity among Real Estate Companies in Toronto The real estate companies engaged in office development in Toronto exhibit spatially distinct practices.
Each type of real estate Company specializes in paficular settings. Figure 1 and 2 (Introduction, p. 4)
show the most dramatic differences in the spatial selectivity of office developeis in the Toronto region.
The operational spaces of the large developer were identified thmugh the examination of annual
reports (for publicly held companies), and various other sources, such as newspaper articles,
publication in the industry joumals, and oie web sites of several companies. These real estate
companies were chosen because they are the most prominent companies that were engaged or are
still engaged in office development or ownenhip of office buildings in the Toronto area.
At a first cut, the spatial division employed here is faiily cnide. Developen are classified as
either core or suburban oriented; oniy a few have both substantial core and suburban office porîfolios
(Table 7.1). The definition of the core includes the Financial, Downtown and Midtown office districts.
The areas outside of the core are considered suburban. Later in this chapter a more finely tuned
differentiation between the spatial practices of developen will be provided.
A number of thresholds were used to differentiate between spatial categories in Table 7.1. A
company is considered as operating mainly in the core if at least two-thirds of its Toronto office floor-
space is in the core. A subuhan company has at least two-thirds of b office floor-space in the
suburbs. Companies that are not pari of one of the above categories are considered as operating both
in the core and in the suburbs.
Table 7.1 shows a set of the large developers and ownen of office space in the Toronto area
for four cross-section dates between 1971 and 1999. Throughout the three decades, the focus of the
largest developers and ownen was in the core area. The most substantial office developments of the
two largest development companies, Cadilbc Fairview and Olympia 8 York (OBY) were in the core,
although 0 8 Y was an exception in 1971, when it was still a suburban developer. The focus of mid-
sized developers was in the Oowntown and Midtown districts. Bramalea Limited and Manulife Financial
Real Estate (a division of the Manufacturers Life lnsurance Company) are examples of this tendency;
Manulife developed office buildings mainiy in the YongeJBloor area (including its head office), and
Bramalea developed buildings that are adjacent to the major subway stations along the Yonge Street
line. Other companies had a more balanced distribution between downtown and suburbs. Y&R
Properties was essentially an office developer in the Financial District, but beginning in the early 1970s,
the company undertook office development in an office park (Consumen Road). H&R Developments, a
developer in the suburban realm until the late 1970s, began developing office buildings in downtown
Toronto in the eariy 1980s, and continued to engage in development in suburban locations in North
York and Mississauga.
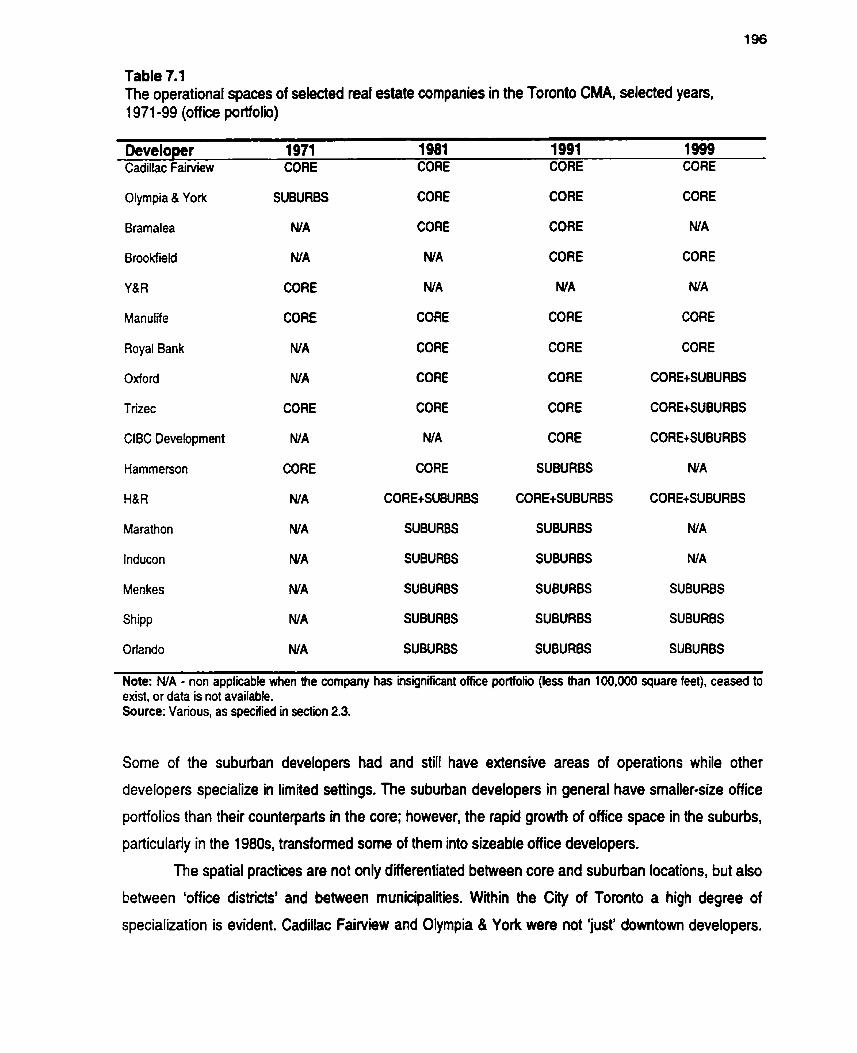
Table 7.1 The operational spaces of selected real estate companies in the Toronto CMA, selected years, 1 971 -99 (office portfolio)
Develo per 1971 1981 1991 1999 Cadillac F a i ~ e w CORE CORE CORE COR€
Olympia 8 York
Bramalea
Brookfield
YbR
Manulife
Royal Bank
Oxford
Trizec
ClBC Development
Hammerson
H&R
Marathon
lnducon
Menkes
Shipp
Orlando
SUBURBS
WA
WA
CORE
COR€
N/A
NIA
CORE
NIA
CORE
NIA
N/A
N/A
N A
NIA
N/A
CORE
CORE
N A
NIA
CORE
COR€
CORE
CORE
NIA
CORE
CORE+SUBURBS
SUBURBS
SUBURBS
SUBURBS
SUBURBS
SUBURBS
CORE
CORE
COR€
NIA
COR€
COR€
CORE
CORE
CORE
SUBURBS
CORE+SUBURBS
SUBURBS
SUBURBS
SUBURBS
SUBURBS
SUBURBS
CORE
N/A
COR€
N A
COR€
COR€
CORE+SUBURBS
CORE+SUBURBS
CORE+SUBURBS
NIA
CORE+SUBURBS
N/A
NIA
SUBURBS
SUBURBS
SUBURBS
Note: N/A - non applicable when the company has insignificant oKce portfoiio (les than 100,000 square feet), ceased to exist, or data is not available. Source: Va rious, as specified in section 2.3.
Some of the suburban developers had and still have extensive areas of operations white other
developers specialize in limited settings. The suburban developers in general have smaller-sire office
portfolios than their counterparts in the core; however, the rapid growth of office space in the suburbs,
particularly in the 1980s. transformed some of them into sizeable office developen.
The spatial practices are not only differentiated between core and suburban locations, but also
between 'office districts' and between municipalities. Within the City of Toronto a high degree of
specialization is evident. Cadillac Faiwiew and Olympia & York were not 'justJ downtown developers.
More specifically, both focused on Toronto's Financial District: Cadillac Fairview from the late 1960s
onward and Olympia & York beginning in the eaily 1970s. Most of the office buildings owned by the
Royal Bank and ClBC (bank) were in the Financial District Other companies developed office buildings
in the areas surrounding the downtown. Allied Canadian Corporation, for example, a Company founded
in 1988, began to recyde older industrial buildings on the western and eastem fringes of downtown in
the mid-1990s.
Spatial selectivity according to municipalities and physical charaderistics is especially evident
in the case of suburban developen. The large suburban developen have operations across the mole
suburban realm, whereas smaller developen focus on one or two municipalities. One of the largest
suburban office developen in the Toronto region until % bankniptcy in 1992. lnducon Development
Corporation, was the most divenified developer in t e n s of municipalities, lnducon had office buildings
in five different municipalities: North York, Etobicoke, Mississauga, Oakville. and in Markham. Another
large suburban office developer, Menkes Developments, has been invohred in development in North
York, Mississauga and Richmond Hill. On the other hand, the office buildings developed by the Orlando
Corporation are exclusively in Mississauga. The second-tier suburban developen are even more
focused on specific municipalities: the smaller the developer, the more likely that the focus of office
development is on a particular municipality. In the case of highly articulated territones, office
development is usually an ancillary operation for real estate companies, whose major activity is
residential development (entire subdivisions or apartment buildings). For exarnple. S.B. Mclaughlin
developed office buildings only in Mississauga since the majority of his land and residential
development was in Mississauga (see section 7.3.3). In a similar fashion, Shipp Corporation developed
office buildings in two adjacent municipalities (Etobicoke and Mississauga), following its single-family
housing and high-rise residential developments in these municipalities. This limited scope of office
development (usually less than half-amillion square feet) replicates the spatial patterns of other
ventures perfoned by these types of developers. For example, the Magnolia Group built office
buildings only in Scarborough and the Matthews Group and Kaneff Properties, both developed office
buildings only in Mississauga.
In addition to specific municipalities, suburban developers specialize in different types of
developments: some developers tend to focus on suburban downtowns while others focus on office
parks. Inducon, which developed office buildings in f i e municipalities, was primarily an office/business
park developer; Orlando develops office buildings only in business parks. On the other hand,
McLaughlin and Shipp developed office buildings only in subuhan downtowns.
At the metropolitan scale, the spatial practices of developen are generally invariable.
Developers usually remain in their familiar settings, and only occasionally venture into new areas. In
case of changing their operational space, the more prominent move is 10 divenify operations within the
suburban realm or to switch from suburban developments to downtown locations. This type of
developer is similar to the type that Logan and Molotch (1987) and Haila (1991) refer to as
serendipitous developers. Shipp Corporation developed an office complex in Etobicoke in the 1970s,
and in the 1980s it carried a limited diversification by moving to the neighboring municipalrty in the
west, Mississauga, constructing the hrgest office complex in the Mississauga City Centre (Canadian
Building, January 1 972; Fe bruary, 1 978).
Spatial practices are matched by financial strength of real estate companies. Smaller real
estate cornpanies begin their operations usually in suburban locations where development requires
less capital and limited expertise. Suburban developments are smaller in ternis of office buildings
constructed and therefore enables smaller real estate companies to act as developers. As a real estate
Company acquires more capital, expertise and reputation, it is able to engage in the development of
larger buildings. This rather rare occurrence was the case of Olympia 8 York. Olympia & York started
its office development business in subutban Toronto (North York) in the 1960s; this was its prime arena
until the early 1970s. In the late 1960s, Olympia & York launched its first development in the core, and
by the early 1970s it penetrated into the Financial District by building one large-scale building, and
eventually developing the largest office building in Canada, the First Canadian Place. However,
suburban real estate companies that remain in the suburbs continue with small to medium-size office
development.
In the following paragraphs the spatial practices of Cadillac Fairview and lnducon are
exarnined. These two cornpanies present extremes in ternis of spatial practices. Cadillac Fairview is
one of the largest Canadian developers; in Toronto its continuous focus was on the Financial District
and Downtown district. lnducon was probably one of Canada's largest suburban office developers, with
development taking place primarily in suburban Toronto. For both companies rich documentation is
available, and several key persons of these cornpanies were interviewed.
7.1 .1 Cadillac Fairview Corporation
From its beginning as an office developer, Cadillac Fairview (initially Faiwiew) was a core area
developer. The company's first two office buildings were in the Downtown district, and then it moved
into the Financial District with the development of the Toronto-Dominion Centre. Until the mid-1970s.
Fainriew and Cadillac, still separate entities. focused on three office clusten: the Financial District,
Midtown (Bloor Street West), and North York (Sheppard and Leslie. developed by Cadillac). In the mid-
1970s, Cadillac Fairview launched its second large-scafe project, the Eaton Centre in downtom
Toronto, a shopping centre with a substantial office component Later in that decade, Cadillac Fainriew
commenced another development by joining forces with another real estate company, Farnous Players,
tu develop a business park (5 office buildings) in Etobicoke near Pearson International Airport.
In the 1980s. Cadillac Fairview continued to develop office buildings in the Financial District
and in the Downtown district, namely fumer parts of the two multi-phase Toronto-Dominion Centre and
Eaton Centre complexes. In addition, its interest in suburban development expanded as it started a
new development in North York (YongeNork Mills area). In the mid 19805, Cadillac Fairview made an
atternpt to penetrate into an unfamiliar office development territory, the City Centre in Mississauga, but
lost to another developer, Daon Development Corporation. In the eaily 1990s, Cadillac Fairview
completed the development of the Toronto-Dominion Centre and the Eaton Centre, and its operations
shifted to trading (acquisition and disposition of properties), and project management.
In spite of some suburban projects, throughout the last twenty-five years Cadillac Faiwiew has
maintained its focus on the Financial District and Downtown (Table 7.2, see also Figure 1 in the
Introduction). The complexes located in these districts, the Toronto-Dominion and Eaton Centres have
been the core of Cadillac Fairview's portfolio in Toronto, constituting in terrns of floor-space, between
two-thirds to three-quartes of its Canadian office portfolio. This fact reflects the substantial arnount of
capital invested in these projects, which in itself reflects a long-terni strategy. At the same time, the
share of its BIoor Street holdings, which were considered less successful, declined from 25 percent in
1975 to 8 percent in 1999. The share of its suburban office portfolio increased substantially between
1987 and 1999. particularly due to the acquisition of a number of office buildings.
According to a former president of Cadillac Faiwiew, the company prefened downtown Toronto
because there was potential for stability and for improving values, and because of the 'scarcity factor'.
According to the same source, in the subuibs, one location is not that different from other; there is an
infinite number of sites. and it is very hard to take a position in the market with any degree of
confidence that the market is going to be ovenupplied. Downtown Toronto, on the other hand, is a
focal point. Transportation, especially rapid transit, is oriented to bnnging suburban residents
downtown. The confluence of firnis that do business together, and the limited availability of space
within a walking distance, made the company believe that they would get premium rents for space that
is in a core location (interview with a former president of Cadillac Faiwiew).
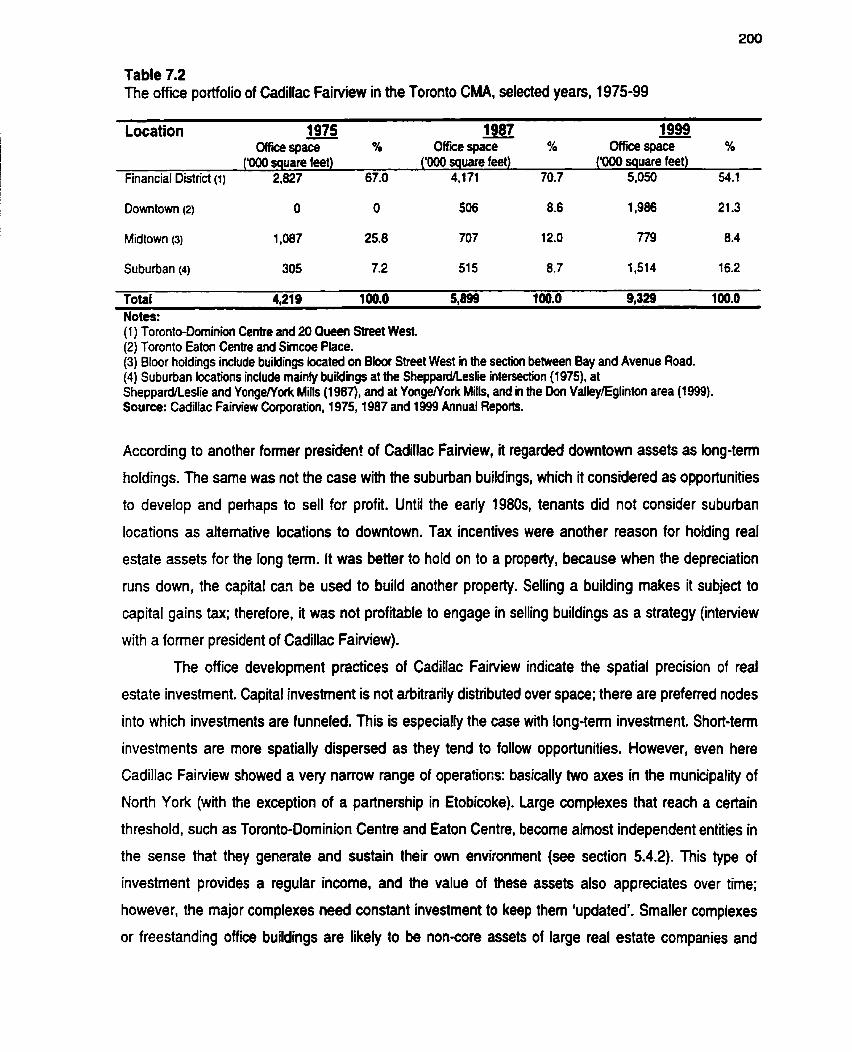
Table 7.2 The office portfolio of Cadillac Fairview in the Toronto CMA, selected years, 1975-99
Location - 1975 - 1987 - 1999 ûffïce space % Office space % ûffice space %
('000 square feet) ('000 square feet) ('000 square feet) Financial District (1) 2,827 67.0 4,171 70.7 5,050 54.1
Downtom (2) O O 506 8.6 1,986 21 -3
Midtown (3) 1,087 25.8 707 12.0 779 8.4
Suburban (4) 305 7.2 51 5 8.7 1,514 16.2
Total 4,219 100.0 5,899 100.0 9,329 100.0 Notes: (1) Toronto-Dominion Centre and 20 Queen Street West. (2) Toronto Eaton Centre and Sirncoe Place. (3) Bloor holdings include buildings b t e d on B b r Street West in the section between Bay and Avenue Road. (4) Suburban locations include mainly buildings at the SheppardReslie intersection (1975), at Sheppardt'eslie and YongeNork Mills (1 98ï), and at YongeNork Mills, and in the Don Valleyflglinton area (1999). Source: Cadillac F a i ~ e w Corporation, 1975,1987 and 1999 Annual Reports.
According to another former presiden! of Cadillac FaiMew, it regarded downtown assets as long-teim
holdings. The same was not the case with the suburban buildings, which it considered as opportunities
to develop and perhaps to sel1 for profi. Until the early 1 9 8 0 ~ ~ tenants did not consider suburban
locations as alternative locations to downtown. Tax incentives were another reason for holding real
estate assets for the long ten . It was better to hold on to a property, because when the depreciation
runs down, the capital can be used to build another property. Selling a building makes it subject to
capital gains tax; therefore, it was not profitable to engage in selling buildings as a strategy (interview
with a former president of Cadillac Fairview).
The office development practices of Cadillac Fairview indicate the spatial precision of real
estate investment. Capital investment is not arbitrarily distnbuted over space; there are preferred nodes
into which investments are funneled. This is especially the case with long-terni investment. Short-terni
investments are more spatially dispersed as they tend to follow opportunities. However, even here
Cadillac Fainriew showed a very narrow range of operatiom: basically two axes in the municipality of
North York (with the exception of a partnership in Etobicoke). Large complexes that reach a certain
threshold, such as Toronto-Dominion Centre and Eaton Centre, become almost independent entities in
the sense that they generate and sustain their own environment (see section 5.4.2). This type of
investment provides a regular incarne, and the value of these assets also appreciates over tirne;
however, the major complexes need constant investment to keep them 'updated'. Smaller complexes
or freestanding office buildings are likely to be noncore assets of large real estate companies and

more dependent on their surroundings. Hence, Meir income Stream is more volatile; in this case
disposing of these assets may offset this volatility and create significant one-time gains.
7.1.2 lnducon Development Corporation
lnducon Development Corporation was the largest suburban office developer in the Toronto region in
the late 1980s. In the mid-1960s. lnducon buitt its first office building which was the company's head
office; it was a small building ( les than 20,000 square feet) located in an industrial area in North York
(Don Valley Parkway and Lawrence Avenue). The decision to build this office building at that location
was based on the fact that "the land was cheap and centrally located" (interview with the founder of
Inducon).
Inducon's fint large-scale office development was in the Consumen Road district (Don Valley
Parkway and Highway 401). In the mid-1960~~ lnducon bought 70 acres of what then was a greenfield
site, and the Company became one of the first developen in this area. In the 1980s. lnducon
experienced exponential growth. During this decade, lnducon moved from one office development to
another. In the northeastern section of the metropolitan area, lnducon moved north along the Don
Valley Parkway into the area of Victoria Park and Steeles (the municipality of North York), and to the
intersection of the Parkway with Highway 7 (Markham). lnducon also developed office space in the
west-end of the Toronto area, moving to the Airport area (Etobicoke and Mississauga), Mississauga
City Centre, and Oakville. By the late 1980s, lnducon was the largest suburban office developer in the
Toronto area with over 3 million square feet of floor-space developed (Table 7.3). The company's
strategy showed similar features in each development. lnducon looked for opportunities to buy cheap
land with high accessibility and get it rezoned from industrial to commercial, largely office development.
By buying cheap land, it was able to build surface parking, thereby tapping into a specific suburban
market for car-oriented tenants. Profas were made principally thmugh the rezoning of land. This
strategy could, of course, not be used in downtown Toronto, where land was expensive, below grade
parking was often a precondition for development, and the capital needed to commence development
is far greater than in the suburbs (interview with Inducon's founder). Also, rezoning would have been a
very major problem in the downtown area, unleashing resistance from a varieîy of opponents.
In its early phase, lnducon took advantage of loopholes in North York's zoning bylaws. Until
the late 1960s North York did not allocate land for office buildings. As a result, office buildings were
permitted as secondary uses in industrial areas, since they wen considered as being associated with
manufacturing rather than accommodating businesses that senred or perfomed other functions
(Matthew, 1989). In the eady 1980s, North York introduced an office development policy, which
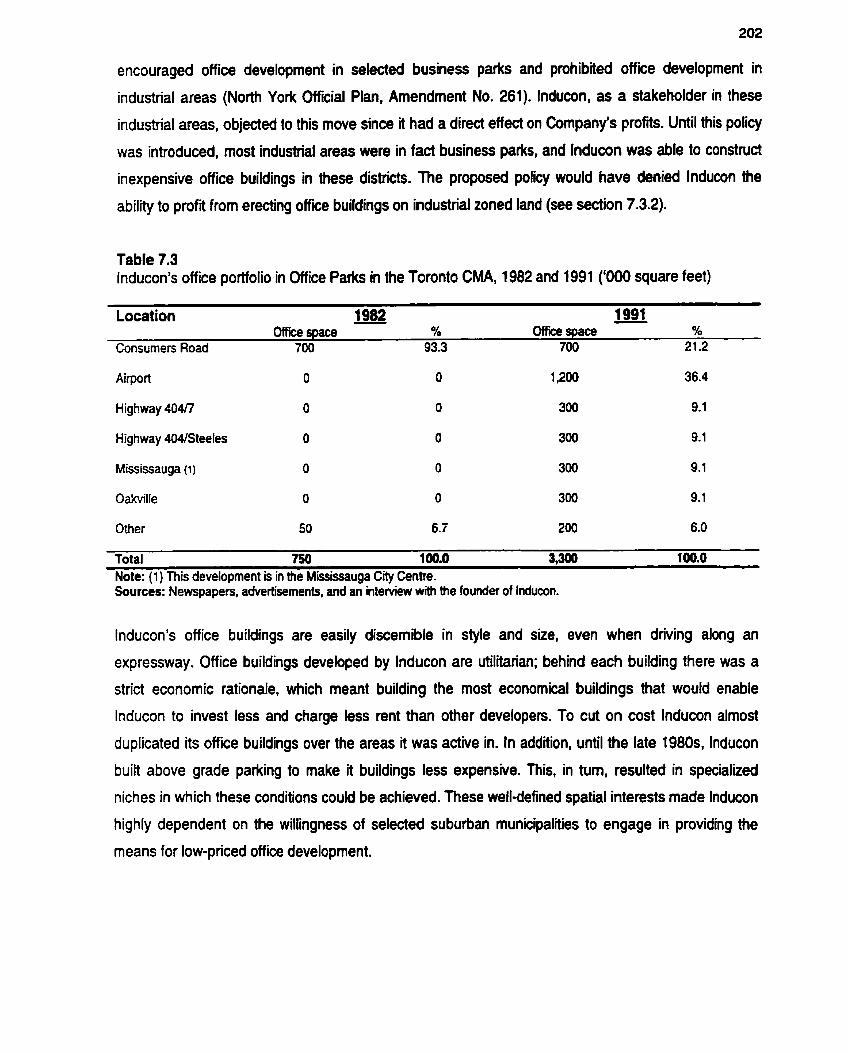
encouraged office development in selected business parks and prohibited office development in
industrial areas (North York Official Plan, Amendment No. 261). Inducon, as a stakeholder in these
industrial areas, objected to this move since it had a direct effect on Company's profits. Until this policy
was introduced, most industrial areas were in fact business parks, and lnducon was able to constnict
inexpensive office buildings in these districts. The proposed policy would have denied lnducon the
abildy to profit from erecting o f f i buildings on industrial zoned land (see section 7.3.2).
Table 7.3 Inducon's office portfolio in Office Parks in the Toronto CMA, 1982 and 1991 ('000 square feet)
Location - 1982 - 1991 Office space % Office space %
Consumers Road 700 93.3 700 21.2
Highway 404n O O 300 9.1
Highway 4WSteefes O O 300 9.1
Mississauga (1)
Oahïlle
Other
Total 750 100.0 3,300 100.0 Note: (1) This development is in the Missiiuga City Centre. Sources: Newspapers, advertisements, and an i n t e ~ e w with the founder of Inducon.
Inducon's office buildings are easily discernible in style and sire, even when driving along an
expressway. Office buildings developed by lnducon are utilitarian; behind each building there was a
strict economic rationale, which meant building the most economical buildings that would enable
lnducon to invest less and charge less rent than other developers. To cut on cost lnducon almost
duplicated its office buildings over the areas it was active in. In addition, until the late 1980s, lnducon
built above grade parking to make it buildings less expensive. This, in tum, resulted in specialized
niches in which these conditions could be achieved. These well-defined spatial interests made lnducon
highly dependent on the witlingness of selected suburban municipalities to engage in providing the
means for low-priced office development.

7.2 Office Development Districts Cadillac Faiwiew has developed some of Canada's largest and most distinct office buildings, mostly in
extremely difficult settings in the City of Toronto. It has also developed somewhat less noticeable
structures on main streets in suburban North York. Inducon, on the other hand, erected standard boxes
largely on greenfield sites in selected suburban municipalities. These two examples show a confluence
of developen, municipalities, physicai settings, and office development These connections lead to the
notion of an 'office development district'. ln an office development district certain preconfigurations,
processes of making and changing development niles, various agents, and distinct development
results corne together. New rounds of development, often consisting of redevelopment, reproduce the
office development district until some fundarnentally new conditions arise.
In the preceding discussions, individual real estate companies and their operations were
emphasized. However, in office development districts monopoly situations are only rarely achieved.
Therefore, the discussion of office development districts must recognke relationships between office
developen (and owners) operating in the same territory In the f o n of a series of propositions, the
basic features of office development districts are highlighted.
1. Oevelopers work in one or a series of distinct sub-areas of the city. While monopolistic control may
be advantageous, it is rarely achievable. Hence, oligopolistic conditions very often prevail in office
development districts.
2. When office developers cannot enjoy monopoly, they compete for tenants in an office development
district, but they also cooperate to create and maintain advantageous if not necessary conditions for
the development of new office space and the maintenance of existing space.
3. Spatially well-defined territories are favourable for a numbar of reasons. Generally, homogeneity is
beneficial because it allows developers/owners ta:
0 achieve efficiencies by constnicting the similar buildings rneasured by size, height, and density;
0 hook the building into the appropriate infrastructure (e.g. roads, types of parking facilities);
require and defend appropriate transpottation facilities:
communicate efficiently with prospective and existing tenants.

4. Developers beneft from the association with similar kinds of real estate companies in the same
territory In office development districts, developen and offne orniers with similar interests can use
their joined force to negotiate with municipal govemments for adequate support.
5. The homogeneity associated with office development districts needs to be established and has to be
maintained; hence offne developen and ownen join to defend the territory from changes and
intrusions by outsiders.
6. Developen require municipal govemments not only to provide specific infrastructure for the office
development district, but also to engage in negotiations which define and protect the office
development district.
7. Municipalities have an interest in attracting office development to specific places within a
municipaliky; and they need office developen who erect and maintain offke buildings in these districts.
8. Office development districts are differentiated and preconfigured by location, transportation facilities,
the presence or absence of previous development, and the character of sunounding land uses and
interests.
9. Given varying degtees of expertise and financial strength, developen have to find appropriate office
development districts for their operations. Negotiation costs Vary spatially (high in inner city settings,
lower in suburban settings) and may disable or enable developers to operate in certain office
development districts.
10. Developerdowners of office buildings, users and municipal govemments have an interest in
maintaining development districts. However, under new conditions, abandonment or redevelopment for
uses other than offices may occur.
These propositions are based on secondary literature discussed in various chapten, and on
observations made during research on office development in Toronto. In the next section, specific
examples of and evidence for the operations of office development districts will be presented.
7.3 Area-Specific Case Studies of Onice Development Districts The Toronto area provides an excellent arena for observing the emergence and functioning of office
development districts. The large and varied area contains older districts with 200-year development
history and districts where office buildings are presentiy const~cted on greenfield sites. As argued
before, real estate companies of different sire and capability have been active in this region. Above all,
the Toronto region consists of a differentiated municipal landsape. There are 27 local municipalities
(after the 1998 amalgamation 21), 'area rnunicipalities' according to legal definitions, in the Census
Metropolitan Area. The municipalities in which noticeable office development has taken place in the
post-WWII era generally have had populations of over 100,000 each at the time when developers
started to construct office buildings of reasonable size (over 20,000 square feet of floor-space). Most
office developrnent has taken place when these municipalities had 200,000 to 700,000-population
range. The size of these municipalities is of considerable importance when discussing office
development, because this type of development rarefy occupied a monopoly in discussions of urban growth and management.
Municipalities, especially the lowest level ones, are absoluteiy cmcial for any kind of
development or redevelopment to happen. While the upper level rnunicipalities (regional rnunicipalities)
and the provincial govemment provide region-wide macroçonditions through investment in major
transportation facilities and trunk sewers, the 'area municipalities' control land use through 'official
plans' and zoning bylaws. These detailed, legally sanctioned, land use control authorities and control
practices make it imperative for developen of office properties to interact with the municipalities. In this
interaction, bargaining is inevitable and can give rise to the notion that municipal govemments are
subject to inappropriate pressures by developen. It is my position here that the bargaining process is
subject to specific empirical investigation. The questions whether there is undue pressure by
developers and when a municipality 'sells out' have to be detennined based on empirical findings. The
major concem in the following pages is to detemine how office developen and municipal govemments
interact rather than to criticize the interaction between govemments and developers in general.
In order to demonstrate the ernergence and functioning of office development districts, three
municipalities have been selected: the City of Toronto. the City of North York and the City of
Mississauga. These three are important and interesting, because they are the municipalities with the
greatest arnount of office floor-space in the 1990s. They also have provided office developen with
quite different conditions and oppominities in the 1950-2000 period. In the City of Toronto office
developrnent has occuned exclusively as redevelopment; in North York greenfield development was
later challenged by the promotion of a large subcsntre on already developed sites, and in Mississauga
office development has occuned almost exclusively on greenfield sites. Each of the three municipal
govemments has had different interests and quite different approaches to offce development. This was
discussed in section 2.1.5 and will be elaborated upon below.
7.3.1 The City of Toronto
The City of Toronto has a 200-year history of urban development. At its very core there are parcels of
land, which saw up to fwe cycles of development and redevelopment. Its whole territory was fully
developed by the 1930s. ûffice development has always been redevelopment on already built spaces,
and has had to contend with complex conditions, since a socially mixed population and a variety of
business interests have displayed conflicting interests and visions.
Since the mid-1970s. the general objective of the rnunicipality has been to restrict office
development, and the so-called Central Area Plan spelled out the rules. In this plan, the Financial
District was subjected to restrictive measures, but in practice high-density office development
continued to be the hallmark of this district, especially in the 1980s. However, high-density office
development did not proceed smoothly; it was forged in a process of very intensive negotiation. The
detailed case of the Scotia Plata development in the mid-1980s illustrates the complex environment
that typifies office development in the Financial District. Areas sunounding downtown were zoned for
light rnanufacturing and other industrial uses. In the mid-1990s. when zoning restrictions in areas west
(King-Spadina) and east (King-Parliament) of downtown were rernoved, many old factories and
warehouses were retrofitted and converted to office space.
Toronto's Central Area Plan
The Central Area Plan, 'adopted' by the City council in 1976, was an ambitious attempt to shape the
downtown area by restricting, among other rneasures, the scale and density of office development.
Down-zoning was adopted; in the newly designated Financial District (the most intensively developed
office district) densities were lowered from a floor space index (FSI) of 12 to 8, while elsewhere in the
Central Area densities were lowered to an FSI of 4. According to this plan, future office employment
growth was to be managed by deconcentration and especially through the establishment of suburban
office centres (Frisken, 1988; Gad, 1999). The strategy of creating suburban city centres and other
secondary centres was also reflected in the Metropolitan Plan and welcomed by the suburban
municipal govemments. The Central Area Plan was in stark contrast to the previous plan, the 1969
Officia1 Plan, which recommended the future redevelopment of large parts of the downtown area and

encouraged the concentration of office buildings in central Toronto (Gad, 1979; Frisken, 1988). Until
the eaily 1970s. there were few explicit policy statements conceming offices as a specific land use, but
many actions taken by the various levels of govemments helped to facilitate the concentration of office
employment in central Tomnto. Before the approval of the 1969 Offcial Plan, the ctty had already
stimulated central area redevelopment through invesbnent in a new city hall, and through encouraging
the enlargernent of the proposed Toronto-Dominion Centre from merely a head office building to an
entire downtown complex (Collier. 1974; Gad, 1979; Lemon, 1985). Also, an important coalition of
downtown land owners, developers and employers. prirnarily banks, insurance companies and
depariment stores, exerted pressure through the so-called Redevelopment Advisory Council.
The uprîsing of citizens' groups against intensive redevelopment in the late 1960s and eariy
1970s, and the election of a 'reforrn' council in 1972, began to reverse the City's downtown
development policy. The emerging planning philosophy held that the development of new office space
in the Central Area should be limited to the capacity of transportation facilities that already existed or
had been committed prior to the plan. The construction of transportation facilities, according to the plan,
enhances the attractbeness and accessibility of the downtown area. and hence encourages new
rounds of office development (Frisken, 1 988).
While city planners considered developrnent in the city of Tomnto as a 'privilege' (Globe &
Mail, November 1, 1 974). developen considered it as a right. The idea of restricting development came
under attack from the real estate sector. Property owners suggested that it would diminish profits and
escalate rental rates. In addition, an organization representing real estate developen appealed to the
Ontario Cabinet seeking the elimination of a ceiling for the construction of new office space (Globe &
Mail, October 4, 1978). This group of developers even suggested that the downtown core should be
removed from the city's jurisdiction and placed under the authority of a separate entity, claiming that
the downtown core belongs not only to tho Ctty, but to the Metro region and the province (Globe & Mail,
October 29, 1975). After a long hearing process at the Ontario Municipal Board, the Ontario Cabinet
approved the Plan in 1979. Although giving its general approval, the Cabinet directed the City Council
to relax zoning restrictions if the dernand for office space grew rapidly. Even the 'reforrn' mayor of
Toronto at that time, John Sewell, recognized that The growth of office space depends more on the
economic climate than on a growth line suggested in the Central Area Plan" (Globe & Mail, February 3.
1 979).
Although development restrictions were imposed, exemptions were prevalent. In the 1 981 -91
period, fiieen office buildings were built in the Financial District at a densw of more than 12 times
(Metropolitan Toronto Office Bank Data, 1993), instead of 8 as indicated in the Central Area Plan.
Several of the most visible office buildings in the Financial District were endorsed by the City Council
after the Central Area Plan was approved. Toronto's City Council ovemhelmingly approved BCE Place,
located at Bay and Front Streets, although the denstty of this project was 12 times of the lot coverage
(Toronto Star, December 15, 1987). The Ci Council also approved the Bay-Adelaide Centre in 1989
(it was mothballed indefinitely in 1993). This 57-storey building is on a site zoned for a 25-storey
building (Toronto Star, May 25, 1989). In these cases, the prevailing condition for the approval of extra
density was the provision of public benefds, such as assisted housing and the preservation of historical
buildings. In one of the most publicized office developments in the 1980s. Scotia Plaza, a density of 16
times the lot coverage was approved due to historical preservation agreements and the transfer of
density rights. Although bonusing was clearîy a possibility outlined in the Central Area Plan, it involved
intensive negotiation in each building project.
ln the whole downtown area office development always seems to have involved negotiations
between developers and the City, regardless of 'official plans1 or development rights as per zoning
bylaws. The 'reforml and the Central Area Plan era were no exception and developers and politicians
kept on 'making dealsl, and downtown developers and their lawyers kept up the practice of close
relations with the members of City Council. These close connections and the notion of 'giveaway to
developers' were documented and criticized in the local and national newspapers (for example,
Toronto Star, November 5, 1988). As noted by an investigation of the Globe & Mail in the mid-1980s.
the rnajority of Toronto counciIlors received most of their campaign contributions from the real estate
industry. An analysis of the voting records of the councillors most reliant on the development industry
for their campaign funds, showed that these pofiticians have supported most of the development
proposals that sought increase in density in the downtown core (Globe & Mail, December 11, 1987).
The Financial District
The largest and densest concentration of office space within the Toronto CMA is in the Financial
District. Within this area of about 800 by 800 meters, a small number of large and powerful owners of
office properties control office development, specifcally the large publicly listed real estate companies
and financial institutions. In this district, the total office space built after 1960 was 27.4million square
feet; more than 60 percent was developed/owned by eight corporations, including joint ventures (Table
7.4).
In addition, the Financial District has a very distinct pattern of tenants. The majonty (56
percent) of jobs in 1989 were in finance, insurance and real estate (Gad, 1991 b). The designation of
this area as the 'Financial District' in the 1976 Central Area Plan with distinct boundaries and specific

zoning, have solidified the position of this area as primarily an office development district through an
act of municipal govemment.
Table 7.4 Top developen and ownen of office space built in the Financial District after 1960
Real estate company Number of buildings Office space ('000 square feet)
Cadillac F a i ~ e w Corporation (1) 6 4,600
Olympia 8 York Developrnents 3 3,700
BCE Oevelopment Corporation 2 2,300
Campeau Corporation (2) 1 1,500
Y&R Properties (3) 3 1,450
ClBC (bank) 3 1,400
Royal Bank 3 1,400
Sun Life 2 1,000
Total eight companks 23 17,350 (34%) (63%)
Total Financial District 68 27,400 (1003C) (100%)
Notes: (1) Toronto-Dominion bank was the joint venture partner in the TD Centre. (2) The Bank of Nova Scotia was a joint venture partner in the Scotia Plata. (3) The portfolio of Y&R indudes buildings it deveroped since the 1920s. Source: A compilation of sources presented in section 2.3.
A number of authors have suggested that the prevailing situation in the Financial District is that of a
spatial oligopoly, Le., a lirnited number of developers control the real estate market, namely the office
market:
o One of the advocates of the conspiracy theory, James Lorimer, insisted on 'the domination of office
space in downtown by a few corporate developers" and that the prevailing conditions eliminate She
smaller, less well-financed office developers" (Lonmer, 1 978, pp. 1 83-84).
O In the Ide 1980s, a report by a financial services company, Salomon Brothers, suggested that
"Buildings in the financial core are owned for the most part by a closely knit group of well-
capitalized developers and banks" (Kostin et al., 1989, p. 16).
A report of the Royal Commission on Corporate Concentration that examined Cadillac Fairview
Corporation in the mid-1970s concluded that there is no evidence of concentration; however, the
"surprisingly high 25 percent" of the class 'A' office space in the Financial District was cited (Gluskin,
1976, p. 82). This semioligopoly prevailing in the Financial District was illustrated in the case of
Olympia 8 York. In 1991, before buying 50 percent of the Scotia Plaza project. OBY sought clearance
from the Bureau of Competition Policy. Olympia 8 York appiied for an advanced ruling 'io lay to rest
fean that it is tightening a stranglehold on the Toronto real estate market" (Globe 8 &ill September
18, 1991), and more specificaliy on the office market in the Financial District. According to the Globe &
Mail. OBY owned directly about 18 percent of the Financial District office inventory; however, OBY also
had 36 percent stake in Trizec, which in tum owned about 68 percent of Bramalea (Globe & Mail,
September 18, 1991). 00th Trizec and Bramalea had existing and planned office projects in the
Financial District.
The Financial District contains a considerable share of the largest office buildings in the
Toronto area (al1 buildings over 1-million square feet, except one, and almost al1 buildings with over 30
floors are in the Financial District). The prime prerequisite for constructing or buying a building of this
size cals for a sizeable amount of capital. Hence, only large real estate corporations, which are
financially sound, are able to secure finance for their ventures. Moreover, a large amount of floor-space
on smali sites results in high-rise buildings with deep underground garages. Development of these
buildings necessitates high level of expertise. In case that expertise is not available intemally, real
estate companies use highprofile architects and specialized engineering consultants. Older buildings
are invariably in the way and cause lengthy negotiation about their demolition or some way of
incorporation, including cornplicated development right transfers. Large-scale office buildings in the
Financial District create spillover effects over large areas. The large number of owners and interests
involved results in lengthy negotiation processes. including hearing at the Ontario Municipal Board. As
a result, only the large real estate companies can engage in this type of office development. Since the
top-twenty buildings in the Financial District consist of the majonty of office space (55 percent of the
total office stock), it is reasonable to suggest that big corporations control the office leasing market.
The developers and owners of office space in the Financial District are also the largest
developers and owners of real estate assets in Canada (see Table 3.2) and the largest developers and
ownen of office space in Toronto (see Table 3.6). Cadillac Fainriew and Olympia 8 York, Toronto's two
largest developen, are also the largest developen in the Financial District. Large-scale developments
necessitate joint ventures between developers and major financial institutions. The Toronto-Dominion
Centre is a joint venture between Cadillac Fainriew and the Toronto-Dominion Bank, First Canadian
Place was a joint venture of Olympia & York, the Bank of Montreal. and the North American Life
Assurance Company, and Scotia Plaza was developed jointly by Campeau Corporation and the Bank

of Nova Scotia. Often financial institutions developed their flagship projects using experienced
developers as project managers. For the development of Royal Bank Plaza, the Royal Bank hired Y&R
Properties as a developer for fee, and Sun Life hired Rostland Corporation (headed by the former
president of YBR) to develop its Financial District head office complex. The exception in this list of large
developen is YBR Properties, which was a Toronto-based office developer active in the fringes of the
old office district, which became the Financial District, since the 1920s. The ownership of land enabled
Y&R to develop sizable office structures in mis area. This quite compact area, its designation as the
Financial District in municipal plans, the similar characteristics of office occupants, the distinctiveness
of its buildings, and the specific set of devekpen active in this district makes it a coherent and distinct
office development district.
The battle over the amroval of the Scotia Plaza deve lo~ment
The Scotia Plaza project illustrates difFicuRies of office development in the Financial District. At first
sight, an unanticipated conflict arose between two real estate interests and a municipal govemment
united in its support for a project that breaks the rules of the Central Area Plan. Another look at the
conflict, however, points to a deep-seated structure of the Financial District as an office development
district.
The Bank of Nova Scotia was the last bank among the five large Canadian banks to build a
post-1960 head office building in Toronto's Financial District. The bank insisted on building its new
head office on a site next to the old head office, refusing to move to potential sites that were already
assembled or in the process of being assembled two blocks further south. Fragmented land ownership
of the Scotia Plaza site resulted in a long process of land assembly, which lasted three years, and
involved several direct purchases of buildings and several lease purchases (interview with a former
president of Campeau Corporation).
In 1 981 , a joint venture of the Bank of Nova Scotia and Campeau Corporation to develop a
new head office for the Bank on the northeast corner of Bay and King Streets was announced (Globe &
Mail, March 13, 1981). Carnpeau, an Ottawa-based developer, argued that using the density allowed
by the Central Area Plan combined with the density bonuses available through preserving historic
buildings would not result in an economically feasible project. To achieve an increased density on this
site, Carnpeau proposed exchanging residential density from another site. In 1969, Campeau received
permission to construct a large commercial project on Toronto's waterfront. However, Campeau did not
show any interest in proceeding on this proposal, and as time went by the City became less pleased
with the massive buildings it had agreed to in 1969. Campeau, therefore, approached the City with the

proposal to exchange 500,000 square feet of residentiaf space from King and Bay for 500,000 square
feet of commercial space from its waterfront site (Cdy Planning, December, 1983). Combining the
Scotia Plaza site's perrnitted density with the bonuses accruing from hentage presewation and the
density transfer increased the projecî's density to 15 times the lot coverage (f iancial Post. June 9,
1984). For this purpose, an amendment of the Official Plan and the zoning bylaw were needed.
The situation became more complicated when one of the close-knit members of the Financial
District 'business community', the Toronto-Dominion Bank (TD) announced its opposition to the
proposed plan and zoning amendments. Before the approval of the plan by the land use committee and
the City Council in May 1984, the TD Bank publicized its objection, which was based on the concem for
the C w s planning policy and possible increase in traffic congestion in the downtown area (Globe &
Mail, May 17, 1984). However, it was suggested that the TD Bank opposed the Scotia Plaza project
because of its major stake in the Financial District's office market. The Toronto-Dominion Bank, jointly
with Cadillac Fairview, has developed and owns the Toronto-Dominion-Centre, the largest office
complex in Toronto, which was located on the opposite corner of King and Bay, the site of Scotia
Plaza. In 1984, the fourth tower of the Toronto-Dominion Centre was under construction, and it was
indicated that thc chairman of the Toronto-Dominion Bank was womed that the Scotia Plaza 'Would
represent significant cornpetition for the TD fourth towef (Globe 6 Mail, May 29, 1984). Even the
Toronto Downtown Redevelopment Advisory Council, whose memben represent top employers and
land ownen in the downtown area, decided to support the TD argument to reduce the size of Scotia
Plaza (Globe & Mail, June 22, 1984). It was suggested that the split in the business communtty
occurred because Campeau was an outsider in the City's traditional corporate circles. The 'old guard'
of the Toronto business elite was already jealous of the newcomer because of the 1969 deal that
ailowed Campeau to build a massive development on the waterfront (Globe & Mail. June 28, 1984).
On the other hand, Toronto's mayor at that time was a keen supporter of this project. The
rnayor argued that Toronto's reputation as an international banking centre would get a strong boost
with the commencement of the Scotia Plaza development, and the project would create construction
jobs and tax revenues (Globe & Mail, October 5, 1982; June 27, 1984). The creation of construction
jobs was a pressing problem in 1982. since Toronto. and the whole of Canada. were in the middle of a
relatively strong recession. The mayor also claimed that the development did not violate the City's
Official Plan, but 'ineets its spirit and helps meet its provisions" (Toronto Star, June 29, 1984). Finally,
in June 1984 Toronto City Council approved the Scotia Plaza project (Toronto Star, June 29, 1984). As
a result, Campeau had transferred rights from its waterfront site allowing the density of the Scotia Plaza
to increase from 12 times the lot coverage to 16 times. In retum. Campeau and the Bank agreed to
preserve to old Bank of Nova Scotia Building (completed in 1951), to give the City land for 200 non-
profit housing units, and to provide daycare facilities in Scotia Plaza (Globe & Mail, November 19,
1984). To avoid further delays, Campeau and the Bank agreed to give $2 million to build non-profit
housing in exchange for a Toronto citizen$ group withdrawing its objection at the Ontario Municipal
Board (OMB). It was indicated that Campeau was willing ta put up the rnoney, because a long delay
would have cost much more, and an adverse decision by the OMB could have reduced the size of the
building (Globe 8 Mail, November 19, 1984). In addlion, Carnpeau and the Bank paid $36 million to
buy out the lease the Toronto-Dominion Bank had in an existing building on the Scotia Plaza site.
The Scotia Plaza case illustrates the difficuities of developing in a district crowded with
buildings and a number of interests. It shows that whatever the plans of the municipal govemment, it
cannot afford a constant path. Different circumstances force the municipality to change its 'planned'
route. Pressures not only from developers, but also, at times of business cycle troughs, from labour
and construction interests, force the municipality to re-asses its development policy and often to 'give-
in' to pressures.
Scotia Plaza shows the paradox of oligopoly and competition in the real estate sector. Real
estate companies, together with major tenants and employees typically stand together in order to
promote the office development district, but crucial competition for tenants splits the ranks. However,
the case became more cornplicated because a new player tried to enter the tenitory, and considerable
attempts were made to keep this developer out. Another aspect of redevelopment in a densely
developed area is quite clear: the enorrnous negotiation costs. During the time between the
announcement of the project (March 1981), the approval (June 1984), and occupancy (Spring 1988)
the real estate company had to incur costs that only a major company can sustain.
7.3.2 North York
Similarly to the City of Toronto, the neighboring municipaltty to the north of Toronto, North York, shows
a mix of restrictive and more permissive policies with regards to office development, and the existence
of two very different types of office development districts. In an attempt to develop its City Centre, an
initiative that was supported by Metropolitan Toronto, the municipality promoted office development in
the area identified as Downtown North York and later as North York City Centre. However, North York
also adopted a policy that attempted to restrict office development in industrial areas in order to direct
future office development to designated office development areas like the Ci Centre.
North York's Downtown
The development of Downtown North York exemplifies the role of a municipality as a promoter of office
development. Until the late 1970s, the Metropolitan Borough of Nom York (City of North York between
1979 and 1998) had no visible centre. During the 1970s, the municipality was confronting massive
redevelopment in the Yonge-Sheppard area as a resuit of the extension of the Yonge Subway fmm
Eglinton Avenue in the City of Toronto to Sheppard Avenue in North York (Figure 6.1). The municipality
adopted a policy of encouraging redevelopment along Yonge Street north of the Sheppard subway
station. However, the rate of development had not come up to the City's expectations. In 1976, the
Council directed the Planning Board (later the Planning Department) to review the Yonge Street
comdor and recommend new policies for ths area. The Downtown Plan, which was adopted in 1979,
provided higher development densities in a comdor along Yonge Street north of Highway 401. A strong
majorii of North York City Council supported the policy that development proposals should be
approved promptly and a development depactment was established to publicize and attract investment
(North York, Department of Planning and Development, 1983; Matthew, 1989). A signifiant promoter
of the development of Downtown North York was the municipality's highprofile mayor. Mel Lastrnan,
the North York mayor from the eariy 1970s to the late 1990s (from 1998, he haî been the mayor of the
new City of Toronto), promoted the plan, mastering a strong opposition from ratepayers.
The development of Downtown North York coincided with the deconcentration policy adopted
by the City of Toronto in the mid-1970s and the efforts by the Metropolitan govemment to encourage a
multi-nodal urban structure. Curbing office development in the City of Toronto probably contributed to
the spillover of office construction in North York's Downtown and in other suburban downtowns. In the
Metropolitan Plan, North York City Centre was identified as one of the two 'Major Centres' in Metro (the
other was Scarborough Town Centre) and the plan recommended the continuous growth of this centre
to an employment level of 40,000 perçons making it the largest office node outside downtown Toronto
(Municipality of Metropolitan Toronto, 1989).
The permissive environment in Downtown North York was designed to attract office
development to the emerging centre. The highest densities in North York were allowed in this area;
much lower densities were allowed in the business parks, and the Office Policy introduced in the eady
1980s attempted to discourage office development in industrial areas (North York Official Plan, 1983).
This policy was designed to strengthen the attractiveness of the emerging downtown. This is the place
to mention that the designated district of Downtown North York is adjacent to low-density residential
neighborhoods. Hence, the plan ignited fierce resistance of ratepayers groups who complained that
massive development would change the neighborhoods' character. This resulted in a long battle

between various citiiens' groups and the City of North York over the review of the Downtown plan in
the 1980s, when further intensification was suggested.
The higher densities proposed in the review of the Downtown plan in the 1980s were designed
to attract 'big cRy' development (Toronto Star, January 13,1988). The proactive role of Me City of North
York in developing its Downtown was cemented by accommodating the basic requirements expected
by the development industry. The testimony of the director of North York's long-range planning
department at the OMB hearing illustrates the role played by the City. In his review of the downtown
history, he noted that after building activity practically stalled from 1969 to 1977, increased densities
were introduced by the new Official Plan in 1979. However, these densities were still not enough to
attract substantial development. As a result, the Council approved amendments allowing higher
densities in the 1980s, which eventually spuned the boom in the Yonge Street conidor in the second
part of the 1980s (Toronto Star, January 13,1988).
North York's Downtown is a case of a municipal-led promotion to develop a city centre as a
result of lacking a visible u&an core. By creating a preferential policy. the municipality attempted to
attract development. The real estate companies engaged in office development in North York City
Centre were not the same developers as in farontok Financial District. The involvement of the
govemment was evident in several of the initial office development projects in North York's Downtown.
Different levels of govemment (federal, provincial and local) erected office buildings in the 1970s; these
projects were the core of the upcoming domtown. North Yoik's developen were locally-based, like
Menkes and Penta Stolp (akhough one of the first dice buildings was developed by a foreign
developer). having had previous expenence in residential or industrial development. When office
development was in demand followed by incentives offered by the municipaliity, these real estate
companies began producing office projects. Only in the later phase of development. after the second
half of the 1980s, several large real estate companies showed interest in North Yoik's Downtown.
Olympia & York was involved in an office development in the City Centre, ClBC Development
Corporation and Ontario Hydro, and a Montreal-based developer, Canderel, and a foreign-based life
insurance Company. Prudential, were in the midst of planning two large-scale complexes. In the early
1990s. ten major office buildings were planned for North York City Centre; these included several high-
rise office buildings of more than 25-storeies. The approval by the Ontario Municipal Board in 1992 of
the Downtown or City Centre Plan. which envisioned massive development, came too late for North
York, because by that time the real estate cycle was already beyond its peak, and many of the
proposed developments were put on hold (Toronto Star, November 26, l991, January 14, 1992).

North York's Office Policv
Office development in North YoKs Domtown/City Centre was long preceded by greenfield site office
developments in so-called industrial areas (briefly discussed in section 6.3.4). An eady exarnple of
these practices is illustrated by Olympia 8 York (OBY). In the mid-1960s, Olympia 8 York
Developments, until then a modest-sire Company, was able to acquire a 600-acre site in the
EglintonIDon Mills area in North York (at that time, in the periphery of Toronto). In a period of ten yean,
O&Y built 3 million square feet of o f f ~ e space and a sizeable amount of industrial space (Foster, 1993;
Stewart, 1993; Banco, 1997). Olympia & York was able to create the first large-scale business park by
a single developer. But, office development in industrial areas, some of which were reluctantly
classified as 'office parks' in the 1989 Metro Plan, began to conflict with the attempts to promote office
development in North YoKs DowntownfCity Centre.
Beginning in the early 1970s, the Borough of North York was struggling to formulate an office
development policy. A study sponsored by the Borough in 1973 recommended that most future office
development to be restdcted to defined office development areas. In the early 1980% as part of the
North York comprehensive official plan, the office policy was reviewed. Responding to the emerging
new office policy, lnducon Development Corporation raised several concems regarding the proposed
policy. Inducon, a developer of industrial and office space, was a veteran development Company in
North York. Started in the eariy 1960s as builder of small industrial buildings in North York, it branched
out to own and develop large units of land in North York's business parks and industrial areas. The
ability to make a quick profi by rezoning industrial land to commercial use was one of the most
profitable techniques used by lnducon (see section 7.1.2).
During the review process of the North York Office Policy in the eariy 1980s, lnducon
presented the North York council with a number of wntten submissions raising concems regarding the
proposed policy. The controversial section of the policy that concemed lnducon was the section that
deals with discouraging office development in industrial areas. lnducon suggested that the prohibition
of future office development in industrial areas would have a number of negative effects (North York,
Su bmissions to Council, Amendment No. 261, February 21, 1983):
+ discriminate against office ernployees because they would be forced to drive to downtown Toronto
offices;
downgrade property values, because previously most industrial areas were in reality 'business
force office usen who c m only afford lower rents to locate outside the City Centre and North York
altogether;
hurt North York financially by not getang higher assesment;
downgrade industrial areas and perpetuate rundown districts.
It seems that Inducon's main concem was related to the impact of this policy on its ability to generate
profb from the so-called industrial areas. Until the policy was introduced, most industrial areas were in
fact business parks, gMng equal status to office and industrial uses. The proposed policy, from the
Company's point of view, downgraded these properties to a lesser value by denying the option of office
uses. In fact, it also denied the ability of Inducon to profit from building commercial uses on industrial
lands. For Inducon, the best scenario would have been designating the majority of industrial land as
business parks, especially those where lnducon had stakes.
Inducon's case illustrates the attempt to shape an office development district by a real estate
company. The development company is not nterested in getting approval for a particular project or
some spot rezoning. In this case, the devekper is askng the municipality to create, or at least sanction
and maintain one or a series of office development districts. The guarantee of such a district allows
frictionless operations of the real estate company. As lnducon sensed that there was trouble in North
York, it shifted its interest to other rnunicipalities in the Toronto CMA that were more tolerant of
Inducon's development pracücas. North York was left behind as arena for office development for outer
rnunicipalities, especially Markham and Mississauga.
7.3.3 Mississauga
The City of Mississauga, which is situated outside of the Metropolitan Toronto boundaries, provides
another distinct picture of office development. The role of private developers was more pronounced in
Mississauga than in the case of Toronto and North York. Its City Centre, one of the Toronto CMA's
major suburban downtowns, was initiated by a private land developer and then prornoted by the
municipality. In a second phase of the Crty Centre's history, control of office development and
ownership passed from the monopoly of one company to an oligopoly of another group of companies.
Private developers created almost monopoly positions in some of the largest office parks in
Mississauga. Markborough Properties owned 3000 acres in the Meadowvale Business Park, and
Orlando Corporation owns 600 acres in the Airport area, and it is in the process of developing 1200
acres in the Heartland Business Park (Figure 6.1).
In Mississauga, one of the fastest growing municipalities in the Toronto area, growth was
promoted strongly, especialfy since it becarne a city in 1974. Its prodevelopment mayor since the late
1970s, Hazel McCallion, has advocated development and facilitated a favourable business climate
through cutting bureaucracy and promoting the image of Mississauga as the perfect environment for
businesses (dubbed a 'builder-friendly city', Mississauga News, November 1995). This corporate-
cooperative culture is evident in Mississauga as the municipality makes efforts to accommodate the
requirements of developen, especially through shortening the development process and providing
infrastructure and bus seMces to specific locations. Developen are aware of the positive attitude
toward development at the civic level, and praise this approach. As suggested by one of the prominent
developers in Mississauga, the business rninded council and Me mayor run the city as if they own it
(Mississauga News, August 1 1,1995).
Records for the 1994 and 1997 contributions for municipal elections in Mississauga were
attained (previous records were destroyed since the law requires to keep records only for the two most
recent election campaigns). The Mississauga City Council is made of nine councillors, al1 of whom
received contributions. In total, local (operating primarily in Mississauga) real estate-related companies
accounted for a substantial share of the contributions; each councillor received between 28 and 55
percent of herhis contributions from these corn panies. For example, Hammenon Canada, the largest
land owner in Mississauga, contributed to al1 nine Mississauga City councillon; Kanneff, a prominent
residential developer in Mississauga, to eight councillors, and Orlando, a leading Mississauga-based
industrial and office developer, contributed to seven councillors.
Private develo~ment of a City Centre: The case of Mississauqa
The idea of developing a city centre in Mississauga was initiated by the largest land owner in
Mississauga in the 1960s and 1 WOs, Bruce McLaughlin (his Company was known as S.B. McLaughlin).
McLaughlin refened to this project as 7he first by a private developer to create an entirely new city
centre". However, he acknowledged the importance of the public realm as "govemment and planning
support is necessary because without such cooperation, adequate space cannot be reserved for such
a new city development" (The Telegram, April17,1968).
McLaughlin started assembling land in the 1950s. and by the late 1960s he had 4000 acres in
Mississauga (S.B. McLaughlin Associates Limited, 1969 Annual Repoit: Lorimer, 1978). Except for
pursuing extensive residential development, his ambition was to build the centre of the new Town of
Mississauga. (A number of municipalities were combined in 1967 to fom the Town of Mississauga.) In
the 1960s, McLaughlin envisioned the development of a major urban area west of Toronto, and he
wanted to build the 'City Centre' on a greenfield site where he owned a 200-acre site (Mississauga
News, March 26, 1968).
The pivot of this centre was Square One (previously known as 'Greenfields'), an enormous
regional shopping centre, completed in 1973. In 1970, he also put up his first office building where he
thought the city centre should be. To cernent his site as the new city centre, he persuaded the town
council to trade its old tom hall (which was about two kilometen south of Mclaughlin's proposed city
centre) for a new building in the pmposed city centre (Mississauga News, July 2, 1969). When
McLaughlin appeared before the Mississauga town council to present his plans for the City Centre in
1969, the town council was extremely supportive. One cf the councillon praised McLaughlin saying
"We are indeed fortunate in having a developer such as Mr. McLaughlin in the municipality"
(Mississauga News, February 12, 1969). This notion was repeated thirty years later as the director of
Economic Development for Me City of Mississauga referred to the developen as "key playen in our
[Mississauga's] future" (Mississauga Business Times, March 2000).
In 1973, the pro-development Mississauga town council was defeated, and a shift in attitudes
towards growth occurred at Town Hall. Questions were raised about whether Mississauga should
favour intensive commercial development on McLaughlin's land or on the location of the old town hall.
However, after the 1976 municipal elections, a newly-elected prodevelopment council approved the
plan designating McLaughlin's land as the Mississauga City Centre, despite the near-monopoly land
ownenhip situation (Mississauga News, March 24, 1976; Lorimer, 1978).
The ability of one major developer to determine the location and type of a city centre points to
the essential role of some private developers in the ctty building process. Landownership and a 'vision'
of an entrepreneurial developer were key elements in this process. However, in spite of his monopoly,
McLaughlin needed municipal cooperation to make his scheme a reality. In this case, the local
govemment, and to some extent the provincial govemment, were drawn in by a private developer. The
main role of local and provincial governments was to facilitate the idea that was conceived earlier by
providing the necessary support in terms of land use designation, limiting competition by supporting the
specific location for the City Centre, and acting as an anchor tenants for the future City Centre.
Mississauaa City Centre: The second hase
McLaughlin, as the owner of the site that constitutes the City Centre, enjoyed a monopoly position
regarding development and under these conditions he erected four office buildings between 1970 and
1979. In the late 1970s, another Mississauga-based developer, Shipp Corporation, branched out from
residential development into office development in the City Centre by developing its first building of a

four-building cornplex. The association of developers and life insurance companies as joint venture
partners is evident in a number of developments in the Mississauga City Centre. The partner of Shipp
was Mutuai Lie of Canada; the partner of the Matthews Group was Great West Lie, and lnducon was
a partner of Prudential Assurance (of the U.K.). After Mclaughlin experienced heavy losses and his
debt swelled in the eariy 1980s, a British-based property company, Hammerson, acquired his assets,
and became the largest land owner in the City Centre.
In the Mississauga City Centre, six private developen (excluding the City of Mississauga) are
responsible for the developrnent of almost 90 percent of the office floor-space (Table 7.5). The size of
office space in the Mississauga City Centre is only one-tenth of the Financial District; therefore, the
potential degree of concentration is much higher. The real estate companies that developed office
buildings in the City Centre were either based in the western fringe of the Toronto area (McLaughlin,
Shipp, and Matthews) or were real estate companies that saw an opportunty in office development in
Mississauga (Prudential, Northsted, and Hammerson).
Table 7.5 Top developen of office space in the Mississauga CQ Centre, 1970-92
Real estate company Number of buildings Office space ('000 square feet) Shipp Corporation (1) 4 1,100
S.B. McLaughlin 4 700
Matthews Group (2) 2 550
City of Mississauga 1 450
Prudential8 lnducon 1 280
The Northsted Group 1 1 90
Hammerson 1 1 90
Total seven companies 14 3,460 (70%) (9296)
Total Mississau~a City Centre 20 3,750 - (loosc) (1 00%)
Notes: (1) Joint venture partner: Mutual Life. (2) Joint venture partner: Great-West Life. Source: A compilation of sources presented in section 2.3.
The City Centre is chaiacterized by a significant number of mid-rise office buildings (1 1-16 stories). It is
designated as the primary office centre in the Mississauga Official Plan, and it is planned to contain the
highest density and the greatest concentration of office development in the City of Mississauga. In

terms of employment, two thirds of office employrnent in the City Centre is in finance, insurance, real
estate and business seMces (Ci of Mississauga, 1998).
The cohesiveness of the Mississauga City Centre is manifested by the 'united' front of real
estate companies against cornpetition from outside developen. In 1988, the president of Hammerson
called the ctty council to reaffirm its mmitment to the City Centre as Mississauga's 'downtown'. He
complained that outside forces are trying to shih the core away from the City Centre (Mississauga
News, February 24, 1988). He was referring to the pmposal of the developen of the West Edmonton
Mall (the Ghenezian brothen) to build a huge retail compiex near the airport (Globe & Mail,
September 9, 1986). This shopping maIl would have competed with the Square One shopping centre
located in the Mississauga City Centre. The objection by the Mississauga City Centre interests resulted
in the rejection of this project (interview with a former president of Hammerson Canada).
The plea to reaffirm the municipal commitment to the Ctty Centre was followed by a promotion
campaign conducted by the City Centre Marketing Group. This initiative was proposed initially to a core
group of developen, which were the most active in Mississauga. These developen were Shipp,
Hammerson Canada, Inducon, and the Matthews Group, al1 with shopping centre and office building
interests in the City Centre. Fclkwing their positive reaction, invitations were extended to other
developers (Mississauga Business Report Magazine, June 1989). This campaign brought together the
City and most of the brgest real estate development companies in Mississauga. The aim of this
initiative was to attract corporate office tenants and to give a strong boost to the development of the
City Centre (Real Estate News, November 25, 1988). One result of this campaign was the launching of
a shuttle bus service within the Cv Centre. In this endeavor, the developers own the buses but the
provincial and the municipal govemments cover the operating costs (Mississauga News, February 18,
1 990).
Following the 1990s real estate recession, this marketing alliance became more onented
toward attracting tenants and leasing office and retail space in the City Centre area rather than
promoting new commercial real estate development (Mississauga Econornic Development Office,
1999). In addition, office and retail development in Mississauga business parks has enjoyed
unprecedented growth during the 1980s and to a lesser extent in the late 1990s, and a shift of office
development away from the City Centre was evident. In this light, Hammerson, as the major land and
property owner in this district, needed to enhance the attract~eness of the City Centre, and, as a result,
confronted and opposed to rezoning of land in business parks for retail development. In the 1990s, the
City Centre stagnated as no office development was commenced; at the same time, especially after the

mid-1990sl a large number of office buildings were constructed in office paiks in Mississauga. One
such office park is the Heartland Business Park, which is discussed in the following paragraphs.
Heartland Business Park: Orlando's territow
Orlando Corporation is a real estate Company engaged in industrial, retail and office development.
Orlando is a rnodei of a suburban real estate company, developing commercial properties mainly in
Mississauga. One of the Company's comparative advantages is its vast land bank. Its first large-scale
real estate development was launched with the purchase of a large piece of land (600 acres) near the
Toronto International Airport in the 1960s. Later developments in the Airport area in the 1980s and
1990s were based on the ownership of large pieces of land. In the mid-to-late 1980s, Oilando
assembled another 1200 acres in the heart of Mississauga to create Canada's biggest business park.
the 'Heartland Business Community'. The most recent stage in Orlando's strategy of purchasing large
land banks and developing entire business parks was announced in mid-2000. O h d o assembled a
500-acre site in the City of Brampton, notth of Mississauga, adjacent to the newest expressway in the
Toronto area, Highway 407. The company plans groundbreaking within the next three to five years
(Mississauga Business m e s , June 2000).
One of the reasons for retaining its presence in Mississauga (except for functional reasons,
such as location, accessibility and growth) is the good relationship the Company has with the pro-
development mayor and the City Council. This relationship is based on a long history of cooperation.
The municipal bureaucracy is considered very efficient, a crucial factor in real estate development.
where the tirne element is very important. Also, since Orlando's land assets include mainly greenfield
sites, its development schemes usuaily do not involve lengthy processes of approval and the Company
tries to avoid any encounter with the Ontario Municipal Board (interview with an Orlando executive).
Orlando's Heartland Business Park in Mississauga is located West of the airport adjacent to a
well-developed network of expressways (Figure 6.1). In 1986, Orlando purchased 800 acres of land
followed by two more deals for an adjoining 400 acres in 1987 to create Heartland (Canadian Building,
March 1989). By 1999, approximately 1 1 million square feet of industrial, office and retail space were
constructed in the Heartland Business Park. When fully developed, Heartland would have 30 million
square feet of space and 30,000 employees (Orlando Report, 1999).
Heartland f is perfectly into Orlando's philosophy. lt is a 'total environment' business park built
by a 'total package' real estate company. Odando is a fully integrated company which provides a total
product tailored for the clients' specifications. Orlando picks a site. builds the roads, designs and
constructs the building, and leases, and manages the building. It is able to provide a building in an

environment which is controlled totally by the Company. The abil i i to conrtnict an entire environment
is illustrated by Street naming in Heartland. As pointed out by John Bentley Mays in an article in the
Globe & Mail, streets in Heartland with names such as Avebury, Venice, and Rodeo Drive have nothing
to do with any local fact or history and "the street-names appeared to be picked for general effect. as
contributors to the scenography of this vast place" (Globe & Mail, August 5, 1992).
Once Orlando has the zoning (in ternis of type of development and density) in place, the
developer is able to build the type of building helshe prefers and thus often disenfranchises, to some
extent, the power of the municipality to influence development. The construction of retail 'powef
centres' ('big box' warehouse retailers) in HeaRland illuminates this argument. In 1994, Mississauga's
mayor complained: When I supported retailcommercial there [Hearthnq it was because we thought
we are getting a maIl for the industrial area, 1 never dreamed 1 would be a power centre". However, she
stressed that the f im [Orlando] %as done nothing wrongn (Mississauga News, October 19, 1994). A
report prepared by the City reaffinns this argument. It indicated that the uses confonn to the Officiai
Plan and the zoning bylaw, which did not specify that the retail units had to be in an enclosed structure
(Mississauga News, February 12, 1995). It is doubtful if this flexibility would be allowed in an
environment which is immediately sunounded by residential or mixed-use properties. However, even in
the case of a large-scale greenfield development such as Heaiaand, conflict might be building at its
fringes. Since this retail complex borders residential areas. ratepayen in the adjacent areas
complained about the loading activities at these warehouses and are wom'ed about traffic created by
this type of development (Mississauga News, October 19, 1994).
Orlando's strategy conflicts with the interests of the oligopolistic ownen of the City Centre.
There are many indications of conflicts coming out into the open. But the conflict is not just between
owners of properties, the conflict is also between two very different office development districts.
Orlando builds smai to medium-size customized office buildings in settings it has full control over. The
relatively sudden uptum in demand by 'high-tech' companies for office space could be met almost
instantaneously by Orlando. On the other hand, the City Centre group of developen specializes in
large buildings in more complex settings. The City Centre has developed from a greenfield site into a
very different and complicated office development district over the last thirty years. The users'
characteristics and land costs play a major role in the success of Heartland and the relative decline of
the City Centre. The ability to merge office uses with spaces for storage and distribution is possible in
Heartland where large tracts of land are available at far less cost than in the City Centre. Alsol these
kinds of storage facilities cannot be accommodated in the City Centre, and it is difficult to promise easy
access by car and ground level parking.
Despite its total conbol over the devekpment of Heartland, Orlando has to depend on
govemment cooperation to make this business park an unintempted success story. When it comes to
rezoning, the role of the municipality is essential. In 1996, Oilando submitted an application to rezone
180 acres of land in Hearthnd from industrial to residential use. At this point the City had the upper
hand since it has the authonty to approve rezoning. As a nsuit of the City's opposition, the Company
rnodified its proposal. Additional opposition arose when Orlando applied for additional rezoning . This
time the ownen of major shopping centres in Mississauga who already incurred loses from its big box
success were detemined to prevent further expansion of retail activities in Heartland (Mississauga
Business Times, June, 1996; October. 1 996; March 1 997).
The role of various levels of govemment is particularly important when it cornes to investrnent
in transportation facilities. The prime advantage of Heartland is its accessibility. It is located on the
major east-west highway of Southem Ontario, Highway 401, on Mississauga's main Street, Hurontario
(Highway 10) adjacent to Toronto's international airport. To keep Heartland's edge, a continuous flow
of investments in transportation infrastructure has to be made. This is where the role of govemments
becomes extremely significant. One recent example in the case of Heartiand was a partnership
between three Ievels of govemment in building a new interchange connecting Heartland and Highway
401 (opened in late 1999). The Ontario Ministry of Transportation, the Region of Peel (the regional
govemment) and the Crty of Mississauga joined forces in this project. Orlando, the owner of the
Heartland Business Cornmuntty 'donated' $3 million worth of land, while the total cost of the project
was more than $16 million (City Business, Winter 2000). Prior to the completion of this project, the local
public transit department, Mississauga Transit, has maintained regular bus routes through the area,
and an express service directly to the Toronto subway system (Mississauga Business k e s , November 1998). These transportation irnprovements and facilities are backed by public finance to
rnaintain or even increase the accessibility of the Heartland Business Park.
Orlando, as a major real estate developer in Mississauga, f is well into the businessoriented
municipality. On the one hand, it is able to create its controlled environments. This way it minimkes
conflicts over land use issues. On the other hand, Oriando engages in a continual dialogue wïth the
municipality to create the necessary conditions that its pmperties will continue to be profitable in the
long tem. However, there is conflict with other real estate companies which compete for customers
and tenants.

7.4 Uneven Surfaces of Office Development The segmentation and differentiation of real estate markets encourage a more refined approach to
analyze real estate development than focusing on the downtown-suburban dichotomy. The uneven
development of offices at the metropolitan level is expressed in a series of relatively small and distinct
districts. In these office development districts municipal interests merge with those of selected groups
of developers and also with emerging physical characteristics The physical characteristics such as
size, height and density of buildings combined with specific transportation modes solidify the
cohesiveness of these districts. Interactions and arrangements between developers and govemments
Vary betwaen municipalities and districts, and consequentty produce specific types of districts.
Research on Toronto indicates a range of o f f i development districts situated in different physical and
municipal settings. These districts include two principal types: centres with a relatively high building
density and low-density office parks.
In centers, an oligopolistic pattern of building ownenhip tends to prevail as groups of specific
real estate companies and other ownen hold a substantial part of office floor-space. These oligopolies
result in competition and cooperation between different developen and ownen. These groups compete
in attracting tenants to their specific buildings but also come together in order to maintain the viability
and the competitiveness of these districts, and they cooperate in order to keep outsiders away.
Development involves intricate negotiations with different interest groups. In these districts bargaining
with local govemments is especially important, since land is expensive and changes in existing zoning
and densities may result in substantial financial gains.
However, there are some differences between these centers. Office development in downtown
or the Financial Distrid is redevelopment of an existing fabric; in suburban downtowns it has been
prirnarily greenfield development. Generally, redevelopment sites require sizeable financial resources.
Consequentiy, the largest reaf estate companies and banks control office development and ownership
in the Financial District. In the City of Toronto, since growth was extensive throughout most of the
penod under investigation, the municipality was able to set restrictive development policies and extract
some benefits from allowing real estate companies to develop at higher densities. In other centres
(suburban downtowns) a different set of real estate companies has been at work. Life insurance
companies joined an oligopoly of smaller and local real estate companies in some cases. In the
suburban centres, local govemments have attempted to attract real estate companies to engage in
development by offenng various incentives. It could be argued that in the case of the North York City
Centre the municipality was in search for a team of developen.

The other type of district, 'office paik' includes a wide range of districts; their emergence and
development is waiting to be more clearly understood. Nevertheless, findings indicate a number of
characteristics. Unlike centres, either downtown or suburban downtowns, office development in office
parks was initially lest controlled by municipalities. These districts developed from areas that were
usually designated as industrial districts, and only in later stages was the importance of office uses
acknowledged, and some were oficially designated as 'office' or business parks, or 'employrnent
areas'. Specialized real estate companies, primarily local, who were familiar with specific suburban
settings, have used this ambigu@ to exploit opportunities and develop office buildings in industrial
areas. As a result of development on greenfield sites and the relatively inexpensive land values, sorne
real estate companies were able to assemble large units of undeveloped land and to establish
prominent positions in particular districts. Developen have been able to determine development in
districts in which they exercise a near monopoly. In these areas, once zoning byhws are in place, the
role of the municipaiii diminishes (its role is important in servicing the land or in case of rezoning), and
the flexibility of the developer is enormous. Unlike the case with downtown sites, where development
densities are open for negotiation and revision, development on suburban sites is normally less about
higher densities since the typical suburban-type development is low-to-medium density. The major
obstacle for development, land use conflicts resulting from proximity to other properties, is reduced,
and the development of these areas becomes relatiely quick and easy.
In the case of office development districts, political connections are important. These
connections take different foms in different districts (more direct relations in suburban downtowns and
office parks and connections mediated by lawyers in downtown), but still, negotiations are based on
some understanding of what makes development possible.
Office developrnent districts show that there are limits to spatial flexibility within the Toronto
region. Each district encompasses specific characteristics based on its physical and political features;
these particular circumstances 'anchor' real estate companies to districts that best fit their capabilities
and their requirements.
CONCLUSIONS
SPATlAL FIX AND SPATiAL SWlTCHlNG OF
REAL ESTATE CAPITAL
In capitalist economies buil structures embody two contradictory features. Buildings are fixed in space
and their physical shift is close to impossible; these buildings represent considerable amounts of sunk
capital. However, the value embodied in buildings is transferable, and the owners of these structures
may consider them as tradable commodles. Scnitinizing this apparent paradox is the core of this
study.
One way to conceptualize and analyze the functioning of the activtty responsible for the
production and trading of these structures, in this case office buildings, is through f i ie major
propositions. These propositions were examined and substantiated in the chapters reviewing the
literature on real estate and office development. and by the findings and evidence assembled on office
development in Toronto and also on the scale of the Canadian urban system.
The first proposition indicated that beyond Haivey's conceptualization of capital switching between
circuits of capital accumulation, there is an intemal logic to investment in the real estate sector. Building
upon Haila's (1991) notion of the 'intrinsic dynamic of the real estate sector', I constructed a framework
that combines structural elements with insights into the practices of the real estate companies. This
framework was introduced to study the practices of real estate capital. This in tum resulted in the
conceptualization of the 'three dimensions of capital switching'. Although the idea of capital switching
was used to scrutinize switching between the pnrnary and the secondary circuits at the macro-
economic scale, I used this framework to analyze the practices of real estate companies at the level of
the individual Company. Capital is neither faceless nor hornogenous; it has identity that is fumished
through the fractions it consists of. The actions of agents representing these fractions are shaped by
macro-economic conditions; however, their own goals, insights, expectations and practices are an
essential part of the notion of switching. The framework of the three dimensions of capital switching
offers a way to conceptualize and analyze office development. It incorporates several sets of variables
that have a major role in shaping the operation of the real estate sector. The dynamism of real estate
capital, which results in a constant search for more profitable outlets, necessitates an analytical
framework that is able to accommodate these sets of variables. The focus of the empirical work in this

study was on the practices of large Canadian real estate companies in the period stretching over
several decades (1 950s to 1990s).
According to this canceptualization, real estate capital considers three core components when
it comes to switching practices; these include operational modes, products and locations. First, real
estate companies can either engage in the development of new office buildings (or altemativeiy
undertake major renovations and re-use existing buildings) or merely engage in trading of existing
properties. There are some properties that are more valuable than others for real estate companies,
these are considered by the companies as %ore assets'. These properties usualiy consist of the largest
office complexes located in downtown areas of the major cities within the urban system. Core assets
provide a stable incame stream of rents and as a resutt of their size are able to create their own
microenvironment. Other assets, which are older, smaller, and not as centraliy located, are held as
'bargaining chips' that can be bought and sold depending on the position of the market for office
properties. Typically, real estate companies start as entrepreneurial firms which are engaged in
development and the subsequent sale of properties. This type of companies lack sufficient capital, and
hence tend to obtain the development gain and seIl the completed propeilies. In later stages of the
corporate Me cycle, real estate companies are able to retain some of their projects. In these phases
real estate companies become traders while striving to keep their core assets intact.
Second, real estate companies switch investment between different pmperty types by re-
deploying capital between residential and commercial properties or between distinct products within the
commercial component (between retail properties and office buildings, for instance). Unfavourable
conditions in the residential component (as a m u t of govemment legislation and econornic recession)
and favourabie conditions in the commercial component, especially in the 1970s in Canada,
contnbuted to the shifting of investment from residential to commercial properties. Within the
commercial cornponent, switching is possible as some elements are considered by the real estate
companies as having favourable growth prospects than othen, as evidenced by the switching between
office and retail properties. Finally, real estate companies shift capital between different spatial scales
and between different locations (this aspect will discussed in detail in the following paragraphs).
In investigating capital switching, the time frame is crucial. Evidence of the existence of the
three dimensions of capital switching is visible at the scale of several decades, and it is also observable
in the everyday practices of real estate companies. Companies employ different investment strategies
in the long-terni, but they are also faced with various possibilities as embodied in the three dimensions
of capital switching at any particular point in tirne. However, processes that encompass longer time
frames, that is over f i years, were not studied here.

In addition, I have suggested that investment in office development or real estate properties is
not the final destination of capital (not the 'last-ditch' as maintained by Harvey). The notion of a one-
way Stream from the primary to the secondary circuit, as advocated by Harvey, has to be expanded to
reciprocal relations between the real estate sector and the wider economy. Some indications based on
the study of the Canadian case suggest that capital is not frozen as real estate capital once it enten
the secondary circuit. Rather, it might seek alternative investrnent channels as conditions in the real
estate sector change. Neither Harvey nor Haila are right or wrong. Diierent time scales, different
questions and different methods determine different outcomes. Naturalty, Harvey's overreaching theory
of caplalism over the last century and a half does not focus solely on real estate. On the other hand,
Haila's notion of the intrinsic dynarnic is an attempt to build a frarnework around real estate intemal
behaviour. Both framewoiks contribute to the understanding of the woikings of real estate investment.
The second proposition questioned the spatial character of real estate capital. The starting point in this
study was the observation that different real estate companies have different operational spaces within
the Toronto metmpolitan area. This observation lad to a focus on Canadian real estate companies as
they engage in dual spatial practices of capital investment, geographical fix. and spatial switching.
Strategies of spatial fix and spatial switching can be employed simultaneously at different spatial scales
and in different locations across the same scale. This study observed limited and specifc spatial
switching of capital as shifting investments at the national scale have reinforced the poslion of selected
urban centres within the urban hierarchy. However, when taking into consideration that non-local real
estate companies control only the lesser part of the urban office stock (in Toronto, the ten largest
owners of office space controlled about 32 percent of the total office stock in 1999). the role of local
developers is undertined. At the metropolitan d e , practices of real estate companies involving spatial
fix seem to be the rule. Also, distinct office development districts, which contain specific physical
features, municipal modis operandi and different demand, give rise to a spatial division of labour
arnong office developers. At the level of the office development district, ownenhip concentration was
clearly visible.
This study indicates the clear spatial preferences of real estate capital. At the national scale.
selected urban centres in Canada, not necessanly al1 the largest cities, are prefened by the large real
estate companies. Certain cities within the top tier of the urban systern, mainly Toronto and Calgary,
were preferred by these companies as places for investment in office buildings over most of the time
period studied. Calgary's outstanding growth in the 1970s and early 1980s established its position as a
prime investment arena. Once a critical mass of investment was reached, it has sustained Calgary's
position, although its growth was less spectacular in the 1980s and 1990s. The large Canadian real
estate companies favour other large cities less, like Montreal or Vancouver. Once a location is chosen,
it is not easily abandoned. In this context, assets that are considered by companies as core assets play
a major role in perpetuating spatial fix. The uniqueness of these assets makes them practically non-
tradable, cementing the nexus between specific real estate companies and specific places.
Related to the previous proposition, the existence and importance of different office building cycles at
different spatial scales and in different locations was suggested. The comparison of national, selected
provincial and two metropolitan scales indicates the existence of building cycles that both converge and
diverge over scales and within different scales. For instance, at the metmpolitan scale, office-building
cycles of Toronto and Calgary have converged in the late 1970s and earfy 1980s, and diverged
throughout the 1980s, converging again in the 1990s. Real estate companies take advantage of
different building cycles by attempting to shift or lock in capital spatially. Their switching practices were
not limited only to spatial switching, but also to operational and product shift Development was
preferred during boom periods, whereas trading was the prominent feature in real estate downtum
times. Preference was given to commercial develcpment, especially office development in the 1980s,
as several large real estate companies disposed of their land and residential portfolios and focused on
office development.
The fourth proposition argued that local knowledge and the reliance on local conditions and networks
limit most real estate companies to specific locations. Real estate companies tend to work within well-
defined boundaries at the metropolitan level. A configuration which 1 cal1 'office development districts'
rationalizes the spatial differentiation of office development within the metropolitan region. In this
context, the structure of relationships between local municipalities and real estate companies within
defined environments is important. In these environments real estate companies carve out their own
territories. This process is influenced by the prevailing municipal agenda. Real estate capital does not
work in a vacuum, but it is positioned in highly specific environments, which have their own features,
rules and conditions. In these environments, some spatially bound social relationships create distinct
playing fields. In the case of Toronto, different political agendas prornoted by the City of Toronto and by
suburban municipalities combined with the interests of metropolitan or regional govemments enhanced
he fragmentation of development agendas. This has further fragmented operational spaces for real
estate companies and has enabled developen to take advantage of differentiated conditions within the
metropolitan region.
In the Toronto area, the large real estate cornpanies are generally more interested in
downtown areas, and less in the suburbs; suburban areas are the territories of local developers. This
dichotomy is based on the structural differences in capital assets and experience with cornplex
negotiations. Large companies can marshall the large financial resources that are essential for
downtown developmenVredevelopment. In the case of Toronto, a spatial division of labour among
developen is strongly supported by the findings of this investigation. There are developers with
operational fields focused on downtown and the traditional devekpment axes, whereas suburban
developen completely ignore these areas prefemng to concentrate their development operations in
different suburban environrnents. It was also proposed that the existence of office development
districts, which is reinforced by distinct physical features, municipal regulation and the practices of reaI
estate companies, contribute to the spatial specificity of office development.
One of the interesting and in my opinion, very contentious issues in research on real estate
development is the question of the global and the local. The global literature on real estate
development includes many assertions on the role of global expertise and capital. Research on Toronto
and Canadian real estate companies engaged in office development (and in the swapping of office
buildings) reveals a very strong local constraint both at the scale of the national urban system and at
the scale of the metropolitan area. The tension between the global and the local can be related to the
inherent dualrty or paradox of real estate, namely the fixity of its physical form and its tradability in its
money form.
There are global and national forces that shape real estate development: demand (as
reflected, for instance, by structural changes in the economy), trade and labour relations, and national
fiscal and monetary policies. There are global trends in architecture, building technology and taste. On
the other hand, creating an office building requires a specific site surrounded by other specific sites in a
specific political junsdiction, which generally has a very nanow spatial reach. This reach may be
variable, but small municipalities are still crucial in regulating land use and as a result in the erection of
buildings. There may be exceptions, such as London and Pans, in which upper level govemments were
involved in the regulation of urban development; there may be pressure to give in to 'global forces'.
However, municipalities are legal, political and social entities that have persisted at least over the
period of the last haff a century. The locality is a structural imperative, a necessity, but each
municipality is different and consists of particular sets of agents and conditions arranged in specific
configurations. In this frarnework, local govemments have considerable leeway to maneuver and as a
result may produce different office development trajectories.
At the local level, municipal jurisddictions are abk to exercise their powen, and to some extent,
function as 'miniature empires'. Municipalities, that apparently share similar qualities, compete for
investment; however, the ability of some municipalities to attract development, while other
municipalities have relatively small-scale investment suggests that beyond structural shifts, some local
factors have an impact of the decision of companies and investon to prefer some places over othen.
Some municipalities do not compete, not because they lack features that attract capital, but rather
because they may reject the notion of growth.
Drawing on Cor and Mair's concept of local dependence (1 988). municipalities and developen
are engaged in reciprocal relations that are spatially immobile; as a result. the maintenance of
functioning relationships becomes a prime goal of both municipalities and developen. These
relationships, based on values like mutual trust and cooperation, could not be easily reproduced
elsewhere. Production is embedded in a social context that is situated, in tum, within a particular
geographical setting (Rast, 1999). For municipalities, previous experience with specific developen that
often involves social relations extending beyond strictly business-based relations encourages the
continuous preference of the developen with whom the municipality had past experience. For
developers, building new social and political networks is an expensive and a timeconsuming process.
Hence, the idea of spatial fix of real estate development as dependent on particular territories may be
defined by political jurisdictions.
The paradox between the necessary and the contingent as far as real estate is concemed
encompasses issues that were addressed in this study. It can be argued that real estate development
is based strictly on necessary conditions. According to real estate professionals, if the Yundamentals'
are not in place, no development is likely to occur. Fundarnentals are primarily economic indicators,
such as rental rates and the cost to develop a project. For instance, employment growth in the finance
and the business sectors creates demand for office space and resuits in the increase of rental rates. If
development is profitable, based on a given costheturn ratio, office space would be produced.
However. even when these fundamentals are in place, development would not necessarily happen and
also it would not happen everywhere. Demand for office space does not necessarily mean office
development, since there are spatially mediating factors. On the national scale, or the metropolitan
realm, there are spaces that are preferred and others that are overlooked by developers and investors.
In this case, the role of the local rnay be vital. Local in this context is not necessarily contingent since
differentiated conditions across space are part of the structural conditions. Contingent factors may
include the practices of agents that practically implement the real estate development process. The
interpretation of the market depends on the indMduals invohred; their perceptions of the future and
their capability to cany development out are not less impoitant than necessaiy conditions.
In the North Arnerican context of uhan development, both the municipality and the developer
are to a large extent regarded as essential components to generate development. One cannot function
without the other; however, empirical investigations suggest that variable local conditions are important
in this equation. Discussion on real estate development has ample references to the role of the local
scale. As suggested by Leitner (1994), location remains an important factor influencing real estate
development and Pryke's (1994b) notion on the 'paiticulanty of place' emphasizes the role of space in
the process of propeity investment. Hence, an altemative approach is to acknowledge that
development is shaped both by both the necessary and the contingent. The property development
process consists of a series of strudured networks and relationships between a variety of capitals;
within this framework, there is a role for national and local govemments and for locally based
specialized developen. The network of relations between the agents invohred produces contingent
outcomes which are inevitably shaped by structural conditions.
The fifth and final proposition focused on the crucial role of finance capital in facillating office
development. The Canadian study suggests close links and relationships between real estate
companies and financial institutions. Specific connections were established between developen and
financiers. some of which resulted in long-terni relationships. These long-term relationships facilitate
the continuous process of real estate production, as capital can be obtained for different types of
developrnents and various locations. As a result of the Canadian financial system being national in
scope, these relationships can be maintained across Canada and even beyond. Financial institutions
are not just 'silent partnen' of real estate companies, but they are also active in real estate
development, primarily as investon and occasionally as devekpeis. The traditional role of financial
institutions as financial intermediaries that supply funds for development was challenged in the 1980s,
as some, principally life insurance companies, became office developers at least for a limited time
period.
The hypennobility of capital, traveling at the speed of light, and the idea that contemporary
capitalism is dominated by 'spaces of flows' rather than 'spaces of places' (Castells, 1996, 1997) is
largely resisted by real estate capital. Arguments claiming that the real estate sector has increasingly
acquired global characteristics have failed to provide substantial empirical evidence. Except in a few
cases of outstanding real estate companies, and the intemationalization of real estate services and
architectural fimis, evidence for intemational flows of real estate capital at a substantial magnitude is

absent from ernpirical investigations and from this study. This study argues Ulat there are considerable
obstacles to the free movement of capital in the sphere of office development. In the discourse on
urban developrnent, some limitations to the free movement of capital are acknowledged, while other
conditions are perceived to facilitate the tlexibility of real estate capital. As noted recently by Harvey,
capital is highly seledive when it comas to places (Harvey, 2000, p. 33): 70 begin with, the gkbe never has been a ievel playing field upon which capital accumulation could play out its
destiny. It was and continues to be an intensely variegated surface, ecokgically, pol i i l ly , socially, and culturally
differentiated. Flows of capital wouM found some terrains easier to occupy than omets in different phases of
developmenr.
Many financial fims that provide financing for real estate development rely heavily on place-specific
investments and clients. As a result, finance capital is not spatially flexible; most financial institutions
adopt conservative approaches, especially life insurance companies, and hence prefer to invest in the
places that generate a substantial pait of their real estate investrnent (their core assets). This in tum
reinforces the importance of the more stable markets, which are typically the larger urban areas. In
Canada, the investrnent in office buildings by large financial institutions for the purpose of income
production has been Iirnited primarily to large cities (particularly Toronto) and to medium to large
buildings. Canadian financial institutions, which have national scope, have been strongly engaged in
office investment and development in downtown areas, while subuiban locations, aithough not ignored
by these companies, have been far less important places of investment.
In current research, the sources of real estate financing are left grossiy simplified. In terrns of
conceptualizations, further exploration of capital flows within the real estate sector and between the
real estate and other sectors is a much-needed avenue of research. The intrinsic dynamic of the real
estate sector is acknowledged in this research. However, it raises the question of the spatial lirnits of
capital flows within this sector. The detenination of these limits deserves more research. This study
was able to identify the existence of these lirnits, but further research should examine the reasons for
these limits, and how these limits are shaped over time.
Barriers to capital switching across international borders reinforce the role of domestic capital
in real estate development. Aithough I had no opportunity to investigate this issue systematically,
newspaper articles and interviews with the exec~iives of financial institutions suggest that the financing
of real estate has definite spatial limits. In the case of Me insurance companies, for example, eariy
bamers imposed by govemment regulation and more recently the conservative policies of boards of
directon (the idea of 'prudent p o l i , which was also adopted by legislation) have restricted capital
flows into real estate properties, and most likely across international and even provincial bordes.
Cunency exchange rates associated with capital flows across borden make trans-border real
estate investrnent risky. In addition, when examining the total invested assets of Me insurance
companies, it becomes evident that they do not need to transfer capital from abroad to finance real
estate development. The risk invohred in importing capital, and the fact that real estate constitutes only
a fraction of the assets of life insurance companies, supports the argument that in most cases
international money is not needed for real estate development.
Finally, the interconneMi between capital flows, in which real estate capital foms oniy a
fraction, should be addressed in future research. Real estate development is neither stnctly dependent
on the prirnary circuit of capital, nor is it an independent activity; it is also related to broad social and
economic processes that make office development a desirable or an ill-fated investment. Building
cycles provide us with the general patterns of macroeconomic conditions, but they fall short in providing
connections between supply, demand, govemment mie, and local conditions. In Canada, in each
decade over the last f i years, a number of factors were responsible for the development of office
buildings. Development in the 1950s was unleashed as a resutt of the govemment lifting restrictions on
building materials for commerciai development. In the 1960s. aftei the large real estate companies
were fomed, demand was strong, and large-scale projects were possible. In the 1970s. the continued
growth of the economy resulted in fuither development. The 1980s were characterized by abundant
supply of capital seeking outlets and even after it was clear that office development at the extent it was
delivered was not needed, available capital was too tempting for both developers and financiers. The
1990s decade was the era of 'prudence' and 'discipline' enforced by tight lending and the careful
scrutiny of office development. In the late 1990s and early 2000. this trend has been reinforced by a
slow stock market for the shares of real estate companies, and subsequently a flow of capital into 'high-
tech' stocks, which has been partially diverted capital from entering or staying in the reai estate sector.
Although real estate companies have posted soaring eamings in the last couple of years, the value of
their stocks has plunged, and currently the market value of companies is severely undenralued. The
lack of interest of the stock market in real estate shares strengthens the notion that the real estate
sector is intertwined with the broader economy. As a result, real estate companies have adopted
conservative strategies (these were 'imposed' by the financial institutions) with regard to office
developrnent.

The future of office development
Are bricks and mortar obsolete at the dawn of the new millennium? Wiff cyberspace eliminate the need
for additional office development? Or will fi change the kinds of office space in the twenty-fint century?
Since these questions deal with the future, answenng them might be 'premature'. However, some
indicators of future trends are visible.
Throughout most of the 1990s, with almost no major office development taking place, the
construction of new office buildings seemed to be the furthest away from the mind of real estate
developen. Office development seems to be a thing of the past. A widely acknowledged impression
was that the Swan Song of sizeable office development was inscribed in the buildings completed in the
last great building boom of the 1980s. The mernoiy of the eady 1990s meltdawn of the real estate
market with record-high vacancy rates and low rental rates was still fresh, and besides, in the electronic
aga, bricks and mortar seem to be rephced by cybenpace (dubbed 'bricks and clicks').
In the late 1990s, however, and more specif'ically at the dawn of the twenty-fint century, office
buildings are still in demand. In his address to the shareholden of O&Y Properties Corp. in the 2000
annual meeting, Philip Reichmann, the chief executive officer. contended that contrary to many
futurists, demand for office space is rising, not falling:
'People used to think technology wouid mean the end of office space. People would be working from home. This
is not the case at all.. .The office building is îhe factory of the information age' (Toronto Star, June 29, 2000).
There is evidence to support this argument. In the United States, recent growth in office supply and
demand has been much greater than expected. In 1999, office completions were expected to be more
than triple the level recorded two yean earfier (Urban Land, January 2000). In Canada, it is expected
that in the year 2000, developen will build more than double the amount of office space they added in
1999 to meet the demand not seen in 13 yean (Globe & Mail, May 3.2000). However, development,
ownership and financing of office buildings may not be the same as it was in the 1950 to the 1990
period. The structure of demand has been changing dramatically as new types of spaces are created
and new office development arenas or office development districts are emerging. As a result, the type
of agents involved in development and ownership. and the form of office buildings might be somewhat
different.
In the second half of the 1990s, after the severe real estate slump, office development became
a more 'disciplined' business. (The term 'discipline' is used in the real estate milieu, both in newspaper
articles and in the intenriews I conducted.) Discipline means that financial institutions scrutinize office
developments more carefully, demanding substantial pre-leasing before providing financing. Therefore,
office developers are more careful in launching development projects. Currently, in the Toronto area
there are very few speculative office buildings under development; most of the buildings under
construction are largely pre-leased or are design-built for single tenants. This means that no major
office towers are being erected in the downtown area or in the suburban downtowns (recently, a few
office projects have re-emerged and they have been frequently discussed by the media). Almost all
suburban office buildings under construction in the late 1990s and in 2000 are buitt for specific single-
tenant occupancy.
Other trends might explain why speculative multisccupancy office buildings are not being built.
First, older buildings are being re-used and converted from commerciaCindustrial loft buildings to office
buildings and older office buildings are being renovated and upgraded. These buildings are located on
the periphery of h e downtown area, in the case of Toronto west or east of the Financial District. Unlike
the conventional office buildings, these buildings are being redeveloped or refurbished by a new kind of
small developer that has emerged in the last decade. The re-use of buildings is even seen in the
suburbs, although involving far fewer buildings in comparison to the Clty of Toronto. In the late 1990s.
Nortel Networks, one of Canada's leading communications companies, renovated a large factory to
create a one million square feet office complex in Brampton and turned it to the Company's
headquarters. This complex is a self-contained environment enclosed in a 'groundscarper'. Also, some
of Toronto's bank back offices use large converted industrial spaces in the suburbs. Another feature of
current office development is the use of 'hybrid' of 'flexible' buildings. The fact that some buildings do
not reveal their function from the outside is due to flex spaces as these structures can be used for
multiple functions. Related to this process is the scarcity of information on the actual processes that
take place in these spaces both in the inner city and in the suburbs. To borrow from the idea of Paul
Knox of 'stealth cities', these buildings constitute stealth office space.
As a result of fewer office developments in the last decade and the new forms of office
development, our notion of off ice 'development' has to be reconfigured. Instead of talking about actual
development, large real estate companies are more focused on ownership, and buying and selling of
office buildings, including the assembly of large portfolios of prestigious office properties. The early
1990s slump transpired in the reduction of real estate portfolios by many real estate companies and
several financial institutions. Pension funds have become extremely important in the real estate sector
in the 1990s decade. Recent acquisitions (mainly in 1998 to early 2000) of large office portfolios by all
the largest Canadian pension funds may suggest a new phase in the structure of the real estate sector
in general and of the office building sector in particular.

To conclude, structural changes. which include the composition of playen, and the emergence
of alternative f ons to the 'standard' off ie building, are transfomihg offce development and
ownership. New agents have joined or expanded their involvement in office development and
ownership, such as pension funds, real estate investrnent trusts and new types of small developen. On
the other hand, banks and life insurance companies are out of office development. In between are the
traditional real estate companies. These types of companies are undergoing a process of restructuring
as some companies continue to be large players but with a closer dependency on their financial
patrons. This emerging picture presents a challenge for future research.
REFERENCES
Books and Articles (including theses and conference papers)
Alonso, W. (1 960) 'A Theory of the Urban Land Markets', Papen and Proceedings of the Regional Science Association, 6, 1 49-57.
Am brose , P. (1 986) Whatever Happened tc Planning?. London: Methuen.
------- and Colenutt, B. (1 975) The Property Machine. Hannondsworth UK: Peng uin.
Amin, A. and Thrift, N. (1 992) 'Neo-ManhaIlian Nodes in Global Networks', international Journal of Urban and Regional Research, 1 6,571 -87.
--- (1 995) 'Globalization, Institutional l'hicknessl, and the Local Economy'. Managing Cities: 7he New Urban Context. Eds. P. Healey, S. Cameron, S. Davoudi, S. Graham and A. Madani- Pour, Chichester UK: Wiley, 91 -108.
Archer, W.R. and Smith, M.T. (1993) 'Why do Suburûan Offices Cluster?', Geographical Analysis, 25, 53-64.
------- and Ling, D.C. (1997) 'The Three Dimensions of Real Estate Markets: Linking Space, Capital and Property', Real Estate Finance, 14.7-14.
Balchin, P.N., Kieve, J.L., and Bull G.H. (1 988) Urban Land Economics and Public Pohcy. 4m Edition. London: Macmillan.
Ball. M. (1 985) The Urban Rent Question', Environment and Planning A, 17,503-25.
---------- (1 986) 'The Built Environment and the Urban Question', Environment and Planning O: Society and Space, 4,447-64.
--------- (1 994) 'The 1 980s Property Boom', Environment and Planning A, 26,671 -95.
---------- (1 996) 'London and Property Markets: A Long Term View', Urban Studies, 33,859-77.
--------- and Wood, A. (1996) 'Does Building lnvestment Affect Economic Growth?', Journal of Properly Research, 1 3, 1 15-30.
---------- Lizieri, C., and MacGregor, B. (1 998) The Economics of Commercial Properfy Markets. London: Routledge.
Barker, G. Penney, J. and Seccombe, W. (1 973) Highrise and Superprofis: An Analysis of oie Development lndustry in Canada. Kitchener, Ontario: Dumont Press.
Barras, R. (1 979a) The Retums from Otfice Development and lnvestment. London: Centre for Environmental Studies, Research Series 35.
-- (1 979 b) The Development Cycle in the City of London. London: Centre for Environmental Studies, Research Series 36.
Y____ (1 983) 'A Simple Theoretical Mode1 of Office-Development Cycle', Environment and Planning A, 15,1381-94.
-m___ (1 987) Technical Change and the Urban Development Cycle', M a n Studies, 24,s-30.
--- (1 994) 'Property and the Economic Cycle: Building Cycles Revisited', Journal of Property Research, 1 1,183-97.
eu__HI and Ferguson, D. (1 985) 'A Spectral Analysis of Building Cycles in Britain', Environment and Planning A, 1 7, 1 369-9 1.
--- and Ferguson, D. (1987) 'Dynamic Modeling of the Building Cycle: 1. Theoretical Framework', Environment and Planning A, 19.353-67.
Baum, A.E. and Lizieri, C.M. (1998) 'International lnvesbnent, Ownership and Risk in the Cw of London Office Market: An Analysis of Trends, 1972-1997; A Paper Presented at the American Real Estate Society Meeting, Monterey CA, April.
Baum. A. and Lizieri, C. (1999) 'Who Owns the City? Office Ownenhip and Oveneas lnvestment in the City of London', Real Estate Finance, 16,87-100.
Beauregard, R.A. (1 989) Urban Restructuring in Comparative Perspective'. Atop the Urban Hierarchy. Ed. R A . Beauregard. Totawa NJ: Rowrnan & Littfefield, 239-74.
------ (1991) 'Capital Fiestructuring and the New Bu# Envimnment of Global Cities: New York and Los Angeles', International Journal of Urban and Regional Research, lS,gO-IO5.
------ (1 993) 'The Turbulence of Housing Markets: Investment, Disinvestment, and Reinvestment in P hiladelphia, 1 963-1 986'. The Restless Urban iandscape. Ed. P.L. Knox. Englewood Cliffs NJ: Prentice Hall, 55-82.
-_____O (1 994) 'Capital Switching and the Built Environment', Environment and Planning A, 26.71 5-32.
------O-- and Haila, A. (1 997) 'The Unavoidable lncompleteness of the City', American Behaviorai Scien tist, 4 1 , 327-4 1 .
Berry, M. (1 994) 'Japanese Propeity Development in Australia', Progress in Planning, 41, 1 13-201.
---------- and Huxley, M. (1992) 'Big Build: Property Capital, the State and Urban Change in Australia', International Journal of Urban and Regional Research, 16,3559.
Berry, B. and Kim H-M (1 993) 'Challenges to the Monocentric Model', Geographical Analysis, 25, 1-4.
Bianco, A. (1 997) The Reichmanns: Family, Faith, Fortune and the Empire of Olympia & York. Toronto: Random House.
Boume, L.S. (1 967) Private Redevelopment of the Central City: Spatial Processes of Structural Change in the City of Toronto. Chicago: Department of Geography, University of Chicago.
-- (1 976) 'Housing Suppiy and Housing Market Behavior in Residential Development', Social Area in Cites: Spatial Processes and Fom. Eds. D. Herbert and R. Johnson, Vol. 1, London: Wiley, 1 1 1-58.
Browett, J. (1 984) 'On the Necessity and Inevitability of Uneven Spatial Development Under Capitalism', htemalional Journal of Utban and Regional Research. 8, 1 55-76.
Bryson, J. R. (1 990) Onlce Development and the Regional City: Process, Interest and Organkation. Unpublished Ph.D. Dissertation, University of Leicester.
---- (1997) 'Obsolescence and the Process of Creative Reconstruction', Uhan Studies, 34, 1439- 58.
Cadman, D. and Austin-Crowe, L. (1 983) Propeiiy Development. London: Spon.
Castells, M. (1 996) The Rise of the Network Society. Oxford: Blackwell.
--- (1 997) The Power of Identity. Oxford: Blackwell.
Catalano, A. and Barras, R. (1 980) Ofice Development in Central Manchester. London: Centre for Environmental Studies, Research Series 37.
Caulfield, J. (1 974) The Tiny Peifect Mayor. Toronto: Lorimer.
Chamberlain, S.B. (1 972) Aspects of Deveioper Behavior in the Land Development Process. Toronto: Centre for Urban and CommunQ Studies, Research Paper No. 56.
Clapp, J. M. (1 993) Dynamics of OHce Markets: Empincal Findings and Research Issues. Washington DC: The Urban Land Institute.
------- Pollakowski. H.O. and Lynford, L. (1992) 'Intrametropolitan Location and Office Market Dynamics', Joumal of the AmenCan Real Estate and M a n Economics Association, 20,229- 57.
Clark. G.L. (1 980) 'Capitalism and Regional Inequality', Annals of the Association of American Geographers 70,226-37.
---- (1 998) 'Stylized Facts and Close Dialogue: Methodology in Economic Geography', Annals of the American Association of Geographers, 88,73-87.
------- Gertler, M.S. and John, E.M. (1 986) Regional Dynamks: Studies in Adjustment Theory. Boston: Allen & Unwin.
Clark, T.N., Goetz, E. (1994) The Antigrowth Machine: Can City Govemments Control, Limit, or Manage Growth'. Urban Innovations: Creafive Strategies for Turbulent Times. Ed. T.N. Clark. Thousand Oaks CA: Sage, 105-45.
Cloke, P., Philo, C. and Sadler D. Eds. (1 991) Appraacching Human Geogmphy: An Introduction to Contemporary Theoretical Debates. New Yoik: Guilford.
Coakley , J. (1 994) 'The lntegration of Propeity and Financial Markets'. Environment and Planning A, 26,697-71 3.
Cochrane, A. (1998) 'Illusions of Power: lntewiewing Local Elites', Environment and Planning A, 30, 21 21 -32.
Coffey, W.J. (1 996a) Employment GroWa, and Change in Ihe Canadian U r b n System, 1971-94. Ottawa: Canadian Policy Research Networks.
----- (1 996b) 'The Role and Location of Service ActMties in the Canadian Space Economy'. Canada and the Global Economy: The Geogmphy of St~ctul i i l and Economic Change. Ed. J. Britton. Montreal & Kingston: McGill-Queen's University Press, 335-51.
Collier, R. W. (1 974) Contemporary Cathedrals: Large-Sale Developments in Canadian Cities. Montreal: Harvest House.
Cox, K. and Mair, A. (1988) 'Locality and CommunQ in the Politics of Local Economic Development', Annals of the Association of American Geographers, 78,307-25.
---- (1989) 'Urban Growth Machines and the Politics of Local Economic Development', lnfemational Journal of Urban and Regional Research, 13,137-46.
Crilley, D. (1 993) 'Megastructures and Urban Change: Aesthetics, ldeology and Design'. The Restiess Urban Landscape. Ed. P.L. Knox. Englewood Cliffs CA: Prentice Hall, 1 27-64.
D'Arcy, E. and Keogh, G. (1 997) 'Towards a Property Market Paradigm of Urban Change', Environment and Planning A, 29,685-706.
Daniels, P.W. (1974) 'New Offices in the Suburbsf. Suburban Growth: Geographical Processes at the Edge of the Western City. Ed. J.H. Johnson. Chichester UK: Wiley, ln-200.
Dear, M. and Clark, G.L. (1 981) 'Dimensions of Local State Autonomy', Environment and Planning A. 13, 1277-94.
Des Rosiers, F. (1 984) Financial Institutions and Property lnvestment: 73e Canadian Case. Unpublished Ph.D. Dissertation. London School of Economics and Political Science.
--------- (1 987) 'Finance and Property: The Role of Institutional lnvestment in British and Canadian Real Estate', Progress in Planning, 28, ?ï-193.
Diamond, D.R. (1991) The City, the 'Big Bang' and Office Development'. London: A New Metropolitan Geography. Eds. K. Hoggart and P. Green. London: Edward Arnold, 79-94.
DiPasquale, D. and Wheaton, W. (1 992) The Markets for Real Estate Assets and Space', Journal of American Real Estate and Utban Economics Association, 20,181 -98.
Dobilas, G. (1 996) The Canadian Financial System in lntemational Perspective'. Canada and the Global Economy: me Geography of StmcturaI and Economb Change. Ed. J. Britton. Montreal 8 Kingston: McGill-Queen's University Press, 84-100.
Domosh, M. (1988) 'The Syrnbolism of the Skyscraper: Case Studies of New YoKs First Tall Buildings', Joumal of Un5m History, 14, 321 -45.
---- (1992) 'Corporate Cultures and the Modem Landscape of New York City'. lnventing Places: Sfudies in Cultural Geography. Eds. K. Anderson and F. Gail. Melbourne: Longman Cheshire, 72-86.
-- (1 996) lnvented Cifies: The Creafion of Landscape in Nineteenth-Cenfury New York and Boston. New Haven and London: Yale Universw Press.
Downs, A. (1993) 'Cycles in Office Space Markets'. The Ofiice Building: From Concept fo hvestmenf Reality. Ed. J.R. White. Chicago: Counselon of Real Estate and the Appraisal Institute, 153- 69.
----O* (1 998) Uhan A f f a i ~ and Uban Policy: 7he Selecfed Essays of Anfhony Downs. Cheltenham, UK: Edward Elgar.
Drewett, R. (1 973) The Developen: Decision Processes'. The Containment of Urban England. Eds. P. Hall, H. Gracey, R. Drewett and R. Thomas. London: Allen & Unwin, 163-93.
Easterlin, R A . (1 968) Populationt Labor Force and Long Swings in Economic Growfh. New York: National Bureau of Economic Research.
Edgington, D.W. (1 995) 'Locational Preferences of Japanese Real Estate lnvestors in North America', Urban Geography, 16,373-96.
--O---H-- (1 996a) 'Japanese Real Estate lnvestment in Canadian Cities and Regions', Canadian Geographer, 40,292-305.
--O---e- (1 996b) Japanese Properfy bvesfors in Canadan Cities and Regions, Vancouver: Centre for Human settlements.
-- (1998) 'The Search for Paradise: Japanese Property Investors in North America'. Japan and the West: The Perception Gap. Eds. K. Nagatani and D.W. Edgington. Aldeehot UK: Ashgate, 153-78.
Eichholtz, P., Hoesli, M., MacGregor, B., and Nanthakumaran, N. (1995) 'Real Estate Portfolio Diversification by Property Type and Region', Journal of Property Finance, 6, 39-59.
Fainstein, S.S. (1 994) The City Builders: Property, Politics and Planning in London and New York. Cambridge, MA: Blackwell.
Feagin, J.R. (1 982) 'Urban Real Estate Speculation in the United States: Implications for Social Science and Urban Planning1, lntemational Joumal of Uiban and Regional Research, 6.35-60.
-- (1 984) 'The Role of the State in Urban Development: The Case of Houston, Texas', Environment and Planning D: Society and Space, 2,447-60.
--- (1 987) 'The Secondary Circuit of Capital: O f f i Construction in Houston, Texas', lntemafional Joumal of Urban and Regional Research, 1 1,172-92.
--- (1 988) Free EnteMise City: Houston in Polifical-Economic Pempectwe. New Brunswick, NJ: Rutgen UniveMy Press.
--- and Parker, R. (1 990) Building Amenkm Cities: The Urban Real Estate Game. Eng lewood Cliffs, N3: Prentice Hall.
Filion, P. (2000) 'Balancing Concentration and Dispersion? Public Policy and Urban Structure in Toronto', Environment and Planning C: Govemment and Policy, 1 8, 1 63-89.
Fisher, J.D. (1 992) 'Integrating Research on Markets for Space and Capital', Journal of the Amencan Real Estate and Urban EconomrCs Association, 20, 1 61 -80.
Ford, L.R. (1 994) Cities and Buildings: Skyscrapers, Skid Rows and Suburbs. Baltimore and London: Johns Hopkins University Press.
Foster, P. (1 986) The Master Buildes: How the Reichmann's Reached for an Empire. Toronto: Key Porter.
Foster, P. (1 993) To wers of Debt: The Rise and Fa11 of the Reichmanns. Toronto: Key Porter.
Fris ken, F. (1 988) City Policy-Making in Theory and Practice: The Case of Toronto's Do wntown Plan. London, Ontario: Department of Political Science, University of Western Ontario.
--------- Boume, L.S., Gad, G. and Murdie, R.A. (1 997) Govemance and Social Well-Being in the Toronto Area: Past Achievements and Future Challenges. Toronto: Centre for Urban and Communtty Studies, Research Paper 193.
Gad, G. (1979) 'Face-to-Face Linkages and Office Decentralization Potentials: A Study of Toronto'. Spatial Patterns of Office Growth and Location. Ed. P.W. Daniels. Chichester, UK: Wiley, 277- 323.
------- (1 985) 'Office Location Dynamics in Toronto: Suburbanization and Central District Specialization', Urban Geography, 6, 331 -51.
------- (1 991a) 'Office Location'. Canadian Cities in Transition. Eds. T. Bunting and P. Filion. Toronto: Oxford University Press, 432-59.
------ (1 99 1 b) 'Toronto's Financial District', Canadian Geographer. 35,203-7.
----- (1 999) 'Downtown Montreal and Toronto: Distinct Places with Much in Cornmon', Canadian Journal of Regional Science, 22, 1 43-70.
-- and Holdsworth, D.W. (1984) ‘Building for C i , Region and Nation: Otfike Development in Toronto 1 834-1 984'. Forging a Consensus: Historia1 Essays on Toronto. Ed. V.L. Russell. Toronto: Toronto Universrty Press, 272-31 9.
-- and Holdsworth, D.W. (1987a) 'Corporate Capitalism and the Ernergence of the High-Rise Office Building', M a n Geography, 8,212-31.
-- and Holdsowrh, D.W. (1987b) 'Looking lnside the Skyscraper: Size and Occupancy of Toronto Office Buildings, 1890-1950'. M a n History Rewiew, 16, 176-89.
-- and Matthew, M. (2000) 'Central and Suburban Downtowns'. Canadian Ciües in Transition: The Twenty-Fnst Century. Eds. T. Banting and P. Filion. 2d Edition, Toronto: Oxford, 248-73.
Garber, J.A. and Imbroscio, D L (1996) The Myth of the North American City Reconsidered: Local Constitutional Regimes in Canada and the United States'. Urban Affain Review, 31,595-624.
Ghosh, C., Guttery, R. and Sirmans, C. (1994) 'The Olympia and York Crisis: Effects on the Financial Performance of US and Foreign Banks', Journal of Properiy Finance, 5,546.
Golden berg , S. (1 981) Men of Properiy: The Canadian Developen Who Are Buying Arne-. Toronto: Personal Library.
Gottlieb, M. (1 976) Long Swings in Udan Development. New York: National Bureau of Economic Research.
G uimond, P.S. and Sinclair, B.R. (1 984) Calgary Architecture: The Boom Years, 1972- 1982. Calgary: Detselig Enterprises.
Gutstein, D. (1 975) Vancouver Ltd. Toronto: Lorimer.
Haila, A. (1 988) 'Land as a Financial Asset: The Theory of Urban Rent as a Mirror of Econornic Transformation', Antipode, 20,7991 01.
---------- (1 990) 'The Theory of Land Fient at the Crossroads', Environment and Planning D: Society and Space, 8,275-96.
-------- (1 991) 'Four Types of lnvestment in Land and Pmperty', International Journal of Uhan and Regional Research, 1 5,343-65.
--------- (1 999a) 'Why is Shanghai Building Gant Speculative Property Bubble?', International Journal of Urtian and Regional Research, 23,583-88.
--.-.-- (1 999b) 'The Singapore and Hong Kong Property Markets: Lessons for the West from Successful Global Cities', European Planning Sudies, 7, 175-87.
Hamelink, F., Hoesli, M., Lizieri, C. and MacGregor, B.D. (2000) 'Hornogeneous Commercial Property Market Groupings and Portfolio Construction in the United Kingdom', Environment and Planning A, 32,3234.
Hanink, D.M. (1996) 'How Local are Local OKice Markets?', Joumal of the Arne- Real Estate and Urban Economics Association, 24,34 1 -58.
(1 997) 'The lntegration of Intrametropolitan OKice Markets', Environment and Planning A, 29, 391 -404.
Hartshom, T.A. and Muller, P.O. (1989) 'Suburban Downtowns and the Transformation of Metropolitan Atlanta's Business Landscape', Urban Geography, 1 O, 375-95.
Harlzell, D., Shulman, D., and Wurtzebach, C. (1987) 'Refining the Analysis of Regional Diversification for IncomeProducing Real estate', Joumal of Property Research, 2, 85-95.
Harvey, D. (1 973) Social Justice and the City. London: Edward Arnold.
---- (1 978) 'The Urban Process under Capitalisrn: A Framework for Analysis', International Journal of Utban and Regional Researd, 2,101 -3 1 .
---- (1 982) The Limits tu Capital, Oxford: Blackwell.
-- (1 985) The Urbaniratbn of Capitaf Studies in the History and Theory of Capitalst Uhanization. Baltimore: The Johns Hopkins University Press.
(1 989) The Condition of Postmodemity: An hpuiry into Re Ongins of Cultural Change. Oxford: Blackwell.
-- (2000) Spaces of Hope. Edinburgh: Edinburgh University Press.
Harvey, J. (1 987) Urban Land Economics: The Economics of Real Properfy. London: Macmillan.
Healey, P. (1 992a) 'An lnstitutional Model of the Development Process', Joumal of Propeily Research, 9, 33-44.
----- (1 992b) 'Urban Regeneration and the Development industry'. Rebujlding the City: Property-Led Urban Regeneration. Eds. P. Healey, S. Davoudi, and S. Tavsanoglu. London: Spon, 14-35.
----- (1 994) 'Urban Policy and Property Development: The Institutional Relations in an Old Industrial District', Environment and Planning A, 26, 1 77-98.
------- (1 998a) 'Regulating Propeity Development and the Capacity of the Developrnent Industry', Joumal of Properj. Research, 1 5,211 -27.
------- (1 998b) 'Building Institutional Capacity through Collaborative Approaches to Urban Planning', Environment and Planning A, 30, 1 53 1 -46.
----- and Banett, S.M. (1990) 'Structure and Agency in Land and Property Development Processes: Some ldeas for Research', Utban Studies, 27,89-1 M.
Hekman, J.S. (1985) 'Rental Price Adjustment and lnvestment in the Office Market', Journal of the Amencan Real Estate and Urban Economics Association, 13,32947.
Hennebeny, J. (1999) 'Convergence and Difference in Regional Onke Development Cycles', Urban Studies, 36, 1439-65.
Hoch, 1. and Waddell, P. (1993) 'Aparbnent Rents: Another Challenge to the Monocentric Model', Geographial Anatysis, 25,20-34.
Hoesli, M., Lizieri, C. and MacGregor, B. (1997) The Spatial Dimensions of the lnvestment Performance of UK Commercial Property', Uhan Studies, 34, 1475-94.
Houghton, T. (1993) 'On the Nature of Real Estate, Monopoly and Fallacies of Monopoly Rent', International Journal of Urban and Regional Research, 1 7,260-73.
Hoyt, H. (1 933) One Hundred Yean of Land Values h Chicago. Chicago: University of Chicago Press.
Huang, S. (1 989) Onim Suburbanuation in Toronto: Fragmentation, WoMorce Composition, and Laboursheds. Unpublished Ph.D. Dissertation, Department of Geograph y, University of Toronto.
Hughes, J.W., Miller, K.T. and Lang, R. (1992) The New Geography of SeMces and Offce Buildings. New Brunswick, NJ: Center for Urban Policy Research.
Hutton , T.A. (1 998) The Transfomation of Canada's Pacfic Metroplis: A Case of Vancouver. Montreal: lnstitute for Research on Public Policy.
Kantor, P. and Savitch, H.V. (1 993) 'Can Politicians Bargain with Business? A Theoretical and Comparative Perspective on Uiban Development', Uhan Affairs Quarte* 29,230-55.
Kennedy-Skipton, H. (1 993) Properiy Development and Uhan Regeneration: Policy-Led Offce Development in Glasgow/Clydebank and Manchester/Saiford. Unpublished Ph .D. Dissertation, Strathclyde University, Glasgow.
Keogh, G. (1 994) 'Use and lnvestment Markets in British Real Estate', Journal of Properly Valuation and Investment, 12,58-72.
Knox, P.L. (1 993) 'Capital, Material Culture and Socio-Spatial Differentiation'. The Restless Urban Landscape. Ed. P.L. Knox. Englewood Cliffs NJ: Prentice Hall, 1-34.
Kostin, D.J., Krutick, J.S., and Goldberg, S.J. (1989) Toronto Real Estate Market. Salomon Brothers.
Knigrnan, B.S. and Furiong, B.A. (1993) The Structure of the Office Industry'. The OMce Building: From Concept to hvestment Reality. Ed. J. R. White. Chicago: Counselon of Real Estate and the Appraisal Institute, 59-80.
Kuznets, S. (1 930) Secular Movements in Production and Prices: Their Nature and their Bearing upon Cyclical Fluctuations. Boston: Houghton Mifflin.
----- (1 958) 'Long Swings in the Growth of Population and in Related Economic Variables'. Proceedings of the AmenCan Philosophical Society, 102,25-52.
Ladd, H. and Wheaton, W. (1 991) 'Causes and Consequences of the Changing Urban Form: Introduction', Regional Science and Urban Ewnomiw, 21, 1 57-62.
Lamarche, F. (1 976) 'Property Development and the Econornic Foundations of the Urban Question'. Urban Sociology: C~itical Essays. Ed. C.G. Pickvance. London: Tavistock Publications, 85-1 1 8.
Leitner, H. (1 990) 'Cities in Punuit of Economic Growth: The Local State as an Entrepreneur', Political Geography QuaRedy, 9,147-70.
(1 994) 'Capital Markets, the Development Industiy and Urban Office Market Dynamics: Rethin king Building Cycles', Environment and Planning A, 26.779-802.
Lernon, J.T. (1 985) Toronto Since 1918: An lllustrated History. Toronto: Lorimer
-- (1 996) Liberal Dreams and Nature's Limits: Great Citjes of North A m e h Sine 160. Toronto: Oxford.
Lichfield, N. and Darin-Drabkin, H. (1980) Land Policy in Planning. London: Allen and Unwin.
Lindahl. D.P. (1 997) New Frontiers of Capital: A Geography of Commercial Real Estate Finance. Unpublished Ph.D. Dissertation, Department of Geography, University of Washington.
Lizieri, C., Baum, A., and Scott. P. (2000) 'Ownenhip, Occupation and Risk: A View of the City of London Office Market, M a n Studies, 37, 1 109-29.
Logan, J. (1 993) 'Cycles and Trends in the Globalization of Real Estate'. The Restless Ur6an Landscape. Ed. P.L. Knox. Englewood Cliffs, NJ: Prentice Hall, 33-54.
------ and Molotch, H. (1 987) Urban Fortunes: The Political Economy of Place. Berkeley: University of California Press.
-------- Whaley, RB., and Crowder, K. (1 997) The Character and Consequences of Growth Regimes: An Assessment of 20 Years of Research', Uhan Affaiis Review, 32,603-30.
Lorimer, J. (1 978) The Developers. Toronto: Lorimer.
McDowell, L. (1 998) 'Elites in the City of London: Sorne Methodological Considerations', Environment and Planning A, 30,2133-46.
McGough, A.J. and Tsolacos, S. (1997) The Stylised Facts of the UK Commercial Building Cycles'. Environment and Planning A, 29,485-500.
McNamara, P.F. (1 985) The Control of Omce Development in Central Edinburgh. Unpublished Ph.D. Dissertation, University of Edinburgh.
MacLaran, A. (1 986) 'Pmperty and the lnstlutional lnvestor in Ireland'. ln5h Geography, 19.69-73.
--------- (1 993) Dublin: The Shaping of a Capital. London and New York: Belhaven.
(1 996) 'Office Development in Dubiin and Tax Incentive Areas', Irish Geography, 29,49-54.
-- Malone, P., and Beamish, C. (1 985) Properly and Lhe Uhan Environment: Dublin. Dublin: Tinity Coflege.
Majury, N.C. (1 999) Local Knowledge, G W M a M s and the Geography of hvesbnent Banking. Un pu blished Ph.0. Dissertation. Deparnent of Geography, University of Toronto.
Markusen, J.R. and Scheffrnan, D.T. (1 977) Speculation and MonopoEy in Uhm Development: Analyfical Foundations wilh Evidence for Toronto. Toronto: University of Toronto Press.
Marriott, 0. (1 967) The Propew Boom. London: Hamish Hamilton.
Martin, R. and Minns, R. (1995) 'The Spatial Structure and Implications of the UK Pension Fund Sy stem', Regional Studies, 29, 1 25-44.
Massey, D. and Catalano, A. (1 978) Capifal and Land: Landownership by Capital in Great Britain. London: Edward Arnold.
Matthew, M. R. (1 989) Toronto Offces: Suburban Patterns and Processes. Unpublished Ph.D. Dissertation, The University of Waterloo.
--- (1 992) 'Office Buildings in Office Parks and Subuhan Downtowns', Canadian Journal of Urban Research, 1,39-57.
-- (1 993a) Case Studies of Some Suburban ûfGce Centres in Toronto. Winnipeg: lnstitute of Urban Studies.
-------- (1 993b) The Suburbanization of Toronto Offices', Canadian Geographer, 37,293-306.
Miles, M. and McCue, T. (1 984) 'Commercial Real Estate Retums', Joumal of the American Real Estate and Urban Economics Association, 12,355-ï?.
Mills, E.S. (1 995) 'Crisis and Recovery in Office Markets', Journal of Real Estate Finance and Economics, 10,49-62.
Milner, 5. (1 99 1 ) The Hidden Establishment: The lnside Story of Canada's international Business Elite. Toronto: Viking.
Miron, J. (2000) 'Cities as Real Estate'. Canadian Cities in Transition: The Twenty-First Century. Eds. T. Banting and P. Filion. 2d Edition, Toronto: Oxford, 154-72.
Mollenkopf, J. (1 983) The Contested City. Princeton: Princeton University Press.
Molotch, H. (1 976) 'The City as a Growth Machine: Toward a Political Economy of Place', American Journal of Sociology, 82,309-30.
----- (1 993) 'The Pollical Economy of Growth Machines', Journal of Man Affairs, 15,29-53.
Moricz, Z., and Murphy, L. (1 997) 'Space Traders: Reregulation, Property Companies and Auckland's Office Market, 1 975-1 994'. htemational Journal of Uhan and Regional Research, 21 , 1 65-79.
Morrison, N. (1992) The Commercial Redevelopment Proces in Glasgow 1980-1991. Unpublished Ph.D. Dissertation, Centre for Planning, University of Strathclyde, Glasgow.
Myrdal, G. (1 957) Economic Theory of Underdeveloped Regions. New York: Harper and Row.
Nanthakumaran, N. and Watkins, C. (2000) 'Understanding Property Market Dynamics: lnsights from Modelling the Supply-Side Adjusment Mechanism', Environment and Planning A, 32,655-71.
OIds, K. (1 995) 'Globalization and the Production of New Urban Spaces: Pacific Rim Megaprojects in the Late 20h Century', Environment and Planning A, 27, 1 71 343.
OIMalley, S.P. (1 989) The Role of Financial lnstilutions, Property Developen and Contractorr in Central Wellington 3 Ofice Development 19584998. Un pu blished MA Thesis, Victoria University, Wellington.
Pickvance, C.G. (1985) 'Spatial Policy as Territorial Politics: The Role of Spatial Coalitions in the Articulation of 'Spatial' lnterests and in the Demand for Spatial Policy'. Political Action and Social Idenfily: Class, Localily and Ideology. Eds. G. Rees. London: Macmillan, 1 17-42.
Pivo, G. (1 993) 'A Taxonomy of Suburban Office Clusten: The Case of Toronto', Urban Studies, 30, 31 -49.
Pratt, A.C. (1 994) Uneven Re-Production: hdustry, Space and Society. Oxford: Pergamon .
Pryke, M. (1 991) 'An International City Going Global: Spatial Change in the City of London', En vironment and Planning D: Society and Space, 9, 1 97-222.
--------- (1 994a) 'Looking Back on the Space of a Boom: (Re)developing Spatial Matrices in the City of London', Environment and Planning A, 26,235-64.
-------- (1 994b) 'Urbanizing Capitals: Towards an lntegration of lime, Space and Economic Calculation'. Money, Power and Space. Eds. S. Corbridge, N. Thrift and R. Martin. Oxford: Blackwell, 21 8-52.
Rabianski, J.S. and Cheng, P. (1 997) 'Intrametropolitan Spatial Diversification', Journal of Real Estate Portfolio Management, 3, 1 1 7-28.
Rast, J. (1 999) Remaking Chicago. DeKalb, IL: Northern Illinois University Press.
Ratcliffe, J. and Stubbs, M. (1996) Uhan Planning and Real Estate Development. London: UCL Press.
Relph, E. (1 987) The Modem Uban Landscape. Baltimore: The Johns Hopkins University Press.
--O------ (1 991) 'Suburban Downtowns of the Greater Toronto Area', Canadian Geographer, 35,421-25.
Richardson, H.W. (1 969) Regional Economics. New York: Praeger.
Rosen, K.T. (1 984) 'Toward a Model of the O f f i Building Secîor', Joumal of fhe American Real Estate and Urban Economics Association, 1 2,261 -69.
Roweis, S.T. and Scott, AJ. (1 981 ) 'The Uiban Land Question'. Urbanizaaoon and Urban Planning in Capitalist Society. Eds. M. Dear and A.J. Scott. London and New York: Methuen. 123-57.
Sancton, A. (1983) 'Conclusion: Canadian City Politics in Comparative Perspective', Cify Politiks in Canada. Eds. W. Magnusson and A. Sancton. Toronto: University of Toronto Press, 291-317.
Sassen. S. (1 991) The Global Cify: New York, London and Tokyo. Princeton NJ: Princeton University Press.
PU (1 994) Cities in a WorM Economy. Thousand Oaks CA: Pine Forge.
Saunders, P. (1 979) Uiban Polittics: A SociologrCal lnterpretation. London: Hutchinson.
Savitch, H.V. (1 995) The Emerging of Delocalued Clies', Urban Affairs Review, 31, 137-42.
Sayer, A. (1 984) Method in Social Science: A Realist Approach. London: Hutchinson.
-------- (1 987) 'Explanation in Economic Geography: Abstractions venus Generalization', Progress in Human Geography, 6,6848.
Schoenberger, E. (1991) 'The Corporate Interview as a Research Method in Economic Geography', Professional Geographer, 43, 1 80.89.
Scott, A.J. (1 980) The Urban Land Nexus and the State. London: Pion.
Scott, P. (1 996) The Property Masters: A History of the Bnfsh Commercial Property Sector. London: Spon.
Sernple, K. (1 996) 'Quatemary Places in Canada'. Canada and the Global Economy: me Geography of Structural and Economic Change. Ed. J. M o n . Moiitreal 8 Kingston: McGill-Queen's University Press, 352-79.
Sewell, J. (1 993) The Shape of the City: Toronto Stmggles with Modem Planning. Toronto: University of Toronto Press.
Shilling, J.D. (1 997) 'Economic Forces Shaping lnvestment in Office Markets', Joumal of Propeity Finance, 8,283-302.
------ Sirmans, C.F., and Corgel, J.B. (1987) 'Price Adjustment Process for Office Rental Space', Joumal of Urban Economics, 22,90-1 W.
Shilton, L. and Stanley, C. (1 996) 'Spatial Concentration of Institutional Property Ownenhip: New Wave Atomistic or Tradlional Urban Clustering', Joumal of Real Estate Research, 12,413-28.
Smith, N. (1 984) Uneven Development. Oxford: Blackwell.
S pun, P. (1 976) Land and Uhan Development: A Preliminary Case Study. Toronto: Lorimer
Stewart, W. (1 993) Too 8ig to Fail, Olympia & York: The Story Behind the Headlines. Toronto: McClelland and Stewart.
Sudjic, D. (1 992) The 100 Mile City. London: Andre Deutsch.
Swyngedouw, E.A. (1 992) The Mammoth Quest. 'Globalization', Interspatial Competition and the Monetary Order. The Construction of New Scales'. Cities and Regions in the New Europe: The Global-Local Interplay and Spatial Development. Eds. M. Danford and G. Kafkalas. London: Belhaven, 39-67.
Todd, G. (1 998) 'Megacity: Globalization and Govemance in Toronto', Studies in Political Economy, 56, 1 93-21 6.
Turok. 1. (1 992) 'Property Lad Urban Economic Regeneration: Panacea or Placebo', Environment and Planning A, 24,36 1 -79.
Urban Land l nstitute (1 985) Ta11 CMce Buildings in the United States. Washington DC: The Urban Land Institute.
___- (1 998) Office Development ifandbook. 2"4 Edition. Washington DC: The Urban Land Institute.
Warf, B. (1 994) 'Vicious Circle: Financial Markets and Commercial Real Estate in the United States. Money, Power and Space. Eds. S. Corbridge, N. Thrift and R. Martin. Oxford: Blackwell, 309- 26.
Watkins, A.J. (1 980) The Practice of Uhan Economics. Beveily Hills CA: Sage.
Weiss, M .A. (1 987) The Rise of the Community Builders: The American Real Estate Industry and Uhan Land Planning. New York: Columbia University Press.
a---- (1 991) 7he Politics of Real Estate Cycles', Business and Economic History. 20, 1 27-35.
Wheaton, W.C. (1 987) The Cyclic Behavior of the National Office Market', Journal of We American Real Esfate and Urban Economic Association, 15,281 -99.
Whitehead, J .C. (1 987) Decision Making in the Propedy Development lndustry During a Business Cycle. Unpublished Ph.D. Dissertation, Department of Geography, University of British Columbia.
-- (1 996) The Midas Syndrome: An Investigation into Property Booms and Busts. Vancouver: B.C. Geographical Senes. Number 51.
W illis, C. (1 995) Fom Follows Finance: Skyscrapers and Skylines in New York and Chicago. New York: Princeton Architectural Press.
Wilson, D. (1991) 'Urban Change, Circuits of Capital and Uneven Development', Professional Geographer, 43,403-15.
Wolverton, M.L., Cheng, P. and Hardin, W.G. (1998) 'Real Estate Portfolio Risk Reduction through ln tracity Diversification', Journal of Real Estate PoMolio Management, 4,3541 .
Zeckendorf, W. (1 970) Tirs Autobiography of Wlliam Z&endod New York: Hol, Rinehart and Winston.
Zukin, S. (1 99 1 ) Landsapes of Po wer: From Detroit to Disney World. Berkeley: University of California Press.
--O-- (1 992) The City as a Landscape of Power: London and New York as Global Financial Capitals'. Global Finance and Urban LMng: A Study of Metropolifan Change. Eds. L Budd and S. Whirnster. New York: Routleâge, 195-223.
Reports and Directories
BOMA of Calgary (1 989) Calgary Building and Leasing Guide.
Colliers l ntemational Property Consuitants, Canadian Real Estate Revie w, Annual, 1 996-20.
InSite Real Estate Information Systems, Canada Office Me, Quarterly, 1997-98.
Royal LePage, Canadian Office Guide, 1999-2000, Mississauga: RLP Publications.
Royal Le Page (previously A. E. Le Page), Toronto Oflice Leasing Directory, Annual, 1 964-99.
Royal Le Page, Office Conversion Report., January 1 995.
Toronto Office Guide, Quarterly, 1 985-91.
Toronto Real Estate Board (1 988) Insight 1988: lndustnal and Commercial Investment.
Government Publications
Bo ro ugh of North Y O rû (1 973) Study of Future Offïce Development Polky.
City of Calgary (1 979) Lo~ation of Oflce Emplopent in Calgacy, Planning Department, Research and Long Range Planning Section, February.
City of Mississauga, New Industrial and Commercial Building Pemits, Economic Develo pment Office, 1 990-99.
City of Mississauga (1 988) Office Space Availabildy Suwey, Economic Development Office, Septem ber.
City of Mississauga (1 997) otf'ke Building lnventory, Economic Development mi , Juiy.
City of Mississauga (1 998) The Outlook for Office Development, August.
City of Mississauga (2000) Cdy Business, A newsletter for Mississauga Businesses, winter.
City of North York, Comprehensive ûffiiial Plan Program, mc ia l Plan Amendment, No. 26 1 (Oflice Policy), 1981, 1 983.
City of North York (1 997) North York Office Survey, Economic Development Centre, Spring.
City of North York (1 997) Yonge Comdor Development Database, Planning Department, Novernber.
G l us kin , 1. (1 976) Royal Commission on Corporate Concentration, Study No. 3, Cadillac Fairvie w Corporation Lhited: A Corporate Background Report, January.
Municipalii of Metropolitan Toronto (1 989) Centres and Mice Areas, Metropolitan Toronto Planning Department, Policy Development Division, Report No. 9.
Municipalii of Metropolitan Toronto (1 989) OMce Space Characteristics Report, Metropolitan Toronto Planning Department, Research Division.
Mun icipality of Metro politan Toronto (1 992), Office space and employment characteistics: Metropolitan Toronto and the Greater Toronto Area, Toronto: The Metropolitan Planning Department Research Division.
Office of the Superintendent of Financial Institutions, Summaiy Financial Data, Life Insurance Companies, Properfy and Casualty lnsurance Campanies (Various years).
Statistics Canada, Building Pemits, Catalogue No. 64-203 (1 961 -97). - - CANSlM Matrix No. 4073 (Building Pemits, 1998-99). - Corporation and Financial Statistlcs, Catalogue No. 61-207 (Various yean). -- Financial and Taxation for Enteqxises, Catalogue No. 6 1 -2 1 9 (Various years). ---- Canadian Standard Industrial Classikation for Companies and Enterprises, 1 980, Catalogue
NO. 12-570E. --- National Economic and Financial Accounts, Quarterly Estimates, 1961 -1 992 and Third Quarter
1998, Catalogue No. 13-001.
Annual Reports
Canadian Health and Life lnsurance Association, 1998 Canadian Institute of Public Real Estate Companies, 1970-96

Real estate c o m ~ a n i e s BCE Development Corporation (previously , Daon Development Corporation) Bentall Corporation Brarnalea Limited Brookfield Properties Corporation Cadillac Fairview Corporation (previously, Cadillac Development Corporation and Fairview Corporation) Cambridge Shopping Centres (previously. Cambridge Leaseholds) Campeau Corporation Dundee Realty Corporation Gentra Inc. Marathon Realty Markborough Properties MEPC Canadian Properties O&Y Properties Oxford Properties Group (previousiy, Oxford Oevelopment Group) S.B. Mctaughlin Associates Limited TrizecHahn Corporation (previously, Trizec Corporation) Y&R Properties
lnsurance c o m ~ a n i e s 1. Canada L ie 2. Confederation Life 3. Great-West Life 4. London Life 5. Manulife Financial (previously Manufacturers Lie) 6. Mutual Life of Canada 7. North American Life 8. Sun Life Financial (previously, Sun Lie Assurance of Canada)
Banks 1. Bank of Nova Scotia 2. Canadian lmperial Bank of Commerce (CIBC)
Newspaper and Magazine Articles
Building Developmenf, 1 971 'M.E.P.C Canadian Pmperties', December.
Building Management, 1966 'Cemp Investment, Fairview Corporation', February, pp. 26-31.
Calgary Herald 1 982 'Office buildings shelved', October 5. ---- 1 982 'Economic woes ground Bankers Hall', October 21. --- 1998 'Cadillac FaiMew buys The Tower', February 10.
Canadian Building 1972 'Shipp. Harbridge join in $30 million commercial project in Etobicoke'. January. ---- 1974 'Office Building: Trends, problems and frustrations', August.
- 1975 September. -- 1976 'British pullout or Canadian take-over?', June. -- 1976 'Office buildings', August. - 1 978 'S hipp Corp. plans commercial centre at Mississauga', February. - 1981 September, p. 15. - 1985 'Pension funds look for better retums', October, pp. 37-41. - 1 989 'Taking Heart', March.
Canadian Business 1976 What's happening in real estate', October. ----- 1996 November, pp. 33-39.
Cify Planning 1983 'The Development Scene: Scotia Plaza-Waterpark Place', December.
Dai& Commercial News 1998 'Ofd Toronto factories to be redeveloped for retail market', October 20. - 1999 'Toronto area office space in short supply', October 1. Financial Post 1981 'New contracts reflect changes in financing', October 24. -- 1984 'Bankers wage a war in Toronto's high-rise jungle', June 9. --- 1987 ' Despite space glut, Calgary is still buildings', March 2. ---- 1989 'Ottawa to small now for Minto Developments', July 17. -- 1989 'Calgary buffer against energy ties'. September 20. ----- 1990 'Real estate a haven for foreign funds', September 1 9. - - 1991 'Hong Kong developer arrives', November 6. ---- 1992 'Sun Life proves itself an insurer with timing', June 29. - - 1992 'York-Hannover besieged', October 7. ----- 1993 'European investors keen on Toronto core', April21. ---- 1994 'Carnrost loses flagship towef, March 8. ----- 1996 'Hong Kong spectre looms once more on Canada's skyline', August 7. ----- 1998 '1 997 was the year of the REIT'. Januarj 3. ---- 1998 'GWL Realty entes Toronto market', January 29. ---- 1998 'Fifth tower proposed for Calgary', June 5. --- 1998 'REITs move into construction', June 6. Financial Post Magazine 1999 Financial Post 500,35m Edition.
Financial Times 1982 'Calgary's dramatic office market downtum', October 25. ---- 1983 'Insurers: The new real estate developers', October 31.
Globe & Mai/ 1973 'In Scarboro, the centre is in the middle', March 9. ---- 1973 'Fairview Corp. plans fourth tower in Toronto-Dominion Centre', June 7. --- 1974 'Developing in city is 'a privilege', Toronto's chief planner tells OMB'. November 1. ---- 1975 'Take core from City Council control, inquiry on Metro urged in two briefs', October 29. ----- 1975 'Will Scarborough find true happiness ... and a downtown?'. December 12. --- 1977 'Marathon Realty intends to become substantial force in U.S. real estate', May 2. ---- 1978 'Developers appealing decision on central area plan to cabinet', October 4. -- 1979 'Cabinet approves Toronto downtown plan that restricts office growth', February 3. ----- 1981 'Scotiabank reported planning $400 million tower in Toronto', March 13. ----- 1981 'Mistakes haunt development', September 24. --- 1982 'Changing role for developers predicted', September 21. ---- 1982 '$300 million bank building eyed for downtown Toronto', October 5. ---- 1983 'Prudential', July 28.
- 1983 'Cadillac, T-D build tower despite oversupply', September 23. -- 1 984 7-D opposes Scotia Plaza zoning', May 17. -- 1984 7-0 bank seeks $36 million in towering feud', May 29. - 1984 'Downtown businessmen back bid to pare tower', June 22. - 1984 'Scotia tower wins approval despite protest', June 27. - 1984 '1 960s revisited with banker on other side', June 28. - 1984 'Secret $2-million donation ciears way for Scotia Plata', November 19. - 1985 'Daon wins office site in bid with Cadillac', October 3. - 1986 'Daon profi will slow during next few years', February 22. - 1986 'Oxford sells to buildings in BCE unit', March 13. -- 1986 'Mississauga mayor detemined to avoid Edmonton's mistakes', September 9. - 1987 'Developers give generously to city politicians', December 1 1. - 1987 'Bell office towers get the green light from City Council', December 15. - - 1988 'Inducon alliances help development projects', October 11. - 1989 'CIBC unveils subsidiary for real estate development', January 1 1. --- 1991 'Developers corne under fire', July 30. - - 1991 'Big banks looking at role as developers', August 26. - 1991 '0&Y seeks advance ruling on Scotia Plaza purchase', September 18. -- 1991 'Real estate market gets powerful investor', October 1. -- 1992 'Tirne more crucial than money for Reichmann restructuring', Maah 26. - 1992 'O&Y showing a variety of debt', March 26. - 1992 'lnducon placed in bankniptcy', March 31. - 1992 'Brarnalea seeks court protection', December 23. -- 1 993 'Prudential claims O&Y tower', January 1. ---O 1993 'Giant Toronto office complex rnothballed', August 19. - - 1994 'U.S. 'vulhires' are flocking north', April29. - 1994 'Cadillac's huge debts revealed', December 31. -- 1995 'Insurers bail out of real estate', Apnl3. - - 1 995 'Spec building back in Toronto', July 1 1. ---- 1996 'Marathon shifts focus to downtown office towers', March 4. - - 1996 'HIR Developrnent spins off property', December 5. - - 1998 'TrizecHahn buys four U.S. office towers', September 4. --- 1998 'Warehouses to become shops, offices', October 15. -- 1998 'Pension funds: The big kids on the block', November 14. ---- 1999 'Sale of Scotiabank's real estate portfolio close to completion', June 17. - - - 1999 'Calgary: Western Canada's head-off ice capital', August 3. --- 1999 'CIBC renews tied to Reichmanns with loan', August 6. ----- 1999 'CIBC plan sweeping sale of real estate', August 13. --- 1999 'Pension funds taking over public real estate companies', December 3. ---- 1 999 'B.C. funds grab CIBC propetties', Decernber 1 1. -O--- 2000 'Teachers leaves Cadillac alone to pick its CEO', March 27. ----- 2000 'TrizecHahn unveils plan to reinvent itself, March 28. --- 2000 'Toronto's garment district is spotting g!ad rags', April29. ---- 2000 'Office construction expected to double', May 3. - - 2000 'Cadillac Fairview CE0 announces new executive team', May 25.
Mays, J.B. 'Places in the Haartland', Globe & Mai/, August 5, 1992.
Metropolitan Toronto Business Jcumal1985 'Ûoing west, young man?', July-August.

Mississauga News 1968 'Suburban sprawk Ifs getting wone, but Peel offen something better', March 26.
-- 1969 'Canada's largest ready for construction', February 12. - - 1969 'McLaughlin offer to good to miss', July 2. - 1976 'Mississauga City Centre', March 24. -- 1988 'Keep downtown in city centre, Square One boss tells council', Februaiy 24. -- 1990 'City centre shuttle bus service unique in North America', February 18. -- 1994 'Orlando power centre development not at al1 what city council expected', October 19. -- 1 995 'Developer defends power centre', February 12. -- 1995 'Developers partnen in shaping cny's future face', August 1 1. - 1995 'Mississauga's builder-friendfy reputation growing', November.
Mississauga Business Times 1 996 'Controversial rezoning divides City councillon', June. - - 1 996 'Controveny dogs plan for rezoning in Heartland', October. -- 1 997 'Hammerson fights Orlando's retail moves', March. ----- 1 998 'Mississauga's Heartland: A 'power centre', November. --- 2000 'The developen: Key players in our future', March. - 2000 'Orlando has big plans for Brampton area', June.
National Post 1999 'Calgary real estate falls out of the saddle: 6.7% vacancy rate', February 10. ---- 1999 'GWL's strategy based on don7 fall in love with your real estate', April 16. ---- 1999 '€-commerce luring banks away from real estate assets', July 31. - 1999 'Cadillac falls to Teachers in $2.38 property deal', December 2. --- 1999 'Pension fund nabs seven CIBC pmperties', December 1 1.
O'Donnell, J. (1 989) 'The Entrepreneurial Developer', Uhaan Land, 48,7,34-5.
Real Estate News 1995 'Downtown office conversions in slowing', February 17. ---- 1 988 'Mississauga begins corporate courting campaign', November 25.
Toronto Star 1984 '68-storey Scotiabank tower approved', June 29. ----- 1987 'Huge Bell development gets approval from council', December 15. ---- 1988 'Let 'downtown' North York expand, panel told', January 13. ---- 1988 'Giveaway to devekpers revives reform group', November 5. --- 1989 'Major bank creates subsidiary to manage real estate holdings', January 11. ---- 1989 'Bay-Adelaide good for city consultants say', May 25. ---- 1990 'CIBC division wins bidding to develop Hydro complex'. March 10. --- 1991 'Residents protest Yonge St. highrises', Novernber 26. --O-- 1992 'Job boom seen in North York', January 14. ---- 1994 'Investors pour millions into Hong Kong corner', December 29. ----- 1999 'Oxford seals Royal Bank deal', September 23. ---- 2000 'Reichmann plans new tower', June 29.
The Telegram 1968 'Phn 25,000 homes, core for new city'. April27.
Trade and Commerce 1 98 1 'Office space creation tops in North America', Aug ust, 72-84.
Interviews
Allison David, Vice President, Investments, Real Estate Dision, Manulife Financial, January 21, 2000 Amell Gordon, Chairman and CEO, Brwkfield Properties (formedy with Oxford Development Corporation and Trizec Corporation), June 1 1,1999 Beales John, Vice President and General Manager, Real Estate Division, Manulife Financial (fomerly with Marathon Realty), January 18,2000 Bullock James, former President, Cadillac Faiwiew Corporation, July 15, 1999 Campbell John, President, Brookfield Properties Management, July 6, 1999 Cowan Jay, Leasing, GWL Realty Advison, June 9,1999 Cuningham Jeff, Manager, Acquisition and Disposition, Oxford Propeities Group, June 9, 1 999 Down Lome, Vice President, Canadian Mortgages, Manulife Financial, April 13,2000 Eagles Stuart, fonner President, Marathon Reaity, June 29,1999 G hert Bernard, former President, Cadillac hirview Corporation, June 1 1, 1999 Gillin Philip, Vice President and General Manager of Real Estate, Sun Life of Canada (fomerly with Cadillac Faiwiew Corporation), June 8,1999 Gluskin Ira, Gluskin Sheff & Associates, June 28, 1999 Heyland Bruce, former President, Hammerson Canada, Apnl 13,2000 Jacob Andrew, formerly with Campeau Corporation, May 21,i 999 Kidzium John, Vice President, Development and Corporate Facilities, Real Estate Division, Manulife Financial, January 18, February 10,2000 King David, fonner President, Campeau Corporation, June 21, 1999 Kramer Gary, Orlando Development Corporation (fonneriy with the Planning Department, City of Mississauga), July 29, 1999 Lennox Andrew, Senior Vice President, Real Estate, Bank of Nova Scotia (formeriy with Hammerson Canada and Daon Development Corporation), March 7,2000 Levitt John, Senior Vice President, Business Development, O&V Properties, May 20, 1999 Love Donald, Founder, Chaiman and President, Oxford Development Group, July 6,1999 Marotta John, Director, Leasing, ClBC Development Corporation, May 26,1999 Moore Bill, Senior Vice President, Office Leasing, Royal LePage Commercial Inc., July 8, 1999 Moyes Scot, Manager, Office Leasing, Orlando Development Corporation (fomerly with Royal LePage), June 1,1999 Rotenberg Kenneth, former President, Y4R Properties, July 5, 1999 Soskolne Ron, fomer Vice-President, Olympia & York Developments; fomerly with the Planning Department, City of Toronto, May 19,1999 Thomson Andrew, Director, Development, TrizecHahn Corporation (formerly with Marathon Realty and Bramalea Limited), May 19, May 28,1999 Weinberg David, President, ClBC ûevelopment Corporation (formerly with Cadillac Faiwiew Corporation and the Planning Department, City of Toronto), June 10, 1999 Wood Neil, former Vice-Chairman and President, Cadillac Faiwiew Corporation; former President. Markborough Proparties, June 22,1999 Zsolt Andrew, Founder and President, lnducon Development Corporation, July 22, 1999