The Brink of Brexit — Event slideshow | PwC Ireland
135
On the brink of Brexit: the economic consequences for the island of Ireland PwC, 17 October 2019 Presentation Slide Pack Organisers: Thomas Conefrey (Central Bank of Ireland), Katy Hayward (Queens University Belfast/UK in a Changing Europe), Ronan MacNioclais (PwC).
-
Upload
khangminh22 -
Category
Documents
-
view
0 -
download
0
Transcript of The Brink of Brexit — Event slideshow | PwC Ireland
On the brink of Brexit: the economic consequences for the island of Ireland
PwC, 17 October 2019
Presentation Slide Pack
Organisers: Thomas Conefrey (Central Bank of Ireland), Katy Hayward (Queens University Belfast/UK in a Changing Europe), Ronan MacNioclais (PwC).
Brexit in historical perspective
Kevin Hjortshøj O’Rourke
NYUAD
What the book does
• To understand Brexit and the negotiations that follow, you need to understand– Three histories (UK, EU and Ireland), how they
have shaped attitudes and economies, and how they are interacting today
– The logic of free trade areas vs customs unions vssingle markets
• A lot of what we have lived through during the course of the last three years follows fairly logically from the above
The EU has a history
“We must ensure that our commemoration [of the First World War] does not give any support to the myth that European integration was the result of the two World Wars”
(memo to David Cameron)
Why is the EU supranational?
• “The profound pooling of sovereignty that is a crucial feature of the European Union permits unprecedentedly deep cooperation, which brings benefits. But it also means that when countries are in the minority they must sometimes accept decisions they do not want…So the British electorate made a choice. They chose the power of domestic democratic control over pooling that control” (Theresa May, September 2017)

Maurice Faure, 5 July 1957
• You see, my dear friends, we still maintain the fiction that there are four Great Powers in the world. Well, there are not four Great Powers, there are only two: America and Russia. There will be a third at the end of the century: China. And it is up to you as to whether or not there will be a fourth: Europe
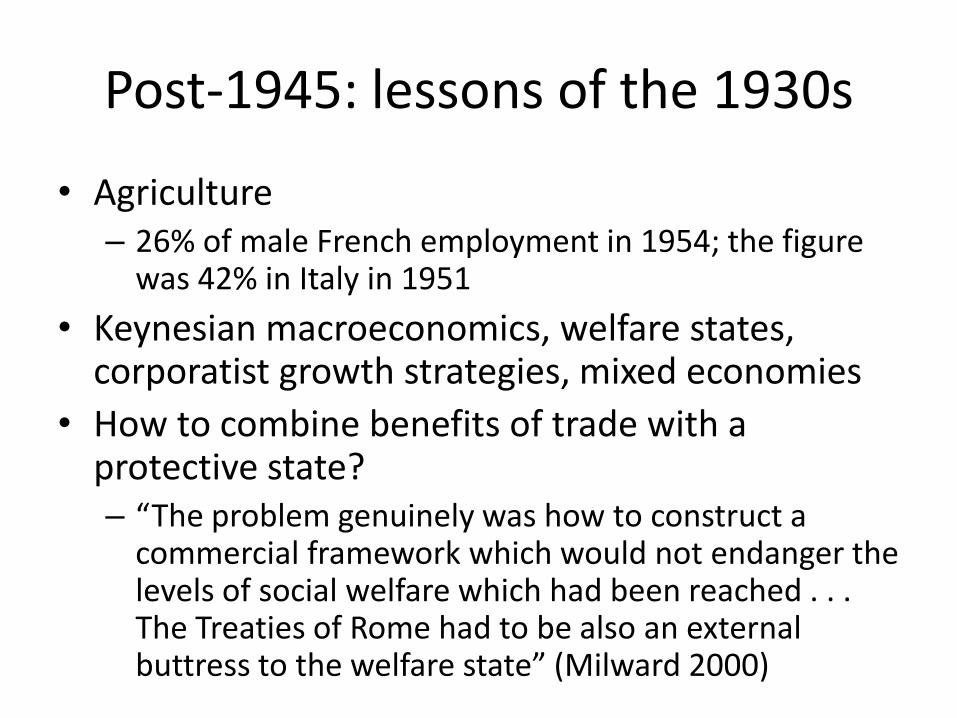
Post-1945: lessons of the 1930s
• Agriculture – 26% of male French employment in 1954; the figure
was 42% in Italy in 1951
• Keynesian macroeconomics, welfare states, corporatist growth strategies, mixed economies
• How to combine benefits of trade with a protective state?– “The problem genuinely was how to construct a
commercial framework which would not endanger the levels of social welfare which had been reached . . . The Treaties of Rome had to be also an external buttress to the welfare state” (Milward 2000)
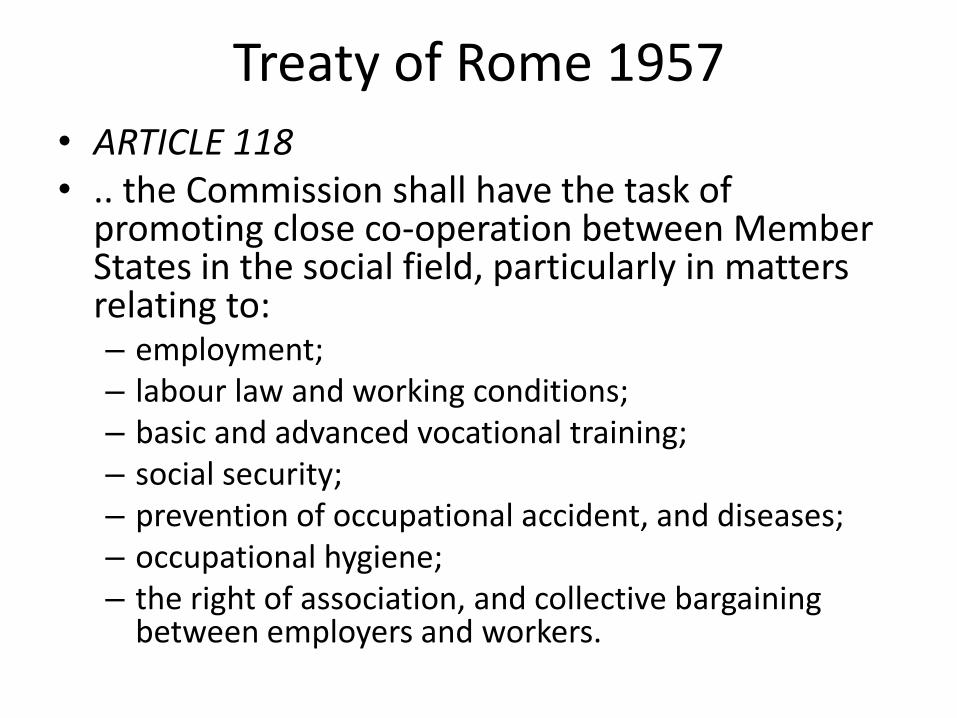
Treaty of Rome 1957
• ARTICLE 118 • .. the Commission shall have the task of
promoting close co-operation between Member States in the social field, particularly in matters relating to: – employment; – labour law and working conditions; – basic and advanced vocational training; – social security; – prevention of occupational accident, and diseases;– occupational hygiene; – the right of association, and collective bargaining
between employers and workers.
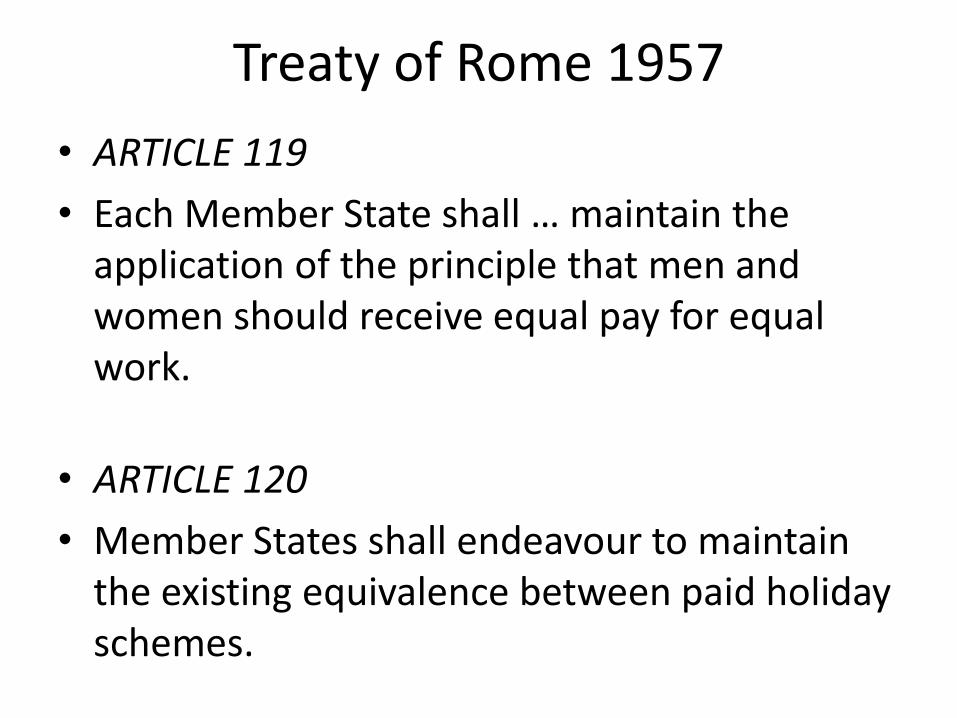
Treaty of Rome 1957
• ARTICLE 119
• Each Member State shall … maintain the application of the principle that men and women should receive equal pay for equal work.
• ARTICLE 120
• Member States shall endeavour to maintain the existing equivalence between paid holiday schemes.
Protocol to Treaty of Rome
• Les Etats membres estiment que l’etablissement du marche commun entrainera..une situation dans laquelle la base au-dela de laquelle sont remunerees les heures supplementaires et le taux moyen de majoration pour ces heures dans l'industrie correspondront a ceux existant en France, selon la moyenne de l'annee 1956.
• A defaut de realisation de la situation ci-dessus…la Commission est tenue d'autoriser la France aprendre, a l'egard des secteurs industriels affectespar l'inegalite dans le mode de remuneration des heures supplementaires, des mesures de sauvegarde dont elle definit les conditions et modalites…
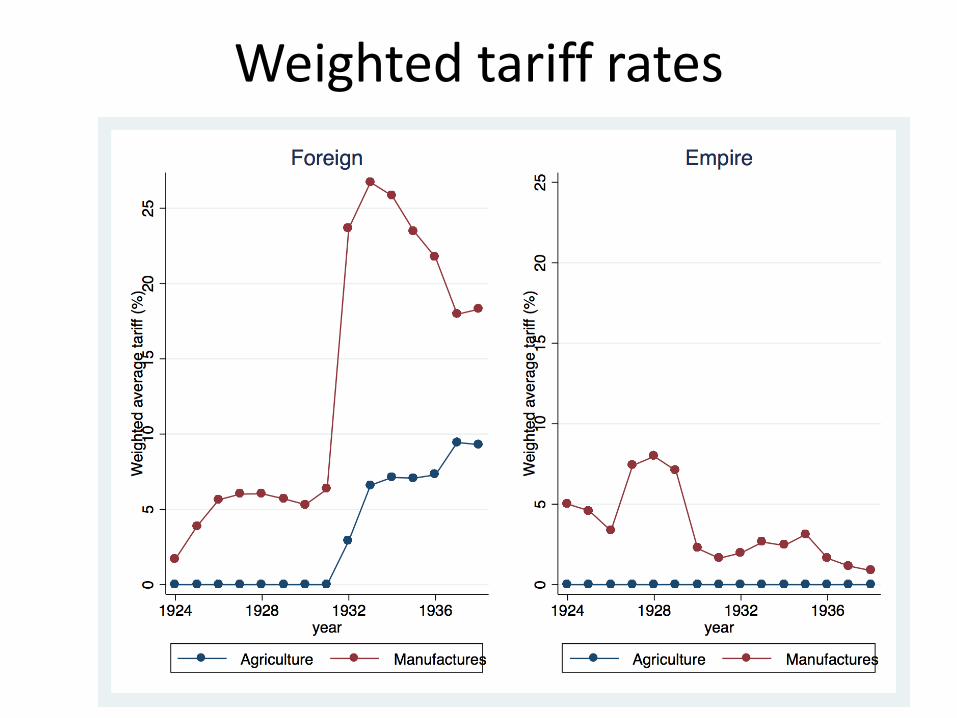
Weighted tariff rates
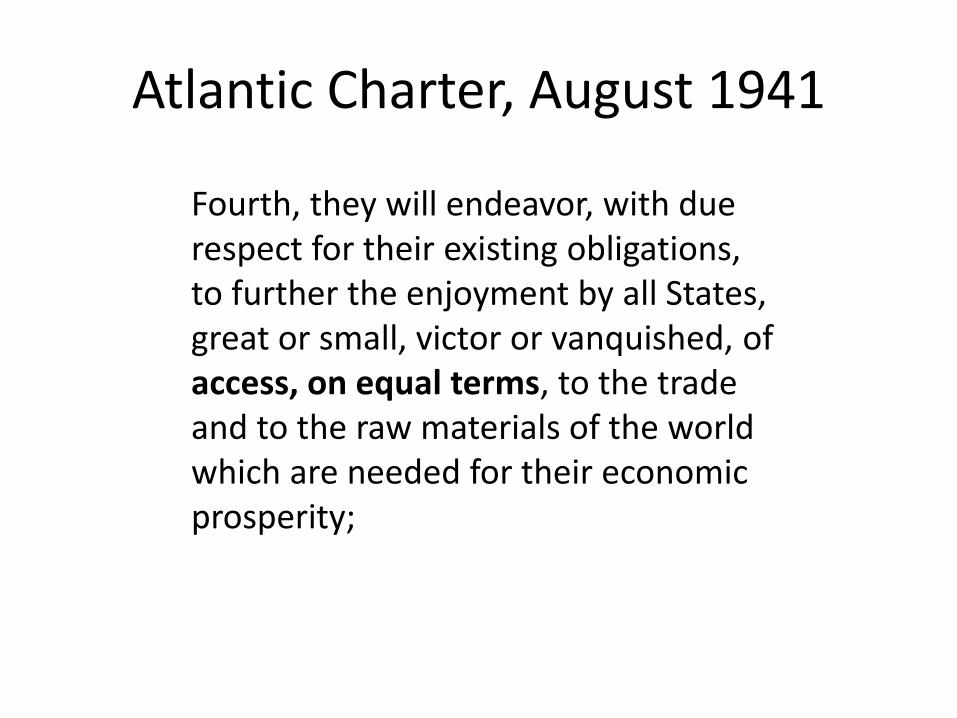
Atlantic Charter, August 1941
Fourth, they will endeavor, with due respect for their existing obligations, to further the enjoyment by all States, great or small, victor or vanquished, of access, on equal terms, to the trade and to the raw materials of the world which are needed for their economic prosperity;
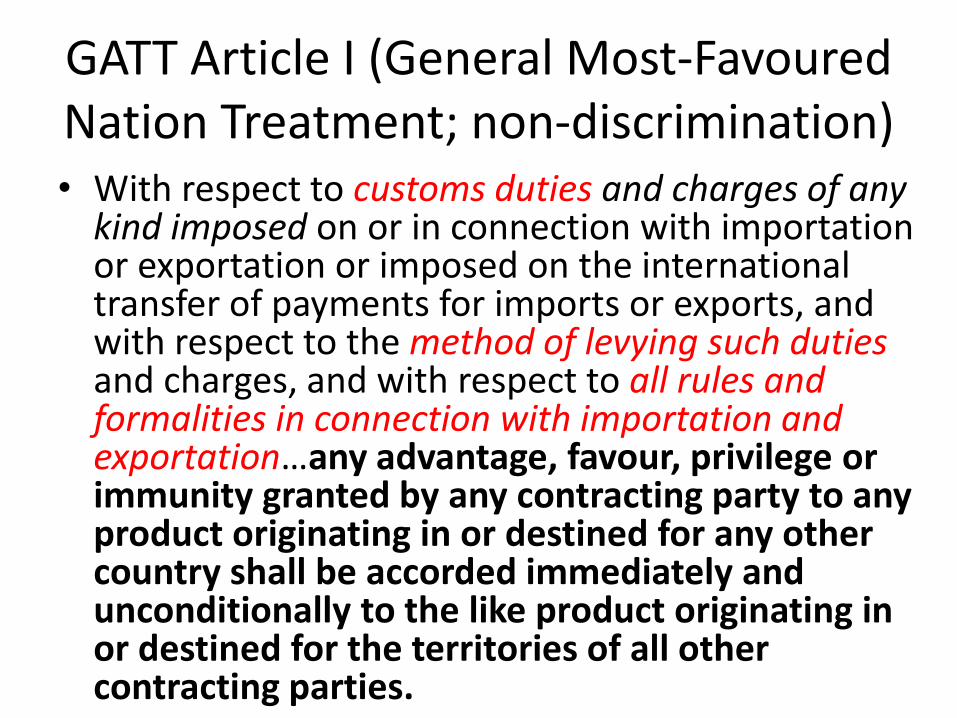
GATT Article I (General Most-Favoured Nation Treatment; non-discrimination) • With respect to customs duties and charges of any
kind imposed on or in connection with importation or exportation or imposed on the international transfer of payments for imports or exports, and with respect to the method of levying such duties and charges, and with respect to all rules and formalities in connection with importation and exportation…any advantage, favour, privilege or immunity granted by any contracting party to any product originating in or destined for any other country shall be accorded immediately and unconditionally to the like product originating in or destined for the territories of all other contracting parties.
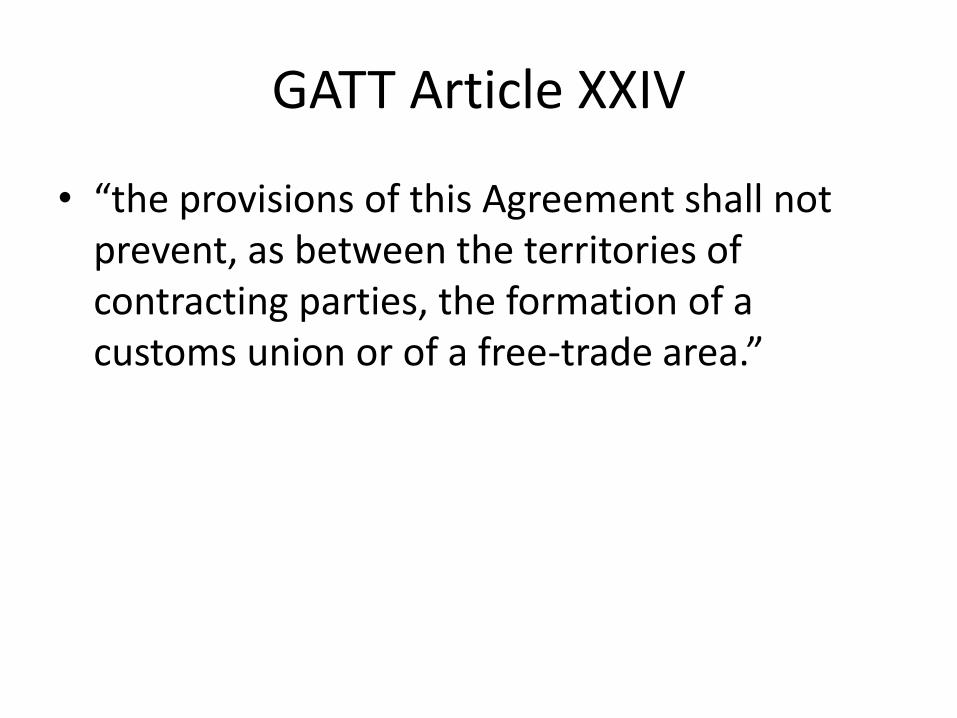
GATT Article XXIV
• “the provisions of this Agreement shall not prevent, as between the territories of contracting parties, the formation of a customs union or of a free-trade area.”
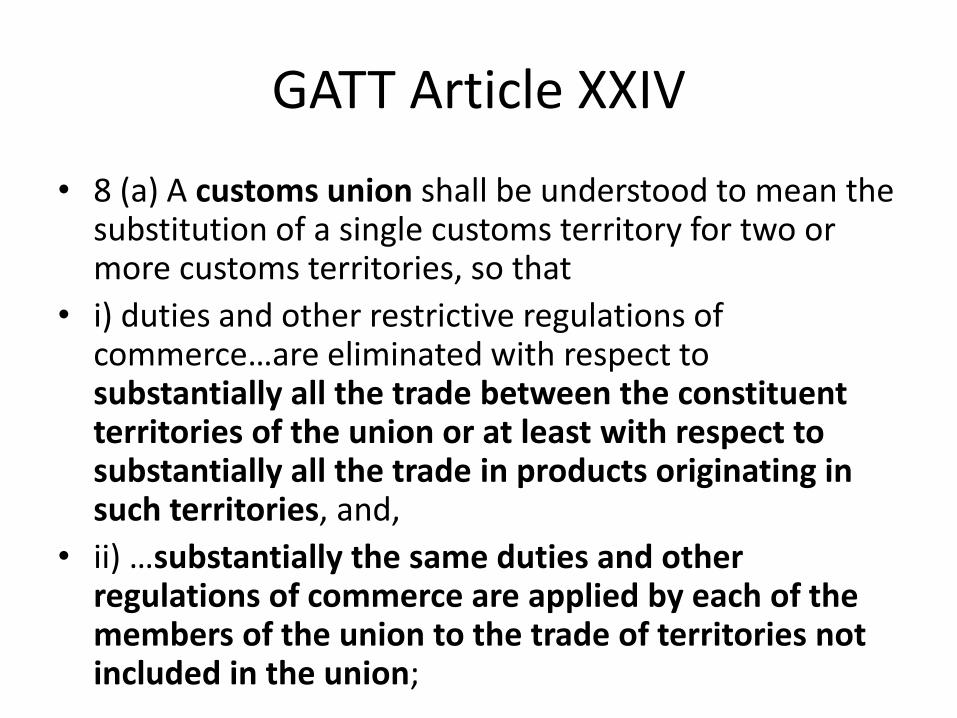
GATT Article XXIV
• 8 (a) A customs union shall be understood to mean the substitution of a single customs territory for two or more customs territories, so that
• i) duties and other restrictive regulations of commerce…are eliminated with respect to substantially all the trade between the constituent territories of the union or at least with respect to substantially all the trade in products originating in such territories, and,
• ii) …substantially the same duties and other regulations of commerce are applied by each of the members of the union to the trade of territories not included in the union;
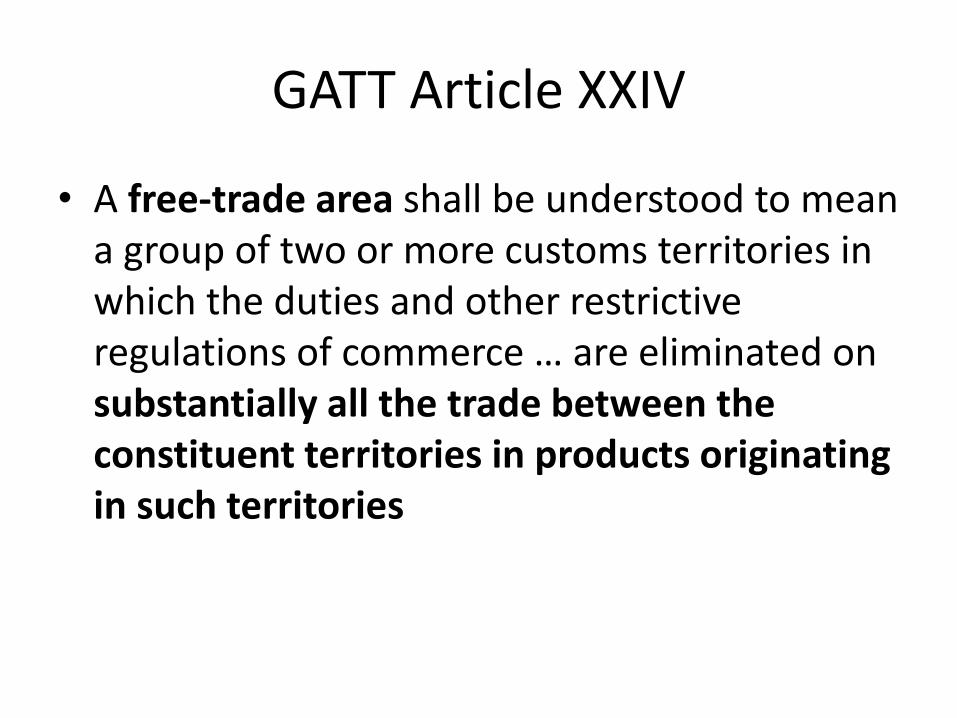
GATT Article XXIV
• A free-trade area shall be understood to mean a group of two or more customs territories in which the duties and other restrictive regulations of commerce … are eliminated on substantially all the trade between the constituent territories in products originating in such territories
EU history shaped EU attitudes during the negotiations
• The Single Market represents a complex diplomatic bargain and there were only 12 members in those days..
– UK can’t be allowed to unravel that bargain
• Need to retain control of Single Market rules
– UK can’t be allowed to influence EU regulations from the outside; it can’t influence the way the EU applies those regulations (e.g. at borders)
EU concerns regarding Northern Irish border
• Here we are talking very practically about –imagine – an import of shrimps from an Asian country where they treat shrimps with antibiotics, which are prohibited in the EU because they can lead to blindness. Now this shipment arrives in Liverpool and is destined for the market in Northern Ireland and also the EU27. At what moment and how do we check that there are no residues of prohibited antibiotics? . . .
EU concerns regarding Northern Irish border
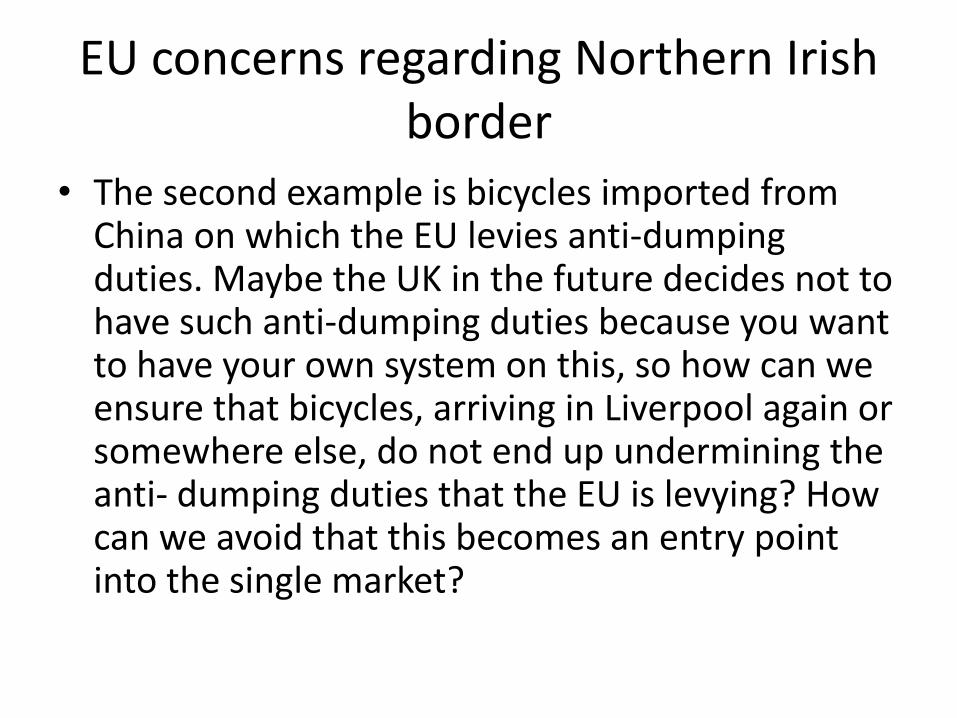
• The second example is bicycles imported from China on which the EU levies anti-dumping duties. Maybe the UK in the future decides not to have such anti-dumping duties because you want to have your own system on this, so how can we ensure that bicycles, arriving in Liverpool again or somewhere else, do not end up undermining the anti- dumping duties that the EU is levying? How can we avoid that this becomes an entry point into the single market?
EU concerns regarding Northern Irish border
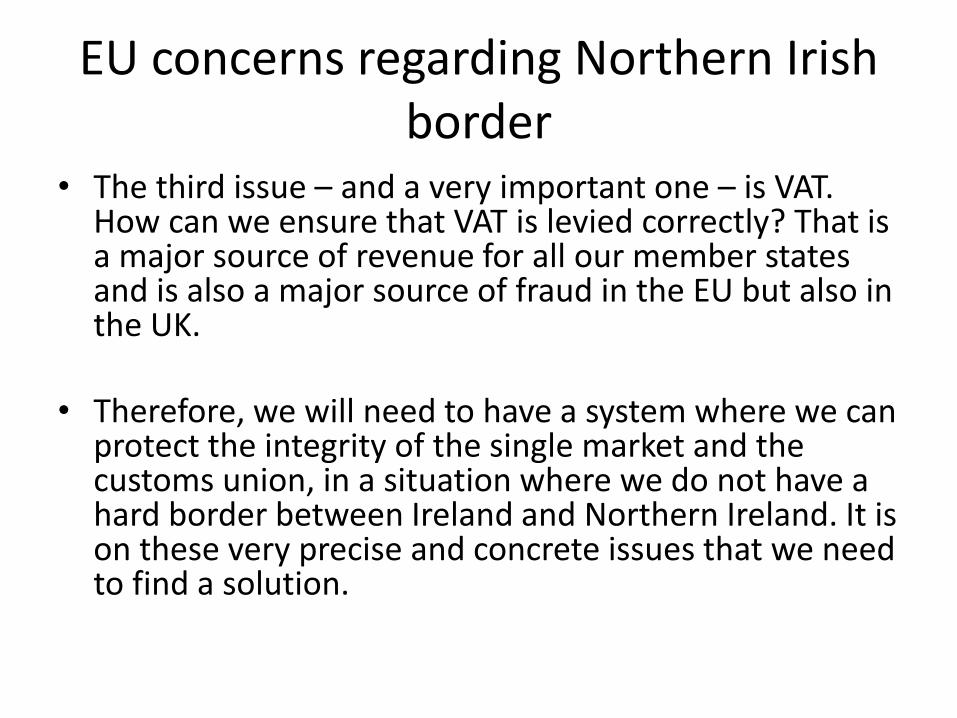
• The third issue – and a very important one – is VAT. How can we ensure that VAT is levied correctly? That is a major source of revenue for all our member states and is also a major source of fraud in the EU but also in the UK.
• Therefore, we will need to have a system where we can protect the integrity of the single market and the customs union, in a situation where we do not have a hard border between Ireland and Northern Ireland. It is on these very precise and concrete issues that we need to find a solution.
EU suspicions
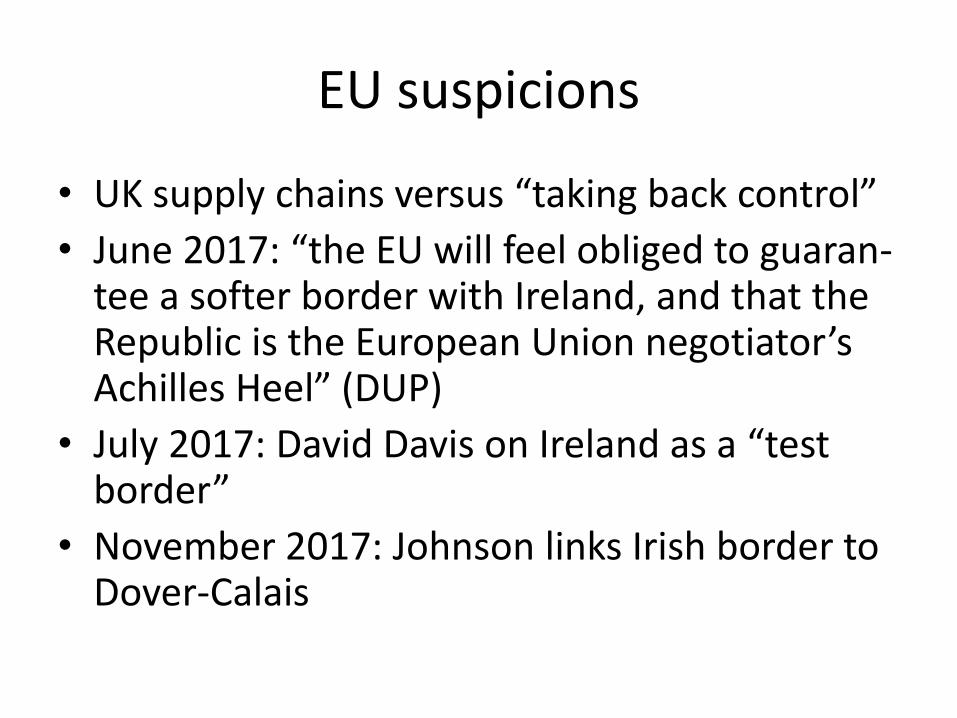
• UK supply chains versus “taking back control”
• June 2017: “the EU will feel obliged to guaran-tee a softer border with Ireland, and that the Republic is the European Union negotiator’s Achilles Heel” (DUP)
• July 2017: David Davis on Ireland as a “test border”
• November 2017: Johnson links Irish border to Dover-Calais
EU history shaped EU attitudes during the negotiations
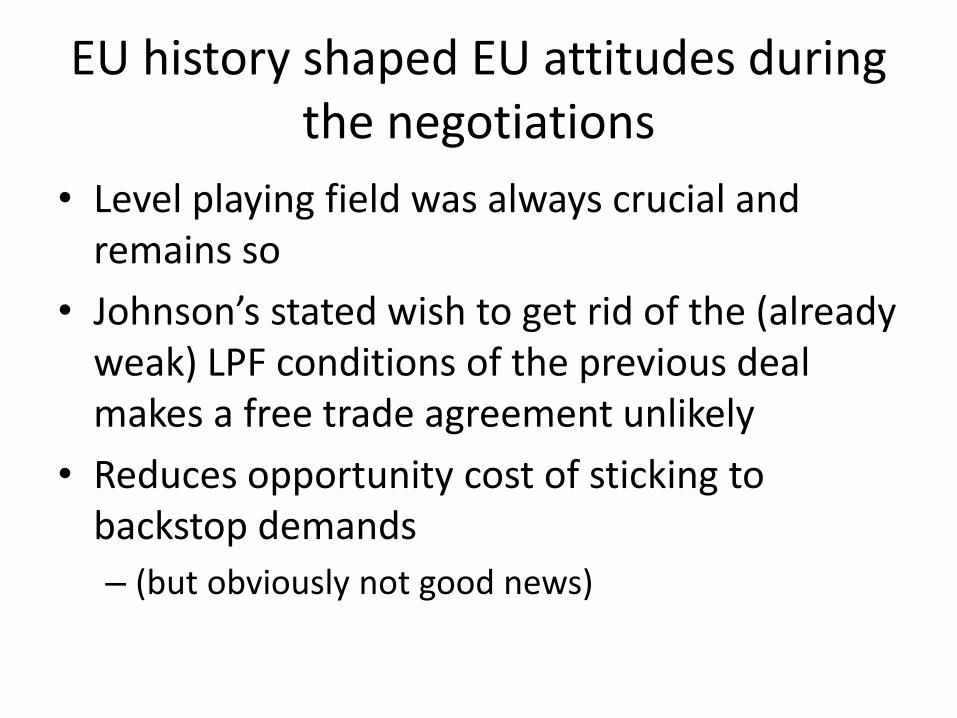
• Level playing field was always crucial and remains so
• Johnson’s stated wish to get rid of the (already weak) LPF conditions of the previous deal makes a free trade agreement unlikely
• Reduces opportunity cost of sticking to backstop demands
– (but obviously not good news)
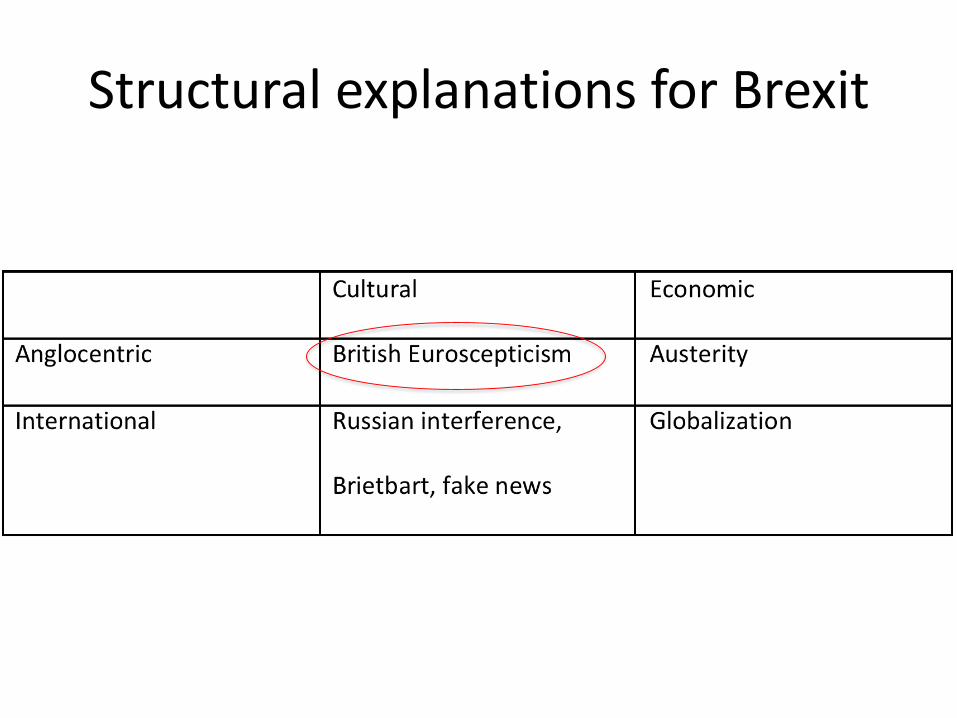
Structural explanations for Brexit
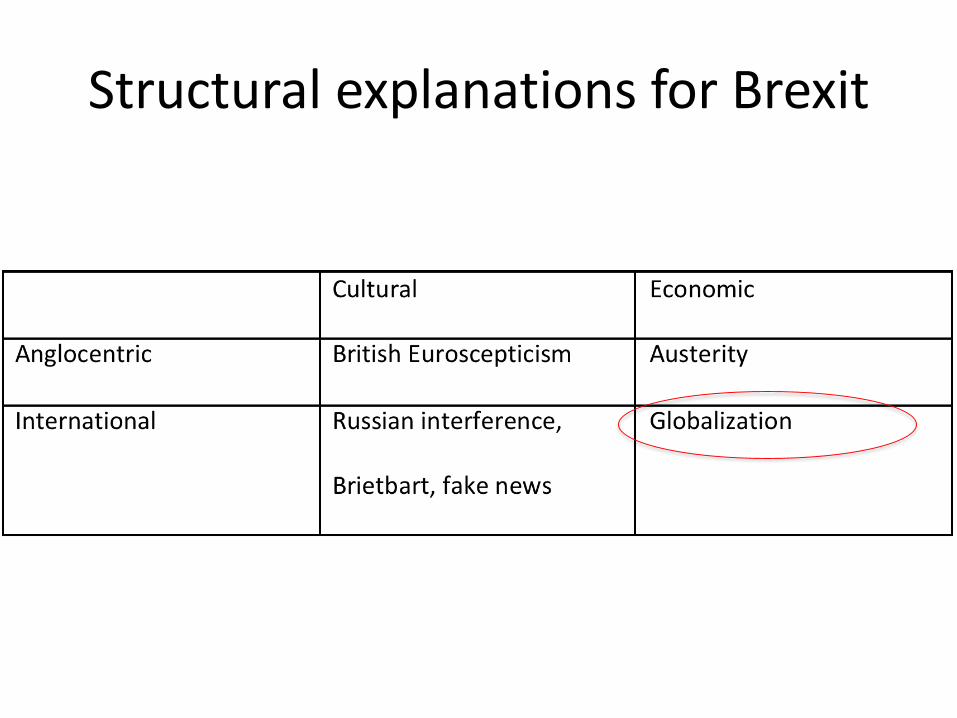
Structural explanations for Brexit
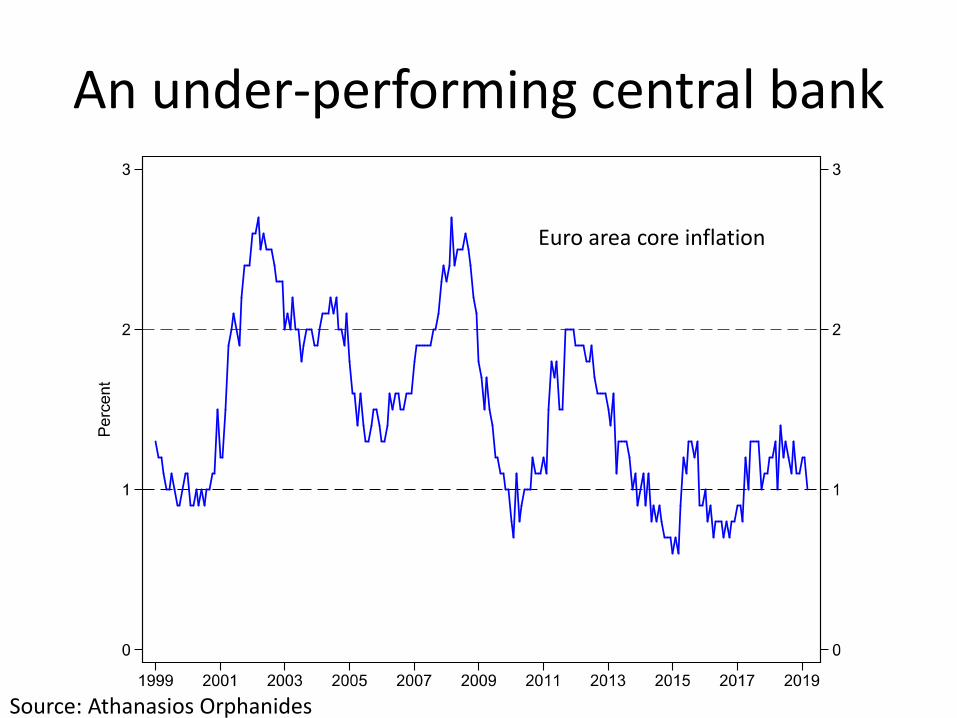
An under-performing central bank
Euro area core inflation
Source: Athanasios Orphanides
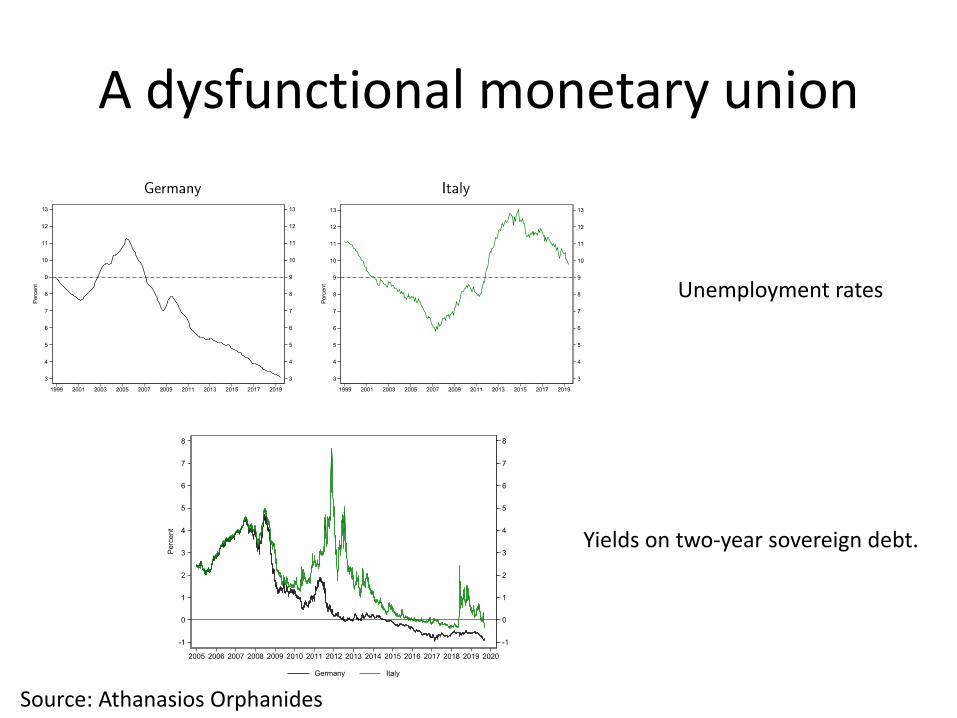
A dysfunctional monetary union
Unemployment rates
Yields on two-year sovereign debt.
Source: Athanasios Orphanides
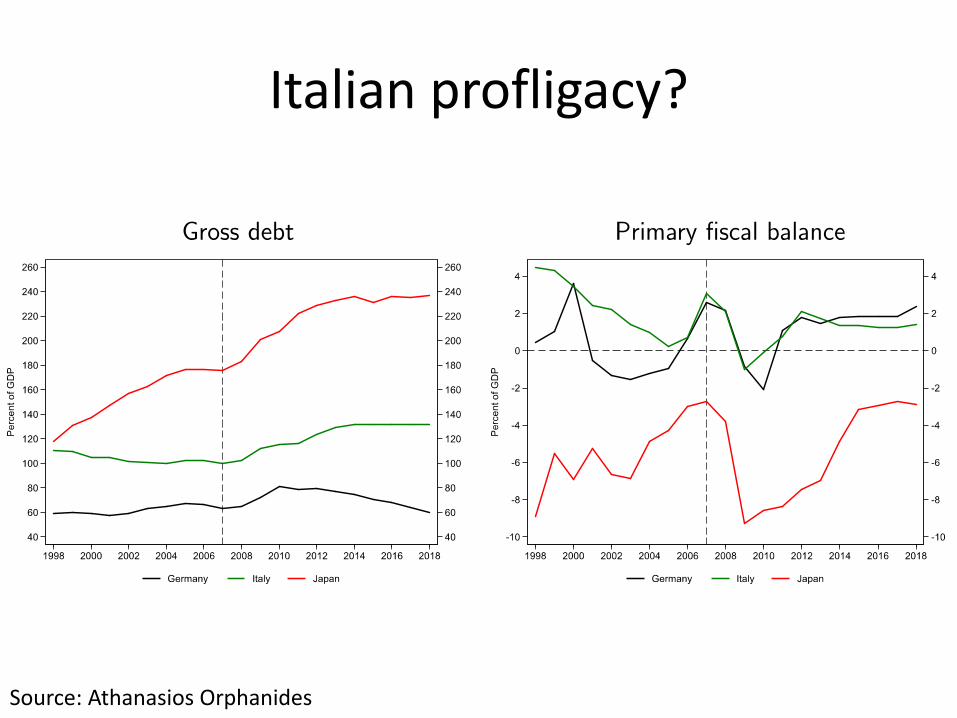
Italian profligacy?
Source: Athanasios Orphanides
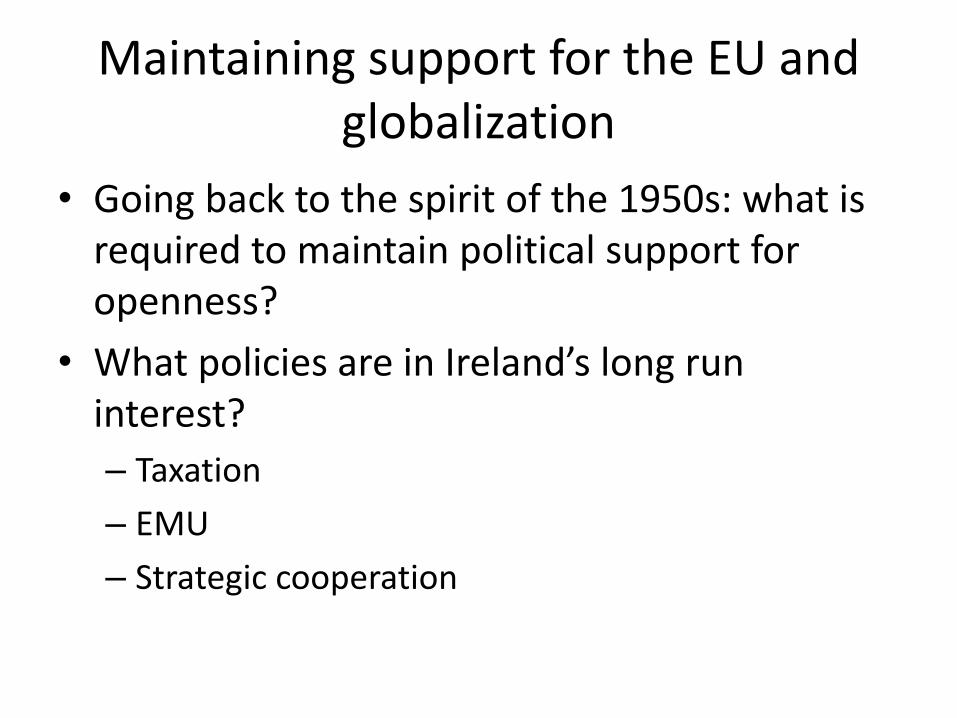
Maintaining support for the EU and globalization
• Going back to the spirit of the 1950s: what is required to maintain political support for openness?
• What policies are in Ireland’s long run interest?
– Taxation
– EMU
– Strategic cooperation
The Impact of a Disorderly Brexit on the Irish Economy
Thomas Conefrey
On the Brink of Brexit, PwC, 17 October 2019
32
Overview
1. The impact of Brexit so far:
UK economic performance
Ireland
2. Modelling the effect of Brexit on the Irish economy.
3. Sector and region-specific problems.
4. Conclusion.
33
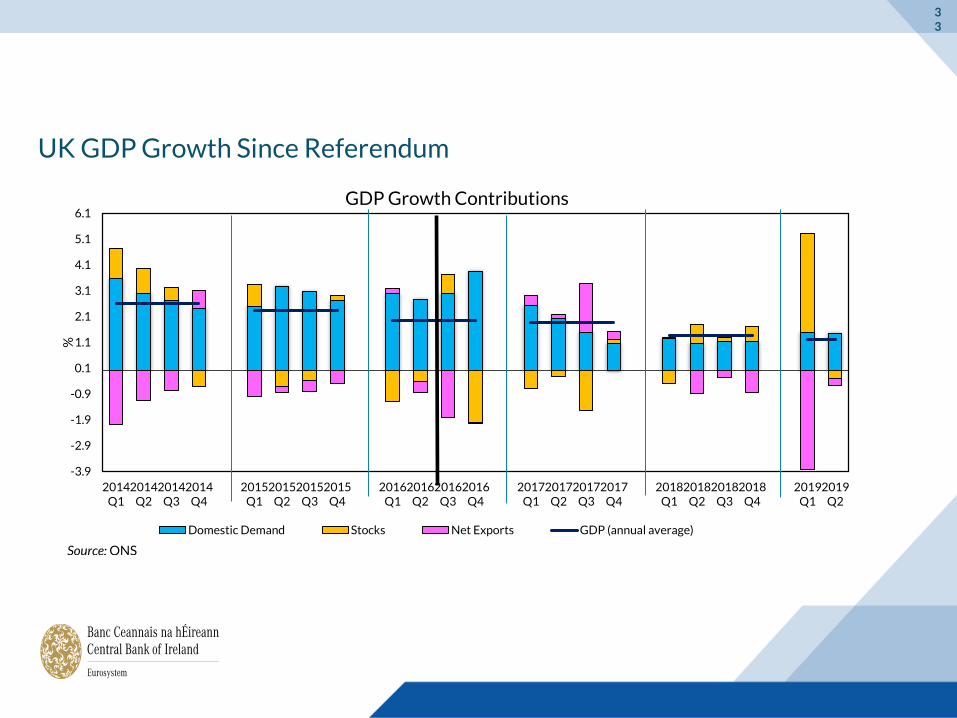
UK GDP Growth Since Referendum
-3.9
-2.9
-1.9
-0.9
0.1
1.1
2.1
3.1
4.1
5.1
6.1
2014Q1
2014Q2
2014Q3
2014Q4
2015Q1
2015Q2
2015Q3
2015Q4
2016Q1
2016Q2
2016Q3
2016Q4
2017Q1
2017Q2
2017Q3
2017Q4
2018Q1
2018Q2
2018Q3
2018Q4
2019Q1
2019Q2
%
GDP Growth Contributions
Domestic Demand Stocks Net Exports GDP (annual average)
Source: ONS
34
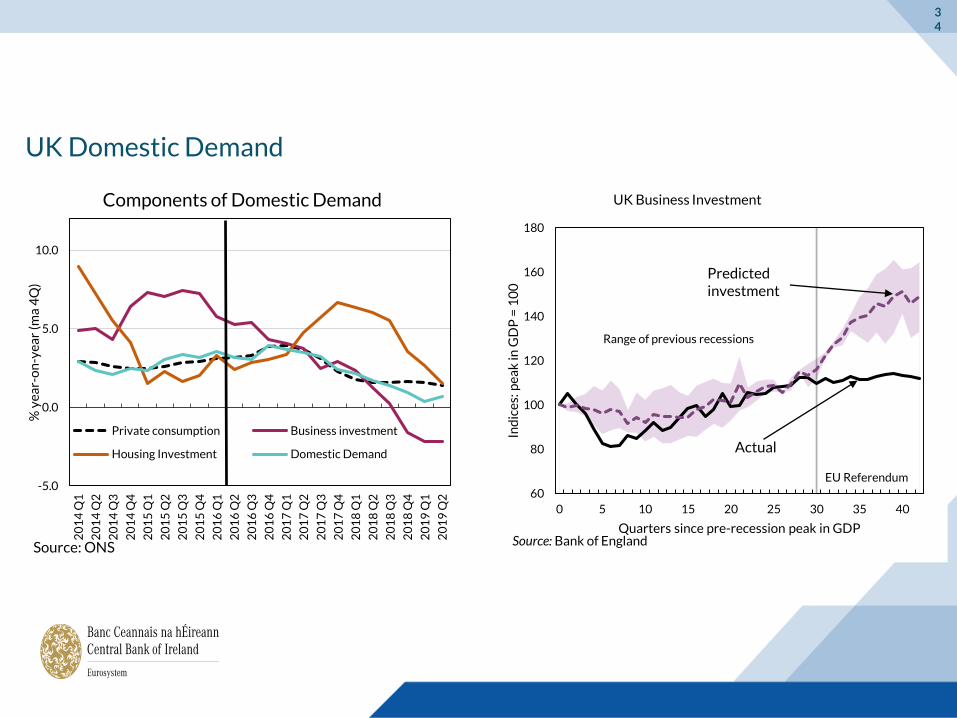
UK Domestic Demand
60
80
100
120
140
160
180
0 5 10 15 20 25 30 35 40In
dic
es:
pe
ak
in G
DP
= 1
00
Quarters since pre-recession peak in GDP
Range of previous recessions
EU Referendum
Source: Bank of England
Actual
Predicted investment
-5.0
0.0
5.0
10.0
20
14
Q1
20
14
Q2
20
14
Q3
20
14
Q4
20
15
Q1
20
15
Q2
20
15
Q3
20
15
Q4
20
16
Q1
20
16
Q2
20
16
Q3
20
16
Q4
20
17
Q1
20
17
Q2
20
17
Q3
20
17
Q4
20
18
Q1
20
18
Q2
20
18
Q3
20
18
Q4
20
19
Q1
20
19
Q2
% y
ea
r-o
n-y
ea
r (m
a 4
Q)
Components of Domestic Demand
Private consumption Business investment
Housing Investment Domestic Demand
Source: ONS
UK Business Investment
35
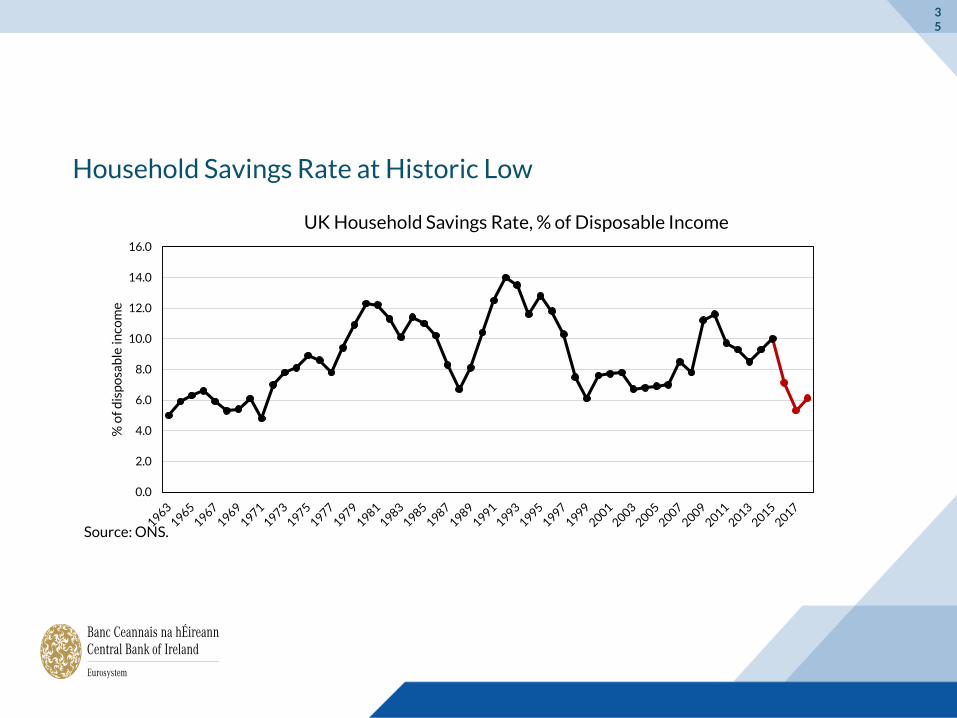
Household Savings Rate at Historic Low
0.0
2.0
4.0
6.0
8.0
10.0
12.0
14.0
16.0
% o
f d
isp
osa
ble
inco
me
UK Household Savings Rate, % of Disposable Income
Source: ONS.
36
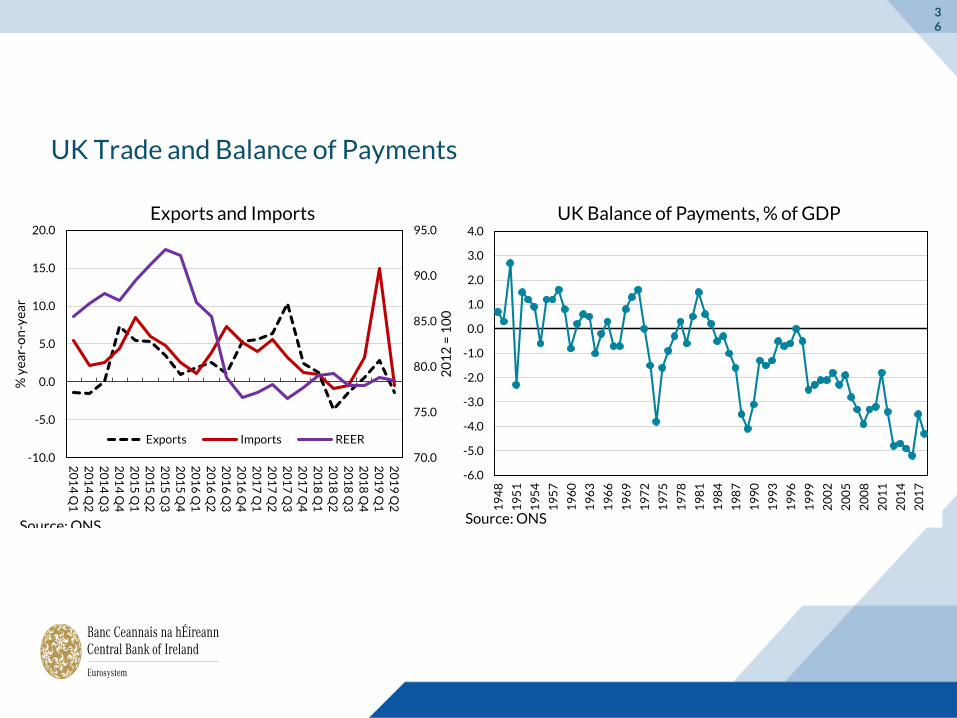
UK Trade and Balance of Payments
70.0
75.0
80.0
85.0
90.0
95.0
-10.0
-5.0
0.0
5.0
10.0
15.0
20.0
20
14
Q1
20
14
Q2
20
14
Q3
20
14
Q4
20
15
Q1
20
15
Q2
20
15
Q3
20
15
Q4
20
16
Q1
20
16
Q2
20
16
Q3
20
16
Q4
20
17
Q1
20
17
Q2
20
17
Q3
20
17
Q4
20
18
Q1
20
18
Q2
20
18
Q3
20
18
Q4
20
19
Q1
20
19
Q2
20
12
= 1
00
% y
ea
r-o
n-y
ea
r
Exports and Imports
Exports Imports REER
Source: ONS
-6.0
-5.0
-4.0
-3.0
-2.0
-1.0
0.0
1.0
2.0
3.0
4.0
19
48
19
51
19
54
19
57
19
60
19
63
19
66
19
69
19
72
19
75
19
78
19
81
19
84
19
87
19
90
19
93
19
96
19
99
20
02
20
05
20
08
20
11
20
14
20
17
UK Balance of Payments, % of GDP
Source: ONS
37
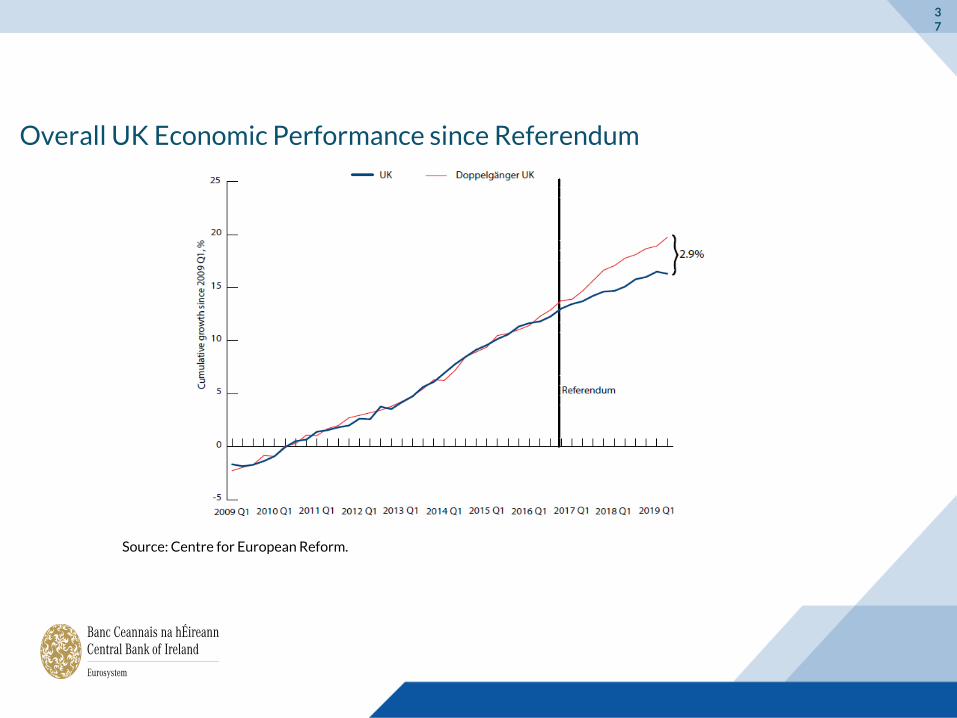
Overall UK Economic Performance since Referendum
Source: Centre for European Reform.
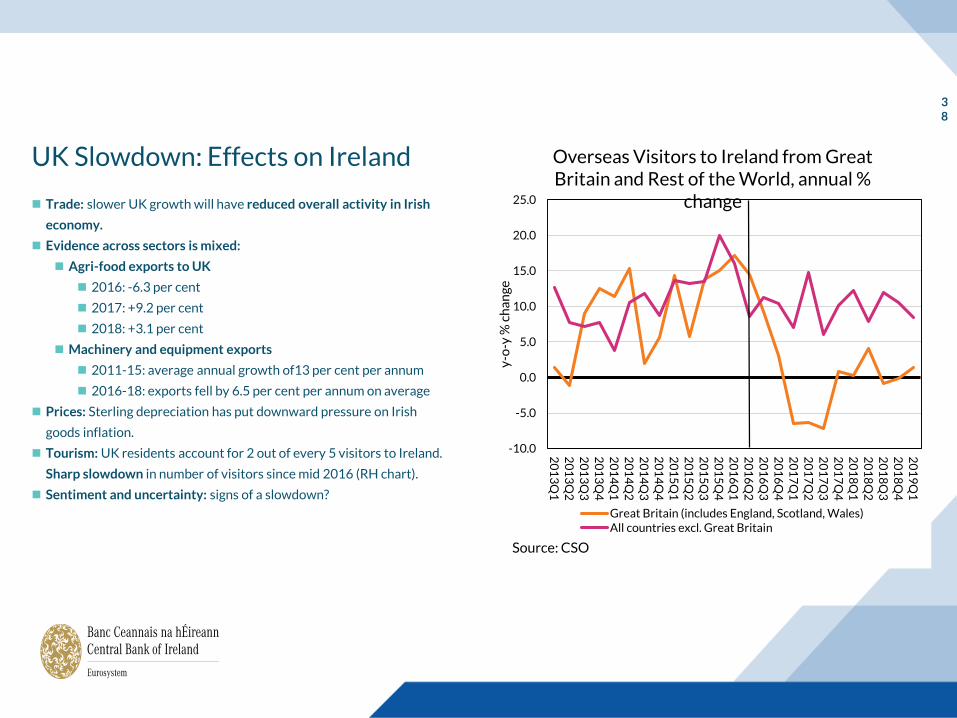
UK Slowdown: Effects on Ireland
Trade: slower UK growth will have reduced overall activity in Irish
economy.
Evidence across sectors is mixed:
Agri-food exports to UK
2016: -6.3 per cent
2017: +9.2 per cent
2018: +3.1 per cent
Machinery and equipment exports
2011-15: average annual growth of13 per cent per annum
2016-18: exports fell by 6.5 per cent per annum on average
Prices: Sterling depreciation has put downward pressure on Irish
goods inflation.
Tourism: UK residents account for 2 out of every 5 visitors to Ireland.
Sharp slowdown in number of visitors since mid 2016 (RH chart).
Sentiment and uncertainty: signs of a slowdown?
38
-10.0
-5.0
0.0
5.0
10.0
15.0
20.0
25.0
20
13
Q1
20
13
Q2
20
13
Q3
20
13
Q4
20
14
Q1
20
14
Q2
20
14
Q3
20
14
Q4
20
15
Q1
20
15
Q2
20
15
Q3
20
15
Q4
20
16
Q1
20
16
Q2
20
16
Q3
20
16
Q4
20
17
Q1
20
17
Q2
20
17
Q3
20
17
Q4
20
18
Q1
20
18
Q2
20
18
Q3
20
18
Q4
20
19
Q1
y-o
-y %
ch
an
ge
Overseas Visitors to Ireland from Great Britain and Rest of the World, annual %
change
Great Britain (includes England, Scotland, Wales)All countries excl. Great Britain
Source: CSO
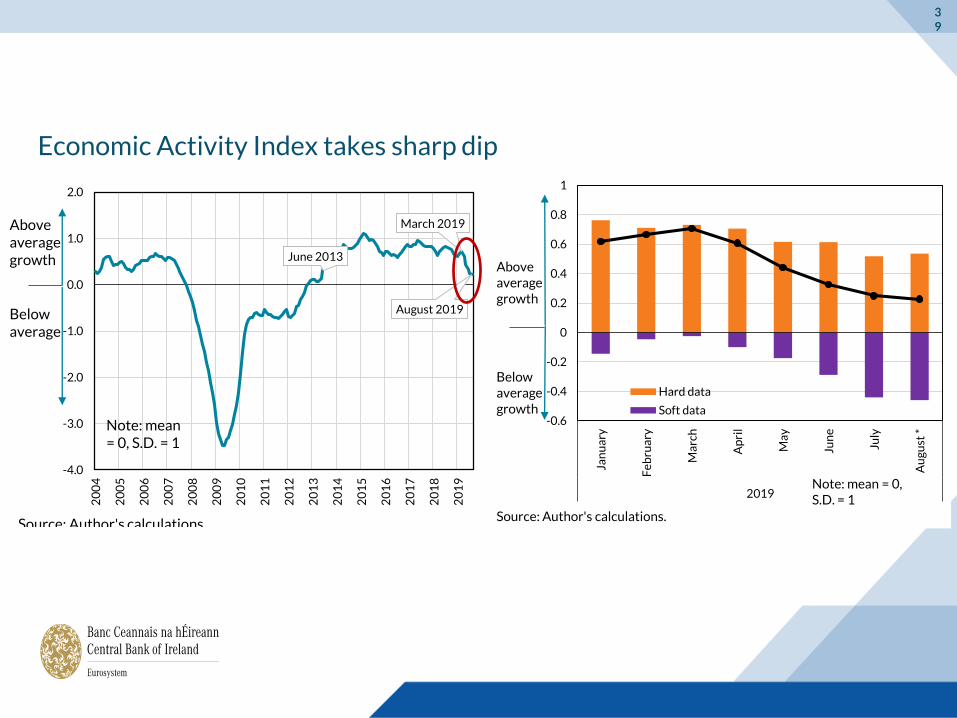
Economic Activity Index takes sharp dip
39
June 2013
March 2019
August 2019
-4.0
-3.0
-2.0
-1.0
0.0
1.0
2.0
20
04
20
05
20
06
20
07
20
08
20
09
20
10
20
11
20
12
20
13
20
14
20
15
20
16
20
17
20
18
20
19
Below average
Above average growth
Note: mean = 0, S.D. = 1
Source: Author's calculations.
-0.6
-0.4
-0.2
0
0.2
0.4
0.6
0.8
1
Jan
ua
ry
Fe
bru
ary
Ma
rch
Ap
ril
Ma
y
Jun
e
July
Au
gu
st *
2019
Hard data
Soft data
Below average growth
Above average growth
Source: Author's calculations.
Note: mean = 0, S.D. = 1
40
Brexit - Modelling the Unknown
The UK is the first country to leave the EU. The consequences of that exit are therefore largely unknown.
“Soft” or “hard” ?: a wide range of Brexit outcomes (still) possible.
Can the model capture the complexity of the change?
Does Brexit cause a structural shift that alters basic relationships embedded within the model?
How quickly will trade fall in a no-deal Brexit?
What will be the scale of the logistical and supply chain disruption?
How will financial markets react?
Nevertheless, quantitative estimates are needed to inform debate and assist policymakers.
Examples of Brexit modelling work carried out in CBI using COSMO:
May 2018 (NIESR Economic Review): impact of an orderly WTO Brexit.
October 2018 (Central Bank Quarterly Bulletin, Box A) : preliminary assessment of impact of UK Government Brexit White Paper (Chequers).
January 2019 (Central Bank Quarterly Bulletin, Box B) : Impact of a disorderly Brexit.
Builds on other similar work for Ireland by Department of Finance, ESRI and others.
41
Approach
1. Model effect of Brexit on UK economy and broader external environment using NiGEM.
2. Use NiGEM outputs as inputs into model of Irish economy (CBI-COSMO).
3. Consider additional shocks important in a disorderly UK exit.
4. Simulate the full scenario.
42
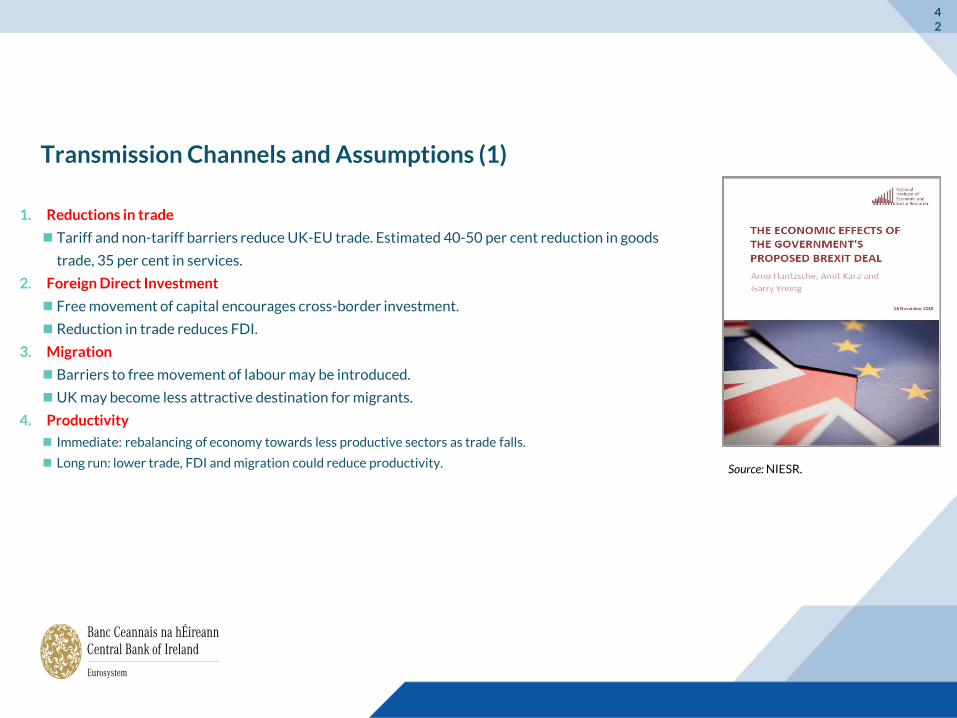
Transmission Channels and Assumptions (1)
1. Reductions in trade
Tariff and non-tariff barriers reduce UK-EU trade. Estimated 40-50 per cent reduction in goods
trade, 35 per cent in services.
2. Foreign Direct Investment
Free movement of capital encourages cross-border investment.
Reduction in trade reduces FDI.
3. Migration
Barriers to free movement of labour may be introduced.
UK may become less attractive destination for migrants.
4. Productivity
Immediate: rebalancing of economy towards less productive sectors as trade falls.
Long run: lower trade, FDI and migration could reduce productivity. Source: NIESR.
43
Other channels:
5. Financial Markets: Potentially large depreciation of sterling. Impact on borrowing costs, equity and
bond prices.
6. Sentiment and Uncertainty: Consumer spending and investment would be negatively affected by fall in
sentiment and adjustment to weaker future growth and incomes.
7. Importing and exporting: around 25 per cent of Irish goods imports come from UK. Disruption to supply
chains with implications for production, distribution and retailing. Added importance due to landbridge.
8. FDI: potential increase in Irish FDI. Magnitude of effect is uncertain. Size of FDI efffect based on Lawless
and Morgenroth (2016).
Calibrate these shocks based on a synthesis of the available literature. Some judgement is also required.
Transmission Channels and Assumptions (2)
44
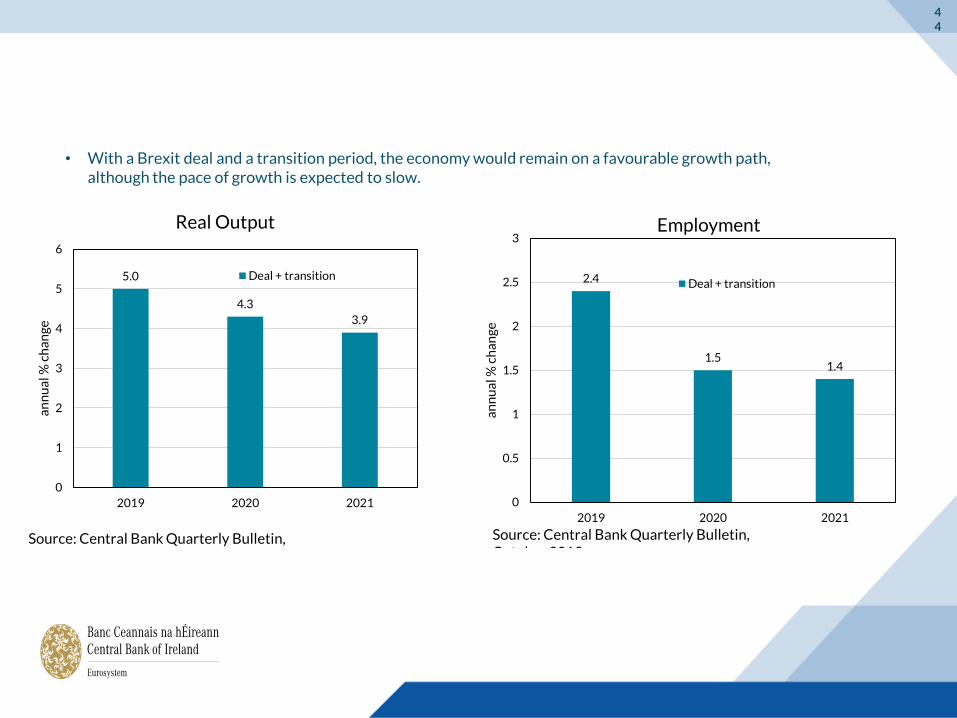
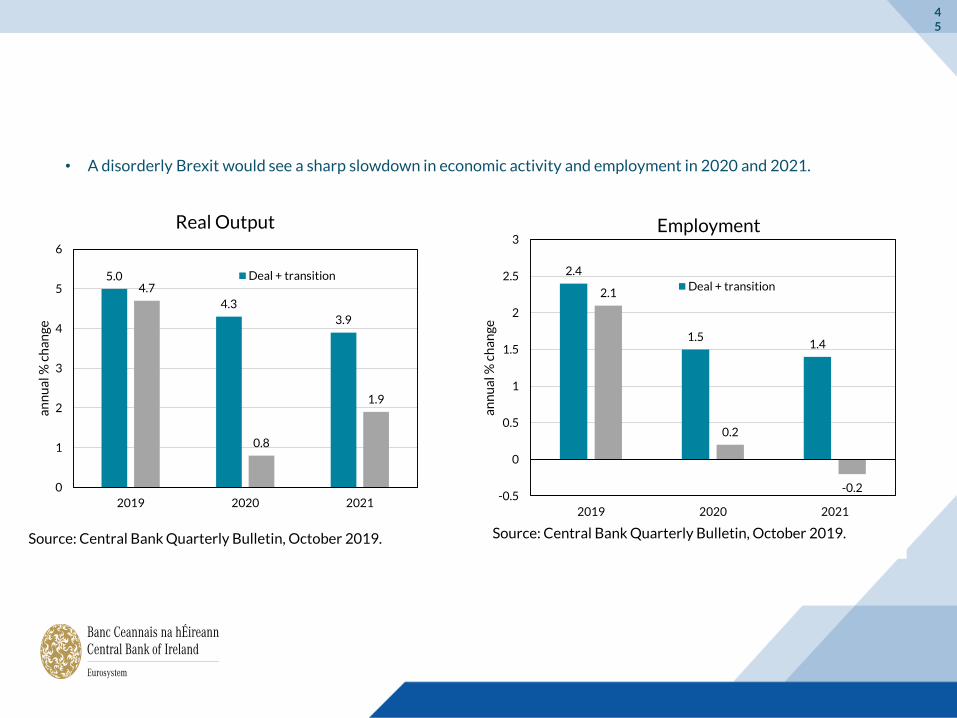
• With a Brexit deal and a transition period, the economy would remain on a favourable growth path, although the pace of growth is expected to slow.
5.0
4.3
3.9
0
1
2
3
4
5
6
2019 2020 2021
an
nu
al %
ch
an
ge
Real Output
Deal + transition
Source: Central Bank Quarterly Bulletin,
2.4
1.51.4
0
0.5
1
1.5
2
2.5
3
2019 2020 2021
an
nu
al %
ch
an
ge
Employment
Deal + transition
Source: Central Bank Quarterly Bulletin, October 2019.
45
5.0
4.3
3.9
4.7
0.8
1.9
0
1
2
3
4
5
6
2019 2020 2021
an
nu
al %
ch
an
ge
Real Output
Deal + transition
Source: Central Bank Quarterly Bulletin, October 2019.
2.4
1.51.4
2.1
0.2
-0.2-0.5
0
0.5
1
1.5
2
2.5
3
2019 2020 2021
an
nu
al %
ch
an
ge
Employment
Deal + transition
Source: Central Bank Quarterly Bulletin, October 2019.
• A disorderly Brexit would see a sharp slowdown in economic activity and employment in 2020 and 2021.
46
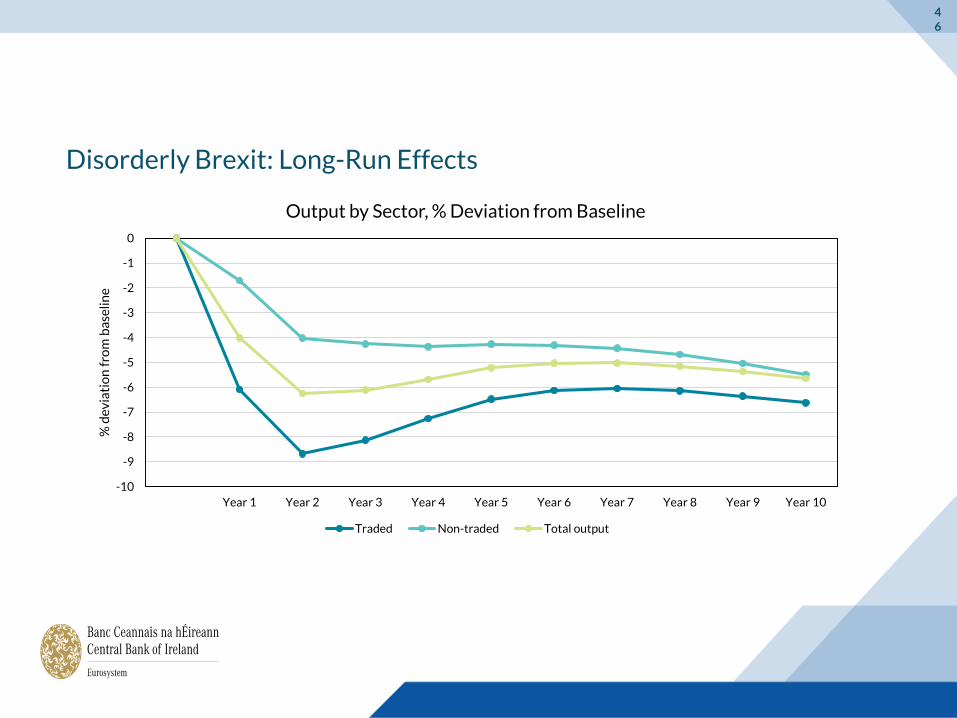
Disorderly Brexit: Long-Run Effects
-10
-9
-8
-7
-6
-5
-4
-3
-2
-1
0
Year 1 Year 2 Year 3 Year 4 Year 5 Year 6 Year 7 Year 8 Year 9 Year 10
% d
ev
iati
on
fro
m b
ase
lin
e
Output by Sector, % Deviation from Baseline
Traded Non-traded Total output
47
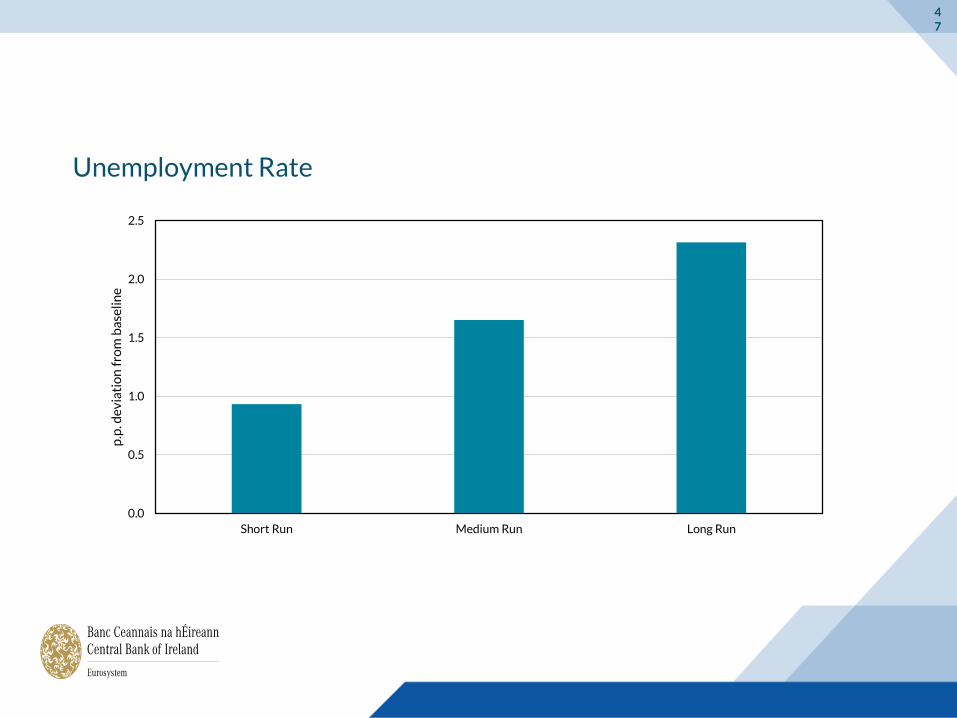
Unemployment Rate
0.0
0.5
1.0
1.5
2.0
2.5
Short Run Medium Run Long Run
p.p
. de
via
tio
n f
rom
ba
seli
ne
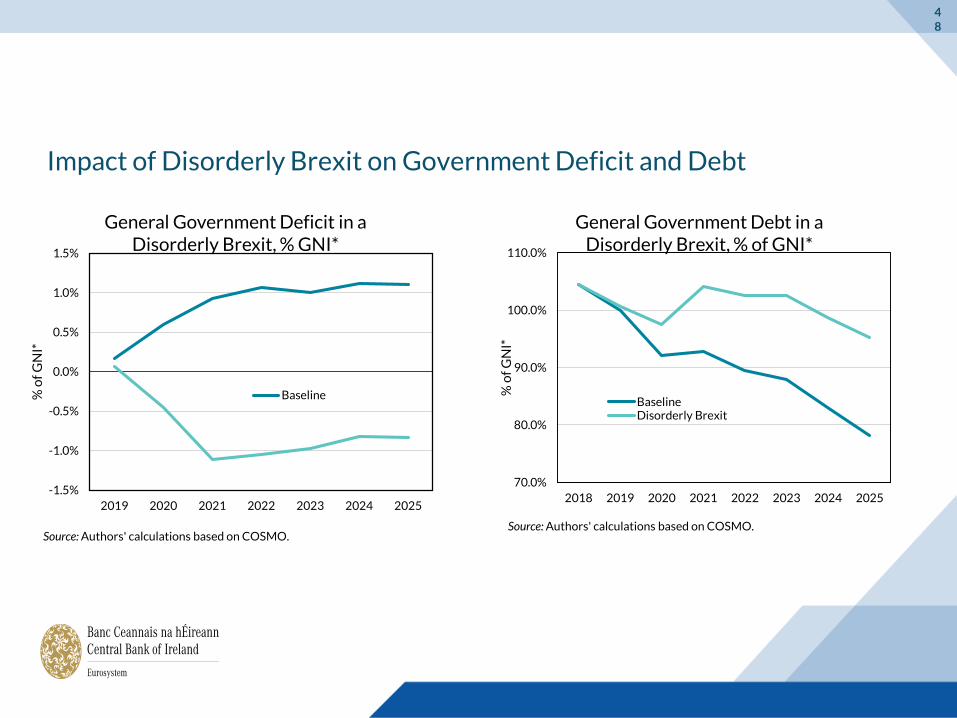
Impact of Disorderly Brexit on Government Deficit and Debt
48
70.0%
80.0%
90.0%
100.0%
110.0%
2018 2019 2020 2021 2022 2023 2024 2025%
of
GN
I*
General Government Debt in a Disorderly Brexit, % of GNI*
BaselineDisorderly Brexit
Source: Authors' calculations based on COSMO.
-1.5%
-1.0%
-0.5%
0.0%
0.5%
1.0%
1.5%
2019 2020 2021 2022 2023 2024 2025
% o
f G
NI*
General Government Deficit in a Disorderly Brexit, % GNI*
Baseline
Source: Authors' calculations based on COSMO.
49
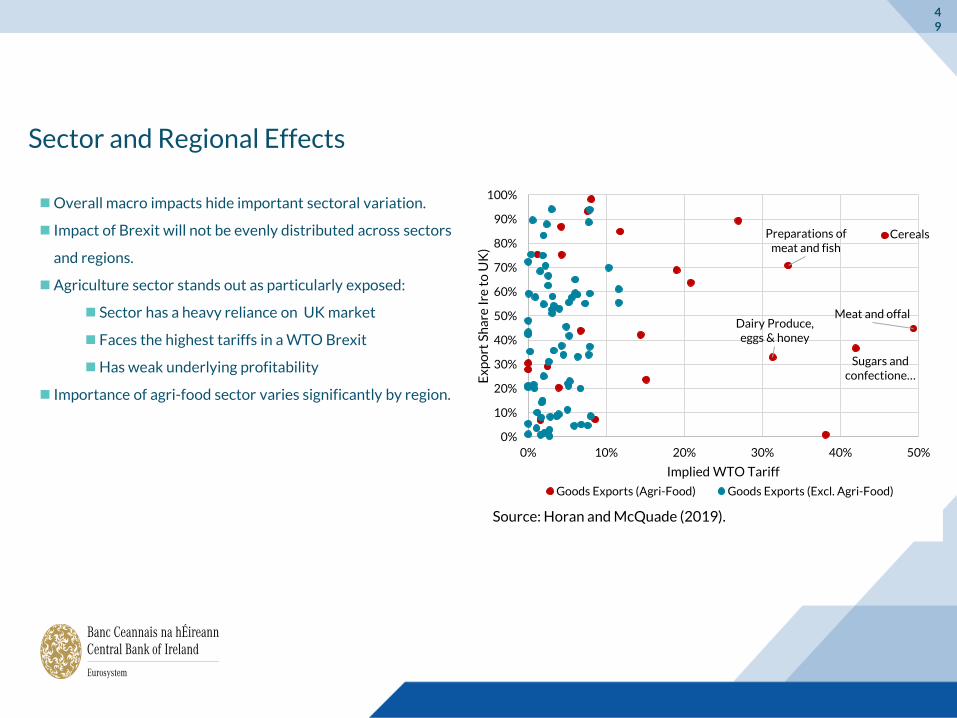
Sector and Regional Effects
Overall macro impacts hide important sectoral variation.
Impact of Brexit will not be evenly distributed across sectors
and regions.
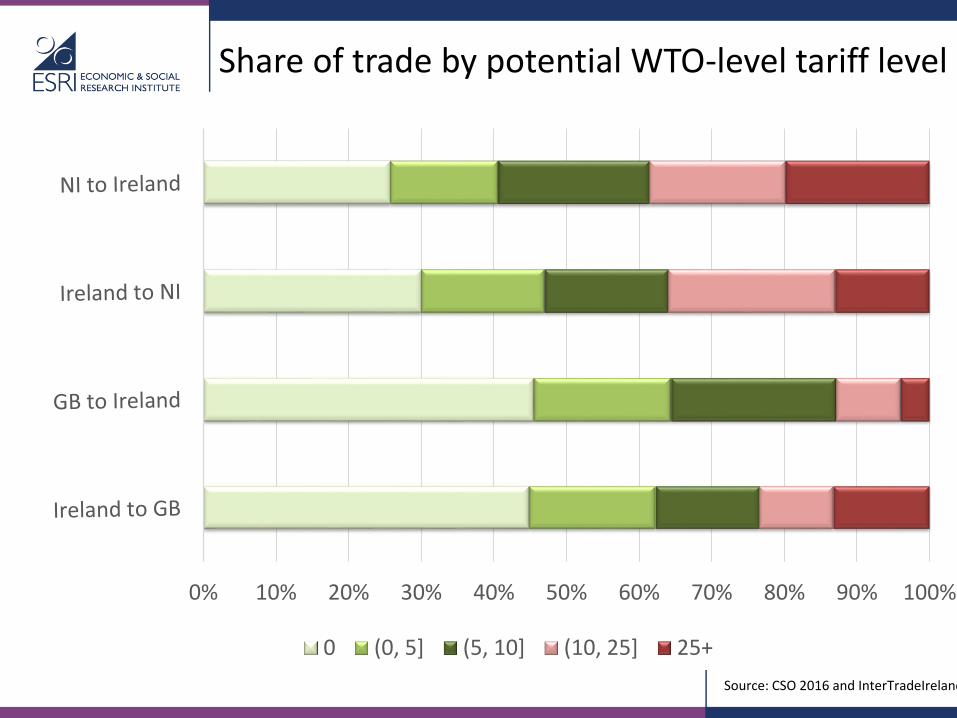
Agriculture sector stands out as particularly exposed:
Sector has a heavy reliance on UK market
Faces the highest tariffs in a WTO Brexit
Has weak underlying profitability
Importance of agri-food sector varies significantly by region.
Meat and offalDairy Produce, eggs & honey
CerealsPreparations of meat and fish
Sugars and confectione…
0%
10%
20%
30%
40%
50%
60%
70%
80%
90%
100%
0% 10% 20% 30% 40% 50%
Ex
po
rt S
ha
re I
re t
o U
K)
Implied WTO Tariff
Goods Exports (Agri-Food) Goods Exports (Excl. Agri-Food)
Source: Horan and McQuade (2019).
50
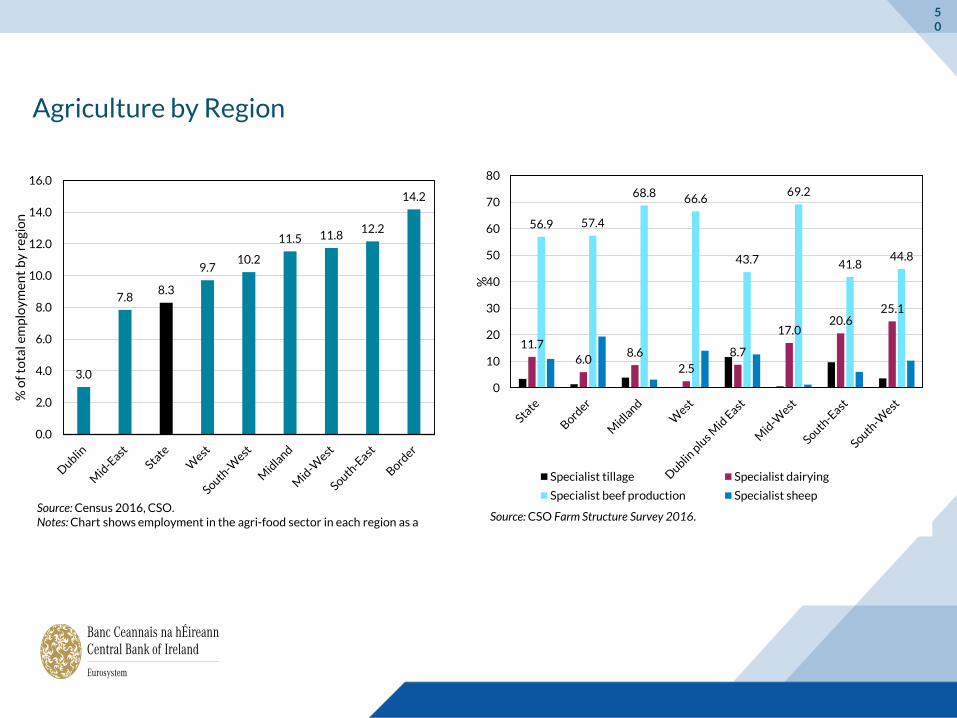
Agriculture by Region
3.0
7.88.3
9.710.2
11.5 11.812.2
14.2
0.0
2.0
4.0
6.0
8.0
10.0
12.0
14.0
16.0
% o
f to
tal e
mp
loy
me
nt
by
re
gio
n
Source: Census 2016, CSO.Notes: Chart shows employment in the agri-food sector in each region as a
11.7
6.08.6
2.5
8.7
17.020.6
25.1
56.9 57.4
68.8 66.6
43.7
69.2
41.844.8
0
10
20
30
40
50
60
70
80
%Specialist tillage Specialist dairying
Specialist beef production Specialist sheep
Source: CSO Farm Structure Survey 2016.
51
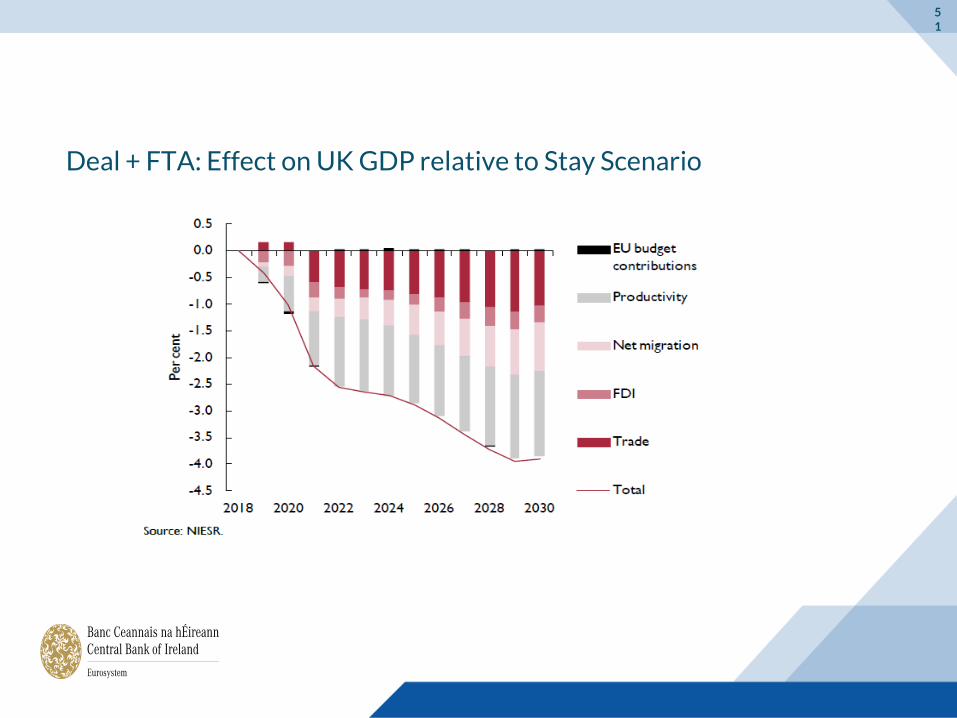
Deal + FTA: Effect on UK GDP relative to Stay Scenario
52
Summary
Evidence that UK economy has slowed since June 2016 referendum.
Reduced UK demand for Irish exports will have lowered overall Irish growth with evidence of more pronounced
effects in some sectors.
Modelling the effect of a disorderly Brexit is an inherently uncertain exercise.
Based on assumptions grounded in the academic literature, we find a significant long-run negative effect on Irish
output, with the output loss front-loaded in a disorderly Brexit.
www.esri.ie @ESRIDublin #ESRIevents #ESRIpublicationswww.esri.ie
Brexit and Cross-Border Trade
DATE17th October 2019
VENUEOn the brink of Brexit: economic consequences for the island of Ireland
AUTHORMartina Lawless
www.esri.ie @ESRIDublin #ESRIevents #ESRIpublications
Outline
Levels of economic integration
Potential impact on Ireland of “no-deal”
outcome
Cross-border trade and integration
Current state of play
www.esri.ie @ESRIDublin #ESRIevents #ESRIpublications
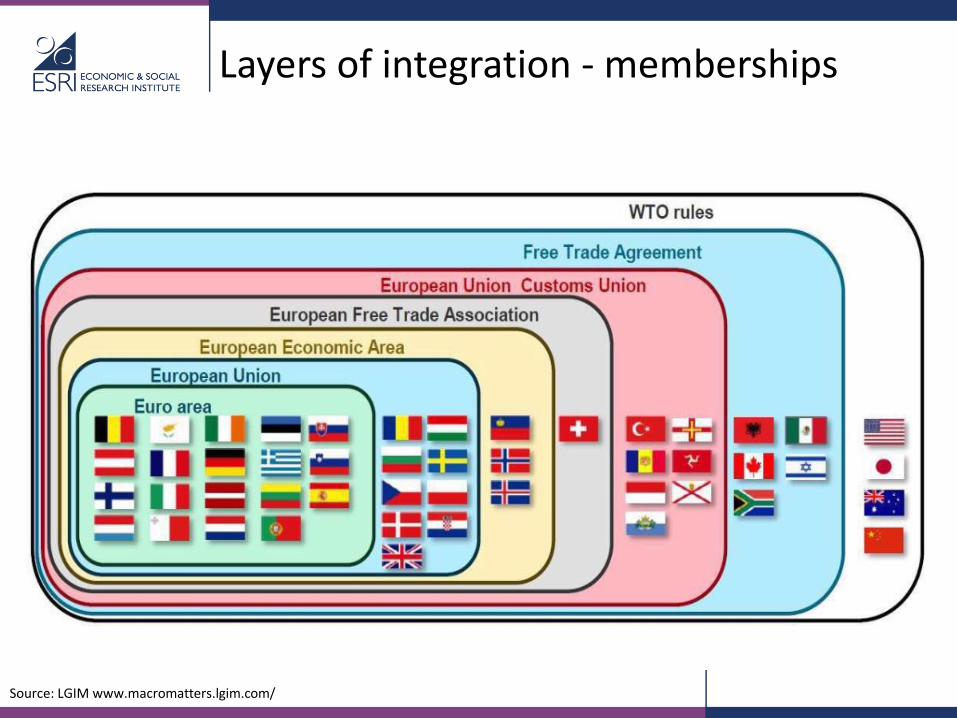
Layers of integration - memberships
Source: LGIM www.macromatters.lgim.com/
www.esri.ie @ESRIDublin #ESRIevents #ESRIpublications
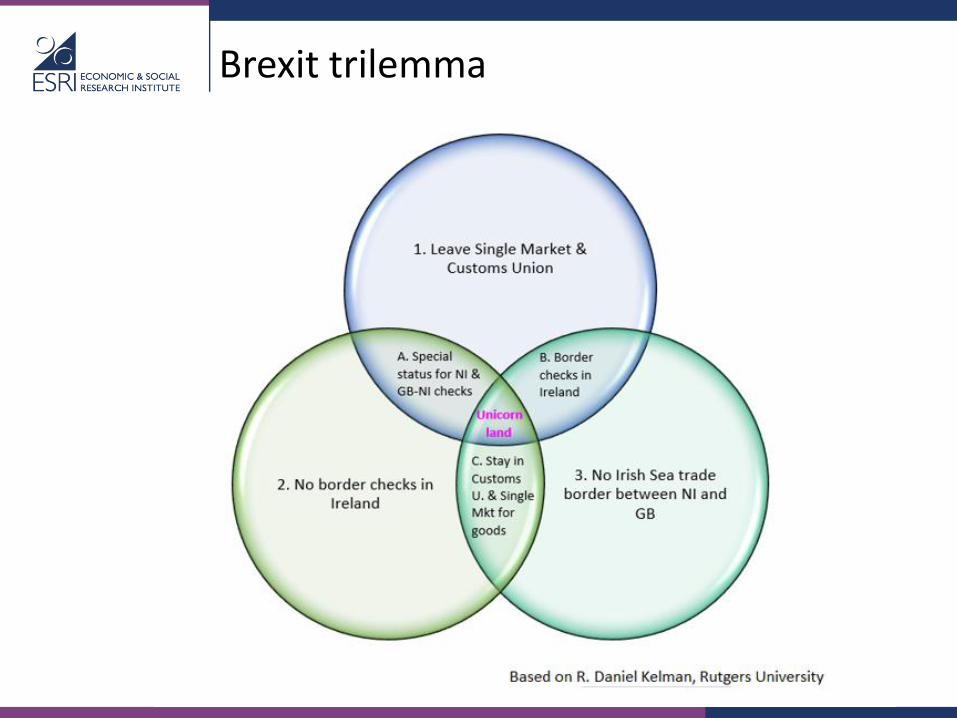
Brexit trilemma
www.esri.ie @ESRIDublin #ESRIevents #ESRIpublications
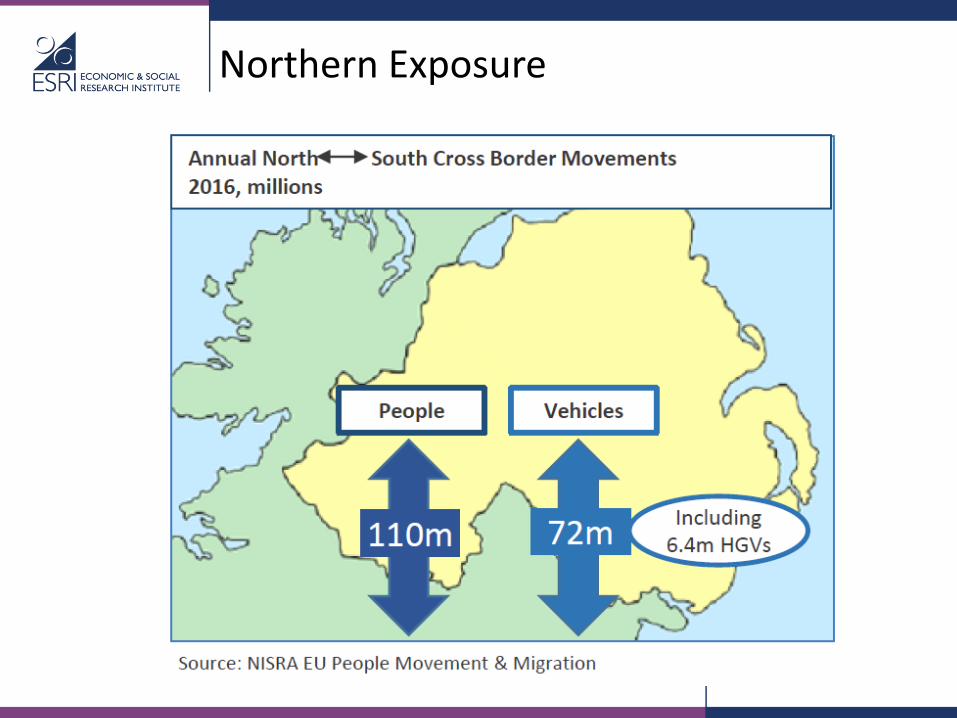
Northern Exposure
www.esri.ie @ESRIDublin #ESRIevents #ESRIpublications
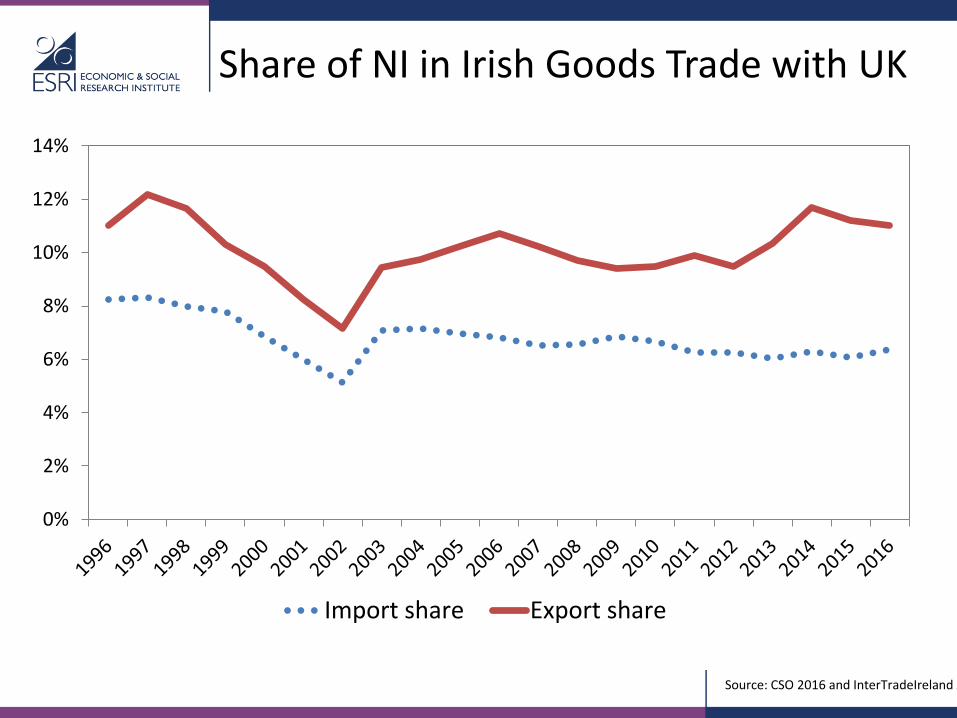
Share of NI in Irish Goods Trade with UK
0%
2%
4%
6%
8%
10%
12%
14%
Import share Export share
Source: CSO 2016 and InterTradeIreland 2018
www.esri.ie @ESRIDublin #ESRIevents #ESRIpublications
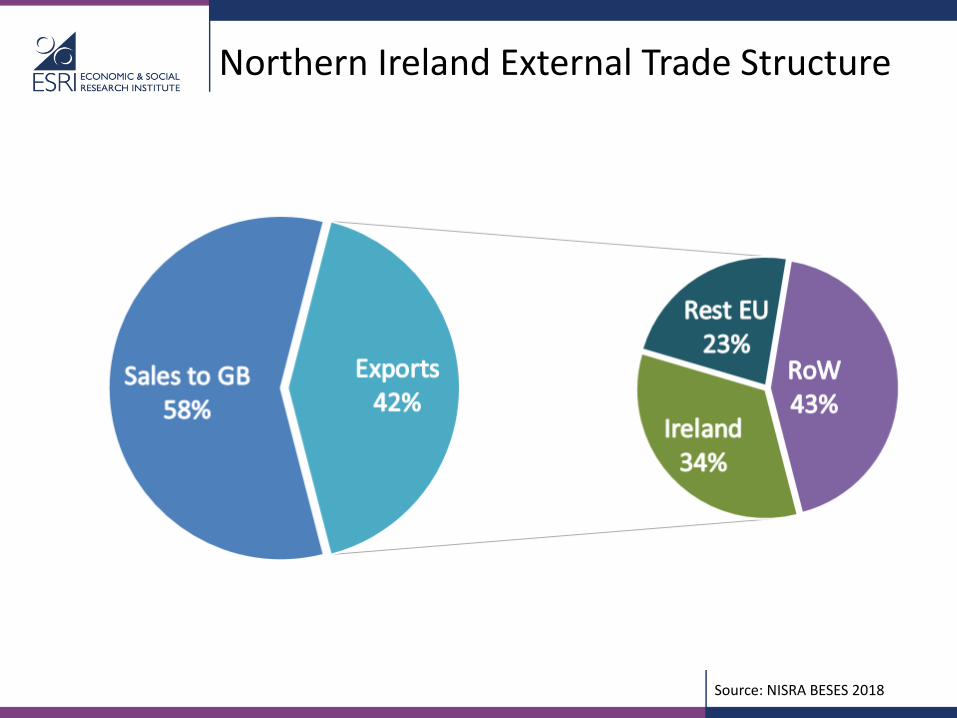
Northern Ireland External Trade Structure
Source: NISRA BESES 2018
www.esri.ie @ESRIDublin #ESRIevents #ESRIpublications
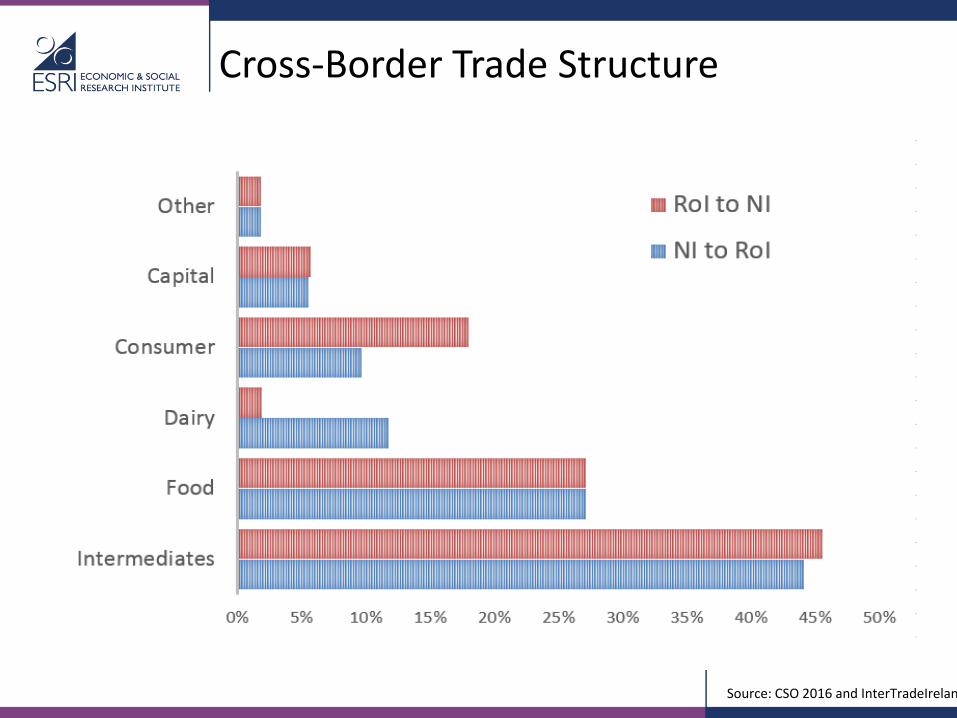
Cross-Border Trade Structure
Source: CSO 2016 and InterTradeIreland
www.esri.ie @ESRIDublin #ESRIevents #ESRIpublications
Share of trade by potential WTO-level tariff level
0% 10% 20% 30% 40% 50% 60% 70% 80% 90% 100%
0 (0, 5] (5, 10] (10, 25] 25+
Source: CSO 2016 and InterTradeIreland 2018
www.esri.ie @ESRIDublin #ESRIevents #ESRIpublications
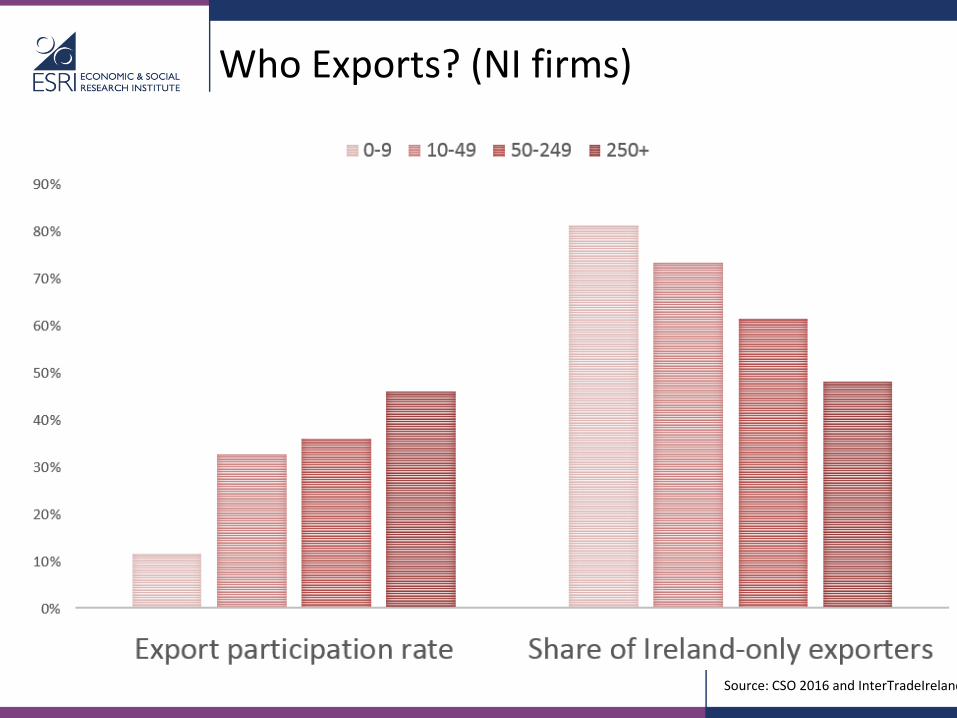
Who Exports? (NI firms)
Source: CSO 2016 and InterTradeIreland 2018
www.esri.ie @ESRIDublin #ESRIevents #ESRIpublications
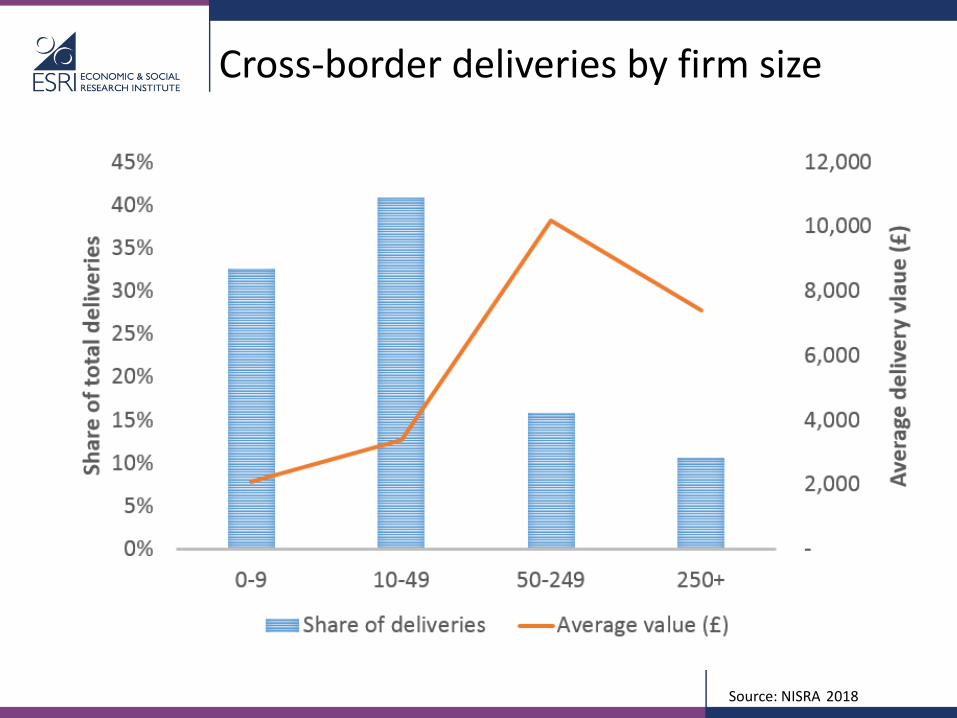
Cross-border deliveries by firm size
Source: NISRA 2018
www.esri.ie @ESRIDublin #ESRIevents #ESRIpublications
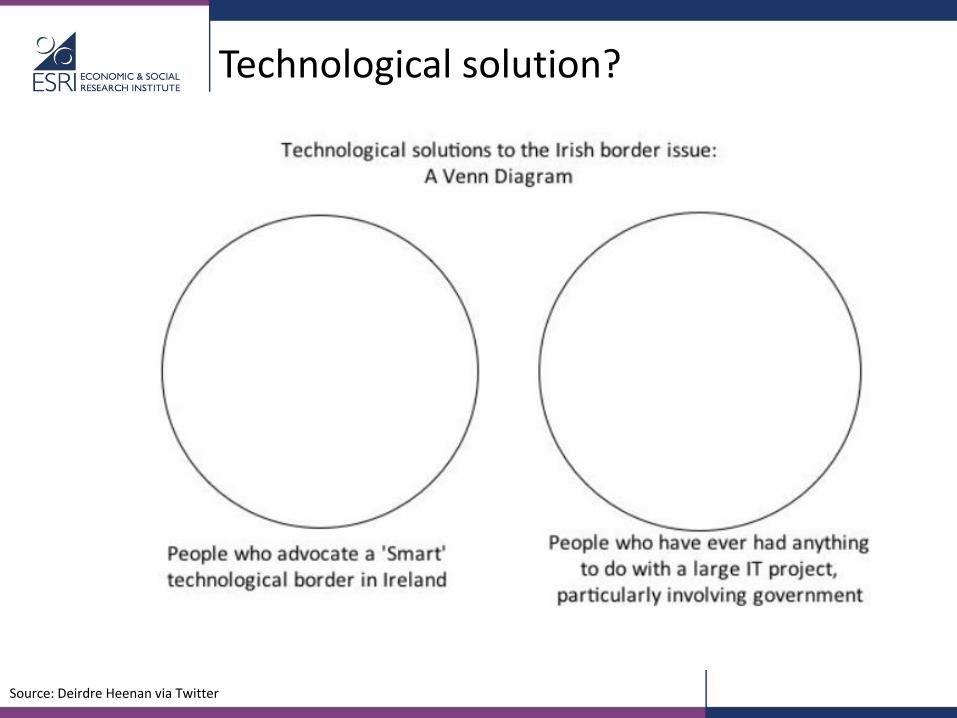
Technological solution?
Source: Deirdre Heenan via Twitter
www.esri.ie @ESRIDublin #ESRIevents #ESRIpublications
Promise of world trade deals?
• For UK as a whole:
• Unlikely to replace levels of trade in integrated EU market.
• Distance still matters to trade.
• Trade-offs part of any international deal – across sectors, standards, migration(?).
• Financial services and car industry most likely to be prioritised.
• For Northern Ireland:
• If trade-offs above mean opening UK up to world food imports, would pose major competitive challenges for NI.
• Services exports not (currently) a major feature of economy.
• Any deal involving changes in food standards very problematic for cross-border flows – technology unlikely to help if standards diverge.
www.esri.ie @ESRIDublin #ESRIevents #ESRIpublications
Impact summary
Cross-border trade between Northern Ireland and Ireland more like local trade than international export activity
Almost all exporting firms in Northern Ireland include Ireland as one of their destination markets.
Over 80% of the smallest firm size group that export from Northern Ireland have all of their export sales in Ireland.
High degree of cross-border integration through supply chains.
High frequency of deliveries and low value per delivery for NI traders across the border.
Impacts of any changes in the cost of trading post-Brexit liable to be felt most particularly by very small firms trading across the border.
The Impact of Brexit on the Agri-Food Sector, North and South
Kevin Hanrahan and Trevor DonnellanTeagasc
On the brink of Brexit: the economic consequences for the island of Ireland
Dublin, October 17 2019
Overview
• Agri-Food on the Island of Ireland
– Similarities and differences
• Why Brexit matters (more) to agri-food
• Analysis of Brexit impacts on Irish agri-food
• Work to do
Agriculture on the island of Ireland
• Agri-food North and South dominated by ruminant grassland agricultural production systems and processing of the resultant meat and milk output
• Both agri-food economies overwhelmingly export dependent
• Agri-food stories of Ireland (North & South) can largely be told through the stories of beef & dairy
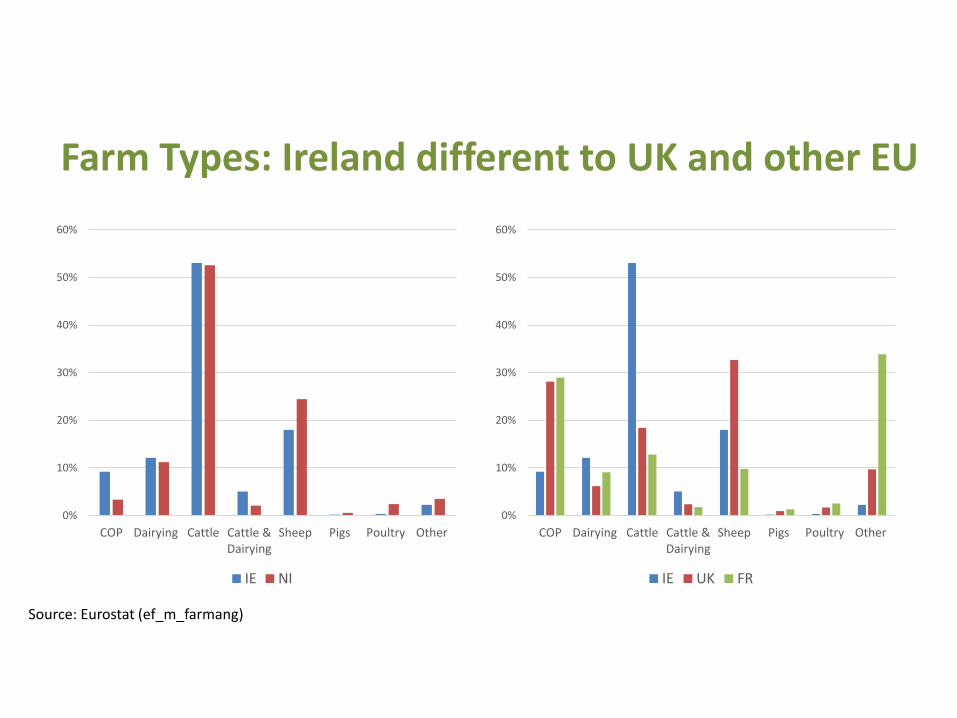
Farm Types: Ireland different to UK and other EU
0%
10%
20%
30%
40%
50%
60%
COP Dairying Cattle Cattle &Dairying
Sheep Pigs Poultry Other
IE NI
0%
10%
20%
30%
40%
50%
60%
COP Dairying Cattle Cattle &Dairying
Sheep Pigs Poultry Other
IE UK FR
Source: Eurostat (ef_m_farmang)
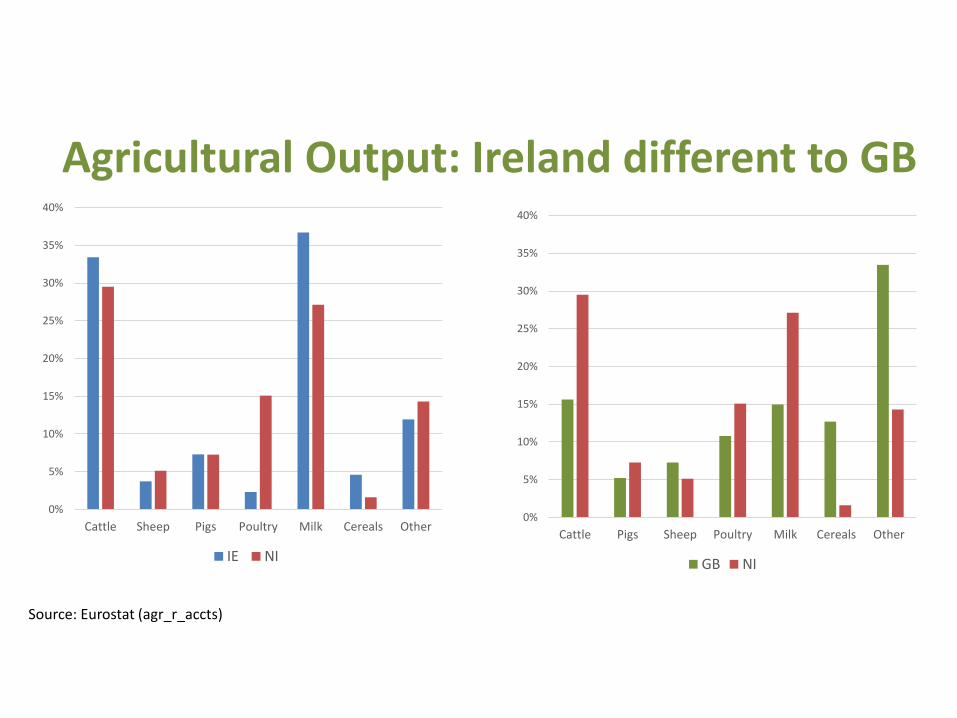
Agricultural Output: Ireland different to GB
0%
5%
10%
15%
20%
25%
30%
35%
40%
Cattle Pigs Sheep Poultry Milk Cereals Other
GB NI
0%
5%
10%
15%
20%
25%
30%
35%
40%
Cattle Sheep Pigs Poultry Milk Cereals Other
IE NI
Source: Eurostat (agr_r_accts)
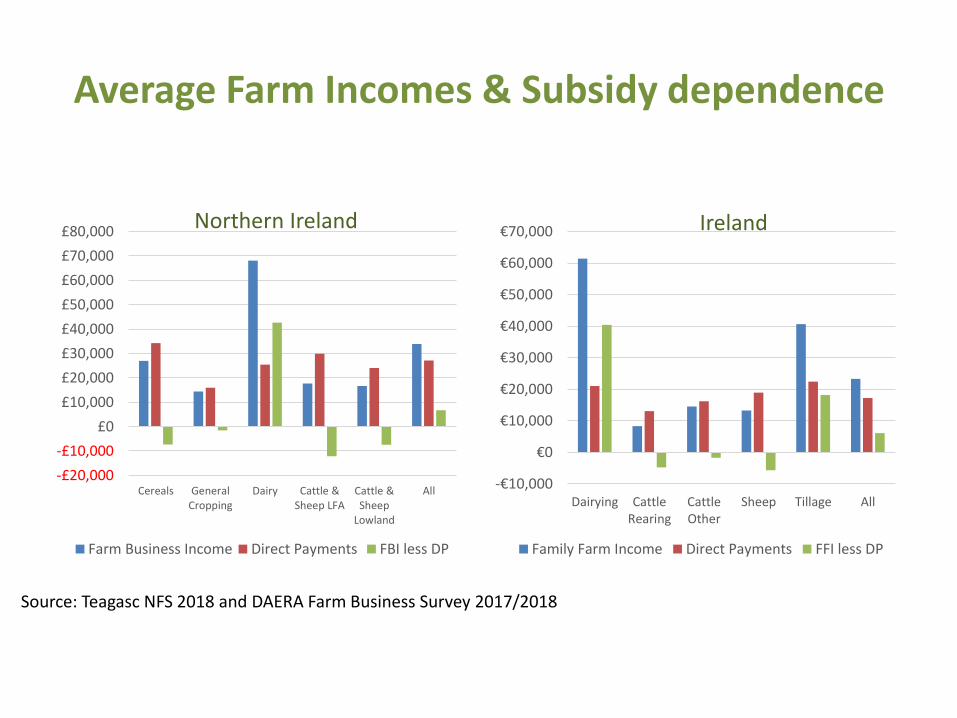
Average Farm Incomes & Subsidy dependence
-£20,000
-£10,000
£0
£10,000
£20,000
£30,000
£40,000
£50,000
£60,000
£70,000
£80,000
Cereals GeneralCropping
Dairy Cattle &Sheep LFA
Cattle &Sheep
Lowland
All
Farm Business Income Direct Payments FBI less DP
-€10,000
€0
€10,000
€20,000
€30,000
€40,000
€50,000
€60,000
€70,000
Dairying CattleRearing
CattleOther
Sheep Tillage All
Family Farm Income Direct Payments FFI less DP
Source: Teagasc NFS 2018 and DAERA Farm Business Survey 2017/2018
Northern Ireland Ireland
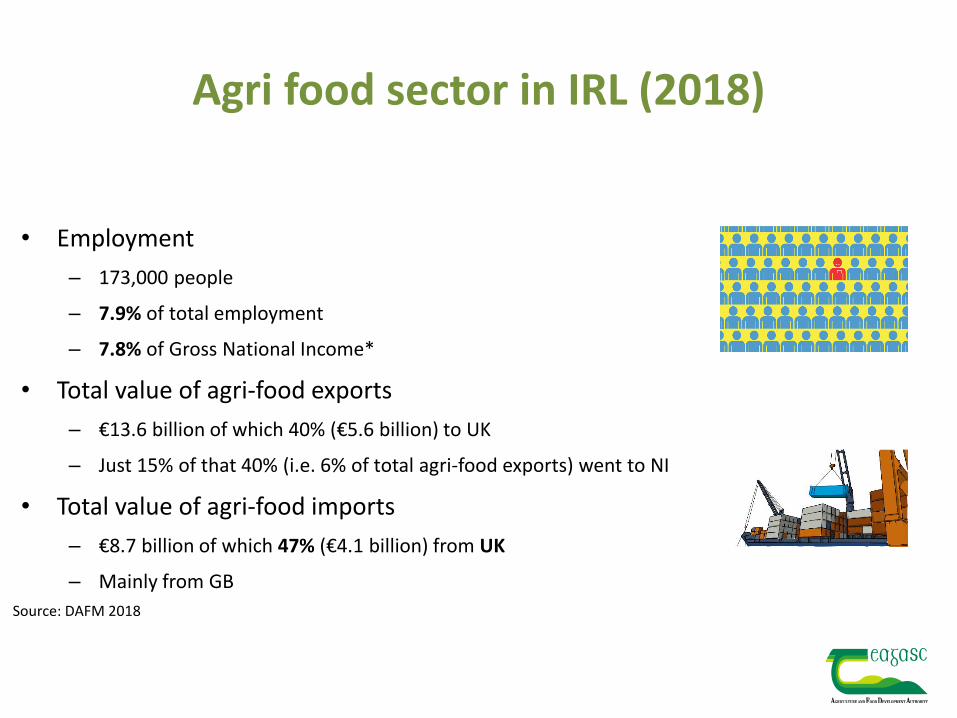
Agri food sector in IRL (2018)
• Employment
– 173,000 people
– 7.9% of total employment
– 7.8% of Gross National Income*
• Total value of agri-food exports
– €13.6 billion of which 40% (€5.6 billion) to UK
– Just 15% of that 40% (i.e. 6% of total agri-food exports) went to NI
• Total value of agri-food imports
– €8.7 billion of which 47% (€4.1 billion) from UK
– Mainly from GB
Source: DAFM 2018
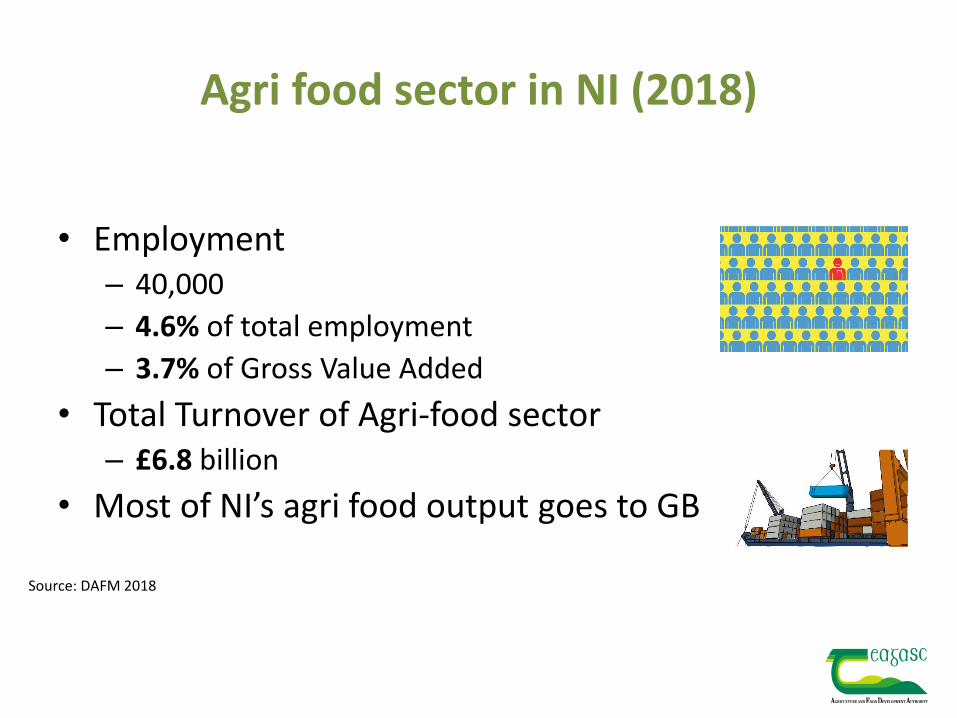
Agri food sector in NI (2018)
• Employment – 40,000
– 4.6% of total employment
– 3.7% of Gross Value Added
• Total Turnover of Agri-food sector– £6.8 billion
• Most of NI’s agri food output goes to GB
Source: DAFM 2018
Agri-food Trade Flows
• East-West agri-food trade flows dominate North-South trade flows
– Gravity matters
• But there are some critical North-South trade flows that are particularly important for NI Ag.
Flow of Trade between IE and NI
• All Island animal health strategy (covering IE and NI)– Treated as a single zone for animal health– EU SPS regulatory alignment
• Agri food trade between IE and NI– Live animals– Finished good and intermediate goods (for further processing)– Trade flows of food products are not so important
• Agri food trade between IE and GB– Large flows in agricultural goods from IE to GB– Large flows in processed food/drink from GB to Ireland
• and onto Northern Ireland
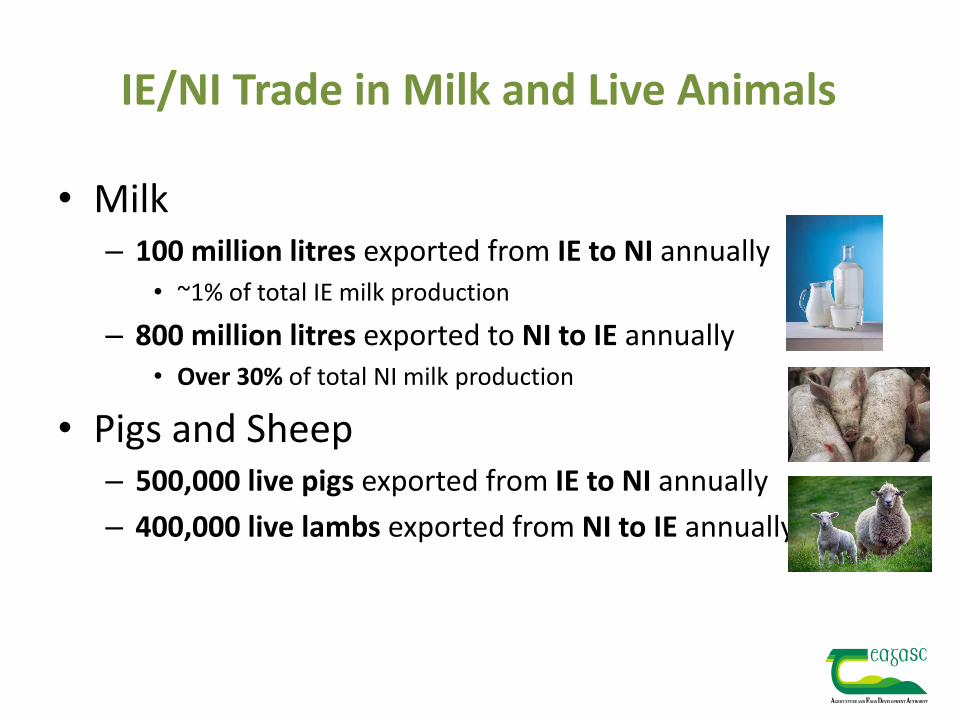
IE/NI Trade in Milk and Live Animals
• Milk– 100 million litres exported from IE to NI annually
• ~1% of total IE milk production
– 800 million litres exported to NI to IE annually• Over 30% of total NI milk production
• Pigs and Sheep– 500,000 live pigs exported from IE to NI annually
– 400,000 live lambs exported from NI to IE annually
Why Brexit Matters to Agri-Food
• Brexit (at least in part) is about changes in trade policy
• Tariffs and non-tariff barriers (NTB) to trade much more important in agri-food than for many other areas of merchandise trade
• Integration of IE and UK (NI) economies means that market price impacts of Brexit likely to be very large
• UK is a large net contributor to the EU budget. – Most of the “juste retour” Ireland gets from the EU budget is via CAP
– UK Brexit “dividend” from lower agricultural income support?
Brexit and Agriculture
• Channels through which Brexit affects Irish/Northern Irish agriculture– Immediate impact via exchange rate
– Tariff & non-tariff barriers to trade
– For IE via impact of Brexit on EU budget and CAP
– For NI via impact of future UK (Devolved?) Ag policy
What does Brexit Mean for Ag ?
• We obviously still don’t know what Brexit means for the magnitude of tariffs and NTB
• We know the No Deal EU trade policy
– The UK is a third country and WTO rules apply
• We think we know the UK trade policy
– The announced “temporary” No Deal tariff schedule
• We don’t know the shape of future UK or devolved NI agricultural policy
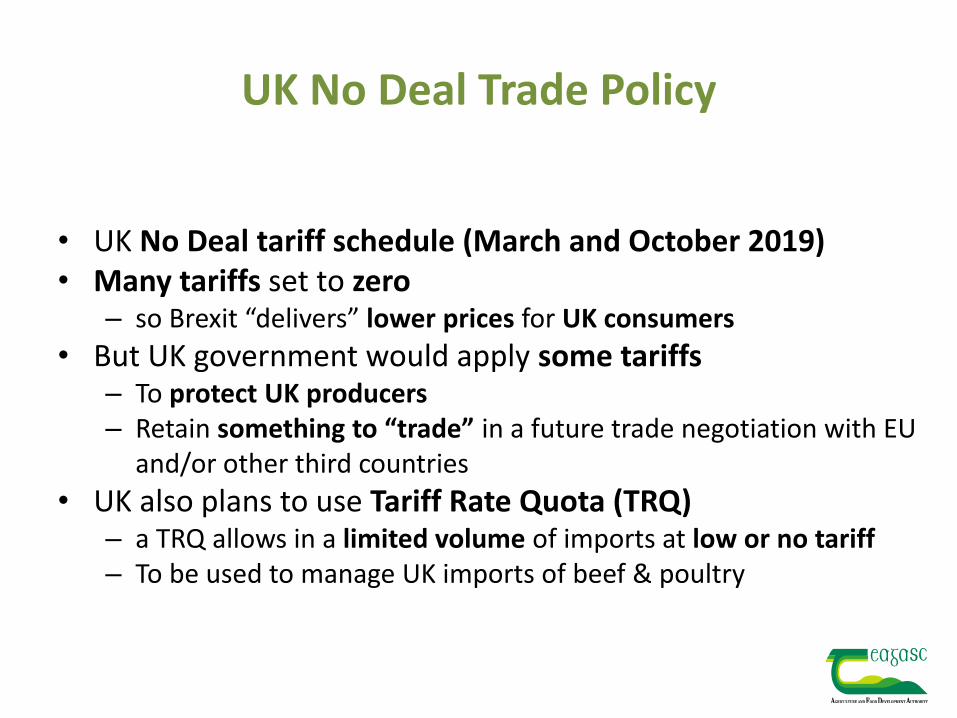
UK No Deal Trade Policy
• UK No Deal tariff schedule (March and October 2019)• Many tariffs set to zero
– so Brexit “delivers” lower prices for UK consumers
• But UK government would apply some tariffs– To protect UK producers– Retain something to “trade” in a future trade negotiation with EU
and/or other third countries
• UK also plans to use Tariff Rate Quota (TRQ)– a TRQ allows in a limited volume of imports at low or no tariff– To be used to manage UK imports of beef & poultry
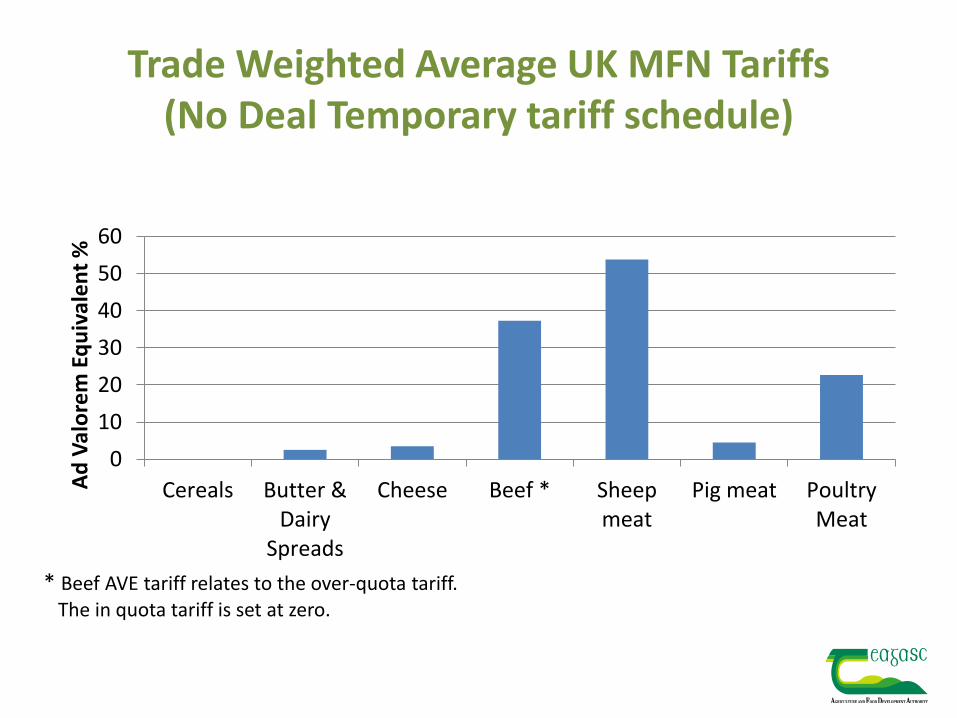
Trade Weighted Average UK MFN Tariffs(No Deal Temporary tariff schedule)
0
10
20
30
40
50
60
Cereals Butter &Dairy
Spreads
Cheese Beef * Sheepmeat
Pig meat PoultryMeat
Ad
Val
ore
m E
qu
ival
en
t %
* Beef AVE tariff relates to the over-quota tariff.The in quota tariff is set at zero.
EU No Deal Trade Policy
• MFN tariffs as per EU schedule at WTO – These tariffs are very high
• Regulatory barriers & customs procedures to protect SM integrity will represent an important NTB– Entry of animal and food products only via BIP
– Requirements for physical inspections on entry to EU
– Licensing/inspection premises in the UK that wish to export to the EU
– Rules governing what is an “EU” product & RoOs
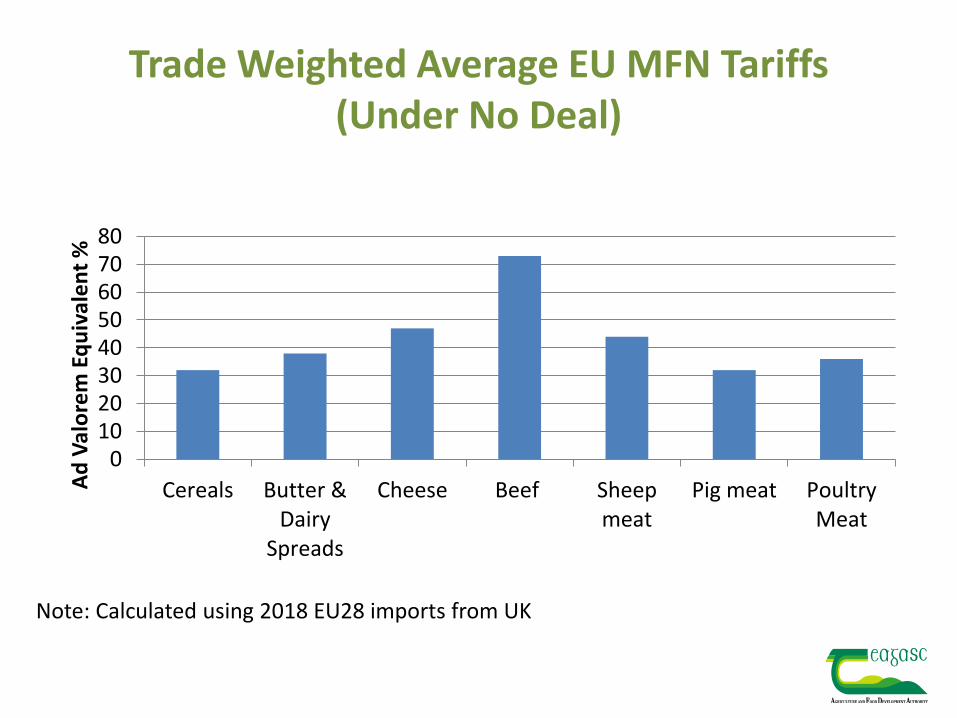
Trade Weighted Average EU MFN Tariffs(Under No Deal)
01020304050607080
Cereals Butter &Dairy
Spreads
Cheese Beef Sheepmeat
Pig meat PoultryMeat
Ad
Val
ore
m E
qu
ival
en
t %
Note: Calculated using 2018 EU28 imports from UK
Irish and Northern Irish Agri-Food & Brexit
• Greatest negative economic impact on sectors where
– Large share of output is exported to the UK (EU)
– That have high levels of tariff protection currently (preferential access) and are not internationally competitive
– High level of income dependence on direct payments
– Where existing margins from production are small
Ireland: Beef
• Most exposed Irish agri-food sector is beef
– Very high dependence on exports to UK
– Large loss in preferential access with No Deal
– Lack of competitiveness at world market prices
– High dependence of farm incomes on CAP direct income support payments
– Chronic low levels of profitability => little or no ability to absorb lower margins at either farm or processing stage
Northern Ireland: Dairy
• Under a No Deal Brexit Northern Irish ag sector most exposed is dairy– Very high dependence on exports of milk for
processing/consumption in Ireland
– Both tariff and non-tariff barriers to trade will apply in event of a no deal and will effectively halt this trade
– No feasible processing capacity for the 800 m litres of NI milk (currently shipped south) within the UK
Northern Ireland: Beef
• Sector v. “export” dependent but market is mostly in GB• Any Brexit opportunities (import substitution) will
depend on degree to which UK No deal trade policy leads/doesn’t lead to lower UK beef prices
• Dependence on CAP direct payments means sector very vulnerable to changes in UK Ag. Policy
• Very low profit levels at farm and processor levels mean sector is unlikely to be able to withstand negative market or policy impacts of Brexit
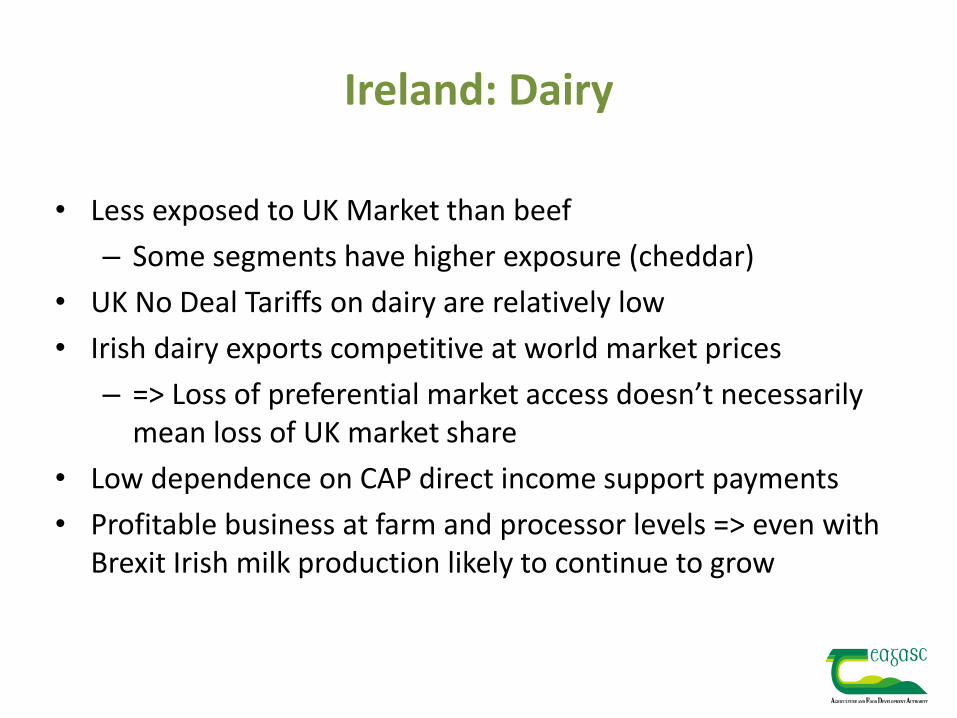
Ireland: Dairy
• Less exposed to UK Market than beef
– Some segments have higher exposure (cheddar)
• UK No Deal Tariffs on dairy are relatively low
• Irish dairy exports competitive at world market prices
– => Loss of preferential market access doesn’t necessarily mean loss of UK market share
• Low dependence on CAP direct income support payments
• Profitable business at farm and processor levels => even with Brexit Irish milk production likely to continue to grow
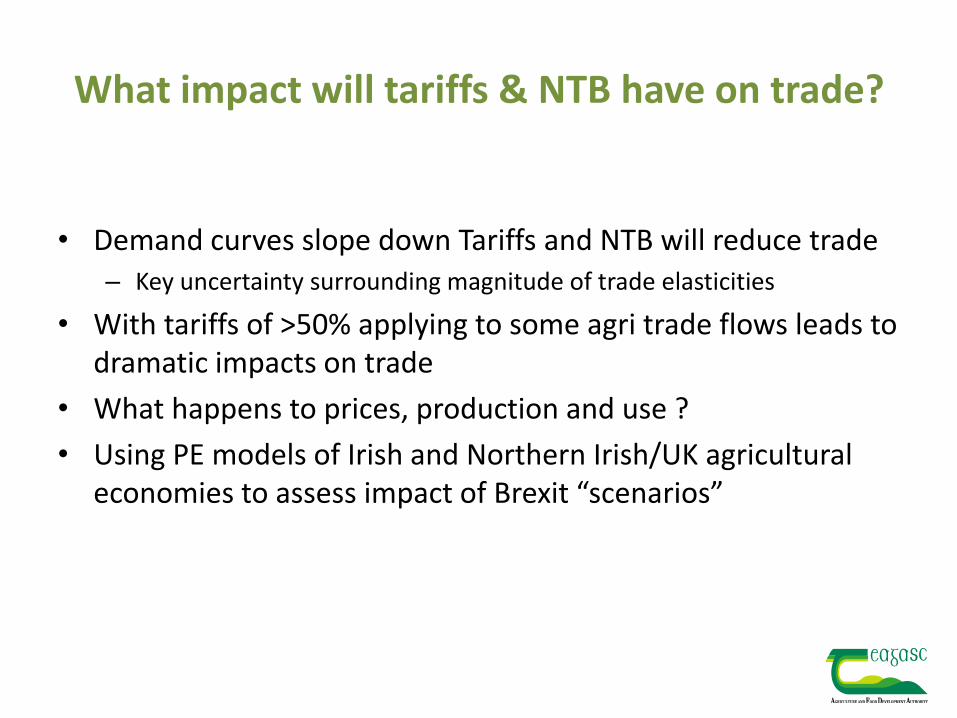
What impact will tariffs & NTB have on trade?
• Demand curves slope down Tariffs and NTB will reduce trade – Key uncertainty surrounding magnitude of trade elasticities
• With tariffs of >50% applying to some agri trade flows leads to dramatic impacts on trade
• What happens to prices, production and use ?
• Using PE models of Irish and Northern Irish/UK agricultural economies to assess impact of Brexit “scenarios”
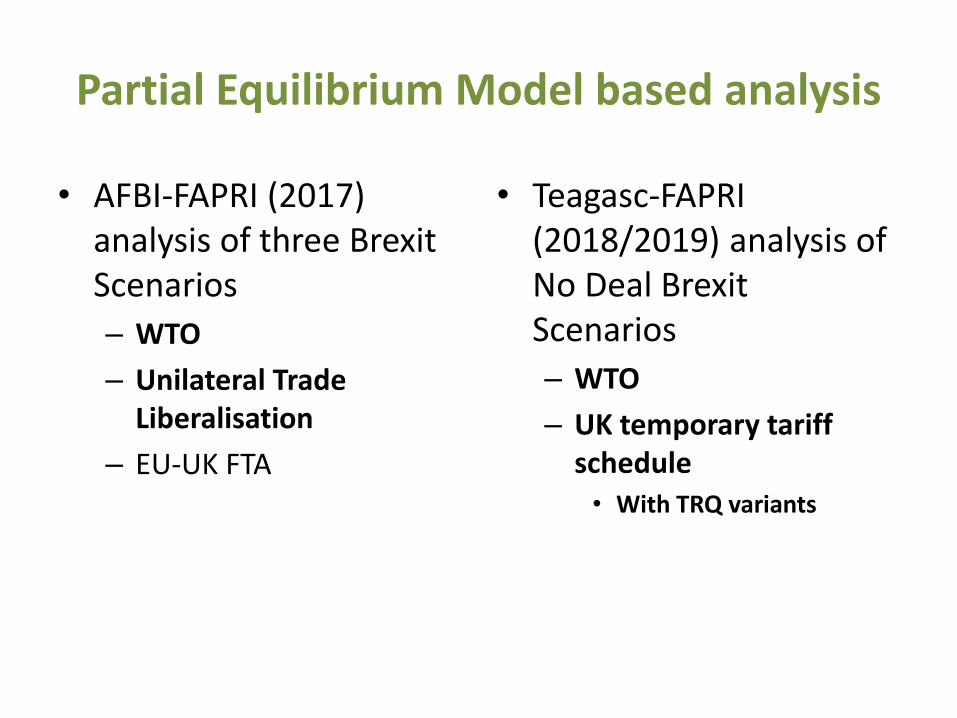
Partial Equilibrium Model based analysis
• AFBI-FAPRI (2017) analysis of three Brexit Scenarios
– WTO
– Unilateral Trade Liberalisation
– EU-UK FTA
• Teagasc-FAPRI (2018/2019) analysis of No Deal Brexit Scenarios
– WTO
– UK temporary tariff schedule• With TRQ variants
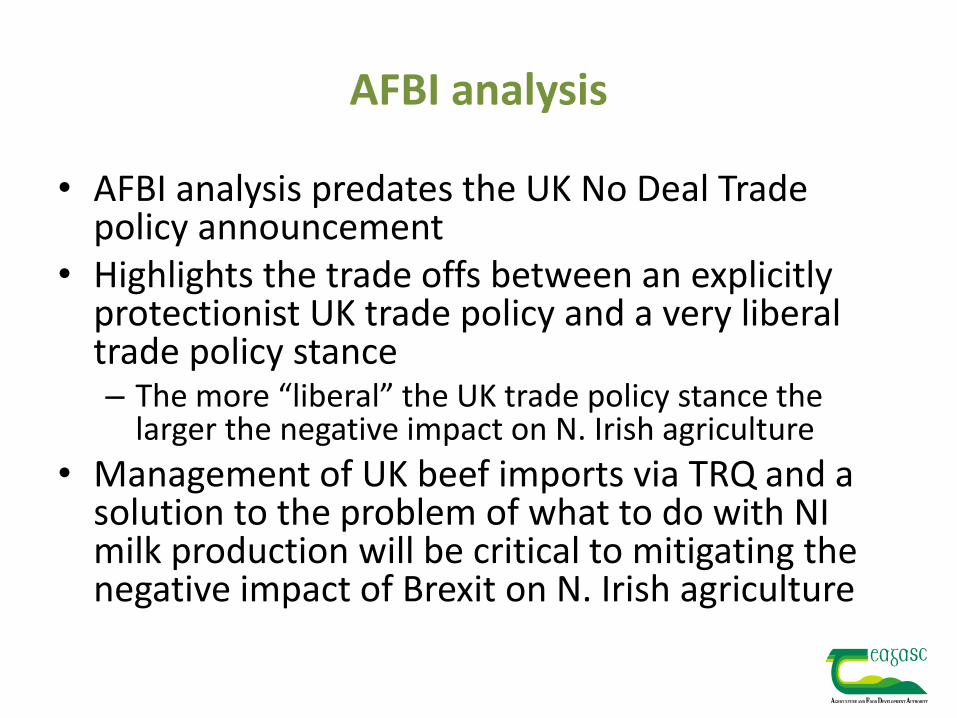
AFBI analysis
• AFBI analysis predates the UK No Deal Trade policy announcement
• Highlights the trade offs between an explicitly protectionist UK trade policy and a very liberal trade policy stance– The more “liberal” the UK trade policy stance the
larger the negative impact on N. Irish agriculture
• Management of UK beef imports via TRQ and a solution to the problem of what to do with NI milk production will be critical to mitigating the negative impact of Brexit on N. Irish agriculture
Teagasc Analysis
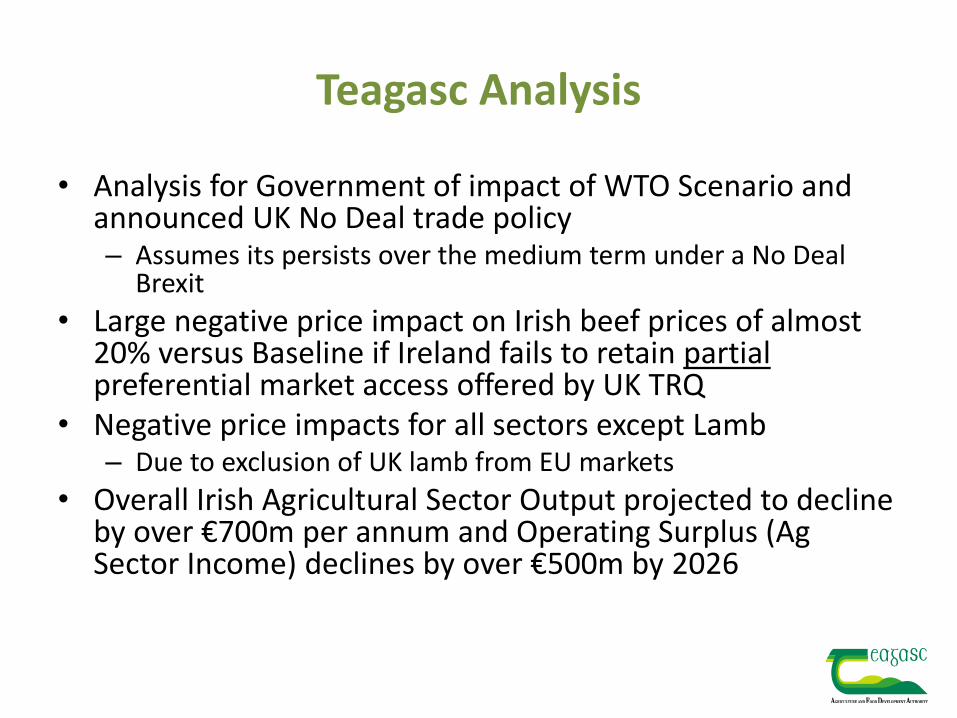
• Analysis for Government of impact of WTO Scenario and announced UK No Deal trade policy – Assumes its persists over the medium term under a No Deal
Brexit
• Large negative price impact on Irish beef prices of almost 20% versus Baseline if Ireland fails to retain partialpreferential market access offered by UK TRQ
• Negative price impacts for all sectors except Lamb – Due to exclusion of UK lamb from EU markets
• Overall Irish Agricultural Sector Output projected to decline by over €700m per annum and Operating Surplus (Ag Sector Income) declines by over €500m by 2026
Work to do
• Analysis has focused on impact of tariff barriers • Questions about impact of NTB will arise in the
event of a future EU-UK FTA• Clarity on actual trade rules will allow for
scenario analysis grounded in some political facts – That will be novel !!
• Analysis of the impact of Brexit on the structure of the Irish and Northern Irish farm sectors will be needed– Brexit likely to accelerate structural change processes
Brexit: Workers at Risk and Policy Responses to Maintain Employment
PA U L M A C F LY N N
N E R I ( N E V I N E C O N O M I C R E S E A R C H I N S T I T U T E )
B E L FA S T
PA U L . M A C F LY N N @ N E R I N S T I T U T E . N E T
W W W. N E R I N S T I T U T E . N E T
On the brink of Brexit
17 October 2017
ContextoUnemployment in NI - historic low of 2.8% (May – Jul ’19).
oTotal no. of jobs >900k (Q2 2019)
oEconomic Inactivity still higher than UK, almost same as ROI.
oSeems like an odd time to be designing gov programmes to deal with significant increase in unemployment.
oAdvantages:o Time – not exogenous shock, conscious policy decision.
o Impact – some idea of where will be hit
oDisadvantages:o Limits to help – compensation for tariffs cannot be direct.
o Unlike cyclical downturn, hard to see natural recovery.
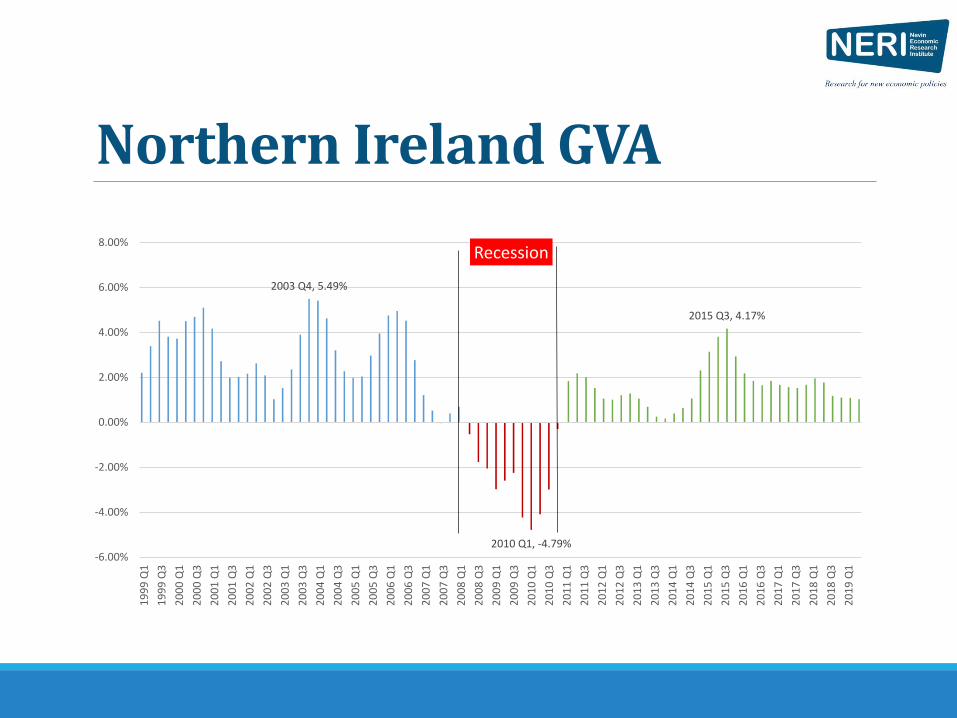
Northern Ireland GVA
2003 Q4, 5.49%
2010 Q1, -4.79%
2015 Q3, 4.17%
-6.00%
-4.00%
-2.00%
0.00%
2.00%
4.00%
6.00%
8.00%
19
99
Q1
19
99
Q3
20
00
Q1
20
00
Q3
20
01
Q1
20
01
Q3
20
02
Q1
20
02
Q3
20
03
Q1
20
03
Q3
20
04
Q1
20
04
Q3
20
05
Q1
20
05
Q3
20
06
Q1
20
06
Q3
20
07
Q1
20
07
Q3
20
08
Q1
20
08
Q3
20
09
Q1
20
09
Q3
20
10
Q1
20
10
Q3
20
11
Q1
20
11
Q3
20
12
Q1
20
12
Q3
20
13
Q1
20
13
Q3
20
14
Q1
20
14
Q3
20
15
Q1
20
15
Q3
20
16
Q1
20
16
Q3
20
17
Q1
20
17
Q3
20
18
Q1
20
18
Q3
20
19
Q1
Recession
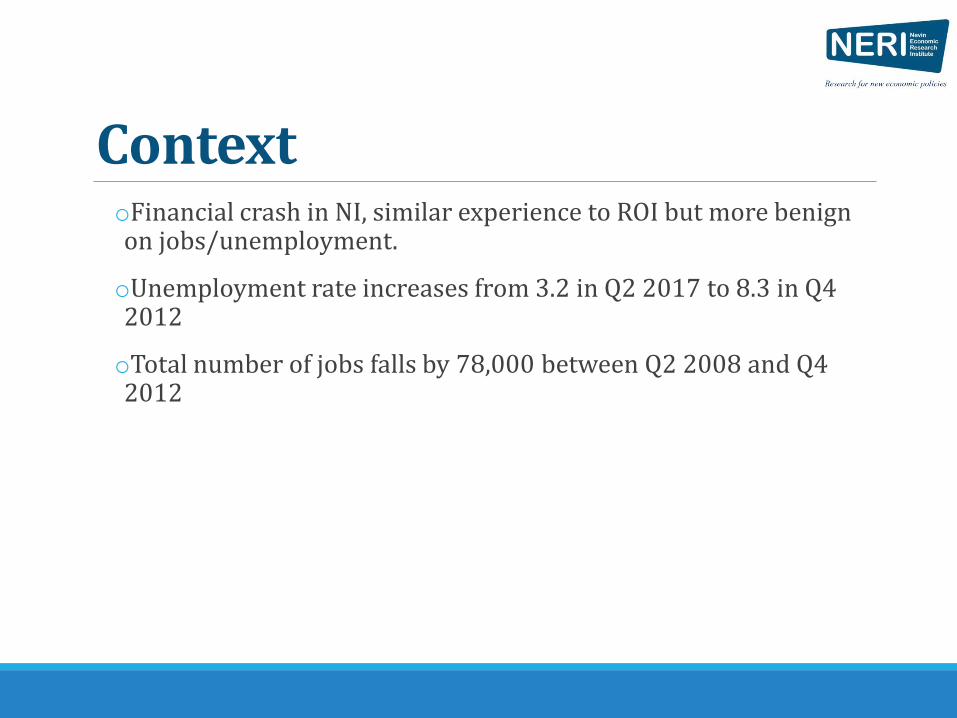
ContextoFinancial crash in NI, similar experience to ROI but more benign on jobs/unemployment.
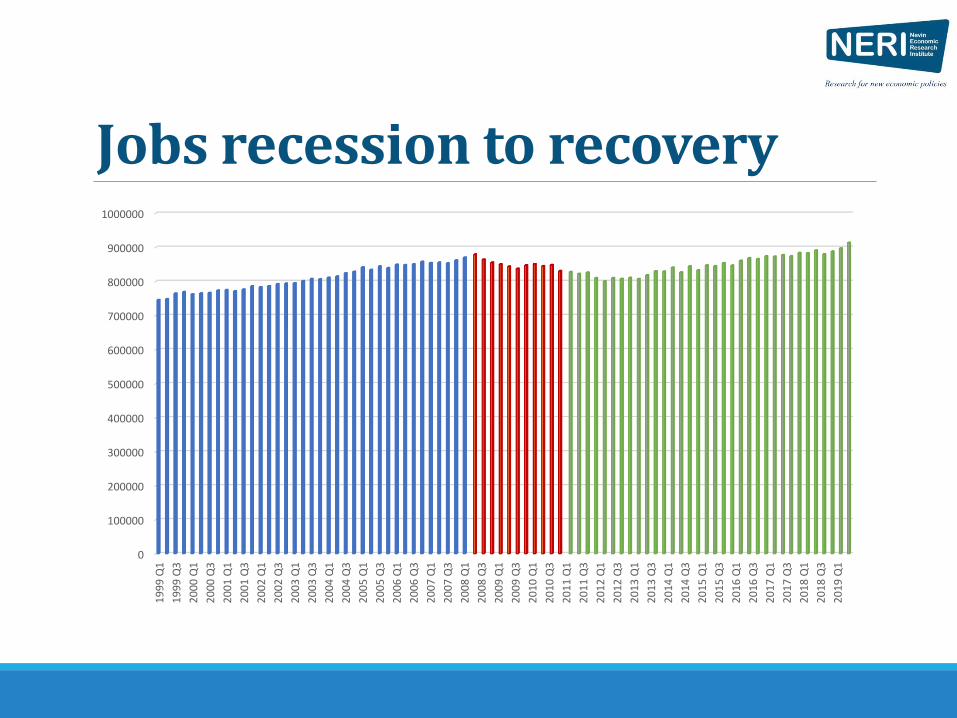
oUnemployment rate increases from 3.2 in Q2 2017 to 8.3 in Q4 2012
oTotal number of jobs falls by 78,000 between Q2 2008 and Q4 2012
Jobs recession to recovery
0
100000
200000
300000
400000
500000
600000
700000
800000
900000
1000000
19
99
Q1
19
99
Q3
20
00
Q1
20
00
Q3
20
01
Q1
20
01
Q3
20
02
Q1
20
02
Q3
20
03
Q1
20
03
Q3
20
04
Q1
20
04
Q3
20
05
Q1
20
05
Q3
20
06
Q1
20
06
Q3
20
07
Q1
20
07
Q3
20
08
Q1
20
08
Q3
20
09
Q1
20
09
Q3
20
10
Q1
20
10
Q3
20
11
Q1
20
11
Q3
20
12
Q1
20
12
Q3
20
13
Q1
20
13
Q3
20
14
Q1
20
14
Q3
20
15
Q1
20
15
Q3
20
16
Q1
20
16
Q3
20
17
Q1
20
17
Q3
20
18
Q1
20
18
Q3
20
19
Q1
Unemployment –recession to recovery
0
1
2
3
4
5
6
7
8
9
19
99
Q1
19
99
Q3
20
00
Q1
20
00
Q3
20
01
Q1
20
01
Q3
20
02
Q1
20
02
Q3
20
03
Q1
20
03
Q3
20
04
Q1
20
04
Q3
20
05
Q1
20
05
Q3
20
06
Q1
20
06
Q3
20
07
Q1
20
07
Q3
20
08
Q1
20
08
Q3
20
09
Q1
20
09
Q3
20
10
Q1
20
10
Q3
20
11
Q1
20
11
Q3
20
12
Q1
20
12
Q3
20
13
Q1
20
13
Q3
20
14
Q1
20
14
Q3
20
15
Q1
20
15
Q3
20
16
Q1
20
16
Q3
20
17
Q1
20
17
Q3
20
18
Q1
20
18
Q3
20
19
Q1
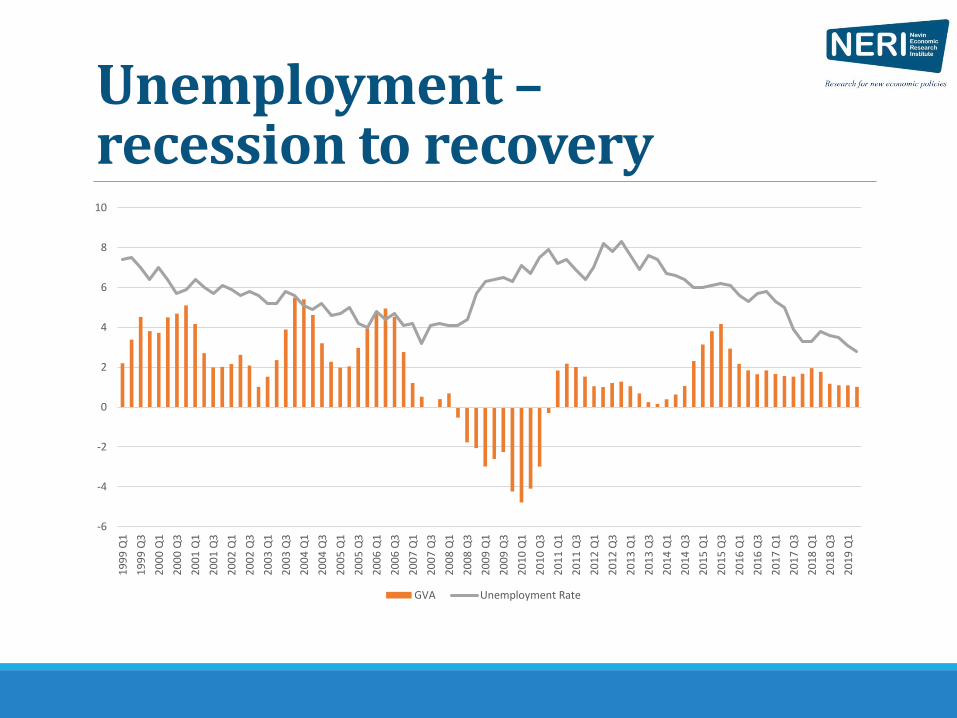
Unemployment –recession to recovery
-6
-4
-2
0
2
4
6
8
10
19
99
Q1
19
99
Q3
20
00
Q1
20
00
Q3
20
01
Q1
20
01
Q3
20
02
Q1
20
02
Q3
20
03
Q1
20
03
Q3
20
04
Q1
20
04
Q3
20
05
Q1
20
05
Q3
20
06
Q1
20
06
Q3
20
07
Q1
20
07
Q3
20
08
Q1
20
08
Q3
20
09
Q1
20
09
Q3
20
10
Q1
20
10
Q3
20
11
Q1
20
11
Q3
20
12
Q1
20
12
Q3
20
13
Q1
20
13
Q3
20
14
Q1
20
14
Q3
20
15
Q1
20
15
Q3
20
16
Q1
20
16
Q3
20
17
Q1
20
17
Q3
20
18
Q1
20
18
Q3
20
19
Q1
GVA Unemployment Rate
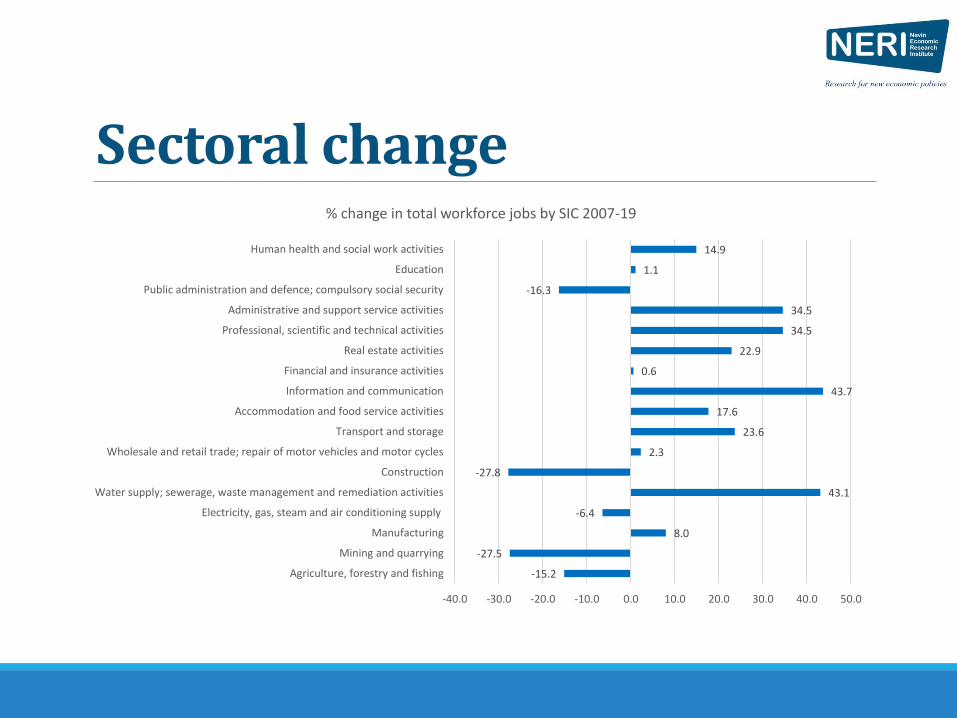
Sectoral change
-15.2
-27.5
8.0
-6.4
43.1
-27.8
2.3
23.6
17.6
43.7
0.6
22.9
34.5
34.5
-16.3
1.1
14.9
-40.0 -30.0 -20.0 -10.0 0.0 10.0 20.0 30.0 40.0 50.0
Agriculture, forestry and fishing
Mining and quarrying
Manufacturing
Electricity, gas, steam and air conditioning supply
Water supply; sewerage, waste management and remediation activities
Construction
Wholesale and retail trade; repair of motor vehicles and motor cycles
Transport and storage
Accommodation and food service activities
Information and communication
Financial and insurance activities
Real estate activities
Professional, scientific and technical activities
Administrative and support service activities
Public administration and defence; compulsory social security
Education
Human health and social work activities
% change in total workforce jobs by SIC 2007-19
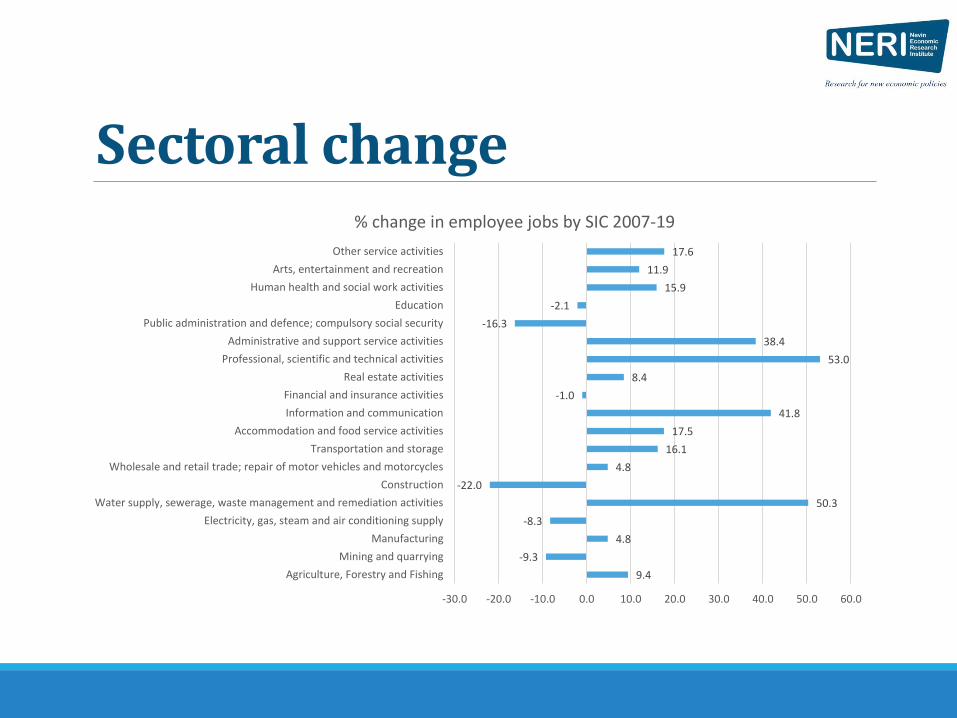
Sectoral change
9.4
-9.3
4.8
-8.3
50.3
-22.0
4.8
16.1
17.5
41.8
-1.0
8.4
53.0
38.4
-16.3
-2.1
15.9
11.9
17.6
-30.0 -20.0 -10.0 0.0 10.0 20.0 30.0 40.0 50.0 60.0
Agriculture, Forestry and Fishing
Mining and quarrying
Manufacturing
Electricity, gas, steam and air conditioning supply
Water supply, sewerage, waste management and remediation activities
Construction
Wholesale and retail trade; repair of motor vehicles and motorcycles
Transportation and storage
Accommodation and food service activities
Information and communication
Financial and insurance activities
Real estate activities
Professional, scientific and technical activities
Administrative and support service activities
Public administration and defence; compulsory social security
Education
Human health and social work activities
Arts, entertainment and recreation
Other service activities
% change in employee jobs by SIC 2007-19
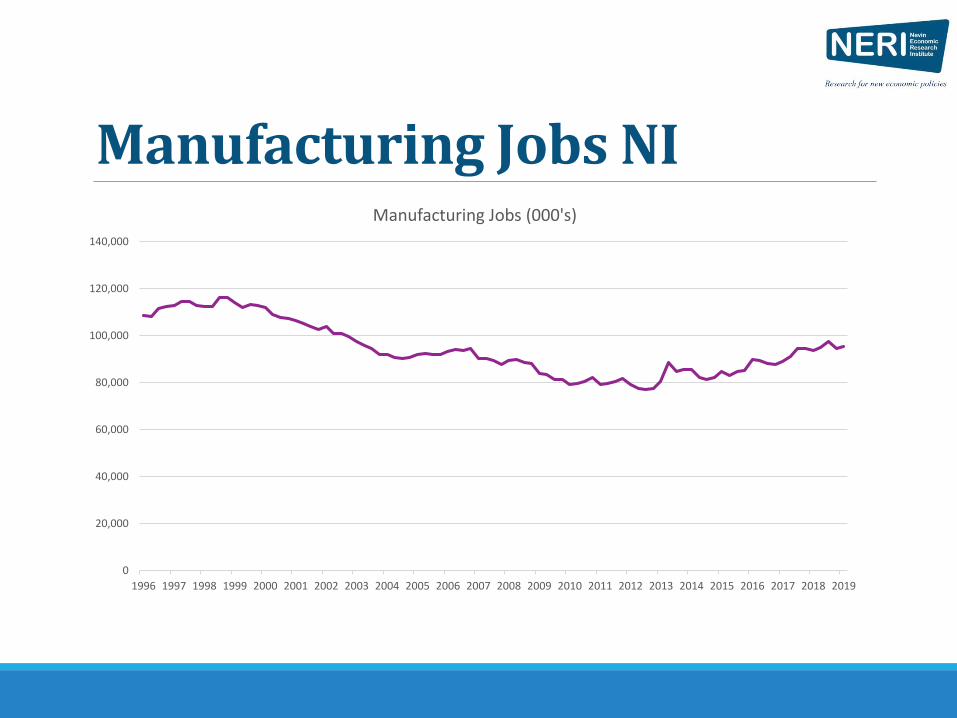
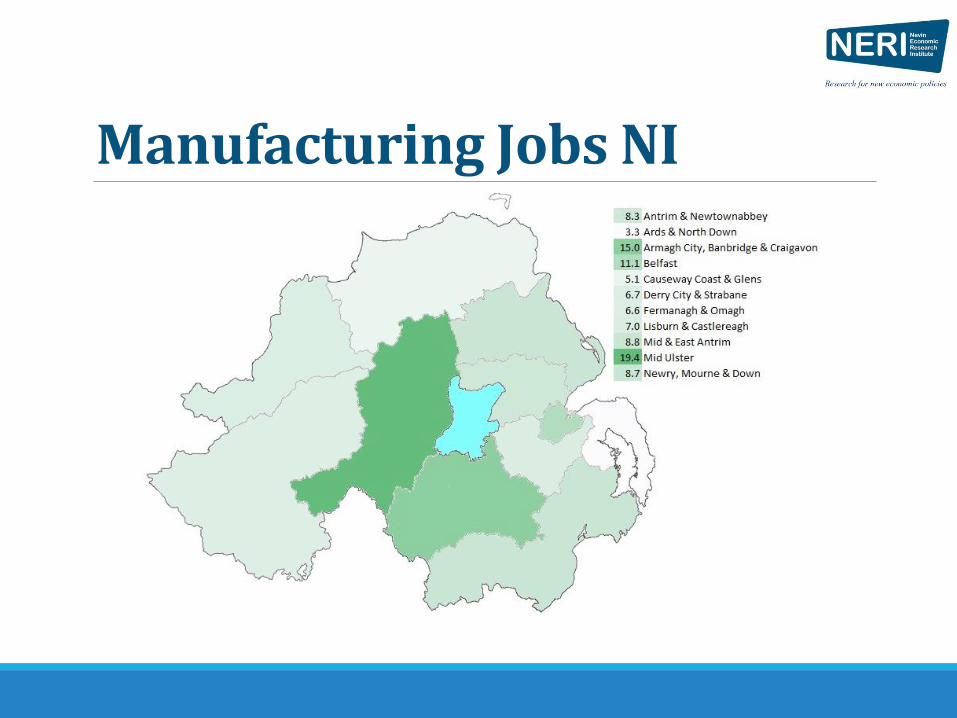
Manufacturing Jobs NI
0
20,000
40,000
60,000
80,000
100,000
120,000
140,000
1996 1997 1998 1999 2000 2001 2002 2003 2004 2005 2006 2007 2008 2009 2010 2011 2012 2013 2014 2015 2016 2017 2018 2019
Manufacturing Jobs (000's)
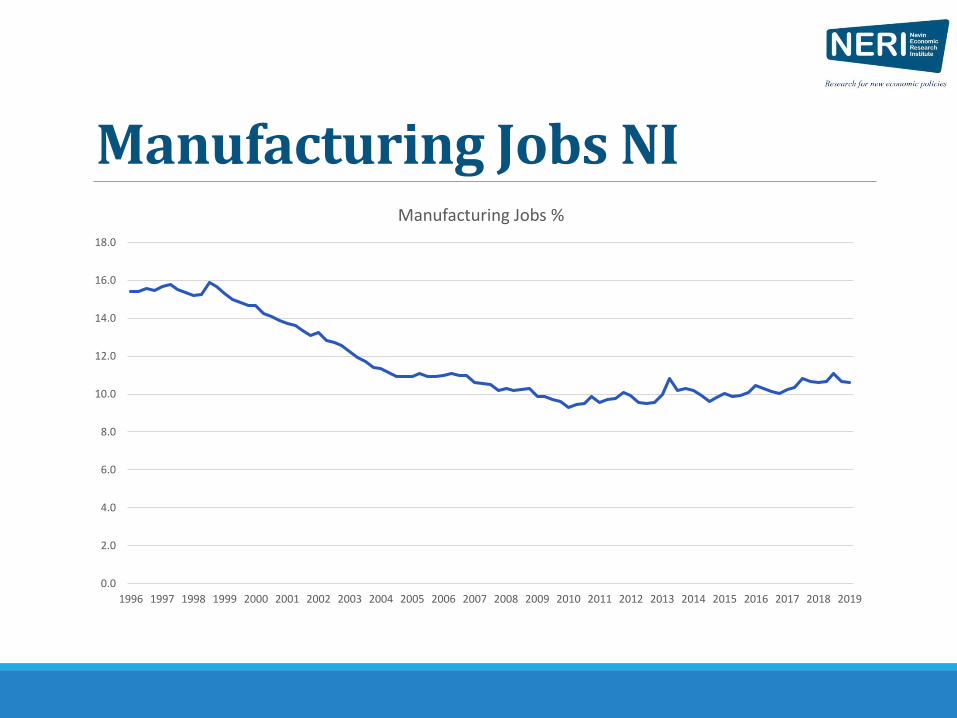
Manufacturing Jobs NI
0.0
2.0
4.0
6.0
8.0
10.0
12.0
14.0
16.0
18.0
1996 1997 1998 1999 2000 2001 2002 2003 2004 2005 2006 2007 2008 2009 2010 2011 2012 2013 2014 2015 2016 2017 2018 2019
Manufacturing Jobs %
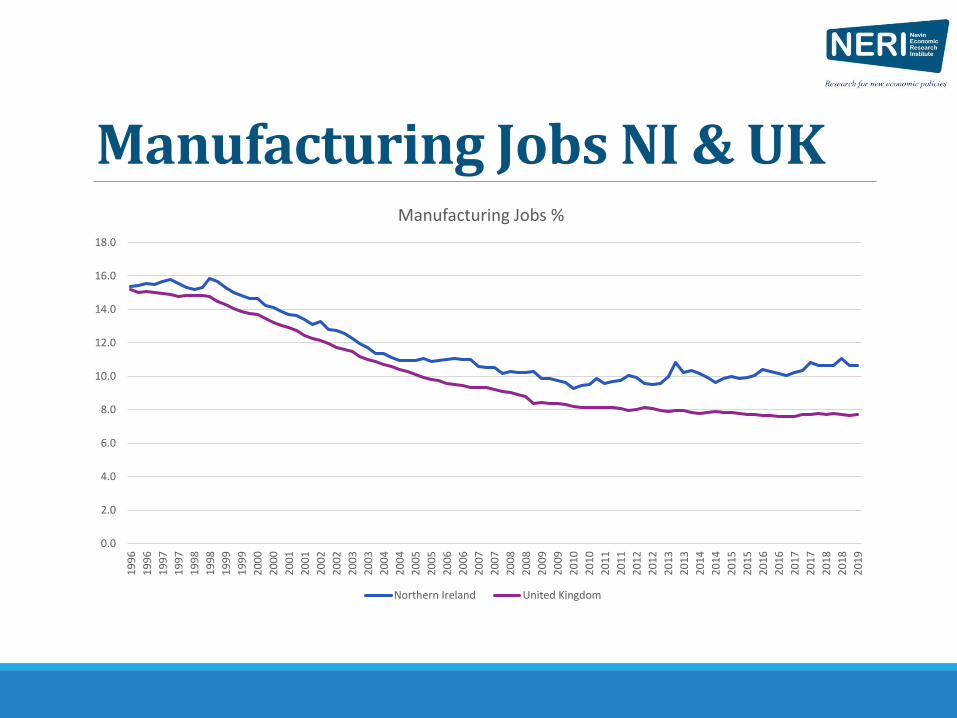
Manufacturing Jobs NI & UK
0.0
2.0
4.0
6.0
8.0
10.0
12.0
14.0
16.0
18.0
19
96
19
96
19
97
19
97
19
98
19
98
19
99
19
99
20
00
20
00
20
01
20
01
20
02
20
02
20
03
20
03
20
04
20
04
20
05
20
05
20
06
20
06
20
07
20
07
20
08
20
08
20
09
20
09
20
10
20
10
20
11
20
11
20
12
20
12
20
13
20
13
20
14
20
14
20
15
20
15
20
16
20
16
20
17
20
17
20
18
20
18
20
19
Manufacturing Jobs %
Northern Ireland United Kingdom
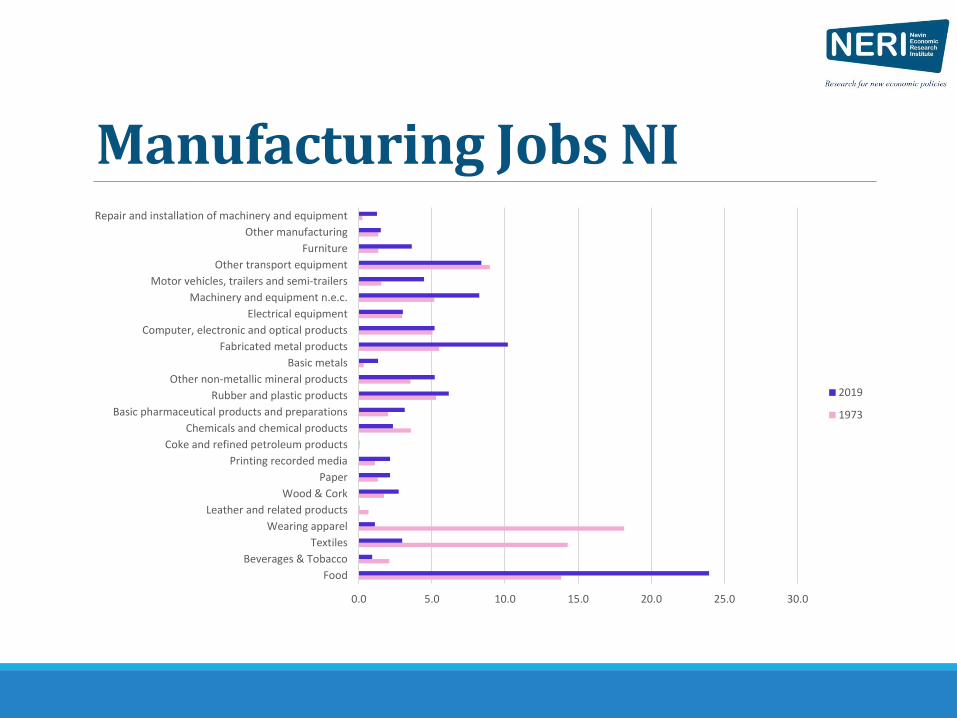
Manufacturing Jobs NI
0.0 5.0 10.0 15.0 20.0 25.0 30.0
Food
Beverages & Tobacco
Textiles
Wearing apparel
Leather and related products
Wood & Cork
Paper
Printing recorded media
Coke and refined petroleum products
Chemicals and chemical products
Basic pharmaceutical products and preparations
Rubber and plastic products
Other non-metallic mineral products
Basic metals
Fabricated metal products
Computer, electronic and optical products
Electrical equipment
Machinery and equipment n.e.c.
Motor vehicles, trailers and semi-trailers
Other transport equipment
Furniture
Other manufacturing
Repair and installation of machinery and equipment
2019
1973
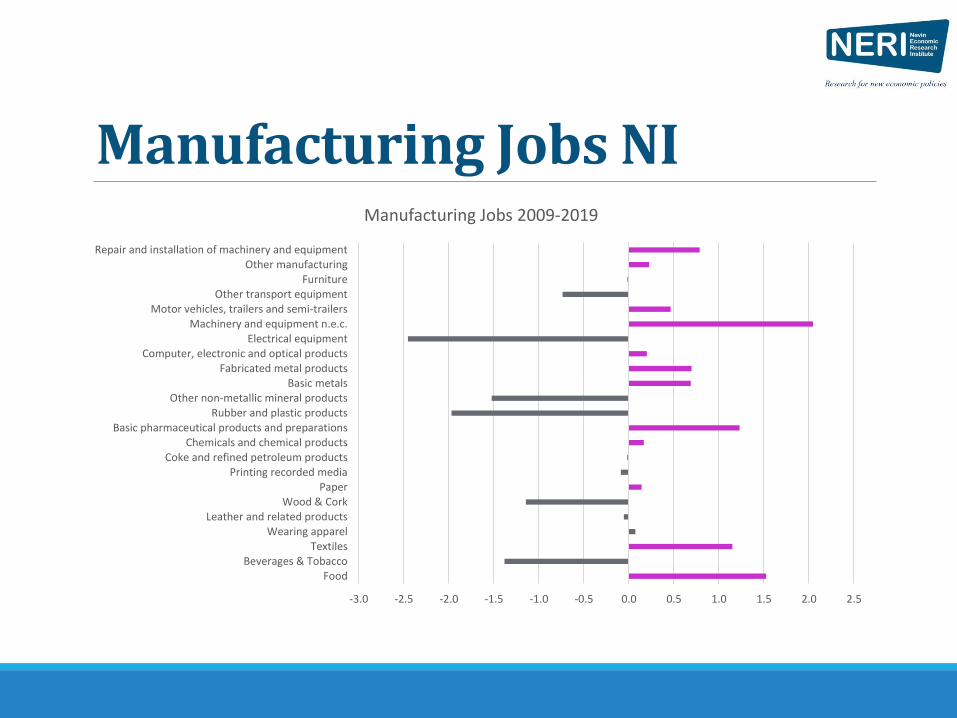
Manufacturing Jobs NI
-3.0 -2.5 -2.0 -1.5 -1.0 -0.5 0.0 0.5 1.0 1.5 2.0 2.5
FoodBeverages & Tobacco
TextilesWearing apparel
Leather and related productsWood & Cork
PaperPrinting recorded media
Coke and refined petroleum productsChemicals and chemical products
Basic pharmaceutical products and preparationsRubber and plastic products
Other non-metallic mineral productsBasic metals
Fabricated metal productsComputer, electronic and optical products
Electrical equipmentMachinery and equipment n.e.c.
Motor vehicles, trailers and semi-trailersOther transport equipment
FurnitureOther manufacturing
Repair and installation of machinery and equipment
Manufacturing Jobs 2009-2019
Manufacturing Jobs NI
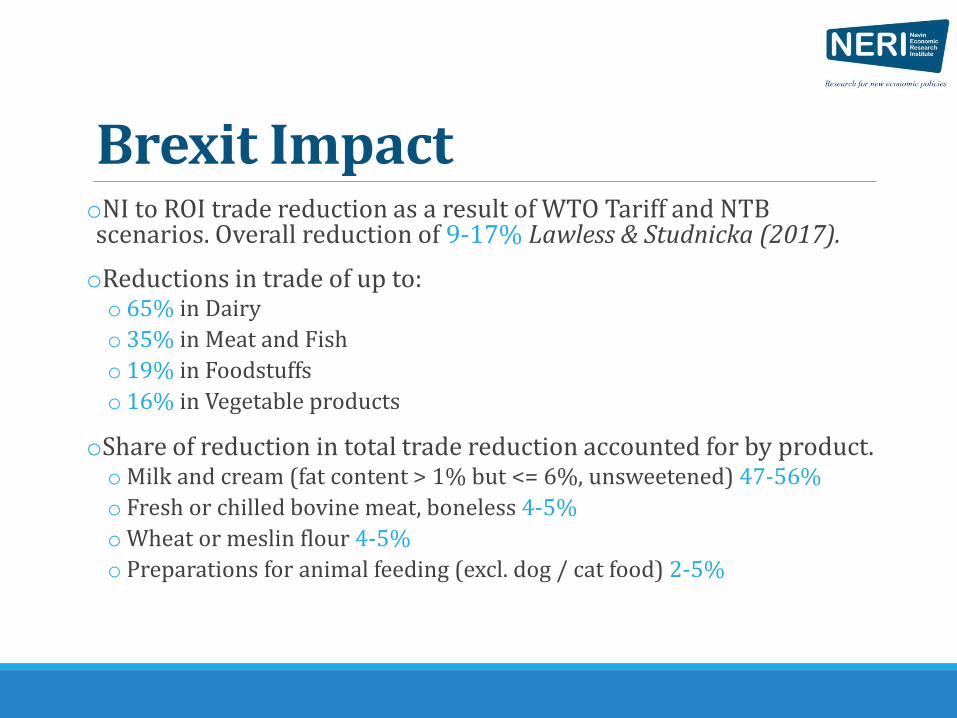
Brexit ImpactoNI to ROI trade reduction as a result of WTO Tariff and NTB scenarios. Overall reduction of 9-17% Lawless & Studnicka (2017).
oReductions in trade of up to:o 65% in Dairy
o 35% in Meat and Fish
o 19% in Foodstuffs
o 16% in Vegetable products
oShare of reduction in total trade reduction accounted for by product. oMilk and cream (fat content > 1% but <= 6%, unsweetened) 47-56%
o Fresh or chilled bovine meat, boneless 4-5%
oWheat or meslin flour 4-5%
o Preparations for animal feeding (excl. dog / cat food) 2-5%
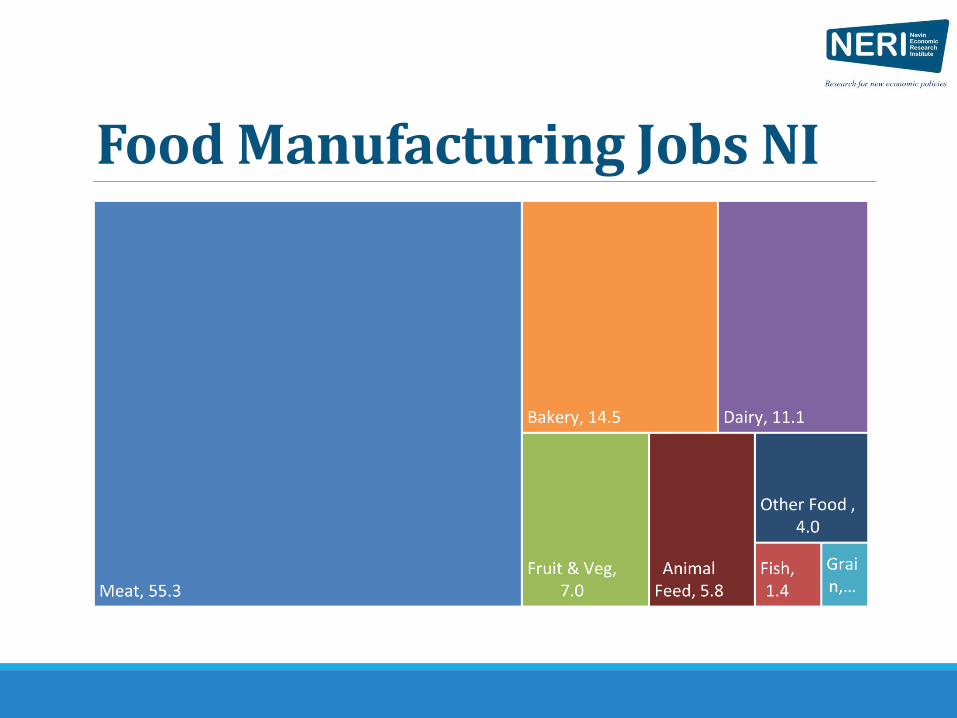
Food Manufacturing Jobs NI
What can policy do?oMany firms - disruption will be short-term – immediate trade disruption, new suppliers, new supply routes, etc.
oThese firms can be helped, but aid needs to be time limited.o Example: Short-time work scheme. Helpful in maintaining employment during temporary
economic shocks. Germany & Italy 4% of workers in STW in 2009.
o Maintains skills in firm, less costly than redundancy and unemployment benefits. Cost split between firm and state (for Brexit, balance should tip to state)
o Not without risk, temporary nature very important.
o How do we determine Brexit effect? Deadweight loss with any subsidy scheme, but less with STW
o If STW is continued after shock, prevents the productive reallocation of labour that comes with recovery.
o Also what starts as temporary shock can evolve. Hard to know in advance or at the time.
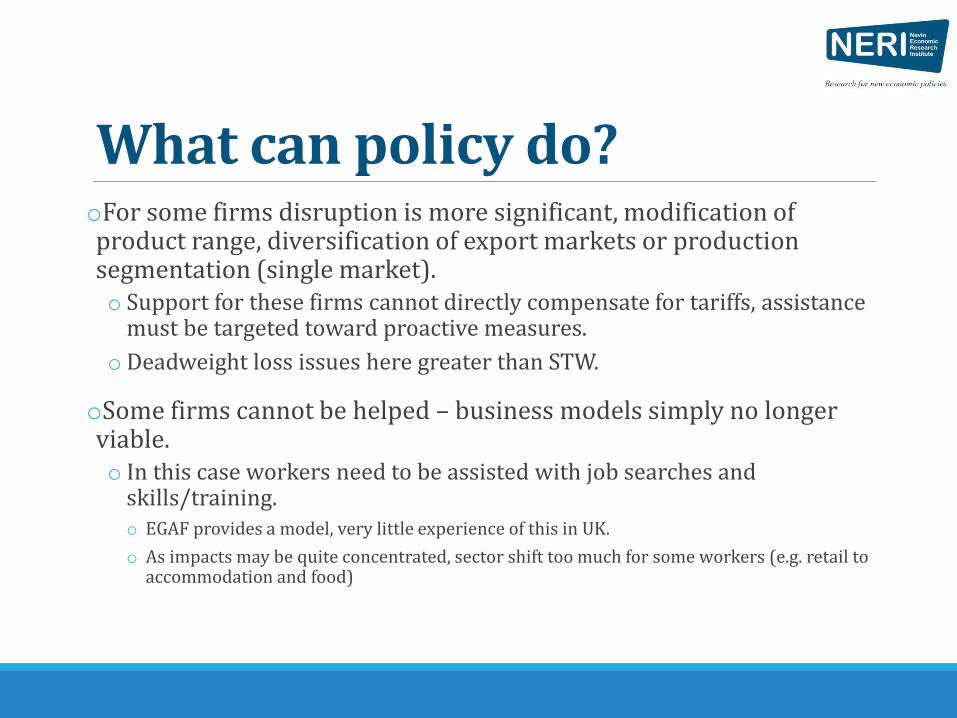
What can policy do?oFor some firms disruption is more significant, modification of product range, diversification of export markets or production segmentation (single market).o Support for these firms cannot directly compensate for tariffs, assistance
must be targeted toward proactive measures.
o Deadweight loss issues here greater than STW.
oSome firms cannot be helped – business models simply no longer viable.o In this case workers need to be assisted with job searches and
skills/training. o EGAF provides a model, very little experience of this in UK.
o As impacts may be quite concentrated, sector shift too much for some workers (e.g. retail to accommodation and food)
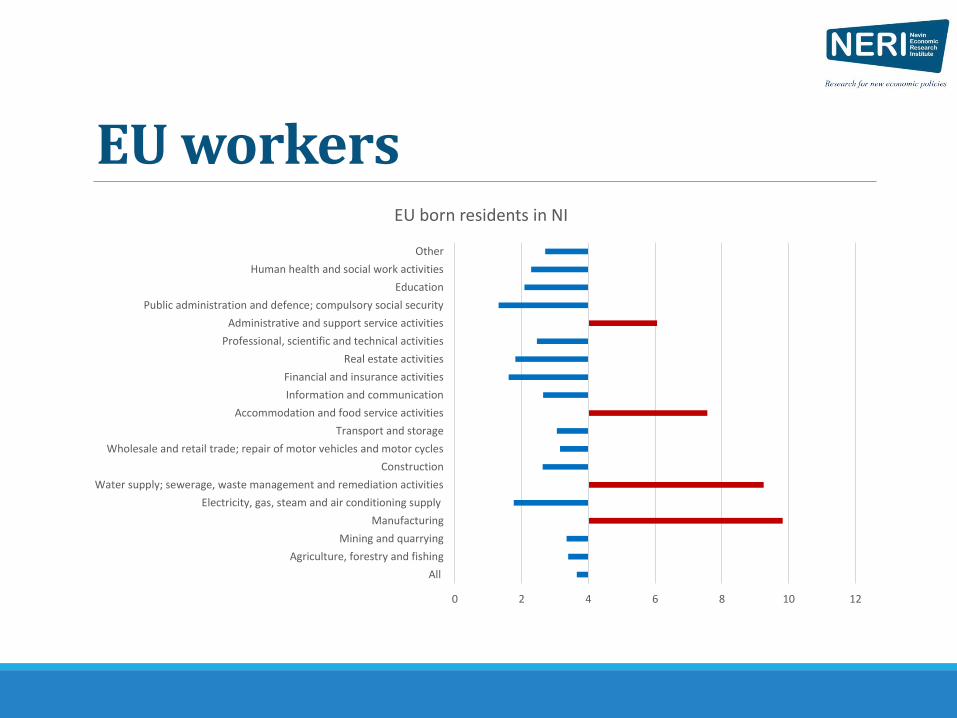
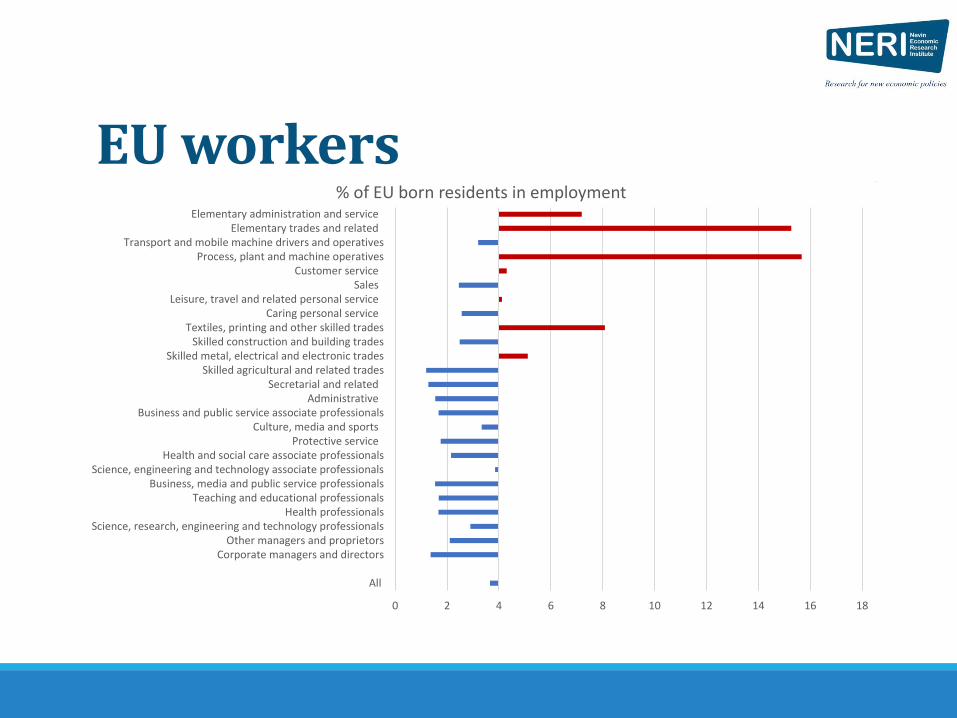
EU workersoEU born NI residents potentially a risk for labour shortage.
oEU born residents more likely to be economically active and have higher skills attainment than NI born.
oCould be the situation that EU born residents work in the same sectors at risk to trade disruption.
oDo not have sufficient data to match down to sub-sectors, but indications this could be the case.
EU workers
0 2 4 6 8 10 12
All
Agriculture, forestry and fishing
Mining and quarrying
Manufacturing
Electricity, gas, steam and air conditioning supply
Water supply; sewerage, waste management and remediation activities
Construction
Wholesale and retail trade; repair of motor vehicles and motor cycles
Transport and storage
Accommodation and food service activities
Information and communication
Financial and insurance activities
Real estate activities
Professional, scientific and technical activities
Administrative and support service activities
Public administration and defence; compulsory social security
Education
Human health and social work activities
Other
EU born residents in NI
EU workers
0 2 4 6 8 10 12 14 16 18
All
Corporate managers and directorsOther managers and proprietors
Science, research, engineering and technology professionalsHealth professionals
Teaching and educational professionalsBusiness, media and public service professionals
Science, engineering and technology associate professionalsHealth and social care associate professionals
Protective serviceCulture, media and sports
Business and public service associate professionalsAdministrative
Secretarial and relatedSkilled agricultural and related trades
Skilled metal, electrical and electronic tradesSkilled construction and building trades
Textiles, printing and other skilled tradesCaring personal service
Leisure, travel and related personal serviceSales
Customer serviceProcess, plant and machine operatives
Transport and mobile machine drivers and operativesElementary trades and related
Elementary administration and service
% of EU born residents in employment
SummaryoSome idea of sectors that will be impacted. Can identify workers.
oNot clear how economy will recover. Preserving existing jobs may not be the answer for all firms.
oImpact of labour shortages also need to be factored in.
oAll of this is avoidable.
BREXIT – IMPLICATIONS FOR NORTHERN IRELAND ECONOMY
OCTOBER 2019
2
BREXIT – A ‘YET TO BE DEFINED’ FUTURE FOR THE NORTHERN IRELAND ECONOMY
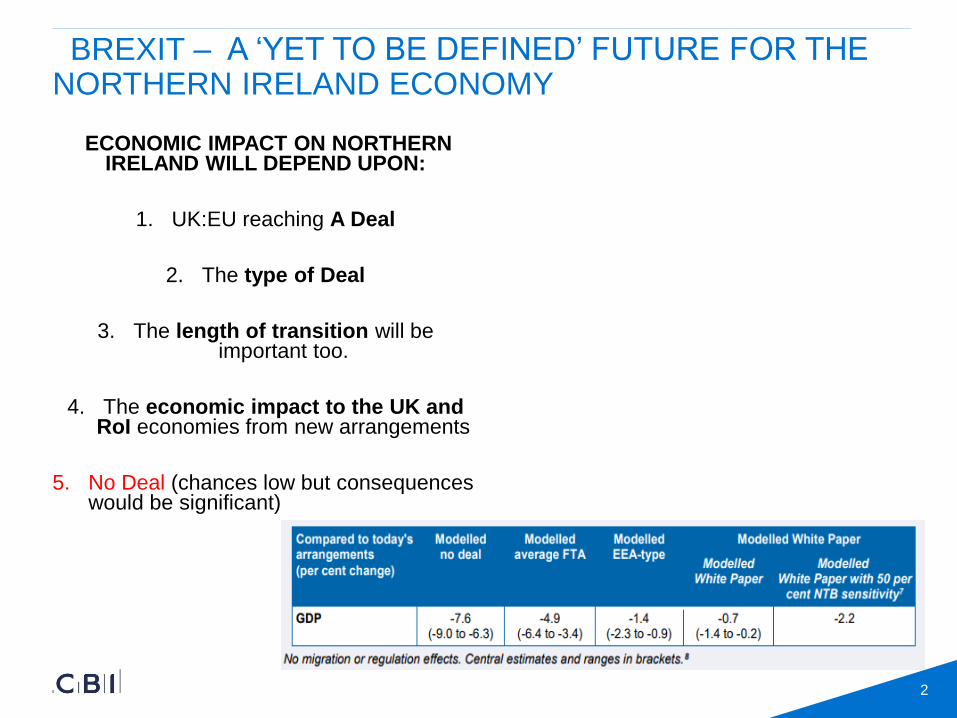
ECONOMIC IMPACT ON NORTHERN IRELAND WILL DEPEND UPON:
1. UK:EU reaching A Deal
2. The type of Deal
3. The length of transition will be important too.
4. The economic impact to the UK and RoI economies from new arrangements
5. No Deal (chances low but consequences would be significant)
3
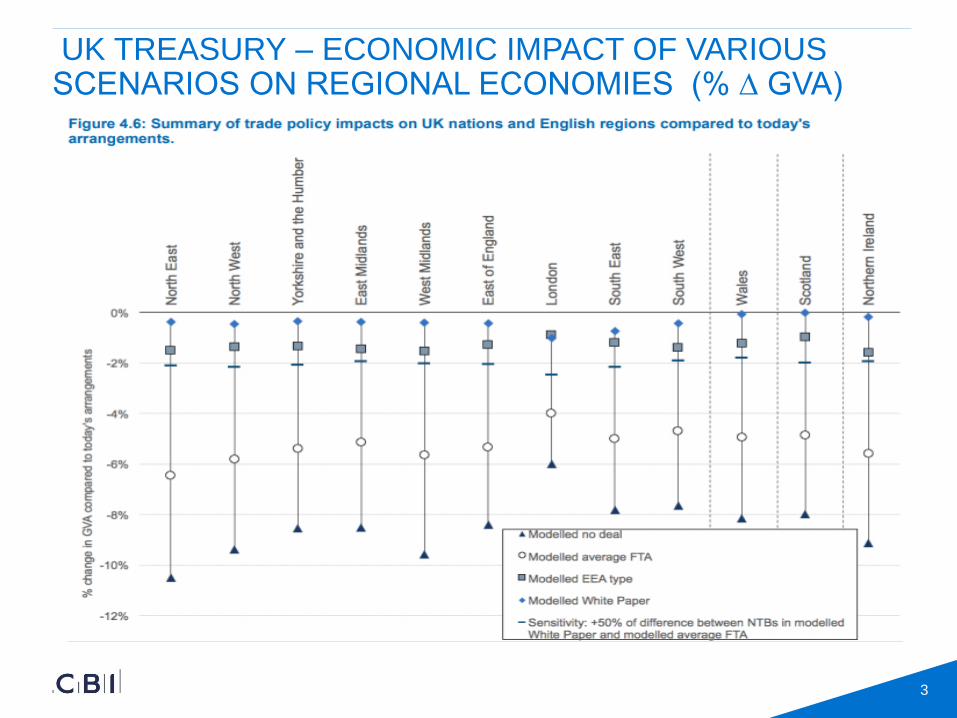
UK TREASURY – ECONOMIC IMPACT OF VARIOUS SCENARIOS ON REGIONAL ECONOMIES (% ∆ GVA)
4
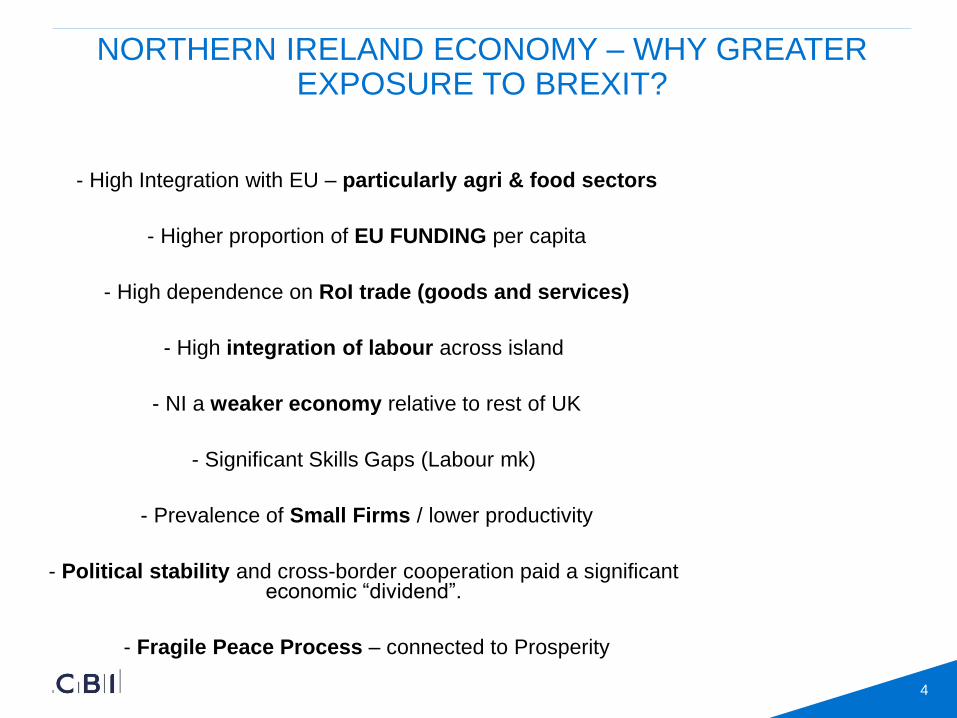
NORTHERN IRELAND ECONOMY – WHY GREATER EXPOSURE TO BREXIT?
- High Integration with EU – particularly agri & food sectors
- Higher proportion of EU FUNDING per capita
- High dependence on RoI trade (goods and services)
- High integration of labour across island
- NI a weaker economy relative to rest of UK
- Significant Skills Gaps (Labour mk)
- Prevalence of Small Firms / lower productivity
- Political stability and cross-border cooperation paid a significant economic “dividend”.
- Fragile Peace Process – connected to Prosperity
5
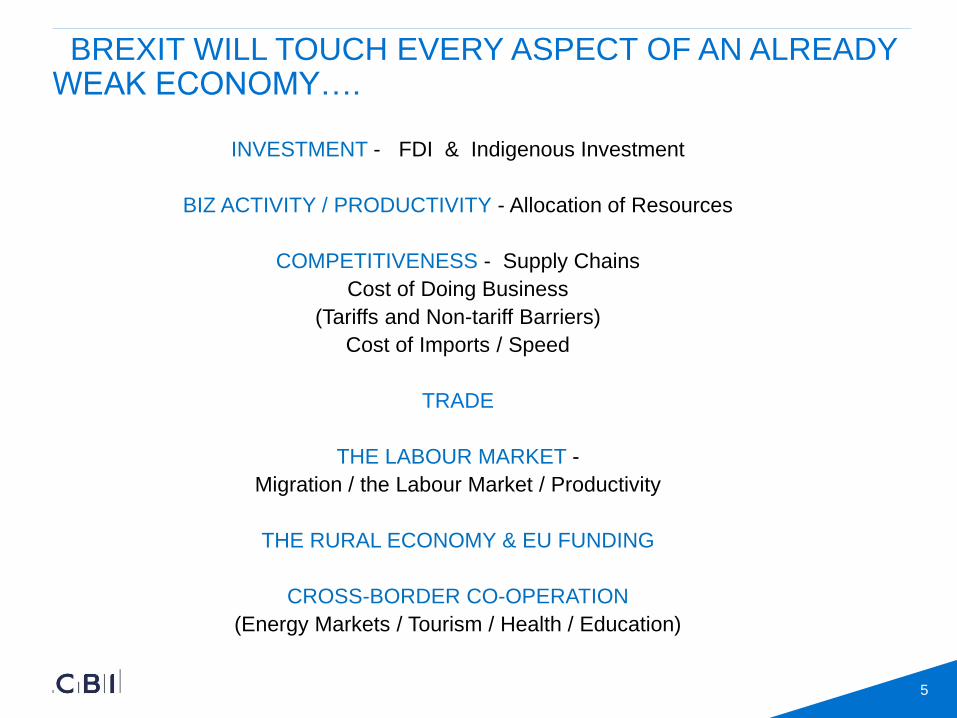
BREXIT WILL TOUCH EVERY ASPECT OF AN ALREADY WEAK ECONOMY….
INVESTMENT - FDI & Indigenous Investment
BIZ ACTIVITY / PRODUCTIVITY - Allocation of Resources
COMPETITIVENESS - Supply Chains
Cost of Doing Business
(Tariffs and Non-tariff Barriers)
Cost of Imports / Speed
TRADE
THE LABOUR MARKET -
Migration / the Labour Market / Productivity
THE RURAL ECONOMY & EU FUNDING
CROSS-BORDER CO-OPERATION
(Energy Markets / Tourism / Health / Education)
6
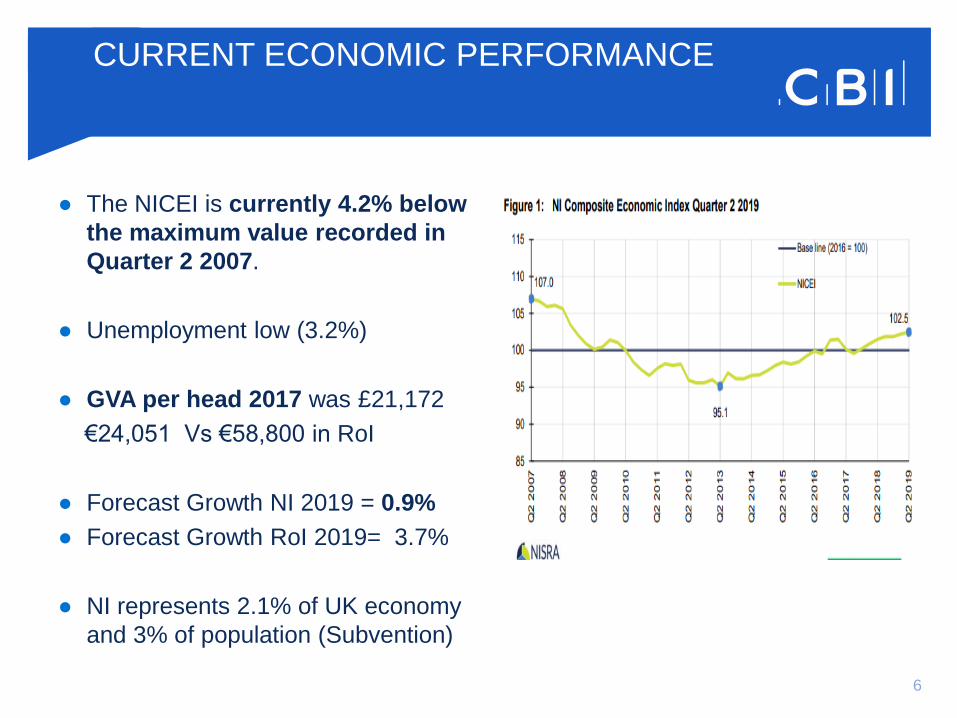
● The NICEI is currently 4.2% below
the maximum value recorded in
Quarter 2 2007.
● Unemployment low (3.2%)
● GVA per head 2017 was £21,172
€24,051 Vs €58,800 in RoI
● Forecast Growth NI 2019 = 0.9%
● Forecast Growth RoI 2019= 3.7%
● NI represents 2.1% of UK economy
and 3% of population (Subvention)
CURRENT ECONOMIC PERFORMANCE
7
-30
-25
-20
-15
-10
-5
0
5
10
15
20
-5.0
-4.0
-3.0
-2.0
-1.0
0.0
1.0
2.0
3.0
1999 2001 2003 2005 2007 2009 2011 2013 2015 2017 2019
Business' investment intentions
Business investment, y/y% (right axis)
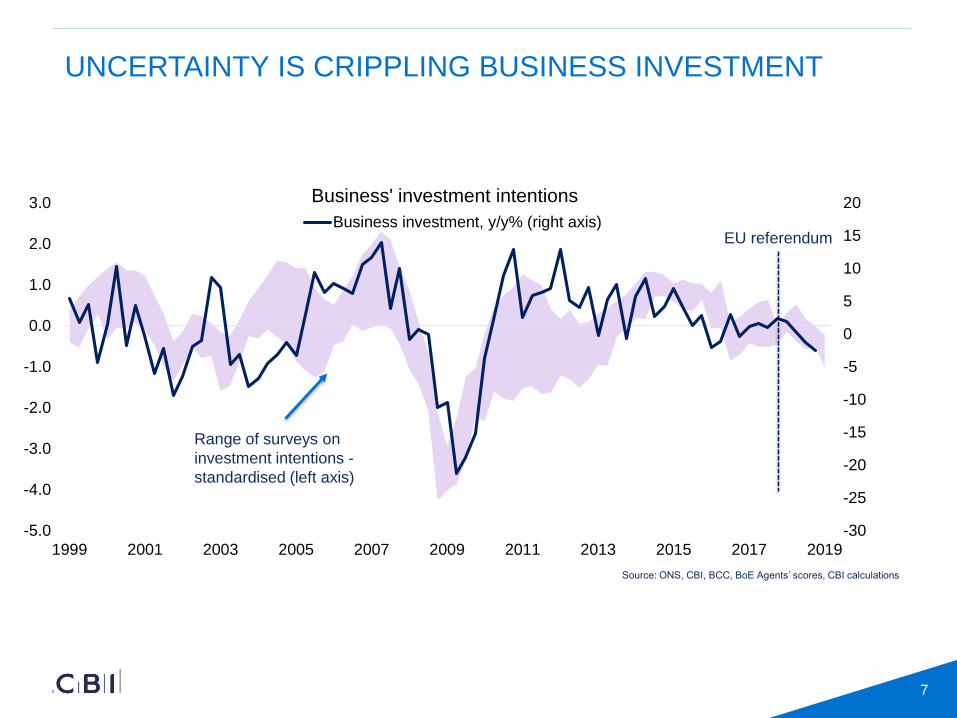
UNCERTAINTY IS CRIPPLING BUSINESS INVESTMENT
Source: ONS, CBI, BCC, BoE Agents’ scores, CBI calculations
EU referendum
Range of surveys on
investment intentions -
standardised (left axis)
8
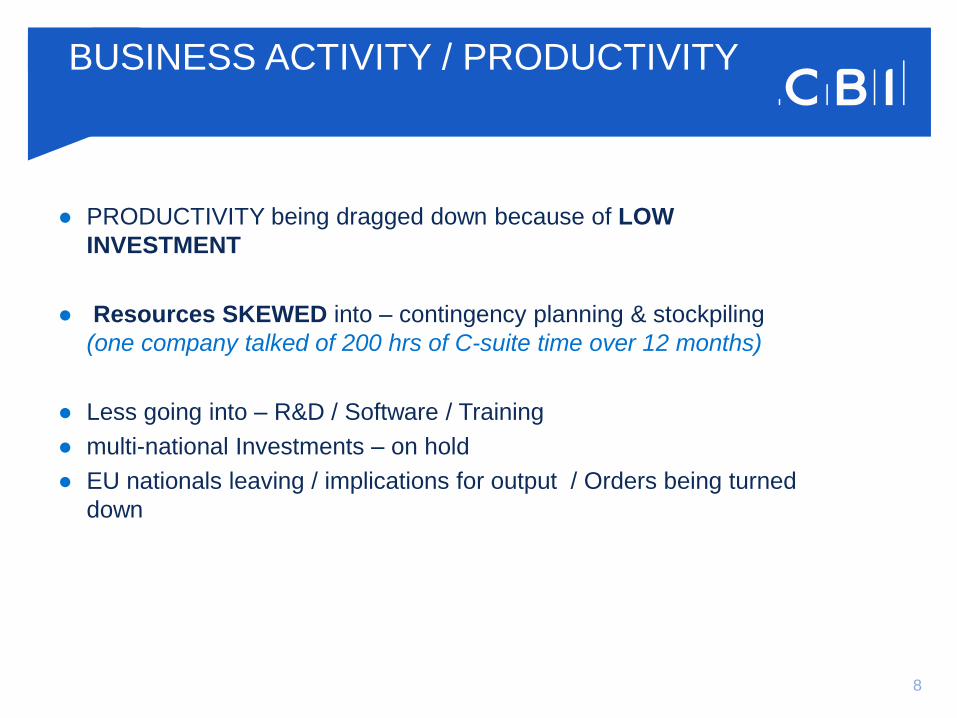
● PRODUCTIVITY being dragged down because of LOW
INVESTMENT
● Resources SKEWED into – contingency planning & stockpiling
(one company talked of 200 hrs of C-suite time over 12 months)
● Less going into – R&D / Software / Training
● multi-national Investments – on hold
● EU nationals leaving / implications for output / Orders being turned
down
BUSINESS ACTIVITY / PRODUCTIVITY
9
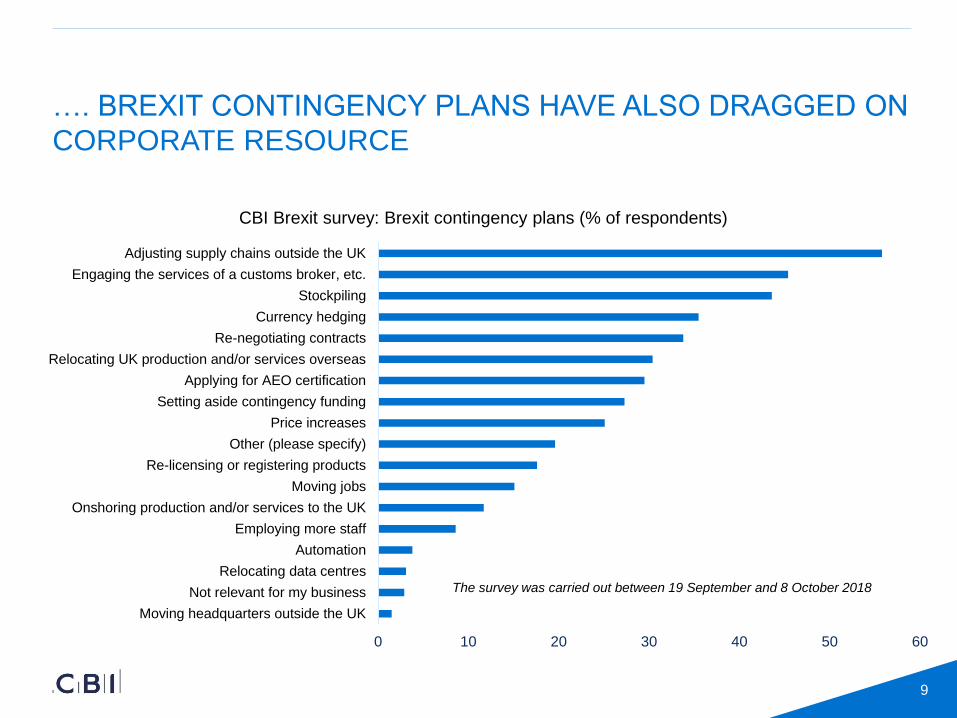
…. BREXIT CONTINGENCY PLANS HAVE ALSO DRAGGED ON
CORPORATE RESOURCE
0 10 20 30 40 50 60
Moving headquarters outside the UK
Not relevant for my business
Relocating data centres
Automation
Employing more staff
Onshoring production and/or services to the UK
Moving jobs
Re-licensing or registering products
Other (please specify)
Price increases
Setting aside contingency funding
Applying for AEO certification
Relocating UK production and/or services overseas
Re-negotiating contracts
Currency hedging
Stockpiling
Engaging the services of a customs broker, etc.
Adjusting supply chains outside the UK
CBI Brexit survey: Brexit contingency plans (% of respondents)
The survey was carried out between 19 September and 8 October 2018
10
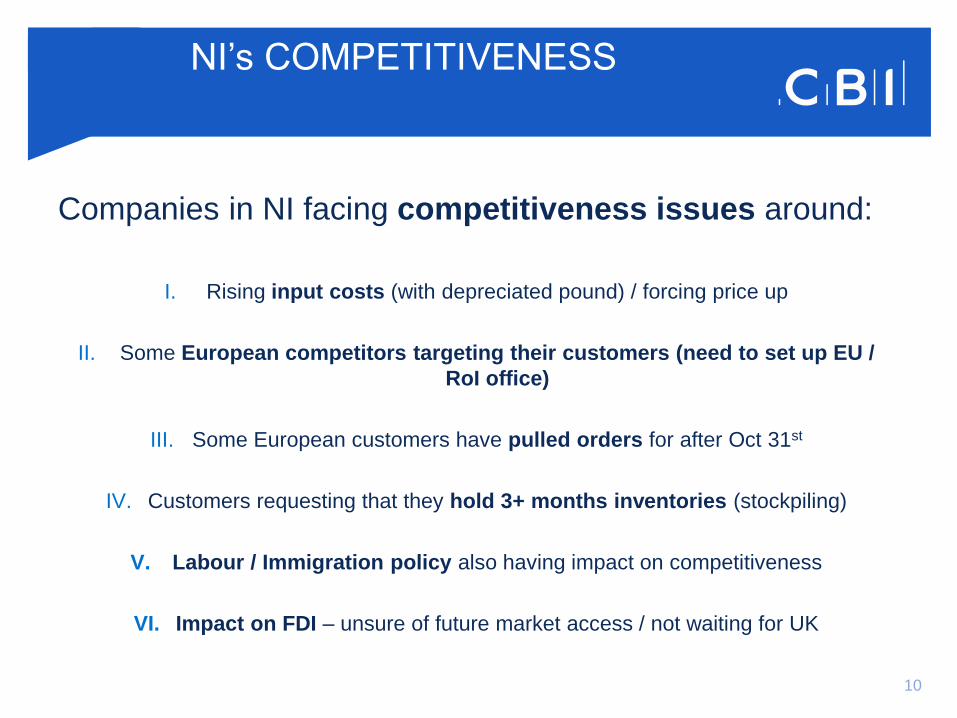
Companies in NI facing competitiveness issues around:
I. Rising input costs (with depreciated pound) / forcing price up
II. Some European competitors targeting their customers (need to set up EU /
RoI office)
III. Some European customers have pulled orders for after Oct 31st
IV. Customers requesting that they hold 3+ months inventories (stockpiling)
V. Labour / Immigration policy also having impact on competitiveness
VI. Impact on FDI – unsure of future market access / not waiting for UK
NI’s COMPETITIVENESS
11
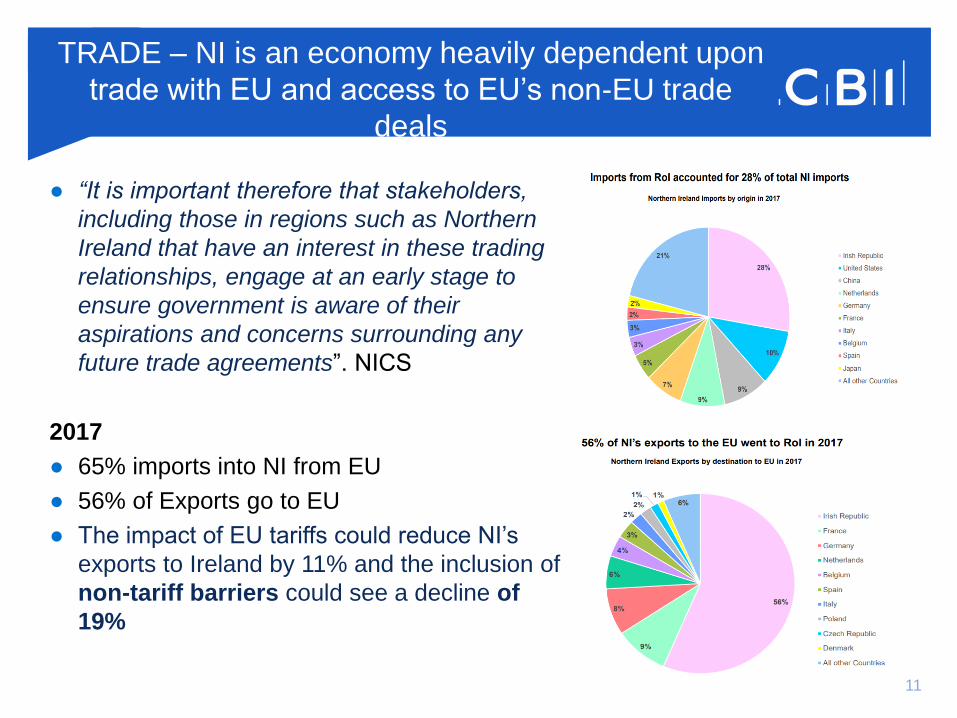
● “It is important therefore that stakeholders,
including those in regions such as Northern
Ireland that have an interest in these trading
relationships, engage at an early stage to
ensure government is aware of their
aspirations and concerns surrounding any
future trade agreements”. NICS
2017
● 65% imports into NI from EU
● 56% of Exports go to EU
● The impact of EU tariffs could reduce NI’s
exports to Ireland by 11% and the inclusion of
non-tariff barriers could see a decline of
19%
TRADE – NI is an economy heavily dependent upon
trade with EU and access to EU’s non-EU trade
deals
12
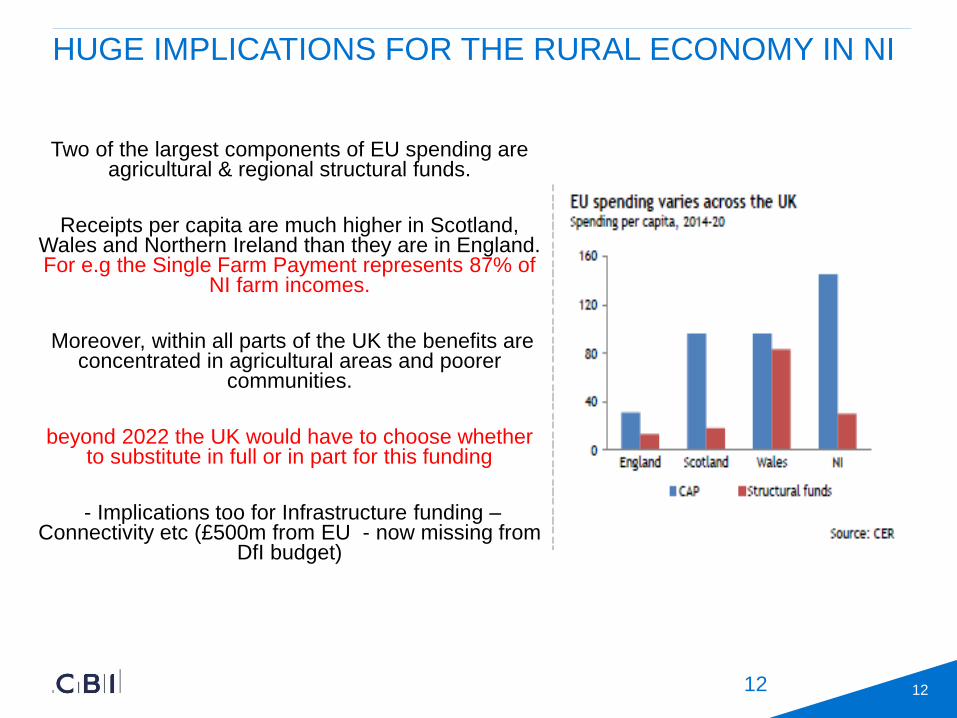
HUGE IMPLICATIONS FOR THE RURAL ECONOMY IN NI
Two of the largest components of EU spending are agricultural & regional structural funds.
Receipts per capita are much higher in Scotland, Wales and Northern Ireland than they are in England. For e.g the Single Farm Payment represents 87% of
NI farm incomes.
Moreover, within all parts of the UK the benefits are concentrated in agricultural areas and poorer
communities.
beyond 2022 the UK would have to choose whether to substitute in full or in part for this funding
- Implications too for Infrastructure funding –Connectivity etc (£500m from EU - now missing from
DfI budget)
12
13
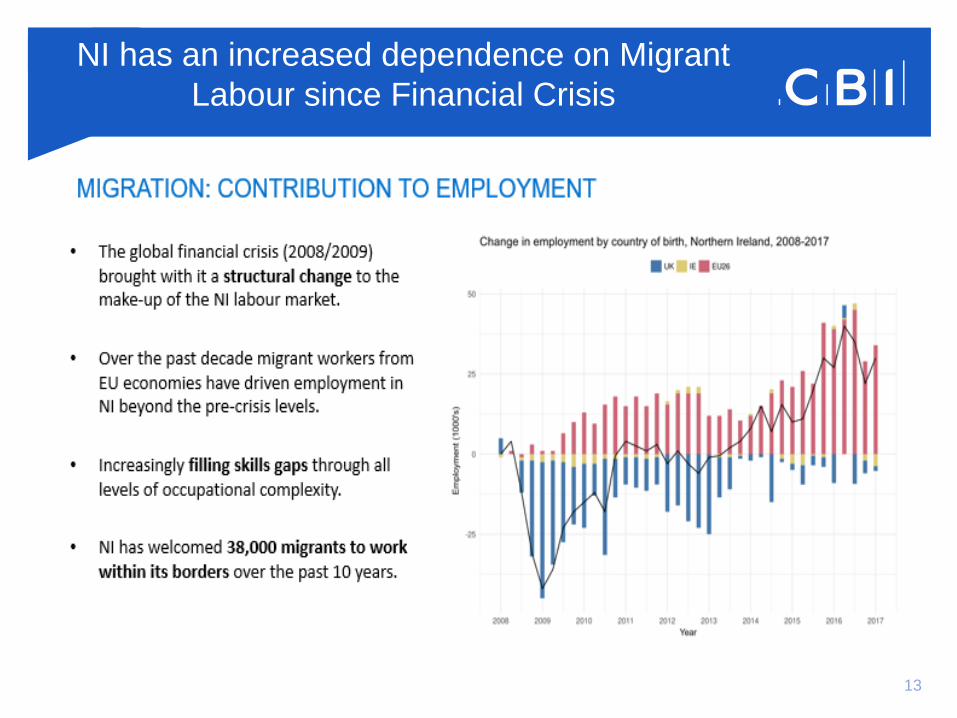
NI has an increased dependence on Migrant
Labour since Financial Crisis
14
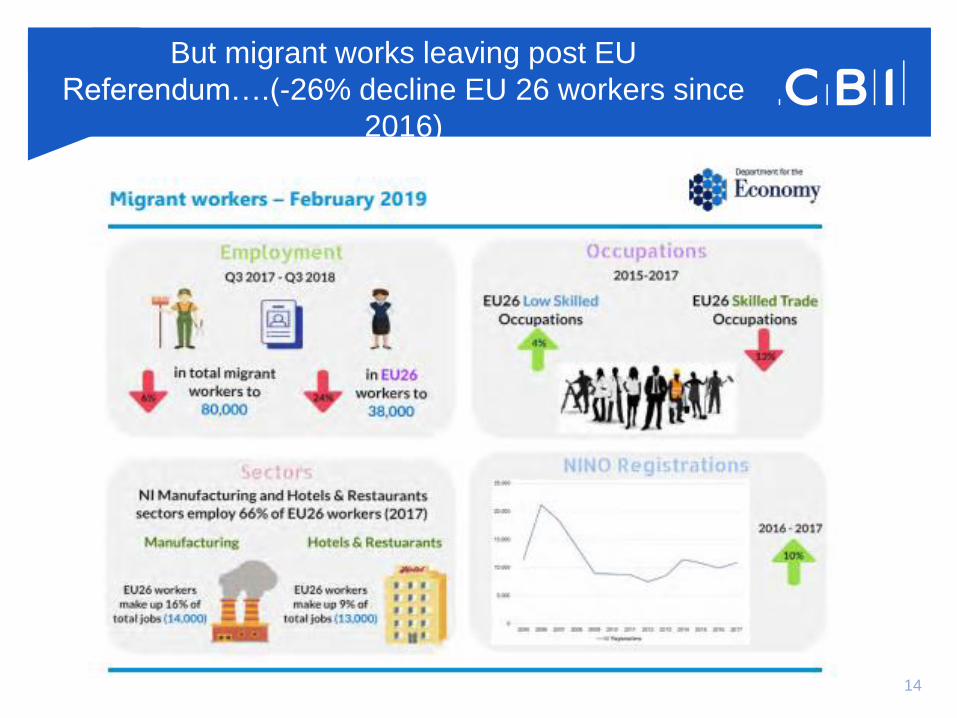
But migrant works leaving post EU
Referendum….(-26% decline EU 26 workers since
2016)
15
● Crashing out of EU without a deal is not a viable option:
● UK would revert to WTO rules
● Tariffs imposed on 90% of our exports to EU market
(Tariffs into EU vary – for agri the ave tariff is 16.4% / textiles 10.5% / 10%
for vehicles and 4.5% on components
● Current proposal on zero UK import tariffs would cripple NI economy
Non-tariff barriers to trade :
● Companies will face the administration burden in terms of paper work trail
(quotas / country of origin w.r.t non-EU intermediate inputs etc)
● Interruption to global supply chains
● Border measures – customs and quotas
● Behind-the-border measures – compliance / regulations / performance
standards etc
WHY “NO DEAL” IS NOT ACCEPTABLE
16
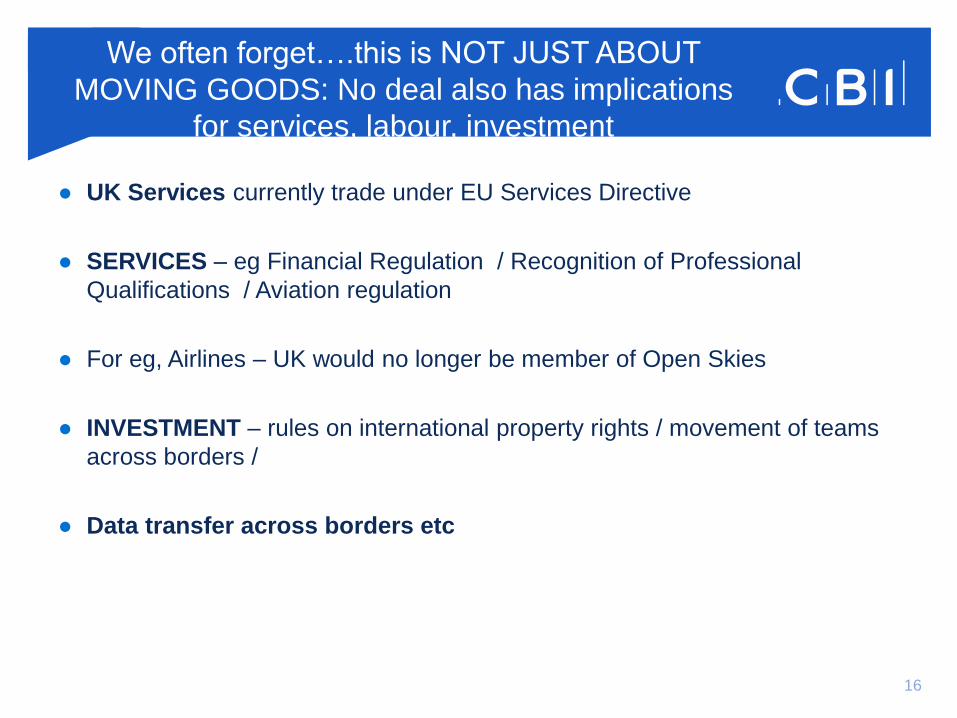
● UK Services currently trade under EU Services Directive
● SERVICES – eg Financial Regulation / Recognition of Professional
Qualifications / Aviation regulation
● For eg, Airlines – UK would no longer be member of Open Skies
● INVESTMENT – rules on international property rights / movement of teams
across borders /
● Data transfer across borders etc
We often forget….this is NOT JUST ABOUT
MOVING GOODS: No deal also has implications
for services, labour, investment
17
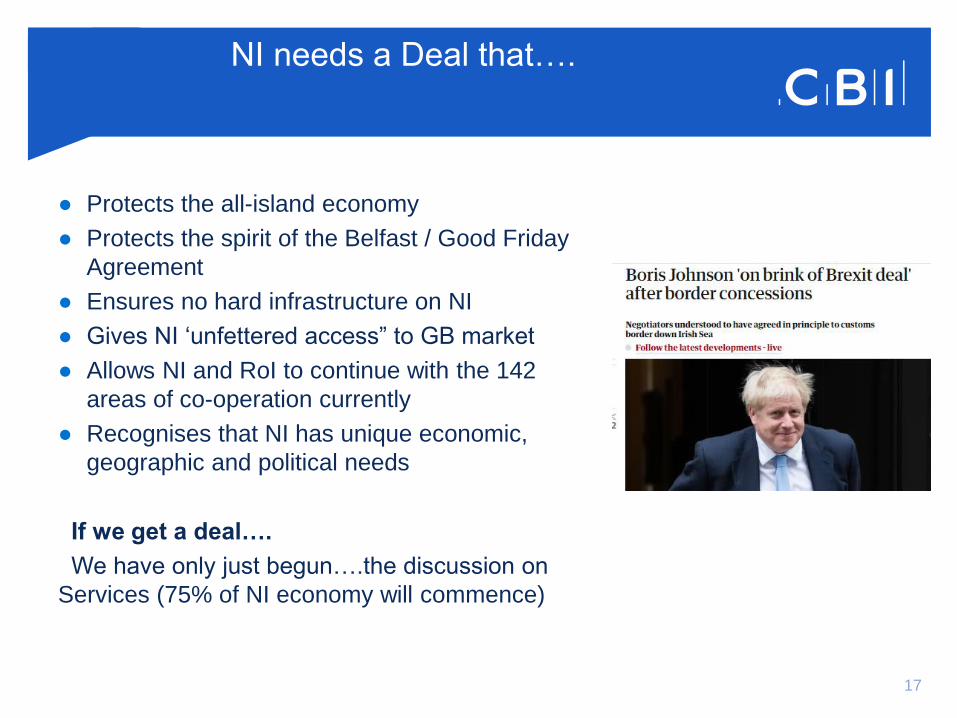
● Protects the all-island economy
● Protects the spirit of the Belfast / Good Friday
Agreement
● Ensures no hard infrastructure on NI
● Gives NI ‘unfettered access” to GB market
● Allows NI and RoI to continue with the 142
areas of co-operation currently
● Recognises that NI has unique economic,
geographic and political needs
If we get a deal….
We have only just begun….the discussion on
Services (75% of NI economy will commence)
NI needs a Deal that….
1821/10/2019
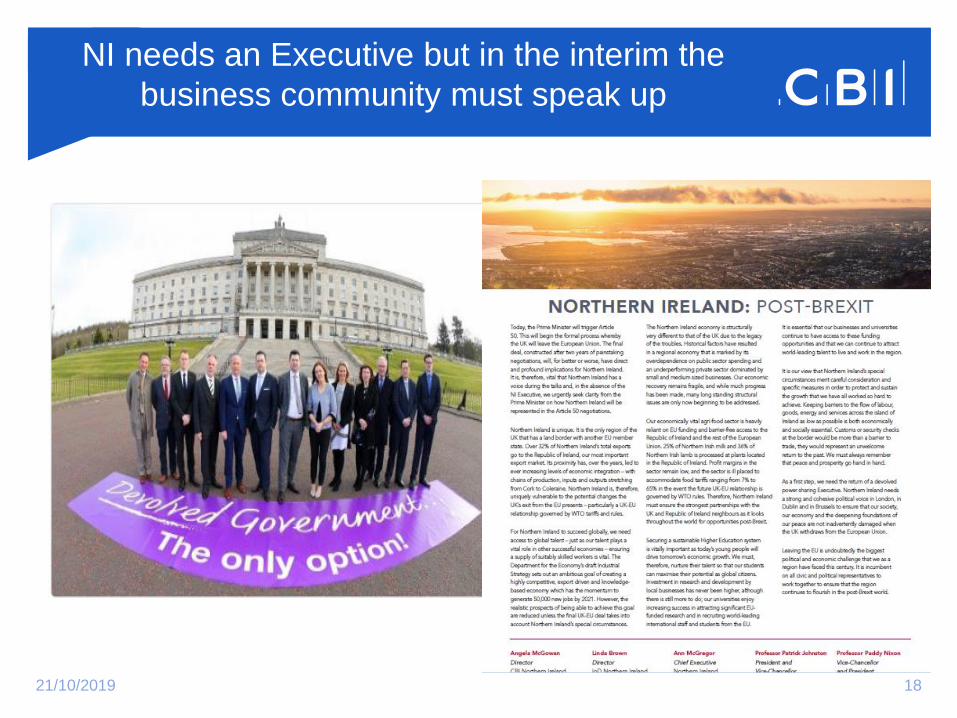
NI needs an Executive but in the interim the
business community must speak up


![Community Development as a Way-Out from Crisis. Guidelines from New York City's Experience [Slideshow]](https://static.fdokumen.com/doc/165x107/631b3365d5372c006e03d5e7/community-development-as-a-way-out-from-crisis-guidelines-from-new-york-citys.jpg)