
The Benefits of Manufacturing Jobs (May 2012) - US ...
10
U.S. Department of Commerce Economics and Statistics Administration By David Langdon and Rebecca Lehrman. Thanks to George McKittrick, Pragya Nandini, Cordaye Ogletree, Robert Rubinovitz, Mark Doms, Office of the Chief Economist, Jane Callen, and Jo Caldwell, Office of the Under Secretary The Benefits of Manufacturing Jobs May 2012 Executive Summary ESA Issue Brief #01-12 T he role of the manufacturing sector in the U.S. economy is more prominent than is suggested solely by its output or number of workers. It is a cornerstone of innovation in our economy: manufacturing firms fund most domestic corporate research and development (R&D), and the re- sulting innovations and productivity growth improve our standard of living. Manufacturing also drives U.S. exports and is crucial for a strong national defense. The current economic recovery has witnessed a welcome return in manufacturing job growth. Since its January 2010 low to April 2012, manufacturing employment has expanded by 489,000 jobs or 4 percent 1 — the strongest cyclical rebound since the dual recessions in the early 1980s. From mid-2009 through the end of February 2012, the number of job openings surged by over 200 percent, to 253,000 openings. 2 Coupled with attrition in the coming years from Baby Boomer re- tirements, this bodes well for continued hiring opportunities in the manufacturing sector. 3 The rebound in manufacturing is important, not only as a sign of renewed strength, but also be- cause manufacturing jobs are often cited as “good jobs:” they pay well, provide good benefits, and manufacturing workers are less likely to quit than workers in other private sector industries. 4 In fact, our analysis finds evidence in support of these claims. Specifically, this report shows that: On average, hourly wages and salaries for manufacturing jobs were $29.75 an hour in 2010 compared to $27.47 an hour for non-manufacturing jobs. Total hourly compensation, which includes employer-provided benefits, was $38.27 for workers in manufacturing jobs and $32.84 for workers in non-manufacturing jobs, a 17 percent premium. Even after controlling for demographic, geographic, and job characteristics, manufacturing jobs maintained significant wage and benefit premiums. The educational attainment of the manufacturing workforce is rising steadily. In 2011, 53 per- cent of all manufacturing workers had at least some college education, up from 43 percent in 1994. The innovative manufacturing sector relies more heavily on STEM (science, technology, engi- neering and mathematics) education than the non-manufacturing sectors. In 2011, nearly 1 out of 3 (32 percent) of college-educated manufacturing workers had a STEM job, compared to 10 percent in non-manufacturing sectors. Higher educational attainment for manufacturing workers carries higher premiums, and the size of the premium, including or excluding benefits, increase consistently with educational attainment. Furthermore, the compensation premium has risen over the past decade across all levels of educational attainment. In sum, manufacturing jobs provide benefits to workers with higher overall compensation than other sectors, and to the economy through innovation that boosts our nation’s standard of living.
-
Upload
khangminh22 -
Category
Documents
-
view
3 -
download
0
Transcript of The Benefits of Manufacturing Jobs (May 2012) - US ...
U.S. Department of Commerce Economics and Statistics Administration
By David Langdon and Rebecca Lehrman. Thanks to George McKittrick, Pragya Nandini, Cordaye Ogletree, Robert Rubinovitz, Mark Doms, Office of the Chief Economist, Jane Callen, and Jo Caldwell, Office of the Under Secretary
The Benefits of Manufacturing Jobs
May
2012
Executive Summary
ESA
Issue Brief
#01-12
T he role of the manufacturing sector in the U.S. economy is more prominent than is suggested solely by its output or number of workers. It is a cornerstone of innovation in our economy:
manufacturing firms fund most domestic corporate research and development (R&D), and the re-sulting innovations and productivity growth improve our standard of living. Manufacturing also drives U.S. exports and is crucial for a strong national defense.
The current economic recovery has witnessed a welcome return in manufacturing job growth. Since its January 2010 low to April 2012, manufacturing employment has expanded by 489,000 jobs or 4 percent1— the strongest cyclical rebound since the dual recessions in the early 1980s. From mid-2009 through the end of February 2012, the number of job openings surged by over 200 percent, to 253,000 openings.2 Coupled with attrition in the coming years from Baby Boomer re-tirements, this bodes well for continued hiring opportunities in the manufacturing sector.3
The rebound in manufacturing is important, not only as a sign of renewed strength, but also be-cause manufacturing jobs are often cited as “good jobs:” they pay well, provide good benefits, and manufacturing workers are less likely to quit than workers in other private sector industries.4 In fact, our analysis finds evidence in support of these claims. Specifically, this report shows that:
On average, hourly wages and salaries for manufacturing jobs were $29.75 an hour in 2010 compared to $27.47 an hour for non-manufacturing jobs. Total hourly compensation, which includes employer-provided benefits, was $38.27 for workers in manufacturing jobs and $32.84 for workers in non-manufacturing jobs, a 17 percent premium.
Even after controlling for demographic, geographic, and job characteristics, manufacturing jobs maintained significant wage and benefit premiums.
The educational attainment of the manufacturing workforce is rising steadily. In 2011, 53 per-cent of all manufacturing workers had at least some college education, up from 43 percent in 1994.
The innovative manufacturing sector relies more heavily on STEM (science, technology, engi-neering and mathematics) education than the non-manufacturing sectors. In 2011, nearly 1 out of 3 (32 percent) of college-educated manufacturing workers had a STEM job, compared to 10 percent in non-manufacturing sectors.
Higher educational attainment for manufacturing workers carries higher premiums, and the size of the premium, including or excluding benefits, increase consistently with educational attainment.
Furthermore, the compensation premium has risen over the past decade across all levels of educational attainment.
In sum, manufacturing jobs provide benefits to workers with higher overall compensation than other sectors, and to the economy through innovation that boosts our nation’s standard of living.
2 U.S. Department of Commerce, Economics and Statistics Administration
When most people think about job quality, pay lev-
els are the first metric that comes to mind. By this
measure, manufacturing jobs are good jobs: a basic
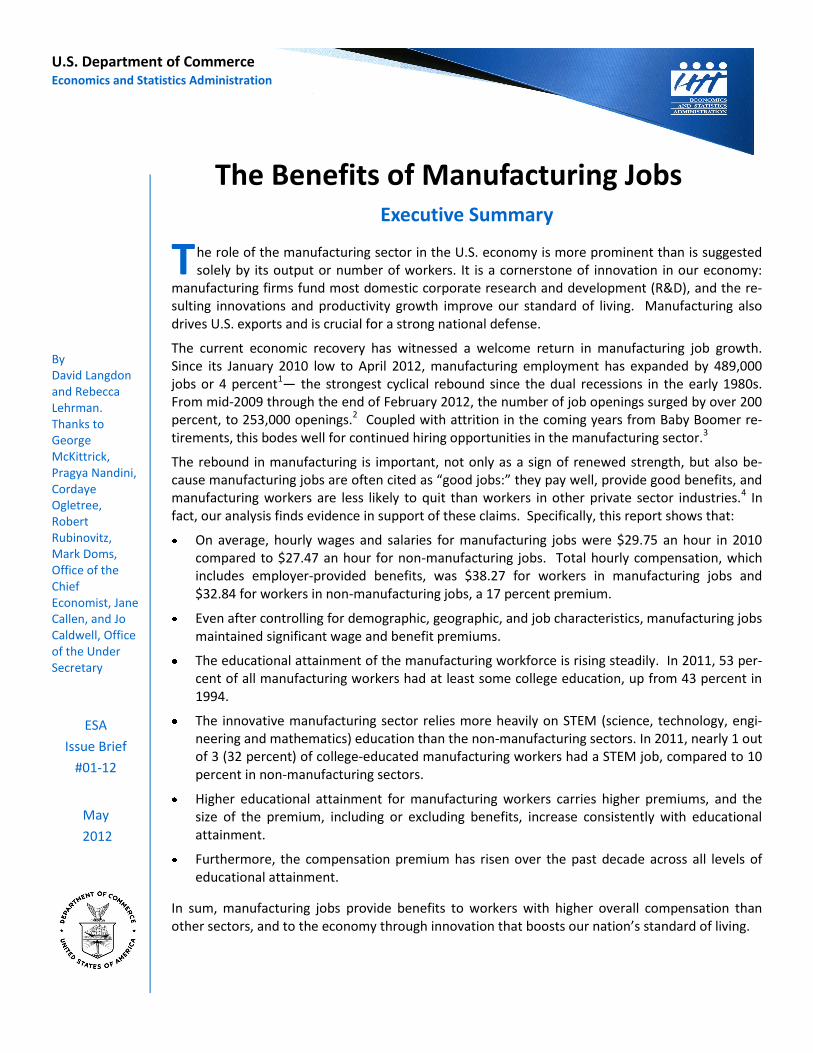
comparison of average wages (Figure 1) shows that
hourly wages and salaries were 8 percent higher in
How Do Manufacturing Jobs Stack Up?
manufacturing than other private industries as of
2010, based on National Income and Product Ac-
counts (NIPA) data available from the Commerce
Department’s Bureau of Economic Analysis.5
Yet, a trip to the doctor and planning for retirement
are two quick reminders that wages alone are an
incomplete measure of job quality. Expanding the
definition to include benefits makes manufacturing
jobs even more attractive to workers than non-
Basic wage and compensation comparison Benefits
Figure 1. Employee Compensation per Hour by Major Industry, 2010
$29.75 $27.47
$8.52$5.37
$0
$5
$10
$15
$20
$25
$30
$35
$40
Manufacturing Non-manufacturingindustries
Wages and salaries:8% difference
Benefits:59% difference
Total compensation:17% difference$38.27
$32.84
Source: ESA calculations using unpublished data from the National Income and Product Accounts, Bureau of Economic Analysis. Note: Wages and salaries include paid leave and supplemental pay, such as overtime and premium pay, shift differentials, and non-production bonuses.
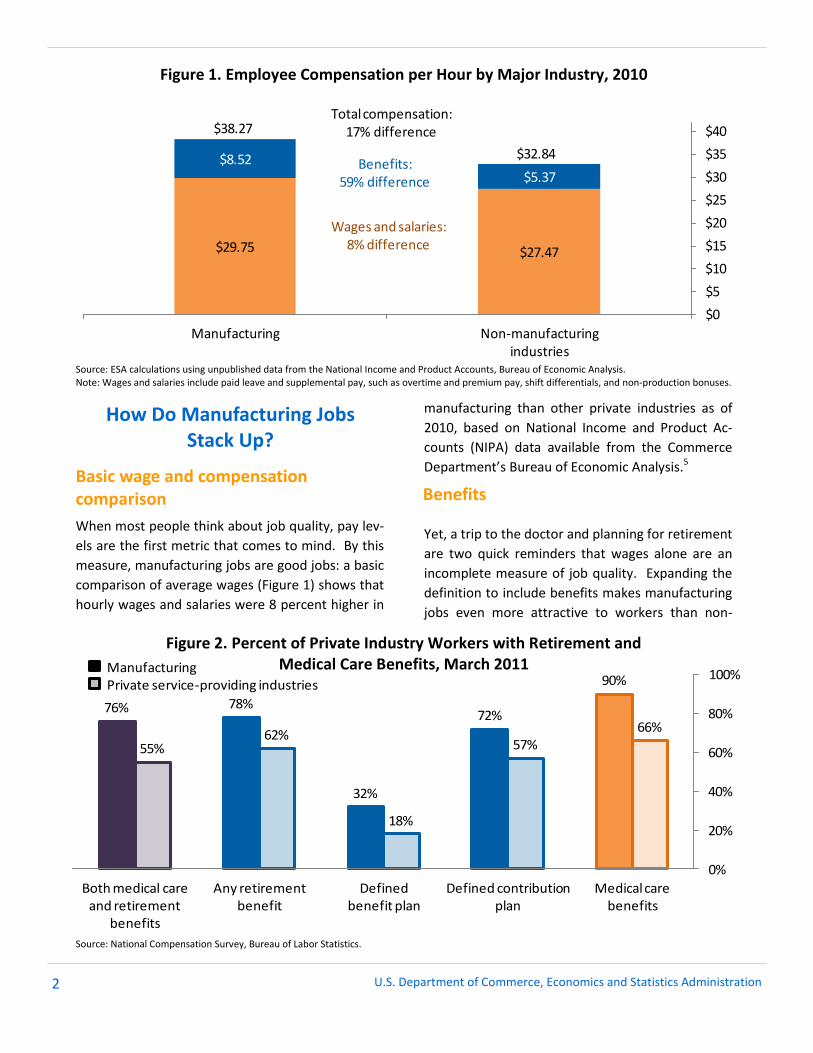
76% 78%
32%
72%
90%
55%62%
18%
57%66%
0%
20%
40%
60%
80%
100%
Both medical care and retirement
benefits
Any retirement benefit
Defined benefit plan
Defined contribution plan
Medical care benefits
ManufacturingPrivate service-providing industries
Figure 2. Percent of Private Industry Workers with Retirement and Medical Care Benefits, March 2011
Source: National Compensation Survey, Bureau of Labor Statistics.
3 U.S. Department of Commerce, Economics and Statistics Administration
manufacturing jobs. First, manufacturing workers
are more likely to have the option of medical care
and retirement benefits, as Figure 2 highlights.
Ninety percent of manufacturing employees have
access to medical care benefits, compared with 66
percent of workers in private service-providing in-
dustries.6,7 And 78 percent of manufacturing work-
ers receive employer contributions to their retire-
ment benefits (primarily to defined-contribution
plans), versus 62 percent of workers in service-
providing industries.8
Manufacturing workers also are more likely to take
advantage of these benefits. In manufacturing es-
tablishments, 81 percent of workers take advan-
tage of medical care benefits compared with a 71
percent “take-up rate” in service-providing indus-
tries.9 This is likely driven by the fact that manu-
facturing employers pay a higher share of health
care premiums than their service providing coun-
terparts. For single coverage and family coverage,
manufacturing employers pay 82 percent and 75
percent, respectively, as compared to the 79 per-
cent and 68 percent share paid by service industry
employers.10 In dollars and cents, the median
monthly employee contribution for family cover-
age is about $262 in manufacturing and $353 in
service-providing industries.11 Similar advantages
are also seen in other benefits. For example,
manufacturing workers have greater rates of ac-
cess to paid leave and paid vacation than workers
in service-providing industries.
Taking into account employer contributions to
benefits such as medical insurance and retirement
highlights an even larger difference between
worker compensation in manufacturing and non-
manufacturing industries. As seen in Figure 1, the
average hourly contributions for insurance, retire-
ment and savings, and legally required benefits
sum to $8.52 in manufacturing, or 59 percent
higher than in non-manufacturing industries. As a
result, total hourly compensation, including benefit
contributions, is 17 percent higher for manufactur-
ing relative to non-manufacturing workers—$38.27
compared with $32.84.12
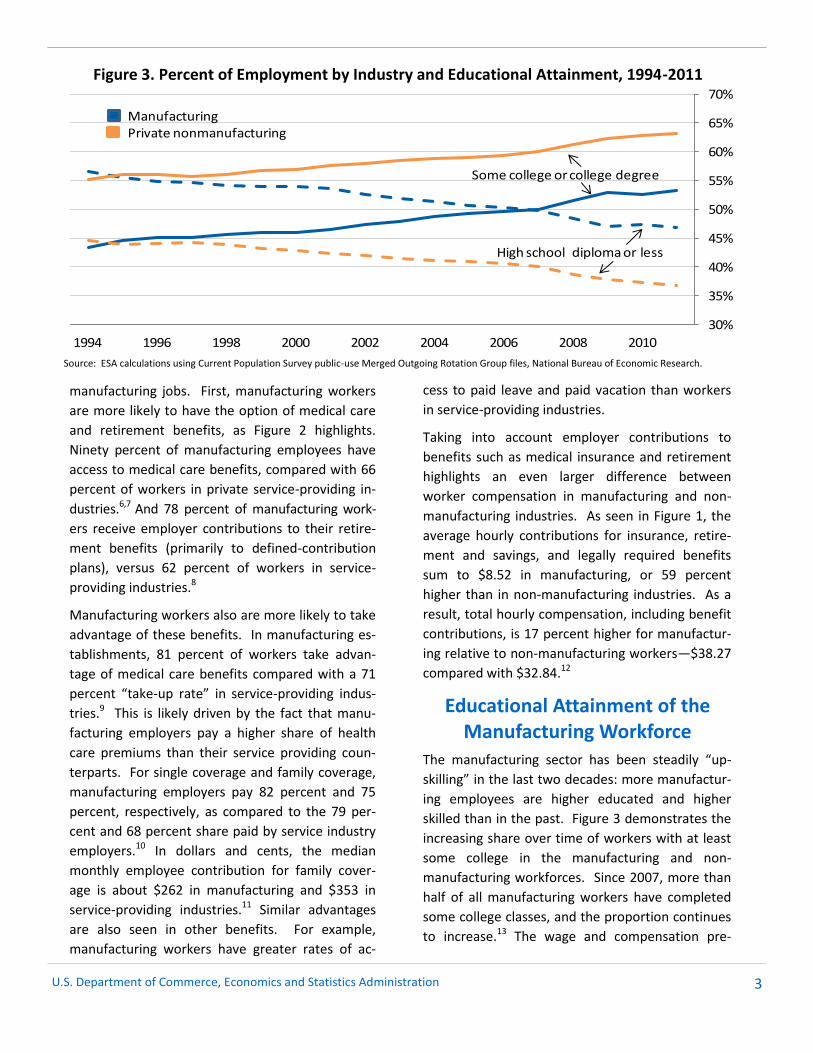
The manufacturing sector has been steadily “up-
skilling” in the last two decades: more manufactur-
ing employees are higher educated and higher
skilled than in the past. Figure 3 demonstrates the
increasing share over time of workers with at least
some college in the manufacturing and non-
manufacturing workforces. Since 2007, more than
half of all manufacturing workers have completed
some college classes, and the proportion continues
to increase.13 The wage and compensation pre-
Educational Attainment of the Manufacturing Workforce
Figure 3. Percent of Employment by Industry and Educational Attainment, 1994-2011
Source: ESA calculations using Current Population Survey public-use Merged Outgoing Rotation Group files, National Bureau of Economic Research.
30%
35%
40%
45%
50%
55%
60%
65%
70%
1994 1996 1998 2000 2002 2004 2006 2008 2010
High school diploma or less
Some college or college degree
ManufacturingPrivate nonmanufacturing
4 U.S. Department of Commerce, Economics and Statistics Administration
mium manufacturing workers enjoy relative to their
non-manufacturing peers also is tied to educational
attainment, as detailed below. On average, higher-
educated workers have a larger premium from
working in the manufacturing sector.
More generally, workers who drive innovation in
our economy earn a premium relative to their
peers in other industries or occupations. This inno-
vation premium has been discussed in a series of
earlier ESA reports published in 2011 about work-
ers in science, technology, engineering and mathe-
matics (STEM).
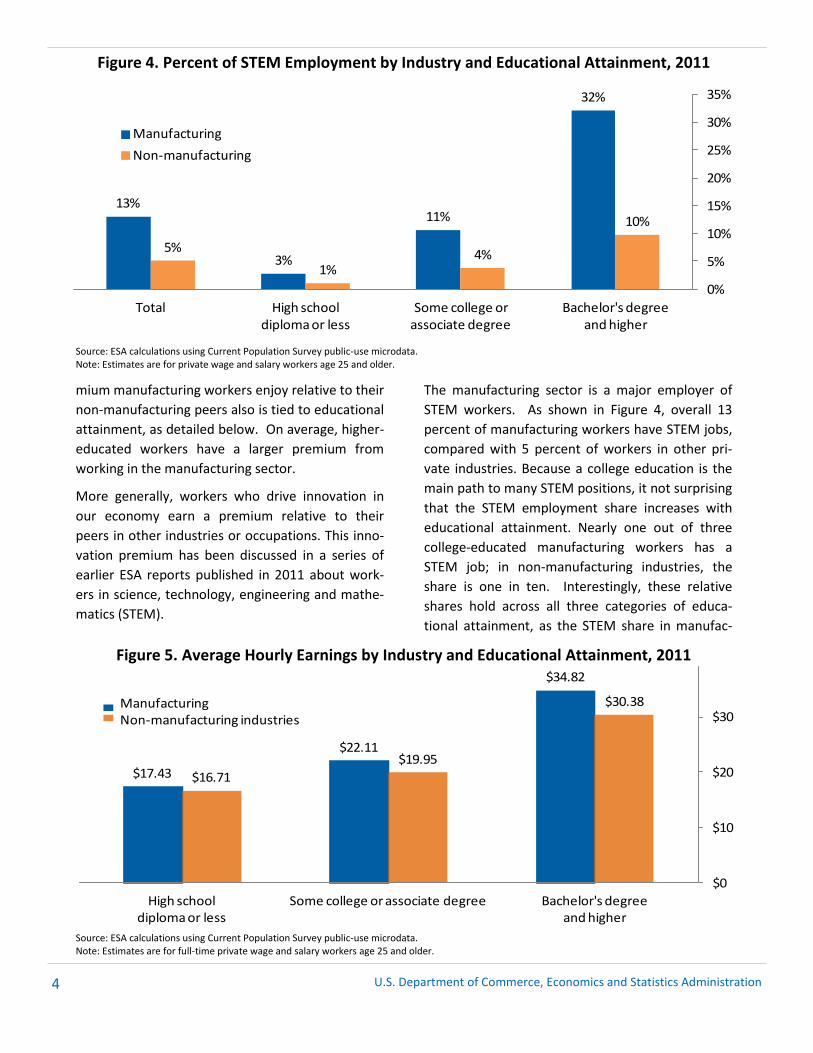
The manufacturing sector is a major employer of
STEM workers. As shown in Figure 4, overall 13
percent of manufacturing workers have STEM jobs,
compared with 5 percent of workers in other pri-
vate industries. Because a college education is the
main path to many STEM positions, it not surprising
that the STEM employment share increases with
educational attainment. Nearly one out of three
college-educated manufacturing workers has a
STEM job; in non-manufacturing industries, the
share is one in ten. Interestingly, these relative
shares hold across all three categories of educa-
tional attainment, as the STEM share in manufac-
Source: ESA calculations using Current Population Survey public-use microdata. Note: Estimates are for full-time private wage and salary workers age 25 and older.
Figure 4. Percent of STEM Employment by Industry and Educational Attainment, 2011
$17.43
$22.11
$34.82
$16.71
$19.95
$30.38
$0
$10
$20
$30
High school diploma or less
Some college or associate degree Bachelor's degree and higher
ManufacturingNon-manufacturing industries
Figure 5. Average Hourly Earnings by Industry and Educational Attainment, 2011
13%
3%
11%
32%
5%
1%4%
10%
0%
5%
10%
15%
20%
25%
30%
35%
Total High school diploma or less
Some college or associate degree
Bachelor's degree and higher
Manufacturing
Non-manufacturing
Source: ESA calculations using Current Population Survey public-use microdata. Note: Estimates are for private wage and salary workers age 25 and older.
5 U.S. Department of Commerce, Economics and Statistics Administration
turing is approximately three times higher than in
non-manufacturing industries.
Clearly, manufacturing jobs are attractive relative
to other industries. Yet, in order to quantify the
extent to which a wage premium really exists in
manufacturing, it is important to consider the ex-
tent to which factors such as educational attain-
ment, location, and job characteristics of workers
affect wages. In order to evaluate the influence of
these factors on wages, we used public-use micro-
data from the U.S. Census Bureau’s Current Popu-
lation Survey (CPS).14 As reflected in Figure 5, the
educational attainment of a given worker does
matter. The wage premium increases with educa-
tional attainment; the manufacturing earnings dif-
ferential is greatest for those with a bachelor’s de-
gree and higher who earned $34.82 per hour, or 15
percent more per hour than those in non-
manufacturing jobs with similar education levels.
In contrast, manufacturing workers with a high
school diploma or less earn about 4 percent more,
on average, than their counterparts in non-
manufacturing jobs.
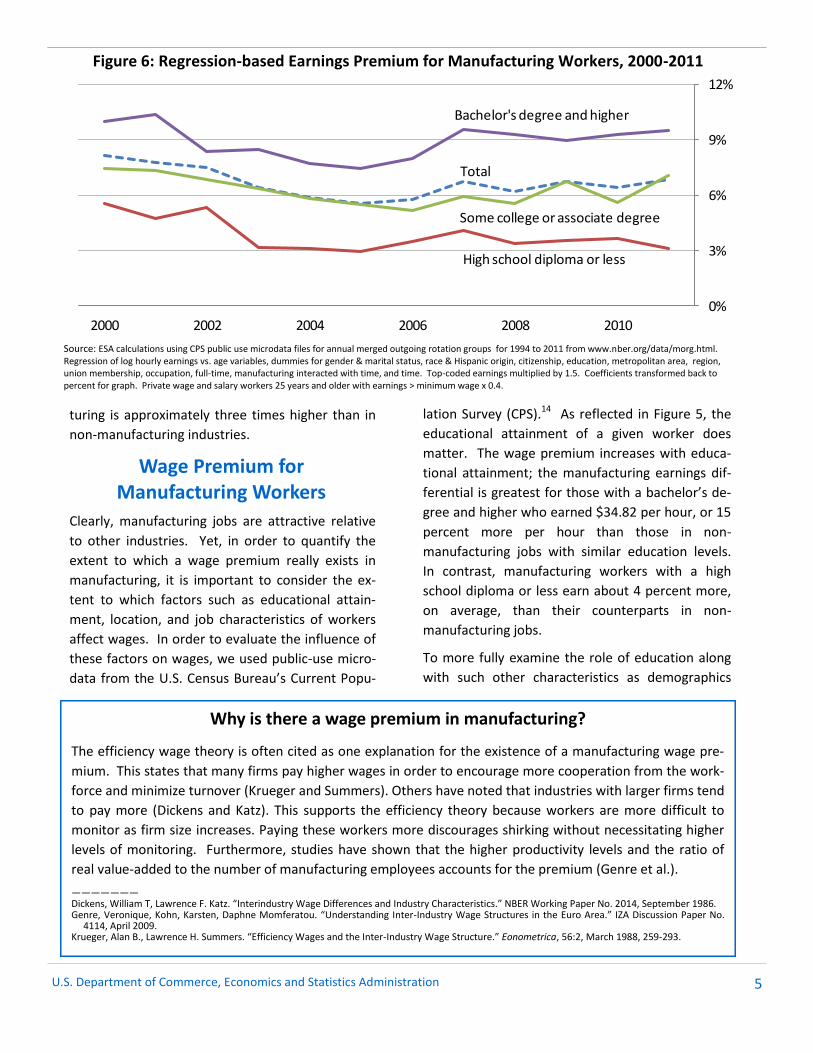
To more fully examine the role of education along
with such other characteristics as demographics
Figure 6: Regression-based Earnings Premium for Manufacturing Workers, 2000-2011
Source: ESA calculations using CPS public use microdata files for annual merged outgoing rotation groups for 1994 to 2011 from www.nber.org/data/morg.html. Regression of log hourly earnings vs. age variables, dummies for gender & marital status, race & Hispanic origin, citizenship, education, metropolitan area, region, union membership, occupation, full-time, manufacturing interacted with time, and time. Top-coded earnings multiplied by 1.5. Coefficients transformed back to percent for graph. Private wage and salary workers 25 years and older with earnings > minimum wage x 0.4.
Why is there a wage premium in manufacturing?
The efficiency wage theory is often cited as one explanation for the existence of a manufacturing wage pre-
mium. This states that many firms pay higher wages in order to encourage more cooperation from the work-
force and minimize turnover (Krueger and Summers). Others have noted that industries with larger firms tend
to pay more (Dickens and Katz). This supports the efficiency theory because workers are more difficult to
monitor as firm size increases. Paying these workers more discourages shirking without necessitating higher
levels of monitoring. Furthermore, studies have shown that the higher productivity levels and the ratio of
real value-added to the number of manufacturing employees accounts for the premium (Genre et al.).
——————— Dickens, William T, Lawrence F. Katz. “Interindustry Wage Differences and Industry Characteristics.” NBER Working Paper No. 2014, September 1986. Genre, Veronique, Kohn, Karsten, Daphne Momferatou. “Understanding Inter-Industry Wage Structures in the Euro Area.” IZA Discussion Paper No.
4114, April 2009. Krueger, Alan B., Lawrence H. Summers. “Efficiency Wages and the Inter-Industry Wage Structure.” Eonometrica, 56:2, March 1988, 259-293.
Wage Premium for Manufacturing Workers
0%
3%
6%
9%
12%
2000 2002 2004 2006 2008 2010
Bachelor's degree and higher
High school diploma or less
Some college or associate degree
Total
6 U.S. Department of Commerce, Economics and Statistics Administration
$15
$18
$21
$24
$27
$30
2000 2002 2004 2006 2008 2010
$3
$6
$9
2000 2002 2004 2006 2008 2010
Manufacturing hourly wages
Non-manufacturing hourly wages
Manufacturing hourly employer benefit contributions
Non-manufacturing hourly employer benefit contributions
and geographic location, we performed regression
analyses investigating the extent to which log
hourly earnings were explained by factors including
age, marital status, race, ethnicity, region, metro-
politan area status, union status, and occupation.15
After controlling for the impacts of this set of char-
acteristics, the manufacturing wage premium in
2011 was estimated to be 7 percent.16
As shown in Figure 6, the regression-adjusted
manufacturing premium rises with educational at-
tainment. The other result of note in Figure 6 is
that the manufacturing earnings premiums have
remained relatively constant for workers with a
bachelor’s or graduate degree, whose premium
ranged from 8 to 10 percent between 2000 and
2011.17 The premium earned by manufacturing
workers with some college or an associate’s degree
declined during the first half of the decade and
largely rebounded in the following years, reaching
7 percent in 2011. Workers with a high school di-
ploma or less saw the premium decline from about
6 percent in 2000 to 3 percent by 2005. Since then,
their premium has fluctuated between 3 and 4 per-
cent.
The monthly CPS does not collect information on
employer contributions to benefits; however, it is
possible to take into account these contributions by
using NIPA data on the share of total compensation
that corresponds to benefits (or “supplements to
wages and salaries” in NIPA jargon). These com-
pensation data highlight the increasingly important
role that benefits have played, particularly in manu-
facturing. Between 2000 and 2010, real hourly
compensation in manufacturing rose more rapidly
than in private non-manufacturing industries, 16
percent versus 11 percent. As shown in Figure 7,
the differential growth comes largely from the em-
ployer contributions to employee benefits, as the
10 percent growth in real wage and salary accruals
per full-time equivalent (FTE) in manufacturing
modestly exceeded the 8-percent non-
manufacturing growth. Benefit contributions per
manufacturing FTE climbed practically by half (48
percent) from 2000 to 2010, essentially double the
25 percent growth for non-manufacturing FTEs.
Following the lead of Krueger and Summers,18 the
NIPA data were used to calculate the ratio of total
compensation to wage and salary accruals by in-
Figure 7: Real Compensation per Hour by Private Industry, 2000-2010 in 2010 dollars
Source: ESA calculations using data from National Income and Product Accounts, Bureau of Economic Analysis. Note: Real compensation was calculated using the personal consumption expenditures price deflator.
Regression-adjusted Total Compensation Premium
7 U.S. Department of Commerce, Economics and Statistics Administration
dustry and year. These ratios were applied to the
CPS-based hourly wage estimates. The resulting
estimate of hourly total compensation can be used
to estimate the total compensation premium in
manufacturing.
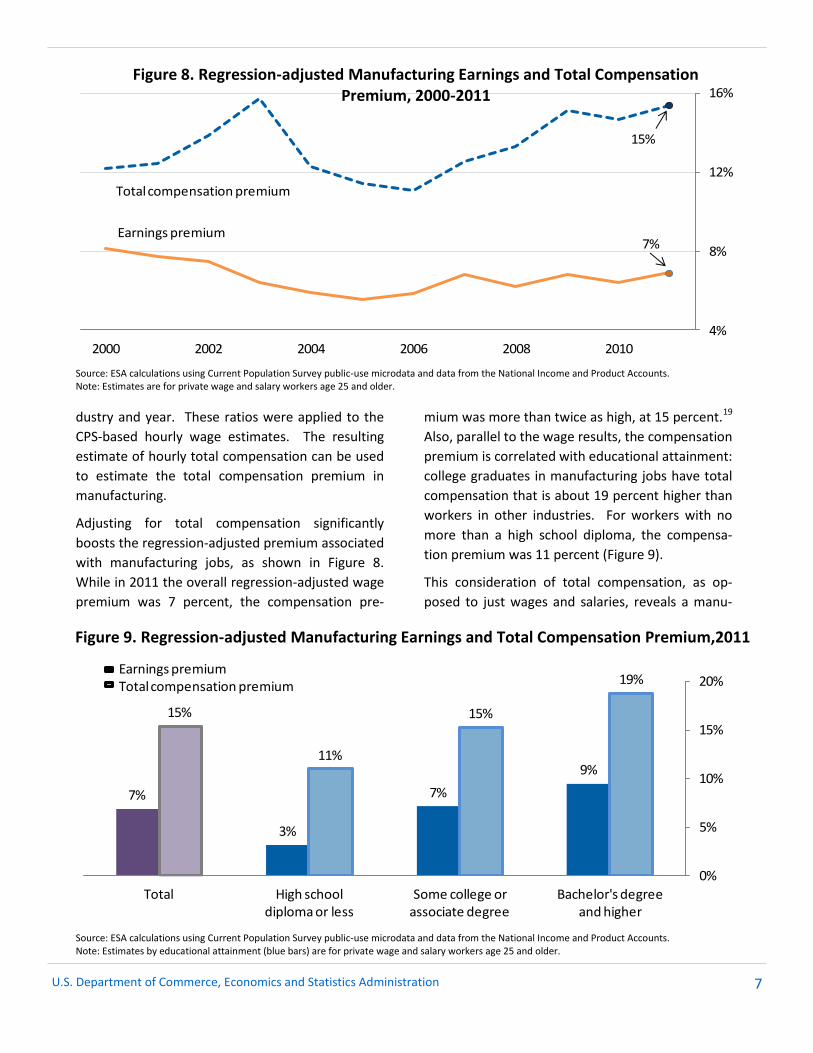
Adjusting for total compensation significantly
boosts the regression-adjusted premium associated
with manufacturing jobs, as shown in Figure 8.
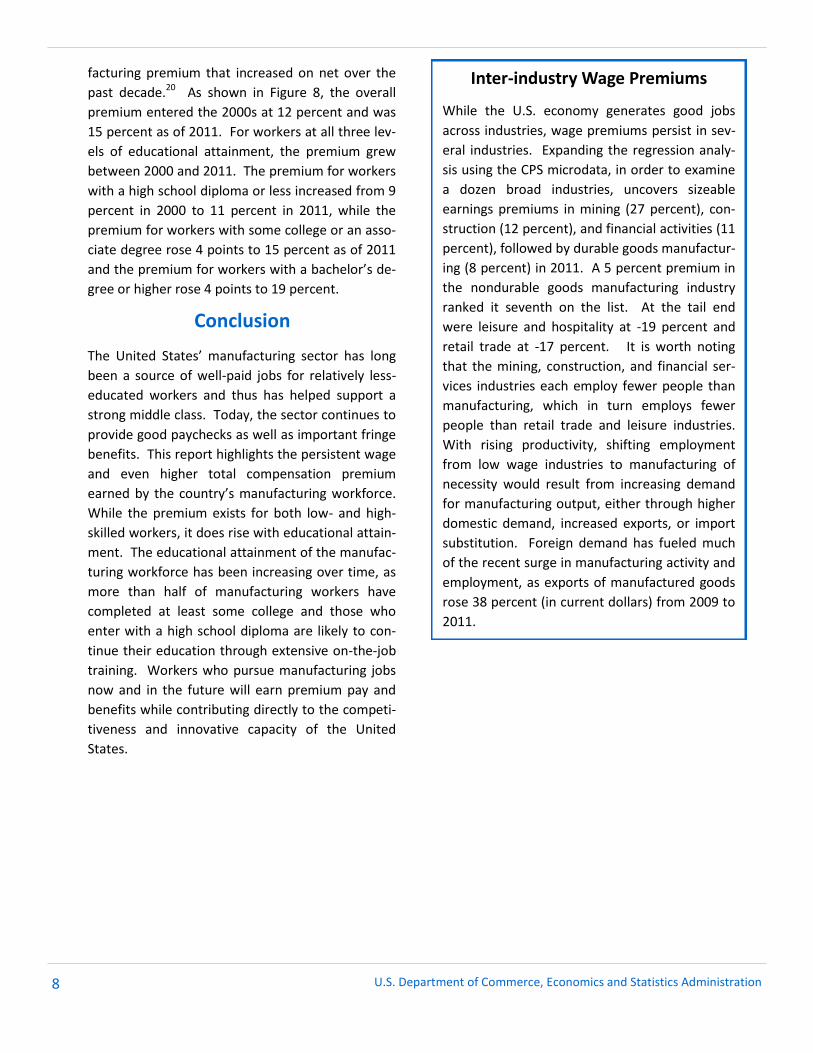
While in 2011 the overall regression-adjusted wage
premium was 7 percent, the compensation pre-
mium was more than twice as high, at 15 percent.19
Also, parallel to the wage results, the compensation
premium is correlated with educational attainment:
college graduates in manufacturing jobs have total
compensation that is about 19 percent higher than
workers in other industries. For workers with no
more than a high school diploma, the compensa-
tion premium was 11 percent (Figure 9).
This consideration of total compensation, as op-
posed to just wages and salaries, reveals a manu-
Source: ESA calculations using Current Population Survey public-use microdata and data from the National Income and Product Accounts. Note: Estimates are for private wage and salary workers age 25 and older.
Source: ESA calculations using Current Population Survey public-use microdata and data from the National Income and Product Accounts. Note: Estimates by educational attainment (blue bars) are for private wage and salary workers age 25 and older.
7%
3%
7%
9%
15%
11%
15%
19%
0%
5%
10%
15%
20%
Total High school diploma or less
Some college or associate degree
Bachelor's degree and higher
Earnings premiumTotal compensation premium
4%
8%
12%
16%
2000 2002 2004 2006 2008 2010
Earnings premium
Total compensation premium
7%
15%
Figure 9. Regression-adjusted Manufacturing Earnings and Total Compensation Premium,2011
Figure 8. Regression-adjusted Manufacturing Earnings and Total Compensation Premium, 2000-2011
8 U.S. Department of Commerce, Economics and Statistics Administration
facturing premium that increased on net over the
past decade.20 As shown in Figure 8, the overall
premium entered the 2000s at 12 percent and was
15 percent as of 2011. For workers at all three lev-
els of educational attainment, the premium grew
between 2000 and 2011. The premium for workers
with a high school diploma or less increased from 9
percent in 2000 to 11 percent in 2011, while the
premium for workers with some college or an asso-
ciate degree rose 4 points to 15 percent as of 2011
and the premium for workers with a bachelor’s de-
gree or higher rose 4 points to 19 percent.
The United States’ manufacturing sector has long
been a source of well-paid jobs for relatively less-
educated workers and thus has helped support a
strong middle class. Today, the sector continues to
provide good paychecks as well as important fringe
benefits. This report highlights the persistent wage
and even higher total compensation premium
earned by the country’s manufacturing workforce.
While the premium exists for both low- and high-
skilled workers, it does rise with educational attain-
ment. The educational attainment of the manufac-
turing workforce has been increasing over time, as
more than half of manufacturing workers have
completed at least some college and those who
enter with a high school diploma are likely to con-
tinue their education through extensive on-the-job
training. Workers who pursue manufacturing jobs
now and in the future will earn premium pay and
benefits while contributing directly to the competi-
tiveness and innovative capacity of the United
States.
Inter-industry Wage Premiums
While the U.S. economy generates good jobs
across industries, wage premiums persist in sev-
eral industries. Expanding the regression analy-
sis using the CPS microdata, in order to examine
a dozen broad industries, uncovers sizeable
earnings premiums in mining (27 percent), con-
struction (12 percent), and financial activities (11
percent), followed by durable goods manufactur-
ing (8 percent) in 2011. A 5 percent premium in
the nondurable goods manufacturing industry
ranked it seventh on the list. At the tail end
were leisure and hospitality at -19 percent and
retail trade at -17 percent. It is worth noting
that the mining, construction, and financial ser-
vices industries each employ fewer people than
manufacturing, which in turn employs fewer
people than retail trade and leisure industries.
With rising productivity, shifting employment
from low wage industries to manufacturing of
necessity would result from increasing demand
for manufacturing output, either through higher
domestic demand, increased exports, or import
substitution. Foreign demand has fueled much
of the recent surge in manufacturing activity and
employment, as exports of manufactured goods
rose 38 percent (in current dollars) from 2009 to
2011.
Conclusion
9 U.S. Department of Commerce, Economics and Statistics Administration
2011, hourly manufacturing wages and salaries were 9 percent higher than in non-manufacturing industries.
6“Service-providing industries” exclude the mining and construction industries and thus are a slightly more nar-row industry grouping than “non-manufacturing.” The National Compensation Survey data on benefit access are available for service-providing industries, but not the broader non-manufacturing grouping. Nevertheless, the general conclusions about the benefits access would be the same whether the comparison group is service-providing industries or non-manufacturing industries.
7Bureau of Labor Statistics, Employee Benefits Survey, Table 9. www.bls.gov/ncs/ebs/benefits/2011/
ownership/private/table05a.pdf. 8Bureau of Labor Statistics, Employee Benefits Survey, Table 2. www.bls.gov/ncs/ebs/benefits/2011/
ownership/private/table02a.pdf. 9Bureau of Labor Statistics, Employee Benefits Survey, Table 9. www.bls.gov/ncs/ebs/benefits/2011/
ownership/private/table05a.pdf. 10Bureau of Labor Statistics, Employee Benefits Survey, Table 11. www.bls.gov/ncs/ebs/benefits/2011/ownership/private/table06a.pdf.
11Bureau of Labor Statistics, Employee Benefits Survey, Table 16. www.bls.gov/ncs/ebs/benefits/2011/
ownership/private/table11a.pdf. 12It is important to highlight two caveats to the benefit contribution data. First, the data do not take into ac-count any intra-industry variation in the ratio of com-pensation to earnings, although it is likely that the ratio is correlated to workers’ occupation and union status, among other factors. Second, the compensation figures include not just the employer contributions for workers currently on payrolls, but also potentially to some retir-ees, such as those receiving employer-provided medical insurance. To the extent that manufacturing retirees are more likely than other workers to receive employer con-tributions, or more generous contributions, for their medical insurance premiums, then this adjustment could bias the manufacturing compensation premium up-wards. Estimates from the Medical Expenditure Panel Survey, which is one of the data sources for the NIPA compensation estimates, suggest that there would be little if any upward bias due to the availability of medical insurance. In fact, the estimates show that manufactur-ing and mining retirees (there are not separate manufac-turing estimates) are less likely than retirees from other industries to have access to medical insurance. In 2011, 7.9 percent of manufacturing and mining retirees age 65 and over and 8.4 percent under age 65 were offered insurance, compared to 10.9 percent of retires age 65
Endnotes
1Bureau of Labor Statistics, Current Employment Sta-tistics. www.bls.gov/ces.
2Bureau of Labor Statistics, Job Openings and Labor Turnover Survey. www.bls.gov/jlt.
3It is important to distinguish between job opportuni-ties and net job growth. While, the Bureau of Labor Statistics (BLS) recently projected essentially no net change in manufacturing employment between 2010 and 2020, millions of openings in the sector will arise in the coming years in order to replace workers who retire or otherwise leave manufacturing jobs. BLS projects such openings by occupational category, and it estimates that, for example, production occupa-tions (which are predominately in the manufacturing industry) will increase by 356,800 between 2010 and 2020, companies will actually need to fill more than 2.2 million openings over the decade. In short, manufacturing firms will continue to be a good source of good job opportunities. One factor poten-tially limiting the growth in manufacturing jobs is a mismatch between the skills needed for the jobs and the skills held by those looking for jobs. See, for ex-ample, “An economy that works: Job creation and America’s future,” Manyika et al., McKinsey Global Institute (June 2011).
4Bureau of Labor Statistics, “Job Openings and Labor Turnover—February 2012,” Table 3. www.bls.gov/news.release/pdf/jolts.pdf.
5This report draws heavily upon data from the Cur-rent Population Survey and the National Income and Product Accounts when comparing manufacturing and non-manufacturing earnings. These are just two of several potential sources of data on hourly em-ployee compensation by industry. While the multiple sources may differ somewhat in definitions, fre-quency, and statistical methodology, all show that on average manufacturing workers have higher earnings than workers in other private industries. The NIPA data cited in Figure 1 show that average hourly wages and salaries in manufacturing were 8 percent higher than in non-manufacturing industries in 2010. Cur-rent Population Survey data for the same time period show a 4 percent difference. Three other data sources from the Bureau of Labor Statistics are in the same ballpark. Monthly payroll survey (or Current Employment Statistics data) for 2010 have hourly manufacturing earnings 4 percent above non-manufacturing earnings, while Occupational Employ-ment Statistics program estimates show a 7 percent difference. According to unpublished estimates from the National Compensation Survey for September
10 U.S. Department of Commerce, Economics and Statistics Administration
The authors are economists in the Office of the Chief Economist of the U.S. Department of Commerce’s Economics and Statistics Administration.
Technical inquiries: Office of the Chief Economist
(202) 482-3523
Media inquiries: Office of Communications
(202) 482-3331
U.S. Department of Commerce
Economics and Statistics Administration
1401 Constitution Ave., NW
Washington, DC 20230
www.esa.doc.gov
and over and 11.7 percent of younger retirees in other industries. See Tables I.A.1, I.A.2.a, and I.A.2.e at http://meps.ahrq.gov/mepsweb/data_stats/quick_tables_search.jsp?component=2&subcomponent=1.
13One important factor that is not captured by the CPS is up-skilling through on-the-job training. A recently re-vised taxonomy of occupations by typical on-the-job training highlights the special importance this type of education has for manufacturing workers, particularly those in jobs whose typical entry-level education is a high school diploma. The BLS classifications indicate that 73 percent of the manufacturing jobs necessitate either moderate-term on-the-job training (1 to 12 months) and long-term on-the-job training (more than 12 months), more than double the share for jobs in non-manufacturing industries. The on-the-job training needs in manufacturing reflect in part the fact that a relatively high share (around 62 percent) of manufacturing jobs have a high school diploma as the entry requirement. Yet, even within occupations requiring a high school di-ploma, the ones that predominate in manufacturing are much more likely to provide on-the-job training. For more information see www.bls.gov/emp/ep_education_tech.htm. 14A basic comparison of CPS average hourly earnings estimates shows a raw manufacturing premium of 11.9 percent in 2011, similar to the 13.8 percent raw pre-mium derived from the NCS.
15More specifically, the earnings regressions control for age (up to a fourth degree polynomial of age), gender, marital status, race and Hispanic origin, nativity and citi-zenship, educational attainment, metropolitan area, region, union representation, major industry, occupa-tion, time, and manufacturing / non-manufacturing dummy interacted with time.
16Consistent with the earnings estimates by educational attainment shown in Figure 3, this wage premium esti-mate is for private wage and salary workers age 25 and over. The wage premium for workers age 16 and over was 7.3 percent in 2011.
17It does turn out, however, that the regression-adjusted earnings premiums for workers with specific levels of educational attainment are somewhat smaller than the raw premiums. These results highlight the value of re-gression adjustments, as raw comparisons cannot cap-ture the differential effect that other factors may have on specific groups of workers. For example, unionization (defined as being a union member or covered by a union contract) has a positive association with earnings, but more so for workers with lower educational attainment.
18Krueger and Summers “Efficiency Wages and the Inter-Industry Wage Structure,” 1988, 266-7.
19Because 2011 NIPA data on compensation by industry are not yet available, the 2010 ratios were applied to the 2011 estimates of hourly earnings.
20Payments to defined-benefit pension plans are a rela-tively volatile component of overall employer contribu-tions to benefits. The 2003 uptick in the manufacturing wage premium in Figure 7 and manufacturing benefit contributions per full-time-equivalent employee in Fig-ure 5 reflect catch-up contributions to pension funds among a few large durable goods manufacturers.