The Basics Chapter 5: Chart Window - User Guide - CQG
108
The Basics Chapter 5: Chart Window User Guide CQG Client Version 7x1 Information in this document is subject to change without notice. No part of this document may be reproduced in any form or by any means, electronic or mechanical, for any purpose without the written permission of CQG, Inc. Information in this document refers to Release 7x1 of CQG software. Your features may vary, depending on your installed release.
-
Upload
khangminh22 -
Category
Documents
-
view
5 -
download
0
Transcript of The Basics Chapter 5: Chart Window - User Guide - CQG
The Basics Chapter 5: Chart Window
User Guide
CQG Client Version 7x1
Information in this document is subject to change without notice. No part of this document may be reproduced in any form or by any means, electronic or mechanical, for any purpose without the written permission of CQG, Inc. Information in this document refers to Release 7x1 of CQG software. Your features may vary, depending on your installed release.
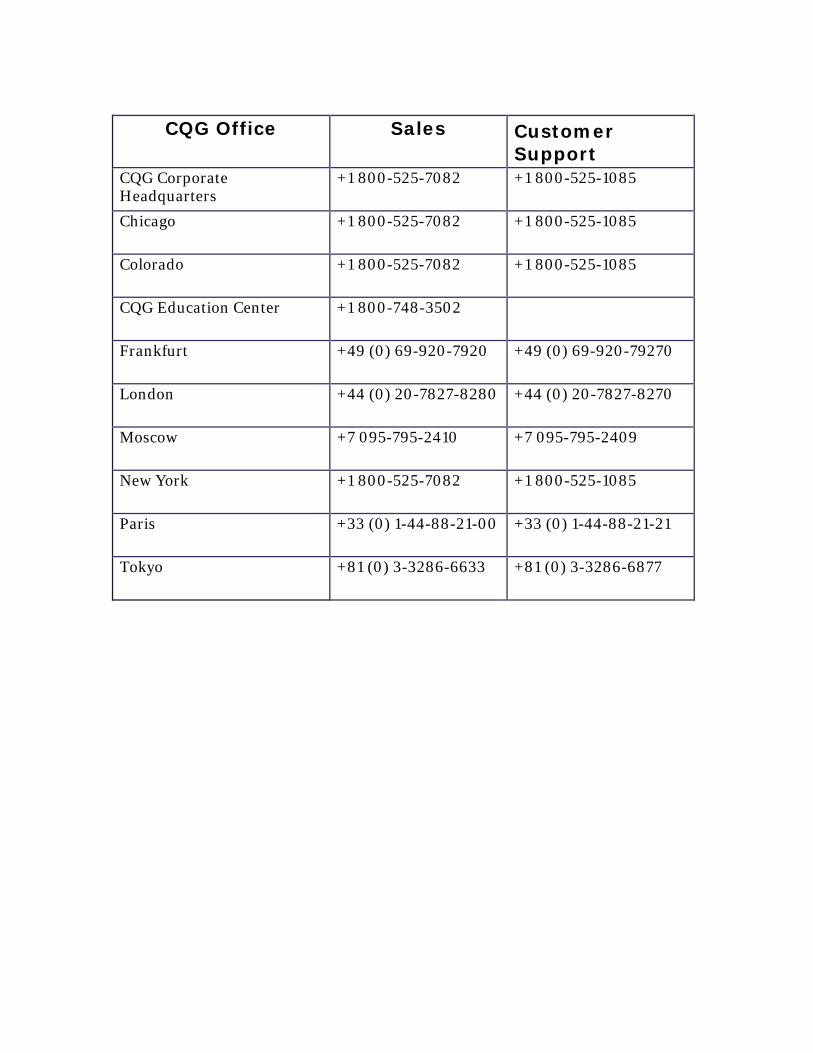
CQG Office Sales Customer
Support CQG Corporate Headquarters
+1 800-525-7082 +1 800-525-1085
Chicago +1 800-525-7082 +1 800-525-1085
Colorado +1 800-525-7082 +1 800-525-1085
CQG Education Center +1 800-748-3502
Frankfurt +49 (0) 69-920-7920 +49 (0) 69-920-79270
London +44 (0) 20-7827-8280 +44 (0) 20-7827-8270
Moscow +7 095-795-2410 +7 095-795-2409
New York +1 800-525-7082 +1 800-525-1085
Paris +33 (0) 1-44-88-21-00 +33 (0) 1-44-88-21-21
Tokyo +81 (0) 3-3286-6633 +81 (0) 3-3286-6877
Contents INTRODUCTION .......................................................................................................................................................... 1-1
USING CQG DOCUMENTATION ..................................................................................................................................... 1-1 UNDERSTANDING MOUSE TERMINOLOGY ..................................................................................................................... 1-1 UNDERSTANDING KEYBOARD TERMINOLOGY............................................................................................................... 1-2 UNDERSTANDING WINDOW TERMINOLOGY .................................................................................................................. 1-3 LOGGING INTO CQG ..................................................................................................................................................... 1-3
Changing Your Password ......................................................................................................................................... 1-4 Letting the System Remember Your Password.......................................................................................................... 1-5
CQG ADVISOR.............................................................................................................................................................. 1-6 USING THE CQG ADVISOR............................................................................................................................................ 1-6
Using the Advisor Button.......................................................................................................................................... 1-7 Using the Advisor Search Dialog ............................................................................................................................. 1-8 Using the Advisor Pointer ........................................................................................................................................ 1-9 Using the [F1] Key ................................................................................................................................................... 1-9
FINDING A SYMBOL....................................................................................................................................................... 1-9 Using the Find Dialog .............................................................................................................................................. 1-9 Using the CQG Advisor .......................................................................................................................................... 1-11
ENTERING SYMBOLS IN CQG ...................................................................................................................................... 1-11 For a Futures Contract........................................................................................................................................... 1-11 For Other Financial Instruments............................................................................................................................ 1-12
THE SELECT COLORS DIALOG ..................................................................................................................................... 1-14 The Color Palette.................................................................................................................................................... 1-15 Using the Select…Colors Dialog............................................................................................................................ 1-15
THE MAIN CQG WINDOW......................................................................................................................................... 2-1 VIEWING THE MAIN CQG WINDOW.............................................................................................................................. 2-1 WHAT IS A CLEAN PAGE................................................................................................................................................ 2-2 USING THE CQG TITLE BAR.......................................................................................................................................... 2-2
Using the Control Menu Button on the CQG Title Bar ............................................................................................ 2-3 Using the Minimize Button ....................................................................................................................................... 2-5 CQG Button on the Task Bar.................................................................................................................................... 2-5 The Supervisor and Nets Core Buttons on the Task Bar........................................................................................... 2-5 Using the Maximize Button....................................................................................................................................... 2-5 Using the Restore Button .......................................................................................................................................... 2-5 Using the Close Button ............................................................................................................................................. 2-5
USING THE CQG ICON IN THE SYSTEM TRAY................................................................................................................ 2-6 CQG Button on the Task Bar................................................................................................................................... 2-6 The Supervisor & Data line Buttons on the Task Bar............................................................................................... 2-6
THE APPLICATION WINDOW.......................................................................................................................................... 2-7 The Application Window Title Bar ........................................................................................................................... 2-7 Arranging Application Windows .............................................................................................................................. 2-7 Using the Control Menu Button on the Application Title Bar .................................................................................. 2-7 Selected Window is In Current Page, Not Maximized or Minimized........................................................................ 2-8 Selected Window is Out of Current Page, Not Maximized or Minimized ............................................................... 2-10 Selected Window is In the Current Page, and Minimized....................................................................................... 2-11 Selected Window is Out of Current Page, and Minimized...................................................................................... 2-11 Selected Window is In Current Page, and Maximized............................................................................................ 2-12
USING THE SETUP BUTTON.......................................................................................................................................... 2-13 USING THE PRINT BUTTON .......................................................................................................................................... 2-14
Printing to the Clipboard........................................................................................................................................ 2-14 CHANGING THE LOOK OF AN APPLICATION WINDOW.................................................................................................. 2-15
The Basics Contents • i
CUSTOMIZING TOOLBARS............................................................................................................................................ 2-16 Displaying the Toolbar Manager Dialog ............................................................................................................... 2-16 Using the Toolbar Manager Dialog ....................................................................................................................... 2-17 Selecting which Buttons appear on the Toolbar ..................................................................................................... 2-21 Selecting a Font for the Toolbar buttons ................................................................................................................ 2-21 Selecting a Button Color......................................................................................................................................... 2-21 The Sorted Checkbox .............................................................................................................................................. 2-22 Selecting a Location for the Toolbars..................................................................................................................... 2-22 Showing and Hiding the Toolbars .......................................................................................................................... 2-22
USING THE APPLICATION TOOLBAR ............................................................................................................................ 2-22 The Application Toolbar Buttons............................................................................................................................ 2-24 Toolbar Button Behavior ........................................................................................................................................ 2-25 Using the More Button............................................................................................................................................ 2-26 Using the Active Window's Buttons ........................................................................................................................ 2-26
USING THE PAGE TOOLBAR ......................................................................................................................................... 2-27 Using the Page Button ............................................................................................................................................ 2-27 Saving Pages........................................................................................................................................................... 2-29 Using the Display Page dialog ............................................................................................................................... 2-31 Deleting Pages........................................................................................................................................................ 2-32 Renaming Pages ..................................................................................................................................................... 2-33 Ordering the Pages for Cycling.............................................................................................................................. 2-33
USING THE PAGE PREFERENCES DIALOG FOR SAVING PAGES ..................................................................................... 2-34 Selecting pages for the cycle list............................................................................................................................. 2-35 Using the Page Selector.......................................................................................................................................... 2-37 Using the +\-Button ............................................................................................................................................... 2-37 Using the Prv Button .............................................................................................................................................. 2-37 Using the Nxt Button............................................................................................................................................... 2-37 Using the Ctrl Keyboard Button ............................................................................................................................. 2-38 Using Customized Page Buttons............................................................................................................................. 2-38 Customizing the Page Toolbar ............................................................................................................................... 2-38
THE SYSTEM MONITOR TOOLBAR ............................................................................................................................... 2-39 Using the CPU Button ............................................................................................................................................ 2-39 Using the Data Button ............................................................................................................................................ 2-39
USING THE SYSTEM TOOLBAR BUTTONS..................................................................................................................... 2-39 Using the System Button ......................................................................................................................................... 2-40 Setting Data Characteristics................................................................................................................................... 2-43
SETTING SYSTEM PREFERENCES.................................................................................................................................. 2-44 Using the Symbol Tab............................................................................................................................................. 2-45 Using the Time Tab in the CQG For Windows Preferences Dialog....................................................................... 2-46 Using the Display Tab ............................................................................................................................................ 2-47 Using the Limits Tab............................................................................................................................................... 2-48 Using the Misc Tab................................................................................................................................................. 2-49 Using the Window Button ....................................................................................................................................... 2-50 Using Auto Backup ................................................................................................................................................. 2-51
USING THE IMPORT/EXPORT FEATURE ........................................................................................................................ 2-54 Exporting Setups..................................................................................................................................................... 2-54 Using the Import Feature ....................................................................................................................................... 2-59 Using the Check Dependencies Dialog................................................................................................................... 2-63 Using the Import Pac - Overwrite Components...................................................................................................... 2-63 The Import Pac - Successful Dialog ....................................................................................................................... 2-64
USING THE EXIT BUTTON ............................................................................................................................................ 2-65 USING THE CQG ADVISOR.......................................................................................................................................... 2-65 USING THE UTILITY TOOLBAR BUTTONS..................................................................................................................... 2-66
Using the Symbols or Find Button.......................................................................................................................... 2-67 Using the Formula Button ...................................................................................................................................... 2-68 Using the Refresh Button ........................................................................................................................................ 2-68
ii • Contents The Basics
USING THE WINDOW SIZING BUTTONS........................................................................................................................ 2-69 CREATING MACROS .................................................................................................................................................... 2-69 THE STATUS BAR ........................................................................................................................................................ 2-70
Displaying and Hiding the Status Bar .................................................................................................................... 2-70 Elements of the Status Bar...................................................................................................................................... 2-70
THE STATUS WINDOW.............................................................................................................................................. 3-1 WHAT IS THE STATUS WINDOW .................................................................................................................................... 3-1 ADDING A STATUS WINDOW WITH THE STATUS BUTTON.............................................................................................. 3-2 THE STATUS TOOLBAR.................................................................................................................................................. 3-3 THE SYSTEM STATUS WINDOW..................................................................................................................................... 3-4
Information included in the System Status Window.................................................................................................. 3-5 MISSING SERVICES REPORT WINDOW ........................................................................................................................... 3-6 THE RESOURCES STATUS WINDOW............................................................................................................................... 3-7
Information Included in the Resources Status Window ............................................................................................ 3-8 Information included in the Resources Status window (cont'd.)............................................................................... 3-9
THE ENABLEMENTS WINDOW ..................................................................................................................................... 3-10 Among the Items Included in the Enablements Dialog ........................................................................................... 3-11
BASIC SERVICES WINDOW .......................................................................................................................................... 3-11 No Charge Services Items....................................................................................................................................... 3-12
OPTIONAL SERVICES LIST ........................................................................................................................................... 3-13 Information Included in Optional Services............................................................................................................. 3-13
THE ENABLEMENT TITLES DIALOG ............................................................................................................................. 3-14 NORTH AMERICAN EXCHANGES OFFERED BY CQG .................................................................................................... 3-15
North American Exchanges Currently Quoted in CQG.......................................................................................... 3-15 WORLD EXCHANGES OFFERED BY CQG...................................................................................................................... 3-16
Non-North American Exchanges Currently Quoted in CQG.................................................................................. 3-16 NEWS SERVICES AVAILABLE IN CQG ......................................................................................................................... 3-17
News Services Available in CQG............................................................................................................................ 3-17 DELAYED QUOTES OFFERED IN CQG .......................................................................................................................... 3-18
Delayed quotes offered by CQG ............................................................................................................................ 3-18 PRINTING A STATUS WINDOW..................................................................................................................................... 3-20
Printing to the Clipboard........................................................................................................................................ 3-21 Using the Print Setup Command ............................................................................................................................ 3-22 Black on White Printing.......................................................................................................................................... 3-22
THE CONTRACT SPECIFICATIONS WINDOW.................................................................................................... 4-1 CONTRACT SPECIFICATIONS IN CQG............................................................................................................................. 4-1 ADDING A CSPEC WINDOW WITH A CSPEC BUTTON ..................................................................................................... 4-3 THE CSPEC TOOLBAR.................................................................................................................................................... 4-3 ELEMENTS OF THE CSPEC DISPLAY............................................................................................................................... 4-4 SELECTING AN INSTRUMENT AND EXCHANGE............................................................................................................... 4-4
Instrument Selectors ................................................................................................................................................. 4-4 The Forward & Back button..................................................................................................................................... 4-4 Using the Find Button............................................................................................................................................... 4-5 Using the CQG Advisor to Locate Symbols.............................................................................................................. 4-5
DATA IN CSPEC............................................................................................................................................................. 4-5 THE FUTURES TAB ........................................................................................................................................................ 4-6
Instrument Symbol List and Names .......................................................................................................................... 4-6 Properties Section..................................................................................................................................................... 4-7 Trading Hours Section For....................................................................................................................................... 4-7 Details Area.............................................................................................................................................................. 4-7 Notes Area ................................................................................................................................................................ 4-7
THE CASH TAB.............................................................................................................................................................. 4-8 Instrument symbol drop-down list and Names.......................................................................................................... 4-8 Trading Hours Section.............................................................................................................................................. 4-9
The Basics Contents • iii
THE CURRENCIES TAB................................................................................................................................................... 4-9 Instrument symbol drop-down list and Names........................................................................................................ 4-10 Properties Box ........................................................................................................................................................ 4-10 Trading Hours Section............................................................................................................................................ 4-10 Details Area............................................................................................................................................................ 4-10 Notes Area .............................................................................................................................................................. 4-10
THE INDICES TAB ........................................................................................................................................................ 4-11 Instrument symbol drop-down list and Names........................................................................................................ 4-11 Properties Box ........................................................................................................................................................ 4-11 Trading Hours Section............................................................................................................................................ 4-12 Details Area............................................................................................................................................................ 4-12 Notes Area .............................................................................................................................................................. 4-12
THE REPORTS TAB ...................................................................................................................................................... 4-13 Instrument symbol drop-down list and Names........................................................................................................ 4-13 Data Sources drop-down list and Names................................................................................................................ 4-13 Properties Box ........................................................................................................................................................ 4-14 Trading Hours Section............................................................................................................................................ 4-14 Details Area............................................................................................................................................................ 4-14 Notes Area .............................................................................................................................................................. 4-14
THE STOCKS TAB ........................................................................................................................................................ 4-15 Properties Box ........................................................................................................................................................ 4-16 Trading Hours Section............................................................................................................................................ 4-16 Details Area............................................................................................................................................................ 4-16 Notes Area .............................................................................................................................................................. 4-16
THE TREASURIES TAB ................................................................................................................................................. 4-17 Instrument symbol drop-down list and Names........................................................................................................ 4-17 Properties Section................................................................................................................................................... 4-18 Trading Hours Section............................................................................................................................................ 4-18 Details and Notes Sections ..................................................................................................................................... 4-18
SELECTING THE ELEMENTS DISPLAYED ...................................................................................................................... 4-19 SIZING THE WINDOW TO FIT........................................................................................................................................ 4-20 VIEWING CSPEC DATABASE INFORMATION ................................................................................................................ 4-20 UPDATING THE DATABASE TEMPLATE ........................................................................................................................ 4-21 RETRIEVING THE LATEST DOWNLOAD ........................................................................................................................ 4-21 SWITCHING FROM THE OPTIONS TO THE UNDERLYING ................................................................................................ 4-21 SWITCHING FROM THE UNDERLYING TO THE OPTIONS ................................................................................................ 4-22 LAUNCHING A CHART FROM CSPEC ............................................................................................................................ 4-22 PRINTING A CONTRACT SPECIFICATIONS WINDOW ..................................................................................................... 4-23
Printing to the Clipboard........................................................................................................................................ 4-24 Using the Print Setup Command ............................................................................................................................ 4-25 Printing the Current Page ...................................................................................................................................... 4-25
SAVING A CSPEC WINDOW TO A PAGE........................................................................................................................ 4-26 THE CHART WINDOW............................................................................................................................................... 5-1
CHARTS IN CQG............................................................................................................................................................ 5-1 ADDING A CHART WITH THE CHART BUTTON ............................................................................................................... 5-2 LAUNCHING CHARTS FROM WITHIN OTHER CQG APPLICATIONS................................................................................. 5-2 OVERLAYING ONE CHART ON ANOTHER....................................................................................................................... 5-2 THE CHART TOOLBAR ................................................................................................................................................... 5-3
Chart Control Buttons that can be added to the Chart Toolbar ............................................................................... 5-4 General Classes of Buttons that can be added to the Chart Toolbar ....................................................................... 5-5
ENTERING COMMANDS.................................................................................................................................................. 5-6 Using a toolbar button to enter commands............................................................................................................... 5-6
ENTERING SYMBOLS IN CQG ........................................................................................................................................ 5-7 For a Futures Contract............................................................................................................................................. 5-7 For Other Financial Instruments.............................................................................................................................. 5-8
iv • Contents The Basics
Methods for Finding a Symbol................................................................................................................................ 5-11 Using Portfolio Navigator ...................................................................................................................................... 5-13
CHANGING THE TIME INTERVAL OF A CHART.............................................................................................................. 5-15 Using a Command Entry to Change the Time Interval........................................................................................... 5-15 Using the Intraday Button to Change Time Intervals ............................................................................................. 5-16 Using the Historical Button to Change Time Intervals........................................................................................... 5-16
SELECTING CHART PREFERENCES ............................................................................................................................... 5-17 SELECTING CHART SESSIONS ...................................................................................................................................... 5-18
Pre-Defined Sessions in CQG................................................................................................................................. 5-19 Creating a Custom Session..................................................................................................................................... 5-22 Setting Defaults for Custom Charts ........................................................................................................................ 5-26 Adding Component Information to a User-Created Session................................................................................... 5-27
SELECTING CONTINUATION CHARACTERISTICS........................................................................................................... 5-28 Changing Continuation Chart Settings................................................................................................................... 5-29
USING COMMANDS TO DISPLAY CONTINUATION CHARTS........................................................................................... 5-31 For Intraday Continuation Charts.......................................................................................................................... 5-31 For Historical Continuation Charts ....................................................................................................................... 5-31
DISPLAYING BOND CONTINUATION CHARTS............................................................................................................... 5-34 SELECTING THE ELEMENTS DISPLAYED ON A CHART.................................................................................................. 5-35 SELECTING CONTRIBUTOR DATA ................................................................................................................................ 5-36
CQG Data Contributors ......................................................................................................................................... 5-37 CQG Data Contributors (cont'd.) ........................................................................................................................... 5-38
DISPLAYING INFORMATION BASED ON VOLUME ......................................................................................................... 5-39 CHANGING THE CHART GRIDS..................................................................................................................................... 5-40 CHANGING CHART LABELS AND VALUES.................................................................................................................... 5-42
The Daily Value Box............................................................................................................................................... 5-43 The Cursor Value Box ............................................................................................................................................ 5-44 Applying the Selections........................................................................................................................................... 5-45
SETTING MISCELLANEOUS CHART CHARACTERISTICS ................................................................................................ 5-45 USING STUDIES IN A CHART WINDOW......................................................................................................................... 5-48
Using the Add Study Dialog ................................................................................................................................... 5-50 Using an Individual Study Button........................................................................................................................... 5-51 Adding a Study without the Study Button................................................................................................................ 5-52 Modifying Study Parameters in a Chart ................................................................................................................. 5-54 Removing a Study from a Chart.............................................................................................................................. 5-56 Setting the Study Recalculation Mode .................................................................................................................... 5-58 Setting the Recalculation Mode at Login................................................................................................................ 5-60 Setting the Chart Type Parameters......................................................................................................................... 5-61
DISPLAYING USER-DEFINED CONDITIONS ON A CHART .............................................................................................. 5-63 Defining a Condition .............................................................................................................................................. 5-63 Displaying the Condition on a Chart...................................................................................................................... 5-64
ADDING A POINTER TOOL TO A CHART ....................................................................................................................... 5-65 Maximum Number of Pointer Tools that can be added to a Chart ......................................................................... 5-66 Using the Magnet Button ........................................................................................................................................ 5-68
CHANGING THE TYPE OF CHART DISPLAYED .............................................................................................................. 5-68 USING CHARTS AND STUDIES IN TRAINING MODE ...................................................................................................... 5-69 VIEWING MOUSE TEXT ............................................................................................................................................... 5-70 VIEWING THE TIME SCALE .......................................................................................................................................... 5-71
Using the Calendar to Move the Chart Display ..................................................................................................... 5-73 USING CURSORS ON A CHART ..................................................................................................................................... 5-74
Using the Vertical Cursor....................................................................................................................................... 5-74 Using the Horizontal Cursor on a Chart ................................................................................................................ 5-75 Using a Cross Hair Cursor on a Chart .................................................................................................................. 5-76 Modifying the Appearance of the Cursors .............................................................................................................. 5-77 Moving the Cursor Value Box ................................................................................................................................ 5-78 Displaying the Cursor Value Menu ........................................................................................................................ 5-78
The Basics Contents • v
VIEWING THE PRICE/VALUE SCALE............................................................................................................................. 5-78 DISPLAYING THE PRICE/VALUE SCALE MENU............................................................................................................. 5-79 SCROLLING THE DATA IN A CHART ............................................................................................................................. 5-79
Using the Right / Left Button .................................................................................................................................. 5-80 Using the Red Warning Arrows .............................................................................................................................. 5-80 Using the Up / Down Button................................................................................................................................... 5-80 Using the AnaLock Button ...................................................................................................................................... 5-81 Using Fine Scrolling............................................................................................................................................... 5-81 Scrolling by Dragging ............................................................................................................................................ 5-81
MAINTAINING A RIGHT MARGIN ................................................................................................................................. 5-81 CHANGING THE AMOUNT OF DATA DISPLAYED IN A CHART....................................................................................... 5-82
Using the Time Compress / Expand Button ............................................................................................................ 5-82 Using the Price Compress / Expand Button ........................................................................................................... 5-82
USING THE CQG ZOOM FEATURE ............................................................................................................................... 5-83 Zooming in on a Chart View................................................................................................................................... 5-83 Zooming out of a Chart View.................................................................................................................................. 5-83 Returning to the Zoomed in View ........................................................................................................................... 5-84
RESETTING A CHART TO DEFAULT SCALING ............................................................................................................... 5-84 CHANGING THE FONTS IN A CHART WINDOW ............................................................................................................. 5-85
Displaying the Fonts Dialog................................................................................................................................... 5-85 Using the Fonts Dialog........................................................................................................................................... 5-86
THE CHART COLOR DIALOG........................................................................................................................................ 5-87 Displaying the Select… Colors Dialog ................................................................................................................... 5-87 The Color Palette.................................................................................................................................................... 5-88 Using the Select…Colors Dialog............................................................................................................................ 5-89
PRINTING A CHART WINDOW ...................................................................................................................................... 5-90 Printing to the Clipboard........................................................................................................................................ 5-92 Using the Print Setup Command ............................................................................................................................ 5-93 Printing the Current Page ...................................................................................................................................... 5-93 Black on White Printing.......................................................................................................................................... 5-94 Hi Resolution Print ................................................................................................................................................. 5-94 Printing a Portfolio ................................................................................................................................................ 5-95 Auto Print Manager................................................................................................................................................ 5-96 Printing a Tabular Display of Chart Data ............................................................................................................. 5-97
SAVING A CHART WINDOW TO A PAGE ....................................................................................................................... 5-98 THE TIME & SALES WINDOW................................................................................................................................. 6-1
WHAT IS THE TIME & SALES WINDOW.......................................................................................................................... 6-1 ADDING A TIME & SALES WINDOW WITH THE T&S BUTTON ....................................................................................... 6-2 USING THE TIME & SALES TOOLBAR ............................................................................................................................ 6-2 ENTERING COMMANDS.................................................................................................................................................. 6-3 ENTERING SYMBOLS IN CQG ........................................................................................................................................ 6-3
For a Futures Contract............................................................................................................................................. 6-3 For Other Financial Instruments.............................................................................................................................. 6-4 Methods for Finding a Symbol.................................................................................................................................. 6-6
UNDERSTANDING THE TIME AND SALES WINDOW ........................................................................................................ 6-9 Indicating Bad Ticks ............................................................................................................................................... 6-10 Indicating Missing Ticks......................................................................................................................................... 6-10 Displaying the Time & Sales Time ......................................................................................................................... 6-10
SETTING THE TIME AND SALES PREFERENCES............................................................................................................. 6-11 Using the Time and Sales Preferences Dialog ....................................................................................................... 6-12 Using the Time and Sales Preferences Dialog (cont'd.) ......................................................................................... 6-13
RESEQUENCING INSERTED PRICES............................................................................................................................... 6-13 DISPLAYING THE VOLUME IN A TIME AND SALES WINDOW ........................................................................................ 6-14 DISPLAYING THE CUMULATIVE VOLUME IN A TIME AND SALES WINDOW.................................................................. 6-15 VIEWING CQG DATA CONTRIBUTORS ........................................................................................................................ 6-16
vi • Contents The Basics
SELECTING THE AMOUNT OF PRICE DATA DISPLAYED IN A TIME AND SALES WINDOW ............................................. 6-16 Displaying Bids, Asks and Trades .......................................................................................................................... 6-16 Displaying Only Trades.......................................................................................................................................... 6-17 Displaying Only Corrections .................................................................................................................................. 6-17
DISPLAYING MINUTES WITHOUT ACTIVITY ................................................................................................................ 6-17 INDICATING THE AMOUNT OF TICK DATA TO BE SAVED (SERVERS ONLY)................................................................. 6-17
Confirming Tick Storage Reduction ....................................................................................................................... 6-18 DISPLAYING TIME & SALES FOR A SPECIFIC TIME ...................................................................................................... 6-18
Using a Command Entry to Change the Reference Time ....................................................................................... 6-18 Using the Goto... Dialog to Change the Reference Time........................................................................................ 6-19 Moving Through Time & Sales Using the Vertical Scrollbar................................................................................. 6-20 Moving Through Time & Sales Using Keyboard Buttons....................................................................................... 6-20
SYNCHRONIZING TIME AND SALES TO A CHART.......................................................................................................... 6-21 CHANGING THE FONTS IN A TIME AND SALES WINDOW.............................................................................................. 6-22
Displaying the Fonts Dialog................................................................................................................................... 6-22 Using the Fonts Dialog........................................................................................................................................... 6-23
THE TIME & SALES COLOR DIALOG............................................................................................................................ 6-24 Displaying the Select...Colors Dialog..................................................................................................................... 6-24 The Color Palette.................................................................................................................................................... 6-25 Using the Select...Colors Dialog ............................................................................................................................ 6-26
PRINTING A TIME AND SALES WINDOW....................................................................................................................... 6-28 Printing to the Clipboard........................................................................................................................................ 6-29 Using the Print Setup Command ............................................................................................................................ 6-29 Printing the Current Page ...................................................................................................................................... 6-30 Black on White Printing.......................................................................................................................................... 6-30
SAVING A TIME AND SALES WINDOW TO A PAGE........................................................................................................ 6-30 THE NEWS WINDOW.................................................................................................................................................. 7-1
NEWS IN CQG ............................................................................................................................................................... 7-1 NEWS HEADLINES IN CQG............................................................................................................................................ 7-1 ADDING A NEWS HEADLINES WINDOW WITH THE NEWS BUTTON ................................................................................ 7-2 THE NEWS TOOLBAR..................................................................................................................................................... 7-2 SOURCES FOR CQG NEWS............................................................................................................................................. 7-3 THE NEWS HEADLINES TITLE BAR................................................................................................................................ 7-3 UNDERSTANDING THE NEWS HEADLINES WINDOW ...................................................................................................... 7-4 USING KEYWORDS TO LIMIT THE NEWS HEADLINES DISPLAY ...................................................................................... 7-5
Using the Specify a Keyword Dialog........................................................................................................................ 7-5 HOLD ON TOP HEADLINES............................................................................................................................................. 7-5 DISPLAYING A NEWS STORY ......................................................................................................................................... 7-6 NEWS STORY EXAMPLE ................................................................................................................................................ 7-7 THE NEWS STORY TITLE BAR ....................................................................................................................................... 7-7 SCROLLING THROUGH NEWS STORIES .......................................................................................................................... 7-7
Using the Previous/Next Button................................................................................................................................ 7-8 Using the Up and Down Arrow Keys........................................................................................................................ 7-8
USING THE AUTO SIZE FEATURE ................................................................................................................................... 7-8 HOLD ON TOP STORIES.................................................................................................................................................. 7-8 RETURNING TO THE NEWS HEADLINES WINDOW .......................................................................................................... 7-9 RETURNING TO THE ALL HEADLINES WINDOW............................................................................................................. 7-9 CHANGING THE FONTS IN A NEWS WINDOW ............................................................................................................... 7-10
Displaying the Fonts Dialog................................................................................................................................... 7-10 Using the Fonts Dialog........................................................................................................................................... 7-11
THE NEWS COLOR DIALOG ......................................................................................................................................... 7-12 Displaying the Select… Colors Dialog ................................................................................................................... 7-12 The Color Palette.................................................................................................................................................... 7-13 Using the Select…Colors Dialog............................................................................................................................ 7-14
PRINTING A NEWS WINDOW........................................................................................................................................ 7-15
The Basics Contents • vii
Printing to the Clipboard........................................................................................................................................ 7-16 Using the Print Setup Command ............................................................................................................................ 7-17 Black on White Printing.......................................................................................................................................... 7-17
SAVING A NEWS WINDOW TO A PAGE ......................................................................................................................... 7-18
viii • Contents The Basics
CQG Basics
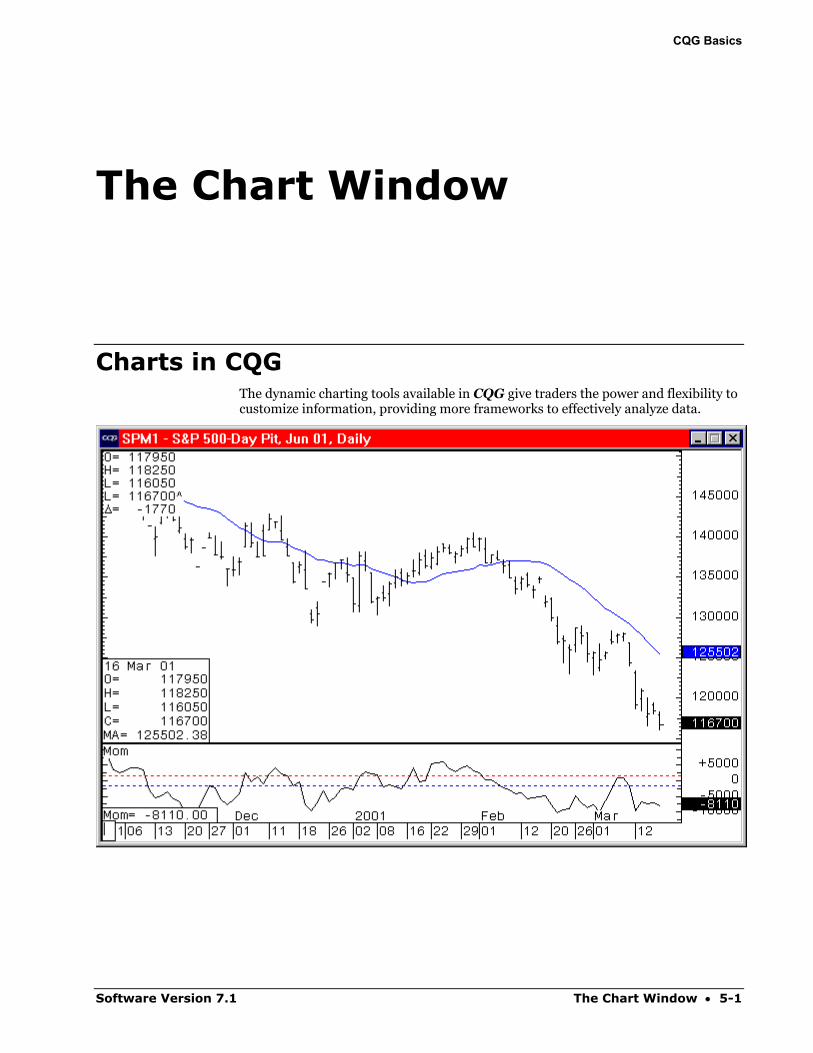
The Chart Window
Charts in CQG The dynamic charting tools available in CQG give traders the power and flexibility to customize information, providing more frameworks to effectively analyze data.
Software Version 7.1 The Chart Window • 5-1
CQG Basics
Adding a Chart with the Chart Button
Left click on the Chart button to launch a bar chart.
Right click on the Chart button to either close a chart or launch a different type of chart.
If the Chart button is not displayed on the application toolbar, you can add it by doing the following:
Left click on the Setup button.
Select Customize Toolbar. This displays the Toolbar Manager dialog.
Select the >>> button in the Add/Remove column in the Chart, Quote, News… row.
Select Chart in the button column.
Left click on the Close buttons on the Customize Application Toolbar and Toolbar Manager dialogs.
Left click on the Chart button to launch a bar chart.
Right click on the Chart button to either close a chart or launch a different type of chart.
Launching Charts from Within Other CQG Applications
Even without a Chart toolbar button, charts can be easily launched from within the following applications:
Basic Quote Displays. See "Displaying a chart from a Quote Cell" in the Quotes chapter of the Quotes volume in the CQG User's Guide.
Custom Quote Board. See "Displaying a chart from a Custom Quote Board Cell" in the Custom Quote Board chapter of the Quotes volume in the CQG User's Guide.
Quote Spreadsheets. See "Displaying a chart from a Quote Spreadsheet Cell" in the Quote Spreadsheet chapter of the Quotes volume in the CQG User's Guide.
Market Scan. See "Displaying a Chart for a Selected Issue" in the Market Scan chapter of the User Formulas and Backtesting volume in the CQG User's Guide.
Options. See "Displaying a Chart from an Options Window" in the Options chapter of the Options volume in the CQG User's Guide.
TSO. See "Launching a Chart with Parameters" in the Trade System Optimizer chapter of the User Formulas and Backtesting volume in the CQG User's Guide.
5-2 • The Chart Window Software Version 7.1
CQG Basics
Overlaying One Chart on Another The Analog study allows one chart to be overlaid on another. All studies on the original chart will also appear on the overlaid chart.
For more information about using the Chart Analog Overlay, refer to the "Standard Studies" chapter of the Basic Studies volume of the CQG User's Guide.
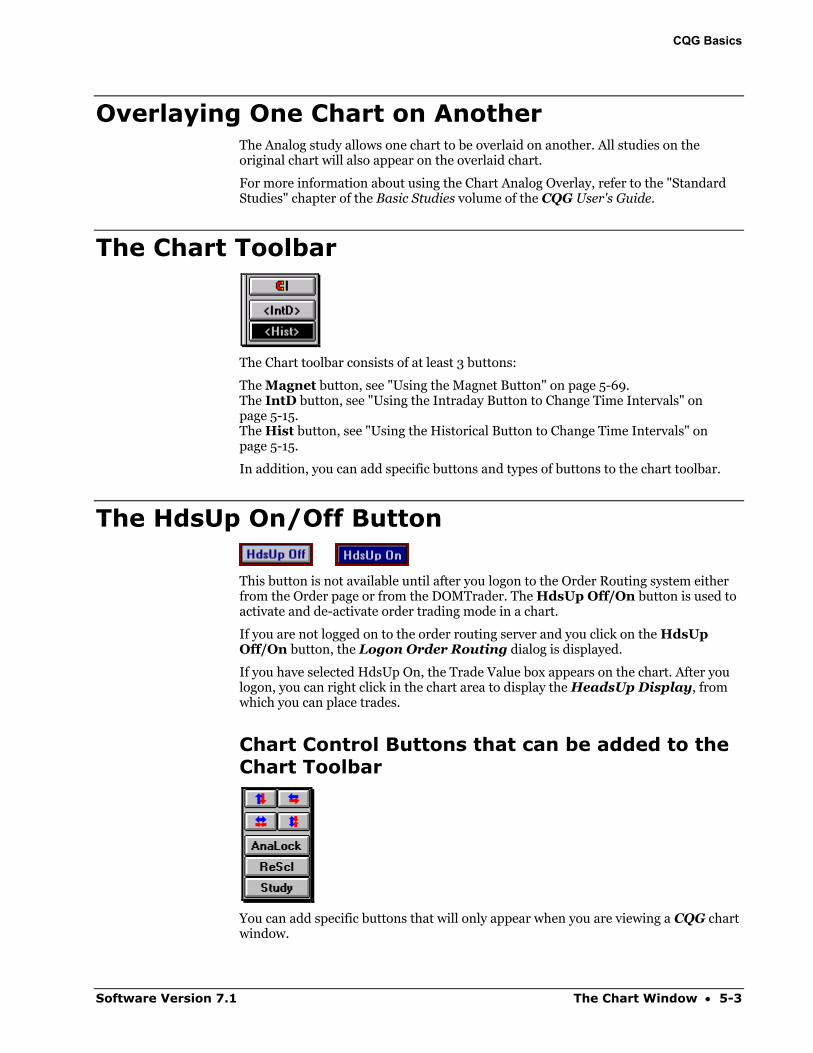
The Chart Toolbar
The Chart toolbar consists of at least 3 buttons:
The Magnet button, see "Using the Magnet Button" on page 5-69. The IntD button, see "Using the Intraday Button to Change Time Intervals" on page 5-15. The Hist button, see "Using the Historical Button to Change Time Intervals" on page 5-15.
In addition, you can add specific buttons and types of buttons to the chart toolbar.
The HdsUp On/Off Button
This button is not available until after you logon to the Order Routing system either from the Order page or from the DOMTrader. The HdsUp Off/On button is used to activate and de-activate order trading mode in a chart.
If you are not logged on to the order routing server and you click on the HdsUp Off/On button, the Logon Order Routing dialog is displayed.
If you have selected HdsUp On, the Trade Value box appears on the chart. After you logon, you can right click in the chart area to display the HeadsUp Display, from which you can place trades.
Chart Control Buttons that can be added to the Chart Toolbar
You can add specific buttons that will only appear when you are viewing a CQG chart window.
Software Version 7.1 The Chart Window • 5-3
CQG Basics
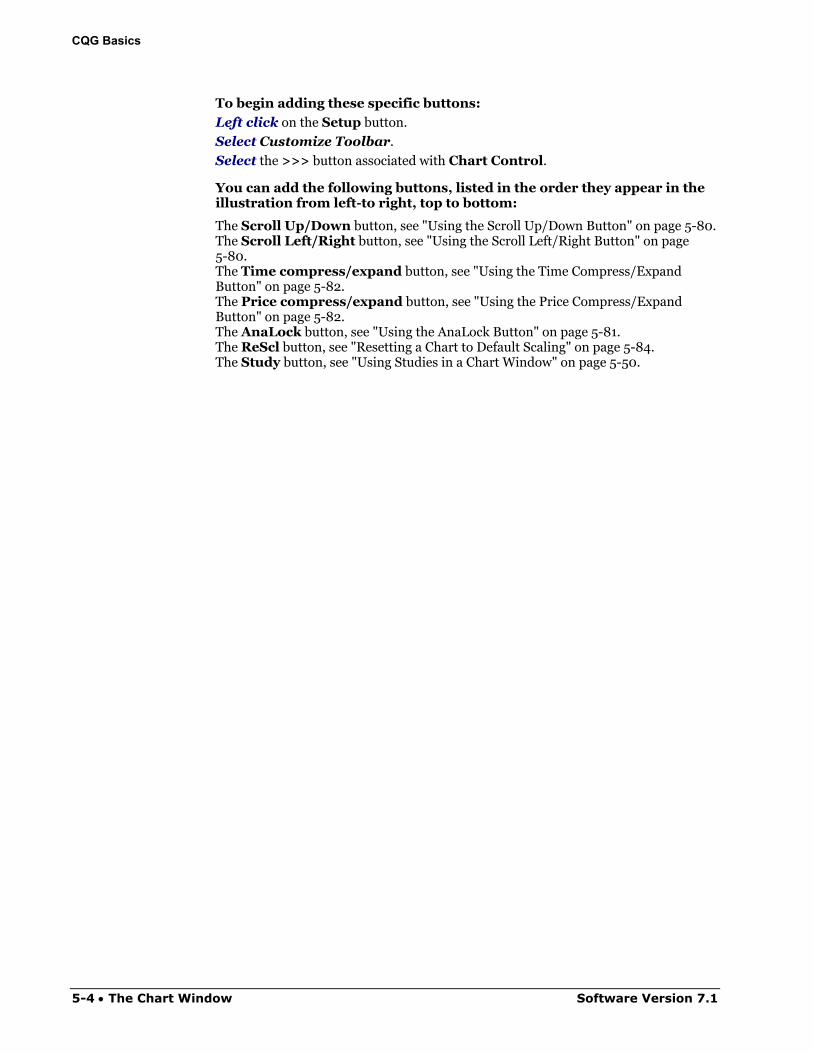
To begin adding these specific buttons:
Left click on the Setup button.
Select Customize Toolbar.
Select the >>> button associated with Chart Control.
You can add the following buttons, listed in the order they appear in the illustration from left-to right, top to bottom:
The Scroll Up/Down button, see "Using the Scroll Up/Down Button" on page 5-80. The Scroll Left/Right button, see "Using the Scroll Left/Right Button" on page 5-80. The Time compress/expand button, see "Using the Time Compress/Expand Button" on page 5-82. The Price compress/expand button, see "Using the Price Compress/Expand Button" on page 5-82. The AnaLock button, see "Using the AnaLock Button" on page 5-81. The ReScl button, see "Resetting a Chart to Default Scaling" on page 5-84. The Study button, see "Using Studies in a Chart Window" on page 5-50.
5-4 • The Chart Window Software Version 7.1
CQG Basics
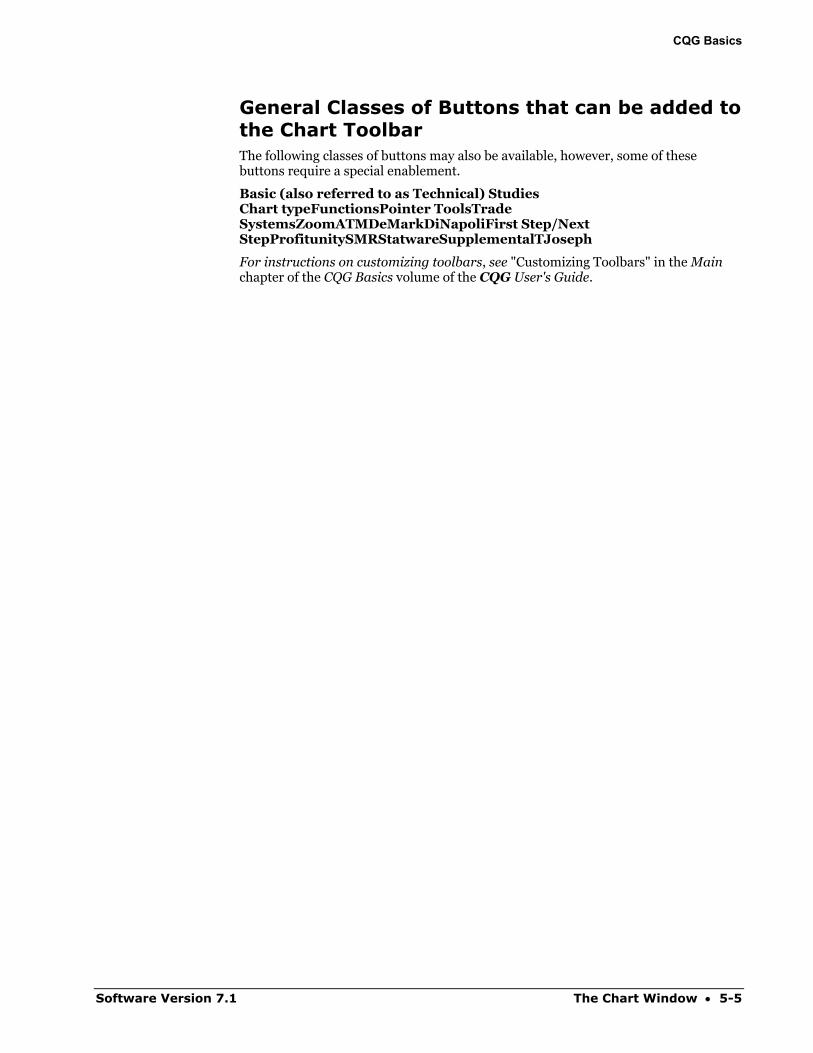
General Classes of Buttons that can be added to the Chart Toolbar The following classes of buttons may also be available, however, some of these buttons require a special enablement.
Basic (also referred to as Technical) Studies Chart typeFunctionsPointer ToolsTrade SystemsZoomATMDeMarkDiNapoliFirst Step/Next StepProfitunitySMRStatwareSupplementalTJoseph
For instructions on customizing toolbars, see "Customizing Toolbars" in the Main chapter of the CQG Basics volume of the CQG User's Guide.
Software Version 7.1 The Chart Window • 5-5

CQG Basics
Entering Commands
The command entry box is located at the lower left corner of the chart window. You can use it to change to a different market and to change the time interval of a chart.
Using a toolbar button to enter commands In addition to the command entry box, you can create toolbar buttons to enter often-used commands quickly.
For example, to create a toolbar button that displays a daily chart of the most current S & P 500 futures contract:
Left click on the Setup button.
Select Customize Toolbar.
Select the >>> button associated with Macros.
Left click on the New button.
Input a button name (up to 10 characters).
Input the appropriate command. For example, SP?1,D.
Select the carriage return checkbox to automatically enter the command.
Left click on the OK button to close the Add Macro Button dialog.
Left clicking on this newly created macro button will display a daily chart showing the first non-expired S&P 500 futures contract.
5-6 • The Chart Window Software Version 7.1
CQG Basics
Entering Symbols in CQG The way you enter a symbol depends on whether you are specifying a futures contract, a stock issue, an option contract, a cash instrument, or a spread.
For a Futures Contract In the command box, enter the following:
Input the Commodity Symbol, SP
the Month Code, U
and the last two digits of the year. 03 [Enter] Example: SPU03 [Enter] would display the information for the September 2003
S &P 500 futures contract.
Note: When a symbol is entered in the command box, symbol entry connects with commodity symbols before contracts. Therefore, entering SF will display the lead month for Swiss Francs, rather than January soybeans. To get the soybean chart, you would need to type in the year (SF2, for example).
For a listing of the available symbols:
Right click on the CQG Advisor button .
Select Symbols by Exchange or Find a Symbol.
Futures Contracts use the following month codes
January F April J July N October V
February G May K August Q November X
March H June M September U December Z
For currently traded (non-expired) contracts, the lead digit of the year can be omitted, as in this example: USAZ8 [Enter].
Note: If you have selected Stocks as your Preferred Type, you must enter an F. before the futures symbol. (You select the Preferred Type setting by left clicking the System button and selecting System Preferences. Preferred Type is on the Symbols tab.)
For the Most Active Futures Contract
You can use the wildcard symbol (?) in your symbols for futures contracts.
Input the Futures Symbol? [Enter].
Example: W? [Enter] displays the most active contract for the CBOT Wheat futures. The contract month displayed changes as trading activity shifts.
Software Version 7.1 The Chart Window • 5-7
CQG Basics
For the First Non-Expired Futures Contract
You can use the wildcard symbol (?) in your symbols for futures contracts.
Input the Futures Symbol?1 [Enter].
Example: SP?1 [Enter] displays the first non-expired S&P 500 futures contract.
For the Second Non-Expired Contract
You can use the wildcard symbol (?) in your symbols for futures contracts.
Input the Futures Symbol?2 [Enter].
Example: SP?2 [Enter] displays the second non-expired S&P 500 futures contract.
For the nth Non-Expired Contract
You can use the wildcard symbol (?) in your symbols for futures contracts. To view contracts that are more than 2 months out, just enter the number of months out.
Input the Futures Symbol?n [Enter].
Example: SP?5 [Enter] displays the fifth non-expired S&P 500 futures contract.
Note: All futures symbols must be at least 3 characters. Therefore, users must type in the last digit of the year for commodities, such as soybeans, whose commodity symbol consists of only one character. Thus, entering SF displays the lead month Swiss Franc contract, whereas typing SF2 displays the February 2002 soybean chart.
For Other Financial Instruments You can easily enter other types of symbols in CQG.
For an Option on a Futures Contract
In the command box, enter the following:
Input C. for a Call or P. for a Put, C.
the Commodity Symbol, SP
the Month Code, Z
a two-digit year code, 01
and a 2- or 3-digit strike price code. 500
[Enter].
Example: C.SPZ00500 [Enter] would display information for the December 2001 1500 calls on the S&P 500 futures contract.
5-8 • The Chart Window Software Version 7.1
CQG Basics
You can also enter options symbols in the following format:
Input C. for a Call or P. for a Put, followed by a period, C.
the Commodity Symbol, SP
an Underscore, _
the Month Code, U
the one-digit Year Code followed by a period, 0.
the Full Strike Price. 1500
[Enter].
Example: C.SP_U1.1500 [Enter] would display information for the September 2001 1500 calls on the S&P 500 futures contract.
For the "At the Money" Call or Put for the Nearby Month
In the command box, enter the following:
Input C. for a call or P. for a put, C.
the Commodity Symbol, SP
and a Question Mark. ?
[Enter].
Example: C.SP? [Enter] will display the March 1999 1245 calls whenever the underlying index is between 1242.50 and 1247.50 after the December expiration and before the March expiration.
Likewise,
P.SP? [Enter] will display the March 1999 1245 puts whenever the underlying index is between 1242.50 and 1247.50 after the December expiration and before the March expiration.
For a Stock
In the command box, enter the following:
Input S. before the stock symbol.
Press [Enter].
Example: S.IBM [Enter] displays an International Business Machines stock quote.
To eliminate the need to type S. before the stock symbol:
Right click on the Setup button.
Select System Preferences…
Select Stocks under Preferred Types on the Symbol tab.
Note: If you change the default from futures to stocks, you must enter an F. before a futures symbol.
For a Cash Contract
In the command box, enter the following:
Input the cash symbol and press [Enter].
Example: SPC [Enter] displays CME Standard & Poor's 500 cash contract.
Software Version 7.1 The Chart Window • 5-9
CQG Basics
For a Spread
In the command box, enter the following:
Input the symbol for the first contract or security, SP
a dash, -
and the symbol for the second security. EP
[Enter].
Example: SP - EP[Enter] displays the Standard & Poor's 500 contract versus the EP-Mini Standard & Poor's 500.
For a Eurobond
Command Input a country code, CA
an interest rate (expressed in whole numbers and eighths),
084
the letter P, P
A maturity date, (2-digit month code and a 2-digit year code).
1203
[Enter].
Therefore, CA084P1203 [Enter] represents a Canadian bond with an 8 ½% coupon that matured in December 2003.
For a Rolling Stri:
A rolling strip is the average price for a series of contracts where the composition of the series is adjusted as contracts expire.
You can use the wildcard symbol (?) to create a rolling strip.
To create an S&P rolling strip consisting of the average of the 1st 3 listed months, enter the following in the command box:
Input the Commodity Symbol, SP
the Wildcard for the selected expiration month,
?1,, ?2 , etc.
the Formula for an average. (SP?1 + SP?2 + SP?3)/3
[Enter].
Note: These contracts will change as time passes and contracts expire. For example, in February the ?1, ?2, ?3 would use the months March, June and September. In April, the same formula would use June, September and December. Entering any symbol in lower case letters displays the inverse value (1/instrument value).
5-10 • The Chart Window Software Version 7.1
CQG Basics
Methods for Finding a Symbol Symbols used in CQG may be identical to symbols used on the Exchanges, but they may not be.
To learn how to find a symbol in CQG, refer to the "Introduction" chapter of the CQG book, CQG Basics. The topic is called, Finding a Symbol.
Software Version 7.1 The Chart Window • 5-11
CQG Basics
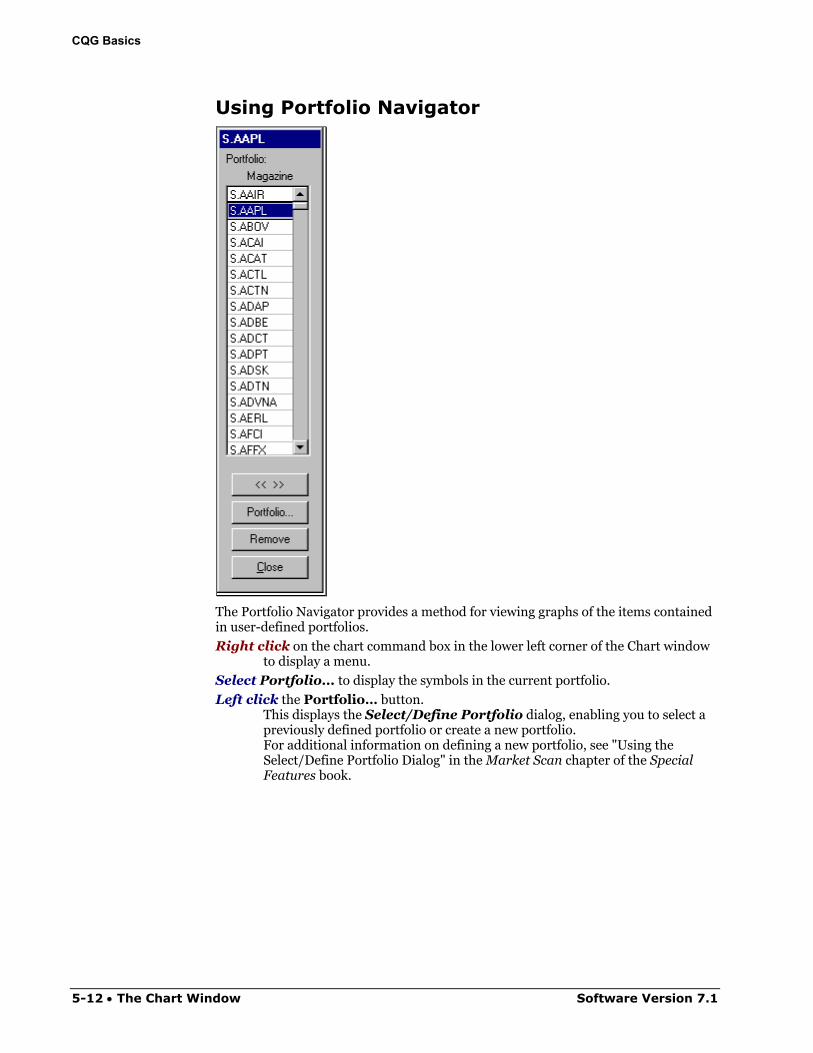
Using Portfolio Navigator
The Portfolio Navigator provides a method for viewing graphs of the items contained in user-defined portfolios.
Right click on the chart command box in the lower left corner of the Chart window to display a menu.
Select Portfolio... to display the symbols in the current portfolio.
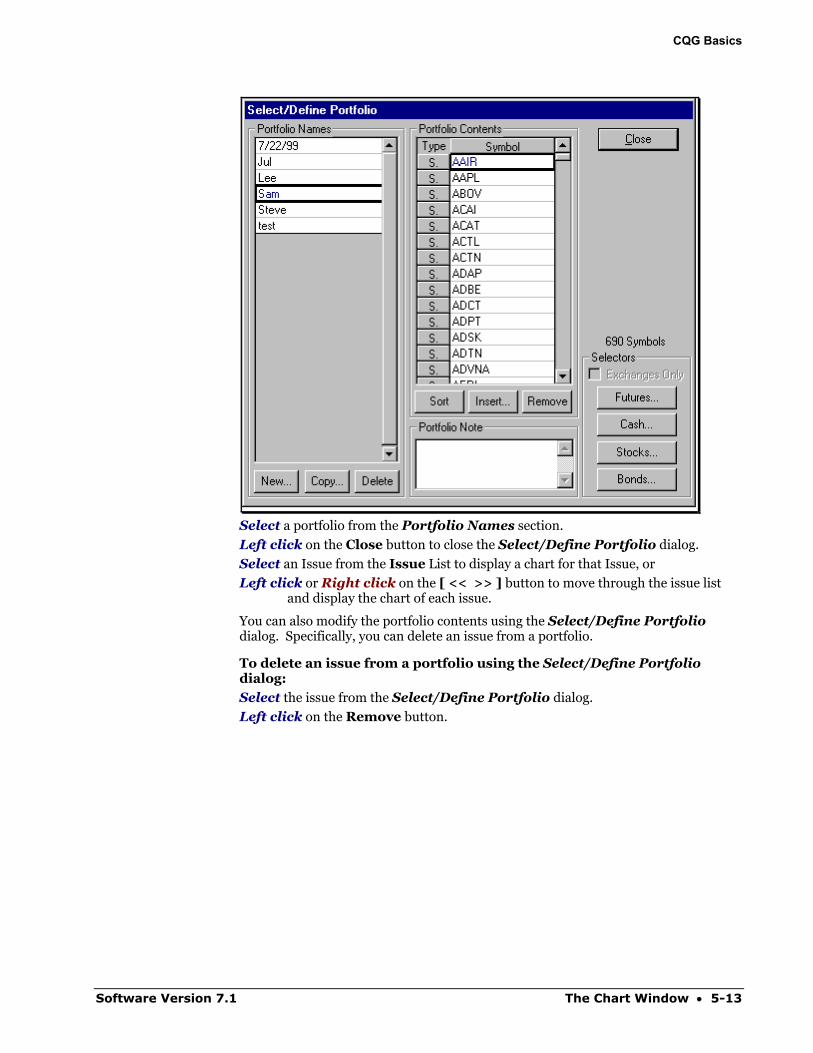
Left click the Portfolio… button. This displays the Select/Define Portfolio dialog, enabling you to select a previously defined portfolio or create a new portfolio. For additional information on defining a new portfolio, see "Using the Select/Define Portfolio Dialog" in the Market Scan chapter of the Special Features book.
5-12 • The Chart Window Software Version 7.1
CQG Basics
Select a portfolio from the Portfolio Names section.
Left click on the Close button to close the Select/Define Portfolio dialog.
Select an Issue from the Issue List to display a chart for that Issue, or
Left click or Right click on the [ << >> ] button to move through the issue list and display the chart of each issue.
You can also modify the portfolio contents using the Select/Define Portfolio dialog. Specifically, you can delete an issue from a portfolio.
To delete an issue from a portfolio using the Select/Define Portfolio dialog:
Select the issue from the Select/Define Portfolio dialog.
Left click on the Remove button.
Software Version 7.1 The Chart Window • 5-13
CQG Basics
Changing the Time Interval of a Chart You can change the time interval of a chart using a Command Entry, the Intraday button, or the Historical button.
Using a Command Entry to Change the Time Interval The following examples illustrate using a command entry to change the time of a Chart.
For Intraday Charts
In the command box, enter the following:
Input the Symbol.
Input a comma.
Input the number of minutes in the desired time interval.
Example: SPM,120 will display a 2-hour chart for the June S&P 500 futures contract.
For Daily or Interday (Historical) Charts
In the command box, enter the following:
Input the commodity symbol.
Input the time frame. The following choices are available:
,D [Enter] for a Daily Chart (Contract Specific) ,W [Enter] for a Weekly Continuation ,M [Enter] for a Monthly Continuation ,Q [Enter] for a Quarterly Continuation ,S [Enter] for a Semi-Annual Continuation ,A [Enter] for an Annual Continuation
For a Contract-Specific Historical Chart: Input the Historical Time Interval Designator twice, and press [Enter].
Note: Contract-specific historical charts reflect the data for a single contract. They are not continuation charts.
Example: ,WW [Enter] displays a contract-specific Weekly chart.
Example: ,MM [Enter] displays a contract-specific Monthly chart.
Example: ,QQ [Enter] displays a contract-specific Quarterly chart.
5-14 • The Chart Window Software Version 7.1
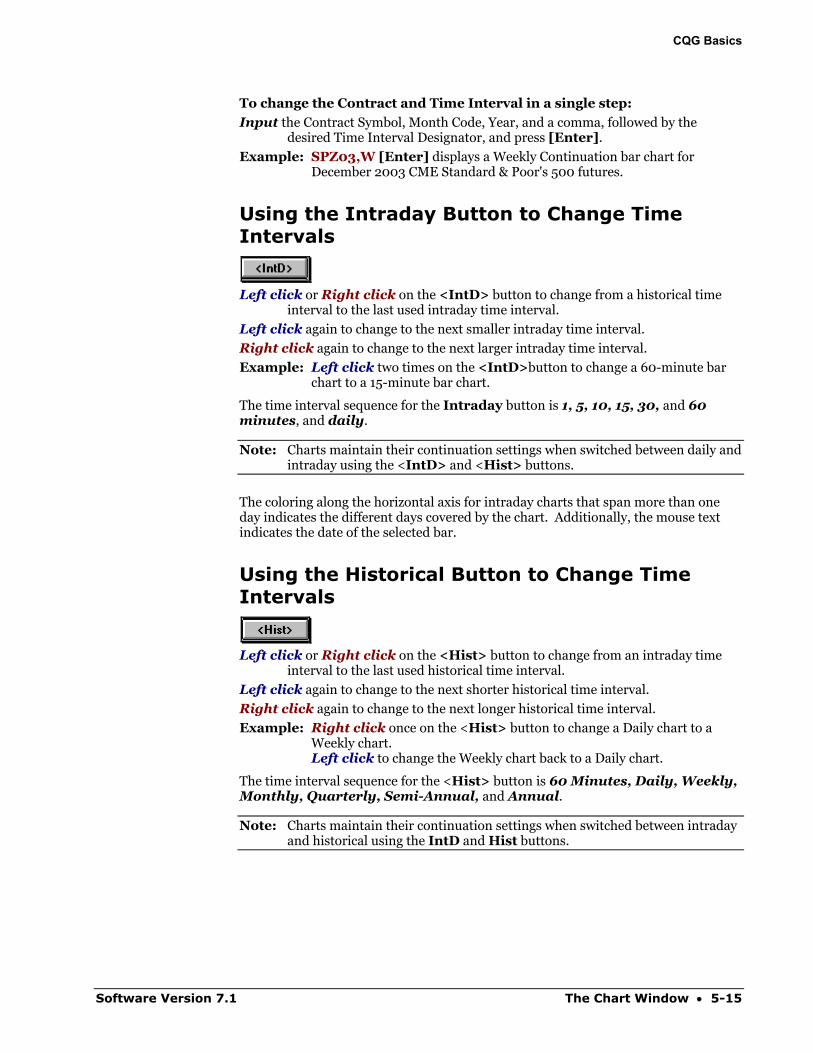
CQG Basics
To change the Contract and Time Interval in a single step:
Input the Contract Symbol, Month Code, Year, and a comma, followed by the desired Time Interval Designator, and press [Enter].
Example: SPZ03,W [Enter] displays a Weekly Continuation bar chart for December 2003 CME Standard & Poor's 500 futures.
Using the Intraday Button to Change Time Intervals
Left click or Right click on the <IntD> button to change from a historical time
interval to the last used intraday time interval.
Left click again to change to the next smaller intraday time interval.
Right click again to change to the next larger intraday time interval.
Example: Left click two times on the <IntD>button to change a 60-minute bar chart to a 15-minute bar chart.
The time interval sequence for the Intraday button is 1, 5, 10, 15, 30, and 60 minutes, and daily.
Note: Charts maintain their continuation settings when switched between daily and intraday using the <IntD> and <Hist> buttons.
The coloring along the horizontal axis for intraday charts that span more than one day indicates the different days covered by the chart. Additionally, the mouse text indicates the date of the selected bar.
Using the Historical Button to Change Time Intervals
Left click or Right click on the <Hist> button to change from an intraday time
interval to the last used historical time interval.
Left click again to change to the next shorter historical time interval.
Right click again to change to the next longer historical time interval.
Example: Right click once on the <Hist> button to change a Daily chart to a Weekly chart. Left click to change the Weekly chart back to a Daily chart.
The time interval sequence for the <Hist> button is 60 Minutes, Daily, Weekly, Monthly, Quarterly, Semi-Annual, and Annual.
Note: Charts maintain their continuation settings when switched between intraday and historical using the IntD and Hist buttons.
Software Version 7.1 The Chart Window • 5-15
CQG Basics
Selecting Chart Preferences Customizing CQG charts is easy. To display the desired information in the desired format:
Left click on the Setup button.
Select Chart Preferences…
The chart Preferences dialog is displayed.
In the chart Preferences dialog, the contract symbol for the currently selected chart is displayed in the title bar. The dialog displays tabs that contain settings for various chart characteristics:
Main, see “Setting the Chart Type Parameters” on page 5-63.
Sessions, see "Selecting Chart Sessions" on page 5-17.
Continuation, see "Selecting Continuation Characteristics" on page 5-27.
Bond Continuation, see "Displaying Bond Continuation Charts" on page 5-33.
BATS (What kinds of Chart data to show: Bids, Asks, Trades, Settlements), see "Selecting the Elements Displayed on a Chart" on page 5-34.
CID, see "Selecting Contributor Data" on page 5-35.
Volume, see "Displaying Information Based on Volume" on page 5-41.
Grid, see "Selecting the Chart Grid" on page 5-42.
Labels and Values, see "Changing Chart Labels and Values" on page 5-44.
Miscellaneous characteristics, see "Setting Miscellaneous Chart Characteristics" on page 5-47.
Recalc, see "Setting the Recalculation Mode at Login" on page 5-59.
5-16 • The Chart Window Software Version 7.1
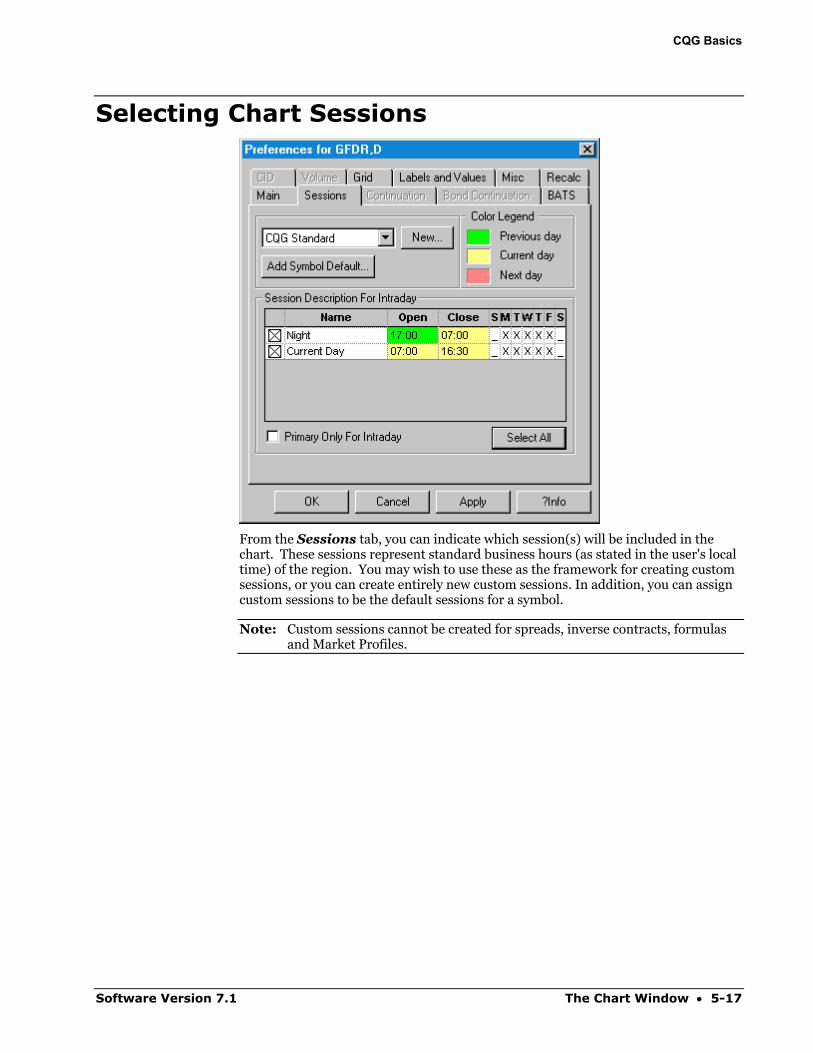
CQG Basics
Selecting Chart Sessions
From the Sessions tab, you can indicate which session(s) will be included in the chart. These sessions represent standard business hours (as stated in the user's local time) of the region. You may wish to use these as the framework for creating custom sessions, or you can create entirely new custom sessions. In addition, you can assign custom sessions to be the default sessions for a symbol.
Note: Custom sessions cannot be created for spreads, inverse contracts, formulas and Market Profiles.
Software Version 7.1 The Chart Window • 5-17
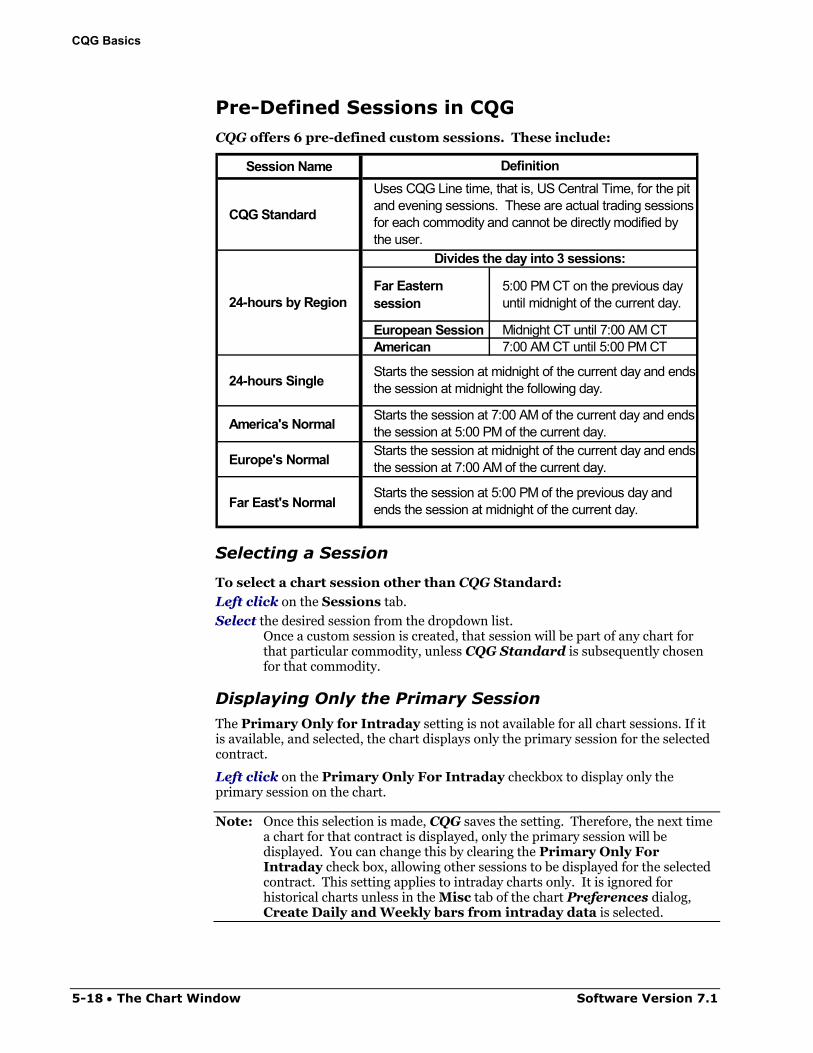
CQG Basics
Pre-Defined Sessions in CQG CQG offers 6 pre-defined custom sessions. These include:
Session Name
CQG Standard
Far Eastern session
5:00 PM CT on the previous day until midnight of the current day.
European Session Midnight CT until 7:00 AM CTAmerican 7:00 AM CT until 5:00 PM CT
24-hours Single
America's Normal
Europe's Normal
Far East's Normal
24-hours by Region
Starts the session at 7:00 AM of the current day and ends the session at 5:00 PM of the current day. Starts the session at midnight of the current day and ends the session at 7:00 AM of the current day.
Starts the session at 5:00 PM of the previous day and ends the session at midnight of the current day.
DefinitionUses CQG Line time, that is, US Central Time, for the pit and evening sessions. These are actual trading sessions for each commodity and cannot be directly modified by the user.
Divides the day into 3 sessions:
Starts the session at midnight of the current day and ends the session at midnight the following day.
Selecting a Session
To select a chart session other than CQG Standard:
Left click on the Sessions tab.
Select the desired session from the dropdown list. Once a custom session is created, that session will be part of any chart for that particular commodity, unless CQG Standard is subsequently chosen for that commodity.
Displaying Only the Primary Session The Primary Only for Intraday setting is not available for all chart sessions. If it is available, and selected, the chart displays only the primary session for the selected contract.
Left click on the Primary Only For Intraday checkbox to display only the primary session on the chart.
Note: Once this selection is made, CQG saves the setting. Therefore, the next time a chart for that contract is displayed, only the primary session will be displayed. You can change this by clearing the Primary Only For Intraday check box, allowing other sessions to be displayed for the selected contract. This setting applies to intraday charts only. It is ignored for historical charts unless in the Misc tab of the chart Preferences dialog, Create Daily and Weekly bars from intraday data is selected.
5-18 • The Chart Window Software Version 7.1
CQG Basics
Directly Modifying a Pre-Defined CQG Session other than CQG Standard CQG offers 5 pre-defined custom sessions, which can be modified directly.
Note: The CQG Standard Session cannot be modified directly. However, it can be modified indirectly. For additional information on using the CQG Standard session, see "Using the CQG Standard Session" on page 5-20.
To modify a pre-defined custom session:
Select the session to be modified from the Preferences dialog.
Left click on the Modify button. This displays the Custom Sessions and Symbol Association dialog.
Left click on the Copy… button. This displays the Copy a Custom Session dialog.
Input a name for the new custom session.
Left click on the OK button to include the new name in the Custom Sessions list and close the Copy a Custom Session dialog.
Or
Left click on the Cancel button to close the Copy a Custom Session dialog without registering the name.
Select the characteristics for the new session.
Note: Creating a session establishes a new component. Therefore, if you have opted to add component information automatically, you must remember the password associated with this component to change its features. For information on using components, see the Pacs and Components chapter in the Trading Systems volume.
Software Version 7.1 The Chart Window • 5-19
CQG Basics
Copying a Pre-Defined CQG Session Select the session to be modified.
Left click on the Copy… button in the Preferences dialog. This displays the Custom Sessions and Symbol Association dialog.
Left click on the Copy… button in the Custom Sessions and Symbol Association dialog. This displays the Copy a Custom Session dialog.
Input a name for the new session.
Left click on the OK button to accept the new name and close the Create a New Custom Session dialog.
Or
Left click on the Cancel button to close the Create a New Custom Session dialog without creating a new custom session name. The new name will appear in the Custom Sessions section in the Custom Sessions tab of the Custom Sessions and Symbol Association dialog and can be modified like any other session. For information on modifying a session, see "Directly Modifying a Pre-Defined CQG Session other than CQG Standard" on page 5-19.
Using the CQG Standard Session The CQG Standard session cannot be modified directly, but it can be used as the basis for new sessions.
To use the CQG Standard Session to create a new session:
Select CQG Standard from the sessions list.
Left click on the New button. This displays the Create a New Custom Session dialog.
Input a name for the new custom session.
Left click on the OK button. This creates a new entry in the Custom Sessions section of the Custom Sessions and Symbol Association dialog, which can be modified like any other session. For information on modifying a session, see "Directly Modifying a Pre-Defined CQG Session other than CQG Standard" on page 5-19.
5-20 • The Chart Window Software Version 7.1
CQG Basics
Creating a Custom Session Left click on the Modify button from the Sessions tab of the Preferences
dialog. This displays the Custom Sessions and Symbol Association dialog.
Note: You must select a session other than CQG Standard.
Left click on the New…button. This displays the Create a New Custom Session dialog.
Input a name for the new custom session.
Left click on OK to close the Create a New Custom Session dialog and display the Custom Sessions and Symbol Association dialog.
Software Version 7.1 The Chart Window • 5-21
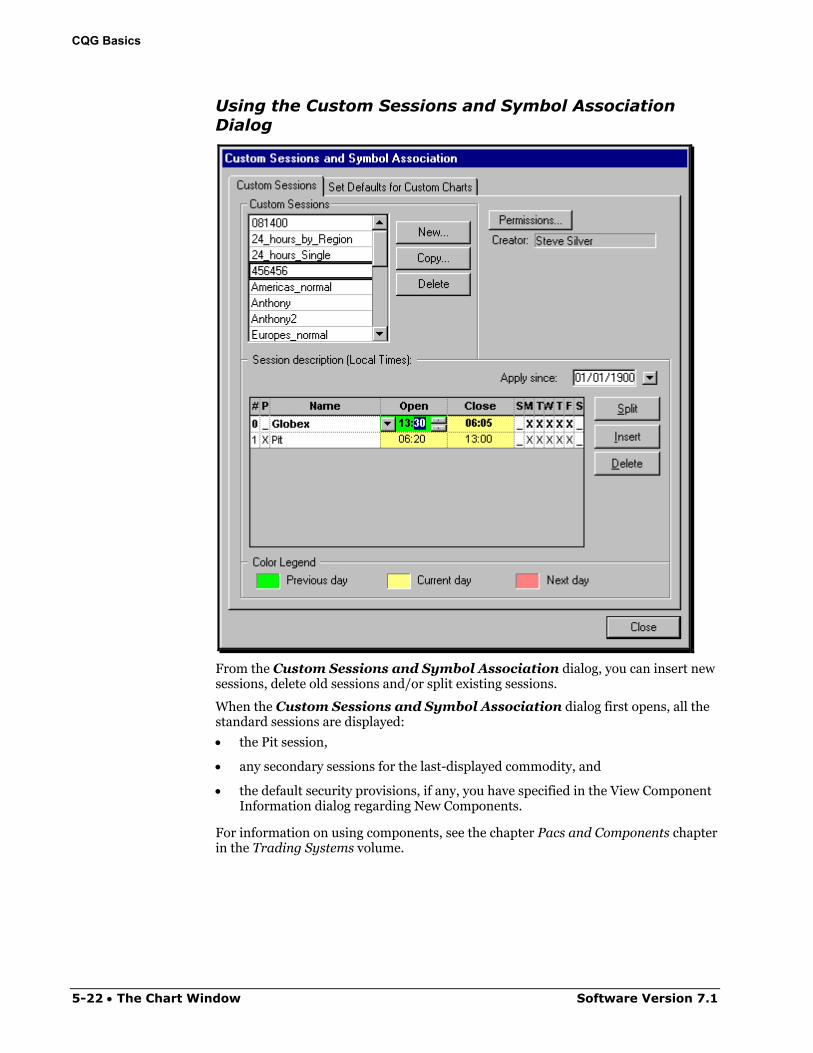
CQG Basics
Using the Custom Sessions and Symbol Association Dialog
From the Custom Sessions and Symbol Association dialog, you can insert new sessions, delete old sessions and/or split existing sessions.
When the Custom Sessions and Symbol Association dialog first opens, all the standard sessions are displayed:
• the Pit session,
• any secondary sessions for the last-displayed commodity, and
• the default security provisions, if any, you have specified in the View Component Information dialog regarding New Components.
For information on using components, see the chapter Pacs and Components chapter in the Trading Systems volume.
5-22 • The Chart Window Software Version 7.1
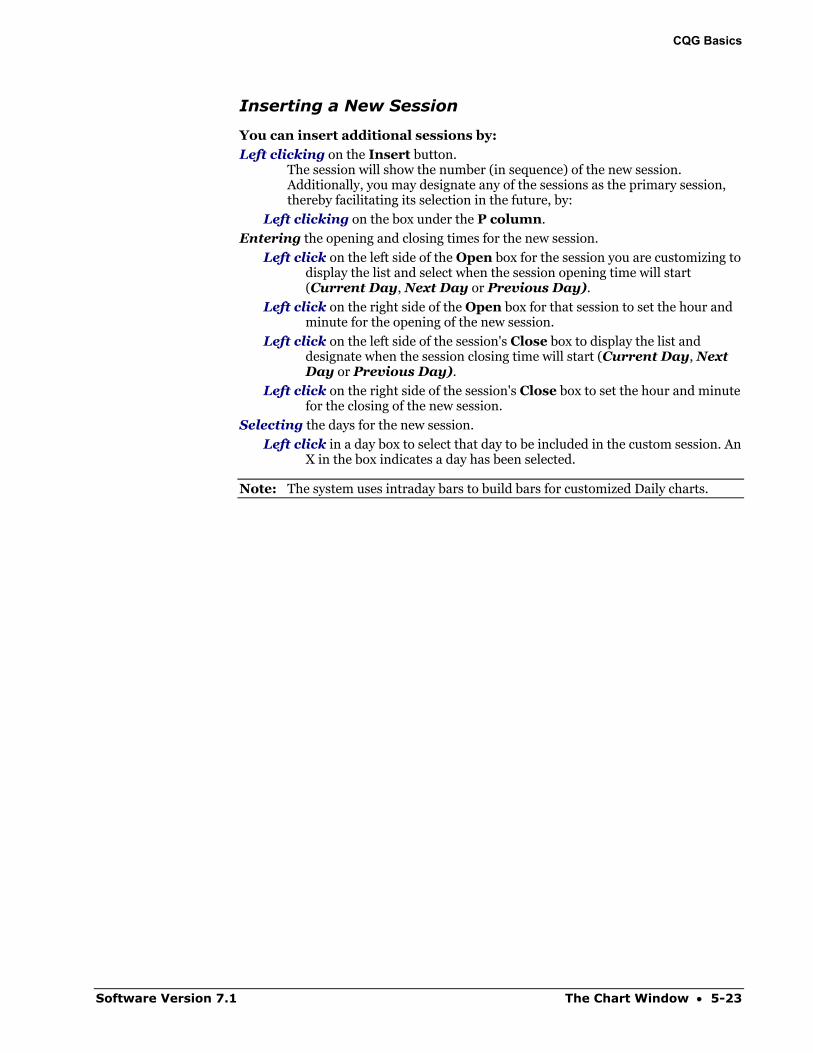
CQG Basics
Inserting a New Session
You can insert additional sessions by:
Left clicking on the Insert button. The session will show the number (in sequence) of the new session. Additionally, you may designate any of the sessions as the primary session, thereby facilitating its selection in the future, by:
Left clicking on the box under the P column.
Entering the opening and closing times for the new session.
Left click on the left side of the Open box for the session you are customizing to display the list and select when the session opening time will start (Current Day, Next Day or Previous Day).
Left click on the right side of the Open box for that session to set the hour and minute for the opening of the new session.
Left click on the left side of the session's Close box to display the list and designate when the session closing time will start (Current Day, Next Day or Previous Day).
Left click on the right side of the session's Close box to set the hour and minute for the closing of the new session.
Selecting the days for the new session.
Left click in a day box to select that day to be included in the custom session. An X in the box indicates a day has been selected.
Note: The system uses intraday bars to build bars for customized Daily charts.
Software Version 7.1 The Chart Window • 5-23
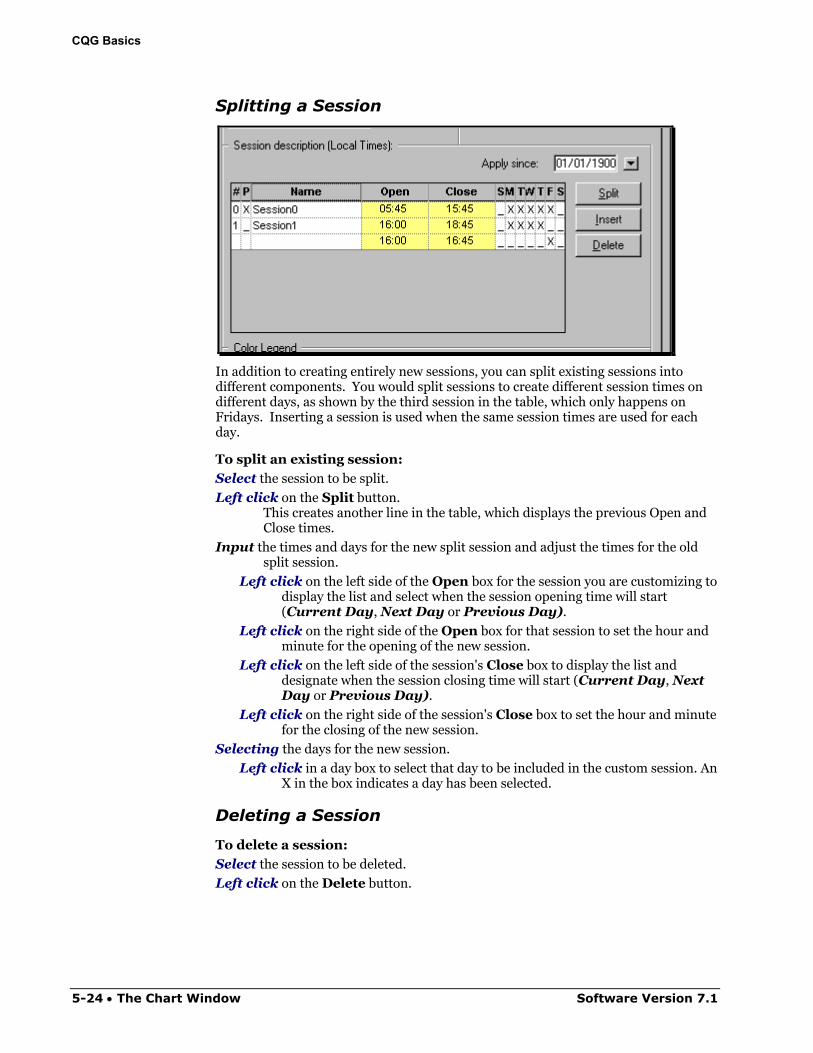
CQG Basics
Splitting a Session
In addition to creating entirely new sessions, you can split existing sessions into different components. You would split sessions to create different session times on different days, as shown by the third session in the table, which only happens on Fridays. Inserting a session is used when the same session times are used for each day.
To split an existing session:
Select the session to be split.
Left click on the Split button. This creates another line in the table, which displays the previous Open and Close times.
Input the times and days for the new split session and adjust the times for the old split session.
Left click on the left side of the Open box for the session you are customizing to display the list and select when the session opening time will start (Current Day, Next Day or Previous Day).
Left click on the right side of the Open box for that session to set the hour and minute for the opening of the new session.
Left click on the left side of the session's Close box to display the list and designate when the session closing time will start (Current Day, Next Day or Previous Day).
Left click on the right side of the session's Close box to set the hour and minute for the closing of the new session.
Selecting the days for the new session.
Left click in a day box to select that day to be included in the custom session. An X in the box indicates a day has been selected.
Deleting a Session
To delete a session:
Select the session to be deleted.
Left click on the Delete button.
5-24 • The Chart Window Software Version 7.1
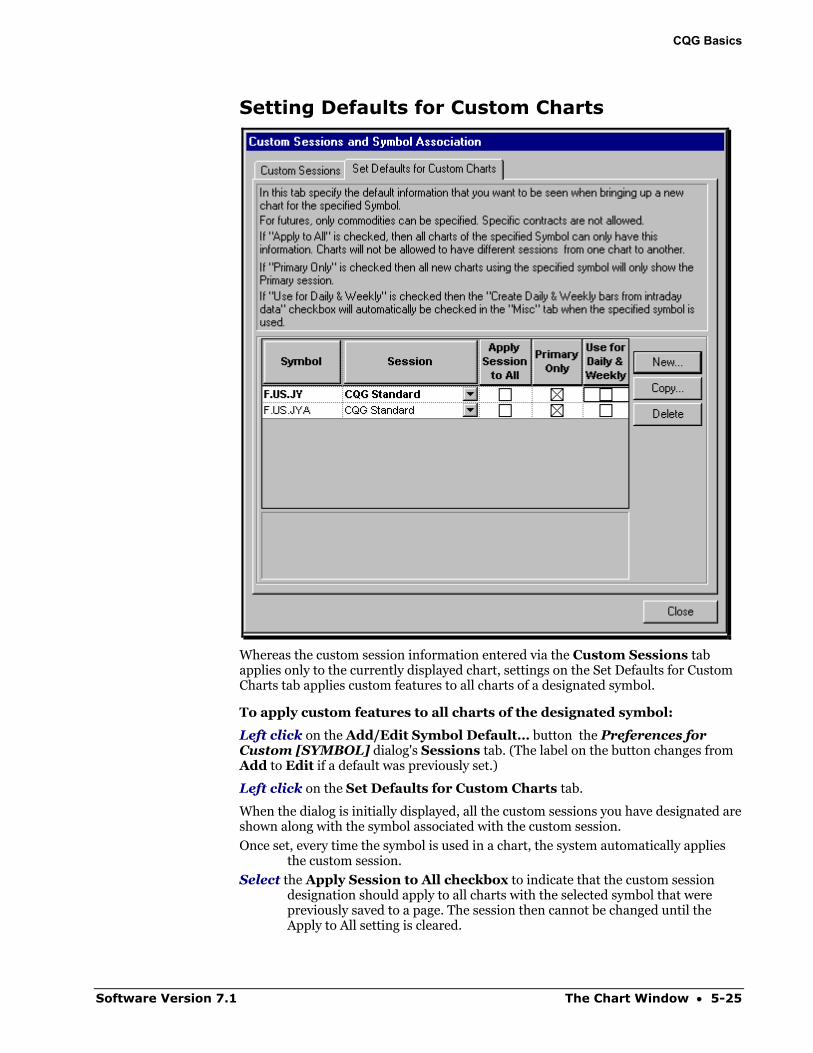
CQG Basics
Setting Defaults for Custom Charts
Whereas the custom session information entered via the Custom Sessions tab applies only to the currently displayed chart, settings on the Set Defaults for Custom Charts tab applies custom features to all charts of a designated symbol.
To apply custom features to all charts of the designated symbol:
Left click on the Add/Edit Symbol Default… button the Preferences for Custom [SYMBOL] dialog's Sessions tab. (The label on the button changes from Add to Edit if a default was previously set.)
Left click on the Set Defaults for Custom Charts tab.
When the dialog is initially displayed, all the custom sessions you have designated are shown along with the symbol associated with the custom session.
Once set, every time the symbol is used in a chart, the system automatically applies the custom session.
Select the Apply Session to All checkbox to indicate that the custom session designation should apply to all charts with the selected symbol that were previously saved to a page. The session then cannot be changed until the Apply to All setting is cleared.
Software Version 7.1 The Chart Window • 5-25
CQG Basics
In addition, you can:
Select the Primary Only checkbox to indicate that intraday charts of the selected symbols will only display the primary session.
And
Select the Use for Daily and Weekly checkbox to indicate that the bar will be constructed based on the last trade of the day. Otherwise, the bar will be constructed based on the settlement price. This allows trades that are done after the close of trading to be included in the bar. Selecting this option has the same effect as selecting Create Daily & Weekly bars from Intraday data checkbox on the Misc tab of the Preferences dialog and activates that checkbox, as well.
Note Selecting this option may result in display delays and limit the number of bars you will be able to see.
Left click on the New button to display the Create a New Symbol-Session Association dialog to add another symbol to the Set Defaults for Custom Charts tab.
Adding Component Information to a User-Created Session Once you have created a custom session, you can specify component information for that custom session, such as Passwording, Read Only, Deny Copy, Deny Export or Enablement Required.
For information on using components, see the Pacs and Components chapter in the Trading Systems volume.
5-26 • The Chart Window Software Version 7.1
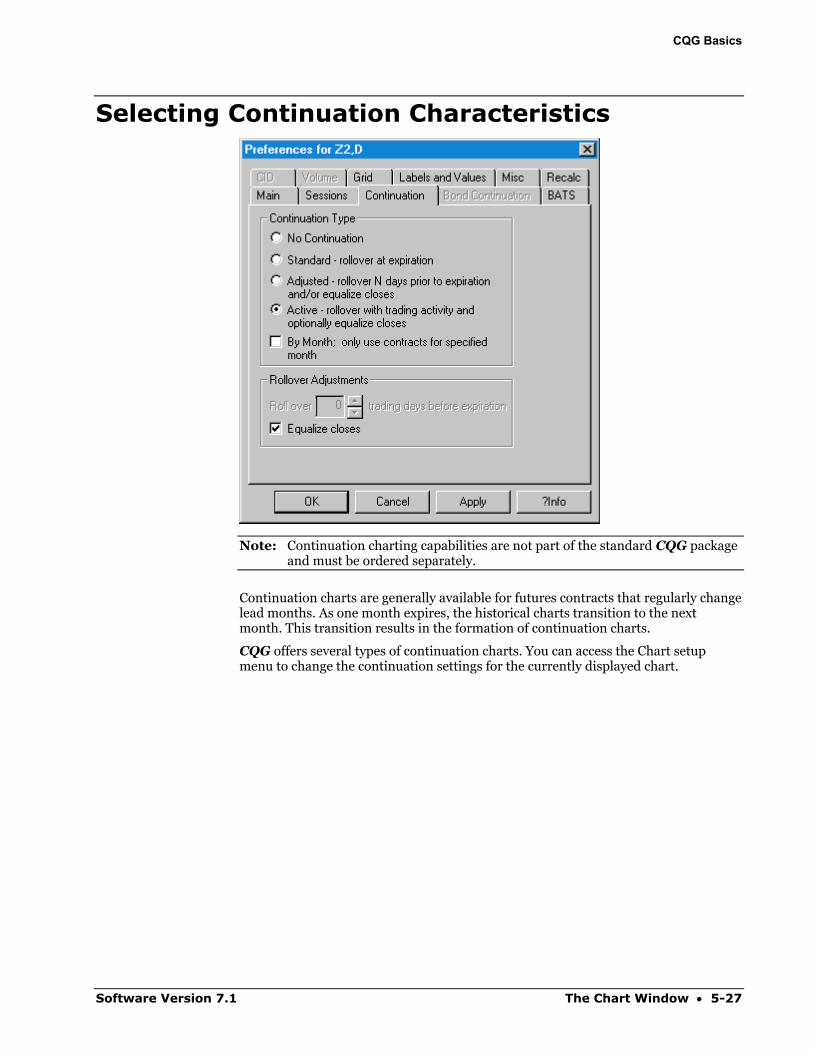
CQG Basics
Selecting Continuation Characteristics
Note: Continuation charting capabilities are not part of the standard CQG package and must be ordered separately.
Continuation charts are generally available for futures contracts that regularly change lead months. As one month expires, the historical charts transition to the next month. This transition results in the formation of continuation charts.
CQG offers several types of continuation charts. You can access the Chart setup menu to change the continuation settings for the currently displayed chart.
Software Version 7.1 The Chart Window • 5-27
CQG Basics
Changing Continuation Chart Settings Left click on the Setup button.
Select Chart Preferences.
Select the Continuation tab.
The available settings are No Continuation, Standard, Adjusted, Active or By Month.
No Continuation
Selecting No Continuation sets the current chart to display the data for a single contract month. It plots the specified contract through expiration. The resulting single contract chart is not a continuation chart.
Standard-rollover at expiration
Selecting Standard-rollover at expiration displays a chart for the lead month contract through expiration and then displays the chart for the next available contract month.
Example: Using the Mar, Jun, Sep, and Dec cycle as an example, if you selected Standard-rollover at expiration, the chart would display data from the Mar contract through expiration and then continue with the Jun, displaying it through the June expiration, and so on for the Sep, and Dec contracts. Colored identification bars appear at the bottom of Daily continuation charts, to indicate a transition between contracts.
Adjusted Continuation – rollover N days prior to expiration and/or equalize closes
Selecting Adjusted – rollover N days prior to expiration and/or equalize closes allows you to select the number of days prior to expiration the rollover will occur. This is accomplished by entering the desired number of days in the box under the Rollover Adjustments section. Additionally, CQG will equalize the closes of the old lead-month contract and the new lead-month contract, if the Equalize closes checkbox in the Rollover Adjustments section is selected. CQG does this by adding to the new lead-month contract the difference between the old lead month and the new lead month. Continuation charts using the Adjusted preference show the word Adjusted in the title bar.
Example: If N = 5 (i.e. 5 days prior to expiration) and SPZ expired on 12/18, then 5 trading days prior to expiration, or 12/11, the following adjustment would occur: Close SPZ on 12/11 = 954.40 Close SPH on 12/11 = 965.30 Amount of Adjustment = 965.30 – 954.40 = 10.90 This figure (10.90) is added to the older contract to arrive at the value displayed on the continuation chart for 12/11.
Note: Charts using adjusted continuation display the word “Adjusted” in their title bar.
5-28 • The Chart Window Software Version 7.1
CQG Basics
Active Continuation – rollover with trading activity and optionally equalize closes
This option sets the chart to display data for the most active contract month. Once the transition occurs between the near-term month and the next month, the further out month remains the active contract until a contract other than that becomes more active. Colored horizontal bars appear at the bottom of the continuation charts, directly above the time scale, to indicate a transition to a new contract. Additionally, you can choose to equalize the closes by selecting Equalize Closes in the Rollover Adjustments section. This equalization is done by adding to the new lead-month contract the difference between the old lead month and the new lead month.
Determining the Most Active Contract:
The most active contract is determined by using tick volume (both daily and tick volume) or by using the near-term month, depending on the algorithm set by CQG.
More specifically, for the "Fast" algorithm, the tick count must be 50% larger before the most active contract is changed. Most financial contracts use the fast algorithm.
For the "Slow" algorithm, both the volume and the tick count must be at least 10% greater in the next month than the currently most active month for the new contract to take over as the most active. Generally, the non-financial contracts, especially the grains, use the slow algorithm since the new crop may see significant activity, even when it is not the front month. Additionally, short-term interest rate contracts use the slow algorithm.
The near term month is used only for inactive contracts such as the EuroYen.
Note: Generally, rollovers occur at the end of the regular trading session. However, automatic rollovers can be over-ridden the following morning when conditions warrant.
Equalizing the closes:
Equalizing the closes makes the expiration comparisons more relevant. The equalization is applied on the day of the rollover (determined by the switch in the most active contract) according the following example:
Example: On 12/11/97:
SPZ = 954.40 SPH = 965.30 Amount of Adjustment = 965.30 – 954.40 = 10.90 This figure (10.90) is added to the older contract to arrive at the value displayed on the continuation chart for 12/11/97. To equalize the closes, the Equalize closes checkbox at the bottom of the dialog must be selected.
Note: The Equalize Closes setting defaults to the last-used setting (either On or Off) for Active or Adjusted Continuation charts.
By Month - only use contracts for a specified month
Selecting By Month… sets the chart to display only the data for the designated contract month.
Software Version 7.1 The Chart Window • 5-29
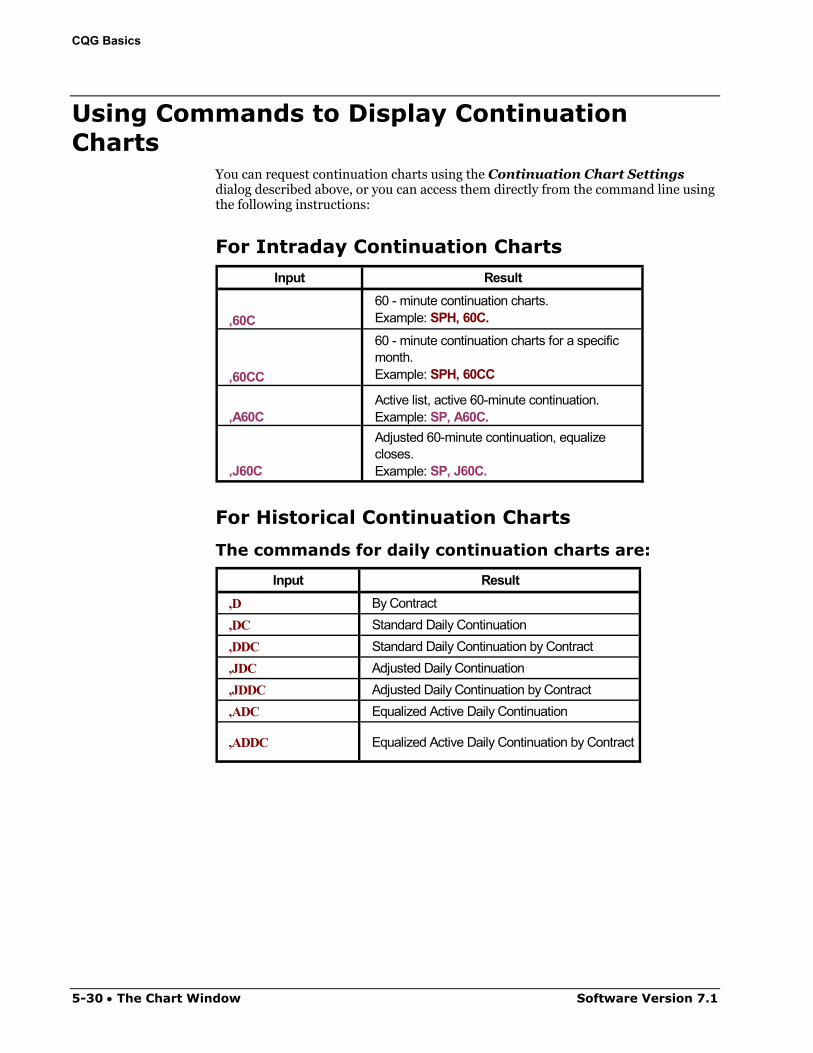
CQG Basics
Using Commands to Display Continuation Charts
You can request continuation charts using the Continuation Chart Settings dialog described above, or you can access them directly from the command line using the following instructions:
For Intraday Continuation Charts
Input Result
,60C60 - minute continuation charts.Example:
,60CC
60 - minute continuation charts for a specific month.Example:
,A60CActive list, active 60-minute continuation.Example: SP, A60C.
,J60C
Adjusted 60-minute continuation, equalize closes.Example: SP, J60C.
SPH, 60C.
SPH, 60CC
,D,DC,DDC,JDC,JDDC,ADC
,ADDC
For Historical Continuation Charts
The commands for daily continuation charts are:
Input ResultBy ContractStandard Daily ContinuationStandard Daily Continuation by ContractAdjusted Daily ContinuationAdjusted Daily Continuation by ContractEqualized Active Daily Continuation
Equalized Active Daily Continuation by Contract
5-30 • The Chart Window Software Version 7.1
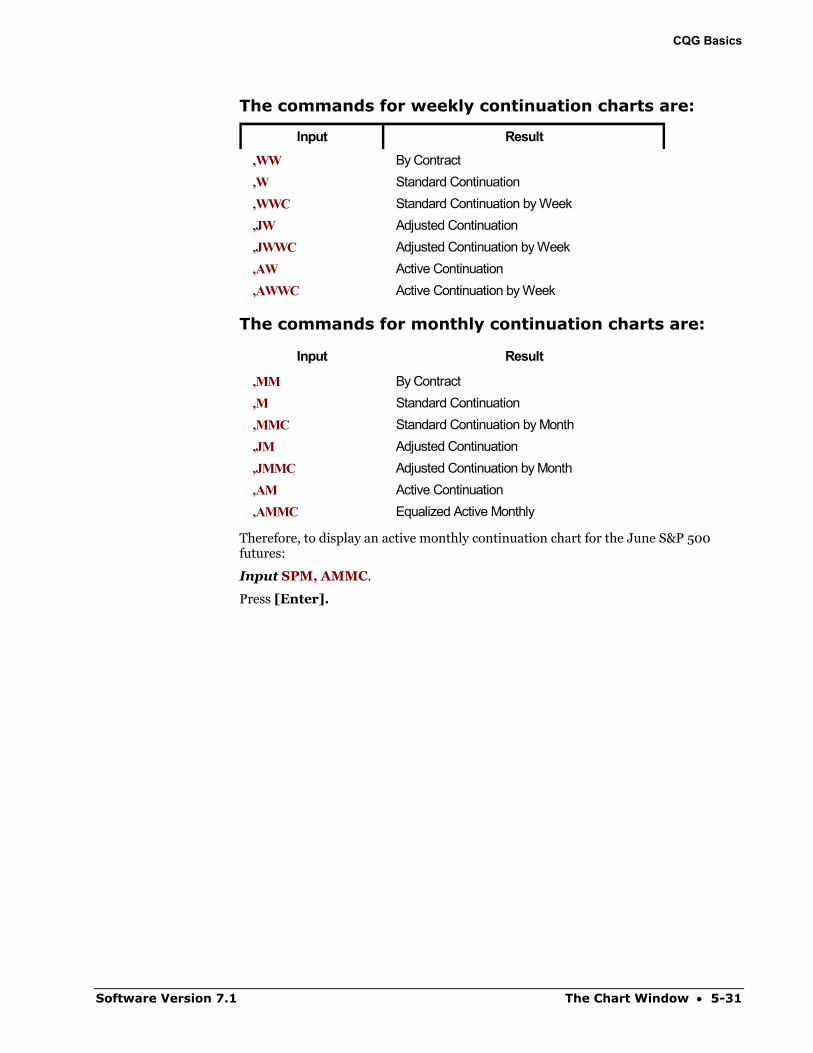
CQG Basics
The commands for weekly continuation charts are:
Input Result
By ContractStandard ContinuationStandard Continuation by WeekAdjusted ContinuationAdjusted Continuation by WeekActive ContinuationActive Continuation by Week
,WW,W,WWC,JW,JWWC,AW,AWWC
,MM,M,MMC,JM,JMMC,AM,AMMC
The commands for monthly continuation charts are:
Input Result
By ContractStandard ContinuationStandard Continuation by MonthAdjusted ContinuationAdjusted Continuation by MonthActive ContinuationEqualized Active Monthly
Therefore, to display an active monthly continuation chart for the June S&P 500 futures:
Input SPM, AMMC.
Press [Enter].
Software Version 7.1 The Chart Window • 5-31
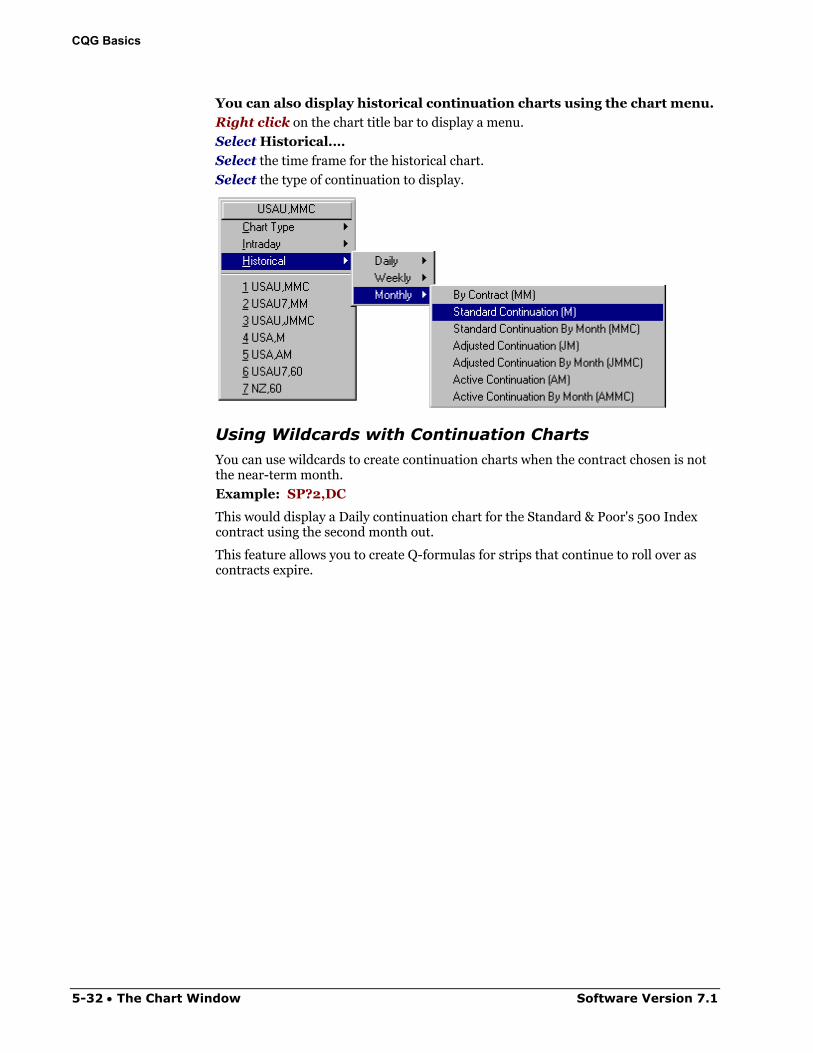
CQG Basics
You can also display historical continuation charts using the chart menu.
Right click on the chart title bar to display a menu.
Select Historical.…
Select the time frame for the historical chart.
Select the type of continuation to display.
Using Wildcards with Continuation Charts You can use wildcards to create continuation charts when the contract chosen is not the near-term month.
Example: SP?2,DC
This would display a Daily continuation chart for the Standard & Poor's 500 Index contract using the second month out.
This feature allows you to create Q-formulas for strips that continue to roll over as contracts expire.
5-32 • The Chart Window Software Version 7.1
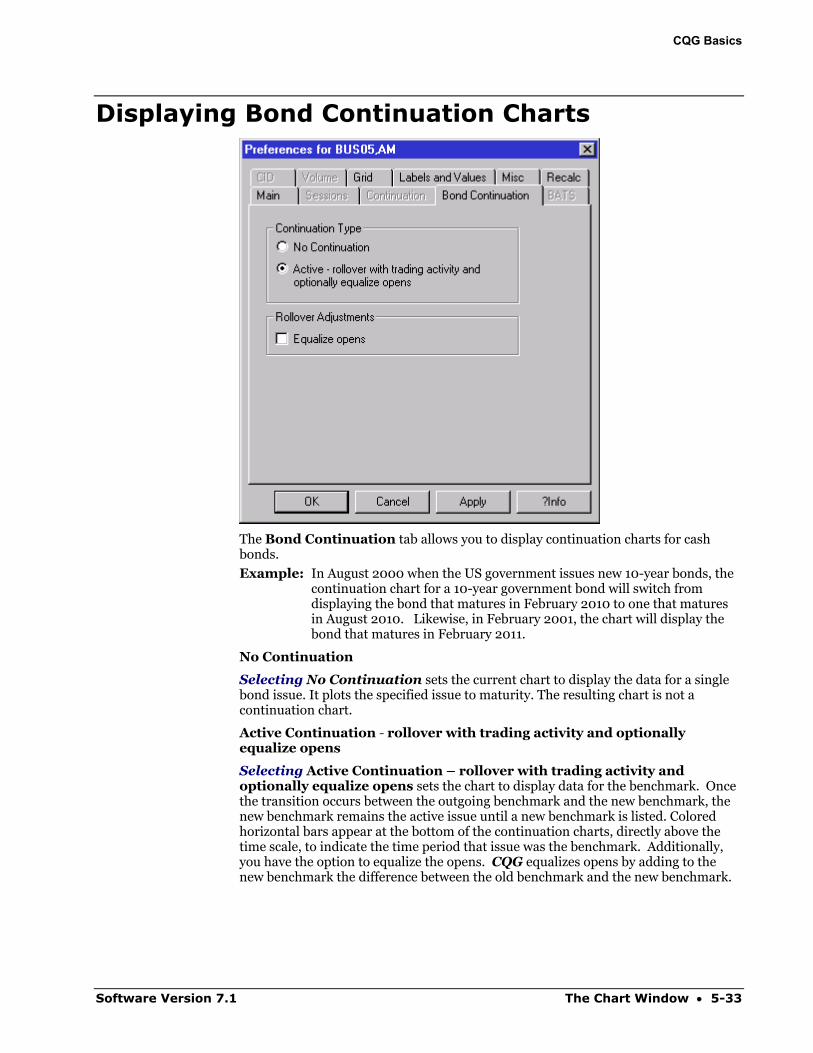
CQG Basics
Displaying Bond Continuation Charts
The Bond Continuation tab allows you to display continuation charts for cash bonds.
Example: In August 2000 when the US government issues new 10-year bonds, the continuation chart for a 10-year government bond will switch from displaying the bond that matures in February 2010 to one that matures in August 2010. Likewise, in February 2001, the chart will display the bond that matures in February 2011.
No Continuation
Selecting No Continuation sets the current chart to display the data for a single bond issue. It plots the specified issue to maturity. The resulting chart is not a continuation chart.
Active Continuation - rollover with trading activity and optionally equalize opens
Selecting Active Continuation – rollover with trading activity and optionally equalize opens sets the chart to display data for the benchmark. Once the transition occurs between the outgoing benchmark and the new benchmark, the new benchmark remains the active issue until a new benchmark is listed. Colored horizontal bars appear at the bottom of the continuation charts, directly above the time scale, to indicate the time period that issue was the benchmark. Additionally, you have the option to equalize the opens. CQG equalizes opens by adding to the new benchmark the difference between the old benchmark and the new benchmark.
Software Version 7.1 The Chart Window • 5-33
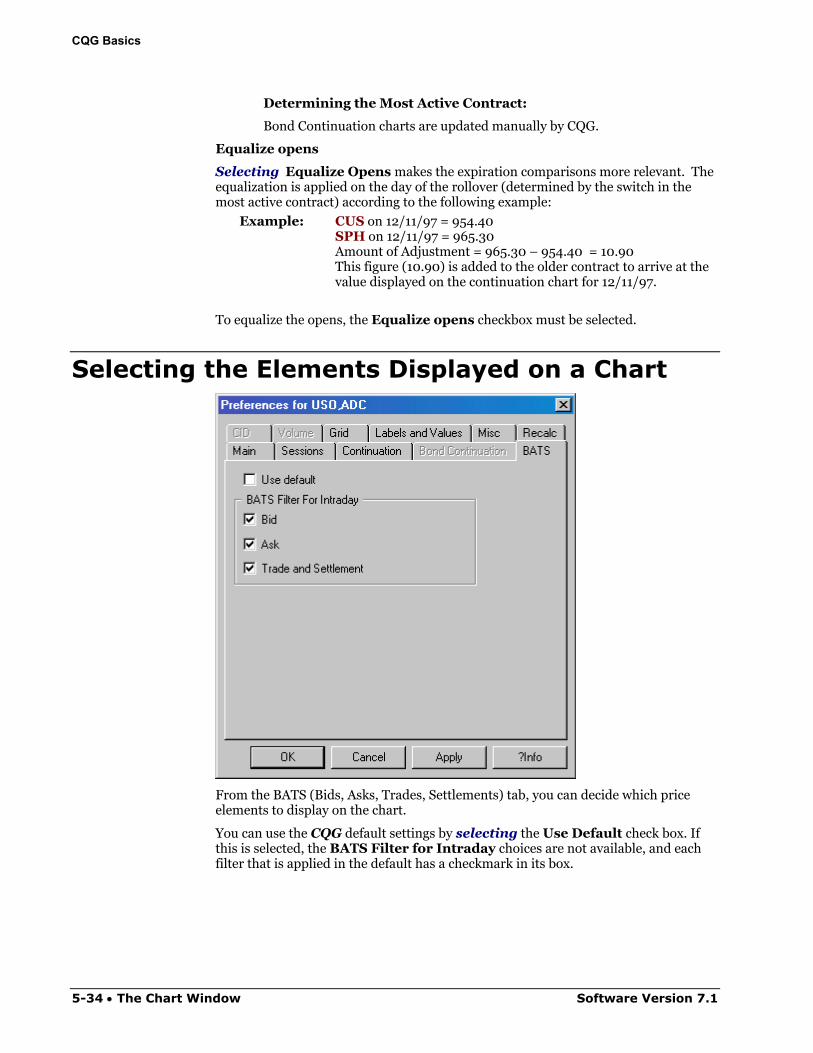
CQG Basics
Determining the Most Active Contract:
Bond Continuation charts are updated manually by CQG.
Equalize opens
Selecting Equalize Opens makes the expiration comparisons more relevant. The equalization is applied on the day of the rollover (determined by the switch in the most active contract) according to the following example:
Example: CUS on 12/11/97 = 954.40 SPH on 12/11/97 = 965.30 Amount of Adjustment = 965.30 – 954.40 = 10.90 This figure (10.90) is added to the older contract to arrive at the value displayed on the continuation chart for 12/11/97.
To equalize the opens, the Equalize opens checkbox must be selected.
Selecting the Elements Displayed on a Chart
From the BATS (Bids, Asks, Trades, Settlements) tab, you can decide which price elements to display on the chart.
You can use the CQG default settings by selecting the Use Default check box. If this is selected, the BATS Filter for Intraday choices are not available, and each filter that is applied in the default has a checkmark in its box.
5-34 • The Chart Window Software Version 7.1
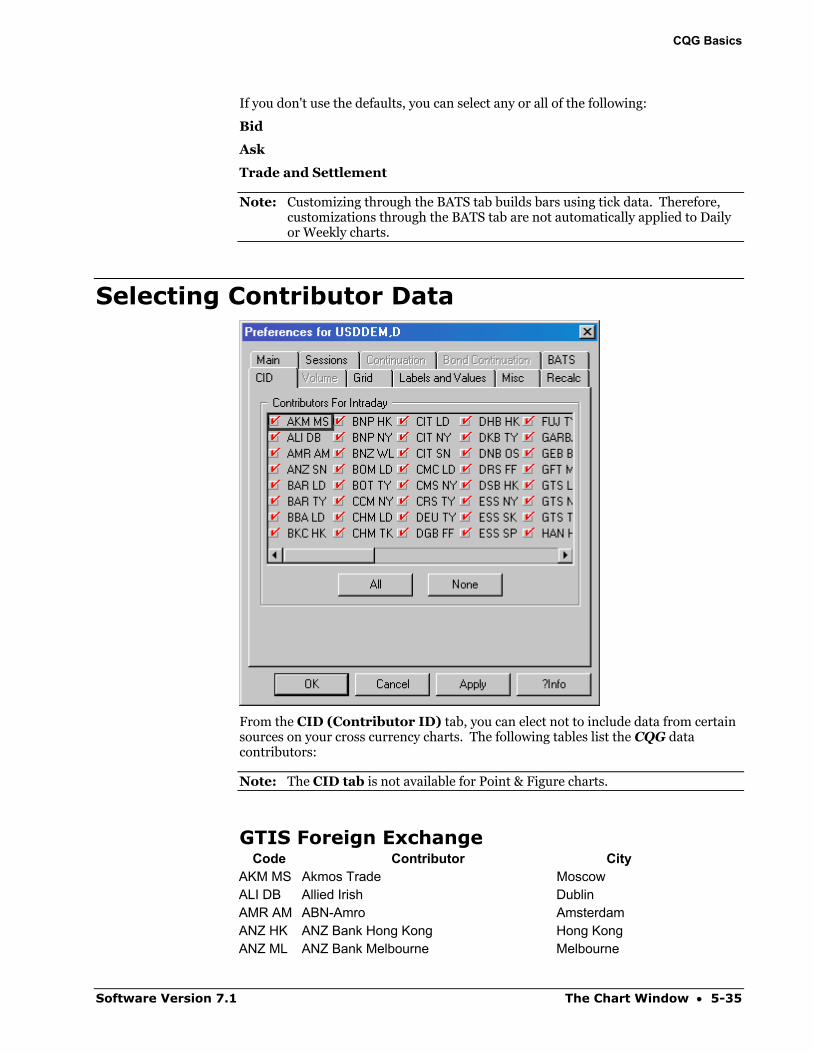
CQG Basics
If you don't use the defaults, you can select any or all of the following:
Bid
Ask
Trade and Settlement
Note: Customizing through the BATS tab builds bars using tick data. Therefore, customizations through the BATS tab are not automatically applied to Daily or Weekly charts.
Selecting Contributor Data
From the CID (Contributor ID) tab, you can elect not to include data from certain sources on your cross currency charts. The following tables list the CQG data contributors:
Note: The CID tab is not available for Point & Figure charts.
GTIS Foreign Exchange Code Contributor City
AKM MS Akmos Trade Moscow ALI DB Allied Irish Dublin AMR AM ABN-Amro Amsterdam ANZ HK ANZ Bank Hong Kong Hong Kong ANZ ML ANZ Bank Melbourne Melbourne
Software Version 7.1 The Chart Window • 5-35
CQG Basics
Code Contributor City ANZ SN Australia New Zealand Bank Sydney ANZ SU ANZ Bank Suva, Fiji Suva BAR LD Barclays Bank London BAR TY Barclays Bank Tokyo BBA LD LIBOR & EURIBOR test London BKC HK Bank of China Hong Kong BNP HK Banque Nationale de Paris Hong Kong BNP NY Banque Nationale de Paris New York BNPANY BNP New York New York BNZ WL Bank of New Zealand Wellington BOM LD Bank of Montreal London BOT TY Bank of Tokyo-Mitsubishi Tokyo CCM NY CCM International. New York CHM LD Chemical Bank London CHM TK Chemical Bank Tokyo CIT LD Citibank London CIT NY Citibank New York CIT SN Citibank Sydney CMC LD Currency Managemant Corp. London CMS NY CMS New York COMMHK Bank of Communications Hong Kong Hong Kong CRS TY Credit-Suisse Tokyo DEU TY Deutsche Bank Tokyo DGB FF DG Bank Frankfurt DHB HK Dao Heng Hong Kong DKB TY Dai-Ichi Kangyo Bank Tokyo DNB OS Den Norske Bank Oslo DRS FF Dresdner Bank Frankfurt DSB HK Dah Sing Bank Hong Kong ESS NY SE Banken New York ESS SK SE Banken Stockholm ESS SP SE Banken Singapore FUJ TY Fuji Bank Tokyo FXN NY Forex Capital Markets New York GAN NY Gain Capital Inc. New York GARBAN Garban Garban GEB BR Generale Bank Brussels Brussels GFT MI Global Forex Trading Michigan GTS LD GTS (consolidated rate) London GTS NY GTS (consolidated rate) New York GTS TY GTS (consolidated rate) Tokyo HAN HK Hantec International Limited Hong Kong HAN SK Svenska Stockholm HAS HK Hang Seng Bank Hong Kong Hong Kong HFH HK Hong Kong Forex Investment Limited Hong Kong HND NY Svenska Handelsbanken New York
5-36 • The Chart Window Software Version 7.1

CQG Basics
Code Contributor City HSB HK Hong Kong Shanghai Hong Kong HSB LD HCSB London HSB SN H S B C Sydney IBJ TY Industrial Bank of Japan Tokyo IOV HK Indover Bank Hong Kong Hong Kong JBA TY Japanese Bankers Association Tokyo KAB IS Koc Bank Istanbul Istanbul KAE MI Kaes USA Inc. Miami KPB HK Kwangtung Provincial Bank Hong Kong LFH HK Lee Fung Hong Hong Kong LTC TY Shinsei Bank Tokyo MIT TY Sumitomo Tokyo MRT HL MRIT Helsinki MTB TY Mitsubishi Trust Bank Tokyo MTR TY Chuo-Mitsui Trust and Banking Tokyo NAT ML National Australia Bank Melbourne NBN WL National Bank of New Zealand Wellington NOC TY Norinchunkin Bank Tokyo NOR SK Nordbanken Stockholm OHA AM OHV Amsterdam PSP HL Postipankki Helsinki RAB UT Rabo Bank Utricht RAD NY Rada Forex New York RADANY Rada Forex New York New York REP HK Republic National Bank Hong Kong RYC LD Royal Bank of Canada London RYC TR Royal Canadian Bank Toronto SAI TY Asahi Bank Tokyo SAN HK Po Sang Bank Hong Kong SAN TY Sanwa Tokyo SBC HK UBS Investment Bank Hong Kong Hong Kong SBC TY SBCO Warburg DR Tokyo SBC ZU UBS Investment Bank Zurich Zurich SBD CP Saxo Bank Copenhagen SCB HK Standard Chartered Bank Hong Kong SHK HK Sun Hung Kai Limited Hong Kong SHK HK Sun Hung Kai Limited Hong Kong SKC TY Shoko Chukin Bank Tokyo SMT TK Sumitomo Tokyo STB TY Sumitomo Trust and Banking Company Tokyo SWD SK Sparbankernas Stockholm TAI TA Taipei Forex Taiwan TAI TK Taipei Forex Tokyo TUB DU Trinkhaus Duesseldorf TULLET Tullet & Tokyo Tullet & Tokyo ULB DB Ulster Bank Dublin
Software Version 7.1 The Chart Window • 5-37
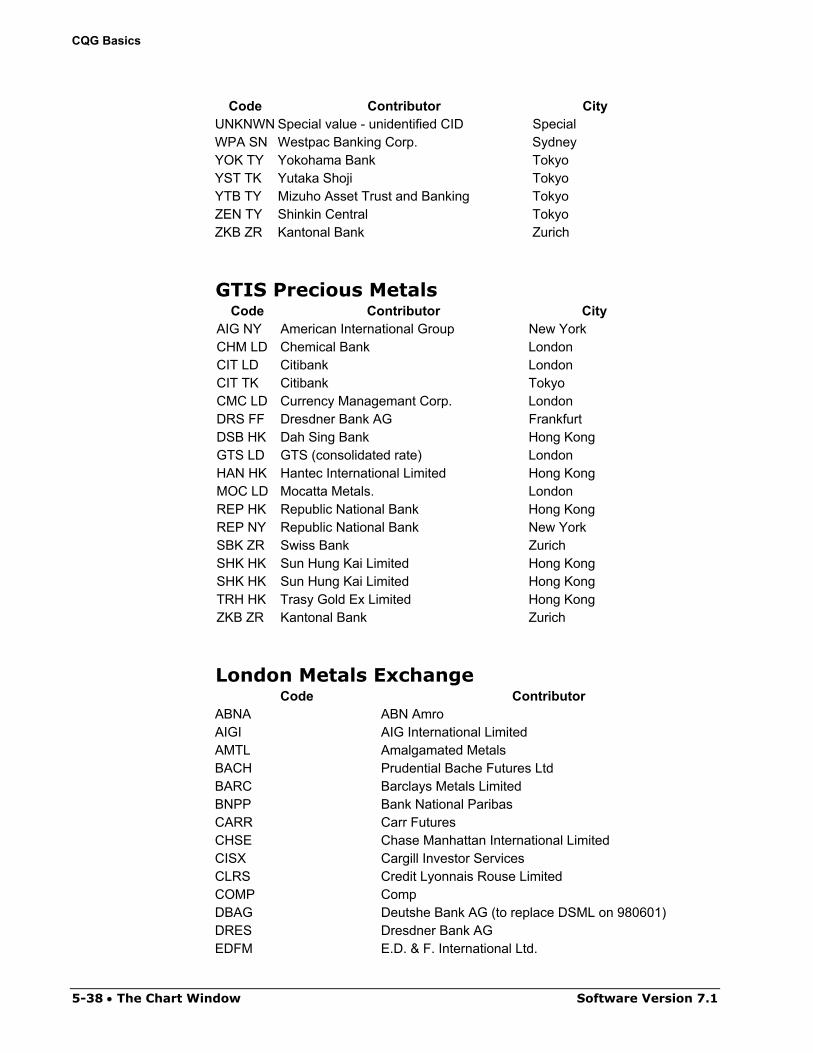
CQG Basics
Code Contributor City UNKNWN Special value - unidentified CID Special WPA SN Westpac Banking Corp. Sydney YOK TY Yokohama Bank Tokyo YST TK Yutaka Shoji Tokyo YTB TY Mizuho Asset Trust and Banking Tokyo ZEN TY Shinkin Central Tokyo ZKB ZR Kantonal Bank Zurich
GTIS Precious Metals Code Contributor City
AIG NY American International Group New York CHM LD Chemical Bank London CIT LD Citibank London CIT TK Citibank Tokyo CMC LD Currency Managemant Corp. London DRS FF Dresdner Bank AG Frankfurt DSB HK Dah Sing Bank Hong Kong GTS LD GTS (consolidated rate) London HAN HK Hantec International Limited Hong Kong MOC LD Mocatta Metals. London REP HK Republic National Bank Hong Kong REP NY Republic National Bank New York SBK ZR Swiss Bank Zurich SHK HK Sun Hung Kai Limited Hong Kong SHK HK Sun Hung Kai Limited Hong Kong TRH HK Trasy Gold Ex Limited Hong Kong ZKB ZR Kantonal Bank Zurich
London Metals Exchange Code Contributor
ABNA ABN Amro AIGI AIG International Limited AMTL Amalgamated Metals BACH Prudential Bache Futures Ltd BARC Barclays Metals Limited BNPP Bank National Paribas CARR Carr Futures CHSE Chase Manhattan International Limited CISX Cargill Investor Services CLRS Credit Lyonnais Rouse Limited COMP Comp DBAG Deutshe Bank AG (to replace DSML on 980601) DRES Dresdner Bank AG EDFM E.D. & F. International Ltd.
5-38 • The Chart Window Software Version 7.1
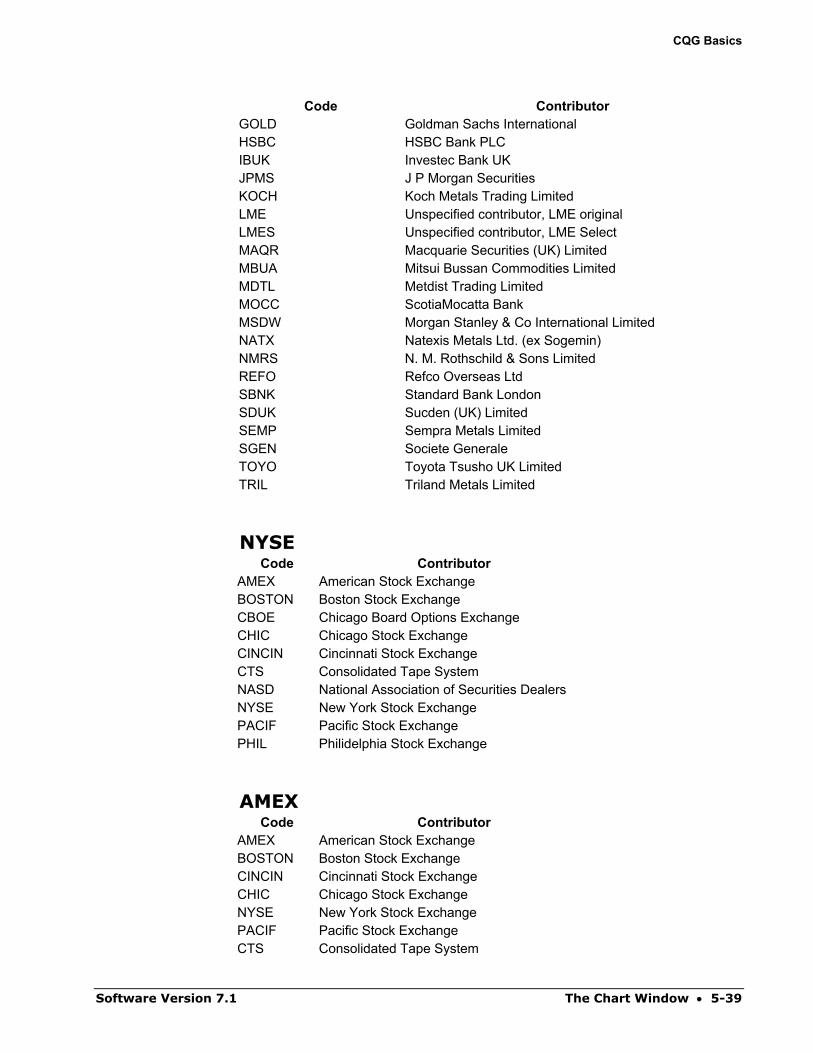
CQG Basics
Code Contributor GOLD Goldman Sachs International HSBC HSBC Bank PLC IBUK Investec Bank UK JPMS J P Morgan Securities KOCH Koch Metals Trading Limited LME Unspecified contributor, LME original LMES Unspecified contributor, LME Select MAQR Macquarie Securities (UK) Limited MBUA Mitsui Bussan Commodities Limited MDTL Metdist Trading Limited MOCC ScotiaMocatta Bank MSDW Morgan Stanley & Co International Limited NATX Natexis Metals Ltd. (ex Sogemin) NMRS N. M. Rothschild & Sons Limited REFO Refco Overseas Ltd SBNK Standard Bank London SDUK Sucden (UK) Limited SEMP Sempra Metals Limited SGEN Societe Generale TOYO Toyota Tsusho UK Limited TRIL Triland Metals Limited
NYSE Code Contributor
AMEX American Stock Exchange BOSTON Boston Stock Exchange CBOE Chicago Board Options Exchange CHIC Chicago Stock Exchange CINCIN Cincinnati Stock Exchange CTS Consolidated Tape System NASD National Association of Securities Dealers NYSE New York Stock Exchange PACIF Pacific Stock Exchange PHIL Philidelphia Stock Exchange
AMEX Code Contributor
AMEX American Stock Exchange BOSTON Boston Stock Exchange CINCIN Cincinnati Stock Exchange CHIC Chicago Stock Exchange NYSE New York Stock Exchange PACIF Pacific Stock Exchange CTS Consolidated Tape System
Software Version 7.1 The Chart Window • 5-39
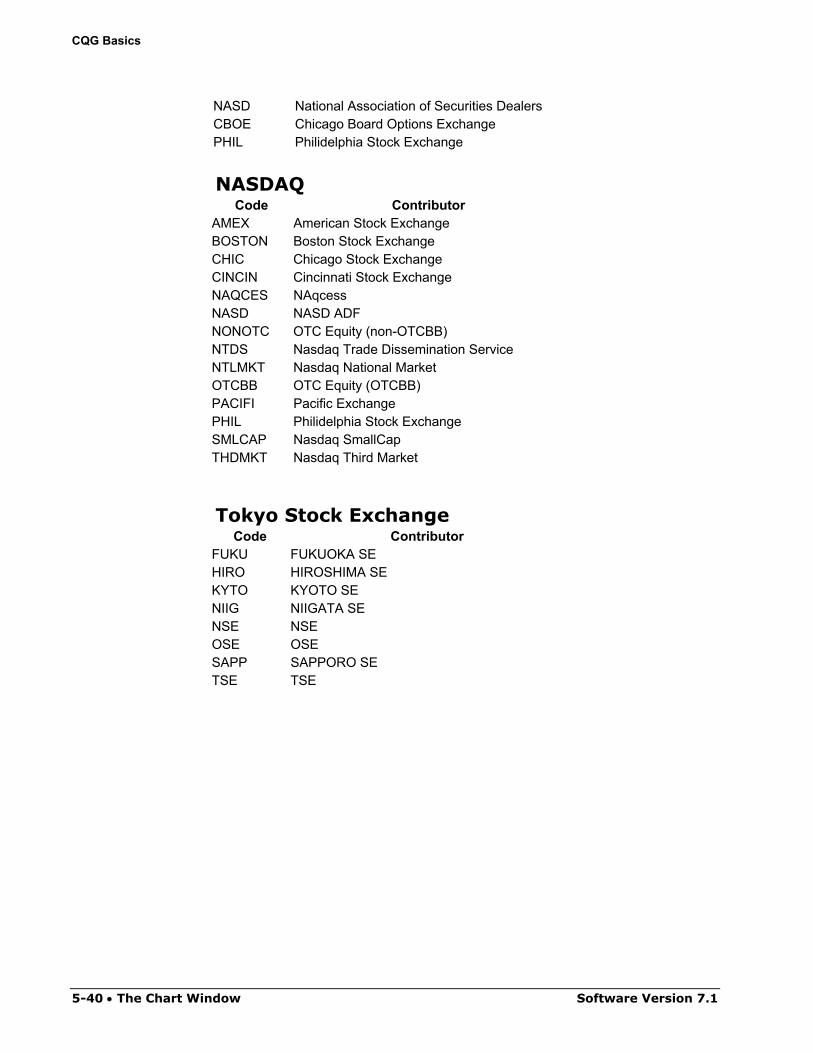
CQG Basics
NASD National Association of Securities Dealers CBOE Chicago Board Options Exchange PHIL Philidelphia Stock Exchange
NASDAQ Code Contributor
AMEX American Stock Exchange BOSTON Boston Stock Exchange CHIC Chicago Stock Exchange CINCIN Cincinnati Stock Exchange NAQCES NAqcess NASD NASD ADF NONOTC OTC Equity (non-OTCBB) NTDS Nasdaq Trade Dissemination Service NTLMKT Nasdaq National Market OTCBB OTC Equity (OTCBB) PACIFI Pacific Exchange PHIL Philidelphia Stock Exchange SMLCAP Nasdaq SmallCap THDMKT Nasdaq Third Market
Tokyo Stock Exchange Code Contributor
FUKU FUKUOKA SE HIRO HIROSHIMA SE KYTO KYOTO SE NIIG NIIGATA SE NSE NSE OSE OSE SAPP SAPPORO SE TSE TSE
5-40 • The Chart Window Software Version 7.1
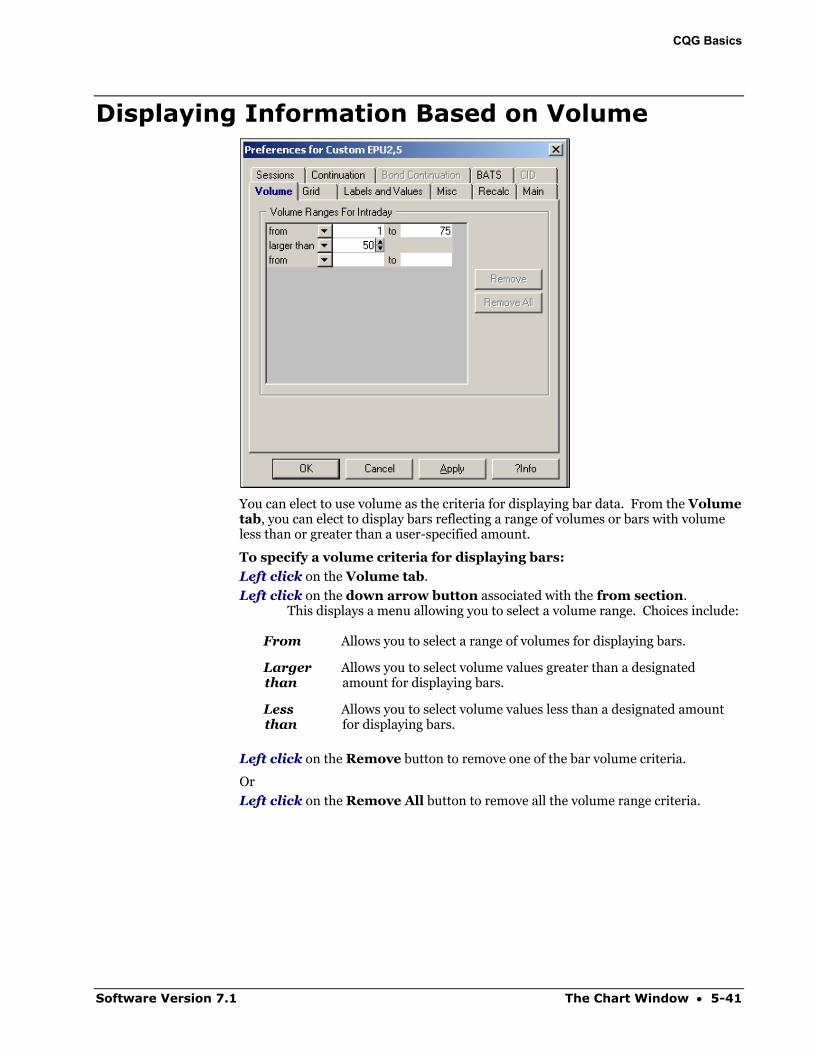
CQG Basics
Displaying Information Based on Volume
You can elect to use volume as the criteria for displaying bar data. From the Volume tab, you can elect to display bars reflecting a range of volumes or bars with volume less than or greater than a user-specified amount.
To specify a volume criteria for displaying bars:
Left click on the Volume tab.
Left click on the down arrow button associated with the from section. This displays a menu allowing you to select a volume range. Choices include:
From Allows you to select a range of volumes for displaying bars.
Larger than
Allows you to select volume values greater than a designated amount for displaying bars.
Less than
Allows you to select volume values less than a designated amount for displaying bars.
Left click on the Remove button to remove one of the bar volume criteria.
Or
Left click on the Remove All button to remove all the volume range criteria.
Software Version 7.1 The Chart Window • 5-41
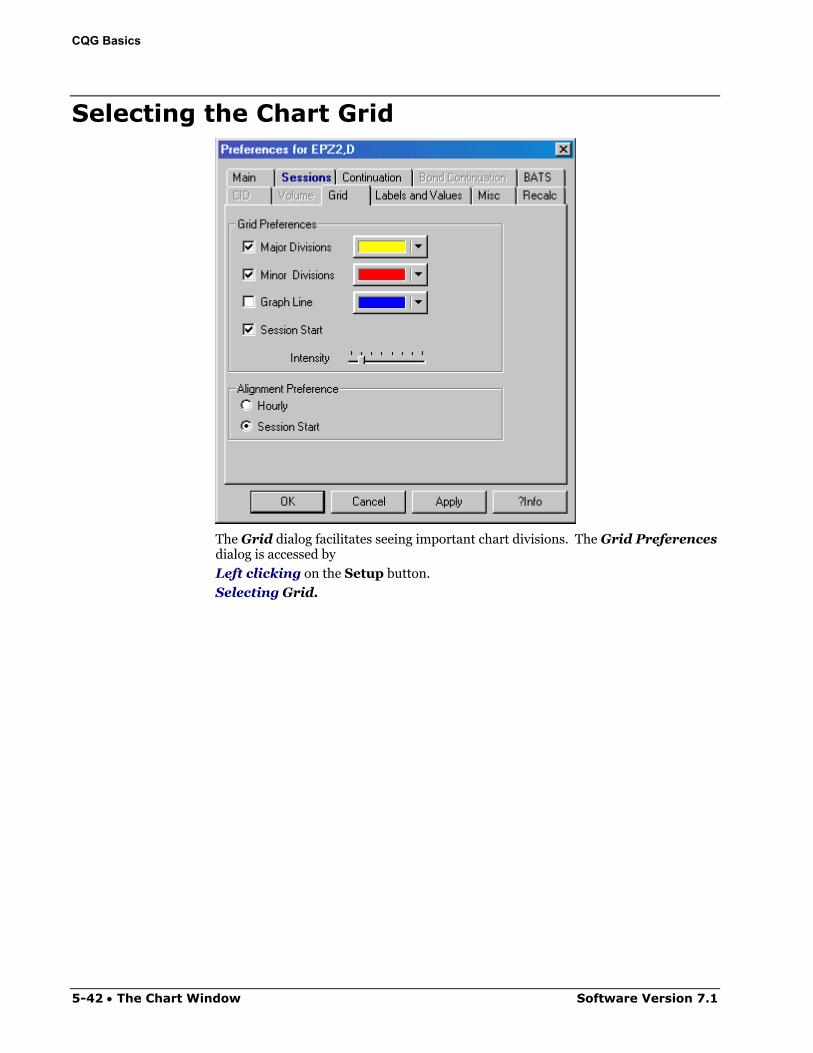
CQG Basics
Selecting the Chart Grid
The Grid dialog facilitates seeing important chart divisions. The Grid Preferences dialog is accessed by
Left clicking on the Setup button.
Selecting Grid.
5-42 • The Chart Window Software Version 7.1
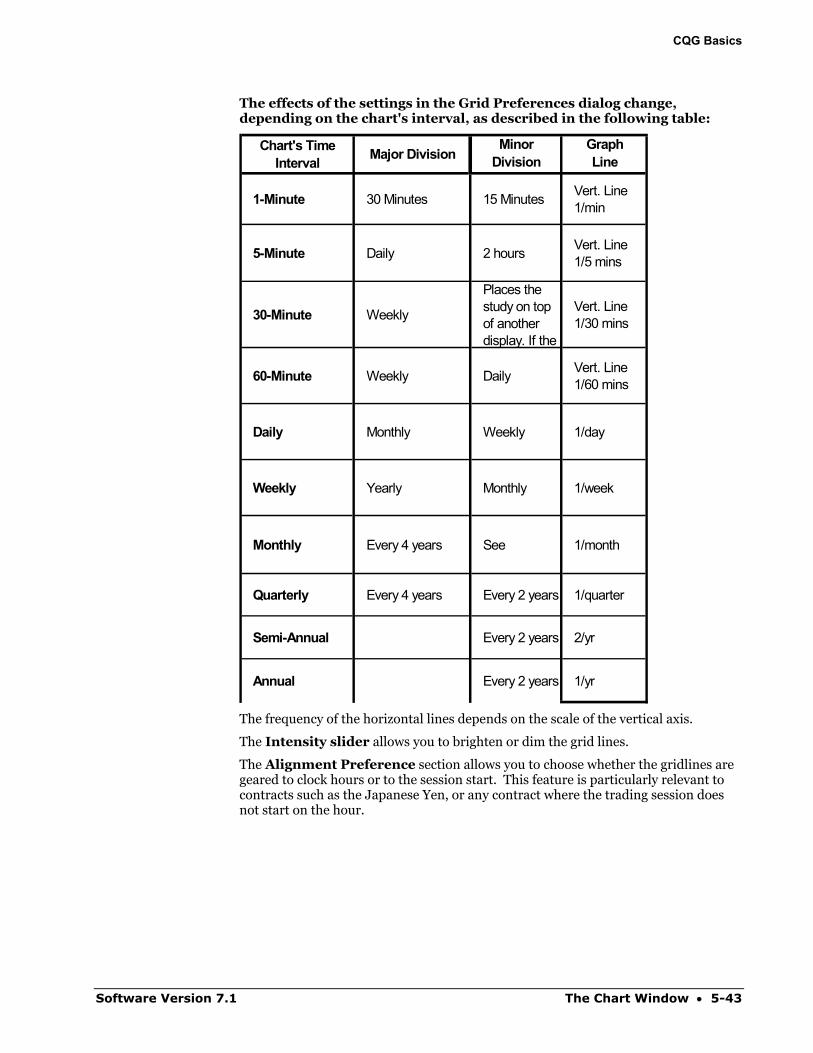
CQG Basics
The effects of the settings in the Grid Preferences dialog change, depending on the chart's interval, as described in the following table:
Chart's Time Interval Major Division
MinorDivision
GraphLine
1-Minute 30 Minutes 15 Minutes Vert. Line 1/min
5-Minute Daily 2 hours Vert. Line 1/5 mins
30-Minute Weekly
Places the study on top of another display. If the
Vert. Line 1/30 mins
60-Minute Weekly Daily Vert. Line 1/60 mins
Daily Monthly Weekly 1/day
Weekly Yearly Monthly 1/week
Monthly Every 4 years See 1/month
Quarterly Every 4 years Every 2 years 1/quarter
Semi-Annual Every 2 years 2/yr
Annual Every 2 years 1/yr
The frequency of the horizontal lines depends on the scale of the vertical axis.
The Intensity slider allows you to brighten or dim the grid lines.
The Alignment Preference section allows you to choose whether the gridlines are geared to clock hours or to the session start. This feature is particularly relevant to contracts such as the Japanese Yen, or any contract where the trading session does not start on the hour.
Software Version 7.1 The Chart Window • 5-43
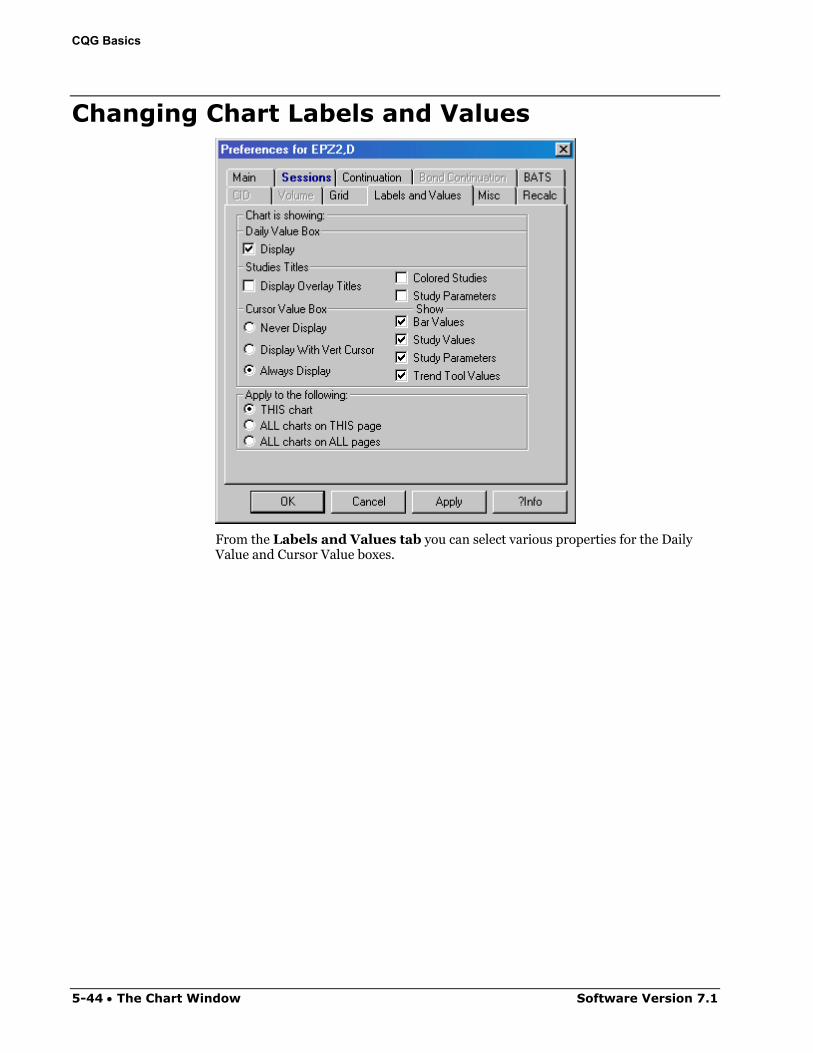
CQG Basics
Changing Chart Labels and Values
From the Labels and Values tab you can select various properties for the Daily Value and Cursor Value boxes.
5-44 • The Chart Window Software Version 7.1
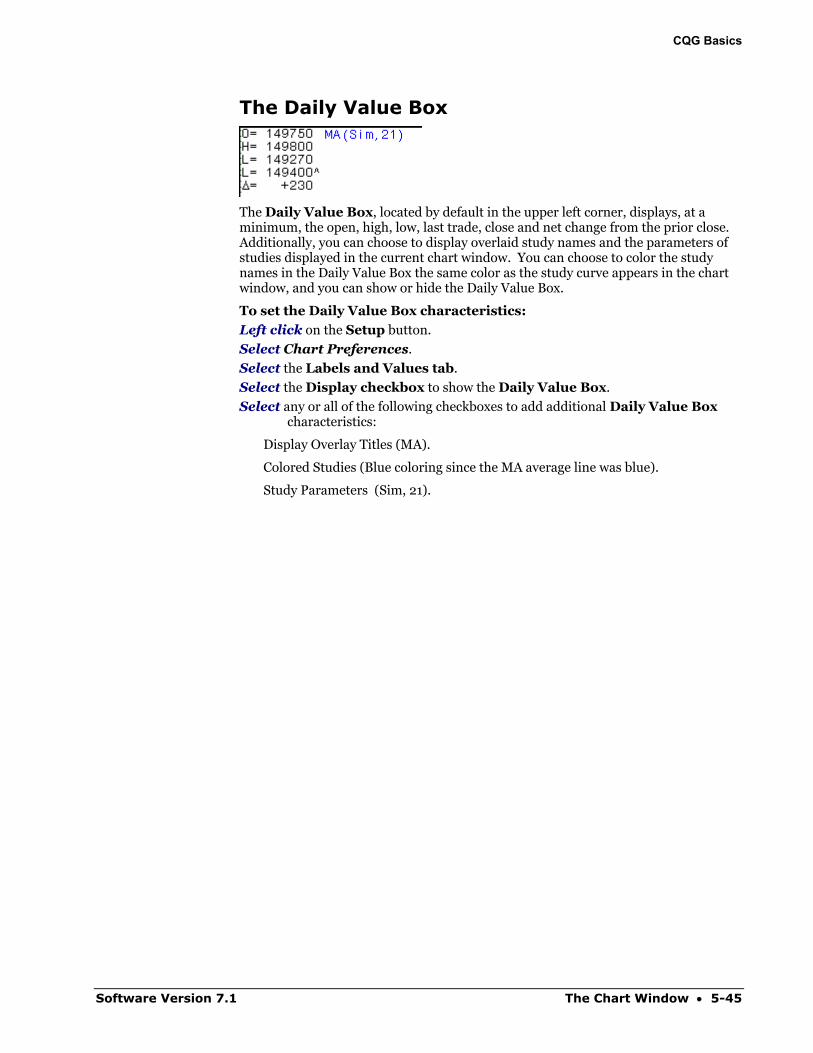
CQG Basics
The Daily Value Box
The Daily Value Box, located by default in the upper left corner, displays, at a minimum, the open, high, low, last trade, close and net change from the prior close. Additionally, you can choose to display overlaid study names and the parameters of studies displayed in the current chart window. You can choose to color the study names in the Daily Value Box the same color as the study curve appears in the chart window, and you can show or hide the Daily Value Box.
To set the Daily Value Box characteristics:
Left click on the Setup button.
Select Chart Preferences.
Select the Labels and Values tab.
Select the Display checkbox to show the Daily Value Box.
Select any or all of the following checkboxes to add additional Daily Value Box characteristics:
Display Overlay Titles (MA).
Colored Studies (Blue coloring since the MA average line was blue).
Study Parameters (Sim, 21).
Software Version 7.1 The Chart Window • 5-45
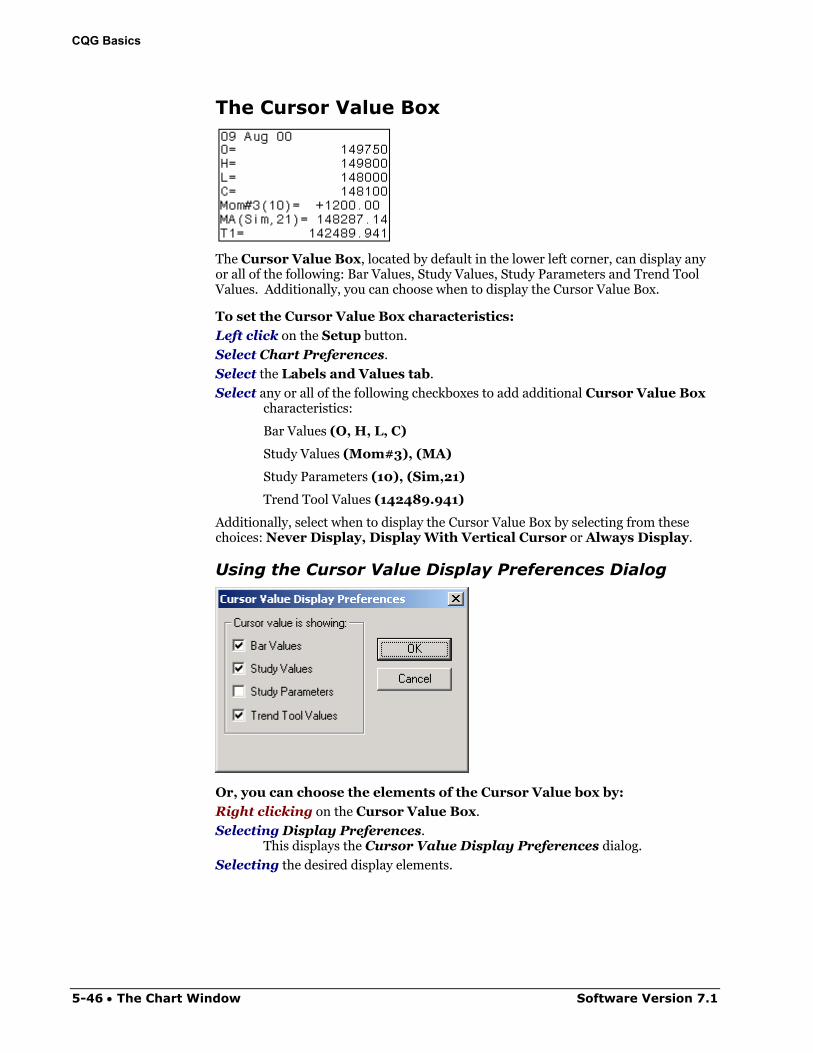
CQG Basics
The Cursor Value Box
The Cursor Value Box, located by default in the lower left corner, can display any or all of the following: Bar Values, Study Values, Study Parameters and Trend Tool Values. Additionally, you can choose when to display the Cursor Value Box.
To set the Cursor Value Box characteristics:
Left click on the Setup button.
Select Chart Preferences.
Select the Labels and Values tab.
Select any or all of the following checkboxes to add additional Cursor Value Box characteristics:
Bar Values (O, H, L, C)
Study Values (Mom#3), (MA)
Study Parameters (10), (Sim,21)
Trend Tool Values (142489.941)
Additionally, select when to display the Cursor Value Box by selecting from these choices: Never Display, Display With Vertical Cursor or Always Display.
Using the Cursor Value Display Preferences Dialog
Or, you can choose the elements of the Cursor Value box by:
Right clicking on the Cursor Value Box.
Selecting Display Preferences. This displays the Cursor Value Display Preferences dialog.
Selecting the desired display elements.
5-46 • The Chart Window Software Version 7.1
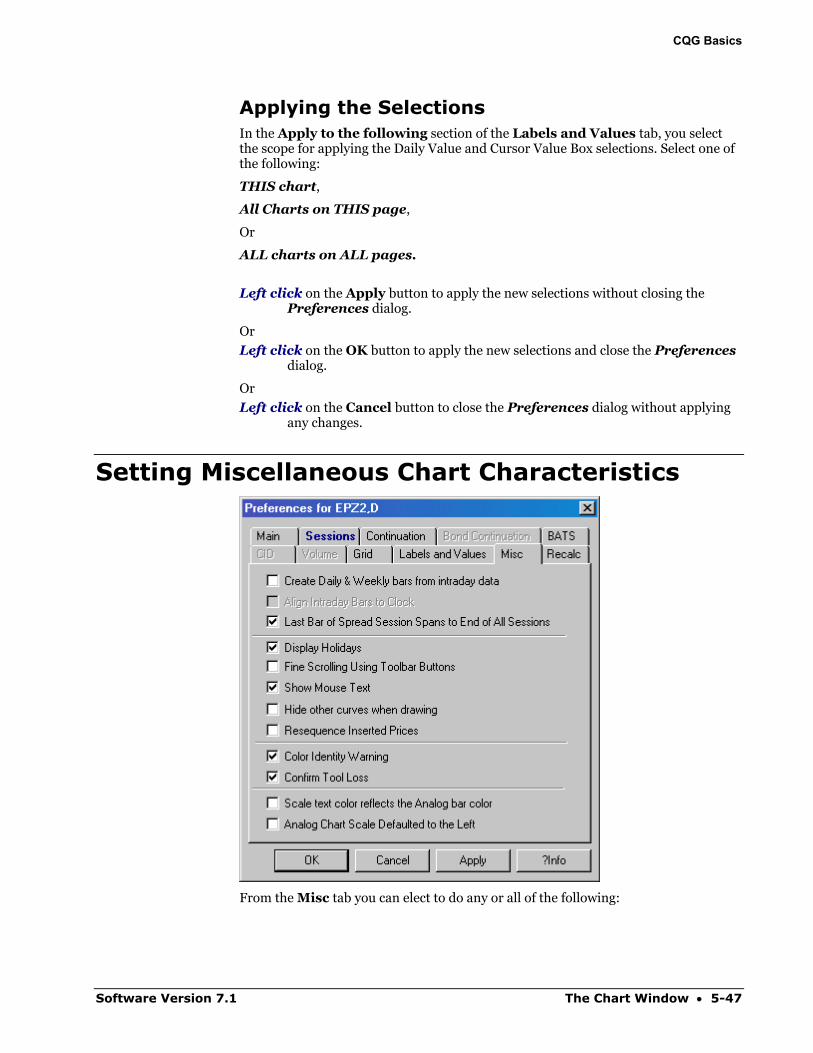
CQG Basics
Applying the Selections In the Apply to the following section of the Labels and Values tab, you select the scope for applying the Daily Value and Cursor Value Box selections. Select one of the following:
THIS chart,
All Charts on THIS page,
Or
ALL charts on ALL pages.
Left click on the Apply button to apply the new selections without closing the Preferences dialog.
Or
Left click on the OK button to apply the new selections and close the Preferences dialog.
Or
Left click on the Cancel button to close the Preferences dialog without applying any changes.
Setting Miscellaneous Chart Characteristics
From the Misc tab you can elect to do any or all of the following:
Software Version 7.1 The Chart Window • 5-47
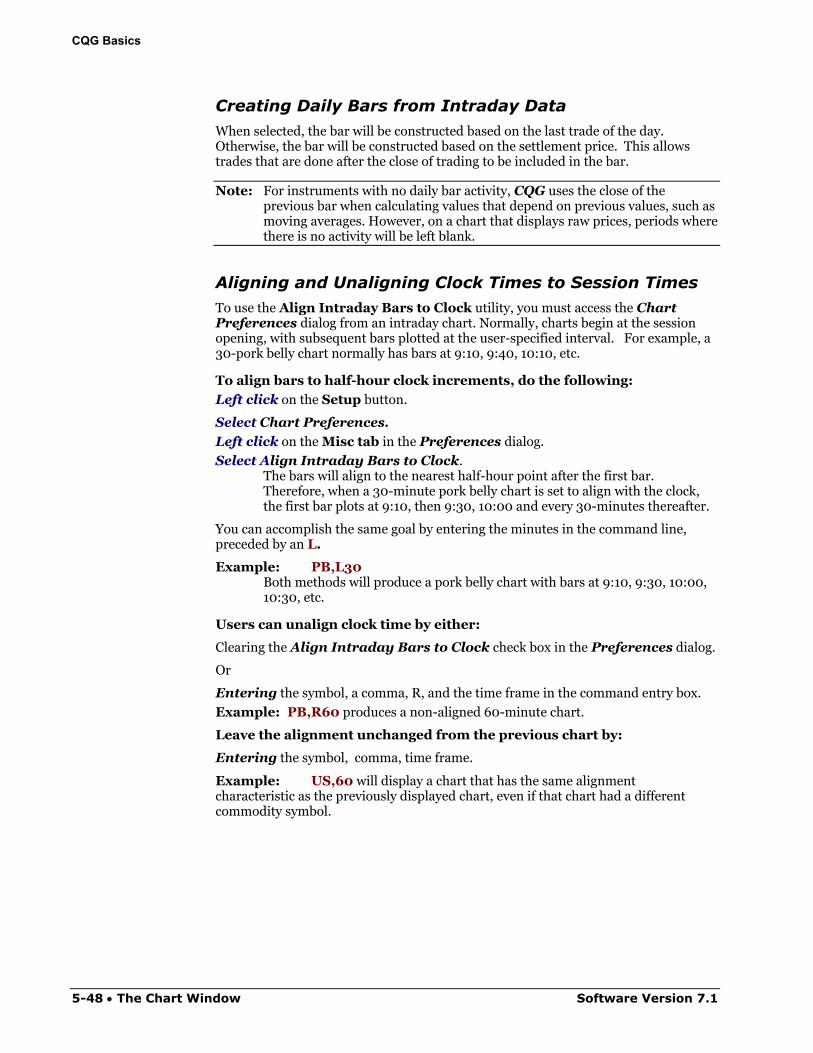
CQG Basics
Creating Daily Bars from Intraday Data When selected, the bar will be constructed based on the last trade of the day. Otherwise, the bar will be constructed based on the settlement price. This allows trades that are done after the close of trading to be included in the bar.
Note: For instruments with no daily bar activity, CQG uses the close of the previous bar when calculating values that depend on previous values, such as moving averages. However, on a chart that displays raw prices, periods where there is no activity will be left blank.
Aligning and Unaligning Clock Times to Session Times
To use the Align Intraday Bars to Clock utility, you must access the Chart Preferences dialog from an intraday chart. Normally, charts begin at the session opening, with subsequent bars plotted at the user-specified interval. For example, a 30-pork belly chart normally has bars at 9:10, 9:40, 10:10, etc.
To align bars to half-hour clock increments, do the following:
Left click on the Setup button.
Select Chart Preferences.
Left click on the Misc tab in the Preferences dialog.
Select Align Intraday Bars to Clock. The bars will align to the nearest half-hour point after the first bar. Therefore, when a 30-minute pork belly chart is set to align with the clock, the first bar plots at 9:10, then 9:30, 10:00 and every 30-minutes thereafter.
You can accomplish the same goal by entering the minutes in the command line, preceded by an L.
Example: PB,L30 Both methods will produce a pork belly chart with bars at 9:10, 9:30, 10:00, 10:30, etc.
Users can unalign clock time by either:
Clearing the Align Intraday Bars to Clock check box in the Preferences dialog.
Or
Entering the symbol, a comma, R, and the time frame in the command entry box.
Example: PB,R60 produces a non-aligned 60-minute chart.
Leave the alignment unchanged from the previous chart by:
Entering the symbol, comma, time frame.
Example: US,60 will display a chart that has the same alignment characteristic as the previously displayed chart, even if that chart had a different commodity symbol.
5-48 • The Chart Window Software Version 7.1
CQG Basics
Choosing how inter-commodity spreads are handled For inter-commodity spreads, or any spread where the two contracts have different trading hours, users can select how to handle the pricing when one entity is not trading.
To select how inter-commodity spreads are handled, in the Misc tab of the Preferences dialog:
Select the Last Bar of Spread Session Spans to End of All Sessions checkbox to have the spread calculated using the closing value for each subsequent bar of the later closing commodity plotted against the closing value of the contract with the earlier close.
Or
De-Select the Last Bar of Spread Session Spans to End of All Sessions checkbox to have the spread stop updating when the early contract closes, with all the values representing concurrent prices between the two commodities
Example:
13:13 13:14 13:15 13:16 15:14
S&P500 1167.50 1167.00 1166.30 1165.50 1168.50
Corn 21.62 21.64 ----------- ----------- -----------
(SPZ-CH)1 1146.70 1146.80 ----------- ----------- -----------
(SPZ-CH)2
1145.90 1145.30 ----------- ----------- -----------
(SPZ – CH)1 = Spread with the checkbox selected.
(SPZ – CH)2 = Spread value without the checkbox selected.
Displaying Holidays on a Chart (Daily Charts Only) When selected, CQG leaves a blank space on the chart to represent the holiday.
Note: On charts where there is Globex trading on a holiday, the holiday Globex session will be included in the bar for the day following the holiday.
Activating the Fine Scrolling Feature
The fine scrolling feature enables you to scroll a chart horizontally by one bar at a time, using the Right/Left arrow button, or vertically by the minimum price change, using the Up/Down arrow button.
Left click on the Misc tab in the Preferences dialog.
Select Fine Scrolling Using toolbar Buttons.
Show Mouse Text
When selected, CQG shows or hides the mouse text.
For additional information, see "Viewing Mouse Text" on page 5-71.
Software Version 7.1 The Chart Window • 5-49
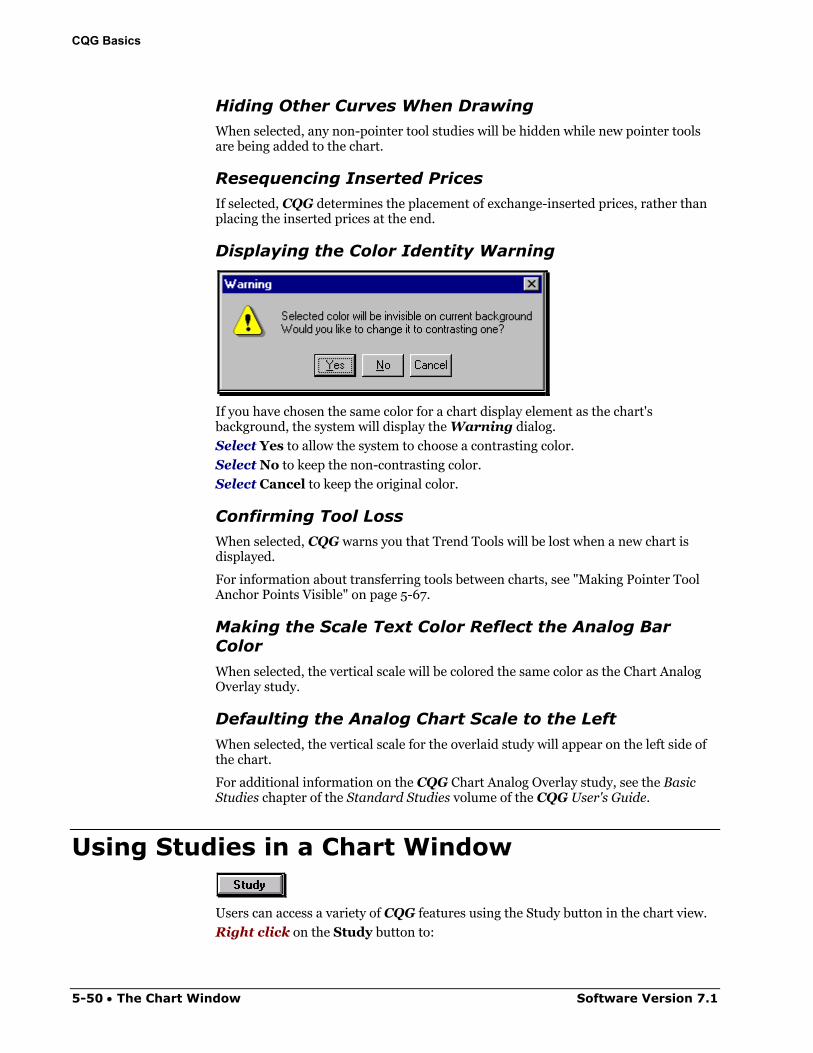
CQG Basics
Hiding Other Curves When Drawing When selected, any non-pointer tool studies will be hidden while new pointer tools are being added to the chart.
Resequencing Inserted Prices
If selected, CQG determines the placement of exchange-inserted prices, rather than placing the inserted prices at the end.
Displaying the Color Identity Warning
If you have chosen the same color for a chart display element as the chart's background, the system will display the Warning dialog.
Select Yes to allow the system to choose a contrasting color.
Select No to keep the non-contrasting color.
Select Cancel to keep the original color.
Confirming Tool Loss When selected, CQG warns you that Trend Tools will be lost when a new chart is displayed.
For information about transferring tools between charts, see "Making Pointer Tool Anchor Points Visible" on page 5-67.
Making the Scale Text Color Reflect the Analog Bar Color
When selected, the vertical scale will be colored the same color as the Chart Analog Overlay study.
Defaulting the Analog Chart Scale to the Left
When selected, the vertical scale for the overlaid study will appear on the left side of the chart.
For additional information on the CQG Chart Analog Overlay study, see the Basic Studies chapter of the Standard Studies volume of the CQG User's Guide.
Using Studies in a Chart Window
Users can access a variety of CQG features using the Study button in the chart view.
Right click on the Study button to:
5-50 • The Chart Window Software Version 7.1
CQG Basics
Add Study. See "Using the Add Study Dialog" on page 5-52. Remove Study. See "Removing a Study from a Chart" on page 5-57. Modify Study Parameters. See "Modifying Study Parameters in a Chart" on page 5-56. Customize Chart Toolbar. See "The Chart Toolbar" on page 5-3. View Trace Bar. See "Using Formula Tracer" in the Formulas in CQG chapter in the User Formulas and Backtesting volume of the CQG User's Guide. Define QFormulas. See "Modifying and Creating Q Formulas in the Formulas in CQG chapter in the User Formulas and Backtesting volume of the CQG User's Guide. Define Conditions. See "Defining a New condition or User Value" in the Formulas in CQG chapter in the User Formulas and Backtesting volume of the CQG User's Guide. Define Studies. See "Defining a Custom Study" in the Formulas in CQG chapter in the User Formulas and Backtesting volume of the CQG User's Guide. Define Trading Systems. See "Backtesting a Trading System" in the Trading Systems chapter in the User Formulas and Backtesting volume of the CQG User's Guide.
Left click on the Study button in the Chart toolbar to display the Add Study dialog. The Add Study dialog shows a list of available Basic Studies, Chart Types, Pointer Tools, Zoom Tools, Functions and Trading Systems, in addition to any third party studies for which you have been enabled.
CQG offers the following third party studies:
ATM DeMark DiNapoli First Step/Next Step Contact customer support for information about First Step/Next Step Profitunity SMR Statware Supplemental TJoseph
Contact customer support for additional information.
Software Version 7.1 The Chart Window • 5-51
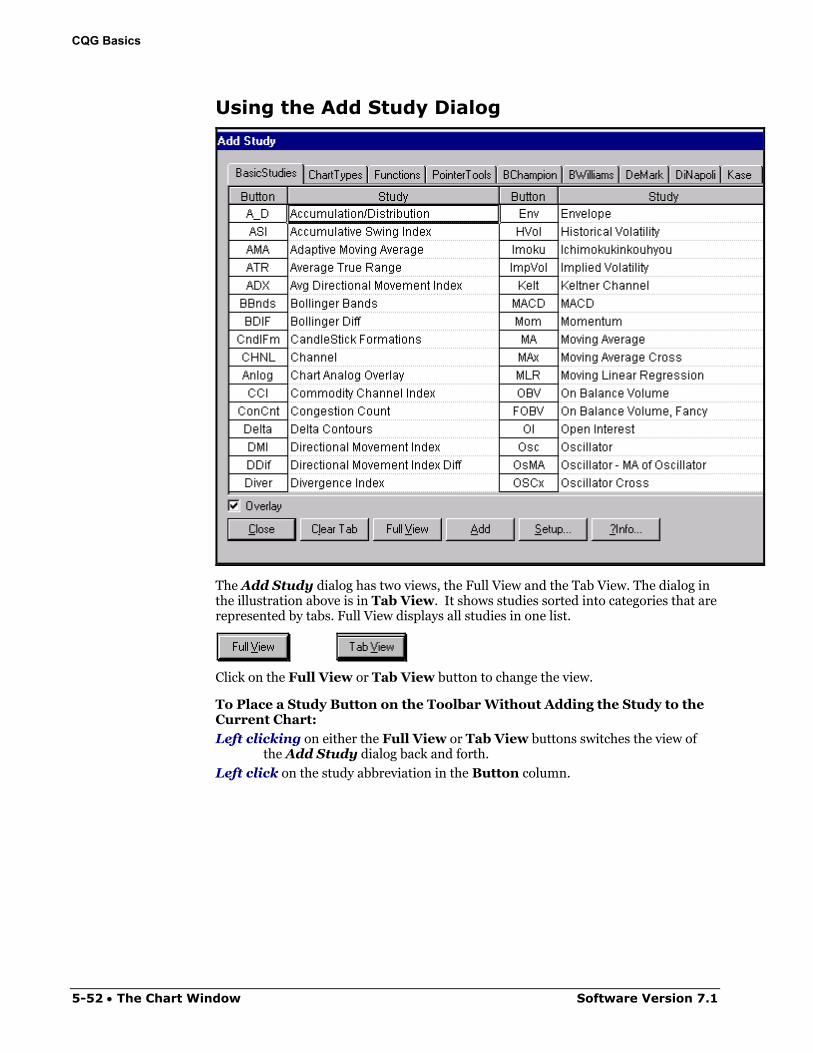
CQG Basics
Using the Add Study Dialog
The Add Study dialog has two views, the Full View and the Tab View. The dialog in the illustration above is in Tab View. It shows studies sorted into categories that are represented by tabs. Full View displays all studies in one list.
Click on the Full View or Tab View button to change the view.
To Place a Study Button on the Toolbar Without Adding the Study to the Current Chart:
Left clicking on either the Full View or Tab View buttons switches the view of the Add Study dialog back and forth.
Left click on the study abbreviation in the Button column.
5-52 • The Chart Window Software Version 7.1
CQG Basics
To Add a Study to a Chart
Left click on either the abbreviation or the full study name.
Left click on the Add button.
Left click on the Overlay checkbox to overlay the study on top of another display. If the box is unchecked, the study will be based on the underlying bar chart and displayed in a separate window.
Note: When a study is added as an overlay from the large Add Study dialog, the overlay is always applied to the underlying bar chart.
Left clicking on the Clear All or Clear Tab button will clear all the buttons, or all
the buttons associated with the currently displayed tab, from the chart toolbar.
Note: Clearing the buttons does not clear the study curves from the chart window.
Displaying Study Parameters
Left click on either the study name or the button name.
Left click on the Setup button.
Accessing Help for Studies
Left click on the ?Info button to access the help file for the selected study.
Using an Individual Study Button
Left click on the MA toolbar button to display the Moving Average study.
Right click on the MA button to remove the Moving Average study, if it is currently displayed on a chart.
Software Version 7.1 The Chart Window • 5-53
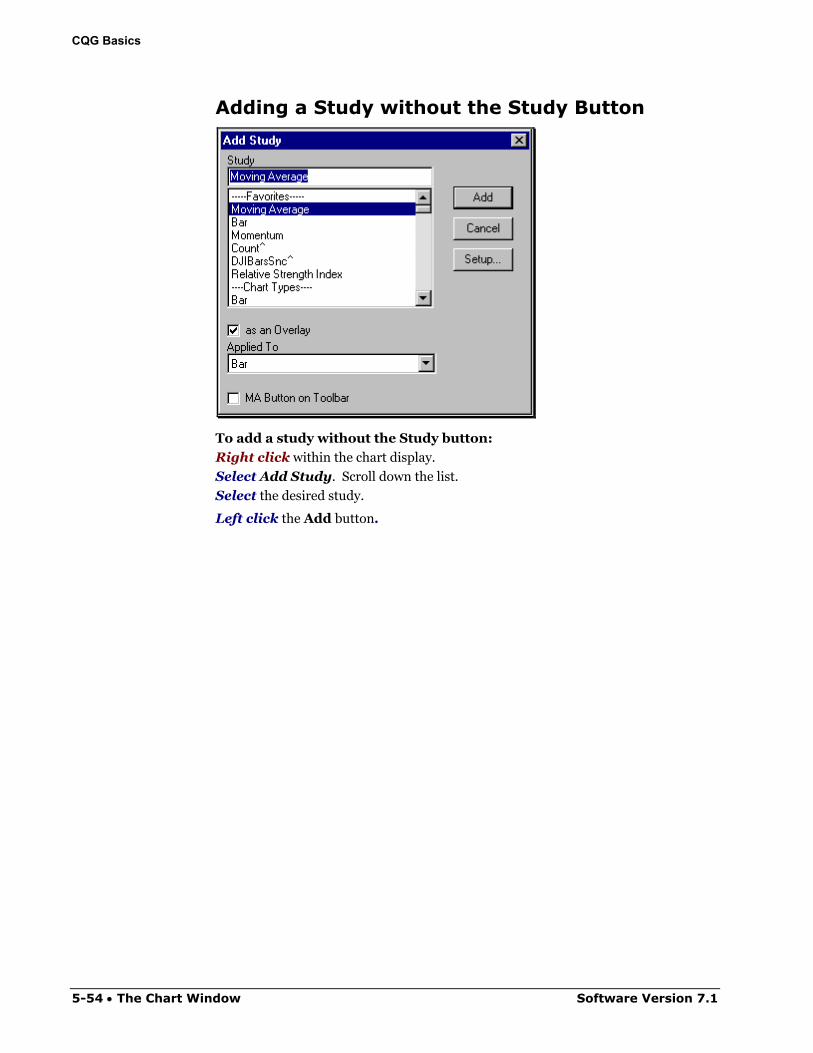
CQG Basics
Adding a Study without the Study Button
To add a study without the Study button:
Right click within the chart display.
Select Add Study. Scroll down the list.
Select the desired study.
Left click the Add button.
5-54 • The Chart Window Software Version 7.1
CQG Basics
Besides adding a study to a chart, the Add Study dialog contains the following:
Dialog Element Action ResultStudy box ---------------- Displays the selected study name
Study list Left click
Displays a list of all the studies available in CQG. The list also includes a Favorites section showing the last 10 studies displayed.
Overlay box Left click
Places the study on top of another display. If the box is not selected (not checked), the study will be based on the chart or study indicated in the Applied To box, but it will be in a separate window.
Applied To box Left clickDisplays a list of current chart windows to which the study can be applied.
Button on Toolbar box Left click Places a button for the selected study
on the toolbar.
Add button Left click Adds the study to a chart.
Cancel button Left click See
Setup…button Left click
Accesses the study parameters, allowing you to change the appearance and calculations in the display.
Software Version 7.1 The Chart Window • 5-55
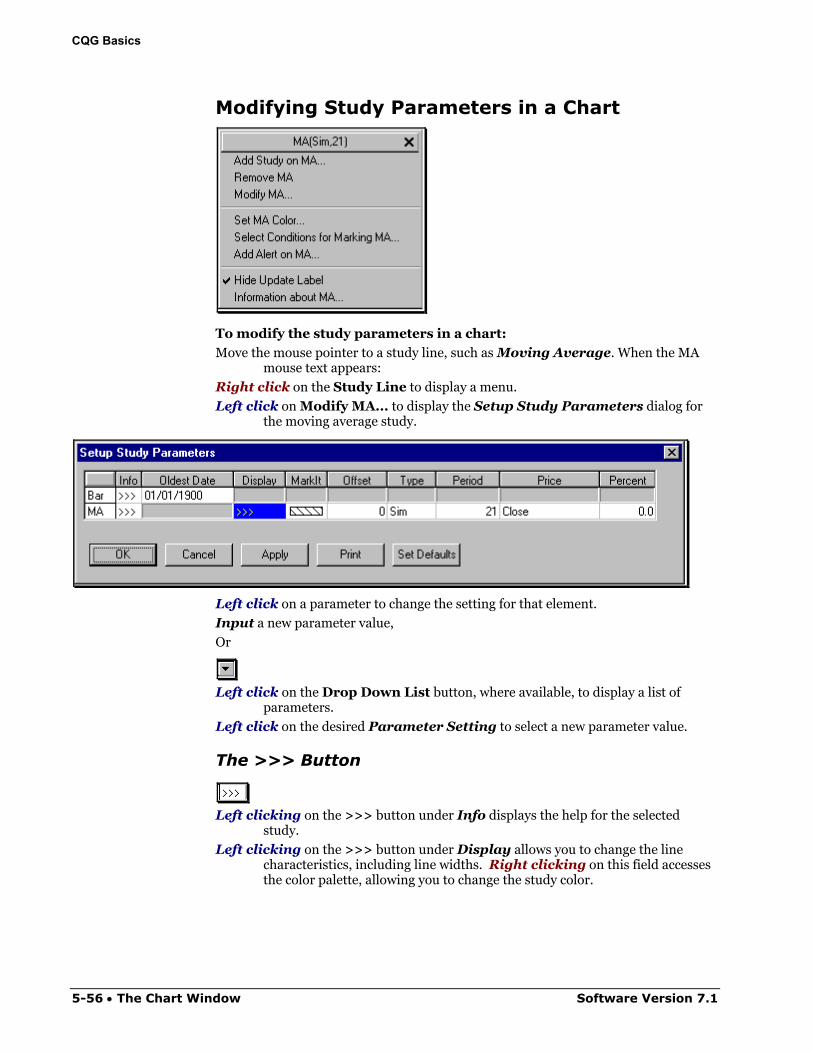
CQG Basics
Modifying Study Parameters in a Chart
To modify the study parameters in a chart:
Move the mouse pointer to a study line, such as Moving Average. When the MA mouse text appears:
Right click on the Study Line to display a menu.
Left click on Modify MA... to display the Setup Study Parameters dialog for the moving average study.
Left click on a parameter to change the setting for that element.
Input a new parameter value,
Or
Left click on the Drop Down List button, where available, to display a list of
parameters.
Left click on the desired Parameter Setting to select a new parameter value.
The >>> Button
Left clicking on the >>> button under Info displays the help for the selected
study.
Left clicking on the >>> button under Display allows you to change the line characteristics, including line widths. Right clicking on this field accesses the color palette, allowing you to change the study color.
5-56 • The Chart Window Software Version 7.1
CQG Basics
The Apply Button
Left click on the Apply button to view the changes on the chart without closing the
Setup Study Parameters dialog.
Closing the Dialog
Left click on the OK button to apply the changes to the study and close the Setup
Study Parameters dialog.
Notes: You can also access the Setup Study Parameters dialog from the Setup button in the Formula Toolbox. However, there are no display parameter choices when the dialog is accessed this way, since the study parameters are only meant to be used as part of Conditions or User Values. Selecting Modify Study Parameters only displays the parameters for the studies in the pane selected when the dialog was activated. To display the parameters for all studies and pointer tools for every pane on the chart, hold down the Ctrl key while selecting Modify Study Parameters….
Removing a Study from a Chart To remove a study from a chart:
Move the mouse pointer to a study line, such as the Moving Average. When the MA mouse text appears:
Right click to display a menu.
Left click on Remove…
Or
Right click anywhere within a chart window.
Select Remove Study.
Left click on the name of the study to be removed.
Left click on the Remove button.
Left click on the Close button.
Or
Right click on the associated Study button to remove that study.
Software Version 7.1 The Chart Window • 5-57

CQG Basics
Removing multiple Studies from a Chart
To remove multiple studies from a chart:
Right click on a blank area in the chart.
Select Remove Study.
Hold down the Ctrl key and Select the studies to be removed.
Left click on the Remove button.
Left click on the Close button to close the Remove study dialog. If the Close button is clicked before the Remove button the Remove Study dialog will close without deleting any studies from the chart.
5-58 • The Chart Window Software Version 7.1
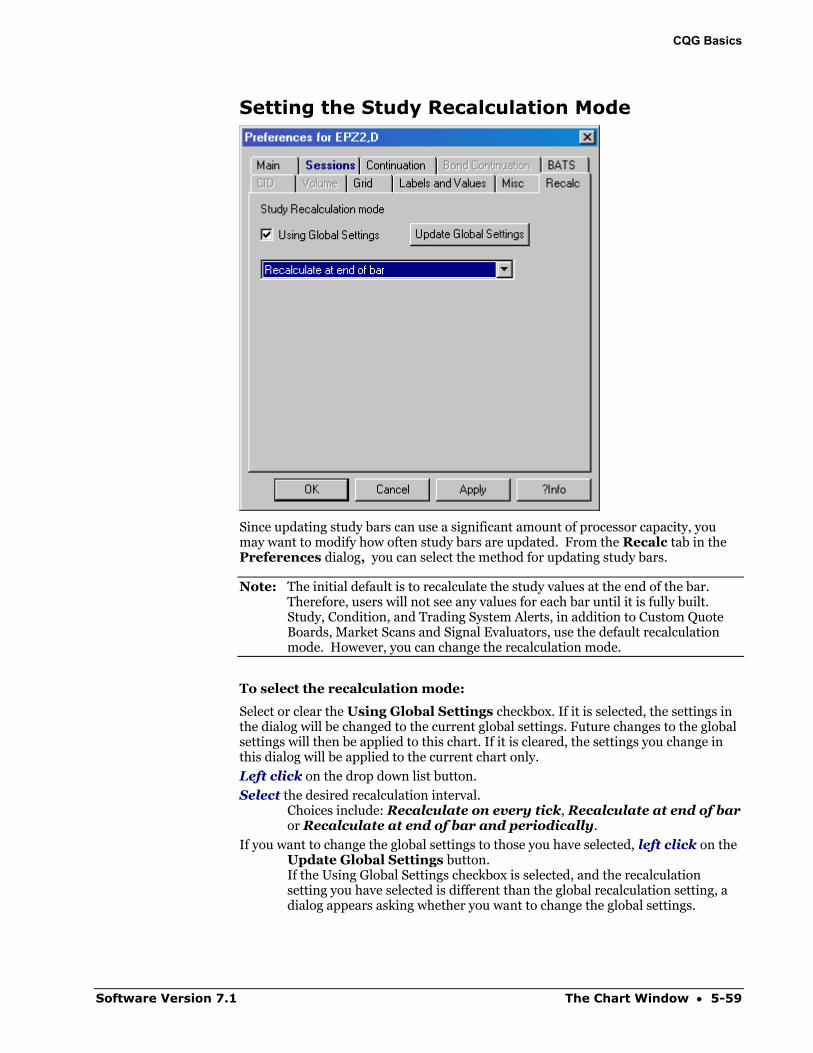
CQG Basics
Setting the Study Recalculation Mode
Since updating study bars can use a significant amount of processor capacity, you may want to modify how often study bars are updated. From the Recalc tab in the Preferences dialog, you can select the method for updating study bars.
Note: The initial default is to recalculate the study values at the end of the bar. Therefore, users will not see any values for each bar until it is fully built. Study, Condition, and Trading System Alerts, in addition to Custom Quote Boards, Market Scans and Signal Evaluators, use the default recalculation mode. However, you can change the recalculation mode.
To select the recalculation mode:
Select or clear the Using Global Settings checkbox. If it is selected, the settings in the dialog will be changed to the current global settings. Future changes to the global settings will then be applied to this chart. If it is cleared, the settings you change in this dialog will be applied to the current chart only.
Left click on the drop down list button.
Select the desired recalculation interval. Choices include: Recalculate on every tick, Recalculate at end of bar or Recalculate at end of bar and periodically.
If you want to change the global settings to those you have selected, left click on the Update Global Settings button. If the Using Global Settings checkbox is selected, and the recalculation setting you have selected is different than the global recalculation setting, a dialog appears asking whether you want to change the global settings.
Software Version 7.1 The Chart Window • 5-59
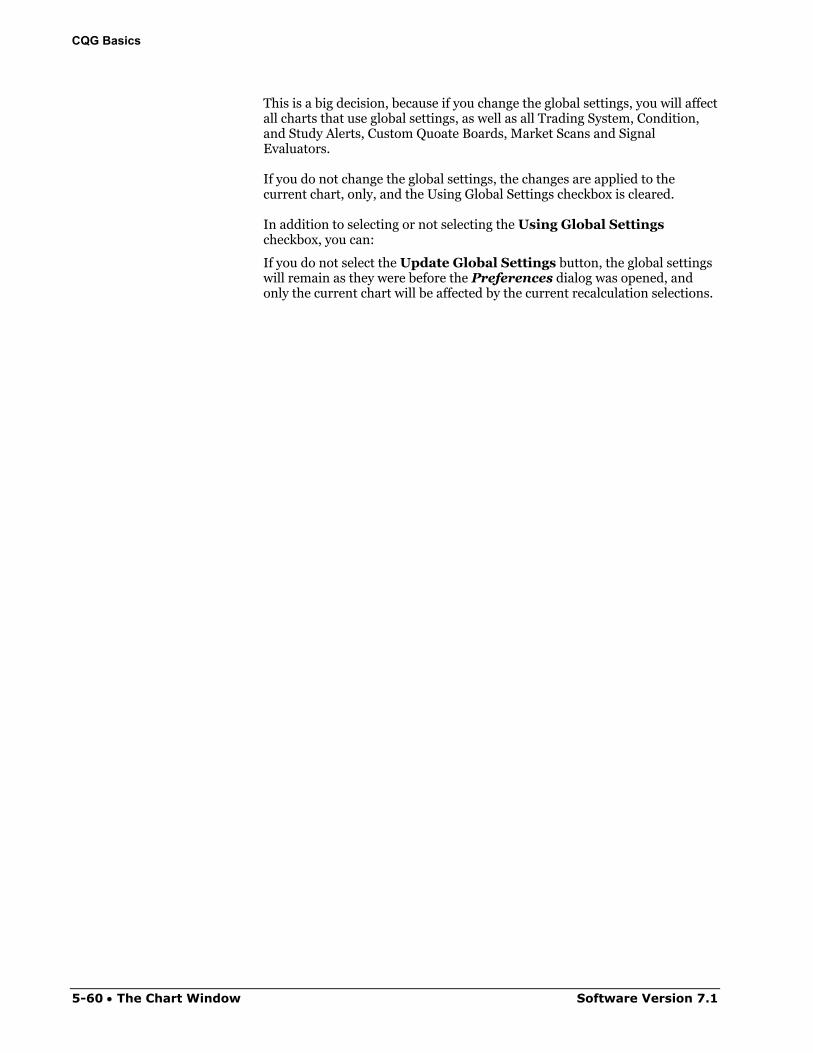
CQG Basics
This is a big decision, because if you change the global settings, you will affect all charts that use global settings, as well as all Trading System, Condition, and Study Alerts, Custom Quoate Boards, Market Scans and Signal Evaluators. If you do not change the global settings, the changes are applied to the current chart, only, and the Using Global Settings checkbox is cleared. In addition to selecting or not selecting the Using Global Settings checkbox, you can:
If you do not select the Update Global Settings button, the global settings will remain as they were before the Preferences dialog was opened, and only the current chart will be affected by the current recalculation selections.
5-60 • The Chart Window Software Version 7.1
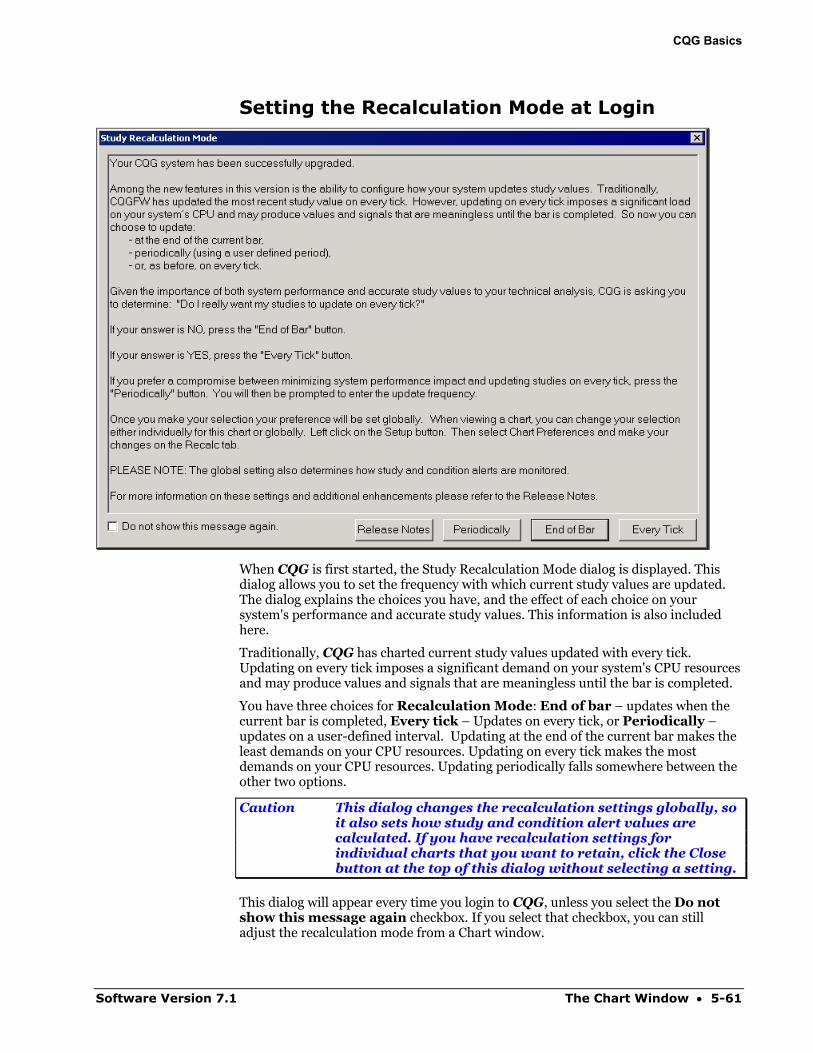
CQG Basics
Setting the Recalculation Mode at Login
When CQG is first started, the Study Recalculation Mode dialog is displayed. This dialog allows you to set the frequency with which current study values are updated. The dialog explains the choices you have, and the effect of each choice on your system's performance and accurate study values. This information is also included here.
Traditionally, CQG has charted current study values updated with every tick. Updating on every tick imposes a significant demand on your system's CPU resources and may produce values and signals that are meaningless until the bar is completed.
You have three choices for Recalculation Mode: End of bar – updates when the current bar is completed, Every tick – Updates on every tick, or Periodically – updates on a user-defined interval. Updating at the end of the current bar makes the least demands on your CPU resources. Updating on every tick makes the most demands on your CPU resources. Updating periodically falls somewhere between the other two options.
Caution This dialog changes the recalculation settings globally, so it also sets how study and condition alert values are calculated. If you have recalculation settings for individual charts that you want to retain, click the Close button at the top of this dialog without selecting a setting.
This dialog will appear every time you login to CQG, unless you select the Do not show this message again checkbox. If you select that checkbox, you can still adjust the recalculation mode from a Chart window.
Software Version 7.1 The Chart Window • 5-61
CQG Basics
Left click on the Every Tick button to recalculate values for all the relevant applications at every tick.
Or
Left click on the End of Bar button to recalculate values for all the relevant applications at every tick.
Or
Left click on the Periodically button to display the Select Update Frequency dialog.
Using the Select Update Frequency Dialog
If you select Periodically on the Study Recalculation Mode dialog that is displayed when CQG is first started, the Select Update Frequency dialog is displayed.
Enter the number of minutes used for the update frequency.
Left click on the OK button to apply the selection and close the Select Update Frequency dialog.
Or
Left click on the Cancel button to close the dialog without changing the previous selection.
5-62 • The Chart Window Software Version 7.1
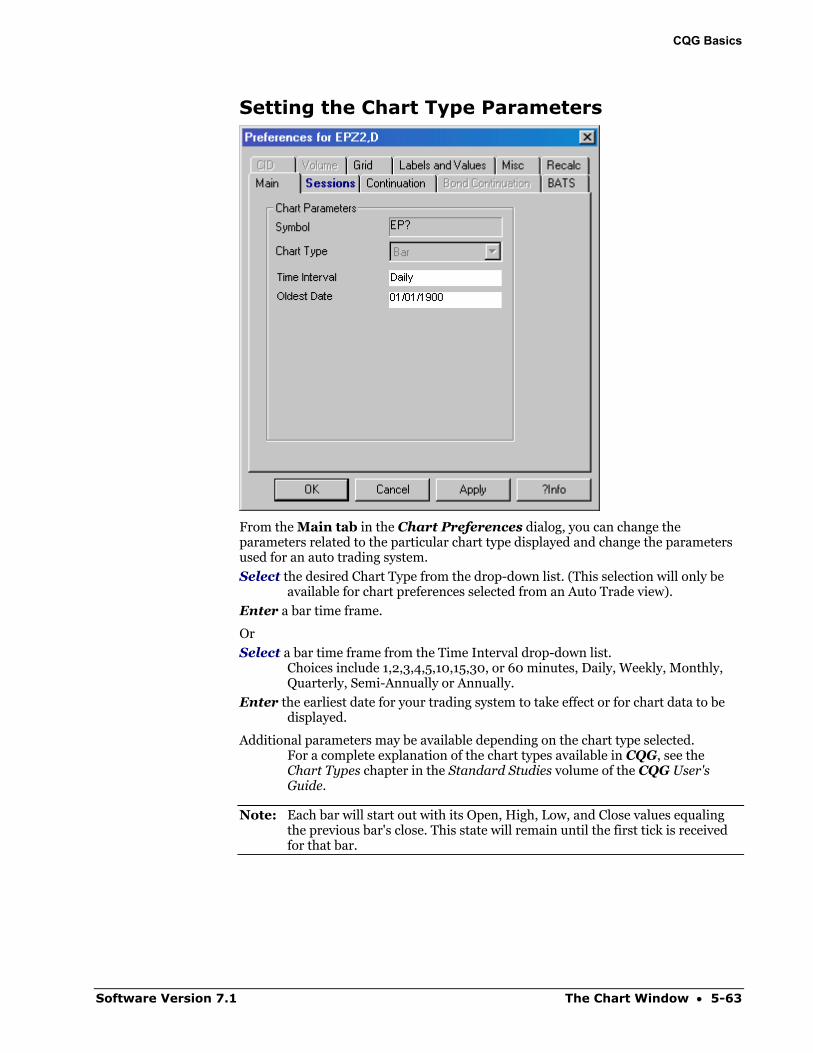
CQG Basics
Setting the Chart Type Parameters
From the Main tab in the Chart Preferences dialog, you can change the parameters related to the particular chart type displayed and change the parameters used for an auto trading system.
Select the desired Chart Type from the drop-down list. (This selection will only be available for chart preferences selected from an Auto Trade view).
Enter a bar time frame.
Or
Select a bar time frame from the Time Interval drop-down list. Choices include 1,2,3,4,5,10,15,30, or 60 minutes, Daily, Weekly, Monthly, Quarterly, Semi-Annually or Annually.
Enter the earliest date for your trading system to take effect or for chart data to be displayed.
Additional parameters may be available depending on the chart type selected. For a complete explanation of the chart types available in CQG, see the Chart Types chapter in the Standard Studies volume of the CQG User's Guide.
Note: Each bar will start out with its Open, High, Low, and Close values equaling the previous bar's close. This state will remain until the first tick is received for that bar.
Software Version 7.1 The Chart Window • 5-63
CQG Basics
Displaying User-Defined Conditions on a Chart You can set up charts to indicate when certain specified conditions have been met. Setting charts to indicate user-specified conditions involves only 2 steps: defining a condition and indicating that you want that condition, when met, to be displayed on the chart.
Defining a Condition Left click on the System button.
Select Define User Formulas.
Left click on the Conditions tab.
Left click on the New button in the Define User Formulas dialog.
Input a name for the condition.
Left click on the OK button.
Left click on the Toolbox button.
Select the appropriate operator buttons to define the condition.
Left click on the Close button in the toolbox.
Left click on the Close or Apply buttons to close the Define User Formulas dialog box.
For additional information about defining a condition, see "Defining a New Condition or User Value" in the Formulas in CQG chapter of the User Formulas and Backtesting volume of the CQG User's Guide.
5-64 • The Chart Window Software Version 7.1
CQG Basics
Displaying the Condition on a Chart Right click on a blank space on the Chart.
Select Modify Study Parameters.
Left click on the box underneath the MarkIt heading. This displays the Specify MarkIt Conditions dialog.
Select the desired condition from the list of Available Conditions.
Left click on the Include button.
Left click on the symbol after the condition name to specify the form used to mark on the chart when the condition is true. Selecting a symbol, rather than only a color, allows more than one condition to be displayed on each bar.
Left click on the square next to the chart symbol to display the list of colors available for the symbol on the chart.
Select a color.
Select the position for the symbol on the chart. Choices are Above or Below.
Select a size for the symbol.
Left click on the Close button to close the Specify MarkIt Conditions dialog.
Left click on the Close button to close the Study Parameters window.
Note: If you have selected the bar coloring option from the Conditions and Symbols for Marking section of the Specify MarkIt Conditions dialog, for more than one condition, and more than one condition is true, only the coloring of the first true condition will be visible*. However, if you assign a different symbol from the Specify MarkIt Conditions dialog for each condition, then multiple conditions can be displayed on a single chart.
* You can change the priorities of the conditions by: Selecting the condition to be re-prioritized. Left clicking on the Move Up and Move Down buttons.
Software Version 7.1 The Chart Window • 5-65
CQG Basics
Adding a Pointer Tool to a Chart CQG offers a variety of pointer tools designed to enhance the view of a chart window.
You can place pointer tools on a chart either directly or using a toolbar button.
Placing the pointer tool directly on the chart:
Right click within the chart window. If no trend tool is currently active, the menu will show the last trend tool used.
Select Pointer Tools.
Select a tool.
Placing a pointer tool button on the toolbar:
Left click on the Study button.
Left click on the Pointer Tools tab.
Left click on the button name next to a pointer tool. This places the button on the toolbar.
Left click on the Close button.
Left click on the Pointer Tool button on the toolbar to place it on the chart.
5-66 • The Chart Window Software Version 7.1
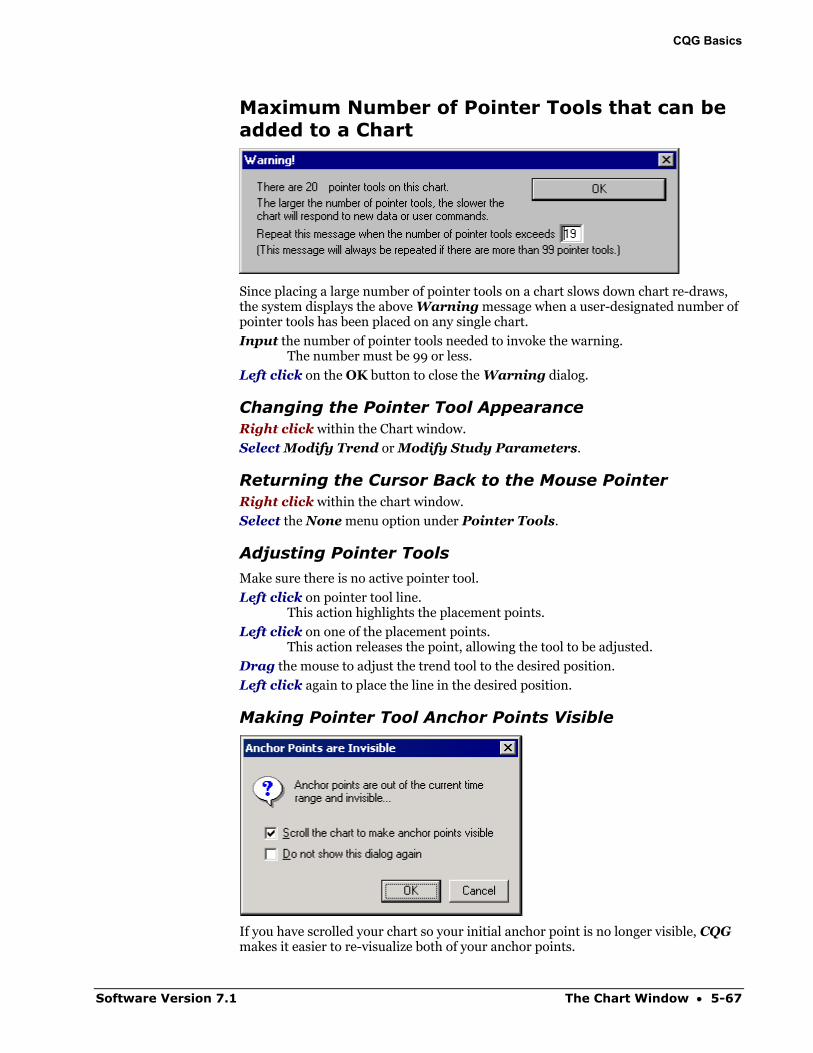
CQG Basics
Maximum Number of Pointer Tools that can be added to a Chart
Since placing a large number of pointer tools on a chart slows down chart re-draws, the system displays the above Warning message when a user-designated number of pointer tools has been placed on any single chart.
Input the number of pointer tools needed to invoke the warning. The number must be 99 or less.
Left click on the OK button to close the Warning dialog.
Changing the Pointer Tool Appearance Right click within the Chart window.
Select Modify Trend or Modify Study Parameters.
Returning the Cursor Back to the Mouse Pointer Right click within the chart window.
Select the None menu option under Pointer Tools.
Adjusting Pointer Tools Make sure there is no active pointer tool.
Left click on pointer tool line. This action highlights the placement points.
Left click on one of the placement points. This action releases the point, allowing the tool to be adjusted.
Drag the mouse to adjust the trend tool to the desired position.
Left click again to place the line in the desired position.
Making Pointer Tool Anchor Points Visible
If you have scrolled your chart so your initial anchor point is no longer visible, CQG makes it easier to re-visualize both of your anchor points.
Software Version 7.1 The Chart Window • 5-67
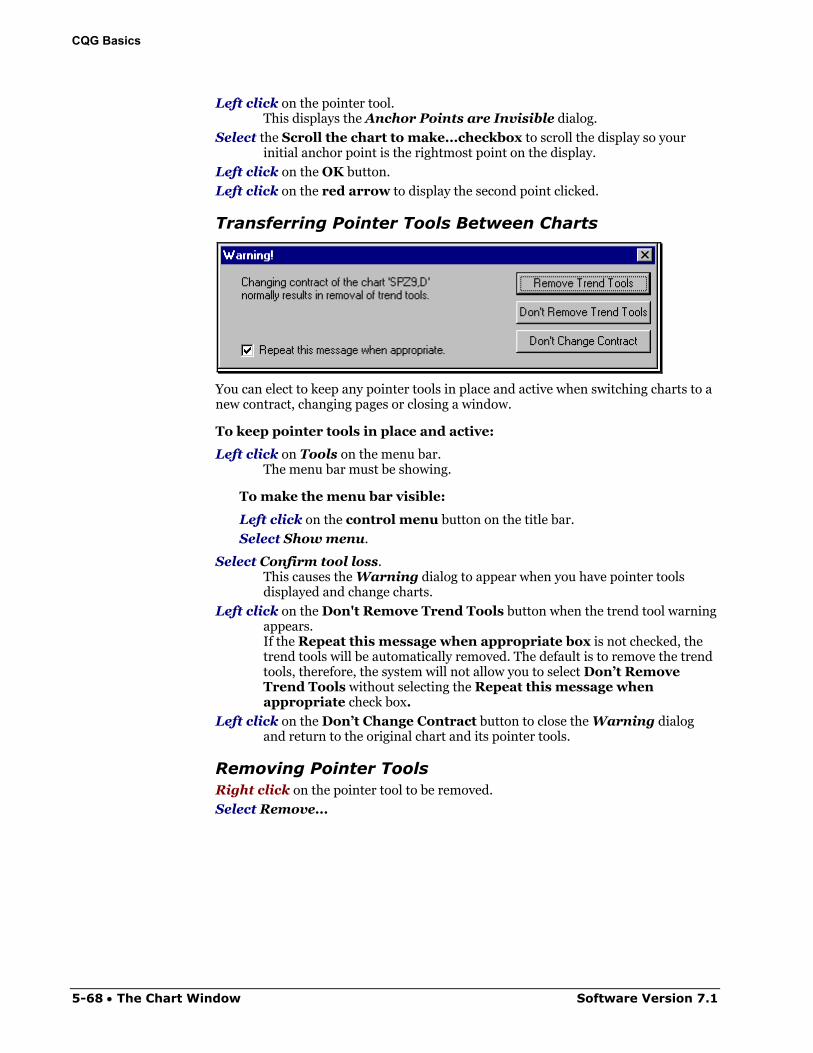
CQG Basics
Left click on the pointer tool. This displays the Anchor Points are Invisible dialog.
Select the Scroll the chart to make...checkbox to scroll the display so your initial anchor point is the rightmost point on the display.
Left click on the OK button.
Left click on the red arrow to display the second point clicked.
Transferring Pointer Tools Between Charts
You can elect to keep any pointer tools in place and active when switching charts to a new contract, changing pages or closing a window.
To keep pointer tools in place and active:
Left click on Tools on the menu bar. The menu bar must be showing.
To make the menu bar visible:
Left click on the control menu button on the title bar.
Select Show menu.
Select Confirm tool loss. This causes the Warning dialog to appear when you have pointer tools displayed and change charts.
Left click on the Don't Remove Trend Tools button when the trend tool warning appears. If the Repeat this message when appropriate box is not checked, the trend tools will be automatically removed. The default is to remove the trend tools, therefore, the system will not allow you to select Don’t Remove Trend Tools without selecting the Repeat this message when appropriate check box.
Left click on the Don’t Change Contract button to close the Warning dialog and return to the original chart and its pointer tools.
Removing Pointer Tools Right click on the pointer tool to be removed.
Select Remove...
5-68 • The Chart Window Software Version 7.1
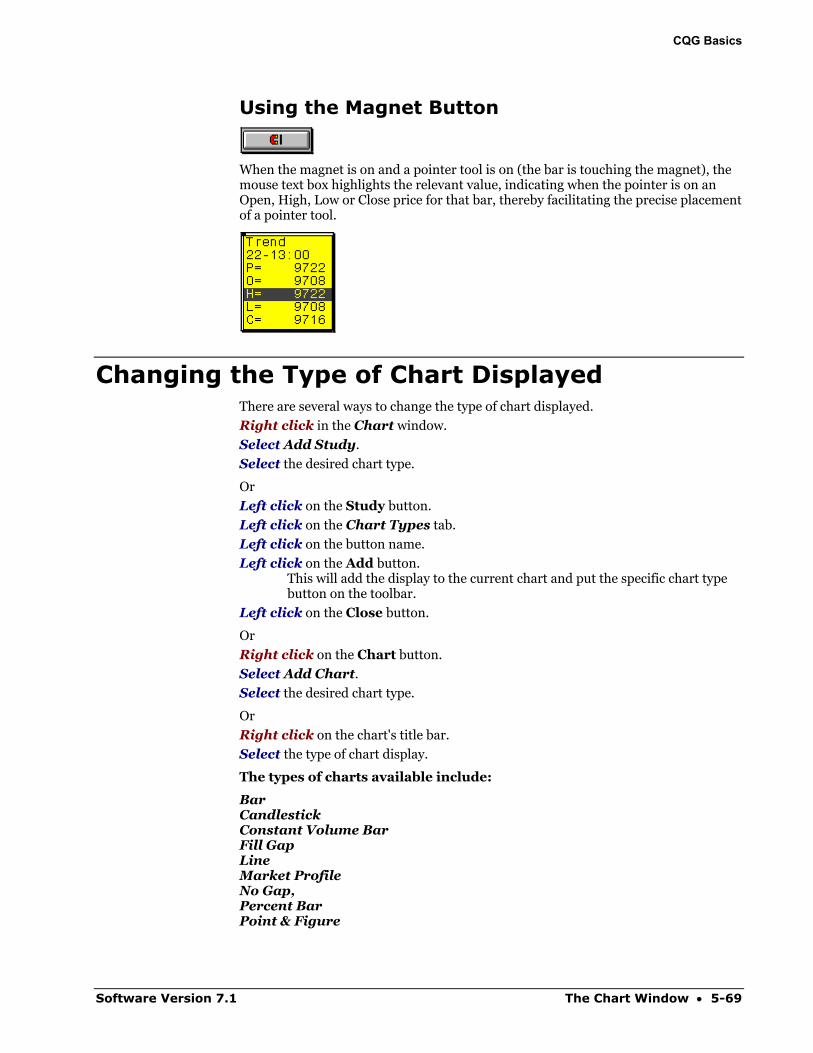
CQG Basics
Using the Magnet Button
When the magnet is on and a pointer tool is on (the bar is touching the magnet), the mouse text box highlights the relevant value, indicating when the pointer is on an Open, High, Low or Close price for that bar, thereby facilitating the precise placement of a pointer tool.
Changing the Type of Chart Displayed There are several ways to change the type of chart displayed.
Right click in the Chart window.
Select Add Study.
Select the desired chart type.
Or
Left click on the Study button.
Left click on the Chart Types tab.
Left click on the button name.
Left click on the Add button. This will add the display to the current chart and put the specific chart type button on the toolbar.
Left click on the Close button.
Or
Right click on the Chart button.
Select Add Chart.
Select the desired chart type.
Or
Right click on the chart's title bar.
Select the type of chart display.
The types of charts available include:
Bar Candlestick Constant Volume Bar Fill Gap Line Market Profile No Gap, Percent Bar Point & Figure
Software Version 7.1 The Chart Window • 5-69
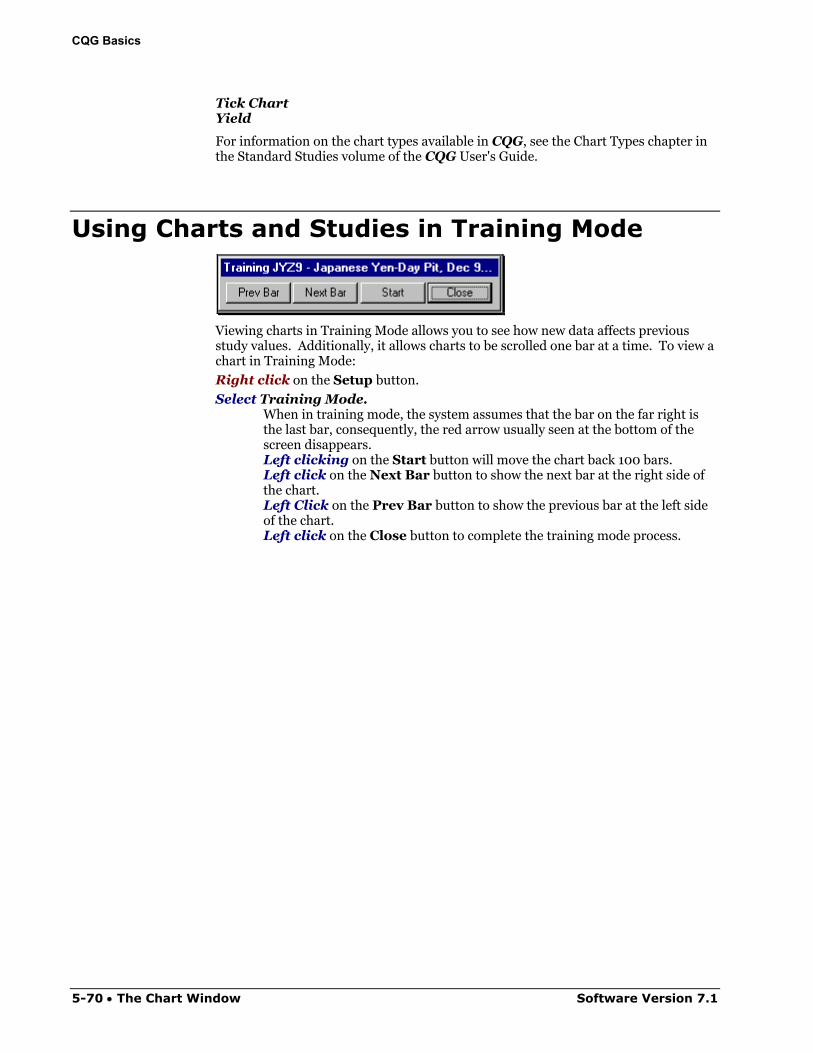
CQG Basics
Tick Chart Yield
For information on the chart types available in CQG, see the Chart Types chapter in the Standard Studies volume of the CQG User's Guide.
Using Charts and Studies in Training Mode
Viewing charts in Training Mode allows you to see how new data affects previous study values. Additionally, it allows charts to be scrolled one bar at a time. To view a chart in Training Mode:
Right click on the Setup button.
Select Training Mode. When in training mode, the system assumes that the bar on the far right is the last bar, consequently, the red arrow usually seen at the bottom of the screen disappears. Left clicking on the Start button will move the chart back 100 bars. Left click on the Next Bar button to show the next bar at the right side of the chart. Left Click on the Prev Bar button to show the previous bar at the left side of the chart. Left click on the Close button to complete the training mode process.
5-70 • The Chart Window Software Version 7.1
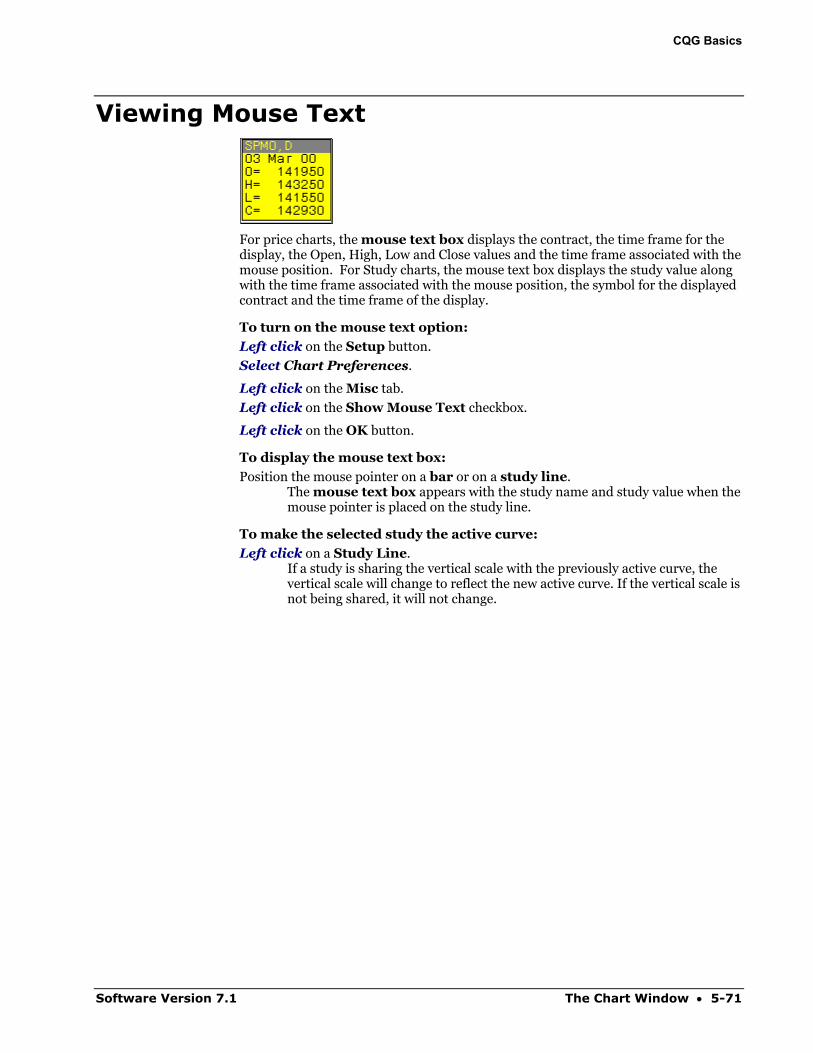
CQG Basics
Viewing Mouse Text
For price charts, the mouse text box displays the contract, the time frame for the display, the Open, High, Low and Close values and the time frame associated with the mouse position. For Study charts, the mouse text box displays the study value along with the time frame associated with the mouse position, the symbol for the displayed contract and the time frame of the display.
To turn on the mouse text option:
Left click on the Setup button.
Select Chart Preferences.
Left click on the Misc tab.
Left click on the Show Mouse Text checkbox.
Left click on the OK button.
To display the mouse text box:
Position the mouse pointer on a bar or on a study line. The mouse text box appears with the study name and study value when the mouse pointer is placed on the study line.
To make the selected study the active curve:
Left click on a Study Line. If a study is sharing the vertical scale with the previously active curve, the vertical scale will change to reflect the new active curve. If the vertical scale is not being shared, it will not change.
Software Version 7.1 The Chart Window • 5-71
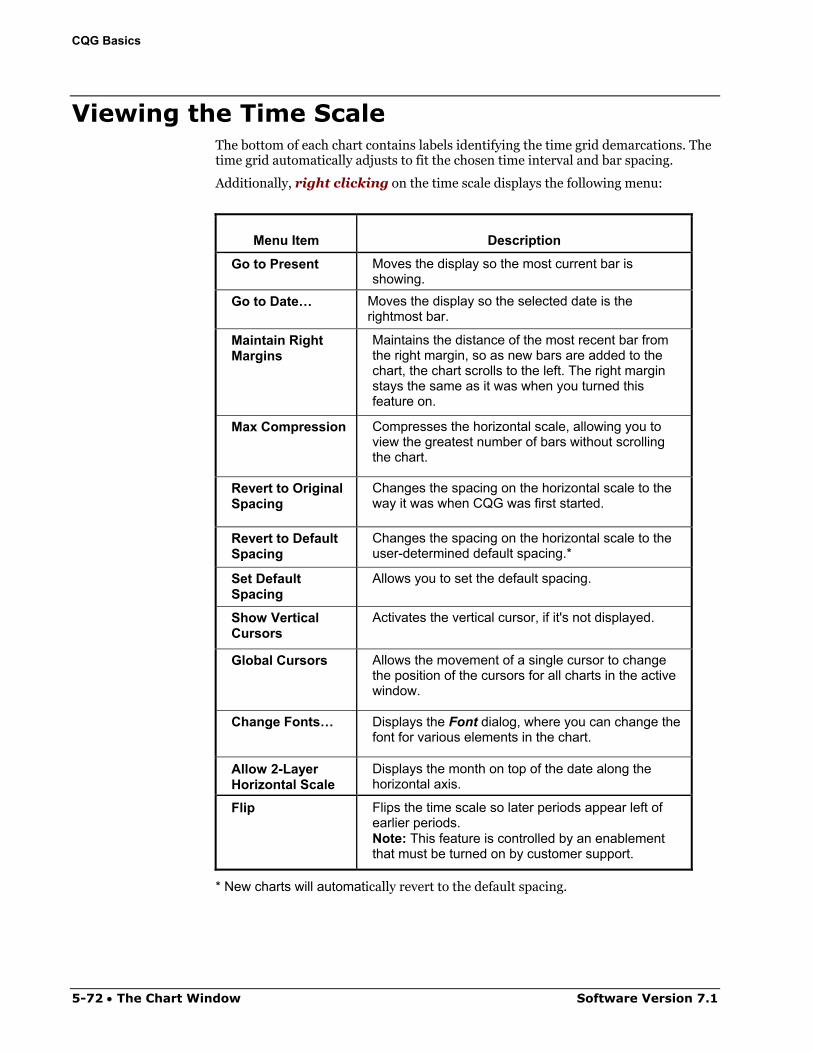
CQG Basics
Viewing the Time Scale The bottom of each chart contains labels identifying the time grid demarcations. The time grid automatically adjusts to fit the chosen time interval and bar spacing.
Additionally, right clicking on the time scale displays the following menu:
Menu Item Description
Go to Present Moves the display so the most current bar is showing.
Go to Date… Moves the display so the selected date is the rightmost bar.
Maintain Right Margins
Maintains the distance of the most recent bar from the right margin, so as new bars are added to the chart, the chart scrolls to the left. The right margin stays the same as it was when you turned this feature on.
Max Compression Compresses the horizontal scale, allowing you to view the greatest number of bars without scrolling the chart.
Revert to Original Spacing
Changes the spacing on the horizontal scale to the way it was when CQG was first started.
Revert to Default Spacing
Changes the spacing on the horizontal scale to the user-determined default spacing.*
Set Default Spacing
Allows you to set the default spacing.
Show Vertical Cursors
Activates the vertical cursor, if it's not displayed.
Global Cursors Allows the movement of a single cursor to change the position of the cursors for all charts in the active window.
Change Fonts… Displays the Font dialog, where you can change the font for various elements in the chart.
Allow 2-Layer Horizontal Scale
Displays the month on top of the date along the horizontal axis.
Flip Flips the time scale so later periods appear left of earlier periods. Note: This feature is controlled by an enablement that must be turned on by customer support.
* New charts will automatically revert to the default spacing.
5-72 • The Chart Window Software Version 7.1
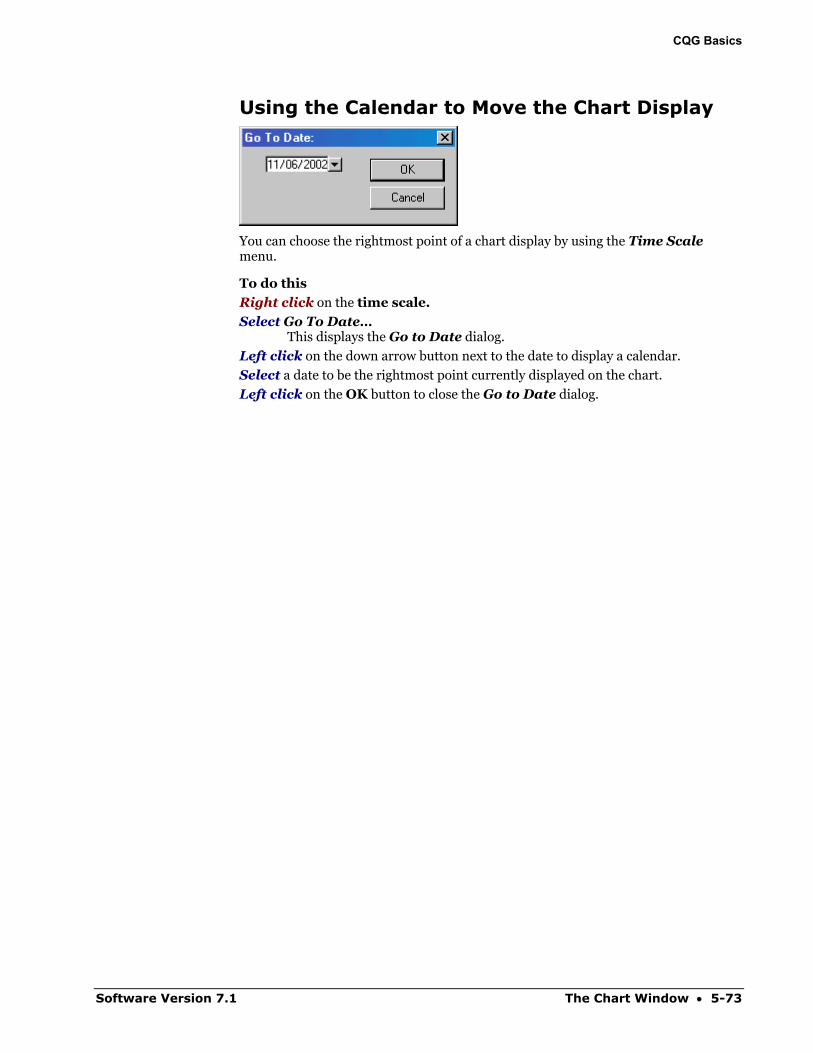
CQG Basics
Using the Calendar to Move the Chart Display
You can choose the rightmost point of a chart display by using the Time Scale menu.
To do this
Right click on the time scale.
Select Go To Date… This displays the Go to Date dialog.
Left click on the down arrow button next to the date to display a calendar.
Select a date to be the rightmost point currently displayed on the chart.
Left click on the OK button to close the Go to Date dialog.
Software Version 7.1 The Chart Window • 5-73
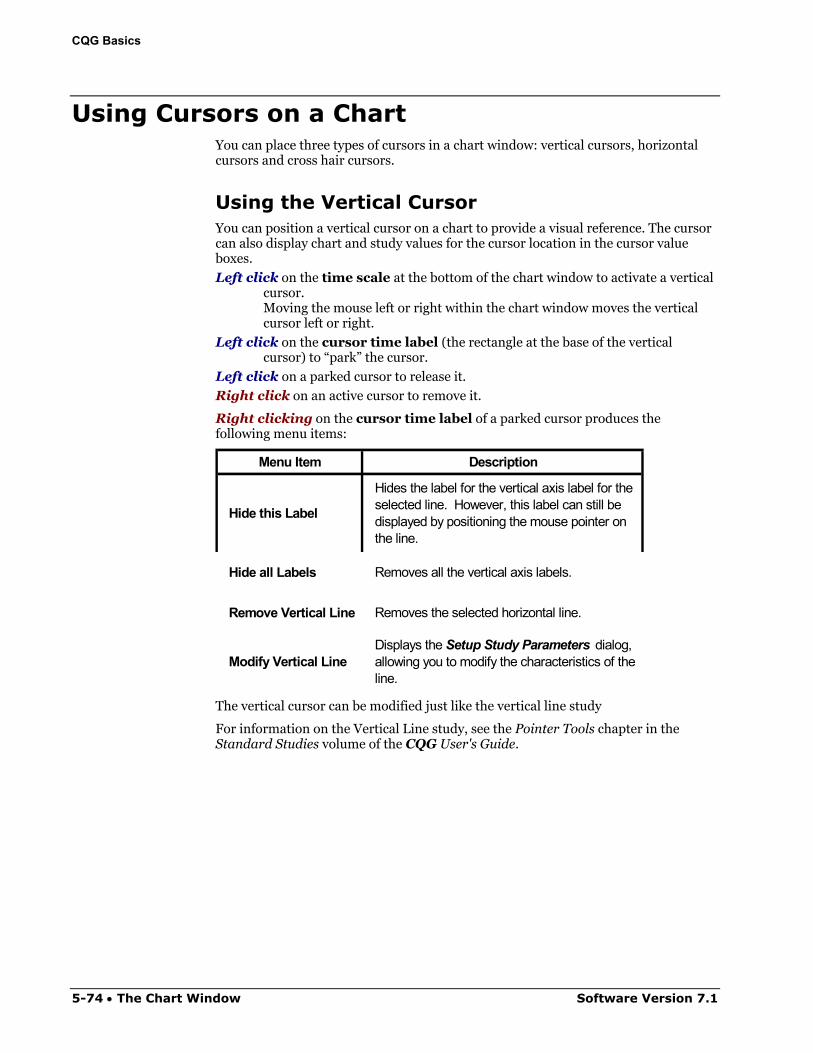
CQG Basics
Using Cursors on a Chart You can place three types of cursors in a chart window: vertical cursors, horizontal cursors and cross hair cursors.
Using the Vertical Cursor You can position a vertical cursor on a chart to provide a visual reference. The cursor can also display chart and study values for the cursor location in the cursor value boxes.
Left click on the time scale at the bottom of the chart window to activate a vertical cursor. Moving the mouse left or right within the chart window moves the vertical cursor left or right.
Left click on the cursor time label (the rectangle at the base of the vertical cursor) to “park” the cursor.
Left click on a parked cursor to release it.
Right click on an active cursor to remove it.
Right clicking on the cursor time label of a parked cursor produces the following menu items:
Menu Item Description
Hide this Label
Hides the label for the vertical axis label for the selected line. However, this label can still be displayed by positioning the mouse pointer on the line.
Hide all Labels Removes all the vertical axis labels.
Remove Vertical Line Removes the selected horizontal line.
Modify Vertical LineDisplays the Setup Study Parameters dialog, allowing you to modify the characteristics of the line.
The vertical cursor can be modified just like the vertical line study
For information on the Vertical Line study, see the Pointer Tools chapter in the Standard Studies volume of the CQG User's Guide.
5-74 • The Chart Window Software Version 7.1
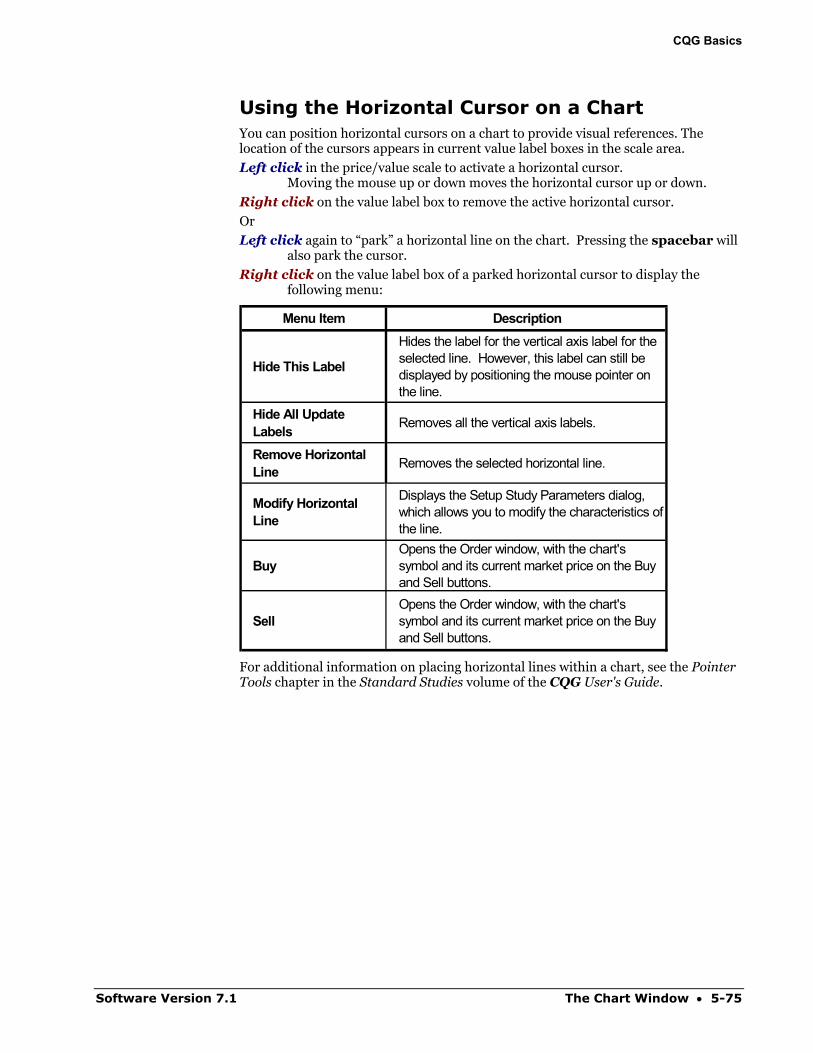
CQG Basics
Using the Horizontal Cursor on a Chart You can position horizontal cursors on a chart to provide visual references. The location of the cursors appears in current value label boxes in the scale area.
Left click in the price/value scale to activate a horizontal cursor. Moving the mouse up or down moves the horizontal cursor up or down.
Right click on the value label box to remove the active horizontal cursor.
Or
Left click again to “park” a horizontal line on the chart. Pressing the spacebar will also park the cursor.
Right click on the value label box of a parked horizontal cursor to display the following menu:
Menu Item Description
Hide This Label
Hides the label for the vertical axis label for the selected line. However, this label can still be displayed by positioning the mouse pointer on the line.
Hide All Update Labels Removes all the vertical axis labels.
Remove Horizontal Line Removes the selected horizontal line.
Modify Horizontal Line
Displays the Setup Study Parameters dialog, which allows you to modify the characteristics of the line.
BuyOpens the Order window, with the chart's symbol and its current market price on the Buy and Sell buttons.
SellOpens the Order window, with the chart's symbol and its current market price on the Buy and Sell buttons.
For additional information on placing horizontal lines within a chart, see the Pointer Tools chapter in the Standard Studies volume of the CQG User's Guide.
Software Version 7.1 The Chart Window • 5-75
CQG Basics
Using a Cross Hair Cursor on a Chart Activate a vertical and horizontal cursor simultaneously to create a cross hair (X-hair) cursor.
Left click in the time scale on the bottom of the chart window to activate a vertical cursor.
Left click in the price/value scale to activate a horizontal cursor.
Left click on the chart to park the cursors.
Left click on a parked cursor to activate it.
Right click on the cursor value label or time scale label of an active cursor to delete the cursor.
Or
Right click on the value label or time label of an inactive cursor.
Select Remove…..
Left click at the intersection of the two cursors to release both cursors, allowing them to move simultaneously.
5-76 • The Chart Window Software Version 7.1
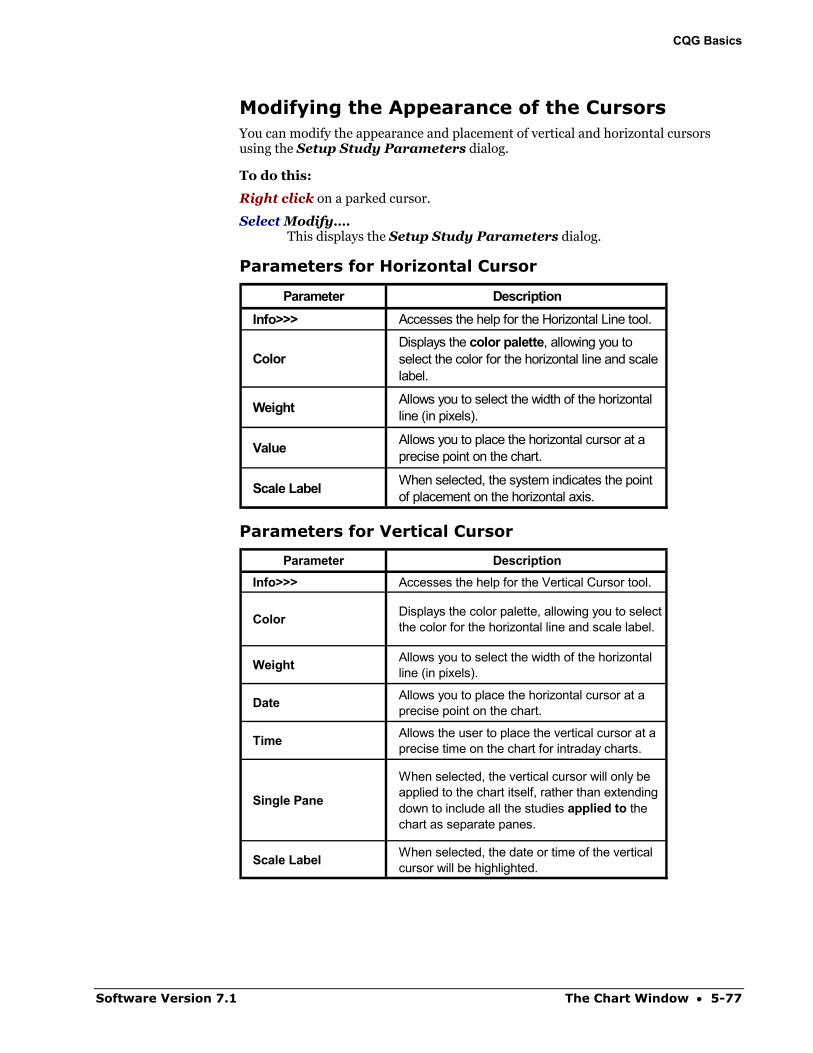
CQG Basics
Modifying the Appearance of the Cursors You can modify the appearance and placement of vertical and horizontal cursors using the Setup Study Parameters dialog.
To do this:
Right click on a parked cursor.
Select Modify…. This displays the Setup Study Parameters dialog.
Parameters for Horizontal Cursor
Parameter DescriptionInfo>>> Accesses the help for the Horizontal Line tool.
ColorDisplays the color palette, allowing you to select the color for the horizontal line and scale label.
Weight Allows you to select the width of the horizontal line (in pixels).
Value Allows you to place the horizontal cursor at a precise point on the chart.
Scale Label When selected, the system indicates the point of placement on the horizontal axis.
Parameters for Vertical Cursor
Parameter DescriptionInfo>>> Accesses the help for the Vertical Cursor tool.
Color Displays the color palette, allowing you to select the color for the horizontal line and scale label.
Weight Allows you to select the width of the horizontal line (in pixels).
Date Allows you to place the horizontal cursor at a precise point on the chart.
Time Allows the user to place the vertical cursor at a precise time on the chart for intraday charts.
Single Pane
When selected, the vertical cursor will only be applied to the chart itself, rather than extending down to include all the studies applied to the chart as separate panes.
Scale Label When selected, the date or time of the vertical cursor will be highlighted.
Software Version 7.1 The Chart Window • 5-77
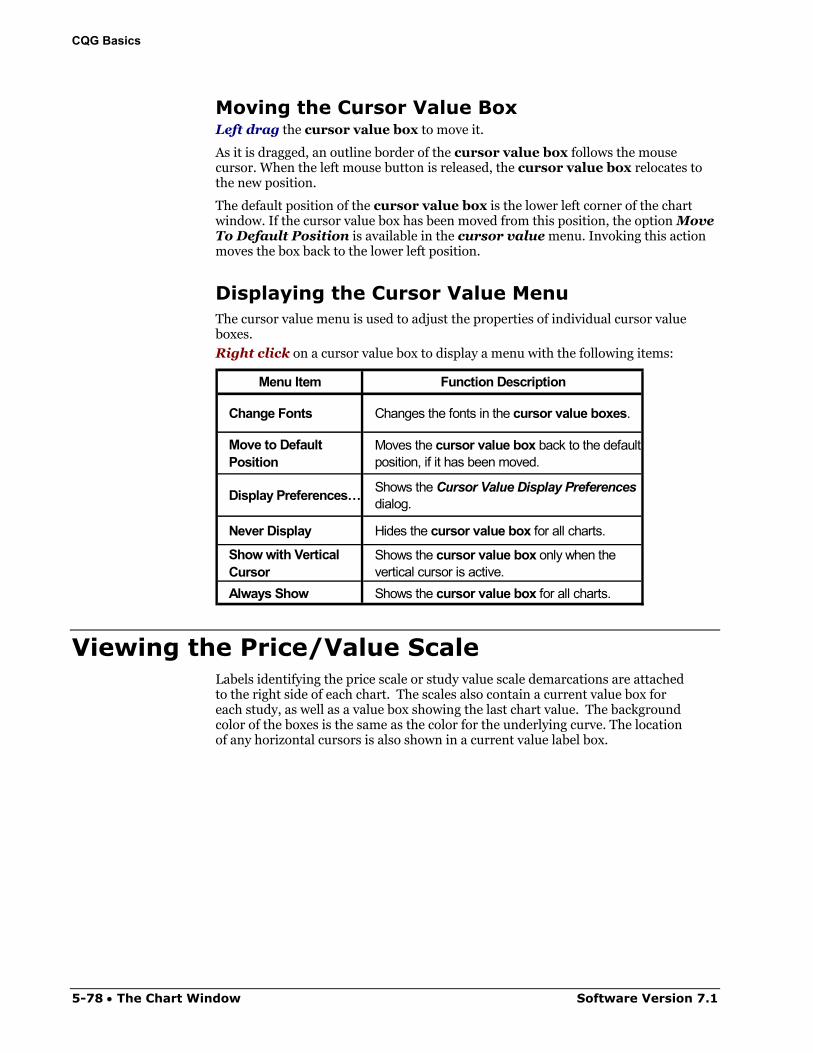
CQG Basics
Moving the Cursor Value Box Left drag the cursor value box to move it.
As it is dragged, an outline border of the cursor value box follows the mouse cursor. When the left mouse button is released, the cursor value box relocates to the new position.
The default position of the cursor value box is the lower left corner of the chart window. If the cursor value box has been moved from this position, the option Move To Default Position is available in the cursor value menu. Invoking this action moves the box back to the lower left position.
Displaying the Cursor Value Menu The cursor value menu is used to adjust the properties of individual cursor value boxes.
Right click on a cursor value box to display a menu with the following items:
Menu Item Function Description
Change Fonts Changes the fonts in the cursor value boxes.
Move to Default Position
Moves the cursor value box back to the default position, if it has been moved.
Display Preferences… Shows the Cursor Value Display Preferences dialog.
Never Display Hides the cursor value box for all charts.
Show with Vertical Cursor
Shows the cursor value box only when the vertical cursor is active.
Always Show Shows the cursor value box for all charts.
Viewing the Price/Value Scale Labels identifying the price scale or study value scale demarcations are attached to the right side of each chart. The scales also contain a current value box for each study, as well as a value box showing the last chart value. The background color of the boxes is the same as the color for the underlying curve. The location of any horizontal cursors is also shown in a current value label box.
5-78 • The Chart Window Software Version 7.1
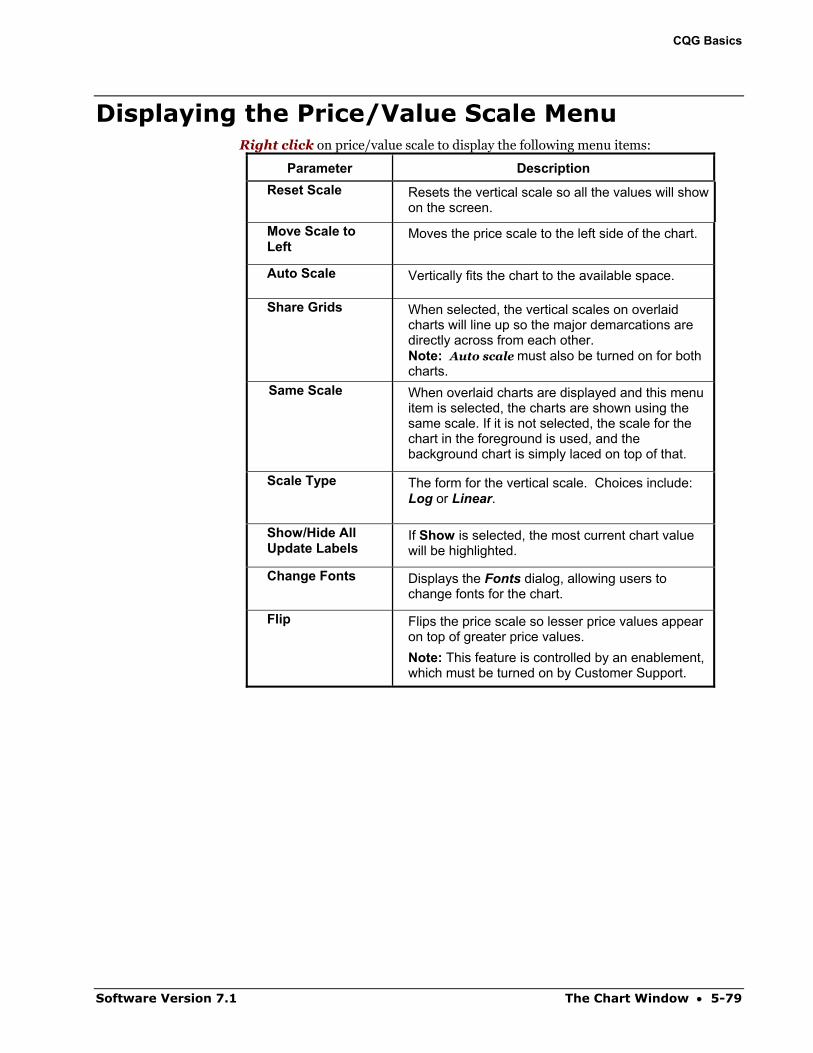
CQG Basics
Displaying the Price/Value Scale Menu Right click on price/value scale to display the following menu items:
Parameter Description Reset Scale Resets the vertical scale so all the values will show
on the screen.
Move Scale to Left
Moves the price scale to the left side of the chart.
Auto Scale Vertically fits the chart to the available space.
Share Grids When selected, the vertical scales on overlaid charts will line up so the major demarcations are directly across from each other. Note: Auto scale must also be turned on for both charts.
Same Scale When overlaid charts are displayed and this menu item is selected, the charts are shown using the same scale. If it is not selected, the scale for the chart in the foreground is used, and the background chart is simply laced on top of that.
Scale Type The form for the vertical scale. Choices include: Log or Linear.
Show/Hide All Update Labels
If Show is selected, the most current chart value will be highlighted.
Change Fonts Displays the Fonts dialog, allowing users to change fonts for the chart.
Flip Flips the price scale so lesser price values appear on top of greater price values. Note: This feature is controlled by an enablement, which must be turned on by Customer Support.
Software Version 7.1 The Chart Window • 5-79
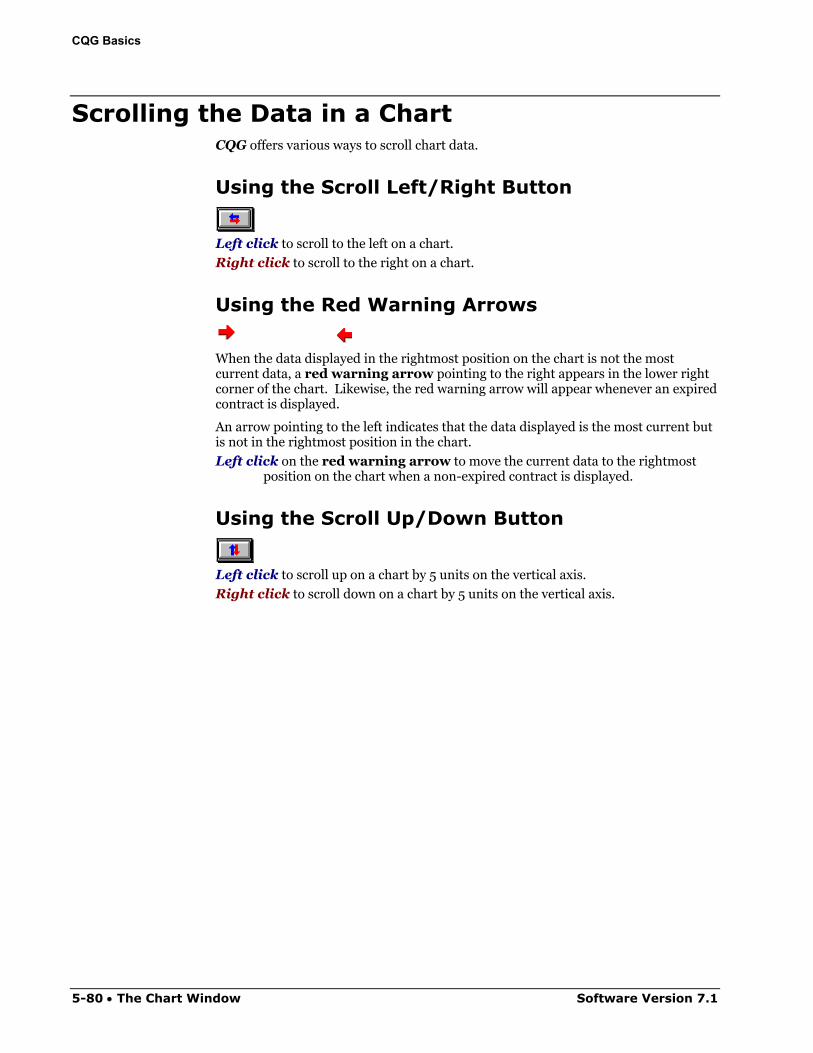
CQG Basics
Scrolling the Data in a Chart CQG offers various ways to scroll chart data.
Using the Scroll Left/Right Button
Left click to scroll to the left on a chart.
Right click to scroll to the right on a chart.
Using the Red Warning Arrows
When the data displayed in the rightmost position on the chart is not the most current data, a red warning arrow pointing to the right appears in the lower right corner of the chart. Likewise, the red warning arrow will appear whenever an expired contract is displayed.
An arrow pointing to the left indicates that the data displayed is the most current but is not in the rightmost position in the chart.
Left click on the red warning arrow to move the current data to the rightmost position on the chart when a non-expired contract is displayed.
Using the Scroll Up/Down Button
Left click to scroll up on a chart by 5 units on the vertical axis.
Right click to scroll down on a chart by 5 units on the vertical axis.
5-80 • The Chart Window Software Version 7.1

CQG Basics
Using the AnaLock Button
You can move the foreground and background charts simultaneously without using the Ctrl button when the AnaLock button is activated (pressed in) on an Analog chart. When the AnaLock button is pressed (the default setting), dragging the chart will move both displays simultaneously. To move only the foreground chart with the AnaLock button activated, hold down the Ctrl button and drag the chart or de-activate the AnaLock button and drag the chart.
Note: The AnaLock button appears on the toolbar only when you display an Analog study. Additionally, you can remove the AnaLock button from the chart toolbar through the Chart Control toolbar, which is accessible by: Left clicking on the Setup button. Selecting Customize Toolbar. Selecting the >>> button in the Chart Control's Add/Remove column. Left Clicking on AnaLock in the button column.
For additional information on the Analog study, see the Basic Studies chapter in the Standard Studies volume of the CQG User's Guide.
Using Fine Scrolling The fine scrolling feature enables you to scroll a chart horizontally by one bar at a time, using the Right/Left button, or vertically by the minimum price change, using the Up/Down arrow button.
To activate fine scrolling:
Left click on the Setup button.
Left click on Chart Preferences.
Left click on the Misc tab.
Select Fine Scrolling Using Toolbar Buttons.
Scrolling by Dragging Click and drag the mouse anywhere on the bar chart grid to reposition the chart
and any displayed study curves.
Maintaining a Right Margin When the Maintain Right Margin option is selected, a user-designated amount of space is unfilled on the right side of the current chart display. Therefore, each new bar is drawn at the same physical location in the chart window.
To maintain a fixed right margin on a chart display:
Left drag the chart display until the desired right margin is visible.
Right click on the time scale of a chart display.
Select Maintain Right Margins.
Software Version 7.1 The Chart Window • 5-81
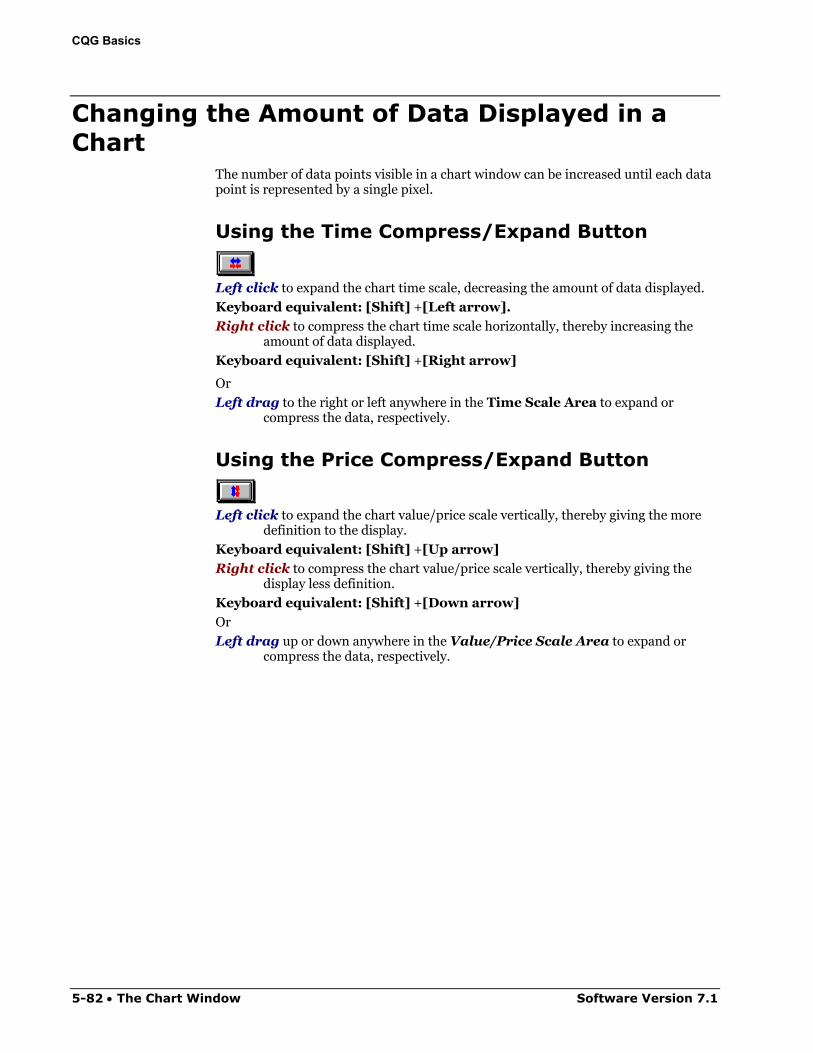
CQG Basics
Changing the Amount of Data Displayed in a Chart
The number of data points visible in a chart window can be increased until each data point is represented by a single pixel.
Using the Time Compress/Expand Button
Left click to expand the chart time scale, decreasing the amount of data displayed.
Keyboard equivalent: [Shift] +[Left arrow].
Right click to compress the chart time scale horizontally, thereby increasing the amount of data displayed.
Keyboard equivalent: [Shift] +[Right arrow]
Or
Left drag to the right or left anywhere in the Time Scale Area to expand or compress the data, respectively.
Using the Price Compress/Expand Button
Left click to expand the chart value/price scale vertically, thereby giving the more
definition to the display.
Keyboard equivalent: [Shift] +[Up arrow]
Right click to compress the chart value/price scale vertically, thereby giving the display less definition.
Keyboard equivalent: [Shift] +[Down arrow]
Or
Left drag up or down anywhere in the Value/Price Scale Area to expand or compress the data, respectively.
5-82 • The Chart Window Software Version 7.1
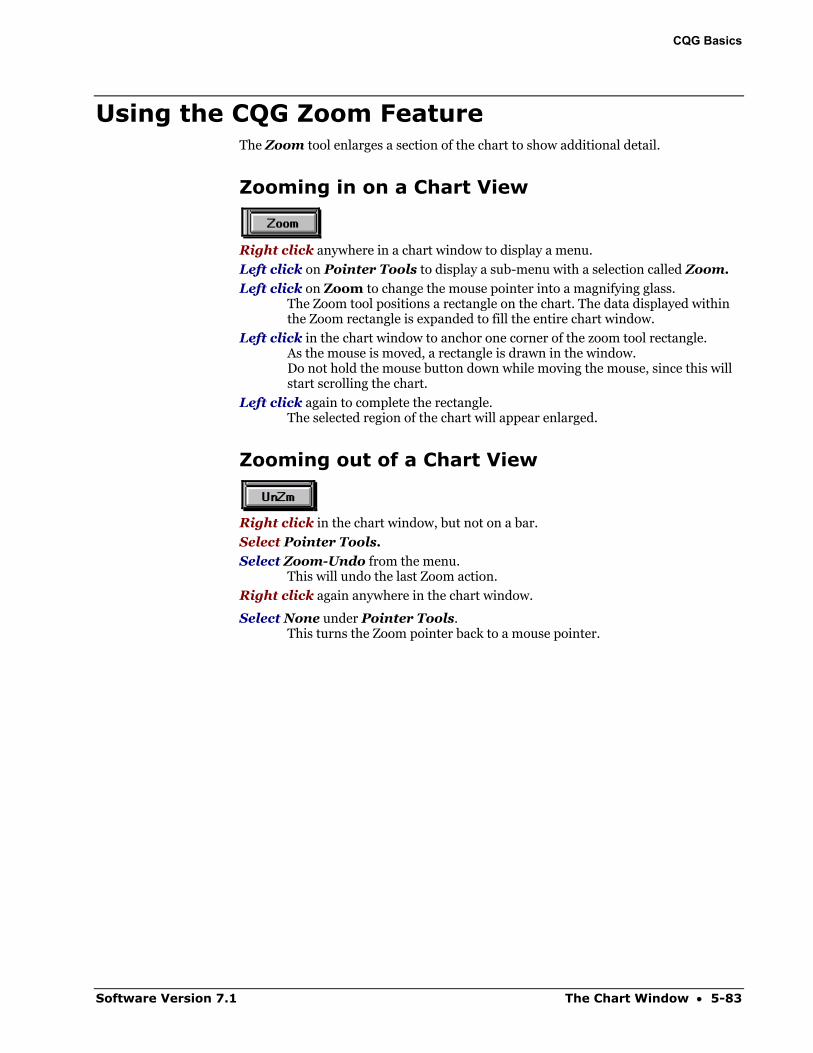
CQG Basics
Using the CQG Zoom Feature The Zoom tool enlarges a section of the chart to show additional detail.
Zooming in on a Chart View
Right click anywhere in a chart window to display a menu.
Left click on Pointer Tools to display a sub-menu with a selection called Zoom.
Left click on Zoom to change the mouse pointer into a magnifying glass. The Zoom tool positions a rectangle on the chart. The data displayed within the Zoom rectangle is expanded to fill the entire chart window.
Left click in the chart window to anchor one corner of the zoom tool rectangle. As the mouse is moved, a rectangle is drawn in the window. Do not hold the mouse button down while moving the mouse, since this will start scrolling the chart.
Left click again to complete the rectangle. The selected region of the chart will appear enlarged.
Zooming out of a Chart View
Right click in the chart window, but not on a bar.
Select Pointer Tools.
Select Zoom-Undo from the menu. This will undo the last Zoom action.
Right click again anywhere in the chart window.
Select None under Pointer Tools. This turns the Zoom pointer back to a mouse pointer.
Software Version 7.1 The Chart Window • 5-83
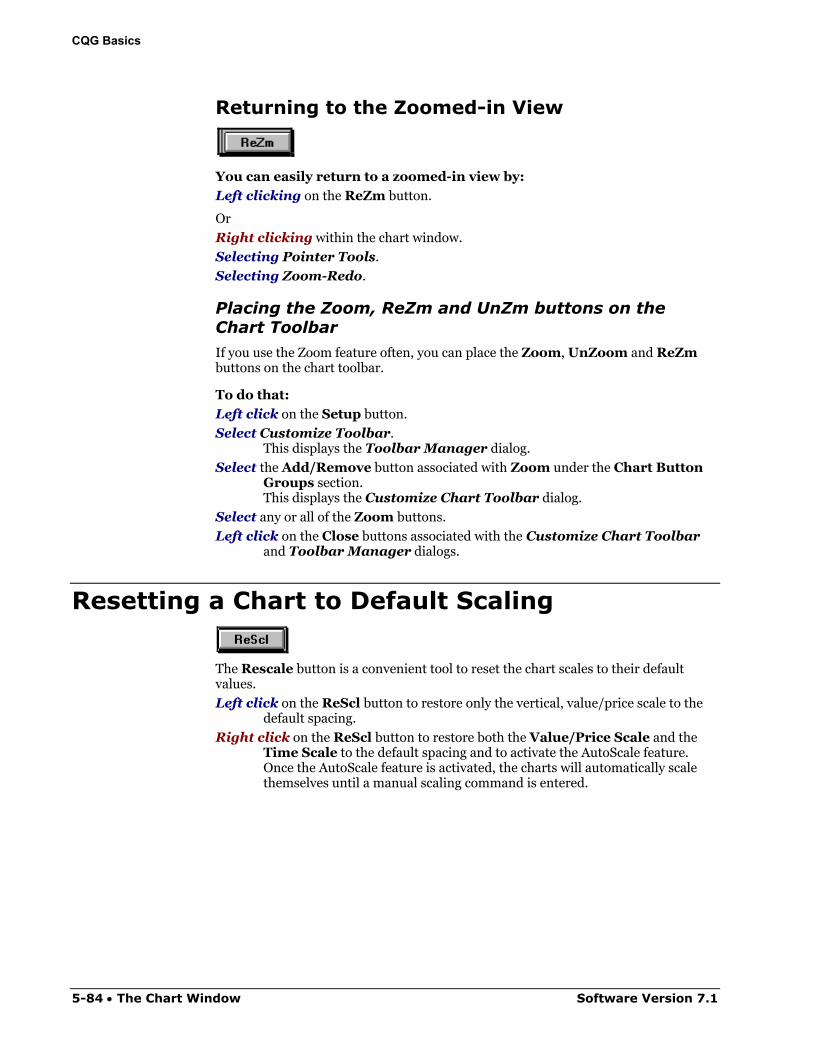
CQG Basics
Returning to the Zoomed-in View
You can easily return to a zoomed-in view by:
Left clicking on the ReZm button.
Or
Right clicking within the chart window.
Selecting Pointer Tools.
Selecting Zoom-Redo.
Placing the Zoom, ReZm and UnZm buttons on the Chart Toolbar If you use the Zoom feature often, you can place the Zoom, UnZoom and ReZm buttons on the chart toolbar.
To do that:
Left click on the Setup button.
Select Customize Toolbar. This displays the Toolbar Manager dialog.
Select the Add/Remove button associated with Zoom under the Chart Button Groups section. This displays the Customize Chart Toolbar dialog.
Select any or all of the Zoom buttons.
Left click on the Close buttons associated with the Customize Chart Toolbar and Toolbar Manager dialogs.
Resetting a Chart to Default Scaling
The Rescale button is a convenient tool to reset the chart scales to their default values.
Left click on the ReScl button to restore only the vertical, value/price scale to the default spacing.
Right click on the ReScl button to restore both the Value/Price Scale and the Time Scale to the default spacing and to activate the AutoScale feature. Once the AutoScale feature is activated, the charts will automatically scale themselves until a manual scaling command is entered.
5-84 • The Chart Window Software Version 7.1
CQG Basics
Changing the Fonts in a Chart Window
Displaying the Fonts Dialog The Fonts dialog facilitates changing the look of the characters within the currently displayed window. Additionally, the Fonts dialog makes it easy to either customize the fonts or keep the look consistent between displays.
To display the Fonts dialog for the active window:
Left click on the Setup button.
Select Chart Fonts… from the menu.
Software Version 7.1 The Chart Window • 5-85
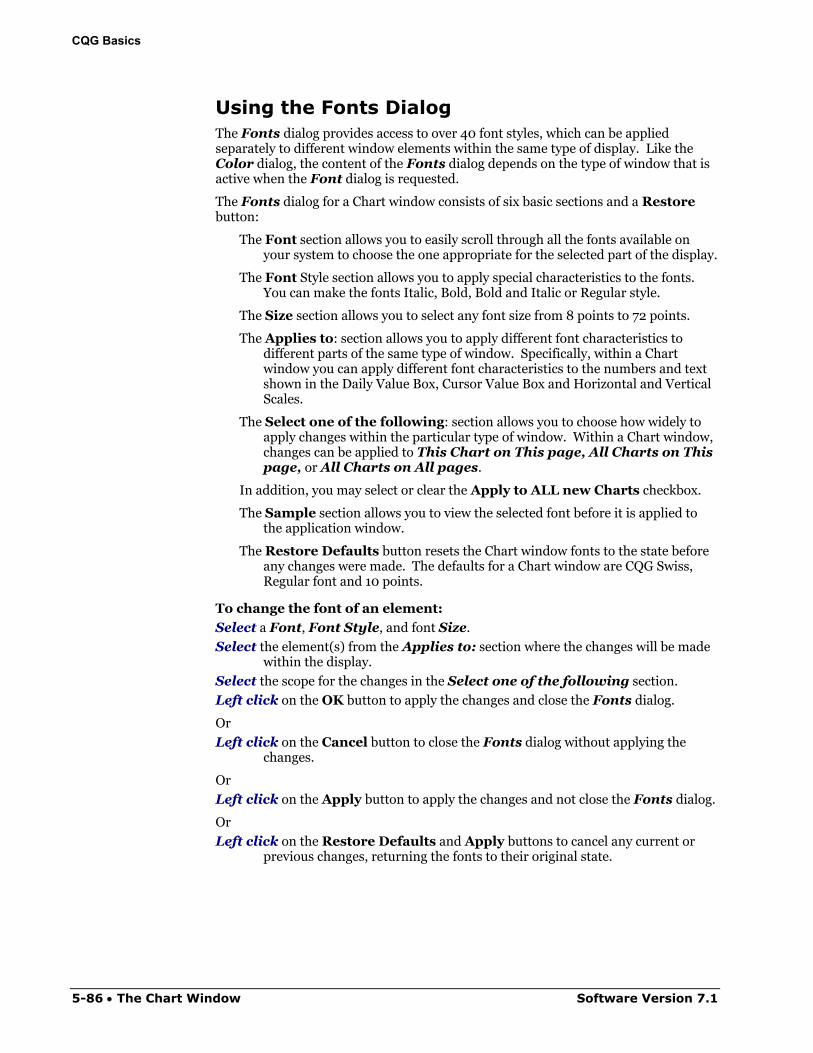
CQG Basics
Using the Fonts Dialog The Fonts dialog provides access to over 40 font styles, which can be applied separately to different window elements within the same type of display. Like the Color dialog, the content of the Fonts dialog depends on the type of window that is active when the Font dialog is requested.
The Fonts dialog for a Chart window consists of six basic sections and a Restore button:
The Font section allows you to easily scroll through all the fonts available on your system to choose the one appropriate for the selected part of the display.
The Font Style section allows you to apply special characteristics to the fonts. You can make the fonts Italic, Bold, Bold and Italic or Regular style.
The Size section allows you to select any font size from 8 points to 72 points.
The Applies to: section allows you to apply different font characteristics to different parts of the same type of window. Specifically, within a Chart window you can apply different font characteristics to the numbers and text shown in the Daily Value Box, Cursor Value Box and Horizontal and Vertical Scales.
The Select one of the following: section allows you to choose how widely to apply changes within the particular type of window. Within a Chart window, changes can be applied to This Chart on This page, All Charts on This page, or All Charts on All pages.
In addition, you may select or clear the Apply to ALL new Charts checkbox.
The Sample section allows you to view the selected font before it is applied to the application window.
The Restore Defaults button resets the Chart window fonts to the state before any changes were made. The defaults for a Chart window are CQG Swiss, Regular font and 10 points.
To change the font of an element:
Select a Font, Font Style, and font Size.
Select the element(s) from the Applies to: section where the changes will be made within the display.
Select the scope for the changes in the Select one of the following section.
Left click on the OK button to apply the changes and close the Fonts dialog.
Or
Left click on the Cancel button to close the Fonts dialog without applying the changes.
Or
Left click on the Apply button to apply the changes and not close the Fonts dialog.
Or
Left click on the Restore Defaults and Apply buttons to cancel any current or previous changes, returning the fonts to their original state.
5-86 • The Chart Window Software Version 7.1
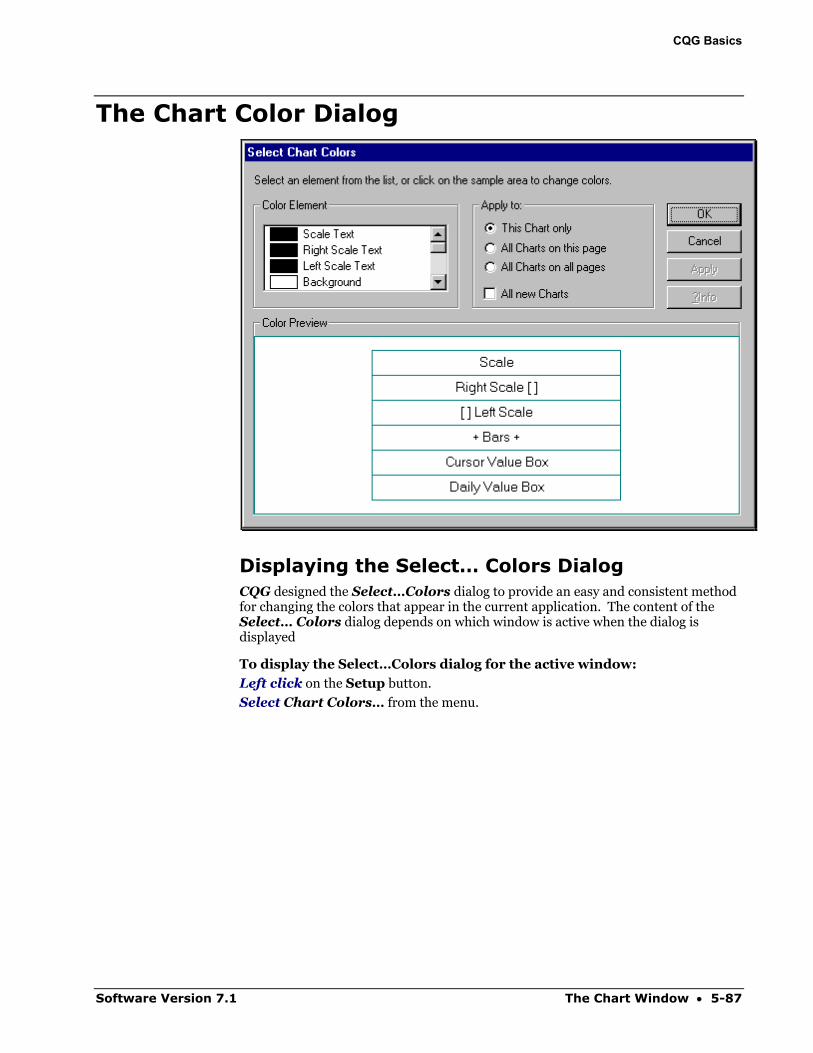
CQG Basics
The Chart Color Dialog
Displaying the Select… Colors Dialog CQG designed the Select…Colors dialog to provide an easy and consistent method for changing the colors that appear in the current application. The content of the Select… Colors dialog depends on which window is active when the dialog is displayed
To display the Select…Colors dialog for the active window:
Left click on the Setup button.
Select Chart Colors… from the menu.
Software Version 7.1 The Chart Window • 5-87
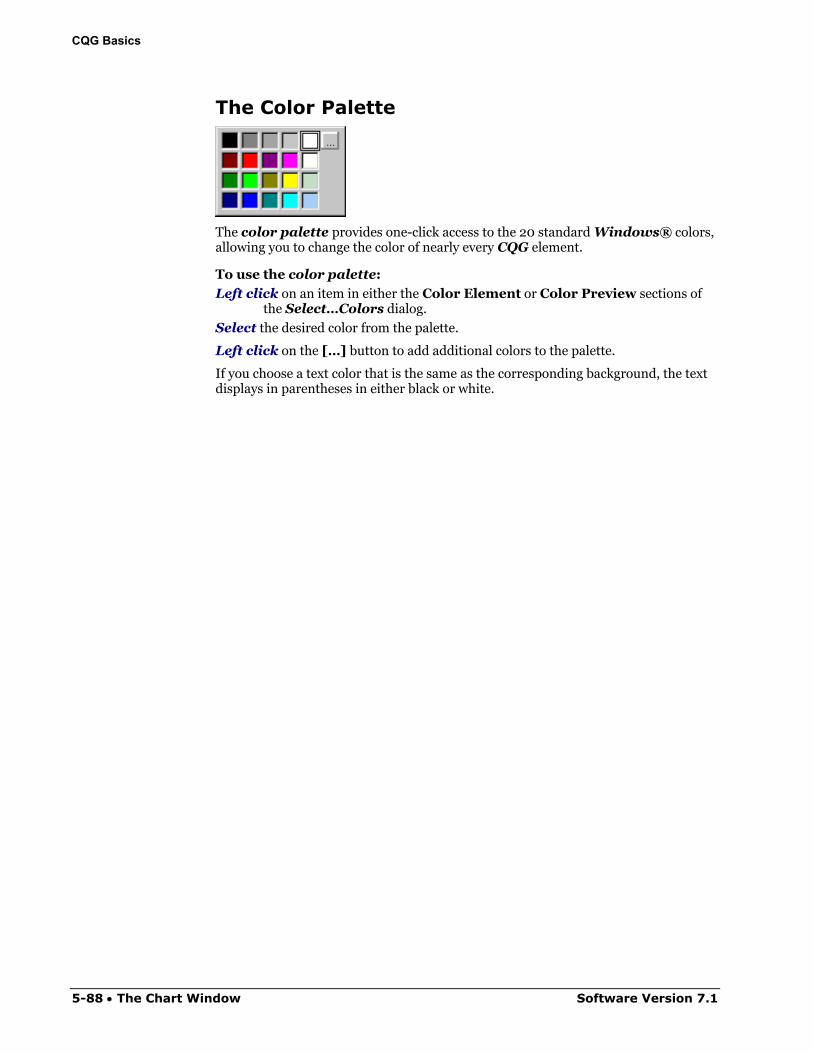
CQG Basics
The Color Palette
The color palette provides one-click access to the 20 standard Windows® colors, allowing you to change the color of nearly every CQG element.
To use the color palette:
Left click on an item in either the Color Element or Color Preview sections of the Select…Colors dialog.
Select the desired color from the palette.
Left click on the […] button to add additional colors to the palette.
If you choose a text color that is the same as the corresponding background, the text displays in parentheses in either black or white.
5-88 • The Chart Window Software Version 7.1
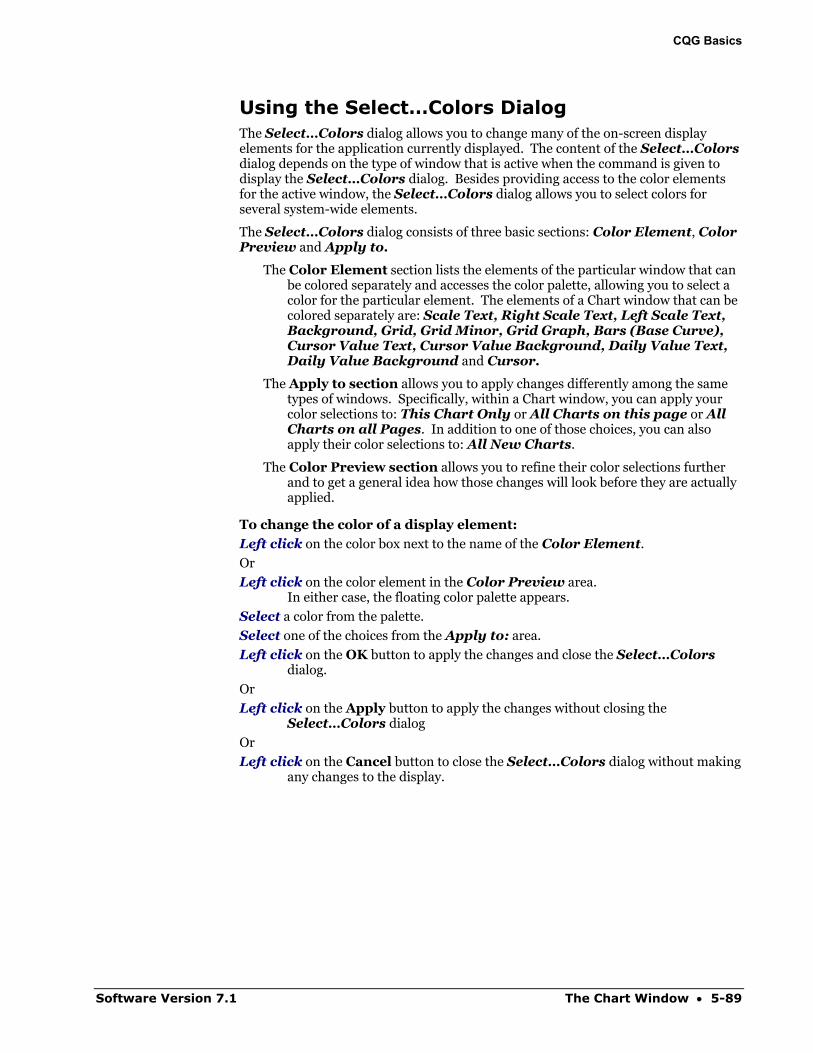
CQG Basics
Using the Select…Colors Dialog The Select…Colors dialog allows you to change many of the on-screen display elements for the application currently displayed. The content of the Select…Colors dialog depends on the type of window that is active when the command is given to display the Select…Colors dialog. Besides providing access to the color elements for the active window, the Select…Colors dialog allows you to select colors for several system-wide elements.
The Select…Colors dialog consists of three basic sections: Color Element, Color Preview and Apply to.
The Color Element section lists the elements of the particular window that can be colored separately and accesses the color palette, allowing you to select a color for the particular element. The elements of a Chart window that can be colored separately are: Scale Text, Right Scale Text, Left Scale Text, Background, Grid, Grid Minor, Grid Graph, Bars (Base Curve), Cursor Value Text, Cursor Value Background, Daily Value Text, Daily Value Background and Cursor.
The Apply to section allows you to apply changes differently among the same types of windows. Specifically, within a Chart window, you can apply your color selections to: This Chart Only or All Charts on this page or All Charts on all Pages. In addition to one of those choices, you can also apply their color selections to: All New Charts.
The Color Preview section allows you to refine their color selections further and to get a general idea how those changes will look before they are actually applied.
To change the color of a display element:
Left click on the color box next to the name of the Color Element.
Or
Left click on the color element in the Color Preview area. In either case, the floating color palette appears.
Select a color from the palette.
Select one of the choices from the Apply to: area.
Left click on the OK button to apply the changes and close the Select…Colors dialog.
Or
Left click on the Apply button to apply the changes without closing the Select…Colors dialog
Or
Left click on the Cancel button to close the Select…Colors dialog without making any changes to the display.
Software Version 7.1 The Chart Window • 5-89
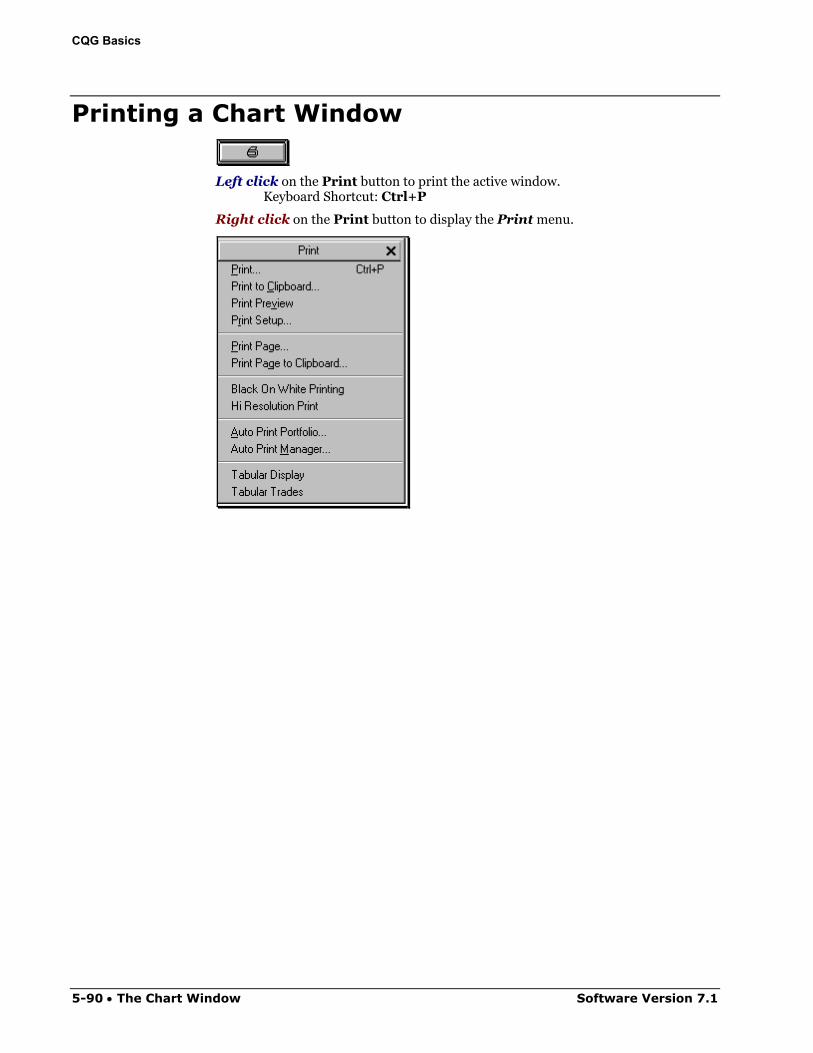
CQG Basics
Printing a Chart Window
Left click on the Print button to print the active window. Keyboard Shortcut: Ctrl+P
Right click on the Print button to display the Print menu.
5-90 • The Chart Window Software Version 7.1
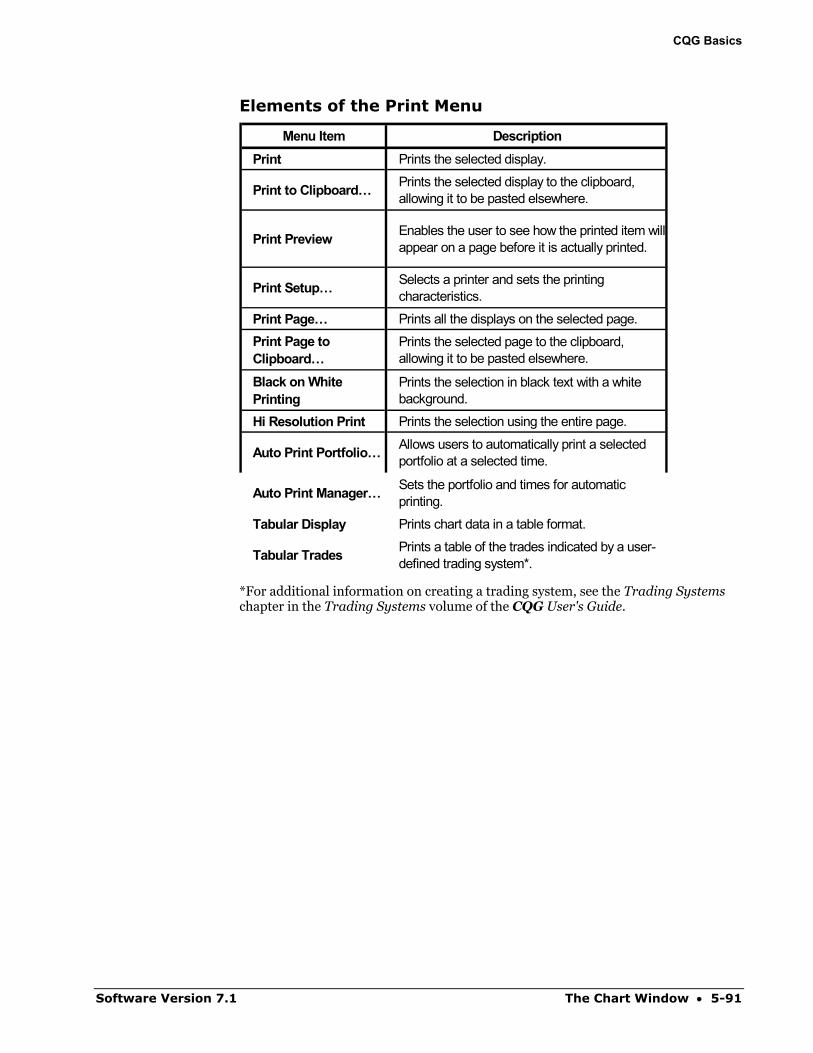
CQG Basics
Elements of the Print Menu
Menu Item DescriptionPrint Prints the selected display.
Print to Clipboard… Prints the selected display to the clipboard, allowing it to be pasted elsewhere.
Print Preview Enables the user to see how the printed item will appear on a page before it is actually printed.
Print Setup… Selects a printer and sets the printing characteristics.
Print Page… Prints all the displays on the selected page.Print Page to Clipboard…
Prints the selected page to the clipboard, allowing it to be pasted elsewhere.
Black on White Printing
Prints the selection in black text with a white background.
Hi Resolution Print Prints the selection using the entire page.
Auto Print Portfolio… Allows users to automatically print a selected portfolio at a selected time.
Auto Print Manager… Sets the portfolio and times for automatic printing.
Tabular Display Prints chart data in a table format.
Tabular Trades Prints a table of the trades indicated by a user-defined trading system*.
*For additional information on creating a trading system, see the Trading Systems chapter in the Trading Systems volume of the CQG User's Guide.
Software Version 7.1 The Chart Window • 5-91
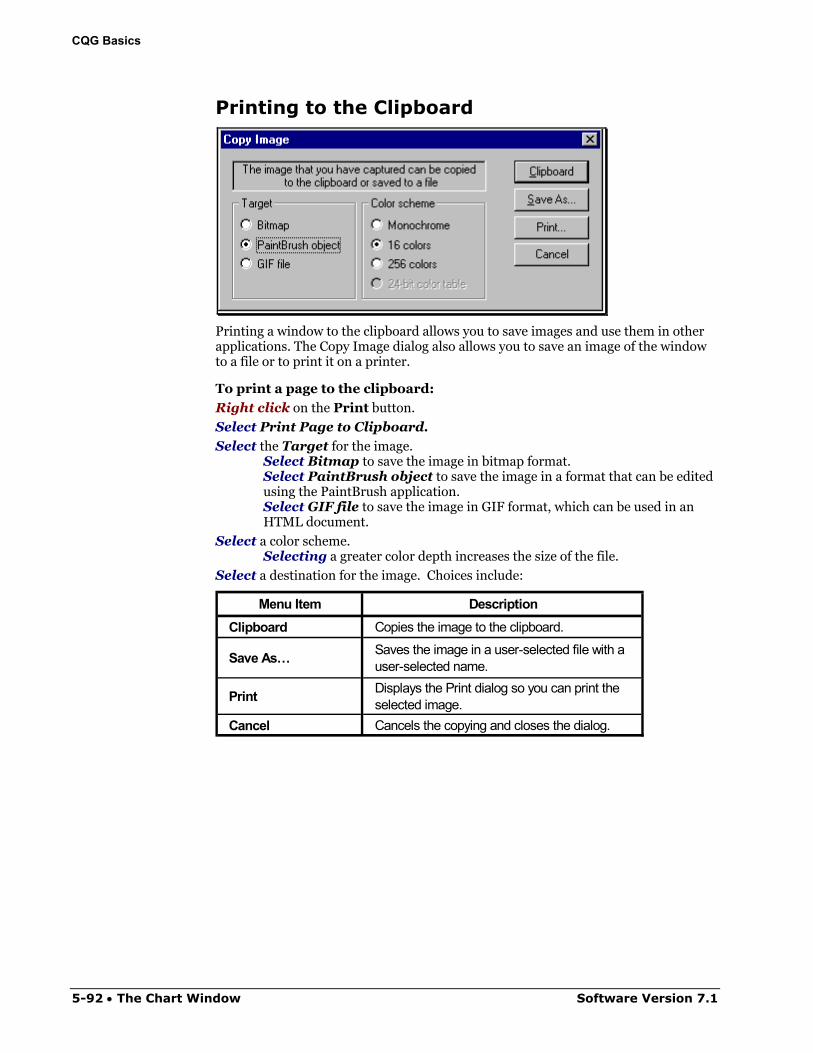
CQG Basics
Printing to the Clipboard
Printing a window to the clipboard allows you to save images and use them in other applications. The Copy Image dialog also allows you to save an image of the window to a file or to print it on a printer.
To print a page to the clipboard:
Right click on the Print button.
Select Print Page to Clipboard.
Select the Target for the image. Select Bitmap to save the image in bitmap format. Select PaintBrush object to save the image in a format that can be edited using the PaintBrush application. Select GIF file to save the image in GIF format, which can be used in an HTML document.
Select a color scheme. Selecting a greater color depth increases the size of the file.
Select a destination for the image. Choices include:
Menu Item DescriptionClipboard Copies the image to the clipboard.
Save As… Saves the image in a user-selected file with a user-selected name.
Print Displays the Print dialog so you can print the selected image.
Cancel Cancels the copying and closes the dialog.
5-92 • The Chart Window Software Version 7.1
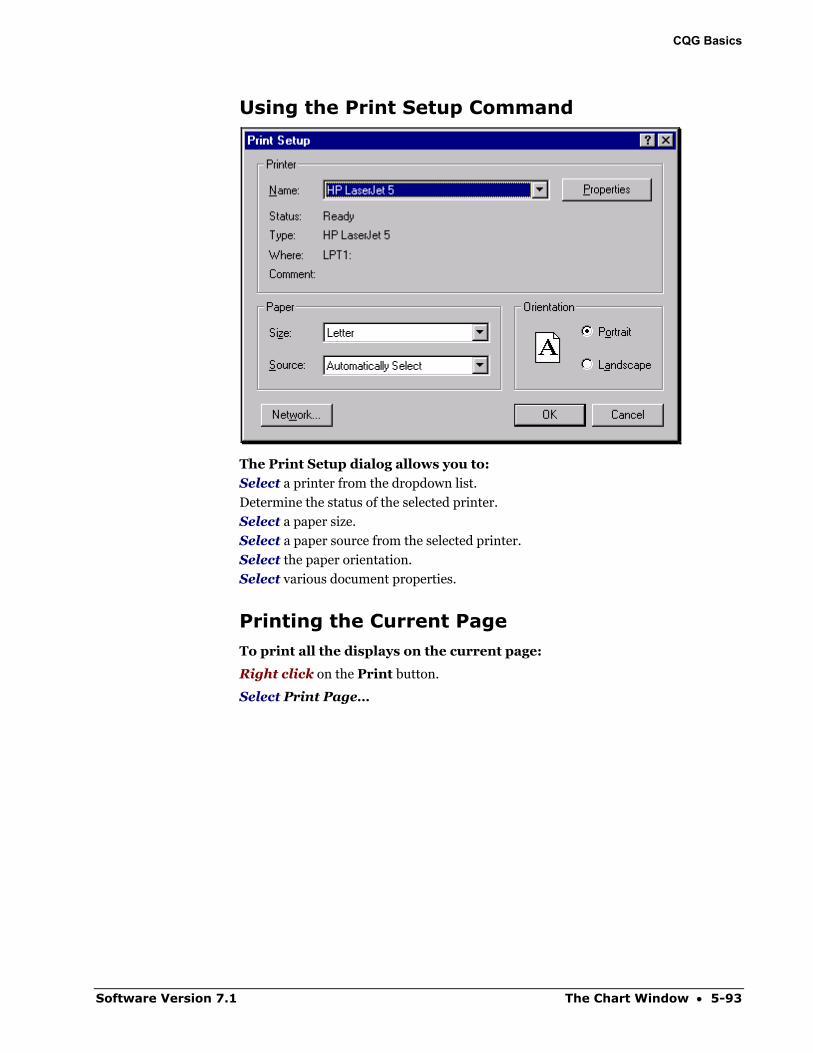
CQG Basics
Using the Print Setup Command
The Print Setup dialog allows you to:
Select a printer from the dropdown list.
Determine the status of the selected printer.
Select a paper size.
Select a paper source from the selected printer.
Select the paper orientation.
Select various document properties.
Printing the Current Page To print all the displays on the current page:
Right click on the Print button.
Select Print Page…
Software Version 7.1 The Chart Window • 5-93
CQG Basics
Black on White Printing The Black on White printing option allows you to print displays using black text and black lines on a white background, even if the screen colors have been altered.
To utilize the Black on White printing option:
Right click on the Print button.
Select Black On White Printing.
Hi Resolution Print When the high-resolution print option is selected, CQG prints the selected chart display over the entire page, thereby adding greater detail to the display.
5-94 • The Chart Window Software Version 7.1
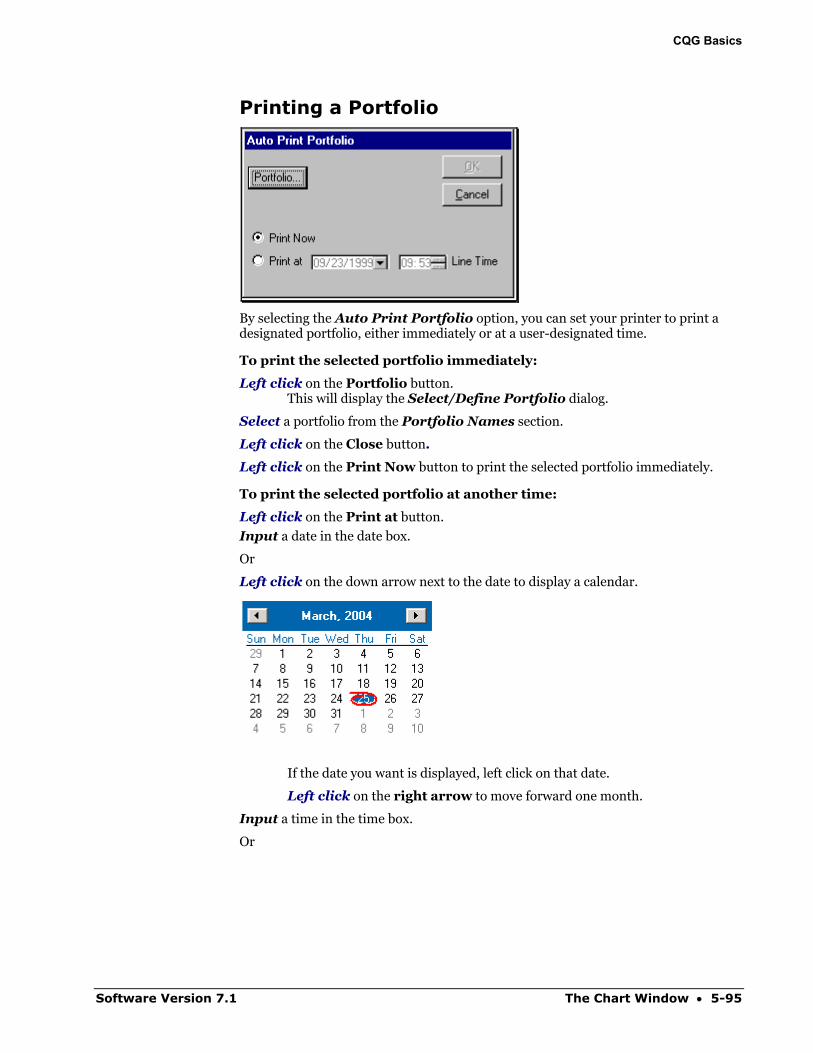
CQG Basics
Printing a Portfolio
By selecting the Auto Print Portfolio option, you can set your printer to print a designated portfolio, either immediately or at a user-designated time.
To print the selected portfolio immediately:
Left click on the Portfolio button. This will display the Select/Define Portfolio dialog.
Select a portfolio from the Portfolio Names section.
Left click on the Close button.
Left click on the Print Now button to print the selected portfolio immediately.
To print the selected portfolio at another time:
Left click on the Print at button.
Input a date in the date box.
Or
Left click on the down arrow next to the date to display a calendar.
If the date you want is displayed, left click on that date.
Left click on the right arrow to move forward one month.
Input a time in the time box.
Or
Software Version 7.1 The Chart Window • 5-95
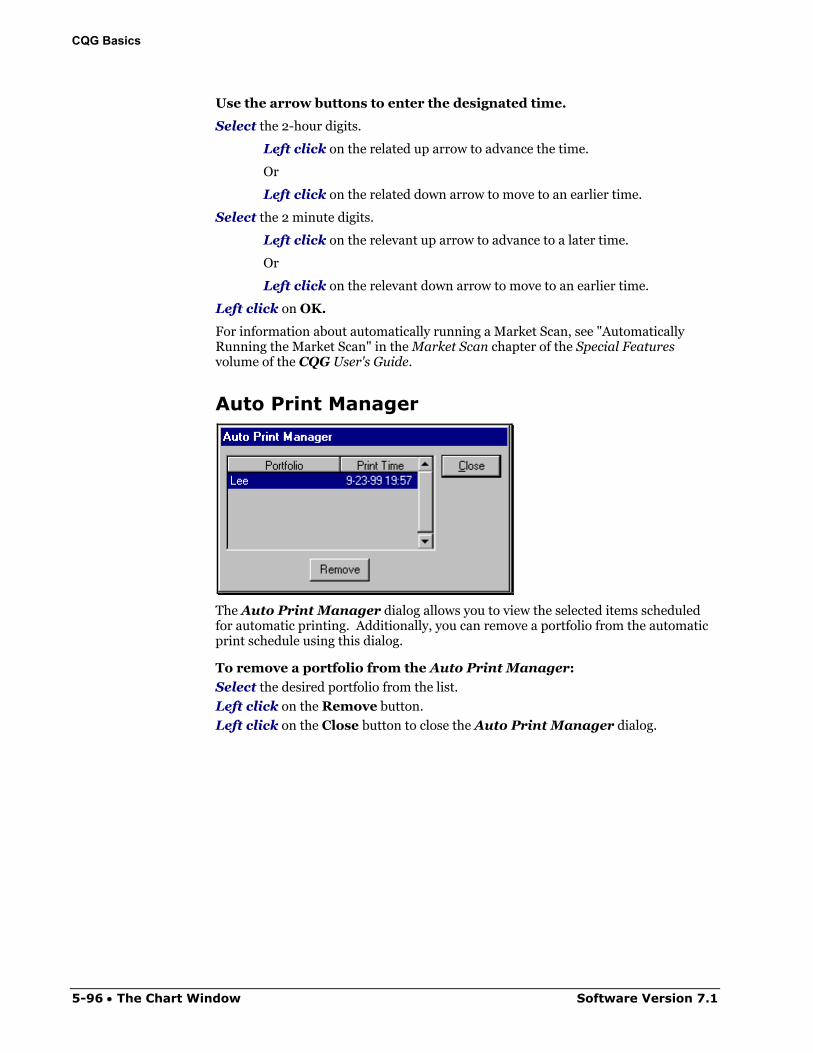
CQG Basics
Use the arrow buttons to enter the designated time.
Select the 2-hour digits.
Left click on the related up arrow to advance the time.
Or
Left click on the related down arrow to move to an earlier time.
Select the 2 minute digits.
Left click on the relevant up arrow to advance to a later time.
Or
Left click on the relevant down arrow to move to an earlier time.
Left click on OK.
For information about automatically running a Market Scan, see "Automatically Running the Market Scan" in the Market Scan chapter of the Special Features volume of the CQG User's Guide.
Auto Print Manager
The Auto Print Manager dialog allows you to view the selected items scheduled for automatic printing. Additionally, you can remove a portfolio from the automatic print schedule using this dialog.
To remove a portfolio from the Auto Print Manager:
Select the desired portfolio from the list.
Left click on the Remove button.
Left click on the Close button to close the Auto Print Manager dialog.
5-96 • The Chart Window Software Version 7.1
CQG Basics
Printing a Tabular Display of Chart Data To print a table of the chart data:
Right click on the Print button.
Left click on Tabular Display.
Left click on the Ascnd button to print the list from oldest date to newest date.
Or
Left click on the Dscnd button to print the list from the most recent date to the oldest date.
Left click on the Print button.
Once you have the tabular data displayed, you can change the data from fractional form to decimal form.
To change the tabular display from fractional form to decimal form:
Left click on the Setup button.
Select Tabular Fonts.
Select a font other than CQG Small (the default font) or CQG Swiss.
Software Version 7.1 The Chart Window • 5-97
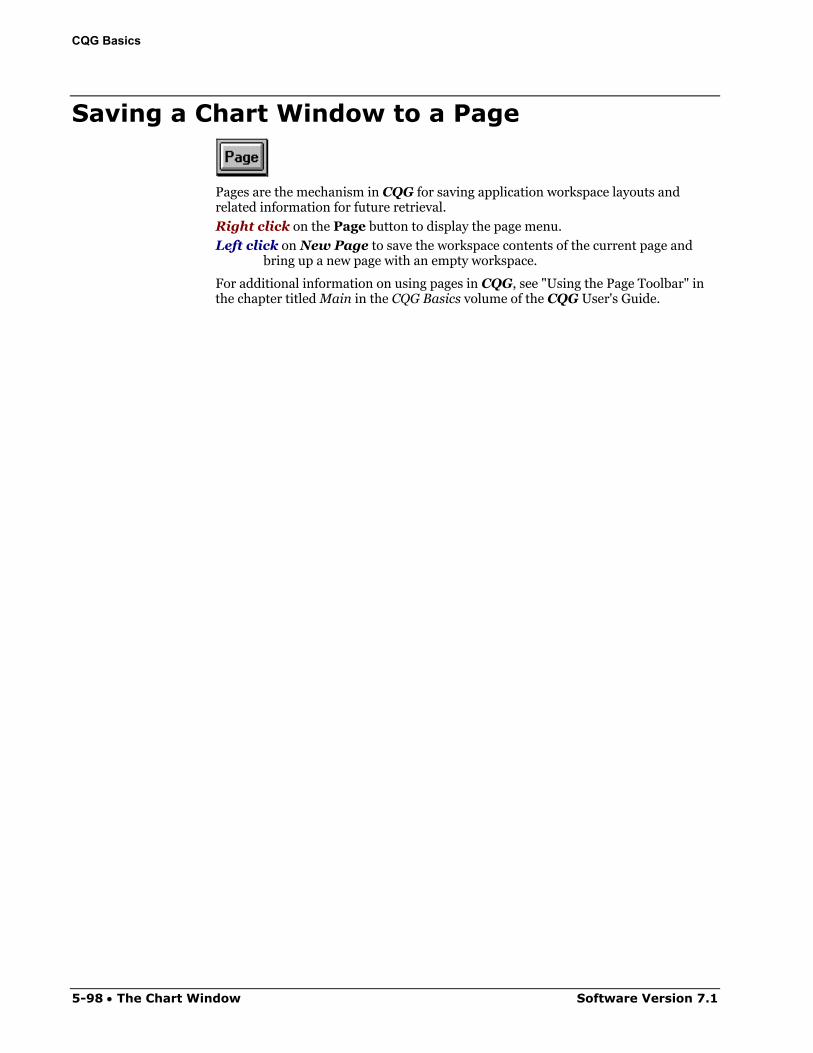
CQG Basics
Saving a Chart Window to a Page
Pages are the mechanism in CQG for saving application workspace layouts and related information for future retrieval.
Right click on the Page button to display the page menu.
Left click on New Page to save the workspace contents of the current page and bring up a new page with an empty workspace.
For additional information on using pages in CQG, see "Using the Page Toolbar" in the chapter titled Main in the CQG Basics volume of the CQG User's Guide.
5-98 • The Chart Window Software Version 7.1