The Base of the Iceberg: - US Agency for International ...
126
The Base of the Iceberg: Prevalence and Perceptions of Maternal Morbidity in Four Developing Countries The Maternal Morbidity Network Judith A. Fortney PhD and Jason B. Smith PhD, editors Family Health International Maternal and Neonatal Health Center Research Triangle Park NC 27709 USA December 1996 Copyright 1997 by Family Health International
-
Upload
khangminh22 -
Category
Documents
-
view
2 -
download
0
Transcript of The Base of the Iceberg: - US Agency for International ...

The Base of the Iceberg: Prevalence and Perceptions of Maternal Morbidity
in Four Developing Countries
The Maternal Morbidity Network
Judith A. Fortney PhD and Jason B. Smith PhD, editors
Family Health InternationalMaternal and Neonatal Health Center
Research Triangle Park NC 27709 USADecember 1996
Copyright 1997 by Family Health International


i
7KH�ZRUN�GHVFULEHG�LQ�WKLV�UHSRUW�ZDV�GRQH�E\�)DPLO\�+HDOWK�,QWHUQDWLRQDOZLWK�VXSSRUW�IURP�WKH�)RUG�)RXQGDWLRQ�DQG�WKH�8�6��$JHQF\�IRU�,QWHU�QDWLRQDO�'HYHORSPHQW��86$,'����7KH�YLHZV�H[SUHVVHG�LQ�WKLV�UHSRUW�GR�QRWQHFHVVDULO\�UHIOHFW�WKRVH�RI�HLWKHU�WKH�)RUG�)RXQGDWLRQ�RU�86$,'�EXW�DUHHQWLUHO\�WKH�UHVSRQVLELOLW\�RI�WKH�DXWKRUV�

ii
Acknowledgments
A study of this type and magnitude necessarily owes many debts of gratitude. The MaternalMorbidity Survey is no exception. By far the biggest debt is to the Ford Foundation, whichsupported this project from its inception in 1988 to its fruition. In particular, Dr. MarjorieKoblinsky (now with JSI MotherCare) was especially instrumental in the conception and gestationof this project; she gave immediate and enthusiastic support to what was initially only a hazy idea,and she identified the countries where the research could be implemented. Since Dr. Koblinsky’sdeparture from the Ford Foundation, Dr. Jose Barzelatto and Dr. Margaret Hempel in the NewYork office have been constant sources of moral support. The Ford field offices showed earlyenthusiasm for this project; in particular, Drs. Saroj Pachauri in New Delhi, George Rubin inDhaka and Sandra Lane in Cairo were most supportive. Indonesia joined the network somewhatlater than the other three countries, and the collaboration was largely because of Dr. CynthiaMyntti’s great interest in the area under study. All of these people have since moved on to otherpositions, but their successors at the Ford Foundation field offices have been no less supportive,our thanks are due to James Ross in Dhaka, Barbara Ibrahim in Cairo, Rosalia Sciortino inJakarta, and Michael Koenig in New Delhi.
Among the Ford Foundation field staff, we extend a special thank you to Dr. Saroj Pachauri whoorganized the first two collaborative meetings (in New Delhi and in Bangalore) at which the earlyresearch design decisions were made. It was Dr. Pachauri who emphasized the importance of thequalitative field work which preceded implementation of the studies, and for this we are especiallygrateful.
Dr. Roger Rochat was with the USAID Mission in New Delhi as this survey was being developed. Because of his long-standing interest in maternal mortality and morbidity, he was very supportiveof our early work, and provided financial support for the two meetings held in India.
iii
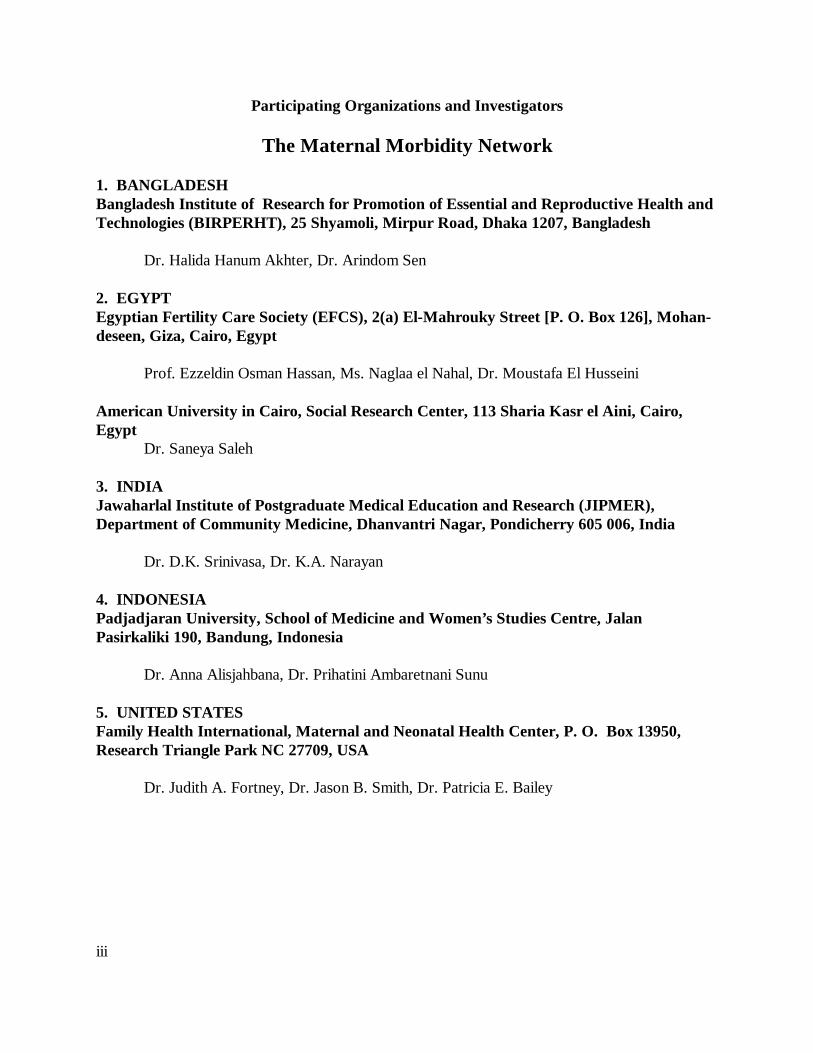
Participating Organizations and Investigators
The Maternal Morbidity Network
1. BANGLADESHBangladesh Institute of Research for Promotion of Essential and Reproductive Health andTechnologies (BIRPERHT), 25 Shyamoli, Mirpur Road, Dhaka 1207, Bangladesh
Dr. Halida Hanum Akhter, Dr. Arindom Sen
2. EGYPTEgyptian Fertility Care Society (EFCS), 2(a) El-Mahrouky Street [P. O. Box 126], Mohan-deseen, Giza, Cairo, Egypt
Prof. Ezzeldin Osman Hassan, Ms. Naglaa el Nahal, Dr. Moustafa El Husseini
American University in Cairo, Social Research Center, 113 Sharia Kasr el Aini, Cairo,Egypt
Dr. Saneya Saleh
3. INDIAJawaharlal Institute of Postgraduate Medical Education and Research (JIPMER),Department of Community Medicine, Dhanvantri Nagar, Pondicherry 605 006, India
Dr. D.K. Srinivasa, Dr. K.A. Narayan
4. INDONESIAPadjadjaran University, School of Medicine and Women’s Studies Centre, JalanPasirkaliki 190, Bandung, Indonesia
Dr. Anna Alisjahbana, Dr. Prihatini Ambaretnani Sunu
5. UNITED STATESFamily Health International, Maternal and Neonatal Health Center, P. O. Box 13950,Research Triangle Park NC 27709, USA
Dr. Judith A. Fortney, Dr. Jason B. Smith, Dr. Patricia E. Bailey

iv
TABLE OF CONTENTS
List of Data Tables ................................................................................................................. vi
List of Acronyms .................................................................................................................. vii
I. INTRODUCTION .............................................................................................................. 1A. Need for Research on Maternal Morbidity........................................................... 1B. Types of Reproductive Morbidity ......................................................................... 2C. Literature Review ................................................................................................... 3
II. STUDY DESIGN AND IMPLEMENTATION............................................................... 11A. Objectives of this Study.......................................................................................... 11B. The Collaborative Nature of this Research ......................................................... 11C. General Study Design ............................................................................................. 12D. Specific Variations of Each of the Projects ......................................................... 13E. Data Collection Methods ...................................................................................... 13F. Study Size Considerations .................................................................................... 15G. Questionnaire Development; Use of Qualitative Research ................................ 17H. Interviewer Training ............................................................................................ 18I. Data Quality Assurance ........................................................................................ 18J. Analysis ................................................................................................................. 19
III. CHARACTERISTICS OF THE STUDY PARTICIPANTS......................................... 20A. Eligibility to Participate in the Study .................................................................. 20B. Characteristics of the Sample .............................................................................. 20C. Characteristics of the Study Participants ........................................................... 20
IV. PREVALENCE OF MORBIDITIES ............................................................................. 36A. During the Index Pregnancy ................................................................................ 36B. Long-term Morbidity............................................................................................ 39C. Discussion ............................................................................................................. 40
V. RATIO OF MORBIDITIES TO MORTALITY ............................................................ 42A. Number of Morbidities per Mortality in the Index Pregnancy........................... 42B. Number of Women with Morbidities per Mortality
in the Index Pregnancy .................................................................................. 43C. Number of Women with Chronic Morbidities per Mortality ............................ 43D. Discussion ............................................................................................................. 44

v
VI. IMPLICATIONS FOR PROGRAMS ........................................................................... 48A. Knowledge of Complications ............................................................................... 48B. Access to Care ...................................................................................................... 51C. Discussion ............................................................................................................. 52
EPILOGUE ........................................................................................................................... 54
APPENDICES
Appendix 1: Data Tables............................................................................................. 57Appendix 2: Study Questionnaires ....................................... Printed in separate volume
REFERENCES .................................................................................................................... 101
List of Text Tables
Table I.1. Ease of detection of obstetric and gynecologic morbidity ........................................... 4Table I.2. Population-based studies of reproductive morbidity ................................................. 9Table I.3. Incidence of obstetric complications in earlier studies per 100 deliveries .................. 10
Table II.1 Perceptibility of obstetric morbidities .................................................................... 14Table II.2 Study size ............................................................................................................... 17
Table III.1 Association between the frequency of selected postpartum conditionsand the proportion of women receiving skilled intrapartum care......................... 28
Table IV.1. Specific morbidities of the index pregnancycovered in questionnaire.................................................................................... 37
Table IV.2. Prevalence of morbidities during the index pregnancy............................................ 40
Table V.1. Estimates of maternal mortality ratios used in calculations...................................... 43Table V.2. Comparison of the present study with other studies ................................................ 46Table V.3. Egyptian study results of physical examination of women reporting
specific morbidities............................................................................................ 47

vi
List of Data Tables (Appendix 1)
Table 1. Description of sample: household screen and individual record.Table 2. Percentage of women with selected demographic characteristics.Table 3. Percentage of women with selected socioeconomic characteristics.Table 4. Percentage of women selecting specified service outlets as usual place
for treatment of "female diseases."Table 5. Percentage of women with live births and with other outcomes of pregnancy
who had selected characteristics of the index country.Table 6. Percentage of women giving selected reasons for no antenatal care.Table 7. Percentage of women with selected characteristics of the index delivery.Table 8. Percentage of women delivering in specified places, by attendant at delivery.Table 9. Intended place of delivery, by actual place of delivery.Table 10. Percentage of women who perceive morbidities as serious, and percentage who
sought care for morbidity among women who had specific antepartum morbidities in the index pregnancy.
Table 11. Care seeking behavior for specific antepartum morbidities, by source of care.Table 12. Specific intrapartum morbidities in the index pregnancy, percent who perceived
them as serious, percent who sought care.Table 13. Care seeking behavior for specific intrapartum morbidities, by source of care.Table 14. Specific postpartum morbidities in the index pregnancy, percent who perceived
them as serious, percent who sought care.Table 15. Care seeking behavior for specific postpartum morbidities, by source of care. Table 16. Specific long-term morbidities, percent who sought care, and percent
with lifestyle changes.Table 17. Care seeking behavior for specific long-term morbidities, by source of care.Table 18. Percentage of women with interventions at the time of the index pregnancy.Table 19. Percent of women with intrapartum morbidity and specific intervention.Table 20. Specific antepartum morbidities, by outcome of index pregnancy.Table 21. Specific intrapartum morbidities or interventions, by outcome
of index pregnancy.Table 22. Specific postpartum morbidities in the index pregnancy, by outcome of
index pregnancy.Table 23. Percent of women with morbidities in the index pregnancy, by severity of morbidity.Table 24. Number of long-term morbidities.Table 25. Ratio of morbidities to maternal mortality.Table 26. Ratio of women with morbidities to maternal mortality.

vii
List of Acronyms
ADS Associacion Demografica SalvadoreñaBIRPERHT Bangladesh Institute of Research and Promotion of Essential and Reproductive
Health TechnologiesCDC Centers for Disease Control and PreventionDHS Demographic and Health SurveysEFCS Egyptian Fertility Care SocietyFHI Family Health InternationalIUD Intrauterine deviceJIPMER Jawaharlal Institute of Postgraduate Medical Education and ResearchJSI John Snow IncorporatedPHC Primary Health CenterPMS Premenstrual syndromeRTI Reproductive tract infectionRVF Rectovaginal fistulaSTD Sexually transmitted diseaseTB TuberculosisTBA Traditional birth attendantUSAID U.S. Agency for International DevelopmentUTI Urinary tract infectionVVF Vesicovaginal fistula


1
I. INTRODUCTION
A. Need for Research on Maternal Morbidity
Each year, 585,000 women in the world die because they are pregnant (Stanton et al, 1995), andalmost all of them live and die in developing countries. The extent of maternal mortality was firstmade widely known at the 1987 Safe Motherhood Conference in Kenya. It is often said that thisstatistic reflects only the "tip of the iceberg," and that many more women suffer life-threateningcomplications which they survive, although sometimes with residual, chronic problems that mayplague them for the rest of their lives.
Knowledge of the many facets of maternal mortality is now quite broadly dispersed. Its terriblemagnitude, the gap between developed and developing countries, and the consequences forindividuals, families and communities are understood by much of the international reproductivehealth community. There are hundreds of studies in scores of countries which attest to theattention maternal mortality has received.
Maternal morbidity, on the other hand, has been largely ignored except for hospital-based studiesof numerator populations. Existing research tells us very little about the real prevalence of maternal morbidity in communities worldwide. At this time, there are quite a few studies ofmaternal mortality that are population-based, but only five studies of obstetric (maternal)morbidity that could be characterized as population-based (Datta et al, 1980; DHS, 1994; Bhatia& Cleland, 1995, 1996; de Graft-Johnson, 1994; ADS & CDC, 1994). In addition, there are afew population-based studies focusing on other aspects of reproductive morbidity C a broaderconcept than maternal morbidity (Fortney, 1995) C some of which include conditions that couldbe of obstetric origin. There are, however, not more than a dozen population-based studies ofreproductive morbidity.
By the mid to late 1980s, the need for population-based studies of reproductive morbidity ingeneral, and maternal morbidity in particular, had become apparent. The research described herewas developed in response to that need, and describes Athe base of the iceberg.@

The Base of the Iceberg: Chapter I
2
B. Types of Reproductive Morbidity
While there is more than one definition of maternal mortality, which researchers dispute, thedefinitions themselves are quite clear.1 However, for maternal morbidity, the underdevelopedstate of this research field is apparent in the lack of clear definition of types of morbidity to beinvestigated. In particular, little uniformity exists in the use of an overall framework ofreproductive morbidity. The broad category of reproductive morbidity includes maternal(obstetric), gynecologic and contraceptive morbidities. There have been investigations of all ofthese, and clearly there is overlap between categories.
The World Health Organization, in 1989 (World Health Organization, 1989), defined reproduc-tive morbidity in the following broad terms:
1. Obstetric Morbidity. Morbidity in a woman who has been pregnant (regardless of thesite or duration of the pregnancy) from any cause related to or aggravated by the preg-nancy or its management, but not from accidental or incidental causes. Obstetricmorbidity falls into three categories:
a. Direct obstetric morbidity results from obstetric complications of the pregnantstate (pregnancy, labor and the puerperium), from interventions, omissions,incorrect treatment, or from a chain of events resulting from any of the above. This can include temporary conditions, mild or severe, which occur duringpregnancy or within 42 days of delivery, or permanent/chronic conditions resultingfrom pregnancy, abortion or childbirth. Some chronic conditions (such as anemiaor hypertension) may be caused by pregnancy and delivery, but are equally likely tohave other causes.
b. Indirect obstetric morbidity results from a previously existing condition ordisease, such as sickle cell disease or tuberculosis, which was aggravated by thephysiologic effects of pregnancy. Such morbidity may occur at any time andcontinue beyond the reproductive years.
c. Psychological obstetric morbidity may include puerperal psychosis, attemptedsuicide, strong fear of pregnancy and childbirth, and may be the consequence ofobstetric complications, obstetric interventions, cultural practices (such as isolation
��������������������
1 See for example, the ICD-10 definition which differs from its predecessor in ICD-9 (WHO, 1993).

The Base of the Iceberg: Chapter I
3
during labor and delivery), or coercion.
2. Gynecologic Morbidity. This category includes any condition, disease or dysfunctionof the reproductive system which is not related to pregnancy, abortion or childbirth, butmay be related to sexual behavior.
a. Direct gynecologic morbidity includes reproductive cancers, premenstrualsyndrome (PMS), endocrine system disorders, bacterial or viral sexually trans-mitted diseases (STDs) and their sequelae (cervical cancer, pelvic inflammatorydisease (PID), secondary sterility, AIDS), reproductive tract infections (RTIs),coital injuries.
c. Indirect gynecologic morbidity includes primarily traditional practices, some ofwhich are for treatment of real or perceived gynecologic conditions (such asfemale genital mutilation, gishiri cuts).
c. Psychological morbidity includes psychological disorders associated withSTDs, infertility, traditional practices, dyspareunia, fistulae, rape.
3. Contraceptive Morbidity. This category includes conditions which result from efforts(other than abortion) to limit fertility, whether they are traditional or modern methods. Examples include menorrhagia from IUD use, thromboses from oral contraceptive use,and wound infections after Norplant insertion.
Thus, studies which focus on the research methodology used for studies of reproductive morbidityis determined to a large extent by the focus. Much gynecologic morbidity remains unnoticed bythe affected woman, especially in its early stages (e.g., cervical cancer, RTI). A much smallerproportion of obstetric morbidity remains inapparent to the woman (e.g. hypertension) (TableI.1). Thus studies focusing on gynecologic morbidity, especially if RTI and STD are importantcomponents, will need to place a greater emphasis on physical examination and laboratory testing,and cannot be undertaken retrospectively. Studies focusing on obstetric morbidity, on the otherhand, can depend more heavily on the respondents’ self-report which, as Stewart and Festin(1995) have reported, is valid for many conditions. There are both obstetric and gynecologicsymptoms that cannot be validated by physical examination, such as dyspareunia, pain (pelvic,back, on urination), dizziness, blurred vision, nausea, or irregular menses.
C. Literature Review
Studies to assess the prevalence of reproductive morbidity can be quite broad and cover all theaspects of reproductive morbidity described above, or can focus on just one category such asgynecologic morbidity or a subset of a category such as cancer or STDs, or an even smallersubset such as cervical cancer or gonorrhea. The more specific the focus, the greater the number

The Base of the Iceberg: Chapter I
4
of studies, although few are population-based.
Table I.1. Ease of detection of obstetric and gynecologic morbidity.
Morbidity Symptomatic Asymptomatic
Obstetric edema, some vaginal infections,fever, some medical conditions,bleeding, fitsor seizures, obstructed orprolonged labor, cesarean deliv-ery, torn perineum, sepsis, pro-lapse, fistula, dyspareunia
hypertension, protein-uria, some medicalconditions, anemia,torn cervix
Gynecologic some STDs, dyspareunia, men-strual disorders, infertility, pelvicpain, UTI, late stage cancer
some STDs, endocrinedisorders, early stagecancer
Contraceptive excessive bleeding, pelvic pain,dizziness, headaches, irregularmenstrual bleeding, spotting,
anemia, hypertension,some thromboses
This report focuses on maternal (obstetric) morbidity, an area few other investigators havechosen, although several investigators have pioneered this territory before us. The following arestudies of reproductive morbidity,2 some of which include obstetric morbidity. All of theseinvestigators found more morbidity (of all categories) than they had expected. The foci of these��������������������
2Several of these studies are population-based, although the population is sometimes quite small. While the study by
Wasserheit and colleagues is clinic-based, the clinic population was one that was not seeking treatment of any condition. The study by Franks et al, was based on all antepartum hospitalizations in US reporting institutions.

The Base of the Iceberg: Chapter I
5
studies are summarized in Table I.2.
1980. The earliest study was done by Datta andhis colleagues (Datta et al, 1980) in India. Theirprospective cohort study measured any morbidi-ty (illness) occurring to women while they werepregnant, regardless of its cause, but illnessesrelated to pregnancy, childbirth and puerperiumwere identified. Their population was defined asall pregnant women in the village of Baskripal-nagar (Rajasthan) during the years 1974-1979. Some women (66 of the 281) were observed formore than one pregnancy. The authors reportthat 48%, 32%, 33% and 32% of pregnantwomen reported morbidity (continuing and newepisodes) in the first, second and third trimestersand the puerperium respectively. They do not report the proportion of women who experiencedno morbidity at any time during their pregnancy. This study is the source of the often-quotedratio of 16.5 obstetric morbidities per maternal death (often rounded to 15).
1985. Wasserheit and her colleagues (Wasserheit et al, 1989) in Bangladesh were interested pri-marily in RTIs. Their study population consisted of married women of reproductive age whoattended a family planning clinic, were not pregnant, had not recently changed contraceptivemethods, and who did not have other conditions which might cause pelvic pain. They examinedonly women who reported symptoms of STDs. They found that 22% of women reported symp-toms consistent with RTI and were therefore referred for examination. Sixty-eight percent ofthese women had clinical and laboratory evidence of RTI.
1989. Bang and her colleagues (Bang et al,1989) in India examined gynecologic morbiditywhich they defined as "structural or functionaldisorders of the female genital tract other thanabnormal pregnancy, delivery or the puerperi-um." The population consisted of all reproduc-tive age women who volunteered to beexamined in two villages in Gadchiroli district inMaharashtra. They found that 92% of theserural women had at least one gynecologiccondition. Findings were based on solely physical examination by a woman doctor regardless ofwhether they reported symptoms. The authors report that 98.4% of symptomatic and 84% ofasymptomatic women had at least one condition. Only 8% had undergone examination andtreatment in the past. Only 72% were of reproductive age, and their conditions are not reported
India: Information was sought on any illnessduring pregnancy:Number of maternal deaths 2
Number of new illnesses reported 116Ratio of new illnesses to
maternal death 58Number of illnesses related to
pregnancy, childbirth andthe puerperium 33
Ratio of obstetric illnesses tomaternal death 16.5
Source: Datta et al; 1980
India: Of the 92% of women with at leastone gynecologic condition:52.7% had menstrual disorder
7.9% had sexual problems27.8% had vaginal infections70.6% had cervical disease28.5% had PID
Source: Bang et al, 1989

The Base of the Iceberg: Chapter I
6
separately.
1992. Analyzing hospital discharge data, Franksand her colleagues (1992) found considerablymore morbidity in the ante-partum period than had been expected. Mor-bidities related to abortions or term pregnancieswere excluded. Also excluded were morbidities(such as hypertension) which were treated bydelivering the infant. The estimate of 22antepartum hospitalizations for each 100deliveries is, by definition, limited to morbiditiessevere enough to require hospitalization, and is, therefore, an underestimate of all antepartummorbidity. Multiple admissions for the same woman were counted separately.
The average hospital stay was two to three days, resulting in a far greater burden on the healthcare system (and on women) than the authors anticipated.
1993. Younis and his colleagues (Younis et al,1994) in Egypt also focused on gynecologicmorbidity, defined as "conditions of ill health un-related to a pregnancy episode, such as repro-ductive tract infections (RTIs), cervical cellchanges, and genital prolapse. Other relatedmorbidity conditions that are commonly asso-ciated with reproductive morbidities includeurinary tract infections (UTIs), anemia, hyper-tension, obesity, and syphilis." (The specificconditions are shown in the box to the right.) Younis’ study aimed to determine the prevalenceof gynecologic and related conditions in 509ever-married women randomly selected from twocommunities. The population was all ever-married women aged 14-60 (though 91% were aged 45 or younger) who were not currently preg-nant, resided in a defined area, and who agreed to be examined. Only 8.6% of women refusedparticipation. Although the investigators did not include women who were pregnant, they didexamine women for prolapse which is often of obstetric origin. Women found to have treatableconditions received treatment. All of the conditions reported in this study were identified byphysical examination or laboratory test.
Gynecologic morbidities were found to be quite prevalent: 44% had vaginitis (22% bacterialvaginosis, 18% trichomoniasis, 11% candida albicans), 10% had cervicitis (almost all chlamydia),
USA: For every 100 hospitalizations fordelivery there are 22.2 hospitalizations duringpregnancy C 14.6 for antenatal complicationsand 7.6 for pregnancy loss. The mostcommon antenatal complications are:
Preterm laborGenitourinary infectionAntenatal hemorrhageExcessive vomitingPregnancy induced hypertensionDiabetes mellitus
Source: Franks et al, 1992
Egypt: Information was sought on 10conditions:
Lower reproductive tract infections (six organisms)
Upper reproductive tract infectionsCervical ectopyCervical cell changesGenital prolapseUrinary tract infectionAnemiaHypertensionObesitySyphilis
Source: Younis et al, 1994

The Base of the Iceberg: Chapter I
7
2% had PID (using a less rigid definition, an additional 17% possibly had PID), 22% had cervicalectopy and 11% had other cervical cell changes. Finally 56% had some degree of genital prolapseand 8% had prolapse involving the uterus. Related morbidities were also quite common: 14%had UTI, 17% were anemic (<12gm/dl), 43% were obese (Quetelet index >25; 20% had QI>30).Only 0.8% had syphilis.
1994. More recently, Stewart and her col-leagues (DHS, 1994) in the Philippines con-ducted the first published study to look primarilyat obstetric morbidity. They collected data onspecific conditions, some of which are life-threatening (postpartum hemorrhage, sepsis,eclampsia and dystocia requiring cesareansection), while others were less serious (pre-mature rupture of membranes, and multiplebirths, among others). The study populationwas drawn from a nationally representativesample and the survey was conducted in conjunction with the Demographic and Health Survey. This study is particularly important because it validated self-reporting of obstetric complications(Stewart & Festin, 1995). They identified women who had delivered in hospital, some of whomhad experienced complications during labor, delivery or immediate puerperium, and some ofwhom had not. Identified women were contacted at home an average of 25-33 months afterdelivery and asked about complications they experienced during the perinatal period. Thesensitivity and specificity of the questions were calculated.3 These findings are shown in the box;there was no tendency in the ability to recall some complications better than others. Overall,10.9% of the respondents had life-threatening complications in the peripartum period, and anadditional 51.9% reported less serious complications during that period.
1994. A nationally representative survey of 6,207 women aged 15-49 in El Salvador (ADS &CDC, 1994) found that among women whose pregnancies did not end in miscarriage, 35% hadedema of legs and/or face, 18% were told they were anemic, 14% were told they were hyper-tensive (with no previous history of hypertension), and 6.3% reported antepartum bleeding orspotting. Fifteen percent of women with live births reported that the labor lasted longer than 24hours, 28.6% reported intense bleeding during delivery, and 1.8% reported convulsions in theperipartum period. Postpartum bleeding was more common (35.4%) than intrapartum.
��������������������
3Sensitivity is the proportion of women with the condition, who correctly reported that they had the condition. Specificity
is the proportion of women without the condition, who correctly reported that they did not have the condition.
Philippines: Can women accurately recalltheir obstetric morbidities? Sensitivity Specificity
Hemorrhage 70% 78%Dystocia 69% 97%Sepsis 89% 83%Eclampsia 44% 96%
Source: Stewart et al, 1995
India: Of 3600 women under 35, with achild under 5:

The Base of the Iceberg: Chapter I
8
1995. Bhatia and Cleland (1996) in India foundthat 18% of women reported a prenatalcomplication, 8% during delivery and 23%postpartum. Eight percent reported potentiallylife-threatening complications during deliveryand 10% after delivery (this last number doesnot include infections, reported by 17% ofwomen). Because different definitions wereused it is difficult to compare their findingsdirectly with those of Stewart and Festin(1995), but Table I.3 shows that they are notinconsistent. As part of a larger study to deter-mine the pathways (including health) through which mother’s education influences the child’ssurvival, Bhatia and Cleland asked about obstetric and gynecologic health in a subdistrict of Kar-nataka. The population (not representative) consisted of 3,600 women under 35 years who had achild under 5 years. The data described here are cross-sectional and were collected in face-to-face interviews conducted in the woman’s home.
Table I.2 summarizes the focus of the studies described above. For the purposes of comparisonwith the study described in this report, the first one (Datta et al, 1980) and the last four are themost important. Table I.3 summarizes the empirical findings for the frequency of specifiedcomplications of labor and delivery (complications of pregnancy, and postpartum morbidities arenot shown) for three of these studies.
Table I.2. Population-based studies of reproductive morbidity.
Author, year Obstetric Gynecologic Contraceptive
Datta et al, 1980India
yes Yes no
Wasserheit et al, 1985Bangladesh
no yesSTD only
yes
Bang et al, 1989India
no yes yes
Franks et al, 1992USA
yesantepartum only
no no
41% had at least one morbidity associated withtheir last pregnancy, 10.2% had at least onepotentially life-threatening complication. 18% had morbidities in the antenatal period, and23% had morbidities in the postpartum period. The proportion with long-term morbidity is notreported.
Source: Bhatia & Cleland, 1995, 1996

The Base of the Iceberg: Chapter I
9
Younis et al, 1993Egypt
noexcept prolapse
yes no
de Graft-Johnson, 1994Ghana
yes no no
Stewart et al (DHS), 1994Philippines
yes no no
ADS & CDC, 1994El Salvador
yes no no
Bhatia and Cleland, 1996India
yes yes no

The Base of the Iceberg: Chapter I
10
Table I.3. Incidence of obstetric complications in earlier studies per 100 deliveries.
Complication India(Bhatia & Cleland, 1996)
Philippines(Stewart & Festin, 1995)
El Salvador(ADS & CDC, 1994)
Eclampsia 0.5 1.3 1.8
Hemorrhage 12.2 7.7 10.8
Sepsis not reported 2.4 not reported
Prolonged labor 5.7* 15.2** 15.0***
Any life-threatening 10.2 12.0 not reported
*>18 hours **>12 hours ***>24 hours

11
II STUDY DESIGN AND IMPLEMENTATION
A0 Objectives of this Study
The research was conducted in Bangladesh, Egypt, India, and Indonesia. The concept for thestudy was explored with the Ford Foundation beginning in 1988, and thereafter developed incollaboration with the Bangladesh Institute of Research for Promotion of Essential andReproductive Health Technologies (BIRPERHT), the Egyptian Fertility Care Society (EFCS),and the Department of Community Medicine at the Jawarhalal Institute of Postgraduate MedicalEducation and Research (JIPMER) in Pondicherry, India. A fourth institution, the HealthResearch Unit, the School of Medicine, Padjajdjaran University in Bandung, Indonesia, joined thecollaboration later. The purposes of this research in four developing countries were to determine:
! the occurrence of morbidity during pregnancy and childbirth
! the proportion of pregnancies that involve potentially life-threatening and/orpermanent morbidity
! the prevalence of permanent morbidities associated with pregnancy andchildbearing
! the magnitude of the morbidity to mortality ratio
! perceptions of morbidity, its implications, seriousness, whether women seek carefor it, and who are the preferred health care providers for its treatment
! the main impediments to seeking care and potential interventions toovercome them.
B0 The Collaborative Nature of this Research C The Maternal Morbidity Network
The research reported here was the result of a collaborative effort on the part of both national andinternational organizations interested in the promotion of women’s health (the Maternal MorbidityNetwork). The study was carried out in four countries: Bangladesh (national survey), Egypt(Menoufeya Governorate), India (Pondicherry and the State of Tamil Nadu), and Indonesia(Tanjungsari, West Java). Sponsorship of the study was provided by the Ford Foundationthrough grants to each national study team and through a coordinating grant to Family HealthInternational. Each individual study was designed and implemented by the national team of
The Base of the Iceberg: Chapter II
12
investigators in consultation with all other national teams for the purposes of overall comparabilityof results. In each country, approvals from the appropriate government oversight agencies wererequested and obtained prior to initiation of study activities.
The Network met annually (in each of the countries where the research was implemented) toreview progress, discuss issues and make decisions, and to plan future activities. The firstmeeting (in New Delhi) was partially funded by the U.S. Agency for International Development aswell as by the Ford Foundation.
The data remain in the countries of origin. Analysis was done by completing a collaborativelyagreed upon analysis plan. This report was written by staff of Family Health International inNorth Carolina, and reviewed by the collaborating investigators. The studies as they wereimplemented at each site stand alone. Analyses have been conducted independently by theinvestigators and the findings submitted for publication.
C0 General Study Design
The Ford Maternal Morbidity Study was designed so that information gathered from each of thefour sites could be used to make comparisons across sites. Several processes were built into thestudy design to foster a common approach and coordinate the overall study.
The first commonality was in the design of the research teams. Each team was originally selectedto have one senior researcher and one junior researcher from each site. This team configurationprovided a training/mentoring opportunity designed to expand and improve the pool of expertisein the area of maternal health research.
The prime mechanism for coordinating common study activities was a series of five investigatormeetings which took place at key points in the development and conduct of the study and wereheld approximately once a year. These meetings were an invaluable part of the research process,allowing the investigators a high degree of scientific autonomy and control over study directions. The meetings also provided investigators with a forum in which they could discuss study problemsand concerns, as well as their successes and solutions, with knowledgeable and dedicatedcolleagues engaged in the same work. The first meeting in New Delhi concentrated on planningand initiating the development of the core questionnaire. The second meeting in Bangalore wasconcerned with finalizing the core questionnaire and planning for data collection. The thirdmeeting in Dhaka was held to discuss data collection issues and plan for analysis. The fourthmeeting in Bali focused on analysis issues. The fifth and final meeting in Cairo centered on tabledesign and reporting issues.
One result of the coordination meeting process was a common research approach. The corequestionnaire consisting of items to be gathered from all sites was developed by a consensus

The Base of the Iceberg: Chapter II
13
process with the active participation of each country research team (the four questionnaires C inEnglish C are shown in Appendix 2, printed in a separate volume). Common study definitionswere agreed upon for use as benchmarks at each site. Qualitative research was conducted ineach study site prior to data collection to discover the perceptions local women had of variousmorbidities and to determine the language they used to describe these conditions. In each casethis qualitative information was used to improve the survey instrument. After considerablediscussion and debate, common analysis and reporting protocols were developed.
D0 Specific Variations of Each of the Projects
While sharing many common elements, each national study stands on its own and retains its ownunique identity and characteristics. The Bangladesh study had two arms, the comparativeretrospective survey which is reported here, and a non-comparative prospective arm which will bedescribed separately elsewhere by the national investigators. The study sample in Bangladesh wasunique in that it was designed to provide estimates representative of the nation as a whole. TheEgyptian study was conducted to represent the population of one governorate (Menoufeya). Inaddition to the comparative retrospective survey included in this report, the Egyptian investigatorsalso conducted a nested case-control study of the validity of survey self-reports. Womenidentified in the survey as having a chronic morbidity were clinically examined in a referralhospital, along with controls matched on age and place of residence. In India, the study wasconducted using a sample representing the catchment area for the JIPMER referral hospital. TheIndian investigators spent considerable time and effort interviewing traditional birth attendantsand experimenting with various qualitative research techniques. In Indonesia, a previous prospec-tive study of the risk approach had been conducted in a cohort of all pregnant women in Tanjun-sari subdistrict, Sumedang district, West Java during a two-year period beginning October 1987. In the current study of maternal morbidity, this cohort formed the pool of women eligible forfollow-up. Extensive qualitative analysis was also done in Indonesia and sets the quantitative datain their social context.
E0 Data Collection Methods C Self-reporting vs Physical Examination vs Laboratory Tests
Can women correctly perceive, remember, and report morbidities they experienced duringpregnancy, labor, delivery and the postpartum period? Some morbidities are readily perceived bythe woman herself and/or her family members, others are not. Table II.1 below shows theconditions that were measured in this study, the perceptibility to the woman experiencing them

Table II.1 Perceptibility of obstetric morbidities.
Morbidity To woman herself and/or family To clinician
Antepartum Edema Hypertension Fits/convulsions Vaginal bleeding Fever >3 days Severe vomiting Urinary problems Pulmonary tuberculosis Malaria Jaundice Rheumatic heart disease Varicose veins
yesnoyesyesyesyesyes
somesomeyes
someyes
yesyesno*no*yesno
someyesyesyesyesyes
Intrapartum Labor >18 hours Fits/convulsions Loss of consciousness Excessive bleeding Ruptured uterus Perineal/vaginal tear
yesyesyes
someno
some
no*no*no*yesyesyes
Postpartum Pelvic pain Painful urination Excessive bleeding High fever Foul smell/discharge Breast condition Shock or loss of consciousness Depression $ 2 weeks Depression < 2 weeks Fits/convulsions
yesyes
someyesyesyesyes
yesyesyes
nonoyesyesyesyesyes
no*no*no*
Chronic Incontinence/VVF Rectovaginal fistula passage of stools passage of gas Uterine prolapse Dyspareunia Hemorrhoids
yes
yesyes
someyes
some
some
somesomeyesnoyes

*These conditions are discernible to the clinician if they occur at the time of the examination.
and to the clinician examining her. The table shows that, unlike many gynecologic conditions,most maternal morbidities are apparent to the woman and/or her family. This answers the firstpart of our opening question. The second part of the opening question is whether women cancorrectly remember and report the morbidities they experienced. Stewart and Festin (1995),working in the Philippines, addressed this question for intrapartum and immediate postpartummorbidities by asking women who had delivered in hospital (and whose condition was a matter ofrecord) whether they experienced complications (see box in Chapter I). The most importantlesson from this analysis is that conditions are more likely to be underreported than overreported. Interestingly, the sensitivity for reporting of prolonged labor decreased with duration of labor:12+ hours was 0.41, 16+ hours was 0.31, and 24+ hours was 0.18; while about 90% of those witha labor of normal duration correctly reported it. Another important finding of this study was thattime since delivery (up to four years) did not affect the accuracy of recall.
It is important to note that obstetric morbidity is unlike most gynecologic morbidity in that it isfeasible to rely on self-reporting of almost all conditions. In the case of gynecologic morbiditieson the other hand, many conditions are detected mainly through a clinical examination or alaboratory test; common examples include RTIs, gynecologic cancers, and endocrine disorders. Interviews with women are unlikely to uncover any significant proportion of gynecologicmorbidity, particularly in the early stages of disease. RTIs are an important cause of morbidityduring pregnancy that our study could not detect.
F0 Study Size Considerations
The most important consideration in determining study size was to collect enough cases of"major" morbidity for analysis.4 Our target was approximately 200 "major" morbidities at eachsite. Because of the nationally representative character of their study, Bangladesh decided to aimfor 400. As one purpose of the study was to determine the prevalence of morbidity, we based ourestimate on the level of maternal mortality, the number of expected births in the selected area, andDatta’s 1980 estimate of 16.5 morbidities for each mortality (in full knowledge of the limitationsof the analysis by Datta and his colleagues).
From the required number of eligible women, we estimated the population size and the number of
��������������������
4Major morbidities were defined as antepartum, intrapartum or postpartum hemorrhage, fits or convulsions, edema,
hypertension, prolonged fever (more than three days), severe vomiting, labor longer than 18 hours, vaginal or cervical tear,shock or loss of consciousness, foul discharge, and malaria or pulmonary tuberculosis.

The Base of the Iceberg: Chapter II
16
households necessary to meet the target. To estimate the number of households to be visited,

The Base of the Iceberg: Chapter II
17
we required the following information:
C maternal mortality ratioC crude birth rateC populationC average household sizeC number of years of pregnancy accumulation (i.e., pregnancy within last two, three or five
years, depending on study site).
The calculation was also based on the premise that levels of morbidity would vary as widely aslevels of mortality C a premise only partly supported by study results.
1. Bangladesh. The study in Bangladesh covered four geographic divisions, and it was plannedto identify at least 100 major morbidities in each division. Based on a maternal mortality ratio of600, and a crude birth rate of 33 (Bangladesh Bureau of Statistics), it was estimated that theapproximately 6,000 pregnancies needed would require 7,025 households equally divided betweenthe four divisions. Eligibility was defined as any married woman with a pregnancy in the last twoyears, and 7,031 eligible women were interviewed.
2. Egypt. Based on a maternal mortality ratio of 190 (Fortney et al, 1988) for the study area, anda crude birth rate of 35, it was estimated that a sample of 14,000 households would be required toyield 200 major morbidities. However, after this estimate was made, the preliminary findingsfrom the Giza morbidity survey (Zurayk et al, 1993) became available; that study foundgynecologic morbidity to be much more common than expected, so we reduced the anticipatednecessary study size. The final estimate was that 7,000 households would be required to identify4,000 eligible women (women with a pregnancy in the last five years). Allowances were made forrefusals and other types of non-response. The final study size was 7,325 households, yielding4,548 eligible women.
3. India. The study in India covered two geographic areas, the Union Territory of Pondicherryand the adjoining South Arcot District of Tamil Nadu which is also part of the catchment area forthe JIPMER hospital. Estimates were based on a maternal mortality ratio of 100 for the urbanarea and 400 for the rural area, and crude birth rates of 21.6 and 23.0 for the two areasrespectively. In the final sample, rural residents accounted for 70% and urban residents 30%. Atotal of 13,235 households were visited. Women were eligible to participate if they had beenpregnant in the last two years. 3,502 eligible women were interviewed, 64% from South ArcotDistrict of Tamil Nadu and 36% from Pondicherry.
4. Indonesia. The design of the study in Indonesia was inherently different, and, to a largeextent, study size was mandated by the size of the available cohort from a previous prospectivestudy of pregnancy. All women identified as being "at risk" during the initial risk approach studywere included in the maternal morbidity study sample. Half of the cohort "not at risk" was

The Base of the Iceberg: Chapter II
18
sufficient to meet the size requirement of the maternal morbidity study. A randomly selected 50%of women classified as having no risk factors in the initial study were included in the current studysample. In addition to the survey element, all women found to suffer from a pregnancy relatedmorbidity were referred to the subdistrict hospital for treatment. The index pregnancies occurredin 1988 and 1989, and the women were interviewed for the present study in early 1993. Theexclusions described above left 3,180 women eligible to be in the study, of whom 1,154 were notinterviewed because they had had a subsequent child and antenatal data had been collected onlyfor the index child.
Table II.2 Study size.
Site Householdsvisited
Eligiblewomen
Completedinterviews
Bangladesh 27 952 7 031 6 493
Egypt 7 221 4 548 4 522
India 13 235 3 502 3 339
Indonesia 3 180 3 180 1 926
G0 Questionnaire Development; Use of Qualitative Research
The study questionnaire included a core set of questions used at all study sites and a second set ofoptional questions designed to meet the unique needs of each site. The draft questionnaire wasdeveloped in English and then translated into the local language used to conduct the interviews. Qualitative research in each site was used to discover the perceptions of women regarding morbidconditions as well as the language used to describe them. This qualitative information was usedto improve the local questionnaires allowing researchers to better define certain types ofmorbidity, explain the signs and symptoms of each morbid condition, and to elicit informationfrom the women about their health care seeking practices. Each local questionnaire was pretestedbefore being finalized and each was then back-translated as a check of the meaning in the originalversion.
H0 Interviewer Training

The Base of the Iceberg: Chapter II
19
While the particulars of interviewer training varied from site to site, there were certain essentialcommon elements across sites:
! All field interviewers were carefully selected for this study.! All interviewers were female.! Most interviewers were health/social service professionals.
All field interviewers were given comprehensive training before field implementation of the study. In some cases the training was a continuous session for a number of weeks. In some cases, thetraining occurred in a series of sessions held over the space of a few months. All training sessionshad common content elements. Each training program made use of both didactic and hands-ontraining methodologies. Each program provided training in reproductive anatomy and physiology,training on use of the study instrument(s), and training on conducting the interview. In eachcase, the program took into account the special circumstances which might occur wheninterviewing women about potentially sensitive reproductive health topics and included trainingon answering questions that participants might ask and managing process problems that couldoccur during the course of an interview.
I0 Data Quality Assurance
Data quality assurance was the responsibility of the investigation team at each site. While theparticulars of data quality assurance varied somewhat by site, there was a set of minimumcommon elements implemented across sites. All field interviewers were organized into teamsheaded by a trained supervisor. All data collection forms at each site were reviewed by asupervisor for completeness and correct coding. In all sites, senior research staff made site visits,on an ad hoc basis, and conducted spot checks of data quality. In addition to these commonelements, the Egyptian team opted to conduct a systematic 5% re-interview. The Bangladeshteam conducted re-interviews of 5-10% of respondents questioned during site visits. The Indianteam conducted in-depth re-interviews with a subset of women reporting morbidities during theirinitial interview.
Once all data was collected and cleaned, each research team completed a set of standard reportingtables and submitted them to FHI. All data reported in these tables were reviewed forcompleteness, internal consistency, and consistency across sites. Any missing, inconsistent orotherwise questionable reports were queried and resolved prior to presentation in this report.
J0 Analysis

The Base of the Iceberg: Chapter II
20
The study had two main goals: the first was to estimate the prevalence of maternal morbidity inthe four sites; the second was to develop a new estimate of the ratio of morbidity to mortality.
The analysis plan was developed collaboratively at one of the annual investigators meetings. Thedata remained with the investigators, and all the analysis was done in-country. The comparisonsbetween sites and the conclusions from the comparisons were made by the FHI coordinators atthe project headquarters in North Carolina. This report was drafted in North Carolina beforebeing sent to each investigator for further input.
1. Univariate analysis. The samples were described in terms of their sociodemographiccharacteristics, which were compared among the sites.
2. Bivariate analysis. For the purposes of this analysis, maternal morbidity was categorized intofour types, the first three are based on the time during pregnancy and puerperium during whichthe morbidity occurred: antepartum, intrapartum, postpartum. The fourth was chronic morbidity. The multivariate analysis was done within this framework. Within each time period, theincidence of morbidity is examined in terms of the response to it C whether care was sought, andwhere it was sought.
3. Rates and ratios. The prevalence of morbidity was examined in terms of the number ofmorbidities that occurred, and the number of women experiencing any morbidity. Prevalence wasfurther analyzed by the degree (number and severity) of morbidity experienced by the women. Finally, we estimated the number of maternal morbidities per maternal mortality.

21
III CHARACTERISTICS OF THE STUDY PARTICIPANTS
A0 Eligibility to Participate in the Study
Women in the study were of reproductive age and had been pregnant within a defined period oftime (two years in India and Bangladesh, five years in Egypt, and three to four years inIndonesia). Although women whose pregnancies did not end in a live birth were eligible forinclusion, in practice they may have been less likely to be included because such pregnancies aremore likely to be forgotten or even concealed. India restricted the sample to married women, buteven in the other study sites where this restriction did not apply, in practice only married womenwere interviewed.
B0 Characteristics of the Sample (Table 1)5
Households in the sample areas were chosen according to criteria established in advance andaccording to defined statistical criteria. In each household, all members were listed; the meanhousehold size ranged from 4.5 in Indonesia to 5.8 in Egypt. Eligible women (aged 15-49,pregnant within a defined time period) were identified. In India and Bangladesh, if more than oneeligible woman per household was identified, only one was selected at random to be interviewed. In Egypt, however, up to three women were interviewed; when more than three were eligible, theyoungest and the oldest only were interviewed. Interviewing took place within a relatively shortperiod of time (three to six months); it took place the same day in Egypt. Refusal rates were low;in Bangladesh, 92.3% of eligible women were interviewed, in Egypt 99.4%, and in India 95.2%. Indonesia contacted a proportion (60%) of women who had been in an earlier prospective study;the proportion was limited primarily because of resources. Of those women with whom contactwas made (i.e. they were both selected and located), almost 100% were interviewed.
C0 Characteristics of the Study Participants
1 Demographic Characteristics (Tables 2, 3)
��������������������
5Except for Table III.1, the tables referred to in this chapter are found in Data Tables (Appendix 1).

22
The current age of the sample of Indian women was less than the study participants at the othersites. The mean age of the Indian women was 24.7"4.6 years compared with 26.2"6.1 inBangladesh, 29.6+6.3 in Indonesia, and 30.1"6.6 in Egypt. Furthermore, 76.2% of the Indianwomen were between the ages of 20 and 29, compared with 58.9% in Bangladesh, 45.1% inEgypt, 50.1% in Indonesia. Bangladesh and India had a greater percentage of women undertwenty than did Egypt and Indonesia; and there was conversely a smaller percentage aged 40 orover.
The mean parity (live births) was highest in Egypt (3.6"2.1) compared with only 2.1"1.2 in India,2.8"1.8 in Indonesia, and 3.2"2.2 in Bangladesh.
The Indonesian sample was very different from the others in terms of education and employment. Fully 90.0% of the Indonesian women were literate and only 2.2% had no education; 47% hadpaid employment. Egypt and India were similar with respect to education; about half hadreceived no schooling and a little more than 40 percent were literate; but Indian women weremuch more likely to have paid employment than Egyptian women (48.5% compared with 22.1%). Only 37.3% of the women in the Bangladesh sample were literate and 62.7% had never been toschool; only 15.3% were in paid employment. The husbands of the women in the samples weremore likely than their wives to have attended school, and the pattern was generally similar acrossthe four countries.
2 Source of Prepregnancy Health Care (Table 4)
We asked women where they usually went for treatment of "female diseases." A large number ofwomen in Bangladesh and India had no usual source of care. Among Bangladeshi women whodid have a usual source of care, a majority sought care from providers of non-Western medicine. Indian women who did report a usual source of care were more likely to report going togovernment health centers/hospitals or private clinics/hospitals. Almost all Egyptian women had ausual source of care, and for nearly half, this was a private clinic; almost all the rest usedgovernment facilities, and little reliance was placed on traditional providers. Virtually allIndonesian women also had a regular source of care and the vast majority went to the governmenthealth center, and only a few to the private sector. Apart from Bangladesh, few women reportedusing non-Western providers as their usual source of care for "female diseases."
3 Use of Antepartum Health Care in Index Pregnancy (Tables 5, 6)
There was greater utilization of antenatal care in India and Indonesia than in Bangladesh andEgypt. In India, only 2% of women had no care, compared with 14% in Bangladesh and 32% inEgypt. All women in Indonesia reported that they had had antenatal care. Where antenatal carewas less common (Bangladesh and Egypt), the lack of care was much more pronounced amongwomen who did not have a live birth, suggesting benefits may have been derived from prenatalcare. The average number of visits among women who sought prenatal care was more than five

The Base of the Iceberg: Chapter III
23
in India and Indonesia, two in Bangladesh and 3.5 in Egypt.The provider of prenatal care varied substantially among the four sites. In Egypt and India, thegovernment health center was the most important source. A proportion of women in Indiareceived antenatal care at home from government health workers as well as visiting the healthclinics. In Bangladesh, while the government health center provided about one quarter of theantenatal care, the most important source (58 percent) was home visits by a health worker. Private hospitals and clinics were an important source in Egypt and India, but negligible inBangladesh. No data on providers are available for Indonesia.
The reason for seeking antenatal care varied widely. The majority of Indian women went forantenatal care because they felt it was useful to have a checkup; about a third of Egyptian womenand very few Bangladeshi women believed this. The desire for an injection of tetanus toxoid wasthe most common reason in Bangladesh, and this was also important in India. In Egypt,confirmation of pregnancy provided a reason to seek care. In the three sites, a small butsignificant percentage sought care for a specific problem during the pregnancy. No data areavailable for Indonesia.
The reasons for not seeking antenatal care (Table 6) also varied widely, although the mostcommon reason given in all sites was that women said they felt fine and care was unnecessary. The next most important reason was financial, which includes the cost of transport as well as thecost of the care itself. Family reasons were much more important in India and Bangladesh than inEgypt C some women were not permitted to attend the clinic, and others were unable to attendbecause of household duties and child care (but note that although these reasons were given byIndian women who did not seek care, there were very few women in this group). Many womenhad more than one reason for not seeking care. No data are available for Indonesia.
In summary, antenatal coverage was more extensive in India and Indonesia, and less extensive inBangladesh and Egypt but for rather different reasons. Egyptian women who did not seek care(37.5%) chose not to do so largely because they did not feel it was important. Bangladeshiwomen who did not seek antenatal care (13.9%) did not do so primarily because sources wereseen as inaccessible and family circumstances made it difficult.
4 Use of Intrapartum Health Care in Index Pregnancy (Tables 7-9)
Except for India, more than three-quarters of women delivered in their own home, and inBangladesh and Indonesia, a significant proportion delivered in someone else=s home, usually theirmother=s. In India, on the other hand, only 41.5% delivered in their own home, and almost nonein anyone else=s home. In India, more than half (55%) delivered in government or privatehospitals. Looked at in another way, the government provided delivery services to 1% of womenin Bangladesh, 4% in Indonesia, 11% in Egypt and 42% in India.
The attendant at delivery is influenced by where the delivery takes place. Most doctors conduct

The Base of the Iceberg: Chapter III
24
deliveries only in hospitals or private clinics. But Table 8 shows that midwives attend aconsiderable proportion of births in hospitals and health centers. The exception is Egypt wherevirtually all hospital births are attended by physicians. Of the four countries in this study, Egypt isalso the only place where physicians attend any significant proportion (12%) of home births. Midwives attend a large proportion of births in hospitals and private clinics in India and Indonesia,and a smaller proportion in Bangladesh (private clinics in Bangladesh are the exclusive domain ofphysicians). Women in Egypt make less use of midwives whose practice is primarily ingovernment health centers and in home deliveries.
As expected, nonmedical birth attendants attend most home deliveries. TBAs are the mostcommonly used birth attendants in three of the four sites, and a very close second in the fourthsite (India). Whether the TBAs had received any training is not specified, but it is likely that somehad.6 Bangladesh was the only country where family members attended a significant number(38%) of births.
The numbers above refer to the actual place of delivery. Although most women delivered wherethey planned to, some did not. Table 9 shows that some women planned to deliver in a healthfacility and did not do so; most often, they delivered at home instead. The reason for the changeof plan is not available, but one can speculate that, in the event, the delivery proceeded faster thanexpected, and/or that transport, funding or child care was not available. Some women planned todeliver at home but, in the event, had an institutional delivery; and we assume that this wasbecause of complications that occurred.
5 Prevalence and Perceptions of Seriousness of Morbidities and Care Seeking Behavior(Tables 10-13)
Obstetric morbidities vary in their objective severity and the degree to which they are life-threatening. They also vary in the degree to which they are subjectively perceived as serious bythe woman herself or by those taking care of her. Importantly, it is this perception of severity thatleads to seeking medical attention for the condition (although not necessarily from a provider ofwestern medicine). The next three sections examine how many women reported morbidity in thethree phases of the index pregnancy, whether the morbidity was perceived as serious, and whethercare was sought. If care was sought, the location where women sought care is examined. Not allof these data are available for Indonesia.
��������������������
6 More than three-fourths of TBAs in Indonesia have received government training, however supervision and refresher
training are less than desirable. The same is true for India.

The Base of the Iceberg: Chapter III
25
a. Antepartum Morbidity (Tables 10,11)
Prevalent morbidities across all sites were edema (10.3 to 22.9%), severe vomiting (19.2 to23.3%), and urinary problems (12.3 to 29.4%). Although there was less consistency among thesites for the other morbidities, the range was still quite narrow; exceptions are fever lasting >3days (which ranged from 4.0% in India to 16.8% in Bangladesh), and hypertension (which rangedfrom 0.9% in India to 15.6% in Egypt).
Fits or convulsions were rare (0.3 to 3.0%) as expected, except in Indonesia where 7.4% ofwomen reported them.7 Antepartum bleeding was rare (2.6 to 4.1%) in three of the fourcountries as expected; but in India it was even more rare and was reported by only 13 women(0.4%).
Fever lasting more than three days was also rare (1.0 to 5.9%) except in Bangladesh where 16.8%reported this condition; the prevalence of fever is related to the prevalence of both urinaryproblems (some of which involve infection) and nonobstetric infections. The relatively highprevalence of urinary problems, malaria and jaundice (a proxy for hepatitis) in Bangladeshcompared with Egypt and India probably explains the three-fold higher reporting of fever byBangladeshi women.
Nonobstetric morbidities were most common in Bangladesh where a small, but not insignificant,number of women suffered from jaundice (5.9%), rheumatic heart disease (5.0%), and malaria(3.2%). The prevalence of pulmonary tuberculosis was a fairly constant 0.2 to 0.3% in all threesites. It is important to note that jaundice (if caused by viral hepatitis), rheumatic heart disease,malaria and pulmonary TB are all much more serious in pregnant than in nonpregnant women.
The ability to report hypertension correctly depends on having had blood pressure measured, andmeasurement of blood pressure is a standard component of antenatal care. Hypertension rangedfrom 0.9% in India (where almost all women received antenatal care) to 3.6% in Bangladesh(where fewer women got antenatal care) and 15.6% in Egypt where the smallest proportion ofwomen received antenatal care. However this estimate is compatible with another report (Ibrahim et al 1995) which found that 7.8% of 25-34 year old Egyptians had essential
��������������������
7 No term for eclamptic fits exists in the local language. The frequency with which they were reported suggests a wide
interpretation of the term.

The Base of the Iceberg: Chapter III
26
hypertension, and that the percentage was higher for women than for men.
For some morbidities (most notably antepartum bleeding, pregnancy induced hypertension, andvaricose veins), the sample of women from India reported a lower prevalence than women at theother sites. While Indian women were also the most likely to seek antenatal care, it is unlikelythat antenatal care would lower the prevalence of the conditions.
Table 10 shows the percentage of women who perceived a condition as serious from among thosewho experienced that condition. Where fewer than 25 women reported the condition, rawnumbers are given instead of percentages. Generally speaking, women in the Egyptian samplewere more likely to perceive morbidities as serious than women in the Bangladeshi sample; theonly exception was severe vomiting, where the percentages were the same.
Of those who did perceive the condition as serious, Egyptian women were also more likely toseek care for it (urinary problems being the only exception). The large majority (more than 75percent) of women in all four sites sought care for conditions they believed to be serious. Forthose who did not seek care, the reader is reminded of barriers to antenatal care described aboveand shown in Table 6. The questions on perception were not asked of Indonesian women. InIndia so few morbidities were reported that interpretation is difficult.
Table 11 shows the sources of care women used for the various antepartum conditions. The tablealso shows the percentage of women who did not seek care. This differs from Table 10 whichshows the percentage of only those who perceived the condition as serious who sought (andconversely did not seek) care.
There were big differences in the main source of care in the four countries. In Bangladesh, by farthe most important source of care was "other," which includes traditional practitioners, traditionalbirth attendants, village doctors, homeopaths, and medical assistants. This category of care wasrelatively unimportant elsewhere. In Egypt and India the private sector was important; Egyptianwomen seek care from private doctors, and Indian women from private doctors and privatehospitals. In Indonesia, on the other hand, the government health center was the most importantsource of care.
b. Intrapartum Morbidity (Tables 12, 13)
The physiology of the human female does not differ in the four sites; thus, if other social andenvironmental factors are also similar, we would expect intrapartum morbidity to occur withsimilar frequency across sites. Therefore, in interpreting the following section, it is important toremember that the four countries differ significantly in where labor and delivery took place and bywhom it was attended. In Bangladesh, almost all (98.4%) women delivered at home (their own orsomeone else’s), half the deliveries were attended by a traditional birth attendant and nearly 40% by a female relative. In Egypt, nearly 80 % delivered at home, but less than 40% were attended

The Base of the Iceberg: Chapter III
27
by a TBA; equal proportions (11 %) delivered in a government hospital/clinic or a private hospi-tal/clinic, and 30 % were delivered by a doctor and 17 % by a midwife. In India, on the otherhand, only 41.5% delivered at home, 55% delivered in a hospital (government or private); notsurprisingly, 61.2% were attended by a doctor or a midwife, and only 35.6% by a TBA. InIndonesia, more than 90% delivered at home (or someone else’s home), and more than 90% wereattended by a TBA (Table 7). Other things being equal, we might, therefore, expect to see moreserious complications of labor and more frequent postpartum complications in Bangladesh andIndonesia than in Egypt and India. This expectation appears to be borne out by Table 12 andTable 23.
1. Prolonged (>18 hours) labor was reported by 6.6%, 3.6%, 1.3% and 5.0% in of thewomen in Bangladesh, Egypt, India and Indonesia respectively. There are several possibleexplanations for these differences, and it is difficult to select the more plausible one. First,because women in Egypt and India were more likely to deliver in hospital, they were less likely tohave a labor lasting more than 18 hours because of the greater probability of earlier interventions. Second, the differences could be attributable to maternal height and size, but this is unlikely giventhe racial similarities of Indians and Bangladeshis. Third, there could be differences in defining thelength of labor; when is the start of labor C first noticeable contraction, rupture of the amnioticsac, start of hard labor?8 The first explanation seems the most likely. The place of delivery alsoinfluences the proportion of women who "seek care." A woman who anticipates an uncompli-cated delivery in hospital may, in fact, experience a complication; but because she is already inhospital, she has no reason to "seek" care. This must be kept in mind while interpreting thissection.
2. Excessive bleeding was the most commonly reported morbidity in two of the four sites(Bangladesh and Indonesia, with 19.6% and 10.5% reporting), and was the second most commonin the remaining two sites.9 Only 56.7% of Bangladeshi women perceived the problem as serious,and only 70.5% sought care. In Egypt, on the other hand, nearly all Egyptian women perceived itas serious and sought care. The number of women reporting the condition in India is too small tocompare, and the question was not asked of the Indonesian sample.��������������������
8In Egypt, interviewers asked women about the length of labor since the pains became regular. Initially, interviewers
had interpreted the question to women as duration of labor since the pain became severe; early analysis showed the meanduration of labor to be <6 hours leading to re-evaluation of the question and retraining the interviewers.
9Blood loss is extremely difficult to measure under the best of circumstances, and there could be cultural reasons (such
as the means of absorbing the blood loss, towels, etc) why there might be systematic biases.

The Base of the Iceberg: Chapter III
28
3. Fits/convulsions were reported by 3.3%, 0.1%, 0.2%, and 1.9% in Bangladesh, Egypt,India, and Indonesia respectively. The higher incidence in Bangladesh is consistent with otherreports (AbouZahr and Royston). The differences, again, could be attributed to the same threereasons described above (1. prolonged labor), with the same caveats.
4. Loss of consciousness was included in order to identify women with severemorbidities that they were not otherwise able to identify. Women can lose consciousness duringlabor either because of loss of blood or because of eclamptic fits; there is potential doublecounting here. No women in Bangladesh reported losing consciousness. In Indonesia, Egypt,and India, the percentages were 3.2%, 2.4%, and 0.9% respectively. Although most women withthe condition (85.4% in Egypt and 68.9% in India) perceived the condition as serious, there was aconsiderable difference in the percentages of women who sought care C 77.3% and 90.0% inEgypt and India respectively. There were probably differences in the way this question wasinterpreted. For example, if women fainted from exhaustion, they could have reported it as lossof consciousness, but not perceived it as serious or sought care.
5. Fortunately, few ruptured uteri were reported; only in Egypt did women report thiscondition. A potential difficulty in interpreting this question is that women who did not seek carefor a ruptured uterus would not have survived; so perhaps it is the site with the most accessiblecare which has surviving women with rupture to report. The validity of some reports of ruptureduterus from Egypt must be questioned, as three of the 13 women reporting this condition did notseek care for it; as they survived, it is unlikely they did, in fact, have a ruptured uterus.
6. Vaginal or cervical tears were the most commonly reported condition reported inEgypt and India with 9.9% and 6.4% respectively. Only 1.5% of Bangladeshi women reportedtears, and the question was not asked in Indonesia. We would expect fewer tears with a higherfrequency of skilled care, but this is not consistent with the pattern of the previous morbidities. None of the Indian women thought the condition serious, perhaps because they were suturedwhile still in hospital, while 58% and 61% of Bangladeshi and Egyptian women with tears thoughtthey were serious, and most sought care.10
Table 13 shows where women sought care for these intrapartum complications. The percentageof women receiving some kind of care varied considerably by morbidity and across sites. Notably,the Indian study reported that almost all women received some care for a reported morbidity. This may be at least partly due to the high number of institutional deliveries at this site.
"Other" was the main source of care for Bangladeshi women with intrapartum, as withantepartum, complications. Egyptian women went primarily to government hospitals and to
��������������������
10Note that circumcision status was not reported.

The Base of the Iceberg: Chapter III
29
private doctors for care. Indian women usually sought care from government hospitals, from private hospitals to a lesser extent, and also made use of "other" providers. Indonesian womenwent to government health centers and also to the private sector.
Table III.1 Association between the frequency of selected postpartumconditions and the proportion of women receiving skilled intrapartum care.
Country Percentdelivered
in hospital
Percentdelivered by
doctor ormidwife
Numberwith com-plication
Numberwith nocomplic-
ation
OddsRatio
95%confi-dencelimits
PROLONGED LABOR
India 55.0 61.2 41 3023 1.00 --
Egypt 12.2 47.5 156 4154 2.77 1.9-4.0
Indonesia 2.3 7.7 96 1795 3.94 2.6-5.4
Bangladesh 1.0 11.1 419 5973 5.17 3.7-7.2
2 for trend 117.1 126.1
P-value <0.000 <0.000
POSTPARTUM BLEEDING
India 55.0 61.2 55 3009 1.00 --
Egypt 12.2 47.5 153 4157 2.01 1.4-2.6
Indonesia 2.3 7.7 215 1676 7.02 5.1-9.6
Bangladesh 1.0 11.1 1096 5296 11.32 8.5-15.1
2 for trend 450.6 727.5
P-value <0.000 <0.000
FITS OR CONVULSIONS
India 55.0 61.2 6 3058 1.00 --
Egypt 12.2 47.5 6 4304 0.71 0.2-2.5

The Base of the Iceberg: Chapter III
30
Indonesia 2.3 7.7 37 1854 10.17 4.1-26.8
Bangladesh 1.0 11.1 224 6168 18.51 8.0-46.1
2 for trend 99.7 186.8
P-value <0.000 <0.000
In addition, in Table III.1, ranking countries in the order of increasing proportion of women withskilled intrapartum care C India, Egypt, Indonesia, Bangladesh C the incidence of threeconditions which can be influenced by the quality of intrapartum care is reported, and the test fortrend and the odds ratio is shown. The test for trend is significant in each case, suggesting thatwhen a higher proportion of women receive intrapartum care from a medically trained provider,they are less likely to develop one of these three complications.11 The odds ratio means that,compared with women in India, women in each of the other three countries have a higher risk ofdeveloping the specified complication.
! Compared with Indian women who are the most likely to deliver in hospital,Egyptian women have nearly three (2.77) times the risk of a labor longer than 18 hours,Indonesian women nearly four (3.94) times, and Bangladeshi women more than five (5.17)times the risk. We assume that this is because women in India are more likely to go tohospital as labor appears to become prolonged or to be already in hospital so thatinterventions occur sooner. Ranking the sites by the proportion of women with skilledintrapartum care, the percentage reporting labors of more than 18 hours increases in theVDPH�RUGHU��WKH� 2 test for trend shows this to be significant.
! The incidence of excessive bleeding can be reduced by appropriate management ofthe placenta, and is therefore similar to prolonged labor in that we would expect dimin-ished incidence as the proportion with skilled intrapartum care increases; the incidenceZDV�������������������DQG��������XVLQJ�WKH�VDPH�RUGHU���WKH� 2 test for trend is alsosignificant.
! The role of skilled intrapartum care for eclampsia (fits/convulsions) may be lessimportant as it is not readily predictable. Nevertheless, (and in spite of much smallernumbers) the test for trend was significant.
c. Postpartum Morbidity (Tables 14, 15)
Some postpartum morbidities can be attributed to delivery practices. These include infection and
��������������������
11There is only one exception to this order; in the case of fits and convulsions, Egyptian women have a lower rate than
Indian women, but the hypothesized order is otherwise maintained.
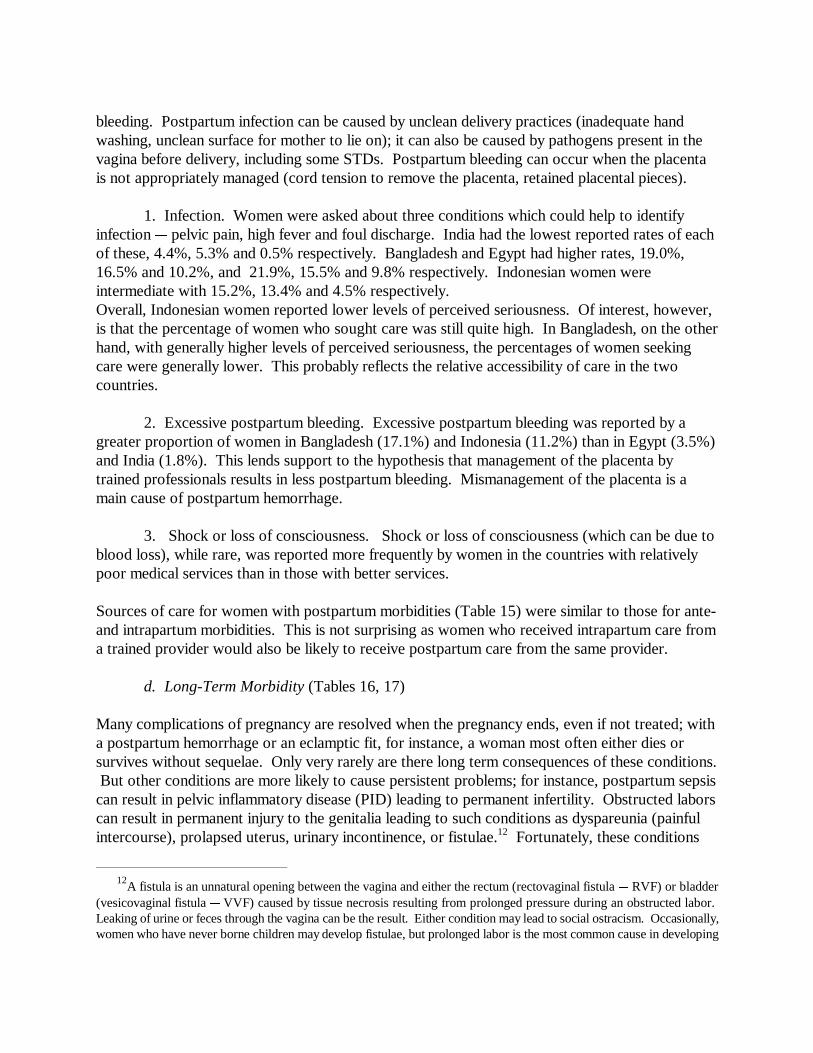
bleeding. Postpartum infection can be caused by unclean delivery practices (inadequate handwashing, unclean surface for mother to lie on); it can also be caused by pathogens present in thevagina before delivery, including some STDs. Postpartum bleeding can occur when the placentais not appropriately managed (cord tension to remove the placenta, retained placental pieces).
1. Infection. Women were asked about three conditions which could help to identifyinfection C pelvic pain, high fever and foul discharge. India had the lowest reported rates of eachof these, 4.4%, 5.3% and 0.5% respectively. Bangladesh and Egypt had higher rates, 19.0%,16.5% and 10.2%, and 21.9%, 15.5% and 9.8% respectively. Indonesian women wereintermediate with 15.2%, 13.4% and 4.5% respectively.Overall, Indonesian women reported lower levels of perceived seriousness. Of interest, however,is that the percentage of women who sought care was still quite high. In Bangladesh, on the otherhand, with generally higher levels of perceived seriousness, the percentages of women seekingcare were generally lower. This probably reflects the relative accessibility of care in the twocountries.
2. Excessive postpartum bleeding. Excessive postpartum bleeding was reported by agreater proportion of women in Bangladesh (17.1%) and Indonesia (11.2%) than in Egypt (3.5%)and India (1.8%). This lends support to the hypothesis that management of the placenta bytrained professionals results in less postpartum bleeding. Mismanagement of the placenta is amain cause of postpartum hemorrhage.
3. Shock or loss of consciousness. Shock or loss of consciousness (which can be due toblood loss), while rare, was reported more frequently by women in the countries with relativelypoor medical services than in those with better services.
Sources of care for women with postpartum morbidities (Table 15) were similar to those for ante-and intrapartum morbidities. This is not surprising as women who received intrapartum care froma trained provider would also be likely to receive postpartum care from the same provider.
d. Long-Term Morbidity (Tables 16, 17)
Many complications of pregnancy are resolved when the pregnancy ends, even if not treated; witha postpartum hemorrhage or an eclamptic fit, for instance, a woman most often either dies orsurvives without sequelae. Only very rarely are there long term consequences of these conditions. But other conditions are more likely to cause persistent problems; for instance, postpartum sepsiscan result in pelvic inflammatory disease (PID) leading to permanent infertility. Obstructed laborscan result in permanent injury to the genitalia leading to such conditions as dyspareunia (painfulintercourse), prolapsed uterus, urinary incontinence, or fistulae.12 Fortunately, these conditions
��������������������
12A fistula is an unnatural opening between the vagina and either the rectum (rectovaginal fistula C RVF) or bladder
(vesicovaginal fistula C VVF) caused by tissue necrosis resulting from prolonged pressure during an obstructed labor. Leaking of urine or feces through the vagina can be the result. Either condition may lead to social ostracism. Occasionally,women who have never borne children may develop fistulae, but prolonged labor is the most common cause in developing

The Base of the Iceberg: Chapter III
32
are relatively rare. We asked women if they had any of these conditions, and if they did, whetherit interfered with their daily lives, and whether it affected their relationship with their husbands. We also asked them if they sought care for the conditions.
�����������������������������������������������������������������
countries. Other causes are genital injuries or radiation therapy.
1. Uterine prolapse. The most common of the long term sequelae of childbirth is uterineprolapse; this occurs when weakened pelvic muscles permit descent of the uterus into the vaginalcavity. This condition was reported by 15.1% of women in Bangladesh, 11.3% in Egypt, 3.3% inIndia and 16.4% in Indonesia. It should be noted that these are self reports, and that a clinicalexamination might have revealed a greater proportion of women with the condition. A study inEgypt (Younis et al, 1994) that included clinical examinations found that 56% of women hadsome degree of uterine prolapse. In addition to the clinical examination (which could diagnose prolapses of lesser severity), the older age of the participants in that study (up to 60 years) couldaccount for the higher prevalence as prolapse can be exacerbated by age. In the present study, atthe Egyptian site, all women reporting chronic morbidities, and a sample of women reporting nomorbidity were examined. Some degree of prolapse was in 28.8% of women who did not reportit (EFCS, 1995)
2. Incontinence. It is not possible to reliably determine by self reports whetherincontinence is due to weak pelvic muscles or a VVF, although the former is more likely toproduce stress incontinence and the latter a constant dribble of urine. Both can result fromobstructed or difficult labors. The condition was reported by 7.7% of women in Bangladesh,6.2% in Egypt, 3.1% in India and 2.3% in Indonesia.
3. Recto-vaginal fistula (RVF). RVFs in which stool was passed through the vagina werereported only rarely in all four sites (0.1%, 0.2%, 0.0% and 0.2% respectively). But passage ofgas was somewhat more common with 5.1%, 1.1%, <0.1% and 0.8% reporting it in Bangladesh,Egypt, India and Indonesia respectively.
4. Dyspareunia and hemorrhoids. Dyspareunia and hemorrhoids were also reportedrelatively infrequently, as Table 17 shows. It is interesting to note that the number of womenreporting that dyspareunia affected their relationship with their husbands C two-thirds of Egyptianwomen, about half of Indonesian women, one-third of Bangladeshi women, and none of theIndian women C was fewer than expected.
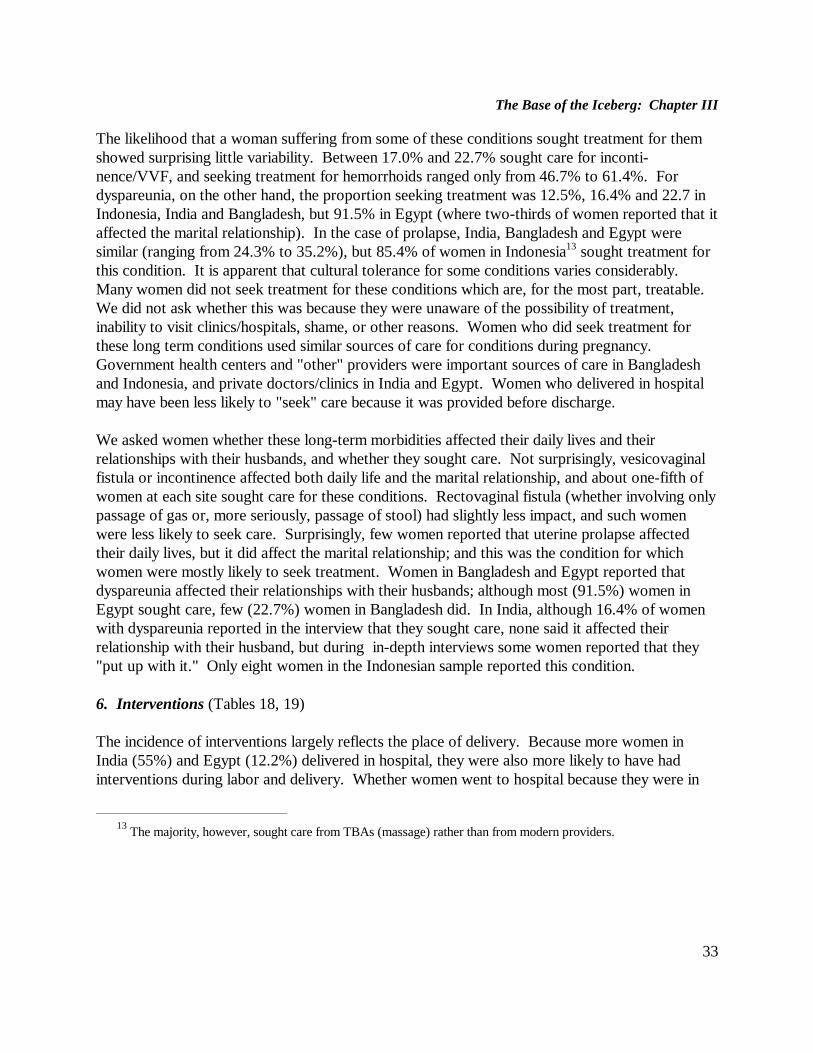
The Base of the Iceberg: Chapter III
33
The likelihood that a woman suffering from some of these conditions sought treatment for themshowed surprising little variability. Between 17.0% and 22.7% sought care for inconti-nence/VVF, and seeking treatment for hemorrhoids ranged only from 46.7% to 61.4%. Fordyspareunia, on the other hand, the proportion seeking treatment was 12.5%, 16.4% and 22.7 inIndonesia, India and Bangladesh, but 91.5% in Egypt (where two-thirds of women reported that itaffected the marital relationship). In the case of prolapse, India, Bangladesh and Egypt weresimilar (ranging from 24.3% to 35.2%), but 85.4% of women in Indonesia13 sought treatment forthis condition. It is apparent that cultural tolerance for some conditions varies considerably.
��������������������
13 The majority, however, sought care from TBAs (massage) rather than from modern providers.
Many women did not seek treatment for these conditions which are, for the most part, treatable. We did not ask whether this was because they were unaware of the possibility of treatment,inability to visit clinics/hospitals, shame, or other reasons. Women who did seek treatment forthese long term conditions used similar sources of care for conditions during pregnancy. Government health centers and "other" providers were important sources of care in Bangladeshand Indonesia, and private doctors/clinics in India and Egypt. Women who delivered in hospitalmay have been less likely to "seek" care because it was provided before discharge.
We asked women whether these long-term morbidities affected their daily lives and theirrelationships with their husbands, and whether they sought care. Not surprisingly, vesicovaginalfistula or incontinence affected both daily life and the marital relationship, and about one-fifth ofwomen at each site sought care for these conditions. Rectovaginal fistula (whether involving onlypassage of gas or, more seriously, passage of stool) had slightly less impact, and such womenwere less likely to seek care. Surprisingly, few women reported that uterine prolapse affectedtheir daily lives, but it did affect the marital relationship; and this was the condition for whichwomen were mostly likely to seek treatment. Women in Bangladesh and Egypt reported thatdyspareunia affected their relationships with their husbands; although most (91.5%) women inEgypt sought care, few (22.7%) women in Bangladesh did. In India, although 16.4% of womenwith dyspareunia reported in the interview that they sought care, none said it affected theirrelationship with their husband, but during in-depth interviews some women reported that they"put up with it." Only eight women in the Indonesian sample reported this condition.
6. Interventions (Tables 18, 19)
The incidence of interventions largely reflects the place of delivery. Because more women inIndia (55%) and Egypt (12.2%) delivered in hospital, they were also more likely to have hadinterventions during labor and delivery. Whether women went to hospital because they were in

The Base of the Iceberg: Chapter III
34
need of intervention, or went for an anticipated normal delivery, cannot be determined from thesedata.
a. Cesarean Section
In the two countries where hospital deliveries were more common, the incidence of cesareansection was 4.2% (Egypt) and 5.5% (India). Between 5% and 15% is generally regarded as asatisfactory cesarean section rate if it is assumed that sections are appropriately allocated (Maineet al, 1992). In Bangladesh and Indonesia the section rates were 0.2% and 0.7%, and we canonly assume that women experienced unnecessary suffering (and possibly death) because of lackof access to cesarean section. Rates of instrumental deliveries (forceps) were similar, and thesame comments apply.
b. Episiotomy
Episiotomies were more common C nearly 10% in Egypt and nearly 20% in India C in the siteswhere hospital deliveries were more common. Nevertheless, tears were reported by 9.9% and6.4% respectively in these two sites (Table 12). Less than one percent of Bangladeshi womenreceived an episiotomy, but, in spite of this, only 1.5% reported any tear. The possibility of underreporting of tears must be considered.
c. Hysterectomy
Hysterectomies were reported only in Egypt (N=9) and Indonesia (N=15), and ruptured uteri(N=13) were reported only in Egypt. Because hysterectomy is often the treatment of last resort(for example, for ruptured uterus or postpartum hemorrhage), it is no surprise so few werereported.
d. Drugs
Drugs to accelerate delivery can mean properly administered oxytocics, oxytocics improperlyadministered by medical or nonmedical personnel, or herbal teas administered by traditionalpractitioners. The use of drugs was most common in India (45.3%), followed by Egypt (41.0%)and Bangladesh (24.2%).
The majority of women in every country except India had no interventions. In India, about half ofall women had no intervention. Although there was considerable variation, there were a fewwomen in each country who had multiple interventions; this was highest in India where 20.3% ofwomen had two or more interventions, and lowest in Indonesia where only 0.1% reported two ormore. In Indonesia, TBAs often give drugs (herbal infusions) to accelerate labor; as respondentswere not asked about this, however, the use of interventions appears lower than it really is.

The Base of the Iceberg: Chapter III
35
Table 20 shows whether women with specific morbidities received any interventions. Note thatinterventions are used to manage obstetric complications, but can also cause other problems. Forinstance, women who deliver by cesarean section are more likely to experience heavy bleeding. InIndia, 18.5% of women with excessive bleeding had delivered by cesarean section.
Table 20 shows that even some women without morbidity were distressingly likely to have beengiven drugs; this is especially true in Bangladesh where almost all women were delivered at homeby a relative or a TBA. We do not know the nature of the drugs given. In both Egypt and

The Base of the Iceberg: Chapter III
36
India, where there were more institutional deliveries, 4.0% and 3.6% of women with no morbiditywere delivered by cesarean section.14
7. Outcome of Pregnancy (Tables 20-22)
The stillbirth rate was 1.4% in India, 2.3% in Indonesia, 3.8% in Bangladesh and 5.6% in Egypt. Several morbidities influenced the outcome of pregnancy (Table 20).
a. Antepartum Morbidity (Table 20)
In each country, antepartum bleeding was associated with perinatal loss. In Egypt 16.1% ofwomen with antepartum bleeding suffered perinatal loss, the corresponding numbers inBangladesh and Indonesia were 13.3% and 8.2%. In India, there were too few cases to calculatea percentage. No other antepartum condition consistently lead to an increase in perinatal loss.
b. Intrapartum morbidity (Table 21)
In Bangladesh, both prolonged labor and fits or convulsions were associated with an increasedrisk of stillbirth, but this was (surprisingly) not the case in the other three sites. Egypt was theonly site to report ruptured uteri, and three of these 13 mothers lost their babies. In all sites butIndia, interventions (cesarean section, instrumental delivery, hysterectomy) were associated withincreased risk of pregnancy loss. Because of the high rate of hospital deliveries in India, it isassumed that the interventions were timely and avoided perinatal loss, whereas in the other sites itis assumed that interventions occurred too late, in some cases, to save the baby.
c. Postpartum Morbidity (Table 22)
Postpartum morbidity does not contribute to perinatal loss, but the same conditions that lead tothe morbidity often contributed to the loss of the baby as well.
8. Induced Abortions and Miscarriages (data not shown)
��������������������
14These could have been repeat cesareans (i.e. the previous delivery was by cesarean) which we have not defined as a
morbidity.
The responses to questions on abortion were disappointing in terms of the likely completeness of

The Base of the Iceberg: Chapter III
37
the reporting; we have, therefore, not shown them. Only 23 women in Bangladesh, 106 in Egyptand 9 in Indonesia reported ever having had an induced abortion. Only 10% in Bangladesh andIndonesia reported ever having had a miscarriage. Four percent of Egyptian women, 1.2% ofBangladeshi women and 2.0% of Indonesian women reported that the index pregnancy ended in amiscarriage. Both of these estimates are far below the number who might be expected to haveexperienced a recognizable miscarriage. However, close to half of Egyptian women reportedhaving at least one miscarriage, which is consistent with the number who might be expected tohave experienced a recognizable spontaneous abortion. Many women reported that they soughtmedical treatment for the pain and bleeding associated with the previous miscarriages C 55.1% inBangladesh, 81.4% in Egypt and 83.3% in Indonesia.
In India, on the other hand, the question was asked only of the index pregnancy; 132 womenreported having had an induced abortion. Because the vast majority (94%) were induced by aphysician, few complications were reported. Nearly 20 percent (18.2%) of women in the Indiansample reported that the index pregnancy ended in a miscarriage, which is consistent with theexpected number of recognizable miscarriages. Most (95%) reported morbidity associated withthe miscarriage and 72% of these women sought treatment. Twenty-seven percent were admittedto hospital (mean number of nights of hospitalization was 2.9) for treatment of thesecomplications. A similar percentage was hospitalized for management of induced abortioncomplications and the average hospital stay was similar. It is important to note, however, thatsome of women may have been hospitalized for the induction itself. Information on gestationalage at induction was not asked for.
9. Impact of Morbidity on Fertility Desires (data not shown)
Between 20 and 40 percent of mothers wanted to have additional children, and this was affectedsurprisingly little by having experienced morbidity. Mothers with long-term morbidity were lesslikely to want additional children, but the difference was not great. Mothers who had experiencedlife-threatening or serious morbidities, in every site, were more likely to want additional children,perhaps because they were more likely to be primiparae.

38
IV. PREVALENCE OF MORBIDITIES
This chapter examines the overall prevalence of pregnancy-related morbidity among these foursamples of women. We look at both the number of morbidities reported, and the percentage ofwomen who reported morbidity. We also examine the severity of the morbidities reported.
Whether a morbidity is appropriately treated sometimes affects its severity (whether it progressesto become an actual life-threatening condition rather than only potentially life-threatening). Wewere not able to assess whether conditions were actually life-threatening, only that they werepotentially life-threatening.
In comparing the frequency of morbidity in the different time periods of pregnancy (ante-, intra-and postpartum), it is important to remember that morbidity tends to be more common duringpregnancy than during delivery or the postpartum period, and this is partly because of the differentdurations of the three time periods C nine months (antepartum), typically about 12-24 hours(intrapartum), and six weeks (postpartum). Some conditions, especially nonobstetric conditionssuch as pulmonary TB, may be influenced by the sociocultural setting and might be expected to bemore common in countries where they are prevalent in the general population, and especiallyamong women of lower socioeconomic status.
Some conditions may persist for the duration, these include the nonobstetric conditions mentionedabove, as well as some obstetric morbidities such as pregnancy-induced hypertension. Studyparticipants were asked about conditions occurring in each of the three time periods, but acontinuing condition is recorded only once.
In addition, there are conditions C some treatable, some less so C which persist beyond the endof the postpartum period, and may last the rest of a woman’s life. Some morbidities result in trulytragic situations for the women who suffer from them. These are not always caused by the indexpregnancy, and they may be cumulative. Study participants were asked about such conditions andhow long they had had them.
A. During the Index Pregnancy (Table 23)
The questionnaire asked women whether they had experienced specific morbidities in each of thethree pregnancy-related periods. The specific morbidities asked about, and their severity, areshown in Table IV.1. Long-term morbidities are covered separately below.

The Base of the Iceberg: Chapter IV
39
Because the Indonesian study was part of a longitudinal study, we were not able to collect data onmorbidities occurring antepartum;15 and not all types of intra- and postpartum conditions werecovered in the questionnaire. Limited data on antepartum morbidities were collected during theearlier prospective study. Where conditions are covered they are included; and where there areno data, this fact is noted.
Table IV.1. Specific morbidities of the index pregnancy covered in questionnaire.16
Antepartum Intrapartum Postpartum
Life-threatening
MalariaHemorrhageFits/convulsions
MalariaHemorrhageFits/convulsionsRuptured uterus
MalariaHemorrhageFits/convulsions
Serious
Edema (hands & face)HypertensionFever >3 daysSevere vomitingJaundicePulmonary TB
Labor >18 hoursVaginal or cervical tear
Fever >3 daysFoul dischargeShock/loss of consciousness
Other
Rheumatic heart diseaseVaricose veinsBurning on urination
Pelvic painPainful urinationBreast conditionsDepression <2 weeks
��������������������
15The antepartum data collected during the earlier study were more limited than the intra- and postpartum data. Where
possible, however, we have made use of them.
16Refers to Tables 10, 12, 14.

The Base of the Iceberg: Chapter IV
40
Frequent urination Depression >2 weeks
The prevalence of morbidity was far higher than anticipated. In fact, most women reported atleast one morbidity at some point during the index pregnancy and puerperium. Among women inthe Indian sample, 58.3% experienced at least one morbidity, the corresponding numbers were66.9% in Egypt and 79.9% in Bangladesh.17 Many women reported more than one (Table 23);1.8% of Indian women, 10.1% of Egyptian women and 23.7% of Bangladeshi women reportedfive or more separate morbidities. Not all, of course, were serious or life-threatening. A life-threatening morbidity was reported by 4.7% of women in the Indian sample, 10.7% of theEgyptian sample and 32% of the Bangladeshi sample. But quite a large proportion of womenreported experiencing serious morbidities; life-threatening or serious morbidities were reported by45.5% of Indian women, 55.1% of Egyptian women and 65.1% of Bangladeshi women.
1. Antepartum Morbidity (Tables 10, 23)
Although antepartum morbidity was quite common, few women had serious morbidities and evenfewer had life-threatening ones. Sixty percent of Indian women, 49.8% of the Egyptian women,and 42.6% of Bangladeshi women reported no morbidity at all during their pregnancies. Although half of the women in the Egyptian sample had at least one morbidity during pregnancy,most of these (28.0%) had only one, 14.8% had two, and 7.4% had more than two. The figureswere quite similar in India (23.0% had only one, 12.0% had two and 4.6% had more than two)and Bangladesh (24.3% had only one, 16.5% had two and 16.4% had more than two).
Life-threatening complications during pregnancy were defined as antepartum hemorrhage,convulsions and malaria. Table 23 shows that few women experienced such extreme conditions,1.2% of women in the Indian sample had one such condition and none reported more than one;4.9% of women in the Egyptian sample had one, and 0.1% had two such conditions; inBangladesh, the corresponding numbers were 6.9% and 0.9%, and in Indonesia 4.2% and 0.
Serious morbidities of pregnancy are defined as edema, hypertension (that was measured), feverlasting longer than 3 days, severe vomiting, jaundice, and pulmonary TB. Between 20 and 30percent of women in the four sites suffered from either a serious or a life-threatening condition:20.8% in India, 17.9% in Indonesia, 27% in Bangladesh, and 29.3% in Egypt. Some women hadmore than one such condition, 4.6% in India, 15.0% in Egypt and 20.3% in Bangladesh.
Table 10 shows the prevalence of specific conditions in the three sites.
��������������������
17Data are not available for Indonesia.

The Base of the Iceberg: Chapter IV
41
2. Intrapartum Morbidity (Tables 12, 23)
Far fewer women reported intrapartum morbidity than reported antepartum, nevertheless asignificant proportion did experience serious or life-threatening complications during delivery(Table 12). More than 70% of women in all the samples reported no complications of delivery:83.6% in India, 82.2% of Egyptian women, and 73.4% of Bangladeshi women. Note that weasked about new conditions that are specific to the (short) period of time that defines labor anddelivery. Continuing conditions (such as hypertension, TB) will also complicate the intrapartumperiod, but are not recorded separately. Because of the inherently brief duration of theintrapartum period, new conditions that are not strictly obstetric are unlikely to occur.
Life-threatening complications during labor and delivery were defined as intrapartum hemorrhage,ruptured uterus, convulsions and malaria. Few women experienced such extreme conditions,1.8% of women in the Indian sample had one such condition and none had more than one; 4.4%of women in the Egyptian sample had one, and <0.1% had two such conditions; but in Bangladeshand Indonesia, the corresponding numbers were higher at 19.9% and 1.5%, and 16.1% and 0.7%respectively.
Serious morbidities of labor and delivery are defined as labor longer than 18 hours, or vaginal orcervical tear. Between 7% and 22% of women suffered from one serious or life-threateningcondition: 13.0% in India, 7.3% in Egypt, 18.3% in Indonesia and 22.1% in Bangladesh. A veryfew women had more than one such condition, 0.6% in Egypt, 0.7% in Indonesia, 3.1% in India,and 4.1% in Bangladesh.
Table 12 shows the specific morbidities.
3. Postpartum Morbidity (Tables 14, 23)
Postpartum morbidity was quite common with one-quarter to two-thirds of all women reportingmorbidity in the postpartum period. In India, 23.5% of women reported any morbidity; thecorresponding number in Egypt was 45.6%, and in Bangladesh was 65.2%. Few life-threateningcomplications in the postpartum period (defined as malaria, hemorrhage or fits) were reported byIndian (1.9%) or Egyptian (3.8%) women. But in Bangladesh and Indonesia, 18.4% and 11.3%respectively of women reported life-threatening complications in the postpartum period. Serious(defined as shock, fever lasting more than 3 days and foul discharge) and life-threateningmorbidities combined were reported by 15.9% of the Indian, 23.1% of the Indonesian, 24.4% ofthe Egyptian and 37.3% of the Bangladeshi samples.
B. Long-term Morbidity (Tables 16, 24)
Many complications of pregnancy and delivery, even those that are serious or life-threatening, areresolved relatively quickly and have no long-term consequences. Nevertheless, there are some

The Base of the Iceberg: Chapter IV
42
long term sequelae which may have severe medical and social consequences for women whosuffer from them. We collected data on only six long term morbidities; we chose these sixbecause they are often symptomatic, making it possible for respondents to detect and report themwithout a clinical examination (Table 16). The six were vesicovaginal and rectovaginal fistulae,incontinence, uterine prolapse, dyspareunia and hemorrhoids. Women with fistulae or other formsof incontinence often become social outcasts, abandoned by their husbands and families. Uterineprolapse and dyspareunia can jeopardize the marital relationship, and prolapse and hemorrhoidscan be debilitating conditions.
Long-term morbidity was reported by 28.6% of the women in the Bangladeshi sample, 25.5% ofEgyptian women, 8.2% of Indian women, and 19.7% of Indonesian women. A few women(<7%) in every site reported more than one such sequelae of childbirth. These chronic problemscould have been caused by pregnancies preceding the index pregnancies through which womenwere selected into these samples. However, because several of these conditions undoubtedlyreduce coital frequency or may terminate sexual relations altogether, these estimates should beconsidered conservative. A reticence to discuss such matters would also lead to a conservativeestimate.
C. Discussion
Given the social, cultural and racial diversity of the four study sites, the consistency of the findingsis somewhat surprising. The percentage of women with any morbidity during the pregnancy andpuerperium ranged from 58.3% in India to 79.9% in Bangladesh. The
Table IV.2. Prevalence of morbidities during the index pregnancy.
Bangladesh Egypt India Indonesia
Antepartum 57.4 50.2 40.0 not available
Intrapartum 26.6 17.8 16.4 not available
Postpartum 65.2 45.6 23.5 not available
Anytime 79.9 66.9 58.3 not available
Source: Based on Table 23.
obvious question to raise is whether different definitions of morbidities were used. Considerableeffort was expended to make definitions as similar as possible; investigators met on a regular basis

The Base of the Iceberg: Chapter IV
43
to develop consensus on definitions, wording and interpretations. Nevertheless, discrepanciesmay have crept in through the use of particular translations, and the possibility that morbiditieswere overstated in Bangladesh and/or understated in India must be considered. Alternativeexplanations are that more extensive intrapartum care in India (and in Egypt to a lesser extent)accounts for fewer intra- and postpartum morbidities, or that the lower parity and age of theIndian sample results in fewer morbidities. Regardless of the reason for the findings, and even if58.3% prevalence of obstetric morbidity in India is an understatement, it is still a far largernumber than anticipated, and should be interpreted in that context.

44
V. RATIO OF MORBIDITIES TO MORTALITY
A primary objective of this study was to develop a new estimate of the number of morbidities foreach maternal mortality. An early estimate from India was 16.5 morbidities per mortality, butthere were a number of characteristics of this estimate that were less than satisfactory. Nevertheless, this number is often used to estimate the number of maternal morbidities in apopulation. Thus, it is useful to replicate the analysis and to determine whether the numberapplies in different settings. The present research estimates two morbidity/mortality ratios; first,for the number of morbidities (Table 25) in the three time periods of pregnancy, and second, forwomen (Table 26) with morbidities in the three periods.18
The morbidity/mortality ratio is influenced by the level of maternal mortality as well as by the levelof maternal morbidity. The estimates of the maternal mortality that we used are shown in thetable below. Two countries (Egypt and India) have a level of maternal mortality that is about halfthat of the other two. Clearly, this influences the morbidity/mortality ratio because it halves thedenominator thus increasing the quotient.
A. Number of Morbidities per Mortality in the Index Pregnancy (Table 25)
Looking first at morbidities of the index pregnancy regardless of their timing or severity, we find643 morbidities per mortality in Bangladesh, 967 in Egypt and 541 in India. Limiting the analysisto serious or life-threatening morbidities, we find 149, 259, 300 and 591 for Indonesia,19 Bangla-desh, India and Egypt respectively; and for life-threatening morbidities only the ratios are 112,114, 24 and 67 respectively.
These estimates leave us with several issues of interpretation. Egypt and India have lower levelsof mortality; therefore, other things being equal, these sites should have higher ratios of morbidity��������������������
18 That is, for "number," one woman can contribute multiple morbidities, whereas for "women," women with multiple
morbidities are counted only once.
19Recall that Indonesia reported data on only a limited number of types of antepartum conditions.

45
to mortality (because the denominators are smaller). While this appears true for Egypt, India alsoreports lower levels of morbidity than the other sites, and a lesser tendency to classify them aslife-threatening.
Table V.1. Estimates of maternal mortality ratios used in calculations.
Country Estimate of maternalmortality ratio20
Source
Bangladesh 460 Statistical Pocketbook of Bangladesh 1994, Bangladesh Bureau of Statistics, StatisticalDivision, Ministry of Planning, Governmentof the Peoples Republic of Bangladesh (page105)
Egypt 190 Fortney (1987), Saleh (1987)
India 240 DANIDA Terminal Evaluation, 1990
Indonesia 450 National Bureau of Statistics
B. Number of Women with Morbidities per Mortality in the Index Pregnancy (Table 26)Turning now to the number of women with morbidities per maternal mortality, the ratio is, ofcourse, smaller. In Bangladesh, 186 women experienced a morbidity (without regard to theseverity and timing of the morbidity) for every woman who died a maternal death; in Egypt and inIndia, the numbers were 374 and 251, respectively.21 If we restrict the analysis to life-threatening
��������������������
20 WHO and UNICEF’s new estimates of maternal mortality per 100,000 live births (with 95% confidence limits for
these countries are: Bangladesh 850 (595 - 1139); Egypt, no change; India 572 (435 - 738); Indonesia 647 (452 - 895). Source: Revised 1990 Estimates of Maternal Mortality: A New Approach by WHO and UNICEF. World HealthOrganization, Geneva, April 1996. These are national estimates; the estimates above for Egypt and India are specific to thearea of the study.
21Data are not available for Indonesia.

46
complications, 72 women in Bangladesh, compared with 56 in Egypt and 20 in India had a life-threatening complication for every woman who died.
C. Number of Women with Chronic Morbidities per Mortality (Table 26)For every woman who died from pregnancy-related causes there are 64.6, 134.2 and 24.5 womenwith chronic morbidity associated with pregnancy in Bangladesh, Egypt and India respectively.

The Base of the Iceberg: Chapter V
47
The Base of the Iceberg: Chapter V
D. Discussion
If we take into account differences of definitions, populations and sample selection procedures,the findings in this report are largely compatible with those of similar studies. The exception isthe earliest study (Datta et al, 1980), and it is, perhaps, unfortunate that because it was for so longthe only source of data, many assumptions were based on it, causing an underestimation of theburden of maternal morbidity. We compare, below, our findings with those of other studies.
Datta and his colleagues (1980) conducted a five-year prospective study; households wereinterviewed once a month and any ailment of a pregnant woman reported by her or her family orobserved by the interviewer was recorded. Three hundred and forty-nine pregnancies in 281women were observed. The reported maternal mortality ratio was 592 per 100,000 live births,although this was based on only two deaths (from postpartum hemorrhage). There were 116 newsicknesses reported during the period (0.33 per pregnancy), of which 28.45% (N=33) werepregnancy related (0.08 per pregnancy). Looking first at the morbidity/mortality ratio (allsicknesses 116/2 = 58; pregnancy-related 33/2 = 16.5), clearly the ratio is very dependent on anestimate of maternal mortality that is not very robust, based, as it is, on two deaths in a five-yearperiod. Had there been one more, or one fewer deaths, the ratios would have been 116 or 39, and33 or 11 respectively. Datta found that 6.8% of women reported an illness in the antenatalperiod.
A study by the US Centers for Disease Control (Franks et al, 1992) found that for every 100hospitalizations for delivery, there are 22.2 for complications during pregnancy (14.6 forpregnancy complications and 7.6 for pregnancy loss22). If we argue that what our study definedas life-threatening or serious complications equates to hospitalizations for antepartum conditions(excluding pregnancy loss) in the CDC study, then CDC estimate of 14.6 can be compared withthe following figures from our study (the figures in parentheses are for life-threatening ante-partum complications): Bangladesh 157 (50) per 100 births; Egypt 101 (13) per 100 births; andIndia 63 (5) per 100 births; the data for Indonesia were not calculated.
The findings from a different CDC study done in collaboration with the Asociación DemograficaSalvadoreña (ADS) in El Salvador, as well as those from two other studies similar to ours arecompared with our studies in Table V.2.
��������������������
22But not for induced abortion

48
The DHS study in the Philippines by Stewart and Festin (1995) reported that 10.9% of womenhad life-threatening complications in the peripartum period.23 If we compare this with theincidence of life-threatening complications in the intrapartum period in our study, we find 21.4%in Bangladesh, 4.4% in Egypt, 1.8% in India, and 16.8% in Indonesia. Although we cannotconstruct a peripartum period for our data, our data appear to be compatible with the data fromthe Philippines.
Bhatia and Cleland (1996) reported that 41% of women in a study in south India had at least onemorbidity associated with their last pregnancy. The comparable figures from our study are 80%,67% and 58% for Bangladesh, Egypt and India respectively. The same study reported that 18%of women had antepartum complications compared with 57%, 50% and 40% (Bangladesh, Egypt,India); and 23% had postpartum morbidity compared with our 65%, 46% and 24% inBangladesh, Egypt and India. The figures are not available for Indonesia.
Part of the present study in Egypt involved referral and examination of women reporting long-term morbidities.24 In addition a sample of women who reported no long-term sequelae wereexamined. The specificity of all conditions was good C better than 90% for all conditions exceptprolapse (28.8% of women who did not report prolapse had some degree of uterine prolapse onphysical examination). Table V.3 shows the results of the examination for the two groups ofwomen, and a comparison of the prevalence reported in Table 16 with the corrected prevalence. In all cases except recto-vaginal fistula (RVF), the prevalence of the condition was higher amongthose who reported it than among those who did not. Two of the conditions (dyspareunia andstress incontinence) cannot be detected by physical examination, but accurate assessment dependson the woman to report correctly; so the fact that more women reported the condition to thedoctor examining them suggests that sensitive questioning in private can elicit more positiveresponses. But which approach is the more valid remains unresolved. One condition (prolapse) isnot easily detected by the woman herself in its early stages, so it is to be expected thatexamination would find the condition more frequently than self-reports.
In spite of these findings, the self-reported prevalence is a reasonable estimated of prevalencefound on examination for three of the five conditions, and is an underestimate for two of them(prolapse and dyspareunia). ��������������������
23Not well defined, but usually the intrapartum plus early postpartum periods.
24In all study sites women who reported continuing morbidity were referred for treatment; in Egypt, however, women
were followed and the results of the examination were recorded.

The Base of the Iceberg: Chapter V
49
The implication of these findings is that questionnaire design continues to need refinement, andpretesting of questionnaires on women known to have specific conditions is desirable.

50
Table V.2. Comparison of the present study with other studies, incidence per 100 deliveries.
Complication El SalvadorADC & CDC
1994
IndiaBhatia & Cleland
1996
PhilippinesStewart & Festin
1995
BangladeshPresentStudy
EgyptPresentStudy
IndiaPresentStudy
IndonesiaPresentStudy
Edema* 35 4.3 n.a. 22.9 12.8 12.6 10.3
Hypertension 14 3.8 n.a. 3.6 15.6 0.2 not avail.
Antepartum bleeding 6.3 0.9 22.1 2.6 4.1 0.4 3.2
Prolonged labor** 15 20.4 15.2 6.6 3.6 1.3 5.0
Intrapartum bleeding 28.6 1.3 7.9 56.7 4.1 0.9 10.5
Convulsions*** 1.8 0.3 1.6 3.5 0.1 0.2 1.9
* Edema of legs and/or face in El Salvador, hands and/or face elsewhere.** More than 24 hours in El Salvador, more than 12 hours in the Philippines, more than 18 elsewhere.*** In the peripartum period in El Salvador, intrapartum only elsewhere.

The Base of the Iceberg
51
Table V.3. Egyptian study results of physical examination of women reportingspecific morbidities.
Prevalence (%)in total sample
Long-termmorbidity
Prevalence (%)among womenNOT reporting
conditionN = 757
Prevalence (%)among women
reporting condition
N = 489
Table16
Corrected
Stress incontinenceor VVF
9.5 17.4 6.2 10.0
RVF 0.2 0.0 0.2 0.2
Prolapse 28.8 48.7 11.3 31.0
Dyspareunia 9.7 18.5 2.1 18.3
Hemorrhoids 7.9 30.4 12.5 10.7
Source: EFCS. Study of the Prevalence and Perception of Maternal Morbidity in Menoufeya Governorate, Egypt. September 1995.

52
VI. IMPLICATIONS FOR PROGRAMS
To develop effective interventions to enhance the utilization of maternity services, we need toknow whether women recognize the symptoms of conditions for which treatment should besought, and whether they know that the condition can and should be treated. One purpose of thisstudy was to determine whether women understood the severity of conditions they experiencedand whether they sought medical help for morbidities of pregnancy, delivery and the puerperium. There are several reasons for not seeking medical attention:
! the morbidity was not recognized
! the morbidity was not seen as serious
! the morbidity was recognized as serious (and needing medical attention is implied),but medical attention was not sought.
Each of these situations requires a different kind of intervention to increase use of services. Thesurvey addressed only the second and third of these. The first we cannot address becauseunrecognized morbidities could not be reported to our interviewers.
A. Knowledge of Complications
1. Antepartum Morbidities (Table 10)
In each of the three countries for which we have data,25 even for very serious conditions likeantepartum bleeding, convulsions or fever lasting more than three days, there was a significantproportion of women who did not perceive the morbidities as serious. Of course, not all of thepotentially serious conditions actually became serious, so we would expect some to be perceivedas not serious.
��������������������
25Indonesia did not ask questions about perceptions of severity, or seeking care for specific complications.

The Base of the Iceberg: Chapter VI
53
This was especially a problem in Bangladesh where more than 40% of women with antepartumbleeding did not perceive it as potentially serious, and 14% of women with fits/convulsions didnot perceive them as serious. This leads us to recommend interventions that would educatewomen and their families to recognize and respond to antepartum symptoms of potentially seriousand even life-threatening conditions. Because most antenatal care in Bangladesh takes place inthe home through the work of health visitors, such interventions need to involve health visitorswho can ask about relevant symptoms at each visit and use the opportunity to explain why thequestions are asked. Women in Bangladesh are often secluded and most are also illiterate. Therefore, consideration must also be given to targeting such information at men throughmosques or other places where men assemble.
Recognition of severity varied among the sites, and was limited for some morbidities. Forexample, although women in India were generally more likely than women in the other sites toseek care, doing so for fever was an exception. A possible explanation is that the Indian sampleconsisted of different and overlapping groups of women; urban and rural, with and withoutantenatal care, planning and not planning institutional delivery. Rural women, however, were noless likely to recognize severity of antepartum conditions
In Egypt, there was widespread recognition of the severity of conditions; for example, almost94% of women with antepartum bleeding recognized that it was potentially serious. However, adesirable goal would be to make this knowledge universal. Because television and radio reach avery high percentage of Egyptian homes, this could be the most effective way to bring aboutuniversal recognition of the symptoms of serious conditions of pregnancy.
2. Intrapartum Morbidities (Table 12)
Recognition of the severity of intrapartum morbidities was not greater than for antepartumconditions. In particular, excessive bleeding in Bangladesh and India was perceived as serious byonly slightly more than half of the women experiencing it. Yet excessive bleeding is a leadingcause of maternal death in both sites. The failure to recognize it is more serious in Bangladeshthan in India, however, as almost all women deliver at home in Bangladesh.
In Bangladesh, more than 85% recognized the severity of prolonged labor and fits or convulsions,but less than 60% recognized the potential importance of bleeding or tears. Thus, healtheducation interventions should reinforce the importance of the former, and re-educate on thelatter. In Egypt, there was broader (80% or more) recognition of the severity of all conditionsexcept tears (61.4%); while tears are often not life-threatening, they can be a source of greatdiscomfort, and can invite infection. In India, prolonged labor and fits were well recognized aspotentially serious complications of labor.

The Base of the Iceberg: Chapter VI
54
3. Postpartum Morbidities (Table 14)
In spite of the fact that the majority of maternal deaths take place in the postpartum period,perception of postpartum morbidities as serious was not as widespread as it should be. Again,generally speaking, Egyptian women were more likely to recognize the severity of conditions thanwomen in Bangladesh or India; and the more serious conditions were more often identified assuch. Fits/convulsions was recognized more often (78% or more) than bleeding (60% or more),shock or loss of consciousness (58% or more), or foul discharge (45% or more). Indonesianwomen, on the other hand, were significantly less likely than women in the other three sites torecognize the importance of all of the conditions, and the percentage who did so is well below thenumbers cited above.
Health education, by whatever means, should be aimed at informing pregnant and postpartumwomen of the potential importance of pelvic pain, foul discharge and fever (especially incombination), and that the potential for significant blood loss is great when bleeding continues forsome time even if the amount does not appear excessive.
Indonesia represents a special case in that recognition of the importance of symptoms was muchlower than that of the other three sites. The need for education before or during pregnancy of theimportance of symptom recognition is, therefore, much greater in Indonesia.
It is well recognized that to reduce maternal mortality and sequelae of morbidities women must betreated for morbidities that arise. Women cannot seek treatment if they and their families do notrecognize the symptoms or, recognizing them, do not believe they are serious. And treatmentcannot be effective if women do not seek it for whatever reason.26 Health education C providingwomen and their families with the information they need to make decisions about when (and how)to seek care C is a crucial element of interventions to reduce maternal death and disability. But itmust also be noted that knowledge of intrapartum complications is far less crucial in a settingwhere the rate of institutional deliveries is high, assuming that women delivering in hospital willbe appropriately cared for regardless of their own knowledge.
While information is necessary to seeking care appropriately, it is, unfortunately, not sufficient. Inaddition, changes in attitude are sometimes necessary. Attitudes present in some cultures thatpresent barriers to seeking care for obstetric problems include: women are supposed to sufferduring delivery, women are not worthy of the necessary time or money, discussion of women’sproblems is embarrassing (or even taboo), and women can’t make decisions about their health
��������������������
26Note that we are assuming that treatment, when given, is effective. The quality of maternity services was not addressed
in this study.

The Base of the Iceberg: Chapter VI
55
care.
B. Access to Care
1. Antepartum Morbidities (Tables 6, 10, 11)
Table 11 shows that a large percentage of women sought no care for many antepartumconditions, and even when the condition was perceived as serious, many did not seek care (Table10). We did not ask the reason for not seeking care, but Table 6 gives some insight into thisquestion and suggests that accessibility and cost are reasons. It is also worth noting that inBangladesh, where the problem is greatest, women are secluded; greater access to womenproviders might increase the proportion of women who seek care.
2. Intrapartum Morbidities (Tables 12, 13)
Table 13 shows that women were more likely to seek care for intrapartum complications thanthose that occurred during the pregnancy. In both India and Indonesia, the proportion receivingno care for intrapartum complications was negligible. In Indonesia, much of the care wasprovided by TBAs rather than by modern medical providers. Given the frequency of antenatalcare in India, it is difficult to understand why women with some complications (edema and urinarycomplications) did not receive treatment for them. In Bangladesh, nearly 60% of women withexcessive bleeding received no care, and in Egypt 30% of women with prolonged labor receivedno care. Even among women who perceived the condition as serious (Table 12), some stillsought no care; for example nearly 20% of Egyptian women with prolonged labor and who knewit was serious, did not seek care.
It is important to recall that accessibility to care varies among the countries. In Egypt, there arefew geographic barriers impeding access to care, and while roads vary in quality and vehicles are sometimes in short supply, the majority of the population live within reasonable distance of ahospital. Bangladesh, on the other hand, is a country dominated by rivers, so in addition to theseclusion of women mentioned earlier, transportation to hospital can be severely impeded bywater barriers and limited access to ferries. In India, although the sample was drawn from thecatchment area of the JIPMER teaching hospital, some women lived relatively further away fromthe hospital.
Interventions in Bangladesh for intrapartum complications might, therefore, focus on improvingaccess by improving transportation and by increasing the number of female care providers whocan provide emergency obstetric care in the home, and this has been tried with some success(Fauveau et al, 1991).
In both Egypt and India, financial barriers to antenatal care were reported (Table 6). There aremany ways to deal with these obstacles, including local insurance plans, delayed payment, and

The Base of the Iceberg: Chapter VI
56
reducing or waiving fees for some patients. Improving access to transportation in Egypt andIndia might improve utilization in the event of emergency. Although in the Indian site thepercentage of institutional deliveries is quite high, there is limited use of Primary Health Centers(PHCs) for this purpose and many women, even from rural areas, go to tertiary governmenthospitals or private facilities for delivery. There is a need to upgrade the PHCs so that they canprovide essential obstetric care. This would reduce travel time, cost of care, and overcrowding inhospitals.27
In Egypt, some TBAs have developed working relationships with physicians and, in some cases,continue to attend their patients after referring them to private clinics. This partnership almostcertainly increases the proportion of women (and their families) who are willing to seek a higherlevel of treatment.
3. Postpartum Morbidities (Tables 14, 15)
As with earlier morbidities, many women received no care, even when they knew the conditionwas potentially serious. And as with the morbidities occurring earlier in pregnancy, Egyptianwomen were more likely to seek care than women in Bangladesh or India. Postpartum carereceives less research attention than antepartum or intrapartum care, in spite of the fact that this isthe period where the majority of deaths occur. While it is recognized that good intrapartum carereduces the number of postpartum complications, it is still important to recognize and treatconditions that occur in the puerperium. Countries with systems of health visitors are in aposition to train health visitors to look for symptoms of postpartum problems, many of which canbe managed below the level of hospital. Much of the attention of health providers in thepostpartum period is focused on the infant, and not enough on the mother.
C. Discussion
This survey has confirmed that there are two entirely distinct types of interventions that wouldimprove the management of maternal morbidities.
The first is improving the knowledge of women and their families about the symptoms that requireattention during pregnancy, labor, delivery and the postpartum period. There are any number of
��������������������
27This has been addressed to some extent by programs such as Child Survival and Safe Motherhood, and the Safety Net
Scheme in India.

The Base of the Iceberg: Chapter VI
57
ways to accomplish this in a variety of cultural settings, and no single way predominates. Considerable attention in the literature has been devoted to this aspect of the solution.
The second is to enable women and their families to avail themselves of health facilities that exist. Barriers include geographic, financial, cultural and psychic, and the magnitude of the barriersvaries considerably. Some barriers can be nearly impossible to overcome (great distances ormountains, for example), others can be easily overcome if the desire genuinely exists (such aspermitting flexibility in some birthing practices, or payment schedules). The increasing role of theprivate sector in some countries may improve access; hours of service are often more flexible inprivate clinics than in the public sector.
A third intervention, improving the quality of maternity care at all levels of service and in allstages of pregnancy and the puerperium, was not addressed by this study. Even though we didnot address this issue, it is essential to recognize that people, including pregnant and laboringwomen, are more likely to seek the care they perceive to be effective.
The challenge, then, for safe motherhood programs is to provide both the knowledge and themeans to act on the knowledge. Communities have shown themselves to be creative in findingways to act once they have the knowledge (Maine et al, 1993) and programs should reward andfacilitate such creativity.

58
EPILOGUE
A great deal of epidemiologic research relies on gathering correct information from respondents. But this information usually has to do with the respondents= recollections of events that might berelated to their disease rather than with the diagnosis of the disease itself. Research in maternalmorbidity shares with other areas of epidemiologic research the problem of detection bias. Detection refers to the variation in the likelihood that a condition will be diagnosed. There is, formost diseases, considerable variation in the likelihood of detection C HIV, in situ cervical cancer,diabetes are all good examples. What is special about research in maternal morbidity, at least atthis stage in its evolution, is that we still depend on respondents to identify many of theirconditions rather than a laboratory test or other technology.
Since this research was completed, research to validate the use of household surveys for thepurpose of estimating prevalence of obstetric morbidity has been completed. There are now sixstudies C in the Philippines, Benin, Ghana, Indonesia, Bolivia and El Salvador. At the time ofwriting (December 1996), only the study from the Philippines has been published (Stewart andFestin, 1995). The results of the other studies are not yet available.
In general, these studies used different techniques to validate the findings from questionnaire-based studies, and measured the sensitivity and specificity of questionnaires to identify specificmaternal complications. In general also, the findings were not encouraging C especially for largescale (national) surveys.
Obviously, these findings (and we have no details at this writing) have important implications forthis report, and they cast some doubt on our findings. Nevertheless, asking people is still the onlymethod we have for collecting information on many subjects. In the case of maternal morbidity,alternatives to simply asking women are quite limited.
We can identify women who are pregnant and follow them through their pregnancy, delivery andpuerperium (this was done in the Bangladesh study reported on here). This technique has its ownmethodological challenges and is not only expensive, but obligates the researcher to intervenewhen complications occur, thus altering their severity.
We can also evaluate clinic records (for events during pregnancy) and hospital records (for eventsduring parturition and immediate postpartum). The limitations of institution-based data are well-known: not all complications are seen in institutions, many women deliver at home, and womenhave few prenatal visits. Events occur after women are discharged from hospital, and while they

The Base of the Iceberg: Epilogue
59
are at home. For many reasons, some complications are more likely to be referred to hospitalthan others. Women who deliver in hospital are fundamentally different from women who deliverat home, and we cannot extrapolate to the population at large from Institution-based data. This isnot to say, however, that institution-based data are not useful for other purposes.
Women who report continuing problems can be examined to confirm (and treat) those conditions. In women who do not report certain conditions, their absence can be confirmed on examination. But many obstetric complications are not continuing conditions C obstructed labor for example Cso clinical examination cannot be used to confirm. Our collaborating investigators in Egyptconducted a clinical examination of all women reporting chronic conditions and a sample of thosereporting no chronic conditions. This resulted in a change in reported prevalence of stressincontinence or VVF from 6.2% to 10.0%, of uterine prolapse from 11.3% to 31.0%, and ofhemorrhoids from 12.5% to 10.7%. Although there was no change in prevalence of RVF, noneof the women who reported it in fact had it, and 0.2% of those who did not report it, did have it. The prevalence of dyspareunia increased from 2.1% to 18.3%, but this resulted from additional(and perhaps more sensitive) questioning rather than a physical examination.
There are at least two lessons to be learned from the validation studies. First, we should not relyon a single method in our efforts to learn more about the prevalence of maternal morbidity. Incountries with good record keeping and near universal institutional deliveries, we can use clinicrecords and hospital discharge surveys, but questionnaire-based surveys would still help us learnmore about the prevalence of complications that are disruptive of women=s lives but not life-threatening.
Second, in countries without good records, and where home deliveries predominate, we mustcontinue to refine questionnaire-based methods as the alternatives are not attractive. Attention toqualitative research in the design phase of the survey almost certainly improves validity. Consideration should be given to alternative respondents (husbands, mothers-in-law, TBAs,neighbors) and perhaps even multiple respondents as in mortality surveys.

60

61
APPENDIX 1: DATA TABLES
Table 1. Description of sample: household screen and individual record.Table 2. Percentage of women with selected demographic characteristics.Table 3. Percentage of women with selected socioeconomic characteristics.Table 4. Percentage of women selecting specified service outlets as usual place
for treatment of "female diseases."Table 5. Percentage of women with live births and with other outcomes of pregnancy
who had selected characteristics of the index country.Table 6. Percentage of women giving selected reasons for no antenatal care.Table 7. Percentage of women with selected characteristics of the index delivery.Table 8. Percentage of women delivering in specified places, by attendant at delivery.Table 9. Intended place of delivery, by actual place of delivery.Table 10. Percentage of women who perceive morbidities as serious, and percentage who
sought care for morbidity among women who had specific antepartum morbidities in the index pregnancy.
Table 11. Care seeking behavior for specific antepartum morbidities, by source of care.Table 12. Specific intrapartum morbidities in the index pregnancy, percent who perceived
them as serious, percent who sought care.Table 13. Care seeking behavior for specific intrapartum morbidities, by source of care.Table 14. Specific postpartum morbidities in the index pregnancy, percent who perceived
them as serious, percent who sought care.Table 15. Care seeking behavior for specific postpartum morbidities, by source of care. Table 16. Specific long-term morbidities, percent who sought care, and percent
with lifestyle changes.Table 17. Care seeking behavior for specific long-term morbidities, by source of care.Table 18. Percentage of women with interventions at the time of the index pregnancy.Table 19. Percent of women with intrapartum morbidity and specific intervention.Table 20. Specific antepartum morbidities, by outcome of index pregnancy.Table 21. Specific intrapartum morbidities or interventions, by outcome
of index pregnancy.Table 22. Specific postpartum morbidities in the index pregnancy, by outcome of
index pregnancy.Table 23. Percent of women with morbidities in the index pregnancy, by severity of morbidity.Table 24. Number of long-term morbidities.Table 25. Ratio of morbidities to maternal mortality.Table 26. Ratio of women with morbidities to maternal mortality.
Conventions
na means number not calculated at the time the report was finalizednc means data not collected, question not asked, response not available-- means no cases in that category0.0 means cases in the category, but percentage rounds to zero
Percentages are not calculated where there are fewer than 25 cases in a cell.

62
Table 1. Description of sample: household screenand interviewing record.
Household screen
Bangladesh Egypt India Indonesia
No. households visited 27 952 7 221 13 235 3 180
Mean household size 5.2 5.8 5.0 4.5
Mean no. of males 2.7 3.0 nc 2.3
Mean no. of females 2.6 2.8 1.4 2.3
Dates of household listing Sept-Oct 1992
Mar 1992 Feb 1993 Dec 1992
Interview record
No. of eligible women 7 031 4 548 3 502 na
Completed interviews6 493 4 522 3 339 1 926
Refusals 538 17 163 na
Others 0 9 0 na
Dates of survey interviewing Oct-Dec1992
Mar 1992-Aug 1993
Feb-May1993
Jan-Mar1993

63
Table 2. Percentage of women with selected demographic characteristics.*
Characteristics Bangladesh Egypt India Indonesia
Age: 15-19 20-24 25-29 30-34 35-39 40-44 45-49 > 50 Total Mean age (+SD)
11.131.627.316.89.72.90.70.0
100.026.2"6.1
2.517.627.522.518.68.82.40.1
100.030.1"6.6
8.742.034.210.34.00.60.10.0
100.024.7"4.6
0.823.027.124.815.66.41.90.3
100.029.6"6.3
Number of pregnancies 1 2-3 4-5 > 6 Total Mean (+SD)
22.436.221.420.0
100.03.5"2.4
12.336.827.223.7
100.04.0"2.4
25.551.918.14.5
100.02.6"1.5
20.748.120.011.2
100.02.2"0.9
Number of live births 0 1 2-3 4-5 > 6 Total Mean (+SD)
0.727.235.120.416.6
100.03.2"2.2
0.316.140.025.917.6
100.03.6"2.1
4.830.553.510.21.0
100.02.1"1.2
0.625.646.418.29.3
100.02.8"1.8
Number of women (6 493) (4 522) (3 339) (1 926)
Table notes: *Based on all women.

64
Table 3. Percentage of women with selected socioeconomic characteristics.
Characteristics Bangladesh Egypt India Indonesia
Education (years completed)* None 1-3 4-6 7-11 12 >12 Total
62.74.5
21.111.2
0.40.1
100.0
50.53.8
13.94.5
19.57.8
100.0
51.120.314.112.7
1.50.3
100.0
2.234.552.8
5.74.30.5
100.0
Literacy status* Can read and write Can neither read nor write Total
37.362.7
100.0
43.456.6
100.0
45.654.4
100.0
90.99.1
100.0
Socioeconomic status* Low Medium High Total
69.729.0
1.4100.0
48.232.918.9
100.0
48.432.818.8
100.0
51.533.415.1
100.0
Employment status* Receives no payment Receives payment Total
84.715.3
100.0
77.922.1
100.0
51.548.5
100.0
53.047.0
100.0
Number of women (6 493) (4 522) (3 339) (1926)
Place of employment** Works at home Works outside home Works at home & outside Total Number of women
85.413.5
1.1100.0(992)
7.188.2
4.7100.0
(1 001)
--100.0
--100.0
(1 618)
20.747.431.9
100.0(1 496)
Husband’s education*** None 1-3 4-6 7-11 12 >12 Don’t know Total Number of women
49.54.4
18.723.1
2.91.30.0
100.0(6 386)
29.31.8
22.49.8
22.414.1
0.2100.0
(4 421)
28.421.622.522.7
4.00.8
--100.0
(3 339)
1.531.850.6
6.88.11.20.1
100.0(1 926)
Table notes: *Based on all women. ** Based on women who do paid work.
*** Based on married women currently in union.

65
Table 4. Percentage of women selecting specified service outlets as usualplace for treatment of "female diseases."
Service Outlet Bangladesh Egypt India Indonesia
Place of service* No usual place Government health center Government hospital Community health worker Private clinic Private hospital Pharmacy1
TBA Traditional practitioner Other2
TotalNumber of women
65.1--
3.7----
4.98.0
--4.5
14.3100.0
(6 493)
2.020.317.4
--48.45.30.30.30.16.0
100.0(4 522)
44.516.410.9
--13.313.60.3
----
1.0100.0
(3 339)
0.977.11.12.0
10.60.4
--1.70.16.1
100.0(1 926)
Time to health facility** <2 hour 2-1 hour >1 hour Can’t estimateTotalNumber of women
--66.533.5
--100.0
(1 761)
53.642.13.50.8
100.0(4 170)
58.35.7
36.0--
100.0(1 852)
42.648.68.8
--100.0
na
Usual mode of transport** Walking only Nonmechanized means Mechanized means Walking and other meansTotalNumber of women
71.916.13.78.3
100.0(1 761)
62.31.4
34.61.7
100.0(4 170)
43.38.0
45.43.3
100.0(1 817)
42.44.3
41.611.6
100.0(1 908)
Table notes: *Based on all women.**Based on women naming a usual source.1 Includes "husband brings home medicine."
2 Includes village doctor, medical assistant, homeopath

66
Table 5. Percentage of women with live births and with other outcomes ofpregnancy who had selected characteristics of the index pregnancy.
Bangladesh Egypt Characteristic
Live birth Other Live birth Other
Knowledge of nearest location of antenatal care* Knows Does not knowTotalNumber of women
71.628.4
100.0(6 237)
76.223.8
100.0(256)
87.911.9
100.0(4 259)
89.210.8
100.0(263)
Number of antenatal care visits* 0 1-3 4-6 $7 Don’t know/rememberMean number of visits**TotalNumber of women
13.979.0
7.1----
2.1"0.8100.0
(6 392)
37.560.9
1.6----nc
100.0(256)
31.546.214.4
7.70.1
3.5+5.0100.0
(4 260)
40.839.611.2
8.00.4
3.7+8.6100.0(250)
Month of first visit** 1-3 4-6 $7TotalNumber of women
20.155.124.8
100.0(5 369)
30.050.619.4
100.0(160)
45.547.8
6.7100.0
(2 912)
50.741.2
8.1100.0(148)
Location of first antenatal visit** Govt health center Govt hospital Private clinic Private hospital Home, with health worker OtherTotalNumber of women
26.9
9 3.9
9 57.811.4
100.0(5 369)
26.3
9 3.8
9 58.111.8
100.0(160)
46.818.629.1
5.20.10.2
100.0(2 916)
39.214.944.6
1.4----
100.0(148)
Reason for first visit** Had specific problem More routine reasons Threatened miscarriage1
Tetanus injection Iron tablets OtherTotalNumber of women
8.01.51.2
82.62.24.4
100.0(5 369)
10.61.31.9
78.81.95.6
100.0(160)
27.232.1
7.232.8
0.10.6
100.0(2 915)
30.441.9
9.517.6
--0.7
100.0(148)
Table Notes: *Based on all women.

67
**Based on all women with care. 1In Bangladesh and Egypt, this category includes confirmation of pregnancy.

68
Table 5 continued. Percentage of women with live births and with other outcomes of pregnancy who had selected characteristics of the index pregnancy.
India IndonesiaCharacteristic
Live birth Other Live birth Other
Knowledge of nearest location ofantenatal care* Knows Does not knowTotalNumber of women
60.739.3
100.0(3 019)
35.664.4
100.0(45)
95.24.8
100.0(1 881)
94.35.7
100.0(45)
Number of antenatal care visits 0 1-3 4-6 $7 Don’t know/rememberMean number of visits**TotalNumber of women
2.435.737.124.8
--5.1"3.1
100.0(3 019)
(1)46.733.317.8
--4.1"2.7
100.0(45)
--22.745.132.2
--5.7
100.0(1 799)
--23.341.235.4
--5.7
100.0(35)
Month of first visit** 1-3 4-6 $7TotalNumber of women
43.447.0
9.6100.0
(2 947)
25.063.611.4
100.0(44)
ncncnc
ncncnc
Location of first antenatal visit** Govt health center Govt hospital Private clinic Private hospital Home, with health worker OtherTotalNumber of women
46.111.512.813.216.2
0.2100.0
(2 947)
36.411.315.927.3
9.1--
100.0(44)
ncncncncncnc
ncncncncncnc
Reason for first visit** Had specific problem More routine reasons Threatened miscarriage Tetanus injection Iron tablets OtherTotalNumber of women
8.464.0
--27.6
----
100.0(2 947)
18.252.3
--29.5
----
100.0(44)
ncncncncncnc
ncncncncncnc
Table Notes: *Based on all women. **Based on all women with care.

69
Table 6. Percentage of women giving selected reasons for no antenatal care.*
Reason Bangladesh Egypt India Indonesia
Felt fine 65.7 88.0 60.3 nc
Financial problems 5.5 12.7 42.5 nc
Accessibility problems Didn’t know about services Too far away No transport Inconvenient hours Others
2.6 13.6
0.30.80.6
1.40.30.00.6nc
9.64.15.52.7nc
ncncncnc
Acceptability problems Poor quality care/bad reputation Prefer traditional treatment Others
8.2
0.80.5
1.1
0.70.0
4.1
0.00.0
nc
ncnc
Family Issues Husband/family didn’t allow No one to watch children Too busy/too much work Others
8.72.06.78.7
0.61.77.13.1
9.617.839.724.6
ncncncnc
Number of women giving One reason Two reasons Three reasons
2408 590 86
1209 210 26
10 23 36
ncncnc
Number of women 964 1445 69 nc
Table notes: *Based on women with no antenatal care.
Percentages may add to more than 100% as more than one response may be given.

70
Table 7. Percentage of women with selected characteristicsof the index delivery.
Characteristics Bangladesh
Egypt India Indonesia
Outcome of index delivery* Live birth Stillbirth Miscarriage/abortion Other (ectopic, mole etc)TotalNumber of women (all)
96.12.41.6
--100.0
(6 493)
94.21.14.50.1
100.0(4 522)
90.41.48.2
--100.0
(3 339)
97.71.80.5
--100.0
(1 926)
Place of delivery** Government hospital Government health center Private hospital Private clinic Own home Someone else’s home Other Total
0.70.30.30.3
75.423.0
--100.0
10.50.51.79.3
77.30.50.1
100.0
40.02.4
15.00.4
41.50.10.6
100.0
2.31.6
--4.1
80.411.20.4
100.0
Attendant at delivery** Physician Midwife TBA Female relative Other None Total
2.46.7
49.039.22.7
--100.0
30.317.437.73.3
11.30.1
100.0
22.239.035.61.31.80.1
100.0
1.36.4
90.70.90.7
--100.0
Length of labor** >18 hours <18 hours Don’t know Total
6.593.5
--100.0
2.795.02.3
100.0
1.498.40.2
100.0
5.194.80.1
100.0
Number of women (with live orstillbirths)
(6 392) (4 310) (3 064) (1 916)
Table notes: *Based on all women. ** Based on women with live or stillbirths.

71
Table 8. Percentage of women delivering in specified places, by attendant at delivery.*
Bangladesh: N = 6392 Egypt: N = 4310
Place of delivery Doctor Midwife TBA Female rel Other Doctor Midwife TBA Female rel Other
Government hospital 86.4 13.6 -- -- -- 96.7 0.4 0.2 1.7 0.9
Government health center 61.1 38.9 -- -- -- 36.4 45.5 13.6 -- 4.5
Private hospital 70.6 29.4 -- -- -- 98.6 -- -- -- 1.4
Private doctor/clinic 100.0 -- -- -- -- 95.8 0.3 0.3 2.1 1.8
Own home 0.8 6.9 50.8 38.4 3.1 12.0 21.9 48.0 3.8 14.4
Someone else’s home -- -- -- -- -- -- 18.2 72.7 9.1 --
Other 2.3 5.3 46.2 44.6 1.6 20.0 20.0 40.0 -- 20.0
India: N = 3064 Indonesia N = 1916
Government hospital 34.0 65.2 0.1 0.1 0.6 46.5 44.2 9.3 -- --
Government health center 31.1 64.8 2.7 -- 1.4 3.3 70.0 13.3 -- 13.3
Private hospital 50.4 49.3 0.3 -- -- -- -- -- -- --
Private clinic 53.8 46.2 -- -- -- 2.6 86.8 10.5 -- --
Own home -- 8.4 85.1 2.8 3.7 0.1 0.6 97.9 1.0 0.5
Someone else’s home -- -- 100.0 -- -- -- -- 100.0 -- --
Other 10.5 26.3 31.6 15.8 15.8 -- 1.4 96.7 0.9 0.9
Table notes: *Based on women with live or stillbirths

72
Table 9. Intended place of delivery, by actual place of delivery.*
Bangladesh N = 6392 Egypt N = 4310
Place of delivery Place of deliveryIntendedplace
of deliveryGovt
hospitalGovthealthcenter
Privatehospital
Privateclinic
Ownhome
Otherhome
Other Total Govthospital
Govthealthcenter
Privatehospital
Privateclinic
Ownhome
Otherhome
Other Total
Govt hospital 89.3 -- -- -- 7.1 -- 3.6 100.0 92.8 -- 0.4 0.4 5.9 0.4 -- 100.0
Govt health ctr -- 77.8 -- 11.1 11.1 -- -- 100.0 7.1 85.7 -- -- 7.1 -- -- 100.0
Private hospital 6.3 -- 56.3 6.3 12.5 -- 18.8 100.0 2.0 0.3 93.8 0.7 3.3 -- -- 100.0
Private clinic -- -- -- 88.2 5.9 -- 5.9 100.0 2.0 0.3 0.7 93.8 3.3 -- -- 100.0
Own home 0.2 0.1 0.1 -- 98.5 -- 0.9 100.0 6.2 0.2 0.2 3.1 90.0 0.2 0.1 100.0
Other home -- -- -- -- -- -- -- -- 10.5 -- -- -- 21.1 68.4 -- 100.0
Other 0.4 0.3 0.2 0.1 10.1 -- 88.9 100.0 -- -- -- -- -- -- 100.0 100.0
India N = 3064 Indonesia N = 1916
Govt hospital 76.0 0.6 4.2 0.2 18.2 0.1 0.7 100.0 nc nc nc nc nc nc nc
Govt health ctr 29.3 48.9 1.1 1.1 18.5 -- 1.1 100.0 nc nc nc nc nc nc nc
Private hospital 13.0 0.6 74.2 -- 12.2 -- -- 100.0 nc nc nc nc nc nc nc
Private clinic 20.6 2.9 11.8 26.5 38.2 -- -- 100.0 nc nc nc nc nc nc nc
Own home 10.8 1.5 3.9 -- 83.2 0.2 0.6 100.0 nc nc nc nc nc nc nc
Other home 57.1 -- -- -- 28.6 14.3 -- 100.0 nc nc nc nc nc nc nc
Other 35.8 -- 18.9 -- 41.5 -- 3.8 100.0 nc nc nc nc nc nc nc

73
Table notes: *Based on women with live or stillbirths.

74
Table 10. Percentage of women who perceived morbidities as serious, and percentage who soughtcare for the morbidity among women who had specific antepartum morbidities in the index pregnancy.*
Bangladesh N = 6392 Egypt N = 4310
Women withmorbidity
Women withmorbidityMorbidity
N % (1)
% perceivedserious
(2)
% soughtcare***
(3) N % (1)
% perceivedserious
(2)
% sought care***
(3)
Edema (hands and face) 1463 22.9 41.9 77.7 551 12.8 61.0 78.9
Bleeding 165 2.6 58.8 80.4 178 4.1 93.8 94.6
Fits/convulsions 190 3.0 85.8 85.8 12 (12) (10) (10)
Fever >3 days 1075 16.8 61.5 86.7 253 5.9 88.1 89.2
evere vomiting 1238 19.4 51.9 75.7 1006 23.3 51.6 78.6
Hypertension** 230 3.6 77.0 96.0 671 15.6 90.9 96.2
Urinary problems 1880 29.4 54.8 77.0 532 12.3 79.7 85.1
Non-obstetric morbidity during pregnancy
Pulmonary TB 22 (22) (16) (13) 10 (10) nc nc
Malaria 200 3.1 69.0 81.9 9 (9) nc nc
aundice 377 5.9 65.0 95.5 3 (3) nc nc
Rheumatic heart disease 324 5.1 49.1 75.5 30 0.7 nc nc

75
Varicose veins 470 7.3 39.4 67.0 315 7.3 nc nc
Table 10 continued. Percentage of women who perceived morbidities as serious, and percentage who soughtcare for the morbidity among women who had specific antepartum morbidities in the index pregnancy.*
India N = 3064 Indonesia N = 1916
Women with morbidity Women withmorbidityMorbidity
N % (1)
% perceivedas serious
(2)
% soughtcare***
(3)N % (1)
% perceivedserious
(2)
% soughtcare***
(3)
Edema (hands and face) 387 12.6 49.9 89.6 198 10.3 nc nc
Bleeding 13 (13) (11) (11) 61 3.2 nc nc
Fits/convulsions 10 (10) (9) (8) 142 7.4 nc nc
Fever >3 days 122 4.0 59.0 95.8 18 (18) nc nc
evere vomiting 589 19.2 48.2 85.6 nc nc nc nc
Hypertension** 27 0.9 (14) (11) nc nc nc nc
Urinary problems 365 12.4 30.7 65.2 nc nc nc nc
Non-obstetric morbidity during pregnancy
Pulmonary TB 6 (6) (4) (4) nc nc nc nc
Malaria 12 (12) (11) (11) nc nc nc nc

76
aundice 3 (2) (2) (2) nc nc nc nc
Rheumatic heart disease 12 (12) (10) (9) nc nc nc nc
Varicose veins 43 1.4 58.1 64.0 nc nc nc nc
Table notes: *Based on women with live and stillbirths. **Based on women whose blood pressure was measured. ***Based on women with the condition and who perceived it to be serious.Col. 1: % women with morbidity = number of women with morbidity / number of women with live or stillbirths x 100.Col. 2: % perceived as serious = number of women who perceived as serious / number of women with morbidity x 100.Col. 3: % sought care = number of women who sought care / number who perceived as serious x 100.

77
Table 11. Care seeking behavior for specific antepartum morbidities,by source of care.*
Bangladesh N = 6392
Morbidity
Govthealth center
%
Govthospital
%
Privatedoctor/clinic
%
Privatehospital
%
Pharmacy
%
Other**
%
No care
%
Total
N
Edema (hands/face) Bleeding Fits/convulsions Fever >3 days Severe vomiting Hypertension*** Urinary problems Pulmonary TB Malaria Jaundice Rheum. heart dis Varicose veins
9.013.921.915.1
9.639.110.3
(4)22.0
8.310.4
9.1
------------------------
------------------------
------------------------
1.2--
0.01.52.00.90.8
--2.41.02.11.9
28.438.252.648.532.440.537.4(10)44.862.833.721.4
61.448.025.535.056.019.651.5
(8)30.228.053.767.7
1463165190
10751238
2301880
22200377324470
India N = 3064
Edema (hands/face) Bleeding Fits/convulsions Fever >3 days Severe vomiting Hypertension*** Urinary problems Pulmonary TB Malaria Jaundice Rheum. heart dis Varicose veins
13.4(2)(3)
19.011.7
(3)14.4
(2)(1)(1)(1)
14.0
19.1(2)(2)9.98.7(5)
10.5--
(1)--
(4)(3)
15.8(4)(1)
33.026.1
(1)13.4
(2)(5)
--(1)
18.6
22.2(5)(1)
23.223.1
(2)18.9
(1)(5)(1)(2)
14.0
(5)----
9.9(5)
--(3)
----------
8.8--
(1)(1)5.9
--10.0
----
(1)(2)(2)
19.4--
(2)(5)
23.6(16)32.0
(1)----
(2)41.7
3871310
121589
27381
612
21243

78
Table 11 continued. Care seeking behavior for specific antepartum morbidities,by source of care.*
Egypt N = 4310
Morbidity
Govthealthcenter
%
Govthospital
%
Privatedoctor/clinic
%
Privatehospital
%
Pharmacy
%
Other**
%
No care
%
Total
N
Edema (hands/face) Bleeding Fits/convulsions Fever >3 days Severe vomiting Hypertension*** Urinary problems Pulmonary TB Malaria Jaundice Rheum. heart dis Varicose veins
7.15.1
--14.2
7.115.216.2
ncncncnc
8.9
5.325.3
(2)12.6
5.611.511.3
ncncncnc
5.1
38.856.2
(8)41.934.561.739.5
ncncncnc
32.1
1.31.7
--3.21.54.54.1ncncncnc
1.9
0.90.6
--11.1
3.00.44.3ncncncnc
0.6
0.50.6
----
0.20.7
--ncncncnc--
46.110.7
(2)17.048.0
6.024.6
ncncncnc
51.4
551178
12253
1006671532
ncncncnc
315
Indonesia N = 1916
Edema (hands/face) Bleeding Fits/convulsions Fever >3 days Severe vomiting Hypertension*** Urinary problems Pulmonary TB Malaria Jaundice Rheum. heart dis Varicose veins
78.375.488.9(15)
ncncncncncncncnc
(4)(3)(8)(1)ncncncncncncncnc
13.1(7)(8)(2)ncncncncncncncnc
(10)(10)
----ncncncncncncncnc
--------ncncncncncncncnc
4.66.60.07.7ncncncncncncncnc
1.50.00.00.7ncncncncncncncnc
198611842ncncncncncncncnc
Table notes: *Based on women with live or stillbirths.**Includes traditional practitioners, TBAs, village doctors, homeopaths and medical assistants.***Based on women whose blood pressure was measured.

79
Table 12. Specific intrapartum morbidities in the index pregnancy,* percent who perceivedthem as serious, and percent who sought care.
Bangladesh N = 6392 Egypt N = 4310
Women withmorbidity
Women withmorbidityMorbidity
N %(1)
% perceivedas serious
(2)
% soughtcare(3)
N %(1)
% perceivedserious
(2)
% soughtcare(3)
Labor >18 hours 419 6 6 85 2 90 8 156 3 6 84 6 81 1
Fits/convulsions 224 3.5 81.7 83.6 6 (6) (6) (6)
Loss of consciousness 0 -- -- -- 103 2.4 85.4 77.3
Excessive bleeding 1255 56.7 56.7 70.5 178 4.1 98.3 94.3
Ruptured uterus 0 -- -- -- 13 (13) (11) (10)
Any tear 98 1.5 58.2 78.9 427 9.9 61.4 70.6

80
Table 12 continued. Specific intrapartum morbidities in the index pregnancy,* percent who perceivedthem as serious, and percent who sought care.
India N = 3064 Indonesia N = 1916
Women withmorbidity
Women withmorbidityMorbidity
N % (1)
% perceivedas serious
(2)
% soughtcare(3)
N % (1)
% perceivedas serious
(2)
% soughtcare(3)
Labor >18 hours 41 1 3 92 7 47 4 96 5 0 nc nc
Fits/convulsions 6 (6) (6) (6) 37 1.9 nc nc
Loss of consciousness 29 0.9 68.9 90.0 62 3.2 nc nc
Excessive bleeding 27 0.9 62.9 100.0 292 10.5 nc nc
Ruptured uterus 0 -- -- -- nc nc nc nc
Any tear 195 6.4 nc nc nc nc nc nc
Table notes: *Based on women with live or stillbirths. Each column is a subset of the previous column; i.e. of women with morbidity, whatpercent perceived it as serious? Of women who perceived it as serious, what percent sought care?
Col. 1: % women with morbidity = number of women with morbidity/ number of women with live or stillbirths x 100. Col. 2: % perceived as serious = number of women who perceived as serious/ number of women with morbidity x 100. Col. 3: % sought care = number of women who sought care/ number who perceived as serious x 100.

81
Table 13. Care seeking behavior for specific intrapartum morbidities,*by source of care.
Bangladesh N = 6392
MorbidityGovt health
center%
Govthospital
%
Private doctor/ clinic
%
Privatehospital
%Pharmacy
%Other
%No care
%Total
N
Labor > 18 hours 28.4 -- -- -- 0.5 52.9 18.1 419
Fits/convulsions 28.5 -- -- -- 0.9 41.1 29.5 224
Loss of consciousness nc nc nc nc nc nc nc nc
Excessive bleeding 11.2 -- -- -- 1.6 29.7 57.5 1255
Ruptured uterus nc nc nc nc nc nc nc nc
Torn vagina/cervix 20.4 0.0 0.0 0.0 3.1 29.6 46.9 98
India N = 3064
Labor > 18 hours 4.9 58.5 0.0 24.4 0.0 9.8 2.4 41
Fits/convulsions --
0.0
(2)
50.0
--
0.0
--
0.0
--
0.0
(4)
0.0
--
50.0
6
2
Loss of consciousness -- 27.6 3.4 10.4 0.0 55.2 3.4 29
Excessive bleeding -- 40.7 3.8 22.2 0.0 29.6 3.7 27
Ruptured uterus -- -- -- -- -- -- -- 0
Torn vagina/cervix 2.6 50.3 0.0 26.6 0.0 20.5 -- 195

82
Table 13 continued. Care seeking behavior for specific intrapartum morbidities,*by source of care.
Egypt N = 4310Morbidity
Govt healthCenter
%
Govthospital
%
Private doctor/clinic
%
Privatehospital
%Pharmacy
%Other
%No care
%Women
N
Labor > 18 hours 3.2 23.1 37.2 3.8 -- 2.6 29.5 156
Fits/convulsions -- (2) (3) -- -- (1) -- 6
Loss of consciousness 2.9 22.3 33.0 1.9 2.9 7.8 29.1 103
Excessive bleeding 3.9 29.2 46.1 1.7 3.9 8.4 6.7 178
Ruptured uterus -- 69.2 -- -- -- -- 30.8 13
Torn vagina/cervix 2.6 9.4 22.7 0.7 11.7 4.7 48.2 427
Indonesia N = 1916
Labor >18 hours 71.9 2.1 14.6 -- -- 10.4 1.0 96
Fits/convulsions 75.7 5.4 16.2 -- -- 2.7 -- 37
Loss of consciousness 75.8 0.0 8.1 1.6 -- 14.5 -- 62
Excessive bleeding 78.4 0.3 9.3 0.7 -- 11.0 0.3 292
Ruptured uterus nc nc nc nc nc nc nc nc
Torn vagina/cervix nc nc nc nc nc nc nc nc
Table notes: * Based on women with live and still births

83
Table 14. Specific postpartum morbidities in the index pregnancy,*percent who perceived them as serious, percent who sought care.
Bangladesh N = 6392 Egypt N = 4310
Women with morbidity Women with morbidity
MorbidityN % (1)
% perceivedas serious
(2)
% sought care***
(3)N % (1)
% perceivedas serious
(2)
% sought care***
(3)
Pelvic pain 3135 19.0 65.6 87.4 944 21.9 55.2 75.6
Painful urination 1238 19.4 46.3 71.2 327 7.6 80.7 75.8
Excessive bleeding 1096 17.1 61.6 74.8 153 3.5 97.4 94.0
High fever 1054 16.5 67.5 86.5 668 15.5 90.0 94.7
Foul smell/discharge 65 10.2 44.6 51.0 424 9.8 56.8 66.8
Breast condition** 425 6.6 60.0 76.4 625 14.5 67.4 82.2
Shock/loss of consciousness 288 4.5 66.0 92.6 89 2.1 87.6 80.8
Depression >2 weeks 416 2.6 16.4 14.7 121 12.8 43.0 44.2
Depression <2 weeks 167 6.5 41.9 44.3 36 0.8 66.7 45.8
Fits/Convulsions 92 1.4 78.3 84.7 6 -- (6) (6)

84
Table 14 continued. Specific postpartum morbidities in the index pregnancy,*percent who perceived them as serious, percent who sought care.
India N = 3064 Indonesia N = 1916
Women with morbidity Women with morbidityMorbidity
N % (1)
% perceivedas serious
(2)
% soughtcare***
(3) N % (1)
% perceivedas serious
(2)
% soughtcare***
(3)
Pelvic pain 136 4.4 67.6 80.4 290 15.2 37.6 89.9
Painful urination 111 3.6 62.2 72.5 110 5.8 50.0 85.5
Excessive bleeding 55 1.8 60.0 66.7 215 11.2 28.4 100.0
High fever 163 5.3 68.1 94.6 257 13.4 23.3 100.0
Foul smell/discharge 14 0.5 (8) (5) 86 4.5 24.4 100.0
Breast condition** 87 2.9 70.1 83.6 40 2.1 75.0 100.0
Shock/loss of consciousness 26 0.9 57.7 73.3 62 3.2 35.5 100.0
Depression >2 weeks 3 0.1 (3) (2) 0 -- -- --
Depression <2 weeks 4 0.1 (3) (2) 91 4.8 39.6 38.9
Fits/Convulsions 11 (11) (9) (8) 20 (20) (8) (7)
Table notes: * Based on women with live or stillbirths. ** Breast abscess in Bangladesh and Indonesia, mastitis and cracked nipples in Egypt and India. *** Note that, in addition, women sought care who did not perceive the morbidity as serious.
Col. 1: % women with morbidity = number of women with morbidity / number of women with live or stillbirths x 100.Col. 2: % perceived as serious = number of women who perceived as serious / number of women with morbidity x 100.Col. 3: % sought care = number of women who sought care / number who perceived as serious x 100.
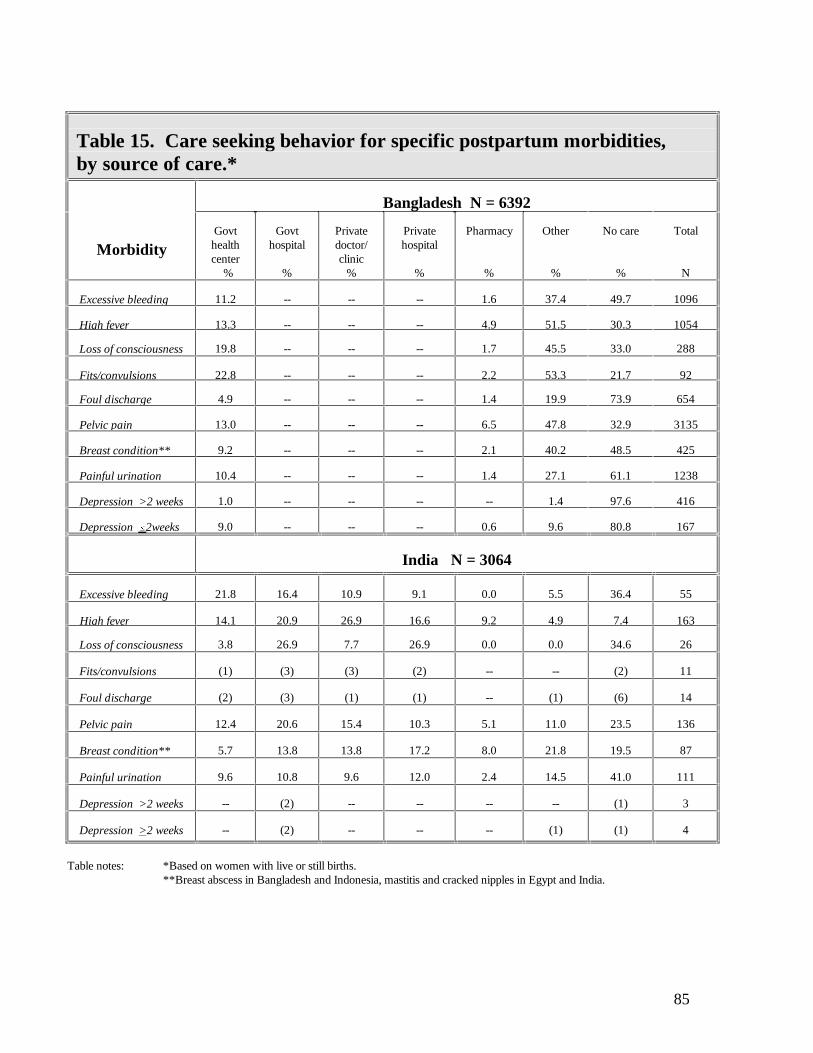
85
Table 15. Care seeking behavior for specific postpartum morbidities,by source of care.*
Bangladesh N = 6392
MorbidityGovthealthcenter
%
Govthospital
%
Privatedoctor/clinic
%
Privatehospital
%
Pharmacy
%
Other
%
No care
%
Total
N
Excessive bleeding 11.2 -- -- -- 1.6 37.4 49.7 1096
High fever 13.3 -- -- -- 4.9 51.5 30.3 1054
Loss of consciousness 19.8 -- -- -- 1.7 45.5 33.0 288
Fits/convulsions 22.8 -- -- -- 2.2 53.3 21.7 92
Foul discharge 4.9 -- -- -- 1.4 19.9 73.9 654
Pelvic pain 13.0 -- -- -- 6.5 47.8 32.9 3135
Breast condition** 9.2 -- -- -- 2.1 40.2 48.5 425
Painful urination 10.4 -- -- -- 1.4 27.1 61.1 1238
Depression >2 weeks 1.0 -- -- -- -- 1.4 97.6 416
Depression #2weeks 9.0 -- -- -- 0.6 9.6 80.8 167
India N = 3064
Excessive bleeding 21.8 16.4 10.9 9.1 0.0 5.5 36.4 55
High fever 14.1 20.9 26.9 16.6 9.2 4.9 7.4 163
Loss of consciousness 3.8 26.9 7.7 26.9 0.0 0.0 34.6 26
Fits/convulsions (1) (3) (3) (2) -- -- (2) 11
Foul discharge (2) (3) (1) (1) -- (1) (6) 14
Pelvic pain 12.4 20.6 15.4 10.3 5.1 11.0 23.5 136
Breast condition** 5.7 13.8 13.8 17.2 8.0 21.8 19.5 87
Painful urination 9.6 10.8 9.6 12.0 2.4 14.5 41.0 111
Depression >2 weeks -- (2) -- -- -- -- (1) 3
Depression >2 weeks -- (2) -- -- -- (1) (1) 4
Table notes: *Based on women with live or still births. **Breast abscess in Bangladesh and Indonesia, mastitis and cracked nipples in Egypt and India.

86
Table 15 continued. Care seeking behavior for specific postpartummorbidities, by source of care.*
Egypt N = 4310
Morbidity
Govthealthcenter
%
Govthospital
%
Privatedoctor/clinic
%
Privatehospital
%
Pharmacy
%
Other
%
No care
%
Total
N
Excessive bleeding 3.9 28.1 46.4 3.3 7.8 2.6 7.8 153
High fever 10.6 13.2 48.2 1.5 15.4 1.8 9.1 668
Loss of consciousness 6.7 20.2 44.9 1.1 1.1 0.0 25.8 89
Fits/convulsions -- (1) (5) -- -- -- -- 6
Foul discharge 6.1 4.0 23.6 0.7 11.1 1.9 52.6 424
Pelvic pain 4.4 6.9 26.3 1.4 16.7 3.5 40.8 944
Breast condition** 4.8 5.3 34.1 1.0 21.0 0.6 33.3 625
Painful urination 10.4 11.6 38.8 2.1 5.2 0.0 31.8 327
Depression >2 weeks 0.0 4.1 12.4 0.8 1.7 0.8 80.2 121
Depression #2weeks 0.0 5.6 27.8 0.0 0.0 0.0 66.7 36
Indonesia N = 1916
Excessive bleeding nc nc nc nc nc nc nc nc
High fever nc nc nc nc nc nc nc nc
Loss of consciousness nc nc nc nc nc nc nc nc
Fits/convulsions nc nc nc nc nc nc nc nc
Foul discharge nc nc nc nc nc nc nc nc
Pelvic pain nc nc nc nc nc nc nc nc
Breast condition** nc nc nc nc nc nc nc nc
Pain urination nc nc nc nc nc nc nc nc
Depression >2 weeks nc nc nc nc nc nc nc nc
Depression >2 weeks nc nc nc nc nc nc nc nc

87
This page left blank intentionally.

88
Table 16. Specific long-term morbidities,* percent who sought care,and percent with lifestyle changes.
Bangladesh N = 6493 Egypt N = 4522
Morbidity Women with
morbidity
N (1) %
Soughtcare
(2) %
Affected daily
activities
(3) %
Affectedrelation-ship withhusband(4) %
Women withmorbidity
N (1) %
Soughtcare
(2) %
Affecteddaily
activities
(3) %
Affectedrelationship
withhusband(4) %
Incontinence/VVF** 502 7.7 22.3 19.3 8.2 282 6.2 17.0 11.7 6.0
Rectovaginal fistula Passage of stools Passage of gas
5 0.1331 5.1
(2)16.3
(2)15.4
(1)6.7
7 0.249 1.1
(0)4.1
(0)10.2
(0)4.1
Uterine prolapse 983 15.1 35.2 -- 9.5 509 1.3 27.3 nc 29.5
Dyspareunia 516 7.9 22.7 -- 34.3 94 .1 91.5 nc 67.0
Hemorrhoids 280 4.3 52.5 -- -- 567 2.5 44.1 nc nc
India N = 3339 Indonesia N = 1926
Incontinence/VVF** 104 3.1 20.2 na na 44 2.31 22.7 15.9 13.6
Rectovaginal fistula Passage of stools Passage of gas
0 --2 0.06
--(1)
--(2) 100.0
3 0.216 0.8
(0)(2)
(2)(2)
(0)(2)
Uterine Prolapse 111 3.3 24.3 nc 0.0 316 16.4 85.42 nc 25.5
Dyspareunia 55 1.7 16.4 nc 0.0 8 0.4 (1) nc (4)
Hemorrhoids 45 1.4 46.7 nc na 44 2.3 61.4 nc nc
Table notes: *Based on all women. **VVF = vesicovaginal fistula. 1 Probably under-reported because of translation problem. 2 Mostly massage by TBA.Col. 1: % women with morbidity = number of women with morbidity / all women.Col. 2: % sought care = number of women who sought care / number of women with morbidity.

89
Col. 3: % women with changed daily life = number of women with changed daily life / number of women with morbidity.Col. 4: % women with changed marital relationship = number of women with changed marital relationship / number of women with morbidity.

90
Table 17. Care seeking behavior for specific long-term morbidities,*by source of care.
Bangladesh N = 6493
MorbidityGovthealthcenter
%
Govthospital
%
GovtCom
healthworker %
Privatedoctor/clinic
%
Privatehospital
%
Pharmacy
%
Other**
%
Nocare
%
Total
N
Incontinence/ VVF 7.8 0.0 0.0 0.0 0.6 0.0 14.8 77.7 502
Rectovaginal fistula Passage of stools Passage of gas
(2)5.2
-- -- -- -- --0.3
--10.9
(3)83.6
5330
Uterine prolapse lapse 12.3 -- -- -- -- 0.0 22.8 64.9 983
Dyspareunia 6.0 -- -- -- -- 0.2 12.5 81.0 516
Hemorrhoids 7.0 0 0 0 0 0 45.4 47.5 280
India N = 3339
Incontinence/VVF 3.9 1.0 -- 6.7 1.0 1.9 1.9 83.6 104
Rectovaginal fistula Passage of stools Passage of gas -- (1) -- -- -- -- -- (1) 2
Uterine prolapse 0.9 6.3 -- 5.4 3.6 -- 3.6 80.2 111
Dyspareunia -- -- -- 3.6 7.3 -- 3.6 85.5 55
Hemorrhoids 6.7 6.7 -- 15.6 6.7 -- 11.1 53.3 45
Table notes: *Based on all women.**Includes traditional practitioners, TBAs, village doctors, homeopaths and medical assistants.

91
Table 17 continued. Care seeking behavior for specific long-term morbidities,*by source of care.
Egypt N = 4522
Morbidity
Govthealthcenter
%
Govt hos-pital
%
Govtcom
healthworker
%
Privatedoctor/clinic
%
Privatehospital
%
Pharmacy
%
Other**
%
Nocare
%
Total
N
Incontinence/VVF 4.3 3.5 0.0 9.2 0.7 0.4 0.4 81.6 282
Rectovaginal fistula Passage of stools Passage of gas
----
----
----
--4.1
----
----
----
--95.9
749
Uterine prolapse lapse
4.3 3.1 -- 19.1 0.2 -- 0.6 72.7 509
Dyspareunia 4.3 1.1 -- 14.9 -- -- 1.1 78.7 94
Hemorrhoids 4.8 5.8 -- 25.7 2.6 4.9 0.2 55.9 567
Indonesia N = 1926
Incontinence/VVF 75.0 0 0 9.1 0 0 15.9 0 44
Rectovaginal fistula Passage of stools Passage of gas
(1)(6)
--(2)
----
--(4)
----
----
(2)(4)
----
316
Uterine prolapse 79.1 1.3 -- 9.2 0.3 -- 9.5 0.6 316
Dyspareunia (7) (1) -- -- -- -- -- -- 8
Hemorrhoids 77.3 -- -- 4.5 2.3 -- 15.9 -- 44

92
This page left blank intentionally.

93
Table 18. Percentage of women with interventions atthe time of the index pregnancy.*
Intervention BangladeshN = 6392
EgyptN = 4310
IndiaN = 3064
IndonesiaN = 1916
Given drugs to accelerate delivery Yes No Don’t know/remember Total
24.2 75.8
--100.0
41.0 58.6 0.4100.0
45.3 54.7 --
100.0
ncncncnc
Cesarean section Yes No Total
0.2 99.8100.0
4.2 95.8100.0
5.5 94.5100.0
0.7 99.3100.0
Instrumental delivery** Yes No Total
0.2 99.8100.0
4.2 95.8100.0
4.5 95.5100.0
1.6 98.4100.0
Episiotomy Yes No Don’t know/remember Total
0.5 99.5
--100.0
9.6 90.2 0.2100.0
19.3 80.7
--100.0
ncncncnc
Hysterectomy Yes No Don’t know/remember Total
--100.0
--100.0
0.2 99.8 --
100.0
--100.0
--100.0
0.8 97.0 2.3100.0
Number of interventions per woman 0 1 2 3 4 5 Total
73.4 22.5 3.8 0.3 -- --
100.0
53.8 35.5 8.8 1.9
-- --
100.0
49.5 30.2 16.9 3.4
-- --
100.0
97.02.90.1
------
100.0
Table notes: *Based on women with live or stillbirths. ** Not including cesarean section.

94
Table 19. Percent of women with intrapartum morbidity andspecific intervention*
Bangladesh N = 6392
MorbidityWomen with
condition Drugs
%
Cesareansection
%
Instrumentaldelivery
%
Episiotomy
%
Hysterectomy
%None
%
Labor > 18 hours 419 71.6 0.7 1.0 1.2 nc na
Fits/convulsions or loss ofconsciousness
nc nc nc nc nc nc nc
Excessive bleeding 1255 34.7 0.2 0.3 0.5 nc na
Ruptured uterus 0 -- -- -- -- -- --
Any tear 98 54.1 -- 2.0 6.1 nc na
No morbidity na 96.9 0.0 0.6 2.5 nc na
India N = 3064
Labor >18 hours 41 82.9 26.8 21.9 39.0 0.0 14.6
Fits/convulsions 6 (1) -- -- (1) -- (4)
Loss of consciousness 29 46.4 0.0 17.8 25.0 0.0 50.0
Excessive bleeding 27 66.7 18.5 3.7 18.5 0.0 25.9
Ruptured uterus 0 -- -- -- -- -- --
Any tear 195 61.0 0.0 3.6 0.0 0.0 39.0
No morbidity 2611 41.1 3.6 3.4 19.6 0.0 53.3

95

96
Table 19 continued. Percent of women with intrapartum morbidity andspecific intervention*
Egypt N = 4310
MorbidityWomen
withcondition
Drugs
%
Cesareansection
%
Instrumentaldelivery
%
Episiotomy
%
Hysterectomy
%
None
%
Labor >18 hours 156 58.3 12.8 14.7 27.6 -- 26.3
Fits/convulsions 6 (5) (1) (1) (2) -- --
Loss of consciousness 103 53.4 3.9 12.6 21.4 1.9 34.0
Excessive bleeding 178 59.6 8.4 13.5 21.9 1.1 28.7
Ruptured uterus 13 (7) (4) (2) (2) (6) (3)
Any tear 427 50.1 2.6 5.6 14.1 0.2 42.9
No morbidity 3555 38.6 4.0 3.3 8.0 0.0 57.0
Indonesia N = 1916
Labor >18 hours 97 nc 28.6 71.4 nc 0.0 na
Fits/convulsions 37 nc 16.7 66.6 nc 16.7 na
Loss of consciousness -- nc 22.3 44.4 nc 33.3 na
Excessive bleeding 29 nc 26.7 46.6 nc 26.7 na
Ruptured uterus nc nc nc nc nc nc na
Any tear nc nc nc nc nc nc na

97
No morbidity na na na na na na na
Table notes: *Based on women with live or stillbirths. Women may have more than one complication or intervention.

98
This page left blank intentionally.

99
Table 20. Specific antepartum morbidities, by outcomeof index pregnancy.*
BangladeshN = 6493
EgyptN =4522
IndiaN = 3339
IndonesiaN = 1926
Morbidi-ty
Women withmorbidity
N
No livebirth
%
Women withmorbidity
N
No livebirth
%
Women withmorbidity
N
No livebirth
%
Women withmorbidity
N
No live birth
%
Edema(hands/ face)
1476 3.7 574 6.6 387 1.8 199 2.5
Bleeding 173 13.3 205 16.1 17 (4) 61 8.2
Fits/convulsions 192 4.7 13 (1) 10 0 18 0
Fever >3 days 1096 4.4 272 9.9 132 11.3 142 0.7
Severevomiting
1256 3.8 1051 5.0 617 5.0 nc nc
Hypertension** 235 4.3 718 9.1 34 0.3 nc nc
Urinary problems 1905 3.7 559 5.7 376 5.6 nc nc
Non-obstetric morbidity during pregnancy
Pulmonary TB 22 (1) 10 -- 6 -- nc nc
Malaria 205 3.9 10 (1) 13 (1) nc nc
Jaundice 386 4.9 3 -- 4 (1) nc nc
Rheumatic heart dis-ease
326 2.8 33 18.2 12 -- nc nc
Varicose veins 473 2.7 331 5.7 44 (1) nc nc

100
Table notes: *Based on all women.**Based on women whose blood pressure was measured.
For each country, the second column refers only to the subset of women who had the morbidity specified.
Table 21. Specific intrapartum morbidities or interventions,by outcome of index pregnancy.*
BangladeshN = 6392
EgyptN = 4309
IndiaN = 3064
IndonesiaN = 1916
Morbidity Women withmorbidity
N
Women withstillbirth
%
Women withmorbidity
N
Women withstillbirth
%
Women withmorbidity
N
Women withstillbirth
%
Women withmorbidity
N
Women withstillbirth
%
Labor >18 hours 419 6.2 156 2.6 41 -- 97 3.1
Fits/convulsions 6 -- 6 (1) 37 --
Loss of conscious-ness
224** 6.2 103 1.9 29 6.9 0 --
Ruptureduterus
nc nc 13 (3) 0 -- 0 --
Torn vagina/ cervix 98 3.1 427 0.7 195 1.0 0 --
Excessivebleeding
1255 3.2 178 3.4 27 11.1 295 2.7
Interventions
Cesareansection
11 (1) 182 2.2 168 -- 14 28.6
Instrumental delivery 14 (2) 180 3.3 130 0.8 32 9.7
Hysterectomy nc nc 8 (2) 0 -- 15 (2)
Table notes: * Based on women with live or stillbirths.** In Bangladesh, Afits/convulsions@ and Aloss of consciousness@ reported together.

101
For each country, the second column refers only to the subset of women who had the morbidity specified.

102
Table 22. Specific postpartum morbidities in the index pregnancy,* by outcome of index pregnancy.
BangladeshN = 6493
EgyptN = 4522
IndiaN = 3339
IndonesiaN = 1926
MorbidityWomen
withmorbidity
N
Womenwith
stillbirth%
Womenwith
morbidityN
Women with
stillbirth%
Womenwith
morbidityN
Womenwith
stillbirth%
Women with
morbidityN
Womenwith
stillbirth%
Pelvic pain 3182 3.9 944 1.1 111 1.8 294 3.1
Painful urination 1257 3.9 327 0.9 83 2.4 111 1.8
Excessive bleeding 1137 6.9 153 3.3 55 -- 216 4.6
High fever 1080 6.0 668 1.8 142 2.8 258 1.9
Foul smell/discharge 666 5.0 424 1.7 14 7.1 87 4.6
Breast condition** 431 3.7 625 1.1 64 9.4 40 --
Shock/loss of consciousness 292 5.5 89 4.5 26 -- 63 6.3
Depression >2 weeks 177 22.6 121 2.5 3 33.3 -- --
Depression <2 weeks 431 13.0 36 5.6 4 -- 92 6.5
Fits/convulsions 95 7.4 6 -- 11 -- 20 (5)
Table notes: *Based on all women. **Breast abscess in Bangladesh and Indonesia, mastitis and cracked nipples in Egypt and India.

103
Table 23. Percentage of women with morbidities in the index pregnancy, by timing and severity of morbidity.*
Bangladesh N=6493 Egypt N = 4522Number ofmorbidities Life
threateningLife threatening or
seriousAll Life threat-
eningLife threatening
or seriousAll
Antepartum morbidities
0 92.1 52.7 42.6 95.0 55.7 49.7
1 6.9 27.0 24.5 4.9 29.3 28.0
2 0.9 13.1 16.5 0.1 11.5 14.8
>3 0.1 7.2 16.4 -- 3.5 7.5
Intrapartum morbidities
0 78.7 73.8 73.4 95.6 92.2 82.2
1 19.9 22.1 22.2 4.4 7.3 15.3
2 1.5 3.7 3.9 0.05 0.5 2.2
>3 -- 0.4 0.5 -- 0.05 0.4
Postpartum morbidities
0 81.6 62.7 34.8 96.2 75.6 54.4
1 17.7 22.9 28.5 3.7 18.6 24.5
2 0.6 10.2 17.7 0.1 5.0 12.9
>3 -- 4.2 19.0 -- 0.8 8.2
Ante-, intra-, and postpartum morbidities of the index pregnancy
0 68.0 34.9 20.1 89.3 44.9 33.1
1 17.3 22.9 19.0 8.5 27.2 20.9
2 11.8 15.8 15.3 1.8 15.6 16.5
3 2.2 11.2 12.2 0.3 7.6 11.7
4 0.6 6.9 9.7 0.05 2.7 7.8
5 0.1 8.2 23.7 -- 1.9 10.1

104
Table 23 continued. Percentage of women with morbidities in the index pregnancy, by timing and severity of morbidity.*
India N = 3339 Indonesia N = 1926**
Number ofmorbidities
Life threatening
Life threatening orserious
All Life threatening
Life threateningor serious
All
Antepartum morbidities
0 98.2 74.6 60.0 95.8 80.1 na
1 1.8 20.8 23.1 4.2 17.9 na
2 -- 4.4 12.0 -- 2.0 na
>3 -- 0.2 4.6 -- 0.1 na
Intrapartum morbidities
0 98.2 89.9 83.6 83.2 79.7 na
1 1.8 7.9 13.0 16.1 18.3 na
2 0 2.6 3.0 0.7 1.7 na
>3 -- 0.5 0.4 -- 0.2 na
Postpartum morbidities
0 98.1 84.1 76.5 88.7 77.0 na
1 1.9 13.7 17.3 10.6 15.8 na
2 0.0 2.1 4.6 0.7 5.4 na
>3 -- 0.1 1.6 -- 1.9 na
Ante-, intra-, and postpartum morbidities of the index pregnancy
0 95.3 54.5 41.7 na na na
1 4.3 28.5 25.6 na na na
2 0.3 12.2 18.1 na na na
3 0.0 3.1 8.9 na na na
4 -- 1.1 4.0 na na na
5 -- 0.2 1.8 na na na
Table notes: * Based on all women.** Indonesia’s numbers are underestimates, especially for the antepartum period,
because questions were not asked about all morbidities.

105
This page left blank intentionally.

106
Table 24. Number of long-term morbidities.*
BangladeshN = 6493
EgyptN = 4522
IndiaN = 3339
IndonesiaN = 1926Number of
morbiditiesTotal
women% Total
women% Total
women% Total
women%
0 4639 71.4 3367 74.5 3065 91.8 1547 80.3
1 1280 19.8 875 19.3 235 7.0 335 17.4
2 416 6.4 218 4.8 36 1.1 36 1.9
>3 158 2.4 62 1.4 3 0.1 8 0.4
Total 6493 100.0 4522 100.0 3339 100.0 1926 100.0
Table notes: *Based on all women, and can have been caused by other than the index pregnancy. Long-term morbidity includes VVF, RVF, incontinence, uterine prolapse, dyspareunia,
hemorrhoids.

107
Table 25. Ratio of morbidities* to maternal mortality.
Bangladesh (MMR = 460) Egypt (MMR = 190)Ratio
Lifethreatening**
Lifethreatening or
serious***
All Lifethreatening**
Lifethreatening or
serious***
All
Number of antepartum morbiditiesper maternal death
19.9 175.7 270.0 24.5 331.7 439.9
Number of intrapartum morbiditiesper maternal death
51.6 69.6 69.6 22.7 94.5 108.8
Number of postpartum morbiditiesper maternal death
43.0 114.0 304.9 19.5 165.1 418.1
Number of antepartum, intrapartumand postpartum morbidities permaternal death
114.4 259.3 643.4 66.8 591.4 966.9
Number of long-term sequelae per maternal death
-- 29.2 91.2 -- 41.7 185.8
Number of morbidities (all types)per maternal death
114.4 338.5 734.6 66.8 633.0 1152.7

108
Table 25 continued. Ratio of morbidities* to maternal mortality.
India (MMR = 240) Indonesia (MMR = 450) Ratio
Lifethreatening**
Life threatening orserious***
All Lifethreatening**
Life threatening orserious***
All
Number of antepartum morbiditieser maternal death
5.7 144.6 294.9 17.6 83.8 na
Number of intrapartum morbiditieser maternal death
8.9 68.8 96.7 70.7 85.3 na
Number of postpartum morbiditieser maternal death
9.4 86.4 149.4 48.2 97.8 na
Number of antepartum, intrapartumnd postpartum morbidities permaternal death
24.0 299.8 541.0 112.0 148.7 na
Number of long-term sequelaeper maternal death
-- 0.3 45.3 25.1 41.5 na
Number of morbidities (all types)per maternal death
24.0 300.1 586.3 na na na
Table notes:*Based on all morbidities to women with live or stillbirths. Each woman can report one or more morbidities in each of the four timeperiods (antepartum, intrapartum, postpartum, long-term).
**Life-threatening includes malaria, hemorrhage and fits/convulsions at any time in the pregnancy.***Serious includes the following:Antepartum C edema, hypertension, fever >3 days, severe vomiting, jaundice pulmonary TB.
Intrapartum C labor >18 hours, vaginal or cervical tear.Postpartum C fever >3 days, shock, foul discharge.
Long-term C vesicovaginal and rectovaginal fistulae.

109
Table 26. Ratio of women with morbidities* to maternal mortality.
Bangladesh MMR = 460 Egypt MMR = 190 Ratio
Lifethreatening**
Life threatening orserious***
All Lifethreatening**
Life threateningor serious***
All
Number of women with antepartum morbidities per maternal death
17.8 107.0 129.9 26.3 233.2 264.2
Number of women with intrapartummorbidities per maternal death
48.2 59.4 60.2 23.2 41.5 93.7
Number of women with postpartummorbidities per maternal death
41.5 84.5 147.6 20.0 128.4 240.0
Number of women with ante-, intra- and post-partum morbidities per maternal death
72.5 147.3 180.7 56.3 290.0 352.1
Number of women with long-term sequelae per maternal death
-- 26.7 64.6 -- 37.9 134.2
Number of women with morbidities (all types)per maternal death
72.5 153.1 186.1 56.3 296.8 374.2

110
Table 26 continued. Ratio of women with morbidities* to maternal mortality
India (MMR = 240) Indonesia (MMR = 450) Ratio
Lifethreatening**
Life threatening orserious***
All Lifethreatening**
Life threatening orserious***
All
Number of women with antepartum morbidi-ties per maternal death
5.0 105.9 166.6 2 316 318
Number of women with intrapartummorbidities per maternal death
7.6 45.7 55.0 1 377 378
Number of women with postpartum morbidi-ties per maternal death
8.1 66.1 98.1 1 575 576
Number of women with ante-, intra- andpostpartum morbidities per maternal death
19.5 174.6 238.3 -- 908 908
Number of women with long-termsequelae per maternal death
-- 0.2 24.5 -- 231 231
Number of women with morbidities (alltypes) per maternal death
19.5 174.8 251.3 -- 908 908
Table notes: *Based on all women. Multiple morbidities are not included. ** Life-threatening includes malaria, hemorrhage and fits/convulsions at any time in the pregnancy.
***Serious includes the following: Antepartum C edema, hypertension, fever >3 days, severe vomiting, jaundice pulmonary TB. Intrapartum C labor >18 hours, vaginal or cervical tear.
Postpartum C fever >3 days, shock, foul discharge.

111

112
REFERENCES
AbouZahr C, Royston E. Maternal Mortality: A Global Factbook. Geneva: World HealthOrganization, 1991.
Asociación Demografica Salvadoreña and the Centers for Disease Control and Prevention. Encuesta Nacional de Salud Familiar (FESAL-93). Atlanta: Centers for Disease Control andPrevention, 1994.
Bang RA, AT Bang, M Baitule, et al. High prevalence of gynecological diseases in rural Indianwomen. Lancet 1989;1(8629):85-88.
Bhatia J, J Cleland. Self-reported symptoms of gynecological morbidity and their treatment inSouth India. Stud Fam Plann 1995; 26,4:203-16.
Bhatia J, J Cleland. Obstetric morbidity in South India: Results from a community survey. SocSci Med 1996;43:1507-16.
DANIDA Terminal Evaluation. Cited in Feruson AF and Co. Children and Women in TamilNadu C A Situation Analysis 1990. A study conducted for the Government of Tamil Nadu.
Datta KK, RS Sharma, PMA Razack et al. Morbidity amongst women in Alwar, Rajasthan C acohort study. Health and Population C Perspectives and Issues 1980;3:282-92.
Demographic and Health Surveys. National Safe Motherhood Survey 1993. Calverton, MD:Philippines National Statistics Office, and Macro International Inc, 1994.
de Graft-Johnson JE. Determinants of maternal morbidity in Bosomtwe-Atwima-KwanwomaDistrict [of Ghana]. Diss. University of North Carolina at Chapel Hill, 1994.
Egyptian Fertility Care Society. The Study of the Prevalence and Perception of MaternalMorbidity in Menoufeya Governorate, Egypt. Cairo: Egyptian Fertility Care Society, 1995.
Fauveau V, Stewart K, Khan SA, Chakraborty J. Effect on mortality of community-basedmaternity-care programme in rural Bangladesh. Lancet 1991;338(8776):1183-89.
Fortney JA. Reproductive Morbidity: A Conceptual Framework. FHI Working Paper 95-02.Research Triangle Park NC: Family Health International, 1995.
Fortney JA. The importance of family planning in reducing maternal mortality. Stud Fam Plann1987;18:109-114.
Fortney JA, Susanti I, Gadalla S, Saleh S, Feldblum PJ, Potts M. Maternal mortality in Indonesiaand Egypt. Int J Gynecol Obstet 1988;26:21-32.

113
Franks AL, Kendrick JS, Olson DR, Atrash HK, Saftlas AF, Moien M. Hospitalization forpregnancy complications, United States, 1986 and 1987. Am J Obstet Gynecol 1992;166:1339-1344.
Ibrahim MM, Rizk H, Appel LJ, et al, for the NHP Investigative Team. Hypertension prevalence,awareness, treatment, and control in Egypt. Hypertension 1995; 26:886-890.
Maine D, McCarthy J, Ward VM. Guidelines for Monitoring Progress in the Reduction ofMaternal Mortality [A Work in Progress]. New York: UNICEF Statistics and MonitoringSection, 1992.
Maine D, Ward V, El Tahir AH. Meeting the Community Halfway: Programming Guidelinesfor the Reduction of Maternal Mortality. New York: UNICEF, 1993.
Saleh S. Maternal mortality in Menoufia, Egypt 1981-1983. In Omran A et al, eds. High RiskMothers and Newborns: Detection, Management and Prevention. Thun: Ott Publishers &Printers, 1987.
Stanton C, K Hill, C AbouZahr, T Wardlaw. Modeling maternal mortality in the developingworld. Paper presented at the Population Association of America Annual Meeting, New Orleans,LA, May 1996.
Stewart MK, M Festin. Validation study of women’s reporting and recall of major obstetriccomplications treated at the Philippine General Hospital. Int J Gynecol Obstet 1995; 48:S53-S66.
Wasserheit JN, JR Harris, J Chakraborty et al. Reproductive tract infections in a family planningpopulation in rural Bangladesh. Stud Fam Plann 1989;20:69-80.
World Health Organization. International Classification of Disease, 9th and 10th Revisions.Geneva, World Health Organization, 1993.
World Health Organization. Measuring Reproductive Morbidity. Report of a Technical WorkingGroup; Geneva, 30 August - 1 September 1989. Geneva: World Health Organization, 1990.
World Health Organization, UNICEF. Revised 1990 Estimates of Maternal Mortality: A NewApproach. Geneva: World Health Organization, 1996.
Younis N, K Khalil, H Zurayk, H Khattab. Learning About the Gynecological Health of Women. The Policy Series in Reproductive Health, No. 2. Cairo: The Population Council Regional Officefor West Asia and North Africa, 1994.
Zurayk H, Khattab H, Younis N, et al. Concepts and measures of reproductive morbidity. HealthTrans Rev 1993;3(1):17-40.

114
Zurayk H, Younis N, Khattab H. Rethinking Family Planning Policy in Light of ReproductiveHealth Research. The Policy Series in Reproductive Health, No. 1. Cairo: The PopulationCouncil Regional Office for West Asia and North Africa, 1994.
Other Readings Campbell OMR,Graham WJ. Measuring Maternal Mortality and Morbidity: Levels and Trends. London: London School of Hygiene and Tropical Medicine, 1990.
Campbell OMR, Graham WJ. Measuring the Determinants of Maternal Mortality andMorbidity: Defining and Selecting Outcomes and Determinants and Demonstrating Associa-tions. London: London School of Hygiene and Tropical Medicine, 1991.
Chamratrithirong A, Singhadej O, Yoddumnern-Attig B. The effect of reduced family size onmaternal and child health: The case of Thailand. World Health Stat Q 40:54-62
Filippi VGA, Graham WJ, Campbell OMR. Utilizing Survey Data on Maternity Care inDeveloping Countries: An Illustrative Study. London: London School of Hygiene and TropicalMedicine, 1991.
Graham WJ, Campbell OMR. Measuring Maternal Health: Defining the Issues. The WorldBank, Population and Human Resources Department, 1991.
Graham WJ, Campbell OMR. Measuring the Effectiveness of Maternal Health Programs.London: London School of Hygiene and Tropical Medicine, 1991.
Graham WJ, Filippi VGA. Monitoring Maternal Health Goals: How Well Do the IndicatorsPerform? London: London School of Hygiene and Tropical Medicine, 1994.
Liljestrand J. Maternal Mortality in Mozambique. Diss. Uppsala: Faculty of Medicine, Universityof Uppsala, 1985.
McCarthy J, Maine D. A frame work for analyzing the determinants of maternal mortality. StudFam Plann 1992;23(1):23-33.
Omran AR, Standley CC. Family Formation Patterns and Health. Geneva: World HealthOrganization, 1976.
Omran AR, Standley CC. Family Formation Patterns and Health: Further Studies. Geneva:World Health Organization, 1981.
Rowley J. A death every minute. People 1987;14(3):3-7

115
Taylor R, Whitmore J, Robertson S, et al. Report of the Niue Women’s Health Survey (1983),Technical Paper #187. Noumea, New Caledonia: South Pacific Commission, 1985.
Thaddeus S, Maine D. Too Far to Walk: Maternal Mortality in Context C Finding from aMultidisciplinary Literature Review. New York: Columbia University Center for Population andFamily Health, 1990.

116