The Baran Ratio, Investment, and British Economic Growth ...
35
University of Louisville University of Louisville ThinkIR: The University of Louisville's Institutional Repository ThinkIR: The University of Louisville's Institutional Repository Faculty Scholarship 8-2021 The Baran Ratio, Investment, and British Economic Growth and The Baran Ratio, Investment, and British Economic Growth and Development Development Thomas E. Lambert University of Louisville, [email protected] Follow this and additional works at: https://ir.library.louisville.edu/faculty Part of the Business Commons, and the Economic History Commons ThinkIR Citation Lambert, Thomas E., "The Baran Ratio, Investment, and British Economic Growth and Development" (2021). Faculty Scholarship. 542. https://ir.library.louisville.edu/faculty/542 This Article is brought to you for free and open access by ThinkIR: The University of Louisville's Institutional Repository. It has been accepted for inclusion in Faculty Scholarship by an authorized administrator of ThinkIR: The University of Louisville's Institutional Repository. For more information, please contact [email protected].
-
Upload
khangminh22 -
Category
Documents
-
view
1 -
download
0
Transcript of The Baran Ratio, Investment, and British Economic Growth ...

University of Louisville University of Louisville
ThinkIR: The University of Louisville's Institutional Repository ThinkIR: The University of Louisville's Institutional Repository
Faculty Scholarship
8-2021
The Baran Ratio, Investment, and British Economic Growth and The Baran Ratio, Investment, and British Economic Growth and
Development Development
Thomas E. Lambert University of Louisville, [email protected]
Follow this and additional works at: https://ir.library.louisville.edu/faculty
Part of the Business Commons, and the Economic History Commons
ThinkIR Citation Lambert, Thomas E., "The Baran Ratio, Investment, and British Economic Growth and Development" (2021). Faculty Scholarship. 542. https://ir.library.louisville.edu/faculty/542
This Article is brought to you for free and open access by ThinkIR: The University of Louisville's Institutional Repository. It has been accepted for inclusion in Faculty Scholarship by an authorized administrator of ThinkIR: The University of Louisville's Institutional Repository. For more information, please contact [email protected].

1
The Baran Ratio, Investment, and British Economic Growth and Development
Thomas E. Lambert, PhD
University of Louisville
Louisville, KY 40292 USA E-mail: [email protected]
Phone: 502-852-7838
Abstract
Investment in capital, new technology, and agricultural techniques has not been considered an
endeavor worthwhile in a medieval economy because of a lack of strong property rights and no incentive
on the part of lords and barons to lend money to or grant rights to peasant farmers. Therefore, the
medieval economy and standards of living at that time often have been characterized as non-dynamic and
static due to insufficient investment in innovative techniques and technology. Paul Baran’s concept of the
economic surplus is applied to investment patterns during the late medieval, mercantile, and early
capitalist stages of economic growth in England and the UK. This paper uses Zhun Xu’s Baran Ratio
concept to try to develop general trends to demonstrate and to reinforce other historical accounts of these
times that a productive and sufficient level of public and private investment out of accumulated capital
income, taxation, and rents does not have a real impact on economic per capita growth until around the
1600s in Britain. This would also be about the time of capitalism’s ascent as the dominant economic
system in England. Even then, dramatic increases in investment and economic growth do not appear until
the late 18th Century when investment more consistently becomes more than one hundred percent of the
level of economic surplus and takes in government spending. The types of investment, threshold amounts
of investment out of profits and rents along with government spending seem to matter when it comes to a
growth path raising GDP per capita and national income per capita to higher levels. Although much of
this knowledge perhaps is embodied in current historical accounts, the Baran Ratio nicely summarizes
and illustrates the importance of levels of investment to economic growth.
JEL Codes: B51, E11, E12, N13
Keywords: Baran Ratio, capitalism, economic growth, feudalism, investment
August 2021
2
Introduction
Under capitalism, many businesses use part or all of the proceeds of their profits to buy more
property, plant, inventory, and equipment if opportunities to expand and earn greater profits exist. Under
feudalism, an economic system that is generally characterized as one that lacks the property rights to
encourage producers to re-invest in or add to their productive capital (North and Thomas 1971 and 1973,
McCloskey 1972, Brenner 1976 and 1985, Dimmock 2014), such investment is only expected to occur on
a very small scale. There is little incentive for serfs to use any gains from their work to try to expand their
efforts and output.1 Any production above a level of subsistence for the peasant farmers and their
families would go to lords and barons as surplus, and therefore efforts to invest or innovate were not
worthwhile. Lords could often coerce and gain more output from them through simple intimidation and
brute force (Dobb 1947, Brenner 1976 and 1985). Surplus extracted from the feudal economy can be
considered to be wasted mostly on “unproductive” expenditures by the aristocracy on large palaces, court
jesters, minstrels, the military, and cathedrals, or items which do not create use value or expand the
productive capacity of a society by increasing labor productivity (Baran 1953 and 1957, Engels 1957,
Smith 2000).
Acemoglu, Johnson, and Robinson (2004) and Acemoglu and Robinson (2012) argue that
political institutions shape economic outcomes as opposed to the general Marxian view that economic and
material circumstances mostly determine political and social institutions. They argue that the ownership
of key resources is enabled by legal and political institutions which in turn dictate the dominant mode of
production. Therefore, according to them, the lord’s or baron’s legal or political control over land and
water and water mills gave rise to serfdom and feudalism rather than small scale subsistence farming
leading to or reinforcing the system of demesnes and feudalism. The purpose of this paper is not to
1Sato (2018) points out that claims and rights to land and land usage were multi-layered under feudalism with lords holding political power over the land while serfs and other commoners of lower classes had rights to use it for subsistence farming, fishing, etc. as long as they shared in the proceeds of their harvests and catches. He argues that it is not until under capitalism that land becomes a commodity and then ownership and rights to land revert to just one person or group of owners who are part of one social class. Multi-layered ownership along class lines cease to exist.
3
examine which comes first or which is more important but to look at the changes in economic
circumstances over time regarding investment levels while noting some important historical
developments in English and British history.
Feudalism probably was weakened due to less and less arable land being available for agriculture,
and plagues and famines2, which caused labor shortages and increasing labor costs. Since food
production often could not keep up with increases in population due to shortages of arable land, small
petty producers, merchant traders, and yeoman farmers started taking some of the profits they earned and
reinvested them back into their operations to finance more productivity, output, and expansion (Brenner
1976 and 1985, Heller 2011, Dimmock 2014). Colander (2020, 73-75) and others claimed that it was
during the 15th Century that mercantilism evolved from feudalism thanks to the growth of markets,
trading, urban areas, global exploration and a larger presence of the government in economic activities
through its sanctioning of guilds and sponsorship of exploration. With the Industrial Revolution and the
ascendancy of manufacturers and major commodities producers, capitalism had fully replaced
mercantilism, although farming in some parts of Europe had already been transformed through greater
investment and output (Heller 2011, 89, Colander 2020, 74-75).
This paper’s empirical research develops general trends that support the view that it probably is
not until the 1600s and especially after 1780 that capital income, investment spending, and investment
levels begin to reach a critical threshold of a society’s economic surplus, that is, a surplus that is society’s
cumulative capital income and land income plus tax revenues (Baran 1957, Baran and Sweezy 1966, Xu
2019, Lambert 2020).3 With this, standards of living dramatically begin to advance in England and the
United Kingdom (UK) with the greatest advances being made in the 1800s. Productive outlets for
2 Which some have claimed were also caused indirectly by a mini-ice age (e.g, Fagan 2000, Blom 2019 among others). 3 Stanfield (1974) emphasized one of Baran’s (1957) concepts of the economic surplus as potential output less essential consumption of a society to yield potential surplus. Without knowing or being able to estimate slack in the British economy from the 13th to 19th Centuries., this paper focuses on Baran’s concept of the actual surplus, which is actual output minus essential consumption.

4
investment make themselves available at this time which helps per capita economic growth, although
capital income has to rebound as a share of economic surplus and net national income after being lower
for several prior centuries (1400s to 1600s).
If data sources for this paper are correct (Clark 2009, Broadberry, et al 2015), capital income and
economic surplus levels might have been higher in the 13th and 14th Centuries than in the next several
centuries and did not reach higher levels again until the 1700s in Britain. See Figures 1 to 3. Money for
investment was available in the late medieval period, but because of few incentives for productive
investment, it was mostly wasted on what some consider unproductive pursuits, and therefore it had little
if much impact on economic growth. It is granted that the building of cathedrals and palaces employed
many people, yet constructing these edifices probably did not in turn raise the current or future
productivity of a nation’s workforce that much. In the transition period of the 15th to 16th Centuries,
investment levels would still be predicted to be low since capitalism was still not the predominant
economic system as mercantilism and trading still reigned. High labor costs (Clark 2009, Humphries and
Weisdorf 2019) for several centuries might have prevented the formation of a large enough economic
surplus to justify investment too. In the 17th Century, the economic surplus began to grow again thanks to
a growth in capital income and a lowering of wages, and these events led to the beginning of a more
consistent and greater level of capital investment in mostly productive endeavors.4,5
(Insert Figures 1 to 3 around here)
4 Rimmer, Higgins, and Pollard (1971) assess the year-to-year rates of investment in the 18th and 19th Centuries in the UK and estimate it to be slower than other estimates and believe a lot of capital investment undertaken was due to the rapid deterioration of many forms of plant and equipment. They cite the frequency with which horseshoes and many farm tools had to be replaced. Nonetheless, such replacement was necessary to propel agricultural output to higher levels, and therefore the investment expenditures were still productive. 5 The debate over productive versus non-productive pursuits and occupations can be traced at least as far back as Adam Smith (2000(1776)). In general, those commercial and governmental activities and occupations which do not add to or help to create value in the production or distribution of products or services are considered unproductive whereas those that do add value are productive. In an enterprise, workers who design and create a product would be considered productive whereas cleaning and bookkeeping personnel, although important, would not really be considered productive. In classical political economy this was an important distinction, and it is still considered important to many heterodox economists. It has mostly been discarded, however, by mainstream and neoclassical economists. It is not a primary focus of this paper, however.

5
This paper proceeds as follows. The next section, Analysis, describes the data sources used in the
research for this paper, the definitions of key variables, and the displays of data. Finally, a Discussion
and Conclusion section discusses the implications of the findings for historical and modern economic
performance and prospects.
Analysis
Lambert (2021) uses Clark (2009) data to estimate levels of aggregate capital stock, investment,
and government surpluses and deficits on a decadal basis from 1200 to 1860, and this is a time span
longer than what has been previously estimated by other researchers who mostly stop their estimates in
the 17th or 18th Centuries.6 Using Lambert’s conjectures, Figure 4 illustrates the growth of the estimated
real capital stock over several centuries, and it is shown that growth in the real capital stock does not
really begin to climb somewhat until the 17th and 18th centuries with accelerating growth in the 19th
century. Lambert’s estimated real annual net investment expenditures or change in the capital stock from
one decade to the next show a similar pattern as displayed in Figure 5. It appears that investment and
capital stock amounts do not really begin to be substantive until the 1600s or 1700s, which according to
many authors is about the time that capitalism becomes the dominant form of economic organization in
England or the UK.7 It is around 1770 to 1780 and beyond when investment begins to climb dramatically
(Figure 5), a time period which corresponds to the rise of important textile innovations and their
implementation in Britain (Caitling 1986).
In some of the decades real net investment is estimated to be negative perhaps because the
depreciation of capital stock is greater than total investment or perhaps due to natural disasters, crop
6 An exception is a paper by Broadberry and Pleijt (2021) which estimates capital stock and investment levels of different types (working capital, fixed, domestic and overseas assets, etc.) usually going back to the 1350s on a every half century basis. They do not estimate government deficit/surpluses, however. 7 The United Kingdom formally came into existence in 1707 thanks to the Treaty of Union between England and Scotland although the two states had been unified through a common monarch when James I (James VI of Scotland) became King of England around 100 years earlier (Macinnes 2011). Although Great Britain or Britain is not quite the same as the United Kingdom, this paper uses these terms interchangeably for ease of exposition.
6
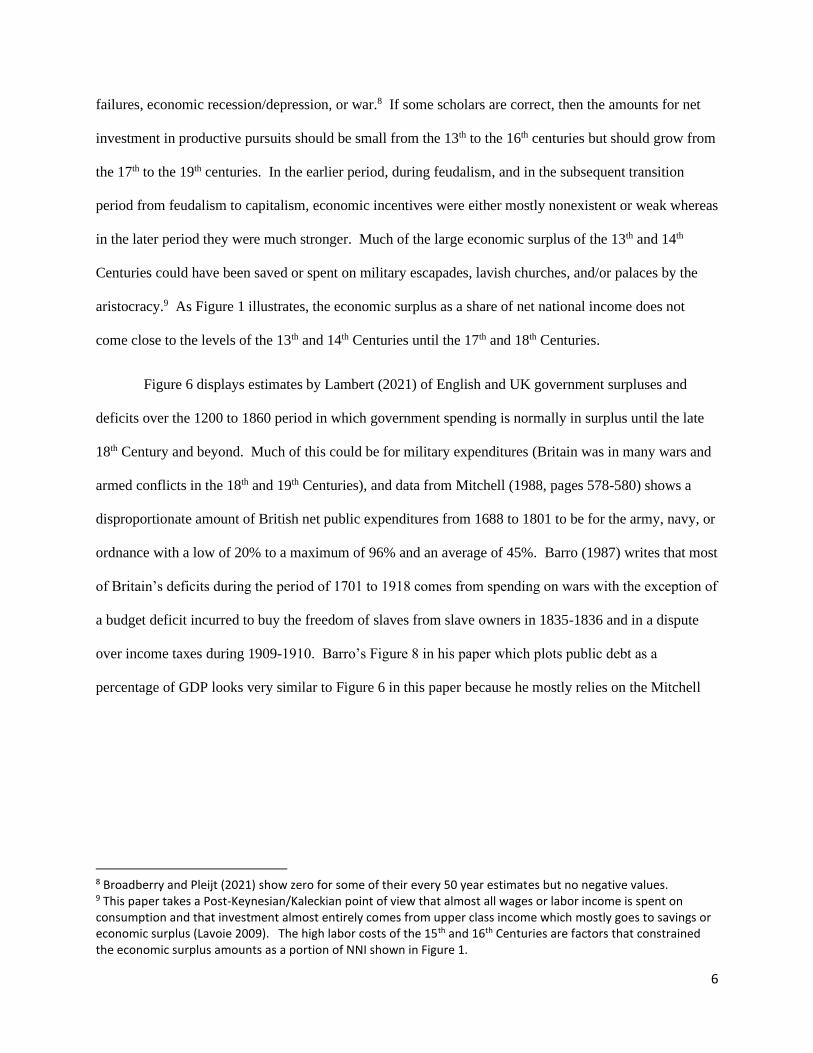
failures, economic recession/depression, or war.8 If some scholars are correct, then the amounts for net
investment in productive pursuits should be small from the 13th to the 16th centuries but should grow from
the 17th to the 19th centuries. In the earlier period, during feudalism, and in the subsequent transition
period from feudalism to capitalism, economic incentives were either mostly nonexistent or weak whereas
in the later period they were much stronger. Much of the large economic surplus of the 13th and 14th
Centuries could have been saved or spent on military escapades, lavish churches, and/or palaces by the
aristocracy.9 As Figure 1 illustrates, the economic surplus as a share of net national income does not
come close to the levels of the 13th and 14th Centuries until the 17th and 18th Centuries.
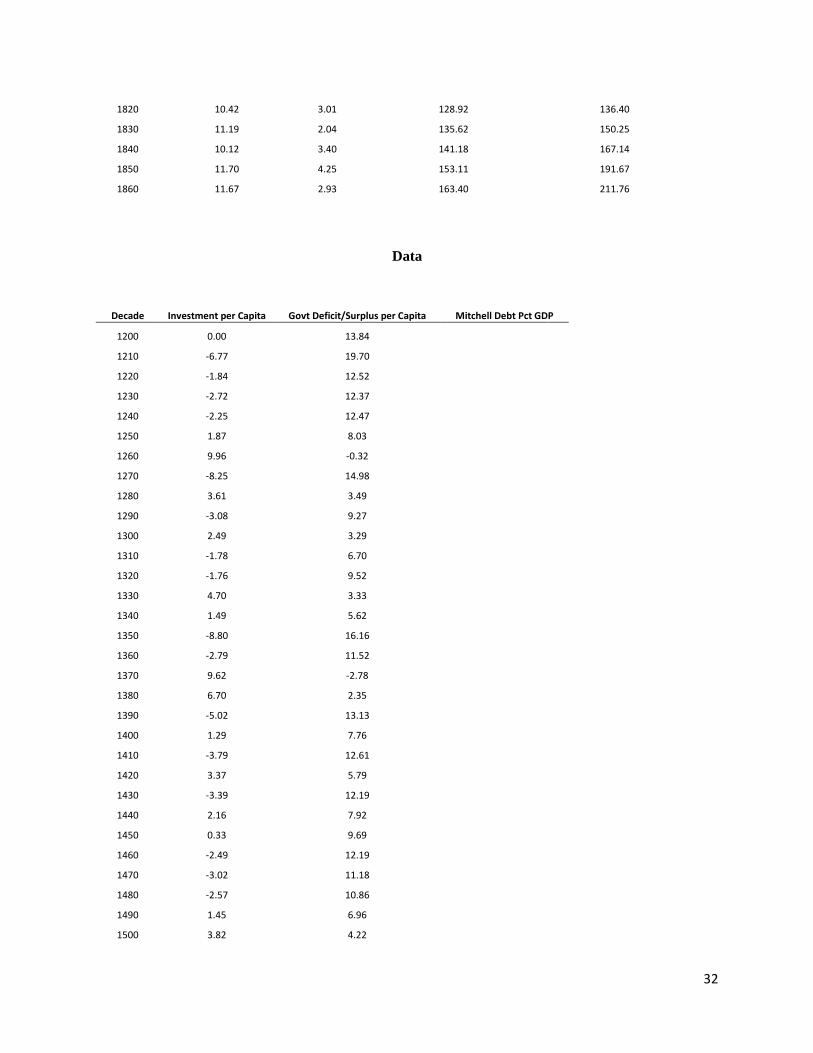
Figure 6 displays estimates by Lambert (2021) of English and UK government surpluses and
deficits over the 1200 to 1860 period in which government spending is normally in surplus until the late
18th Century and beyond. Much of this could be for military expenditures (Britain was in many wars and
armed conflicts in the 18th and 19th Centuries), and data from Mitchell (1988, pages 578-580) shows a
disproportionate amount of British net public expenditures from 1688 to 1801 to be for the army, navy, or
ordnance with a low of 20% to a maximum of 96% and an average of 45%. Barro (1987) writes that most
of Britain’s deficits during the period of 1701 to 1918 comes from spending on wars with the exception of
a budget deficit incurred to buy the freedom of slaves from slave owners in 1835-1836 and in a dispute
over income taxes during 1909-1910. Barro’s Figure 8 in his paper which plots public debt as a
percentage of GDP looks very similar to Figure 6 in this paper because he mostly relies on the Mitchell
8 Broadberry and Pleijt (2021) show zero for some of their every 50 year estimates but no negative values. 9 This paper takes a Post-Keynesian/Kaleckian point of view that almost all wages or labor income is spent on consumption and that investment almost entirely comes from upper class income which mostly goes to savings or economic surplus (Lavoie 2009). The high labor costs of the 15th and 16th Centuries are factors that constrained the economic surplus amounts as a portion of NNI shown in Figure 1.

7
data.10 Finally Figure 7, using Mitchell’s data, shows UK net public debt as a percentage of GDP from
1692 to 1860 accelerating during the 18th and 19th Centuries.11
Using investment levels or changes in capital stock that Lambert derives from estimates from the
Clark (2009) data, one can calculate a Baran Ratio (Xu 2019, Lambert 2020) which shows the amount of
investment on a yearly basis that comes out of a society’s economic surplus, which in this case is the sum
of Clark’s domestic capital and land income estimates plus domestic taxes collected by the state. If
overseas borrowing is undertaken to finance investment, or perhaps there exists a capital account surplus
from overseas exploration/conquest or war, or there are earnings from trading in slaves12, or if
government debt is used to finance investment, then the Baran Ratio can be greater than one. Xu (2019)
labels this the Baran Ratio since the economist Paul Baran (1953 and 1957) believes that capital
formation mostly comes out of the economic surplus.
Put on a yearly basis, the ratio can be expressed as
Baran Ratio = Investment / Economic Surplus .
Xu (2019) believes that Baran’s concept of the economic surplus is important in understanding
investment in a capitalist economy because investment spending can only come from the surplus
generated from labor. That is, profits, gains, and rents earned by owners or landlords and the taxes
collected by a government come mostly if not entirely from the labor employed in capitalist enterprises or
10 Interestingly one thing that Barro finds is that as long as currency could be converted to gold, money supply growth and inflation are not problems resulting from the budget deficits or the temporary rises in government spending mostly due to military spending. He claims that such deficits are associated with increases in long term interest rates, however, except for the deficits associated with the slave buy out and the income tax dispute. In those two cases, long term rates do not rise. Clark (2001) in estimating deficits from the 1720s to the 1830s finds no “crowding out” effects of British deficits. Figure A1 in the appendix also plots Clark’s estimates of real interest rates from 1200 to 1860. 11 Esteban (2001) writes that the French wars would have been very difficult for Britain to finance had it not been for trade credits from India. 12 Richardson (1987) and Etlis and Richardson (2008), among other scholars, estimate that the British slave trade of the 17th to 19th Centuries had a big impact on British economic growth. Graeber (2006), among others, claims that earnings from the slave trade is a key factor in propelling capitalism to greater heights in Europe, yet also notes that wage labor is a necessary replacement to slavery since mass consumption is necessary to complement the mass production that starts with the industrial revolution.

8
farms. It is not until the Baran Ratio reaches consistently positive levels and achieves a critical and
sustained level of more than 1 and usually of around 2 or more that economic growth and higher levels of
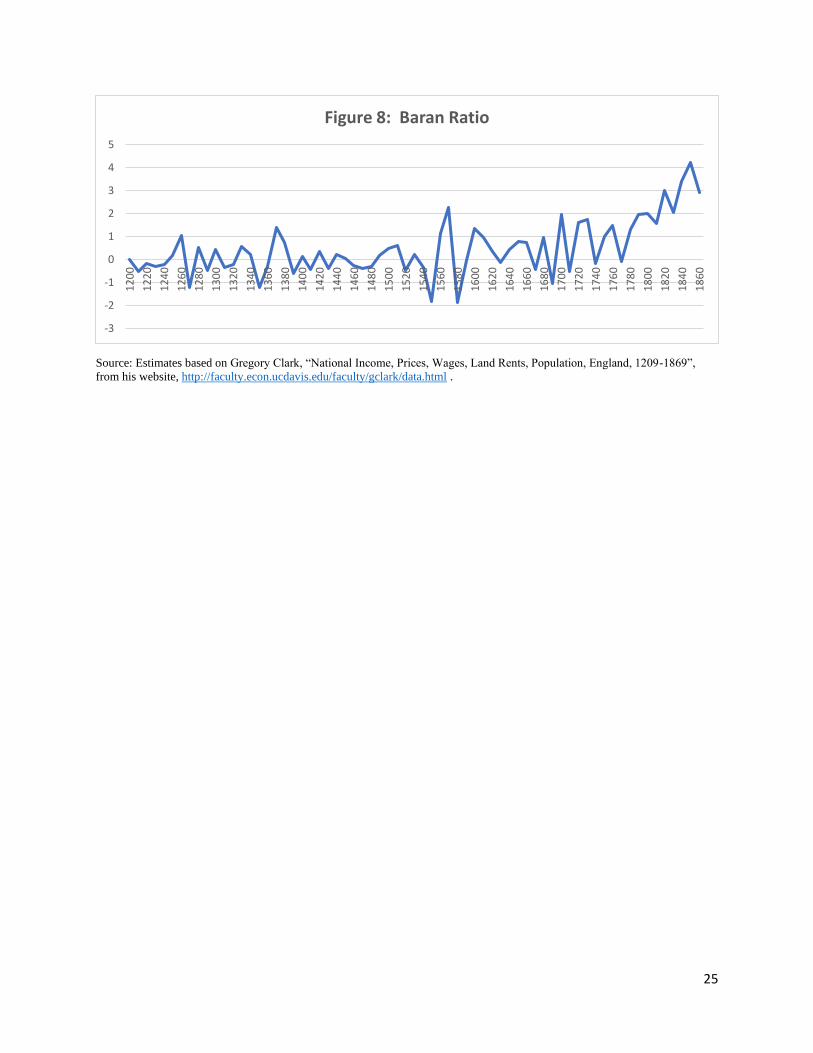
development can be attained. Figure 8 displays the decadal pattern of the Baran Ratio, which as can be
seen in the diagram does not begin to increase until late in the 16th Century, and it is not until after 1770
that the Baran Ratio shows consistent and substantive increases in magnitude, a period long after the
proliferation of greater property rights brought about by various key events including the English Civil
War / Revolution and the Glorious Revolution. Figure 5 shows a similar pattern when it comes to real
investment amounts.13
To domestically invest more than 100% of the economic surplus implies either larger and larger
amounts of government borrowing and/or capital account surpluses due to foreign investment, trading in
slaves and/or conquest. However, Brezis (1995, page 51) shows net capital outflows, not inflows, from
the late 18th Century to 1900, and Mitchell (1988, pages 449-450) mostly shows positive and growing
external trade (exports minus imports) balances during this same time period. This in turn implies capital
account deficits (investment flowing outward). Yet, obviously there can be money flowing in although to
a lesser degree than that going out. Given Mitchell’s data, greater absolute and per capita debt is
accumulated during this time period, which although it mostly helped to finance the military, some of it
could have been used for domestic public investment. This could also make up for investment outflows.
Any one or all of these could have made up the extra domestic investment amounts.14
(Insert Figures 4 to 8 and Tables 1 and 2 around here)
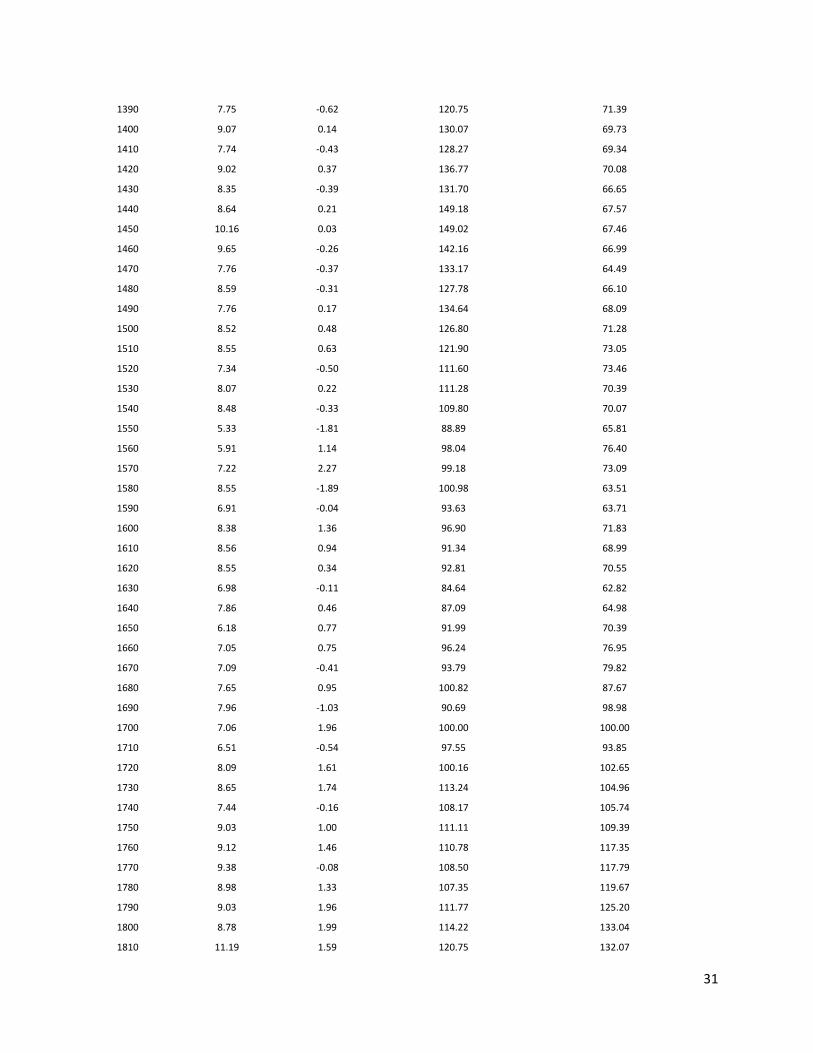
Table 1 shows a Pearson correlation coefficient matrix among the variables real economic surplus
per head, real investment per head, real government surpluses/deficits per head, the Baran Ratio, Clark’s
13 A table of all the data used in this paper is displayed in the appendix. 14 Clark (2009) calculates domestic estimates for the UK from 1200 to 1860 yet refers to “net national income” rather than using net domestic income. Also, since Broadberry et al (2015) are very careful to count only income and output from within England and the UK, one must assume that income and output from colonies and territories are not included in their estimates.

9
estimates of real income-based GDP per head, Broadberry et al’s estimates of real output-based GDP per
head and net public debt as a percentage of GDP (Mitchell 1988 and Chantrill n,d,) for the decades 1200
to 1860 with the exception of Broadberry et al’s numbers which range from 1270 to 1860. Per capita
estimates are made using either Clark’s (2009) or Broadberry et al’s population estimates. All
coefficients are statistically significant at an alpha of 5% and show moderate to strong correlations. More
importantly, the amount of real economic surplus per capita, real investment per capita, and the Baran
Ratio are positively and moderately correlated with Clark’s income based real GDP per capita
measurement and are strongly and positively associated with the Broadberry, et al output based real GDP
per capita estimates.15 Real government surpluses per capita are negatively and moderately correlated
with Clark GDP per capita estimates and strongly and negatively correlated with real investment per
capita, the Baran Ratio and the Broadberry, et al real GDP per capita values. The greater the real
government surplus (net total local and national tax revenues less spending), the lower real investment,
the Baran Ratio and the lower the real GDP per capita on average. Conversely, the greater the deficit, the
higher values of these variables on average.16 Finally, net public debt as a percentage of GDP is strongly
correlated with the economic surplus and moderately and positively correlated with the two
measurements of GDP per capita, real investment, and the Baran ratio. It is inversely and moderately
correlated with government surpluses/deficits in that larger deficits (negative numbers) correspond to
larger debt percentage numbers which are all greater than zero.
Since serial correlation exists in the relationships among the variables, using the Augmented
Dickey-Fuller (Cheung and Lai 1995) test finds rejection of the null hypothesis that the Baran Ratio,
Investment per Head, Surplus per Head, and Surpluses/Deficits per Capita are non-stationary (have a unit
15 There is of course a simultaneous relationship among many of these variables with investment not only leading to higher real output/income per capita, but the latter also leads to higher investment, consumption, etc., in turn. That is, a feedback loop exists among investment and output. 16 The high negative correlation between investment per capita and government surpluses/deficits per capita is not surprising, of course, since surpluses/deficits were derived by taking the economic surplus minus investment estimates.

10
root) at 0, 1, or 2 lags whereas there is failure to reject the null hypothesis for Clark Real Income per
Head, Broadberry GDP per Capita, and Debt as a percentage of GDP at 0, 1, or 2 lags.17 Johansen (1995)
tests for cointegration for the variables in Table 1 are displayed in Table 2 and show that with a lag of 1
there are at least 3 or fewer cointegrating equations among the variables.18
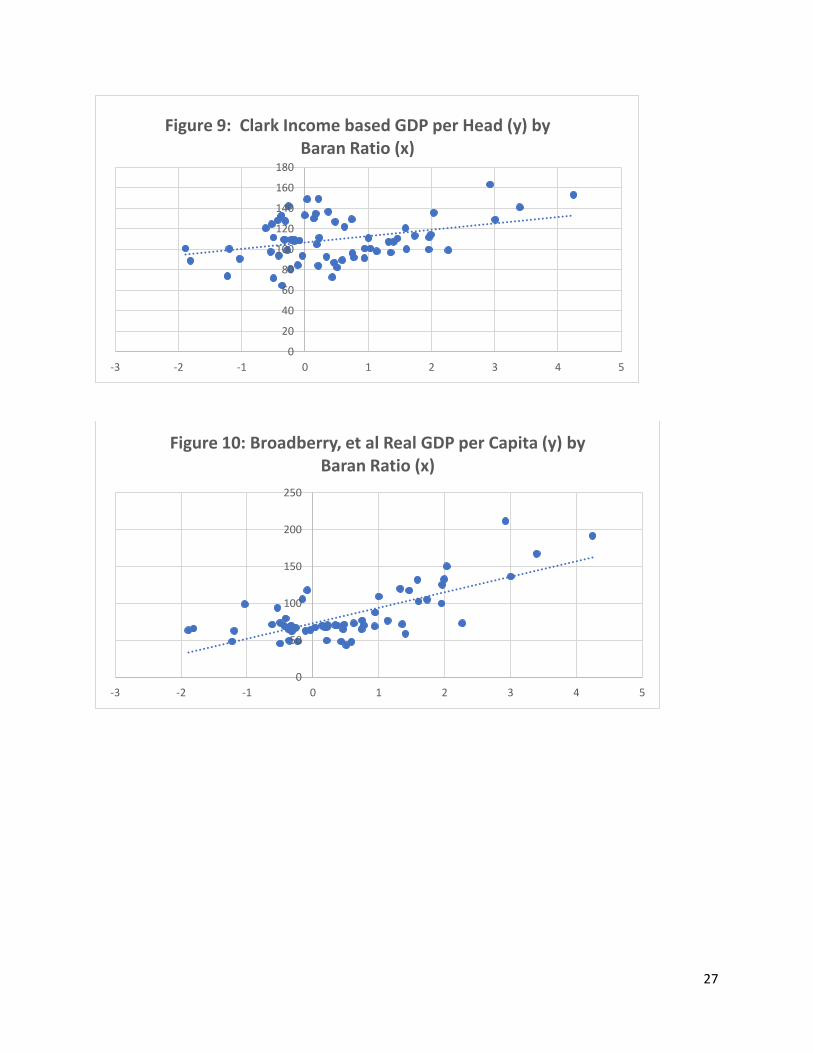
Figure 9 plots the Baran Ratio as an independent variable against Clark’s real income based GDP
per capita estimates from 1200 to 1860, and Figure 10 plots the Baran Ratio against Broadberry et al’s
real GDP per capita values as a dependent variable from 1200 to 1860. Vector autoregression diagnostic
techniques indicate that a lag of one provides cointegration for the Baran Ratio and the Broadberry real
GDP per capita measurement and suggest a lag of 1 or 3 for the Baran Ratio and the Clark real income
per capita. However, with the latter pair, a lag of 1 allows the Baran Ratio coefficient to achieve
statistical significance at 5% whereas this is not the case with a lag of 3.19 Table 3 displays vector
autoregression models using the Baran Ratio as an exogenous variable with a lag of one and the two
income/GDP per capita measurements as endogenous variables. A 1 unit increase in the Baran Ratio is
correlated with an approximate 2 to 4 unit increase in real income or real GDP per capita on average, and
each model explains at least 86% of the variation in their respective dependent variables.
(Insert Table 3 and Figures 9 and 10 around here)
A Chow (1960) test indicates that the year 1780 is a valid break point in the data, and in looking
at Figures 9 and 10, the Baran Ratio beginning in 1780 predicts higher levels of real GDP per head once it
achieves a consistent level of approximately 1 or more, and then standards of living go up even further as
the Baran Ratio achieves and then exceeds 2.
17 These results can be provided upon request by the author. 18 Conceptually the relationships among some of the variables should not be spurious since they are related by definition. Investment is defined as coming from savings (surplus), and investment is part of the equation GDP = Consumption + Investment + Government Expenditures + (Exports – Imports). 19 Please see these tables in the Appendix.

11
A Post-Keynesian Application of the Baran Ratio
Keynes discussed an investment multiplier and how it affected consumption and employment
(248-249) and noted the consequences of savings being greater than investment in the macroeconomy
resulting in less than full employment and stagnation. Or, in the minds of Sweezy (1942) and Baran and
Sweezy (1966), and similar to Keynes (1964 (1936)), not enough of the economic surplus generated by an
economy was absorbed by investment opportunities, and so the economy often tended toward recession or
stagnation as
δ I / δ t > δ C / δ t
where the rate of consumption I over time (t) began to fall behind the rate of investment (I) over time
(Sweezy 1942, 186-189).
Many heterodox economists contend that Keynes argued that the disequilibrium between savings
and investment as well as the gap between actual and full employment and between actual and potential
real GDP could not only last in the short run but also into the long run and could be the usual state of
affairs in a capitalist economy (Lavoie 2009, Marglin 2018) . If so, although we have no real records of
unemployment or underemployment and potential real GDP in England and the UK during the time
period covered in the research for this paper, and although feudalism and mercantilism are different
economic systems than capitalism, this paper tries to show that the greater the level of investment
expenditures and the greater the Baran Ratio, the greater the real GDP per capita and the greater the
economic growth. The slow growth or no-net-growth or static Malthusian economic systems of
feudalism and mercantilism perhaps could be argued to be a long run equilibrium that is finally
transformed by the right type and right levels of investment under appropriate institutional settings.
Using an “old post-Keynesian” or Cambridge growth equation (Lavoie 2009, 108-109)
r = g / s

12
where “r” is the profit rate or rate of return to capital, “g” is the economic growth rate, and “s” is the
propensity to save out of profits, and it is assumed that workers either do not save or save very little out of
total savings, then rearranging we have
g = s*r
If it is assumed that savings = investment, or that they are roughly equal, then “s” can be considered to
be similar to the Baran Ratio in this paper, and “r” is the return to capital estimated by Clark (2009).
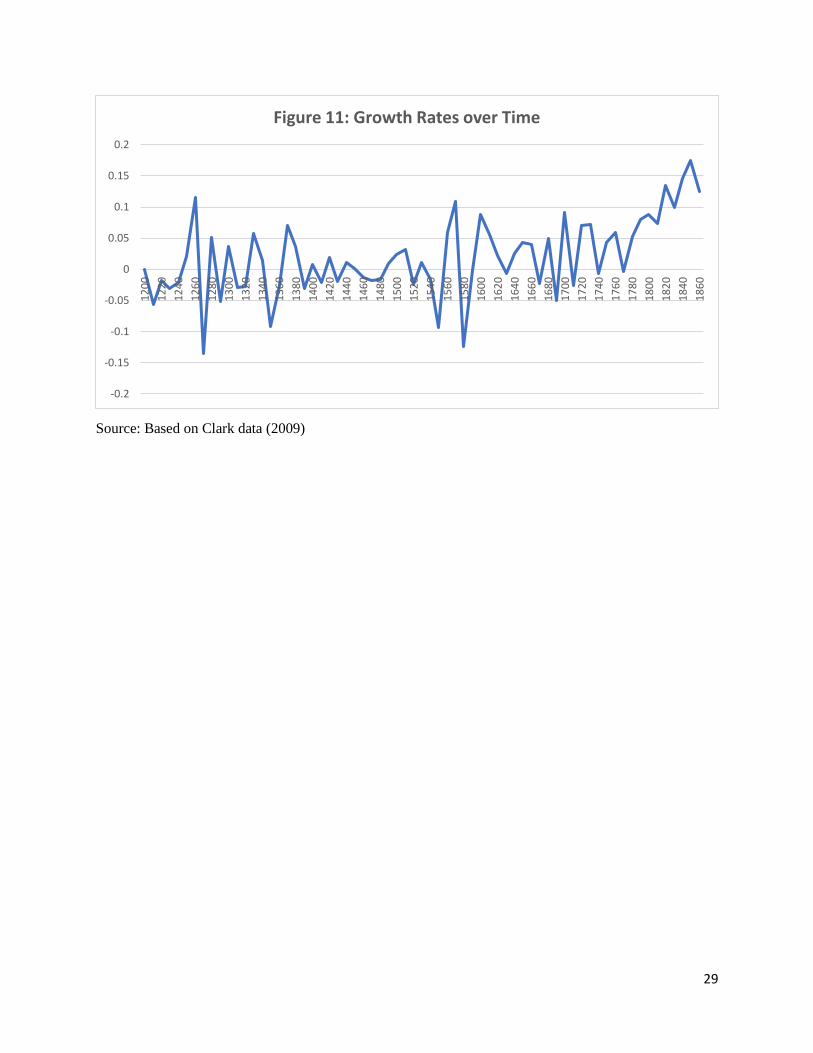
Calculating the growth rates over the centuries on a decadal basis and using the last formula, Figure 11
shows that growth rates do not really become that large and consistently positive in value until the late 16th
and most of the 17th Centuries, the centuries during which capitalism supposedly becomes more prevalent.
Prior to this time, growth rates appear to vary widely under feudalism and then tend to vary less so during
the mercantilism era. Up until 1600, this paper estimates that the average growth rate is around 0%, and
then thereafter, it is around 5.6% over the decades, which somewhat supports the econometric work of
Crafts and Mills (2017). More so, the growth rate over the decades from 1780 to 1860 is around 10.8%.
(Insert Figure 11 around here)
Discussion and Conclusion
The finding of this exploratory paper are based upon estimates made from historical records
analyzed by economic historians using various and different techniques. The data are examined through
heterodox economic theories and points of view. A limitation of the results found in this paper is that
during the periods examined not nearly as many complete economic records existed then as they do
today. Clark and his data perhaps are influenced by a Malthusian point of view of medieval times (Clark
2007a) whereas Broadberry, et al (2015) see this time period as less stagnant. However, general trend
estimates from these two comprehensive sources of British economic history over seven centuries have to
suffice in order to do any type of economic and quantitative analyses of the time period that covers the

13
transition from feudalism to capitalism. Most historical accounts with data only go back to the 17th
Century.
Yet if the conjectures are fairly reasonable, and since this paper is mostly interested in estimating
general trends for the purposes or reinforcing and making certain points, the results lend some additional
support to some of the arguments regarding the transition from feudalism to mercantilism to capitalism.
Economic surplus, investment, investment rates, government spending and debt appear to be largely
ineffective or too small before the 17th or 18th centuries to impact standards of living. This supports
Crafts and Mills (2017) who argue that trend growth in England and the UK up until the industrial
revolution basically roughly averages zero and supports Clark (2007b) on how the general economic
efficiency and productivity of the British economy is mostly stationary until the 17th Century.20 As Clark
(2001) notes, government deficits have no “crowding out” effects on the economy of the 1700s and
1800s, and one could speculate that the deficits actually have a “crowding in” effect on British economic
growth given the analysis above.
It can also be argued that the type and level of investment also matters. In Baran’s view, a lot of
the economic surplus would have been wasted in the 13th and 14th centuries when feudalism is still the
dominant economic system. The economic surplus as a portion of net national income according to the
2009 Clark data is higher in these centuries than later ones, yet investment levels are lower. Even with
feudalism in decline in subsequent centuries, some of the economic surplus could have been “wasted” by
the aristocracy on cathedrals, palaces, and wars rather than spent on productive machinery and tools or on
ports, canals and roadways. Sweezy (1976(1950)) notes that traders and merchants during the
mercantilist era improved transportation technology but did not contribute much to changes in productive
technology. Brenner (1985) writes that medieval and mercantile era guilds, through their monopoly
power, frustrated investment in innovative techniques, and it is not until petty producers come along that
20 Graphs of real GDP per capita using the Clark and Broadberry et al data showed pretty much a flat line trend pretty much during both feudalistic and mercantilistic (or transition period) epochs.

14
this changes. Investment in larger land holdings and more advanced farming techniques yield greater
economies of scale than the typical smaller, medieval farms that featured mostly subsistence style farming
(Brenner 1985, Heller 2011, Cockshot 2019). These events coincide with the enclosure movement as
those who are forced to leave common farm areas become the manufacturing workers of the industrial
revolution (McCloskey 1972, Marx and Engels 2004 (1848)). Rights to property, investment, and global
trade are established well before the late 18th Century, but perhaps dramatic gains are not seen in real
GDP per capita until 1780 and beyond as this paper shows. Perhaps property rights are a necessary but
not a sufficient condition for strong economic development and robust growth. Other major conditions
are the levels of public and private sector investments that need to reach a certain level before real and
sustained economic growth occurs.
For those readers familiar with the Dobby-Sweezy debate (Dobb 1947, Sweezy 1976 (1950)
among many other publications) as well as the Brenner debate (Brenner 1976, Brenner 1985, Heller 1985,
Heller 2011 among many others), the statistical findings of this paper are probably not surprising since
many of these authors note the stagnation of most of the medieval period and economic decline in the late
medieval period in Europe. They also note the slow and gradual transition from feudalism to
mercantilism and then to capitalism and the takeoff of economic growth with the agricultural and
industrial revolutions. This paper’s findings also somewhat support the writings of those who emphasize
the importance of property rights for investment and economic advancement in that such rights are not
strong enough for advancement until around the 16th and 17th centuries (North and Thomas 1971 and
1973, McCloskey 1972).
As classical economists like Smith and Marx and later the neo-Marxists Baran (1953 and 1957)
and Baran and Sweezy (1966) noted, some forms of business could be claimed to be “productive” and
others as “unproductive” or wasteful. Baran and Baran and Sweezy claimed that much of finance,
retailing, wholesaling, advertising, military expenditures, R&D efforts on packaging and design, etc. in a
capitalist economy were all wasteful and really did not contribute that much to a society’s economic net
15
welfare. On the other hand, “productive” industries included those in manufacturing, mining, agriculture,
education, etc. in which the populace gains something tangible and useful from the consumption of their
products or services. Therefore, not only did innovation and investment matter, but also the type of
investment in innovation (productive versus unproductive) could matter in addition to the property rights
and strong national government presence needed to secure the rights of ownership and to profits.
Schumpeter in Capitalism, Socialism, and Democracy (2003 (1943)) noted how that the
economies that preceded capitalism were like a circular flow system of trading of exchange that remained
static and never really expanded. It was only with innovation and investment under capitalism that the
circular flow expanded and grew thanks to waves and cycles of innovation. For Schumpeter, early in
capitalism entrepreneurs sought investment for their ideas in order to make a profit. In the General
Theory (1964(1936)), Keynes indicated that job creation during an economic downturn could be done
through unproductive activities such as burying treasury notes in bottles and having workers dig them
back up again (129) although he conceded that it would be better to have people employed in more
productive activities through greater levels of some type of investment even if it meant the “socialization”
of some investment. British governmental deficits and net public debt grew substantially probably due to
military and warfare expenditures, which are unproductive uses of resources in some minds (Baran and
Sweezy 1966, Mohun 1994, Lambert and Kwon 2015), yet some funds were spent on ports, bridges,
canals, roads, and other forms of infrastructure.21
Perhaps many topics and themes discussed in this paper do not cover that much new ground. Yet
it is argued that the Baran Ratio concept succinctly summarizes how a large enough level of investment is
necessary for a society to make large advancements in standards of living. To re-invest all of the
economic surplus or its equivalent and to dramatically increase government spending and to earn huge
21 Although Baran and Sweezy emphasized that it was World War II that eventually lifted the US out of the Great Depression and restored full capacity utilization and full employment.

16
amounts on exports on a continuous basis are large amounts of stimuli for a national economy.22 A
modern day example could be China perhaps. At the same time, many of the other advanced nations of
the world are being criticized for not reinvesting enough in their infrastructure, schools, and health care
systems. If there also exists too much unemployment and underemployment in various world economies,
then greater use of corporate profits for reinvestment in productive activities such as manufacturing and
construction or greater spending by governments on infrastructure and education at even higher levels
than exist now in order to start on a path of greater economic growth may be a viable alternative as
illustrated by the Baran Ratio.
22 It is granted that Britain engaged in a slave trade and engaged in overseas conquest in order to expand its export business, and these also are factors in its debt and deficit levels. Yet it also engaged in investment in many productive activities such as infrastructure, scientific innovation, manufacturing plants, etc.

17
References:
Acemoglu, Daron, Simon Johnson, and James Robinson. 2004. Institutions as the Fundamental Cause of
Long-Run Growth. National Bureau of Economic Research (NBER) Working Paper w10481. DOI
10.3386/w10481. Issue Date May 2004. https://www.nber.org/papers/w10481 . Accessed on October
27, 2020.
Acemoglu, Daron, and James A Robinson. 2012. Why Nations Fail: The Origins of Power, Prosperity
and Poverty. New York: Crown Publishers.
Baran, Paul. 1953. Economic Progress and Economic Surplus. Science & Society, 17(4), 289-317.
Retrieved from http://www.jstor.org/stable/40400214 . Accessed on October 16, 2019.
Baran, Paul A. 1957. The Political Economy of Growth. New York, NY: Monthly Review Press.
Baran, Paul A. and Paul M. Sweezy. 1966. Monopoly Capital: An Essay on the American Economic
and Social Order. New York, NY: Monthly Review Press.
Barro, Robert. 1987. “Government spending, interest rates, prices, and budget deficits in the United
Kingdom, 1701-1918”. Journal of Monetary Economics, 20(2): 221-247.
Blom, Phillipp. 2019. Nature’s Mutiny : How the Little Ice Age of the Long Seventeenth Century
Transformed the West and Shaped the Present. New York, NY: Liveright Publishing Corporation, a
division of W.W. Norton & Company.
Brenner, Robert. 1976. “Agrarian Class Structure and Economic Development in Pre-Industrial Europe.”
Past & Present 70(February): 30–75.
Brenner, Robert. 1985. “The Agrarian Roots of European Capitalism.” In The Brenner Debate:
Agrarian Class Structure and Economic Development in Pre-industrial Europe, edited by Ashton, T. H.,
and C. H. E. Philpin. Cambridge, UK: Cambridge University Press, pages 213-327.
Brezis, Elise S. “Foreign Capital Flows in the Century of Britain’s Industrial Revolution: New Estimates,
Controlled Conjectures.” The Economic History Review, New Series, 48, no. 1 (1995): 46-67. Accessed
November 15, 2020. Doi:10.2307/2597870.
Broadberry, S., Campbell, B., Klein, A., Overton, M., & Van Leeuwen, B. 2015. British Economic
Growth, 1270–1870. Cambridge: Cambridge University Press. Doi:10.1017/CBO9781107707603 . Data
set located at https://www.cambridge.org/gb/academic/subjects/history/economic-history/british-
economic-growth-12701870?format=PB . Accessed on June 18, 2020.
Broadberry, Stephen and de Pleijt, Alexandra. 2021. “Capital and Economic Growth in Britain, 1270-
1870: Preliminary Findings” (March 2021). CEPR Discussion Paper No. DP15889, Available at SSRN:
https://ssrn.com/abstract=3805304 . Accessed on August 19, 2021.
Catling, Harold. 1986. The Spinning Mule. Preston: The Lancashire Library.
Chantrill, Christopher. No Date. Public Net Debt, 1692-2020. UK Public Spending.
https://www.ukpublicspending.co.uk/spending_chart_1692_2020Ukp_XXc1li111tcn_G0t . Accessed on
November 22, 2020.
Cheung, Y.-W., & Lai, K. S. 1995. Lag order and critical values of the augmented Dickey–Fuller
test. Journal of Business & Economic Statistics, 13(3), 277–280.
18
Chow, Gregory C. 1960. “Tests of Equality Between Sets of Coefficients in Two Linear Regressions”
(PDF). Econometrica. 28 (3): 591–605. Doi:10.2307/1910133. JSTOR 1910133 .
Clark, Gregory. 2007a. “A Farewell to Alms: A Brief Economic History of the World.” Princeton;
Oxford: Princeton University Press. Retrieved August 31, 2021, from
http://www.jstor.org/stable/j.ctt7srwt .
Clark, Gregory. 2007b. “The Long March of History: Farm Wages, Population, and Economic Growth,
England 1209-1869.” The Economic History Review, 60(1), new series, 97-135. Retrieved December 16,
2020, from http://www.jstor.org/stable/4121997 .
Clark, Gregory. 2009. “The Macroeconomic Aggregates for England, 1209-2008”, UC Davis,
Economics WP 09-19. http://faculty.econ.ucdavis.edu/faculty/gclark/data.html . Accessed on February
23, 2020.
Clark, Gregory. 2010. ‘The Macroeconomic Aggregates for England, 1209-2008.” Research in Economic
History, 27: 51-140.
Colander, David C. 2020. Economics, 11th Edition. New York, NY: McGraw-Hill Publishers.
Crafts, Nicholas and Terence C. Mills, 2017. “Six Centuries of British Economic Growth: a Time-series
Perspective”. European Review of Economic History, Volume 21, Issue 2, May 2017, Pages 141–158,
https://doi.org/10.1093/ereh/hew020 .
Dimmock, Spencer. 2014. The Origin of Capitalism in England, 1400-1600. Leiden, UK: Brill
Publishers.
Dobb, Maurice. 1947. Studies in the Development of Capitalism. New York, NY: International
Publishers.
Engels, Friedrich. 1957. “The Decline of Feudalism and the Rise of the Bourgeoisie.” Monthly Review
April 1957, pp. 445-454. Originally written in 1884 and from an unfinished manuscript discovered
amongst Engels posthumous papers: “Ueber den Verfall des Feudalismus and das Aufkommen der
Bourgeoisie”, Berlin DDR, 1953.
https://marxists.catbull.com/archive/marx/works/1884/decline/index.htm . Accessed on October 29,
2019.
Eltis, D., & Richardson, D. (2008-10-07). A New Assessment of the Transatlantic Slave
Trade. In Extending the Frontiers: Essays on the New Transatlantic Slave Trade Database. : Yale
University Press. Retrieved 15 Dec. 2020, from
https://yale.universitypressscholarship.com/view/10.12987/yale/9780300134360.001.0001/upso-
9780300134360-chapter-1 .
Esteban, Javier. 2001. “The British Balance of Payments, 1772-1820: India Transfers and War Finance.”
The Economic History Review, 54(1), 58-86. Retrieved December 16, 2020, from
http://www.jstor.org/stable/3091714 .
Fagan, Brian M. 2000. The Little Ice Age: How Climate Made History, 1300-1850. New York: Basic
Books.
Feinstein, C.H., 1978. Capital formation in Great Britain. In: Mathias, P., Postan, M. (Eds.), The
Cambridge Economic History of Europe, vol. 7, pp. 28–96.
Feinstein, C.H., 1981. Capital accumulation and the Industrial Revolution. In: Floud, R., McCloskey,D.N.
(Eds.), The Economic History of Britain Since 1700, vol. 1, first ed. Cambridge, pp. 128–142.

19
Feinstein, C.H., 1988. The rise and fall of the Williamson curve. Journal of Economic History 48,699–
729.P. Antraas, H.-J. Voth / Explorations in Economic History 40 (2003) 52–7775
Foster, John Bellamy, and McChesney, Robert W. 2012. The Endless Crisis: How Monopoly-Finance
Capital Produces Stagnation and Upheaval from the U.S.A. to China. New York, NY: Monthly Review
Press.
Graeber, David. (2006). “Turning Modes of Production Inside Out: Or, Why Capitalism is a
Transformation of Slavery.” Critique of Anthropology, 26(1), 61–85.
https://doi.org/10.1177/0308275X06061484
Heller, Henry. 1985. “The Transition Debate in Historical Perspective.” Science & Society, 49(2), 208-
213. Retrieved June 19, 2020, from www.jstor.org/stable/40402645 .
Heller, Henry. 2011. The Birth of Capitalism: A Twenty-First Century Perspective. London, UK: Pluto
Press.
HM Revenues & Customs. 2010. “A Brief History of the Income Tax.”
https://web.archive.org/web/20100724033906/http://www.hmrc.gov.uk/history/taxhis1.htm . Accessed
on November 21, 2020.
Humphries, Jane and Jacob Weisdorf. 2019. “Unreal Wages? Real Income and Economic Growth in
England, 1260–1850”, The Economic Journal, Volume 129, Issue 623, October 2019, Pages 2867–2887,
https://doi.org/10.1093/ej/uez017 .
Johansen, S. 1995. Likelihood-Based Inference in Cointegrated Vector Autoregressive Models. Oxford:
Oxford University Press.
Keynes, John Maynard. 1964. The General Theory of Employment, Interest, and Money. New York, NY:
A Harvest Book, Harcourt Brace and Company. Originally published in 1936.
Lambert, Thomas E. 2020. “Paul Baran’s Economic Surplus, the Baran Ratio, and the Decline of
Feudalism.” Monthly Review 72(7): 34-49. https://monthlyreview.org/2020/12/01/paul-barans-
economic-surplus-concept-the-baran-ratio-and-the-decline-of-feudalism/ . Accessed on December 13,
2020.
Lambert, Thomas. E. 2021. “Conjectures of English and UK Economic Surplus, Investment, Tax
Revenues and Deficit Amounts from the 13th to the 19th Century.” Unpublished Manuscript.
https://ir.library.louisville.edu/faculty/538/ . Accessed on August 19, 2021.
Lambert, Thomas E. and Edward Kwon. 2015. “Monopoly capital and capitalist inefficiency”
International Review of Applied Economics, 29:4, 533-552, DOI: 10.1080/02692171.2015.1016409
Lavoie, Marc. 2009. Introduction to Post-Keynesian Economics. New York, NY: Palgrave-MacMillan.
Lippit, Victor D. 1985. “The Concept of the Surplus in Economic Development.” Review of Radical
Political Economics 17(1/2): 1-19.
Lipson, Ephraim. 1959 . The Economic History of England. London, UK: A. and C. Black.
Macinnes, Allan I. 2011. “Acts of Union: The Creation of the United Kingdom.” BBC History website.
http://www.bbc.co.uk/history/british/empire_seapower/acts_of_union_01.shtml#four . Accessed on April
12, 2020.
Marglin, Stephen A. 2018. “Raising Keynes: A General Theory for the 21st century,” EconomiA, 19(1):
1-11. ISSN 1517-7580, https://doi.org/10.1016/j.econ.2018.02.001.
20
Marx, Karl and Friedrich Engels (2004) [1848]. Manifesto of the Communist Party. Marxists Internet
Archive. https://www.marxists.org/archive/marx/works/1848/communist-manifesto/ . Accessed on June
20, 2020.
McCloskey, Donald N. 1972. “The Enclosure of Open Fields: Preface to a Study of Its Impact on the
Efficiency of English Agriculture in the Eighteenth Century,” Journal of Economic History 32 (1, Mar
1972): 15-35.
Mitchell, B. R. 1988. British Historical Statistics. Cambridge University Press; Cambridge, UK.
Mohun, Simon. 1994. “A Re(in)Statement of the Labor Theory of Value.” Cambridge Journal of
Economics 18: 391–412.
North, Douglas and Robert Paul Thomas. 1971. “The Rise and Fall of the Manorial System: A
Theoretical Model.” The Journal of Economic History 31(4): 777-803.
North, Douglas and Robert Paul Thomas. 1973. The Rise of the Western World: A New Economic
History. Cambridge, UK/New York, NY: Cambridge University Press.
O’Brien, P. K and P. Hunt. 1999. “Excises and the rise of a fiscal state in England” in M. Ormrod et al
(eds.), Essays in European fiscal history (Stamford, 1999). Data is located on
https://www.esfdb.org/Database.aspx . Accessed on November 29, 2020.
Piketty, T., & Goldhammer, A. 2014. Capital in the twenty-first century. Cambridge Massachusetts: The
Belknap Press of Harvard University Press.
Richardson, D. 1987. The Slave Trade, Sugar, and British Economic Growth, 1748-1776. The Journal of
Interdisciplinary History, 17(4), 739-769. Doi:10.2307/204652
Rimmer, Gordon, J. P. P. Higgins, and Sidney Pollard, editors, with the assistance of J. E. Ginarlis. 1971.
Aspects of Capital Investment in Great Britain, 1750–1850: A Preliminary Survey. (Report of a
conference held at the University of Sheffield, 5–7 January 1969.) London: Methuen and Company;
distributed by Barnes and Noble, New York.
Sato, Hajime. 2018. “The Emergence of ‘Modern’ Ownership Rights Rather than Property Rights.”
Journal of Economic Issues 52(3): 676-693.
Schumpeter, Joseph A. 2003. Capitalism, Socialism, and Democracy. New York, NY: Taylor and
Francis e-Library. Originally published in 1943.
Seely, Antony. 1995. Inheritance Tax Research Paper 95-107. House of Commons Library.
https://researchbriefings.files.parliament.uk/documents/RP95-107/RP95-107.pdf . Accessed on
November 21, 2020.
Smith, Adam. 2000. The Wealth of Nations. Introduction by Robert Reich ; Edited, with Notes, Marginal
Summary, and Enlarged Index by Edwin Cannan. New York :Modern Library, 2000. Originally
published in 1776.
Stanfield, Ron. 1974. “Revision of the Economic Surplus Concept.” Review of Radical Political
Economics 6(3):69-74. Doi:10.1177/048661347400600305
Sweezy, Paul M. 1942. The Theory of Capitalist Development: Principles of Marxian Political
Economy. New York, NY: Monthly Review Press.
Sweezy, Paul M. 1976 (1950). “A Critique,” in The Transition from Feudalism to Capitalism, edited by
Hilton, Rodney, London, UK: NLB, pages 33-56. Originally published with Dobb in Science and

21
Society, Spring 1950: Sweezy, Paul M., and Maurice Dobb. “The Transition from Feudalism to
Capitalism.” Science & Society 14, no. 2 (1950): 134-67.
Sweezy, Paul. 1978. ‘Comment on Brenner,’ New Left Review, I/108, March–April, pp. 94–5.
Xu, Zhun. 2019. “Economic Surplus, the Baran Ratio, and Capital Accumulation.” Monthly Review,
70(10). March 2019. https://monthlyreview.org/2019/03/01/economic-surplus-the-baran-ratio-and-
capital-accumulation/ . Accessed on April 11, 2020.
Source: Gregory Clark, “National Income, Prices, Wages, Land Rents, Population, England, 1209-1869”, from his website,
http://faculty.econ.ucdavis.edu/faculty/gclark/data.html .
0
10
20
30
40
50
60
12
09
12
26
12
43
12
60
12
77
12
94
13
11
13
28
13
45
13
62
13
79
13
96
14
13
14
30
14
47
14
64
14
81
14
98
15
15
15
32
15
49
15
66
15
83
16
00
16
17
16
34
16
51
16
68
16
85
17
02
17
19
17
36
17
53
17
70
17
87
18
04
18
21
18
38
18
55
Figure 1: Economic Surplus / Net National Income %

22
Source: Gregory Clark, “National Income, Prices, Wages, Land Rents, Population, England, 1209-1869”, from his website,
http://faculty.econ.ucdavis.edu/faculty/gclark/data.html .
Source: Gregory Clark, “National Income, Prices, Wages, Land Rents, Population, England, 1209-1869”, from his website,
http://faculty.econ.ucdavis.edu/faculty/gclark/data.html .
0
10
20
30
40
50
60
70
80
12
09
12
26
12
43
12
60
12
77
12
94
13
11
13
28
13
45
13
62
13
79
13
96
14
13
14
30
14
47
14
64
14
81
14
98
15
15
15
32
15
49
15
66
15
83
16
00
16
17
16
34
16
51
16
68
16
85
17
02
17
19
17
36
17
53
17
70
17
87
18
04
18
21
18
38
18
55
Figure 2: Capital Income / Economic Surplus %
0
5
10
15
20
25
30
35
40
12
09
12
26
12
43
12
60
12
77
12
94
13
11
13
28
13
45
13
62
13
79
13
96
14
13
14
30
14
47
14
64
14
81
14
98
15
15
15
32
15
49
15
66
15
83
16
00
16
17
16
34
16
51
16
68
16
85
17
02
17
19
17
36
17
53
17
70
17
87
18
04
18
21
18
38
18
55
Figure 3: Capital Income / Net National Income %

23
Source: Lambert (2021) estimates based on Gregory Clark, “National Income, Prices, Wages, Land Rents, Population, England,
1209-1869”, from his website, http://faculty.econ.ucdavis.edu/faculty/gclark/data.html .
Source: Lambert (2021) stimates based on Gregory Clark, “National Income, Prices, Wages, Land Rents, Population, England,
1209-1869”, from his website, http://faculty.econ.ucdavis.edu/faculty/gclark/data.html .
0
500
1000
1500
2000
2500
3000
3500
4000
45001
20
0
12
20
12
40
12
60
12
80
13
00
13
20
13
40
13
60
13
80
14
00
14
20
14
40
14
60
14
80
15
00
15
20
15
40
15
60
15
80
16
00
16
20
16
40
16
60
16
80
17
00
17
20
17
40
17
60
17
80
18
00
18
20
18
40
18
60
Figure 4: Real Capital Stock, £ millions
-200
0
200
400
600
800
1000
12
00
12
20
12
40
12
60
12
80
13
00
13
20
13
40
13
60
13
80
14
00
14
20
14
40
14
60
14
80
15
00
15
20
15
40
15
60
15
80
16
00
16
20
16
40
16
60
16
80
17
00
17
20
17
40
17
60
17
80
18
00
18
20
18
40
18
60
Figure 5: Real Investment, £ millions

24
Source: Lambert (2021) estimates based on Gregory Clark, “National Income, Prices, Wages, Land Rents, Population, England,
1209-1869”, from his website, http://faculty.econ.ucdavis.edu/faculty/gclark/data.html .
Source: From B.R. Mitchell, British Historical Statistics (1988) and Christopher Chantrill (no date) UK Public Spending,
https://www.ukpublicspending.co.uk/
-800.0
-700.0
-600.0
-500.0
-400.0
-300.0
-200.0
-100.0
0.0
100.0
200.01
20
0
12
20
12
40
12
60
12
80
13
00
13
20
13
40
13
60
13
80
14
00
14
20
14
40
14
60
14
80
15
00
15
20
15
40
15
60
15
80
16
00
16
20
16
40
16
60
16
80
17
00
17
20
17
40
17
60
17
80
18
00
18
20
18
40
18
60
Figure 6: Real Govt Deficit/Surplus, £ millions
0
20
40
60
80
100
120
140
160
180
200
16
92
16
97
17
02
17
07
17
12
17
17
17
22
17
27
17
32
17
37
17
42
17
47
17
52
17
57
17
62
17
67
17
72
17
77
17
82
17
87
17
92
17
97
18
02
18
07
18
12
18
17
18
22
18
27
18
32
18
37
18
42
18
47
18
52
18
57
Figure 7: Public Net Debt / GDP %, 1692-1860
25
Source: Estimates based on Gregory Clark, “National Income, Prices, Wages, Land Rents, Population, England, 1209-1869”,
from his website, http://faculty.econ.ucdavis.edu/faculty/gclark/data.html .
-3
-2
-1
0
1
2
3
4
51
20
0
12
20
12
40
12
60
12
80
13
00
13
20
13
40
13
60
13
80
14
00
14
20
14
40
14
60
14
80
15
00
15
20
15
40
15
60
15
80
16
00
16
20
16
40
16
60
16
80
17
00
17
20
17
40
17
60
17
80
18
00
18
20
18
40
18
60
Figure 8: Baran Ratio

26
Table 1—Correlation Matrix for 1200 to 1860 Values
Real
Economic
Surplus
per Head
Real
Investment
per Head
Real Govt
Surpluses/Deficits
per Head
Baran
Ratio
Clark
Real
Income
per Head
Broadberry,
et al Real
GDP per
Head
Debt/GDP
Pct
Real Economic Surplus per Head 1 Real Investment per Head 0.4357* 1 Real Govt Surpluses/Deficits per Head -0.2991* -0.9892* 1 Baran Ratio 0.3851* 0.9739* -0.9698* 1 Clark Real Income per Head 0.7312* 0.4032* -0.3084* 0.3495* 1 Broadberry, et al Real GDP per Head 0.7329* 0.8195* -0.7875* 0.7304* 0.5295* 1
Debt/GDP Pct 0.6900* 0.5386* -0.5116* 0.5034* 0.5489* 0.4993* 1
*p < 0.05
Table 2–Johansen tests for Cointegration
Trend: constant Number of obs = 16
Sample: 52 – 67 Lags = 1
-------------------------------------------------------------------------------
maximum rank parms LL eigenvalue
trace
statistic
5% critical
value
0 7 -255.93659 . 262.4201 124.24
1 20 -201.46118 0.9989 153.4692 94.15
2 31 -169.40441 0.98181 89.3557 68.52
3 40 -146.36658 0.94385 43.2800* 47.21
4 47 -135.5438 0.7415 21.6345 29.68
5 52 -128.47646 0.58663 7.4998 15.41
6 55 -126.07518 0.2593 2.6972 3.76
7 56 -124.72656 0.15513
-------------------------------------------------------------------------------
27
0
20
40
60
80
100
120
140
160
180
-3 -2 -1 0 1 2 3 4 5
Figure 9: Clark Income based GDP per Head (y) by Baran Ratio (x)
0
50
100
150
200
250
-3 -2 -1 0 1 2 3 4 5
Figure 10: Broadberry, et al Real GDP per Capita (y) by Baran Ratio (x)

28
Table 3—Vector Autoregression Results
1) Dependent Variable is Clark Real Income Based GDP per Capita
b S.E.
Constant 8.59 5.2
Baran Ratio, 1 lag 3.93* 0.82
n=66
Adj. r2 = 0.87
2) Dependent Variable is Broadberry Real GDP per Capita
b S.E.
Constant -3.17 2.17
Baran Ratio, 1 lag 2.06* 0.74
n=59
Adj. r2 = 0.98
p<0.05
29
Source: Based on Clark data (2009)
-0.2
-0.15
-0.1
-0.05
0
0.05
0.1
0.15
0.21
20
0
12
20
12
40
12
60
12
80
13
00
13
20
13
40
13
60
13
80
14
00
14
20
14
40
14
60
14
80
15
00
15
20
15
40
15
60
15
80
16
00
16
20
16
40
16
60
16
80
17
00
17
20
17
40
17
60
17
80
18
00
18
20
18
40
18
60
Figure 11: Growth Rates over Time

30
Appendix
Source: Clark (2009).
Data
(money values in £s)
Decade Econ Surplus per Capita Baran Ratio Clark Income Based GDP per Head Broadberry GDP Per Head
1200 13.83 0.00 133.33
1210 13.99 -0.52 124.67
1220 11.09 -0.17 109.48
1230 9.16 -0.28 99.35
1240 9.31 -0.22 109.31
1250 9.92 0.19 104.90
1260 10.11 1.03 100.82
1270 7.64 -1.23 74.02 48.54
1280 6.76 0.51 82.35 43.43
1290 7.14 -0.50 71.73 45.49
1300 5.50 0.43 73.04 48.32
1310 4.75 -0.36 64.71 49.43
1320 8.26 -0.23 80.88 48.56
1330 7.29 0.59 89.54 47.89
1340 6.75 0.21 83.99 49.69
1350 8.44 -1.20 100.49 62.72
1360 8.80 -0.32 109.31 61.67
1370 4.96 1.40 107.52 59.02
1380 8.33 0.74 129.41 65.09
0
2
4
6
8
10
12
14
12
00
12
20
12
40
12
60
12
80
13
00
13
20
13
40
13
60
13
80
14
00
14
20
14
40
14
60
14
80
15
00
15
20
15
40
15
60
15
80
16
00
16
20
16
40
16
60
16
80
17
00
17
20
17
40
17
60
17
80
18
00
18
20
18
40
18
60
Fig. A1: Real Return on Capital, 1200 to 1860
31
1390 7.75 -0.62 120.75 71.39
1400 9.07 0.14 130.07 69.73
1410 7.74 -0.43 128.27 69.34
1420 9.02 0.37 136.77 70.08
1430 8.35 -0.39 131.70 66.65
1440 8.64 0.21 149.18 67.57
1450 10.16 0.03 149.02 67.46
1460 9.65 -0.26 142.16 66.99
1470 7.76 -0.37 133.17 64.49
1480 8.59 -0.31 127.78 66.10
1490 7.76 0.17 134.64 68.09
1500 8.52 0.48 126.80 71.28
1510 8.55 0.63 121.90 73.05
1520 7.34 -0.50 111.60 73.46
1530 8.07 0.22 111.28 70.39
1540 8.48 -0.33 109.80 70.07
1550 5.33 -1.81 88.89 65.81
1560 5.91 1.14 98.04 76.40
1570 7.22 2.27 99.18 73.09
1580 8.55 -1.89 100.98 63.51
1590 6.91 -0.04 93.63 63.71
1600 8.38 1.36 96.90 71.83
1610 8.56 0.94 91.34 68.99
1620 8.55 0.34 92.81 70.55
1630 6.98 -0.11 84.64 62.82
1640 7.86 0.46 87.09 64.98
1650 6.18 0.77 91.99 70.39
1660 7.05 0.75 96.24 76.95
1670 7.09 -0.41 93.79 79.82
1680 7.65 0.95 100.82 87.67
1690 7.96 -1.03 90.69 98.98
1700 7.06 1.96 100.00 100.00
1710 6.51 -0.54 97.55 93.85
1720 8.09 1.61 100.16 102.65
1730 8.65 1.74 113.24 104.96
1740 7.44 -0.16 108.17 105.74
1750 9.03 1.00 111.11 109.39
1760 9.12 1.46 110.78 117.35
1770 9.38 -0.08 108.50 117.79
1780 8.98 1.33 107.35 119.67
1790 9.03 1.96 111.77 125.20
1800 8.78 1.99 114.22 133.04
1810 11.19 1.59 120.75 132.07
32
1820 10.42 3.01 128.92 136.40
1830 11.19 2.04 135.62 150.25
1840 10.12 3.40 141.18 167.14
1850 11.70 4.25 153.11 191.67
1860 11.67 2.93 163.40 211.76
Data
Decade Investment per Capita Govt Deficit/Surplus per Capita Mitchell Debt Pct GDP
1200 0.00 13.84
1210 -6.77 19.70
1220 -1.84 12.52
1230 -2.72 12.37
1240 -2.25 12.47
1250 1.87 8.03
1260 9.96 -0.32
1270 -8.25 14.98
1280 3.61 3.49
1290 -3.08 9.27
1300 2.49 3.29
1310 -1.78 6.70
1320 -1.76 9.52
1330 4.70 3.33
1340 1.49 5.62
1350 -8.80 16.16
1360 -2.79 11.52
1370 9.62 -2.78
1380 6.70 2.35
1390 -5.02 13.13
1400 1.29 7.76
1410 -3.79 12.61
1420 3.37 5.79
1430 -3.39 12.19
1440 2.16 7.92
1450 0.33 9.69
1460 -2.49 12.19
1470 -3.02 11.18
1480 -2.57 10.86
1490 1.45 6.96
1500 3.82 4.22

33
1510 4.58 2.74
1520 -3.54 10.68
1530 1.76 6.09
1540 -2.39 9.66
1550 -9.26 14.38
1560 6.55 -0.78
1570 14.38 -8.03
1580 -14.42 22.03
1590 -0.26 6.50
1600 11.24 -2.95
1610 7.40 0.46
1620 2.67 5.18
1630 -0.78 7.79
1640 3.18 3.74
1650 5.46 1.59
1660 5.58 1.86
1670 -2.98 10.19
1680 7.44 0.43
1690 -7.10 13.98
1700 15.08 -7.37 23.43
1710 -4.12 11.75 34.08
1720 12.74 -4.79 82.95
1730 15.48 -6.57 76.15
1740 -1.29 9.45 67.71
1750 9.01 -0.02 107.44
1760 13.00 -4.12 130.22
1770 -0.74 9.50 111.34
1780 11.16 -2.74 94.89
1790 17.81 -8.73 92.18
1800 20.37 -10.14 111.03
1810 16.88 -6.26 115.70
1820 32.72 -21.84 169.03
1830 22.42 -11.41 154.99
1840 37.17 -26.24 130.80
1850 49.85 -38.11 129.66
1860 35.98 -23.69 94.05

34
Vector Autoregression Diagnostics
Selection-order criteria
Sample: 5 - 67 Number of obs = 63
lag LL LR df p FPE AIC HQIC SBIC
0 -277.777 421.553 8.8818 8.90856 8.94984
1 -217.483 120.59* 1 0.000 64.1768 6.99945 7.03959* 7.1015*
2 -216.337 2.2916 1 0.130 63.8868 6.99482 7.04834 7.13089
3 -214.93 2.814 1 0.093 63.077* 6.9819* 7.0488 7.15199
4 -214.348 1.1629 1 0.281 63.9364 6.99519 7.07546 7.19929
+---------------------------------------------------------------------------+
Endogenous: Clark Income based GDP per head
Exogenous: Baran Ratio
Selection-order criteria
Sample: 12 - 67 Number of obs = 56
lag LL LR df p FPE AIC HQIC SBIC
0 -256.426 596.851 9.22951 9.25756 9.30185
1 -168.926 175* 1 0.000 27.1788* 6.14021* 6.18228* 6.24871*
2 -168.39 1.072 1 0.300 27.6368 6.15678 6.21287 6.30145
3 -167.907 0.96617 1 0.326 28.1583 6.17524 6.24535 6.35608
4 -167.594 0.62495 1 0.429 28.8683 6.1998 6.28393 6.4168
+---------------------------------------------------------------------------+
Endogenous: Broadberry GDP Per Head
Exogenous: Baran Ratio