The association between acanthosis nigricans and dysglycemia in an ethnically diverse group of...
13
The Association between Acanthosis Nigricans and Dysglycemia in an Ethnically Diverse Group of Eighth Grade Students Lisa Rafalson, PhD 1,2 , Trang H. Pham, MS 3 , Steven M. Willi, MD 4 , Marsha Marcus, PhD 5 , Ann Jessup, MSN, FNP, CS 6 , and Tom Baranowski, PhD 7 1 D’Youville College, Health Service Administration, Buffalo, NY 2 University at Buffalo, Departments of Family Medicine and Pediatrics, Buffalo, NY 3 George Washington University, The Biostatistics Center, Rockville, MD 20852 4 University of Pennsylvania, Department of Pediatrics, Philadelphia, PA, 19104 5 University of Pittsburgh Medical Center, Western Psychiatric Institute, Pittsburgh, PA 15213 6 University of North Carolina, Chapel Hill, School of Nursing, Chapel Hill, NC 27599 7 Baylor College of Medicine, Children’s Nutrition Research Center, Houston, TX 77030 Abstract The purpose of this study was to describe the prevalence of acanthosis nigricans (AN) and to quantify its association with dysglycemia in an ethnically diverse group of eighth grade students. Data were collected in 2003 from a cross-sectional study of students from 12 middle schools in three U.S. states. Sex, race/ethnicity and pubertal status were self-reported. Anthropometric measures were recorded. Trained staff identified the presence and severity of AN by inspection of the back of the neck. Fasting and 2hr blood samples were analyzed for impaired fasting glucose (IFG), impaired glucose tolerance (IGT), and high-risk glycated hemoglobin (A1C), respectively defined as ≥100 mg/dl, ≥140 mg/dl, and ≥ 5.7-6.4%. Overall, 25.0%, 58.2%, and 16.8% were Black, Hispanic and White, respectively. AN was present among 406 /1438 (28.2%) of students: 39% among Black, 30% among Hispanic, and 5.4% among White. IGT and highArisk A1C were present among 2.1%, and 12.4%, respectively. In multivariate logistic modeling after adjusting for gender, family history of diabetes, BMI percentile and pubertal staging, the presence (vs. absence) of AN was associated with a 59% increased likelihood of highArisk A1C: (P = 0.04), twice the likelihood of IGT (P=0.06), and 47% greater likelihood of IGT/IFG combined (P<0.0001). Adjustment for insulin attenuated the ORs by 25-70%. In a racially/ethnically diverse sample of U.S. adolescents, AN was common, occurring in 28% of the sample. AN was associated with a 50-100% increased likelihood of dysglycemia even after consideration of established diabetes risk factors. Corresponding author: Lisa Rafalson, Assistant Professor, D’Youville College, 320 Porter Ave., Buffalo, NY 14201, (716) 829-8489 phone, (716)829-8184 fax, [email protected]. No conflicts of interest. HEALTHY intervention materials are available for download at http://www.healthystudy.org/. DISCLOSURE None NIH Public Access Author Manuscript Obesity (Silver Spring). Author manuscript; available in PMC 2013 September 01. Published in final edited form as: Obesity (Silver Spring). 2013 March ; 21(3): E328–E333. doi:10.1002/oby.20129. NIH-PA Author Manuscript NIH-PA Author Manuscript NIH-PA Author Manuscript
-
Upload
independent -
Category
Documents
-
view
0 -
download
0
Transcript of The association between acanthosis nigricans and dysglycemia in an ethnically diverse group of...
The Association between Acanthosis Nigricans andDysglycemia in an Ethnically Diverse Group of Eighth GradeStudents
Lisa Rafalson, PhD1,2, Trang H. Pham, MS3, Steven M. Willi, MD4, Marsha Marcus, PhD5,Ann Jessup, MSN, FNP, CS6, and Tom Baranowski, PhD7
1D’Youville College, Health Service Administration, Buffalo, NY2University at Buffalo, Departments of Family Medicine and Pediatrics, Buffalo, NY3George Washington University, The Biostatistics Center, Rockville, MD 208524University of Pennsylvania, Department of Pediatrics, Philadelphia, PA, 191045University of Pittsburgh Medical Center, Western Psychiatric Institute, Pittsburgh, PA 152136University of North Carolina, Chapel Hill, School of Nursing, Chapel Hill, NC 275997Baylor College of Medicine, Children’s Nutrition Research Center, Houston, TX 77030
AbstractThe purpose of this study was to describe the prevalence of acanthosis nigricans (AN) and toquantify its association with dysglycemia in an ethnically diverse group of eighth grade students.Data were collected in 2003 from a cross-sectional study of students from 12 middle schools inthree U.S. states. Sex, race/ethnicity and pubertal status were self-reported. Anthropometricmeasures were recorded. Trained staff identified the presence and severity of AN by inspection ofthe back of the neck. Fasting and 2hr blood samples were analyzed for impaired fasting glucose(IFG), impaired glucose tolerance (IGT), and high-risk glycated hemoglobin (A1C), respectivelydefined as ≥100 mg/dl, ≥140 mg/dl, and ≥ 5.7-6.4%. Overall, 25.0%, 58.2%, and 16.8% wereBlack, Hispanic and White, respectively. AN was present among 406 /1438 (28.2%) of students:39% among Black, 30% among Hispanic, and 5.4% among White. IGT and highArisk A1C werepresent among 2.1%, and 12.4%, respectively. In multivariate logistic modeling after adjusting forgender, family history of diabetes, BMI percentile and pubertal staging, the presence (vs. absence)of AN was associated with a 59% increased likelihood of highArisk A1C: (P = 0.04), twice thelikelihood of IGT (P=0.06), and 47% greater likelihood of IGT/IFG combined (P<0.0001).Adjustment for insulin attenuated the ORs by 25-70%. In a racially/ethnically diverse sample ofU.S. adolescents, AN was common, occurring in 28% of the sample. AN was associated with a50-100% increased likelihood of dysglycemia even after consideration of established diabetes riskfactors.
Corresponding author: Lisa Rafalson, Assistant Professor, D’Youville College, 320 Porter Ave., Buffalo, NY 14201, (716) 829-8489phone, (716)829-8184 fax, [email protected].
No conflicts of interest.
HEALTHY intervention materials are available for download at http://www.healthystudy.org/.
DISCLOSURE None
NIH Public AccessAuthor ManuscriptObesity (Silver Spring). Author manuscript; available in PMC 2013 September 01.
Published in final edited form as:Obesity (Silver Spring). 2013 March ; 21(3): E328–E333. doi:10.1002/oby.20129.
NIH
-PA Author Manuscript
NIH
-PA Author Manuscript
NIH
-PA Author Manuscript
Keywordsacanthosis nigricans; glycosilated hemoglobin; hyperglycemia; insulin resistance; screening;adolescents
INTRODUCTIONType 2 diabetes is an international public health problem (1). Once considered exclusivelyan adult chronic disease it has been diagnosed more frequently in the United States amongchildren and adolescents. It now comprises an increasingly large proportion (8-45%) ofnewly diagnosed diabetes cases (2, 3), especially among minority youth 10 to 19 years ofage (4). Moreover, precursor states to type 2 diabetes including impaired fasting glucose(IFG) and impaired glucose tolerance (IGT) have become more prevalent among adolescents(5-7).
Acanthosis nigricans (AN) is a disorder of the skin characterized by hyperpigmentation,hyperkeratosis, and papillomatosis, presenting as darkish blackish- brown, velvety lesionsmost often on the back of the neck, but also on other areas of the body, especially those thatare prone to perspiration or friction (8). AN has been associated with rare, genetic defects ininsulin action, i.e., Type A insulin resistance and internal malignant neoplasms, especiallyadenocarcinomas. (8, 9). The increase in circulating insulin levels manifested inhyperinsulinemia results in the binding and stimulation of insulin receptors and growthfactor-1 receptors on keratinocytes and dermal fibroblasts (10). Thus, AN is a visible,clinical marker of hyperinsulinemia.
AN is more prevalent among persons of minority race than whites (11, 12). In addition,strong associations have been demonstrated between AN and excess body weight (13, 14),hyperinsulinemia, homeostasis model assessment insulin resistance (HOMA-IR), anddirectly measured insulin sensitivity (Si) (11, 13-16). But, the use of varying indexes, as wellas the lack of a standardized assay and a universally accepted threshold of insulin resistance,hampers both the ability to quantify the association between AN and insulin resistance, andto compare study results (17). Laboratory analyses of glucose concentrations, in contrast, arestandardized and clinical cut points well-established, thereby enabling comparisons of riskestimates between studies.
Clinical studies that have reported on the association between glucose concentrations andAN have been restricted to mostly or exclusively overweight or obese children. Forexample, among 160 obese Turkish children (mean age 10.4 ± 3.3 years) followed at apediatric endocrinology clinic, no significant differences in mean fasting or 2 hr postAloadglucose concentrations were noted between children with and without AN (14). Similarly,no differences were noted among 139 overweight African American and White 6 to 10 yearolds (18). In contrast, among 287 obese children 8-14 years from urban primary pediatricoffices, children with AN had a higher prevalence of abnormal glucose homeostasis thanchildren without AN (19). Although several school-based studies have described theprevalence of AN (12, 20) and its association with insulin sensitivity (11), only one hasspecifically examined AN and impaired glucose metabolism (21).
The aim of this study was to examine the prevalence of AN, and to quantify its associationwith aspects of impaired glucose homeostasis among a racially/ethnically diverse sample ofeighth grade students from lower income schools.
Rafalson et al. Page 2
Obesity (Silver Spring). Author manuscript; available in PMC 2013 September 01.
NIH
-PA Author Manuscript
NIH
-PA Author Manuscript
NIH
-PA Author Manuscript
RESEARCH DESIGN AND METHODSThe data presented here are from a pilot study conducted by the Studies to Treat or PreventPediatric Type 2 Diabetes (STOPP-T2D) Prevention Study Group. STOPP-T2D Preventionis a National Institute of Diabetes and Digestive and Kidney Diseases sponsored multisitestudy designed to reduce the prevalence of risk factors for type 2 diabetes among middleschool children. Data were collected at three field centers in Texas (Baylor College ofMedicine), California (University of California, Irvine), and North Carolina (University ofNorth Carolina at Chapel Hill). The STOPP-T2D coordinating center was at The GeorgeWashington University Biostatistics Center (Rockville, MD). The institutional reviewboards at each site approved this study.
Participant recruitment methods and inclusion criteria have been reported elsewhere (22). Inbrief, participants were eighth grade students recruited from 12 schools (4 per field center),in which at least 50% of the participants were from a minority race/ethnicity. Schools werealso required to have at least 50% of their enrolled students eligible for free or reduced priceschool lunch. All eighth grade students who provided written parental consent and childhoodassent and who did not have a diagnosis of either type 1 or type 2 diabetes were eligible toparticipate. Participants received 50 US dollars and a free breakfast for participating in thestudy.
Participant ethnicity (Hispanic yes/no) and race were asked of each student as two separatequestions with laminated cards showing and defining choices. To assess the presence of AN,staff trained by experienced physicians inspected the most commonly affected area (23, 24),the back of the neck. AN may be present on other areas of the body, but in light of theschool setting, large sample size and student participants, the back of the neck was the onlysite selected for evaluation given its obvious ease of examination which does not requiredisrobing. Severity was recorded using Burke’s scale (23): 0 = Absent: not detectable onclose inspection; 1 = Present: clearly present on close visual inspection, not visible to the,casual observer, extent not measurable; 2 = Mild: limited to the base of the skull, does notextend to the lateral margins of the neck (usually < 3″ or 8 cm in breadth); 3 = Moderate:extending to the lateral margins of the neck (posterior border of the sternocleidomastoid;usually 3-6″ or 8-16 cm), should not be visible when the participant is viewed from thefront; 4 = Severe: extending anteriorly (> 6″ or 16 cm), visible when the participant isviewed from the front. AN was considered absent if the score was <1 and present if the scalescore was ≥1. Pubertal development was selfAassessed using the Pubertal DevelopmentScale (25). Height was measured to the nearest 0.1 cm on a stadiometer (PEAAIMA101;Perspective Enterprises, Kalamazoo, MI) with the participants shoeless and the head in theFrankfort plane. Body weight was measured to the nearest 0.1 kg using a calibratedelectronic scale (SECA Alpha 882; Vogel & Halke, Hamburg, Germany) with theparticipants shoeless and pockets empty. BMI (weight in kilograms divided by the square ofheight in meters) and BMI percentiles were then calculated using Centers for DiseaseControl and Prevention ageA and sexAspecific percentiles; participants were grouped asnormal weight (BMI <85th percentile), overweight (BMI 85th -94th percentile), obese (BMI≥95thA98th percentile) and severely obese (BMI ≥ 99th percentile). Waist circumferencewas assessed to the nearest 0.1 cm at the lateral border of the right iliac crest according tothe NHANES protocol with use of a weighted measuring tape by research assistants whowere within 90% agreement with a criterion observer during a preAstudy training procedure.Participants were called the night before the blood sampling and reminded that they neededto fast before the test. At the beginning of the blood sampling, participants were asked whenthey last ate; any participant who reported eating or drinking after midnight was considerednonfasting and asked to return another time when still eligible for the incentive. Noparticipants reported taking any lipid-lowering or antihypertensive medications. Fasting
Rafalson et al. Page 3
Obesity (Silver Spring). Author manuscript; available in PMC 2013 September 01.
NIH
-PA Author Manuscript
NIH
-PA Author Manuscript
NIH
-PA Author Manuscript
venous blood samples were obtained by experienced phlebotomists to determine insulin,glucose and HbA1c% (A1C). Blood was collected in 2-ml Vacutainers (Becton Dickinson,Franklin Lakes, NJ) containing sodium fluoride for glucose and sodium heparin for insulin.Students were then given oral glucose (solution 1.75 g/kg to a maximal dose of 75g).Twohours post-glucose load, another blood sample was obtained to determine glucose levels.Glucose was assessed using a Hitachi 917 autoanalyzer by the Hexokinase method usingreagent from Roche Diagnostics. The measurement of relative proportion of hemoglobinsubclasses and calculation of the HbA1c level was performed using an automated non-porous ion exchange high performance liquid chromatography system (G-7 TosohBiosciences, Inc.). The intra-assay CV is 0.047% and the inter-assay CV 0.070%. IFG andIGT were defined according to the American Diabetes Association’s (ADA) criteria (26).A1C cutpoints of <5.7% and 5.7-6.4% were classified as normal and high-risk, respectively(27). Students with type 2 diabetes identified by FPG ≥125 mg/dl or OGTT ≥200mg/dl orA1C >6.4% were not eligible for inclusion in this report (n=12). Blood was spun andseparated into serum and plasma, frozen, packed in dry ice, and shipped to the NorthwestLipid Metabolism and Diabetes Research Laboratory at the University of Washington.
Statistical AnalysisDescriptive statistics including means, SDs, and percentages were calculated for allvariables. Generalized estimating equation (GEE) models that took into account theclustering of observations within schools were used to test for differences in demographics,metabolic profile and clinical measures between those with and without AN. Equalcorrelation between all interschool observations (exchangeable) was chosen as thecovariance structure. Three logistic regression GEE models were used to predict IGT, IFGand/or IGT combined, and highArisk A1C by AN presence vs. absence. Model 1 adjusts forgender, family history of diabetes, and racial/ethnic group. In order to assess possibleconfounding, BMI percentile and pubertal stage were added to the variables in the firstmodel to create Model 2. An additional adjustment for fasting insulin (log transformed) wasadded in Model 3 which included all the variables in models 1 and 2) A multivariateapproach was used to examine possible interactions among gender and race/ethnicity andBMI with AN. Because none of the interactions were significant, they were removed fromall models. All descriptive data from this pilot study of a multisite trial are consideredexploratory and thus all P values are presented without adjustment for multiple comparisonswith α set at 0.05. SAS statistical software (version 9.2; SAS Institute, Cary NC) was usedfor all statistical analyses.
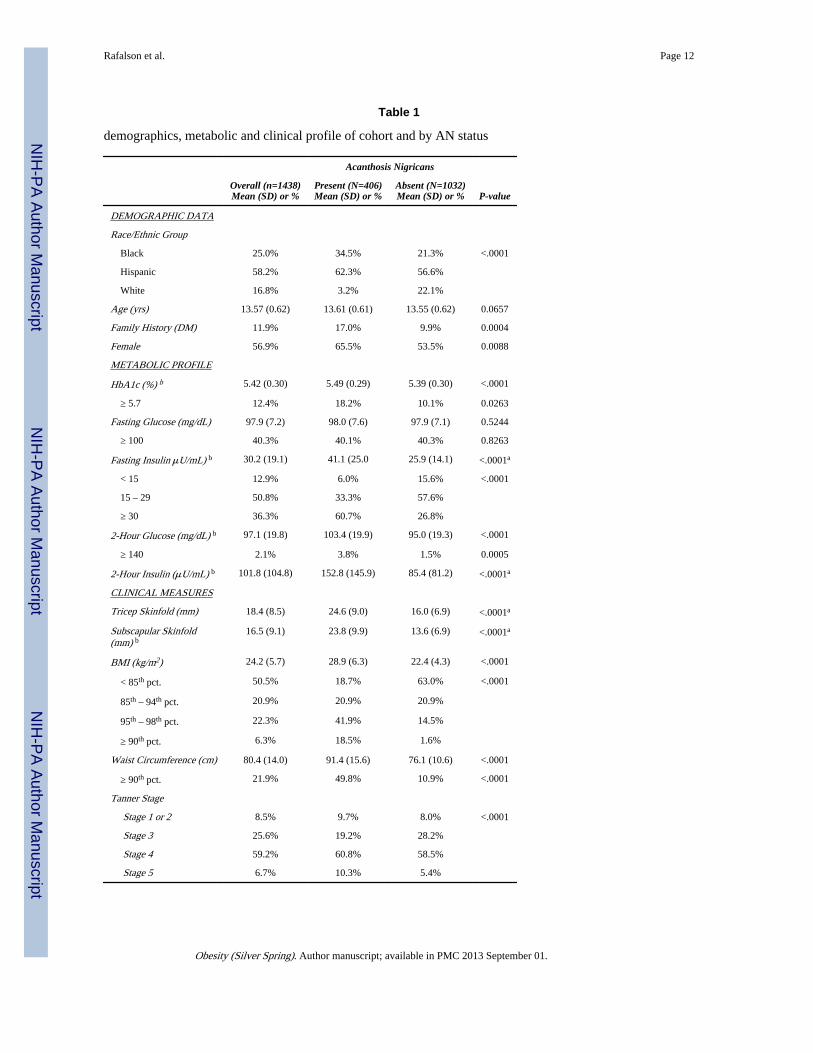
RESULTSA total of 1,740 eighth grade students participated in the study. Twelve students wereexcluded due to having type 2 diabetes. However, complete data was not collected on allstudents. One hundred forty-five students were excluded for incomplete data. American-Indians (AI) n= 43 and other race (n=102) were excluded leaving 1,438 participants forthese analyses. No significant differences were noted in metabolic, clinical or demographiccharacteristics between youth included in the analysis (n=1438) and those excluded (n=302).Table 1 shows the results for the overall sample and by AN presence and absence. The racialdistribution was 25% Black, 58.2% Hispanic, and 16.8 % White; mean age was 13.6 (0.6)years and 56.9% were female. Overall, 406 of 1438 (28.2%) students had AN; 39%, 30%,and 5.4% among, Black, Hispanic and White, respectively (data not shown). The prevalenceof a family history of diabetes was 12% overall, significantly higher among those with ANpresent vs. absent (17% vs. 10%, P < 0.0004). Overall,12.4% had high-risk A1C, 2.1% hadIGT and 40.3% had IFG. The number of students with IFG/IGT was n=584: 165 (28%) of
Rafalson et al. Page 4
Obesity (Silver Spring). Author manuscript; available in PMC 2013 September 01.
NIH
-PA Author Manuscript
NIH
-PA Author Manuscript
NIH
-PA Author Manuscript
whom had AN present. Nearly 50% of students had a BMI ≥ 85th percentile: 22.3% wereobese and 6.3% of students were severely obese, BMI ≥ 99th percentile
Students with AN showed a less favorable metabolic profile compared to students withoutAN (Table 1). For example, 10.1% of students without AN and 18. 2% with AN hadhighArisk A1C. IGT was twice as high in the AN present vs. AN negative group (3.8% vs.1.5%, P < 0.0005). Among students with AN the prevalence of BMI ≥ 95th percentile wasnearly four times higher than that among students without AN (60.4% vs. 16.1%). A greaterproportion of students with AN were at a Tanner staging of 4 or 5 (P < 0.0001).
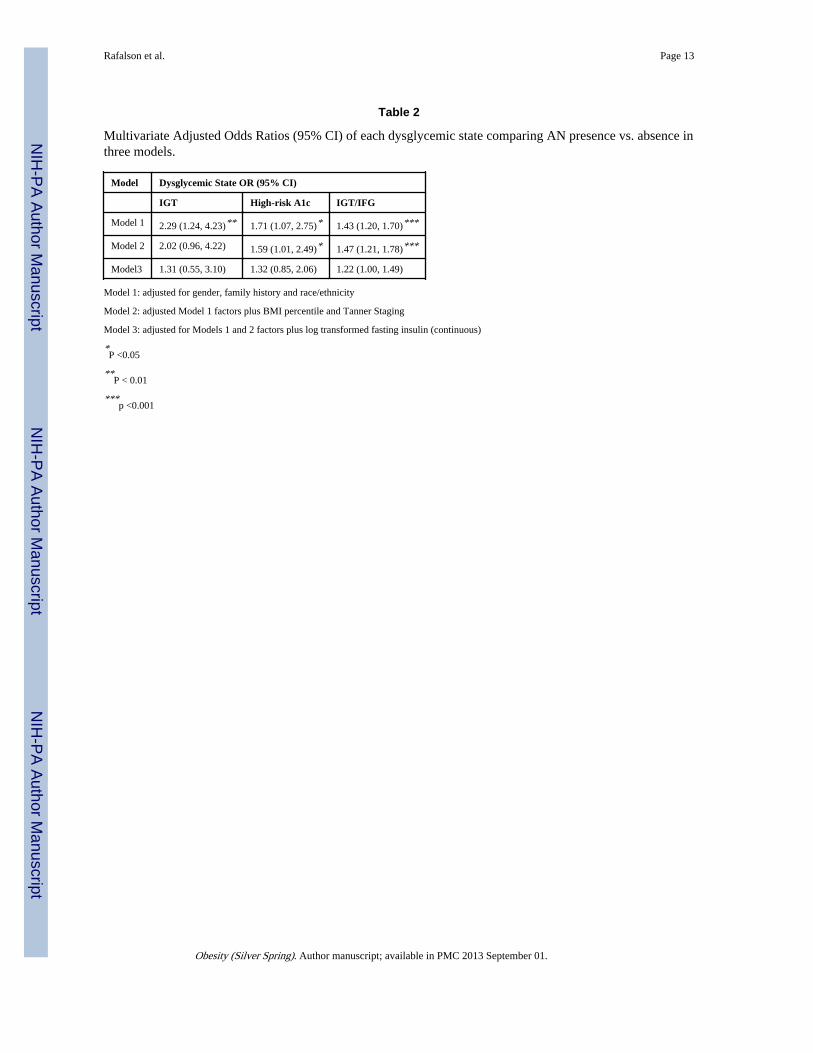
To quantify the association between AN with IGT, IFG/IGT combined, and high-risk A1C,logistic regression models were used to estimate the OR (95% CI) after adjustments forcovariates. Compared to students without AN, among students with AN, the OR of IGT (vs.NGT) was 2.30 (95% CI 1.24- 4.23) after adjustment for race/ethnicity, gender, and familyhistory of diabetes. Additional adjustment for BMI percentile and Tanner staging (Model 2)attenuated the association (OR 2.02, P =0.06. Inclusion of fasting insulin in the modelattenuated the association by 70%. (Table 2)
Table 2 shows the multivariate association between AN and high-risk A1C. Compared tostudents without AN, among persons with AN, the OR of high-risk A1C was 1.71 (95% CI:1.07-2.75), which remained essentially unchanged after adjustment for the addition ofModel 2 covariates. Again, when insulin was added to the modeling, the association wasattenuated but no longer significant. When IGT/ IFG were combined, the OR among thosewith AN was 1.47(P < 0.0001). Further adjustment for insulin attenuated the OR to 1.22 (p=0.05). In an analysis that was restricted to Blacks and Hispanics only, the results wereessentially the same (data not shown).
Figure 1 shows the mean BMI (standard error) percentile by AN severity only among Blacksand Hispanics; whites were excluded because of their low prevalence of AN. For Blacks andHispanics AN is absent at BMI < 70th percentile. The slight presence of AN appears amongBlacks at a lower mean BMI percentile than it does among Hispanics, 76th and 86thpercentile respectively. Mild AN is also evident at a lower BMI percentile among Blacksthan Hispanics, 85th and 95th percentile respectively. In contrast, moderate and severe ANare noted at BMI 95th percentile for both race groups. No significant difference was noted inmean BMI percentile between Blacks and Hispanics overall (74.1 vs. 76.6, respectively);moreover, Blacks were significantly more likely to have highArisk A1C (15.1% vs. 10.7%)(data not shown). Among normal weight Blacks with and without AN the only significantdifferences were noted between mean 2hr insulin (88.5 vs. 75.0 μU/dL, P<0.0001) and FPG(93.0 vs. 97.0 mg/dL, P= 0.007) (data not shown). These differences were not noted amongnormal weight Hispanic students.
CONCLUSIONIn this racially/ethnically diverse sample of eighth grade adolescents the overall prevalenceof AN was 28.2% and varied by race: 39%, 30%, and 5.4% among, Blacks, Hispanics andWhites, respectively. These results are remarkably similar to another school-based screeningprogram of 854 obese youth (mean age 11.4 years, 75% Black, at least 50% eligible for free/reduced lunch) (21). In that study, the prevalence of AN was 26%: 31%, 10.7% and 6.7%among Black, Hispanic and White students respectively. In contrast, the prevalenceestimates in the present study are somewhat higher than in other studies. For example, in aconvenience sample of 6th through 8th grade students (n=675) in New Mexico, (mean age13.5 years, 19% Native-American and 46.5% Hispanic, 26.6% obese) 19.7% of Hispanics,38.6% of Native-Americans, and 5.4% Whites had AN (11). In another school -based
Rafalson et al. Page 5
Obesity (Silver Spring). Author manuscript; available in PMC 2013 September 01.
NIH
-PA Author Manuscript
NIH
-PA Author Manuscript
NIH
-PA Author Manuscript
screening of 1,412 students in 6th and 8th grade (mean age 13.4 years, 27% obese) in Texas,the prevalence of AN was 7.1% overall; 13%, 5.5% and 0.4% among Blacks, Hispanics andWhites, respectively. (12) Finally, among 102,733 youth in 3rd, 5th and 8th grades (8 -15years) in Dallas (20), the overall prevalence of AN was 14.4%. One reason for the higherprevalence observed in the present study is the higher proportion (50%) of overweight/obesity among these students, which in part reflects the secular trend toward increasedobesity. Further, a higher proportion of our subjects were pubertal, with nearly 85% inTanner Stages 3 and 4 (which corresponds to the period of greatest insulin resistance) (28).Finally, the proportion of Black and Hispanic students in this study was nearly 85%.
This study expands the literature by quantifying the risk between AN and severaldysglycemic states that are in the pathophysiolgic pathway of the natural history of type 2diabetes. AN was associated with a two-fold increased likelihood of IGT, a 60% increasedlikelihood of high-risk A1C, and a 50% increased likelihood of IFG/IGT combined, evenafter adjustment for pubertal development and BMI percentile, suggesting that AN confersan additional risk of dysglycemia beyond obesity, consistent with some reports (11, 29). ANwas not associated with IFG, i.e. elevated fasting plasma glucose (FPG), alone in anymultivariate modeling (data not shown), possibly due to the high prevalence (40%) amongpersons with and without AN; the lack of variability between groups may mask anassociation, if there is one. Further explanation for this lack of association comes from thefact that mechanisms which control plasma glucose concentration during the fasting state aredifferent from those that regulate plasma glucose after a meal (27). FPG is primarilydetermined by the rate of hepatic glucose production, which relates to hepatic, rather thanperipheral, insulin resistance (30). On the other hand, postAprandial glucose concentrationsare determined by the rate of glucose stimulated insulin secretion and skeletal muscle insulinsensitivity. As these two entities (hepatic and peripheral insulin resistance) are intertwined,it seems logical to associate fasting plasma glucose (and IFG) with peripheral insulinresistance. However, discordance between these measurements of glycemic control is oftenencountered (31). Moreover, IFG is also correlated with reduced beta cell function amongnondiabetic children and this may provide another epidemiologic avenue for the associationwith AN (32). The attenuation of the odds ratios after adding insulin in the modelingunderscores the strong influence it has on dysglycemia; that is, when insulin is taken intoaccount the association between AN and dysglycemia reflects the association of insulinresistance with dysglycemia.
Previous studies, have focused on the association between AN and elevated levels of insulin,or insulin resistance. The difficulty with insulin assessments is the lack of a standardizedinsulin assay or a universal threshold to classify persons with and without insulin resistance.As a consequence, comparing risk between studies has been hampered (17). In contrast,quantifying risk estimates based on clinically established cutpoints of glucose measurementshas the advantage of allowing meaningful comparisons between studies; moreover, theresults are easily interpretable.
Furthermore, AN was present among Blacks even in the absence of elevated BMI. Similarfindings have been reported in other race groups (13, 29, 33, 34). The ADA recommendsscreening for type 2 diabetes among asymptomatic children with a BMI >85th percentile forage and sex, plus two additional risk factors. Our findings suggest that non-obese Blackyouth may be overlooked for screening, and the opportunity for targeted intervention toprevent or delay the onset of diabetes may be missed. Based on our data, the only metabolicdifference between normal weight youth with and without AN was the 2hr insulinconcentration, corroborating other studies that have reported African American youth havehigher concentrations of insulin than white youth (35-37).
Rafalson et al. Page 6
Obesity (Silver Spring). Author manuscript; available in PMC 2013 September 01.
NIH
-PA Author Manuscript
NIH
-PA Author Manuscript
NIH
-PA Author Manuscript
One of the major strengths of this study was the collection and assessment of covariates thathad not been available in other school -based samples, namely pubertal staging, the OGTTand A1C. In multivariate analyses we were able to take into account the effects of pubertaldevelopment, a period of transitory insulin resistance (38, 39) on the dysglycemic states.Also, the narrow age range in the sample reduced the confounding effect of age -relatedchanges in insulin sensitivity on glycemia.
Some limitations are worthy of mention. With regard to the assessment of AN, we wereunable to evaluate the between or within rater variability of AN. However, Burke et al.(23)reported >80% inter-observer agreement when identifying AN on the back of the neck andNguyen et al. (18) reported 100% concordance between raters for the presence or absence ofAN. Furthermore, over 90% of the time AN will be apparent on the neck (12, 23, 24).Another limitation is the cross-sectional design, impeding the ability to establish temporalassociations and causation.
In summary, AN is associated with an approximately 50% increased likelihood of severaldysglycemic states known to herald the development of type 2 diabetes. Although AN willnot be present in every high-risk youth, it is an easily identifiable clinical marker of IGT andhigh-risk A1C.
AcknowledgmentsWe wish to thank the administration, faculty, staff, students, and their families at the middle schools and schooldistricts that participated in the HEALTHY study. This work was completed with funding from NIDDK/NIH grantnumbers U01-DK61230, U01-DK61249, U01-DK61231, and U01-DK61223 to the STOPPAT2D collaborativegroup. The writing group for this manuscript was: Lisa Rafalson, Trang H. Pham, Steven M. Willi, Marsha D.Marcus, Ann Jessup, and Tom Baranowski.
The following individuals and institutions constitute the HEALTHY Study Group (* indicates principal investigatoror director): Study Chair Childrens Hospital Los Angeles: F.R. Kaufman Field Centers Baylor College ofMedicine: T. Baranowski*, L. Adams, J. Baranowski, A. Canada, K.T. Carter, K.W. Cullen, M.H. Dobbins, R.Jago, A. Oceguera, A.X. Rodriguez, C. Speich, L.T. Tatum, D. Thompson, M.A. White, C.G. Williams OregonHealth & Science University: L. Goldberg*, D. Cusimano, L. DeBar, D. Elliot, H.M. Grund, S. McCormick, E.Moe, J.B. Roullet, D. Stadler Temple University: G. Foster* (Steering Committee Chair), J. Brown, B. Creighton,M. Faith, E.G. Ford, H. Glick, S. Kumanyika, J. Nachmani, L. Rosen, S. Sherman, S. Solomon, A. Virus, S. Volpe,S. Willi University of California at Irvine: D. Cooper*, S. Bassin, S. Bruecker, D. Ford, P. Galassetti, S. Greenfield,J. Hartstein, M. Krause, N. Opgrand, Y. Rodriguez, M. Schneider University of North Carolina at Chapel Hill: J.Harrell*, A. Anderson, T. Blackshear, J. Buse, J. Caveness, A. Gerstel, C. Giles, W. Hall, A. Jessup, P. Kennel, R.McMurray, AAM. SiegaARiz, M. Smith, A. Steckler, A. Zeveloff University of Pittsburgh: M.D. Marcus*, M.Carter, S. Clayton, B. Gillis, K. Hindes, J. Jakicic, R. Meehan, R. Noll, J. Vanucci, E. Venditti University of TexasHealth Science Center at San Antonio: R. Treviño*, A. Garcia, D. Hale, A. Hernandez, I. Hernandez, C. Mobley, T.Murray, J. Stavinoha, K. Surapiboonchai, Z. Yin Coordinating Center George Washington University: K. Hirst*,K. Drews, S. Edelstein, L. El ghormli, S. Firrell, M. Huang, P. Kolinjivadi, S. Mazzuto, T. Pham, A. WheelerProject Office National Institute of Diabetes and Digestive and Kidney Diseases: B. Linder*, C. Hunter, M. StatenCentral Biochemistry Laboratory University of Washington Northwest Lipid Metabolism and Diabetes ResearchLaboratories: S.M. Marcovina*
List of Abbreviations and Acronyms
(AN) Acanthosis nigricans
(BMI) Body mass index
(CI) Confidence interval
(IFG) Impaired fasting glucose
(IGT) Impaired glucose tolerance
(A1C) Glycated hemoglobin A1C
Rafalson et al. Page 7
Obesity (Silver Spring). Author manuscript; available in PMC 2013 September 01.
NIH
-PA Author Manuscript
NIH
-PA Author Manuscript
NIH
-PA Author Manuscript
(HOMAAIR) Homeostasis model assessment –insulin resistance
(OGTT) Oral glucose tolerance test
(OR) Odds Ratio
REFERENCES1. van Dieren S, Beulens JWJ, van der Schouw YT, Grobbee DE, Neal B. The global burden of
diabetes and its complications: an emerging pandemic. European Journal of CardiovascularPrevention and Rehabilitation. 2010; 17(Suppl 1):S3–S8. [PubMed: 20489418]
2. American Diabetes Association. Type 2 diabetes in children and adolescents. Diabetes Care. Mar;2000 23(3):381–9. [PubMed: 10868870]
3. Fagot-Campagna A, Pettitt DJ, Engelgau MM, Burrows NR, Geiss LS, Valdez R, et al. Type 2diabetes among North American children and adolescents: an epidemiologic review and a publichealth perspective. The Journal of pediatrics. May; 2000 136(5):664–72. [PubMed: 10802501]
4. Liese AD, D’Agostino RB Jr. Hamman RF, Kilgo PD, Lawrence JM, Liu LL, et al. The burden ofdiabetes mellitus among US youth: prevalence estimates from the SEARCH for Diabetes in YouthStudy. Pediatrics. Oct; 2006 118(4):1510–8. [PubMed: 17015542]
5. Williams DE, Cadwell BL, Cheng YJ, Cowie CC, Gregg EW, Geiss LS, et al. Prevalence ofimpaired fasting glucose and its relationship with cardiovascular disease risk factors in USadolescents, 1999-2000. Pediatrics. Nov; 2005 116(5):1122–6. [PubMed: 16263998]
6. Li C, Ford ES, Zhao G, Mokdad AH. Prevalence of Pre-Diabetes and Its Association WithClustering of Cardiometabolic Risk Factors and Hyperinsulinemia Among U.S. Adolescents.Diabetes Care. Feb; 2009 2009(2):342–7. [PubMed: 18957533]
7. Duncan GE. Prevalence of diabetes and impaired fasting glucose levels among US adolescents:National Health and Nutrition Examination Survey, 1999-2002. Archives of pediatrics & adolescentmedicine. May; 2006 160(5):523–8. [PubMed: 16651496]
8. Sinha S, Schwartz RA. Juvenille acanthosis nigricans. J Am Acad Dermatol. Sep; 2007 57(3):502–8. [PubMed: 17592743]
9. Schwartz RA, Janninger CK. Childhood Acanthosis Nigricans. Pediatr Dermatol. Jun.1995 55:337–41.
10. Rogers DL. Acanthosis Nigricans. Seminars in Dermatology. Sep; 1991 10(3):160–3. [PubMed:1931564]
11. Mukhtar Q, Cleverly G, Voorhees R, McGrath J. Prevalence of acanthosis nigricans and itsassociation with hyperinsulinemia in New Mexico adolescents. Journal of Adolescent Health.May; 2001 28(5):372–6. 2001. [PubMed: 11336866]
12. Stuart CA, Pate CJ, Peters EJ. Prevalence of Acanthosis Nigricans in an Unselected Population.The American Journal of Medicine. Sep.1989 87:269–72. [PubMed: 2773965]
13. Brickman WJ, Binns HJ, Jovanovic BD, Kolesky S, Mancini AJ, Metzger BE. Acanthosisnigricans: a common finding in overweight youth. Pediatr Dermatol. 2007; 24(6):601–6. [PubMed:18035980]
14. Guran T, Turan S, Akcay T, Beredet A. Significance of acanthosis nigricans in childrhood obesity.Journal of Paediatrics and Child Health. 2008; 44:338–41. [PubMed: 18476925]
15. Kobaissi H, Weigensberg M, Ball G, Cruz M, Shaibi G, Goran M. Relation between acanthosisnigricans and insulin sensitivity in overweight Hispanic children at risk for type 2 diabetes.Diabetes Care. Jun.2004 27(6) 2004.
16. Stoddart M, Blevins K, Lee E, Wang W, Blacket P. Association of acanthosis nigricans withhyperinsulinemia compared with other selected risk factors for type 2 diabetes in CherokeeIndians: the Cherokee Diabetes Study. Diabetes Care. Jun; 2002 25(6):1009–14. 2002. [PubMed:12032107]
17. Staten MA, Stern MP, Miller WG, Steffes MW, Campbell SE. Insulin Assay StandardizationLeading to measures of insulin sensitivity and secretion for practical clinical care. Diabetes Care.2010; 33(1):205–6. [PubMed: 20040676]
Rafalson et al. Page 8
Obesity (Silver Spring). Author manuscript; available in PMC 2013 September 01.
NIH
-PA Author Manuscript
NIH
-PA Author Manuscript
NIH
-PA Author Manuscript
18. Nguyen TT, Keil MF, Russell DL, Pathomvanich A, Uwaifo GI, Sebring NG, et al. Relation ofacanthosis nigricans to hyperinsulinemia and insulin resistance in overweight African Americanand white children. The Journal of pediatrics. 2001; 138:484–80.
19. Brickman WJ, Huang J, Silverman BL, Metzger BE. Acanthosis nigricans identifies youth at highrisk for metabolic abnormalities. The Journal of pediatrics. Jan; 2010 156(1):87–92. [PubMed:19796772]
20. Hardin DS. Screening for type 2 diabetes in children with acanthosis nigricans. The DiabetesEducator. Jul-Aug;2006 32(4) 2006.
21. Rafalson L, Eysaman J, Quattrin T. Screening Obese Students for Acanthosis Nigricans and OtherDiabetes Risk Factors in the Urban School-Based Health Center. Clin Pediatr (Phila). 2011; 50(8):747–52. [PubMed: 21727074]
22. Baranowski T, Cooper DM, Harrell J, Hirst K, Kaufman FR, Goran M, et al. Presence of diabetesrisk factors in a large U.S. eighth-grade cohort. Diabetes Care. Feb; 2006 29(2):212–7. [PubMed:16443862]
23. Burke JP, Hale DE, Hazuda HP, Stern MP. A Quantitative Scale of Acanthosis Nigricans. DiabetesCare. 1999; 22:1655–9. [PubMed: 10526730]
24. Stuart CA, Gilkison CR, Smith MM, Bosma AM, Keenan BS, Nagamani M. Acanthosis nigricansas a risk factor for non-insulin dependent diabetes mellitus. Clin Pediatr (Phila). 1998; 37(2):73–9.[PubMed: 9492114]
25. Petersen AC, Crockett L, Richards M, Boxer A. A self-report measure of pubertal status:reliability, validity, and initial norms. J Youth Adolescence. 1988; 17:117–33.
26. The Expert Committee on the Diagnosis and Classificatino of Diabetes Mellitus: Follow-up reporton the diagnosis of diabetes mellitus. Diabetes Care. 2003; 26:3160–7. [PubMed: 14578255]
27. Standrads of Medical Care in Diabetes. Diabetes Care. Jan; 2010 33(Suppl 1):s11–s51. [PubMed:20042772]
28. Moran A, Jacobs DR Jr. Steinberger J, Hone CP, Prineas R, Luepker R, et al. Insulin resistanceduring puberty: results from clamp studies in 357 children. Diabetes. 1999; 48:2039–44. [PubMed:10512371]
29. Kong AS, Williams RL, Smith M, Sussman AL, Skipper B, Hsi AC, et al. Acanthosis nigricansand diabetes risk factors: prevalence in young persons seen in southwestern US primary carepractices. Annals of Family Medicine. May-Jun;2007 5(3) 2007.
30. DeFronzo RA. Pathogenesis of type 2 diabetes mellitus. Med Clin NorthAm. 2004; 8:787–835.
31. DeFronzo RA, Ferrannini E, Simonson DC. Fasting hyperglycemia in non-insulin dependentdiabetes mellitus: contributions of excessive hepative glucose production and impaired tissueglucose uptake. Metabolism. 1989; 38:387–95. [PubMed: 2657323]
32. Tfayli H, Lee S, Arslanian S. Declining beta-cell function relative to insulin sensitivity withincreasing fasting glucose levels in the nondiabetic range in children. Diabetes Care. Sep; 201033(9):2024–30. [PubMed: 20805276]
33. Chang Y, Woo H-Y, Sung E, Kim CH, Kang K, Ju YS, et al. Prevalence of acanthosis nigricans inrelation to anthropometric measure: Community -based cross-sectional study in KKorean pre-adolscent school children. Pediatrics International. 2008; 50:667–73. [PubMed: 19261117]
34. Nsiah-Kumi PS, Beals J, Lasley S, Whiting M, Brushbreaker C, Erickson J, et al. Body Mass IndexPercentile More Sensitive than Acanthosis Nigricans for Screening Native American Children forDiabetes Risk. Journal of the National Medical Association. 2010; 102(10):944–9. [PubMed:21053710]
35. Arslanian S, Suprasongsin C, Janosky JE. Insulin secretion and sensitivity in black versus whiteprepubertal healthy children. The Journal Of Clinical Endocrinology And Metabolism. 1997;82(6):1923–7. [PubMed: 9177407]
36. Lee JM, Okumura MJ, Davis MM, Herman WH, Gurney JG. Prevalence and Determinants ofInsulin Resistance Among U.S. Adolescents. Diabetes Care. 2006; 29:2427–32. [PubMed:17065679]
37. Ford ES, Li C, Imperatore G, Cook S. Age, Sex, and Ethnic Variations in Serum InsulinConcentrations Among U.S. Youth. Diabetes Care. 2006; 29:2605–11. [PubMed: 17130192]
Rafalson et al. Page 9
Obesity (Silver Spring). Author manuscript; available in PMC 2013 September 01.
NIH
-PA Author Manuscript
NIH
-PA Author Manuscript
NIH
-PA Author Manuscript
38. Ball GD, Huang TT, Gower BA, Cruz ML, Shaibi GQ, Weigensberg MJ, et al. Longitudinalchanges in insulin sensitivity, insulin secretion, and beta-cell function during puberty. The Journalof pediatrics. Jan; 2006 148(1):16–22. [PubMed: 16423592]
39. Goran MI, Gower BA. Longitudinal study on pubertal insulin resistance. Diabetes. Nov; 200150(11):2444–50. [PubMed: 11679420]
Rafalson et al. Page 10
Obesity (Silver Spring). Author manuscript; available in PMC 2013 September 01.
NIH
-PA Author Manuscript
NIH
-PA Author Manuscript
NIH
-PA Author Manuscript
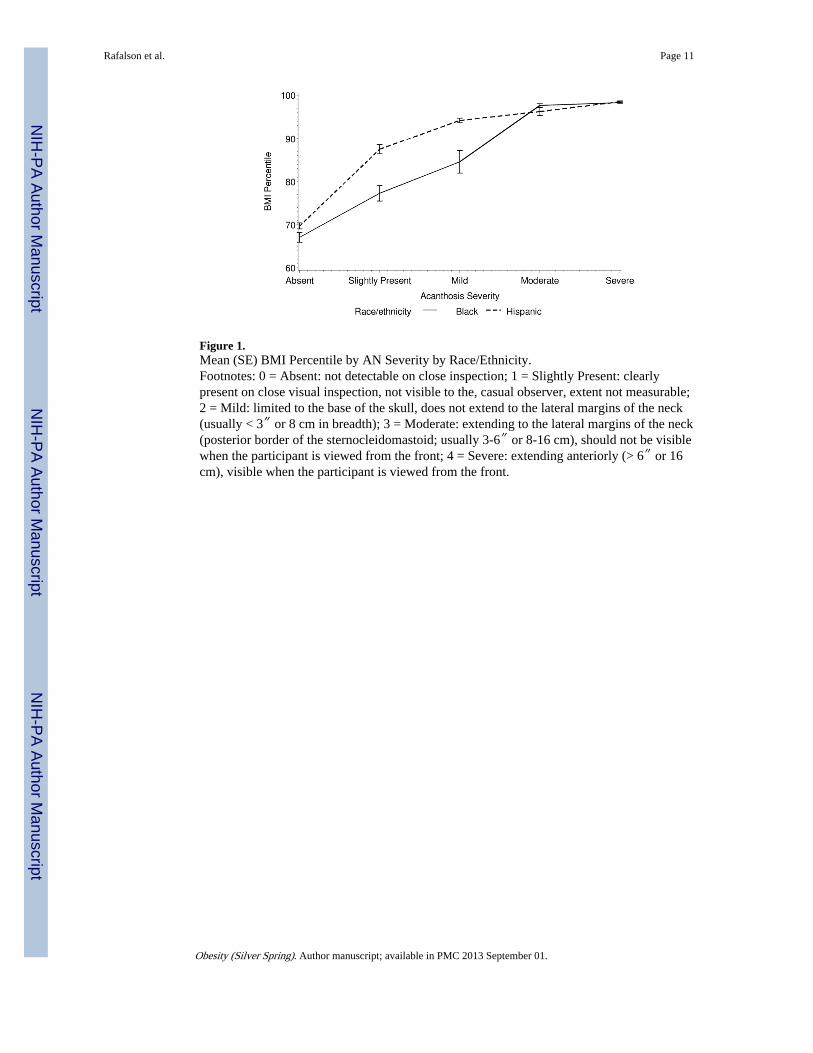
Figure 1.Mean (SE) BMI Percentile by AN Severity by Race/Ethnicity.Footnotes: 0 = Absent: not detectable on close inspection; 1 = Slightly Present: clearlypresent on close visual inspection, not visible to the, casual observer, extent not measurable;2 = Mild: limited to the base of the skull, does not extend to the lateral margins of the neck(usually < 3″ or 8 cm in breadth); 3 = Moderate: extending to the lateral margins of the neck(posterior border of the sternocleidomastoid; usually 3-6″ or 8-16 cm), should not be visiblewhen the participant is viewed from the front; 4 = Severe: extending anteriorly (> 6″ or 16cm), visible when the participant is viewed from the front.
Rafalson et al. Page 11
Obesity (Silver Spring). Author manuscript; available in PMC 2013 September 01.
NIH
-PA Author Manuscript
NIH
-PA Author Manuscript
NIH
-PA Author Manuscript
NIH
-PA Author Manuscript
NIH
-PA Author Manuscript
NIH
-PA Author Manuscript
Rafalson et al. Page 12
Table 1
demographics, metabolic and clinical profile of cohort and by AN status
Acanthosis Nigricans
Overall (n=1438)Mean (SD) or %
Present (N=406)Mean (SD) or %
Absent (N=1032)Mean (SD) or % P-value
DEMOGRAPHIC DATA
Race/Ethnic Group
Black 25.0% 34.5% 21.3% <.0001
Hispanic 58.2% 62.3% 56.6%
White 16.8% 3.2% 22.1%
Age (yrs) 13.57 (0.62) 13.61 (0.61) 13.55 (0.62) 0.0657
Family History (DM) 11.9% 17.0% 9.9% 0.0004
Female 56.9% 65.5% 53.5% 0.0088
METABOLIC PROFILE
HbA1c (%) b 5.42 (0.30) 5.49 (0.29) 5.39 (0.30) <.0001
≥ 5.7 12.4% 18.2% 10.1% 0.0263
Fasting Glucose (mg/dL) 97.9 (7.2) 98.0 (7.6) 97.9 (7.1) 0.5244
≥ 100 40.3% 40.1% 40.3% 0.8263
Fasting Insulin μU/mL) b 30.2 (19.1) 41.1 (25.0 25.9 (14.1) <.0001a
< 15 12.9% 6.0% 15.6% <.0001
15 – 29 50.8% 33.3% 57.6%
≥ 30 36.3% 60.7% 26.8%
2-Hour Glucose (mg/dL) b 97.1 (19.8) 103.4 (19.9) 95.0 (19.3) <.0001
≥ 140 2.1% 3.8% 1.5% 0.0005
2-Hour Insulin (μU/mL) b 101.8 (104.8) 152.8 (145.9) 85.4 (81.2) <.0001a
CLINICAL MEASURES
Tricep Skinfold (mm) 18.4 (8.5) 24.6 (9.0) 16.0 (6.9) <.0001a
Subscapular Skinfold(mm) b
16.5 (9.1) 23.8 (9.9) 13.6 (6.9) <.0001a
BMI (kg/m2) 24.2 (5.7) 28.9 (6.3) 22.4 (4.3) <.0001
< 85th pct. 50.5% 18.7% 63.0% <.0001
85th – 94th pct. 20.9% 20.9% 20.9%
95th – 98th pct. 22.3% 41.9% 14.5%
≥ 90th pct. 6.3% 18.5% 1.6%
Waist Circumference (cm) 80.4 (14.0) 91.4 (15.6) 76.1 (10.6) <.0001
≥ 90th pct. 21.9% 49.8% 10.9% <.0001
Tanner Stage
Stage 1 or 2 8.5% 9.7% 8.0% <.0001
Stage 3 25.6% 19.2% 28.2%
Stage 4 59.2% 60.8% 58.5%
Stage 5 6.7% 10.3% 5.4%
Obesity (Silver Spring). Author manuscript; available in PMC 2013 September 01.
NIH
-PA Author Manuscript
NIH
-PA Author Manuscript
NIH
-PA Author Manuscript
Rafalson et al. Page 13
Table 2
Multivariate Adjusted Odds Ratios (95% CI) of each dysglycemic state comparing AN presence vs. absence inthree models.
Model Dysglycemic State OR (95% CI)
IGT High-risk A1c IGT/IFG
Model 1 2.29 (1.24, 4.23)** 1.71 (1.07, 2.75)* 1.43 (1.20, 1.70)***
Model 2 2.02 (0.96, 4.22) 1.59 (1.01, 2.49)* 1.47 (1.21, 1.78)***
Model3 1.31 (0.55, 3.10) 1.32 (0.85, 2.06) 1.22 (1.00, 1.49)
Model 1: adjusted for gender, family history and race/ethnicity
Model 2: adjusted Model 1 factors plus BMI percentile and Tanner Staging
Model 3: adjusted for Models 1 and 2 factors plus log transformed fasting insulin (continuous)
*P <0.05
**P < 0.01
***p <0.001
Obesity (Silver Spring). Author manuscript; available in PMC 2013 September 01.