
The Asian Biomass Handbook - 日本エネルギー学会
338
The Asian Biomass Handbook A Guide for Biomass Production and Utilization Support Project for Building Asian-Partnership for Environmentally Conscious Agriculture, Entrusted by Ministry of Agriculture, Forestry, and Fisheries The Japan Institute of Energy
-
Upload
khangminh22 -
Category
Documents
-
view
1 -
download
0
Transcript of The Asian Biomass Handbook - 日本エネルギー学会

The Asian Biomass Handbook
A Guide for Biomass Production and Utilization
Support Project for Building Asian-Partnership for
Environmentally Conscious Agriculture, Entrusted by
Ministry of Agriculture, Forestry, and Fisheries
The Japan Institute of Energy

This handbook was editied as a part of a project entrusted by the Ministry of Agriculture, Forestry, and Fisheries, Japan, with the help of Asia Biomass Association.

Preface It is a great pleasure and honor for me to give some words for this Biomass Handbook. In
2002 we had already published Biomass Handbook in Japanese edition with the help of more than 60 contributors who are distinguished specialists in this field. This time English version has been issued with the cooperation of scientists and engineers of Asian countries in addition to domestic contributors.
As we are aware, negative impacts of global warming has been remarkably coming out. Carbon dioxide discharged from fossil fuel combustion has been accumulated in the atmosphere as far as we consume coal, petroleum, and natural gas. On the other hand, it is clear that the life of fossil fuels is limited, for example, the life, the ratio of reserve divided by the production, of petroleum, coal, and natural gas will be about 41, 160, 65 years, respectively. I believe that we are at the gateway to the new age independent on the fossil fuels and biomass is a key resource to open up a new vista of the future.
Biomass means, in general, a substantial amount of bioorigin resources which can be utilized in the form of energy and materials. Wood, grass, marine algae, micro algae, agricultural wastes, forestry wastes, and municipal wastes fall into this category. Energy crops are one of promising biomass which could make energy plantation possible in a large scale, though it has not yet been commercialized at the present.
One of the strong countermeasures to suppress carbon dioxide emission is the introduction of renewable energies. Renewable energies mean biomass, photovoltaics, geothermal, wind, hydro, tidal, and wave energies. How does differ biomass from other renewable energy?
Biomass forms own body by photosynthesis. The concentration of carbon dioxide in the atmosphere remains unchanged as far as carbon dioxide, which is emitted by combustion of biomass after energy utilization, is refixed by, for example, reforestation. It is called the carbon neutrality of biomass. Energy which replaces fossil fuels can be derived from the cycle, that is, biomass combustion, carbon dioxide emission, and carbon dioxide refixation. Thus, the carbon dioxide emission can be reduced by replacing fossil fuels by biomass.
Biomass is only organic or carbonaceous among renewable energies. In other words, ethanol, methanol, dimethyl ether, and hydrocarbons can be produced only from biomass among renewable energies. It has the same meaning that biomass can be transportable and storable in the form of material. It should be emphasized that wind , photovoltaic, tidal, wave, and geothermal energy can produce heat and power but not chemicals and fuels. However, carbon dioxide emitted from biomass utilization will be accumulated irreversibly into the atmosphere in a similar manner with fossil fuel utilization unless otherwise reforestation is made. Sustainable forestry management is essential to the long and stable supply of bioenegy.
This Biomass Handbook deals with the characteristics and resources of biomass, thermochemical and biochemical conversion of biomass, and system development of sustainability. However, the most important aspect is the contribution of many specialists of Asian countries, that is, Brunei, Cambodia, China, India, Indonesia, Korea Malaysia, Myanmer, Philippines, Singapore, Taipei Chinese, Thailand, Viet Nam. I should like to appreciate all the people who contributed this Handbook. Also I appreciate the Ministry of Agriculture, Forestry and Fisheries which gave an opportunity to enable us to issue this Handbook by financial support.
January 2008 Editor-in-chief
Shinya Yokoyama

Editors
Yokoyama, Shinya The University of Tokyo, Japan Matsumura, Yukihiko Hiroshima University, Japan
Associate Editors Ando, Shotaro National Agriculture and Food Research Organizaition, National
Institute of Livestock and Grassland Science, Japan Sakanishi, Kinya National Institute of Advanced Industrial Science and Technology,
Japan Sano, Hiroshi Lab. ofico de Global-Energi-Sistemo, Japan Minowa, Tomoaki National Institute of Advanced Industrial Science and Technology,
Japan Yamamoto, Hiromi Central Research Institute of Electric Power Industry, Japan Yoshioka, Takuyuki Nihon University, Japan
Advisory Board Kitani, Osamu Nihon University, Japan Saka, Shiro Kyoto University, Japan Shirai,Yoshihito Kyushu Institute of Technology, Japan Yamaji Kenji The University of Tokyo, Japan
Contributors Abe, Toshimi The Chugoku Electric Power Co. Inc., Japan Amano, Masahiro Waseda University, Japan Ando, Shotaro National Agriculture and Food Research Organizaition, National
Institute of Livestock and Grassland Science, Japan Arai, Yoshiaki Meidensya Corporation, Japan Cai, Yimin National Agriculture and Food Research Organizaition, National
Institute of Livesstock and Grassland Science, Japan Chollacoop, Nuwaong National Metal and Materials Technology Center, NSTDA,
Thailand Elauria, Jessie Cansanay Uniersity of the Philippines Los Banos, Philippines Fukui, Hisatomo Kajima Corporation, Japan Fujii, Shigeo Takuma Co., Ltd, Japan Fujino, Junichi National Institute for Environmental Studies, Japan Hada, Kenichiro Mizuho Information & Research Institute, Inc., Japan Hirata, Satoshi Kawasaki Heavy Industries, Ltd, Japan Kamide, Mitsushi Hokkaido Industrial Research Institute, Japan Kawamoto, Sumire Forestry and Forest Products Research Institute, Japan Kitani, Osamu Nihon University, Japan Lee, Tin-Suk Korea Institute of Energy Research, Korea Liang, David Tee Nanyang Technological University Innovation Center, Singapore Liu, Dehua Tsinghua University, China
Malaykham, Bouathep Ministry of Energy and Mines, Laos Man, Tran Dinh Institute of Biotechnology, VAST, Vietnam Matsuto, Toshihiko Hokkaido Universty, Japan Matsumura, Yukihiko Hiroshima University, Japan Miura, Masakatsu National Institute of Advanced Industrial Science and Technology,
Japan Minowa, Tomoaki National Institute of Advanced Industrial Science and Technology,
Japan Mohamad, Ali Hassan University Putra, Malaysia Nakagawa, Hitoshi National Institute of Agrobiogical Science, Japan Nakamata, Keiichi Hokuestu Paper Mills, Ltd, Japan Nivitchanyong, Siriluck National Metal and Materials Technology Center, NSTDA,
Thailand Ogi, Tomoko National Institute of Advanced Industrial Science and Technology,
Japan Osada, Takashi Nationa Agriculture and Food Research Organizaition, National
Agricultural Research Center for Hokkaido Region, Japan Panaka. Petrus PT Gikoko Kogyo, Indonesia Saiki, Takashi Japan Alcohl Association, Japan Saka, Shiro Kyoto University, Japan Sakai, Masayasu Nagasaki Institute of Applied Science, Japan Sano, Hiroshi Lab. ofico de Global-Energi-Sistemo, Japan Sawayama, Shigeki National Institute of Advanced Industrial Science and Technology,
Japan Shiau, Tzay-An National Taiwan Ocean University, Taipei Chinese Shirai, Yoshihito Kyushu Institute of Technology, Japan Sovanna, Toch Ministry of Industry Mines and Energy, Cambodia Suzuki, Tsutomu Kitami Institute of Technology, Japan Sekiguchi, Shizuo Lion Corporation, Japan Takahashi, Masayuki Kochi University, Japan Tonosaki, Mario Forestry and Forest Products Research Institute, Japan Tomari, Miyuki Biomass Industrial Society Network (BIN), NPO, Japan Topaiboul, Subongkoj National Metal and Materials Technology Center, NSTDA,
Thailand Yagishita, Tatsuo National Institute of Advanced Industrial Science and Technology,
Japan Yagita, Hiroshi Nippon Institute of Technology, Japan Yamamoto, Hiromi Central Research Institute of Electric Power Industry, Japan Yamamoto, Kazutaka Nationa Agriculture and Food Research Organizaition, National
Food Research Institute, Japan Yamamoto, Susumu Okayama Universty, Japan Yokoyama, Shinya The University of Tokyo, Japan Yoshioka, Takuyuki Nihon University, Japan

Contents 1. Benefit of biomass utilization・・・・・・・・・・・・・・・・・・・・・・・・・・・・・・・・・・・・・・・・・・・・・・・・・ 1 1.1 Benefit of biomass ・・・・・・・・・・・・・・・・・・・・・・・・・・・・・・・・・・・・・・・・・・・・・・・・・・・・・・・・・ 1
1.1.1 What is biomass?・・・・・・・・・・・・・・・・・・・・・・・・・・・・・・・・・・・・・・・・・・・・・・・・・・・・・・・・ 1 1.2 Characteristics of biomass ・・・・・・・・・・・・・・・・・・・・・・・・・・・・・・・・・・・・・・・・・・・・・・・・・ 3
1.2.1 General scope ・・・・・・・・・・・・・・・・・・・・・・・・・・・・・・・・・・・・・・・・・・・・・・・・・・・・・・・・・・・ 3 1.2.2 Renewable・・・・・・・・・・・・・・・・・・・・・・・・・・・・・・・・・・・・・・・・・・・・・・・・・・・・・・・・・・・・・・ 3 1.2.3 Carbon neutral・・・・・・・・・・・・・・・・・・・・・・・・・・・・・・・・・・・・・・・・・・・・・・・・・・・・・・・・・・ 4 1.2.4 Sustainable agriculture ・・・・・・・・・・・・・・・・・・・・・・・・・・・・・・・・・・・・・・・・・・・・・・・・・・ 4
1.3 How to use biomass ・・・・・・・・・・・・・・・・・・・・・・・・・・・・・・・・・・・・・・・・・・・・・・・・・・・・・・・・ 6 1.3.1 General scope ・・・・・・・・・・・・・・・・・・・・・・・・・・・・・・・・・・・・・・・・・・・・・・・・・・・・・・・・・・・ 6 1.3.2 Conversion and utilization ・・・・・・・・・・・・・・・・・・・・・・・・・・・・・・・・・・・・・・・・・・・・・・・ 7
1.4 Benefit of biomass utilization・・・・・・・・・・・・・・・・・・・・・・・・・・・・・・・・・・・・・・・・・・・・・・・・ 8 1.4.1 General scope ・・・・・・・・・・・・・・・・・・・・・・・・・・・・・・・・・・・・・・・・・・・・・・・・・・・・・・・・・・・ 8 1.4.2 Oil depletion ・・・・・・・・・・・・・・・・・・・・・・・・・・・・・・・・・・・・・・・・・・・・・・・・・・・・・・・・・・・・ 9 1.4.3 Global warming ・・・・・・・・・・・・・・・・・・・・・・・・・・・・・・・・・・・・・・・・・・・・・・・・・・・・・・・・・ 9 1.4.4 Improving standard of living ・・・・・・・・・・・・・・・・・・・・・・・・・・・・・・・・・・・・・・・・・・・・ 10 1.4.5 Increasing farmers’ income ・・・・・・・・・・・・・・・・・・・・・・・・・・・・・・・・・・・・・・・・・・・・・・ 10 1.4.6 Energy security ・・・・・・・・・・・・・・・・・・・・・・・・・・・・・・・・・・・・・・・・・・・・・・・・・・・・・・・・ 11 1.4.7 Foreign currency ・・・・・・・・・・・・・・・・・・・・・・・・・・・・・・・・・・・・・・・・・・・・・・・・・・・・・・・ 11
2. Biomass resources・・・・・・・・・・・・・・・・・・・・・・・・・・・・・・・・・・・・・・・・・・・・・・・・・・・・・・・・・・ 12 2.1 Classification of biomass ・・・・・・・・・・・・・・・・・・・・・・・・・・・・・・・・・・・・・・・・・・・・・・・・・・・ 12
2.1.1 Definition of biomass ・・・・・・・・・・・・・・・・・・・・・・・・・・・・・・・・・・・・・・・・・・・・・・・・・・・ 12 2.1.2 Definition of biomass (energy) in Law ・・・・・・・・・・・・・・・・・・・・・・・・・・・・・・・・・・・・ 12 2.1.3 Characteristics of biomass energy・・・・・・・・・・・・・・・・・・・・・・・・・・・・・・・・・・・・・・・・ 13 2.1.4 Biomass categories ・・・・・・・・・・・・・・・・・・・・・・・・・・・・・・・・・・・・・・・・・・・・・・・・・・・・・ 13 2.1.5 An Example of biomass categorization (in terms of use and application) ・・・・ 13
2.2 Availability of biomass ・・・・・・・・・・・・・・・・・・・・・・・・・・・・・・・・・・・・・・・・・・・・・・・・・・・・・ 15 2.2.1 Estimation of potential for waste biomass ・・・・・・・・・・・・・・・・・・・・・・・・・・・・・・・・ 16
2.3 Biomass composition ・・・・・・・・・・・・・・・・・・・・・・・・・・・・・・・・・・・・・・・・・・・・・・・・・・・・・・ 20 2.3.1 Overview of biomass composition ・・・・・・・・・・・・・・・・・・・・・・・・・・・・・・・・・・・・・・・・ 20 2.3.2 Typical biomass components・・・・・・・・・・・・・・・・・・・・・・・・・・・・・・・・・・・・・・・・・・・・・ 21 2.3.3 Constituent analyses of representative biomass types・・・・・・・・・・・・・・・・・・・・・・ 22
2.4 Biomass energy content・・・・・・・・・・・・・・・・・・・・・・・・・・・・・・・・・・・・・・・・・・・・・・・・・・・・ 24 2.4.1 Indicators of biomass energy content ・・・・・・・・・・・・・・・・・・・・・・・・・・・・・・・・・・・・・ 24 2.4.2 Heating values of various kinds of biomass ・・・・・・・・・・・・・・・・・・・・・・・・・・・・・・・ 25 2.4.3 Estimating heating value by calculation ・・・・・・・・・・・・・・・・・・・・・・・・・・・・・・・・・・ 27
2.5 Carbon cycle ・・・・・・・・・・・・・・・・・・・・・・・・・・・・・・・・・・・・・・・・・・・・・・・・・・・・・・・・・・・・・・ 28 2.5.1 Global carbon budget ・・・・・・・・・・・・・・・・・・・・・・・・・・・・・・・・・・・・・・・・・・・・・・・・・・・ 28 2.5.2 Carbon cycle in forest ecosystem ・・・・・・・・・・・・・・・・・・・・・・・・・・・・・・・・・・・・・・・・・ 29 2.5.3 Carbon cycle model ・・・・・・・・・・・・・・・・・・・・・・・・・・・・・・・・・・・・・・・・・・・・・・・・・・・・・ 30 2.6 Woody biomass・・・・・・・・・・・・・・・・・・・・・・・・・・・・・・・・・・・・・・・・・・・・・・・・・・・・・・・・・・・・ 31
2.6.1 Types of woody biomass material and its characteristics ・・・・・・・・・・・・・・・・・・・ 31 2.6.2 Growth rate・・・・・・・・・・・・・・・・・・・・・・・・・・・・・・・・・・・・・・・・・・・・・・・・・・・・・・・・・・・・ 32 2.6.3 Woody biomass resources ・・・・・・・・・・・・・・・・・・・・・・・・・・・・・・・・・・・・・・・・・・・・・・・ 34
2.7 Herbaceous biomass ・・・・・・・・・・・・・・・・・・・・・・・・・・・・・・・・・・・・・・・・・・・・・・・・・・・・・・・ 34 2.7.1 The herbaceous biomass means・・・・・・・・・・・・・・・・・・・・・・・・・・・・・・・・・・・・・・・・・・ 34 2.7.2 C3 species and C4 species・・・・・・・・・・・・・・・・・・・・・・・・・・・・・・・・・・・・・・・・・・・・・・・・ 35 2.7.3 Primary production and existing amount of herbaceous biomass ・・・・・・・・・・・・ 37 2.7.4 Switchgrass・・・・・・・・・・・・・・・・・・・・・・・・・・・・・・・・・・・・・・・・・・・・・・・・・・・・・・・・・・・・ 37
2.8 Sugar and starch crops ・・・・・・・・・・・・・・・・・・・・・・・・・・・・・・・・・・・・・・・・・・・・・・・・・・・・ 40 2.8.1 General scope of sugar and starch crops ・・・・・・・・・・・・・・・・・・・・・・・・・・・・・・・・・・ 40 2.8.2 Cassava ・・・・・・・・・・・・・・・・・・・・・・・・・・・・・・・・・・・・・・・・・・・・・・・・・・・・・・・・・・・・・・・ 42 2.8.3 Sugarcane ・・・・・・・・・・・・・・・・・・・・・・・・・・・・・・・・・・・・・・・・・・・・・・・・・・・・・・・・・・・・・ 43
2.9 Oil producing biomass ・・・・・・・・・・・・・・・・・・・・・・・・・・・・・・・・・・・・・・・・・・・・・・・・・・・・・ 44 2.9.1 What is oil producing biomass? ・・・・・・・・・・・・・・・・・・・・・・・・・・・・・・・・・・・・・・・・・ 44 2.9.2 Production method of fat & oil ・・・・・・・・・・・・・・・・・・・・・・・・・・・・・・・・・・・・・・・・・・・ 45 2.9.3 Production volume of oil producing biomass・・・・・・・・・・・・・・・・・・・・・・・・・・・・・・・ 45 2.9.4 Bio-diesel fuel・・・・・・・・・・・・・・・・・・・・・・・・・・・・・・・・・・・・・・・・・・・・・・・・・・・・・・・・・・ 46 2.9.5 Oil palm ・・・・・・・・・・・・・・・・・・・・・・・・・・・・・・・・・・・・・・・・・・・・・・・・・・・・・・・・・・・・・・・ 46 2.9.6 Coconut ・・・・・・・・・・・・・・・・・・・・・・・・・・・・・・・・・・・・・・・・・・・・・・・・・・・・・・・・・・・・・・・ 47 2.9.7 Jatropha ・・・・・・・・・・・・・・・・・・・・・・・・・・・・・・・・・・・・・・・・・・・・・・・・・・・・・・・・・・・・・・ 50
2.10 Aquatic plant biomass ・・・・・・・・・・・・・・・・・・・・・・・・・・・・・・・・・・・・・・・・・・・・・・・・・・・・ 52 2.10.1 What is aquatic plant biomass?・・・・・・・・・・・・・・・・・・・・・・・・・・・・・・・・・・・・・・・・・ 52 2.10.2 Productivity ・・・・・・・・・・・・・・・・・・・・・・・・・・・・・・・・・・・・・・・・・・・・・・・・・・・・・・・・・・ 53 2.10.3 Current practical resource utilization ・・・・・・・・・・・・・・・・・・・・・・・・・・・・・・・・・・・ 53 2.10.4 Standing stock of biomass resources ・・・・・・・・・・・・・・・・・・・・・・・・・・・・・・・・・・・・ 55
2.11 Agricultural residues ・・・・・・・・・・・・・・・・・・・・・・・・・・・・・・・・・・・・・・・・・・・・・・・・・・・・・ 56 2.11.1 Types and features of agricultural residues ・・・・・・・・・・・・・・・・・・・・・・・・・・・・・・ 56 2.11.2 Volume of production ・・・・・・・・・・・・・・・・・・・・・・・・・・・・・・・・・・・・・・・・・・・・・・・・・・ 56 2.11.3 Bio-energy potential of the world ・・・・・・・・・・・・・・・・・・・・・・・・・・・・・・・・・・・・・・・ 57
2.12 Wooden residuals ・・・・・・・・・・・・・・・・・・・・・・・・・・・・・・・・・・・・・・・・・・・・・・・・・・・・・・・・ 58 2.12.1 Characteristics and environmental significance ・・・・・・・・・・・・・・・・・・・・・・・・・・ 58 2.12.2 Residuals from wood industries・・・・・・・・・・・・・・・・・・・・・・・・・・・・・・・・・・・・・・・・・ 59 2.12.3 Residuals from wood utilization ・・・・・・・・・・・・・・・・・・・・・・・・・・・・・・・・・・・・・・・・ 61 2.12.4 Technologies of energy utilization ・・・・・・・・・・・・・・・・・・・・・・・・・・・・・・・・・・・・・・・ 61
2.13 Animal waste ・・・・・・・・・・・・・・・・・・・・・・・・・・・・・・・・・・・・・・・・・・・・・・・・・・・・・・・・・・・・ 62 2.13.1 What is animal waste?・・・・・・・・・・・・・・・・・・・・・・・・・・・・・・・・・・・・・・・・・・・・・・・・・ 62 2.13.2 Characteristics of animal waste ・・・・・・・・・・・・・・・・・・・・・・・・・・・・・・・・・・・・・・・・ 62 2.13.3 Production of animal waste ・・・・・・・・・・・・・・・・・・・・・・・・・・・・・・・・・・・・・・・・・・・・ 63 2.13.4 General treatment and usage of animal waste ・・・・・・・・・・・・・・・・・・・・・・・・・・・ 64 2.13.5 Animal waste value and total amount in the world ・・・・・・・・・・・・・・・・・・・・・・・ 65
2.14 Sewage sludge ・・・・・・・・・・・・・・・・・・・・・・・・・・・・・・・・・・・・・・・・・・・・・・・・・・・・・・・・・・・ 65 2.14.1 What is sewage sludge? ・・・・・・・・・・・・・・・・・・・・・・・・・・・・・・・・・・・・・・・・・・・・・・・・ 66 2.14.2 Types and characteristics of sewage sludge ・・・・・・・・・・・・・・・・・・・・・・・・・・・・・・ 66 2.14.3 Utilization of sewage sludge・・・・・・・・・・・・・・・・・・・・・・・・・・・・・・・・・・・・・・・・・・・・ 67
2.15 Municipal solid waste ・・・・・・・・・・・・・・・・・・・・・・・・・・・・・・・・・・・・・・・・・・・・・・・・・・・・ 68 2.15.1 Methane recovery in landfills・・・・・・・・・・・・・・・・・・・・・・・・・・・・・・・・・・・・・・・・・・・ 68 2.15.2 Biogasification (methane fermentation) ・・・・・・・・・・・・・・・・・・・・・・・・・・・・・・・・・ 69 2.15.3 Incineration with energy recovery ・・・・・・・・・・・・・・・・・・・・・・・・・・・・・・・・・・・・・・ 70 2.15.4 Refuse-derived fuel production and power generation・・・・・・・・・・・・・・・・・・・・・ 70
2.15.5 Pyrolysis ・・・・・・・・・・・・・・・・・・・・・・・・・・・・・・・・・・・・・・・・・・・・・・・・・・・・・・・・・・・・・ 71 2.16 Black liquor ・・・・・・・・・・・・・・・・・・・・・・・・・・・・・・・・・・・・・・・・・・・・・・・・・・・・・・・・・・・・・ 72
2.16.1 Black liquor ・・・・・・・・・・・・・・・・・・・・・・・・・・・・・・・・・・・・・・・・・・・・・・・・・・・・・・・・・・ 72 2.16.2 Process of black liquor generation・・・・・・・・・・・・・・・・・・・・・・・・・・・・・・・・・・・・・・・ 72 2.16.3 Characteristics and significance of black liquor ・・・・・・・・・・・・・・・・・・・・・・・・・・ 74
2.17 Food processing waste ・・・・・・・・・・・・・・・・・・・・・・・・・・・・・・・・・・・・・・・・・・・・・・・・・・・・ 75 2.17.1 Potential of food processing waste ・・・・・・・・・・・・・・・・・・・・・・・・・・・・・・・・・・・・・・ 75 2.17.2 Baggase ・・・・・・・・・・・・・・・・・・・・・・・・・・・・・・・・・・・・・・・・・・・・・・・・・・・・・・・・・・・・・・ 76 2.17.3 Corn cob・・・・・・・・・・・・・・・・・・・・・・・・・・・・・・・・・・・・・・・・・・・・・・・・・・・・・・・・・・・・・・ 77 2.17.4 Molasses ・・・・・・・・・・・・・・・・・・・・・・・・・・・・・・・・・・・・・・・・・・・・・・・・・・・・・・・・・・・・・ 79
3. Physical conversion of biomass ・・・・・・・・・・・・・・・・・・・・・・・・・・・・・・・・・・・・・・・・・・・・・・ 81 3.1 Firewood ・・・・・・・・・・・・・・・・・・・・・・・・・・・・・・・・・・・・・・・・・・・・・・・・・・・・・・・・・・・・・・・・ 81
3.1.1 General scope ・・・・・・・・・・・・・・・・・・・・・・・・・・・・・・・・・・・・・・・・・・・・・・・・・・・・・・・・・・ 81 3.1.2 Firewood supply・・・・・・・・・・・・・・・・・・・・・・・・・・・・・・・・・・・・・・・・・・・・・・・・・・・・・・・・ 82
3.1.3 Utilization of firewood ・・・・・・・・・・・・・・・・・・・・・・・・・・・・・・・・・・・・・・・・・・・・・・・・・・ 84 3.2 Pelletizing ・・・・・・・・・・・・・・・・・・・・・・・・・・・・・・・・・・・・・・・・・・・・・・・・・・・・・・・・・・・・・・・・ 85
3.2.1 What are pellet and palletizing? ・・・・・・・・・・・・・・・・・・・・・・・・・・・・・・・・・・・・・・・・・ 85 3.2.2 Characteristics of pellet and CCB ・・・・・・・・・・・・・・・・・・・・・・・・・・・・・・・・・・・・・・・・ 87 3.2.3 Fundamental test for briquetting ・・・・・・・・・・・・・・・・・・・・・・・・・・・・・・・・・・・・・・・・ 88 3.2.4 Energy efficiency ・・・・・・・・・・・・・・・・・・・・・・・・・・・・・・・・・・・・・・・・・・・・・・・・・・・・・・・ 89
3.3 Particleboard production・・・・・・・・・・・・・・・・・・・・・・・・・・・・・・・・・・・・・・・・・・・・・・・・・・・ 90 3.3.1 Particleboard ・・・・・・・・・・・・・・・・・・・・・・・・・・・・・・・・・・・・・・・・・・・・・・・・・・・・・・・・・・ 90 3.3.2 Particleboard production and Consumption ・・・・・・・・・・・・・・・・・・・・・・・・・・・・・・・ 90 3.3.3 Particleboard manufacture ・・・・・・・・・・・・・・・・・・・・・・・・・・・・・・・・・・・・・・・・・・・・・・ 90 3.3.4 Use of particleboard for material recycling・・・・・・・・・・・・・・・・・・・・・・・・・・・・・・・・ 92 3.3.5 Statistics of woody biomass including wood-based panels・・・・・・・・・・・・・・・・・・・ 92 3.3.6 Application in Asia ・・・・・・・・・・・・・・・・・・・・・・・・・・・・・・・・・・・・・・・・・・・・・・・・・・・・・ 93
4. Thermochemical conversion of biomass・・・・・・・・・・・・・・・・・・・・・・・・・・・・・・・・・・・・・・・ 94 4.1 Combustion・・・・・・・・・・・・・・・・・・・・・・・・・・・・・・・・・・・・・・・・・・・・・・・・・・・・・・・・・・・・・・・ 94
4.1.1 General scope ・・・・・・・・・・・・・・・・・・・・・・・・・・・・・・・・・・・・・・・・・・・・・・・・・・・・・・・・・・ 94 4.1.2 CHP ・・・・・・・・・・・・・・・・・・・・・・・・・・・・・・・・・・・・・・・・・・・・・・・・・・・・・・・・・・・・・・・・・・ 96 4.1.3 Co-Firing ・・・・・・・・・・・・・・・・・・・・・・・・・・・・・・・・・・・・・・・・・・・・・・・・・・・・・・・・・・・・・・ 97
4.2 Gasification・・・・・・・・・・・・・・・・・・・・・・・・・・・・・・・・・・・・・・・・・・・・・・・・・・・・・・・・・・・・・・ 100 4.2.1 Definition・・・・・・・・・・・・・・・・・・・・・・・・・・・・・・・・・・・・・・・・・・・・・・・・・・・・・・・・・・・・・ 100 4.2.2 Classification of gasification method ・・・・・・・・・・・・・・・・・・・・・・・・・・・・・・・・・・・・ 100 4.2.3 Examination of biomass material properties ・・・・・・・・・・・・・・・・・・・・・・・・・・・・・ 101 4.2.4 Gasification agent ・・・・・・・・・・・・・・・・・・・・・・・・・・・・・・・・・・・・・・・・・・・・・・・・・・・・・ 101 4.2.5 Fundamental phenomenon of biomass gasification ・・・・・・・・・・・・・・・・・・・・・・・ 102 4.2.6 Characteristics of gasification product gas ・・・・・・・・・・・・・・・・・・・・・・・・・・・・・・・ 103 4.2.7 Gasification equipment and a practical example・・・・・・・・・・・・・・・・・・・・・・・・・・ 103
4.3 Pyrolysis ・・・・・・・・・・・・・・・・・・・・・・・・・・・・・・・・・・・・・・・・・・・・・・・・・・・・・・・・・・・・・・・・ 104 4.3.1 What is pyrolysis? ・・・・・・・・・・・・・・・・・・・・・・・・・・・・・・・・・・・・・・・・・・・・・・・・・・・・・ 104 4.3.2 Characteristics of pyrolysis・・・・・・・・・・・・・・・・・・・・・・・・・・・・・・・・・・・・・・・・・・・・・ 105 4.3.3 Reactors at laboratory scale ・・・・・・・・・・・・・・・・・・・・・・・・・・・・・・・・・・・・・・・・・・・・ 105 4.3.4 Reactors at R&D ・・・・・・・・・・・・・・・・・・・・・・・・・・・・・・・・・・・・・・・・・・・・・・・・・・・・・・ 106 4.3.5 Products・・・・・・・・・・・・・・・・・・・・・・・・・・・・・・・・・・・・・・・・・・・・・・・・・・・・・・・・・・・・・・ 106

4.3.6 Status of technology ・・・・・・・・・・・・・・・・・・・・・・・・・・・・・・・・・・・・・・・・・・・・・・・・・・・ 107 4.4 Carbonization・・・・・・・・・・・・・・・・・・・・・・・・・・・・・・・・・・・・・・・・・・・・・・・・・・・・・・・・・・・・ 107
4.4.1 What is carbonization?・・・・・・・・・・・・・・・・・・・・・・・・・・・・・・・・・・・・・・・・・・・・・・・・・ 107 4.4.2 Characteristics of carbonization ・・・・・・・・・・・・・・・・・・・・・・・・・・・・・・・・・・・・・・・・ 107 4.4.3 Reactions in carbonization ・・・・・・・・・・・・・・・・・・・・・・・・・・・・・・・・・・・・・・・・・・・・・ 108 4.4.4 Energy efficiency of carbonization・・・・・・・・・・・・・・・・・・・・・・・・・・・・・・・・・・・・・・・ 109 4.4.5 Products of carbonization ・・・・・・・・・・・・・・・・・・・・・・・・・・・・・・・・・・・・・・・・・・・・・・ 110 4.4.6 Status-quo of the technology・・・・・・・・・・・・・・・・・・・・・・・・・・・・・・・・・・・・・・・・・・・・ 110
4.5 Hydrothermal gasification ・・・・・・・・・・・・・・・・・・・・・・・・・・・・・・・・・・・・・・・・・・・・・・・・ 111 4.5.1 What is hydrothermal gasification? ・・・・・・・・・・・・・・・・・・・・・・・・・・・・・・・・・・・・・ 111 4.5.2 Characteristics of hydrothermal gasification ・・・・・・・・・・・・・・・・・・・・・・・・・・・・ 111 4.5.3 Reactors for hydrothermal gasification ・・・・・・・・・・・・・・・・・・・・・・・・・・・・・・・・・・ 112 4.5.4 Energy efficiency of hydrothermal gasification ・・・・・・・・・・・・・・・・・・・・・・・・・・・ 112 4.5.5 Products of hydrothermal gasification ・・・・・・・・・・・・・・・・・・・・・・・・・・・・・・・・・・・ 113 4.5.6 Status-quo of the technology・・・・・・・・・・・・・・・・・・・・・・・・・・・・・・・・・・・・・・・・・・・・ 113
4.6 Hydrothermal liquefaction ・・・・・・・・・・・・・・・・・・・・・・・・・・・・・・・・・・・・・・・・・・・・・・・・ 114 4.6.1 What is hydrothermal liquefaction? ・・・・・・・・・・・・・・・・・・・・・・・・・・・・・・・・・・・・・ 114 4.6.2 Characteristics of hydrothermal liquefaction・・・・・・・・・・・・・・・・・・・・・・・・・・・・・ 114 4.6.3 Reaction scheme of hydrothermal liquefaction ・・・・・・・・・・・・・・・・・・・・・・・・・・・ 114 4.6.4 Product oil from hydrothermal liquefaction ・・・・・・・・・・・・・・・・・・・・・・・・・・・・・・ 115 4.6.5 Energy efficiency of hydrothermal liquefaction ・・・・・・・・・・・・・・・・・・・・・・・・・・・ 115 4.6.6 Status-quo of the technology・・・・・・・・・・・・・・・・・・・・・・・・・・・・・・・・・・・・・・・・・・・・ 116
4.7 Biodiesel production ・・・・・・・・・・・・・・・・・・・・・・・・・・・・・・・・・・・・・・・・・・・・・・・・・・・・・・ 116 4.7.1 What is biodiesel production?・・・・・・・・・・・・・・・・・・・・・・・・・・・・・・・・・・・・・・・・・・・ 116 4.7.2 Characteristics of biodiesel production ・・・・・・・・・・・・・・・・・・・・・・・・・・・・・・・・・・ 117 4.7.3 Reactors for biodiesel production・・・・・・・・・・・・・・・・・・・・・・・・・・・・・・・・・・・・・・・・ 117 4.7.4 Energy efficiency of biodiesel production・・・・・・・・・・・・・・・・・・・・・・・・・・・・・・・・・ 118 4.7.5 Status-quo of the technology・・・・・・・・・・・・・・・・・・・・・・・・・・・・・・・・・・・・・・・・・・・・ 118
5. Biochemical conversion of biomass ・・・・・・・・・・・・・・・・・・・・・・・・・・・・・・・・・・・・・・・・・・ 120 5.1 Biomethanation・・・・・・・・・・・・・・・・・・・・・・・・・・・・・・・・・・・・・・・・・・・・・・・・・・・・・・・・・・ 120
5.1.1 What is biomethanation?・・・・・・・・・・・・・・・・・・・・・・・・・・・・・・・・・・・・・・・・・・・・・・・ 120 5.1.2 Feature of biomethanation ・・・・・・・・・・・・・・・・・・・・・・・・・・・・・・・・・・・・・・・・・・・・・ 120 5.1.3 Mechanism of biomethanation ・・・・・・・・・・・・・・・・・・・・・・・・・・・・・・・・・・・・・・・・・・ 120 5.1.4 Current status ・・・・・・・・・・・・・・・・・・・・・・・・・・・・・・・・・・・・・・・・・・・・・・・・・・・・・・・・ 122
5.2 Ethanol fermentation・・・・・・・・・・・・・・・・・・・・・・・・・・・・・・・・・・・・・・・・・・・・・・・・・・・・・ 123 5.2.1 General scope ・・・・・・・・・・・・・・・・・・・・・・・・・・・・・・・・・・・・・・・・・・・・・・・・・・・・・・・・・ 123 5.2.2 Ethanol fermentation of saccharine materials・・・・・・・・・・・・・・・・・・・・・・・・・・・・ 124 5.2.3 Ethanol fermentation of starch ・・・・・・・・・・・・・・・・・・・・・・・・・・・・・・・・・・・・・・・・・ 126 5.2.4 Ethanol fermentation of lignocellulosics ・・・・・・・・・・・・・・・・・・・・・・・・・・・・・・・・・ 127
5.3 Acetone-butanol fermentation ・・・・・・・・・・・・・・・・・・・・・・・・・・・・・・・・・・・・・・・・・・・・ 129 5.3.1 What is acetone-butanol fermentation? ・・・・・・・・・・・・・・・・・・・・・・・・・・・・・・・・・・ 129 5.3.2 Characteristics of acetone-butanol fermentation・・・・・・・・・・・・・・・・・・・・・・・・・・ 129 5.3.3 Reactions of acetone-butanol fermentation・・・・・・・・・・・・・・・・・・・・・・・・・・・・・・・ 129 5.3.4 Energy efficiency of acetone-butanol fermentation・・・・・・・・・・・・・・・・・・・・・・・・ 130 5.3.5 Products of acetone-butanol fermentation ・・・・・・・・・・・・・・・・・・・・・・・・・・・・・・・ 130

5.4 Hydrogen fermentation ・・・・・・・・・・・・・・・・・・・・・・・・・・・・・・・・・・・・・・・・・・・・・・・・・・・ 132 5.4.1 What is hydrogen fermentation? ・・・・・・・・・・・・・・・・・・・・・・・・・・・・・・・・・・・・・・・・ 132 5.4.2 Characteristics of hydrogen fermentation・・・・・・・・・・・・・・・・・・・・・・・・・・・・・・・・ 132 5.4.3 Reactions of hydrogen fermentation ・・・・・・・・・・・・・・・・・・・・・・・・・・・・・・・・・・・・・ 132 5.4.4 Energy efficiency of hydrogen fermentation ・・・・・・・・・・・・・・・・・・・・・・・・・・・・・・ 133 5.4.5 Products of hydrogen fermentation・・・・・・・・・・・・・・・・・・・・・・・・・・・・・・・・・・・・・・ 134
5.5 Lactic acid fermentation ・・・・・・・・・・・・・・・・・・・・・・・・・・・・・・・・・・・・・・・・・・・・・・・・・・ 135 5.5.1 What is lactic acid fermentation? ・・・・・・・・・・・・・・・・・・・・・・・・・・・・・・・・・・・・・・・ 135 5.5.2 Lactic acid bacteria ・・・・・・・・・・・・・・・・・・・・・・・・・・・・・・・・・・・・・・・・・・・・・・・・・・・・ 135 5.5.3 Biomass resources for lactic acid fermentation ・・・・・・・・・・・・・・・・・・・・・・・・・・・ 136 5.5.4 Utilization of unused biomass from palm oil industry ・・・・・・・・・・・・・・・・・・・・・ 136 5.5.5 Lactic acid fermentation from kitchen garbage ・・・・・・・・・・・・・・・・・・・・・・・・・・・ 137 5.5.6 Purification of lactic acid ・・・・・・・・・・・・・・・・・・・・・・・・・・・・・・・・・・・・・・・・・・・・・・・ 137
5.6 Silage ・・・・・・・・・・・・・・・・・・・・・・・・・・・・・・・・・・・・・・・・・・・・・・・・・・・・・・・・・・・・・・・・・・・ 138 5.6.1 What is silage? ・・・・・・・・・・・・・・・・・・・・・・・・・・・・・・・・・・・・・・・・・・・・・・・・・・・・・・・・ 138 5.6.2 Silage making・・・・・・・・・・・・・・・・・・・・・・・・・・・・・・・・・・・・・・・・・・・・・・・・・・・・・・・・・ 139 5.6.3 Silage fermentation・・・・・・・・・・・・・・・・・・・・・・・・・・・・・・・・・・・・・・・・・・・・・・・・・・・・ 139 5.6.4 Roll bale silage ・・・・・・・・・・・・・・・・・・・・・・・・・・・・・・・・・・・・・・・・・・・・・・・・・・・・・・・・ 140 5.6.5 Technological actuality・・・・・・・・・・・・・・・・・・・・・・・・・・・・・・・・・・・・・・・・・・・・・・・・・ 140
5.7 Composting・・・・・・・・・・・・・・・・・・・・・・・・・・・・・・・・・・・・・・・・・・・・・・・・・・・・・・・・・・・・・・ 141 5.7.1 What is composting?・・・・・・・・・・・・・・・・・・・・・・・・・・・・・・・・・・・・・・・・・・・・・・・・・・・ 141 5.7.2 Basic principles of composting ・・・・・・・・・・・・・・・・・・・・・・・・・・・・・・・・・・・・・・・・・・ 141 5.7.3 Basic elements of composting・・・・・・・・・・・・・・・・・・・・・・・・・・・・・・・・・・・・・・・・・・・ 141 5.7.4 Current composting technology ・・・・・・・・・・・・・・・・・・・・・・・・・・・・・・・・・・・・・・・・・ 142
6. System development for sustainability ・・・・・・・・・・・・・・・・・・・・・・・・・・・・・・・・・・・・・・ 144 6.1 Fundamentals of LCA ・・・・・・・・・・・・・・・・・・・・・・・・・・・・・・・・・・・・・・・・・・・・・・・・・・・・ 144
6.1.1 Outline of life cycle assessment ・・・・・・・・・・・・・・・・・・・・・・・・・・・・・・・・・・・・・・・・・ 144 6.1.2 Goal and scope definition・・・・・・・・・・・・・・・・・・・・・・・・・・・・・・・・・・・・・・・・・・・・・・・ 145 6.1.3 Lifecycle inventory analysis(LCI) ・・・・・・・・・・・・・・・・・・・・・・・・・・・・・・・・・・・・・・・ 145 6.1.4 Lifecycle impact assessment (LCIA) ・・・・・・・・・・・・・・・・・・・・・・・・・・・・・・・・・・・・・ 146 6.1.5 Interpretation・・・・・・・・・・・・・・・・・・・・・・・・・・・・・・・・・・・・・・・・・・・・・・・・・・・・・・・・・ 148
6.2 Energy efficiency・・・・・・・・・・・・・・・・・・・・・・・・・・・・・・・・・・・・・・・・・・・・・・・・・・・・・・・・・ 149 6.2.1 Energy consumption for biomass cultivation and harvest・・・・・・・・・・・・・・・・・・ 149 6.2.2 Energy consumption of pretreatment for energy conversion of biomass ・・・・・ 150 6.2.3 Energy efficiency comparison between biomass energy and fossil fuel ・・・・・ 151
6.3 Carbon dioxide emission and environmental impact ・・・・・・・・・・・・・・・・・・・・・・・・・ 153 6.3.1 CO2 emission of biomass ・・・・・・・・・・・・・・・・・・・・・・・・・・・・・・・・・・・・・・・・・・・・・・・ 153 6.3.2 Comparison between biomass power generation and the other・・・・・・・・・・・・・ 154 6.3.3 Environmental impact of biomass・・・・・・・・・・・・・・・・・・・・・・・・・・・・・・・・・・・・・・・ 156
6.4 Economical evaluation of bioenergy ・・・・・・・・・・・・・・・・・・・・・・・・・・・・・・・・・・・・・・・・ 157 6.4.1 Cost of bioenergy ・・・・・・・・・・・・・・・・・・・・・・・・・・・・・・・・・・・・・・・・・・・・・・・・・・・・・・ 157 6.4.2 Bioenergy resource cost ・・・・・・・・・・・・・・・・・・・・・・・・・・・・・・・・・・・・・・・・・・・・・・・・ 157 6.4.3 Biomass technology conversion cost ・・・・・・・・・・・・・・・・・・・・・・・・・・・・・・・・・・・・・ 158 6.4.4 Secondary energy cost ・・・・・・・・・・・・・・・・・・・・・・・・・・・・・・・・・・・・・・・・・・・・・・・・・ 159
6.5 Other evaluation ・・・・・・・・・・・・・・・・・・・・・・・・・・・・・・・・・・・・・・・・・・・・・・・・・・・・・・・・・ 160 6.5.1 Standard of living ・・・・・・・・・・・・・・・・・・・・・・・・・・・・・・・・・・・・・・・・・・・・・・・・・・・・・ 160

6.5.2 Farmers’ income ・・・・・・・・・・・・・・・・・・・・・・・・・・・・・・・・・・・・・・・・・・・・・・・・・・・・・ 161 6.5.3 Energy security and foreign currency・・・・・・・・・・・・・・・・・・・・・・・・・・・・・・・・・・・・ 162
6.6 Problems to be considered・・・・・・・・・・・・・・・・・・・・・・・・・・・・・・・・・・・・・・・・・・・・・・・・・ 163 6.6.1 Biodiversity (An example of a palm-oil production) ・・・・・・・・・・・・・・・・・・・・・・・ 163 6.6.2 Land use competitions ・・・・・・・・・・・・・・・・・・・・・・・・・・・・・・・・・・・・・・・・・・・・・・・・・ 165
6.7 Energy models ・・・・・・・・・・・・・・・・・・・・・・・・・・・・・・・・・・・・・・・・・・・・・・・・・・・・・・・・・・・ 166 6.7.1 Outline of energy models・・・・・・・・・・・・・・・・・・・・・・・・・・・・・・・・・・・・・・・・・・・・・・・ 166 6.7.2 Typical energy model ・・・・・・・・・・・・・・・・・・・・・・・・・・・・・・・・・・・・・・・・・・・・・・・・・・ 166 6.7.3 DNE21 model ・・・・・・・・・・・・・・・・・・・・・・・・・・・・・・・・・・・・・・・・・・・・・・・・・・・・・・・・・ 167 6.7.4 GLUE model・・・・・・・・・・・・・・・・・・・・・・・・・・・・・・・・・・・・・・・・・・・・・・・・・・・・・・・・・・ 167 6.7.5 Land use competitions in GLUE model ・・・・・・・・・・・・・・・・・・・・・・・・・・・・・・・・・・ 168
7. Biomass situation in Asian countries ・・・・・・・・・・・・・・・・・・・・・・・・・・・・・・・・・・・・・・・・ 169 7.1 China ・・・・・・・・・・・・・・・・・・・・・・・・・・・・・・・・・・・・・・・・・・・・・・・・・・・・・・・・・・・・・・・・・・・ 169 7.2 Korea ・・・・・・・・・・・・・・・・・・・・・・・・・・・・・・・・・・・・・・・・・・・・・・・・・・・・・・・・・・・・・・・・・・・ 171 7.3 Myanmar・・・・・・・・・・・・・・・・・・・・・・・・・・・・・・・・・・・・・・・・・・・・・・・・・・・・・・・・・・・・・・・・ 174 7.4 Laos ・・・・・・・・・・・・・・・・・・・・・・・・・・・・・・・・・・・・・・・・・・・・・・・・・・・・・・・・・・・・・・・・・・・・ 177 7.5 Brunei Darussaalam ・・・・・・・・・・・・・・・・・・・・・・・・・・・・・・・・・・・・・・・・・・・・・・・・・・・・・ 179 7.6 Indonesia・・・・・・・・・・・・・・・・・・・・・・・・・・・・・・・・・・・・・・・・・・・・・・・・・・・・・・・・・・・・・・・・ 182 7.7 Cambodia ・・・・・・・・・・・・・・・・・・・・・・・・・・・・・・・・・・・・・・・・・・・・・・・・・・・・・・・・・・・・・・・ 186 7.8 Malaysia ・・・・・・・・・・・・・・・・・・・・・・・・・・・・・・・・・・・・・・・・・・・・・・・・・・・・・・・・・・・・・・・・ 189 7.9 Philippines ・・・・・・・・・・・・・・・・・・・・・・・・・・・・・・・・・・・・・・・・・・・・・・・・・・・・・・・・・・・・・・ 194 7.10 Singapore ・・・・・・・・・・・・・・・・・・・・・・・・・・・・・・・・・・・・・・・・・・・・・・・・・・・・・・・・・・・・・・ 197 7.11 Thailand ・・・・・・・・・・・・・・・・・・・・・・・・・・・・・・・・・・・・・・・・・・・・・・・・・・・・・・・・・・・・・・・ 198 7.12 Vietnam・・・・・・・・・・・・・・・・・・・・・・・・・・・・・・・・・・・・・・・・・・・・・・・・・・・・・・・・・・・・・・・・ 201 7.13 Japan ・・・・・・・・・・・・・・・・・・・・・・・・・・・・・・・・・・・・・・・・・・・・・・・・・・・・・・・・・・・・・・・・・・ 203 7.14 Taipei,Chinese ・・・・・・・・・・・・・・・・・・・・・・・・・・・・・・・・・・・・・・・・・・・・・・・・・・・・・・・・・・ 205 8. Examples for biomass utilization ・・・・・・・・・・・・・・・・・・・・・・・・・・・・・・・・・・・・・・・・・・・ 207 8.1 Small-scale biomethanation ・・・・・・・・・・・・・・・・・・・・・・・・・・・・・・・・・・・・・・・・・・・・・・・ 207
8.1.1 What are biomethane and biomethanation?・・・・・・・・・・・・・・・・・・・・・・・・・・・・・・ 207 8.1.2 Situation of biomethane in China ・・・・・・・・・・・・・・・・・・・・・・・・・・・・・・・・・・・・・・・ 207 8.1.3 Characteristics of small-scale biomethanation・・・・・・・・・・・・・・・・・・・・・・・・・・・・ 208 8.1.4 Process of small-scale biomethanation・・・・・・・・・・・・・・・・・・・・・・・・・・・・・・・・・・・ 208 8.1.5 Energy supply of small scale biomethanation ・・・・・・・・・・・・・・・・・・・・・・・・・・・・ 209
8.2 Large scale biomethanation ・・・・・・・・・・・・・・・・・・・・・・・・・・・・・・・・・・・・・・・・・・・・・・・ 209 8.2.1 Outline of large scale biomethanation ・・・・・・・・・・・・・・・・・・・・・・・・・・・・・・・・・・・ 209 8.2.2 Large-scale anaerobic digestion systems・・・・・・・・・・・・・・・・・・・・・・・・・・・・・・・・・ 210 8.2.3 Examples of large-scale anaerobic digestion systems・・・・・・・・・・・・・・・・・・・・・・ 211
8.3 Jatropha plantation ・・・・・・・・・・・・・・・・・・・・・・・・・・・・・・・・・・・・・・・・・・・・・・・・・・・・・・ 213 8.3.1 Jatropha cultivation ・・・・・・・・・・・・・・・・・・・・・・・・・・・・・・・・・・・・・・・・・・・・・・・・・・・ 213 8.3.2 Propagation method ・・・・・・・・・・・・・・・・・・・・・・・・・・・・・・・・・・・・・・・・・・・・・・・・・・・ 214 8.3.3 Jatropha biodiesel ・・・・・・・・・・・・・・・・・・・・・・・・・・・・・・・・・・・・・・・・・・・・・・・・・・・・・ 214
8.4 Power generation from rice husk・・・・・・・・・・・・・・・・・・・・・・・・・・・・・・・・・・・・・・・・・・・ 217 8.4.1 Power producer promotion in Thailand ・・・・・・・・・・・・・・・・・・・・・・・・・・・・・・・・・・ 217 8.4.2 Biomass power plant in Thailand ・・・・・・・・・・・・・・・・・・・・・・・・・・・・・・・・・・・・・・・ 217 8.4.3 Gasification technology for rice husk ・・・・・・・・・・・・・・・・・・・・・・・・・・・・・・・・・・・・ 218
8.5 Ethanol production ・・・・・・・・・・・・・・・・・・・・・・・・・・・・・・・・・・・・・・・・・・・・・・・・・・・・・・・ 219 8.5.1 What is a good source for ethanol production? ・・・・・・・・・・・・・・・・・・・・・・・・・・・・ 219 8.5.2 Lignocellulosic biomass feedstock for ethanol in Thailand ・・・・・・・・・・・・・・・・・ 219
8.5.3 R&D pioneer work on processing ・・・・・・・・・・・・・・・・・・・・・・・・・・・・・・・・・・・・・・・ 220 Appendix ・・・・・・・・・・・・・・・・・・・・・・・・・・・・・・・・・・・・・・・・・・・・・・・・・・・・・・・・・・・・・・・・・・・ 223 A1. Tokyo declaration on Asian biomass ・・・・・・・・・・・・・・・・・・・・・・・・・・・・・・・・・・・・・・・ 225 A2. Kyoto protocol ・・・・・・・・・・・・・・・・・・・・・・・・・・・・・・・・・・・・・・・・・・・・・・・・・・・・・・・・・・・ 239 A3. Statistics on Asian countries ・・・・・・・・・・・・・・・・・・・・・・・・・・・・・・・・・・・・・・・・・・ 293 A4. Unit conversion・・・・・・・・・・・・・・・・・・・・・・・・・・・・・・・・・・・・・・・・・・・・・・・・・・・・・・・・・・ 294 A5. Atomic weight ・・・・・・・・・・・・・・・・・・・・・・・・・・・・・・・・・・・・・・・・・・・・・・・・・・・・・・・・・・・ 310 A6. Thermodynamic properties ・・・・・・・・・・・・・・・・・・・・・・・・・・・・・・・・・・・・・・・・・・・・・・・ 314 A7. Heating values of fossil fuels and lifetime ・・・・・・・・・・・・・・・・・・・・・・・・・・・・・・・・・・ 318 A8. APEC framework ・・・・・・・・・・・・・・・・・・・・・・・・・・・・・・・・・・・・・・・・・・・・・・・・・・・・・・・・ 319 A9. Each country’s targets・・・・・・・・・・・・・・・・・・・・・・・・・・・・・・・・・・・・・・・・・・・・・・・・・・・・ 320 A10. Related histories・・・・・・・・・・・・・・・・・・・・・・・・・・・・・・・・・・・・・・・・・・・・・・・・・・・・・・・・ 322 A11. Each country’s language ・・・・・・・・・・・・・・・・・・・・・・・・・・・・・・・・・・・・・・・・・・・・・・・・・ 323 A12. Related books ・・・・・・・・・・・・・・・・・・・・・・・・・・・・・・・・・・・・・・・・・・・・・・・・・・・・・・・・・・ 324

-1- Asian Biomass Handbook
Part 1. Benefit of biomass utilization
1.1 Benefit of Biomass
1.1.1 What is biomass? Generally biomass is the matter that can be derived directly or indirectly from plant which is
utilized as energy or materials in a substantial amount. “Indirectly” refers to the products
available via animal husbandry and the food industry. Biomass is called as “phytomass” and
is often translated bioresource or bio-derived-resource. The resource base includes hundreds
of thousands of plant species, terrestrial and aquatic, various agricultural, forestry and
industrial residues and process waste, sewage and animal wastes. Energy crops, which make
the large scale energy plantation, will be one of the most promising biomass, though it is not
yet commercialized at the present moment. Specifically biomass means wood, Napier grass,
rape seed, water hyacinth, giant kelp, chlorella, sawdust, wood chip, rice straw, rice husk,
kitchen garbage, pulp sludge, animal dung etc. As plantation type biomass, eucalyptus, hybrid
poplar, oil palm, sugar cane, switch grass etc. are included in this category.
According to Oxford English Dictionary, it was in 1934 that the term ”biomass” appeared
first in the literature. In Journal of Marine Biology Association, Russian scientist Bogorov
used biomass as nomenclature. He measured the weight of marine plankton (Calanus finmarchicus) after drying which he collected in order to investigate the seasonal growth
change of plankton. He named this dried plankton biomass.
Biomass is very various and the classification will be reviewed in 2.(1). Biomass specifically
means agricultural wastes such as rice straw and rice husk, forestry wastes such as sawdust
and saw mill dust, MSW, excrement, animal dung, kitchen garbage, sewage sludge, etc. In the
category of plantation type, biomass includes wood such as eucalyptus, hybrid poplar, palm tree,
sugar cane, switch grass, kelp etc.
Biomass is renewable resource and the energy derived from biomass is called renewable
energy. However, biomass is designated as new energy in Japan and this naming is a legal term
peculiar to our country. Law concerning promotion of the use of new energy was enforced in
April of 1997. Though biomass was not approved as one of new energies at this moment,
-2- Asian Biomass Handbook
biomass was legally approved when the law was amended in January of 2002.
According to the Law, power generation by photovoltaics, wind energy, fuel cell, wastes, and
biomass as well as thermal use of waste are designated as new energy. Legally new energy is
provided by the law what should be the production, generation, and utilization of petroleum
alternatives, what is insufficiently infiltrated by the economic restriction, and what is
specially prescribed in order to promote the use of new energy by the government ordinance.
In foreign countries, biomass is usually called and designated as one of renewable energies.
Many studies have suggested that biomass-derived energy will provide a greater share of the
overall energy supply as the price of fossil fuels increase over the next several decades. The use
of biomass a source of energy is very attractive, since it can be a zero net CO2 energy source,
and therefore does not contribute to increased greenhouse gas emission. It is carbon neutrality
of biomass, which is precisely described in 1.(2). The combustion of biomass energy results in
the emission of CO2, however, since nearly all of the carbon in the fuel is converted to CO2, just
as it is during the consumption of fossil fuels. The zero net CO2 argument relies on the
assumption that new trees, or other plants, will be replanted to the extent that they will fix any
CO2 released during the consumption of biomass energy. This may well be true for the
properly managed energy plantations, but is not likely to pertain in many developing countries
where most of the biomass energy is obtained from forests which are not being replanted, at
least not to the same degree that they are being harvested.
The widespread expansion of biomass energy use may result in significant concerns about
availability of land, which may otherwise be used for food production, or other commercial use
such as timber production. Recent reports showed that a wide range of estimates of future
biomass energy potential, ranging from the current level of approximately 42 EJ to nearly 350
EJ close to the current level of total energy production by the year 2100. Consequently, it is
desired that biomass energy should be wisely utilized in accordance with the food or valuable
material production as well as environmental preservation.
Biomass is quite various and different in its chemical property, physical property, moisture
content, mechanical strength etc. and the conversion technologies to materials and energy are
also diversified. Researches which make it possible to develop cost effective and
environmentally friendly conversion technologies have been done to reduce the dependence on
fossil fuels, to suppress CO2 emission, and to activate rural economies.
-3- Asian Biomass Handbook
1.2 Characteristics of Biomass
1.2.1 General scope Biomass resource can be utilized substancially in endless number of times, on the basic rail
of carbon circulation by photosynthetic process. On the other hand, a fossil resource is limited
to a transitory use in principle. Additionally the irreversal emission of CO2 caused by fossil
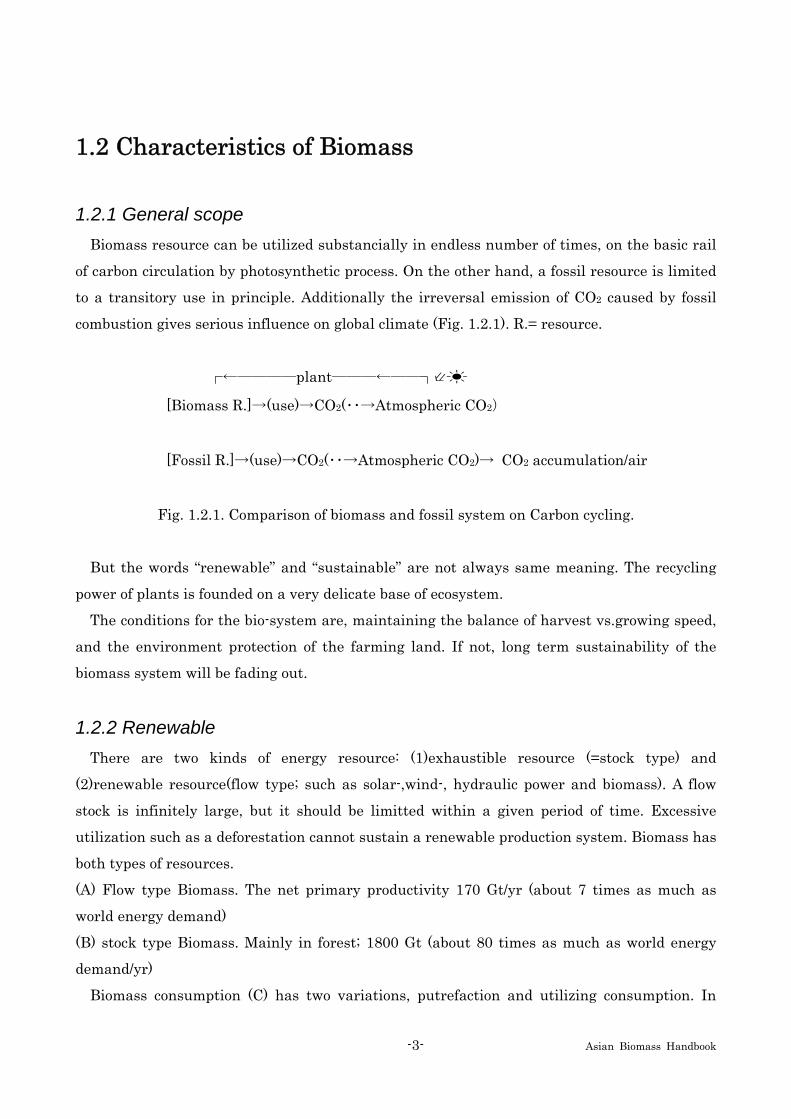
combustion gives serious influence on global climate (Fig. 1.2.1). R.= resource.
┌←――――plant―――←――┐⇙☀
[Biomass R.]→(use)→CO2(・・→Atmospheric CO2)
[Fossil R.]→(use)→CO2(・・→Atmospheric CO2)→ CO2 accumulation/air
Fig. 1.2.1. Comparison of biomass and fossil system on Carbon cycling.
But the words “renewable” and “sustainable” are not always same meaning. The recycling
power of plants is founded on a very delicate base of ecosystem.
The conditions for the bio-system are, maintaining the balance of harvest vs.growing speed,
and the environment protection of the farming land. If not, long term sustainability of the
biomass system will be fading out.
1.2.2 Renewable There are two kinds of energy resource: (1)exhaustible resource (=stock type) and
(2)renewable resource(flow type; such as solar-,wind-, hydraulic power and biomass). A flow
stock is infinitely large, but it should be limitted within a given period of time. Excessive
utilization such as a deforestation cannot sustain a renewable production system. Biomass has
both types of resources.
(A) Flow type Biomass. The net primary productivity 170 Gt/yr (about 7 times as much as
world energy demand)
(B) stock type Biomass. Mainly in forest; 1800 Gt (about 80 times as much as world energy
demand/yr)
Biomass consumption (C) has two variations, putrefaction and utilizing consumption. In
-4- Asian Biomass Handbook
natural forest, there are nearly equall amounts of growing and the putrefaction, the
equilibrium (A)=(C)would be established.
(A) Flow-biomas →(B) Stock-biomas →(C) Putrefaction or useful consumption
170 Gt/y 1800 Gt (variable)
Although we cannot realize (C)>(A), it is capable to get a bigger share of biomass utilization
in the distribution among (C), by our policy and technology.
1.2.3 Carbon neutral Biomass fuel also emits CO2 by the combustion. But people permit a CO2 indulgence for
biomass、 because of the CO2 absorption during the growing process.
That is, [CO2 emission] = [CO2 fixation by the growing process]. However, coal also has a
biomass-originated history, the carbon is circulating in long term, several hundred million
years. Then under the consideration of term of CO2-repayment, CO2 immunity rate should be
estimated.
Just after the biomass combustion, none can pay back its CO2. Therefore, it is estimated
that a temperate forest (about 25 years for regeneration time) aquires [CO2 immunity rate=1],
as a standard. At subpolar forest, the regeneration time =100 years case, the immunity rate
becomes [25/100=0.25]. In the case of brown coal (the origin was 25 milion years before), this
immunity rate is only 1 ppm. So fossil fuel has no hope to get the effective CO2 indulgence.
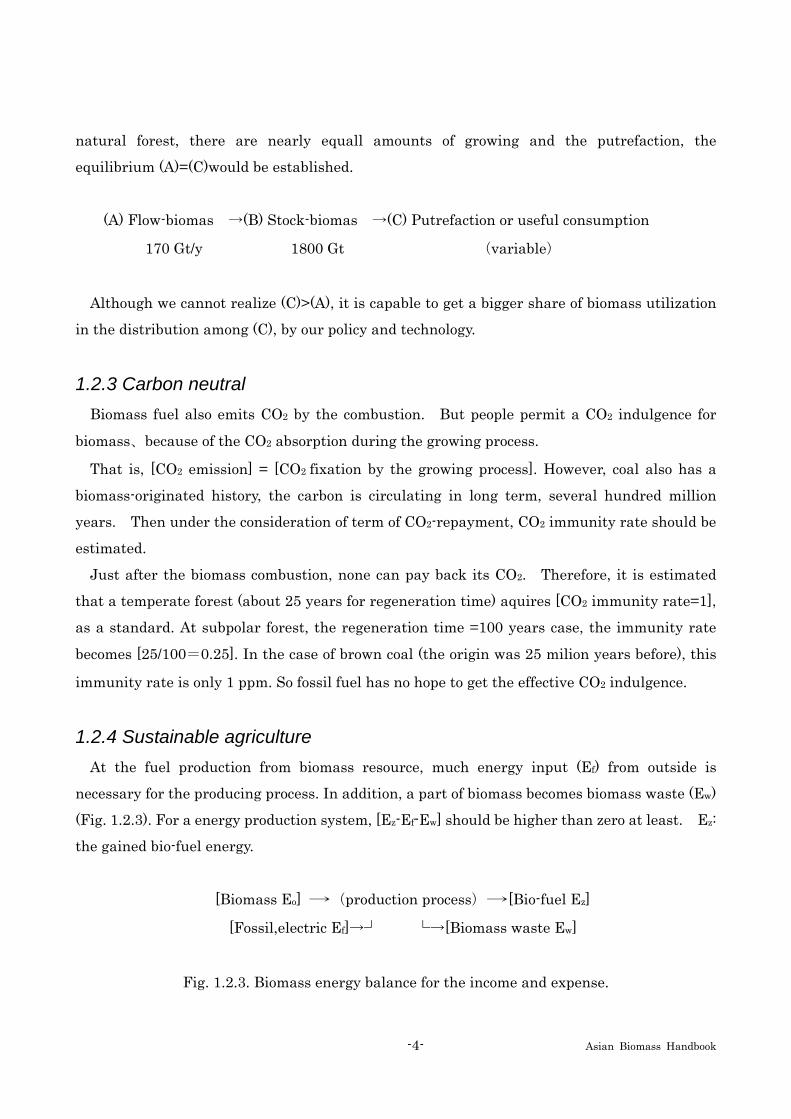
1.2.4 Sustainable agriculture At the fuel production from biomass resource, much energy input (Ef) from outside is
necessary for the producing process. In addition, a part of biomass becomes biomass waste (Ew)
(Fig. 1.2.3). For a energy production system, [Ez-Ef-Ew] should be higher than zero at least. Ez:
the gained bio-fuel energy.
[Biomass Eo] →(production process)→[Bio-fuel Ez]
[Fossil,electric Ef]→┘ └→[Biomass waste Ew]
Fig. 1.2.3. Biomass energy balance for the income and expense.

-5- Asian Biomass Handbook
Total energy yield in this system is shown as Ez/[Eo+Ef], if the value is lower than 0.5, the
biomass is merely auxiliary fuel. But even small part of biomass can contributes to new energy
system if energy balance ratio (products/invested fossil fuel) is over than 1, in the case of
coal-biomass mixed combustion generation. When biomass waste can substitute a fossil fuel in
the system, the Ef is so decreased that the energy balance ratio is much improved. The typical
success example is found at cane sugar industry which uses bagasse as an alternative fossil
fuel. Biomass production system with inferior energy balance ratio often loses its
casrbon-neutral sustainability. In agriculture, production of grain and potatoes, the energy
balance ratio is about 1.5~5 (neglected man-power calculation), while lower than 0.5 in almost
vegetables that is on loss-making railroad line. In this point, forestry is more excellent than
agricultural crops because of a little cultivation energy.
(a) Man-power investment. Inceasing of man-power is often able to cut down a fossil and/or
electric energy consumption, causing an improvement of apparent energy balance ratio.
However, man-power and fossil energy has a trade-off relation. Energy unit for man-power is
estimated by 0.073 toe/yr/man (biological standard)~1 toe/yr/man (total life consuming). Labor
intensive production often gives a faked saving energy system.
(b) Cycling of N,P,K. N (nitrogen), P (phosfer), and K (kalium) are main components of
fertilizer. They so often disappears by exploitative production that a recycling system is
necessary to hold N,P and K in soil. At a woody thermal power station, it is necessary to return
the ash for sustaining P and K. Component N cannot stay in the ash, so another N-supply route
is indispensable to restore the system. Exceptionally, traditional forestry need not any fertilizer
because there is sufficient nitrate-N from rain. But future energy forestry will demand
N-fertilizer because the N-balance will collapse.
(c) Conservation of biodiversity. Biodiversity is often fragile by enhancing a biomass
production according to the uniformity, the large scale farm, and the intensive process. For
example, mixed cropping like agroforestry, is hopeful to have a sustainable soil conservation.
Further information Sano,H.in “Biomass Handbook”, Japan Institute of Energy Ed., Ohm-sha, 2002, pp.311-323. (in
Japanese)
UN Energy “Sustainable Bioenergy: A Framework for Decision Maker”, 2007.
-6- Asian Biomass Handbook
1.3 How to Use Biomass
1.3.1 General scope For the utilization of biomass, a raw biomaterial is selected among various kinds of biomass
by taking into consideration of its utilization purpose, demand and availability. Then, the raw
material is converted to new material or energy.
Biomass as bioresource comes mainly from plants and their debris. Animals and
microorganisms as well as their organic matters are also important. Many species of plants are
useful as biomass. Land biomass mainly consists of herbal biomass from major farm crops, and
woody biomass from forest. Many of them are cultivated, converted and utilized for specific
purposes. Aquatic biomass from oceans, lakes and rivers can also be cultivated in such a case
as kelp. Biomass which is cultivated on farm land or felled from forest for specific purposes is
called virgin biomass, whereas the discarded biomaterials in production, conversion and
utilization processes are named waste biomass and used for other purposes. For example,
bagasse which is the waste of sugarcane processing is used as excellent fuel for the sugar
extraction and ethanol distillation processes. Utilization of waste biomass is also important for
avoiding the conflict of bioenergy utilization with food and feed. Bagasse is also considered as
one of the major raw materials for “the second-generation biofuel”.
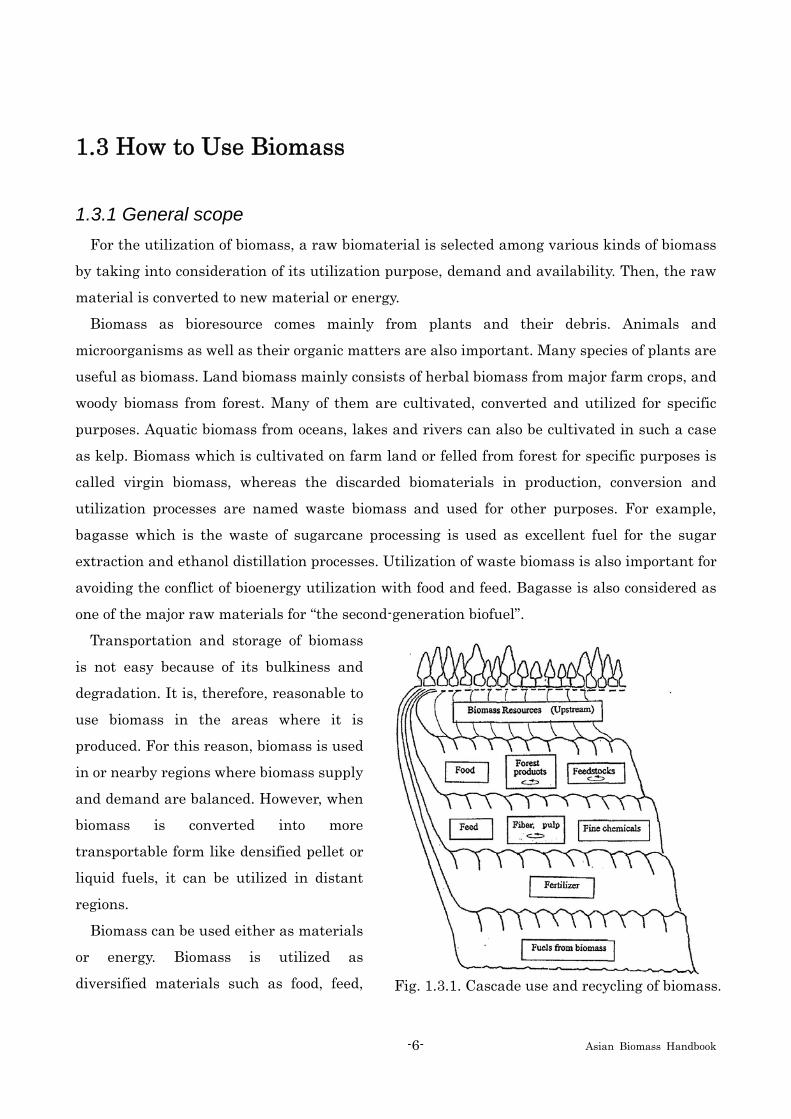
Transportation and storage of biomass
is not easy because of its bulkiness and
degradation. It is, therefore, reasonable to
use biomass in the areas where it is
produced. For this reason, biomass is used
in or nearby regions where biomass supply
and demand are balanced. However, when
biomass is converted into more
transportable form like densified pellet or
liquid fuels, it can be utilized in distant
regions.
Biomass can be used either as materials
or energy. Biomass is utilized as
diversified materials such as food, feed, Fig. 1.3.1. Cascade use and recycling of biomass.

-7- Asian Biomass Handbook
fiber, feedstock, forest products, fertilizer and fine chemicals. Utilization as energy in the form
of biofuels occurs on the final stage and biomass is decomposed into carbon dioxide or methane
and emitted in the air. The diversified use can be called ”8F Use” of biomass.
Biomass can be used stepwise like a cascade as its quality is degraded. Fig. 1.3.1.
illustrates examples of cascade use of food to feed and then to fertilizer.
Food waste can be treated into good feed. Feed changes into livestock manure which can be
fermented into methane. The digested sludge can be used as fertilizer. Forest products such
as wood from pulled down houses can be utilized as particleboard or pulp, and as the final step,
it can be converted into energy through the combustion of bio-solid fuel.
Recycling is made for paper, fiber, some feedstock and wood products as shown with
round-arrows in Fig. 1.3.1. So far as biomass is used as material, its carbon is kept in the
material and does not emit any greenhouse effect gas contributing to reduce the ill effect of
global warming.
1.3.2 Conversion and utilization There are many conversion technologies available for changing the quality of biomass to
match its utilization purposes. They are physical, chemical and biological techniques. Fig. 1.3.2
illustrates typical conversion technologies.
Physical conversion includes milling, grinding and steam explosion to decompose the
biomass structure for increasing its surface areas to accelerate chemical, thermal or biological
processes. It also covers separation, extraction, distillation etc. for obtaining useful ingredients
of biomass as well as densification, drying or moisture control for making biomass more
suitable for transportation and storage. Physical conversion technologies are also often used for
the pretreatment to accelerate the main processes.
Chemical conversion includes hydrolysis, partial oxidation, combustion, carbonization,
pyrolysis, hydrothermal reactions for decomposing biomass, and also synthesis, polymerization,
hydrogenation for constructing new molecules or reforming biomass. Generation of electrons in
oxidation process of biomass can be used for fuel cells to generate electricity.
Biological conversion is mainly composed of fermentation processes such as ethanol
fermentation, methane fermentation, acetone-butanol fermentation, hydrogen fermentation,
and enzymatic treatments which will play more important role to bring the second-generation
bioethanol on the practical stage. Application of photosynthesis and photolysis processes will be
important to improve biomass systems.

-8- Asian Biomass Handbook
Combustion heat of
biomass is converted to
mechanical power by
means of such heat
cycles as Otto cycle (for
gasoline engine), Diesel
cycle (Diesel engine),
Rankine cycle (steam
engine), Brayton cycle
(gas turbine) and others.
Electric generator with
electromagnetic
induction is used to
convert mechanical
power into electricity.
Such pretreatments as separation, extraction, milling, grinding, moisture regulation etc. are
often performed before the main conversion processes. Fig. 1.3.2 illustrates so-call-ed a magic
box in which biomass is put on the bottom and converted by using various techniques to
match its utilization purpose.
Evaluation of the conversion processes is done in terms of product quality, energy efficiency,
yield and system economy.
Planning of conversion and utilization system should take the following items into
consideration: fluctuation of biomass supply, means and cost of transportation & storage,
managing organization and rules which are in harmony with the relevant regulations, as well
as the economy of the total system.
1.4 Benefit of Biomass Utilization
1.4.1 General scope Though energy from biomass is generally not cost-competitive with fossil fuels under current
technology and market conditions in many of developed economies, the production of biomass
Fig. 1.3.2. Various conversion and pretreatment technologies.

-9- Asian Biomass Handbook
for materials and energy will produce a variety of benefits. These benefits vary from case to
case, however, some noticeable ones include, among others, offsetting greenhouse gas
emissions from the combustion of fossil fuels, creating jobs and income thorough the
development of a new industry and the utilization of locally produced raw materials, and
enhancing energy security by reducing dependence on imports. Yet, the values of these
benefits are far less understood than biomass and bioenergy production costs. Assessing these
benefits will provide a more comprehensive picture about the overall competitiveness of
biomass and bioenergy, offering implications for bioenergy development and policy formulation.
1.4.2 Oil depletion Forests and coal resources were in abundance and were sufficient to meet energy demands.
However, as human creativity exceeded expectations, producing a more efficient energy
technology based on coal and then on oil was needed.
World ultimate conventional oil reserves are estimated at 2000 billion barrels. The global
daily consumption of oil equals 71.7 million barrels. It is estimated that around 1000 billion
barrels have already been consumed and 1000 billion barrels of proven oil reserves are left in
the world (Asifa and Muneer, 2007). The price of petrol and other fuels will rocket with
potentially disastrous economic consequences unless people have moved to alternatives to fossil
fuels. Increased use of biomass will extend the lifetime of diminishing crude oil supplies.
For instance, Carpentieri et al. (2005) shows the important environmental advantages of
biomass utilization in terms of reduction of natural resource depletion, although an improved
impact assessment methodology may better highlight the advantages due to the biomass
utilization.
1.4.3 Global warming Globally, increase in emission rates of greenhouse gases, e.g., CO2, present a threat to the
world climate. As an estimate in the year 2000, over 20 million metric tons of CO2 were
expected to be released in the atmosphere every year (Saxena et al., in press). If this trend
continues, some extreme natural calamities are expected such as excessive rainfall and
consequent floods, droughts, and local imbalances. Biomass is a carbon neutral resource in its
life cycle and the primary contributor of greenhouse effect. Biomass is the fourth largest
source of energy in the world after coal, petroleum, and natural gas, providing about 14% of the
world’s primary energy consumption (Saxena et al., in press). Biomass is being considered as

-10- Asian Biomass Handbook
an important energy resource all over the world.
In order to reduce greenhouse gas emissions from energy consumption, several policy
alternatives such as emission taxes and tradable emission permits have been proposed. These
mitigation policies are likely to enhance the competitive advantage of biomass energy over
fossil fuels as the former can displace CO2 emissions from the latter. However, it is well
understood that the conversion of biomass to bioenergy requires additional energy inputs, most
often provided in some form of fossil fuel. The life cycle energy balance of a biomass compared
to conventional fossil fuel should be positive, but depending on the processing choices, the
cumulative fossil energy demand might, at times, only be marginally lower or even higher than
that of liquid fossil fuels. Bioenergy systems should be compared to conventional fuel ones
from a point of view of a life cycle basis, or using LCA.
1.4.4 Improving standard of living Since agriculture is of much importance for the economies under development, it is desirable
that sustainable agriculture leads to improvement of farmers’ standard of living as well as
their income. Education of people is important, since the literacy rate in the rural area of
developing countries is expected to be not so high. In this sense, it is important to supply
proper information on this technology to the farmers. What is important for the biomass
utilization for farmers to be effective is the accessibility of the biomass plant or biomass
collecting site from farmers. Even if farmers possess or produce biomass feedstock, it is
nothing if they do not have access to the sites where it can be made use of.
1.4.5 Increasing farmers’ income There are mainly two ways to support farmers (The Japan Institute of Energy, 2007). One
is to supply energy so that they have the access to useful fuels. In Thailand, small-scale
biomethanation provides cooking gas to farmers, so they need not to buy propane gas for
cooking. This support to farmers is also effective for sustainable agriculture due to the
reduction of fossil fuel utilization. The other support is by cash. When they grow feedstock
for ethanol production and sell it at a higher price, they can get money for buying electricity.
Since those who use ethanol as fuel are richer compared to farmers, this mechanism can be
considered as ‘redistribution of wealth.’

-11- Asian Biomass Handbook
1.4.6 Energy security The economies of all countries, and particularly of the developed countries, are dependent on
secure supplies of energy. Energy security means consistent availability of sufficient energy
in various forms at affordable prices. These conditions must prevail over the long-term if
energy is to contribute to sustainable development. Attention to energy security is critical
because of the uneven distribution of the fossil fuel resources on which most countries
currently rely. The energy supply could become more vulnerable over the near term due to the
growing global reliance on imported oil. Biomass is a domestic resource which is not subject to
world price fluctuations or the supply uncertainties as of imported fuels.
1.4.7 Foreign currency There are opportunities for developing countries to get foreign currency by exporting
bioenergy. In the case of cassava production in Thailand, for instance, the cassava production
for food and that for ethanol are balanced now. However, the future use of cassava should be
carefully determined. In the future, the amount of cassava production for ethanol may
increase, while it is often said that bioenergy utilization may be in conflict with food production,
i.e., the international growing demand for ethanol may threaten the stability of domestic
supply of food.
Further information Asifa, M.; Muneer, T. Energy supply, its demand and security issues for developed and emerging
economies, Renewable and Sustainable Energy Reviews, 11, 1388-1413 (2007)
Carpentieri, M.; Corti, A.; Lombardi, L. Life cycle assessment (LCA) of an integrated biomass
gasification combined cycle (IBGCC) with CO2 removal, Energy Conservation and Management, 46,
1790-1808 (2005)
Saxena, R.C.; Adhikaria, D.K.; Goyal, H.B. Biomass-based energy fuel through biochemical routes: A
review, Renewable and Sustainable Energy Reviews (in press)
The Japan Institute of Energy. “Report on the Investigation and Technological Exchange Projects
Concerning Sustainable Agriculture and Related Environmental Issues,” Entrusted by the Ministry
of Agriculture, Forestry and Fisheries of Japan (Fiscal year of 2006) (2007)

-12- Asian Biomass Handbook
Part 2. Biomass resources
2.1 Classification of biomass
2.1.1 Definition of biomass As stated in Chapter 1.1, “What Is Biomass?,” the word “biomass” consists of “bio” + “mass”,
and originally used in the field of ecology simply referring to amount of animal and plant.
After the oil shocks, the meaning of the word was widened beyond ecological field and came to
include the meaning “biological resources as energy sources”, since it was vigorously proposed
that alternative (new) energy sources should be promoted. There is still no strict definition of
biomass, and the definition differs from one field to another. From the perspective of energy
resources, a common definition is “a general term for animal and plant resources and the
wastes arising from them, which have accumulated in a certain amount (excluding fossil
resources)”. Accordingly, biomass encompasses a wide variety including not only agricultural
crops, timber, marine plants, and other conventional agriculture, forestry, and fisheries
resources, but also pulp sludge, black liquor, alcohol fermentation stillage, and other organic
industrial waste, municipal waste such as kitchen garbage and paper waste, and sewage
sludge. Because some countries do not classify municipal waste as biomass, care is needed in
the use of statistical data.
2.1.2 Definition of biomass (energy) in Law As an example of definition in law, Japanese case is shown below. On January 25, 2002, the
Law on Special Measures for Facilitating the Use of New Energy Sources (New Energy Law)
was partially amended, and biomass was for the first time recognized as a new energy source in
Japan. Fig. 2.1.1 shows the position of biomass among other “new energies”. Formerly, biomass
had been considered as merely a kind of renewable resources, but the amended law now sees it
as an independent category of new energy. However, some wastes, such as paper waste, food
waste, demolition waste, and black liquor, are considered to be recyclable resources as well
according to circumstances, and they are not strictly classified.

-13- Asian Biomass Handbook
Fig. 2.1.1. Definition of biomass energy in Japan.
2.1.3 Characteristics of biomass energy Up to the 19th century, biomass in the form of firewood and charcoal was the main source of
energy, but these were replaced by coal and oil in the 20th century. In the 21st century, however,
biomass shows signs of being revived because of the following characteristics: it is renewable, it
is storable and substitutive, it is abundant, and it is carbon neutral.
2.1.4 Biomass categories There is no established way of categorizing biomass, which is defined differently according to
the field; categorization changes depending on the purpose and application. Generally there
are two ways to categorize biomass: one is biological categorization based on types of existing
biomass in nature (such as categorization according to ecology or type of vegetation), and the
other is based on the use or application as resources. The latter is highly significant in terms of
making effective use of energy (resources).
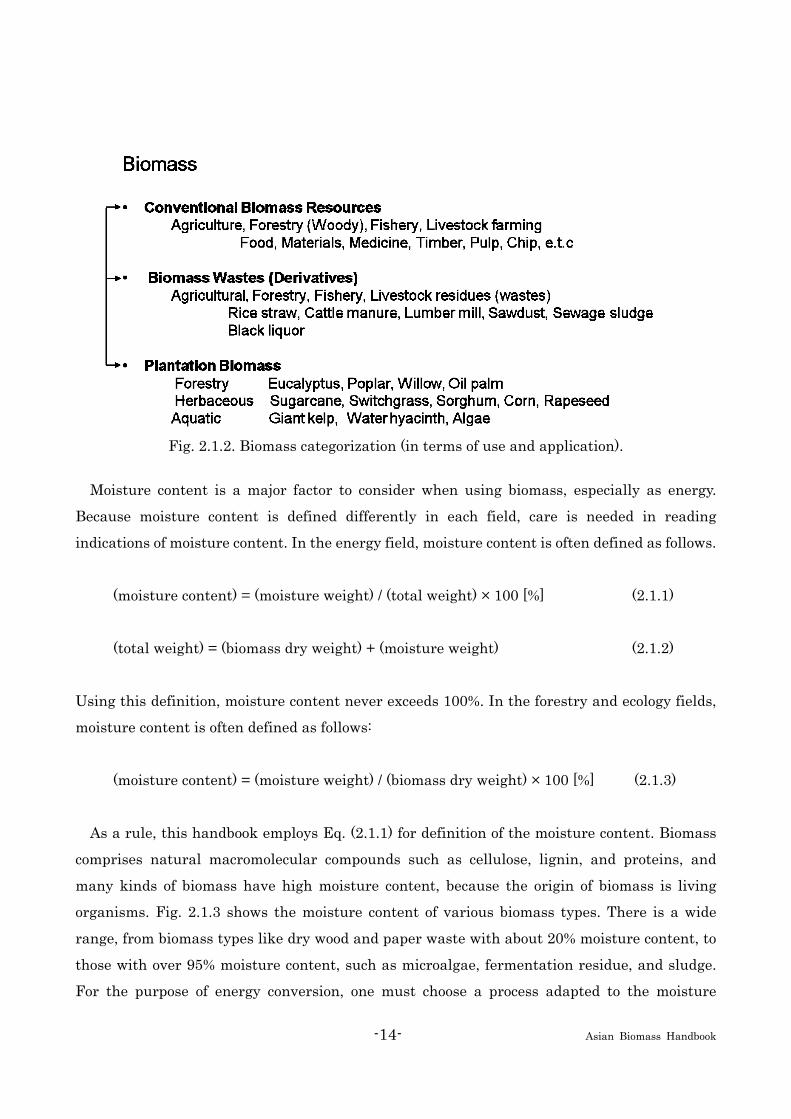
2.1.5 An example of biomass categorization (in terms of use and application) An example of biomass categorization appears in Fig. 2.1.2. In this categorization, biomass
includes not only the conventional product and waste from agriculture, forestry, and fisheries,
but also plantation biomass. Categorization according to source is important for designing
biomass usage systems.
-14- Asian Biomass Handbook
Fig. 2.1.2. Biomass categorization (in terms of use and application).
Moisture content is a major factor to consider when using biomass, especially as energy.
Because moisture content is defined differently in each field, care is needed in reading
indications of moisture content. In the energy field, moisture content is often defined as follows.
(moisture content) = (moisture weight) / (total weight) × 100 [%] (2.1.1)
(total weight) = (biomass dry weight) + (moisture weight) (2.1.2)
Using this definition, moisture content never exceeds 100%. In the forestry and ecology fields,
moisture content is often defined as follows:
(moisture content) = (moisture weight) / (biomass dry weight) × 100 [%] (2.1.3)
As a rule, this handbook employs Eq. (2.1.1) for definition of the moisture content. Biomass
comprises natural macromolecular compounds such as cellulose, lignin, and proteins, and
many kinds of biomass have high moisture content, because the origin of biomass is living
organisms. Fig. 2.1.3 shows the moisture content of various biomass types. There is a wide
range, from biomass types like dry wood and paper waste with about 20% moisture content, to
those with over 95% moisture content, such as microalgae, fermentation residue, and sludge.
For the purpose of energy conversion, one must choose a process adapted to the moisture

-15- Asian Biomass Handbook
content.
Further information Ogi, T. in “Biomass Handbook”, Japan Institute of Energy Ed., Ohm-sha, 2002, pp.2-6 (in Japanese)
2.2 Availability of Biomass
The earth has a huge stock biomass covering wide regions including forests and the ocean.
The total biomass of the world is 1,800 billion tons on the ground and 4 billion tons in the ocean,
and a comparative amount of biomass exists in the soil. The total biomass on the ground is
33,000 EJ on the energy basis, which corresponds to 80 times or more of the annual energy
consumption of the world.
However, some part of the biomass is used as food by living things including humans, and
10
Effe
ctiv
e he
atin
g va
lue
[MJ/
kg]
-1 0
0
2 0
0 10 .5
M o is tu re co n ten t [kg /kg -w e t]
D ry w oo d
R a w w oo d
M u n ic ipa l w a s te
H e a t ca p a c ity o f ash
20 % a sh
5 0%a sh
1 0 0%a sh
P u re o rg an ic (a sh fre e )
8 0 % a sh
D rys lu dg e
R a w s lu d g e
L im ita tio n o f co m b u s tion
S e w a g es lu d g e
F e rm en ta tionre s id u e
L a te n t h e a o f w a te r
Fig. 2.1.3. Relation of moisture contents and heating value.

-16- Asian Biomass Handbook
also for uses other than foods, which are necessary for the human living. Therefore, it is
important to estimate quantity of biomass resources, which can be used for energy source.
2.2.1 Estimation of potential for waste biomass Waste biomass includes wastes and residues discharged from our living. Quantity of this
production is now referred to as “waste biomass production”. Waste biomass has a variety of
uses, not only for energy but also for feed or fertilizer. On the other hand, biomass currently not
being utilized but convertible to energy is referred to as "energy potential of biomass."
In this section, a method of estimating the quantity of resource will be shown, referring to
waste biomass generated in association to production in agriculture, forestry, and livestock
industry (a) Amount of waste biomass production
It is necessary to know the waste biomass production to estimate current stock of waste
biomass, but it is difficult to know the amount of waste biomass production in each country and
region of the world. Therefore, the waste biomass production is often estimated typically by
assuming ratio of waste production relative to the biomass resources production. An example of
the parameters for the estimation of waste biomass production is shown in Table 2.2.1 Note
that these parameters are generalized on the global basis, and that it is desirable to set
parameters adapted to each region, in a study of a limited region.
Fig. 2.2.1 shows the current stock of waste biomass estimated using the above parameters by
the following procedure;
• Amounts of production of agricultural waste and forestry waste were estimated by
adjusting agricultural (2000) and forestry (1999) productions using statistics of the FAO,
multiplied by ratio of waste production.
• Amount of production of livestock waste was estimated by determining the number of head
of livestock (2000), and using amount of dung per head.
• The current stock of biomass was estimated based on waste biomass production multiplied
by a coefficient of energy conversion.
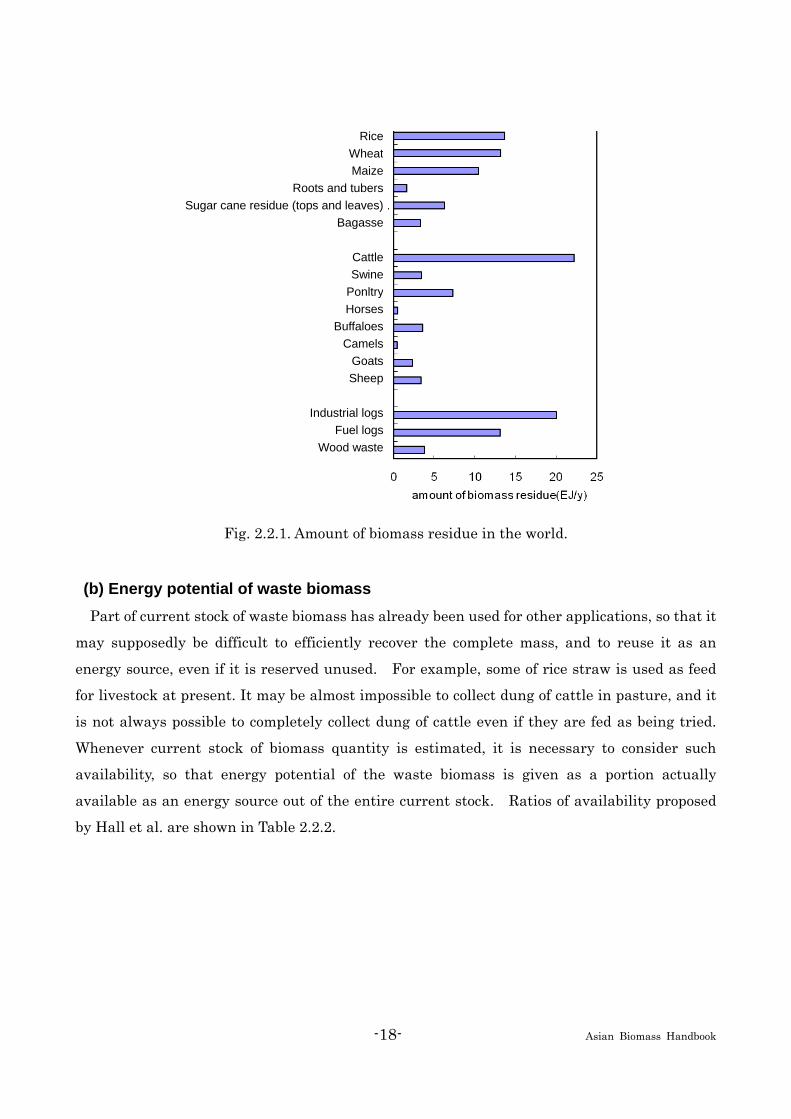
The current stock (annual value) of waste biomass was estimated as approximately 43 EJ
for livestock biomass, approximately 48 EJ for agricultural biomass, and approximately 37 EJ
for forestry biomass, totals approximately 128 EJ. Approximately 22 EJ of dung of cattle
accounts for the largest part of resources, which is followed by an approximately 20 EJ of log
residue.

-17- Asian Biomass Handbook
Table 2.2.1. Parameters used for estimating waste biomass production and amount of resources
Biomass species Ratio of waste production (t/t)
Coefficient of energy conversion (GJ/t)
Rice 1.4 16.3
Wheat 1.3 17.5
Maize (corn) 1.0 17.7
Roots and tubers 0.4 6.0 Sugarcane residue (tops and leaves) 0.28 17.33
Cattle 1.10 (t/y/head) 15.0
Swine 0.22 (t/y/head) 17.0
Poultry 0.037(t/y/head) 13.5
Horses 0.55 (t/y/head) 14.9
Buffaloes and camels 1.46 (t/y/head) 14.9
Sheep and goats 0.18 (t/y/head) 17.8
Industrial logs 1.17 16.0
Fuel logs 0.67 16.0
Wood waste 0.784 16.0
*dung production rate, dry tons basis
-18- Asian Biomass Handbook
Fig. 2.2.1. Amount of biomass residue in the world.
(b) Energy potential of waste biomass
Part of current stock of waste biomass has already been used for other applications, so that it
may supposedly be difficult to efficiently recover the complete mass, and to reuse it as an
energy source, even if it is reserved unused. For example, some of rice straw is used as feed
for livestock at present. It may be almost impossible to collect dung of cattle in pasture, and it
is not always possible to completely collect dung of cattle even if they are fed as being tried.
Whenever current stock of biomass quantity is estimated, it is necessary to consider such
availability, so that energy potential of the waste biomass is given as a portion actually
available as an energy source out of the entire current stock. Ratios of availability proposed
by Hall et al. are shown in Table 2.2.2.
RiceWheatMaize
Roots and tubersSugar cane residue (tops and leaves)
Bagasse
CattleSwine
PonltryHorses
BuffaloesCamels
GoatsSheep
Industrial logsFuel logs
Wood waste

-19- Asian Biomass Handbook
Table 2.2.2. Biomass species and availability ratio of energy
Biomass species Availability ratio of energy (%)
Agricultural waste Rice, Wheat, Maize, Roots and tubers, Sugarcane (crop residue) 25
Livestock waste Cattle, Sheep and Goats, Swine, Horses, Buffaloes and Camels, Poultry 12.5
Industrial log 75
Fuel log 25 Forestry waste
Wood waste 100 [Hall et al., 1993]
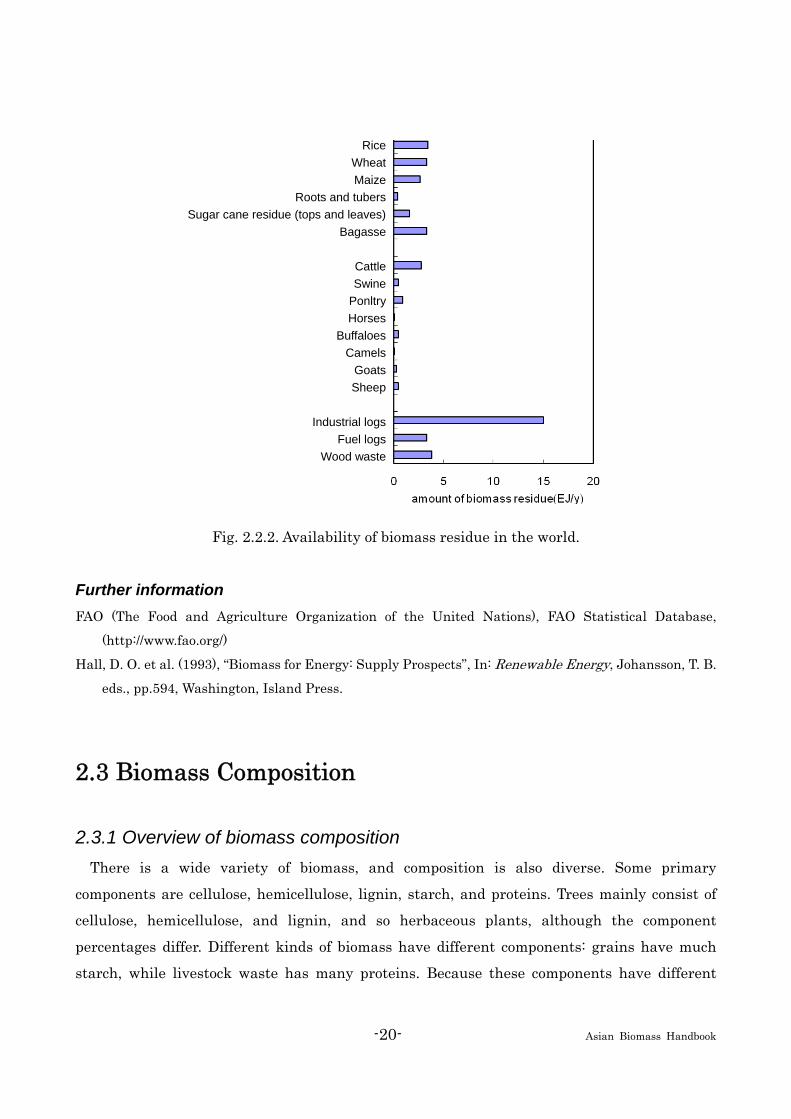
Energy potential of waste biomass estimated using ratio of availability is shown in Fig. 2.2.2.
The largest portion of the energy potential of waste biomass (annual value) is contributed by
forestry waste biomass, which accounts for approximately 22 EJ on the worldwide basis.
Especially, log residue accounts for approximately 15 EJ, which is about two-thirds of the waste
forestry biomass, and accounts for as much as approximately 36% of the total biomass
resources. There is approximately 15 EJ of agricultural waste biomass on the worldwide basis.
The individual items of the agricultural biomass in concern exist to as much as 1.5-3.5 EJ on
the average. On the other hand, livestock biomass is about 5.4 EJ on the worldwide basis,
where the largest contribution is approximately 2.8 EJ of cattle dung.
-20- Asian Biomass Handbook
Fig. 2.2.2. Availability of biomass residue in the world.
Further information FAO (The Food and Agriculture Organization of the United Nations), FAO Statistical Database,
(http://www.fao.org/)
Hall, D. O. et al. (1993), “Biomass for Energy: Supply Prospects”, In: Renewable Energy, Johansson, T. B.
eds., pp.594, Washington, Island Press.
2.3 Biomass Composition
2.3.1 Overview of biomass composition There is a wide variety of biomass, and composition is also diverse. Some primary
components are cellulose, hemicellulose, lignin, starch, and proteins. Trees mainly consist of
cellulose, hemicellulose, and lignin, and so herbaceous plants, although the component
percentages differ. Different kinds of biomass have different components: grains have much
starch, while livestock waste has many proteins. Because these components have different
RiceWheatMaize
Roots and tubersSugar cane residue (tops and leaves)
Bagasse
CattleSwine
PonltryHorses
BuffaloesCamels
GoatsSheep
Industrial logsFuel logs
Wood waste

-21- Asian Biomass Handbook
chemical structures, their reactivities are also different. From the standpoint of energy use,
lignocellulose biomass, which consists mainly of cellulose and lignin such as trees, exist in
large amounts and have great potential.
2.3.2 Typical biomass components (a) Cellulose
A polysaccharide in which D-glucose is linked uniformly by β-glucosidic bonds. Its molecular
formula is (C6H12O6)n. The degree of polymerization, indicated by n, is broad, ranging from
several thousand to several tens of thousands. Total hydrolysis of cellulose yields D-glucose (a
monosaccharide), but partial hydrolysis yields a disaccharide (cellobiose) and polysaccharides
in which n is in the order of 3 to 10. Cellulose has a crystalline structure and great resistance to
acids and alkalis. Fig. 2.3.1-a shows the structural formula of cellulose. (b) Hemicellulose
A polysaccharide whose units are 5-carbon monosaccharides including D-xylose and
D-arabinose, and 6-carbon monosaccharides including D-mannose, D-galactose, and D-glucose.
The 5-carbon monosaccharides outnumber the 6-carbon monosaccharides, and the average
molecular formula is (C5H8O4)n. Because the degree of polymerization n is 50 to 200, which is
smaller than that of cellulose, it breaks down more easily than cellulose, and many
hemicelluloses are soluble in alkaline solutions. A common hemicellulose is xylan, which
consists of xylose with 1,4 bonds. Figure 2.3.1-c shows the structural formula of xylan. Other
hemicelluloses include glucomannan, but all hemicelluloses vary in amounts depending on tree
species and the part of the plant. (c) Lignin
A compound whose constituent units, phenylpropane and its derivatives, are bonded
3-dimensionally. Its structure is complex and not yet fully understood. Figure 2.3.1-d shows a
constituent unit. Its complex 3-dimensional structure is decomposed with difficulty by
microorganisms and chemicals, and its function is therefore thought to be conferring
mechanical strength and protection. Cellulose, hemicellulose, and lignin are universally found
in many kinds of biomass, and are the most plentiful natural carbon resources on Earth. (d) Starch
Like cellulose, starch is a polysaccharide whose constituent units are D-glucose, but they
are linked by α-glycosidic bonds. Owing to the difference in the bond structures, cellulose is not
water-soluble, while part of starch (see Figure 2.3.1-b) is soluble in hot water (amylose, with a

-22- Asian Biomass Handbook
molecular weight of about 10,000 to 50,000, accounting for 10%–20% of starch) and part is not
soluble (amylopectin, with a molecular weight of about 50,000 to 100,000, accounting for
80%–90% of starch). Starch is found in seeds, tubers (roots), and stems, and has a very high
value as food. (e) Proteins
These are macromolecular compounds in which amino acids are polymerized to a
high degree. Properties differ depending on the kinds and ratios of constituent amino
acids, and the degree of polymerization. Proteins are not a primary component of
biomass, and account for a lower proportion than do the previous three components. (f) Other components (organic and inorganic)
The amount of the other organic components vary widely depending on specie, but there are
also organic components with high value, such as glycerides (representative examples include
rapeseed oil, palm oil, and other vegetable oils) and sucrose in sugarcane and sugar beet. Other
examples are alkaloids, pigments, terpenes, and waxes. Although these are found in small
amounts, they have very high added value as pharmaceutical ingredients. Biomass comprises
organic macromolecular compounds, but it also contains inorganic substances (ash) in trace
amounts. The primary metal elements include Ca, K, P, Mg, Si, Al, Fe, and Na. Substances and
their amounts differ according to the feedstock type.
Fig. 2.3.1. Chemical structures of major biomass components.
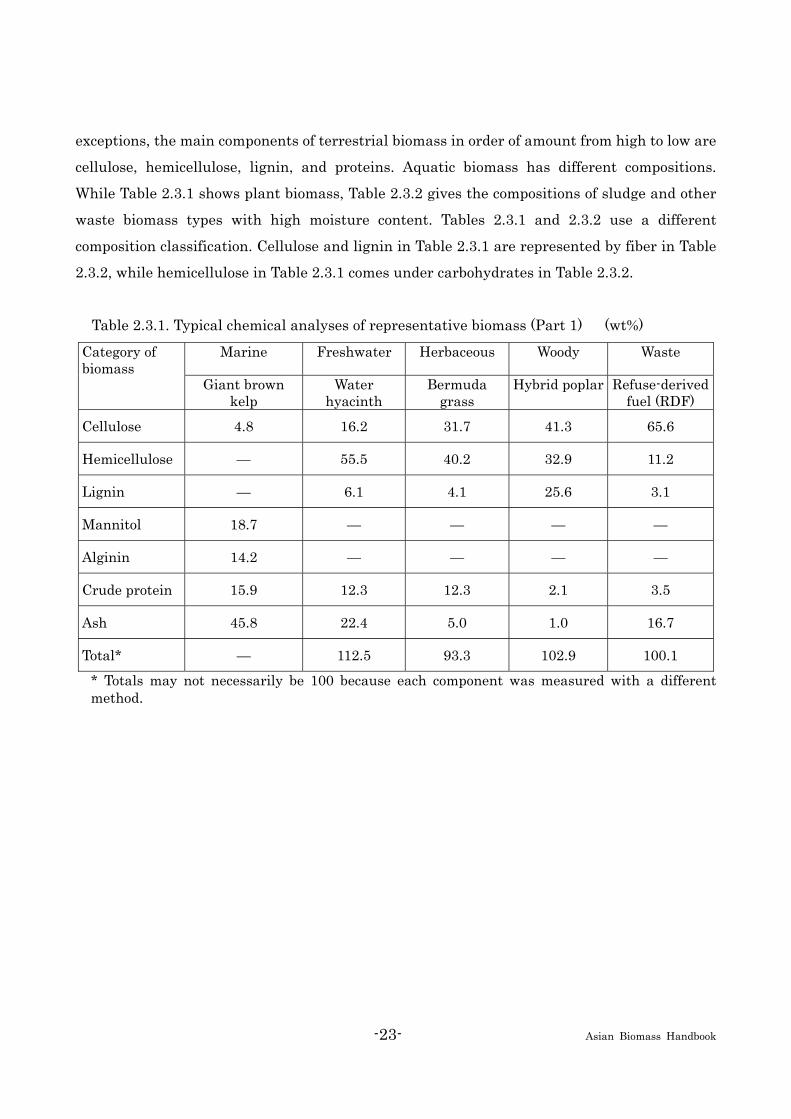
2.3.3 Constituent analyses of representative biomass types Table 2.3.1 presents representative compositions of major biomass types. Although there are
Cellulos
e
Xylan sugar chain
Starch sugar chain
Lignin structure unit (phenylpropane
-23- Asian Biomass Handbook
exceptions, the main components of terrestrial biomass in order of amount from high to low are
cellulose, hemicellulose, lignin, and proteins. Aquatic biomass has different compositions.
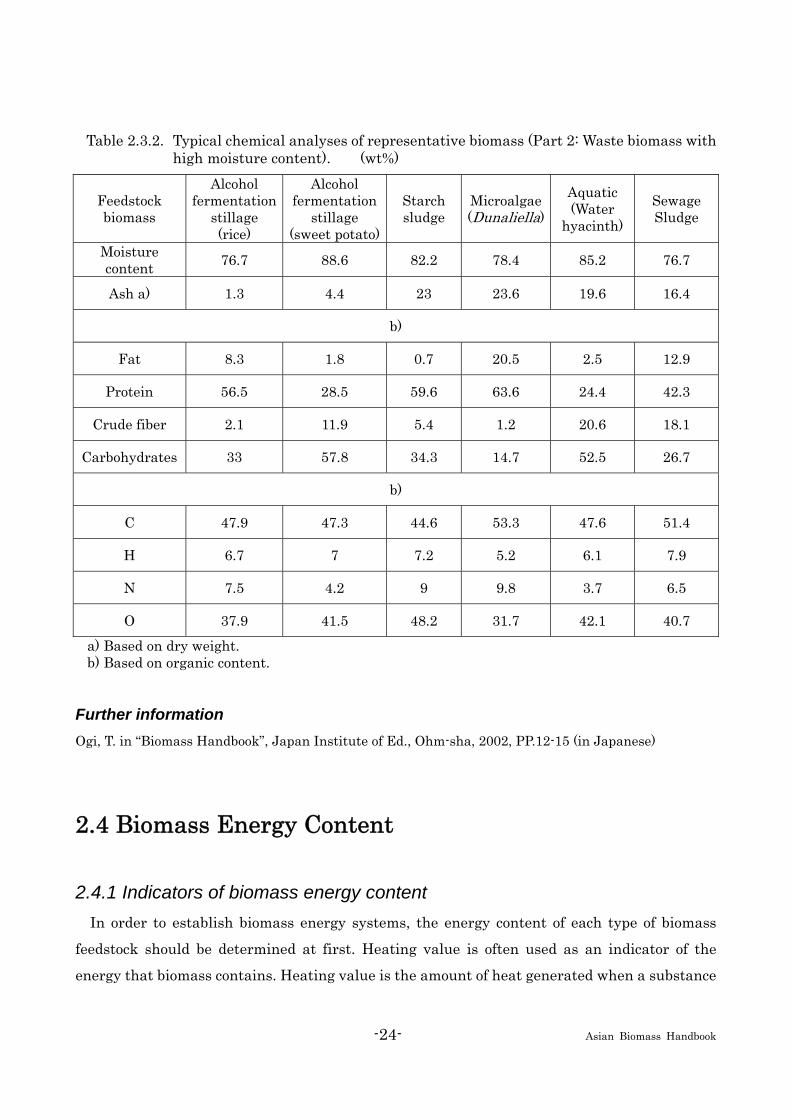
While Table 2.3.1 shows plant biomass, Table 2.3.2 gives the compositions of sludge and other
waste biomass types with high moisture content. Tables 2.3.1 and 2.3.2 use a different
composition classification. Cellulose and lignin in Table 2.3.1 are represented by fiber in Table
2.3.2, while hemicellulose in Table 2.3.1 comes under carbohydrates in Table 2.3.2.
Table 2.3.1. Typical chemical analyses of representative biomass (Part 1) (wt%)
Marine Freshwater Herbaceous Woody Waste Category of biomass
Giant brown kelp
Water hyacinth
Bermuda grass
Hybrid poplar Refuse-derived fuel (RDF)
Cellulose 4.8 16.2 31.7 41.3 65.6
Hemicellulose — 55.5 40.2 32.9 11.2
Lignin — 6.1 4.1 25.6 3.1
Mannitol 18.7 — — — —
Alginin 14.2 — — — —
Crude protein 15.9 12.3 12.3 2.1 3.5
Ash 45.8 22.4 5.0 1.0 16.7
Total* — 112.5 93.3 102.9 100.1 * Totals may not necessarily be 100 because each component was measured with a different method.
-24- Asian Biomass Handbook
Table 2.3.2. Typical chemical analyses of representative biomass (Part 2: Waste biomass with high moisture content). (wt%)
Feedstock biomass
Alcohol fermentation
stillage (rice)
Alcohol fermentation
stillage (sweet potato)
Starch sludge
Microalgae (Dunaliella)
Aquatic (Water
hyacinth)
Sewage Sludge
Moisture content 76.7 88.6 82.2 78.4 85.2 76.7
Ash a) 1.3 4.4 23 23.6 19.6 16.4
b)
Fat 8.3 1.8 0.7 20.5 2.5 12.9
Protein 56.5 28.5 59.6 63.6 24.4 42.3
Crude fiber 2.1 11.9 5.4 1.2 20.6 18.1
Carbohydrates 33 57.8 34.3 14.7 52.5 26.7
b)
C 47.9 47.3 44.6 53.3 47.6 51.4
H 6.7 7 7.2 5.2 6.1 7.9
N 7.5 4.2 9 9.8 3.7 6.5
O 37.9 41.5 48.2 31.7 42.1 40.7 a) Based on dry weight. b) Based on organic content.
Further information Ogi, T. in “Biomass Handbook”, Japan Institute of Ed., Ohm-sha, 2002, PP.12-15 (in Japanese)
2.4 Biomass Energy Content
2.4.1 Indicators of biomass energy content In order to establish biomass energy systems, the energy content of each type of biomass
feedstock should be determined at first. Heating value is often used as an indicator of the
energy that biomass contains. Heating value is the amount of heat generated when a substance

-25- Asian Biomass Handbook
undergoes complete combustion, and is also called the heat of combustion. Heating value is
determined by the ratio of components and the kinds and ratios of elements (especially carbon
content) in biomass. (a) Higher and lower heating value
Biomass comprises organic substances composed mostly of carbon, hydrogen, and oxygen,
and when it is completely combusted, it produces water and carbon dioxide. The generated
water and water vapor contain much latent heat that is given off upon condensation. The
heating value which includes latent heat is the high heating value (HHV), while that from
which latent heat is subtracted is the low heating value (LHV). (b) Available heat
Heating value Q0 is the amount of heat that arises from complete combustion per unit
material under standard conditions. Actual biomass contains much moisture and ash, which
must be taken into consideration when energy is producing. Merely evaluating low heating
value is inadequate as an indicator whether biomass in its natural state will sustain
combustion. The energy to raise ambient air to the temperature that maintains the fire and the
endothermic energy of ash should also be taken into account. The heat amount that takes them
into account is the available heat, and is expressed with this equation:
Available heat Q = Q0 (1 − w) − 1000 w − [flue heat absorption] − [ash heat absorption]
(w: moisture content)
Fig. 2.1.3. uses values calculated for available heat Q at 900°C. A positive (+) value for
available heat Q is the condition for combustion to occur.
2.4.2 Heating values of various kinds of biomass Table 2.4.1 gives the data for moisture content, organic matter content, ash content, and
heating value of representative types of biomass.

-26- Asian Biomass Handbook
Table 2.4.1. Typical analyses and heating values of representative types of biomass, coal, and peat.
Category Biomass Moisture content*
[wt%]
Organic matter
[dry wt%]
Ash**
[wt%]
High heating value
[MJ/dry-kg]Waste Cattle manure 20—70 76.5 23.5 13.4
Activated biosolids 90—97 76.5 23.5 18.3
Refuse-derived fuel(RDF) 15—30 86.1 13.9 12.7
Sawdust 15—60 99.0 1.0 20.5
Herbaceous Sweet sorghum 20—70 91.0 9.0 17.6
plant Switch grass 30—70 89.9 10.1 18.0
Aquatic plant Giant brown kelp 85—97 54.2 45.8 10.3
Water hyacinth 85—97 77.3 22.7 16.0
Woody plant Eucalyptus 30—60 97.6 2.4 18.7
Hybrid poplar 30—60 99.0 1.0 19.5
Sycamore 30—60 99.8 0.2 21.0
Derivatives Paper 3—13 94.0 6.0 17.6
Pine bark 5—30 97.1 2.9 20.1
Rice straw 5—15 80.8 19.2 15.2
Coal Illinois bituminous 5—10 91.3 8.7 28.3
Peat Reed sedge 70 —90 92.3 7.7 20.8 * Moisture content is determined from the weight loss after drying for at 105°C under
atmospheric pressure. ** Ash content is determined from the weight of residue (metal oxides) left after heating at about
800°C.
Moisture content differs considerably depending on the kind of biomass, for example, 3% in
paper and 98% in sludge. With most biomass types, water content exceeding two-thirds makes
the available heat negative (–). Therefore, even if the heating value of the biomass itself is high,
if it has a high moisture content in its natural state, it is not suitable for combustion. For
example, water hyacinth and sewage sludge have high heating values, when they are dried, but
moisture content is about 95% at the sampling, and they are unsuitable for combustion
actually.
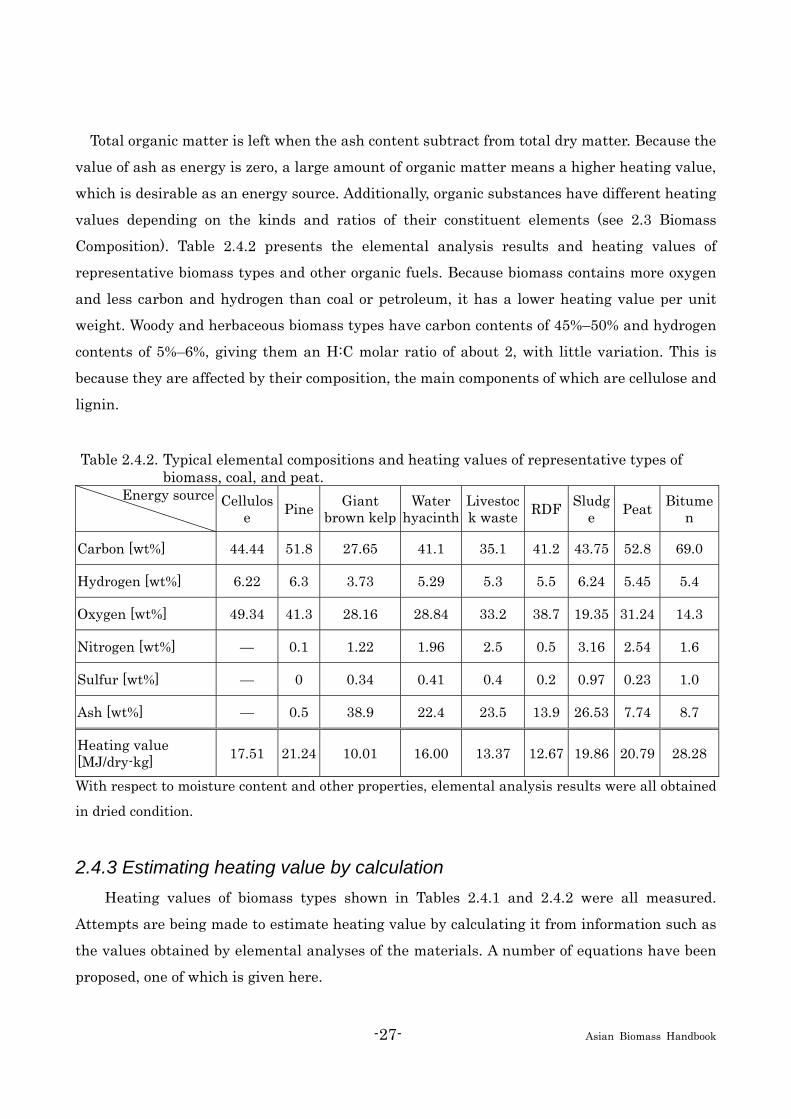
-27- Asian Biomass Handbook
Total organic matter is left when the ash content subtract from total dry matter. Because the
value of ash as energy is zero, a large amount of organic matter means a higher heating value,
which is desirable as an energy source. Additionally, organic substances have different heating
values depending on the kinds and ratios of their constituent elements (see 2.3 Biomass
Composition). Table 2.4.2 presents the elemental analysis results and heating values of
representative biomass types and other organic fuels. Because biomass contains more oxygen
and less carbon and hydrogen than coal or petroleum, it has a lower heating value per unit
weight. Woody and herbaceous biomass types have carbon contents of 45%–50% and hydrogen
contents of 5%–6%, giving them an H:C molar ratio of about 2, with little variation. This is
because they are affected by their composition, the main components of which are cellulose and
lignin.
Table 2.4.2. Typical elemental compositions and heating values of representative types of
biomass, coal, and peat. Energy source Cellulos
e Pine Giant brown kelp
Water hyacinth
Livestock waste RDF Sludg
e Peat Bitumen
Carbon [wt%] 44.44 51.8 27.65 41.1 35.1 41.2 43.75 52.8 69.0
Hydrogen [wt%] 6.22 6.3 3.73 5.29 5.3 5.5 6.24 5.45 5.4
Oxygen [wt%] 49.34 41.3 28.16 28.84 33.2 38.7 19.35 31.24 14.3
Nitrogen [wt%] — 0.1 1.22 1.96 2.5 0.5 3.16 2.54 1.6
Sulfur [wt%] — 0 0.34 0.41 0.4 0.2 0.97 0.23 1.0
Ash [wt%] — 0.5 38.9 22.4 23.5 13.9 26.53 7.74 8.7
Heating value [MJ/dry-kg] 17.51 21.24 10.01 16.00 13.37 12.67 19.86 20.79 28.28
With respect to moisture content and other properties, elemental analysis results were all obtained
in dried condition.
2.4.3 Estimating heating value by calculation Heating values of biomass types shown in Tables 2.4.1 and 2.4.2 were all measured.
Attempts are being made to estimate heating value by calculating it from information such as
the values obtained by elemental analyses of the materials. A number of equations have been
proposed, one of which is given here.
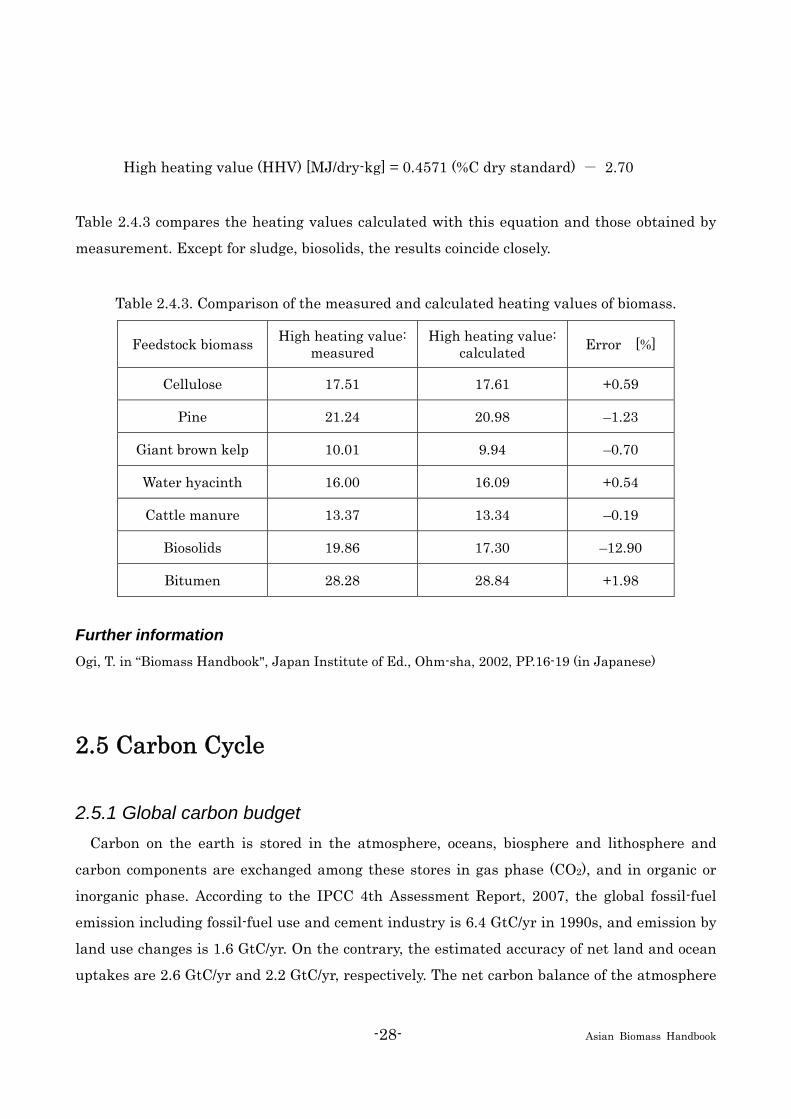
-28- Asian Biomass Handbook
High heating value (HHV) [MJ/dry-kg] = 0.4571 (%C dry standard) - 2.70
Table 2.4.3 compares the heating values calculated with this equation and those obtained by
measurement. Except for sludge, biosolids, the results coincide closely.
Table 2.4.3. Comparison of the measured and calculated heating values of biomass.
Feedstock biomass High heating value: measured
High heating value: calculated Error [%]
Cellulose 17.51 17.61 +0.59
Pine 21.24 20.98 –1.23
Giant brown kelp 10.01 9.94 –0.70
Water hyacinth 16.00 16.09 +0.54
Cattle manure 13.37 13.34 –0.19
Biosolids 19.86 17.30 –12.90
Bitumen 28.28 28.84 +1.98
Further information Ogi, T. in “Biomass Handbook", Japan Institute of Ed., Ohm-sha, 2002, PP.16-19 (in Japanese)
2.5 Carbon Cycle
2.5.1 Global carbon budget Carbon on the earth is stored in the atmosphere, oceans, biosphere and lithosphere and
carbon components are exchanged among these stores in gas phase (CO2), and in organic or
inorganic phase. According to the IPCC 4th Assessment Report, 2007, the global fossil-fuel
emission including fossil-fuel use and cement industry is 6.4 GtC/yr in 1990s, and emission by
land use changes is 1.6 GtC/yr. On the contrary, the estimated accuracy of net land and ocean
uptakes are 2.6 GtC/yr and 2.2 GtC/yr, respectively. The net carbon balance of the atmosphere

-29- Asian Biomass Handbook
in 1990s is 3.2 GtC/yr (=8.0−2.6−2.2) as shown in Table 1. These values of carbon balances have
been assessed thorough comparative check of many results related carbon cycle. The global
fossil-fuel emissions of CO2 and the net carbon balances of the atmosphere are now rather well
established, the others in the Table 2.5.1 are less accurate. And also, there are carbon cycles in
the land and ocean-biosphere, the net carbon balances are related to the activities of them. The
status of carbon cycle in each store is controlled by forest management and climatic changes.
The Kyoto Protocol, which accounts for offsetting reduced targets of CO2 emission by carbon
sequestration in forests through forest management, became effective in February 2005. The
rules for the effective management have focused attention on the role of the terrestrial
biosphere in global scale carbon cycles. Therefore, accurate data are required for carbon stocks
and cycle over various terrestrial ecosystems. However, uncertainty remains about the change
in carbon stock from forest management and the response of the ecosystem CO2 exchange to
climate change.
Table 2.5.1. Global carbon budget. by convention, CO2 fluxes leaving the atmospheric reservoir. (i.e. “CO2 sinks”) have a negative sign. Numbers in parentheses are ranges. Units: GtC/yr. NA: No information available to separate. (IPCC 4th assessment report, 2007)
1980s 1990s 2000-2005
Atmospheric increase 3.3±0.1 3.2±0.1 4.1±0.1
Emissions (fossil fuel + cement) 5.4±0.3 6.4±0.3 7.0±0.3
Ocean-atmosphere flux −1.8±0.8 2.2±0.4 −2.2±0.4
Land use change flux 1.3 1.6 NA
(0.3 to 2.8) (0.5 to 2.8)
Residual land sink −1.6 −2.6 NA
(−4.0 to 0.3) (−4.3 to -1.0)
2.5.2 Carbon cycle in forest ecosystem Global amounts of carbon in forest ecosystems are 330 GtC in the forest biomass and 780
GtC in the soil after Dixson et al., 1994. Furthermore, uptake of carbon in net by forest
ecosystem is regulated photosynthesis and respiration controlled by meteorological and
-30- Asian Biomass Handbook
ecophysiological characteristics of forest trees and understorey vegetation. Amount of carbon
storage in the forest ecosystem classified into vegetation above ground, vegetation below
ground, litter and woody debris, and also organic carbon in the soil. Forests and soils contain
the largest stocks of organic matter globally, and organic carbon in the soil has a potential to
release more CO2 by increasing soil respiration and to increase atmospheric high concentration
of CO2 under the warm condition in the future. The trunk of tree is useful for timber and part of
timber are reserved in the houses for long time. Plant growth can be stimulated by increased
atmospheric CO2 concentrations and nutrient deposition (fertilization effects). However, in the
field studies, the fertilization effect is not clear for forest ecosystems.
2.5.3 Carbon cycle model For the proper management of carbon budget in the future, land-ecosystem models that are
truly useful for ecosystem monitoring and carbon budget evaluation are inevitably required. To
extrapolate the results based on ground-observation data in a spatial and a temporal scale,
more studies will be required to develop satellite remote sensing and statistical ecosystem
models. Using a land-use model and land-ecosystem carbon cycle model, we can predict the
fluctuations in carbon balance caused by human activities (i.e. terrestrial carbon management)
and climate change in the future. And also, we can conduct the assessment of carbon
management potential.
By Oikawa and Ito, a process-based carbon cycle model (Sim-CYCLE) was developed and
validated with observational data at many measurement sites. The changes of carbon balances
and stocks from present to future condition (after 70 years under twice time of CO2
atmospheric concentration and higher air temperature by 2,1℃) was estimated using the
Sim-CYCLE model. As shown in Fig.2.5.1 (T. Oikawa, 2002), carbon stocks in soil and
vegetation of land-ecosystem will increase from 642.3, 1495.1 GtC at present to 835.1, 1559.0
GtC in the future, respectively.
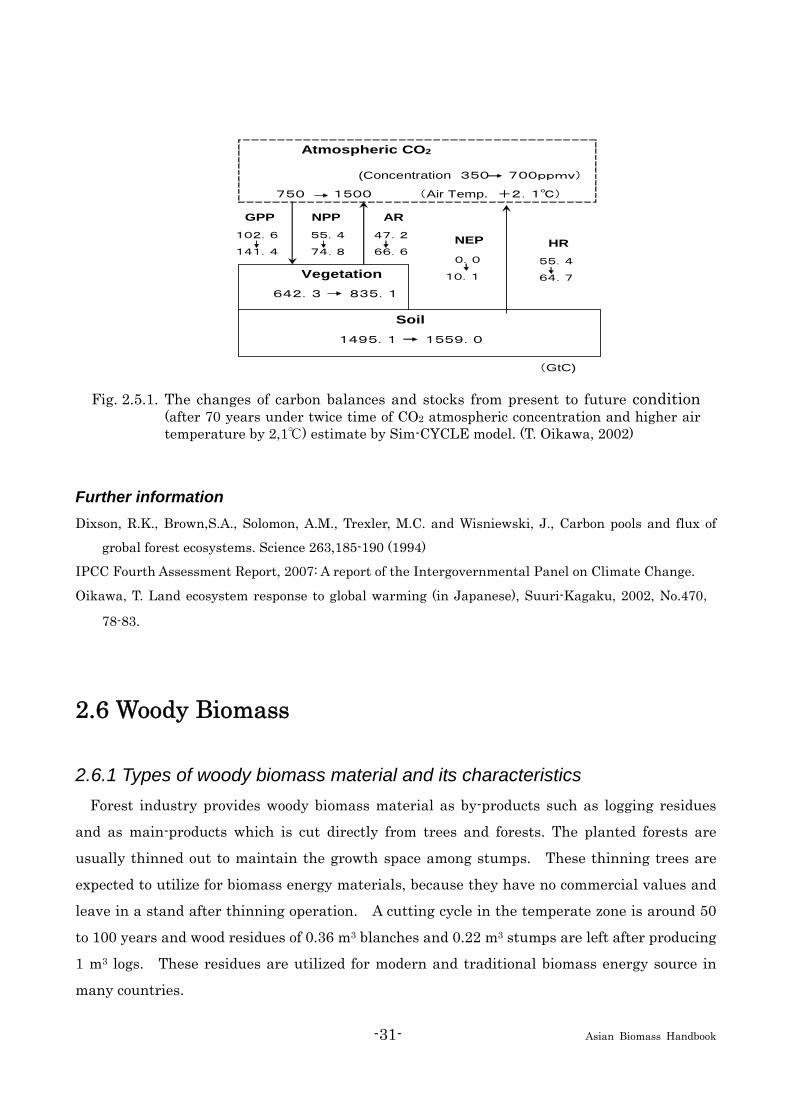
-31- Asian Biomass Handbook
Atmospheric CO2
(Concentration 350 700ppmv)
750 1500 (Air Temp. +2.1℃)
Vegetation642.3 835.1
Soil1495.1 1559.0
HR55.4
64.7
NEP
0.0
10.1
AR47.2
66.6
NPP55.4
74.8
GPP102.6
141.4
(GtC) Fig. 2.5.1. The changes of carbon balances and stocks from present to future condition
(after 70 years under twice time of CO2 atmospheric concentration and higher air temperature by 2,1℃) estimate by Sim-CYCLE model. (T. Oikawa, 2002)
Further information Dixson, R.K., Brown,S.A., Solomon, A.M., Trexler, M.C. and Wisniewski, J., Carbon pools and flux of
grobal forest ecosystems. Science 263,185-190 (1994)
IPCC Fourth Assessment Report, 2007: A report of the Intergovernmental Panel on Climate Change.
Oikawa, T. Land ecosystem response to global warming (in Japanese), Suuri-Kagaku, 2002, No.470,
78-83.
2.6 Woody Biomass
2.6.1 Types of woody biomass material and its characteristics Forest industry provides woody biomass material as by-products such as logging residues
and as main-products which is cut directly from trees and forests. The planted forests are
usually thinned out to maintain the growth space among stumps. These thinning trees are
expected to utilize for biomass energy materials, because they have no commercial values and
leave in a stand after thinning operation. A cutting cycle in the temperate zone is around 50
to 100 years and wood residues of 0.36 m3 blanches and 0.22 m3 stumps are left after producing
1 m3 logs. These residues are utilized for modern and traditional biomass energy source in
many countries.

-32- Asian Biomass Handbook
Woodfuel accounts for about 53 percent of total round wood produced in the world. However
woodfuel accounts for only several percent in industry countries at present, tough industry
countries used to depend on woodfuel until 1960s. In Japan case, hardwood forests located
near rural communities used to be main resources for fuelwood and charcoal. Nowadays
hardwood forests have not been utilized as woody resources, because hardwood timber value is
cheaper compared with softwood. Though hardwood forests have not industrial values so far,
they have high potential to provide renewable energy sources to mitigate global warming.
Aside from this, fast growing species, such as willow (Salix), poplars (Populus), and birch
(Retula), have been planted to produce biomass energy materials.
2.6.2 Growth rate The use of woody biomass energy has grown in importance as part of the efforts to reduce
dependence on non-renewable energy sources such as fossil fuels. Though woody biomass
release carbon into atmosphere when it is burned to produce energy, replanted trees absorb the
same amount of carbon from atmosphere into the forest ecosystem through photosynthesis
which is in proportion to the growth rate of tree species. The growth rate is depended on
temperature, precipitation, soil characteristics and other environmental factors. In general
the growth rate is low in boreal zone and high in tropical zone respectively. Fast growing
species such as eucalyptus (Eucalyplus), poplar and Acasia manngium in Southeast Asia
capture from 5 to 15 ton carbon per hector annually. Whereas Sugi (Cryptomeria japonica),
one of representative plantation species in Japan, captures carbon from 2 to 3.5 ton per hector
annually.
The growth of forest biomass shows high rate in the early stage and fall down with getting
mature. Table 2.6.1 expresses how man-made forest stores carbon in their biomass.
Hardwood forests located close to rural communities in Japan used to be the main source to
provide fuel wood. Table 2.6.2 shows annual increment of these forests. If we focus on only
quantity and do not care timber quality, it is reasonable to adopt cutting rotation at the
maximum annual increment which is generally younger than regular timber harvesting
rotation.

-33- Asian Biomass Handbook
Table 2.6.1. Accumulated biomass carbon of manmade forest.
Biomass weight age (ton/ha) 10 13.5
20 59.2
30 105.8
40 145.9
50 172.0
60 189.5
70 198.0
80 203.0
90 206.5
100 208.6
Table 2.6.2. Accumulated biomass carbon of hardwood forest.
Biomass weight Mean annual increment age (ton/ha) (ton/ha) 10 18.3 1.8
20 41.6 2.1
30 59.9 2.0
40 74.0 1.9
50 85.2 1.7
60 93.7 1.6
70 100.0 1.4
80 104.9 1.3
90 109.2 1.2
100 112.0 1.1

-34- Asian Biomass Handbook
2.6.3 Woody biomass resources According to the FAO statistics, total forest area is 4 billion ha, corresponding to an average
of 0.62ha per capita. This forest area accounts for one-third of total global land. However,
deforestation is a significant problem and 13 million ha of forest land has annually disappeared.
On the other hand, China and India have aggressively expanded new plantation every year,
then net loss of world forests area in the period of 2000-2005 is estimated at 7.3 million ha per
year. In addition to deforestation, there are about 1.6 billion ha of degraded forests. It is
important to rehabilitate degraded forests for global environment and sustainable development.
If woody biomass is limited to stem biomass, there is 350 billion tons of dry-biomass in the
world forest ecosystem. One third of dried woody biomass is existed in South America.
The area of forest plantation is 140 million ha and has increased by about 2.8 million ha
annually in the period of 2000-2005. Forest plantations in tropical countries consist primarily
of introduced species which growth rates are 15-50 m3 per year of Eucalyptus grandis, 14-25 m3
of Acacia mearnsii, 12-35 m3 of Pinus radiate, and 20-50 m3 of Pinus caribaea. These annual
growth rates are three times of Japanese species for forest plantation. The forest plantations
in tropical countries have a big potentiality to provide woody biomass with short rotation and
low costs. Though a large-scale of forest plantation is sometimes criticized for poor
biodiversity, forest plantation can be harmonized timber production operation with other forest
function and services if it will be well managed under a concept of sustainable forest
management. This concept usually requests forest managers to take care not only forest
plantation but also natural forest with indigenous species.
Further Information FAO, Global Forest Resources Assessment 2005, FAO, 2006
FAO, Forest Resources Assessment 1990, 7, FAO, 1995
2.7 Herbaceous Biomass
2.7.1 The herbaceous biomass means Herbaceous biomass includes grasses and legumes growing on grasslands. It includes under
utilized wild species as well as cultivated forages with higher forage quality. Broadly speaking,

-35- Asian Biomass Handbook
food crops, such as rice, wheat, maize, and sugarcane represent sources of herbaceous biomass.
By-products or residues, such as rice straw, are also considered herbaceous biomass; however,
their use as herbaceous biomass is dependent on quality issues. Bamboos (Phyllastachys spp.)
and sasas (Sasa spp.) are considered gramineous woody-type biomass species. Tropical grasses
grow faster than trees and produce higher biomass in a shorter period. Grasses are classified
into annual species, which include many cereals, and perennial species, which include many
forage grasses. Legumes consist of shruby, viny, and wood-types, of which the two former types
are considered herbaceous biomass. An important component of legumes is their ability to fix
nitrogen in symbiosis with Rhizobium bacteria located in root nodules. It is economically
necessary that a reduction in the use of chemical nitrogen fertilizers will be a component of
biomass production. By rotating or sowing a mix-culture of forage and leguminous species in
biofuel production pastures, the application of nitrogen fertilizer can be minimized. Published
biomass production of leguminous species is 8-17 t/ha/year for alfalfa (Medicago sativa) in
temperate Aichi Prefecture and 5-19 t/ha/year for tropical legumes in the subtropical Ishigaki
Island. This production level is much lower than that for tropical grasses.
2.7.2 C3 species and C4 species Growth rates of plants are regulated by the photosynthetic ability and a multitude of
environmental factors. Grasses are classified into C3 species and C4 species based on their
unique photosynthetic pathway. It is important to note the anatomical differences in leaf and
bundle sheath cells that occur between C3 and C4 grasses. Typically, the optimum light
intensity for C4 species is ca. 50,000-60,000 lux and is twice that for C3 species (15,000-30,000
lux). The highest photosynthetic efficiency of the C4 species generally reaches at high
temperature and high light intensity which is characteristics of tropical regions. The C4 species,
however, cannot maintain their high photosynthetic efficiency under low light intensity and
low temperature. Table2.7.1 shows that napiergrass recorded a yield of 85 t/ha/year and the
yield of sugarcane is 64 t/ha/year, with a mean of 232 kg/ha/day, and 176 t/ha/day, respectively.
The yield of sugarcane and guineagrass in subtropical regions is 50 t/ha (140 kg/ha/day) and
that of some tropical grasses is 25-30 t/ha (50-80 kg/ha/day). Since forage grasses generally
exhibit rapid regrowth and persistency, they are utilized for low-input and sustainable biomass
production. As one example, “Natsuyutaka” guineagrass has attained 40 t/ha (all are dry
matter weight in the report) on a seven-year average in subtropical Ishigaki Island, Okinawa.
In temperate regions, winter-hardy tropical grasses such as bermudagrass and bahiagrass

-36- Asian Biomass Handbook
produce 20-30 t/ha/year (50-80 kg/ha/day) but go dormant in winter. On the other hand,
temperate grasses produces 15-26 t/ha/year (40-70 kg/ha/day) but go dormant in summer. A
primary advantage in utilizing perennial C3 or C4 grasses for biomass production is that less
maintenance is required and stands can persist for 5-10 years producing stable amount of
biomass following stand establishment.
Table 2.7.1. Biomass of perennial gramineous forages.
Species DM yield(t/ha/y)
Daily DM (kg/ha) site
C4 species Napiergrass
84.7
232.1
Puerto Rico
Guineagrass3 51.1 140.0 Ishigaki, JP
Sugarcane 49.5 135.6 Okinawa, JP C3 species
Perennial ryegrass
26.6 72.8
New Zealand
Orchadgrass 22.0 60.3 New Zealand
Tall fescue 15.0 41.1 Kumamoto, JP
Timothy 15.0 41.1 Hokkaido, JP
Table 2.7.2. Biomass of annual gramineous crops.
Species DM yield (t/ha)
Total Days
Daily DM (kg/ha) Site
C4 species Sorghum
46.6
210
221.9
California
Sorgum (green A) 28.8 190 151.6 Nagano, JP
Maize 34.0 140 245.7 Italy
Maize 27.2 104 261.5 Ohita, JP C3 species Rice (Akihikari)
19.2
134
221.9
Iwate, JP
Wheat (Akiba-komugi) 14.3 219 65.3 Ibaraki, JP
Oat 16.4 193 85.0 Hyogo, JP
Rye 15.6 195 80.0 Tochigi, JP
Annual ryegrass 14.8 230 4.3 Chugoku,JP

-37- Asian Biomass Handbook
In the annual C4 species, such as maize, exhibiting superior seedling vigor following
germination can produce a rangeing, respectively from 13-34 t/ha to 132-260 kg/ha/day in 5
months. These yields are comparable to that of perennial napiergrass. These data suggest that
the highest yield in tropical regions is achieved in the summer of temperate regions by using
these C4 crops. Although rice is C3 plants, it can compete with C4 species and produce high
amount of biomass in temperate regions. However, winter cereals, such as wheat, annual
forages, can produce lower yields per day, but can be cultivated during the winter month.
2.7.3 Primary production and existing amount of herbaceous biomass Existing biomass of tropical savanna is lower than that of tropical rainforest. The primary
production of the tropical savanna, which has rich rhizosphere and the grasses vigorously grow
under heavy grazing of animals, is similar to that of tropical rainforest, whose rhizosphere is
shallow, of poor quality. As such, tropical savanna greatly contributes to the reduction of CO2
when compared to tropical rainforest1. As advancements in fermentation and gasification
techniques, the utilization of herbaceous biomass as a biofuel, has attracted much attention.
Annual production of herbaceous by-products is estimated at 18.95 million tons (Mt) from rice
straw and husks, 1.90 Mt from barley and wheat, 0.5 Mt from sugarcane. Furthermore,
estimated data of forage production of 40 t/ha in 560,000 ha of abandoned fields, 40 t/ha in
79,000 ha of abandoned paddy field, 5-20 t/ha in un-utilized land comes to 32.08 Mt. The total
of available herbaceous biomass comes at least to 53.43 Mt/year in Jpan. But these are utilized
partly for forages of cattle now.
2.7.4 Switchgrass (a) What is switchgrass?
Switchgrass (Panicum virgatum L.) is a perennial
tropical grass (C4 species) native to the Great Plains
of the USA. The indigenous people of the region saw
and called prairies consisting of switchgrass “Ocean
of grass”. The plant height is ca. 90-150 cm, the leaf
blade length is 15-45 cm, the width is 0.6-1.3 cm, with
short rhizomes. Switchgrass exhibits adaptation to
relatively wet and fertile soils and is also tolerant of Fig. 2.7.1. Switchgrass Trial (USDA-ARS, El Reno, OK, USA, courtesy of Dr. B. Venuto)

-38- Asian Biomass Handbook
both drought and flooding conditions. Annual dry matter yields are ca. 15 t/ha (Some data
exhibit nearly 30 t/ha) and as with most forage species, its nutritious value lessens after the
flowering. Seed yield is ca. 230 kg/ha from broadcasted stands and ca. 690 kg/ha from
row-seeded stands. The 1,000-seed weight ranges 1.07-1.22 g. (b) Advantages of switchgrass as a raw material for biofuel production
In the USA, Switchgrass has attracted the interest as a raw material for bioethanol
production through cellulosic fermentation. The dry matter yield, however, is mostly similar to
or less than some temperate and tropical forage grasses, it will not be very useful to use this
grass for biofuel production in Japan. For example, if ca. 16t/ha of hay is harvested and 300 L of
ethanol is produced from 1 t of hay, based on the price of raw materials, the cost of producing 1
gallon of ethanol from switchgrass is estimated at 0.51-0.89 USD, which is lower than the cost
of 0.7-1.21 USD utilizing corn. This report suggests that the potential conversion of ca. 33
million ha of pasture, typically consisting of poorer soils and utilized for the production of a low
quality hay crop for horses, to corn would lead to dramatic increases in soil erosion. If, however,
switchgrass is sown to this area, ca. 520 million tons of hay can be produced and bypass the soil
erosion problem caused by an annual corn crop. This point is very important for the USA,
which maintains vast pasturelands and has a need to establish a cultivation system of
perennial forage grasses, such as switchgrass, for biofuel production.
Once switchgrass pastures are established, a low-input, sustainable cultivation system for
biofuel production may be practical. This system would be similar to the system in Japan that
utilizes Miscanthus for a similar purpose. One deficit of the species is its seed dormancy.
Seedlings germinate irradically and more than 1 year may be required to achieve a full stand. (c) Cultivar of Switchgrass
Some cultivars developed in the USA are explained below.
(1) Alamo
Soil Conservation Service (SCS) and Texas Agriculture Experiment Station (AES) selected
from collection in Texas, and released in 1978. It is a “lowland type”, flowers 1 or 2 month later
than cv. Blackwell, taller, wider leaves with medium saline tolerance and high productivity. It
grows well on all soil types with 630 mm or more annual precipitation, from Iowa to Florida.
(2) Blackwell
The SCS in Kansas developed this cultivar from single plant collected in Blackwell, OK and
released it in 1944. It is an “upland type” of medium height with rather large stems, good in
seedling vigor, high in forage production, and grows well on wide range of soil types with 500

-39- Asian Biomass Handbook
mm or more annual precipitation in Kansas, Oklahoma, southern Nebraska and north Texas.
(3) Cave-In-The-Rock
The SCS and Missouri AES developed from the collections of Cave-in-the-Rock, IL and
released in 1973. It is a “lowland type” with high seedling vigor, resistance to lodging and
diseases. It is tolerant to flooding and drought and grows well in Iowa, Kansas, and Missouri.
(4) Dacotah
The SCS and Northern Great Plains Research Laboratory selected 10 plants from collections
of North Dakota and released the cultivar in 1989. It flowers 27 days earlier than cv.
Forestburg, 45 days earlier than cv. Blackwell and cv. Pathfinder. It is shorter in height and
exhibits high drought tolerance. It grows well in North Dakota, Minnesota, and Montana.
(5) Forestburg
The SCS in North Dakota and Northern Great Plains Research Laboratory developed this
cultivar from collections obtained near Forestburg, ND and released in 1987. It has superior
winter hardiness and persistence, seed production ability, and is of earlier maturity than other
cultivars. Forage production at northern latitude exceeds that of cv. Dacotha, cv. Nebraska 28.
It grows well in Montana, North and South Dakota, and Minnesota.
(6) Kanlow
The Kansas AES developed this cultivar from collections in Oklahoma and released in 1963.
It is a tall and productive “lowland type”, especially adapt to lowlands where excess water
problems occur; it also performs well on upland sites where soils are not too thin or dry.
(7) Pathfinder
The Nebraska AES originally released this cultivar as “Type-F” from a polycross and progeny
test of collections in 1967. It is a late-flowering “highland type”, winter-hardy, vigorous, leafy,
and resistant to rust and drought. It grows well in Nebraska and adjacent areas.
(8) Shelter
The SCS in New York developed this cultivar from collections made in West Virginia and it
was released 1986. The cultivar exhibits thicker stems and fewer leaves than the other
cultivars with the exception of cv. Kanlow. It is taller and flowers earlier by 7-10 days than cv.
Blackwell but exhibits less seedling vigor during the 1st year of establishment. It grows well in
a wide region ranging from the East Coast to Arkansas in the central USA.
(9) Trail Blazer
Nebraska AES developed this cultivar from collections made in Nebraska and Kansas and
released in 1984. It is a “highland type” exhibiting both higher forage value and yield, flowers
-40- Asian Biomass Handbook
at the same time of cv. Blackwell. It grows well in central Great Plains and eastern states.
Additional released cultivars not described are: cv. Sunburst, cv. Caddo, cv. Summer etc.
Further information Long, S.P. et al. (eds.): Primary productivity of grass ecosystems of the biosphere, 1-267,Chapman & Hall
(1992)
Nakagawa, H.: Development and cultivation of forage grasses and crops for clean bio-methanol
production to keep gobal environment, Farming Japan Vol. 35-2:22-31(2001)
Nakagawa H. and Momonoki T.: Yield and persistence of guineagrass and rhodesgrass cultivars on
subtropical Ishigaki Island, Grassland Science, Vol. 46, pp. 234-241 (2000)
Sakai, M., and Nakagawa H.: A new biofuel towards 21st century, The Chemical Daily Co. Ltd., (in Japanese), pp. 1-197
Burnhart, S., Management guide for the production of switchgrass for biomass fuel in Southern Iowa,
http://www.extension.iastate.edu/Publications/PM1710.pdf, (2003)
Nakagawa, H., Forage crops in tropics, Association for International Cooperation of Agriculture and
Forestry, Tokyo (in Japanese) (1998)
United States Department of Agriculture, Grass varieties in the United States, CRC Press, Boca Raton.
(1995)
Vogel, P. K., Energy production from forages (or American Agriculture – back to the future), Journal of Soil and Water Conservation, Vol. 51, No. 2, 137-139. (1996)
2.8 Sugar and Starch Crops
2.8.1 General scope of sugar and starch crops Starch and sugar can be fermented to biofuel such as ethanol, but fibrous saccharides such as
cellulose and hemicellulose in the residual waste cannot easily be hydrolized to fermentable
carbohydrates such as glucose.
Primary starch crops are rice (Oryza sativa and Oryza glaberrima), potato (Solanum tuberosum L.), sweet potato (Ipomoea batatas (L.) Lam.), corn (maize; Zea mays L.), wheat
(Triticum L.), barley (Hordeum spontaneum C. Koch (wild-type two-rowed barley); H. vulgare L.
(six-rowed barley); H. distichum L. (two-rowed barley)), cassava (bitter cassava, cassava,
manioc, manihot, sweet-potato tree, tapioca, tapioca plant, yuca; Manihot esculenta Crantz),

-41- Asian Biomass Handbook
and sago palm (Metroxylon sagu Rottb.). As primary sugar crops, sugar cane (Saccharum officinarum L.) and sugar beet (Beta vulgaris var. altissima) are widely known.
Yields of three primary cereals (corn, wheat, and rice) are increasing up to 725, 6.33, and
6.06 million tons, respectively, with a sum of 1,963 million tons, which is about 86% of total
cereal production of 22.74 million tons (2004), being realized by novel cultivars and
development of cultivation technology (Fig. 2.8.1). However, due to limitations of the
conventional technologies, further extension of cultivation area will require novel technology
such as genetic modification to cold-, drought-, or halo-resistant cultivars. Production of sugar
cane has been increasing up to 1,332 million tons (2004), while that of sugar beet has been
around 200 million tons (Fig. 2.8.2). Total production of sugar and starch crops (4,572 million
tons (2004)) contributes to the high nutritional intake (2,808 kcal/capita/day (2003)) for 6,370
million population in the world (2004). However, around 800 million people, mainly in
population explosion area of Asia and Africa, are still suffering from starvation. Therefore, it
should be morally criticized if the crops would be further used as “non-food” energy crops. We
have to increase the amount of the foodstuffs by increasing the cultivation area and crop yields
with novel technology such as genetic modification, while promoting cultivation of energy crops
and developing new technology to convert crop wastes to biofuel.
0
100
200
300
400
500
600
700
800
year
1962
1964
1966
1968
1970
1972
1974
1976
1978
1980
1982
1984
1986
1988
1990
1992
1994
1996
1998
2000
2002
年
生産
量(百
万ト
ン)
トウモロコシ
コムギ
イネ
ジャガイモ
キャッサバ
オオムギ
カンショ
ソルガム
ヤムイモ
オートムギ
ライムギ
タロイモ
ソバ
prod
uctio
n (m
illion
ton)
year
cornwheatpaddy ricepotatocassavabarleysweet potatosorghumyamoatryetarobuckwheat
0
200
400
600
800
1000
1200
1400
1600
1961
1964
1967
1970
1973
1976
1979
1982
1985
1988
1991
1994
1997
2000
2003
年
生産
量(百
万ト
ン)
サトウキビ
テンサイ
その他砂糖生産型作物
prod
uctio
n (m
illion
ton)
year
sugar canesugar beatthe other sugar crops
0
200
400
600
800
1000
1200
1400
1600
1961
1964
1967
1970
1973
1976
1979
1982
1985
1988
1991
1994
1997
2000
2003
年
生産
量(百
万ト
ン)
サトウキビ
テンサイ
その他砂糖生産型作物
prod
uctio
n (m
illion
ton)
year
sugar canesugar beatthe other sugar crops
Fig. 2.8.1. World production of starch crops. Fig. 2.8.2. World production of sugar crops.
(ref. FAOSTAT: http://www.faostat.fao.org/default.aspx)

-42- Asian Biomass Handbook
2.8.2 Cassava Cassava (Manihot esculenta) is a woody shrub and widely cultivated in tropical and
subtropical regions in the world. In 2006, total production of the world was 226 million tons in
18.6 million ha of harvested area. The biggest cassava producer is Nigeria and followed by
Brazil, Thailand and Indonesia (Fig. 2.8.3). The yield of cassava in Thailand is ranked first and
about 21 ton/ha averaged over whole 1.1 million ha of harvested area (Fig. 2.8.4).
Nigeria Brazil Thailand Indonesia Congo MozambiqueGhana Angola Vietnam
Nigeria, 18.7%
Brazil, 13.1%Thailand, 9.6%Indonesia, 0
5
10
15
20
25
Nigeria
Brazil
Thail
and
Indon
esiaCon
go
Mozam
bique
Ghana
Angola
Vietna
m
Stat
istic
s
Harvested area (M ha)Yield per hectare (ton/ha)
Fig. 2.8.3. World leading countries of cassava production in 2006.
Fig. 2.8.4. Harvest area and yield of cassava.
Cassava is propagated by stem cutting, which is planted on a soil in a vertical and inclined
position. It can grow well even on an infertile soil and is tolerant of drought. Starch-rich
tuberous root is harvested by hand around 12 months after planting, but it can be harvested as
early as 8 months or as late as 24 months. Starch content of tuberous root in Thailand is about
25%. In Thailand, yield of cassava gradually increases mainly due to the consistent
development of better varieties (Fig. 2.8.5). Currently, Rayong 9 with up to 30 ton/ha yield has
been distributed since 2006.
Tuberous roots of most varieties contain cyanide and it should be removed by soaking
cassava flour. Cassava has been used as a staple source of carbohydrate for human
consumption in many tropical countries, as an ingredient in animal feeds, and as a source of
starch. Bio-ethanol production from cassava starch is developing. Cassava production of
Thailand in 2007 was 27 million tons and the flow chart (Fig. 2.8.6) shows the breakdown of
cassava applications in food, feed and fuel.

-43- Asian Biomass Handbook
Cassava in Thailand
0
5
10
15
20
25
30
1998 1999 2000 2001 2002 2003 2004 2005 2006 2007
Year
Pro
duct
ion
(M to
n)/
Yie
ld (t
on/h
a)
0.0
0.5
1.0
1.5
2.0
2.5
3.0
Pla
nted
Are
a (M
ha)
ProductionYield per hectarePlanted area
Fig. 2.8.5. History of cassava statistic in Thailand.
Fig. 2.8.6. Uses of cassava in Thailand.
2.8.3 Sugarcane Sugarcane is a tall perennial grass and cultivated widely in tropical and subtropical regions
of the world for sugar production. It belongs to genus Saccharum and most commercial
varieties are hybrid with S. officinarum. In 2006, total sugarcane production of the world was
1,392 million tons in 20.4 million ha of harvested area. The biggest sugarcane producer is
Brazil and followed by India, China, Mexico and Thailand (Fig. 2.8.7). The yield of sugarcane in
Thailand is about 49.4 ton/ha averaged over whole 0.97 million ha of harvested area (Fig.
2.8.8).
Brazil India China Mexico Thailand
Pakistan Colombia Australia Indonesia U.S.A
Brazil, 35.2%
India, 21.8%
Thailand,3.7%
China, 6.8%Mexico, 3.9%
0102030405060708090
100
Brazil
India
China
Mexico
Thail
and
Pakist
an
Colombia
Austra
lia
Indon
esia
U.S.A
Sta
tistic
s
Harvested area (0.1M ha)Yield per hectare (ton/ha)
Fig. 2.8.7. World leading countries of sugarcane production in 2006.
Fig. 2.8.8. Harvest area and yield of sugarcane.
Stem cutting with buds is used for planting. Sugarcane is C4 plant with high photosynthesis

-44- Asian Biomass Handbook
ability. Optimal temperature is between 20 and 35 ℃ and minimum requirement of rainfall is
1,200 mm/year. Stalks of sugarcane are harvested 9 to 14 months after planting by hand or by
harvester. Once planted, sugarcane can be harvest several times, because new stalks, called
ratoons, come from stubble. Top of sugarcane removed at harvest is used as animal feed in
some areas. Over the past ten years of sugarcane cultivation in Thailand, sugarcane production
unpredictably varies due to the weather
from year to year (Fig. 2.8.9).
By-products from sugar mill are bagasse,
filter cake (sugar juice residue) and
molasses. Approximately, 1 ton of
sugarcane gives 105 kg of sugar, 500 kg of
water, 280 kg of bagasse, 30 kg of filter
cake and 55 kg of molasses. Bagasse is a
squeezed fibrous residue and usually fed
back into the boiler to generate steam
within the sugar mill. It makes sugar mill
self-sufficient in energy. Filter cake is
typically used as fertilizer. The most
valuable by-product is molasses, which can
be further processed to ethanol or monosodium glutamate. About the half of sugarcane
produced in Brazil are used to produce ethanol. Ethanol, which is made from not only molasses
but also sugar juice, is blended with gasoline (gasohol) for transportation fuel. At the moment,
sugarcane is the most economically and environmentally advantageous crop for bio-ethanol
production.
2.9 Oil Producing Biomass
2.9.1 What is oil producing biomass? Oil producing biomass produces and accumulates fat & oil in its seed or fruit meat. The main
component of fat & oil is tri-ester of fatty acid and glycerin. Fat & oil is widely used as food,
industrial raw material and bio-diesel production as an alternative for mineral diesel oil.
Sugarcane in Thailand
0
10
20
30
40
50
60
70
80
1998 1999 2000 2001 2002 2003 2004 2005 2006 2007
Year
Pro
duct
ion
(M to
n)/
Yie
ld (t
on/h
a)
0.0
0.5
1.0
1.5
2.0
2.5
3.0
3.5
4.0
Pla
nted
Are
a (M
ha)
ProductionYield per hectarePlanted area
Fig. 2.8.9. History of sugarcane statistic in Thailand.
-45- Asian Biomass Handbook
Examples of oil producing biomass are as follows;
(a) Soybean (Glycine max Merrill)
USA, Brazil, Argentina and China are the main production country. Soybean oil contains
oleic acid (20-35%), linoleic acid (50-57%) and linolenic acid (3-8%). It is widely used as edible
oil and raw material for paints and varnish as an un-drying oil.
(b) Rape (Brassica campestris L)
Rape is cultivated in wide area from Asia to Europe because it can grow even in the cold
district. Main production countries are China, Canada, India, Germany and France. Rape
seed oil expressed from rape seed contains oleic acid (55-59%), linoleic acid (21-32%) and
linolenic acid (9-15%). It is mainly used as food such as frying oil and salad oil.
(c) Palm Tree (Elaeis guineenis Jacq)
Main production countries are Malaysia and Indonesia. Palm tree has the highest oil
productivity in oil producing biomass because palm fruits can be harvested several times in a
year. Palm oil expressed from palm fruit contains saturated fatty acid such as palmitic acid
(35-38%) and Stearic acid (3-7%), and it is used not only in food industry but also in detergent
industry.
2.9.2 Production method of fat & oil For the fat & oil isolation from seed/fruit expression process or solvent extraction process is
applied. (a) Expression process
Used for high oil content seed such as rapeseed by rough crashing by roll mill, flaking,
heating at 75-85℃ and expression by expeller.
(b) Solvent extraction process
Applied for low oil content seed such as soybean by extraction with hexane.
2.9.3 Production volume of oil producing biomass World oil seed and fat & oil production (2005/06) are summarized in the following table.
Production volume of palm fruit was calculated by the palm oil production volume and oil
content in palm fruit.

-46- Asian Biomass Handbook
Table 2.9.1 World oil seed and fat & oil production (2005/06, million ton)
Soybean Rapeseed Sunflower Coconut Palm kernel Palm Others Total
Oil seed production 220 43 30 5.3
(Copra) 9.4 180 (Fruit) 78.3 566
Fat & oil production 34.8 17.7 10.5 3.3 4.1 35.2 16.3 121.9
2.9.4 Bio-diesel fuel Fatty acid methyl ester produced by the trans-esterification of fat & oil with methanol has
the similar physical properties as mineral diesel oil in terms of heating value, viscosity, cetane
number etc,. and it is used as bio-diesel fuel (Diesel oil alternatives).
As raw materials for bio-diesel production, rapeseed oil in EU, soybean oil in USA and palm
oil in Asia are mainly used. In EU nation’s, bio-diesel has been spreading since 2002 and its
consumption reached to 4 million ton in 2005.
2.9.5 Oil palm The oil palm tree (Elaeis guineensis) originated from West Africa. It was first introduced to
Malaysia as an ornamental plant. In 1917, the first commercial planting took place in
Tennamaran Estate in Selangor, laying the foundations for the vast oil palm plantations and
palm oil industry in Malaysia. Later in the 1960s, the government introduced land settlement
schemes for planting oil palm as a means to eradicate poverty for the landless farmers and
smallholders. Now the oil palm plantations in Malaysia are largely based on the estate
management system and small holders scheme. Today, more than 4 million ha of land in
Malaysia is under oil palm cultivation producing 16 million tons of palm oil in 2006.
Oil palm is a crop that bears both male and female flowers on the same tree. Each tree
produces 12-20 bunches per year (normally referred as fresh fruit bunches, FFB) weighing
between 10-20 kg with more than 1000 fruitlets per bunch. Each fruitlet is spherical or
elongated in shape. Generally the fruitlet is dark purple or almost black and the colour turns
to orange red when ripe. Each fruitlet consists of a hard kernel (seed) inside a shell
(endocarp) which is surrounded by the fleshy mesocarp. The oil palm produces two kinds on
oil; crude palm oil from the mesocarp, and palm kernel oil from the kernel or seed. The trunks
of young and adult plants are wrapped in fronds which give them a rather rough appearance.
The older trees have smoother trunks apart from the scars left by the fronds which have
withered and fallen off.

-47- Asian Biomass Handbook
Oil palm trees start to bear fruits after 3 years old. Their most economic life is between 5-15
years, although palm trees continue to bear fruits until 25-30 years old. After that they are too
tall (up to 20 m in height), generally they are fallen down for replantation with new trees or
new clones. In Malaysia, the trees planted are mainly the tenera variety, a hybrid between
the dura and pisifera. The tenera variety yields about 4 to 5 tons of crude palm oil (CPO) per
ha per year and about 1 ton of palm kernels. The oil palm is most efficient, requiring only 0.25
ha to produce one ton of oil in comparison to soybean, sunflower and rapeseed which need 2.15,
1.50 and 0.75 ha, respectively.
2.9.6 Coconut (a) Plant taxonomy
The coconut palm (Cocos nucifera) belongs to Plant Kingdom under Magnoliophyta Division,
Class Liliopsida, Order Arecales, Family Arecaceae and Genus Cocos.
(b) Origin
There are two contrasting views on to the origin of coconut. One is that it originated in
America as several species in the genus Cocos are found only in America and the occurrence of
coconuts in America antedates recorded history. On the other hand, others said that coconut
originated in Asia as shown by the discovery of nuts of Cocos species in the Pleiocene deposit in
North Auckland, New Zealand, the presence in Southeast Asia of a greater range of coconut
varieties than in America and other reasons (Banzon, 1982). (c) Description
Early Spanish explorers called it coco, which means "monkey face" because the three
indentations (eyes) on the hairy nut resembles the head and face of a monkey. Nucifera means
"nut-bearing." The coconut palm is generally described as a perennial tree. The coconut palm
has long trunk of the tree, and several stems or leaves come from upper trunk, with green
foliage, inconspicuous white flowers, and brown fruits. The greatest bloom is usually observed
in the indeterminate, with fruit and seed production starting in the year round and continuing
until year round. Leaves are retained year to year. The coconut palm has a moderate life span
relative to most other plant species and a moderate growth rate. At maturity, the typical
coconut palm will reach up to about 20 m high. (d) Ecology
Coconut is a sun-loving plant requiring sufficient sunlight for photosynthesis and raising the
-48- Asian Biomass Handbook
temperature of the air. It grows best at a mean temperature of 27oC and is sensitive to low
temperatures. It is also observed that coconut does best at rainfall of 1,300 to 2,300 mm per
year. It may even do well at 3,800 mm or more if the sol has good drainage. It does very well in
humid climate. The best soil for coconut is a deep mellow soil such as sandy or silty loam or clay
with granular structure. (e) Fruiting
Different varieties come to bear fruits at different ages. The dwarf varieties start bearing
fruits in 3-4 years after planting while the tall varieties start at 5-7 years. The complex of
sunlight, rainfall and temperature result in periodicity of yield in the different months of the
year. Results of studies showed that the heavier yields are obtained in March to June. (f) The fruit
A coconut fruit is actually a one-seeded drupe. On the outside is the "husk", which is initially
green but turns brown after being picked and dried. Inside the outer coat of the fruit lies the
mesocarp, which is packed with vascular bundles. This fiber is called the "coir" and is used for
making mats and rope. What we buy in the grocery store is the "stone" of this drupe, which has
a hard "shell," the endocarp, and the seed, which is inside of the shell. The shell is used for
containers and is widely employed by artisans to make ornaments and decorations. The thin
seed coat is the next, and then there are the white flesh or “copra” and “coconut milk.” Both the
copra and the milk are the endosperm of this seed. Yes, coconut is unique among plants in
having copious liquid endosperm, which bathes the young embryo. Initially the milk is fairly
sweet and the copra is thin, but as the seed matures, the liquid is converted into solid
endosperm rich in oils (triglycerides). The solid endosperm, copra, is harvested, dried, and then
pressed to release the oil, widely used for chief ingredients of shampoo and hair conditioners. (g) Product forms of coconut
Coconut is called the tree of life because of its many uses. Primary coconut products include
coconut oil, desiccated coconut, fresh coconut, and copra (dried mature coconut meat). The
major coconut products produced in the Philippines are copra, copra cake, coconut oil,
desiccated coconut, fresh young coconut and coconut coir. From this list, desiccated coconut,
“buko” fresh young coconut meat and coconut oil are the most in demand products in foreign
markets.
Of the estimated 14 million nuts produced in the country per annum during 2001-2005,
about 90% is processed into copra. Annual copra production is estimated at two million MT.
The remaining portion (10%) of the total coconut production is devoted to the manufacture of
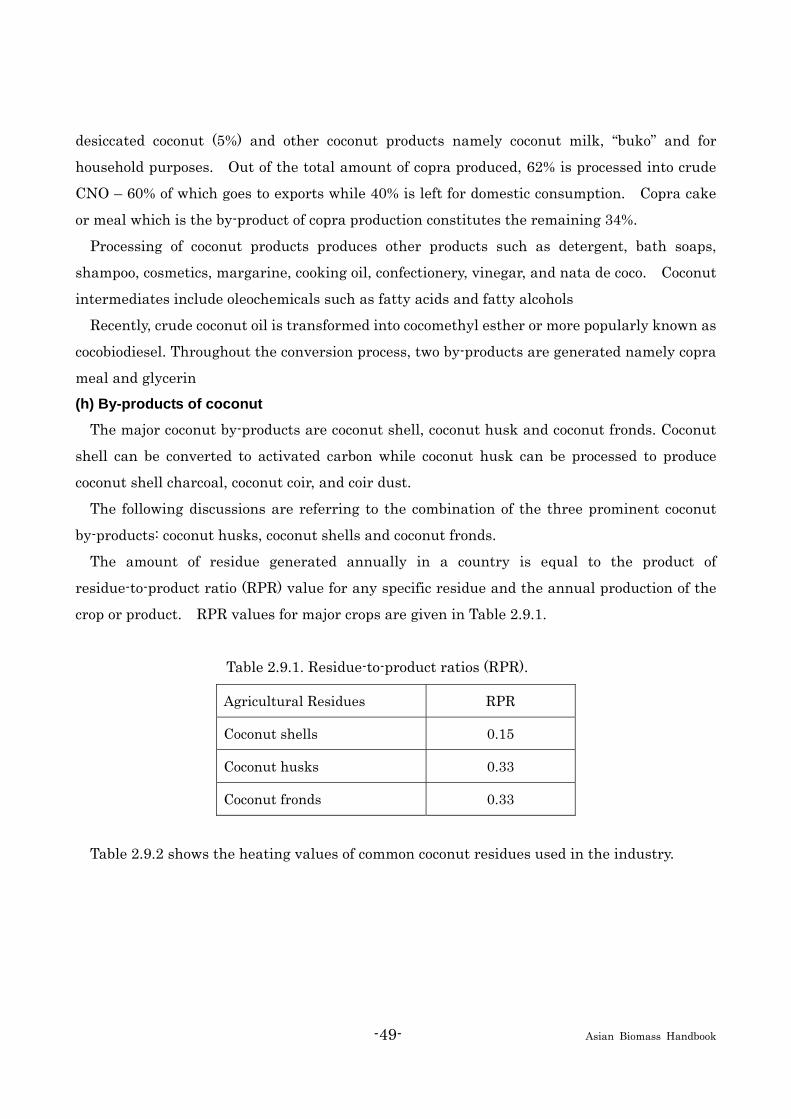
-49- Asian Biomass Handbook
desiccated coconut (5%) and other coconut products namely coconut milk, “buko” and for
household purposes. Out of the total amount of copra produced, 62% is processed into crude
CNO – 60% of which goes to exports while 40% is left for domestic consumption. Copra cake
or meal which is the by-product of copra production constitutes the remaining 34%.
Processing of coconut products produces other products such as detergent, bath soaps,
shampoo, cosmetics, margarine, cooking oil, confectionery, vinegar, and nata de coco. Coconut
intermediates include oleochemicals such as fatty acids and fatty alcohols
Recently, crude coconut oil is transformed into cocomethyl esther or more popularly known as
cocobiodiesel. Throughout the conversion process, two by-products are generated namely copra
meal and glycerin (h) By-products of coconut
The major coconut by-products are coconut shell, coconut husk and coconut fronds. Coconut
shell can be converted to activated carbon while coconut husk can be processed to produce
coconut shell charcoal, coconut coir, and coir dust.
The following discussions are referring to the combination of the three prominent coconut
by-products: coconut husks, coconut shells and coconut fronds.
The amount of residue generated annually in a country is equal to the product of
residue-to-product ratio (RPR) value for any specific residue and the annual production of the
crop or product. RPR values for major crops are given in Table 2.9.1.
Table 2.9.1. Residue-to-product ratios (RPR).
Agricultural Residues RPR
Coconut shells 0.15
Coconut husks 0.33
Coconut fronds 0.33
Table 2.9.2 shows the heating values of common coconut residues used in the industry.

-50- Asian Biomass Handbook
Table 2.9.2. Heating Values of coconut residues.
Type of Coconut residue Heating Value, Kcal.kg Coconut shell Coconut shell charcoal Coconut husk charcoal
4.436 (I. Cruz) 6,540 (Lozada) 6,320 (Lozada)
(i) Uses of coconut residues
Coconut shell is consumed mostly by commercial establishments for energy purposes due to
its high heating value. Major users of coconut shells are by restaurants or food processors
owners. Coconut shell is also used for drying of crops like copra and rubber. Other energy uses
of coconut shells are in the ceramic industry and in heating.
Most of the coconut husk is used in drying of copra using the traditional method called
“tapahan”. The rest of the coconut husk is used as fuel in bakeries, drying of fish, pottery,
ceramics, brick making and in commercial food preparation.
Coconut frond is used as fuel for drying copra while others are in restaurants, bakeries, fish
drying and others.
2.9.7 Jatropha The genus name Jatropha derived from the Greek
iatrós (doctor) and trophé (food) which implies
medicinal uses. Jatropha curcas L. belonging to the
Euphorbiaceae or spurge family. Curcas purgans
Medic. Vernacular/common names: English- physic nut, purging nut; Thailand - sabudam; Indonesia -
jarak pagar; Chinese - yu-lu-tzu; the Philippines -
túbang-bàkod; Brazil - mundubi-assu; Tanzania -
makaen. By definition, it is a perennial small tress
or large shrub which can reach a height of up to 6 m.
The plant, originating in Central America, is mainly
grown in Asia and in Africa, where it is known as
Pourghère. It is cultivated in the tropics and semi
tropics as a living fence. The seeds, however, are toxic
to humans and many animals, and this species is a
Fig. 2.9.1. Important parts of the Jatropha Curcas: a-flowering branch, b-bark, c-leaf veinature,d-pistillate flower, e-staminate flower, f-cross-cut of immature fruit, g-fruit, h-longitudinal cut of fruits; Source: Physic nut, Joachim Heller, IPGRI. p.11.
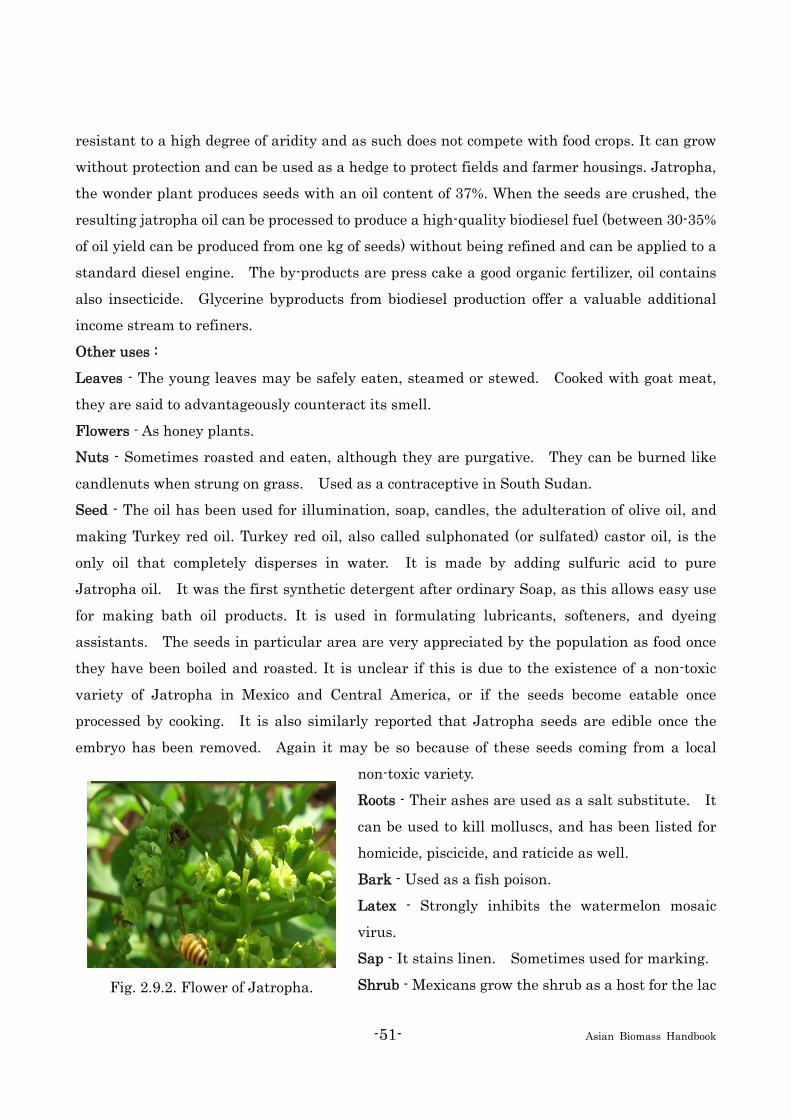
-51- Asian Biomass Handbook
resistant to a high degree of aridity and as such does not compete with food crops. It can grow
without protection and can be used as a hedge to protect fields and farmer housings. Jatropha,
the wonder plant produces seeds with an oil content of 37%. When the seeds are crushed, the
resulting jatropha oil can be processed to produce a high-quality biodiesel fuel (between 30-35%
of oil yield can be produced from one kg of seeds) without being refined and can be applied to a
standard diesel engine. The by-products are press cake a good organic fertilizer, oil contains
also insecticide. Glycerine byproducts from biodiesel production offer a valuable additional
income stream to refiners.
Other uses :
Leaves - The young leaves may be safely eaten, steamed or stewed. Cooked with goat meat,
they are said to advantageously counteract its smell.
Flowers - As honey plants.
Nuts - Sometimes roasted and eaten, although they are purgative. They can be burned like
candlenuts when strung on grass. Used as a contraceptive in South Sudan.
Seed - The oil has been used for illumination, soap, candles, the adulteration of olive oil, and
making Turkey red oil. Turkey red oil, also called sulphonated (or sulfated) castor oil, is the
only oil that completely disperses in water. It is made by adding sulfuric acid to pure
Jatropha oil. It was the first synthetic detergent after ordinary Soap, as this allows easy use
for making bath oil products. It is used in formulating lubricants, softeners, and dyeing
assistants. The seeds in particular area are very appreciated by the population as food once
they have been boiled and roasted. It is unclear if this is due to the existence of a non-toxic
variety of Jatropha in Mexico and Central America, or if the seeds become eatable once
processed by cooking. It is also similarly reported that Jatropha seeds are edible once the
embryo has been removed. Again it may be so because of these seeds coming from a local
non-toxic variety.
Roots - Their ashes are used as a salt substitute. It
can be used to kill molluscs, and has been listed for
homicide, piscicide, and raticide as well.
Bark - Used as a fish poison.
Latex - Strongly inhibits the watermelon mosaic
virus.
Sap - It stains linen. Sometimes used for marking.
Shrub - Mexicans grow the shrub as a host for the lac Fig. 2.9.2. Flower of Jatropha.

-52- Asian Biomass Handbook
insect, which is used in medicine as hepatoprotective and anti-obesity drug. Used for erosion
control.
Further information Banzon, J. A.; Velasco, J. R. Coconut: production and utilization. (1982)
2.10 Aquatic Plant Biomass
2.10.1 What is aquatic plant biomass? Aquatic plant biomass is produced in freshwater and marine environments and has some
potential human uses. Most current aquatic plant biomasses include seed plants, seaweeds
and micro-algae, which are mostly produced naturally as well as some with man-made culture
production.
Seed plant biomasses in freshwater are a water plant (Eichihornia crassipes (Mart.) Solms)
and duckweeds. E. crassipes native to Brazil grows actively at 18-32 oC but shows no positive
growth above 34 oC and below 0 oC. No duckweed species including about 30 species recorded
has been selected as biomass utilization yet.
Within 60 species belonging 13 genera of 3 families (Hydrocharitaceae, Zosteraceae and
Cymodoceaceae) as marine seed plants (sea grasses) in the world, eel grass (Zostera marina L.)
and related species distributing at middle and high latitudes attract mostly for biomass uses
(Hartog, 1970).
Algae include multi-cellular macro-algae (seaweeds) and unicellular micro-algae
(phytoplankton). Seaweed inhabits, mostly in seawater and active biomass utilization is
made with 220 species of red algae, 88 species of brown algae and 27 species of green algae in
the world(Indergaard, 1982).
Micro-algae are distributed widely both in fresh- and marine waters although species are
different. Current attractive species for biomass are green algae belonging Chlorella, Scenedesmus and Dunaliella and blue green alga of Spiriluna in freshwater. Selected strains
are cultured artificially for biomass uses, and some freshwater strains are cultured in seawater
after acclimation treatment.
-53- Asian Biomass Handbook
2.10.2 Productivity Productivity of E. crassipes was recorded as 11-23 kgFW (fresh weight)/m2.year (0.5-1.2
kgDW (dry weight)/m2.year) during growing season in Japan, and reached 21.1 kgDW /m2.year
under sufficient light and nutrients. Eel grass productivity is 0.3-0.8 kgDW/m2.year (120-320
gC/m2.year), and that of Thalassia reached 5 gDW/m2.day during 8 months in Florida, U.S.A.
Red alga, Hypnea, had productivity of 12-17gDW/m2.day in outdoor tank (Slesser and Lewis,
1973). Productivity of micro-algae is 2-10 gDW/m2.day in outdoor tank on average, and
increases to 500 gDW/m2.day under the optimum condition.
2.10.3 Current practical resource utilization E. crassipes containing all essential amino acids supplies excellent livestock feed such as pig
and chicken although heavy metals absorbed in the plant has to be eliminated for practical
applications. For energy uses, 373 m3/tonFW bio-gas containing 60-80% methane and ca.
5,300 kcal/m3 for burning calorie was obtained by anoxic fermentation of E. crassipes. Since E. crassipes contains 3.2% of nitrogen, 0.7% of phosphorus and 2.8% of potassium in total DW,
applications for fertilizer and soil amendment agent are now under considered.
Eeel-grass biomass is used as a part of feed of sea pig and manatee in aquaria. Technology
of artificial cultivation of eel-grass has not been established yet.
Seaweed biomass has been widely used in the world (Table 2.10.1). Yearly harvesting of
attractive seaweeds is ca. 1.3 M (million) tonsFW for brown algae and ca. 0.81 M tonsFW for
red algae. Most of them are natural, and artificial cultivation has increased recently.
Seaweeds have been used for dried feed, human food, fertilizers, soil amendment agent and so
on. Useful materials contained in seaweeds such as unique polysaccharides, iodine and so on
are used for raw materials for extracting the useful substances (Indergaard, 1982). Kelp
contains alginic acid in 13-45% of DW which is used for producing foods, medicines, cosmetics,
dyes, paints, paper manufacturing, interior finishing materials, lubricating oil and so on. Some
red algae contain agar and agar-like carrageenan.
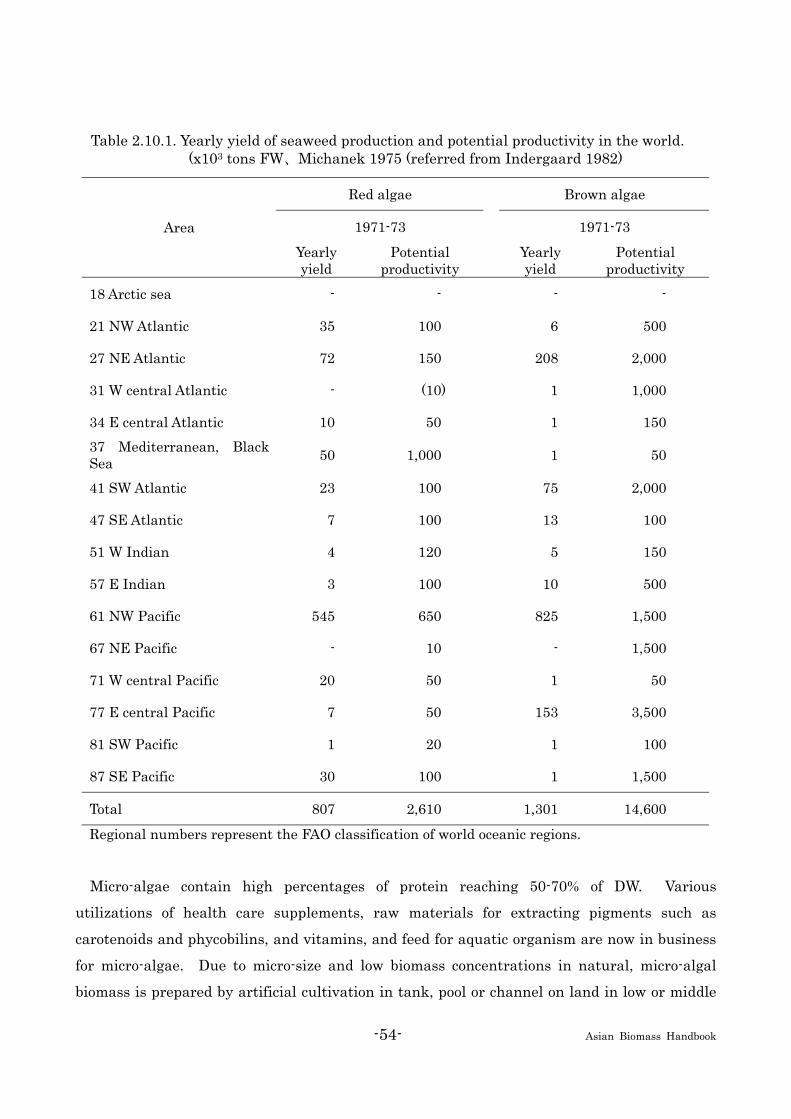
-54- Asian Biomass Handbook
Table 2.10.1. Yearly yield of seaweed production and potential productivity in the world. (x103 tons FW、Michanek 1975 (referred from Indergaard 1982)
Red algae Brown algae
1971-73 1971-73 Area Yearly yield
Potential productivity
Yearly yield
Potential productivity
18 Arctic sea - - - -
21 NW Atlantic 35 100 6 500
27 NE Atlantic 72 150 208 2,000
31 W central Atlantic - (10) 1 1,000
34 E central Atlantic 10 50 1 150 37 Mediterranean, Black Sea 50 1,000 1 50
41 SW Atlantic 23 100 75 2,000
47 SE Atlantic 7 100 13 100
51 W Indian 4 120 5 150
57 E Indian 3 100 10 500
61 NW Pacific 545 650 825 1,500
67 NE Pacific - 10 - 1,500
71 W central Pacific 20 50 1 50
77 E central Pacific 7 50 153 3,500
81 SW Pacific 1 20 1 100
87 SE Pacific 30 100 1 1,500
Total 807 2,610 1,301 14,600
Regional numbers represent the FAO classification of world oceanic regions.
Micro-algae contain high percentages of protein reaching 50-70% of DW. Various
utilizations of health care supplements, raw materials for extracting pigments such as
carotenoids and phycobilins, and vitamins, and feed for aquatic organism are now in business
for micro-algae. Due to micro-size and low biomass concentrations in natural, micro-algal
biomass is prepared by artificial cultivation in tank, pool or channel on land in low or middle

-55- Asian Biomass Handbook
latitudes suitable for year round cultivation. A business model has been proposed to culture
filter feeder sea shells fed micro-algae cultured by nutrient rich deep seawater (Roels et al.,
1979).
2.10.4 Standing stock of biomass resources Actual standing stock of E. crassipes and duckweeds has not been estimated yet. Since E.
crassipes is actively propagating due to acceleration of eutrophication in various places of low
latitudes particularly serious in Africa where large rivers are dammed by the plant, attractive
biomass utilization is urgently required.
Standing stock of biomass of natural sea grass bed is 0.1-0.5 kgDW/m2 on average reaching
to 2 kgDW/m2 in a dense community. Sea grass bed is decreasing due to environmental
changes and land reclamation in the world, and then artificial maintenance and recovery
techniques are under challenged. Assuming 0.3 kgDW/m2 of average density and 90% of
water content of eel grass, it is expected more than a few 10 Mtons of eel grass biomass in the
world.
According to the estimates based upon natural seaweed resources by Jensen (1978, after
Indergaard, 1982), demand of alginic acid is 50,000 tons per year which requires 1.30 MtonsFW
of seaweed. Yearly demands of carrageenan, agar, “nori”, “wakame” and kelp are 30,000,
20,000, 35,000, 30,000, 250,000 tons, respectively, and required seaweeds for respective those
are 0.40, 0.50, 0.40, 0.20 and 2.00 MtonsFW. These are 1.1-3.0 times compared to the
requirements made in the late 1970s. In addition, there are several M tonsFW to several 10
M tonsFW of seaweeds requested for seaweed meal, chemical industry, energy uses and high
purity chemical industries, respectively. In order to meet with these large requirements of
seaweed, a large increase of seaweed production is requested essentially in coastal areas as
well as open seas in the future.
Further information Hartog, C. den. Seagrasses of the world. North Holland, Amserdam. pp.275 (1970)
Indergaard, M. The aquatic resource. In Biomass utilization (ed. W. A. Cote) Plenum Press, New York,
pp.137-168 (1982)
Mann, K. H. Ecology of coastal waters: a systems approach. Univ. Calif. Press, pp.322. (1982)
Roel, O. A.; Laurence, S.; Farmer, M. W.; Hemelryck, L. Van. The utilization of cold, nutrient-rich deep
ocean water for energy and mariculture. Ocean Mangement, 5,199-210 (1979).
Slesser, M. and C. Lewis. Biological energy resources. E. & F. N. Spon Ltd., London (1979)
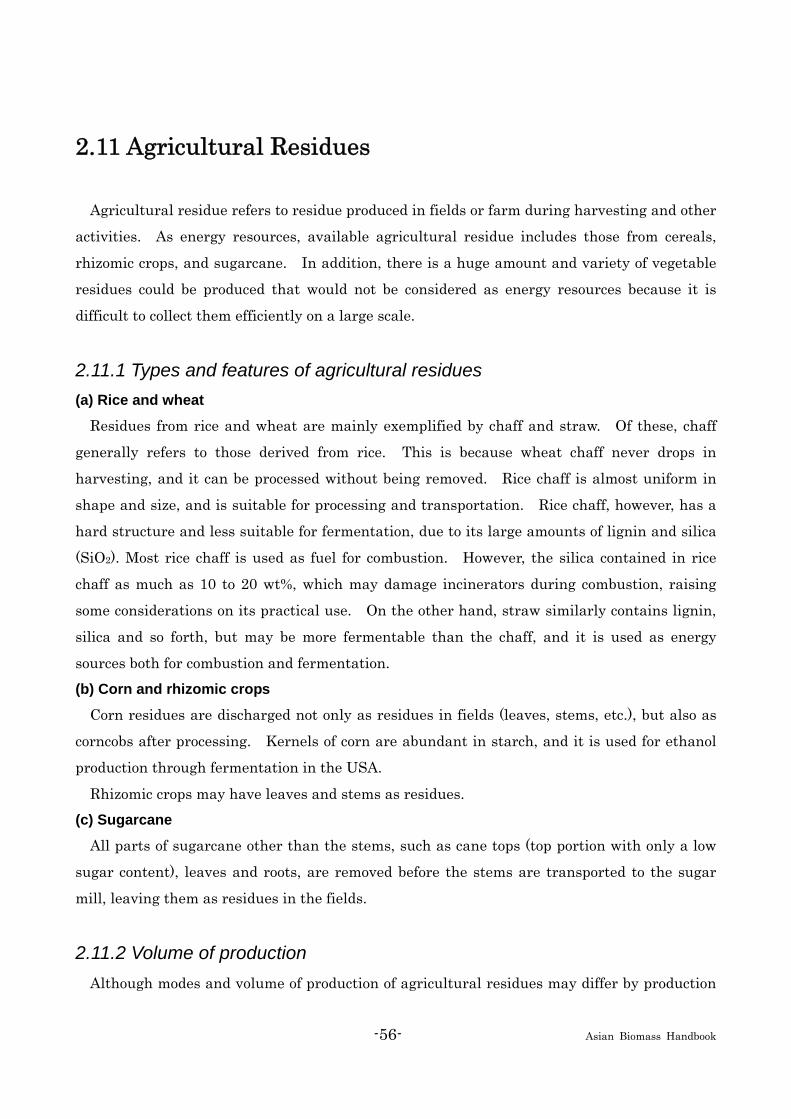
-56- Asian Biomass Handbook
2.11 Agricultural Residues
Agricultural residue refers to residue produced in fields or farm during harvesting and other
activities. As energy resources, available agricultural residue includes those from cereals,
rhizomic crops, and sugarcane. In addition, there is a huge amount and variety of vegetable
residues could be produced that would not be considered as energy resources because it is
difficult to collect them efficiently on a large scale.
2.11.1 Types and features of agricultural residues (a) Rice and wheat
Residues from rice and wheat are mainly exemplified by chaff and straw. Of these, chaff
generally refers to those derived from rice. This is because wheat chaff never drops in
harvesting, and it can be processed without being removed. Rice chaff is almost uniform in
shape and size, and is suitable for processing and transportation. Rice chaff, however, has a
hard structure and less suitable for fermentation, due to its large amounts of lignin and silica
(SiO2). Most rice chaff is used as fuel for combustion. However, the silica contained in rice
chaff as much as 10 to 20 wt%, which may damage incinerators during combustion, raising
some considerations on its practical use. On the other hand, straw similarly contains lignin,
silica and so forth, but may be more fermentable than the chaff, and it is used as energy
sources both for combustion and fermentation. (b) Corn and rhizomic crops
Corn residues are discharged not only as residues in fields (leaves, stems, etc.), but also as
corncobs after processing. Kernels of corn are abundant in starch, and it is used for ethanol
production through fermentation in the USA.
Rhizomic crops may have leaves and stems as residues. (c) Sugarcane
All parts of sugarcane other than the stems, such as cane tops (top portion with only a low
sugar content), leaves and roots, are removed before the stems are transported to the sugar
mill, leaving them as residues in the fields.
2.11.2 Volume of production Although modes and volume of production of agricultural residues may differ by production
-57- Asian Biomass Handbook
areas, rates of production of residues relative to crop yield are reported as 140% for rice, 130%
for wheat, 100% for corn, and 40% for rhizomic crops (Hall et al., 1993). In this literature, the
rate of production of sugarcane residue derived from stems, leaves and tops produced in the
fields during harvesting is reported as 28% relative to the crop yield.
Annual production of agricultural residues estimated by determining production of each crop
based on the FAO statistics (2000), and using the above-described rates of production of
residues is shown in Fig. 2.11.1. About 3 billion tons of agricultural residues in total are
produced around the world, in which rice residue accounts for a largest production of 836
million tons. Residue of rhizomic crops amounts 272 million tons, and wheat and corn
residues, which not produced very much in Japan, amounts 754 and 591 million tons,
respectively.
世界における農産廃棄物発生量
3,002(百万トン)
バガス6%
サトウキビ残余12%
根茎作物残余9%
トウモロコシ残余20%麦残余
25%
米残余28%
Fig. 2.11.1. Production of cereal residues and bagasse.
2.11.3 Bio-energy potential of the world World's bio-energy potential of the agricultural residue in 2000 is shown in Table 2.11.1.
These values were estimated based on production of residues multiplied by energy conversion
factor, availability factor and so forth (Hall et al., 1993).
Rice residue was found to be as largest as 3.4 EJ, followed by bagasse and wheat residue as
much as 3.3 EJ, respectively.
Bagasse6%
Sugarcane residue
12% Rice residue
28%
Wheat residue25%
Production of
agricultural residues of the world
Rhizomic crops residue
9%
Cone residue20%

-58- Asian Biomass Handbook
Table 2.11.1. Bio-energy potential from agricultural residues.
Bio-energy potential (PJ/y)
Rice residue 3,407
Wheat residue 3,299
Corn residue 2,614
Rhizomic crops residue 407
Sugarcane residue 1,550
Total 11,277
Further information Food and Agriculture Organization of the United Nations, FAO Statistical Database, FAO Statistical
Database, (http://www.fao.org/)
Hall, D. O.; Rosillo-Calle, F.; Williams, R. H.; Woods, J. “Biomass for Energy: Supply Prospects”, In:
Renewable Energy, Johansson, T. B. eds., (1993) pp.594, Washington, Island Press.
2.12 Wooden Residuals
2.12.1 Characteristics and environmental significance Wood-based carbon from sustainable forestry, in which the amount harvested is less than or
equal to the amount of growth, circulates in forests, human communities, and the atmosphere.
Wood from sustainable forestry is called “carbon neutral” as it will not cause a rise of carbon
dioxide concentration in the atmosphere. Fossil fuel consumption for forestry production is
less than in agriculture or fisheries, and less energy is used for producing wooden products like
sawn timber or wooden buildings than for producing steel products etc. The promotion of
wood utilization could contribute to carbon dioxide reduction. However, only 30% of tree
biomass carbon can be stocked in final wood products like wooden buildings. Thus, it is
important to achieve a balance between resource saving through material-recycling and fossil
fuel saving by consuming wooden residuals for energy.
Densities of wood and wooden composites vary from 0.2 to 1.0 g/cm3, and the weight of
low-density wood can vary by up to 3-fold, depending on moisture content conditions. Thus in

-59- Asian Biomass Handbook
most cases, wood statistics are listed using volume as the unit. Average oven dry density of
wood used in Japan is estimated to be 0.42 g/cm3. Carbon content is 0.5. However, sometimes a
carbon content value of 0.45 is used for wooden composites like particle board or medium
density fiber board, which contain 10% weight ratio of adhesives, as a wood-derived portion.
2.12.2 Residuals from wood industries Types and moisture content of wood residuals from wood processing plants like sawmills or
plywood mills can vary widely. Larger residuals are chipped and sold for pulp or wood
composites like log slabs from sawmills or peeled cores from plywood mills. Smaller residuals
like bark, sawdust, planer dust, or veneer residuals are utilized as livestock bedding in nearby
farms, as boiler fuel in the mill, or as compost. Only 7% of the estimated 12 million m3 of wood
residuals produced in 2005 was uselessly burned or otherwise wasted.
In large scale mills, even zero emission production is possible by recycling residuals for
electric power generation or steam for wood drying. But for small sawmills without drying
facilities or precut mills, a residuals utilization system such as a small-scale round
accumulation system, must be established. Recently, wooden pellet production from bark or
sawdust, which is easy to handle and has higher energy density, has been increasing.

-60- Asian Biomass Handbook
Fig. 2.12.1. Wood flow in Japan.
Table 2.12.1. Shipment of wooden primary products to utilization sectors (1,000m3) (2005).
-61- Asian Biomass Handbook
2.12.3 Residuals from wood utilization In the 2005 estimates, 22 million m3 of residuals were produced in the construction,
furniture, transportation, and civil engineering sectors. Residuals from civil engineering
include trees felled during construction works.
Only 10% of residuals were recycled as materials; 1.6 million m3 for particle board etc., and
0.8 million m3 for pulp. The “Construction Recycle Law” mandates that construction-derived
wood wastes from construction and civil engineering sectors are to be separated and recycled.
In 2005, an estimated 62.8% of the 15 million m3 of residuals produced is recycled in some way,
mostly, for energy generation, except for the volume reducing by incineration.
In the first commitment period of the Kyoto Protocol, the rise of petroleum prices has given
many industries like power plants, steel mills, cement mills, and paper mills added incentive to
start wooden residuals for energy production. Recycling companies also benefit easily, because
they can collect a disposal fee for residuals from wood utilization. The objectives of the
“Construction Recycle Law” will undoubtedly be achieved, and there may even be a shortage of
wood residuals.
Material-recycling for conserving resources must have top priority. However, residuals with
adhesives or paint cannot be used for pulp chips, and almost no waste wooden boards are
material-recycled. Also small or composite wooden residuals, which cost much to be
material-recycled, should be crushed and used as fuel chips. So, more than half of wood
residuals could be energy-recycled without wasting, which in turn could reduce fossil fuel
consumption by more than 1 million tons-C.
2.12.4 Technologies of energy utilization Except for felled trees from civil engineering projects, the moisture content of residuals from
wood utilization is considered to be 15% in dry base. Energy efficiency of direct burning as
fuel chips is relatively high. There is also the possibility of gasification for electric power
generation or for production of gas or liquid fuels. On the other hand, further consideration is
necessary to utilize residuals from wood industries for energy production, because the moisture
content may be nearly 100% in dry base and there are many types of residuals. Sawdust and
bark, which requires little powdering energy, can be used as wood pellets.
The Japanese government is aiming to produce 2 million kL of bioethanol from wooden
residuals by 2020. Lignin encloses cellulose etc. in the cell walls of wood, so saccharification
-62- Asian Biomass Handbook
and fermentation are difficult without pre-processing. There is an opinion that automobiles
should be powered by electricity rather than liquid fuel in future.
Further information Ministry of Land, Infrastructure and Transport Japan: Investigation of construction byproducts
2005(2006) (in Japanese)
Mayu Takagi, Hachiro Takeda, Takeshi Okano: Trends in the carbon transferred from forests to the
populated area of Japan –Estimates from timber supply and demand statistics-, Wood Industry,
62(8), 354-357(2007) (in Japanese)
Mario Tonosaki, Yuko Tsunetsugu, Masayuki Ozawa, Kenji Hanaoka: Wood utilization for Japanese
forestry, Journal of the Japan Institute of Energy, 84, 973-979(2005) (in Japanese)
2.13 Animal Waste
2.13.1 What is animal waste? Livestock feces and urine are the major animal waste products and the amounts of livestock
feces and urine account for the greatest portion of domestic organic waste in Japan. The feces
and urine contain many easily degradable organic materials and many nutrient materials,
such as nitrogen and phosphorus. The quantity and quality of feces and urine are very different
depending on the kind of livestock, weight, feed, amount of drinking water, breeding system,
season, and livestock conditions. According to their characteristics, feces and urine are
processed and stored or used by suitable methods. Other animal waste products include
slaughterhouse residue and other by-products of meat processing.
2.13.2 Characteristics of animal waste Table 2.13.1 shows the amount of standard excretion for major livestock types. The amount
of feces and urine excreted from each type of livestock is calculated under the conditions of
standard feed conditions according to animal type and body weight. Generally, cow manure has
a high carbon content (C/N ratio: ratio of carbon and nitrogen contents), but there are many
organic materials that are relatively difficult to degrade, and poultry manure includes high
concentrations of nutrient chemicals, such as nitrogen, phosphorus and potassium, and also
contains many types of organic matters that are relatively easy to decompose. The category
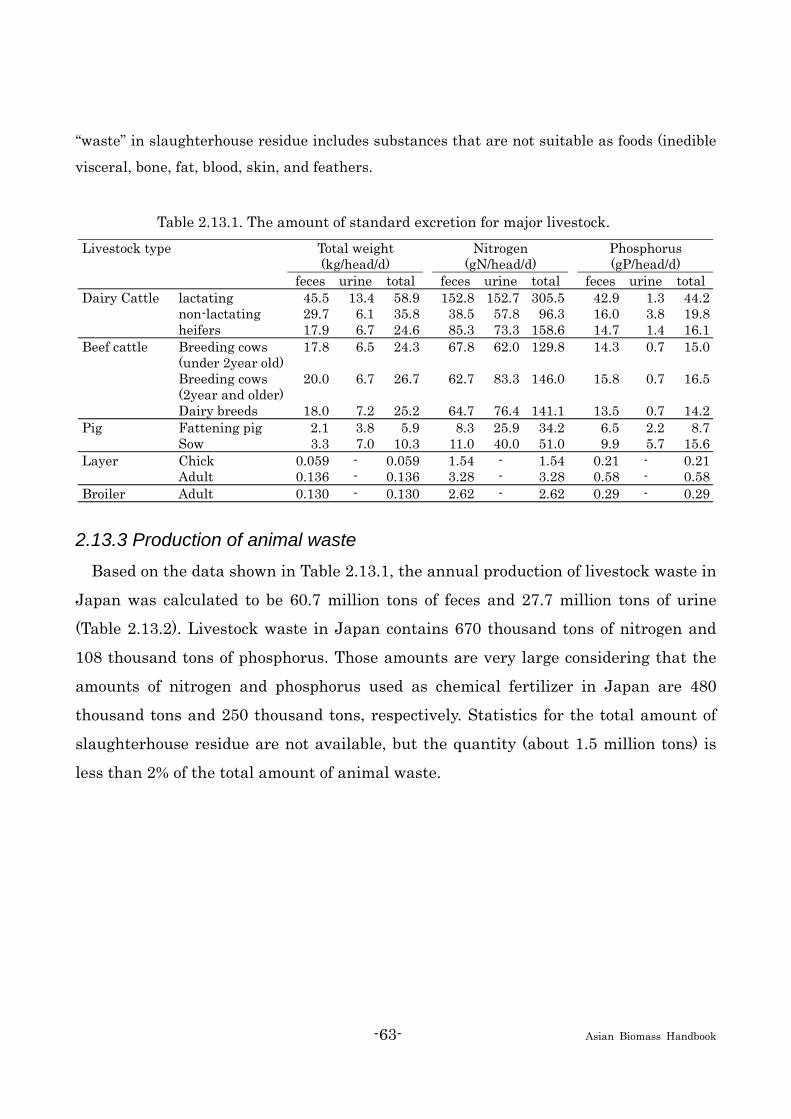
-63- Asian Biomass Handbook
“waste” in slaughterhouse residue includes substances that are not suitable as foods (inedible
visceral, bone, fat, blood, skin, and feathers.
Table 2.13.1. The amount of standard excretion for major livestock.
Livestock type Total weight (kg/head/d)
Nitrogen (gN/head/d) Phosphorus
(gP/head/d) feces urine total feces urine total feces urine totalDairy Cattle lactating 45.5 13.4 58.9 152.8 152.7 305.5 42.9 1.3 44.2 non-lactating 29.7 6.1 35.8 38.5 57.8 96.3 16.0 3.8 19.8 heifers 17.9 6.7 24.6 85.3 73.3 158.6 14.7 1.4 16.1Beef cattle Breeding cows
(under 2year old) 17.8 6.5 24.3 67.8 62.0 129.8 14.3 0.7 15.0
Breeding cows (2year and older)
20.0 6.7 26.7 62.7 83.3 146.0 15.8 0.7 16.5
Dairy breeds 18.0 7.2 25.2 64.7 76.4 141.1 13.5 0.7 14.2Pig Fattening pig 2.1 3.8 5.9 8.3 25.9 34.2 6.5 2.2 8.7 Sow 3.3 7.0 10.3 11.0 40.0 51.0 9.9 5.7 15.6Layer Chick 0.059 - 0.059 1.54 - 1.54 0.21 - 0.21 Adult 0.136 - 0.136 3.28 - 3.28 0.58 - 0.58Broiler Adult 0.130 - 0.130 2.62 - 2.62 0.29 - 0.29
2.13.3 Production of animal waste Based on the data shown in Table 2.13.1, the annual production of livestock waste in
Japan was calculated to be 60.7 million tons of feces and 27.7 million tons of urine
(Table 2.13.2). Livestock waste in Japan contains 670 thousand tons of nitrogen and
108 thousand tons of phosphorus. Those amounts are very large considering that the
amounts of nitrogen and phosphorus used as chemical fertilizer in Japan are 480
thousand tons and 250 thousand tons, respectively. Statistics for the total amount of
slaughterhouse residue are not available, but the quantity (about 1.5 million tons) is
less than 2% of the total amount of animal waste.
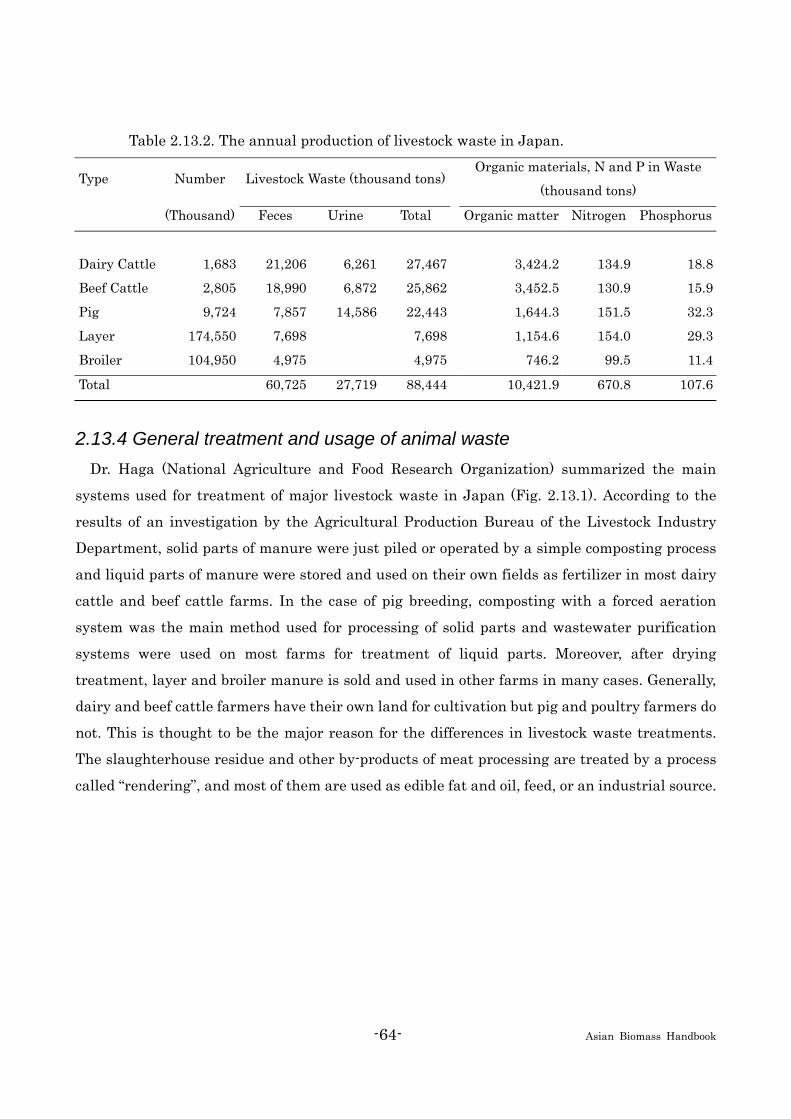
-64- Asian Biomass Handbook
Table 2.13.2. The annual production of livestock waste in Japan.
Type Number Livestock Waste (thousand tons)Organic materials, N and P in Waste
(thousand tons)
(Thousand) Feces Urine Total Organic matter Nitrogen Phosphorus
Dairy Cattle 1,683 21,206 6,261 27,467 3,424.2 134.9 18.8
Beef Cattle 2,805 18,990 6,872 25,862 3,452.5 130.9 15.9
Pig 9,724 7,857 14,586 22,443 1,644.3 151.5 32.3
Layer 174,550 7,698 7,698 1,154.6 154.0 29.3
Broiler 104,950 4,975 4,975 746.2 99.5 11.4
Total 60,725 27,719 88,444 10,421.9 670.8 107.6
2.13.4 General treatment and usage of animal waste Dr. Haga (National Agriculture and Food Research Organization) summarized the main
systems used for treatment of major livestock waste in Japan (Fig. 2.13.1). According to the
results of an investigation by the Agricultural Production Bureau of the Livestock Industry
Department, solid parts of manure were just piled or operated by a simple composting process
and liquid parts of manure were stored and used on their own fields as fertilizer in most dairy
cattle and beef cattle farms. In the case of pig breeding, composting with a forced aeration
system was the main method used for processing of solid parts and wastewater purification
systems were used on most farms for treatment of liquid parts. Moreover, after drying
treatment, layer and broiler manure is sold and used in other farms in many cases. Generally,
dairy and beef cattle farmers have their own land for cultivation but pig and poultry farmers do
not. This is thought to be the major reason for the differences in livestock waste treatments.
The slaughterhouse residue and other by-products of meat processing are treated by a process
called “rendering”, and most of them are used as edible fat and oil, feed, or an industrial source.
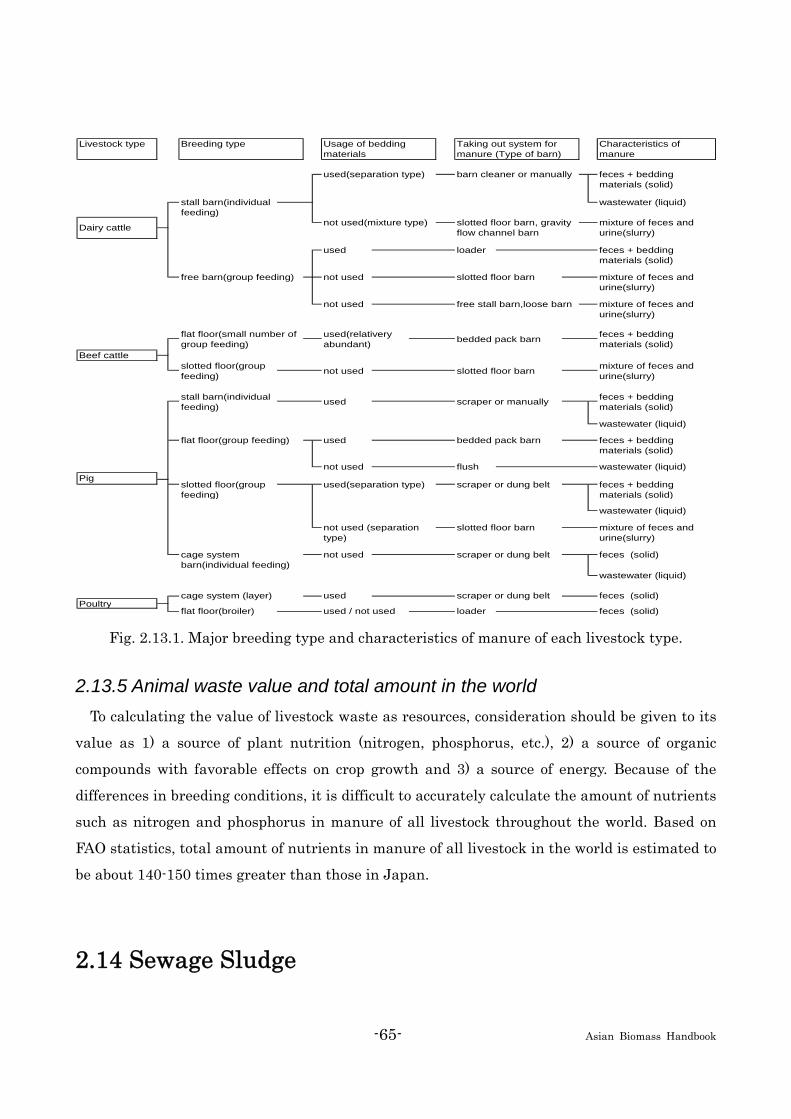
-65- Asian Biomass Handbook
Fig. 2.13.1. Major breeding type and characteristics of manure of each livestock type.
2.13.5 Animal waste value and total amount in the world To calculating the value of livestock waste as resources, consideration should be given to its
value as 1) a source of plant nutrition (nitrogen, phosphorus, etc.), 2) a source of organic
compounds with favorable effects on crop growth and 3) a source of energy. Because of the
differences in breeding conditions, it is difficult to accurately calculate the amount of nutrients
such as nitrogen and phosphorus in manure of all livestock throughout the world. Based on
FAO statistics, total amount of nutrients in manure of all livestock in the world is estimated to
be about 140-150 times greater than those in Japan.
2.14 Sewage Sludge
Livestock type Characteristics ofmanure
loader feces (solid)Poultry
flat floor(broiler) used / not used
used scraper or dung belt feces (solid)cage system (layer)
cage systembarn(individual feeding)
wastewater (liquid)
not used flush
slotted floor(groupfeeding)
used(separation type) scraper or dung belt feces + beddingmaterials (solid)
wastewater (liquid)
mixture of feces andurine(slurry)
slotted floor barnnot used (separationtype)
feces (solid)scraper or dung beltnot used
Pig
flat floor(group feeding) used feces + beddingmaterials (solid)
wastewater (liquid)
bedded pack barn
Beef cattle
stall barn(individualfeeding) used feces + bedding
materials (solid)
wastewater (liquid)
slotted floor barn
scraper or manually
flat floor(small number ofgroup feeding)
used(relativeryabundant)
feces + beddingmaterials (solid)
slotted floor(groupfeeding) not used mixture of feces and
urine(slurry)
bedded pack barn
not used free stall barn,loose barn mixture of feces andurine(slurry)
stall barn(individualfeeding)
Dairy cattle slotted floor barn, gravityflow channel barn
mixture of feces andurine(slurry)
free barn(group feeding) slotted floor barnnot used mixture of feces andurine(slurry)
Usage of beddingmaterials
used(separation type)
not used(mixture type)
Breeding type
used loader feces + beddingmaterials (solid)
Taking out system formanure (Type of barn)
barn cleaner or manually feces + beddingmaterials (solid)
wastewater (liquid)
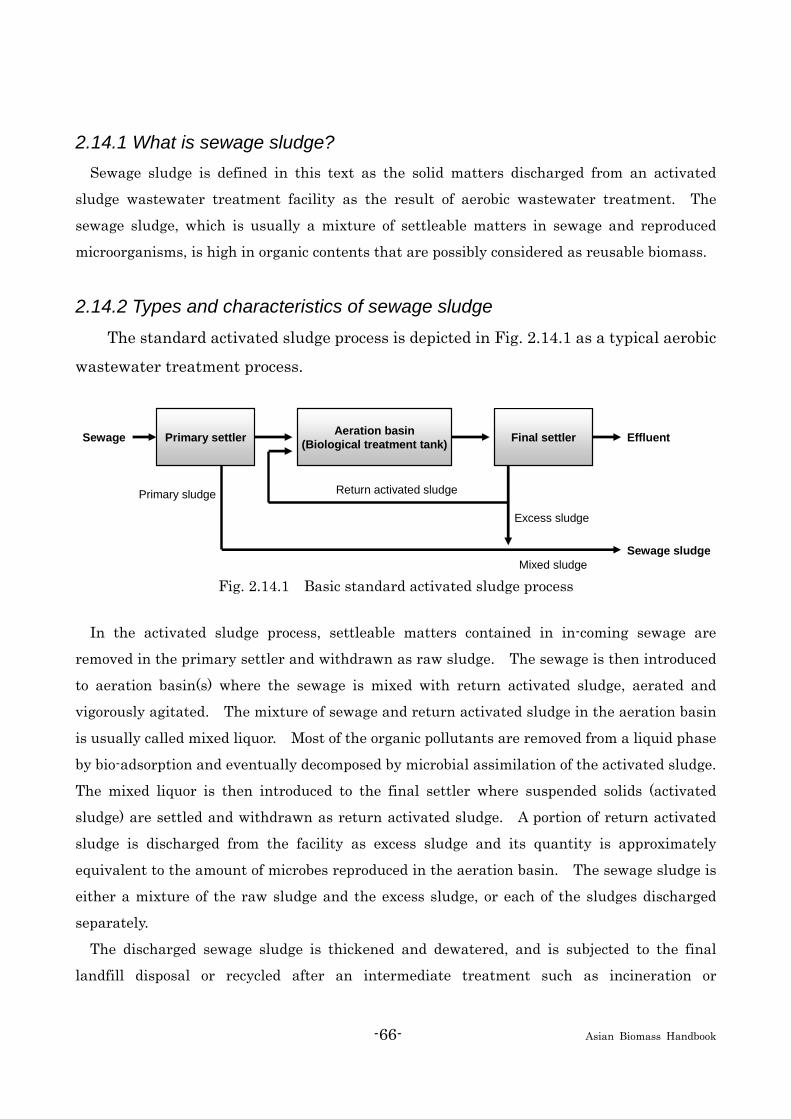
-66- Asian Biomass Handbook
2.14.1 What is sewage sludge? Sewage sludge is defined in this text as the solid matters discharged from an activated
sludge wastewater treatment facility as the result of aerobic wastewater treatment. The
sewage sludge, which is usually a mixture of settleable matters in sewage and reproduced
microorganisms, is high in organic contents that are possibly considered as reusable biomass.
2.14.2 Types and characteristics of sewage sludge The standard activated sludge process is depicted in Fig. 2.14.1 as a typical aerobic
wastewater treatment process.
Fig. 2.14.1 Basic standard activated sludge process
In the activated sludge process, settleable matters contained in in-coming sewage are
removed in the primary settler and withdrawn as raw sludge. The sewage is then introduced
to aeration basin(s) where the sewage is mixed with return activated sludge, aerated and
vigorously agitated. The mixture of sewage and return activated sludge in the aeration basin
is usually called mixed liquor. Most of the organic pollutants are removed from a liquid phase
by bio-adsorption and eventually decomposed by microbial assimilation of the activated sludge.
The mixed liquor is then introduced to the final settler where suspended solids (activated
sludge) are settled and withdrawn as return activated sludge. A portion of return activated
sludge is discharged from the facility as excess sludge and its quantity is approximately
equivalent to the amount of microbes reproduced in the aeration basin. The sewage sludge is
either a mixture of the raw sludge and the excess sludge, or each of the sludges discharged
separately.
The discharged sewage sludge is thickened and dewatered, and is subjected to the final
landfill disposal or recycled after an intermediate treatment such as incineration or
Primary settler Aeration basin(Biological treatment tank)Sewage Effluent
Primary sludge
Mixed sludge
Return activated sludge
Sewage sludge
Final settler
Excess sludge

-67- Asian Biomass Handbook
gasification-melting. Typical treatment/disposal processes for sewage sludge are shown in Fig.
2.14.2.
Fig. 2.14.2. Typical treatment process of the sewage sludge.
2.14.3 Utilization of sewage sludge With various degrees of treatments including anaerobic digestion, dewatering, drying,
incineration and/or melting, the sewage sludge is recycled and utilized as shown in Fig. 2.14.3.
Fig. 2.14.3. Example of sewage sludge recycling.
Thickening Dewatering
Anaerobicdigestion
Sundrining
DisposalRecicling
CompostingDryness
IncinerationMelting
②Sewage sludge
③Sewage sludge
①Sewage sludge
Thickening
Thickening
Anaerobicdigestion
Anaerobicdigestion
Dewatering
DewateringDisposalRecicling
Recicling
Electricity
Heatingfuel
Subgradematerial
Cementmaterial
Soilconditioner
Horticultual soil
Aggregate Water
permeable block
Fertilizer
Soilconditioner
Solidfuel
Ornamentation
Tile
Base coursematerial
Construction material
Block
(Anaerobic digestion)
(Dewartering)
(Incineration)
(Melting)
Sewage sludge
Aggregate
Horticultual
soil
Electricity
Construction
material
Composting
Desiccation
-68- Asian Biomass Handbook
By anaerobic digestion treatment, organic fraction of the sewage sludge is degraded by
anaerobic microbes and converted to biogas. Since the biogas mostly consists of methane and
carbon dioxide, it can be used as fuel for a gas engine or a gas boiler to generate electricity
and/or steam/hot water, which, in turn, can be used at the wastewater treatment facility.
By-products of dewatering, incineration or melting treatment of sewage sludge can be
utilized as a fertilizer/soil conditioner in agricultural applications, or as construction materials
such as aggregates, tiles and water-permeable blocks in civil engineering applications. Rapid
expansion of recycling and utilization of the by-products of sewage sludge treatments is
expected to continue in the future.
Further information Japan Sewage Works Association: Sewage facilities planning, policy and explanation (second part) 2001,
pp.15-47, Japan (2001) (in Japanese)
Japan Sewage Works Association: Sewage facilities planning, policy and explanation (second part) 2001,
pp.335, Japan (2001) (in Japanese)
Japan Sewage Works Association: Japan Sewage Works 2005, pp.141, Aikosha (2005) (in Japanese)
The Japan Institute of Energy: Biomass Handbook, Ohmsha, pp.70-72, Ohmsha (2002) (in Japanese)
2.15 Municipal Solid Waste
The major biomass components in municipal solid waste (MSW) are food waste and paper,
and thus biological (2.15.1 and 2) or thermal processes (2.15.3 and 5) are used to recover energy
from the biomass fraction.
2.15.1 Methane recovery in landfills In landfills containing organic waste, anaerobic biodegradation of biomass produces methane
gas because oxygen diffused from the atmosphere is consumed near the landfill surface.
Landfill gas can damage nearby plant growth and even cause neighboring buildings to explode.
Therefore, gas control methods including flaring have been implemented since the 1960s. In
large-scale landfills, vertical wells are installed to pump out the gas, which is used on-site for
power generation or sold as fuel. Average gas recovery rates range from 120 to 150 m3/ton of
dry MSW, equivalent to a heating value of 2500 MJ/ton (the methane concentration of landfill

-69- Asian Biomass Handbook
gas is around 55%). Since the late 1990s, many American studies have investigated “bioreactor
landfill,” in which moisture content is controlled to maximize biodegradation. Bioreactors also
increase the rate of gas generation and consequently the rate of energy recovery.
In contrast, landfill gas is not recovered in Japan for two reasons: landfills contain little
organic content due to the common practice of incineration, and landfills are aerated through
the use of a semi-aerobic landfill structure, in which natural convection is allowed to form an
aerobic zone around leachate collection pipes below the landfill. The Chuo-Botahei landfill in
Tokyo Bay does recover methane, but its annual power generation (averaged over 20 years) is
3000 MWh, enough power for only 850 households.
2.15.2 Biogasification (methane fermentation) Biogasification, a technology for recovering methane gas from organic matter in an anaerobic
reactor, is also referred to as “anaerobic digestion.” This process was developed in the 1980s to
treat organic wastewater. In 1997, 90 facilities operated worldwide (total throughput is 3.5
million tons/year). Japan has 12 facilities to treat human waste and food waste, and 3 of these
treat only food waste. Fig. 2.15.1 illustrates the main processes of biogasification. Low solid
concentrations (6 to 10%) are treated using a “wet system,” while high solid concentrations (25
to 40%) are treated using a “dry system.” Treatment systems are also classified by their
dominant microorganisms: methophilic (used at 30 to 40°C) or thermophilic (used at 50 to
60°C).
Fig. 2.15.1. Process flow of biogasification.

-70- Asian Biomass Handbook
2.15.3 Incineration with energy recovery MSW produces a heating value about one-third that of coal heat, and can burn at
temperatures as high as 1000°C. When the combustion gas is cooled to between 200 and 300°C
by gas control equipment, energy can be recovered by a boiler system. While even small-scale
incinerators commonly reuse waste heat for heating and hot water supply, large-scale facilities
can use high-temperature steam for power generation. In 2005, more than 60% of MSW
incinerators reused hot water, and 20% generated power.
However, on average, MSW incinerators have a power generation efficiency of only 10%,
much lower than coal power plants. They cannot be highly efficient because steam
temperatures must remain low to prevent corrosion at temperatures of 320°C or higher;
economic incentives are also low due to the low price of generated electricity and the high cost
involved in generating power.
An incinerator of the 600 ton/day class can provide central heating service for 1000 to 1500
households. However, this is usually impossible because MSW incinerators are generally
located far from residential areas. To increase energy efficiency, waste management systems
should be incorporated into city planning.
2.15.4 Refuse-derived fuel production and power generation Refuse-derived fuel (RDF) is fuel recovered from waste. It includes a wide range of fuel
including gas and oil, but usually refers to shredded waste from which incombustibles have
been removed. In Japan, RDF was first produced from uniform commercial waste, such as
plastics or paper, and in the late 1980s, RDF production began to include household waste.
Produced after a series of processes including separation of incombustibles, drying, shredding,
and palletizing, RDF can be easily stored and transported, and therefore has been selected as
an alternative method of incineration in small- and medium-sized cities. After problems related
to dioxins limited RDF use as fuel for small-scale boilers, regional RDF power generation (in
which RDF produced in member municipalities is used in a central power plant) became a
promising option when decentralized small-scale incineration was not possible.
Compared to unprocessed waste, RDF provides a higher heating value and uniform
composition, and yields improved power generation efficiency. Five RDF power generation
plants have been in operation since 2001 in Japan. They were expected to yield throughput of
160 to 310 tons/day, power generation efficiency of 20 to 30%, and output of 3000 to 20,000 kW.
-71- Asian Biomass Handbook
However, a RDF storage tank exploded at one plant in 2003, and extensive surveys revealed
that similar accidents were not rare; a considerable fraction of RDF is now being sent to
landfills. As of 2003, 43 RDF production facilities were in operation or under construction, but
this technology has been discredited in Japan due to its poor safety record. The United States
currently has 15 large RDF incinerators in operation, but in that country, RDF contains only
shredded combustible waste, termed “fluff RDF” (or coarse RDF).
2.15.5 Pyrolysis In the late 1990s, problems related to dioxin motivated incinerator manufacturers to develop
a pyrolysis (or gasification) system in addition to a melting system. Solid waste is heated at
around 500°C in a scarce- or low-oxygen atmosphere, and the resulting combustible gas and
solid residue is burned at between 1200 and 1500°C to melt ash. This process was expected to
yield benefits such as low dioxin emission, high power generation efficiency, and recycling
molten slag, and 77 facilities were in operation by 2005. However, recent studies have found
that these facilities require high consumption of supplemental fuel and electricity, and produce
a low slag recycling rate. To minimize these drawbacks, the first part of the pyrolysis-melting
system is used as carbonization. The product, char, can be used as a charcoal alternative, soil
conditioner, and powdered coal for blast furnaces. In contrast, in the European Union,
pyrolysis is used as an alternative technology for energy from waste, but its target is pyrolysis
gas.
Further information R.Stegmann, “Landfill gas utilization: An overview” in Landfilling of waste: Biogas (ed.T.H.Christensen,
R.Cossu, R.Stegmann), E&FN SPON (1996)
Tadashi Abe, “Beikoku ni-okeru Gomi-hatsuden no Hatten”, Waste Management Research7(4)、
305-315(1996) (in Japanese)
Hideaki Fujiyoshi, “Toshi-gomi no Tanka-nenryo-ka Shisetsu”, ENERGY, 57-59 (2001-4) (in Japanese)
Shigeo Shikura, Hideki Harada, “Toshi-haikibutsu no Kenkisei-shoka”, Waste Management Research
10(3)、241-250(1999) (in Japanese)
Website of Tokyo-to, http://www2.kankyo.metro.tokyo.jp/tyubou/ (in Japanese)
Toru Furuichi, Norio Nishi (ed), “Biocycle”, Kankyo-Shinbunsha (2006) (in Japanese)
Tsukasa Kagiya, “RDF Hokanji no Hatsunetsu to Kongo-no Taio”, Kankyo-Shisetsu 94, 48-55 (2003) (in
Japanese)
“RDF Hatsuden-shisetsu o Kaku to-suru Gomi-shori Koiki-ka ni Kadai”, Kankyo-Shisetsu 94,42-47

-72- Asian Biomass Handbook
(2003) (in Japanese)
Hideaki Fujiyoshi, “Gasu-ka Yoyu-ro no Unten Kanri to Kaizen Jirei”, Kankyo-Gijutsu-Kaishi 129,86-99
(2007) (in Japanese)
2.16 Black Liquor
2.16.1 Black liquor Black liquor, a mixture of organic wastes, is made from a wood as a by-product during the
production of chemical pulp. And it’s routinely burned as a liquid fuel in a recovery boiler in a
pulp mill. Approximately 1.5 tones of black liquor are produced in the manufacture of 1 tone of
pulp. Generally, a calorimetric heat value of black liquor is 12.6 MJ/kg and its energy is mainly
used for pulp and paper making process.
2.16.2 Process of black liquor generation There are a number of different processes which can be used for separating of the wood fibers.
And their produced pulp is mainly divided into 2 types. One is mechanical pulp which is
manufactured by a grinding process. The other is chemical pulp which is manufactured by a
cooking process where the cellulose fibers are cooked out from the wood. Black liquor is
produced during the cooking process. In this chapter, details of black liquor generation are
described in terms of the kraft process so that the kraft process is nowadays the main stream
for pulping (Fig. 2.16.1).
Wood, the raw material of paper, is composed by wood fibers which consist of cellulose,
hemicellulose, and lignin which is an integral part between the fibers. The ratio of cellulose,
hemicellulose and lignin is approximately 55: 20: 25.
The process to extract lignin from a wood chip by means of decomposition and
dissolubilization is called cooking process. In the kraft process, Na2S and NaOH are added as a
chemical to cook and the mixture is heated to 140 - 170℃ and it keeps several hours. Although
it’s important not to damage to the cellulose and the hemicellulose fibers during the process,
indeed, a part of the cellulose and most of the hemicellulose fibers are decomposed and
dissolved. Generally, the half of the organic materials in the wood turns to pulp and the other
turns to black liquor.

-73- Asian Biomass Handbook
Fig. 2.16.1. The main stream for pulping.
Black liquor contains decomposed and dissolved lignin, hemicellulose, and Na and S. After
the cooking process, the concentration of black liquor is usually 15 to 20%. Then the liquor is
concentrated to approximately 70 to 75%. Finally, it’s burned in a boiler called recovery boiler.
As for a hard wood chip, 1 tone of the pulp turns to 1.5 tons of black liquor. Generally, a
calorimetric heat value of black liquor is 12.6 mJ/kg.
During the process, melted Na and S which were contained in the liquor are extracted and
then dissolved into hot water. After that, they’re reproduced to Na2S and NaOH in the
causticizing process, and then used in the cooking process again. On the other hand, separated
wood fibers turn to pulp through the washing process and the bleaching process. Finally,
they’re used as a raw material of paper.
Cooking Process
Washing Process
Bleaching Process
Bleached kraft Pulp
Forest
Wood Chip
Unbleached kraft Pulp
Paper Making Process Paper
Black Liquor
Recovery Boiler
Solar Energy
CO2 in the air
Combustion CO2
Energy (Electric, Steam)
Na2S,NaOH
Chemicals Recovering Process
Na2S, Na2CO3
Pulp and Paper Making Process
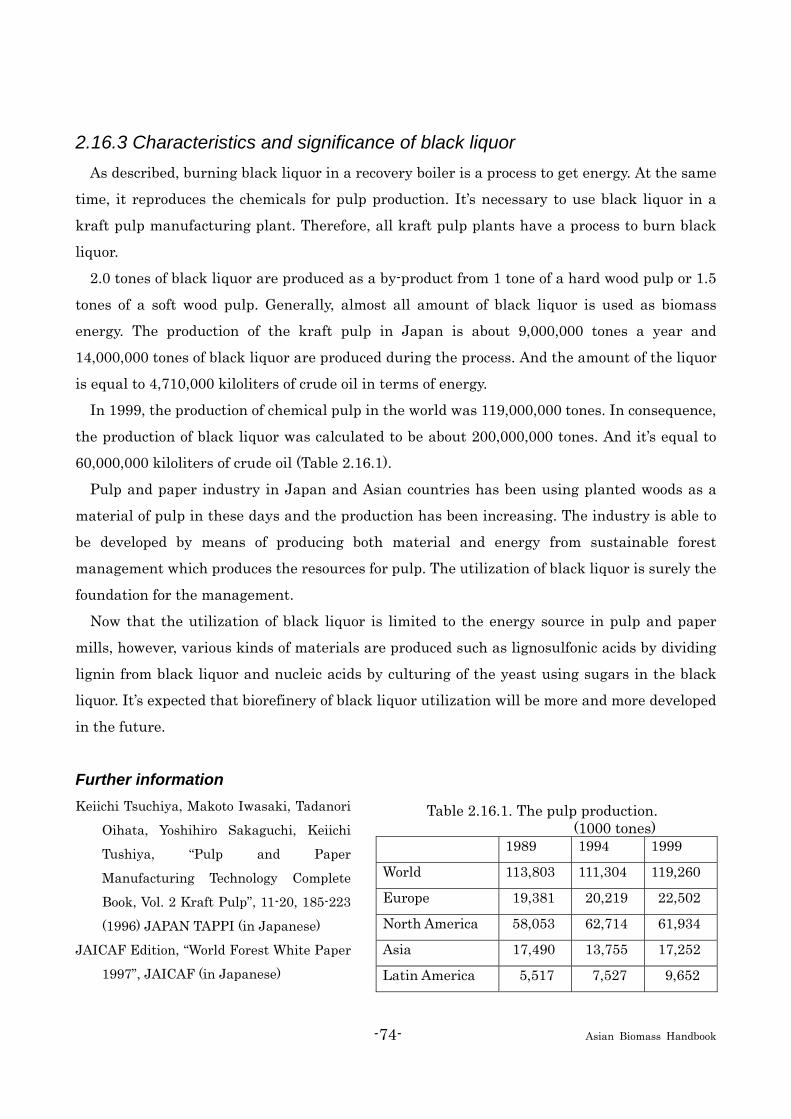
-74- Asian Biomass Handbook
Table 2.16.1. The pulp production. (1000 tones) 1989 1994 1999
World 113,803 111,304 119,260
Europe 19,381 20,219 22,502
North America 58,053 62,714 61,934
Asia 17,490 13,755 17,252
Latin America 5,517 7,527 9,652
2.16.3 Characteristics and significance of black liquor As described, burning black liquor in a recovery boiler is a process to get energy. At the same
time, it reproduces the chemicals for pulp production. It’s necessary to use black liquor in a
kraft pulp manufacturing plant. Therefore, all kraft pulp plants have a process to burn black
liquor.
2.0 tones of black liquor are produced as a by-product from 1 tone of a hard wood pulp or 1.5
tones of a soft wood pulp. Generally, almost all amount of black liquor is used as biomass
energy. The production of the kraft pulp in Japan is about 9,000,000 tones a year and
14,000,000 tones of black liquor are produced during the process. And the amount of the liquor
is equal to 4,710,000 kiloliters of crude oil in terms of energy.
In 1999, the production of chemical pulp in the world was 119,000,000 tones. In consequence,
the production of black liquor was calculated to be about 200,000,000 tones. And it’s equal to
60,000,000 kiloliters of crude oil (Table 2.16.1).
Pulp and paper industry in Japan and Asian countries has been using planted woods as a
material of pulp in these days and the production has been increasing. The industry is able to
be developed by means of producing both material and energy from sustainable forest
management which produces the resources for pulp. The utilization of black liquor is surely the
foundation for the management.
Now that the utilization of black liquor is limited to the energy source in pulp and paper
mills, however, various kinds of materials are produced such as lignosulfonic acids by dividing
lignin from black liquor and nucleic acids by culturing of the yeast using sugars in the black
liquor. It’s expected that biorefinery of black liquor utilization will be more and more developed
in the future.
Further information Keiichi Tsuchiya, Makoto Iwasaki, Tadanori
Oihata, Yoshihiro Sakaguchi, Keiichi
Tushiya, “Pulp and Paper
Manufacturing Technology Complete
Book, Vol. 2 Kraft Pulp”, 11-20, 185-223
(1996) JAPAN TAPPI (in Japanese)
JAICAF Edition, “World Forest White Paper
1997”, JAICAF (in Japanese)

-75- Asian Biomass Handbook
JAPAN TAPPI Energy Committee, “Survey on Energy Consumption in the Pulp and Paper Mills in
Japan Part 1”, 55, 573-591 (2001) JAPAN TAPPI (in Japanese)
JAPAN TAPPI Edition “Pulp and Paper technical handbook”, 105-136 (1971) JAPAN TAPPI (in
Japanese)
Yuuichi Hayase, “Seishi-koujou kara-no Fukuseigenryou ”, 50, 1253-1259, Thermal and Nuclear Power
Engineering Society (in Japanese)
Masahiro Kitazume, “Sekai no Kami Parupu”, 8-15, September (2000) Kami-Parupu (in Japanese)
Keiichi Nakamata, “Kami to Shinrin no Kakawari”,Global Environmental Policy in Japan the 1st report,
1-9 (1999) Chuo University Press (in Japanese)
2.17 Food Processing Waste
2.17.1 Potential of food processing waste In this chapter, the example of Thailand is given to show the utilization of food processing
waste. As one of the agricultural based countries, food industry sector plays an important role
in Thai economy and also is worth a great fraction of Thai export value each year. The
processing of food and its related commodity often involves thermal, mechanical and chemical
treatment, which reluctantly poses environmental problems on proper treatment of the food
processing waste. Broadly, food processing waste can be categorized into two types, according
to its physical states, namely solid and liquid wastes. Solid waste varies from empty oil palm
bunches, baggase, rice straw/stubble/husk, waste from cassava starch factory and corncob.
On the other hands, liquid waste mainly comes from any food processing that involves washing,
cleaning, extracting with water or any other solvents.
Conventionally, solid wastes have often been thrown back into the boiler in order to generate
steam for the plant processing itself or power generation. With biomass technology like
gasification, solid wastes find higher efficiency conversion to energy than simply uncontrolled
burning. On the other hand, since liquid wastes are regulated for environmental concern,
processing plants are required to install wasted water treatment system. Often such system
is of an anaerobic digestion technology, from which biogas can also be produced and used as
energy source in the plants.
From the Ministry of Energy evaluation back in 2000, the first nine industries of high
potential for biogas production are of cassava, sugar, palm oil, canned seafood, frozen product,

-76- Asian Biomass Handbook
slaughterhouse, canned pineapple, carbonated soda and liquor, respectively. Recent
investigation on the wasted water from cassava, sugar, oil palm, canned pineapple and ethanol
plants to assess the biogas potential was conducted by TRF (http://www.trf.or.th). The results
are shown in Table 2.17.1. Cassava plant has the highest potential to produce biogas, more
than twice the runner-up ethanol plant. Some reasons for seemingly low potential of biogas
production in certain industries are the better management of waste water treatment system
and also better by-product utilization.
Table 2.17.1 Potential biogas production from different industries.
Biogas data in 2005 Energy substituted by biogas Industries Production
(Mm3/y) Energy equiv.
(ktoe/y) MWe Plant capacity
(GWh/y) %Plant capacity
Fuel oil equiv. (ML)
Cassava 344 167 57 413 82.2 158
Ethanol 149 97 20.5 179 100 69
Oil palm 84 39 14 100 82.2 39 Canned pineapple 13 6 3.7 16 50 6
Sugar 4.2 0.7 3.6 5 27.4 0.3
Total 594.2 309.7 98.8 713 272.3 Source: TRF (Thailand Research Fund) final project report, 2007 Remarks: Fuel oil equivalent is calculated based on methane content in biogas with the following conversion factors: 1 m3 of CH4 = 33.8 MJ, 1 m3 of biogas = 0.46 L of fuel oil equiv. = 1.2 kWh
2.17.2 Baggase Baggase is the fibrous solid waste produced after stalks of sugarcane are crushed to extract
sugar juice in the sugar mill. Typically, about 25-30% of sugar cane production is baggase,
contributing to about 10.9-22.3 Tg/year (Mt/year) from the sugarcane production of 43.5-74.3
Tg/year (Mt/year) over the period between 1998 and 2007 in Thailand. Currently, almost all of
baggase from the sugar mills in Thailand are used up as biomass fuel to generate energy
partially for the sugar processing within the mills, leaving negligible amount for other
applications. As shown below, more than half of grid biomass power plant in 2007 uses
baggase as the fuel.
Since 1994, there are 37 SPPs (Small Power Producers) and VSPPs (Very Small Power

-77- Asian Biomass Handbook
Producers) operating on baggase with installed capacity over 780 MW with almost 300 MW of
which are sold back to the grid. The recent rapid increase in the baggase power plants are due
to governmental strong support on electricity generation.
Bagasse Rice husk/Eucalytus barkRice husk Black liquorPara wood waste Palm oil residue Eucalytus bark BiogasMSW Rice straw
53%16%
15%
5% 4% 3%
Bagasse Power Plants in Thailand
0
100
200
300
400
500
600
700
800
1994 1995 1997 1999 2001 2003 2005 2007
Year
Elec
trici
ty (M
W)
Capacity (MW)Sold to Grid (MW)
Fig. 2.17.1. Breakdown of biomass power plants by fuel type in 2007.
Fig. 2.17.2. History of baggase power plants in Thailand.
Source: Adapted from Energy for Environment Foundation (http://www.efe.or.th)
Furthermore, baggase can only be used to produce other value-added products like
biodegradable food container (as shown below) and particle board. The baggase residue & ash
from power plants can also be compressed to make a construction brick that weighs 3.2
kg/brick, sustains 80-90 kg/cm2 load and costs only 4 Baht/brick (compared to typical
construction brick of 5.8 kg, 70 kg/cm2 strength and 8 Baht/brick cost).
2.17.3 Corn cob Even though corn or maize is not one of the most economic crops in Thailand, there has been
an increasing utilization of corn cob in power generation and solid fuel in order to achieve
zero-waste philosophy in corn processing industry. The figure below shows the 2006
production of maize around the world, where USA is accounted for almost half of the world
Fig. 2.17.3. Biodegradable food container from baggase fiber.

-78- Asian Biomass Handbook
production and also with the highest yield in the world. Although China has a similar amount
of land for maize plantation to USA, the lower yield in China makes its production only half of
the USA figure.
USA China Brazil MexicoIndia Argentina France IndonesiaItaly Canada Thailand
USA, 48.9%
China, 25.5%
Thailand, 0.7%
Brazil, 7.8%0
5
10
15
20
25
30
USAChina
Brazil
Mexico Ind
ia
Argenti
na
France
Indon
esia
Italy
Canada
Thaila
nd
Sta
tistic
s
Harvested area (M ha)Yield per hectare (ton/ha)
Fig. 2.17.4. World leading countries in maize
production in 2006. Fig. 2.17.5. Harvested area and yield of
maize in 2006.
For the past 10 years in Thailand, the yield has been gradually increasing but not fast enough
to compensate the decreasing plantation land, resulting in a decreasing maize production, as
shown in Fig. 2.17.6. In 2006, the yield is 411 g/m2 (4.11 t/ha) averaged over whole 9,000 km2
(0.9 million ha) harvested area. Most of maize production in Thailand goes to food and feed
industry; both of which corn cob is left as solid waste in the plants. In 2006, 33 Gg (0.33 Mt) of
corn cob is reported, where 200 Gg (0.2 Mt) comes from the lower North part in Thailand
especially Phetchabun (76 Gg (0.076 Mt)), Tak (35 Gg (0.035 Mt)) and Nakorn-sawan (33 Gg
(0.033 Mt)). This corn cob is usually dried
before putting in the boiler to generate steam
for power generation, e.g. 10 MW power
generation unit in the ethanol plant
Pornvilai International Group Co.
Another value-added product for corn cob
is corn charcoal, where corn cob is first
heated to about 900-1000oC before being
palletized with proper binder. Then, the
final drying at 120oC for 12 h is conducted to
obtain charcoal with less than 5% moisture.
0.00.51.01.52.02.53.03.54.04.55.0
1998 1999 2000 2001 2002 2003 2004 2005 2006 2007
Year
Pla
nt a
rea
(M h
a)/P
rodu
ctio
n (M
to
n)/Y
ield
(ton
/ha)
Planted areaProductionYield per hectare
Fig. 2.17.6. History of maize statistic in Thailand.
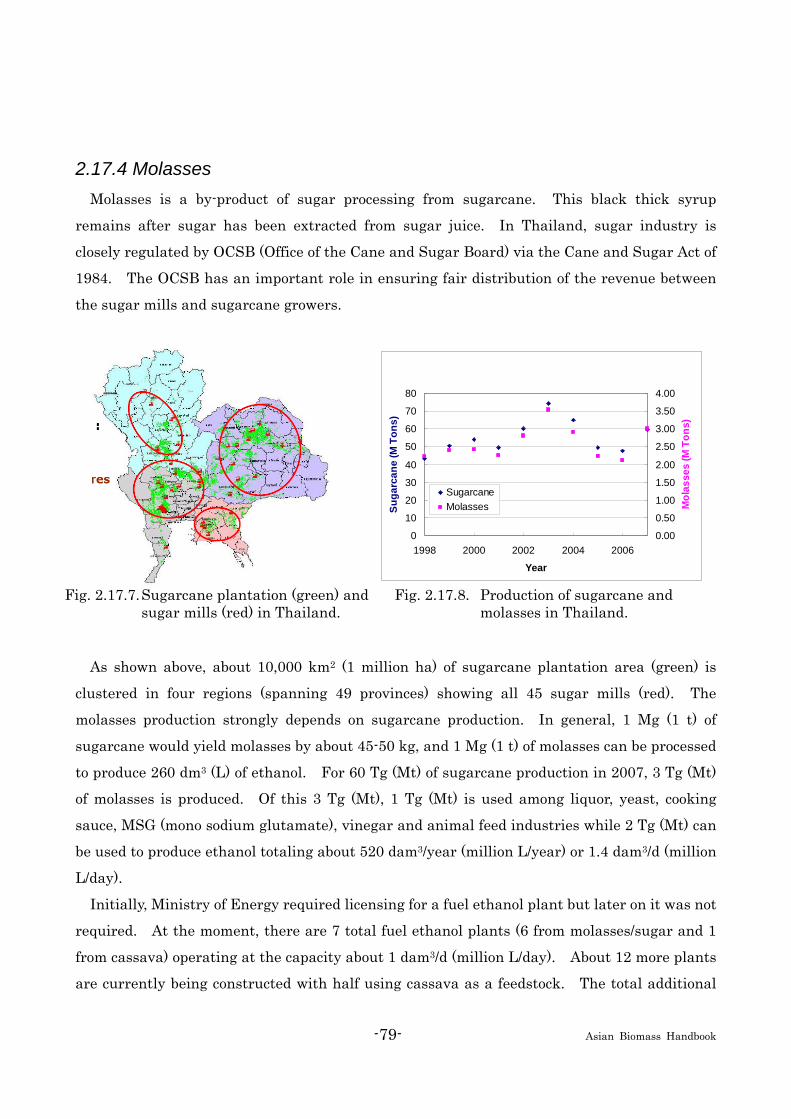
-79- Asian Biomass Handbook
2.17.4 Molasses Molasses is a by-product of sugar processing from sugarcane. This black thick syrup
remains after sugar has been extracted from sugar juice. In Thailand, sugar industry is
closely regulated by OCSB (Office of the Cane and Sugar Board) via the Cane and Sugar Act of
1984. The OCSB has an important role in ensuring fair distribution of the revenue between
the sugar mills and sugarcane growers.
Sugarcane & Molasses
0
10
20
30
40
50
60
70
80
1998 2000 2002 2004 2006
Year
Suga
rcan
e (M
Ton
s)
0.00
0.50
1.00
1.50
2.00
2.50
3.00
3.50
4.00
Mol
asse
s (M
Ton
s)
SugarcaneMolasses
Fig. 2.17.7. Sugarcane plantation (green) and sugar mills (red) in Thailand.
Fig. 2.17.8. Production of sugarcane and molasses in Thailand.
As shown above, about 10,000 km2 (1 million ha) of sugarcane plantation area (green) is
clustered in four regions (spanning 49 provinces) showing all 45 sugar mills (red). The
molasses production strongly depends on sugarcane production. In general, 1 Mg (1 t) of
sugarcane would yield molasses by about 45-50 kg, and 1 Mg (1 t) of molasses can be processed
to produce 260 dm3 (L) of ethanol. For 60 Tg (Mt) of sugarcane production in 2007, 3 Tg (Mt)
of molasses is produced. Of this 3 Tg (Mt), 1 Tg (Mt) is used among liquor, yeast, cooking
sauce, MSG (mono sodium glutamate), vinegar and animal feed industries while 2 Tg (Mt) can
be used to produce ethanol totaling about 520 dam3/year (million L/year) or 1.4 dam3/d (million
L/day).
Initially, Ministry of Energy required licensing for a fuel ethanol plant but later on it was not
required. At the moment, there are 7 total fuel ethanol plants (6 from molasses/sugar and 1
from cassava) operating at the capacity about 1 dam3/d (million L/day). About 12 more plants
are currently being constructed with half using cassava as a feedstock. The total additional

-80- Asian Biomass Handbook
capacity is 1.97 dam3/d (million L/day). This drive for ethanol capacity building is a result of
the governmental initiative on using 10% ethanol-blended gasoline or so-called “gasohol E10”
for both 91 & 95 octane rating. Recently, gasohol E20 (octane rating of 95) or 20%
ethanol-blended gasoline will be commercially available at selected gas station from January 1,
2008 onwards.
For molasses export market, Thailand has recently become the largest molasses exporter
(value at $41.6 M in 2004), where the second and third largest are USA and Guatemala.
About 37% of the export goes to ASEAN countries, and other 53% goes to other countries in
Asia. Other molasses exporting countries nearby are Philippines, Indonesia and Australia.
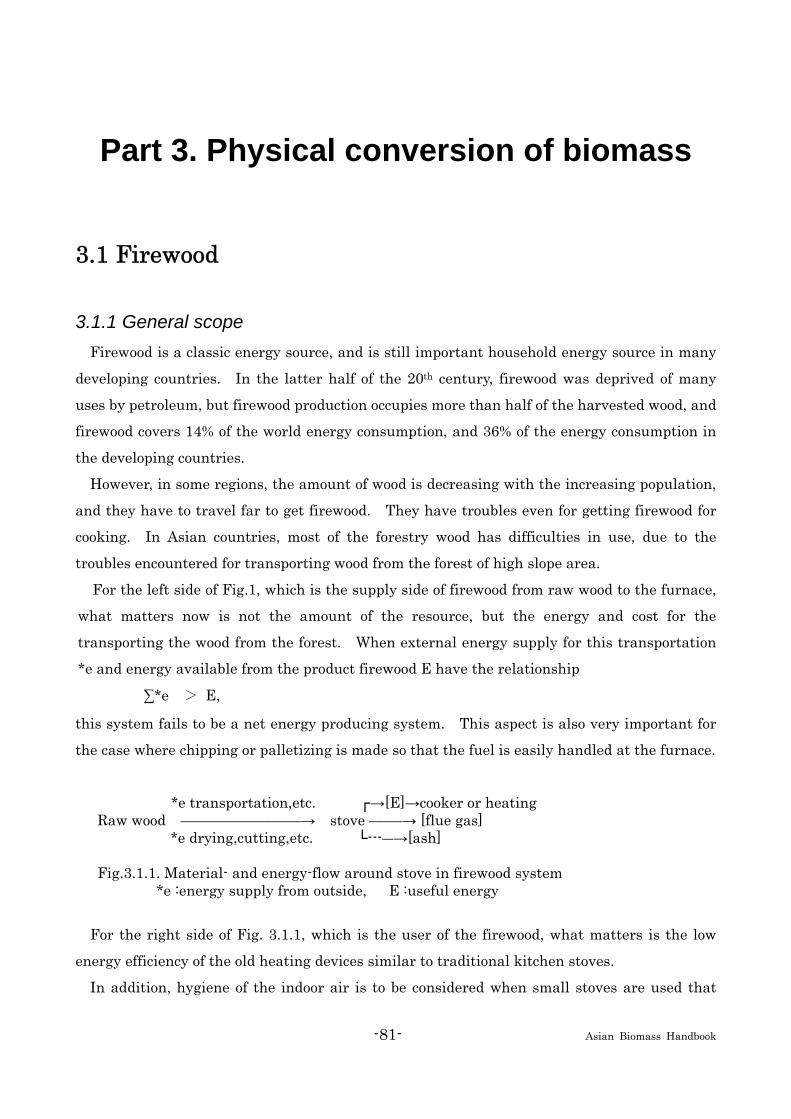
-81- Asian Biomass Handbook
Part 3. Physical conversion of biomass
3.1 Firewood
3.1.1 General scope Firewood is a classic energy source, and is still important household energy source in many
developing countries. In the latter half of the 20th century, firewood was deprived of many
uses by petroleum, but firewood production occupies more than half of the harvested wood, and
firewood covers 14% of the world energy consumption, and 36% of the energy consumption in
the developing countries.
However, in some regions, the amount of wood is decreasing with the increasing population,
and they have to travel far to get firewood. They have troubles even for getting firewood for
cooking. In Asian countries, most of the forestry wood has difficulties in use, due to the
troubles encountered for transporting wood from the forest of high slope area.
For the left side of Fig.1, which is the supply side of firewood from raw wood to the furnace,
what matters now is not the amount of the resource, but the energy and cost for the
transporting the wood from the forest. When external energy supply for this transportation
*e and energy available from the product firewood E have the relationship
∑*e > E,
this system fails to be a net energy producing system. This aspect is also very important for
the case where chipping or palletizing is made so that the fuel is easily handled at the furnace.
*e transportation,etc. ┌→[E]→cooker or heating Raw wood ―――――――――――→ stove ―――→ [flue gas]
*e drying,cutting,etc. └---―→[ash]
Fig.3.1.1. Material- and energy-flow around stove in firewood system *e :energy supply from outside, E :useful energy
For the right side of Fig. 3.1.1, which is the user of the firewood, what matters is the low
energy efficiency of the old heating devices similar to traditional kitchen stoves.
In addition, hygiene of the indoor air is to be considered when small stoves are used that

-82- Asian Biomass Handbook
often accompanies with incomplete combustion. The problems of soot, carbon monoxide (CO),
tar, Non-methane volatile organic matter (NMVOC), and polyaromatic hydrocarbons (PAH,
carcinogen) are pointed out.
Ash content of the firewood is lower than that of coal by one order, but ash removal is
important from the view point of mass balance, although it usually does not cause a serious
problem. Ash of wood has high content of potassium, which is an important fertilizer, and
return of ash to the forest is essential for the sustainability of the system.
Herbaceous plants have higher ash content than wood by 5-20 times, and ash treatment is a
large problem for production of artificial firewood from straw, husk, and bagasse.
Heating values of plant is about 20GJ/t-dry for various woody biomass (half of heating value
of oil), and mostly decided by its water content. Woody biomass is not suitable for
transportation of long distance due to its bulkiness. This is why utilization of firewood near
the forest is insisted.
3.1.2 Firewood supply The potential of firewood supply is discussed here. According to FAO (Food and Agriculture
Organization), forest area of the world is 39,500 km2 (3.95 Gha) and decreasing gradually
(-0.2%/year). Although the primary growth rate of forest is estimated to be more than 5.1
km3/year (5.1 billion m3/year), annual lumber production is as small as 1.6 km3/year (1.6 billion
m3/year) for industrial use, and 1.8 km3/year (1.8 billion m3/year) for fuel use. Even if forestry
area is constant, artificial forest with high growth rate is increasing gradually, and supply
increase with mild development of economy can be met.
For lumber production, production of forest residue and thinning wood is accompanied with.
If proper development is made for transportation of these biomass, supply potential largely
increases. However, transportation from steep mountain that is often found in Japan and Asian
countries leads to very large value of *e-1 in Fig. 3.1.2, and the woody biomass cannot be
effectively utilized. The value of *e-1 is expected to increase with distance proportionally, and
increase with the slope with the exponent value of 2 to 3, but has not been studied in detail.
The bulk density largely affects the transportability. Packing factor is 1/4-1/3 for twigs, 1/2
at maximum for chip, and 0.6 for pellets.
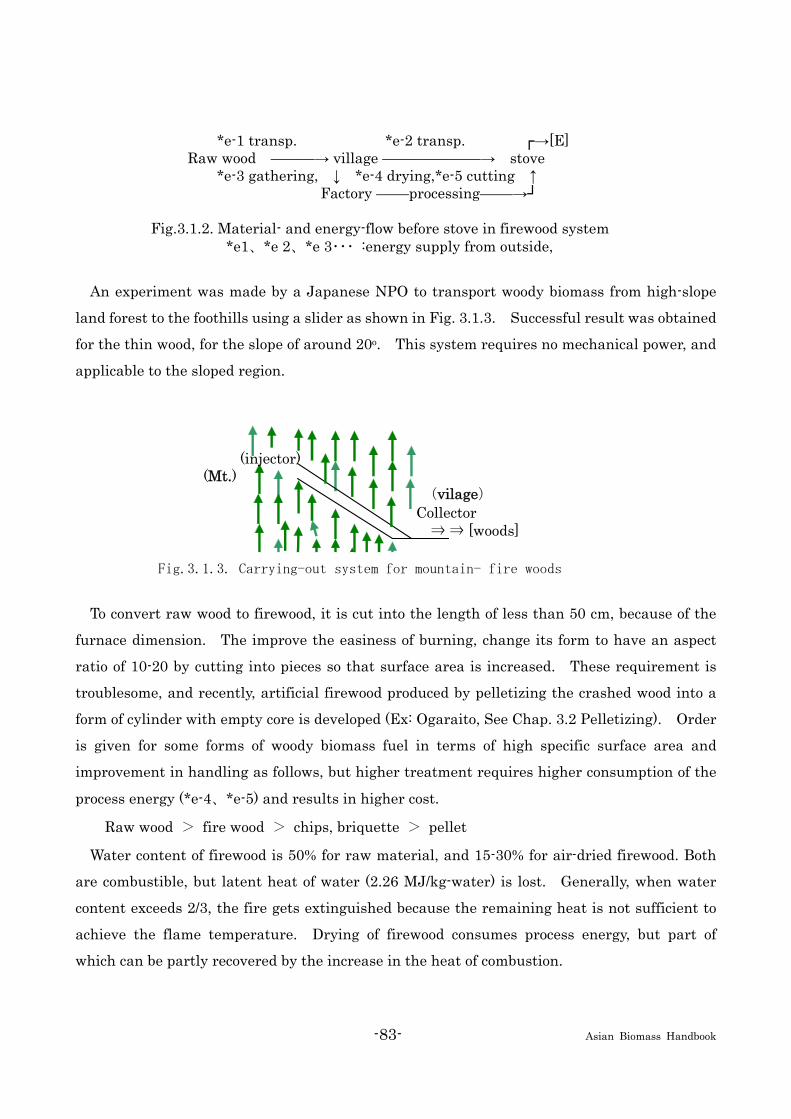
-83- Asian Biomass Handbook
*e-1 transp. *e-2 transp. ┌→[E] Raw wood ――――→ village ―――――――――→ stove
*e-3 gathering, ↓ *e-4 drying,*e-5 cutting ↑ Factory ―――processing―――→┘
Fig.3.1.2. Material- and energy-flow before stove in firewood system
*e1、*e 2、*e 3・・・ :energy supply from outside,
An experiment was made by a Japanese NPO to transport woody biomass from high-slope
land forest to the foothills using a slider as shown in Fig. 3.1.3. Successful result was obtained
for the thin wood, for the slope of around 20o. This system requires no mechanical power, and
applicable to the sloped region.
(injector) (Mt.)
(vilage) Collector ⇒ ⇒ [woods]
Fig.3.1.3. Carrying-out system for mountain- fire woods
To convert raw wood to firewood, it is cut into the length of less than 50 cm, because of the
furnace dimension. The improve the easiness of burning, change its form to have an aspect
ratio of 10-20 by cutting into pieces so that surface area is increased. These requirement is
troublesome, and recently, artificial firewood produced by pelletizing the crashed wood into a
form of cylinder with empty core is developed (Ex: Ogaraito, See Chap. 3.2 Pelletizing). Order
is given for some forms of woody biomass fuel in terms of high specific surface area and
improvement in handling as follows, but higher treatment requires higher consumption of the
process energy (*e-4、*e-5) and results in higher cost.
Raw wood > fire wood > chips, briquette > pellet
Water content of firewood is 50% for raw material, and 15-30% for air-dried firewood. Both
are combustible, but latent heat of water (2.26 MJ/kg-water) is lost. Generally, when water
content exceeds 2/3, the fire gets extinguished because the remaining heat is not sufficient to
achieve the flame temperature. Drying of firewood consumes process energy, but part of
which can be partly recovered by the increase in the heat of combustion.

-84- Asian Biomass Handbook
3.1.3 Utilization of firewood Firewood can be used with simple equipment, but the mode of combustion changes as shown
below. Char combustion is 10-20% of the whole combustion.
Drying → dry-distillation → flame combustion → char combustion (~150℃,endothermic)
(250~400℃,endothermic) (main combustion) (solid combustion)
When air supply is in shortage, hazardous tar is produced in the dry-distillation stage. At
the stage of flame combustion, CO and soot (carbon particles) are produced, and part of tar is
converted into carcinogenic PAH by pyrolysis. To prevent these pollutant from getting in the
flue gas shown in Fig.3.1.4, high temperature and oxygen content is to be maintained by using
air amount a little bit in excess from stoichiometry.
For safe combustion of firewood, air ratio of 1.25-1.4 is usually employed. When the air
ratio is too high, the flame is diluted, and the flame temperature is lowered, thus, supplying
excess air as secondary air is recommended. A device to place combustion catalyst over the
flame is available commercially, which aims at achievement of complete combustion even at the
air ratio close to 1.0, but gas flow is deteriorated, and yearly exchange of the catalyst is needed.
[E]→cooker ↑ └→ heating
Fuel woods → stove ―――→ [flue gas] ―→(chimney) └→ ash pan ---―→[ash] ---→ fertilizer Fig.3.1.4 Material- and energy-flow after stove in fire wood system
*e1、*e 2、*e 3・・・ :energy supply from outside,
At the upper part of Fig.4 is shown the use of heat. For air conditioning, heat loss can be
small, but for cooking, effective use of heat is not always easy because heat transfer to the pot
is needed. Development of an apparatus that works as both cooking stove and room heater
requires elaborate work.
Generally, the top part of the stove, where the highest temperature is available, is used for
cooking. For hot water supply which does not need boiling, lower temperature part is
assigned.
Further Information
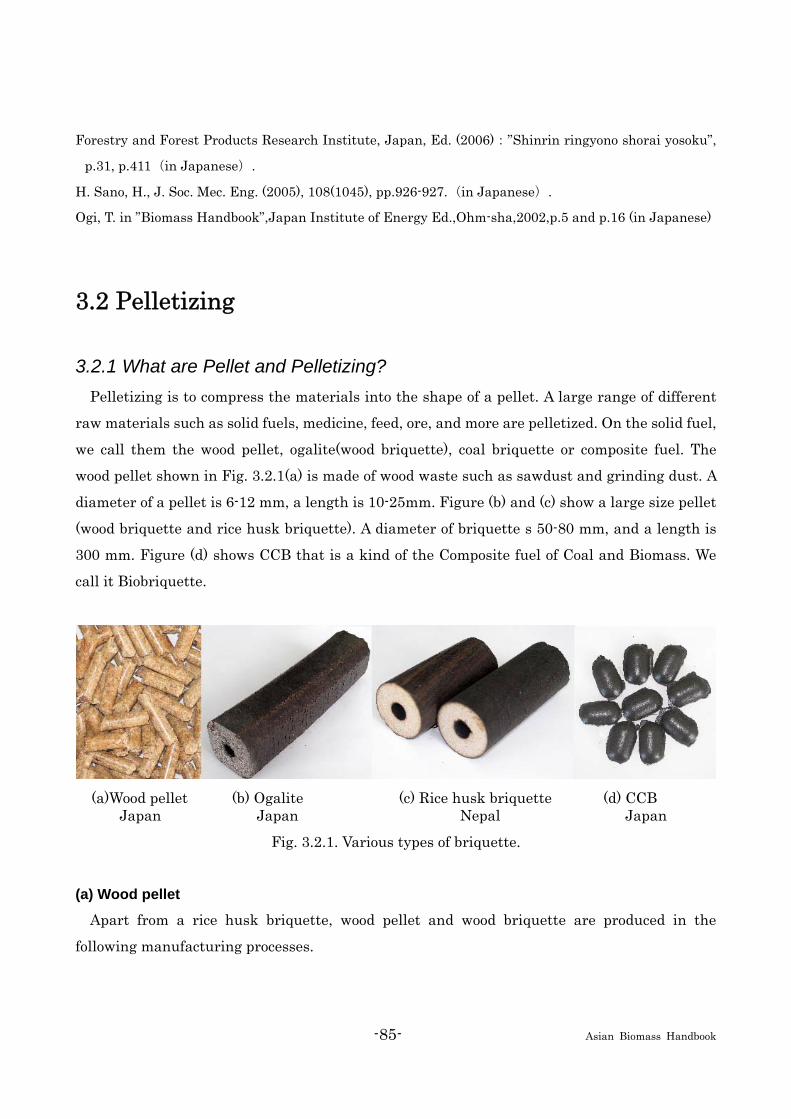
-85- Asian Biomass Handbook
Forestry and Forest Products Research Institute, Japan, Ed. (2006):”Shinrin ringyono shorai yosoku”,
p.31, p.411(in Japanese).
H. Sano, H., J. Soc. Mec. Eng. (2005), 108(1045), pp.926-927.(in Japanese).
Ogi, T. in ”Biomass Handbook”,Japan Institute of Energy Ed.,Ohm-sha,2002,p.5 and p.16 (in Japanese)
3.2 Pelletizing
3.2.1 What are Pellet and Pelletizing? Pelletizing is to compress the materials into the shape of a pellet. A large range of different
raw materials such as solid fuels, medicine, feed, ore, and more are pelletized. On the solid fuel,
we call them the wood pellet, ogalite(wood briquette), coal briquette or composite fuel. The
wood pellet shown in Fig. 3.2.1(a) is made of wood waste such as sawdust and grinding dust. A
diameter of a pellet is 6-12 mm, a length is 10-25mm. Figure (b) and (c) show a large size pellet
(wood briquette and rice husk briquette). A diameter of briquette s 50-80 mm, and a length is
300 mm. Figure (d) shows CCB that is a kind of the Composite fuel of Coal and Biomass. We
call it Biobriquette.
(a)Wood pellet (b) Ogalite (c) Rice husk briquette (d) CCB Japan Japan Nepal Japan
Fig. 3.2.1. Various types of briquette.
(a) Wood pellet
Apart from a rice husk briquette, wood pellet and wood briquette are produced in the
following manufacturing processes.

-86- Asian Biomass Handbook
(1) drying process
Generally the original moisture content of wood is about 50%. It is necessary to dry the raw
materials to moisture content 10-20% in order to obtain the optimum pulverizing and
pelletizing conditions. Big particle size of raw material should be dried with the rotary kiln,
and small particle size of raw material should be dried with the flash dryer.
(2) pulverizing process
The raw materials should be pulverized in accordance with size of the pellet. In case of whole
wood or large size wastes, the raw materials should be crushed before drying process in order
to prepare the moisture content uniformly. This process is needless in case of the raw material
is rice husk.
(3) pelletizing process
Pelletizer consists of feeder, roller, dies as shown in Fig. 3.2.2-3.2.3. Fig. 3.2.2 shows the
schematic drawing of pelletizer for wood pellet. This type of pelletizer is the most popular in
the world. Fig. 3.2.3 shows the schematic drawing of briquetting machine for wood briquette
and rice husk briquette.
(4) cooling process
Because the pellet of manufacture right after is high temperature and contains much
moisture, it needs to cool off.
(5) screening process
Low quality pellets are removed in this process. They are utilized as energy for drying.
hopper
screw feeder
dice
heatingunit
roll
ring dice
cutter
pellets
Fig.3.2.3. Briquetting machine for wood
and rice husk briquette. Fig. 3.2.2. Pelletizer for wood pellet.

-87- Asian Biomass Handbook
(b) CCB (Composite fuel of Coal and Biomass;Biobriquette)
In the second oil crisis, CCB was developed
as kerosene substitute fuel in Japan. CCB is a
kind of composite fuel of coal (<2 mm) and
biomass (<2 mm) that is produced by the high
pressure briquetting machine as shown in Fig.
3.2.4. The fundamental raw materials mixing
ratio of CCB is coal 70-90%, biomass 10-30%
by the weight. When coal includes sulfur
content, slaked lime or lime stone of
equivalence ratio 1-2 is added as a
desulfurizer. Coal can be utilized from a
lignite to smokeless coal, and wood waste,
agricultural waste and something like that
can be utilized as biomass. Because biomass is
mixed with coal and the combustion efficiency
of fuel is high, ignitability and flammability is good, there is a little emission of smoke, the
effect of energy saving is high. In particular the reduction of the carbon dioxide is easy so that
CCB includes 10-30% of biomass. The sulfurous acid gas of 50-80% can be reduced by adding
a desulfurizer with fuel The technology of CCB is one of the clean coal technology and
transferred to many countries as alternative fuels production technology of firewood, kerosene
and charcoal In particular, the technical support requests for energy saving, reduction of
carbon dioxide and prevention of acid are increasing rain from China.
3.2.2 Characteristics of pellet and CCB (a) Wood pellet
Characteristics of the wood pellet which compared with wood tip and fire wood are as follows;
handling, igniting and burning are easy, shape and characteristics of fuel are uniformly, there
is a little emission of harmful gas during burning, transportation efficiency is high, energy
density is high. (b) CCB
CCB includes 10-30% of biomass. Generally biomass has the defect that heat quantity is low.
screw feeder
roll tire
hopper
Fig. 3.2.4. Briquetting machine for CCB.

-88- Asian Biomass Handbook
On the other hand, it has superior characteristics such as good ignitability, good flammability,
little smoke emission, low ash content. These characteristics are not in coal and make the
utilizing of low quality coal possible. These characteristics make the use of low-grade coal
possible.
3.2.3 Fundamental test for briquetting (a) Wood pellet
It is thought that the factors that affect on pelletizing condition are pressure, temperature,
compression time, particle size of raw materials, moisture content and chemical composition of
wood. As for the boundary condition on pelletizing, it is not clear yet. It is actual that pellet is
produced on the basis of experience of operator. It is different with a kind of wood material, but
the experience value of pelletizing pressure and temperature is 70MPa and 100-150 degrees.
However, there is no doubt that lignin, glucide and pectin play as a binding agent. (b) CCB
We use a high pressure roll type briquetting machine for production of CCB. Tablet tests are
carried out to obtain the optimum blending ratio of the raw materials and indispensable as a
preliminary step in briquette manufacturing. The blended material is compressed to tablet of
25 mm diameter. A steel ball with a diameter of 20 mm is placed on a tablet and the ball is
forced down onto the tablet until the tablet breaks. The breaking strength is measured as the
criteria of quality. Fig. 3.2.5 shows the breaking strength of the tablets prepared from coal and
biomass. The breaking strength becomes increasingly higher as the content of the biomass
increases. Heating the raw materials under briquetting is an effective way to increase the
breaking strength. Fig. 3.2.6 shows that a higher temperature of molding increases the
breaking strength of tablet. This is attributable to the enhancement of the plastic deformation
of the biomass by heat. The blending ratio of coal and biomass that achieves a breaking
strength of briquette of 1 kN is 20% of biomass content and molding temperature 50 degrees.
Based on these results, the standard blending ratio of coal and biomass is determined. When a
CCB was produced with high pressure roll press machine, the shearing stress occurs between
roll tire and raw materials, and raw materials is heated in about 70-80 degrees. Therefore
heating control of raw materials is not done in briquetting process.
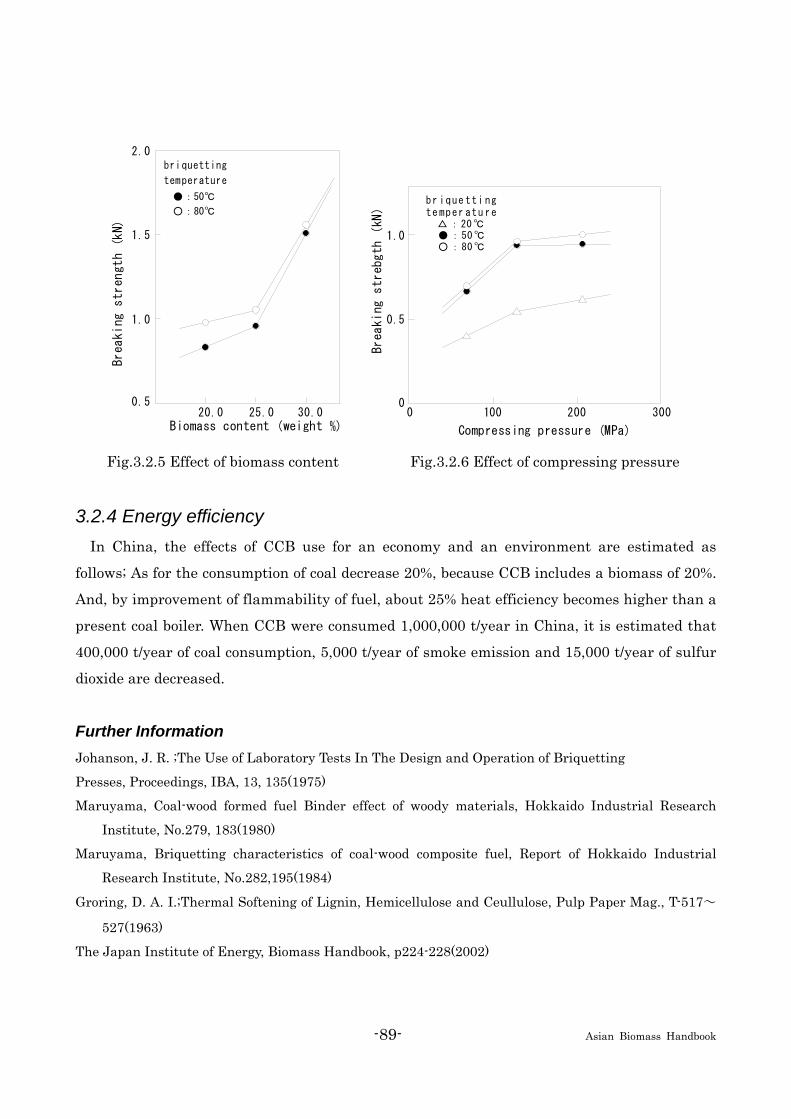
-89- Asian Biomass Handbook
0.5
1.0
Brea
king
str
ength
(kN)
20.0 25.0 30.0Biomass content (weight %)
1.5
2.0briquetting
temperature
●:50℃
○:80℃
0.5
0
1.0
Breaking
strebg
th
(kN
)
100 200 300
Compressing pressure (MPa)
br ique tti ngte mper atu re
△:20℃●:50℃○:80℃
0
Fig.3.2.5 Effect of biomass content Fig.3.2.6 Effect of compressing pressure
3.2.4 Energy efficiency In China, the effects of CCB use for an economy and an environment are estimated as
follows; As for the consumption of coal decrease 20%, because CCB includes a biomass of 20%.
And, by improvement of flammability of fuel, about 25% heat efficiency becomes higher than a
present coal boiler. When CCB were consumed 1,000,000 t/year in China, it is estimated that
400,000 t/year of coal consumption, 5,000 t/year of smoke emission and 15,000 t/year of sulfur
dioxide are decreased.
Further Information Johanson, J. R. ;The Use of Laboratory Tests In The Design and Operation of Briquetting
Presses, Proceedings, IBA, 13, 135(1975)
Maruyama, Coal-wood formed fuel Binder effect of woody materials, Hokkaido Industrial Research
Institute, No.279, 183(1980)
Maruyama, Briquetting characteristics of coal-wood composite fuel, Report of Hokkaido Industrial
Research Institute, No.282,195(1984)
Groring, D. A. I.;Thermal Softening of Lignin, Hemicellulose and Ceullulose, Pulp Paper Mag., T-517~
527(1963)
The Japan Institute of Energy, Biomass Handbook, p224-228(2002)
-90- Asian Biomass Handbook
3.3 Particleboard Production
3.3.1 Particleboard Composition board has many names and definitions. Particleboard is a general term for a
panel manufactured from lignocellulosic materials (usually wood), primarily in the form of
discrete pieces or particles, as distinguished from fibers, combined with synthetic resin or other
suitable binder. The particles are bonded together under heat and pressure in a hot press by a
process in which the entire interparticle bond is created by the added binder; other materials
may be added during manufacture to improve certain properties (ASTM D 1554). Classification
of particleboard varies, depending on country. For example, Japanese Industrial Standard (JIS)
A 5908 classifies particleboard into five categories on the basis of: 1) surface condition, 2)
bending strength, 3) adhesive, 4) formaldehyde release amount, and 5) flame resistance.
Fiberboard is a general term for a panel manufactured from lignocellulosic fiber. This chapter
does not cover fiberboard.
Products made from comminuted woody materials in the shape of fiber, shavings, and
particles can be made from woodworking waste, noncommercial or low-value wood, and
agriculture waste. Bark, forest slash, and industrial waste can be included in the products. The
manufacture of composition board is a conversion of previously unused natural resources to
useful products. Thus, particleboard production is considered a technology for recycling woody
cellulosic biomass resources for sustainable forestry.
3.3.2 Particleboard Production and Consumption There are 16 factories that manufacture particleboard in Japan (April, 2006). In October,
2006, total domestic production was 1,234,000 m3 and imported particleboard production was
391,000 m3. Of this total (1,625,000 m3), 60% was used for furniture and 37% was used for
construction. To meet the goals of Japanese laws for recycling 60 % dismantled construction
wood, 61% of raw materials for wood composite panel manufacturing was from dismantled
waste in 2005.
3.3.3 Particleboard Manufacture The process of particleboard manufacture is shown in Fig. 3.3.1. The first stage of the process

-91- Asian Biomass Handbook
is manufacturing raw particles from the mixture of waste wood, which is described as “particle
formation process.” Dismantled construction wood and industrial waste wood are processed on
different lines in the particle formation process. Several processes are performed for reducing
bulk wood to chip size and eliminating foreign materials. Raw materials are sent to a shear
crushing machine for initial size reduction, metal is removed by magnets, and the material is
then further reduced in a hammer crusher. Material is screened and sorted by airflow,
eliminating sand and concrete. The remaining raw material is sent through a search-coil
magnetometer, which eliminates non-metal foreign materials. The second stage of the process
is to manufacture board from the raw particles created by the first process. To obtain uniformly
thick particles, a ring flaker is used for particle size reduction. the particles are then dried and
screened. Energy for the drying kiln is often supplied by burning dust produced in the plant.
The particles are classified by size prior to blending them with adhesive. Separate surface and
core blenders are used for three-layered particleboards. The blended furnish is moved to the
three mat formers, hot-pressed, cured, and sanded. Nondestructive testing is sometimes
performed to eliminate products that include defects, such as blisters. After sanding, products
are inspected for shipping.
Fig.3.3.1. Particleboard Manufacturing Process. Courtesy of Saito, Y., Tokyo Board Industries, Co., Ltd.
-92- Asian Biomass Handbook
3.3.4 Use of Particleboard for Material Recycling Particleboard manufacture is a valuable process for recycling woody waste that might
otherwise be landfilled or burned. The process permits blending recycled materials with fiber
from other sources to achieve specific properties. For example, limiting shorter recycled
elements to the core and using longer elements from other sources on the surface can improve
strength. Particleboard manufacture is a mature industry in Japan, but there are
opportunities for improving the efficiency of the process. As oil prices continue to increase, the
costs for transportation, adhesives, and energy for plant operation continue to increase.
Particleboard manufacturers must compete with other industries for woody raw materials.
Some recent policies that focus on woody biomass for energy make the situation even worse.
The Minister of Agriculture, Forestry and Fishery started a comprehensive program focusing
on agricultural woody biomass resources, with clear goals for: 1) education, 2) technology
development of transportation fuel such as bio-ethanol, 3) promotion and networking of local
societies that use biomass resources, 4) research and development of technologies for using
woody biomass and other potential natural resources, 5) initiatives for using biomass products
and promoting recycling, and 6) technology transfer to other Asian countries. Most
particleboard industries that use local woody wastes intend to improve efficiency by increasing
their use of recycled material and supplementing energy for plant operation by burning
material that is unsuitable for manufacturing particleboard.
3.3.5 Statistics of Woody Biomass Including Wood-Based Panels Wood biomass includes bark, sawdust, and cut-offs from lumber, veneer, plywood, and
engineered wood products. The total amount of woody biomass use in Japan was 10,782,000 m3
in 2006. Almost all of this (10,197,000 m3 (95%)) was used as a biomass resource, while the rest
was discarded. Woody biomass is classified as: 1) wood chips, 4,408,000 m3 (43%); 2) fuel,
2,330,000 m3 (23%); 3) livestock bedding materials, 2,256,000 m3 (2 %); 4) compost or soil
improvement materials, 580,000 m3 (5.7%); and 5) wood-based panels such as particleboard
258,000 m3 (2.5%). Fuel (2,330,000 m3) is classified as: 1) energy for operating drying kilns
(1,550,000 m3), 2) electric power (595,000 m3), and 3) energy for manufacturing pellets (46,000
m3).

-93- Asian Biomass Handbook
3.3.6 Application in Asia Kenaf grows faster than wood and is considered an environmentally friendly material.
Panasonic Malaysia developed an environmentally friendly system for manufacturing kenaf
(Hibiscus cannabinus) particleboard. The process decreased pollution, thus conserving
Malaysia’s rich coral reef ecosystem. The technique for manufacturing kenaf board was
originally developed in cooperation with Kyoto University using kenaf grown in China. In 2005,
Panasonic succeeded in developing a process for growing kenaf in Malaysia that was suitable
for manufacturing high quality kenaf particleboard. This process produces 30% waste, but the
fiber is burned to provide electric power for the manufacturing plant and the ash is returned to
fields to fertilize kenaf (see http://panasonic.co.jp/ism/kenaf/index.html).
Further Information American Society for Testing Materials (ASTM) Standard. D 1554 Standard Terminology Relating to
Wood-Base Fiber and Particle Panel Materials. (2001)
Japanese Industrial Standard (JIS) A 5908. Particleboards. (2003)
“Field survey on use of woody biomass,” Statistic Department, Minister of Agriculture, Forestry and
Fishery. (2006)
Statistics of Ceramics and Construction Materials, Ministry of Trade and Industry,
ISBN:9784903259192. (2006)
Thomas M. Maloney, Modern Particleboard. ISBN 0-87930-063-9. Published by Miller Freeman
Publications Inc. (1977)
Walter T, Kartal S.N, Hang W.J, Umemura S, Kawai S. Strength, decay and termite resistance of
oriented kenaf fiberboard. J Wood Science, 53(6) 481-486 (2007)
S. Kawai, K. Ohnishi, Y. Okudaira and M. Zhang. Manufacture of oriented fiberboard from kenaf bast
fibers and its application to the composite panels. The 2000 International Kanaf Symposium,
p.144-148, Oct. 13-14, Hiroshima (2000)
K. Ohnishi, Y. Okudaira, M. Zhang, and S. Kawai. Manufacturing and properties of oriented medium
density fiberboard from non-wood lignocellulosic fibers I. Mokuzai Gakkaishi, 46 (2) 114-123 (2000)
(Japanese)
S. Suzuki. The state of the arts on current timber structures. V: The state of the arts on reuse and recycle
of wooden structures. Journals of the Society of Materials Science, Japan, 53 (4) 465-470 (2004)
(Japanese)
-94- Asian Biomass Handbook
Part 4. Thermochemical conversion of biomass
4.1 Combustion
4.1.1 General scope (a) What is combustion?
Combustion is an exothermic chemical reaction accompanied by large heat generation and
luminescence, and is a phenomenon in which the reaction is spontaneously continued by the
heat generated by the reaction. When using biomass as fuel, the heat-generating oxidation
reaction, where carbon, hydrogen, oxygen, combustible sulfur, and nitrogen contained in
biomass react with air or oxygen, is known as combustion, industrially. Combustion process
proceeds by gas phase reaction, surface reaction, or both, following processes such as fusion,
evaporation, and pyrolysis. In actual combustion reaction, complicated phenomena such as
evaporation, mixture, diffusion, convection, heat conduction, radiation, and luminescence
advance complexly at a very high velocity. Gas fuel burns directly in gas phase as premix
combustion or diffuse combustion. Liquid fuel burns as inflammable gas in gas phase after
surface evaporation, which is called evaporation combustion., Heavy oil etc. burns in
evaporation combustion but decomposition combustion also proceeds, where decomposing the
fuel portion occurs by the produced heat. (b) Forms of combustion
The combustion forms of direct combustion of biomass, which is in solid form, include
evaporation combustion, decomposition combustion, surface combustion, and smoldering
combustion. In evaporation combustion, the fuel containing simple component and molecular
structure with comparatively low fusing point fuses and evaporates by heating, and reacts with
oxygen in gas phase and burns. In decomposition combustion, gas produced from thermal
decomposition by heating (H2, CO, CmHn, H2O, and CO2) reacts with oxygen in gas phase, forms
flame, and burns. Usually, char remains after these forms of combustion and burns by surface
combustion. Surface combustion occurs in the case of the component composed of only carbon

-95- Asian Biomass Handbook
containing little volatile portions such as charcoal, and oxygen, CO2, or steam diffuses to pores
existing inside or on solid surface of the component, and burns by surface reaction. Smoldering
combustion is the thermal decomposition reaction at temperature lower than the ignition
temperature of volatile component of the reactive fuels such as wood. If ignition is forced to
smoke or temperature exceeds ignition point, flammable combustion occurs. In industrial
direct combustion of biomass, decomposition combustion and surface combustion are the main
forms of the combustion. (c) Combustion method
Industrially, combustion surplus air is supplied in addition to the theoretical amount
required for biomass combustion. If surplus air rate is too high, it causes decrease in
combustion temperature and thermal efficiency. As the combustion method of biomass, grate
combustion (fixed grate and moving grate), fluidized bed combustion, rotary hearth furnace
combustion, and burner combustion are used. The features of each combustion method are
shown in Table 4.1.1.
(d) Application
The combustion of biomass is the simplest use of biomass to obtain heat, and is widely used
because experiences of fossil fuel technology can be applied, because generation of NOx, SOx,
Table 4.1.1 Combustion type and feature of biomassCombustion method
Combustion type Features
Fixed bed combustion
Horizontal/Inclined grate
Water-cooling grate Dumping grate
Grate is level or sloping. Ignites and burns as surface combustion of biomass supplied to grate. Used in small-scale batch furnace for biomass containing little ash.
Moving bed combustion
Forward moving grateReverse moving grateStep grate Louver grate
Grate moves gradually and is divided into combustion zone and after-combustion zone. Due to continuous ash discharge, grate load is large. The combustion obstruction caused by ash can be avoided. Can be applied to wide range of fuels from chip type to block type.
Fluidized bed combustion
Bubbling fluidized bed combustion Circulation fluidized bed combustion
Uses sand for bed material, keeps fuel and sand in furnace in boiling state with high-pressure combustion air, and burns through thermal storage and heat transmission effect of sand. Suitable for high moisture fuel or low grade fuel.
Rotary hearth furnace combustion
Kiln furnace Used for combustion of high moisture fuel such as liquid organic sludge and food residue, or large waste etc. Restricted to fuel size on its fluidity.
Burner combustion
Burner Burns wood powder and fine powder such as bagasse pith by burners, same as that for liquid fuel.
-96- Asian Biomass Handbook
HCl, and dioxin is low, which is the advantage of biomass combustion, and because
flammability is excellent. Combustion heat is used for power generation and heat production by
recovering heat through heat transfer media such as steam and hot water using boilers and
heat exchangers. In district heat supply and in energy centers of industrial complexes,
cogeneration fueled by waste wood and agricultural waste is widely used. There are many
power plants and heat utilization plants regardless of scale using paddy husk, bagasse, waste
wood, oil palm waste and poultry chicken droppings, etc. as fuels.
Further information Fujii, S. in “Baiomasu Enerugino Riyo, Kenchiku, Toshi Enerugi Sisutemuno Shingijutsu", Kuuki Chowa
Eisei Kogakkai Ed., 2007, pp.212-218 (in Japanese)
Mizutani, Y. in "Nensho Kogaku", 3ed., Morikita Shuppan, 2002, pp.169-181 (in Japanese)
4.1.2 CHP (a) What is CHP?
Production of electricity and heat from one energy source at the same time is called
Combined Heat and Power (CHP). Because the energy efficiencies are higher than the cases to
produce only electricity, attention is paid to CHP by the viewpoint of effective use for energy. (b) Energy conversion in CHP
To generate electricity from biomass, the energy of the biomass is changed into the kinetic
energy, the dynamo is turned by it, and the electrical energy is obtained. The main method of
changing the energy of the biomass into the kinetic energy is as follows; 1) Steam is made by
heat of combustion of the biomass and the steam turbine is turned, 2) The combustible gas is
made by pyrolysis or microbial degradation of biomass and the gas engine or the gas turbine is
turned using the gas. In any case, the heat obtained by the combustion is converted into the
kinetic energy. As all thermal energy cannot be converted into the kinetic energy, a part of the
heat is discharged. The energy efficiency of the biomass utiliazation can be improved if this
heat is collected and supplied with the electricity. The CHP has the advantage of raising the
energy conversion efficiency in this way. (c) Possibility of a large-scale plant
CHP can be applied even in a large-scale power plant. The reason for locating a thermal
power plant and a nuclear plant near the coast or the big river is to use a large amount of
seawater or river water to throw away heat. On the other hand, there is a case to sell the heat
that occurs from the power plant to the nearby factories. It would be desirable to consider heat

-97- Asian Biomass Handbook
supply when a large-scale power plant is planned. (d) Applicability of factories and housing complexes
The CHP facilities can be designed and be set up in a factory or a housing complex according
to the demand for the electric power and heat. There are various specifications for the obtained
heat from the steam of high temperature and high pressure to the warm water. The collections
and supplies of the heat are easier at low temperature and low pressure. The steam and the hot
water can also be supplied by combining the CHP facilities with the existing boiler. When the
biomass is used as fuel, the generation efficiency decreases when the scale of the facilities gets
smaller. In case of the boiler and turbine processes, the scale of 2,000 kW or more in electrical
output is necessary and in case of the gasification and gas engine process, the scale of 50 kW or
more in electrical output is also necessary. (e) Examples
An example of the small-scale CHP facility using woody biomass is shown below. In this
facility, the wood scrap from the factory is used as fuel, pyrolysis and gasification is performed
and electricity, hot air, hot water and cold water are supplied to the factory. The process flow
diagram is shown in Fig. 4.1.1.
Fig. 4.1.1. Outline flow diagram of a small CHP using woody biomass
Gross power output of electricity is 175 kW and net power output is 157 kW. Heat outputs are
174 kW (150 Mcal/h) as hot air (67oC), 116 kW (100 Mcal/h) as hot water (80oC) and 70 kW (60
Mcal/h) as cold water (7oC). The energy efficiency in the facility can be raised by using heat that
is originally thrown away as exhaust and cooling water.
Silo
Gasifier Gas cleaner
Gas engine
Generator
Fuel
Charcoal Ash
Electricity
Heat exchanger
Absorption chiller
Hot water for air-conditioning
Cold water for air-conditioning
Hot air for heating
Exhaust
Heat exchanger
-98- Asian Biomass Handbook
4.1.3 Co-Firing (a) What is co-firing?
Co-firing refers to the technology whereby biomass is fired with fossil fuels at thermal power
stations and so on. The advantage of this technology is that, simply by making some minor
revisions to existing equipment to enable biomass treatment, it becomes possible to fire
biomass in highly efficient large-scale combustion facilities. Here, an introduction is given to
research and development of coal and woody biomass co-firing technology that has been jointly
implemented by The Chugoku Electric Power Co., Inc., Hitachi Ltd. and Babcock-Hitachi K.K. (b) Goals
Upon burning around 5-10% of woody biomass in a coal fired power station (hereafter the
proportion of mixed fuel is shown in terms of the calorific base), they aimed to secure stable
operation and to clear environmental standards while at the same time minimizing any
reduction in generating efficiency. Aiming for generating efficiency equivalent to approximately
40% the level in the existing coal fired power station, they held the reduction in efficiency at
the sending end to within 0.5% when the mixed fuel firing rate was 5% (and within 0.8% when
the mixed fuel firing rate was 10%). (c) Feedstock
Based on component analysis of pine, cedar, cypress and bamboo, etc., woody biomass has
greater volatile content than coal (bituminous coal), its fuel ratio (ratio of fixed carbon content
to volatile matter content) is approximately 1/10 of that of coal, and its ash content is low. Upon
conducting tests in a small hammer mill, etc., grinding power consumption for woody biomass
was at least 10 times higher than that for the same weight of coal and simultaneous grinding
testing of coal and woody biomass revealed that the grindability of coal is reduced a lot when
the mixing ratio of wood is increased. (d) Process flow
Figure 4.1.2 shows the flow diagram of the biomass pretreatment equipment. The woody
biomass consisted of thinned timber and bamboo chips procured from the Chugoku region with
a size of no more than 50 mm and water content of 50wt%. The chips were crushed to a size
suitable for drying (no more than 20 mm) and dried to a water content of 20% or less. Next, two
types of pulverizer were combined to regulate the pieces to a top size of 1~5 mm, and the
materials were blown into the furnace by fixed quantity feeder. The mixed fuel firing rate was a
maximum of 15%. Two types of burner were used: a coaxial coal and biomass mixed burner and
a biomass dedicated burner (separately installed).

-99- Asian Biomass Handbook
(e) Results
Figure 4.1.3 shows some of the test results. As the proportion of mixed fuel was increased,
the unburned matter and relative value of NOx fell in both the coaxial burner and separately
installed burner. The reduction in the unburned matter indicates that mixing of the highly
volatile biomass caused the ambient temperature to rise and the combustion efficiency of the
fuel itself to increase. The rate of decline in NOx was lower than the value forecast from the
rate of decline in the N content of fuel .
8
6
4
2
00
Biomass co-fir ing ratio (%)
Co-axial burnerSeparate burner
Wood type : pine(moisture21%,-2mm)
20
UB
C i
n a
sh
(%)
5 10 15
1.2
1 .0
0 .8
0 .6
0 .4
0 .2
00
Biomass co-fir ing ratio (%)
Co-axial burner
Separate burner
Wood type : pine(moisture21%,-2mm)
20
Rela
tive N
ox
(-)
5 10 15
Forecast from the fuel N
Combustion test value
Fig. 4.1.3 Mixed Fuel Firing Test Results
1m
Cyclone
Pulverizer-1
m
Burner
BlowerFeeder
FeederBiomass inlet
Drier
Stack
HopperCrusher
Heater Furn
ace
Hopper 5
Baghouse
Feeder
Switcher
3
Pulverizer-2
3Hopper
Fig. 4.1.2 Schematic of the Pretreatment Flow

-100- Asian Biomass Handbook
(f) Efficiency
Based on the results of the combustion tests, the basic equipment and system composition in
the case of application to the existing coal fired power station (selecting three units of 75-500
MW) was examined and the power generating efficiency and generating cost were assessed.
Factors that cause the mixed fuel firing to affect power generating efficiency are thought to be
changes in boiler efficiency and auxiliary power. In the case where thinned wood chips having
water content of 30% and chip size of 50 mm or less following natural drying of the forest land,
etc. are introduced to the power station, this wood is converted to crushed biomass of 20%
water content and 2-mm particle size following pulverization and conveyance, and this is
combusted in the boiler, whereas the unburned matter of ash is lower than in the case of firing
only coal, the boiler efficiency drops slightly due to the water content of the woody biomass. As
for auxiliary power of the plant, from the pilot test findings and based on estimation of the
crushing power in the case where a two-stage shock crusher is used, the drop in overall sending
end efficiency is 0.44% and 0.77% when the proportion of mixed fuel is 5% and 10% respectively,
and these values are within the respective targets of 0.5% and 0.8%. Furthermore, upon
comparing costs between woody biomass-only firing (10 MW) and mixed fuel firing, since the
mixed fuel firing was less expensive than dedicated firing (11.3 yen/kWh), the superiority of
mixed fuel firing was confirmed.
4.2 Gasification
4.2.1 Definition The process to convert biomass solid raw material into fuel gas or chemical feedstock gas
(syngas) is called gasification or thermochemical gasification.
4.2.2 Classification of gasification method Gasification methods are classified according to combinations of conditional factors shown in
Table 4.2.1..
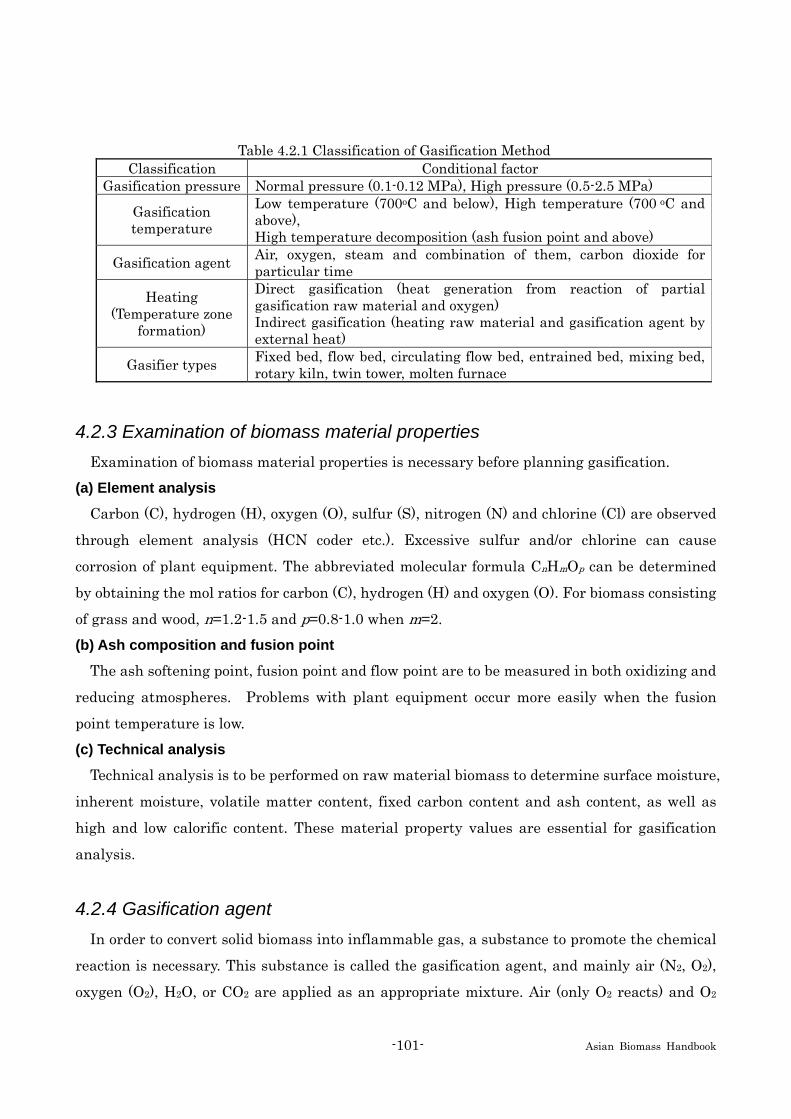
-101- Asian Biomass Handbook
4.2.3 Examination of biomass material properties Examination of biomass material properties is necessary before planning gasification.
(a) Element analysis
Carbon (C), hydrogen (H), oxygen (O), sulfur (S), nitrogen (N) and chlorine (Cl) are observed
through element analysis (HCN coder etc.). Excessive sulfur and/or chlorine can cause
corrosion of plant equipment. The abbreviated molecular formula CnHmOp can be determined
by obtaining the mol ratios for carbon (C), hydrogen (H) and oxygen (O). For biomass consisting
of grass and wood, n=1.2-1.5 and p=0.8-1.0 when m=2. (b) Ash composition and fusion point
The ash softening point, fusion point and flow point are to be measured in both oxidizing and
reducing atmospheres. Problems with plant equipment occur more easily when the fusion
point temperature is low. (c) Technical analysis
Technical analysis is to be performed on raw material biomass to determine surface moisture,
inherent moisture, volatile matter content, fixed carbon content and ash content, as well as
high and low calorific content. These material property values are essential for gasification
analysis.
4.2.4 Gasification agent In order to convert solid biomass into inflammable gas, a substance to promote the chemical
reaction is necessary. This substance is called the gasification agent, and mainly air (N2, O2),
oxygen (O2), H2O, or CO2 are applied as an appropriate mixture. Air (only O2 reacts) and O2
Table 4.2.1 Classification of Gasification Method Classification Conditional factor
Gasification pressure Normal pressure (0.1-0.12 MPa), High pressure (0.5-2.5 MPa)
Gasification temperature
Low temperature (700oC and below), High temperature (700 oC and above), High temperature decomposition (ash fusion point and above)
Gasification agent Air, oxygen, steam and combination of them, carbon dioxide for particular time
Heating (Temperature zone
formation)
Direct gasification (heat generation from reaction of partial gasification raw material and oxygen) Indirect gasification (heating raw material and gasification agent by external heat)
Gasifier types Fixed bed, flow bed, circulating flow bed, entrained bed, mixing bed, rotary kiln, twin tower, molten furnace

-102- Asian Biomass Handbook
generate heat by oxidation, and increased O2 decreases the effective amount of inflammable
gas.
4.2.5 Fundamental phenomenon of biomass gasification Fundamental gasification processes are as follows:
(a) Evaporation of surface moisture
Surface moisture evaporates from the raw material at the water boiling point (depends on
pressure). Inner moisture remains when the raw material is large. (b) Evaporation of inherent moisture
Following surface moisture evaporation, inherent moisture evaporates at 110-120℃.
(c) Volatilization
Thermal decomposition of biomass begins at 200-300℃, and CO, CO2, H2 and H2O are
vaporized as gas. Thermal decomposition is a heat generating reaction which is a characteristic
phenomenon of biomass CnHmOp). (d) Volatilization and gasification reaction
The temperature is raised further during volatilization, and the volatile matter of the
lightweight hydrocarbons (CxHy: where x and y are integers of at least 1; a low value of x
indicates lightness and a high value of x indicates heaviness) is transformed into heavy CxHy
with a high boiling point. Subsequently, the CxHy reacts with the gasifying agent for conversion
to lightweight molecule clean gas, although tar and soot can form when diffusion of the
gasifying agent is slow and the CxHy condenses. (e) Char gasification
Following volatilization of the volatile content in the raw material biomass, the fixed carbon
and ash become char, and the char is heated to the surrounding temperature. The subsequent
reaction with the gasifying agent transforms the carbon into CO and CO2. However, in cases
where the gasifying agent contains excess steam and the surrounding temperature is over
750℃, a wet gas reaction occurs (C+H2O ( CO+H2) producing gas composed mainly of CO, CO2
and H2.
(f) Char residue
The reaction rate of the wet gas reaction is slow, and char residue can easily form. The formation
of tar, soot and char tends to reduce efficiency, as well causing equipment trouble.

-103- Asian Biomass Handbook
4.2.6 Characteristics of gasification product gas Gasification generally adopts the direct gasification method with partial combustion of raw
material to raise the temperature. Raw materials are mainly wood chips and corn stalks. Most
gasification furnaces use normal pressure and a direct gasification process. To keep the
reaction temperature at 800℃ and above for direct gasification, air, oxygen and steam (as
appropriate) are required for the gasification agent. For this purpose, approximately 1/3 of the
oxygen required for complete combustion (known as the oxygen ratio) is supplied, with partial
combustion (partial oxidation) causing gasification. The calorific value of product gas depends
on the percentage of inflammable gas (CO, H2, CxHy) contained. Generally, gas can be divided
into low calorie gas (4-12 MJ/m3), medium calorie gas (12-28 MJ/m3) and high calorie gas
(above 28 MJ/m3). For the most part, direct gasification of biomass yields low calorie gas. Fig.
4.2.1 presents composition of the product gas from rice straw when steam and oxygen is
employed as gasifying agent. The ratio between the calorific content of the biomass and that of
the product gas (at room temperature) is called cold gas efficiency.
4.2.7 Gasification equipment and a practical example Here is shown a fixed bed gasifier, based on the combustion or gasification of solid fuel, and
featuring a comparatively simple structure and low equipment cost. Fig. 4.2.2 shows a concept
diagram of the gasifier. Wood chips of about 2.5-5 cm are generally used as the raw material.
They are supplied from the upper feed port, and layered in the furnace. The gasifying agent (air,
oxygen, steam or a mixture thereof) is supplied from the bottom in a rising flow (some systems
CO2
C2+
CH4
CO
H2
0 0.25 0.50 0.75 1.00[O2] / [C] Mol Ratio
H2,
CO,
CH 4
,C
2+ ,C
O2
(vol
%)
0
20
40
60
80
1000
20406080
100〔Note〕 C2
+ means C2H4,C2H6,C3H8
Col
d G
as E
fficie
ncy
(%)
Fig. 4.2.1 Changes in product gas
composition due tooxygen ratio
Rotary Fire Grate
Gasifier Main Unit (insulated walls)
Product GasProduct Layer
Volatalization & Decomposition Layer
Char Layer
Ash Layer
Gasification Agent(Air, Oxygen and Steam)
Ash
Biomass Supply(Wood Chips Approx. 5cm)
Drying and Tar Removal~250℃
Volatile Content Gasification250~800℃
Char Gasification800~1000℃
Char Combustion1000~1200℃
Fig. 4.2.2 Concept diagram of a fixed bed gasifier
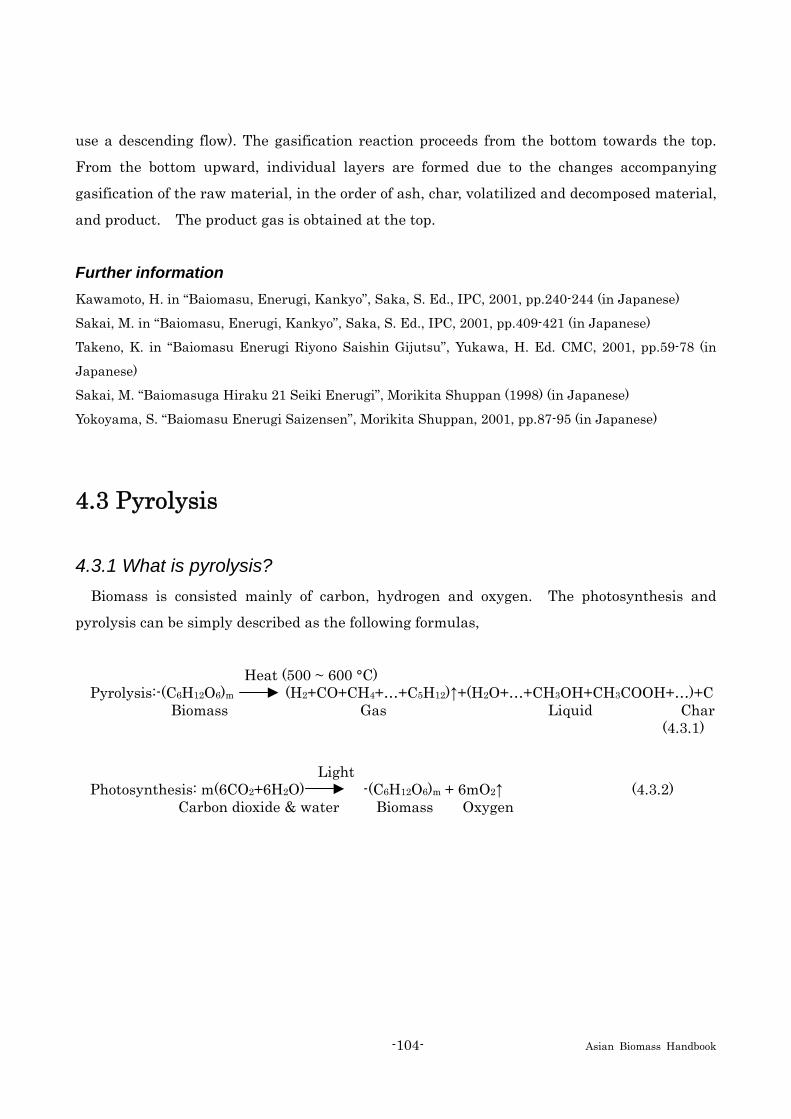
-104- Asian Biomass Handbook
use a descending flow). The gasification reaction proceeds from the bottom towards the top.
From the bottom upward, individual layers are formed due to the changes accompanying
gasification of the raw material, in the order of ash, char, volatilized and decomposed material,
and product. The product gas is obtained at the top.
Further information Kawamoto, H. in “Baiomasu, Enerugi, Kankyo”, Saka, S. Ed., IPC, 2001, pp.240-244 (in Japanese)
Sakai, M. in “Baiomasu, Enerugi, Kankyo”, Saka, S. Ed., IPC, 2001, pp.409-421 (in Japanese)
Takeno, K. in “Baiomasu Enerugi Riyono Saishin Gijutsu”, Yukawa, H. Ed. CMC, 2001, pp.59-78 (in
Japanese)
Sakai, M. “Baiomasuga Hiraku 21 Seiki Enerugi”, Morikita Shuppan (1998) (in Japanese)
Yokoyama, S. “Baiomasu Enerugi Saizensen”, Morikita Shuppan, 2001, pp.87-95 (in Japanese)
4.3 Pyrolysis
4.3.1 What is pyrolysis? Biomass is consisted mainly of carbon, hydrogen and oxygen. The photosynthesis and
pyrolysis can be simply described as the following formulas,
Heat (500 ~ 600 °C) Pyrolysis:-(C6H12O6)m (H2+CO+CH4+…+C5H12)↑+(H2O+…+CH3OH+CH3COOH+…)+C Biomass Gas Liquid Char
(4.3.1)
Light Photosynthesis: m(6CO2+6H2O) -(C6H12O6)m + 6mO2↑ (4.3.2) Carbon dioxide & water Biomass Oxygen

-105- Asian Biomass Handbook
The main chemical components of biomass are
cellulose, hemicellulose and lignin. Fig. 4.3.1
shows the composition changing during pyrolysis.
The cellulose, hemicellulose and lignin are
decomposed with temperature increase. Solid
residue is char in the yield of 10 to 25%.
4.3.2 Characteristics of pyrolysis During pyrolysis, moisture evaporates at first
(- 110°C), and then hemicellulose is decomposed
(200- 260°C), followed by cellulose (240-340 °C)
and lignin (280-500 °C). When temperature
reaches 500°C, the reactions of pyrolysis are almost finished. Therefore, at the heating rate of
10°C/s, the pyrolysis finishes in 1 min, while it finishes in 5 s at 100°C/s. Higher heating rate
results in the more rapid generation of vapor product, increasing pressure, shorter residence
time of vapor product in the reactor, and higher liquid yield; named fast pyrolysis or flash
pyrolysis. Dynamotive (Canada) and BTG (Netherlands) have developed fast pyrolysis
reactors, which show high liquid yield of 60 to 80%. Since heat conductance of wood is
0.12−0.42 W/(m K), which is around 1/1000 of copper, heat transfer is important for fast
pyrolysis, and the milling to small particles is required.
4.3.3 Reactors at laboratory scale Thermobalance is most commonly used at laboratory for the fundamental study. Very small
amount of sample, around a few mg to 10s mg, is heated up from room temperature to the
desired temperature at the desired heating rate to measure the weight changing. However, it
is difficult to recover the products.
A few g to 10s g of sample is used at laboratory scale rector to recover the products. Sand
bath or molten salt bath are used as the heater for the batch type reactor. Infrared rays
heater is usually used for the continuous reactor. At these reactors, mass balance and product
analysis are studied.
Carbonizedresidue
Charcoal
(Residue weight) / (initial weight) [wt%]
Water solubledistillate
Lignin
Gas
Non-volatile residue
Wei
ght f
ract
ion Cellulose
etc.
(Room temperature)HighLow
Liquid product
Gas
Temperature
H2O, me-thanol,acetic acid,phenol,etc.
Guaiacol, eu-genol, etc.
Heavy distillate
(Tar)
Hemicellulose
(Wood vinegar)
Fig. 4.3.1 Composition changing duringpyrolysis.
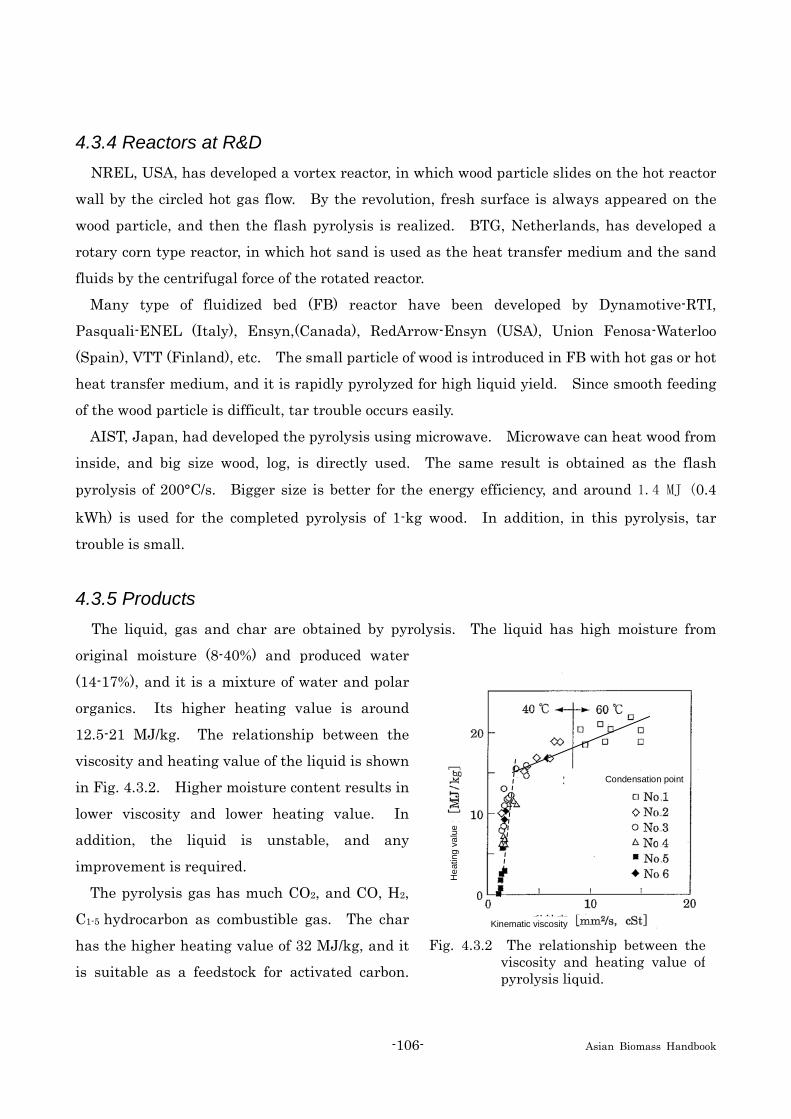
-106- Asian Biomass Handbook
4.3.4 Reactors at R&D NREL, USA, has developed a vortex reactor, in which wood particle slides on the hot reactor
wall by the circled hot gas flow. By the revolution, fresh surface is always appeared on the
wood particle, and then the flash pyrolysis is realized. BTG, Netherlands, has developed a
rotary corn type reactor, in which hot sand is used as the heat transfer medium and the sand
fluids by the centrifugal force of the rotated reactor.
Many type of fluidized bed (FB) reactor have been developed by Dynamotive-RTI,
Pasquali-ENEL (Italy), Ensyn,(Canada), RedArrow-Ensyn (USA), Union Fenosa-Waterloo
(Spain), VTT (Finland), etc. The small particle of wood is introduced in FB with hot gas or hot
heat transfer medium, and it is rapidly pyrolyzed for high liquid yield. Since smooth feeding
of the wood particle is difficult, tar trouble occurs easily.
AIST, Japan, had developed the pyrolysis using microwave. Microwave can heat wood from
inside, and big size wood, log, is directly used. The same result is obtained as the flash
pyrolysis of 200°C/s. Bigger size is better for the energy efficiency, and around 1.4 MJ (0.4
kWh) is used for the completed pyrolysis of 1-kg wood. In addition, in this pyrolysis, tar
trouble is small.
4.3.5 Products The liquid, gas and char are obtained by pyrolysis. The liquid has high moisture from
original moisture (8-40%) and produced water
(14-17%), and it is a mixture of water and polar
organics. Its higher heating value is around
12.5-21 MJ/kg. The relationship between the
viscosity and heating value of the liquid is shown
in Fig. 4.3.2. Higher moisture content results in
lower viscosity and lower heating value. In
addition, the liquid is unstable, and any
improvement is required.
The pyrolysis gas has much CO2, and CO, H2,
C1-5 hydrocarbon as combustible gas. The char
has the higher heating value of 32 MJ/kg, and it
is suitable as a feedstock for activated carbon.
Condensation point
Kinematic viscosity
Hea
ting
valu
e
Fig. 4.3.2 The relationship between theviscosity and heating value ofpyrolysis liquid.

-107- Asian Biomass Handbook
However, all of the char is usually used as heat resource for the pyrolysis system.
4.3.6 Status of technology The pyrolysis liquid can not be mixed with the transportation fuel, and any improvement is
required. There is tar trouble, but the know-how to operate the rector is not opened. To get
liquid at high yield, rapid heating and cooling are needed, and heat loss and recovery is an
important issue. Merit and demerit should be considered.
Further information Miura, M. in “Biomass Handbook”, Japan Institute of Energy Ed., Ohm-sha, 2002, pp.106-115 (in
Japanese)
Miura, M.; Kaga, H.; Sakurai, A.; Takahashi, K. Rapid pyrolysis of wood block by microwave heating, J. Anal. Appl. Pyrolysis, 71, 187-199 (2004)
4.4 Carbonization
4.4.1 What is carbonization? Carbonization is the method or technology to obtain charcoal as the main product by heating
such solid biomass as wood, bark, bamboo, rice husks, etc. at 400-600°C in the almost or
complete absence of air or oxygen. It can afford tar, pyroligneous acid, and combustible gases as
by-products. In case of discrimination from ‘dry distillation’ aiming at the recovery and
utilization of liquid products, ‘charcoal making’ is used as the terminology. Carbonization
customarily means charcoal making, although it is the general term including dry distillation.
4.4.2 Characteristics of carbonization Carbonization is a classical energy conversion means of biomass, similarly to combustion.
While the main objective is increase in the calorific value of the solid product charcoal, it has
two sides of liquefaction and gasification. As liquefaction means corresponding to ordinary
pyrolysis (see Chapter 4.3), commercial operation was early examined together with high
pressure (direct) process (Chapter 4.6). However, the obtained tar (oil) was in a low yield (<
30%) with poor quality (high viscosity, high oxygen content, low heating value, low pH, etc.), so
that the process was given up after the appearance of rapid pyrolysis (Chapter 4.3) yielding a
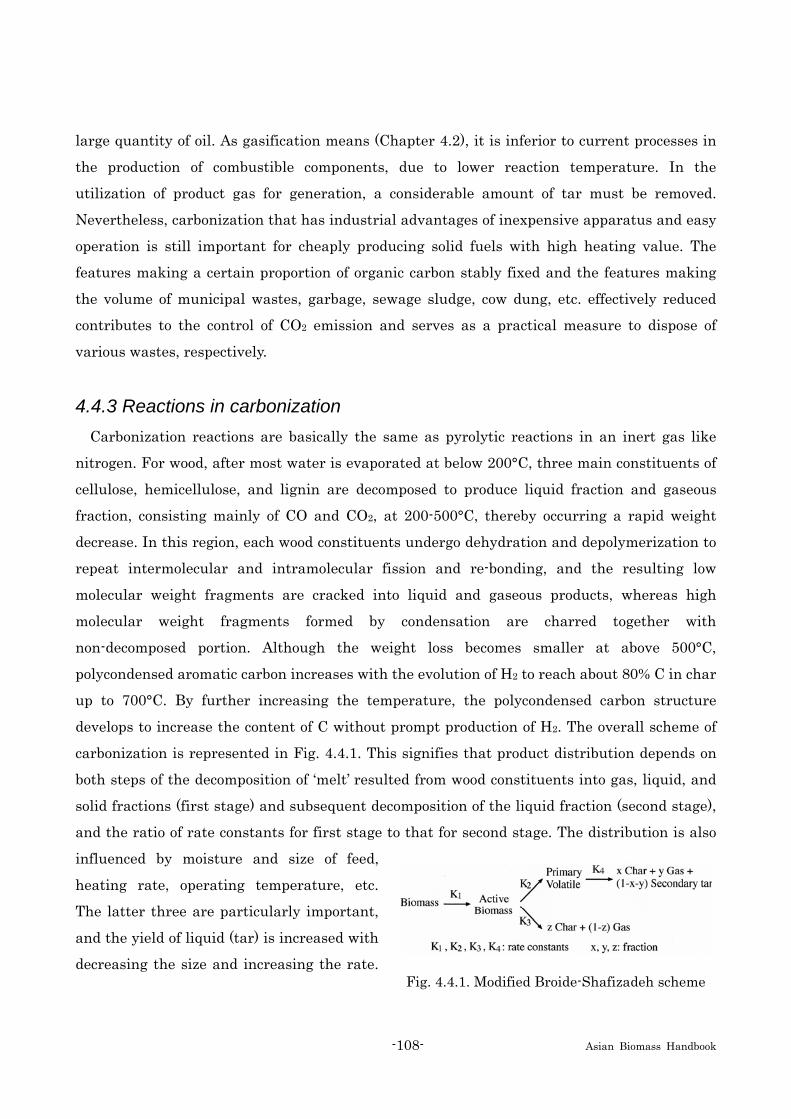
-108- Asian Biomass Handbook
Fig. 4.4.1. Modified Broide-Shafizadeh scheme
large quantity of oil. As gasification means (Chapter 4.2), it is inferior to current processes in
the production of combustible components, due to lower reaction temperature. In the
utilization of product gas for generation, a considerable amount of tar must be removed.
Nevertheless, carbonization that has industrial advantages of inexpensive apparatus and easy
operation is still important for cheaply producing solid fuels with high heating value. The
features making a certain proportion of organic carbon stably fixed and the features making
the volume of municipal wastes, garbage, sewage sludge, cow dung, etc. effectively reduced
contributes to the control of CO2 emission and serves as a practical measure to dispose of
various wastes, respectively.
4.4.3 Reactions in carbonization Carbonization reactions are basically the same as pyrolytic reactions in an inert gas like
nitrogen. For wood, after most water is evaporated at below 200°C, three main constituents of
cellulose, hemicellulose, and lignin are decomposed to produce liquid fraction and gaseous
fraction, consisting mainly of CO and CO2, at 200-500°C, thereby occurring a rapid weight
decrease. In this region, each wood constituents undergo dehydration and depolymerization to
repeat intermolecular and intramolecular fission and re-bonding, and the resulting low
molecular weight fragments are cracked into liquid and gaseous products, whereas high
molecular weight fragments formed by condensation are charred together with
non-decomposed portion. Although the weight loss becomes smaller at above 500°C,
polycondensed aromatic carbon increases with the evolution of H2 to reach about 80% C in char
up to 700°C. By further increasing the temperature, the polycondensed carbon structure
develops to increase the content of C without prompt production of H2. The overall scheme of
carbonization is represented in Fig. 4.4.1. This signifies that product distribution depends on
both steps of the decomposition of ‘melt’ resulted from wood constituents into gas, liquid, and
solid fractions (first stage) and subsequent decomposition of the liquid fraction (second stage),
and the ratio of rate constants for first stage to that for second stage. The distribution is also
influenced by moisture and size of feed,
heating rate, operating temperature, etc.
The latter three are particularly important,
and the yield of liquid (tar) is increased with
decreasing the size and increasing the rate.
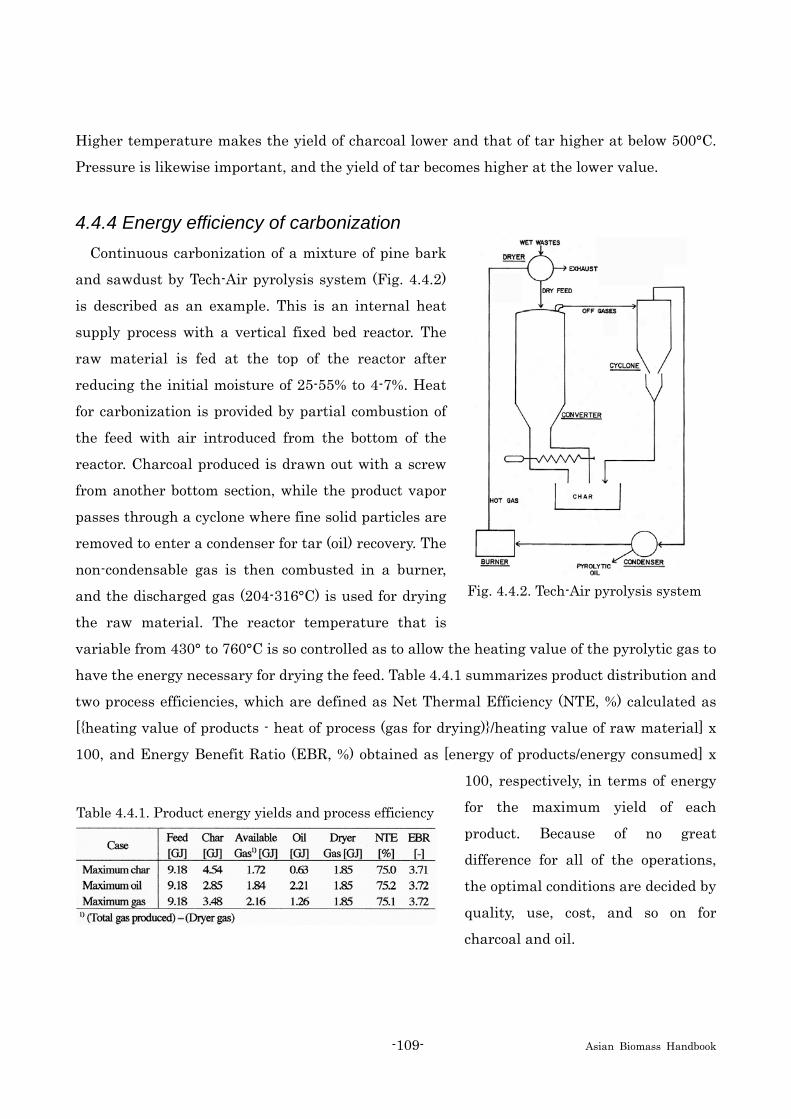
-109- Asian Biomass Handbook
Fig. 4.4.2. Tech-Air pyrolysis system
Table 4.4.1. Product energy yields and process efficiency
Higher temperature makes the yield of charcoal lower and that of tar higher at below 500°C.
Pressure is likewise important, and the yield of tar becomes higher at the lower value.
4.4.4 Energy efficiency of carbonization Continuous carbonization of a mixture of pine bark
and sawdust by Tech-Air pyrolysis system (Fig. 4.4.2)
is described as an example. This is an internal heat
supply process with a vertical fixed bed reactor. The
raw material is fed at the top of the reactor after
reducing the initial moisture of 25-55% to 4-7%. Heat
for carbonization is provided by partial combustion of
the feed with air introduced from the bottom of the
reactor. Charcoal produced is drawn out with a screw
from another bottom section, while the product vapor
passes through a cyclone where fine solid particles are
removed to enter a condenser for tar (oil) recovery. The
non-condensable gas is then combusted in a burner,
and the discharged gas (204-316°C) is used for drying
the raw material. The reactor temperature that is
variable from 430° to 760°C is so controlled as to allow the heating value of the pyrolytic gas to
have the energy necessary for drying the feed. Table 4.4.1 summarizes product distribution and
two process efficiencies, which are defined as Net Thermal Efficiency (NTE, %) calculated as
[{heating value of products - heat of process (gas for drying)}/heating value of raw material] x
100, and Energy Benefit Ratio (EBR, %) obtained as [energy of products/energy consumed] x
100, respectively, in terms of energy
for the maximum yield of each
product. Because of no great
difference for all of the operations,
the optimal conditions are decided by
quality, use, cost, and so on for
charcoal and oil.

-110- Asian Biomass Handbook
4.4.5 Products of carbonization In Japan, charcoal is widely used as soil improver, fodder, moisture conditioner, etc. by
making use of the adsorption capacity (so-called ‘charcoal for new uses’), in addition to solid
fuel for cooking and heating. For liquid products, low boiling point fraction, pyroligneous acid,
is on the market as agricultural materials, deodorant, etc. In contrast, high boiling point
fraction, tar, has a limited practical utilization, like creosote as medicine. In a laboratory scale,
the production of phenolic resin adhesive, the recovery of wood preservatives, conversion into
electroconductive carbon, etc. has been reported. The use of gas fraction is a supplementary
fuel for process.
4.4.6 Status-quo of the technology A variety of reactors in scale and shape are developed in response of the diversification of
material, and they are commercially operated, although the current system does not greatly
differ from the earlier one. Nickel-catalyzed carbonization of wood at 900°C, which was
conducted in a laboratory scale to obtain a functional carbon with conductivity and liquid phase
adsorption in concurrence with hydrogen-rich gas, has attracted considerable attention.
Further information Bridgwater, A. V.; Bridge, S. A.: “Biomass Pyrolysis Liquids Upgrading and Utilization”, Bridgwater, A.
V., Grassi G., Eds., Elsevier Applied Science, 1991, p. 22,
Lede, J. Reaction temperature of solid particles undergoing an endothermal volatilization. Application to
the fast pyrolysis of biomass, Biomass Bioenergy, 7, 49-60 (1994)
Pomeroy, C. F. “Biomass Conversion processes for Energy and Fuels”, Sofer, S. S., Zaborsky, O. R. Eds.,
pp. 201-211, Plenum (1981)
Suzuki, T.; Miyamoto, M.; Luo, W.-M.; Yamada, T.; Yoshida, T. in “Science in Thermal and Chemical
Biomass Conversion”, Vol. 2, Bridgwater, A. V.; Boocock, D. G. B., Eds., CPL Press, 2006, pp. 1580-1591
Suzuki, T.; Suzuki, K.; Takahashi, Y.; Okimoto, M.; Yamada, T.; Okazakik N.; Shimizu, Y.; Fujiwara, M.
Nickel-catalyzed carbonization of wood for coproduction of functional carbon and fluid fuels I., J. Wood Sci., 53, 54-60 (2007)
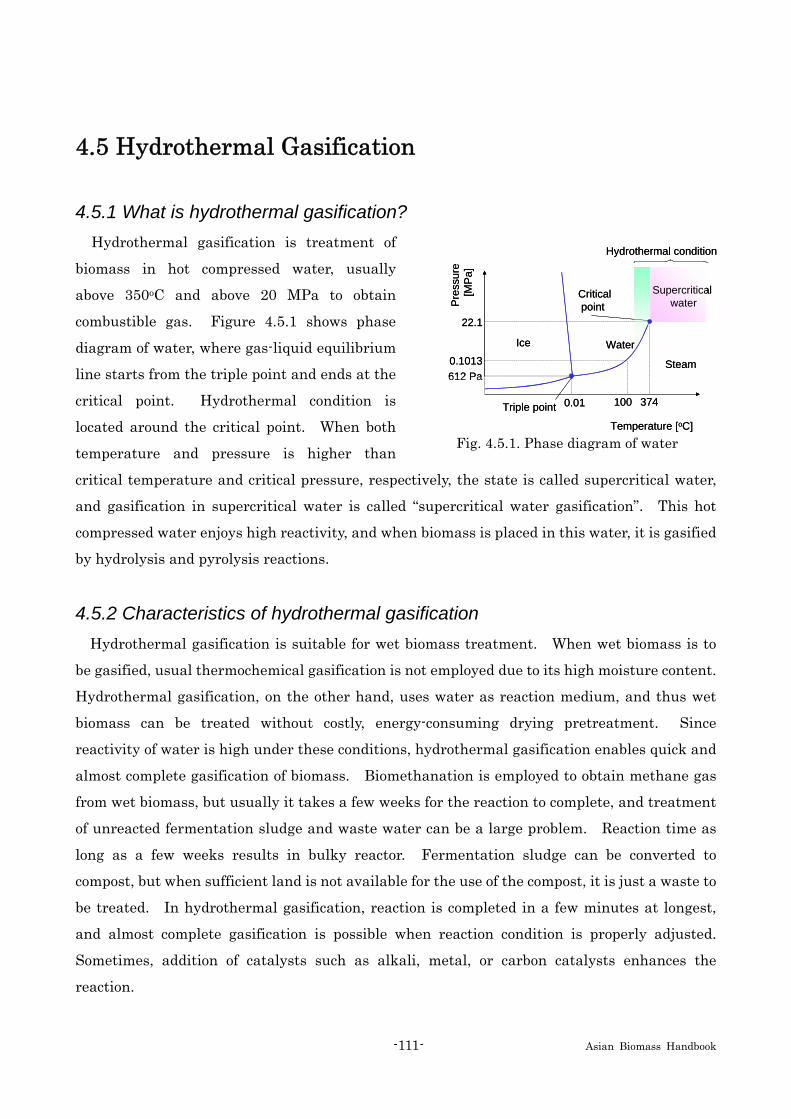
-111- Asian Biomass Handbook
4.5 Hydrothermal Gasification
4.5.1 What is hydrothermal gasification? Hydrothermal gasification is treatment of
biomass in hot compressed water, usually
above 350oC and above 20 MPa to obtain
combustible gas. Figure 4.5.1 shows phase
diagram of water, where gas-liquid equilibrium
line starts from the triple point and ends at the
critical point. Hydrothermal condition is
located around the critical point. When both
temperature and pressure is higher than
critical temperature and critical pressure, respectively, the state is called supercritical water,
and gasification in supercritical water is called “supercritical water gasification”. This hot
compressed water enjoys high reactivity, and when biomass is placed in this water, it is gasified
by hydrolysis and pyrolysis reactions.
4.5.2 Characteristics of hydrothermal gasification Hydrothermal gasification is suitable for wet biomass treatment. When wet biomass is to
be gasified, usual thermochemical gasification is not employed due to its high moisture content.
Hydrothermal gasification, on the other hand, uses water as reaction medium, and thus wet
biomass can be treated without costly, energy-consuming drying pretreatment. Since
reactivity of water is high under these conditions, hydrothermal gasification enables quick and
almost complete gasification of biomass. Biomethanation is employed to obtain methane gas
from wet biomass, but usually it takes a few weeks for the reaction to complete, and treatment
of unreacted fermentation sludge and waste water can be a large problem. Reaction time as
long as a few weeks results in bulky reactor. Fermentation sludge can be converted to
compost, but when sufficient land is not available for the use of the compost, it is just a waste to
be treated. In hydrothermal gasification, reaction is completed in a few minutes at longest,
and almost complete gasification is possible when reaction condition is properly adjusted.
Sometimes, addition of catalysts such as alkali, metal, or carbon catalysts enhances the
reaction.
Supercritical water
Steam
WaterIce
Triple point
Temperature [oC]
Pre
ssur
e
[MPa
]
0.1013612 Pa
22.1
0.01 100 374
Criticalpoint
Hydrothermal condition
Supercritical water
Steam
WaterIce
Triple point
Temperature [oC]
Pre
ssur
e
[MPa
]
0.1013612 Pa
22.1
0.01 100 374
Criticalpoint
Hydrothermal condition
Fig. 4.5.1. Phase diagram of water

-112- Asian Biomass Handbook
4.5.3 Reactors for hydrothermal gasification To investigate the reactions taking place in hydrothermal gasification, tube-bomb reactors of
the volume of several mL and autoclaves are often used. However, when you want to develop
a commercial plant, a continuous reactor such as is shown in Fig. 4.5.2 is a must. Biomass is
fed to the reactor at a high pressure, and then heated to the reaction temperature. In the
reactor, biomass is gasified under hydrothermal condition, and the effluent is cooled down to
the room temperature. Heat released at this time is recovered by the heat exchanger, and
used to heat up the feedstock. After reaching the room temperature, the effluent is
depressurized to atmospheric pressure, and the product gas is recovered. The continuous
reactor is needed because of the large amount of heat needed to attain the hydrothermal
condition. This heat sometimes matches the heat of combustion of the biomass to be gasified,
and thus heat recovery using a heat exchanger is needed. Only flow reactors allow this heat
recovery. In Fig. 4.5.2, heat balance for the ideal case is also shown. Combustion heat of
biomass is maintained in the product gas while heat required to attain hydrothermal condition
is recovered so that no heat is added from outside during gasification operation. In practice,
the efficiency of the heat exchanger cannot be unity, and endothermic reaction results in
necessity of additional heat supply to the reactor.
4.5.4 Energy efficiency of hydrothermal gasification For the ideal process as shown in
Fig. 4.5-2, the energy efficiency of
hydrothermal gasification is unity.
This is to be noted since
misunderstanding that energy
efficiency of hydrothermal
gasification is low due to the large
amount of heat required to attain
hydrothermal condition. When
heat recovery is properly made, a
high energy efficiency is possible.
Energy efficiencies higher than 70% including electricity and heat loss at the heat exchangers
have been shown by a detail process calculation.
Biomass 20 kg (400 MJ)Water 80 kg (0 MJ)
Biomass 400 MJ Water 280 MJ
Product gas 400 MJ Water 280 MJ
Product gas 400 MJ Water 0 MJ
SCWG reactor
600℃, 25 MPa
Biomass 20 kg (400 MJ)Water 80 kg (0 MJ)
Biomass 400 MJ Water 280 MJ
Product gas 400 MJ Water 280 MJ
Product gas 400 MJ Water 0 MJ
SCWG reactor
600℃, 25 MPa
Fig. 4.5.2. Heat balance of hydrothermal gasification.
-113- Asian Biomass Handbook
4.5.5 Products of hydrothermal gasification The product gas is automatically separated from liquid phase when the reactor effluent is
cooled down to the room temperature. Tar free gas is available, which is a benefit over usual
thermochemical gasification of biomass. The main component is hydrogen, carbon dioxide,
and methane. Due to the water-shift gas reaction the yield of carbon monoxide is negligible.
The high temperature, low pressure, and dilute feedstock favors high hydrogen content. The
heating value of the product gas depends on reaction condition, and usually varies from 12 to
18 MJ/m3-N.
4.5.6 Status-quo of the technology Many reports on experiment with laboratory scale reactors exist. There are three pilot
plants in operation: Energia Co. plant in Japan; VERENA Plant in Germany; and TEES
Process in USA. The capacity ranges from 1 to 2.4 t-wet/d. Feedstocks tested are many
including chicken manure, corn silage, and cheese whey. No commercial plants have been
built mainly due to the high plant cost at present.
Further information Antal, M. J., Jr.; Allen, S. G.; Schulman, D.; Xu, X. D.; Divilio, R. J. Biomass gasification in supercritical
water, Ind. Eng. Chem. Res., 39, 4040-4053 (2000)
Elliott, D.C.; Hart, T.R.; Neuenschwander, G.G. Chemical Processing in High-Pressure Aqueous
Environments. 8. Improved Catalysts for Hydrothermal Gasification, Ind. Eng. Chem. Res., 45,
3776-3781 (2006)
Kruse, A.; Henningsen, T.; Sinag, A.; Pfeiffer, J. Biomass gasification in supercritical water: Influence of
the dry matter content and the formation of phenols, Ind. Eng. Chem. Res., 42, 3711-3717(2003)
Matsumura, Y.; Minowa, T.; Potic, B.; Kersten, S. R. A.; Prins, W.; van Swaaij, W. P. M.; van de Beld, B.;
Elliott, D. C.; Neuenschwander, G. G.; Kruse, A.; Antal, M. J. Jr. Biomass gasification in near- and
super-critical water: Status and prospects, Biomass Bioenergy, 29, 269-292 (2005)
Xu, X.; Matsumura, Y.; Stenberg, J.; Antal, M. J., Jr. Carbon-catalyzed gasification of organic feedstocks
in supercritical water, Ind. Eng. Chem. Res., 35, 2522-2530(1996)
Yu, D.; Aihara, M.; Antal, M.J., Jr. Hydrogen production by steam reforming glucose in supercritical
water, Energy Fuels, 7, 574-577 (1993)

-114- Asian Biomass Handbook
4.6 Hydrothermal Liquefaction
4.6.1 What is hydrothermal liquefaction? Hydrothermal liquefaction is pyrolysis in hot compressed water of around 300°C and 10 MPa.
Biomass is converted into gas, liquid and solid, like common pyrolysis in gas phase. The light
tar fraction, such as pyroligneous, can be dissolved in water, and the heavy tar fraction can be
obtained in the mixing with char. That is, products are gas, aqueous, and oily material.
4.6.2 Characteristics of hydrothermal liquefaction Since hydrothermal liquefaction proceeds
in water, drying process of feedstock is not
needed. Therefore, it is suitable for high
moisture content biomass, such as aquatic
biomass, garbage, organic sludge, and so on.
In addition, many kinds of reaction can
occur at different reaction temperatures,
and many application is possible. Fig.
4.6.1 shows the reactions which occur in the
hot compressed water. At around 100°C,
aqueous soluble fraction is dissolved, and extraction is applicable. At above 150°C, hydrolysis
occurs, and biomass polymers, such as cellulose, hemicellulose, protein, and so on, are
degraded into monomer. At around 200°C and 1 MPa, solid like biomass is changed to slurry
(liquidization), and oily product, however, is not obtained. At severer condition of 300°C and
10 MPa, liquefaction occur, and oily product is obtained. When reaction condition is changed
such as reaction time or catalyst, main product can be changed to char (hydrothermal
carbonization). At around critical point and with catalyst, biomass can be gasified (see
Chapter 4.5).
4.6.3 Reaction scheme of hydrothermal liquefaction Fundamentally, hydrothermal liquefaction is pyrolysis, and therefore degradation and
polymerization occur. Simple reaction scheme is shown in Fig. 4.6.2. At first step, biomass
can be degraded into water-dissolved materials. Then the water-dissolved materials are
374oCCritical point
100oCBoiling point
200oC
300oC
Extraction
Liquefaction
Liquidization
Carbonization
Hydrolysis
Gasification
Fig. 4.6.1. Reactions which occur in the
hot-compressed water
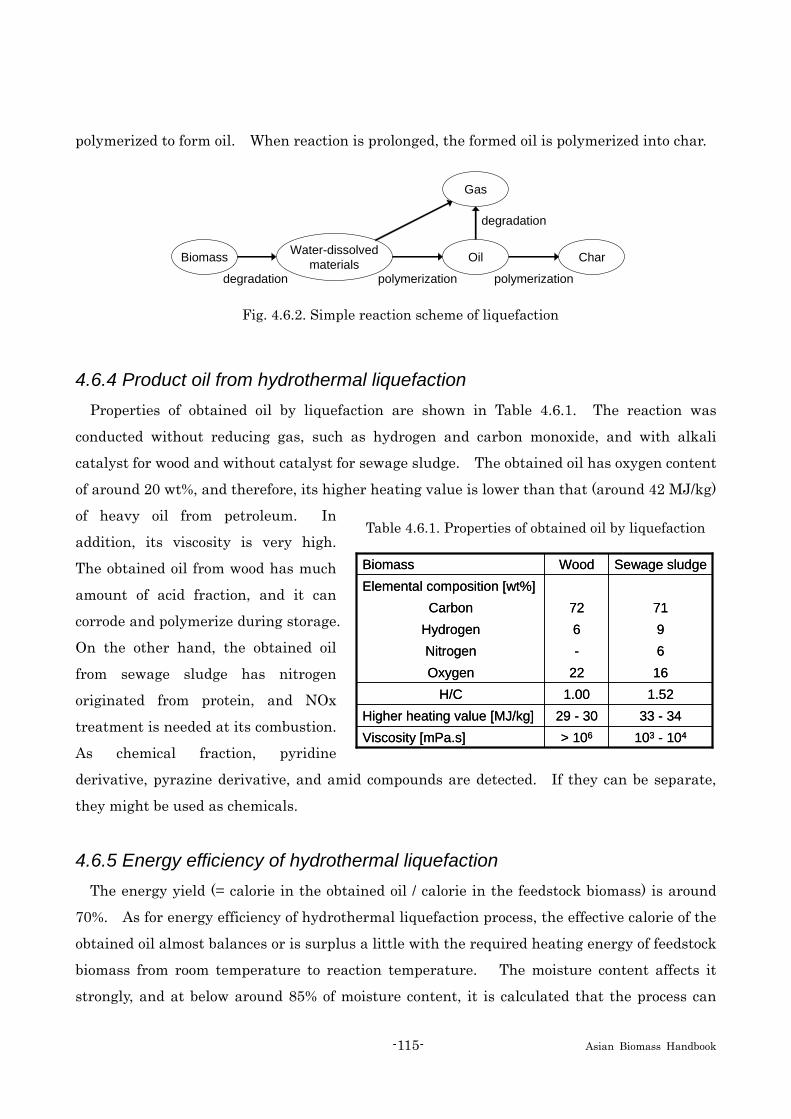
-115- Asian Biomass Handbook
polymerized to form oil. When reaction is prolonged, the formed oil is polymerized into char.
4.6.4 Product oil from hydrothermal liquefaction Properties of obtained oil by liquefaction are shown in Table 4.6.1. The reaction was
conducted without reducing gas, such as hydrogen and carbon monoxide, and with alkali
catalyst for wood and without catalyst for sewage sludge. The obtained oil has oxygen content
of around 20 wt%, and therefore, its higher heating value is lower than that (around 42 MJ/kg)
of heavy oil from petroleum. In
addition, its viscosity is very high.
The obtained oil from wood has much
amount of acid fraction, and it can
corrode and polymerize during storage.
On the other hand, the obtained oil
from sewage sludge has nitrogen
originated from protein, and NOx
treatment is needed at its combustion.
As chemical fraction, pyridine
derivative, pyrazine derivative, and amid compounds are detected. If they can be separate,
they might be used as chemicals.
4.6.5 Energy efficiency of hydrothermal liquefaction The energy yield (= calorie in the obtained oil / calorie in the feedstock biomass) is around
70%. As for energy efficiency of hydrothermal liquefaction process, the effective calorie of the
obtained oil almost balances or is surplus a little with the required heating energy of feedstock
biomass from room temperature to reaction temperature. The moisture content affects it
strongly, and at below around 85% of moisture content, it is calculated that the process can
Biomass Water-dissolvedmaterials Oil Char
Gas
degradation
degradation
polymerization polymerization
Fig. 4.6.2. Simple reaction scheme of liquefaction
Table 4.6.1. Properties of obtained oil by liquefaction
6-Nitrogen
33 - 3429 - 30Higher heating value [MJ/kg]
1622Oxygen
96Hydrogen
Elemental composition [wt%]
103 - 104> 106Viscosity [mPa.s]
1.521.00H/C
7172Carbon
Sewage sludgeWoodBiomass
6-Nitrogen
33 - 3429 - 30Higher heating value [MJ/kg]
1622Oxygen
96Hydrogen
Elemental composition [wt%]
103 - 104> 106Viscosity [mPa.s]
1.521.00H/C
7172Carbon
Sewage sludgeWoodBiomass
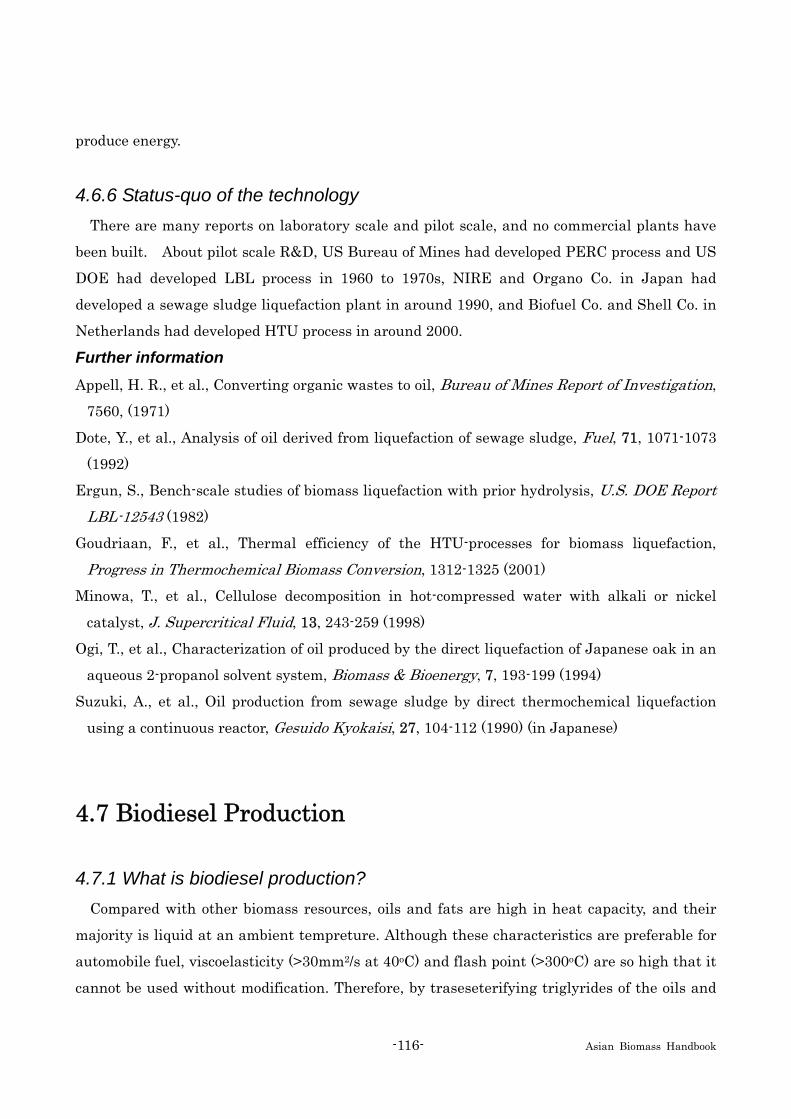
-116- Asian Biomass Handbook
produce energy.
4.6.6 Status-quo of the technology There are many reports on laboratory scale and pilot scale, and no commercial plants have
been built. About pilot scale R&D, US Bureau of Mines had developed PERC process and US
DOE had developed LBL process in 1960 to 1970s, NIRE and Organo Co. in Japan had
developed a sewage sludge liquefaction plant in around 1990, and Biofuel Co. and Shell Co. in
Netherlands had developed HTU process in around 2000.
Further information Appell, H. R., et al., Converting organic wastes to oil, Bureau of Mines Report of Investigation,
7560, (1971)
Dote, Y., et al., Analysis of oil derived from liquefaction of sewage sludge, Fuel, 71, 1071-1073
(1992)
Ergun, S., Bench-scale studies of biomass liquefaction with prior hydrolysis, U.S. DOE Report LBL-12543 (1982)
Goudriaan, F., et al., Thermal efficiency of the HTU-processes for biomass liquefaction,
Progress in Thermochemical Biomass Conversion, 1312-1325 (2001)
Minowa, T., et al., Cellulose decomposition in hot-compressed water with alkali or nickel
catalyst, J. Supercritical Fluid, 13, 243-259 (1998)
Ogi, T., et al., Characterization of oil produced by the direct liquefaction of Japanese oak in an
aqueous 2-propanol solvent system, Biomass & Bioenergy, 7, 193-199 (1994)
Suzuki, A., et al., Oil production from sewage sludge by direct thermochemical liquefaction
using a continuous reactor, Gesuido Kyokaisi, 27, 104-112 (1990) (in Japanese)
4.7 Biodiesel Production
4.7.1 What is biodiesel production? Compared with other biomass resources, oils and fats are high in heat capacity, and their
majority is liquid at an ambient tempreture. Although these characteristics are preferable for
automobile fuel, viscoelasticity (>30mm2/s at 40oC) and flash point (>300oC) are so high that it
cannot be used without modification. Therefore, by traseseterifying triglyrides of the oils and

-117- Asian Biomass Handbook
fats, its viscoelasticity and flash point are reduceed respectively down to 3~5mm2/s and 160oC
which would be appropriate with cetane number of 50-60 to substitute for the diesel fuel. This
fatty acid methyl seter is called biodiesel fuel (BDF).
4.7.2 Characteristics of biodiesel production Biodiesel is low in SOx, dark smoke and particulate matters, compared with diesel.
Therefore, its exhausted emission is relatively clean. Additionally, there exists an advantage to
keep carbon balance on the earth due to its biomass-derived product. Furthermore, it contains
oxygen as an ester to be 11% low in heat capacity. However, due to its lubricity and less dark
smoke emission, biodiesel is almost comparable to diesel in practical engine performance.
4.7.3 Reactors for biodiesel production For biodiesel production, transesterification is applied for vegetable oils (Reaction 4.7.1) in
which triglycerides, the esters of glycerin with fatty acids, and free fatty acids exist. Generally,
oils are mixed with methanol using alkali catalyst such as potassium hydroxide or sodium
hydroxide, and its mixture is stirred at 60-70oC for 1 h. After the reaction, the lower and upper
portions are phase-separated with glycerin in the lower and estrified products in the upper
which is washed to be fatty acid methyl esters as biodiesel. Since free fatty acids are contained
in the waste oils, they can react with a catalyst to produce saponified products (Reaction 4.7.2),
thus reducing the yield of biodiesel.
Reaction 4.7.2
Reaction 4.7.1
Reaction 4.7.2
Reaction 4.7.1
R1COOCH3
R2COOCH3 +
R3COOCH3
Fatty acid methyl esters Glycerin
CH2-OH│CH - OH│CH2-OH
CH2- COOR1
│CH - COOR2
│CH2- COOR3
Triglyceride Methanol
Alkali catalyst+ 3CH3OH
R’COOH
Fatty acid Alkali catalyst
+ KOH R’COOK + H2O
Saponified product Water
R1, R2, R3, R’; Hydrocarbon residues
Due to such a disadvantage of the alkali catalyst method, it is reported that free fatty acids
are first esterified by acid catalyst, followed by alkali catalyst method. As non-catalytic
methods, ion-exchanged resin catalyst method, lipase catalyst method and supercritical

-118- Asian Biomass Handbook
methanol method are proposed. In addition, to promote efficiency of esterification, the two-step
supercritical methanol method is also proposed by hydrolyzing triglycerides with subcritical
water followed by esterification of fatty acids with methanol in its supercritical state (Reactions
4.7.3 and 4.7.4, Fig. 4.7.1). This process is the only one to handle the low-grade waste oils with
water and high fatty acids into high-grade biodiesel.
Hydrolysis Esterification
BDF
Water phase (glycerin)
Oils
Water
Methanol
Methanol
Methanol/Water
Vaporizer
Vaporizer
High-pressurepump
Phaseseparator Oil phase
(fatty acid)
Back-pressure regulator
Re-esterification
Fig. 4.7.1. Two-Step supercritical methanol process adopting the re-esterification step.
4.7.4 Energy efficiency of biodiesel production Transesterification of triglycerides and esterification of fatty acids are both exothermic
reactions but their heat capacity is small. In alkali catalyst process, energy to increase the
system to 60-70oC, energy for a methanol, and energy for the whole reaction process are
essential. Futhermore, additional enrgy is required after the reaction for purifying the glycerin
as a by-product. In the biodiesel production with 2.2 kg/s (70,000 t/year) capacity, energy
efficiency is reported to be 62% on higher heating value basis.
4.7.5 Status-quo of the technology Biodiesel production has been commercially developed in Europe and North America, and
their production is mainly based on alkali catalyst method. However, for the low-grade waste
Reaction 4.7.4
Reaction 4.7.3
Reaction 4.7.4
Reaction 4.7.3+ 3H2O
R1COOH
R2COOH +
R3COOH
Fatty acids Glycerin
CH2-OH│CH - OH│CH2-OH
CH2- COOR1
│CH - COOR2
│CH2- COOR3
Triglyceride Subcritical water
R’COOH
Fatty acid Supercritical methanol
+ CH3OH R’COOCH3+ H2O
Fatty acid methyl ester Water
R1, R2, R3, R’; Hydrocarbon residues

-119- Asian Biomass Handbook
oils, a combined process with acid catalyst has been developed with their own non-disclosed
technologies. Due to the limited raw materials in Japan, new development of the technology
will be expected to handle the low-grade waste oils to be converted into high-quality biodiesel.
Further information Ban, K.; Kaieda, M.; Matsumoto, T.; Kondo, A.; Fukuda, H. Whole cell biocatalyst for biodiesel fuel
production utilizing rhizopus oryzae cells immobilized within Biomass Support Particles, Biochem Eng J, 8, 39-43 (2001)
Boocock D.G. Biodiesel fuel from waste fats and oils: A process for converting fatty acids and
triglycerides, Proc. of Kyoto Univ Int’l Symp. on Post-Petrofuels in the 21st Century, Prospects in the
Future of Biomass Energy, Montreal, Canada, 171-177 (2002)
Kusdiana, D.; Saka, S. Two-step preparation for catalyst-free biodiesel fuel production; hydrolysis and
methyl esterification, Appl. Biochem. Biotechnol., 115, 781-791 (2004)
Mittelbach, M.; Remschmidt, C. Biodiesel, The comprehensive handbook, Boersedruck Ges. m.b.H,
Vienna, Austria, 1-332 (2004)
Saka, S. “All about Biodiesel”, IPC Publisher, 2006, pp.1-461 (in Japanese)
Sekiguchi, S. in “Biomass Handbook”, Japan Institute of Energy Ed., Ohm-sha, 2002, pp.138-143 (in
Japanese)
-120- Asian Biomass Handbook
Part 5. Biochemical conversion of biomass
5.1 Biomethanation
5.1.1 What is biomethanation? “Methane fermentation” or “anaerobic digestion” is usually used to indicate
“biomethanation”. Biomethanation is a complex microbial process in which organic compounds
are degraded into methane and carbon dioxide by variety of anaerobes. This biogas has a low
heating value of 20-25 MJ/m3-N (5,000~6,000 kcal/m3-N) and can be used for fuel after
desulfurization of hydrogen sulfide. Biomethanation is used as a technique of biofuel recovery
from biomass and treatment of waste biomass. Fermented residue can be used for liquid
fertilizer and raw material of compost.
5.1.2 Feature of biomethanation First of all, organic compounds are decomposed to organic acid or hydrogen by variety of
anaerobes. At the final stage, acetate or hydrogen and carbon dioxide are converted to methane.
Biomethanation takes place under anaerobic conditions, especially, methanogens require
absolute anaerobic conditions for methane production. Biomethanation is a microbiological
process; therefore, this process proceeds under normal temperature and pressure.
Biomethanation can be applied for variety of biomass compared with ethanol fermentation due
to activities of complex microflora.
5.1.3 Mechanism of biomethanation When organic compounds are maintained at 5-70℃ and neutral pH under anaerobic
conditions, spontaneously biomethanation will happen. Biogas is often produced from
underground of landfill. Kitchen garbage and sewage sludge have been used as substrates of
biomethanation. Organic wastewater from food factory containing sugars and starch has been
also used as substrate for biomethanation.
Biomethanation is composed of hydrolysis, acetogenesis and methanogenesis. Fig. 5.1.1
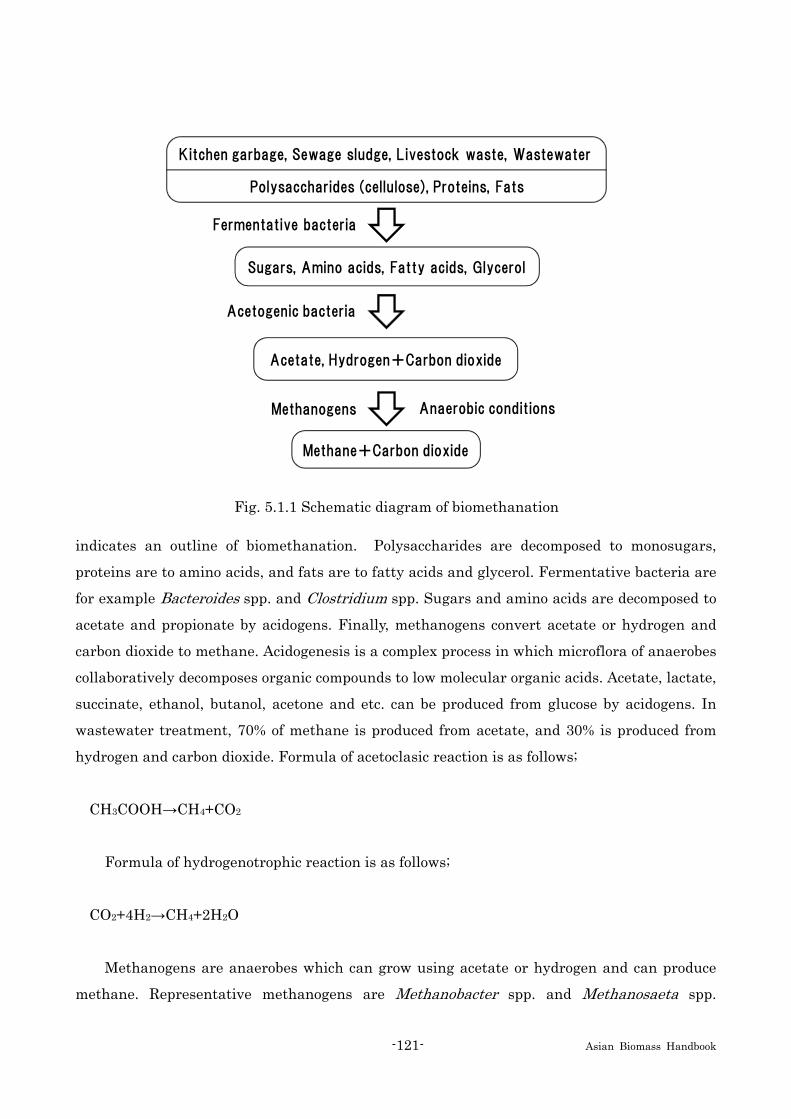
-121- Asian Biomass Handbook
indicates an outline of biomethanation. Polysaccharides are decomposed to monosugars,
proteins are to amino acids, and fats are to fatty acids and glycerol. Fermentative bacteria are
for example Bacteroides spp. and Clostridium spp. Sugars and amino acids are decomposed to
acetate and propionate by acidogens. Finally, methanogens convert acetate or hydrogen and
carbon dioxide to methane. Acidogenesis is a complex process in which microflora of anaerobes
collaboratively decomposes organic compounds to low molecular organic acids. Acetate, lactate,
succinate, ethanol, butanol, acetone and etc. can be produced from glucose by acidogens. In
wastewater treatment, 70% of methane is produced from acetate, and 30% is produced from
hydrogen and carbon dioxide. Formula of acetoclasic reaction is as follows;
CH3COOH→CH4+CO2
Formula of hydrogenotrophic reaction is as follows;
CO2+4H2→CH4+2H2O
Methanogens are anaerobes which can grow using acetate or hydrogen and can produce
methane. Representative methanogens are Methanobacter spp. and Methanosaeta spp.
Acetate, Hydrogen+Carbon dioxide
Methane+Carbon dioxide
Kitchen garbage, Sewage sludge, Livestock waste, Wastewater
Fermentative bacteria
Sugars, Amino acids, Fatty acids, Glycerol
Acetogenic bacteria
Methanogens Anaerobic conditions
Polysaccharides (cellulose), Proteins, Fats
Fig. 5.1.1 Schematic diagram of biomethanation

-122- Asian Biomass Handbook
Methanogens are killed by exposure to oxygen; therefore, methane formation requires obligate
anaerobic conditions. Phylogenetic analyses indicate that methanogens are placed in Archaea
group, distinguished from eukaryote and prokaryote. Methanogens can only use hydrogen,
formate, acetate, 2-propanol, 2-buthanol, methylamine, methanol, methylmercaptan to
produce methane.
5.1.4 Current status Biomethanation is commercialized for food waste, cattle waste, sewage sludge, and
wastewater. European countries have developed biomethanation technology. Biogas plants
have been gradually increasing in Japan. The reaction takes place at high, moderate, or low
fermentation temperature, and organic content classifies biomethanation into wet and dry
fermentation. High temperature systems reveal high gasification performance compared with
other temperatures. Disadvantageous points of biomethanation are low digestion ratio, low
removal ratios of ammonium and phosphate, long treatment time, and necessity of heat.
Fermented effluent and residue should be recycled for agriculture as an organic fertilizer since
treatment cost is high. Technological developments is being conducted to overcome these
issues.
Methane fermentation tank
Desulfurizer
Decomposer
Reserve tank
Gas holder
Liquid fertilizer, Compost,Wastewater
Heat
Biogas
Kitchen garbage
Unsuitable materials
Gas engine Cogeneration
Electricity・heat
Selection
Fig. 5.1.2. Biomethanation flow of kitchen garbage.

-123- Asian Biomass Handbook
Further information Ahring, B. K., “Biomethanation I”, Springer, (2003)
Nagai, S.; Ueki, K., “Anaerobic microbiology”, Youkenndou, (1993) (in Japanese)
Speece, R. E., “Anaerobic biotechnology for industrial wastewaters”, Archae Pr, (1996)
5.2 Ethanol Fermentation
5.2.1 General scope In ethanol fermentation saccharine materials like glucose, fructose, and sucrose are
metabolized by yeast strains through glycolysis pathway (Embden-Meyerhof Pathway) to
produce ethanol and carbon dioxide in anaerobic condition (Eq. (5.2.1)). In this reaction two
molecules of ATP are generated from one molecule of glucose and are used as energy for growth
of yeast cells. Mankind has long known and utilized ethanol fermentation for brewery of
alcohol drinks, manufacture of fermented food, bakery and so on for several thousands years.
In the medieval period, people came to know how to make distilled liquor. Ethanol became
available in the field of various chemical industries, beverage and food industry, medical use,
as well as fuel, since great progress was achieved with technologies of fermentation and
distillation in 19-20th century. Large amount of fuel ethanol has been produced from corn in
the USA and from sugar cane in Brazil for the purpose to alternate fossil fuel and to prevent
global warming, particularly after two times of oil crisis in 1970’s. Extensive research and
development are undergoing in the world on technologies for ethanol production from various
cellulosic materials which are available in large amount and do not compete with food
utilization.
C6H12O6 → 2C2H5OH + 2CO2 (5.2.1) 100 g 51.14 g 48.86 g
Ethanol fermentation is a biological reaction at room temperatures and under atmospheric
pressure. Saccharomyces cerevisiae is the yeast which is widely used for industrial and fuel
ethanol production, and has excellent ethanol fermenting ability and ethanol tolerance. Yeast
strains produce 51.14 g of ethanol from 100 g of glucose according to Eq. (5.2.1). In this
reaction nearly 50% weight of glucose is lost as carbon dioxide, but about 91% of energy
-124- Asian Biomass Handbook
contained in glucose (2.872 MJ/mol) is retained in ethanol. Therefore, ethanol fermentation is
an excellent biological process to convert biomass to liquid fuel ethanol. Yeast cells were first
isolated from beer as pure cultures in 1883 in Denmark and a great deal of work were carried
out on their metabolic pathway of ethanol fermentation. S. cerevisiae can ferment many
sugars including glucose, fructose, galactose, mannose, sucrose, maltose, except pentoses like
xylose and arabinose. Pichia stipitis and Pachysolen tannophilus are known as yeasts capable
of fermenting pentoses, but they are not so tolerant to ethanol as S. cerevisiae is. Strain
improvement research to construct strains of S. cerevisiae having pentose fermentability is
undergoing in many laboratories.
Next to S. cerevisiae, Zymomomas mobilis is excellent bacterium to ferment a limited range
of sugars of glucose, fructose and sucrose to ethanol. Fermentation yield and fermentation
rate of Z. mobilis are supposed to be better than those of yeast S. cerevisiae, but Z. mobilis is
not so tolerant to ethanol as S. cerevisiae is. Zymobacter palmae, isolated in 1980’s in Japan,
has ethanol fermenting ability similar to that of Z. mobilis and its genome base sequence has
been determined recently. Strain improvement of Z. mobilis and Z. palmae regarding pentose
and mannose fermentation has been successfully made in Japan. Pentoses are contained at
relatively high concentration in hard woods and herbaceous plants, and mannose is a
characteristic component of soft woods.
DNA recombinant strains of Escherichia coli and Corynebacterium glutamicum having
ethanol fermenting ability have been constructed through biotechnology. Other ethanol
fermenting bacteria like hetero-lactic acid bacteria (Lactobacillus), cellulose degrading
Clostridium bateria, and anaerobic thermophilic bacteria Themoanaerobacter have been
known so far, but they can produce ethanol at relatively low concentration and with byproducts
like organic acids. Therefore, these bacteria are considered difficult for the industrial use at
least for the present.
5.2.2 Ethanol fermentation of saccharine materials Saccharine materials used for ethanol production at a large scale are juice and molasses of
sugar cane and sugar beet. Molasses is a byproduct which is concentrated mother liquid after
sugar crystallization. Sugar concentration of molasses is around 50% and contains glucose,
fructose and sucrose as main sugar components. These saccharine materials are good
substrate for ethanol fermentation by yeast and Zymomonas. A lot of cane juice is used for
ethanol production in Brazil and India.

-125- Asian Biomass Handbook
Popular ethanol fermentation process in Brazil is continuous or semi-continuous
fermentation process called Melle-Boinot process in which yeast cells are recovered from beer
through centrifuge and recycled to fermentation tank after sterilization of contaminated
bacteria with dilute sulfuric acid at pH 3. Ethanol fermentation at high concentration of yeast
cells can make beer containing 6 to 8 % of ethanol from cane juice (11-17% sugar concentration)
in about 15 h of fermentation period. Molasses is used for fermentation after two-times
dilution or mixing with cane juice or beet juice.
When fermentation yield is 82% (based on total sugar), and sugar concentration of molasses
is 55%, the amount of molasses required to produce 1 m3 (kL) of 95% ethanol is 3.3 t-wet.
Unique saccharine materials are milk whey and citrus molasses. In dairy industry of New
Zealand, for example, a large amount of milk whey containing about 4% lactose is discharged.
They use the waste whey for ethanol fermentation to recover value-added byproduct and to
reduce BOD.
A large amount of citrus peel is discharged in citrus juice manufacture. Secondary juice
from citrus peel containing about 8% sugar and bitter components is concentrated to citrus
molasses of sugar concentration of over 40% for ethanol production.
juice
filter
molasseswater
dilution tank
beer
mash
beer tank
centrifuge
acid treatment vessel
fermentor fermentor
decanter
yeast cell slurry
sulfuric acid
to distillation process
waste water from tank washing
Fig. 5.2.1. Ethanol Fermentation by Melle-Boinot Process (Saiki, 2007).

-126- Asian Biomass Handbook
5.2.3 Ethanol fermentation of starch Starch is a polymer of glucose in which glucose units are linked with each other via α- 1,4
and α-1,6 linkages. Starchy materials are first hydrolyzed to glucose using amylase enzymes
(Eq. (5.2.2)).
(C6H10O5)n + nH2O → nC6H12O6 (5.2.2) molecular weight n(162.14) n(18.02) n(180.16) 100 g 11.11 g 111.11 g
Starchy materials are first cooked at temperatures between 100 and 130oC and then
hydrolyzed to glucose by using α-amylase and gluco-amylase.
A large amount of ethanol is produced from corn in USA and from sweet potato in China.
Low temperature cooking procedure for ethanol production from sweet potato which was the
practice in Japan until 1990's is described below. Raw sweet potato is first crushed by
hammer-mill, cooked at 80-90 oC for 60min, added with α-amylase to liquefy starch and to
reduce viscosity, and then cooled to temperature of about 58oC. Liquefied starch is hydrolyzed
to glucose in two hours of hydrolysis by gluco-amylase. Glucose concentration of mash is
adjusted at about 15%. Fermented beer of about 8 vol% ethanol is obtained after four days of
batch-wise fermentation at 30-34oC. When starch value of raw sweet potato is 24.3% (27%
glucose equivalent), and fermentation yield is 92%, the amount of raw sweet potato required to
produce 1 m3 (kL) of 95% ethanol is 6.03 t-wet.
Fuel ethanol is produced mostly from corn in USA. In a wet mill process corn is immersed
in dilute sulfite solution, fractionated into starch, germ, gluten, and fiber. Starch fraction is
hydrolyzed to glucose by the amylases after cooking and then fermented by yeast. One of the
popular fermentation process is a continuous fermentation process with several fermentation
tanks connected in series in which yeast cells are recycled via centrifuge resulting in high
fermentation rate. Traditional batch-wise process is also the practice in some of ethanol
plants. Final ethanol concentration of fermented beer is 8 to 11 vol% on average. Wet-mill
process of corn to ethanol conversion is indicated in Figure 5.2.2. When starch value is 63%
(70% glucose equivalent), and fermentation yield 90%, the amount of corn necessary to produce
1 m3 (kL) of 95% ethanol is about 2.4 t-wet.

-127- Asian Biomass Handbook
5.2.4 Ethanol fermentation of lignocellulosics Lignocellulosic biomass is generally composed of cellulose, hemicellulose and lignin (Table
5.2.1). Before ethanol fermentation, biomass has to be pre-treated with acid or alkali, and/or
with cellulases to be hydrolyzed into sugar solution.
Table 5.2.1. Compositions of Various Biomass (%). cellulose hemicellulose lignin Soft wood 43 28 29 Hard wood 43 35 22 Rice straw 38 25 12 Office paper 69 2 11
corn
starch milk
sulfite immersion
wet mill germ, fiber
CSL
glucose
cooking α-amylase
cooling
gluco-amylase
gluten
beer
yeast fermentation
95% ethanol
distillation
absolute ethanol
corn gluten feed
Fig. 5.2.2. Production process of ethanol and high fructose syrup from corn. (Modified from (Elander, 1996))
high fructose syrup
glucose isomerase
azeotropic distillation,
or PSA
stillage

-128- Asian Biomass Handbook
(a) Concentrated Sulfuric Acid Process
The process of Arkenol Co. Ltd. (USA) was modified and improved in NEDO project between
2001 and 2005. Concentrated sulfuric acid is sprayed on to wood chips (moisture of about
15%) which is then kneaded well at room temperature. During the kneading the structure of
cellulose is decrystallized. Concentration of sulfuric acid is then adjusted at 20 to 30% by
adding water, and the wood material is kept at around 90oC for 10 to 15 min for hydrolysis.
After solid fraction is removed through filtration, sugar components are separated from the
acid on ion-exchange chromatography. Sugar solution containing hexoses and pentoses are
fermented by yeast or Zymomonas strains genetically modified. Sulfuric acid is concentrated
again to reuse. (b) Dilute Sulfuric Acid Process
Hemicellulose fraction is degraded into sugars composed of mainly pentose and some hexoses
through first dilute sulfuric acid (0.5-1.0%) treatment at 150-180oC, and at about 1 MPa (10
atm). Residual fraction containing cellulose and lignin is again treated with similar
concentration of the dilute acid at 230-250oC and at 3-5 MPa (30-50 atm) to produce glucose.
Sugar yield in first and secondary treatments are reported to be about 90%, and 50-60%,
respectively. In the ethanol plant of “Bioethanol Japan Kansai” (Osaka, Japan), which has
been operated since January, 2007, sugar solution only from hemicellulose fraction of wood is
reported to be converted to ethanol through fermentation by genetically modified E. coli. In the United States, research groups including NREL have been challenging to improve
cellulase activity for industrial use in dilute sulfuric acid process. Their target is, reportedly,
to start production of bioethanol from biomass like corn stover in 2013.
Further information 9th Alcohol Handbook, Japan Alcohol Association Ed., Gihodo Shuppan Co. Ltd, 1997
Elander, R. T.; Putsche, V/ L/, in Handbook on Bioethanol, Wyman, C. E. Ed., Taylor & Francis Pub. 1996,
pp329-350
Saiki, T. in Biomass Handbook, Japan Institute of Energy Ed., Ohm-sha, 2002, pp157-165, (in
Japanese)
Saiki, T.; Karaki, I.; Roy, K.,in CIGR Handbook of Agricultural Engineering, Vol.V, Energy and Biomass Engineering, Kitani, O. Ed., American Society of Agricultural Engineers, 1999, pp139-164
Saiki, T., in Bioethanol Production Technology, Japan Alcohol Association Ed., Kogyochosakai 2007,
pp75-101. (in Japanese)
Yamada, T., in Bioethanol Production Technology, Japan Alcohol Association Ed., Kogyochosakai 2007,

-129- Asian Biomass Handbook
pp102-126. (in Japanese)
5.3 Acetone-Butanol Fermentation
5.3.1 What is acetone-butanol fermentation? Aceton-butanol fmentation is a reaction in which acetone and butanol are produced from
glucose using Clostridium, a strictly anaerobic bacterium. Further, ethanol is also produced.
Therefore, acetone-butanol fermentation is also called as ABE fermentation. Clostridium is
widely distributed in soil, and secretes amylase, xylanase, protease and lipase out of cells.
There are two types of strain in acetone-butanol fermentation. One is Weizmann-type which
produces butanol from starch, and the other is Saccaro-type which produces butanol from
sucrose.
5.3.2 Characteristics of acetone-butanol fermentation Acetone-butanol fermentation has a long history and is industrialized technology.
Acetone-butanol fermentation was utilized to produce acetone as a raw material of smokeless
powder in WWI and butanol for fuels of fighter planes in WWII. After WWII, acetone-butanol
fermentation fell out of use due to development of petroleum chemistry. Recently, butanol is
reviewed as biofuel.
5.3.3 Reactions of acetone-butanol fermentation The strains of bacteria utilized for industrial production of butanol were acetone-butanol
producing bacteria and butanol-isopropanol producting bacteria which produce butanol and
isopropanol, a reduced product of acetone. The reaction pathway is shown in Fig. 5.3.1.
Glucose is decomposed to pyruvate, acetyl-CoA, and acetoacetyl-CoA via EMP pathway, and
finally acetone, butanol, isopropanol and ethanol are produced. The stoichiometrical equation
of acetone-butanol fermentation is shown in Eq. 5.3.1.
95C6H12O6 60C4H9OH + 30CH3COCH3 + 10C2H5OH + 220CO2 + 120H2 + 30 H2O (5.3.1)
In acetone-butanol fermentation, butanol is gradually accumulated and cause production

-130- Asian Biomass Handbook
inhibition at more than 3 kg/m3 (g/L) of the butanol concentration. When the production
inhibition occurs, the growth of bacteria cells, consumption of substrates, and accumulation of
products are suppressed. Final concentration of butanol reaches about 30 kg/m3 (g/L). After
fermentation, the culture solution is distilled and products are separated by the difference in
their boiling points, e.g. acetone (BP 56.3°C), ethanol (BP 78.3°C) and butanol (BP117°C).
5.3.4 Energy efficiency of acetone-butanol fermentation. From Eq. 5.3.1, 60 mol butanol (170 MJ), 30 mol acetone (54 MJ), 10 mol ethanol (14 MJ) and
120 mol hydrogen (34 MJ) are produced from 95 mol glucose (273 MJ) in acetone-butanol
fermentation. Almost all energy in glucose can be moved to butanol, acetone, ethanol and
hydrogen.
5.3.5 Products of acetone-butanol fermentation Acetone-butanol fermentation was industrialized for supply of raw materials of smokeless
powder and fighter planes. Presently, acetone and butanol are synthesized in petroleum
industry. Biofuels, renewable gasoline or diesel additives are now paid much attention
throughout the world. Butanol can be added to both gasoline and diesel fuels and has more
affinity for gasoline than ethanol. Therefore, butanol will be promising biofuel.
Further information Crabbe, E.; N-Hipolito, C.; Kobayashi, G.; Sonomoto, K.; Ishizaki, A., Biodiesel production from crude
palm oil and evaluation of butanal extraction and feel properties, Process Biochim., 37, 65-71 (2001)
Ishizaki, A.; Michiwaki S.; Crabbe, E.; Kobayashi, G.; Sonomoto, K.; Yoshino, S., Extractive
acetone-butanol-ethanol fermentation using methylated crude palm oil as extractant in batch
culture of Clostridium saccharoperbutyl acetonicum N1-4 (ATCC13564), J. Biosci, Bioeng., 87,
352-356 (1999)
Lee, T. M.; Ishizaki, A.; Yoshino, S.; Furukawa, K., Production of aceton, butanol and ethanol from palm
oil waste by N1-4, Biotechnol. Letters, 17, 649-654(1995)

-131- Asian Biomass Handbook
Fig. 5.3.1. Reaction pathway of Asetone-Butanol fermentation.
-132- Asian Biomass Handbook
5.4 Hydrogen Fermentation
5. 4. 1 What is hydrogen fermentation? Anaerobic fermentation is a reaction in which anaerobic microorganisms oxidatively
decompose organic materials to get energy under anaerobic conditions. We call fermentative
reactions in which hydrogen is the final product as hydrogen fermentation. In hydrogen
fermentation, some organic materials and alcohols are produced with hydrogen. Although
final electron acceptor is oxygen or inorganic materials in respiration, oxidatively degraded
organic materials and carbon dioxide etc. from substrate materials are final products in
fermentation. For example, final products are ethanol and carbon dioxide from glucose during
ethanol fermentation. While ATP synthesis is coupled with electron transfer chain in
respiration, ATP is produced in reactions at substrate level in fermentation. Energy gained
from fermentation is smaller than that from respiration for the same amount of substrate.
5.4.2 Characteristics of hydrogen fermentation The role of hydrogen production is to regulate oxidation-reduction level in bacterial cells by
converting excess reducing power to hydrogen. There are bacteria which can take in and
utilize such hydrogen. In order to increase hydrogen yields, the reverse reactions consuming
hydrogen should be suppressed. Generally, it is needed to treat waste water from hydrogen
fermentation, since hydrogen fermentation includes the production of some organic materials.
5.4.3 Reactions of hydrogen fermentation Hydrogen-producing bacteria are classified into 2 types by the difference in reaction
enzymes. One is bacteria with hydrogenase, and the other with nitrogenase.
Hydrogenase: 2H+ + X2- H2 + X (5.4.1)
Nitrogenase: 2H+ + 2e- + 4ATP H2 + 4ADP + Pi (5.4.2)
X: electron carrier, Pi: inorganic phosphate
As shown in above reactions, hydrogenase catalyzes a reversible reaction of evolution and
uptake of hydrogen. On the other hand, the reaction by nitrogenase needs energy (ATP). In
anaerobic fermentation, the reaction by hydrogenase is mainly investigated. Representative

-133- Asian Biomass Handbook
hydrogen fermentation reactions are as follows:
C6H12O6 + 2H2O 2CH3COOH + 2CO2 + 4H2 ΔG0’ = -184 kJ (5.4.3)
C6H12O6 CH3CH2CH2COOH + 2CO2 + 2H2 ΔG0’ = -257 kJ (5.4.4)
Figure 5.4.1 shows the pathway of hydrogen fermentation. Hydrogen is formed from
hydrogenase via both NADH and ferredoxin, via only ferredoxin, or via formate-lyase. In
hydrogen fermentation, hydrogen is produced from oxidative decomposition of organic
substrates. Therefore, hydrogen fermentation is utilized as treatment of wastes and waste
water. In such cases, the following treatment such as methane fermentation or activated
sludge method is needed, since hydrogen fermentation accompanies the production of organic
acids. The reaction rate of hydrogen fermentation is fast compared with methane
fermentation. It may be promising pre-treatment method of methane fermentation.
5.4.4 Energy efficiency of hydrogen fermentation
Since hydrogen fermentation accompanies organic acids production, it is needed to consider
total system combined subsequent treatment methods such as methane fermentation. In
hydrogen fermentation, 4 mol of hydrogen is theoretically produced from 1 mol of glucose (Eq.
(5.4.3)). When subsequently formed acetate is utilized for methane fermentation and
converted to methane, the reaction is shown as follows:
2CH3COOH 2CH4 + 2CO2 (5.4.5)
Fig.5.4.1. Pathway of hydrogen fermentation

-134- Asian Biomass Handbook
Total reaction of hydrogen-methane two-stage fermentation is shown as follows:
C6H12O6 + 2H2O 3CO2 + 4H2 + 2CH4 (5.4.6)
The sum of high heat value of these products is 2.924 MJ (2,924 kJ). On the other hand, in
only methane fermentation, the reaction is shown as follows:
C6H12O6 3CO2 + 3CH4 (5.4.7)
High heat value of the product from Eq. (5.4.7) is 2.671 MJ (2,671 kJ). It is obvious from
these results that the energy yield of hydrogen-methane fermentation increases 10% compared
with that of only methane fermentation.
5.4.5 Products of hydrogen fermentation The product gas evolved from hydrogen and methane fermentation might be utilized to fuel
cells which have higher energy conversion efficiency than those of gas turbine and gas engine.
Methane from methane fermentation has to be converted to hydrogen for fuel cells.
CH4 + 2H2O CO2 + 4H2 ΔG0’ = 253 kJ (5.4.8)
Since Eq. 5.4.8 is an endothermic reaction, supply of energy is needed to proceed the reaction.
Generally, methane gas is converted to hydrogen gas under nickel catalysts at 650-750°C. On
the other hand, in hydrogen fermentation, energy yield is higher than that of methane
fermentation and the catalytic conversion of methane is not needed to provide hydrogen gas to
fuel cells.
Further information Noike, T.; Mizuno, O., Hydrogen fermentation of organic municipal wastes, Water Sci. Technol., 42,
155-162(2000)
Rachman, M. A.; Nakashimada, Y.; Kakizono, T.; Nishio, N., Hydrogen production with high yield and
high evolution rate in a packed-bed reactor, Appl. Microbiol. Biotechnol., 49, 450-454(1998)
Tanisho, S.; Tu, H.-P.; Wakao, N. Fermentative hydrogen evolution from various substrates by
Enterobacter aerogenes, Hakkokogaku, 67, 29-34(1989)

-135- Asian Biomass Handbook
Taguchi, F.; Yamada, K.; Hasegawa, K.; Taki-Saito, K.; Hara, K. Continuous hydrogen production by
Clostridium sp. No.2. from cellulose hydrolysate in an aqueous two-phase system, J. Ferment. Bioeng., 82, 80-83(1996)
Ueno, Y.; Otsuka, S.; Morimoto, M.; Hydrogen production from industrial waste-water by anaerobic
microflora in chemostat culture, J. Ferment. Bioeng., 82, 194-197(1996)
5.5 Lactic Acid Fermentation
5.5.1 What is lactic acid fermentation? Lactic acid has alcohol (OH) and carboxylic (COOH) sites inside the molecule. Since it
includes chiral carbon, it has two chiral isomers, D-lactic acid and L-lactic acid. Recently,
demand of poly-lactate, a biomass plastic, is increasing, and demand of lactic acid is also
increasing as a raw material of poly-lactate. Then the lactic acid with almost 100% of the
optical purity is strongly requested. Generally, lactic acid is produced by chemical syntheses or
by microbial fermentations. In the chemical syntheses, a method using hydrolysis of
lacto-nitrile is usually adopted, yielding D-lactic acid and L-lactic acid half by half of which the
optical purity is nul. Thus lactic acid for the production of poly-lactate is always produced by
fermentation. Lactic acid can be produced by either bacteria or fungi. Here the lactic acid
fermentation with bacteria is focused on.
5.5.2 Lactic acid bacteria Lactic acid bacteria produce a lot of lactic acid from several types of sugars. They are
gram-positive rod-type or spherical bacteria which can grow under an anaerobic condition.
They show no mobility and negative in a catalatic reaction. They form no spores. They use only
sugars as an energy source to yield lactic acid, and convert more than 50% of the consumed
sugars. There are the following four groups in the bacterial species to satisfy the
above-mentioned conditions: Lactobacillus, Leuconostoc, Pediococcus, and Streptococcus.
Lactic acid bacteria can grow with higher growth rates and produce lactic acid with higher
productivities. Since they request a lot of nutrients including amino acids and vitamins, the
composition of the fermentation broth is not simple. We can classify lactic acid fermentation
into two groups, homo-lactic acid fermentation and hetero-lactic acid fermentation. In the
-136- Asian Biomass Handbook
homo fermentation two moles of lactic acid and two moles of ATP can be produced from one
mole of mono-saccharides with almost 100% of the lactic yield. On the other hand, in the hetero
fermentation, lactic acid and other compounds are produced; it is classified into two groups: 1)
one yielding lactic acid, ethanol and carbon dioxide. 2) one yielding one mole of lactic acid and
1.5 moles of acetic acid from one mol of mono-saccharides. Lactic acid bacteria possess both D
type and L type or either D type or L type of lactate-dehydrogenases. Thus D-lactic acid and
(or) L-lactic acid can be produced by the bacteria. Most of lactic acid bacteria has enzymes
which racemize the produced lactic acid, affecting the chiral quality of lactic acid. Lactobacillus rhamnosus can produce only L-lactic acid with almost 100% of the optical purity, which is used
as a raw material for the poly-lactate production.
5.5.3 Biomass resources for lactic acid fermentation Glucose is a major substrate for lactic acid fermentation, which is usually obtained by
hydrolysis of starch. Starch is now obtained from crops. However, we sometimes worry about
competition between energy or materials and food, as claimed in the ethanol production from
biomass resources. Thus soft cellulosic biomass like rice husk which has been currently not
used is expected for biomass resources. Anyhow such unused biomass has less quality and that
is why it has not yet been used. Then some conditions must be considered for its utilization in
fermentation. First, constant and stable supply of the biomass is required. Next, sugars should
be obtained easily with energy as least as possible. Of course, more effective and sophisticated
technology for the fermentation is needed, and moreover, it is also important to solve the issues
accompanied by transportation and storage of biomass in terms of energy, cost, etc.
5.5.4 Utilization of unused biomass from palm oil industry Palm oil is one the three major vegetable oils in the world. It can be harvested throughout a
year only around the equator. In the mill operation to produce oil, more than 10 Tg (Mt) of
unused biomass is obtained as business as usual. Since the palm oil mills are very large, more
than a few tens Gg (thousand tones) of uniform unused biomass can be collected constantly
throughout a year. Moreover, the replanting season of oil palm trees is arriving currently and a
large amount of oil palm trunks shall be wasted. Recently, it was found that there exists a lot of
glucose inside the trunks and that glucose syrup can be easily obtained by pressing them like
sugarcane processing.
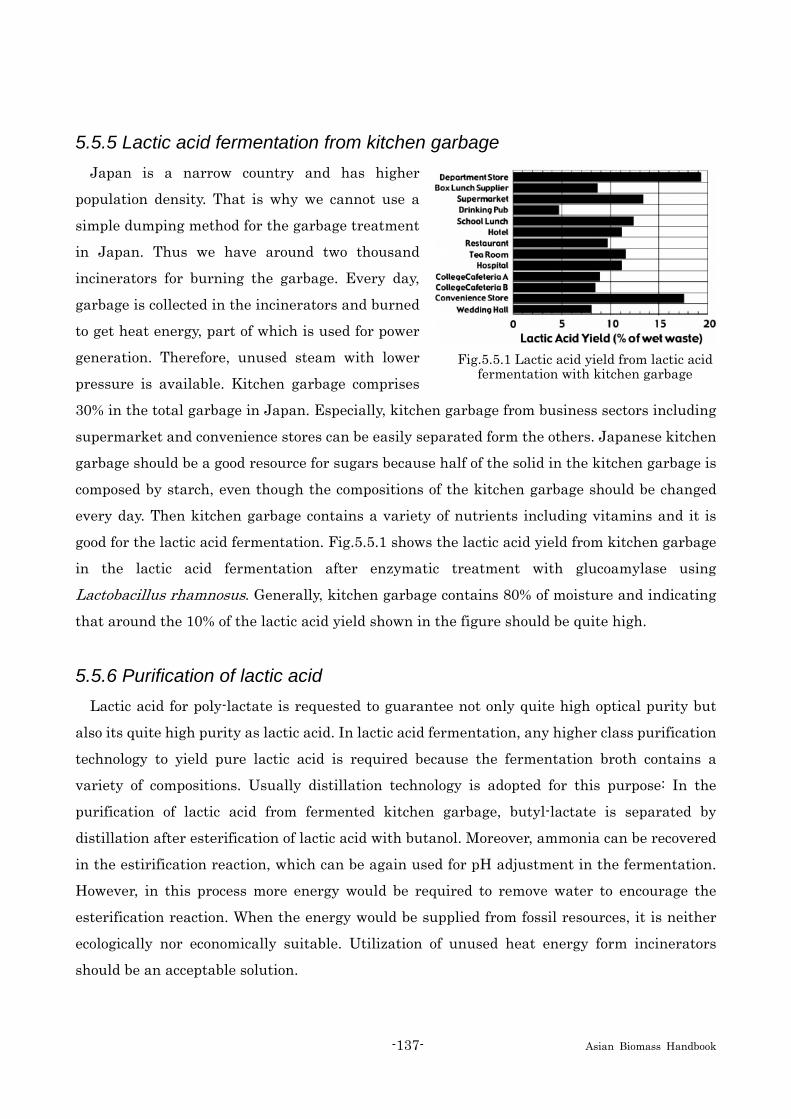
-137- Asian Biomass Handbook
5.5.5 Lactic acid fermentation from kitchen garbage Japan is a narrow country and has higher
population density. That is why we cannot use a
simple dumping method for the garbage treatment
in Japan. Thus we have around two thousand
incinerators for burning the garbage. Every day,
garbage is collected in the incinerators and burned
to get heat energy, part of which is used for power
generation. Therefore, unused steam with lower
pressure is available. Kitchen garbage comprises
30% in the total garbage in Japan. Especially, kitchen garbage from business sectors including
supermarket and convenience stores can be easily separated form the others. Japanese kitchen
garbage should be a good resource for sugars because half of the solid in the kitchen garbage is
composed by starch, even though the compositions of the kitchen garbage should be changed
every day. Then kitchen garbage contains a variety of nutrients including vitamins and it is
good for the lactic acid fermentation. Fig.5.5.1 shows the lactic acid yield from kitchen garbage
in the lactic acid fermentation after enzymatic treatment with glucoamylase using
Lactobacillus rhamnosus. Generally, kitchen garbage contains 80% of moisture and indicating
that around the 10% of the lactic acid yield shown in the figure should be quite high.
5.5.6 Purification of lactic acid Lactic acid for poly-lactate is requested to guarantee not only quite high optical purity but
also its quite high purity as lactic acid. In lactic acid fermentation, any higher class purification
technology to yield pure lactic acid is required because the fermentation broth contains a
variety of compositions. Usually distillation technology is adopted for this purpose: In the
purification of lactic acid from fermented kitchen garbage, butyl-lactate is separated by
distillation after esterification of lactic acid with butanol. Moreover, ammonia can be recovered
in the estirification reaction, which can be again used for pH adjustment in the fermentation.
However, in this process more energy would be required to remove water to encourage the
esterification reaction. When the energy would be supplied from fossil resources, it is neither
ecologically nor economically suitable. Utilization of unused heat energy form incinerators
should be an acceptable solution.
Fig.5.5.1 Lactic acid yield from lactic acidfermentation with kitchen garbage
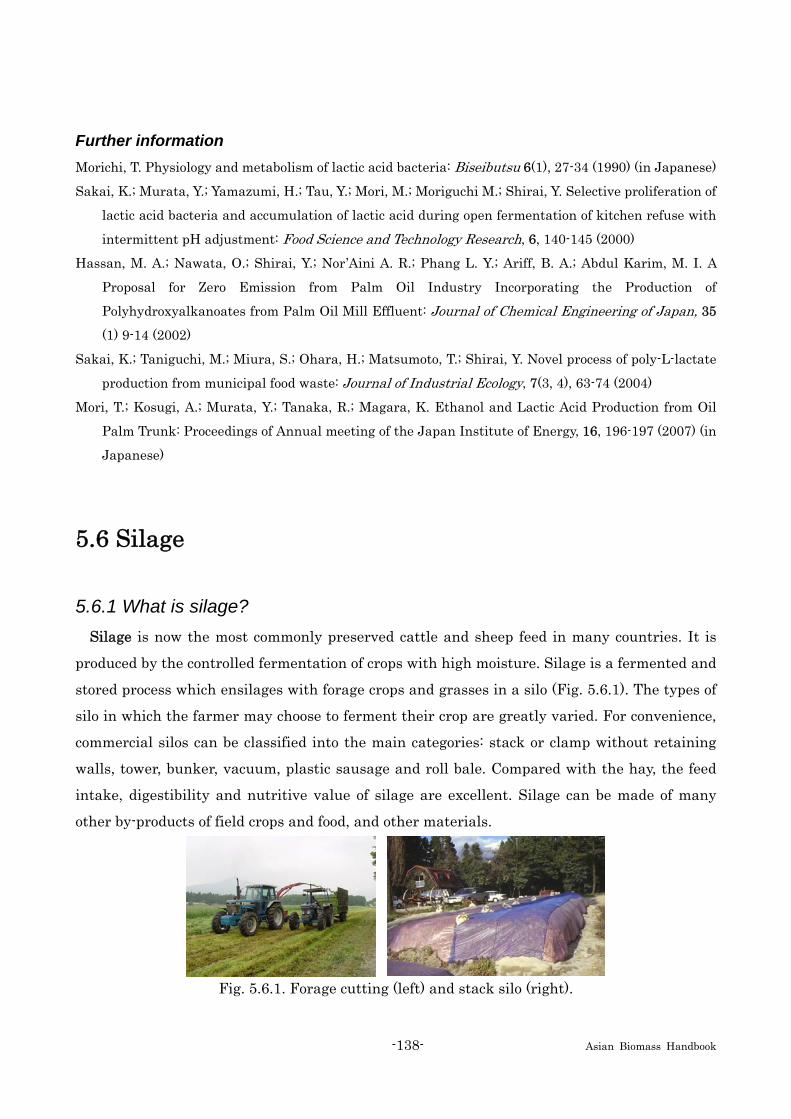
-138- Asian Biomass Handbook
Further information Morichi, T. Physiology and metabolism of lactic acid bacteria: Biseibutsu 6(1), 27-34 (1990) (in Japanese)
Sakai, K.; Murata, Y.; Yamazumi, H.; Tau, Y.; Mori, M.; Moriguchi M.; Shirai, Y. Selective proliferation of
lactic acid bacteria and accumulation of lactic acid during open fermentation of kitchen refuse with
intermittent pH adjustment: Food Science and Technology Research, 6, 140-145 (2000)
Hassan, M. A.; Nawata, O.; Shirai, Y.; Nor’Aini A. R.; Phang L. Y.; Ariff, B. A.; Abdul Karim, M. I. A
Proposal for Zero Emission from Palm Oil Industry Incorporating the Production of
Polyhydroxyalkanoates from Palm Oil Mill Effluent: Journal of Chemical Engineering of Japan, 35
(1) 9-14 (2002)
Sakai, K.; Taniguchi, M.; Miura, S.; Ohara, H.; Matsumoto, T.; Shirai, Y. Novel process of poly-L-lactate
production from municipal food waste: Journal of Industrial Ecology, 7(3, 4), 63-74 (2004)
Mori, T.; Kosugi, A.; Murata, Y.; Tanaka, R.; Magara, K. Ethanol and Lactic Acid Production from Oil
Palm Trunk: Proceedings of Annual meeting of the Japan Institute of Energy, 16, 196-197 (2007) (in
Japanese)
5.6 Silage
5.6.1 What is silage? Silage is now the most commonly preserved cattle and sheep feed in many countries. It is
produced by the controlled fermentation of crops with high moisture. Silage is a fermented and
stored process which ensilages with forage crops and grasses in a silo (Fig. 5.6.1). The types of
silo in which the farmer may choose to ferment their crop are greatly varied. For convenience,
commercial silos can be classified into the main categories: stack or clamp without retaining
walls, tower, bunker, vacuum, plastic sausage and roll bale. Compared with the hay, the feed
intake, digestibility and nutritive value of silage are excellent. Silage can be made of many
other by-products of field crops and food, and other materials.
Fig. 5.6.1. Forage cutting (left) and stack silo (right).
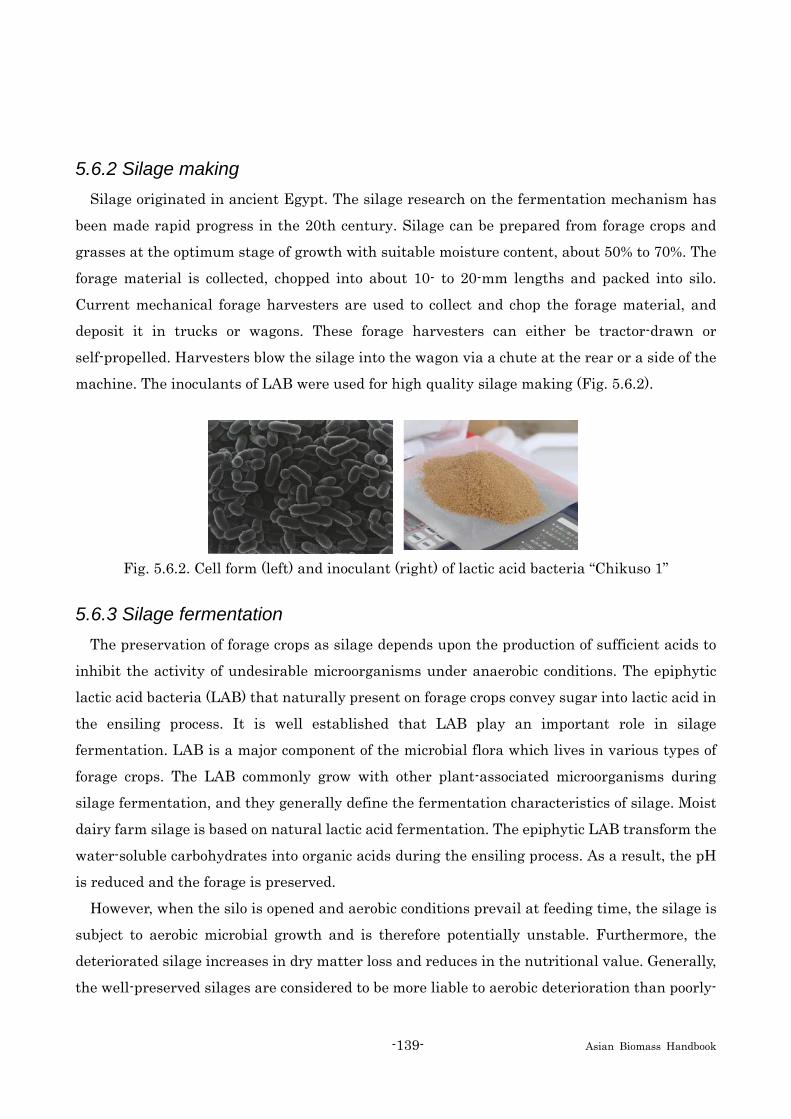
-139- Asian Biomass Handbook
5.6.2 Silage making Silage originated in ancient Egypt. The silage research on the fermentation mechanism has
been made rapid progress in the 20th century. Silage can be prepared from forage crops and
grasses at the optimum stage of growth with suitable moisture content, about 50% to 70%. The
forage material is collected, chopped into about 10- to 20-mm lengths and packed into silo.
Current mechanical forage harvesters are used to collect and chop the forage material, and
deposit it in trucks or wagons. These forage harvesters can either be tractor-drawn or
self-propelled. Harvesters blow the silage into the wagon via a chute at the rear or a side of the
machine. The inoculants of LAB were used for high quality silage making (Fig. 5.6.2).
Fig. 5.6.2. Cell form (left) and inoculant (right) of lactic acid bacteria “Chikuso 1”
5.6.3 Silage fermentation The preservation of forage crops as silage depends upon the production of sufficient acids to
inhibit the activity of undesirable microorganisms under anaerobic conditions. The epiphytic
lactic acid bacteria (LAB) that naturally present on forage crops convey sugar into lactic acid in
the ensiling process. It is well established that LAB play an important role in silage
fermentation. LAB is a major component of the microbial flora which lives in various types of
forage crops. The LAB commonly grow with other plant-associated microorganisms during
silage fermentation, and they generally define the fermentation characteristics of silage. Moist
dairy farm silage is based on natural lactic acid fermentation. The epiphytic LAB transform the
water-soluble carbohydrates into organic acids during the ensiling process. As a result, the pH
is reduced and the forage is preserved.
However, when the silo is opened and aerobic conditions prevail at feeding time, the silage is
subject to aerobic microbial growth and is therefore potentially unstable. Furthermore, the
deteriorated silage increases in dry matter loss and reduces in the nutritional value. Generally,
the well-preserved silages are considered to be more liable to aerobic deterioration than poorly-

-140- Asian Biomass Handbook
fermented silages and some aerobic microorganisms can be harmful to the health of livestock.
Therefore, the prevision of aerobic deterioration is an important task in making silage.
5.6.4 Roll bale silage Roll bale is another form of stored forage. Grass is cut and baled while it’s still fairly wet. If it
is too wet , it can’t be baled and stored the same as hay. Thus, the proper moisture content for
roll bale silage making is around 60 to 70%. The bales are wrapped tightly with 6 layers of
0.025-mm thick plastic film on a bale wrapper. The material then goes through a limited
fermentation in which short chain fatty acids are produced to protect and preserve the forage.
This method has become popular on some farms. In Japan, the roll bale silage preparation
method of fresh rice straw was developed (Fig. 5.6.3), and the animal feed production from
biomass resources is expected to make the best use of roll bale technology.
Fig. 5.6.3 Roll bale silage making (left) and wrapping (right) of rice straw.
5.6.5 Technological actuality In recent years, the amount of silage conserved as roll bales has increased dramatically, and
this system of making silage is now widely practiced in Japan and other countries. Today, the
new silage inoculant of LAB and new types of chopped roll baler for silage making of corn and
forage paddy rice were developed. The research of unused biomass resources for silage making
of crops and food by-products are advanced in Japan.
Further information Abe, A.,The best use manual of food circulation resource, Science Forum. (2006)
Cai, Y., Silage, Dairy Japan (2004)
McDonald, P.;Henderson, N.;Heron, S.,The Biochemistry of Silage, 2nd ed., Chalcombe Publications
(1991)

-141- Asian Biomass Handbook
5.7 Composting
5.7.1 What is composting? Compost is a mixture of biodegradable organic matter such as straw, husks, tree bark,
animal waste products and organic animal/plant matter (excluding sludge and fish organs)
that are accumulated or mixed, and decomposed by heat. However sludge and fish organs
may be considered compost if properly processed.
5.7.2 Basic principles of composting Composting is the process of accumulating, mixing and aerating organic matter to
decompose them with aerobic bacteria inside the material, evaporate the moisture generated
by the heat from decomposition, and sterilize or make the harmful microbes or weed seeds
inactive, to render the compost mixture safe and hygienic. Figure 5.7.1 shows the composting
process. Composting offers the advantages of: (1) being easy to handle by hygienically-minded
users since it eliminates noxious odors and the sense of handling biological waste products, (2)
producing nutrients including the correct amount of elements for safe and high quality
fertilizer for soil and crops, and (3) contributing to create a society that recycles its resources.
Easily biodegradableorganic matter
Not easilybiodegradable organic
Not easilybiodegradable organic
Inorganic matter Inorganic matter
Compost material Compost
Moisture
Easily biodegradableorganic matter
Moisture
Microorganism
Fermentation
Fermentation heat
Evaporation
Decomposition
Fig. 5.7.1. Concept image of composting process.
5.7.3 Basic elements of composting Composting is basically made up of (a) preprocessing, (a) fermentation processing, and (c)

-142- Asian Biomass Handbook
product forming processing. (a) Preprocessing
Preprocessing requires equipment for adjusting factors such as the moisture and organic
matter, particle sizes, and aeration to make compost with the desired properties. When
starting the composting, the moisture must usually be adjusted between 55 to 70 % and
good aeration must be provided. This preprocessing includes additive methods (addition
of adjustment materials such as shell, husks, sawdust, and chips), return methods
(returning the product compost and mix with composting feedstock), and drying methods
(drying using external energy). (b) Fermentation
Fermentation requires a fermenting tank, aeration equipment and hydrolysis equipment.
The fermentation tank decomposes organic matter and emits heat to raise the temperature
of material accumulated in the fermentation tank so that conditions to produce safe and
hygienic compost is attained by raising the temperature of the entire compost material to
65°C or higher and maintaining that temperature for 48 h or more. Fermentation
methods are broadly grouped into accumulation methods and mechanical return methods.
In the accumulation methods, materials such as compost, adjustment materials, and
returned compost are accumulated on the floor and then repeatedly turned as needed with
a shovel loader, etc. In the mechanical return method, an agitating device having a
material loading slot and drainage slot for mixing the material is installed on the upper
side wall of the fermentation tank. The aeration equipment maintains the material at a
uniform aerobic state and provides ventilation to make the moisture evaporate from the
material simultaneous with causing fermentation. The hydrolysis equipment supplies
water to the material to ensure continued aerobic fermentation since microbial activity in
the material ceases when the moisture in the material falls below 40%. (c) Product forming process
The product forming process includes mechanical sorting and bagging/packing equipment
for enhancing the product value and making the product compost easier to handle. Other
facilities may include deodorizing equipment as part of environmental measures.
5.7.4 Current composting technology Table 5.7.1 shows main materials usable in composting. Husk and woody materials have a
low biodegradable material index so their decomposition takes time but are effective for

-143- Asian Biomass Handbook
improving soil and can be used in combination with other materials to produce high quality
compost. Raw garbage contains many materials impossible to ferment such as plastic, metal,
and glass and also requires thorough sorting and the right preprocessing. Sludge may require
special measures for dealing with heavy metals, etc.
Among the recycling technologies of composting, biogas, drying, carbonization, livestock feed,
and incineration, composting can use vaious kinds of materials and offers significant
advantages in terms of technology and distribution. However, amount and period of the
product demand are limited, and some regions have excess compost stocks. Future production
efforts will require elaborate quality control, composting of all material produced in a region,
and regional consumption of the entire amount produced in those areas.
Further information Japan Livestock Industry Association Ed., Composting Facility Design Manual(2003) (in Japanese)
Japan Organics Recycling Association Ed., Composting Manual(2004) (in Japanese)
Livestock Industry’s Environmental Improvement Organization Ed., Livestock Dung Process Facility – Machine Setup Guidebook (compost processing facility version) (2005) (in Japanese)
Table 5.7.1. Comparison of materials available for composting and other recycling technologies
(Japan Organics Recycling Association 2004). Material
NameType Composting Biogas Drying Carbonization Livestock
feedIncineration
Cattle dung ◎ ○Cattle dung/urine ○ ◎Dairy cow dung ◎ ○Dairy cow dung/urine △ ◎Pig dung ◎ ○Pig dung/urine △ ◎Chicken dung ◎ ◎ ◎ ◎
Garbage Raw garbage ◎ ◎ △ △ ○Sludge Dehydrated sludge ◎ ◎ ◎ ○ ○
Rice husks ◎ ◎ △ ◎Paddy straw ◎ ○Sawdust ○ △ ◎Bark ◎ ◎Pruning waste ○ ◎ ◎Chips ◎ ◎ ◎
Note: ◎: Matches category ○: Usable △: Usable after preprocessing
Wood
Livestock
Cropresidue
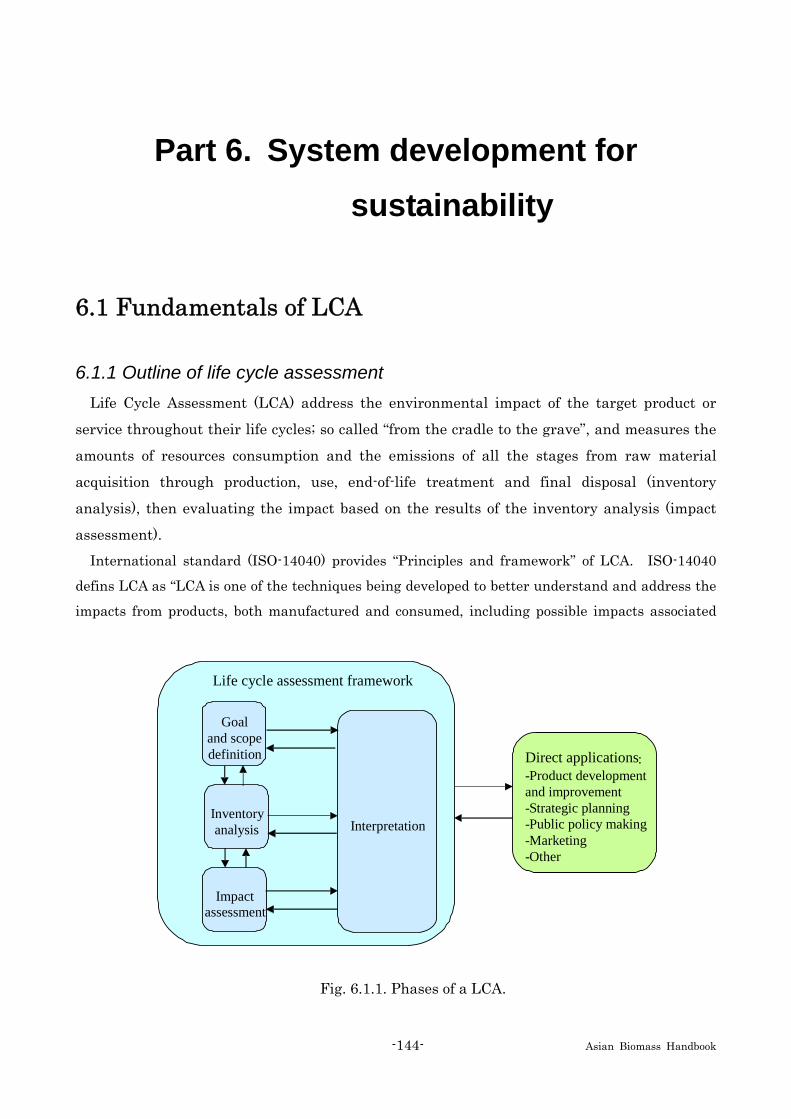
-144- Asian Biomass Handbook
Part 6. System development for sustainability
6.1 Fundamentals of LCA
6.1.1 Outline of life cycle assessment Life Cycle Assessment (LCA) address the environmental impact of the target product or
service throughout their life cycles; so called “from the cradle to the grave”, and measures the
amounts of resources consumption and the emissions of all the stages from raw material
acquisition through production, use, end-of-life treatment and final disposal (inventory
analysis), then evaluating the impact based on the results of the inventory analysis (impact
assessment). International standard (ISO-14040) provides “Principles and framework” of LCA. ISO-14040
defins LCA as “LCA is one of the techniques being developed to better understand and address the
impacts from products, both manufactured and consumed, including possible impacts associated
Impactassessment
Inventory analysis
Life cycle assessment framework
Interpretation
Goal and scope definition Direct applications :
-Product development and improvement -Strategic planning -Public policy making -Marketing -Other
Fig. 6.1.1. Phases of a LCA.
-145- Asian Biomass Handbook
with”. ISO-14040 also clearly shows the four phases for conducting LCA: “Goal and scope definition”,
“Inventory analysis”, “Impact assessment”, and “Interpretation” (Fig. 6.1.1).
6.1.2 Goal and scope definition In this phase, the practitioner of LCA defines the product system to be studied and clarifies
the goal. For instance, assume that an "influence for global warming of a refrigerator" is
defined as the evaluation target. According to the goal, LCA practitioner decides the emissions
to be measured and the boundary to be evaluated. The target to be studied in LCA is originally
"a function" of the product. For example, it is a function to "cool a thing in the storage" if it is "a
refrigerator". Therefore, the same "function” such as same volume, same durability year is to
be set when different models of refrigerator are compared. Moreover, when conducting LCA, it
is difficult to cover everything in the process related to the target product or service. The
process, whose contribution level is low in comparison with the goal of LCA, is excluded from a
study (cut-off). A so-called cut-off criteria is used to decide to be excluded from the process.
There is no general rule to cut-off because an important process can be different if the goal of
study is different. It is fundamental that scope is consistent with the goal of the LCA.
6.1.3 Lifecycle inventory analysis (LCI) The inventory analysis is a phase of life cycle assessment involving the compilation and
quantification of inputs and outputs for a product throughout its life cycle within the boundary
(product system) determined from the goal of the study.
Firstly, the practitioner of inventory analysis needs to collect the data related to
manufacturing, use, and final disposal of a targeted product. These data are generally called
“Foreground data” and they should be collected by the practitioner of LCA.
The next data to collect are the input-output data for production of raw materials used to
produce the product (including primary or secondary material), and for generation of electricity
needed to utilize the product, etc. These data are generally called “Background data”. It is
difficult for the practitioner of LCA to collect the background data, and usually the background
data is quoted from research papers or past LCA case studies. When LCA practitioner refers to
some data, it is necessary to check the consistency because the emissions for the combustion of
heavy oil or the electricity generation may be different from literature to literature. Relation of
foreground data and background data is shown for Fig. 6.1.2.
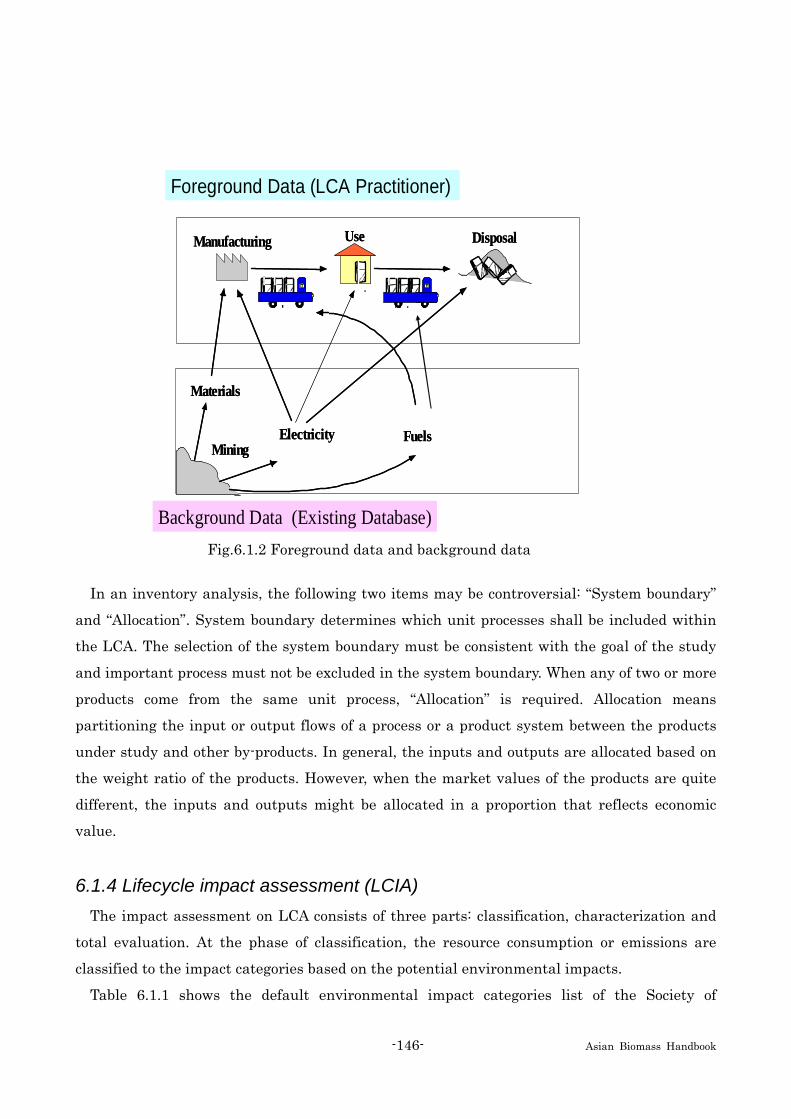
-146- Asian Biomass Handbook
Fig.6.1.2 Foreground data and background data
In an inventory analysis, the following two items may be controversial: “System boundary”
and “Allocation”. System boundary determines which unit processes shall be included within
the LCA. The selection of the system boundary must be consistent with the goal of the study
and important process must not be excluded in the system boundary. When any of two or more
products come from the same unit process, “Allocation” is required. Allocation means
partitioning the input or output flows of a process or a product system between the products
under study and other by-products. In general, the inputs and outputs are allocated based on
the weight ratio of the products. However, when the market values of the products are quite
different, the inputs and outputs might be allocated in a proportion that reflects economic
value.
6.1.4 Lifecycle impact assessment (LCIA) The impact assessment on LCA consists of three parts: classification, characterization and
total evaluation. At the phase of classification, the resource consumption or emissions are
classified to the impact categories based on the potential environmental impacts.
Table 6.1.1 shows the default environmental impact categories list of the Society of
Foreground Data (LCA Practitioner)
MaterialsMaterials
ElectricityElectricity FuelsFuels
ManufacturingManufacturing UseUse DisposalDisposal
MiningMining
Background Data (Existing Database)
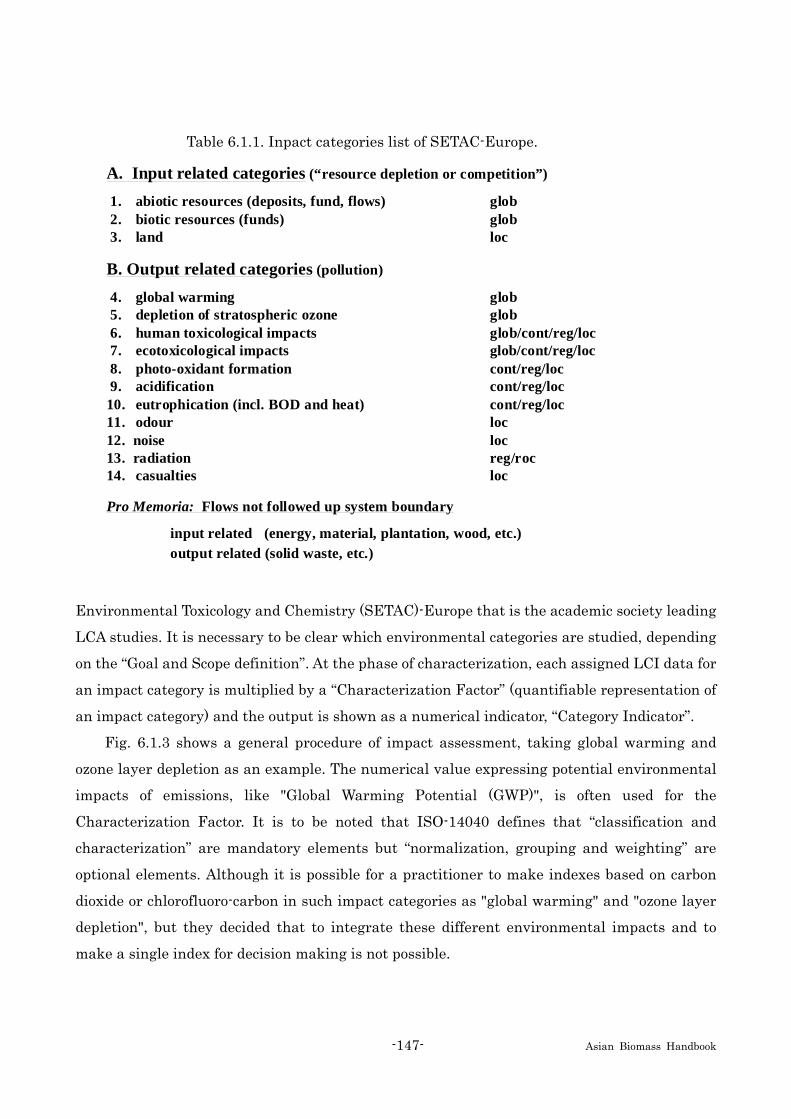
-147- Asian Biomass Handbook
Environmental Toxicology and Chemistry (SETAC)-Europe that is the academic society leading
LCA studies. It is necessary to be clear which environmental categories are studied, depending
on the “Goal and Scope definition”. At the phase of characterization, each assigned LCI data for
an impact category is multiplied by a “Characterization Factor” (quantifiable representation of
an impact category) and the output is shown as a numerical indicator, “Category Indicator”.
Fig. 6.1.3 shows a general procedure of impact assessment, taking global warming and
ozone layer depletion as an example. The numerical value expressing potential environmental
impacts of emissions, like "Global Warming Potential (GWP)", is often used for the
Characterization Factor. It is to be noted that ISO-14040 defines that “classification and
characterization” are mandatory elements but “normalization, grouping and weighting” are
optional elements. Although it is possible for a practitioner to make indexes based on carbon
dioxide or chlorofluoro-carbon in such impact categories as "global warming" and "ozone layer
depletion", but they decided that to integrate these different environmental impacts and to
make a single index for decision making is not possible.
Table 6.1.1. Inpact categories list of SETAC-Europe.
A. Input related categories (“resource depletion or competition”)
1. abiotic resources (deposits, fund, flows) glob2. biotic resources (funds) glob3. land loc
B. Output related categories (pollution)
4. global warming glob5. depletion of stratospheric ozone glob6. human toxicological impacts glob/cont/reg/loc7. ecotoxicological impacts glob/cont/reg/loc8. photo-oxidant formation cont/reg/loc9. acidification cont/reg/loc10. eutrophication (incl. BOD and heat) cont/reg/loc11. odour loc12. noise loc13. radiation reg/roc14. casualties loc
Pro Memoria: Flows not followed up system boundary
input related (energy, material, plantation, wood, etc.)output related (solid waste, etc.)
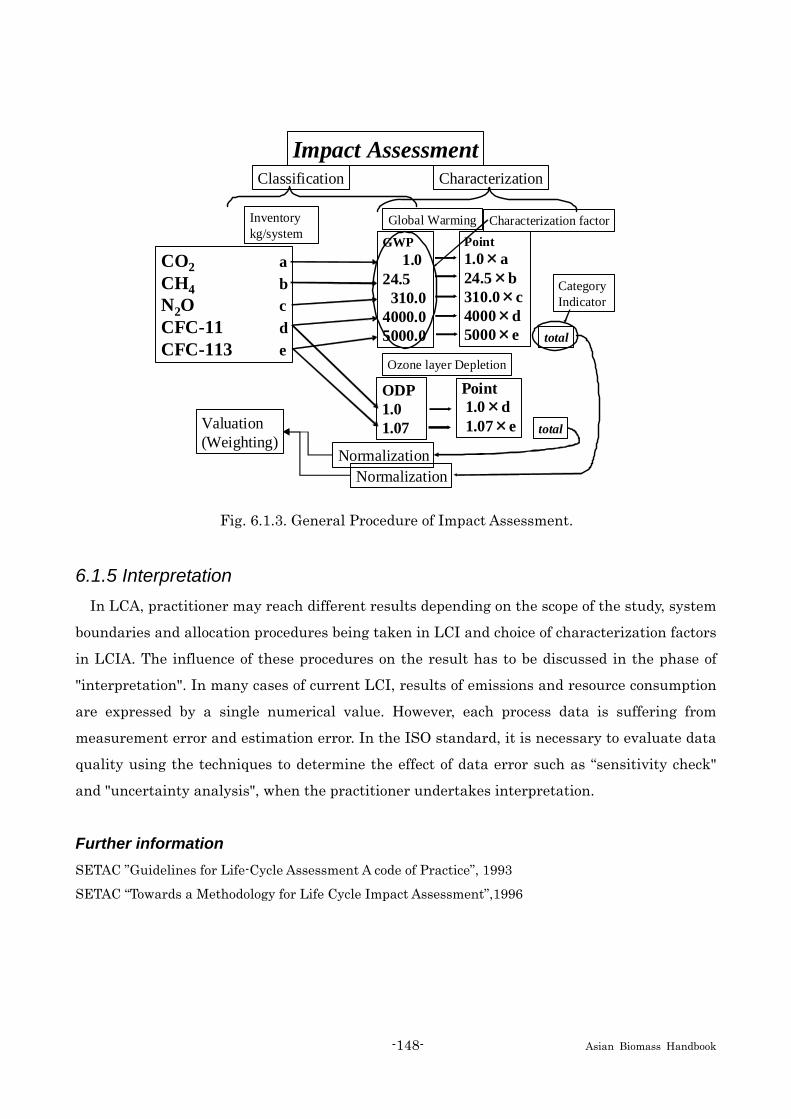
-148- Asian Biomass Handbook
6.1.5 Interpretation In LCA, practitioner may reach different results depending on the scope of the study, system
boundaries and allocation procedures being taken in LCI and choice of characterization factors
in LCIA. The influence of these procedures on the result has to be discussed in the phase of
"interpretation". In many cases of current LCI, results of emissions and resource consumption
are expressed by a single numerical value. However, each process data is suffering from
measurement error and estimation error. In the ISO standard, it is necessary to evaluate data
quality using the techniques to determine the effect of data error such as “sensitivity check"
and "uncertainty analysis", when the practitioner undertakes interpretation.
Further information SETAC ”Guidelines for Life-Cycle Assessment A code of Practice”, 1993
SETAC “Towards a Methodology for Life Cycle Impact Assessment”,1996
Classification Characterization
Inventorykg/system
Valuation(Weighting)
Normalization
CO2 aCH4 bN2O cCFC-11 dCFC-113 e
Ozone layer Depletion
Global Warming
GWP1.0
24.5310.0
4000.05000.0 total
total
ODP1.01.07
Point1.0×a 24.5×b 310.0×c 4000×d5000×e
Point1.0×d1.07×e
Impact Assessment
Characterization factor
Category Indicator
Normalization
Fig. 6.1.3. General Procedure of Impact Assessment.
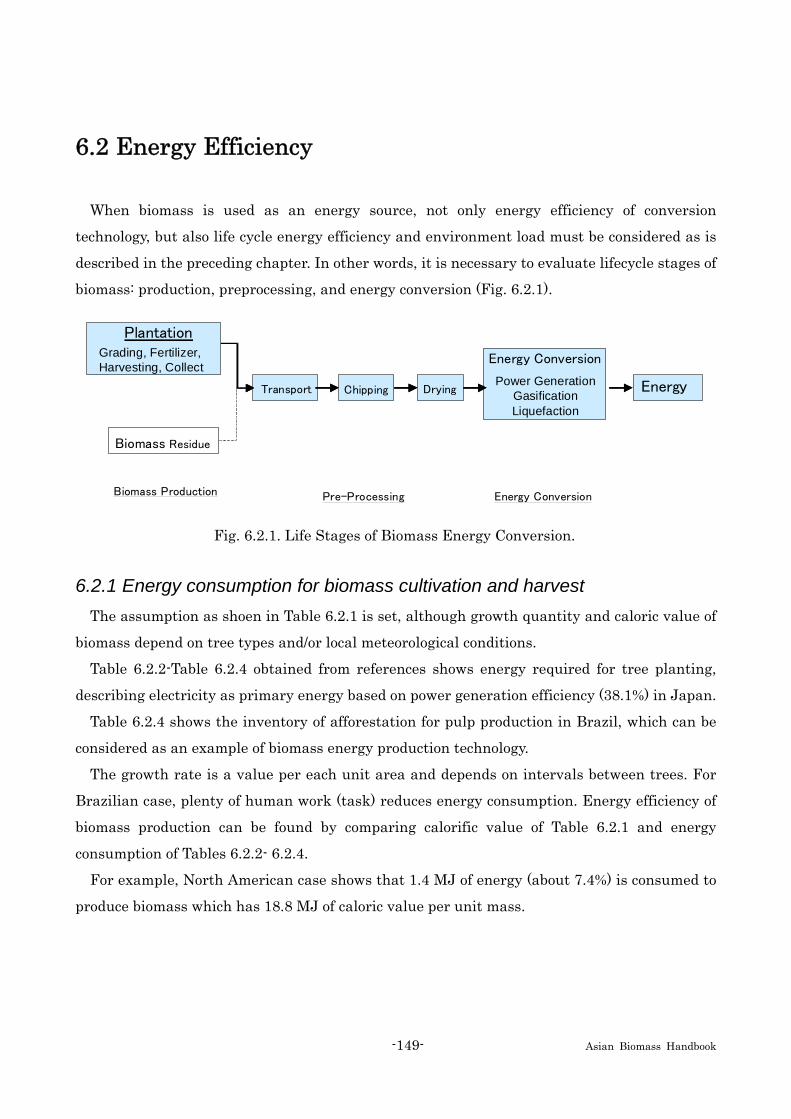
-149- Asian Biomass Handbook
6.2 Energy Efficiency
When biomass is used as an energy source, not only energy efficiency of conversion
technology, but also life cycle energy efficiency and environment load must be considered as is
described in the preceding chapter. In other words, it is necessary to evaluate lifecycle stages of
biomass: production, preprocessing, and energy conversion (Fig. 6.2.1).
6.2.1 Energy consumption for biomass cultivation and harvest The assumption as shoen in Table 6.2.1 is set, although growth quantity and caloric value of
biomass depend on tree types and/or local meteorological conditions.
Table 6.2.2-Table 6.2.4 obtained from references shows energy required for tree planting,
describing electricity as primary energy based on power generation efficiency (38.1%) in Japan.
Table 6.2.4 shows the inventory of afforestation for pulp production in Brazil, which can be
considered as an example of biomass energy production technology.
The growth rate is a value per each unit area and depends on intervals between trees. For
Brazilian case, plenty of human work (task) reduces energy consumption. Energy efficiency of
biomass production can be found by comparing calorific value of Table 6.2.1 and energy
consumption of Tables 6.2.2- 6.2.4.
For example, North American case shows that 1.4 MJ of energy (about 7.4%) is consumed to
produce biomass which has 18.8 MJ of caloric value per unit mass.
Plantation
Biomass Residue
Transport Chipping Drying
Energy Conversion
Biomass Production Energy Conversion
Energy
Pre-Processing
Power GenerationGasificationLiquefaction
Grading, Fertilizer, Harvesting, Collect
Fig. 6.2.1. Life Stages of Biomass Energy Conversion.
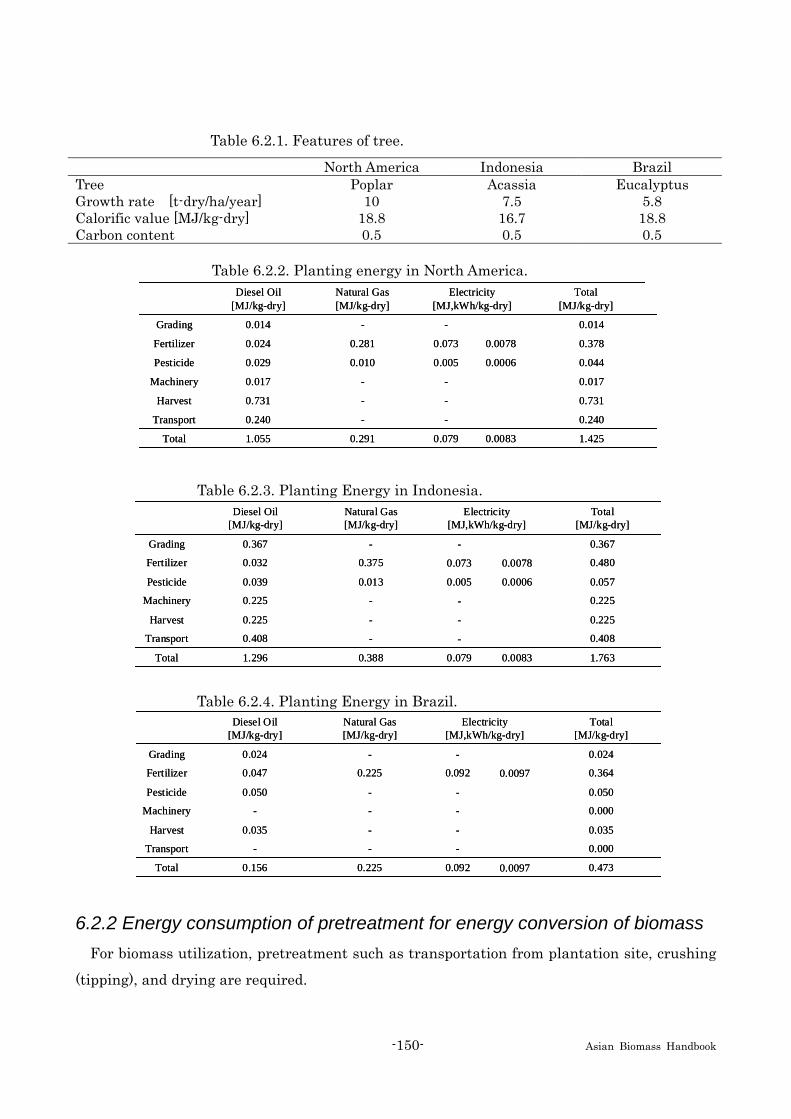
-150- Asian Biomass Handbook
Table 6.2.1. Features of tree.
North America Indonesia Brazil Tree Poplar Acassia Eucalyptus Growth rate [t-dry/ha/year] 10 7.5 5.8 Calorific value [MJ/kg-dry] 18.8 16.7 18.8 Carbon content 0.5 0.5 0.5
Table 6.2.2. Planting energy in North America.
Table 6.2.3. Planting Energy in Indonesia.
Table 6.2.4. Planting Energy in Brazil.
6.2.2 Energy consumption of pretreatment for energy conversion of biomass For biomass utilization, pretreatment such as transportation from plantation site, crushing
(tipping), and drying are required.
1.4250.00830.0790.2911.055Total
0.240--0.240Transport
0.731--0.731Harvest
0.017--0.017Machinery
0.0440.00060.0050.0100.029Pesticide
0.3780.00780.0730.2810.024Fertilizer
0.014--0.014Grading
Total[MJ/kg-dry]
Electricity[MJ,kWh/kg-dry]
Natural Gas[MJ/kg-dry]
Diesel Oil[MJ/kg-dry]
1.4250.00830.0790.2911.055Total
0.240--0.240Transport
0.731--0.731Harvest
0.017--0.017Machinery
0.0440.00060.0050.0100.029Pesticide
0.3780.00780.0730.2810.024Fertilizer
0.014--0.014Grading
Total[MJ/kg-dry]
Electricity[MJ,kWh/kg-dry]
Natural Gas[MJ/kg-dry]
Diesel Oil[MJ/kg-dry]
1.7630.00830.0790.3881.296Total
0.408--0.408Transport
0.225--0.225Harvest
0.225--0.225Machinery
0.0570.00060.0050.0130.039Pesticide
0.4800.00780.0730.3750.032Fertilizer
0.367--0.367Grading
Total[MJ/kg-dry]
Electricity[MJ,kWh/kg-dry]
Natural Gas[MJ/kg-dry]
Diesel Oil[MJ/kg-dry]
1.7630.00830.0790.3881.296Total
0.408--0.408Transport
0.225--0.225Harvest
0.225--0.225Machinery
0.0570.00060.0050.0130.039Pesticide
0.4800.00780.0730.3750.032Fertilizer
0.367--0.367Grading
Total[MJ/kg-dry]
Electricity[MJ,kWh/kg-dry]
Natural Gas[MJ/kg-dry]
Diesel Oil[MJ/kg-dry]
0.4730.00970.0920.2250.156Total
0.000---Transport
0.035--0.035Harvest
0.000---Machinery
0.050--0.050Pesticide
0.3640.00970.0920.2250.047Fertilizer
0.024--0.024Grading
Total[MJ/kg-dry]
Electricity[MJ,kWh/kg-dry]
Natural Gas[MJ/kg-dry]
Diesel Oil[MJ/kg-dry]
0.4730.00970.0920.2250.156Total
0.000---Transport
0.035--0.035Harvest
0.000---Machinery
0.050--0.050Pesticide
0.3640.00970.0920.2250.047Fertilizer
0.024--0.024Grading
Total[MJ/kg-dry]
Electricity[MJ,kWh/kg-dry]
Natural Gas[MJ/kg-dry]
Diesel Oil[MJ/kg-dry]
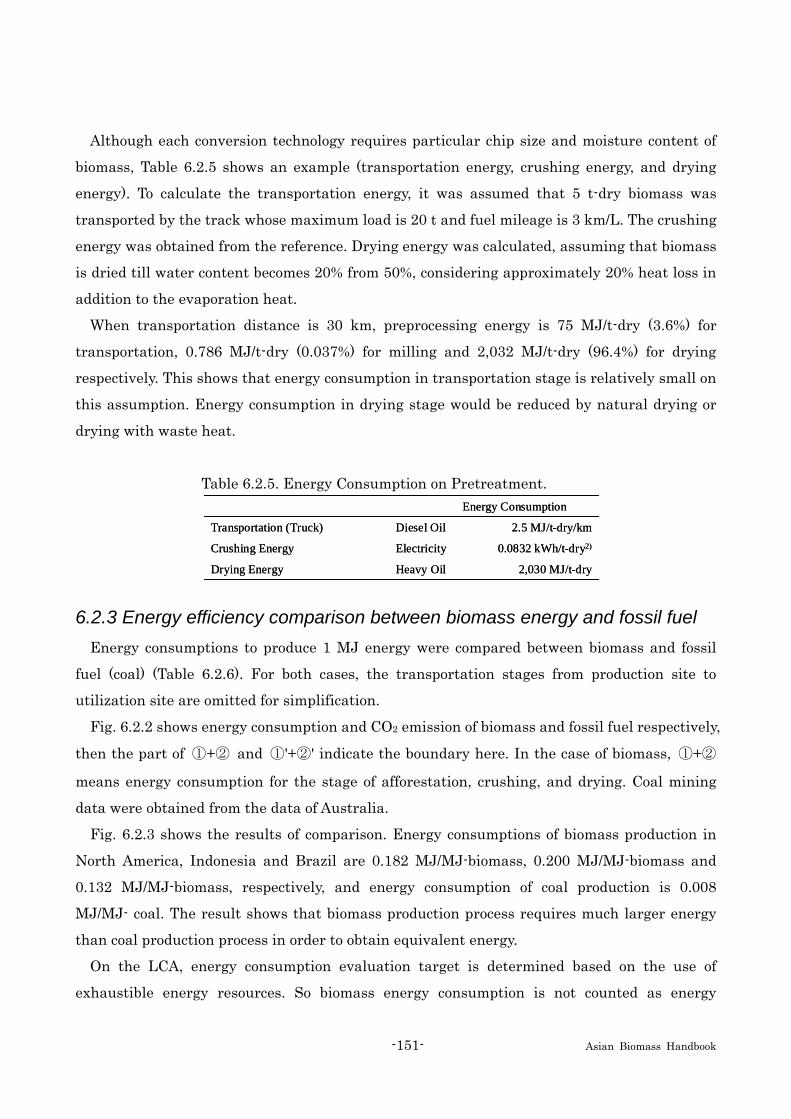
-151- Asian Biomass Handbook
Although each conversion technology requires particular chip size and moisture content of
biomass, Table 6.2.5 shows an example (transportation energy, crushing energy, and drying
energy). To calculate the transportation energy, it was assumed that 5 t-dry biomass was
transported by the track whose maximum load is 20 t and fuel mileage is 3 km/L. The crushing
energy was obtained from the reference. Drying energy was calculated, assuming that biomass
is dried till water content becomes 20% from 50%, considering approximately 20% heat loss in
addition to the evaporation heat.
When transportation distance is 30 km, preprocessing energy is 75 MJ/t-dry (3.6%) for
transportation, 0.786 MJ/t-dry (0.037%) for milling and 2,032 MJ/t-dry (96.4%) for drying
respectively. This shows that energy consumption in transportation stage is relatively small on
this assumption. Energy consumption in drying stage would be reduced by natural drying or
drying with waste heat.
Table 6.2.5. Energy Consumption on Pretreatment.
6.2.3 Energy efficiency comparison between biomass energy and fossil fuel Energy consumptions to produce 1 MJ energy were compared between biomass and fossil
fuel (coal) (Table 6.2.6). For both cases, the transportation stages from production site to
utilization site are omitted for simplification.
Fig. 6.2.2 shows energy consumption and CO2 emission of biomass and fossil fuel respectively,
then the part of ①+② and ①'+②' indicate the boundary here. In the case of biomass, ①+②
means energy consumption for the stage of afforestation, crushing, and drying. Coal mining
data were obtained from the data of Australia.
Fig. 6.2.3 shows the results of comparison. Energy consumptions of biomass production in
North America, Indonesia and Brazil are 0.182 MJ/MJ-biomass, 0.200 MJ/MJ-biomass and
0.132 MJ/MJ-biomass, respectively, and energy consumption of coal production is 0.008
MJ/MJ- coal. The result shows that biomass production process requires much larger energy
than coal production process in order to obtain equivalent energy.
On the LCA, energy consumption evaluation target is determined based on the use of
exhaustible energy resources. So biomass energy consumption is not counted as energy
2,030 MJ/t-dryHeavy OilDrying Energy
0.0832 kWh/t-dry2)ElectricityCrushing Energy
2.5 MJ/t-dry/kmDiesel OilTransportation (Truck)
Energy Consumption
2,030 MJ/t-dryHeavy OilDrying Energy
0.0832 kWh/t-dry2)ElectricityCrushing Energy
2.5 MJ/t-dry/kmDiesel OilTransportation (Truck)
Energy Consumption
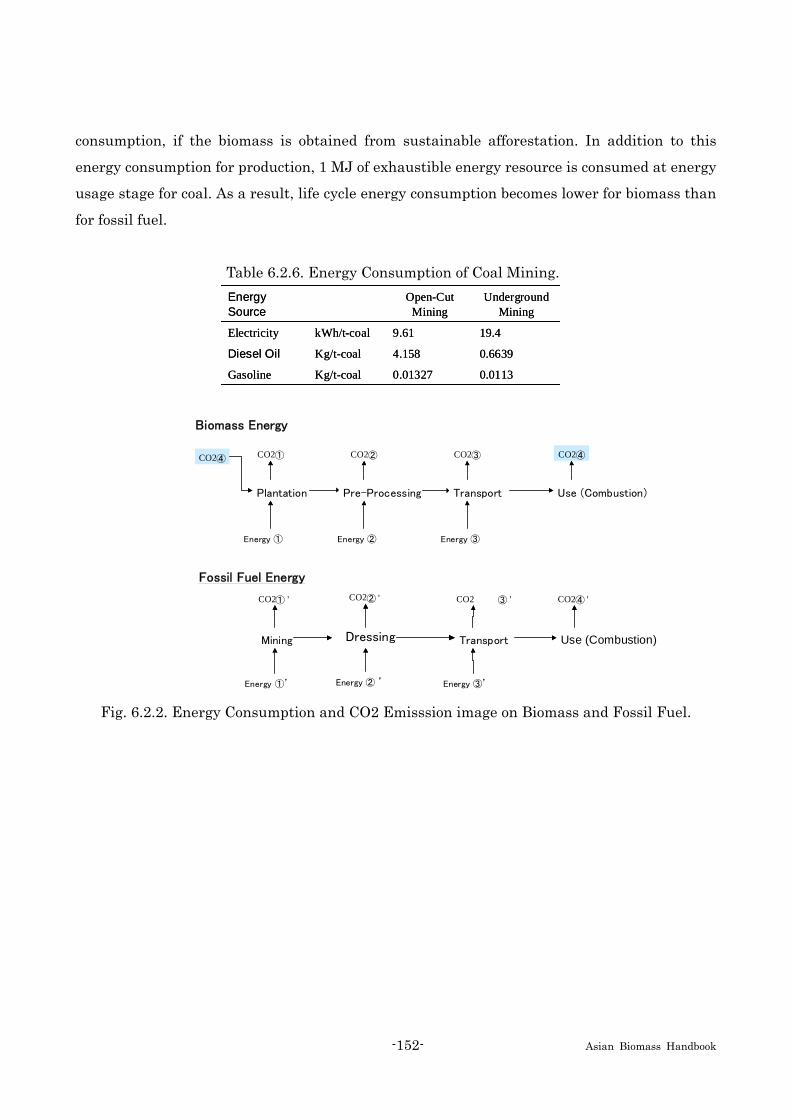
-152- Asian Biomass Handbook
consumption, if the biomass is obtained from sustainable afforestation. In addition to this
energy consumption for production, 1 MJ of exhaustible energy resource is consumed at energy
usage stage for coal. As a result, life cycle energy consumption becomes lower for biomass than
for fossil fuel.
Table 6.2.6. Energy Consumption of Coal Mining.
Fig. 6.2.2. Energy Consumption and CO2 Emisssion image on Biomass and Fossil Fuel.
0.01130.01327Kg/t-coalGasoline
0.66394.158Kg/t-coalDiesel Oil
19.49.61kWh/t-coalElectricity
Underground Mining
Open-Cut Mining
Energy Source
0.01130.01327Kg/t-coalGasoline
0.66394.158Kg/t-coalDiesel Oil
19.49.61kWh/t-coalElectricity
Underground Mining
Open-Cut Mining
Energy Source
Mining Dressing Transport Use (Combustion)
Fossil Fuel Energy
Energy ①’ Energy ② ’ Energy ③’
CO2① ’ CO2② ’ CO2 ③ ’ CO2④ ’
Plantation Pre-Processing Transport Use (Combustion)
Biomass Energy
Energy ① Energy ② Energy ③
CO2① CO2② CO2③ CO2④CO2④
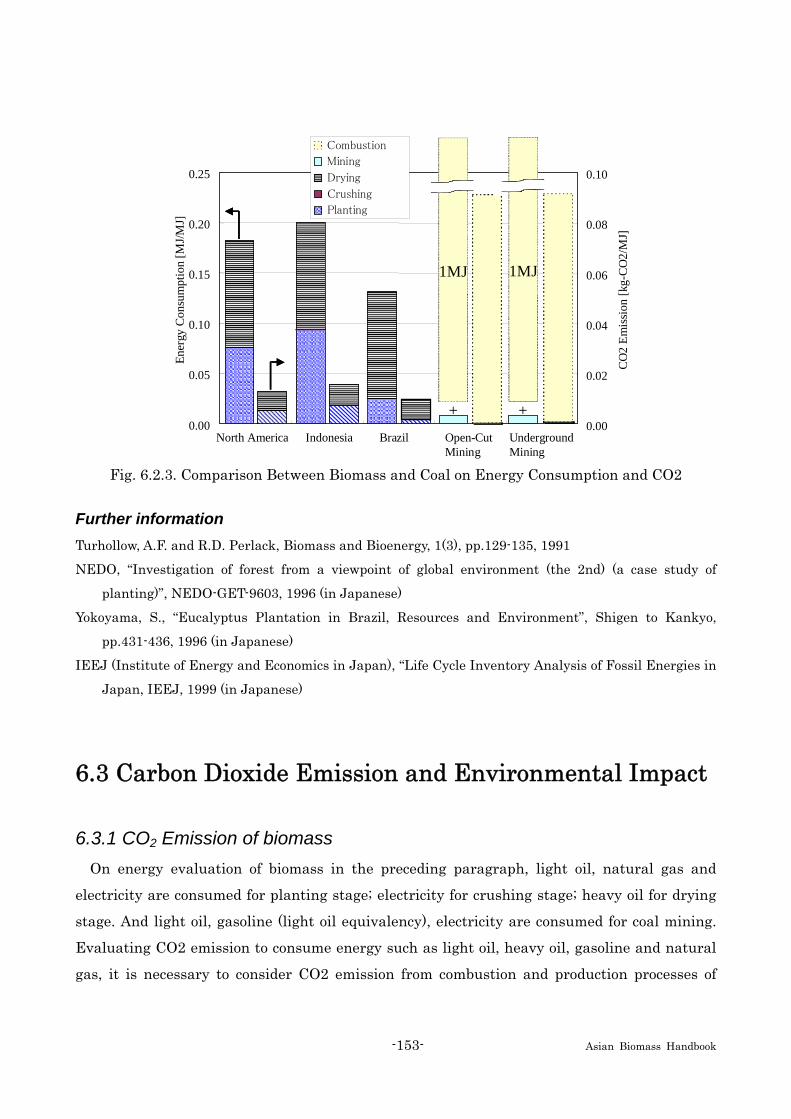
-153- Asian Biomass Handbook
Fig. 6.2.3. Comparison Between Biomass and Coal on Energy Consumption and CO2
Further information Turhollow, A.F. and R.D. Perlack, Biomass and Bioenergy, 1(3), pp.129-135, 1991
NEDO, “Investigation of forest from a viewpoint of global environment (the 2nd) (a case study of
planting)”, NEDO-GET-9603, 1996 (in Japanese)
Yokoyama, S., “Eucalyptus Plantation in Brazil, Resources and Environment”, Shigen to Kankyo,
pp.431-436, 1996 (in Japanese)
IEEJ (Institute of Energy and Economics in Japan), “Life Cycle Inventory Analysis of Fossil Energies in
Japan, IEEJ, 1999 (in Japanese)
6.3 Carbon Dioxide Emission and Environmental Impact
6.3.1 CO2 Emission of biomass On energy evaluation of biomass in the preceding paragraph, light oil, natural gas and
electricity are consumed for planting stage; electricity for crushing stage; heavy oil for drying
stage. And light oil, gasoline (light oil equivalency), electricity are consumed for coal mining.
Evaluating CO2 emission to consume energy such as light oil, heavy oil, gasoline and natural
gas, it is necessary to consider CO2 emission from combustion and production processes of
0.00
0.05
0.10
0.15
0.20
0.25
North America Indonesia Brazil Open-CutMining
UndergroundMining
Ener
gy C
onsu
mpt
ion
[MJ/M
J]
0.00
0.02
0.04
0.06
0.08
0.10
CO2
Emis
sion
[kg-
CO2/
MJ]
Combustion
Mining
Drying
Crushing
Planting
1MJ 1MJ
+ +

-154- Asian Biomass Handbook
them. The power resources composition should be considered to evaluate CO2 emission of
electricity consumption. It was assumed that CO2 emission according to production process of
these energy was equal to those of Japan, and the emission factors were obtained from LCA
results (Table 6.3.1) (Tahara 1997, Tahara 1998).
CO2 emissions of biomass and coal are obtained by multiplying CO2 emission factor, to
energy consumption about biomass production (Fig. 6.2.1). The CO2 emission of biomass
production is 0.0130 kg-CO2/MJ-biomass. The CO2 emissions of open-pit and underground coal
mining are 0.00053 kg-CO2/MJ- coal, 0.00039 kg-CO2/MJ- coal respectively and both of them
become 0.091 kg-CO2/MJ-coal with consideration burning(combustion) stage. It was assumed
that the forest would absorb the CO2 emission (CO2 ④) from biomass combustion as shown in
Fig. 6.2.2.
Table 6.3.1. Unit CO2 Emission of Various Energy in Japan.
6.3.2 Comparison between biomass power generation and the other Biomass generation technology is compared with the other generation technology (coal fired,
oil fired, LNG fired, hydropower, ocean thermal energy conversion, photovoltaic). The biomass
power generation is defined as the scale that can manage as much as biomass grown by 30km2
afforestation in North America, Indonesia, and Brazil. Annual quantity of sending end
generation and power station scale of each power station are shown in table 6.3.2.
The CO2 emission per 1kWh of each generation plant can be found dividing the sum of CO2
emission on power station construction and operation (fuel burning and maintenance repair) by
the amount of total generated energy, assuming durability year of each generation plant. The
durability of all power stations was defined as 30 years here.
Table 6.3.3 and Fig. 6.3.1 show each plant CO2 emission based on LCA. While facilities of
biomass power generation have a similarity to thermal power generation by fossil fuel, CO2
emission per unit electricity of the biomass generation has a drastic reduction because CO2
emission on the biomass combustion is not counted. About CO2 emission, biomass power
0.4378 kg-CO2/kWhElectricity
0.0516 kg-CO2/MJLNG
0.0715 kg-CO2/MJGasoline
0.0746 kg-CO2/MJHeavy Oil
0.0715 kg-CO2/MJDiesel Oil
CO2 Emission
0.4378 kg-CO2/kWhElectricity
0.0516 kg-CO2/MJLNG
0.0715 kg-CO2/MJGasoline
0.0746 kg-CO2/MJHeavy Oil
0.0715 kg-CO2/MJDiesel Oil
CO2 Emission

-155- Asian Biomass Handbook
generation is a highly competitive technology to the other renewable energy generation.
Table 6.3.2. Plant Scale of Various Power Generation Station.
Table 6.3.3. Unit CO2 Emission of Various Power Generation.
0.024Biomass Fired(Brazil)
0.119Biomass Fired(Indonesia)
0.081Biomass Fired(North America)
0.187Photovoltaic (Japan)
0.148Photovoltaic (Indonesia)
0.014OTEC (100MW)
0.119OTEC (2.5MW)
0.017Hydropower
0.563LNG Fired
0.756Oil Fired
0.916Coal Fired
[kg-CO2/kWh]
Unit CO2 EmissionType of Generation
0.024Biomass Fired(Brazil)
0.119Biomass Fired(Indonesia)
0.081Biomass Fired(North America)
0.187Photovoltaic (Japan)
0.148Photovoltaic (Indonesia)
0.014OTEC (100MW)
0.119OTEC (2.5MW)
0.017Hydropower
0.563LNG Fired
0.756Oil Fired
0.916Coal Fired
[kg-CO2/kWh]
Unit CO2 EmissionType of Generation
Tahara et al., 19981145.98×108Biomass Fired (Brazil)
Tahara et al., 1998941.65×108Biomass Fired (Indonesia)
Tahara et al., 19981971.04×109Biomass Fired (North America ) Inaba et al. , 1995108.64×106Photovoltaic (Japan)
Inaba et al. , 1995101.18×107Photovoltaic(Indonesia)
Tahara et al., 19931005.70×108OTEC (100MW)
Resources Council,19832.58.76×106OTEC (2.5MW)
Resources Council,1983103.93×107Hydropower
Uchiyama et al. , 199110006.34×109LNG Fired
Uchiyama et al. , 199110006.17×109Oil Fired
Uchiyama et al. , 199110006.08×109Coal Fired
ReferencesPlant Scale[MW]
Annual Generation[kWh/y]Type of Generation

-156- Asian Biomass Handbook
Fig. 6.3.1. Unit CO2 Emission of Various Power Generation.
6.3.3 Environmental impact of biomass CO2 emission has been focused on as only one environmental impact of biomass. But it is
necessary to consider the emission of other greenhouse gases such as CH4 and N2O in biomass
production. Land use of biomass production is also key effect to environment.
In addition, the competition with food might be considered as derivative environmental impact
in the case of cultivation type of biomass.
Further information Tahara, K. et al. “Evaluation of generation plant by LCA-Calculation of CO2 payback time “, Chemical
Engineering, 23(1), pp.88-94, 1997 (in Japanese)
Uchiyama, Y. and H. Yamamoto, “Impact of Generation Plant on Global Warming”, Central Res. Inst. of
Electric Power Industry report Y91005, 1992 (in Japanese)
Science and Technology Agency resource survey society, “Natural energy and generation technology”,
Taisei Publishing co. Ltd, 1983 (in Japanese)
Tahara, K. et al., “Role of ocean thermal energy conversion in the issue of carbon dioxide”, Macro Review,
6, pp.35-43, 1993 (in Japanese)
Inaba, A, et al, “Life cycle assessment of photovoltaic power generation system, Energy and Resources”,
16(5), pp.525-531, 1995
Tahara, K., et al. “Life Cycle Assessment of Biomass power Generation with Sustainable Forestry
System” 4th International Conference on Greenhouse Gas Control Technologies (GHGT-4) 1998, 9,
Interlaken, Switzerland
0.00.10.20.30.40.50.60.70.80.91.0
Coal F
ired
Oil Fired
LNG Fired
Hyd
ropo
wer
OTEC (2.5M
W)
OTEC (100
MW)
Photov
oltaic (Indo
nesia
)
Photov
oltaic (Japa
n)
Biom
ass F
ired (N
orth A
merica
)
Biom
ass Fired (Ind
ones
ia)
Biom
ass Fired (B
razil
)
Uni
t CO
2 Em
issio
n [k
g-CO
2/kW
h]

-157- Asian Biomass Handbook
6.4 Economical Evaluation of Bioenergy
6.4.1 Cost of bioenergy Cost of Bioenergy can be disaggregated into 3 stages: resource cost, conversion technology
cost, and secondary energy cost at consumer end.
Resource cost consists of not only cost of resource but also 1) opportunity cost (the value if
biomass was used as material or food), 2) waste management cost for appropriate disposal, and
3) environment cost (environmental impact of biomass production).
Conversion technology cost is dependent on type of biomass input, type of technology, time
frame of evaluation, and other factors.
Secondary energy (electricity, heat, fuel, and other forms that are converted from biomass
resources) cost is calculated as summation of resource cost and conversion technology cost.
It is necessary to evaluate the cost of bioenergy with the latest information relating to energy
cost, land use competition, available bioenergy technologies, externality of environment, and
other aspects.
6.4.2 Bioenergy resource cost Bioenergy resource consists of raw material, plantation bioenergy, and residue biomass
(discharge during biomass conversion and consumption process). When raw material such as
wood and food are converted into bioenergy, opportunity cost is incurred. Environment cost is
estimated based on impacts on local land use change, biodiversity and aspects. Biomass residue
can be negative when appropriate waste management of biomass is implemented.
-10-8-6-4-20246
Energ
y C
rop
Indu
strial
Roundw
ood
Resi
due
Saw
mill
Resi
due
Wood
Scra
p
Sug
arcan
e R
esid
ue
Liv
est
ock
man
ure
Hum
an F
eces
Oil
Bio
mas
s C
ost
($/G
J)
-10-8-6-4-20246
Energ
y C
rop
Indu
strial
Roundw
ood
Resi
due
Saw
mill
Resi
due
Wood
Scra
p
Sug
arcan
e R
esid
ue
Liv
est
ock
man
ure
Hum
an F
eces
Oil
Bio
mas
s C
ost
($/G
J)
Fig. 6.4.1 Biomass Cost.

-158- Asian Biomass Handbook
Bioenergy resource cost can be expressed by the following equation:
[bioenergy resource cost] = [supply cost] + [opportunity cost] + [environment cost] - [disposal
cost]
Modern wood fuel and wooden chip have higher cost due to their good quality as material and
opportunity cost. Cereal residues also have higher cost due to transportation and stock.
Plantation cost is essentially high. Residue bioenergy can be available at negative cost due to
waste management.
6.4.3 Biomass technology conversion cost Traditional biomass is directly used as wood or charcoal. Modern biomass is consumed as
useful energy carrier such as electricity, liquid fuels, and gaseous fuels. There are several types
of conversion technologies such as electricity generation (steam generation, integrated
gasification generation), pylorysis, and fermentation (anaerobic digestion generation, ethanol
production).
Generation cost of biomass integrated gasification was evaluated as follows. Installation cost
was projected to be 2102 $/kWe (capacity 75 MWe, efficiency 36%) in 1997 , 1892 $/kWe
(capacity 100MWe, efficiency 37%) in 2000, 1111 $/kWe (capacity 110 MWe, efficiency 45%) in
2030 (price in the year of 1996). But still it is in experimental stage in 2001. Another evaluation
estimates installation cost to be 1221 $/kWe with 100 MWe capacity (1990 price). Annual
expenditure (as a portion of annualized installation cost and operation cost) is assumed to be
12%.
Fig shows bioenergy conversion cost of typical technologies. Though cost of fermentation
technology is higher than others, it can be moderated to include waste management cost of
livestock manure. Technology cost for steam generation, integrated gasification generation,
and pylorysis is expected to be cheaper due to technology development and deployment, but it
is uncertain. Cost of co-firing generation is the additional cost to reform existing coal fired
plant.
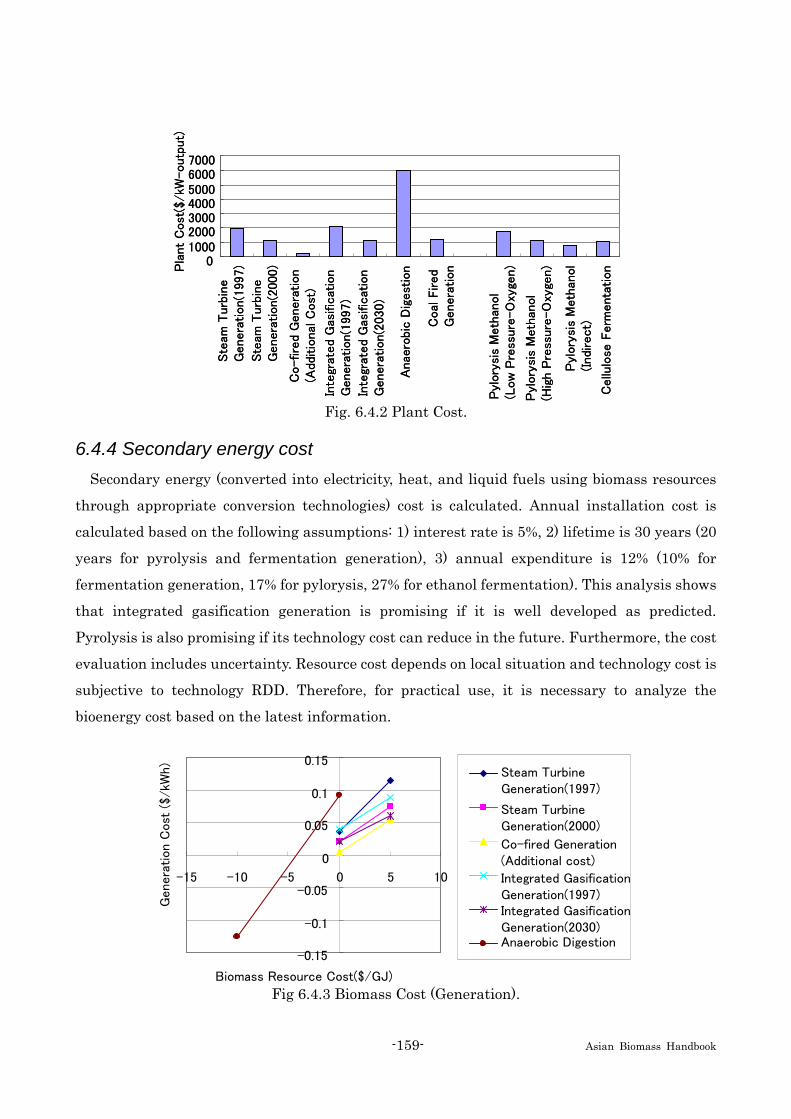
-159- Asian Biomass Handbook
01000200030004000500060007000
Ste
am T
urb
ine
Genera
tion(1
997)
Co-fire
d G
enera
tion
(Add
itio
nal
Cost
)
Inte
grat
ed
Gas
ific
atio
n
Genera
tion(1
997)
Anae
robi
c D
igest
ion
Coal
Fired
Genera
tion
Pyl
ory
sis
Meth
anol
(Low
Pre
ssure
-O
xyge
n)Pla
nt
Cost
($/kW
-outp
ut)
Ste
am T
urb
ine
Genera
tion(2
000)
Inte
grat
ed
Gas
ific
atio
n
Genera
tion(2
030)
Pyl
ory
sis
Meth
anol
(Hig
h P
ress
ure
-O
xyge
n)
Pyl
ory
sis
Meth
anol
(Indi
rect)
Cellu
lose
Ferm
enta
tion0
1000200030004000500060007000
Ste
am T
urb
ine
Genera
tion(1
997)
Co-fire
d G
enera
tion
(Add
itio
nal
Cost
)
Inte
grat
ed
Gas
ific
atio
n
Genera
tion(1
997)
Anae
robi
c D
igest
ion
Coal
Fired
Genera
tion
Pyl
ory
sis
Meth
anol
(Low
Pre
ssure
-O
xyge
n)Pla
nt
Cost
($/kW
-outp
ut)
Ste
am T
urb
ine
Genera
tion(2
000)
Inte
grat
ed
Gas
ific
atio
n
Genera
tion(2
030)
Pyl
ory
sis
Meth
anol
(Hig
h P
ress
ure
-O
xyge
n)
Pyl
ory
sis
Meth
anol
(Indi
rect)
Cellu
lose
Ferm
enta
tion
Fig. 6.4.2 Plant Cost.
6.4.4 Secondary energy cost
Secondary energy (converted into electricity, heat, and liquid fuels using biomass resources
through appropriate conversion technologies) cost is calculated. Annual installation cost is
calculated based on the following assumptions: 1) interest rate is 5%, 2) lifetime is 30 years (20
years for pyrolysis and fermentation generation), 3) annual expenditure is 12% (10% for
fermentation generation, 17% for pylorysis, 27% for ethanol fermentation). This analysis shows
that integrated gasification generation is promising if it is well developed as predicted.
Pyrolysis is also promising if its technology cost can reduce in the future. Furthermore, the cost
evaluation includes uncertainty. Resource cost depends on local situation and technology cost is
subjective to technology RDD. Therefore, for practical use, it is necessary to analyze the
bioenergy cost based on the latest information.
-0.15
-0.1
-0.05
0
0.05
0.1
0.15
-15 -10 -5 0 5 10
Biomass Resource Cost($/GJ)
Genera
tion C
ost
($/kW
h)
Steam Turbine Generation(1997)
Co-fired Generation (Additional cost)
Integrated Gasification Generation(1997)
Steam Turbine Generation(2000)
Integrated Gasification Generation(2030)Anaerobic Digestion
Fig 6.4.3 Biomass Cost (Generation).
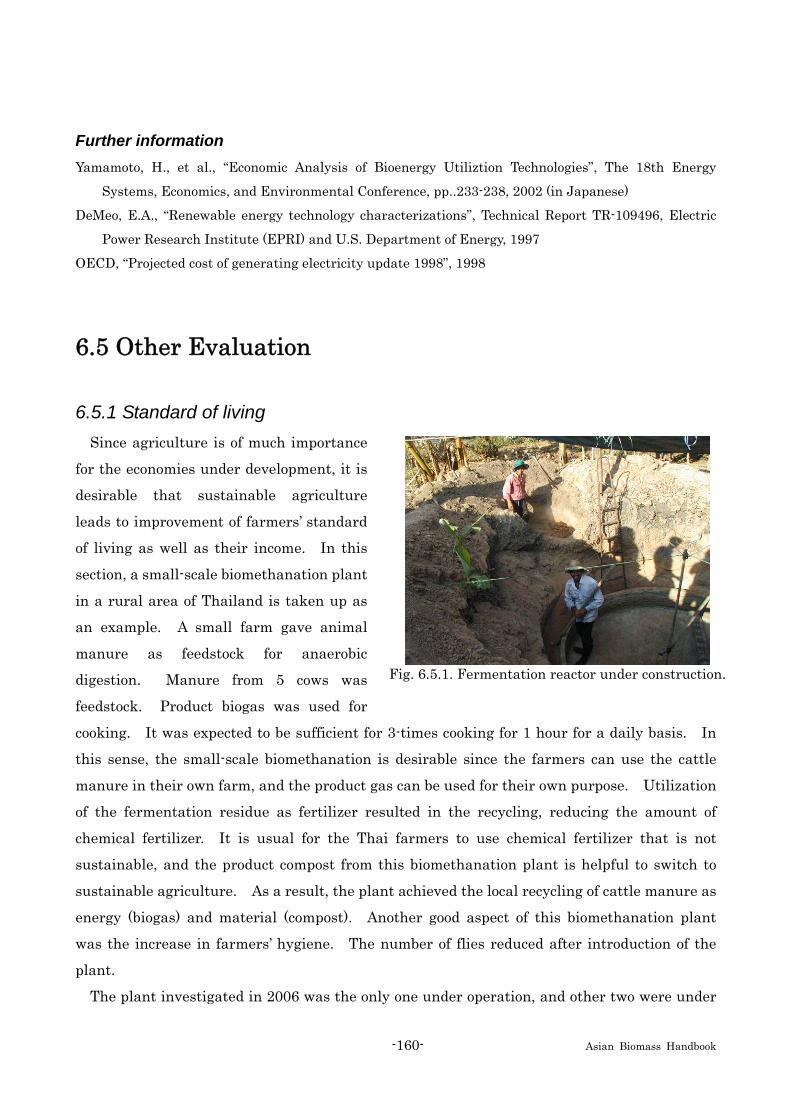
-160- Asian Biomass Handbook
Fig. 6.5.1. Fermentation reactor under construction.
Further information Yamamoto, H., et al., “Economic Analysis of Bioenergy Utiliztion Technologies”, The 18th Energy
Systems, Economics, and Environmental Conference, pp..233-238, 2002 (in Japanese)
DeMeo, E.A., “Renewable energy technology characterizations”, Technical Report TR-109496, Electric
Power Research Institute (EPRI) and U.S. Department of Energy, 1997
OECD, “Projected cost of generating electricity update 1998”, 1998
6.5 Other Evaluation
6.5.1 Standard of living Since agriculture is of much importance
for the economies under development, it is
desirable that sustainable agriculture
leads to improvement of farmers’ standard
of living as well as their income. In this
section, a small-scale biomethanation plant
in a rural area of Thailand is taken up as
an example. A small farm gave animal
manure as feedstock for anaerobic
digestion. Manure from 5 cows was
feedstock. Product biogas was used for
cooking. It was expected to be sufficient for 3-times cooking for 1 hour for a daily basis. In
this sense, the small-scale biomethanation is desirable since the farmers can use the cattle
manure in their own farm, and the product gas can be used for their own purpose. Utilization
of the fermentation residue as fertilizer resulted in the recycling, reducing the amount of
chemical fertilizer. It is usual for the Thai farmers to use chemical fertilizer that is not
sustainable, and the product compost from this biomethanation plant is helpful to switch to
sustainable agriculture. As a result, the plant achieved the local recycling of cattle manure as
energy (biogas) and material (compost). Another good aspect of this biomethanation plant
was the increase in farmers’ hygiene. The number of flies reduced after introduction of the
plant.
The plant investigated in 2006 was the only one under operation, and other two were under

-161- Asian Biomass Handbook
Fig. 6.5.2. Ethanol production plant in Thailand.
construction (Fig. 6.5.1). The reason for this should be the farmers’ ignorance on this
technology. During the discussion with Thai people, it was pointed out that education of
people is important. In the rural area of Thailand, the literacy rate is not high. Actually, the
investigated plant was a demonstration one fully supported by the local government to show
neighbors the effectiveness of the biomethanation plant. In this sense, it is important to
supply proper information on this technology to the farmers.
What is important for the biomass utilization for farmers to be effective is the accessibility of
the biomass plant or biomass collecting site from farmers. Even if farmers possess or produce
biomass feedstock, it is nothing if they do not have access to the sites where it can be made use
of.
6.5.2 Farmers’ income By the use of the plant described above,
the farmer did not need to pay 350 bahts a
month (100 bahts = 2.85 US$, as of
December 2006), which was the cost of
propane gas. This was a fair amount for a
farmer’s family, and they said that they
were happy with the reduction of this cost.
The fermentation residue was placed in a
bag by 30 kg and sold at 12 bahts per bag.
The system was quite simple, and the plant
could be fabricated by villagers in 9 days. The material cost 5,000 bahts and total cost was
7,400 bahts, so the economic payback period was 21.1 months. A person from the local
government who knew the know-how could help the farmer for building. The means to make
the process economically feasible is simple structure and free labor to help each other in the
village. The materials are cheap. No special skill was needed for operation, the main body of
operation is farmers themselves, and this reduces the labor cost. The simplicity results in no
necessity of operation person or labor cost, and farmers themselves can construct the plant.
Incidentally, income of farmers living around an ethanol production plant in Thailand is
discussed here (Fig. 6.5.2.). The plant is planning to construct a 100,000-L/day ethanol plant
and its feedstock is assumed to be cassava. It is because the market price of cassava is rather
stable than that of molasses. The farmers could not get income when the plant used molasses
-162- Asian Biomass Handbook
since the plant paid to sugar production factories. Therefore, the plant thinks that increase in
the ethanol production from cassava will make cassava cultivation more attractive and people
in rural area remain. The unit price of cassava chips is now 3.7 bahts/kg. In order to sell
cassava to the plant, farmers have to chip and dry (below 18% of water content) for
pretreatment. Considering this, they can earn 1 baht/kg and this profit is quite attractive for
them.
There are mainly two ways to support farmers. One is to supply energy so that they have
the access to useful fuels. In Thailand, small-scale biomethanation provides cooking gas to
farmers, so they need not to buy propane gas for cooking. This support to farmers is also
effective for sustainable agriculture due to the reduction of fossil fuel utilization. The other
support is by cash. When they grow feedstock for ethanol production and sell it at a higher
price, they can get money for buying electricity. Since those who use ethanol as fuel are richer
compared to farmers, this mechanism can be considered as ‘redistribution of wealth.’
6.5.3 Energy security and foreign currency Production of bioenergy is expected to improve domestic energy security. On the other hand,
there are opportunities for developing countries to get foreign currency by exporting bioenergy.
Here describes the commitment to bioenergy production by the Thai government briefly.
At the time of December 2006, the unit price of ethanol was 23.50 baht per liter, which is
determined by the Ministry of Energy, Thailand. In Thailand, 6 plants are licensed to produce
ethanol fuel from cassava. The production capacity of the 6 plants will be 702 million L/year,
demanding 4.13 million ton/year of cassava. Thailand is the largest exporter of cassava in
Asia. The average annual production is 20 million ton/year: About 8 million ton for domestic
starch consumption; Another 8 million ton (cassava chips) for export; The remaining 4 million
ton can be used for ethanol. Therefore, the cassava production for food and that for ethanol
are balanced now. Cultivated area of cassava is about 1 million ha. The expansion of
agricultural land is prohibited, but farmers can grow a different crop if allowed by the
government. In the future, the amount of cassava production for ethanol may increase, while
it is often said that bioenergy utilization may be in conflict with food production, e.g., the
international growing demand for ethanol may threaten the stability of domestic supply of food.
Even the cassava production for food and that for ethanol are balanced in Thailand now, the
future use of cassava root should be carefully determined. Moreover, the market price of
cassava heavily declined before, so financial support by the government to farmers will be
-163- Asian Biomass Handbook
necessary in some instances.
Further information The Japan Institute of Energy. “Report on the Investigation and Technological Exchange Projects
Concerning Sustainable Agriculture and Related Environmental Issues,” Entrusted by the Ministry
of Agriculture, Forestry and Fisheries of Japan (Fiscal year of 2006) (2007)
6.6 Problems to be Considered
6.6.1 Biodiversity (An example of a palm-oil production) (a) The summary of a palm-oil production
About biomass utilization, the palm oil production gives an urgent serious to biodiversity in
Malaysia and Indonesia, now.
Malaysia and Indonesia account for about 85% of the palm oil production in the world. In
Malaysia, a large scale plantation began to be suddenly developed in 1960’s. An Indonesian
government put out the policy said becoming the world’s largest production country of palm oil,
and production including the construction of a large scale plantation was begun in 1980’s. From
1990 to 2002, the oil palm plantation areas increase about twice in Malaysia and more than 3
times in Indonesia.
As the development of the oil palm plantation, very large land need for the operation of oil
mill (the scale of Southeastern Asian typical plantations is 10,000-25,000 ha), and there are a
lot of things that the forest is destroyed in creation. About 87% of the deforestation in Malaysia
from 1985 to 2000 is considered to be the oil palm plantation development, and it is said by
Indonesia that at least 70% of the plantation cleared a forest. Furthermore, the oil palm
plantations are developed more and more around the buffer zone such as the national parks,
and the biological important area. (b) Palm oil production and biodiversity
The palm oil plantations are overlapped the low land in tropical rain forests where hold the
highest biodiversity on the earth, as it were, located the “Hot Spot” where is "the area that is on
the verge of the destruction though to hold the high biodiversity on the earth scale". This area
is a little habitation area of the orangutan, Sumatra tiger, Borneo elephant, rhinoceros,
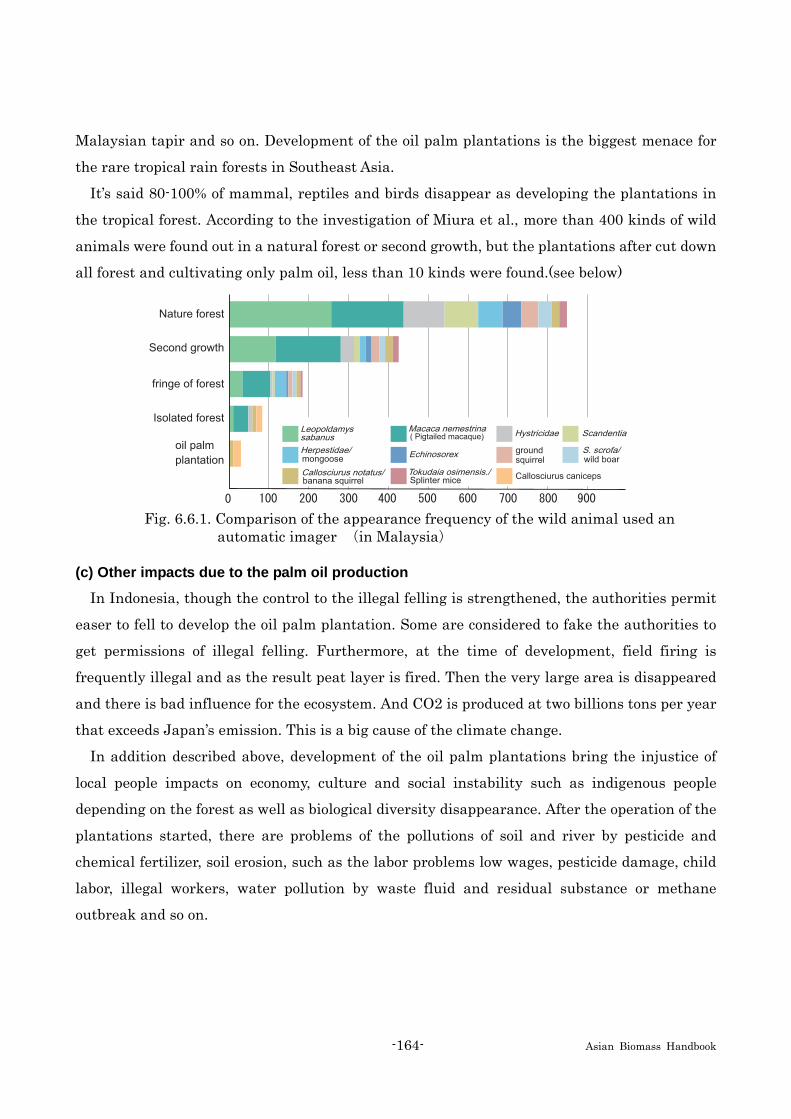
-164- Asian Biomass Handbook
Malaysian tapir and so on. Development of the oil palm plantations is the biggest menace for
the rare tropical rain forests in Southeast Asia.
It’s said 80-100% of mammal, reptiles and birds disappear as developing the plantations in
the tropical forest. According to the investigation of Miura et al., more than 400 kinds of wild
animals were found out in a natural forest or second growth, but the plantations after cut down
all forest and cultivating only palm oil, less than 10 kinds were found.(see below)
Fig. 6.6.1. Comparison of the appearance frequency of the wild animal used an automatic imager (in Malaysia)
(c) Other impacts due to the palm oil production
In Indonesia, though the control to the illegal felling is strengthened, the authorities permit
easer to fell to develop the oil palm plantation. Some are considered to fake the authorities to
get permissions of illegal felling. Furthermore, at the time of development, field firing is
frequently illegal and as the result peat layer is fired. Then the very large area is disappeared
and there is bad influence for the ecosystem. And CO2 is produced at two billions tons per year
that exceeds Japan’s emission. This is a big cause of the climate change.
In addition described above, development of the oil palm plantations bring the injustice of
local people impacts on economy, culture and social instability such as indigenous people
depending on the forest as well as biological diversity disappearance. After the operation of the
plantations started, there are problems of the pollutions of soil and river by pesticide and
chemical fertilizer, soil erosion, such as the labor problems low wages, pesticide damage, child
labor, illegal workers, water pollution by waste fluid and residual substance or methane
outbreak and so on.
-165- Asian Biomass Handbook
6.6.2 Land use competitions The limit of biomass resources human beings use becomes obvious. Therefore, it is expected
that competitions between of biomass uses such as food, material, and energy will become
severe; consequently land use competitions between forest, arable land, pasture, and other
lands will become severe, too. (a) Competitions between forest, arable land, pasture, and other lands.
Forests have decreased by activity of human beings for long years. The forest area in the
world has decreased by 1.2 billion hectares since 1700. Especially, the forest area of North
Africa and the Middle East, and China decreased below half. In the same period the arable
land in the world increased by 1.2 billion hectares. In the same period, the pasture in the world
decreased a little by 70 million hectares. Thus, in the historical view point, the deforestation
was caused by the increase of arable land. Conversely, the deforestation area was converted to
arable land.
Concerning land use change after 1950, deforestation in developed regions has been stopped
and forest areas in Western Europe and North America increase reversely. On the other hand,
in developing regions such as tropical regions, China, and Middle East, deforestation continues.
The reasons are conversion to arable land and pasture and un-sustainable slash-and-burn
farming, etc.
The deforestation in the developing regions causes not only a regional environmental
destruction but also global environmental problem of CO2 emission. In addition, in regions in
high population density and industries in high speed such as Japan, South Korea, and Taiwan,
the arable lands are decreasing. This is because in those regions land demands for housing and
factory increase and the agriculture is not competitive in the global agriculture markets. In
Japan the arable land decreased by 10% from 5.0 million hectares to 4.6 million hectares
between 1976 and 1991. In South Korea, the arable land decreased by 6.6% in the same period. (b) Competition between food production and energy crop production
On arable land, energy crops are also producible besides food. In countries where surplus
arable land is available such as the United States and Brazil, they could use the surplus arable
land for energy crop production rather than for fallow field. Especially, in those countries in
2006 to 2007 when the oil price hits the historical record, they produce energy crops and
produce biofuel such as bioethanol and bio-diesel (BDF). In the United States they produce
bioethanol from corn on a large scale. In Brazil they produce bioethanol from sugarcane on a
large scale. In addition, BDF is produced from vegetable oil such as rapeseed oil and palm oil.

-166- Asian Biomass Handbook
However, since arable lands are limited, the production of energy crops reduces the arable
land where food crops are producible. It is pointed out that excessive production of energy crop
may lead to food shortage. In addition, it is explained in 6.7.5 that the competition between
food production and energy crop production is handled in an energy model.
Further information BIN (Biomass Industry Network) et al., “Bio-nenryo Riyo ni kansuru Kyodo Teigen”, 2007 (in Japanese)
The Japan Institute of Energy, “Biomass Yogo Jiten”, Ohmsha, 2004 (in Japanese)
Yamaji, K. et al., “Bioenergy”, Myosin Shuppan, 2000 (in Japanese)
6.7 Energy Models
6.7.1 Outline of energy models An energy model is a mathematical model that expresses energy systems. Since energy systems
including primary energy production, energy transportation, and energy conversion are
complicated, it is difficult to get intuit insight about the desired energy system. Using the energy
model they can analyze an economic energy systems and energy structure in the future. An energy model is divided into two kinds that are a simulation type and an optimized type.
The simulation type is a type that assembles energy system composition in the future
deductively from the initial condition of the energy system and various kinds of exogenous
assumptions such as future population and economic growth rates.
The optimization type is a type that uses mathematical optimization technique and finds the
optimal energy system under exogenous constraints. The typical optimal standards are
minimization of energy system cost and maximization of total consumption in the society. The
typical exogenous constraints are energy resource constraints and data of energy conversion
technologies.
6.7.2 Typical energy model Energy models that are used for policy study about energy and environment were developed
as following orders. First, energy models that focus on specific energy technologies that are
gigantic technologies to need long-term development plan and huge cost such as nuclear
-167- Asian Biomass Handbook
technologies.
Since latter half of 1980's when global warming is important topic, energy models that
include overall energy systems and CO2 emission have been developed. The first energy model
that focused on policy study about global warming is Edmonds-Reilly model developed in the
United States that is a simulation type model. ETA-MACRO and DICE model developed in the
United States are typical optimization model that evaluate global energy, economy, and
environment. In addition, GLUE model developed in Japan is a typical model that evaluates
global bioenergy supply potential considering land use competitions and overall biomass flows.
6.7.3 DNE21 model DNE21 model is an optimization model that was developed for assessment of technologies
that mitigate global warming. DNE21 model is based on the NE21 (New Earth 21) model that
was developed for numerical analysis of "New Earth Plan" announced in 1990 by Japanese
government. DNE21 is dynamic model that minimizes inter-temporal energy systems cost in
the world. In the model the world is divided into 10 regions and global energy systems till 2100
are analyzed. In the model bioenergy conversion technologies are analyzed in detail.
6.7.4 GLUE model GLUE model is the abbreviation of global land use and energy model and was developed in
Japan. The model that is a simulation model is a typical model that evaluates bioenergy supply
potential in present and in the future. In the model, biomass demand is calculated by data of
biomass demand per capita and population. Biomass supply potential is calculated by data of
arable land area and arable land productivity. In the model the biomass demand and the
biomass supply potential are compared and the surplus arable land and the energy crop supply
potential produced on the surplus arable land are calculated. In addition, the model evaluates
supply potential of biomass residues discharged from processes of biomass flows such as
production, processing, consumption, disposal, and recycling.
The recent version of GLUE model is an optimization type and evaluates not only bioenergy
supply potential but also biomass utilization technologies.

-168- Asian Biomass Handbook
6.7.5 Land use competitions in GLUE model In a GLUE model, the surplus arable land considering land use competitions is calculated as
follows. Biomass demand is calculated from population and food demand per capita. Biomass
supply potential is calculated from land areas for biomass production and the biomass
productivity of the land areas. Then, surplus arable land considering land use competitions is
calculated from the biomass demand and the biomass supply potential.
The details of the calculation about land use competitions are as follows. First, animal food
demand produced from cereal feed is calculated from animal food demand minus fish supply
minus animal food supply from pasture. Cereal demand is calculated from the cereal feed
demand plus cereal demand for vegetable food. The land demand for cereals is calculated from
the cereal demand divided by cereal productivity. The land for energy crop production is
calculated from the total land for cereal production minus the land demand for cereal
production. If the total land for cereal production is smaller than the land demand for cereal
production, food shortage occurs and the land for energy crop production is zero.
Consequently, in a GLUE model it is assumed that the highest priority in the land use
competitions of arable land is the land use for vegetable food production. The next is the land
use for feed production that is converted to animal food. The last is the land use for energy
crops production. In order to enlarge the total calorie supply, it is assumed that priority is given
to supply of vegetable food over supply of animal food.
Further information The Japan Institute of Energy, “Biomass Yogo Jiten”, Ohmsha, 2004 (in Japanese)

-169- Asian Biomass Handbook
Part 7. Biomass situation in Asian countries
7.1 China
7.1.1 Background With rapid economic development, energy demand increases rapidly also in China. China's
total energy consumption already occupies the second place in the world. Fig.1 shows the trends
of China's oil consumption and net imports from 1990 to 2006. Since 1993 when China became
a net import country of petroleum, the dependency of petroleum upon import increased from
7.6% in 1995 to 47.0% in 2006. It is forecasted that in 2020 the petroleum consumption and
import in China will amount to 450 million tons and 250 million tons, respectively, with 55%
dependency of petroleum upon petroleum import. It’s expected that transportation will
contribute the most oil consumption growth in future. Compared to the transportation oil
consumption in 2000 which accounts for about 1/3 of the total petroleum consumption, it is
forecasted that the ration will rise to 43% and 57% by 2010 and 2020.
Fig. 7.1.1. Trends of China's oil consumption and net imports from 1990 to 2006

-170- Asian Biomass Handbook
7.1.2 Situation of biofuels development in China Because of the insufficient fuel supply and the requirements for energy saving and pollutants
emissions reduction, China national government pays more and more attentions to research
and development of bio-fuels. The People's Republic of China Renewable Energy Law was
issued in 2005.
Ethanol gasoline project started in 2001 in China. There are only four plants permitted by
the government to produce food based fuel ethanol. The governments’ supports play an
important role on simulating the ethanol gasoline development in China, especially at the
initiation stage of the ethanol gasoline demonstration by preferential policies like incentives.
The incentives include: 1) The excise tax of denatured fuel ethanol (5%) is free. 2) The
value-added tax of denatured fuel ethanol is imposed first, and then given back to the ethanol
provider. 3) The price of denatured fuel ethanol sold to the petroleum companies which are also
the blending operators is (0.9111*manufacturer's price of 90# gasoline). While the market
prices of all kinds of E10 (90#, 93# or 97#) are the same as 90#, 93# or 97# gasoline. 4) An
allowance is paid to the ethanol provider. These incentives will be executed until 2008. Now
ethanol gasoline has been used in 9 provinces and the total consumption was 1.54 million tons
in 2006. However, to ensure the food safety, no more food based fuel ethanol plants are
permitted by the China national government any more. In the future, non-food feedstock
including cassava, sweet potato, sweet sorghum and lignocellulose are potential for fuel
ethanol production. A 200 000 tons/year fuel ethanol plant with cassava as feedstock in
Guangxi province has been permitted by the government and is expected to start up soon. The
four exiting fuel ethanol plants are encouraged to use non-food feedstock too.
There are more than 10 biodiesel plants in China. The amount of production is about 100 000
tons/year. <Biodiesel Blend Stock (BD100) for Diesel Engine Fuels> was issued in May 2007.
But there is not yet regular policy for biodiesel sales like fuel ethanol. Some biodiesel are for
non-engine utilization. One problem of biodiesel development in China now is the feedstock
supply. China needs to import more than 6 million tons edible oil per year. It is impossible to
use edible oil such as soybean oil and rape seed oil for bio-diesel production. Now most biodiesel
plants in China are using waste oils as feedstock. However, with the development of biodiesel,
the price of waste oils is higher and higher. Woody oils are getting more and more attentions.
The “national bioenergy-directed forest construction program” and “Woody feedstock
plantation plan for biodiesel during 11th Five-Year plan” were issued by State Forestry
Administration of China, which indicate that 400 000 hectares of Jatropha curcas will be
-171- Asian Biomass Handbook
planted in Yunnan, Sichuan, Guizhou and Chongqing provinces; 250 000 hectares of Pistacia
Chinensis will be planted in Hebei, Shanxi, Anhui and Henan Provinces; 50 000 hectares of
Cornus Wilsoniana will be planted in Hunan, Hubei and Jiangxi Provinces; 133 333 hectares of
Xanthoceras Sorbifolia will be planted in Inner Mongolia, Liaoning and Xinjiang provinces.
7.1.3 Conclusion With the rapid economic development, the great insufficiency of energy supply has become
the “Bottleneck” of sustainable development in China. Currently the important issue to be
solved is to accelerate the development of biomass energy so as to relieve the pressure of
resources and the environment. Moreover, as a responsible country, China should take the
international responsibility to save energy and reduce pollution discharge. Hence, the biomass
energy industry is promising with a fairly bright future in China. At present, the biomass
energy consumption is 8% of the total fuel consumption. According to “Mid and Long Term
Development Plan of Renewable Energies” issued on September 4th 2007, the percentages of
biomass energy consumption will increase to 10% by 2010 and 15% by 2020. By 2010, annual
consumption of non-grain based fuel ethanol shall reach 2 million tons, and that of biodiesel
shall reach 200 000 tons in China; by 2020, annual consumption of fuel ethanol shall reach 10
million tons, and that of biodiesel shall reach 2 million tons in China.
7.2 Korea
7.2.1 Amount of biomass resources in Korea Major biomass resources available in Korea are organic wastes and the agricultural
and forest residues. The potential and recoverable amounts of biomass for energy
utilization are summarized in Table 7.2.1. According to the data in Table 7.2.1, the total
amount of biomass resources available in Korea is about 80 million ton, only 30% of the
potential biomass resources are currently utilized for energy production.
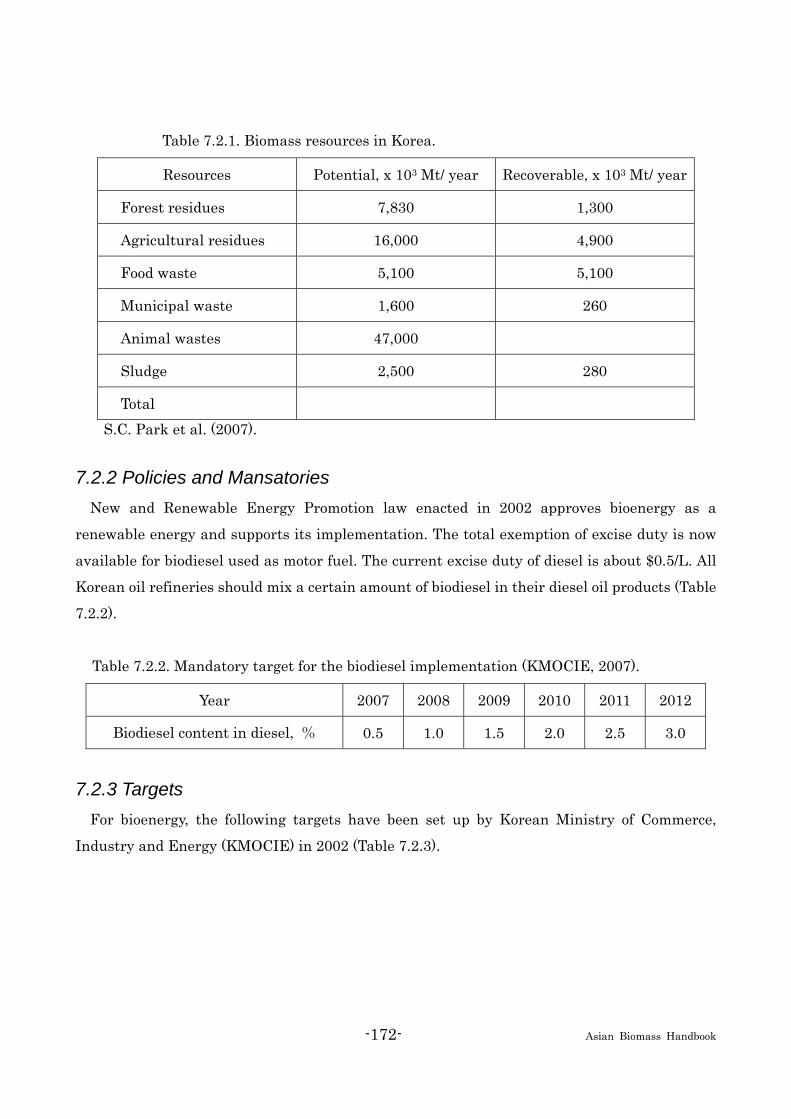
-172- Asian Biomass Handbook
Table 7.2.1. Biomass resources in Korea.
Resources Potential, x 103 Mt/ year Recoverable, x 103 Mt/ year
Forest residues 7,830 1,300
Agricultural residues 16,000 4,900
Food waste 5,100 5,100
Municipal waste 1,600 260
Animal wastes 47,000
Sludge 2,500 280
Total S.C. Park et al. (2007).
7.2.2 Policies and Mansatories New and Renewable Energy Promotion law enacted in 2002 approves bioenergy as a
renewable energy and supports its implementation. The total exemption of excise duty is now
available for biodiesel used as motor fuel. The current excise duty of diesel is about $0.5/L. All
Korean oil refineries should mix a certain amount of biodiesel in their diesel oil products (Table
7.2.2).
Table 7.2.2. Mandatory target for the biodiesel implementation (KMOCIE, 2007).
Year 2007 2008 2009 2010 2011 2012
Biodiesel content in diesel, % 0.5 1.0 1.5 2.0 2.5 3.0
7.2.3 Targets For bioenergy, the following targets have been set up by Korean Ministry of Commerce,
Industry and Energy (KMOCIE) in 2002 (Table 7.2.3).
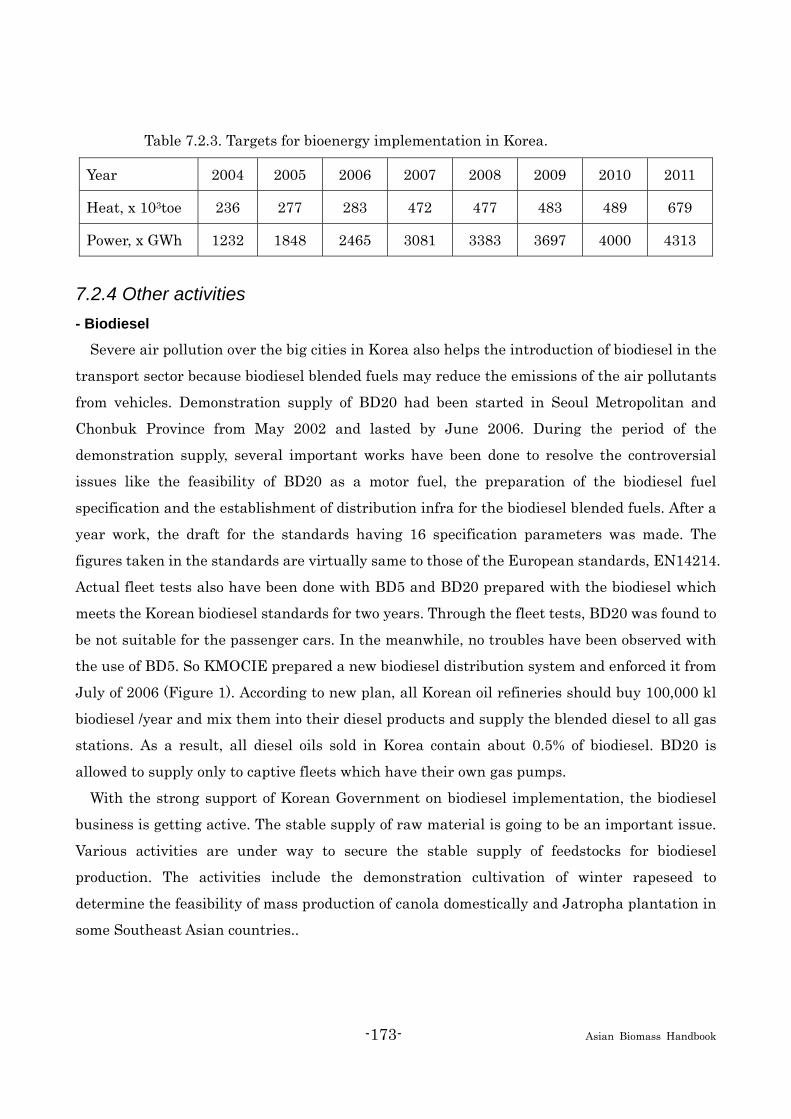
-173- Asian Biomass Handbook
Table 7.2.3. Targets for bioenergy implementation in Korea.
Year 2004 2005 2006 2007 2008 2009 2010 2011
Heat, x 103toe 236 277 283 472 477 483 489 679
Power, x GWh 1232 1848 2465 3081 3383 3697 4000 4313
7.2.4 Other activities - Biodiesel
Severe air pollution over the big cities in Korea also helps the introduction of biodiesel in the
transport sector because biodiesel blended fuels may reduce the emissions of the air pollutants
from vehicles. Demonstration supply of BD20 had been started in Seoul Metropolitan and
Chonbuk Province from May 2002 and lasted by June 2006. During the period of the
demonstration supply, several important works have been done to resolve the controversial
issues like the feasibility of BD20 as a motor fuel, the preparation of the biodiesel fuel
specification and the establishment of distribution infra for the biodiesel blended fuels. After a
year work, the draft for the standards having 16 specification parameters was made. The
figures taken in the standards are virtually same to those of the European standards, EN14214.
Actual fleet tests also have been done with BD5 and BD20 prepared with the biodiesel which
meets the Korean biodiesel standards for two years. Through the fleet tests, BD20 was found to
be not suitable for the passenger cars. In the meanwhile, no troubles have been observed with
the use of BD5. So KMOCIE prepared a new biodiesel distribution system and enforced it from
July of 2006 (Figure 1). According to new plan, all Korean oil refineries should buy 100,000 kl
biodiesel /year and mix them into their diesel products and supply the blended diesel to all gas
stations. As a result, all diesel oils sold in Korea contain about 0.5% of biodiesel. BD20 is
allowed to supply only to captive fleets which have their own gas pumps.
With the strong support of Korean Government on biodiesel implementation, the biodiesel
business is getting active. The stable supply of raw material is going to be an important issue.
Various activities are under way to secure the stable supply of feedstocks for biodiesel
production. The activities include the demonstration cultivation of winter rapeseed to
determine the feasibility of mass production of canola domestically and Jatropha plantation in
some Southeast Asian countries..
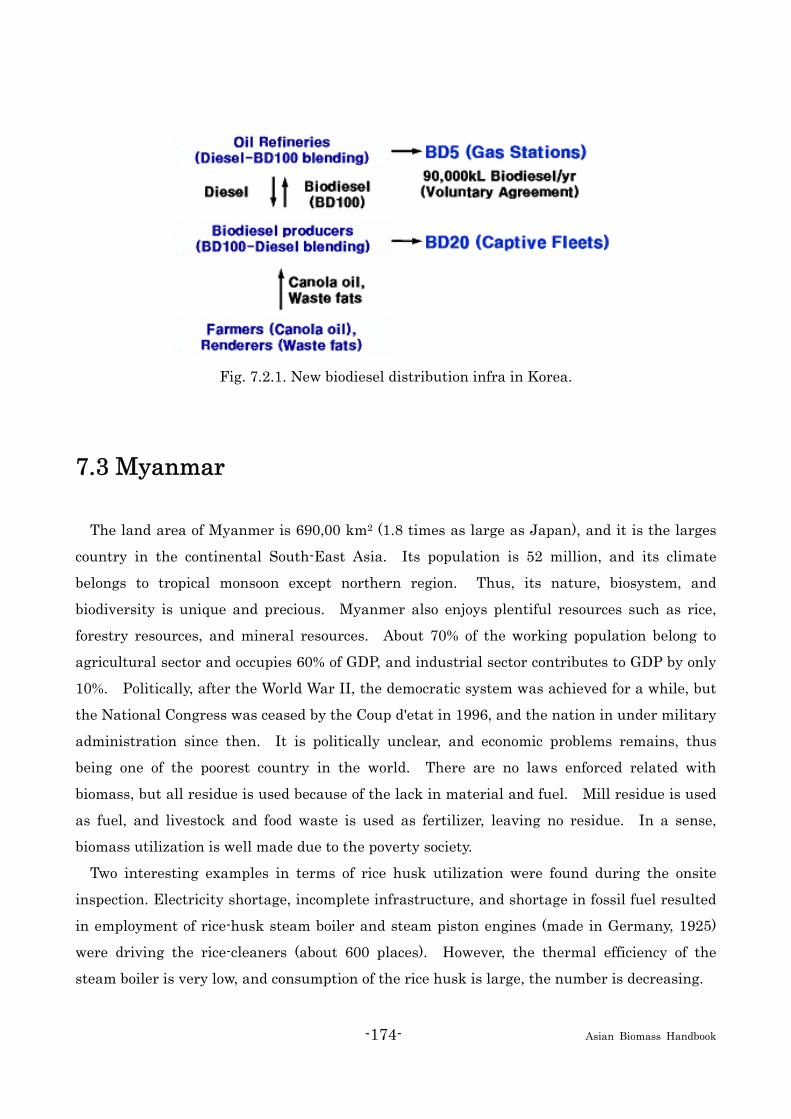
-174- Asian Biomass Handbook
Fig. 7.2.1. New biodiesel distribution infra in Korea.
7.3 Myanmar
The land area of Myanmer is 690,00 km2 (1.8 times as large as Japan), and it is the larges
country in the continental South-East Asia. Its population is 52 million, and its climate
belongs to tropical monsoon except northern region. Thus, its nature, biosystem, and
biodiversity is unique and precious. Myanmer also enjoys plentiful resources such as rice,
forestry resources, and mineral resources. About 70% of the working population belong to
agricultural sector and occupies 60% of GDP, and industrial sector contributes to GDP by only
10%. Politically, after the World War II, the democratic system was achieved for a while, but
the National Congress was ceased by the Coup d'etat in 1996, and the nation in under military
administration since then. It is politically unclear, and economic problems remains, thus
being one of the poorest country in the world. There are no laws enforced related with
biomass, but all residue is used because of the lack in material and fuel. Mill residue is used
as fuel, and livestock and food waste is used as fertilizer, leaving no residue. In a sense,
biomass utilization is well made due to the poverty society.
Two interesting examples in terms of rice husk utilization were found during the onsite
inspection. Electricity shortage, incomplete infrastructure, and shortage in fossil fuel resulted
in employment of rice-husk steam boiler and steam piston engines (made in Germany, 1925)
were driving the rice-cleaners (about 600 places). However, the thermal efficiency of the
steam boiler is very low, and consumption of the rice husk is large, the number is decreasing.
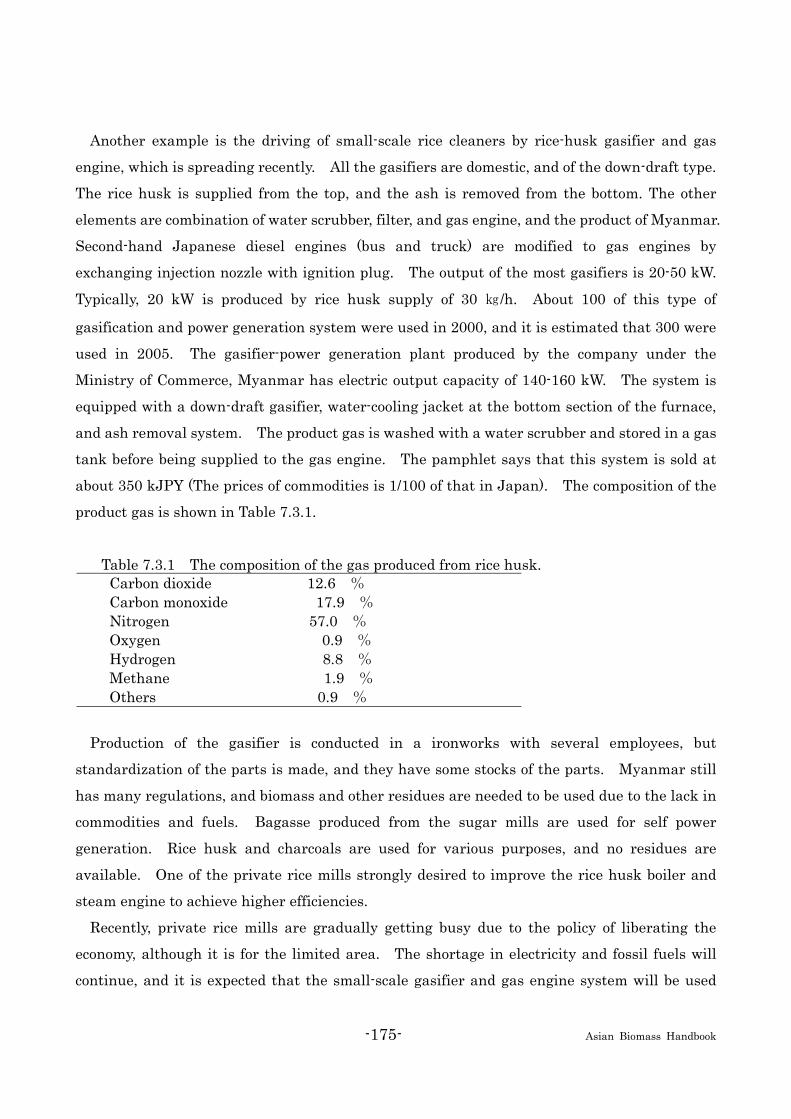
-175- Asian Biomass Handbook
Another example is the driving of small-scale rice cleaners by rice-husk gasifier and gas
engine, which is spreading recently. All the gasifiers are domestic, and of the down-draft type.
The rice husk is supplied from the top, and the ash is removed from the bottom. The other
elements are combination of water scrubber, filter, and gas engine, and the product of Myanmar.
Second-hand Japanese diesel engines (bus and truck) are modified to gas engines by
exchanging injection nozzle with ignition plug. The output of the most gasifiers is 20-50 kW.
Typically, 20 kW is produced by rice husk supply of 30 ㎏/h. About 100 of this type of
gasification and power generation system were used in 2000, and it is estimated that 300 were
used in 2005. The gasifier-power generation plant produced by the company under the
Ministry of Commerce, Myanmar has electric output capacity of 140-160 kW. The system is
equipped with a down-draft gasifier, water-cooling jacket at the bottom section of the furnace,
and ash removal system. The product gas is washed with a water scrubber and stored in a gas
tank before being supplied to the gas engine. The pamphlet says that this system is sold at
about 350 kJPY (The prices of commodities is 1/100 of that in Japan). The composition of the
product gas is shown in Table 7.3.1.
Table 7.3.1 The composition of the gas produced from rice husk. Carbon dioxide 12.6 % Carbon monoxide 17.9 % Nitrogen 57.0 % Oxygen 0.9 % Hydrogen 8.8 % Methane 1.9 % Others 0.9 %
Production of the gasifier is conducted in a ironworks with several employees, but
standardization of the parts is made, and they have some stocks of the parts. Myanmar still
has many regulations, and biomass and other residues are needed to be used due to the lack in
commodities and fuels. Bagasse produced from the sugar mills are used for self power
generation. Rice husk and charcoals are used for various purposes, and no residues are
available. One of the private rice mills strongly desired to improve the rice husk boiler and
steam engine to achieve higher efficiencies.
Recently, private rice mills are gradually getting busy due to the policy of liberating the
economy, although it is for the limited area. The shortage in electricity and fossil fuels will
continue, and it is expected that the small-scale gasifier and gas engine system will be used
-176- Asian Biomass Handbook
more and more for driving rice mill and other devices. Presently, production and introduction
of biofuels are not yet made, but Myanmar has a large area and good climate and possesses
high potential of producing forest resources and plantation crops. In long term, potential to
produce bioethanol and biodiesel is as promissing as Thailand, Malaysia, and Indonesia.
The proper form of biomass utilization differs from case to case depending on the natural,
social, and economic conditions, and thus elaborate planning is needed. To collect the latest
information for this purpose, collaboration office between universities and other sectors is
desirable. This kind of collaborative network among university, academic organization, NPO,
and international organization will encourage the utilization of small-scale biomass.
Myanmar is a Buddhist country has a high level of education (the rate of school attendance:
96.56%, the literacy rate: 93.3%). The economic development may be late among ASEAN
countries, but for its development foreign universities and academic organizations can be a
large help.
Further information Myanmar Ministry of Information. Myanmar: Building a Modern State(2004)
Myat Thein. Economic development of Myanmar, Institute of Southeast Asian Studies,
Singapole(2004)
San San Rice Husk Gasifier. San San Cooperative Ltd., No. 279, Shwegondine Road. BahanTownship,
Yangon, Myanmar(2005)
The paddy husk gas generating plant. Myanmar Agricultural Produce Trading(MAPT). Ministry of
Commerce, Yangon Division, Mingalartaungnyunt Township, Yangon(2003)
Makoto Hoki, Hideto Mashimo, “Tonan Ajia shokokuni okeru baiomasu riyono doko”, J. Jpn. Inst. Energy,
submitted. (in Japanese)
United Nations, Statistic Division, “Sekai tokei nenkan”, Hara Shobo (2005). (in Japanese)
Shin-ichi Yano, “Ajiani okeru bioennryo seisan riyono tenboto sansokendeno seizo gijutu kaihatsu”,
Kankyo Gijutsu, 36(12), 7-12 (2007). (in Japanese)

-177- Asian Biomass Handbook
7.4 Laos
Lao PDR is a mountainous country with a population of about 5.6 million, over 80% of which
lives in rural areas and is engaged in rice-based agriculture and harvesting of forest products.
The narrowly based economy is one of the least developed in Asia with an approximate per
capita Gross National Product of around US$ 500 per annum ( 2006 )
The Main Economic in Laos is from the Agriculture , Forestry, Power Generation, Mining,
Small industries and agriculture is 42.2 % of the Gross Domestic Product , while the Industry
is 31.5 % , Services 25.4 % and Import duties 0.9 % ( in 2006 ) .
Lao PDR is endowed with significant indigenous energy resources for electricity generation.
Hydropower is the most abundant and cost-effective form. The energy resources range from
traditional energy source such as fuel-wood to coal and hydropower. The forest areas which
cover about 40 % of total land are a potential source for substantial traditional energy supplies.
The Lao power sector is in the good progress stage as 54.1 % of the population having access
to electricity in 2006 . but the main energy consumption in Laos comes from fuelwood for
cooking .
In order to meet the government target for the increasing the households electrification
ration to be 70 % of total households in 2010 and 90% in 2020 , the Government set up the
Power Sector Policy :
1. Maintain and expand an affordable, reliable and sustainable electricity supply in Lao
PDR to promote economic and social development;
2. Promote power generation for export to provide revenues to meet GOL development
objectives;
3. Develop and enhance legal and regulatory framework to effectively direct and facilitate
power development; and
4. Strengthen institutions and institutional structures to clarify responsibilities,
strengthen commercial functions and streamline administration
In order to meet those targets and Policies , now a day there are more than 50 MOU for the
hydropower development with the capacity from 5 – 1080 MW and 6 projects are under
construction , if we look on those hydropower development plan , we could see that there are

-178- Asian Biomass Handbook
many waste wood in the reservoirs need to be clear and if we have the good technologies and
investment capital then we could construct biomass cogeneration projects in Laos .
Lao PDR import 100 % fossil fuels , at the present there are 3 companies to conduct the
survey for the natural gas and oil and it takes about 10 years for getting all information and for
the production of natural gas and oil ( if feasible ) , for reduction of import fuel and high
efficiency fossil fuel consumption , the government of Laos also support the biofuel as biodiesel
from the Jatropha and palm oil and bioethanol from the sugarcane .
After the government announced for promotion of biofuel , the are some companies started
the business by plantation of Jatropha to produce the bio diesel , the biggest investor is Kolao
Farm company , their target is plant the Jatropha 40.000 hac , the factory is under
construction , it is far from the Vientiane Municipality about 70 km .
The second company is LaoBiodiesel company just started the construction of the factory in
Champasak province on 10 March 2008 and their plantation is 100 hac for the Jatropha .
There are two companies to invest on the palm oil , the first one in Champsak province with
the plantation of 25 hac , this company started in 2006 and the second one in Bolikhamsay
province with the plantation of 20 hac this company started in 2006 .
The other companies to invest on Jatropha for biodiesel are small plantation .
Under Lao – Thai cooperation of Energy sector , the Ministry of Energy of Thailand give one
set of Biodiesel production equipment from Jatropha to Ministry of Energy and Mines for the
demonstration .
The Promotion of biodiesel is much more popular than biothethanol because the investment
cost and the technology of bioethanol is high and now there is only one small existing of sugar
factory in Laos , there other two factories are under construction in Savannaketh province .
Because of there is no any document for the promotion of biofuel in Laos , the department of
Electricity , Ministry of Energy and Mines requested New Energy and Industrial Technology
Development Organization ( NEDO ) , Representative Office in Bangkok to support the finance
to hire the Lao Institute of Renewable Energy in Laos ( LIRE ) to conduct the survey and
drafted the recommendation for the Strategy and Policy for the Promotion of Biodiesel in Laos .
The target of the government to reduce the fossil fuel consumption 5 % by promotion of
biodiesel production .
The details of Strategy and Policy will be developed more ..
-179- Asian Biomass Handbook
7.5 Brunei Darussaalam
7.5.1 General scope Brunei has large amount of fossil fuel resources such as oil and natural gas, and obtains
half of its GDP by exporting these resources to enjoy good economy. Thus, they do not
have interest in biofuel development so much.
Meanwhile, the land area is small (5,770 km2), and agricultural land is very small, thus
most of the food is imported. National development plan always aims at improvement of
self-supply rate of food. However, since its independence in 1984, governmental sector was
developed and stable high-income jobs are available, which lead to the people’s removal
from agriculture. In general, agriculture is stagnant, and its productivity within total
GDP is only 2.7%.
7.5.2 Natural conditions of Brunei The whole country area belongs to the tropical climate. The tropical rain forest occupies
80% of the national land (4,690 km2). Seventy per cent of the forest is virgin, and half of
which is environmentally preserved. The land is roughly divided into eastern and western
regions, and the eastern region, Templon River basin, is undeveloped forest except seaside, and
forms a vast national park. Most of the population lives in the three district in the western
region.
Agricultural productivity of Eastern Asia countries including Brunei is low compared to the
monsoon region. Tropic soil easy loses nutrition salts, and is not suitable for agriculture.
Leaves and cut trees are soon decomposed by microbes and termites, leaving no humus behind.
Additionally, as the effect of heat and water, soil components other than aluminum oxide and
iron oxide are easily washed away, and the soil is barren. In the rain forest, the nutrition to
support the forest is collected not by the soil, but by the trees and plants at the canopy.
Small scale agriculture includes dry rice cropping in the forest in the mountain region and
rice cropping at the terraced paddy field. For short term, taros are produced by slush and
burn agriculture to use the nutrition collected by the forest biomass, but this destroys the
forest, which is the main nutrition collector, and the soil nutrition is used up in 2 years, and
after that the land becomes barren.
At the low wet land where the washed nutrition is stored, Sago palm plantation is

-180- Asian Biomass Handbook
possible. Swamp forest arises at this kind of land. This swamp forest is composed of
trees with low height, and the plants grows only by single layer. This leads to good supply
of light, but since the oxygen in soil lacks, humus decomposition is prevented, and peat is
formed. Thus, even if agricultural field is made, the surface begins to sink soon to form
pad. Agriculture is difficult in this region.
At the seaside exists mangrove forest at the brackish water region where seawater is
comes and goes with low and high tide. The soil of this forest is strongly acidic due to the
root acid that mangrove root secrets. This land cannot be used for slush and burn
agriculture, and was barren in terms of agriculture. It was not until 20th century that it
got used for fish breeding.
7.5.3 Policy of Brunei In the 7th 5-year plan (1996―2000年 ) included activation of agriculture to improve
self-supply rate of various agricultural product, but the rate stays only 20%, making biofuel
development very difficult.
The plan proceeds study to improve the culturing technology and production system that
fits the natural condition of the country so that food demand increasing year by year should
be met. It proceeded introduction of new technologies such as water cultivation, and
extending of agricultural area. For proceeding water cultivation, half of the expense
needed for the tools and fertilizer were supported. The Ministry of Agriculture approved
new land-developing zone in 2000. They are for production of vegetables (50 ha), fruits
(500 ha), and livestock (100 ha).
The effort to improve self-supply rate of food is taking its effect. In 2004, production of
eggs exceeded 100 million eggs/year, and chickens exceeded 13 million, achieving almost
100% of self-supply rate. (Note most of the feed is imported.) However, self-supply rate
of other food is still low: tropical vegetables 53%, milk 13%, beef 3.85, goat 3%, other crops
2%, rice 1%. The agriculture has to be much more developed.
7.5.4 Characteristic biomass products Sago palm (Metroxylon sagu) is characteristic to this region. It produces large amount
of starch. Sago palm production is distributed from Southeast Asia to Oceania. Brunei is
-181- Asian Biomass Handbook
classified as sago district with Celebes Island and the Moluccas. This is the district where
sago starch supplies several tens of per cent in the main starch supply.
Sago palm belongs to palm family, but is a unique angiosperm because starch can be
obtained from its trunk. After 16 years from plantation, or 10 years under good conditions,
it forms trunk with a diameter of 40-60 cm, and height of 12-15 m and stores high purity of
starch inside in preparation for flowering and fruition. All of this starch is used for
breeding, and the tree dies, leaving seeds behind. The tree is cut down just before
flowering when the starch amount is the most, and the trunk is cut in the length less than 1
m. The trunk has a skin which is several centimeters thick. It is cut vertically, and the
pith of starch which is held by the fibers inside is taken out. Starch is obtained by
loosening the pith, washing it with water, and removing the fiber with a net, as
precipitation in the water. In this way, 300-500 kg-wet (100-150 kg-dry) of starch is
available form one mature tree.
The advantage of sago plantation is the easiness of the job and large amount of starch
obtained with small labor. Sago palm can be cultivated with the peat soil, which most of
the plant cannot grow with, and sago plantation does not deteriorates the soil. Sago is the
most suitable plant for the seaside of the rainforest region.
Production of ethanol from sago starch is technically easy, but the self-supply rate of the
region is very low, and production of starch for biofuel is not practical.
Further information Sano,H.in ”Biomass Handbook”,Japan Institute of Energy Ed.,Ohm-sha,2002,p.37.(in Japanese)
”Baiomasu yogo jiten”、Japan Institute of Energy Ed.,2006,p.178.(in Japanese)

-182- Asian Biomass Handbook
7.6 Indonesia
Indonesia has a wide range of
indigenous energy resources such as
oil, natural gas, coal, hydro-power,
geothermal, solar and also biomass.
However, Indonesia still has a
problem that until now the use of
primary energy in the energy mix is
still unbalance. A large portion of oil
in energy mix still dominates
domestic consumption, about 52%
respectively, followed by Natural Gas,
Coal, Hydro Power and Geothermal.
The utilization of Biofuel itself is still very low. In order to balance the final energy mix and to
alternate oil as the largest contributor of energy, the Government of Indonesia has set out that
in 2025, Biofuel is expected to contribute at least 5% of National Energy Mix. As a mid –
term goal, in 2010 Biofuel is targeted to take part as a source of energy in household and
commercial sector, transportation and power plant sector. Biofuel will substitute the role of oil.
It can be seen in the diagram (Fig. 7.6.1). For transportation sector, Biofuel in form of
Bioethanol will contribute to 1.85 million kL of transportation energy mix, Biodiesel 1.24
million kL and Bio-oil 4.8 million kL respectively by 2010. Together, the summary of Biofuel
will reach 10% of energy mix, only in transportation sector. For the household and commercial
sector and power plant, Biofuel will be utilized in form of Biokerosene and Bio-oil or Pure
Plantation Oil.
The high potential for biofuel feedstock in
Indonesia is provided by varies biofuel feedstock
that can be developed. Palm oil and Jatropha are
developed as feedstock for biodiesel, meanwhile
cassava and sugar cane are utilized as feedstock
for bioethanol (Fig.7.6.2). However, as
mentioned before, Indonesia is also opened for
Source : Sony, 2007
Fig 7.6.1. Biofuel for fossil fuelsubstitution (2010)
7
Palm Oil
Jatropha curcas
Cassava
Sugarcane
BIODIESEL
BIOETHANOL
Fig. 7.6.2. Biofuel Feedstock.
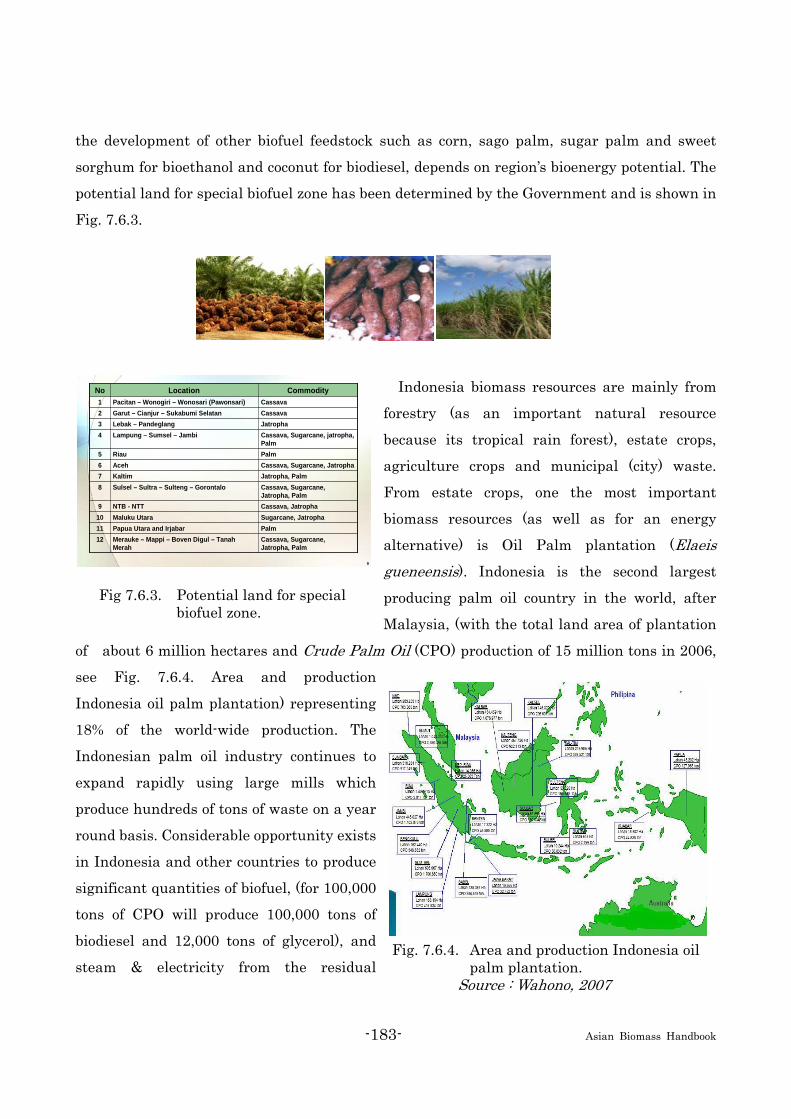
-183- Asian Biomass Handbook
the development of other biofuel feedstock such as corn, sago palm, sugar palm and sweet
sorghum for bioethanol and coconut for biodiesel, depends on region’s bioenergy potential. The
potential land for special biofuel zone has been determined by the Government and is shown in
Fig. 7.6.3.
Indonesia biomass resources are mainly from
forestry (as an important natural resource
because its tropical rain forest), estate crops,
agriculture crops and municipal (city) waste.
From estate crops, one the most important
biomass resources (as well as for an energy
alternative) is Oil Palm plantation (Elaeis gueneensis). Indonesia is the second largest
producing palm oil country in the world, after
Malaysia, (with the total land area of plantation
of about 6 million hectares and Crude Palm Oil (CPO) production of 15 million tons in 2006,
see Fig. 7.6.4. Area and production
Indonesia oil palm plantation) representing
18% of the world-wide production. The
Indonesian palm oil industry continues to
expand rapidly using large mills which
produce hundreds of tons of waste on a year
round basis. Considerable opportunity exists
in Indonesia and other countries to produce
significant quantities of biofuel, (for 100,000
tons of CPO will produce 100,000 tons of
biodiesel and 12,000 tons of glycerol), and
steam & electricity from the residual Fig. 7.6.4. Area and production Indonesia oil
palm plantation. Source : Wahono, 2007
9
Cassava, Sugarcane, Jatropha, Palm
Merauke – Mappi – Boven Digul – TanahMerah
12Palm Papua Utara and Irjabar11Sugarcane, JatrophaMaluku Utara10Cassava, JatrophaNTB - NTT9
Cassava, Sugarcane, Jatropha, Palm
Sulsel – Sultra – Sulteng – Gorontalo8Jatropha, PalmKaltim7Cassava, Sugarcane, JatrophaAceh6PalmRiau5
Cassava, Sugarcane, jatropha, Palm
Lampung – Sumsel – Jambi4JatrophaLebak – Pandeglang3CassavaGarut – Cianjur – Sukabumi Selatan2CassavaPacitan – Wonogiri – Wonosari (Pawonsari)1
CommodityLocation No
Fig 7.6.3. Potential land for special biofuel zone.

-184- Asian Biomass Handbook
biomass while mitigating environmental impacts both locally and globally.
The palm oil residues generated from the palm oil production process are : fresh fruit
bunches (FFB) or the oil palm fruit produce Crude palm oil (CPO) and Kernel palm oil (KPO)
which can be utilized to produce biodiesel or to generate steam and power.
The climate of Indonesia is also well-known for very suitable of sugarcane (Saccharum officinarum). Indonesia is the richest country for sugarcane genetics and is believed as the
origin of the world sugarcane (Papua). At least 2 million hectares of land is suitable for cane
field which scattered over Papua (majority), Kalimantan, Sumatera, Maluku and Java. By the
appropriate planning, policy and development, it is very likely Indonesia in the future will
become one of sugar exporter countries and also as a bioethanol producer (similar to Brazil).
Cassava (Manihot esculenta), known as one of bioethanol feedstock is cultivated intensively
nowadays by the farmers especially in Lampung, Java and NTT regions. The cultivated area is
around 1.24 million hectares all over Indonesia and the production was 19.5 million tons in
2005. The conversion of cassava to bioethanol is 6.5:1 or 1 ton of cassava will produce 166.6
liter of bioethanol.
Jatropha curcas (English Physic nut) - another biomass source for biofuel, unlike palm oil
and cassava, the seed and hence the oil is non-edible, so there is no competition between food
vs fuel.
During Japanese occupancy (1942-1945), planting of Jatropha is a compulsory for native
people. That’s why Jatropha can still be found today in the eastern part of the islands, such as
NTT and NTB provinces.
Various local names had been given to Jatropha Curcas, such as : nawaih nawas (Aceh), jarak kosta (Sunda), jarak gundul, jarak cina, jarak pagar (Java), paku kare (Timor), peleng kaliki (Bugis), etc.
Also, when the jatropha plantation is to be developed in the critical lands or barren lands has
two important steps that have been achieved, i.e. afforestation or replanting and the
conservation efforts which will result of the improvement of local/regional environment. And
also the jatropha oil can be extracted and be used as fuel. Normally Jatropha seeds content
average of 1,500 liter of oil/ha/year, with the productivity of 5 tons per ha of dry seeds and the
oil yield of 30%.
The R&D of Agriculture Institute, Department of Agriculture has identified about 19.8
million ha of land (see map above,orange color) from various provinces in Indonesia are

-185- Asian Biomass Handbook
suitable for Jatropha curcas plantation, in
which 14.277 million ha of land is
categorized as a very suitable and 5.534
million ha is suitable (green color). The
suitable land is scattered within 31
provinces with the largest being in East
Kalimantan, South East Sulawesi, East
Java, South Kalimantan, Lampung , Papua
and West Irian Jaya provinces. It is
projected that jatropha cultivation areas in
Indonesia will achieve to 3 million ha by 2015. It is expected that jatropha oil as fuel will play
an important role in rural villages of Indonesia, so called “Energy Self Sufficient Villages”, and
ultimately to achieve poverty & jobless alleviation goals.
Of course Indonesia as a tropical country has many other biomass resources which can be
developed and utilized as energy resources such as coconut (Cocos nucifera), corn (Zea mays),
sorgum (Sorgum bicolor L.), arenga pinnata, rubber (Hevea brasillensis), sunflower
(Helianathus annuus), nipha (Nypa fruticans), sweet potato (Ipomoea batatas L.), sago
(Metroxylon sp.) and many others.
Further information Andi Alam Syah. Biodiesel Jarak Pagar. PT AgroMedia Pustaka. Jakarta. 2006.
Bambang Prastowo. Sustainable Production of Biofuel Crops. Indonesian Center for Estate Crops
Research & Development. On Sustainable Aspect of Biofuel Production Workshop, Jakarta. June 21,
2007.
Joachim Heller. Physic nut. IPGRI. Germany. 1996.
Bambang Prastowo. Sustainable Production of Biofuel Crops. Indonesian Center for Estate Crops
Research & Development. On Sustainable Aspect of Biofuel Production Workshop, Jakarta. June 21,
2007.
Paulus Tjakrawan. Indonesia Biofuels Industry. Indonesia Biofuels Producer Association (APROBI). On
Sustainable Aspect of Biofuel Production Workshop, Jakarta. June 21, 2007.
Rama Prihadana et al. Bioethanol Ubi Kayu : Bahan Bakar Masa Depan. PT AgroMedia Pustaka.
Jakarta. 2007.
Rama Prihadana & Roy Hendroko. Energi Hijau. Penebar Swadaya. Jakarta. 2007.
Soni S. W. Energy Generation Opportunities from Palm Oil Mills in Indonesia. 4th Asia Biomass
-186- Asian Biomass Handbook
Workshop. Kuala Lumpur, November, 2007.
Sudradjat H.R. Memproduksi Biodiesel Jarak Pagar. Penebar Swadaya. Jakarta. 2006.
Tim Nasional Pengembangan BBN. Bahan Bakar Nabati. Penebar Swadaya. Jakarta. 2007.
Wahono Sumaryono. Palm Complex Model : An integrated preliminary concept for sustainable plantation and CPO-based industries. 4th Asia Biomass Workshop. Kuala Lumpur, November, 2007.
7.7 Cambodia
7.7.1 Biomass resources in Cambodia
Biomass resources such as wood and agricultural residues are abundant in Cambodia. It is
estimated that biomass fuel accounted for some 80% of the national energy consumption
(MIME 2001) but biomass fuel used for power generation is limited for a few small-scale
projects and negligible amount among the total national power production. Woody biomass
accounts for more than 95% of the biomass energy used in the country.
According to our initial survey, rice husk and some other agricultural residues, old rubber
wood occurred as the result of new planting and forest wood from plantations and managed
natural forests are high potential energy source for electricity generation. The status of those
high potential biomass resources is described below:
(i) Rice Husk: In 2003, rice was cultivated in 2.3 million ha of the field and 4.7 million ton was
produced (MAFF 2003). The COGEN3 program which is funded by European Commission to
promote the use of cogeneration in ASEAN countries has conducted a pre-investment study for
a potential biomass-fired cogeneration project of 1.5MW electrical capacity at the Angkor
Kasekam Roongroeung rice mill just outside Phnom Penh .
(ii) Cashew Nuts Shell: The cashew Anacardium occidentale is a tree in the flowering plant
family, Anacardiaceae. Cashew nut is the single seed of the cashew fruit. Cashew nuts trees
have been planted 37,140 ha in Cambodia (MAFF 2004) and the number of grower is
increasing. The production in Cambodia would be 14,000 t/yr.
(ii) Other Agricultural Residues: Bagasse is the residue of sugar processing from sugarcane.

-187- Asian Biomass Handbook
It represents 30% of total sugarcane weight. Direct combustion power generating system has
been widely introduced to the sugar processing factory in the major sugar production countries.
Cambodia produced 330,649 t of sugarcane in 2003. The production of cassava in 2003 was
330,649 t and the area of coconut farm was 27,054 ha. The productions of coconut and cassava
residues are not known. The peanut production in 2003 was 18,483 t. Peanuts shells
represent approximately 30% of the total weight of the peanuts.
(iv) Woody Biomass from Forests : The 95% of population is dependent on woodfuel for cooking
(NIS 1999) and the biomass energy covered 86% of the total national energy supply (ADB 1996).
The total fuel wood consumption was estimated about 6 million m3, while log production
estimated 1.5 million m3 in 1995 (World Bank and others 1995).
(v) Plantations: There are total 11,125 ha of forest plantations mainly with Acacia spp. and
Eucalyptus spp. in Cambodia (2003). The purpose of plantation of most case is production of
wood chip materials for export.
(vi) Tree Farming: Tree farming of fast growing species is an appropriate method of supplying
biomass for village level electrification. Anlong Ta Mei Community Energy Cooperative in
Battambang province, the only biomass electricity generation operating in practical manner in
Cambodia uses tree farming system for fuel supply.
(vii) Community Forestry: Community forestry (CF) is recognized as an important strategy to
manage the forest at sustainable manner in Cambodia. The majority case of CF activity is
managing existing primary or degraded forest rather than reforestation by planting.
7.7.2 Current Biomass Electrification Used in Cambodia
There are biomass fuelled electricity generation facilities in Cambodia.
(i) Centre for Livestock and Agriculture Development (CelAgrid)
CelAgrid is the institute conducting various research on rural development mainly based on
agricultural technologies. There are 17 academic staff and 40 students working in the
institute. They purchased a 9 kWe (gross) biomass gasification electricity generation system
from Ankur Scientific (India) in September 2004. Center's currently conducting a research on
comparing different biomass such as coconut husk, cassava stem, mulberry stem and Cassia
tree for suitability and efficiency for gasification.
-188- Asian Biomass Handbook
(ii) Anlong Ta Mei Community Energy Project
Anlong Ta Mei village (Bannan District, Battambang Province) community energy cooperative
project is the only biomass electricity supply system operated profitable base rather than
research. The project introduced a 9 kWe biomass gasification electricity generation system
(same model as CelAgrid) and set up a mini grid. They use planted Leucaena branches for the
fuel. They started the operation in February 2005.
(iii) NEDO and Biogas Hybrid Power Generation Project
In December 2003, Japan’s NEDO completed the construction of a hybrid electricity generation
system consist of a solar photovoltaic (50 kW) and 2 x 35kWe duel fuel biogas engine near
Sihanoukville. The biogas is extracted from cattle excrements from a farm. The system is
currently operating but the project is considered to be mainly a demonstration and research
venture and would not economically viable yet.
7.7.3 Wood and Other Biomass Use in Cambodia
□ 94 % of fuel wood is used directly as fuel,
□ 6 % of fuel wood is converted to charcoal,
□ 90 % of total fuel wood supply is consumed directly by households in rural areas,
□ 8 % of total fuel wood supply is used in other urban households,
□ Less than 1 % of total fuel wood supply is used in industrial sector,
□ Less than 1 % of total fuel wood supply is used in service sector
□ The other biomasses such as wood, wood waste and rice husk are used by brick kilns,
bakeries, and food processing,
□ Cane husk, palm branches and tree leaf are used by cane sugar and palm sugar
producers,
□ Coconut branches, coconut husk and rice husk are used by rural households for
cooking animal food,
□ Some rural households use coconut branches, palm branches, rice straw with cow
dung, rice husk and wood waste for cooking their food.
□ They use these biomasses for directly firing.

-189- Asian Biomass Handbook
7.8 Malaysia
In Malaysia, biomass resources are mainly from the palm oil, wood and agro-industries. All
of these residues come in many forms such as palm oil mill residues, bagasse, rice husks and
wood/forest residues. Major sources of biomass come from the oil palm residues in the form of
empty fruit bunches (EFB), fibers, shells, palm trunks, fronds and palm oil mill effluent
(POME). The energy content in each residue is different to each other. This is mainly because
the caloric value, moisture content and some other parameters that are different.
As shown in table below, the palm oil residues accounts for the largest biomass waste
production in the country. This is because the palm oil mill residues are easily available and
are presently requiring cost effective means of disposal. Currently, most of these residues are
disposed of through incineration and dumping. A small portion is used as fuel for the mills' heat
and power requirement in a very inefficient manner.
Table 7.8.1. Biomass and energy resource potential.
Sector Quantity kton / yr Potential Annual Generation (GWh)
Potential Capacity (MW)
Rice Mills 424 263 30
Wood Industries 2177 598 68
PalmOil Mills 17980 3197 365
Bagasse 300 218 25
POME 31500 1587 177
Total 72962 5863 665
7.8.1 Biomass energy utilization in Malaysia The abundant biomass resources coming mainly from its palm oil, wood and agro-industries
are used mainly to produce steam for processing activities and also for generating electricity.
Biomass fuels contribute to about 16 percent of the energy consumption in the country, out of
which 51 percent comes from palm oil biomass waste and 27 percent wood waste. Other
biomass energy contributors are from plant cultivations, animal and urban wastes. There are
currently about 400 palm oil mills in operation, which self generates electricity from oil palm

-190- Asian Biomass Handbook
wastes not only for their internal consumption but also for surrounding remote areas. Studies
also found that 75.5 percent of the potential biomass that can be harnessed in Malaysia is
unutilized and wasted.
7.8.2 Oil palm residues The oil palm industry generates residues during the harvesting, replanting and milling
processes. The residue that comes from the milling processes are fruit fibers, shell and empty
fruit bunches (EFB). Other residues including trunks and fronds are available at the
plantation area. Currently shells and fibres are used as boiler fuel to generate steam and
electricity for the mill’s consumption. The EFB is return back to the plantation for mulching.
This is only practiced in bigger plantations. For old palm oil mills, the EFB is burned in the
incinerator to produce fertilizer. However, there are still palm oil mills disposing the EFB
through landfill method particularly the mills without enough plantations or estates.
Palm oil mill effluent (POME) is the wastewater discharged from the sterilization process,
crude oil clarification process and cracked mixture separation process. The amount of POME
generated depends on the milling operation. For a palm oil mill with good housekeeping, it is
estimated that 2.5 tonnes of POME are generated from every tonne of crude palm oil produced.
The average value for Malaysian palm oil mill is 3.5 tonnes for every tonne of crude palm oil
produced. The POME contains high chemical and biological oxygen demand, total solids and
require a treatment system before it can be discharged to the environment. Biogas is generated
from the biological treatment of POME. The composition is mainly methane (60-70%) and
carbon dioxide (30-40%). The calorific value is between 4740-6560 kcal per Nm3 and the
electricity generation is 1.8 kWh/cm3 of biogas. Some plantations practice zero waste
management system.
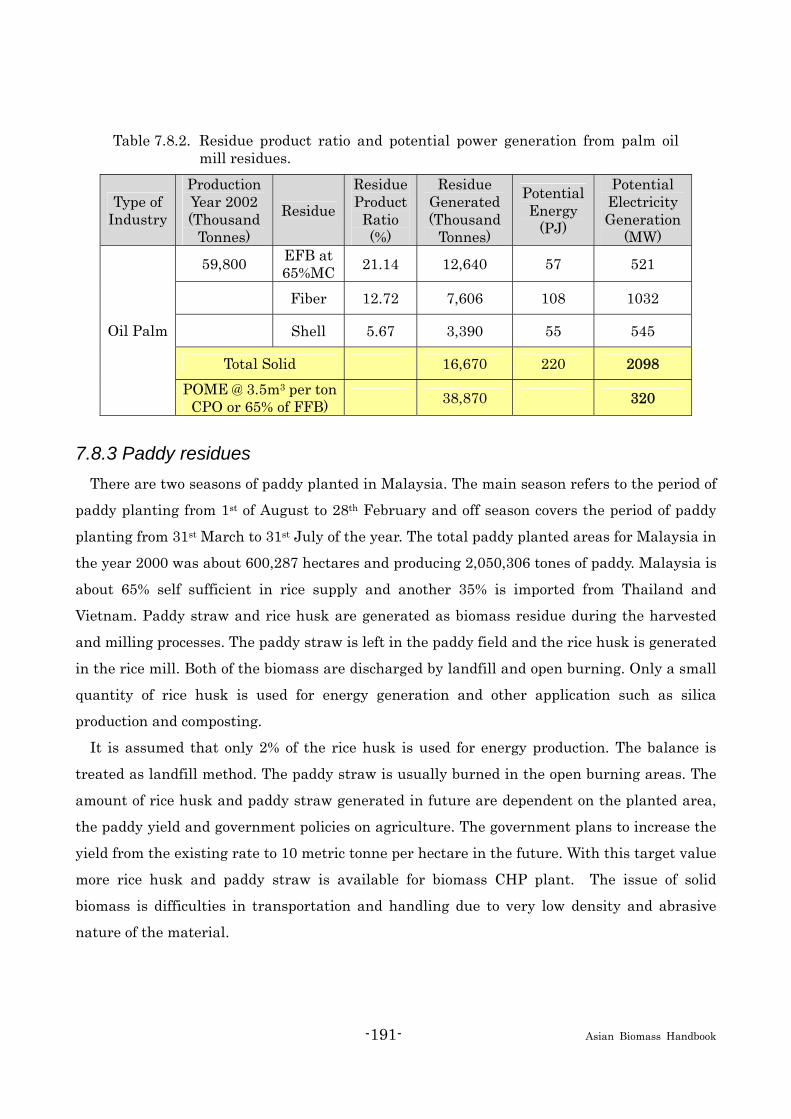
-191- Asian Biomass Handbook
Table 7.8.2. Residue product ratio and potential power generation from palm oil mill residues.
Type of Industry
Production Year 2002 (Thousand
Tonnes)
Residue
Residue Product
Ratio (%)
Residue Generated (Thousand
Tonnes)
Potential Energy
(PJ)
Potential Electricity Generation
(MW)
59,800 EFB at65%MC 21.14 12,640 57 521
Fiber 12.72 7,606 108 1032
Shell 5.67 3,390 55 545
Total Solid 16,670 220 2098
Oil Palm
POME @ 3.5m3 per ton CPO or 65% of FFB) 38,870 320
7.8.3 Paddy residues There are two seasons of paddy planted in Malaysia. The main season refers to the period of
paddy planting from 1st of August to 28th February and off season covers the period of paddy
planting from 31st March to 31st July of the year. The total paddy planted areas for Malaysia in
the year 2000 was about 600,287 hectares and producing 2,050,306 tones of paddy. Malaysia is
about 65% self sufficient in rice supply and another 35% is imported from Thailand and
Vietnam. Paddy straw and rice husk are generated as biomass residue during the harvested
and milling processes. The paddy straw is left in the paddy field and the rice husk is generated
in the rice mill. Both of the biomass are discharged by landfill and open burning. Only a small
quantity of rice husk is used for energy generation and other application such as silica
production and composting.
It is assumed that only 2% of the rice husk is used for energy production. The balance is
treated as landfill method. The paddy straw is usually burned in the open burning areas. The
amount of rice husk and paddy straw generated in future are dependent on the planted area,
the paddy yield and government policies on agriculture. The government plans to increase the
yield from the existing rate to 10 metric tonne per hectare in the future. With this target value
more rice husk and paddy straw is available for biomass CHP plant. The issue of solid
biomass is difficulties in transportation and handling due to very low density and abrasive
nature of the material.

-192- Asian Biomass Handbook
Table 7.8.3. Residue product ratio and potential power generation from rice mill residues.
Type of Industry
Production Year 2000 (Thousand
Tonne)
Residue
Residue product Ratio (%)
Residue Generated (Thousand
Tonne)
Potential Energy
(PJ)
PotentialPower ( MW )
Rice 2,140 Rice Husk 22 471 7.536 72.07
Paddy Straw 40 856 8.769 83.86
TOTAL 2,140 1327 16.305 155.93
7.8.4 Sugar cane residues Basically in Malaysia, there are only 2 out of 5 sugar factories, which use sugar cane as raw
materials for refined sugar production. The other plants would use solely brown sugar as raw
materials for sugar production. The main objectives of the industry are for food security supply,
creation of jobs, development of industrial projects in rural areas and reducing foreign
exchange.
Bagasse is the residue after sugarcane has been processed to remove the sugar juice. On
average, about 32 % of bagasse is produced from every tonne of sugar cane processed. The
amount of sugar cane processed in 2002 is about 1,111,500 tonnes. Thus, the amount of bagasse
produced is 355,680 tonnes. This bagasse is not wasted as it acts as a biomass residue fuel to
the boiler for its cogeneration plant. This saves the factory expenditure in boiler fuel oil and
electricity expenses.
At the current rate of usage, all of the bagasse is used as fuel for its cogeneration
plant. In fact there is insufficient bagasse for the sugar mills. Thus, they are buying
other biomass residues such as rice husk, wood off cuts and palm oil residues to be used
as fuel.
7.8.5 Wood residues Total forest areas in Malaysia are about 5.9 million hectares. Only 1.29% of the total area is
allowed for logging industry. The balance is mainly for permanent forest estate, forest
plantation, state land, and wildlife reserve and annual coupe for permanent forest estate. Wood
industries are mainly referred to the logging industry, saw milling industry, the panel product
industry (plywood, veneer, particle board, and medium density fibre board), the moulding

-193- Asian Biomass Handbook
industry and the furniture industry. The forest industries are rapidly moving away from
manufacturing low value products to value added products. These industries generated
different type of biomass residues namely sawdust, off cut and wood barks. A waste
minimization program is implemented in the wood based industries due to shortage of tropical
wood supply. A value added such as particle board and finger joints are manufactured from the
wood waste for the furniture industry.
The wood industries maximized the biomass residues into the value added products. The
residue such as off-cut from the saw mills is used as fuel for the kiln drying or sold as boiler
fuels. The middle portions of the log from the plywood and veneer mills are used as boiler fuels.
The remaining wastes are mainly the bark and the saw dust. In the isolated areas they are
burned in the incinerator or boiler to produce heat.
The generation of biomass residues from the wood based industry is declined due to limited
supply of logs and maximization of residues into value added product. The biomass from the
processing plants is used as fuel for their combined heat and power plant or sell to the potential
users such as brick manufactures. The chart below shows the estimated potential energy and
electricity from the waste generated from the saw mills, plywood and moulding plants.
7.8.6 Municipal solid waste (MSW) The Malaysian population has been increasing at a rate of 2.4 % per annum or about 600,000
per annum since 1994. With this population growth, the MSW generation also increases, which
makes MSW management crucial. Currently, the MSW is managed mainly through landfill.
However, due to rapid development and lack of new space for it, the big cities and islands are
considering incineration to tackle this problem.
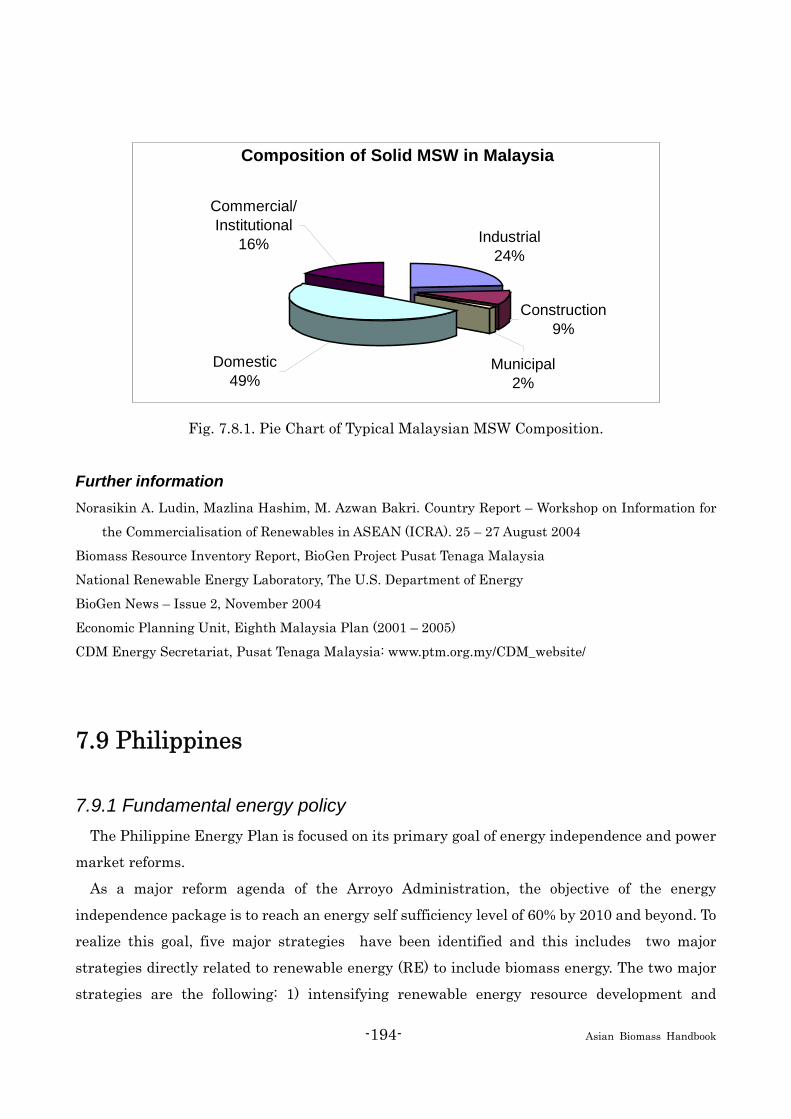
-194- Asian Biomass Handbook
Fig. 7.8.1. Pie Chart of Typical Malaysian MSW Composition.
Further information Norasikin A. Ludin, Mazlina Hashim, M. Azwan Bakri. Country Report – Workshop on Information for
the Commercialisation of Renewables in ASEAN (ICRA). 25 – 27 August 2004
Biomass Resource Inventory Report, BioGen Project Pusat Tenaga Malaysia
National Renewable Energy Laboratory, The U.S. Department of Energy
BioGen News – Issue 2, November 2004
Economic Planning Unit, Eighth Malaysia Plan (2001 – 2005)
CDM Energy Secretariat, Pusat Tenaga Malaysia: www.ptm.org.my/CDM_website/
7.9 Philippines
7.9.1 Fundamental energy policy The Philippine Energy Plan is focused on its primary goal of energy independence and power
market reforms.
As a major reform agenda of the Arroyo Administration, the objective of the energy
independence package is to reach an energy self sufficiency level of 60% by 2010 and beyond. To
realize this goal, five major strategies have been identified and this includes two major
strategies directly related to renewable energy (RE) to include biomass energy. The two major
strategies are the following: 1) intensifying renewable energy resource development and
Composition of Solid MSW in Malaysia
Industrial24%
Commercial/Institutional
16%
Domestic49%
Municipal2%
Construction9%
-195- Asian Biomass Handbook
increasing the use of alternative fuels.
7.9.2 Intensifying renewable energy resource development In line with the government’s intensified efforts to promote RE development and use, the
Philippine Department of Energy (DOE) formulated the Renewable Energy Policy Framework
which embodies its objectives, goals, policies and strategies as well as programs and projects to
further develop the RE sector within the perspective of the sector’s supply and demand
prospects and its current stage of development. Specifically, the identified long-term goals are
the following: (i) increase RE-based generating capacity by 100 percent within the next ten
years; and (ii) increase non-power contribution of RE to the energy mix by 10 MMBFOE in the
next 10 years. Included in these goals is the increase in the contribution of biomass, solar and
wind in power generation.
Resource Potential
Based on current projections of the Philippine Department of Energy (DOE), RE will
provide at least 40 percent of the country’s primary energy requirements for the next 10 years
beginning 2005. Other RE such as biomass, used mostly for non-power applications, will
remain to be the largest contributors to the total share of RE in the energy supply mix with at
least 30 percent share. According to the Power Development Plan, biomass will provide 30 MW
capacity in 2007 and will increase to 55 MW in 2008.
Based on the study, “Power Switch and Strategies for Clean Power Development in the
Philippines”, the country has a potential resource capacity of 235.7 MW from bagasse resources.
Other studies as well, shows the potential of the country for several small 1-2 MW rice hull
fired power plants just like 1 MW rice hull fired power plant currently installed in the
Northern part of Luzon.
7.9.3 Increasing the use of alternative fuels The government will continue to promote the use of alternative energy in the transport
sector particularly biofuels (i.e cocobiodiesel or cocomethyl esther, fuel ethanol and jatropha
carcus.)
The President has signed into law RA 9367 or the Biofuels Law that mandates the use of
biodiesel and bioethanol nationwide.
At present, biodiesel is already being used nationwide at 1% of the total volume of diesel sold.

-196- Asian Biomass Handbook
This is in accordance with the provision of the Law that , three months after the approval of the
Act, a minimum of 1% biodiesel by volume shall be blended into all diesel engine fuels sold in
the country. The country has 211.3 million liters per year capacity from 5 accredited biodiesel
producers.
Biodiesel requirement in 2007 is 41 million liters at 1% blend. 100% compliance nationwide.
Targets:
Within two years from the effectivity of the Act, the Philippine Department of Energy, may
mandate a total of 2% blend depending on the results of the study by the national Board
created under the Act. Provided that the ethanol and biodiesel blends conform to Philippine
National Standard. Two years from the effectivity of the Act, at least 5% bioethanol by volume
of the total volume of gasoline fuel sold and distributed by each and every oil company in the
country. Within four years from the effectivity of the Act, the Philippine Department of Energy,
may mandate a mimimum of 10% blend depending on the results of the study by the national
Board created under the Act.
Raw Material Requirement:
For bioethanol, supply of feedstock is initially from sugar based ethanol. With 880,000 liters
per day committed capacity from various plants. Other feedstocks considered are sweet
sorghum and cassava. For biodiesel, is currently from coconut oil or CME but Jatropha is also
being considered.
Current feedstock yield: sugarcane has 23.98 million metric tons, corn has 5.25 million
metric tons, and cassava 1.64 million metric tons. Coconut oil production is 1.4 billion liters
per year (80% for export and 20% for local use).
Biodiesel requirement : 85 million liters in 2008, 229 million liters in 2010 and 277
million liters per year in 2015.
Further information Banzon, J.A. and J. R. Velasco, Coconut: production and Utilization, 1982
Philippine Energy Plan 2005-2014 (2006 Update)
Elauria, Jessie C., Policy and Actual Biomass Status in the Philippines. Paper presented during the
Biomass Asia Workshop held in Japan
Elauria, J.C., M.L.Y. Castro, M.M. Elauria, S.C. Bhattacharya and P. Abdul Salam (2005). Assessment of
Sustainable Energy Potential of Non-Plantation Biomass Resources in the Philippines. Volume 29.
September 2005. pp. 191-198.

-197- Asian Biomass Handbook
7.10 Singapore
Singapore has always enjoyed a reputation as a “Garden City” for being “clean and green”
due to its effective management of the urban environment and maintenance of the green space.
With a land mass of approximately 700 square km and population of 4.5 million, it has also
invested heavily on the environmental infrastructures such as waste water treatment and
waste disposal facilities. Most recently, it has embarked on the recycling and reuse of the
water resources under a program called “Newater” which has become a model for many
countries to follow.
It is now 2008, energy security dominates international stage, crude oil price is nearing a
record high of over $100 US a barrel, global warming and climate change are now household
concerns. Europe-led market demand for biofuels is all the rage. Singapore claims to be the
world’s second largest petroleum refinery center with installed capacity of well over 1 million
barrels/d. However, Singapore relies on the import of nearly100% of its raw energy supply.
This reliance on imported fossil energy necessarily subjects Singapore's economic and
environmental sustainability to external factors that all energy importing countries must also
face. These included global oil/gas market fluctuations; political instability of the oil
exporting countries; international protocol (Kyoto Agreement) to limit CO2 emission from fossil
energy use, as well as changes in public energy consumption patterns.
Government has encouraged development of clean, alternative energy programs such as the
Sinergy Program which provided a testbed for hydrogen based fuel cell vehicles since the 1990’s.
More recently, it has announced major R&D funding program on clean and renewable energy.
It has successfully attracted major investments for the manufacturing of solar-PV panels with
the announced capacity of 1,500 MWe per year, as well as a wafer manufacturing plant to
provide the mono-silicon materials needed for the solar cells.
On the other hand, private sector investors have taken advantage of Singapore’s strategic
location in the tropical SE Asia together with its well established infrastructures for crude oil
handling, storage, and refineries. Singapore is benefiting directly from its proximity to this rich
repository of biomass resources. In recent years, Singapore has attracted major foreign direct
-198- Asian Biomass Handbook
investments in biodiesel production facilities. All together, 6 biodiesel production projects
have been confirmed, with a total combined capacity of close to 2 million tonnes/per year and
the total investment dollars is close to S$2 billion. All of these investments aim to bring in
crude plant/seed based oil from the region and refine them in Singapore. A regional biofuels
analysis center is also being set-up to cope with the anticipated demand from all these
activities.
Domestically, Singapore generates about 650,000 Tonnes/year of biomass wastes which
includes food waste, wood/timber wastes and sludge/biosolids. Many of the woody biomass
comes from the thriving shipping/trans-shipping industry in Singapore where wooden pallets
are routinely disposed when they become unrepairable. Increasingly, the government of
Singapore, through the National Environment Agency (NEA) and private sector investors are
exploring opportunities for their energy recovery and utilisation. Once plant has been built by
local investor to convert food waste to biogas, another diverts about 600 tonnes/d of municipal
solid waste (MSW) for recycling and reuse, of which about 300 tonnes/d of woody biomass are
used as fuel for cogen. The third recovers energy and generates hot water from horticultural
wastes. Government is now encouraging more opportunities for diverting biomass waste from
the incinerators and landfill sites. It is expected that more private sector investment will see
the economic benefit for recovering energy from the biomass resources.
In summary, Singapore is in the forefront of bioenergy R&D, it is also racing ahead to explore
more sustainable 2nd and 3rd generation of biofuels technology and will likely to lead the
commercial developments of these renewable energy due to its pro-active government policies
for attracting investments.
7.11 Thailand
The Royal Thai Government launched a strategy to increase renewable energy share in the
energy mix since 2005. This was a cabinet resolution, binding all governmental agencies to
harmonize policy direction to achieve the declared policy targets. In response to this policy
needs, the Ministry of Energy has set forth the seven strategies for energy sufficiency

-199- Asian Biomass Handbook
development as follows.
1. Establish the independent organization to regulate electricity and natural gas
2. Foster energy security by recourse to His Majesty Sufficiency Initiatives
3. Promote efficient energy usage
4. Promote the development of renewable energy
5. Seek for appropriate pricing structure for energy
6. Establish clean energy development mechanism
7. Encourage private sectors and the public to contribute to policy making process.
Targets of Biomass-derived energy :
The target set forth by the government is that Thailand must increase the share of
renewable energy in the final energy consumption from 0.5% in 2005 to 8% by 2011 (6,540
ktoe). The target for renewable share in the transportation fuel is 3% for biofuels i.e. bioethanol
use must be at leat 3 Million L/day and biodiesel must be 4.0 Million L/day by 2011. A target
for biomass-deriveded heat and steam is 4% equivalent to 3940 KTOE by 2011. A share of 1%
was set for electricity from renewable resources which is equivalent to 3251 MW by 2011. Due
to recent price increase of crude oil, an adjustment of the target has been announced by the
government to start implementing E20 gasohol (20% blend of ethanol into gasoline) on
January 1st 2008 and B2 (2% blend of biodiesel into biodiesel) has been mandated since
February 1st, 2008. This implementation has made Thailand the first country in Asia to fully
commercialize both bioethanol and biodiesel blends all over the country.
Duties
The policy targets and implementation milestones are reviewed and adjusted periodically
and reported to the government by the National Energy Policy Committee.
Biomass utilization
At the end of 2007 more than 4000 service stations distribute E10 gasohol all over the
country and all stations distribute B2 as mandated by the government. B5 biodiesel blend is
now available in more than 3000 stations. Bioethanol used in December was 600 KL/day in
average. Biodiesel used was 150 KL/day in for low-blend of 2-5% before the mandatory
period. After the mandate of blending 2% biodiesel in all highspeed diesel, the use of biodiesel
jumped to above 1 million l./day level in February 2008. Renewable eletricity production
-200- Asian Biomass Handbook
reached 2057 MWe and biomass-based heat and steam was 1840 KTOE in 2007.
Amount of biofuel production
Biodiesel Production is about 1,150 KL/day; production capacity is 2,185 KL/day. Bioethanol
Production is 700 KL/day (Feb.2008) and the production capacity is 1,150 KL/day.
Situation of biofuel introduction
Biofuel introduction is now accelerating in Thailand. Bioethanol-blended gasoline (E10) is
now reaching 6 ML/day out of 20 ML/day of total gasoline consumption and the bioethanol
blends(E10) gained a market share of 23% of all gasoline use at the end of 2007.
Biodiesel-blended diesel is now 3 ML/day out of 50 ML/day total diesel consumption in
December 2007. The consumption figure for Feb. 2008, the market for B5 was 5ML/day of the
total diesel market of 50 ML/day, the rest of the fuels were B2 blended as mandated by the
government.
Energy crops
For ethanol, 1-2 million tons of molasses are used as raw material (this is by-product from
sugar production which is about 5 million tons from 64 million cane production), another raw
material for ethanol is cassava, only 180,000 tons out of 26 million tons of cassava roots is used
for ethanol production. For biodiesel, about 100,000 tons of palm oil is used for biodiesel out of
1.5 million tons production in 2007. The use of palm oil for biodiesel in 2008 is expected to
reach 300,000 tons levels.
Future prospects
Many new ethanol plants using both molasses and cassava will begin production in 2008; it
is expected that by December 2008 the total production capacity will reach 8 Million litres /day
and Thailand can produce much more due to the surplus of raw materials for ethanol. As for
biodiesel, the government started to promote the new oil palm plantation with a target to
increase area by 200,000 acres/year for the next 5 years so that raw material will be sufficient
to meet the target for biodiesel production. By 2011, it is expected that Thailand will have 1.1
million hectares of oil palm plantation, at least half of the production will be used for bioenergy
production by 2011. In this respect, the bioenergy crop development in Thailand, given the
appropriate policy implementation, will be the new engine of growth to increase the income

-201- Asian Biomass Handbook
for rural agricultural sectors. It is also foreseen that co-operation among the Greater-Mekong
subregion in biomass energy areas will also enhance the significance of energy sufficiency
development in the region.
Successful examples
Thailand is today the only country in Asia to adopt bioenergy into the main consumer market
where both bioethanol and biodiesel blends are available in all region of the country.
Renewable electricity and heat/steam are also promoted in the industry and substantial
progress are being made to meet the target set by the government.
MTEC and NSTDA will focus on the R&D efforts to help the industry and the small and
medium enterprize to adopt and integrate bionergy into their respective energy production and
utilization. The success of Thailand will be a good example for other countries in the region,
especially LPDR, Cambodia, Myanmar and Vietnam, to explore the ways forward with this new
developmental vehicle. It is expected that CDM mechanism and climate-change adaptation
schemes will become a significant developmental issue in the coming years.
7.12 Vietnam
7.12.1 Governmental policy Project No 177/2007/QD-TTg (Nov. 20, 2007) of Gov. for development of biofuels to 2015 and
line of vision to 2025 and Gov. Strategy No 1855/QD-TTg (Dec. 27, 2007) for development of
National Energy to 2020 and line of vision to 2050. The government approves a new and
renewable energy as 3, 5 and 11% to 2010, 2020 and 2050 respectively. There are no duties for
biomass introduction. Ministry of Industry and Trade; Ministry of Science and Technology;
Ministry of Agriculture and Rural Development; Ministry of Natural Resources anfd
Environment.
7.12.2 Utilization of biomass Availability, amount used, and how to use, for each biomass is listed below.
-202- Asian Biomass Handbook
Livestock waste: availability: Pig dung - 25.7 million tons/year; Cattle dung - 20.2 million
tons/year; Buffalo dung - 16.0 million tons/year; Municipal garbage - 6.4 million tons/year ,
amount used 70-80% (compost; fertilizer; Biogas...
Food waste: availability not determined (animal feed)
Paper: consumpition 997,400t/year, amount used 70% (recylce)
Black liquor: availability not determined, amount used 40% (combustion)
Sawn wood: 3,414 thous. m³ Lumber-mill residue: amount used 100% (energy use)
Forestry residue: availability 1,648.5 thousand tons/year, amount used 0%
Non-edible portions of farming crops: availability: rice straws:76 Mt/year; rice husks 7.6
Mt/years; Bagasse2.5 Mt/year, amount used 20% (compost, animal feed, animal bedding
material, electrcity, Mushroom production...); 73,800 tons of used cooking oil; 60,000 tons of
“Basa” fish oil (2005) now producing 10,000-tons/year
Amount of biofuel production is shown below.
Bioethanol
Feedstock: Casava, molasses, rice
Production:76.63 ML in 2006.
Biodiesel
Feedstock: waste cooking oil; Basa fish oil; rubber oil; Jatrofa
Prodution: R&D project"
Biofuel introduction has not been made, but by plan of Gov. to 2021 will be 100,000 t of E5 and
50,000 t of B5 available on the market
7.12.3 Energy crops Amount of production and utilization of energy crops are none, but in the future, introduction
of 2 ethanol factories using cassava, each productivity of 100 ML/year (1 factory produces
50ML/year using molasses and sugarcane) is planned.
7.12.4 Successful examples 40,000 family-size biogas digesters (1-50 m3) had been installed. Development of new
technology for biofuel production from agricultural residue is under way.
-203- Asian Biomass Handbook
7.13 Japan
7.13.1 Policy New Energy Promotion Law (Jan. 2002) approves bioenergy as a "new energy", and supports
its introduction. The council for energy in METI (Ministry of Economy, Trade and Industry)
publishes the target values for “new energy” at 2010; thermal use of biomass, 3.08 million kL
oil equivalent, and electricity production from biomass and wastes, 5.86 million kL oil
equivalent. These values, however, have no duty.
The strategy for biomass utilization “Biomass Nippon Strategy” was published in cabinet
(Dec. 2002). The target values at 2010 were revised (Mar. 2006); biofuel for transportation,
0.5 million kL oil equivalent, utilization rate of unutilized biomass, 25%, number of “Biomass
Town”, 300 areas. Ministry of Agriculture, Forestry, and Fishery approves municipalities that
utilize biomass based on the characteristics of the region as "Biomass Towns".
7.13.2 Status of biomass utilization The status of biomass utilization in Japan is shown in Fig. 7.13.1. Livestock waste is used
as compost etc., food waste as compost and animal feed, lumber-mill residue as energy and
fertilizer, construction-derived wood residue as paper production, particleboard production,
animal bedding material, combustion etc., sewage sludge as construction material and compost,
non-edible portions of farming crops as compost, animal feed, animal bedding material etc.
paper waste as recycle and heat production, black liquor as combustion use. Forestry residue
is not any used.
Bio diesel fuel from waste cooking oil is produced around 3,000 t/year. Bio-ethanol
production is almost in R&D stage, and bio-ethanol is produced commercially 1,400 kL from
waste wood in 2007. Test sales of ETBE-mixed gasoline (3%-EtOH equivalent) and E3 just
started in 2007.
Energy crops is not tried yet. Introduction is limited due to the limited land and high labor
cost, although test production of sugarcane and ethanol production is going on in Okinawa.

-204- Asian Biomass Handbook
7.13.3 Successful example The First Energy Service Co., Ltd., commercially collects waste wood and produces electricity.
They established 3 power generation companies using waste wood; 10,000 kW at Iwakuni Wood
Power Co., Ltd., 11,500 kW at Shirakawa Wood Power Co., Ltd., and 12,000 kW at Hita Wood
Power Co., Ltd.
7.13.4 Other comments Non
Further information MAFF webpage: http://www.maff.go.jp/j/biomass/index.html
0% 10% 20% 30% 40% 50% 60% 70% 80% 90%100%
Livestock waste, 91Mt/year
Food waste, 19Mt/year
Lumber-mill residue, 6.1Mt/Year
Construction-derived wood residue,4.8Mt/year
Sewage sludge, 76Mt/year
Forestry residue, 3.9Mt/year
Non-edible portions of farming crops,13Mt/year
Livestock waste, 89Mt/year
Food waste, 22Mt/year
Lumber-mill residue, 5Mt/Year
Construction-derived wood residue,4.6Mt/year
Sewage sludge, 75Mt/year
Forestry residue, 3.7Mt/year
Non-edible portions of farming crops,13Mt/year
Paper, 36Mt/year
Black liquor, 14Mt/year
Utilization Non-utilization
2002FY
2005FY
Fig. 7.13.1. Status of biomass utilization in Japan.

-205- Asian Biomass Handbook
7.14 Taipei, Chinese
7.14.1 Policies, mandatories, and targets One of the key tasks of energy policy in Taiwan is to stabilize energy supply to increase
energy independence. The installed capacity of power generation from renewable energy is
identified to be 12% in total to enhance energy self sufficiency, and the target of 10% in total is
set to be reached in 2010. Power generation from biomass and wastes is set to be the third
largest sources of renewable energy, which is 1.44% in total (741MW) in 2010. In order to
promote the utilization of renewable energy, the “Renewable Energy Development Bill” has
been drafted and submitted to the Legislative Yuan for approval.
The application of biofuels to transportation sector is in growing trend in recent years. The
pilot project started by Environmental Protection Administration is to blend 20% of biodiesel
(B20) to garbage truck from 2004. Since then, the Bureau of Energy proceeded the
demonstration project with four stages. Firstly, the Green Bus Project was started in 2006,
which 2% of biodiesel (B2) is blended to bus fleet operated by public sector. Secondly, test sales
of B1 at gas station of Taoyuan county,
Chiayi city, and Chiayi county was started in 2007, which is called Green County Project.
Thirdly, the target of B1 sales at all gas station will be reached in July, 2008. Finally, the target
of B2 applied in nationwide area, which is estimated to be 100 dam3/year (100,000 kL/year) in
total will be reached in 2010.
The application of bioethanol was started in 2007, test sales of E3 at 8 gas station in Taipei
city is focused on official’s car, and private car is also encouraged to use. The target of E3 at all
gas station of Taipei and Kaohsiung city will be started in January, 2009. It is expected to use
E3 in nationwide area in 2011, which is estimated to be 100 dam3/year (100,000 kL/year) in
total.
Up to now, subsidizing for biomass utilization is still inevitable. The related mandatories are
listed below:
・ Measures for purchasing electricity from renewable energy sources
・ Measures for rewarding methane power generation in landfill
・ Measures for subsidizing energy crop green bus projects
・ Measures for subsidizing green county promoting projects
・ Measures for subsidizing green official’s car pilot projects

-206- Asian Biomass Handbook
Considering the area of farm to cultivate energy crops is limited, it is possible to import
biofuels from abroad. The “Petroleum Administration Act” should be revised to enhance the
management of imported renewable energy, such as bioethanol, biodiesel etc.
7.14.2 Amount of resources Up to now, most of biomass utilization in Taiwan is wastes and residues. The noticeable
items are listed below:
・ There are 24 municipal solid waste incinerators equipped with power generation facilities,
and total capacity is 528.8 MW.
・ There are installed capacity of power generators utilizing biogas generated from 4 large
landfills and some middle to small scale pig farms.
・ There are also some power plants using industrial and agricultural wastes, including
bagasse, paper mill waste, plastic waste, rice hull and RDF-5 (Refuse Derived Fuel) etc.
The total capacity of these plants is around 67.5 MW.
In addition, the enforcement of recycling used frying oil was started in September, 2007 for
enterprise. Household is also encouraged. The potential biodiesel product from used frying oil
is estimated to be around 80,000 kL/year.
In the near future, 80 km2 (8,000 ha) of rested cultivating farm is planned to cultivate energy
crops. The potential of farmland for cultivating energy crops could be 5,000 km2 (500,000 ha).
If seaweed could be cultivated around 100 km2 (10,000 ha) of seashore, the potential product
of 150-300 dam3 (150,000-300,000 kL) biodiesel is expected.
-207- Asian Biomass Handbook
Part 8. Examples for biomass utilization
8.1 Small-Scale Biomethanation
8.1.1. What are biomethane and biomethanation? Biomethane (sometimes referred to as "Biogas) is generated from organic materials as they
decay. The main component of biomethane is CH4 (55%-70%) and CO2 (25%-40%). Biomethane
can be used for cooking, lighting, heating, generating electricity and so on.
Biomethanation is the process of conversion of organic matter in the waste (liquid or solid) to
biomethane and manure by microbial action in the absence of air, known as "anaerobic
digestion."
8.1.2. Situation of biomethane in China The annual quantity of waste in China is more than 150 million tons. The production and
disposal of large quantities of life and industrial waste without adequate or proper treatment
result in widespread environmental pollution. While some of these wastes can be collected and
biomethane is generated from anaerobic digesters where the manure decomposes. Especially in
some far rural area where the transportation of electricity is expensive, biomethane is a good
way to provide energy for cooking, lighting and heating, etc.
Since 1950s, Chinese governments encouraged small-scale biomethanation using animal and
agricultural waste as feedstock. Table 1 shows the rural biomethane development in China.
Till 2006, about 20 million families in rural area are using biomethane for cooking and lighting.
Annual consumption reaches 5 million standard coal equivalent. Subsidy of 2.5 billion RMB
from government is for small-scale biomethanation development, which means one small-scale
biomethanation can get subsidy of 800-1200 RMB. China nation government plans to build 30
million biomethane digesters in 2010 and 45 million biomethane digesters in 2020.

-208- Asian Biomass Handbook
Table 8.1.1. Survey of rural biomethane in China, 1991-2005.
Year Biomethane digesters (million) Annual output (billion m3)
1991 4.75 1.11
1995 5.70 1.47
1999 7.63 2.25
2001 9.57 2.98
2002 11.10 3.70
2003 12.89 4.58
2004 15.41 5.57
2005 18.07 7.06
8.1.3. Characteristics of small-scale biomethanation In China, the area of small-scale biomethane digester is about 6-8 m2. Annual output is 300
m3. Cost of each biomethane digester is 1500-2000 RMB.
In spite of providing energy, biomethane in China also has the following characteristics: 1)
environment friendly. For an 8-10 m3 biomethane digester, dejecta of 5-8 pigs or 2000-3000
chickens can be used. 2) The residues in the digester can also be used for fertilizer. 3)
economically. It saves money of buying electricity or save labor of seeking firewood. And the
woods can be saved.
8.1.4. Process of small-scale biomethanation The process of small-scale biomethanation includes feedstock collecting, pretreatment,
fermentation, treatment and purifying, storage and transportation, where the fermentation
digester is the main equipment. The digesters are required to be airtight and impervious to
make sure they are anaerobic. The temperature in the digester should be maintained at
20-40℃. There should be enough manure in the digester. Appropriate water (about 80%)
content and pH (7-8.5) are required.
Batch fermentation and semi-continuous fermentation are usual technologies for small-scale
biomethanation. In batch fermentation technology, all the feedstock is added at the first. The
biomethane generates fast at the beginning and then decreases. This technology is easy for
-209- Asian Biomass Handbook
management, but the biomethane generation rates are different. In semi-continuous
fermentation technology, 1/4 - 1/2 feedstock was added at the first. When the biomethane
generation slows down, more feedstock is added to make the biomethane generation work in
order.
8.1.5. Energy supply of small-scale biomethanation Usually, the biomethane generation rate of digester is 0.2-0.25 m3/(m3.d). So annual output of
a 10 m3 digester is about 600 m3 biomethane. Usually, heat value of 1 m3 biomethanol is
equivalent to that of 3.3 kg raw coal. As mentioned in previous, annual consumption of
biomethane reached 5 million standard coal equivalent in China. It is obvious that biomethane
plays an important role in rural energy supply.
Further information http://www.cogeneration.net/BioMethanation.htm
Wang Haibo, Yang Zhanjiang, Geng Yeqiang. Analysis on the influence factors of rural household biogas
production in China. Renewable Energy Resources, Vol. 25 No.5 Oct. 2007: 106-109
http://www.biogas.cn/
Gao Yunchao, Kuang Zheshi, etc. Development progress and current situation analysis of the rural
household biogas in China, Guangdong Agricultural Sciences, 2006. 1: 22-27
Huang Fenglian, Zheng Xiaohong, etc. Actions and modes of household biogas for new rural area
construction in China. Guangdong Agricultural Sciences, 2007. 8: 114-116
8.2 Large Scale Biomethanation
8.2.1 Outline of large scale biomethanation Anaerobic digestion has been in practical use for a long time. Its industrial installations
had started as early as in around 1900. Since then, the anaerobic digestion systems have
been continuously improved and enlarged to treat a wide range of biomass wastes such as food
industry wastewater/waste, garbage, livestock waste, night soil and sewage sludge among
others.
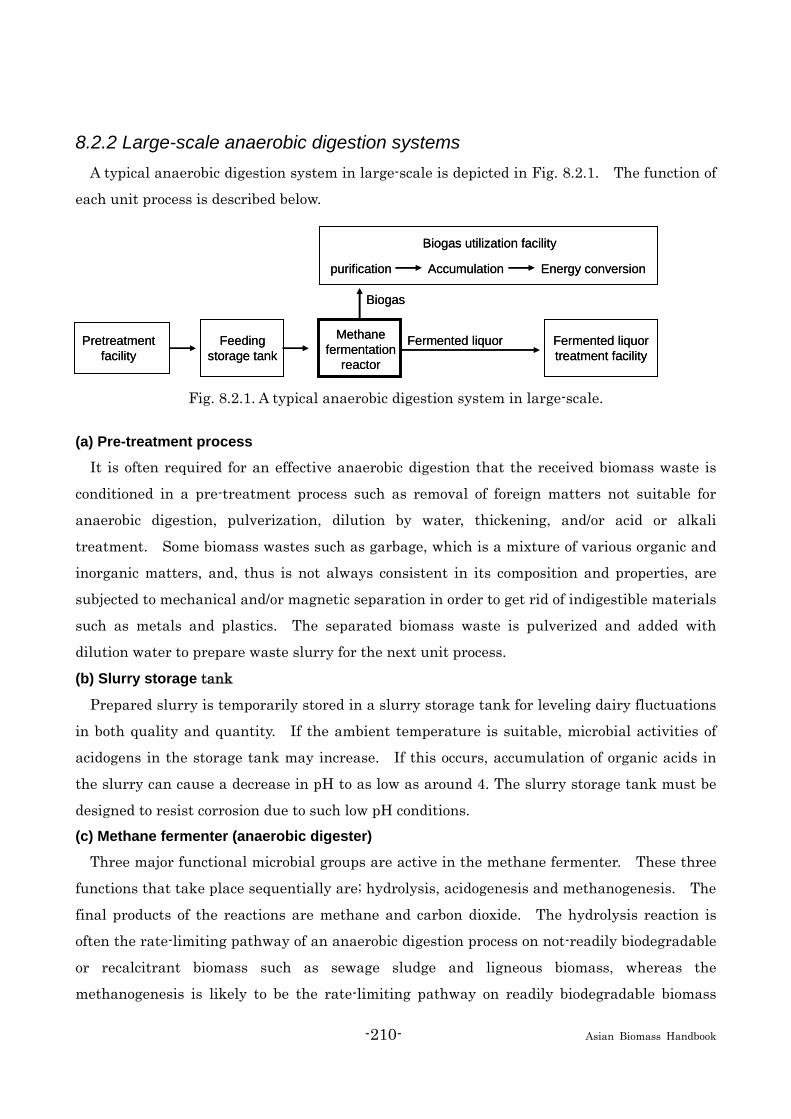
-210- Asian Biomass Handbook
8.2.2 Large-scale anaerobic digestion systems A typical anaerobic digestion system in large-scale is depicted in Fig. 8.2.1. The function of
each unit process is described below.
Fig. 8.2.1. A typical anaerobic digestion system in large-scale. (a) Pre-treatment process
It is often required for an effective anaerobic digestion that the received biomass waste is
conditioned in a pre-treatment process such as removal of foreign matters not suitable for
anaerobic digestion, pulverization, dilution by water, thickening, and/or acid or alkali
treatment. Some biomass wastes such as garbage, which is a mixture of various organic and
inorganic matters, and, thus is not always consistent in its composition and properties, are
subjected to mechanical and/or magnetic separation in order to get rid of indigestible materials
such as metals and plastics. The separated biomass waste is pulverized and added with
dilution water to prepare waste slurry for the next unit process.
(b) Slurry storage tank
Prepared slurry is temporarily stored in a slurry storage tank for leveling dairy fluctuations
in both quality and quantity. If the ambient temperature is suitable, microbial activities of
acidogens in the storage tank may increase. If this occurs, accumulation of organic acids in
the slurry can cause a decrease in pH to as low as around 4. The slurry storage tank must be
designed to resist corrosion due to such low pH conditions. (c) Methane fermenter (anaerobic digester)
Three major functional microbial groups are active in the methane fermenter. These three
functions that take place sequentially are; hydrolysis, acidogenesis and methanogenesis. The
final products of the reactions are methane and carbon dioxide. The hydrolysis reaction is
often the rate-limiting pathway of an anaerobic digestion process on not-readily biodegradable
or recalcitrant biomass such as sewage sludge and ligneous biomass, whereas the
methanogenesis is likely to be the rate-limiting pathway on readily biodegradable biomass
Pretreatment facility
Feeding storage tank
Methane fermentation
reactor
Fermented liquor treatment facility
purification
Biogas utilization facility
Biogas
Fermented liquor
Accumulation Energy conversion
Pretreatment facility
Feeding storage tank
Methane fermentation
reactor
Fermented liquor treatment facility
purification
Biogas utilization facility
Biogas
Fermented liquor
Accumulation Energy conversion
-211- Asian Biomass Handbook
such as garbage and starchy wastewater. In order to establish an efficient anaerobic digestion
system, it is important to consider the rate-limiting pathway and to select the most suitable
reactor design for the properties of anticipated biomass waste. For example, the overall rate
of anaerobic digestion on readily biodegradable biomass waste heavily depends on the density
of active methanogens in the reactor, thus the reactor should be designed to maximize the
density or mass of the methanogens within the system. (d) Fermentation wastewater treatment
Fermentation wastewater discharged from the anaerobic digester usually contains high
concentrations of organic matters, nitrogen compounds and phosphorus compounds. The
fermentation wastewater should be treated to reduce the concentrations of these pollutants to
meet the standards for final discharge to a receiving body of water or sewer system. The most
typical fermentation wastewater treatment system is the activated sludge process with tertiary
treatment. (e) Biogas utilization
Since most of the biomass wastes contain proteins (a source of nitrogen and sulfur) and
sulfate salts, the biogas contains certain concentrations of hydrogen sulfide and ammonia.
The biogas produced from sewage sludge, which sometimes contains a considerable amount of
silicones, may contain siloxanes as well. Since these impurities can possibly cause damage to
biogas utilization facilities such as a gas engine, gas boiler, gas turbine and fuel cell, and/or
cause secondary air pollution, a biogas utilization unit process is often equipped with a
desulfurization device and/or siloxane remover prior to the gas holding tank.
8.2.3 Examples of large-scale anaerobic digestion systems Some of the typical implementations of large-scale anaerobic digestion systems are described
below. (a) Sewage Sludge
Sewage sludge is a waste biomass which is discharged in large quantities from sewage
treatment facilities. For a long time, anaerobic digestion has been one of the treatments on
sewage sludge to stabilize the sludge and reduce its volume. The reactor design usually
applied to sewage sludge digestion is a completely mixed reactor design (Fig. 8.2.2). A
contemporary anaerobic digester for sewage sludge is as large as 10,000 m3 in the effective
volume. Typical design parameters include the operational temperatures of ambient (ca. 20
degC) to mesophilic (ca. 35 degC) range, and the relatively long retention time of 20 to 30 days.

-212- Asian Biomass Handbook
(b) Industrial organic wastewater
Industrial wastewater containing readily biodegradable organic matters, but little solids,
such as the wastewater discharge from a beer brewery, the UASB (up-flow, anaerobic sludge
blanket) reactor design, which was originally developed in the Netherlands, is usually selected.
The UASB reactor design maintains a high density of anaerobic microorganisms in the form of
self-aggregated microbial "granules" that enables a high rate of anaerobic digestion.
(c) Organic wastes from food industries
Anaerobic digester designs which allow a high rate anaerobic digestion on readily
biodegradable biomass containing high concentrations of organic solids are being developed,
and some have already been in actual operation in recent years. An example of such a new
design is the DAPR (down-flow anaerobic packed-bed reactor) design. Many high-rate
anaerobic digestion facilities for food wastes and distillery wastes, incorporating the DAPR
design, have been implemented in Japan. The largest facility as of writing has the design
capacity of 400 tons/day (Fig. 8.2.3).
Further information R.E.Speece: Anaerobic Biotechnology, Archae Press, pp.127, Tennessee (1996)
Japan Sewage Works Association: Sewage Facilities planning, policy and explanation (second part) 2001,
pp.384, Japan (2001)
J.B.Lier: Current Trends in Anaerobic Digestion; Diversifying from waste(water) treatment to re-source
oriented conversion techniques, 11th IWA World Congress on Anaerobic Digestion, 23-27 September
Fig. 8.2.2. Example of a large scale sewage sludge anaerobic digester.
(Northern second sewage treatmentplant)
Fig. 8.2.3. Example of a large scale biomethanation plant of food waste.
(Distilled spirit processing waste recycling plant of Kirishima Shuzo co. LTD.)
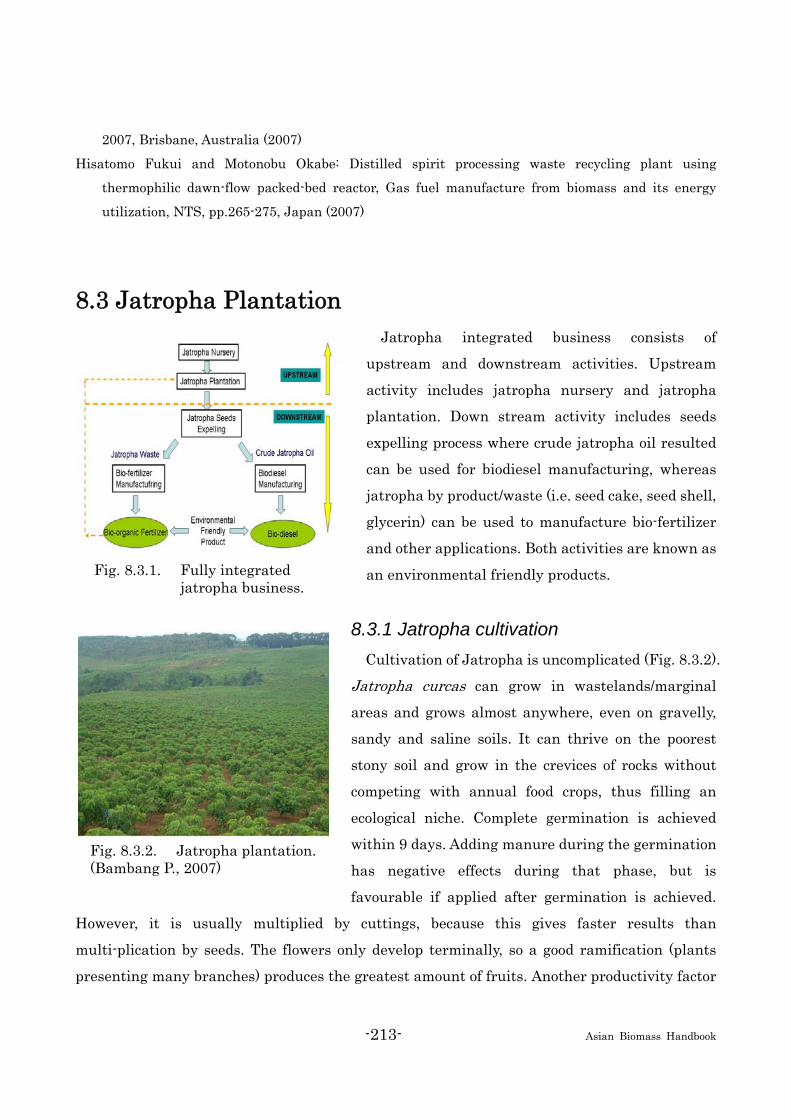
-213- Asian Biomass Handbook
2007, Brisbane, Australia (2007)
Hisatomo Fukui and Motonobu Okabe: Distilled spirit processing waste recycling plant using
thermophilic dawn-flow packed-bed reactor, Gas fuel manufacture from biomass and its energy
utilization, NTS, pp.265-275, Japan (2007)
8.3 Jatropha Plantation Jatropha integrated business consists of
upstream and downstream activities. Upstream
activity includes jatropha nursery and jatropha
plantation. Down stream activity includes seeds
expelling process where crude jatropha oil resulted
can be used for biodiesel manufacturing, whereas
jatropha by product/waste (i.e. seed cake, seed shell,
glycerin) can be used to manufacture bio-fertilizer
and other applications. Both activities are known as
an environmental friendly products.
8.3.1 Jatropha cultivation Cultivation of Jatropha is uncomplicated (Fig. 8.3.2).
Jatropha curcas can grow in wastelands/marginal
areas and grows almost anywhere, even on gravelly,
sandy and saline soils. It can thrive on the poorest
stony soil and grow in the crevices of rocks without
competing with annual food crops, thus filling an
ecological niche. Complete germination is achieved
within 9 days. Adding manure during the germination
has negative effects during that phase, but is
favourable if applied after germination is achieved.
However, it is usually multiplied by cuttings, because this gives faster results than
multi-plication by seeds. The flowers only develop terminally, so a good ramification (plants
presenting many branches) produces the greatest amount of fruits. Another productivity factor
Fig. 8.3.2. Jatropha plantation. (Bambang P., 2007)
Fig. 8.3.1. Fully integrated jatropha business.
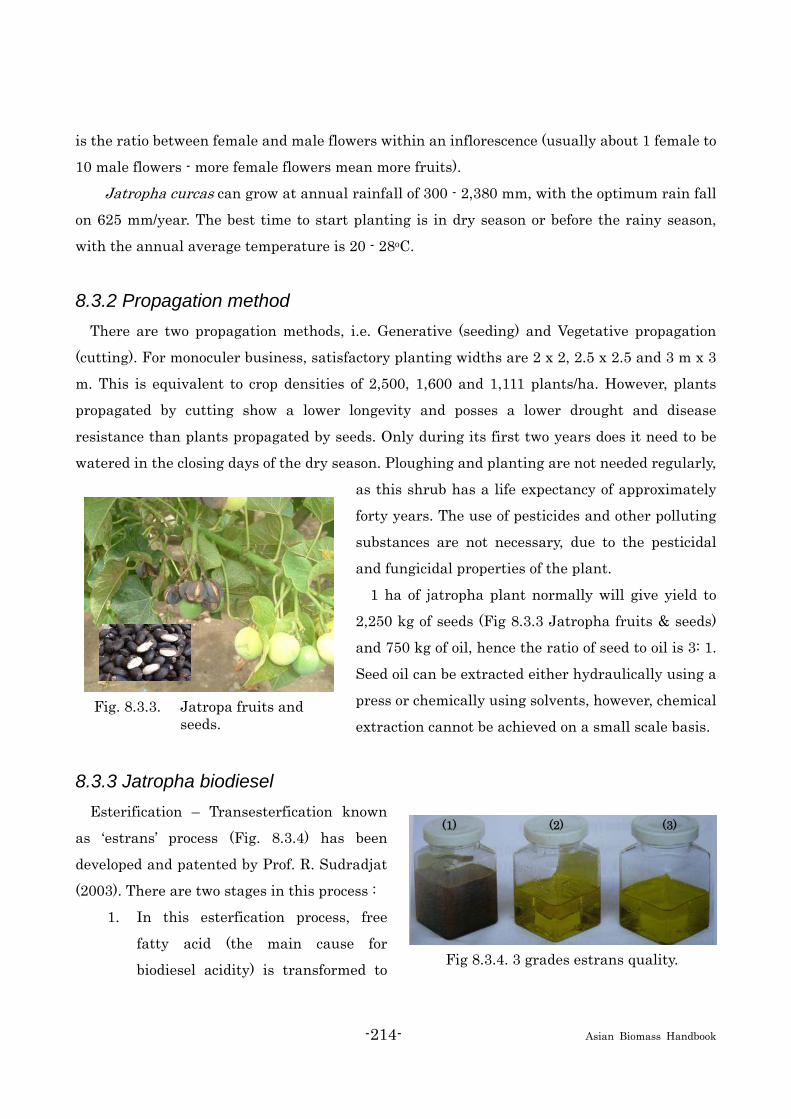
-214- Asian Biomass Handbook
is the ratio between female and male flowers within an inflorescence (usually about 1 female to
10 male flowers - more female flowers mean more fruits).
Jatropha curcas can grow at annual rainfall of 300 - 2,380 mm, with the optimum rain fall
on 625 mm/year. The best time to start planting is in dry season or before the rainy season,
with the annual average temperature is 20 - 28oC.
8.3.2 Propagation method There are two propagation methods, i.e. Generative (seeding) and Vegetative propagation
(cutting). For monoculer business, satisfactory planting widths are 2 x 2, 2.5 x 2.5 and 3 m x 3
m. This is equivalent to crop densities of 2,500, 1,600 and 1,111 plants/ha. However, plants
propagated by cutting show a lower longevity and posses a lower drought and disease
resistance than plants propagated by seeds. Only during its first two years does it need to be
watered in the closing days of the dry season. Ploughing and planting are not needed regularly,
as this shrub has a life expectancy of approximately
forty years. The use of pesticides and other polluting
substances are not necessary, due to the pesticidal
and fungicidal properties of the plant.
1 ha of jatropha plant normally will give yield to
2,250 kg of seeds (Fig 8.3.3 Jatropha fruits & seeds)
and 750 kg of oil, hence the ratio of seed to oil is 3: 1.
Seed oil can be extracted either hydraulically using a
press or chemically using solvents, however, chemical
extraction cannot be achieved on a small scale basis.
8.3.3 Jatropha biodiesel Esterification – Transesterfication known
as ‘estrans’ process (Fig. 8.3.4) has been
developed and patented by Prof. R. Sudradjat
(2003). There are two stages in this process :
1. In this esterfication process, free
fatty acid (the main cause for
biodiesel acidity) is transformed to
Fig. 8.3.3. Jatropa fruits and seeds.
(1) (2) (3)
Fig 8.3.4. 3 grades estrans quality.
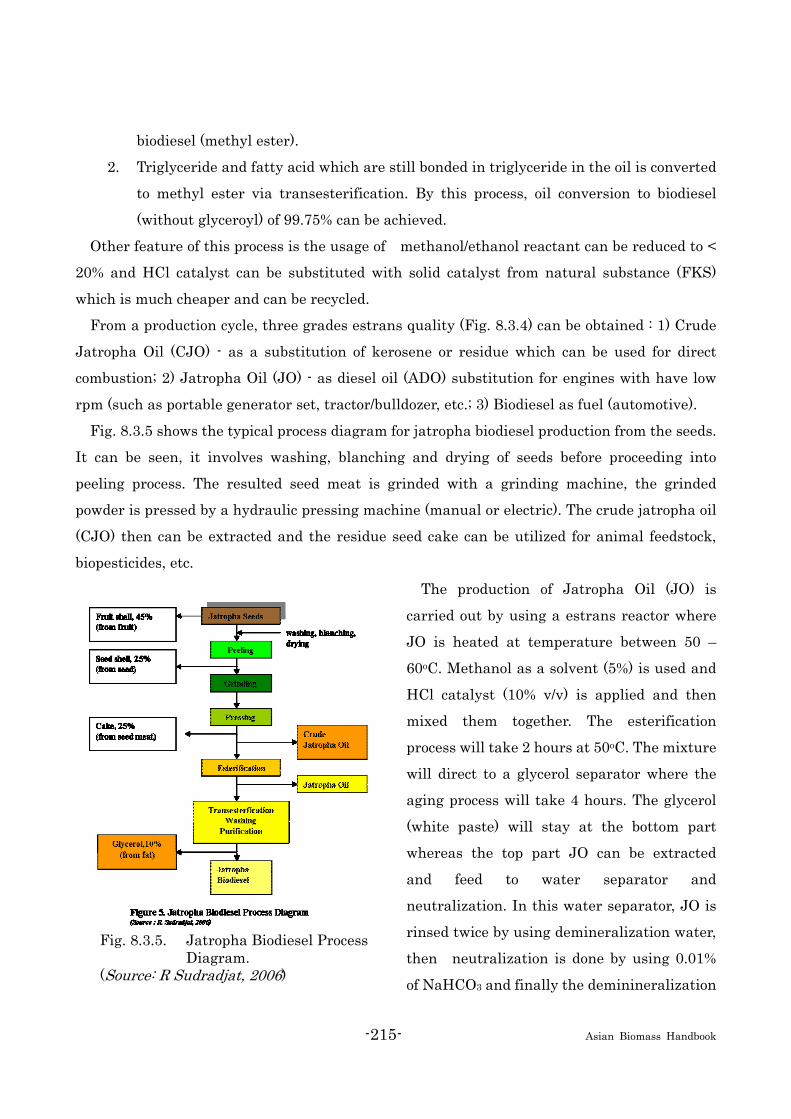
-215- Asian Biomass Handbook
biodiesel (methyl ester).
2. Triglyceride and fatty acid which are still bonded in triglyceride in the oil is converted
to methyl ester via transesterification. By this process, oil conversion to biodiesel
(without glyceroyl) of 99.75% can be achieved.
Other feature of this process is the usage of methanol/ethanol reactant can be reduced to <
20% and HCl catalyst can be substituted with solid catalyst from natural substance (FKS)
which is much cheaper and can be recycled.
From a production cycle, three grades estrans quality (Fig. 8.3.4) can be obtained : 1) Crude
Jatropha Oil (CJO) - as a substitution of kerosene or residue which can be used for direct
combustion; 2) Jatropha Oil (JO) - as diesel oil (ADO) substitution for engines with have low
rpm (such as portable generator set, tractor/bulldozer, etc.; 3) Biodiesel as fuel (automotive).
Fig. 8.3.5 shows the typical process diagram for jatropha biodiesel production from the seeds.
It can be seen, it involves washing, blanching and drying of seeds before proceeding into
peeling process. The resulted seed meat is grinded with a grinding machine, the grinded
powder is pressed by a hydraulic pressing machine (manual or electric). The crude jatropha oil
(CJO) then can be extracted and the residue seed cake can be utilized for animal feedstock,
biopesticides, etc.
The production of Jatropha Oil (JO) is
carried out by using a estrans reactor where
JO is heated at temperature between 50 –
60oC. Methanol as a solvent (5%) is used and
HCl catalyst (10% v/v) is applied and then
mixed them together. The esterification
process will take 2 hours at 50oC. The mixture
will direct to a glycerol separator where the
aging process will take 4 hours. The glycerol
(white paste) will stay at the bottom part
whereas the top part JO can be extracted
and feed to water separator and
neutralization. In this water separator, JO is
rinsed twice by using demineralization water,
then neutralization is done by using 0.01%
of NaHCO3 and finally the deminineralization
Fig. 8.3.5. Jatropha Biodiesel Process Diagram.
(Source: R Sudradjat, 2006)
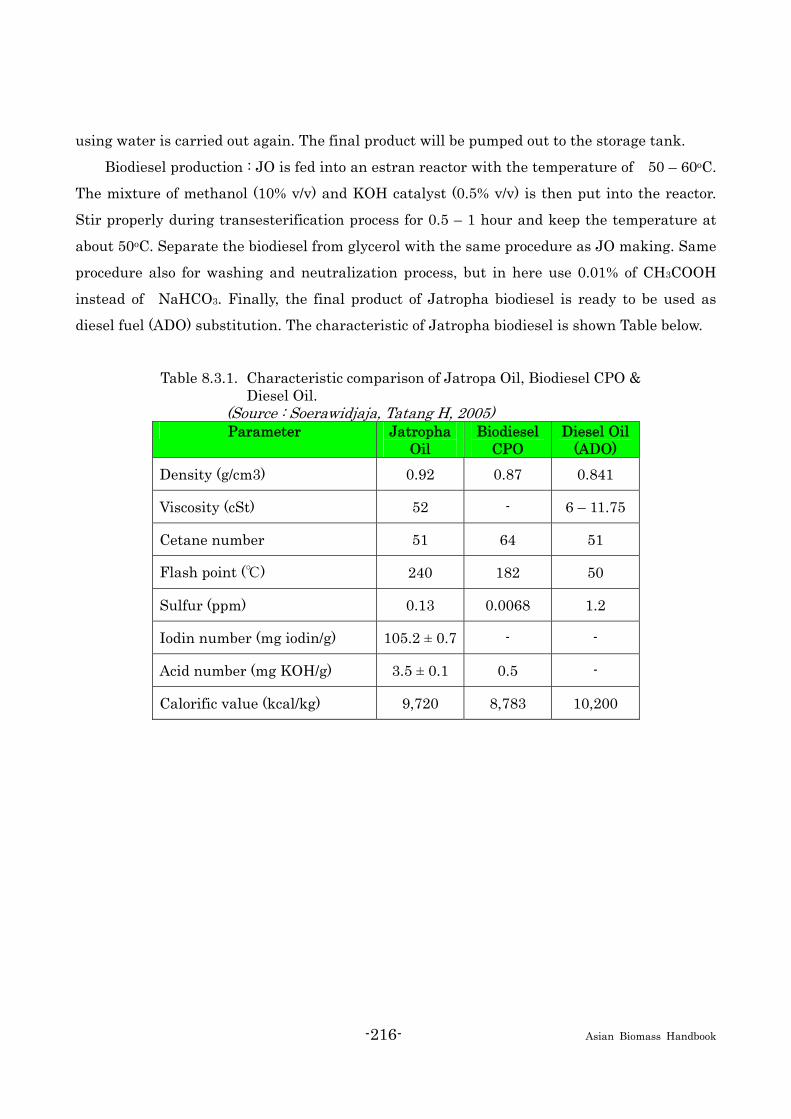
-216- Asian Biomass Handbook
using water is carried out again. The final product will be pumped out to the storage tank.
Biodiesel production : JO is fed into an estran reactor with the temperature of 50 – 60oC.
The mixture of methanol (10% v/v) and KOH catalyst (0.5% v/v) is then put into the reactor.
Stir properly during transesterification process for 0.5 – 1 hour and keep the temperature at
about 50oC. Separate the biodiesel from glycerol with the same procedure as JO making. Same
procedure also for washing and neutralization process, but in here use 0.01% of CH3COOH
instead of NaHCO3. Finally, the final product of Jatropha biodiesel is ready to be used as
diesel fuel (ADO) substitution. The characteristic of Jatropha biodiesel is shown Table below.
Table 8.3.1. Characteristic comparison of Jatropa Oil, Biodiesel CPO & Diesel Oil.
(Source : Soerawidjaja, Tatang H, 2005) Parameter Jatropha
Oil Biodiesel
CPO Diesel Oil
(ADO) Density (g/cm3) 0.92 0.87 0.841
Viscosity (cSt) 52 - 6 – 11.75
Cetane number 51 64 51
Flash point (℃) 240 182 50
Sulfur (ppm) 0.13 0.0068 1.2
Iodin number (mg iodin/g) 105.2 ± 0.7 - -
Acid number (mg KOH/g) 3.5 ± 0.1 0.5 -
Calorific value (kcal/kg) 9,720 8,783 10,200
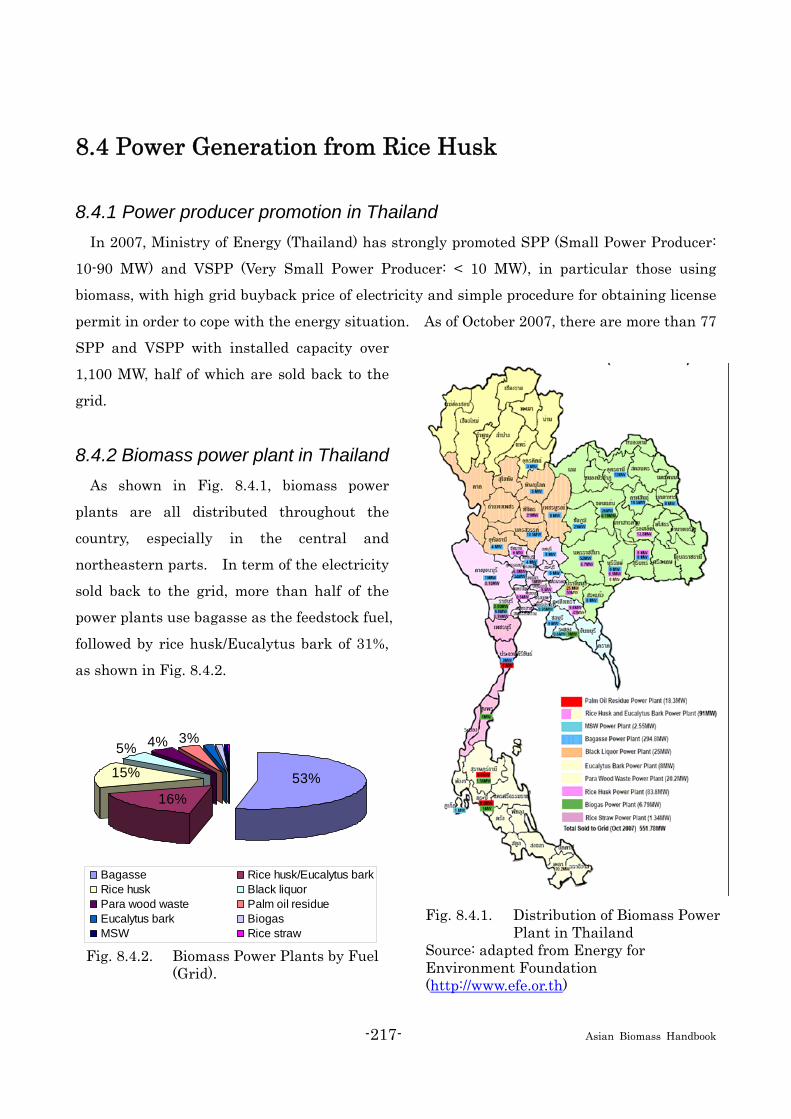
-217- Asian Biomass Handbook
8.4 Power Generation from Rice Husk
8.4.1 Power producer promotion in Thailand In 2007, Ministry of Energy (Thailand) has strongly promoted SPP (Small Power Producer:
10-90 MW) and VSPP (Very Small Power Producer: < 10 MW), in particular those using
biomass, with high grid buyback price of electricity and simple procedure for obtaining license
permit in order to cope with the energy situation. As of October 2007, there are more than 77
SPP and VSPP with installed capacity over
1,100 MW, half of which are sold back to the
grid.
8.4.2 Biomass power plant in Thailand As shown in Fig. 8.4.1, biomass power
plants are all distributed throughout the
country, especially in the central and
northeastern parts. In term of the electricity
sold back to the grid, more than half of the
power plants use bagasse as the feedstock fuel,
followed by rice husk/Eucalytus bark of 31%,
as shown in Fig. 8.4.2.
Fig. 8.4.1. Distribution of Biomass Power Plant in Thailand
Source: adapted from Energy for Environment Foundation (http://www.efe.or.th)
Bagasse Rice husk/Eucalytus barkRice husk Black liquorPara wood waste Palm oil residue Eucalytus bark BiogasMSW Rice straw
53%16%
15%
5% 4% 3%
Fig. 8.4.2. Biomass Power Plants by Fuel(Grid).

-218- Asian Biomass Handbook
8.4.3 Gasification technology for rice husk Despite many biomass power plants, some of them are still running at the low efficiency
using conventional burning to produce a steam for power generation. Hence,
thermo-mechanical conversion process like gasification technology can help solve the problem.
Rice husk is another attractive feedstock for biomass power plant due to its plentiful
availability from the rice mills, its small size and low moisture. Recently, Ministry of Energy
has funded a project to demonstrate the feasibility of constructing the community biomass
gasification system (using rice husk) to Kasetsart University and Great Agro Co., Ltd. This
project was initiated to foster Sufficiency Economy philosophy by His Majesty the Kind of
Thailand. The system produces not only 80kW electricity but also heat and biomass ash for
fertilizer, as shown in Fig. 8.4.3. The system design uses three-stage fluidized bed pyrolysis
and gasification, comprising of 5 main units: drying, pyrolysis, gasification, cooling system and
engine/generator set, as shown in Fig. 8.4.4.
Fig. 8.4.3. Concept of Biomass
Gasification System. Fig. 8.4.4. Units of Gasification System.
As shown in Fig. 8.4.5 and 8.4.6, the system was installed at Lamlukka Cooperative Rice Mill
& Paddy Center Market Co., Ltd for demonstration and test run for more than 360 hours.
With gas flow rate of 240 m3/hr (heating value at 4.5 MJ/m3) and rice husk consumption of 85
kg/hr, the overall gasification system efficiency is 92%. In other words, 1.25 kg/hr
consumption of rice husk generates 1 kW of electricity. Furthermore, the residue tar volume
from the system is approximately 22 mg/m3. On the economic analysis, this 80kW system
requires a capital investment of ~3.9M Baht with the operating cost of ~1.79 Baht/unit.
Assume that the system produces the electricity at 460,800 unit/year, which substitutes the
electricity cost of 3 Baht/unit, the net profit is estimated to be 0.56M Baht/year with the

-219- Asian Biomass Handbook
payback period of 7 year. The next step would be the collaboration between MTEC and Great
Agro Co., Ltd to scale up the system to 1MW capacity.
Fig. 8.4.5. Flow Diagram of Gasification System
Fig. 8.4.6. Test Run of the Complete Set
Further information S. Nivitchanyong, Alternative Energy Cluster, National Metal and Materials Technology Center: MTEC
8.5 Ethanol Production
8.5.1 What is a good source for ethanol production? In Thailand, most existing commercial ethanol production plants use molasses as a feedstock
but with increasing new facilities to use cassava in the near future. However, these two
energy crops are still considered as food, which may interfere with the ‘food vs. fuel’ issue. As
a result, more people are looking for alternative non-edible energy crops. Among many others,
lignocellulose from various agricultural residues has received a great deal of attention,
commencing the era of 2nd generation lignocellulosic bioethanol.
8.5.2 Lignocellulosic biomass feedstock for ethanol in Thailand Each year in Thailand, agricultural industries generate millions of tons of various
lignocellulosic biomass feedstock known as agricultural residues, including rice straw, sugar
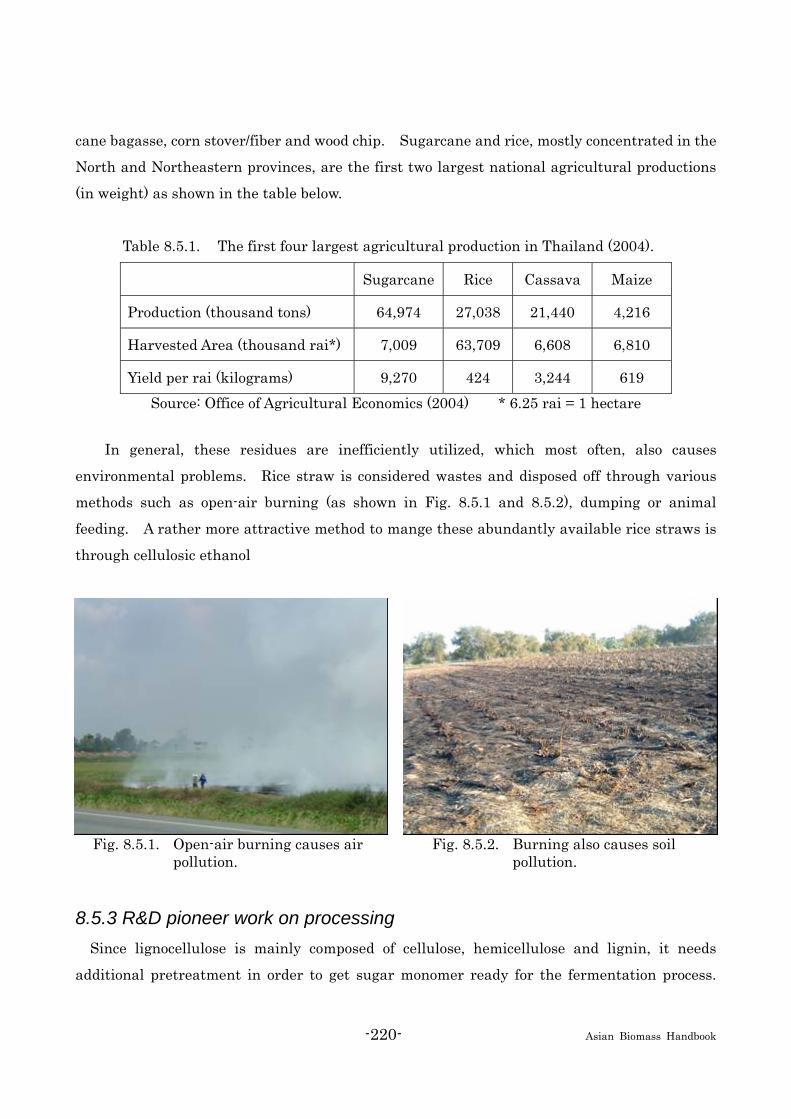
-220- Asian Biomass Handbook
cane bagasse, corn stover/fiber and wood chip. Sugarcane and rice, mostly concentrated in the
North and Northeastern provinces, are the first two largest national agricultural productions
(in weight) as shown in the table below.
Table 8.5.1. The first four largest agricultural production in Thailand (2004).
Sugarcane Rice Cassava Maize
Production (thousand tons) 64,974 27,038 21,440 4,216
Harvested Area (thousand rai*) 7,009 63,709 6,608 6,810
Yield per rai (kilograms) 9,270 424 3,244 619 Source: Office of Agricultural Economics (2004) * 6.25 rai = 1 hectare
In general, these residues are inefficiently utilized, which most often, also causes
environmental problems. Rice straw is considered wastes and disposed off through various
methods such as open-air burning (as shown in Fig. 8.5.1 and 8.5.2), dumping or animal
feeding. A rather more attractive method to mange these abundantly available rice straws is
through cellulosic ethanol
Fig. 8.5.1. Open-air burning causes air pollution.
Fig. 8.5.2. Burning also causes soil pollution.
8.5.3 R&D pioneer work on processing Since lignocellulose is mainly composed of cellulose, hemicellulose and lignin, it needs
additional pretreatment in order to get sugar monomer ready for the fermentation process.

-221- Asian Biomass Handbook
Typical process requires SHF (Separate Hydrolysis and Fermentation) of great complexity
involving pretreatment, fractionation, delignification, hydrolysis and fermentation.
Alternatively, pretreatment with proper steam explosion yields the hydrolysate, which can be
enzymatically digested and fermented in a single reactor via SSF (Simultaneous
Saccharification and Fermentation) method, as shown in Fig. 8.5.3, 8.5.4 and 8.5.5, involving
only the pretreatment and hydrolysis/fermentation steps. The goal is to seek for the
appropriate SSF that uses a commercially available cellulase enzyme and microorganism
available in Thai market.
Rice Straw
Solid Phase Liquid Phase
Sugars
Ethanol
Fermentation
LigninDelignification & Water wash
Cellulose
Fermentation Hydrolysis
Sugars
Ethanol
Rice Straw
Solid Phase Liquid Phase
Sugars
Ethanol
Fermentation
LigninDelignification & Water wash
Cellulose
Fermentation Hydrolysis
Sugars
Ethanol
Fig. 8.5.3. Typical process of lignocellulosic ethanol production. Fig. 8.5.4. Prototype of steam explosion unit.
Source: C. Pomchaitaward et al, MTEC report (2007)
The steam explosion was applied to rice straw
Supunburi1™ showing good carbohydrate
recovery and high ethanol concentrations
obtained in a single reactor with minimal enzyme
and yeast supplementation. A 150 g of dried rice
straw was steamed with pressure between 10 to
25 bar (with corresponding temperature 185 and
210 ℃ , respectively) for 5 minutes. Higher
steam pressure (or higher temperature) favored
hemicelluloses solubilization. However, the
strong influence of steam pressure on the cellulose solubilization was not found. The optimum
Fig.8.5.5. Exploded rice straw.

-222- Asian Biomass Handbook
pretreatment condition resulted in the production of a very small amount of sugar
decomposition products, which enabled an effective fermentation of sugars to ethanol. In
conclusion, mild steam pretreatment condition at 15 bars for 5 minutes results the highest
hydrolysis yield.
This process substantially reduces the complexity of the overall rice straw to ethanol
bioconversion, while simultaneously lowering the capital investment cost and time associated
with the need for separate processes. Furthermore, it significantly lowers environmental
impact due to less hazardous process chemicals and conditions involved. Last but not least, it
provides an alternative for better energy efficiency in agricultural residue management.
Further information C. Pomchaitaward et al, Feasibility Study of Ethanol Production from Lignocellulosic Materials via the
Steam Explosion Pretreatment, MTEC in-house project report 2007 ([email protected])
S. Nivitchanyong, Alternative Energy Cluster, MTEC ([email protected])

-223- Asian Biomass Handbook
APPENDIX
A1 Tokyo Declaration on Asian Biomass A2. Kyoto Protocol A3. Statistics on Asian Countries A4. Unit Conversion A5. Atomic Weight A6. Thermodynamic Properties A7. Heating Values of Fossil Fuels and Lifetime A8. APEC Framework A9. Each Country's Targets A10. Related histories A11 Each country's language A12 Related books

-224- Asian Biomass Handbook
-225- Asian Biomass Handbook
A1 Tokyo Declaration on Asian Biomass
A1.1 Tokyo Declaration on Asian Biomass
At the Biomass Asia Forum, which was organized mainly by the Ministry of Agriculture,
Fishery, and Forestry, Japan, Tokyo Declaration on Asian Biomass was adopted. This
declaration arranged the things to be considered and the direction of activities for the
utilization of biomass in Asian countries based on the discussion in the forum. The
declaration is as following.
Tokyo Declaration on Asian Biomass Considering the increasing expectations held for biomass, the Biomass Asia Forum
adopts the following declaration for the effective utilization of Asian biomass resources.
1. The renewability and carbon neutrality of biomass resources should be recognized and
the utilization of biomass resources promoted.
2. When using biomass resources, the importance of sustainability should be emphasized
and reductions in carbon dioxide emissions properly evaluated.
3. The contribution of biomass resources to the activation of Asian industry and regional
economies should be recognized and appropriate measures taken to make the most of these
economic effects.
4. When using biomass resources, the possibility of creating a recycling society should be
discussed and appropriate measures for realizing such a society promoted.
5. The effectiveness of the development and introduction of appropriate technologies in the

-226- Asian Biomass Handbook
utilization of biomass resources should be recodnized and the development of related
technologies through appropriate support and subsidization promoted.
6. An association to promote biomass resource utilization, composed of members from Asian
countries, should be organized and should conduct self-supporting activities.
7. Utilization of biomass resources should contribute to the improvement of conditions in all
countries; thus biomass utilization that contributes to the solution of poverty, prevention of
environmental damage, suppression of disease, and realization of a better quality of life should
be promoted and policies for realizing such utilization pursued.
-227- Asian Biomass Handbook
A1.2 Biomass Asia Workshop and Biomass Asia Forum
Structuring of a network for the purpose of sharing information among members related to
Asian biomass and developing mutual understanding is important. There are two streams in
this term. The one is Biomass Asia Forum, which was organized mainly by the Ministry of
Agriculture, Forestry, and Fishery, Japan, and the other is Biomass ASEAN Project, which is
proceeded mainly by the National Institute of Advanced and Industrial Science and Technology,
Japan (AIST), and Japan International Research Center for Agricultural Science (JIRCAS)
with the subsidies from the Ministry of Education, Culture, Sports, Science and Technology,
Japan. In the year of 2004, these two projects started independently, but soon it was notice
that both projects have similar goals, and it was decided to have a joint-workshop, which was
the 1st Biomass Asia Workshop, held in January, 2005, in Tokyo and Tsukuba, Japan. In
December, 2005, the 2nd Biomass Asia Workshop was held in Bangkok, Thailand, and Biomass
Asia Forum was held in January, 2006 in Tokyo. Through these workshops and forum, the
situation of biomass in Asian countries was studied, and the purpose of its effective use was
discussed. Based on these concept, the network development was discussed at the 3rd Biomass
Asia Workshop in Novemer, 2006. This flow is shown in Fig. 1.
The 4th Biomass Asia Workshop was held in November, 2007 in Shah Alam, Malaysia. The
5th workshop is to be held in China.
To overview the trend of recent biomass activities, the program of the 4th Biomass Asia
Workshop is also shown here.
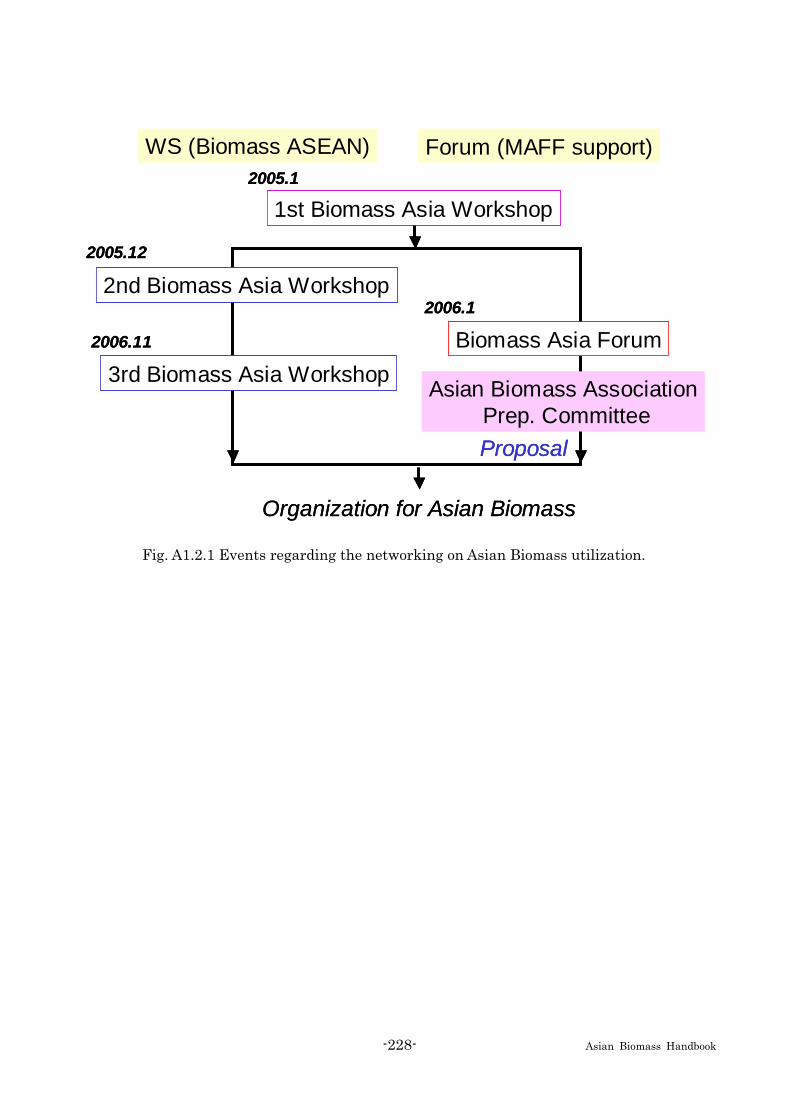
-228- Asian Biomass Handbook
1st Biomass Asia Workshop
WS (Biomass ASEAN) Forum (MAFF support)
Biomass Asia Forum
2nd Biomass Asia Workshop
3rd Biomass Asia Workshop Asian Biomass AssociationPrep. Committee
2005.1
2005.12
2006.11
2006.1
Organization for Asian Biomass
Proposal
1st Biomass Asia Workshop
WS (Biomass ASEAN) Forum (MAFF support)
Biomass Asia Forum
2nd Biomass Asia Workshop
3rd Biomass Asia Workshop Asian Biomass AssociationPrep. Committee
2005.1
2005.12
2006.11
2006.1
Organization for Asian Biomass
Proposal
Fig. A1.2.1 Events regarding the networking on Asian Biomass utilization.

-229- Asian Biomass Handbook
Fourth Biomass-Asia Workshop Date: 20-22 November, 2007 Venue: Grand BlueWave Hotel Shah Alam Perbandaran, Seksyen 14, 40000 Shah Alam, Selangor Darul Ehsan, Malaysia Day 1 (Nov. 20, 2007) 0830-0900 Registration Opening Remarks 0900-0915 Tatsuo Katsura Senior Vice President, AIST, on behalf of Representative of Biomass-Asia Research Consortium, Japan 0915-0930 Kunio Oguri Deputy Director General,Agriculture, Forestry and Fisheries Research Council Secretariat, MAFF, Japan 0930-1000 Break Special Lecture Chair: Zainal Abidin Mohd Yusuf (Vice President, SIRIM, Malaysia 1000-1030 Lignocellulose refinery system must be realized for global environment and economy Kenji Iiyama President, JIRCAS, Japan 1030-1100 Coffee Break Plenary Lecture Chair: Yasuyuki Yagi (Councillor, International Affairs Dept., AIST, Japan) 1100-1125 Food Security with Biofuels: FAO Perspective Abdolreza Abbassian Secretary of the Intergovernmental Group on Grains, FAO, UN 1125-1150 Biomass for Energy Generation in Malaysia Anuar Abdul Rahman CEO of Pusat Tenaga Malaysia (PTM) 1150-1215 Biomass for Material Application Peesamai Jenvanitpanjakul Deputy Governor, Thailand Institute of Scientific and Technological Research(TISTR), Thailand 1215-1240 Policy and Legislation on Biofuel Utilisation Datu Dr. Michael Dosim Lunjew Secretary General, Ministry of Plantation Industries and Commodities Malaysia 1240-1420 Lunch / Poster Session Keynote Speech
-230- Asian Biomass Handbook
1430-1500 H.E. Dato’ Sri Dr. Lim Keng Yaik Minister of Energy, Water and Communications, Malaysia Future Prospect of Biomass Utilisation in Asian Countries Chair: Masayuki Kamimoto (Research Coordinator, AIST, Japan) 1500-1525 Biomass-Asia Project-Second Stage: Research and Technological Development for Sustainable Biomass Utilization in Asian Countries Kinya Sakanishi Representative of Research Core for Asian Biomass Energy, AIST, Japan 1525-1550 The Road Map of Chinese Biomass Energy Development Haibin Li Guangzhou Institute of Energy Conversion (GIEC), Chinese Academy of Sciences (CAS), China 1550-1610 Coffee Break 1610-1635 Rice-Sugarcane Complex Model Klanarong Sriroth Associate Professor, Department of Biotechnology, Faculty of Agro-Industry, Kasetsart University, Thailand 1635-1700 Palm Complex Model Wahono Sumaryono Deputy Chairman for Agroindustry and Biotechnology, Agency for Assessment and Application of Technology (BPPT), Indonesia - Panel Discussion - Asian Partnership on Sustainable Environmentally Benign Biomass Production and Utilisation Moderator: Yukihiko Matsumura (Professor, Hiroshima University, Japan) 1700-1830 <Panelists> China:The Development of Biofuels in China Dehua Liu Professor, Director of Institute of Applied Chemistry, Department of Chemical Engineering, Tsinghua University Indonesia : Biofuel Development in Indonesia Petrus Panaka Professor, Project Development Advisor, PT Gikoko Kogyo Indonesia Malaysia : Sustainable Biomass Production and Utilisation - Profit, People and Planet - Mohamad Ali Hassan Dean, Faculty of Biotechnology and Biomolecular Sciences, University Putra Malaysia (UPM) Philippines: Non-fossil Energy Luis F. Razon Director, University Research Coordination Office, Associate Professor, Department of Chemical Engineering, De La Salle University Thailand : Asian Partnership on Sustainable Environmentally Benign Biomass Production and Utilization Nuwong Chollacoop

-231- Asian Biomass Handbook
National Metal and Materials Technology Center (MTEC), National Science and Technology Development Agency (NSTDA) Vietnam : Seaweed: Potential Biomass for Ethanol Production Truong Nam Hai Deputy Director, Institute of Biotechnology, Vietnamese Academy of Science and Technology (VAST) 2000-2130 Reception hosted by Dato’ Dr. Halim Man Secretary General for Ministry of Energy, Water and Communications, Malaysia Day 2 (Nov. 21, 2007) <Room 1> Palm Oil Energy Complex Model Chair: Chen Sau Soon (SIRIM,Malaysia) Tomoaki Minowa (AIST, Japan) 0900-0920 Palm Oil Industry in Malaysia Dato' Dr. Choo Yuen May, Deputy Director-General, Malaysian Palm Oil Board 0920-0940 Electricity Generation from Palm Oil Mills in Indonesia (extended abstract) Soni Solistia Wirawan Head of Institute for Engineering and Technology System Design (Engineering Center), BPPT, Indonesia 0940-1000 Palm Oil Energy Complex and CDM Yoshihito Shirai Professor, Graduate School of Life Science and Systems Engineering, Kyushu Institute of Technology, Japan 1000-1020 Potential of Oil Palm Trunk as a Source for Ethanol Production Ryohei Tanaka FFPRI, Japan co-authored by Yutaka Mori (JIRCAS) Mohd Nor Mohd Yusoff (FRIM) Othman Sulaiman (USM) Shu Yoshida (Sojitz Machinery Corporation) 1020-1040 Coffee Break
-232- Asian Biomass Handbook
1040-1100 Biomass Plastics from Palm Oil Mill Effluent in Malaysia Mohamad Ali Hassan Dean, Faculty of Biotechnology and Biomolecular Sciences, University Putra Malaysia(UPM), Malaysia 1100-1120 Co-firing of Biomass with Coal for Power Generation Suthum Patumsawad Assistant Professor, Department of Mechanical Engineering, King Mongkut’s Institute of Technology North Bangkok (KMITNB), Thailand 1120-1140 Benchmarking of Biodiesel Fuel Standards for Vehicles in East Asia Shinichi Goto Director, Research Center for New Biomass Technology Research Center, AIST, Japan 1140-1200 Production of Second-Generation Biofuels from Palm Wastes Shinichi Yano Senior Research Scientist, Biomass Technology Research Center, AIST, Japan 1200-1220 Discussion <Room 2> Utilisation of Agriculture and Wood Wastes Chair : Guangwen Xu (CAS, China) Takahiro Yoshida (FFPRI, Japan) Brazil: Brazilian Present and Future Ethanol Production - Biomass Ethanol Potential Elba P.S.Bon Associate Professor in Biochemistry, Chemistry Institute, Federal University of Rio de Janeiro Cambodia: Biomass in Cambodia Lieng Vuthy Deputy Director, Department of Energy Techique, Ministry of Industry, Mines and Energy China: High Efficient Conversion of Cellulosic Process Residue into Middle-Caloric Gas

-233- Asian Biomass Handbook
Guangwen Xu Professor, Institute of Process Engineering, CAS Indonesia: Agricultural and Wood Waste Potentials and Utilization in Indonesia Unggul Priyanto Director, Energy Resources Development Technology Center, BPPT Japan: Biomass Refinery Systems -Case Studt at Miyako Island, Japan- Yoshiyuki Shinogi Head, Laboratory of Farmland Engineering, Department of Land and Water Resources, National Institute for Rural Engineering, NARO 1020-1040 Coffee Break Laos: Brief Report of Biomass in LAO PDR Bouathep Malaykham Chief of Electric Power Management Division, Department of Electricity, Ministry of Energy and Mines Myanmar: Anhydrous Ethanol Production Su Su Hlaing Lecturer of Department of Chemical Engineering, Mandalay Technological University Philippines:Outlook of Biomass Industry in the Philippines Ruby B. De Guzman Supervising Science Research Specialist Alternative Fuels and Energy Technology Division, Department of Energy Thailand:Zero Waste Agriculture for Jatropha Plantation Siriluck Nivitchanyong Assistant Director, MTEC, Alternative Energy Program Host, NSTDA Vietnam:Utilization of Agricultural and Wood Wastes in Vietnam Tran Dinh Man Deputy Director, Institute of Biotechnology, VAST Discussion Moderator's Summary Moderator: Yukihiko Matsumura (Hiroshima University, Japan)

-234- Asian Biomass Handbook
1220-1330 Lunch / Poster Session For Sustainable Biomass Utilization Chair: Yoshihito Shirai (Professor, Kyushu Institute of Technology, Japan) 1330-1355 Asia Biomass Community Issei Sawa Senior Manager, Liquid Biofuel, New Energy Business Unit, Mitsubishi Corporation, Japan 1355-1420 Financing for Biomass and Renewable Energy Projects Mohd Nordin Che Omar Manager of High Technology, representing Chairman of Bank Pembangunan Malaysia 1420-1445 Evaluation of Environmental Impacts of Biomass Utilisation by LCA Masayuki Sagisaka Deputy Director, Life Cycle Assessment Research Center, AIST, Japan 1445-1510 Improving Drought and Salt Stress Tolerance in Plants by Gene Transfer Yasunari Fujita Senior researcher, Biological Resources Division, JIRCAS, Japan 1530-1600 Coffee Break Way Forward Session -Panel Discussion- Moderator: Shinya Yokoyama (Professor, The University of Tokyo, Japan) 1600-1730 Moderator's Summary : Energy Situation in Asian Region <Panelists> Haibin Li, China Wahono Sumaryono, Indonesia Kinya Sakanishi, Japan Mohamad Ali Hassan, Malaysia Peesamai Jenvanitpanjakul, Thailand Tran Dinh Man, Vietnam for the 5th Biomass-Asia Workshop Closing Remarks 1730-1740 Masakazu Yamazaki Vice President, AIST, Japan 1740-1750 Chen Sau Soon Senior General Manager, Environment & Bioprocess Technology Centre SIRIM, Malaysia 2000-2130 Workshop Dinner hosted by AIST Day 3 (Nov. 22, 2007) Technical tour 1. Waste to Energy Plant, Banting 2. Biodiesel Palm Oil Mill, Labu

-235- Asian Biomass Handbook
A1.3 Asia Biomass Association
Based on the discussion on structuring of network, which is also clearly stated in the Tokyo
Declaration on Asian Biomass, setting of Asia Biomass Association was proposed at the
Biomass Asia forum.
This proposal is further based on the concept that conventional collaborative activities on
Asian biomass are based on programs supported by a specific budget, and when the program is
over, the activity is also over, but that the network should be continued, and thus the network
should be free from specific budget. For example, the Ministry of Agriculture, Forestry, and
Fishery, Japan does not have the eternal budget for the Biomass Asia Forum. The Ministry of
Education, Culture, Sport, Science, and Technology, Japan is supporting the Biomass ASEAN
Project only for three year. The network so far built up should not be cancelled, but the
activities of the network are wanted to continue even when these budgets are over. Thus,
structuring of the framework of the association was decided.
As the first step, a preparation committee was decided to be placed where the detail of the
network that allows voluntary based activities without any budget is discussed. The name of
the network was decided to be Asia Biomass Association (tentative), and the following
fundamental policies were agreed.
- The Asia Biomass Association should be a voluntary-based neutral and non-political group.
- The association is composed of individual and group members, and has a steering
committee, management committee, and, when necessary, working groups.
- Its activity is based on the membership fee, and the membership fee is decided by the
steering committee based on the GDP per capita of each country.
- The least activities should be management of a mailing list and homepages. When budget
is available, publication of brochure, organization of Biomass Asia Conference, and other
activities by the proposal of other members should be made.
Members of the preparation committee is selected from the attendants of the Forum, one
from each of 9 countries including Japan, and as the chair, Dr. Shin-ya Yokoyama was
nominated. The management of the preparation committee was undertaken by the research
group SETA, where Dr. Yokoyama is working as the International Steering Committee Chair.

-236- Asian Biomass Handbook
This preparation committee decided to officially start the Asia Biomass Association in March,
2008. For this purpose, the following agreement was made.
Agreement of the Asian Biomass Association
1. This association should be known as the “Asian Biomass Association”, and abbreviated as
“ABA”. It is a framework network based on voluntary activities and shall be a neutral and
apolitical association.
2. The purpose of this association is to achieve effective utilization of Asian biomass based on
the Tokyo Declaration on Asian Biomass. For this purpose, the association manages its
homepage and the mailing list of the members.
3. The members of the association are a person or a group from Asian countries who are
interested in the purpose of this association.
4. This association has the following bodies.
Steering Committee
Management Committee
Working Groups
5. The Steering Committee is composed of representatives from Asian countries. The number
of the representatives is one for a country. The representative of a country is decided by the
discussion among the members of the country’s nationality.
6. The Organization Committee has a Chair who is selected by election among the members of
the committee. The duration of the Chairmanship is 2 years, and re-election is limited to 2
times.
7. The Organization Committee nominates members of the Management Committee.

-237- Asian Biomass Handbook
8. The Organization Committee decides the activities of the association other than those shown
above, and entrusts it to the Management Committee, and other parties. The Organization
Committee decides the place of the office of the Association.
9. The Organization Committee starts and terminates the Working Groups for the activities of
the association.
10. The Association Members includes personal members and group members. The joining
and removal of a member needs approval by the Organizing Committee.
11. The membership fee is decided by the Organization Committee.
12. Amendment of this agreement requires the consent of 2/3 of its members.
The management of the mailing list and homepages were entrusted to Japan Institute of
Energy. The Steering Committee members from each country are shown inTable A1.3.1.

-238- Asian Biomass Handbook
Table A1.3.1 Steering Committee members
Country Steering Committee member
Japan Prof. Shin-ya Yokoyama*
Malaysia Prof. Mohamad Ali Hassan
Philippines Dr. Jessie Cansanay Elauria
Indonesia Dr. Petrus Panaka
Vietnam Dr. Hai Nam Truong
China Prof. Dehua Liu
Thailand Dr. Paritud Bhandhubanyong
Korea Dr. Jin-Suk Lee
Taiwan Prof. Tzay-An Shiau
Laos Mr. Bouathep Malaykham
-239- Asian Biomass Handbook
A2. Kyoto Protocol
A2.1 The United Nations Framework Convention on Climate Change (UNFCCC)
The Parties to this Convention, Acknowledging that change in the Earth's climate and its adverse effects are a common
concern of humankind, Concerned that human activities have been substantially increasing the atmospheric
concentrations of greenhouse gases, that these increases enhance the natural greenhouse effect, and that this will result on average in an additional warming of the Earth's surface and atmosphere and may adversely affect natural ecosystems and humankind,
Noting that the largest share of historical and current global emissions of greenhouse gases
has originated in developed countries, that per capita emissions in developing countries are still relatively low and that the share of global emissions originating in developing countries will grow to meet their social and development needs,
Aware of the role and importance in terrestrial and marine ecosystems of sinks and reservoirs
of greenhouse gases, Noting that there are many uncertainties in predictions of climate change, particularly with
regard to the timing, magnitude and regional patterns thereof, Acknowledging that the global nature of climate change calls for the widest possible
cooperation by all countries and their participation in an effective and appropriate international response, in accordance with their common but differentiated responsibilities and respective capabilities and their social and economic conditions,
Recalling the pertinent provisions of the Declaration of the United Nations Conference on the
Human Environment, adopted at Stockholm on 16 June 1972, Recalling also that States have, in accordance with the Charter of the United Nations and the
principles of international law, the sovereign right to exploit their own resources pursuant to their own environmental and developmental policies, and the responsibility to ensure that activities within their jurisdiction or control do not cause damage to the environment of other States or of areas beyond the limits of national jurisdiction,
Reaffirming the principle of sovereignty of States in international cooperation to address
climate change,
-240- Asian Biomass Handbook
Recognizing that States should enact effective environmental legislation, that environmental
standards, management objectives and priorities should reflect the environmental and developmental context to which they apply, and that standards applied by some countries may be inappropriate and of unwarranted economic and social cost to other countries, in particular developing countries,
Recalling the provisions of General Assembly resolution 44/228 of 22 December 1989 on the
United Nations Conference on Environment and Development, and resolutions 43/53 of 6 December 1988, 44/207 of 22 December 1989, 45/212 of 21 December 1990 and 46/169 of 19 December 1991 on protection of global climate for present and future generations of mankind,
Recalling also the provisions of General Assembly resolution 44/206 of 22 December 1989 on
the possible adverse effects of sea-level rise on islands and coastal areas, particularly low-lying coastal areas and the pertinent provisions of General Assembly resolution 44/172 of 19 December 1989 on the implementation of the Plan of Action to Combat Desertification,
Recalling further the Vienna Convention for the Protection of the Ozone Layer, 1985, and the
Montreal Protocol on Substances that Deplete the Ozone Layer, 1987, as adjusted and amended on 29 June 1990,
Noting the Ministerial Declaration of the Second World Climate Conference adopted on 7
November 1990, Conscious of the valuable analytical work being conducted by many States on climate change
and of the important contributions of the World Meteorological Organization, the United Nations Environment Programme and other organs, organizations and bodies of the United Nations system, as well as other international and intergovernmental bodies, to the exchange of results of scientific research and the coordination of research,
Recognizing that steps required to understand and address climate change will be
environmentally, socially and economically most effective if they are based on relevant scientific, technical and economic considerations and continually re-evaluated in the light of new findings in these areas,
Recognizing that various actions to address climate change can be justified economically in
their own right and can also help in solving other environmental problems, Recognizing also the need for developed countries to take immediate action in a flexible
manner on the basis of clear priorities, as a first step towards comprehensive response strategies at the global, national and, where agreed, regional levels that take into account all greenhouse gases, with due consideration of their relative contributions to the enhancement of the greenhouse effect,
Recognizing further that low-lying and other small island countries, countries with low-lying
coastal, arid and semi-arid areas or areas liable to floods, drought and desertification,
-241- Asian Biomass Handbook
and developing countries with fragile mountainous ecosystems are particularly vulnerable to the adverse effects of climate change,
Recognizing the special difficulties of those countries, especially developing countries, whose
economies are particularly dependent on fossil fuel production, use and exportation, as a consequence of action taken on limiting greenhouse gas emissions,
Affirming that responses to climate change should be coordinated with social and economic
development in an integrated manner with a view to avoiding adverse impacts on the latter, taking into full account the legitimate priority needs of developing countries for the achievement of sustained economic growth and the eradication of poverty,
Recognizing that all countries, especially developing countries, need access to resources
required to achieve sustainable social and economic development and that, in order for developing countries to progress towards that goal, their energy consumption will need to grow taking into account the possibilities for achieving greater energy efficiency and for controlling greenhouse gas emissions in general, including through the application of new technologies on terms which make such an application economically and socially beneficial,
Determined to protect the climate system for present and future generations, Have agreed as follows: -------------------------------------------------------------------------------- ARTICLE 1 DEFINITIONS* -------------------------------------------------------------------------------- For the purposes of this Convention: 1. "Adverse effects of climate change" means changes in the physical environment or biota
resulting from climate change which have significant deleterious effects on the composition, resilience or productivity of natural and managed ecosystems or on the operation of socio-economic systems or on human health and welfare.
2. "Climate change" means a change of climate which is attributed directly or indirectly to
human activity that alters the composition of the global atmosphere and which is in addition to natural climate variability observed over comparable time periods.
3. "Climate system" means the totality of the atmosphere, hydrosphere, biosphere and
geosphere and their interactions. 4. "Emissions" means the release of greenhouse gases and/or their precursors into the
atmosphere over a specified area and period of time.
-242- Asian Biomass Handbook
5. "Greenhouse gases" means those gaseous constituents of the atmosphere, both natural and anthropogenic, that absorb and re-emit infrared radiation.
6. "Regional economic integration organization" means an organization constituted by
sovereign States of a given region which has competence in respect of matters governed by this Convention or its protocols and has been duly authorized, in accordance with its internal procedures, to sign, ratify, accept, approve or accede to the instruments concerned.
7. "Reservoir" means a component or components of the climate system where a greenhouse gas
or a precursor of a greenhouse gas is stored. 8. "Sink" means any process, activity or mechanism which removes a greenhouse gas, an
aerosol or a precursor of a greenhouse gas from the atmosphere. 9. "Source" means any process or activity which releases a greenhouse gas, an aerosol or a
precursor of a greenhouse gas into the atmosphere. * Titles of articles are included solely to assist the reader. -------------------------------------------------------------------------------- ARTICLE 2 OBJECTIVE -------------------------------------------------------------------------------- The ultimate objective of this Convention and any related legal instruments that the
Conference of the Parties may adopt is to achieve, in accordance with the relevant provisions of the Convention, stabilization of greenhouse gas concentrations in the atmosphere at a level that would prevent dangerous anthropogenic interference with the climate system. Such a level should be achieved within a time-frame sufficient to allow ecosystems to adapt naturally to climate change, to ensure that food production is not threatened and to enable economic development to proceed in a sustainable manner.
-------------------------------------------------------------------------------- ARTICLE 3 PRINCIPLES -------------------------------------------------------------------------------- In their actions to achieve the objective of the Convention and to implement its provisions, the
Parties shall be guided, INTER ALIA, by the following: 1. The Parties should protect the climate system for the benefit of present and future
generations of humankind, on the basis of equity and in accordance with their common but differentiated responsibilities and respective capabilities. Accordingly,

-243- Asian Biomass Handbook
the developed country Parties should take the lead in combating climate change and the adverse effects thereof.
2. The specific needs and special circumstances of developing country Parties, especially those
that are particularly vulnerable to the adverse effects of climate change, and of those Parties, especially developing country Parties, that would have to bear a disproportionate or abnormal burden under the Convention, should be given full consideration.
3. The Parties should take precautionary measures to anticipate, prevent or minimize the
causes of climate change and mitigate its adverse effects. Where there are threats of serious or irreversible damage, lack of full scientific certainty should not be used as a reason for postponing such measures, taking into account that policies and measures to deal with climate change should be cost-effective so as to ensure global benefits at the lowest possible cost. To achieve this, such policies and measures should take into account different socio-economic contexts, be comprehensive, cover all relevant sources, sinks and reservoirs of greenhouse gases and adaptation, and comprise all economic sectors. Efforts to address climate change may be carried out cooperatively by interested Parties.
4. The Parties have a right to, and should, promote sustainable development. Policies and
measures to protect the climate system against human-induced change should be appropriate for the specific conditions of each Party and should be integrated with national development programmes, taking into account that economic development is essential for adopting measures to address climate change.
5. The Parties should cooperate to promote a supportive and open international economic
system that would lead to sustainable economic growth and development in all Parties, particularly developing country Parties, thus enabling them better to address the problems of climate change. Measures taken to combat climate change, including unilateral ones, should not constitute a means of arbitrary or unjustifiable discrimination or a disguised restriction on international trade.
-------------------------------------------------------------------------------- ARTICLE 4 COMMITMENTS -------------------------------------------------------------------------------- 1. All Parties, taking into account their common but differentiated responsibilities and their
specific national and regional development priorities, objectives and circumstances, shall:
(a) Develop, periodically update, publish and make available to the Conference of the Parties,
in accordance with Article 12, national inventories of anthropogenic emissions by sources and removals by sinks of all greenhouse gases not controlled by the Montreal Protocol, using comparable methodologies to be agreed upon by the Conference of the Parties;

-244- Asian Biomass Handbook
(b) Formulate, implement, publish and regularly update national and, where appropriate,
regional programmes containing measures to mitigate climate change by addressing anthropogenic emissions by sources and removals by sinks of all greenhouse gases not controlled by the Montreal Protocol, and measures to facilitate adequate adaptation to climate change;
(c) Promote and cooperate in the development, application and diffusion, including transfer, of
technologies, practices and processes that control, reduce or prevent anthropogenic emissions of greenhouse gases not controlled by the Montreal Protocol in all relevant sectors, including the energy, transport, industry, agriculture, forestry and waste management sectors;
(d) Promote sustainable management, and promote and cooperate in the conservation and
enhancement, as appropriate, of sinks and reservoirs of all greenhouse gases not controlled by the Montreal Protocol, including biomass, forests and oceans as well as other terrestrial, coastal and marine ecosystems;
(e) Cooperate in preparing for adaptation to the impacts of climate change; develop and
elaborate appropriate and integrated plans for coastal zone management, water resources and agriculture, and for the protection and rehabilitation of areas, particularly in Africa, affected by drought and desertification, as well as floods;
(f) Take climate change considerations into account, to the extent feasible, in their relevant
social, economic and environmental policies and actions, and employ appropriate methods, for example impact assessments, formulated and determined nationally, with a view to minimizing adverse effects on the economy, on public health and on the quality of the environment, of projects or measures undertaken by them to mitigate or adapt to climate change;
(g) Promote and cooperate in scientific, technological, technical, socio-economic and other
research, systematic observation and development of data archives related to the climate system and intended to further the understanding and to reduce or eliminate the remaining uncertainties regarding the causes, effects, magnitude and timing of climate change and the economic and social consequences of various response strategies;
(h) Promote and cooperate in the full, open and prompt exchange of relevant scientific,
technological, technical, socio-economic and legal information related to the climate system and climate change, and to the economic and social consequences of various response strategies;
(i) Promote and cooperate in education, training and public awareness related to climate
change and encourage the widest participation in this process, including that of non- governmental organizations; and
(j) Communicate to the Conference of the Parties information related to implementation, in
accordance with Article 12.
-245- Asian Biomass Handbook
2. The developed country Parties and other Parties included in Annex I commit themselves specifically as provided for in the following:
(a) Each of these Parties shall adopt national1 policies and take corresponding measures on the
mitigation of climate change, by limiting its anthropogenic emissions of greenhouse gases and protecting and enhancing its greenhouse gas sinks and reservoirs. These policies and measures will demonstrate that developed countries are taking the lead in modifying longer-term trends in anthropogenic emissions consistent with the objective of the Convention, recognizing that the return by the end of the present decade to earlier levels of anthropogenic emissions of carbon dioxide and other greenhouse gases not controlled by the Montreal Protocol would contribute to such modification, and taking into account the differences in these Parties' starting points and approaches, economic structures and resource bases, the need to maintain strong and sustainable economic growth, available technologies and other individual circumstances, as well as the need for equitable and appropriate contributions by each of these Parties to the global effort regarding that objective. These Parties may implement such policies and measures jointly with other Parties and may assist other Parties in contributing to the achievement of the objective of the Convention and, in particular, that of this subparagraph;
(b) In order to promote progress to this end, each of these Parties shall communicate, within six
months of the entry into force of the Convention for it and periodically thereafter, and in accordance with Article 12, detailed information on its policies and measures referred to in subparagraph (a) above, as well as on its resulting projected anthropogenic emissions by sources and removals by sinks of greenhouse gases not controlled by the Montreal Protocol for the period referred to in subparagraph (a), with the aim of returning individually or jointly to their 1990 levels these anthropogenic emissions of carbon dioxide and other greenhouse gases not controlled by the Montreal Protocol. This information will be reviewed by the Conference of the Parties, at its first session and periodically thereafter, in accordance with Article 7;
(c) Calculations of emissions by sources and removals by sinks of greenhouse gases for the
purposes of subparagraph (b) above should take into account the best available scientific knowledge, including of the effective capacity of sinks and the respective contributions of such gases to climate change. The Conference of the Parties shall consider and agree on methodologies for these calculations at its first session and review them regularly thereafter;
(d) The Conference of the Parties shall, at its first session, review the adequacy of
subparagraphs (a) and (b) above. Such review shall be carried out in the light of the best available scientific information and assessment on climate change and its impacts, as well as relevant technical, social and economic information. Based on this review, the Conference of the Parties shall take appropriate action, which may include the adoption of amendments to the commitments in subparagraphs (a) and (b) above. The Conference of the Parties, at its first session, shall also take decisions regarding criteria for joint implementation as indicated in subparagraph (a) above. A second review of subparagraphs (a) and (b) shall take place not later than 31 December 1998, and thereafter at regular intervals determined by the Conference of the Parties, until the objective of the Convention is met;
-246- Asian Biomass Handbook
(e) Each of these Parties shall : i) Coordinate as appropriate with other such Parties, relevant economic and administrative
instruments developed to achieve the objective of the Convention; and (ii) Identify and periodically review its own policies and practices which encourage activities
that lead to greater levels of anthropogenic emissions of greenhouse gases not controlled by the Montreal Protocol than would otherwise occur;
(f) The Conference of the Parties shall review, not later than 31 December 1998, available
information with a view to taking decisions regarding such amendments to the lists in Annexes I and II as may be appropriate, with the approval of the Party concerned;
(g) Any Party not included in Annex I may, in its instrument of ratification, acceptance,
approval or accession, or at any time thereafter, notify the Depositary that it intends to be bound by subparagraphs (a) and (b) above. The Depositary shall inform the other signatories and Parties of any such notification.
3. The developed country Parties and other developed Parties included in Annex II shall
provide new and additional financial resources to meet the agreed full costs incurred by developing country Parties in complying with their obligations under Article 12, paragraph 1. They shall also provide such financial resources, including for the transfer of technology, needed by the developing country Parties to meet the agreed full incremental costs of implementing measures that are covered by paragraph 1 of this Article and that are agreed between a developing country Party and the international entity or entities referred to in Article 11, in accordance with that Article. The implementation of these commitments shall take into account the need for adequacy and predictability in the flow of funds and the importance of appropriate burden sharing among the developed country Parties.
4. The developed country Parties and other developed Parties included in Annex II shall also
assist the developing country Parties that are particularly vulnerable to the adverse effects of climate change in meeting costs of adaptation to those adverse effects.
5. The developed country Parties and other developed Parties included in Annex II shall take
all practicable steps to promote, facilitate and finance, as appropriate, the transfer of, or access to, environmentally sound technologies and know-how to other Parties, particularly developing country Parties, to enable them to implement the provisions of the Convention. In this process, the developed country Parties shall support the development and enhancement of endogenous capacities and technologies of developing country Parties. Other Parties and organizations in a position to do so may also assist in facilitating the transfer of such technologies.
6. In the implementation of their commitments under paragraph 2 above, a certain degree of
flexibility shall be allowed by the Conference of the Parties to the Parties included in Annex I undergoing the process of transition to a market economy, in order to enhance the ability of these Parties to address climate change, including with regard to the historical level of anthropogenic emissions of greenhouse gases not controlled by the
-247- Asian Biomass Handbook
Montreal Protocol chosen as a reference. 7. The extent to which developing country Parties will effectively implement their
commitments under the Convention will depend on the effective implementation by developed country Parties of their commitments under the Convention related to financial resources and transfer of technology and will take fully into account that economic and social development and poverty eradication are the first and overriding priorities of the developing country Parties.
8. In the implementation of the commitments in this Article, the Parties shall give full
consideration to what actions are necessary under the Convention, including actions related to funding, insurance and the transfer of technology, to meet the specific needs and concerns of developing country Parties arising from the adverse effects of climate change and/or the impact of the implementation of response measures, especially on:
(a) Small island countries; (b) Countries with low-lying coastal areas; (c) Countries with arid and semi-arid areas, forested areas and areas liable to forest decay; (d) Countries with areas prone to natural disasters; (e) Countries with areas liable to drought and desertification; (f) Countries with areas of high urban atmospheric pollution; (g) Countries with areas with fragile ecosystems, including mountainous ecosystems; (h) Countries whose economies are highly dependent on income generated from the production,
processing and export, and/or on consumption of fossil fuels and associated energy-intensive products; and
(i) Land-locked and transit countries. Further, the Conference of the Parties may take actions, as appropriate, with respect to this
paragraph. 9. The Parties shall take full account of the specific needs and special situations of the least
developed countries in their actions with regard to funding and transfer of technology. 10. The Parties shall, in accordance with Article 10, take into consideration in the
implementation of the commitments of the Convention the situation of Parties, particularly developing country Parties, with economies that are vulnerable to the adverse effects of the implementation of measures to respond to climate change. This applies notably to Parties with economies that are highly dependent on income generated from the production, processing and export, and/or consumption of fossil fuels and associated energy-intensive products and/or the use of fossil fuels for which such Parties have serious difficulties in switching to alternatives.
-248- Asian Biomass Handbook
-------------------------------------------------------------------------------- ARTICLE 5 RESEARCH AND SYSTEMATIC OBSERVATION -------------------------------------------------------------------------------- In carrying out their commitments under Article 4, paragraph 1(g), the Parties shall: (a) Support and further develop, as appropriate, international and intergovernmental
programmes and networks or organizations aimed at defining, conducting, assessing and financing research, data collection and systematic observation, taking into account the need to minimize duplication of effort;
(b) Support international and intergovernmental efforts to strengthen systematic observation
and national scientific and technical research capacities and capabilities, particularly in developing countries, and to promote access to, and the exchange of, data and analyses thereof obtained from areas beyond national jurisdiction; and
(c) Take into account the particular concerns and needs of developing countries and cooperate
in improving their endogenous capacities and capabilities to participate in the efforts referred to in subparagraphs (a) and (b) above.
-------------------------------------------------------------------------------- ARTICLE 6 EDUCATION, TRAINING AND PUBLIC AWARENESS -------------------------------------------------------------------------------- In carrying out their commitments under Article 4, paragraph 1(i), the Parties shall: (a) Promote and facilitate at the national and, as appropriate, subregional and regional levels,
and in accordance with national laws and regulations, and within their respective capacities:
(i) The development and implementation of educational and public awareness programmes on
climate change and its effects; (ii) Public access to information on climate change and its effects; (iii) Public participation in addressing climate change and its effects and developing adequate
responses; and (iv) Training of scientific, technical and managerial personnel. (b) Cooperate in and promote, at the international level, and, where appropriate, using existing
bodies:

-249- Asian Biomass Handbook
(i) The development and exchange of educational and public awareness material on climate
change and its effects; and (ii) The development and implementation of education and training programmes, including the
strengthening of national institutions and the exchange or secondment of personnel to train experts in this field, in particular for developing countries.
-------------------------------------------------------------------------------- ARTICLE 7 CONFERENCE OF THE PARTIES -------------------------------------------------------------------------------- 1. A Conference of the Parties is hereby established. 2. The Conference of the Parties, as the supreme body of this Convention, shall keep under
regular review the implementation of the Convention and any related legal instruments that the Conference of the Parties may adopt, and shall make, within its mandate, the decisions necessary to promote the effective implementation of the Convention. To this end, it shall:
(a) Periodically examine the obligations of the Parties and the institutional arrangements
under the Convention, in the light of the objective of the Convention, the experience gained in its implementation and the evolution of scientific and technological knowledge;
(b) Promote and facilitate the exchange of information on measures adopted by the Parties to
address climate change and its effects, taking into account the differing circumstances, responsibilities and capabilities of the Parties and their respective commitments under the Convention;
(c) Facilitate, at the request of two or more Parties, the coordination of measures adopted by
them to address climate change and its effects, taking into account the differing circumstances, responsibilities and capabilities of the Parties and their respective commitments under the Convention;
(d) Promote and guide, in accordance with the objective and provisions of the Convention, the
development and periodic refinement of comparable methodologies, to be agreed on by the Conference of the Parties, inter alia, for preparing inventories of greenhouse gas emissions by sources and removals by sinks, and for evaluating the effectiveness of measures to limit the emissions and enhance the removals of these gases;
(e) Assess, on the basis of all information made available to it in accordance with the provisions
of the Convention, the implementation of the Convention by the Parties, the overall effects of the measures taken pursuant to the Convention, in particular environmental, economic and social effects as well as their cumulative impacts and the extent to which progress towards the objective of the Convention is being

-250- Asian Biomass Handbook
achieved; (f) Consider and adopt regular reports on the implementation of the Convention and ensure
their publication; (g) Make recommendations on any matters necessary for the implementation of the
Convention; (h) Seek to mobilize financial resources in accordance with Article 4, paragraphs 3, 4 and 5, and
Article 11; (i) Establish such subsidiary bodies as are deemed necessary for the implementation of the
Convention; (j) Review reports submitted by its subsidiary bodies and provide guidance to them; (k) Agree upon and adopt, by consensus, rules of procedure and financial rules for itself and for
any subsidiary bodies; (l) Seek and utilize, where appropriate, the services and cooperation of, and information
provided by, competent international organizations and intergovernmental and non-governmental bodies; and
(m) Exercise such other functions as are required for the achievement of the objective of the
Convention as well as all other functions assigned to it under the Convention. 3. The Conference of the Parties shall, at its first session, adopt its own rules of procedure as
well as those of the subsidiary bodies established by the Convention, which shall include decision-making procedures for matters not already covered by decision- making procedures stipulated in the Convention. Such procedures may include specified majorities required for the adoption of particular decisions.
4. The first session of the Conference of the Parties shall be convened by the interim secretariat
referred to in Article 21 and shall take place not later than one year after the date of entry into force of the Convention. Thereafter, ordinary sessions of the Conference of the Parties shall be held every year unless otherwise decided by the Conference of the Parties.
5. Extraordinary sessions of the Conference of the Parties shall be held at such other times as
may be deemed necessary by the Conference, or at the written request of any Party, provided that, within six months of the request being communicated to the Parties by the secretariat, it is supported by at least one third of the Parties.
6. The United Nations, its specialized agencies and the International Atomic Energy Agency, as
well as any State member thereof or observers thereto not Party to the Convention, may be represented at sessions of the Conference of the Parties as observers. Any body or agency, whether national or international, governmental or non- governmental, which is qualified in matters covered by the Convention, and which has informed the secretariat of its wish to be represented at a session of the Conference of the Parties as

-251- Asian Biomass Handbook
an observer, may be so admitted unless at least one third of the Parties present object. The admission and participation of observers shall be subject to the rules of procedure adopted by the Conference of the Parties.
-------------------------------------------------------------------------------- ARTICLE 8 SECRETARIAT -------------------------------------------------------------------------------- 1. A secretariat is hereby established. 2. The functions of the secretariat shall be: (a) To make arrangements for sessions of the Conference of the Parties and its subsidiary
bodies established under the Convention and to provide them with services as required;
(b) To compile and transmit reports submitted to it; (c) To facilitate assistance to the Parties, particularly developing country Parties, on request, in
the compilation and communication of information required in accordance with the provisions of the Convention;
(d) To prepare reports on its activities and present them to the Conference of the Parties; (e) To ensure the necessary coordination with the secretariats of other relevant international
bodies; (f) To enter, under the overall guidance of the Conference of the Parties, into such
administrative and contractual arrangements as may be required for the effective discharge of its functions; and
(g) To perform the other secretariat functions specified in the Convention and in any of its
protocols and such other functions as may be determined by the Conference of the Parties.
3. The Conference of the Parties, at its first session, shall designate a permanent secretariat
and make arrangements for its functioning. -------------------------------------------------------------------------------- ARTICLE 9 SUBSIDIARY BODY FOR SCIENTIFIC AND TECHNOLOGICAL ADVICE -------------------------------------------------------------------------------- 1. A subsidiary body for scientific and technological advice is hereby established to provide the

-252- Asian Biomass Handbook
Conference of the Parties and, as appropriate, its other subsidiary bodies with timely information and advice on scientific and technological matters relating to the Convention. This body shall be open to participation by all Parties and shall be multidisciplinary. It shall comprise government representatives competent in the relevant field of expertise. It shall report regularly to the Conference of the Parties on all aspects of its work.
2. Under the guidance of the Conference of the Parties, and drawing upon existing competent
international bodies, this body shall: (a) Provide assessments of the state of scientific knowledge relating to climate change and its
effects; (b) Prepare scientific assessments on the effects of measures taken in the implementation of
the Convention; (c) Identify innovative, efficient and state-of-the-art technologies and know-how and advise on
the ways and means of promoting development and/or transferring such technologies; (d) Provide advice on scientific programmes, international cooperation in research and
development related to climate change, as well as on ways and means of supporting endogenous capacity-building in developing countries; and
(e) Respond to scientific, technological and methodological questions that the Conference of the
Parties and its subsidiary bodies may put to the body. 3. The functions and terms of reference of this body may be further elaborated by the
Conference of the Parties. -------------------------------------------------------------------------------- ARTICLE 10 SUBSIDIARY BODY FOR IMPLEMENTATION -------------------------------------------------------------------------------- 1. A subsidiary body for implementation is hereby established to assist the Conference of the
Parties in the assessment and review of the effective implementation of the Convention. This body shall be open to participation by all Parties and comprise government representatives who are experts on matters related to climate change. It shall report regularly to the Conference of the Parties on all aspects of its work.
2. Under the guidance of the Conference of the Parties, this body shall: (a) Consider the information communicated in accordance with Article 12, paragraph 1, to
assess the overall aggregated effect of the steps taken by the Parties in the light of the latest scientific assessments concerning climate change;
(b) Consider the information communicated in accordance with Article 12, paragraph 2, in
-253- Asian Biomass Handbook
order to assist the Conference of the Parties in carrying out the reviews required by Article 4, paragraph 2(d); and
(c) Assist the Conference of the Parties, as appropriate, in the preparation and implementation
of its decisions. -------------------------------------------------------------------------------- ARTICLE 11 FINANCIAL MECHANISM -------------------------------------------------------------------------------- 1. A mechanism for the provision of financial resources on a grant or concessional basis,
including for the transfer of technology, is hereby defined. It shall function under the guidance of and be accountable to the Conference of the Parties, which shall decide on its policies, programme priorities and eligibility criteria related to this Convention. Its operation shall be entrusted to one or more existing international entities.
2. The financial mechanism shall have an equitable and balanced representation of all Parties
within a transparent system of governance. 3. The Conference of the Parties and the entity or entities entrusted with the operation of the
financial mechanism shall agree upon arrangements to give effect to the above paragraphs, which shall include the following:
(a) Modalities to ensure that the funded projects to address climate change are in conformity
with the policies, programme priorities and eligibility criteria established by the Conference of the Parties;
(b) Modalities by which a particular funding decision may be reconsidered in light of these
policies, programme priorities and eligibility criteria; (c) Provision by the entity or entities of regular reports to the Conference of the Parties on its
funding operations, which is consistent with the requirement for accountability set out in paragraph 1 above; and
(d) Determination in a predictable and identifiable manner of the amount of funding necessary
and available for the implementation of this Convention and the conditions under which that amount shall be periodically reviewed.
4. The Conference of the Parties shall make arrangements to implement the above- mentioned
provisions at its first session, reviewing and taking into account the interim arrangements referred to in Article 21, paragraph 3, and shall decide whether these interim arrangements shall be maintained. Within four years thereafter, the Conference of the Parties shall review the financial mechanism and take appropriate measures.
5. The developed country Parties may also provide and developing country Parties avail
-254- Asian Biomass Handbook
themselves of, financial resources related to the implementation of the Convention through bilateral, regional and other multilateral channels.
-------------------------------------------------------------------------------- ARTICLE 12 COMMUNICATION OF INFORMATION RELATED TO IMPLEMENTATION -------------------------------------------------------------------------------- 1. In accordance with Article 4, paragraph 1, each Party shall communicate to the Conference
of the Parties, through the secretariat, the following elements of information: (a) A national inventory of anthropogenic emissions by sources and removals by sinks of all
greenhouse gases not controlled by the Montreal Protocol, to the extent its capacities permit, using comparable methodologies to be promoted and agreed upon by the Conference of the Parties;
(b) A general description of steps taken or envisaged by the Party to implement the Convention;
and (c) Any other information that the Party considers relevant to the achievement of the objective
of the Convention and suitable for inclusion in its communication, including, if feasible, material relevant for calculations of global emission trends.
2. Each developed country Party and each other Party included in Annex I shall incorporate in
its communication the following elements of information: (a) A detailed description of the policies and measures that it has adopted to implement its
commitment under Article 4, paragraphs 2(a) and 2(b); and (b) A specific estimate of the effects that the policies and measures referred to in subparagraph
(a) immediately above will have on anthropogenic emissions by its sources and removals by its sinks of greenhouse gases during the period referred to in Article 4, paragraph 2(a).
3. In addition, each developed country Party and each other developed Party included in Annex
II shall incorporate details of measures taken in accordance with Article 4, paragraphs 3, 4 and 5.
4. Developing country Parties may, on a voluntary basis, propose projects for financing,
including specific technologies, materials, equipment, techniques or practices that would be needed to implement such projects, along with, if possible, an estimate of all incremental costs, of the reductions of emissions and increments of removals of greenhouse gases, as well as an estimate of the consequent benefits.
5. Each developed country Party and each other Party included in Annex I shall make its initial
communication within six months of the entry into force of the Convention for that Party. Each Party not so listed shall make its initial communication within three

-255- Asian Biomass Handbook
years of the entry into force of the Convention for that Party, or of the availability of financial resources in accordance with Article 4, paragraph 3. Parties that are least developed countries may make their initial communication at their discretion. The frequency of subsequent communications by all Parties shall be determined by the Conference of the Parties, taking into account the differentiated timetable set by this paragraph.
6. Information communicated by Parties under this Article shall be transmitted by the
secretariat as soon as possible to the Conference of the Parties and to any subsidiary bodies concerned. If necessary, the procedures for the communication of information may be further considered by the Conference of the Parties.
7. From its first session, the Conference of the Parties shall arrange for the provision to
developing country Parties of technical and financial support, on request, in compiling and communicating information under this Article, as well as in identifying the technical and financial needs associated with proposed projects and response measures under Article 4. Such support may be provided by other Parties, by competent international organizations and by the secretariat, as appropriate.
8. Any group of Parties may, subject to guidelines adopted by the Conference of the Parties, and
to prior notification to the Conference of the Parties, make a joint communication in fulfilment of their obligations under this Article, provided that such a communication includes information on the fulfilment by each of these Parties of its individual obligations under the Convention.
9. Information received by the secretariat that is designated by a Party as confidential, in
accordance with criteria to be established by the Conference of the Parties, shall be aggregated by the secretariat to protect its confidentiality before being made available to any of the bodies involved in the communication and review of information.
10. Subject to paragraph 9 above, and without prejudice to the ability of any Party to make
public its communication at any time, the secretariat shall make communications by Parties under this Article publicly available at the time they are submitted to the Conference of the Parties.
-------------------------------------------------------------------------------- ARTICLE 13 RESOLUTION OF QUESTIONS REGARDING IMPLEMENTATION -------------------------------------------------------------------------------- The Conference of the Parties shall, at its first session, consider the establishment of a
multilateral consultative process, available to Parties on their request, for the resolution of questions regarding the implementation of the Convention.
-------------------------------------------------------------------------------- ARTICLE 14

-256- Asian Biomass Handbook
SETTLEMENT OF DISPUTES -------------------------------------------------------------------------------- 1. In the event of a dispute between any two or more Parties concerning the interpretation or
application of the Convention, the Parties concerned shall seek a settlement of the dispute through negotiation or any other peaceful means of their own choice.
2. When ratifying, accepting, approving or acceding to the Convention, or at any time
thereafter, a Party which is not a regional economic integration organization may declare in a written instrument submitted to the Depositary that, in respect of any dispute concerning the interpretation or application of the Convention, it recognizes as compulsory ipso facto and without special agreement, in relation to any Party accepting the same obligation:
(a) Submission of the dispute to the International Court of Justice, and/or (b) Arbitration in accordance with procedures to be adopted by the Conference of the Parties as
soon as practicable, in an annex on arbitration. A Party which is a regional economic integration organization may make a declaration with
like effect in relation to arbitration in accordance with the procedures referred to in subparagraph (b) above.
3. A declaration made under paragraph 2 above shall remain in force until it expires in
accordance with its terms or until three months after written notice of its revocation has been deposited with the Depositary.
4. A new declaration, a notice of revocation or the expiry of a declaration shall not in any way
affect proceedings pending before the International Court of Justice or the arbitral tribunal, unless the parties to the dispute otherwise agree.
5. Subject to the operation of paragraph 2 above, if after twelve months following notification
by one Party to another that a dispute exists between them, the Parties concerned have not been able to settle their dispute through the means mentioned in paragraph 1 above, the dispute shall be submitted, at the request of any of the parties to the dispute, to conciliation.
6. A conciliation commission shall be created upon the request of one of the parties to the
dispute. The commission shall be composed of an equal number of members appointed by each party concerned and a chairman chosen jointly by the members appointed by each party. The commission shall render a recommendatory award, which the parties shall consider in good faith.
7. Additional procedures relating to conciliation shall be adopted by the Conference of the
Parties, as soon as practicable, in an annex on conciliation. 8. The provisions of this Article shall apply to any related legal instrument which the

-257- Asian Biomass Handbook
Conference of the Parties may adopt, unless the instrument provides otherwise. -------------------------------------------------------------------------------- ARTICLE 15 AMENDMENTS TO THE CONVENTION -------------------------------------------------------------------------------- 1. Any Party may propose amendments to the Convention. 2. Amendments to the Convention shall be adopted at an ordinary session of the Conference of
the Parties. The text of any proposed amendment to the Convention shall be communicated to the Parties by the secretariat at least six months before the meeting at which it is proposed for adoption. The secretariat shall also communicate proposed amendments to the signatories to the Convention and, for information, to the Depositary.
3. The Parties shall make every effort to reach agreement on any proposed amendment to the
Convention by consensus. If all efforts at consensus have been exhausted, and no agreement reached, the amendment shall as a last resort be adopted by a three-fourths majority vote of the Parties present and voting at the meeting. The adopted amendment shall be communicated by the secretariat to the Depositary, who shall circulate it to all Parties for their acceptance.
4. Instruments of acceptance in respect of an amendment shall be deposited with the
Depositary. An amendment adopted in accordance with paragraph 3 above shall enter into force for those Parties having accepted it on the ninetieth day after the date of receipt by the Depositary of an instrument of acceptance by at least three fourths of the Parties to the Convention.
5. The amendment shall enter into force for any other Party on the ninetieth day after the date
on which that Party deposits with the Depositary its instrument of acceptance of the said amendment.
6. For the purposes of this Article, "Parties present and voting" means Parties present and
casting an affirmative or negative vote. -------------------------------------------------------------------------------- ARTICLE 16 ADOPTION AND AMENDMENT OF ANNEXES TO THE CONVENTION -------------------------------------------------------------------------------- 1. Annexes to the Convention shall form an integral part thereof and, unless otherwise
expressly provided, a reference to the Convention constitutes at the same time a reference to any annexes thereto. Without prejudice to the provisions of Article 14, paragraphs 2(b) and 7, such annexes shall be restricted to lists, forms and any other

-258- Asian Biomass Handbook
material of a descriptive nature that is of a scientific, technical, procedural or administrative character.
2. Annexes to the Convention shall be proposed and adopted in accordance with the procedure
set forth in Article 15, paragraphs 2, 3 and 4. 3. An annex that has been adopted in accordance with paragraph 2 above shall enter into force
for all Parties to the Convention six months after the date of the communication by the Depositary to such Parties of the adoption of the annex, except for those Parties that have notified the Depositary, in writing, within that period of their non-acceptance of the annex. The annex shall enter into force for Parties which withdraw their notification of non-acceptance on the ninetieth day after the date on which withdrawal of such notification has been received by the Depositary.
4. The proposal, adoption and entry into force of amendments to annexes to the Convention
shall be subject to the same procedure as that for the proposal, adoption and entry into force of annexes to the Convention in accordance with paragraphs 2 and 3 above.
5.If the adoption of an annex or an amendment to an annex involves an amendment to the
Convention, that annex or amendment to an annex shall not enter into force until such time as the amendment to the Convention enters into force.
-------------------------------------------------------------------------------- ARTICLE 17 PROTOCOLS -------------------------------------------------------------------------------- 1. The Conference of the Parties may, at any ordinary session, adopt protocols to the
Convention. 2. The text of any proposed protocol shall be communicated to the Parties by the secretariat at
least six months before such a session. 3. The requirements for the entry into force of any protocol shall be established by that
instrument. 4. Only Parties to the Convention may be Parties to a protocol. 5. Decisions under any protocol shall be taken only by the Parties to the protocol concerned. -------------------------------------------------------------------------------- ARTICLE 18 RIGHT TO VOTE --------------------------------------------------------------------------------

-259- Asian Biomass Handbook
1. Each Party to the Convention shall have one vote, except as provided for in paragraph 2 below.
2. Regional economic integration organizations, in matters within their competence, shall
exercise their right to vote with a number of votes equal to the number of their member States that are Parties to the Convention. Such an organization shall not exercise its right to vote if any of its member States exercises its right, and vice versa.
-------------------------------------------------------------------------------- ARTICLE 19 DEPOSITARY -------------------------------------------------------------------------------- The Secretary-General of the United Nations shall be the Depositary of the Convention and of
protocols adopted in accordance with Article 17. -------------------------------------------------------------------------------- ARTICLE 20 SIGNATURE -------------------------------------------------------------------------------- This Convention shall be open for signature by States Members of the United Nations or of any
of its specialized agencies or that are Parties to the Statute of the International Court of Justice and by regional economic integration organizations at Rio de Janeiro, during the United Nations Conference on Environment and Development, and thereafter at United Nations Headquarters in New York from 20 June 1992 to 19 June 1993.
-------------------------------------------------------------------------------- ARTICLE 21 INTERIM ARRANGEMENTS -------------------------------------------------------------------------------- 1. The secretariat functions referred to in Article 8 will be carried out on an interim basis by
the secretariat established by the General Assembly of the United Nations in its resolution 45/212 of 21 December 1990, until the completion of the first session of the Conference of the Parties.
2. The head of the interim secretariat referred to in paragraph 1 above will cooperate closely
with the Intergovernmental Panel on Climate Change to ensure that the Panel can respond to the need for objective scientific and technical advice. Other relevant scientific bodies could also be consulted.

-260- Asian Biomass Handbook
3. The Global Environment Facility of the United Nations Development Programme, the United Nations Environment Programme and the International Bank for Reconstruction and Development shall be the international entity entrusted with the operation of the financial mechanism referred to in Article 11 on an interim basis. In this connection, the Global Environment Facility should be appropriately restructured and its membership made universal to enable it to fulfil the requirements of Article 11.
-------------------------------------------------------------------------------- ARTICLE 22 RATIFICATION, ACCEPTANCE, APPROVAL OR ACCESSION -------------------------------------------------------------------------------- 1. The Convention shall be subject to ratification, acceptance, approval or accession by States
and by regional economic integration organizations. It shall be open for accession from the day after the date on which the Convention is closed for signature. Instruments of ratification, acceptance, approval or accession shall be deposited with the Depositary.
2. Any regional economic integration organization which becomes a Party to the Convention
without any of its member States being a Party shall be bound by all the obligations under the Convention. In the case of such organizations, one or more of whose member States is a Party to the Convention, the organization and its member States shall decide on their respective responsibilities for the performance of their obligations under the Convention. In such cases, the organization and the member States shall not be entitled to exercise rights under the Convention concurrently.
3. In their instruments of ratification, acceptance, approval or accession, regional economic
integration organizations shall declare the extent of their competence with respect to the matters governed by the Convention. These organizations shall also inform the Depositary, who shall in turn inform the Parties, of any substantial modification in the extent of their competence.
-------------------------------------------------------------------------------- ARTICLE 23 ENTRY INTO FORCE -------------------------------------------------------------------------------- 1. The Convention shall enter into force on the ninetieth day after the date of deposit of the
fiftieth instrument of ratification, acceptance, approval or accession. 2. For each State or regional economic integration organization that ratifies, accepts or
approves the Convention or accedes thereto after the deposit of the fiftieth instrument of ratification, acceptance, approval or accession, the Convention shall enter into force on the ninetieth day after the date of deposit by such State or regional economic integration organization of its instrument of ratification, acceptance, approval or

-261- Asian Biomass Handbook
accession. 3. For the purposes of paragraphs 1 and 2 above, any instrument deposited by a regional
economic integration organization shall not be counted as additional to those deposited by States members of the organization.
-------------------------------------------------------------------------------- ARTICLE 24 RESERVATIONS -------------------------------------------------------------------------------- No reservations may be made to the Convention. -------------------------------------------------------------------------------- ARTICLE 25 WITHDRAWAL -------------------------------------------------------------------------------- 1. At any time after three years from the date on which the Convention has entered into force
for a Party, that Party may withdraw from the Convention by giving written notification to the Depositary.
2. Any such withdrawal shall take effect upon expiry of one year from the date of receipt by the
Depositary of the notification of withdrawal, or on such later date as may be specified in the notification of withdrawal.
3. Any Party that withdraws from the Convention shall be considered as also having
withdrawn from any protocol to which it is a Party. -------------------------------------------------------------------------------- ARTICLE 26 AUTHENTIC TEXTS -------------------------------------------------------------------------------- The original of this Convention, of which the Arabic, Chinese, English, French, Russian and
Spanish texts are equally authentic, shall be deposited with the Secretary- General of the United Nations.
IN WITNESS WHEREOF the undersigned, being duly authorized to that effect, have signed
this Convention. DONE at New York this ninth day of May one thousand nine hundred and ninety- two.

-262- Asian Biomass Handbook
-------------------------------------------------------------------------------- ANNEX I AND ANNEX II COUNTRIES Annex I Australia Austria Belarus* Belgium Bulgaria* Canada Czechoslovakia* Denmark European Economic Community Estonia* Finland France Germany Greece Hungary* Iceland Ireland Italy Japan Latvia* Lithuania* Luxembourg Netherlands New Zealand Norway Poland* Portugal Romania* Russian Federation* Spain Sweden Switzerland Turkey Ukraine* United Kingdom of Great Britain and Northern Ireland United States of America *Countries that are undergoing the process of transition to a market economy. Annex II Australia Austria Belgium

-263- Asian Biomass Handbook
Canada Denmark European Economic Community Finland France Germany Greece Iceland Ireland Italy Japan Luxembourg Netherlands New Zealand Norway Portugal Spain Sweden Switzerland Turkey United Kingdom of Great Britain and Northern Ireland United States of America
-264- Asian Biomass Handbook
A2.2 Kyoto Protocol to the United Nations Framework Convention on Climate Change
The Parties to this Protocol,
Being Parties to the United Nations Framework Convention on Climate Change, hereinafter
referred to as "the Convention",
In pursuit of the ultimate objective of the Convention as stated in its Article 2,
Recalling the provisions of the Convention,
Being guided by Article 3 of the Convention,
Pursuant to the Berlin Mandate adopted by decision 1/CP.1 of the
Conference of the Parties to the Convention at its first session,
Have agreed as follows:
Article 1
For the purposes of this Protocol, the definitions contained in Article 1 of the Convention shall
apply. In addition:
1. "Conference of the Parties" means the Conference of the Parties to the Convention.
2. "Convention" means the United Nations Framework Convention on Climate Change,
adopted in New York on 9 May 1992.
3. "Intergovernmental Panel on Climate Change" means the Intergovernmental Panel on
Climate Change established in 1988 jointly by the World Meteorological Organization and the
-265- Asian Biomass Handbook
United Nations Environment Programme.
4. "Montreal Protocol" means the Montreal Protocol on Substances that Deplete the Ozone
Layer, adopted in Montreal on 16 September 1987 and as subsequently adjusted and amended.
5. "Parties present and voting" means Parties present and casting an affirmative or negative
vote.
6. "Party" means, unless the context otherwise indicates, a Party to this Protocol.
7. "Party included in Annex I" means a Party included in Annex I to the Convention, as may be
amended, or a Party which has made a notification under Article 4, paragraph 2(g), of the
Convention.
Article 2
1. Each Party included in Annex I, in achieving its quantified emission limitation and
reduction commitments under Article 3, in order to promote sustainable development, shall:
(a) Implement and/or further elaborate policies and measures in accordance with its national
circumstances, such as:
(i) Enhancement of energy efficiency in relevant sectors of the national economy;
(ii) Protection and enhancement of sinks and reservoirs of greenhouse gases not controlled by
the Montreal Protocol, taking into account its commitments under relevant international
environmental agreements; promotion of sustainable forest management practices,
afforestation and reforestation;
(iii) Promotion of sustainable forms of agriculture in light of climate change considerations;
(iv) Research on, and promotion, development and increased use of, new and renewable forms
of energy, of carbon dioxide sequestration technologies and of advanced and innovative

-266- Asian Biomass Handbook
environmentally sound technologies;
(v) Progressive reduction or phasing out of market imperfections, fiscal incentives, tax and duty
exemptions and subsidies in all greenhouse gas emitting sectors that run counter to the
objective of the Convention and application of market instruments;
(vi) Encouragement of appropriate reforms in relevant sectors aimed at promoting policies and
measures which limit or reduce emissions of greenhouse gases not controlled by the Montreal
Protocol;
(vii) Measures to limit and/or reduce emissions of greenhouse gases not controlled by the
Montreal Protocol in the transport sector;
(viii) Limitation and/or reduction of methane emissions through recovery and use in waste
management, as well as in the production, transport and distribution of energy;
(b) Cooperate with other such Parties to enhance the individual and combined effectiveness of
their policies and measures adopted under this Article, pursuant to Article 4, paragraph 2(e)(i),
of the Convention. To this end, these Parties shall take steps to share their experience and
exchange information on such policies and measures, including developing ways of improving
their comparability, transparency and effectiveness. The Conference of the Parties serving as
the meeting of the Parties to this Protocol shall, at its first session or as soon as practicable
thereafter, consider ways to facilitate such cooperation, taking into account all relevant
information.
2. The Parties included in Annex I shall pursue limitation or reduction of emissions of
greenhouse gases not controlled by the Montreal Protocol from aviation and marine bunker
fuels, working through the International Civil Aviation Organization and the International
Maritime Organization, respectively.
3. The Parties included in Annex I shall strive to implement policies and measures under this
Article in such a way as to minimize adverse effects, including the adverse effects of climate
change, effects on international trade, and social, environmental and economic impacts on
-267- Asian Biomass Handbook
other Parties, especially developing country Parties and in particular those identified in Article
4, paragraphs 8 and 9, of the Convention, taking into account Article 3 of the Convention. The
Conference of the Parties serving as the meeting of the Parties to this Protocol may take
further action, as appropriate, to promote the implementation of the provisions of this
paragraph.
4. The Conference of the Parties serving as the meeting of the Parties to this Protocol, if it
decides that it would be beneficial to coordinate any of the policies and measures in paragraph
1(a) above, taking into account different national circumstances and potential effects, shall
consider ways and means to elaborate the coordination of such policies and measures.
Article 3
1. The Parties included in Annex I shall, individually or jointly, ensure that their aggregate
anthropogenic carbon dioxide equivalent emissions of the greenhouse gases listed in Annex A
do not exceed their assigned amounts, calculated pursuant to their quantified emission
limitation and reduction commitments inscribed in Annex B and in accordance with the
provisions of this Article, with a view to reducing their overall emissions of such gases by at
least 5 per cent below 1990 levels in the commitment period 2008 to 2012.
2. Each Party included in Annex I shall, by 2005, have made demonstrable progress in
achieving its commitments under this Protocol.
3. The net changes in greenhouse gas emissions by sources and removals by sinks resulting
from direct human-induced land-use change and forestry activities, limited to afforestation,
reforestation and deforestation since 1990, measured as verifiable changes in carbon stocks in
each commitment period, shall be used to meet the commitments under this Article of each
Party included in Annex I. The greenhouse gas emissions by sources and removals by sinks
associated with those activities shall be reported in a transparent and verifiable manner and
reviewed in accordance with Articles 7 and 8.
4. Prior to the first session of the Conference of the Parties serving as the meeting of the
Parties to this Protocol, each Party included in Annex I shall provide, for consideration by the

-268- Asian Biomass Handbook
Subsidiary Body for Scientific and Technological Advice, data to establish its level of carbon
stocks in 1990 and to enable an estimate to be made of its changes in carbon stocks in
subsequent years. The Conference of the Parties serving as the meeting of the Parties to this
Protocol shall, at its first session or as soon as practicable thereafter, decide upon modalities,
rules and guidelines as to how, and which, additional human-induced activities related to
changes in greenhouse gas emissions by sources and removals by sinks in the agricultural soils
and the land-use change and forestry categories shall be added to, or subtracted from, the
assigned amounts for Parties included in Annex I, taking into account uncertainties,
transparency in reporting, verifiability, the methodological work of the Intergovernmental
Panel on Climate Change, the advice provided by the Subsidiary Body for Scientific and
Technological Advice in accordance with Article 5 and the decisions of the Conference of the
Parties. Such a decision shall apply in the second and subsequent commitment periods. A Party
may choose to apply such a decision on these additional human-induced activities for its first
commitment period, provided that these activities have taken place since 1990.
5. The Parties included in Annex I undergoing the process of transition to a market economy
whose base year or period was established pursuant to decision 9/CP.2 of the Conference of the
Parties at its second session shall use that base year or period for the implementation of their
commitments under this Article. Any other Party included in Annex I undergoing the process of
transition to a market economy which has not yet submitted its first national communication
under Article 12 of the Convention may also notify the Conference of the Parties serving as the
meeting of the Parties to this Protocol that it intends to use an historical base year or period
other than 1990 for the implementation of its commitments under this Article. The Conference
of the Parties serving as the meeting of the Parties to this Protocol shall decide on the
acceptance of such notification.
6. Taking into account Article 4, paragraph 6, of the Convention, in the implementation of their
commitments under this Protocol other than those under this Article, a certain degree of
flexibility shall be allowed by the Conference of the Parties serving as the meeting of the
Parties to this Protocol to the Parties included in Annex I undergoing the process of transition
to a market economy.
7. In the first quantified emission limitation and reduction commitment period, from 2008 to

-269- Asian Biomass Handbook
2012, the assigned amount for each Party included in Annex I shall be equal to the percentage
inscribed for it in Annex B of its aggregate anthropogenic carbon dioxide equivalent emissions
of the greenhouse gases listed in Annex A in 1990, or the base year or period determined in
accordance with paragraph 5 above, multiplied by five. Those Parties included in Annex I for
whom land-use change and forestry constituted a net source of greenhouse gas emissions in
1990 shall include in their 1990 emissions base year or period the aggregate anthropogenic
carbon dioxide equivalent emissions by sources minus removals by sinks in 1990 from land-use
change for the purposes of calculating their assigned amount.
8. Any Party included in Annex I may use 1995 as its base year for hydrofluorocarbons,
perfluorocarbons and sulphur hexafluoride, for the purposes of the calculation referred to in
paragraph 7 above.
9. Commitments for subsequent periods for Parties included in Annex I shall be established in
amendments to Annex B to this Protocol, which shall be adopted in accordance with the
provisions of Article 21, paragraph 7. The Conference of the Parties serving as the meeting of
the Parties to this Protocol shall initiate the consideration of such commitments at least seven
years before the end of the first commitment period referred to in paragraph 1 above.
10. Any emission reduction units, or any part of an assigned amount, which a Party acquires
from another Party in accordance with the provisions of Article 6 or of Article 17 shall be added
to the assigned amount for the acquiring Party.
11. Any emission reduction units, or any part of an assigned amount, which a Party transfers to
another Party in accordance with the provisions of Article 6 or of Article 17 shall be subtracted
from the assigned amount for the transferring Party.
12. Any certified emission reductions which a Party acquires from another Party in accordance
with the provisions of Article 12 shall be added to the assigned amount for the acquiring Party.
13. If the emissions of a Party included in Annex I in a commitment period are less than its
assigned amount under this Article, this difference shall, on request of that Party, be added to
the assigned amount for that Party for subsequent commitment periods.

-270- Asian Biomass Handbook
14. Each Party included in Annex I shall strive to implement the commitments mentioned in
paragraph 1 above in such a way as to minimize adverse social, environmental and economic
impacts on developing country Parties, particularly those identified in Article 4, paragraphs 8
and 9, of the Convention. In line with relevant decisions of the Conference of the Parties on the
implementation of those paragraphs, the Conference of the Parties serving as the meeting of
the Parties to this Protocol shall, at its first session, consider what actions are necessary to
minimize the adverse effects of climate change and/or the impacts of response measures on
Parties referred to in those paragraphs. Among the issues to be considered shall be the
establishment of funding, insurance and transfer of technology.
Article 4
1. Any Parties included in Annex I that have reached an agreement to fulfil their commitments
under Article 3 jointly, shall be deemed to have met those commitments provided that their
total combined aggregate anthropogenic carbon dioxide equivalent emissions of the greenhouse
gases listed in Annex A do not exceed their assigned amounts calculated pursuant to their
quantified emission limitation and reduction commitments inscribed in Annex B and in
accordance with the provisions of Article 3. The respective emission level allocated to each of
the Parties to the agreement shall be set out in that agreement.
2. The Parties to any such agreement shall notify the secretariat of the terms of the agreement
on the date of deposit of their instruments of ratification, acceptance or approval of this
Protocol, or accession thereto. The secretariat shall in turn inform the Parties and signatories
to the Convention of the terms of the agreement.
3. Any such agreement shall remain in operation for the duration of the commitment period
specified in Article 3, paragraph 7.
4. If Parties acting jointly do so in the framework of, and together with, a regional economic
integration organization, any alteration in the composition of the organization after adoption of
this Protocol shall not affect existing commitments under this Protocol. Any alteration in the
composition of the organization shall only apply for the purposes of those commitments under
Article 3 that are adopted subsequent to that alteration.

-271- Asian Biomass Handbook
5. In the event of failure by the Parties to such an agreement to achieve their total combined
level of emission reductions, each Party to that agreement shall be responsible for its own level
of emissions set out in the agreement.
6. If Parties acting jointly do so in the framework of, and together with, a regional economic
integration organization which is itself a Party to this Protocol, each member State of that
regional economic integration organization individually, and together with the regional
economic integration organization acting in accordance with Article 24, shall, in the event of
failure to achieve the total combined level of emission reductions, be responsible for its level of
emissions as notified in accordance with this Article.
Article 5
1. Each Party included in Annex I shall have in place, no later than one year prior to the start
of the first commitment period, a national system for the estimation of anthropogenic
emissions by sources and removals by sinks of all greenhouse gases not controlled by the
Montreal Protocol. Guidelines for such national systems, which shall incorporate the
methodologies specified in paragraph 2 below, shall be decided upon by the Conference of the
Parties serving as the meeting of the Parties to this Protocol at its first session.
2. Methodologies for estimating anthropogenic emissions by sources and removals by sinks of
all greenhouse gases not controlled by the Montreal Protocol shall be those accepted by the
Intergovernmental Panel on Climate Change and agreed upon by the Conference of the Parties
at its third session. Where such methodologies are not used, appropriate adjustments shall be
applied according to methodologies agreed upon by the Conference of the Parties serving as the
meeting of the Parties to this Protocol at its first session. Based on the work of, inter alia, the
Intergovernmental Panel on Climate Change and advice provided by the Subsidiary Body for
Scientific and Technological Advice, the Conference of the Parties serving as the meeting of the
Parties to this Protocol shall regularly review and, as appropriate, revise such methodologies
and adjustments, taking fully into account any relevant decisions by the Conference of the
Parties. Any revision to methodologies or adjustments shall be used only for the purposes of
ascertaining compliance with commitments under Article 3 in respect of any commitment
period adopted subsequent to that revision.
-272- Asian Biomass Handbook
3. The global warming potentials used to calculate the carbon dioxide equivalence of
anthropogenic emissions by sources and removals by sinks of greenhouse gases listed in Annex
A shall be those accepted by the Intergovernmental Panel on Climate Change and agreed upon
by the Conference of the Parties at its third session. Based on the work of, inter alia, the
Intergovernmental Panel on Climate Change and advice provided by the Subsidiary Body for
Scientific and Technological Advice, the Conference of the Parties serving as the meeting of the
Parties to this Protocol shall regularly review and, as appropriate, revise the global warming
potential of each such greenhouse gas, taking fully into account any relevant decisions by the
Conference of the Parties. Any revision to a global warming potential shall apply only to
commitments under Article 3 in respect of any commitment period adopted subsequent to that
revision.
Article 6
1. For the purpose of meeting its commitments under Article 3, any Party included in Annex I
may transfer to, or acquire from, any other such Party emission reduction units resulting from
projects aimed at reducing anthropogenic emissions by sources or enhancing anthropogenic
removals by sinks of greenhouse gases in any sector of the economy, provided that:
(a) Any such project has the approval of the Parties involved;
(b) Any such project provides a reduction in emissions by sources, or an enhancement of
removals by sinks, that is additional to any that would otherwise occur;
(c) It does not acquire any emission reduction units if it is not in compliance with its obligations
under Articles 5 and 7; and
(d) The acquisition of emission reduction units shall be supplemental to domestic actions for
the purposes of meeting commitments under Article 3.
2. The Conference of the Parties serving as the meeting of the Parties to this Protocol may, at
its first session or as soon as practicable thereafter, further elaborate guidelines for the
implementation of this Article, including for verification and reporting.

-273- Asian Biomass Handbook
3. A Party included in Annex I may authorize legal entities to participate, under its
responsibility, in actions leading to the generation, transfer or acquisition under this Article of
emission reduction units.
4. If a question of implementation by a Party included in Annex I of the requirements referred
to in this Article is identified in accordance with the relevant provisions of Article 8, transfers
and acquisitions of emission reduction units may continue to be made after the question has
been identified, provided that any such units may not be used by a Party to meet its
commitments under Article 3 until any issue of compliance is resolved.
Article 7
1. Each Party included in Annex I shall incorporate in its annual inventory of anthropogenic
emissions by sources and removals by sinks of greenhouse gases not controlled by the Montreal
Protocol, submitted in accordance with the relevant decisions of the Conference of the Parties,
the necessary supplementary information for the purposes of ensuring compliance with Article
3, to be determined in accordance with paragraph 4 below.
2. Each Party included in Annex I shall incorporate in its national communication, submitted
under Article 12 of the Convention, the supplementary information necessary to demonstrate
compliance with its commitments under this Protocol, to be determined in accordance with
paragraph 4 below.
3. Each Party included in Annex I shall submit the information required under paragraph 1
above annually, beginning with the first inventory due under the Convention for the first year
of the commitment period after this Protocol has entered into force for that Party. Each such
Party shall submit the information required under paragraph 2 above as part of the first
national communication due under the Convention after this Protocol has entered into force for
it and after the adoption of guidelines as provided for in paragraph 4 below. The frequency of
subsequent submission of information required under this Article shall be determined by the
Conference of the Parties serving as the meeting of the Parties to this Protocol, taking into
account any timetable for the submission of national communications decided upon by the
Conference of the Parties.

-274- Asian Biomass Handbook
4. The Conference of the Parties serving as the meeting of the Parties to this Protocol shall
adopt at its first session, and review periodically thereafter, guidelines for the preparation of
the information required under this Article, taking into account guidelines for the preparation
of national communications by Parties included in Annex I adopted by the Conference of the
Parties. The Conference of the Parties serving as the meeting of the Parties to this Protocol
shall also, prior to the first commitment period, decide upon modalities for the accounting of
assigned amounts.
Article 8
1. The information submitted under Article 7 by each Party included in Annex I shall be
reviewed by expert review teams pursuant to the relevant decisions of the Conference of the
Parties and in accordance with guidelines adopted for this purpose by the Conference of the
Parties serving as the meeting of the Parties to this Protocol under paragraph 4 below. The
information submitted under Article 7, paragraph 1, by each Party included in Annex I shall be
reviewed as part of the annual compilation and accounting of emissions inventories and
assigned amounts. Additionally, the information submitted under Article 7, paragraph 2, by
each Party included in Annex I shall be reviewed as part of the review of communications.
2. Expert review teams shall be coordinated by the secretariat and shall be composed of experts
selected from those nominated by Parties to the Convention and, as appropriate, by
intergovernmental organizations, in accordance with guidance provided for this purpose by the
Conference of the Parties.
3. The review process shall provide a thorough and comprehensive technical assessment of all
aspects of the implementation by a Party of this Protocol. The expert review teams shall
prepare a report to the Conference of the Parties serving as the meeting of the Parties to this
Protocol, assessing the implementation of the commitments of the Party and identifying any
potential problems in, and factors influencing, the fulfilment of commitments. Such reports
shall be circulated by the secretariat to all Parties to the Convention. The secretariat shall list
those questions of implementation indicated in such reports for further consideration by the
Conference of the Parties serving as the meeting of the Parties to this Protocol.

-275- Asian Biomass Handbook
4. The Conference of the Parties serving as the meeting of the Parties to this Protocol shall
adopt at its first session, and review periodically thereafter, guidelines for the review of
implementation of this Protocol by expert review teams taking into account the relevant
decisions of the Conference of the Parties.
5. The Conference of the Parties serving as the meeting of the Parties to this Protocol shall,
with the assistance of the Subsidiary Body for Implementation and, as appropriate, the
Subsidiary Body for Scientific and Technological Advice, consider:
(a) The information submitted by Parties under Article 7 and the reports of the expert reviews
thereon conducted under this Article; and
(b) Those questions of implementation listed by the secretariat under paragraph 3 above, as
well as any questions raised by Parties.
6. Pursuant to its consideration of the information referred to in paragraph 5 above, the
Conference of the Parties serving as the meeting of the Parties to this Protocol shall take
decisions on any matter required for the implementation of this Protocol.
Article 9
1. The Conference of the Parties serving as the meeting of the Parties to this Protocol shall
periodically review this Protocol in the light of the best available scientific information and
assessments on climate change and its impacts, as well as relevant technical, social and
economic information. Such reviews shall be coordinated with pertinent reviews under the
Convention, in particular those required by Article 4, paragraph 2(d), and Article 7, paragraph
2(a), of the Convention. Based on these reviews, the Conference of the Parties serving as the
meeting of the Parties to this Protocol shall take appropriate action.
2. The first review shall take place at the second session of the Conference of the Parties
serving as the meeting of the Parties to this Protocol. Further reviews shall take place at
regular intervals and in a timely manner.

-276- Asian Biomass Handbook
Article 10
All Parties, taking into account their common but differentiated responsibilities and their
specific national and regional development priorities, objectives and circumstances, without
introducing any new commitments for Parties not included in Annex I, but reaffirming existing
commitments under Article 4, paragraph 1, of the Convention, and continuing to advance the
implementation of these commitments in order to achieve sustainable development, taking into
account Article 4, paragraphs 3, 5 and 7, of the Convention, shall:
(a) Formulate, where relevant and to the extent possible, cost-effective national and, where
appropriate, regional programmes to improve the quality of local emission factors, activity data
and/or models which reflect the socio-economic conditions of each Party for the preparation and
periodic updating of national inventories of anthropogenic emissions by sources and removals
by sinks of all greenhouse gases not controlled by the Montreal Protocol, using comparable
methodologies to be agreed upon by the Conference of the Parties, and consistent with the
guidelines for the preparation of national communications adopted by the Conference of the
Parties;
(b) Formulate, implement, publish and regularly update national and, where appropriate,
regional programmes containing measures to mitigate climate change and measures to
facilitate adequate adaptation to climate change:
(i) Such programmes would, inter alia, concern the energy, transport and industry sectors as
well as agriculture, forestry and waste management. Furthermore, adaptation technologies
and methods for improving spatial planning would improve adaptation to climate change; and
(ii) Parties included in Annex I shall submit information on action under this Protocol,
including national programmes, in accordance with Article 7; and other Parties shall seek to
include in their national communications, as appropriate, information on programmes which
contain measures that the Party believes contribute to addressing climate change and its
adverse impacts, including the abatement of increases in greenhouse gas emissions, and
enhancement of and removals by sinks, capacity building and adaptation measures;
(c) Cooperate in the promotion of effective modalities for the development, application and
-277- Asian Biomass Handbook
diffusion of, and take all practicable steps to promote, facilitate and finance, as appropriate, the
transfer of, or access to, environmentally sound technologies, know-how, practices and
processes pertinent to climate change, in particular to developing countries, including the
formulation of policies and programmes for the effective transfer of environmentally sound
technologies that are publicly owned or in the public domain and the creation of an enabling
environment for the private sector, to promote and enhance the transfer of, and access to,
environmentally sound technologies;
(d) Cooperate in scientific and technical research and promote the maintenance and the
development of systematic observation systems and development of data archives to reduce
uncertainties related to the climate system, the adverse impacts of climate change and the
economic and social consequences of various response strategies, and promote the development
and strengthening of endogenous capacities and capabilities to participate in international and
intergovernmental efforts, programmes and networks on research and systematic observation,
taking into account Article 5 of the Convention;
(e) Cooperate in and promote at the international level, and, where appropriate, using existing
bodies, the development and implementation of education and training programmes, including
the strengthening of national capacity building, in particular human and institutional
capacities and the exchange or secondment of personnel to train experts in this field, in
particular for developing countries, and facilitate at the national level public awareness of, and
public access to information on, climate change. Suitable modalities should be developed to
implement these activities through the relevant bodies of the Convention, taking into account
Article 6 of the Convention;
(f) Include in their national communications information on programmes and activities
undertaken pursuant to this Article in accordance with relevant decisions of the Conference of
the Parties; and
(g) Give full consideration, in implementing the commitments under this Article, to Article 4,
paragraph 8, of the Convention.
-278- Asian Biomass Handbook
Article 11
1. In the implementation of Article 10, Parties shall take into account the provisions of Article 4,
paragraphs 4, 5, 7, 8 and 9, of the Convention.
2. In the context of the implementation of Article 4, paragraph 1, of the Convention, in
accordance with the provisions of Article 4, paragraph 3, and Article 11 of the Convention, and
through the entity or entities entrusted with the operation of the financial mechanism of the
Convention, the developed country Parties and other developed Parties included in Annex II to
the Convention shall:
(a) Provide new and additional financial resources to meet the agreed full costs incurred by
developing country Parties in advancing the implementation of existing commitments under
Article 4, paragraph 1(a), of the Convention that are covered in Article 10, subparagraph (a);
and
(b) Also provide such financial resources, including for the transfer of technology, needed by the
developing country Parties to meet the agreed full incremental costs of advancing the
implementation of existing commitments under Article 4, paragraph 1, of the Convention that
are covered by Article 10 and that are agreed between a developing country Party and the
international entity or entities referred to in Article 11 of the Convention, in accordance with
that Article.
The implementation of these existing commitments shall take into account the need for
adequacy and predictability in the flow of funds and the importance of appropriate burden
sharing among developed country Parties. The guidance to the entity or entities entrusted with
the operation of the financial mechanism of the Convention in relevant decisions of the
Conference of the Parties, including those agreed before the adoption of this Protocol, shall
apply mutatis mutandis to the provisions of this paragraph.
3. The developed country Parties and other developed Parties in Annex II to the Convention
may also provide, and developing country Parties avail themselves of, financial resources for
the implementation of Article 10, through bilateral, regional and other multilateral channels.
-279- Asian Biomass Handbook
Article 12
1. A clean development mechanism is hereby defined.
2. The purpose of the clean development mechanism shall be to assist Parties not included in
Annex I in achieving sustainable development and in contributing to the ultimate objective of
the Convention, and to assist Parties included in Annex I in achieving compliance with their
quantified emission limitation and reduction commitments under Article 3.
3. Under the clean development mechanism:
(a) Parties not included in Annex I will benefit from project activities resulting in certified
emission reductions; and
(b) Parties included in Annex I may use the certified emission reductions accruing from such
project activities to contribute to compliance with part of their quantified emission limitation
and reduction commitments under Article 3, as determined by the Conference of the Parties
serving as the meeting of the Parties to this Protocol.
4. The clean development mechanism shall be subject to the authority and guidance of the
Conference of the Parties serving as the meeting of the Parties to this Protocol and be
supervised by an executive board of the clean development mechanism.
5. Emission reductions resulting from each project activity shall be certified by operational
entities to be designated by the Conference of the Parties serving as the meeting of the Parties
to this Protocol, on the basis of:
(a) Voluntary participation approved by each Party involved;
(b) Real, measurable, and long-term benefits related to the mitigation of climate change; and
(c) Reductions in emissions that are additional to any that would occur in the absence of the
certified project activity.

-280- Asian Biomass Handbook
6. The clean development mechanism shall assist in arranging funding of certified project
activities as necessary.
7. The Conference of the Parties serving as the meeting of the Parties to this Protocol shall, at
its first session, elaborate modalities and procedures with the objective of ensuring
transparency, efficiency and accountability through independent auditing and verification of
project activities.
8. The Conference of the Parties serving as the meeting of the Parties to this Protocol shall
ensure that a share of the proceeds from certified project activities is used to cover
administrative expenses as well as to assist developing country Parties that are particularly
vulnerable to the adverse effects of climate change to meet the costs of adaptation.
9. Participation under the clean development mechanism, including in activities mentioned in
paragraph 3(a) above and in the acquisition of certified emission reductions, may involve
private and/or public entities, and is to be subject to whatever guidance may be provided by the
executive board of the clean development mechanism.
10. Certified emission reductions obtained during the period from the year 2000 up to the
beginning of the first commitment period can be used to assist in achieving compliance in the
first commitment period.
Article 13
1. The Conference of the Parties, the supreme body of the Convention, shall serve as the
meeting of the Parties to this Protocol.
2. Parties to the Convention that are not Parties to this Protocol may participate as observers
in the proceedings of any session of the Conference of the Parties serving as the meeting of the
Parties to this Protocol. When the Conference of the Parties serves as the meeting of the
Parties to this Protocol, decisions under this Protocol shall be taken only by those that are
Parties to this Protocol.

-281- Asian Biomass Handbook
3. When the Conference of the Parties serves as the meeting of the Parties to this Protocol, any
member of the Bureau of the Conference of the Parties representing a Party to the Convention
but, at that time, not a Party to this Protocol, shall be replaced by an additional member to be
elected by and from amongst the Parties to this Protocol.
4. The Conference of the Parties serving as the meeting of the Parties to this Protocol shall
keep under regular review the implementation of this Protocol and shall make, within its
mandate, the decisions necessary to promote its effective implementation. It shall perform the
functions assigned to it by this Protocol and shall:
(a) Assess, on the basis of all information made available to it in accordance with the provisions
of this Protocol, the implementation of this Protocol by the Parties, the overall effects of the
measures taken pursuant to this Protocol, in particular environmental, economic and social
effects as well as their cumulative impacts and the extent to which progress towards the
objective of the Convention is being achieved;
(b) Periodically examine the obligations of the Parties under this Protocol, giving due
consideration to any reviews required by Article 4, paragraph 2(d), and Article 7, paragraph 2,
of the Convention, in the light of the objective of the Convention, the experience gained in its
implementation and the evolution of scientific and technological knowledge, and in this respect
consider and adopt regular reports on the implementation of this Protocol;
(c) Promote and facilitate the exchange of information on measures adopted by the Parties to
address climate change and its effects, taking into account the differing circumstances,
responsibilities and capabilities of the Parties and their respective commitments under this
Protocol;
(d) Facilitate, at the request of two or more Parties, the coordination of measures adopted by
them to address climate change and its effects, taking into account the differing circumstances,
responsibilities and capabilities of the Parties and their respective commitments under this
Protocol;
(e) Promote and guide, in accordance with the objective of the Convention and the provisions of

-282- Asian Biomass Handbook
this Protocol, and taking fully into account the relevant decisions by the Conference of the
Parties, the development and periodic refinement of comparable methodologies for the effective
implementation of this Protocol, to be agreed on by the Conference of the Parties serving as the
meeting of the Parties to this Protocol;
(f) Make recommendations on any matters necessary for the implementation of this Protocol;
(g) Seek to mobilize additional financial resources in accordance with
Article 11, paragraph 2;
(h) Establish such subsidiary bodies as are deemed necessary for the implementation of this
Protocol;
(i) Seek and utilize, where appropriate, the services and cooperation of, and information
provided by, competent international organizations and intergovernmental and
non-governmental bodies; and
(j) Exercise such other functions as may be required for the implementation of this Protocol,
and consider any assignment resulting from a decision by the Conference of the Parties.
5. The rules of procedure of the Conference of the Parties and financial procedures applied
under the Convention shall be applied mutatis mutandis under this Protocol, except as may be
otherwise decided by consensus by the Conference of the Parties serving as the meeting of the
Parties to this Protocol.
6. The first session of the Conference of the Parties serving as the meeting of the Parties to this
Protocol shall be convened by the secretariat in conjunction with the first session of the
Conference of the Parties that is scheduled after the date of the entry into force of this Protocol.
Subsequent ordinary sessions of the Conference of the Parties serving as the meeting of the
Parties to this Protocol shall be held every year and in conjunction with ordinary sessions of
the Conference of the Parties, unless otherwise decided by the Conference of the Parties
serving as the meeting of the Parties to this Protocol.
-283- Asian Biomass Handbook
7. Extraordinary sessions of the Conference of the Parties serving as the meeting of the Parties
to this Protocol shall be held at such other times as may be deemed necessary by the
Conference of the Parties serving as the meeting of the Parties to this Protocol, or at the
written request of any Party, provided that, within six months of the request being
communicated to the Parties by the secretariat, it is supported by at least one third of the
Parties.
8. The United Nations, its specialized agencies and the International Atomic Energy
Agency, as well as any State member thereof or observers thereto not party to the Convention,
may be represented at sessions of the Conference of the Parties serving as the meeting of the
Parties to this Protocol as observers. Any body or agency, whether national or international,
governmental or non-governmental, which is qualified in matters covered by this Protocol and
which has informed the secretariat of its wish to be represented at a session of the Conference
of the Parties serving as the meeting of the Parties to this Protocol as an observer, may be so
admitted unless at least one third of the Parties present object. The admission and
participation of observers shall be subject to the rules of procedure, as referred to in paragraph
5 above.
Article 14
1. The secretariat established by Article 8 of the Convention shall serve as the secretariat of
this Protocol.
2. Article 8, paragraph 2, of the Convention on the functions of the secretariat, and Article 8,
paragraph 3, of the Convention on arrangements made for the functioning of the secretariat,
shall apply mutatis mutandis to this Protocol. The secretariat shall, in addition, exercise the
functions assigned to it under this Protocol.
Article 15
1. The Subsidiary Body for Scientific and Technological Advice and the Subsidiary Body for
Implementation established by Articles 9 and 10 of the Convention shall serve as, respectively,

-284- Asian Biomass Handbook
the Subsidiary Body for Scientific and Technological Advice and the Subsidiary Body for
Implementation of this Protocol. The provisions relating to the functioning of these two bodies
under the Convention shall apply mutatis mutandis to this Protocol. Sessions of the meetings
of the Subsidiary Body for Scientific and Technological Advice and the Subsidiary Body for
Implementation of this Protocol shall be held in conjunction with the meetings of, respectively,
the Subsidiary Body for Scientific and Technological Advice and the Subsidiary Body for
Implementation of the Convention.
2. Parties to the Convention that are not Parties to this Protocol may participate as observers
in the proceedings of any session of the subsidiary bodies. When the subsidiary bodies serve as
the subsidiary bodies of this Protocol, decisions under this Protocol shall be taken only by those
that are Parties to this Protocol.
3. When the subsidiary bodies established by Articles 9 and 10 of the Convention exercise their
functions with regard to matters concerning this Protocol, any member of the Bureaux of those
subsidiary bodies representing a Party to the Convention but, at that time, not a party to this
Protocol, shall be replaced by an additional member to be elected by and from amongst the
Parties to this Protocol.
Article 16
The Conference of the Parties serving as the meeting of the Parties to this Protocol shall, as
soon as practicable, consider the application to this Protocol of, and modify as appropriate, the
multilateral consultative process referred to in Article 13 of the Convention, in the light of any
relevant decisions that may be taken by the Conference of the Parties. Any multilateral
consultative process that may be applied to this Protocol shall operate without prejudice to the
procedures and mechanisms established in accordance with Article 18.
Article 17
The Conference of the Parties shall define the relevant principles, modalities, rules and
guidelines, in particular for verification, reporting and accountability for emissions trading.
The Parties included in Annex B may participate in emissions trading for the purposes of

-285- Asian Biomass Handbook
fulfilling their commitments under Article 3. Any such trading shall be supplemental to
domestic actions for the purpose of meeting quantified emission limitation and reduction
commitments under that Article.
Article 18
The Conference of the Parties serving as the meeting of the Parties to this Protocol shall, at its
first session, approve appropriate and effective procedures and mechanisms to determine and
to address cases of non-compliance with the provisions of this Protocol, including through the
development of an indicative list of consequences, taking into account the cause, type, degree
and frequency of non-compliance. Any procedures and mechanisms under this Article entailing
binding consequences shall be adopted by means of an amendment to this Protocol.
Article 19
The provisions of Article 14 of the Convention on settlement of disputes shall apply mutatis
mutandis to this Protocol.
Article 20
1. Any Party may propose amendments to this Protocol.
2. Amendments to this Protocol shall be adopted at an ordinary session of the Conference of the
Parties serving as the meeting of the Parties to this Protocol. The text of any proposed
amendment to this Protocol shall be communicated to the Parties by the secretariat at least six
months before the meeting at which it is proposed for adoption. The secretariat shall also
communicate the text of any proposed amendments to the Parties and signatories to the
Convention and, for information, to the Depositary.
3. The Parties shall make every effort to reach agreement on any proposed amendment to this
Protocol by consensus. If all efforts at consensus have been exhausted, and no agreement
reached, the amendment shall as a last resort be adopted by a three-fourths majority vote of
the Parties present and voting at the meeting. The adopted amendment shall be communicated

-286- Asian Biomass Handbook
by the secretariat to the Depositary, who shall circulate it to all Parties for their acceptance.
4. Instruments of acceptance in respect of an amendment shall be deposited with the
Depositary. An amendment adopted in accordance with paragraph 3 above shall enter into
force for those Parties having accepted it on the ninetieth day after the date of receipt by the
Depositary of an instrument of acceptance by at least three fourths of the Parties to this
Protocol.
5. The amendment shall enter into force for any other Party on the ninetieth day after the date
on which that Party deposits with the Depositary its instrument of acceptance of the said
amendment.
Article 21
1. Annexes to this Protocol shall form an integral part thereof and, unless otherwise expressly
provided, a reference to this Protocol constitutes at the same time a reference to any annexes
thereto. Any annexes adopted after the entry into force of this Protocol shall be restricted to
lists, forms and any other material of a descriptive nature that is of a scientific, technical,
procedural or administrative character.
2. Any Party may make proposals for an annex to this Protocol and may propose amendments
to annexes to this Protocol.
3. Annexes to this Protocol and amendments to annexes to this Protocol shall be adopted at an
ordinary session of the Conference of the Parties serving as the meeting of the Parties to this
Protocol. The text of any proposed annex or amendment to an annex shall be communicated to
the Parties by the secretariat at least six months before the meeting at which it is proposed for
adoption. The secretariat shall also communicate the text of any proposed annex or
amendment to an annex to the Parties and signatories to the Convention and, for information,
to the Depositary.
4. The Parties shall make every effort to reach agreement on any proposed annex or amendment to an annex by consensus. If all efforts at consensus have been exhausted, and no

-287- Asian Biomass Handbook
agreement reached, the annex or amendment to an annex shall as a last resort be adopted by a three-fourths majority vote of the Parties present and voting at the meeting. The adopted annex or amendment to an annex shall be communicated by the secretariat to the Depositary, who shall circulate it to all Parties for their acceptance. 5. An annex, or amendment to an annex other than Annex A or B, that has been adopted in accordance with paragraphs 3 and 4 above shall enter into force for all Parties to this Protocol six months after the date of the communication by the Depositary to such Parties of the adoption of the annex or adoption of the amendment to the annex, except for those Parties that have notified the Depositary, in writing, within that period of their non-acceptance of the annex or amendment to the annex. The annex or amendment to an annex shall enter into force for Parties which withdraw their notification of non-acceptance on the ninetieth day after the date on which withdrawal of such notification has been received by the Depositary. 6. If the adoption of an annex or an amendment to an annex involves an amendment to this Protocol, that annex or amendment to an annex shall not enter into force until such time as the amendment to this Protocol enters into force. 7. Amendments to Annexes A and B to this Protocol shall be adopted and enter into force in accordance with the procedure set out in Article 20, provided that any amendment to Annex B shall be adopted only with the written consent of the Party concerned. Article 22 1. Each Party shall have one vote, except as provided for in paragraph 2 below. 2. Regional economic integration organizations, in matters within their competence, shall exercise their right to vote with a number of votes equal to the number of their member States that are Parties to this Protocol. Such an organization shall not exercise its right to vote if any of its member States exercises its right, and vice versa. Article 23 The Secretary-General of the United Nations shall be the Depositary of this Protocol.
-288- Asian Biomass Handbook
Article 24
1. This Protocol shall be open for signature and subject to ratification, acceptance or approval
by States and regional economic integration organizations which are Parties to the Convention.
It shall be open for signature at United Nations Headquarters in New York from
16 March 1998 to 15 March 1999. This Protocol shall be open for accession from the day after
the date on which it is closed for signature. Instruments of ratification, acceptance, approval or
accession shall be deposited with the Depositary.
2. Any regional economic integration organization which becomes a Party to this Protocol
without any of its member States being a Party shall be bound by all the obligations under this
Protocol. In the case of such organizations, one or more of whose member States is a Party to
this Protocol, the organization and its member States shall decide on their respective
responsibilities for the performance of their obligations under this Protocol. In such cases, the
organization and the member States shall not be entitled to exercise rights under this Protocol
concurrently.
3. In their instruments of ratification, acceptance, approval or accession, regional economic
integration organizations shall declare the extent of their competence with respect to the
matters governed by this Protocol. These organizations shall also inform the Depositary, who
shall in turn inform the Parties, of any substantial modification in the extent of their
competence.
Article 25
1. This Protocol shall enter into force on the ninetieth day after the date on which not less than
55 Parties to the Convention, incorporating Parties included in Annex I which accounted in
total for at least 55 per cent of the total carbon dioxide emissions for 1990 of the Parties
included in Annex I, have deposited their instruments of ratification, acceptance, approval or
accession.
2. For the purposes of this Article, "the total carbon dioxide emissions for 1990 of the Parties
included in Annex I" means the amount communicated on or before the date of adoption of this
-289- Asian Biomass Handbook
Protocol by the Parties included in Annex I in their first national communications submitted in
accordance with Article 12 of the Convention.
3. For each State or regional economic integration organization that ratifies, accepts or
approves this Protocol or accedes thereto after the conditions set out in paragraph 1 above for
entry into force have been fulfilled, this Protocol shall enter into force on the ninetieth day
following the date of deposit of its instrument of ratification, acceptance, approval or accession.
4. For the purposes of this Article, any instrument deposited by a regional economic integration
organization shall not be counted as additional to those deposited by States members of the
organization.
Article 26
No reservations may be made to this Protocol.
Article 27
1. At any time after three years from the date on which this Protocol has entered into force for a
Party, that Party may withdraw from this Protocol by giving written notification to the
Depositary.
2. Any such withdrawal shall take effect upon expiry of one year from the date of receipt by the
Depositary of the notification of withdrawal, or on such later date as may be specified in the
notification of withdrawal.
3. Any Party that withdraws from the Convention shall be considered as also having
withdrawn from this Protocol.
Article 28
The original of this Protocol, of which the Arabic, Chinese, English, French, Russian and

-290- Asian Biomass Handbook
Spanish texts are equally authentic, shall be deposited with the Secretary-General of the
United Nations.
DONE at Kyoto this eleventh day of December one thousand nine hundred and ninety-seven.
IN WITNESS WHEREOF the undersigned, being duly authorized to that effect, have affixed
their signatures to this Protocol on the dates indicated.

-291- Asian Biomass Handbook
Annex A Annex B
Party Quantified emission limitation or
reduction commitment (percentage
of base year or period)
Australia 108 Austria 92 Belgium 92 Bulgaria* 92 Canada 94 Croatia* 95 Czech Republic* 92
Denmark 92 Estonia* 92 European Community 92
Finland 92 France 92 Germany 92 Greece 92 Hungary* 94 Iceland 110 Ireland 92 Italy 92 Japan 94 Latvia* 92 Liechtenstein 92 Lithuania* 92 Luxembourg 92 Monaco 92 Netherlands 92 New Zealand 100 Norway 101 Poland* 94 Portugal 92 Romania* 92 Russian Federation* 100
Greenhouse gases Carbon dioxide (CO2) Methane (CH4) Nitrous oxide (N2O) Hydrofluorocarbons (HFCs) Perfluorocarbons (PFCs) Sulphur hexafluoride (SF6)
Sectors/source categories Energy Fuel combustion Energy industries Manufacturing industries and construction Transport Other sectors Other
Fugitive emissions from fuels Solid fuels Oil and natural gas Other Industrial processes Mineral products Chemical industry Metal production Other production Production of halocarbons and sulphur hexafluoride Consumption of halocarbons and sulphur hexafluoride Other
Solvent and other product use Agriculture Enteric fermentation Manure management Rice cultivation Agricultural soils Prescribed burning of Slovakia* 92
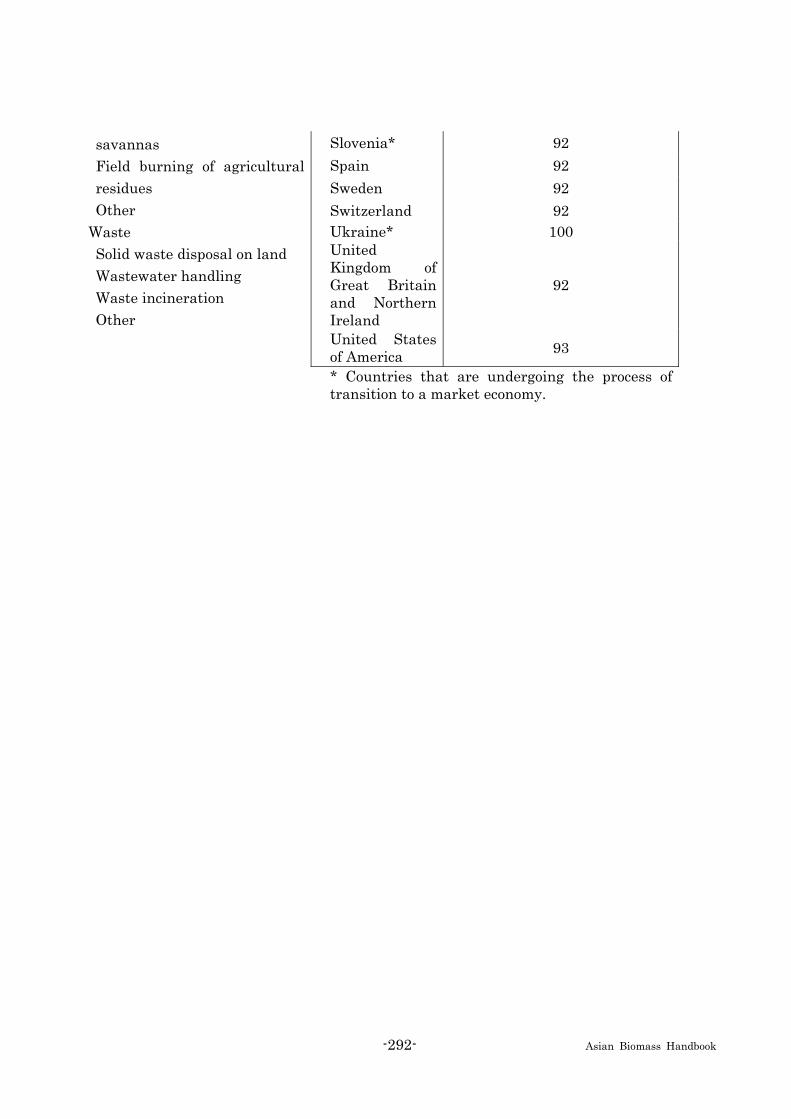
-292- Asian Biomass Handbook
Slovenia* 92 Spain 92 Sweden 92 Switzerland 92 Ukraine* 100 United Kingdom of Great Britain and Northern Ireland
92
United States of America 93
savannas Field burning of agricultural residues Other
Waste Solid waste disposal on land Wastewater handling Waste incineration Other
* Countries that are undergoing the process of transition to a market economy.
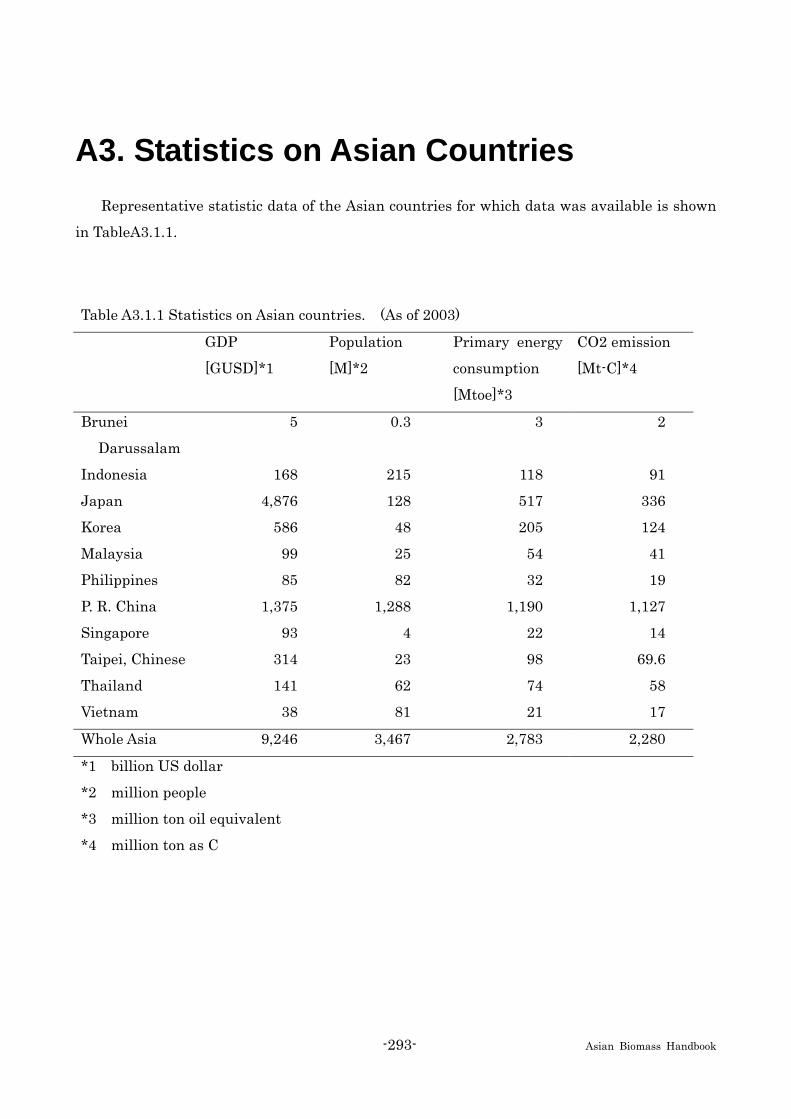
-293- Asian Biomass Handbook
A3. Statistics on Asian Countries
Representative statistic data of the Asian countries for which data was available is shown
in TableA3.1.1.
Table A3.1.1 Statistics on Asian countries. (As of 2003)
GDP
[GUSD]*1
Population
[M]*2
Primary energy
consumption
[Mtoe]*3
CO2 emission
[Mt-C]*4
Brunei
Darussalam
5 0.3 3 2
Indonesia 168 215 118 91
Japan 4,876 128 517 336
Korea 586 48 205 124
Malaysia 99 25 54 41
Philippines 85 82 32 19
P. R. China 1,375 1,288 1,190 1,127
Singapore 93 4 22 14
Taipei, Chinese 314 23 98 69.6
Thailand 141 62 74 58
Vietnam 38 81 21 17
Whole Asia 9,246 3,467 2,783 2,280
*1 billion US dollar
*2 million people
*3 million ton oil equivalent
*4 million ton as C

-294- Asian Biomass Handbook
A4. Unit Conversion
Literatures of biomass is found in many fields, and sometimes, unfamiliar units are used.
Since utilization of SI unit is recommended, SI unit is explained first, and then conversion with
other units is explained in this part. If you can read Japanese, books by Koizumi and Ebihara
are useful.
A4.1 SI Unit System
Utilization of SI Unit Systems was recommended at the International at the General
Conference on Weights and Measures in 1960, and many countries including Japan officially
employs this unit system. SI unit system is composed of seven base units, and derived units,
which are derived by combining these base units. It also employs prefixes to express integer
power of 10 to be multiplied to the base unit. The following are the list of these units.
Table A4.1.1 SI base units
Base quantity Symbol (name) Base quantity Symbol (name)
Length m (meter) Thermodynamic temperature
K (kelvin)
Mass kg (kilogram) Amount of substance
mol (mole)
Time s (second) Luminous intensity cd (candela)
Electric current A (ampere)

-295- Asian Biomass Handbook
Table A4.1.3 Representative SI derived units
Base quantity Symbol (name) Expression in terms of SI base
units
Force N (newton) m kg s-2
Pressure Pa (pascal) N m-2 = m-1 kg s-2
Energy, work J (joule) N m = m2 kg s-2
Power W (watt) J s-1 = m2 kg s-3
Table A4.1.2 Units for angles
Base quantity Symbol (name)
Plane angle rad (radian)
Solid angle sr (steradian)
*1 To understand the concept of solid angle, consider the light emitted from a
flash light. How wide the light is emitted it the solid angle. Considering a
sphere with radius R whose center is the light source, 1 sr of solid angle is the
wideness of the light when the light forms area or R2 on the sphere.
*2 These units were originally supplementary units, but became derived units
in 1995.

-296- Asian Biomass Handbook
TableA4. 1.4 SI prefixes
Symbol (name) Factor Symbol (name) Factor
da (deca) 101 d (deci) 10-1
h (hector) 102 c (centi) 10-2
k (kilo) 103 m (milli) 10-3
M (mega) 106 � (micro) 10-6
G (giga) 109 n (nano) 10-9
T (tera) 1012 p (pico) 10-12
P (peta) 1015 f (femto) 10-15
E (exa) 1018 a (atto) 10-18
Z (zetta) 1021 z (zepto) 10-21
Y (yotta) 1024 y (yocto) 10-24
*1 When possible, choose a prefix so that preceding number falls in 0.1-1000. For example,
50 pm is recommended, not 0.05 nm.
*2 The base unit of mass is "kg", but the prefix is added to "g". For example, 29 mg is used,
not 20 mkg.
*3 To produce derived units formed from multiple units, only on prefix is used. For
example, 20 kg/m2 is used, not 20 kg/m2. The exception is “kg.” For example, 21 MJ/kg
is used, not 21 kJ/g.
-297- Asian Biomass Handbook
A4.2 Unit conversion
Although using SI unit system is recommended, in the field of energy, traditional unit such
as “barrel” or “ton oil equivalent” are often used even today. Conversion of unit is also needed
when reading old literature.
When a quantity in one unit is to be expressed in another unit, a conversion formula is
needed. For example, temperature in oC CT is converted to temperature in K KT by the
following formula.
15.273+= CK TT
When the conversion formula takes the form of the proportional equation, the
proportionality constant is called conversion factor. For example, in the conversion formula
to convert length in in (inch) to length in m (meter)
inm LL 21054.2 −×= ,
the conversion factor is m/in1054.2 2−× .
To convert derived units formed from multiple units, substitute the original unit with the
corresponding conversion formulae. For example, to convert 1 500 ft/h to a value in m/s,
m10048.3ft1 1−×= and s6003h1 = are used as follows.
( ) ( )s6003m10048.35001ft/h5001 1−×=
( ) ( ) ( ) m/s600310048.35001 1−×=
m/s127.0= To convert an equation expressed in one unit system to the equation expressed in another
unit system, substitute the conversion formulae to the variables in the equation. For example,
when the following formula for water vapor pressure

-298- Asian Biomass Handbook
( )C
Torr Tp
+−=
02.22744.381630363.18ln
is to be converted to SI unit systems, the conversion forumulae
PaTorr pp 31050062.7 −×=
15.273−= KC TT
are substituted. Then,
( ) ( )15.27302.22744.381630363.181050062.7ln 3
−+−=× −
KPa T
p
( )K
Pa Tp
+−−=+× −
15.27302.22744.381630363.18ln1050062.7ln 3
( )K
Pa Tp
+−−×−= −
15.27302.22744.38161050062.7ln30363.18ln 3
and finally,
KPa T
p+−
−=13.46
44.38161964.23ln
is obtained.
In the following pages are shown the tables of conversion factors. The horizontal line
shows the same quantity. Fortran expression is employed where 3.937×101 is expressed as
3.9370E+01 and so on. For example, the first line of the Table A4.2.1 means
in39.37ft 3.2808m1 == Table A4.2.1 Conversion factors for length
m ft in
1 3.2808E+00 3.9370E+01
3.0480E-01 1 1.2000E+01
2.5400E-02 8.3333E-02 1
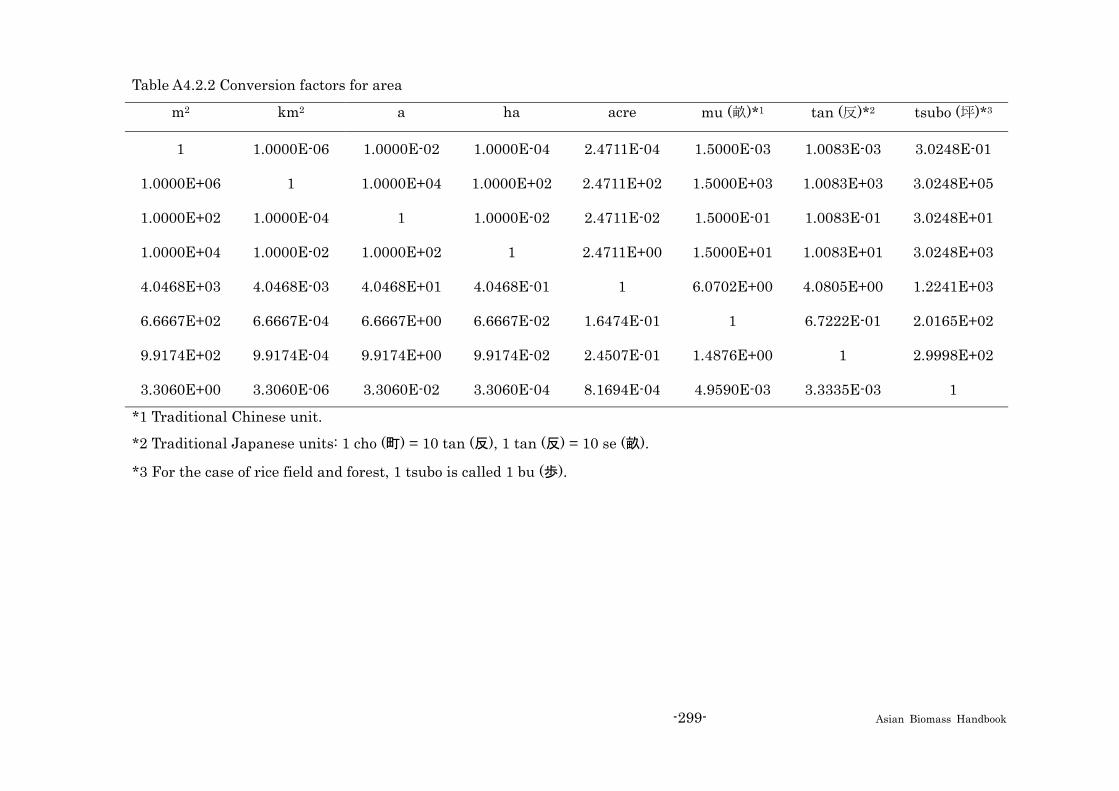
-299- Asian Biomass Handbook
Table A4.2.2 Conversion factors for area
m2 km2 a ha acre mu (畝)*1 tan (反)*2 tsubo (坪)*3
1 1.0000E-06 1.0000E-02 1.0000E-04 2.4711E-04 1.5000E-03 1.0083E-03 3.0248E-01
1.0000E+06 1 1.0000E+04 1.0000E+02 2.4711E+02 1.5000E+03 1.0083E+03 3.0248E+05
1.0000E+02 1.0000E-04 1 1.0000E-02 2.4711E-02 1.5000E-01 1.0083E-01 3.0248E+01
1.0000E+04 1.0000E-02 1.0000E+02 1 2.4711E+00 1.5000E+01 1.0083E+01 3.0248E+03
4.0468E+03 4.0468E-03 4.0468E+01 4.0468E-01 1 6.0702E+00 4.0805E+00 1.2241E+03
6.6667E+02 6.6667E-04 6.6667E+00 6.6667E-02 1.6474E-01 1 6.7222E-01 2.0165E+02
9.9174E+02 9.9174E-04 9.9174E+00 9.9174E-02 2.4507E-01 1.4876E+00 1 2.9998E+02
3.3060E+00 3.3060E-06 3.3060E-02 3.3060E-04 8.1694E-04 4.9590E-03 3.3335E-03 1
*1 Traditional Chinese unit.
*2 Traditional Japanese units: 1 cho (町) = 10 tan (反), 1 tan (反) = 10 se (畝).
*3 For the case of rice field and forest, 1 tsubo is called 1 bu (歩).
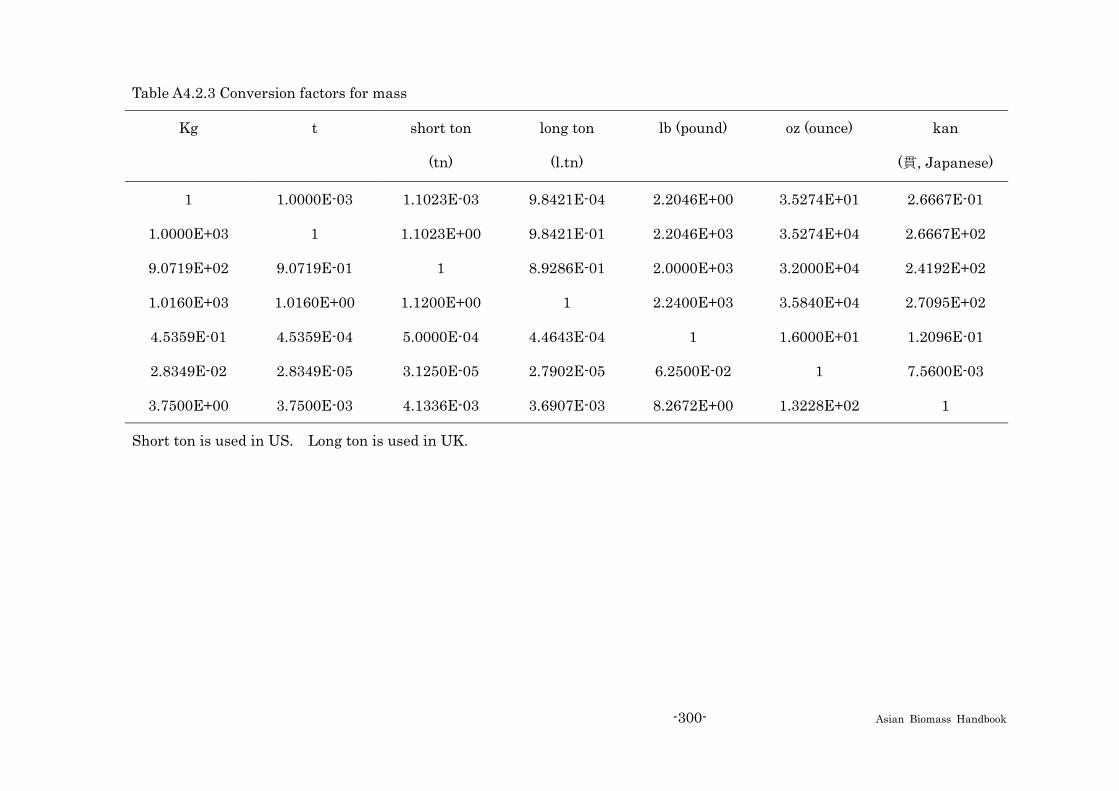
-300- Asian Biomass Handbook
Table A4.2.3 Conversion factors for mass
Kg t short ton
(tn)
long ton
(l.tn)
lb (pound) oz (ounce) kan
(貫, Japanese)
1 1.0000E-03 1.1023E-03 9.8421E-04 2.2046E+00 3.5274E+01 2.6667E-01
1.0000E+03 1 1.1023E+00 9.8421E-01 2.2046E+03 3.5274E+04 2.6667E+02
9.0719E+02 9.0719E-01 1 8.9286E-01 2.0000E+03 3.2000E+04 2.4192E+02
1.0160E+03 1.0160E+00 1.1200E+00 1 2.2400E+03 3.5840E+04 2.7095E+02
4.5359E-01 4.5359E-04 5.0000E-04 4.4643E-04 1 1.6000E+01 1.2096E-01
2.8349E-02 2.8349E-05 3.1250E-05 2.7902E-05 6.2500E-02 1 7.5600E-03
3.7500E+00 3.7500E-03 4.1336E-03 3.6907E-03 8.2672E+00 1.3228E+02 1
Short ton is used in US. Long ton is used in UK.

-301- Asian Biomass Handbook
Table A4.2.4 Conversion factors for volume
m3 L ft3 US gallon UK gallon bbl koku (石)*1
1 1.0000E+03 3.5315E+01 2.6417E+02 2.1997E+02 6.2898E+00 5.5440E+03
1.0000E-03 1 3.5315E-02 2.6417E-01 2.1997E-01 6.2898E-03 5.5440E+00
2.8317E-02 2.8317E+01 1 7.4805E+00 6.2288E+00 1.7811E-01 1.5699E+02
3.7854E-03 3.7854E+00 1.3368E-01 1 8.3267E-01 2.3810E-02 2.0986E+01
4.5461E-03 4.5461E+00 1.6054E-01 1.2010E+00 1 2.8594E-02 2.5204E+01
1.5899E-01 1.5899E+02 5.6146E+00 4.2000E+01 3.4972E+01 1 8.8143E+02
1.8038E-04 1.8038E-01 6.3699E-03 4.7650E-02 3.9677E-02 1.1345E-03 1
*1 Traditional Japanese units: 1 koku (石) = 100 sho (升).
*2 Sometimes, the amount of gaseous substance is expressed using the unit of volume with “N”. This amount corresponds to
the amount of substance in the gas of the stated volume at normal state (0oC, 1.013x10⁵ Pa). For example, gas of 22.4 Nm3
corresponds to 1 kmol.
*3 For liter, “L” is recommended to distinguish from “I (capital i)” and “1 (one)”.
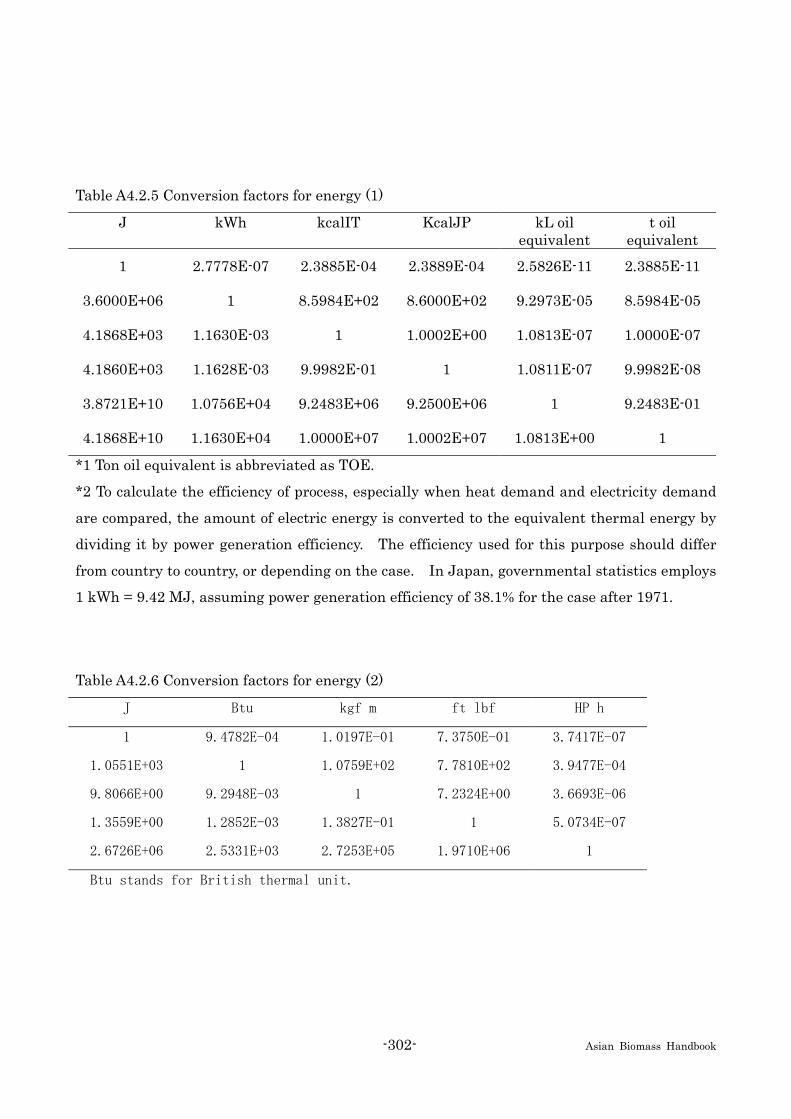
-302- Asian Biomass Handbook
Table A4.2.5 Conversion factors for energy (1)
J kWh kcalIT KcalJP kL oil equivalent
t oil equivalent
1 2.7778E-07 2.3885E-04 2.3889E-04 2.5826E-11 2.3885E-11
3.6000E+06 1 8.5984E+02 8.6000E+02 9.2973E-05 8.5984E-05
4.1868E+03 1.1630E-03 1 1.0002E+00 1.0813E-07 1.0000E-07
4.1860E+03 1.1628E-03 9.9982E-01 1 1.0811E-07 9.9982E-08
3.8721E+10 1.0756E+04 9.2483E+06 9.2500E+06 1 9.2483E-01
4.1868E+10 1.1630E+04 1.0000E+07 1.0002E+07 1.0813E+00 1
*1 Ton oil equivalent is abbreviated as TOE.
*2 To calculate the efficiency of process, especially when heat demand and electricity demand
are compared, the amount of electric energy is converted to the equivalent thermal energy by
dividing it by power generation efficiency. The efficiency used for this purpose should differ
from country to country, or depending on the case. In Japan, governmental statistics employs
1 kWh = 9.42 MJ, assuming power generation efficiency of 38.1% for the case after 1971.
Table A4.2.6 Conversion factors for energy (2)
J Btu kgf m ft lbf HP h
1 9.4782E-04 1.0197E-01 7.3750E-01 3.7417E-07
1.0551E+03 1 1.0759E+02 7.7810E+02 3.9477E-04
9.8066E+00 9.2948E-03 1 7.2324E+00 3.6693E-06
1.3559E+00 1.2852E-03 1.3827E-01 1 5.0734E-07
2.6726E+06 2.5331E+03 2.7253E+05 1.9710E+06 1
Btu stands for British thermal unit.

-303- Asian Biomass Handbook
Table A4.2.7 Conversion factors for pressure
Pa psi kgf/cm2 atm bar Torr
1 1.4499E-04 1.0194E-05 9.8697E-06 1.0000E-05 7.5010E-03
6.8971E+03 1 7.0307E-02 6.8073E-02 6.8971E-02 5.1735E+01
9.8100E+04 1.4223E+01 1 9.6822E-01 9.8100E-01 7.3585E+02
1.0132E+05 1.4690E+01 1.0328E+00 1 1.0132E+00 7.6000E+02
1.0000E+05 1.4499E+01 1.0194E+00 9.8697E-01 1 7.5010E+02
1.3332E+02 1.9329E-02 1.3590E-03 1.3158E-03 1.3332E-03 1
*1 1 Torr = 1mmHg. Also expressed as torr, but since this unit is named after a person’s name
(Torricelli), capitalization is recommended.
*2 There are two expression of pressure: absolute and gauge. The absolute and gauge
pressures are expressed by adding A and G after the unit, respectivelyThe absolute pressure is
measured from the absolute vacuum. The gauge pressure is measured from the atmospheric
pressure. Thus, the former is larger than the latter by 1 atm. For example, 5 atmG = 6
atmA.
Vacuum
Atmospheric pressure
101.325 kPa
Gauge pressure
Absolute pressure
Fig. 4.2.1 Absolute pressure and gauge pressure
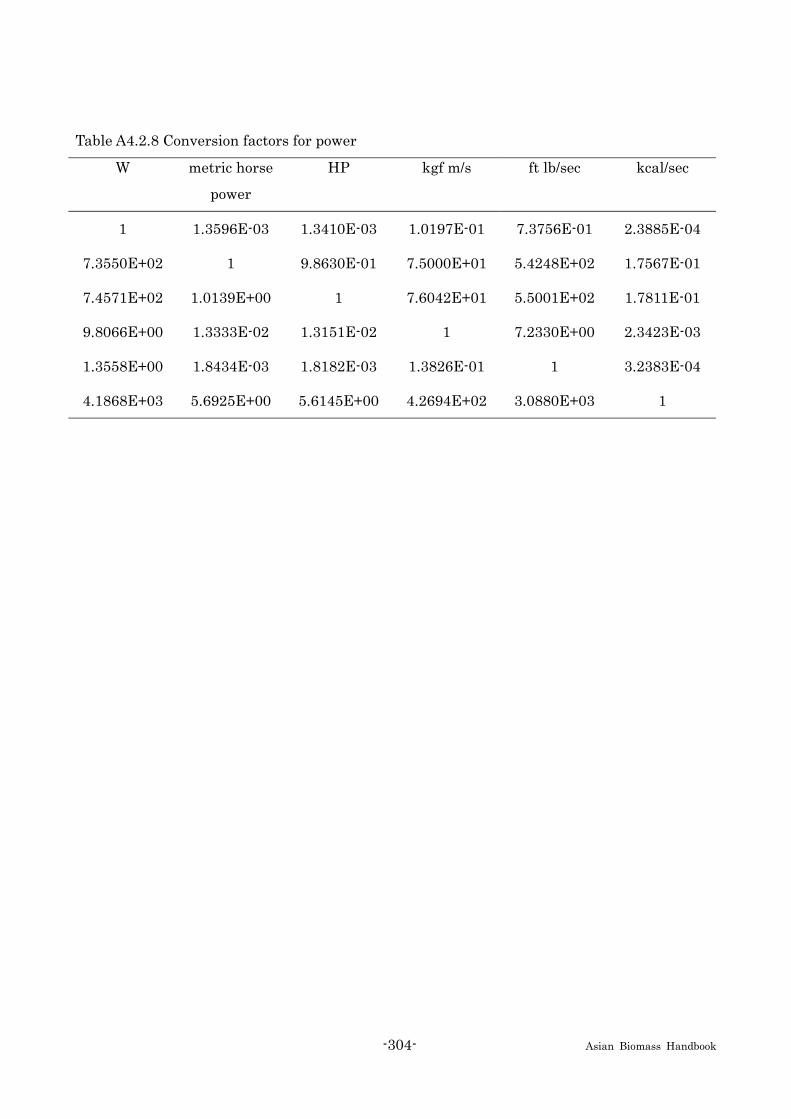
-304- Asian Biomass Handbook
Table A4.2.8 Conversion factors for power
W metric horse
power
HP kgf m/s ft lb/sec kcal/sec
1 1.3596E-03 1.3410E-03 1.0197E-01 7.3756E-01 2.3885E-04
7.3550E+02 1 9.8630E-01 7.5000E+01 5.4248E+02 1.7567E-01
7.4571E+02 1.0139E+00 1 7.6042E+01 5.5001E+02 1.7811E-01
9.8066E+00 1.3333E-02 1.3151E-02 1 7.2330E+00 2.3423E-03
1.3558E+00 1.8434E-03 1.8182E-03 1.3826E-01 1 3.2383E-04
4.1868E+03 5.6925E+00 5.6145E+00 4.2694E+02 3.0880E+03 1

-305- Asian Biomass Handbook
A4.3 Concentrations of alcohol and sugar
There exits various expression for the concentration of sugar and alcohol due to the tradition.
Ethanol production from sugar is an important technology for biomass use, but various units
are used from literature to literature. Special caution should be taken when reading
literatures.
A4.3.1 Concentration of alcohol The following units are used.
Molar concentraion: SI unit. Molar number of alcohol (ethanol) in 1 L of the solution. The unit
is mol(-EtOH)/L(-solution). Sometimes it is expressed as “M”.
Molal concentration: SI unit. Molar number of alcohol in 1 kg of solvent. The unit is
mol(-EtOH)/kg(-solvent). Sometimes it is expressed as “m”.
Volumetric percentage: The ratio of volume of alcohol before mixing to the sum of the volumes
of water and alcohol before mixing. Because the volume decreases by mixing of water and
alcohol, the volumes before mixing is employed as the base. The unit is expressed as vol%.
Proof (US): Used in US. The volumetric percentage is doubled.
Proof (British): Special measure with water being 100 proof under and pure alcohol being 75.1
proof over. When the volumetric percentage is w, the value in this unit is (w/57.1)×100-100.
Namely, for the alcohol concentration of 57.1 vol %, the British proof is zero.
A4.3.2 Concentration of sugar
Molar and molal concentration is defined in the same way as alcohol. However, make clear
which sugar is stated; mol-glucose, total mole of sugars available for ethanol fermentation,
monomer only, or monomer equivalent for monoer, dimer, trimer, etc.
Weight percentage: percentage of weight of sugar in 1 kg of solution. The unit is wt % or
mass %.
Brix: The same as weight percentage. However, this is not equivalent to the brix used as a
unit of density.
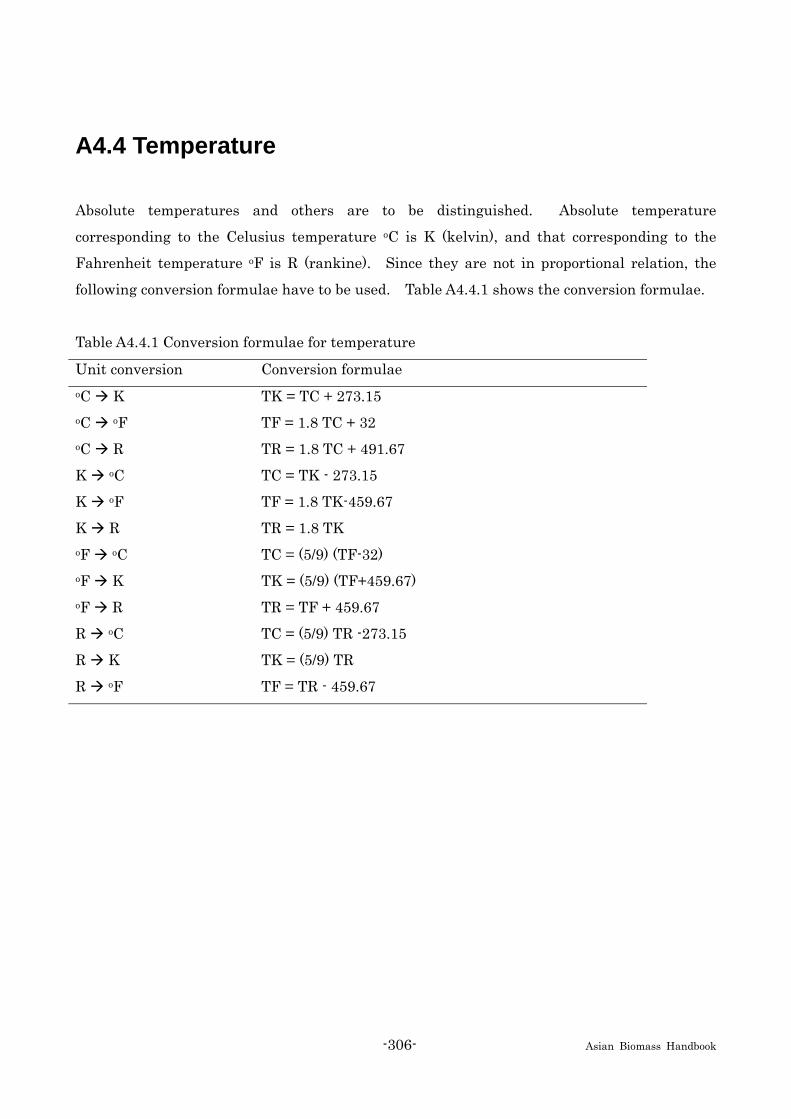
-306- Asian Biomass Handbook
A4.4 Temperature
Absolute temperatures and others are to be distinguished. Absolute temperature
corresponding to the Celusius temperature oC is K (kelvin), and that corresponding to the
Fahrenheit temperature oF is R (rankine). Since they are not in proportional relation, the
following conversion formulae have to be used. Table A4.4.1 shows the conversion formulae.
Table A4.4.1 Conversion formulae for temperature
Unit conversion Conversion formulae oC K TK = TC + 273.15 oC oF TF = 1.8 TC + 32 oC R TR = 1.8 TC + 491.67
K oC TC = TK - 273.15
K oF TF = 1.8 TK-459.67
K R TR = 1.8 TK oF oC TC = (5/9) (TF-32) oF K TK = (5/9) (TF+459.67) oF R TR = TF + 459.67
R oC TC = (5/9) TR -273.15
R K TK = (5/9) TR
R oF TF = TR - 459.67
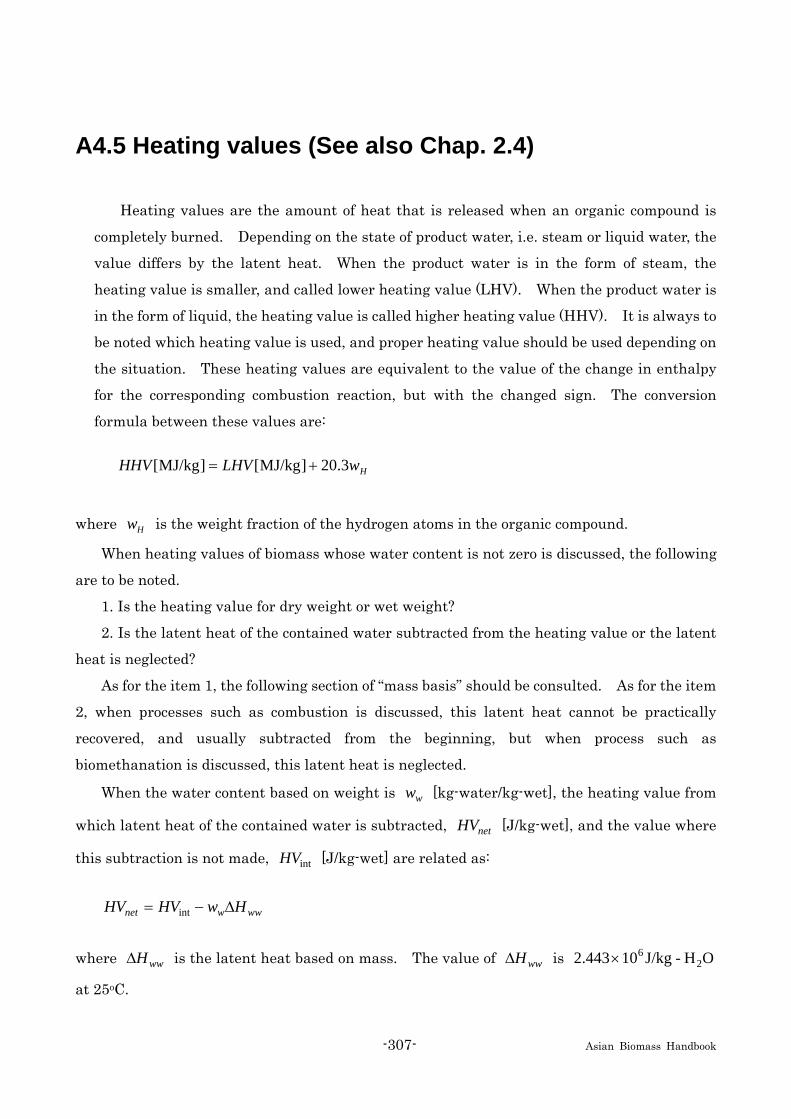
-307- Asian Biomass Handbook
A4.5 Heating values (See also Chap. 2.4)
Heating values are the amount of heat that is released when an organic compound is
completely burned. Depending on the state of product water, i.e. steam or liquid water, the
value differs by the latent heat. When the product water is in the form of steam, the
heating value is smaller, and called lower heating value (LHV). When the product water is
in the form of liquid, the heating value is called higher heating value (HHV). It is always to
be noted which heating value is used, and proper heating value should be used depending on
the situation. These heating values are equivalent to the value of the change in enthalpy
for the corresponding combustion reaction, but with the changed sign. The conversion
formula between these values are: HwLHVHHV 3.20]MJ/kg[]MJ/kg[ +=
where Hw is the weight fraction of the hydrogen atoms in the organic compound.
When heating values of biomass whose water content is not zero is discussed, the following
are to be noted.
1. Is the heating value for dry weight or wet weight?
2. Is the latent heat of the contained water subtracted from the heating value or the latent
heat is neglected?
As for the item 1, the following section of “mass basis” should be consulted. As for the item
2, when processes such as combustion is discussed, this latent heat cannot be practically
recovered, and usually subtracted from the beginning, but when process such as
biomethanation is discussed, this latent heat is neglected.
When the water content based on weight is ww [kg-water/kg-wet], the heating value from
which latent heat of the contained water is subtracted, netHV [J/kg-wet], and the value where
this subtraction is not made, intHV [J/kg-wet] are related as:
wwwnet HwHVHV Δ−= int
where wwHΔ is the latent heat based on mass. The value of wwHΔ is OH-J/kg10443.2 2
6×
at 25oC.

-308- Asian Biomass Handbook
A4.6 Weight basis
When characteristic value of biomass per unit weight is discussed, the caution should be
made for the following:
1. Is the unit weight with water, or without?
2. Is the unit weight with ash, or without?
When the biomass with low water and ash contents such as dry wood is discussed, the
effect of this difference is small. However, when biomass with high water and ash contents
such as sewage sludge is discussed, this effect is important. The relation between values
based on dry weight dbx and that based on wet weight wbx are expressed as following, using
weight fraction of water ww .
( ) ( ) ( )w
wb
w
wb
wwbdbdb w
xwmp
wmp
mpx
−=
−=
−==
11/
1
where, p is the physical value to be discussed, dbm and wbm are dry weight and wet
weight, respectively. Similarly, the relation between values based on weight free of ash afx ,
and that based on weight including ash, wax , are expressed as following, using weight fraction
of ash, ashw .
( ) ( ) ( )ash
wa
ash
wa
ashwaafaf w
xwmp
wmp
mpx
−=
−=
−==
11/
1
For example, when biomass with water content of 20 wt% is gasified, and gas production based
on wet weight is wet-/kgm75.0 3 , gas production based on dry weight is:
( ) dry-/kgm9375.02.01
75.0 3=−

-309- Asian Biomass Handbook
A4.7 Other comments
In the engineering field in US, the symbol “MM” is sometimes used. This corresponds to 106
from the fact that M expresses 1000 in Roman numeric system, and that 1000 x 1000 = 106.
For example, 500 MMG means 500 x 106 gallon = 500 million gallon.
When unfamiliar unit ending with M is found, it can mean some amount “per minute”. For
example, 200 rpm means 200 revolutions per minute, 4 GPM means 4 gallon per minute, and
35 ccm means 35 cubic centimeters per minute.

-310- Asian Biomass Handbook
A5. Atomic weight
A5.1 Atomic weight
Atomic weight is often needed in the calculation related biomass. Table A5.1.1 shows the
list of atomic weight. The values for C, H, O, N, S are often used.
Table A5.1.1 Atomic weight
Atomic number Symbol of element Element Atomic weight
[g/mol]
1 H Hydrogen 1.0079
2 He Helium 4.0026
3 Li Lithium 6.941
4 Be Beryllium 9.0122
5 B Boron 10.811
6 C Carbon 12.0107
7 N Nitrogen 14.0067
8 O Oxygen 15.9994
9 F Fluorine 18.9984
10 Ne Neon 20.1797
11 Na Sodium 22.9897
12 Mg Magnesium 24.305
13 Al Aluminum 26.9815
14 Si Silicon 28.0855
15 P Phosphorus 30.9738
16 S Sulfur 32.065
17 Cl Chlorine 35.453
18 Ar Argon 39.948
19 K Potassium 39.0983
20 Ca Calcium 40.078

-311- Asian Biomass Handbook
Table A5.1.1 Atomic weight (Continued)
Atomic number Symbol of element Element Atomic weight
[g/mol]
21 Sc Scandium 44.9559
22 Ti Titanium 47.867
23 V Vanadium 50.9415
24 Cr Chromium 51.9961
25 Mn Manganese 54.938
26 Fe Iron 55.845
27 Co Cobalt 58.9332
28 Ni Nickel 58.6934
29 Cu Copper 63.546
30 Zn Zinc 65.39
31 Ga Gallium 69.723
32 Ge Germanium 72.64
33 As Arsenic 74.9216
34 Se Selenium 78.96
35 Br Bromine 79.904
36 Kr Krypton 83.8
37 Rb Rubidium 85.4678
38 Sr Strontium 87.62
39 Y Yttrium 88.9059
40 Zr Zirconium 91.224
41 Nb Niobium 92.9064
42 Mo Molybdenum 95.94
43 Tc Technetium 98
44 Ru Ruthenium 101.07
45 Rh Rhodium 102.9055
46 Pd Palladium 106.42
47 Ag Silver 107.8682
48 Cd Cadmium 112.411
49 In Indium 114.818
50 Sn Tin 118.71
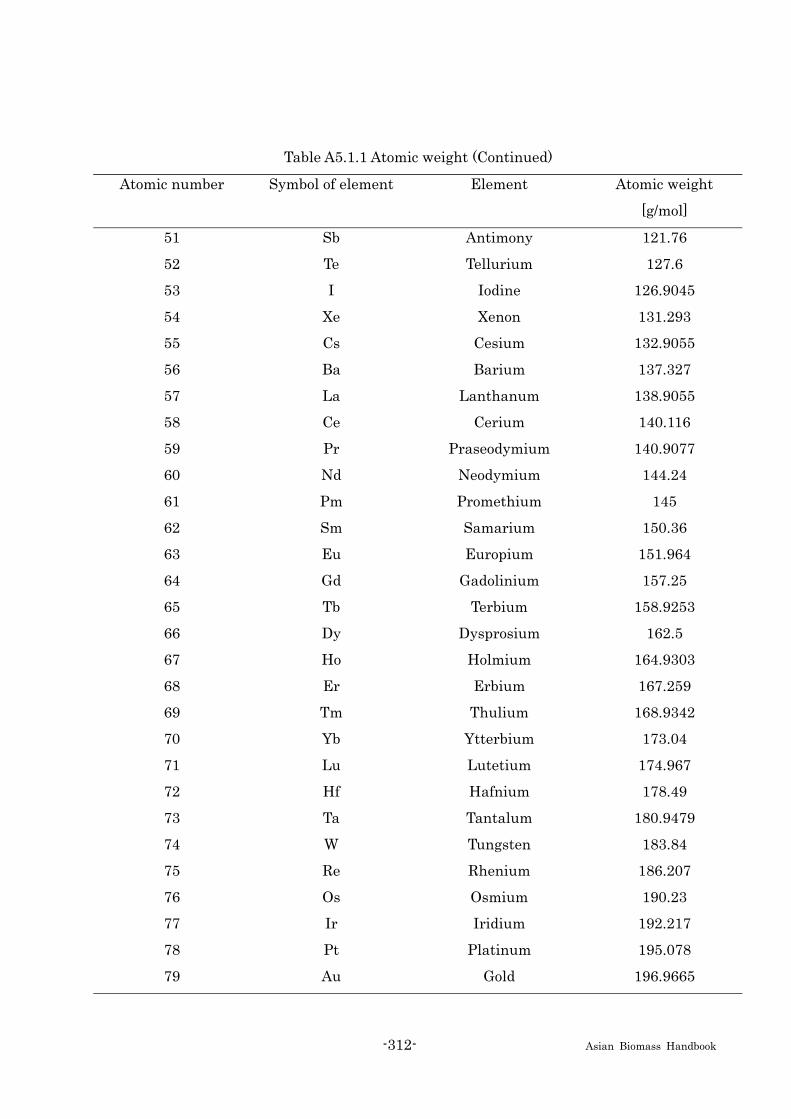
-312- Asian Biomass Handbook
Table A5.1.1 Atomic weight (Continued)
Atomic number Symbol of element Element Atomic weight
[g/mol]
51 Sb Antimony 121.76
52 Te Tellurium 127.6
53 I Iodine 126.9045
54 Xe Xenon 131.293
55 Cs Cesium 132.9055
56 Ba Barium 137.327
57 La Lanthanum 138.9055
58 Ce Cerium 140.116
59 Pr Praseodymium 140.9077
60 Nd Neodymium 144.24
61 Pm Promethium 145
62 Sm Samarium 150.36
63 Eu Europium 151.964
64 Gd Gadolinium 157.25
65 Tb Terbium 158.9253
66 Dy Dysprosium 162.5
67 Ho Holmium 164.9303
68 Er Erbium 167.259
69 Tm Thulium 168.9342
70 Yb Ytterbium 173.04
71 Lu Lutetium 174.967
72 Hf Hafnium 178.49
73 Ta Tantalum 180.9479
74 W Tungsten 183.84
75 Re Rhenium 186.207
76 Os Osmium 190.23
77 Ir Iridium 192.217
78 Pt Platinum 195.078
79 Au Gold 196.9665

-313- Asian Biomass Handbook
Table A5.1.1 Atomic weight (Continued)
Atomic number Symbol of element Element Atomic weight
[g/mol]
80 Hg Mercury 200.59
81 Tl Thallium 204.3833
82 Pb Lead 207.2
83 Bi Bismuth 208.9804
84 Po Polonium 209
85 At Astatine 210
86 Rn Radon 222
87 Fr Francium 223
88 Ra Radium 226
89 Ac Actinium 227
90 Th Thorium 232.0381
91 Pa Protactinium 231.0359
92 U Uranium 238.0289
93 Np Neptunium 237
94 Pu Plutonium 244
95 Am Americium 243
96 Cm Curium 247
97 Bk Berkelium 247
98 Cf Californium 251
99 Es Einsteinium 252
100 Fm Fermium 257
101 Md Mendelevium 258
102 No Nobelium 259
103 Lr Lawrencium 262

-314- Asian Biomass Handbook
A6. Thermodynamic Properties
A6.1 Thermodynamic properties of fundamental chemicals
Heat release and heat absorption with chemical reaction or phase transition, and the
extent to which a chemical reaction proceeds can be obtained using thermodynamics. In this
chapter is shown part of the data needed for this calculation. Detail can be found in Chemical
Handbook, a book by Ried et al., Steam Table, Chemical Engineering Handbook etc. For
thermodynamic calculation, books by Atkins, Komiiyama (in Japanese), Yamaguchi (in
Japanese), and other textbook on physical chemistry or chemical thermodynamics can be
consulted. There is a book that collects thermodynamic data of general substances including
biomass.
A6.2 Standard enthalpy of formation, standard entropy, and standard Gibbs free energy of formation
Table A6.2.1 shows the standard enthalpy of formation, standard entropy, and standard
Gibbs free energy of formation for chemical substances related to biomass. “g”, “l”, and “s” for
state stand for gas, liquid, and solid, respectively.

-315- Asian Biomass Handbook
Table A6.2.1 Standard enthalpy of formation, standard entropy, and standard Gibbs free
energy of formation for chemical substances related to biomass.
Standard
enthalpy of
formation
Standard
entropy
Standard
Gibbs free
energy of
formation
Substance Chemical
formula State
[kJ mol-1] [J mol-1] [kJ mol-1]
Carbon monoxide CO g −110.53 197.67 −137.17
Ethanol C2H5OH l −277.1 159.86 −173.9
Ethane C2H6 g −83.8 229.60 −31.9
Ethene (Ethylene) C2H4 g 52.5 219.56 68.4
Formic acid HCOOH l −425.1 131.84 −362.6
Glucose C6H12O6 s −1273.3 N/A N/A
Acetic acid CH3COOH l −484.3 158.0 −388.9
Oxygen O2 g 0 205.14 0
Hydrogen H2 g 0 130.68 0
Carbon (graphite) C s 0 5.74 0
Carbon dioxide CO2 g −393.51 213.74 −394.36
Propane C3H8 g −104.7 270.02 −24.2
Water H2O l −285.83 69.91 −237.13
Water H2O g −241.82 188.83 −228.57
Methanol CH3OH l −239.1 127.19 −166.8
Methane CH4 g −74.4 186.38 −50.3
From Chemistry Handbook (Kagaku Benran).

-316- Asian Biomass Handbook
A6.3 Enthalpy change of transition for water, methanol, and ethanol
Table A6.3.1 shows the enthalpy change of transition for water, methanol, and ethanol.
Table A6.3.1 Enthalpy change of transition for water, methanol, and ethanol.
Transition Temperature of transition
at
1.013×10⁵ Pa
Enthalpy change of
transition
[oC] [kJ/mol]
Water s → l 273.15 6.01
Water l → g 373.15 40.66
Methanol l → g 337.9 35.27
Ethanol l → g 351.7 38.6
From Chemistry Handbook (Kagaku Benran).
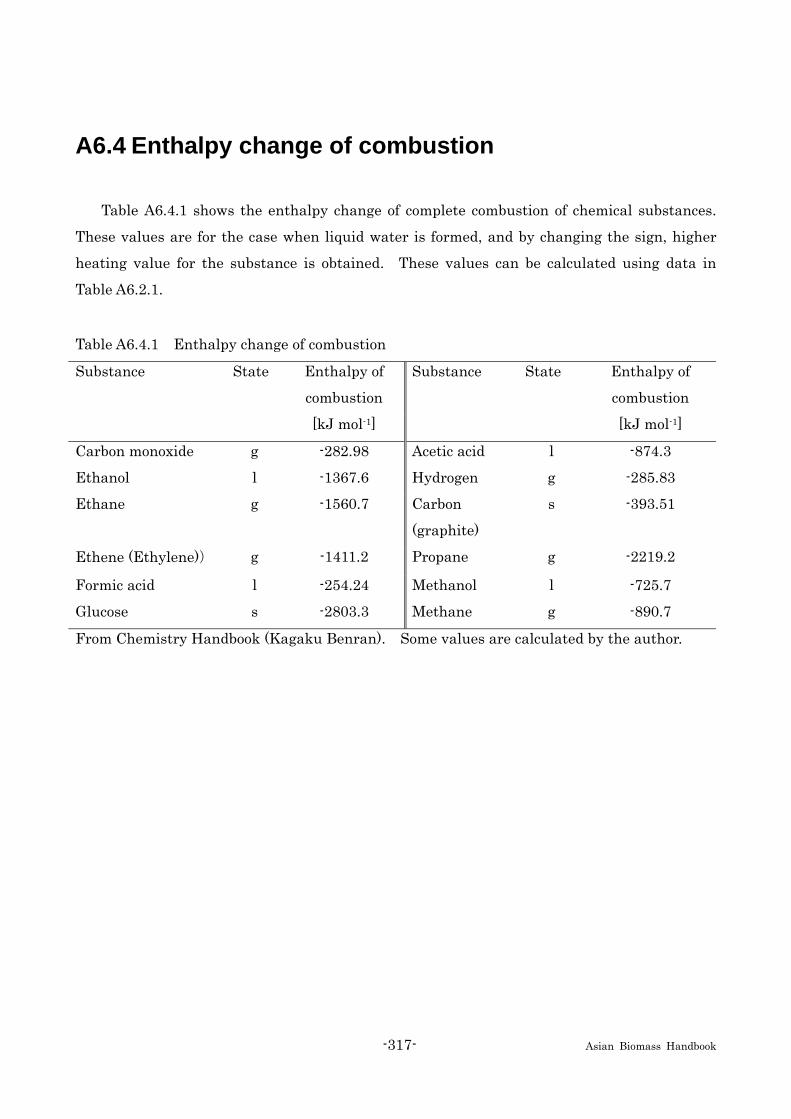
-317- Asian Biomass Handbook
A6.4 Enthalpy change of combustion
Table A6.4.1 shows the enthalpy change of complete combustion of chemical substances.
These values are for the case when liquid water is formed, and by changing the sign, higher
heating value for the substance is obtained. These values can be calculated using data in
Table A6.2.1.
Table A6.4.1 Enthalpy change of combustion
Substance State Enthalpy of
combustion
Substance State Enthalpy of
combustion
[kJ mol-1] [kJ mol-1]
Carbon monoxide g -282.98 Acetic acid l -874.3
Ethanol l -1367.6 Hydrogen g -285.83
Ethane g -1560.7 Carbon
(graphite)
s -393.51
Ethene (Ethylene)) g -1411.2 Propane g -2219.2
Formic acid l -254.24 Methanol l -725.7
Glucose s -2803.3 Methane g -890.7
From Chemistry Handbook (Kagaku Benran). Some values are calculated by the author.

-318- Asian Biomass Handbook
A7. Heating Values of Fossil Fuels and Lifetime
A7.1 Heating values of fossil fuels and lifetime
Table A7.1.1 shows the heating values of fossil fuels and lifetime.
Table A7.1.1 Heating values of fossil fuels and lifetime
Petroleum Coal Natural gas
Heating value
(representative)* [MJ/kg]
40 28 56
R/P ratio [year]** 46 219 64
* These are representative values, and actual values differs largely depending on the production site and treatment. These values are higher heating values.
** Reserve/Production ratio.

-319- Asian Biomass Handbook
A8. APEC Framework
A8.1 What is APEC? APEC (Asia-Pacific Economic Cooperation) is a forum that aims at sustainable development in
the Asia and Pacific region, and all main countries and regions participate with. It started at
the ministerial conference in November, 1989 (Canberra, Australia), and has been organizing
top-level conferences since 1993. Its main activities are liberation and harmonization of trade
and investment, and economical and technological collaboration in the region.
Table A8.1.1 APEC Countries
Australia Russia
Brunei Darussalam* Singapore*
Cambodia Taipei, Chinese
Canada Thailand*
Chili United States of Amarica
Hongkong, Chinese Vietnam*
Indonesia*
Japan
Korea
Laos
Malaysia*
Mexico
New Zealand
Papua New Guinea
Peru
Philippines*
P. R. China
* ASEAN Countries

-320- Asian Biomass Handbook
A9. Each Country's Targets
A9.1 Each country's target for biomass introduction
Table A9.1.1 shows the target of biomass introduction for each country.
Table A9.1.1 Target of each country
Country Target
Cambodia There are no targets.
Indonesia Development of biofuel plantation in 5.25 M ha unused land. According to
Road Map Biofuel Development the Biofuel utilization (biodiesel,
bioethanol, bio-oil) will be 2% of national energy mix of 5.29 M kL by 2010.
Japan Thermal use of biomass: 3.08 M kL, Elecricity production from biomass
and wastes: 5.86 M kL oil equivalent at 2010
Korea Thermal use of biomass: 0.679 million kL, Elecricity production from
biomass and wastes: 0.367 million kL oil equivalent at 2011
Laos Now the government drafting the policy and target for the biofuel
especially biodiesel from the Jatropha to mix with the fossil diesel to be B5
by the year 2012, B5 by the year 2015 and B15 by 2020. And For the
Ethanol is E10 by the year 2015 and E20 by the year 2020. These target is
under drafting of the document.
Malaysia The target for electricity generation from renewable energy (including
biomass) is set at 350MWe in Peninsular Malaysia and 50MWe in Sabah
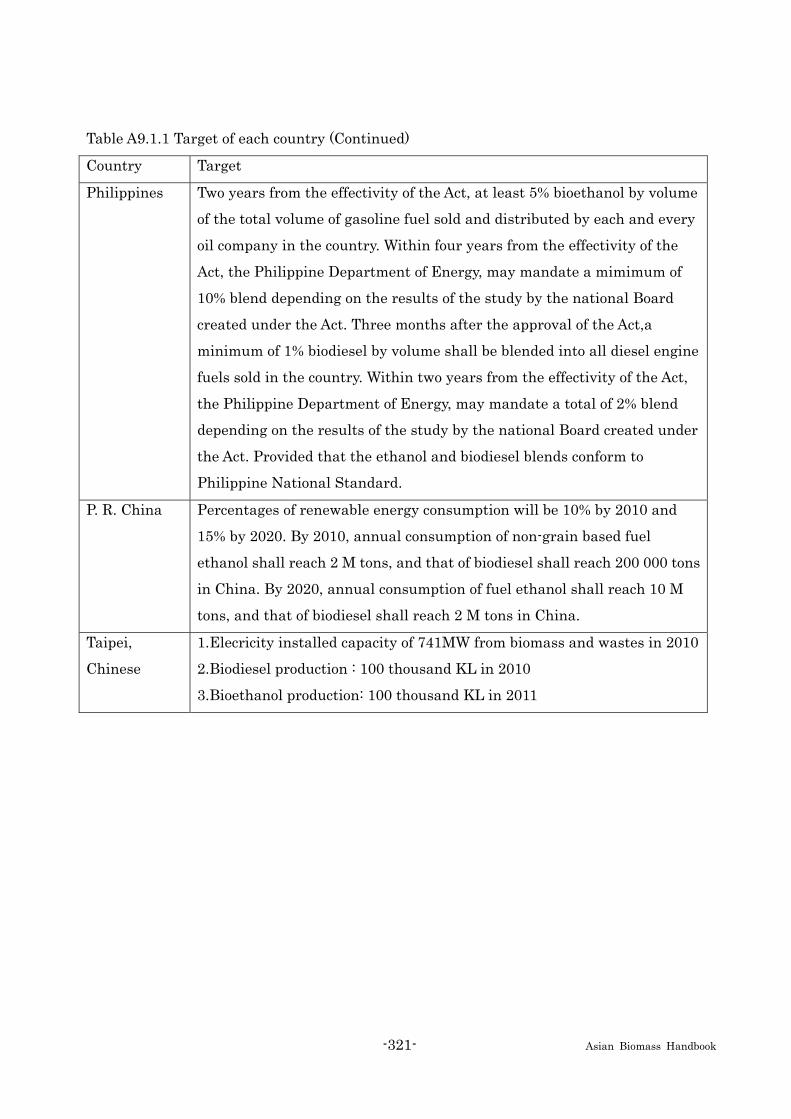
-321- Asian Biomass Handbook
Table A9.1.1 Target of each country (Continued)
Country Target
Philippines Two years from the effectivity of the Act, at least 5% bioethanol by volume
of the total volume of gasoline fuel sold and distributed by each and every
oil company in the country. Within four years from the effectivity of the
Act, the Philippine Department of Energy, may mandate a mimimum of
10% blend depending on the results of the study by the national Board
created under the Act. Three months after the approval of the Act,a
minimum of 1% biodiesel by volume shall be blended into all diesel engine
fuels sold in the country. Within two years from the effectivity of the Act,
the Philippine Department of Energy, may mandate a total of 2% blend
depending on the results of the study by the national Board created under
the Act. Provided that the ethanol and biodiesel blends conform to
Philippine National Standard.
P. R. China Percentages of renewable energy consumption will be 10% by 2010 and
15% by 2020. By 2010, annual consumption of non-grain based fuel
ethanol shall reach 2 M tons, and that of biodiesel shall reach 200 000 tons
in China. By 2020, annual consumption of fuel ethanol shall reach 10 M
tons, and that of biodiesel shall reach 2 M tons in China.
Taipei,
Chinese
1.Elecricity installed capacity of 741MW from biomass and wastes in 2010
2.Biodiesel production : 100 thousand KL in 2010
3.Bioethanol production: 100 thousand KL in 2011

-322- Asian Biomass Handbook
A10. Related histories
A10.1 History related to Asian biomass
Table A10.1.1 shows the recent history related to Asian biomass.
Table A10.1 Time table on Asian biomass
2005.1 1st Biomass Asia Workshop (Tokyo and Tsukuba)
2005.12 2nd Biomass Asia Workshop (Bangkok)
2006.1 Biomass Asia Forum (Tokyo)
2006.11 3rd Biomass Asia Workshop (Tokyo and Tsukuba)
2007.3 Startup of Asia Biomass Association
2007.4 Laos joins Asia Biomass Association
2007.11 4th Biomass Asia Workshop (Shar Alam)

-323- Asian Biomass Handbook
A11 Each country's language
A11.1 Each country’s language and greeting words
Table A11.1.1 shows each country’s language and greeting words.
1.1.1 バイオマスとは何か?
バイオマス(Biomass)とは一般に、光合成により直接的あるいは間接的に生産され、エネ
ルギーあるいはマテリアル利用が可能なある一定量集積した生物起源の資源を意味する。
間接的という意味は、畜産業や食品工業から排出される資源を指す。バイオマスには何十
万種という植物、すなわち陸生植物や水生植物、農業系残渣、森林系残渣、産業廃棄物、
下水汚泥や動物の排泄物が含まれる。
Table A11.1.1 Language and “Hello” in each country
Country Language “Good morning/ afternoon”
Brunei Darussalam Malay Selamat pagi/ petang
Cambodia Khmer Arun suo sdei/ Tiveah suor sdei
Indonesia Bahasa Indonesia Selamat pagi/ sinag
Japan Japanese Ohayo/ Kon’nichiwa
Korea Korean Annyunghaseyo/
Annyunghashimnikka
Laos Lao Sabaidee
Malaysia Bahasa Melayu Selamat pagi/ petang
Philippines Filipino, English Magandang umaga
P. R. China Chinese Nihao
Singapore Mandarin, English, Malay, Hokkien Nihao
Taipei, Chinese Chinese, Taiwanese Nihao
Thailand Thai Sawatdee
Vietnam Vietnamese Xin chao
-324- Asian Biomass Handbook
A12 Related books
A12.1 Books in English
Knoef, H. Ed., “Handbook Biomass Gsification”, BTG Biomass Technology Group (2005)
Van Loo, S. and Koppejan, J. Eds., “Handbook of Biomass Combustion and Co-Firing”, Twente
University Press (2002)
Klass, D. L., “Biomass for Renewable Energy, Fuels, and Chemicals,” Academic Press (1998)
Boyle, G. Ed., “Renewable Energy Power for a Sustainable Future,” Oxford University Press
(1996)
Wyman, C. E. Ed., “Handbook on Bioethanol: Production and Utilization”, Taylor & Francis
(1996)
Kitani, O. and Hall, C. W. Eds., “Biomass Handbook”, Gordon and Breach Science (1989)
E. S. Domalski, T. L. Jobe, Jr., T. A. Milne, Eds., “Thermodynamic data for biomass materials
and waste components”, American Society of Mechanical Engineers (1987)

-325- Asian Biomass Handbook
A12.2 Books in Japanese (in Japanese) 日本エネルギー学会「バイオマス用語事典」 オーム社 (2006) 坂志朗「バイオディーゼルのすべて」 アイピーシー (2005) 木谷収「バイオマスー生物資源と環境」 コロナ社 (2004)
小宮山宏ら編著「バイオマス・ニッポン―日本再生に向けて」 日刊工業新聞社 (2003)
日本エネルギー学会「バイオマスハンドブック」 オーム社 (2002)
湯川英明編「バイオマス―究極の代替エネルギー」 化学工業日報社 (2002)
横山伸也「持続社会へむけて バイオエネルギー 前線」森北出版 (2001)
坂志朗編著「バイオマス・エネルギー・環境」 アイピーシー (2001)
山地憲治、山本博巳、藤野純一「バイオエネルギー」ミオシン出版 (2000) 坂井正康「バイオマスが拓く21世紀エネルギー 地球温暖化の元凶 CO2 排出はゼロにできる」
森北出版 (1998) 本多淳裕「バイオマスエネルギー : 生物系資源・廃棄物の有効利用」省エネルギーセンター (1986)
鈴木周一編「バイオマスエネルギー変換」講談社 (1983)
M.スレッサー, C.レウィス著 ; 須之部淑男, 増川重彦訳「バイオマス : 生物エネルギー資源」共立
出版 (1982)
山沢新吾編「バイオマスエネルギー」朝倉書店 (1982) 柴田和雄, 木谷収編「バイオマス : 生産と変換」上, 下, 学会出版センター (1981)

-326- Asian Biomass Handbook
A12.3 Books in Chinese (in Chinese)
日本能源学会編、史仲平、華兆哲訳「生物質和生物能源手冊」化学工業出版社 (2007)
小宮山宏他編著、李大寅、蒋偉忠訳 「日本生物質総合戦略」 中国環境化学出版社 (2003)
中国農村能源年鑑編集委員会編 「中国農村能源年鑑 1997」 中国農業出版社 (1997)


![本機县業經經濟部電子遊戲機- 評鑑委員會(6] [> 月23日人才](https://static.fdokumen.com/doc/165x107/631e180a5c567f54b403e4ca/-6-23.jpg)