The Amity Prison TC Evaluation: Reincarceration Outcomes
24
National Development and Research Institutes, Inc. Center for Therapeutic Community Research Two World Trade Center, 16 th Floor New York, N.Y. 10048 (212) 845-4452 The Amity Prison TC Evaluation: Reincarceration Outcomes Harry K. Wexler, George De Leon, George Thomas, David Kressel and Jean Peters Wexler, H. K., De Leon, G., Kressel, T. G., & Peters, J. (1999). The Amity prison evaluation: Reincarceration outcomes. Criminal Justice and Behavior, 26 (2), 147-167.
-
Upload
independent -
Category
Documents
-
view
0 -
download
0
Transcript of The Amity Prison TC Evaluation: Reincarceration Outcomes

National Development and Research Institutes, Inc.Center for Therapeutic Community Research
Two World Trade Center, 16th FloorNew York, N.Y. 10048
(212) 845-4452
The Amity Prison TC Evaluation: Reincarceration Outcomes
Harry K. Wexler, George De Leon, George Thomas, David Kresseland Jean Peters
Wexler, H. K., De Leon, G., Kressel, T. G., & Peters, J. (1999). The Amity prisonevaluation: Reincarceration outcomes. Criminal Justice and Behavior, 26 (2), 147-167.

2
The Amity Prison TC Evaluation: Reincarceration Outcomes
Harry K. Wexler, George De Leon, George Thomas, David Kressel and Jean Peters
Abstract
The present report is drawn from an ongoing evaluation ofthe effectiveness of the Amity prison therapeutic community(TC) and aftercare program for substance abusers located inSan Diego, California. Data collection consisted of face- to-face interviews and reviews of criminal justice records, on asample of 715 male inmates. This study reports on reincar-ceration rates established from the California correctionalsystem data files. The experimental design involved randomassignment to the prison TC intent-to treat group and no-treatment control group from a waiting list of inmates whohad volunteered for substance abuse treatment in the Amityprogram. Reductions in reincarceration rates of over 40% at12 months and over 50% at 24 months after release fromprison were found for the group that completed prison TCplus aftercare. These improvements remained significantafter controlling for client characteristics that have beenidentified as predictors of recidivism. The findings supportthe efficacy of prison TC plus aftercare in reducingreincarceration rates among inmates treated for substanceabuse.
The efficacy of the modified prison therapeutic community (TC) for thetreatment of substance abusing inmates has been substantiated in a number ofrecent studies (see reviews by Lipton, 1995; Wexler, 1995). In general thesestudies report significant reductions in criminality and substance abuse atfollow-up among inmates treated in prison based TC programs.
Therapeutic community evaluation studies document that a critical factorrelated to positive outcomes, in both community and prison based TC substanceabuse treatment, has been “treatment density” or “time in treatment” (De Leon,1984; Wexler, Falkin, & Lipton, 1990). Treatment density has been truncated inearlier prison TC studies because treatment duration did not include communityaftercare. For example, the earlier "Stay'n Out" program, provided only

3
anecdotal information indicating improved outcomes for inmates who attendedresidential treatment programs after release from prison. The impact ofaftercare, itself, was not systematically studied.
Recently, several large scale prison TC evaluations have been undertaken toassess the effects of prison TC substance abuse treatment followed by eitherwork release (Inciardi, Butzin, Hooper, & Harrison, 1997) or an aftercare (Knight& Simpson, 1996) TC treatment. Both treatment studies indicate that prison TCswith aftercare produce large positive outcomes while prison TCs alone showsrelatively small and mostly non-significant effects. Differences in samples, andmethodology across these studies surface several issues that are relevant to theinterpretation of the efficacy of Prison TCs.
The study by Inciardi and associates evaluated a Delaware prison TCprogram (Key) and a TC work release program (CREST) by comparing theirindividual and combined effects with a comparison group. There were severaldesign limitations that compromised the comparability of the prison TC groupincluding: (a) the Key prison TC sample was not randomly selected; (b) the Keysample was historical, so time at risk in the community was not synchronouswith the other groups; (c) the prison TC group was all male (who sometimeshave poorer outcomes) while females were included in the other groups; (d) theKey group was exposed to fewer treatment phases than the other treatmentgroups; and, (e) 56% of the no-treatment comparison group actually receivedsome treatment after prison, which may have improved their outcomes. Thus,information is needed on the contribution of post release aftercare to outcomesamong the inmates who do not enter TC oriented after settings.
The study by Simpson and associates which evaluated prison TC andaftercare outcomes also has several design limitations: (a) Random selection wasnot employed (a quasi-experimental design with a matched-comparison samplewas used); (b) the in-prison sample was actually a group who completed a prisonTC and then went on to an aftercare program that they failed to complete. Thesecond design issue is important since the in-prison TC group was actually anaftercare drop-out group that does not represent prison TC graduates whosimply go on to regular parole. Thus, there is a need to evaluate dropouts aswell as completers of Prison TCs and of aftercare programs.
Another issue emerging from the research on prison TCs concerns thegenerality of effects. For example, the above studies showed relatively smalleffects for prison treatment alone which contradicts the positive time in prisontreatment findings reported in the earlier Stay-in- Out study. Such apparentcontradictions may reflect differential program and client characteristics. Ingeneral, however, the programs studied were adaptations of the Stay-in- Out

4
program and utilized similar treatment models. Therefore inmate characteristics,particularly criminal severity and psychological status, must be considered whileinterpreting differential treatment outcomes across studies.
With regard to the above issue an important distinction between “static” and“dynamic” variables has been drawn in the TC literature (e.g., Condelli & DeLeon, 1993). Static variables refer to background information that is set atspecific time periods and not susceptible to change (e.g., sex, ethnicity, or parentseducational level), while dynamic variables describe personal characteristics thatcan change, such as psychological and behavioral variables. Recently,Gendreau, Little, & Goggin (1996) conducted a meta-analysis to identify staticand dynamic client variables that consistently predict recidivism in non-treatment offender populations. Thus, the relevance of these predictors must beclarified for inmate substance abusers electing prison TC drug treatment.
A broader issue concerns the use of various measures of criminal outcomes toassess treatment efficacy. Each measure has its own clinical, theoretical as wellas policy implications. Past studies have shown that reductions inreincarceration rates are generally correlated with reductions in drug abuse andother measures of criminal activity. Treatment related reductions inreincarceration rates provide compelling empirical support for alternatives suchas TC oriented prison treatment and aftercare programs.
These issues shaped the aims and design of the present study. First, thestudy design assigned inmates randomly to an intent-to-treat group and a no-treatment control group. This assignment provides a clearer test of treatmenteffects. In addition, clearly delineated study groups based on extent of treatmentinvolvement are identified. This allows for a rigorous comparison of outcomesalong a continuum of treatment duration. Second, multivariate analysesassessed the relative contribution of dynamic and static client characteristics andtreatment group differences to reincarceration outcomes. Third, the studyfocused on returning to prison rather than other outcome variables. Changes inreincarceration rates and time to first reincarceration were assessed in relation toTC oriented treatment in prison and in post release aftercare. In this studyreincarceration data was abstracted from department of corrections files.Additional reports provide outcomes in criminality; drug use and other socialand psychological domains based on self-reported data.
MethodTreatment Program Description
The Amity prison TC was set up as a demonstration project funded by theCalifornia Department of Corrections (CDC) in 1989. The Amity TC is located atR. J. Donovan medium security Correctional Facility in San Diego. (See Winnet,

5
Lowe, Mullen, & Missakian, 1992; Graham & Wexler, 1997, for detailed programdescriptions.)
The prison houses approximately 4,000 men in five self-contained livingareas. All aspects of daily living (housing, sustenance, education, and work) areaccommodated within the confines of each prison area. One 200 man-housingunit was designated for Amity project occupancy. The men who resided in theunit participated in daily programming, which was conducted in two trailerslocated in close proximity to the housing unit.
The program utilized a three phase treatment process that has been describedin the literature (e.g., De Leon, 1995; De Leon & Rosenthal, 1989; Wexler &Williams, 1986). The initial phase (2 to 3 months) included orientation, clinicalassessment of resident needs and problem areas, and planning interventions andtreatment goals. Most residents were assigned to prison industry jobs and givenlimited responsibility for the maintenance of the TC. During the second phase oftreatment (5 to 6 months), residents were provided opportunities to earnpositions of increased responsibility by showing greater involvement in theprogram and through hard emotional work. Encounter groups and counselingsessions focused on self-discipline, self-worth, self-awareness, respect forauthority, and acceptance of guidance for problem areas. During the reentryphase (1 to 3 months), residents strengthened their planning and decisionmaking skills and worked with program and parole staff to prepare for theirreturn to the community.
Restraints on inmates’ freedom and working within the many rules andlimitations of the Donovan prison posed a number of problems. The TC staffcoped with these problems by modifying the program and negotiatingcompromises with the prison administration. Some of the problems andprogram modifications included:
1. Program activities had to be scheduled to conform to the prison generalschedule (e.g., meals, and “count” where inmates are locked up and countedseveral times a day).
2. Permission for special groups that conflicted with prison schedules (e.g.,extended 24-hour groups) was negotiated and had to be limited.
3. A Donovan prison requirement that all inmates had to hold prison jobsreduced the time TC members could participate in the program. The TCnegotiated an allotment of 40 paid inmate positions for the program thatprovided a core group of full time residents. The remaining 160 residentsdivided their time between prison work assignments and treatment.

6
Upon release from prison, graduates of the Amity prison TC were offered anopportunity to participate in a community based TC treatment program for up toone year in an Amity operated facility. The community TC accommodated up to40 residents. Residents at the Amity Aftercare TC had responsibility for thework to maintain this facility (under staff supervision) and to continue theprogram curriculum they began in prison. The program content built on thefoundation of the prison TC curriculum and was individualized for each residentbased on the progress achieved by the resident while in the prison treatmentprogram. The aftercare TC also provided services for the wives and children ofresidents.
Highly committed people who are primarily recovering from substance abuse andcriminal histories staff the Amity prison and aftercare programs. The staff is willingto share their personal growth experiences and are very proud of their ability todemonstrate current life styles that have integrity. The program also has a number ofunique components that are rarely found in other community or prison TCs. They arebriefly summarized:
1. Use of formal curriculum to complement informally mediated teachings. Thecurriculum which includes workbooks, teachers guides and video tapes focuses onsuch topics as: "Basic Assumptions of a Teaching and Therapeutic Community," "TheTherapeutic Community as a School for Moral Development,” and "UnderstandingViolence Both Inside and Outside of Yourself."
2. Use of psychodrama groups to complement standard TC groups andmeetings. Participants reenact roles or situations that remain unresolved.Through role play these action oriented groups often elicit strong emotion andinsights through role play.
3. Use of video playback as a therapeutic tool to raise self-awareness and fosterrealistic self-perception. Through video playback, residents can seethemselves and make appropriate judgments as they would if they wereviewing another person.
4. Use of ”lifers” as counselor interns and counseling staff. Several lifersserve as "live-in" staff with the program 24 hours a day, seven days aweek. They are carefully selected, trained extensively, and remain underthe supervision of senior Amity staff. They are credited with lendingcredibility to the program “on the yard” and adding stability to theprogram. Lifers are especially credible role models because they havedemonstrated great commitment and very positive personal changes inspite of their severe criminal histories.

7
Study DesignA prospective follow-up study (N=715 males) was conducted to evaluate the
Amity TC. The study utilized an experimental design with random selection ofclients. An eligible pool was created by the formation of a waiting list ofvolunteers who met the admission criteria of having a drug problem and beingbetween 9 and 14 months from parole. Inmates who had been convicted of arsonor sexual crimes to minors were excluded. Subjects in the voluntary pool wererandomly selected and assigned to the treatment condition, as bed space becameavailable. The random assignment procedure was stratified to obtainapproximately equal ethnic proportions. Inmates who were not randomlyselected remained in the pool until they had less than nine months to serve, atwhich time they were removed from the pool and became members of the no-treatment control group. Approximately 10% of the control group, however,consisted of inmates who met the program eligibility criteria but were notadmitted into the sample pool for technical reasons (e.g., less then 9 months fromparole).
Data CollectionData were collected on inmates prior to admission, during prison TC treatment,
during community TC aftercare treatment, and at follow-up 12 months post releasefrom prison. The current study analysis utilizes the background interview andCalifornia Department of Corrections reincarceration record data. The backgroundinterview included information on family background, criminal involvement, drug usehistory, educational background, psychological and medical health status, attitudestoward substance abuse treatment and treatment history. A psychological test batterywas administered that included the Beta IQ, the Tennessee Self-Concept Scales, the BeckDepression Inventory, the Symptom Checklist-90 (SCL-90-R), and the Taylor ManifestAnxiety Scale. In addition, the Diagnostic Interview Survey (DIS), a structuredpsychiatric interview developed to generate DSM-III-R diagnoses, was utilized. TheCircumstances, Motivation, Readiness and Suitability Scale (De Leon, Melnick, Kressel,& Jainchill, 1994), a treatment motivation measure, was also included.
Reincarceration information was obtained from the California Department ofCorrections computerized data system. Reincarceration outcomes are lessambiguous than incidents of arrest because they include an adjudication processthat is more likely to reflect significant criminal behavior. The study included arelated outcome measure, “days until first incarceration”, which providedinformation on relative treatment effectiveness for inmates who were returned toprison. All study subjects had been released from prison for at least 12 months(“period at risk”) before their reincarceration records were reviewed.Reincarceration included returns to prison for either a parole violation, or for

8
new arrests. Drug and alcohol temporary returns for less than 30 days, known as“dry outs”, were not considered reincarcerations.
Study groupsInmates were randomly assigned to an intent-to-treat group and a no-
treatment group. At the conclusion of the study five study groups wereidentified: (a) inmates who volunteered for the in-prison TC program but whowere never selected for participation (no-treatment control); (b) inmates whoentered the in-prison treatment program but who left prematurely fordisciplinary or personal reasons (prison TC drop outs); (c) inmates whocompleted the in-prison TC but did not choose to parole to the aftercare TC inthe community (prison TC treatment completers); (d) inmates who completedthe in-prison TC and volunteered to attend the aftercare TC but dropped out inless than three months (aftercare TC treatment drop outs); and, (e) inmates whocompleted the prison and after TC programs (aftercare TC completers).
The five study groups spent differential amounts of time participating in theprison and/or community aftercare TCs: (1) no-treatment control group (0 days);(2) prison TC drop out group (175 mean days); (3) prison TC completer groupwho were directly paroled to the community (377 mean days); (4) aftercare TCtreatment drop out group (390 prison TC mean days plus 33 aftercare TC meandays); and, (5) aftercare completer group (381 prison TC mean days plus 270aftercare TC mean days). The study expectation was that increasing amounts ofprogram time would be negatively associated with incidence of reincarcerationand positively associated with the number of days until first incarceration.
Analytic Strategy To assess treatment effectiveness analyses first tested the overall
comparisons between the intent-to-treat and no-treatment groups followed byanalyses of differences between the five study groups. Reincarceration rates andthe number of days until first reincarceration were analyzed for 12 and 24-monthperiods of risk. Outcomes for the first 12 months post release were obtained forall 715 subjects; and, 24 month outcomes were obtained for a smaller sub- groupof 263 subjects who had been at risk for a minimum of 24 months at the time ofrecord review.
For the prediction analyses, client variables were classified into static anddynamic factors that were similar to the Gendreau et al. (1996) classification ofclient characteristics that have consistently predicted recidivism. The static anddynamic variables were then independently correlated with reincarceration toidentify significant predictors to be included in the multivariate analyses.

9
The static variables included: (a) age was divided into three categories: lessthan 25; 26-35; 36 plus); (b) ethnicity was coded into white and nonwhitecategories (ethnicity was included although it was not correlated with outcomes);(c) criminal history was coded as a dichotomous variable indicating whethersubjects were incarcerated before the age of 18; (d) IQ was used as a measure ofintellectual functioning; and (e) history of childhood problems was the numberof self-reported childhood behavioral problems. Other categories of staticbackground variables that were not significantly related to recidivism in thecurrent study -- family criminality, family structure, and family social economicstatus -- were excluded from the analyses.
The dynamic variables consisted of: (a) anti-social personality andcriminogenic needs, defined by antisocial DSM-III-R diagnostic criteria, whichincludes an array of antisocial behaviors; (b) personal distress, an index of threevariables (SCL-90-R anxiety subscale and psychosis subscale, and self reportedserious lifetime anxiety) (Cronbach alpha = .64); and, (c) social achievementwhich was assessed by a three category education variable measuringrespondent’s level of education. Other categories of dynamic backgroundvariables that were not significantly related to recidivism in the current study(e.g., anti-social companions and interpersonal conflict) were not included in theanalyses.
Results
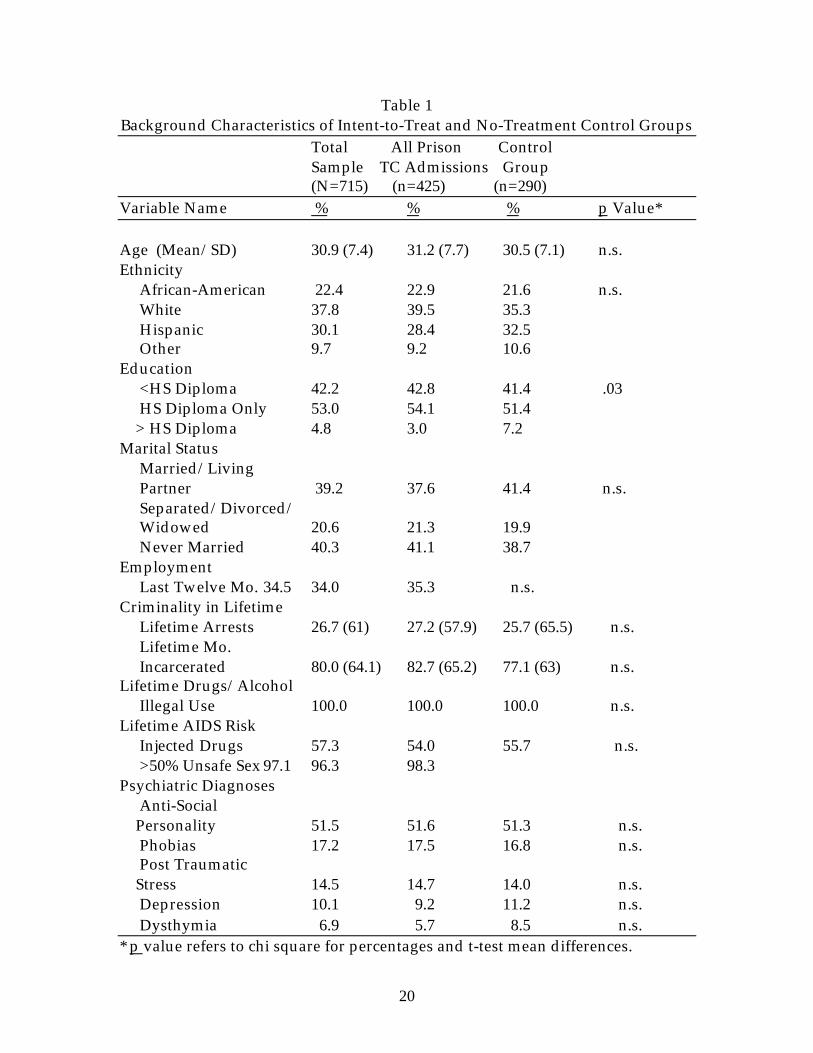
Client ProfilesTable 1 shows profile characteristics for inmates randomly assigned to the
intent-to-treat and control groups. The only significant group difference was ineducational level where the control group had slightly more subjects who hadcontinued their education beyond the high school level.
Table 1 About Here
The inmates at Donovan prison who volunteered for the Amity TC hadextensive criminal histories. Table 1 shows that 74% had been arrested beforeage 18, 55% had been arrested for violence against persons, and 49% had beenarrested for weapons charges. As expected, the rate of drug related arrests washigh with 80% reporting drug possession arrests and 49% having been arrestedfor drug sales. Overall, the men had been arrested 27 times and had beenincarcerated for a total of about 80 months during their lifetime. Clearly, thesample was at high risk for continued criminality after prison.
Other than alcohol, various forms of stimulant drugs (cocaine,methamphetamine, crack) were the most widely used drugs, taken by 95% of the

10
inmates surveyed at some time throughout their lives. Almost 60% engaged inintravenous drug use at some time in their lives. In addition, more than threefifths of these men had injected with dirty needles and 25% had shared needleswith strangers. Sexual relations were for the most part limited to heterosexualpartners (except for 4%) and almost all the inmates (97%) practiced unprotectedsex. The inmates were at considerable risk for continued substance abuse andHIV related behaviors after release from prison.
There was considerable prevalence of psychiatric disorders in the studygroup. As might be expected, over half the group received an Anti-socialPersonality diagnosis. Of special interest is the considerable number of inmateswho had a diagnosis of Adult Attention Hyperactivity Disorder (33%).
Reincarceration RatesFigure 1 shows the reincarceration rates after 12 months at risk following
release from prison for the intent-to-treat and control groups as well as for thetreatment study groups (prison TC drop outs, prison TC treatment completers,aftercare TC treatment drop outs, and aftercare TC completers).
At 12 months post release, the no-treatment control group had significantly(Chi Sq. = 17.828, d.f. = 1, p<.0001) greater levels of recidivism to prison than theintent-to-treat group (49.7% vs. 33.9%). The 12-month reincarceration rate wasconsistently higher for the control group and decreased consistently across thefour-treatment study groups. The offenders who completed both the prison andaftercare TCs showed the lowest rate of reincarceration (8.2%).
Figure 1 About Here
A possible confound in the 12 month findings is that the aftercare completergroup spent almost all their 12 months post prison at risk time in the residentialTC aftercare setting. Although they could leave at any time, these clientsvoluntarily elected to remain in the aftercare program. Nevertheless it could beargued that they were at “less risk” during the 12-month follow-up period thanprison TC completers who paroled directly to the community. However, thepotential confounding effect of residential status is less a factor in the 24-monthoutcomes.
Figure 2 shows a pattern of 24-month reincarceration outcomes, which is verysimilar to the 12-month results. The no-treatment control group had significantly(Chi Sq. = 13.039, d.f. = 1, p<. 001) greater levels of recidivism to prison than theintent-to-treat group (67.1% vs. 43.3%, receptively). A non-significant reversaloccurs for the aftercare TC drop outs, although they still maintained a successrate that was 7% better than the no-treatment control group. The study group

11
that completed both the prison and aftercare TCs had a very low reincarcerationrate of 14% at 24 months which is a full 12 months after completing aftercare TCtreatment.
Figure 2 About Here
Days to ReincarcerationAmong the offenders who were returned to prison, there were significantly (t
(286) = 1.92, p = .05) fewer days to reincarceration for the no-treatment controlscompared to the intent-to-treat group (172 mean days vs. 192 mean days,respectively). Table 2 shows the average number of days until reincarceration at12 months after release from prison. There was a consistent and significantpattern of increasing days to reincarceration across the five study groups. Thegreatest difference was found for the group that completed aftercare TCtreatment compared to the control group. As with the reincarceration rateresults, the potential confounding effect of residentia4/28/98l aftercare status isless a factor in the 24-month outcomes. Table 2 shows a similar pattern ofincreasing days to incarceration after 24 months at risk. The group thatcompleted aftercare TC treatment returned to prison 175 days later than thecontrol group.
Table 2 About Here
Overall, reincarceration rates and days to reincarceration display a similarpattern of positive results. The full intent-to-treat group revealed significantlymore positive effects than the no-treatment controls. And within thetreatment sample, post release improvements are generally related to increasedtreatment involvement. The most favorable outcomes occur in clients whocompleted both the Prison TC and the Vista aftercare program.
Predictors of ReincarcerationTable 3 shows the simple correlations between the static and dynamic
variables with reincarceration at 12 months post prison. Logistic regression andmultiple regression procedures were employed to examine the relativecontribution of client and treatment factors to reincarceration. Logisticregression was used with the dichotomous 12 and 24 month reincarcerationvariables and ordinary least squares regression (OLS) was used to assesspredictors of the number of days until first reincarceration. The client variableswere entered into the equations hierarchically, static predictors entered first,followed by the dynamic factors and finally the level of treatment variable (i.e.,study groups) was entered. The effects of static and dynamic client variableswere assessed both before and after the introduction of treatment.

12
Table 3 About Here
The first set of logistic and OLS regressions focused on comparisons betweenthe controls and the full intent-to-treat group. After controlling for static anddynamic client predictors, participation in the TC program was most related topositive outcomes. At 12 months post prison, the intent-to-treat group had asignificantly lower reincarceration rate and the odds ratio was .52 (p<.001).Thus, compared to controls, inmates who had any level of participation in theprison TC treatment were 48% less likely to be reincarcerated within 12 monthsafter release to the community. Similar reincarceration findings were found at 24months post prison with a significant odds ratio of .63 (p<.01). Compared tocontrols TC participants were 37% less likely to be reincarcerated at 24 monthsfollowing release from prison.
Additional regression analyses were conducted to assess the impact ofincreasing amounts of treatment (reflected by the four treatment study groups)on the reincarceration outcome measures, while controlling for clientbackground characteristics. Separate regressions examined the relativecontribution of each treatment group to outcomes. The control group served asthe reference group for each analysis. The 4 sequential levels of treatmentincluded prison TC dropouts, prison TC treatment completers, aftercare TC dropouts, and aftercare TC completers. The results are presented sequentially belowfor each group.
There were no significant predictors of reincarceration for the prison TC dropout group at either 12 months or 24 months post prison and there were nosignificant client predictors of outcomes in either the dropouts or the prison TCcompleters only group.
For the aftercare TC completers, client variables and treatment condition predicted outcomes. Age, criminal history and personal distress weresignificant 12-month reincarceration predictors after treatment was entered intothe equation, and age remained significant after treatment participation wasaccounted for at 24 months. The OLS regressions yielded similar results for theaftercare completion group on days to first incarceration. Aftercare completionhad a positive relation to days until reincarceration after background factorswere held constant (R2=.10, p<.01). In addition, only the client factor of ageremained significant after treatment effects were controlled for.
The significant relationships between age, criminal history, and personaldistress show those older inmates with less severe criminal histories and lesspersonal distress have better post prison outcomes independent of treatment.

13
However, when these individual predictors are controlled, treatmentparticipation continued to show significant positive impacts on recidivism. Anexamination of the interactions between age, criminal history, personal distressand treatment participation did not reveal any significant interactions betweenclient characteristics and treatment. However, in all these regressions,completing aftercare remained the largest and most significant predictor ofpositive outcomes regardless of client contribution.
Discussion
The overall finding that the group of inmates who were randomly assignedto the treatment condition (intent-to-treat group) had significantly lowerrecidivism rate than the no-treatment control group provides general empiricalsupport for the effectiveness of prison TC drug treatment. The modest positiveoutcomes for prison TC completers who did not attend aftercare, indicates thatprison TCs alone can produce moderate impacts on recidivism. However, themost impressive outcomes were found for inmates who completed both theprison TC and Aftercare TC and the effects remained significant up to 24 monthspost prison.
The present reincarceration findings replicate those reported in the earlierStaying ‘n Out study in New York, which did not analyze aftercare, and thosereported in recent studies of prison TCs with aftercare components. Post releasereductions in criminality (and drug use) were obtained for The CREST workrelease project in Delaware (Inciardi & Lockwood, 1995; Inciardi et al., 1997) andfor a prison TC with an aftercare component in Texas (Knight & Simpson, 1996).The Amity, Delaware and Texas studies are not strictly comparable in that theirreports focused on different criminal outcome variables. Nevertheless, all threestudies report superior effects for groups that had prison plus aftercare.
The Amity-Donovan findings also suggest that prison TC treatment can beeffective across a range of criminal populations. Compared to other prison TCstudies, the Donovan prison study sample shows higher overall recidivism rates.The differences in recidivism may be related to sample characteristics. Apreliminary comparison of the criminal histories found in the California,Delaware and Texas, and original Stay ‘n Out study samples indicated greatercriminal severity among the Donovan inmates. For example, the total number oflifetime arrests for the Donovan sample averaged 27 versus 10.3 for Delaware, 17for Texas and 8 for Stay ‘n Out. The ages for the four samples were similar,ranging from 29.5 to 35, with the Donovan mean age at 30.5 years. These sampledifferences in criminal severity across studies provide empirical support for thegenerality of conclusions concerning the effectiveness of prison TC treatmentplus aftercare.

14
One of the reasons the Amity program performed so well may be the high-risk level of the population it served and its focus on antisocial behavior.Andrews and his colleagues (Andrew & Bonta, 1994; Andrews, Bonta, & Hodge,1990) have developed the “risk/need/responsivity theory” which states thateffective treatment needs to be responsive to “criminogenic needs” -- antisocialattitudes and behaviors in the areas of authority, interpersonal relationships,peers, leisure activities, substance abuse, and work. The “risk principle” statesthat intensive treatment will primarily benefit offenders at higher risk (e.g., moresevere antisocial backgrounds).
With respect to client predictors of reincarceration, the present multivariateresults show limited effects of the variables that have consistently been found torelate to recidivism among non-treatment inmate populations (Gendreau, et al.,1996). In part, this may reflect differences in client samples studied. Forexample, inmates with self identified drug use problems who volunteer forPrison TC treatment may not be representative of inmate populations in general.For these drug-abusing inmates treatment involvement appears to be the mainpredictor of recidivism, although dynamic client factors are not unimportant.
Limitations and CaveatsSeveral limitations in the present study bear on the interpretation of findings.
The study design did not randomly assign inmates to the aftercare TC andregular parole conditions. Although the California Department of Correctionsdid allow random assignment to the prison TC (intent-to-treat group) andregular prison conditions (no-treatment control group), they felt strongly that allprogram completers should have an opportunity to go to the aftercare TC. Thus,client selection factors may have influenced entry into and/ or completion of theVista aftercare program.
The self-selection question awaits clarification from a study in progressassessing motivational factors as client predictors of the various treatmentconditions. However, preliminary findings showed that higher motivationalscores were significantly correlated with choosing any post release treatment,compared to those who did not elect post prison treatments; and, those whochose TC aftercare (Vista) showed small but significantly higher motivationallevels than the clients who chose non-TC treatments post prison. Reincarcerationrates were lower for the clients in the control and intent-to- treat groups who didenter post release treatments suggesting a general positive effect of post releasetreatments. However, reductions for Vista completers were nearly 3 timesgreater than clients in non-Vista treatments.

15
The motivational findings provide evidence for self-selection across allconditions, controls and the intent-to-treat group. Although Vista clients showedthe highest motivation, self selection did not appear to be a major contributor tothe large differential effects obtained between Vista and the other study groups.(See De Leon, 1998 and De Leon, Inciardi, & Martin, 1995 for an informativediscussion on the role of self selection factors such as motivation in interpretingtreatment effectiveness.)
Another limitation is the way in which reincarceration outcomes are drawnfrom files. Specifically, clients in local jails (not prison) during the post releaseperiod would not appear in the reincarceration file data reflecting a possible“time at risk” artifact in the group differences. This question was addressed inthe self-reported data, which corroborated the present file results. Total days injail and/ or prison during the post release period decreased linearly across thestudy groups.
More generally, although highly important, reincarceration findings are onlya part of the Donovan TC evaluation results. Later evaluation reports willdescribe client psychological and behavioral changes during treatment and theirrelationship to outcomes. Analyses of outcomes will be expanded to include self-reported crime, substance abuse, employment and other social adjustmentoutcomes. Special studies will also be reported, such as systematic analyses ofmotivation and treatment retention.
Notwithstanding these limitations, the Amity-Donovan reincarcerationfindings are consistent with developing research documenting the effectivenessof prison TC programs for substance abusers. The present studies focus ondifferent levels of treatment involvement underscores the conclusion that prisonTC treatment followed by TC oriented community aftercare treatment producesthe greatest positive impacts.
Implications for Policy and ResearchThe finding that reincarnation rates decreased and days until first
incarceration increased with greater time spent in program is consistent with thewell known finding in TC literature that the greater time spent in TC programs(or treatment duration) is related to better outcomes. These findings provideclear support for a comprehensive approach that includes prison TC drugtreatment along with integrated community TC aftercare facilities for prisoninmates with histories of substance abuse. Both reincarceration and days untilfirst incarceration have important cost avoidance implications that will beprovided in future reports.

16
The replication of highly positive outcome findings related to thecombination of prison TC and aftercare TC treatment raises empirical questionsconcerning the relative impacts of treatment placement and of treatmentduration. The next research steps need to systematically vary the length andtype of both in prison and aftercare treatment to identify which combinations arethe most effective and cost effective for specific groups of offenders.

17
Author Note:This research was supported by a National Institute on Drug Abuse grant (5
PAO DA07700-01) awarded to the Center for Therapeutic Community Researchat NDRI.
The Amity staff is acknowledged for their dedicated clinical work and fullcooperation and participation with the research. Points of view or opinions inthis article do not necessarily represent the official position of the U.S.government or NDRI.
Requests for reprints and correspondence can be sent to Harry K. Wexler,CTCR at NDRI, 2 World Trade Center, 16th Floor, New York, NY 10048; and e-mail: [email protected].

18
References
Andrews, D. A. & Bonta, J. (1994). The psychology of criminal conduct. Cincinnati,OH: Anderson.
Andrews, D. A., Bonta, J. & Hoge, R. D. (1990). Classification for effectiverehabilitation: Rediscovering psychology. Criminal Justice and Behavior, 17, 19-52.
Condelli, W. S. & De Leon, G. (1993). Fixed and dynamic predictors of retention intherapeutic communities. Journal of Substance Abuse Treatment, 10, 11-16.
De Leon, G. (1995). Therapeutic communities for addictions: A theoreticalframework. International Journal of the Addictions, 30, 1603-1645.
De Leon, G. (In press). Commentary: Reconsidering the self selection factor inaddiction treatment research. Psychology of Addictive Behaviors.
De Leon, G., Inciardi, J. A., & Martin, S. S. (1995). Residential drug abusetreatment research: Are conventional control designs appropriate for assessingtreatment effectiveness? Journal of Psychoactive Drugs, 27, 85-91.
De Leon, G., Melnick, G. Kressel, D. & Jainchill, N. (1994). Circumstances,motivation, readiness and suitability (The CMRS Scales): Predicting retention intherapeutic community treatment. The American Journal of Drug and AlcoholAbuse, 20, 495-515.
De Leon, G., & Rosenthal, M. S. (1989). Treatment in residential communities. In T. B.Karasu (Ed.), Treatments of psychiatric disorders, Vol. II (pp. 1379-1396). Washington,DC: American Psychiatric Association Press.
Gendreau, P., Little, T. & Goggin, C. (1996). A meta-analysis of the predictors ofadult offender recidivism: What works. Criminology, 34, 575-607.
Graham, W. F. & Wexler, H. K. (1997). The Amity therapeutic communityprogram: Description and approach. In G. De Leon (Ed.), Community asmethod: Modified therapeutic communities for special populations and specialsettings (pp. 69-86) Westport, CT: Greenwood Press.
Lipton, D. S. (1995). The effectiveness of treatment for drug abusers under criminaljustice sanctions. (NIJ Research Report 157642). Washington, DC: U.S. GovernmentPrinting Office.
Inciardi, J. A., Martin, S. S., Butzin, C. A., Hooper, R. M. & Harrison, L. D.(1997). An effective model of prison-based treatment for drug-involvedoffenders. Journal of Drug Issues, 27, 261-278.
Knight, K., Simpson, D. D., & Hiller, M. L. (1996). Evaluation of prison-basedtreatment and aftercare: Process and outcomes. Paper presented at the meetingof the American Psychological Association, Toronto Canada.
Wexler, H. K. (1995). The success of therapeutic communities for substanceabusers in American prisons. Journal of Psychoactive Drugs, 27, 57-66.
Wexler, H. K., Falkin, G. P. & Lipton, D. S. (1990). Outcome evaluation of aprison therapeutic community for substance abuse treatment. Criminal Justiceand Behavior , 17, 71-92.

19
Wexler, H. K. & Williams, R. (1986). The Stay 'n Out therapeutic community: Prisontreatment for substance abusers. Journal of Psychoactive Drugs, 18, 221-230.
Winett, D., Lowe, L. Mullen, R. & Missakian, E. (1992). Amity Right Turn: Ademonstration drug abuse treatment program for inmates and parolees. In C.G. Leukefeld &F.M. Tims (Eds.), Drug abuse treatment in prisons and jails (pp. 84-98). National Institute onDrug Addiction. (DHHS Publication No. ADM 92-1884) Washington, DC: U.S. GovernmentPrinting Office.
20
Table 1Background Characteristics of Intent-to-Treat and No-Treatment Control Groups
Total All Prison ControlSample TC Admissions Group(N=715) (n=425) (n=290)
Variable Name % % % p Value*
Age (Mean/SD) 30.9 (7.4) 31.2 (7.7) 30.5 (7.1) n.s.Ethnicity African-American 22.4 22.9 21.6 n.s. White 37.8 39.5 35.3 Hispanic 30.1 28.4 32.5 Other 9.7 9.2 10.6Education <HS Diploma 42.2 42.8 41.4 .03 HS Diploma Only 53.0 54.1 51.4 > HS Diploma 4.8 3.0 7.2Marital Status Married/Living Partner 39.2 37.6 41.4 n.s. Separated/Divorced/ Widowed 20.6 21.3 19.9 Never Married 40.3 41.1 38.7Employment Last Twelve Mo. 34.5 34.0 35.3 n.s.Criminality in Lifetime Lifetime Arrests 26.7 (61) 27.2 (57.9) 25.7 (65.5) n.s. Lifetime Mo. Incarcerated 80.0 (64.1) 82.7 (65.2) 77.1 (63) n.s.Lifetime Drugs/Alcohol Illegal Use 100.0 100.0 100.0 n.s.Lifetime AIDS Risk Injected Drugs 57.3 54.0 55.7 n.s. >50% Unsafe Sex 97.1 96.3 98.3Psychiatric Diagnoses Anti-Social Personality 51.5 51.6 51.3 n.s. Phobias 17.2 17.5 16.8 n.s. Post Traumatic Stress 14.5 14.7 14.0 n.s. Depression 10.1 9.2 11.2 n.s. Dysthymia 6.9 5.7 8.5 n.s.* p value refers to chi square for percentages and t-test mean differences.

21
Table 2
Days Until Reincarceration at 12 and 24 Months Post Release
Comparison Groups N Mean Days SD12 Months at Risk No-treatment 144 171.88 88.63 Prison TC Drop Outs 44 173.05 79.31 Prison TC Completers 78 190.36 88.79 Aftercare Drop Outs 14 211.29 89.12 Aftercare Completers 8 274.25 68.62
Statistic F=3.437Significance p<.01
24 Months at Risk No-treatment 57 216.44 138.21 Prison TC Drop Outs 23 234.39 172.56 Prison TC Completers 39 253.74 155.13 Aftercare Drop Outs 9 333.33 188.00 Aftercare Completers 6 391.17 206.61
Statistic F=2.575Significance p<.05

22
Table 3
Simple Correlations Between Static and Dynamic Variables with Recidivism
Predictors Incarceration at12 Months(N=715)
r
Incarceration at24 Months
(n=263)r
Days UntilIncarceration at
12 Months(n=288)
rStatic Variables Age -.16** -.16** .10* Ethnicity .00 .05 .03 Criminal History .08* .04 -.09 IQ .09* -.07 .08 Childhood Problems .07 .10* .05Dynamic Variables Antisocial Personality .04 .00 -.13** Personal Distress .02 .00 .11* Social Achievement -.02 .06 -.15**p <.05. **p<.01.

23
C on tro ls(N = 2 9 0)
Int en t toTrea t
(N =4 2 5)
Pri son T CD ropo uts
(N =9 8 )
Pri so n T CC om pl ete rs
(N = 1 94)
Prison T CC om plete rs/A fte rc a re TC
Dropouts
P riso n TCC om pl eter s/Aft erca re TCC om plete rs
0
10
20
30
40
50
60
70
80
90
10 0
Rei
nca
rcer
atio
n %
C on tro ls(N = 2 9 0)
Int en t toTrea t
(N =4 2 5)
Pri son T CD ropo uts
(N =9 8 )
Pri so n T CC om pl ete rs
(N = 1 94)
Prison T CC om plete rs/A fte rc a re TC
Dropouts
P riso n TCC om pl eter s/Aft erca re TCC om plete rs
49.7
33.9
44.940.2 38.9
8.2
Figure 1
Outcomes at 12 Months: Reincarceration (N=715)
(N=36) (N=97)

24
Figure 2
Outcomes at 24 Months: Reincarceration (N=263)
C on tro ls(N =8 5 )
In te nt toTrea t
(N = 17 8)
P rison TCDropouts
(N = 40 )
Pri so n T CCom pl et ers
(N = 8 0)
P riso n TCCom plete rs/Af te rc are TC
D ropo ut s
P riso n TCCom pl et ers/Aft erca re TCC om plete rs
0
10
20
30
40
50
60
70
80
90
100
Rei
nca
rcer
atio
n %
C on tro ls(N =8 5 )
In te nt toTrea t
(N = 17 8)
P rison TCDropouts
(N = 40 )
Pri so n T CCom pl et ers
(N = 8 0)
P riso n TCCom plete rs/Af te rc are TC
D ropo ut s
P riso n TCCom pl et ers/Aft erca re TCC om plete rs
67.1
43.3
57.5
48.8
60.0
14.0
(N=15) (N=43)