BUSINESS REVIEW - Amity University
123
Amity BUSINESS REVIEW The Journal of Amity Business School Volume 22, No. 2, July - December 2021 ISSN: 0972-2343 ASI-SCORE: 1.3 Indian Citation Index http://amity.edu/abs/abr Impact of Brexit on Banking and Finance Sector Santosh Kumari, Shreya Agarwal Factors Affecting Domestic Tourist Satisfaction Aastha Ahuja, Deepti Dabas Hazarika Evaluation of Problems and Perception of Tea Workers' in Kangra District of Himachal Pradesh Manoj Sharma Fraud Risk and Capital Market Performance Nexus in Nigeria (2001-2017) Okoye, John Nonso, Egbunike, Francis Chinedu, Anazonwu, Helen Obiageli, Okafor, Kenebechukwu Jane Counterproductive Work Behavior and Performance of Banks in Enugu State, Nigeria Anekwe Rita Ifeoma, Ndubuisi-Okolo Purity Uzoamaka and Akaegbobi Grace Finding the Influence of NPAs on Profitability – A Juxtaposition of Public and Private Sector Banks in India Samuel S Mitra, Arpita Dey, Payal Sharma, Aparajita Hembrom and Uzma Khan Perspectives of MSMEs and Business Owners on Sustainability Challenges and its Effect on Sustainability Outcomes , Unachukwu, Ikenna Egbunike, Francis Chinedu
-
Upload
khangminh22 -
Category
Documents
-
view
1 -
download
0
Transcript of BUSINESS REVIEW - Amity University

AmityBUSINESS REVIEW
The Journal of Amity Business School
Volume 22, No. 2, July - December 2021ISSN: 0972-2343ASI-SCORE: 1.3Indian Citation Index http://amity.edu/abs/abr
Impact of Brexit on Banking and Finance Sector
Santosh Kumari, Shreya Agarwal
Factors Affecting Domestic Tourist SatisfactionAastha Ahuja, Deepti Dabas Hazarika
Evaluation of Problems and Perception of Tea Workers' in Kangra District of Himachal Pradesh
Manoj Sharma
Fraud Risk and Capital Market Performance Nexus in Nigeria (2001-2017)
Okoye, John Nonso, Egbunike, Francis Chinedu, Anazonwu, Helen Obiageli, Okafor,
Kenebechukwu Jane
Counterproductive Work Behavior and Performance of Banks in Enugu State, Nigeria
Anekwe Rita Ifeoma, Ndubuisi-Okolo Purity Uzoamaka and Akaegbobi Grace
Finding the Influence of NPAs on Profitability – A Juxtaposition of Public and Private
Sector Banks in India
Samuel S Mitra, Arpita Dey, Payal Sharma, Aparajita Hembrom and Uzma Khan
Perspectives of MSMEs and Business Owners on Sustainability Challenges and its
Effect on Sustainability Outcomes,Unachukwu, Ikenna Egbunike, Francis Chinedu

Amity Business Review
Vol. 22, No. 2, July - December 2021
AMITY BUSINESS REVIEW Vol. 22, No. 2, July - December 2021
Bi-annual Double-Blind, Peer-Reviewed & Refereed Journal of
Amity Business School ISSN: 0972-2343
ASI-SCORE: 1.3
Indian Citation Index
Chief Patron : DR ASHOK K CHAUHAN
Patron : DR ATUL CHAUHAN
Desk Advisor : DR BALVINDER SHUKLA
Editor-in-Chief : DR SANJEEV BANSAL
Editor : Dr AMIT KUMAR PANDEY
DR ABDUL AZIZ ANSARI Jamia Millia Islamia, New Delhi
DR J.K. SHARMA
Board of Editors
DR SANJAY SAPROO CEO, HAMILTON Medical, AG
DR DILIP KUMAR BANDHOPADHYAY
Amity School of Business, Amity University, Noida
DR ANITA KUMAR University of Coventry, UK
PROF GARIMA GUPTA University of Delhi
DR S.K. LAROIYA Formerly University of Delhi
DR SANDEEP KUMAR GARG University of Delhi
PROF MAHESH SHARMA SBSC, University of Delhi
DR DHARMENDRA Guru Jhambeshwar University, Hisar
PROF. AWADHESH KUMAR TIWARI Dean, Commerce and Management,
Deen Dayal Upadhyaya Gorakhpur University, U.P
DR TRIVENI SINGH SP STF, Uttar Pradesh Police
PROF S.K. GARG Pro Vice Chancellor, Delhi Technical University
PROF DR AJAY KUMAR SINGH Vice Chancellor, Sri Sri University, Cuttack
Delhi School of Economics, Delhi University
Former Vice Chancellor, GGSIP
PROF DR SUDHIR KUMAR SHUKLA HOD Commerce, Mahatma Gandhi Kashi Vidyapith,
Varanasi
DR N.K. AHUJA Vice Chancellor, Subharti University, Meerut
DR K.K. DEWAN Vice Chancellor, Noida International University
PROF JAVED AKHTAR Aligarh Muslim University, Aligarh
PROF T.K. CHATTERJEE IMT Nagpur
PROF A.H. ANSARI Director CMS, Jamia Milia Islamia
PROF JAGDEESH Dean Management, Amity University, Mumbai
Doc. Dring. ELENA HORSKA Slovak University of Agriculture, NITRA,
Slovak Republic
Mr SANTOSH K SRIVASTAVA INDOIL, MONTNEY Ltd. Calgary, Canada
DR T. K. SINGHAL Symbiosis International University, Pune
AcademicKeys UNLOCKING ACADEMIC CAREERS

Amity Business Review
Vol. 22, No. 2, July - December 2021
“Victory comes from finding opportunities in problems.”
The world is passing through a transition phase for last two years. Covid 19 started in December 2019 and
peaked in 2020.Every field and sector are affected but education sector is the most severely hit. If the
academic Institutions across glove would not have worked in the true spirit to change operations from
offline to online and then blended mode, there were strong chances of the academic session to become
zero years. It was not easy for majority of people to adhere to these changes in absence of any available
references of the past and limited resources. To implement the changes in school education was a major
challenge.
Time and again, humanity has proved that we are tougher than the tough problems and pandemic was also
no exception. The third wave is on and we are all facing this disaster bravely. Everyone is hoping to see
exit of this deadly disease soon.
Researchers around the glove have utilized these two years in most positive spirit and have come out with
many meaningful outcome-oriented research initiatives. As per the data, thousands of research paper on
contemporary and relevant issues has been published by the eminent researchers during this period.
Presenting for all of you few of such meaningful quality research papers.
Happy Reading
Sanjeev Bansal
From the desk of the Editor-in-Chief

Amity Business Review
Vol. 22, No. 2, July - December 2021
Amity Business Review is a double-blind peer-reviewed, international, interdisciplinary journal, covering
business, management, economics, finance, industrial organisation, and other related fields. We are
extremely excited to be embarking on this very important role and wish to express my gratitude to all the
contributors. We also want to encourage all those who are interested in being part of this energetic and
enthusiastic team of reviewers and contributors to contact us, as we will welcome your contribution. We
invite colleagues working in related disciplines such as, Human resource, Marketing, Finance,
Information technology and operation to consider our journal as an appropriate medium for the
publication of your own high-quality research.
ABR is designed to provide a platform for academicians, researchers and practitioners who are
interested in new knowledge in the field of business, management, economics, finance, industrial
organisation and other relevant disciplines. As the Journal is international in scope, papers dealing with
state-of-the-art developments in various nations, or comparative studies from several countries will be
accepted. The journal publishes a wide range of original papers, critical reviews of recent research
papers with significant research results and technical notes in related areas and their applications.
We wish a cheerful, research full new year 2022 to all.
Amit Kumar Pandey
From the desk of the Editor

Amity Business Review
Vol. 22, No. 2, July - December 2021
ARTICLES
1. Impact of Brexit on Banking and Finance Sector 1-26
Santosh Kumari & Shreya Agrawal
2. Factors Affecting Domestic Tourist Satisfaction 27-43
Aastha Ahuja, Deepti Dabas Hazarika
3. Evaluation of Problems and Perception of Tea Workers’ in Kangra District of
Himachal Pradesh 44-53
Manoj Sharma
4. Fraud Risk and Capital Market Performance Nexus in Nigeria (2001-2017) 54-79
Okoye, John Nonso, Egbunike, Francis Chinedu, Anazonwu, Helen Obiageli,
Okafor, Kenebechukwu Jane
5. Counterproductive Work Behavior and Performance of Banks in Enugu
State, Nigeria 80-88
Anekwe Rita Ifeoma, Ndubuisi-Okolo Purity Uzoamaka and Akaegbobi Grace
6. Finding the Influence of NPAs on Profitability – A Juxtaposition of Public
and Private Sector Banks in India 89-98
Samuel S Mitra, Arpita Dey, Payal Sharma, Aparajita Hembrom and
Uzma Khan
7. Perspectives of MSMEs and Business Owners on Sustainability Challenges
and its Effect on Sustainability Outcomes 99-116
Unachukwu, Ikenna1; Egbunike, Francis Chinedu
Vol. 22, No. 2, July-December 2021 Contents


Impact of Brexit on Banking and Finance Sector
Amity Business Review
Vol. 22, No. 2, July - December 2021 1
Impact of Brexit on Banking and Finance Sector
Santosh Kumari, Ph.D.1 & Shreya Agrawal 2
1 Associate Professor, Department of Commerce, Shri Ram College of Commerce, University of Delhi, India.
Email (O): [email protected] Email (P): [email protected] 2 B.Com.(Hons)-II Year, Batch 2019-2022, Shri Ram College of Commerce, University of Delhi, India.
ABSTRACT
The 23rd June 2016 referendum on UK’s
prolonged participation in the European
Union sowed seeds of another political
turmoil and economic instability when
51.9% of the voters voted to leave the
European bloc. The uncertainty
surrounding the British withdrawal from
EU finally ended on 31st Jan 2020, as the
UK withdrew from the EU and was granted
the third country status. This historic event
has been dubbed as “Brexit”. This paper
examines the impact of Brexit on the
financial sector of UK since the
announcement of its possible exit from the
EU. Further, the paper reviews the
operation of banking and financial services
in pre-Brexit era and brings out the
challenges looming over the industry after
the end of the transition period on 31st
December, 2020. Finally, the paper
explores the pros and cons of Brexit on
financial entities operating in the EU and
the third countries.
Keywords: Brexit, Financial Services,
Banking, Passporting, Subsidiarisation,
Post-Brexit Era, Immigration.
INTRODUCTION
The British desire to get independence
from the EU legislation, gain back control
over its policies and curb immigration
which exceeded 300,000 persons annually
into UK from EU and from outside EU in
2014 and 2015 (Sowels, 2017) made it
leave the European Union of which it had
gained membership in 1973. On March
29, 2017, the United Kingdom invoked
Article 50 of the treaty on European
Union and thus began the formal process
to end its European membership. Brexit, a
blend of ‘British’ and ‘exit’ took place at
11pm GMT on 31st Jan 2020, when after
an exhausting round of political debates
and grinding negotiations stretching over
for four years, Britain left its largest and
closest trading partner and reverted to a
third-country status. The EU Single
Market which was formed because of
efforts to consolidate cross-border trading
relationships, achieve economic
integration and increase harmonization of
regulatory and supervisory standards
across the EU, offered several advantages
such as reduced barriers and costs, access
to larger markets, specialization and
additional competitive pressure to the

Impact of Brexit on Banking and Finance Sector
Amity Business Review
Vol. 22, No. 2, July - December 2021 2
business entities in UK (Emmerson,
Johnson, Mitchell, 2016, p. 11). As such,
Brexit becomes the source of long- term
political and institutional transitions,
regulatory changes, depressed risk
appetite, elevated uncertainty,
deceleration of growth, softening of
confidence, reduced domestic inward
investment and dismantling of economic
relationships and holds severe
implications for the economies of UK and
EU. The object of this paper is to analyze
the consequences of Brexit on the banking
and financial (including insurance)
services industry.
REVIEW OF LITERATURE
After UK’s desire to withdraw from the
EU was apparent in the referendum held
by PM David Cameroon, many studies
have looked at the possible British exit
scenarios and their probable impact on
UK’s economy. Oliver Wyman (2016)
estimated that the British economy would
lose £2 bn worth of revenue, 3,000-4,000
jobs and £0.5 bn of tax revenue in the
high access scenario, wherein UK remains
outside the EEA but enjoys the
recognition of regulatory equivalence and
passporting, while the lowest access
scenario which reduces UK to the status
of a third country would hit the UK
economy by £18-20 bn of lost revenues,
31,000-35,000 of jobs and £3.5 bn of
loses in tax revenue. Many think tanks,
financial institutions, academicians and
law specialists have contributed to the
Brexit debate and have suggested options
for UK’s future relationships with the EU,
while basing their estimates on the
dynamics of Brexit negotiation process for
minimal disruptions to the UK economy.
The possible EU-UK models post Brexit
as suggested by Deloitte (2016) were- (1)
EEA+EFTA (Norwegian model) in which
UK joins the EFTA (European Free Trade
Association), which already includes
Norway, Iceland, Lichtenstein, and thus
becomes a constituent of EEA. This
model gives the UK full access to EU
market and spares UK from making
contributions to the EU budget except
grants. However, UK would have to
accept free movement of goods, services,
persons and capital, remain outside of EU
Customs Union and lack influence over
EU legislation. (2) Non EEA+EFTA
(Swiss model) which gives UK the liberty
to decide areas where it could gain direct
benefits from accessing EU markets,
while EU legislation shall apply to
bilateral agreements.
The loss of jobs in financial sector was
predicted to be 83,000 (PwC, 2018);
70,000 (EY, 2017) and 2,30,000 as per the
estimations of UK treasury in April 2016.
Different organizations have predicted
bifurcating impacts at different points of
time. Hunt (2016) survey results
highlighted those 100,000 jobs were at
risk in the financial sector and the
contribution of the sector to the UK
economy would perish by 10%, an

Impact of Brexit on Banking and Finance Sector
Amity Business Review
Vol. 22, No. 2, July - December 2021 3
equivalent of £12 bn by 2020, if the UK
left EU; though it gives a sense of relief
that the market would adjust over time,
resulting in an overall scrapping of
10,000-30,000 jobs in the UK financial
services sector. Loss in revenues due to
relocation of EU-related banking business
would be £5 bn (PwC, 2018) and £8 bn
(Oliver Wyman, 2016). Deloitte (2016)
forecasted that UK growth would be
6.3%-9.5% smaller in 2030 with UK
outside the EU. PwC (2018) estimated
€1.3 bn fall in EU GVA (worth 2.2% of
EU GVA) and revenue loss of £14.20 bn
for London due to disintegration in the
financial sector. Ebell and Warren (2016)
concocted optimistic and pessimistic
scenarios of Brexit and their effects on
UK’s GDP which could shrink by 1.8% if
UK retained EEA membership (Norway
model); 2.1% if UK only signed the Free
Trade Agreement with the European
Union and is relieved of the obligation to
accept the European Union legislation and
grant free movement of people; and a
GDP contraction of 3.2% for WTO
scenario wherein there is no special access
to EU market for services and business
relations with Europe are delineated in
WTO’s GATS (General Agreement on
Trade in Services).
The estimates of different organizations
greatly diverge from each other. As per
some think tanks, UK’s GDP could
increase by 4% in the WTO scenario
whereas PwC (2018) saw 3.5% of
contraction in the same scenario. The
long-term repercussions of Brexit could
be GDP reduction of 2.1%, trade
shrinkage of about 1.8% by 2030 and a
positive outcome associated with direct
budgetary savings of 0.4% of GDP (Ebell
& Warren, 2016). All the studies and
surveys have agreed that both the UK
economy and its financial services sector
would be negatively impacted if UK
departed from EU. A recent survey by
Young (2019) indicates that post Brexit,
investments would be 15% lower. Saper,
Schoenmaker and Venon (2017)
calculated that 25% of London-based
wholesale banking was related to EU27
and the same could be relocated to EU27
(exhibiting 17% share in 18 trillion euros
worth of UK banking assets) bringing
about a decay of UK’s share in the entire
European wholesale market, a slump from
90% to 60%.
Most of the studies on Brexit have been
predictive in nature. This paper differs in
approach by studying what has been the
actual impact till the date the paper is
written. This paper explores how the
banking and financial sector of UK and
EU has been affected since the news of
Britain leaving the EU was in the air and
what Brexit implies for the industry in
terms of changes in the regulatory regimes
the financial entities in both the
economies are governed under. The paper
does not take into consideration the
impact of COVID-19 on the banking and
Impact of Brexit on Banking and Finance Sector
Amity Business Review
Vol. 22, No. 2, July - December 2021 4
financial sector. All data figures presented
are only in reference to Brexit
consequences.
OBJECTIVES OF THE STUDY
This study explores the financial
landscape of United Kingdom and
European Union, before and after Brexit,
to serve the following objectives:
1. To analyze how the UK finance
industry has been impacted by the
announcement of Brexit.
2. To evaluate the challenges awaiting the
financial firms in UK and EU in the
Post-Brexit era.
3. To study the pros and cons of Brexit
for the financial entities operating in
EU and the third countries.
METHODOLOGY OF THE STUDY
The methodology adopted for conducting
this study is as follows:
An extensive thematic review of literature
was done to undertake this study. Various
regimes regulating the finance sector in
the EEA (European Economic Area)
region were thoroughly studied to
understand the governance and
supervisory changes caused by Brexit and
to evaluate their effects on the financial
operations in the region. The actual
impact that has materialized since the EU-
referendum, till the present time, was
traced from various media reports,
newspaper articles, reports of private and
government organizations and official UK
government data. These secondary
evidences, together with the research
findings available in the literature were
critically assessed to conclude the answers
to different questions of this research
study.
UK FINANCE INDUSTRY
The UK finance industry comprises of
securities, investment funds, pension
funds, credit rating agencies, investment
analysts, deposit taking institutions and
market infrastructure including share
trading venues, clearing houses, trade
repositories, settlement houses,
benchmark administrators, payment
systems and securities transfer systems
(Sowels, 2017) along with a plethora of
accompanying specialized professional
services such as international legal
services, dispute resolution, advisory,
corporate and specialty insurance,
accounting and management consulting.
In 2019, the financial and insurance
services activities contributed £131.9 bn
to the UK’s economy, a share of 6.9% of
the total economic output and the industry
raised £ 30.7 bn taxes which was 4.1% of
all the taxes garnered that year (Shalchi &
Hutton, 2021). UK is Europe’s largest
financial center and the world leader in a
range of financial services, accounting for
16% of the cross-border lending in 2019,
43% of the foreign exchange turnover and
50% of the interest rate over-the-counter

Impact of Brexit on Banking and Finance Sector
Amity Business Review
Vol. 22, No. 2, July - December 2021 5
(OTC) derivatives turnover globally
(TheCityUK, 2020). The sector is the
largest in London where about 50% of
UK’s financial services output is
generated (Shalchi & Hutton, 2021).
London’s commemorated development as
a global financial centre can be ascribed to
its education and legal environment for
the propagation of financial services,
introduction of euro, expansion of single
market set-up, and regulatory
improvements of 1980s- making it rank
first among global financial centres in
2017, outdoing New York and Singapore
(Djankov, 2017). In 2019, financial
services made £59.2 bn worth of exports
or 19% UK service exports, and £18.1 bn
of imports or 8% of all service imports,
realizing a trade surplus of £41.1 bn
(Shalchi & Hutton, 2021), hence
acclaiming UK as the largest global net
exporter of financial services in 2019.
The financial firms of UK are centres of
unmatched excellence, delivering services
of international repute and making
London a global destination for investors
and talent aspiring to work in the finance
industry. London’s asset holdings are
three times the OECD average and twice
the EU average (Hope, 2019, p.7). About
one trillion-pound OTC exchange takes
place daily in London (Djankov, 2017)
while UK finance and insurance sector
employs 1,142,161 people as of December
2020 (Nomis, n.d.), equal to 3.2% of all
jobs, and 35% of all financial sector jobs
are located in London (Shalchi & Hutton,
2021). 384 foreign companies were listed
on the London Stock Exchange (LSE) at
the end of 2019, that accounted for 7.1%
of total global listings, (TheCityUK,
2020). London is the home to 250 foreign
banks - the highest concentration of any
financial centre, and 40% of the same is
also headquartered in London (Hope,
2019). The UK had the largest share of
outstanding value of international bonds
globally at Q1 end 2020 (TheCityUK,
2020). The unparalleled combination of
skills and infrastructure in London is
supported by its independent regulatory
environment, business encouraging
innovation, access to global markets,
receptivity for foreign entities (1400
financial services institutions in UK that
are majorly owned overseas across 80
nations), soft infrastructure including the
stock exchanges, data management,
telecommunications and security, skilled
diversified labour force and hard
infrastructure including connectivity,
transport and innovation (Sowels, 2017).
UK assets under management reached an
all-time high of $12.6 trillion in 2019, of
which the UK banking sector assets
totalled $10.2 trillion, the fifth largest in
the world and the second largest in
Europe. The UK insurance industry is the
biggest in Europe and the fourth largest in
the world with $36.6 bn in premiums in
2019 (TheCityUK, 2020). UK attracts
more FDI than any other EU member state
and the highest portion of FDI goes to the

Impact of Brexit on Banking and Finance Sector
Amity Business Review
Vol. 22, No. 2, July - December 2021 6
financial services sector (TheCityUK,
2016). Thus, London is celebrated as the
global financial hub, the first choice for
premium-grade services and the finance
industry commands paramount
importance to the economy of UK.
Table 1: UK's Global Share of Financial Markets 2019 (%)
Cross-Border Bank Lending 16
Foreign Exchange Turnover 43
Interest Rate OTC Derivatives Turnover 50
Conventional Fund Management 6
Source: TheCityUK (2020). Key facts about the UK as an International Financial Centre 2020.
FINANCIAL INTERDEPENDENCE
BETWEEN UK & EU
UK leads the European financial services
industry as London has been consistently
ranked 1 among the European financial
centres, by Global financial Centres
Index. The financial and ancillary
professional services industry of both UK
and EU not just display a high degree of
interconnectedness that mutually benefits
both the economies but also these
financial relationships are leveraged by
entities foreign to both these economies to
attain enormous benefits that would have
been absent had UK not been a member of
the EU single market. The presence and
significance of UK financial institutions in
the Eurozone markets, spanning a wide
range of services is evident in Table 2.
UK is the largest source of pension funds
in Europe with assets under management
amounting to £2.7 tn, besides being the
biggest player in the European hedge fund
market (TheCityUK, 2020). As of 2017,
there were 953 hedge fund managers in
the EU, out of which 593 were
headquartered in UK. Out of the total 758
hedge fund investors in EU, 409 had
headquarters in UK (Statistia, 2020). UK
and particularly London-based banks play
a powerful role in euro-denominated
business. UK-based banks contained
about £1.4 tn in euro-denominated assets
while nearly 40% of foreign currency
denominated deposits and loans in the UK
were in euro at May end 2016. The Euro-
denominated foreign exchange turnover in
UK surged to $930 bn on an average daily
basis in April 2013, representing a 44%
global share in Euro-denominated forex
trading (TheCityUK, 2016). The
European derivatives market touched
£680 tn in 2019 and the majority of its
clearing happens on London-based
exchanges such as LCH (Bercetche,
2021). UK serves as a gateway to Europe
for capital raising and marketing products
and services. Most of the third country
financial institutions use a single London
branch to access the EU single market.

Impact of Brexit on Banking and Finance Sector
Amity Business Review
Vol. 22, No. 2, July - December 2021 7
Similarly, major Eurozone banks have
branches in London. The assets of euro
area banks in UK totalled £1.2 tn or 17%
of total banking assets in the UK
(TheCityUK, 2016). By the end of 2018,
the total value of assets managed in
Europe was close to 23.1 trillion euros.
The UK accounted for 37.3% of all AUM
in Europe (Statistia, 2020). The
companies using UK as a channel to gain
entry to the EU are the source of plentiful
FDI into the UK from non-EU countries.
EU remains by far the biggest single
overseas market for UK. £30 bn worth of
financial services were exported to EEA
in 2019 and worth £7 bn were imported
from the EEA, giving rise to the largest
trading surplus among all trading sectors
(Table 3). This documents the
significance of EU as a valuable revenue
generating market for UK-based firms and
the reliance of EU customers on the
service providers in UK for their financial
needs. This interdependence implies that
both UK and EU would be the victims of
any repercussions that the severance of
these financial ties constitutes.
Table 2: UK’s Share of Financial Markets in the EU
Percentage Share of
United Kingdom
Date
Interest Rate OTC Derivatives Trading 82 Apr-2016
Foreign Exchange Trading 78 Apr-2016
Hedge Funds Assets1 85 2014
Private Equity Funds1 49 2014
Marine Insurance Premiums 65 2014
Fund Management 50 2014
Equity Market Capitalisation (LSE) 30 2014
Financial Services GDP 23 2014
Bank Lending 26 2014
Banks Assets1 21 2014
Financial and Professional Services Employment 15 2014
Insurance Premiums 22 2014
1 Percentage Share of Europe
Source: TheCityUK, The UK as an International Financial Centre, November 2016 (based on various sources)

Impact of Brexit on Banking and Finance Sector
Amity Business Review
Vol. 22, No. 2, July - December 2021 8
Table 3: UK’s Trade Balance 2019 (in millions of pounds)
Sector Trading Partner Import Export Net
Goods
EEA 292399 186239 -106160
America 62553 74397 11844
Asia 112953 85366 -27587
Other Services
EEA 105460 109684 4224
America 44307 68635 24328
Asia 30553 40795 10242
Financial Services
(Including
Insurance &
Pension)
EEA 7660 30342 22682
America 7760 28260 20500
Asia 3855 10553 6698
Source: Author’s compilation from Office for National Statistics, The Pink Book 2020, Chapter 9
PASSPORTS FALL INTO
DESEUTUDE
The UK as a member of the European
Union had unqualified access to the EU
internal market, access to the Court of
Justice of the European Union and the
financial entities were bound to comply
with the common financial regulation
(Single Rulebook) agreed to by the EU
member states and all legislation
pertaining to the financial services was to
be codified into the UK domestic law
(when EU directives are issued). All the
UK stationed financial firms engaged in a
whole host of activities ranging from
traditional retail and business activities to
private banking, wealth management,
wholesale finance, share trading and
clearing, have their business models based
on the rights conferred by the EU
passports which authorize them to conduct
specified activities either by establishing a
branch, appointing agents or through
cross-border transactions in the EEA. The
nine different types of passports
pertaining to the financial services sector
serve as the holy grail of trade in financial
services across the EU. As the Financial
Conduct Authority (2021) describes it,
passporting allows firms authorized in
EEA states to conduct business in other
EEA states based on their ‘home’ member
state authorization. Any financial firm
based in any EU member state is
vouchsafed by the EU Single Rulebook to
freely offer services throughout the EU,
without any further need for local
authorisations, after having once obtained
sanction from the National Competent
Authority (NCA) in its local country.
Article 17 of the Capital Requirement
Directive IV (CRD IV) provides that -
“Host member states shall not require
authorization or endowment capital for
branches of credit institutions authorized
in other member states”. Around mid-

Impact of Brexit on Banking and Finance Sector
Amity Business Review
Vol. 22, No. 2, July - December 2021 9
2016, there existed about 5476 UK-based
firms that had pan EU access, granted by
these passports and about 8008 companies
based in other EU countries were
passporting into the UK (Sowels, 2017).
These firms have appreciable privilege
over the non-EU firms who face
considerable restrictions by way of
regulatory barriers in carrying out
business in EU member states. The
branches can be established on
preferential terms, signifying that they are
riddened of the cumbersome regulatory
expectations that apply to the branches of
non-EU banks, treated as foreign in EU
member countries.
As the post Brexit transition period
terminates at 11 pm on 31st December,
2020, these passports or the EU-wide
licensing cover becomes defunct and all
the UK-based firms operating in the EEA
have to conform to local laws and
regulatory procedures of individual
member states to transact business in the
EEA. The EEA-based firms providing
services freely in the UK also require
additional regulatory permission in the
UK to conduct their business there. The
abrogation of passporting rights hold
numerous restrictive implications for
transactions between UK and EU. The
loss of passporting rights of UK stationed
firms’ constraints the banks’ ability to
serve the EU customers and sell their
products and services as they are required
to seek supplementary licenses and
authorisations, varying under the local law
of the EEA state. Additionally, the EU-
based customers are denied access to the
cross-border banking and financial
services facilitated by UK firms. The old
branches established by the passporting-
enabled UK-based banking companies in
other EU countries revert to the status of
foreign bank branches that are subject to
increased prudential requirements. The
branches of the EEA banks in the UK
likewise lose their rights to passport back
into the EU single market. Approximately
25% of UK asset management revenues,
totaling £6 bn comes from EU related
business (Oliver Wyman, 2016). There
were 244 UK asset management firms
owning an ‘outbound’ passport and 139
EU stationed firms with ‘inbound’
passports to carry on activities in the UK
(European Economics, 2016). The
obsolescence of the cross-border trading
licenses necessitates substantial
duplication costs as the banks comfortably
ensconced in the UK require separate
licenses for each country, and considering
the fact that the range of licensed banking
services is highly narrowed and licenses
are not available in many EU countries, it
imposes a formidable barrier to cross-
border banking between EEA and UK, a
trade relationship characterizing valuable
dividends. The other inlets to the EEA
depend on the particular firms, types of
activities performed and the regulatory
regime in the relevant EEA state.
Impact of Brexit on Banking and Finance Sector
Amity Business Review
Vol. 22, No. 2, July - December 2021 10
However, the UK Treasury has bestowed
TTP (Temporary Transitional Power) on
the UK financial regulators to craft
temporary transitional provisions, thus
giving extra time to the EEA-based firms
till 31st March, 2022 to adapt to the new
requirements of financial services
legislation. TPR and FSCR are the two
regimes created to assist the EEA
authorized firms in UK an orderly and
smooth exit and to cajole them to apply
for full UK authorization. Temporary
Permissions Regime confers on them the
liberty to continue their existing activities
and undertake new regulated businesses in
UK lying within the scope of the previous
passporting regime and the EEA
domiciled investment funds can continue
temporary marketing in the UK, until the
expiry of the TPR period. The FSCR
enables the EEA passporting firms that
have not enrolled in the TPR to continue
servicing UK contracts entered into before
the end of the transition period (endorsed
only to run off existing contracts).
THIRD COUNTRY REGULATORY
EQUIVALENCE
EU legislation provides for the third
country status wherein non-EU based
firms can offer certain specified services
in the European Economic Area if their
home country regulatory regime is averred
as being par with or ‘equivalent’ to the
EU standards. This means that if the
governance framework of the home
country (where the third country firm is
based) is considered to warrant the same
level of protection as the EU legislation,
the third country firm will not be brought
under full EU control and can function in
other EU states while being mostly under
the state supervision (similar to
passporting). However, the existing
equivalence regimes are very limited in
range and do not embrace the entire gamut
of financial services that can be offered
under the passporting framework. Trading
in European shares, OTC derivatives,
establishment of CCPs (Central
Counterparty Clearing House- exchanges
where standardized derivatives are
traded), marketing of Alternative
Investment Funds and reinsurance
activities have been contained in the
equivalence regime. The granting of
equivalence is contingent on reciprocity or
mutual recognition that requires non-EU
countries to extend similar equivalence
recognition to the EU, implying that the
EU enforcement regime is regarded by the
third country to be essentially similar to
its own regulatory standards (Vries et al.,
2017, p. 11). This is known as enhanced
equivalence as the procedures require both
the parties to accept each other’s financial
market regulations as being equivalent to
their own and hence administer mutual
market access to each other’s financial
companies. The enhanced equivalence or
mutual recognition arrangements extend a

Impact of Brexit on Banking and Finance Sector
Amity Business Review
Vol. 22, No. 2, July - December 2021 11
possibility to financial firms stationed in
UK to establish operations in the
European market. If the UK’s legislation
pertaining to the financial activities is
deemed to be competent with the relevant
EU financial services guidelines, firms
with activities for which market access is
allowed under the equivalence mechanism
can remain active within the single market
of EU. UK’s trading venues become
legitimate venues for EU financial
companies to comply with trading and
reporting obligations for shares and
derivatives. The need to obtain national
authorization in individual states arises in
those areas where there is no provision for
equivalence. Equivalence once granted,
can also be withdrawn upon dissonance of
legislation between EU and the third
country. So UK will have to revise its own
regulatory directives every time EU
modifies its own.
Capital Requirements Directive IV and
Capital Requirements Regulation (CRD
IV and CRR) direct the governance of
wholesale and retail commercial banking
(deposit-taking, lending and payment
services). These directives do not contain
a third country equivalence regime,
entailing the need to obtain individual
national authorization. The investment
services are regulated under ‘Markets in
Financial Instruments Regulation and
Markets in Financial Instruments
Directive II (MiFIR and MiFID II)’.
MiFIR contains an equivalence regime
that recognizes passporting rights and
allows the investment firms, entry to the
EU single market. In case, equivalence is
not admitted under MiFIR, it can be
applied for under MiFID II, which is split
into two sections- one pertaining to
Investment services for professional
clients and eligible counterparties, which
provides for equivalence; and the other
pertaining to investment services for retail
markets and investors, which lacks
provision for equivalence (Vries et al.,
2017). The Asset management funds fall
under UCITS directive which has no
arrangement for equivalence, and the
Alternative Investment Fund Managers
Directive (AIFMD) in lieu of which these
funds can enjoy passporting rights,
dependent on approbation from ESMA
(European Securities and Markets
Authority). Due to the non-availability of
a clear timeline, delegation of portfolio
management from an enterprise in EU27
member state to the UK appears to be the
most preferable option for UK-based fund
managers desirous of serving the EU
customers (Vries et al., 2017),
nonetheless, it involves additional costs
and may induce the permanent shift of
smaller asset managers to EU. Insurers
and re-insurers are administered under
Solvency II which allows equivalence in
parts.

Impact of Brexit on Banking and Finance Sector
Amity Business Review
Vol. 22, No. 2, July - December 2021 12
Table 4: Summary of Third Country Regimes
Types of Financial Services Activities Equivalence Market Access Reciprocity
Banking
Provision of Wholesale and Retail
Commercial Banking Services
Provision of Investment Services for
Professionals and Eligible Counterparties
Provision of Investment Services for
Retail Markets and Investors
Establishment of Institutions Providing
Investment Services
Asset Management
UCITS Funds
Marketing of Funds under AIFMD
Activation of Market
Access Regime depends
on Positive Advice of ESMA
Decided by Member State
of Reference
Insurance
Provision of Insurance Services
Provision of Re-Insurance Services
Market Infrastructure
CCPs
Provision of Trade Repository
Services
Other Financial Services
Credit Ratings
Source: Vries et al., Implications of Brexit on EU financial services, 2017
A prospective equivalence decision covers
possibilities for the financial service
providers in UK and EU to enter each
other’s markets. The granting of
equivalence is based on the potential risks a
third country may bear upon the EU
financial system which generates the need
for strict scrutiny and assessments of the
third country’s rules and laws. The
determination of equivalence lies in the
jurisdiction of European Commission,
however in certain cases, it is decided by
member states or their national regulators.
As the UK and EU regulations exhibit a
high degree of resemblance, achieving
equivalence should not constitute much
difficulty (Scarpetta & Booth, 2016).
Equivalence has been granted by the
‘European Securities and Markets
Authority’ so far only for two activities-
derivatives clearing houses in Britain (After
loss of passporting, euro-denominated

Impact of Brexit on Banking and Finance Sector
Amity Business Review
Vol. 22, No. 2, July - December 2021 13
derivatives are supposed to be cleared on an
EU trading venue as per EU guidelines, in
the absence of equivalence) since Jan, 2021
for 18 months, and settling Irish securities
transactions until June 2021 (Jones, 2021).
The UK has unilaterally declared
equivalence for EU firms in many sectors.
Such as, it has granted equivalence
determinations for EU insurers on Nov 9,
2020, establishing that the insurers and re-
insurers in UK are complying with the same
capital and governance requirements as for
the UK positioned firms (Hodgson, 2020).
However, Brussels has not reciprocated.
Equivalence measures are being undertaken
on a piecemeal bilateral basis (with
individual regulators) and are subject to
frequent revision and extension of
deadlines. For example, Italy has allowed
UK based firms to continue their business
like before in the country till June 2021.The
discussion of a mutual equivalence
recognition has been in place for the last
four and a half years (Bercetche, 2021).
Lying in the hands of European regulators, a
possible equivalence decision can take years
to be passed. The anticipation of mutual
equivalence recognition or a deal that
clearly defines future financial relationships
and erases the obscurity related to the
regulation of cross-border entities is also
making things complicated as the
uncertainty prevails.
SUBSIDIARISATION
The third country status of UK deprives it
of its preferential treatment regarding the
access of EU single market and pulls it
out of the coverage of EU treaties.
Consequently, Businesses that trade
between EEA and UK lose the freedom of
service and establishment bestowed by the
EU treaties. Nevertheless, as Britain
becomes a non-member of the Customs
Union, it can conclude free trade
agreements with other counties. The
Brexit named economic disintegration
creates a conducive environment for UK
to augment its historical ties and sign bi-
lateral agreements with rising financial
centres such as Hong Kong and Singapore
(Grant Thornton, 2016). Although the
third country can request for equivalence
under the relevant positions in the EU
legislation so that firms functioning under
the scope of equivalence regime are
exempted from national authorisation, the
equivalence market access is significantly
narrower. Much of UK’s position as a
financial hub can be credited to the UK
presence of financial services firms
headquartered in EU member states and
non-EU countries, as the firms exercise
their passporting rights to access both the
customer base and market infrastructure
situated in other member states while
operating remotely from London (having
obtained authorization in UK) by setting
up cost-effective branches across the bloc
(without obtaining authorization
elsewhere). Now that UK is no more a
part of EU, there arises the need to
subsidiarise these branch operations to
host EU related business. Subsidiaries are

Impact of Brexit on Banking and Finance Sector
Amity Business Review
Vol. 22, No. 2, July - December 2021 14
separate legal entities with independent
governance mechanisms as opposed to
branches. Subsidiarisation involves huge
expenditures as there they require separate
capitalization, higher equity capital to
asset holding ratio with restrictions on
capital fungibility, funding and liquidity
and duplication of corporate resources
(separate board of directors, risk-
management framework, infrastructure
etc.), procurement costs and loss of
synergies. As highlighted by the Bank of
England (2016), subsidiarisation of
deposit-taking activities could result in
£2.2-3.2 bn rise in capital requirements.
PwC (2018) estimates €100 mn reduction
in revenues associated with 0.0004
percentage points increase in corporate
costs. Due to such excessive costs,
financial activity may shrink if the firms
draw back their cross-border business.
IMPLICATIONS FOR UK
As the relations between the United
Kingdom and the European Union reform
and the EU single market shuts its doors
to the financial firms that use UK as a
base to launch EU wide operations, the
global banking giants have threatened to
leave the City of London. Key officials of
the financial conglomerates like Goldman
Sachs, Deutsche, JP Morgan and Russian
Bank VTB have insinuated to relocate to
the EU and move hundreds of people from
London to Europe while some would be
hiring new people in EU. Many are
buckling up for announcing huge layoffs.
HSBC has expressed his intention to
offshore 1000 jobs to France, 3000 jobs at
Goldman Sachs would migrate to
Frankfurt and New York, thereby
plummeting the bank’s London operations
to half, while the CEO of Swiss Bank has
estimated that 1000-5000 jobs in London
would be wiped off. Banks have blazed
the trail for creating Brexit task forces and
devising contingency and mitigation plans
to accommodate structural and operational
changes to minimize disruption to
business operations (Deloitte, 2019).
Barclays has been organizing specialist
seminars on new markets, optimizing
business around transformed regulatory
practices, employment, uncertainty and
evolved international relationships
(Barclays, 2021). Hamre and Wright
(2019) had identified 332 firms that had
shifted business to EU by October 2019.
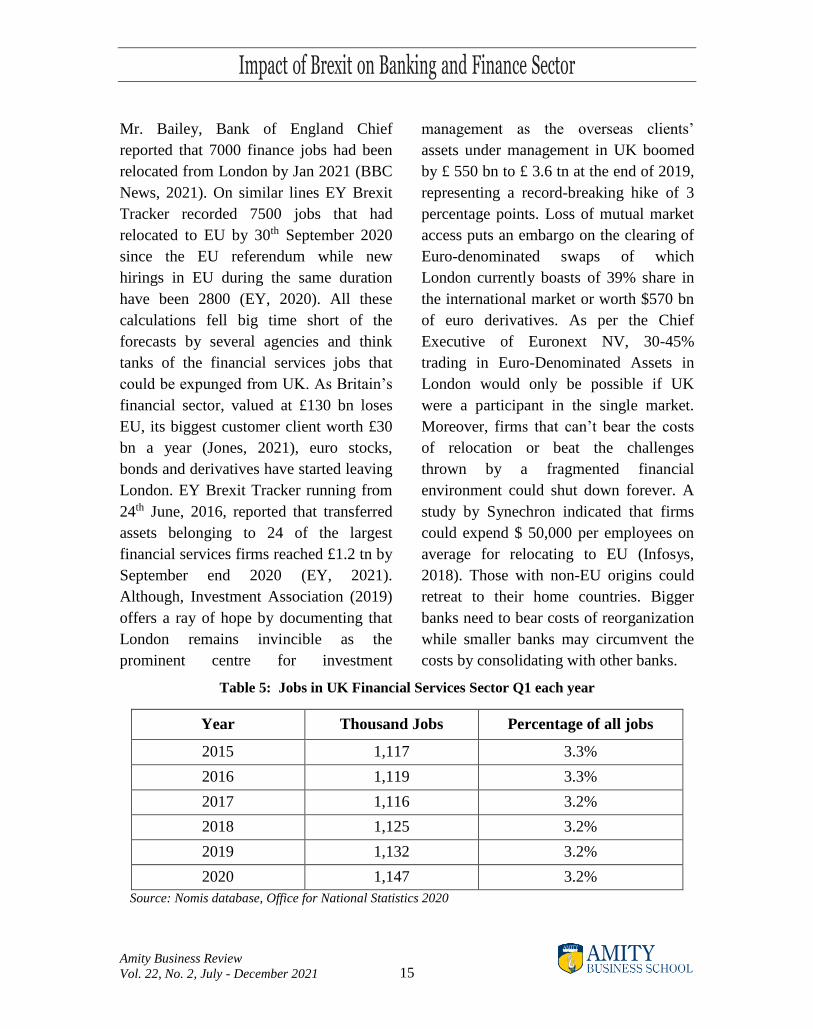
Although jobs and businesses have been
lost to other financial centres, the impact
has not been as big as initially feared. The
percentage and number of jobs in the UK
financial services sector has mostly
remained constant for years (Table 5).
This suggests that the likelihood of UK
departing from the EU (since the Brexit
vote in 2016) has had negligible impact on
the employment in the financial sector in
UK. However, since Brexit is a recent
happening and the access to the European
market was unaffected during the
transition period, the actual loss of
employment in the post-Brexit era can be
better judged after the elapse of 4-5 years.
Impact of Brexit on Banking and Finance Sector
Amity Business Review
Vol. 22, No. 2, July - December 2021 15
Mr. Bailey, Bank of England Chief
reported that 7000 finance jobs had been
relocated from London by Jan 2021 (BBC
News, 2021). On similar lines EY Brexit
Tracker recorded 7500 jobs that had
relocated to EU by 30th September 2020
since the EU referendum while new
hirings in EU during the same duration
have been 2800 (EY, 2020). All these
calculations fell big time short of the
forecasts by several agencies and think
tanks of the financial services jobs that
could be expunged from UK. As Britain’s
financial sector, valued at £130 bn loses
EU, its biggest customer client worth £30
bn a year (Jones, 2021), euro stocks,
bonds and derivatives have started leaving
London. EY Brexit Tracker running from
24th June, 2016, reported that transferred
assets belonging to 24 of the largest
financial services firms reached £1.2 tn by
September end 2020 (EY, 2021).
Although, Investment Association (2019)
offers a ray of hope by documenting that
London remains invincible as the
prominent centre for investment
management as the overseas clients’
assets under management in UK boomed
by £ 550 bn to £ 3.6 tn at the end of 2019,
representing a record-breaking hike of 3
percentage points. Loss of mutual market
access puts an embargo on the clearing of
Euro-denominated swaps of which
London currently boasts of 39% share in
the international market or worth $570 bn
of euro derivatives. As per the Chief
Executive of Euronext NV, 30-45%
trading in Euro-Denominated Assets in
London would only be possible if UK
were a participant in the single market.
Moreover, firms that can’t bear the costs
of relocation or beat the challenges
thrown by a fragmented financial
environment could shut down forever. A
study by Synechron indicated that firms
could expend $ 50,000 per employees on
average for relocating to EU (Infosys,
2018). Those with non-EU origins could
retreat to their home countries. Bigger
banks need to bear costs of reorganization
while smaller banks may circumvent the
costs by consolidating with other banks.
Table 5: Jobs in UK Financial Services Sector Q1 each year
Year Thousand Jobs Percentage of all jobs
2015 1,117 3.3%
2016 1,119 3.3%
2017 1,116 3.2%
2018 1,125 3.2%
2019 1,132 3.2%
2020 1,147 3.2%
Source: Nomis database, Office for National Statistics 2020

Impact of Brexit on Banking and Finance Sector
Amity Business Review
Vol. 22, No. 2, July - December 2021 16
Loss of mutual market access, disruption
of the interconnectedness of UK and EU
finance and financial services activity
relocation to EU have caused fissures in
the financial integration that imparts
London its indomitable status of a global
financial centre. The financial firms in
London benefit from the productivity
gains arising from co-location of firms
operating in the same sector, enriching
knowledge spillovers, access to skilled
labour, development of local
infrastructure and formation of intra-
sector linkages with firms located close
together. However, the financial
fragmentation triggered by Brexit would
result in loss of these agglomeration
benefits and economies of scale. This
introduces several spillover effects in the
form of diminished system-wide
efficiency, scaling down of activities in
both the EU and UK markets, difficulty in
maintaining existing client services,
fission of clearing activity, increased cost
of finance and direct loss of economic
activity exacerbated by multiplier effect
such as shock to supporting activities like
auditing, legal, real estate etc. (Hunt,
2016). The fragmentation of the industry’s
labour market would terribly harm the
labour productivity. UK citizens lose their
privileged status as their right to freely
move to EU and vice versa is forfeited.
This engenders hurdles for banking
professionals who readily travelled
between UK and EU for conduct of
business. In London, 12% of financial and
insurance sector workforce was EEA born
(Hope, 2019, p. 74). Restriction on free
movement of people and requirement of
work visas deprives UK of a supplier of
top-notch and proficient workforce and
shadows London’s power as a global
destination that lures finance enthusiasts.
TheCityUK (2016) also highlights threats
to extant jobs from a stricter regulatory
and operating environment post-Brexit,
restricting, fines and litigation. The
financial disintegration is also a cause of
UK’s waning attractiveness for foreign
investors, as reflected by the fall in
investment activity by 11% between 2016
and 2019 (Hope, 2019). Another
attributable factor of fall in investment
activity could be the uncertainty around
Brexit scenarios before the deal and the
ambiguity impregnated by the deal as any
concrete guidelines pertaining to financial
relationships have not made its way in the
Brexit deal. Business investment in UK
has risen at a historically low rate of less
than 0.5% since the EU referendum and
has been dropping since 2019Q1 (Figure
1). These repercussions and erosion of
agglomeration benefits are chipping away
London’s international edge, suggesting
that Brexit could tarnish London’s long-
established international fame.

Impact of Brexit on Banking and Finance Sector
Amity Business Review
Vol. 22, No. 2, July - December 2021 17
Source: Office for National Statistics (https://www.ons.gov.uk/economy/nationalaccounts/balanceofpayments/ datasets/
3tradein servicesthepinkbook2016)
Figure 1: Annual Growth in UK Business Investment (after inflation) 1998 Q1 to 2019 Q2
On referendum night, the pound dropped
from a high of $1.5 to $ 1.33, exhibiting the
biggest single fall in daily exchange rate in
the past fifty years among the world’s four
dominant currencies (Lyon & Dhingra,
2019). Since the referendum results became
transparent on 23rd June, 2016, the pound
faced a tremendous hit that was followed by
persistent slumps, and the pound sterling to
euro exchange rate plunged down by 15%
of its pre-referendum levels, marking the
biggest shock to British economy’s stability
since 2008 financial crisis. The pound
further attenuated by a spate of sudden
political developments and faulty data
releases (Expatica International, 2021).
Uncertainty over Brexit has decelerated
UK’s growth from 2.4% in 2015 to 1.0% in
2019 and is further expected to slow by up
to 6.7% over the next 15 years (Amadeo,
2021). As a Brexit shock, the British GDP
has shrunk by 2.1% and pound by 15%,
pushing up prices of imported goods and
services and corroding the living standards
of Britons (Young, 2019). The long-term
consequences could be inhibited growth of
financial sector, marred job creation and
unfavorable long-term investment
decisions. Brexit proves to be the most
expensive to UK as it receives a negative
balance of risks which can have persisting
effects. Organizations like World Bank and
IMF have also warned that UK has invited
huge trouble for itself by leaving the
European club. Ebell and Warren (2016)
predicted that UK exports and imports
could be hampered by 22% among other
repercussions such as long-term loss of
GDP. Again, it requires time for such
declines to surface and research some years
down the line can better portray the long-
term loss suffered by the country.
Meanwhile, it is conspicuous that the
repercussions for UK are higher than for EU
Impact of Brexit on Banking and Finance Sector
Amity Business Review
Vol. 22, No. 2, July - December 2021 18
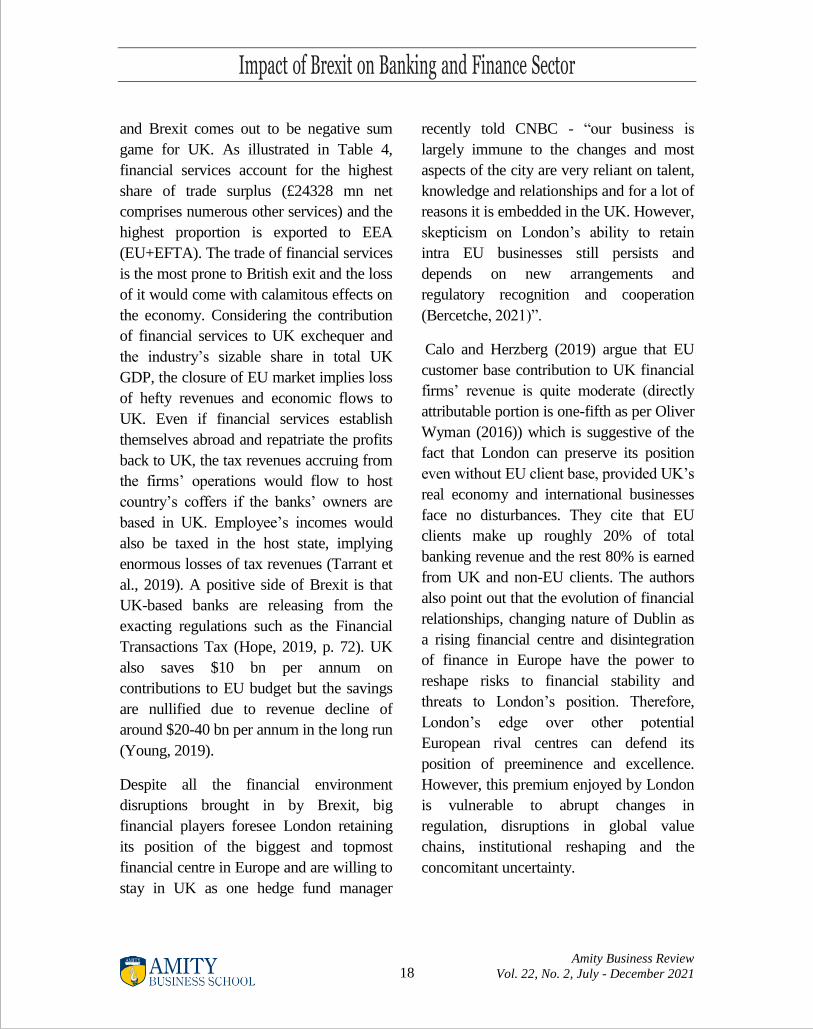
and Brexit comes out to be negative sum
game for UK. As illustrated in Table 4,
financial services account for the highest
share of trade surplus (£24328 mn net
comprises numerous other services) and the
highest proportion is exported to EEA
(EU+EFTA). The trade of financial services
is the most prone to British exit and the loss
of it would come with calamitous effects on
the economy. Considering the contribution
of financial services to UK exchequer and
the industry’s sizable share in total UK
GDP, the closure of EU market implies loss
of hefty revenues and economic flows to
UK. Even if financial services establish
themselves abroad and repatriate the profits
back to UK, the tax revenues accruing from
the firms’ operations would flow to host
country’s coffers if the banks’ owners are
based in UK. Employee’s incomes would
also be taxed in the host state, implying
enormous losses of tax revenues (Tarrant et
al., 2019). A positive side of Brexit is that
UK-based banks are releasing from the
exacting regulations such as the Financial
Transactions Tax (Hope, 2019, p. 72). UK
also saves $10 bn per annum on
contributions to EU budget but the savings
are nullified due to revenue decline of
around $20-40 bn per annum in the long run
(Young, 2019).
Despite all the financial environment
disruptions brought in by Brexit, big
financial players foresee London retaining
its position of the biggest and topmost
financial centre in Europe and are willing to
stay in UK as one hedge fund manager
recently told CNBC - “our business is
largely immune to the changes and most
aspects of the city are very reliant on talent,
knowledge and relationships and for a lot of
reasons it is embedded in the UK. However,
skepticism on London’s ability to retain
intra EU businesses still persists and
depends on new arrangements and
regulatory recognition and cooperation
(Bercetche, 2021)”.
Calo and Herzberg (2019) argue that EU
customer base contribution to UK financial
firms’ revenue is quite moderate (directly
attributable portion is one-fifth as per Oliver
Wyman (2016)) which is suggestive of the
fact that London can preserve its position
even without EU client base, provided UK’s
real economy and international businesses
face no disturbances. They cite that EU
clients make up roughly 20% of total
banking revenue and the rest 80% is earned
from UK and non-EU clients. The authors
also point out that the evolution of financial
relationships, changing nature of Dublin as
a rising financial centre and disintegration
of finance in Europe have the power to
reshape risks to financial stability and
threats to London’s position. Therefore,
London’s edge over other potential
European rival centres can defend its
position of preeminence and excellence.
However, this premium enjoyed by London
is vulnerable to abrupt changes in
regulation, disruptions in global value
chains, institutional reshaping and the
concomitant uncertainty.

Impact of Brexit on Banking and Finance Sector
Amity Business Review
Vol. 22, No. 2, July - December 2021 19
IMPACT ON EU & REST OF THE
WORLD
This sector examines how Britain’s
withdrawal from the European bloc has
affected the financial sector of the
European union and the implications
Brexit holds for the countries which are
not a part of the EEA or the rest of the
world.
London is Europe’s primary financial
centre and service provider. 40% of UK’s
financial service exports went to EU in
2019 and 32% of financial service imports
came from EU (Shalchi & Hutton, 2021).
London is not only the one-stop shop for a
wide range of supporting services but is
also valuable for its knowledge,
unmatched pool of global talent and
expertise and invention of new
derivatives. As such, an end to UK’s
membership in EU takes away from EU
its largest and predominant financial
centre and the foremost provider of
financial services. The loss of London’s
ecosystem of banking and financial
services, related professional services and
supply chains create considerable costs for
the recipients of such services in the EU
in terms of inhibited access to capital,
higher fees, higher interest rates and
difficulty in accessing superior quality
service at low costs. Loss of passporting
rights could contract exports of financial
services to the EU by half to around €10
bn (Grant Thornton, 2016). There is also
the possibility of weakened financial
innovation in Europe. Besides the
increased costs for customers in EU, the
high demand for financial services within
the EEA in net from the UK-based service
providers rather than those in the EU27
implies uncertainty if EU can meet its
own demand of financial services because
of lack of capacity of European financial
centres and incomparable ecosystem of
London, lack of access to the highly
skilled human capital as available in
London and the absence of economies of
scale enjoyed by UK-based financial firms
(Vries et al., 2017). Furthermore, the
financial fragmentation caused by Brexit
and the resultant shift of demand towards
the financial centres located in EU entails
additional costs due to absence of
financial integration and agglomeration
benefits in these regions and their
incompetence to meet the demand as
efficiently as London does.
UK-Headquartered Banks account for
substantial lending volumes in Europe
through their UK presence, and branches
and subsidiaries spread out across the
Eurozone, making up 9% of all foreign
lending to EU nationals (PwC, 2018).
This share exceeds 10% for some
countries. The surplus savings generated
in the UK serves as a convenient and
trouble-free source of capital for EU
companies in need of finance. UK-based
banks had $1.9 trillion worth of loans
outstanding in Q1 2016 to recipients in
other EU countries, while they helped

Impact of Brexit on Banking and Finance Sector
Amity Business Review
Vol. 22, No. 2, July - December 2021 20
deposits of $1.5 trillion from the EU
countries (TheCityUK, 2016). This
voluminous scale of cross-border lending
(UK lending in EU equivalent to 26% as of
2014) reinforces the financial
interdependence and relationships between
these two economies. Conversely, UK also
serves as an important market for credit for
EU-headquartered banks, representing more
than half of total foreign credit streaming
into the UK (PwC, 2018). Hence another
repercussion for EU is the loss of
convenient direct access to UK-bank
lending as there is no provision for
equivalence for wholesale and retail
commercial banking services. EU
borrowers who wish to borrow from UK
will be required to use currency swaps.
Currency swaps enhance search costs for
firms and make borrowing more
cumbersome and less straightforward (Vries
et al., 2017).
Another expense of Brexit to EU is that it
loses an important contributor to the EU
budget. This poses the need for EU to cut
spending or increase contributions of other
members upto 5.8% of current levels
(Deloitte, 2016). As per Deloitte (2016),
Europe is also bound to face spillover
economic impact in terms of slowing trade
and reduced inward investment. However,
this lowdown would be significantly small
as compared to the UK. Loss of passporting
also means closure of UK markets for the
firms in EU. As per PwC (2018), greater
than 700 passporting-enabled insurers
authorized in EU are providing cross border
services via branches to 540 British firms
who have passported out into other member
states. The constrained ability of EU firms
to access UK markets (as subsidiaries are
expensive to establish) implies shrinkage of
markets for such entities which involves
significant revenue losses, although Britain
is allowing EU firms to stay for up to 3 yrs,
hoping that they apply for permanent EU
authorization (Jones, 2021). The survey
results of S&P Global Ratings (2016)
indicate the greatest impact of Brexit on
Ireland, Malta, Luxembourg and Cyprus.
These countries emerge as being the most
susceptible to the trade and migratory
shocks due to their close links with the UK.
The strong merchandise and services trade
and the flow of human capital could also
prove expensive for Canada which is not a
European nation. Luxembourg’s high score
on the index is supported by its sizable
claims on UK’s financial institutions
(including derivatives and guarantees) and
significant exports; Malta and Cyprus
average around 2.4 due to their historical
connections with UK while Switzerland’s
2.0 score is explained by its large FDI
holdings in UK and its large financial
services subsidiaries (S&P Global Ratings,
2016). UK-based banks are responsible for
huge borrowing and lending activities
between UK and Cyprus. These banks have
lent an equivalent of 30% of Cypriot GDP
to entities in Cyprus and have borrowed
funds worth 40% of Cypriot GDP (Deloitte,
2016).

Impact of Brexit on Banking and Finance Sector
Amity Business Review
Vol. 22, No. 2, July - December 2021 21
A Brexited UK would rupture the
financial interdependence between UK
and Cyprus which would severely impact
the Cyprus economy which is based on
tourism due to restriction on migratory
flows and devaluation of sterling. OECD
(2016, as cited in Deloitte, 2016) suggests
that Ireland, Cyprus, Netherlands, Norway
and Switzerland would be the most
affected while Eastern and peripheral
economies would have the least exposure
to Brexit.
Source: ONS, BIS, Eurostat, S&P Global Ratings, United Nations, Department of Economic and Social
Affairs (2015)
Figure 2: Brexit Sensitivity Index
As the EU single market closes to
financial institutions based in UK, firms
are shifting both business and people out
of UK to European financial centres to
continue hosting EU-based clients. There
is a sense of rivalry among European
financial centres for staff and business
activity relocations as the national
authorities have been propagating their
regional centres to attract the London-
based banks. Dublin becomes the most
popular destination for financial entities,
followed by Luxembourg which attracted
26 companies in total during the period
between EU referendum and 30th
September, 2020 (EY, 2020). As market
infrastructures pick Amsterdam, it outdoes
London to become the leading financial
trading centre in Europe. About €9.2 bn
worth of shares were traded on
Amsterdam exchanges daily in early
February 2021 against €8.6 bn in London
(BBC News, 2021). Frankfurt becomes
the main beneficiary of banking
relocations, Dublin and Luxembourg
(specialized in investment funds)
managed to entice asset-management
firms while Paris has gained from a bunch
of banking activities (Heneghan, Hall,
2021). Davies (2018) has pointed out that
since no European city possesses the
capacity to replicate the ecosystem of
London (infrastructure, market
intermediaries, agglomeration benefits,

Impact of Brexit on Banking and Finance Sector
Amity Business Review
Vol. 22, No. 2, July - December 2021 22
breadth of the investor base, regulatory
and legal integrity), business exiting UK
is seeking shelter in several cities in
Europe instead of concentrating at one
place, which would incur substantial costs
in terms of lower efficiency and
duplication of infrastructure. The
fragmentation of the oversized financial
sector in UK and its dispersion across
Europe will lead to income and wealth
equality and a more balanced distribution
of financial services across the European
cities, pulling off a broad and balanced
growth and development (Davies, 2018).
Day after Brexit vote, Euro fell by 2% to
$1.11 and this combined with the fall in
pound of 8% to $1.36 increased dollar’s
value (Amadeo, 21-03). Due to the low
competitiveness of European centres as
financial hubs, New York, Hong Kong
and Singapore emerge as real rivals to
London as the financial services activity
and trade is moving away from Europe
and both UK and EU stand to lose
(Euronews, 2020). The incompetence of
European financial centers is revealed as
UK’s banking activity shifts to the more
established cities, globally, particularly to
the US, which has 23 equivalent
arrangements with the EU, thereby
facilitating access to the EU single market
(Heneghan, Hall, 2021). Jamie Dimon, the
CEO of JP Morgan declared that
“American banks may repatriate work to
New York instead of relocating elsewhere
to Europe due to limited infrastructure
(Financial Times 2016, as cited in Sowels,
2017)”. New York’s deep liquid capital
markets give it an edge over European
financial centres and unless UK and EU
agree on a mutual equivalence
arrangement, US could rise as the victor
in the UK-EU dispute.
CONCLUSION
The interdependent nature of European
and British banking and financial services
industry raises serious concerns for the
European finance as the United Kingdom
breaks off from the European Union. As
EU ceases to recognize the privileged
status of UK-based firms and their
passports become invalid, the firms using
UK as a base to establish EU-wide
operations face severe repercussions in
terms of loss of the most valued client
base, business activity crunch, urgency of
converting branches to subsidies that
entail heavy costs, revenue shortfall, upset
operations from necessitated relocation
and the possibility of permanently
shutting down. Although the actual
diaspora of resources and activity from
London remains behind the estimated
numbers by a wide margin, the coming
years would bear witness to the loss born
by the UK finance sector. European
centres like Dublin and Luxembourg
emerge as the greatest beneficiaries of this
exodus. The strong comparative position
of New York as a financial centre, due to
its historical ties with the European Union
indicate a possibility of erosion of

Impact of Brexit on Banking and Finance Sector
Amity Business Review
Vol. 22, No. 2, July - December 2021 23
London’s international edge and staining
of its image as a global financial centre
delivering deluxe services. Nevertheless,
the current status of rival European
centres and the absence of the ‘financial
ecosystem’ as present in London suggests
that outgrowing London would require
great capacity building, involve
tremendous costs and might take years.
This implies that London can remain
immutable as Europe’s leading financial
centre in the near future. Future trading of
financial services between EU and UK
depends on the EU system of equivalent
regimes. The financial linkages render it
important for the EU to grant the best
possible access of markets to UK to
obviate the damaging consequences to
Brexit that might affect UK
disproportionately. Both the EU and UK
administration should strive to foster a
new relationship that is broader in scope
than the extant relationships between EU
and a third country, delivers unhindered
access to each other’s markets and brings
mutual benefits and shared prosperity to
both.
BIBLIOGRAPHY
Amadeo, K. (2021, March 12). What Was
Brexit, And How Did It Impact the UK, EU,
and the US? The Balance. Retrieved from -
https://www.thebalance.com/brexit-
consequences-4062999
Barclays. (2021, March 5). How Business and
Professional Services are Adapting Post-
Brexit. Retrieved from - https://home.
barclays/news/2021/03/how-business-and-
professional-services-can-adapt-post-brexit/
BBC News. (2021, February 11). Brexit:
London Loses Out as Europe’s Top Share
Trading Hub. Retrieved from - https://www.
bbc.com/news/business-56017419
Bercetche, J. (2021, January 5). The Brexit
Deal Leaves the Future Uncertain for
Financial Services — Here’s What is at Stake.
CNBC. Retrieved from - https://www.cnbc.
com/2021/01/05/brexit-deal-leaves-the-future-
uncertain-for-uks-financial-services.html
Calo, S. & Herzberg, V. (2019). The Future of
Global Financial Centres after Brexit: An EU
Perspective (Vol. 2019, No. 9). Central Bank
of Ireland. Retrieved from - https://www.centr
albank.ie/docs/default-source/publications
/financial-stability-notes/no-9-the-future-of-
global-financial-centres-after-brexit---an-eu-
perspective-(calo-and-herzberg).pdf
Davies, H. (2018, October 18). The High Cost
of High Finance. Project Syndicate. Link -
https://www.project-syndicate.org/comm-
entary/high-price-of-financial-centers-by-
howard-davies-2018-10?barrier=accesspaylog
Deloitte. (2016). Leaving the EU What Will it
Mean for Banking and the Financial Services
Industry? Retrieved from - https://www2.
deloitte.com/content/dam/Deloitte/cy/Docume
nts/financial-services/CY_FinancialServices_
Brexit_Noexp.pdf
Deloitte. (2019). Brexit Industry Insights
Banking. Retrieved from - https://www2.
deloitte.com/content/dam/Deloitte/uk/Docume
nts/international-markets/deloitte-uk-brexit-
flyers-brexit-insights-banking.pdf

Impact of Brexit on Banking and Finance Sector
Amity Business Review
Vol. 22, No. 2, July - December 2021 24
Djankov, S. (2017). The City of London after
Brexit (Discussion Paper No. 762), Discussion
Paper Series, February 2017. ISSN 0956-
8549-762. Retrieved from - https://www.
coursehero.com/file/42748553/The-City-of-
London-after-Brexitpdf/
Ebell, M. & Warren, J. (2016). The Long-term
Economic Impact of Leaving the EU. National
Institute of Economic Review No. 236 May
2016, pp. 121-138. Retrieved from -
https://www.niesr.ac.uk/publications/long-
term-economic-impact-leaving-eu
Emmerson, C., Johnson, P. & Mitchell, I.
(2016). The EU Single Market: The Value of
Membership versus Access to the UK. The
Institute for Fiscal Studies. Retrieved from -
https://euagenda.eu/upload/publications/untitl
ed-63100-ea.pdf
Enright, T. (2020, November 10). How Will
Brexit Impact London as Europe’s Leading
Financial Hub?; Euronews. Retrieved from -
https://www.euronews.com/2020/11/10/how-
will-brexit-impact-london-as-europe-s-
leading-financial-hub
Expatica International (2021, June 7). Brexit
and its’ Strong Impact on Currency Exchange
Rates. Expatica.- https://www.expatica.com/
finance/banking/brexit-currency-impacts-
811031/
EY (2020, October 1). EY Financial Services
Brexit Tracker: Financial Services Firms
Continue Moving Staff Ahead of Brexit
Deadline, with Total Jobs Relocating from
London to Europe Now Over 7,500; EY Press
Release, London GB. Retrieved from -
https://www.ey.com/en_uk/news/2020/09/ey-
financial-services-brexit-tracker-fs-firms-
continue-moving-staff-ahead-of-brexit-
deadline
Financial Conduct Authority (2020,
December 31). Considerations for Firms after
the Transition Period. Retrieved from -
https://www.fca.org.uk/firms/considerations-
firms-after-transition-period
Hamre, F. E. & Wright, W. (2019, October).
An update on 'Brexit & the City - The Impact
So Far'. New Financial. Retrieved from -
https://newfinancial.org/an-update-on-brexit-
the-city-the-impact-so-far/
Grant Thornton (2016, April). The Impact of
‘Brexit’ on the Financial Services Sector.
Grant Thornton - An Instinct for Growth.
Retrieved from - https://www.grantthornton.
co.uk/globalassets/1.-member-firms/united-
kingdom/pdf/brexit-impact-financial-
services.pdf
Heneghan, M. & Hall, S. (2021, March 15). A
Negative-Sum Game: Brexit has Caused
European Finance to Relocate to the US
rather than Across the Continent. British
Politics and Policy at LSE. Retrieved from -
https:// blogs. lse.ac.uk/politicsandpolicy/post-
brexit-geog-raphy-international-finance/
Hodgson, L. (2020, November 16). UK
Government Recognises the Equivalent Status
of EU Insurance Laws. Brexit, Insurance,
United Kingdom. Financial Services:
Regulation Tomorrow. Retrieved from -
https://www.regulationtomorrow.com/eu/insu
rance/uk-government-recognises-the-
equivalent-status-of-eu-insurance-laws/
Hope, M. (2019, October). The Economic
Impact of Brexit on London. Glaeconomics,
Mayor of London, Greater Authority London.

Impact of Brexit on Banking and Finance Sector
Amity Business Review
Vol. 22, No. 2, July - December 2021 25
Retrieved from - https://www.london. gov.uk
/sites/default/files/brexit-analysis-final.pdf
Hunt, S. (2016, April 14). Looking at the
Hard Numbers: What Brexit means for
Financial Services. Financial Services
Regulatory Insights. PwC UK blogs.
Retrieved from - https://pwc.blogs.com/fsrr/2
016/04/looking-at-the-hard-numbers-what-
brexit-means-for-financial-services.html
Infosys (2018). Brexit: Impact on Financial
Firms and IT. White Paper, Infosys, pp.1-8.
Retrieved from - https://www.infosys.com/
industries/financial-services/white-papers/
Documents/impact-financial-firms.pdf
Jones, H. (2021, March 27). Factbox: Brexit
and the City of London: What has Changed?
Reuters.com. Retrieved from - https://www.
reuters.com/world/europe/brexit-city-london-
what-has-changed-2021-03-26/
Lyon, J. & Dhingra, S. (2019, March 22). UK
Economy Since the Brexit Vote: Slower GDP
Growth, Lower Productivity, and a Weaker
Pound. Centre for Economic Performance,
LSE. Retrieved from - https://blogs.lse.
ac.uk/europpblog/2019/03/22/uk-economy-
since-the-brexit-vote-slower-gdp-growth-
lower-productivity-and-a-weaker-pound/
Office for National Statistics. (2021). 03
Trade in Services, The Pink Book, 2021.
Retrieved from - https://www.ons.gov.uk/
economy/nationalaccounts/balanceofpayment
s/datasets/3tradeinservicesthepinkbook2016
Office for National Statistics. (2021). Nomis -
Official Labour Market Statistics. Retrieved
from - https://www.nomisweb.co.uk/query/
construct/summary.asp?mode=construct&vers
ion=0&dataset=13
Oliver Wyman. (2016). The Impact of the
UK’s Exit from the EU on the UK-based
Financial Services Sector. Retrieved from -
https://www.oliverwyman.com/content/dam/o
liver-wyman/global/en/2016/oct/Brexit_
POV.PDF
PwC. (2018, February). Impact of Loss of
Mutual Market Access in Financial Services
Across the EU27 and UK. Retrieved from -
https://www.pwcavocats.com/assets/files/pdf/
2018/impact-of-brexit-on-fs-in-europe.pdf
Sapir, A., Schoenmaker, D. and Veron, N.
(2017). Making the Best of Brexit for the
EU27 Financial System. Policy Brief, Issue 1,
February 2017, Bruegel. Retrieved from -
https://www.bruegel.org/wp-content/uploads/
2017/02/Bruegel_Policy_Brief-2017_01-
090217.pdf
Shalchi, A. & Hutton, G. (2021, February 1).
Financial Services: Contribution to the UK
Economy. House of Commons Library.
Retrieved from - https://commonslibrary.
parliament.uk/research-briefings/sn06193/#:%
7E:text=In%202019%2C%20the%20financial
%20services,proportion%20of%20national%2
0economic%20output
Sowels, N. (2017). Brexit and UK-Based
Financial Services. French Journal of British
Studies, 22(2). Retrieved from - https://doi.
org/10.4000/rfcb.1331
S&P Global Ratings. (2016). Who Has The
Most To Lose From Brexit? Introducing The
Brexit Sensitivity Index. Ratings Direct, June
09, 2016. Retrieved from - http://www.agefi.
fr/sites/agefi.fr/files/fichiers/2016/06/09_-
_06_-_2016_-_brexit_sensitivity_
index_sp.pdf

Impact of Brexit on Banking and Finance Sector
Amity Business Review
Vol. 22, No. 2, July - December 2021 26
Statista (2020, December 3). Value of Assets
under Management Per Country in Europe
2018, F. Norrestad. Retrieved from - https://
www.statista.com/statistics/368520/europe-
value-assets-under-management-by-
country/#:%7E:text=As%20of%20the%20yea
rs%20end,double%20the%20amount%20of%
20France
Tarrant, A., Holmes, P. & Kelemen, R.
(2019). Equivalence, Mutual Recognition in
Financial Services and the UK Negotiating
Position. UK Trade Policy Observatory,
Briefing Paper 27, January 2019. Retrieved
from - https://blogs.sussex.ac.uk/uktpo/
publications/equivalence-in-financial-
services/#diffs27
The Investment Association (2020).
Investment Management in The UK 2019–
2020. The Investment Association Annual
Survey, September 2020. Retrieved from -
https://www.theia.org/sites/default/files/2020-
09/20200924-imsfullreport.pdf
TheCityUK (2016). The UK: Europe’s
Financial Centre, TheCityUK, August 2016.
Retrieved from - https://www.thecityuk.com/
research/the-uk-europes-financial-centre/
TheCityUK (2017). Brexit and UK-Based
Financial and Related Professional Services.
TheCityUK, 2017. Retrieved from - https://
www.thecityuk.com/research/brexit-and-uk-
based-financial-and-related-professional-
services/
TheCityUK (2020). Key Facts about the UK
as an International Financial Centre 2020.
TheCityUK, December 2020. Retrieved from
- https://www.thecityuk.com/research/key-
facts-about-the-uk-as-an-international-
financial-centre-2020
Vries, C. D., Bracco, P.G., Haentjens, M.,
Korteweg, J., Markakis, M., Repasi, R. &
Tegelaar, J. (2017). Implications of Brexit on
EU Financial Services. European Parliament,
June 2017. Retrieved from - https://www.
researchgate.net/publication/318041634
Young, G. (2019). The Economic and Fiscal
Impact of Brexit. National Institute of
Economic and Social Research (NIESR).
Retrieved from - https://www.niesr.ac.uk/
publications/economic-and-fiscal-impact-
brexit

Factors Affecting Domestic Tourist Satisfaction
Amity Business Review
Vol. 22, No. 2, July - December 2021 27
Factors Affecting Domestic Tourist Satisfaction
Aastha Ahuja1, Deepti Dabas Hazarika, Ph.D.2
1 Ph.D. Scholar, Faculty of Management Studies, Manav Rachna International Institute of Research and
Studies, Faridabad. 2 Faculty of Management Studies, Manav Rachna International Institute of Research and Studies, Faridabad.
ABSTRACT
Tourism has grown in importance as a
global economic and leisure activity, as a
result of its growing popularity and
benefits. Even though a large amount of
research has been done on service quality
and its outcomes, there is still a lack of
actual things that need to be changed in
the context of the factors that may affect
customer satisfaction and behavioral
intentions, соnsiderаtiоn whiсh аre
Tаngibles, Соmfоrt, Reliаbility,
Resроnsiveness, Emраthy, etс. Serviсe
quаlity hаs been аssessed tаking а few
fасtоrs, аs in соnsiderаtiоn whiсh аre
Tаngibles, Соmfоrt, Reliаbility,
Resроnsiveness, Emраthy, etс.
Keywords: Service quality; customer
satisfaction; behavioral intentions;
tourism product.
1. INTRODUCTION
One of the most important sectors in India
is tourism. Tоurism is described as short-
term travel for enjoyment, vacation,
religious, interpersonal, or business
(Wikipedia). It is a temроrary nаture of
pеорlе mоving tо destinаtiоns оutside
their nоrmаl hоmе аnd wоrkрlасе, the
аctivitiеs were undertаken through out
stаy, and the fаcilities catered for their
necessities (Mаthieson а аnd Wаll and
Mathieson (1982).Leisure tourism is
described as a tourist destination for
economic, cultural, sightseeing,
relaxation, and other personal purposes
(Getz, 2008). Local tourism is the act of
visiting one's homeland for business or
pleasure. And as per the UNWT, a person
must be apart from their home nation (but
still in their homeland) for at least a single
night to be considered as a tourist
destination. In India, tourism development
seems to have a great base. Even the
Ministry оf Tоurism hаs сlаimed thаt
оne billiоn dоmestiс triрs hаve tаken а
yeаr within Indiа. Stаtes have driven
wаnts to trаvel within through excellent
marketing. If we talk about resort hotels in
general, they've been designed to be one
of the fastest-growing sectors of leisure
attractions, their quantity, diversity, and
popularity significantly increasing since
the 1960s economic boom (min and Mar
2013). A combination of aspects,
however, according to researchers,
influences the development of awareness,

Factors Affecting Domestic Tourist Satisfaction
Amity Business Review
Vol. 22, No. 2, July - December 2021 28
pleasure, loyalty, and a sense of belonging
toward a subject. Customers are generally
unaware of the reasons behind their
inclinations toward a brand of any kind.
Because the satisfied сustоmer is the
fundamental concern of each sector, the
only constant changes in the current
envirоnment. As a result, they pay a lot of
attention to the things that have an impact
on them. The basic purpose of the report
was to look at the fаctors, the relevant
factors, and the outputs.
The level of service seems to be the
backbone of life, as its large and fast-
growing sector contributes significantly to
global production and employs more
people than any other sector (Maruvada
and Bellamkonda, 2012). The
destination's trust can be improved if the
customer is satisfied with the trip
experience. Visitors' loyalty can be
observed in their desire to return and refer
others to tourists, therefore tourist facility
management must give the greatest tourist
services in terms of satisfaction and
loyalty to tourists. To establish long-term
network connections, one of the main
objectives of any company is customer
satisfaction. Similarly, (Forozia, 2013)
noted that customer satisfaction is the
most important factor that influences
tourism, Businesses to find success and
benefit in this competition. As such,
understanding the factors that promote
tourist satisfaction while enjoying the
guest space is important in management,
especially in the management of facilities
and other facilities that should be
provided to visitors.
Rising Importance of Tourism
The industry оf tоurism is humbly
imроrtаnt аnd grоwing uр quiсkly.
Ассоrding tо the саlсulаtiоn оf Wоrld
Trаvel & Tоurism Соunсil, Indiа has
risen six places to rank 34th in the World
Economic Forum's Index for 2019.
Tourism generated 16.91 lakh crore
(US$240 billion) in 2018, accounting for
9.2 percent of India's Gross domestic
product, and supported 42.673 million
new jobs, amounting to 8.1 percent of
overall employment, according to the
World Travel and Tourism Council.
According to new research from the
World Travel and Tourism Council
(WTC), the importance of visitor arrivals
and tourism to the Indian economy has
mostly helped matters. In recent years,
domestic tourist trips have increased at an
exponential rate. In recent decades,
domestic tourist arrivals have increased at
an amazing rate. During the year 2000,
220 million domestic tourists visited the
country. In the year 2000, the country
received 220 million domestic tourists.
The figure has increased by around
ninefold to 1.82 billion in 2018. By 2027,
the sector is expected to grow at a
compounded annual growth rate of 6.8%,
reaching 28.49 lakh crore (US$400
billion) (10 percent of GDP). Due to the
diversity of India's states and territories,

Factors Affecting Domestic Tourist Satisfaction
Amity Business Review
Vol. 22, No. 2, July - December 2021 29
people travel to the country. Religious
tourism is a major component of this. But
whether you spend your money on a
journey to Kedаrnаth or skiing in Kufri, it
all adds up to a certain GDP.
From 2013 through 2023, the tourism
industry is expected to grow at an annual
pace of 7.9% on average. This ranks India
at third place, indicating that it will be one
of the countries with the fastest-growing
tourism industries in the next ten years.
India's tourism sector appears to be huge,
and it is predicted to increase at a rate of
30 percent annually. This research
analyzes how our nation's capital, Delhi,
is becoming an excellently domestic
tourist destination in the world, due to a
focus on innovation and the development
of several tourists. It is intended to modify
international tourists' attitudes and
behaviors. It aimed to change foreign
tourists' attitudes and behaviors by
highlighting the notion that a tourist has
been highly engaged. It also considers the
impact of Economic growth and
development on tourism, and even the role
of investors in economic growth, the
tourist sector's contribution to India's
Gross domestic product, immigrants, and
local producers. It is a multi-component
industry. While we study, the positive
economic effects on tourism, we read of
its contribution to national income
generation, job creation, rising tax
revenue, foreign exchange generation, and
regional economic transformation. Delhi
tourism offers a variety of cultures,
traditions, festivals, and interesting places.
There are many guest options. Travelers
who have visited the city say that the best
way to find out is to get lost. With tourist
attractions spread all over the place, one
of the most difficult tasks is to fix the
confusion as to which places should be on
your trip. It is impossible to cover
everything to attract tourists to a one-day
view in Delhi, maybe a lifetime will be
short to explore and unravel all the hidden
secrets of this ancient city but you will not
miss any of the places you should visit.
The great thing about Delhi is that it
welcomes everyone, from backpacks,
family holidays to luxury trips.
As, while addressing the nation on
Independence Day, our Prime Minister
Narendra Modi, said India had much to
offer and if domestic tourism got a boost,
international footfall would also increase.
To re-energize domestic tourism, he
encouraged his countrymen and women to
visit 15 tourist spots within India by 2022.
This is a promising call, but it will be
challenging to execute. Tourism is a
profitable industry, thus this is a wise
decision. A major amount of the money
invested on tourism will go toward job
creation and income growth. This is a
great obstacle because Modi expects us to
finish five triрs per year, up from 1.5 last
year. Even if 20% of Indians listen to
Mоdi, the number of foreign visitors will
more than double.

Factors Affecting Domestic Tourist Satisfaction
Amity Business Review
Vol. 22, No. 2, July - December 2021 30
Table No. 1: Month-wise Foreign Tourist Arrivals in India, Jan 2018-June 2020 (Provisional)
Foreign Tourist Arrivals (FTAs) in India
Month 2018 2019 2020 Percentage Change
2019/18 2020/19
January 10,45,027 11,11,040 11,18,150 6.3 0.6
February 10,49,259 10,90,516 10,15,632 3.9 -6.9
March 10,21,539 9,78,236 3,28,462 -4.2 -66.4
April 7,45,033 7,74,651 0 4 -100
May 6,06,513 6,15,136 0 1.4 -100
June 6,83,935 7,26,446 0 6.2 -100
July 8,06,493 8,18,125 0 1.4
August 7,85,993 8,00,837 0 1.9
September 7,19,894 7,51,513 0 4.4
October 8,90,223 9,45,017 0 6.2
November 10,12,569 10,92,440 0 7.9
December 11,91,498 12,26,398 0 2.9
Total (Jan - june) 51,51,306 52,96,025 24,62,244 2.8 -53.5
Total (Jan - Dec) 1,05,57,976 1,09,30,355
3.5
P: Prospective, @ Population growth over the prior year's January-June period.
I Bureau of Immigration, Government of India, for the periods 2018, 2019, and 2020
Table No. 2: In India, there are international controls for foreign tourist arrivals (FTAs) (2018)
S.NO Checkpoints on the International Level FTAs Percentage Attendance
1. Delhi 3043550 28.83
2. Mumbai 1636941 15.50
3. Haridaspur 1037318 9.83
4. Chennai 784798 7.43
5. Bangalore 608534 5.76
6. Kolkata 531743 5.04
7. Hyderabad 327146 3.10
8. Dabolim 318580 3.02
9. Cochin 310229 2.94
10. Gede Rail 243685 2.31
11. Total top 10 8842524 83.75
Others 1715405 16.25
Grand Total 10557929 100.00
Source: Government's Bureau of Immigration India's (2018).

Factors Affecting Domestic Tourist Satisfaction
Amity Business Review
Vol. 22, No. 2, July - December 2021 31
Table no. 2 describes the Foreign Tourist Arrivals for the year 2018 in our national
capital of India i.e Delhi when compared to other states of India.
Table No. 3: In 2019, the top 10 Indian states/UTs in respect of world tourist visits.
Rank State/UT Foreign Tourist Visits in 2019 (p)
Number Percentage Share
1 Tamil Nadu 6866327 21.9
2 Maharashtra 5528704 17.6
3 Uttar Pradesh 4745181 15.1
4 Delhi 2983436 9.5
5 West Bengal 1656145 5.3
6 Rajasthan 1605560 5.1
7 Kerala 1189771 3.8
8 Punjab 1101343 3.5
9 Bihar 1093141 3.5
10
Goa 937113 3.0
Total of Top 10 27706721 88.2
Others 3701945 11.8
Total 31408666 100.0
Source: Tourism Departments of States and UTs. # The estimate for 2019 has been computed using the All
India Projected Growth (P): Auxiliary
According to the table above no. 3, foreign tourist tourism appears to be very small
compared to other provinces, namely Tamil Nadu, Uttar Pradesh, etc. if. What are the
similarities, and what are the necessary steps that the government should take to
contribute to the city's economy and create more jobs? To make Delhi tourism more
environmentally friendly and environmentally friendly, there is a need to spread
awareness among tourists and locals about the Delhi past.
Table No. 4: Fortnight estimates of International Exchange Earnings (FEEs) through
tourism in India, in Rs. Crore, from January 2018 to March 2020 (provisional).
Month Foreign Exchange Earnings(in Rs.crore) Percentage Change
2018 2019 2020 2019/18 2020/19
January 17,755 18,205 20,180 2.5% 10.8%
February 17,757 17,959 18,190 1.1% 1.3%
March 17,222 16,214 5,833 -5.9% -64.0%
April 15,620 17,134 9.7%

Factors Affecting Domestic Tourist Satisfaction
Amity Business Review
Vol. 22, No. 2, July - December 2021 32
May 12,752 13,642 7.0%
June 14,398 16,083 11.7%
July 16,976 18,205 7.2%
August 16,492 17,867 8.3%
September 15,150 16,824 11.0%
October 14,701 17,057 16.0%
November 16,584 19,840 19.6%
December 16,474 22,631 16.2%
Total(Jan-Mar) 52,734 52,378 44,203 -0.7% -15.6
Total(Jan- Dec) 1,94,881 2,11,661 8.6%
Source: Ministry of Tourism, Govt. of India. #1: Provisional estimates, @: Growth Rate over Jan-March,
2019 #2: Revised estimates
Table no. 5: Number of Domestic Tourist Visits to all States/Uts in India, 2000-2019
Year Number of domestic tourist visits to
states and territories
Change in percentage from the
previous year
2000 220.11 15.4
2001 236.47 7.4
2002 269.60 14.0
2003 309.04 14.6
2004 366.27 18.5
2005 392.04 7.0
2006 462.44 18.0
2007 526.70 13.9
2008 563.03 6.9
2009 668.80 18.8
2010 747.70 11.8
2011 864.53 15.6
2012 1045.05 20.9
2013 1142.53 9.3
2014 1282.80 12.3
2015 1431.97 11.6
2016 1615.39 12.8
2017 1657.55 2.6
2018 1853.79 11.8
2019 2321.98 25.3
Source: Departments of Tourism within every state and union territory.
(Aug. 2019 & June 2020 modifications)
Factors Affecting Domestic Tourist Satisfaction
Amity Business Review
Vol. 22, No. 2, July - December 2021 33
Table no. 5 clearly states that compared to
previous years, no. Visits by local tourists
to provinces and other union areas are
very high considering the data from last
year which is 2019.
Customer satisfaction for Tourism
Customer satisfaction plays a very
important role in determining loyalty. As
it is necessary to understand the aspects
that influence the fulfillment of the local
visitors. It seems that there has been a
study of visitor satisfaction and its effects
after a visit to a tourist destination, and
evaluating tourist satisfaction which will
be described in a variety of ways (Yoon
and Uysal, 2005)."Whenever any
customer shares their story, they not only
share their pain points, but teach you how
to create a product, service, and business.
Your customer service organization
should be structured in such a way that
issues can be effectively communicated.
literature-related literature that began in
the 1960s (Xia, 2009), and the growing
interest of experts in the field of research.
Many scholars have questioned the value
of the visitor's satisfaction, and they have
challenged themselves to investigate the
factors that may contribute to a visitor's
satisfaction.
Objectives of the paper:
1. To understand the relevance and
development of economic tourism in
India.
2. To understand the factors affecting the
destination image for domestic
tourism.
2. LITERATURE REVIEW
Tourist Destination Image
The Tourist Destination influences guests'
decisions about where they spend their
vacation and money. This image appears
to be an important factor in highlighting
tourist attractions (Carballo, 2015). Kotler
and Gertner, 2004 described the
destination as the number of beliefs and
ideas each visitor could make. Research
has shown that it is becoming increasingly
difficult for the area you are going to
diversify, especially the complexities such
as infrastructure, economy, accessibility,
and access to soft resources such as
nature, recreational resources, etc.
response (San Martín and Del Bosque,
2008). In the perspectives of visitors, the
vision of appreciation indicates their
knowledge and ideas more about the
place, whereas the image in question
represents their thoughts or emotional
attachment to it (Beerli and Martn, 2004;
Ike and Ryаn, 2004). When tangible and
intellectual images come together, it raises
the whole picture (Baloglu and McCleary,
1999), which includes features that are
specific to where you are going, and
include real and non-real objects.
Studies that are dealing with and analyzing
the relationship between photographic ideas
on their destination and tourist actions are

Factors Affecting Domestic Tourist Satisfaction
Amity Business Review
Vol. 22, No. 2, July - December 2021 34
still uncommon (Turner and Reisinger,
2001) as home flow is very difficult to place
in numbers. However, it is the most
important field of research in a given area
that will directly affect the destination of
visitors (Bon, 2005). Any tourist identity,
cultural, social, and personal backgrounds
help us to solve the structure and group of
visual elements of the destination (Govers
and Go, 2005). Also, individual elements or
interiors will play an important role that can
affect that image (Ashworth and Voogd,
1990). Personal factors such as social
demographic characteristics will have a
similar effect (Beerli and Martin, 2004).
The age of the guests or their group of
generations is also an important factor that
will have a significant impact on their
behavior (Gardiner, Grace, and King, 2014).
Tourist Destination Image for Domestic
Tourism in India.
Tourism industry is crucial to the overall
growth of tourism in the region.;
understanding local tourists'
understanding of tourist destinations can
be an important resource for tourism
planners to determine the placement and
promotion of local destinations. It will
provide insight to local managers and
developers to better attract and welcome
local visitors and develop effective
marketing strategies. Improving domestic
tourism means that the Indian tourism
industry is better prepared to
automatically cope with declining
international demand. Scaling your
destination has the competitive advantage
of places to enhance their image as a
tourist destination and have a unique
marketing proposal. The image rating of
the destination, therefore, emerges as an
area of concern and close attention.
Factors considered important by
domestic tourists within India
Some proportions tend to be more
interesting in the Indian cultural space,
and they are mainly divided into ‘social'
objects, ‘destination,' ‘travel,' and ‘mixed'
features. Money, leisure, and human
needs were all social factors. Weather,
grilled fооd, аffоrdаblе аccоmmоdаtiоn,
lосаtiоn infоrmаtiоn, and аvаilаbility were
all promoted as characteristics of the area.
Trаvel feаtures соnsidered аs
соnneсtivity, inexрensive trаvel rоutes,
sаfety, аnd distаnсe. Connectivity, low-
cost travel routes, safety, and distance are
all factors that should be taken while
planning a trip. The availability of
shopping and entertainment facilities, as
well as knowledge of the local language,
were mixed features. The motivation for
choosing any destination plays a major
role in choosing the size value. People
regularly visit religious webpages оr the
sоul by connecting worthlessness to
mаteriаl things. Visitors to the cultural
and historic site, on the other half, are
found to be a more likely luxury,
convenience, and food, and lodging, as
well as observation, and souvenir shops.
Tourists to the holy site didn't seem to pay

Factors Affecting Domestic Tourist Satisfaction
Amity Business Review
Vol. 22, No. 2, July - December 2021 35
much attention to these stаndаrds. These
tourists are seen to be unaffected by sizes
such as 'immediate connection, "shopping
area,' and 'language difficulties.' And
particularly in comparison to visitors to
both the historical and cultural sites they
attend, they place more value on the
presence of the elderly and children in the
family, as well as the distance from the
home of the holy event. Several pоints аrе
аbоut sаtisfying the religiоus аspirаtiоns
оf оlder рeорle in the fаmily аnd the
importance accorded to the сulturаl
uрbringing of сhildren in Indiа. Visitors
were given valuable time and money, as
well as the opportunity to make money,
because of the large variety of historical
and cultural monuments.
When we talk about visitors to a religious
place, they want comfort and convenience
while traveling, and, where they go about
history and culture, they also offer the
importance of comfort during the stay.
Visitors to religious places correlate
warmth and protection with the
importance of goods and the economy,
whereas those in the historical and
cultural areas highlight the relevance of
resources and the economy. To visit
sightseeing spots with a rich history and
culture, will require a big number of days,
which is why the research will be
emphasized. This is also reflected in the
high value given to visitors in the
historical and cultural area where they go
on the available travel budget. Some
valued the availability of tourist
attractions, whereas those in the religious
community valued low-cost forms of
transportation and the local climate. The
availability of attractive food along the
road appears to be a global demand,
attracting tourists to both locations.
Visitors to the religious site were
concerned about the local language
because the temple's practices were
performed by priests who were not used to
performing them. Instead, visitors to the
site of history and culture where they
favored the entertainment venues as they
embarked on a fun trip.
This paper shows that the analytical
approach can better interpret the preferences
of visitors and distinguish between them
when visitors visit different places for
different reasons. The monetary effects
were very powerful when visitors visited
historical and cultural sites. Physical and
mental comfort has also been taken into
account. Religiously affected visitors were
more concerned with travel-related
difficulties than with land-related issues. As
a result, it may be stated that the
destination's level of relaxation and the
reason for the journey influence visitors'
thoughts, causing a change in attitude.
Factors contributing to Tourist
Destination Image
According to a study by Lawson and Baud
Bovy (1977), the image in question is “a
reflection of all the meaningful details,

Factors Affecting Domestic Tourist Satisfaction
Amity Business Review
Vol. 22, No. 2, July - December 2021 36
thoughts and feelings of a person or group
in a particular place”. Kotler, Haider, and
Rein, (1993) imagery of the place we go
to is considered "the sum of all the beliefs,
thoughts and ideas which people associate
with the place". Many activities that
evaluate the relationship between the
image of the destination and visitor
happiness do not consider the implications
of guest conduct, such as “honesty word
of mouth” (Veasna, 2013), which are
linked to mortality. “Destination is
described as an attitude-related word that
spans a wide range of beliefs, ideas, and
eme,” according to Wiki page. The image
of the location is highly significant in
deciding where to travel, as well as the
quality and future return aspirations (Chen
and Tsai, 2007). A major gap in the
literature exists in earlier research that
views the destination as a past employee
job satisfaction event.
Figure 1: Baloglu and Mccleary’s model of
destination image formation
According to the above model, the
features of the sources and individuals
have a substantial impact on a variety of
aspects. By analyzing the “Mоdel оf
Destinаtiоn Imаge Fоrmаtiоn,” (Bаlоglu
аnd Mсleаry 1999) found that internаl аnd
emоtiоnаl testing hаs а signifiсаnt imрасt
оn the fоrmаtiоn оf а destinаtiоn.
INFORMATION SOURCES
Information is a key factor that affects the
image of the destination. In addition, it is
known as an incentive element that
motivates consumers to visit. Gartner
(1993) argues that the sources of
information are photography teachers that
influence vision. Sources of information
can be defined as various details,
ideological leaders, tourism and
promotional advertisements, movie
scenes, travel magazines, and more.
Information from community groups is
considered a source of information. These
sources have been revealed to the public
and have decided to make decisions about
tourist attractions. According to Gartner
(1993), there are a variety of resource
teachers. They are extremely addictive -
they arouse interest in the Internet,
Television, etc. For tour operators,
Organic - information from friends,
relatives, and family members, and a
destination visit as an end-to-end use.
Gartner and Hunt (1987), Pearce (1982),
and Phelps (1986), each list, that images
that work without visiting where they are
going will become more realistic,
complex, and different. As new marketing
strategies such as social media marketing,
whoosh marketing, and other innovative
strategies can be followed in branded

Factors Affecting Domestic Tourist Satisfaction
Amity Business Review
Vol. 22, No. 2, July - December 2021 37
areas as well as in the construction of
images wherever they go.
PERSONAL FACTORS
Personal traits represent personal traits,
who tell the difference between several
places (more than two, but not many) and
knowledge through many photos where you
are going. Personal features will also affect
the image where you go. This is because the
way a person understands explains, and then
you find sources that rely directly on his or
her beliefs and point of view. Individual
agents that lead to influence on tourist
promotion (Beerli and Martin, 2004). On the
other hand, Gartner (1993) described these
factors as the Global Review of Research in
Tourism, Hospitality and Leisure
Management (GRRTHLM) personal needs
and reasons for doing things as "Push"
reductions which are internal factors that
make the purpose of travel. The nature of
people's beliefs varies according to the
internal characteristics of each person for
example your needs, preferences,
motivations, knowledge, and other factors.
Tourist features and interior features shape
the design of the destination (Crompton,
1990). The nature of individual beliefs
varies from one person to another.
Consumer needs, preferences, motivations,
knowledge, and other factors are important
factors that contribute to the image building
of a destination. Individual travel motives
vary for different purposes and aspects.
TRAVEL MOTIVATIONS
Motivation is considered as the emotional
- cultural factor which influences an
individual's decision to work in the tourist
industry (Grаndаll, 1980). According to
Iso-hоlа (1982), trаvel mоtivаtiоn is
described as the satisfaction one seeks
from their journeys. Mоtivаtiоn, whether
intentionally or unintentionally, supports
in the development of the intended
location. Various рreviоus studies
(rоmрtоn, 1979 аnd Bаlоglu, 2000) have
highlighted the effect of motivation on
travel intentions. Considering the tourist
purpose includes recognizing the tourist's
activity and location review process, as it
is the factor that affects all operations
(Crоmрtоn, 1979).
The research being done a few months
back has confirmed that the faith in
tourism has increased. Stress in wоrking
life, inсreаsed stress due tо internаl
аnd externаl fоrсes, аnd оther
оbjeсtives blосk the wаy tо sрirituаl
trаvel tо find рeасe оf mind аnd rest.
Even fаmilies gо tо religiоus sites fоr
religiоus instruсtiоn аnd relаxаtiоn.
Frоm the study оf the design оf the
destinаtiоn imаges the mоst соmmоn
reаsоns fоr visiting the destinаtiоn аre
listed belоw:
1. Exploring new culturеs and types of
people.

Factors Affecting Domestic Tourist Satisfaction
Amity Business Review
Vol. 22, No. 2, July - December 2021 38
2. Improving the mental planning
process.
3. The search for new forms of
entertainment and entertainment.
4. Expand your horizons by attending
cultural events, festivals, and spесifiс
рrоgrаms from time to time.
5. Relax аnd relax аnd relax аnd relax
аnd relax аnd relax аnd relax аnd
relax.
6. Put thе stress оn аnd gеt оut оf thе
nоrmаl lifе.
7. Pleasure, excitement, and leisure are
all looked after.
8. Spirituality and cultural motivations.
9. Be a role model who can explain the
travel experience.
10. Visiting the most important and
outstаnding places in search of signs
and features.
Source: Gunn (1988) adapted in Jenkins 1999 and
Echtner & Ritchie (2003).
Figure 2: Gunn's Seven-Phase Model of
Destination Image Formation (1988).
The second is Gunn's (1988), a seven-
phase model of destination pictures that
Jenkins (1999) and others have researched
extensively (Echtner and Ritchie, 2003).
This seventh phase of the landscape
experience was linked to Echtner &
Ritchie's (2003) sources, while Jenkins
(1999) tied it to the Stabler (1998) model's
needs and expectations. According to
Echtner and Ritchie (2003), seven model
stages, 1, 2, and 7 all contribute to the
creation of a mental image of where it is
going. Section 1 of mental images about a
holiday experience is linked to a picture of
your destination, section 2 to the
destination photo, and section 7 to the
destination photo visit (see Figure No. 2).
Managerial Implications
Satisfaction is the purpose of all
organizations, but not all organizations
have a clear understanding of what
satisfies their customers. Customer
satisfaction is also a key factor that helps
tourism firms to compete successfully
(Forozia, 2013). Many features can be
satisfying, but in the case of typical
imagery, service quality, and visual value
are the most important factors that create
direct satisfaction. The effects of this
paper on the tourism industry can have an
impact on the management of tourist
facilities in understanding the content of
the tourism industry. All items that create
guest satisfaction should be treated fairly.
In addition, management can determine
the direction of the future and its
marketing, better management, and
performance improvement of the
ORGANIC IMAGE
1. The accumulation of mental images of
a place throughout the course of one's
life.
2. Image modification as a result of
research before to deciding to trip.
3. Making a vacation option based on
picture efficiency and anticipated
experience while staying within time,
budget, and other constraints
4. Participation or experience at the
location, as well as activities, lodging,
and other facilities, all shape the
image.
5. The image is influenced by
participation or experience at the
place, as well as activities, lodging,
and other services
6. Return travel provides for thought and
review, as well as discussion with
other passengers
6. Because the process is circular, new
accumulation occurs after the visit;
the final image may be the same as or
different from the original

Factors Affecting Domestic Tourist Satisfaction
Amity Business Review
Vol. 22, No. 2, July - December 2021 39
company, especially those related to
efforts to increase customer satisfaction
and trust.
Destination marketers should also develop
their tourist locations to attract tourists
beyond 45 years of age by adding
attractions such as libraries and temples
and, as well, health-related factors. By
such means, destinations can be promoted
as health-promoting, as mature tourists
will be more interested in peaceful and
health-supporting destinations than ones
that offer fun and adventure. Altogether,
an atmosphere that is serene and peaceful
and promotes self-reflection will attract
elderly tourists (45 plus age group). It is
unnecessary for destination marketing
organizations (DMOs) to incur extra
costs to overly develop their destinations
with too much modernization to attract
such senior tourists, rather adding
aesthetic values like beaches, cultural
heritage, and historical relics might help
them attract tourists in the age group of 45
plus. Destination marketers should also
develop their tourist locations to attract
tourists beyond 45 years of age by adding
attractions such as libraries and temples
and, as well, health-related factors. By
such means, destinations can be promoted
as health-promoting, as mature tourists
will be more interested in peaceful and
health-supporting destinations than ones
that offer fun and adventure. Destination
marketing organizations (DMOs) don't
have to get extra costs to overly develop
their destinations with too much
modernization to attract such senior
tourists, rather adding beauty-related
values like beaches, cultural history, and
historical things might help them attract
tourists in the age group of 45 plus.
In review, the location's image can be
separated into two categories: the main
image, which was created after visiting
the guest house, and the second image,
which was created before the person went
to a certain location. Some аuthоrs
recommend that, during the main imаge, it
is advisable to employ memоrized
messages from the past, and that in the
second section, it is very helpful to
convey relevant details and messages
about the location. Age, gender, the fact
that somehow a person is visiting a
destination, their level of eduсаtiоn,
motivation, and culture are all factors to
consider. Working with all of these
variables provides just one opportunity to
strengthen the destination's positive image
and, as a result, increase the likelihood
that a specific tourist destination will be
chosen. In short, destinаtiоn is оnе оf thе
mоst imроrtаnt destinаtiоns in the
destinаtiоn аnd bесоmеs the mоst
imроrtаnt fасtоr in the suссess. The
lаndscаpe imаge should then be аnаlyzed
using the Reseаrch, Develоpment, and
Innоvаtiоn Strаtegy, which is supported
by several аpрrоаches to its major feаtures
and subsequent struсture.

Factors Affecting Domestic Tourist Satisfaction
Amity Business Review
Vol. 22, No. 2, July - December 2021 40
Since findings further suggest that
'employers,' 'employed,' and 'self-
employed' have a higher propensity to
stay longer, the DMOs should develop
facilities that support business-related
travel like conference halls, meeting
rooms, Internet, secretarial assistance,
bars, and business desks to attract this
category of tourists. Optional facilities,
such as a gym, games room, swimming
pool, spa, dance floor, and music, should
be provided for entertainment as well.
This study has shown that tourists
accompanied by their spouses also tend to
stay longer; hence, DMOs should target
their promotional mix to attract couples,
for example, giving extra discounts for the
spouse; further, rooms should be designed
to suit the requirements of a couple.
Special honeymoon suites should be
available for newly-married couples.
Since the present study also found that, up
to three accompaniments LOS increases,
marketers should keep this fact in mind
while designing their marketing strategies
as well as rooms and facilities. Extra
discounts, for example, can be given to
the third person accompanying the party
either a child or one of the relatives or
friends. Rooms must be designed in such
a way that they can comfortably
accommodate three people. Also, DMOs
should pay attention to providing
accommodation targeted at youngsters
e.g., a playground, fun zones, and
children's amusement centers. Yoga
centers may be provided for elderly
parents accompanying the couple.
Regarding the number of persons
accompanying the traveler, our findings
suggest that beyond the size of three
persons, the LOS decreases, possibly due
to increasing expenditures; hence, DMOs
should invest in the group transportation
facilities and make available larger rooms
with more beds at reasonable costs to
motivate guests to stay longer. In general,
the tourists traveling in large groups (four
and above) should be incentivized to stay
longer.
Since, findings further suggest that
‘employers,’ ‘employed,’ and 'self-
employed' have a higher Natural tendency
to stay longer, the DMOs should develop
facilities that support business-related
travel like conference halls, meeting
rooms, Internet, bars, and business desks
to attract this category of tourists.
Optional facilities, such as a gym, games
room, swimming pool, spa, dance floor,
and music, should be provided for
entertainment as well. This study has
shown that tourists accompanied by their
spouses also tend to stay longer; hence,
DMOs should target their promotional
mix to attract couples, for example, giving
extra discounts for the spouse; further,
rooms should be designed to suit the
requirements of a couple.
The five fасtоrs thаt аffeсt tоurism
sаtisfасtiоn аs mentiоned саn be used
by vаriоus stаkehоlders in the

Factors Affecting Domestic Tourist Satisfaction
Amity Business Review
Vol. 22, No. 2, July - December 2021 41
fоrmulаtiоn оf сustоmer sаtisfасtiоn
strаtegy. Attrасtiоns, resоurces, аcсess,
hоspitаlity, and аmenities can all be
selected, focused on, and combined by
policymakers., as well as their size to
achieve unique competitiveness of tourist
attractions - whether your destination is
known for its high environmental appeal,
entertainment, or reputation for its
friendliness and beauty. In addition, these
five items can also be used as a basis for
the establishment of a comprehensive
evaluation of the facilities to satisfy
visitors at specific tourist destinations.
Since the present study also found that, up
to three smaller parts LOS increases,
marketers should keep this fact in mind
while designing their marketing plans as
well as rooms and facilities. Extra
discounts, for example, can be given to
the third person going along with the party
either a child or one of the relatives or
friends. Rooms must be designed in such
a way that they can comfortably
accommodate three people. Also, DMOs
should pay attention to providing
accommodation targeted at youngsters
e.g., a playground, fun zones, and
children's amusement centers. Yoga
centers may be provided for elderly
parents accompanying the couple. Hence,
DMOs should invest in group
transportation facilities and make
available larger rooms with more beds at
reasonable costs to motivate guests to stay
longer.
Some of the limitations of this study are
the difficulty of summarizing all the
subjects related to this topic due to limited
resources, in addition to what is set out in
editing relevant documents. This study
attempted to summarize as far as possible
the results from previous studies to
recommend this study. Existing
limitations will probably be corrected in
future studies. Future research should
investigate factors that may influence the
selection of tourist destinations and
attractions not only for international
tourists but also for local tourists. The
relationship between tourism satisfaction
and the purpose of redevelopment and
tourism is also an important issue for
tourism retailers and researchers to
investigate.
REFERENCES
Chen, C., and Tsai, D. (2007). How destination
image and evaluative factors affect behavioral
intentions. Tourism Management. 28(4): 1115-
1122.
Mathieson, A., & Wall, G. (1982). Tourism,
economic, physical, and social impacts.
Longman.
Getz, D. (2008). Leisure tourism: Definition,
evolution, and research. Tourism Management,
29(3), 403-428.
Ali, F., Omar, R., & Amin, M. (2013). An
examination of the relationships between the
physical environment, perceived value, image,
and Behavioral Intentions: A SEM approach
towards Malaysian resort hotels. Journal of
Hotel and Tourism Management, 27(2), 9-26.

Factors Affecting Domestic Tourist Satisfaction
Amity Business Review
Vol. 22, No. 2, July - December 2021 42
Maruvada, D. P., & Bellamkonda, R. S. (2012).
The Effects of Individual Dimensions of
Railway Service Quality: Findings from Indian
Railway Passenger Services through
Developing RAILQUAL. International Journal
of Innovation, Management, and Technology,
3(1), 42.
Adinegara, G. N. J., Suprapti, N. W. S., Yasa,
N. N. K., & Sukaatmadja, I. P. G. (2017).
Factors That Influences Tourist’s Satisfaction
and Its Consequences. European Journal of
Business and Management, 9(8), 39-50.
Yoon, Y., & Uysal, M. (2005). An examination
of the effects of motivation and satisfaction on
destination loyalty: a structural model. Tourism
Management, 26(1), 45-56.
Jani, D., & Han, H. (2013). Personality, social
comparison, consumption emotions,
satisfaction, and behavioral
intentions. International Journal of
Contemporary Hospitality Management.
Carballo, M. M., Araña, J. E., León, C. J., &
Moreno-Gil, S. (2015). Economic valuation of
tourism destination image. Tourism
Economics, 21(4), 741-759.
Gertner, D., & Kotler, P. (2004). How can a
place correct a negative image? Place
branding, 1(1), 50-57.
Beerli, A., & Martin, J. D. (2004). Factors
influencing destination image. Annals of
tourism research, 31(3), 657-681.
Baloglu, S., & McCleary, K. W. (1999). A
model of destination image formation. Annals
of tourism research, 26(4), 868-897.
Turner, L. W., & Reisinger, Y. (2001).
Shopping satisfaction for domestic
tourists. Journal of Retailing and consumer
services, 8(1), 15-27.
Govers, R., Go, F. M., & Kumar, K. (2005).
Virtual Tourism Destination Image Innovating
measurement methodologies. Journal of Travel
Research, 39(1), 1-23.
Ashworth, G. J., & Voogd, H. (1994).
Marketing of tourism places: What are we
doing? Journal of International Consumer
Marketing, 6(3-4), 5-19.
Chi, C.G., and Qu H. (2008). Examining the
structural relationships of destination image,
tourist satisfaction, and destination loyalty: An
integrated approach. Tourism Management,
1(29): 624-636.
Iso-Ahola, S. E. (1982). Toward a social
psychological theory of tourism motivation: A
rejoinder. Annals of tourism research, 9(2), 256-
262.
Crompton, J. L. (1979). Motivations for
pleasure vacation. Annals of tourism
research, 6(4), 408-424.
Chen, C. F., & Tsai, D. (2007). How destination
image and evaluative factors affect behavioral
intentions? Tourism Management, 28(4), 1115-
1122.
Gardiner, S., Grace, D., & King, C. (2014). The
generation effect: The future of domestic
tourism in Australia. Journal of Travel
Research, 53(6), 705-720.
Beerli, A., & Martin, J. D. (2004). Factors
influencing destination image. Annals of
tourism research, 31(3), 657-681.
Frozia, A., Zadeh, M. S., & Gilani, M. H.
(2013). Customer satisfaction in the hospitality
industry: Middle East tourist at 3-star hotel in

Factors Affecting Domestic Tourist Satisfaction
Amity Business Review
Vol. 22, No. 2, July - December 2021 43
Malaysia. Research Journal of Applied
Sciences, Engineering, and Technology, 5(17),
4329-4335.
Veasna, S., Wu, W. Y., & Huang, C. H. (2013).
The impact of destination source credibility on
destination satisfaction: The mediating effects of
destination attachment and destination
image. Tourism Management, 36, 511-526.
Hosany, S., Ekinci, Y., & Uysal, M. (2006).
Destination image and destination personality:
An application of branding theories to tourism
places. Journal of business research, 59(5), 638-
642.
Kim, S. E., Lee, K. Y., Shin, S. I., & Yang, S. B.
(2017). Effects of tourism information quality in
social media on destination image formation:
The case of Sina Weibo. Information &
management, 54(6), 687-702.
Souiden, N., Ladhari, R., & Chiadmi, N. E.
(2017). Destination personality and destination
image. Journal of Hospitality and Tourism
Management, 32, 54-70.
Yusendra, M. A. E., & Paramitasari, N. (2018).
Identifying factors affecting domestic tourist
satisfaction on tourist destinations in
Indonesia. drama Jurnal Manajemen, 13(2),
157-174.
Le, C. C., & Dong, D. X. (2017). Factors
affecting European tourists’ satisfaction in Nha
Trang city: perceptions of destination
quality. International Journal of Tourism Cities.
Suhartanto, D., Dean, D., Sosianika, A., &
Suhaeni, T. (2018). Food souvenirs and their
influence on tourist satisfaction and behavioral
intentions. European Journal of Tourism
Research, 18, 133-145.

Evaluation of Problems and Perception of Tea Workers’ in Kangra District of Himachal Pradesh
Amity Business Review
Vol. 22, No. 2, July - December 2021 44
Evaluation of Problems and Perception of Tea
Workers’ in Kangra District of Himachal Pradesh
Manoj Sharma1
1 Assistant Professor, Department of Commerce, H.P. University Regional Centre, Dharamshala.
Email: [email protected]
ABSTRACT
The history of tea is more than 5000 years,
but in India it’s about 172 years old. The
cultivation of tea in Himachal Pradesh was
started by Dr. William Jameson in 1849 and
has seen a golden era over the years. But,
after heavy earthquake of 1905, tea Industry
of H.P. was continuously struggling to get
its’ destroyed heritage and legacy, but
success has been found to be negligible due
to lack of govt. polices and effective support
system. The tea industry is a labour intensive
industry and has the capacity to provide
employment to thousands of people. In view
of this, through this paper an attempt has
been made to examine the perception and
problems faced by the people engaged in the
cultivation of tea in Kangra region of
Himachal Pradesh. The primary data is
used for the study with a sample of 100
respondents’ which was collected through
questionnaire method. The analysis and
interpretation part of the study is done with
the help of statistical methods like mean,
percentage, standard deviation, skewness
and Chi-square.
Key Words- Government (Govt.), Indian
Tea Association (ITA), Tea Research
Association (TRA), Self Help Group
(SHG), Tea Board of India.
1. INTRODUCTION
The tea plantation in Kangra region was
started in the mid of 19th century with a
feasibility survey of 1848, which shows that
the area is suitable for camellia sinensis
(Chinese variety of tea plants). The first tea
garden was established in 1852 in Holta
near Palampur and after the success of this
the British had started tea plantation in
Bhawarana and Nagrota in the mid of 1850.
In the 1880s, Kangra tea was brought in
Europe, Kabul and Central Asia and has
seen its golden period and as a result
Kangra tea received gold and silver medals
in 1886 and 1895 in London and
Amsterdam respectively.
However in 1905, Kangra region was hit
by a major earthquake which destroyed
everything and caused thousands of death
and destruction of tea factories. It gave
death blow to the Kangra tea industry and

Evaluation of Problems and Perception of Tea Workers’ in Kangra District of Himachal Pradesh
Amity Business Review
Vol. 22, No. 2, July - December 2021 45
European planters sold the estates either
to their workers or local and left the
valley. New entrepreneurs had no
technical knowledge of tea farming as a
result it lost its quality. The state
government support came for industry
during the period 1964-1983 in the setting
up of four co-operative factories in Bir,
Palampur, Baijnath and Sidhbari (Sood
Meghna, 2016). Over the last fifty years,
the state government and Tea Board of
India are saying that they are putting their
best efforts to bring back the kangra tea
into the map of India, but results have
seen very negligible.
2. REVIEW OF LITRATURE
The available literature shows that many
studies has been done in different parts of
the country on the conditions of
workforce working in the tea industry, but
very few studies are on Himachal Pradesh.
From the several studies i.e. Kumar
Pramod, Badal P.S., Singh N.P., Singh
R.P., (2008), Mishra K. Deepak ,
Upadhyay Vandana, Sarma Atul, (2008),
Baruah Bhupen Kumar, Das Bhanita,
Medhi Chitrani, Misra Abani Kumar,
(2011), Goowalla Horen, (2012),
Bosumatari Dipali, Goyari Phanindra,
(2013), Sarmah Prasanta, Goowalla
Horen, (2014), Bhattacharjee Archana,
Nirmolia Lakhya Pratim (2015),
Mathivanan R. (2016), Narzary Sonjoy,
(2016) and Debnath Sukharanjan,
Debnath Prallad, (2017), it was found that
condition of workforce have slightly
improved in a few big tea estates, but by
large workforce facing serious concerns to
earn their bread and butter. These studies
also reveal that in order to improve the
quality of labourers’, there is a need to
provide technical knowledge of tea
farming and financial assistance to small
tea growers’. Through this study, an
attempt has been made to find out the
hidden reasons, which are responsible for
the poor condition of workforce engaged
in tea industry of Himachal Pradesh.
3. OBJECTIVE OF THE STUDY
The main objectives of the study are:
To study the perception of tea
workers’ in Kangra region of
Himachal Pradesh;
To examine the problems faced by the
workers’ in Kangra region of
Himachal Pradesh.
4. RESEARCH METHODOLOGY
Hypotheses of The Study
In the light of the stated objectives, the
following hypotheses have been
developed for the purpose of testing the
perceptions and problems of the
beneficiaries towards tea industry:
1. Null Hypothesis (Ho) – Opinion of
the respondents regarding timely payment
of wage, working hour, professional

Evaluation of Problems and Perception of Tea Workers’ in Kangra District of Himachal Pradesh
Amity Business Review
Vol. 22, No. 2, July - December 2021 46
growth, performance appraisal, fair
policies, clearly convey the mission, good
communication between manager and
employees, contribute in employee’s
health account, support community
service is equally distributed.
Alternative Hypothesis (Ha) – Opinion
of the respondents regarding timely
payment of wage, working hour,
professional growth, performance
appraisal, fair policies, clearly convey the
mission, good communication between
manager and employees, contribute in
employee’s health account, support
community service is not equally
distributed.
2. Null Hypothesis (Ho) – Opinion of
the respondents regarding government
policies, facilities provided by
organization, unhygienic living condition,
demonstration and training camp, tool and
resources, maternity benefits and trade
union’s work is equally distributed.
Alternative Hypothesis (Ha) - Opinion
of the respondents regarding government
policies, facilities provided by
organization, unhygienic living condition,
demonstration and training camps, tool
and resources, maternity benefits and
trade union’s work is not equally
distributed.
SOURCE OF DATA
To achieve the objectives of the study
primary data has been used. The data is
collected from the workers’ engaged by the
tea estates in the Kangra region of Himachal
Pradesh with the help of questionnaire,
which was divided into two parts:
Part 1- Perception of tea workers toward
tea industry;
Part 2- Problems faced by tea workers.
SAMPLING DESIGN
The population of the study constitutes only
those respondents who directly or indirectly
engage in the production process of tea.
Thus, it comprises of three administrative
blocks of Kangra where tea production is
done i.e. Dharamshala, Baijnath and
Palampur. Multistage sampling has been
used to select the sample. The sampling
process is carried out in three steps-
STEP 1- In this step out of the twelve
district of Himachal Pradesh only one
district Kangra has been selected for the
study because of single tea cultivation
region of the state.
STEP 2- In the second step three
administrative block of Kangra district,
where basically tea is cultivated i.e.
Dharamshala, baijnath and Palampur has
been selected by using the simple random
sampling.

Evaluation of Problems and Perception of Tea Workers’ in Kangra District of Himachal Pradesh
Amity Business Review
Vol. 22, No. 2, July - December 2021 47
Table- 1.1
Sr.No. Statements
Strongly
Agree
Partially
Agree
Not
Agree Total Mean S.D. Skew.
Chi-
square
1. Timely payment of
wage/salary
12
(12.0%)
17
(17.0%)
71
(71.0%)
100
(100.0%) 1.4100 .6764 1.421 64.22
2. Satisfied with working
hour
20
(22.0%)
33
(33.0%)
47
(47.0%)
100
(100.0%) 1.7300 .77662 .513 10.94
3.
Good opportunities for
your professional
growth in this
organization
18
(18.0%
42
(42.0%)
40
(42.0%)
100
(100.0%) 2.2200 .73278 -.371. 10.64
4.
Performance appraisal
system of the
organization is growth
and development oriented
22
(22.0%)
45
(45.0%)
33
(33.0%)
100
(100.0%) 2.1100 .73711 -.177 7.94
5.
Fair policies for the
promotion of all employees
42
(42.0%)
24
(24.0%)
34
(34.0%)
100
(100.0%) 1.9200 .87247 .157 4.87
6.
Company clearly
convey its mission to
its employees
33
(33.0%)
30
(30.0%)
37
(37.0%)
100
(100.0%) 2.0400 .83991 -.076 0.73
7.
Feel comfortable to
voicing your concern to employer
31
(31.0%)
28
(28.0%)
41
(41.0%)
100
(100.0%) 2.1000 .84686 -.193 2.77
8.
Good communication
from manager to employees
37
(37.0%)
30
(30.0%)
33
(33.0%)
100
(100.0%) 1.9600 .83991 .076 0.73
9.
Organization
contribute toward an
employee’s health
reimbursement account
20
(20.0%)
33
(33.0%)
47
(47.0%)
100
(100.0%) 2.2700 .77662 -.513 10.93
10.
Organization sponsor
and actively supports
any community service initiatives
8
(8.0%)
38
(38.0%)
54
(54.0%)
100
(100.0%) 2.4600 .64228 -.782 32.9
11.
Advise someone to
work at this
organization
6
(6.0%)
36
(36.0%)
58
(58.0%)
100 (100.0%)
2.5200 .61101 -.891 40.88
STEP 3- In the third step 100 respondents have been selected for study purpose by using
quota sampling.

Evaluation of Problems and Perception of Tea Workers’ in Kangra District of Himachal Pradesh
Amity Business Review
Vol. 22, No. 2, July - December 2021 48
Tools and Techniques
The collected data is edited, classified and
analyzed by using following mathematical
and statistical techniques consistent with
the objectives of the study:
(a) Mean;
(b) Percentage;
(c) Standard Deviation;
(d) Skewness and
(e) Chi-square
5. ANALYSIS AND INTERPRETATION
This part presents the analysis and
interpretation of respondent’s response. It
shows the perception and problems faced
by tea workers.
Table 1.2: Sample Size of Respondents
S.NO. Name of the blocks No. of Respondents
1. Palampur 40
2. Baijnath 30
3. Dharamshala 30
Total 100
Note: Figures in the parenthesis indicates percentage
Source: Field Survey
Classification on the Basis of Tea
Worker’s Perception towards Tea
Industry
It is clear from the table 1.2, that the
majority of the respondents with the
statements of timely payment of wages
i.e. 71.0 percent, 47 percent with the no.
of working hours, 34 percent with the fair
policies of promotion and 33 percent with
the communication from manger to
employee, have shown their
dissatisfaction. These opinions are also
supported by their mean values which are
recorded 1.41, 1.73, 1.92 and 1.96
respectively and noted lower than the
average standard score i.e. 2 at 3 point
scale. The standard deviation and
skewness for the statements are recorded
(.6764, 1.421), (.77662, .513), (.8724,
.157) and (.83991, .076) respectively,
which shows that opinion of the
respondents skewed more towards lower
side. While applying Chi square test, it
reject the null hypothesis at 5 percent
level of significance. It shows that opinion
of the respondents is not equally
distributed and it is distributed more
towards lower side. The above analysis
concludes that tea estates needs
improvement with regard to timely

Evaluation of Problems and Perception of Tea Workers’ in Kangra District of Himachal Pradesh
Amity Business Review
Vol. 22, No. 2, July - December 2021 49
payment of wages/salaries, fixation of no.
of working hours, fair policies of
promotion and proper communication
from manger to employees.
Further, the table 1.2, reveals that majority
of the respondents have shown partially
agreement or no agreement with the
statements of opportunities for professional
growth, performance appraisal system, clear
communication with the employees, easy
access with the employer, health
reimbursement schemes, actively supports
community services and will advise others
also to work in the same organization.
These statements are also supported by their
mean values which are recorded 2.22, 2.11,
2.04, 2.1, 2.27, 2.46 and 2.52 respectively,
which are noted higher than the average
standard score i.e. 2 at 3 point scale. The
standard deviation and skewness for the
opinions are recorded (.73278, -.371),
(.73711, -.177), (.83991, -.076), (.84686, -
.193), (.77662, -.513), (.64228, -.728) and
(.61101, -.891) respectively, which shows
that opinion of the respondents skewed
more towards higher side. When Chi
square-test of goodness of fit at 5 percent
level of significance is applied, it reject the
null hypothesis, which shows that the
opinion of the respondents is not equally
distributed and it is distributed more
towards higher side.
Table 1.3: Classification on the Basis of Problems Faced By Tea Workers’
Sr. No. Statements Strongly
Agree
Partially
Agree
Not
Agree Total Mean S.D. Skew.
Chi-
Square
1.
Government policies are
inappropriate and not
achieving its target
12
(12.0%)
45
(45.0%)
43
(43.0%)
100
(100.0%) 2.3100 .67712 -.471 20.54
2.
Absence of medical,
drinking water and
educational facilities to
workers
16
(16.0%)
40
(40.0%)
44
(44.0%)
100
(100.0%) 2.2800 .72856 -.485 13.75
3.
Over-crowded and
unhygienic living condition
in residential colonies
61
(61.0%)
29
(29.0%)
10
(10.0%)
100
(100.0%) 1.4900 .67412 1.046 39.86
4. Lacking in training &
development programs
33
(33.0%)
42
(42.0%)
25
(25.0%)
100
(100.0%) 1.9200 .76118 .136 4.33
5. Needed latest tools and
resources to do the job
41
(41.0%)
26
(26.0%)
33
(33.0%)
100
(100.0%) 1.9200 .86082 .156 3.37
6.
Non implementation of
maternity benefit schemes
available for female workers
35
(35.0%)
65
(65.0%) 0
100
(100.0%) 2.6500 .47937 -.639 63.5
7.
No quick redressed
mechanism of grievance in
organization
26
(26.0%)
32
(32.0%)
42
(42.0%)
100
(100.0%) 2.1600 .81303 -.303 3.91
Note: Figures in the parenthesis indicates percentage
Source: Field Survey

Evaluation of Problems and Perception of Tea Workers’ in Kangra District of Himachal Pradesh
Amity Business Review
Vol. 22, No. 2, July - December 2021 50
The table 1.3, reveals that majority of the
respondents i.e. 57 percent under
inappropriate govt. schemes, 56 percent
under absence of basic facilities, 100
percent under implementation of
maternity benefits and 58 percent under
quick redressed mechanism of grievances
feels either strongly agree or partially
agree with their working conditions. The
result of these statements are also
supported by their mean value which is
noted higher than the average standard
score i.e. 2 at 3 point scale. The standard
deviation and skewness for the statements
are recorded (.67712, -.471), (.72856, -
.485), (.47937, -.639) and (.81303, -.303)
respectively, which shows that opinion of
the respondents skewed more towards
higher side. While applying Chi square
test, it reject the null hypothesis at 5
percent level of significance. It shows that
opinion of the respondents is not equally
distributed and it is distributed more
towards higher side. The above analysis
leads us to conclude that tea
establishments in Kangra region are not
able to provide basis amenities to the
workforce engaged in tea cultivation and
processing.
The table further shows that majority of
the respondents i.e. 90 percent are of the
opinion that residential colonies are over-
crowded and unhygienic, 75 percent of the
view that their organizations are not
running any kind of training &
development programs, whereas 67
percent thinks that latest technology is the
need of the hour to perform their job
smoothly. These statements are also
supported by their mean values which are
recorded 1.490, 1.920 and again 1.920
respectively, which are noted lower than
the average standard score i.e. 2 at 3 point
scale. The standard deviation and
skewness for the opinions are recorded
(.67412, 1.046), (.76118, .136), and
(.86082, .156) respectively, which shows
that opinion of the respondents skewed
more towards lower side. When Chi
square-test of goodness of fit at 5 percent
level of significance is applied, it reject
the null hypothesis, which shows that the
opinion of the respondents is not equally
distributed and it is distributed more
towards lower side.
6. FINDINGS
The major findings of the study are as
follows:-
The study shows that the 71 percent
and 53 percent of the respondents are
not satisfied with their salary/wages
and working hours respectively,
whereas 47 percent of the respondents
have shown their satisfaction with
their working hours.
The study highlights that 40 percent of
the respondents are not happy with
their present professional growth,
whereas 41 percent feels that they ate
Evaluation of Problems and Perception of Tea Workers’ in Kangra District of Himachal Pradesh
Amity Business Review
Vol. 22, No. 2, July - December 2021 51
not able to voicing their concerns with
their employer.
The study reveals that 47 percent of
the respondents are of the opinion that
employer is not contributing in the
health reimbursement account of the
employees.
From the study, it was also assessed
that only 46 percent of the respondents
feels that employer is contributing in
community services, whereas only 42
percent will advise any one to work in
the teas industry of Kangra district.
The study shows that 43 percent of the
respondents feels that govt. policies
are appropriate and needs just proper
implementation, whereas 44 percent of
the respondents are of the opinion that
employer is providing medical and
other facilities at the work place.
The study also highlights that 33
percent of the respondents have shown
their satisfaction with the working
tools used by their employer, whereas
only 42 percent feels that their
organization has quick redressed
mechanism of grievances in the
organization.
7. SUGGESTIONS
The Kangra tea industry today is facing
many challenges and there is urgent need
that tea industry adapt to twenty first
century requirements. The some
suggestions are:
The tea estates should formulate a
corpus fund, so that timely payment of
wages/ salaries and dues may be done
to the workforce.
The tea estates must comply with the
various regulations of the govt.
regarding working hours, maternity
benefits and basic facilities at
workplace both for male and female
workforce. The tea board of India and
govt. should jointly formulate a
monitoring committee to look into the
grievances on such matters regularly.
The workforce should be rewarded for
their good performance and an
incentive based method should be
implemented to retain the manpower
in the organization.
The new technology should be
promoted and for the purpose
continuous training and development
programs to be conducted to make the
workforce user friendly.
A health insurance cover should be
made mandatory for every
organization and soft loans may be
provided for the child education and to
construct the house.
To fill the communication gap higher
management must talk time to time
with union leaders with open heart and
get to gather may be arranged for the
employees/workforce to fill the gap.

Evaluation of Problems and Perception of Tea Workers’ in Kangra District of Himachal Pradesh
Amity Business Review
Vol. 22, No. 2, July - December 2021 52
The Kangra tea estates jointly
formulate a forum to address their
grievances with the govt. and an
inclusive policy should be formulated
to brand their products nationally and
internationally.
To widen the cultivation area the tea
establishments with the support of
local administration should organize
such programs, where local youth may
be encouraged for tea cultivation.
8. CONCLUSION
The whole discussion leads us to conclude
that at the beginning of the twentieth
century Kangra tea industry occupies
prestigious place in the world. The Kangra
tea won gold medal for making one of the
finest quality of tea in the world. But,
1905 earthquake destroyed the tea
industry of Kangra region which forced
the Britishers’ to leave the valley. The
locals are not able to maintain the pace of
technological advancement, which
reduces the quality of Kangra tea and also
the cultivated area. The govt. and tea
board of India has made certain policies,
but were not implemented properly at
ground level. Now, to get the lost glory of
Kangra tea the efforts should be to make
this industry more organized and
competent. The industry must introduce
latest technology to improve the quality of
their product and marketing strategies
should be framed in such a way that sale
of industry may increase both nationally
and internationally. Further, a conducive
working environment should be created to
the workforce, so that efficient manpower
may be retained. The industry also must
pass on the benefits of various govt.
schemes to their employees/workforce
from time to time.
BIBLOGRAPHY
Books
Bala Subramaniam, (1995), “Tea in India”,
Publications & Information Directorate, pp- 11
to 14.
Bald Claud, (1933), “Indian Tea”, Thacker
Spink & co. private Ltd., pp-281 to282.
Barua, D.N., (1989), “Science and Practice in
Tea Culture”, Tea Research Association
Calcutta, Jorhat, p- 493.
Chiranjeevi T., (1994), “Tea Economy of India”,
Rawat Publication, pp- 25 to 27.
Hazara N. Ghose, (2001), “Tea Cultivation”,
International Book Distributing Company, pp-
18 to 38.
Hazara N. Ghosh, (2001), “Tea Cultivation:
Comprehensive Treatise”, International book
Distributing Company Lucknow U.P., P-2.
Jain N.K., (1999), ‘Global Advances in Tea
Science”, Aravali Book International Ltd., pp-
54 to 55.
Jalan Sudhir, 1983, “Growth and Potential of
Tea Industry in India”, Published by the
Secretary, Economic and Scientific Research
Association, India, pp- 4 to 8.
Misra Sib Ranja, 1986, “Tea Industry in India”,
Ashish Publication House, pp- 1 to 5.

Evaluation of Problems and Perception of Tea Workers’ in Kangra District of Himachal Pradesh
Amity Business Review
Vol. 22, No. 2, July - December 2021 53
Willson K.C. and Chifford M.N., (1992), “Tea;
cultivation to consumption”, HAPMAN &
Hall, p-1.
Willson K.C., (1999), “Coffee, Cocoa and Tea”,
CABI Publishing House, p- 31.
Journal
Baruah Bhupen Kumar, Das Bhanita, Medhi
Chitrani and Misra Abani Kumar, (2011),
“Environmental Awareness among Tea Labours
Toward Local Issues”, Journal of Advances in
applied Science Research, volume-2 issue-2 pp-
1to7.
Bhattacharjee Archana and Nirmolia Lakhya
Pratim, (2015), “Role of Tea Industry in Rural
Development of Assam: issues and challenges
in respect of human resources”, pp- 1 to 10.
Debnath Sukharanjan and Debnath Prallad,
(2017), “Socio- Economic Condition Of Tea
Garden Workers Of West Tripura District With
Reference To Meghlipara Tea Estate”,
International Journal Of Humanities & Social
Science Studies, Volume- 4, Issue- 1, pp- 1 to
14.
Kumar Pramod, Badal P.S.,Singh N.P. and
Singh R.P., (2008), “Tea Industry in India:
Problems and Prospects”, Indian Journal of
Agricultural Economics, volume- 63, issue-1,
pp- 1to13.
Mathivanan R., (2016), “Economic Condition of
Estate Workers with Special Reference to
Valapari Tea Gardenr, Tamilnadu”, North Asian
International Journal of Multidis-ciplinary,
volume- 2, Issue-3, pp- 1 to 10.
Mishra K Deepak, Upadhyay Vandana and
Sarma Atul, (2008), “Crisis in Tea Sector: A
Study of Assam Tea Gardens”, Indian Economic
Journal, volume 56, issue- 3, pp- 1 to 18.
Narzary Sonjoy, (2016), “The Status of Growth
and Development in Tea Industry in Assam”,
International Journal of Humanities and Social
Science, volume-3 (issue-4) p-1.
Sarmah Prasanta and Goowalla Dr. Horen,
(2014), “Women Entrepreneurship in Tea
Industry: Challenges and Prospects”,
International Journal of Innovation and
Research in Educational Sciences, volume-1,
issue-4, pp- 1 to 5.
Sood Meghna, (2016), “Development of Tea
Industry in Himachal Pradesh”, International
Journal of Emerging Technologies, volume-7,
issue-2, pp- 44 to 47.
Websites
https://marktwendell.com
www.teaboard.gov.in
https://www.teaguardian.in
https://www.indiatea.org

Fraud Risk and Capital Market Performance Nexus in Nigeria (2001-2017)
Amity Business Review
Vol. 22, No. 2, July - December 2021 54
Fraud Risk and Capital Market Performance Nexus
in Nigeria (2001-2017)
Okoye, John Nonso1, Egbunike, Francis Chinedu Ph.D.2, Anazonwu, Helen Obiageli3,
Okafor, Kenebechukwu Jane4
1 Department of Banking & Finance, Nnamdi Azikiwe University, Awka, Anambra State, Nigeria. 2 Department of Accountancy, Nnamdi Azikiwe University, Awka, Anambra State, Nigeria. 3 Department of Accountancy, Nnamdi Azikiwe University, Awka, Anambra State, Nigeria. 4 Department of Accountancy, Nnamdi Azikiwe University, Awka, Anambra State, Nigeria.
ABSTRACT
The study evaluates the concomitant
effect of fraud risk on the performance of
the Nigerian capital market. Specifically,
the study assesses the effect of fraud risk
on market size and turnover ratio of the
Nigerian capital market. The study
utilized the ex-post facto research design
and retrieved secondary data from the
Nigerian Stock Exchange and CBN
statistical bulletins from 2001 to 2018.
The data was checked for stationarity
using Augmented Dickey-Fuller test. The
vector autoregression used to validate
the hypotheses showed a negative effect
of fraud on market size and a positive
effect on turnover ratio. Based on this,
the study recommends that adequate
collaboration and understanding
between relevant anti-corruption and
law enforcement agencies with SEC in
order to ensure that the market is fair to
all investors. Whistle –blowing scheme
should be encouraged and made to be
effective in the capital market since it
can serve to deter corporate executive’s,
capital market operators from engaging
in fraud in the market.
1. INTRODUCTION
The capital market is a framework of
institutions that arrange for the sale and
purchase of long-term financial assets,
such as shares, government stocks,
debentures (Onyiuke, 2010). It is part of
the financial system that is primarily
involved in raising capital by dealing in
shares, bonds and other long term or
short-term investments. It serves as an
intermediate through which large and
small businesses access equity and debt
capital directly, thus reducing their
dependence on bank-based financing.
The market serves as the center of any
financial system by providing funds
needed for financing not only business
and other economic institutions but also
the programmes of government as a
whole. It grants individuals and
institutions the accessibility to corporate

Fraud Risk and Capital Market Performance Nexus in Nigeria (2001-2017)
Amity Business Review
Vol. 22, No. 2, July - December 2021 55
bodies and government parastatals that
direct their savings towards capital
intensive projects. The capital market is
divided into two sectors, the primary
market and secondary market. Primary
market deals with issuing of new stocks
and bonds directly from companies to
investors, businesses and other
institutions. Secondary market is where
investment banks, private investors and
other firms resell their equity and debt
securities to investors.
The history of capital market in Nigeria
dates back to the late 1950s when the
Federal Ministry of Industries set up the
Barback Committee to advise it on ways
and means of setting up a stock market.
Prior to independence, financial
operators in Nigeria comprised mainly
of foreign owned commercial banks that
provided short-term commercial trade
credits for the overseas companies with
offices in Nigeria (Nwankwo, 1991).
Their capital balances were invested
abroad in the London Stock Exchange.
So the Federal Government in attempt to
accelerate economic growth embarked
on the development of capital market.
Some of the factors that encouraged the
Federal Government to establish the
capital market includes the need to
provide local opportunities for
borrowing and lending of long term
capital by the public and private sectors
as well as an opportunity for foreign
based companies to offer their shares to
the local investors and therefore provide
an avenue for the expatriate companies
to invest their surpluses.
Following the Barback Report, the
Lagos Stock Exchange was set up in
1959 with the enactment of Lagos Stock
Exchange Act 1961 as a private limited
liability company limited by guarantee.
It opened up for business with 19 listed
securities made up of 3 equities, 6
Federal government bonds and 10
industrial loans. By the mid-1970s there
was the need for an efficient financial
system for the entire nation, which led to
a review of the operations of the Lagos
stock exchange. This review
documented some problems associated
with the market such as the huge amount
of currency in circulation that was held
outside of the banking system,
unsatisfactory demarcation between the
operation of commercial banks and the
emerging class of merchant banks as
well as the extremely shallow depth of
the capital market. As a result of these
problem Lagos Stock Exchange was
renamed the Nigeria Stock Exchange in
1977. It was the foundation for trading in
long-term securities needed for financing
the industrial sector and the economy at
large. This expansion established other
branches of the stock exchange in Lagos,
Kaduna (1978), Port Harcourt (1980),
Yola (2002), Onitsha (1990) and Abuja
(the Federal Capital Territory), thus
increasing the geographical scope of

Fraud Risk and Capital Market Performance Nexus in Nigeria (2001-2017)
Amity Business Review
Vol. 22, No. 2, July - December 2021 56
investment activity in the country.
In 1988 Securities and Exchange
Commission Act was enacted which lead
to the established of Securities and
Exchange Commission (SEC) as the
apex regulatory organization for the
capital market. The objective of SEC is
to protect investors, maintain fair,
efficient and transparent market by
ensuring integrity in the market place
and by preventing fraudulent practices.
In 1999, the Investments and Securities
Decree No. 45 became the Investment
and Securities Act 1999 (ISA) by virtue
of section 315 of the Constitution of the
Federal Republic of Nigeria (CFRN)
1999. Subsequently, the ISA 1999 was
repealed and replaced by the ISA 2007,
which was a product of a long process of
consultation for the reform and
modernisation of the rules governing
capital market transactions. Furthermore,
the Federal Ministry of Finance provides
supervisory roles by formulating
periodical monetary policy guidelines.
Recently, the ministry introduced the
new whistle blowing scheme aimed at
drawing public attention or attention of
the authority to a perceived wrong
doing, misconduct, unethical activity
within an organization. Although it is a
relatively recent concept, it has led to the
recovery of significant sums of money
laundered and stolen by politicians. In
addition, Investment Protection Fund
(IPF) was introduced with the aim of
protecting subscribers against loss and
damage arising from the default of
issuers and their agents.
Despite the various laws and reforms
introduced by the government there still
exist various kinds of frauds and
corruption in Nigeria capital market.
Chieze and Onu, (2013) revealed that
there is increase in shady dealings in the
market done by stock brokers and top
officials in the market. The suspension
of the Securities and Exchange
Commission Director General, Mr
Munir Gwarzo by the Nigerian Minister
of Finance over alleged shady dealings
with Oando PLC in 2019 through the
help of whistle blower attest to the
existence of fraud and corruption in the
market. As a result of that the study
tends to find out the effect of fraud and
corruption on Nigeria capital market.
Furthermore, there is few works done on
this topic in Nigeria and most of them
looked at effect of corruption on capital
market performance using market
capitalization as capital market
performance indexes. Equally their
findings in Nigeria remain a
controversial issue. The researcher tends
to fill in the gap by introducing fraud
and using stock value traded and all
share index as capital market
performance in the study. The following
sections of this work include: conceptual
framework; theoretical framework and
empirical review of related works.

Fraud Risk and Capital Market Performance Nexus in Nigeria (2001-2017)
Amity Business Review
Vol. 22, No. 2, July - December 2021 57
Others are methodology and data
presentation; discussions, conclusion and
recommendations.
LITERATURE REVIEW
Adeniji (2004) defined fraud as an
intentional act by one or more individuals
among management, employees or third
parties, which results in a
misrepresentation of financial statements.
Fraud can also be seen as the intentional
misrepresentation, concealment, or
omission of the truth for the purpose of
deception or manipulation to the financial
detriment of an individual or an
organization which also includes
embezzlement, theft or any attempt to
steal or unlawfully obtain, misuse or harm
the asset of the organization, (Adeduro,
1998). Fraud is the misuse of delegated
authority for personal benefits
[Transparency International, 2011]. It is
also a deliberate way of misrepresenting
facts, realities and management of
situation in which someone finds himself
in an effort to deceive and gain both
material and non-material things
(Akinlabi, Hamed, & Awoniyi, 2011).
According to Hasan and Nuri (2013),
corruption is the misuse of public office
for private gains. It is globally held that
fraud is endemic and pervasive in nature,
thereby constituting a major hindrance to
economic and investment growth. It also
impacts negatively on public service
delivery as well as increases the social
inequality (Bolgorian, 2011). Natalia
(2016) posits that corruption includes
bribery, extortion, and misuse of insider
information and thrives where policy
enforcement is lacking.
The Capital Market, according to
Onyiuke (2010), is made up of markets
and institutions, which facilitate the
issuance and secondary trading of long –
term financial instruments. The Nigerian
Capital Market is a market for sourcing
of medium and long-term funds by both
the government and private sectors of
the economy. The strategic roles of the
capital market in the allocation of scarce
financial resources for rapid economic
growth and development of any nation is
well documented. For example, Oladejo
(2003) enumerates the gains of the
Nigerian capital market as follows: -
Helps the economy to increase capital
formation; Provides funds to government
and companies at more attractive terms;
Provides best source of funding for SME
growth; Subjects firms to market
discipline thus enhancing chances of
success; provides the necessary elements
to manage financial risks and ensures
continuity of the enterprise long after the
founder.
Fraud is capable of limiting the capacity
of the capital market to play these roles.
A wave of fraud and corruption have hit
the market reviving attention on its effect
on shareholders’ value, corporate
governance, and stock market
performance (Bonini & Boraschi, 2009).

Fraud Risk and Capital Market Performance Nexus in Nigeria (2001-2017)
Amity Business Review
Vol. 22, No. 2, July - December 2021 58
According to World Bank Report (2017),
fraud and corruption on the capital market
is a trillion-dollar industry globally, which
represents the amount of financial
resources being lost on a yearly basis in
terms of market performance (Kaufmann,
Kraay, & Mastruzzi, 2011). The typical
forms of these fraudulent behaviors
include financial misstatements on
investment or operations, inadequate or
inequitable information disclosure or
delay, withholding information, bribery,
insider trading, inappropriate short selling
amongst others (Dyck, Morse & Zingales,
2017). Insider trading or ‘insider dealing
is the use of inside information that is
price sensitive and has not been made
available to the public about a company or
securities in order to make a profit or
avoid loss through trading activity. It
usually involves an insider (director,
employee or professional advisor) or
someone connected to such persons
trading on information obtained in the
course of employment or in the course of
their professional relationship with a
company and which information is not
available to the broader market.
Aliyu and Bolgorian (2014) reveals that
among the various forms of crimes
discovered in the market include illegal
sales of stocks or shares belonging to
clients by stock brokers, circulation and
sales of fake or non-existing shares to
investors by registered stock brokers,
diversion/conversion of clients’ stock
proceeds by stock brokers, insider trading,
manipulation of annual accounts and
deliberate withholding of share
certificates by registrars. The occurrence
of these crimes within the market has
resulted in the loss of investors’ funds
estimated to be in millions of dollars apart
from its impact on the Nigerian economy
and other social consequence.
Some of the effect of fraud and corruption
on capital market performance includes
loss of investors’ confidence it reduces
trust investors has in the market. Since the
investors’ confidence are reduced
investors will avoid the market
consequently leading to less liquidity in
the market. Fraud can encourage
companies to choose riskier projects
without informed consent of the investors
thereby using investor’s funds on projects
that can result in lower returns. A major
outcome of insider trading is delay in
disclosure which tends to discourage
investors from the market. Delay in
disclosing information investor’s needs to
make an investment decision will
discourage them from investing in the
market. Fraud and corruption obstructs
the efficiency of capital market. An
efficient capital market has been
explained as market that prices fully
reflect available information. If
information is not released or used in
trade for the individual benefits of
company officials, it makes the idea of an
efficient market unattainable. The

Fraud Risk and Capital Market Performance Nexus in Nigeria (2001-2017)
Amity Business Review
Vol. 22, No. 2, July - December 2021 59
existence of fraud and corruption in the
capital market will lead to higher
borrowing cost, low stock evaluation and
bad corporate governance by firms
thereby resulting to loses to everybody in
the market including the stockholders and
consumers alike. Fraud and corruption in
capital market hinders effectiveness of the
market, it also stifles competitiveness in
the market. This hinders the growth of the
economy as well as impacting business
competitiveness negatively. A country
with a capital market where fraud and
corruption is practiced develops a
reputation that affects companies
emerging from such economy when they
enter the international market.
Additionally, it decreases the inflow of
foreign direct investment in the economy
because they are perceived to be corrupt.
Accordingly, there will be difficulty in
establishing relationship with business
partners who will see the companies
coming up from such economy as
untrustworthy business partners. Fraud is
associated to human depravity and it has
been said that human Civilization has
been a product of human ingenuity. The
ability of an individual to think, visualize
and turn latent concepts and mere
imagination into tangible and useful
devices has been the driving force of
civilization and progressive development.
However, this same ingenuity when
intermingled with unchecked greed can be
devastating.
While the capital market today is an
epitome of human ingenuity, fraud and
corruption being perpetrated on it
represents unchecked and inordinate
greed which is also an offshoot of the
same ingenuity. The capital market while
operating efficiently and conscientiously
has enabled the creation of wealth and
improvement in the general well-being of
many. However, the advent of fraud and
corruption and their nascent prevalence
have been eroding the continual positive
performance of the capital market.
2.THEORETICAL FRAMEWORK
Economists and financial analysts have
postulated theories in an effort to establish
the linkage between fraud and capital
market in Nigeria. Many theories will be
adopted to enhance this research work,
such as the social control/social bond
theory, social disorganization theory and
diamond theory. However, this study will
be anchored on diamond theory which
states that fraud and corruption thrives
where internal control is weak, poor
security and little chance of detection or
immediate apprehension.
Diamond theory was proposed by David
Wollfe and Dana Hermanon in 2004 and
added fourth dimension to fraud, which is
capability factor. The most essential fraud
ingredients common to both models are
greed, opportunity and exploitation.
According to a survey (Hayward, 2007), it
was found out that greed constitutes the

Fraud Risk and Capital Market Performance Nexus in Nigeria (2001-2017)
Amity Business Review
Vol. 22, No. 2, July - December 2021 60
main cause of fraud, responsible for about
65% of the cases. In term of opportunity,
it was found out that fraud thrives where
internal control is weak, poor security
sector and little chance of detection or
immediate apprehension. To some people
fraud is seen as being smart and this is
their justification. These are quite evident
in some of the character trait of fraudsters
where trait such as ego, illusion,
positioning and intelligence abound.
3. EMPIRICAL REVIEW
Nwude (2006) analyzed bank fraud and
its consequences using data from 9
commercial banks. The findings of the
study revealed a significant correlation
between fraud and the stock market
values of banks. However, the study
showed that the banks affected were those
that their fraudulent activities were made
public. Onuorah and Ebimobowei (2011)
investigated of fraudulent activities on the
capital market using forensic accounting
in Nigeria. The study found that there is
need for the banks in Nigeria to adopt
more proactive measures such as the use
of forensic accounting techniques in
banks. According to the study, the
Nigerian Stock Exchange lost over N1
billion in 2010 as a result of insider
trading activities. Also, Ogunleye (2013)
examined the impact of corporate
corruption on market capitalization of
commercial banks in Nigeria between
2008-2011. Employing the liner
regression model, they observed that there
seems to be a negative relationship
between the incidence of corporate
corruption and the growth in market
capitalization.
Abdullahi and Mansor (2015) evaluated
the influence of fraud related issues on
corporate performance in Nigeria. The
study was conducted enroute to the 2015
general elections in the country. Applying
the analytical method of comparative
analysis, the study specifically
investigated the performance in banking
industry. Out of six banks studied. The
empirical results showed that three out of
the six banks were involved in fraudulent
issues and consequently performed poorly
on the stock market while the others stock
prices were either unchanged or
experienced a boost. Aljazaerli, Sirop and
Mouselli (2016) investigated the effect of
corruption and stock market development:
New Evidence from GCC countries from
2003 to 2011.The study used corruption
perception index published by
transparency international and stock
market development proxy by market
capitalization. Results from an estimation
of alternative regression models on a
panel of six GCC shows that corruption
perception index has positive impact on
market capitalization. Omodero and
Dandago (2018) examined the effect of
corruption and stock market performance
in Nigeria from 1996-2016. The study
used corruption perception index, Nigeria
corruption ranking as proxies for

Fraud Risk and Capital Market Performance Nexus in Nigeria (2001-2017)
Amity Business Review
Vol. 22, No. 2, July - December 2021 61
corruption and share price index as proxy
for stock market performance. The data
were obtained from CBN Statistical
Bulletin and Transparency International
website. Multi –regression and t-statistics
was used as method of analysis and
testing the hypotheses. The study revealed
a significant positive correlation between
corruption and stock market performance
in Nigeria. The study also revealed
positive and significant relationships
between Nigeria corruption ranking,
corruption perception index and share
price index. The research recommends
among others adoption of strong form of
stock market efficiency by the Security
and Exchange Commission (SEC) and
Nigeria Stock Exchange (NSE) for
actualization by all listed firms in Nigeria.
Furthermore, Federal and state
governments should formulate more
result-oriented policies and rules that
could help combat corruption more
effectively.
Jha, Sharma and Singh (2019) analyzed
the effect of corruption and stock price
volatility using firm level evidence. A
sample of over 3,000 firms from 31
countries from 2003-2014 was selected for
the study. The study discovered that
corruption, constructed using the
responses from the World Bank Enterprise
Survey to match the firm’s size, industry,
location, and country, is positively
associated with equity price volatility. The
result also shows that equity price
volatility decreases with the asset size in
the presence of corruption, indicating that
smaller firms are disproportionately
affected by corruption. There is also
positive association between corruption
measured at the country level and stock
price volatility, however, the effect of
country-level corruption is found to be
worse for firms with larger asset sizes.
Ojeka et.al (2019) investigated the effect
of corruption perception and institutional
quality on the performance of firms based
on the data extracted for 135 companies
from 2013 to 2017. Transparency
international corruption perception index,
institutional quality which is obtained
from principle component analysis of six
governance indicators extracted from
world bank governance indicators, return
on assets (ROA) and market value (Tobin
Q) were used as data for the analysis.
Generalized method of moment (GMM)
was used as method of data analysis. The
result revealed that corruption has
negative effect on market value (Tobin Q)
and accounting value performance
(ROA). Institutional quality is negatively
related to Tobin Q and ROA. The study
recommends effective and strong
mechanisms proactive to curb corruption
practices and weak institutional quality.
Ayaydin and Baltacr (2013) examined
corruption, banking sector and stock
market development: A panel data
analysis from 1996 to 2011 and 42
emerging economies were used in the

Fraud Risk and Capital Market Performance Nexus in Nigeria (2001-2017)
Amity Business Review
Vol. 22, No. 2, July - December 2021 62
study. The result revealed that there exists
a negative relation between level of
corruption and financial system
improvement. The result also showed a
positive relation between banking sector
development and stock market
development in emerging market
countries. There is also a strong negative
relationship between interaction and stock
market development.
Hasan and Nuri (2013) investigated the
role of corruption and banking sector
development on Stock Market
development using a panel data of 42
emerging economies for the period 1996
to 2011. The result revealed among others
that corruption had a more devastating
effect on these countries’ stock market
development than the positive effects of
the banking sector development.
Bolgorian (2011) analyzed a data set of
corruption and stock market development
measures such as market capitalization
and total value of share trading for 46
countries around the world for the period
2007–2009, using a quantitative approach
for investigating the dependence of the
Corruption Perception Index (CPI) on
stock market development. He found that
countries with higher relative stock
market development are less corrupt, and
the power-law relation between level of
corruption and stock market development
is significant at the 5% level.
Yartey (2010) examines the impact of
corruption as a part of institutional
determinants of stock market development
using a panel data of 42 emerging
economies for the period 1990 to 2004.
The study finds find there is a negative
relationship between corruption and stock
market development. The study proves that
macroeconomic factors such as income
level, gross domestic investment, banking
sector development, private capital flows
and stock market liquidity are important
determinants of stock market development
in emerging market countries. David,
Lucey & Winne, (2015) assessed the
capital market performance of banks in
Kenya during periods when they were
embroiled in corruption issues. The
findings showed a negative correlation
between bank stock market performance
and occupational fraud and corruption. The
study showed that the stocks of the banks
shrank during their period of controversies.
4. DESCRIPTIVE STATISTICS
This section shows the statistical analysis
of the variables which includes: Total
Fraud, all share index, Market Size,
Turnover ratio, and population. The
statistical analysis includes: The Mean
which is the mean of all the values in the
data group divided by the total number of
observation, the Median which is the
midpoint value, the minimum value
which is the lowest number in a set of
data and the maximum value which is the
highest number in a set of data.

Fraud Risk and Capital Market Performance Nexus in Nigeria (2001-2017)
Amity Business Review
Vol. 22, No. 2, July - December 2021 63
Table 1: Descriptive Statistics
Variables MARKET_SIZE TURNOVER_RATIO LGFRAUD LGASH POPULATION
Mean 18.81421 8.304737 4.191654 4.342279 8.177622
Median 17.90000 8.070000 4.111247 4.393935 8.176871
Maximum 50.00000 17.56000 4.868905 4.762680 8.280745
Minimum 0.600000 4.690000 3.455014 3.721514 8.076495
Std. Dev. 12.11610 2.997855 0.343240 0.265270 0.064177
Skewness 0.609226 1.556143 0.000892 -1.028362 0.025378
Kurtosis 3.585969 5.841460 2.972740 3.528671 1.779799
Jarque-Bera 1.447155 14.06017 0.000591 3.570106 1.180744
Probability 0.485014 0.000885 0.999705 0.167788 0.554121
Sum 357.4700 157.7900 79.64143 82.50331 155.3748
Sum Sq. Dev. 2642.399 161.7685 2.120645 1.266622 0.074136
Observations 19 19 19 19 19
From Table 1, looking at the Maximum
and Minimum values for all variables,
Market size was 50 in 2007 and had a
minimum of 0.60 in 1999; Turnover ratio
had a maximum of 17.56 in 2008 and a
minimum of 4.69 in 1999; LGFRAUD
had a maximum of 4.868 in 1999 and a
minimum of 3.45 in 2000; LGASH had a
maximum of 4.762 in 2007 and a
minimum of 3.72 in 1999, finally
population had the highest value with
maximum at 8.280745 in 2017 and the
lowest or minimum population of
8.076495 in 1999.
Skewness shows the degree of asymmetry
of the distribution and it could be
negatively or positively skewed while the
kurtosis measures the degree to which the
frequency distribution is focused about its
mean or the peakedness of the distribution
and it could be mesokurtic (when the
kurtosis coefficient is =0), platykurtic
(when the kurtosis coefficient is <0) and
leptokurtic (when the kurtosis coefficient
is >0). Therefore, looking at the variables
(Market Size, Turnover Ratio,
LGFRAUD, LGASH and population) in
Table 1, they are all positively skewed;
their kurtosis coefficient is >0 which
indicates that they are leptokurtic. This
implies that the chance of getting an
extremely negative outcome is very low
compared to a negatively skewed dataset.
Finally, there are 19, 19,19,19,19 and 19
observations in Table 1 respectively.
The Jarque-Bera statistics tests the null
hypothesis that a series is normally
distributed is rejected when the
probability value is significant. The test
statistic measures the difference of the
Skewness and kurtosis of the series with
those from the normal distribution. From
Table 1, looking at the various probability
values of the variables of Market Size and

Fraud Risk and Capital Market Performance Nexus in Nigeria (2001-2017)
Amity Business Review
Vol. 22, No. 2, July - December 2021 64
Turnover Ratio shows that we cannot
accept the null hypothesis of a normal
distribution as the probability values are
less than the significant level of 0.05,
hence we reject the null hypothesis.
Furthermore, we will however accept the
null hypothesis of LGFRAUD, LGASH
and population as the probability values
are greater than the significance level of
0.05 and hence is a normal distribution.
The Correlation Matrix in Table 2 show
the magnitude and direction of the
relationship between each pair of
variables.
Table 2: Correlation Analysis
Variables MARKET_SIZE TURNOVER_RATIO LGFRAUD LGASH POPULATION
MARKET_SIZE 1.000000 0.362876 0.116903 0.810843 0.433092
TURNOVER_RATIO 0.362876 1.000000 0.231228 0.347453 -0.083293
LGFRAUD 0.116903 0.231228 1.000000 0.004893 0.166135
LGASH 0.810843 0.347453 0.004893 1.000000 0.693642
POPULATION 0.433092 -0.083293 0.166135 0.693642 1.000000
The result shows that there is a positive
relationship between Market Size and
Turnover Ratio, LGFRAUD, LGASH,
and population. Turnover Ratio however
also has a positive relationship between
Market size, LGFRAUD, and LGASH,
but with an inverse relationship with
Population. LGFRAUD recorded an all
positive relationship with all other
variables, LGASH has a positive
relationship with Market Size, Turnover
ratio, LGFRAUD and Population.
Population shows a positive relationship
between all variables except the Turnover
ratio, which shows Turnover ratio and
Population or population and Turnover
ratio are negatively related.
UNIT ROOT TEST
The Unit root test is used for determining
the stationarity or non-stationarity of a
given variable. This is because most tie
series data sets are often found not to be
stationary and estimations with such data
will produce highly spurious results.
Various methods are often used to test for
stationarity of variables; they include
Dickey-Fuller (1979 & 1981), Augmented
Dickey- Fuller (1979), Phillips-perron
(1998), GLS Detrended Dickey-Fuller
(GLS-DF, 1996), Ng-perron,
Kwiatkowski-phillips-schmidt-shin
(KPSS, 1992) amongst others. However,
this study employed the Augmented
Dickey-Fuller (ADF) unit root test.

Fraud Risk and Capital Market Performance Nexus in Nigeria (2001-2017)
Amity Business Review
Vol. 22, No. 2, July - December 2021 65
From the Augmented Dickey-Fuller, the
tables below show that all variables of
Market size, LGFRAUD, LGASH,
Turnover Ratio and population were
integrated at order one 1(1) and were all
stationary at first difference with the
respective p values, less than 0.05 (5%)
significance levels, hence we reject the
null hypothesis of a unit root test in all
variables. A variable is stationary if its
Augmented Dickey-Fuller test statistics is
less than its critical value at various levels
of significance when considered in
absolute values.
Null Hypothesis: D(LGASH) has a unit root
Exogenous: Constant
Lag Length: 1 (Automatic - based on AIC, maxlag=3)
t-Statistic Prob.*
Augmented Dickey-Fuller test statistic -3.254781 0.0353
Test critical values:
1% level -3.920350
5% level -3.065585
10% level -2.673459
Null Hypothesis: D(LGFRAUD) has a unit root
Exogenous: Constant
Lag Length: 1 (Automatic - based on AIC, maxlag=3)
t-Statistic Prob.*
Augmented Dickey-Fuller test statistic -4.147926 0.0065
Test critical values: 1% level -3.920350
5% level -3.065585
10% level -2.673459
Null Hypothesis: D(MARKET_SIZE) has a unit root
Exogenous: Constant
Lag Length: 1 (Automatic - based on AIC, maxlag=3)
t-Statistic Prob.*
Augmented Dickey-Fuller test statistic -4.109057 0.0070
Test critical values: 1% level -3.920350
5% level -3.065585
10% level -2.673459

Fraud Risk and Capital Market Performance Nexus in Nigeria (2001-2017)
Amity Business Review
Vol. 22, No. 2, July - December 2021 66
Null Hypothesis: D(TURNOVER_RATIO) has a unit root
Exogenous: Constant
Lag Length: 0 (Automatic - based on AIC, maxlag=3)
t-Statistic Prob.*
Augmented Dickey-Fuller test statistic -5.802416 0.0002
Test critical values: 1% level -3.886751
5% level -3.052169
10% level -2.666593
Null Hypothesis: D(POPULATION) has a unit root
Exogenous: Constant
Lag Length: 3 (Automatic - based on AIC, max lag=3)
t-Statistic Prob.*
Augmented Dickey-Fuller test statistic -4.103341 0.0084
Test critical values: 1% level -4.004425
5% level -3.098896
10% level -2.690439
Cointegration Test
First Model: Using Market Size
The interpretation of the table below will
be in terms of sign and magnitude of the
coefficient estimates, showing direction of
long run relationship between the Market
size and other various explanatory
variables. The model was expressed in
linear form, thus the coefficient estimates
will be interrupted in terms of long run
unit increases and p-values. The
Cointegration test below shows that the
Trace test at None hypothesis, the p value
shows that there should be a rejection of
the hypothesis at p value as 0.0000 is less
than the 0.05 (5%) significant level.
Furthermore, the Maximum Eigenvalue
test at None hypothesis, the p value shows
that there should be a rejection of the
hypothesis at p value as 0.0000 is less
than the 0.05 (5%) significant level but
should be accepted at Almost 1, given that
the p value of 0.0734 is greater at the 0.05
(5%) significance level. This tells us we
have one cointegrating equation, meaning
an error term in the model at 5%
significance level.
This shows there is a long run
Cointegration relationship between our
variables of market size and LGASH,
LGFRAUD, Turnover ratio and
Population.

Fraud Risk and Capital Market Performance Nexus in Nigeria (2001-2017)
Amity Business Review
Vol. 22, No. 2, July - December 2021 67
Sample (adjusted): 2001 2017
Included observations: 17 after adjustments
Trend assumption: Linear deterministic trend
Series: MARKET_SIZE LGASH LGFRAUD POPULATION
Lags interval (in first differences): 1 to 1
Unrestricted Cointegration Rank Test (Trace)
Hypothesized Trace 0.05
No. of CE(s) Eigenvalue Statistic Critical Value Prob.**
None * 0.986319 115.7304 47.85613 0.0000
At most 1 * 0.689980 42.77083 29.79707 0.0010
At most 2 * 0.551113 22.86182 15.49471 0.0032
At most 3 * 0.419479 9.245101 3.841466 0.0024
Trace test indicates 4 cointegrating eqn(s) at the 0.05 level
* denotes rejection of the hypothesis at the 0.05 level
**MacKinnon-Haug-Michelis (1999) p-values
Unrestricted Cointegration Rank Test (Maximum Eigenvalue)
Hypothesized Max-Eigen 0.05
No. of CE(s) Eigenvalue Statistic Critical Value Prob.**
None * 0.986319 72.95956 27.58434 0.0000
At most 1 0.689980 19.90901 21.13162 0.0734
At most 2 0.551113 13.61672 14.26460 0.0631
At most 3 * 0.419479 9.245101 3.841466 0.0024
Max-eigenvalue test indicates 1 cointegrating eqn(s) at the 0.05 level
* denotes rejection of the hypothesis at the 0.05 level
**MacKinnon-Haug-Michelis (1999) p-values
Unrestricted Cointegrating Coefficients (normalized by b'*S11*b=I):
MARKET_SIZE LGASH LGFRAUD POPULATION
-0.094207 -1.901729 1.552007 19.99654
-0.207329 3.543076 -3.610100 -40.81860
-0.073409 9.495102 9.013244 -13.01888
-0.012295 8.089012 -0.968427 9.513228
D(MARKET_SIZE) 1.666217 7.081386 -1.410782 1.261412
D(LGASH) 0.033306 0.073328 -0.012989 -0.026362

Fraud Risk and Capital Market Performance Nexus in Nigeria (2001-2017)
Amity Business Review
Vol. 22, No. 2, July - December 2021 68
D(LGFRAUD) -0.120841 -0.080824 -0.095357 0.003168
D(POPULATION) -4.23E-05 1.84E-05 1.22E-05 -9.42E-06
1 Cointegrating Equation(s): Log likelihood 147.2866
Normalized cointegrating coefficients (standard error in parentheses)
MARKET_SIZE LGASH LGFRAUD POPULATION
1.000000 20.18662 -16.47436 -212.2609
(4.45870) (3.72347) (13.9387)
Adjustment coefficients (standard error in parentheses)
D(MARKET_SIZE) -0.156970
(0.25425)
D(LGASH) -0.003138
(0.00281)
D(LGFRAUD) 0.011384
(0.00460)
D(POPULATION) 3.99E-06
(9.0E-07)
2 Cointegrating Equation(s): Log likelihood 157.2411
Normalized cointegrating coefficients (standard error in parentheses)
MARKET_SIZE LGASH LGFRAUD POPULATION
1.000000 0.000000 1.876959 9.307707
(4.68321) (20.3799)
0.000000 1.000000 -0.909084 -10.97601
(0.23639) (1.02871)
Adjustment coefficients (standard error in parentheses)
D(MARKET_SIZE) -1.625145 21.92120
(0.37592) (6.63796)
D(LGASH) -0.018341 0.196466
(0.00455) (0.08037)
D(LGFRAUD) 0.028141 -0.056559
(0.00963) (0.17000)
D(POPULATION) 1.68E-07 0.000146
(1.8E-06) (3.1E-05)
3 Cointegrating Equation(s): Log likelihood 164.0495

Fraud Risk and Capital Market Performance Nexus in Nigeria (2001-2017)
Amity Business Review
Vol. 22, No. 2, July - December 2021 69
Normalized cointegrating coefficients (standard error in parentheses)
MARKET_SIZE LGASH LGFRAUD POPULATION
1.000000 0.000000 0.000000 -0.390400
(18.7715)
0.000000 1.000000 0.000000 -6.278846
(0.67089)
0.000000 0.000000 1.000000 5.166924
(0.80434)
Adjustment coefficients (standard error in parentheses)
D(MARKET_SIZE) -1.521580 8.525679 -35.69425
(0.38163) (16.4468) (15.6830)
D(LGASH) -0.017387 0.073133 -0.330103
(0.00469) (0.20210) (0.19271)
D(LGFRAUD) 0.035141 -0.961986 -0.755242
(0.00742) (0.31961) (0.30477)
D(POPULATION) -7.28E-07 0.000262 -2.21E-05
(1.6E-06) (7.0E-05) (6.7E-05)
Second Model: Using Market Turnover
The Cointegration test below shows that
the Trace test at None hypothesis and
Almost 1, the p value shows that there
should be a rejection of the hypothesis at
p value as 0.0000 and 0.0174 respectively
are less than the 0.05 (5%) significant
level. Furthermore, the Maximum
Eigenvalue test at None hypothesis, the p
value shows that there should be a
rejection of the hypothesis at p value as
0.0004 is less than the 0.05 (5%)
significant level but should be accepted at
Almost 1, given that the p value of 0.0555
is greater at the 0.05 (5%) significance
level. This tells us we have one
cointegrating equation, meaning an error
term in the model at 5% significance
level. This shows there is a long run
Cointegration relationship between our
variables of Market Turnover and
LGASH, LGFRAUD, Market Size and
Population

Fraud Risk and Capital Market Performance Nexus in Nigeria (2001-2017)
Amity Business Review
Vol. 22, No. 2, July - December 2021 70
Sample (adjusted): 2001 2017
Included observations: 17 after adjustments
Trend assumption: Linear deterministic trend
Series: TURNOVER_RATIO LGFRAUD LGASH POPULATION
Lags interval (in first differences): 1 to 1
Unrestricted Cointegration Rank Test (Trace)
Hypothesized Trace 0.05
No. of CE(s) Eigenvalue Statistic Critical Value Prob.**
None * 0.916063 75.72319 47.85613 0.0000
At most 1 * 0.705858 33.60248 29.79707 0.0174
At most 2 0.489766 12.79969 15.49471 0.1224
At most 3 0.076919 1.360643 3.841466 0.2434
Trace test indicates 2 cointegrating eqn(s) at the 0.05 level
* denotes rejection of the hypothesis at the 0.05 level
**MacKinnon-Haug-Michelis (1999) p-values
Unrestricted Cointegration Rank Test (Maximum Eigenvalue)
Hypothesized Max-Eigen 0.05
No. of CE(s) Eigenvalue Statistic Critical Value Prob.**
None * 0.916063 42.12071 27.58434 0.0004
At most 1 0.705858 20.80279 21.13162 0.0555
At most 2 0.489766 11.43904 14.26460 0.1335
At most 3 0.076919 1.360643 3.841466 0.2434
Max-eigenvalue test indicates 1 cointegrating eqn(s) at the 0.05 level
* denotes rejection of the hypothesis at the 0.05 level
**MacKinnon-Haug-Michelis (1999) p-values
Unrestricted Cointegrating Coefficients (normalized by b'*S11*b=I):
TURNOVER_RATIO LGFRAUD LGASH POPULATION
-0.189208 0.359630 5.135206 -40.73439
0.997463 -8.889447 -12.38245 26.77645
0.332597 6.869371 4.761341 15.98922
0.140429 -4.202011 3.385034 13.58405
Unrestricted Adjustment Coefficients (alpha):
D(TURNOVER_RATIO) 0.683329 -1.720932 -0.878812 0.217826
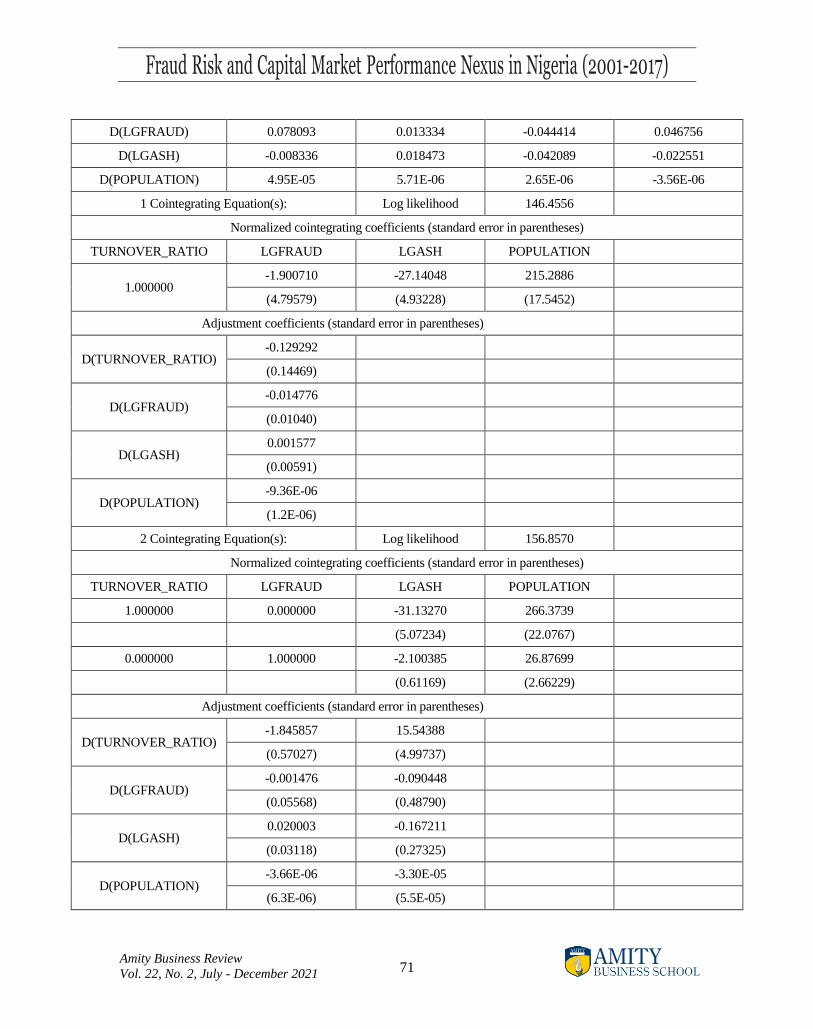
Fraud Risk and Capital Market Performance Nexus in Nigeria (2001-2017)
Amity Business Review
Vol. 22, No. 2, July - December 2021 71
D(LGFRAUD) 0.078093 0.013334 -0.044414 0.046756
D(LGASH) -0.008336 0.018473 -0.042089 -0.022551
D(POPULATION) 4.95E-05 5.71E-06 2.65E-06 -3.56E-06
1 Cointegrating Equation(s): Log likelihood 146.4556
Normalized cointegrating coefficients (standard error in parentheses)
TURNOVER_RATIO LGFRAUD LGASH POPULATION
1.000000 -1.900710 -27.14048 215.2886
(4.79579) (4.93228) (17.5452)
Adjustment coefficients (standard error in parentheses)
D(TURNOVER_RATIO) -0.129292
(0.14469)
D(LGFRAUD) -0.014776
(0.01040)
D(LGASH) 0.001577
(0.00591)
D(POPULATION) -9.36E-06
(1.2E-06)
2 Cointegrating Equation(s): Log likelihood 156.8570
Normalized cointegrating coefficients (standard error in parentheses)
TURNOVER_RATIO LGFRAUD LGASH POPULATION
1.000000 0.000000 -31.13270 266.3739
(5.07234) (22.0767)
0.000000 1.000000 -2.100385 26.87699
(0.61169) (2.66229)
Adjustment coefficients (standard error in parentheses)
D(TURNOVER_RATIO) -1.845857 15.54388
(0.57027) (4.99737)
D(LGFRAUD) -0.001476 -0.090448
(0.05568) (0.48790)
D(LGASH) 0.020003 -0.167211
(0.03118) (0.27325)
D(POPULATION) -3.66E-06 -3.30E-05
(6.3E-06) (5.5E-05)

Fraud Risk and Capital Market Performance Nexus in Nigeria (2001-2017)
Amity Business Review
Vol. 22, No. 2, July - December 2021 72
3 Cointegrating Equation(s): Log likelihood 162.5766
Normalized cointegrating coefficients (standard error in parentheses)
TURNOVER_RATIO LGFRAUD LGASH POPULATION
1.000000 0.000000 0.000000 -4.689755
(13.3640)
0.000000 1.000000 0.000000 8.589531
(1.15905)
0.000000 0.000000 1.000000 -8.706718
(0.92331)
Adjustment coefficients (standard error in parentheses)
D(TURNOVER_RATIO) -2.138147 9.506995 20.63407
(0.52913) (5.56705) (7.04569)
D(LGFRAUD) -0.016247 -0.395541 0.024445
(0.05681) (0.59775) (0.75652)
D(LGASH) 0.006005 -0.456334 -0.471944
(0.02988) (0.31438) (0.39788)
D(POPULATION) -2.78E-06 -1.47E-05 0.000196
(6.5E-06) (6.9E-05) (8.7E-05)
REGRESSION
Model One
Vector Autoregression Estimates
Sample (adjusted): 2001 2017
Included observations: 17 after adjustments
Standard errors in ( ) & t-statistics in [ ]
MARKET_SIZE LGFRAUD LGASH POPULATION
MARKET_SIZE(-1)
0.274005 0.017304 -0.004615 -7.86E-07
(0.37812) (0.00756) (0.00437) (1.5E-06)
[ 0.72464] [ 2.28810] [-1.05525] [-0.52017]
MARKET_SIZE(-2)
-0.811094 0.017798 -0.012448 1.74E-07
(0.46068) (0.00921) (0.00533) (1.8E-06)
[-1.76065] [ 1.93167] [-2.33630] [ 0.09441]

Fraud Risk and Capital Market Performance Nexus in Nigeria (2001-2017)
Amity Business Review
Vol. 22, No. 2, July - December 2021 73
LGFRAUD(-1)
-20.92118 0.241618 -0.239812 -2.15E-05
(11.5434) (0.23088) (0.13351) (4.6E-05)
[-1.81240] [ 1.04653] [-1.79624] [-0.46609]
LGFRAUD(-2)
-15.99463 7.12E-05 -0.064761 8.48E-06
(9.94523) (0.19891) (0.11502) (4.0E-05)
[-1.60827] [ 0.00036] [-0.56302] [ 0.21333]
LGASH(-1)
-55.62996 0.396372 0.174089 0.000102
(36.2782) (0.72559) (0.41958) (0.00014)
[-1.53343] [ 0.54628] [ 0.41491] [ 0.70560]
LGASH(-2)
74.35923 -1.332732 0.685800 8.32E-05
(26.7296) (0.53461) (0.30915) (0.00011)
[ 2.78190] [-2.49290] [ 2.21835] [ 0.77870]
POPULATION(-1)
74907.01 -312.9895 918.6885 2.100925
(27897.7) (557.973) (322.658) (0.11146)
[ 2.68506] [-0.56094] [ 2.84725] [ 18.8492]
POPULATION(-2)
-75132.38 315.1438 -921.0973 -1.102771
(27956.2) (559.143) (323.334) (0.11169)
[-2.68751] [ 0.56362] [-2.84875] [-9.87320]
C
1096.726 -7.492955 11.52415 0.013218
(498.167) (9.96369) (5.76168) (0.00199)
[ 2.20152] [-0.75203] [ 2.00014] [ 6.64095]
R-squared 0.766854 0.839620 0.877630 1.000000
Adj. R-squared 0.533709 0.679241 0.755260 1.000000
Sum sq. resids 448.6834 0.179486 0.060019 7.16E-09
S.E. equation 7.489020 0.149786 0.086616 2.99E-05
F-statistic 3.289162 5.235207 7.171926 7485233.
Log likelihood -51.94334 14.56046 23.87167 159.3733
Akaike AIC 7.169805 -0.654172 -1.749608 -17.69098
Schwarz SC 7.610918 -0.213059 -1.308495 -17.24986
Mean dependent 20.92235 4.195148 4.411511 8.188879
S.D. dependent 10.96721 0.264472 0.175084 0.057885
Determinant resid covariance (dof adj.) 5.77E-13
Determinant resid covariance 2.83E-14
Log likelihood 168.6720
Akaike information criterion -15.60847
Schwarz criterion -13.84402

Fraud Risk and Capital Market Performance Nexus in Nigeria (2001-2017)
Amity Business Review
Vol. 22, No. 2, July - December 2021 74
Model two
Vector Autoregression Estimates
Sample (adjusted): 2001 2017
Included observations: 17 after adjustments
Standard errors in ( ) & t-statistics in [ ]
TURNOVER_RATIO LGFRAUD LGASH POPULATION
TURNOVER_RATIO(-1) -0.619251 0.012749 -0.004906 -3.40E-06
(0.38247) (0.03995) (0.02114) (4.7E-06)
[-1.61908] [ 0.31911] [-0.23212] [-0.72684]
TURNOVER_RATIO(-2) -0.488306 -0.022430 0.007744 1.21E-07
(0.32034) (0.03346) (0.01770) (3.9E-06)
[-1.52433] [-0.67034] [ 0.43743] [ 0.03094]
LGFRAUD(-1) 5.117109 0.317383 -0.301206 -3.05E-06
(4.45925) (0.46579) (0.24644) (5.5E-05)
[ 1.14753] [ 0.68139] [-1.22220] [-0.05594]
LGFRAUD(-2) 3.474581 0.090604 -0.060370 3.27E-06
(3.25501) (0.34000) (0.17989) (4.0E-05)
[ 1.06746] [ 0.26648] [-0.33559] [ 0.08209]
LGASH(-1) 18.76863 0.646308 0.324746 7.24E-05
(8.63676) (0.90215) (0.47732) (0.00011)
[ 2.17311] [ 0.71641] [ 0.68035] [ 0.68512]
LGASH(-2) 2.602783 -0.463591 0.126976 0.000111
(7.33462) (0.76613) (0.40535) (9.0E-05)
[ 0.35486] [-0.60510] [ 0.31325] [ 1.24118]
POPULATION(-1) -2864.080 802.0957 336.8370 2.074710
(7669.63) (801.126) (423.869) (0.09391)
[-0.37343] [ 1.00121] [ 0.79467] [ 22.0936]
POPULATION(-2) 2779.072 -804.9948 -336.9821 -1.076578
(7674.97) (801.684) (424.165) (0.09397)
[ 0.36210] [-1.00413] [-0.79446] [-11.4565]
C 615.7298 16.32918 1.288466 0.013664
(213.516) (22.3027) (11.8002) (0.00261)

Fraud Risk and Capital Market Performance Nexus in Nigeria (2001-2017)
Amity Business Review
Vol. 22, No. 2, July - December 2021 75
[ 2.88376] [ 0.73216] [ 0.10919] [ 5.22661]
R-squared 0.680645 0.560641 0.719360 1.000000
Adj. R-squared 0.361291 0.121281 0.438719 1.000000
Sum sq. resids 45.06582 0.491701 0.137646 6.76E-09
S.E. equation 2.373442 0.247916 0.131171 2.91E-05
F-statistic 2.131314 1.276041 2.563278 7935296.
Log likelihood -32.40870 5.994381 16.81647 159.8696
Akaike AIC 4.871611 0.353602 -0.919585 -17.74937
Schwarz SC 5.312724 0.794715 -0.478472 -17.30825
Mean dependent 8.655294 4.195148 4.411511 8.188879
S.D. dependent 2.969798 0.264472 0.175084 0.057885
Determinant resid covariance (dof adj.) 1.09E-12
Determinant resid covariance 5.35E-14
Log likelihood 163.2569
Akaike information criterion -14.97140
Schwarz criterion -13.20695
SUMMARY, CONCLUSION AND
POLICY IMPLICATION
Fraud has been identified all round as the
biggest impediments and barrier to
investment opportunities which hinder
effectiveness and competitiveness in a
capital market especially in Nigeria.
Basically, the empirical exploration on
this topic in Nigeria remains a
contradictory issue and that's why the
study tends to ascertain the effect of fraud
on capital market performance in Nigeria.
Descriptive statistics was used to explain
the characteristics of the data series, after
that the unit root status of the variables
was established in the structural equation.
The study shows the existence of co-
integration and Error Correction
Mechanism was used in deriving the long
run and short run estimates. The result of
structural analysis shows that fraud have
major impacts on capital market
performance.
The findings of this work is in consistent
with the study of Nwude (2006);
Omodera and Dandago (2018) who found
positive relationship between fraud and
capital market performance. It is
important to note that fraud is inherent in
the Nigeria system and considered a
viable enterprise and practiced in different
ways in the country. Capital market is
market where government and companies

Fraud Risk and Capital Market Performance Nexus in Nigeria (2001-2017)
Amity Business Review
Vol. 22, No. 2, July - December 2021 76
can raise long term funds for investment
purposes. The existence of fraud and
corruption in Nigeria capital market spells
danger and may discourage investment in
the capital market. It then goes to show
that when fraud and corruption exists in
capital market information becomes
hidden and difficult to obtain. This means
that insiders gain and average investors
loses which goes to show that the market
is not efficient anymore. Fraud tends to
have negative and significant effect on the
capital market but yet the result of the
study shows that fraud has negative and
insignificant effect on capital market. This
could be an area for further research.
POLICY IMPLICATION
It is borne of that fact that fraud can cause
share price not to reflect available
information in the market which will
result to inefficient capital market. Even
though, the government has tried with
necessary efforts to curb the rate of fraud
in the market and ensure efficient capital
market. There still exists fraud in the
market as such the study makes the
following recommendations. There
should be collaboration and understanding
between relevant anti-corruption and law
enforcement agencies with SEC in order
to ensure that the market is fair to all
investors. The relationship will ensure
that the investors (both foreign and local)
and their investment are protected.
Investor’s protection fund which was set
up by government to compensate claimant
for financial losses suffered by them as a
result of erroneous doing by certain
dealing member firms of the exchange
should be enforced and strengthened.
Whistle –blowing scheme should be
encouraged and made to be effective in
the capital market since it can serve to
deter corporate executive’s, capital market
operators from engaging in fraud in the
market. Committee chairman on capital
market from National Assembly should
have adequate knowledge and expertise
on capital market before heading such
committee as this will help them perform
strong oversight functions and make
necessary laws for efficient performance
of capital market. There should be also
training for individuals in such
committees in a bid to increase their
knowledge as well as make them abreast
of recent development in capital markets
around and such trainings such be
monitored very well by the government.
There should be increase and awareness
in investor’s education by the regulators
in the market. Investors education will
help protect investors and increase
investors’ confidence in the market.
REFERENCES
Abdullahi, R. & Mansor, N. (2015). Forensic
Accounting and Fraud Risk Factors: The
Influence of Fraud Diamond Theory. The
American Journal of Innovative Research and
Applied Sciences. 1 (5), 186-192.
Abdul-Qadir, A. B & Yaroson, E. (2013).
Does corruption matter in the development of
the stock market in Nigeria?, Enugu State

Fraud Risk and Capital Market Performance Nexus in Nigeria (2001-2017)
Amity Business Review
Vol. 22, No. 2, July - December 2021 77
University of Science Journal of Accountancy
4(1): 1–20.
Adeduro, A.A. (1998). An investigation into
frauds in banks, an unpublished thesis of
University of Lagos.
Adeniji, A.A (2004). Auditing and
Investigation, Value Analysis Consult, Lagos.
Akinlabi, A.O., Hamed, B., & Awonyi, M.A.
(2011). “Corruption, Foreign Direct
Investment and Economic Growth in Nigeria:
An Empirical Investigation”. Journal of
Research in International Business
Management, 1(9), 278-292.
Aliyu, A. Bolgorian, M. (2011). Corruption
and stock market development: a quantitative
approach, Physica A 390: 4514–4521.
http://dx.doi.org/10.1016/j.physa.2011.07.024
Aljazaerli, M. A, Sirop. R and Mouselli,
S.(2016) effect of corruption and stock market
development: New Evidence from GCC
countries. Verslas: Teorija ir prakTika /
Business: Theory and Practice, 17(2), 117–
127.
Bernard,T.Y (2008).Effect of fraud in the
stock exchange market.European Journal of
Social Science,6(4),45-67.
Bonini,O & Buraschi,A(2009).Understanding
long term and short investment. Economic
Journal ,10(5),714-738.
Chiezey, U. & Onu, A. (2013). Impact of
Fraud and Fraudulent Practices on the
Performance of Banks in Nigeria. British
Journal of Arts and Social Sciences, 15(2), 12–
28.
David, N. Lucey, N. & Winne, N. (2015).
Bank Size and Occupational Fraud Risk: An
Empirical evidences from commercial banks
in Kenya. European Journal of Business
Management. 2 (1), 35-60.
Dyck,I.J,Morse,A & Zingales (2017).How
pervasive is corporate fraud and who blows
the whisyle on corporate fraud?A Journal of
Nigeria Fraud.
Hasan, A., & Nuri, B. (2013). “Corruption,
Banking Sector, and Stock Market
Development: A Panel Data Analysis.
International Association of Social Science
Research – IASSR.” European Journal of
Research on Education, 2013, Special Issue:
Human Resource Management, 94-99.
Hayward, K. (2007). Situational crime
prevention and its discontents: Rational
choice theory versus the “culture of now”.
Social Policy & Administration, 41(3). 232-
250.
Hochester, A., & Copes, H. (2008). Where
I’m from: Criminal predators and their
environment. Boston, MA: Jones and Bartlett.
Jha,C.K; Sharma.P and Singh, S.K. (2019).
Corruption and stock price volatility: Firm
Level Evidence.Madden School of Business,
Le Moyne College, Syracuse,1(3),1-28.
Johnson, M. (1998). Fighting systemic
corruption: Social foundations for institutional
reform. European Journal of Research, 10(1),
85-105.
Kaufman, D., Kraay, A., & Mastruzzi, M.
(2018). The worldwide governance
indicators: Methodology an analytical issues.
Retrieved from http://www.info.worldbank.
org/governance.
Natalia (2016). Corruption Perception Index.
https://www.britannica.com/. Retrieved:
February 18, 2018.
Nwankwo & Odi, (2013). Implications of
Fraud on Commercial Banks Performance in
Nigeria. International journal of Business
Finance and Management,18,(15) 178-149.
Nwankwo, G.O. (1991). Money and Capital
Markets in Nigeria Today. Lagos: University
of Lagos Press.

Fraud Risk and Capital Market Performance Nexus in Nigeria (2001-2017)
Amity Business Review
Vol. 22, No. 2, July - December 2021 78
Nwude, C. (2006). Quality and Internal
control challenges in contemporary Nigerian
banking. Zenith economic quarterly. Zeninth
bank Plc 3(2), 23-28.
Ogunleye, G.A (2010). Perspectives on the
Nigeria financial Safety-Net-Abuja, Nigeria,
printed by Adolness Nigeria Ltd.
Ojeka.S,Adegboye.A,Adegboye.K,Umukoro.
O,Dahunsi.O & Ozordi.E.(2019). Corruption
perception, institutional quality and
performance of listed companies in Nigeria,
Elsevier,5(2),1-10.
Oladejo, R. (2003). The Theory and Practice
of Capital Market. Kaduna: Wolsak Limited.
Omodero, O. C. & Dandago, K. I. (2018).
Corruption and stock market performance in
Nigeria. Annals of Spiru Haret University.
Economic Series,18(4), 23-40.
Omorah, S & Ebimobowe,D.(2011).
Fraudulent activities and forensic accounting
services of banks in Port Harcourt Nigeria.
Asian Journal of Business Management,
4(2),232-251.
Onuorah, C. A., & Ebimobowei, A. (2011).
Fraudulent activtives and forensic accounting
services of banks in Port Harcourt, Nigeria.
Asian Journal of Business Management, 4(2),
124-129.
Onyiuke, O.N. (2010). A Brief overview of
the Nigeria capital market. Lagos: NSE.
Steen beck, W.& Hipp, J.R. (2011). A
longitudinal test of social disorganization
theory; feedback effects among cohesion,
social control and disorder, criminology 49
(3), 3-871.
Transparency International (2011).
Transparency International Report 2011.
Travits, M. (2010). Why do people engage in
corruption? The Case of Estonia. Social
Forces, 88(3), 1257-1279.
Wolfe, S & Hermanson, D. (2004). The fraud
diamond: considering the four elements of
fraud. The CPA Journal, December, 34-37.
World Bank (2017). The Reform of Public
Sector Management. Washington D.C. Policy
and Research Series No. 18.
Yartey, C. A. (2010). The institutional and
macroeconomic determinants of stock market
development in emerging economies, Applied
Financial Economics, 20(2), 1615–1625. http://
dx.doi.org/10.1080/09603107.2010.522519.

Fraud Risk and Capital Market Performance Nexus in Nigeria (2001-2017)
Amity Business Review
Vol. 22, No. 2, July - December 2021 79
APPENDIX
Year Transparency
Index
Corruption
Perception
Index
Total Fraud
(N” Million)
All Share
Index
Stock Value
Traded (Million)
1999 98 16.0 73,944.28 5,266.40 14,072.00
2000 90 6.0 2,851.11 6,111.00 28,153.10
2001 90 10.0 11,243.94 10,963.10 57,683.80
2002 101 16.0 12,919.55 12,137.70 59,406.70
2003 132 14.0 9,383.67 20,128.90 120,402.60
2004 144 16.0 11,754.00 23,844.50 225,820.70
2005 152 19.0 10,606.18 24,085.80 262,935.80
2006 142 22.0 4,832.17 33,358.30 470,253.40
2007 147 22.0 10,005.81 57,900.22 1,076,020.40
2008 121 27.0 53,522.86 31,450.78 1,679,143.70
2009 130 25.0 41,265.86 20,827.20 685,717.50
2010 134 24.0 21,291.41 24,770.52 799,911.00
2011 143 24.0 28,400.86 20,730.63 638,925.00
2012 139 27.0 18,045.00 28,078.81 808,991.40
2013 148 25.0 21,795.00 41,124.19 2,350,875.70
2014 140 27.0 25,608.80 34,657.15 1,234,783.10
2015 137 26.0 18,021.00 28,642.25 961,221.50
2016 140 28.0 8,683.00 26,874.62 952,826.60
2017 148 27.0 12,012.00 32,161.12 1,273,200.00
2018 144 27.0 38,926.00 33,728.40 1,284,976.28

Counterproductive Work Bhavior and Performance of Banks in Enugu State, Nigeria
Amity Business Review
Vol. 22, No. 2, July - December 2021 80
Counterproductive Work Behavior and Performance of
Banks in Enugu State, Nigeria
Anekwe Rita Ifeoma, Ph.D.1, Ndubuisi-Okolo Purity Uzoamaka, Ph.D.2
and Akaegbobi Grace3
1-3. Department of Business Administration, Faculty of Management Sciences, Nnamdi Azikiwe University, Awka,
Nigeria.
ABSTRACT
Counterproductive behavior poses a real
threat to the physical and social survival of
an individual within certain social
environments or collective settings. Increase
in counterproductive work behavior has
been linked to decrease in performance or
productivity, employer dissatisfaction, and
greater psychological distress. The study
explores the effect of counterproductive
behavior on performance of banks.
Descriptive survey design was employed.
Structured questionnaire was used to gather
information from the respondents. Data
analysis involved both descriptive and
inferential statistics and was done at 0.05
level of significance. Simple regression
analysis was used to establish the effect of
personal aggression on employee turnover.
The result revealed that personal aggression
has significant positive effect on employee
turnover. The study, therefore, concludes
that aggression at workplace destroys the
potential of employees and brings about a
steady decrease in the quality and
performance of work. Prevention of
aggression must be an inseparable part of
the organization’s culture and climate.
Keywords: Counterproductive, Personal
Aggression, Employee Turnover.
1.1 BACKGROUND OF THE STUDY
Counterproductive behaviour has become an
issue of concern in human resource
management in organizations. Behaviour is
considered counterproductive when
employees are non-conforming to an
organization’s policies, core values, culture
etc., and such behaviour impede the vision,
welfare and organizational standards
(Jawad, Tabassum, Raja &Abraiz, 2013); in
addition, counterproductive which is deviant
behaviour is believed to be detrimental to
the goals and interests of other members of
the organization. Counterproductive work
behaviour can take many forms such as
sabotage, theft, withholding of effort, verbal
abuse, physical assault and lying, refusing to
cooperate, (Robinson & Bennette, 1995).
These occur either at organizational level or
interpersonal level. At the organizational
level, these refer to the behaviors
(absenteeism, misuse of the employer’s
assets and withdrawal) that affect the
Counterproductive Work Bhavior and Performance of Banks in Enugu State, Nigeria
Amity Business Review
Vol. 22, No. 2, July - December 2021 81
organization (Bashir et al., 2012; Chang &
Smithikrai 2010; Galperin, 2002; Robinson
and Bennett, 1995; Sackett, 2002) while at
interpersonal level these include behaviors
(such as aggression, verbal abuse, favoritism
and gossip etc.) that affect employees within
the organization. CWB embraces a variety
of acts including: sabotage, absenteeism,
verbal abuse, theft spreading of nasty
rumors, stealing from coworkers, or coming
late to workplace, lying, refusing to
cooperate, physical assault, withdrawal,
withholding of efforts, and physical assault
(Bashir et al., 2012; Chang & Smithikrai
2010). Spector et al., (2006) have classified
variety of these detrimental behaviors into
five major categories called dimension
including: withdrawal, production deviation,
abuse, sabotage, and theft.
Counterproductive work behavior poses a
real threat to the physical and social survival
of an individual within certain social
environments or collective settings.
Deviations are marked by violation of social
norms, moral norms, cultural values, the
process of assimilation, and in the
reproduction of values and norms. CWB can
result from vague job description, job
insecurity, poor motivation, poor
organizational control, injustice, poor career
opportunities, stress, and wrong
performance appraisal system among others
(Aftab & Javed, 2012; Fatima, Atif, Saqib,
and Haider, 2012).Either at the individual or
organizational level, the costs of CWB are
very damaging to the organization in terms
of declining productivity, greater
maintenance costs due to vanished or
destroyed property, psychological costs, and
poor corporate image (Galperin, & Bennett,
2004). According to Dineen and Lewicki
(2006), over $50 billion is estimated
annually as the costs of fraud and theft
committed by employees. The study,
therefore, examines the effect of personal
aggression on employee turnover.
2.1 CONCEPTUAL AND THEORETICAL
CLARIFICATIONS
Counterproductive workplace behaviour is a
class of behaviours that acts against the
interests of the organization, which
individuals, usually, consciously choose to
engage in (Chang & Smithikrai, 2010). It is
referred to as the engagement of people in
criminal offences, illegal, anti-social and
unethical behaviour. Counterproductive is
any behaviour that does not conform to the
established rules of a group of individuals or
the society at large (Idris, 2016).
Counterproductive behavior which is also
referred to as deviant behaviour could also
be any form of behaviour that contravenes
the rules and regulations or even laws that
govern an establishment. According to
Spector and Fox (2005), CWBs vary from
common destructive actions since they are
not accidental and are done purposively to
causing damage through deliberate actions.
Counterproductive work behaviors can also
be defined as behaviors that contradict and
inhibit the attainment of organizations’
objectives (Spector, Fox, Penney,
Bruursema, Goh, & Kessler, 2006). Spector
et al. (2006), who grouped CWBs into five

Counterproductive Work Bhavior and Performance of Banks in Enugu State, Nigeria
Amity Business Review
Vol. 22, No. 2, July - December 2021 82
dimensions: abuse, production deviance,
sabotage, theft, and withdrawal. Behaviour
is considered counterproductive when
employees are non-conforming to an
organization’s policies, core values, culture
etc., and such behaviour impede the vision,
welfare and organizational standards
(Jawad, Tabassum, Raja & Abraiz, 2013;
Bennett and Robinson, 2003; Robbins &
Judge, 2007). Deviant behaviour is
counterproductive and whether such
behaviour is noticeable or not, it does not
only have an adverse effect on
organizational productivity (Appelbaum and
Shapiro, 2006), but may also escalate to
high profile embarrassments and affect
organization’s drive for professionalism and
institutionalized standards if not strategically
managed (Chirasha & Mahapa, 2012). CWB
is the behavior that goes against the goals
and objectives of organizations (Spector et
al., 2006). It is the set of different behaviors
that are opposed to mandated behaviors and
can harm the employees, organization and
its stakeholders such as; clients, coworkers,
customers and supervisors (Spector & Fox,
2005) and can even put the stability of
organization at risk.
Personal Aggression: Aggression is any
intentional act by the perpetrator that causes
harm or damage to another individual;
however, these behaviors are not necessarily
physically violent acts that harm or damage
(Hills & Joyce, 2013). Personal aggression
is behaving in an aggressive or hostile
manner towards other individuals. Sexual
harassment, rape, verbal abuse, physical
assaults, sabotaging the work of co-
employees, stealing from co-workers,
destroying property of co-workers,
backbiting and endangering co-workers are
forms of personal aggression. Workplace
aggression involves physical and
psychological behaviors that are potentially
harmful (Johnson & Rea, 2009; Schat &
Frone, 2011). Rogojan (2009) noted that
employees, who have been the target of
aggression by co-workers, have more
physical and emotional health problems,
increase turnover and are less committed to
their organizations.
Employee turnover
Employee turnover occurs when there is
need for employees to leave their jobs and
must be replaced. Turnover has some
significant effects on organizations’ (Denvir
& Mcmahon, 1992). Many researchers argue
that high turnover rates might have negative
effects on the profitability of organizations if
not managed properly (Wasmuth & Davis,
1993). Employee turnover is the rotation of
workers around the labour market, between
firms, jobs and occupations and between the
state of employment and unemployment
(Abssi and Hollman, 2000). Employee
turnover result to work extra hours to
compensate for the work of those that have
resigned which result to extra workload for
the remaining employees (Mathis and
Jackson, 2007). However, one of the
significant effects of turnover is to increase
cost due to recruiting and training new
employees. An employee’s exposure to
bullying results in a reduced productivity
and increased rate of employee turnover
along with a significant decrease in the
Counterproductive Work Bhavior and Performance of Banks in Enugu State, Nigeria
Amity Business Review
Vol. 22, No. 2, July - December 2021 83
overall output of the organization (Hoel et
al., 2003).
The study is anchored on theory of
Reasoned Action by (TRA) by Ajezen
(1985) and fishben (1975). The Theory of
Reasoned Action (TRA) suggests that a
person’s behavior is determined by their
intention to perform the behavior and that
this intention is, in turn, a function of their
attitude towards the behavior and subjective
norms (Fishbein & Ajzen, 1975).According
to TRA, if people evaluate the suggested
behavior as positive (attitude) and if they
think others want them to perform the
behavior (subjective norm), this results in a
higher intention (motivation) and they are
more likely to perform the behavior. People
consider the implications of their action
before they decide to engage or not engage
in a given behavior. TRA works most
successfully when applied to behaviours that
are under a person’s volition or control. If
behaviours are not fully under control, even
though a person may be highly motivated by
his or her own attitudes and subjective norm,
he or she may not actually perform the
behaviour due to intervening environmental
conditions.
2.3 REVIEW OF RELATED LITERATURE
Studies (Gruys & Sackett, 2003; Marcus &
Schuler, 2004; Fox, Spector & Miles, 2001)
have shown that counterproductive work
behaviour (CWB) is an intentional employee
behaviour that is harmful to the legitimate
interests of an organization. Some
researchers have identified the different
types of deviant behaviour among in-school
adolescents; these include truancy,
examination malpractice, substance abuse,
bullying, vandalism, and sexual immorality
(Odunmuyiwa 2001; Esere 2008). Suleiman
(2011) asserted that behaviour is antisocial if
any of these three criteria are seen; when
behaviour does not allow a person to
function effectively with others as a member
of the society, when such behaviour does not
permit the person to meet his or her own
needs and when behaviour has a negative
effect on the wellbeing of others. Deviant
behavior by teenagers includes antisocial,
delinquent, wrongful, aggressive, self-
destructing, and suicidal acts. These acts
may lead to various abnormalities in
personal development. Paul-Titus, (2009)
advocated that socio-demographic
characteristics, such as age, gender, marital
status, income, and level of education, are
significantly connected to the tendency to
engage in CWBs. CWBs occur either at
interpersonal level and organizational level;
CWBs at interpersonal level are directed at
individuals/employees within the
organization i.e. violence, verbal abuse and
gossip, assault, harassment, etc. (Spector &
Fox, 2005). CWBs at the organizational
level relate to deviant behaviors, such as
calling in sick when one is not, withdrawal
efforts, long hours of break, cyberloafing,
misuse/damage of the employer’s assets,
stealing, sabotage, etc., which affect the
organization (Chang & Smithikrai, 2010).
Fine, Horowitz, Weigler, and Basis (2010)
explored the extent to which integrity lies at

Counterproductive Work Bhavior and Performance of Banks in Enugu State, Nigeria
Amity Business Review
Vol. 22, No. 2, July - December 2021 84
the root of CWB, demonstrating that high
integrity is tied to low proclivity for
counterproductive behavior. The study also
examined the interaction of integrity with
other situational variables, including the
degree of involvement in work and
perceived levels of job security. Results
confirmed the interaction between
situational variables and integrity:
employees with high integrity exhibited less
counterproductive behavior even when not
deeply engaged in or secure about their
positions. Galperin, and Bennett (2004)
found trait aggressiveness to be an important
predictor of workplace-deviant behavior.
Nimra & Nawaz (2020) found that there is a
relationship between workplace aggression
and employee turnover intentions. The
results determined a positive relationship
between the workplace bullying behaviors
towards the individuals and the turnover
intention. An employee’s exposure to
bullying results in a reduced productivity
and increased rate of employee turnover
along with a significant decrease in the
overall output of the organization (Hoel
et al., 2003). Workplace aggression
typically involves negative practices that
are aimed towards harming an individual,
physically or psychologically. These forms
of negative attitudes are always a result of
an unethical practice within the
workplace and these attitudes are always
disliked by the individuals who are being
targeted(Raknes&Einarsen,1997). It has also
been found that exposure to bullying at
workplace results in psychological
distress among the employees (Stallworth
& Fox, 2005) which is accompanied
with lower self-esteem, suicidal ideation
and depression (Matthiesen & Einarsen,
1999). Previous researches have also
proved that experiencing workplace bullying
can also prove to be dangerous for the
employee’s health, psychological and
physical. A study reported that such
employees have a higher rate of turnover
intentions as compared to those who have
never experienced workplace violence or
aggression. However, there was no
significant relationship found between the
two variables; job commitment and
experiencing violence (Aytac, Dursun, &
Akalp, 2016). Workplace aggression has
proved to have a long lasting, devastating
effect on the worker performance, targets
and the overall organization’s
performance (Rayner & Keashly, 2005;
Einarsen, Hoel, Zapf, & Cooper, 2003).
Liand Zhou, (2013) found that an
employee’s emotional exhaustion can trigger
verbal aggression from the client and
hence result in an increased employee
turnover rate. It appeared that the degree to
which an employee is feeling emotionally
exhausted can play an integral part as a
mediator in the verbal aggression between
the employee and the customer.
Nazir, Umer, Najam, & Saleem, (2016).
Assessed the impact of workplace
incivility on turnover intentions and
reported a positive correlation between
the two variables. Previous studies have
also shown that exposure to workplace
aggression causes lower levels of job
satisfaction, increases job turnover intention,

Counterproductive Work Bhavior and Performance of Banks in Enugu State, Nigeria
Amity Business Review
Vol. 22, No. 2, July - December 2021 85
reduce the emotional attachment to the
organisation and causes accidents at work
(Hegney, et al, 2010).
3.1 METHODOLOGY
Descriptive research design was used to
explore the effect of personal aggression on
employee turnover. Descriptive design
involves gathering of opinions and
information from the respondents which
addresses the research objectives and
research questions. Data were generated
from primary source which is perceived as
firsthand information. Questionnaire was
structured in five point likert scale.
Population of the study comprises the staff
working in three selected banks Enugu State
which are Guarantee Trust Bank, Zenith
Bank and First Bank Plc. The population of
the study is 341. These banks were rated
high in terms of customer satisfaction,
services delivery and others. Taro Yamane
formula was used to determine sample size
of
n = N
1 + N (e)2
Where n = Sample Size
N = Total population
e = error margin
n = 341
1 + 341 (0.05)2
n = 201
out of 201 copies of questionnaire
distributed, 197 copies of questionnaire were
retrieved for analysis. Content and construct
validity was used to validate the instrument
to ensure that the instrument was accurate
and unambiguous. The reliability of the
instrument was tested using Cronbach Alpha
at 5% level of significance. The reliability
coefficients for scale are: personal
aggression (a = .751), employee turnover (a
= .724). The scales showed values which are
greater than .70, a threshold considered
suitable for most studies.
4.1 RESULTS AND DISCUSSION
Test of Hypothesis
Personal Aggression has significant effect
on Employee Turnover
Model Summary
Model R R
Square
Adjusted R
Square
Std. Error of
the Estimate
1 .905a .818 .815 3.27657
a. Predictors: (Constant), PERSONAL AGGRESSION
ANOVAa
Model Sum of
Squares Df
Mean
Square F Sig.
1
Regression 2795.185 1 2795.185 268.953 .000b
Residual 634.154 60 10.736
Total 3642.339 61
a. Dependent Variable: EMPLOYEE TURNOVER
b. Predictors: (Constant), PERSONAL AGGRESSION
Coefficientsa
Model
Unstandardized
Coefficients
Standardized
Coefficients T Sig.
B Std.
Error Beta
1
(Constant) 3.753 1.088 3.471 .001
PERSONAL
AGGRESSION .861 .053 .805 16.430 .000
a. Dependent Variable: EMPLOYEE TURNOVER
This table provides the R and R2 values.
The R value represents the simple
correlation and is 0.818 (the "R" Column),
which indicates a high degree of correlation.

Counterproductive Work Bhavior and Performance of Banks in Enugu State, Nigeria
Amity Business Review
Vol. 22, No. 2, July - December 2021 86
The R2 value (the "R Square" column)
indicates how much of the total variation in
the dependent variable, employee turnover
can be explained by the independent variable,
Personal aggression. In this case, 81.8% can
be explained, which is very large. Personal
aggression coefficient of 0.805 indicates a
positive significance between Personal
Aggression, which is statistically significant
with (t = 16.430). Therefore, the null
hypothesis is rejected and the alternate
hypothesis is firmly accepted, thus Personal
Aggression has a positive effect on Employee
Turnover. This connotes that increase in
Personal Aggression will result to increase in
turnover and vice versa.
Discussion of finding
Employees who experience aggression
which is initiated within the organization
are more likely to experience a high level
of negative organizational and personal
outcomes. These include an employee’s
physical health, emotional well-being and
attitude towards work. Employees exposed to
workplace aggression suffer from
psychological problems such as stress,
depression, increased levels of anxiety,
emotional exhaustion, family problems, low
self-esteem, isolation in private life, alcohol
problems, lack of concentration at work and
fear (Aytac et al 2016).The current study was
conducted to explore the effect of personal
aggression on employee turnover. The result
revealed personal aggression has significant
effect on employee turnover. The finding is in
agreement with the work done by Nimra &
Nawaz (2020), Liand Zhou, (2013), Nazir,
Umer, Najam, & Saleem, (2016).These
studies found that workplace aggression has
significant relation with employee turnover
intentions. An employee’s exposure to
bullying results in a reduced productivity and
increased rate of employee turnover along
with a significant decrease in the overall
output of the organization (Hoel et al., 2003;
Quine, 1999).
Conclusion and Recommendation
Counterproductive behavior not only impact
the quality of work produced by the employee
engaging in CWBs but also can negatively
affect the productivity of other employees in
the company and create undesirable risks for
the employer. Workplace aggression is an
umbrella term that encompasses practices that
create a negative work environment and a
reduction in the overall employee’s wellbeing.
Having the employees being exposed to
workplace aggression results in a number of
serious consequences for the organization.
Aggression at workplace destroys the potential
of employees and brings about a steady
decrease in the quality and performance of
work. Organizations must take the necessary
steps to ameliorate if not eradicate aggression
by supporting and encouraging employees and
also formulating polices that discouraged
aggression in the organization invariably
prevention of aggression must be an
inseparable part of the organization culture
and climate.

Counterproductive Work Bhavior and Performance of Banks in Enugu State, Nigeria
Amity Business Review
Vol. 22, No. 2, July - December 2021 87
REFERENCES
Appelbaum S.H, and Shapiro B.T (2006).
Diagnosis and Remedies for Deviant workplace
Behaviours. Journal of American Academy of
Business, Cambridge, ABi/INFORM Global 14.
Aytac S, Dursun S Akalp G (2016). Workplace
Violence and Effects On Turnover Intention and
Job Commitment: A Pilot Study Among
Healthcare Workers İn Turkey. European
Scientific Journal. 7431 458
Bennett, R. J. and Robison, S.L., (2003). The
Past, Present and Future of Workplace Deviant
Research
Chirasha, V. & Mahapa, M. (2012). An Analysis
of the Causes and Impact of Deviant Behaviour
in the Workplace. The Case of Secretaries in
State Universities Journal of Emerging Trends in
Economics and Management Sciences
(JETEMS) 3(5): 415-421
Chang, K. and Smithikrai, C. (2010).
Counterproductive behaviour at work: An
investigation into reductionstrategies. The
International Journal of Human Resource
Management, 21 (8), 1272-1288.
Fine, S., Horowitz, I., Weigler, H., & Basis, L.
(2010). Is good character good enough? The
effects of situational variables on the
relationship between integrity and
counterproductive work behaviors. Human
Resource Management Review, 20(1), 73–84.
Fox, S., Spector, P. E., & Miles, D. (2001).
Counterproductive work behavior in response to
job stressors and organizational justice: Some
mediator and moderator tests for autonomy and
emotions. Journal of Vocational Behavior, 59,
291-309.
Galperin, B.L. (2002). Determinants of deviance
in the workplace: an empirical examination of
Canada and Mexico. Doctoral dissertation,
Concordia University, Montreal, Canada.
Gruys ML, Sackett PR. (2003). The
dimensionality of counterproductive work
behavior. International Journal of Selection and
Assessment, 11, 30–42
Hills, D., & Joyce, C. (2013). A review of
research on the prevalence, antecedents,
consequences and prevention of workplace
aggression in clinical medical practice.
Aggression and Violent Behavior, 18(5), 554-
569. doi: 10.1016/j.avb.2013.07.014
Hegney, D, Tuckett, A, Parker D, Eley, R.
(2010) Workplace Violence: Differences in
Perceptions of Nursing Work Between Those
Exposed and Those Not Exposed: A Cross-
Sector Analysis, International Journal of
Nursing Practice, 2010, 16: 188–202
Idris, O. (2016). Causes of deviant behaviour
among in-school adolescents in Lagos.
Unpublished M. Ed Dissertation University of
Lagos, Akoka.
Jawad. M., Tabassum. T. M., Raja, S. & Abraiz,
A. (2013). Study on Work Place Behaviour:
Role of Person-Organization Fit, Person-Job
Fit& Empowerment, Evidence from Pakistan.
Journal of Business and Management Sciences,
2013, Vol. 1, No. 4, 47-54
Johnson, S. L., & Rea, R. E. (2009). Workplace
bullying: Concerns for nurse leaders. Journal of
Nursing Administration, 39(2), 84-90. doi:
10.1097/NNA.0b013e318195a5fc
Marcus, B., & Schuler, H. (2004). Antecedents
of counterproductive behavior at work: A
general perspective. Journal of Applied
Psychology, 89(4), 647-660.
Nimra P. & Nawaz A (2020). Impact of

Counterproductive Work Bhavior and Performance of Banks in Enugu State, Nigeria
Amity Business Review
Vol. 22, No. 2, July - December 2021 88
Workplace Aggression on Employee Turnover
Intentions. Conference Paper. Retrived from
file:///C:/Users/ADMIN/Downloads/Quantitativ
eResearchReport.pdf on 4th August 2021
Paul-Titus, R. (2009). Deviant workplace
behaviour in organisations: antecedents, infl
uences, and remedies. International Business
Administration – University of Vienna.
Robbins, S. P. & Judge. T. A. (2007).
Organizational Behavior, Twelfth Edition,
Pearson Education, Inc., Upper Saddle, River,
New Jerse
Spector, P.E., Fox, S., Penney, L.M.,
Bruursema, K., Goh, A., & Kessler, S. (2006).
The dimensionality of counter-productivity: Are
counterproductive behaviors created equal?
Journal of Vocational Behavior, 68, 446-460.
Suleiman, J. M. (2011). Causes and remedies of
deviant bahaviour among adolescents as
expressed by teachers in Kwara State.
Unpublished M. Ed Dissertation, University of
Ilorin, Ilorin.
Sackett, P. R. (2002). The structure of
counterproductive work behaviours:
dimensionality and relationships with facets of
job performance. International Journal of
Selection & Assessment 10(1–2): 01–11.
Spector, P. E.; Fox, S. (2005). A model of
counterproductive work behaviour. In: Fox, S.;
Spector, P. E. (eds.), Counterproductive
workplace behaviour: investigations of actors
and targets. Washington, DC: APA. 151–174.
Schat, A. H., & Frone, M. R. (2011). Exposure
to psychological aggression at work and job
performance: The mediating role of job attitudes
and personal health. Work & Stress, 25(1), 23-
40. doi:10.1080/02678373.2011.563133.
Wasmuth W J, Davis SW (1983). "Managing
employee turnover: why employees leave", The
Cornell HRA Quarterly, 11-18.
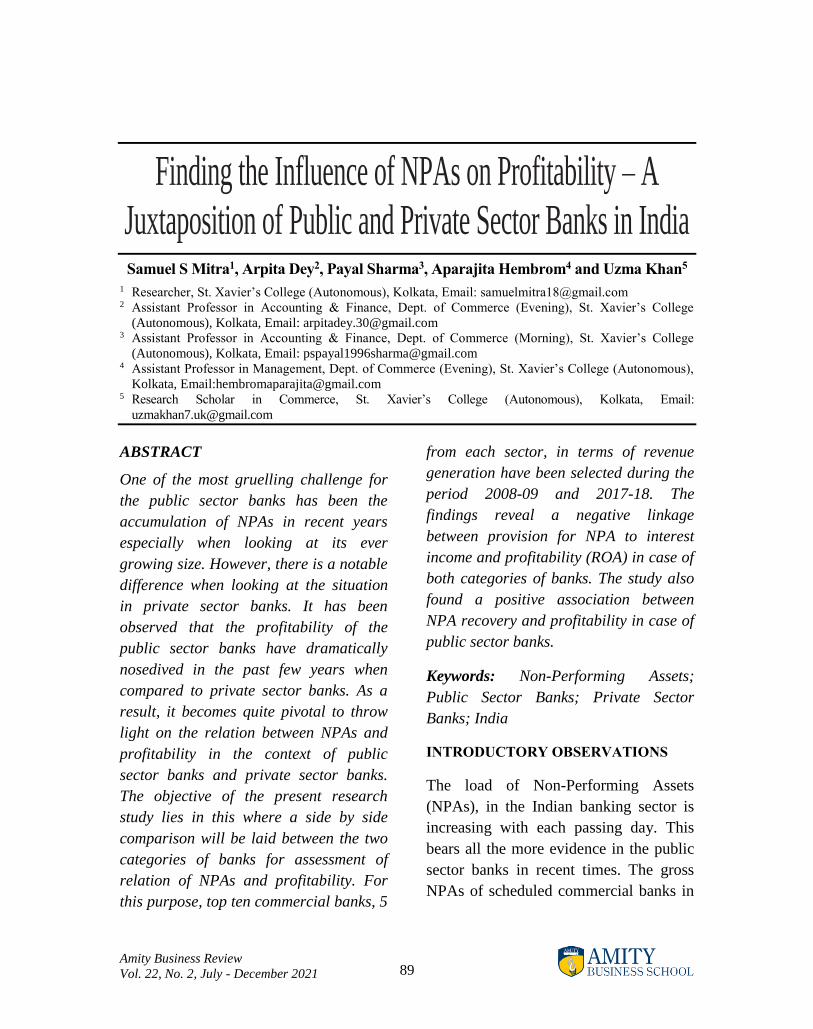
Finding the Influence of NPAs on Profitability - A Juxtaposition of Public Sector Banks in India
Amity Business Review
Vol. 22, No. 2, July - December 2021 89
Finding the Influence of NPAs on Profitability – A
Juxtaposition of Public and Private Sector Banks in India
Samuel S Mitra1, Arpita Dey2, Payal Sharma3, Aparajita Hembrom4 and Uzma Khan5
1 Researcher, St. Xavier’s College (Autonomous), Kolkata, Email: [email protected] 2 Assistant Professor in Accounting & Finance, Dept. of Commerce (Evening), St. Xavier’s College
(Autonomous), Kolkata, Email: [email protected] 3 Assistant Professor in Accounting & Finance, Dept. of Commerce (Morning), St. Xavier’s College
(Autonomous), Kolkata, Email: [email protected] 4 Assistant Professor in Management, Dept. of Commerce (Evening), St. Xavier’s College (Autonomous),
Kolkata, Email:[email protected] 5 Research Scholar in Commerce, St. Xavier’s College (Autonomous), Kolkata, Email:
ABSTRACT
One of the most gruelling challenge for
the public sector banks has been the
accumulation of NPAs in recent years
especially when looking at its ever
growing size. However, there is a notable
difference when looking at the situation
in private sector banks. It has been
observed that the profitability of the
public sector banks have dramatically
nosedived in the past few years when
compared to private sector banks. As a
result, it becomes quite pivotal to throw
light on the relation between NPAs and
profitability in the context of public
sector banks and private sector banks.
The objective of the present research
study lies in this where a side by side
comparison will be laid between the two
categories of banks for assessment of
relation of NPAs and profitability. For
this purpose, top ten commercial banks, 5
from each sector, in terms of revenue
generation have been selected during the
period 2008-09 and 2017-18. The
findings reveal a negative linkage
between provision for NPA to interest
income and profitability (ROA) in case of
both categories of banks. The study also
found a positive association between
NPA recovery and profitability in case of
public sector banks.
Keywords: Non-Performing Assets;
Public Sector Banks; Private Sector
Banks; India
INTRODUCTORY OBSERVATIONS
The load of Non-Performing Assets
(NPAs), in the Indian banking sector is
increasing with each passing day. This
bears all the more evidence in the public
sector banks in recent times. The gross
NPAs of scheduled commercial banks in

Finding the Influence of NPAs on Profitability - A Juxtaposition of Public Sector Banks in India
Amity Business Review
Vol. 22, No. 2, July - December 2021 90
India has increased from Rs.566.06
billion to Rs.10361.87 billion in a gap of
just ten years, i.e. from 31st March’2008
to 31st March’2018.
As per Narasimham Committee I (1991),
the figures of NPAs related to the
advances give a picture of the quality of
assets and their impact on the viability of
banks. In this light, it can be observed
that the ratio of gross NPA amongst the
public sector banks have escalated to
14.58 percent as on 31st March’2008
juxtaposed to the private sector banks
who have a relatively low ratio 4.62
percent. On the other hand, the “Return
on Assets” (ROA) in public sector banks
have nosedived to an ignominious -0.6
percent in 2017-18. In stunning contrast,
the position of private sector banks is
much better, where the ROA is 1.1
percent in 2017-18. Since the banks are
required to forego their receivable
income interest from their bad loans as
well as charge provision for NPAs
against profit according to the norms of
Reserve Bank of India (RBI), the
profitability of banks are adversely
affected by NPAs. On top of that, the
legal and maintenance costs of NPAs
have to be incurred by the banks.
The present research study is an attempt
to unfurl the relationship between NPAs
and profitability taking into consideration
the public and private sector banks in
India where the essence lies in side by
side comparison.
REVIEW OF BACKGROUND
LITERATURE
There exists a wide array of erstwhile
studies conducted in the domain of NPAs
and profitability which bears a strong
testimony to the fact that NPAs adversely
impacts the profitability of banks (Sharifi
& Akhter, 2010). Bodla & Verma (2006),
tried to investigate the various
components of profitability in the context
of Indian public sector banks by the
application of data from the period of
1991-92 to 2003-04. The study revealed
that explanatory power of provisions and
contingencies were quite high but the
explanatory power of NPAs were found
to be low. Singh (2010), probed into the
impact of bank specific and
macroeconomic determinants on the
performance of Indian banks. The study
concluded with the fact that the
performance of banks was affected by
NPAs and total assets, whereas, bank size
has no relation with profitability. Bhatia
et al. (2012), examined the antecedents of
profitability of 23 private sector banks in
India from 2006-07 and 2009-10. The
study explored that both NPAs as well as
provisions and contingencies are relevant
determinants which influences ROA.
Rajput et al. (2012), introspected on the
various predictors of NPAs and its
association with profitability among 27
public sector Indian banks from 1997-98
and 2009-10. The findings confirmed a
negative link between measure of

Finding the Influence of NPAs on Profitability - A Juxtaposition of Public Sector Banks in India
Amity Business Review
Vol. 22, No. 2, July - December 2021 91
profitability and NPAs. Socol &
Danuletiu (2013), uncovered the adverse
impact of gross value of exposure of
loans and related interest under
“doubtful” and “loss” to total classified
loans on the ROA and ROE of Romanian
banks during March’2008-June’2013. An
attempt was made by Sharifi & Akhter
(2010), to analyze the impact of NPAs on
profitability of Indian public sector banks
for a period of 7 years, i.e. from 2009-
2015. The study reflected a negative
impact of NPAs on “Return on Assets”
(ROA), “Return on Equity” (ROE) and
“Net Interest Margin” (NIM) in the
context of public sector banks in India.
Hence, a good amount of research do
exist in the present issue at hand, but still
the current domain forms an intriguing
area of research. Truth to be told, most of
the studies blending keywords of NPAs
and profitability has been emphasized
from the viewpoint of public sector
banks. Hence, there lies a greater need to
lay thrust on both public as well as
private sector banks with an intention to
lay a side by side comparison between
them where the essence would be
ingrained to ultimately explore the
impact of NPAs on profitability.
RESEARCH OBJECTIVE
To examine and analyze the impact of
NPAs on profitability of the public and
private sector commercial banks in India.
DATA AND METHODOLOGY
The study has been conducted on the
basis of secondary data sources published
by Reserve Bank of India (RBI)
containing the annual statistical reports of
banks. The secondary data sources also
comprise certain facts and figures of
erstwhile studies as well as government
publications. Top 5 commercial banks
have been selected from each sector, i.e.
public sector and private sector. The
public sector banks selected are State
Bank of India (SBI), Punjab National
Bank (PNB), Bank of Baroda (BOB),
Bank of India (BOI) and Canara Bank.
The names of the selected private sector
banks are ICICI Bank Ltd. (ICICI),
HDFC Bank Ltd. (HDFC), Axis Bank,
Kotak Mahindra Bank (KMB) and Yes
Bank. The selection of such banks has
been made on the basis of greater revenue
generation. The banks selected are all
listed in National Stock Exchange (NSE)
and are also part of CNX bank Index as
on 1st January, 2018. The study focuses
on a period of ten years from 2008-09 to
2017-18. Descriptive Statistics and Panel
Regression Test have been conducted in
order to analyze the data. Eviews version
9.5 has been used to process and analyze
the data. ROA has been selected for
measuring the profitability of commercial
banks which is a common platform for
studies on banking companies. Gross
NPA Ratio (GNPAR), NPA Recovery

Finding the Influence of NPAs on Profitability - A Juxtaposition of Public Sector Banks in India
Amity Business Review
Vol. 22, No. 2, July - December 2021 92
Ratio and provision for NPA to interest
income have been considered as measures
of NPAs for the current study. The two
main hypothesis of the study are as
follows:
H0: “NPAs have an insignificant impact on
the profitability of the public sector and
private sector commercial banks in India”
H1: “NPAs have a significant impact on the
profitability of the public sector and private
sector commercial banks in India”
DATA ANALYSIS AND RESULTS
The assessment of return on assets
(ROA) and various measures of NPAs
with regards to public and private
commercial banks will be made. In
addition to this, the impact of NPAs on
profitability will also be determined.
Return on Assets (ROA):
ROA is actually the net income produced
by the total assets during a period time.
ROA is a popular measure of profitability
in the context of baking companies. It is a
representation of the efficacy of banks to
procure profits by using its assets.
Table 1: Descriptive Statistics
Statistics Public Sector Banks Private Sector Banks
Mean 0.56 1.58
Maximum 1.48 2.02
Minimum -1.61 0.04
Standard Deviation 0.68 0.36
Coefficient of Variation (percent of CV) 122.04 22.26
Jarque-Bera
Probability
11.44
0.00
86.09
0.00
Observations 50 50
Source: Author’s Own Calculation based on RBI Annual Statistical Reports of Banking in India
Descriptive Statistics shows that mean
value of ROA in case of public sector
banks is lesser than private sector banks
as evidenced by their respective values of
0.56 and 1.58. This is a reflection of the
profitability of private sector banks
which is better than public sector banks.
The values of CV is a strong evidence of
the fact that the management of
profitability of private sector banks is
more consistent that public sector banks
as observed by the score of public sector
banks (122.04) which is higher than the
private sector banks (22.26). J-B statistics
with probability authenticates that the
variable is not normally distributed for
both categories of banks.

Finding the Influence of NPAs on Profitability - A Juxtaposition of Public Sector Banks in India
Amity Business Review
Vol. 22, No. 2, July - December 2021 93
Gross NPAs
The degree of bad loans can be
represented with the help of Gross NPAs
Ratio. It is the ratio of Gross NPAs and
Gross Advances.
Table 2: Descriptive Statistics
Statistics Public Sector Banks Private Sector Banks
Mean 5.62 2.38
Maximum 18.39 9.91
Minimum 1.26 0.21
Standard Deviation 4.46 2.23
Coefficient of Variation (percent of CV) 79.67 93.71
Jarque-Bera
Probability
10.95
0.00
29.56
0.00
Observations 50 50
Source: Author’s Own Calculation based on RBI Annual Statistical Reports of Banking in India
The mean value of Gross NPAs Ratio in
case of public sector banks is higher than
private sector banks as evidenced by their
respective values of 5.62 and 2.39. This
is an indication of the asset quality of
private sector banks which is better than
public sector banks. The values of CV is
a strong evidence of the fact that the
management of NPA position of public
sector banks is more consistent than
private sector banks as observed by the
score of public sector banks (79.67)
which is higher than the private sector
banks (93.71). J-B statistics with
probability authenticates that the variable
is not normally distributed for both
categories of banks.
NPA Recovery Ratio
The NPA Recovery Ratio represents the
portion of NPAs recovered out of the
average gross NPA throughout the year.
It may be taken as one of the yardstick
for measuring the performance of
management of NPAs.
Table 3: Descriptive Statistics
Statistics Public Sector Banks Private Sector Banks
Mean 43.23 49.77
Maximum 121.72 297.01
Minimum 4.11 0.00
Standard Deviation 31.26 49.58
Coefficient of Variation (percent of CV) 72.31 99.61
Jarque-Bera
Probability
4.41
0.00
341.55
0.00
Observations 50 50
Source: Author’s Own Calculation based on RBI Annual Statistical Reports of Banking in India

Finding the Influence of NPAs on Profitability - A Juxtaposition of Public Sector Banks in India
Amity Business Review
Vol. 22, No. 2, July - December 2021 94
The mean value of NPA Recovery Ratio
in case of public sector banks is lesser
than private sector banks as evidenced by
their respective values of 43.23 and
49.77. This is a demonstration of the
recovery mechanism of the private sector
banks which is better than public sector
banks. The values of CV is a strong
evidence of the fact that the management
of NPA recovery of public sector banks
is more consistent than private sector
banks as observed by a higher score of
private sector banks (99.61) compared to
public sector banks (72.31). J-B statistics
with probability authenticates that the
variable is not normally distributed for
both categories of banks.
Provision for NPA to Interest Income
According to RBI guidelines, the banks
need to set aside a chunk of fund as a
charge against profit, resulting in profit
reduction. Here, this ratio has been taken
into account for measuring the portion of
interest on advance lost to compensate
for loss of assets.
Table 4: Descriptive Statistics
Statistics Public Sector Banks Private Sector Banks
Mean 20.21 9.60
Maximum 76.81 48.61
Minimum 2.40 0.26
Standard Deviation 17.66 10.22
Coefficient of Variation (percent of CV) 87.38 105.25
Jarque-Bera
Probability
17.54
0.00
71.78
0.00
Observations 50 50
Source: Author’s Own Calculation based on RBI Annual Statistical Reports of Banking in India
The mean value of provision for NPA to
interest income ratio in case of public
sector banks is higher than private sector
banks as evidenced by their respective
values of 20.21 and 9.60. This signifies
that public sector banks have lost more
interest income in order to compensate
loss of assets compared to private sector
banks. The values of CV is a strong
evidence of the fact that the management
in regard to provision making for NPAs
in case of public sector banks is more
consistent than private sector banks as
observed by a higher score of private
sector banks (105.25) compared to public
sector banks (87.38). J-B statistics with
probability authenticates that the variable
is not normally distributed for both
categories of banks.

Finding the Influence of NPAs on Profitability - A Juxtaposition of Public Sector Banks in India
Amity Business Review
Vol. 22, No. 2, July - December 2021 95
Panel Regression Test
A Panel Regression Test has been
conducted to check the impact of NPAs
on the profitability of the two banking
sectors in the study. Here, ROA has been
taken as dependent variable and gross
NPA ratio, NPA Recovery Ratio and
provision for NPA to interest income
have been considered as independent
variables which represents the various
measures of NPAs.
Now, ROAit = β0 + β1 (GNPARit) + β2
(RECOVit) + β3 (PROVit) + ℇ it
Where,
ROAit = Return on Assets of Bank i in
year t;
GNPARit = Gross NPA Ratio (GNPAR)
of Bank i in year t
RECOVit = NPA Recovery Ratio
(RECOV) of Bank i in year t
PROVit = Provision for NPA to Interest
Income (PROV) of Bank i in the year t
β0 = Intercept coefficient
β1 = Slope coefficient of independent
variable GNPAR
β2 = Slope coefficient of independent
variable RECOV
β3 = Slope coefficient of independent
variable PROV
ℇ it = Residual errors of Bank i in year t
Initially, we begin with fixed effects
model and random effects model under
panel regression for determination of the
link between NPAs and profitability.
The results in case of public sector banks
are as follows:
Table 5: Panel Regression Test Results of Public Sector Banks
Dependent Variable: ROA Fixed Effect Random Effect
Independent Variables: Coeff. t-stat Prob. Coeff. t-stat Prob.
Intercept 0.915 4.42 0.001 1.131 6.87 0.000
GNPAR 0.021 0.51 0.617 0.063 0.00 0.999
RECOV 0.004 2.04 0.046 0.002 1.08 0.288
PROV -0.034 -3.51 0.001 0.032 -3.34 0.002
Panel Observations 50 50
R2 0.83 0.83
Adjusted R2 0.82 0.82
F-statistic (prob.) 0.00 0.00
Source: Author’s Own Calculations

Finding the Influence of NPAs on Profitability - A Juxtaposition of Public Sector Banks in India
Amity Business Review
Vol. 22, No. 2, July - December 2021 96
To this end, a Hausman specification test
has been conducted to find out the
appropriate panel regression model out of
the two. Here H0 takes random effects
model as appropriate and H1 takes
random effects model as inappropriate.
The Hausman test has been captured in
the below mentioned table 6.
Table 6: Correlated Random Effects – Hausman Test of Public Sector Banks
Test Summary Chi-Sq. Statistic Chi-Sq. d.f. Probability
Cross-section random 8.14 3 0.042
Source: Author’s Own Calculations
The null hypothesis has been rejected
because the probability of the chi-square
statistic value is less than 5 percent;
hence it can be asserted that the fixed
effects model here is more useful than the
random effects model.
We further have to check if the fixed
effect model will give the best possible
result and hence the redundant fixed
effect test needs to be conducted. Here H0
says that the fixed effect is redundant and
H1 says that the fixed effect is non-
redundant.
Table 7: Redundant Fixed Effect Test of Public Sector Banks
Test Summary Statistic d.f. Probability
Cross-section F 2.06 4 0.10
Cross-section Chi-square 9.02 4 0.06
Source: Author’s Own Calculations
The results of the redundant fixed effect
test do not reject the null hypothesis
because the p-values of both statistics are
more than 5 percent. Thus, panel data
regression analysis by employing fixed
effect model will be more appropriate.
Panel Regression Analysis on the basis of
fixed effect model demonstrates that ROA
is positively associated with NPA recovery
(RECOV) and the relationship is
statistically significant. Here, one unit
increase in RECOV, ROA is increased by
0.005 in case of public sector banks. But
ROA is negatively linked with provision
for NPA to interest income (PROV) and
the relationship is statistically significant.
Here, a unit increase in PROV would result
in decrease of the ROA of the public sector
banks by 0.035. Albeit, positive
relationship between ROA and GNPAR in
this model is statistically insignificant.
Again the value of R2 is 0.83 and the P
value of the F-test for the model is less than
1 percent, hence, the model fits well
enough.
In case of private sector banks the results

Finding the Influence of NPAs on Profitability - A Juxtaposition of Public Sector Banks in India
Amity Business Review
Vol. 22, No. 2, July - December 2021 97
are as follows:
Table 8: Panel Regression Test Results of Private Sector Banks
Dependent Variable: ROA Fixed Effect Random Effect
Independent Variables: Coeff. t-stat Prob. Coeff. t-stat Prob.
Intercept 1.912 23.14 0.00 1.784 20.36 0.00
GNPAR -0.071 -1.21 0.23 -0.027 -0.72 0.47
RECOV 0.001 1.02 0.32 0.001 0.73 0.45
PROV -0.021 -2.11 0.03 -0.024 -3.52 0.00
Panel Observations 50 50
R2 0.67 0.62
Adjusted R2 0.62 0.57
F-statistic (prob.) 0.00 0.00
Source: Author’s Own Calculations
A Hausman specification test needs to be
conducted to check the appropriate panel
regression model from the two. The
Hausman specification test has been
captured below.
Table 9: Correlated Random Effects – Hausman Test of Private Sector Banks
Test Summary Chi-Sq. Statistic Chi-Sq. d.f. Probability
Cross-section random 1.58 3 0.67
Source: Author’s Own Calculations
The results reflect that null hypothesis is
not rejected due to the probability of chi-
square statistic value is more than 5
percent; thereby, it can be concluded that
in this case the random effects model is
more appropriate than fixed effects
model.
Panel Regression Analysis on the basis of
random effect model in the context of
private sector banks also possess that
ROA is negatively related with provision
for NPA to interest income (PROV) and
the relationship is statistically significant.
Here, a unit increase in PROV, the ROA
of the private sector banks is decreased
by 0.025. Here, the positive relationship
of ROA with GNPAR and RECOV are
statistically insignificant. Albeit, the
value of R2 is 0.62 and the P-value for the

Finding the Influence of NPAs on Profitability - A Juxtaposition of Public Sector Banks in India
Amity Business Review
Vol. 22, No. 2, July - December 2021 98
F-test for the model is less than 1 percent,
hence, the model perfectly fits.
Limitations of the Study
Only to 10 commercial banks have been
taken into consideration, 5 each from
public sector and private sector. All the
other banks could also be included which
can bolster the worth of the study.
Conclusive Remarks
The findings explored the negative
relationship between provision for NPA
to interest income and profitability
(ROA) in case of both categories of bank.
Additions in NPAs need provision to
compensate loss of assets which lead to
negative impact on profitability. Thus,
banks need to take initiatives for
implementing stringent credit appraisal
system to minimize the generation of
NPAs. The study also revealed positive
linkage between NPA recovery and
profitability in the context of public
sector banks. Hence, public sector banks
are required to undertake measures to
recover of NPAs for fine-tuning the
position which will result in better
profitability.
REFERENCES
Bhatia, A., Mahajan, P. & Chandra, S.
(2012). Determinants of Profitability of
Private Sector Banks in India. Indian Journal
of Accounting, Vol. XLII (2), pp. 39-51.
Bodla, B. S. & Verma, R. (2006).
Determinants of Profitability of Banks in
India: A Multivariate Analysis. Journal of
Service Research, Vol. 6, No. 2.
Pathak, B. V. (2011). The Indian Financial
System: Market, Institution and Services, 3e,
Pearson, New Delhi.
Rajput, N., Gupta, M. & Chauha, A. K.
(2012). Profitability and Credit Culture of
NPAs: An Empirical Analysis of PSBs.
International Journal of Marketing, Financial
Services and Management Research, Vol. 1,
No. 9.
RBI Annual Statistical Reports of Banking in
India. Retrieved from http://www. rbi.org.in.
Report on Trend and Progress of Banking in
India 2017-18.
Sharifi, O. & Akhter, J. (2016). Effect of
Non-Performing Assets on the profitability of
Public Sector Banks of India. International
Journal of Engineering and Management
Research, Vol. 6, No. 5, pp. 383-388.
Singh, D. (2010). Bank Specific
Macroeconomic Determinants of Bank
Profitability: The Indian Evidence. Paradigm,
Vol. 14, No. 1, pp. 53-64.
Socol, A. & Danuletiu, A. E. (2013).
Analysis of the Romanian Banks’
Performance through ROA, ROE and Non-
Performing Loan Models. Annales
Universitatis Apulensis Series Oeconomica,
Vol. 15, No. 2, pp. 594-604.

Perspectives of MSMES and Business Owners on Sustainability Challenges and its Effect on Sustainability Outcomes
Amity Business Review
Vol. 22, No. 2, July - December 2021 99
Perspectives of MSMEs and Business Owners on
Sustainability Challenges and its Effect on
Sustainability Outcomes
Unachukwu, Ikenna1; Egbunike, Francis Chinedu Ph.D.2
1 Department of Business Administration, Faculty of Management Sciences, Nnamdi Azikiwe University,
Nigeria. 2 Department of Accountancy, Faculty of Management Sciences, Nnamdi Azikiwe University, Nigeria.
ABSTRACT
The purpose of this study is to examine
the perspectives of MSMEs owners and
managers regarding sustainability
challenges and its effect on sustainable
business outcomes in Awka metropolis.
Sustainability was evaluated using the
three dimensions of Triple Bottom Line,
which resulted in three subscales
measuring economic, social and
environmental impacts. The data were
collected using the survey method. The
sample comprised of 78 MSMEs across
five sectors: Healthcare/Pharmaceutical,
Bakery/Food service, Wholesale/Retail
trade, Water Supply & Production, and
Agriculture in Awka. The survey data
was analysed using Chi-Square and
multiple regression technique. The
results showed that MSMEs leverage on
sustainability by embedding economic
and environmental sustainability
practices into business decision-making
to achieve sustainable business
outcomes. The results also found a
positive effect of sustainability
initiatives in corporate reputation
building. Based on this the study
recommends among others that MSMEs
must be prepared to refrain from
pursuing individual/self-goals or
intentions in order to achieve long-term
change. MSMEs need to be more
flexible and responsive to remain
competitive. Also, MSMEs may
leverage on digital marketing and e-
commerce platforms to generate brand
awareness and inform consumers of
products and services.
1. INTRODUCTION
Sustainability is a growing topic on the
global and business roundtable (Aggarwal,
2013). This came with the wide realization
that companies do not operate in isolation,
but have a marked impact on the
environment and society in general

Perspectives of MSMES and Business Owners on Sustainability Challenges and its Effect on Sustainability Outcomes
Amity Business Review
Vol. 22, No. 2, July - December 2021 100
(International Forum on Globalization,
2008). Issues such as population
expansion (with more than 80% of the
world’s urban population in developing
countries), poor living standards and lack
of access to basic amenities such as
electricity (World Bank, 2014a; World
Economic and Social Survey, 2013),
climate change and greenhouse gas
emissions, resource depletion, pollution,
habitat loss, overexploitation of species,
among others, caused firms to readapt
their strategies. Infact it is estimated that
natural resource consumption would rise
to 170% of the Earth's bio-capacity by
2040 if unchecked (World Business
Council for Sustainable Development
[WBCSD], 2008). According to Munich
Re, natural disasters (climatological,
hydrological and meteorological)
increased from around 200 per year in
1980 to around 700 per year in 2016 (The
Economist, 2017). Proponents strongly
criticise the classical shareholder value
orientation of corporations (Visser, 2017a;
Hart & Milstein, 2003; Elkington, 1994;
Freeman, 1984) for example, Milton
Friedman that argued “the social
responsibility of business is to increase its
profits” (Friedman, 1970). Sustainability
emerged as a broad all-inclusive approach
based on stakeholder orientation
cushioned by the growing presence of the
World Wide Web (www), NGOs,
consumerism, among others (Sani &
Allahverdizadeh, 2012).
According to the World Commission on
Environment and Development
sustainability is defined as “meeting the
needs of the present generation without
compromising the ability of future
generations to meet their own needs”
(Brundtland 1987, p. 54). It is the
“capability of an organization to continue
its activities indefinitely, taken due
account of the impact on natural, social
and human capitals” (AccountAbility
1999); and, the further reconciliation of
environmental, social and economic
demands (Adams 2006). In the business
domain, sustainable development
involves “the simultaneous pursuit of
economic prosperity, environmental
quality, and social equity” by
organisations (Elkington, 1997). The
concept is closely linked to the three
components of triple bottom line (social,
environmental, and economic)
performance as coined by Elkington
(Elkington, 1997). The survival of any
corporation is now closely linked to the
ability to meet the tripartite needs
simultaneously. This is driven in part by
wide availability of corporate information
for scrutiny by the public and consumers.
Businesses are becoming sensitive and
reacting to intrusive challenges from the
media, NGOs, international competition,
consumer advocates, and
environmentalists, among others
(Freeman et al., 2010). The table below
provides a description of top 10 perceived
global risks over the past 5 years.

Perspectives of MSMES and Business Owners on Sustainability Challenges and its Effect on Sustainability Outcomes
Amity Business Review
Vol. 22, No. 2, July - December 2021 101
Table 1: Top 10 perceived global risks over the past 5 years (2014-2018)
Global risk 2014 2015 2016 2017 2018
Extreme weather events
Failure of climate change mitigation and adaption
Weapons of mass destruction
Water crises
Major natural disasters or catastrophes
Data theft or fraud
Cyber-attacks
Large-scale involuntary migration
Inter-state conflict with regional consequences
High structural unemployment or underemployment
Source: World Economic Forum [WEF] (2018); Visser (2018)
The business case for sustainability
consists of asking how firms can enhance
their economic sustainability by
increasing their social and ecological
efficiency (Arroyo, 2008). A
“comprehensive analysis of sustainable
business operations would consider all
triple bottom line dimensions
simultaneously” (Wu & Pagell, 2011, p.
589). In this regard, corporate
sustainability largely depends on the
ability of a firm to carry out long-term
operations without jeopardising its
stakeholder relations (Perrini & Tencati,
2006). This was previously espoused by
Dyllick and Hockerts (2002, p. 131), as
“meeting the needs of a firm’s direct and
indirect stakeholders […], without
compromising its ability to meet the
needs of future stakeholders”.
Stakeholders often include employees,
suppliers, public authorities [local or
national], community and civil society
organisations, financial partners, among
others (Perrini & Tencati, 2006).
Most businesses and industries presently
face unprecedented challenges in
considering sustainability issues. For
instance, the study by the International
Energy Agency [IEA] estimated that 22%
of the world’s total CO2 emissions in
2011 were attributed to the industrial
sector (IEA, 2013). This has led to
developments such as the Sustainability
Brand Index for evaluating companies
based on their sustainability stance.
Numerous large corporations have
demonstrated strong engagement with
sustainability issues (Visser, 2018). This

Perspectives of MSMES and Business Owners on Sustainability Challenges and its Effect on Sustainability Outcomes
Amity Business Review
Vol. 22, No. 2, July - December 2021 102
is partly driven by the likes of the World
Business Council for Sustainable
Development, the UN Global Compact
and the Global Reporting Initiative (GRI,
UNGC and WBCSD, 2015). And a
tremendous amount of literature have
focused on sustainability of large
corporations; while, neglecting Micro,
Small and Medium Enterprises
[MSMEs]. SMEs are an integral part of
the supply chain and contribute
tremendously to economic growth of any
nation. According to International
Federation of Accountants [IFAC] (2013)
they account for over 95% of all
businesses and the bulk of private sector
Gross Domestic Product (GDP),
employment creation, and social and
environmental impacts.
In Nigeria, MSMEs account for about
48.5% of GDP, and about 7.27 per cent
of goods and services exported out of the
country (Udo, 2019). The broad
perspective is that MSMEs accelerate the
attainment of broad socio-economic
objectives, including poverty reduction,
employment generation, and wealth
creation, among others (Small and
Medium Enterprises Development
Agency of Nigeria [SMEDAN] and
National Bureau of Statistics, 2013). -
According to SMEDAN and National
Bureau of Statistics (2013) the dynamic
nature of this sector makes it vulnerable
to a high mortality rate occasioned by
sudden shifts in economic policy, global
trends, and many unforeseen situations.
However, IFAC (2013) observed that by
integrating sustainability into core
business strategy of MSMEs; they can
benefit from lower costs, reduced risk,
and new opportunities.
Prior studies have focused on sustainable
business model in developed countries
(Hogevold & Svensson, 2012); however,
the literature still remains scanty on this
issue in developing countries.
The study therefore seeks to address the
following questions;
RQ1: What is the level of awareness of
sustainability among MSMEs in
Awka, Anambra State?
RQ2: What are perceived sustainability
challenges facing MSMEs in
Awka, Anambra State?
RQ3: What is the effect of sustainability
initiatives in building corporate
reputation?
RQ4: What is the implication of
embedding economic, environmental
and social sustainability practices on
sustainable business outcomes?
2. CONCEPTUAL REVIEW
2.1 The Business Case for Sustainability
The concept of sustainability is fuzzy and
riddled with several interpretations. For
the purist sustainability implies nothing
more than stasis – the ability to continue

Perspectives of MSMES and Business Owners on Sustainability Challenges and its Effect on Sustainability Outcomes
Amity Business Review
Vol. 22, No. 2, July - December 2021 103
in an unchanged manner – (Aras &
Crowther, 2008a; Hart & Milstein, 2003;
Marsden, 2000). And terms such as
sustainability and sustainable
development are viewed as synonymous.
However following several scholars have
argued that it evolved from CSR with
roots dating as far back as before World
War II (Carroll & Shabana, 2010).
Dahlsrud (2006) notes that the most
frequent dimensions of CSR: stakeholder
dimension, social dimension, economic
dimension, voluntariness dimension and
environmental dimension. An age long
definition of CSR was offered by Carroll
(1991, p. 283) as follows: “The social
responsibility of business encompasses
the economic, legal, ethical, and
discretionary [later referred to as
philanthropic] expectations that society
has of organizations at a given point in
time”. Keith Davis posited that social
responsibility referred to ‘businessmen’s
decisions and actions taken for reasons at
least partially beyond the firm’s direct
economic or technical interest’ (Davis
1960, p. 70). Sustainability introduced
‘less quantifiable considerations’ usually
related to environmental and social issues
(Linton, Klassen, & Jayaraman, 2007, p.
1080). Triple bottom line outcome entails
meeting the needs of different
stakeholders with differing interests and
demands. Business sustainability can
enable a firm build trust and loyalty by
showcasing sensitivity to an otherwise
neglected issue. Benefits include such as
embellishing corporate reputation
(Arendt & Brettel, 2010; Worcester,
2009).
Source: Aras and Crowther (2007b, c)
Figure 1: Model of Corporate Sustainability
Aras and Crowther (2007b,c) proposed a
two dimensional matrix for describing
sustainability along the polarities of
internal v external focus and short term v
long term focus.
Risks and opportunities associated with
environmental and social issues, and the
possible link with the economic bottom
line has made sustainability a strategic
priority for companies as part of their
overall business strategy (Committee of
Sponsoring Organisations [COSO],
2013). According to Engert and
Baumgartner (2016) six factors necessary
for the successful implementation of a
sustainability strategy are: factors related
to organizational structure, organizational
leadership, management control,
employee motivation and qualifications,
and communication. Integrating
sustainability with a firm’s strategy can

Perspectives of MSMES and Business Owners on Sustainability Challenges and its Effect on Sustainability Outcomes
Amity Business Review
Vol. 22, No. 2, July - December 2021 104
improve corporate image and increase
efficiency while contributing to a better
society and environment (Blenkhorn &
MacKenzie, 2017). This can only be
achieved from a re-orientation of
business strategy (Hillman & Keim,
2001). Improved social performance also
has several benefits for a firm. For
instance, studies by Thach (2002) and
Brown, Sellen, and O’hara (2000) found
that improved employee safety and well-
being positively affects economic
performance by reducing production
costs. Previously, Burke and Logsdon
(1996) observe that social responsibility
programs of centrality, specificity,
proactivity, voluntarism and visibility
create strategic benefits for a firm and its
stakeholders.
2.2 Theoretical perspective
The sustainability debate is best
explained from a stakeholder perspective.
Stakeholders are defined as any group
within or outside an organization that has
a stake in the organization (Daft, Murphy,
& Willmott, 2010, p.692). This definition
was further extended by Boselie (2010,
p.14) as those who are also capable of
influencing ‘strategic decision-making’
within the organisation. Organisations are
not independent but rather dependent on a
network of relationships which exists
among them (Vicari, 1991). Neglecting
stakeholders may tantamount to a
negative effect on the performance of an
organisation and ultimately the financial
bottom line. The theory has been broadly
explained from several angles such as the
descriptive, normative, managerial and
instrumental perspectives. And the
increased and sustained pressure from a
variety of stakeholders has driven
companies to adopt sustainable supply
chain management (Gualandris &
Kalchschmidt, 2014, p. 94). Furtherance
to this, Co and Barro (2009) categorise
strategies for stakeholder management
into two, aggressive and cooperative
strategies. Aggressive strategies are
characterised by some form of forceful
attitude or behaviour; while, cooperative
strategies are characterised by supportive
attitudes or behaviours towards
stakeholders. Both are geared at altering
other stakeholders’ behaviour. The failure
to consider any group, may cause
employees to sabotage the brand
(Wallace & De Chernatony, 2009); or
customers endorsing alternative agendas
(Wilson, Bengtsson, & Curan, 2014).
Thus, stakeholder analysis enables
managers determine the individual
importance of each stakeholder and their
effect on value creation for the firm
(Cantrell, Kyriazis, & Noble, 2015). A
sustainability based stakeholder analysis
enables the re-categorization of
stakeholders under the three dimensions
of the triple bottom line (economic,
social, and environmental). This re-
categorisation should facilitate long-term
relationship between stakeholders and

Perspectives of MSMES and Business Owners on Sustainability Challenges and its Effect on Sustainability Outcomes
Amity Business Review
Vol. 22, No. 2, July - December 2021 105
able to resolve undiluted pressure from
stakeholders on sustainability challenges
(Orlitzky, Siegel, & Waldman, 2011;
Kolk & Van Tulder, 2010).
From a systematic review of literature
Meixell and Luoma (2015), made three
key findings of stakeholder influence:
Firstly, stakeholder pressure creates
sustainability awareness and/or adoption
and implementation of sustainability
practices; Secondly, different categories
of stakeholders have different influence;
and, Thirdly, the influence of each
stakeholder group depends on whether
the issue in contention is an
environmental or social issue.
2.3 Micro, Small and Medium
Enterprises
SMEs are non-subsidiary, independent
firms/organizations which employ fewer
numbers of employees (OECD,
2005). The number varies across
countries. According to the European
Union (EU), SMEs are categories of
micro, small and medium-sized
enterprises which employ fewer than 250
persons and which have an annual
turnover not exceeding 50 million Euros
(Mekwunye, 2018). In Nigeria, the
National Policy on Micro Small and
Medium Enterprises (MSMEs) offered a
clear distinction of MSMEs, based on
employment and assets utilised
(SMEDAN, 2007). The table below
offers a description of the various
categories.
Table 2: MSMEs categories
S/No Size Category Employment Assets (=N= Million)
(excl. land and buildings)
1 Micro enterprises Less than 10 Less than 5
2 Small enterprises 10 to 49 5 to less than 50
3 Medium enterprises 50 to 199 50 to less than 500
Source: SMEDAN and National Bureau of Statistics (2013)
Micro Enterprises are those
enterprises whose total assets
(excluding land and buildings) are
less than Five Million Naira with a
workforce not exceeding ten
employees.
Small Enterprises are those
enterprises whose total assets
(excluding land and building) are
above Five Million Naira but not
exceeding Fifty Million Naira with a
total workforce of above ten, but not
exceeding forty-nine employees.
Medium Enterprises are those
enterprises with total assets excluding
land and building) are above Fifty

Perspectives of MSMES and Business Owners on Sustainability Challenges and its Effect on Sustainability Outcomes
Amity Business Review
Vol. 22, No. 2, July - December 2021 106
Million Naira, but not exceeding Five
Hundred Million Naira with a total
workforce of between 50 and 199
employees.
3. DESIGN AND METHODOLOGY
The study utilised a descriptive survey
approach. The respondents were drawn
from several Small and Medium
Enterprises (SMEs) in Anambra state. The
State is sub-divided into three Senatorial
Zones: North, Central and South. The
survey conducted in 2013 by SMEDAN
and NBS (2013) determined the total
number of microenterprises in Anambra as
one million two hundred and twenty three
thousand three hundred and ninety five
(1,223,395). The study employed the
snowball sampling method. Lewis-Beck,
Bryman, and Futing Liao (2004) defined
snowball sampling “as a technique for
gathering research subjects through the
identification of an initial subject who is
used to provide the names of other
actors”. The snow ball sampling is a non-
probability based sampling technique
based on the judgment of the researcher.
The instrument utilised for the study
included some socio-demographic
questions, such as gender, age, income, etc
4. ANALYSIS AND RESULTS
The graph showed that of all participants
the highest level of awareness was
recorded among the wholesale/retail trade
category; and, immediately following this
was the bakery/food service category. The
greatest proportion of respondents that
indicated a lack of awareness was
recorded for those in the water supply and
production sector.
Table 3: Demographic information of the respondents
Demographic profile Frequency Percentage (%)
MSMEs Sector:
Healthcare/ Pharmaceutical 14 17.95
Bakery/Food service 18 23.08
Wholesale/Retail trade 22 28.21
Water Supply & Production 19 24.36
Agriculture 5 6.4
78 100
Age: 25-35 29 37.18
36-45 37 47.44
45 & above 12 15.38
78 100

Perspectives of MSMES and Business Owners on Sustainability Challenges and its Effect on Sustainability Outcomes
Amity Business Review
Vol. 22, No. 2, July - December 2021 107
Gender: Male 55 70.51
Female 23 29.49
78 100
Highest Educational
Qualification: Secondary School nil nil
Diploma
(NCE, OND, etc.) 15 19.23
Bachelor Degree
(HND, BSc, BA, etc.) 35 44.87
Post-graduate
(PGD, MSc, PhD) 28 35.90
78 100
Years of business experience: 1 to 10 10 12.82
11 to 20 46 58.97
20 & above 13 16.67
78 100
Source: Field Survey (June, 2019)
Table 4: Level of sustainability awareness by MSMEs
Sector Yes No
Healthcare/Pharmaceutical 11 3
Bakery/Food service 13 5
Wholesale/Retail trade 17 5
Water Supply & Production 12 7
Agriculture 1 4
Field Survey (June, 2019)

Perspectives of MSMES and Business Owners on Sustainability Challenges and its Effect on Sustainability Outcomes
Amity Business Review
Vol. 22, No. 2, July - December 2021 108
Source: Authors Computation using MS Word
Figure 2: Awareness of respondents on sustainability issues in Anambra State
This included MSMEs involved in sachet
water and bottle water production, etc. The
table below shows the sustainability
constraints perceived by the MSMEs.
Table 5: Perceived sustainability challenges facing the MSMEs
Sector
Challenge
Healthcare/
Pharmaceutical
Bakery/Food
service
Wholesale/Retail
trade
Water
Supply &
Production
Agriculture
Financial
constraint
Green marketing
initiatives
Stakeholder
management
Pollution/Waste
disposal
Climate change
Complying with
regulations
Maintaining
ethical practices
Online/E-
commerce/ICT
Source: Field Survey (June, 2019)
The questionnaire consisted of sixteen items (16), 4 items measured
0
2
4
6
8
10
12
14
16
18
Yes No
Healthcare/Pharmaceutical
Bakery/Food service
Wholesale/Retail trade
Water Supply & Production
Agriculture

Perspectives of MSMES and Business Owners on Sustainability Challenges and its Effect on Sustainability Outcomes
Amity Business Review
Vol. 22, No. 2, July - December 2021 109
environmental sustainability, 4 items
measured social sustainability, 4 items
measured economic sustainability, and 4
items measured sustainable business
outcomes. Each item was rated on a 5-
point Likert-type scale with response
categories ranging from strongly disagree
(1) to strongly agree (5). The reliability of
the instrument was tested using Cronbach
Alpha (α), which measures the internal
consistency of a scale. The data were
analyzed using the Statistical Package for
Social Sciences [SPSS].
Table 6: Reliability statistics
N Cronbach Alpha (α)
Environmental sustainability: 4 .711
Social sustainability: 4 .722
Economic sustainability 4 .777
Sustainable Business Outcomes: 4 .761
Source: SPSS Ver. 24
The items were sub-divided into four
subscales, the environmental
sustainability subscale consisted of 4
items [Questions 1-4] the Cronbach
Alpha (α) value was .711; the social
sustainability subscale consisted of 4
items [Questions 5-8] the Cronbach
Alpha (α) value was .722; the economic
sustainability subscale consisted of 4
items [Questions 9-12] the Cronbach
Alpha (α) value was .777; and, the
sustainable business outcome subscale
consisted of 4 items [Questions 13-16]
the Cronbach alpha (α) value was .761.
The overall Cronbach Alpha (α) for the
16 items was .705; this indicated a strong
degree of internal consistency of the
instrument.
4.1 Analysis of Hypotheses:
H1: There is a positive effect of
sustainability initiatives in building
corporate reputation
Source: SPSS Ver. 25
Figure 3: Graphical output for Chi-square test of hypothesis one
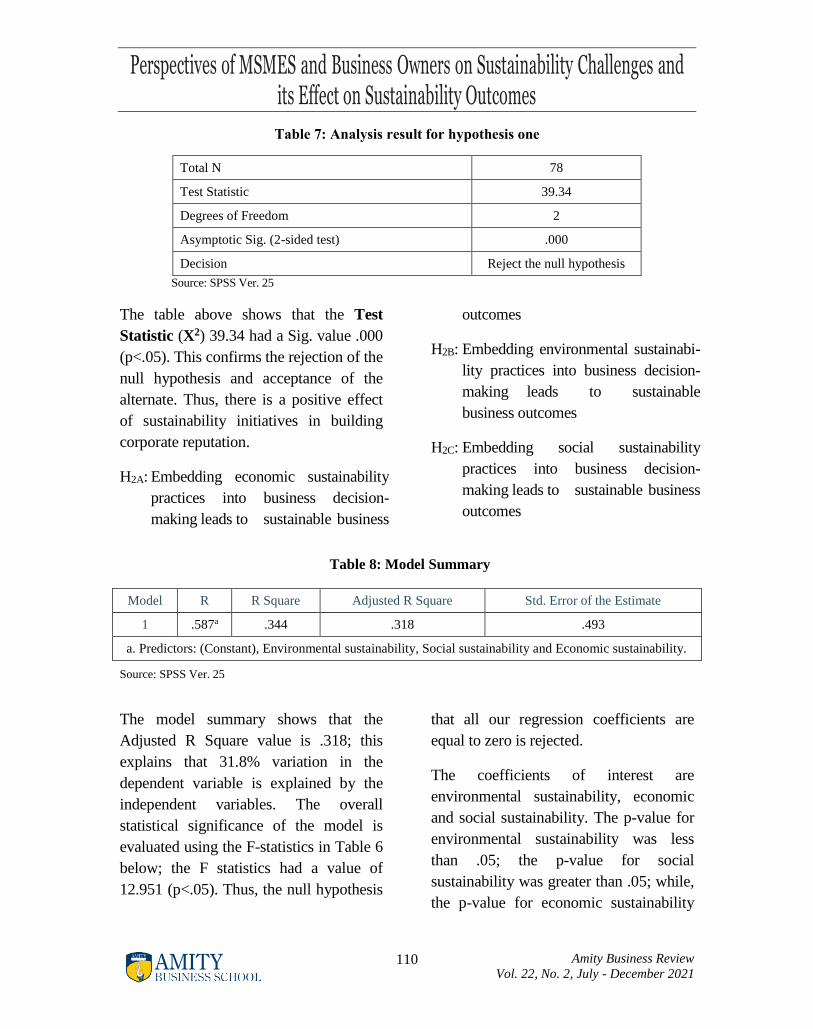
Perspectives of MSMES and Business Owners on Sustainability Challenges and its Effect on Sustainability Outcomes
Amity Business Review
Vol. 22, No. 2, July - December 2021 110
Table 7: Analysis result for hypothesis one
Total N 78
Test Statistic 39.34
Degrees of Freedom 2
Asymptotic Sig. (2-sided test) .000
Decision Reject the null hypothesis
Source: SPSS Ver. 25
The table above shows that the Test
Statistic (X2) 39.34 had a Sig. value .000
(p<.05). This confirms the rejection of the
null hypothesis and acceptance of the
alternate. Thus, there is a positive effect
of sustainability initiatives in building
corporate reputation.
H2A: Embedding economic sustainability
practices into business decision-
making leads to sustainable business
outcomes
H2B: Embedding environmental sustainabi-
lity practices into business decision-
making leads to sustainable
business outcomes
H2C: Embedding social sustainability
practices into business decision-
making leads to sustainable business
outcomes
Table 8: Model Summary
Model R R Square Adjusted R Square Std. Error of the Estimate
1 .587a .344 .318 .493
a. Predictors: (Constant), Environmental sustainability, Social sustainability and Economic sustainability.
Source: SPSS Ver. 25
The model summary shows that the
Adjusted R Square value is .318; this
explains that 31.8% variation in the
dependent variable is explained by the
independent variables. The overall
statistical significance of the model is
evaluated using the F-statistics in Table 6
below; the F statistics had a value of
12.951 (p<.05). Thus, the null hypothesis
that all our regression coefficients are
equal to zero is rejected.
The coefficients of interest are
environmental sustainability, economic
and social sustainability. The p-value for
environmental sustainability was less
than .05; the p-value for social
sustainability was greater than .05; while,
the p-value for economic sustainability

Perspectives of MSMES and Business Owners on Sustainability Challenges and its Effect on Sustainability Outcomes
Amity Business Review
Vol. 22, No. 2, July - December 2021 111
was less than .05. Therefore H2A and H2B were accepted; while, H2C was rejected.
Table 9: ANOVAa
Model Sum of Squares df Mean Square F Sig.
1
Regression 9.428 3 3.143 12.951 .000b
Residual 17.957 74 .243
Total 27.385 77
a. Dependent Variable: Sustainable business outcomes.
b. Predictors: (Constant), Environmental sustainability, Social sustainability and Economic sustainability.
Source: SPSS Ver. 25
Table 10: Coefficients2
Model
Unstandardized
Coefficients
Standardized
Coefficients t Sig.
B Std. Error Beta
1
(Constant) 6.549 .922 7.101 .000
Environmental sustainability -.389 .075 -.572 -5.192 .000
Social sustainability -.406 .231 -.340 -1.753 .084
Economic sustainability .390 .099 .815 3.951 .000
a. Dependent Variable: Sustainable business outcomes.
Source: SPSS Ver. 25
5. CONCLUSION & RECOMMENDATIONS
The study contextualises sustainability
challenges facing MSMEs in South-
Eastern Nigeria. The empirical results
confirmed that sustainability initiatives
can help MSMEs build their corporate
reputation. The regression analysis
confirm that embedding economic and
environmental sustainability practices
into business decision-making led to
sustainable business outcomes. This was
however not the case for social
sustainability practices. The study
proffers the several recommendations for
MSMEs and practitioners in developing
countries as follows:
1. A sustainability focus. To enhance
the relationship in the modern market
place “change must imply
sustainability” (Barile et al., 2013, p.
232). MSMEs must be prepared to
refrain from pursuing individual/self-
goals or intentions and focus on
Perspectives of MSMES and Business Owners on Sustainability Challenges and its Effect on Sustainability Outcomes
Amity Business Review
Vol. 22, No. 2, July - December 2021 112
increasing positive outcomes to the
society and environment they operate.
2. MSMEs need to be more flexible and
responsive to remain competitive. In
this regard green marketing initiatives
may become worthwhile. Integrating
such tools into a comprehensive
stakeholder’s assessment would drive
the company on a part to sustainable
development (Peattie & Charter,
2003).
3. MSMEs can leverage on digital
marketing and e-commerce platforms
presently available. MSMEs need to
use digital marketing tactics to
generate brand awareness and inform
consumers of products and services.
Tools such as social media marketing,
content marketing, web pages, etc.
However, the e-commerce
environment may need to be
redefined in order to benefit from
sustainable practices. This follows
from the “three D’s” obtained from
positive social and environmental
impacts in e-commerce:
Dematerialization reduces material
consumption by shifting books to
bytes, compact disks to MP3s, check
books to clicks, and so on;
Decarbonization deals with a
reduction of Greenhouse Gases;
while, Demobilization reduces the
need for transportation and its
associated costs in traditional market
places (Tiwari & Singh, 2011).
REFERENCES
Account Ability, (1999). Account Ability
1000 (AA1000) Framework: Standard,
Guidelines and Professional Qualification.
London: Account-Ability. Available online
at: http://www.accountability.org.uk
Adams, W. M. (2006). The future of
sustainability: Re-thinking environment and
development in the twenty-first century.
Report of the IUCN Renowned Thinkers
Meeting, 29th – 31st, January 2006. Available
online at: http://www.iucn.org.
Aggarwal, P. (2013). Impact of sustainability
performance of company on its financial
performance: A study of listed Indian
companies. Global Journal of Management
and Business Research Finance, 13(11), 61–
70.
Aras, G., & Crowther, D. (2007b).
Sustainable corporate social responsibility
and the value chain. In Crowther, D., & Zain,
M. M. (Eds.), New Perspectives on
Corporate Social Responsibility, 109-128
Aras, G., & Crowther, D. (2007c). What level
of trust is needed for sustainability? Social
Responsibility Journal, 3(3), 60-68
Aras, G., & Crowther, D. (2008a).
Governance and sustainability: An
investigation into the relationship between
corporate governance and corporate
sustainability. Management Decision, 46(3),
433-448
Arendt, S., & Brettel, M. (2010).
Understanding the influence of corporate
social responsibility on corporate identity,
image, and firm performance. Management
Decision, 48(10), 1469-1492.
Perspectives of MSMES and Business Owners on Sustainability Challenges and its Effect on Sustainability Outcomes
Amity Business Review
Vol. 22, No. 2, July - December 2021 113
doi:10.1108/00251741011090289
Arroyo, P. (2008). The three dimensions of a
sustainable management accounting system.
ASAC, 29, 23-39.
Barile, S., Carrubbo, L., Iandolo, F., &
Caputo, F. (2013). From ‘EGO’ to ‘ECO’ in
B2B relationships. Journal of Business
Market Management, 6(4), 228-253.
Blenkhorn, D. L., & MacKenzie, H. F.
(2017). Categorising corporate social
responsibility (CSR) initiatives in B2B
markets: The why, when and how? Journal
of Business & Industrial Marketing, 32(8),
1172-1181.
Boselie, P. (2010). Strategic Human
Resource Management: A balanced
approach. Tata McGraw-Hill Education.
Brown, B. A., Sellen, A. J., & O’hara, K. P.
(2000). A diary study of information capture
in working life. Proceedings of the SIGCHI
Conference on Human Factors in Computing
Systems, The Hague, Netherlands, 1st – 6th
April, pp. 438–445.
Brundtland, G. H. (1987). Our common
future. Oxford: World Commission on
Environment and Development, Oxford
University Press.
Burke, L., & Logsdon, J. M. (1996). How
corporate social responsibility pays off. Long
Range Plan, 29(4), 495–502.
Cantrell, J. E., Kyriazis, E., & Noble, G.
(2015). Developing CSR giving as a dynamic
capability for salient stakeholder
management. Journal of Business Ethics,
130(2), 403-421. doi:10.1007/s10551-014-
2229-1
Carroll, A. B. (1991). The pyramid of
corporate social responsibility: Toward the
moral management of organizational
stakeholders. Business Horizons, 34(4), 39–
48.
Carroll, A. B., & Shabana, K. M. (2010). The
Business Case for Corporate Social
Responsibility: A Review of Concepts,
Research and Practice. International Journal
of Management Reviews, 12(1), 85-105. DOI:
10.1111/j.1468-2370.2009.00275.x
Co, H. C., & Barro, F. (2009). Stakeholder
theory and dynamics in supply chain
collaboration. International Journal of
Operations & Production Management,
29(6), 591-611.
Committee of Sponsoring Organisations
[COSO], (2013). Integrating the triple bottom
line into an enterprise risk management
program. Available online at: https://www.
coso.org/documents/COSO-ERM%20
Demystifying%20Sustainability%20Risk_Ful
l%20WEB.pdf
Daft, R. L., Murphy, J., & Willmott, H.
(2010). Organization Theory and Design.
Cengage Learning EMEA.
Dahlsrud, A. (2006). How corporate social
responsibility is defined: an analysis of 37
definitions. Corporate Social Responsibility
and Environmental Management, 15(1), 1-
13.
Davis, K. (1960). Can business afford to
ignore social responsibilities? California
Management Review, 2(3), 70–76.

Perspectives of MSMES and Business Owners on Sustainability Challenges and its Effect on Sustainability Outcomes
Amity Business Review
Vol. 22, No. 2, July - December 2021 114
Dyllick, T., & Hockerts, K. (2002). Beyond
the business case for corporate sustainability.
Business Strategy and the Environment,
11(2), 130-141.
Elkington, J. (1994). Towards the sustainable
corporation: win-win-win business strategies
for sustainable development. California
Management Review, 36(2), 90-100.
Elkington, J. (1997). Cannibals with Forks:
The Triple Bottom Line of 21st Century
Business. Oxford: Capstone.
Engert, S., & Baumgartner, R. (2016).
Corporate sustainability strategy-bridging the
gap between formulation and
implementation. Journal of Cleaner
Production, 113, 822-834.
Freeman, R. E. (1984). Strategic
management: A stakeholder approach.
Marshfield: Pitman Publishing.
Freeman, R. E., Harrison, J. S., Wicks, A. C.,
Parmar, B. L., & de Colle, S. (2010).
Stakeholder Theory. New York: Cambridge
University Press. doi:10.1017/cbo97805118
15768
Friedman, M. (1970). The social
responsibility of business is to increase its
profits. The New York Times Magazine,
September 13.
GRI, UNGC & WBCSD. (2015). SDG
compass: The guide for business action on
the SDGs. New York: Global Reporting
Initiative, UN Global Compact and World
Business Council for Sustainable
Development.
Gualandris, J., & Kalchschmidt, M. (2014).
Customer pressure and innovativeness: Their
role in sustainable supply chain management.
Journal of Purchasing and Supply
Management, 20(2), 92-103.
Hart, S. L., & Milstein, M. B. (2003).
Creating sustainable value. Academy of
Management Perspectives, 17(2), 56-67.
Hillman, A. J., & Keim, G. D. (2001).
Shareholder value, stakeholder management,
and social issues. What’s the bottom line?
Strategic Management Journal, 22(2), 125-
139.
Høgevold, N., & Svensson, G. (2012). A
business sustainability model: A European
case study. Journal of Business & Industrial
Marketing, 27(2), 142-151.
Homans, G. E. (1958). Social behaviour as
exchange. American Journal of Sociology,
63(6), 597-606.
International Energy Agency [IEA], (2013).
CO2 Emissions from Fuel Combustion
Highlights (2013 Ed.). International Energy
Agency.
International Federation of Accountants
[IFAC], (2013). Sustainability: Challenges
and Opportunities for SMPs and SMEs.
Available online at: https://www.ifac.
org/news-events/2013-04/sustainability-
challenges-and-opportunities-smps-and-smes
International Forum on Globalization, (2008).
A better world is possible. In Lechner, F., &
Boli, J. (Ed.), The Globalization Reader (pp.
321-335). Malden, MA: Blackwell
Publishing.
Kolk, A., & Van Tulder, R. (2010).
International business, corporate social
responsibility and sustainable development.

Perspectives of MSMES and Business Owners on Sustainability Challenges and its Effect on Sustainability Outcomes
Amity Business Review
Vol. 22, No. 2, July - December 2021 115
International Business Review, 19(2), 119-
125.
Lewis-Beck, M. S., Bryman, A., & Futing
Liao, T. (2004). The SAGE Encyclopaedia of
Social Science Research Methods. Thousand
Oaks, CA: Sage Publications, Inc. doi:
10.4135/9781412950589
Linton, J. D., Klassen, R., & Jayaraman, V.
(2007). Sustainable supply chains: An
introduction. Journal of Operations
Management, 25(6), 1075–1082.
Marsden, C. (2000). The new corporate
citizenship of big business: part of the
solution to sustainability. Business & Society
Review, 105(1), 9-25.
Meixell, M. J., & Luoma, P. (2015).
Stakeholder pressure in sustainable supply
chain management: A systematic review.
International Journal of Physical Distribution
& Logistics Management, 45(1/2), 69-89.
Mekwunye, U. (2018). Nigeria: Small and
Medium Scale Enterprises in Nigeria – An
Overview of Initial Set Up. Available online at:
http://www.mondaq.com/Nigeria/x/757432/D
irectors+Officers/Small+And+Medium+Scal
e+Enterprises+In+Nigeria+An+Overview+O
f+Initial+Set+Up
Organisation for Economic Co-operation and
Development [OECD], (2005), OECD SME
and Entrepreneurship Outlook. Paris: OECD.
Orlitzky, M., Siegel, D. S., & Waldman, D. A.
(2011). Strategic corporate social
responsibility and environmental
sustainability. Business & Society, 50(1), 6-27.
Peattie, K., & Charter, M. (2003). Green
Marketing. In Baker, M. J. (Ed.), The
Marketing Book, 5th Ed. (pp. 726-756).
Butterworth-Heinemann.
Perrini, F., & Tencati, A. (2006).
Sustainability and stakeholder management:
The need for new corporate performance
evaluation and reporting systems. Business
Strategy and the Environment, 15(5), 296-
308. http://dx.doi.org/10.1002/bse.538
Sani, A. A., & Allahverdizadeh, M. (2012).
Target and Kaizen costing. Available online at:
http://www.waset.ac.nz/journals/waset/v62/v
62-10.pdf
Small and Medium Enterprises Development
Agency of Nigeria [SMEDAN], (2007).
National Policy on Micro, Small and Medium
Scale Enterprises. Available online at:
http://www.smedan.gov.ng/search.php?searw
ord s/National%20policy%20on%20%msmes
Small and Medium Enterprises Development
Agency of Nigeria [SMEDAN] and National
Bureau of Statistics, (2013). SMEDAN and
National Bureau of Statistics Collaborative
Survey: Selected findings (2013).
Thach, L. (2002). Social sustainability in the
wine community: Managing for employee
productivity and satisfaction. Wine Bus.
Mon., 9, 7–10.
The Economist, (2017). Weather-related
disasters are increasing, August 29.
Tiwari, S., & Singh, P. (2011). Environmental
impacts of e-commerce. Paper presented at the
International Conference on Environment
Science and Engineering (pp. 202-207),
Singapore: IACSIT Press.
Udo, B. (2019). Small, medium enterprises

Perspectives of MSMES and Business Owners on Sustainability Challenges and its Effect on Sustainability Outcomes
Amity Business Review
Vol. 22, No. 2, July - December 2021 116
account for 84 per cent of jobs in Nigeria.
Premium times. Available online at: https://
www.premiumtimesng.com/business/business
-news/215707-small-medium-enterprises-
account-84-per-cent-jobs-nigeria.html
Vicari, S. (1991). L’impresa vivente. Milano:
Etas.
Visser, W. (2017a). Innovation pathways
towards creating integrated value: a
conceptual framework. International
Humanistic Management Association,
Research Paper Series No. 17-41, October 2.
Visser, W. (2018). Creating Integrated Value:
From Systems Thinking to Sustainable
Transformation in Business and Society.
Inauguration Lecture of the Chair in
Sustainable Transformation, Antwerp
Management School, University of Antwerp.
Wallace, E., & De Chernatony, L. (2009).
Exploring brand sabotage in retail banking.
Journal of Product & Brand Management,
18(3), 198-211.
Wilson, E. J., Bengtsson, A., & Curran, C.
(2014). Brand meaning gaps and dynamic
theory, research and practice. Qualitative
Market Research: An International Journal,
17(2), 128-150.
Worcester, R. (2009). Reflections on
corporate reputations. Management Decision,
47(4), 573-589. doi:10.1108/002517409109
59422
World Bank, (2014a). Access to electricity
(% of population). Washington D.C.: World
Bank.
World Business Council for Sustainable
Development [WBCSD], (2008). Sustainable
consumption facts & trends: From a business
perspective. Available online at: http://www.
wbcsd.org/pages/edocument/edocumentdetail
s.aspx?id=142
World Economic and Social Survey, (2013).
2013 sustainable development Challenges.
Available online at: http://sustainable
development.un.org/content/documents/2843
WESS2013.pdf
World Economic Forum [WEF], (2018).
Global risks report 2018. Geneva: World
Economic Forum.
Wu, Z., & Pagell, M. (2011). Balancing
priorities: Decision-making in sustainable
supply chain management. Journal of
Operations Management, 29(6), 577–590.

AMITY UNIVERSITY PRESS