
text cut within - the book only
422
-
Upload
khangminh22 -
Category
Documents
-
view
1 -
download
0
Transcript of text cut within - the book only


TEXT CUT WITHINTHE BOOK ONLY
TIGHT BINDING BOOK

OU_158988>5co


Titles in the E. L. B. S. 'Science Today* Series
Physicsfor the Modern World Andrade 2s 6d
An Approach to Modern Physics Andrade 75 Gd
Science and its Background Anthony 6s 6d
Inside the Living Cell Butler 7s 6d
Frontiers ofAstronomy Hoylc 55 Gd
Nuclear Power Today and Tomorrow Jay 75 6d
Men who changed the World Larsen 48 6d
Chemistryfor the Modern World Porter 2s Gel
Life on Other Worlds Spencer Jones is 6d
Mathematics in Action Sutton 43 Gd
The Atom Thomson 33 6d
Biologyfor the Modern World Waddington as 6d

FRONTIERSOF ASTRONOMY
by
FRED HOYLE
THE ENGLISH LANGUAGE BOOK SOCIETY
and
HEINEMANN EDUCATIONAL BOOKS LTD
FIRST PUBLISHED 1955REPRINTED 1 955 (twice), 1956, 1961 (tWLCC)
E.L.B.S. EDITION 1963
This book is copyright. It may not b
reproduced in whole or in part, nor mayillustrations be copied for any purpose,without permission. Application with
regard to copyright should be addressed
to the Publishers.
Published by Htinmtm Emotional Books Ltd
15-16 Queen Strett, Mqyfair, London W.i
for tht English Language Book Society
Printed in Great Britain by
Bookprint Limited, Kingswood, Surrey

TO MY WIFE

It is a pleasure to thank colleagues with whom I have
collaborated on various investigations mentioned in the
present book: I am indebted to Mr. T. Gold in relation to
Chapter Six, to Prof. Bondi and Dr. R. A. Lyttleton in
relation to Chapter Seven, and to Dr. Martin Schwarz-
schild concerning topics discussed in Chapters Eight and
Nine.
I also wish to thank those many astronomers with whomI have argued over knotty problems, and who have so
often put me right (I hope!) on many points.
My debt is great to the Observatories that have supplied
the photographs with which this volume is illustrated.
Individual astronomers have also been most generous in
making their personal photographs available to me. Mythanks in this respect are due to Dr. Bart. J. Bok, Dr. Peter
van de Kamp, Mr. W. Miller, Mr. M. Ryle, and Dr. Fritz
Zwicky.

CONTENTSPage
PROLOGUE xv
I ODDITIES ABOUT THE EARTH i
II THE WORKING EARTH 18
III THE TAP ROOT 40
IV SOME VARIED APPLICATIONS OF PHYSICS 57
V GENERALITIES ABOUT THE MOON AND PLANETS 66
VI THE ORIGIN OF THE PLANETS 83
VII THE MYSTERY OF THE SOLAR ATMOSPHERE 106
VIII THE SUN AND ITS EVOLUTION 128
IX THE EVOLUTION OF STARS OF A MEDIUM CONTENT 149
X THE MEASUREMENT OF ASTRONOMICAL DISTANCES 164
XI DWARFS AND GIANTS 178
XII EXPLODING STARS 204
XIII THE SPIRAL ARMS OF OUR OWN GALAXY 227
XIV THE ORIGIN OF THE STARS IN THE ARMS OF OURGALAXY 236
XV THE GALAXY AS A MAGNET 255
XVI THE WORLD OF GALAXIES 273
XVII THE FORMATION OF GALAXIES 292
XVIII THE EXPANDING UNIVERSE 306
XIX OBSERVATIONAL TESTS IN COSMOLOGY 324
XX THE CONTINUOUS ORIGIN OF MATTER 344
EPILOGUE 352
INDEX356
Vll


LIST OF PLATES
Plates I-X will befound as a complete section
between pp. 64 and 65
I. THE HORSE-HEAD NEBULA.
II. HALLEY'S COMET.
III. A SCENE FROM THE LICK OBSERVATORY.
IV. MARS.
V. THE PLANET VENUS.
VI. THE PLANET SATURN.
VII. THE PLANET JUPITER.
VIII. THE MOON AT SECOND QUARTER.IX. FULL MOON.
X. THE CRATER COPERNICUS AND ITS ENVIRONS.
Plates XI-XXI will befound as a complete
section between pp. 128 and 129.
XI. THE ORION NEBULA.
XII. THE SOLAR CORONA AT THE ECLIPSE OF 1900,MAY 28.
XIII. THE SOLAR CORONA AT THE ECLIPSE OF 1918,
JUNE 8.
XIV. A COLOSSAL PROMINENCE.
XV. SUNSPOTS.
XVI. THE SOLAR CORONA AT THE ECLIPSE OF 1926,c. JANUARY 14.
XVII. THE PLEIADES.
XVIII. THE GLOBULAR CLUSTER, M 3.
XIX. THE 2OO-INCH HALE TELESCOPE BY MOONLIGHT.XX. THE 48-lNCH SCHMIDT TELESCOPE.
XXI. THE GALAXY, MSI.ix

LIST OF PLATES
Plates XXII-XXXI will be found as a
complete section between pp. 160 and 161.
XXII. THE LARGE MAGELLANIC CLOUD.
XXIII. THE SMALL MAGELLANIC CLOUD.
XXIV. THE GALAXY, M8i.XXV. A SECTION OF THE MILKY WAY.XXVI. THE GALAXY, NGC 4594.
XXVII. THE GLOBULAR GALAXY, M8y.XXVIII. FLARE ON KRUGER 60 B.
XXIX. THE CRAB NEBULA.
XXX. THE LOOPED NEBULA IN CYGNUS.
XXXI. THE 'ELEPHANT'S TRUNK'.
Plates XXXII-XL will be found as a
complete section between pp. 192 and 193.
XXXII. THE ROSETTE NEBULA.
XXXIII. NGC66n.XXXIV. THE TRIFID NEBULA.
XXXV. THE RADIO TRANSMITTER IN CASSIOPEIA.
XXXVI. 1C 1613.
XXXVII. THE GALAXY, M^.XXXVIII. GALAXIES OF THE VIRGO CLOUD.
XXXIX. CENTRAL REGIONS OF THE COMA CLUSTER.
XL. CLUSTER OF GALAXIES IN CORONA BOREALIS.
Plates XLI-L will be found as a complete
section between pp. 224 and 225.
XLI. CLUSTER OF GALAXIES IN HYDRA.
XLII. THE DEPTHS OF SPACE.
XLIII. THE 2OO-INCH HALE TELESCOPE.
XLIV. DIAGRAM OF THE 2OO-INCH TELESCOPE.
XLV. ELLIPTICAL AND IRREGULAR GALAXIES.
XLVI. THE GALAXY, NGC 2841.

LIST OF PLATES
XLVIL THE GALAXY, MSI.XLVIIL CLASSIFICATION OF SPIRAL GALAXIES.
XLIX. COLLIDING GALAXIES IN CYGNUS.
L. THE GALAXY, NGC 147.
Plates LI-LIX will be found as a complete
section between pp. 288 and 289.
LI. THE GALAXY, NGC 5128.
LII. GROUP OF GALAXIES IN LEO.
LIII. A BRIDGE BETWEEN GALAXIES.
LIV. THE GALAXY, M 74.
LV. THE GALAXY, NGC 72 17.
LVI. THE GALAXY, NGC 1300.
LVII. EVIDENCE FOR THE EXPANSION OF THE UNIVERSE.
LVIII. THE CAMBRIDGE RADIO-TELESCOPE.
LIX. THE RING NEBULA.

LINE ILLUSTRATIONS
page
1. Interior of the Earth 20
2. The decay of C1458
3. Diameters and depths of lunar craters 78
4. Shrinkage of the solar condensation 88
5. Magnetic spokes 92
6. The origin of life 102
7. Field of a bar magnet 109
8. The Sun's polar field 1 10
9. Infalling material and the splash corona 119
10. Energy flow inside the Sun 133
11. The Hertzsprung-Russell diagram 135
1 2 . Contours of equal stellar radii 1 36
13. The main-sequence 138
14. Evolution for mixed stars 140
15. Evolution of an unmixed star 142
1 6. Evolutionary sequence of a group ofstars ofidentical
ages 144
17. The stars of the globular cluster MS 145
1 8. The stars of the globular cluster M 92 146
19. Star with helium core 150
20. R R Lyrae stars, the relation of light oscillation to
period 1 58
21. Evolutionary track to the white dwarfs 159
22. Fixing the intrinsic brightness ofR R Lyrae stars 164
23. Schematic drawing of our Galaxy seen edge-on 166
xii

LINE ILLUSTRATIONS
24. Determination of the distance of the galactic centre 167
25. A circle 168
26. The halo around our Galaxy 169
27. A triangle 172
28. Direction measurements 172
29. A triangle 173
30. Another triangle 173
3 1 . Different brands of star 1 78
32. The nearest stars 181
33. The evolutionary hypothesis 185
34. The Cepheid zone 186
35. Oscillation in size of a Cepheid 187
36. Oscillation in the light of a Cepheid 187
37. Stars of the Pleiades 191
38. Superimposed open clusters 193
39. Stars of the open cluster Praesepe 194
40. The motion of the stars of an Algol binary 195
41. The light curve of an Algol binary 196
42. Improbable evolution of an Algol binary 197
43. Evolution of an Algol binary by interchange of
material 199
44. Evolution without interchange of material 201
45. A three-zoned star 205
46. A four-zoned star 208
47. A seven-zoned star 211
48. Yardstick method of determining distance 216
49. The evolutionary hypothesis 219
50. Schematic drawing of the galaxy M 31 228
51. Use of the main-sequence to determine the intrinsic
brightness of a star 229
xiii
LINE ILLUSTRATIONS
52. Our Galaxy in plan 231
53. Observing through two lanes of gas 232
54. Motions of the stars of the Persei cluster 237
55. Producing a gas bullet 247
56. Energy levels 260
57. Emission versus frequency for different modes of
emission of radio-waves 267
58. The elliptical sequence 275
59. The coffee-cup effect 288
60. Dependence on energy supply of the temperature of
an extragalactic cloud 293
61. Thermal and aerodynamic motions 294
62. The hierarchy sequence 297
63. The compacting of a galaxy 299
64. Linear relation between distances and speeds of
recession of galaxies 3 1 1
65. The colour-curve ofM 32 335
66. The effect of the recession ofa galaxy on the colour-
curve 336
67. A comparison of colour curves, M 32 and a galaxy
in the Corona cluster 338
xiv
PROLOGUE
The spin of a coin depends on chance. So do many of the
things that take place in our minds: the precise moment of
time when a new idea forms itselfin a man's brain, for instance.
But chance is a concept all too readily overworked. When at a
loss to understand something, we are only too often temptedto suppose that our ignorance lies in a failure to trace some
random quirk. And nowhere is this done more easily than in
astronomy. Yet I think there are few studies in which chance
is less important at root than it is in astronomy. The great
stage where the Universe acts out its play is one on which the
twin roles of coincidence and chance have scarcely any entry.
From the vast expanding system of galaxies down to the
humblest planet, and to the creatures that may live on it, there
seems to be a strongly forged chain of cause and effect. Acci-
dents there must be sometimes, but they matter not a jot to
the march ofthe larger events.
The main theme of the present book lies not so much in any
particular astronomical topic as in an attempt to write coinci-
dence and chance out of the play. The first and last chaptershave nothing factual in common, but they are linked by this
underlying aim.
The astronomer seems at first sight to be the most help-less of all scientists. He cannot experiment with the Universe.
It is a significant matter of nomenclature that whereas we
speak of experimental work in other sciences we speak of
observational work in astronomy. The astronomer cannot
move around the Universe taking an especially detailed
look at any object that he finds of interest, as the 'field* worker
does in other sciences. He cannot tear objects such as stars
to pieces when he wants to find out how they work, which is
the method used by the physicists the tough guys of science.
Astronomers perforce have to accept a comparatively meekrole. They cannot alter the light that comes into the telescope,
although they can build larger telescopes to get more light and
xv
PROLOGUE
they can use more efficient devices to analyse the light. Yet
the astronomer possesses one well-nigh overwhelming advan-
tage. This lies in the sheer variety of the things that can be
observed. The Universe is so vast, and the lengths of time that
are of interest in astronomy are so long, that almost everyconceivable type of astronomical process is still going on some-
where or other. The astronomer's problem is not a lack of
information but an embarrassing excess of it. His is often a
problem of disentanglement rather than one of synthesis:
among the great wealth of detail he has to decide what is
important and what is irrelevant. The light that enters the
telescope contains a truly fantastic tangle of information. It is
just to assist in the unwinding of the tangle that astronomical
theory has been developed, the weapons of astronomical theory
being derived directly from physics, chemistry, aerodynamics,and a host of other sciences in a lesser degree. Often the
theories that are used are well-known and well-tried but some-
times they are less well-known and sometimes they lie at the
very frontiers ofknowledge.
xvi

CHAPTER ONE
Oddities About the Earth
Man's claim to have progressed far beyond his fellow animals
must be supported, not by his search for food, warmth, and
shelter (however ingeniously conducted) but by his penetrationinto the very fabric of the Universe. It is in the world of ideas
and in the relation of his brain to the Universe itself, that
the superiority of Man lies. The rise of Man may justly be
described as an adventure in ideas.
The present book is concerned with one of the chapters of
this adventure. It is in some respects the most spectacular
chapter the one in which the large scale features of the
Universe are beginning to be unfolded to us in all their majesty.But we cannot seek for grandeur at the outset, rather must we
begin very modestly with the Earth itself.
Let's start with the Earth, and with a very simple questionabout it.
Why is the length ofthe day 24 hours?
Half the Earth is lit by the Sun and the other half lies in
shadow. Because ofthe rotation of the Earth we are constantly
turning from shadow to Sun and from Sun to shadow: we
experience the procession of night and day. The Earth is
turning with respect to the Sun rather like a joint on a spit,
although of course there is no material spit stuck through the
Earth we are turning freely in space, just as we are movingfreely in space on our annual journey around the Sun.
In the past the Earth rotated considerably more rapidlythan it does now: at the time of its origin the cycle of day and
night may have been as short as 10 hours. The spin of the
Earth must accordingly have been slowed down during the
4,000 million years or so that have elapsed since the early
FRONTIERS OF ASTRONOMY
period of its life. The agency responsible for the brakingaction is known. It is just the twice-daily tides that are raised
by the Moon and the Sun. The oceanic tides cause a frictional
resistance when they impinge on the continental margins.This friction produces heat at the expense of the energy of
rotation of the Earth, thereby slightly slowing the Earth's
spin. In return for its effect on the Earth, the Moon experiences a
force that pushes it gradually farther and farther away from us.
Formerly it was thought that the spin of the Earth has been
slowing down continuously ever since the time of its formation,
so that on this old view it just happens that we are living at
the time when the spin has been braked down to 24 hours: it
was thought that in the past the cycle of night and day took
less than 24 hours, and that in the future it would take more.
But a very recent theory, due to E. R. R. Holmberg, disagreeswith this last step, disagrees that the cycle of day and nightwill ever take longer than 24 hours in the future.
Now since the braking effect of the oceanic tides is un-
doubtedly still operative, this view of Holmberg evidentlydemands that there shall be some compensating process
tending to speed up the spin of the Earth. The substance of
the new argument is that such a compensating speeding-up
process does in fact exist. To understand how it operates let
us first consider an analogy. Take a weight suspended from
a spring, give the weight a pull downwards, and then let go.
The system will start oscillating up and down. Now give the
weight a small push downward during each oscillation. It
will be found that, provided the weight is always pushed at
the same stage of each oscillation, a quite violent motion will
be built up. This is known as forcing an oscillation in reson-
ance 'forcing' because of the pushes and 'in resonance' because
the pushes are adjusted to come at the same stage of each
oscillation.
Now the atmosphere of the Earth oscillates up and downlike the spring and the weight, the pressure in the air takingthe part of the spring and the weight of the atmosphere
acting, of course, as the weight. Not only this, but the atmos-
phere is pushed by the same forces as those that raise the
oceanic tides. But the force due to the Moon, which is the

ODDITIES ABOUT THE EARTH
more important in the raising of the oceanic tides, does not
act in resonance with the oscillations of the atmosphere and
consequently does not build up appreciable motions of the
atmospheric gases. The somewhat weaker pushes due to the
Sun do act in resonance with the atmosphere, however. Theresult is that very considerable up and down motions of the
air are set up. These motions are accompanied by oscillations
of pressure that can be detected on a sensitive barometer.
The variations occur twice daily, just as the oceanic tides do.
The pressure is found to be at a maximum about two hours
before midday and about two hours before midnight. By a
careful calculation it can be shown that this precedence of the
atmospheric tides before midday and midnight causes the
gravitational field ofthe Sun to put a twist on the Earth tendingto speed it up. The strength of the twist can also be estimated.
The very important result emerges that the twist is comparablewith the slowing down effect of the oceanic tides, just as
Holmberg's theory requires it to be.
It is important to realise that the speeding-up process need
not exactly compensate all the time for the slowing-downeffect of the oceanic tides. It is sufficient if the two processes
compensate each other on the average, averages being calculated
over say a time of 100,000 years. Indeed exact equality at all
times is not to be expected for the reason that the slowingeffect is likely to vary quite appreciably and quickly from onetime to another. During the last ice-age for instance the slowingeffect may well have been much less than it is today.The theory is also favoured by another point, one that seems
to me to be well nigh decisive; namely that the time of oscilla-
tion of the atmosphere and the time between successive pushesof the Sun on the atmosphere depend on entirely different
considerations. The time for the oscillation depends on the
temperature, density, and chemical nature of the air, whereas
the time between successive pushes of the Sun depends on the
rate of spin of the Earth. How comes it then that the two are
so closely coincident?
In answering this question, Holmberg follows the older
ideas to begin with. He supposes that at one time the Earth
was rotating considerably faster than at present. There was

FRONTIERS OF ASTRONOMY
tnen no resonance between the pushes of the Sun and the
oscillations of the atmosphere. Consequently no strong oscilla-
tions were set up, so that the speeding-up process was in-
appreciable. The slowing-down effect of the oceanic tides
therefore operated essentially unchecked, just as used to be
supposed. But here now is the crucial point. As the Earth
slowed to a day of 24 hours the pushes of the Sun graduallycame into resonance with the oscillations of the atmosphere.So larger and larger motions of the air were built up, and the
speeding-up process increased correspondingly. This went onuntil the speeding-up process came into average balance with
the slowing effect of the oceanic tides. A state of balance has
been operative ever since.
These ideas of Holmberg lead to other interesting conse-
quences. It appears that the Earth must be spiralling very
slowly inwards towards the Sun, and the Moon must be
spiralling slowly outwards from the Earth. The change in
the distance of the Earth from the Sun remains very small,
but the change in the distance of the Moon from the Earth
does not remain small. Given sufficient time the Moon will
spiral so far away from the Earth that it will fall prey to the
gravitational influence of the Sun. The Sun will pull it awayfrom the Earth entirely so that it will no longer go circling
around us, but will move independently around the Sun as a
planet in its own right. This will happen when the slow
spiralling that is going on all the time takes the Moon out
from its present distance of nearly a quarter of million miles
to a distance of about a million miles. Long before this stageis reached we shall unfortunately lose one of the finest of all
cosmic spectacles, however: the total eclipse of the Sun. This
depends on the Moon coming between us and the Sun andon it serving to block out so much of the fierce solar glare that
we are able to see the delicate extensive outer atmosphere of
the Sun the corona. At present the Moon is only just able
to do this: and when it has spiralled a little farther away it will
not be able to produce a total eclipse at all. Conversely in
earlier ages when the Moon was nearer to the Earth such
eclipses must have been more frequent, more striking, andmore prolonged than they now are.
THE JGE AGES
The Ice-Ages
Over most of the long history of the Earth the climate
throughout the world has been considerably warmer than it is
at present. But during the last million years the Earth has
been plunged into one of its rare transient cold epochs; epochsthat are characterised by the presence of ice-sheets in the Arctic
and by the frequent excursions of these ice-sheets into tem-
perate latitudes the so-called ice-ages. The exceptionalnature of present-day conditions is shown by the temperatureof the Atlantic Ocean, which is now some ten degrees centi-
grade lower than normal; normal being reckoned as the
average situation taken over the whole existence of the Earth,
over 4,000 million years.
There have been four major periods during the last million
years when a glacial climate has been dominant in the northern
temperate zone of the Earth (since the southern temperatezone is nearly all sea a straightforward similarity between the
two hemispheres is not to be expected). At their greatest
extension, the glaciers have stretched from the Arctic into N.
Europe and N. America, reaching into England and Denmark,and into positions south of the great lakes in the UnitedStates. These periods of glacial dominance each occupiedsome 50,000 to 70,000 years. The last of them came to an end
only very recently, geologically speaking about 10,000 years
ago. Partly because it was so recent, and partly because one
ice-age tends to obliterate the relics left from previous ice-
ages, more is known about this last of the ice-ages than about
the earlier ones. Perhaps its most remarkable feature was the
abruptness of its end. The ice simply melted, the water flowing
away in huge rivers into the sea. Within only two or three
thousand years the glaciers retreated into the Arctic, to muchtheir present locations. The climate of the northern temperatezone changed within this short time (again geologically speak-
ing) from a pronouncedly glacial character to being distinctly
wanner than at present. The rapidity of this melting of the ice
sets a challenging problem. How was it possible for such a
startling change of climate to occur within such a short time
(3,000 years!)?

FRONTIERS OF ASTRONOMY
The external theory ofthe ice-ages
The cause of the ice-ages is not known with any certainty,
but two theories that deserve close consideration have been putforward very recently. We shall consider the first of these now,
leaving the second to be discussed at the end of the present
chapter. The reader may then like to make his own choice as
to which ofthe two alternatives is to be preferred.The first theory seeks to explain the ice-ages in terms of a
cause external to the Earth. The simplest such cause would be
a change in the amount of light and heat that we receive from
the Sun. An increase of the Sun's radiation by several per cent
would certainly have been sufficient to cause the rapid meltingof the last ice-sheet. Our climate is very sensitively balanced
to the amount of radiation that we receive from the Sun.
Normally we pay little attention to things outside the Earth,but if the Sun were to vary a little, only a very little, we should
soon be faced by a situation beside which the political crises
that fill our lives would fall into entire insignificance.
There is neither theoretical nor observational evidence that
changes take place in the radiation of the Sun, however. It is
difficult to see how anything occurring inside the Sun could
produce an appreciable fluctuation in a time as short as 3,000
years. The time for changes to become important in the Sunmust be measured in millions or even in thousands of millions
of years. In support of this it is certain that variations in the
Sun's radiation from year to year are very small at the presenttime. This has been established by Harold Johnson using a
new method of observation of considerable interest. Instead
of attempting to measure directly the amount of heat and light
that we receive from the Sun, which is difficult to do because
the intensity of sunlight is too great to allow of easy measure-
ment, Johnson measures the sunlight that is reflected by the
planet Uranus. This can be done with great accuracy. Since
if the Sun's radiation were to vary there would be a propor-tionate alteration in the amount ofsunlight reflected by Uranusthis method is an excellent one for keeping a watch on the Sunifthe Sun tries any monkey business we shall soon know about it.
With the Sun out of court, we are left to search for a more
6
THE GREENHOUSE EFFECT
subtle external cause ofclimatic variation. Instead ofdescribingthe many unsuccessful attempts that have in the past been madeto discover such a cause, let us come straight away to somerecent ideas that seem far preferable to the older suggestions.
Perhaps the best way to approach these ideas is from a direction
that you would least expect. Let us think for the moment about
the ordinary horticultural greenhouse. Even without an inter-
nal supply of heat the temperature will be found to be higherinside a greenhouse than it is outside. Why? Let us try first to
answer this everyday question.The glass roof of a greenhouse allows much of the incident
light and heat from the Sun to pass freely into the interior,
where it is mostly absorbed by the contents of the greenhouse,
by plants and other materials, causing them to becomeheated. Now as more and more sunlight streams through the
roof why do the plants not become steadily hotter and hotter?
Because sooner or later they begin to lose as much energy as
they are receiving from the sunlight. This loss of energy
happens in a not very obvious way. It takes place because the
plants emit infra-red radiation.
Possibly it may come as a surprise to realise that every object
we handle in our daily lives emits radiation. But the radiation
is invisible infra-red and does not enable us to see everyday
objects. We see everyday objects because they reflect sunlight.
During the day every object becomes heated by constantly
absorbing light and simultaneously becomes cooled by con-
stantly emitting infra-red radiation, the two processes workingin opposite directions, tending to compensate each other. This
is the situation for the plants inside a greenhouse.Let us now come quickly to the crucial point. The glass roof
of a greenhouse allows sunlight to stream freely in but it does
not allow the infra-red radiation emitted by the plants and the
other contents to stream freely out. It is just because sunlightcan come freely in but the infra-red cannot go easily out that
the temperature is raised inside a greenhouse.Now our atmosphere acts like the roof of a greenhouse.
Thus while it allows sunlight to come more or less freely in,
it tends to trap the radiation that is constantly being emitted
by the surface material of the Earth. The temperature is
7
FRONTIERS OF ASTRONOMY
thereby raised very appreciably, just as it is in a greenhouse.This rise of temperature is very crucial to our existence, for
without it the whole Earth would be plunged into a permanent
glacial condition.
Evidently then an ice-age would arise if the greenhouse effect
of our atmosphere were destroyed or seriously weakened. This
would happen if the concentrations of those gases of the atmos-
phere that are responsible for blocking the infra-red radiation
were appreciably reduced. The gas ofmain importance in this
respect is water vapour. The question therefore arises as to
how the amount of water vapour in the atmosphere might be
systematically reduced, especially the amount at a height of
some 20,000 feet above the ground. In this, may lie the answer
to the riddle of the ice-ages.
The water vapour in the atmosphere sometimes condenses
into liquid droplets that fall to the ground as rain. This pro-cess tends to decrease the water vapour content of the atmos-
phere. Evaporation from the oceans works in the oppositedirection tending to increase the water vapour content. Thusthe amount of water vapour in the atmosphere represents a
balance between these two opposing processes. Evidently the
balance can be altered, in the sense of decreasing the amountof water vapour, either if the evaporation rate is reduced or
if the tendency for the water to fall as rain is increased. Ofthese two possibilities the former can be dismissed, since a
general reduction of evaporation would only occur if there
was a decrease in the amount of light and heat that we receive
from the Sun; and we have already seen that this is not a likely
possibility.
How then can the tendency for the water to fall out of the
atmosphere as rain be increased? Possibly through the entryinto the atmosphere of swarms of the tiny particles known as
meteors. Such particles do actually exist in great numbers in
the realms of space between the planets. As the Earth movesaround the Sun particles are constantly being swept into our
atmosphere. The entry of exceptionally large meteors, of
about the size of a small pea, can often be seen at night: theyare the well-known shooting stars (the trail of a shooting star
can be seen on Plate I). But a normal meteor, with a size of
8

METEORS AND COMETS
perhaps one thousandth part of a centimetre, is too small to
be seen in this way. Their motions are largely checked when
they are about 60 miles up in the atmosphere, where they are
sometimes observed as the famous noctilucent clouds. After
this they fall slowly downwards, taking a number of days to
reach the surface of the Earth.
Now conditions are often operative in the atmosphere, sayat a height of about 20,000 feet, where a considerable con-
centration of water vapour exists that does not fall as rain
because there is no way of forming large water drops out of
the vapour and only drops of an appreciable size can fall as
rain. The arrival from above of a large number of meteoric
particles mightwell produce a drastic change in such a situation,
since water drops would immediately tend to condense
around the particles. If the concentration of the water vapourwere large enough, rain would probably fall.
The tendency of meteoric particles to bring down water
vapour as rain must weaken the greenhouse effect, and the
possibility exists that for a sufficiently large number ofmeteoric
particles entering the atmosphere the greenhouse effect mightbe weakened to the point of onset of a glacial climate.
The recent work of E. G. Bowen gives support to these
ideas. By analysing records for the last fifty years it has become
apparent that there is a world-wide tendency for exceptionally
heavy falls of rain to take place on specific days in the year, on
January I2th to isth for instance. Bowen's explanation is
that at some time prior to these exceptional dates the Earth onits journey round the Sun passes across the track of an excep-
tionally dense swarm of meteors meteors that for the most
part are much too small to show as shooting stars when theyenter our atmosphere. The meteors fall through the atmos-
phere and are available to produce rain in the manner wehave just discussed.
Comets and Meteors
Meteors become distributed throughout the solar systemwhen a comet breaks up, as comets are observed to do fromtime to time. According to the theory of Lyttleton, comets
9

FRONTIERS OF ASTRONOMY
are nothing but swarms of tiny particles probably composedof ice.* The break-up of a comet accordingly consists of the
break-up of a swarm, not of the break-up ofa few large chunks
of solid material. We can think of the break-up of a cloud of
birds as an analogy. The comets break up not through anyinternal influence, but through the external action of the Sun.
Usually comets break up rather slowly, but sometimes if one
comes too close to the Sun the break-up may be very sudden.
It might seem from this that the density of interplanetary
particles must be steadily increasing, since further comets are
being broken up all the time. But this is not so, because two
other processes are working in an opposite direction by causingthe meteors to fall steadily towards the Sun. Of these probablythe more important arises from a flow of gas within the
whole solar system. (Evidence will be presented in Chapter 7
showing that a flow ofgas is actually taking place at the present
time.) Whereas a large body like the Earth is scarcely affected
at all by the gas, a tiny meteoric particle must experience a
strong dragging influence; a tiny particle instead of moving
indefinitely round and round the Sun, as the Earth does, will
be caused to spiral inwards towards the Sun until eventuallyit is brought in close enough to become entirely vaporised bythe scorching heat.
We see therefore that the meteors in the solar system form a
reservoir with an input and an output. The break-up of
comets supplies the input, while the dragging effect of gaswithin the solar system supplies the output. The situation is
therefore similar to an ordinary reservoir, the capacity ofwhich
can be increased either by stepping up the inflow or by de-
creasing the output, or of course by both of these. The sudden
break-up of an exceptionally large comet might conceivablyincrease the reservoir of meteors to the point at which glacial
conditions would return to the Earth. But such an occurrence
would probably cause the glacial conditions to have a sudden
beginning and a slow end which is just the opposite from
what happened at the end of the last ice-age. A sudden end
to an ice-age demands a sharp increase in the outflow from the
For a thorough discussion of this theory, see Lyttleton's book. The Comets**d Their Origin, Cambridge, 1952.
IO

METEORS AND COMETS
reservoir, and this requires a sudden increase in the flow 01
gas within, the solar system. It seems more likely, therefore,
that if the variations ofclimate of the last ten thousand years or
so are to be explained in terms of the present theory they must
come from changes in the flow of gas rather from changes in
the rate ofbreak-up of comets.
We are now following a different trail. We started by con-
sidering the greenhouse effect. Then we moved on to meteors
and comets. Now we have come to a flow of gas within the
solar system. Next we must ask: where does this flow of gascome from? Although there is a fairly general agreement
among astronomers that the flow exists, there is a divergenceof opinion on its origin. Some maintain that the flow comes
outwards from the Sun, others take the view that it comes
inwards from the vast cloud of diffuse gas that fills the spacebetween the stars the interstellar gas. On this second view
the Sun is constantly scooping up quantities of the interstellar
gas, and this produces a flow into, not out of, the Sun.
Perhaps before we go on to more argument it is as well to
take a look at the villain of the piece the comet. One of themis shown in Plate II. It is an old superstition that the appear-ance of comets in the sky presages disaster. Perhaps the old
superstition was right.
It has been estimated that the break-up of many comets is
taking place at such a rate that they will be entirely disruptedwithin a million years. It is an immediate inference that these
comets cannot have been moving around the Sun as they are
at present for much longer than a million years, since otherwise
they would already have been broken up.Now the theory of the ice-ages discussed in the previous
section requires the last million years to have a special signi-
ficance in the history of the comets. If this were not so, it
would be difficult to understand why the Earth's climate
during the last million years has been so different from the
preceding 100 million years no ice-ages occurred at all
during the whole of this long period. Indeed for over 100
million years, up to the last million years, the climate qf the
Earth was considerably warmer than it is now. This would be
entirely explicable in terms of our theory if the break-up of
ii

FRONTIERS OF ASTRONOMY
comets were an abnormal process belonging to the last million
years, a process that scarcely occurred at all during the pre-
ceding 100 million years.
The toppling over ofthe Earth
Not all evidence of glaciation can be explained completelyin the manner discussed above. Several hundred million years
ago glaciations of a very strange sort occurred. The glaciated
areas did not occur at all in the present arctic zones, but in an
arc stretching from Western Australia to India, then to
Madagascar and the central African plateau, and thence to
the western part of Brazil. It would indeed be difficult to
explain this except on the basis that the arctics, tropics, and the
temperate zones were differently situated in the distant pastfrom what they are today. We need to suppose that some 200
or 300 million years ago one of the poles, probably the south
pole, was moving around very considerably from place to
place in the Indian Ocean.This idea can be subjected to a test. If regions now in the
tropics were once in the arctic it is necessary that land at
present in the two arctic zones must formerly have enjoyed a
considerably warmer climate than they do now. Was this so?
Evidence from fossilised plants shows that this was indeed the
case. Plants that require a warm climate once grew in Spitz-
bergen, Greenland, and on the antarctic continent. The idea
gains further credence from this evidence.
How then could this have happened? Not I think throughthe continents floating around on the surface of the Earth,
being sometimes in one place and sometimes in another. Howa continent composed of rock some 35 kilometres thick could
contrive to move is something that has never been explained,and until some plausible reason is offered in its support weneed scarcely take the notion of 'drifting continents' at all
seriously. Nor can we accept the idea that the Earth's axis
of rotation, the axis that determines the climatic zones, was
differently aligned in the past to what it is now. The Earth's
axis ofrotation is tilted at an angle ofabout 67 to the plane of
the orbit in which the Earth moves around the Sun. The
12

TOPPLING OP THE EARTH
climatic zones would indeed be altered if this angle were
changed, but a careful analysis by G. H. Darwin showed manyyears ago that such a change is quite out of the question. Thetilt of the axis of rotation cannot have altered by any appre-ciable margin since the time offormation of the Earth.
There remains the more subtle idea that the Earth may have
turned relative to its axis of rotation. Imagine a metal skewer
stuck through a sphere of butter. Evidently the sphere could be
turned even though the skewer stayed fixed the skewer would
simply cut through the butter as the sphere turned. We could
describe this by saying that the sphere had turned relative to
the skewer. Now replace the butter by the Earth, and the
skewer by the axis around which the Earth is spinning. Aturning of the Earth relative to its axis of rotation implies the
same idea as the turning of the butter relative to the skewer.
But we have still to explain how such a reorientation might
happen to the Earth.
Suppose to begin with that the Earth were entirely uniform
in composition. Then suppose a mountain range to developin some part of the surface. According to a recent suggestionof T. Gold the Earth must turn slowly relative to its axis of
rotation until the mountain range comes to lie on the equator.
Formerly it was thought that the equatorial bulge of the Earth
acts as a stabilising influence to prevent such a toppling-overfrom occurring. It is well known that as a consequence of its
rotation the equatorial diameter of the Earth exceeds the
polar diameter by about 27 miles the Earth is slightly
squashed at its poles in other words. The bulge at the equatorwould certainly prevent toppling-over from occurring if the
material of the Earth were rigid. But the material of the
Earth is not rigid; even rocks can move slowly when subjectedto large forces. According to Gold it is just this lack ofcomplete
rigidity that allows the toppling-over to occur. What happensis that the bulge adjusts itself in such a way as the Earth turns
that it is always maintained at the equator, irrespective of
what parts of the surface happen to lie at the equator at anymoment. This is the new aspect of the problem that was not
realised by previous investigators.
Of course in actuality the Earth is not entirely uniform

FRONTIERS OF ASTRONOMY
apart from one mountain range. The interior of the Earth is
not uniform, as we shall see in the following chapter. Nor is
there just one irregularity on the surface. But a similar argu-ment must be applicable in the actual case. The Earth musttake up such a position that all its irregularities are placed in a
suitably disposed position with respect to the equator. Andif for any reason the irregularities should alter, the Earth will
turn relative to its axis of rotation until the new irregularities
arrive at a new position ofstability in which they again become
suitably averaged with respect to the equator.We see therefore that the question of why the Earth is
differently orientated today from what it was about 200
million years ago can be answered by saying that the present
irregularities are different to what they formerly were. Sucha suggestion is entirely plausible. It is especially possible that
the internal irregularities of the Earth have altered duringthe last 200 million years.
It is perhaps a little curious that no one in the past seems to
have given serious consideration to the question of why the
Earth is orientated as we find it: why is Greenland near the
north pole? Why is Ceylon near the equator? I suppose that
if I had been asked these questions a few years ago I would
have answered that the way the Earth happens to be orientated
is a matter of chance, depending on the way that the Earth
happened to be spinning at the time it was formed. But
according to these new ideas no chance enters the issue. TheEarth must be orientated as we find it because of the presentdistribution of its irregularities change these and the orienta-
tion will be changed. Even if a cosmic giant were to turn the
Earth relative to its axis of rotation, as we might turn a model
globe, the Earth given time a few millions of years wouldcome back to its present position. We are balanced in our
present orientation.
It is perhaps a pity that the Earth would take manythousands of years to heel over, otherwise a novel method of
warfare could be suggested. Instead of blowing our enemies to
perdition we could simply turn them up into the Arctic a
much more elegant procedure. This might be done by spendingour resources on the creation of vast inland seas into which we
14

THEORY OF THE ICE-AGES
could pump water from the oceans. Instead of building tanks>
bombs, planes, and battleships, we should concentrate on
building bigger and bigger pumps. Hydraulics would become
the science of the day. High honours would come to those whoinvented better and better pumps, and international espionagewould devote its sinister activities to the winkling out of the
other fellows' watery secrets (which would become a veryserious matter indeed).
The internal theory ofthe ice-ages
We introduced the subject of the toppling of the Earth by
pointing out that ice once lay on strange regions of the Earth
Australia, India, Africa, and Brazil. Now if we explain the
glaciation of such regions by a movement of the Earth relative
to its polar axis, why should we not explain the recent ice-agesof the last million years in a similar fashion? Such ice-sheets
would undoubtedly sweep over N. America and N. Europe if
the Earth were to turn so that the North pole were to fall in
Greenland. This theory would be highly satisfactory if twodifficulties could be overcome.
One difficulty is to make the Earth topple fast enough. Tofit the rapid changes of climate that are known to have taken
place, it would be necessary for the poles to move appreciablyover the surface of the Earth in 10,000 years, or perhaps in
even less time than this. Until recently it seemed most unlikelythat changes so sudden could come about, but recent calcula-
tions by Gold have suggested that perhaps this difficulty is not
so serious as it was once thought to be.
There is a second awkward point. Some thirty million years
ago there were marked disturbances in the contours of the
Earth's surface. During this epoch the great mountain rangeswere thrust up the Himalayas, Rockies, and Alps, amongothers. Such changes in the irregularities of the surface mightperhaps have been expected to topple the Earth to an appreci-able degree. Yet no appreciable polar-wander took place, andthere were no ice-ages. This can only be explained on the basis
that the present orientation of the Earth possesses a largemeasure of stability and some quite exceptional disturbance is
15

FRONTIERS OF ASTRONOMY
apparently required to shift it. Hence we see that, if polar-wander has been responsible for the ice-ages of the last million
years, then the disturbing agent must have been of outstanding
potency it must have been stronger and more effective than
the process ofuplift ofthe great mountain ranges. The questionthen arises: what was the disturbing agent? It is here that the
difficulty emerges, because no disturbance of the required
magnitude and of the required rapidity of change is known to
have occurred. Certainly no such disturbance has occurred at
the Earth's surface. Indeed the theory can only be saved from
annihilation on this point if marked changes have taken placein irregularities that are situated deep inside the Earth. Thediscussion of the next chapter will show that this hypothesis is
perhaps not so wild as it might at first sight be thought to be.
Let us turn now to the outstanding merit of the theory. If
the North pole were once in Greenland then Siberia must have
lain nearer the equator than it is at present. Consequentlythere should have been no glaciation of Siberia. In fact there
was no glaciation of Siberia.
It has been customary to explain this by saying that precipita-tion was inadequate to build ice-fields in N. Asia. A very cold
climate is not by itself a guarantee that glaciers will form onthe land there must also be sufficient snowfall. For myselfI have always been a little suspicious of this argument. It is
true that precipitation in Siberia was probably less than in
N. America and N. Europe, but I have always felt that ice-
sheets would nevertheless be formed if the temperature waslow enough.Here then we have a notable difference between the two
theories described in the present chapter. Ifthe meteoric theoryis correct the lowering of temperature during an ice-age must
have operated over the whole Earth, and in particular in
Siberia. If on the other hand the polar-wander theory is
correct the temperature in Siberia must have been higher, not
lower, during an ice-age than it is now. Similar differences
apply to other parts of the Earth. The polar-wander theory
requires the N. Atlantic to have been colder during an ice-age,but the N. Pacific should have been warmer. Australia on the
other hand should have been colder. It will eventually be
16

THEORY OF THE ICE-AGES
possible to check these different predictions. For instance, the
ocean temperatures of the past can be ascertained in various
ways. By carrying out measurements of ocean temperatures
systematically over the whole Earth it is likely that enoughinformation can be obtained for a clear-cut decision to be
made between the two theories. On which do you put your
money?

CHAPTER TWO
The Working Earth
It has often been supposed that we possess a ready perceptionofthe three dimensions ofspace. But this is not really so. Everystudent of geometry knows that it is much easier to think about
problems in two dimensions, problems that can be completely
represented on a sheet of paper, than it is to think about
problems in three dimensions. Intuition cannot be trusted in
three dimensions, as it can in two. Engineers and architects
recognise this in their use of drawings and plans, which
ingeniously seek to represent three dimensional objectsmachines and buildings, in a two dimensional way. Yet weare not wholly lacking in our perception of a third spacial
dimension. Perhaps we should say that our perception extends
to two and a half dimensions.
The reason for this somewhat curious state of affairs lies in
the way we live, and in a past evolution that has equipped us
with rather defective sense organs. We judge distances anddirections over the surface of the Earth with commendable
accuracy, and it is no doubt from this that we derive our
geometrical abilities in two dimensions. But our idea of the
third dimension, up and down, is woefully inaccurate. Lookout over an impressive landscape, and you get the idea that
distances upwards through the air are as great as distances over
the land. This gives us the notion that the atmosphere is a big
place. Yet the atmosphere is no more than a thin skin surround-
ing the Earth like a single thickness ofpaper pasted on a billiard
ball. Our whole existence lies in this skin and all our intuitive
notions about the Earth are derived from it. Creatures that
move in the air probably have a better intuitive grasp of the
three dimensions of space than we have. But such creatures
do not possess the powers of analysis to find out the thingsthat they do not intuitively perceive. Herein lies our special
18

THE WORKING EARTH
strength. From our studies of two dimensions we have de-
veloped methods that can be extended with complete pre-
cision, if not with intuition, to three dimensions and even to
four or more dimensions. And by analysis we can probe into
the Earth, and can find out what it is made of, and about the
things that are happening inside it.
What the interior of the Earth is like
The planet we live on is not just a ball of inert material.
During past ages dramatic changes have taken place inside
the Earth. Indeed it is likely that without these changes life
could never have originated on the Earth. And changes are
still going on today. They show themselves in the occurrence
of earthquakes, in the outbursts of volcanoes, and in the uplift
ofmountain ranges.In outward appearance the Earth is a nearly spherical ball
with a radius of some 6,350 kilometres. Internally the Earth
consists of two parts, a core and a mantle. An essential dis-
tinction is that the core consists mainly of liquid and the
mantle mainly of solid rock. The core extends outwards from
the centre to a distance of some 3,450 kilometres. The mantle
as its name implies is an outer covering extending from the
core to the surface of the Earth.
Judged by ordinary standards the core is made of rather
dense stuff. Bulk for bulk the material at the centre of the
Earth is at least 13 times as heavy as ordinary water, while in
the outer parts of the core the material is about 10 times as
heavy as ordinary water.
The mantle possesses a thin outer crust that is exceptional in
being composed of a particularly light kind of rock, with a
density about 2.7 times that of water (compare this with a
density of 13 at the centre of the Earth). Over the continents
of the world this crustal rock is about 35 kilometres thick,
while over the oceans it is at most only two or three kilometres
thick. Below the crustal layer comes a different, denser rock,
probably of a basic silicate variety. Indeed it seems likely
that apart from the thin outer crust the rocks of the wholemantle are of a basic silicate variety right down to the junction
19
FRONTIERS OF ASTRONOMY
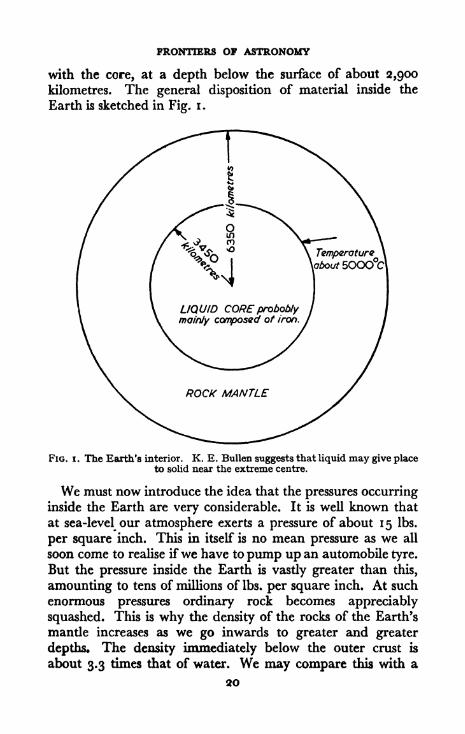
with the core, at a depth below the surface of about 2,900kilometres. The general disposition of material inside the
Earth is sketched in Fig. i.
LIQUID COREprobobtymainly composed of iron.
FIG. i. The Earth's interior. K. E. Bullen suggests that liquid may give placeto solid near the extreme centre.
We must now introduce the idea that the pressures occurringinside the Earth are very considerable. It is well known that
at sea-level our atmosphere exerts a pressure of about 15 Ibs.
per square inch. This in itself is no mean pressure as we all
soon come to realise ifwe have to pump up an automobile tyre.
But the pressure inside the Earth is vastly greater than this,
amounting to tens of millions of Ibs. per square inch. At such
enormous pressures ordinary rock becomes appreciably
squashed. This is why the density of the rocks of the Earth's
mantle increases as we go inwards to greater and greater
depths* The density immediately below the outer crust is
about 3.3 times that of water. We may compare this with a
20

INTERIOR OF THE EARTH
density 4.0 at a depth of 500 kilometres, 4.5 at 1,000 kilo-
metres, about 5.0 at 2,000 kilometres, and with about 5.6 at
the surface of the core at a depth of 2,900 kilometres.
The last of these values raises an important question. Weare now saying that the density in the part of the mantle
immediately outside the core is about 5.6 times that of water.
On the other hand immediately inside the core the density is
about 9.7. This means that at the surface of the core there is
not only a change from liquid on the inside to solid on the
outside, but there is also a very considerable change in the
density of the material, from 9.7 on the inside to 5.6 on the
outside. This change gives an important clue to the nature
of the material that constitutes the core, and the next main
step in our argument will be to consider this question.Before doing this, however, it may be of interest to say a
little about how the results so far mentioned have been obtained.
At first sight it might seem impossible to obtain experimentalevidence about the situation inside the Earth. We shall nowsee that this is not so, that perhaps surprisingly the above
results are all soundly based on experiment.
By good fortune the Earthitselfgoesa longwaytowards reveal-
ing its own secrets. This it does through the earthquake. Earth-
quakes are caused by a fracturing and slipping of rocks inside
the Earth. This happens at all depths down to about 700
kilometres, but not at greater depths. How the rocks come to
fracture, and why apparently they do not do so at depths
greater than 700 kilometres is a problem that we shall take upat a later stage.
When an earthquake occurs vibrations travel away from the
centre of fracture in all directions. Vibrations come vertically
upwards from the fracture to the surface of the Earth often
causing loss of life and damage to property, but they also goinwards towards the centre of the Earth. Such vibrations can
go right through the central regions of the Earth and emerge at
the surface on the far side of the world. The effects of an
earthquake occurring in California can be studied in Singapore,for instance. Indeed the effects of an earthquake occipringin California can be studied all over the world, although verysensitive instruments may be required since the vibrations
21

FRONTIERS OF ASTRONOMY
naturally become very feeble when they have spread out
through the whole Earth.
The behaviour of the vibrations depends on the nature ofthe
material through which they travel. The behaviour dependson the density of the material, and very critically indeed on
whether the material is liquid or solid. Vibrations that have
passed through the core of the Earth always show that theyhave passed through liquid. This is why we can be so sure that
the core is largely composed of liquid. The dependence of the
vibrations on density also shows how the density varies inside
the Earth, yielding the estimates that were quoted above. It
was in this way that the jump of density at the surface of the
core was discovered, a jump from a value of 9.7 on the inside
to about 5.6 on the outside. Much of our knowledge derived
from this source is due to the work of K. E. Bullen.
What is the core made of?
The simplest explanation of why there should be such a
decisive jump of density at the surface of the core is that the
surface of the core marks the boundary of separation between
two entirely different materials. We have seen that the material
of the mantle is probably mainly a basic silicate rock. Wemust now consider what the material of the core is likely to be.
This problem is best tackled by considering what sort of
material would give about the right density for the core.
Taking account ofthe squashing effect ofthe very high pressurein the core, we have to decide what material would givedensities ranging from about 13 at the centre to 9.7 at the
surface of the core. Allowance for the effect of squashing
suggests that such material under ordinary laboratory condi-
tions would have a density of about 8, This places it rather
definitely in what is known as the 'iron group' of elements;
that is to say, material composed mainly of the followingelements: chromium, manganese, iron, cobalt and nickel.
The material might also contain moderate concentrations of
titanium, copper, and zinc.
The density argument will not take us any further than this,
however. It will not tell us which ofthe 'iron group' is likely to
22

THE EARTH'S GORE
be present in the greatest abundance. For this step we must
appeal to astronomy. The Earth belongs to the Universe. So
we may expect its composition to bear some relation to the
composition of other cosmic bodies with the exception that the
Earth being very small fry as cosmic bodies go has been unable
to hang on to the light gases, hydrogen and helium, both of
which are very abundant indeed in the stars, but which are
in only low abundance on the Earth. Particularly we expectthat if the core of the Earth is composed of elements in the
'iron group* then these elements will bear the same proportionsto one another as they do in the stars. On this argument the
composition of the core comes out to be about 89 per cent
iron, 10 per cent nickel, and about i per cent of titanium,
chromium, manganese, cobalt, copper and zinc.
It is possible to test the present conclusion. If we neglect
any small amount of iron that there may be outside the core
our result requires 30 per cent of the Earth to consist of iron.
The remainder is largely basic silicate rock, of which the mainelements are oxygen, magnesium, and silicon. Reckoning the
oxygen at some 30 per cent, magnesium and silicon togethertherefore make up about 40 per cent of the mass of the wholeEarth. This means that the ratio in the Earth of iron to mag-nesium and silicon is about 3/4. The searching question that
we can now pose is: do the stars show the same ratio? If theydo we can feel a considerable confidence in our cosmic com-
parison of the Earth with the stars, and as a corollary we can
feel considerable confidence in our identification of the Earth's
core as an iron-nickel alloy, with iron the greatly dominating
component.
Fortunately the compositions of the stars are well enoughknown for the present question to be answered. It turns out
that in the stars the ratio of the mass of iron to the combinedcontributions of magnesium and silicon is indeed so close to
3/4 as to pretty well clinch our identification ofthe Earth's core
as an iron core.
An interesting supporting argument is worth mentioning.Chunks of matter, known as meteorites, sometimes plunge into
the atmosphere from outer space and manage to penetrate
right through to the surface of the Earth. They ace of two
23

FRONTIERS OF ASTRONOMY
types, a 'stony' silicate variety, and an iron variety. Since the
meteorites are thought to have compositions that are repre-sentative ofbits ofa planet like the Earth, it is natural to supposethatjust as the meteorites are oftwo types so the material ofthe
Earth falls into two categories; the material ofthe rocky mantle
and the material of the iron core.
Care should be taken not to confuse meteorites with meteors.
Meteors are much smaller particles that also enter the atmos-
phere from outside. But whereas the incidence of meteorites is
rare, meteors enter our atmosphere constantly and in quite
large numbers. Meteorites are thought to either representdebris left over from the process of formation of the planets
themselves, or to be products of the break-up ofa small planet.
Meteors, on the other hand, represent debris left over from the
break-up ofcomets.
The temperature inside the Earth
At the surface of the core the temperature must satisfy twoconditions. It must be high enough to melt the iron of the
core but it must not be high enough to melt the rock of the
solid mantle. This means that the temperature at the surface
of the core must lie between two definite limits: it must lie
above the melting point of iron and it must lie below the
melting point of the rocky mantle. If we are fortunate andthese two limits turn out to be fairly close together, then the
temperature at the surface of the core becomes contained to
within a close margin.
Geophysicists have been aware of this possibility for a long
time, but no one could make effective use of it because the
melting point of iron at high pressure was unknown. Veryrecently, however, F. E. Simon has estimated the melting
point of iron at the surface of the core as about 4,000 C.
Reckoning the melting point of the rocky mantle at about
6,000 C, we see that the temperature at the surface of the core
must be greater than about 4,000 C. but less than 6,000 C.
Evidently if we estimate 5,000 C. the margin of error cannot
be very appreciable.We must now add one further idea in order to complete the

THE TEMPERATURE INSIDE THE EARTH
argument. The iron of the core being a metal is a good con-
ductor of heat. It can be shown by a rather technical dis-
cussion, of a sort that will come up again in a later chapter,that there cannot in such a case be much of a variation of
temperature within the core. The core must everywhere be at
very nearly the same temperature. This means that the tem-
perature we have just determined, about 5,000 C., must be
regarded as a quite typical value for the whole core.
The thermal history of the Earth
In the days when it was thought that the Earth originatedin a high temperature molten condition an internal tempera-ture of 5,000 C. would have seemed rather low. But accordingto modern views the Earth was aggregated out of a largenumber of small, cold bodies; and in such a theory an internal
temperature of 5,000 C. does not seem at all low rather is
there a difficulty in explaining how the temperature comes to
be so high.The most obvious possibility is that the Earth is growing
hotter due to the heat that is constantly being released byradioactive substances, of which uranium and potassium are
the most important. That the Earth must be heated in this
way is undoubted. The question is to what degree. Howmuch heating can we expect the radioactive processes have
produced? On the supposition that the Earth was originally
cold, and that none of the heat released has been lost, howhot should the interior now be? This evidently depends onhow much radioactive material was present in the Earth at
the time of its formation. An answer has been worked out byHarold Urey on the very reasonable supposition that the pro-
portion of radioactive material originally present in the Earth
was the same as the proportion originally present in the
meteorites. The latter can be inferred from the observed com-
position of meteorites (when this is taken together with anestimate of their age, about 4,000 million years). The result
obtained by Urey contains an element of surprise. It turns out
that the main heating comes from radioactive potassium, not
from uranium as was at one time believed. But even including
25
FRONTIERS OF ASTRONOMY
the effect of potassium, the degree of heating is rather small.
It amounts to only about 1,500 C.
It was this result that led me to suggest a few years ago that
the temperature inside the Earth might be not very high.". . . We see that there is no direct evidence in favour of an
Earth that is really hot inside. What indirect evidence there is
points in the opposite direction and suggests that the centre
may be no warmer than a wood fire."*
But some pretty direct evidence has since become avail-
able to show that this view was incorrect. We have seen that
the recent work of Simon on the melting point of iron suggeststhat the temperature of the core is about 5,000 C. This is
much hotter than a wood fire. It is even hotter than an electric
furnace, but not quite as hot as the surface of the Sun. Noris it at all hot when compared to the inside of the Sun, where
the temperature exceeds 10,000,000 C. But it is quite hot
enough to demand an explanation!An interesting further possibility has been suggested by
Harold Urey. It would be very artificial to assume that the
iron of the Earth's core all happened to lie in the central
regions at the time that the Earth was formed. This would
require a highly implausible mode of coagulation of the bodies
that went to form the Earth. It would require chunks of
material made largely of iron to coagulate first, and chunks of
material made largely of rock to be added only after an iron
nucleus had thus been built up. Quite apart from there beingno certainty that the originally separate bodies were sharplydifferentiated into iron-bodies and rock-bodies, such a pre-ferential coagulation clearly cannot be accepted. But if the
iron now in the Earth's core was not there originally it musthave sunk to the centre since the Earth was formed. And it
turns out that a sinking of the iron releases energy, thereby
heating the interior of the Earth to an appreciable degree,over and above the heating due to radioactive substances.
Yet ingenious as this suggestion undoubtedly is I suspectthat it is not likely to be the sought-for explanation. The
difficulty is that until the iron has sunk to the centre the tem-
perature ought to be no more than about 1,500 C., and at
*Quotation from The Nature of the Universe.
26
FORMATION OF THE EARTH
this temperature the deep interior of the Earth would be quitesolid. And it seems most doubtful whether the iron could
sink through a solid matrix of rock: the deposits of iron ore
on the surface of the Earth are certainly not sinking inwards.
My suspicion is that the iron would simply stay put, embeddedin the rock, and that no core would be formed. But if this
suggestion does not succeed in solving our problem it does have
interest in raising an important new question, the questionofhow the Earth's core came to be formed. This also demandsan answer.
The following argument gives what I now personally believe
to be the correct solution to the problem of the interior tem-
perature of the Earth. I do this rather diffidently, because
the results of my own calculations in this respect seem to
disagree with those that I can find by other authors. I will
indicate where the difference lies at the relevant stage.
We imagine that the formation of the Earth consisted in the
gradual accumulation of a large number of comparativelysmall cold chunks of material. Even after an agglomerationof appreciable size was formed we may think of a rain of small
bodies continuing to fall on to the surface of the primitive
planet. When a particle hit the surface its motion was destroyedand heat was produced. But this only succeeded in warmingup the surface, not the interior. And any heat released at the
surface was simply radiated away into space. The heating of
the interior had to come about in a different way. As the
primitive Earth grew in size the pressure inside it increased
accordingly. And as the internal pressure increased the material
became squashed, at first very little, and then more and more.
This squashing caused heat to be released, and the heat
caused the internal temperature to rise.
That this process must have occurred is undoubted. The
only issue in doubt is its efficacy. Estimates that I have con-
sulted suggest that the resulting rise of temperature would be
comparatively unimportant, but my own recent calculations
yield a very different result. Perhaps it would be as well to be
specific. Just outside the core, rock has been squashed, from
a normal density of about 3.3 (times that ofordinary water) to
a density ofabout 5.6. This has occurred at a pressure ofabout
27

FRONTIERS OF ASTRONOMY
20 million Ibs. per square inch. Under these conditions I find that
the heat released must have been sufficient to raise the tem-
perature of an equal mixture of rock and iron to a value some-
what in excess of 4,000 G. This agrees almost exactly with
our requirements. It seems natural therefore to suggest that the
present temperature inside the Earth is mainly a survival from
the heating that occurred during the accumulation of the
Earth, the heating being due to the compression of material
produced by high pressure.The inclusion of the effects ofcompression would accordingly
seem to solve the temperature problem. It still remains, how-
ever, to consider the manner of formation of the core. At first
sight it would seem easy to understand how the iron came to
fall towards the inner regions. With the internal temperaturenear 5,000 C. material must have been close to a liquid condi-
tion; and if the material were liquid the iron would certainly
settle to the centre. Yet such a dismissal of the problem glosses
over subtleties. The iron it is true was probably heated suffi-
ciently for it to assume a molten condition (except of course in
the outermost surface layers). But since the rock is not molten
at the present time it would be unsafe to assume that the
melting point of the rocks was also reached at the time of
formation of the Earth. So the problem is not one of a heavy
liquid (iron) falling through a less dense liquid (rock). It is
the problem of liquid iron embedded in solid rock. How in
such circumstances did the iron manage to work its waytowards the centre of the Earth? So far as I am aware the
only attempt that has been made to answer the question in
this form is a theory due to T. Gold. This is a topic suited to a
separate discussion.
Gold"spore theory
We may expect that to begin with the Earth was a hetero-
geneous jumble of different sorts of material. Not only this,
but since we are regarding the Earth as being assembled fromsmall particles there may have been very appreciable initial
differences of composition between places that were quiteclose together. We do not expect the iron to be distributed in
28

THE PORE THEORY
a few large pools, but in a multitude ofsmall pores. Sometimesone porfe would be connected with another, and when this
happened liquid would usually flow between them, rather as
air is found to rush between two balloons placed neck to neck.
In this way there must have been a tendency for increasingly
large pores to be formed.
An important question now arises. When two pores becomethus connected what decides which way the liquid flows
between them? What decides which pore grows at the expenseof the other? The answer is determined by the distances of
the two pores from the centre of the Earth. When the liquidis denser than the surrounding rock, as molten iron is denser
than the surrounding rock, the pore nearer the centre growsat the expense of the other one. (When there happens to be
equality of distance no flow occurs, however.) In this waythe iron has a marked tendency to flow inwards to the centre
of the Earth. It is squeezed inwards by the surrounding rock
whenever any radial channel of communication is openedfrom one volume of liquid to another. According to Gold this
represents the manner of formation of the core of the Earth.
There is an extension of these considerations of special
interest to us who live on the surface. Indeed it seems that this
extension may provide us with an explanation of the outburst
of volcanoes, the incidence of earthquakes, the origin of the
oceans, the formation of mineral deposits, and perhaps even
of the origin of the continents.
Other substances besides iron must have become liquid
during the compression that accompanied the formation of
the Earth. Although iron and magnesium silicates were almost
certainly the dominant materials in the swarm of small bodies
that went to form the Earth, other substances must equally
certainly have been present to a minor degree. Among themwould be many materials that are far more readily liquifiable
than iron is: water, sulphur, tin and lead are examples. Suchmaterials would also form liquid pores inside the Earth andwould be subject to the same sort of behaviour as the pores of
liquid iron but with one important difference in some of the
cases. When a liquid is less dense than the surrounding rocks
the flow from pore to pore is upwards towards the surface,
FRONTIERS OF ASTRONOMY
not down towards the centre as in the case of liquid iron.
Now what happens to the light liquids that are thus squeezed
upwards? When does the squeezing stop? If the outermost
rocks contained no fissures even very light liquids would be
unable to penetrate through them to the surface of the Earth.
This would mean that the light liquids would be trappedbeneath the outermost rocks. Suppose that such a situation
has arisen; that in the first few hundred kilometres of depthbelow the surface a quantity of light liquid has been squeezed upfrom the inner regions of the Earth. The quantity is of course
nothing like so great as the amount of heavy liquid that has been
squeezed inwards because the materials of the light liquids were
present only in low concentrations in the bodies that went to
construct the Earth. Even so the light liquids may perhapscome to occupy a few per cent of the volume of the subcrustal
rocks. The liquid is distributed in pores some of which will be
connected by veins and channels. Let a fissure now develop in
the overlying rock and let the fissure be such as to establish a
connection from the surface down to one of the pores. What
happens? Evidently the pressure of the surrounding rocks forces
the liquid in the pore to gush to the surface. This phenomenonis observed in the outburst of a volcano.
Unless an obstruction develops in the upward vent the whole
pore-full of liquid will rise to the surface. Indeed the liquid in
every pore to which there happens to be a channel of communi-cation will also burst through to the surface. But if a block
develops in the vent this will not happen. Now a block maydevelop simply through the liquid solidifying as it cools on
approaching the surface. Whether this happens or not dependson the melting point of the liquid. Some volcanoes exudelavas ofrather low melting point, about 900 C. At this melting
point there is very little solidification in the vent. For this
reason these volcanoes are capable of ejecting enormous
quantities of lava in quite a short time a whole pore, or evena whole system of pores, being drained in one outburst. Cases
where the lava flow has been immense are known. On the
Deccan plateau of India for instance, there is a lava flow with
a depth of about 2 kilometres and a surface area of some
500,000 square kilometres.
30

VOLCANOES
Some volcanoes, on the other hand, emit lavas of higher
melting -point which have a pronounced tendency to form
obstructive plugs in the output vent. This prevents veryextensive quantities of lava from being spouted out but it
leads to another dangerous phenomenon. Sometimes after a
plug has been formed the movement of liquid in the subcrustal
regions leads to a rise of pressure in the liquid below the solid
plug. If the pressure should become greater than the plug can
withstand a further outburst can no longer be prevented. In
such cases the outburst occurs with extraordinary violence
because of the exceptionally high pressure that the plug has
allowed to build up. This was the process that presumablycaused the tremendous explosion of Krakatoa in 1883.
Fissures of the type required to promote volcanism are most
likely to be found along the chains of the great folded moun-tains. This is no doubt the reason why volcanoes are so
intimately associated with the folded mountains, especiallywith young folded mountains, the old folded mountains,such as the Scottish Highlands, having presumably had all
their fissures thoroughly plugged up by now. It is an interesting
thought that it is possibly only the absence of connecting vents
that saves the Eastern United States and the British Isles froma whole rash of volcanoes.
It may have come as something of a surprise that our first
application of the upward squeezing of light liquids should
have been to the rocky material exuded by volcanoes since wehave always spoken of the rock inside the Earth as being in asolid condition. Yet if the Earth originally contained a light,
comparatively easily melted, type of rock this would probablybecome the most abundant of the light liquids. The existence
of volcanic lavas goes far towards establishing the existence
of such a type of rock. Volcanic lava is the least dense of all
rocks, so that from the present point of view it can certainly beconsidered as a 'light' liquid. Moreover lava, even the lava
ofa volcano ofthe Krakatoa type, has a distinctly lower melting
point than the magnesium silicates, of which most of the rock
of the mantle is probably composed.It seems therefore that we must admit the presence of a low
density fluid rock inside the Earth at the time of its formation.

FRONTIERS OF ASTRONOMY
Now it seems rather unlikely that this exceptional sort of rock
was present only in the very minute quantity that is necessaryto explain the lava flows from known volcanoes, active andextinct. Rather would we expect that a lightweight fluid
rock, if it were present at all would be present in a concentra-
tion of at least a per cent or two. The rising of the lightweightfluid would then lead to the Earth developing an outer zone
oflow density rock.
But the Earth does in fact possess a covering of particularlylow density rock, the rocks of the crust, especially the rocks of
the continents. It was previously something of a mystery howthe continental rocks managed to get on the outside of the
Earth. The explanation now seems obvious. The continents,
being composed of low density rock of low melting point, were
simply squeezed outwards from the interior of the Earth bythe denser solid rock of the mantle.
This does not mean that the material of the continents wasall poured out by a vast number of unknown volcanoes in the
distant past. In the case of a volcano liquid rock oflow densityreaches the surface of the Earth. This is an unnecessarily
stringent condition so far as the building of the continents is
concerned, for all that is required in order to increase the
continents is that additional rock should be added at their
base there is evidently no need for the rock to burst throughto the surface, except in order to establish some initial thick-
ness of the crustal rocks.
Now once we come to think that the continents were
squeezed out from the deep interior of the Earth it puts nostrain on the imagination to think that the water of the oceans
was also squeezed out of the deep interior. It would indeed
be difficult to deny that the Earth's interior must have been
an important source of surface water, except on the suppositionthat the bodies out of which the Earth accumulated did not
contain any water.
It is of interest to notice some of the evidence that seems to
favour the theory developed above. The evidence is perhapsbest discussed as a separate topic.

URANIUM IN THE EARTH'S CRUST
The internal origin of the continents and oceans
It appears likely that the crustal rocks contain a much
higher concentration of uranium than the normal rock of the
mantle does. Certainly the rocks of the crust contain a verymuch higher concentration of uranium than the meteorites do,and the rocks of the mantle are likely to be much more similar
to the meteorites than they are to the crustal rocks.
Part of the explanation of this curious situation comes from
the exceptionally large size of the uranium atom. It is easier
for a large atom to fit itself into the interstices between the
atoms of a light kind of rock than between the atoms of a dense
form of rock. This is simply because the atoms that form a
light rock are farther apart than the atoms of a dense rock.
Thus a uranium atom, if it is given its choice, will prefer to
make its home in the rocks of the crust rather than in the
interior rocks of the mantle. But how does the uranium atomcome to be given its choice? The answer to this forms the
second part of the problem.We must, I think, regard the uranium as being initially dis-
tributed pretty well uniformly throughout the Earth. Howthen did the uranium manage to get concentrated in the
surface rocks? The only plausible explanation for this, ofwhichI am aware, is that the uranium was brought to the surface bythe crustal rock itself. We can readily visualise in terms of the
pore theory how this happened. Consider a pore of light liquidrock initially deep inside the Earth but subsequently to be
squeezed outwards to join the rocks of the crust. At the surface
of the pore, where the liquid meets the solid denser rock of the
mantle, uranium will tend to pass from the dense rock to the
light rock for just the reason explained above. Now the liquiddoes not stay permanently in contact with the same piece of
solid rock. On its journey outward it is constantly coming in
contact with new samples of the dense rock of the mantle anduranium constantly passes to the liquid rock. In this way the
pores act as collectors of uranium. They tend to sweep the
interior clean of uranium and to carry it out to the surface.
This it would seem is the explanation of the excess concen-
tration of uranium in the crustal rocks. A similar process' must
33

FRONTIERS OF ASTRONOMY
operate to concentrate other atoms of large size, for examplethe elements lead, gold, platinum, and mercury.Let us next consider the problem of the formation of sub-
marine canyons, reminiscent of the canyons cut by rivers onland (the Grand Canyon for instance). The submarine
canyons are often located in places where existing rivers, or
formerly existing rivers, would have extended their flow if
the level of the oceans were once much lower than at present.It is natural therefore to suggest that the oceans were once
appreciably lower than they are now, and that the canyonswere then cut by the rivers. The Hudson is a river that
possesses one of these great offshore canyons.An internal origin for the oceans provides an immediate
answer as to why the sea was at one time much lower than at
present because in the past less water had been squeezed out
of the Earth's interior. But a difficulty arises, a difficulty so
serious that many geologists have abandoned the straight-
forward theory that the canyons were cut by rivers and have
come to prefer the notion that the cutting has been done bysubmarine mud chutes. Since many of the canyons have been
fashioned out of rather hard rock this suggestion seems some-
what absurd try to punch someone when you are under
water and the absurdity becomes obvious.
The argument against the view that the now submerged
canyons were once cut by rivers arises from the fact that their
beds are very much steeper than the river bed of any known
canyon on the land. The floor of the Hudson canyon is about
ten times steeper than the river bed of the Grand Canyon, for
instance. Not only this, but it is pointed out that if by some
magic the level of the sea were to fall and the rivers were to
flow down the now submerged canyons the resulting tre-
mendous cascades of water would very soon lead to drastic
changes in the forms of the canyons. As this argument is
almost certainly correct, how can we suppose that the canyonswere ever cut by rivers? If they had been cut by rivers, wouldnot their beds have been much less steep than they are observed
to be?
This argument depends for its force on the assumption that
over the time since the canyons were cut the continents have
34

ORIGIN OF THE OCEANS
remained substantially unchanged. But if the continents have
been considerably augmented by further additions of light
rock arriving at their bases from the interior of the Earth then
the difference of level between the continents and the ocean
bottoms must have been increasing steadily all the time. This
means that the drop between the continental edges and the
ocean depths must have been steadily steepening. And anycanyons that were cut in this slope by the action of ancient
rivers must have steepened correspondingly. In this way it is
possible to reconcile the cutting of the canyons by river action
with the present steepness of their beds. That the dilemmacould be resolved by such a steepening of the continental
margins was pointed out some years ago by F. P. Shepard.Mud chutes probably do enter the problem in one respect.
They may well operate to prevent the canyons from becomingsilted up.
More about the pore theory
The idea that the light fluid rock responsible for the forma-
tion of the crustal rocks may have carried the water of the
oceans with it is capable of extension. Quantities of other
readily liquifiable materials must also have mixed with the
molten rock, and must thereby have been carried outwards
to the crust by the squeezing process. In cases where the
molten rock managed to gush to the extreme surface these
materials would also reach the surface. It was almost cer-
tainly in this way that the highly volatile substances that wefind on the Earth managed to reach the surface the com-
pounds of arsenic, and of mercury, the deposits of almost
pure sulphur, and so forth.
Sometimes a pore filled with light fluid rock must have
become connected to a pore filled with heavy liquid; the heavyliquid being composed mainly of iron, to a lesser extent of
nickel, and in a minor degree of titanium, chromium, man-
ganese, cobalt, copper, zinc, lead, etc. If the pore containingthe rock should happen to be nearer the centre of the Earth,the light liquid would rise into the upper pore, and the heavy
liquid would drain downwards. The two liquids would thus
35

FRONTIERS OF ASTRONOMY
stream past each other, and in so doing some of the heavy
liquid would become dissolved in the light liquid, since it is
known that molten rock dissolves small quantities of the metals
quite readily. Such dissolved metals do not increase the
density of the liquid rock significantly, however, and therefore
would not prevent it from being squeezed outwards in the
manner we have already discussed. The effect of this process is
to cause small quantities of the core-forming metals to be
carried upwards to the outer crust.
If the rock carrying these metals should manage to spout to
the extreme surface then the metals would be carried to the
surface, but their concentration in the outward streaminglava would not be high. To explain the high concentration
found in many ore deposits it is necessary to appeal to a rather
different process.
Suppose liquid rock manages to come close to the surface
but without a complete break-through occurring. We expectthat the rock will circulate around in a fine network of thin
veins, located at a depth of perhaps a few miles. Owing to the
comparatively low temperature of the outermost parts of the
Earth there will be a pronounced tendency for these liquid
rocks to solidify; and given sufficient time they will certainlydo so, unless a circulatory connection is maintained with
material at significantly greater depths where the temperaturesare much higher. Such a connection requires the network of
veins to possess roots that extend downwards to the base of
the crustal rocks at least.
Evidently there will be cases where the circulating rocks
almost solidify. It is in such cases that the deposition ofmineral
ores is likely to occur. For if the main body of the rock only
just escapes solidification any material dissolved in it that
happens to have a higher melting point will indeed solidify
at some place in the circulatory system. The place where this
happens will depend on the temperature distribution within
the circulating rock and on the melting point of the material
in question, and will be quite critically located. So as the
rock circulates the dissolved material will always solidify out
at approximately the same definite place. A high concentra-
tion of the material will therefore be built up at this place.
36

MINERAL DEPOSITS
In such a way rich deposits of iron and other metallic ores can
be formed. It is of course the situation that such ore depositsmust always be formed below the extreme surface. But sub-
sequent folding, buckling, and erosion of the outermost rocks
can lead to the veins being brought to the surface.
Gold considers this explanation of the origin of metallic
ores to be one of the strongest points in favour of the pore
theory. He also believes that the occurrence of another im-
portant sort of deposit may possibly be explained in terms of
the pore theory, namely the deposits of oil.
The idea that oil, so important to our modern civilisation,
has been squeezed out of the Earth's interior derives an im-
mediate plausibility from Urey's discovery that the meteorites
contain small concentrations of hydrocarbons. The presenceof hydrocarbons in the bodies out of which the Earth is formed
would certainly make the Earth's interior contain vastly moreoil than could ever be produced from decayed fish a strange
theory that has been in vogue for many years.
Among the many remaining aspects of the pore theory wehave just space to discuss one more. To end with I have
reserved what is perhaps the simplest and most striking con-
sequence of the theory. This is the explanation that it affords
of the origin of earthquakes. We have seen that liquid flows
from one pore to another. When this occurs an unoccupied
space develops in the pore that happens to lose liquid. Then
owing to the pressure in the surrounding solid material the
unoccupied space tends to get filled in with rock. If the pore
empties quickly enough the filling-in process can lead to a
catastrophic collapse of the surrounding wall of rock andthis is exactly the sort of event that would manifest itself as
an earthquake. It is clear that we should expect just the close
connection that is actually found to occur between volcanoes
and earthquakes.Now why do earthquakes not occur at depths greater than
about 700 kilometres? Perhaps because all the liquid that was
originally present in the deeper parts of the mantle has bynow either been squeezed down into the core or into the outer
parts of the mantle. Perhaps there are no pores of liquid still
remaining in the mantle at depths greater than 700 kilometres.
37

FRONTIERS OF ASTRONOMY
The simplicity of this explanation contrasts with the difficulty
that is otherwise encountered. Without the pore theory one
would have to argue that a change in the composition of the
solid rock occurred at a depth of about 700 kilometres above
700 kilometres the rock being liable to fracture, but below
700 kilometres the rock being such as will not permit fracture.
Such a change if it occurred ought to be accompanied bysome major change in the density of the rock. Yet no such
major change exists.
Thefuture changes of the EartKs interior
The theory we have considered suggests that down to a
depth of several hundred kilometres the Earth is probably
honeycombed with a network of pores and interconnectingchannels containing 'light' liquids that are constantly tryingto force themselves outwards to the surface. Since the amountof liquid so contained may amount to as much as a few per cent
of the amount of solid surrounding rock, it is clear that the
amount of liquid if it were all to break through to the crustal
rocks would be sufficient to produce profound modifications
in the surface features of the Earth.
It seems likely that the continents will continue to grow andwill continue to lift themselves above the ocean bottoms. Theseas will likewise continue to acquire more and more water.
The addition of further quantities of light rock to the bases of
the continents may well be a somewhat patchy process: morerock may be added in one part of a continent than in another.
Ifso one part ofa continent will be elevated more than another.
Unevenness of this sort will produce lowlands and highland
plateaus, and may even be an important component in the
origin of mountain ranges.If our prognostication that the oil deposits have also been
squeezed out from the interior of the Earth is correct, then wemust I think accept the view that the amount of oil still presentat great depths vastly exceeds the comparatively tiny quantitiesthat man has been able to recover. Whether it will ever be
possible to gain access to these vast supplies is an entertaining
speculation.
38

EARTHQUAKES
It has sometimes been said that our civilisation is gobbling upthe mineral resources of the world, and that when they are
exhausted the conditions that we are now enjoying will never
again be experienced. This view is probably incorrect. Newmineral deposits will be laid down by the processes we havediscussed and new reserves of oil will be squeezed up frominside the Earth. Conditions will again become suited to anindustrial civilisation. Yes, but when? several hundredmillion years hence.
39

CHAPTER THREE
The Tap Root
Thefour revolutions ofphysics
It is not only the smallest features of the Universe that are
controlled by the laws of physics. The behaviour of matter
on the very large scale that concerns us in astronomy is also
determined by physics. The heavenly bodies dance like
puppets on strings. If we are to understand why they dance
as they do, it is necessary to find out how the strings are
manipulated.
Physics has developed in three major steps, or if we include
the revolution of thought that is taking place at the present
time, in four major steps. The first era was concerned with
the study of gravitation and with the dynamics of massive
moving bodies, an era overwhelmingly associated with the work
of Newton. The outstanding achievement of this first phasewas the demonstration that the properties of the physicalworld can be described and predicted with a precision that had
previously been unexpected and unhoped-for. Science did
better than even its warmest protagonists had anticipated.The further development of the Newtonian era is associated
with the names ofthe Bernoullis, Euler, Lagrange, and Laplace.But in spite of the impetus added by these outstanding men,the first great scientific revolution had largely lost its momentumby the middle of the nineteenth century, and physics in order
to come alive again had to enter its second era.
The second erawas concerned with the electrical and magnetic
properties of matter in bulk, and with the nature of radiation.
The establishment of the experimental basis of this second
phase is notably associated with the name of Faraday, and its
theoretical description with that of Maxwell. It was this
revolution that ushered in the age of electricity. Modern
40

THE TAP ROOT
industry is now entirely dominated by the discoveries of this
era: the modern science of electronics stems directly from it.
This is an opportune moment to say something about the
properties of radiation. Radiation is composed of individual
units, known as quanta. When there are enough of them the
quanta arrange themselves in wave patterns. Each pattern
possesses a wavelength, and it is by wavelengths that we
usually describe radiation. For instance radiation with 'long*
wavelengths, from several thousand metres down to about
one-tenth of a centimetre is just the radio wave-band. Froma wavelength of one-tenth of a centimetre down to 8 hundred-
thousandths ofa centimetre we have the range of the infra-red.
Then from 8 hundred-thousandths to 4 hundred-thousandths
comes ordinary visible light. The ultra-violet comprises the
range from 4 hundred-thousandths down to a millionth of a
centimetre; from a millionth to a thousand-millionth is the
range of X-rays; while radiation of still shorter wavelengths is
known as y-rays, now unfortunately only too well known fromits presence in atomic explosions. All this is summarised as
follows:
GLASS OF RADIATION WAVELENGTH RANGE
Radio-waves Several thousand metres down to atenth ofa centimetre.
Infra-red One-tenth down to 8 hundred-thou-
sandths of a centimetre.
Visible light 8 hundred-thousandths of a centi-
metre down to 4 hundred-thousandthsUltra-violet light 4 hundred-thousandths down to one
millionth of a centimetre.
X-rays One millionth down to one thousand-
millionth ofa centimetre.
y-rays Wavelengths shorter than one thou-
sand-millionth of a centimetre.
It is worth noting that the shorter the wavelength the more
energetic the individual quanta become. It is because of this
that y-rays, X-rays, and even ultra-violet light are so destruc-
tive of animal tissue, and why radio-waves are so harmless.

FRONTIERS OF ASTRONOMY
A further interesting point is that of the vast range of wave-
length from radio-waves to y-rays only the narrow band from
8 hundred-thousandths to 4 hundred-thousandths of a centi-
metre can be detected by the human senses with reasonable
precision (other wavelengths can sometimes be crudelydetected by a heating effect on the skin). This confinement
of human vision is not an accident, however, because this is
just the range in which most of the Sun's radiation is emitted.
It is true that the Sun does emit some ultra-violet and even
some X-rays, but the Earth's atmosphere absorbs such des-
tructive radiation quite strongly, thereby preventing it from
reaching the ground. Consequently there has never been an
opportunity for creatures on the Earth to develop senses
receptive to these wavelengths. Similarly most of the infra-red
from the Sun is absorbed by the water vapour in the Earth's
atmosphere you may remember the greenhouse effect dis-
cussed in the first chapter. Yet there are narrow bands of
infra-red that do succeed in penetrating through the atmos-
phere (these bands do not affect the operation ofthe greenhouse
effect), so that the failure of our eyes to accept these bands
cannot be explained by a similar argument of biological
evolution. Plate III shows two photographs of the same scene
one taken in visible light and the other in infra-red (photo-
graphic plates sensitive to a limited range of the infra-red
from about a wavelength of 12 hundred-thousandths of a
centimetre down to 8 hundred-thousandths can be madeas can plates sensitive to ultra-violet light, X-rays, and y-rays).
Evidently the infra-red gives a far greater penetration in
distance. This is because of small water droplets that are
always present in the lower parts of our atmosphere. In
contrast to water vapour these droplets absorb visible light
much more readily than they absorb infra-red. Hence in the
lower atmosphere, where droplets are a dominating influence,
penetration is always less in visible light. Clearly it would be
a great advantage to possess eyes that were sensitive to infra-
red, as indeed I suspect that birds may. This would go far
towards explaining the amazing eyesight that birds seem to
possess.
Even though this diversion is now becoming somewhat long,
4*

THE NATURE OF LIGHT
we may notice that a similar situation occurs with sound waves.
Sound can be described in terms of wavelengths, as radiation
can, but sound ordinary sound is a disturbance of the air,
whereas radiation is an electric oscillation in space: radiation
can travel across a vacuum but sound cannot. The pitch of a
note of sound is an indication of wavelength, while colour is
an indication of the wavelength of visible light the whole
range of colours, violet, indigo, blue, green, yellow, orange,and red lie in the range of wavelengths from 8 hundred-
thousandths of a centimetre down to 4 hundred-thousandths,red at 8 hundred-thousandths and violet at 4 hundred-
thousandths.
The wave nature of light was an important discovery of the
second phase of physics. Before the second phase had been
allowed to run its course, physics was already in the throes
of its third revolution. This opened quietly enough, at the
beginning of the present century, with Planck's discovery of
the quantum nature of light. But soon with the coming of
Einstein's theory of relativity, Rutherford's work on the atom,Bohr's quantum theory, and later the new quantum theory,scientists were plunged into an intellectual maelstrom out of
which it seemed that they had come unscathed by the earlynineteen-thirties.
Much of the present chapter will be concerned with a verybrief description of some of the knowledge that has been wonin this third phase, knowledge that has led to almost explosive
progress in astronomy. It is interesting in this connection to
notice that physics in its first phase was very largely concerned
with astronomy. Then during the second phase interest
swung away from the heavens to the terrestrial laboratory.Now something of a reversal of this trend has come about, but
it has only come about through the knowledge that has been
won in the laboratory. Astronomy could never have climbed
to its present height if it had been obliged to remain in the
Newtonian era.
It seemed at one time in the middle nineteen-thirties as if
physics was destined for a rather lengthy period of compara-tively tranquil development. It seemed as if the calm after
the storm had been reached. But appearances were deceptive.
43

FRONTIERS OF ASTRONOMY
The calm presaged the bursting of another storm, a storm that
seems to be even more violent than before, a storm that does
not yet seem to have reached its height.
The fourth revolution of physics started in 1938 with the
discovery of a new type of material particle by C. Anderson.
This turned out to be typical of later discoveries. By now about
14 new sorts of particles have been found. All are evanescent.
All change either directly or by a series of intermediate steps
into previously known particles (whose nature will be discussed
later in this chapter). What lies behind this plethora of evanes-
cent particles is still quite unknown, and how physical theorywill develop in the future is still quite uncertain. It is to be
expected that the patient accumulation of new data must
precede any startlingly new theoretical developments, muchas happened in the three preceding phases of physics.
The discoveries of the last few years have come rather as a
shock. In the middle thirties physicists were beginning to
think that they had at last dug through to bedrock. To have
such a pleasant dream so rudely shattered in a few short yearswas naturally a somewhat disturbing experience. But nowthat the worst of the shock is over most physicists, I think, are
coming to the view that the present situation is really a very
healthy one. Looking back it is becoming clear that without
the new developments physics must soon have found itself at
a dead-end.
It is still far too early to offer any opinion as to how the
fourth revolution in physics will affect astronomy. Astrono-
mers seem fairly confident that most of their problems are not
likely to be concerned with anything more than the third phaseof physics. There is one important problem, however, where
this may not be so. This is the problem of cosmology. Whenin the last chapters we come to speak about the origin ofmatter
(and a consideration of this problem can be shown to be un-
avoidable) it is difficult to resist the impression that new
physical knowledge may turn out to be of overriding im-
portance at just this point. When we come to examine the
ultra-small we find that our present knowledge peters out in
shifting sands. When we come to examine the ultra-large wefind that it does likewise. It is tempting to suppose that ignor-
44
BUILDING OUT OF ATOMS
ance in the one field bears a relation to ignorance in the other.
Certainly it would be quite astonishing if radically new
physical knowledge of the nature of matter should have no
application to the Universe in the large.
Building out of atoms
Everyone is familiar with a child's constructional toy in
which certain basic components are purchased that can then
be built into a variety of structures. A vitally important con-
cept underlies the use of such toys, a concept that has applica-tions that are anything but toylike. Let us take one or two
important examples. The electronic computer, a great moderninvention almost certainly destined to have a decisive influence
on human history, is built out of what are in themselves quite
simple units. All animals and plants are also built out of basic
units. Our interest in both these cases can be divided into
separate parts: a consideration of the units by themselves, anda consideration of the structures that can be built out of the
units. The structural element must not be overlooked. Theunit out of which a human is made is not in itself, when taken
alone, more interesting or remarkable than the unit out of
which a cabbage is made: the added interest comes only whenwe go on to consider the structural organisation into whichthe human unit can be built. A fine building is somethingmore than the pile of bricks out ofwhich it is assembled.
On a still smaller scale matter is constructed in a similar
way, out of units called atoms. There are 90 different sorts
of atoms occurring naturally on the Earth, while an additional
half-dozen or so can be prepared artificially in the laboratory.
Physics is conveniently divided into two parts a study of the
atoms themselves and a study of the structures that can be
built out of them. We shall begin with the second of these,
although most of what is to follow in this chapter will be con-
cerned with the first.
Matter in bulk is constructed out of atoms, either as a single
stage process, or in two stages. In the single stage process a
particular type of atom forms the building unit this is the
situation with most of the metals, for instance. In the two stage
45

FRONTIERS OF ASTRONOMY
process a number of atoms, often of several different kinds, are
first combined into a molecule and it is the molecule that then
acts as the building unit. A water droplet is a structure built
out of a simple molecule, consisting of two atoms of hydrogenand one ofoxygen (hydrogen and oxygen being different atoms
whose internal properties we shall discuss later). Water vapour,on the other hand, consists of separate molecules uncombinedinto any structure. While the molecule out of which sugar is
built is much more complex than the molecule of water, the
structure of sugar is simpler than that of liquid water: from
which we see that a simple molecule does not necessarily build
into a simple structure, nor does a complex molecule necessarily
give rise to a complex structure.
It may be remarked as an aside that simple molecules are
sometimes found in the atmospheres of stars of those stars
with particularly cool atmospheres, cooler than that of the
Sun; but molecules are too fragile to exist in the fiercely hot
interiors of the stars. Molecules are present to an important
degree in the gases that lie between the stars where their
presence leads to considerable astronomical complexities.We may add a note on how small atoms and molecules are
when judged by ordinary standards. Even a pin's head con-
tains considerably more than a million, million, million atoms
of iron, while a pig's head contains more than a million,
million, million, million molecules of water.
Solids, liquids, and gases
When in an assembly with a large number of atoms or mole-
cules the individuals can move freely around among their
neighbours the bulk material is said to behave as a gas. But
when the behaviour of one particle is appreciably influenced
by its neighbours the material has either the properties of a
liquid or of a solid. In a solid this interaction is sufficiently
strong to entirely prevent the individuals from wanderingaround in a nomad existence: they stay put in definite posi-
tions, like the average worker in a modern industrial com-
munity. Liquids are intermediate between gases and solids.
In a liquid the interaction between neighbouring individuals

ELECTRONS
is neither so small as it is in a gas nor is it so large as to preventthe molecules from wandering around, as in a solid.
It is the interactions of molecules with their neighbours that
produce the well-known properties of materials in everydaylife: the difference between the fluidity of water and the
stickiness of molasses, the tensile strength of solids, and so
forth. Indeed the cohesive strength of a material comes from
the interactions of atoms or molecules with their neighbours,rather as the strength of a human community comes from the
extent to which the individuals co-operate with each other.
Atoms
It is now appropriate to consider the inner structure of the
atoms themselves. An account of this inner structure was first
given by Rutherford, according to whom the main substance
is contained within a tiny central nucleus that is surrounded
by a comparatively extensive diaphanous cloud of particles
known as electrons a name derived from their electric pro-
perties. It is these electron clouds that become associated
when a molecule is formed out of separate atoms. It is also
the electron clouds that are responsible for the interactions
that occur in solids and liquids.
Sometimes electrons get knocked out of an atom. When this
happens the atom is said to be ionised, the degree of ionisation
being determined by the number of electrons that have thus
been knocked out. Such knocked-out electrons were indeed
discovered by J. J. Thomson some years before the work of
Rutherford.
There are many ways of knocking electrons out of atoms.
The simplest is to rub two surfaces together. The shock that
you may get from sliding on the plastic seating ofan automobile
is due to electric effects that arise from the knocking-out of
electrons; so is the crackling that you may hear when a nylonor a silk garment is taken off on a day of low humidity;so is the lightning in a thunderstorm knocking-out occurs
in this case when large water-drops fragment into smaller
ones.
The rubbing of surfaces is not the only way that atoms may47

FRONTIERS OF ASTRONOMY
become ionised. When light falls on an atom, electrons maybe knocked out. This is known as the photo-electric effect. It
forms the basis of many technological processes. When a door
opens, apparently by itself, as you approach it, you can be
pretty sure that the photo-electric effect is being used. More
important, electric effects produced by light form the physio-
logical basis of human sight.
But important as the photo-electric processes occurring in
everyday life undoubtedly are, they are still very weak com-
pared with the situation inside the stars, where the intensity
ofradiation is so great that the knocking-out process is extremely
powerful. Nowhere in the Universe is the photo-electric effect
as strong as it is inside stars.
When one or more electrons have been knocked out of an
atom, the atom develops the property of attracting electrons
towards itself. Sometimes an electron from outside such an
atom may come so close that it is pulled into the electron
cloud of the atom itself, in which case there is a good chance
that it will remain permanently within the cloud, instead of
moving out again. When this happens radiation is emitted.
This process is just the reverse of the photo-electric effect.
Most of the light and heat that we now receive from the Sunand the stars was emitted by atoms that managed to capture
wandering electrons in this way.We see therefore that there are two contrary processes in
nature, one a knocking-out process that removes electrons
from atoms, and the other a recombination process in which
atoms capture electrons. What happens in any particular
physical environment depends on the balance between these
processes. On the Earth knocking-out processes are for the
most part comparatively weak, with the result that the great
majority of terrestrial atoms are not ionised. Inside the stars,
on the other hand, the photo-electric effect is so strong that
nearly all the electrons are stripped out of the atoms.
Protons
A vitally important problem remains from the previous dis>
cussion; namely to decide what the nucleus of the atom is com-
48

PROTONS
posed of. We may start with the simplest of the chemical
elements, hydrogen. Hydrogen is the simplest element because
it has but one electron in its outer cloud, whereas all other
elements have more: the helium atom has 2 cloud electrons,
the lithium atom 3, beryllium 4, boron 5, carbon 6, nitrogenhas 7, oxygen 8, iron has 26 electrons, lead has 82, uranium
92; and of the new elements, recently artificially producedin the laboratory, neptunium has 93, plutonium has 94,americium 95, and californium 96.
The nucleus of a hydrogen atom has an electric charge but
of a different sort from that of the electron. To distinguishbetween the two kinds of charges we notice that two particles
with the same type of charge tend to push away from each
other. On the other hand two particles with opposite kinds of
charge pull towards each other. So while two electrons push
away from each other, the nucleus of the hydrogen atom andits surrounding electron pull together. This cohesion explainshow the hydrogen atom holds together. The nucleus of the
hydrogen atom has been given a special name; it is called a
proton.The concept of electric charge has a simple numerical
property. Let us write + i for the charge of the proton, and- i for the charge of the electron. Then the total charge of
7 protons is + 7, and the total charge of 5 electrons is -5.
Now what is the total charge of 7 protons and 5 electrons whentaken together? The answer is
+ 7-
5 = + *
This means that a group of 7 protons and 5 electrons has the
same total charge as 2 protons. What is the total charge of the
hydrogen atom with i proton and i electron? The answer is
+ i - i = o
The hydrogen atom has zero total charge, the electron andthe proton just compensate each other. We say, in such a case,
that the atom is neutral.
Electric compensation also occurs in all other un-ionised
atoms. In the un-ionised oxygen atom, for instance, the nucleus
has the same electric charge that 8 protons would have, while
49 c

FRONTIERS OF ASTRONOMY
in the surrounding cloud there are 8 electrons. Now how doesthe nucleus of the oxygen atom contrive to have the same
charge as 8 protons? The answer given by physics is simpleand straightforward: because the nucleus of the oxygen atomcontains 8 protons. And in a like manner the nuclei of other
atoms are regarded as containing a number of protons, a
number that for neutral atoms is always equal to the numberof electrons in the surrounding cloud. The element helium
accordingly has 2 protons in its nucleus, lithium has 3, beryllium4, boron 5, carbon 6, nitrogen 7, . < . iron has 26, and uranium
92.
We are now in a position to describe the answer given bymodern physics to one of the great classical problems of science;what decides the chemical properties that an atom possesses?The number of protons contained in the nucleus determinesthe number of electrons in the surrounding cloud. This fixes
all the building properties of the atom. Hence we reach the
simple and elegant conclusion that the chemistry of an atomis determined by the number of protons in its nucleus.
The co-existence ofmore than one proton in all nuclei exceptthat ofhydrogen shows us that an entirely new type of cohesiveforce must operate in the nucleus, a cohesive force that is notelectrical in origin. We have seen that particles with the samesort of electric charge tend to push away from each other.
Clearly then the protons in a nucleus, the 8 protons in the
oxygen nucleus, for instance, would simply push apart fromeach other unless they were held together by some new force
more powerful than the electric forces. This new force is
called the nuclear force. It is thought to be intensely strongso long as the protons are very close together. This is indeed
why the atomic nuclei are so small in size, for it is only if thenucleus is very tightly packed that the nuclear forces can
prevent the electric forces from dispersing it.
As the number of protons in the nucleus increases, theelectric force tending towards disruption grows more rapidlythan the cohesive effect of the nuclear forces. This means thatifwe were to go on increasing the number of protons sooner orlater the electric forces would become dominant. Parts of thenucleus would then be forced to break away from the main
50

NEUTRONS
body under the repulsive action of the electric forces. Thenucleus would no longer be stable; in the usual terminologyit would be radioactive (a terminology that has nothing to dowith radio-waves!) This explains why the elements do not
go on indefinitely, why there is a largest nucleus found in
nature that of the element uranium. Even if larger nuclei
were present in the Earth at the time of its origin they wouldall have disappeared by now. Indeed uranium itself is un-
stable, but not in a sufficient degree for it all to have yet dis-
appeared. But the margin in the case of uranium is not very
great: the electric forces are nearly able to push the nucleus
apart they will in fact do so if the nucleus is suitably jostled.
This is just what happens in the fission of uranium, the processon which atomic energy is based.
The neutron
It is now necessary to introduce the idea that there is some-
thing else inside the atomic nuclei besides protons (except in
the case of ordinary hydrogen, where the nucleus contains
nothing but a single proton). If the oxygen atom, for instance,
consisted only of a nucleus with 8 protons surrounded by a
cloud with 8 electrons, the oxygen atom would have a weightabout 8 times greater than the hydrogen atom. Actually the
weight of the oxygen atom is about 16 times that of the hydro-
gen atom. Remembering that the weight of the electron cloud
is quite negligible, we see that an additional contribution to
the weight must come from some new component present in
the nucleus. Chadwick's discovery of the neutron resolved the
puzzle as to what this component might be. The neutron wasfound to be a particle without electric charge, and with weight
nearly equal, but a little greater than that of the proton. Thenucleus of the ordinary oxygen atom contains 8 protons and8 neutrons the neutrons add weight but do not affect the
electric charge. The whole aggregate of neutrons and protonsis bound together by the self-same nuclear forces that werementioned above.
Now suppose that we had 8 protons and 9 neutrons bound
together in a nucleus. What would be the properties of the
5 1
FRONTIERS OF ASTRONOMY
resulting atom? Since the neutrons themselves possess no
electric charge the addition of one extra neutron does not
affect the number of electrons that must be present in the
surrounding cloud in order to compensate for the charge of
the nucleus. Since moreover the building properties of an
atom are determined by the electron cloud it follows that the
chemistry of the new atom is no different from that of an
ordinary oxygen atom with 8 protons and 8 neutrons in its
nucleus. Therefore we must still regard the new atom as an
atom of oxygen. To distinguish the two cases we refer to the
ordinary oxygen atom as O 18 and to the other as O 17,the index
1 6 telling us that in the one case there are 16 particles in the
nucleus and in the other case 17.
In a similar way we could consider a nucleus with 8 protonsand 10 neutrons. From what has been said the resulting atomwould still possess the chemical properties of oxygen, andwould be denoted by O 18
. When atoms differ as O 16,O 17
,and
O 18differ, in possessing nuclei with different numbers of
neutrons, they are said to be isotopes of the same element. Thenotion of an element is derived from chemistry, in other words
from the molecule-building properties of an atom: we get a
different element when we change the number of protons in
the nucleus; we get a different isotope when we change the
number of neutrons.
Of the elements found in nature many possess isotopes.
When a chemist obtains what he regards as a chemically pure
sample of an element it is often found to contain a mixture of
different isotopes. These can be separated by the physicist
using a method that depends on differences of weight, not ondifferences in chemical behaviour. Generally speaking chemical
separation separation according to the number of protons in
the nucleus is a much easier job than the separation of
isotopes.
This suggests an aside on atomic energy. Only one naturally
occurring nucleus possesses the particular fission properties that
are of importance in atomic energy projects. This is one of the
isotopes of uranium, U285, containing 92 protons and 143
neutrons. The natural abundance of Um is less than one
per cent of the natural abundance of U288(92 protons, 146
52

ISOTOPES
neutrons). It will therefore be realised that to separate pureU 236 from the naturally occurring mixture of U285 and U288
is an awkward problem. This explains the difficulties that
were encountered in setting up the first plant at Oak Ridgefor obtaining supplies of fissionable material. In later develop-ments it was found possible to prepare artificially an element
with the required fission properties. This is an isotope of
plutonium, the nucleus possessing 94 protons and 145 neutrons.
Because plutonium is a different element it can be separatedfrom uranium by chemical processes. This greatly simplifies
the problem of obtaining supplies of fissionable material, and
explains why this is so much easier to do today than it was
ten years ago.The elements and their isotopes are very queerly distributed
in nature. An understanding ofhow the observed abundances
came about cannot be answered by physics alone. To solve this
problem astronomy must also be called upon. In a later
chapter we shall see how it is plausible to suppose that the
simplest of the elements hydrogen forms the base out of
which all the other nuclei have been fashioned. We shall see
how conditions inside stars lead to the building of complexnuclei, and that the abundances of the nuclei as we find themon the Earth can be explained in these terms.
^-disintegration and the neutrino
Now what limits the number of isotopes that a particularelement can have? If we built an atom with a nucleus of 8
protons and 11 neutrons we should still have an atom of
oxygen O 19. Is O 19 found in nature? The answer is that O 19
is not found in nature, but O 19 can be prepared artificially in
the laboratory. A study of its properties shows immediately
why O 19 is not found in nature. It is unstable. One of the
neutrons changes spontaneously into a proton emitting anelectron as it does so, the electron being disgorged by the
nucleus. This is the process known as ^-disintegration. Thereason for this behaviour lies, not in the electrical forces as in
the fission of uranium, but in the nuclear forces themselves
which act in such a way as to prevent the disparity in the
53

FRONTIERS OF ASTRONOMY
numbers of neutrons and protons from becoming too large.
In the case ofoxygen a disparity of 2 is allowable (O 18 is stable),
but a disparity of 3 induces instability. When one of the
neutrons in O 19changes to a proton, the element is changed
since the number ofprotons is increased to 9. The new element
is fluorine.
Nuclear forces are similarly able to change a proton into a
neutron. In this case the nucleus disgorges, not an ordinary
electron, but a positron, a particle otherwise similar to an
electron but possessing the opposite sort of charge. The
positron was discovered experimentally by C. Anderson and
by P. M. S. Blackett, but theoretical reasons for its existence
had been given earlier by P. A. M. Dirac, A positron and anelectron can combine together, the result being not a material
particle but a quantum of radiation.
A nucleus with 8 protons and 7 neutrons O 16, another
isotope of oxygen, can also be prepared artificially. It is also
unstable, with one of the protons changing into a neutron,the result being the isotope N lf of nitrogen with 7 protons and8 neutrons. The dream of the alchemists the transmutation
of one element into another, has become a commonplacereality of modern physics.We now see that the answer to our question as to what
limits the number of stable isotopes of a given element is that
the nuclear forces prevent the difference between the numberof neutrons and the number of protons from being varied bymore than a small margin. There is no absolute prohibitionon the existence of other isotopes, but they are unstable, they
change by ^-disintegration into other elements.
Now when an electron is thrown out of a nucleus by /?-
disintegration (a neutron changing into a proton) the speedof emission is not fixed. The electrons emitted when O 19
decaysinto fluorine, for instance, have variable speeds, even thoughthe initial state of the nucleus before decay and the final state
after decay are the same in all cases.
The explanation of this remarkable fact is that a second
particle is emitted by the decaying nucleus at the same time as
the electron. The neutrino, as this particle is called, takes someof the enei-gy released by the decay of the nucleus. This

FOURTH REVOLUTION OF PHYSICS
enables us to say that although the electron alone does not
always receive the same energy the electron and the neutrino
together always receive the same energy. When the electron
takes less energy the neutrino takes more, and vice versa. In
this way an energy balance can be maintained in all cases.
The neutrino possesses no electric charge being in this respectlike the neutron, and it apparently possesses no mass being in
this respect like a quantum of radiation. These propertiesmake the neutrino very difficult to observe.
In astronomy neutrinos act as a sink of energy. Neutrinos
produced inside the stars escape out into space carrying energywith them. In the Sun the loss of energy by this process is
small compared to the loss through the escape of radiation
from the surface, but in some exceptional stars energy loss
through the escape of neutrinos is a much more powerful
process than it is in the Sun. Indeed it can on occasion greatly
exceed the loss of energy through the escape of radiation from
the surface of the star, as was first pointed out by G. Gamow.Stars can collapse catastrophically due to this cause, as weshall later see.
Thefourth revolution ofphysics
Several questions arise out of the above discussion that go
beyond the scope of the third phase of physics. Does the
neutrino have a connection with gravitation? What is the
relationship between gravitational, electrical, and nuclear
forces? Why is there only one unit of electric charge (proton
+ i, electron -i)? Why are the weights of the proton and
neutron so nearly equal, and yet not exactly equal? It is the
hope that answers to questions such as these will eventuallybe forthcoming when the fourth phase of physics comes to
be better understood. Much remains to be done.
It was remarked at the outset that it is also the hope that bythe new developments the ultra-large aspects of the Universe
may become closely related to the ultra-small. It may be of
interest, by way of ending the present chapter to give a more
precise idea of what is meant by ultra-large and ultra-small.
Atoms are small: 10,000,000,000 of them placed end to end
55

FRONTIERS OF ASTRONOMY
along a line would cover a distance comparable to the heightof a human: an adult human contains about 7,000,000,000,
000,000,000,000,000,000 atoms. The nuclei ofatoms are ultra-
small: only about one million millionth of the space within anatom is occupied by the nucleus. Turning to the ultra-large,
the problems to be considered in the last chapters concern the
distribution of matter on a scale that is almost incredibly vast
compared with the size of the atomic nucleus. The ultra-
large exceeds the ultra-small by the fantastic number 10,000,
000,000,000,000,000,000,000,000,000,000,000,000. The prob-lems of science cover this range.

CHAPTER FOUR
Some Varied Applications of Physics
Let us consider a few applications of the ideas of the previous
chapter.
Physics invades history
As an outcome of the work of W. F. Libby, the nucleus C 14
with 6 protons and 8 neutrons is now of great importance in
historical and archaeological studies. This nucleus has a 'half-
life' close to 5,550 years. If we start with a large number of
C 14nuclei, then after 5,550 years one-half of them will have
changed into the isotope N 14 ofnitrogen (7 protons, 7 neutrons)in accordance with a ^-disintegration in which a neutron
changes into a proton. After a further interval of 5,550 yearsone-half of those C 14 nuclei still remaining will then also have
decayed; so that after 11,100 years one-quarter of the nuclei
initial present will still remain as C 14. After a further 5,550
years one-half of this residue will again have decayed into
nitrogen and so forth. All this can be seen by consulting
Fig. 2 where a plot is given of the fraction of C 14 that remains
after various lengths of time.
The curve shown in Fig. 2 can be made use of in several
ways. If we are given a sample of C 14, then we can read off
how much of it will remain after any specified length of time.
If we are given a sample of C 14 and we are told that its ageis such-and-such, then we can use Fig. 2 to tell us how muchC 14 there must have been originally. Thirdly, if we are givena sample of C 14 and we are also told how much C 14 there was
originally, then Fig. 2 allows us to determine the age of the
sample (since the prescribed information tells us what fraction
of C 14remains). It is this third use of Fig. 2 that is important
in the present instance.

FRONTIERS OF ASTRONOMY
The nucleus C14 enters history through the action of the
cosmic rays. Cosmic rays are highly energetic particles, mostly
protons, that enter the Earth's atmosphere from outside space.
Their nature and origin forms an important topic to be dis-
cussed in a later chapter.
205 IO 15
*- Time in thousands of years
FIG. 2. The decay of C1*.
The incoming cosmic rays collide with the nuclei of the
atoms in the Earth's atmosphere. These collisions are the
most violent of any yet known to physics. They produce a
whole lot of debris, of which wandering Tree* neutrons is one
constituent(
c
free' neutrons are neutrons that are not locked
away inside nuclei). These free neutrons move around until
they collide with the nuclei of other atoms in the atmosphere.
Sometimes they enter the nuclei of atoms of nitrogen. Whenthis happens the nitrogen nucleus may disgorge a proton,
thereby yielding C 14: thus
N" (n, p) C14
This means that a nucleus of nitrogen (7 protons, 7 neutrons)
58
30

PHYSICS INVADES HISTORY
absorbs a neutron (n), emits a proton (p), and thereby becomesa nucleus of C 14
(6 protons, 8 neutrons). In this way G 14 is
produced in small quantities in our atmosphere. The atmos-
pheric concentration strikes a balance between the rate at
which G 14 is thus formed and the rate at which it decays.
Living creatures take in carbon from the atmosphere. Most
of the carbon absorbed is C12, the common stable isotope of
carbon with 6 protons and 6 neutrons; but a tiny fraction of
the carbon taken in is G14, the unstable G14 formed through
the action of the cosmic rays. The ratio of C 14 to C 18 in living
tissue, whether animal or vegetable, therefore depends on the
ratio of C14 to C 11 in the atmosphere, and this depends on the
balance between the rate of formation of G 14 and its decay.Now the half-life for decay is a fixed quantity; and the forma-
tion rate is not likely to change much over many thousands of
years. Consequently we may expect the ratio of C14 to C12 in
the atmosphere and hence in living tissue, to be a definite
determinable quantity that does not change appreciably with
time, at any rate over an interval of many millennia.
Next we notice that when an animal or a plant dies there
is no longer an intake of carbon from the atmosphere. Con-
sequently as the C 14 in the tissue of the animal or plant decaysthere is no renewal from the atmosphere. This means that
the C14 must gradually disappear from dead tissue.
Suppose now that we are given a piece of dead tissue, say a
piece of wood. Then by careful analysis the fraction of the
carbon in the tissue that remains as G 14 can be found. Thefraction of the carbon that is present as G14 in living tissue can
also be found. These items of information enable the curve
of Fig. 2 to be used in the third of the ways described above.
That is to say, the age of the piece ofwood can be read off from
the curve, the age since the tree ofwhich it formed a part died.
In this way Libby has dated pieces of sequoia that are up to
about 1,500 years old, and the results have been checked
against an independent age determination based on the
counting of tree rings. The agreement is highly satisfactory.
But this is not all, for pieces of wood can be recovered fmmancient tombs and the same method used. Not only this, but
the method really only comes into its own when specimens
59

FRONTIERS OF ASTRONOMY
that are as old as 5,000 years, or even older, are examined.
This takes us back to the days of the earliest civilisations of
Mesopotamia and Egypt, It has been estimated, for instance,
that the age of the tomb of Hemaka is about 4,900 years.
Estimates based on historical data, by Braidwood, suggestedan age between 4,700 years and 5,100 years.
This remarkable agreement should give us pause for thought.When we reflect on the long chain ofreasoning that is necessaryto connect the documentary evidence on which an historian's
assessment of the past is based on the one hand, with the
physicist's development of the theory of the atomic nucleus on
the other, it is a matter for astonishment that the whole
intricate mental operation, involving the thoughts of not one
individual but of many, should have been carried out with
such sustained accuracy.When the last of the great ice-sheets from the Arctic thrust
its way into N. America and into N. West Europe an advancing
tongue of ice somewhere tore down and buried a tree. Whenthe ice retreated bits of the tree were left buried among the
general rubble that had been accumulated by the ice. Manythousands of years later men dug up the pieces of the tree.
The bits were taken to a laboratory to have their C 1 * content
measured. And so the age of the bits ofwood was found. Andso the men came to know how long ago it was since the advanc-
ing tongue of ice tore down the tree.
In such a fashion the date of the last great ice-age has been
discovered to have been only 10,000 years ago, much morerecent than had previously been supposed by many geologists.
All human habitation in N. America seems to have been later
than this. In Europe, on the other hand, men lived in caves
to the south of the ice. The cave of Lascaux in France, with
its famous wall paintings, was occupied some 15,500 years
ago. This is known from the analysis of a piece of charcoal
found in the cave.
What was the temperature ofthe Atlantic Ocean 200 millionyears ago?
At first sight this question might seem impossible to answer.
Yet it turns out, most remarkably, to be susceptible of attack
60

PHYSICS INVADES HISTORY
by an ingenious method invented by Harold Urey. This
depends on the isotopes ofoxygen. It will be recalled that three
isotopes of oxygen are found in nature O lf the main isotopewith a nucleus containing 8 protons and 8 neutrons, O 17 con-
taining 8 protons and 9 neutrons, and O 18 with 8 protons and10 neutrons. Water is a molecule containing two atoms of
hydrogen and one of oxygen. The oxygen atom normally has
an O 16nucleus, but in a small proportion of water molecules
the oxygen atom has an O 17 nucleus or an O 18 nucleus. In
sea-water about one molecule in 2,000 contains O 17, and about
one in 300 contains O 18.
Now certain small animals living in the sea take in oxygenfrom the water in order to build up the carbonates of whichtheir shells are formed. It is therefore to be expected that the
shells of these animals will contain all three isotopes of oxygen.But here is the point the relative proportions of the three
isotopes in the shells are not exactly the same as they are in the
water. Their proportions are slightly altered by the chemical
processes that lead to the deposition ofthe carbonates, and theyare altered by amounts that depend on the temperature of the
water. Hence ifwe examine the shell ofsome animal that lived
in the distant past the proportions of the oxygen isotopes in
the shell will tell us the temperature of the ocean in which the
animal lived. The shell serves as a fossil thermometer.
This plan is rather awkward to operate in practice since
very small concentrations of the isotopes have to be measured ,
Indeed it has only proved possible to use the O 18 and O 1*
isotopes, for the reason that the concentration ofO 17is too low
for effective measurement. Care has to be taken that the shells
have not altered since the deaths of the animals themselves.
It is moreover essential to use only the shells of animals that
lived in sea water of full salinity, because fresh water possessesdifferent isotope ratios from sea water. In spite of these andother difficulties, measurements have been carried through
by Urey, Lowenstam, Epstein, and McKinney. They have
discovered, for instance, that the temperature over a widebelt ofocean ranging from latitude 33 in the Mississippi basin
over the N. Atlantic to England and Denmark was remarkablyconstant at about 15 C. This was 200 million years ago.
61

FRONTIERS OF ASTRONOMY
One other point may be mentioned. The building of the
shell of a sea animal may take several years. By examiningthe isotopic composition of different bits ofthe shell it is possible
to find out how the sea temperature changed during the life
of the animal. This has been done by the authors alreadymentioned. They find a systematic oscillation of temperature
through a range of about 6 C., which is considered to reflect
the change of sea temperature between summer and winter.
This is an astonishing result. To be able to measure the
seasonal changes of ocean temperature that occurred some200 million years ago seems quite fantastic.
The age of the Earth
We have spoken several times of the Earth being some 4,000million years old. It is of interest to say a little about how this
estimate has been arrived at. The method used is in principlethe same as that employed in the dating of historical and
archaeological remains. But the decay of the C 14 nucleus is
useless for the purpose of dating the Earth the Earth is so
old that any C14initially present inside it would have dis-
appeared long ago. Evidently to avoid this difficulty we requirea nucleus that decays in a half-life of 1,000 million years or
more. This greatly limits our choice of radioactive substance,
since only a very few nuclei possess such long half-lives. In
fact only two types of nuclei have been extensively used for
this purpose. They are the two isotopes of uranium, Ua$8
(92 protons, 146 neutrons) with a half-life of 4,510 million
years, and the isotope U 236(92 protons, 143 neutrons) with a
half-life of 707 million years.
The uranium isotopes are unstable because of large electrical
forces within their nuclei, the electrical forces causing bits to be
shot out ofthe nuclei from time to time. Once one bit (actuallya nucleus of helium with 2 protons and 2 neutrons) has beenfired out of a uranium nucleus other bits are ejected in com-
paratively quick succession, the process going on until a stable
nucleus is eventually reached. This happens when the electrical
forces have been reduced sufficiently for the nuclear forces to
gain complete control of the situation. Uranium ultimately
62

AGE OF THE EARTH
ends as lead. The isotope U888decays eventually into the
isotope of lead Pb aofl(82 protons, 124 neutrons), and U 88i
decays into the isotope Pb 207(82 protons, 125 neutrons).
It is particularly to be noticed that this is not the process of
fission that occurs in the atomic bomb. We are now referring
to what is known as the natural radioactivity of uraniumwhat uranium will do if left to itself for a sufficiently long time.
The fission of uranium has to be induced artificially. This is
done by stirring up the uranium nucleus by adding a neutron
to it. When a uranium nucleus undergoes fission it does not
simply eject small pieces but splits into two comparable
portions. The processes are similar, however, in the sense that
they are both caused by the intensity of the electrical forces
in the uranium nucleus.
Coming back now to our problem of determining the ageof the Earth, this might appear from what has been said to be
a rather simple matter. Suppose that we analyse a sample of
rock and determine its present content of U 288(for instance).
Suppose further that we determine the content of Pb 206,
Cannot we argue that both the original and the present U288
content are thereby determined, since the Pb206 has comefrom the uranium that has decayed since the rock was formed?
Knowing the half-life of U 288 a simple calculation would then
give the age of the piece of rock. But such an argumentassumes that there was no Pb260 in the rock at the time it formed.
If there was, the calculation is vitiated. This uncertainty has
proved a serious obstacle to the use ofuranium for determiningthe age ofthe Earth a similar difficulty evidently arises also for
the other isotope of uranium U 886. Only very recently has it
been found possible to use the method in a way that seems free
from objection. This has been done by C. Patterson and R.
Hayden working at the California Institute of Technology.The new step consists in the analysis of a meteorite that
contains no uranium, and which apparently never did contain
uranium. The object of this step is to determine the lead
content as it was originally, for the lead content of this parti-cular meteorite has certainly not been altered by the decay of
uranium. If then we take a second meteorite that does contain
uranium, the difference of lead content in the two cases can
63

FRONTIERS OF ASTRONOMY
validly be regarded as due to the uranium. The age of the
latter meteorite can then be deduced by a simple calculation.
Moreover, provided we assume that the lead isotopes were
originally distributed in the same proportions in the Earth as in
the meteorites, the ages of the rocks ofthe Earth can also readily
be determined. The results both for the ages of meteorites and
for the age of the Earth turn out at about 4,000 million years
(it may be mentioned that the commonest isotope of lead
Pb 204 is not affected in any way by the decay of uranium so
that measurements of Pb206 and Pb 207 are always referred to
the content of Pb 204 as a standard of reference).The estimate of 4,000 million years for the age of the Earth,
and presumably for the age of the solar system, is about twice
as great as the estimates that were widely quoted a few years
ago. It may be wondered where the error in the former
estimates lay. The answer is in erroneous allowances for the
initial concentrations of Pb208 and Pb 207. The antiquity of the
Earth seems considerably greater than was formerly believed
by most scientists a notable exception being that of Holmes,who made estimates many years ago that were close to 4,000million years.
The energy of the Sun
A great mystery has been solved during the last few years,the mystery of the source of the vast amount of energy that the
Sun constantly pours out into space: in one second of time the
Sun emits more energy than men have consumed in the wholeof their history.
The energy is now known to come very largely from nuclear
processes that occur deep inside the Sun. These processes are:
m (p, jS)H*
(i)
H* (p, y) He'(ii)
He (He8, sp) He* (in)
The discovery of (i) and(ii) was due to H. Bethe and C. L.
Critchfield, and (iii) to C. Lauritsen. The operation of the
whole set of processes has recently been investigated by E,
Salpeter.

THE ENERGY OF THE SUN
These reactions are not so difficult to understand as one mightthink at first sight. In reaction (i) H1
is hydrogen, ordinary
hydrogen with a nucleus containing one particle, a proton.The H symbol in H 2
signifies hydrogen, and the a signifies a
nucleus with two particles. Since the chemical element
hydrogen has i proton this implies a nucleus with i proton andi neutron. Such a nucleus is known, and is called the deuteron.
The symbolism of reaction (i) tells us that a proton added to
H 1 makes H 2 a proton plus a proton makes a nucleus with
i proton and i neutron. This requires a proton to change into
a neutron during the process and this is indicated by the
symbol ft. Reaction (ii) implies that a proton added to H 2
(i proton, i neutron) gives the isotope He8(2 protons, i
neutron) of helium, radiation being emitted in the reaction.
Reaction (iii) implies that He* (2 protons, i neutron) whenadded to He8
(2 protons, i neutron) gives the isotope He4
(2 protons, 2 neutrons) of helium and that 2 protons are
ejected in the reaction.
The net effect of the three reactions is that hydrogen is
converted to helium. Energy appears as an electron of positivecharacter (positron) emitted in the ft process of reaction (i),
in the radiation emitted in (ii), and in the energy of motion of
the two protons that are ejected in reaction (iii). These addtheir energy to the material of the star. A neutrino emitted
in the ft process carries its energy away from the star, however,and this is irretrievably lost.
The processes that we have just discussed make life possible
on the Earth; for without the energy derived from the con-
version of hydrogen to helium the Sun would have become a
dead star several thousands of millions of years ago. Men have
worshipped things more foolish than reactions (i), (ii), and (iii).

CHAPTER FIVE
Generalities About the Moonand Planets
Thefour inner planets
The first four planets in the order of their distances from
the Sun Mercury, Venus, Earth, and Mars, seem to be closely
similar in their compositions. This can be judged from the
information given in the following table:
Average density
Average distance without
PUmtt from the Sun Mass Average density compression
Mercury 0.3871 0.0543 4.5 to 5.0 4.5 to 5.0
Venus 0.7233 0.8136 4.87 4.4
Earth i.oooo i.oooo 5.52 4.4
Mars *-5*37 0.1080 4.0 to 4.2 3.8 to 4.0
Some explanation of the different columns of this table is
necessary.The Earth moves around the Sun in a nearly circular path
at an average distance from the Sun of about 150 million
kilometres. The distances of the planets from the Sun are
given in our table in terms of this distance as unit which
explains, of course, why the distance of the Earth is given as
i.oooo. Like the Earth the other planets also follow pathsaround the Sun that are nearly circles, all the orbits fitting very
nearly into one plane, the whole solar system forming a flat
distribution. To allow for the small deviation from circular
motions, the distance in each case is given as an average of the
greatest and least distances of the planet from the Sun.
The mass of a body is a measure of how much material it
contains. The table shows that the amount of material in
Mars is 10.8 per cent of the amount in the Earth. Of the four
66

THE FOUR INNER PLANETS
planets the Earth evidently has most material. Venus comes
second with 81.36 per cent of the amount in the Earth and
Mercury is last with only 5.43 per cent.
The third column of the table gives the average densities of
the planets in terms of the density of water (i gram per c.c.).
It will be noticed that there are uncertainties in the values for
Mercury and Mars. This is due to the difficulty of measuringthe sizes of these small planets with great accuracy, in the case
of Mercury because it lies so far towards the Sun and in the
case of Mars because the presence of an atmosphere causes us
to misjudge the size: the effect of the Martian atmosphere can
be seen in Plate IV, especially in the comparison of photo-
graphs taken in red and blue light.
The densities given in the third column cannot as theystand be used as indicators of composition because densities
are affected by compression and the compression is different
inside the different planets. The compression inside the Earth
is much greater than that inside Mars, for instance. To allow
for this the effects of compression have been removed from
the last column, where estimates are given for what the averagedensities of the planets would be if there were no compression
occurring inside them.
Two features are immediately noteworthy from the entries
in this last column. One is that the densities of the Earth andVenus become closely comparable, indicating that these planetsare probably built out of almost identical material. The other
is the progressive shift of density from the innermost planet,
Mercury, to the outermost planet, Mars. This would suggestthat the relative proportions of rock and iron change system-
atically from perhaps 40 per cent ofiron in the case ofMercury,to 30 per cent for Venus and the Earth, and to about 20 percent in the case of Mars.
The similarity of Venus and the Earth suggests that in
Venus an iron core has probably also been formed by the pro-cesses that were discussed in the second chapter. With Mercuryand Mars the situation is somewhat uncertain, however. It is
true that compressional heating, so important in the case of
the Earth, must have been very much less in these planets.But even if compressional heating is ignored in the cases of
6?

FRONTIERS OF ASTRONOMY
Mercury and Mars, it is still possible that iron has liquified in
their interiors. The point here is that because of the muchlower pressures inside Mercury and Mars the melting pointof iron, even in the deep interiors, cannot be much greaterthan 1,500 C., and this is within the possible range of heatingthat might be produced by radioactivity. Evidently a deter-
mination of whether Mercury and Mars do or do not possess
high density cores would be of great importance, since it
would provide information on the degree of heating of the four
inner planets that has been generated by radioactivity (always
assuming that the concentration of radioactive substances is
much the same in one planet as another). Unfortunately
present-day objprvations are scarcely accurate enough to
decide this question.Let us turn now from a consideration of the formation of
high density cores to the opposite process in which 'light*
liquids are squeezed outwards to the surface of a planet. Theinternal temperatures in all cases must be adequate for the
squeezing out of water. Yet on only one of the inner planets,
other than the Earth, has water been detected. This is onMars. And even on Mars there is only a very small quantityof water.
The failure to find water on Mercury is not surprising, for
any water that was squeezed out of the interior of Mercurymust have evaporated rapidly away into outside space, thereby
leaving the planet altogether. Such an evaporation of water
does not happen to any appreciable extent on the Earth,because the Earth being much more massive than Mercuryhas a gravitational field that is strong enough to hold water
in check.
So the main problem concerns the case of Venus, and here
we encounter an acute situation. Venus has a gravitationalfield almost as strong as that of the Earth. Accordingly wecannot argue that Venus has lost water through evaporationinto space. Why then, if Venus is so similar to the Earth, is
no water found on Venus? It scarcely seems plausible to
suppose that the bodies out of which Venus accumulated con-
tained no water. Because of their greater proximity to the
Sun we might perhaps claim that these bodies contained less
68

THE FOUR INNER PLANETS
water than the bodies out of which the Earth accumulated,but that they should contain no water at all seems scarcely
feasible. It appears necessary therefore to consider what mighthave happened if water was indeed contained in Venus at the
time of its formation.
As in the case of the Earth, water would be squeezed out
of the interior of Venus to the surface, where some of it would
evaporate into a gaseous atmosphere but not off the planet
altogether as in the case of Mercury. Once in the atmosphere,molecules of water would probably become dissociated into
their constituent atoms of hydrogen and oxygen through the
action of ultra-violet light from the Sun. This process does
not happen very much in our own atmosphere for a reason
that would almost certainly not have been operative on Venus.
In the atmosphere of the Earth oxygen rises higher than the
water vapour and oxygen has the property of absorbing ultra-
violet light, thereby preventing it from attacking the underly-
ing water vapour. On Venus, oxygen would probably not have
risen higher than the water vapour, so that no protective
shielding of the water vapour from the solar ultra-violet light
would be operative. The difference between the two cases
depends simply on the higher temperature that the atmosphereof Venus must have, on account of closer proximity to the Sun.
In the Earth's atmosphere water vapour, if it tries to rise high,becomes cooled and condenses into droplets which fall back to
the surface as rain. The same prevention of the rise of water
vapour would not occur at the higher temperature on Venus.We arrive then at the conclusion that a steady dissociation of
water molecules into hydrogen and oxygen atoms must have
gone on in the atmosphere of Venus. At first thought it mightseem that this process would be just balanced by a recombina-
tion of the hydrogen and oxygen atoms back into water mole-
cules. But this ignores the point that hydrogen atoms can
escape completely from the atmosphere ofVenus the gravita-tional field of Venus is strong enough to hold water vapour in
check, but not to hold on to hydrogen. Thus the hydrogenof the water would steadily be lost into space, leaving aa
atmosphere ofoxygen instead ofwater.
All this would be very fine if Venus were observed to have
69

FRONTIERS OF ASTRONOMY
an extensive atmosphere of oxygen. Venus does have quite an
atmosphere, but it is an atmosphere of carbon dioxide. Nofree oxygen at all can be detected. The situation is not entirely
without hope, however, because oxygen is extremely active in
its chemical properties, so that oxygen may have combinedwith some other substance. It seems possible in particularthat the oxygen that is present in the carbon dioxide molecules
(each molecule with one atom of carbon and two of oxygen)
may be just the residual oxygen that we are seeking.The considerations of the next chapter are important in the
present connection in that they suggest that carbon was muchmore likely to be initially present in combination with hydro-
gen, not with oxygen. If this is correct then we may be in sight
of the solution of the water problem of Venus. For if all the
carbon was initially locked away in the higher hydrocarbons,an oxidation process was necessary in order to produce the
carbon dioxide that we now observe. It is possible that the
oxygen derived from the dissociation of the water was all
absorbed in the oxidation of hydrocarbons.The words 'all absorbed* are important because they point
the way to an understanding of a further difference between
Venus and the Earth. For all the oxygen of Venus to be thus
used up, there must initially have been an excess of hydro-carbons over water. The situation on the Earth seems to have
been the other way round. We had an excess of water over
hydrocarbons. To appreciate the consequences of these
remarks we need to give some attention to the case of the
Earth.
Suppose an enormous quantity of oil were to gush to the
Earth's surface: what would the effect be? The oil, consistingas it does of hydrocarbons, would proceed to absorb oxygenfrom the air. If the amount of oil were great enough all the
oxygen would be removed. When this happened the water
vapour in our atmosphere would no longer be protected from
the disruptive effect of ultra-violet light from the Sun. So
water vapour would begin to be dissociated into separateatoms of oxygen and hydrogen. The oxygen would combinewith more oil, while the hydrogen atoms would proceed to
escape altogether from the Earth out into space. More and
70

THE CLOUDS OF VENUS
more of the water would be dissociated and more and more of
the oil would become oxidised. The process would only cometo an end when either the water or the oil became exhausted.
On the Earth it is clear that water has been dominant over oil.
On Venus the situation seems to have been the other wayround, the water has become exhausted and presumably the
excess of oil remains just as the excess of water remains onthe Earth.
This possibility has an interesting consequence. The surface
of Venus is perpetually covered by thick white clouds. In
writing previously about these clouds* I said that the only
suggestion that seemed to fit the observations was that the
clouds are made up of fine dust particles. To this suggestionwe must now add the possibility that the clouds might consist
of drops of oil that Venus may be draped in a kind of per-
petual smog. The white appearance of Venus, due possiblyto this smog, can be seen in Plate V.
There is another problem that may be soluble in terms of
these ideas. Venus apparently rotates very slowly on her axis.
The 'day5 on Venus seems to occupy more than 20 Earth-days.
Since it is likely that Venus originally rotated at much the
same rate as the Earth, the problem is to explain how the rota-
tion rate of Venus came to be slowed down so much. IfVenus
possesses oceans the question is readily solved, because Venus
being nearer the Sun would experience stronger tides than the
Earth does (even with Moon's action added to that of the Sun).Not only this, but the atmosphere of Venus being of quitedifferent composition to that of the Earth, there need be no
process of the sort discussed by Holmberg to prevent the rota-
tion rate ofVenus being slowed down to a much greater degreethan that of the Earth. It is thus reasonable to suppose that
the slowing down of Venus can be explained by the friction of
tides if Venus possesses oceans, but not I think otherwise.
Previously the difficulty was to understand what liquid the
oceans were made of. Now we see that the oceans may well be
oceans of oil. Venus is probably endowed beyond the dreams
of the richest Texas oil-king.
One point remains. We have still to explain why Venus* The Nature of the Universe.
7'
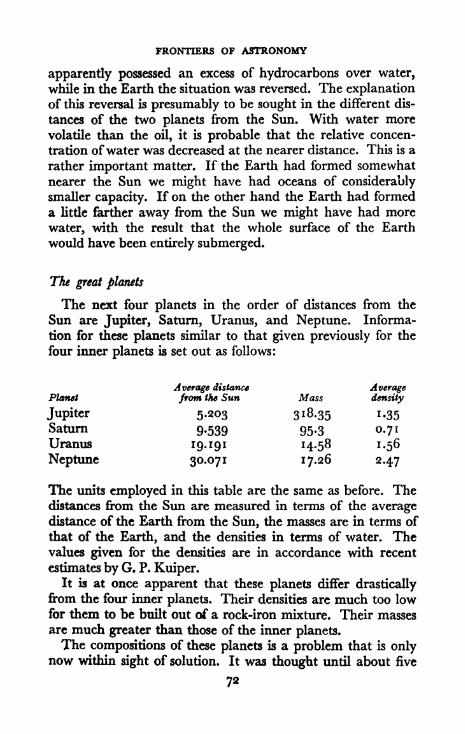
FRONTIERS OF ASTRONOMY
apparently possessed an excess of hydrocarbons over water,
while in the Earth the situation was reversed. The explanationof this reversal is presumably to be sought in the different dis-
tances of the two planets from the Sun. With water morevolatile than the oil, it is probable that the relative concen-
tration ofwater was decreased at the nearer distance. This is a
rather important matter. If the Earth had formed somewhat
nearer the Sun we might have had oceans of considerablysmaller capacity. If on the other hand the Earth had formed
a little farther away from the Sun we might have had more
water, with the result that the whole surface of the Earth
would have been entirely submerged.
The great planets
The next four planets in the order of distances from the
Sun are Jupiter, Saturn, Uranus, and Neptune. Informa-
tion for these planets similar to that given previously for the
four inner planets is set out as follows:
Average distance AveragePlanet from the Sun Mass density
Jupiter 5.203 3 1 8.35 1.35
Saturn 9.539 95.3 0.71
Uranus I9^9i 14-58 1.56
Neptune 30.071 17.26 2.47
The units employed in this table are the same as before. Thedistances from the Sun are measured in terms of the averagedistance of the Earth from the Sun, the masses are in terms of
that of the Earth, and the densities in terms of water. Thevalues given for the densities are in accordance with recent
estimates by G. P. Kuiper.It is at once apparent that these planets differ drastically
from the four inner planets. Their densities are much too lowfor them to be built out of a rock-iron mixture. Their masses
are much greater than those of the inner planets.The compositions of these planets is a problem that is only
now within sight of solution. It was thought until about five
72

THE GREAT PLANETS
years ago that even the very low density of Saturn could be
explained on the. basis that the great planets contain a rather
modest proportion ofthe lightest ofall the elements, hydrogennot more than 40 per cent for Saturn, about 20 per cent for
Jupiter and still less for Uranus and Neptune. Although this
would require the great planets to contain considerably more
hydrogen than the inner planets do, the concentration of
hydrogen would still be very much less than it is in the material
of the Sun. Indeed the great planets would be deficient in
hydrogen, as compared to the material of the Sun, by a factor
ofabout 300.Recent work has very much altered the situation for Jupiter
and Saturn, however. It has been pointed out by Harrison
Brown and by W. H. Ramsey that the older work made a quite
inadequate allowance for the effects of compression in Jupiterand Saturn (it will be noticed that the present densities donot allow for compression, as the last column of table on page66 does). The work of Ramsey has shown that Jupiter andSaturn must contain at least 80 per cent hydrogen. But the
situation remains as it was before for Uranus and Neptune.Water, methane, ammonia and possibly neon would giveabout the right densities for these planets.
The strange case ofPluto
One more planet remains to be mentioned, the last planetof the solar system, Pluto, discovered in 1930 by C. W. Tom-bough at the Lowell Observatory.The orbit of Pluto differs quite appreciably from a circle.
On the average Pluto is about 30 per cent farther away fromthe Sun than Neptune, but because its orbit is not a circle
Pluto actually dips inside the orbit of Neptune when it is
nearest to the Sun. This peculiarity led Lyttleton to suggestthat Pluto may be an escaped satellite of Neptune. Some
plausibility is attached to this suggestion because Pluto is a
planet of small mass, like the four inner planets.The mass of Pluto has been inferred from slight distortions
of the orbit of Neptune that are believed to be due to the
influence of Pluto. According to Dirk Brouwer the mass is
73

FRONTIERS OF ASTRONOMY
nearly equal to that of the Earth. This result when combinedwith observations by G. P. Kuiper on the size of Pluto allows
the density to be worked out. The answer is the impossiblevalue of 50 times the density of water impossible because no
material at the pressures operative in Pluto can have a densityas high as this. Where the mistake lies is not known, but there
must certainly be a mistake somewhere. One might suspectthat the measurement of the size of Pluto is more likely to be
in error than the estimation of its mass. This is especially so,
since there is one possibility that would completely vitiate anyobservational attempt to determine the size. If Pluto acted
like a highly polished ball we should not observe the ball itself,
but only a highly illuminated spot near the centre. The effect
can be seen by holding a polished steel ball in sunlight. But
why Pluto should behave like a polished ball remains a
mystery.
The satellites
As we go outwards from the Sun, the Earth is the first planetto possess a satellite the Moon. Then comes Mars with two,
but both are extremely small compared with the Moon. Indeed
the Moon is a very respectably-sized satellite even when we
compare it with the satellites of the great planets. Of the 12
satellites ofJupiter only two have larger masses than the Moon.Of the 9 satellites ofSaturn only one has a larger mass than the
Moon. None of the 5 satellites of Uranus compares with the
Moon, although one of the 2 satellites of Neptune does. Themasses and densities of the larger satellites of the solar systemare given as follows:
Mass (in terms AveragePlanet Satellite of the Moon) density
Earth Moon i.oo 3.33
Jupiter lo 0.99 4.03
Europa 0.64 3.78
Ganymede 2.11 2.35Callisto 1.32 2.06
Saturn Titan 1.92 2.4
Neptune Triton x.8 2 (?)
74

THE SATELLITES
It is particularly to be noted that the masses are given here
in terms of the Moon as unit, not in terms of the Earth (as in
tables on pages 66 and 72). The mass of the Moon is 1*23
per cent of that of the Earth. Since the mass of the smallest
planet, Mercury, is 5.43 per cent of that of the Earth it follows
that the masses of the satellites fit smoothly on to the masses of
the planets, although no satellite has a mass quite as great as
Mercury.The average density of the Moon suggests that the Moon is
entirely made of rock, similar to the rocks of the Earth's
mantle. The compositions of lo and Europa seem to be similar
to Mars, about 20 per cent of iron being necessary in order
to explain the densities of these satellites. In the other
cases, however, it is clear that a mixture of rock and iron is
quite inappropriate, for no known rock has a density low
enough for these satellites. To obtain the observed densities,
appreciable quantities of such substances as water, ammonia,carbon disulphide are required. An interesting feature of the
present table is the tendency of the density to fall as the
distance of the parent planet from the Sun increases. The sig-
nificance of this trend will become clear in the next chapter.The case of the Moon deserves detailed comment. Unless
the rock of the Moon is of the light variety found in the crustal
zone of the Earth the Moon can contain no iron. This raises
serious issues. The Earth and the Moon were evidently formed
quite close to each other. How then did the Earth come to
contain iron in a proportion of about 30 per cent, while the
Moon apparently possesses none? This question seems so diffi-
cult to answer that one is tempted to accept the alternative
view that the rocks of the Moon are light rocks like the rocks
of the terrestrial continents with a density of about 2.7. This
would allow the Moon to contain about 30 per cent iron, so
that its chemical composition would then be quite similar to
that of the Earth.
The idea that the Moon might be largely composed of a light
sort of rock agrees with an important observed characteristic of
the Moon there is no volcanic activity on the Moon. We swin the second chapter that volcanoes on the Earth probablyarise from light molten rock that is squeezed to the surface by
75

FRONTIERS OF ASTRONOMY
the solid denser rock of the mantle. If the rocks of the Moonwere all light rocks, squeezing could not take place.
There is, of course, an alternative explanation of the lack
of volcanic activity on the Moon the interior of the Moon
may be entirely solid. If this is the case then the heating by
radioactivity in the Moon must have been insufficient to raise
the internal temperature much above 1,500 C., since at the
pressures occurring in the Moon melting points cannot be
much different from the values measured in the laboratory
(1,500 C. for iron, between 900 C. and 1,800 C. for various
kinds of rock). This would tend to confirm the view expressedin the third chapter, that the heating of the Earth's interior byradioactivity has probably not been a factor of great import-ance.
The origin of the lunar craters
The lack of volcanic activity on the Moon suggests that weabandon the old theory that the craters on the Moon were
formed by lunar volcanoes. This is all to the good, since the
volcanic theory never succeeded in explaining the vast dimen-
sions of the lunar craters, the largest of which are nearly 100
miles in diameter. This is more than ten times the diameter of
any terrestrial volcanic crater. The appearance of the surface
of the Moon, studded with craters large and small can be
judged from the photograph reproduced in Plate VIII.
The last bodies that fell into the Moon must have plungedinto the surface at very considerable speeds, speeds of several
miles per second. A body falling on to the surface of the Moonat such a speed (or on to the surface of the Earth) would not
have its progress immediately halted at the moment it struck
the surface. It would penetrate some distance below the surface,
as a bullet penetrates into a block of wood. But whereas an
ordinary bullet shoulders aside the wood through which it
passes, it seems unlikely that this could happen in the case of
a very high velocity missile which would ram impedingmaterial in front of it the material would not be shouldered
aside because there would be no time to get out of the way!When a missile plunged into the Moon the rocks of the lunar
76

ORIGIN OF THE LUNAR CRATERS
surface at the point of impact must simply have been crushed
flat. This would change the material from a solid into a high
temperature gas. The gas would form a pocket driven in front
of the missile. As more and more gas joined the pocket the
pressure would rise until eventually it became sufficient to
stop the missile. When this happened the pocket of high pres-sure gas might have been several miles below the surface of
the Moon. The next step is obvious. A pocket of gas at high
pressure situated a few miles below the surface must producea shattering explosion, the result being a crater.
A striking confirmation of these arguments is shown in Fig. 3,
which is due to R. B. Baldwin. It plots the depth of craters
against their diameters. The points at the bottom of the curve
refer to terrestrial craters made by shells, bombs, and other
explosions. The points marked are terrestrial craters that
are known to have been formed by missiles that have struck the
Earth from outside (the famous Arizona crater being one of
them). The points at the upper end of the curve all refer to
lunar craters. The excellent fit of the various sorts of crater
to a common curve leaves little doubt that the lunar craters
originated by explosion.The origin of the bright rays shown on the photograph of
the full Moon in Plate IX provides another point in favour
of the impact theory. These are the rays that radiate outwards
from the prominent craters. The bright rays from Tycho, the
most notable crater showing on Plate IX, stretch in some places
completely across the visible hemisphere. The bright rays are
probably jets of fused glass-like material that were shot out
by the explosions that produced the associated craters.
Plate IX also brings out the marked tendency of the dark
patches towards a circular shape. These dark patches are the
lunar seas or maria, so named before it was realised that theyare not oceans. It is thought by many astronomers that even
the maria were produced by impact, but by the impact of
larger bodies than were responsible for the craters, by veritable
planetesimals perhaps a hundred miles or so in diameter.
Often two craters intersect each other, as can be seen froman examination of Plate VIII. When they do so it is nearly
always the wall of the larger crater that is broken, the smaller
77

FRONTIERS OF ASTRONOMY
Lunar Crotera
Terwtrffl!
Meteorite
Craten
. /. Explosion Pit*
Bomb Crattrt
f..\ Shill Crater*
1,000,001
100,000
10,000
1000
100.
100010 100
Depth in feet
FIG. 3, Diameters and depths ot craters. (R. B. Baldwin)
10,000 100,000

ORIGIN OF THE LUNAR GRATERS
crater being usually complete. This might be explained by
saying that the smaller crater was produced after the largerone. But why should the larger missile fall first in almost all
cases? This apparently awkward question can be partiallycountered by noticing that if the larger missile fell second it
would in many cases simply obliterate the smaller crater. This
gives a systematic tendency for the observed double craters to
be the ones in which the smaller crater formed second. I find
it difficult to believe that this argument is entirely adequate to
explain all the facts, however. That it is an argument with
considerable force is clear, but there seem to be so many cases
where small craters lie absolutely squarely on the walls of a
large crater, or on the central cone of a large crater, that I donot think the matter can be entirely dismissed in this way.Such cases can be found by a careful examination of the moredetailed photograph shown in Plate X. These cases look as if
they may have been caused by the collapse of domes of rubble.
This sort of occurrence could well happen if a few bubbles
of gas remained trapped for a time in the rubble after the
explosion that led to the formation of the main crater.
Even a casual glance at Plate VIII shows that the maria
are notably lacking in distinctive craters. One suggestion that
has been put forward to account for this is that the large bodies
that gave rise to the maria fell into the Moon practically last of
all. This view was expressed to me by Harold Urey, whobelieves that the maria are great flows ofmolten lava producedby the heat of impact of the striking bodies. Urey considers
that iron sulphide may be a notable constituent of these lava
flows, and that it is this compound that gives to the maria
their characteristic dark appearance.Much as Professor Urey's arguments on this question demand
respect, I have grave doubts as to whether this view can be
correct, however. Quite apart from the implausible suggestionthat the maria were formed by almost the last bodies to join the
Moon, I do not believe that the impact of fast moving missiles
with the surface of the Moon would produce any liquifaction.The surface of the Moon is not liquified at the point of impact,it is gasified. Even if it be argued that the velocities of the
missiles that produced the maria were so low that gasification,
79

FRONTIERS OF ASTRONOMY
along the lines described above did not occur, I still doubt
whether any substantial liquifaction of the colliding materials
would occur. A bullet fired into wood does not liquify the
wood. It loses its energy in destroying the fibre structure of
the wood. I suspect that a missile falling with small speed onto the surface of the Moon (if indeed this were ever to occur)would likewise lose its energy in breaking the crystal structure
of the rocks of the Moon's surface, not in liquifaction. If the
maria are indeed lava flows, then the molten rock must have
come from the interior of the Moon.An important clue to the understanding of the nature of
the maria comes from a careful examination of their surfaces.
This soon shows that although notable craters on the maria are
certainly rare, there are very many places where the circular
outlines of quite substantial craters can be faintly detected.
In many places a part of the wall of a crater can be seen
sticking out of the maria. How were these so-called 'drowned'
craters formed? Certainly they could not have been formed
before the maria, since then they would surely have been
entirely obliterated during the formation of the maria them-
selves. And if we argue that they were formed after the maria
then we must admit that many substantial missiles did in fact
fall after those that produced the maria. So we are back at
the difficulty of explaining why the drowned craters do not
show up more notably. It has been suggested that the later
missiles fell into the maria at a time when they were still
molten. This would have no effect however on the explosive
gasification process that produced the craters. All that can
be argued along these lines is that the craters produced in a
molten maria would have molten walls, and that the walls
might proceed to flow away. But at this point the argumentcollapses because in those cases where portions of the walls of
craters stick up above the floor of the maria the walls can be
seen to be entirely normal, indistinguishable from the walls
of the craters outside the maria.
As far as I am aware only one suggestion has been madethat is capable of meeting this situation. This is a suggestiondue to Gold, that I already described in The Nature of the
Universe. On this view there are just as many craters on the
80

ORIGIN OF THE LUNAR GRATERS
maria as anywhere else. The 'drowned' craters are examples of
these, and are regarded as being entirely normal craters. The
'drowning' agent is taken to be, not lava, but fine dust, which
is supposed to have accumulated on the maria to very con-
siderable depths. Cases where a part of the wall of a drownedcrater is plainly visible are simply cases where the walls stick
up above the level ofthe dust. It is an immediately encouragingfeature that whenever an obstacle rises out of the level maria
the slope does not increase gradually, the obstacle rears upabruptly like a cliff out of the sea.
The two outstanding craters on Plate IX form an interesting
comparison, Tycho lying off the maria in the lunar uplands,and Copernicus lying on the maria. Tycho is cleanly sculpturedin its internal form and its external ray system is bright and
straight. Copernicus on the other hand has a noticeably terraced
internal structure and its ray system is contorted and less
marked than that of Tycho. Yet the two craters being com-
parable in size must have been produced by explosions of
comparable violence. How do we account for these differences?
The natural explanation is that the explosion that produced
Tycho occurred in solid rock, whereas the explosion that pro-duced Copernicus occurred in a mixture of dust and rock.
Gold has also considered the problem of how dust is formed
on the Moon and of how it is transported from place to place.
Since the Moon possesses no atmosphere the surface is con-
stantly being bombarded with ultra-violet light and with
X-rays from the Sun. This must tend to break down the crystal
structure of rock at the extreme surface, allowing small bits to
break away. The bits are thought to be transported to the
lower parts of the lunar surface, which indeed is where the
maria are found, by the combined action of electrical forces andof gravitation.
It is also worth noticing that a considerable quantity of fine
dust was presumably added to the Moon during the process of
its origin. Much of the dust now to be found on the lunar
surface may be simply primeval dust tiny particles that
showered on to the Moon during the final phases of its
formation.
The surface rocks of the Moon are not coloured like the
81 o

FRONTIERS OF ASTRONOMY
surface rocks of the Earth. Examination through a small
telescope or with binoculars shows the Moon to be a monoto-
nous grey. This is now thought to be also due to the incidence
of ultra-violet light from the Sun, which is known to destroycolour.
The dry, dead, colourless surface of the Moon gives us a
graphic picture of what the surface of the Earth was once like.
Before the Earth developed its atmosphere and oceans it musthave gone spinning through space the same sort of dead greyball that we now observe the Moon to be. With the coming of
the oceans and the atmosphere, wonderful transformations of
the Earth's surface began. The old scars, left from the accumu-lation of the Earth, were soon removed by erosion. The
atmosphere shielded the surface from the deadly ultra-violet
rays, so that colours could arise and persist. The fall of rain
quickly suppresses the once dusty surface of the planet. Sowas the stage gradually laid for the emergence of life.

CHAPTER SIX
The Origin of the Planets
Planets by the billion
Besides satisfying a natural curiosity as to how our particularhome came into being, a study of the origin of the planets is
also of great interest in suggesting how frequently places like
the Earth are to be found in the Universe. In a former dis-
cussion* of this particular problem, I was led to the conclusion
that there might be as many as one million planetary systems
very similar to our own among the stars of the Milky Way.The arguments of the present chapter will show that this
estimate is in need of revision. The new number comes out,
not at a mere i million, but at 100,000 million.
In outline, my earlier idea was that at one time the Sun wasa member of a double-star system two stars that movedaround each other. It was also supposed that the Sun's com-
panion exploded with enormous violence, the catastrophic dis-
integration causing the remains to be flung away from the
Sun, save for a small wisp of material that the Sun managedto hang on to. The wisp of material then spread out around
the Sun as a disk, and in this disk condensations occurred that
eventually grew into the planets.The suggestion that the material of the Earth was indeed
derived from an exploding star a supernova, is supported
by strong evidence, as we shall see in Chapter 12. But it nowseems less likely that the supernova was a companion to the
Sun in a double system. Rather does it seem that the Sun wasborn in a whole shower of stars and that the supernova (or
supernovae) belonged to the shower. Evidence for this will be
considered in Chapter 15.
Although this new view may not seem much different from* The Nature of the Universe.
83

FRONTIERS OF ASTRONOMY
the old, it turns out that the changes of argument are far
greater than might be thought at first sight. The shower of
stars must have been surrounded by a cloud of gas the cloud
from which the stars had just condensed. A supernova under-
going violent disintegration must have expelled gases that went
to join this cloud, the material from the supernova thereby
getting mixed with the large quantity of hydrogen ofwhich the
cloud was mainly composed. Our problem is then to explainhow both the Sun and planets were formed out ofthis mixture of
materials. In particular, we have to explain how the materials
of the Earth, derived from the supernova, were separated out
again after they had thus become mixed with a great deal of
hydrogen.But before we deal with this question we have other more
immediate difficulties to face, difficulties that confront all
theories that seek to explain the origin of solar system, Sun and
planets together, in terms of a condensation process from the
interstellar gas. How, for instance, do we explain the wide
separations of the planets from the Sun?
To appreciate the seriousness of this question, consider a
model with the Sun represented by a ball 6 inches in diameter,about the size of a grapefruit. On this model the inner planets
Mercury, Venus, Earth, and Mars are at the respective dis-
tances of 7, 13, 1 8, and 27 yards, being in themselves not morethan the size of a pin's head. The great planets Jupiter,
Saturn, Uranus, and Neptune are of the sizes of small peas at
about 90, 170, 350 and 540 yards respectively from the Sun.
Pluto is a speck of silver about 700 yards away.
The clue
It is the characteristic of a good detective story that one
vital clue should reveal the solution to the mystery, but that
the clue and its significance should be far from obvious. Sucha clue exists in the present problem. It turns on the simplefact that the Sun takes some 26 days to spin once round onits axis the axis being nearly perpendicular to the orbits of
the planets, which lie nearly in the same plane. The im-
portance of this fact is that the Sun has no business to be
84

THE ORIGIN OF THE PLANETS
rotating in 26 days. It ought to be rotating in a fraction of a
day, several hundred times faster than it is actually doing.
Manifestly something has slowed the spin of the Sun. It is
this something that yields the key to the mystery. But before we
go on to discuss the crucial steps of the argument we oughtfirst to understand why the Sun might have been expected to
spin very much faster than it is in fact doing.Stars are the products of condensations that occur in the
dense interstellar gas clouds. A notable cloud is shown in
Plate XI. This is the well-known Orion Nebula whose
presence in the 'sword' of Orion can easily be seen with
binoculars. It is known that stars are forming in large numberswithin the Orion Nebula at the present time.
Stars forming out of the gas in such clouds must undergo a
very great degree of condensation. To begin with, the material
of a star must occupy a very large volume, because of the
extremely small density of the interstellar gas. In order to
contain as much material as the Sun does, a sphere ofgas in the
Orion Nebula must have a diameter ofsome 10,000,000,000,000miles. Contrast this with the present diameter ofthe Sun, which
is only about a million miles. Evidently in order to produce a
star like the Sun a blob of gas with an initial diameter of some
10,000,000,000,000 miles must be shrunk down in some wayto a mere million miles. This implies a shrinkage to one ten-
millionth of the original size.
Now it is a consequence of the laws of dynamics, the laws
discovered in the first revolution of physics, that unless someexternal process acts on it a blob of gas must spin more andmore rapidly as it shrinks. The size of a condensation andthe speed of its spin keep an inverse proportion with each
other: a decrease of size to one ten-millionth of the originaldimensions leads to an increase in the speed of spin by 10
million. So if the initial speed was only i centimetre persecond the final speed would be 10 million centimetres persecond 100 kilometres per second, that is (100,000 centimetres
equals i kilometre). But the rotation speed of the Sun is onlyabout 2 kilometres per second at the equator, and the speedis faster at the equator than anywhere else. At a speed of 100
kilometres per second the Sun would spin around once in
85

FRONTIERS OF ASTRONOMY
about half a day, instead of in the observed time of 26 days.
The discrepancy cannot be evaded by saying that the
original spin should not be set as high as i centimetre persecond. Observations of the motion of the gases in the Orion
Nebula lead to the opposite conclusion, that we have alreadyset the initial speed much too low. An initial speed of 10
centimetres per second, or even of 100 centimetres per second,
would agree better with the observations. These initial speedswould lead to final speeds of 1,000 kilometres per second, and
of 10,000 kilometres per second respectively. Actually no
star like the Sun could spin as rapidly as this it would be
torn apart by rotary forces, as a flywheel bursts if it is spun too
quickly.As a desperate measure we might feel tempted to argue
that the Sun is a freak case. It is true that any calculation
based on observations of the Orion Nebula refers to an average
situation, to an average star. Perhaps we could set the initial
speed of spin at less than i centimetre per second for the case
of the Sun, even though the initial spin must be much more
rapid for the average star? But this would require the majorityof stars otherwise similar to the Sun to spin very rapidly, in
flat contradiction with observation. Stars otherwise similar
to the Sun are also similar in that they spin slowly. The policyof desperation fails.
Only one loophole remains. We must appeal to some external
process to slow down the spin of the solar condensation. Our
problem is to discover how such an external process operates.
The external process
First we must decide at what stage of the condensation the
external process acts. Does it act while the condensing blob
still has very large dimensions? Or does it operate only in the
later stages, as the condensation reaches the compact stellar
state? Or does it operate more or less equally throughout the
whole shrinkage?These questions have an obvious relevance to the origin of
the planets. If the slowing down occurred while the solar
condensation was still spread out through a vast volume with
86
THE ORIGIN OF THE PLANETS
dimensions of some 10,000,000,000,000 miles the process wouldhave operated much too soon. Jupiter, the largest planet, is
situated some 500 million miles from the Sun, a distance muchsmaller than the original size of the solar condensation.
Evidently unless the slowing of the rotation occurred onlyafter the proto-Sun had shrunk to less than one-thousandth of
its original size, the process could not have had any effect on
the origin of the planets. It seems likely that this was so, not
for any reason connected with the planets themselves, but from
an entirely independent line of evidence. The point is such
an important one that even at the expense of interrupting our
main discussion it is worth giving a short outline of this
evidence.
A strong hint that the process must act mainly in the late
stages of the condensation comes from observations of the
rates of spin of the stars. It is found that the rates of spin have
a very curious dependence on surface temperature. Stars like
the Sun, with surface temperatures less than 6,000 C. (the
surface temperature of the Sun is about 5,460 C.), rotate
slowly like the Sun. But stars with surface temperatures
greater than 7,000 G. rotate considerably more rapidly, their
equatorial speeds of rotation being usually greater than 50kilometres per second. Although this is still much less than
what we should expect if no external process were operative,it is considerably greater than the equatorial rotation speed
possessed by the Sun. This shows that while the external
process must be operative in all cases, it is operative to different
degrees that depend on the surface temperature of the final
star. Now the difference between one star and another can
scarcely show at all during the early stages of the shrinkage.
Certainly the difference between two condensations, one yield-
ing a scar of surface temperature 6,000 G. and the other
yielding a star of surface temperature 7,000 C., must be verysmall indeed during the early stages, much too small for the
two stars to come to have markedly different rotation speedsif the external process were of main effect during the early
stages. The inference is that the process operates mainly duringthe late stages of condensation.
Now what was the external process? We have mentioned
87

FRONTIERS OF ASTRONOMY
that rotary forces must have become important during the
late stages of the condensation. The effect of these forces was
to cause the condensation to become more and more flattened
at its poles. Eventually the flattening became sufficient for an
external rotating disk to begin growing out of the equator.
This sequence of events is illustrated in Fig. 4.
Condensation is initially Condensation becomes Eventually the
of an approximately increasingly ellipticalcondensation grom
spherical shape. during shrinkage. o disk.
FIG. 4. Shrinkage of solar condensation. The shrinkage reduces the dimensionsten million-fold and consequently cannot be drawn to scale. The condensation
is shown edge-on.
Once the Sun had thus grown a disk the external processwas able to come into operation. The word 'external' simplymeans 'external to the Sun', and the disk was now external to
the Sun. The process consisted of a steady transference of
rotational momentum from the Sun to the disk. Two birds
were thereby killed with one stone. The Sun was slowed downto its present slow rate of spin and the disk, containing the
material out of which the planets were subsequently to con-
dense, was pushed farther and farther from the Sun. Thesolar condensation probably first grew its disk when it hadshrunk to a size somewhat less than the orbit of the innermost
planet, Mercury. The pushing outwards of the main bulk of
the material of the disk explains why the larger planets nowlie so far from the Sun.
Overcoming thefirst difficulty
It may be wondered why such an obvious theory was not
put forward long ago. The answer is that there seemed to be
such grave objections to it that not until very recently has it
been examined at all seriously. And now it turns out that the
88

THE ORIGIN OF THE PLANETS
objections arc not so grave as was previously believed. Both
the Matterhorn and Everest were climbed by routes that were
at first thought to be impossible. Only after failure had attended
all attempts by what were thought to be the most feasible
routes did mountaineers turn their attention to the ways that
they had first rejected. Then it was found that the difficulties
were more imagined than real. A similar situation seems to
exist in the problem of the origin of the planets.
If all the planets were scooped up and mixed into the Sun,the Sun would certainly rotate much faster than it does the
equatorial speed of rotation would be about 100 kilometres per
second, instead of the present 2 kilometres per second. But
this is not fast enough. At such a rotation speed the Sunwould become somewhat flattened at its poles, but the rotaryforces would not be sufficient to make the Sun grow a disk.
The Sun would have about the same shape as Jupiter has (see
Plate VII). The Sun would not grow a disk any more than
Jupiter is growing a disk at the present time.
This would seem at first sight to dispose of the theory. If
putting all the planets back into the Sun would not cause the
Sun to grow a disk, how was the Sun able to grow a disk duringthe condensation process? If the Sun rotated fast enough in
the past to grow a disk of planetary material, should not the
Sun again become unstable if the material of the planets were
returned to it? Unquestionably yes, if the present planetscontain all the material that originally left the Sun. But
perhaps this is not so. Perhaps only a small proportion of the
material that formed the original disk is now locked awayinside the planets. This would overcome the difficulty.
But where then is the missing material? It is certainly not
moving around the Sun at the present time, so that our
answer must be that it escaped entirely from the gravitationalinfluence of the Sun and went back to join the clouds of inter-
stellar gas (we cannot reply that the material fell back into
the Sun since this would reinstate the difficulty that we are
now seeking to overcome). The theory stands or falls on the
correctness or otherwise of this suggestion.
Fortunately it seems probable that a great deal of hydrogendid indeed succeed in escaping from the disk out to the inter-
89

FRONTIERS OF ASTRONOMY
stellar gas. Otherwise the scarcity of hydrogen in the planetsUranus and Neptune cannot be satisfactorily explained.
Jupiter and Saturn seem to contain much the same amount of
hydrogen (see Chapter 5) as the Sun does, but the moredistant Uranus and Neptune have comparatively little hydro-
gen. To account for this, large quantities of hydrogen must
have escaped from the outermost parts of the disk of planetarymaterial from the outermost parts presumably because the
restraining pull of the Sun was at its weakest there.
Ifwe make the very reasonable supposition that Uranus and
Neptune consist mainly of carbon, nitrogen, oxygen, and neon,we can readily estimate the amount ofhydrogen that must have
escaped. Carbon, nitrogen, oxygen, and neon make up about
i per cent of the mass of the material of the Sun, so that onthe basis that planetary material and solar material were
originally identical (a necessity in the present theory), we
require the mass of hydrogen that escaped from the outer partsof the planetary disk to have been about 100 times greater than
the combined mass of Uranus and Neptune which togetheramount to rather more than 30 times the mass of the Earth
as can be seen from the table on page 72. Hence the mass of
escaping hydrogen must have been about 3,000 times the
Earth. This may be compared with about 450 Earth-masses
now resident in all the planets. The escaping hydrogen there-
fore exceeded the total mass of the present planets about
sevenfold.
Our difficulty is entirely resolved by these considerations.
We see that instead of having to reckon only with the mass of
the planets we have to regard the original disk of material as
having possessed nearly ten times as much material as is nowcontained in the planets. Putting back the disk into the Sunwould therefore raise the speed of rotation, not to 100 kilo-
metres per second, but to about 1,000 kilometres per second;and at this speed the Sun would certainly grow a disk. Indeed
this speed is so large that the Sun must have grown its disk
when it was of appreciably larger size than it is at present. The
contracting solar condensation must have grown a disk whenits dimensions were perhaps fifty times the present size of the
Sun.
90
THE ORIGIN OF THE PLANETS
Overcoming the second difficulty
Consider the following curious situation. After the solar
condensation grew its disk the condensation continued to
shrink. The disk, on the other hand, was pushed farther and
farther outwards. This must have caused a gap to open upbetween the solar condensation and the inner edge of the disk.
How did rotational momentum continue to be transferred
across this gap? Here we have the second major difficulty that
the theory must surmount.
A suggestion was put forward some years ago by H. Alfv^n
that may well be capable of fitting this piece of the puzzleinto place. Alfv&i pointed out that rotational momentum
might be carried by a magnetic field, even across a gap of the
sort that must arise in the present problem. The idea that
magnetic fields may play an important role in the process of
origin of the planets is an important new concept deserving of
close consideration. Many years ago Faraday showed that it
was possible to think of a magnetic field as a collection of lines
of forces, the lines of force behaving in many ways like elastic
strings. The analogy of elastic strings is of particular value in
the present instance as we shall soon see. To get to grips with
the matter, consider a wheel with an inner hub connected to
an outer rim by spokes. When the spokes are rigid the rim
is forced to rotate around in exactly the same time as the hub.
But if the spokes were made of elastic the rim could lag behind
the hub. This would cause the spokes to become stretched in the
manner shown in Fig. 5. Such a stretching of the elastic has
the effect of speeding up the rim and of slowing down the hub.
For the hub of the wheel now read the Sun, for the rim
read the disk of planetary material, and for the elastic spokesread the magnetic field. The magnetic field slows down the
rotation of the Sun just as the elastic spokes pull back the hubof the wheel in our analogy. The magnetic field also affects
the disk of planetary material, not quite by speeding up the
disk, but by pushing it farther and farther away from the Sun.
This is just the situation that we require.It appears therefore that a process for coupling the rotation
of the Sun to the planetary material may exist. A further
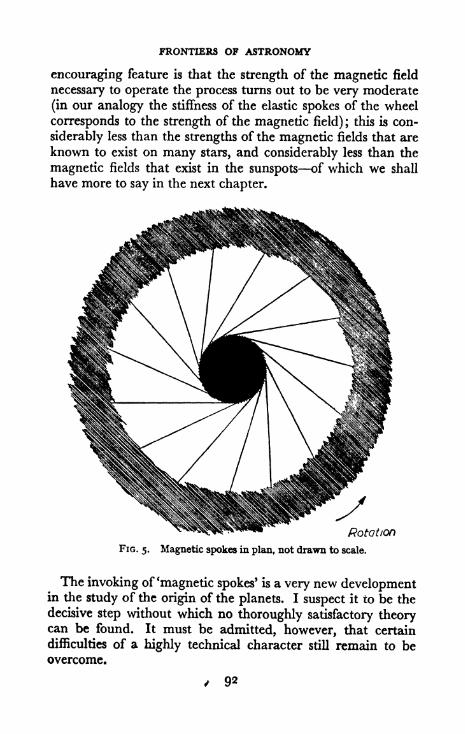
FRONTIERS OF ASTRONOMY
encouraging feature is that the strength of the magnetic field
necessary to operate the process turns out to be very moderate
(in our analogy the stiffness of the elastic spokes of the wheel
corresponds to the strength of the magnetic field) ; this is con-
siderably less than the strengths of the magnetic fields that are
known to exist on many stars, and considerably less than the
magnetic fields that exist in the sunspots of which we shall
have more to say in the next chapter.
Potation
FIG. 5. Magnetic spokes in plan, not drawn to scale.
The invoking of 'magnetic spokes' is a very new developmentin the study of the origin of the planets. I suspect it to be the
decisive step without which no thoroughly satisfactory theorycan be found. It must be admitted, however, that certain
difficulties of a highly technical character still remain to beovercome.
/ 92

THE ORIGIN OF THE PLANETS
Overcoming the third difficulty
The third and last severe difficulty concerns the compositionsof the four inner planets. These are made very largely of rock
and iron. Now iron and the magnesium and silicon of the rock
were presumably only very minor components of the original
planetary material. We can infer this because the planetarymaterial must (on the present theory) have been exactly like
solar material at one time and the solar content of iron>
magnesium, and silicon is only some i per cent by weight.What process then was responsible for separating out the rock
and iron? How was the iron, magnesium, and silicon separatedfrom the main constituents of the planetary material, notablyfrom the great mass of hydrogen?The present difficulty is a consequence of the change from
the theory advocated in The Mature of the Universe. Iron andthe rock-forming atoms are derived from the stars, probably
mainly from the exploding supernovae. The composition of
the inner planets would therefore be explained immediately,if (as in the former theory) the planetary material were
derived directly from a supernova. But this simple explanationis destroyed if (as in the present theory) the material from the
supernovae first mixes with a large quantity of interstellar
gas. The success or failure of the ideas of the present chapter
depends on the outcome of a search for an alternative explana-tion. Actually an entirely satisfactory alternative explanationcan indeed be found, as we shall now see.
Our theory requires the gases of the disk to be pushedfarther and farther away from the Sun as the rotation of the
Sun is slowed down. Now the magnetic coupling between the
Sun and the disk depends for its functioning on the material of
the disk being a gas. If solid or liquid particles of appreciablesize were to condense out of the gas of the disk, rather as rain-
drops condense out of the water vapour in the clouds of the
terrestrial atmosphere, they would not be subjected to any
appreciable magnetic effects. Solid or liquid particles of saya few yards or more in size condensing out of the gas wouldtherefore be left behind as the main gases were pushed farther-
from the Sun*
93

FRONTIERS OF ASTRONOMY
Now what substances may be expected to have condensed
out as solid or liquid particles? The answer depends on the
temperature within the gas, and this evidently depends on the
distance of the gas from the Sun the nearer to the Sun the
higher the temperature. When the temperature is compara-
tively high only very refractory substances such as the silicates,
iron, and some other metals can condense. But with increasingdistance and progressively lower temperatures substances of
lower and lower boiling points condense oil, water, ammonia.Let us try to visualise what happened to the disk as it moved
outwards from the Sun. Before the material reached the dis-
tances of the great planets, the most refractory substances
became condensed out of the gas as a swarm of solid bodies.
Already a great deal is explained. We see why the inner
planets must represent aggregations built up out of muchsmaller bodies (this being the view that guided our discussion
of the internal properties of the Earth in a former chapter). Wealso see how it came about that the inner planets were built upalmost entirely of rock and iron simply because the rock andiron were the first important materials to separate out of the
gas. This is an outstanding point in favour of the theory; for
quite apart from our now being able to understand how the
iron and rock came to be separated out from the planetarymaterial we also see why the inner planets must be the ones
that are made of the rock and iron.
Many details remain to be understood, however. Howexactly did the multitude of small bodies become agglomeratedinto planets? What decided the distances of Mercury, Venus,
Earth, and Mars from the Sun? Only hints can at present be
given as to what the answers to these questions may turn out
to be. It has been suggested by Harold Urey, and independently
by H. E. Suess, that liquids may have played an important
part in the agglomeration process. The idea is that liquids canact as a sort of glue that sticks the solid bodies together. Twobodies coated with sticky liquids would certainly be muchmore likely to remain joined together after collision than
would two entirely solid bodies. The identity of such sticking
agents is not known with any certainty. Urey suggests water
in the form ofslushy snow. It is true that some water molecules
94

THE ORIGIN OF THE PLANETS
may be expected to combine with the silicates as hydrates.This indeed is necessary in order to explain how water cameto be present on the Earth. But slush is essentially pure water,and I doubt whether any pure water would condense from
the vapour until the gases receded beyond the orbits of the
inner planets. My impression is that we must look elsewhere
for a sticking agent. The higher hydrocarbons would con-
dense as oil. In itself oil is perhaps not a very suitable sticking
agent, but pitch, obtained by oxidising certain hydrocarbons,would be a sticker par excellence.
The problem of deciding why the planets were formed at
just their present distances from the Sun is an important one.
I am inclined to believe that the distances were strictly deter-
mined by the regions in which sticking agents were particu-
larly active. If this is correct the distance of the Earth from the
Sun is not a matter of chance and another apparently
arbitrary quality disappears from the solar system.
The origin ofJupiter and Saturn
Beyond the inner planets water and ammonia were able to
condense out ofthe gas. The agglomeration ofbodies composedlargely of water and ammonia presumably represented the
first phase in the building of Jupiter and Saturn. Because
water and ammonia must have been more important con-
stituents of the original planetary material than either rock or
iron it is only to be expected that Jupiter and Saturn should
be more massive than the four inner planets. But this is not
in itself sufficient to account for the very large differences of
mass that actually exist. We might expect a difference perhaps
by a factor 10 on this score, but not by the factor of 100 or
more that we actually find. To explain factors of this order wemust suppose that Jupiter and Saturn managed to add large
quantities of uncondensed gas to themselves, the main com-
ponent of the gas being hydrogen.It may be wondered how it is possible for a planet to pick
up gaseous substances. So far we have spoken of a planet
forming through the agglomeration of solid and liquid bodies.
This must be the way that the first steps of planet formation
95

FRONTIERS OF ASTRONOMY
occur. But once a body of considerable size has thus been
built up, the gravitational field of the body itself may begin to
play an important role in the condensation. This will be
especially so if the newly forming planet happens to be im-
mersed in gas, as the young Jupiter and the young Saturn
presumably were. In the cases of the inner planets, the gases
must have been pushed out beyond their orbits by the time
that the first bodies of a sufficient size to be able to pull in
gaseous material were built up. In this way it is possible to
understand why the inner planets picked up so little water,
neon, ammonia, etc. The necessity for giving a satisfactory
explanation of this point has been emphasised by Harold Urey.Now was this an accident? Was it an accident that the inner
planets did not aggregate until after the gases had been
pushed out beyond their orbits? I suspect that there was no
accident at all. In keeping with the general theme of this book,I believe that nothing arbitrary entered the chain of incident
that connected the origin of the Earth, and of living creatures
on the Earth, with the general march ofcosmic events. Rather
do I suspect that no suitable sticking agent was available while
the swarm of small bodies out of which the inner planets were
later to agglomerate were still immersed in the hydrogen gas:
that it was only after the gases had moved farther outwards, to
the orbits ofJupiter and Saturn, that chemical changes leadingto the presence of sticking agents occurred among the swarmof small rock and iron bodies.
The origin of Uranus and Neptune
Four problems have to be solved to give a satisfactory theoryof the origin of Uranus and Neptune. The first is to discover
the nature of the substances that remain to be condensed out
of the gas. Water and ammonia must have been already lost
when the gases moved out past the orbits ofJupiter and Saturn.
Perhaps one of the lower hydrocarbons initiated the condensa-
tion from the gas. The second problem is the identity of the
sticking agent responsible for the building up of bodies of con-
siderable size. The third problem is to showwhy bodies of con-
siderable size were not built up until after the hydrogen had
96
THE ORIGIN OF THE PLANETS
escaped from the region ofUranus and Neptune out again to the
interstellar gas clouds. The fourth problem is to find out whythe hydrogen escaped from the outer parts of the solar system.
Several proposals have been put forward to explain whythe hydrogen escaped. Some astronomers regard the heatingeffect of ultra-violet light from the Sun as the cause. Others
attribute importance to friction between the planetary material
and the interstellar gas, while a third idea is that a very hot
luminous star happened at one time to be in the vicinity of
the solar system and that it was the heating effect of this
neighbouring star that caused the hydrogen to escape. Ofthese possibilities only the third seems to me to be certainly
workable; and since there are reasons why a star ofthe necessary
type might indeed have been quite close to the solar systemat the time the Sun was formed, this idea may well turn out
to be the correct one. We shall return to it in a later chapter.The third problem, of explaining why aggregations of
appreciable size were not formed before the hydrogen was
lost, raises a very pertinent issue. For if aggregations that were
large enough to pull in gas by their gravitational fields hadformed first, then Uranus and Neptune would have contained
large quantities of hydrogen just as Jupiter and Saturn con-
tain large quantities of hydrogen. A very satisfactory solution
to this problem would be obtained if, as in the case of the inner
planets, it could be shown that no sticking agent was available
so long as the hydrogen remained, but that a sticking agent could
arise from chemical changes once the hydrogen was lost. This
would solve the problem without any appeal to chance effects.
It may be noted that gases such as methane and neon wouldnot be evaporated away from the solar system like the hydro-
gen. These gases would remain to be picked up by gravita-tional action once appreciable aggregation had taken place.Neon and methane are probably major constituents of Uranusand Neptune.
Further problems
It will be clear from what has been said above that the
solar system, for all its tininess when viewed on a cosmic scale
97

FRONTIERS OF ASTRONOMY
abounds in intricate problems. It is no wonder that these
problems have teased the wits of many generations of astrono-
mers. It is also clear that a great deal of thought will still have
to be expended before the subject reaches the rather unin-
teresting stage of being 'worked out'. But in science the excite-
ment lies in the chase, not in the kill.
The issues discussed above are indeed only a selection of
the problems that will have to be solved before the understand-
ing of our system becomes reasonably complete. To discuss all
problems in any appreciable detail would go far beyond the
resources of the present chapter. It will therefore be under-
stood that what is now to be said about further problems must
necessarily be very brief.
The picture of how small solid bodies become aggregatedinto larger bodies needs a great deal of development. The
recognition that a sticking agent is probably necessary for
aggregation to take place may well turn out to be a most im-
portant step. But it is not the whole story of the aggregation
process. We can ask the further question, for instance: did
every major aggregation form a separate planet? In the case
of the Earth was there just one major aggregation that grewsteadily through the addition of small bodies, or was the Earth
formed by the addition of several major agglomerations,
agglomerations of the size of the Moon, say? A clue to the
answers to these questions can be got by considering the
orientations of the axes of spin of the planets.
The axis about which the Earth spins is inclined at an angle of
about 67 to the plane of the Earth's orbit around the Sun. The
corresponding inclinations for the other planets are given here.
Inclination of the axis of spin to the plane of the
Planet planets' orbits around the Sun. (G. P. Kuiper)
Mercury 87 (?)
Venus 80 (?)
Earth 66.5Mars 65
Jupiter 89Saturn 62
Uranus 7
Neptune 70
98

THE ORIGIN Or THE PLANETS
The relevance of these values to the problem under discussion
is that we should expect an inclination close to 90 for a planetthat was formed as just one major aggregation. Mercury,Venus, and Jupiter are the only planets that fall into this
category. The other planets seem as if they must have formed
by the coagulation of two or more agglomerations of compar-able sizes. This must almost certainly have been the case for
Uranus whose axis of spin lies nearly in the plane of its orbit
around the Sun. Uranus was probably formed by the coagula-tion ofjust two bodies of about the same size. Only in this waydoes it seem possible to explain the astonishing direction of the
axis ofspin. On Uranus the 'seasons ofthe year' must be odd in
the extreme. Instead of the Sun being only overhead at pointsnear the equator, as on the Earth, at any point on Uranus the
Sun must be overhead or nearly overhead at some appropriatetime in the year. When the Sun is overhead (or nearly so) at
one of the poles it stays continuously overhead for several
Earth-years on end!
Another problem whose solution demands a more precise
knowledge of the details of the aggregation process is that of
the origin of the satellites of the planets. It is easy enough to
say that the satellites are simply fragments left over from the
aggregation process, but this is not sufficient. The difficulty
is not so much to see why a number of fragments should, be
left over, but why more fragments were not left over. Why did
the Earth not have a dozen satellites? Why have Mercury andVenus no satellites? I suspect that questions such as these will
not be easy to answer. The problem may turn out to requirean extremely intricate piece ofdynamical analysis. No solution
is yet in sight.
A satisfactory feature of the present theory is that it explainsthe tendency shown in the table on page 74 for the densities of
the satellites to decrease as the distance of the parent planetfrom the Sun increases. The Moon was formed in the rock-iron
zone. The satellites lo and Europa ofJupiter mark the end of
this zone. Already the other two large satellites of Jupiter,
Ganymede and Callisto, must contain appreciable quantitiesof a less dense material, presumably of water. The satellites
of Saturn probably consist mainly of water and ammonia.
99

FRONTIERS OF ASTRONOMY
But it is something of a difficulty that the density of Titan
should be as high as 2. A density close to i would correspondbetter to a satellite composed mainly of water and ammonia.
Mention has just been made of the end of the rock-iron zone.
It is tempting to suppose that this zone petered out, not at
Jupiter, but already in the region between Mars and Jupiter.
This would give a rock-iron zone that stretched from just inside
the orbit of Mercury to just outside the orbit of Mars. This
view has the advantage that it gives some indication of the
order of size among the inner planets. Mercury and Mars
lying near the inner and outer boundaries of the rock-iron
zone are the two small members of the group: Venus and the
Earth lying towards the central regions of the zone acquiredmost of the rock and iron.
This view is supported by the bodies that are actually found
between Mars and Jupiter. It is estimated that about 30,000small bodies lie in this region. These bodies, known as asteroids
or minor planets, are made of rock and iron, like the inner
planets. All lumped together they would scarcely make up an
aggregation as large as the Moon. The asteroids seem to
represent the very last of the rock and iron, when there was so
little left that no reasonable sized planet could be made. Theexistence of this swarm of comparatively tiny bodies also gives
confirmation of the view developed above, that the first stepin planet-formation is the condensation of a multitude of small
bodies. I suspect that in some way Jupiter managed to capturethe material of the satellites lo and Europa from the asteroid
zone.
The origin of life
Although this is a problem for the biologist and the bio-
chemist rather than for an astronomer there is one feature that
may be important and which might tend to be overlooked if the
astronomer should keep himself entirely out of the problem.The principle on which life is based seems to be fairly clear.
Under the action of ultra-violet light from the Sun a mixture
of simple substances such as water, methane, ammonia can bebuilt into molecules of moderate complexity, molecules that
TOO

THE ORIGIN OF LIFE
contain up to perhaps 20 or 30 separate atoms, such as the
amino acids. These molecules contain considerable stores of
internal energy supplied to them by the ultra-violet light. Nowit is a general rule that molecules with interned stores of
energy tend to undergo chemical changes that get rid of the
energy. Normally we should expect that a break-back into
the original materials would occur, the stored energy being
thereby released again. But owing to a chemical freak this
does not happen in the present case provided the molecules are
kept at the comparatively low temperature occurring on die
Earth. It is on this freak that life is based. The lack ofa straight-
forward process of break-down forces the molecules to disposeof their energy by adding themselves together into more andmore complex molecules, small quantities of energy beingreleased at each step. It is to be noticed that ultra-violet light
is not necessary to this adding process, only to the building upof the molecules with the energy reservoir.
Ultimately the molecules become so large, and the aggrega-tions of molecules develop to such a degree, that at last a
collapse back to the primary substances becomes possible. In
this way a chemical cycle based on the generating influence of
ultra-violet light becomes set up. The cycle is illustrated in
Fig. 6. The main interest in this cycle lies in the complexmolecules and structures that precede the break-back into
the primary chemicals. The nature of these structures probably
depends rather sensitively on environmental factors such as
the temperature, the intensity of ultra-violet light, the con-
centrations of the primary chemicals, and so on.
At what stage may life be said to appear? This depends on
what we mean by life. As more becomes known about life it is
increasingly clear that there is no hard and fast dividing line
between what is alive and what is not alive. It is to a consider-
able extent a matter of choice where the line is drawn. This
does not mean that the ordinary terminology whereby we saythat a dog is alive and a stone is not alive loses its value. Wecan speak about rich men and poor men without implyingthat there is a sharp dividing line between wealth and poverty.We say that a dog is alive to denote the fact that the material
of the dog is in a special condition, differing markedly from
101

FRONTIERS OF ASTRONOMY
that of the material of the stone. But the properties of both the
dog and the stone are different manifestations of the behaviour
of matter.
Living material
Structures built
of molecules of
high complexity.
Molecules of moderate
complexity
Break-back into primarychemicals.
Ultra-vfolet fightfrom the Sun
FIG. 6. The origin of life.
Perhaps the most convenient definition of the origin of life
is at the stage where some structure (built out of the highly
complex molecules) becomes capable of using itself as a blue-
print for the building ofsimilar structures. Even here subtleties
arise. Sometimes a structure may be able to reproduce itself
in the presence of certain other complex structures, but not in
the presence of the molecules produced by the solar radiation
alone. The virus is a case in point. A virus can only act as a
blueprint in the presence of other complex structures. Is a
virus alive? It all depends on what you mean by alive.
The final break-back into the primary chemicals plays an
important part in the processes of life. Certain structures have
developed that possess the property of being able to break
down other structures without being broken down themselves.
These substances, known as enzymes, release the supplies of
energy required by plants and animals.
But our present object is not to enter into a discussion of the
chemistry of life, except in so far as our considerations mayhave an astronomical connotation. It has always been supposed
102
THE ORIGIN OF LIFE
that life originated on the Earth. The physical and chemical
requirements must, however, have been far more favourable
for the building of complex molecules before the Earth was
aggregated. The Earth intercepts only a tiny fraction of the
ultra-violet light emitted by the Sun, whereas the gases out of
which the planets condensed intercepted a large fraction of the
ultra-violet. The energy source was therefore much greaterbefore the planets were aggregated than it was afterwards.
Another point in favour of a pre-planetary origin of life
appears when we consider in a little more detail how the com-
plex molecules were built up. This requires the addition
together of many much smaller molecules. Now how did the
smaller molecules manage to come in contact with each other?
If the molecules were dissolved in the sea, for instance, the
chance of enough of the right kinds of molecules coming to-
gether would be negligible (this would seem to rule out the
sea as the original source of life). Bernal has called attention
to the necessity for solving this problem of association, and has
suggested that favourable conditions would probably occur if
the molecules were coated as a film on the surface of a solid
particle. Such a condition would undoubtedly best be satisfied
before the planets were aggregated, while the planetarymaterial was still distributed as a swarm of small bodies.
An interplanetary origin of life would have seemed impossiblein the days when it was believed that the Earth was formed
in an entirely molten state, for the associated high temperaturewould have destroyed all complex organic molecules. Nowthat we realise that the Earth must have accumulated from
a multitude of cold bodies it is no longer possible to be so sure
of this. It is true that the temperature deep inside the Earth
became high due to compression, but the temperature at, and
near the surface probably was quite low especially during the
last phases of the aggregation process. I do not see whyalready complicated chemical structures should not have been
added to the Earth in this phase.It is important to realise that all our present considerations
refer to stages in the process of origin of life that preceded the
stages that are studied by the biologist Evolution from amoeba
to man is only a part ofthe story of life. From a chemical point
103

FRONTIERS OF ASTRONOMY
of view amoeba is already an extremely complex structure.
The crux of the origin of life had already been passed by the
time that amoeba had evolved. It is to such earlier phases that
all the above remarks apply. There is no suggestion that
animals and plants as we know them originated in inter-
planetary space. But the vital steps on which life is based mayhave occurred there.
More about otherplanetary systems
To end the present chapter, it is desirable to stress the im-
portance of the part played by the magnetic field in the theorydescribed above. The action of the magnetic field in slowingdown the spin of the Sun and in pushing the gaseous disk awayfrom the Sun is the pivot on which the whole theory turns.
This may be seen by thinking about what would happen if
there were no magnetic field to produce these effects.
We saw that the solar condensation probably began to growa disk when it had shrunk to a size somewhat less than the
orbit of Mercury. This would also occur in the absence of a
magnetic field. But the Sun would then grow a much moresubstantial disk: it would go on growing a disk throughout the
remainder of its contraction. The amount of material that
would thus come to reside in the disk can be estimated, and it
turns out to be comparable with the mass of the Sun itself. The
implication is that when the disk condensed it would condense,not into comparatively tiny planets, but into a veritable star, a
star that shone by its own light and which was comparablewith, although probably somewhat smaller than, the Sun.
In the absence of a magnetic field the solar condensation
would therefore have evolved into a double-star system. Thetwo stars would have been quite close together, their separa-tion being less than the radius of the orbit of Mercury, and
they would have revolved around each other in orbits that were
nearly circles. Both components instead of spinning slowly as
the Sun does would have rotated with considerable rapidity,since no magnetic slowing down was operative.
It is a matter for considerable satisfaction that double-star
systems with these characteristics are actually observed. They
104

OTHER PLANETARY SYSTEMS
are known as the W Ursa Majoris stars, named after the proto-
type star W Ursa Majoris (the star with catalogue designationW in the constellation of the Great Bear). It is tempting to
ascribe them to cases where the magnetic process was veryweak or entirely absent. They comprise less than one per cent
of all cases, indicating that the solar case is normal.
The great majority of stars are indeed slowly spinning stars
like the Sun, stars that presumably have undergone the same
process of slowing down that occurred in the case of the Sun.
Accordingly we may expect planetary systems to have developedaround the majority of the stars. This requires the numberof planetary systems existing in the Milky Way to be about
100,000 million, since the number of ordinary slowly spinningstars is of this order.
It has been stated by some that only as a result of a series of
prodigious accidents were conditions made suitable for the
development of life on the Earth. The present theory is in
opposition to this view at every point. It was not an accident
that the small planets were formed nearest the Sun. Nor dothe compositions of the planets seem in the least to be a matter
of chance. Rather do I think it would be somewhat surprisingif anything very different had occurred in any of the other
planetary systems. Even the origin of life is beginning to look
as if it was no accident.
Living creatures must it seems be rather common in the
Universe. It is something of a cosmic tragedy that the dis-
tances from one star to another are so vast by ordinary stan-
dards that there seems no prospect of one group of creatures
being able to establish communication with another. This is a
pity, because the supporters ofvarious ideologies after attempt-
ing to impress the superior merits of their views on each other
(through the aid of fusion bombardment and other massive
activities), could proceed to impress themselves on the rest of
the Milky Way. Not only this, but the opportunity for tax-
collectors would be enormous. With taxes levied on say
250,000,000,000,000,000,000 individuals instead of on a mere
2,500 million it would be possible to whack up the defence
programme for the Milky Way to something like reasonable
proportions.
105

CHAPTER SEVEN
The Mystery of the Solar Atmosphere
In the previous chapter we attempted to follow a trail that
had gone cold. We were following on some 4,000 million yearsafter the event. In the present chapter we shall see that prob-lems can also be difficult even when the trail is very hot, even
when everything is happening in front of our noses. Noproblem shows this better than the tantalising mystery of the
solar atmosphere. Let us first come to the atmosphere before
we come to the mystery.If you should look at the Sun through a piece of dark cello-
phane paper (to cut down the glare) you will find that the
limb of the Sun looks sharp, as if the Sun ended at a definite
place. This place is the photosphere, so called because this is
where most of the Sun's light comes from. But the Sun does
not end completely at the photosphere. It also possesses a
faint outer atmosphere. Something of this atmosphere can be
seen in Plate XII, which was obtained during a total eclipseof the Sun when the Moon came between the Sun and the
Earth in such a way as to block out the fierce glare from the
photosphere. The lower part of the solar atmosphere up to a
height of 10,000 kilometres above the photosphere (for com-
parison, the radius of the photosphere is some 700,000 kilo-
metres) is called the chromosphere. The higher portion of the
atmosphere is called the corona.
To understand why this atmosphere sets such a serious
problem consider what our expectations would be if we hadnever actually seen it! We should expect on the basis of a
straightforward calculation that the Sun would 'end' itself in a
simple and rather prosaic way; that with increasing heightabove the photosphere the density of the solar material woulddecrease quite rapidly, until it became pretty well negligible
only two or three thousand kilometres up. Since the radius
106

THE MYSTERY OF THE SOLAR ATMOSPHERE
of the photosphere is very much greater than this about
700,000 kilometres we should accordingly expect the atmos-
phere to be confined to a very thin skin. Reference to Plate XIIshows that the solar atmosphere is certainly not confined to a
thin skin. The atmosphere is a huge bloated envelope. The
problem is to explain why this envelope exists.
The problem is all the more strange because the atmosphere
begins as if it were going to do the expected thing. In the first
one or two thousand kilometres of height above the photo-
sphere the density of the material does indeed fall very rapidly,as we anticipate; but then the rapid fall is suddenly halted,
and thereafter the decline with increasing height becomes veryslow. This marked change is accompanied by an astonishingsituation concerning the temperature of the material.
In the first 2,000 kilometres of height the temperature is
not very different from that of the photosphere. But above this
height the temperature, instead of decreasing slightly as we
might expect, begins to increase. At a height of 3,000 kilo-
metres the temperature is probably as high as 7,000 C.; at a
height of 4,000 kilometres, temperatures in excess of 20,000 C.
are probably attained in some parts of the atmosphere; while
at the top ofthe chromosphere at a height of 10,000 kilometres,
the temperature rises quite steeply to 100,000 C. The rise
continues at still greater heights, and at a height of 100,000kilometres in the corona the temperature approaches a million
degrees. Why should the temperature increase in this almost
incredible fashion?
Before we attempt to answer this question it may be useful
to insert a diversion on the meaning of temperature. In the
present sense, temperature is a measure of the average randommotion of the particles of the solar atmosphere. The designa-tion 'kinetic temperature' is often used to denote this particular
way of using the concept of temperature. The statements of
the previous paragraph imply that the average speed of motion
of the particles increases as we go upwards from the photo-
sphere. The atoms contained in the gases shown in Plate XII
mostly have speeds of nearly a million miles an hour.
The word temperature is sometimes used in a different way,as a measure of the intensity and quality of the radiation
107

FRONTIERS OF ASTRONOMY
emitted by matter. When we speak of the temperature of
material deep inside the Sun we can use the word with this
significance. But it cannot be so used in the case of the solar
atmosphere. If the solar atmosphere were at a 'radiation
temperature' of 1,000,000 C. the atmosphere would be very
much brighter than the photosphere: indeed the atmospherewould emit so much radiation that Pluto would be vaporised.It is fortunate for us that the temperature of the solar atmos-
phere is only a kinetic temperature.This is not to say that the solar atmosphere emits no radia-
tion at all, however. It not only emits some radiation, but it
emits a very peculiar kind. The high part of the atmosphereemits X-rays as well as visible light, and the low part emits
ultra-violet light. This is the radiation responsible for pro-
ducing the well-known ionised layers ofthe Earth's atmosphere.Now quite apart from the radiation that is thus being emitted
by the solar atmosphere, scattering of light also occurs. We can
easily understand what this means by thinking about the tiny
particles of dust that are sometimes seen scintillating in a beamof light, as when a shaft of sunlight comes through a gap in a
curtain. These particles ofdust are scattering light, not emittingit: the scattering of light is simply a deflecting process. In a
similar way the particles in the Sun's atmosphere scatter a small
proportion of the light that is emitted by the photosphere.When the solar atmosphere is photographed at a total eclipse
of the Sun, much of the light that enters the camera is simply
photospheric light that has been deflected by the particles of
the atmosphere. The photograph shown in Plate XII wastaken in this scattered light, not in the ultra-violet or X-raysdiscussed in the previous paragraph. The latter radiation
cannot be observed at sea-level since it is absorbed in the upper
parts of our atmosphere, the parts where the ionised layers
occur. But it can be detected with the cameras that are carried
by high flying rockets. This is one of the more important uses
to which recent military work on long distance rockets can be
put.After this diversion on temperature and radiation we must
come back to the central problem of the present chapter: whydoes the Sun possess such a bloated atmosphere? What is the
108
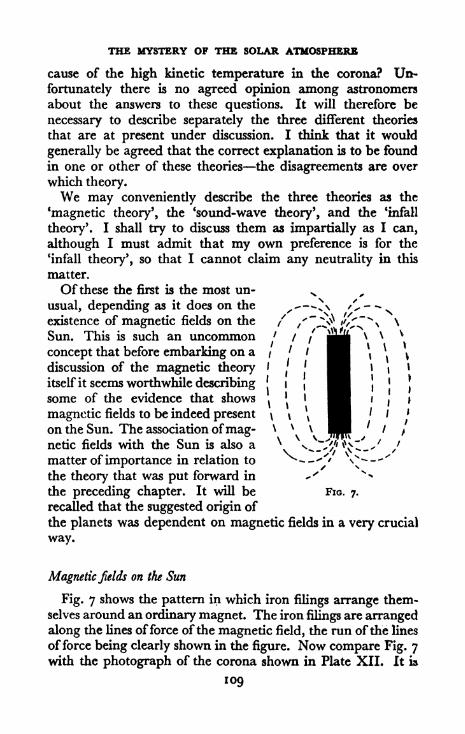
THE MYSTERY OF THE SOLAR ATMOSPHERE
cause of the high kinetic temperature in the corona? Un-
fortunately there is no agreed opinion among astronomers
about the answers to these questions. It will therefore be
necessary to describe separately the three different theories
that are at present under discussion. I think that it would
generally be agreed that the correct explanation is to be found
in one or other of these theories the disagreements are over
which theory.We may conveniently describe the three theories as the
'magnetic theory', the 'sound-wave theory', and the 'infall
theory*. I shall try to discuss them as impartially as I can,
although I must admit that my own preference is for the
'infall theory', so that I cannot claim any neutrality in this
matter.
Of these the first is the most un- x ,
usual, depending as it does on the
existence of magnetic fields on the
Sun. This is such an uncommon
concept that before embarking on a
discussion of the magnetic theoryitself it seems worthwhile describingsome of the evidence that shows
magnetic fields to be indeed presenton the Sun. The association ofmag-netic fields with the Sun is also a
matter of importance in relation to
the theory that was put forward in
the preceding chapter. It will be FIG. 7.
recalled that the suggested origin of
the planets was dependent on magnetic fields in a very crucial
way.
Magnetic fields on the Sun
Fig. 7 shows the pattern in which iron filings arrange them-selves around an ordinary magnet. The iron filings are arranged
along the lines offeree of the magnetic field, the run of the lines
offeree being clearly shown in the figure. Now compare Fig. 7with the photograph of the corona shown in Plate XII. It ia
109

FRONTIERS OF ASTRONOMY
difficult to resist the impression that the material near the
poles ofthe Sun is arranged along the lines offorce ofa magneticfield, lines of force that emerge from the Sun rather like the
lines of force emerge from the ends of the magnet in Fig. 7.
The correctness of this view has recently been demonstrated
by H, D. and H. W. Babcock, who have shown by observation
that a magnetic field does indeed emerge from the poles of the
Sun.
But the problem of the Sun's field is not as simple as that of
an ordinary magnet. It will be noticed in Fig. 7 that the lines
offeree emerging from one end of the
magnet curve round and enter the
other end ofthe magnet. No evidence
for such a connection between the
two poles of the Sun can be seen in
Plate XII. Indeed a careful exam-ination of the polar plumes of the
corona suggests that the lines offeree
emerging from the poles of the Sunshow the behaviour indicated in
Fig. 8. The lines of force apparentlymake a bee-line dead away from the
Sun, and the farther they go the less
indication there seems to be that
they are ever going to curve round
and join up with the lines of force
from the other pole. Where do these
lines of force go to? This questionraises a puzzle to which there is no
agreed answer. It certainly looks as
though the lines of force either must go out to join the inter-
stellar gas or they mustjoin up at a distance far outside the Sun.
Two other lines of evidence show magnetic fields to be
present on the Sun, one from prominences and the other from
sunspots. Prominences are local condensations of cool material
that occur from time to time in the corona. The cool material
emits ordinary light, instead of ultra-violet light and X-raysas the hot material of the normal corona does. A photographof a large prominence taken in this ordinary light is shown in
no
FIG. 8.
MAGNETIC FIELDS ON THE SUN
Plate XIV. It will be seen that this prominence has a curious
arch-like structure.
The comparatively dense, cool material ofsuch a prominencedoes not stay entirely fixed in position. It often plunges downthe arches into the Sun. Indeed there is such a preponderanceof downward motions in most prominences that apparentlythere must be a steady condensation of material from the
corona, in order to provide a continuous supply of falling
material. Queer problems arise. When material plunges down-ward it scarcely ever falls as it would if gravitational forces
alone were acting on it. Some other force must also be opera-
tive, and without doubt the force must be ofa magnetic nature.
Another problem is to explain how the hot material of the
corona manages to condense into a cool prominence. Onewould suppose that this is another effect of a magnetic field,
although exactly how the condensation occurs is far from being
fully understood.
The magnetic fields associated with prominences producelocal modifications in the structure of the corona. These are
of the same general arch-like form that is shown by the promin-ences themselves. This can be seen quite clearly in Plate XIII.
The strongest magnetic fields observed on the Sun are found
in sunspots. In a terrestrial laboratory magnetic fields as
large as those of sunspots can be made artificially, but it is only
possible to maintain them over a distance of a few metres, in
contrast with a sunspot which maintains its field over dis-
tances of many thousands of kilometres. But large as they are,
sunspots are a good deal smaller than the Sun itself, so that
we must think of the magnetic field of a sunspot as being a
localised solar phenomenon. It is true that the field mayspread out from the sunspot into a larger volume but it be-
comes much weakened when it does so.
An appreciable sized sunspot is shown in Plate XV. It is
now generally believed that the darkening ofsuch a spot arises
from processes that are associated with its magnetic field. Afew remarks concerning why the sunspots are dark may be of
interest.
There is a flow of energy outwards from the deep interior of
the Sun to the surface. In the inner two-thirds of the Sun this
in

FRONTIERS OF ASTRONOMY
flow of energy is carried by radiation but in the outer third
of the Sun the flow is mainly carried by convection, by a general
stirring or boiling of the gases of the Sun in fact: it is carried in
the same sort ofway as heat is carried in a boiling pan ofwater.
At the extreme photosphere, however, the convection is much
reduced, and the flow changes back to a flow by radiation.
This change-back is not just a matter of chance. The Sun
carefully adjusts itself so that it can do this, otherwise it would
not be possible to radiate away the outflow of energy steadily
into space.
Returning now to the sunspots, it seems that the magneticfields of the sunspots interfere with the flow of energy in the
underlying convection zone by preventing the material from
boiling. This produces a serious reduction in the outflow of
energy, so that there is less available for radiation out into
space from the photosphere. The surface of the sunspot there-
fore looks dark compared with other parts of the photosphere,
Arguments infavour of the magnetic origin of the solar atmosphere
The magnetic theory seeks to explain the high random
speeds of motion of the particles of the solar atmosphere in
terms of continuous magnetic disturbances, of which sunspotsand prominences are exceptional examples. There are several
facts and arguments that can be put forward in support of this
theory. The emission oflight by the ionised atoms ofthe corona
suggests that the hottest spots in the corona are generally found
in the neighbourhood of sunspots, and W. O. Roberts tells methat there seems to be a tendency for these hot spots to diffuse
outwards from the sunspot areas. According to J. H. Pidding-ton and R. D. Davies measurements of the radio-waves emitted
by the corona suggest the same conclusion.
Another point in favour of the magnetic theory comes from
a different source; from the phenomenon known as a flare. Aflare is a localised region of the lower atmosphere that becomes
heated, often quite suddenly, to an unusual degree. A largeflare might cover as much as one-tenth of a per cent of the
whole solar surface. The probable explanation of the sudden
heating is that rapidly moving particles are first produced in
112
SUNSPOTS
some magnetic disturbance and that these particles then
collide with the ordinary material of the solar atmosphere.
Certainly at times of solar flares fast particles are often shot
out of the Sun in wide-angled jets. These jets of particles are
readily recognised whenever they impinge on the Earth. Theypush the Earth's magnetic field around to a degree that can
readily be detected. These are the so-called geomagneticstorms. Intense displays oftheaurora borealis are also associated
with these solar jets of particles. The work of the Australian
radiophysicists has shown that the powerful bursts of radio-
waves sometimes emitted by the Sun are also produced bythese same jets of particles. It is found that the sources of the
bursts travel outwards through the corona with a speed of
about 1,000 kilometres per second, and this is just about the
speed that the particles are known to have. At this speed theytake about 40 hours to reach the Earth.
As an aside, it may be mentioned that some evidence has
recently been obtained by the Australian radiophysicists to
show that the main jet of particles may be preceded by a groupof particles moving at much higher speeds, at speeds approach-
ing that of light itself 300,000 kilometres per second. Slightdisturbances of the intensity of the cosmic ray particles that
hit the Earth sometimes occur about half an hour after onset
of intense solar flares. This phenomenon is probably connected
with these groups of very high speed particles.
All this evidence of the origin of high speed particles, pre-
sumably produced by a magnetic agency, adds plausibility to
the idea that the high random motions of the particles of the
solar atmosphere arise from magnetic processes. And since
flares are strongly associated with sunspot areas this wouldtend to confirm the view that the high temperature material
originates near sunspots. Another pointer in the same direction
is that the temperature of the corona seems to be higher in the
equatorial regions of the Sun than it is at the poles; for sunspotsare confined to an equatorial belt around the Sun, none are
found at the poles.

FRONTIERS OF ASTRONOMY
Arguments against the magnetic theory
The evidence that the chromosphere and corona are affected
by magnetic fields is overwhelmingly strong. But this does
not prove that the existence of the chromosphere and corona
is due to magnetic processes as a primary agent. The solar
atmosphere might owe its origin to a quite different processand yet undergo disturbances by magnetic fields. The issue
is not whether magnetic disturbances occur this is undoubted,the issue is whether or not the magnetic effects are primary'.The arguments developed in the preceding section representan extreme view, the view that the magnetic fields are basic.
It is now necessary to consider the arguments that go in the
contrary direction. These seem so strong that it is difficult to
believe that the whole story of the origin ofthe solar atmospherelies in the magnetic theory.
It is well known that the number of spots found on the Sunwaxes and wanes periodically in an n-year cycle, the sunspot
cycle. At the maximum phase, the incidence of spots may be
as much as a hundred times greater than at minimum phase.If then the heating of the solar atmosphere is due to sunspots,we should expect a corresponding fluctuation in the size and
temperature of the atmosphere to occur. We should expectmoreover that at the maximum phase of sunspots the corona
should be particularly strongly developed in the equatorialzone of the Sun since the spots are confined to the equatorial
regions.
These predictions do not agree with observation. It is true
that the solar atmosphere does change with the sunspot cyclebut the changes are much smaller than the magnetic theorywould lead us to expect. Moreover the changes that actuallyoccur are in the wrong direction. Instead of the corona beingenhanced in equatorial regions at times of maximum sunspot
numbers, it is enhanced at times ofminimum numbers!
Another equally grave objection can be brought against the
magnetic theory. If the heated coronal gases are formed over
sunspot areas we should expect a horizontal flow of material
to occur away from these areas. No indication of any such
general flow can be detected. An examination of Plates XII
114

THE SOUND-WAVE THEORY
and XIII shows that the structure of the corona is predomin-
antly radial not horizontal.
And this brings us to a point that seems to have caused a
good deal of misunderstanding. Every photographer knowshow to print from a negative in such a way as to bring out
wanted features of a photograph and to suppress unwantedfeatures. This is often a very useful procedure in astronomy.It has been used in Plate XIII to bring out the arch-like
structures in the corona, and in Plate XII to bring out the
polar plumes. But we must be on our guard against regardingsuch prints as normal: when a print is distorted to bring out
some detail, we must always remember that it is distorted andhow it is distorted. Plate XVI is perhaps a less interesting
photograph because the structural details of the corona are
not so evident. But Plate XVI is really a more accurate
representation of the situation. It is certainly true that somefeatures of the corona have a structure that can only be
explained through the agency of magnetic fields. These
features are only details however. The dominant features of
the corona are its radial structure and its general globular
form, and neither of these features is plausibly explained bythe magnetic theory. It is therefore a reasonable judgment to
say that magnetic fields exist in the solar atmosphere but their
importance is secondary not primary. In our search for an
explanation of the origin of the solar atmosphere we must I
think look elsewhere.
The sound-wave theory
We have seen that below the photosphere down to a con-
siderable depth the Sun is boiling. Indeed the boiling gasbreaks right through to the photosphere. This can be seen
from actual observations of the Sun. The gas boils up in cells
about i ,000 kilometres in size. These are called granules.Now according to a suggestion of M. Schwarzschild sound
waves are generated by the moving gases: the granules makea noise! Sound waves then travel upwards from the photo-
sphere into the solar atmosphere. As they do so they pass
through more and more tenuous gas and this causes them to
"5

FRONTIERS OF ASTRONOMY
become more and more violent, until by the time the corona
is reached the particularly violent sort of wave known as a
shock wave becomes generated. It is these shock waves that are
supposed to cause the high kinetic temperature of the corona.
The process will perhaps be better understood by consideringa mechanical analogue. A whip is made from a piece oftaperedcord. Energy is fed into the whip at the thick end of the cord
in such a way that a wave is made to travel along the cord
towards the tip. Owing to the taper the wave becomes moreand more violent as it moves along, until by the time that the
extreme tip is reached the motion becomes very rapid indeed.
The crack of a whip is caused by a violent agitation of the air
produced by the fast moving tip. In the solar case the decreas-
ing density of the material of the solar atmosphere as the waves
move upwards is the analogue of the taper of the whip, and
the high kinetic temperature of the corona is the analogue of
the rapid motion of the tip.
How far the corona should extend outwards from the Sun on
this theory is uncertain. The consequences of the propagationof shock-waves in the corona have not yet been thoroughly
investigated, so that it is not known whether the corona should
end at some more or less definite distance from the Sun, or
whether it should extend with a slowly decreasing density
indefinitely outwards into space.Now to what extent do observations support this picture? Is
there evidence of increasingly violent motions at greater and
greater heights in the corona? Up to a point there is. The
speeds of the granules as they boil up to the photosphere are
about 0.5 kilometres per second. Compare this with speeds of
about 20 kilometres per second in the material of the chromo-
sphere and with probable speeds of about 100 kilometres persecond in the corona. Here is a marked increase with height.So far so good.But when we look into details the situation is less favourable.
The main decrease of density as we go outwards from the
photosphere occurs in the first 2,000 kilometres of height, in
which the density falls to about one-millionth of its photosphericvalue. Hence we should expect that there should be a very
rapid increase in the violence of the motions ofmaterial in these
116

THE INFALL THEORY
first 2,000 kilometres. So far no evidence has been obtained to
show that this is so. Indeed the observations at present available
indicate that there is no increase at all in the first 1,000 kilo-
metres although some small increase may perhaps occur in the
second thousand. Unless for some reason the present observa-
tions can be shown to be in error, this must be counted a veryserious point against the theory. To this we may add that the
motions that undoubtedly exist at heights above this bottom
layer of the solar atmosphere (at heights of more than 2,000kilometres above the photosphere, that is) are not really the
sort of motion contemplated by the theory. The motions that
actually occur are of the nature of a general streaming of the
material rather than of a wave motion. These difficulties
suggest that we turn our attention to the third theory.
The infall theory
The Sun and the other stars do not move around in a vacuum.A highly diffuse gas fills the space between the stars. This gashas a tendency to condense into clouds. Plate XI shows an
exceptionally dense cloud of this interstellar gas 'exceptionallydense* means that one cubic centimetre of space may contain
1,000 atoms. Clouds less dense than that shown in Plate XIoccur, some containing no more than 10 atoms to the cubic
centimetre. The gas still persists between the clouds but with
an even lower density, mainly less than one atom to the cubic
centimetre. Most of the atoms are known to be hydrogen.The normal kinetic temperature of the gas in the dense
clouds is about-i 70 C. But sometimes the clouds becomeheated to a temperature of 20,000 C. or more when there is ahot bright star nearby. What happens is that the atoms of
hydrogen absorb ultra-violet light emitted by the star, electrons
often getting knocked out of the atoms by the photo-electriceffect. The resulting heating causes the pressure in the gas to
rise, thereby tending to expand the cloud. A group ofsuch hot
bright stars are shown in Plate XVII. This is the famous groupknown as Pleiades.
Stars like the Sun do not emit enough ultra-violet light to
produce much heating of the gas clouds, however. So if the
117

FRONTIERS OF ASTRONOMY
Sun moves into a cloud the main effect that occurs is not one
of heating the gas and of causing the cloud to expand. Rather
does the gravitational field of the Sun produce a compressionin the gas, a compression that leads to the Sun capturing gasfrom the cloud. This is the process of scooping-up that was
mentioned in Chapter i. The Sun drills out a tube or tunnel
of material as it goes along, the material that was initially
present in the tube being captured by the Sun. As mightbe anticipated the tube follows the direction of the Sun's
motion through the gas. Its diameter, the question of whether
it is fat or thin, depends on the Sun's speed of motion throughthe gas. A small speed gives a thick tube and a large speed
gives a thin tube. A typical speed for the Sun would be 10
kilometres per second, and at this speed the diameter of the
tube would be about the same as the diameter of the orbit of
the planet Saturn. On a model with the Sun represented bya ball 6 inches in diameter, this would give a tube with a
diameter of about 350 yards, so it will be realised that the size
of the tube quite dwarfs that of the Sun. The Sun's power of
sweeping up interstellar gas is therefore very considerable.
The captured gases accordingly fill a region with dimensions
of the order of the size of the orbit of Saturn and they come in
towards the Sun from all directions. As the gases stream
inwards they accelerate due to the pull ofthe Sun's gravitationalfield. The velocity of infall increases greatly; initially it is onlyabout 10 kilometres per second but by the time the material
reaches the Earth's orbit its speed has increased to about 40kilometres per second, at Mercury's orbit the speed is about
70 kilometres per second, and by the time the gases reach the
Sun the inward motion has risen to a speed approaching 600
kilometres per second.
According to the infall theory the captured gases produce a
splash when they strike the Sun. This splash, which is illus-
trated in Fig. 9, is regarded as comprising the chromosphereand the inner part of tha corona. The infalling gases them-
selves comprise the outer part of the corona. The splash maybe thought of as a protective shield of hot gas that the Sunerects around itself in order to take up the shock of the impactofthe infalling material.
118

THE INFALL THEORY
We must now consider how this third theory compares with
observation. The first question that evidently arises is whether
anything corresponding to a boundary of the splash regioncan be detected. Of course we cannot expect the splash region
INTERIOR OFTHE SUN
FIG. 9. Infailing material and splash corona.
to have an exact sharp boundary but there should be somedistance away from the Sun where the splash region fades
away quite rapidly. Actually such a region does exist, at about
twice the photospheric radius from the centre of the Sun (thecircle in Fig. 9). The density of the material of the solar
atmosphere falls off steeply at this distance. Observation
therefore confirms the requirement that the splash region mustend rather abruptly.
It is not easy to observe the part of the corona beyond the
splash region. The further extension of the corona is very faint
and accordingly is difficult to separate from the general glow of
light that arises from the scattering of sunlight by fine particles
"9

FRONTIERS OF ASTRONOMY
of dust. It will be recalled from our discussion in Chapter i
of the terrestrial ice-ages that a reservoir of dust particles exists
in interplanetary space as an outcome ofthe break-up ofcomets.
The scattering of sunlight by those particles that happen to
lie more or less along the line from the Earth to the Sun causes
a faint glow of light to appear around the Sun. This gets mixed
up with the genuine corona. So long as the genuine corona is
comparatively bright, as it is in the splash region, the dust glowdoes not matter much but the dust glow becomes a nuisance
as soon as the genuine corona becomes faint, as it does outside
the splash region.A word of caution is necessary. Radially directed irregu-
larities, or streamers as they are called, can often be detected
outside the splash region. There has never been any questionbut that these irregularities belong to the genuine corona. Whatis difficult to decide by direct observation is whether or not the
corona has a general extension beyond the splash region. This
difficulty led many astronomers, only a few years ago, to assert
that apart from the streamers no general far corona exists, a
view that has been abandoned in the face ofnew evidence that
has come to light in the last two or three years. This is just as
well for the infall theory which would certainly have had to be
abandoned if the corona had indeed 'ended' in the way that
was formerly believed by many scientists.
We may begin our consideration of this new evidence by
noticing an important item of information given by a close
study of photographs of the corona. These show that the
material at the outer boundary of the splash region (the circle
in Fig. 9) has a density of about i million atoms per cubic
centimetre, the atoms being predominantly hydrogen. Usingthis observation the infall theory enables us to work out whatthe density of material should be at various distances from the
Sun. The results of calculation are shown as follows:
Distance from the centre
of the Sun (radius of
the photosphere as unit) 2 20 200 2,000Number ofhydrogen atoms
per cubic centimetre 1,000,000 30,000 1,000 30
1 20

THE INFALL THEORY
The distance of 2,000 photospheric units corresponds to the
radius of the tube of interstellar gas that the Sun is sweeping
up according to the infall theory. Hence the value of 30 atoms
per cubic centimetre gives an estimate for the density of the
cloud of gas through which we are supposing the Sun to be
now passing. If this value of the density could be confirmed bydirect observation of the interstellar gas the theory wouldreceive powerful support. Unfortunately it is not possible to
decide by observation what density the interstellar gas possesses
in the neighbourhood of the Sun. All we can do then, so far as
the last column in the table is concerned, is to ask whether a
density of 30 atoms per cubic centimetre is a reasonable value
for the interstellar gas to possess. From what has alreadybeen said above it will be realised that the present calculated
value is entirely appropriate: it will be recalled that in the
minor clouds the density is about 10 atoms per cubic centi-
metre, while in the large dense clouds the density may be
as high as 1,000 atoms per cubic centimetre (or perhaps even
higher than this in exceptional regions). It follows that the
infall theory requires the Sun to be immersed in a modest sort
of cloud. No observations are known that contradict this
requirement.The possibility of obtaining a direct observational check on
the theory accordingly depends on the entries in the second andthird columns of the above table. But a slight difficulty arises
at the outset. A neutral hydrogen atom is not susceptible
to observation in the present case. It is only when an atombecomes ionised, when the electron and the proton become
separated, that the atom makes any contribution to what can
be observed. This is because it is the free electrons that are
observed, not the whole atoms. Now the numbers of hydrogenatoms given in the above table include both ionised atoms
and neutral atoms. It is therefore necessary to separate out
those atoms that are ionised before a comparison with observa-
tion can be made. This is somewhat awkward to do. Hydrogenatoms become ionised by absorbing ultra-violet light from the
Sun but unfortunately the amount of ultra-violet light emitted
by the Sun is not known with sufficient accuracy to allow a
close estimate to be made of the fraction of hydrogen atoms
121

FRONTIERS OF ASTRONOMY
that must be ionised at the different distances from the Sun.
An approximate calculation yields the following values, but
these may be wrong by as much as a factor 2.
Distance from the centre ofthe Sun
(radius ofthe photosphere as unit) 2 20 200
Number of ionised hydrogen atoms
per cubic centimetre 500,000 10,000 300
It will be noticed that the reduction of the numbers given in
the latter table below those of the previous table depends on
distance from the Sun: there is a reduction by a factor 2 in the
first column and by a factor 10/3 in the second and third
columns. This is because more and more hydrogen atoms
become ionised as the material approaches the Sun, a largefraction becoming ionised by the time the splash region is
reached.
Recently Siedentopf and Behr have detected the presence of
free electrons in interplanetary space and their results are in
excellent agreement with the third column of the second table.
Since the electrons presumably come from the ionisation
of hydrogen atoms this gives strong confirmation of the infall
theory.
To remove the unlikely possibility that this agreement is due
to chance (that there might be a lot of gas in interplanetary
space which was not connected in any way with the corona) it
is necessary to consider the second column of the table. Herethe problem of observational detection is at its most diffi-
cult. The density given in the first column can be checked
by direct photographs of the corona taken during an eclipseof the Sun. The density given in the third column can be con-
firmed by observations carried out at night when the glare of
the Sun is absent the distance from the Sun is great enough for
this to be possible. But neither of these methods can be used
at the intermediate distance. The eclipse photographs cannot
be used for reasons already given, while the distance from the
Sun is much too small for nocturnal observations to be
possible.
The problem of devising an effective method of observation
122

THE GAS STREAM
has been solved in a most ingenious fashion by Hewish, Machin,and Smith. The new method depends on radio detection
instead of visual detection. Through the year the Sun appearsto us to move against the background of stars (this arises of
course from the motion of the Earth around the Sun). In
the month ofJune the constellation of Taurus forms the back-
ground to the Sun. Now in Taurus there is one of the strangecosmic sources of radio-waves, about which we shall have muchmore to say in a later chapter. We receive radio-waves fromthis source all the year round but the waves that are received
in June are of special interest because they pass through the
corona before they reach us. Now radio-waves have their
characteristics altered when they pass through material that
contains free electrons and which possesses irregularities of
distribution. Such alterations are detected when the radio-
waves from the source in Taurus pass the Sun and they are
detected as far out as the distance given in the second columnof the table on page 122, thereby showing that the corona
extends out to this distance. The corona does not stop at the
splash region.
These observations do not immediately yield a value for the
density of the ionised hydrogen atoms, however, because the
effect on the radio-waves depends also on irregularities in the
distribution of the material of the corona. To give reasonable
agreement with the second column of the above table the
irregularities would have to be about 500,000 kilometres in
extent, a size comparable with the photospheric radius. Smaller
irregularities would yield smaller densities and larger irre-
gularities would give larger densities. But since it seems most
unlikely that the irregularities can have sizes much smaller than
500,000 kilometres, the fair judgment is that the density of the
far corona is probably in close accord with the requirements of
the infall theory.The new evidence makes it almost certain that the corona
extends right out to the interstellar gas. Some astronomers
have argued that this is not necessarily inconsistent with aninternal theory of the origin of the corona. It could be that the
material is flowing outwards from the Sun not inwards towards
it. While this is not impossible it does raise issues of scientific
123

FRONTIERS OF ASTRONOMY
method. A theory becomes open to suspicion if it turns out to
require serious patching when new facts come to light. A few
years ago it was thought that the corona 'ended* about 2
photospheric radii out from the centre of the Sun. This was
argued as disposing of the infall theory in favour of someinternal theory. Now that observations show the corona to
extend out to the interstellar gas, as the infall theory requiredfrom the outset, it becomes highly suspicious to suppose that
an internal theory might also provide such an extension. If
this is so, it should have been stated to be so before observa-
tion revealed the existence of the far corona. To predict the
result ofa race after the race has been run is no prediction at all.
This does not exhaust the case for the infall theory. There
are several other predictions that were made by the theory andwhich have subsequently been verified by observation.
Before the infalling material reaches the splash region it is
to be expected that its kinetic temperature will remain com-
paratively low. It is only after the material has plunged into
the splash region and only after the intalling particles have
collided with the material of the Sun that we may expect
high temperatures to be generated. This agrees with other
observations by the Cambridge radioastronomers which in-
dicate that the temperature in the splash region is consider-
ably higher than it is farther out.
The temperature to be expected in the splash region can be
calculated. It turns out that the kinetic temperature in the
upper parts of the splash should be about 1,000,000 C.,
which is just of the order that is actually observed. Not onlythis but the theory requires the material of the splash to be in
a boiling condition, and* there to be differences of tempera-ture even between points that are at the same height above the
photosphere. In the higher parts of the splash a comparisonof points at the same height above the photosphere should
reveal regions with temperatures about twice as great as in
other regions. In the lower parts, in the chromosphere, the
variations of temperature should be greater still. All these
expectations are also confirmed by observation.
These details when taken together build a strong case for the
infall theory. It must be emphasised, however, that these
124
BOILING IN THE SPLASH REGION
considerations all refer to the general radial aspect of the solar
atmosphere. It is certain that irregularities of the sort discussed
in connection with Plates XII and XIII are produced bymagnetic distortions of the atmosphere.One way in which a disturbance can be caused is through a
localised magnetic field interfering with the free boiling of the
material in some part of the splash region. This prevents the
energy of the infalling material from being transferred down-wards into the Sun. Energy therefore accumulates in a localised
region of the solar atmosphere. But this cannot go on indefin-
itely. Sooner or later an outlet for the energy must be found,and if a downward outlet into the Sun and a sideways outlet
are prevented the reliefmust be obtained by sending the energyoutwards in the direction from which it came. The way in
which this probably happens contains several points of interest.
The first effect of the accumulation of energy is to raise the
temperature ofthe localised region in question. The maximumincrease of temperature that can occur is about 10,000,000 C.,
compared with the normal temperature of about 1,000,000 C.
in the higher parts of the splash. The average speed of motion
of the particles increases as the temperature rises and by the
time 10,000,000 G. is attained the particles are moving rapidly
enough to move outwards away from the Sun. This providesthe required outlet of energy. If the splash is prevented from
boiling downwards it will sooner or later succeed in boilingoutwards.
Now particles that evaporate outwards due to this sort of
process will best be able to escape from the Sun if they move
strictly radially outwards, because this makes it easier for themto fight their way through the stream of inward moving par-ticles. The outward moving particles may therefore be expectedto form a jet that is directed radially outwards. Such jets, or
streamers, can often be seen in photographs of the corona.
(We discussed in a previous section the emission of particles
from the Sun by solar flares. This was a quite different processto that now contemplated. It is known that the Sun does
indeed eject particles in two distinct processes, one associated
with flares and the other with active spots in the corona. Our
present arguments suggest how such active spots arise, by the
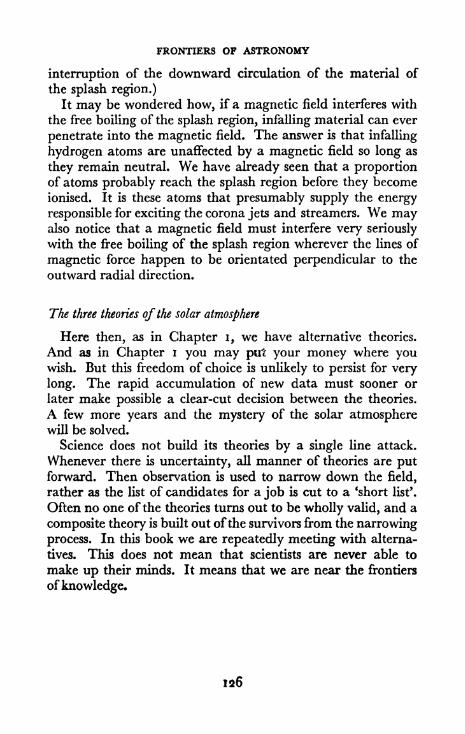
FRONTIERS OF ASTRONOMY
interruption of the downward circulation of the material of
the splash region.)
It may be wondered how, if a magnetic field interferes with
the free boiling of the splash region, infalling material can ever
penetrate into the magnetic field. The answer is that infalling
hydrogen atoms are unaffected by a magnetic field so long as
they remain neutral. We have already seen that a proportionof atoms probably reach the splash region before they becomeionised. It is these atoms that presumably supply the energy
responsible for exciting the corona jets and streamers. We mayalso notice that a magnetic field must interfere very seriously
with the free boiling of the splash region wherever the lines of
magnetic force happen to be orientated perpendicular to the
outward radial direction.
The three theories of the solar atmosphere
Here then, as in Chapter i, we have alternative theories.
And as in Chapter i you may put your money where youwish. But this freedom of choice is unlikely to persist for very
long. The rapid accumulation of new data must sooner or
later make possible a clear-cut decision between the theories.
A few more years and the mystery of the solar atmospherewill be solved.
Science does not build its theories by a single line attack.
Whenever there is uncertainty, all manner of theories are putforward. Then observation is used to narrow down the field,
rather as the list of candidates for a job is cut to a 'short list*.
Often no one of the theories turns out to be wholly valid, and a
composite theory is built out ofthe survivors from the narrowing
process. In this book we are repeatedly meeting with alterna-
tives. This does not mean that scientists are never able to
make up their minds. It means that we are near the frontiers
ofknowledge.
126

CHAPTER EIGHT
The Sun and its Evolution
The pressure balance
Since time immemorial men have looked on the Sun in
wonder and have pondered on what lies inside it. What does
lie inside it? Well as we go inwards from the photosphere both
the radiation temperature and the density rise steadily until at
the centre of the Sun the temperature reaches the enormousvalue of 13 million degrees, the density being some 50 times
that of water. Such a very high temperature is necessary in
order that the central pressure be sufficient to withstand the
enormous weight of the overlying layers the pressure requiredamounts to about 1,000,000,000,000 Ibs. per square inch,
compared with a pressure of some 50 million Ibs. per squareinch near the centre of the Earth and with a mere 15 Ibs. per
square inch at the surface of the Earth. A man would need a
tough hide to withstand the pressure inside the Sun.
Now what would happen if the inside of the Sun did not
possess such an enormously high pressure? The Sun would
collapse, not slowly like the changes to be described later in
this chapter, but visibly to the naked eye in a few minutes.
Just as a stone dropped over a cliff gains energy as it falls so
the hypothetical collapse of the Sun would release energy. Andthe energy thus developed would be taken up in heating the
material of the solar interior. The heating would proceed to
such a degree that temperatures in excess of 10 million degreeswould soon arise, the internal pressure rising correspondinglyuntil it became sufficient to withstand the weight of the over-
lying layers, at which stage the collapse would be halted. Sowe see why there must be a high temperature inside the Sun;because if there were not, an adjustment would very quicklytake place that would create a sufficiently high temperature
127

FRONTIERS OF ASTRONOMY
for a state ofbalance to be reached. It can be shown that ifbysome magic all heat could suddenly be taken out of the Sun,within about an hour the Sun would take up a new state of
balance at about half its present size.
The energy balance and the surface balance
If this experiment could actually be carried out it would be
found that the state of balance reached by the Sun would
possess a dynamical character, for the Sun would not take upjust one definite size, it would oscillate inwards and outwards
around the new state of balance. One oscillation of this sort
would take a time of a few hours. So the Sun would presenta remarkable and frightening aspect, alternately swelling and
contracting sometimes glowing white-hot and sometimes blue-
hot (blue-hot at smallest size and white-hot at largest size). In
this situation it is doubtful if life could persist on the Earth:
survival might just be possible in the N. and S. polar areas.
After a few centuries these oscillations would die away and
the Sun would be left as a blue star somewhat brighter than at
present. But this would not be all. The Sun would slowly
expand back to its present size reaching it again after a time
of a few million years. The reason for this re-expansion back
to the present size depends on there being a second state of
balance in the Sun, besides the pressure balance discussed
above. This second balance is one in which the rate at which
the Sun loses energy due to the emission ofradiation into space,which is constantly going on at the photosphere, is compensated
by processes depending on the nuclei of the atoms, processesthat produce energy in the central regions of the Sun. These
are just the processes that we have already discussed in
Chapter 4. The reason for this second type of balance an
energy balance is important. Once again the way to under-
stand the reason for it is to see what would happen if the energybalance did not exist. If the radiation that constantly escapesfrom the photosphere were to give a loss of energy greater than
the gain from nuclear processes occurring in the interior there
would be a steady tendency for the internal pressure to be
always falling below what is required to maintain the pressure
128

Ml. Wihoii andPalomar Observatories
XI THE ORION NEBULA
This great glowing cloud of gas can be seen by the naked eye as a hazy patch
in the 'sword' of Orion. New stars are forming continually inside clouds like
this one, which measures some 100,000,000,000,000 miles in its dimensions.

E. E. Barnard
XII THE SOLAR CORONA, AT THE ECLIPSE OF 1900, MAY 28
The spikes or 'plumes' at the north and south poles of the Sun can be clearlyseen. These plumes are an indication that the Sun acts like a huge magnet.
XIII THE SOLAR CORONA, AT THE ECLIPSE OF 1918, JUNE 8
Notice the arch-like structures in the corona. These are an indication of the
existence of localised magnetic disturbances on the Sun.
Lick Observatory
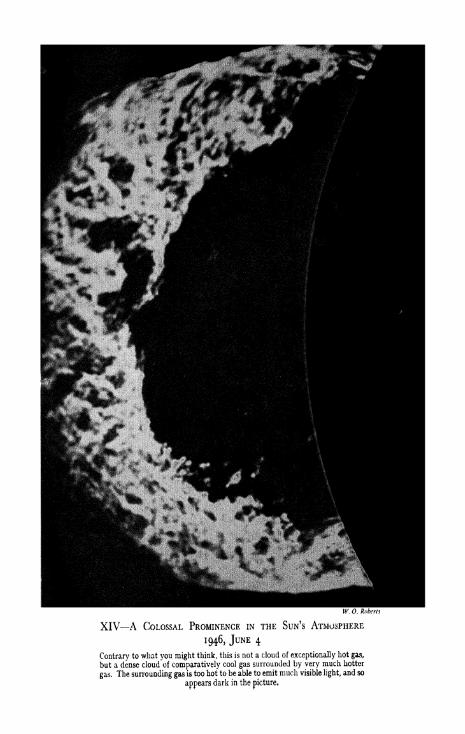
W. 0. Roberts
XIV A COLOSSAL PROMINENCE IN THE SUN'S ATMOSPHERE
1946, JUNE 4
Contrary to what you might think, this is not a cloud of exceptionally hot gas,
but a dense cloud of comparatively cool gas surrounded by very much hotter
gas. The surrounding gas is too hot to be able to emit much visible light, and so
appearsdark in the
picture,

oya/ Observatory Greenwich
XV SUNSPOTS, 1926, JANUARY 20
Enormous magnetic fields are associated with sunspots. It is thought that the
darkening of the spots is due to magnetic effects. These spots are very near the
edge, the 'limb', of the Sun. Notice how the light falls away towards the edge.This is known as 'limb darkening'.
XVI THE SOLAR CORONA
AT THE ECLIPSE OF 1926,
JANUARY 14
Although the corona shows manyintricate local details, it possesses anoverall globular form that is well
shown in this picture.

Dominion Astrophyslcal Observatory, Victoria B.C. J. A. Pearce
XVII-THE PLEIADES
A shower of stars with a common origin. This group situated some
2,000,000,000,000,000 miles away is easily seen with the naked eye.
XVIII THE GLOBULAR CLUSTER, M 3
A far greater shower of about 100,000 stars also with a common origin.
Mr. Wilson and Palomar Observatories

XIX THE 2oo-iNCH HALE TELESCOPE BY MOONLIGHT
The scale of this vast instrument can best be judged from the flights of steps
that lead up to the large doorway, which measure perhaps n feet in height.

XX THE 48-iNCH SCHMIDT TELESCOPE ON PALC$!M MT,

Forty-eight-inch Schmidt Telescope
XXI THE GALAXY M 31 IN THE CONSTELLATION OF ANDROMEDAThis blazing galaxy contains about 100,000,000,000 stars, and is pretty well atwin of the Milky Way the Milky Way would look like this if we could see it
from outside. M 31 is a flat spiral galaxy seen obliquely. Notice the satellite
galaxies M 32 and NGC 205 (the stars sprinkled over the picture are of course
near-by local stars of the Milky Way). M 31 is distant some 450,000 parsecs.Since i parsec equals 19,200,000,000,000 miles, this means that the distance
of M ^i in round numbers is 9,000,000,000,000,000,000 miles.

THE SUN AND ITS EVOLUTION
balance. In accordance with our discussion of the pressurebalance this must cause the Sun to shrink. The shrinkagewould however be a slow one taking millions of years, not the
time of a few minutes that occurs in the hypothetical catastro-
phic case of an entire removal of the internal pressure that was
considered previously. A shrinkage of the Sun arising in such
a way would cause both an increase in the energy radiated
from the photosphere and in the energy produced by the
nuclear processes. But the latter would increase proportion-
ately the faster, with the result that sooner or later the pro-duction ofenergy must become sufficient to balance the loss. Acorresponding situation arises in the opposite case in which we
imagine that the rate of production of energy is initially
greater than the rate of loss. Then the tendency is for the
internal pressure to rise above what is required to maintain
the pressure balance. This must lead to a slow expansion of
the Sun and the proportionate decrease in the production of
energy is then greater than the decrease in the loss rate. So
sooner or later the production of energy must again come into
balance with the loss.
The second of these cases provides the reason why in our
hypothetical case of a suddenly collapsed Sun there must be a
final re-expansion back to the present size, even though for
several million years the Sun would be smaller, bluer, and
brighter than it is at present.The upshot of all this discussion is that it is no accident that
the Sun is in its present state. This is an outcome of two
balancing requirements, one a pressure balance and the other
an energy balance. If either were by some magically contrived
interference put temporarily out of balance the Sun would
quite invariably return to its present configuration.The time ofa few million years required for energy balancing
to operate has led to the suggestion that the peculiar climate
experienced by the Earth during the last million years mayhave been due to the Sun getting in some way out of adjust-ment. While it scarcely seems possible to entirely disprove this
idea, the evidence would on the whole seem to be against it.
The structure of the Sun is such a markedly self-stabilising onethat it is difficult to see why the Sun should ever get out of
129
FRONTIERS OF ASTRONOMY
adjustment, even to the comparatively minor degree that
would be necessary to explain the fluctuations of terrestrial
climate. The variations that we considered above were all
hypothetical that was why the phrase 'by some magic*seemed appropriate: the present-day meaning of the word
'magic' as something that one might consider to happen but
which cannot is of course very different from the meaning that
used to be attached to the word in ancient times, or even a few
centuries ago.The above discussion raises an important issue: why does
radiation continue to escape from the photosphere out into
space? The principle underlying the answer to this question is
easily understood. Whenever a variation oftemperature occurs
inside material, energy must flow from the regions of higher
temperature to the regions of lower temperature. So energymust of necessity flow outwards from the very hot central
regions of the Sun, unless of course the whole Sun were every-where as hot as it is at the centre. But in this case the photo-
sphere would radiate at an enormous rate and would soon cool
off thereby setting up a difference of temperature, so that even
in this hypothetical case energy would of necessity soon start
to flow.
It is as well for us that this latter case is indeed hypothetical.For if the surface of the Sun were at a radiation temperatureof 10 million degrees or more the escaping flood of radiation
would be so intense that the whole Earth would be entirely
vaporised in a few minutes. But hypothetical as this case
certainly is for the Sun, it does actually occur for some excep-tional stars which have their outer parts suddenly stripped
away by an enormous cosmic explosion. These are the super-
novae, stars that will be allotted a special chapter later on.
The reason why the surface temperature of an ordinary star
like the Sun takes up some definite value will be clear from the
following argument: if the escape of radiation at the photo-
sphere were greater than the flux of energy from the interior,
the surface would simply cool down; conversely if the loss of
energy outwards from the photosphere were less than the flux
coming up from below, the surface would be obliged to heat
up until a balance was again reached. In this way we see that
130

THE SUN AND ITS EVOLUTION
a star must achieve a further type of balance in which the
energy lost from its photosphere just equals the flow of energyout from the central regions. It is this further balance that
decides what surface temperature a star shall have. We see
then that the Sun is balanced in three ways, a pressure balance,an energy balance, and now thirdly a surface balance.
The pattern ofenergyflow
So far nothing has been said about the way energy flows in
the Sun, except that it must occur whenever there is a variation
of temperature. In an electric kettle heat is produced in the
'element'. This raises the temperature of the element abovethe temperature of the metal walls of the kettle and above anywater it may contain. Common experience shows that after
a time both the water and the outer walls of the kettle becomehot. This happens by two quite different processes. Energyflows from the element to the metal walls by the process knownas conduction. Heat is passed along by atoms being knocked
by their neighbours, in rather the way that a bucket can be
handed along a chain of men the bucket can travel a long
way without any man in the chain having to move very much.The energy passes from the element to the water in quiteanother way, by the process known as convection. It is as
though the line of men, instead of handing buckets from one to
another, were to break up and each man were to carry his
own bucket. In this case the buckets and the men move the
same distances. In a solid the atoms are in a chain gang, as it
were; they are not free to move about and heat-flow occurs byconduction only, as in the metal walls of the kettle. In a liquidor a gas, heat may flow by both conduction and convection,
although one or other will usually be the more efficient in any
given case: water is heated in a kettle largely by convection, bya general bubbling around; but if mercury were heated in a
kettle the main transfer would be by conduction even though
mercury is a liquid. With a gas, convection is nearly alwaysthe more efficient, although there are some exceptions to this.
In stars like the Sun the influence of conduction is well nigh
negligible, however.

FRONTIERS OF ASTRONOMY
There is a third way that energy can flow, by radiation.
When a man singes his trousers through standing too near an
open fire the damage is done by radiation that travels directly
across the space between the fire and the trousers. Conduction
and convection take place by material contact and material
motion: they cannot occur across a vacuum as radiation can.
Radiation can transfer energy whether matter is present or not.
Radiation is the main process of transfer deep inside the Sunwhere a great deal ofmaterial is present. It is also the means of
transferring energy from the Sun to the Earth across regionswhere there is very little matter.
The radiation deep inside the Sun is not like the ordinary
light and heat emitted outwards from the photosphere. It is
not even for the most part ultra-violet light. Rather does it
belong to the type of radiation that we call X-rays (this
designation dates from the time when the nature of X-rays was
unknown, the X denoting ignorance; the name has persisted
for want of a better). Now X-rays and ultra-violet light are
very efficient at knocking electrons out of the clouds that
surround the atomic nuclei. This is the photo-electric process.So strong is this process that almost all the atoms inside the
Sun have their electron clouds entirely removed: the electrons
are left free to wander around, not being attached to any
particular atom, except on rare occasions; from time to time
an electron may become attached to a definite atom, but it
soon gets knocked away again. It is because the atomic nuclei
and the electrons are almost completely free to wander around
that the material inside the Sun is a gas, even though in the
central regions of the Sun the density much exceeds the densityof water. (It will be recalled that in a solid the particles are
not able to wander around, and even in a liquid the freedom
to wander is only very partial.)
Although radiation is the most effective mode of transferring
energy in the inner parts of the Sun, convection is the most
effective mode in the outer parts, except that near the photo-
sphere the transfer must again be by radiation. The differing
zones ofinfluence are depicted in Fig. 10. According to Fig. 10
the outer third or so of the Sun is convective. This does not
mean that transfer by radiation ceases. It means that in order
132

THE SUN AND ITS EVOLUTION
to pass on the flow of energy from the inner radiative zone, the
outer zone must call on convection to aid in the transport,radiation alone being insufficient. The outer third of the Sunis a gas that is forced to boil in order to pass on the flow of
Energy flows byradiation at photosphere
Energy flows
by convection
Energy flowf
by radiation
FIG. 10. Zones of energy flow inside the Sun.
energy from inside. It is important to notice that the flow
must change back to radiation at the photosphere to allow
energy to escape outwards into space, for it is only by radiation
that this can happen, only radiation can carry energy throughthe region outside the Sun where there is very little matter.
It is precisely through this change-back that the third balance
referred to above is able to operate the photosphere must
radiate energy out into space at just the rate that energy is
transferred up from below.
The depth of the convection zone of Fig. 10 is a feature that
has to be decided by calculation since the depth cannot be
observed. Present calculations suggest that it must extend to
133

FRONTIERS OF ASTRONOMY
a depth below the photosphere where the radiation tempera-ture is about 3 million degrees and the density is about one
third of that of water. Although the convection zone fills morethan half the total volume it contains only one or two per cent
of the total material of the Sun.
The present condition of the Sun, as studied above, forms a
suitable preliminary to a discussion of what the future history
of the Sun is going to be a point ofsome considerable interest
since it is this that will determine the ultimate fate of the Earth.
It might seem a somewhat hazardous enterprise to predictwhat is going to happen in the far distant future to a material
system whose nature we cannot examine in detail. But it turns
out, as we shall see at a later stage, that stars can be observed
that are now doing just what we think the Sun is going to do
in the future. So we do not have to wait thousands of millions
of years before our predictions can be tested.
Representing the stars
The rest of this chapter will be mainly concerned with the
future evolution of the Sun. But we cannot turn to this topic
yet. A discussion on how astronomers represent the outward
characteristics of a star is necessary first. The two propertiesof a star most amenable to direct observation are:
(i) the amount of visible light emitted in a given interval of
time the brightness of the star as we shall call it;
(ii)the distribution of the light with respect to wavelength
(i.e. with respect to colour).From (ii) the temperature at the surface of the star can
be estimated.
These two characteristics are represented in the wayin Fig. ii. This is the famous Hertzsprung-Russell diagram,or the H-R diagram as we shall abbreviate it. There are a
number of unusual things about the H-R diagram. It will be
seen that the surface temperature is plotted so as to increase
from right to left, instead of in the more conventional way
134

THE MAIN SEQUENCE
from left to right. There is no advantage in this rather strange
practice, which came about from the historical developmentof the subject. It could be changed but this has not been
thoughtworthwhile since it is not a disadvantage either: it isjust
lOOOtOOO
tOQOOO
IQOOO
100
I
IOO
I
1,000
I: X Pleiont
X Siriut
K Sun
50 4Q 3O 2O 109 8 7 6 5 4 J 2
Surface temperature in thousands degrees Centigrade
FIG. ii. The Hertzsprung-Russell diagram.
as easy to go from right to left as from left to right. As in ordinarylife a regard for conventions is on the whole a good thing but
conformity can be carried to excess. It will be noticed that the
way the brightness (comparative to the Sun) is marked also
has a special character: it goes injumps often.
Fig. ii has the important advantage that once a star is
'35

FRONTIERS OF ASTRONOMY
marked as a point in the diagram its brightness and its surface
temperature can be read off at a glance. Three stars are
marked in Fig. 1 1, the Sun, the well-known Sirius, and Pleione
one of the brightest of the Pleiades (Plate XVII). It is at
1,000,000
100,000
IQOOO
1000
JI 100
25
,o
too
ipoo
IOO IOOO
IOOO
IOO
SO 4O 3O 2O IO9 8 7 6 5 4 3 2
Surface temperature in thousands degrees Centigrade
JFio. 12. Contours of equal stellar radii. Markings are comparative to Sun
once apparent that Sirius is about 20 times brighter than the
Sun, and that Pleione is more than 1,000 times as bright. Thesurface temperature of Sirius is close to 10,000 C. and Pleione
close to 15,000 C.
The position of a star in the H-R diagram tells us somethingmore besides its surface temperature and its brightness. It also
tells us the size of the star, since the size can be determined by
136

THE MAIN SEQUENCE
calculation when both the surface temperature and the bright-
ness are known. Contours of equal size have been drawn in
Fig. 12, the unit of size being taken as the radius of the Sun
(of the solar photosphere, that is). These contours enable us to
estimate at a glance the size of a star placed at any point in
the diagram. Sirius for instance is about half as large againas the Sun, and Pleione has a radius about 5 times greater than
the Sun.
Now what determines the position that a star takes up in the
H-R diagram? According to astronomical theory this dependson two things and on two things only. One is the mass of the
star, how much material it contains, and the other is its com-
position, what chemical elements it is made up of. That is to
say we must know how much stuff there is in a star and whatsort of stuff. And if the composition is not everywhere the
same throughout a star then of course we must know how it
changes from place to place.The simplest case to consider is that of stars with different
amounts of material in them but the material being always of
the same composition. This is not a useless idealisation because
it represents very well the situation at the time stars are born
out of the interstellar gas clouds. Stars that were born out
of the interstellar gas clouds at the same time as the Sun seemto have a composition by weight approximately as follows:
Carbon, nitrogen, oxygen, neon, and other
non-metals, apart from hydrogen andhelium I per cent.
Metals i per cent.
Helium 10 per cent.
Hydrogen the rest.
Now what positions in our diagram do stars of differing masses,but all with this composition, occupy? Fig. 13 supplies the
answer to this query. They fit on to the line shown. This line
has a special name, it is called the main-sequence, and stars
that lie on it or near it are called main-sequence stars. Fig. 13shows that the Sun, Sirius and Pleione all fall near this curve.
They are main-sequence stars.
Before leaving the main-sequence it is important to say in a
137

FRONTIERS OF ASTRONOMY
little more detail how the mass of a main-sequence star affects
its position on the curve. A star containing say one-fifth of the
amount of material in the Sun would possess a brightness of
about one-tenth of a per cent of the solar brightness. A star
containing twice as much material as the Sun would have a
brightness about ten times greater. A star containing ten
times as much material as the Sun would have a brightnessabout a thousand times greater. The corresponding surface
temperatures for these three cases would be about 3,000 C.,
10,000 C., and 20,000 C. respectively. The relation of the
position of a star on the main-sequence to its mass is indicated
by the markings in Fig. 13.
UXX5.000
IOO.OOO
IQOOO
I.OOOev>
f'oo
>
I 10
I
I* I
JW:
-5 10
1 -L.- 100
looo
JOO times moss of SUB
IO times mass of Sun
IO time! mast of SUB
Pleione
,4 times mats of SUB
7 mass of SUB
mass of Sun
5OO3O 2O IO96765-4 3 2
Surface temperature in thousands degrees Centigrade
FIG. 13. The main-sequence.
138

THE CARBON-NITROGEN CYCLE
The evolution of the Sun
This discussion of the placing of a star on the main-sequencerefers to the situation that follows the condensation of the star
before nuclear processes have had sufficient time to produce a
serious change in the composition of the material of the star.
Inside stars with brightnesses not more than ten times that of
the Sun the important nuclear processes are those alreadydescribed in Chapter 4 a set of reactions that may be referred
to as the proton-chain. A different set of reactions, known as
the carbon-nitrogen cycle are of greater effect than the proton-chain inside more luminous stars, however.
The reactions of the carbon-nitrogen cycle, discovered byH. A. Bethe, are set out in detail in the following table:
Meaning of symbols
C 12(p, y) N 18 C12
(6 protons, 6 neutrons) plus a proton
gives N18(7 protons, 6 neutrons), ay-ray
being emitted.
N 18(P) C18 N18
undergoes a 0-process, thereby chang-
ing to C13(6 protons, 7 neutrons).
C13(p, y) N14 C13
plus a proton gives N14(7 protons, 7
neutrons), ay-ray being emitted.
N14(p, y) O 15 N14
plus a proton gives O 15(8 protons, 7
neutrons), ay-ray being emitted.
O 15(/?) N16 O15
undergoes a /J-process, thereby chang-
ing to N 16(7 protons, 8 neutrons.)
N 15(p, He
4)C12 N15
plus a proton gives C 12,He4
(2 pro-
tons, 2 neutrons) being emitted.
The latest information on these processes is due to the work
ofW. A. Fowler.
The last of the reactions of the preceding table deserves
comment. When a proton is added to N15,instead of O 16
(8
protons, 8 neutrons) being formed with the emission of ay-ray
something quite different happens: the nucleus changes back
to the starting point C12 and helium is emitted. Evidently C12
(and nitrogen also) can go through this same cycle time after
time. As in chemistry where a substance that promotes a
reaction but without being changed itself is called a catalyst
'39

FRONTIERS OF ASTRONOMY
so we may think of carbon and nitrogen as nuclear catalysts.
Energy is produced in the carbon-nitrogen cycle through the
conversion of hydrogen to heliumwhich is the net effect of
the set of reactions. The energy appears in several forms: in
000,000
100.000
IQOOO
UOOO
I
Io IOO
J
,o
I
10
I
3 too
IOOO
SO 4O 3O 20 109 8 7 6 5 4 3 2
Surfocc UiBptroturt In thoutondf degrees Cenrigrodc
FIG. 14. Evolution for mixed stars.
the y-rays, in the electrons of positive character and tne
neutrinos emitted by the ^-processes, and in the energy of
motion of the He4particles emitted in the last reaction of the
table. Ofthese contributions all but the energy ofthe neutrinos
becomes absorbed into the material of the star. The neutrinos
escape from the star and their energy is lost. As with the
proton-chain the quantity of energy that can be produced by
140

THE CARBON-NITROGEN CYCLE
the carbon-nitrogen cycle is enormous whenjudged by ordinarystandards the conversion of but 100 tons of hydrogen into
helium yields more energy than is used up in a year by the
whole ofhumanity.Now whether the carbon-nitrogen cycle or the proton-chain
happens to be the main process of energy generation in a parti-
cular star the resulting change of composition is the same,
hydrogen is built into helium the building process is different
in the two cases but the result is the same. The proportion of
hydrogen decreases with time and the proportion of helium
increases correspondingly. It used to be thought that the
helium so produced gets mixed throughout the star by meansof currents that circulate slowly within it. But in the last few
years astronomers have come to doubt whether this is so it
now seems unlikely that any circulation occurs at all. This is the
outcome of a recent investigation by L. Mestel. The only
remaining uncertainty is whether or not magnetic fields inside
a star may produce some partial degree of circulation.
The problem of determining the evolution of a star takes a
very different form according to whether mixing of the helium
occurs or not. When there is complete mixing the position
occupied by the star on the H-R diagram changes slowly with
time but not in such a way as to depart much from the line of
the main-sequence. The changes are of the sort shown in Fig.
14. A star initially at A (near the Sun) would evolve alongthe line A to A'. A star initially at B (near Sirius) would evolve
along the line B to B'. The lines of evolution are not quite
along the main-sequence, they move off slightly to the left.
In the more likely case that the helium stays put where it is
produced the future evolution of the Sun will be along a line
of the form shown in Fig. 15. This is a dramatic evolution.
The Sun is at present just beginning to work its way towards
the kink of the curve at M. Once round this kink the swoopof the curve up to O implies a very large increase in brightness,
sufficient eventually to vaporise the Earth. The lowering of
the surface temperature during this phase arises because of a
tremendous expansion of the Sun. At point O the Sun will
be some 200 or 300 times its present size. This expansion will
enable the Sun to engulf Mercury, Venus, and possibly also
141

FRONTIERS OF ASTRONOMY
the Earth. After the turn round at O a general shrinkage sets
in. Accompanying the shrinkage there is a falling off in bright-
ness and a rise ofsurface temperature. By the time P is reached
the Sun will have become a blue star with a size similar to its
present size but with a much greater brightness. The nature of
the evolution beyond P forms a topic to be discussed in a future
chapter.
1000
* 100
4
10 9 55 4-5
Surface temperature in thousands degrees Centigrade
FIG. 15. Evolution of an unmixed star.
Extinction of life on the Earth will not have to await this
spectacular sequence of events. Already by the time the kink
at M is reached the Sun will be about 3 times as bright as it
is now. This would be sufficient to raise the average tempera-ture on the Earth to near the boiling point of water, with a
disastrous consequence to all forms of life.
Now the evolution will not take place at a uniform rate. The
142

EVOLVING STARS
position of the Sun will not move at a steady rate along the
curve of Fig. 15. The time required to reach the kink at Mwill be something like a hundred times longer' than the time
required for the evolution from O to P. What happens is that
at first the evolution is extremely slow but once the kink at Mis passed the evolution goes more and more rapidly. Not onlyare the later changes very spectacular but their onset comes
about with comparative rapidity. This explains why the Sunis spending so long in reaching M, why it has spent about
4,000 million years and has still not reached the kink. Another
5,000 million years will, however, be sufficient to tip the scale.
The Sun will then enter on a career of violence, in markedcontrast to the placid existence that it has so far enjoyed. The
game will be up with the Sun in 5,000 million years time, andwith others besides.
The evolution of the stars of the globular clusters
Stars with masses not too different from the Sun also go
through lines of evolution very similar to the curve of Fig. 15.
Those with more material in them than the Sun go throughtheir evolution more quickly than the Sun does. Those with
less material require more time than the Sun. These differ-
ences raise an intriguing problem. Suppose a whole group of
stars all condensed at effectively the same time and supposetheir compositions were initially identical. Then at the time of
condensation their positions in the H-R diagram would lie onthe line of the main-sequence, the position of a particular star
simply depending on how much matter it happened to con-
tain. Stars with large quantities of material would lie high onthe main-sequence, those with comparatively small quantitieswould lie low on the main-sequence. The problem is then to
decide how the distribution in the H-R diagram of the whole
group of stars will change as time goes on. What will the dis-
tribution be after 100 million years, after 1,000 million years,after 5,000 million years? One of the central lines of investiga-tion in astronomy today is concerned with the answering of this
problem. It leads us naturally into a discussion of stars other
than the Sun.
H3

FRONTIERS OF ASTRONOMY
Let us put a precise query: what will the distribution of a
group of stars in the H-R diagram be after a time of 5,000
million years, the stars being taken as initially of uniform com-
position, and of the same age? The answer is that we expect
the stars to fall on a track ofthe general form A to D in Fig. 16,
woo
too
10
40 <J 8 7 6 $5 54-54 3-5
Surfoet ttmperoturi in thouiondi degree! Centigrode
FIG. 16, Evolutionary sequence of a group of stars of identical ages.
The points marked in this figure are important. The points
A, B, C, D, have a correspondence to the points 0, 4, cy d, on
the main-sequence, in that stars at A after 5,000 million years
were initially at a, stars at B were initially at i, stars at C were
initially at c> stars at D were initially at d. It will thus be seen
that all the stars found after 5,000 million years in the part or
the track from A to D are derived from the small segment of the
main-sequence between a and d. What then has happened to
all the stars that initially were on other parts of the main-
144

EVOLVING STARS
sequence? Stars initially lower down the main-sequence than
a are still there; in 5,000 million years they have not had suffi-
cient tune to evolve significantly. This is just the case with the
Sun. The Sun is still down near a. It has not yet had sufficient
time to go through much evolution, but it belongs to the next
batch of stars that are booked for rapid evolution.
1003Vt
10
8
I
10 9 6 7 6 55 5 4-5 4 3-5 3
. .. Surface temperature in thoutonds degrees Centigrade
FIG. 17. The stars of the globular cluster M 3 (Sandage).
Now how do we know that the Sun is thus poised on the
brink? Because other stars of a little greater mass than the
Sun, and perhaps also of a little greater age have already
taken the plunge. The double-star system known as Herculis
has a component that contains only about ten per cent more
material than the Sun. Yet this star has already evolved to
about the position B of Fig. 16. This is a particularly well
documented case, and there are many other slightly less well
determined examples that could be added to it.
Turning away from the Sun, what then about the stars that
'45

FRONTIERS OF ASTRONOMY
initially lay higher up the main-sequence than the point rf?
Where would they lie after a time of 5,000 million years? In
no part of the diagram indicated in Fig, 16. They have
evolved along their respective lines of evolution. The fate of
these stars, what happens to them after they pass the stage of
their evolution corresponding to the point D of Fig. 16 will be
discussed in the next chapter. We shall then consider howstars die.
100
f2
I
i
10
L.
10 9 8 7 6 55 5 4-5 4 35
* Surface temperature in thoutondj degrees Centigrade
FIG. 1 8. The stars of the globular clusterM 92 (Arp, Baum and Sandage).
How do we know all this? In part by theory, but even more
certainly by observation. In Fig. 17 the actual plot in the
H-R diagram of the stars of a particular group is shown. This
is a case with an interpretation identical to that already givenfor Fig. 1 6. The observations are due to A. R. Sandage andwere made on a special group of stars, the stars of the globular
cluster, shown in Plate XVIII (catalogue designation M 3).
Similar plots for other globular clusters have been obtained
146

EVOLVING STARS
by H. C. Arp, and by Arp, Baum, and Sandage. Fig. 18 is the
corresponding diagram for the cluster with catalogue designa-tion M 92. As its name implies a globular cluster is an almost
spherical group of stars. The very high concentration of stars
in such clusters there may be as many as 100,000 makes it
clear that they are not a chance aggregation but a group with
a common origin, as our interpretation requires.
147

CHAPTER NINE
The Evolution of Stars of a
Medium Content
The observational work summarised in Figs. 17 and 18
represents a decisive turning point in astronomy. Besides
showing clearly what the fate of our Sun is going to be the
observations shed light on a whole range of basic problems.The potentialities of this work were fully appreciated manyyears ago by Walter Baade, ai\d stressed by him at the time of
the inauguration of the aoo-inch Hale telescope. Let us con-
sider another important application of the results of Figs. 1 7
and 1 8.
The age ofthe Milky Way
Figs. 17 and 18 enable the ages of these globular clusters to
be estimated. And since there is reason to believe that the
globular clusters originated at the same time as the whole
Milky Way system (see Chapter 17), it is clear that such an
estimate has the added importance of telling us the age of
the great system of stars in which we live.
To see how this is done we go back to Fig. 16. This was drawnso that the time of evolution from the main-sequence was
5,000 million years. Now do the stars of Figs. 17 and 18 fall
on the curve of Fig. 16, in which case these two globularclusters must be about 5,000 million years old? Or do the
stars fall below the curve of Fig. 16, in which case the globularclusters must be older than 5,000 million years? Or do the
stars fall above the curve of Fig. 16, in which case the globularclusters must be younger than 5,000 million years?A clear-cut decision between these possibilities depends on
Fig. 1 6 being a correct representation of the situation after
148

THE AGE OF THE MILKY WAY
5,000 million years. How do we know that this is so? By a
theoretical calculation: the present method of estimating
star-ages depends crucially on our being able to calculate the
evolution of the stars with great accuracy. Although presentcalculations still fall seriously short of the desirable degree of
precision, the indications are that the stars shown in Figs. 17and 18 do fall near and perhaps slightly below the theoretical
curve drawn for an age of 5,000 million years. Opinions still
differ as to how close the agreement is. My own impression is
that the curve calculated for an age of 5,000 million years lies
quite close to the evolutionary sequences of the globular cluster
stars. Perhaps the best age estimate that can be given at the
present time is from 5 to 6 thousand million years. It will be
recalled that the age of the Earth is about 4,000 million years.
Evidently the Earth is not very much younger than the whole
Milky Way itself. Our residence in the Universe has a very
respectable antiquity. We are all ofa very respectable pedigree.This discussion brings out the importance of a theoretical
understanding of the processes of stellar evolution. It was
stated in the previous chapter that the evolution of the Sunand of stars like the Sun stars of medium capacity, is alonga track of the form shown in Fig. 15, and this was made
plausible by an appeal to the observations shown in Figs. 17and 1 8. But it may be wondered why the conversion of
hydrogen into helium, the helium staying put where it is
produced, should lead to such a remarkable evolution. Themain aim of the present chapter is to deal with this query
thereby serving to complete the discussion of the previous
chapter and also making way for further developments.
The evolution from L to M (Fig. 15)
In the early stages of the evolution the most rapid productionof helium is at the centre of the star. This is because the tem-
perature and density of the material are highest there; and the
higher the temperature and density the faster the nuclear
reactions take place. Complications eventually arise, however,because after a time all the hydrogen in the central regionsbecomes converted into helium. The star develops a core of
H9

FRONTIERS OF ASTRONOMY
nearly pure helium as shown in Fig. 19. When this happens
energy ceases to be generated in the core. Yet energy must
continue to be produced in the star in order to maintain the
energy balance. How is this achieved? The answer to this
question was given many years ago by Gamow and Critchfield.
The energy must be produced in a skin that surrounds the
helium core, as indicated in Fig. 19. To effect a sufficient degreeof energy production the inside of the star shrinks, thereby
increasing the temperature in the skin until the necessary
degree of energy production is achieved.
Flow of energy
by radiation ot
surface.Flow of energyby convection
Flow of energy
by radiation
Energy generatingskin.
FIG. 19. Star with helium core not drawn to scale.
Now although the inside of the star shrinks during the early
stages of evolution this does not mean that the total radius of
the star gets less. Whether it does or not has to be decided bycalculation: it turns out that the total radius of the star does
not shrink; between L and M of Fig. 15 it remains nearly the
150

DEGENERACY PRESSURE
same; and after M towards N it actually increases very con-
siderably.Next we must consider how the outward flow of energy is
maintained as the star evolves. The pattern of flow outside the
core is much the same as it initially was. First there is a regionin which energy flows by radiation alone. Then the mainflow is taken over by convection the star boils, and this con-
tinues outwards until the extreme photospheric layers are
reached where a change-back to flow by radiation occurs in
order that there shall be a free escape of energy outwards into
space.A tricky question remains to be cleared up however. What
happens to the energy flow in the helium core? Either the
energy flow must effectively cease altogether or the core must
go on shrinking in order to supply by gravitation the energythat constantly flows out of it. Our problem is to decide which
of these alternatives must be chosen.
According to recent calculations it turns out that after
shrinking for a time the energy flow ceases. The reason for this
is connected with the pressure balance.
It will be recalled that the necessity for maintaining a
pressure balance inside a star is overriding. In the case of the
Sun we saw that any serious departure from balance would
immediately, in a few minutes, lead to devastating effects.
Indeed we used the necessity for maintaining a pressurebalance to explain why the material of the Sun's interior is veryhot. It is now necessary to say that our former argument had
validity in this respect only because the internal density of the
Sun is not very great. This is a strange point but an importantone. In stars with internal densities less than about 1,000
times water, all our previous arguments can be applied. But
when the density rises above this when a pint jug wouldcontain more than half a ton of material, a new type of pressureknown as degeneracy pressure begins to develop as an out-
come of the sheer squashing together of material. The morethe material is squashed the higher this new form of pressurebecomes. Squashing is the determining factor for degeneracy
pressure, not a high temperature as is the case with the ordinary
pressure inside the Sun.

FRONTIERS OF ASTRONOMY
This has relevance to our helium cores. Provided a crucial
condition is satisfied it can be demonstrated by exact calcula-
tion that sooner or later shrinkage must come to a stop, because
after a certain stage further shrinkage would cause the pressurein the inner regions to become too high: too much squashing of
the internal material would raise the degeneracy pressureabove what was needed to withstand the weight ofthe overlying
layers. The condition that has to be satisfied is one of the most
curious in all astronomy, so curious that such a great astronomer
as Eddington could never bring himself to accept it. The mass
of the helium of the core must not exceed 1.44 times the Sun.
In the title of this chapter we referred to stars ofmedium con-
tent. This was intended to mean stars with masses large
enough for them to have undergone a significant degree of
evolution masses upwards of i.i times the Sun say, but not
with masses large enough for this present condition ever to be
infringed. Throughout this chapter we shall be concerned
with stars that have masses ranging from about i.i to 1.4 times
the Sun.
Although it is not our present purpose to consider stars
of large mass this is deferred to Chapter 12 it may be
wondered what would happen if the core should infringe the
1.44 condition. Then (as was first shown by E. Stoner andextended by S. Chandrasekhar) no degree of shrinkage could
ever develop sufficient degeneracy pressure to balance the
weight of the overlying layers.
In case there should seem to be pedantry in this point, let it
be said that the whole manner of the death of a star is deter-
mined by the 1.44 criterion by Chandrasekhar's limit as it is
usually called. Whether a star ends its days in a comparatively
peaceful way, as the stars considered in this chapter do, or
whether a star bursts out as one of the most violent explosionsin the Universe, depends on Chandrasekhar's limit.
The upshot of all this argument is that the shrinkage that
occurs at first in the helium core of a star of medium content
cannot continue indefinitely, because sooner or later degeneracy
pressure becomes great enough to prevent any further shrinkagefrom occurring. At this stage the energy flow in the core must
cease, since no source of energy then remains both the
152

THE POPPING CORE
gravitational energy released by shrinkage and the energy
generated by the conversion of hydrogen to helium have
stopped. This requires the temperature to become everywherethe same throughout the core since otherwise energy would be
bound to flow because energy always flows from material at a
higher temperature to material at a lower temperature.
Accordingly we reach the conclusion that the star must take
up a structure with a degenerate constant temperature (isother-
mal) core.
Outside the core comes the energy-generating skin, then a
region with a radiative flow of energy, then the boiling con-
vective region, and ultimately the radiative zone at the photo-
sphere. It is likely that this structure becomes established bythe time the point M of Fig. 15 is reached. The temperaturein the core of the star at this stage lies in the range from 15 to
20 million degrees, according to the precise mass of the star.
The type of structure just described was first proposed byGamow and Keller in 1945. At that time it did not receive a
general approval among astronomers, but opinion has steadily
hardened in its favour. Alternative suggestions for the changeof structure that accompanies evolution from L to M of Fig. 15now appear implausible.
Evolution from M to (Fig. 15)
Evolution fromM to N of Fig. 15 proceeds in a fairly straight-forward fashion. Hydrogen is changed to helium in the skin
that surrounds the helium core. As a consequence more andmore helium gets added to the core. The process is rather like
skinning an onion in reverse. Instead of taking off successive
skins, successive skins are added. Accompanying the growthof the core the outer convection zone must become deeper and
deeper. Indeed by the time the point O of Fig. 15 is reached
the convection zone extends inwards almost to the energy-
generating skin.
The section of the evolutionary track of Fig. 15 from N to Ois characterised by a general rise of temperature in the core
and in the energy-generating skin, a rise that is caused by the
onion process. By the time the point O is reached the tern-
153

FRONTIERS OF ASTRONOMY
perature at the centre becomes high enough about 100
million degrees for an interesting new situation to arise in
the core. This is in part due to a novel sort ofenergy-producingreaction. It may be wondered how any energy-generation can
occur in the core since all the initial hydrogen has become con-
verted to helium. The answer is that the new process makesuse of the helium as a fuel, a possibility first noted by E.
Salpeter, At the higher temperatures now occurring in the
core, helium becomes converted into carbon, oxygen, and neon
by nuclear reactions (the details of which we shall consider
in a moment) and this liberates energy.The curious feature of the new situation is not limited to the
onset of helium-burning, however. An explosive condition
develops in the core, causing it to expand very suddenly in a
time of a few minutes! The expansion goes on until the
degeneracy pressure disappears and the star assumes a moreor less normal structure once again. This 'popping' of the
core is not sufficiently violent to blow the star to pieces as
the explosions to be considered in Chapter 12 do. But the
popping of the core has an important effect on the evolution.
This is apparently the cause of the 'turn round* at O; it starts
the stars on the stage of their evolution from O to P. Stars on
their way from O to P are thus characterised by deriving their
energy from two sources, from the burning of helium in the
core and from the burning ofhydrogen in a shell that surrounds
the core.
The helium-burning reactions and the popping of the core
It is as well to look at some of these statements in a little
more detail before we continue with the discussion of the
evolutionary track of Fig. 15 beyond the point O. The reac-
tions that yield energy from helium are given in the followingtable:
Reaction Meaning of Symbols
He4(aHe
4, y) Cia A nucleus of ordinary helium He4
(2
protons, 2 neutrons) together with twoother helium nuclei give C12
(6 pro-
tons, 6 neutrons) , ay-ray being emitted.
154

THE POPPING CORE
Reaction Meaning of Symbols
C 12(He
4, y) O 16 C12
plus He4gives O 16
, ay-ray beingemitted.
O 16(He
4, y) Ne20 O 16
plus He4gives the isotope Ne 20
(10
protons, 10 neutrons) of neon, ay-ray
being emitted.
When helium-burning starts up near the point O of Fig. 15it is likely that the material in the central parts of the core is
degenerate. This leads to explosive conditions for a reason that
will now be explained.
Referring back to the Sun it will be recalled that there is a
good reason why an energy balance must exist inside the Sun.
If not enough energy were being generated to balance the
outward flow to the surface, the Sun would slowly shrink andthe internal temperature would slowly rise. The rise of tem-
perature would then increase the rate of energy-productionuntil an energy balance was reached. Conversely if the Sunwere initially generating more energy than is flowing out to the
surface, a slow expansion would take place, the internal tem-
perature falling meanwhile. The fall of temperature woulddecrease the rate of energy-production until a balance was
again reached.
This self-governing property depends very critically on the
material inside the Sun behaving like an ordinary gas, on it not
being 'degenerate', for L. Mestel has recently shown that self-
governing does not take place in degenerate material. Indeed
the very opposite of self-governing occurs, since the slightest
initial unbalance becomes more and more accentuated in
degenerate material as time goes on. If initially the energy-
production is less than the outward flow, the material does not
raise its temperature; instead it cools off thereby decreasingthe energy-production. The unbalance is accordingly increased.
Conversely if the energy-production initially exceeds the out-
flow the material instead of reducing its temperature actuallyheats up. The heating up increases the energy-production andthe unbalance is again accentuated.
The heating of the helium core of our evolving star by the
reverse-onion process eventually sets the helium-burning
155

FRONTIERS OF ASTRONOMY
reactions of the above table working to a degree that causes
the energy-production to exceed the outflow that also starts
up in the core. The material being degenerate, the condi-
tion of instability described in the previous paragraph there-
fore arises. What happens? The material heats up more and
more, the helium-burning reactions becoming more rapidmeanwhile. But there is a limit to the amount of heating up,because eventually the ordinary high temperature form of
pressure takes over control from the degeneracy pressure.
When this happens the core is able to cool itself by expansionand thereby to bring the helium-burning reactions under
control.
Calculation shows that the fate of the star is a rather touch
and go affair. So much energy is released by the helium-
burning reactions before they are thus brought into moderation
that the star is very nearly blown to pieces. The situation is in
many respects like a terrestrial atomic bomb by the time
material becomes hot enough to expand, explosion conditions
have been generated. But because the core lies inside the rest
of the star its explosion, as a sort of monstrous helium bomb, is
controlled by the tamping effect of the outer parts of the star
which succeed in holding the core in. The core is therebyrestrained to a 'popping', the popping whose effect is to
reverse the evolution of the star from the point O of Fig. 15towards P.
The RR Lyrae Stars
A comparison of Fig, 15 with Fig. 17 shows that the point Pis situated in a curious gap in Fig. 17. This gap is not intended
to indicate an absence of stars many stars of the cluster M 3lie inside the gap, but that this region is characterised by a
singular property. In the previous chapter we discussed whatwould happen to the Sun if by some magic the internal high
temperature could suddenly be removed. We saw that the Sunwould collapse swiftly down to about half its present size andwould then oscillate inwards and outwards about a new posi-tion of pressure balance, the oscillations going through a full
cycle in a time of a few hours. The stars in the gap of Fig. 17
156

R R LYRAE STARS
arc oscillating inwards and outwards in this fashion, the time
for a full cycle depending on the position of the star within the
gap: the time varies from almost eight hours at the left end to
about a day at the right end.
It is to be emphasised that no suggestion is being made that
the cause of the oscillations are the same as our hypotheticalsudden withdrawal of the heat inside the Sun. The cause of
the oscillations of these stars is at present entirely unknown.It seems to be connected quite critically with the structure
of the star. Thus a star situated just outside the gap does not
oscillate but one just inside does. The changeover from non-
oscillation to oscillation is an extremely sharp and significant
transition.
Oscillating stars occur also in other globular clusters, for
instance in the cluster M 92, the stars of which are plotted in
Fig. 1 8. But the proportion ofoscillating stars is widely different
in different clusters. For example, although M 3 and M 92are clusters with roughly the same total stellar populations, M 3contains about 150 of these oscillating stars whereas M 92contains only 6. Other globular clusters tend apparently to be
more like M 92 than M 3; M 3 would seem to contain a quiteunusual proportion. A comparison of Figs. 17 and 18 shows
immediately what the difference consists of. While M 3 has a
considerable group of stars in the region of the point P of Fig.
15, the corresponding, group in M 92 occurs in the region of
the point Q. Why this difference should occur is another
problem whose solution is not yet understood.
The oscillating stars at present under discussion are often
referred to as 'cluster variables', a name derived from their
presence in the globular clusters. But since this kind of star is
by no means entirely confined to the globular clusters the nameis not really a suitable one. The designation 'R R Lyrae stars*
is often preferred to that of 'cluster variables' for this reason.
The latter name is derived from the particular star R R Lyraewhich is a typical example. The name 'R R Lyrae stars' will
be used in all later discussions.
The R R Lyrae stars not only oscillate in size but they varyin brightness. This makes them easy to recognise observa-
tionally, a point of importance in the next chapter. Fig. 20
157

FRONTIERS OF ASTRONOMY
shows the relation that exists between the time of oscillation
and the percentage change in brightness. This figure demon-strates quite clearly what astronomers have suspected for some
years, that the R R Lyrae stars must be divided into two kinds,those with oscillation periods longer than 10 hours (marked
soo
I*
1100
oo
S 50
240
Ou 3O
I
*
10
X X*X
X *
K
O-l O2 O3 O-4 OS O-6 O7
Period of OK i Morion in days
FlG. 2O
0-9
X in Fig. 20) and those with periods less than 10 hours (markedin Fig. 20). It is thought that these two groups represent
different modes of oscillation, but once again the cause of the
difference is not understood a somewhat dolorous note.
The last stages ofevolution
The evolutionary track of Fig. 15 has been redrawn in Fig.21. It will be seen that the track now extends beyond the pointQ. Th* oart of the track from Qto T represents the last stages
158

WHITE DWARFS AND NOVAE
of evolution that take place once nuclear reactions cease to
produce energy within the star. Eventually all the hydrogenof the star becomes exhausted (we shall have more to say-
later about the details of how this happens) and no more
10.000
1.000
10
100White dworft
i
'
1.000
50 4O 3O 2O 109 8 7 6 5 4 J 2
Surface temperature in thousands degrees Centigrade
FIG. 21. Evolutionary track to the white dwarfs
energy is then produced by the conversion of hydrogen into
helium. Helium-burning in accordance with the reactions of
the table on page 154 must also cease eventually because of
an exhaustion of the helium. And in a like manner anyother nuclear fuel that may arise in the star must eventually
become exhausted. (For the possibility of other reactions see
Chapter 12.)
When this happens the star cools off along the track Q,to Tof Fig. 21. As the temperature of the interior material falls,
degeneracy pressure takes over control throughout the star
159

FRONTIERS OF ASTRONOMY
(with the exception of the immediate photospheric layers).
Degeneracy pressure is able to do this because we are now
considering stars that have masses below Chandrasekhar's
limit.
Calculation shows that the time for cooling becomes pro-
gressively longer as the star goes from S to R to T in Fig. 21.
Ultimately the rate of evolution becomes so slow that within
the age of the Milky Way no star has had time enough to cool
much beyond T. Hence we expect to find most dying stars
lodged in the part of the diagram from R to T. This agrees
very well with observation. Stars are found in considerable
numbers in the region R to T. They are known as the white-
dwarf stars, a name derived from their shrunken size and from
their surfaces which are white-hot. A typical white dwarf is
no larger than the planet Jupiter, although its mass may be
1,000 times greater than that ofJupiter. Evidently the white-
dwarf stars are very squashed indeed.
On account of their low intrinsic brightness, white dwarfs
cannot be detected by observation unless they happen to be
quite close to us. But in spite of this handicap two hundred or
more of them have so far been discovered, notably by Luyten.White dwarfs seem to be rather common: there are a dozen
or so of them within our immediate stellar neighbourhood.
The novae
It is unlikely that stars die without a spectacular protest.
We can see how this comes about by considering how the last
dregs of a star's hydrogen become exhausted. It is apparentthat the energy-generating skin of Fig. 19 cannot work its wayentirely to the surface, since the temperature required for
energy-generation exceeds 10 million degrees and the star
cannot have a surface as hot as this, otherwise the flood of
radiation emitted into space would be impossibly large. Yetstars apparently do consume their hydrogen right to the surface.
This has been shown by Bidelman and by Greenstein whohave observed such stars in the region P to Q,of Fig. 21.
One way for the outer hydrogen to be consumed would be
for it to be carried downward into an interior energy-generating.
160

WHITE DWARFS AND NOVAE
region by circulating currents. This would mean that the
helium produced in the energy-generating region instead of
being entirely added to the core was in part exchanged with
hydrogen from the surface. While this process may well occur in
some degree there is strong reason to believe that it is not the
whole story, that the last of a star's hydrogen may be got rid
of in quite a different way.We have spoken of the material becoming degenerate
throughout the star except for the immediate photospheric
layers. If the outer skin of hydrogen should ever become
degenerate or an appreciable portion of it become degeneratean explosive condition must arise in a way similar to that
already discussed in connection with the 'popping' of the core.
This has been pointed out by Mestel, who considers that
violent outbursts may occur in this way. There is an important
practical difference between the present case and that of the
popping of the core. The explosion now occurs on the outside
of the star where it should be much easier to observe.
The results of a precise calculation can be expressed in two
ways. If the energy released were entirely converted into
motion then in the absence of the restraining gravitationalfield of the star the exploding material would blow outwards
from the star with an average speed of about 1,000 kilometres
per second. Ifon the other hand the energy were all converted
into heat, and if the amount of hydrogen concerned in the
explosion were say 10 per cent of the mass of the Sun, the star
could keep shining for several weeks at a rate that exceeded
the Sun 100,000 times. This suggests a relation with the
exploding stars known as novae. A typical nova is a star that is
observed to increase suddenly in brightness from about 30times the Sun, corresponding perhaps to the point Q,of Fig. 21,
to about 100,000 times the Sun. A typical nova maintains this
brightness for a week or two and then declines steeply. Not
only this, but material is fired off the star with a speed of about
2,000 kilometres per second. That this velocity is higher than
the average speed suggested by our calculations is probably
important. It suggests that most of the exploding hydrogen is
retained by the strong gravitational field of the star: that the
heated hydrogen expands but for the most part does not
161

FRONTIERS OF ASTRONOMY
possess enough speed to leave the star. This again agrees with
the indications of observation which suggest that the amount of
material actually expelled by a nova is very small, amountingto no more than about a hundredth of a per cent of the whole
mass of the star. After a time the main mass of the heated
hydrogen must cool off and sink back to its former state. The
process must be then repeated a second time, and a third time,
and so on. About 1,000 such outbursts would probably be
required to rid the star of the last of its hydrogen. This enables
an interesting calculation to be made. In the whole of the
Milky Way there are perhaps TOO million stars now evolving
along a track similar to Fig. 21. Reckoning that each such
star will experience 1,000 outbursts this gives a total of
100,000 million outbursts for the whole group of evolving stars.
Since the time of evolution of these stars is about 5,000 million
years this would imply that novae occur at a rate of about 20
per year. Estimates have been made of the number of novae
actually occurring in the whole Milky Way each year. Theresult is about 20 or 30 an excellent agreement.
162

CHAPTER TEN
The Measurement of Astronomical
Distances
Astronomical distances have the air of a conjuring trick.
The vastncss of cosmic dimensions fills us with astonishment.
Yet like a conjuring trick it all looks very obvious when we see
how it is done. The methods of measurement are indeed of a
very mundane character.
Perhaps the most important is in essence just the methodthat an automobile driver uses at night to judge the distance
of an approaching car. If the car's headlights seem faint
we judge it to be far away; if they appear very bright we
regard the car as being rather close. A correct judgment in
such cases depends on our having a pretty good idea of how
bright the headlights would look from some standard distance,
say at a range of 50 yards. It is clear from practical experiencethat we go wrong in estimating distance if an approaching car
happens to be carrying headlights that are intrinsically parti-
cularly bright. In this case we suppose the car to be nearer
than it really is. Conversely if the oncoming car is equippedwith headlights that are intrinsically rather dim we tend to
misjudge the distance thinking the car to be farther away than
it really is.
Now ifwe tried to use the stars indiscriminately as 'headlights'for astronomical distance determinations we should run
immediately into a serious difficulty, because the intrinsic
brightnesses of the stars are highly variable. A tenfold differ-
ence between a very bright automobile headlight and a dimone would represent a fairly extreme case. But the stars differ
in their intrinsic brightnesses much more than this. Hence if
we are to use the 'headlight* method ofjudging distances wemust be particularly careful to use only stars with known
163

FRONTIERS OF ASTRONOMY
true brightnesses. Since the intrinsic brightness of the Sun
is known with great accuracy we could for instance decide
to use stars that are very similar to the Sun. But such a pro-
cedure would have two disadvantages. First because the Sun
Stars at this point of M3 diagram hove
a surface temperature equal to
of the Sun. This is determined by
observation
67 6 5* 5 45 4 >5 3
Surface temperature in thousands degrees Centigrade
FIG. 22. Fixing the intrinsic brightness of the R R Lyrae stars,
is not a very bright star, similar stars cannot readily be detected
if they are far away from us. Second, a rather tedious search,in which many stars were examined, would be necessary in
order to pick out those special stars that happened to be like
the Sun.
Both these disadvantages are overcome by using the R RLyrae stars as 'standard headlights'. The R R Lyrae stars are
about 100 times brighter than the Sun intrinsically and there-
fore they can be detected at much greater distances than could

THE MEASUREMENT OF ASTRONOMICAL DISTANCES
be done for stars like the Sun. Moreover their characteristic
type ofoscillation allows them to be picked up very readily,
The R R Lyrae Stars as distance indicators
The application of the R R Lyrae stars as distance indicators
requires an observation to be combined with an item of know-
ledge. Taking the observation first, the more or less casual
motorist's judgment of the apparent brightness ofan oncomingheadlight must be replaced by a strict measurement. This can
be done by photographing our R R Lyrae star in an exposureof known duration, the apparent brightness being estimated
from the intensity with which the star marks the plate. Thecalculation of the distance of the star also requires a know-
ledge of the intrinsic brightness of an R R Lyrae star. This
was stated above to be about 100 times the Sun. How is this
known?The answer is given pictorially in Fig. 22. The sequence of
the stars of the cluster M 3 is shown there together with the
territory occupied by the R R Lyrae stars. Now stars near the
point S in this figure emit light with a very closely similar dis-
tribution of colour to the light emitted by the Sun. Moreoverthe stars near the point S are almost certainly on the main-
sequence as the Sun is. It accordingly seems a reasonable
inference that these stars are also similar to the Sun in their
intrinsic brightness. Accepting this, the scale of brightnessbecomes fixed for the whole diagram. It was indeed in just this
way that the scale of Fig. 17 was determined. The last stepis to read off the factor 100 by which the brightness of anR R Lyrae star exceeds the stars at S. This step depends onthe fact that all the stars ofM 3 (Plate XVIII) are effectivelythe same distance from us, so that the observed ratio of the
apparent brightnesses of two stars is just the same as the ratio
of their intrinsic brightnesses.It is convenient at this stage to say a few words about the
Milky Way. The stars of the Galaxy as the Milky Wayis often called form a flattened lens-like structure probablywith a pronounced central bulge or nucleus as indicated
in Fig. 23. The Sun and the planets lie well out from the centre
165

FRONTIERS OF ASTRONOMY
as is also indicated in Fig. 23. How far out? An answer to this
question has been given by Walter Baade. By measuring the
distances of a large number of R R Lyrae stars in the nucleus
Baade was able to estimate the frequency with which these
Frequency of occurrence
of HR Lyrae scars amaximum here,
see Fig 24}
^^/////////////^^^
Sun and planets: the
stars that are prominentin the night sky are justthe nearby stars inside
this sphere.
FIG. 23. Schematic drawing of our Galaxy seen edge-on.
special stars occur in space. He found a distribution of the
sort as shown in Fig. 24. The interpretation of the curve of
Fig. 24 is that the R R Lyrae stars have a maximum frequencyof occurrence at the centre, corresponding to the point C in
Fig. 23, Away from the centre the frequency falls off: the point
A is away from the centre on the near side and B is away from
the centre on its far side. This is made clear by the correspond-
ing marking ofthe points in the two figures. The distance ofthe
Sun from the centre of the Galaxy then follows simply by
reading off the distance of the peak of the curve of Fig. 24.
Baade's result was a little in excess of 8,000 parsecs in more
conventional units about 150,000,000,000,000,000 miles, a
goodly step.
The parsec is the unit of distance used by astronomers. Its
meaning is easily understood. Consider the diameter EF of
the circle shown in Fig. 25. Take two lines drawn from your
eye, one to the point E and the other to F. Evidently there is
an angle between these two lines. The diameter EF is said to
subtend this angle at the eye. Now move the circle farther and
farther away keeping it square on to the eye. Then the anglesubtended by the diameter EF gets less and le*j. Indeed by
166

THE MEASUREMENT. OF ASTRONOMICAL DISTANCES
moving the circle away to an appropriate distance we can makethe angle come as small as we please. For example there wouldbe a definite distance at which the angle subtended by EF was2 seconds of arc. (It will be recalled that in a right angle L
!
8 \4O parsecs
B
Distance
FIG. 24. Determining the distance of the centre of our Galaxy.
there are 90 'degrees'; in I degree there are 60 'minutes'; in i
minute there are 60 'seconds', not of course of time but of
angular measure this is indicated by the words 'of arc'.)
Now imagine that the diagram of Fig. 25 represents the orbit
of the Earth around the Sun, and that the line EF is a diameter
of the Earth's orbit. The distance at which the line EF sub-
tends an angle of 2 seconds is called a parsec. Light, travelling
186,000 miles for every second of time, takes a little more than
3 years to cover a distance of i parsec. For comparison light
takes only 8 minutes to travel from the Sun to the Earth andabout 5 hours to reach Pluto the most distant of the planets.
Clearly then a distance of i parsec is very vast indeed com-
pared to the dimensions of the planetary system.The reason why astronomers like to use the parsec as a unit
of distance to talk of distances as being so many parsecs, is
partly because the parsec is about e^^a) to the average distance
16}

FRONTIERS OF ASTRONOMY
between the stars and partly because all distances within our
Galaxy come out at very reasonable numbers. It is muchmore convenient to say that the Sun is at a distance of about
8,000 parsecs from the centre of the Galaxy (Baade's actual
value was 8,140 parsecs) rather than to say that the centre is
150,000,000,000,000,000 miles away.
FIG. 25.
Distances outside the Milky Way
Besides being used for measurements within our Galaxy the
R R Lyrae stars can be used to determine distances outside our
Galaxy. It must now be stressed that our Galaxy is an isolated
system of stars. Ifwe were to go out on a journey into space in
any direction after travelling sufficiently far we would comeclear of the Milky Way altogether. This would happen at a
distance of perhaps 30,000 parsecs a statement that seems at
first sight to be inconsistent with the picture of the Galaxysketched in Fig. 23. In this figure the Sun is drawn lying in
the outskirts of the Galaxy, so that we might expect to comeclear of the stars of the Galaxy very quickly unless it just
happened that we were to set out in a direction towards the
centre, and even in this case we might still expect to come clear
1 68

THE MEASUREMENT OF ASTRONOMICAL DISTANCES
of the Galaxy in a distance of not much more than 15,000
parsecs.
But what is not shown in Fig. 23 is the great diffuse halo of
stars that surrounds our Galaxy. Fig. 23 is correct so far as the
main distribution of the stars is concerned, but a very extensive
halo of stars must be thought of as surrounding Fig. 23. This
is indicated in Fig. 26. The distance across this halo may be as
great as 60,000 parsecs.
FIG. 26. The halo around our Galaxy.
At a distance of about 30,000 parsecs from its centre the
Galaxy also seems to possess a number of satellite star systems.These are groups of stars larger than globular clusters but
small compared to the Galaxy itself (they probably contain
about 10 million stars, as compared with roughly 100,000 in a
globular cluster, and with roughly 100,000 million in the
Galaxy itself). They are appropriately named satellites because
169
FRONTIERS OF ASTRONOMY
they probably move around the Galaxy rather as satellites of
the solar system move around their parent planets, or as the
planets themselves move around the Sun except that movingaround the Galaxy takes not a few months or years as is the
case within the solar system but about 2,000 million years.
Such satellite star systems have been detected by the surveyof the heavens that is now being carried out at Palomar Mt.
Eventually our traveller would come clear of the Galaxy.He would then pass out into space, but he would not find space
entirely empty. Here and there he would find other great star
systems. Some would be very like our Galaxy itself. Onesuch similar system is shown in Plate XXI. This is the great
galaxy in the constellation of Andromeda, at one time thoughtto be somewhat smaller than our own Galaxy, but now believed
to be somewhat larger. The distance of the Andromeda nebula
(catalogue designation M 31) has been determined by Baadebut the distance indicators in this case were not the R R Lyraestars (as we shall see below). It turned out that M 31 is at
the almost fantastic distance of nearly 450,000 parsecs about
10,000,000,000,000,000,000 miles. The distance across the
part of M 31 shown in Plate XXI is about 25,000 parsecs as
compared with not much more than 15,000 parsecs for the
corresponding distance in our own Galaxy.In addition to what is shown on Plate XXI, M 31 also
possesses a halo too faint to be easily photographed. The halo
in the case of M 31 may extend out to a distance as great as
50,000 parsecs from the centre. MSI also has two satellite star
systems. These are very much more notable satellites than
those possessed by our own Galaxy. A very recent investiga-tion by M. Schwarzschild has shown that the mass of these
satellites may be some 5 per cent or so ofthe whole mass ofM 31 .
In the case of our Galaxy the mass of the satellites is probablynot greater than a tenth ofa per cent of the total.
The great system ofM 31 is not by any means the nearest of
the external star systems but it is the nearest of the really large
systems. All nearer ones are comparatively faint unspectacular
groups but their importance to astronomers is nevertheless very
great. The nearest visible in the northern hemisphere of the
Earth is a recently discovered system in a direction that lies in
170

THE MEASUREMENT OF ASTRONOMICAL DISTANCES
the constellation of Draco. It is now under active investiga-tion by the observers at Palomar Mt. Still nearer external star
systems are visible to observers in the southern hemisphere of
the Earth. The nearest are indeed notable objects even to the
unaided eye. These are the Magellanic clouds the clouds of
Magellan, appropriately named after that intrepid explorer,shown in Plates XXII and XXIII. Their distances, determined
by Thackeray and Wesselinck using the R R Lyrae distance
indicators, are about 50,000 parsecs. This is close enough to
make one wonder whether or not they should be classed as
satellites of our Galaxy. Present opinion is that probably theyshould not but the question is still an open one. What seems
likely is that these two star systems form a connected pair. It
has been shown by the Australians F. J. Kerr and J. V. Hynd-man that the two clouds are moving in orbits around each
other, rather like the two stars of a double star system. This
result has been established by a new method ofradio-astronomyto be described in a later chapter.The Magellanic clouds have a very special importance in
astronomy. As well as containing all the normal sorts of stars
they also contain most of the freaks that are found in the
Galaxy. But whereas the study of freak cases is made difficult
in the Galaxy because their distances are often entirely un-
known, the distance ofall the stars in the Magellanic clouds are
immediately known from the use of the R R Lyrae stars (the
clouds are of small size compared to their distance so that all
parts of them may be considered to be the same distance awayfrom us, to a high degree of accuracy). This is an importantfeature to which several references will be made later on. Atthe present time this work is only just getting under way at the
Radcliff Observatory, Pretoria and at the Commonwealth
Observatory, Mt. Stromlo. It is safe to say that many advances
in astronomy will be forthcoming in the next decades from a
close study of the Magellanic clouds.
Distance measurements by the surveying method
It was mentioned at the beginning ofthis chapter that several
methods of measuring distances are used by astronomers. So
171

FRONTIERS OF ASTRONOMY
far we have been concerned with only one of them. Now it is
opportune to say something ofa second. The first astronomical
distances were measured by a method identical in principlewith that used by a surveyor. This
is illustrated in Fig. 27. A and Bare to be thought ofas known pointsand AB as a known line. C is the
point whose distance is sought. Themethod consists simply in sightingC from A and from B. The first
observation settles the slope of the
line AC compared with AB, as in
fl
FIG. 27.
(a) of Fig. 28, while the second observation settles the slope of
line BC, as in (b) of Fig. 28. Then C lies where the two direc-
tions intersect each other, the one from A and the one from B.
The surveyor uses this method when C is some inaccessible
spot, say the top of a mountain. The astronomer also uses the
method with C as an inaccessible spot, a distant astronomical
body.
(a) Measurement from *A (b) Measurement from 8
Direction of CDirection of C
B BFIG. 28.
The essence of the surveying method is that the points A and
B must be accessible and the distance from A to B must be
known. One way to ensure that this condition is satisfied
would be to take A and B as points on the surface of the Earth,
say the positions of two observatories, the two observatories
carrying out simultaneous measurement of the directions of C.
This is in fact the way that distances inside the planetary
system are measured. The distances of the planets from the
Sun given in Chapter 5, were determined in essentially this
fashion.
172

THE MEASUREMENT OF ASTRONOMICAL DISTANCES
The surveying method suffers from a serious handicaphowever. It depends on our being able to distinguish betweenthe directions of G as seen from A and B. When these twodirections become nearly indistinguishable, as they do whenC is very far away see Fig. 29 the method tends to break
down. This is particularly serious in astronomy because the
distances we wish to measure are always very large comparedto the distance from A to B, so that the triangle ABC is always
very elongated, very much more so than in Fig. 29. Two
A
FIG. 29.
things have to be done. One is to measure directions very
accurately so that the difference between the directions of Cas seen from A and B can be distinguished even if it is verysmall. Indeed so accurate are astronomical measurementsthat differences of direction that are as small as one-thirtieth
of a second of arc can be measured. But with even the most
careful precautions accurate measurement is difficult when the
difference of angle becomes less than this.
ong/e AS theeasier to measure
FIG. 30.
It is also of great importance to make the distance from A to
B as large as possible. This is evident because the larger ABthe greater the difference between the directions ofC becomes,as can be seen by comparing the triangle of Fig. 29 with that of
Fig. 30. Now what is the largest distance we can achieve for
AB, bearing in mind that A and B must be points that we can
actually go to in order to make the angle measurements of

FRONTIERS OF ASTRONOMY
course. Two points on opposite sides of the Earth, as in the
measurement of planetary distances? This would be entirely
insufficient to measure the distance of even the nearest star.
Yet is this not the greatest possible distance consistent with the
accessibility requirement? The answer is, no! We can achieve
a much greater distance if we take A and B to be points at
opposite ends ofa diameter of the Earth's orbit around the Sun.
This gives an increase of more than 20,000 times in the lengthof AB; while the Earth's motion around the Sun makes the
points A and B accessible once every year. By making 6
monthly measurements of the direction of C, first from A then
from B, then back to A, and so on, the distances of the nearest
stars can be accurately measured. But although distances are
very reliable out to 10 parsecs, distances of 100 parsecs are less
reliably measured, and distances appreciably beyond 100
parsecs cannot be measured at all by the surveying method.
The surveying method accordingly provides a very accurate
guide to the distances of stars that lie in the immediate neigh-bourhood of the Sun but is quite useless at larger distances.
At the larger distances we must use the 'headlight' method.
Brighter headlights
Even the R R Lyrae stars fail as indicators when we go to
really great distances. The R R Lyrae stars can perhaps be
used to a distance of 200,000 parsecs but not much farther, not
as far as the great galaxy M 31 in Andromeda which lies at a
distance of some 450,000 parsecs. The headlight method
requires extension if it is to yield distance measurements as
great as this.
The R R Lyrae stars must be replaced by some other brighter
type ofstar. Any brighter star that possesses an easily recognised
peculiarity and whose intrinsic brightness is known can be used.
We shall consider several kinds of star that satisfy these require-ments in later discussions. Two of the most effective types have
intrinsic brightnesses more than 1,000 times greater than the
R R Lyrae stars (more than 100,000 times brighter than the
Sun). Such stars can be used to measure distances perhaps
up to about 10 million parsecs.
174

THE MEASUREMENT OF ASTRONOMICAL DISTANCES
Before we discuss the significance of such distances it may be
asked how we can know that a particular star is, say 1,000 times
brighter intrinsically than the R R Lyrae stars. The best wayto make such a determination is to find a system of stars all at
effectively the same distance away from us in which both the
star in question and R R Lyrae stars can readily be observed.
A straightforward comparison then tells us how much brighterour special type of star is. The Magellanic clouds are ideal
systems for use in this sort ofwork. They are not only sufficientlynear to us for the R R Lyrae stars to be readily distinguishedbut they contain almost every known type of star. Actually
owing to the fact that the Magellanic clouds are only visible
from the southern hemisphere of the Earth very little of this
work has so far been done on them. Perversely astronomers
have insisted on doing things in a much harder way from the
northern hemisphere. It can hardly be doubted however that
the Magellanic clouds will be used more and more in the
future for this purpose. They provide us with an ideal way of
calibrating our various types of stellar headlights.Let us return now to the statement that the brightest stellar
headlight yet discovered (actually the novae, and a certain
type of irregular oscillating star these will be discussed in
later chapters) make distance determinations up to 10 million
parsecs possible. The great nebula M 31 (Plate XXI) at a
distance of about 450,000 parsecs lies well within the range of
possible measurement. Indeed the measurement of the dis-
tance ofM 31 does not demand the use of the brightest possible
type of headlight, although it does demand a brighter typethan the R R Lyrae stars.
Beyond MSI are about 1,000 other galaxies whose distances
might be measured with the aid of the brightest stars for which
the headlight method is applicable. So far only a few have
had their distances measured in this way. The beautiful
galaxy M 81 shown in Plate XXIV is one of these. Accordingto the recent work of A. R. Sandage, M 81 is at a distance of
about 2,500,000 parsecs.It should eventually be possible to measure the distance of
such galaxies as the one shown in Plate XXVI (catalogue
designation N.G.C. 4594), which is probably at a distance
175

FRONTIERS OF ASTRONOMY
approaching 10 million parsecs. This galaxy shows a most
pronounced central bulge. Also the clouds containing dust are
shown as a dark band: this is similar to the Tog' within our own
Galaxy. The large number of objects which can be seen
lying outside the galaxy but grouped symmetrically around
the nucleus is a third point ofinterest. These are not foregroundstars ofour own Galaxy but a group ofglobular clusters belong-
ing to N.G.G. 4594. The distance of N.G.C. 4594 is so greatthat even the vast array of stars in a globular cluster (comparewith Plate XVIII for a globular cluster in our own Galaxy)shows only as a faint blur. Another galaxy with a very largenumber ofglobular clusters is shown in Plate XXVII (catalogue
description M 87).
The last two Plates XXVI and XXVII suggest that instead of
using an individual star as headlight it might be possible to
take a group of stars together. One hopeful possibility is to
use a whole globular cluster, the brightest of which are about
10,000 times more luminous than an individual R R Lyraestar. This possibility is under active investigation at the
present time. Difficulties lie in making an effective calibration
of the intrinsic brightnesses of the whole range of globularclusters (it is obvious from a glance at Plates XXVI and XXVIIthat globular clusters do not all have the same intrinsic bright-
ness, as for instance the R R Lyrae stars all seem to have). It
is hoped that the work now being carried out at the Mt. Wilson
and Palomar Observatories and by N. U. Mayall at the Lick
Observatory will eventually lead to whole globular clusters
becoming useful as distance indicators.
Even globular clusters however would not be capable of
measuring the full distances in which astronomers are interested.
These 'ultimate' distances go out into space to 1,000 million
parsecs for comparison the distance ofthe Earth from the Sunis but one two-hundred-thousandth part of one parsec. This
is so enormous that only a source of light that exceeded the
Sun ten thousand millionfold in brightness could be used as a
standard headlight. We shall take up the question as to howsuch a source can be obtained in a later chapter.
176

CHAPTER ELEVEN
Dwarfs and Giants
The stars in general
The comparative simplicity of the evolutionary sequenceshown in Fig. 17 is due to the fact that the stars plotted there
belong to the same cluster and therefore presumably had a
common origin and now have a common age. When we con-
sider the totality of all stars of the Milky Way the picture be-
comes far more complex; for in place of the one degree of
variation that exists in a globular cluster variation of mass
from star to star we now have three degrees of variation at
least: variation of mass, variation of age, and variation of
initial composition. To these some astronomers might add a
variation of magnetic field but it is not yet known whether this
is a matter of any real importance.In Chapter 8 the initial composition possessed by stars that
formed in the Milky Way contemporaneously with the Sunwas listed. Have stars ever formed with compositions impor-
tantly different from this? Yes, the first stars to condense in the
Galaxy had a considerably smaller metal content. It maycome as a surprise that this difference should turn out to have
important consequences since even the metal content of a
young star is probably less than a per cent by weight, while that
of an old star is much smaller still. Yet metal atoms can have a
deceptive importance on the surface balance of a star. It will
be recalled that in the photospheric layers the energy must
always be made to flow by radiation. In stars with photo-
spheric temperatures less than about 5,000 C. stars that lie
to the right of the Sun in the H-R diagram the metal atoms
can have a decisive importance in controlling the photospheric
energy flow even if their abundance is very small.
Because of the three possibilities of variation the full totality
177 G

FRONTIERS OF ASTRONOMY
of stars of the Milky Way scatter very widely over the H-Rdiagram. According to the part of the diagram in which theylie the stars are given rather picturesque names: blue giants,
1.000.000
100.000
10,000
1.000
IOO
10
I
To"
IOO
I
1,000
White Dwarfs
5O 4O JO 2O IO9 7 6 5 4
Surface temperature in thousands degrees Centigrade
FIG. 31. Different brands of star.
dwarfs, red dwarfs, sub-dwarfs, white dwarfs, giants, sub-
giants, red giants, and supergiants. There are also character-
istic parts of the diagram in which lie oscillating stars R RLyrae stars, Cepheids, and the irregular variables. This is
illustrated in Fig. 31.
At the time of their condensation the stars lie on or near
the main-sequence, their positions being dependent on their

DWARFS AND GIANTS
masses. Those of large mass lie high on the main-sequence in
the territory of the blue giants. The stars of small mass at the
bottom of the main-sequence are the red-dwarfs and those like
the Sun are just plain dwarfs. The task of the astronomer is to
explain how the stars evolve away from the main-sequenceand thereby to understand how the various regions of the
diagram come to be populated.
During its evolution a star moves from one region to another.
The globular cluster stars for instance evolve along a track of
the form of Fig. 15. They start as dwarfs on the main-sequence,then they move into the region of the sub-giants and thence to
the giants. After the turn-round at the point O of Fig. 15 the
stars move down and to the left into the R R Lyrae region.Still moving to the left and downwards they cross the main-
sequence and then enter the territory of the Zwicky-Humasonblue stars. In the last phases of their evolution the stars then
move downwards until at last they reach the realm of the
white dwarfs.
We may suppose that a star initially well up the main-
sequence, higher than the dwarfs, follows an evolutionary track
with the general form of Fig. 15 but lifted in the diagramaccording to the starting point. Such stars could therefore
evolve into higher regions into the territory of the super-giants.There is accordingly no difficulty in understanding in a general
way how the upper parts of the diagram come to be occupiedbut subtleties wiU arise when we come later to discuss details.
Stars initially lower down the main-sequence than the Sunwould if they were given sufficient time evolve into the regionof the diagram to the right of the sub-giants and below the
red-giants. But the Galaxy is not yet old enough for this to have
happened, so that we expect these parts of the diagram to be
still unoccupied an expectation that is in accordance with
observation.
We may add a remark on evolution times. The time requiredfor a significant evolution of stars near the bottom of the main-
sequence, the red-dwarfs, may be as long as 1,000,000,000,000
years, as compared to about 10,000 million years for the Sun,about 1,000 million for a star like Sinus and no more than 10
million years for stars that are very high on the main-sequence.
179

FRONTIERS OF ASTRONOMY
The stars of the solar neighbourhood
The Sun and the planets are moving at a speed of about half
a million miles an hour around a huge orbit that circles the
Galaxy. This motion takes us past other stars and sometimes
through gas clouds of the Milky Way. One would supposethat the protagonists of the more romantic aspects of spacetravel would wax enthusiastic about ourjourneying thus amongthe stars since no rocket they will ever construct will take themso swiftly or so comfortably through the Galaxy.The stars among which we are moving at the present time
are plotted in Fig. 32. It is at once apparent that these nearbystars cover only a very limited part of the diagram. The main-
sequence is represented to a brightness about 50 times greaterthan the Sun, but most of the stars lie on the main-sequencebelow the Sun. In addition to the main-sequence stars there are
two white dwarfs (catalogue designations Wolf 1346 and AC +70 8247), two sub-dwarfs (Groombridge 1830 and 66 717),several sub-giants and a number of red giants, of which
Arcturus and Aldebaran are the most noteworthy examples.The absence of very bright stars, blue giants and super-
giants, is simply due to the extreme rarity of such highlyluminous stars we do not happen to be near any of them at
the present time. The stars plotted in Fig. 32 are just commonstars. We see that the Sun, negligible compared with the
giants, is nevertheless brighter than the average star.
There is no special characteristic about the distribution of
the nearest stars over the sky. But this was not understood bythe astrologers of the ancient world, who sought to relate the
stars to human experience. Attempts were made to associate
groups of stars with animals and people: the stars in one patchof the sky became Draco the dragon, another became Leo the
lion, Pisces the fishes, Ursa Major the great bear, Orion the
hunter, Andromeda after the heroine of ancient legend, Virgothe virgin, and other such fanciful names. These imaginaryassociations became known as the constellations. They are
still retained as appellations in modern astronomy in spite of
their complete lack of physical significance, partly for their
attractive descriptions and partly because it is often convenient
180

DWARFS AND GIANTS
176
64
32
16
a
2
Siriui
Procyo*
*
.{Hercullt
9 Al4boro
16
32
64
i
126
2~56
t
512
ip24
I
2046
. 'i
tubdworf
(Groombridg* 1670)
wKirc dwarf
'(Wolf 1346)
white dworf
10 9 8 7 6 5 4
-' ^ Surfoct temperotur* tn rhoutondi dcgrett
FIG. 32. The nearest stars.
181

FRONTIERS OF ASTRONOMY
to have a rough and ready way ofreferring to various parts of
the sky. To say that a star system is in Draco tells one immedi-
ately the approximate place where the system is to be found.
For the purposes of practical observation this method of
reference is of course much too inaccurate and more precise
descriptions have to be used. These are given by various
catalogues, the Messier catalogue for nebulous objects (denoted
by M), the New General Catalogue (NGC), the Shapley-Amescatalogue, the Henry-Draper catalogue, and so on.
But although the nearby stars may be just common stars theynevertheless abound in difficult problems. Take for instance
the mystery ofthe faint red dwarfs. Calculations ofthe emission
of radiation from the stars agree very well with the observed
brightnesses over all the main-sequence except in its extreme
lowermost part. Here the calculations fall short of the actual
emission by a factor of nearly 10 a vast discrepancy. Wherethe resolution of the difficulty lies is not at all understood. Un-less the faintest red-dwarfs were born with a quite unusually
large proportion of helium in them, some very surprising pointhas apparently been overlooked.
In Chapter 7 when we were discussing the atmosphere of the
Sun we mentioned the occurrence of solar flares. It is the
flares that apparently send out the jets of particles that cause
the great geomagnetic storms and the aurora borealis andwhich produce outbursts from the Sun both of cosmic rays andof radio-waves. Flares also occur on the red dwarf stars.
Whereas a flare on the Sun, even a big flare, does not makemore than a one per cent change in the amount of radiation
emitted by the Sun (for a short time only) flares on the red
dwarfs cause a far greater proportionate change because the
normal emission is so much less than in the case of the Sun.
This explains why flares are so noteworthy when they occur
on a faint star and why it has proved possible to observe their
occurrence. Flares of a comparable intensity occurring onstars brighter than the Sun would be quite unobservable. Aflare on a red dwarf star is shown in Plate XXVIII. It is of
interest to see that detailed processes in the solar system occur
also on a cosmic scale another reminder that there is nothing
particularly privileged in our position.
182

DWARFS AND GIANTS
The sub-dwarfs are a further mystery. What makes themdiffer from the normal dwarf stars of the main-sequence? Ofthe three possible causes of variation of position in the H-Rdiagram (mass, age, composition) variation of mass gives a
shift of position not into sub-dwarf regions but along the main-
sequence. Variation of age seems no more hopeful: the evolu-
tion arising from increasing age takes the stars along an upwardevolutionary track, not downwards into the sub-dwarf region.This leaves the possibility of composition differences. Now it is
true that a composition difference does exist between the sub-
dwarfs and the normal main-sequence dwarfs: elements other
than hydrogen (and possibly helium) are much less abundantin the sub-dwarfs. It is also true that such a shortage wouldtake a star into sub-dwarf territory but not nearly as far as the
observations seem to require!*After these rebuffs it is as well to come to a problem whose
solution is satisfactorily understood. Fig. 32 shows clear
evidence of an evolutionary track that branches off the main-
sequence at nearly the same place as the evolutionary track of
the stars of the globular clusters (compare with Fig. 17). The
evolving stars of Fig. 32 must be of much the same mass as the
globular cluster stars say i.i or 1.2 times the Sun, and of
much the same age say 5,000 million years.
But there are differences ofdetail. The evolutionary sequencesof the globular clusters pass through the sub-giants to the
ordinary giants, whereas the sequence of Fig. 32 runs from the
sub-giants to the red-giants it moves more to the right in the
diagram. Why is this? Because of a difference of composition:as in the sub-dwarfs the proportion of metals in the stars of the
globular clusters is considerably less than the proportion
present in the evolving stars of Fig. 32. Now the surface
balance requires the flow of energy to be carried by radiation
in the photospheric layers, and this is controlled in stars of low
photospheric temperature by the metal atoms. So the opera-tion of the surface balancing condition is changed by alterations
in the abundance of the metal atoms, the changes turning out
*Just before this book goes to Press, I have received some recent calcula-
tions which show that composition differences have more effect than used to
be thought. The text is therefore too pessimistic. It now seems quite likelythat the sub-dwarfs arise from differences of composition.
183

FRONTIERS OF ASTRONOMY
to explain very accurately the difference between evolution to
the giants (Fig. 17) and evolution to the red giants (Fig. 32).
Yet the evolutionary sequence of Fig. 32 contains another
puzzle. There is no sign of the sequence turning back to the
left into the domain of the Zwicky-Humason stars. Is this a
genuine difference or is the absence of a swing-back in Fig. 32due to the smallness of the number of stars perhaps we see the
swing-back in the case of the globular clusters because their
populations are so much larger? For myself I believe the
difference to be genuine but if so the cause of the difference is
mysterious. Perhaps the core instead of popping at the top of
the sequence, as in the globular cluster stars, explodes with
sufficient violence to shatter these stara completely.Let us take a final problem, one that can be readily under-
stood. The main-sequence persists in Fig. 32 well above the
point at which the evolutionary track branches off. Now the
evolution times for the stars that are highest on the main-
sequence are substantially less than the times for the stars that
are actually evolving about 500 million years as comparedwith 5,000 million years. Why then if stars that require 5,000million years are now actually evolving have stars on the main-
sequence that require only 500 million years not evolved long
ago? The answer is straightforward. Because the stars of the
solar neighbourhood are not of a uniform age. One group of
stars has ages of some 4,000 or 5,000 million years the Sun is
one of these; another group has ages less than 500 million
years. The two groups have been plotted together in Fig. 32.
This is the cause of the apparent peculiarity.
The Cepheids
We begin a more systematic study of the general distribution
of stars in the H-R diagram by making a tentative hypothesis:that given sufficient time every star evolves along an evolu-
tionary track of the form shown in Fig. 33, irrespective of the
position on the main-sequence of the starting point A. Weknow from the globular clusters (Figs. 17 and 18) that our
hypothesis is certainly satisfied when A lies among the dwarfs
near the Sun. Our concern is now to extend the evolutionary
184

DWARFS AND GIANTS
development to cases where A lies above the dwarfs. Whetheror not the present hypothesis then yields results that agree with
observation is a matter that will be discussed in detail at a later
stage. We shall find that the hypothesis is apparently satisfied
in some cases but not in others.
*5
Surfo
FIG. 33. The evolutionary hypothesis.
The scales of brightness and of surface temperature have not
been marked in Fig. 33 for the reason that the starting pointA is intended to be any point on the main-sequence. The generalfeatures are that from A to B the star grows both brighter andredder implying a considerable increase of size, the star swells
as it grows brighter. This continues until a turning point near
C is reached. At C the star is about 1,000 times brighter than
it was at A. Thereafter the star shrinks and becomes less brightas it passes through D and E. In analogy to the R R Lyraestars we might also expect that some characteristic oscillatory
state might be set up near the point D.
Oscillating stars are indeed found in the zone of the H-Rdiagram indicated in Fig. 34. For comparison the R R Lyraestars have also been marked in this diagram. The oscillating
stars occupying the zone from P to T are the famous Cepheid
185

FRONTIERS OF ASTRONOMY
variables. The Cepheid zone is not to be regarded as part of
an evolutionary track. Rather does it seem that the stars
oscillate when their evolutionary tracks intersect the zone, as
indicated by the dotted lines of Fig. 34. The particular part of
100.000 -
10,000
MOOO
IOC
Evolutionory
trock
RR Lyroe
876 5
Surface feaperoturt In degree* Ceatigrodc
FIG. 34. The Cepheid zone.
the zone crossed by the evolutionary track of a given star
depends where on the main-sequence the star was initially
placed. Since stars that lie initially quite near the Sun on the
main-sequence are known to follow evolutionary tracks that
carry them through the R R Lyrae region it seems likely that
stars with evolutionary tracks that pass through the Cepheidzone at the lowermost point P (this point being not muchabove the R R Lyrae region) also cannot have had initial
positions much further up the main-sequence than the Sun,
186

CEPHEID VARIABLES
Stars initially about 50 times brighter than the Sun might be
expected to cross the Cepheid zone in the neighbourhood of
Q, and R, while stars initially two or three hundred times
brighter than the Sun should cross the Cepheid zone near
Maximum sizt tntermtdiate /**
(star contracting)
Mttmvm /ntormect/ott st?t
(star txponding)
MQxiiaum s/i*
Tfme
FIG. 35. Oscillation in size of a Cepheid.
S and T. It would therefore seem as if the whole Cepheid zone
can be accounted for in terms of stars that initially lie in the
range of the main-sequence from about 10 times the Sun upto perhaps 400 times the Sun. The stars of the solar neighbour-hood shown in Fig. 32 that occupy the higher part of the main-
sequence are just the sort of stars that we should expect to
evolve eventually through the Cepheid zone.
The oscillation of a Cepheid seems to consist of a radially
inwards and outwards pulsation. Various stages of the pulsa-
tion are indicated in Fig. 35. And a Cepheid oscillates not only
- TimeFIG. 36. Oscillation in the light of a Cepheid.
187

FRONTIERS OF ASTRONOMY
in size but also in its brightness, the characteristic type of
variation being that shown in Fig. 36. Successive times of
maximum brightness at B and E of Fig. 36 do not coincide
exactly with the times of minimum size but occur somewhat
after. The time required for one oscillation of the light curve,
the time from B to E say, is called the period of the Cepheid.On account of their great intrinsic brightness (as shown in
Fig. 34 Cepheids can be very much brighter than the R R Lyraestars e.g. Cepheids near T are about 300 times brighter than
the R R Lyrae stars) and on account of the variation of light
illustrated in Fig. 36 the Cepheids are easily recognisable stars.
This suggests that we consider their use as distance indicators.
The problem is not the same as in the case of the R R Lyrae
stars, for the Cepheids do not form an even approximatelyuniform group. Cepheids at T of Fig. 34 are about 100 times
brighter than Cepheids at P. There can be no suggestiontherefore that the Cepheids as a group may be used as a single
'standard headlight'. What makes the Cepheids of great use
as distance indicators, however, is an important property of
their periods of oscillation. This varies systematically from
P to T (Fig. 34), being about 2^ days at P, 5 days at Q, 10
days at R, 20 days at S, 35 days at T. Evidently if the periodof oscillation of a Cepheid is determined by observation weknow straight away where in the zone from P to T it must lie
if observation of a star gives a period of 10 days for examplethen we know that the star must lie near R. Hence from Fig.
34 we can read off the intrinsic brightness of the star andhence we can use it as a 'standard headlight'.
The Cepheids are so important as distance indicators that
it is worth adding a note on how the results shown in Fig. 34were obtained. The simplest observational method comes froma study of the Larger Magellanic Cloud, all the stars of whichcan be considered to be at the same distance away from us.
Now the Larger Magellanic Cloud contains both Cepheids andR R Lyrae stars. The distance can accordingly be determined
by observing the R R Lyrae stars. (It will be recalled that
R R Lyrae stars can be used to a distance of about 200,000
parsecs. The Magellanic clouds are nearer than this, beingsome 50,000 parsecs away.) With the distance of the Larger
188

IRREGULAR VARIABLES
Magellanic Cloud thus determined, the intrinsic brightnessesof the Cepheids in it can then be read off (when we know howfar a car is away the apparent brightness of its headlights tells
us at once how bright they really are). In this way it can be
shown that the Cepheids occupy the zone marked in Fig. 34.
Then finally an observational determination of the periods of
oscillation of the Cepheids that lie in the different parts of the
zone tells us how the period varies as we go from P to T,
Because Cepheids near T are about 300 times brighter than
the R R Lyrae stars their use as distance indicators enables
measurements to be made at distances that are far too largefor the R R Lyrae stars. Cepheids near T of Fig. 34 can be
used to measure distances out to about 4 million parsecs. It
was mentioned in Chapter 10 that Sandage has recentlyshown the galaxy M 81 (Plate XXIV) to be at a distance of
some 2,500,000 parsecs. The use of a Cepheid as a standard
headlight was one of the several methods employed by Sandagein this determination.
Why stars should start to oscillate when their evolutionarytracks epter a particular zone in the H-R diagram is not known,
any more than the cause of the oscillation of the R R Lyraestars is understood. What can however be shown by astrono-
mical theory is why, granted oscillations to occur, the Cepheidshave the periods that we observe, nhy for instance the Cepheidsnear P of Fig. 34 oscillate in a period of about 2 \ days, with
in a period of 10 days at R, why in 20 days at S, and so on. In
short the dependence of period on position within the Cepheidzone is understood (this being just the property that allows the
Cepheids to be used as distance indicators). The theoretical
work in this field was first laid down by Eddington. A recent
review of the theory by Schwarzschild and Epstein has shownexcellent agreement between the calculated periods and the
observed periods.
The irregular variables
The irregular variables are the only brand of star appearingin Fig. 31 that has not so far been mentioned. To understand
how these stars come to be thus placed in the H-R diagram it is

FRONTIERS OF ASTRONOMY
necessary to introduce the idea that two oscillatory states
apparently occur on the evolutionary track of Fig. 33. Oneis the state near D that we have already considered. The other
occurs near the uppermost point of the track, near the point C.
The two states are easy to distinguish from each other. In
the Cepheids the periodicity of the oscillations is maintained
with extreme constancy and the shape of the light curve (Fig.
36) is also maintained without variation from one cycle to
another as near as can be determined. The irregular variables
on the other hand show changes both in their periods and in
the shape of their light curves from one oscillation to the next.
Examples of irregularly oscillating stars are found in the
globular clusters near the tip of the evolutionary sequence
(near the point O of Fig. 15). Many irregular variables also
occur among the scattered stars of the Milky Way, althoughnone of them is to be found among the nearest stars. Whenthese 'long period variables' as they are often called are
plotted on Fig. 32 they fall on an extension of the evolutionary
sequence beyond the star Aldebaran. A famous example is
the star Mira (The Wonderful).Certain irregular variables are among the brightest of all
stars over 100,000 times brighter than the Sun. These very
bright oscillators have readily recognisable peculiarities that
make them useful as distance indicators. One such star wasused by Sandage in his determination of the distance of the
great galaxy M 81 as with the Cepheid method this irregularoscillator gave about 2,500,000 parsecs for the distance.
The mystery of the missing supergiants
We shall now examine how far the evolutionary hypothesismade above leads to results that agree with observation. It
will be recalled that the whole range of Cepheids from P to Tin Fig. 34 is apparently derivable from the range of the main-
sequence from about 10 times the brightness of the Sun up to
perhaps 400 times the brightness of the Sun stars not morethan about 6 or 7 times the mass of the Sun. Now what about
stars that are initially much brighter than this? How about the
Cepheids corresponding to the evolutionary tracks of stars that
190

MISSING SUPERGIANTS
initially were more than 400 times brighter than the Sun? Theanswer is that no such Cepheids are found. The point T of
Fig. 34 represents the observational upper limit to the Cepheidzone.
lOOjOOO
IOPOO
1,000
100
10
I
IOO
2O 109 8 7 6 5 4 3 2
Stffoct temperature in thoujondi degrees Centigrode
FIG. 37. The stars of the Pleiades lie on the solid line.
The conclusion suggested by these considerations is that
stars initially higher up the main-sequence than about 400times the solar brightness do not satisfy our evolutionary
hypothesis they apparently evolve in some entirely different
way. This conclusion is so important that it is desirable to
seek other evidence that may support it. Confirmation comesfrom an entirely different line of argument, an argument basedon observations of the groups of stars known as open clusters.
The open clusters differ importantly from the globular clusters
in that they are much less populated and their constituent
stars are not necessarily of very great age, as the stars of the

FRONTIERS OF ASTRONOMY
globular clusters are indeed very bright young stars are often
found in the open clusters. The Pleiades (Plate XVII) form
an open cluster.
Now clusters possess the important feature that all stars in
them may be expected to be of essentially the same age. Hencethe main-sequence in a cluster should always be observed to
have a fairly definite upper limit the argument is that stars
initially above the upper limit (as at present observed) have
by now completed their evolution and disappeared, while
stars initially below the upper limit have not yet had sufficient
time to evolve; their turn will come in the future. We also
expect that stars near the upper limit will show signs ofincipientevolution the sort of situation sketched in Fig. 37 for the case
of the Pleiades. From A to B of Fig. 37 the stars must still be
close to the line of the main-sequence but from B to C we
expect a slight spreading away from the main-sequence to be
showing itself. Stars between B and C are just those that are
beginning their evolution.
As a next step let a number ofclusters be represented togetherin the H-R diagram. We notice first that the lower parts of
the main-sequence for the various clusters must fit on top of
each other since these are all stars for which evolution has so
far been negligible they must all therefore fit on the line of
the main-sequence irrespective of which cluster they happento belong to. A distribution of stars of the form shown in Fig.
38 is therefore obtained. The notable feature of Fig. 38 lies
in the deviations a, b, c, d, e . . . from the main-sequence.
They represent just those stars that are beginning to evolve
away from the main-sequence in the various clusters: the stars
of the deviation e belong to one cluster, those of d to another
cluster, and so on from the deviations c, b> a. An interpretationof Fig. 38 can be given in terms of different ages for the various
clusters. The cluster with the deviation a is the youngest, b is
the next youngest, then cy then d, and e is the oldest. As time
passes clustei a will come to look like b, then like c, then like d,
and so on.
These remarks refer only to the stars of the clusters that lie
on or near the main-sequence. Now how about stars away to
the right of the main-sequence what about the stars that have
192

Mr. Wilson and Palomar Observatorl
XXXII-THE ROSETTE NEBULA
Notice the small dark globules that can be seen when they are projected
against the bright background of the nebulosity. Star showers are probably
born out of such globules. The dimensions of nebulae like this are to be
measured in hundreds of millions of millions of miles.

Mt, Wilson and Palomar Observatories
XXXIII NGC 6611, A HOT CLOUD OF GAS EXPANDING
INTO COOLER GAS
The hot gas is heated by stars and is bursting outwards like a bomb. Notice
the curious irregularities of shape.

Mt. Wilm andPahmar Observatories
-THE TRIFID NEBULA
This cloud is a weak transmitter of radio-waves.

W$?&$ti4%r :SJ.'^lV*w >'$t||g
!'S J
!$$^^'
*'C;^;:
51
iil!ililiii|:'-t: :'," '..'>
|4^f9|^^ :^;,.'.:.V
M/. Wilson and Palomar Observatories
XXXV THE RADIO TRANSMITTER IN CASSIOPEIA
One of the most powerful radio transmitters in the Milky Way. This is a
negative print that is to say the sky is shown white and the stars shown dark.
The radio transmitter is not located in the stars. The radio emission comes from
a twisted mass of gaseous filaments. Some of the filaments, distant about
30,000,000,000,000,000 miles, can be seen in the left-centre of the picture.
XXXVI 1C 1613, AN EXAMPLE OF A STRUCTURELESS,
LOOSE GALAXY
Mt. Wilson and Palomar Observatories

Ml. Wilson andPalomar Observatories
XXXVII M 33, GALAXY IN TRIANGULUM
Our Galaxy and M 31 (Plate XXI) are the most important members of the
Local Group. M 33, an Sc spiral, is the next most important member. Thedistance across this galaxy is about 40,000,000,000,000,000 miles.

Ml. Wilson and Palomar Observatories
XXXVIII GALAXIES OF THE VIRGO CLOUD
A negative print. Astronomers like to use negative prints because more can
be seen on them. The distance across this cluster of galaxies is about
20,000,000,000,000,000,000 miles.

Mt. Wilson and Palomar Observatories
XXXIX THE CENTRAL REGIONS OF THE COMA CLUSTER
Notice the difference between distant galaxies and local stars. The local stars
of the Milky Way have hard circular outlines The galaxies are fuzzy in outline
and are not usually of circular shape.

MISSING SUPERGIANTS
undergone extensive evolution? It is here that a strange situa-
tion arises. Stars far away from the main-sequence are foundin some clusters but not in others. Their occurrence or absence
seems to be controlled by a definite criterion. If the stars near
1.000,000
100,000
IQOOO
J!
1000
IOO
3 10
JL.100
40 30 2O 1098 7 6 S 4 3 2
Surface temperoture In thousand! degrees Centigrade
FIG. 38. Superimposed open clusters.
the upper limit of the main-sequence are not more than about
400 times the brightness of the Sun, evolution far to the rightof the main-sequence is found. For instance this is the case
in the cluster represented in Fig. 39, the cluster Praesepe.If on the other hand the stars near the upper limit of the
main-sequence are more than about 400 times the brightnessof the Sun no evidence of the looped evolution of Fig. 33 is
193

FRONTIERS OF ASTRONOMY
found e.g. in the Pleiades. The cluster c, d, and e of Fig. 38would show evolution, but not a and possibly not b. This curious
situation was pointed many years ago by Trumpler. The likely
inference is I think that stars evolving far to the right of the
100
JJ 10
JC
2
5
4 '
'5
_10
JO9676 5 4 3
Surface temperature in thousands degrees Centigrade
FIG. 39. The stars of the open cluster Praesepe.
main-sequence are not found in the very bright clusters for the
reason that they do not occur there.
When we take this evidence from the open clusters with our
previous discussion of the Cepheids the conclusion becomes
well nigh overwhelming that stars initially more than about
400 times as bright as the Sun do not evolve far away to the
194

DEMON STARS
right of the main-sequence in the same way that fainter stars
do. The situation seems to be that all stars if they are givensufficient time begin to evolve by turning away to the rightfrom the main-sequence. If their initial brightness is less than
about 400 times the Sun they continue to move away from the
main-sequence by embarking on an evolutionary track of the
form indicated in Fig. 33. If on the other hand their initial
brightness is more than about 400 times that of the Sun some-
thing quite different happens to them. The question is what?
This question, a vital one in the understanding of the evolution
of the stars, has been much emphasised by Otto Struve. Weshall consider a possible answer to it in the following chapter.We must defer our suggested solution of the mystery of the
missing supergiants until then.
The mysUry of the demon stars
To end the present chapter we shall consider one final puzzle.This concerns a particular type of double-star system, the
Algol binaries named after their prototype Algol. The specialcharacteristic of the Algol binaries is that at certain times in
To the arth
Fainter star
moves alongthis path.
Fainter star with
red hot surface.
FIG. 40. The motions of the stars of an Algol binary.
195

FRONTIERS OF ASTRONOMY
the motion of the two stars around each other the fainter com-
ponent eclipses the brighter one, thereby cutting off much of
the light of the system. The situation is shown in Fig. 40. It
will be seen that in these systems the fainter star is the larger of
the two.
As the stars move around in their orbits a stage is also reached
where the brighter star partially eclipses the fainter one. This
also causes a decrease in the amount of light that we receive,
but not nearly so markedly as when the brighter component is
eclipsed. The light we receive thus oscillates in the manner
shown in Fig. 41, the big dips in the curve correspond to the
occasions on which the brighter component is eclipsed, and
the small dips when the faint component is eclipsed.
FIG. 41 . The light curve of an Algol binary.
In the case of Algol itself the period of the oscillation (which
is the time between the dip L and the dip M) is 2 days 20
hours and 49 minutes. This variation is so marked that it is
readily visible to the naked eye. To the minds of the men of
the ancient civilisations any change occurring in the heavens
was fraught with great consequences to human affairs. Algol
with its readily visible regular oscillations seemed to be a
particularly fearsome star. Hence its namethe Demon Star.
Because the fainter star is the larger, the Algol double stars
196

DEMON STARS
have an important bearing on our evolutionary picture. Sucha situation would not be possible if the two components were
both main-sequence stars, for in this case the fainter componentwould of necessity have to be of smaller size. The fainter star
can only be the larger if it has evolved to the right of the main-
sequence, thereby increasing its size appropriately. But observa-
tion shows that the brighter star still lies on or near the main-
sequence. How is this possible? How is it possible to explainan evolutionary development of the faint star such as is in-
dicated in Fig. 42 without the bright star also evolving?
Moin-sequence
Brighter component
Fainter component
Surface temperature
FIG. 42. Improbable evolution of an Algol binary.
197

FRONTIERS OF ASTRONOMY
Our general evolutionary picture can be reconciled with the
pattern of evolution shown in Fig. 42 only if the bright star is
much younger than the fainter one. This is a possibility to be
considered. Reference to Fig. 32 shows that it would be possible
to pick out two stars from the solar neighbourhood, one a young
main-sequence star about 100 times brighter than the Sunand the other an older sub-giant. The combination of two
such stars into a double system would yield an Algol-type
binary. But is it plausible to suppose that a double systemcould originate through a random combination of stars from
entirely different age groups, particularly double systems in
which the two stars are very close together as they are in the
Algol binaries? All the indications of the theory ofhow double
systems originate (to be discussed in a later chapter) are that
such a mode of origin is quite impossible. The evidence is that
the two stars of a double system are always born at closely the
same time and place. This view which I think is shared by all
astronomers leaves us with an evolutionary paradox.Either we must discard our evolutionary picture (and there
are so many points where it fits the observational data that
such a step is scarcely to be thought of) or we are forced to
regard the Algol systems as the seat of some singular process.
The tracing of this process is a matter for detective work.
Suppose to begin with that the stars of a binary system occupydifferent places on the main-sequence. Suppose further that
the higher star is not more than about 400 times the brightnessof the Sun, so that we can apply our general ideas of an evolu-
tion away from the main-sequence to the right in the H-Rdiagram. Then the star higher up the main-sequence mustbe the first to evolve. We have the situation of Fig. 43, the
points B and F denoting the initial positions of the two stars.
Now as the star initially at F evolves from the main-sequenceit increases in size. And for a binary in which the two com-
ponent stars are very close together this has the effect that the
star B soon finds itself inside the evolving star: rather as we
imagine that the inner planets Mercury, Venus, and possiblythe Earth may come to lie one day inside an enormously dis-
tended Sun. But whereas a distended Sun would readily
gobble up such a tiny body as the Earth, the star evolving
198

DEMON STARS
from F does not gobble up the star B. The situation is reversed:
the material of the distended star is gobbled up by B. This
produces an interesting situation, as we shall now see.
Moin-tequence
The Inifioflj brighter iror tvolves
off the main sequenct and becomes
fainter
Suffoc tmptrofur
FIG. 43. Evolution of an Algol binary by interchange of material.
It will be recalled that evolution away from the main-
sequence is produced by the helium core coming to contain an
increasing proportion of the material of a star. We have
thought so far of this happening through hydrogen being con-
verted into helium in the deep interior and through the helium
core growing steadily in consequence. There is a second wayin which the proportionate importance of the core can be
increased however by taking hydrogen away from the outside
ofa star; and this isjust what gobbling up by B does. So gobbling
up by B, instead of sending the evolving companion back
towards the main-sequence actually fosters the evolution,

FRONTIERS OF ASTRONOMY
tending rather to promote the swelling than to hinder it. Andas the evolving star swells, the star B takes up more and more
material. Thus B, initially the more sedate of the two stars,
becomes increasingly predatory as the process gets under way.Where does it stop? Only after B has swallowed so much of
its companion that the evolution of the latter is pushed to the
late stage of the evolution where shrinkage begins to occur.
Eventually the shrinkage of the evolving star becomes sufficient
for it to escape at last from its marauding companion. Because
the evolving star thus loses a large proportion of its material
the evolution does not make it appreciably brighter, so that
we obtain the evolutionary diagram shown in Fig. 43. Thestar B ascends the main-sequence because it has gained
material, while the evolving star moves to the right and perhapseven downwards in the H-R diagram.Two points support this strange dog-eats-dog evolution. On
the basis of the above argument we expect that the stars in an
Algol-type system must always be rather close to each other.
This is the case. We should also expect that some signs of a
passage of material from one star to another should still be
present. It is I think significant that a reservoir of gas is usuallyfound lying between the two stars in these systems. Observation
does not reveal the source of this gas but it is not unreasonable
to suppose that it represents a late stage in the process of
transfer between the two stars.
Another curious issue may be raised: what will happen whenthe now brighter component begins its own evolution awayfrom the main-sequence? It may be expected to swell and to
engulf the companion that it robbed so unfeelingly in the past.
What will then happen almost defies the power of analysis.
There is the possibility that the predatory star will be forced to
make amends for its former behaviour by returning material
to the (at present) fainter star. In the interests of cosmic
justice it is to be hoped that this happens but whether it does
or not is unsure.
It is also interesting to consider how evolution proceeds in the
case where the component stars are not close together as in the
Algol systems but are widely distant from each other. Becauseof the wide separation there is then no question of the initially
200

DEMON STARS
fainter star coming to steal material from the evolving star.
Instead we have a development illustrated in Fig. 44. Herewe have the possibility of a double-system that contains the
main-sequence star F, together with a star that may lie highin the diagram near C. Such systems may be very spectacular.
LU
Main-Sequence
Brighter componentevolves
X B
Fainter component stayson main-sequenct
Surface temperatureFIG. 44. Evolution without interchange of material.
2OI

FRONTIERS OF ASTRONOMY
Suppose F is 100 times brighter than the Sun and B is initially
300 times brighter than the Sun. When evolution has taken
the star initially at B to C we have the combination of F with
a very large red star about 300,000 times brighter than the Sun.
Such systems are known. A famous case is the system ofWCephei.
Just one final remark about Algol itself. Algol has four com-
ponent stars, not two. But two of the four have no relevance at
all to the above discussion. The two important stars are the
ones we have considered it is these that serve as the proto-
type of the Algol binaries. They are close to each other,
moving completely around one another in 2 days, 20 hours,
49 minutes. The other components lie afar off, the third moves
around the important inner two stars in a time of 1.873 years
and the fourth lies so far away that it takes rather more than
1 88 years to move around the other three. Imagine the planets
Mercury, Jupiter, and Pluto to be puffed up into veritable
stars: the solar system would then have a mild similarity to
the amazing system of Algol.
202

CHAPTER TWELVE
Exploding Stars
Ckandrasekhar's limit
The ultimate course of evolution described in Chapter 9 is
impossible for a star with mass greater than Chandrasekhar's
limit. It will be recalled that in the last stages of this evolution
the pressure balance was maintained by degeneracy effects, bypressure developed through the sheer squashing together of
material. When degeneracy thus took over control the star
was able to cool off. It was the cooling off that took the evolu-
tionary track downwards in the H-R diagram into the territory
of the white dwarfs.
But the singular condition will also be recalled that the
masses of the stars had to be less than 1.44 times the Sun less
than Chandrasekhar's limit, otherwise degeneracy could not
maintain the pressure balance. Our present concern is to
discuss the case where the mass lies above Chandrasekhar's
limit. The trail of investigation then leads to thoroughlyremarkable conclusions.
We start by noticing that if the pressure balance cannot be
maintained by degeneracy then the only alternative means for
maintaining it is by ordinary high temperature pressure, of
the sort operative in the Sun. So if the pressure balance is to
be maintained the star can never cool off. And because coolingoff cannot occur the star is unable to reduce the outflow of
energy from the hot interior energy must always flow from a
higher temperature to a lower temperature, the precise modeof flow being irrelevant to the present argument. It wouldseem then that when the mass exceeds Chandrasekhar's limit
the star cannot succeed in ever reducing to any really im-
portant degree the energy that flows out from its central regionsto the surface, and which is thence radiated away into space.
203

FRONTIERS OP ASTRONOMY
Now where does this energy come from? How does the star
manage to balance its energy budget? Nuclear reactions can
supply energy for a limited time only, for the reason that everynuclear fuel, whether hydrogen, helium, or some other, has
only a limited lifetime sooner or later it becomes exhausted.
Hence we cannot appeal to nuclear energy to maintain the
energy balance indefinitely. The one source of energy that wecan always call on, however, is the gravitational energy that is
released by a shrinkage ofthe star. Does the star, after exhaust-
ing its nuclear energy, then maintain itself by an indefinite
shrinkage? Does it go on contracting endlessly? Does it con-
tract down to a size less than the Earth and then to sizes smaller
still perhaps only a few miles in diameter, or even less?
These queries are so remarkable that we may ask whether
the argument leading to them is really inevitable. Is there any
loophole? The answer is that the above argument is inevitable
unless we dispense with the condition that the pressure balance
be maintained. The penalty for dispensing with this condition
is catastrophic however; for if the pressure balance is not
maintained, the star must either collapse catastrophically or
blow up catastrophically.It follows that the fate of stars with masses greater than
Chandrasekhar's limit is certainly most curious, whichever
alternative they elect to follow. One possibility is that theyshrink indefinitely, the other that a fantastic catastrophe occurs.
Which? Our conclusion, reached below after much detailed
discussion, will be in favour of a catastrophe or rather of two
catastrophes, first a catastrophic collapse, then a catastrophic
explosion. The explosion turns out to solve the star's problem,for it removes so much material that the mass is brought below
Chandrasekhar's limit. When this happens degeneracy can
take over control of the pressure balance, the star can cool off,
and evolution can proceed tranquilly to the white-dwarf state,
just as in the case of the stars that were studied in Chapter 9.
Nuclearfuels
For a considerable way along the evolutionary track of a
star, say of mass 3 times the Sun, things proceed in much the
204

EXPLODING STARS
way we have described already in Chapter 9. We expect
hydrogen-burning to take the star along the part A to B to Gofits track (see Fig. 33). During these stages hydrogen-burningcauses the core to grow. Eventually near G the release of
OXYGEN,NEON. CORE
FIG. 45.
gravitational energy through the addition ofhelium to the core
becomes sufficient to heat up the core to the stage at which
helium-burning reactions start up this occurs at a temperaturesomewhat higher than 100 million degrees. We then have a
double-source star, a star in which energy is produced bynuclear reactions in two quite distinct ways, by helium-
burning near the centre and by hydrogen-burning farther out.
As a result of the helium-burning an oxygen-neon inner core
tends to form at the centre of the star, and we then have the
sort ofinternal structure shown in Fig. 45.
205

FRONTIERS OF ASTRONOMY
It will be seen from Fig. 45 that the helium-burning skin is
separated by a helium zone from the outer hydrogen zone.
This suggests that hydrogen is never mixed with the productsof helium-burning, a view that is probably largely correct.
But if even a small quantity of hydrogen were to penetrate
through to the helium-burning zone, a whole set of important
subsidiary reactions would occur. According to the work of
W. A. Fowler, G. Burbidge, and M. Burbidge the most impor-tant would be
Ne 20(p, y) Na21 Ne 20
plus a proton gives the isotope Na 21
(n protons, 10 neutrons) of sodium,radiation being emitted.
Na21(]8)
Ne21 Na21changes by a process to Ne 2J
(10 protons, n neutrons).
Ne21(He
4,n) Mg24 Ne21
plus He4gives the isotope Mg24
(12 protons, 12 neutrons) of magnesiumand a free neutron is emitted.
These reactions serve as a source offree neutrons.
Now contained in the material is a small quantity of metals
of the iron group, these metals having been present in the star
from the moment of its origin. The free neutrons are readily
absorbed by the metals, the effect being to build them into
heavier and heavier elements. Moreover the absorption ofeven
a quite small quantity of hydrogen by the Ne20 would supplysufficient free neutrons to provide for the building in this wayofall the elements heavier than zinc, ofwhich arsenic, strontium
silver, tin, barium, gold, platinum, lead, and uranium are
examples. It is a curious reflection that but for the occurrence
of these reactions inside stars there might have been no goldor uranium in the Earth; and this would have meant noatomic energy, no nuclear weapons, and a changed economyfor S. Africa.
So far the evolution differs importantly from the case of a
star with a mass less than Chandrasekhar's limit only in that
much more hydrogen is left in the outer envelope at the momentthat helium-burning starts up.A further important difference arises, however, as more and
1206

EXPLODING STARS
more helium is burnt. As the oxygen-neon core increases in
mass towards Chandrasekhar's limit an important shrinkagetakes place (since the pressure balance in the core can no
longer be maintained by degeneracy).We therefore visualise the star as adopting the structure of
Fig. 45 and its innermost regions as shrinking slowly in a time
of a few million years. As the star shrinks its internal tempera-ture rises steadily, from 300 million degrees upwards. Nowalthough the oxygen and neon are quite inert at 300 million
degrees they do not remain inert if the temperature is raised
sufficiently. With rising temperature new nuclear reactions
must start up sooner or later. An analysis of the matter shows
that the first important process to occur happens to the Ne20,
probably at a temperature of about 600 million degrees.
The neon is destroyed and magnesium is produced in its
stead. This neon-burning supplies the star with a further
temporary phase in which the energy balance is maintained in
the inner regions by the nuclear reactions. The chemistry ofthe
star is now even more complicated than before. We can dis-
tinguish the four zones of Fig. 46, the innermost region now
consisting mainly of the elements oxygen and magnesium,with the neon being burned; the next region with oxygen and
neon; then a helium zone, and lastly an outer hydrogen skin.
It is possible that some degree of mixing takes place between
the different zones, but present-day theory is too undevelopedto decide this with any definiteness.
When the inner parts of the star run out of neon the processis repeated once again: the inner parts shrink and the internal
temperature rises still further until some new nuclear reaction
is set up. The next phase is one of oxygen-burning. Thereactions that occur in this phase are so intricate that instead of
describing them in detail we shall simply mention their results.
The main effect is to build silicon, the essential constituent of
the rocks of the Earth. But many other elements are also built
up by the complex reactions that accompany the oxygen-
burning. The most abundant of these other elements are
sulphur, aluminium, calcium, and argon, but other elements
are also produced at this stage phosphorus, chlorine, and
potassium. The largest nuclei so built up contain about 40
207

FRONTIERS OP ASTRONOMY
particles; for example Ca40 the isotope of calcium with 20
protons and 20 neutrons. The temperature at which all this
occurs is in the neighbourhood of 1,500,000,000 degrees.
By this stage the chemical structure of the star is still further
SHRINKING COREwith oxygen, and
magnesium, but no
neon left.
Neon still present and
being burend.
Hydrogen still left andbeing burned
FIG. 46. Schematic drawing of a four-zoned star.
increased in complexity to six main zones an innermost
region with magnesium, aluminium, silicon, phosphorus,
sulphur, chlorine, argon, potassium and calcium and with
oxygen being burnt; a second zone with oxygen, sodium,
magnesium, and with neon being burnt; a third with oxygen,neon and with carbon being burnt; a fourth zone with oxygen,carbon and neon, and with helium being burnt; a fifth zone of
helium alone; and lastly an outermost skin of hydrogen. Once
again some mixing may occur between the zones.
208

EXPLODING STARS
When eventually the oxygen-burning phase ends in the
inner regions due to exhaustion ofoxygen, the shrinkage is once
again resumed. With the rising temperature a new effect
becomes increasingly more important. At temperatures in
excess of 1,000 million degrees the radiation inside a star is of
the extremely short wavelength variety known as y-rays. The
intensity is also very great as may be judged from the fact
that the pressure exerted by the radiation amounts to some
100,000,000,000,000,000 Ibs. per square inch (compare with
the pressure of the Earth's atmosphere which is only 15 Ibs.
per square inch). Now under these conditions radiation beginsto strip particles out of the atomic nuclei. This process becomes
extremely powerful when the temperature rises to about
2,000 million degrees (this knocking-out of particles from the
nuclei should not be confused with the knocking-out of elec-
trons from an atom the latter is a comparatively trivial
process, no atom has any electrons permanently attached to it
in these stars).
This knocking-out of particles from the nuclei at 2,000million degrees means that no nucleus is then stable. Particles
get knocked out of them all, even out of such a tightly boundnucleus as that of silicon. This is not equivalent to saying that
the nuclei are entirely broken down into individual neutrons
and protons, however, for a particle that gets knocked out
of one nucleus recombines with another; for instance a protonthat gets detached from a nucleus does not remain detached for
very long: it quickly gets recombined with some other nucleus.
Perhaps it will appear surprising that it should be possible to
calculate what happens in such a complicated situation with
any degree of definiteness but this can in fact be done, once
the temperature becomes high enough (above about 2,000million degrees) for the knocking-out and the recombination
processes to become very frequent. This allows a method of
averaging to be used and the resulting simplification makes the
calculations straightforward.The outcome of the calculations is also rather surprising.
Instead of the nuclei being broken down the reverse situation
applies, heavier nuclei are built up. The calculations showthat in the temperature range from 2 to 5 thousand million
209 H

FRONTIERS OF ASTRONOMY
degrees the previously existing nuclei magnesium, aluminium,
silicon, phosphorus, sulphur, chlorine, argon, and calcium
mainly are almost entirely changed to a quite different set of
nuclei nuclei of titanium, vanadium, chromium, manganese,
iron, cobalt, nickel, copper, and zinc. Of these latter iron is
much the most abundant, followed by nickel, chromium,
manganese and cobalt, exactly in the order of abundancefound in nature.
The change of composition from the 'silicon group' of
elements to the 'iron group* supplies energy, so once again the
inner parts of the star have a source to draw on. Not until this
source becomes exhausted (i.e. not until the silicon group is
entirely converted into the iron group) does the shrinkage of
the innermost parts of the star continue and not until then
does the temperature of these regions rise above about 2,000
million degrees. When the conversion to the iron group is
eventually completed and shrinkage of the central regionsstarts again the chemical structure of the star has become most
complex: we can now distinguish seven general zones as
indicated in Fig. 47. In the inner region we have the iron-
group of elements. In region 2 where the temperature of the
material has not yet reached 2,000 million degrees we still have
the silicon group of elements; in region 3 the temperature is
lower and oxygen-burning is still incomplete; in region 4
neon-burning is still incomplete; in region 5 carbon-burningis still incomplete; in region 6 helium is still present; and the
seventh zone is the outermost hydrogen skin. It is seen there-
fore that the star contains all the elements from helium, carbon,
oxygen, neon, etc., up to iron, cobalt, nickel, copper, andzinc but with various groups resident in different parts of the
star which now is indeed like an onion with skins of quitedifferent materials.
Nuclear refrigeration
At this point of the evolution the stage is set for catastrophe.The nuclear reactions occurring in the iron core of the star
introduce a new and increasingly drastic source of energy loss
from the star. The relevant reactions are the ft processes that
210

NUCLEAR REFRIGERATION
change protons into neutrons. Now in j8 processes neutrinos
are emitted and the energy carried by them is lost from the star.
This source of loss becomes acute for temperatures above
2,000 million degrees, when it exceeds the loss from the outflow
HYDROGEN
FIG. 47. Schematic drawing of a seven-zoned star.
of radiation. The star is thereby obliged to shrink faster in
order to supply the energy required to make good what is beinglost through the neutrinos. Gravitation still supplies enough
energy, however, both to make good this loss and to maintain
the pressure balance. So the catastrophe is held off for the
time being. But in maintaining the pressure balance the tem-
211

FRONTIERS OF ASTRONOMY
perature has to rise higher and higher, and this only increases
the rate of loss through the emission of neutrinos. The star
is now in desperate straits. It is forced to shrink faster and
faster in order to supply the rapidly increasing drain on its
energy. When the internal temperature has risen to 3,000million degrees shrinkage becomes appreciable in a year, as
compared with the former time of millions of years. When the
internal temperature has risen to 4,000 million degrees,
shrinkage is appreciable in only a month and the shrinkageis even more rapid than this for still higher temperatures.Yet the neutrino loss is not the cause of the final disaster.
The hard-pressed star now has to face an even more inexorable
process. It is this that applies the coup de grdce. It has been
explained above that the knocking-out of particles from the
nuclei and their recombination with other nuclei produces a
situation in which the general abundances of the nuclei can be
calculated with a considerable degree of accuracy. It was on
the basis of these calculations that the 'iron group' of elements
was said to be built up from the 'silicon group'. This was for a
temperature of 2,000 million degrees. Now as the temperaturerises the 'iron group' of elements continues to be maintained
until the temperature reaches about 5,000 million degrees.At this temperature an extremely sharp change sets in. Instead
of the material of the innermost part of the star continuing to
belong to the iron group a dramatic change of compositionoccurs. The material changes back into helium. This is an
unexpected situation. We have followed the material of the
inside of the star as it changed, first from hydrogen to helium,then from helium into carbon, oxygen, and neon, then from
carbon, neon, and oxygen (in that order) into elements rangingfrom sodium to calcium the silicon group, then from the
silicon group into the iron group. Now we have a reversion
to helium at a temperature of about 5,000 million degrees.
Astonishing as this may be there can be no doubt at all about
its correctness. The calculations depend on very well knownand reliable principles and the calculations leave no element
of uncertainty the material must change almost entirely into
helium if the temperature rises to a value in the neighbourhoodof 5,000 million degrees.
212

THE EXPLOSION
The collapse
The inner regions of the star are now faced by a crisis. After
drawing steadily on the energy yielded by the conversion of
helium into heavier elements in successive stages the star is
suddenly called on to pay all the energy back, for to convert
the 'iron group' back into helium requires just as much energyas the star received while the building processes were goingon. After living for millions of years on borrowed energy the
star is suddenly called on to pay back its borrowings, and with-
out delay too. Naturally the star calls on its assets, namely on
its gravitational field to foot the bill the inner part of the
star shrinks. But the demand for energy is now so acute that
the energy released by the shrinkage is not sufficient any moreboth to foot the energy bill and to raise the temperature
sufficiently to maintain the pressure balance! What happenscan be calculated, the paying back of energy must proceed at
such a rate that the pressure balance cannot be maintained.
We saw in Chapter 8 that if the pressure balance were to
fail inside the Sun then a catastrophic collapse would occur
in about half an hour. The situation is even more extreme in
the case of our star. The long shrinkage of the star over its
extensive evolution has greatly increased the density of the
material in the inner regions a match-box full of material
taken from the star's centre must contain between 100 andi ,000 tons, and at this sort of density the collapse is muchswifter than in the case of the Sun. The collapse takes placein about a second. No human bankrupt has ever collapsed so
dramatically.
The explosion
But the star manages to make a remarkable recovery from
disaster. Lack of energy in the innermost parts ofthe star leads
to an excess of energy in the outer parts. The collapse of the
inner parts removes the pressure that has hitherto held up the
outer parts, just as the collapse of the inside of the Earth wouldremove the support of the outer crust which would then be
pulled catastrophically inwards by the Earth's gravitational
213

FRONTIERS OF ASTRONOMY
field. So in the star there is a catastrophic infall of the outer
parts as well as of the inner parts. The infall of the outer partsis limited, however, by a further remarkable situation that
arises. Infall releases a supply of gravitational energy and this
causes the temperature of the outer material to rise. A rise of
temperature hastens the nuclear reactions that are still taking
place in the outer material and since the reactions in the outer
parts of the star are still of an energy-producing kind, the effect
if sufficiently drastic must be to produce an excess of energy on
the outside ofthe star.
Calculation shows that a rise of temperature to 3,000 million
degrees in the oxygen-burning zone, for instance, leads to an
extremely rapid release of energy. The whole of the energyderivable from oxygen-burning is released in a time of about a
second, this being comparable with the time of collapse of the
star. The implication is that an explosion occurs in the outer
regions of the star. The situation is in many ways similar to
the explosion of a nova but the present explosion is on a vastly
greater scale.
When the amount of material in the outer part of the star is
specified the amount of energy released can be worked out.
For an amount equal to the mass of the Sun the energy released
by the nuclear reactions in only a second of time is as much as
the nuclear reactions inside the Sun yield in about 1,000
million years. This gives a graphic idea of the tremendously
explosive effects of the nuclear reactions that promote the
oxygen-burning, neon-burning, etc., when the temperatureis suddenly raised by the gravitational energy released in the
sudden collapse of the star. It is the sudden rise of temperature
promoted by the collapse of the inside of the star that triggers
the explosive effects.
The amount of energy released is sufficient to endow the
exploding outer parts of the star with velocities of 2,000 to
3,000 ^kilometres per second, and is sufficient to enable the
star to radiate at 200 million times the rate of the Sun for a
time of about a fortnight. Exploding stars with exactly these
properties are observed to occur. They are called supernovaeto distinguish them from the much milder outbursts ofordinarynovae. For comparison an ordinary nova ejects a mass of
214

DISTANCE MEASUREMENTS AGAIN
material that is only about one ten-thousandth part of the
mass of the Sun, whereas a supernova ejects an amount of
material that is comparable with the total mass of the Sunitself. Not only this but a supernova explosion is some 10,000
times brighter than an ordinary nova explosion. Althoughthere are these big differences between novae and supernovaethe two types ofoutburst have one important point in common,the velocity of ejection of material. This is probably because
both types of explosion arise from an uncontrolled release of
energy by nuclear reactions that yield to each unit quantity of
material much the same amount of energy in the two cases.
The supernova differs so much from the nova not because each
unit quantity of material releases much more energy but
because much more material is concerned in the supernovacase. This can be seen from the difference in the amount of
material ejected and in the differences in the amount of light
emitted in the explosion which are both some 10,000 times
greater in the supernova.Plate XXIX shows material that was ejected from a super-
nova. This supernova occurred in A.D. 1054. Its occurrence
is without mention in the European records of the period but
it was very carefully documented by Chinese astronomers from
whose writings Baade has been able to reconstruct the generalcharacteristics of the explosion and to show that these charac-
teristics are extremely similar to those of supernovae that have
been observed in our own day (of which more will be men-tioned below). The gases of the Crab Nebula, as the gaseousmass of Plate XXIX is called, are found to be still streamingoutwards with a velocity of about 1,000 kilometres per second,a rather slow rate for a supernova explosion. Since it is now
900 years since the outburst was first observed and the gaseshave been moving outwards for this length of time at the speedof 1,000 kilometres per second, it is clear that they must have
expanded quite a way by now. A simple calculation shows that
the gaseous cloud of Plate XXIX must be about 2 parsecsacross.
This raises an interesting point. Sometimes in particularcases astronomical distances can be measured in a way that
differs from the two main methods discussed in Chapter 10.
215

FRONTIERS OF ASTRONOMY
Here we have such a case. Knowing the general velocity of
expansion and knowing the age of the Crab Nebula about
900 years, we have seen that a simple calculation gives the
size of the nebula. But if we know the true size of any objectits distance can readily be estimated from its apparent size
this is pretty well the way that the human eye judges distance.
It can be seen from Fig. 48 how this method works. Let Pbe an observer and O some object. Then the apparent size of
O is given by the angle made by the object at P. This anglenot only depends on the size of the object but on its distance
from P. Evidently a measurement of the angle subtended byan object, say by the Crab Nebula, will tell us the distance if
the real size of the object is known but not otherwise. It is
impossible for the eye to judge distance on a uniform snowfield
A measurement of th/s angledetermines the distance of the objectwhen its size is known
FIG. 48. Yardstick method of determining distance.
for instance because there are no objects of known size that
can be used as a reference. Mountaineers are very conscious
ofjust this point. The whole problem ofjudging the scale of a
mountain depends on knowing the true size of various irregu-
larities of boulders, rock pinnacles, snow slopes, etc. Thenthe distance can be judged from the apparent size of the
irregularities, just as the distance of the Crab Nebula is judged.The distance of the Crab Nebula turns out to be about i ,000
parsecs, a distance roughly 4,000,000,000,000,000 greater than
the scale of Mt. Everest, the Earth's highest mountain.
This method ofjudging distances may be added to our two
previous methods. We may call it the method of the standard
yard-stick. Just as the method of the standard head-light
depends on the observation of a source of light of knownintrinsic brightness, so the method of the standard yard-stick
216

DISTANCE MEASUREMENTS AGAIN
depends on the observation of an extended object of knownsize. The method of the standard yard-stick has not so far
been much used in astronomy but there are indications that
for the purpose of determining very great distances, distances
of galaxies at many millions of parsecs, the standard yard-stick
method may ultimately turn out to be of very great value
indeed.
The next question concerning the general problem of super-novae and its relation to the Crab Nebula is whether anyremnants of the star that exploded in A.D. 1054 can now be
found. Such a remnant is to be expected since it seems unlikelythat the outburst, violent as it was, can have been sufficient
to destroy the entire star. Of the several stars found in the
neighbourhood of the centre of the Crab Nebula it is significant
that one is of a highly peculiar type, so that it seems natural
to associate this star with the supernova of A.D. 1054.The expectation that a stellar remnant is left behind after the
explosion prompts the remark that any remnant must proceed
eventually to the wiute-dwarf state. The explosion serves to
rid the star of sufficient material to bring its mass below Chan-drasekhar's limit. Evolution can then proceed exactly as in
the final phases of the stars that were discussed in Chapter 10.
There are several very notable cases of white dwarfs that are
probably remnants from supernovae. The star Sirius is a
member of double-system, its companion being a white dwarf
with mass little below that of the Sun. The star Procyon also
has a white dwarf companion. Although Sirius and Procyonare now the dominant components of their respective systemsat one time they must have been the inferior members. But
their spectacular companions, being initially the more massive
and higher on the main-sequences, have completed their
evolution. Sirius and Procyon are now accompanied by dyingstars with nothing left of their former splendour and so all
prodigal stars end.
Thefate ofthe missing supergiants
Our evolutionary picture now possesses an important new
development that enables us to modify the hypothesis made
217

FRONTIERS OF ASTRONOMY
in the preceding chapter. Fig. 49 is a reproduction of Fig. 33.
We make the better hypothesis: that a star proceeds along the
evolutionary loop of Fig. 49 only so long as the mass of hydro-
gen that is consumed does not appreciably exceed Chandrasek-
har's limit. When the consumed hydrogen exceeds this amountthe star becomes shattered by a supernova explosion :n accord-
ance with the processes discussed above.
It is important to realise that two quite different criteria are
concerned here. The extent of the evolution along the loop of
Fig. 49 is determined by the fraction of the mass of the star
that comes to reside in the core. The relevant fractions are
those marked in Fig. 49: it will be seen, for instance, that the
star evolves to the highest point of the loop when about 40
per cent of its mass lies in the core. The explosion point, on
the other hand, is determined by the total mass in the core,
quite regardless of what fraction of the star this happens to be.
Evidently a star of mass 1.5 times the Sun will not explode until
almost the whole mass comes to reside in the core. Hencesuch a star does not explode until it reaches a late stage of the
evolutionary loop. But a star of mass 15 times the Sun will ex-
plode on our hypothesis when only about 10 per cent of its
hydrogen has been consumed. Such a star would therefore
be disintegrated at almost the beginning of the evolutionarytrack. For a star to evolve appreciably to the right of the main-
sequence its mass should not exceed about 6 times the Sun.
This would seem to clear up the mystery of the missing
supergiants. It will be recalled from the previous chapter that
there is strong evidence to show that when the starting pointA of Fig. 49 is sufficiently high on the main-sequence the star
does not evolve along a looped evolutionary track. We see nowhow this can come about because the evolutionary develop-ment is interrupted by disintegration. We see why the H-Rdiagram of young open clusters may be of the form shown in
Fig. 37, without any stars far to the right of the main-sequence.The most massive stars of the cluster after evolving a little wayfrom the main-sequence burst and strip off their remaining
hydrogen, so that the stellar remnant takes up a new position in
the diagram a position en route for the white dwarfs.
It is also to be expected that stars may explode when they are
218
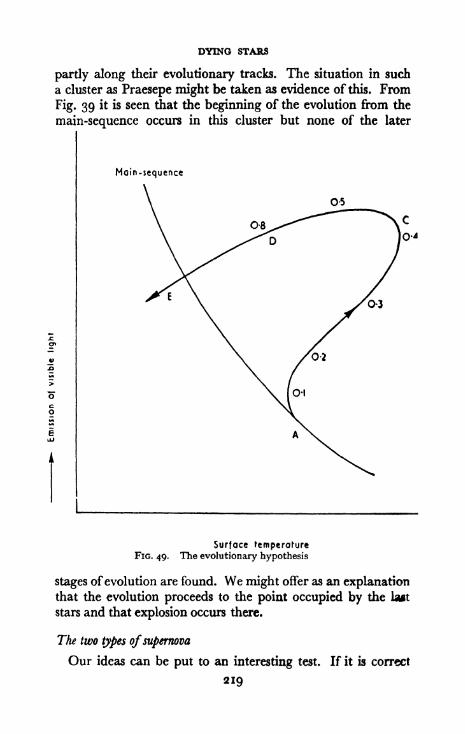
DYING STARS
partly along their evolutionary tracks. The situation in such
a cluster as Praesepe might be taken as evidence of this. From
Fig. 39 it is seen that the beginning of the evolution from the
main-sequence occurs in this cluster but none of the later
Main-sequence
0-5
Surface temperatureFIG. 49. The evolutionary hypothesis
stages ofevolution are found. We might offer as an explanationthat the evolution proceeds to the point occupied by the la*t
stars and that explosion occurs there.
The two types ofsupernova
Our ideas can be put to an interesting test. If it is correct
219

FRONTIERS OF ASTRONOMY
that stars explode when the mass of the core exceeds Chan-drasekhar's limit, supernovae may be expected to occur in
cases where the total mass only slightly exceeds the limit
these are cases where explosion occurs in the late stages of
the evolutionary track. Now such cases will differ from the
explosions occurring in appreciably more massive stars in that
very little of the original hydrogen will be left unconsumed at
the moment of explosion. We therefore expect that in somecases very little hydrogen will be found in the gases expelledfrom a supernova. These cases are not likely to be so rare as
might be thought at first sight, because stars with a mass sayof 1.5 times the Sun are of much more frequent occurrence
than stars with say 15 times the solar mass; so that although
hydrogen-poor supernovae can occur only in a narrow range of
stellar masses the range is a comparatively well populated one.
Two kinds ofsupernovae withjust the required characteristics
have indeed been distinguished by Minkowski: hydrogen-poor
supernovae described as Type I supernovae, and hydrogen-abundant supernovae described as of Type II. The Crab
Nebula seems to be of Type I.
Another difference to be expected between the two types is
that the energy released in Type I should be less than in TypeII, since the energy released in the Type II case not onlycontains contributions from an oxygen-burning explosion, a
neon-burning explosion, and a carbon-burning explosion, as
the Type I supernovae do, but also a hydrogen-burning
explosion which the Type I supernovae do not. It is un-
certain whether this theoretical prediction is correct or not.
There seems to be some tendency for higher velocities of
expansion to be associated with Type II than with Type I,
which would be in accordance with the prediction. But the
visual brightness of a Type II supernova is actually less than
of a Type I supernova. This may not be real contradiction,
however, for the observed brightnesses refer only to light that
falls in the visual range of wavelengths. There is a strongindication ofa large ultra-violet emission in the case ofType II
but not of Type I. It is therefore conceivable that the total
radiation emitted by a Type II supernova is indeed greaterthan the emission from a Type I supernova.
220
THE ORIGIN OF THE ELEMENTS
The origin of the elements
We have seen that along the evolutionary track of a star
various chemical elements are produced by nuclear reactions
in the interior more precisely all the elements and their
isotopes ranging from carbon to zinc. Not only this but it can
be shown that these various elements are produced in muchthe same abundances relative to each other as they are found
in the Earth and in stars like the Sun. This suggests that the
elements are built inside stars.
A difficulty that might previously have been raised to this
idea now disappears. Formerly it might have been argued that
to produce materials deep inside a particular type of star was
scarcely a solution to the origin of the chemical elements, since
the materials so produced would simply stay put inside theii
parent stars. But we see now that the very stars in which the
elements originate are just the ones that come to scatter their
materials into space through the supernova process. We can
see this scattering process going on in such a case as that of the
Crab Nebula (Plate XXIX). What eventually will happento the material of the Crab Nebula? As it spreads out farther
and farther it will become more tenuous. Some of the material
will eventually impinge on the normal clouds of gas that lie
between the stars (Plate XI). The material from the supernovawill then become entangled with the normal interstellar gas*
Thereafter it will be available for condensation into new stars.
Some of the material from the Crab may fail to impinge on
any interstellar gas, however. On account of its high speed we
may expect such material to escape entirely from our Galaxyand to pass out into the realms of space between the galaxies.The suggestion that by this process the Universe builds all
materials other than hydrogen can be given some immediate
quantitative support. The fact that the weight of hydrogen in
the Sun is something like 100 times greater than the weightof the elements from carbon to zinc suggests that about one
per cent of the interstellar gas (the Sun having formed frominterstellar gas) must have been derived from supernovae.Has there been a sufficient number of supernovae to explainsuch a total amount of non-hydrogenic material?
221

FRONTIERS OF ASTRONOMY
The total quantity of the interstellar gas is not known with
any great certainty. Perhaps a fair estimate would be about
20,000 million times the mass of the Sun if all the interstellar
gas were made into bodies like the Sun there would be some-
thing like 20,000 million of them. The elements from carbon
to zinc comprise about one per cent of the total, giving a mass
of about 200 million times the Sun in these elements. We must
now compare this estimate with the material thrown off by all
the supernovae that have occurred since our Galaxy was formed
some 5,000 million years ago. The main contribution is
probably derived from supernovae of Type II. Now we have
seen that supernovae of Type II come from stars with masses
greater than about twice the Sun. We can estimate the numberof such stars. About i in 300 of the stars found in the solar
neighbourhood have a mass greater than twice the Sun.
Reckoning the total available population of stars as 30,000million this would give 100 million for the number of Type II
supernovae. And if on the average each supernova distributed
two solar masses of elements ranging from carbon to zinc, weobtain the required quantity of material. The agreement is
as good as can be expected in view of the uncertainties of the
calculation.
Our discussion of the origin of the chemical elements is
incomplete in that we have referred explicity only to elements
whose nuclei contain a sum total of protons and neutrons
that range from 12 to about 66. Of the elements with
numbers less than 12, hydrogen is the primeval element andhelium is amply provided for, since helium must be ejected from
supernovae along with the group from carbon to zinc. The
remaining elements with less than 12 nuclear particles are
lithium, beryllium, and boron. The situation is still not entirely
satisfactory for these three elements, although it is possible to
understand in some measure how they are produced.The elements with more than 66 protons and neutrons,
gallium to uranium, are present on the Earth and in the stars
only in very small abundances. Thus the combined abundancesof the 62 elements from gallium to uranium amount to onlyabout one-hundredth of one per cent of the combined abund-ances of the 25 elements from carbon to zinc. Consequently
222

ORIGIN OF THE MATERIAL OF THE EARTH
the formation of these 'upper' elements must be a somewhat
marginal process. One possible explanation of their origin
lies in the processes that were mentioned on page 206.
Let us now return to the materials added by the supernovaeto the interstellar gas. A point was left over from our dis-
cussion of this process that now requires comment. It is easyto see how elements other than hydrogen come to be presentin stars that are condensing at the present time these are just
the elements distributed by past exploding stars. But how about
stars that were formed very early in the history of the Galaxy,before very many supernovae had added their quota ofelements
to the interstellar gas? Where did such stars get their elements
from? A partial answer is that the oldest stars contain only verylow concentrations of elements other than hydrogen andhelium: the sub-dwarfs and the stars of the globular clusters
possess concentrations that are only about one-twentieth of
the concentration in the Sun. This observation lends powerful
support to the idea that the proportion of 'heavy' elements in
the interstellar gas has increased steadily during the lifetime of
our Galaxy and that the younger a star is, the greater its content
of 'heavy' elements should be. The observation of the defi-
ciency in the present respect of the old stars indeed goes far
towards establishing the general correctness of the evolutionary
picture described above. But should not the very first stars
have contained nothing but hydrogen, without even a trace of
other elements? This is a deep question that we shall defer to
a later chapter. We end the present discussion by noticingthat while such stars are significantly deficient in heavyelements there seem to be no stars in which heavy elements are
entirely absent. Whether or not this is in disagreement with
our general evolutionary picture we must leave over for a
subsequent settlement.
The material of the Earth
We have now come a long way from the discussion of the
opening chapters. Starting with the Earth, then with planets,then with the Sun, then with stars like the Sun, then with stars
not so like the Sun, we moved to exploding stars, then to the
223

FRONTIERS OF ASTRONOMY
origin of the chemical elements, and so at last we come back
full circle to the Earth, to the origin of the material of the
Earth. The rocks of the mantle, the iron of the Earth's core,
the objects that we handle in everyday life all were at one time
inside a supernova. The carbon, nitrogen, and oxygen inside
ourselves were once deep inside a star, inside a particularly
spectacular sort of star that scattered its material by explosioninto interstellar space where it became available for the processthat led to the origin of the Sun and planets.We spoke at an early stage of the dualistic nature ofmatter
of atoms and of the different structures that can be built out
of atoms. We saw that a structure is something more than the
units out of which it is built. An iron atom in a supernova is
entirely the same as an iron atom in the cutlery that you use
to feed yourself but the structures into which the iron is built
are utterly different in the two cases. The ramifications of
which matter is capable are truly astonishing. It is fashionable
nowadays to use the appellation 'materialist' in a derogatory
sense, largely I suppose because it has become a catchword in
a war of political ideologies. This apart, the notion that matter
is something inert and uninteresting is surely the veriest
nonsense. If there is anything more wonderful than matter in
the sheer versatility ofits behaviour, I have yet to hear tell of it.
2*4

ML Wilson and Palomar Observatories
XLI THE CLUSTER OF GALAXIES IN HYDRA
These galaxies arc so distant that even though they may each contain
100,000,000,000 stars they nevertheless appear fainter than single stars within
our own Galaxy. The latter appear as the hard circular images. The galaxies
appear as faint fuzzy dots near the centre of the picture.
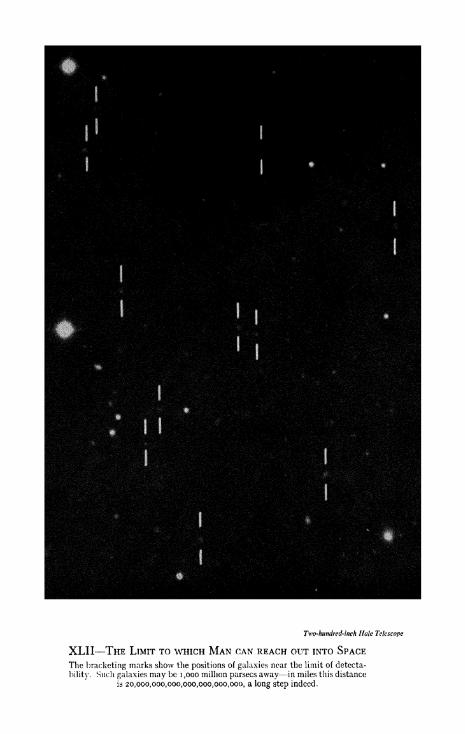
XLII-
Two-hundred-inch Hale Telescope
-THE LIMIT TO WHICH MAN CAN REACH OUT INTO SPACE
The bracketing marks show the positions of galaxies near the limit of detecta-
bility. Such galaxies may be 1,000 million parsecs away in miles this distance
is 20,000,006,000,000,000,000,000, a long step indeed.

XLIII-THE SOO-INCH HALE TELESCOPE
W.MtOu
Notice the flight of steps and the door at bottom-centre. These fix the huge
scale of the instrument.

Of fHI

EO NGC 3379
E7 NGC 3115
/. Wilson and Pulomar Observatories
XLV ELLIPTICAL AND IRREGULAR GALAXIES

Mt. Wilson and Palomar Observatories
XLVI-THE GALAXY NGC 2841
Notice the numerous tight wrappings of the spiral arms of this galaxy.
Mt. Wilson and Palomar Observatories
XLVII-TuE 'WHIRL-
POOL' GALAXY M 51
A good example of spiralstructure. Notice how one of
the arms extends as a bridgeto the outlying system.

Sa NGC4594
Sb NGC 2841 SBb NGC 565C
Ml. Wilson and Palomar Observatories
XLVIII THE CLASSIFICATION OF SPIRAL GALAXIES
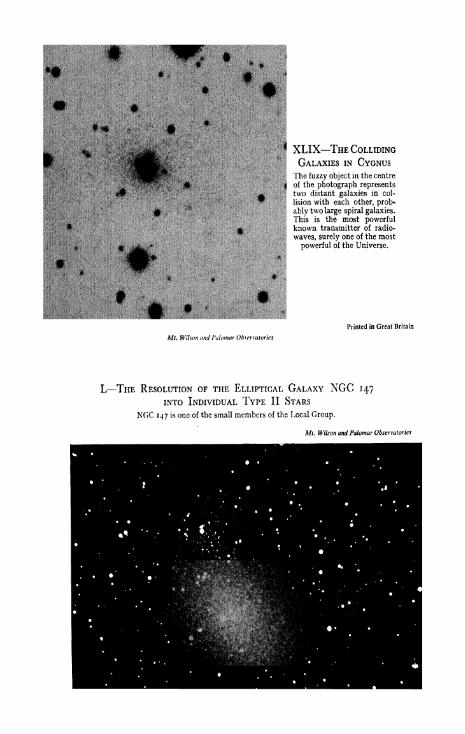
teiifeSIcwIRiH'jt
1
*,'I'^f '' v $i i^* J ^ r '
^ iisw 7^ u (tHf'>"'*,
uf ''
f's
, c, ".,'.
/v^''^
If'
mm^f!!^F^^i
li|l^kl:-'t
XLIX THE COLLIDING
GALAXIES IN CYGNUS
The fuzzy object in the centre
of the photograph representstwo distant galaxies in col-
lision with each other, prob-
ably two large spiral galaxies.This is the most powerfulknown transmitter of radio-
waves, surely one of the most
powerful of the Universe.
Printed in Great Britain
Mt. Wihon and Palo
L THE RESOLUTION OF THE ELLIPTICAL GALAXY NGC 147
INTO INDIVIDUAL TYPE II STARS
NGC 147 is one of the small members of the Local Group.
Mt. Wilson and Palomar Observatories

CHAPTER THIRTEEN
The Spiral Arms of Our Own Galaxy
There has scarcely been any necessity so far to explain the
inner plan of this book the outer plan is just the obvious onethat every book on astronomy must more or less follow: to
start with the Earth and our particular immediate locality in
space and then to open up vistas on an increasingly large scale
until the problems of the whole Universe come ultimately into
focus. The inner plan consists of three parts, three separatemovements. In the first part, the part that ended with the
previous chapter, we were concerned with discussing planetsone at a time and stars one at a time. While it is true that
occasionally we referred to groups of stars, to open clusters,
globular clusters, and sometimes to whole galaxies, these
references were aside from the main discussion. In the second
part, the movement that will occupy this and the four succeed-
ing chapters, we shall be concerned with the internal structures
of galaxies. Instead of being concerned with stars one at a time
we shall now be concerned with galaxies one at a time. Onlywhen we come to the third and final part will we engage with
the greatest of all problems, the structure that is built out of
the galaxies themselves, the Universe itself. And as in dealingwith the stars one at a time we started with the nearest andmost familiar star the Sun, so we shall now start with the
nearest and most familiar galaxy the one in which we live,
our own.
Our Galaxy and its twin
Partly because we lie inside it and partly because of the
dust that lies along the plane of the Milky Way which acts as asort of fog, it is not very easy to get a clear idea of what our
Galaxy would look like if we could see it as a whole from out-
225

FRONTIERS OF ASTRONOMY
side. But painstaking and difficult researches have in recent
years shown that our Galaxy, if we could see it from outside,
would have a very similar general appearance to that of our
sister galaxy in the constellation of Andromeda, the galaxyM 31 shown in Plate XXI. Our Galaxy is somewhat the
smaller of the two. The distance of the outer parts of M 31
(the outer parts in Plate XXI, that is) from the centre is about
12,000 parsecs as compared with a corresponding distance of
some 8 or 9 thousand parsecs in the case of the Galaxy. Wealready saw in Chapter 10 that the solar system lies well out
from the centre of the Galaxy, at a distance slightly greaterthan 8,000 parsecs.
Both M 31 and the Galaxy are rotating like great wheels.
The solar system partakes in the rotation. We on the Earth are
moving along with the Sun and the other planets at a speed of
some 225 kilometres per second along a more or less circular
orbit around the centre of the Galaxy. It takes us rather morethan 200 million years to complete a single circuit of this orbit.
Since their formation the Sun and planets have completedabout 20 trips round the Galaxy.
I find the craze for speed difficult to understand. To drive a
car at 100 m.p.h. seems very unimpressive compared with our
everyday speed ofsome half million m.p.h. around the Galaxy.It may be said that our trip through the Galaxy gives us no
impression of speed, whereas driving a car at 100 m.p.h. does.
But the impression of speed that we get from driving a car
comes from the shaking and lurching of the car. It would be
just as effective to be jiggled about in an otherwise stationary
box.
Spectral lines and velocities
Our discussion in Chapter 10 described ways and means of
determining distances and sizes. But from time to time speedshave also been mentioned, for instance the speed of our motion
around the Galaxy. How are motions measured? Before we
go further it may be as well to clear up this point. To do so wemust go back to the electron clouds that surround the nuclei
of ordinaryun-ionised atoms. These clouds possess a structure
226

THE SPIRAL ARMS OF OUR OWN GALAXY
or rather they can possess one or other ofa number ofstructures,known as the 'states' of the atom. For the most part the cloud
of electrons is to be found in one particular state, namely the
state of lowest energy. But every now and then the atomcollides with another particle and then the electron cloud mayget jolted into one of the other states, into a state of higher
energy. When this happens the cloud reverts to its initial state
by a spontaneous rearrangement of itself and in so doing light
is emitted. This is one of the main processes whereby matter
is able to emit light.
The light emitted in any particular change of state has a
characteristic wavelength, a characteristic pitch as we might
say in analogy to a note of sound. The pitch of light is justwhat we mean by colour. Atoms that undergo the same changeof state emit light of the same colour. This we describe bysaying that the atoms emit a spectral line.
Now when emitting atoms are moving towards us or awayfrom us the colour of the light that we receive is altered by the
motion. If the moving atoms are coming towards us the pitchof the light is raised, just as the note of an automobile horn is
raised when a car is coming towards us. Conversely the pitchof the light is lowered when the atoms travel away from us.
Not only this but the degree to which the pitch is raised or
lowered depends on the speed of motion towards or away from
us, the larger the speed the greater the shift.
This explains the powerful method used by astronomers for
determining cosmic velocities: a measurement of the spectral
lines that are received from the material in the atmosphere of a
star or in a cloud of gas enables one to decide whether any
change of pitch has taken place, and if so to what degree. The
speed of motion required to cause the measured shift can then
immediately be inferred.
It is particularly to be noticed that only motions towards us
or away from us can be so determined. This is because sidewaysmotions do not cause any changes of pitch and consequentlycannot be estimated in this way.
227

FRONTIERS OF ASTRONOMY
The spiral arms of the Galaxy
The arms that can be seen winding their way from the
nucleus of M 31 to the outermost parts are a most notable
feature. They take the form shown schematically in Fig. 50.
A very important and recent development in astronomy has
been the demonstration that our Galaxy also possesses spiral
arms. Three quite different methods have been used with
entirely concordant results.
M 32Far side
Potation
Near side % NGC 2O5FIG. 50.
The first one, used by Morgan, Whitford, and Code dependson the stars of the ordinary main-sequence. So long as weknow for certain that a star lies on the main-sequence its
brightness can be judged from an observational estimation of
its surface temperature. We simply use the main-sequence as
a means of reading off the brightness once the surface tempera-ture has been determined, as is indicated in Fig. 51. Once the
brightness is thus known the star can be used as a standard
headlight. This method of determining distances has been
known for many years. It is the method by which the dis-
tances of open clusters are determined, for instance. Evidentlyit can be used to the greatest effect if stars high on the main-
sequence are employed, since these are so bright that they can
be observed when very far off.
But simple as this may seem, it has proved very awkward to
apply the method in practice. There are two difficulties. Onearises from the dust contained in the clouds of gas that lie
228

THE SPIRAL ARMS OF OUR OWN GALAXY
between the stars. Light from a star far off in the Milky Wayhas to pass through such clouds before it reaches us and in
doing so some of it is absorbed. Even if light of different colours
were absorbed equally, application of the headlight method
<oooooo
100000
10000
5O 4O 3O 2O IO 9 8 7 6 & 4 3
Surface temperature in thousands degrees Centigrade
FIG. 51. Use of main-st,quence to determine intrinsic brightness of a star.
would still lead to serious errors unless allowance for the
absorption by the dust were made. But light of different
colours is not equally absorbed and this adds a further com-
plication; blue light is absorbed more strongly than red light,
which introduces errors in estimating the surface temperaturesof stars. This is particularly serious when we aim to use stars
high on the main-sequence as standard headlights. The
229

FRONTIERS OP ASTRONOMY
steepness of the upper part of the main-sequence means that
even a small misjudgment of the surface temperature leads
to a large error in the brightness that we read off from the
curve. Evidently the method is quite unusable for stars highon the main-sequence unless absorption by dust can be
accurately allowed for.
The second difficulty is that the method depends on the star
lying on the main-sequence. Very serious mistakes will be madeif it is applied to stars that have evolved off the main-sequence.For these reasons the use of the main-sequence for calibrating
standard headlights, notably among stars high on the main-
sequence, had not yielded results that were at all reliable until
the recent work of Morgan, Whitford, and Code, who have
been able not only to allow for the effects ofdust but to developcriteria whereby it was possible to decide whether or not a
blue star lies near the main-sequence. These criteria are
based on the spectral lines emitted by the atoms in the atmos-
pheres of the stars.
With these precautions Morgan, Whitford, and Code have
shown that the stars high on the main-sequence are not dis-
tributed uniformly in the plane of the Galaxy. They lie in
groups that are arranged along the three lanes shown in Fig. 52.
Although the survey is still very incomplete the implication is
that these lanes are portions of spiral arms, in one of which
the Sun happens to lie. It appears then that there is a multi-
plicity of arms in the Galaxy. The distance across 'our' armis about 300 parsecs, the distance from one arm to the next is
about 1,500 parsecs.
The second way of demonstrating the concentration of the
material of the solar neighbourhood into a spiral arm is due to
Guido Miinch. This actually takes advantage of the fact that
the light of a distant star is partially absorbed when it passes
through the interstellar clouds. Miinch's method depends on
the absorption by gas, not dust, however. A distant star
observed through both 'our' arm and the next arm is indicated
in Fig, 53. If the gaseous matter is concentrated in the arms,
absorption is not continuous over the whole of the distance
from the Sun to the star but occurs over two sections of the
track of the light, the two sections that lie within the arms-
230

THE SPIRAL ARMS OF OUR OWN GALAXY
Munch has found that the absorption is not continuous but is
indeed concentrated in two sections, and in two sections that
agree with the positions of the belts of blue giants found by
Morgan, Whitford, and Code.
Presenf position ofthe Sun
FIG. 52. Our Galaxy in plan. Regions of high hydrogen density shown
by hatching, and groups of blue giants by dots. The Sun and planetsmove together in a clockwise sense approximately around the circle.
Even before these observations there was strong evidence
for this coincidence from Baade's studies of M 31, since
Baade had already established a marked association of both
blue stars and clouds in the spiral arms of M 31. It was
therefore probable that a similar association would be found
in our Galaxy. The work ofMunch goes far towards establish-
ing this.
231

FRONTIERS OF ASTRONOMY
The final and decisive step in establishing the coincidence of
the gas clouds and bright stars in the spiral arms of our Galaxyhas come from a third line of attack along entirely novel lines.
It was suggested about ten years ago by van de Hulst that it
> Stor observed
Cos
SUMFIG. 53. Observing through two lanes of gas (Munch).
should be possible to observe radio-waves emitted by low
temperature interstellar hydrogen gas. This was a most
important prediction because there was good reason for believ-
ing that large quantities of cool interstellar hydrogen existed
in interstellar space but up to that time no means of observingcool hydrogen had been devised. Hydrogen near stars of
particularly high temperature had sometimes been observed
but this depended upon the hydrogen becoming greatly heated
by the stars. Since only a small percentage of the hydrogen in
the Galaxy is hot, the former observational technique was not
one of really widespread application. The important thingwas to have a way ofobserving the main tracts ofcool hydrogen.Van de Hulst's prediction of the emission of radio-waves
depended on there being two ways in which the electron in the
hydrogen atom can be attached to a proton. The radio-waves
are emitted through atoms switching between these two arrange-ments. As with the light that is emitted when the electrons
in an atom alter their arrangement the radio-waves have a
definite wavelength, they form a spectral line. The wavelengthin van de Hulst's case is close to 2 1 centimetres, a value placed
conveniently for observation.
232

THE SPIRAL ARMS OF OUR OWN GALAXY
The prediction of the emission of radio-waves by cool hydro-
gen clouds was confirmed by Ewen and Purcell at Harvard
University, and by Oort and Mtiller ofthe Leiden Observatory,and by Christiansen and Hyndman in Australia almost simul-
taneously. The situation was found to be exactly in accordance
with van de Hulst's calculations.
This new development has provided a tool for surveying the t
Galaxy for dense clouds of cool hydrogen. The results so far
achieved are also shown in Fig. 52. The hydrogen is seen to be
strongly concentrated in the same arms as the blue giants of
Morgan, Whitford, and Code. In addition there is importantevidence of the existence of a second arm inside our own. In
the next decade the further details of the hydrogen distribution
will almost certainly be determined, so that the distribution of
gas within our Galaxy will become known with considerable
precision. This is a result that twenty years ago would have
seemed impossible of attainment an outstanding step in
astronomy.The detection of 21 cm. radio emission may also turn out to
be a powerful tool for the investigation of cool hydrogen clouds
in galaxies other than our own. So far only the Magellanicclouds have been examined. It has been found by the Austra-
lian radio-astronomers F. J. Kerr and J. V. Hyndman that
both the Magellanic clouds contain considerable quantities of
hydrogen. Also from this investigation it has become knownthat the two Magellanic clouds are in motion in orbits aroundeach other, like the components of a double star system. The
investigation of this motion depends on the displacements of
the radio spectral line, the 'pitch' of the line being raised or
lowered according as to whether the emitting masses of hydro-
gen are moving towards or away from us. It also appears that
the clouds possess internal rotations within themselves.
No really systematic attack has yet been made on other
galaxies however. But it can hardly be doubted that this will
sooner or later probably sooner be turned into a major
weapon of investigation. The main reason why apart fromthe Magellanic clouds little work has yet been done is that this
branch of radio astronomy is still only about 5 years old. So
rapidly is progress being made nowadays.

CHAPTER FOURTEEN
The Origin of the Stars in the
Arms of Our Galaxy
The stars that we see in the sky belong mainly to the outer
regions of our Galaxy. We do not normally see the profusionof stars that belong to the nucleus of the Galaxy. Partlybecause they are so far away and partly because they are muchobscured by the clouds of dust that lie along the Milky Way,a large telescope is needed to distinguish the inner stars. But
even without the vast aggregation of the nucleus there is no
shortage of stars, as a glance at Plate XXV will show. Theseare all stars of the spiral arms, stars whose origin we shall nowdiscuss.
It is an obvious suggestion that stars form out of the inter-
stellar clouds of gas but the precise manner of their formation
raises intricate problems. It used to be thought that a star
could be produced by condensing a quantity of gas as an
isolated system, each star forming as the outcome of a separate
process. But this idea leads to very serious difficulties.
To see why, let us return once again to the great degree of
concentration necessary to produce a star. If it were distributed
at the normal density of the interstellar clouds of gas, the solar
material would occupy a region that exceeded the present size
of the Sun about ten million times, a region with dimensions of
the order of a parsec. The gravitational field of such a large
scale distribution would be very weak indeed. Consider the
following comparison. A hypothetical man standing on the
Sun as it is at present would have to throw a ball at nearly620 kilometres per second for it to escape out into space. But
if the Sun were expanded ten million times the ball would
escape into space ifthe man were to throw at only one-fifth ofa
kilometre per second. This emphasises the dependence of
234

DISPERSING STAR SHOWERS
gravitating power on condensation, the less the concentration
of material the weaker is its restraining field.
Now cosmically speaking, one-fifth of a kilometre per second
is a very slow speed. The atoms of the interstellar gas are
moving around at speeds more than five times greater than
this. The atoms must therefore act like escaping balls. The Sundistended to the density of the interstellar gas clouds wouldhave an insufficient gravitational field to control the motions
of the individual atoms they would simply evaporate away.Hence we may conclude with some certainty that stars like the
Sun cannot originate singly out of the interstellar gas in a one
at a time process, their gravitating power in the uncondensed
state would not be strong enough.The difficulty becomes less serious and may disappear
altogether for a larger quantity of material. Whatever the
internal motions of the atomic particles and whatever their
density may be, a cloud can pull itself together by its own
gravitational field ifit contains a sufficient quantity of material. Themasses required for condensation turn out to be very much
greater than the Sun, however. At the density and tempera-ture existing in the cool regions of the interstellar gas clouds
the necessary mass turns out to be about 1,000 times that of the
Sun. This is a typical mass for a whole interstellar gas cloud.
Evidently then the interstellar gas clouds are aggregations that
can hold themselves together by their own gravitational field.
The situation is that a whole interstellar cloud can begin con-
densing but a small portion of it cannot condense alone.
At first sight there is an element of paradox in this. Howthen do the stars come to contain so little material? Theanswer is that stars are formed in groups. A large interstellar
cloud condenses. As it does so the material of the cloud
becomes more concentrated. This makes it possible for bits of
the cloud to hold themselves together by self-gravitation. Indeed
if the cloud condenses sufficiently the resulting concentration of
material becomes so large that bits containing no morematerial than the Sun are then able to hold themselves together.
We have, already remarked that the gravitational holding
power of a quantity of material depends on the degree of it&
condensation. We are now saying the same thing in a slightly
235

FRONTIERS OF ASTRONOMY
different way. At maximum dispersion only the gravitational
field of a whole interstellar cloud of gas can produce condensa-
tion. But as condensation gets under way separate regionsinside the cloud develop gravitational fields that become
strong enough for them to condense separately. And the morethe main cloud condenses, the smaller the regions inside it that
become capable of separate condensation, until regions con-
taining no more material than the Sun can ultimately hold
themselves together by their own gravitation. A shower of
stars is thus produced inside the cloud.
The formation of stars in groups explains in a very satis-
factory way the origin of open clusters such as the Pleiades
(Plate XVII), for it is scarcely conceivable that the stars of
these clusters originated separately and subsequently becameassociated together.
Dispersing star showers
Most stars are not members of clusters at the present time,
however. But for consistency in our argument we must still
demand that all stars were formed in groups. This forces us to
argue that all stars form in showers the majority of which
become disintegrated, only a minority preserving their associa-
tion this minority being just the open clusters.
Recent observational work by A. Blaauw goes far towards
establishing the correctness of this view. It appears that most
star-showers are self-disruptive. The first cluster to be exam-ined in detail by Blaauw was the group of bright stars of which
Persei is a member. By a very careful analysis Blaauw has
obtained the stellar motions shown in Fig. 54. The clear
implication is that the stars of Fig. 54 are expanding outwards
from a common centre. The cluster is about 30 parsecs in
diameter at the present time and is about 300 parsecs awayfrom us. The stellar velocities average about 12 kilometres persecond. At this speed of expansion the cluster will increase
significantly in size in a million years. We may accordinglyconclude that the Persei cluster is not much more than a
million years old since the stars would otherwise have dispersed
long ago.
236

DISPERSING STAR SHOWERS
It is not easy to repeat this work for other clusters. Thenumber of very young expanding clusters is comparatively
small, and only very young expanding clusters can be observed
in the convenient compact state of the Persei group. Not only
V *
-> .'
FIG. 54. Motions of the stars of the f Persei cluster.
this but a cluster has to be fairly close by if the motions of its
constituent stars are to be measured with accuracy. Evidently
we cannot expect to find many clusters that are both very
young and very close to us. Indeed we are lucky to have found
one in the Persei cluster. A further investigation ofexpandingclusters must therefore depend on a new method of observa-
tion. Fortunately another method is available. An initially
spherical group of expanding stars does not stay spherical,
because after a time the constituent stars get pulled differently
by the gravitational field of the Galaxy. The effect is to
change initially spherical groups of stars into groups with
characteristic ellipsoidal forms. It is possible to recognise
expanding clusters from these characteristic forms. Blaauw has.
237

FRONTIERS OF ASTRONOMY
found one such ellipsoidal group in the Scorpio-Centaurus
region of the sky. This group is about 2,000 parsecs away and
seems to be expanding at about 1.7 kilometres per second.
Blaauw and Morgan have found another similar group in the
constellation of Lacerta.
The existence of expanding clusters was correctly foreseen
before the observations of Blaauw by the Russian astronomer
V. A. Ambartzumian, whose arguments were closely related
to what has just been said. Ambartzumian noticed that brightstars high on the main-sequence occur together in groups, in
associations as he called them. From a study of the associations
he suggested precisely the interpretation given above that
they are expanding clusters whose shapes have been distorted
from an initially spherical form by the gravitational field of the
Galaxy. Indeed Ambartzumian inferred that the velocity of
expansion of the associations must lie in the range from about
i kilometre per second to 10 kilometres per second, which is
just the range found by Blaauw, the Persei cluster being at
one extreme and the Scorpio-Centaurus group being at the
other.
The shrinkage of the interstellar clouds
The details of star formation remain to be discussed. Wehave still to explain why some groups of stars expand like the
Persei cluster, whereas other groups like the Pleiades stay
together. There are other subtle problems to be solved. Howis it that all the clouds of gas did not condense into stars long
ago? Our Galaxy is some 5,000 million years old. How has
so much gas been able to preserve itself over such a long periodfrom condensing into stars?
Let us start by considering the last question. The inter-
stellar gas sets off as if it intended to condense into stars, for
the gas is widely condensed into clouds. The hesitation in the
star-forming process sets in only after clouds have formed. Thesituation seems to be that the dense clouds are so opaque to
radiation, especially to the infra-red radiation emitted by the
material inside them, that their shrinkage is an extremely slow
affair. The behaviour of a very dense cloud is rather similar to
238
SHRINKAGE OF INTERSTELLAR CLOUDS
the behaviour of a star that lacks energy-generation by nuclear
reactions. A temperature higher inside the cloud than outside
produces an outward flow of energy that is radiated away bythe surface. This steady loss of energy has to be made goodby the cloud shrinking very slowly inwards, so that gravitationcan maintain the pressure balance within the cloud. The time
for an appreciable shrinkage to occur in this way must perhapsbe reckoned in hundreds ifnot in thousands of millions of years.The interstellar clouds are opaque to visible light because
of the fogging effect of the dust particles consider the greatdark band of dust that can be seen in Plate XXVI. The clouds
are opaque in the infra-red for a reason that also depends onthe dust particles, although not directly through a foggingeffect. Hydrogen atoms of the surrounding gas collide with the
dust particles and sometimes stick to them. The dust particles
accordingly come to possess a very thin film of hydrogen on
their surfaces. The atoms in this film, being contiguous with
each other,join up together to form molecules that subsequently
evaporate off the dust back into the gas. In this way the gascomes to contain molecules as well as atoms. The hydrogenmolecules then have decisive effects. They cause the coolingofthe bulk ofthe interstellar gas down to very low temperaturesdown to about 300 degrees of frost (degrees Fahrenheit).
And together with other molecules water, ammonia, theycause the dense clouds to become highly opaque to radiation
in the infra-red.
Dust particles although they comprise only a small fraction
of the mass of the interstellar clouds thus play an important
part in controlling the properties of the gas. Indeed dust
particles are so important that it seems worthwhile saying a
few words about their origin, even though this is not very
clearly understood at the present time.
Two entirely different dust forming processes have been
suggested. One idea is that tiny solid particles condense out of
the gaseous materials of the interstellar clouds, rather as water
drops condense out of the vapour in our own terrestrial atmos-
phere. According to the work of Bates and Spitzer this might
happen inside rather dense clouds. But the interstellar gascan only condense into clouds, particularly into dense clouds,
*39

FRONTIERS OF ASTRONOMY
if it is extremely cool. Molecules are required to produce cool
gas, and dust is required to produce molecules. So the argu-ment goes in a circle, the condensation of dust demands the
presence of dust. In the entire absence of dust it seems unlikelythat dust can form at all in this way.The second suggestion is that dust particles originate in the
atmosphere of stars of low surface temperature. 2t can be
shown that at temperatures below about 2,000 degrees, carbon
atoms in the atmosphere of a star will not remain gaseous but
will condense into solid particles. It can also be shown that
when the particles grow to about the wavelength ofblue light
about one-hundred-thousandth of an inch the radiation from
the star pushes them outwards even in spite of the inward
gravitational pull of the star.
This idea also has to face up to a criticism. In the majorityof stars with atmospheres of low temperature the carbon atoms
are linked with oxygen atoms to form molecules of carbon
monoxide. And molecules of carbon monoxide do not form
dust particles. A second difficulty is that a stellar source of dust
requires stars to exist before the dust whereas our argumentswould at first sight seem to suggest that dust must exist before
stars, otherwise the interstellar gas would not become suffi-
ciently cooled for clouds and stars to condense. Although for
these reasons we might feel tempted to dismiss this second
suggestion I am rather loath to do so because of a striking
agreement with observation. The interstellar dust particles doin fact have a size ofabout one-hundred-thousandth ofan inch.
This as we have already noted is just the size at which a stellar
source would blow them out into space.Much remains to be understood but there are hints to show
how it may perhaps be possible to resolve both the difficulties
just mentioned. Exceptional stars are known that contain
free carbon in their atmospheres, carbon atoms that are not
linked with oxygen. Those are the so-called carbon stars. Thecarbon stars are also stars with cool atmospheres. Accordinglyit seems that such stars if their surface temperatures should
fall below 2,000 degrees must shower out a rain of soot.
It may also be possible to resolve the difficulty of the order
of origin of dust and stars. In a later chapter we shall see that
240

FRAGMENTATION INTO STARS
the stars in the central region of our Galaxy arise in a verydifferent way from the stars of the spiral arms. Indeed we shall
see that the stars of the nucleus arise in a way that demands the
absence of dust. The origin of the central stars must therefore
have preceded the origin of the dust. This would seem to
remove the difficulty since we can appeal to the central stars
to provide the first supplies ofdust.
Fragmentation into stars
Now why does a condensing cloud of interstellar gas break
up into a shower of several hundred or even perhaps several
thousand stars, instead of shrinking as a whole into just one
enormous star? Let us now try to answer this important
question.As the cloud shrinks gravitational energy is released. This
causes the temperature inside the cloud to rise in the same waythat the temperature rises inside a shrinking star. Sooner or
later the temperature must become high enough for the mole-
cules in the central parts of the cloud to become dissociated
into their constituent atoms and for the dust particles to
become evaporated into gas. Then something very remarkable
indeed happens. The gas fragments by a process to be dis-
cussed in Chapter 17 into a shower of stars. The fragmentationis extremely rapid, taking no more than a few thousand years!
This spectacular development occurs when the temperaturerises to about 3,000 degrees, a temperature that is attained
when the cloud condenses to about one per cent of its initial
size. Reckoning the initial size as 10 parsecs, the cloud there-
fore fragments into stars when it has shrunk to about one-tenth
of a parsec. Shrinkage to this size increases the density a
millionfold. Thus if initially the density was say 10 atoms
per cubic centimetre (mostly hydrogen) the shrinkage pre-
ceding fragmentation increases the density to about 10
million atoms per cubic centimetre. Although this representsa very high concentration for the interstellar gas it is still
much lower than the average density inside a star. The
average density inside the Sun for instance amounts to about
1,000,000,000,000,000,000,000,000 atoms per cubic centimetre.
241 i

FRONTIERS OF ASTRONOMY
Evidently a further considerable concentration of material is
still necessary after fragmentation has taken place before
veritable stars are produced.Calculations show that the initial masses of the stars lie in the
range from about one-fifth up to about twice the Sun. At
the time of their origin the stars lie on the main-sequence but
they do not populate it to levels far above the Sun only to
about 20 times the brightness of the Sun. How then do the
blue giants arise? By a further sweeping up of gas from the
surrounding cloud. We must remember that it is only the
heated innermost part of the cloud that fragments into stars.
The stars at the time of their birth must therefore be sur-
rounded by a cloud of comparatively dense gas with a densityof about 10 million atoms per cubic centimetre. A star
immersed in such a nutritive medium must grow rapidly bythe tunnelling process discussed in Chapter 7.
The heating of the gas
As stars grow by tunnelling into blue giants their emission
of radiation is greatly increased. And the proportion of the
radiation that lies in the ultra-violet also increases very
markedly. Now radiation in the ultra-violet is appreciablyabsorbed in the surrounding gas which must therefore become
strongly heated. Eventually the temperature of the gas rises
to a value comparable with the surface temperatures of the
exciting stars themselves, say to a temperature of 20,000 degrees.
Apart from in a few exceptional cases (to be mentioned later)
the gas then evaporates away from the cloud into surrounding
space.It appears therefore that the building of blue giants is a
self-terminating process. Sooner or later the blue giants simplyblow the surrounding gas away, and tunnelling must then
cease. This leads to a crucial point. Inside a newly formed
cluster the stars possess motions but so long as all the original
gas remains within or around the cluster the motions do not
cause the stars to disperse, they simply move around amongthe other stars and among the gas. Once gas is evaporatedhowever the motions cannot be controlled as readily as before
242

BLOWING UP THE INTERSTELLAR GAS
because the restraining gravitational field has been weakened
by the loss of the evaporated gas. Two cases now arise. Onein which the velocities of the stars cause a swelling in the size of
the cluster but not an entire dispersal. We associate such causes
with the open clusters. We may regard the Pleiades and
Praesepe as having originated in this way. In the other case
the velocities are sufficient to disperse the stars entirely. Weassociate this second case with the expanding clusters ofBlaauwand Ambartzumian. The velocities of expansion can be
estimated. For a system with a diameter before expansion of
one-tenth of a parsec (this is the order suggested by our con-
siderations) and with a mass 1,000 times the Sun, the velocities
of expansion of the stars must average about 3 kilometres persecond. This is intermediate in the range inferred by Ambart-zumian and measured by Blaauw, the range from i kilometre
per second up to 10 kilometres per second.*
What is it that decides whether a cluster disperses or not?
The answer probably lies in the proportion ofthe original cloud
that becomes condensed into stars. In the case where only a
low proportion is condensed most of the gravitational holding
power of the cluster is originally supplied by gas not by the
stars. When the gas is evaporated off most of the restraining
gravitational field is then lost. We may expect a complete
evaporation of the stars to occur in such a case. But if a high
proportion of the gas becomes condensed into stars then the
evaporation of the remaining gas will not weaken the restrain-
ing gravitational field very much. In such a case it is unlikelythat a complete evaporation of the cluster will take place,
although some degree of expansion must still occur.
Another possible variant may be mentioned. It might
happen in exceptional cases that a cloud or a portion of a cloud
shrinks to such a degree that in spite of the presence of blue
giants the degree of heating of the gas is insufficient to evapor-ate it away from the cluster. The concentration necessary for
this to occur is unusually large. A cloud with a mass 1,000times the Sun would have to shrink to less than a tenth of a
* The present suggestions were put forward by the writer in lectures deliveredat Princeton University in the Spring of 1953. The same idea was also putforward by Dr. F. Zwicky at a meeting of the Astronomical Society of thePacific in June 1953.
243

FRONTIERS OF ASTRONOMY
parsec in order that the heating by very luminous blue giants
should fail to evaporate it away. Two courses of evolution are
then possible. One is that all the gas becomes swept up by the
stars within the cloud. The other is that before the whole of
the gas is swept up one of the bright stars within the cluster
evolves to the supernova stage. The energy released by the
supernova is so great that in this second case the remaining gasmust become heated to a very high temperature, far higherthan could be produced by the radiation of the brightest blue
giants. Evaporation of the remaining gas can then no longerbe delayed in spite of the strong restraining field of the cluster.
Once the gas is gone the stars within the cluster become
subject to expansion and dispersal exactly as before. But nowthe velocities of the stars are much greater than before. In a
cloud one-thousandth of a parsec in size and with mass 1,000times the Sun the expansion velocities of the stars can be as
high as 100 kilometres per second. It is of particular interest
that Blaauw and Morgan have recently identified a case of
two bright blue stars, A E Aurigae and p, Columbae, that
are moving outwards in nearly opposite directions from a
common centre. The speeds of motion of both stars are close
to 127 kilometres per second. It is difficult to see how such
high velocities could arise in any other way except through the
agency of a supernova.It may be added that the explosion of supernovae inside
exceptionally dense gas clouds is a process that may explain the
origin of curious more or less spherical expanding clouds that
are found in the Galaxy. These clouds look superficially like
the products ofsupernovae, but they are expanding much more
slowly than the gas from a supernova (hundreds rather than
thousands of kilometres per second) and they contain con-
siderably more material than could be derived from a super-nova. A portion of one of these large slowly expanding clouds
is shown in Plate XXX.
Recognising shrinking interstellar clouds
A shrinking interstellar cloud must be highly opaque to
visible light. Even if the dust particles become entirely
244

DARK GLOBULES
evaporated in the innermost parts of the cloud, dust in the
outer parts must produce a high degree of opacity. So a
shrinking cloud should be thought of as a roughly spherical
opaque blob. Examples of dark blobs can be seen in the
nebulosities shown in Plate XXXII. The blobs are detected
only because they happen to be projected against brightclouds. A dark globule obviously cannot be seen by its own
light.
The possible connection between dark globules and the
process of star-formation was pointed out many years ago byBok and Reilly, and has been elaborated by Spitzer and
Whipple. This view has been opposed by Baade, who main-
tains that star-formation in the spiral arms of our Galaxy can
have little to do with the dark globules. There is no knowncase of a globule in an intermediate condition between gas andstars.
It is possible that these apparently contradictory views can
be brought into agreement. The lack ofan observed connection
between the dark globules and star-formation is an apparently
strong point in favour of Baade's opinion. Yet it can scarcelybe denied that the clouds out ofwhich clusters ofstars condense
must look like dark globules in the pre-stellar stage. Theresolution of the dilemma is probably that the great majority of
the dark globules do not lie outside the large interstellar clouds,
as the blobs that can be seen on Plate XXXII do. Most ofthemare tucked away inside the main clouds, where they are hidden
from our view. It would then follow that star-formation wouldoccur mainly inside the large clouds. In this way it is possibleto reconcile Baade's view that star-formation occurs deep inside
large clouds such as the Orion Nebula (Plate XI) and the
Rosette Nebula (Plate XXXII) with the view that star-forma-
tion occurs as an outcome ofthe slow shrinkage and subsequent
rapid fragmentation of dense masses of gas that in their early
phases look like the globules that are occasionally found out-
side the clouds.
According to Baade star-formation is a process that in its
actual occurrence is irrevocably hidden from us because it
occurs deep inside large clouds where the dust in the generalcloud (not only in the globules) prevents us from inspecting the
245
FRONTIERS OF ASTRONOMY
process as it goes on. It is only after star-formation has occurred
and blue giants have been produced that we have any chance
of observing what has happened; for once they originate the
blue giants blow the surrounding gas and dust away, to reveal
a gap in the clouds where the new stars lie. So we only see
things after the event. It is indeed just because we do not see
these processes actually going on but only after they are com-
pleted that it has proved so difficult to understand how star-
formation takes place.
Perhaps there is one exception to the statement that star-
formation can never be observed. When bright stars are pro-duced in a region of a large cloud such as the Orion Nebula
they may happen to blow away sufficient of the dust from
neighbouring regions to enable us to see into the cloud but
without the gas being so completely evaporated that all star-
formation ceases. This seems to be the case for the T Tauri
stars (named after T Tauri the prototype star) which occur in
large numbers in the Orion Nebula. Several hundred appar-
ently growing T Tauri stars can be observed in this cloud. But
the cases of intense 'star cookery' remain hidden from us. Wesee such groups as the % Persei cluster because the bright stars
of this cluster have blown away the dust from their neighbour-hood. Even if astronomers had lived over the last million
years they would not have observed the early stages of forma-
tion of this cluster, for the reason that a veil of dust must
initially have shielded the process of star-formation from view.
Gas pistons and gas bullets
It has been pointed out by Spitzer and Oort that the heatingof the interstellar gas by the blue giants has many interesting
consequences. Let us think about the whole interstellar gas,
not about just one cloud. In some places the gas is heated to a
high temperature (20,000 degrees). In other places the gascontains unevaporated dust and molecules and consequentlyis at a low temperature. The pressures developed in the high
temperature regions cause the hot gas to push the eold gasaround with some violence. Examples are shown in Plates I,
XXXI, and XXXIII. In Plate I a cool opaque cloud contain-
246

OAS BOMBS
ing dust, the horse's head, is being squeezed by surroundingheated gas. In Plate XXXI the long dark lane, the elephant's
trunk, is similarly being squeezed. In Plate XXXIII a cloud of
hot luminous gas is expanding like a bomb blast into cooler
surrounding gas.
Particles evaporatedue to heating byBLUE GIANT
BLUE GIANT
GAS CLOUDFIG. 55. Producing a gas bullet.
A blue giant can cause gas to be evaporated from a cloud
even when the star itself does not lie inside the cloud. Radia-
tion from the blue giant then hits the cloud from one side only,
as is indicated in Fig. 55. In such a situation the cloud is
impelled like a rocket, the one-sided evaporation of particles
acting as a jet. As more and more of the gas is evaporated the
residue of the cloud accelerates to greater and greater speeds.
When 90 per cent of the gas has been evaporated the speed of
the residue rises above 20 kilometres per second. When 99 percent of the original material of the cloud has been evaporatedthe speed of the residue rises above 50 kilometres per second.
Such speeds are quite exceptional. The random speeds of the
interstellar clouds average about 8 kilometres per second. But
clouds with speeds of 50 kilometres per second or more are
sometimes observed. It is significant that they are always small.
247

FRONTIERS OF ASTRONOMY
This is indicative that their high velocities have been produced
by the rocket-process shown in Fig. 55. Small clouds accelerated
by the rocket-process become gas-bullets that may strike
another cloud at high speed.
Star-formation as a cyclic process
The heating of the interstellar clouds by blue giants maycause cyclic changes in the process of star-formation. Star-
formation depends on the existence of interstellar clouds of gas.Let the clouds be evaporated into a general gaseous mediumand star-formation must cease. But once the blue giants have
run their course, perhaps evolving to the white dwarf state in
accordance with the discussion of Chapter 12, no more heatingoccurs. So a cooling phase is reached in which the interstellar
clouds reform themselves. Then a new crop of blue giants
arises, the interstellar gas becomes reheated, and the whole
cycle begins afresh. The cycle need not be everywhere in the
same stage of development. The cooling phase leading to
star-formation may be operative in one part of a spiral arm,and the heating phase may be operative in another part. It is
perhaps this variation that gives the 'string ofpearls' appearanceto the arms of the Andromeda Nebula (Plate XXI). The placeswhere the star-forming phase has recently been operative show
up as the bright regions of the arms, and the places where the
blue giants have died as the relatively faint parts.
The cooling that follows the death of the blue giants maybe a rather complicated process. It is probably not just a
question of the reforming of molecules in gaseous layers on the
dust particles, because in the expansion phase the dust particles
themselves may be evaporated or blown clear of the spiral
arms altogether. The cooling phase must then await a resupplyof dust particles, possibly from the surfaces of giant stars with
cool atmospheres.The Magellanic Clouds (Plates XXII and XXIII) provide
some evidence that star-formation is a cyclic process that
includes a dust-free phase. The Large Cloud contains dust,
gas, and extremely luminous blue giants. The Small Cloud
contains gas but no dust, while the few blue giants in the Small
248

THE ORIGIN OF MULTIPLE STARS
Cloud are not nearly so bright as those of the Large Cloud.
This would suggest that the cyclic process in the Small Cloudis now at the phase in which the dust of the last star-forming
period has been evaporated or blown clear away. The LargeCloud seems on the other hand to be at just the opposite phase,with plenty of dust, condensed gas, and with very bright blue
giants. It is possible that a few million years hence the situation
will have reversed, with the Small Cloud then containing the
condensed gas and very bright stars, and with the Large Cloud
going through a dust-free era.
The origin of multiple stars
Showers of several hundred stars at a time provide ideal
conditions for the formation of multiple star systems. It is not
at all improbable that in such circumstances one star will
become linked with another in a double system, their distance
apart being perhaps 100 times the radius of the Earth's orbit.
After the general dispersal of the star shower in which theywere born such a linked pair would stay permanently together.It may therefore be anticipated that a very appreciablefraction of the stars should be members of double-systems, an
expectation that agrees with observation more than half the
spiral arm stars of our Galaxy apparently belong to double
systems.Next we must consider the possibility that two stars become
linked together before their full condensation is complete. Then
something remarkable occurs. The two components go closer
together, and as they do so the orbits in which they movearound each other become more and more circular. Supposefor instance that a continued sweeping up of gas raises the
components from say half the mass of the Sun to 2.5 times the
Sun. This fivefold increase causes the distance between the
components to decrease to about one per cent of its initial
value, so that if the initial distance was 100 times the radius
of the Earth's orbit the increase of mass causes the separationto decrease to about the radius of the Earth's orbit. We thus
obtain a rather close separation instead of the initial rather
wide separation. Since the increase of mass must be different
249

FRONTIERS OF ASTRONOMY
in the different cases this explains why considerable differences
of separation exist from one double system to another.
The present theory also explains the origin of multiplestars containing more than two stellar components. Notable
examples are the system of Castor to be observed in the con-
stellation of Gemini, and the systems of Cancri and c Lyrae.Castor has six components arranged in three pairs, each pair
being a close double. One of the pairs moves around a second
pair in a time ofjust over 300 years, and the third pair movesaround the other two in a period ofmore than 10,000 years. The
system of Lyrae has four stars arranged in two moderatelywide pairs that move around each other in a time of several
hundred thousand years. The system of % Cancri also contains
four stars arranged in two moderately wide pairs that movearound each other in a time of about 1,000 years. A curious
feature of Cancri is that one of the four stars is invisible.
It may be wondered how in this case we know of its existence.
The answer is that one of the visible stars is observed to movearound something that is invisible in a period of 17.6 years.
It is inferred that this 'something' is a star, probably a faint
white dwarf that is too distant to be seen.
The origin of these highly complex systems is probably quite
simple. They are probably relics of open clusters. Openclusters tend to become disrupted by encounters with other
clusters and with other stars. In the final stages of disintegra-tion a few members ofa cluster may be left. These few members
may well form the sort of arrangement that is found in the
system of Castor.
The possibility that a white dwarf is present in the systemof Cancri raises a curious point concerning the two dog stars,
the brightest star in the constellation of the Large Dog, Sirius,
and the brightest star in the Small Dog, Procyon. Both Sirius
and Procyon are double systems. Both have a main star that is
brighter than the Sun: the main star in Sirius has a mass about
two and a half times the Sun, is about 25 times brighter than
the Sun, and the main star in Procyon is about seven times
drighter than the Sun. The companion star in both cases is a
white dwarf. In Sirius the separation of the white dwarf fromthe main star is about 20 times the radius of the Earth's orbit,
250

THE ORIGIN OF MULTIPLE STARS
and in Procyon the separation is about 13 times the radius
of the Earth's orbit. Now it is clear from the mode of origin of
a double system that the two component stars must be of
very closely the same age (this was a point already made use of
in the discussion at the end of Chapter n). It follows that
evolution must have been more rapid in the white dwarf than
in what are at present the main components. In their early
history the relative importance of the components must have
been reversed, with the white dwarfs then the more massive
and luminous stars. This means that the white dwarf in Sirius
must at one time have been quite a massive star, more than 2.5times the Sun. But the white dwarf component of Sirius has a
present mass of only 0.9 times the Sun. Hence the evolution
must have proceeded in such a fashion as to rid the originally
more massive and luminous component of most of its material.
A supernova explosion is clearly indicated. A similar argumentholds for Procyon. It appears likely therefore that the white
dwarf companions of both of the Dog Stars were at one time
supernovae, probably several hundred millions of years ago.If Sirius was then as close to the solar system as it is now,
the supernova when viewed from the Earth must have been
about as bright as the full Moon a most impressive sight.
Unfortunately the human species had not evolved when this
happened, and so man was not able to appreciate the spectacle.
It was presumably seen by the dinosaurs but I expect it meantlittle to them.
The solar system again
The discussion of Chapter 6 was incomplete in an important
respect. It will be recalled that we had to postulate the presenceof a luminous blue star rather near the solar system in order
to explain how hydrogen at the outer edge of the planetarydisk came to be evaporated away from the gravitationalinfluence of the Sun. This was necessary to explain why the
planets Uranus and Neptune contain little hydrogen. In
Chapter 6 this step may have seemed rather artificial and
perhaps a little unsatisfactory. But the situation is now muchbetter. If the Sun was born among a cluster of several hundred
251

FRONTIERS OF ASTRONOMY
stars it is quite likely that a star of the required type was onhand during the early history of the solar system. It would be
rather surprising if it were otherwise. So this apparent accident
also disappears from the theory, and with it almost all element
of arbitrariness. It seems as if our system of planets, instead of
being in any way exceptional, is a thoroughly normal develop-ment of a thoroughly normal star.

CHAPTER FIFTEEN
The Galaxy as a Magnet
Whales can make progress through water either by waggingtheir tails up and down or from side to side. Light can travel
through space in two ways, one like a tail moving up and downand the other like the tail moving from side to side. What of
course wags in the case of light is an electric oscillation not a
tail. These two ways of travelling are called the two directions
of polarisation of light. When we receive light in which the
two directions are equally represented the light is said to be
unpolarised. When one direction is more heavily representedthan the other the light is said to be polarised in the direction
in which it is more heavily represented. If the intensity of the
light in one direction exceeds that in the other by i per cent
the light is said to be i per cent polarised, if by 10 per cent the
light is said to be 10 per cent polarised, and so on.
The development of polaroid glass for automobile headlightsis a practical case in which the polarisation of light is met with
in everyday life.
Most sources of light, an electric light bulb or the Sun, emit
unpolarised light. But as was discovered independently byHall and Hiltner the light from some stars is polarised up to as
much as 10 per cent. Ofthe stars examined by Hall and Hiltner
some showed strong polarisation and others practically none.
All those showing strong polarisation turned out to be cases
where the light travels to the solar system along paths that pass
through considerable clouds of dust, while those that showedno polarisation or only weak polarisation were the cases where
little dust was encountered on the way to the solar system.This suggested that the phenomenon of strong polarisation is
associated, not with the emission conditions at the surfaces of
the stars, but with the passage of light through clouds of dust.
In order to produce polarisation the dust particles must
*53

FRONTIERS OF ASTRONOMY
absorb one of the two types of light more strongly than the
other. Large dust particles, such as those that float around in
the Earth's atmosphere would not do this, but the tiny particles
in interstellar space might (being mostly about one-hundred-
thousandth of an inch in size). Such small particles will
polarise light if they are of irregular shape. A needle-shaped
particle for instance absorbs light more strongly when the
electric oscillations wag in the direction of the needle than when
they wag at right angles to it. So far so good. But to producethe observed polarisation large numbers of dust particles must
be involved, and even if we grant that an appreciable fraction
are needle-shaped, why should more of them point in one
direction than another?
A magnetic theory proposed by L. Davis and J. L. Green-
stein gives the best answer to this question. The needles turn
around like propeller blades. And as a propeller turns around
a shaft so we can think of a spinning needle turning around a
shaft, albeit an imaginary shaft. The point of the Davis-
Greenstein theory is that a sufficiently strong magnetic field
causes all the shafts to have a systematic tendency to become
parallel to the magnetic field. So if the Galaxy possesses a
strong enough magnetic field the shafts will become so directed
that the needles themselves never point along the direction of
the magnetic field.
An analysis of the polarisation of the light of many distant
stars shows that the observed results are consistent with this
theory if the Galaxy possessed a magnetic field with an intensity
about a hundred thousand times less than the magnetic
intensity at the poles of the Sun, and if in our neighbourhoodin the Galaxy the magnetic field points along our spiral arm.
The acceptance of the Greenstein-Davis theory therefore leads
to the inference that our Galaxy possesses a magnetic field.
The intensity might at first sight seem rather low but we mustremember the vast volume over which it is maintained. This
demands an enormous flow of electric current. The largest
current ofwhich we have terrestrial experience is the surge of a
lightning stroke, when a total flow of about 100,000 amperes is
sometimes attained for a brief instant. In contrast, the total
electric current that must flow continuously in the interstellar
*54

THE MAGNETIC FIELDS OF THE STARS
gas, amounts to some 3,000,000,000,000,000,000 amp&res.
Evidently then the inference to be drawn from the polarisa-tion of starlight is a very far-reaching one. It leads to manyimportant consequences that we shall now discuss.
The origin ofthe magneticfields of the Sun and stars
It is also possible to appreciate the strength of the interstellar
magnetic field inferred by Davis and Greenstein from a con-
sideration of the magnifying effects that occur when a star
condenses. The shrinkage of a magnetised gas enhances the
field, for the reason that condensing material carries the lines
of force of the magnetic field with it, thereby squeezing the
field and increasing its intensity. A calculation along appar-
ently straightforward lines suggests that the very large con-
centration necessary to produce a star would increase the
magnetic field about ten million millionfold. So a field with
the initial intensity indicated by the Davis-Greenstein theorywould be magnified by the shrinkage into an intensity a
hundred million times greater than the intensity actuallyobserved at the poles of the Sun.
This enormous overestimate cannot be explained away by
saying that deep inside the Sun the field is indeed of about the
calculated intensity but that we do not observe it because it lies
below an outer casing of weakly magnetised material. A very
large internal field would make an important contribution to
the pressure balance within the Sun. Such a magnetic con-
tribution would be unlikely to possess the radial symmetrynecessary to keep the Sun so accurately spherical in shape: the
Sun would be appreciably squashed at its poles, flattened
rather like the planet Jupiter is flattened by its rotation (see
Plate VII) the magnetic field indeed producing much the
same effect as a rapid rotation would do. Since this is not
observed it seems certain that no magnetic field anything like
as high as that calculated can exist inside the Sun.
Nor can we argue that the Sun is an exceptional case, since
the great majority of stars seem to be magnetically similar to
the Sun. It is true that a number of exceptional stars do show
comparatively high magnetic fields. These have been much

FRONTIERS OF ASTRONOMY
investigated in recent years, notably by H. W. Babcock andA. Deutsch. The majority of them are stars of the main-
sequence about 50 to 100 times brighter than the Sun, usuallywith surface temperatures in the range from eight to ten
thousand degrees. These exceptional stars show magnetic fields
about ten thousand times more intense than the field at the
poles of the Sun, but even this is very much less about
ten thousand times less than our calculated value. Well-
authenticated cases consistent with calculation are extremelyrare. The magnetic field found by H. W. Babcock for the
supergiant component of the double-star system VV Cephei is
one of the rarities. This double-system is a most remarkable
one, with one component lying moderately high on the main-
sequence (100 times the brightness of the Sun) together with
an enormously swollen component possessing a brightness of
from 10,000 to 100,000 times the Sun and with a radius somei ,000 times the Sun. The giant component ofW Cephei if
swopped with the Sun would engulf the planet Jupiter and
might even engulf Saturn. It is this giant component that
shows the strong magnetic field. Apart from this case, however,and possibly one or two rather similar cases, there is no evidence
from the magnetic fields observed in stars to support the
apparently straightforward calculations based on the Davis-
Greenstein theory of the interstellar polarisation of starlight.
The observation that the Sun and certain other stars do possess
magnetic fields can be taken as confirming the actual existence
of an interstellar magnetic field but an interstellar field of one
per cent, or even one-tenth of one per cent, of the strength
required by the Davis-Greenstein theory would seem to fit
better with our knowledge of the magnetic fields of stars.
Two possibilities for resolving the discrepancy may be men-
tioned, although it is not known at the present time whether
either of them can be substantiated. One is that the aligningmechanism considered by Davis and Greenstein may be muchmore efficient than has hitherto been supposed. Comparativelylittle is known about the magnetic properties of very small
particles such as comprise the particles of interstellar dust,
especially if they are built up out of the type of molecule that
chemists describe as a Tree radical'. If the process were an
256

COSMIC RAYS
unexpectedly efficient one it could operate with a smaller inter-
stellar magnetic field than that suggested by the work of
Davis and Greenstein and this might reduce the magneticfields inside stars to values that could perhaps be tolerated.
The second possibility is that the concentration of the
magnetic field that accompanies the concentration of material
when a star is formed is a much less efficient process than has
hitherto been supposed. Certain assumptions are made (in
order to avoid very intricate situations) in calculating the con-
centration of the magnetic field and one or other of these mayturn out to be invalid. In particular it is possible that com-
plicated effects arise in the late stages of the condensation.
Indeed in Chapter 6 when we were discussing the origin of
planets we saw how one such complication probably does arise.
For myself, I am inclined to suspect that present calculations
are indeed at fault at just this point: that stars possess subtle
ways of getting rid of the magnetism of the gases out of which
they form.
I am also coming to suspect that the curious magnetic effects
that we observe at the solar photosphere and in the solar
atmosphere may be the Sun's way of getting rid of the mag-netism that it is still acquiring from the constant scooping upof interstellar gas (see Chapter 7), the rotation of the Sun
playing an important part in the process. It is customary to
suppose that these magnetic effects come from deep inside the
Sun but so far this idea has met with very meagre success.
Perhaps instead the fields really come from outside the Sun.
The long-sought key to the origin of sunspots and to their
cyclic waxing and waning may also lie here.
Cosmic rays and their origin
Further evidence for the presence of an interstellar magneticfield comes from an entirely different quarter, from the cosmic
rays. Cosmic rays are highly energetic particles that for the
most part enter the solar system from outside. Cosmic rays are
emitted on occasion by the Sun but the main contribution
comes it seems from interstellar space.The physical nature of cosmic rays has been a puzzle for
257

FRONTIERS OF ASTRONOMY
many years. The incoming rays do not penetrate our atmos-
phere down to the surface of the Earth. They collide with the
nuclei of the atoms of the terrestrial atmosphere, the collisions
being ofan extremely violent kind. Indeed collisions equivalentto even the mildest of them have been produced artificially in
the laboratory only during the last few years, by means of the
vast machines that have been built, notably at Brookhaven andat the Berkeley laboratory of the University of California. It
will still be many years before it is possible to simulate artificially
the most violent collisions of the cosmic rays with the atoms of
our atmosphere. As an outcome atomic nuclei are smashed
up and among the fragments are some particles that manageto penetrate down through the atmosphere to sea-level.
Among them are the now well-known evanescent mesons. It
was through these secondary particles that the earlier investi-
gators received evidence of the entry of cosmic rays into the
atmosphere.This will explain the numerous errors that have been made
in the identification of cosmic rays. It was first thought that
the cosmic rays consisted of radiation ofvery short wavelength,
y-rays. This view was shown to be wrong when it was found
that their intensity is not the same all over the Earth but is
related to the local form of the Earth's magnetic field. Radia-
tion would not have been affected by a magnetic field, so this
immediately showed that the cosmic rays must be mainlymaterial particles. The next idea was that the cosmic rayswere electrons moving with very high speeds, speeds close to
that of light itself. But after a time it was found that the effect
of the Earth's magnetic field is inconsistent with this view.
And with the accumulation of information concerning the
nature of the secondary particles it became clear that an
electronic component can be present only in very small pro-
portion, if at all. In the next stage it was then supposed that
the cosmic rays were almost entirely protons. Such was the
state ofaffairs at the end ofthe late war.
Physicists at a conference held in Cambridge in 1946scorned the suggestion that the cosmic rays probably contained
the nuclei of atoms other than hydrogen. The incredulity was
so great that nobody at the conference thought it worthwhile
258

COSMIC RAYS
to send up a balloon with photographic plates attached a
simple experiment that would at once have shown whether
or not the nuclei of heavy atoms such as oxygen and iron were
present among the incoming particles. In the event this experi-ment had to wait another two years before it was carried out
by Bradt and Peters at Rochester. The nuclei ofelements other
than hydrogen were immediately found.
An initial assessment of the new observations led to the
suggestion that the nuclei of all atoms are represented in the
cosmic rays in about the same proportion as they are found in
ordinary stars like the Sun. More recent work has cast serious
doubts on this, however. Rather does it seem that the nuclei of
the heavier atoms like iron, and of medium light nuclei like
oxygen, are over-represented as much as tenfold.
A very remarkable possibility arises out of this situation:
that at the time of their origin the cosmic rays consist entirely
of heavy nuclei. The argument takes the line that all the pro-
tons, helium nuclei, and other light nuclei now found in the
cosmic rays are the products of splintering of heavy nuclei in
collisions. It can indeed be shown that splintering does providea very plausible explanation of the observed distribution of the
nuclei among the cosmic rays. There is thus much to be said
in favour of the view that initially the cosmic rays are heavynuclei. It has been urged against this view that if the light
nuclei are splinter products then lithium, beryllium, and boron
ought to be fairly strongly represented among the cosmic ray
particles that enter our atmosphere. The experimentalists at
Rochester claimed for some years that this is not the case but
C. F. Powell and his colleagues at Bristol have confirmed the
presence of these particular nuclei. While the controversy onthis point may not be entirely settled the evidence seems to be
swinging in favour of the Bristol point of view. The evidence
while still not compelling is pointing very suggestively towards
the conclusion just indicated, that the real primary cosmic rayis the heavy nucleus.
A complete understanding of cosmic rays cannot be forth-
coming until we know how they originate. This was for longfelt to be a very deep mystery but an important step towards a
satisfactory theory was made by E. Fermi in 1949. The exist-
259

FRONTIERS OF ASTRONOMY
ence of magnetic fields in interstellar space is a basic supposi-
tion in Fermi's work,
A moving electric particle is deflected by a magnetic field.
The local magnetic field possessed by a cloud of interstellar
IO,OOQOOO,000,000,OOOPOO
ltOOQOOO,000,OOQpOQPOO
100.000,000,000,000,000
10,000,000,000,000,000
IPOQOOQOOOPOQOOO
100,000,000,000,000
10,000,000,000,000
1.000,000,000,000
ioqooo,ooopoo
10,000,000,000
ljOOO,OOC,000
100,000,000
10,000,000
ljOOO.000
Z 100,000o
10,000
1,000
100
10
I
High energy cosmic rays
low energy cosmic rays
nergy of electrons producing fhe radio wavej in rh Cassiooeii source (?)
Energy of an atom at the centre of a supernova
Energy of an atom in the explosion of an atomic bomb
Energy of an atom at the centre of a blue giant
Energy of an atom about one third in from the surface to the centre of the Sun
Energy of an atom in the Sun's corona
Energy of an atom near the top of the Solar chromosphere
Energy of an atom in the coolest stellar atmospheres
Energy of an atom IA the human body
FlG. 56.
gas is able to deflect the motions of charged interstellar par-
ticles, If the clouds were at rest these deflection processes, or
'magnetic collisions' as we may call them, would not alter the
energies of the particles. But if the clouds are in motion, and if
different clouds have different motions, the particles gain
energy as an outcome of the magnetic collisions. We are to
think of particles wandering around in amongst a whole group
260
COSMIC RAYS
of clouds, the clouds themselves moving with different veloci-
ties. The gains of energy in the magnetic deflections are madeat the expense of the motions of the clouds.
But although all charged particles thus tend to pick upenergy from the clouds, the great majority simply fritter their
gains away. This they do by colliding with each other, with a
resulting loss of energy by radiation, notably radiation in the
infra-red. Indeed only a tiny minority, those that are movingat very high speeds, manage to gain more from the magneticcollisions than they lose by colliding with other particles.
The next point is perhaps best explained with the aid of
Fig. 56. Each step in Fig. 56 represents a tenfold multiplicationin energy, the unit being taken as the average energy of motion
of the atoms in the human body. It is seen that even the so-
called 'low' energy cosmic rays possess much more energy than
any other atomic particle found in nature. The low energycosmic rays possess a million times more energy than the
particles at the centre of the Sun, for instance. Now we cometo a crucial question. At what level in Fig. 56 would an inter-
stellar particle gain more energy from magnetic collisions than
is lost by collisions with other particles? The answer dependson the nature of the particle. For protons and heavy nuclei
the required level lies in the region of the low energy cosmic
rays. For electrons the level is still higher in the diagram.Hence Fermi's ideas do not give a complete explanation of the
origin of cosmic rays. What is achieved is an explanation of
how still greater energies can be produced if low energy cosmic
rays are already present among the interstellar particles. It remains
then to discover the source of the low energy cosmic rays.
A likely possibility is that the low energy cosmic rays are
injected into the interstellar gas by stars. We have seen that onoccasion the Sun itself is a producer of cosmic rays. The rays
generated by the Sun belong to the lower part of the cosmic
ray distribution shown in Fig. 56. As they move outwards
from the Sun a small proportion are intercepted by the Earth
(and are hence detected) but the majority must travel out into
space where they augment the interstellar cosmic rays. Similar
processes on other stars, and in particular on stars having
stronger magnetic fields than the Sun, may very well be capable
261

FRONTIERS OF ASTRONOMY
of supplying the required low energy component of the cosmic
rays.
The main problem now extant is to find out the process
whereby the Sun and the stars produce their low energy cosmic
rays. Many attempts to discuss this problem have been madebut so far no satisfactory theory has emerged. My own im-
pression is that the most likely process is one that works in an
analogous way to the cyclotron invented by E. V. Lawrence.
The cyclotron was the first of the machines employed byphysicists for producing high energy particles in the laboratory.Its operation depends on a very careful adjustment between
a magnetic field and the oscillations ofan electric field. Unless
this is accurately maintained particles do not get driven to high
energies. Now several conditions have to be satisfied in order
to preserve the necessary adjustment. For instance the acceler-
ating particles must not be too numerous otherwise the driving
process becomes overloaded. This may explain why heavynuclei become accelerated and why protons and electrons do
not. The protons and electrons in the atmosphere of a star
are so very abundant that an attempt to drive them all would
surely overload the accelerating mechanism. Heavy nuclei,
particularly the very heavy nuclei, are much less numerous and
would accordingly satisfy this condition best,
The magnetic stars
Observational evidence from the magnetic stars (the ones
mentioned above with brightness some 50 to 100 times that of
the Sun, and with surface temperatures from about 8,000to 10,000 degrees) would seem to show that nuclei are
indeed accelerated in stellar atmospheres. In these stars
entirely anomalous abundances of heavy atoms are often
found. In particular the elements described by chemists as
the rare earths, of which the europium is an especially notable
example, sometimes occur in quite unusual concentrations.
Among medium heavy nuclei strontium is an important case.
To this we may add the elements manganese, chromium,
calcium, and silicon.
The best explanation of these exceptional abundances is
262

MAGNETIC STARS
one given by G. Burbidge, M. Burbidge and W. A. Fowler^
according to whom the most important nuclear process
occurring in stellar atmospheres is one of exchange between
neutrons and protons. A free proton collides with a heavynucleus and is absorbed by it, a free neutron being emitted
in its stead. The nucleus then returns to its original state bymeans of a j8-process. To promote reactions of this sort either
accelerated protons or accelerated heavy nuclei are required.
According to the above argument the electro-magnetic accelera-
tion of heavy nuclei must be considered the more likely of these
two possibilities.
The neutrons so produced do not remain free for very long.
They add themselves on to other nuclei in the atmosphere.
They may add themselves to protons producing nuclei con-
sisting of i proton and i neutron, namely nuclei of deuteriumas the isotope H 2 of hydrogen is called. The deuterium of the
Universe may well be produced in this way. The neutrons mayalso add themselves to nitrogen giving the unstable G14 dis-
cussed in Chapter 4. Addition of neutrons to other nuclei
turns out to have some strange effects. Oxygen can onlyabsorb i neutron. If it tries to absorb two it emits an He 4
nucleus and gets broken back to nitrogen. Neon and mag-nesium, on the other hand, tend to get built up into silicon but
no further. Sulphur and argon are built into calcium but nofurther. Neutrons added to the isotope Fe 54
(26 protons,28 neutrons) produce an excess of manganese and chromium.Neutrons added to still heavier nuclei produce the excesses of
such elements as strontium, the rare earths, and lead. We mayadd a most important point here. It seems possible that these
neutrons, released as a consequence of electro-magnetic
acceleration, may provide for the building of nuclei heavier
than zinc. The origin of such nuclei was briefly touched onin Chapter 12, where we saw that they occur in very low
abundances in the universe. The process of their formation
must accordingly be a marginal one. Here we have a marginal
process that may be added to that discussed on page 206.
The proton-neutron exchange process described above
depends on the collison of the protons and heavy nuclei not
being too violent. In cases of great violence the heavy nuclei,
263

FRONTIERS OF ASTRONOMY
instead ofemitting a free neutron, will tend to splinter, emittinga whole number of fragments. Such spalation reactions havebeen studied in the laboratory and are known to yield nuclei
of the light elements, lithium, beryllium and boron. This is
probably the process by which these particular light nuclei
originate in the Universe.
The strange properties of these stars are enhanced by the
variability of many of them. It is found that in some cases the
magnetic fields change cyclically with time. Two explanationshave been proposed by H. W. Babcock. One requires a
genuine oscillation of the whole magnetic field of the star, suchas might arise from a mechanical oscillation of the star itself.
The second explanation is much simpler. The field of an
ordinary magnet can be varied by turning the magnet round.The second suggestion is that the cyclic variations of magneticfield in the stars in question arise in a similar way, the stars
acting like magnets that are turned round and round byrotation.
The work ofArmin Deutsch has gone far towards establishingthe correctness of the second of these two suggestions. Thestraightforward way to show this is to measure the times of
rotation of the stars and to compare the result with the times of
variation of their magnetic fields. If the two always agree thenthe evidence for a connection between the rotation and thevariation of magnetic field becomes very strong. This has beendone by Deutsch who has been able to show an identity of the
rotation period and the magnetic period in many cases. Oneor two stars show unusual features but the agreement is im-
pressive for the great majority of them.
Radio-astronomy
Our atmosphere provides a protective skin around theEarth. Besides supplying the air that we breathe, it shields usfrom all harmful radiations, particularly from y-rays, X-rays,and ultra-violet light. But nothing is quite perfect in life, for
this shielding is a great nuisance to the astronomer. It forces
him to study the Universe in very limited ranges of wavelength.Indeed only two ranges of wavelength penetrate more or less
264

RADIO-ASTRONOMY
freely down through the atmosphere. One is that of visible
and near infra-red light, and the other is the radio-band.
Until very recently astronomy had concentrated entirely on
optical studies on the visible light. The aim of radio-
astronomy is to extend our studies of the Universe to the radio-
band. Already in less than ten years so many new and entirely
unexpected results have appeared that one cannot help
wondering what aspects of the Universe might not be revealed
if the whole range of wavelengths (set out in Chapter 3) were
available for analysis. More and more astronomers are comingto think of remedying the defects of our present situation bymaking observations from above the atmosphere. It may be
beyond present-day technical resources to mount a radio-
controlled telescope on an artificial satellite moving round andround the Earth (completing a circuit every hour and a half)but it will surely not be beyond the resources of a future
generation to do so. It is a reasonable prophecy that future
developments will be directed more and more towards instru-
ments that operate from positions located either high up in
the atmosphere, or outside it entirely.
Radio-astronomy is conveniently discussed at this stage,
because the preceding parts of the present chapter contain
ideas that are important in radio-astronomy. The emission
of radio-waves by cool hydrogen clouds has already been dis-
cussed in Chapter 13, so that we shall now be concerned with
other features of the subject. It will be useful to give a list of
the other known sources of radio-waves:
(i)the Sun;
(ii)clouds ofhot hydrogen distributed along the Milky Way;
(iii)an emission extending outside the plane of the Milky
Way but still coming from the Galaxy;
(iv) discrete sources of exceptional power within the
Galaxy;
(v) discrete sources outside the Galaxy;
(vi) an emission from the central regions of the Galaxy.
These sources all differ in a very crucial respect from the
emission by cool hydrogen. It will be recalled that the emission
265

FRONTIERS OF ASTRONOMY
by cool hydrogen occurred at a definite wavelength of about 21
centimetres. In all the present cases, emission occurs at everyradio wavelength. In terms of an analogy, we have the differ-
ence between striking a single note on the piano and depressingthe whole keyboard simultaneously.The present chapter will be confined to items (ii), (iii), (iv),
and (vi), leaving (v) to be discussed subsequently. Item (i)has
already been considered in an earlier chapter.The observed distribution of intensity with wavelength is
quite different in (ii) from what it is in (iii), (iv), and (vi). This
contrast is shown in Fig. 57. The difference presumably arises
from a marked dissimilarity in the mode of origin of the
emission. It will be our main concern to trace what these
modes of origin are. This is done more easily for (ii) than for
(iii), (iv), or (vi). For simplicity we shall therefore consider
(ii) first, even though this is perhaps the least important case.
Radio emission
A large proportion of the light emitted by stars high on the
main-sequence is absorbed in surrounding interstellar gas, the
absorption often serving to break the connection of the electron
and proton in the hydrogen atoms of which the gas is mainly
composed the photo-electric effect again. After ionisation has
occurred the protons and electrons are left free to wanderaround independently. In their wanderings the particles often
collide with each other that is to say they approach each other
comparatively closely. Sometimes when this happens theybecome attached together again. Visible light may then be
emitted. It is indeed through such recombinations that we can
see the high temperature clouds of hydrogen. More usuallyhowever the colliding electrons and protons do not recombine.
The radiation then emitted is not confined to any particular
range of wavelength. Ultra-violet light, and blue, green,
yellow, and red visible light is emitted, and infra-red also, andradio-waves. The fact that radio-waves are emitted in this waywas first pointed out by Henyey and Keenan.
It has only been in the last year or so that radio emission bythe hot hydrogen regions of the Galaxy has been detected.
266

RADIO-ASTRONOMY
IQOO
1.0
Wovtlenoth in metres
FIG. 57.

FRONTIERS OF ASTRONOMY
Ryle and Scheuer have detected what seems to be a generalemission along the plane ofthe Milky Way. In their experimentthere was no question of observing single clouds but of an
averaging together of many regions of hot hydrogen. Still
more recently Haddock, Mayer, and Sloanaker of the Naval
Research Lab., Washington, have managed, using a wave-
length of 9.4 cm., to distinguish individual clouds. Two clouds
that have now been detected in this way are the Orion Nebulashown in Plate XI, and the Trifid Nebula shown in Plate
XXXIV.We now turn our attention to a quite different mode of
emission, that associated with the items (iii) and (iv) listed
above. We can perhaps do this best by considering (iv) first.
The Crab Nebula (Plate XXVIII) is an example of an impor-tant discrete source within the Galaxy. The Crab is situated in
the constellation of Taurus. It is indeed the Crab that acts as
the source for investigating the Sun's far corona (see Chapter 7).
The discrete sources are vastly more powerful emitters than
the hot hydrogen clouds. A careful investigation by Green-
stein and Minkowski has shown that the emission from the
Crab Nebula is about 100 times stronger than anything that
can be explained in terms of the emission by the collisions of
wandering electrons and protons. And the Crab Nebula is not
by any means the strongest of the exceptional radio sources
that have been observed. An exceptionally intense source
situated in the constellation of Cassiopeia radiates at a rate
that approaches a million times what might be expected from
a hot hydrogen region.A photograph of this source is shown in Plate XXXV, It
appears as a large number of small filaments. Baade and
Minkowski have shown that these filaments are moving in a
most astonishing fashion. The sharply defined elements are
found to be approaching us at speeds up to about 200 kilo-
metres per second. The more diffuse filaments yield velocities
very much higher than this, however. They are sometimes
moving towards and sometimes away from us, the variation
between the most rapid velocity of approach and the most
rapid velocity of recession exceeds the enormous value of
4,000 kilometres per second. Even within a single filament
268

RADIO-ASTRONOMY
variations of velocity of several thousand kilometres per second
are found.
No completely convincing suggestion has yet been given of
the origin of such a curious object. A clue is perhaps to be
obtained from the radio data which shows that the emission is
not by any means confined to the visible filaments but comesfrom a region ofwhich the filaments are only a part. A possible
explanation of the whole phenomenon was mentioned to me
by Baade. This explanation is based on the supernova explosionas the most likely source of a considerable quantity of material
moving at speeds of several thousand kilometres per second.
The idea is that material from a supernova may be colliding
with a dark cloud of gas and dust, the material from the super-nova being on the far side of the cloud where we do not see it
(because of the obscuring effect of the dust) except in placeswhere it is spilling over the edge of the dark cloud.
It is to be expected that magnetic fields play an important
part in controlling the motion of the filaments of Plate XXXV.If we accept the Davis-Greenstein value for the strength of the
general interstellar magnetic field we must also accept the view
that still more intense fields arise when two clouds of gasescollide violently with each other, since it is to be expected that
a considerable compression both of material and magnetic field
will occur in the region of collision. The intensity in such asituation may rise to about one-thousandth of the field at the
poles of the Sun. With a magnetic field of this order and with
the very large velocities that are observed in the strong radio
sources, it seems possible to explain the manner of emission of
the radio-waves. The theory now to be outlined follows alonglines suggested in 1950 by H. Alfvn and N. F. Herlofson.
The exceptionally high velocities play an important part.
They serve to accelerate electrons by a process of magnetic
collisions, a process similar to that proposed by Fermi for
generating the high energy cosmic rays. The electrons so
accelerated then emit radio-waves as they move in the magneticfield. The details of the emission are well known from labora-
tory observations of high speed electrons. The situation is
that for electrons accelerated to the low energy end of the
cosmic ray distribution, and for magnetic fields of the strength
269

FRONTIERS OF ASTRONOMY
considered above, emission of radio-waves occurs at what
(cosmically speaking) is an extremely rapid rate.
The requirement oflarge velocities (in order that the accelera-
tion ofelectrons shall take place) seems to fit the results ofBaadeand Minkowski very well indeed. It has been found that all the
strong radio sources contain gaseous masses with rapid internal
motions. This is the case for example in the Crab Nebula whererandom motions of about 300 kilometres per second are found.
The implication of the theory is that unless such motions exist,
electron acceleration does not take place, and unless electrons
with cosmic ray energies (at the low end of the distribution)
are produced no strong emission of radio-waves can take place.
All this would suggest that the recipe for producing a strongcosmic radio transmitter is really a very simple one. It con-
sists in taking a cloud of gas and in stirring it up with sufficient
violence. We shall see in the next chapter that this recipe holds
good when we pass from strong radio sources within our own
Galaxy to sources outside the Galaxy.All this does not exhaust the radio-waves received from
our Galaxy we still have to consider items (iii) and (vi)
listed above. It used to be thought that the general radiation
within our Galaxy came from scattered stars. Recently this
view has been called into some question. Rather does it seemas if energetic electrons may be the source of the waves justas they are in the powerful discrete sources. But the electrons
cannot be strongly concentrated in special clouds otherwise
these clouds would be detected by the radio-astronomers as
discrete sources. Possibly the electrons are produced in special
regions, such as that of the Cassiopeia source, and then manageto escape out of their parent clouds thereby coming to form a
general galactic stratum of emitting particles.
Perhaps we should add a remark by way of conclusion, onthe intensities of cosmic radio sources. A terrestrial radio
transmitter is reckoned to be fairly powerful if its output is as
high as 1,000 kilowatts. The output of the strange source in
Cassiopeia is some 100,000,000,000,000,000,000,000 kilowatts.
As sources go within the Galaxy this is an intense one. But as
sources go in the Universe it is quite modest. We shall meetstill more powerful radio transmitters in the next chapter.
270

CHAPTER SIXTEEN
The World of Galaxies
The Local Group
In the last three chapters we have considered the structure
of our own Galaxy. From time to time we have mentioned the
Andromeda Nebula, M 31 (Plate XXI), and several smaller
systems of stars such as the Magellanic Clouds (Plates XXIIand XXIII) . It is now ourpurpose to pass from these particularcases to a study of galaxies in general their distribution in
space, their physical forms, their internal properties.
It used to be thought twenty years ago that the majority of
galaxies were quite separate from one another, that only a
minority were members of clusters. In recent years there has
been a marked swing of opinion towards an opposite point of
view, for it is now believed that the normal state of affairs is
for a galaxy to belong to a cluster. Lone galaxies arise onlywhen they happen to be ejected from clusters, as galaxies do
from time to time. A recent survey carried out by C. D. Shane
and C. A. Wirtanen at the Lick Observatory, and analysed by
J. Neyman and E. L. Scott, and C, D. Shane, lends strong
support to this point of view.
Our own Galaxy is a member of a cluster, known as the Local
Group. The other main member is M 31, the great galaxy in
Andromeda. The next most notable number is M 33, found in
the constellation ofTriangulum and shown in Plate XXXVII.In all 19 members ofthe Local Group are known. They occupya region of space about i million parsecs in diameter, with our
Galaxy and the Andromeda Nebula on opposite sides of the
centre. M 33 is a considerably smaller system than either of
these two main monsters and many of the other members of
the Local Group are considerably poorer systems still. After
M 33 the only two that contain many highly luminous stars
271

FRONTIERS OF ASTRONOMY
stars high on the main-sequence and supergiants are the
Large Magellanic Cloud and the system NGC 6822 (althougha few rather bright stars are found in the Small Magellanic
Cloud), The weakest systems are those to be found in the con-
stellations of Draco, Sculptor and Fornax, which are not a
great deal brighter in their total light than a globular cluster.
Indeed as we shall come to see, poor systems of the Draco typeare probably formed in the same process as that which gives
rise to globular clusters. Intermediate systems are those of the
satellite galaxies of the Andromeda Nebula, catalogue numbersM 32 and NGC 205, which are shown on Plate XXL CompareM 32 and NGC 205 with the weak system of 1C 1613 shownin Plate XXXVI. It is seen that M 32 and NGC 205 are muchmore concentrated, the weak system being very 'loose'.
Because of their comparative nearness, because our Galaxyis immersed in the Local Group, the other members appearscattered over the sky; some such as the Andromeda Nebula
being visible from the N. hemisphere of the Earth, and others
such as the Magellanic Clouds being visible in the S. hemi-
sphere. Because of the obscuration produced by the dust lying
along the plane of the Galaxy any faint members of the Local
Group that happened to lie in directions along the Milky Waywould probably escape detection. It is possible that the Local
Group possesses three or four faint members that have not
been observed for this reason.
It should now be said that the Local Group of galaxies is
a bound system. Just as the planets are bound to the Sun andmove together with the Sun around the centre of our Galaxy,so the galaxies of the Local Group are to be considered as a
single connected physical system. The relevance of this remarkwill become much clearer when in a later chapter we come to
consider the expansion of the Universe. The Local Group is
not expanding.A word may also be said about the total amount of matter
in the Local Group. Outstanding contributions come from the
Galaxy andM 3 1 . Between them these two monsters contribute
about 400,000 million times more material than is present in
the Sun. But the volume occupied by the Local Group is so
vast that even this enormous mass of material if it were spread
272

THE WORLD OF GALAXIES
uniformly through the Local Group would yield only the
minute average density of some 60 parts in a million million
million million million of the density of water.
The distribution ofgalaxies in space
Next beyond the Local Group come a few other small
clusters of galaxies, in one of which the beautiful spiral M 8 1
(Plate XXIV) is particularly outstanding. M 81 is at a dis-
tance of about 2,500,000 parsecs. The first of the great clusters
is reached at a distance of about 10 million parsecs.* This is
the huge cloud found in the constellation of Virgo, the cloud
shown in Plate XXXVIII. A particularly important individual
member is shown in Plate XXVII. The Virgo cloud contains
upwards of 1,000 visible galaxies. It may also contain a largenumber of systems like those of Fornax and Sculptor which
would be far too faint to be seen.
Although the Virgo cloud is incomparably richer than the
Local Group, it is not a great deal bigger. The Virgo cloud is
about twice the size of the Local Group.
Beyond the Virgo cloud large numbers of clusters can be
distinguished. Because of their relation to the discussion of
later chapters a few of them will be mentioned explicitly. In
Plate XXXIX we see the central regions of the Comacluster, a cluster also with upwards of 1,000 members. Owingto the increased distance the galaxies of this cluster appearsmaller than those of the Virgo cloud, although of course in
actual size they are much the same. The Coma cluster, one
of the richest of all known clusters, is probably at a distance
of about 50 million parsecs. This distance is much beyond the
range of the methods of measurement discussed in previous
chapters. How such very great distances are inferred will
form a topic of discussion in a later chapter.Another special cluster, that in the constellation of Corona
Borealis, is at the even greater distance of about 150 million
parsecs. This is shown in Plate XL. At still greater dis-
tances the number of clusters is very great, so that only one* The estimates of very large distances given in this book are rather un-
orthodox, being greater than the values that are usually quoted. My reasonsfor accepting the present values are given in Chapter 19.
273 x

FRONTIERS OF ASTRONOMY
or two representative cases can be mentioned. One that has
played an important part in astronomical measurements is
shown in Plate XLI. This lies in the constellation ofHydra at a
distance of some 400 million parsecs. By now the distance is so
great that the structural details of the galaxies can no longerbe distinguished, by now we must identify a galaxy either on
the basis ofa fuzziness of outline or of a lack of spherical shape.Even the galaxies shown in Plate XLI are not the most
distant that can be photographed with the 2OO-inch Hale
reflector. What a galaxy looks like near the ultimate limiting
distance to which the 2OO-inch telescope can penetrate is shownin Plate XLIL To assist the identifications bracketing marks
have been drawn on the plate. It is seen that there is no
shortage of these very distant galaxies. Indeed when the limit
of faintness is reached more galaxies can be seen on manyplates than can stars of our own Galaxy. The faint galaxies
shown in Plate XLII are probably at distances of about 1,000million parsecs, or about 20,000,000,000,000,000,000,000 miles
away. Somewhere between 100 and 1,000 million galaxies can
be seen with the 2OO-inch telescope. The total number of
galaxies within 1,000 million parsecs must, however, be much
greater than this. We have seen that our Local Group contains
19 identified members. Yet only six or seven of them could
be seen at a distance of 10 million parsecs, and only two could
be seen at distances approaching 1,000 million parsecs; these
being our Galaxy and the Andromeda Nebula.
From what has been said it will be realised that there is a
considerable variability between different clusters. Some,
probably the majority, are rather poor specimens like the
Local Group. Others are extremely rich like the Comacluster. An astronomer's life might be more interesting if welived in the Coma cluster, but perhaps we should then get a
somewhat false impression of what the average situation in the
Universe is like.
The structuralforms ofthe galaxies
Next we shall consider the forms of the galaxies. The basis
of the present discussion will be a system of classification intro-
274

THE WORLD OF GALAXIES
duced by Hubble. We first distinguish cases in which no dust
clouds are observed. These can be fitted into the elliptical
sequence shown in Fig. 58. It will be seen that the polardiameter remains much the same along the entire sequence.Different degrees of rotation cause the differences in the
equatorial diameter. For instance an Eo galaxy would be
changed to the elongated form of an 7 galaxy if it were
endowed with a sufficiently rapid rotation. The polar diameter
often has a length of about 1,000 to 1,500 parsecs, while in a
galaxy of type 7 the equatorial diameter may be as great as
5,000 parsecs. Galaxies fitting into the scheme of Fig. 58 are
called elliptical galaxies. The two satellites of the AndromedaNebula (Plate XXI) are elliptical galaxies. Other examples are
shown in Plate XLV.
"O
^6 El
FIG. 58. The elliptical sequence. The members Ei, 3 and 5are not shown.
When we turn to galaxies that contain dust clouds we find
a curious situation. Dust is scarcely ever found in the central
regions but only in a flattened outer part. The nucleus of such
galaxies if taken by itself could very well be classified in the
sequence of Fig. 58. The nucleus of the Andromeda Nebula
might be classified as an elliptical galaxy of perhaps type 3.
It almost seems as if galaxies containing dust consist of two
parts, a central nucleus of the elliptical type with an outer disk
attached. A case where it is difficult to resist the impression
275

FRONTIERS OF ASTRONOMY
that we are looking at just such a two-part system is that of the
'sombrero hat', the galaxy NGC 4594 shown in Plate XXV.The nucleus in this case would correspond to an elliptical
nebula of about type 3. This plate illustrates the important
point that dust is a constituent of the disk, not of the nucleus.
Where the disk comes in front of the nucleus the light from
the nucleus is blotted out by a great equatorial band of obscur-
ing material.
When a galaxy possesses an outer disk, spiral arms are almost
invariably observed. In cases where the nucleus is very largeand the disk comparatively small, as in NGC 4594, the galaxyis said to be of type Sa. Galaxies with disks are referred to as
'spirals' to distinguish them from those without disks the
ellipticals. The letter S in the designation Sa denotes a spiral
(i.e. a galaxy with a disk) and the small letter a denotes the
fact that the nucleus is really the dominant feature.
The spiral galaxies possess a sequence. This is not determined
so much by rotation as by the dominance or otherwise of the
nucleus. The Sa galaxy typified by NGG 4594 has a thoroughlydominant nucleus. At the other extreme, galaxies of type Sc
have extensive disks and spiral arms and only minor nuclei
glorified globular clusters as they have been called. Themember M 33 (Plate XXXVII) of the Local Group is an
example of an Sc spiral. Another example is shown in Plate
XLVII. This is the 'whirlpool' galaxy, M 51.
There is an intermediate type of spiral denoted by Sb in
which the nucleus and the disk are both well represented. TheAndromeda Nebula (Plate XXI) and M 81 (Plate XXIV)are examples of Sb galaxies. Our own Galaxy is also probablyof type Sb.
When we look at such photographs as those of the galaxies
NGC 4594 and MSI it is difficult to resist the impression that
the outer disk has grown out of the nucleus. One is insistently
reminded of the magnetic effects discussed in connection with
the origin of planets, in which a disk of gas is pushed awayfrom the Sun by a magnetic twisting process. The discussion
given in the previous chapter in favour of the existence of a
strong magnetic field in the disk of our own Galaxy adds pointto this view. At a later stage we shall consider whether the
276

THE WORLD OF GALAXIES
whole phenomena of spiral arms may not have its roots in the
action of magnetic fields.
It must now be said that while this classification into E andS galaxies deals with most of the cases that are actually
observed, it does not include every known galaxy. We haveseen that in the Local Group the majority of systems are veryfaint objects such as the system of 1C 1613 shown in Plate
XXXVI. These loose systems are so feeble that even thoughthey may be the most frequent type of galaxy only those of our
Local Group can be observed. These systems have the appear-ance of weak elliptical galaxies that have not yet managed to
take up the concentrated forms shown in Fig. 58, In the
following chapter we shall see that all galaxies may at one time
have been in a similar loose condition but that in systems
containing much more material and many more stars than is the
case in 1C 1613 a process of concentration has occurred to
produce the E and S galaxies.
In addition to the probably very numerous weak loose
systems, there are two other groups of galaxies that fall outside
the classification so far discussed. One is the class of irregular
galaxies. The Magellanic Clouds are examples. Others are
shown in Plate XLV. Although they are rather displeasing to
the eye, we must realise that these irregular galaxies are not
loose formless structures like 1C 1613. They contain dust,
which the loose systems apparently do not, and they are
characterised by a bar-like feature. This has suggested to manyastronomers that the irregular galaxies may have a connection
with the second group that falls outside the above classification.
This second group is denoted by the letters SB, S for spiral, andB for a barred characteristic.
The general forms of the SB galaxies are in many wayssimilar to those of the S galaxies but whereas the spiral arms
of the S galaxies emerge directly from the nucleus, in the SB
galaxies the spiral arms emerge from a bar that extends across
the nucleus, as in Plate LVI. Just as the S galaxies possess the
subdivision Sa, Sb, Sc, so the SB galaxies possess the sub-
divisions SBa, SBb, SBc, with the same connotation of decreas-
ing importance of the nucleus. This is illustrated in Plate
XLVIII. A very odd feature of these barred spirals is that their
277

FRONTIERS OF ASTRONOMY
nuclei often contain an inner set of spiral arms. This is perhapsthe most puzzling of all the problems that are raised by the
observed shapes of the galaxies.
The difference between elliptical and spiral galaxies
Why do some galaxies possess an outer disk and others not?
An important step towards answering this query has been
made by Baade and Spitzer who point out that one galaxymust collide with another from time to time. Galaxies moveabout relative to each other. The galaxies of a cluster movearound inside the cluster and may collide with one another.
The effect of a collision is not so drastic as might be thoughtat first sight. The stars of one galaxy do not hit the stars of the
other, because interstellar distances are very large compared to
the sizes of the stars themselves. Think of the stars as ordinaryhousehold specks of dust. Then we must think of a galaxy as
a collection of specks a few miles apart from each other, the
whole distribution filling a volume about equal to the Earth.
Evidently one such collection of specks could pass almost freely
through another.
This free interpenetration does not hold good, however, for
any gas that the two galaxies may contain. Gas clouds of one
galaxy must collide violently with gas clouds of the other. Suchcollisions produce high temperatures within the gas. Indeed if
the velocity of collision is large enough the temperature mustbecome so high that a considerable proportion of the gas gets
evaporated entirely away from the parent galaxies. What maybe an actual collision of two galaxies in progress is shown in
Plate XLIX.We can now relate the elliptical and spiral galaxies. We
say that all galaxies at the time of their birth possess the meansof developing into spiral galaxies, they possess a nucleus and a
residue of gas that could grow into an outer disk. But because
of collisions several alternative lines of evolution arise. First
a galaxy might lose its gas through collision before any disk
developed, in which case an ordinary elliptical galaxy wouldbe produced, belonging to the sequence Eo to Ey of Fig. 58.Second a galaxy might suffer a collision after an outer disk
278

THE GREATEST RADIO TRANSMITTER
had developed. In such a case we would expect to find a
structure similar to NGC 4594, but without the dark band of
the sombrero the collision of the gas would also strip out the
dust, since the dust is mixed with the gas. Such galaxies are
known. They were classified by Hubble as So galaxies. It
was indeed just the existence of So galaxies that led Baade and
Spitzer to suspect the importance of collisions between galaxies.
The third possibility is that a galaxy does not suffer a collision
at all in which case it retains its gas, a disk grows, and the
galaxy becomes a spiral.
An observational test can be applied to these ideas. Weshould expect fewer spirals in proportion to ellipticals in those
places where collisions are frequent. This expectation agreeswith observation. A low proportion of spirals is found near
the centres of dense aggregations such as the Coma cluster,
where collisions must be comparatively frequent. The pro-
portion of spirals increases quite markedly towards the outside
of the dense clusters. This is also in accord since the probabilityof a galaxy suffering collision is much less in the outer partsof a cluster than it is in the much more congested central
regions.
The greatest radio transmitters in the Universe
When two galaxies containing large tracts of gas inter-
penetrate each other the motion of the colliding gas masses
must be unprecedentedly violent. Remembering the con-
clusion reached from our discussion of the origin of radio-waves
emitted by the intense sources within our own Galaxy (it will
be recalled that violent gaseous motions were thought to be
the recipe for producing an intense radio source), we may expectan outstandingly strong radio emission from colliding galaxies.
This agrees with observation, for the most powerful knownradio emission comes from two distant colliding galaxies in
the constellation of Cygnus. These galaxies being at greatdistance are faint objects even when seen in a large telescope.
They are the ones shown in Plate XLIX. The identification
of these galaxies as the most powerful known source of radio-
waves came about partly from the radio observation of F. G,
279

FRONTIERS OF ASTRONOMY
Smith and partly from the optical investigations of Baade andMinkowski.
The emission of radio energy by these galaxies is rather
greater than their emission of visible light, a situation that no
one would have guessed to be possible only a few years ago.The radio power output of the Cygnus galaxies amounts to
about 1,000,000,000,000,000,0005000,000,000,000,000 kilowatts.
Other examples of encounters between galaxies are knownbut none so extreme as the Cygnus case, probably because the
Cygnus case represents the head-on collision of two excep-
tionally large spirals like ours and the Andromeda Nebula.
When an elliptical galaxy collides with a spiral the gas that is
present in the latter certainly gets a fair measure of stirring up,sufficient to make it a moderately strong emitter but nothinglike the situation that arises when both galaxies are spirals,
both containing large quantities of gas. The case shown in
Plate LI is probably an example of the collision of an elliptical
galaxy and a spiral galaxy.
Quite apart from radio emission arising from collisions
between galaxies a much weaker emission of radio-waves
occurs in other galaxies, just as it occurs in our own. Anobserver in the Andromeda Nebula could detect the radio
emission from our Galaxy and in a like manner an observer in
our Galaxy can detect the Andromeda Nebula. This was in
fact first done by Hanbury-Brown and Hazard at the Universityof Manchester. This work followed the discovery by Ryle at
Cambridge ofwhat were at one time called 'radio stars'. These
were discrete sources of radio-waves identified in various placesin the sky. The first survey revealed about 50 such sources.
The first discrete source to be identified was that of the Crab
Nebula, the identification being due to J. G. Bolton. TheAndromeda Nebula was next identified by Hanbury-Brownand Hazard. Then Ryle soon added about four more galaxiesas identified sources.
Three or four years ago there was serious uncertainty about
the nature of the majority of the 50 or so discrete sources then
known (by now the work of Ryle has increased this number to
about i,800). It was first suggested that they might be very
nearby unidentified objects within our own Galaxy hence the
280

THE TWO TYPES OF STAR
now discarded term of 'radio stars'. The approximate uni-
formity of their directions (they were found more or less
equally in all directions) precluded any distant sources within
our own Galaxy, since such sources would be distributed alongthe Milky Way not uniformly over the sky. A drastic alterna-
tive to the purely local radio star hypothesis was proposed byGold even before the identification of the Andromeda Nebula.
He argued that the uniformity of directions could equally well
be explained if most of the sources were very far off, far outside
our Galaxy, and he proposed for consideration the view that
the majority of the discrete sources were simply galaxies other
than our own. The balance of evidence now favours this inter-
pretation.
After this historical digression let us return for a brief
moment to the ordinary galaxies as emitters of radio-waves
not the colliding galaxies. By now a considerable number of
nearby galaxies have not only been identified but several of
them have had their rates of emission accurately measured. Acurious situation emerges. So long as we keep to Sb and Sc
galaxies there seems to be a simple proportionality between
the emission of radio energy and the emission of visible light: if
one galaxy emits x times as much visible light as the other then
it also emits x times the amount of radio-waves the two
keeping step together. This relationship holds good for M 31
(Plate XXI), M 81 (Plate XXIV), and M 51 (Plate XLVII).
The two types of stars
We come now to important new concepts that we have been
skirting around for some time. The main idea can be put very
briefly. The stars in the elliptical galaxies and the stars in the
nuclei of the spirals are old stars like the stars of the globularclusters. In contrast, the highly luminous blue giants and super-
giants are young stars. Young stars are found only in the arms
of the spirals.
This discovery due to Baade cleared up a serious difficulty.
Until 1944 it had not been possible to distinguish any individual
stars in the nucleus of even the comparatively close Andromeda
Nebula, although individual stars had been resolved by Hubble
281

FRONTIERS OF ASTRONOMY
in considerable numbers in the spiral arms. This was a curious
situation, particularly as much of the light ofM 31 comes from
the nucleus.
When in 1944, equipped with a new type of photographic
plate specially sensitive to red light, Baade succeeded in
resolving the individual stars in the nucleus ofM 31 it became
plain that the puzzle lay in differences between the stars of the
nucleus and the stars of the spiral arms. To emphasise their
differences Baade called the latter 'stars of Type F and the
former 'stars of Type II'. The elliptical galaxies, globular
clusters, and the nuclei of the spiral galaxies are of TypeII, while the stars in the arms of the spiral galaxies are of
Type I.
A more detailed understanding of the situation can be got
by returning to Fig. 16 where a schematic evolutionary
sequence for the stars of the globular clusters is shown. Thestars of the elliptical galaxies and of the nuclei of the spirals are
believed also to follow much the same sequence. At the greatdistance ofM 31 the only stars that Baade could distinguish in
the nucleus were those in the upper part of the giant sequencenear the point C of Fig. 16. In contrast to this situation for
the nucleus, the stars that Hubble had previously been able
to distinguish in the spiral arms of M 31 belong either very
high on the main-sequence in the territory of the blue giants or
to the region of the supergiants. They were all extremelyluminous stars, considerably brighter than the stars at G of
Fig. 1 6.
It may be wondered how we can be sure that the stars of the
nucleus ofM 31 follow much the same sequence as the stars of
the globular clusters when only the tip of the M 31 sequencewas thus detected. Part of the answer is that Baade has found
that when the stars of the nucleus ofM 31 become separately
distinguished, so do the stars lying in the globular clusters that
belong to M 31. No important difference between the resolved
stars of the nucleus of M 31 and of the associated globularclusters can be found. A second argument in favour of the
uniformity of the star distributions of Type II comes from the
two elliptical galaxiesM 32 and NGC 205, the satellites ofM 31 .
The brightest stars of these satellite galaxies are indistinguish-
282

THE TWO TYPES OF STAR
able both in brightness and in colour, from the resolved stars
of the nucleus ofM 31.
The same situation holds for the Fornax galaxy which
possesses three associated globular clusters: the resolved stars
of the Fornax system are closely similar to the stars of the three
globular clusters. The agreement now becomes more complete,because the Fornax system is appreciably nearer to us than the
Andromeda Nebula and can therefore be resolved down to
intrinsically fainter stars more of the evolutionary sequenceof the stars can be distinguished, not just the tip of the sequenceas in the case ofM 31.
The Large Magellanic Cloud contains a predominantly
Type I population but the Small Cloud contains both Type I
and Type II stars. The Small Cloud also possesses globularclusters. It accordingly provides an ideal place to test the
similarity of the Type II sequences in globular clusters and in
galaxies. Indeed the Small Cloud is sufficiently near to us for
the identity of the two sequences to be established nearly downto their junction with the main-sequence, i.e. down to about
the point A of Fig. 16. An even more comprehensive identifi-
cation could come from an analysis of the stars in the nucleus
of our own Galaxy. This is a somewhat ticklish project since
observations towards the centre of the Galaxy must of necessitybe made through dust clouds. But in the opinion of such an
experienced observer as Baade the practical difficulties of such
a project can be overcome.
The upshot of our present discussion is that there are two
populations of stars, those of Type I belonging to the arms of
the spiral galaxies, and those of Type II belonging to the
elliptical galaxies, the globular clusters, and the nuclei of the
spiral galaxies. Now what is the physical basis of this classifica-
tion into two stellar populations?The outstanding point is that all stars of Type II are old
stars. In an earlier chapter we saw that the globular clusters
in our Galaxy are probably older than 4,000 million yearsand younger than 8,000 million years we saw that 5 or 6
thousand million years was about the most likely estimate.
Other Type II stars are similar enough to the globular cluster
stars for us to be sure that they all possess a comparable
283

FRONTIERS OF ASTRONOMY
antiquity. The Type I stars, on the other hand, are not all old
stars. A Type I population contains stars of variable ages
ranging from stars like the Sun, which with an age of about
4,000 million years is almost as old as the Type II stars, to
stars high on the main-sequence with ages of not more than
a few million years.
The reason why a Type I population contains both old and
young stars is clear. The arms of spiral galaxies contain clouds
ofgas and dust that are always available for the making ofnewstars. It is out of these clouds that the highly luminous stars
we observe in the spiral arms have recently been born. In
contrast the elliptical galaxies, the globular clusters and the
nuclei of the spirals do not contain gas and dust and conse-
quently no new stars are being born there.
An interesting and important inference is that the exhaustion
of the supplies of gas in the nuclei of the spirals, in elliptical
galaxies and in the globular clusters must have become almost
complete at an early phase oftheir histories. Gas must originally
have been present in order to form the Type II stars themselves
but the gas did not persist in any great degree after the Type II
stars were formed. This suggests that in the early history of a
galaxy there was something of the nature of a star-forming
catastrophe. In the earliest phase of the history of a galaxy all
the material presumably was gaseous. But the gas did not
condense into stars steadily. Rather was there one process in
which stars were produced wholesale. In the case of a galaxysuch as our own or the Andromeda Nebula this wholesale
process must have yielded not only the stars that now make upthe nucleus but also the stars of the globular clusters and those
of the huge halo enveloping the whole system. The stars of the
halo ofour Galaxy (see Fig. 26) are also stars ofType II.
More about the origin of the elements
There is a further difference between the two types of star,
one that is often used for distinguishing them. Stars of Type I
contain an appreciably higher proportion of metal atoms than
those of Type II. This difference was first found by Schwarz-schild and Spitzer, whose observational work on this question
284

THE ORIGIN OF THE ELEMENTS
has recently been extended by Greenstein, who finds that the
difference in metal content may be as much as a factor of 20.
The Sun as a Type I star contains about J per cent by mass in
the form of metals. Greenstein finds Type II stars in which
the metal content may be as little as T&J of a per cent.
The method of establishing this depends on observations of
nearby stars of our own Galaxy. Stars of the halo move in
orbits that occasionally take them through the disk of the
Galaxy. We may expect that a small number of such stars
may be plunging through the part of the disk in the neighbour-hood of the Sun at the present time. These visitors from the
halo can be recognised from the high velocities with which
they appear to be moving: their orbits around the centre of the
Galaxy are not at all similar to that of the Sun, or to those of
the other stars that belong to the disk of the Galaxy, so that
the difference of velocity between a halo star and the Sun is
usually very large. The visitors when so distinguished are
found to have the low metal content mentioned above.
The reason for this marked difference of composition is
readily understandable in terms of the discussions of Chapter12. We saw that elements other than hydrogen are built upby nuclear reactions occurring inside evolving stars. Suchelements are constantly being blown out into the interstellar gas
by the exploding stars. Now those stars that originated before
this manufacturing and distributing process got well under waymust be poor in their heavy element content. Those that
originated later must contain progressively more and more
heavy elements. So we see that the heavy element content of a
star can be interpreted as a measure of its age. Old stars are
very poor, while young stars are comparatively rich (only to
the tune ofa per cent or so in metals though).The interpretation just given of the differences of heavy
element content found in the stars implies that there should be
a continuous variation from the very oldest stars to the very
youngest stars. There should be no question ofjust two groups,
heavy-element-poor-stars, and heavy-element-rich-stars. This
seems to be in accordance with observation, so far as observa-
tion has gone. Among the stars that are genuine residents of
the disk of our Galaxy there is, in addition to the normal stars
285

FRONTIERS OF ASTRONOMY
of Type I, a group of stars that seem to be intermediate
between Type I and the Type II stars. The normal Type I
stars are often referred to as a 'spiral-arm* population, while
the intermediate class of star is said to constitute a 'disk-
population'. The metal content of the disk population is about
a third of the metal content of spiral arm population. Besides
possessing a lower metal content than the spiral arm stars, the
disk population has other distinguishing characteristics. The
proportion of them that are double stars is considerably less
than the proportion among the spiral arm population, a point
already noted by J. H. Oort many years ago.Now how should we refer to the disk-population? Are they
to be classed as Type I or as Type II stars? No definite answer
has been agreed on this question. The properties of the disk
population, properties of age and composition, suggest theyshould be classified as Type II stars. They are old stars, older
than the Sun, as can be seen from their lower metal content.
Yet their position in the outer part of the Galaxy, in the disk of
the Galaxy, conflicts with the simple idea that Type II stars
are those belonging to the nuclei of the spiral galaxies and to
their halos, to the elliptical galaxies and to the globular clusters,
while the Type I stars are those that belong to the disks of the
spirals. This conflict has led some astronomers to refer to the
disk population as 'intermediate' or as 'late' Type II or 'disk'
Type II. No one is really satisfied with this sort ofcompromise,and some more powerful system of classification is needed.
Remarks about the arms of the spiral galaxies
The disk population does not contain blue giants or any
supergiants. These extremely luminous stars are confined to
the regions containing gas and dust, to the spiral arms. It is
indeed because the bright blue stars are confined to the spiral
arms that the arms stand out so well on plates sensitive to blue
light. When plates sensitive in red light (but not in the blue)are used the spiral structure largely disappears. It is a curious
thought that if we possessed instruments that were only sensi-
tive to very red light we should probably be unaware of the
existence of spiral structures. This emphasises the importance
286

THE ARMS OF THE SPIRAL GALAXIES
ofdeveloping observational methods that transcend the presentlimited ranges of wavelength. Probably it will be necessaryto go outside our terrestrial atmosphere. A telescope on anartificial satellite is a high priority astronomical requirement.Now why is a spiral type of structure almost invariably
found whenever a galaxy possesses an outer disk (exceptions in
the case of galaxies of type So)? Although it is the light of
bright stars that cause spiral arms to show up so prominentlythe issue is not a stellar one. The problem is to explain whygas and dust become concentrated in spiral arms, for wherever
the gas and dust go the bright stars are sure to follow. Therealisation that the spiral arm problem is a gas and dust
problem not a stellar problem is most important because it
allows forces other than gravitation to play a part, pressureforces and magnetic forces. But in spite of this undoubted
step forward no convincing explanation has yet been given of
why gas and dust should become concentrated in spiral arms.
So we can only discuss possibilities.
A 'coffee-cup' theory has been suggested by Weizsaecker.
Stir black coffee vigorously with spoon. Then take the spoonout of the cup leaving the coffee swirling around. Lastly pouron a few drops of cream near the centre. A species of spiral
galaxy will be produced. What happens is this. The cup dragsback the outer part of the liquid causing it to take longer to
move in a circuit around the cup than the liquid nearer the
centre. The drop of cream gets drawn out into a spiral just
because the coffee on the outside is subject to this draggingeffect.
Weizsaecker's argument is that at the time a galaxy originatesthe gas that goes to form the outer disk will not usually possess
exact symmetry: it might for instance have the sort of shapesketched in Fig. 59 (a). If the outer parts are rotating more
slowly than the inner parts (this is a very likely supposition) then
a coffee-cup effect will arise causing the gas to be drawn out into
a form reminiscent of spiral structure (see Fig. 59 (b)). Theessence of the argument lies in a denial that any really im-
portant reason is required to explain spiral structure: the
plausible assumption that the outer parts of a galaxy rotate
more slowly than the inner parts (take longer to complete a
287
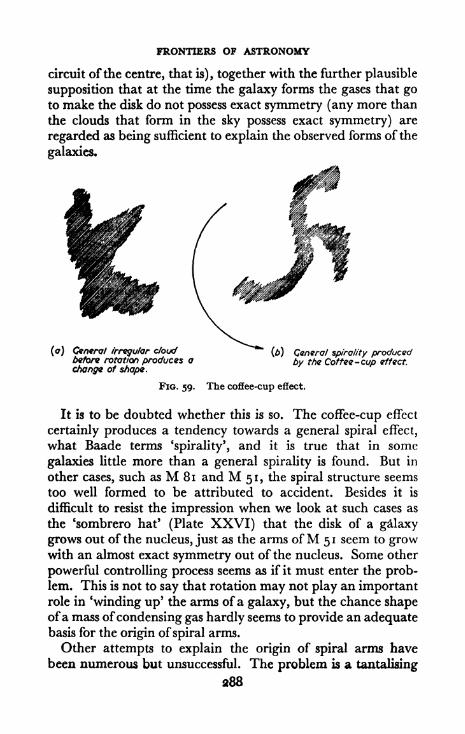
FRONTIERS OF ASTRONOMY
circuit of the centre, that is), together with the further plausible
supposition that at the time the galaxy forms the gases that goto make the disk do not possess exact symmetry (any more than
the clouds that form in the sky possess exact symmetry) are
regarded as being sufficient to explain the observed forms of the
galaxies.
(<7) General /rreoufor c/oud^^
(a) Genera/ sp/ral/ty producedbefore rotation produces a by the Coffee -cup effect
change of shape.
FIG. 59. The coffee-cup effect.
It is to be doubted whether this is so. The coffee-cup effect
certainly produces a tendency towards a general spiral effect,
what Baade terms 'spirality', and it is true that in some
galaxies little more than a general spirality is found. But in
other cases, such as M 81 and MSI, the spiral structure seems
too well formed to be attributed to accident. Besides it is
difficult to resist the impression when we look at such cases as
the 'sombrero hat' (Plate XXVI) that the disk of a galaxy
grows out of the nucleus, just as the arms ofM 51 seem to growwith an almost exact symmetry out of the nucleus. Some other
powerful controlling process seems as if it must enter the prob-lem. This is not to say that rotation may not play an importantrole in 'winding up' the arms ofa galaxy, but the chance shapeofa mass ofcondensing gas hardly seems to provide an adequatebasis for the origin of spiral arms.
Other attempts to explain the origin of spiral arms have
been numerous but unsuccessful. The problem is a tantalising
288

Mt. Wilson and Palomar Observatories
LI NGC 5128, PROBABLY A COLLISION OF Two GALAXIES,A GLOBULAR GALAXY AND A SPIRAL
This is another strong transmitter of radio-waves.

Mt. Wilson and Palomar Observatories
LI I A GROUP OF GALAXIES IN THE CONSTELLATION OF LEO
Notice the way the two galaxies at right-centre influence one another.

F. Zwicky
LI 1 1 BRIDGES BETWEEN GALAXIES
This photograph in negative form shows the lanes of stars that sometimes
stretch between galaxies. An obvious bridge is seen in the upper central part
Of the photograph. The hard circular images are local stars of our own Galaxy.

Mt. Wilson and Palomar Observatories
LIV THE GALAXY M 74, AN Sc SPIRAL
LV THE GALAXY NGC 7217, AN EXAMPLE OF 'SPIRALITY'
Mt. Wilson and Palomar Observatories

Mt. Wilson and Palomar Observatories
LVI NGC 1300, A FINE EXAMPLE OF A BARRED SPIRAL

CLUSTER APPROXIMATE DISTANCE
NEBULA IN IN PARSECS
10,000,000
RED-SHIFTS
VIRGO 750 MILES PER SECOND
URSA MAJOR
100,000,000
9,300 MILES PER SECOND
CORONA BOREALIS
150,000,000
13,400 MILES PER SECOND
BOOTES
250,000,000
24,400 MILES PER SECOND
HYDRA
400,000,000
38,000 MILES PER SECOND
Ml. Wihon am! Palomar Observatories
LVII-THE RED-SHIFT EFFECT
Observational evidence for the expansion of the Universe,
i parsec equals 19,200,000,000,000 miles.


Mt, Wilson and Palomar Observatories
LIX THE RING NEBULAA shell of gas surrounding a star at a late evolutionary stage (beyond the
Zwicky-Humason stars). The gas has presumably been expelled from the star.

THE ARMS OF THE SPIRAL GALAXIES
one. The formation of spiral arms seems to be universal in all
galaxies that possess outer gaseous disks, so widespread indeed
as to make it certain that some quite decisive process must beat work. Yet no idea as to how the process operates has been
suggested that compels even lukewarm support the cofTee-cupidea might perhaps be accepted as a plausible contributoryfactor but not as the main process.
In view of the long series of failures in attempts on this
problem I think it is tempting to suppose that we simply have
not been getting hold of the right end of the stick, that an
entirely novel idea is required. The present hope is that the
accumulation of knowledge about cosmic magnetic fields maysupply the missing clue, for opinion is coming somewhat
insistently to the point where magnetic fields are being thoughtof as playing a key role. But exactly how a magnetic field
might cause spiral arms to be formed is still far from clear.
For myself, I incline to the view that the galaxies maypossess magnetic fields that are not entirely internal in origin
that electric currents flowing in intergalactic space mayserve to connect one galaxy to another. In Plate LII we have a
case where one galaxy apparently influences the structural
form of another. It used to be thought, on slender grounds,that the influence is gravitational but I think that a magneticeffect is more likely to prove correct. Cases are known wherea spiral arm connects two galaxies. Plate LIII shows an extreme
example observed by F. Zwicky in which an arm extends as a
bridge between two galaxies. It would seem that if spiral
arms are a manifestation of a galactic magnetic field then the
bridge shown in Plate LIII should be considered as evidence of
the presence of a supragalactic magnetic field. There is someevidence that these intergalactic bridges may be powerfulemitters of radio waves. This would support their association
with magnetic fields.
289

CHAPTER SEVENTEEN
The Formation of Galaxies
Stars by the million
The discussion of star-formation in Chapter 14 was entirely
concerned with the origin of spiral arm stars, with stars of
Type I. We must now extend our discussion to include the
origin of the Type II stars. Some of our former argumentsretain their cogency in this new context, particularly the argu-ment that stars cannot condense one at a time. Yet the Type II
stars in the nucleus of a spiral or in an elliptical galaxy do not
seem to be arranged in separate clusters. How do we explainthis? By what might seem a staggering answer, by saying that
the nucleus of a spiral (or an elliptical galaxy) is itselfjust one
gigantic cluster. We say that the Type II stars of a galaxywere all formed in a common process. In this way we explainat a stroke how it comes about that the Type II stars ofa galaxyare of closely similar ages, why they are all old stars. But other
questions remain to be answered. Why are Type II stars pro-duced by millions at a time, whereas Type I stars are produced
by only a few hundreds at a time? What is the cause of the
Type II star-making cataclysms?Two significant hints can be used to attack these questions.
We have already noticed in Chapter 14 that a cloud can
always pull itself together by its own gravitation if it con-
tains a sufficient quantity of material. The amount required
depends on the temperature of the gas. The higher the tem-
perature the greater the mass of the cloud must be if condensa-
tion is to take place. And the greater the mass the larger the
number of stars into which the cloud will eventually fragment.The second hint points to the same conclusion. We have
seen that the galaxies seem to be enveloped by extended halos
of Type II stars. Presumably the halo stars were formed along
290

THE FORMATION OF GALAXIES
with the rest of the Type II stars in the same gigantic process.
Star-formation must therefore have taken place throughoutthe whole vast volume of the halo. Remembering that the halo
surrounding a galaxy may be of two or three times the size of
the galaxy itself, it is clear that the original gas cloud must have
contained the whole galaxy. Evidently the origin of the
galaxies themselves is closely associated with the formation of
Type II stars. This gives us a plan to work on. We must nowconsider how the evolution of a galaxy out of a huge cloud of
gas can be related to the formation of the Type II stars.
Supragalactic clouds
Let us first give attention to the density and temperaturethat the material of a supragalactic cloud is likely to possess.
The density is easily discussed. We know fairly accuratelywhat the average density in our Local Group of galaxiesamounts to. It is about 60 parts in a million million million
million million of the density of water. It must have been
from material with this sort of density that the galaxies in our
Local Group condensed. And since more distant galaxies seemto be very similar to those of the Local Group it is reasonable
to suppose that the galaxies in general condensed from densities
of about this amount.It is much more difficult to decide what temperature the
cloud is likely to have. To produce an enormous shower of
stars a rather high temperature is necessary. This demands an
initial absence of dust, for dust would cause molecules to be
formed and molecules would produce an unduly low tempera-
ture, just as molecules produce low temperatures in the com-
paratively tiny interstellar clouds that lie in the spiral arms
of the Galaxy (Plate XI). This requirement is not at all trouble-
some, however. Rather would it be very surprising if dust werenot initially absent, for dust could neither be spontaneously
generated by condensation from the gas at the low densities
now in question, nor could any dust be produced by stars
because no stars were present initially. We may suppose there-
fore that hydrogen atoms were the only important constituent
of our supragalactic cloud.
Atomic hydrogen is unable to lose much energy by radiation

FRONTIERS OF ASTRONOMY
unless its temperature rises above 10,000 degrees centigrade.
But above 10,000 degrees, collisions between particles of the
gas cause electrons to be knocked out of an increasing fraction
of the atoms. The radiating power of the hydrogen then
becomes quite strong.
Now a considerable amount of energy must be released bythe gravitational field that causes the contraction of the very
large clouds out of which whole clusters of galaxies form. This
energy must heat up the gas. The degree to which the tem-
perature of the gas will rise depends in part on the rate that
energy is supplied to it and in part on the radiating propertiesofthe hydrogen. Perhaps the most instructive way ofpresentingresults is in terms of the curve of Fig. 60. It is seen that the
energy requirement rises very steeply for temperatures between
10,000 and 25,000 degrees. This steep rise is mainly due to the
strong emission of radiation that sets in when hydrogen is
heated above 10,000 degrees. Comparatively little extra energyis required to lift the temperature from 25,000 to 100,000
degrees. But significantly greater quantities of energy are
required to generate temperatures of millions of degrees.It may be noted that the energy scale in Fig. 60 depends
on the time taken for our supragalactic cloud to condense.
Estimating this at 3,000 million years the unit of energy in
Fig. 60 comes out at 100 kilowatts for every gram of material
in the cloud*. For a typical cloud this would amount to a total
of some i ,000,000,000,000,000,000,000,000,000,000,000,000,
000,000,000,000 kilowatts for the whole cloud. For comparisonthe total amount of energy consumed by the human species
throughout the whole of its history is a mere 300,000,000,000,
000,000,000 kilowatts.
The energy supply is not likely to be so small that the initial
temperature lies below 10,000 degrees. Nor does it seem
likely that the temperature can be higher than i million degreessince this would require an implausibly large energy supply.Nor are all temperatures between 10,000 degrees and i million
equally probable. The range from 25,000 to 150,000 degrees,B to C in Fig. 60, is an improbable range since it is most
*Properly, the unit of energy should here be written as the kilowatt-second,
not the kilowatt.
292

THE FORMATION OF GALAXIES
Energy supplied per gram of the cloud In hundreds of kilowatts
^"
(timescale 3.OOO.OOO.OOO years)
Oo o
313(ft
QC
i
(ft
oca3CL.
CL.n>CO
n =:
aa.rt>
FIG. 60. Dependence of the temperature of an extragalactic cloud oninitial supply of gravitational energy.

FRONTIERS OF ASTRONOMY
unlikely that the energy supply will happen to fall in the narrow
band that leads to temperatures in this section of the curve.
The most probable temperatures fall into two ranges, the
range from 10,000 to 25,000 degrees, and the range from150,000to about i million degrees. We shall deal with these two cases
separately beginning with the lower interval, the interval from
10,000 to 25,000 degrees.
Fragmentation into galaxies of a moderate
Consider then a supragalactic cloud condensing under its
own gravitation, the initial temperature inside the cloud lyingsomewhere in the range from 10,000 to 25,000 degrees. Therise ofdensity produced by condensation increases the radiating
power of the hydrogen. This forces down the temperature in
spite ofthe energy that is released by the shrinkage ofthe cloud.
Eventually the temperature declines to about 10,000 degrees.Thereafter the temperature stays balanced near 10,000 degreesas the cloud continues to shrink.
i,"1 '"
,1,,
(a) Thermal motion (b) Aerodynamic motfon
FIG. 61. In actual cases (a) and (b) are superimposed.
Equipped with this information we can now carry out a
most relevant calculation. We can determine the proportionof the energy released by gravitation that goes into randomthermal motions of the atomic particles (Fig. 6ia) and howmuch goes into general aerodynamic motions inside the cloud
(Fig. 6ib). The answer depends on how much material there
294
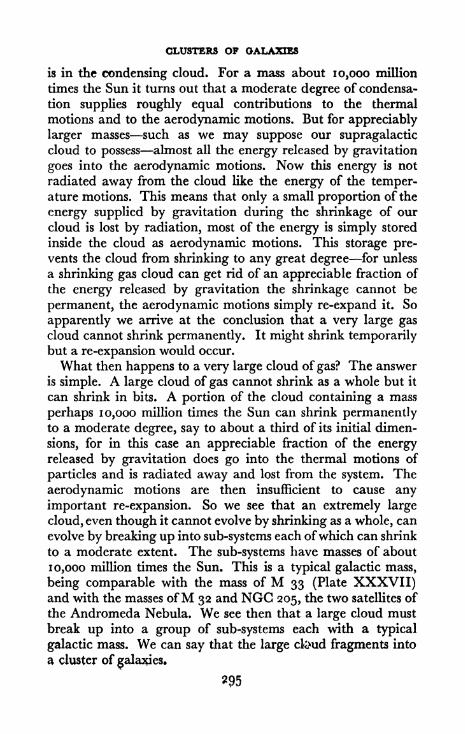
CLUSTERS OF GALAXIES
is in the condensing cloud. For a mass about 10,000 million
times the Sun it turns out that a moderate degree of condensa-
tion supplies roughly equal contributions to the thermal
motions and to the aerodynamic motions. But for appreciably
larger masses such as we may suppose our supragalacticcloud to possess almost all the energy released by gravitation
goes into the aerodynamic motions. Now this energy is not
radiated away from the cloud like the energy of the temper-ature motions. This means that only a small proportion of the
energy supplied by gravitation during the shrinkage of our
cloud is lost by radiation, most of the energy is simply stored
inside the cloud as aerodynamic motions. This storage pre-vents the cloud from shrinking to any great degree for unless
a shrinking gas cloud can get rid of an appreciable fraction of
the energy released by gravitation the shrinkage cannot be
permanent, the aerodynamic motions simply re-expand it. So
apparently we arrive at the conclusion that a very large gascloud cannot shrink permanently. It might shrink temporarilybut a re-expansion would occur.
What then happens to a very large cloud of gas? The answer
is simple. A large cloud of gas cannot shrink as a whole but it
can shrink in bits. A portion of the cloud containing a mass
perhaps 10,000 million times the Sun can shrink permanentlyto a moderate degree, say to about a third of its initial dimen-
sions, for in this case an appreciable fraction of the energyreleased by gravitation does go into the thermal motions of
particles and is radiated away and lost from the system. The
aerodynamic motions are then insufficient to cause any
important re-expansion. So we see that an extremely large
cloud, even though it cannot evolve by shrinking as a whole, can
evolve by breaking up into sub-systems each ofwhich can shrink
to a moderate extent. The sub-systems have masses of about
10,000 million times the Sun. This is a typical galactic mass,
being comparable with the mass of M 33 (Plate XXXVII)and with the masses ofM 32 and NGG 205, the two satellites of
the Andromeda Nebula. We see then that a large cloud must
break up into a group of sub-systems each with a typical
galactic mass. We can say that the large cfeud fragments into
a cluster ofgalaxies.

FRONTIERS OF ASTRONOMY
These arguments give the beginning of an explanation of
why galaxies have masses in the general neighbourhood of
10,000 million times the Sun, and of why a cloud with mass
much greater than this must condense into a cluster of galaxiesinstead of into one single aggregation. Many subtleties still
remain however. We have still to explain how monster
galaxies like the Andromeda Nebula and our own Galaxyare produced. The monster galaxies have masses about
100,000 million times the Sun, ten times our present estimate.
In the other direction there are many dwarf galaxies with
masses probably no greater than 300 million times the Sun.
The dwarf galaxies certainly cannot originate in the processes
we have just described because at the density and tempera-ture at present under discussion, sub-regions of a cloud with
masses as small as those of the dwarf galaxies do not possess
sufficient self-gravitation to shrink at all. So although our
arguments are beginning to make some important things clear,
we are still far from a thorough understanding of the whole
process of formation of galaxies. At a later stage we shall see
that a more complete understanding comes from thinking about
clouds with temperatures in the high range from 150,000 to
i million degrees. Since we have still to consider this case it is
scarcely surprising that our present arguments do not give a
complete description of the origin ofgalaxies. Before we discuss
the high temperature range it will, however, be useful to con-
tinue the present discussion through to the stage where Type II
star-formation takes place.
Theformation ofthe Type II stars
Calculation shows that the shrinkage of a galaxy with a mass
about 10,000 million times the Sun can proceed only to a
moderate degree, perhaps to about one-third of the initial
size. The gravitational energy released in any further con-
traction then goes nearly all into aerodynamic motions not
into thermal motions. So no further permanent shrinkage cantake place the aerodynamic motions cause re-expansion justas they did with the original supragalactic cloud. And what
happens next is similar to what happened before. The increase
296

CLUSTERS OF GALAXIES
ofdensity produced by the first moderate permanent shrinkageof the galaxy allows sub-regions within the galaxy to condense
permanently. So the galaxy instead of continuing to condense
as a whole, fragments into perhaps four or five sub-regions.
The experience of each of the sub-regions is then entirely
similar to that of the galaxy itself. The sub-regions can onlyshrink permanently by a moderate amount before they them-
selves again run into the same aerodynamic situation. Each of
Step I
Large cloud condenses into
four or five fragments.
Step 2
The fragments from step I
each condense into four or
five stfll smaller fragments,
And so on I
Step 4 Step 3 """///**"'
The fragments from step 3 r/W fragments from step 2
each condense into stiff each condense into four or
smaller fragments. five stiff smaller fragments,
FIG. 62. The hierarchy sequence.
the sub-regions must then fragment into four or five sub-sub-
regions. The experience of each of the sub-sub-regions is then
entirely similar to that ofthe sub-regions and so on. Evidentlywe have to do with a step-by-step process along a hierarchy
sequence. This is illustrated in Fig. 62.
Here we reach an important point. The times required for
the steps of Fig. 62 grow less as we pass along the sequence.The time for stage (ii) is about one-quarter of the time for
stage (i), and the time for stage (iii)is about one-quarter of the
time for stage (ii), and so on for further stages. This may be
expressed by saying that the time required for a whole series
297

FRONTIERS OF ASTRONOMY
of steps (i), (ii), (iii), (iv), (v), (vi), (vii) ... is only 25 per cent
longer than the time required for step (i) alone. At each stagethe fragments decrease in mass and size to about one-fifth of
the mass and size at the previous stage.
Now does this hierarchical sequence go on indefinitely until
the fragments become of negligible mass and size or does it
stop after a more or less definite number of steps, and if so why?It appears that only a decline in the radiation emitted by the
fragments can prevent the hierarchy sequence from continuing
indefinitely. But a decline does eventually occur, because
sooner or later the rising density within the fragments produced
by the repeated shrinkages cause the fragments to become
opaque. When this happens radiation can no longer escape
freely from the interior ofa fragment out into space. The situa-
tion becomes like the interior of a star. When this happens
fragmentation stops.
Now we reach another crucial question. At what stage do
the bits thus become sufficiently opaque to radiation? Fortun-
ately calculation gives a fairly precise answer. It turns out that
the masses of the final fragments must lie in a range from about
0.3 times the Sun as a lower limit up to about 1.5 times the
Sun as an approximate upper limit. This is exactly the
observed range of the masses of the Type II stars. We have
now dug through to the root of the cataclysmic process in
which the Type II stars are formed. We see how thousands of
millions of stars can be formed in one stroke and we see more-
over just why the Type II stars must have the individual
masses that we observe them to possess.
We are not yet quite at the end of our consideration of the
details of star-formation, however. It is in the very nature of
the fragmentation sequence that a 'loose' system of stars is
produced, not a closely condensed system like those of the
elliptical galaxies or like the nuclei of the spirals. But this is no
disadvantage, since we have to provide for the origin of the
very extensive halos of stars that surround the galaxies. Wenow say that the halo of a galaxy is simply the volume occupied
by the loose hierarchical system at the end of the fragmentation
process. Then by encounters between different members of the
loose structure a central condensation of stars is gradually
398

THE ORIGIN OF TYPE 2 STARS
built up. The members of the loose system tend to fall inwards
towards a common centre. In the congestion that then arises
near the centre the hierarchical system gets broken up and in
its place a central amorphous mass of stars is formed. The
process is illustrated in Fig. 63. Calculation gives about 1,000
parsecs for the diameter of the inner amorphous region in
excellent agreement with the dimensions of the satellites of
the Andromeda Nebula. The uncondensed residue in such a
case as that sketched in Fig. 63 forms the halo surroundingthe galaxy.
*
' '
/
ty* '..* * r .
*,
Compacted state
Initial statQ with halo
FIG. 63. The compacting of a Galaxy.
One point needs adding. Any rotation possessed by our
original cloud must become particularly exaggerated during the
formation of the inner condensed amorphous region. Rota-
tional velocities and rotational forces always become more
exaggerated as a system condenses. All supragalactic clouds
may be expected to possess rotation even though in some cases
it may be only slight. The gravitational field of one cluster of
galaxies can endow another cluster with rotation. This is
probably the main source from which the galaxies derive their
rotations, although even within a particular cluster the gravita-tional field of one galaxy can endow another with a small
degree of rotation. The effect of rotation is indicated by the
299

FRONTIERS OF ASTRONOMY
elliptical form given to the central condensation of Fig. 63.
The degree of the flattening will of course vary from one
galaxy to another.
Monster galaxies
Our next step must be to consider the second of the two
temperatures cases, the high temperature range from 150,000 to
i million degrees. In this case radiation by the hydrogen does
not become important until the supragalactic cloud has con-
densed to a very considerable degree. During this first con-
traction there is no significant development of aerodynamicmotions. Consequently this first contraction is permanent.We may note that at a temperature of i million degrees the
smallest cloud that can contract in this way has a mass about
100,000,000,000,000 times greater than the Sun. This estimate
agrees very well with the observed masses of the rich clusters of
galaxies.
Now as contraction proceeds the density eventually rises
sufficiently for radiation by the hydrogen to become important.This happens when the density rises to about one part in a
hundred million million million million of water. At this stagethe cloud probably possesses a diameter of about 2 million
parsecs. It is again significant that both this density anddiameter agree quite closely with the observed diameter and
average densities of the rich clusters of galaxies.
We reach a dramatic situation. Once radiation thus becomes
important, a swift fall of temperature down to about 10,000
degrees takes place. Further contraction then produces frag-
mentation on an enormous scale. Because of the higher density
produced by the first phase of shrinkage it turns out that the
fragments are smaller and less massive than before. A calcula-
tion shows that they possess a mass some 300 million times the
Sun, about a thirtieth of the former value. So our large
supragalactic cloud breaks up into about 30,000 small galaxieseach with about 300 million times the mass of the Sun.
The situation for each of these small galaxies follows alonglines that are in some respects similar to those already dis-
cussed. Stars form by just the same sort of cataclysmic acceler-
300

MONSTER GALAXIES
ating fragmentation process* If each loosely built system could
be considered as an isolated system the final stages of develop-ment shown in Fig. 63 would again occur for each system
separately. But now we have to consider the development,not of just one loose hierarchical structure but of a whole
cluster containing as many as 30,000 systems. It seems that
compacted amorphous masses of stars may form not out of
one loose galaxy but out of many by addition. In this waymonster galaxies containing upwards of 100,000 million times
the mass of the Sun can be formed, requiring the compacting
together of perhaps two or three hundred of the smaller
galaxies. The view that the very large galaxies are formed bythe compacting ofmany sub-systems is supported by the attach-
ment of several hundred globular clusters to such monsters as
NGC 4594 (the 'Sombrero'), toM 31 the Andromeda Nebula,to M 8 1, to our own Galaxy, etc. The globular clusters repre-sent fragments that in themselves become separately compactedand so become attached to the monsters but without beingabsorbed by them. On this basis we might say that the Local
Group was at one time composed of loose systems such as
1C 1613 and the Fornax and Sculptor systems, of perhaps1,000 of these systems. The Andromeda Nebula and our
Galaxy were then formed in a mopping-up operation, an
operation in which several hundred loose smaller systems were
aggregated together. The smaller members of the Local
Group are simply debris that have survived from the mopping-up operation.
In this way it seems possible to explain both the existence
of many small loose galaxies and of the monster galaxies.
The gaseous residue and the origin of magneticfields
Some gas is likely to be left uncondensed. Indeed at each
stage of the hierarchy sequence only those parts of the gaswhere the density is higher than average are likely to condense;the low density regions of a cloud do not condense. The un-
condensed gas in a galaxy at the time of its formation might
perhaps be as great as 30 per cent ofthe total mass.
It is from such an uncondensed residue that the outer disks
301

FRONTIERS OF ASTRONOMY
of the spirals are probably derived. The formation of the disk
of a spiral may well be connected with the development of a
magnetic field within the gas. An initially very small magneticfield can be built up into a large field by an appropriate generalmotion of the gas. This problem has been examined byBatchelor and independently by Biermann and Schluter whoall find that the type of motion, turbulent motion, that we mayexpect the gas masses to possess causes them to act like a dynamo.It is very likely in this way that the magnetic fields we have so
often discussed originate the magnetic fields that generatecosmic rays and intense radio-waves, the magnetic fields that
may be ofimportance in the origin of spiral arms, the magneticfields that are passed on to the Type I stars when they condense,the magnetic fields that probably play a key role in the originof planetary systems.We may sum up by itemising the important stages in the
formation of a monster spiral galaxy such as our own: frag-
mentation of most of the material of a cloud into an assemblyof 'loose' Type II star systems; a concentration of the loose
systems into a nucleus; a concentration of the gaseous residue;
a magnetic field generated within the gaseous residue as anoutcome of turbulent motions; a disk of gas growing out of the
nucleus probably through the agency of the magnetic field.
To this we may add the possibility of the gaseous material of
the disk developing spiral arms.
We are now concluding a cycle of argument that beganwith Chapter 13. For now we have seen in a brief outline howa galaxy such as our own can originate, a galaxy possessing a
nucleus of perhaps 100,000 million stars, with an outer gaseous
disk, with a magnetic field, possibly with spiral arms (our
starting point in Chapter 13), with a surrounding halo of stars,
with hundreds of attached globular clusters, and belongingwith other galaxies to a cluster.
One point remains to make the chain complete. It seems
unlikely that a second phase of star-formation will arise in the
arms of the spirals until a supply of dust becomes available to
cause a cooling of the gaseous residue. Where does this dust
come from? We can probably guess the answer correctly.
From the Type II stars of the nucleus and of the halo* The
3<*

MONSTER GALAXIES
cooling produced indirectly by the dust (indirectly throughmolecule formation) concentrates the gas of the spiral armsand allows it to condense into the interstellar clouds that wehave so often discussed. A second phase of star-formation then
occurs within the interstellar clouds by just the processes that
we considered in Chapter 14. These are the Type I stars. So it
seems that the Sun and our planetary system came into being.

CHAPTER EIGHTEEN
The Expanding Universe
The Universe is everything; both living and inanimate
things; both atoms and galaxies; and if the spiritual exists as
well as the material, of spiritual things also; and if there is a
Heaven and a Hell, of Heaven and Hell too; for by its verynature the Universe is the totality of all things.
There is a general impression abroad that the large scale
aspects of the Universe are not very important to us in our
daily lives that if the Earth and Sun remained all else mightbe destroyed without causing us any serious inconvenience.
Yet this view is very likely to prove wildly wrong. Present-day
developments in cosmology are coming to suggest rather
insistently that everyday conditions could not persist but for
the distant parts of the Universe, that all our ideas of spaceand of geometry would become entirely invalid if the distant
parts of the Universe were taken away. Our everyday experi-ence even down to the smallest details seems to be so closely
integrated to the grand scale features of the Universe that it is
wellnigh impossible to contemplate the two being separated.
Gibers' paradox
Let us start with an everyday question, one so trivial that
probably few have ever bothered to ask it, and yet one that
has the most profound connections with the distant parts of
the Universe. This is a question first asked by Olbers in 1826,and recently revived by H. Bondi.* Why is the sky dark at
night? To appreciate the depth of this strange query supposethe Universe to be uniformly populated with clusters ofgalaxies.Draw a sphere with a large radius, anything you please sayi,000 million parsecs. Then draw a series of larger spheres, all
Cosmology, Cambridge Monographs in Physics, 1952.
304

THE EXPANDING UNIVERSE
with the same centre, the difference in radius between one andthe next being always the same, say 1,000 parsecs. The regionsbetween successive spheres form the skins of an onion but of
an infinite onion; they extend out indefinitely however manyspheres we draw, we can always draw one more. Now the
volume of the successive skins increases proportionately to the
square of the radius. Then since for a uniformly populatedUniverse the number of stars that fall in a particular skin muston the average be proportional to its volume, we see that the
number of stars in successive skins increases as the square of
the radius. But the intensity of the light that we receive from
any individual star is proportional to the inverse of the squareof its distance away from us double the distance and wereceive only a quarter of the light. So we have the followingsituation: each skin of the onion contains on the average a
number of stars proportional to the square of its radius, while
the intensity of radiation from each star as measured by an
observer at the centre of the system is inversely proportionalto the square of the radius. So the total intensity of the radia-
tion received at the centre from all the stars of a particularskin does not depend at all on its radius the increase in one
factor simply cancels the decrease in the other. But since the
number of skins can be made as large as we please, this meansthat the intensity of the light at the centre can also be made as
large as we please or at any rate large to the point where one
star blocks out the light of another, and this does not arise
until the whole sky becomes everywhere as bright as the disk
of the Sun (taking the Sun to be a typical star). This requiresthe light and heat received from the Universe by the Earth to
be about 6,000 million times greater than the intensity of full
sunlight. Well, we don't receive this amount of radiation,
otherwise we should be instantly burned up.
Obviously something has gone verywrongwith the argument.The question is where ? The immediate temptation is to doubt
our starting assumption that the Universe is uniformly popu-lated. The paradox would not arise if the material of the
Universe were to exist in an isolated region of space, since in
such a case the contributions of the skins could not be con-
tiiiued indefinitely. This was indeed the way that the scientists
305 l

FRONTIERS OF ASTRONOMY
of the nineteenth century sought to escape from the dilemma.
According to nineteenth-century views our Galaxy was to be
regarded as isolated in space with nothing outside it. As late
as the beginning of the present century a great controversytook place at an international conference of astronomers. Onthe one side, championed notably by R. A. Proctor, was the
view that large numbers of galaxies exist outside our own,
stretching away into the depths of space. On the other side,
at that time the victorious side, the view was still expressedthat the Universe consisted ofour Galaxy only. Other galaxieswere interpreted as local nebulosities lying within our own.The protagonists of this latter quite erroneous view based their
case on a thoroughly wrong-headed argument, namely that
no galaxies are observed in directions along the plane of the
Milky Way. This was thought to prove the association of the
galaxies with the Milky Way. But Proctor argued, just as wedo today, that this apparent absence of galaxies is simply dueto the absorbing effects of dust along the plane of the Galaxy.But the majority of astronomers in the first two decades of the
present century could not accept this view for the reason that
most of their researches on the structure of our Galaxy had
proceeded on the assumption that dust was not a serious
obscuring agent. It was not until about 1925 that these views
became discredited, and the suggestions of Proctor became
thoroughly vindicated. Notably as a result of the work of
J. H. Oort and B. Lindblat it became realised that the structure
of our Galaxy is radically different from what had formerlybeen thought, and that the older views were wholly in error
due to the neglect of the obscuring effects of the interstellar
dust particles. At about the same time it was established
beyond question by E. P. Hubble that the galaxies are great
independent star systems similar to our own and lying at
enormous distances from us. In a few years Hubble took man's
conception of the Universe from a localised region of a few
thousand parsecs in dimensions out to unprecedented distances
of hundreds of millions of parsecs; for not only did Hubbleshow that the galaxies are unquestionably great star-systems,as the Galaxy is, but he showed that out to distances ofhundredsof millions of parsecs there is no evidence that we live in a
306

THE EXPANDING UNIVERSE
purely localised aggregation of matter. The galaxies stretch
away from us farther and farther into space and by the time
they are lost to view (through faintness due to great distance)some 100 million or more of them are accounted for.
Since this decisive reorientation of man's outlook on the
Universe one of the most important scientific revolutions of
thought of all time no one has thought fit to suggest that the
distribution of matter is localised in space. Rather has the
opposite point of view come to gain general credence, that
apart from local variations the presence ofa cluster ofgalaxiesin one locality rather than in another, there are no marked
spatial fluctuations in the distribution of matter on the large
scale, that regardless ofwhat the special position of the observer
happens to be the Universe presents the same large scale
aspects in the distribution of galaxies. It follows that Olbers'
paradox is reinstated. It cannot be answered in the mannerthat scientists of the nineteenth and early twentieth centuries
attempted to answer it.
A more sophisticated attempt to defeat Gibers' paradox
depends on a time argument instead of a space argument. If
all the stars of the Universe were younger than a definite ageour former considerations would become invalid, since light
from sufficiently distant skins of our onion would not yet have
reached us. The process would have to be 'cut off' at a certain
distance, the distance from which the transit time of light
equalled the ages of the oldest stars. No light from still moredistant skins could yet have arrived into our locality. This
would invalidate our procedure of adding together equalcontributions from as many skins as we please. Only a limited
number could be reckoned as contributing to the light of the
night sky.
Now we saw in Chapter 9 that the stars in our Galaxy are
probably all younger than about 6,000 million years, and the
similarity of the stars of neighbouring galaxies with those of
our own suggests that they too are probably not much older
than about 6,000 million years. So there is a measure of
observational support for the present line ofescape from Olbers'
paradox. What we are now saying is that the Universe,
although not constructed in such a way that its material content
307
FRONTIERS OF ASTRONOMY
is confined to a particular spatial locality (and indeed althoughit may be spacially unlimited) is limited in time.
But this is a view that we must consider with some caution.
There is a suspicious similarity between the nineteenth-century
attempt to localise the material content of the Universe in
space and the present suggestion of confining the existence of
matter (or at any rate of stars) in time. In the case of spacial
limitation the old views were supported by the finite spacialextension of our Galaxy. Now we are supporting the time
limitation by the finite ages of the stars of our Galaxy. Thetwo processes are logically similar in character and one ofthem
having proved disastrously wrong we must be a little chary of
accepting the other.
When the proposition is generalised from the statement that
all stars are younger than a definite age to the proposition that
the Universe is younger than a definite age I am inclined to be
still more sceptical. What is implied by this view is that at a
certain definite time in the past say 6,000 million years ago,the laws of physics suddenly became applicable. Before this
time physics was not applicable. After this time physicsdominated the behaviour of the Universe. The transition
between no-physics and all-physics was instantaneous.*
One has to be particularly cautious in accepting this sort of
view because the human brain apparently possesses a kink in
these matters that only too readily leads to serious mistakes.
Europeans of the eighteenth century used to believe that the
Universe came into being about 6,000 years ago! When this
view was shown to be utterly wrong it was then said that the
Universe was 20 million years old, then 100 million years, andso by a series of steps up to the 6,000 million years mentioned
above.
Such arguments carry one no further, however, than the
stage of suggestive speculation. But what does go further is a
staggering discovery made by V. M. Slipher and by E. P.
Hubble and M. Humason. If a singular origin of the Universe
were the only escape from Olbers' paradox we should be well-
*Expressed in mathematical terminology, that the equations of physics
possessed singularities about 6,000 million years ago, and that the equationscannot be continued through these singularities.
308

THE EXPANDING UNIVERSE
nigh forced to accept it. But the discovery just alluded to
provides an escape along entirely unexpected lines. Theexistence of such a very strange resolution of the paradox
greatly increases my doubts of the correctness of a finite tem-
poral origin of the Universe.
The Universe is expanding. This is the purport of these
discoveries. It is important to say right at the outset that the
expansion is on the large scale, not local. The distances in our
own solar system are not expanding, nor are the distances in
our Galaxy, nor the distances in the Local Group. But beyondthe Local Group, beyond about half a million parsecs, expan-sion begins. The giant galaxyM 81 (Plate XXIV) at a distance
of 2,500,000 parsecs is moving away from us, its distance is
increasing at about 80 miles per second. The galaxies of the
Virgo cloud at a distance of perhaps 10 million parsecs are
moving away from us at a speed ofabout 750 miles per second.
The Corona cluster of galaxies (Plate XL) is moving awayfrom us at rather more than 13,000 miles per second, while
the Hydra cluster (Plate XLI) at a distance of some 400million parsecs is increasing its distance every second by a
further 38,000 miles. It may be of interest to compute howmuch farther away the Hydra cluster is now than it was at the
moment when you began to read this chapter.
The red-shift
Now how is this known? In Chapter 13 we saw how motions
towards or away from the observer can be determined bya study of the pitch of spectral lines emitted by a source of
light. Our present sources are whole galaxies. It is thus found
that all galaxies outside the Local Group are steadily movingaway from us. Before examining Plate LVII, which illustrates
these observations, we should notice that spectral lines can
occur in two forms, as bright lines or as dark lines, the twocases being rather like the negative and positive of a photo-
graph. When the atoms of a gas emit spectral lines the lines
are bright. For example the lines emitted by a hot interstellar
gas cloud are bright. When on the other hand light of all
wavelengths without spectral lines is produced by a hot

FRONTIERS OF ASTRONOMY
source e.g. by the photosphere of a star, and when the light
then passes through a comparatively cool cloud of gas, the
cool gas often absorbs light at just the same characteristic
wavelengths that it would emit if it were hot. In such a case
the light that comes through the cool cloud is weakened at
these characteristic wavelengths, which therefore appear as
dark lines. The light from the Sun contains dark lines rather
than bright lines, because the light from the photosphere passes
through the slightly cooler material in the lower parts of the
solar atmosphere. This is also the situation for most other
stars. Dark lines are not of invariable occurrence, however.
Very hot stars, stars very high on the main-sequence, emit
bright lines. And some very cool stars also emit bright lines,
as if particular patches on their otherwise cool surfaces becomeheated to comparatively high temperatures.The relation of all this to the measurement of the red shifts
the displacement of lines in the direction of decreasing wave-
length is that because the great majority of stars show dark
lines, the combined light of all the stars of a galaxy also shows
dark lines. Several ofthe classic measurements by M. Humasonare shown in Plate LVII, the lines employed being the H and Klines of calcium. In Plate LVII it is the somewhat hazy central
band that represents the emission of the galaxy, wavelength
increasing from left to right. The strong upper and lower lines
were produced by terrestrial atoms. These were also photo-
graphed for comparison purposes.The great discovery that galaxies far off are increasing their
distances much more rapidly than the comparatively nearby
galaxies is clearly shown by the examples given in Plate LVII.It may be noted that the distances marked in Plate LVII do not
represent the original measurements of Hubble but have been
modified to take account of more recent estimates to be dis-
cussed in the next chapter. The dependence of recessional
velocities on the distances of the galaxies is shown in a moredirect form in Fig. 64. The outstanding feature of this repre-sentation is the line that can be drawn through the observed
results, showing that the expansion of the Universe takes placein a linear fashion double the distance of a galaxy and the
rate at which its distance is increasing also doubles. This
310
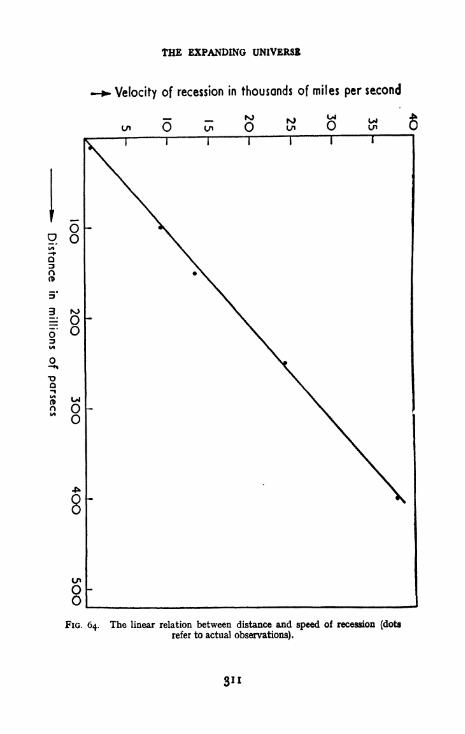
THE EXPANDING UNIVERSE
Velocity of recession in thousands of miles per second
FIG. 64. The linear relation between distance and speed of recession (dotsrefer to actual observations).
3"

FRONTIERS OF ASTRONOMY
result can be expressed in more precise form by saying that
for every increase of a million parsecs in the distance the
recessional speed increases by about 100 miles per second.
A galaxy at 10 million parsecs has a recessional speed of about
i ,000 miles per second; a galaxy at 100 million parsecs has a
recessional speed of about 10,000 miles per second; a galaxy at
500 million parsecs has a recessional speed of about 50,000miles per second.
The fastest rate of recession so far measured is close to
40,000 miles per second. Still more distant galaxies are so
faint that it is difficult to measure their speeds because of a
lack of light. There are good grounds, however, for the hopethat by improved techniques it will eventually prove possibleto extend the measurements to still more distant galaxies. If
this becomes possible what will the result be? Almost I think
without exception astronomers are prepared to predict that
the rates of recession will continue to increase in accordance
with the straight line of Fig. 64. This straight line is taken to
represent a fundamental feature of the Universe. It has been
generally accepted that the line can be extended indefinitelyto distances as great as we please. Whether or not this extra-
polation is really justified is something that needs urgent con-
firmation, but unfortunately a complete verification up to
speeds comparable with that of light itself is probably beyondthe power of observation. In conformity with general opinionwe shall assume that the line of Fig. 64 can be extended
indefinitely. Many of the arguments that will be used below
would need serious alteration if this assumption should be
found to be in error.
The observed uniform expansion of the Universe out to
distances of the order of 400 million parsecs occurs in all
directions. Whatever the direction of observation the results
are always the same. That apart from the galaxies of the Local
Group the whole system of galaxies seems to be expanding
away from us has suggested to many people that our Local
Group must be at the centre of the Universe. But this idea is a
logical non sequitur. Imagine a pudding containing raisins
being steamed in an oven. Let the raisins represent the
clusters of galaxies. Suppose that the raisins do not expand as
312

THE EXPANDING UNIVERSE
the pudding cooks, but that the pudding itself swells steadily.
Then in the swelling every raisin moves away from every other
raisin: an observer attached to any raisin would see the others
all receding away from him. Moreover if the pudding were
to swell uniformly (in such a way that its material remainedof a uniform consistency) the raisins would have the linear
property shown in Fig. 64 the greater the distance between
two raisins the greater the rate at which their distance apartincreases double the distance and the rate of increase also
doubles.
Of course it can be said that a pudding has a centre but
wejudge the centre ofa pudding from the shape ofits boundary.To give a parallel with the Universe we must imagine the
pudding not possessing a boundary, but being an infinite
pudding. The word 'infinite' should cause no conceptualdifficulties. It simply means that however much of the puddingwe consider there is always more of it,
Others' paradox again
It is now necessary to relate all this back to Gibers' paradox.It will be recalled that Gibers' paradox arose from dividing
space up by a series of spheres thereby forming a series of
skins. It turned out that the contribution of the stars in a
particular skin to the light received at the centre was alwaysthe same no matter what the radius of the skin happened to be.
This property depended on the number of stars in a skin
increasing with the radius of the skin in a way that just com-
pensated for the weakening by increasing distance of the light
received from each star. Now this cancellation no longeroccurs when the clusters of galaxies are receding from each
other. This is a most important and significant point. It turns
out that expansion causes a further weakening of the light, an
additional weakening that destroys the cancellation, and which
completely resolves Gibers' paradox.This further weakening of the light is very small for galaxies
that are near to us, such as the galaxies of the Virgo cloud.
But the effect becomes stronger as the distances increase. Atthe greatest distance to which red-shift measurements have
3'3

FRONTIERS OF ASTRONOMY
been made (the galaxies of the Hydra cluster at about 400million parsecs) the weakening is to about $ of the intensity
that the light would have if no expansion were occurring. Atthe maximum distance of about 1,000 million parsecs to which
the aoo-inch telescope at Palomar Mt. can penetrate (Plate
XLII) the light is weakened to about of what it would be
if no expansion were occurring. The situation becomes even
more drastic at still greater distances (assuming the extra-
polation of the line of Fig. 64). Indeed at a distance of about
2,000 million parsecs, where the rate of increase of the distance
comes up to the speed of light itself, the light is weakened to
nothing at all! No light emitted by the stars in a skin with a
radius greater than about 2,000 million parsecs can ever reach
us. There is an absolute cut-off at this distance. So our former
argument that the number of contributing skins can be madeas large as we please is no longer valid. Hence the amount of
light received cannot be made extremely great and Gibers'
paradox is resolved. Indeed the amount of light that we can
receive can be worked out from the known distribution of
galaxies. It turns out to be very small, much less than the
sunlight scattered by the gases that lie within our own planetary
system and which contributes to the glow of the night sky.
The effect of the very distant galaxies on this glow is therefore
very small. The sky is dark at night because the Universe expands.
This is the unexpected resolution of the puzzle so unexpectedthat it never occurred to the scientists ofthe nineteenth century.We started the present chapter by saying that everyday matter
of fact observations are deeply related to the grand scale
features of the Universe. Here we have an illustration of this
statement.
Did the Universe have a singular origin?
At an earlier stage we considered the possibility of avoidingGibers' paradox by assigning a definite origin in time to the
Universe. Now that Gibers' paradox is resolved in a far subtler
way it would be natural to discount entirely the idea of a
singular origin were it not that the expansion of the Universe
apparently gives support to it from an unexpected direction.
3'4

THE EXPANDING UNIVERSE
Expansion takes the clusters of galaxies apart from each
other. Space is therefore (it seems) getting more and more
empty as time goes on. Space must accordingly (it seems)have been more densely occupied in the past than it is today.Indeed if the Universe has always been expanding as it is at
present, space must (it seems) have been jammed tight with
matter not so very long ago.Let us formulate the argument a little more precisely.
Suppose we take the distance of a particular cluster of galaxiesand divide by the rate at which its distance is increasing.
Because of the linear property of Fig. 64 the result is essentially
the same whatever cluster we elect to use for this purpose. Theresult is a period of time known as the Hubble constant
constant because it is the same for all clusters. Perhaps the
best value consistent with all present-day knowledge is about
7,000 million years. The determination of this particularvalue will be discussed in the next chapter. Now let us imagineourselves going backwards in time for 7,000 million years (nota fantastic piece of theorising; the Earth is some 4,000 million
years old). Then if the clusters of galaxies have always hadtheir present rates of recession the manner of derivation of
Hubble's constant requires all the clusters of galaxies to have
beenjammed on top ofeach other at that time, giving a densityof matter in space that rises inordinately high, indefinitely
high, infinitely high. This state of affairs represents, accord-
ing to the view of some astronomers, the singular start of the
Universe. On this view such important features of the Universe
as its expansion and its large scale uniformity of compositionwere impressed on the Universe at the start by the manner of
creation. Creation could have occurred quite differently,
matter might have been distributed lopsidedly without largescale uniformity, but it isn't because it wasn't created that way.Indeed the Universe might have been created in any of an
infinity of other ways but it wasn't. It was created to have justthe properties of expansion and of uniformity that we observe.
Ifwe ask why so, no answer can be given.At the time ofcreation the density of material was very high,
much higher than the density of water. As expansion pro-ceeded the density became steadily less: it decreased to the
3*5

FRONTIERS OF ASTRONOMY
density of water; then steadily down and down until it reached
a millionth of the density of water; then steadily further downto a million millionth of the density of water; down and ever
down to a million million millionth of the density of water;
further down and still further down to a million million million
millionth of the density of water; and so down to about a
thousand million million million millionth of the density of
water, when at long last something happened the clusters of
galaxies were formed, presumably as a result of some such
process as was described in the previous chapter. Once the
clusters of galaxies had condensed, the expansion continued
by way of increasing the distances between the clusters, this
being the stage of the proceedings that we now observe.
Let us see whether this argument is really an inescapableone. What are the alternative possibilities? One alternative
is to deny that the Universe has always been expanding. This
can be done in a consistent way by postulating that the real
nature of gravitation differs from classical Newtonian ideas.
Instead of requiring attraction always to occur between two
particles as in the Newtonian theory it can be argued that
attraction occurs only if the distance between two particles
is not too great, otherwise attraction is replaced by repulsion.
And if instead of considering just two particles we consider a
whole cloud of matter the modified situation is that gravitation
produces a condensation of the cloud only if its density is
sufficiently high, otherwise a general repulsion and dispersaloccurs. The densities at which repulsive gravitation thus
becomes operative are so low that there is no question of the
ordinary attractive form of gravitation being appreciablymodified in our solar system or in the Galaxy or in other
galaxies.
Similar arguments can be applied to the Universe at large.
If the average density in the Universe is less than a certain
critical value (fixed by hypothesis) then the Universe will
start to expand even if it is not expanding to begin with. If
on the other hand the average density in the Universe is just
equal to the critical value, the Universe remains static if it is
initially static. But this state of balance is unstable give the
Universe a slight expansion and it continues to expand with
3*6

THE EXPANDING UNIVERSE
ever increasing speed, give it a slight contraction and it con-
tracts with ever increasing speed.The object of thus altering the law of gravitation is to explain
the observed expansion of the Universe without any need for
an initially explosive state. On this view when we go back into
the past the density of matter does not pile up indefinitely
because the expansion was then slower than it is now; and
sufficiently back in the past there was no expansion at all
because the Universe started from the balanced state just
described.
A special feature of this theory is that it provides a better wayof forming galaxies. It can be shown that clusters of galaxiescould condense in the balanced initial state. Although on the
very large scale it must be supposed that some unknown cause
disturbed the Universe in such a way as to set it off expandinginstead of contracting, in local regions the reverse situation
might have occurred local regions might have started con-
tracting instead of expanding, thereby forming clusters of
galaxies. In the explosion theory the formation of clusters
of galaxies has to be introduced as an ad hoc process that
takes place for no good reason at just the stage where the
density of matter falls to a thousand million million million
millionth part of the density of water (or perhaps somewhatless than this). But in a theory with gravitation modified alongthe lines indicated above the origin of the clusters of galaxiesis afforded a more natural explanation. A state of balance
implies the possibility of the balance being tipped in localised
regions towards contraction.
To end the present chapter a second flaw in the argumentfor a superdense singular explosive origin of the Universe will
be discussed. Without any modification of gravitation of the
sort contemplated above it is still incorrect to argue that
expansion necessarily implies a superdense singular explosive
origin of the Universe. This inference is not valid unless all
the matter now in existence was also in existence in the past.
It is therefore important to examine the idea that many of
the atoms now in existence were not in existence in the past,
and that many of the atoms of the Universe that will be in
existence in the future are not in existence today. This idea
317
FRONTIERS OP ASTRONOMY
requires atoms to appear in the Universe continually instead
of being created explosively at some definite time in the past.
There is an important contrast here. An explosive creation
of the Universe is not subject to analysis. It is something that
must be impressed by way of an arbitrary fiat. In the case
of a continuous origin of matter on the other hand the creation
must obey a definite law, a law that has just the same sort of
logical status as the laws of gravitation, of nuclear physics, of
electricity and magnetism. This distinction is very importantand is worth a rather more detailed exposition.The laws ofphysics are expressed by mathematical equations.
The symbols that appear in the equations are related either
directly or indirectly to quantities that can be determined byobservation. The logic of classical physics is very straight-
forward. If the observable quantities are known at one
particular instant of time, the equations must enable us to
determine their values at all other times. That is to say the
laws of physics allow us to proceed from a known situation to a
prediction of what is going to happen in the future. It is because
of the ability to make correct predictions that physics has
come to play such a dominant role in our modern civilisation.
Past societies ofmen are referred to as the stone-age, the bronze-
age, and the iron-age. The civilisation ofthe present day might
perhaps most appropriately be termed the age of physics. In
the past there has been no shortage of prophets and necro-
mancers, but it is physics that has proved the first really reliable
agent in human experience for the making of predictions.Now what decides the laws of physics? What decides the
form of the mathematical equations that refer to the pheno-menon ofgravitation for instance the equations that determine
how the planets move around the Sun? What decides the
form of the mathematical equations that refer to the propaga-tion of radio-waves? The answer to these questions is very
simple the success of the predictions that are made by the
equations. The laws of physics are governed by a process of
intellectual natural selection. When they make correct pre-dictions they survive. When they make incorrect predictions
they become extinct. Physicists then look for new laws that donot make incorrect predictions.

THE EXPANDING UNIVERSE
By now we are in a position to appreciate the difference
between the two views on the origin of the material of the
Universe. In the case of an explosive origin of the material,the origin is expressed by the starting conditions, not by the
laws of physics themselves. In the case of a continuous originthere is no possibility of expressing the creation as a starting
condition, since creation happens all the time. A continuous
origin must therefore be expressed in terms of equations whose
properties can be worked out by the processes of mathematics,and whose predictions can be confirmed or disproved. In one
case the origin is assigned to an arbitrary fiat and no modifica-
tion of the laws of physics is required. In the other case there is
no arbitrary fiat but a modification of the laws of physics has
to be made. The origin of matter thus becomes susceptible to
treatment on a similar footing to the phenomena of gravitation,of electro-magnetism, and of the forces that bind the atomic
nuclei together. We shall have more to say on the divergencebetween these two points of view in the last chapter. For the
present it is sufficient to realise that a theory of the continuous
origin of matter must face up to the challenging issue of deter-
mining a mathematical law that serves to control the creation
of matter. Let it be said at once that no thoroughly satis-
factory way of devising such a law has yet been found. All the
attempts that have yet been made are clearly susceptible of
improvement, and one can now be fairly sure of the direction
that the improvements are likely to take. This again is anissue that we shall take up in the last chapter. For the presentit is enough that imperfect as the equations no doubt are theyare good enough to enable a number of very interesting results
to be obtained.
The first is that the Universe must expand. The steady originof matter forces the Universe to expand. The effect of the
origin is to cause a stretching of space that takes the clusters of
galaxies apart from each other. The stretching of space takes
the part of the swelling of the pudding in the analogy we used
above. The steady potentiality for new atoms to appear in
space gives space active physical properties, it is no longer aninert something in which matter resides.
The origin of matter not only forces the Universe to expand
319

FRONTIERS OF ASTRONOMY
but the rate of expansion is determined. If the Universe were
expanding initially at some arbitrary rate, then the origin of
matter causes the rate either to increase or to decrease accordingto the initial conditions until a definite value is reached, after
which the rate is steadily maintained. The expansion rate so
reached has the same value irrespective of the initial state of
affairs, a value such that the average density of matter in
space is maintained constant. The steady origin of matter in
space does not therefore lead to space becoming fuller andfuller of material. Nor does the expansion of the Universe
lead to space becoming more and more empty. The rate of
expansion is forced to come into step so as to compensate
exactly for the steady origin ofmaterial. It is the appearance of
this remarkable balance as a consequence of the theory that gives
one of the strongest reasons for regarding the continuous
origin of matter as a serious possibility whose consequencesdemand just as careful consideration as those of the two
other types of theory that were discussed above. It should be
explained here that a somewhat different outlook on the whole
problem ofthe continuous origin ofmatter has been put forward
by Bondi and Gold. Bondi has described this in detail in a
recent book Cosmology.* The present development expresses
my own outlook, which has been also influenced by the work of
W. H. McCrea and by F. Pirani.
The maintenance of a constant average density of matter in
space has led to the concept of the steady-state universe. Since
the average density of matter in space is the same at all times,
the present and the future should be just as good for the con-
densation of clusters of galaxies as the past was. So the theory
suggests that clusters of galaxies should not only have formed
in the past but should be forming at present and should go on
forming in the future. This is in sharp distinction to the other
two types of theory, which require all galaxies to have con-
densed about 6,000 million years ago. The steady-state theory
suggests that although expansion leads to the distances between
the centres of clusters of galaxies increasing, new clusters of
galaxies condense at such a rate that the average numberwithin a fairly large region of space remain effectively un-
* H. Bondi, op. tit.
320

THE EXPANDING UNIVERSE
altered with time. In this way we arrive at a Universe in
which the individuals the clusters of galaxies change andevolve with time but which itself does not change. The old
queries about the beginning and end of the Universe are dealt
with in a surprising manner by saying that they are meaning-less, for the reason that the Universe did not have a beginningand it will not have an end. Every cluster of galaxies, every
star, every atom had a beginning, but not the Universe itself.
The Universe is something more than its parts, a perhaps
unexpected conclusion.
3*'

CHAPTER NINETEEN
Observational Tests in Cosmology
Was there ever a superdense state?
It is a suspicious feature of the explosion theory that no
obvious relics of a superdense state of the Universe can be
found. One might have expected for instance that galaxies of
very high average density would have been formed during the
early stages of expansion. But this did not happen. The
average densities actually occurring in the galaxies are very
low, amounting to no more than one million million million
millionth part of that of water. What is the explanation of
this? Why are there no galaxies with an average density of
one million millionth of water? Why did the Universe appar-
ently wait until the average density of matter in space sank
below one million million million millionth part of that of
water before any condensation occurred?
An ingenious answer has been offered to these questions by
George Gamow, who argues that during the early phases of a
superdense Universe radiation was the predominant form of
energy, not matter. According to Gamow's theory the im-
portance of radiation decreased as expansion proceeded until
the main source of energy eventually came to be resident in
the matter. It was not until this stage was reached that
clusters ofgalaxies could condense.
As an aside, we may ask why the energy carried by radiation
declines as the Universe expands. What happens to the energyof the radiation? It goes into expanding the Universe. This
also answers a question often asked about the radiation that is
constantly being emitted by the stars in all the galaxies. What
happens to the radiation of a star as it travels out into space?Where does it go to? It does not travel indefinitely without
modification, since it experiences the red-shifting process. This
322

OBSERVATIONAL TESTS IN COSMOLOGY
means that the electric vibrations of the light go slower and
slower the farther the light travels. The red-shift process thus
causes the light to lose energy. This is just the Olbers paradox
again or rather this is just the cut-off process that saves us
from Olbers5
paradox. The energy lost by the light goes into
expanding the Universe. But we must not make the mistake
of supposing that the light from present-day stars providesthe main cause of expansion. It amounts to less than a
hundredth of one per cent of what is required to drive the
Universe at its observed rate of expansion. The effect is a
small one.
Returning now to our main argument, although the reason
why we do not observe superdense galaxies can be explained
away in the manner suggested by Gamow it is a little sus-
picious that it should be necessary to explain it away. It is
strange that events have conspired to hide from us all direct
evidence ofthe existence ofa state as spectacular as an explosivecreation of the Universe must certainly have been, if it ever
existed.
Until recently it seemed as if the elements other than
hydrogen might be taken as evidence in favour of a superdensestate. According to views developed by Gamow, Alpher, andHerman all the elements were built up from free neutrons
(neutrons decay into hydrogen) during the earliest phases of
the existence of the Universe in the first 20 minutes or so:
according to Gamow's phrase 'in less time than it takes to
cook roast duck and potatoes'. So on this basis it could be
said that relics of the superdense state do exist, namely the
elements other than hydrogen.If this view were correct we should expect all stars to con-
tain the same proportion of metal atoms; for if the process that
led to the origin of heavy elements were a universal one there
should be no local variations of composition. But this is not so.
We have seen that the earliest stars to form ia the Galaxy
possess very low concentrations of heavy elements; and that
through the building of heavy elements in stars, and throughtheir distribution in space by the supernovae, stars possess moreand more heavy elements in proportion to hydrogen the later
the stage at which they are born. This gives such a good
323

FRONTIERS OF ASTRONOMY
account of the observed differences between young and old
stars that it can scarcely be maintained any longer that the
building of all heavy elements belongs to the earliest momentsof a superdense universe. The best that can be argued is that
a small proportion of the elements, the small proportion found
in the oldest stars, might be associated with the superdensestate. But this is such a serious weakening of the original pro-
position that it must be considered to point quite strongly
against the concept of the superdense state. The argumentcould to some extent be saved if the presence of comparativelysmall proportions of heavy elements in the oldest stars could
not be explained in any other way. But it can be explained in
another way, very readily by the steady state theory. This
point is worth considering at some length, especially as it offers
the answer to a question that was left over from Chapter 12.
So far in our discussion of the continuous origin of matter
we have said little about its composition at the time of origin.
We now introduce the assumption that it is the simplest of all
substances, hydrogen. Neutrons might seem an equivalent
choice, since neutrons decay by a 0-process into hydrogenatoms. But neutrons represent a higher energy state than
hydrogen atoms, so we shall suppose that matter originates as
hydrogen atoms, choosing the lower energy condition of these
two possibilities. The hypothesis that matter originates
throughout space as hydrogen does not mean that a galaxymust consist entirely of pure hydrogen at the time it condenses
however. This would only be correct if there were no pre-
existing galaxies. But in the steady-state theory there are
always other galaxies that pre-exist any particular galaxy, andthese will already have produced heavy elements. Some of the
heavy elements thus generated will certainly remain trappedinside the interstellar gases of their parent galaxies but a pro-
portion must escape altogether, not only from the parent galaxybut even from the cluster of galaxies of which it is a member.This is especially so for elliptical galaxies which contain verylittle gas wherewith to trap the heavy elements. So we see that
space is not only populated by the hydrogen atoms that
originate in space but also by heavy elements that are thrownoff by exploding stars in the galaxies, although of course the
3*4

OBSERVATIONAL TESTS IN COSMOLOGY
latter contribution is very small compared with the former.
But it is large enough to account for the low concentrations of
elements that are found in the oldest stars of our Galaxy.It should be possible to check this argument by observation.
If the elements present in the oldest stars of our Galaxy were
produced in a superdense state of the Universe, while the
majority of the heavy elements present in young stars are pro-duced by exploding stars, then we should expect that the relative
proportions ofone heavy element to another should be different
in the two cases for the reason that two entirely different
processes of origin of the heavy elements must be reflected byconsiderable differences in their relative abundances. If onthe other hand the heavy elements present in the 'first* stars
to form in a newly condensed galaxy were produced by the
supernovae of previously existing galaxies, as the steady-state
theory requires, then there should be no notable differences in
the relative abundances of heavy elements in young and old
stars the absolute concentrations should be different but not
the relative proportions of one element to another. Here then
is a definite means of testing the two theories. Within a few
years definitive results should be available. The observations
although difficult to make should be within the range of whatis possible.
Before leaving this question of heavy elements it may be
noted that the presence of heavy elements, even in low con-
centration, in very old stars is a strong point against the second
type of theory that was discussed above, the theory that
depended on modifying the nature of gravitation. In such a
theory all galaxies form at the same time and if the material
that they form out of is hydrogen then the 'first' stars should
consist of pure hydrogen previously existing galaxies cannot
be invoked in the same way as in the steady-state theory, nor
is there any superdense state in which to build an initial
supply of heavy elements.
The value ofHubble9s constant
Bubble's constant was introduced in the previous chapter,where its most probable value was given as about 7,000 million
3*5

FRONTIERS OF ASTRONOMY
years. It is desirable, because of its subsequent importance, to
see how this value is obtained before we go on to discuss
further ways of testing the different cosmological theories. Toobtain Bubble's constant from observation it is necessary first
to choose a cluster that is sufficiently distant for any purelyrandom motions that the galaxies inside it may possess to con-
tribute only negligibly to the red-shift measurement. This is
the case for example with the Hydra cluster, which is found to
be receding from us at a speed of about 60,000 kilometres persecond. So if the distance of the Hydra cluster can be found
we have only to divide the distance by 60,000 kilometres persecond to obtain Hubble's constant. The question therefore
turns on the determination of the distance of this cluster,
or ofsome other suitable cluster.
Now a determination of distance cannot be made with the
aid of any of the standard headlights discussed in earlier
chapters, since no single star except possibly a supernova can
be separately distinguished at the distance of the Hydra cluster.
Only a whole galaxy can serve as a standard headlight at this
distance. It is at this stage of the argument that great caution
must be exercised. The galaxies of the Local Group and other
nearby galaxies vary very considerably in brightness from one
to another. Which should we regard as typical?
Perhaps the best procedure that can be adopted at the presenttime is to assume that the brighter galaxies in all clusters are
closely comparable in their luminosities. This would make the
brighter galaxies comparable with MSI, our large companionin the Local Group. It is true that the majority of galaxies are
considerably fainter than M 31, but these are not the galaxiesthat we see at great distances great distance forces us to giveattention only to the brightest galaxies.
The case for choosing the Andromeda Nebula as a standard
headlight is not as arbitrary as this brief statement might
suggest. In the first place the three galaxies M 31, M 81 (Plate
XXIV) and our own Galaxy, turn out (with the new distance
measurements discussed in former chapters) to be of verysimilar brightnesses as well as of very similar masses, so similar
as to suggest that all three belong to a group of more or less
standard galaxies. This view is supported by the determinations
326

OBSERVATIONAL TESTS IN COSMOLOGY
of the average masses of the galaxies in the Virgo cloud andin the Coma cluster made some years ago by Sinclair Smith and
by F. Zwicky. These determinations yielded average masses
quite close to that of the Andromeda Nebula, as indeed has the
recent determination by Thornton Page of the average mass of
double galaxies. Double galaxies are galactic systems that movearound each other as the two stars of a double star do.
The argument for regarding M 31 as a typical member of
the brighter class of galaxy accordingly seems to be a strongone. The headlight method for determining distances can be
used on this basis, since the intrinsic brightness ofM 31 is nowknown with considerable accuracy, thanks to the work of
Baade and of Erik Holmberg. It turns out that the distance of
the Hydra cluster is rather more than 400 million parsecs,and Hubble's constant is about 7,000 million years.
Now this value is very much greater than the 1,800 million
years quoted a few years ago, so much greater that a short
comment on the reasons for the change is worthwhile. Theformer estimate of 1,800 million years was based on two
seemingly erroneous steps: one a fourfold underestimate of
the intrinsic brightness of M 31, and the other the curious
assumption that M 31 is the brightest galaxy in the Universe,
being some 4 times more luminous than the brightest galaxiesin any of the great clusters surely an unlikely supposition.That the new determination of Bubble's constant is much
more likely to be correct than the old value is shown by an
entirely independent argument. In Chapter 12, when dis-
cussing the Crab Nebula (Plate XXIX), we saw that distances
can also be determined by what we called the method of the
standard yardstick: that when the actual size of an object is
known a measurement of its apparent size enables the distance
to be calculated. Now the actual size ofM 31 is known with
a considerable degree of accuracy. So if we assume that other
galaxies of structurally similar form, other Sb galaxies that is
to say, have the same size as M 31 their distances can readilybe determined. Distances obtained in this way confirm that
Bubble's constant must be as great as 7,000 million yearsindeed the yardstick method suggests that 9,000 million years
might possibly be a better value.
327

FRONTIERS OF ASTRONOMY
Criteria depending on Hubble9s constant
Hubble's constant plays an important but different part in
each of the three theories at present under review. In the
superdense theory the ages of all the galaxies must be com-
parable with, but less than, Hubble's constant. This require-ment can only be tested with reasonable accuracy in the case
of our own Galaxy. With the age of the Galaxy at about
6,000 million years and with Hubble's constant at 7,000 million
years the requirement is evidently well satisfied. In the second
theory with the modified form of gravitation, the ages of the
galaxies should all be greater than Hubble's constant. Thecase of our own Galaxy would thus seem to contradict the
second theory. In the theory based on the continuous originof matter the galaxies should on the average have ages that are
comparable with, and probably somewhat less than, Hubble's
constant but there is no special requirement on the age of a
particular galaxy (such as our own for instance). The third
theory is not therefore exposed to any serious test on this parti-
cular point, although it is satisfactory that our Galaxy comesout to have an age not much different from the average for
all galaxies.
Hubble's constant does have a further deeper significance in
the third theory however. We have seen that in this theory the
rate of expansion of the Universe is determined by the rate of
the origin of matter Hubble's constant is determined by the
rate of origin of matter that is to say. We can now ask the
question: what rate of origin is required to explain a value of
7,000 million years for Hubble's constant? The answer is that
one hydrogen atom must originate every second in a cube with
a 160 kilometre side; or stated somewhat differently: that
about a quarter of a million hydrogen atoms originate everysecond in a volume of space equal to the volume of the Earth,or about one atom every century in a volume equal to the
Empire State Building. Although this might seem very small,
it is not small when added up throughout the whole 'observable'
Universe. The 'observable' Universe is defined to be just the
part of the Universe within the Gibers' cut-off distance at some
2,000 million parsecs. Within this region of space matter
328

OBSERVATIONAL TESTS IN COSMOLOGY
originates at about a hundred million million million million
million tons per uecond.
In the steady-state theory the average density of matter in
space does not decrease with time, as in the other two theories.
It remains constant at a value that depends on the rate of
origin of matter. For the rate just quoted the density is about
3 parts in a hundred thousand million million million million
of the density of water, or about one atom of hydrogen to a
good sized suitcase. Contrast this with the interior of a super-nova where a good sized suitcase would contain several million
tons of material.
In the steady-state theory we expect expansion to cease
wherever the density exceeds the average more than two or
threefold. Any localised region in which this occurs then
forms a 'bound* system. On the steady-state theory we accord-
ingly expect that 'bound' regions can exist at all densities
greater than this. We expect the density of matter within the
clusters of galaxies to vary from one cluster to another but
never so as to fall below two or three times the average for the
whole Universe. This requirement of the theory is strikingly
confirmed by observation as the following remarks will show.
The Local Group is an example of a particularly weak
cluster, so that the observed density in the Local Group can be
regarded as giving an estimate for the density of the weakest
bound systems. Now it turns out that the density within the
Local Group is indeed about two or three times greater than the
theoretical average density for the whole Universe, the one
corresponding to a value of 7,000 million years for Bubble's
constant. The agreement oftheory and observation is excellent.
It has been supposed by some supporters of the steady-state
theory that the change in Bubble's constant from the old
value of i,800 million years to 7,000 million years is a pity for
the reason that a value of 1,800 million years presented such a
severe age difficulty to the superdense theory as apparently to
place it entirely out of court. What was not perceived in this
view however was that 1,800 million years for Bubble's con-
stant would also be in flat disagreement with the steady-state
theory. Such a value for Bubble's constant would imply an
average density of matter in the whole Universe some 15 times
3^9

FRONTIERS OF ASTRONOMY
greater than the value given above. This would place the
density within the Local Group lower than the average densityin space and would require the Local Group to expand apart,which it is not doing. It needs a value of 7,000 million yearsfor Bubble's constant to explain why the Local Group remains
a bound cluster.
Remarks on the formation of new galaxies in the steady-state theory
Only those features that are self-propagating can exist in a
steady-state Universe. The formation of galaxies is an exampleof a feature that must be self-propagating, one generation of
galaxies giving rise to the next generation as with humans.
We may think of the galaxies as possessing a reproduction
factor, defined as the factor by which the average space densityof galaxies in one generation exceeds that in the previous
generation.Now on a very general argument the only possible average
reproduction factor is i. The reason for this rests on the
infinitely large number of generations that have occurred in
the past (infinitely large simply means greater than any number
you care to mention). Thus if in the past the average repro-duction factor had been less than i the density of galaxies
would have grown less generation by generation, until after
a sufficiently large number of generations no galaxies at all
would have been left which we observe not to be the case.
If on the other hand the average reproduction factor had been
greater than i the space density of galaxies would have growngreater generation by generation until by now the densitywould have become infinitely great which also we observe
not to be the case. So we see that the only possible averagefactor is i . What reason can we give for this?
The best explanation is a very simple one: that the densityof galaxies is limited by the availability of material. Supposethat the reproduction factor is greater than i when plenty of
material is available. Then the density of galaxies will increase
steadily until a shortage of material does eventually arise, as
it must sooner or later since the average total density of matter
in space is fixed, (the total density includes both condensed
330

OBSERVATIONAL TESTS IN COSMOLOGY
and uncondensed material). The reproduction factor must
then fall back to i and stay thereafter at i.
The argument is entirely analogous to the discussion byMalthus of human populations. With human populations the
average reproduction factor is greater than i when amplesupplies offood are available. The population increases genera-tion by generation until a shortage offood arises. The resultingincrease in the mortality rate then cuts the reproduction rate
back to i. In our own time Malthus has been foolishly dis-
credited on the basis that his predictions have been falsified in
Western civilisation. The reason for the falsification is that
supplies of food have risen to a degree that Malthus never
anticipated. But no mathematician can have the slightest
faith in the arguments of the opponents of Malthus. Risingfood supplies must sooner or later (the word must is unqualified)fail to keep pace with rising populations so long as the repro-duction factor is greater than i. It may be added by way of
ending this comparison between our human society and the
galaxies that whereas a human generation is reckoned at 30
years, a galactic generation must be reckoned in terms of
Hubble's constant, 7,000 million years!
Tests of the steady-state theory
We have now amassed sufficient information to apply another
test to the steady-state theory, but we must be careful to getthe conditions of the test correct. It is not a valid conclusion
from the above remarks that the material of the galaxies
spread smoothly throughout space should equal the averagetotal density in the Universe. To see why not, consider the
following further results yielded by the mathematical form of
the theory.The average age of material in the Universe is equal, not to
Hubble's constant, but to of Hubble's constant. Only some
5 per cent ofmaterial is as old as Hubble's constant, only about
i of a per cent is as old as twice Hubble's constant, only about
T&T of a per cent is as old as three times Hubble's constant.
This decreasing proportion of material with age arises from the
expansion of the Universe, which spreads out material more
33 1

FRONTIERS OF ASTRONOMY
and more thinly as it ages. The explanation of the seemingly
paradoxical remarks of the previous paragraph is now clear.
All material condenses into galaxies but the condensation takes
a time of the order of Bubble's constant. We must allow time
for a supragalactic cloud of gas to condense, for stars to form,for the initially loose structure of galaxies to compact. Onlythen do we observe a cluster of galaxies. This means that the
condensed galaxies should comprise only a few per cent of the
material of the Universe. What in fact is observed? That the
average density given by smoothing the observed galaxies
through space is a few per cent of the average total densitycalculated from the steady-state theory. Within the uncer-
tainties of the observations, the agreement between observa-
tion and the theory is again excellent.
An entirely decisive confirmation of the steady-state theorywould be obtained if clusters could be detected at an early
stage offormation, before their constituent galaxies compacted.But unfortunately observations on this point are very difficult
to make, for reasons that can readily be appreciated. Supposethat we distributed the Type II stars of M 31 throughout a
vast halo, say 100,000 parsecs in diameter, and then removedthe whole structure to a distance of 5 million parsecs. The
resulting object would be extremely difficult to detect, since
all that could possibly be observed would be a very faint glowin the sky. Yet this is how even a large galaxy newly formingat a comparatively moderate distance outside the Local Groupwould look. So although there may be quite a number of
galaxies now condensing within a distance of 10 million parsecsit is not surprising that they have as yet escaped detection.
The position is a good deal more hopeful ifinstead ofattempt-
ing to detect the early 'loose' structural form ofa newly forming
galaxy we consider the situation after the majority of the TypeII stars have concentrated into a central amorphous nucleus.
The problem is then no longer one of structural detection,since the galaxy now has a normal concentrated form, but of
distinguishing a young Type II assembly from older Type II
assemblies. Of the possible ways of distinguishing a youngcondensed galaxy probably the most effective will turn out to
depend on the distribution of the total light of the galaxy with
332
OBSERVATIONAL TESTS IN COSMOLOGY
respect to colour. But as this possibility will take much the
longest to discuss, it is best to consider another interesting
possibility first.
The gaseous residue left over from the Type II star-formation
process must become very considerably agitated during the
concentration of a galaxy from an initially loose form. Nowwe have seen in previous chapters that the agitation of gasseems to be strongly correlated with the emission of radio-
waves. It is possible therefore that galaxies might be detected
during the concentration phase by strong radio emission, not
of course so strong as when two galaxies collide as in the case
of the two galaxies in Cygnus (Plate XLIX) but considerably
stronger than a fully formed galaxy. In support of this view
cases are known of galaxies that are not colliding with anyother galaxy but which are unusually strong radio emitters.
M 87 (Plate XXVII) is a spectacular example. Strong radio
emission comes from the whole volume of this galaxy, which is
also peculiar in possessing an enormous number of globularclusters and a jet of gas inside the main distribution of stars,
the jet seemingly being emitted from near the centre of the
system. One cannot help wondering whether M 87 mightnot be a galaxy of comparatively recent formation. A photo-electric examination of the extent of the halo of this galaxy
might well prove of interest, as indeed might be the case for all
those galaxies that show exceptionally strong radio emission
and which are not collision cases.
A subtle criterion
It may eventually prove possible to obtain a precise deter-
mination of the age of a Type II star system from the distribu-
tion of colour within the total light emitted by the stars. Tosee how this might be done we note that most of the light of a
Type II assembly comes from stars that are evolving off the
main-sequence, and we may anticipate that its colour distribu-
tion must depend on what particular point of the main-
sequence the stars are evolving from. Now this depends on the
age of the system, so the colour distribution will therefore
depend on the age of the system. It follows that by measuring
333

FRONTIERS OF ASTRONOMY
the colour distribution it should be possible to infer the age in a
straightforward way.This would almost certainly be so if we knew just how the
evolutionary tracks depend on the point of emergence from
the main-sequence. The best way to obtain this information
would be by direct observation. But the only complete evolu-
tionary tracks so far determined by observation are for Type II
star assemblies belonging to our own Galaxy and since these
are of nearly the same age we only obtain the evolutionarytracks as they branch off rather a narrow range of the main-
sequence. With one or two exceptions other galaxies are too
distant for the important parts of the evolutionary track of
their Type II stars to be obtained through the observation of
individual stars. The exceptions are the Magellanic Clouds
and one or two of the nearby loose systems of the Local Group.So far no measurements on these are available.
The alternative to an observational attack on the problemis to determine the evolutionary tracks by theoretical analysis.
Although this project is being strenuously followed up, the
theoretical results so far achieved are very far from being precise
enough to be yet used in this context. So we see that as things
stand at present there is no possibility of a direct inference of
the age of a Type II star system from the colour distribution of
its total light. This does not prevent a more limited observa-
tional programme from being applied, however. For exampleit is possible to find out whether the Type II star systems in the
galaxies all have light with the same colour distribution. If
so we should have a strong indication that all galaxies are of
almost exactly the same age, thereby contradicting the steady-state theory. If on the other hand appreciable differences are
found, we should have a strong indication that there are
differences of age, although just what differences it would be
impossible to tell until either the observational or theoretical
knowledge discussed above becomes available.
This more limited programme has been started by Stebbins
and Whitford. The results so far achieved will now be described.
The distribution with respect to wavelength of the light
received from the elliptical galaxy M 32 (Plate XLV), one of
the satellite galaxies of the Andromeda Nebula, is shown in
334

OBSERVATIONAL TESTS IN COSMOLOGY
Fig. 65. Two wavelengths are marked in this figure at A and
B. The ratio of the amount of light received at B to the amount
at A determines what is known as the index of colour for M 32.
Although it gives a very incomplete representation of the shape
MH
10
04
O6
0-5
]0,
10-20-1
Wavelength (rh* unit ft ont hundred thousandth of a centimetre)
FIG. 65. The colour-curve of M 32.
of the whole curve this index is often used in observational
work because its measurement is accomplished much more
readily than the measurement of the whole colour-curve.
Now observations of colour index for a number of nearby
elliptical galaxies and for the nuclei of a number of nearby
spirals have shown a remarkable degree (f constancy from one
galaxy to another (although not agreeing with the Type II
stars in the globular clusters it may be xioted). This has been
interpreted as indicating that all Type II systems in nearby
elliptical galaxies and in the nuclei of the nearby spirals have
colour curves of the same shape as that shown in Fig. 65. Such
a view is perhaps a plausible one but it cannot be regarded as
certainly established since only measurements for the whole
range of wavelengths can settle the matter beyond question,
and this has not yet been confirmed.
Accepting, however, the identity of the colour-curves in our
immediate region of the Universe, it was at first argued that all
335
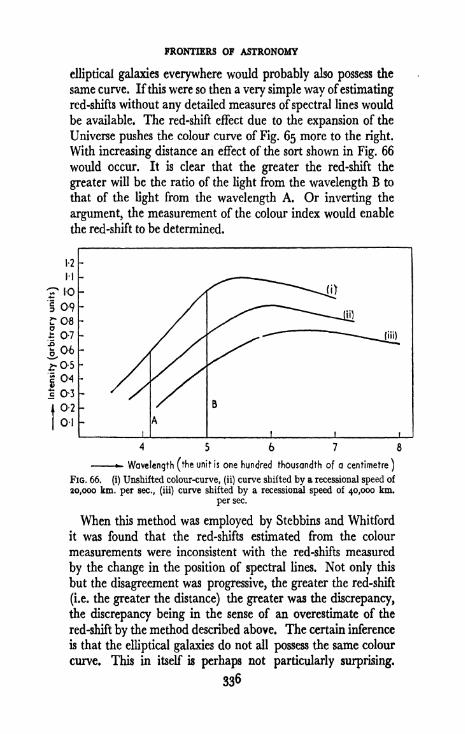
FRONTIERS OF ASTRONOMY
elliptical galaxies everywhere would probably also possess the
same curve. If this were so then a very simple way ofestimating
red-shifts without any detailed measures of spectral lines would
be available. The red-shift effect due to the expansion of the
Universe pushes the colour curve of Fig. 65 more to the right.
With increasing distance an effect of the sort shown in Fig. 66
would occur. It is clear that the greater the red-shift the
greater will be the ratio of the light from the wavelength B to
that of the light from the wavelength A. Or inverting the
argument, the measurement of the colour index would enable
the red-shift to be determined.
5678-Wavelength (the
unit is one hundred thousandth of a centimetre)
FIG. 66.(i) Unshifted colour-curve, (ii) curve shifted by a recessional speed of
20,000 km. per sec., (iii) curve shifted by a recessional speed of 40,000 km.
per sec.
When this method was employed by Stebbins and Whitford
it was found that the red-shifts estimated from the colour
measurements were inconsistent with the red-shifts measured
by the change in the position of spectral lines. Not only this
but the disagreement was progressive, the greater the red-shift
(i.e. the greater the distance) the greater was the discrepancy,
the discrepancy being in the sense of an overestimate of the
red-shift by the method described above. The certain inference
is that the elliptical galaxies do not all possess the same colour
curve. This in itself is perhaps not particularly surprising.
336

OBSERVATIONAL TESTS IN COSMOLOGY
But what at first sight seems surprising is that the colour curves
of the elliptical galaxies should change in a systematic way with
distance. If we accept this conclusion and if further we reject
the idea that our own locality in the Universe has the dis-
tinguishing feature of being placed in some special spacial
sequence with respect to the colour curves of the elliptical
galaxies observed by Stebbins and Whitford, then we seem to
be left with only one argument. The systematic effect must
apparently be due to the increasing time required for light to
travel to us as the distances of the galaxies increase. We see a
distant galaxy not as it is at the present time but as it was at the
time the light set out on its journey across space to us. This
idea leads to even more surprising conclusions when we follow
its implications a little further.
The time required for light to travel to us from the mostdistant of the galaxies observed by Stebbins and Whitford is
only some 1,000 million years. This is short compared to the
times of evolution of the Type II stars in our own Galaxythese have evolution times of about 6,000 million years.
Apparently then the track of the evolving Type II stars (mostof the light comes from the evolving stars) must change in
some very pronounced way in a time of only 1,000 million
years, even though the time for the whole evolution must beabout 6,000 million years. At first sight this seems impossiblebut a detailed consideration of the problem suggests one some-what implausible loophole. The index of colour depends on the
ratio of the light received at two wavelengths. It certainlyseems impossible that an appreciable change should occur in
only 1,000 million years in the light received at the longer
wavelength, B of Fig. 65, the light at this wavelength beingemitted mainly by the stars in the ascending part of the
evolutionary track N to O of Fig. 15. But a change of the
index of colour could equally well arise from a change in the
light received at the shorter wavelength A of Fig. 65. There is
an appreciable contribution (ifwe accept information from the
globular clusters) to this shorter wavelength range from stars
that are placed late in the evolutionary track, from P to Q,ofFig. 15. Perhaps the difference lies in these stars. So little is
yet known about their detailed structural behaviour that we
337 M

FRONTIERS OF ASTRONOMY
arc not in a position to deny the assertion that the disposition
of these stars may change appreciably in as little as 1,000million years.
1-2
,-x H
|10
3 O906
I 07
^06> 06
1 04I 0-3
|
0-2
0-1
Corona
galaxy
Corona /^. /galaxy / \S
/ S\SM32
M32
34567> Wavelength (the
unit is one hundred thousandth of o centimetre}
FIG. 67.
By observing at six different wavelength ranges instead of
only two, Whitford and Code have recently confirmed that the
differences of the colour curves do indeed lie at the shorter
wavelengths. The nature of the differences found by Whitford
and Code is shown in Fig. 67, where the colour curve ofM 32is given together with that ofan elliptical galaxy in the Corona
Borealis cluster (which is at about half the maximum distance
to which Stebbins and Whitford carried their original measure-
ments). The wavelength positions A and B are also marked in
Fig. 67. It is seen that these particular wavelengths happen to
be in positions that exaggerate to the full the difference between
the ratios B to A for these two galaxies. If the wavelength Ahad been placed at a somewhat shorter wavelength no difference
in the index ofcolour would have been measured, and ifA hadbeen placed at a still smaller wavelength the colour index
would have been altered in an opposite sense, the galaxy in the
Corona Borealis cluster would have seemed bluer instead of
redder than M 32. This somewhat arbitrary feature of the
method of measuring an index of colour has emphasised the
338

OBSERVATIONAL TESTS IN COSMOLOGY
importance of examining the whole colour curve, rather than
just two portions of it.
But these remarks do not alter the situation that a systematic
change of the colour curve, in the sense of an increasing ultra-
violet emission with increasing distance, does seem to exist.
Now let us move helter-skelter to a dramatic conclusion.
Such a distance effect, depending on time differences of only
1,000 million years and for galaxies at moderate distances
on times appreciably shorter than this, would be entirelymasked if there were intrinsic age differences as great as 1,000
million years between the galaxies. Hence all the galaxiesmust have identical ages to within a few hundred million years.
This conclusion, ifwe accept it, destroys the steady-state theoryat once.
Indeed it turns out that only the superdense theory in the
form advocated by Gamow can survive the present interpre-tation of the observations of Stebbins and Whitford. In
Gamow's exposition the galaxies all condensed at the particular
stage of the expansion of the Universe at which the average
density in space was comparable with the average densities
now found in the galaxies. The galaxies are supposed to be
localised regions that at a certain stage ofthe general expansionfailed for some unknown reason to continue in the expansion.The material of the Universe after expanding from the super-dense state is supposed to have suddenly gone into blobs that
did not continue themselves to expand, the expansion becom-
ing confined to the distances between the blobs. In this waythe ages of the galaxies can be made coincident within a few
hundred million years, as the Stebbins-Whitford measurements
apparently require. But this theory has the serious weakness
that it fails to explain why the galaxies are concentrated in
clusters, and the existence ofweak clusters like the Local Groupseems to be entirely beyond explanation.The impasse now reached is a serious one in which all three
types of theory seem in one way or another to be in serious
contradiction with observation. In these circumstances it
seems worthwhile considering whether we were justified in
dismissing at the outset the alternative possibility that the
clusters of galaxies in which Stebbins and Whitford carried
339

FRONTIERS OF ASTRONOMY
out their observations the Local Group, the Virgo Cloud
(Plate XXXVIII), the Corona Borealis cluster (Plate XL),and the Bo6tes cluster (Plate LVII) form a sequence with
respect to age. Is it possible that the times of travel of the light
from these various clusters has nothing at all to do with the
matter; that it is the clusters themselves that are of grosslydifferent ages? The degree of coincidence required is not very
great. We require the Local Group and the Virgo Cloud to be
of about the same age, then the Corona Borealis cluster must
have a shifted age, and the Bootes cluster must have an ageshifted still more in the same direction (at this stage of the argu-ment we do not have to specify whether older or younger). It
has been pointed out by Gold and Sciama that a graduationboth as regards size and population exists between these same
clusters, the Virgo Cloud being larger and containing more
galaxies than the Corona Borealis cluster and the Coronacluster being larger and containing more galaxies than the
Bootes cluster. In view of these differences, why not a gradua-tion with respect to age also?
Another point that requires emphasis is that Stebbins andWhitford found elliptical galaxies to be the only ones showing
systematic effects. Spiral galaxies showed no systematic effects
presumably because of the presence in spirals of bright youngstars of Type I. Now in some degree the distinction between
elliptical galaxies and spiral galaxies is not an entirely clear-
cut one. In Chapter 15 we saw that the ellipticals predominatein the clusters probably because they are stripped of gas bycollisions with one another. When we observe an elliptical
galaxy two ages are really relevant, one is the age of its Type II
population, and the other is the interval since it lost its gas bycollision. This latter age is important because it affects the
issue as to what Type I stars might still be left even though all
the gas has been lost. A galaxy that lost its gas say 2,000million years ago might well still contain sufficient ofthe not too
bright Type I stars that condensed 2,000 million years ago
(before the gas was lost) for its emission of blue light to be
much affected. Another galaxy might have lost its gas say
5,000 million years ago in which case the Type I stars mightcontribute only negligibly to the blue light. The chance of a
340

OBSERVATIONAL TESTS IN COSMOLOGY
galaxy losing gas by collision inside a cluster is much affected
by the richness of the cluster, so we see how a variation in the
population of clusters might well play a role in affecting the
colour curves of its constituent galaxies, even of those that are
apparently of an elliptical type.
These two additional possibilities, one a gross difference of
age between the clusters examined, and the other a com-
plication through contamination of some apparent elliptical
galaxies with Type I stars, seem inherently more plausible than
the interpretation in accordance with a strict similarity of ages.This is not only because of the impasse reached in the above
argument but also because so far no explanation is available as
to how a time as short as 1,000 million years can appreciablyaffect the colour curve of any old Type II distribution of stars.
There is also what seems a crushing argument that has so far
been held in reserve. Stebbins and Whitford found considerable
variations in the index of colour from one elliptical galaxy to
another within the Virgo Cloud. Differences in the time of
transit of light cannot be used here, so that we must of necessityfall back on inherent differences. The steady-state theory, in
that it requires the material of the Virgo Cloud to have con-
densed from an initially more dispersed state, leads to the
conclusion that differences of ages amounting to several
thousand million years should occur within one and the samecluster. This is in accordance with observation. On the
explosion theory there should be no differences.
The upshot of this discussion is that an observational examin-
ation of the colour curves of the elliptical galaxies provides the
possibility of a powerful attack on the problem of the ages of
the galaxies. We have seen that the interpretation of the
observations is still fraught with great uncertainties but it does
seem as though this type of work should be able to answer the
question posed by the steady-state theory as to whether the
galaxies are of variable age or not. This should go far toward
making a definite choice between the three types of theory. If
matters still seem very uncertain it must always be rememberedthat clearly sign-posted roads are not to be expected at a
pioneering frontier.
34'

CHAPTER TWENTY
The Continuous Origin of Matter
The origin ofmatter as a law
It remains in this last chapter to discuss more of the details
of the continuous origin of matter and of the cosmological
theory based on it. There is an impulse to ask where originatedmaterial comes from. But such a question is entirely meaning-less within the terms of reference of science. Why is there
gravitation? Why do electric fields exist? Why is the Universe?
These queries are on a par with asking where newly originatedmatter comes from, and they are just as meaningless and un-
profitable. The dividing line between what can validly be
asked and what cannot depends on the organisation of science,
in particular on the role played by the laws of physics. Wecan ask questions quite freely about the consequences of the
laws of physics. But if we ask why the laws of physics are as
they are, we shall receive only the answer that the lawg of
physics have consequences that agree with observation. If
further we ask why this agreement exists, we enter into the
territory of metaphysics the scientist at all events will not
attempt any answer. Newton's law of gravitation can be used
to predict when and where the next total eclipse of the Sun is
going to occur, and you may depend on it that events will fall
pat in accordance with prediction. But we must then be
satisfied. We must not go on to ask why.It follows that when the origin of matter becomes a law of
physics it is completely protected from such prying questionsas: where does matter come from? An impregnable shield
against such questions is provided by law, scientific law, the
modus operandi of science. This does not of course mean that
the continuous origin of matter is protected from all attack. It
means that the attack must come from a different quarter. It
342

THE CONTINUOUS ORIGIN OF MATTER
must come from a comparison of the consequences of the law
with observation. And this is just what the preceding chapterwas about.
The present situation is not new. When a neutron changesto a proton by a 0-process an electron is disgorged. Theelectron originates. It did not exist before the process, after
the process it does. Yet no one ever seems to have been worried
by the question of where the electron comes from. We saythat it originates in accordance with the laws of j8-disintegra-
tion.
It is time now that we came to the law of the continuous
origin of matter itself. Matter is capable of exerting several
types of influence or fields as they are usually called. There is
the nuclear field that binds together the atomic nuclei. Thereis the electro-magnetic field that enables atoms to absorb light.
There is the gravitational field that holds the stars and galaxies
together. And according to the new theory there is also a
creation field that causes matter to originate. Matter originatesin response to the influence of other matter. It is this latter
field that causes the expansion of the Universe. The distances
over which the several fields operate are in an ascending scale
the nuclear field has the smallest range, although within this
range it is easily the most powerful; next come the electro-
magnetic influences which have their main importance over
the range of size from atoms up to stars (the range in which wehumans lie); then the gravitational field is dominant over all
sizes from planets and stars up to the clusters of galaxies; and
lastly comes the universal field, the creation field, dominant in
the largest aspects of the Universe.
We can pull off an important stroke at this stage. Because
the creation influence is mainly determined by very distant
material it cannot vary much from point to point. The prox-
imity of the Sun does not produce any enhanced influence here
on the Earth, nor does the fact that we happen to lie in the
Galaxy. It may well be this smooth distribution of the creation
influence that is responsible for the large scale spatial uniformityof the Universe.
343

FRONTIERS OF ASTRONOMY
Mack's Principle and the General Theory of Relativity
It is curious how even the most everyday incidents are
intimately related to the large scale aspects of the Universe.
The darkness of the sky at night is one example. The winds
are another. The winds have a general prevailing direction
from west to east. Every air-traveller knows that because of
the winds it takes longer to fly from London to New York than
from New York to London. The meteorologist explains this in
terms ofthe Earth's rotation, by saying that the Earth is turningaround on its polar axis in such a way as to rotate from west to
east. If the Earth rotated the opposite way the winds would
blow from east to west, and the East Coast of the U.S. wouldthen have a climate like Mediterranean Europe, N.W. Europewould be frozen out, and the British Isles in particular would
take up a climate similar to that of Kamchatka.
Although there is little doubt that these prognosticationswould prove correct, the argument good enough as it is for
ordinary purposes does not pass muster in a strict logical test.
It is not really correct to talk of a body as spinning around
(although we have often done so in earlier chapters!). There
is no such thing as a spin pure and simple. We can talk with
precision of a body as spinning around relative to somethingor other, but there is no such thing as an absolute spin: the
Earth is not spinning to those of us who live on its surface andour point of view is as good as anyone else's but no better.
So it is really quite wrong to speak of the winds as blowing on
the Earth from west to east because the Earth is spinninground from west to east. We can only say that the winds blow
predominantly from west to east because the Earth is turningrelative to something or other. Now turning relative to what?
Turning relative to an observer on the Moon (i.e. turning as
seen by an observer on the Moon)? Turning as seen by an
observer on the Sun? Turning as seen by an observer on Sirius
(assuming such an observer could see the Earth)? Turning as
seen by an observer in some globular cluster? Turning as seen
by some observer in the Andromeda Nebula? Turning as seen
by an observer inM 87?These questions may have a monotonous aspect, but they
344

THE CONTINUOUS ORIGIN OF MATTER
are all very relevant. Every one of the observers would arrive
at a different answer if they could measure the rotation of the
Earth accurately, although several of the measurements wouldbe extremely close to each other. The situation that the
measurements would disagree with each other by however
small a margin makes it extremely implausible that we should
answer any one of the questions in the affirmative. If we did
so, if we said for instance that it is the rotation relative to the
observer on Sinus that sets the winds blowing on the Earth,
we should then have to face up to the demand for an explana-tion ofwhy this one observer should be so privileged and not the
others. Rather than attempt to meet such a seemingly im-
possible demand we must agree that it cannot be the rotation
of the Earth relative to any of these observers that is the single
determining factor. Rather does it seem preferable to say that
it is not the rotation of the Earth relative to any one body or
particle that is decisive but that some average rotation has to be
determined, a rotation averaged in some manner with respectto all the material in the Universe. In such an average we mayexpect that material at great distances from the Earth will
dominate, just as it must in the law of the continuous origin of
matter. So we can perhaps best answer the question of whatmakes the winds blow on the Earth by saying that it is rotation
relative to the really distant material of the Universe, material
at distances comparable with the Olbers limit, about 2,000million parsecs, 40,000,000,000,000,000,000,000 miles away.
This is an astonishing conclusion but one I think that can
scarcely be gainsaid. It was first enunciated in 1893 by the
Austrian philosopher Ernst Mach, and is usually referred to as
Mach's principle. One of the original aims of Einstein in the
formulation of his general theory ofrelativity was to give precisemathematical expression to Mach's principle. In the outcomethe general theory of relativity contains a curious dichotomy.From one point ofview it does give precise expression to Mach's
principle. From another point of view it contradicts Mach's
principle. This dichotomy is worth considering.If it is assumed that matter is distributed uniformly on a
large scale then the relativity theory allows one to prove Mach's
principle. But this highly satisfactory result is much tempered
345

FRONTIERS OF ASTRONOMY
by the situation that when we do not assume the material in
the Universe to be uniformly distributed on a large scale a
corresponding result cannot be proved. There is indeed a very
simple case in which the theory leads to an absurdity. The
theory permits us to think of a 'universe' that contains only
the Earth and the Sun with no other material present at all.
In such a universe the forces that control the terrestrial winds
can be made (according to the theory) to do anything we
please, to drive the winds just as they actually occur ifwe wish,
or even if we feel so disposed to make the winds blow in the
opposite direction from east to west. According to Mach's
principle it should only be the rotation of the Earth relative
to the Sun that has significance in such a universe. Yet the
theory of relativity admits rotary forces that are in no wayconnected with the rotation of the Earth relative to the Sun.
This notable failure of the theory is characteristic of any dis-
cussion of a 'universe' containing only a spatially localised
distribution of material.
Two entirely different points of view have been put forward
to meet this situation. One argues that the material of the
Universe does in fact seem to be distributed uniformly, andthat in this case the relativity theory satisfies Mach's principle.
This first point of view makes no claim to answer the questionofwhy the material of the Universe is uniformly distributed onthe large scale. Instead it is supposed that the uniformity of
the Universe is a property derived from the manner of its
creation the Universe was started uniform and has been
approximately that way ever since. This is the view of the
protagonists of the superdense cosmology. On this view we are
obliged not only to attribute such general cosmic manifestations
as the expansion of the Universe and the large scale uniformityof matter to the way that the Universe started off, but also the
forces controlling such literary mundane matters as the winds
on the Earth.
In spite of the unsatisfactory character of a theory that is
obliged to place its crucial processes beyond the range of both
observational verification and of tests of theoretical consistency,a number of physicists have expressed themselves as not in
disagreement with this procedure. The disposition to fall back
346

THE CONTINUOUS ORIGIN OF MATTER
in so many essential features on the way the Universe was
started off is presumably due to a common situation in physics;that the behaviour of a localised system always depends on
starting conditions. But the starting conditions in such a case
are simply a way of giving precise exposition to how the systemin question happens to be localised. Manifestly the Universe
is not a localised system, by definition the Universe is synony-mous with 'everything there is'. Consequently there is no real
parallel between the problems of everyday physics and prob-lems that concern the whole Universe. I am strongly of the
view that the difference is a crucial one and that all starting
conditions should be eschewed in cosmology. If this opinionis accepted the above argument must be entirely abandoned,and a quite different approach to the cosmological problemmust be sought.The direction that such a new line of attack should take was
already foreshadowed in our discussion of the relation of the
relativity theory to Mach's principle. The implication of this
discussion would seem to be that the theory is not wrong but
incomplete, that components are missing that would make an
important difference in the case where the theory is unsuccess-
ful but which would make no important difference in the
successful case. It is at just this point that the mathematical
expression for the creation influence becomes important. The
theory ofrelativity can be modified in an interesting way by the
inclusion of the creation field in its equations. The new terms
lead to the continuous origin of matter and to the expansionof the Universe. It is on the resulting mathematical theorythat all previous statements about the steady-state theory have
been based.
The position in this respect of the steady-state theory is
worth emphasising. Assuming a general spatial uniformity, it
is found that if at a particular time the average density of
matter is less than a certain critical value, space will becomefuller and fuller of material until the density rises to the
critical value, after which the density is maintained constant.
Conversely ifthe average density ofmatter were initially greaterthan the critical value the Universe would expand so fast that
the density would fall back to the same value as before, after
347
FRONTIERS OF ASTRONOMY
which it would again be maintained constant. The Universe
accordingly possesses uniformity with respect to time. This
suggests a penetrating question: must the Universe also possess
a general uniformity with respect to space? Is it the case that
if at one time the material in the Universe were not distributed
uniformly with respect to space that sooner or later it must
come to be so distributed? If this could be shown, subject to
one essential proviso, the outstanding problem of cosmologywould have been solved.
The proviso just mentioned is that the theory must not
establish spatial uniformity too strongly, otherwise condensa-
tion leading to the formation of clusters of galaxies could not
occur. The requirement is one of very large scale uniformitybut not of complete uniformity. This is an important and
probably crucial aspect of the problem. To appreciate its
significance we may consider in general terms the process bywhich new clusters of galaxies are supposed to form. As with
humans, one generation of galaxies impresses its pattern on the
next. The basic idea, due to Sciama, is that processes occurringinside already existing clusters lead to portions of the clusters
breaking away from the main group. These evaporated frag-
ments move out from their parent clusters into newly originatedmaterial where they act as condensation centres for the forma-
tion ofnew clusters. This idea is undoubtedly correct, in that
fragments must certainly evaporate away on occasion from
already existing clusters, and they must then act as new con-
densation centres. But the requirements of the steady-state
theory are far more stringent than this. Because in the steady-state theory we have to deal with an indefinitely large numberof generations the population of galaxies must have a repro-duction factor from generation to generation exactly equal to i.
And in addition to the total population of galaxies the average
spatial size of the clusters must also be reproduced from genera-tion to generation. If the reproduction factor for size were less
than i clusters would eventually die out and all galaxieswould become single. If on the other hand the reproductionfactor were maintained greater than i the size of the clusters
would grow indefinitely and the large scale uniformity of the
Universe would ultimately be destroyed.
348

THE CONTINUOUS ORIGIN OF MATTER
What then controls the reproduction factor for cluster sizes?
Shortage of material may be the answer, as it probably is in
the case of the total number of galaxies. But it is difficult to
resist the impression that subtler effects are at work. It seems
perhaps most likely that above a certain size the large scale
unifying requirement of the Universe becomes dominant. The
suggestion is that if the average cluster size were less than a
critical value the reproduction factor for cluster sizes would be
greater than i and the average size of clusters would growfrom generation to generation until the critical value was
reached, at which stage the tendency towards uniformity wouldcut the reproduction factor back to i. A stable situation wouldthen be reached with the average cluster size neither growing
larger nor smaller. Perhaps the central problem facing the
protagonists of the steady-state theory is to demonstrate the
correctness of this proposition.
349

Epilogue
It is now time to give a general summing up of the discussion
of both this and the two preceding chapters. It will be clear
that the aim of the steady-state theory is to dispense with
arbitrary conditions: arbitrary starting conditions leading to
expansion and large scale uniformity, arbitrary conditions
leading to the formation of galaxies. Instead of attributingthe main features of the Universe to arbitrary fiat it is pro-
posed that nothing less should be possible than a demonstra-
tion that all the main features of the Universe are consequencesof the laws of physics, entirely independent of any starting
conditions.
The conventional outlook of present-day physics is that all
physical laws are to be discovered by an examination of verysmall scale happenings in the laboratory, by the examination
ofthe properties ofatoms with particular reference to the nuclei
of the atoms. Yet we have an example of a law of physics that
was not discovered by experiments in the laboratory and whose
relation to the field of atomic physics is still not understood.
This is the law ofgravitation. What we know about gravitationwas discovered from a study of phenomena on the scale of our
own solar system (this statement applies both to the work of
Newton and of Einstein). Are we then to suppose that nofurther additions to the laws of physics are to be obtained
through the study of the Universe on a scale larger than the
solar system? The distance to Gibers' limit is more than
100,000,000,000,000 times greater than the distance of the
Earth from the Sun. Is the study of the Universe on such a
tremendous scale to be no more than an exercise in the applica-tion of what we have already learned on the Earth and within
the solar system? We should certainly doubt whether this is so
were it not for the fact that a great deal of what happens on a
larger scale is very readily explicable in terms of our extremely
locally derived knowledge. The behaviour of the whole of our
Galaxy, of the stars in it, of their formation from gas clouds, of
350
EPILOGUE
the motions and properties of the gas clouds, all appear entirely
explicable in terms of locally derived knowledge. It is onlywhen we come to phenomena on an extragalactic scale, on a
scale greater than the clusters of galaxies, that we arrive at a
situation where our locally derived knowledge apparentlybreaks down for it seems fair to describe a recourse to a whole
set of arbitrary starting conditions as a break-down. The
suspicion is that what we ought to be deriving as consequencesof the laws of physics we are being obliged to accept as condi-
tions arbitrarily imposed for no reasons that we understand.
This procedure is quite characteristic ofthe outlook ofprimitive
peoples, who in attempting to explain the local behaviour of
the physical world are obliged in their ignorance of the laws of
physics to have recourse to arbitrary starting conditions. These
are given credence by postulating the existence of gods, godsof the sea who determine the arbitrary starting conditions that
control the motion of the sea, gods of the mountains, gods of
the forests, of the air, of the seasons of the year, of the Sun, of
the Moon, and so forth. There is a strong hint that whatmodern man has tried to do with the Universe is no better than
what primitive man did with problems whose nature we nowfind simple but which once no doubt seemed just as complicatedas the problems that remain unsolved today. In principle
arbitrary starting conditions are to be avoided if any alterna-
tive attack is possible.
The argument leading to the steady-state theory is one such
line of attack. Already the old requirement that the expansionof the Universe be imposed as a starting condition has been
disposed of, but many problems remain the average size of
clusters of galaxies and the large scale uniformity of the
Universe are two of them.
How far the present attack will go is difficult to say. Myimpression is that it will go a considerable way but that a
complete success is not to be expected. More penetrating
developments seem necessary, for the theory must surely be*
related to the properties of individual particles in a more
significant way than anything that is understood at present.
We have spoken of material originating as hydrogen and there
is now strong evidence that this view is correct. Why does the
351
FRONTIERS OF ASTRONOMY
material of the Universe originate as hydrogen? Hydrogen is
certainly the simplest of the elements, but an argument based
on simplicity is scarcely an entirely satisfactory one. There must
it seems be a clear-cut reason why it is hydrogen that originates
and not other elements. What this reason is we do not know.
Nor can the reason apparently be supplied within the frame-
work of any of the theories that are being considered at the
moment. Yet unless a reason can be given we are once againfaced with an arbitrary situation. Even if all the projects out-
lined above turn out successfully the theory must still be judged
incomplete until it has explained why it is only hydrogen that
can originate and not other elements. And we can scarcely
imagine that such an explanation can be forthcoming until a
connection with the detailed theories of nuclear physics has
been established.
In the first chapter we spoke of the fourth revolution in
physics, the revolution that has only just started, and we said
that so far it is not known how this revolution may come to
affect our conceptions of the Universe. It is difficult to resist
the impression that we have now reached the stage of our
argument where a connection with the fourth revolution of
physics is likely to take place. At the moment man's investiga-
tion of the ultra-small ends in mystery and his investigation of
the ultra-large ends in mystery. It is not a very far-fetched
hope that the two mysteries will turn out to be closely con-
nected. We spoke in the first chapter of the range of size of the
phenomena examined by physics, the size of the ultra-large
being greater than the size of the ultra-small by the huge num-ber 10,000,000,000,000,000,000,000,000,000,000,000,000,000.The hope is that the two ends of this enormous span will be-
come tightly connected and that physics instead of being
entirely contained in the ultra-small will come to be considered
over a whole connected circle of argument.There are some extremely curious numerical similarities that
give support to this view. If we take the ratio of the electrical
force between a proton and an electron to the gravitationalforce between them we again obtain an enormous number, andit turns out to be close to the enormous number written downabove. Is this just a chance coincidence? If we put it down to
352
EPILOGUE
chance, then what do we make of the fact that if we take the
square root of the number of hydrogen atoms within the
Olbers limit we obtain another extremely large number, a
number that is again very close to the one written down in the
previous paragraph. Is this just another coincidence? If wetake the ratio of the density in the central region ofa supernovato the average density of material in the Universe we againobtain a number that is similar to the one of the previous
paragraph. Is this a coincidence once more? Unless we are
willing to answer that all are coincidences, we are obliged to
suppose that the laws of physics as we know them today are
substantially incomplete and that so far unperceived connec-
tions must exist between the physics of the ultra-small and the
physics of the ultra-large.
The only really serious attempt to discover what these
curious relations may be was made by Eddington. Yet Edding-ton's work in this respect has passed without much regard,not because physicists doubt that relations exist, but because it
is very seriously doubted whether enough is yet known to
allow any useful insight to be gained into the problem. Edding-ton's attempt was made within the terms of reference of whatwe have called the third revolution of physics. It is generallyfelt that physics was then too incomplete, and that the hoped-for understanding will only be forthcoming in the course of the
fourth revolution.
One further remark must be made about the steady-state
theory of the Universe. It is not a point in support of this
theory that it contains conclusions for which we might happento have an emotional preference. Herbert Dingle has quite
correctly warned us recently against promoting a theory
simply because we happen to like it. The grounds for the
acceptance of a theory are its agreement with observation.
The grounds for a serious discussion of a theory lie in the
possibility of subjecting it to observational test. This condition
the steady-state theory fulfils in good measure, as we saw in the
previous chapter. The steady-state theory must always be
more subject to observational check than its rivals because bydisposing of arbitrary starting conditions it removes a whole
series ofhypotheses that from their very nature are beyond test.
353

FRONTIERS OF ASTRONOMY
The weakness of the superdense theory for instance is that it
puts most ofthe important observational features ofthe Universe
into its starting conditions the reason for the expansion of the
Universe, for its large scale uniformity, for the condensation
of the galaxies, are put into the theory in a manner that cannot
be tested. This is to miss what seems to be the whole point of a
scientific theory, that its value depends on the possibility of
disproving it: Gold has expressed this most aptly by sayingthat 'for a theory to be of any value it must be vulnerable'.
Vulnerability supplies the conditions for success or failure in
accordance with observational tests, and it is on this that
science, and indeed all rational argument, is based. The aim
in science is not to build a theory that is so hedged in with pro-tective conditions that nobody can get at it. The aim is to
build a theory that is exposed to observational attack in as
many directions as possible, and which then manages to
survive.
Quite apart from its attempt to eliminate arbitrary starting
conditions there is a further reason why the steady-state theorymust be more vulnerable to observational attack than anyother cosmological theory. In the steady-state theory all
observable features must be consequences of processes that are
still happening. In other theories most of the importantfeatures of the Universe are consequences of processes that are
over and done with. In some cases there may be a possibility
of examining the situation at an earlier time by observing light
received from great distances (the light having started on its
journey at a much earlier time, and therefore giving informa-
tion about an earlier state of affairs). But this will not alwaysbe the case, and indeed no positive observation has so far beenmade that refers unequivocally to a significantly different
epoch from the present. In the steady-state theory all pro-cesses must on the other hand still be happening and are there-
fore susceptible to observation. The steady-state theory there-
fore places observation on a stronger footing than any other
theory, since according to the steady-state theory there is no
aspect of cosmology that cannot (at any rate in principle) be
directly verified. It is true that we must not accept a theory onthe basis of an emotional preference but it is not an emotional
35*

EPILOGUE
preference to attempt to establish a theory that would placeus in a position to obtain a complete understanding of the
Universe. The stakes are high, and win or lose, are worth
playing for.
355


Index
Ages oi Type I and Type II stars, 284Algol binaries and their evolution,
.
Atoms, 45; building out of, 45; size
of, 46; ionised, 47AE Aurigae, 244
Barred spirals, 277Beta-disintegration, 53Blue giants, 178, 239, 242, 246, 282
C14, half life of, 57; application to
archaeology and history, 58 et seq,
f Cancri, 250Carbon-nitrogen cycle, 139Carbon stars, 240Castor, 250Cassiopeia, radio source in, 268, 270Cephei, W, 202, 256Cepheids, 178, 185 et seq.Chandrasekhar's limit, 152, 203 et seq,
Coffee-cup theory of spiral arms, 287Colliding galaxies in Cygnus, 279n Columbae, 244Coma cluster of galaxies, 273, 279Comets, 10; break-up of, 1 1
Compacting of a galaxy, 299Composition of Type I and II stars,
285Continuous origin of matter, 318 et
seq., 342 et seq.Corona cluster of galaxies, 273, 309,
34Cosmic rays, 58, 257; nature of, 258;
origin of, 260; produced on stars,
262Crab Nebula (radio source in Taurus),
123, 215 et seq., 221, 268Cut-off due to expansion of Universe,
31$ et seq.
Dark globules, 245Degeneracy pressure, 151, 203Difference between giants and red-
giants, 183Dispersing star showers, 236, 243Distance indicators, R R Lyrae stars
as, 164 et seq.', irregular oscillators
and novae as, 175; globular clusters
as, 176; Cepheids as, 188; blue
giants as, 228; galaxies as, 326Draco system, 171, 272Dust as a polarising agent, 254Dwarfs, 178
Earth, spiralling towards Sun, 4; tilt
of axis of rotation of, 12; tropicaland semi-tropical glaciations of,
12; equatorial bulge of, 13; polarwander of, 13; surface and internal
irregularities of, 14; orientation of,
14; ice-ages due to a toppling of,
15; core and mantle of, 19 et seq.',
thickness of continents of, 19;
density inside, 19; pressure inside,
20, 127; internal temperature of,
24, 25; formation of core of, 26 et
seq.; heating by compression of, 27;
origin of oceans of, 32; origin of
continents of, 32; volatile materialsin crust of, 35; origin of ore
deposits in crust of, 36; origin of
oil deposits in crust of, 37; future
of, 38; age of, 62; origin of material
of, 223; winds on, 344Earthquakes, 20, 37Electrons, 47 et seq.
Elements, nature of, 50; formation of
very heavy, 206; formation of
medium light, 207; origin of, 221et seq., 323 et seq.
Evolution of, mixed stars, 141;unmixed stars, 141 et seq,, 179, 282;of solar type stars, 143 et seq., 149et seq.
Expansion of Universe, 309 et seq. t
3*9Expanding spherical gas clouds, 244Exploding stars, 83, 213 et seq. t 244,
323Explosive conditions, 155
Fall of meteors through terrestrial
atmosphere, 9
357

INDEX
Fornax system, 272, 283, 301
Galaxy, age of, 148; distance of
centre of, 166; halo of, 169;satellites of, 169; size of, 226;
spiral arms of, 228 et seq.; gas anddust in the arms of, 230 et seq.;
condensation of stars in the spiralarms of, 234 et seq.} radio emissionfrom clouds of hot hydrogen in,
266; radio emission from discrete
sources in, 268; general radio
emission from, 270; radio emissionfrom centre of, 270; disk popula-tion of, 286; magnetic field in spiralarms of, 254, 288; mass of, 272, 326
Galaxies, in clusters, 271; distribu-
tion in space of, 273; limits of
detectability of, 274; elliptical,
275; collisions between, 278; radioemission ,from, 280; intergalactic
bridges and magnetic fields, 289;
fragmentation of supragalacticcloud into cluster of, 294; massesof, 296, 326; monster, 300; con-densation of, 316, 330, 348; colourcurves of, 335; displacement of
colour curves by red-shift, 336;transit time of light from distant,
337; sizes and populations of
clusters of, 340.Gas bullets, 247Giants, 178Globular clusters, stars of, 146 et seq.,
157, 281 et seq.; formation of, 300;colour of, 335
Greenhouse effect, 7Gravitation, modification of the law
of, 316
Helium burning, 154, 205Helium cores, formation of, 150;
explosion of, 154, 184f Herculis, 145Hertzsprung-Russell diagram, 134Hubble's constant, 315; the value of,
326 et seq.; criteria depending on,
328 et seq.
Hydra cluster of galaxies, 274, 309Hydrocarbons, 37, 70, 96
Ice-ages, quaternary, 5 et seq., 15'tropical and semi-tropical/ 12;
testing theories of, 161C 1613, 272, 277, 301Interstellar gas clouds, 84, 117; con-
densation of, 235; dust and mole-
cules in, 239 et $eq.; fragmentationinto stars, 241; heating of by bine
giants, 242; opacity of, 245lonisation, 47, 108, 122, 132, 209, 200
Isotopes, 52Irregular variables, 190
Jupiter, 72; composition of, 73; con-densation of, 95
Length of the terrestrial day, I et seq.
Light, wave and quantum nature of,
41; polarisation of, 253Local group, 270, 309, 326, 329e Lyrae, 250
M 3, 146, 157, 165M 31, 248, 271, 275, 276, 282, 301,
326; distance of, 170; satellites of,
170; size of, 226; spiral arms of,
228; radio emission from, 280, 281M 32, 228, 272, 295; colour curve of,
334M 33, 271, 276, 295M 51, 276, 281M 81, 273, 276, 301, 309, 326; distance
of, 175, 189; radio emission from,281
M 87, 176, 333M 92, 146, 157Mach's principle, 344 et seq.
Magnetic fields, 91 et seq.; on Sun,109; in sunspots, in; in pro-minences, in; interstellar, 254;
origin of solar, 255; origin of
stellar, 255; in spiral galaxies, 276;in spiral arms, 254, 288; origin of,
302Magnetic stars, 256, 262 et seq.;
abnormal chemical abundances in
the atmospheres of, 262; oscilla-
tions of, 265Magellanic clouds, 249, 271, 277, 283;
distance of, 171Main-sequence, 137 et seq.
Mars, mass and density, 66; com-pression inside, 67; atmosphere of,
68; water on, 68; condensation and
composition of, 93Measuring astronomical distances,
163 et seq.; by parallaxes, 172; byyardstick method, 216, 327
Mercury, mass and density of, 66;
compression inside, 67; compositionand condensation of, 93
Mesons, 44, 258Metals, in Earth, 22 et seq.; in stars,
177, 183; formation of, 210
358

INDEX
Meteorites, 24, 63Molecules, 46, 239, 246, 303Moon, spiralling away from the Earth,
4; composition of, 75; volcanic
activity on, 76; craters on, 76;
bright rays on, 77; properties and
origin of craters on, 77; maria on
79; dust on, 81
Near-by stars, 180
Neon, formation of, 155; burning of,
207Neutrinos, 53, 65, 140, 212
Neutrons, 51, 206, 263Neptune, 72, 96Newtonian dynamics, 40NGC 205, 228, 272, 295NGC 4594, 176, 276, 301Novae, 160 et seq.Nuclear refrigeration, 211
Oceanic and atmospheric terrestrial
tides, 2; compensation between, 3Gibers' paradox, 304 et seq.
Open clusters, 191
Origin of, life, 100; planets, 83 et seq.,
224; multiple stars, 249; solar
system, 251; magnetic fields of
Sun and stars, 255; cosmic rays,260; deuterium, 263; lithium,
beryllium, and boron, 264; cosmicradio waves, 269; of elliptical
galaxies, 278; of Type II stars, 290;of magnetic fields, 302; the uni-
verse, 314; matter, 342 et seq.
Oxygen, 49; isotopes of, 52, 61;formation of 155; burning of, 207
Orion Nebula, 85, 268
Paleotemperatures, 60 et seq.
Parsec, definition of, 167f Persei cluster, 237 et seq.Photoelectric effect, 48Planets, origin of, 83 et seq., 224;
rotation of, 98Planetary disk, growth of, 88
Planetary material, origin of, 84;
composition of, 89; transference of
angular momentum from Sun to, 91Planetary systems, frequency of, 83;
in general, 104Pleiades, 136, 192Pleione, 136Pluto, 73; density of, 74Positron, 54Potassium (radioactive), 25Praesepe, 193
Pressure inside collapsed stars, 209Procyon, 217Protons, 49Proton-chain, 64, 139
Radiation, general properties of, 41
Radio-astronomy, 264 et seq.
Radiogenic lead, 63Radio-waves, from Sun, 113; emitted
by neutral hydrogen atoms, 233;from hot hydrogen, 266; fromdiscrete sources in the Galaxy, 268;from centre of the Galaxy, 266,
270; from colliding galaxies, 279;from galaxies in general, 280
Red dwarfs, 178; flares on, 182
Red-giants, 178, 183Relativity theory, 43, 344 et seq.
Rosette Nebula, 245R R Lyrae stars, 157 et seq.
Satellites, 74; composition of, 75;formation of, 99
Saturn, 72; condensation of, 95Scorpio-Centaurus cluster, 238Sculptor system, 272, 301Sirius, 136, 250Solar, constant, 6; system flow of gas
in, 10; system scale of, 84; atmos-
phere, corona, and chromosphere,106; chromosphere, temperatureand size of, 106, 107; corona,
temperature and size of, 107, 108;
atmosphere, ultraviolet light andX-rays from, 108; magnetism, 109;
prominences, in; flares, 113;cosmic rays, 113; radio-waves, 113;conditions at photosphere, 130
Solids, liquids, and gases, 47Spectral fines, 226, 310Spiral galaxies, 276Stars, masses of main-sequence, 138;
evolution of mixed, 141; evolutionof unmixed, 142; evolution of solar
type, 143, 149; of globular clusters,
146; formation of helium cores
inside, 150; stable and unstable,
155; R R Lyrae, 157; in general,
177; near-by, 180; energy produc-tion in, 204; formation of elements
inside, 206 et seq.; pressure inside
collapsed, 209; condensation in
spiral arms of, 234 et seq.; forma-tion of clusters of, 236; carbon,
240; fragmentation into, 241; TTauri, 246; formation as a cyclic
process, 248; origin of multiple,249; polarisation of light from
359

INDEX
distant, 253; magnetic, 262; thetwo types of, 281
Steady state theory of Universe, 320el seq.\ tests of, 331
Stellar, radii, 136; evolution, 179;
catastrophes, 2x2
Sticking agents, 94, 97Submarine canyons, 34Subdwarfs, 178; problems concerning,
183Superdense state of Universe, 315,
322Supergiants, 178; missing, 191, 218
Supernovae, 83, 213 ct seq. t 244; two
types of, 220
Supragalactic clouds, temperatureand density inside, 291; fragmenta-tion into clusters of galaxies, 294
Sun, motion of meteors towards, 10;
energy generation in, 64, 128;
rotation of, 84; condensation of,
85; ultraviolet light and X-raysfrom, 108; infall of material into,
117; accretion of interstellar
material by, 118; far corona of,
122; coronal streamers of, 125;
temperature, density, and pressureinside, 128; convection and radia-
tive energy flow inside, 131
Sunspots, in, 257
T Tauri stars, 746
Terrestrial, rainfall, 8; .atmosphere,entry of meteors into, 8
The hierarcy sequence, 297 et seq.
Type II stars, in nucleus of Galaxy,283; in Magellanic clouds, 283; ageof, 284; origin of, 290, 296; massesof, 298; colour of, 334
Universe, age of, 308; expansion of,
309, 319; origin of, 314; superdensstate of, 315, 322; steady state oi,
320; average density of matter in,
329; tests of steady state of, 331Uranium, 25, 52, 62; in surface rocki
of the Earth, 33W Ursa Majoris stars, 105
Velocity determinations, 227, 309Velocity distance relation, 310Venus, 66; interior of, 67; lack qjf
water on, 68; atmosphere of, 69;oil on, 70; rotation of, 71; clouds of,
71; oceans on, 71; condensation of,
93Virgo cloud of galaxies, 273, 309, 341Volcanoes, 30 et seq.
White dwarfs, 178, 217, 251; origin of,
159
Young and old stars, 223
360


![sequential.ppt [Read-Only]](https://static.fdokumen.com/doc/165x107/6319ca5fc51d6b41aa04902b/sequentialppt-read-only.jpg)