texas academic performance report (tapr) - Calhoun County ISD
625
CALHOUN COUNTY ISD TEXAS ACADEMIC PERFORMANCE REPORT (TAPR) INCLUDES: ● 20152016 DISTRICT ACCREDITATION STATUS AND 20152016 TEXAS ACADEMIC PERFORMANCE REPORT ● 20142015 PEIMS FINANCIAL REPORT ● 20162017 DISTRICT & CAMPUS IMPROVEMENT PLANS ● 20152016 REPORT ON VIOLENT/CRIMINAL INCIDENTS ● 20152016 ACADEMIC PERFORMANCE HIGHER ED. REPORT
-
Upload
khangminh22 -
Category
Documents
-
view
1 -
download
0
Transcript of texas academic performance report (tapr) - Calhoun County ISD
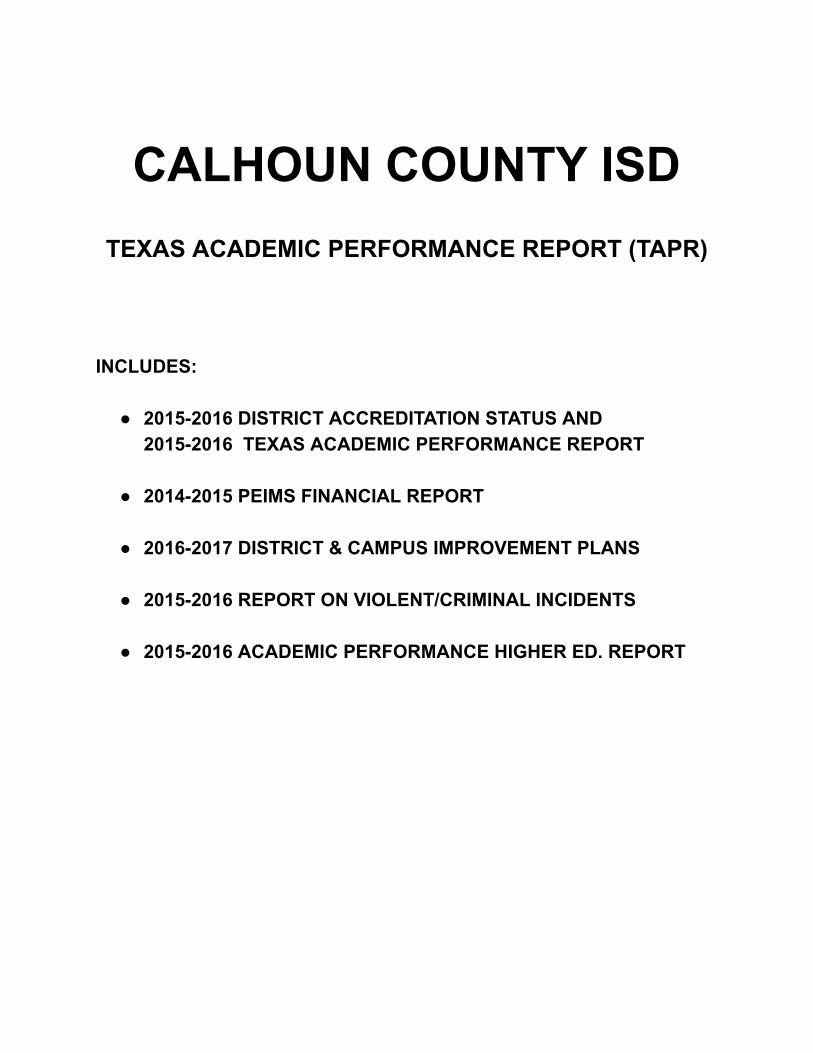
CALHOUN COUNTY ISD
TEXAS ACADEMIC PERFORMANCE REPORT (TAPR)
INCLUDES:
● 20152016 DISTRICT ACCREDITATION STATUS AND 20152016 TEXAS ACADEMIC PERFORMANCE REPORT
● 20142015 PEIMS FINANCIAL REPORT
● 20162017 DISTRICT & CAMPUS IMPROVEMENT PLANS
● 20152016 REPORT ON VIOLENT/CRIMINAL INCIDENTS
● 20152016 ACADEMIC PERFORMANCE HIGHER ED. REPORT

Calhoun County ISD
GLOSSARY

Glossary November 2016
2015–16 Texas Academic Performance Report
Accountability Rating: The labels assigned to districts and campuses by the state academic accountability system that indicate acceptable and unacceptable performance or that a district or campus is not rated. Possible ratings are as follows:
• Met Standard
• Met Alternative Standard
• Improvement Required
• Not Rated
• Not Rated: Data Integrity Issues
For a detailed explanation of this year’s accountability system, see the 2016 Accountability Manual, available at http://tea.texas.gov/2016accountabilitymanual.aspx.
Accountability Subset: The collection of STAAR assessment results that are used to determine district and campus accountability ratings.
Campus-level accountability subset: Campuses are held accountable for the performance of only those students enrolled in the campus on both the snapshot date (the last Friday in October) and the testing date. For example, if a student was enrolled at one campus on October 30, 2015* then moved to another campus before the testing date, that student’s performance is not included in the accountability results for either campus.
District-level accountability subset: A district is held accountable for the performance of only those students enrolled in the district on both the snapshot date (the last Friday in October) and the testing date. For example, if a student was enrolled in one district on October 30, 2015* then moved to another district before the testing date, that student’s performance is not included in the accountability results for either district. If that student had moved from one campus to another in the same district, however, his or her performance would have been included in the district’s results, even though it was not included in the results for either campus. This can cause districts performance results to vary from the aggregate of its campuses’ results.
*In the case of STAAR End-of-Course exams administered in July 2015, the accountability subset date is for the prior year, October 31, 2014.
Advanced/Dual-Credit Course Completion: The percentage of students who complete and receive credit for at least one advanced course. TAPR includes separate completion percentages for grades 9–12 and grades 11–12. Decisions about awarding high school credit for college courses is described in Texas Administrative Code §74.25.
Appendix B lists all courses identified as advanced, with the exception of courses designated only as dual-credit. Courses for which a student can earn dual credit are not listed because they vary from campus to campus.
Course completion information is reported by districts through the Public Education Information Management System (PEIMS) after the close of the school year. For example, the values, expressed as percentages for grades 11–12, are calculated as follows:
Texas Education Agency | Academics | Performance Reporting 1 of 29

2015–16 TAPR Glossary November 2016
number of students in grades 11 and 12 in 2014–15 who received credit for at least one advanced/dual-credit course
number of students in grades 11–12 who received credit for least one course in 2014–15
This indicator was used in awarding distinction designations to high schools in 2016. For a detailed explanation of distinction designations, see Chapter 5 of the 2016 Accountability Manual. (Source of data: PEIMS; Record 415, Course Completion Data – Student; Submission 3).
Advanced Placement Examinations: Please see AP/IB Results.
Annual Dropout Rate: The percentage of students who drop out of school during a school year. Annual dropout rates are shown for districts and campuses that serve grades 7–8 and/or 9–12. State law prohibits including a student who meets any of the following criteria from campus and district annual dropout rate calculations:
• Is ordered by a court to attend a high school equivalency certificate program but hasnot earned a high school equivalency certificate
• Was previously reported to the state as a dropout
• Was in attendance but not in membership for purposes of average daily attendance (i.e.,students for whom school districts are not receiving state Foundation School Program[FSP] funds)
• Was initially enrolled in a school in the United States in any grade 7 through 12 as anunschooled refugee or asylee as defined by TEC §39.027(a-1)
• Attends a district exclusively as a function of having been detained at a county detentionfacility and is not otherwise a student of the district in which the facility is located
• Is incarcerated in a state jail or federal penitentiary as an adult or as a person certifiedto stand trial as an adult
Annual Dropout Rate (Gr 7–8). This includes only grades 7 and 8. It is calculated as follows:
number of dropouts in grades 7 and 8 during the 2014–15 school year
number of students in grades 7 and 8 in attendance at any time during the 2014–15 school year
Annual Dropout Rate (Gr 9–12). This includes grades 9 through 12. It is calculated as follows:
number of dropouts in grades 9 through 12 during the 2014–15 school year
number of students in grades 9–12 in attendance at any time during the 2014–15 school year
Both annual rates appear on campus, district, region, and state TAPRs. The state and region annual dropout rates that are reported on district and campus TAPRs, however, are calculated without the exclusions required for campus and district calculation.
Note that with all annual dropout rate calculations, a cumulative count of students is used in the denominator. This method for calculating the dropout rate neutralizes the effect of mobility by including in the denominator every student ever reported in attendance at the district or
Texas Education Agency | Academics | Performance Reporting 2 of 29

2015–16 TAPR Glossary November 2016
campus throughout the school year, regardless of length of enrollment. For a more complete description of dropout rates and exclusions, see the Secondary School Completion and Dropouts in Texas Public Schools, 2014–15 reports, available on the TEA website at http://tea.texas.gov/acctres/dropcomp_index.html.
For detailed information on data sources, see Appendix K in the 2016 Accountability Manual. See also Dropout and Leaver Record. (Source of data: PEIMS; Record 203, Student – School Leaver; Record 400, Student – Basic Attendance; Record 500, Student – Flexible Attendance Data, Submissions 1, 3, and 4)
Annual Graduates: The count of students who graduate from a district or campus in a school year regardless of cohort. This is separate from, and may include different students than, the longitudinal graduation rates. (Source of data: PEIMS; Record 203, Student – School Leaver; Submissions 1 and 3)
AP/IB Course Completion: The percentage of annual graduates who completed at least one Advanced Placement (AP) course and/or the International Baccalaureate’s (IB) course in the 2011–12 to 2014–15 school years.
number of 2014–15 annual graduates who completed at least one AP or IB course in the 2011–12 to 2014–15 school years
Number of 2014–15 annual graduates
AP/IB Results (Participation): The percentage of students in grades 11 and 12 who took the College Board’s Advanced Placement (AP) examinations and/or the International Baccalaureate’s (IB) Diploma Program examinations.
The percentage of students in grades 11 and 12 taking at least one AP or IB examination
number of 11th and 12th graders in the 2014–15 school year taking at least one AP or IB examination
total students enrolled in 11th and 12th grades
AP/IB Results (Examinees >= Criterion): The percentage of students in grades 11 and 12 with at least one AP or IB score at or above the criterion score. High school students may take one or more of these examinations, ideally upon completion of AP or IB courses, and may receive advanced placement or credit, or both, upon entering college. Generally, colleges will award credit or advanced placement for scores of 3, 4, or 5 on AP examinations and scores of 4, 5, 6, or 7 on IB examinations. Requirements vary by college and by subject tested.
The percentage of students in grades 11 and 12 with at least one AP or IB score at or above the criterion score (3 on AP or 4 on IB)
number of 11th and 12th graders with at least one AP or IB score at or above criterion
number of 11th and 12th graders with at least one AP or IB examination
This indicator was used in determining the 2016 postsecondary readiness distinction designation for campuses and districts. For a detailed explanation of distinction designations, see Chapter 5 of the 2016 Accountability Manual. (Sources of data: The College Board, Aug. 2015,
Texas Education Agency | Academics | Performance Reporting 3 of 29
2015–16 TAPR Glossary November 2016
Jan. 2015; The International Baccalaureate Organization, Aug. 2015, Aug. 2014; and PEIMS; Record 101, Student – Demographic, Submission 1)
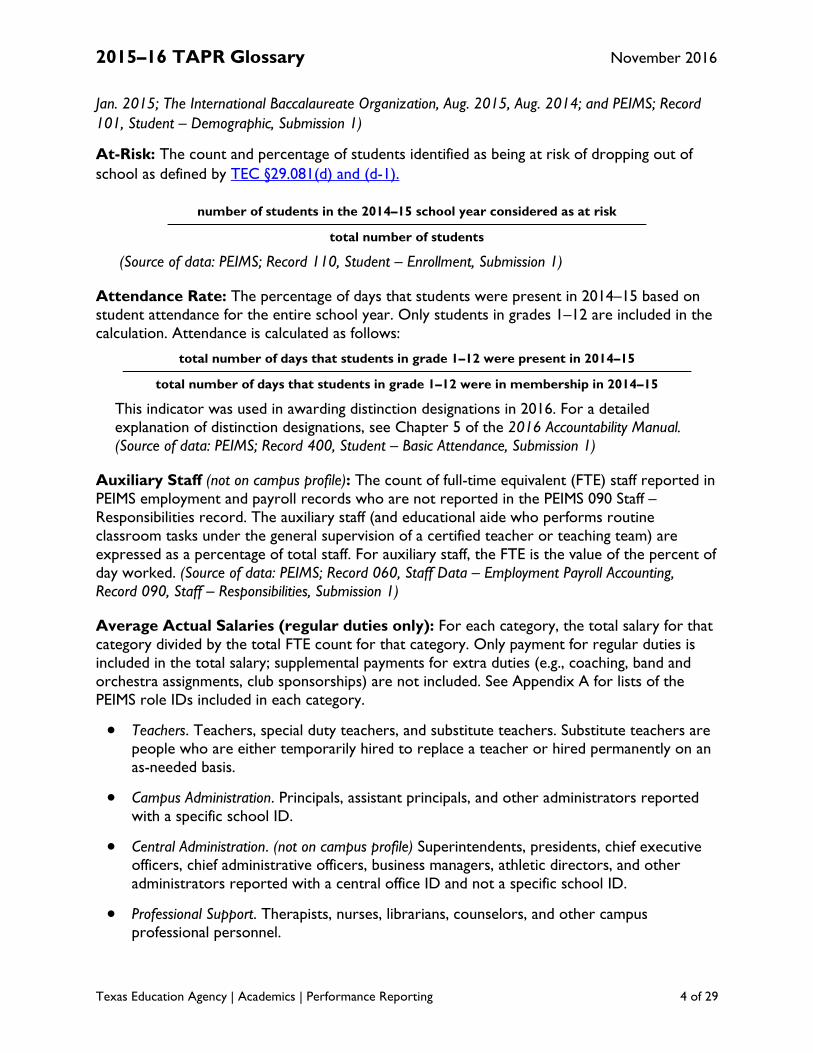
At-Risk: The count and percentage of students identified as being at risk of dropping out of school as defined by TEC §29.081(d) and (d-1).
number of students in the 2014–15 school year considered as at risk
total number of students
(Source of data: PEIMS; Record 110, Student – Enrollment, Submission 1)
Attendance Rate: The percentage of days that students were present in 2014–15 based on student attendance for the entire school year. Only students in grades 1–12 are included in the calculation. Attendance is calculated as follows:
total number of days that students in grade 1–12 were present in 2014–15
total number of days that students in grade 1–12 were in membership in 2014–15
This indicator was used in awarding distinction designations in 2016. For a detailed explanation of distinction designations, see Chapter 5 of the 2016 Accountability Manual. (Source of data: PEIMS; Record 400, Student – Basic Attendance, Submission 1)
Auxiliary Staff (not on campus profile): The count of full-time equivalent (FTE) staff reported in PEIMS employment and payroll records who are not reported in the PEIMS 090 Staff – Responsibilities record. The auxiliary staff (and educational aide who performs routine classroom tasks under the general supervision of a certified teacher or teaching team) are expressed as a percentage of total staff. For auxiliary staff, the FTE is the value of the percent of day worked. (Source of data: PEIMS; Record 060, Staff Data – Employment Payroll Accounting, Record 090, Staff – Responsibilities, Submission 1)
Average Actual Salaries (regular duties only): For each category, the total salary for that category divided by the total FTE count for that category. Only payment for regular duties is included in the total salary; supplemental payments for extra duties (e.g., coaching, band and orchestra assignments, club sponsorships) are not included. See Appendix A for lists of the PEIMS role IDs included in each category.
• Teachers. Teachers, special duty teachers, and substitute teachers. Substitute teachers are people who are either temporarily hired to replace a teacher or hired permanently on an as-needed basis.
• Campus Administration. Principals, assistant principals, and other administrators reported with a specific school ID.
• Central Administration. (not on campus profile) Superintendents, presidents, chief executive officers, chief administrative officers, business managers, athletic directors, and other administrators reported with a central office ID and not a specific school ID.
• Professional Support. Therapists, nurses, librarians, counselors, and other campus professional personnel.
Texas Education Agency | Academics | Performance Reporting 4 of 29
2015–16 TAPR Glossary November 2016
Average Teacher Salary by Years of Experience (regular duties only): Total pay for all teachers in each category divided by the total teacher FTE count in that category. For the purpose of this calculation, the total actual salary amount is pay for regular duties only and does not include supplemental pay. For teachers who also have non-teaching roles, only the portion of time and pay dedicated to classroom responsibilities is factored into the average teacher salary calculation. (Source of data: PEIMS; Record 060, Staff Data – Employment Payroll Accounting, Submission 1)
Average Years’ Experience of Teachers: The average number of completed years of professional experience, regardless of district. Weighted averages are calculated by multiplying each teacher’s FTE coefficient (1 for a full-time teacher, .75 for a three-quarter-time teacher, and .5 for a half-time teacher, for example) by his or her years of experience. These amounts are added together and divided by the sum of all teachers’ FTE coefficients. (Source of data: PEIMS; Record 040, Staff – Identification/Demographic, Record 050, Staff – Employment – Payroll Summary, Record 090, Staff – Responsibilities, Submission 1)
Average Years’ Experience of Teachers with District: The average number of years employed in the district regardless of any interruption in service. Weighted averages are calculated by multiplying each teacher’s FTE coefficient by his or her years of experience in the district. These amounts are added together and divided by the sum of all teacher’s coefficients. (Source of data: PEIMS; Record 050, Staff – Employment – Payroll Summary, Submission 1)
Bilingual Education (BE) Dual-language program that enables English language learners to become competent in listening, speaking, reading, and writing in English through the development of literacy and academic skills in both the primary language and English. This category includes the transitional bilingual/early exit, the transitional bilingual/late exit, the dual language immersion/one-way, and the dual language immersion/two-way instructional models.
Bilingual Education/English as a Second Language Reports: The performance for selected indicators disaggregated by bilingual and English as a second language (ESL) instructional models. The TAPR shows the statutorily-required performance indicators disaggregated by eleven columns for students identified as limited English proficient (LEP) in the current school year.
For definitions of the BE/ESL instructional programs, see the PEIMS Data Standards, available at http://tea.texas.gov/index4.aspx?id=25769817517.
Campus Number: A unique nine-digit number assigned to every public school. It is comprised of a three-digit county number (assigned alphabetically from 001 to 254), followed by a three-digit district number (9XX is used primarily for traditional campuses, 8XX for charter campuses), and ending with a three-digit campus number (typically 00X_ for high schools, 04Xfor middle schools, and 1XX for elementary schools).
Class Size Averages by Grade and Subject: The average class size by grade (elementary) or selected subjects (secondary classes).
For secondary classes, averages are determined by totaling the number of students served (in a given subject at the campus) and dividing that sum by the count of classes for that subject.
Texas Education Agency | Academics | Performance Reporting 5 of 29

2015–16 TAPR Glossary November 2016
For elementary classes, how the average is determined depends on the instructional model. If an elementary teacher teaches all subjects to the same group of fourth graders all day, the class size average is simply the numbers of fourth grade students served by that teacher. If an elementary teacher teaches a single subject to five different sections of fourth graders each day, however, the average is calculated the same way as it is for secondary subjects. For example, one fourth grade science teacher teaches five science classes each day with 18, 20, 19, 21, and 22 students in each class. The total of 100 students divided by the five classes produces an average class size of 20 students for that teacher.
The following rules apply to the average class sizes:
• Classes identified as serving regular, compensatory/remedial, gifted and talented, career and technical, and honors students are included in the calculation.
• Subjects in the areas of English language arts (ELA), mathematics, science, social studies, languages other than English, computer science, and career and technical education are included in the calculation, as are self-contained classrooms.
• Classes where the number of students served is reported to be zero are not included.
• Service codes with the “SR” prefix are not included.
• Teacher roles coded as “teacher” and/or “substitute teacher” are included.
• Only class settings coded as “regular class” are included.
• Missing partial FTE counts are not included.
• Elementary classes in which the number of students exceeds 100 are not included.
• Mixed grade-level class averages are not included.
(Source of data: PEIMS; Record 090, Staff Data – Responsibilities, Submission 1)
Cohort: a group of students who begin grade 9 for the first time in the same school year plus any students who, in the next three school years, enter the Texas public school system in the grade level expected for the cohort
A cohort is formed when a group of students begins ninth grade, regardless of whether the school that they attend has students in any other grades.
• A student transfers into a campus, district, or state cohort when he or she moves into the cohort from another high school in Texas, from another district in Texas, or from out of state.
• A student transfers out of a campus or district cohort when he or she moves to another public high school in Texas or moves to another district in Texas. Note that these students are transferred into the cohort of the high school or district to which they moved. There are also students who move out of state or out of the country and students who transfer to private schools or who are home-schooled. These types of transfer students cannot be tracked and are not included in longitudinal rate calculations.
Texas Education Agency | Academics | Performance Reporting 6 of 29
2015–16 TAPR Glossary November 2016
• A student does not change cohorts if he or she repeats or skips a grade. A student who begins with the 2011–12 ninth-grade cohort remains with that cohort. A student who started the ninth grade in 2011–12 but takes 5 years to graduate (i.e., graduates in May 2016) is still part of the 2015 cohort; he or she is not switched to the 2016 cohort. This student would be considered a continuing student and counted as part of the Continued HS number for the class of 2015. This is also true for the five-year and six-year extended longitudinal cohorts.
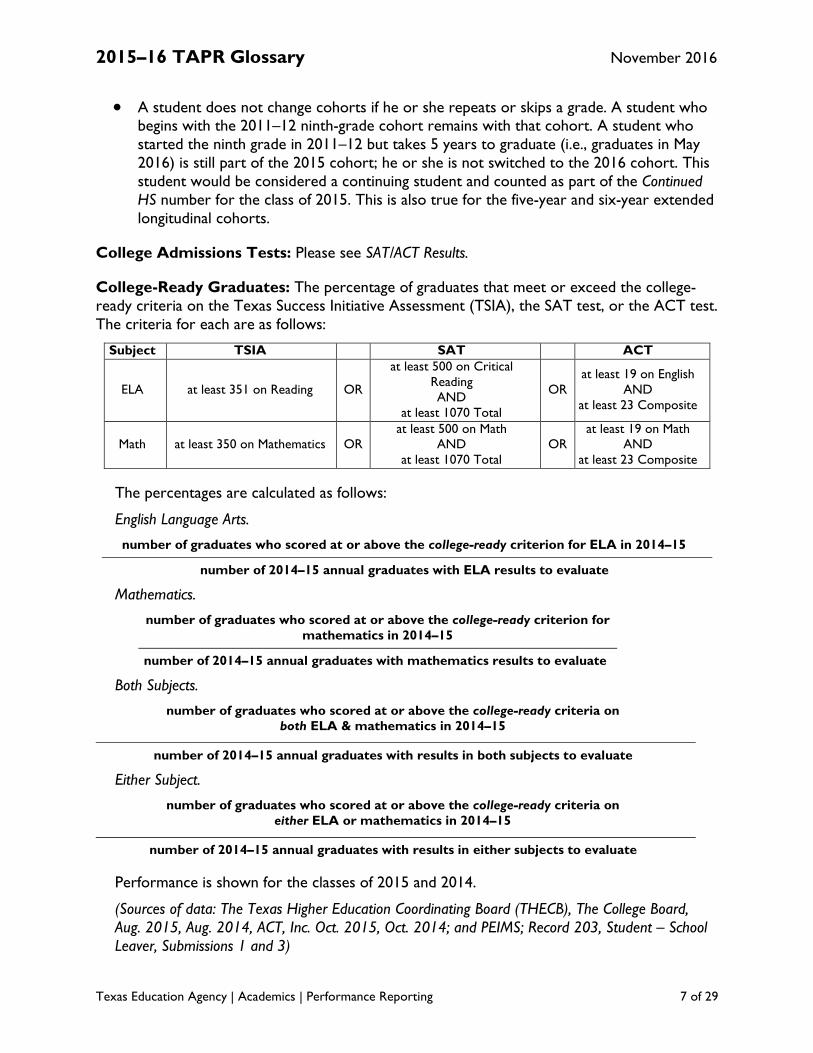
College Admissions Tests: Please see SAT/ACT Results.
College-Ready Graduates: The percentage of graduates that meet or exceed the college-ready criteria on the Texas Success Initiative Assessment (TSIA), the SAT test, or the ACT test. The criteria for each are as follows:
Subject TSIA SAT ACT
ELA at least 351 on Reading OR
at least 500 on Critical Reading AND
at least 1070 Total
OR at least 19 on English
AND at least 23 Composite
Math at least 350 on Mathematics OR at least 500 on Math
AND at least 1070 Total
OR at least 19 on Math
AND at least 23 Composite
The percentages are calculated as follows:
English Language Arts.
number of graduates who scored at or above the college-ready criterion for ELA in 2014–15
number of 2014–15 annual graduates with ELA results to evaluate
Mathematics.
number of graduates who scored at or above the college-ready criterion for mathematics in 2014–15
number of 2014–15 annual graduates with mathematics results to evaluate
Both Subjects.
number of graduates who scored at or above the college-ready criteria on both ELA & mathematics in 2014–15
number of 2014–15 annual graduates with results in both subjects to evaluate
Either Subject.
number of graduates who scored at or above the college-ready criteria on either ELA or mathematics in 2014–15
number of 2014–15 annual graduates with results in either subjects to evaluate
Performance is shown for the classes of 2015 and 2014.
(Sources of data: The Texas Higher Education Coordinating Board (THECB), The College Board, Aug. 2015, Aug. 2014, ACT, Inc. Oct. 2015, Oct. 2014; and PEIMS; Record 203, Student – School Leaver, Submissions 1 and 3)
Texas Education Agency | Academics | Performance Reporting 7 of 29
2015–16 TAPR Glossary November 2016
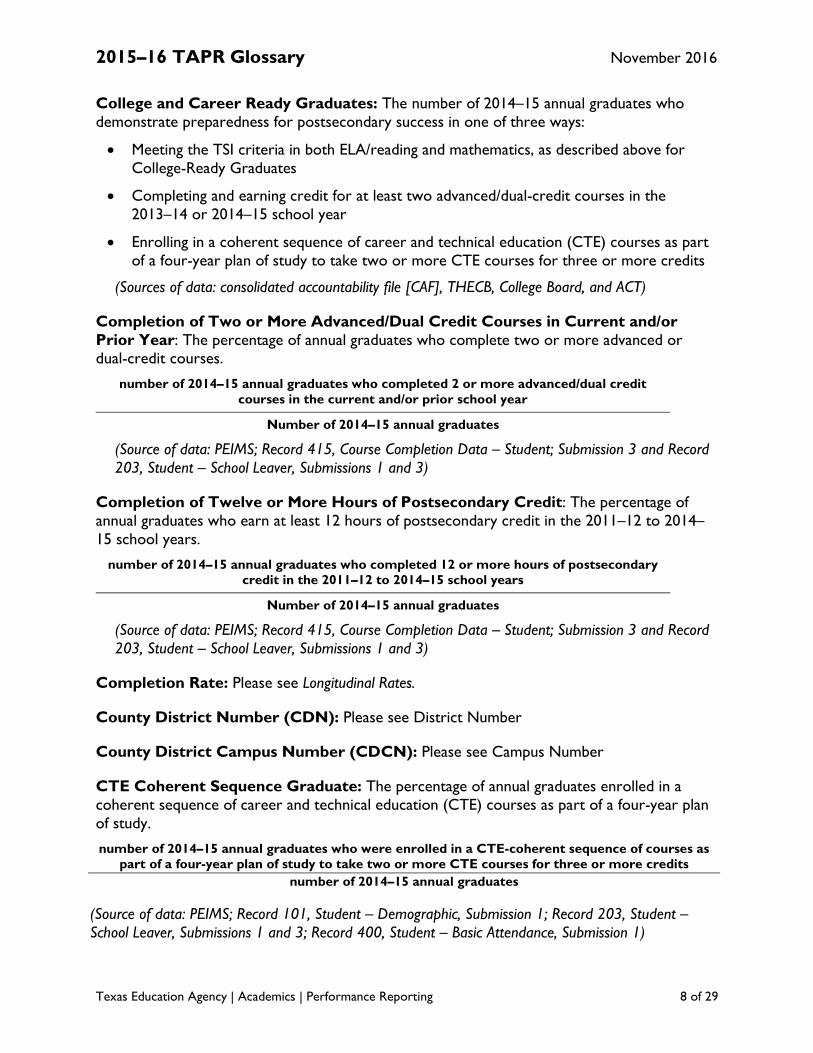
College and Career Ready Graduates: The number of 2014–15 annual graduates who demonstrate preparedness for postsecondary success in one of three ways:
• Meeting the TSI criteria in both ELA/reading and mathematics, as described above for College-Ready Graduates
• Completing and earning credit for at least two advanced/dual-credit courses in the 2013–14 or 2014–15 school year
• Enrolling in a coherent sequence of career and technical education (CTE) courses as part of a four-year plan of study to take two or more CTE courses for three or more credits
(Sources of data: consolidated accountability file [CAF], THECB, College Board, and ACT)
Completion of Two or More Advanced/Dual Credit Courses in Current and/or Prior Year: The percentage of annual graduates who complete two or more advanced or dual-credit courses.
number of 2014–15 annual graduates who completed 2 or more advanced/dual credit courses in the current and/or prior school year
Number of 2014–15 annual graduates
(Source of data: PEIMS; Record 415, Course Completion Data – Student; Submission 3 and Record 203, Student – School Leaver, Submissions 1 and 3)
Completion of Twelve or More Hours of Postsecondary Credit: The percentage of annual graduates who earn at least 12 hours of postsecondary credit in the 2011–12 to 2014– 15 school years.
number of 2014–15 annual graduates who completed 12 or more hours of postsecondary credit in the 2011–12 to 2014–15 school years
Number of 2014–15 annual graduates
(Source of data: PEIMS; Record 415, Course Completion Data – Student; Submission 3 and Record 203, Student – School Leaver, Submissions 1 and 3)
Completion Rate: Please see Longitudinal Rates.
County District Number (CDN): Please see District Number
County District Campus Number (CDCN): Please see Campus Number
CTE Coherent Sequence Graduate: The percentage of annual graduates enrolled in a coherent sequence of career and technical education (CTE) courses as part of a four-year plan of study.
number of 2014–15 annual graduates who were enrolled in a CTE-coherent sequence of courses as part of a four-year plan of study to take two or more CTE courses for three or more credits
number of 2014–15 annual graduates
(Source of data: PEIMS; Record 101, Student – Demographic, Submission 1; Record 203, Student – School Leaver, Submissions 1 and 3; Record 400, Student – Basic Attendance, Submission 1)
Texas Education Agency | Academics | Performance Reporting 8 of 29
2015–16 TAPR Glossary November 2016
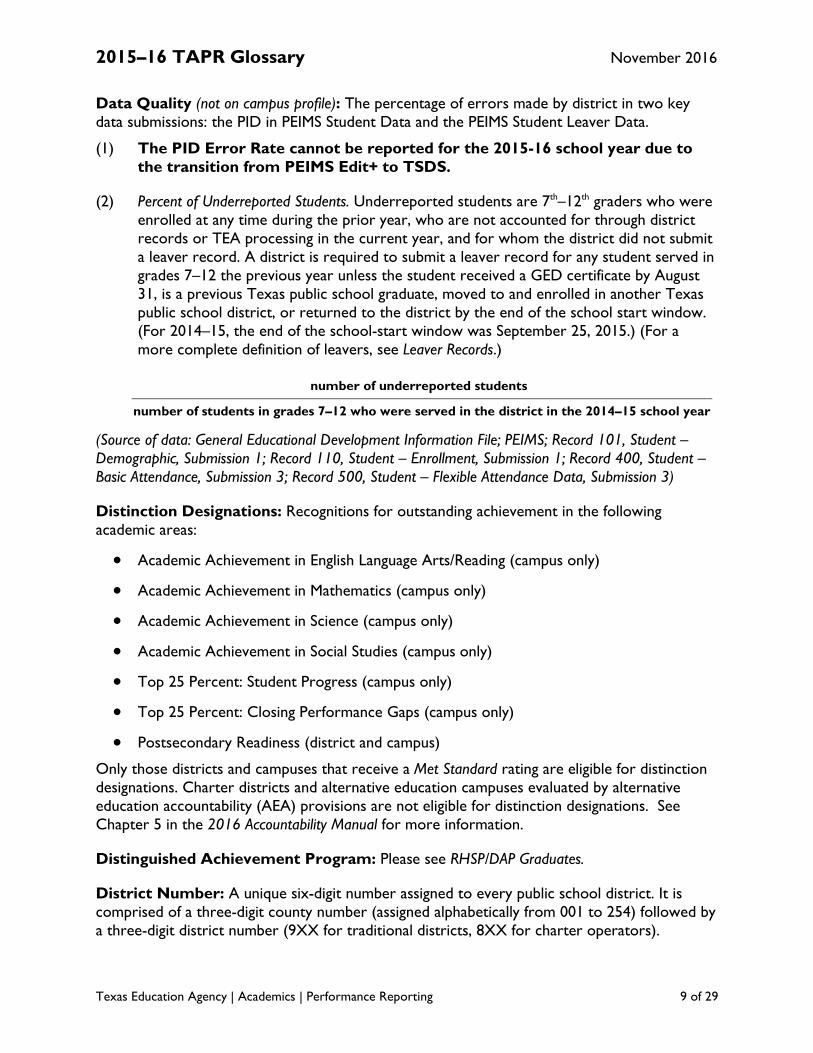
Data Quality (not on campus profile): The percentage of errors made by district in two key data submissions: the PID in PEIMS Student Data and the PEIMS Student Leaver Data.
(1) The PID Error Rate cannot be reported for the 2015-16 school year due to the transition from PEIMS Edit+ to TSDS.
(2) Percent of Underreported Students. Underreported students are 7th–12th graders who were enrolled at any time during the prior year, who are not accounted for through district records or TEA processing in the current year, and for whom the district did not submit a leaver record. A district is required to submit a leaver record for any student served in grades 7–12 the previous year unless the student received a GED certificate by August 31, is a previous Texas public school graduate, moved to and enrolled in another Texas public school district, or returned to the district by the end of the school start window. (For 2014–15, the end of the school-start window was September 25, 2015.) (For a more complete definition of leavers, see Leaver Records.)
number of underreported students
number of students in grades 7–12 who were served in the district in the 2014–15 school year
(Source of data: General Educational Development Information File; PEIMS; Record 101, Student – Demographic, Submission 1; Record 110, Student – Enrollment, Submission 1; Record 400, Student – Basic Attendance, Submission 3; Record 500, Student – Flexible Attendance Data, Submission 3)
Distinction Designations: Recognitions for outstanding achievement in the following academic areas:
• Academic Achievement in English Language Arts/Reading (campus only)
• Academic Achievement in Mathematics (campus only)
• Academic Achievement in Science (campus only)
• Academic Achievement in Social Studies (campus only)
• Top 25 Percent: Student Progress (campus only)
• Top 25 Percent: Closing Performance Gaps (campus only)
• Postsecondary Readiness (district and campus)
Only those districts and campuses that receive a Met Standard rating are eligible for distinction designations. Charter districts and alternative education campuses evaluated by alternative education accountability (AEA) provisions are not eligible for distinction designations. See Chapter 5 in the 2016 Accountability Manual for more information.
Distinguished Achievement Program: Please see RHSP/DAP Graduates.
District Number: A unique six-digit number assigned to every public school district. It is comprised of a three-digit county number (assigned alphabetically from 001 to 254) followed by a three-digit district number (9XX for traditional districts, 8XX for charter operators).
Texas Education Agency | Academics | Performance Reporting 9 of 29

2015–16 TAPR Glossary November 2016
Dropout: A student who was enrolled in public school in grade 7–12 during the previous year, did not return to public school in current year, was not expelled, and did not graduate, receive a high school equivalency certificate, continue school outside the public school system, begin college, or die. Dropout counts are obtained from PEIMS records. For more information, see Annual Dropout Rate. (Source of data: PEIMS; Record 203, Student – School Leaver, Submissions 1, 3)
Dropout Rate: Please see Annual Dropout Rate.
Economically Disadvantaged: The count and percentage of students eligible for free or reduced-price lunch or eligible for other public assistance.
number of students eligible for free or reduced-price lunch or other public assistance
total number of students
See also Total Students. (Source of data: PEIMS; Record 101, Student – Demographic, Submission 1; and TEA Student Assessment Division)
Educational Aides: The count and percentage of paraprofessional staff who are reported with a role of 033 (Educational Aide) or 036 (Certified Interpreter). The FTE counts of educational aides are expressed as a percentage of the total staff FTEs. See Appendix A for all PEIMS Role IDs. (Source of data: PEIMS; Record 090, Staff Data – Responsibilities, Submission 1)
English as a Second Language (ESL): An intensive program designed to develop proficiency in listening, speaking, reading, and writing in the English language. This category includes both ESL content and ESL pull-out instructional models.
English Language Learners (ELLs): The count and percentage of students whose primary language is other than English and who are in the process of acquiring English. The terms “English Language Learner,” “English Learner,” and “Limited English Proficient” (LEP) are used interchangeably.
Inclusion and exclusion of ELL performance varies by indicator:
• ELL performance of students who are in their first year in U.S. schools is excluded from all STAAR indicators. Exclusion of other ELL performance varies, depending on the indicator. For detailed information on the inclusion and exclusion of ELL performance, see Appendix I in the 2016 Accountability Manual.
• ELL performance is included in all other non-STAAR indicators, regardless of years in U.S. schools.
In the Profile section of the reports, the percentage of ELLs is calculated by dividing the number of ELLs by the total number of students in the district or campus. Not all students identified as ELLs receive bilingual or English as a second language instruction. (Source of data: PEIMS; Record 110, Student – Enrollment, Submission 1)
Enrollment: Please see Total Students.
Texas Education Agency | Academics | Performance Reporting 10 of 29

2015–16 TAPR Glossary November 2016
Ethnic Distribution: The number and percentage of students and staff who are identified as belonging to one of the following groups: African American, Hispanic, White, American Indian, Asian, Pacific Islander, and Two or More Races. (Source of data: PEIMS; Record 101, Student – Demographic, Record 040, Staff – Identification/Demographic, Record 050, Staff – Employment – Payroll Summary, Record 090, Staff – Responsibilities, Submission 1; The College Board; ACT Inc.; The International Baccalaureate Organization; and TEA Student Assessment Division)
Expenditure Information: Information available on the PEIMS Financial Standard Reports at http://tea.texas.gov/financialstandardreports/.
Foundation High School Program (FHSP): Please see Graduation Plan.
Full Time Equivalent (FTE): A measure of the extent to which a person (or responsibility) occupies a full-time position; it is calculated for each staff member reported in PEIMS. FTE values are used in various staff reports as well as input to the Budget and Actual financial allocation process.
An employee who works half time and has a reported actual salary of $30,000 has a full-time equivalent salary of $60,000. All average salaries are expressed in full-time equivalent form by dividing the sum of the actual salaries earned by the total FTE count. (Source of data: PEIMS; Record 050, Staff – Employment – Payroll Summary, Record 060, Staff Data – Employment Payroll Accounting, Record 090, Staff – Responsibilities, Submission 1)
Fund Balance Information: Information is available on the PEIMS Financial Standard Reports at http://tea.texas.gov/financialstandardreports/.
Graduates: The count and percentage of students who graduate at some time during the school year. It includes summer graduates and is reported by districts in the fall of the following school year. It includes all students in grade 12 who graduated, as well as graduates from other grades. Students served by special education who graduate are included in the totals. Counts of students graduating under the following graduation types in 2014–15 are also shown:
• Minimum High School Program (MHSP)
• Recommended High School Program (RHSP)
• Distinguished Achievement Program (DAP)
• Foundation High School Plan (FHSP)
See also College-Ready Graduates, Longitudinal Rate, RHSP/DAP Graduates, RHSP/DAP/FHSP-E/FHSP-DLA Graduates. (Source of data: PEIMS; Record 203, Student – School Leaver; Submissions 1 and 3)
Texas Education Agency | Academics | Performance Reporting 11 of 29

2015–16 TAPR Glossary November 2016
Graduation Plan: The percentage of students who graduated under one of the following:
• FHSP-DLA Graduates (Longitudinal Rate) (Class of 2015) The percentage of graduates who, after four years, satisfied the course requirements for the Foundation High School Program at the distinguished level of achievement.
number of graduates in the Class of 2015 who complete a 4-year FHSP-DLA
number of graduates in the Class of 2015 with reported FHSP graduation plans)
• FHSP-E Graduates (Longitudinal Rate) (Class of 2015) The percentage of graduates who, after four years, satisfied the course requirements for the Foundation High School Program with an endorsement.
number of graduates in the Class of 2015 who complete a 4-year FHSP-E
number of graduates in the Class of 2015 with reported FHSP graduation plans
• RHSP/DAP Graduates (Longitudinal Rate) (Class of 2015, Class of 2014) The percentage of graduates who, after four years, satisfied the course requirements for the Recommended High School Program or Distinguished Achievement Program.
number of graduates in the Class of 2015 who complete a 4-year RHSP or DAP
number of graduates in the Class of 2015 with reported graduation plans
• RHSP/DAP/FHSP-E/FHSP-DLA Graduates (Longitudinal Rate) (Class of 2015) The percentage of graduates who, after four years, satisfied the course requirements for the Recommended High School Program, Distinguished Achievement Program, or the Foundation High School Program with an endorsement or at the distinguished level of achievement.
number of graduates from the Class of 2015 who complete a 4-year RHSP or DAP or FHSP-E or FHSP-DLA
number of graduates in the Class of 2015 with reported graduation plans
• FHSP-DLA Graduates (Annual Rate) (2014–15) The percentage of graduates in 2015 who satisfied the course requirements for the Foundation High School Program at the distinguished level of achievement.
number of graduates in SY 2014–15 who earn an FHSP-E
number of graduates in SY 2014-15 with reported FHSP graduation plans (excludes graduates with RHSP and DAP degree plans)
Texas Education Agency | Academics | Performance Reporting 12 of 29

Texas Education Agency | Academics | Performance Reporting 13 of 29
http://tea.texas.gov/graduation.aspx
2015–16 TAPR Glossary November 2016
FHSP-E Graduates (Annual Rate) (2014–15) The percentage of graduates in 2015 whosatisfied the course requirements for the Texas State Board of Foundation High SchoolProgram with an endorsement.
number of graduates in SY 2014–15 who earn an FHSP-E
number of graduates in SY 2014–15 with reported FHSP graduation plans
RHSP/DAP Graduates (Annual Rate) (2014–15) The percentage of graduates in 2015who satisfied the course requirements for the Recommended High School Program orDistinguished Achievement Program.
number of graduates in SY 2014–15 reported with graduation codes for RHSP or DAP
number of graduates in SY 2014–15 with reported graduation plans
RHSP/DAP/FHSP-E/FHSP-DLA Graduates (Annual Rate) (2014–15) The percentage ofgraduates in 2015 who satisfied the course requirements for the Recommended High School Program, Distinguished Achievement Program, or at the Foundation High SchoolProgram with an endorsement or the distinguished level of achievement.
number of graduates in SY 2014–15 reported with graduation codes for RHSP or DAP or FHSP-E or FHSP-DLA
number of graduates in SY 2014–15 with reported graduation plans
RHSP graduates have graduation type codes of 19, 22, 25, 28, or 31; DAP graduates have graduation type codes of 20, 23, 26, 29, or 32; FHSP graduates are students with graduation type codes of 34, 35, 54, 55, 56, or 57. See the PEIMS Data Standards for more information. Results are shown for the Class of 2015 and the Class of 2014. See also Graduates. (Source of data: PEIMS; Record 203, Student – School Leaver and Graduation Program, Submissions 1 and 3)
For additional information about graduation programs please see
Graduates Enrolled in Texas Institution of Higher Education (TX IHE): The percentage of students who enroll and begin instruction at an institution of higher education in Texas for the school year following high school graduation.
number of graduates during the 2013–14 school year who attended a public or independent college or university in Texas in the 2014–15 academic year
number of graduates during the 2013–14 school year
Students who enrolled in out-of-state colleges or universities or any non-public career school are not included. Students who attend public community colleges in Texas are included. (Source of data: Texas Higher Education Coordinating Board)

2015–16 TAPR Glossary November 2016
Graduates in TX IHE Completing One Year Without Remediation: The percentage of students who enrolled and began instruction at an institution of higher education in Texas for the school year following high school graduation and did not require a developmental education course.
number of graduates during the 2013–14 school year who enrolled in a public college or university in Texas for the school year following the year they graduated
and met the Texas Success Initiative requirement in all subject areas (reading, writing, and
mathematics)
number of graduates during the 2013–14 school year who enrolled in a public college or university in Texas for the school year following the year they graduated
Students who attended Texas public two- or four-year institutions of higher education are included.
Students who enrolled in independent colleges or universities in Texas, out-of-state colleges or universities, or any non-public career school are not included.
Additional reports showing students enrolled in Texas public colleges and universities are available on the Texas Higher Education Coordinating Board (THECB) site at http://www.txhighereddata.org/generatelinks.cfm?Section=HS2Col.
For more information on the data used in this indicator, contact the Texas Higher Education Coordinating Board at (512) 427-6153. (Source of data: Texas Higher Education Coordinating Board, Fall 2016)
Graduation Rate: Please see Longitudinal Rates.
Instructional Expenditure Ratio (2014–15): This information is available on the PEIMS Financial Standard Reports at http://tea.texas.gov/financialstandardreports/.
Instructional Staff Percent (district profile only): The percentage of the district's FTEs whose job function was to provide classroom instruction directly to students during the 2014–15 school year. The instructional staff percent is a district-level measure and is calculated as follows:
total number of hours for district staff who were reported under expenditure object codes 6112, 6119, and 6129, and function codes 11, 12, 13, and 31
total number of hours worked by all district employees
Contact the Division of Financial Compliance at (512) 463-9095 for further details about this measure. (Source of data: PEIMS; Record 040, Staff – Identification/Demographic, Record 050, Staff – Employment – Payroll Summary, Record 090, Staff – Responsibilities, Submission 1)
International Baccalaureate (IB) Results: See AP/IB Results.
Texas Education Agency | Academics | Performance Reporting 14 of 29

2015–16 TAPR Glossary November 2016
Leaver Record: The PEIMS record that reports the status of prior year grade 7–12 students who are no longer enrolled at a Texas public school. Districts are required to submit a leaver record for each student who graduated, enrolled in school in another state, returned to his or her home country, died, or dropped out.
See Data Quality. (Source of data: PEIMS; Record 203, Student – School Leaver; Submissions 1 and 3); Secondary School Completion and Dropouts in Texas Public Schools, 2014–15, Texas Education Agency)
LEP (Limited English Proficient): Please see English Language Learner.
Longitudinal Rates: The status of a group (cohort) of students after four years in high school (4-Year Longitudinal Rate), after five years in high school (5-Year Extended Longitudinal Rate), or after six years in high school (6-Year Extended Longitudinal Rate).
For the 4-Year Longitudinal Rate, the cohort consists of students who first attended ninth grade in 2011–12. They are followed through their expected graduation with the class of 2015.
For the 5-Year Extended Longitudinal Rate, the cohort consists of students who first attended ninth grade in 2010–11. They are followed for five years and included if they graduated within a year after their expected graduation with the class of 2014.
For the 6-Year Extended Longitudinal Rate, the cohort consists of students who first attended ninth grade in 2009–10. They are followed for six years, and included if they graduated within two years after their expected graduation with the class of 2013.
Additional Information on Cohorts:
• A student transfers into a campus, district, or state cohort when he or she moves into the cohort from another high school in Texas, from another district in Texas, or from out of state.
• A student transfers out of a campus or district cohort when he or she moves to another public high school in Texas or moves to another district in Texas. Note that these students are transferred into the cohort of the high school or district to which they moved. There are also students who move out of state or out of the country and students who transfer to private schools or who are home-schooled. These types of transfer students cannot be tracked and are not included in longitudinal rate calculations.
• A student does not change cohorts if he or she repeats or skips a grade. A student who begins with the 2011–12 ninth-grade cohort remains with that cohort. A student who started the ninth grade in 2011–12 but takes 5 years to graduate (i.e., graduates in May 2016) is still part of the 2015 cohort; he or she is not switched to the 2016 cohort. This student would be considered a continuing student and counted as part of the Continued HS number for the class of 2015. This is also true for the five-year and six-year extended longitudinal cohorts.
Texas Education Agency | Academics | Performance Reporting 15 of 29
2015–16 TAPR Glossary November 2016
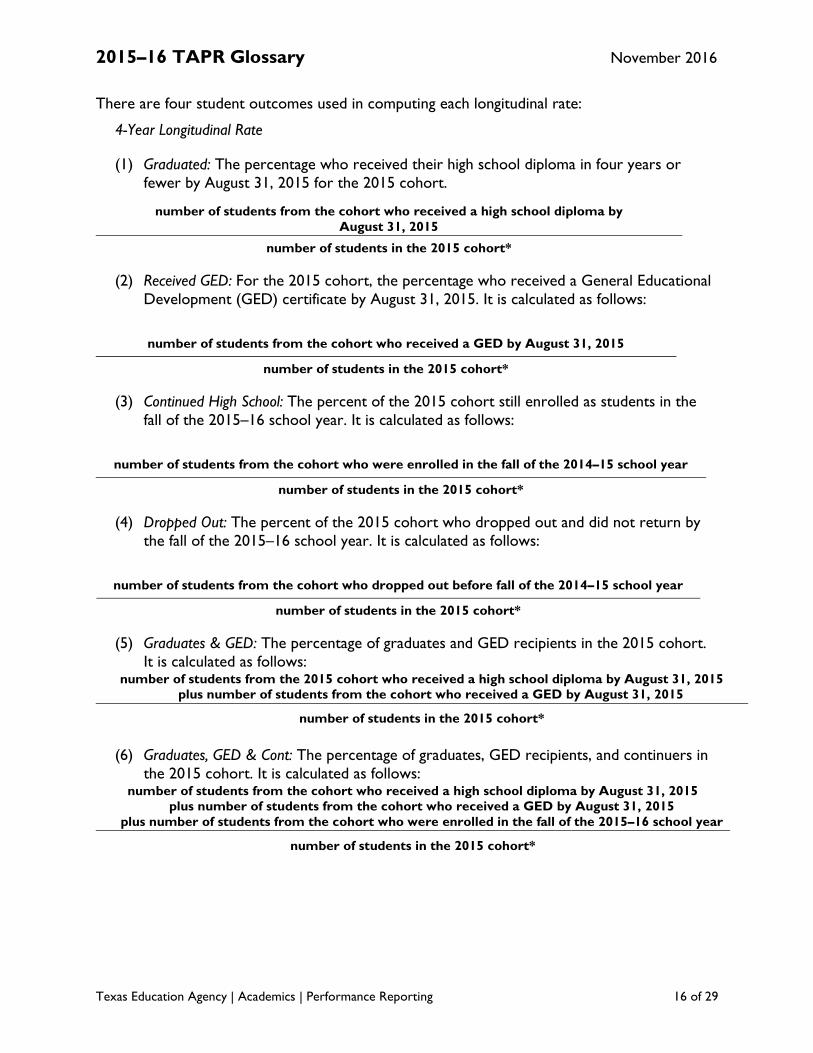
There are four student outcomes used in computing each longitudinal rate:
4-Year Longitudinal Rate
(1) Graduated: The percentage who received their high school diploma in four years or fewer by August 31, 2015 for the 2015 cohort.
number of students from the cohort who received a high school diploma by August 31, 2015
number of students in the 2015 cohort*
(2) Received GED: For the 2015 cohort, the percentage who received a General Educational Development (GED) certificate by August 31, 2015. It is calculated as follows:
number of students from the cohort who received a GED by August 31, 2015
number of students in the 2015 cohort*
(3) Continued High School: The percent of the 2015 cohort still enrolled as students in the fall of the 2015–16 school year. It is calculated as follows:
number of students from the cohort who were enrolled in the fall of the 2014–15 school year
number of students in the 2015 cohort*
(4) Dropped Out: The percent of the 2015 cohort who dropped out and did not return by the fall of the 2015–16 school year. It is calculated as follows:
number of students from the cohort who dropped out before fall of the 2014–15 school year
number of students in the 2015 cohort*
(5) Graduates & GED: The percentage of graduates and GED recipients in the 2015 cohort. It is calculated as follows:
number of students from the 2015 cohort who received a high school diploma by August 31, 2015 plus number of students from the cohort who received a GED by August 31, 2015
number of students in the 2015 cohort*
(6) Graduates, GED & Cont: The percentage of graduates, GED recipients, and continuers in the 2015 cohort. It is calculated as follows:
number of students from the cohort who received a high school diploma by August 31, 2015 plus number of students from the cohort who received a GED by August 31, 2015
plus number of students from the cohort who were enrolled in the fall of the 2015–16 school year
number of students in the 2015 cohort*
Texas Education Agency | Academics | Performance Reporting 16 of 29

2015–16 TAPR Glossary November 2016
5-Year Extended Longitudinal Rate
(1) Graduated: The percentage who received their high school diploma by August 31, 2015, for the 2014 cohort. It is calculated as follows:
number of students from the cohort who received a high school diploma by August 31, 2015
number of students in the 2014 cohort*
(2) Received GED: For the 2014 cohort, the percentage who received a GED certificate by August 31, 2015. It is calculated as follows:
number of students from the cohort who received a GED by August 31, 2015
number of students in the 2014 cohort*
(3) Continued High School: The percent of the 2014 cohort still enrolled as students in the fall of the 2015–16 school year. It is calculated as follows:
number of students from the cohort who were enrolled in the fall of the 2014–15 school year
number of students in the 2014 cohort*
(4) Dropped Out: The percent of the 2014 cohort who dropped out and did not return by the fall of the 2015–16 school year. It is calculated as follows:
number of students from the cohort who dropped out before fall of the 2014–15 school year
number of students in the 2014 cohort*
(5) Graduates & GED: The percentage of graduates and GED recipients in the 2014 cohort. It is calculated as follows:
number of students from the cohort who received a high school diploma by August 31, 2015 plus number of students from the cohort who received a GED by August 31, 2015
number of students in the 2014 cohort*
(6) Graduates, GED & Cont: The percentage of graduates, GED recipients, and continuers in the 2014 cohort. It is calculated as follows:
number of students from the cohort who received a high school diploma by August 31, 2015 plus number of students from the cohort who received a GED by August 31, 2015
plus number of students from the cohort who were enrolled in the fall of the 2015–16 school year
number of students in the 2014 cohort*
Six-year Extended Longitudinal Rate
(1) Graduated: The percentage who received their high school diploma by August 31, 2015, for the 2013 cohort. It is calculated as follows:
number of students from the cohort who received a high school diploma by August 31, 2015
number of students in the 2013 cohort*
(2) Received GED: For the 2013 cohort, the percentage who received a GED certificate by August 31, 2015. It is calculated as follows:
number of students from the cohort who received a GED by August 31, 2015
number of students in the 2013 cohort*
Texas Education Agency | Academics | Performance Reporting 17 of 29
2015–16 TAPR Glossary November 2016
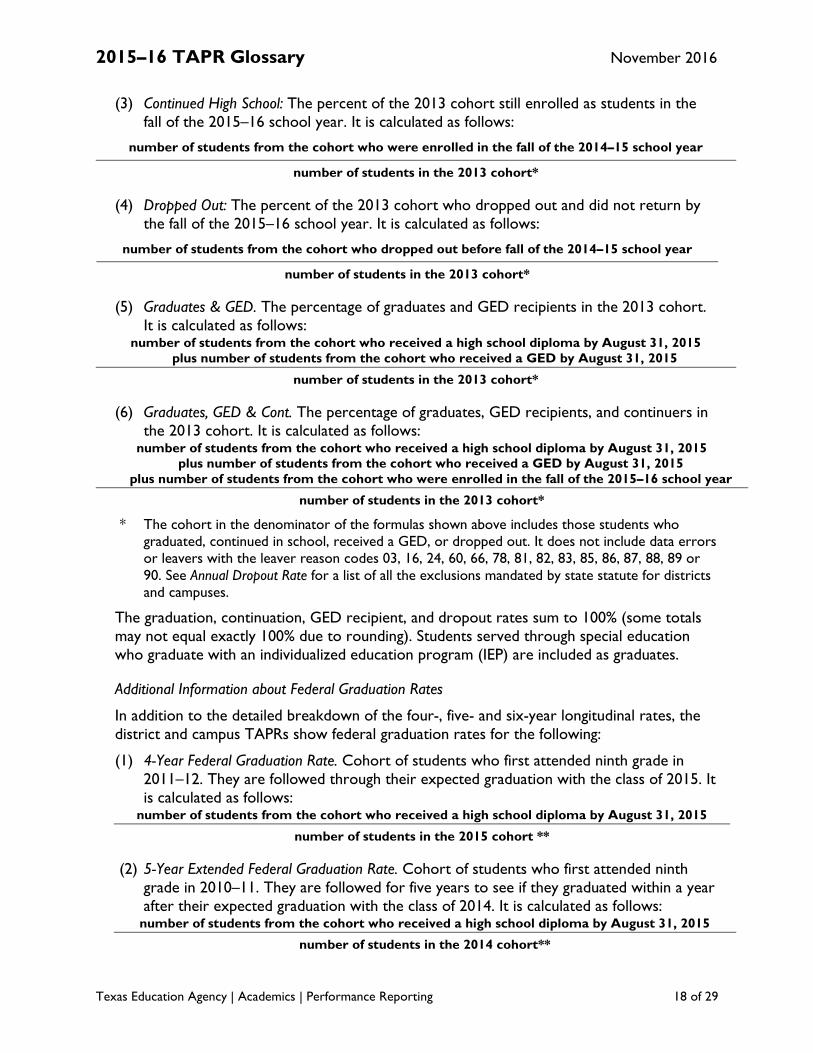
(3) Continued High School: The percent of the 2013 cohort still enrolled as students in the fall of the 2015–16 school year. It is calculated as follows:
number of students from the cohort who were enrolled in the fall of the 2014–15 school year
number of students in the 2013 cohort*
(4) Dropped Out: The percent of the 2013 cohort who dropped out and did not return by the fall of the 2015–16 school year. It is calculated as follows:
number of students from the cohort who dropped out before fall of the 2014–15 school year
number of students in the 2013 cohort*
(5) Graduates & GED. The percentage of graduates and GED recipients in the 2013 cohort. It is calculated as follows:
number of students from the cohort who received a high school diploma by August 31, 2015 plus number of students from the cohort who received a GED by August 31, 2015
number of students in the 2013 cohort*
(6) Graduates, GED & Cont. The percentage of graduates, GED recipients, and continuers in the 2013 cohort. It is calculated as follows:
number of students from the cohort who received a high school diploma by August 31, 2015 plus number of students from the cohort who received a GED by August 31, 2015
plus number of students from the cohort who were enrolled in the fall of the 2015–16 school year
number of students in the 2013 cohort*
* The cohort in the denominator of the formulas shown above includes those students who graduated, continued in school, received a GED, or dropped out. It does not include data errors or leavers with the leaver reason codes 03, 16, 24, 60, 66, 78, 81, 82, 83, 85, 86, 87, 88, 89 or 90. See Annual Dropout Rate for a list of all the exclusions mandated by state statute for districts and campuses.
The graduation, continuation, GED recipient, and dropout rates sum to 100% (some totals may not equal exactly 100% due to rounding). Students served through special education who graduate with an individualized education program (IEP) are included as graduates.
Additional Information about Federal Graduation Rates
In addition to the detailed breakdown of the four-, five- and six-year longitudinal rates, the district and campus TAPRs show federal graduation rates for the following:
(1) 4-Year Federal Graduation Rate. Cohort of students who first attended ninth grade in 2011–12. They are followed through their expected graduation with the class of 2015. It is calculated as follows:
number of students from the cohort who received a high school diploma by August 31, 2015
number of students in the 2015 cohort **
(2) 5-Year Extended Federal Graduation Rate. Cohort of students who first attended ninth grade in 2010–11. They are followed for five years to see if they graduated within a year after their expected graduation with the class of 2014. It is calculated as follows:
number of students from the cohort who received a high school diploma by August 31, 2015
number of students in the 2014 cohort**
Texas Education Agency | Academics | Performance Reporting 18 of 29
2015–16 TAPR Glossary November 2016
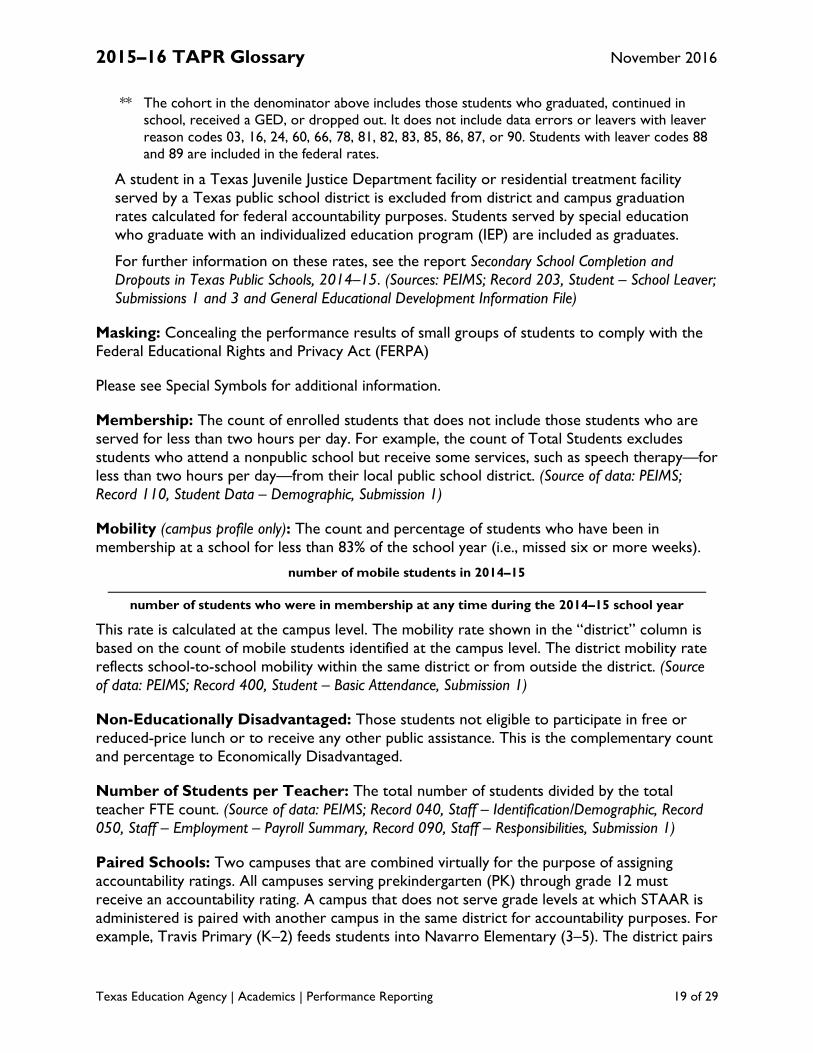
** The cohort in the denominator above includes those students who graduated, continued in school, received a GED, or dropped out. It does not include data errors or leavers with leaver reason codes 03, 16, 24, 60, 66, 78, 81, 82, 83, 85, 86, 87, or 90. Students with leaver codes 88 and 89 are included in the federal rates.
A student in a Texas Juvenile Justice Department facility or residential treatment facility served by a Texas public school district is excluded from district and campus graduation rates calculated for federal accountability purposes. Students served by special education who graduate with an individualized education program (IEP) are included as graduates.
For further information on these rates, see the report Secondary School Completion and Dropouts in Texas Public Schools, 2014–15. (Sources: PEIMS; Record 203, Student – School Leaver; Submissions 1 and 3 and General Educational Development Information File)
Masking: Concealing the performance results of small groups of students to comply with the Federal Educational Rights and Privacy Act (FERPA)
Please see Special Symbols for additional information.
Membership: The count of enrolled students that does not include those students who are served for less than two hours per day. For example, the count of Total Students excludes students who attend a nonpublic school but receive some services, such as speech therapy—for less than two hours per day—from their local public school district. (Source of data: PEIMS; Record 110, Student Data – Demographic, Submission 1)
Mobility (campus profile only): The count and percentage of students who have been in membership at a school for less than 83% of the school year (i.e., missed six or more weeks).
number of mobile students in 2014–15
number of students who were in membership at any time during the 2014–15 school year
This rate is calculated at the campus level. The mobility rate shown in the “district” column is based on the count of mobile students identified at the campus level. The district mobility rate reflects school-to-school mobility within the same district or from outside the district. (Source of data: PEIMS; Record 400, Student – Basic Attendance, Submission 1)
Non-Educationally Disadvantaged: Those students not eligible to participate in free or reduced-price lunch or to receive any other public assistance. This is the complementary count and percentage to Economically Disadvantaged.
Number of Students per Teacher: The total number of students divided by the total teacher FTE count. (Source of data: PEIMS; Record 040, Staff – Identification/Demographic, Record 050, Staff – Employment – Payroll Summary, Record 090, Staff – Responsibilities, Submission 1)
Paired Schools: Two campuses that are combined virtually for the purpose of assigning accountability ratings. All campuses serving prekindergarten (PK) through grade 12 must receive an accountability rating. A campus that does not serve grade levels at which STAAR is administered is paired with another campus in the same district for accountability purposes. For example, Travis Primary (K–2) feeds students into Navarro Elementary (3–5). The district pairs
Texas Education Agency | Academics | Performance Reporting 19 of 29

2015–16 TAPR Glossary November 2016
these two campuses for accountability purposes. This means that the performance index outcome of Navarro Elementary is also used as the rating Travis Primary. For more information about paring, please see Chapter 6 in the 2016 Accountability Manual.
Professional Staff: The full-time equivalent (FTE) count of teachers, professional support staff, campus administrators, and on the district profile, central office administrators. Staff are grouped according to roles as reported in PEIMS. Each type of professional staff is shown as a percentage of the total staff FTE. See also Appendix A. (Source of data: PEIMS; Record 040, Staff – Identification/Demographic, Record 050, Staff – Employment – Payroll Summary, Record 090, Staff – Responsibilities, Submission 1)
Progress of Prior-Year Non-Proficient Students (Percent of students who did not reach the satisfactory standard on at least one STAAR assessment in the previous year): The percentage of students in grades 4–8 who did not reach the satisfactory standard on STAAR (including STAAR Alt 2 and STAAR A) in the prior year but passed the corresponding assessment in the current year. For 2016, rates for ELA/reading and mathematics are calculated as follows:
number of matched students who did not reach the satisfactory standard in 2015 but passed in 2016
number of matched students who did not reach the satisfactory standard in 2015
For 2016, students in grades 4–8 included in these measures are those who
• took the spring 2016 STAAR, STAAR A or STAAR Alt 2 in ELA/reading and/or mathematics. This indicator does not include grade 3 test takers because that is the first STAAR test;
• are part of the 2016 accountability subset;
• can be matched to the spring 2015 STAAR administration—anywhere in the state—to find their prior year score for ELA/reading and/or mathematics; and
• did not reach the satisfactory standard on the 2015 STAAR administration of ELA/reading and/or mathematics.
(Source of data: TEA Student Assessment Division)
Recommended High School Program: Please see Graduation Plan.
Retention Rates by Grade (not on campus profile): The percentage of students in Texas public schools who enrolled in fall 2015 in the same grade in which they were reported for the last six-week period of the prior school year (2014–15).
the number of students enrolled in the same grade from one school year to the next
the number of students enrolled from one school year who return the next year or who graduate
Special education retention rates are calculated and reported separately because local retention practices differ for students served by special education.
Texas Education Agency | Academics | Performance Reporting 20 of 29

2015–16 TAPR Glossary November 2016
The TAPR shows retention rates only for grades K–8. Retention rates for all grades can be found in Grade-Level Retention in Texas Public Schools, 2014–15, available from TEA. (Source of data: PEIMS; Record 110, Student Data – Enrollment, Submission 1)
Revenue Information: Please see the PEIMS Financial Standard Reports at http://tea.texas.gov/financialstandardreports/.
SAT/ACT Results: Participation and performance of graduating seniors from all Texas public schools on the College Board’s SAT and ACT, Inc.’s ACT assessment. Only one record is sent per student. If a student takes an ACT and/or SAT test more than once, the agency receives the record for the most recent examination taken.
Four values are calculated for this indicator:
(1) Tested: The percentage of graduates who took either college admissions test:
number of graduates who took either the SAT or the ACT
Total number of graduates reported
(2) At/Above Criterion: The percentage of examinees who scored at or above the criterion score on either test (1110 on the SAT critical reading and mathematics sections combined, or 24 on the ACT composite):
number of graduating examinees who scored at or above the criterion score
number of graduating examinees taking either the SAT or the ACT
(3) Average SAT Score: The average score for the SAT critical reading, writing, and mathematics combined. The maximum score is 2400. It is calculated as follows:
sum of total scores (critical reading + writing + mathematics) of all students who took the SAT
number of students who took the SAT
(4) Average ACT Score: The average score for the ACT composite. The maximum score is 36. It is calculated as follows:
sum of total composite scores of all students who took the ACT
number of students who took the ACT
See also Criterion Score. (Sources: The College Board, Aug. 2015, Jan. 2015; ACT, Inc. (ACT) Oct. 2015, Oct. 2014; and PEIMS; Record 203, Student – School Leaver and Graduation Program, Submissions 1 and 3)
School Type: A specific label given to a campus for the purposes of determining its index targets. How it is labeled—elementary, middle, elementary/secondary, or high—is determined by the grades served by the campus as reported in the fall PEIMS enrollment snapshot. For more information about school types and how they are used in accountability, see Chapter 2 of the 2016 Accountability Manual.
Texas Education Agency | Academics | Performance Reporting 21 of 29

2015–16 TAPR Glossary November 2016
Snapshot Date: The first submission of data to PEIMS of a new school year. Enrollment information submitted by this date is used for accountability. It is the last Friday of October. October 30, 2015, is the PEIMS snapshot date for the 2015–16 school year.
Special Education: The population of students served by special education programs. Assessment decisions for students in special education programs are made by their admission, review, and dismissal (ARD) committees. In the 2015–16 school year, a student in special education may have been administered the STAAR, STAAR A, or STAAR Alt 2.
Other indicators that include the performance of students served by special education are advanced course/dual-credit course completion, attendance rate, annual dropout rates, college-ready graduates, longitudinal rates, and RHSP/DAP/FHSP rates. Information that would allow the separation of performance of students in special education on college admissions tests and on Advanced Placement and International Baccalaureate examinations is not available. Note that in the Profile section of the report, retention rates (district profile only) for students receiving special education services are shown separately. See STAAR Special Education Assessments and STAAR Participation. (Source of data: PEIMS; Record 163, Student – Special Education Program, Submission 1)
Special Education Determination Status (district TAPR only): The 2015–16 TAPR provides the 2015–16 special education integrated intervention stage/determination status for each district on the cover page of the report. This label represents an integrated determination status based on an evaluation of each district’s Performance-Based Monitoring Analysis (PBMAS) indicators in the special education program area; the State Performance Plan (SPP) compliance indicators 9, 10, 11, 12, and 13; data integrity; uncorrected noncompliance; and audit findings. Districts receive one of four special education determination statuses:
• Meets Requirements
• Needs Assistance
• Needs Intervention
• Needs Substantial Intervention
For more information, see the special education intervention guidance and resources documents at the following link:
http://tea.texas.gov/Student_Testing_and_Accountability/Monitoring_and_Interventions/Progra m_Monitoring_and_Interventions/Special_Education_Intervention_Guidance_and_Resources/.
Additional resources include the PBMAS Manual and the State Performance Plan at the following links:
http://tea.texas.gov/pbm/PBMASManuals.aspx
http://tea.texas.gov/Reports_and_Data/Data_Submission/State_Performance_Plan/State_Perfor mance_Plan_and_Annual_Performance_Report_and_Requirements/
Texas Education Agency | Academics | Performance Reporting 22 of 29
2015–16 TAPR Glossary November 2016
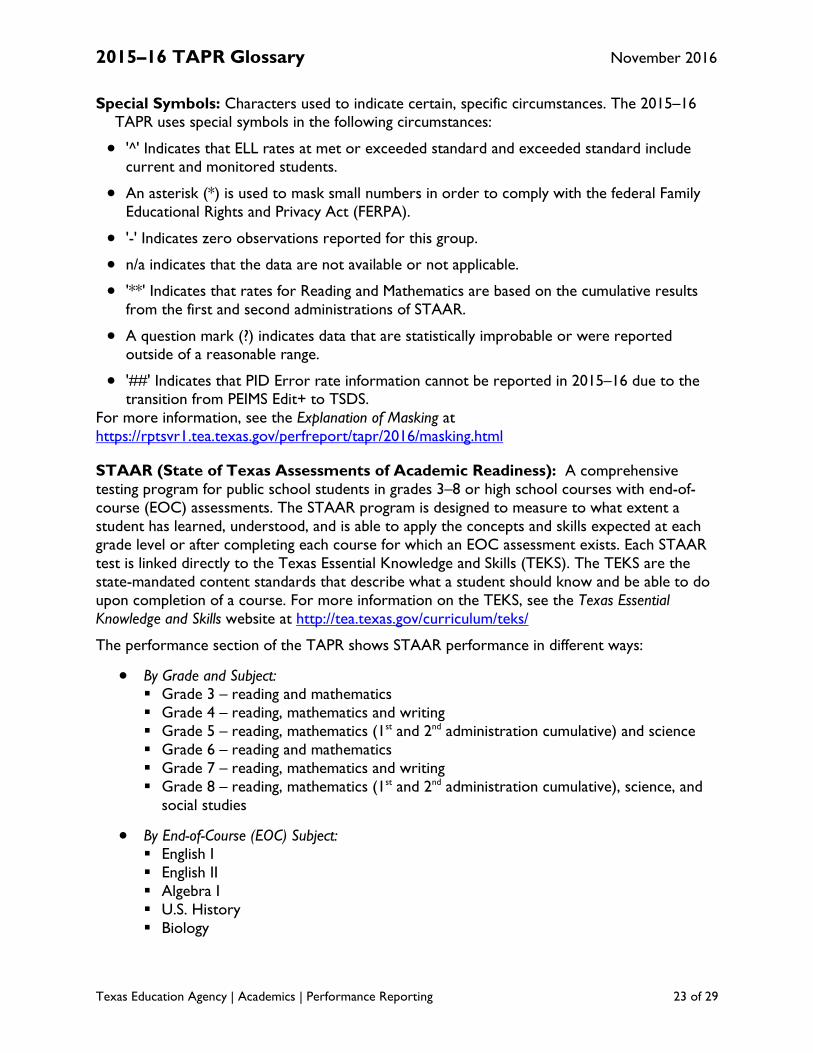
Special Symbols: Characters used to indicate certain, specific circumstances. The 2015–16 TAPR uses special symbols in the following circumstances:
• '^' Indicates that ELL rates at met or exceeded standard and exceeded standard include current and monitored students.
• An asterisk (*) is used to mask small numbers in order to comply with the federal Family Educational Rights and Privacy Act (FERPA).
• '-' Indicates zero observations reported for this group.
• n/a indicates that the data are not available or not applicable.
• '**' Indicates that rates for Reading and Mathematics are based on the cumulative results from the first and second administrations of STAAR.
• A question mark (?) indicates data that are statistically improbable or were reported outside of a reasonable range.
• '##' Indicates that PID Error rate information cannot be reported in 2015–16 due to the transition from PEIMS Edit+ to TSDS.
For more information, see the Explanation of Masking at https://rptsvr1.tea.texas.gov/perfreport/tapr/2016/masking.html
STAAR (State of Texas Assessments of Academic Readiness): A comprehensive testing program for public school students in grades 3–8 or high school courses with end-ofcourse (EOC) assessments. The STAAR program is designed to measure to what extent a student has learned, understood, and is able to apply the concepts and skills expected at each grade level or after completing each course for which an EOC assessment exists. Each STAAR test is linked directly to the Texas Essential Knowledge and Skills (TEKS). The TEKS are the state-mandated content standards that describe what a student should know and be able to do upon completion of a course. For more information on the TEKS, see the Texas Essential Knowledge and Skills website at http://tea.texas.gov/curriculum/teks/
The performance section of the TAPR shows STAAR performance in different ways:
• By Grade and Subject: Grade 3 – reading and mathematics Grade 4 – reading, mathematics and writing Grade 5 – reading, mathematics (1st and 2nd administration cumulative) and science Grade 6 – reading and mathematics Grade 7 – reading, mathematics and writing Grade 8 – reading, mathematics (1st and 2nd administration cumulative), science, and
social studies
• By End-of-Course (EOC) Subject: English I English II Algebra I U.S. History Biology
Texas Education Agency | Academics | Performance Reporting 23 of 29
2015–16 TAPR Glossary November 2016
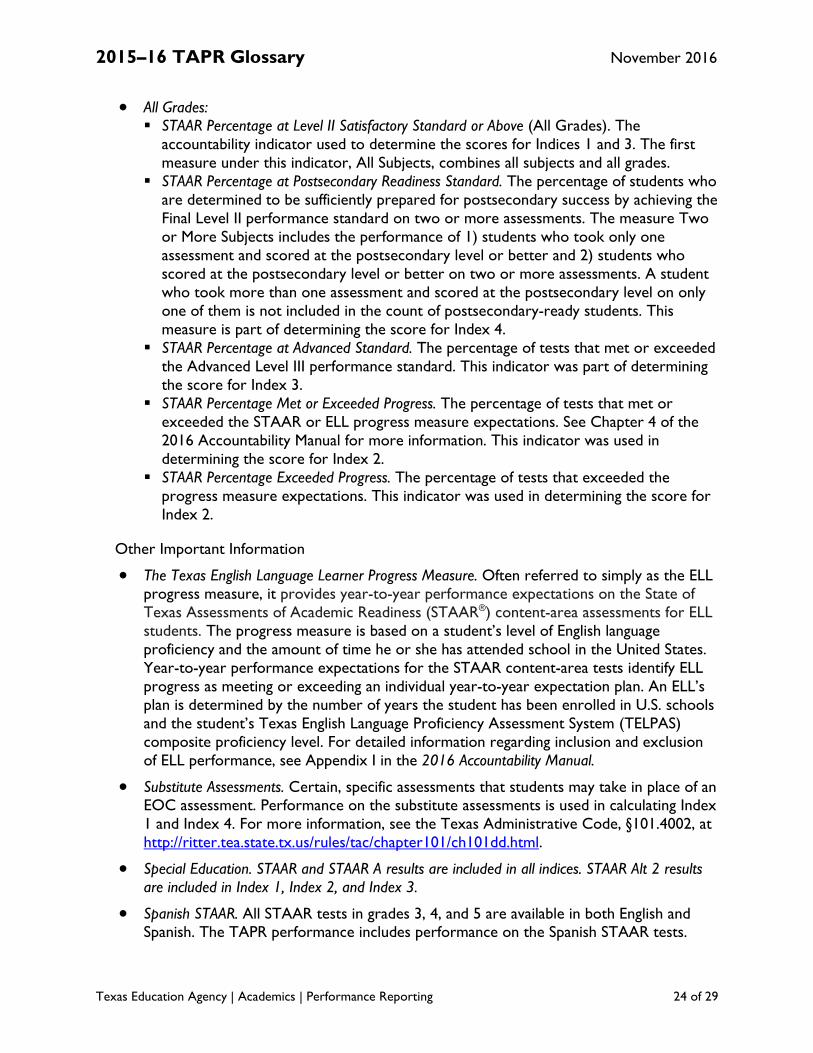
• All Grades: STAAR Percentage at Level II Satisfactory Standard or Above (All Grades). The
accountability indicator used to determine the scores for Indices 1 and 3. The first measure under this indicator, All Subjects, combines all subjects and all grades.
STAAR Percentage at Postsecondary Readiness Standard. The percentage of students who are determined to be sufficiently prepared for postsecondary success by achieving the Final Level II performance standard on two or more assessments. The measure Two or More Subjects includes the performance of 1) students who took only one assessment and scored at the postsecondary level or better and 2) students who scored at the postsecondary level or better on two or more assessments. A student who took more than one assessment and scored at the postsecondary level on only one of them is not included in the count of postsecondary-ready students. This measure is part of determining the score for Index 4.
STAAR Percentage at Advanced Standard. The percentage of tests that met or exceeded the Advanced Level III performance standard. This indicator was part of determining the score for Index 3.
STAAR Percentage Met or Exceeded Progress. The percentage of tests that met or exceeded the STAAR or ELL progress measure expectations. See Chapter 4 of the 2016 Accountability Manual for more information. This indicator was used in determining the score for Index 2.
STAAR Percentage Exceeded Progress. The percentage of tests that exceeded the progress measure expectations. This indicator was used in determining the score for Index 2.
Other Important Information
• The Texas English Language Learner Progress Measure. Often referred to simply as the ELL progress measure, it provides year-to-year performance expectations on the State of Texas Assessments of Academic Readiness (STAAR®) content-area assessments for ELL students. The progress measure is based on a student’s level of English language proficiency and the amount of time he or she has attended school in the United States. Year-to-year performance expectations for the STAAR content-area tests identify ELL progress as meeting or exceeding an individual year-to-year expectation plan. An ELL’s plan is determined by the number of years the student has been enrolled in U.S. schools and the student’s Texas English Language Proficiency Assessment System (TELPAS) composite proficiency level. For detailed information regarding inclusion and exclusion of ELL performance, see Appendix I in the 2016 Accountability Manual.
• Substitute Assessments. Certain, specific assessments that students may take in place of an EOC assessment. Performance on the substitute assessments is used in calculating Index 1 and Index 4. For more information, see the Texas Administrative Code, §101.4002, at http://ritter.tea.state.tx.us/rules/tac/chapter101/ch101dd.html.
• Special Education. STAAR and STAAR A results are included in all indices. STAAR Alt 2 results are included in Index 1, Index 2, and Index 3.
• Spanish STAAR. All STAAR tests in grades 3, 4, and 5 are available in both English and Spanish. The TAPR performance includes performance on the Spanish STAAR tests.
Texas Education Agency | Academics | Performance Reporting 24 of 29

2015–16 TAPR Glossary November 2016
• Rounding of STAAR results. STAAR performance shown on the TAPR is rounded to whole numbers. For example, 49.877% is rounded to 50%; 49.4999% is rounded to 49%; and 59.5% is rounded to 60%.
• Masking. STAAR performance rates are masked when necessary to comply with FERPA. For more information, see the Explanation of Masking at https://rptsvr1.tea.texas.gov/perfreport/account/2016/masking.html
See STAAR Participation and Student Success Initiative. (Source of data: TEA Student Assessment Division)
STAAR Participation: The percentage of students who were administered a STAAR assessment. Includes STAAR, STAAR A, STAAR Alt 2, TELPAS, and STAAR-L. The details on the participation categories are as follows:
• Test Participant: 1) answer documents (STAAR, STAAR A, STAAR Alternate 2, STAAR-L, TELPAS) with a score code of “S”, 2) STAAR Alternate 2 testers with a score code of “N”, 3) STAAR, STAAR A or STAAR Alternate 2 reading testers with a score code of “A” or “O” who also have a scored TELPAS assessment, and 4) year 1-5 asylee/refugees and SIFE mathematics testers with a scored TELPAS assessment. Included in Accountability: scored answer documents used in determining the
district or campus accountability rating, including substitute assessments with a score code of O
Not included in Accountability: answer documents counted as participants, but not used in determining the district or campus accountability rating ♦ Mobile: answer documents were excluded because the students enrolled in
the district or campus after the fall PEIMS submission dates (October 30, 2015, or October 31, 2014 for summer 2015 EOCs)
♦ Other Exclusions. The following answer documents were excluded from the rating determination: Answer documents for students who were tested only on the TELPAS or
TELPAS plus STAAR tests with score codes of A or O. Answer documents of students who are either an ELL who has been is
school in the U.S. for less than two years or an asylee, refugee, or SIFE student who has been in school in the U.S. for less than six years.
Answer documents of ELL students who have been in U.S. schools for two to four years, took the STAAR in English, and for whom an ELL progress measure was not calculated for reasons other than parental denial of services or the student having exceeded the ELL progress measure plan.
Answer documents of STAAR Alt 2 testers with a score code of N.
• Not Tested: answer documents with score codes A or O Absent: answer documents with a score code A Other: answer documents with score codes O, except for substitute assessments.
Texas Education Agency | Academics | Performance Reporting 25 of 29

2015–16 TAPR Glossary November 2016
The denominator for participation is the sum of these five categories: Included in Acct, Mobile, Other Exclusions, and Not Tested (Absent and Other). STAAR Participation Rate is rounded to whole numbers. For example, 94.49% is rounded to 94%. Small values may show as zero: 0.4% is rounded to 0%, and 0.6% is rounded to 1%. (Source of data: TEA Student Assessment Division)
Staff Exclusions (not on campus profile): The counts of individuals who serve public school students but are not included in the FTE totals for any of the other employee statistics. There are two types of these entries: individuals participating in a shared services arrangement and individuals on contract with the district to provide instructional services. Shared Services Arrangement (SSA) Staff are staff who work in schools located in districts other than their employing district or whose assigned organization (in PEIMS) shows a code of 751, indicating that they are employed by the fiscal agent of an SSA. Only the portion of a person’s total FTE amount associated with the school in another district (or with the 751 organization code) is counted as SSA. SSA staff are grouped into three categories: Professional Staff (which includes teachers, administrators, and professional support); Educational Aides; and Auxiliary Staff. Note that SSA Auxiliary Staff are identified by the type of fund from which they are paid. Contracted Instructional Staff (District and Campus Profiles) refers to counts of instructors for whom the district has entered into a contractual agreement with some outside organization. Through the contract, the outside organization has committed to supplying instructional staff for the district. They are never employees of the reporting school district. (Source of data: PEIMS; Record 055, District Finance Data – Contracted Instructional Staff, Record 060 – Staff Data – Employment Payroll Accounting, Submission 1)
Student Enrollment by Program: The count and percentage of students served in programs and/or courses for special education, career and technical education, bilingual/ESL education, or gifted and talented education. The percentages do not total to 100 because students may participate in more than one of these programs. (Source of data: PEIMS; Record 110 – Student – Enrollment, Record 163 – Student – Special Education Program, Record 169 – Student – Career and Technical Education Program, Submission 1)
Student Success Initiative (SSI): Grade-advancement requirements enacted by the 76th
Legislature in 1999 that requires students to demonstrate proficiency on the mathematics and reading assessments at grades 5 and 8.
For 2016, the TAPR shows the following for each SSI grade:
(1) Students Meeting Level II 2015–16 Satisfactory Standard on First STAAR Administration: The percentage of students who met Level II Satisfactory Standard during the first administration. It is calculated as follows:
number of students who met Level II Satisfactory Standard in the first administration
number of students tested in the first administration
(2) Students Requiring Accelerated Instruction: The percentage of students who did not pass the first administration of the STAAR. It is calculated as follows:
number of students who did not meet the standard in the first administration
number of students in the first administration
Texas Education Agency | Academics | Performance Reporting 26 of 29
2015–16 TAPR Glossary November 2016
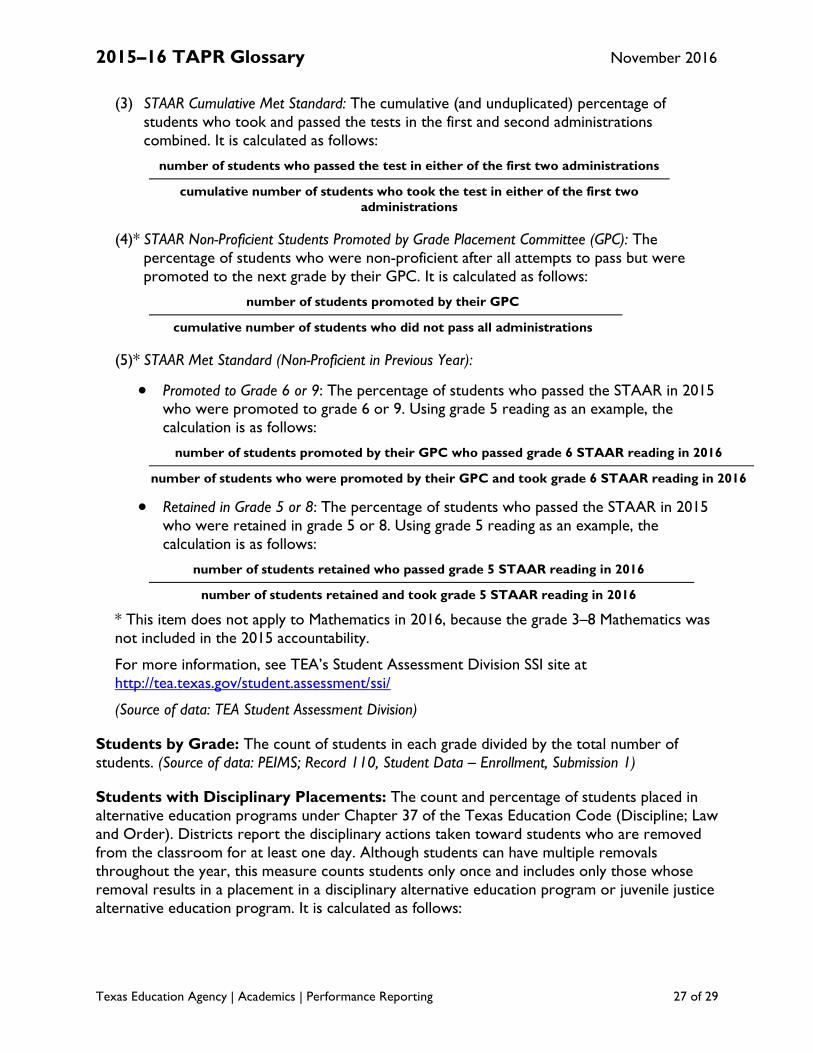
(3) STAAR Cumulative Met Standard: The cumulative (and unduplicated) percentage of students who took and passed the tests in the first and second administrations combined. It is calculated as follows:
number of students who passed the test in either of the first two administrations
cumulative number of students who took the test in either of the first two administrations
(4)* STAAR Non-Proficient Students Promoted by Grade Placement Committee (GPC): The percentage of students who were non-proficient after all attempts to pass but were promoted to the next grade by their GPC. It is calculated as follows:
number of students promoted by their GPC
cumulative number of students who did not pass all administrations
(5)* STAAR Met Standard (Non-Proficient in Previous Year):
• Promoted to Grade 6 or 9: The percentage of students who passed the STAAR in 2015 who were promoted to grade 6 or 9. Using grade 5 reading as an example, the calculation is as follows:
number of students promoted by their GPC who passed grade 6 STAAR reading in 2016
number of students who were promoted by their GPC and took grade 6 STAAR reading in 2016
• Retained in Grade 5 or 8: The percentage of students who passed the STAAR in 2015 who were retained in grade 5 or 8. Using grade 5 reading as an example, the calculation is as follows:
number of students retained who passed grade 5 STAAR reading in 2016
number of students retained and took grade 5 STAAR reading in 2016
* This item does not apply to Mathematics in 2016, because the grade 3–8 Mathematics was not included in the 2015 accountability.
For more information, see TEA’s Student Assessment Division SSI site at http://tea.texas.gov/student.assessment/ssi/
(Source of data: TEA Student Assessment Division)
Students by Grade: The count of students in each grade divided by the total number of students. (Source of data: PEIMS; Record 110, Student Data – Enrollment, Submission 1)
Students with Disciplinary Placements: The count and percentage of students placed in alternative education programs under Chapter 37 of the Texas Education Code (Discipline; Law and Order). Districts report the disciplinary actions taken toward students who are removed from the classroom for at least one day. Although students can have multiple removals throughout the year, this measure counts students only once and includes only those whose removal results in a placement in a disciplinary alternative education program or juvenile justice alternative education program. It is calculated as follows:
Texas Education Agency | Academics | Performance Reporting 27 of 29

2015–16 TAPR Glossary November 2016
number of students with one or more disciplinary placements
number of students who were in attendance at any time during the school year
For 2015–16, the following 19 action codes on the PEIMS 425 record are included as disciplinary placements: 02, 03, 04, 07, 08, 10, 12, 13, 14, 15, 51, 52, 53, 54, 55, 57, 59, 60, and 61. (Source of data: PEIMS; Record 425, Disciplinary Action Data, Submission 3)
Superintendent: The educational leader and administrative manager of the district or charter operator. It includes other titles that may apply to charter operators, such as chief executive officer, president, and chief administrative officer.
Tax Information: This information, including tax rates and assessed district property values, is available on the PEIMS Financial Standard Reports at http://tea.texas.gov/financialstandardreports/.
Teachers by Ethnicity and Sex: The counts of teacher FTEs by ethnic group and by sex. Counts are also expressed as a percentage of the total teacher FTEs. (Source of data: PEIMS; Record 040, Staff – Identification/Demographic, Record 050, Staff – Employment – Payroll Summary, Record 090, Staff – Responsibilities, Submission 1)
Teachers by Highest Degree Held: The distribution of degrees held by teachers. The FTE counts of teachers with no degree, a bachelor’s degree, a master’s degree, or a doctorate are expressed as a percentage of the total teacher FTEs. (Source of data: PEIMS; Record 040, Staff – Identification/Demographic, Record 050, Staff – Employment – Payroll Summary, Record 090, Staff – Responsibilities, Submission 1)
Teachers by Program (population served) (district profile only): The FTE count of teachers categorized by the type of student populations served: regular, special, compensatory, career and technical, bilingual/ESL, gifted and talented education students, and other populations. Teacher FTE values are allocated across population types for teachers who serve multiple population types. Percentages are expressed as a percent of total teacher FTEs. (Source of data: PEIMS; Record 040, Staff – Identification/Demographic, Record 050, Staff – Employment – Payroll Summary, Record 090, Staff – Responsibilities, Submission 1)
Teachers by Years of Experience: The FTE count of teachers by total years of experience for the individual, not necessarily years of experience in the reporting district or campus. Teacher counts within each range of experience are expressed as a percentage of total teacher FTEs. A beginning teacher is a teacher reported with zero years of experience. (Source of data: PEIMS; Record 040, Staff – Identification/Demographic, Record 050, Staff – Employment – Payroll Summary, Record 090, Staff – Responsibilities, Submission 1)
Texas Education Agency | Academics | Performance Reporting 28 of 29

2015–16 TAPR Glossary November 2016
Texas Education Agency | Academics | Performance Reporting 29 of 29
Texas Success Initiative Assessment (TSIA): The percentage of annual graduates who met the TSI criteria on the TSIA
Percentages are calculated and shown for English and mathematics separately.
number of 2014–15 annual graduates who met the TSI criteria on the TSIA number of 2014–15 annual graduates
(Source of data: THECB [applicable scores from June 2011 through October 2015] and Record 203, Student – School Leaver, Submissions 1 and 3)
Total Staff: The total count of staff which includes professional staff (teachers, professional support, administrators), educational aides, and (on the district profile) auxiliary staff. Minority staff is the sum of the FTE counts for all non-white staff groups (African American, Hispanic, American Indian, Asian, Pacific Islander, and Two or More Races). The minority staff FTE count is expressed as a percent of the total staff FTE. (Source of data: PEIMS; Record 040, Staff – Identification/Demographic, Record 050, Staff – Employment – Payroll Summary, Record 090, Staff – Responsibilities, Submission 1)
Total Students: The total number of public school students who were reported in membership on October 30, 2015, at any grade from early childhood education through grade 12. Membership differs from enrollment because it does not include those students who are served in the district for less than two hours per day. For example, the count of Total Students excludes students who attend a nonpublic school but receive some services, such as speech therapy—for less than two hours per day—from their local public school district. (Source of data: PEIMS; Record 110, Student Data – Demographic, Submission 1)
Turnover Rate for Teachers (not on campus profile): The percentage of teachers from the fall of 2014–15 who were not employed in the district in the fall of 2015–16. It is calculated as the total FTE count of teachers from the fall of 2014–15 who were not employed in the district in the fall of 2015–16, divided by the total teacher FTE count for the fall of 2014–15. Staff who remained employed in the district but not as teachers also count toward teacher turnover. (Source of data: PEIMS; Record 050, Staff – Employment – Payroll Summary, Record 090, Staff Data – Responsibilities, Submission 1)

Texas Education Agency | Academics | Performance Reporting
Who to Call Information about the calculation of all Texas Academic Performance Report (TAPR) data elements is provided in this Glossary. If, after reading the Glossary you have questions about the calculation of TAPR indicators, contact Performance Reporting at (512) 463-9704.
Questions related to programs and policies for the following subjects should be directed to the contacts listed below.
Subject Contact Number Accountability Ratings (methodology) Performance Reporting ................................................. (512) 463-9704 Advanced Courses Curriculum ....................................................................... (512) 463-9581 Charter Schools Charter Schools .............................................................. (512) 463-9575 College Admissions Tests: SAT College Board .................................................................. (512) 721-1800 ACT ACT Regional Office ...................................................... (512) 320-1850 Copies of TAPR reports https://rptsvr1.tea.texas.gov/perfreport/tapr/index.html DAEP (Disciplinary Alternative Education Program) Discipline, Law, and Order........................................... (512) 463-9286 Distinguished Achievement Program Curriculum ....................................................................... (512) 463-9581 Distinction Designations Performance Reporting ................................................. (512) 463-9704 Dropouts Accountability Research ................................................ (512) 475-3523 English Language Learners Testing Issues Student Assessment ....................................................... (512) 463-9536 Other Issues Curriculum (Bilingual Education Program Unit) ...... (512) 463-9581 Financial Standard Reports State Funding ................................................................... (512) 463-9238 General Inquiry General Inquiries ............................................................ (512) 463-9290 Graduates Accountability Research ................................................ (512) 475-3523 Graduates Enrolled in Texas IHE Texas Higher Education Coordinating Board .......... (512) 427-6101 JJAEP (Juvenile Justice Alternative Education Program) Discipline, Law, and Order........................................... (512) 463-9286 Federal Accountability Federal and State Education Policy ............................. (512) 463-9414 PBM Special Education Monitoring Results Status School Improvement .................................................... (512) 463-5226 PEIMS (TSDS PEIMS) PEIMS HelpLine ............................................................... (512) 463-9229 Recommended High School Program Curriculum ....................................................................... (512) 463-9581 Retention Policy Curriculum ....................................................................... (512) 463-9581 School Finance State Funding ................................................................... (512) 463-9238 School Governance School Governance ........................................................ (512) 463-9623 School Report Card Performance Reporting ................................................. (512) 463-9704 Special Education Testing Issues Student Assessment ....................................................... (512) 463-9536 Other Issues Special Education ............................................................ (512) 463-9414 STAAR (all assessments) Student Assessment ....................................................... (512) 463-9536 STAAR Testing Contractor ETS .................................................................................... (855) 333-7770 Pearson ............................................................................. (800) 328-5999 Austin Operational Center .......................................... (512) 989-5300 Statutory (Legal) Issues Legal Services ................................................................... (512) 463-9720 TELPAS Student Assessment ....................................................... (512) 463-9536 TAIS Texas Accountability Intervention System ............... (512) 463-9414
Information on the Internet: http://tea.texas.gov/accountability/

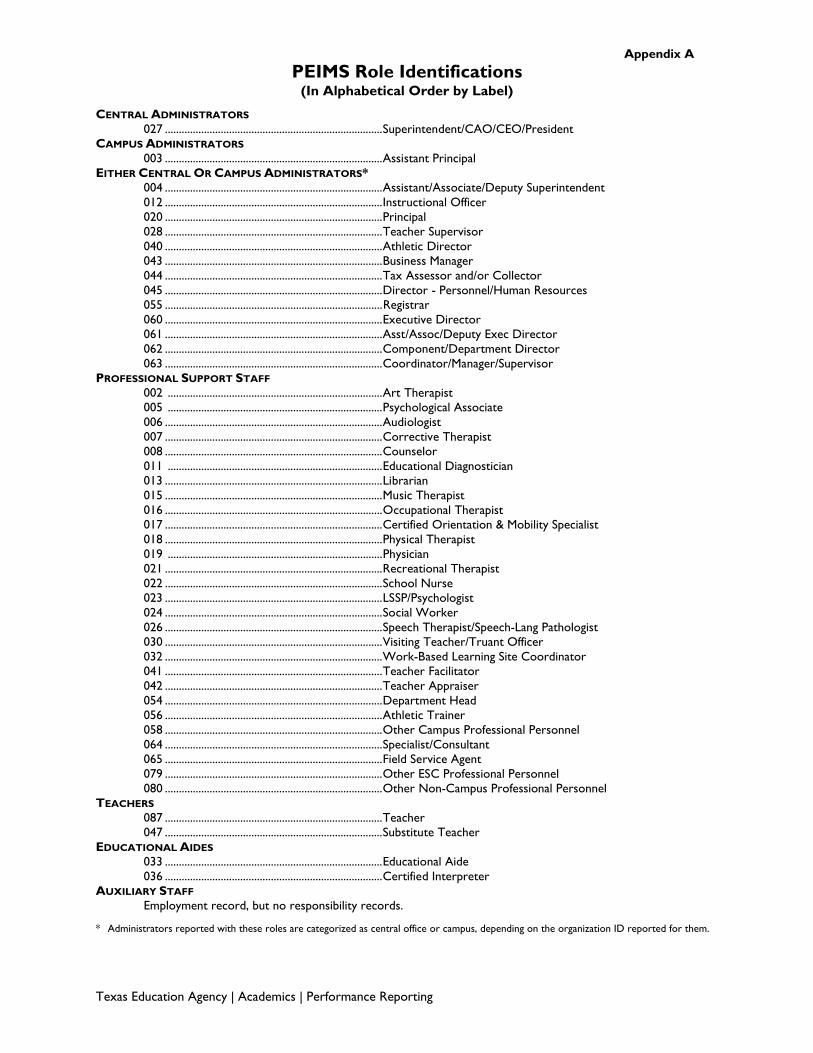
Appendix A
PEIMS Role Identifications (In Alphabetical Order by Label)
CENTRAL ADMINISTRATORS
027 .............................................................................. Superintendent/CAO/CEO/President CAMPUS ADMINISTRATORS
003 .............................................................................. Assistant Principal EITHER CENTRAL OR CAMPUS ADMINISTRATORS*
004 .............................................................................. Assistant/Associate/Deputy Superintendent 012 .............................................................................. Instructional Officer 020 .............................................................................. Principal 028 .............................................................................. Teacher Supervisor 040 .............................................................................. Athletic Director 043 .............................................................................. Business Manager 044 .............................................................................. Tax Assessor and/or Collector 045 .............................................................................. Director - Personnel/Human Resources 055 .............................................................................. Registrar 060 .............................................................................. Executive Director 061 .............................................................................. Asst/Assoc/Deputy Exec Director 062 .............................................................................. Component/Department Director 063 .............................................................................. Coordinator/Manager/Supervisor
002 ............................................................................. Art Therapist PROFESSIONAL SUPPORT STAFF
005 ............................................................................. Psychological Associate 006 .............................................................................. Audiologist 007 .............................................................................. Corrective Therapist 008 .............................................................................. Counselor 011 ............................................................................. Educational Diagnostician 013 .............................................................................. Librarian 015 .............................................................................. Music Therapist 016 .............................................................................. Occupational Therapist 017 .............................................................................. Certified Orientation & Mobility Specialist 018 .............................................................................. Physical Therapist 019 ............................................................................. Physician 021 .............................................................................. Recreational Therapist 022 .............................................................................. School Nurse 023 .............................................................................. LSSP/Psychologist 024 .............................................................................. Social Worker 026 .............................................................................. Speech Therapist/Speech-Lang Pathologist 030 .............................................................................. Visiting Teacher/Truant Officer 032 .............................................................................. Work-Based Learning Site Coordinator 041 .............................................................................. Teacher Facilitator 042 .............................................................................. Teacher Appraiser 054 .............................................................................. Department Head 056 .............................................................................. Athletic Trainer 058 .............................................................................. Other Campus Professional Personnel 064 .............................................................................. Specialist/Consultant 065 .............................................................................. Field Service Agent 079 .............................................................................. Other ESC Professional Personnel 080 .............................................................................. Other Non-Campus Professional Personnel TEACHERS
087 .............................................................................. Teacher 047 .............................................................................. Substitute Teacher EDUCATIONAL AIDES
033 .............................................................................. Educational Aide 036 .............................................................................. Certified Interpreter AUXILIARY STAFF
Employment record, but no responsibility records.
* Administrators reported with these roles are categorized as central office or campus, depending on the organization ID reported for them.
Texas Education Agency | Academics | Performance Reporting

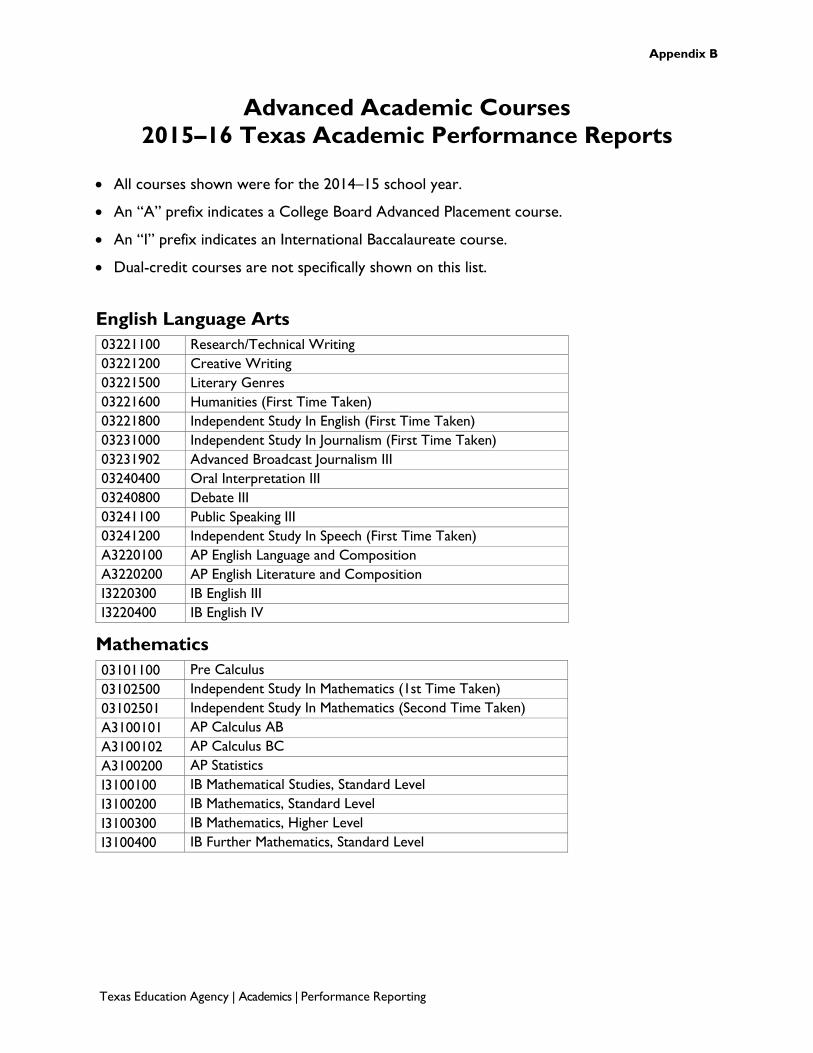
Appendix B
Texas Education Agency | Academics | Performance Reporting
Advanced Academic Courses 2015–16 Texas Academic Performance Reports
• All courses shown were for the 2014–15 school year.
• An “A” prefix indicates a College Board Advanced Placement course.
• An “I” prefix indicates an International Baccalaureate course.
• Dual-credit courses are not specifically shown on this list.
English Language Arts 03221100 Research/Technical Writing 03221200 Creative Writing 03221500 Literary Genres 03221600 Humanities (First Time Taken) 03221800 Independent Study In English (First Time Taken) 03231000 Independent Study In Journalism (First Time Taken) 03231902 Advanced Broadcast Journalism III 03240400 Oral Interpretation III 03240800 Debate III 03241100 Public Speaking III 03241200 Independent Study In Speech (First Time Taken) A3220100 AP English Language and Composition A3220200 AP English Literature and Composition I3220300 IB English III I3220400 IB English IV
Mathematics 03101100 Pre Calculus 03102500 Independent Study In Mathematics (1st Time Taken) 03102501 Independent Study In Mathematics (Second Time Taken) A3100101 AP Calculus AB A3100102 AP Calculus BC A3100200 AP Statistics I3100100 IB Mathematical Studies, Standard Level I3100200 IB Mathematics, Standard Level I3100300 IB Mathematics, Higher Level I3100400 IB Further Mathematics, Standard Level
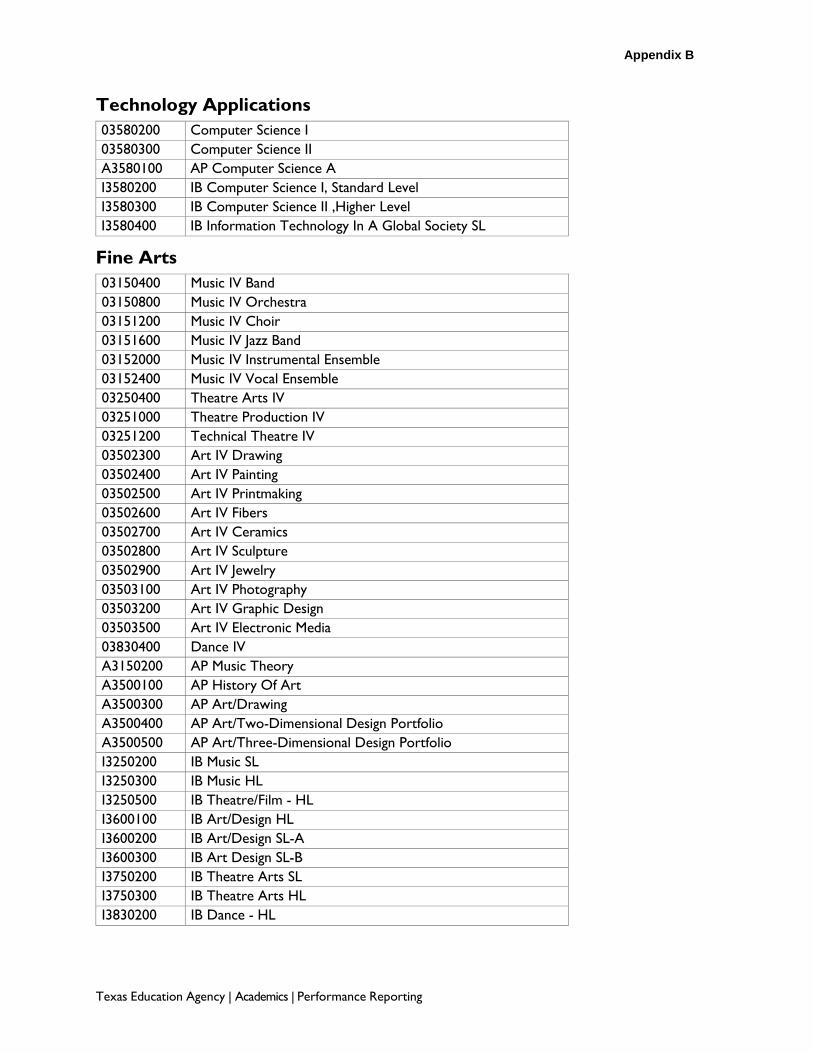
Appendix B
Texas Education Agency | Academics | Performance Reporting
Technology Applications 03580200 Computer Science I 03580300 Computer Science II A3580100 AP Computer Science A I3580200 IB Computer Science I, Standard Level I3580300 IB Computer Science II ,Higher Level I3580400 IB Information Technology In A Global Society SL
Fine Arts 03150400 Music IV Band 03150800 Music IV Orchestra 03151200 Music IV Choir 03151600 Music IV Jazz Band 03152000 Music IV Instrumental Ensemble 03152400 Music IV Vocal Ensemble 03250400 Theatre Arts IV 03251000 Theatre Production IV 03251200 Technical Theatre IV 03502300 Art IV Drawing 03502400 Art IV Painting 03502500 Art IV Printmaking 03502600 Art IV Fibers 03502700 Art IV Ceramics 03502800 Art IV Sculpture 03502900 Art IV Jewelry 03503100 Art IV Photography 03503200 Art IV Graphic Design 03503500 Art IV Electronic Media 03830400 Dance IV A3150200 AP Music Theory A3500100 AP History Of Art A3500300 AP Art/Drawing A3500400 AP Art/Two-Dimensional Design Portfolio A3500500 AP Art/Three-Dimensional Design Portfolio I3250200 IB Music SL I3250300 IB Music HL I3250500 IB Theatre/Film - HL I3600100 IB Art/Design HL I3600200 IB Art/Design SL-A I3600300 IB Art Design SL-B I3750200 IB Theatre Arts SL I3750300 IB Theatre Arts HL I3830200 IB Dance - HL

Appendix B
Texas Education Agency | Academics | Performance Reporting
Science A3010200 AP Biology A3020000 AP Environmental Science A3040000 AP Chemistry A3050002 AP Physics C I3010200 IB Biology I3020000 IB Environmental Systems and Societies I3030001 IB Design Technology SL I3030002 IB Design Technology HL I3040001 IB Chemistry I I3050001 IB Physics I
Social Studies/History 03310301 Economics Advanced Studies (First Time Taken) 03380001 Social Studies Advanced Studies (First Time Taken) A3310100 AP Microeconomics A3310200 AP Macroeconomics A3330100 AP United States Government and Politics A3330200 AP Comparative Government and Politics A3340100 AP United States History A3340200 AP European History A3350100 AP Psychology A3360100 AP Human Geography A3370100 AP World History I3301100 IB History I3301200 IB History: Africa I3301300 IB History: Americas I3301400 IB History: East and Southeast Asia I3301500 IB History: Europe I3302100 IB Geography, Standard Level I3302200 IB Geography, Higher Level I3303100 IB Economics, Standard Level I3303200 IB Economics, Higher Level I3303300 IB Business and Management I I3303400 IB Business and Management II I3304100 IB Psychology, Standard Level I3304200 IB Psychology, Higher Level I3366010 IB Philosophy

Appendix B
Texas Education Agency | Academics | Performance Reporting
Advanced Languages (Modern or Classical) 03110400 Arabic IV 03110500 Arabic V 03110600 Arabic VI 03110700 Arabic VII 03120400 Japanese IV 03120500 Japanese V 03120600 Japanese VI 03120700 Japanese VII 03400400 Italian IV 03400500 Italian V 03400600 Italian VI 03400700 Italian VII 03410400 French IV 03410500 French V 03410600 French VI 03410700 French VII 03420400 German IV 03420500 German V 03420600 German VI 03420700 German VII 03430400 Latin IV 03430500 Latin V 03430600 Latin VI 03430700 Latin VII 03440400 Spanish IV 03440440 Spanish For Spanish Speakers IV 03440500 Spanish V 03440550 Spanish For Spanish Speakers V 03440600 Spanish VI 03440660 Spanish For Spanish Speakers VI 03440700 Spanish VII 03440770 Spanish For Spanish Speakers VII 03450400 Russian IV 03450500 Russian V 03450600 Russian VI 03450700 Russian VII 03460400 Czech IV 03460500 Czech V 03460600 Czech VI 03460700 Czech VII

Appendix B
Texas Education Agency | Academics | Performance Reporting
Advanced Languages (cont.) 03470400 Portuguese IV 03470500 Portuguese V 03470600 Portuguese VI 03470700 Portuguese VII 03480400 Hebrew IV 03480500 Hebrew V 03480600 Hebrew VI 03480700 Hebrew VII 03490400 Chinese IV 03490500 Chinese V 03490600 Chinese VI 03490700 Chinese VII 03510400 Vietnamese IV 03510500 Vietnamese V 03510600 Vietnamese VI 03510700 Vietnamese VII 03520400 Hindi IV 03520500 Hindi V 03520600 Hindi VI 03520700 Hindi VII 03980400 American Sign Language IV 03980500 American Sign Language V 03980600 American Sign Language VI 03980700 American Sign Language VII 03996000 Other Foreign Languages Level IV 03996100 Other Foreign Languages Level V 03996200 Other Foreign Languages Level VI 03996300 Other Foreign Languages Level VII A3120400 AP Japanese A3410100 AP French A3420100 AP German A3430100 AP Latin A3440100 AP Spanish A3440200 AP Spanish A3490400 AP Chinese I3110400 IB Arabic IV I3110500 IB Arabic V I3120400 IB Japanese IV I3120500 IB Japanese V I3410400 IB French IV I3410500 IB French V I3420400 IB German IV
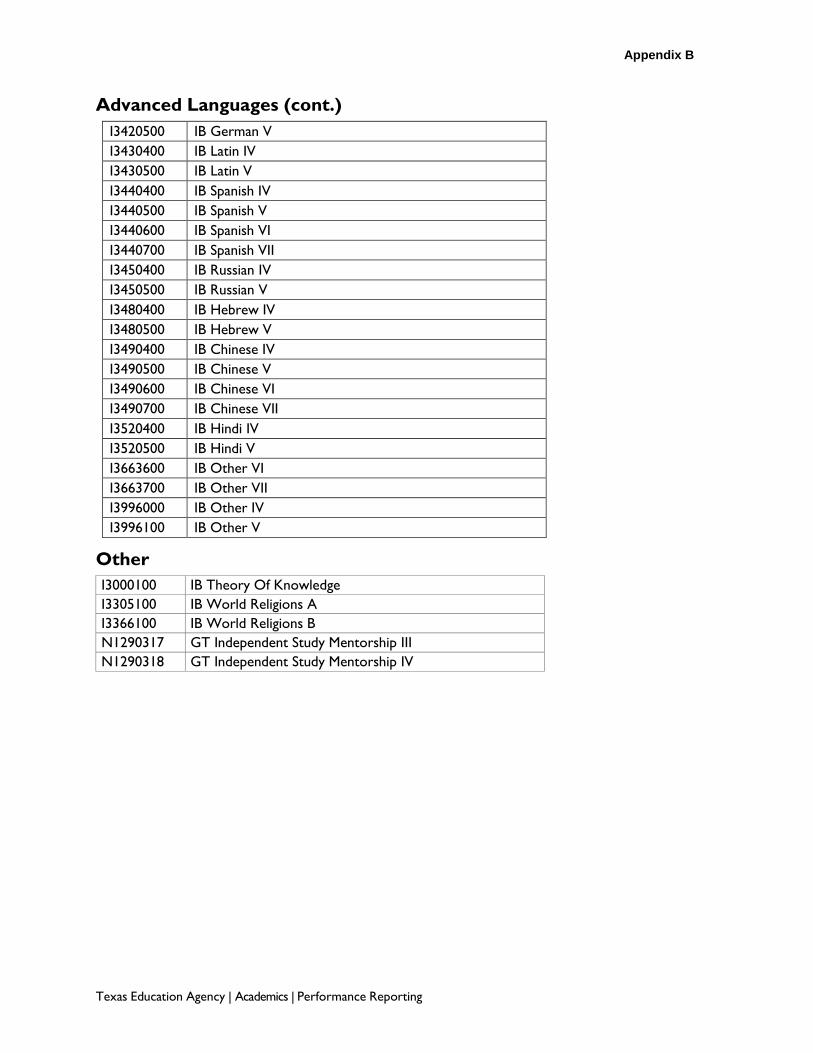
Appendix B
Texas Education Agency | Academics | Performance Reporting
Advanced Languages (cont.) I3420500 IB German V I3430400 IB Latin IV I3430500 IB Latin V I3440400 IB Spanish IV I3440500 IB Spanish V I3440600 IB Spanish VI I3440700 IB Spanish VII I3450400 IB Russian IV I3450500 IB Russian V I3480400 IB Hebrew IV I3480500 IB Hebrew V I3490400 IB Chinese IV I3490500 IB Chinese V I3490600 IB Chinese VI I3490700 IB Chinese VII I3520400 IB Hindi IV I3520500 IB Hindi V I3663600 IB Other VI I3663700 IB Other VII I3996000 IB Other IV I3996100 IB Other V
Other I3000100 IB Theory Of Knowledge I3305100 IB World Religions A I3366100 IB World Religions B N1290317 GT Independent Study Mentorship III N1290318 GT Independent Study Mentorship IV

2015-2016 ACADEMIC PERFORMANCE/
HIGHER EDUCATION
Calhoun County ISD

Report of 2013-2014 High School Graduates’ Enrollment and Academic Performance in Texas Public Higher Education in FY 2015
Texas statute requires every school district to include, with their performance report, information received under Texas Education Code §51.403(e). This information, provided to districts from the Texas Higher Education Coordinating Board (THECB), reports on student performance in postsecondary institutions during the first year enrolled after graduation from high school.
Student performance is measured by the Grade Point Average (GPA) earned by 2013-2014 high school graduates who attended public four-year and two-year higher education in FY 2015. The data is presented alphabetically for each county, school district and high school. The bookmarks can be used to select the first letter of a county. Then the user can scroll down to the desired county, school district and high school.
For each student, the grade points and college-level semester credit hours earned by a student in fall 2014, spring 2015, and summer 2015 are added together and averaged to determine the GPA. These GPAs are accumulated in a range of five categories from < 2.0 to > 3.5. If a GPA could not be calculated for some reason, that student is placed in the “Unknown” column. GPA data is only available for students attending public higher education institutions in Texas. If a high school has fewer than five students attending four-year or two-year public higher education institutions, the number of students is shown but no GPA breakout is given. If a student attended both a four-year and a two-year institution in FY 2015, the student’s GPA is shown in the type of institution where the most semester credit hours were earned.
The number of students located at Texas independent institutions is presented. Also shown are "not trackable" graduates, those with non-standard ID numbers that cannot be used to match student identifiers at Texas higher education institutions. "Not found" graduates have standard ID numbers but were not located in FY 2015 at Texas higher education institutions. They might have enrolled in higher education outside of Texas.
No data is given for high schools with 25 or fewer graduates.
Because the statute calls for data on the first year enrolled after graduation, the level of the institution attended by students in this report may not match that given in THECB’s high school to college report at http://www.txhighereddata.org/Interactive/HSCollLink. That report shows where students attended in the fall semester after their high school graduation year. This report attributes students to the level of institution where they earned the most semester credit hours during the whole academic year, not just the fall semester.
Please note: In May 2012 the 2006-2007, 2007-2008, and 2008-2009 versions of the Report of High School Graduates’ Enrollment and Academic Performance in Texas Public Higher Education were updated to reflect a minor correction in how the GPA data are distributed across ranges.

Texas High School Graduates from FY2014
Enrolled in Texas Public or Independent Higher Education in FY 2015
GPA for 1st Year in Public Higher Education in Texas
Total 2.0- 2.5- 3.0-County District Graduates <2.0 2.49 2.99 3.49 >3.5 Unk
CALHOUN CALHOUN COUNTY ISD
029901001 CALHOUN H S Four-Year Public University 32 4 4 6 6 12 0 Two-Year Public Colleges 78 29 13 13 11 10 2 Independent Colleges & Universities 6 Not Trackable 7 Not Found 105 Total High School Graduates 228
HOPE H S 029901003 Four-Year Public University 1 Two-Year Public Colleges 2 Independent Colleges & Universities 0 Not Trackable 3 Not Found 53 Total High School Graduates 59
Source: Texas Higher Education Coordinating Board and Texas Education Agency
"Not found" graduates have standard ID numbers that were not found in the specified year at Texas higher education institutions. "Not trackable" graduates have non-standard ID numbers that will not find a match at Texas higher education institutions. Includes high schools with more than 25 graduates. If enrolllment in public higher education less than 5, the GPA data is omitted.
Calhoun County ISD
2015-2016 DISTRICT ACCREDITATION STATUS
& TEXAS ACADEMIC PERFORMANCE REPORT
(TAPR)

2015-16 Texas Academic Performance Report2015-16 Texas Academic Performance Report
District Name: CALHOUN COUNTY ISD
Campus Name: PORT O CONNOR EL
Campus Number: 029901105
2016 Accountability Rating: Met Standard
Distinction Designations:
Academic Achievement in Mathematics
Top 25 Percent: Student Progress
Top 25 Percent: Closing Performance Gaps
Postsecondary Readiness

This page intentionally left blank.
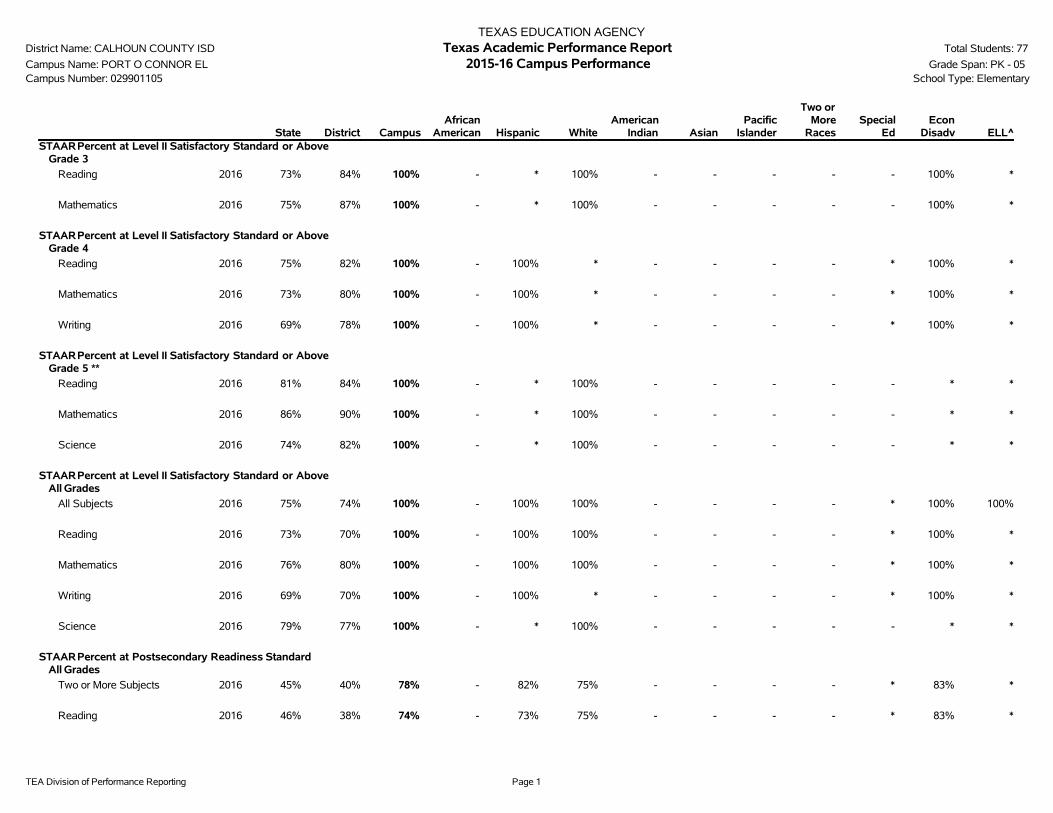
TEA Division of Performance Reporting Page 1
TEXAS EDUCATION AGENCYDistrict Name: CALHOUN COUNTY ISD Texas Academic Performance Report Total Students: 77
Campus Name: PORT O CONNOR EL 2015-16 Campus Performance Grade Span: PK - 05Campus Number: 029901105 School Type: Elementary
State District CampusAfrican
American Hispanic WhiteAmerican
Indian AsianPacific
Islander
Two orMore
RacesSpecial
EdEcon
Disadv ELL^STAARPercent at Level II Satisfactory Standard or Above
Grade 3
Reading 2016 73% 84% 100% - * 100% - - - - - 100% *
Mathematics 2016 75% 87% 100% - * 100% - - - - - 100% *
STAARPercent at Level II Satisfactory Standard or AboveGrade 4
Reading 2016 75% 82% 100% - 100% * - - - - * 100% *
Mathematics 2016 73% 80% 100% - 100% * - - - - * 100% *
Writing 2016 69% 78% 100% - 100% * - - - - * 100% *
STAARPercent at Level II Satisfactory Standard or AboveGrade 5 **
Reading 2016 81% 84% 100% - * 100% - - - - - * *
Mathematics 2016 86% 90% 100% - * 100% - - - - - * *
Science 2016 74% 82% 100% - * 100% - - - - - * *
STAARPercent at Level II Satisfactory Standard or AboveAll Grades
All Subjects 2016 75% 74% 100% - 100% 100% - - - - * 100% 100%
Reading 2016 73% 70% 100% - 100% 100% - - - - * 100% *
Mathematics 2016 76% 80% 100% - 100% 100% - - - - * 100% *
Writing 2016 69% 70% 100% - 100% * - - - - * 100% *
Science 2016 79% 77% 100% - * 100% - - - - - * *
STAARPercent at Postsecondary Readiness StandardAll Grades
Two or More Subjects 2016 45% 40% 78% - 82% 75% - - - - * 83% *
Reading 2016 46% 38% 74% - 73% 75% - - - - * 83% *
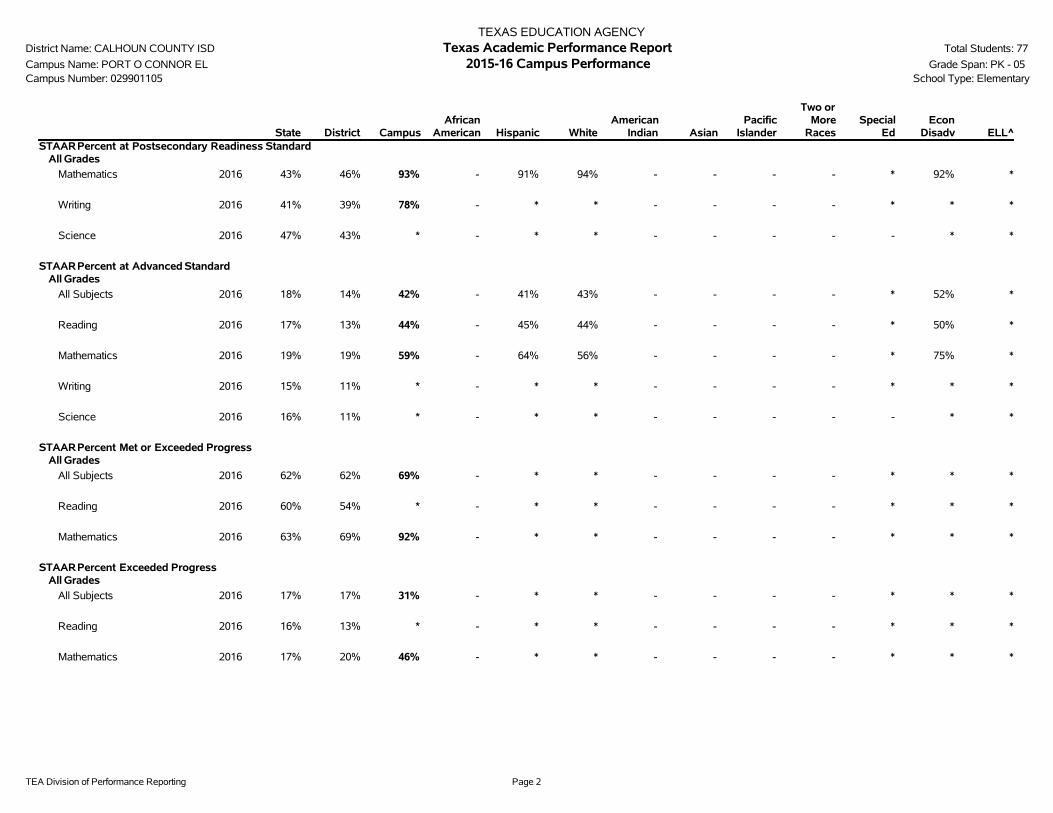
TEA Division of Performance Reporting Page 2
TEXAS EDUCATION AGENCYDistrict Name: CALHOUN COUNTY ISD Texas Academic Performance Report Total Students: 77
Campus Name: PORT O CONNOR EL 2015-16 Campus Performance Grade Span: PK - 05Campus Number: 029901105 School Type: Elementary
State District CampusAfrican
American Hispanic WhiteAmerican
Indian AsianPacific
Islander
Two orMore
RacesSpecial
EdEcon
Disadv ELL^STAARPercent at Postsecondary Readiness Standard
All Grades
Mathematics 2016 43% 46% 93% - 91% 94% - - - - * 92% *
Writing 2016 41% 39% 78% - * * - - - - * * *
Science 2016 47% 43% * - * * - - - - - * *
STAARPercent at Advanced StandardAll Grades
All Subjects 2016 18% 14% 42% - 41% 43% - - - - * 52% *
Reading 2016 17% 13% 44% - 45% 44% - - - - * 50% *
Mathematics 2016 19% 19% 59% - 64% 56% - - - - * 75% *
Writing 2016 15% 11% * - * * - - - - * * *
Science 2016 16% 11% * - * * - - - - - * *
STAARPercent Met or Exceeded ProgressAll Grades
All Subjects 2016 62% 62% 69% - * * - - - - * * *
Reading 2016 60% 54% * - * * - - - - * * *
Mathematics 2016 63% 69% 92% - * * - - - - * * *
STAARPercent Exceeded ProgressAll Grades
All Subjects 2016 17% 17% 31% - * * - - - - * * *
Reading 2016 16% 13% * - * * - - - - * * *
Mathematics 2016 17% 20% 46% - * * - - - - * * *

TEA Division of Performance Reporting Page 3
TEXAS EDUCATION AGENCYDistrict Name: CALHOUN COUNTY ISD Texas Academic Performance Report Total Students: 77
Campus Name: PORT O CONNOR EL 2015-16 Campus Performance Grade Span: PK - 05Campus Number: 029901105 School Type: Elementary
State District CampusAfrican
American Hispanic WhiteAmerican
Indian AsianPacific
Islander
Two orMore
RacesSpecial
EdEcon
Disadv ELLStudent Success Initiative
Grade 5 Reading
Students Meeting Level II Standard on First STAARAdministration
2016 73% 72% 100% - * 100% - - - - - * *
Students Requiring Accelerated Instruction
2016 27% 28% * - * * - - - - - * *
STAARCumulative Met Standard
2016 80% 83% 100% - * 100% - - - - - * *
Grade 5 Mathematics
Students Meeting Level II Standard on First STAARAdministration
2016 77% 83% 100% - * 100% - - - - - * *
Students Requiring Accelerated Instruction
2016 23% 17% * - * * - - - - - * *
STAARCumulative Met Standard
2016 85% 90% 100% - * 100% - - - - - * *

TEA Division of Performance Reporting Page 4
TEXAS EDUCATION AGENCYDistrict Name: CALHOUN COUNTY ISD Texas Academic Performance Report Total Students: 77
Campus Name: PORT O CONNOR EL 2015-16 Campus Performance Grade Span: PK - 05Campus Number: 029901105 Bilingual Education/English as a Second Language (Current Year ELL Students)
State District CampusBilingual
EducationBE-TransEarly Exit
BE-TransLate Exit
BE-DualTwo-Way
BE-DualOne-Way ESL
ESLContent
ESLPull-Out
LEP NoServices
LEP WithServices
TotalELL
STAARPercent at Level II Satisfactory Standard or AboveAll Grades
All Subjects 2016 75% 74% 100% - - - - - 100% * 100% - 100% 100%
Reading 2016 73% 70% 100% - - - - - * * * - * *
Mathematics 2016 76% 80% 100% - - - - - * * * - * *
Writing 2016 69% 70% 100% - - - - - * - * - * *
Science 2016 79% 77% 100% - - - - - * - * - * *
STAARPercent at Postsecondary Readiness StandardAll Grades
Two or More Subjects 2016 45% 40% 78% - - - - - * * * - * *
Reading 2016 46% 38% 74% - - - - - * * * - * *
Mathematics 2016 43% 46% 93% - - - - - * * * - * *
Writing 2016 41% 39% 78% - - - - - * - * - * *
Science 2016 47% 43% * - - - - - * - * - * *
STAARPercent at Advanced StandardAll Grades
All Subjects 2016 18% 14% 42% - - - - - * * * - * *
Reading 2016 17% 13% 44% - - - - - * * * - * *
Mathematics 2016 19% 19% 59% - - - - - * * * - * *
Writing 2016 15% 11% * - - - - - * - * - * *
Science 2016 16% 11% * - - - - - * - * - * *
STAARPercent Met or Exceeded ProgressAll Grades
All Subjects 2016 62% 62% 69% - - - - - * - * - * *
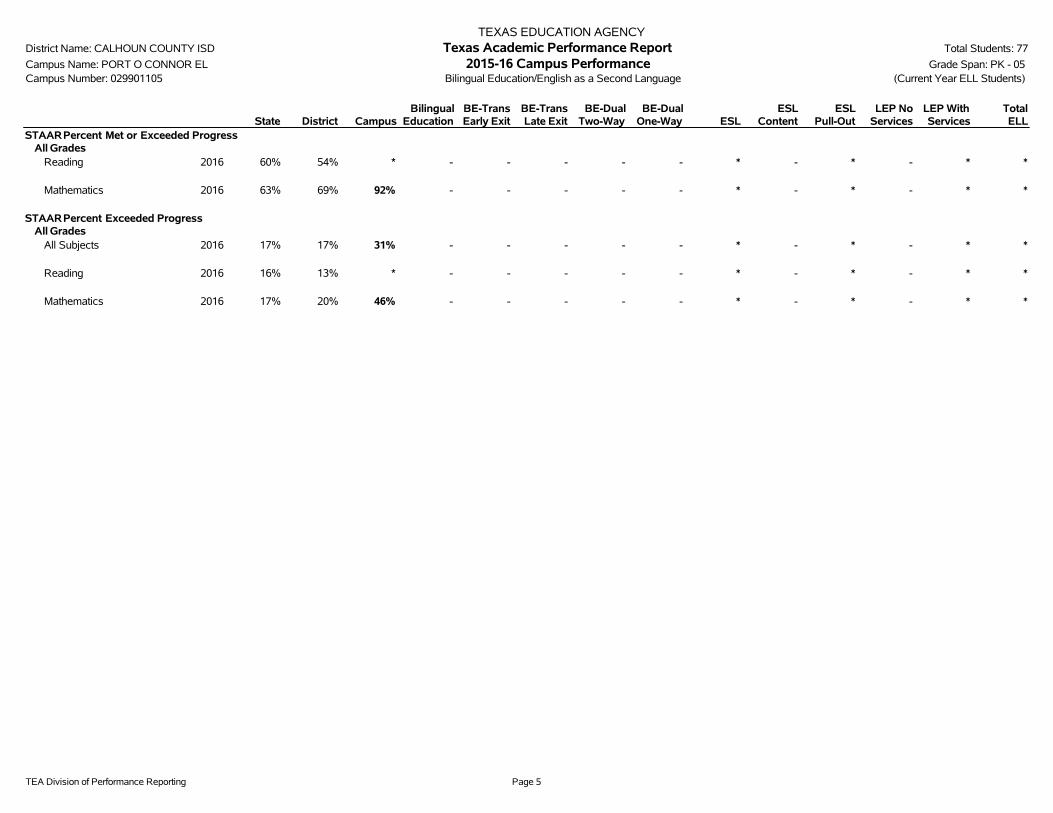
TEA Division of Performance Reporting Page 5
TEXAS EDUCATION AGENCYDistrict Name: CALHOUN COUNTY ISD Texas Academic Performance Report Total Students: 77
Campus Name: PORT O CONNOR EL 2015-16 Campus Performance Grade Span: PK - 05Campus Number: 029901105 Bilingual Education/English as a Second Language (Current Year ELL Students)
State District CampusBilingual
EducationBE-TransEarly Exit
BE-TransLate Exit
BE-DualTwo-Way
BE-DualOne-Way ESL
ESLContent
ESLPull-Out
LEP NoServices
LEP WithServices
TotalELL
STAARPercent Met or Exceeded ProgressAll Grades
Reading 2016 60% 54% * - - - - - * - * - * *
Mathematics 2016 63% 69% 92% - - - - - * - * - * *
STAARPercent Exceeded ProgressAll Grades
All Subjects 2016 17% 17% 31% - - - - - * - * - * *
Reading 2016 16% 13% * - - - - - * - * - * *
Mathematics 2016 17% 20% 46% - - - - - * - * - * *
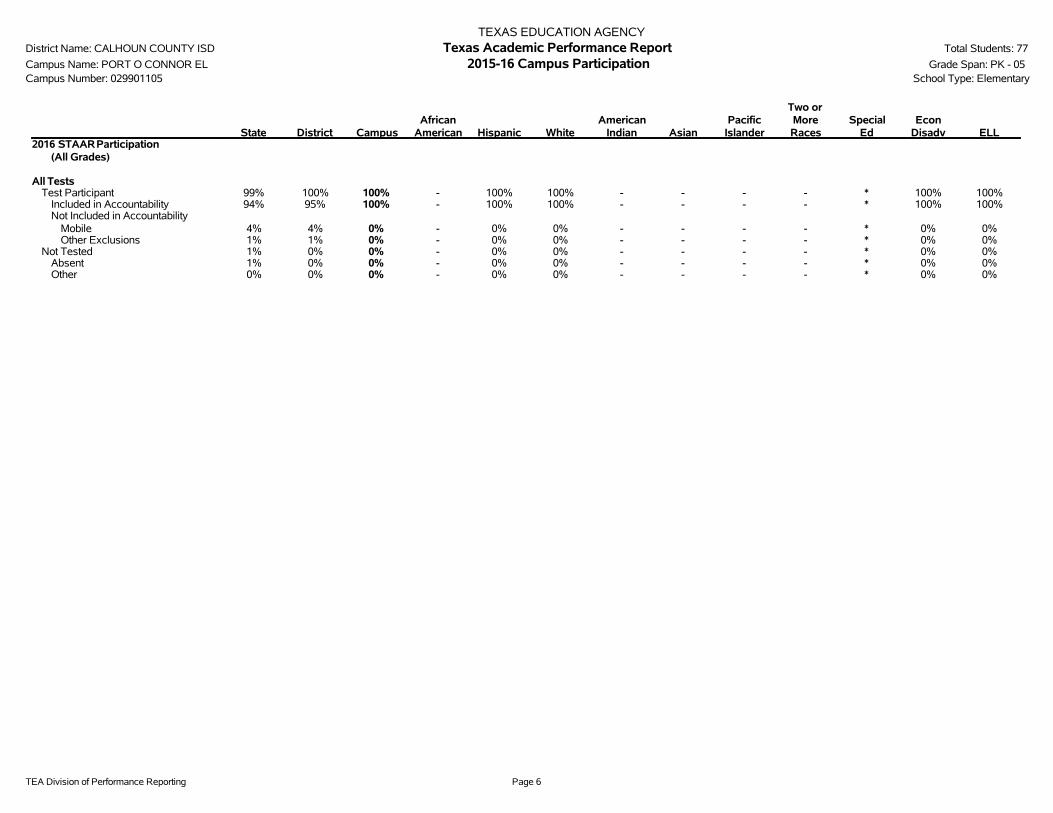
TEA Division of Performance Reporting Page 6
TEXAS EDUCATION AGENCYDistrict Name: CALHOUN COUNTY ISD Texas Academic Performance Report Total Students: 77
Campus Name: PORT O CONNOR EL 2015-16 Campus Participation Grade Span: PK - 05Campus Number: 029901105 School Type: Elementary
State District CampusAfrican
American Hispanic WhiteAmerican
Indian AsianPacific
Islander
Two orMoreRaces
SpecialEd
EconDisadv ELL
2016 STAARParticipation(All Grades)
All TestsTest Participant 99% 100% 100% - 100% 100% - - - - * 100% 100%
Included in Accountability 94% 95% 100% - 100% 100% - - - - * 100% 100%Not Included in Accountability
Mobile 4% 4% 0% - 0% 0% - - - - * 0% 0%Other Exclusions 1% 1% 0% - 0% 0% - - - - * 0% 0%
Not Tested 1% 0% 0% - 0% 0% - - - - * 0% 0%Absent 1% 0% 0% - 0% 0% - - - - * 0% 0%Other 0% 0% 0% - 0% 0% - - - - * 0% 0%

TEA Division of Performance Reporting Page 7
TEXAS EDUCATION AGENCYDistrict Name: CALHOUN COUNTY ISD Texas Academic Performance Report Total Students: 77
Campus Name: PORT O CONNOR EL 2015-16 Campus Attendance and Postsecondary Readiness Grade Span: PK - 05Campus Number: 029901105 School Type: Elementary
State District CampusAfrican
American Hispanic WhiteAmerican
Indian AsianPacific
IslanderTwo or
More RacesSpecial
EdEcon
Disadv ELL
Attendance Rate2014-15 95.7% 95.0% 96.4% - 96.3% 96.4% * - - - * 96.4% 98.6%2013-14 95.9% 95.2% 97.2% - 97.3% 97.1% - - - - * 97.3% 98.2%
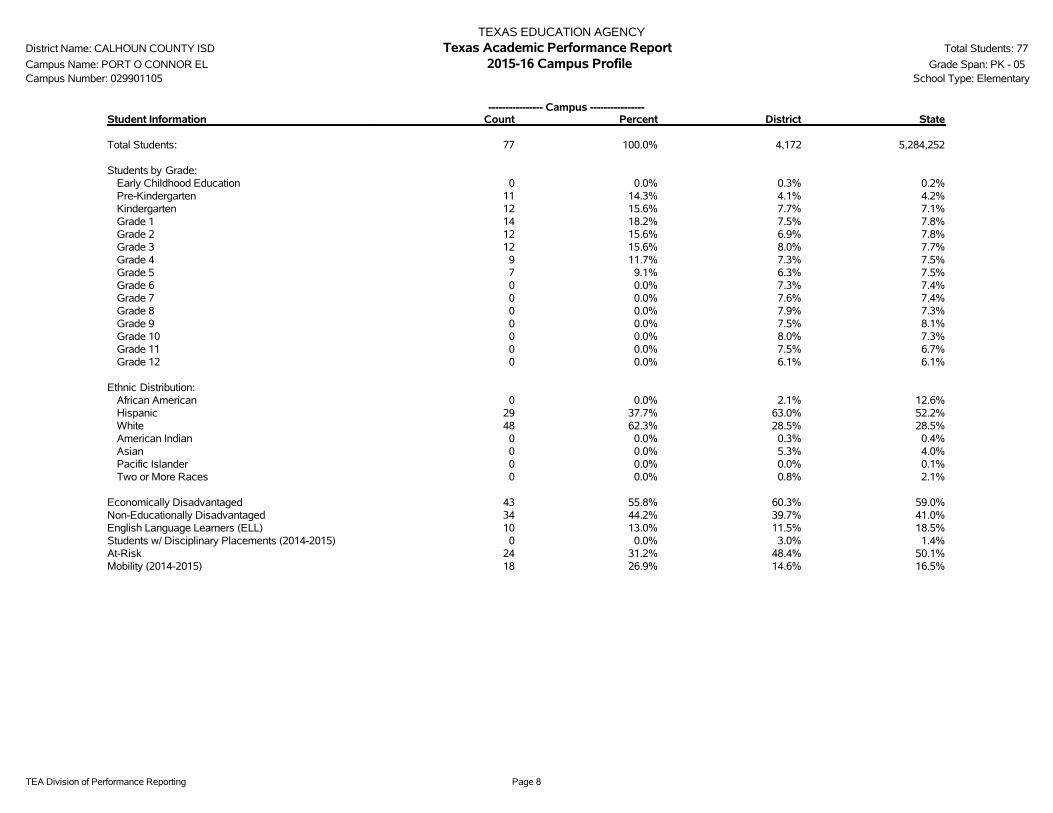
TEA Division of Performance Reporting Page 8
TEXAS EDUCATION AGENCYDistrict Name: CALHOUN COUNTY ISD Texas Academic Performance Report Total Students: 77
Campus Name: PORT O CONNOR EL 2015-16 Campus Profile Grade Span: PK - 05Campus Number: 029901105 School Type: Elementary
---------------- Campus ----------------Student Information Count Percent District State
Total Students: 77 100.0% 4,172 5,284,252
Students by Grade:Early Childhood Education 0 0.0% 0.3% 0.2%Pre-Kindergarten 11 14.3% 4.1% 4.2%Kindergarten 12 15.6% 7.7% 7.1%Grade 1 14 18.2% 7.5% 7.8%Grade 2 12 15.6% 6.9% 7.8%Grade 3 12 15.6% 8.0% 7.7%Grade 4 9 11.7% 7.3% 7.5%Grade 5 7 9.1% 6.3% 7.5%Grade 6 0 0.0% 7.3% 7.4%Grade 7 0 0.0% 7.6% 7.4%Grade 8 0 0.0% 7.9% 7.3%Grade 9 0 0.0% 7.5% 8.1%Grade 10 0 0.0% 8.0% 7.3%Grade 11 0 0.0% 7.5% 6.7%Grade 12 0 0.0% 6.1% 6.1%
Ethnic Distribution:African American 0 0.0% 2.1% 12.6%Hispanic 29 37.7% 63.0% 52.2%White 48 62.3% 28.5% 28.5%American Indian 0 0.0% 0.3% 0.4%Asian 0 0.0% 5.3% 4.0%Pacific Islander 0 0.0% 0.0% 0.1%Two or More Races 0 0.0% 0.8% 2.1%
Economically Disadvantaged 43 55.8% 60.3% 59.0%Non-Educationally Disadvantaged 34 44.2% 39.7% 41.0%English Language Learners (ELL) 10 13.0% 11.5% 18.5%Students w/ Disciplinary Placements (2014-2015) 0 0.0% 3.0% 1.4%At-Risk 24 31.2% 48.4% 50.1%Mobility (2014-2015) 18 26.9% 14.6% 16.5%

TEA Division of Performance Reporting Page 9
TEXAS EDUCATION AGENCYDistrict Name: CALHOUN COUNTY ISD Texas Academic Performance Report Total Students: 77
Campus Name: PORT O CONNOR EL 2015-16 Campus Profile Grade Span: PK - 05Campus Number: 029901105 School Type: Elementary
--------- Non-Special Education Rates --------- ------------- Special Education Rates -------------Student Information Campus District State Campus District State
Retention Rates by Grade:
Kindergarten 0.0% 10.5% 1.9% - 6.3% 8.2%Grade 1 0.0% 14.6% 4.1% 0.0% 15.4% 7.4%Grade 2 0.0% 6.5% 2.7% - 0.0% 3.4%Grade 3 0.0% 2.9% 2.0% 0.0% 3.7% 1.6%Grade 4 0.0% 2.1% 1.0% 0.0% 0.0% 0.8%Grade 5 0.0% 0.4% 0.9% - 0.0% 1.0%Grade 6 - 0.0% 0.6% - 3.3% 0.8%Grade 7 - 0.7% 0.8% - 0.0% 0.9%Grade 8 - 0.0% 0.8% - 0.0% 1.3%
Class Size Information Campus District State
Class Size Averages by Grade and Subject (Derived from teacher responsibility records):
Elementary:Kindergarten 12.0 18.7 18.9Grade 1 14.0 17.9 19.1Grade 2 12.0 17.6 19.1Grade 3 12.0 17.1 19.1Grade 4 9.0 17.5 19.0Grade 5 7.0 16.4 20.8Grade 6 - 19.6 20.4
Secondary:English/Language Arts - 16.3 17.1Foreign Languages - 17.4 19.1Mathematics - 15.7 18.1Science - 16.6 19.1Social Studies - 18.0 19.5

TEA Division of Performance Reporting Page 10
TEXAS EDUCATION AGENCYDistrict Name: CALHOUN COUNTY ISD Texas Academic Performance Report Total Students: 77
Campus Name: PORT O CONNOR EL 2015-16 Campus Profile Grade Span: PK - 05Campus Number: 029901105 School Type: Elementary
---------------- Campus ----------------Staff Information Count/Average Percent District State
Total Staff 9.3 100.0% 100.0% 100.0%
Professional Staff: 8.3 89.3% 58.4% 64.3%Teachers 7.0 75.0% 47.5% 50.5%Professional Support 1.3 14.3% 7.5% 9.8%Campus Administration (School Leadership) 0.0 0.0% 2.5% 2.9%
Educational Aides: 1.0 10.7% 10.5% 9.6%
Total Minority Staff: 1.0 10.7% 38.1% 48.2%
Teachers by Ethnicity and Sex:African American 0.0 0.0% 1.2% 10.1%Hispanic 1.0 14.3% 20.8% 26.0%White 6.0 85.7% 77.2% 60.8%American Indian 0.0 0.0% 0.0% 0.4%Asian 0.0 0.0% 0.7% 1.5%Pacific Islander 0.0 0.0% 0.0% 0.2%Two or More Races 0.0 0.0% 0.0% 1.1%
Males 0.0 0.0% 23.7% 23.5%Females 7.0 100.0% 76.3% 76.5%
Teachers by Highest Degree Held:No Degree 0.0 0.0% 1.1% 1.0%Bachelors 7.0 100.0% 86.2% 74.7%Masters 0.0 0.0% 12.7% 23.6%Doctorate 0.0 0.0% 0.0% 0.6%
Teachers by Years of Experience:Beginning Teachers 1.0 14.3% 9.0% 8.1%1-5 Years Experience 1.0 14.3% 24.6% 27.3%6-10 Years Experience 1.0 14.3% 14.7% 21.7%11-20 Years Experience 2.0 28.6% 32.1% 27.3%Over 20 Years Experience 2.0 28.6% 19.6% 15.7%
Number of Students per Teacher 11.0 n/a 15.4 15.2
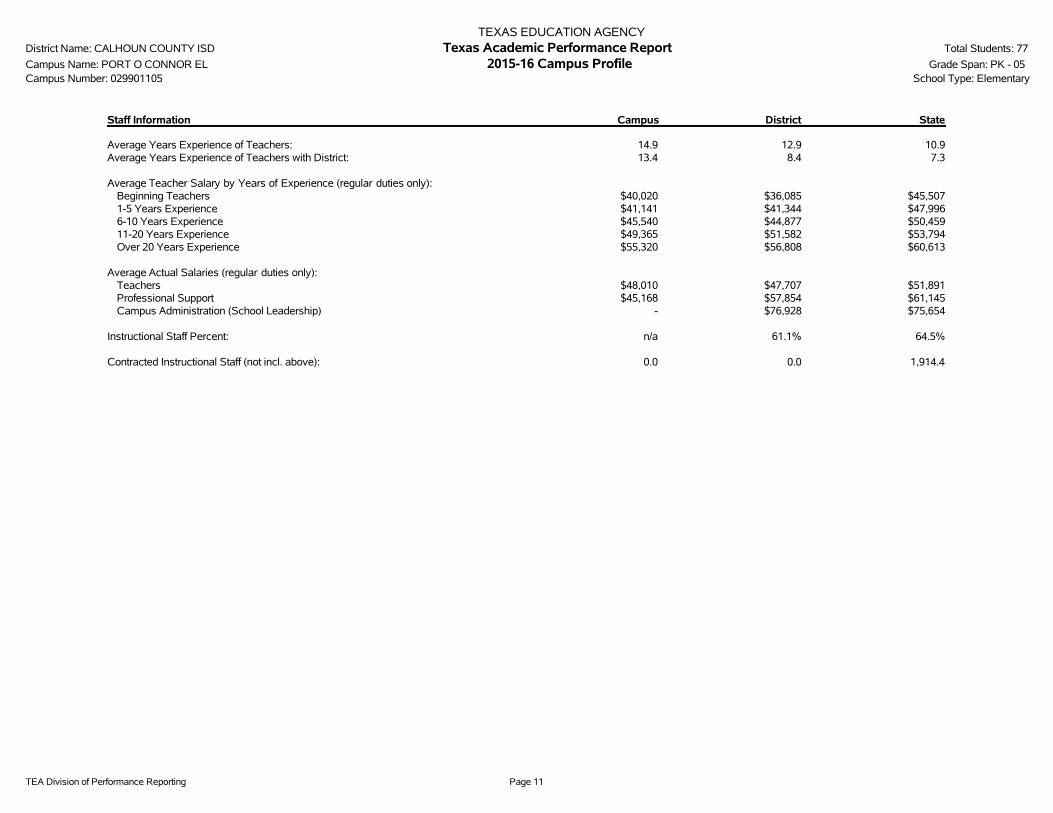
TEA Division of Performance Reporting Page 11
TEXAS EDUCATION AGENCYDistrict Name: CALHOUN COUNTY ISD Texas Academic Performance Report Total Students: 77
Campus Name: PORT O CONNOR EL 2015-16 Campus Profile Grade Span: PK - 05Campus Number: 029901105 School Type: Elementary
Staff Information Campus District State
Average Years Experience of Teachers: 14.9 12.9 10.9Average Years Experience of Teachers with District: 13.4 8.4 7.3
Average Teacher Salary by Years of Experience (regular duties only):Beginning Teachers $40,020 $36,085 $45,5071-5 Years Experience $41,141 $41,344 $47,9966-10 Years Experience $45,540 $44,877 $50,45911-20 Years Experience $49,365 $51,582 $53,794Over 20 Years Experience $55,320 $56,808 $60,613
Average Actual Salaries (regular duties only):Teachers $48,010 $47,707 $51,891Professional Support $45,168 $57,854 $61,145Campus Administration (School Leadership) - $76,928 $75,654
Instructional Staff Percent: n/a 61.1% 64.5%
Contracted Instructional Staff (not incl. above): 0.0 0.0 1,914.4

TEA Division of Performance Reporting Page 12
TEXAS EDUCATION AGENCYDistrict Name: CALHOUN COUNTY ISD Texas Academic Performance Report Total Students: 77
Campus Name: PORT O CONNOR EL 2015-16 Campus Profile Grade Span: PK - 05Campus Number: 029901105 School Type: Elementary
---------------- Campus ----------------Program Information Count Percent District State
Student Enrollment by Program:Bilingual/ESL Education 10 13.0% 11.4% 18.3%Career & Technical Education 0 0.0% 30.2% 24.3%Gifted & Talented Education 7 9.1% 7.2% 7.7%Special Education 4 5.2% 8.3% 8.6%
Teachers by Program (population served):Bilingual/ESL Education 0.0 0.0% 0.7% 5.9%Career & Technical Education 0.0 0.0% 5.3% 4.4%Compensatory Education 0.0 0.6% 1.3% 2.9%Gifted & Talented Education 0.0 0.0% 1.4% 1.9%Regular Education 7.0 99.4% 82.4% 72.6%Special Education 0.0 0.0% 6.2% 8.8%Other 0.0 0.0% 2.8% 3.4%
Link to: PEIMS Financial Standard Reports/ 2014-2015 Financial Actual Report
' '̂ Indicates that ELL rates at met or exceeded standard and exceeded standard include current and monitored students.'*' Indicates results are masked due to small numbers to protect student confidentiality.'-' Indicates zero observations reported for this group.'n/a' Indicates data reporting is not applicable for this group.'**' Indicates that rates for Reading and Mathematics are based on the cumulative results from the first and second administrations of STAAR.'?' Indicates that the data for this item were statistically improbable, or were reported outside a reasonable range.'##' Indicates that PID Error rate information cannot be reported in 2015-16 due to the transition from PEIMS Edit+ to TSDS.
2015-16 Texas Academic Performance Report2015-16 Texas Academic Performance Report
District Name: CALHOUN COUNTY ISD
Campus Name: HARRISON/JEFFERSON/MADISON COMPLEX
Campus Number: 029901101
2016 Accountability Rating: Met Standard
Distinction Designations:
Academic Achievement in Mathematics
Academic Achievement in Science
Top 25 Percent: Closing Performance Gaps
Postsecondary Readiness

This page intentionally left blank.
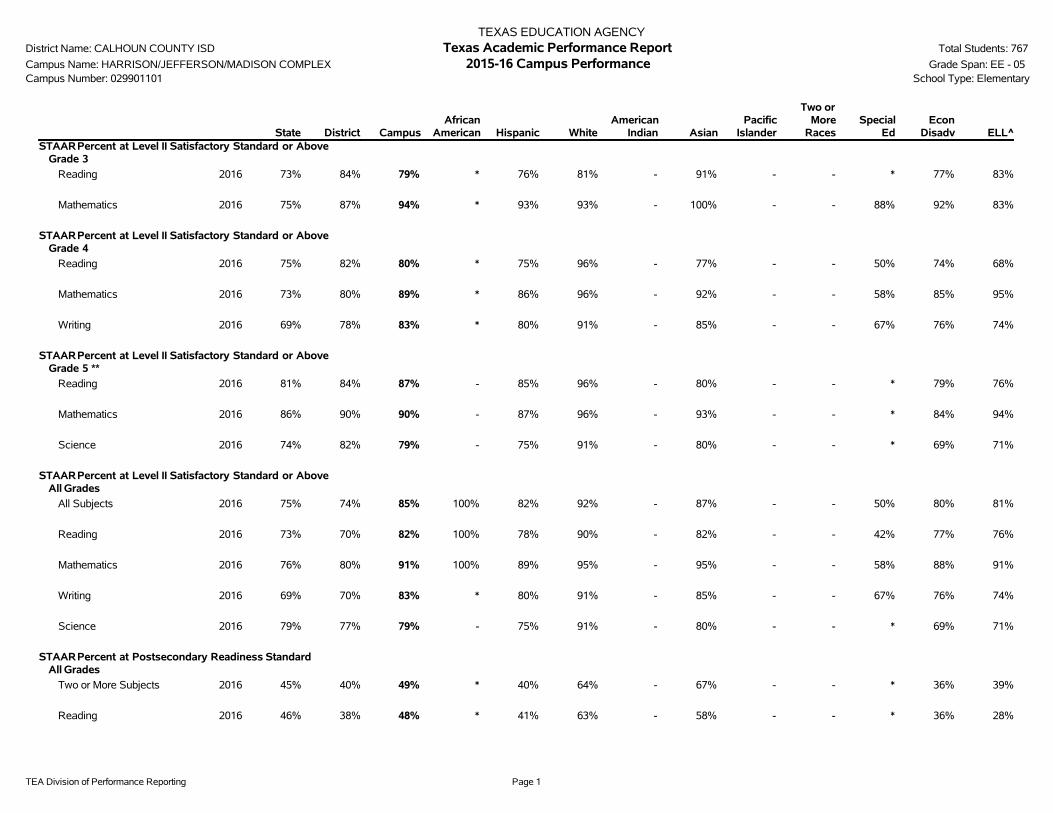
TEA Division of Performance Reporting Page 1
TEXAS EDUCATION AGENCYDistrict Name: CALHOUN COUNTY ISD Texas Academic Performance Report Total Students: 767
Campus Name: HARRISON/JEFFERSON/MADISON COMPLEX 2015-16 Campus Performance Grade Span: EE - 05Campus Number: 029901101 School Type: Elementary
State District CampusAfrican
American Hispanic WhiteAmerican
Indian AsianPacific
Islander
Two orMore
RacesSpecial
EdEcon
Disadv ELL^STAARPercent at Level II Satisfactory Standard or Above
Grade 3
Reading 2016 73% 84% 79% * 76% 81% - 91% - - * 77% 83%
Mathematics 2016 75% 87% 94% * 93% 93% - 100% - - 88% 92% 83%
STAARPercent at Level II Satisfactory Standard or AboveGrade 4
Reading 2016 75% 82% 80% * 75% 96% - 77% - - 50% 74% 68%
Mathematics 2016 73% 80% 89% * 86% 96% - 92% - - 58% 85% 95%
Writing 2016 69% 78% 83% * 80% 91% - 85% - - 67% 76% 74%
STAARPercent at Level II Satisfactory Standard or AboveGrade 5 **
Reading 2016 81% 84% 87% - 85% 96% - 80% - - * 79% 76%
Mathematics 2016 86% 90% 90% - 87% 96% - 93% - - * 84% 94%
Science 2016 74% 82% 79% - 75% 91% - 80% - - * 69% 71%
STAARPercent at Level II Satisfactory Standard or AboveAll Grades
All Subjects 2016 75% 74% 85% 100% 82% 92% - 87% - - 50% 80% 81%
Reading 2016 73% 70% 82% 100% 78% 90% - 82% - - 42% 77% 76%
Mathematics 2016 76% 80% 91% 100% 89% 95% - 95% - - 58% 88% 91%
Writing 2016 69% 70% 83% * 80% 91% - 85% - - 67% 76% 74%
Science 2016 79% 77% 79% - 75% 91% - 80% - - * 69% 71%
STAARPercent at Postsecondary Readiness StandardAll Grades
Two or More Subjects 2016 45% 40% 49% * 40% 64% - 67% - - * 36% 39%
Reading 2016 46% 38% 48% * 41% 63% - 58% - - * 36% 28%
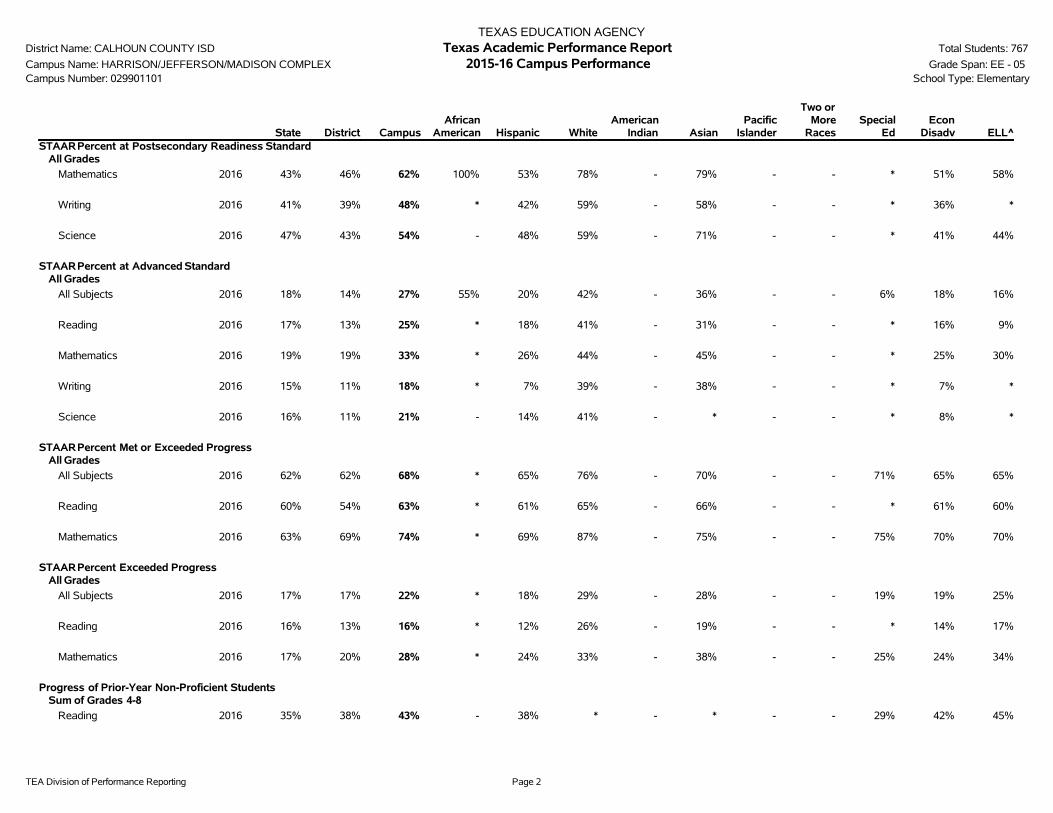
TEA Division of Performance Reporting Page 2
TEXAS EDUCATION AGENCYDistrict Name: CALHOUN COUNTY ISD Texas Academic Performance Report Total Students: 767
Campus Name: HARRISON/JEFFERSON/MADISON COMPLEX 2015-16 Campus Performance Grade Span: EE - 05Campus Number: 029901101 School Type: Elementary
State District CampusAfrican
American Hispanic WhiteAmerican
Indian AsianPacific
Islander
Two orMore
RacesSpecial
EdEcon
Disadv ELL^STAARPercent at Postsecondary Readiness Standard
All Grades
Mathematics 2016 43% 46% 62% 100% 53% 78% - 79% - - * 51% 58%
Writing 2016 41% 39% 48% * 42% 59% - 58% - - * 36% *
Science 2016 47% 43% 54% - 48% 59% - 71% - - * 41% 44%
STAARPercent at Advanced StandardAll Grades
All Subjects 2016 18% 14% 27% 55% 20% 42% - 36% - - 6% 18% 16%
Reading 2016 17% 13% 25% * 18% 41% - 31% - - * 16% 9%
Mathematics 2016 19% 19% 33% * 26% 44% - 45% - - * 25% 30%
Writing 2016 15% 11% 18% * 7% 39% - 38% - - * 7% *
Science 2016 16% 11% 21% - 14% 41% - * - - * 8% *
STAARPercent Met or Exceeded ProgressAll Grades
All Subjects 2016 62% 62% 68% * 65% 76% - 70% - - 71% 65% 65%
Reading 2016 60% 54% 63% * 61% 65% - 66% - - * 61% 60%
Mathematics 2016 63% 69% 74% * 69% 87% - 75% - - 75% 70% 70%
STAARPercent Exceeded ProgressAll Grades
All Subjects 2016 17% 17% 22% * 18% 29% - 28% - - 19% 19% 25%
Reading 2016 16% 13% 16% * 12% 26% - 19% - - * 14% 17%
Mathematics 2016 17% 20% 28% * 24% 33% - 38% - - 25% 24% 34%
Progress of Prior-Year Non-Proficient StudentsSum of Grades 4-8
Reading 2016 35% 38% 43% - 38% * - * - - 29% 42% 45%

TEA Division of Performance Reporting Page 3
TEXAS EDUCATION AGENCYDistrict Name: CALHOUN COUNTY ISD Texas Academic Performance Report Total Students: 767
Campus Name: HARRISON/JEFFERSON/MADISON COMPLEX 2015-16 Campus Performance Grade Span: EE - 05Campus Number: 029901101 School Type: Elementary
State District CampusAfrican
American Hispanic WhiteAmerican
Indian AsianPacific
Islander
Two orMore
RacesSpecial
EdEcon
Disadv ELLStudent Success Initiative
Grade 5 Reading
Students Meeting Level II Standard on First STAARAdministration
2016 73% 72% 79% - 80% 83% - 73% - - * 69% 59%
Students Requiring Accelerated Instruction
2016 27% 28% 21% - 20% * - * - - 90% 31% 41%
STAARCumulative Met Standard
2016 80% 83% 87% - 85% 96% - 80% - - * 79% 76%
STAARNon-Proficient Students Promoted by Grade Placement Committee
2015 95% * * - * - - - - - - * -
Grade 5 Mathematics
Students Meeting Level II Standard on First STAARAdministration
2016 77% 83% 90% - 86% 96% - 93% - - * 84% 94%
Students Requiring Accelerated Instruction
2016 23% 17% 10% - 14% * - * - - 70% 16% *
STAARCumulative Met Standard
2016 85% 90% 90% - 86% 96% - 93% - - * 84% 94%
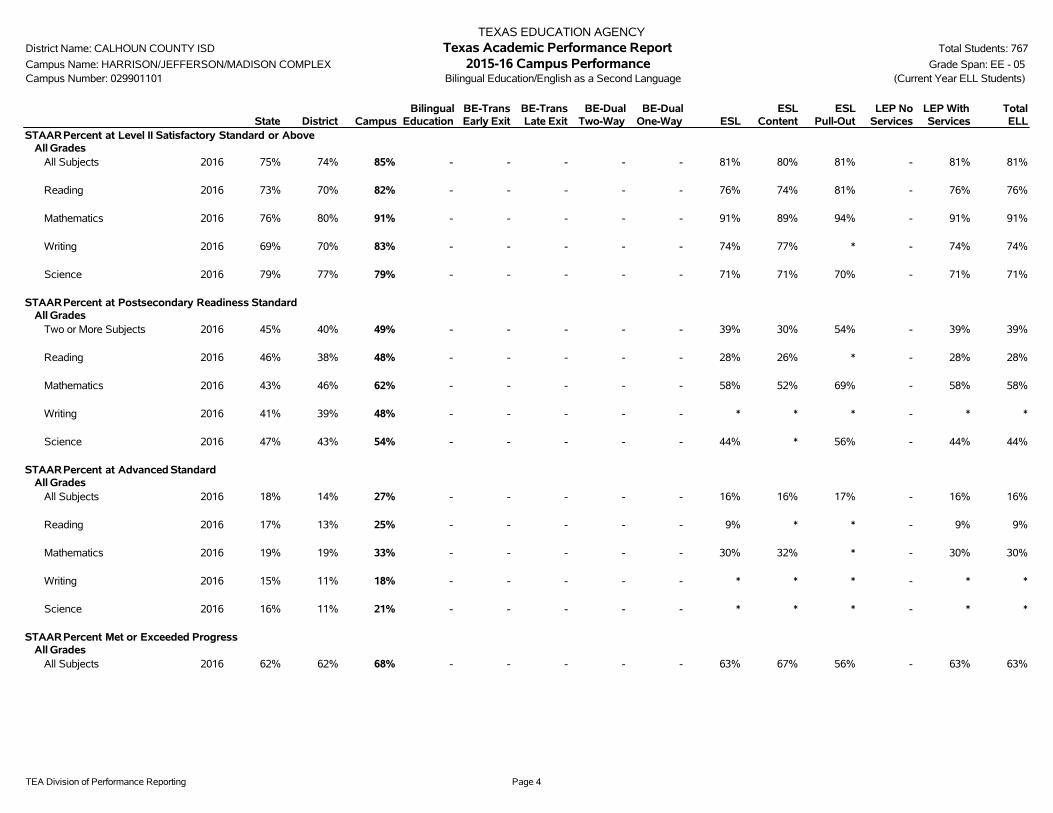
TEA Division of Performance Reporting Page 4
TEXAS EDUCATION AGENCYDistrict Name: CALHOUN COUNTY ISD Texas Academic Performance Report Total Students: 767
Campus Name: HARRISON/JEFFERSON/MADISON COMPLEX 2015-16 Campus Performance Grade Span: EE - 05Campus Number: 029901101 Bilingual Education/English as a Second Language (Current Year ELL Students)
State District CampusBilingual
EducationBE-TransEarly Exit
BE-TransLate Exit
BE-DualTwo-Way
BE-DualOne-Way ESL
ESLContent
ESLPull-Out
LEP NoServices
LEP WithServices
TotalELL
STAARPercent at Level II Satisfactory Standard or AboveAll Grades
All Subjects 2016 75% 74% 85% - - - - - 81% 80% 81% - 81% 81%
Reading 2016 73% 70% 82% - - - - - 76% 74% 81% - 76% 76%
Mathematics 2016 76% 80% 91% - - - - - 91% 89% 94% - 91% 91%
Writing 2016 69% 70% 83% - - - - - 74% 77% * - 74% 74%
Science 2016 79% 77% 79% - - - - - 71% 71% 70% - 71% 71%
STAARPercent at Postsecondary Readiness StandardAll Grades
Two or More Subjects 2016 45% 40% 49% - - - - - 39% 30% 54% - 39% 39%
Reading 2016 46% 38% 48% - - - - - 28% 26% * - 28% 28%
Mathematics 2016 43% 46% 62% - - - - - 58% 52% 69% - 58% 58%
Writing 2016 41% 39% 48% - - - - - * * * - * *
Science 2016 47% 43% 54% - - - - - 44% * 56% - 44% 44%
STAARPercent at Advanced StandardAll Grades
All Subjects 2016 18% 14% 27% - - - - - 16% 16% 17% - 16% 16%
Reading 2016 17% 13% 25% - - - - - 9% * * - 9% 9%
Mathematics 2016 19% 19% 33% - - - - - 30% 32% * - 30% 30%
Writing 2016 15% 11% 18% - - - - - * * * - * *
Science 2016 16% 11% 21% - - - - - * * * - * *
STAARPercent Met or Exceeded ProgressAll Grades
All Subjects 2016 62% 62% 68% - - - - - 63% 67% 56% - 63% 63%
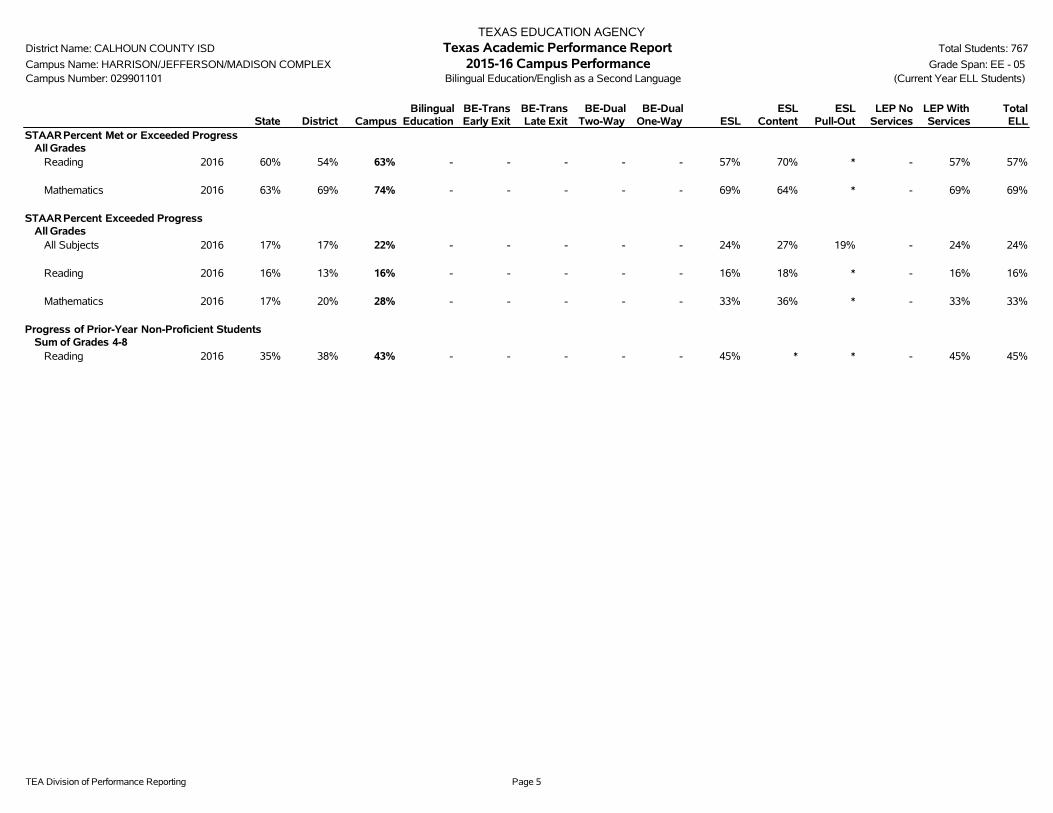
TEA Division of Performance Reporting Page 5
TEXAS EDUCATION AGENCYDistrict Name: CALHOUN COUNTY ISD Texas Academic Performance Report Total Students: 767
Campus Name: HARRISON/JEFFERSON/MADISON COMPLEX 2015-16 Campus Performance Grade Span: EE - 05Campus Number: 029901101 Bilingual Education/English as a Second Language (Current Year ELL Students)
State District CampusBilingual
EducationBE-TransEarly Exit
BE-TransLate Exit
BE-DualTwo-Way
BE-DualOne-Way ESL
ESLContent
ESLPull-Out
LEP NoServices
LEP WithServices
TotalELL
STAARPercent Met or Exceeded ProgressAll Grades
Reading 2016 60% 54% 63% - - - - - 57% 70% * - 57% 57%
Mathematics 2016 63% 69% 74% - - - - - 69% 64% * - 69% 69%
STAARPercent Exceeded ProgressAll Grades
All Subjects 2016 17% 17% 22% - - - - - 24% 27% 19% - 24% 24%
Reading 2016 16% 13% 16% - - - - - 16% 18% * - 16% 16%
Mathematics 2016 17% 20% 28% - - - - - 33% 36% * - 33% 33%
Progress of Prior-Year Non-Proficient StudentsSum of Grades 4-8
Reading 2016 35% 38% 43% - - - - - 45% * * - 45% 45%

TEA Division of Performance Reporting Page 6
TEXAS EDUCATION AGENCYDistrict Name: CALHOUN COUNTY ISD Texas Academic Performance Report Total Students: 767
Campus Name: HARRISON/JEFFERSON/MADISON COMPLEX 2015-16 Campus Participation Grade Span: EE - 05Campus Number: 029901101 School Type: Elementary
State District CampusAfrican
American Hispanic WhiteAmerican
Indian AsianPacific
Islander
Two orMoreRaces
SpecialEd
EconDisadv ELL
2016 STAARParticipation(All Grades)
All TestsTest Participant 99% 100% 100% 100% 100% 100% - 100% - - 100% 100% 100%
Included in Accountability 94% 95% 96% 79% 96% 96% - 98% - - 92% 95% 99%Not Included in Accountability
Mobile 4% 4% 4% 21% 4% 5% - 2% - - 3% 5% 1%Other Exclusions 1% 1% 0% 0% 1% 0% - 0% - - 4% 0% 0%
Not Tested 1% 0% 0% 0% 0% 0% - 0% - - 0% 0% 0%Absent 1% 0% 0% 0% 0% 0% - 0% - - 0% 0% 0%Other 0% 0% 0% 0% 0% 0% - 0% - - 0% 0% 0%
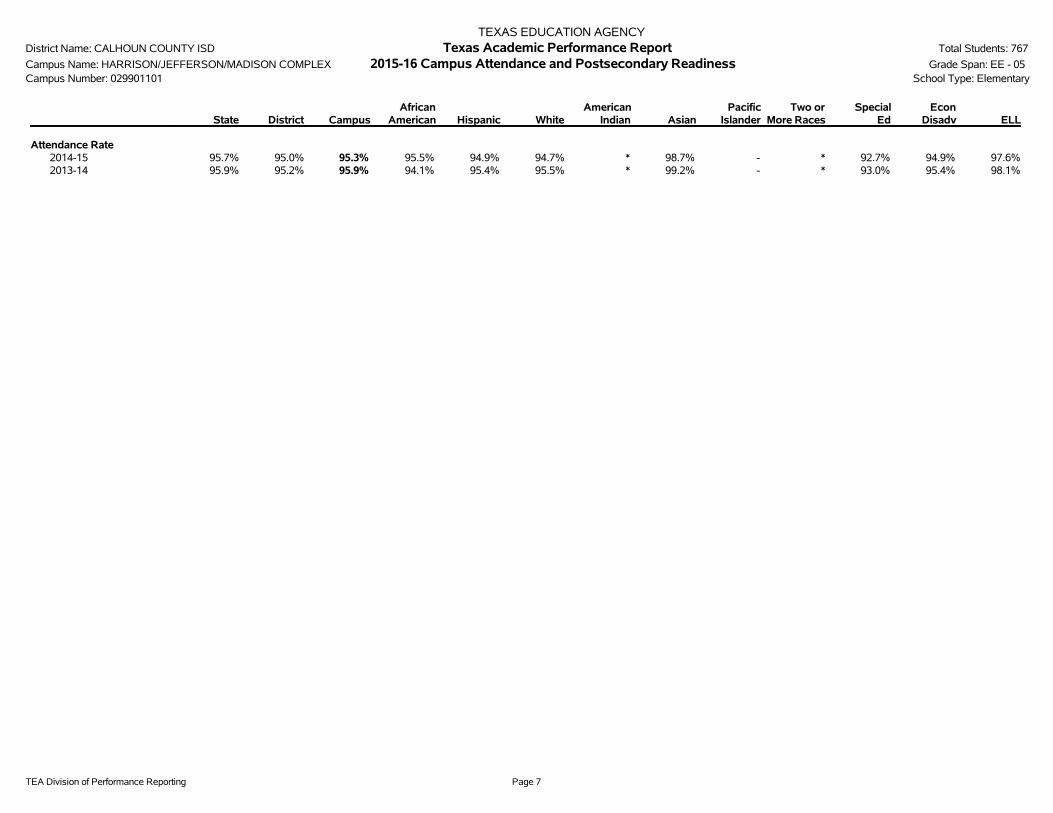
TEA Division of Performance Reporting Page 7
TEXAS EDUCATION AGENCYDistrict Name: CALHOUN COUNTY ISD Texas Academic Performance Report Total Students: 767
Campus Name: HARRISON/JEFFERSON/MADISON COMPLEX 2015-16 Campus Attendance and Postsecondary Readiness Grade Span: EE - 05Campus Number: 029901101 School Type: Elementary
State District CampusAfrican
American Hispanic WhiteAmerican
Indian AsianPacific
IslanderTwo or
More RacesSpecial
EdEcon
Disadv ELL
Attendance Rate2014-15 95.7% 95.0% 95.3% 95.5% 94.9% 94.7% * 98.7% - * 92.7% 94.9% 97.6%2013-14 95.9% 95.2% 95.9% 94.1% 95.4% 95.5% * 99.2% - * 93.0% 95.4% 98.1%
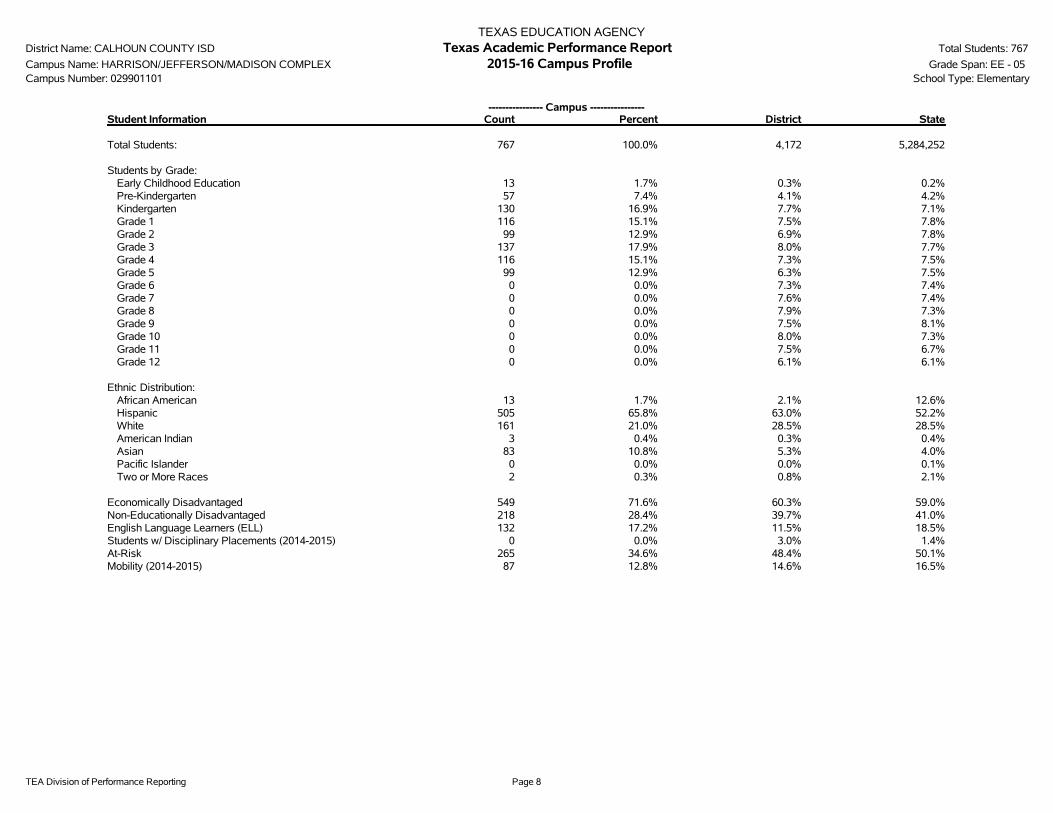
TEA Division of Performance Reporting Page 8
TEXAS EDUCATION AGENCYDistrict Name: CALHOUN COUNTY ISD Texas Academic Performance Report Total Students: 767
Campus Name: HARRISON/JEFFERSON/MADISON COMPLEX 2015-16 Campus Profile Grade Span: EE - 05Campus Number: 029901101 School Type: Elementary
---------------- Campus ----------------Student Information Count Percent District State
Total Students: 767 100.0% 4,172 5,284,252
Students by Grade:Early Childhood Education 13 1.7% 0.3% 0.2%Pre-Kindergarten 57 7.4% 4.1% 4.2%Kindergarten 130 16.9% 7.7% 7.1%Grade 1 116 15.1% 7.5% 7.8%Grade 2 99 12.9% 6.9% 7.8%Grade 3 137 17.9% 8.0% 7.7%Grade 4 116 15.1% 7.3% 7.5%Grade 5 99 12.9% 6.3% 7.5%Grade 6 0 0.0% 7.3% 7.4%Grade 7 0 0.0% 7.6% 7.4%Grade 8 0 0.0% 7.9% 7.3%Grade 9 0 0.0% 7.5% 8.1%Grade 10 0 0.0% 8.0% 7.3%Grade 11 0 0.0% 7.5% 6.7%Grade 12 0 0.0% 6.1% 6.1%
Ethnic Distribution:African American 13 1.7% 2.1% 12.6%Hispanic 505 65.8% 63.0% 52.2%White 161 21.0% 28.5% 28.5%American Indian 3 0.4% 0.3% 0.4%Asian 83 10.8% 5.3% 4.0%Pacific Islander 0 0.0% 0.0% 0.1%Two or More Races 2 0.3% 0.8% 2.1%
Economically Disadvantaged 549 71.6% 60.3% 59.0%Non-Educationally Disadvantaged 218 28.4% 39.7% 41.0%English Language Learners (ELL) 132 17.2% 11.5% 18.5%Students w/ Disciplinary Placements (2014-2015) 0 0.0% 3.0% 1.4%At-Risk 265 34.6% 48.4% 50.1%Mobility (2014-2015) 87 12.8% 14.6% 16.5%

TEA Division of Performance Reporting Page 9
TEXAS EDUCATION AGENCYDistrict Name: CALHOUN COUNTY ISD Texas Academic Performance Report Total Students: 767
Campus Name: HARRISON/JEFFERSON/MADISON COMPLEX 2015-16 Campus Profile Grade Span: EE - 05Campus Number: 029901101 School Type: Elementary
--------- Non-Special Education Rates --------- ------------- Special Education Rates -------------Student Information Campus District State Campus District State
Retention Rates by Grade:
Kindergarten 13.3% 10.5% 1.9% 9.1% 6.3% 8.2%Grade 1 20.9% 14.6% 4.1% 0.0% 15.4% 7.4%Grade 2 7.6% 6.5% 2.7% 0.0% 0.0% 3.4%Grade 3 0.9% 2.9% 2.0% 7.7% 3.7% 1.6%Grade 4 0.0% 2.1% 1.0% 0.0% 0.0% 0.8%Grade 5 0.0% 0.4% 0.9% 0.0% 0.0% 1.0%Grade 6 - 0.0% 0.6% - 3.3% 0.8%Grade 7 - 0.7% 0.8% - 0.0% 0.9%Grade 8 - 0.0% 0.8% - 0.0% 1.3%
Class Size Information Campus District State
Class Size Averages by Grade and Subject (Derived from teacher responsibility records):
Elementary:Kindergarten 17.9 18.7 18.9Grade 1 18.2 17.9 19.1Grade 2 18.9 17.6 19.1Grade 3 18.8 17.1 19.1Grade 4 18.4 17.5 19.0Grade 5 19.1 16.4 20.8Grade 6 - 19.6 20.4
Secondary:English/Language Arts - 16.3 17.1Foreign Languages - 17.4 19.1Mathematics - 15.7 18.1Science - 16.6 19.1Social Studies - 18.0 19.5

TEA Division of Performance Reporting Page 10
TEXAS EDUCATION AGENCYDistrict Name: CALHOUN COUNTY ISD Texas Academic Performance Report Total Students: 767
Campus Name: HARRISON/JEFFERSON/MADISON COMPLEX 2015-16 Campus Profile Grade Span: EE - 05Campus Number: 029901101 School Type: Elementary
---------------- Campus ----------------Staff Information Count/Average Percent District State
Total Staff 73.5 100.0% 100.0% 100.0%
Professional Staff: 59.0 80.3% 58.4% 64.3%Teachers 47.6 64.8% 47.5% 50.5%Professional Support 8.4 11.4% 7.5% 9.8%Campus Administration (School Leadership) 3.0 4.1% 2.5% 2.9%
Educational Aides: 14.5 19.7% 10.5% 9.6%
Total Minority Staff: 19.3 26.2% 38.1% 48.2%
Teachers by Ethnicity and Sex:African American 1.0 2.1% 1.2% 10.1%Hispanic 10.0 20.9% 20.8% 26.0%White 36.7 77.0% 77.2% 60.8%American Indian 0.0 0.0% 0.0% 0.4%Asian 0.0 0.0% 0.7% 1.5%Pacific Islander 0.0 0.0% 0.0% 0.2%Two or More Races 0.0 0.0% 0.0% 1.1%
Males 1.7 3.6% 23.7% 23.5%Females 46.0 96.4% 76.3% 76.5%
Teachers by Highest Degree Held:No Degree 1.0 2.0% 1.1% 1.0%Bachelors 42.7 89.6% 86.2% 74.7%Masters 4.0 8.4% 12.7% 23.6%Doctorate 0.0 0.0% 0.0% 0.6%
Teachers by Years of Experience:Beginning Teachers 3.9 8.2% 9.0% 8.1%1-5 Years Experience 14.7 30.9% 24.6% 27.3%6-10 Years Experience 7.0 14.7% 14.7% 21.7%11-20 Years Experience 15.0 31.5% 32.1% 27.3%Over 20 Years Experience 7.0 14.7% 19.6% 15.7%
Number of Students per Teacher 16.1 n/a 15.4 15.2

TEA Division of Performance Reporting Page 11
TEXAS EDUCATION AGENCYDistrict Name: CALHOUN COUNTY ISD Texas Academic Performance Report Total Students: 767
Campus Name: HARRISON/JEFFERSON/MADISON COMPLEX 2015-16 Campus Profile Grade Span: EE - 05Campus Number: 029901101 School Type: Elementary
Staff Information Campus District State
Average Years Experience of Teachers: 12.3 12.9 10.9Average Years Experience of Teachers with District: 9.6 8.4 7.3
Average Teacher Salary by Years of Experience (regular duties only):Beginning Teachers $28,672 $36,085 $45,5071-5 Years Experience $40,809 $41,344 $47,9966-10 Years Experience $44,731 $44,877 $50,45911-20 Years Experience $51,206 $51,582 $53,794Over 20 Years Experience $56,177 $56,808 $60,613
Average Actual Salaries (regular duties only):Teachers $45,916 $47,707 $51,891Professional Support $50,363 $57,854 $61,145Campus Administration (School Leadership) $73,334 $76,928 $75,654
Instructional Staff Percent: n/a 61.1% 64.5%
Contracted Instructional Staff (not incl. above): 0.0 0.0 1,914.4

TEA Division of Performance Reporting Page 12
TEXAS EDUCATION AGENCYDistrict Name: CALHOUN COUNTY ISD Texas Academic Performance Report Total Students: 767
Campus Name: HARRISON/JEFFERSON/MADISON COMPLEX 2015-16 Campus Profile Grade Span: EE - 05Campus Number: 029901101 School Type: Elementary
---------------- Campus ----------------Program Information Count Percent District State
Student Enrollment by Program:Bilingual/ESL Education 129 16.8% 11.4% 18.3%Career & Technical Education 0 0.0% 30.2% 24.3%Gifted & Talented Education 31 4.0% 7.2% 7.7%Special Education 65 8.5% 8.3% 8.6%
Teachers by Program (population served):Bilingual/ESL Education 0.0 0.0% 0.7% 5.9%Career & Technical Education 0.0 0.0% 5.3% 4.4%Compensatory Education 0.0 0.0% 1.3% 2.9%Gifted & Talented Education 0.0 0.0% 1.4% 1.9%Regular Education 41.3 86.6% 82.4% 72.6%Special Education 6.4 13.4% 6.2% 8.8%Other 0.0 0.0% 2.8% 3.4%
Link to: PEIMS Financial Standard Reports/ 2014-2015 Financial Actual Report
' '̂ Indicates that ELL rates at met or exceeded standard and exceeded standard include current and monitored students.'*' Indicates results are masked due to small numbers to protect student confidentiality.'-' Indicates zero observations reported for this group.'n/a' Indicates data reporting is not applicable for this group.'**' Indicates that rates for Reading and Mathematics are based on the cumulative results from the first and second administrations of STAAR.'?' Indicates that the data for this item were statistically improbable, or were reported outside a reasonable range.'##' Indicates that PID Error rate information cannot be reported in 2015-16 due to the transition from PEIMS Edit+ to TSDS.
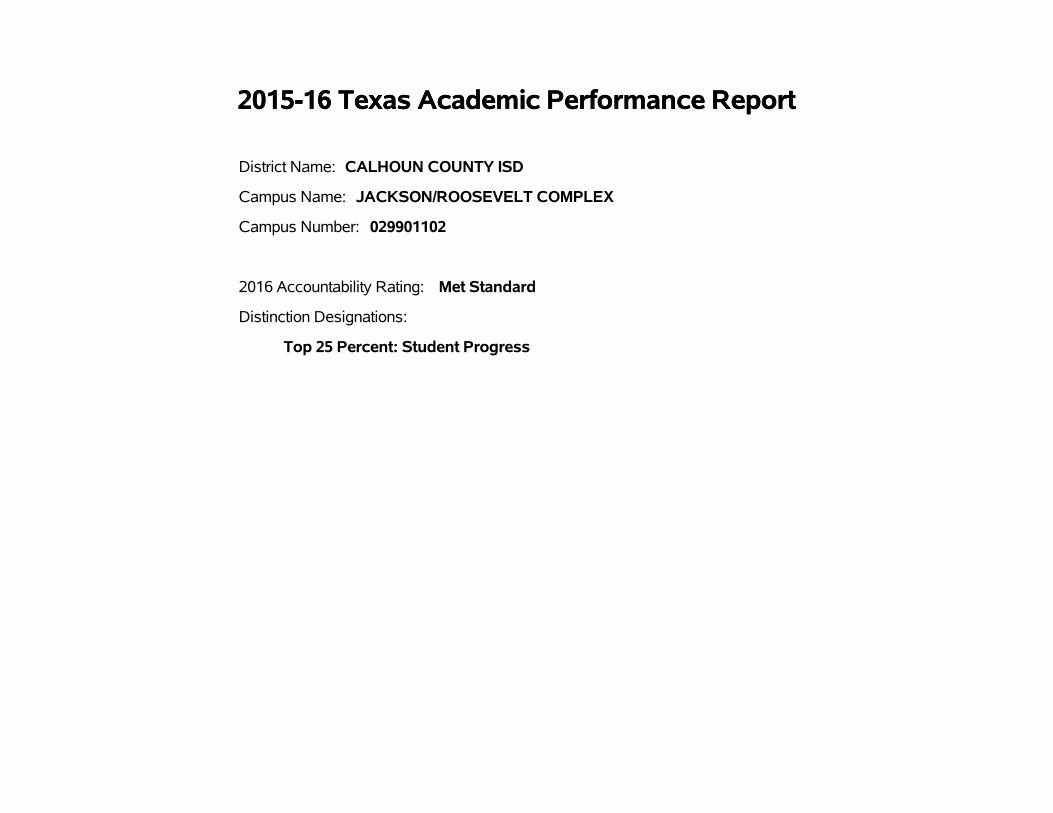
2015-16 Texas Academic Performance Report2015-16 Texas Academic Performance Report
District Name: CALHOUN COUNTY ISD
Campus Name: JACKSON/ROOSEVELT COMPLEX
Campus Number: 029901102
2016 Accountability Rating: Met Standard
Distinction Designations:
Top 25 Percent: Student Progress

This page intentionally left blank.

TEA Division of Performance Reporting Page 1
TEXAS EDUCATION AGENCYDistrict Name: CALHOUN COUNTY ISD Texas Academic Performance Report Total Students: 988
Campus Name: JACKSON/ROOSEVELT COMPLEX 2015-16 Campus Performance Grade Span: PK - 05Campus Number: 029901102 School Type: Elementary
State District CampusAfrican
American Hispanic WhiteAmerican
Indian AsianPacific
Islander
Two orMore
RacesSpecial
EdEcon
Disadv ELL^STAARPercent at Level II Satisfactory Standard or Above
Grade 3
Reading 2016 73% 84% 88% * 87% 90% - * - * * 86% 89%
Mathematics 2016 75% 87% 81% * 79% 88% - * - * * 77% 84%
STAARPercent at Level II Satisfactory Standard or AboveGrade 4
Reading 2016 75% 82% 82% * 79% 88% - * - - 36% 73% 63%
Mathematics 2016 73% 80% 71% * 69% 78% - * - - 43% 61% 57%
Writing 2016 69% 78% 72% * 70% 83% - * - - * 60% 50%
STAARPercent at Level II Satisfactory Standard or AboveGrade 5 **
Reading 2016 81% 84% 81% * 75% 93% - * - * 43% 73% 67%
Mathematics 2016 86% 90% 89% * 85% 100% - * - * 43% 84% 81%
Science 2016 74% 82% 83% * 76% 100% - * - * 50% 76% 67%
STAARPercent at Level II Satisfactory Standard or AboveAll Grades
All Subjects 2016 75% 74% 81% 75% 77% 89% - 80% - 100% 45% 74% 69%
Reading 2016 73% 70% 83% 83% 81% 90% - 86% - * 45% 78% 72%
Mathematics 2016 76% 80% 80% 67% 77% 87% - 86% - * 45% 74% 73%
Writing 2016 69% 70% 72% * 70% 83% - * - - * 60% 50%
Science 2016 79% 77% 83% * 76% 100% - * - * 50% 76% 67%
STAARPercent at Postsecondary Readiness StandardAll Grades
Two or More Subjects 2016 45% 40% 34% * 30% 43% - * - * * 26% 26%
Reading 2016 46% 38% 42% * 36% 56% - * - * * 32% 24%
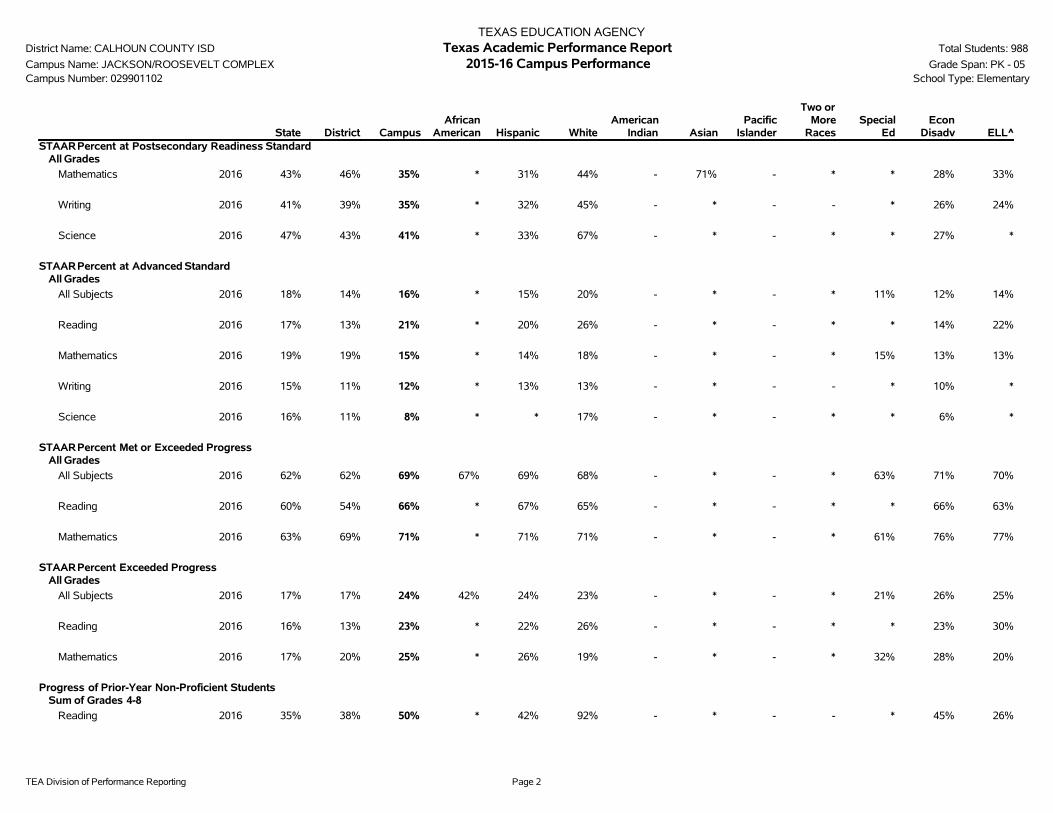
TEA Division of Performance Reporting Page 2
TEXAS EDUCATION AGENCYDistrict Name: CALHOUN COUNTY ISD Texas Academic Performance Report Total Students: 988
Campus Name: JACKSON/ROOSEVELT COMPLEX 2015-16 Campus Performance Grade Span: PK - 05Campus Number: 029901102 School Type: Elementary
State District CampusAfrican
American Hispanic WhiteAmerican
Indian AsianPacific
Islander
Two orMore
RacesSpecial
EdEcon
Disadv ELL^STAARPercent at Postsecondary Readiness Standard
All Grades
Mathematics 2016 43% 46% 35% * 31% 44% - 71% - * * 28% 33%
Writing 2016 41% 39% 35% * 32% 45% - * - - * 26% 24%
Science 2016 47% 43% 41% * 33% 67% - * - * * 27% *
STAARPercent at Advanced StandardAll Grades
All Subjects 2016 18% 14% 16% * 15% 20% - * - * 11% 12% 14%
Reading 2016 17% 13% 21% * 20% 26% - * - * * 14% 22%
Mathematics 2016 19% 19% 15% * 14% 18% - * - * 15% 13% 13%
Writing 2016 15% 11% 12% * 13% 13% - * - - * 10% *
Science 2016 16% 11% 8% * * 17% - * - * * 6% *
STAARPercent Met or Exceeded ProgressAll Grades
All Subjects 2016 62% 62% 69% 67% 69% 68% - * - * 63% 71% 70%
Reading 2016 60% 54% 66% * 67% 65% - * - * * 66% 63%
Mathematics 2016 63% 69% 71% * 71% 71% - * - * 61% 76% 77%
STAARPercent Exceeded ProgressAll Grades
All Subjects 2016 17% 17% 24% 42% 24% 23% - * - * 21% 26% 25%
Reading 2016 16% 13% 23% * 22% 26% - * - * * 23% 30%
Mathematics 2016 17% 20% 25% * 26% 19% - * - * 32% 28% 20%
Progress of Prior-Year Non-Proficient StudentsSum of Grades 4-8
Reading 2016 35% 38% 50% * 42% 92% - * - - * 45% 26%
TEA Division of Performance Reporting Page 3
TEXAS EDUCATION AGENCYDistrict Name: CALHOUN COUNTY ISD Texas Academic Performance Report Total Students: 988
Campus Name: JACKSON/ROOSEVELT COMPLEX 2015-16 Campus Performance Grade Span: PK - 05Campus Number: 029901102 School Type: Elementary
State District CampusAfrican
American Hispanic WhiteAmerican
Indian AsianPacific
Islander
Two orMore
RacesSpecial
EdEcon
Disadv ELLStudent Success Initiative
Grade 5 Reading
Students Meeting Level II Standard on First STAARAdministration
2016 73% 72% 65% * 59% 80% - * - * * 55% 50%
Students Requiring Accelerated Instruction
2016 27% 28% 35% * 41% 20% - * - * 73% 45% 50%
STAARCumulative Met Standard
2016 80% 83% 79% * 73% 93% - * - * * 70% 61%
Grade 5 Mathematics
Students Meeting Level II Standard on First STAARAdministration
2016 77% 83% 76% * 67% 97% - * - * * 68% 61%
Students Requiring Accelerated Instruction
2016 23% 17% 24% * 33% * - * - * 73% 32% 39%
STAARCumulative Met Standard
2016 85% 90% 87% * 82% 100% - * - * * 81% 74%
TEA Division of Performance Reporting Page 4
TEXAS EDUCATION AGENCYDistrict Name: CALHOUN COUNTY ISD Texas Academic Performance Report Total Students: 988
Campus Name: JACKSON/ROOSEVELT COMPLEX 2015-16 Campus Performance Grade Span: PK - 05Campus Number: 029901102 Bilingual Education/English as a Second Language (Current Year ELL Students)
State District CampusBilingual
EducationBE-TransEarly Exit
BE-TransLate Exit
BE-DualTwo-Way
BE-DualOne-Way ESL
ESLContent
ESLPull-Out
LEP NoServices
LEP WithServices
TotalELL
STAARPercent at Level II Satisfactory Standard or AboveAll Grades
All Subjects 2016 75% 74% 81% 71% 71% - - - 56% 56% - * 68% 69%
Reading 2016 73% 70% 83% 73% 73% - - - 67% 67% - * 71% 72%
Mathematics 2016 76% 80% 80% 74% 74% - - - 67% 67% - * 73% 73%
Writing 2016 69% 70% 72% 60% 60% - - - * * - - 50% 50%
Science 2016 79% 77% 83% 73% 73% - - - * * - - 67% 67%
STAARPercent at Postsecondary Readiness StandardAll Grades
Two or More Subjects 2016 45% 40% 34% 27% 27% - - - * * - * 24% 26%
Reading 2016 46% 38% 42% 27% 27% - - - * * - * 22% 24%
Mathematics 2016 43% 46% 35% 30% 30% - - - * * - * 32% 33%
Writing 2016 41% 39% 35% 28% 28% - - - * * - - 24% 24%
Science 2016 47% 43% 41% * * - - - * * - - * *
STAARPercent at Advanced StandardAll Grades
All Subjects 2016 18% 14% 16% 16% 16% - - - * * - * 14% 14%
Reading 2016 17% 13% 21% 22% 22% - - - * * - * 21% 22%
Mathematics 2016 19% 19% 15% 16% 16% - - - * * - * 13% 13%
Writing 2016 15% 11% 12% * * - - - * * - - * *
Science 2016 16% 11% 8% * * - - - * * - - * *
STAARPercent Met or Exceeded ProgressAll Grades
All Subjects 2016 62% 62% 69% 70% 70% - - - 63% 63% - - 69% 69%
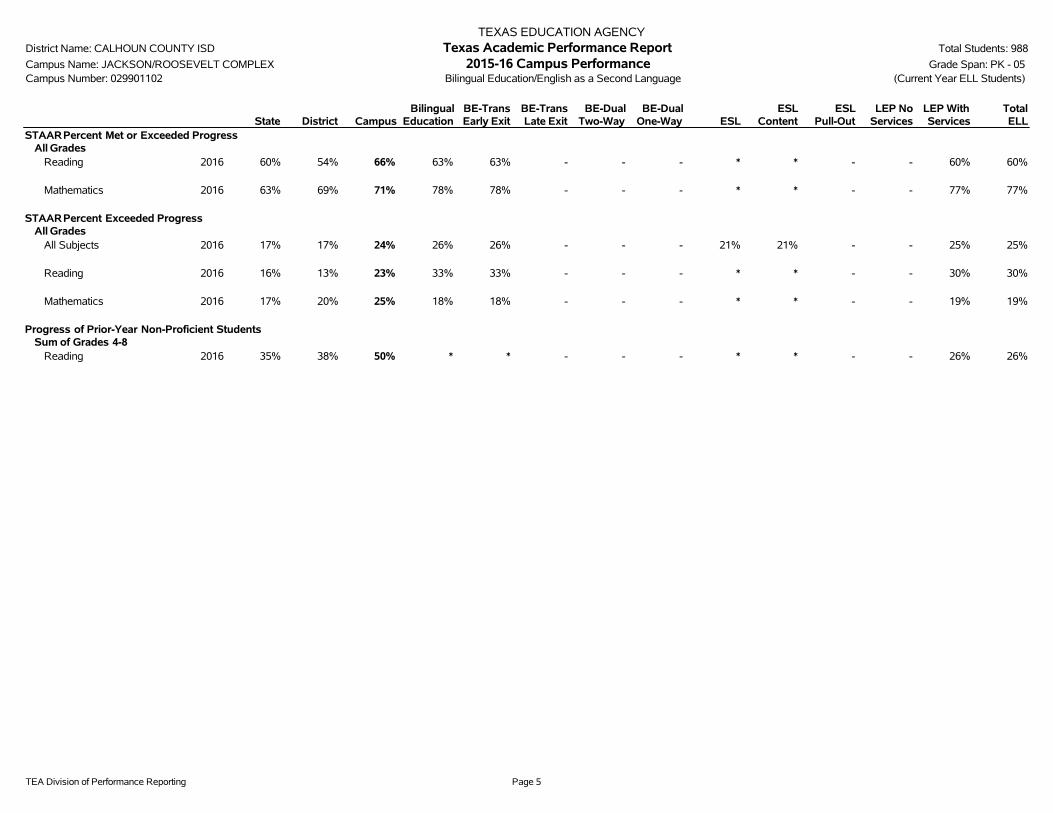
TEA Division of Performance Reporting Page 5
TEXAS EDUCATION AGENCYDistrict Name: CALHOUN COUNTY ISD Texas Academic Performance Report Total Students: 988
Campus Name: JACKSON/ROOSEVELT COMPLEX 2015-16 Campus Performance Grade Span: PK - 05Campus Number: 029901102 Bilingual Education/English as a Second Language (Current Year ELL Students)
State District CampusBilingual
EducationBE-TransEarly Exit
BE-TransLate Exit
BE-DualTwo-Way
BE-DualOne-Way ESL
ESLContent
ESLPull-Out
LEP NoServices
LEP WithServices
TotalELL
STAARPercent Met or Exceeded ProgressAll Grades
Reading 2016 60% 54% 66% 63% 63% - - - * * - - 60% 60%
Mathematics 2016 63% 69% 71% 78% 78% - - - * * - - 77% 77%
STAARPercent Exceeded ProgressAll Grades
All Subjects 2016 17% 17% 24% 26% 26% - - - 21% 21% - - 25% 25%
Reading 2016 16% 13% 23% 33% 33% - - - * * - - 30% 30%
Mathematics 2016 17% 20% 25% 18% 18% - - - * * - - 19% 19%
Progress of Prior-Year Non-Proficient StudentsSum of Grades 4-8
Reading 2016 35% 38% 50% * * - - - * * - - 26% 26%

TEA Division of Performance Reporting Page 6
TEXAS EDUCATION AGENCYDistrict Name: CALHOUN COUNTY ISD Texas Academic Performance Report Total Students: 988
Campus Name: JACKSON/ROOSEVELT COMPLEX 2015-16 Campus Participation Grade Span: PK - 05Campus Number: 029901102 School Type: Elementary
State District CampusAfrican
American Hispanic WhiteAmerican
Indian AsianPacific
Islander
Two orMoreRaces
SpecialEd
EconDisadv ELL
2016 STAARParticipation(All Grades)
All TestsTest Participant 99% 100% 100% 100% 100% 100% - 100% - 100% 100% 100% 100%
Included in Accountability 94% 95% 95% 94% 94% 97% - 87% - 100% 97% 94% 86%Not Included in Accountability
Mobile 4% 4% 4% 6% 5% 3% - 13% - 0% 3% 4% 9%Other Exclusions 1% 1% 1% 0% 1% 0% - 0% - 0% 0% 1% 5%
Not Tested 1% 0% 0% 0% 0% 0% - 0% - 0% 0% 0% 1%Absent 1% 0% 0% 0% 0% 0% - 0% - 0% 0% 0% 0%Other 0% 0% 0% 0% 0% 0% - 0% - 0% 0% 0% 1%

TEA Division of Performance Reporting Page 7
TEXAS EDUCATION AGENCYDistrict Name: CALHOUN COUNTY ISD Texas Academic Performance Report Total Students: 988
Campus Name: JACKSON/ROOSEVELT COMPLEX 2015-16 Campus Attendance and Postsecondary Readiness Grade Span: PK - 05Campus Number: 029901102 School Type: Elementary
State District CampusAfrican
American Hispanic WhiteAmerican
Indian AsianPacific
IslanderTwo or
More RacesSpecial
EdEcon
Disadv ELL
Attendance Rate2014-15 95.7% 95.0% 96.2% 95.4% 96.2% 96.0% - 97.6% - * 96.1% 96.0% 97.0%2013-14 95.9% 95.2% 96.3% 97.5% 96.2% 96.4% * 98.4% - * 94.9% 96.0% 96.9%

TEA Division of Performance Reporting Page 8
TEXAS EDUCATION AGENCYDistrict Name: CALHOUN COUNTY ISD Texas Academic Performance Report Total Students: 988
Campus Name: JACKSON/ROOSEVELT COMPLEX 2015-16 Campus Profile Grade Span: PK - 05Campus Number: 029901102 School Type: Elementary
---------------- Campus ----------------Student Information Count Percent District State
Total Students: 988 100.0% 4,172 5,284,252
Students by Grade:Early Childhood Education 0 0.0% 0.3% 0.2%Pre-Kindergarten 84 8.5% 4.1% 4.2%Kindergarten 153 15.5% 7.7% 7.1%Grade 1 157 15.9% 7.5% 7.8%Grade 2 149 15.1% 6.9% 7.8%Grade 3 156 15.8% 8.0% 7.7%Grade 4 154 15.6% 7.3% 7.5%Grade 5 135 13.7% 6.3% 7.5%Grade 6 0 0.0% 7.3% 7.4%Grade 7 0 0.0% 7.6% 7.4%Grade 8 0 0.0% 7.9% 7.3%Grade 9 0 0.0% 7.5% 8.1%Grade 10 0 0.0% 8.0% 7.3%Grade 11 0 0.0% 7.5% 6.7%Grade 12 0 0.0% 6.1% 6.1%
Ethnic Distribution:African American 28 2.8% 2.1% 12.6%Hispanic 671 67.9% 63.0% 52.2%White 265 26.8% 28.5% 28.5%American Indian 1 0.1% 0.3% 0.4%Asian 19 1.9% 5.3% 4.0%Pacific Islander 0 0.0% 0.0% 0.1%Two or More Races 4 0.4% 0.8% 2.1%
Economically Disadvantaged 654 66.2% 60.3% 59.0%Non-Educationally Disadvantaged 334 33.8% 39.7% 41.0%English Language Learners (ELL) 168 17.0% 11.5% 18.5%Students w/ Disciplinary Placements (2014-2015) 0 0.0% 3.0% 1.4%At-Risk 525 53.1% 48.4% 50.1%Mobility (2014-2015) 100 12.5% 14.6% 16.5%

TEA Division of Performance Reporting Page 9
TEXAS EDUCATION AGENCYDistrict Name: CALHOUN COUNTY ISD Texas Academic Performance Report Total Students: 988
Campus Name: JACKSON/ROOSEVELT COMPLEX 2015-16 Campus Profile Grade Span: PK - 05Campus Number: 029901102 School Type: Elementary
--------- Non-Special Education Rates --------- ------------- Special Education Rates -------------Student Information Campus District State Campus District State
Retention Rates by Grade:
Kindergarten 11.4% 10.5% 1.9% 0.0% 6.3% 8.2%Grade 1 13.4% 14.6% 4.1% 40.0% 15.4% 7.4%Grade 2 6.0% 6.5% 2.7% 0.0% 0.0% 3.4%Grade 3 3.5% 2.9% 2.0% 0.0% 3.7% 1.6%Grade 4 0.9% 2.1% 1.0% 0.0% 0.0% 0.8%Grade 5 0.0% 0.4% 0.9% 0.0% 0.0% 1.0%Grade 6 - 0.0% 0.6% - 3.3% 0.8%Grade 7 - 0.7% 0.8% - 0.0% 0.9%Grade 8 - 0.0% 0.8% - 0.0% 1.3%
Class Size Information Campus District State
Class Size Averages by Grade and Subject (Derived from teacher responsibility records):
Elementary:Kindergarten 21.9 18.7 18.9Grade 1 19.0 17.9 19.1Grade 2 18.0 17.6 19.1Grade 3 16.8 17.1 19.1Grade 4 18.6 17.5 19.0Grade 5 16.9 16.4 20.8Grade 6 - 19.6 20.4
Secondary:English/Language Arts - 16.3 17.1Foreign Languages - 17.4 19.1Mathematics - 15.7 18.1Science - 16.6 19.1Social Studies - 18.0 19.5

TEA Division of Performance Reporting Page 10
TEXAS EDUCATION AGENCYDistrict Name: CALHOUN COUNTY ISD Texas Academic Performance Report Total Students: 988
Campus Name: JACKSON/ROOSEVELT COMPLEX 2015-16 Campus Profile Grade Span: PK - 05Campus Number: 029901102 School Type: Elementary
---------------- Campus ----------------Staff Information Count/Average Percent District State
Total Staff 75.2 100.0% 100.0% 100.0%
Professional Staff: 61.6 81.9% 58.4% 64.3%Teachers 54.3 72.2% 47.5% 50.5%Professional Support 5.2 7.0% 7.5% 9.8%Campus Administration (School Leadership) 2.0 2.7% 2.5% 2.9%
Educational Aides: 13.6 18.1% 10.5% 9.6%
Total Minority Staff: 29.2 38.9% 38.1% 48.2%
Teachers by Ethnicity and Sex:African American 0.0 0.0% 1.2% 10.1%Hispanic 16.5 30.4% 20.8% 26.0%White 36.8 67.8% 77.2% 60.8%American Indian 0.0 0.0% 0.0% 0.4%Asian 1.0 1.8% 0.7% 1.5%Pacific Islander 0.0 0.0% 0.0% 0.2%Two or More Races 0.0 0.0% 0.0% 1.1%
Males 6.0 11.0% 23.7% 23.5%Females 48.3 89.0% 76.3% 76.5%
Teachers by Highest Degree Held:No Degree 0.0 0.0% 1.1% 1.0%Bachelors 48.8 89.9% 86.2% 74.7%Masters 5.5 10.1% 12.7% 23.6%Doctorate 0.0 0.0% 0.0% 0.6%
Teachers by Years of Experience:Beginning Teachers 1.8 3.3% 9.0% 8.1%1-5 Years Experience 16.0 29.5% 24.6% 27.3%6-10 Years Experience 14.0 25.8% 14.7% 21.7%11-20 Years Experience 14.5 26.7% 32.1% 27.3%Over 20 Years Experience 8.0 14.7% 19.6% 15.7%
Number of Students per Teacher 18.2 n/a 15.4 15.2
TEA Division of Performance Reporting Page 11
TEXAS EDUCATION AGENCYDistrict Name: CALHOUN COUNTY ISD Texas Academic Performance Report Total Students: 988
Campus Name: JACKSON/ROOSEVELT COMPLEX 2015-16 Campus Profile Grade Span: PK - 05Campus Number: 029901102 School Type: Elementary
Staff Information Campus District State
Average Years Experience of Teachers: 11.3 12.9 10.9Average Years Experience of Teachers with District: 8.1 8.4 7.3
Average Teacher Salary by Years of Experience (regular duties only):Beginning Teachers $40,027 $36,085 $45,5071-5 Years Experience $40,816 $41,344 $47,9966-10 Years Experience $43,881 $44,877 $50,45911-20 Years Experience $50,084 $51,582 $53,794Over 20 Years Experience $55,632 $56,808 $60,613
Average Actual Salaries (regular duties only):Teachers $46,236 $47,707 $51,891Professional Support $53,093 $57,854 $61,145Campus Administration (School Leadership) $74,719 $76,928 $75,654
Instructional Staff Percent: n/a 61.1% 64.5%
Contracted Instructional Staff (not incl. above): 0.0 0.0 1,914.4

TEA Division of Performance Reporting Page 12
TEXAS EDUCATION AGENCYDistrict Name: CALHOUN COUNTY ISD Texas Academic Performance Report Total Students: 988
Campus Name: JACKSON/ROOSEVELT COMPLEX 2015-16 Campus Profile Grade Span: PK - 05Campus Number: 029901102 School Type: Elementary
---------------- Campus ----------------Program Information Count Percent District State
Student Enrollment by Program:Bilingual/ESL Education 167 16.9% 11.4% 18.3%Career & Technical Education 0 0.0% 30.2% 24.3%Gifted & Talented Education 61 6.2% 7.2% 7.7%Special Education 44 4.5% 8.3% 8.6%
Teachers by Program (population served):Bilingual/ESL Education 0.0 0.0% 0.7% 5.9%Career & Technical Education 0.0 0.0% 5.3% 4.4%Compensatory Education 2.5 4.6% 1.3% 2.9%Gifted & Talented Education 0.0 0.0% 1.4% 1.9%Regular Education 51.8 95.4% 82.4% 72.6%Special Education 0.0 0.0% 6.2% 8.8%Other 0.0 0.0% 2.8% 3.4%
Link to: PEIMS Financial Standard Reports/ 2014-2015 Financial Actual Report
' '̂ Indicates that ELL rates at met or exceeded standard and exceeded standard include current and monitored students.'*' Indicates results are masked due to small numbers to protect student confidentiality.'-' Indicates zero observations reported for this group.'n/a' Indicates data reporting is not applicable for this group.'**' Indicates that rates for Reading and Mathematics are based on the cumulative results from the first and second administrations of STAAR.'?' Indicates that the data for this item were statistically improbable, or were reported outside a reasonable range.'##' Indicates that PID Error rate information cannot be reported in 2015-16 due to the transition from PEIMS Edit+ to TSDS.
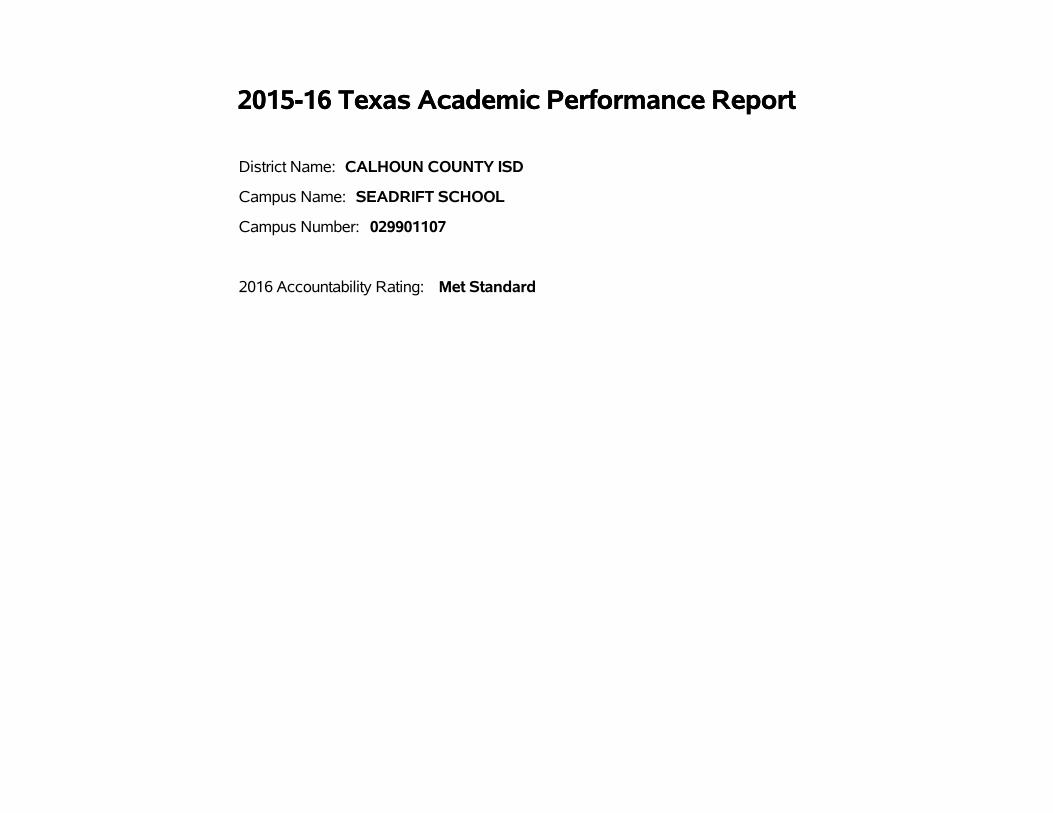
2015-16 Texas Academic Performance Report2015-16 Texas Academic Performance Report
District Name: CALHOUN COUNTY ISD
Campus Name: SEADRIFT SCHOOL
Campus Number: 029901107
2016 Accountability Rating: Met Standard

This page intentionally left blank.
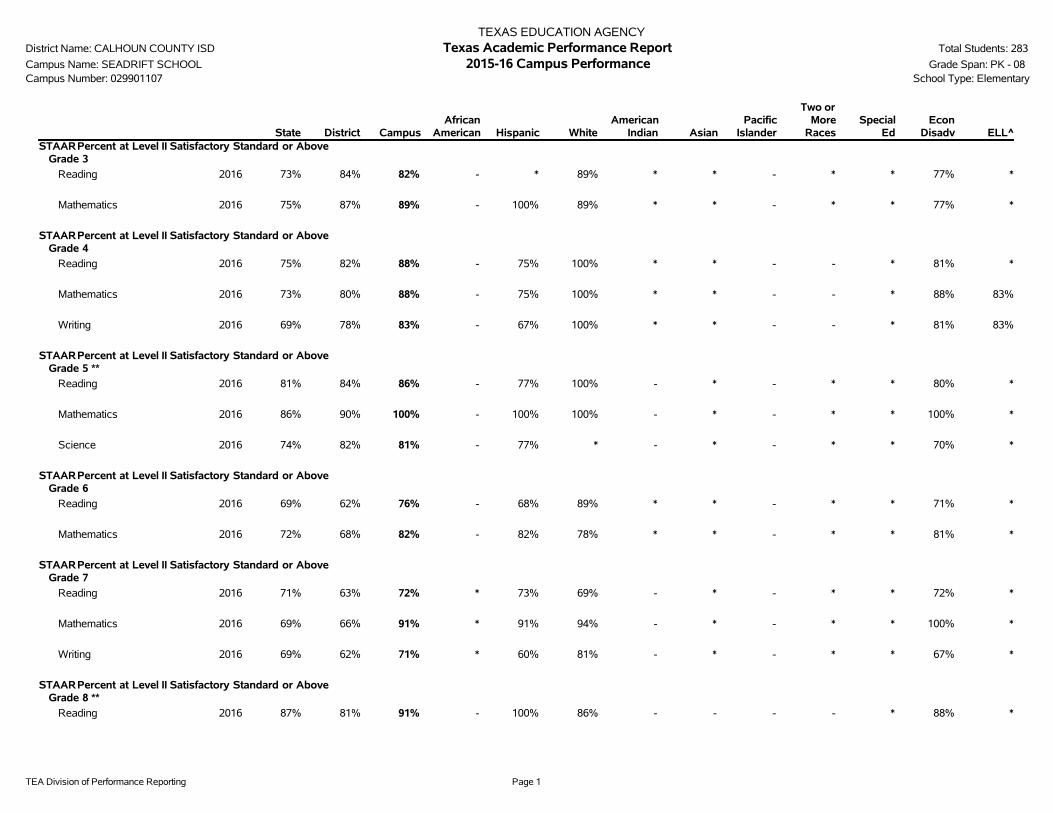
TEA Division of Performance Reporting Page 1
TEXAS EDUCATION AGENCYDistrict Name: CALHOUN COUNTY ISD Texas Academic Performance Report Total Students: 283
Campus Name: SEADRIFT SCHOOL 2015-16 Campus Performance Grade Span: PK - 08Campus Number: 029901107 School Type: Elementary
State District CampusAfrican
American Hispanic WhiteAmerican
Indian AsianPacific
Islander
Two orMore
RacesSpecial
EdEcon
Disadv ELL^STAARPercent at Level II Satisfactory Standard or Above
Grade 3
Reading 2016 73% 84% 82% - * 89% * * - * * 77% *
Mathematics 2016 75% 87% 89% - 100% 89% * * - * * 77% *
STAARPercent at Level II Satisfactory Standard or AboveGrade 4
Reading 2016 75% 82% 88% - 75% 100% * * - - * 81% *
Mathematics 2016 73% 80% 88% - 75% 100% * * - - * 88% 83%
Writing 2016 69% 78% 83% - 67% 100% * * - - * 81% 83%
STAARPercent at Level II Satisfactory Standard or AboveGrade 5 **
Reading 2016 81% 84% 86% - 77% 100% - * - * * 80% *
Mathematics 2016 86% 90% 100% - 100% 100% - * - * * 100% *
Science 2016 74% 82% 81% - 77% * - * - * * 70% *
STAARPercent at Level II Satisfactory Standard or AboveGrade 6
Reading 2016 69% 62% 76% - 68% 89% * * - * * 71% *
Mathematics 2016 72% 68% 82% - 82% 78% * * - * * 81% *
STAARPercent at Level II Satisfactory Standard or AboveGrade 7
Reading 2016 71% 63% 72% * 73% 69% - * - * * 72% *
Mathematics 2016 69% 66% 91% * 91% 94% - * - * * 100% *
Writing 2016 69% 62% 71% * 60% 81% - * - * * 67% *
STAARPercent at Level II Satisfactory Standard or AboveGrade 8 **
Reading 2016 87% 81% 91% - 100% 86% - - - - * 88% *

TEA Division of Performance Reporting Page 2
TEXAS EDUCATION AGENCYDistrict Name: CALHOUN COUNTY ISD Texas Academic Performance Report Total Students: 283
Campus Name: SEADRIFT SCHOOL 2015-16 Campus Performance Grade Span: PK - 08Campus Number: 029901107 School Type: Elementary
State District CampusAfrican
American Hispanic WhiteAmerican
Indian AsianPacific
Islander
Two orMore
RacesSpecial
EdEcon
Disadv ELL^STAARPercent at Level II Satisfactory Standard or Above
Grade 8 **
Mathematics 2016 82% 85% 95% - 100% 92% - - - - * 92% *
Science 2016 75% 63% 82% - 75% 86% - - - * * 71% *
Social Studies 2016 63% 41% 62% - 50% 71% - - - * * 41% *
STAARPercent at Level II Satisfactory Standard or AboveEnd of Course
Algebra I 2016 78% 86% 100% - * 100% - - - * - 100% -
STAARPercent at Level II Satisfactory Standard or AboveAll Grades
All Subjects 2016 75% 74% 83% * 78% 87% 100% 89% - 89% 41% 78% 66%
Reading 2016 73% 70% 82% * 76% 86% * 86% - 100% * 78% 61%
Mathematics 2016 76% 80% 91% * 89% 92% * 86% - 100% 53% 89% 74%
Writing 2016 69% 70% 76% * 64% 88% * * - * * 74% 88%
Science 2016 79% 77% 82% - 76% 85% - * - * * 70% *
Social Studies 2016 77% 66% 62% - 50% 71% - - - * * 41% *
STAARPercent at Postsecondary Readiness StandardAll Grades
Two or More Subjects 2016 45% 40% 35% * 26% 40% * * - * * 23% *
Reading 2016 46% 38% 37% * 28% 42% * * - * * 27% *
Mathematics 2016 43% 46% 45% * 39% 47% * * - * * 31% *
Writing 2016 41% 39% 38% * * 46% * * - * * 31% *
Science 2016 47% 43% 40% - 38% 38% - * - * * 19% *
Social Studies 2016 47% 36% 24% - * 24% - - - * * * *
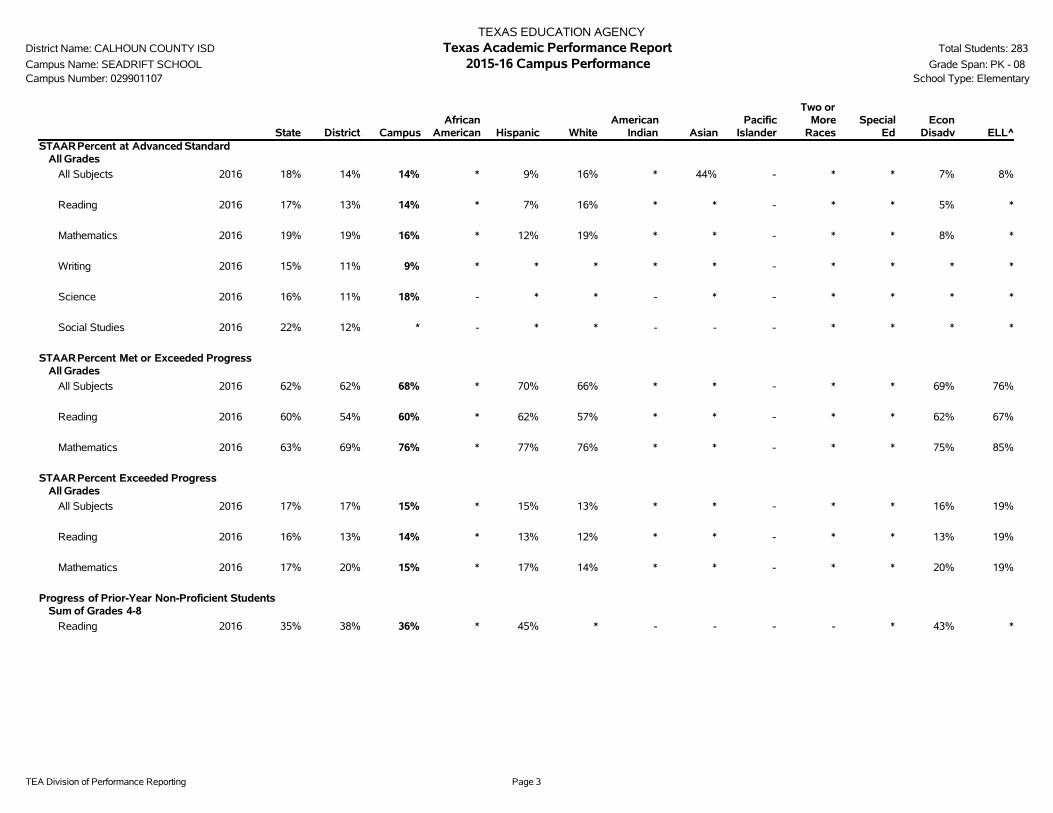
TEA Division of Performance Reporting Page 3
TEXAS EDUCATION AGENCYDistrict Name: CALHOUN COUNTY ISD Texas Academic Performance Report Total Students: 283
Campus Name: SEADRIFT SCHOOL 2015-16 Campus Performance Grade Span: PK - 08Campus Number: 029901107 School Type: Elementary
State District CampusAfrican
American Hispanic WhiteAmerican
Indian AsianPacific
Islander
Two orMore
RacesSpecial
EdEcon
Disadv ELL^STAARPercent at Advanced Standard
All Grades
All Subjects 2016 18% 14% 14% * 9% 16% * 44% - * * 7% 8%
Reading 2016 17% 13% 14% * 7% 16% * * - * * 5% *
Mathematics 2016 19% 19% 16% * 12% 19% * * - * * 8% *
Writing 2016 15% 11% 9% * * * * * - * * * *
Science 2016 16% 11% 18% - * * - * - * * * *
Social Studies 2016 22% 12% * - * * - - - * * * *
STAARPercent Met or Exceeded ProgressAll Grades
All Subjects 2016 62% 62% 68% * 70% 66% * * - * * 69% 76%
Reading 2016 60% 54% 60% * 62% 57% * * - * * 62% 67%
Mathematics 2016 63% 69% 76% * 77% 76% * * - * * 75% 85%
STAARPercent Exceeded ProgressAll Grades
All Subjects 2016 17% 17% 15% * 15% 13% * * - * * 16% 19%
Reading 2016 16% 13% 14% * 13% 12% * * - * * 13% 19%
Mathematics 2016 17% 20% 15% * 17% 14% * * - * * 20% 19%
Progress of Prior-Year Non-Proficient StudentsSum of Grades 4-8
Reading 2016 35% 38% 36% * 45% * - - - - * 43% *

TEA Division of Performance Reporting Page 4
TEXAS EDUCATION AGENCYDistrict Name: CALHOUN COUNTY ISD Texas Academic Performance Report Total Students: 283
Campus Name: SEADRIFT SCHOOL 2015-16 Campus Performance Grade Span: PK - 08Campus Number: 029901107 School Type: Elementary
State District CampusAfrican
American Hispanic WhiteAmerican
Indian AsianPacific
Islander
Two orMore
RacesSpecial
EdEcon
Disadv ELLStudent Success Initiative
Grade 5 Reading
Students Meeting Level II Standard on First STAARAdministration
2016 73% 72% 76% - 62% 100% - * - * * 70% *
Students Requiring Accelerated Instruction
2016 27% 28% 24% - 38% * - * - * * * *
STAARCumulative Met Standard
2016 80% 83% 86% - 77% 100% - * - * * 80% *
Grade 5 Mathematics
Students Meeting Level II Standard on First STAARAdministration
2016 77% 83% 90% - 92% * - * - * * 80% *
Students Requiring Accelerated Instruction
2016 23% 17% * - * * - * - * * * *
STAARCumulative Met Standard
2016 85% 90% 100% - 100% 100% - * - * * 100% *
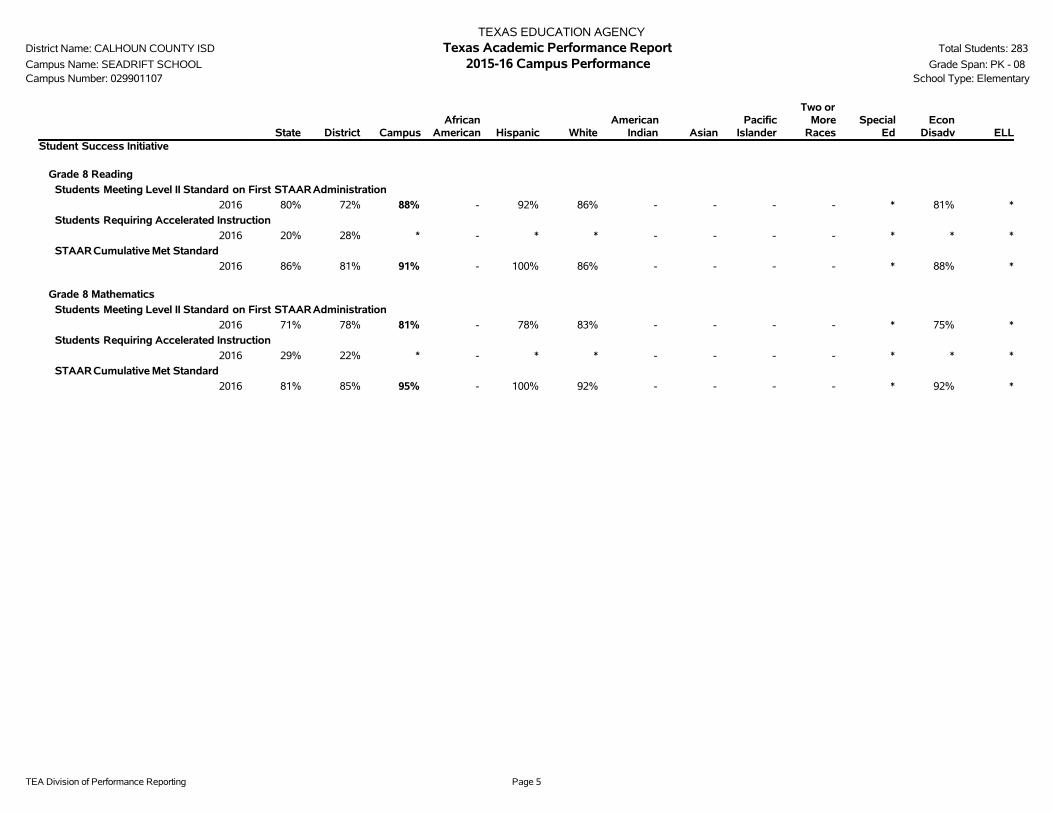
TEA Division of Performance Reporting Page 5
TEXAS EDUCATION AGENCYDistrict Name: CALHOUN COUNTY ISD Texas Academic Performance Report Total Students: 283
Campus Name: SEADRIFT SCHOOL 2015-16 Campus Performance Grade Span: PK - 08Campus Number: 029901107 School Type: Elementary
State District CampusAfrican
American Hispanic WhiteAmerican
Indian AsianPacific
Islander
Two orMore
RacesSpecial
EdEcon
Disadv ELLStudent Success Initiative
Grade 8 Reading
Students Meeting Level II Standard on First STAARAdministration
2016 80% 72% 88% - 92% 86% - - - - * 81% *
Students Requiring Accelerated Instruction
2016 20% 28% * - * * - - - - * * *
STAARCumulative Met Standard
2016 86% 81% 91% - 100% 86% - - - - * 88% *
Grade 8 Mathematics
Students Meeting Level II Standard on First STAARAdministration
2016 71% 78% 81% - 78% 83% - - - - * 75% *
Students Requiring Accelerated Instruction
2016 29% 22% * - * * - - - - * * *
STAARCumulative Met Standard
2016 81% 85% 95% - 100% 92% - - - - * 92% *
TEA Division of Performance Reporting Page 6
TEXAS EDUCATION AGENCYDistrict Name: CALHOUN COUNTY ISD Texas Academic Performance Report Total Students: 283
Campus Name: SEADRIFT SCHOOL 2015-16 Campus Performance Grade Span: PK - 08Campus Number: 029901107 Bilingual Education/English as a Second Language (Current Year ELL Students)
State District CampusBilingual
EducationBE-TransEarly Exit
BE-TransLate Exit
BE-DualTwo-Way
BE-DualOne-Way ESL
ESLContent
ESLPull-Out
LEP NoServices
LEP WithServices
TotalELL
STAARPercent at Level II Satisfactory Standard or AboveAll Grades
All Subjects 2016 75% 74% 83% - - - - - 66% 66% - - 66% 66%
Reading 2016 73% 70% 82% - - - - - 61% 61% - - 61% 61%
Mathematics 2016 76% 80% 91% - - - - - 74% 74% - - 74% 74%
Writing 2016 69% 70% 76% - - - - - 88% 88% - - 88% 88%
Science 2016 79% 77% 82% - - - - - * * - - * *
Social Studies 2016 77% 66% 62% - - - - - * * - - * *
STAARPercent at Postsecondary Readiness StandardAll Grades
Two or More Subjects 2016 45% 40% 35% - - - - - * * - - * *
Reading 2016 46% 38% 37% - - - - - * * - - * *
Mathematics 2016 43% 46% 45% - - - - - * * - - * *
Writing 2016 41% 39% 38% - - - - - * * - - * *
Science 2016 47% 43% 40% - - - - - * * - - * *
Social Studies 2016 47% 36% 24% - - - - - * * - - * *
STAARPercent at Advanced StandardAll Grades
All Subjects 2016 18% 14% 14% - - - - - 8% 8% - - 8% 8%
Reading 2016 17% 13% 14% - - - - - * * - - * *
Mathematics 2016 19% 19% 16% - - - - - * * - - * *
Writing 2016 15% 11% 9% - - - - - * * - - * *
Science 2016 16% 11% 18% - - - - - * * - - * *

TEA Division of Performance Reporting Page 7
TEXAS EDUCATION AGENCYDistrict Name: CALHOUN COUNTY ISD Texas Academic Performance Report Total Students: 283
Campus Name: SEADRIFT SCHOOL 2015-16 Campus Performance Grade Span: PK - 08Campus Number: 029901107 Bilingual Education/English as a Second Language (Current Year ELL Students)
State District CampusBilingual
EducationBE-TransEarly Exit
BE-TransLate Exit
BE-DualTwo-Way
BE-DualOne-Way ESL
ESLContent
ESLPull-Out
LEP NoServices
LEP WithServices
TotalELL
STAARPercent at Advanced StandardAll Grades
Social Studies 2016 22% 12% * - - - - - * * - - * *
STAARPercent Met or Exceeded ProgressAll Grades
All Subjects 2016 62% 62% 68% - - - - - 74% 74% - - 74% 74%
Reading 2016 60% 54% 60% - - - - - * * - - * *
Mathematics 2016 63% 69% 76% - - - - - 83% 83% - - 83% 83%
STAARPercent Exceeded ProgressAll Grades
All Subjects 2016 17% 17% 15% - - - - - 20% 20% - - 20% 20%
Reading 2016 16% 13% 14% - - - - - * * - - * *
Mathematics 2016 17% 20% 15% - - - - - 22% 22% - - 22% 22%
Progress of Prior-Year Non-Proficient StudentsSum of Grades 4-8
Reading 2016 35% 38% 36% - - - - - * * - - * *

TEA Division of Performance Reporting Page 8
TEXAS EDUCATION AGENCYDistrict Name: CALHOUN COUNTY ISD Texas Academic Performance Report Total Students: 283
Campus Name: SEADRIFT SCHOOL 2015-16 Campus Participation Grade Span: PK - 08Campus Number: 029901107 School Type: Elementary
State District CampusAfrican
American Hispanic WhiteAmerican
Indian AsianPacific
Islander
Two orMoreRaces
SpecialEd
EconDisadv ELL
2016 STAARParticipation(All Grades)
All TestsTest Participant 99% 100% 100% * 99% 100% 100% 100% - 100% 100% 99% 100%
Included in Accountability 94% 95% 93% * 93% 94% 100% 100% - 76% 93% 91% 100%Not Included in Accountability
Mobile 4% 4% 7% * 6% 6% 0% 0% - 24% 7% 9% 0%Other Exclusions 1% 1% 0% * 0% 0% 0% 0% - 0% 0% 0% 0%
Not Tested 1% 0% 0% * 1% 0% 0% 0% - 0% 0% 1% 0%Absent 1% 0% 0% * 1% 0% 0% 0% - 0% 0% 1% 0%Other 0% 0% 0% * 0% 0% 0% 0% - 0% 0% 0% 0%

TEA Division of Performance Reporting Page 9
TEXAS EDUCATION AGENCYDistrict Name: CALHOUN COUNTY ISD Texas Academic Performance Report Total Students: 283
Campus Name: SEADRIFT SCHOOL 2015-16 Campus Attendance and Postsecondary Readiness Grade Span: PK - 08Campus Number: 029901107 School Type: Elementary
State District CampusAfrican
American Hispanic WhiteAmerican
Indian AsianPacific
IslanderTwo or
More RacesSpecial
EdEcon
Disadv ELL
Attendance Rate2014-15 95.7% 95.0% 95.4% * 95.9% 94.6% * 97.7% * 95.8% 95.2% 95.4% 97.4%2013-14 95.9% 95.2% 95.9% * 95.9% 95.6% * 99.3% * 95.3% 95.3% 95.7% 97.5%
Annual Dropout Rate (Gr 7-8)2014-15 0.3% 0.3% 0.0% - 0.0% 0.0% - - * * 0.0% 0.0% *2013-14 0.5% 0.0% 0.0% - 0.0% 0.0% - * * * 0.0% 0.0% *

TEA Division of Performance Reporting Page 10
TEXAS EDUCATION AGENCYDistrict Name: CALHOUN COUNTY ISD Texas Academic Performance Report Total Students: 283
Campus Name: SEADRIFT SCHOOL 2015-16 Campus Profile Grade Span: PK - 08Campus Number: 029901107 School Type: Elementary
---------------- Campus ----------------Student Information Count Percent District State
Total Students: 283 100.0% 4,172 5,284,252
Students by Grade:Early Childhood Education 0 0.0% 0.3% 0.2%Pre-Kindergarten 17 6.0% 4.1% 4.2%Kindergarten 28 9.9% 7.7% 7.1%Grade 1 25 8.8% 7.5% 7.8%Grade 2 29 10.2% 6.9% 7.8%Grade 3 30 10.6% 8.0% 7.7%Grade 4 26 9.2% 7.3% 7.5%Grade 5 23 8.1% 6.3% 7.5%Grade 6 34 12.0% 7.3% 7.4%Grade 7 35 12.4% 7.6% 7.4%Grade 8 36 12.7% 7.9% 7.3%Grade 9 0 0.0% 7.5% 8.1%Grade 10 0 0.0% 8.0% 7.3%Grade 11 0 0.0% 7.5% 6.7%Grade 12 0 0.0% 6.1% 6.1%
Ethnic Distribution:African American 2 0.7% 2.1% 12.6%Hispanic 119 42.0% 63.0% 52.2%White 144 50.9% 28.5% 28.5%American Indian 4 1.4% 0.3% 0.4%Asian 8 2.8% 5.3% 4.0%Pacific Islander 0 0.0% 0.0% 0.1%Two or More Races 6 2.1% 0.8% 2.1%
Economically Disadvantaged 153 54.1% 60.3% 59.0%Non-Educationally Disadvantaged 130 45.9% 39.7% 41.0%English Language Learners (ELL) 32 11.3% 11.5% 18.5%Students w/ Disciplinary Placements (2014-2015) 1 0.3% 3.0% 1.4%At-Risk 95 33.6% 48.4% 50.1%Mobility (2014-2015) 46 16.5% 14.6% 16.5%
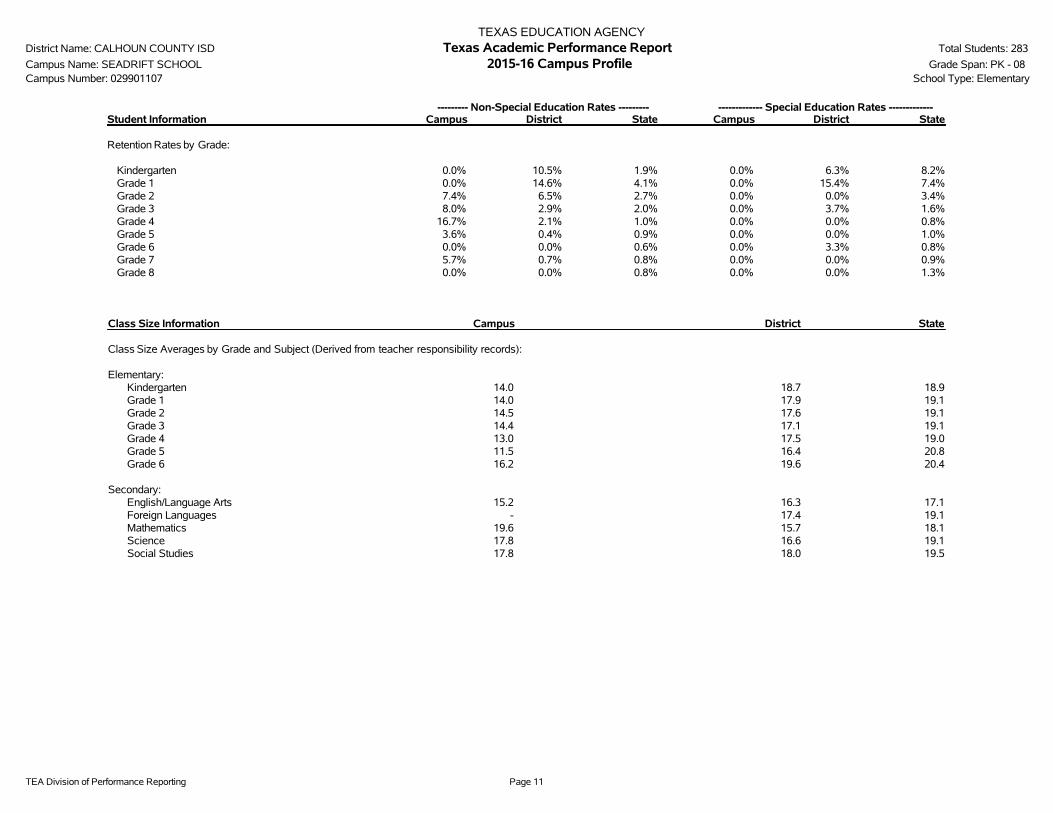
TEA Division of Performance Reporting Page 11
TEXAS EDUCATION AGENCYDistrict Name: CALHOUN COUNTY ISD Texas Academic Performance Report Total Students: 283
Campus Name: SEADRIFT SCHOOL 2015-16 Campus Profile Grade Span: PK - 08Campus Number: 029901107 School Type: Elementary
--------- Non-Special Education Rates --------- ------------- Special Education Rates -------------Student Information Campus District State Campus District State
Retention Rates by Grade:
Kindergarten 0.0% 10.5% 1.9% 0.0% 6.3% 8.2%Grade 1 0.0% 14.6% 4.1% 0.0% 15.4% 7.4%Grade 2 7.4% 6.5% 2.7% 0.0% 0.0% 3.4%Grade 3 8.0% 2.9% 2.0% 0.0% 3.7% 1.6%Grade 4 16.7% 2.1% 1.0% 0.0% 0.0% 0.8%Grade 5 3.6% 0.4% 0.9% 0.0% 0.0% 1.0%Grade 6 0.0% 0.0% 0.6% 0.0% 3.3% 0.8%Grade 7 5.7% 0.7% 0.8% 0.0% 0.0% 0.9%Grade 8 0.0% 0.0% 0.8% 0.0% 0.0% 1.3%
Class Size Information Campus District State
Class Size Averages by Grade and Subject (Derived from teacher responsibility records):
Elementary:Kindergarten 14.0 18.7 18.9Grade 1 14.0 17.9 19.1Grade 2 14.5 17.6 19.1Grade 3 14.4 17.1 19.1Grade 4 13.0 17.5 19.0Grade 5 11.5 16.4 20.8Grade 6 16.2 19.6 20.4
Secondary:English/Language Arts 15.2 16.3 17.1Foreign Languages - 17.4 19.1Mathematics 19.6 15.7 18.1Science 17.8 16.6 19.1Social Studies 17.8 18.0 19.5
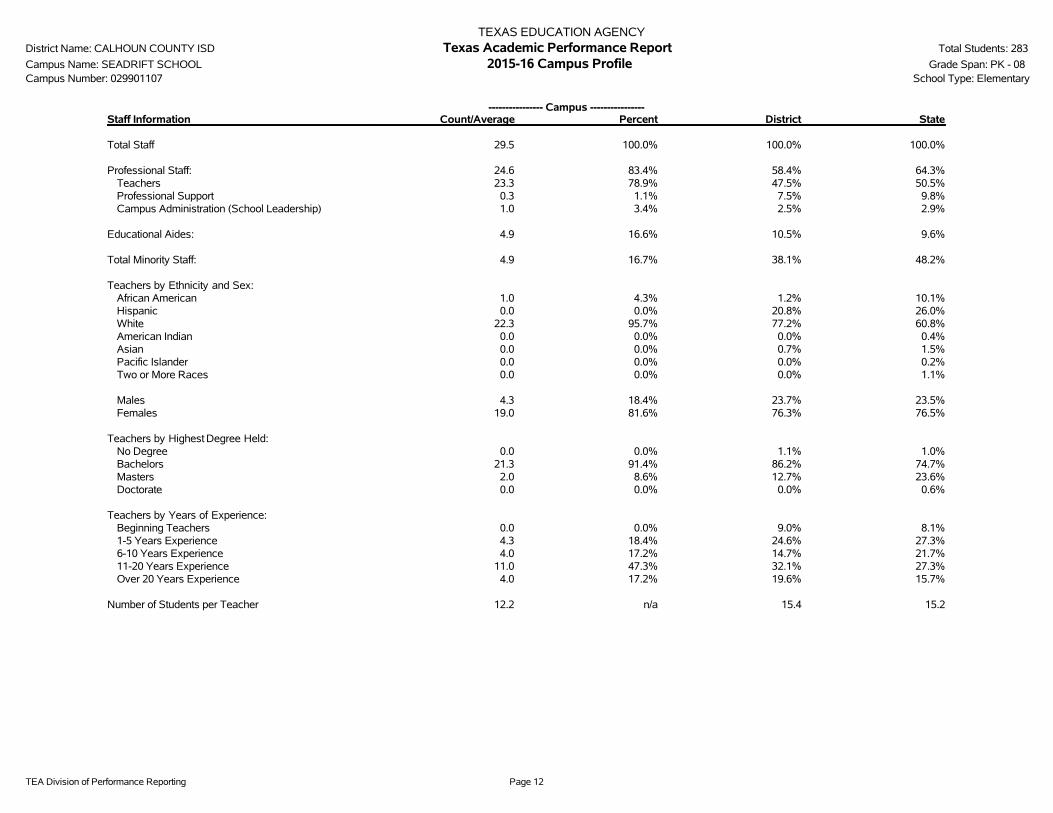
TEA Division of Performance Reporting Page 12
TEXAS EDUCATION AGENCYDistrict Name: CALHOUN COUNTY ISD Texas Academic Performance Report Total Students: 283
Campus Name: SEADRIFT SCHOOL 2015-16 Campus Profile Grade Span: PK - 08Campus Number: 029901107 School Type: Elementary
---------------- Campus ----------------Staff Information Count/Average Percent District State
Total Staff 29.5 100.0% 100.0% 100.0%
Professional Staff: 24.6 83.4% 58.4% 64.3%Teachers 23.3 78.9% 47.5% 50.5%Professional Support 0.3 1.1% 7.5% 9.8%Campus Administration (School Leadership) 1.0 3.4% 2.5% 2.9%
Educational Aides: 4.9 16.6% 10.5% 9.6%
Total Minority Staff: 4.9 16.7% 38.1% 48.2%
Teachers by Ethnicity and Sex:African American 1.0 4.3% 1.2% 10.1%Hispanic 0.0 0.0% 20.8% 26.0%White 22.3 95.7% 77.2% 60.8%American Indian 0.0 0.0% 0.0% 0.4%Asian 0.0 0.0% 0.7% 1.5%Pacific Islander 0.0 0.0% 0.0% 0.2%Two or More Races 0.0 0.0% 0.0% 1.1%
Males 4.3 18.4% 23.7% 23.5%Females 19.0 81.6% 76.3% 76.5%
Teachers by Highest Degree Held:No Degree 0.0 0.0% 1.1% 1.0%Bachelors 21.3 91.4% 86.2% 74.7%Masters 2.0 8.6% 12.7% 23.6%Doctorate 0.0 0.0% 0.0% 0.6%
Teachers by Years of Experience:Beginning Teachers 0.0 0.0% 9.0% 8.1%1-5 Years Experience 4.3 18.4% 24.6% 27.3%6-10 Years Experience 4.0 17.2% 14.7% 21.7%11-20 Years Experience 11.0 47.3% 32.1% 27.3%Over 20 Years Experience 4.0 17.2% 19.6% 15.7%
Number of Students per Teacher 12.2 n/a 15.4 15.2

TEA Division of Performance Reporting Page 13
TEXAS EDUCATION AGENCYDistrict Name: CALHOUN COUNTY ISD Texas Academic Performance Report Total Students: 283
Campus Name: SEADRIFT SCHOOL 2015-16 Campus Profile Grade Span: PK - 08Campus Number: 029901107 School Type: Elementary
Staff Information Campus District State
Average Years Experience of Teachers: 14.3 12.9 10.9Average Years Experience of Teachers with District: 10.8 8.4 7.3
Average Teacher Salary by Years of Experience (regular duties only):Beginning Teachers - $36,085 $45,5071-5 Years Experience $40,736 $41,344 $47,9966-10 Years Experience $44,810 $44,877 $50,45911-20 Years Experience $50,556 $51,582 $53,794Over 20 Years Experience $57,513 $56,808 $60,613
Average Actual Salaries (regular duties only):Teachers $48,961 $47,707 $51,891Professional Support $56,320 $57,854 $61,145Campus Administration (School Leadership) $82,529 $76,928 $75,654
Instructional Staff Percent: n/a 61.1% 64.5%
Contracted Instructional Staff (not incl. above): 0.0 0.0 1,914.4
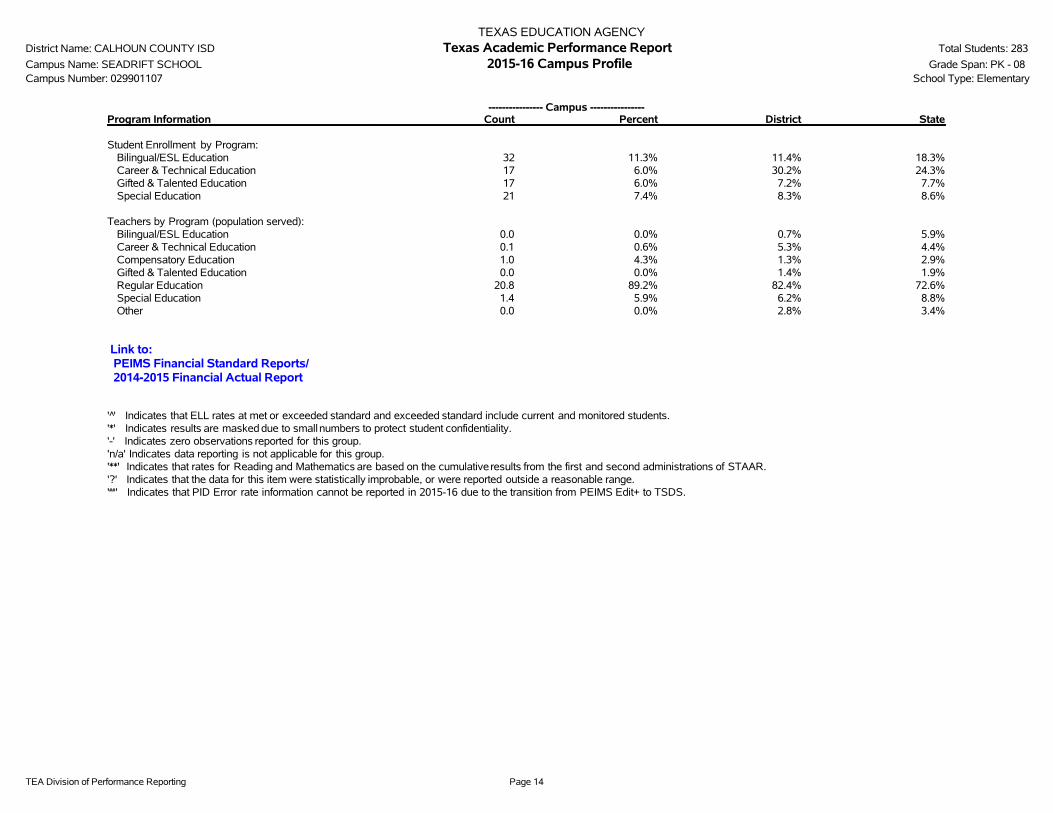
TEA Division of Performance Reporting Page 14
TEXAS EDUCATION AGENCYDistrict Name: CALHOUN COUNTY ISD Texas Academic Performance Report Total Students: 283
Campus Name: SEADRIFT SCHOOL 2015-16 Campus Profile Grade Span: PK - 08Campus Number: 029901107 School Type: Elementary
---------------- Campus ----------------Program Information Count Percent District State
Student Enrollment by Program:Bilingual/ESL Education 32 11.3% 11.4% 18.3%Career & Technical Education 17 6.0% 30.2% 24.3%Gifted & Talented Education 17 6.0% 7.2% 7.7%Special Education 21 7.4% 8.3% 8.6%
Teachers by Program (population served):Bilingual/ESL Education 0.0 0.0% 0.7% 5.9%Career & Technical Education 0.1 0.6% 5.3% 4.4%Compensatory Education 1.0 4.3% 1.3% 2.9%Gifted & Talented Education 0.0 0.0% 1.4% 1.9%Regular Education 20.8 89.2% 82.4% 72.6%Special Education 1.4 5.9% 6.2% 8.8%Other 0.0 0.0% 2.8% 3.4%
Link to: PEIMS Financial Standard Reports/ 2014-2015 Financial Actual Report
' '̂ Indicates that ELL rates at met or exceeded standard and exceeded standard include current and monitored students.'*' Indicates results are masked due to small numbers to protect student confidentiality.'-' Indicates zero observations reported for this group.'n/a' Indicates data reporting is not applicable for this group.'**' Indicates that rates for Reading and Mathematics are based on the cumulative results from the first and second administrations of STAAR.'?' Indicates that the data for this item were statistically improbable, or were reported outside a reasonable range.'##' Indicates that PID Error rate information cannot be reported in 2015-16 due to the transition from PEIMS Edit+ to TSDS.

2015-16 Texas Academic Performance Report2015-16 Texas Academic Performance Report
District Name: CALHOUN COUNTY ISD
Campus Name: TRAVIS MIDDLE
Campus Number: 029901043
2016 Accountability Rating: Met Standard

This page intentionally left blank.

TEA Division of Performance Reporting Page 1
TEXAS EDUCATION AGENCYDistrict Name: CALHOUN COUNTY ISD Texas Academic Performance Report Total Students: 843
Campus Name: TRAVIS MIDDLE 2015-16 Campus Performance Grade Span: 06 - 08Campus Number: 029901043 School Type: Middle
State District CampusAfrican
American Hispanic WhiteAmerican
Indian AsianPacific
Islander
Two orMore
RacesSpecial
EdEcon
Disadv ELL^STAARPercent at Level II Satisfactory Standard or Above
Grade 6
Reading 2016 69% 62% 60% * 54% 78% - 71% - * * 47% 37%
Mathematics 2016 72% 68% 66% * 61% 78% - 76% - * 26% 56% 58%
STAARPercent at Level II Satisfactory Standard or AboveGrade 7
Reading 2016 71% 63% 62% 75% 56% 66% * 95% - * * 46% 36%
Mathematics 2016 69% 66% 62% 63% 61% 63% * 81% - * 22% 48% 45%
Writing 2016 69% 62% 60% 56% 54% 68% * 89% - * * 46% 27%
STAARPercent at Level II Satisfactory Standard or AboveGrade 8 **
Reading 2016 87% 81% 80% 100% 71% 96% * 93% - * 27% 71% 33%
Mathematics 2016 82% 85% 85% 86% 82% 92% * 89% - * 55% 82% 67%
Science 2016 75% 63% 60% * 51% 76% * 93% - * * 49% 33%
Social Studies 2016 63% 41% 38% * 30% 48% * 93% - * * 27% 33%
STAARPercent at Level II Satisfactory Standard or AboveEnd of Course
Algebra I 2016 78% 86% 100% - 100% 100% - 100% - - - 100% -
STAARPercent at Level II Satisfactory Standard or AboveAll Grades
All Subjects 2016 75% 74% 64% 65% 58% 75% 71% 86% - 40% 19% 53% 42%
Reading 2016 73% 70% 68% 76% 60% 82% * 85% - * 13% 55% 36%
Mathematics 2016 76% 80% 73% 71% 69% 80% * 83% - * 33% 64% 56%
Writing 2016 69% 70% 60% 56% 54% 68% * 89% - * * 46% 27%
Science 2016 79% 77% 60% * 51% 76% * 93% - * * 49% 33%

TEA Division of Performance Reporting Page 2
TEXAS EDUCATION AGENCYDistrict Name: CALHOUN COUNTY ISD Texas Academic Performance Report Total Students: 843
Campus Name: TRAVIS MIDDLE 2015-16 Campus Performance Grade Span: 06 - 08Campus Number: 029901043 School Type: Middle
State District CampusAfrican
American Hispanic WhiteAmerican
Indian AsianPacific
Islander
Two orMore
RacesSpecial
EdEcon
Disadv ELL^STAARPercent at Level II Satisfactory Standard or Above
All Grades
Social Studies 2016 77% 66% 38% * 30% 48% * 93% - * * 27% 33%
STAARPercent at Postsecondary Readiness StandardAll Grades
Two or More Subjects 2016 45% 40% 32% 28% 23% 47% * 58% - * * 19% *
Reading 2016 46% 38% 31% * 26% 43% * 58% - * * 19% 10%
Mathematics 2016 43% 46% 42% 47% 34% 58% * 65% - * * 30% 24%
Writing 2016 41% 39% 36% * 30% 43% * 72% - * * 22% *
Science 2016 47% 43% 30% * 21% 43% * 62% - * * 19% *
Social Studies 2016 47% 36% 14% * 10% 16% * 62% - * * 6% *
STAARPercent at Advanced StandardAll Grades
All Subjects 2016 18% 14% 12% * 8% 15% * 43% - * * 6% 4%
Reading 2016 17% 13% 13% * 9% 18% * 39% - * * 7% *
Mathematics 2016 19% 19% 16% * 11% 19% * 50% - * * 8% 9%
Writing 2016 15% 11% 7% * 4% 13% * * - * * * *
Science 2016 16% 11% 12% * 7% 15% * 57% - * * 6% *
Social Studies 2016 22% 12% 5% * * * * 50% - * * * *
STAARPercent Met or Exceeded ProgressAll Grades
All Subjects 2016 62% 62% 58% * 56% 63% * 68% - * 48% 54% 47%
Reading 2016 60% 54% 51% * 50% 53% * 69% - * 40% 47% 42%
Mathematics 2016 63% 69% 66% * 62% 73% * 68% - * 55% 60% 52%

TEA Division of Performance Reporting Page 3
TEXAS EDUCATION AGENCYDistrict Name: CALHOUN COUNTY ISD Texas Academic Performance Report Total Students: 843
Campus Name: TRAVIS MIDDLE 2015-16 Campus Performance Grade Span: 06 - 08Campus Number: 029901043 School Type: Middle
State District CampusAfrican
American Hispanic WhiteAmerican
Indian AsianPacific
Islander
Two orMore
RacesSpecial
EdEcon
Disadv ELL^STAARPercent Exceeded Progress
All Grades
All Subjects 2016 17% 17% 14% * 12% 16% * 32% - * 11% 11% 10%
Reading 2016 16% 13% 14% * 13% 14% * 22% - * 10% 12% 10%
Mathematics 2016 17% 20% 14% * 11% 17% * 42% - * 12% 11% 10%
Progress of Prior-Year Non-Proficient StudentsSum of Grades 4-8
Reading 2016 35% 38% 32% * 27% 45% * * - * * 27% 21%

TEA Division of Performance Reporting Page 4
TEXAS EDUCATION AGENCYDistrict Name: CALHOUN COUNTY ISD Texas Academic Performance Report Total Students: 843
Campus Name: TRAVIS MIDDLE 2015-16 Campus Performance Grade Span: 06 - 08Campus Number: 029901043 School Type: Middle
State District CampusAfrican
American Hispanic WhiteAmerican
Indian AsianPacific
Islander
Two orMore
RacesSpecial
EdEcon
Disadv ELLStudent Success Initiative
Grade 8 Reading
Students Meeting Level II Standard on First STAARAdministration
2016 80% 72% 70% 100% 60% 90% * 87% - * 23% 60% *
Students Requiring Accelerated Instruction
2016 20% 28% 30% * 40% 10% * * - * 77% 40% 81%
STAARCumulative Met Standard
2016 86% 81% 80% 100% 71% 96% * 87% - * 27% 71% 31%
STAARNon-Proficient Students Promoted by Grade Placement Committee
2015 97% * * - * - - - - - - * *
STAARMet Standard (Non-Proficient in Previous Year)
Retained in Grade 8
2016 44% * * - * - - - - - - * -
Grade 8 Mathematics
Students Meeting Level II Standard on First STAARAdministration
2016 71% 78% 77% 71% 74% 86% * 90% - * 45% 73% 63%
Students Requiring Accelerated Instruction
2016 29% 22% 23% * 26% 14% * * - * 55% 27% 38%
STAARCumulative Met Standard
2016 81% 85% 85% 86% 82% 92% * 90% - * 55% 82% 69%
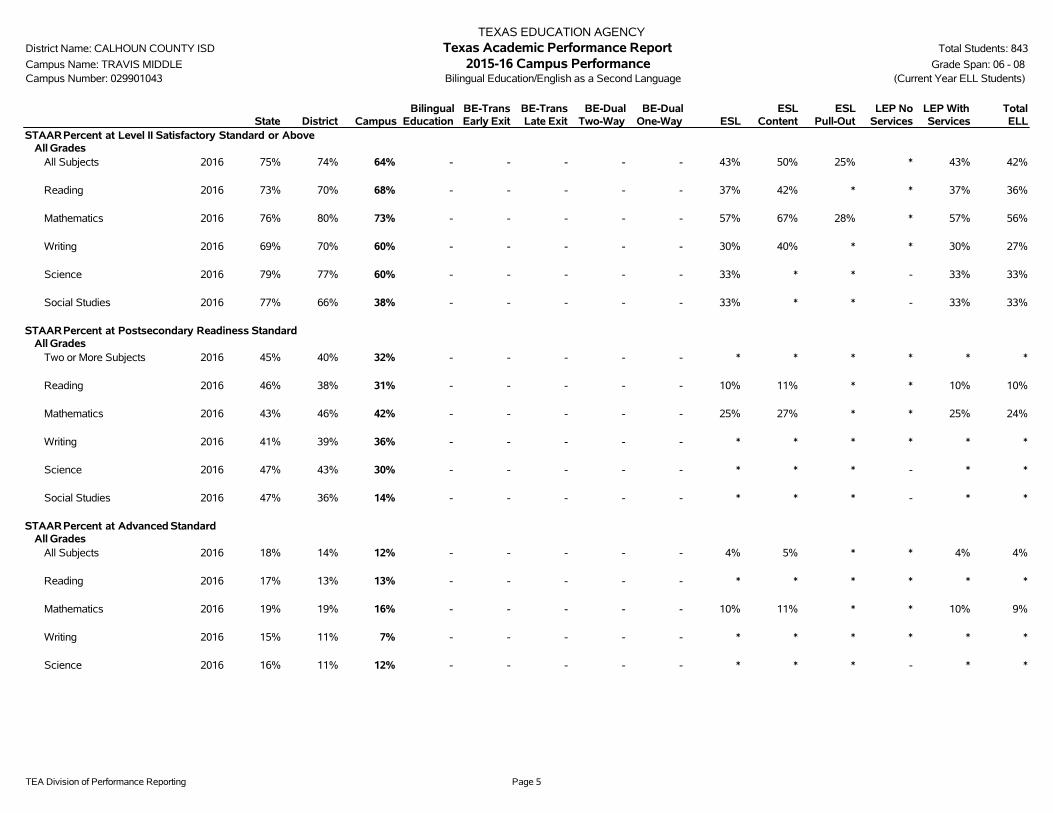
TEA Division of Performance Reporting Page 5
TEXAS EDUCATION AGENCYDistrict Name: CALHOUN COUNTY ISD Texas Academic Performance Report Total Students: 843
Campus Name: TRAVIS MIDDLE 2015-16 Campus Performance Grade Span: 06 - 08Campus Number: 029901043 Bilingual Education/English as a Second Language (Current Year ELL Students)
State District CampusBilingual
EducationBE-TransEarly Exit
BE-TransLate Exit
BE-DualTwo-Way
BE-DualOne-Way ESL
ESLContent
ESLPull-Out
LEP NoServices
LEP WithServices
TotalELL
STAARPercent at Level II Satisfactory Standard or AboveAll Grades
All Subjects 2016 75% 74% 64% - - - - - 43% 50% 25% * 43% 42%
Reading 2016 73% 70% 68% - - - - - 37% 42% * * 37% 36%
Mathematics 2016 76% 80% 73% - - - - - 57% 67% 28% * 57% 56%
Writing 2016 69% 70% 60% - - - - - 30% 40% * * 30% 27%
Science 2016 79% 77% 60% - - - - - 33% * * - 33% 33%
Social Studies 2016 77% 66% 38% - - - - - 33% * * - 33% 33%
STAARPercent at Postsecondary Readiness StandardAll Grades
Two or More Subjects 2016 45% 40% 32% - - - - - * * * * * *
Reading 2016 46% 38% 31% - - - - - 10% 11% * * 10% 10%
Mathematics 2016 43% 46% 42% - - - - - 25% 27% * * 25% 24%
Writing 2016 41% 39% 36% - - - - - * * * * * *
Science 2016 47% 43% 30% - - - - - * * * - * *
Social Studies 2016 47% 36% 14% - - - - - * * * - * *
STAARPercent at Advanced StandardAll Grades
All Subjects 2016 18% 14% 12% - - - - - 4% 5% * * 4% 4%
Reading 2016 17% 13% 13% - - - - - * * * * * *
Mathematics 2016 19% 19% 16% - - - - - 10% 11% * * 10% 9%
Writing 2016 15% 11% 7% - - - - - * * * * * *
Science 2016 16% 11% 12% - - - - - * * * - * *

TEA Division of Performance Reporting Page 6
TEXAS EDUCATION AGENCYDistrict Name: CALHOUN COUNTY ISD Texas Academic Performance Report Total Students: 843
Campus Name: TRAVIS MIDDLE 2015-16 Campus Performance Grade Span: 06 - 08Campus Number: 029901043 Bilingual Education/English as a Second Language (Current Year ELL Students)
State District CampusBilingual
EducationBE-TransEarly Exit
BE-TransLate Exit
BE-DualTwo-Way
BE-DualOne-Way ESL
ESLContent
ESLPull-Out
LEP NoServices
LEP WithServices
TotalELL
STAARPercent at Advanced StandardAll Grades
Social Studies 2016 22% 12% 5% - - - - - * * * - * *
STAARPercent Met or Exceeded ProgressAll Grades
All Subjects 2016 62% 62% 58% - - - - - 47% 51% * * 47% 47%
Reading 2016 60% 54% 51% - - - - - 43% 46% * * 43% 42%
Mathematics 2016 63% 69% 66% - - - - - 52% 56% * * 52% 52%
STAARPercent Exceeded ProgressAll Grades
All Subjects 2016 17% 17% 14% - - - - - 11% 12% * * 11% 11%
Reading 2016 16% 13% 14% - - - - - 11% 11% * * 11% 10%
Mathematics 2016 17% 20% 14% - - - - - 12% 14% * * 12% 12%
Progress of Prior-Year Non-Proficient StudentsSum of Grades 4-8
Reading 2016 35% 38% 32% - - - - - 21% 20% * * 21% 21%
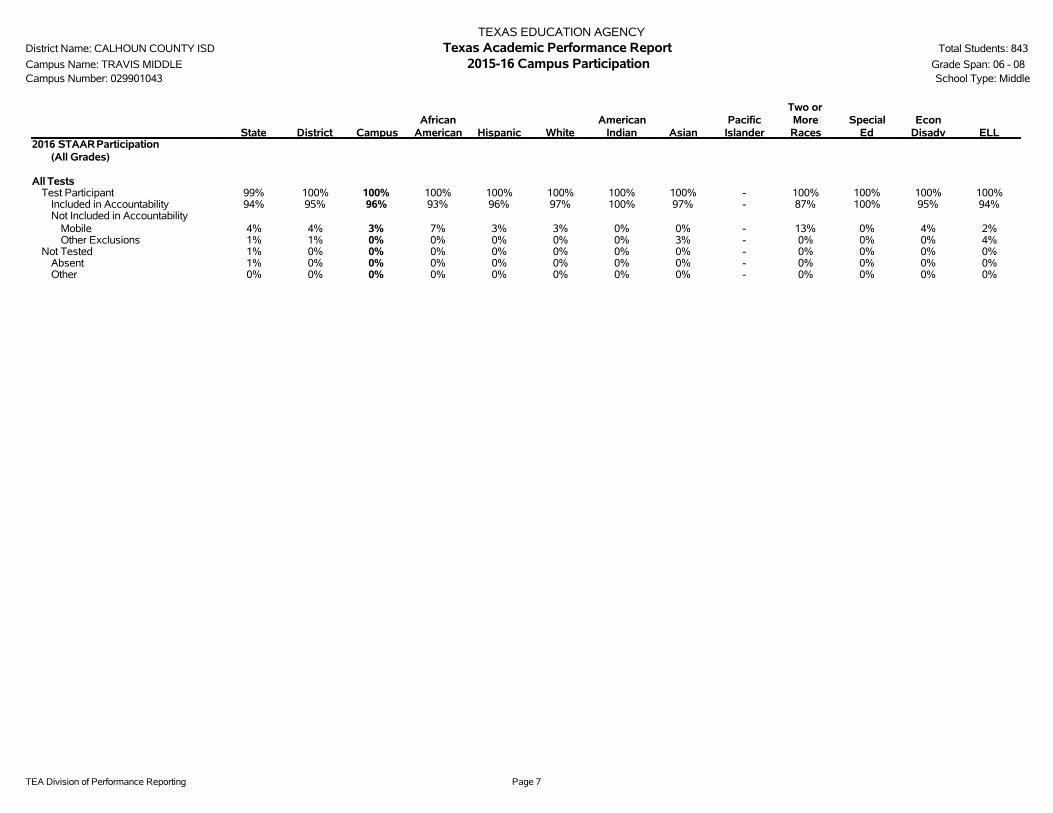
TEA Division of Performance Reporting Page 7
TEXAS EDUCATION AGENCYDistrict Name: CALHOUN COUNTY ISD Texas Academic Performance Report Total Students: 843
Campus Name: TRAVIS MIDDLE 2015-16 Campus Participation Grade Span: 06 - 08Campus Number: 029901043 School Type: Middle
State District CampusAfrican
American Hispanic WhiteAmerican
Indian AsianPacific
Islander
Two orMoreRaces
SpecialEd
EconDisadv ELL
2016 STAARParticipation(All Grades)
All TestsTest Participant 99% 100% 100% 100% 100% 100% 100% 100% - 100% 100% 100% 100%
Included in Accountability 94% 95% 96% 93% 96% 97% 100% 97% - 87% 100% 95% 94%Not Included in Accountability
Mobile 4% 4% 3% 7% 3% 3% 0% 0% - 13% 0% 4% 2%Other Exclusions 1% 1% 0% 0% 0% 0% 0% 3% - 0% 0% 0% 4%
Not Tested 1% 0% 0% 0% 0% 0% 0% 0% - 0% 0% 0% 0%Absent 1% 0% 0% 0% 0% 0% 0% 0% - 0% 0% 0% 0%Other 0% 0% 0% 0% 0% 0% 0% 0% - 0% 0% 0% 0%

TEA Division of Performance Reporting Page 8
TEXAS EDUCATION AGENCYDistrict Name: CALHOUN COUNTY ISD Texas Academic Performance Report Total Students: 843
Campus Name: TRAVIS MIDDLE 2015-16 Campus Attendance and Postsecondary Readiness Grade Span: 06 - 08Campus Number: 029901043 School Type: Middle
State District CampusAfrican
American Hispanic WhiteAmerican
Indian AsianPacific
IslanderTwo or
More RacesSpecial
EdEcon
Disadv ELL
Attendance Rate2014-15 95.7% 95.0% 94.7% 94.3% 94.5% 94.4% * 98.4% - 94.3% 93.3% 93.9% 96.5%2013-14 95.9% 95.2% 94.6% 91.8% 94.4% 94.9% * 97.8% - 93.5% 92.9% 93.7% 95.9%
Annual Dropout Rate (Gr 7-8)2014-15 0.3% 0.3% 0.3% 0.0% 0.3% 0.6% - 0.0% - 0.0% 0.0% 0.3% 0.0%2013-14 0.5% 0.0% 0.0% 0.0% 0.0% 0.0% * 0.0% - 0.0% 0.0% 0.0% 0.0%
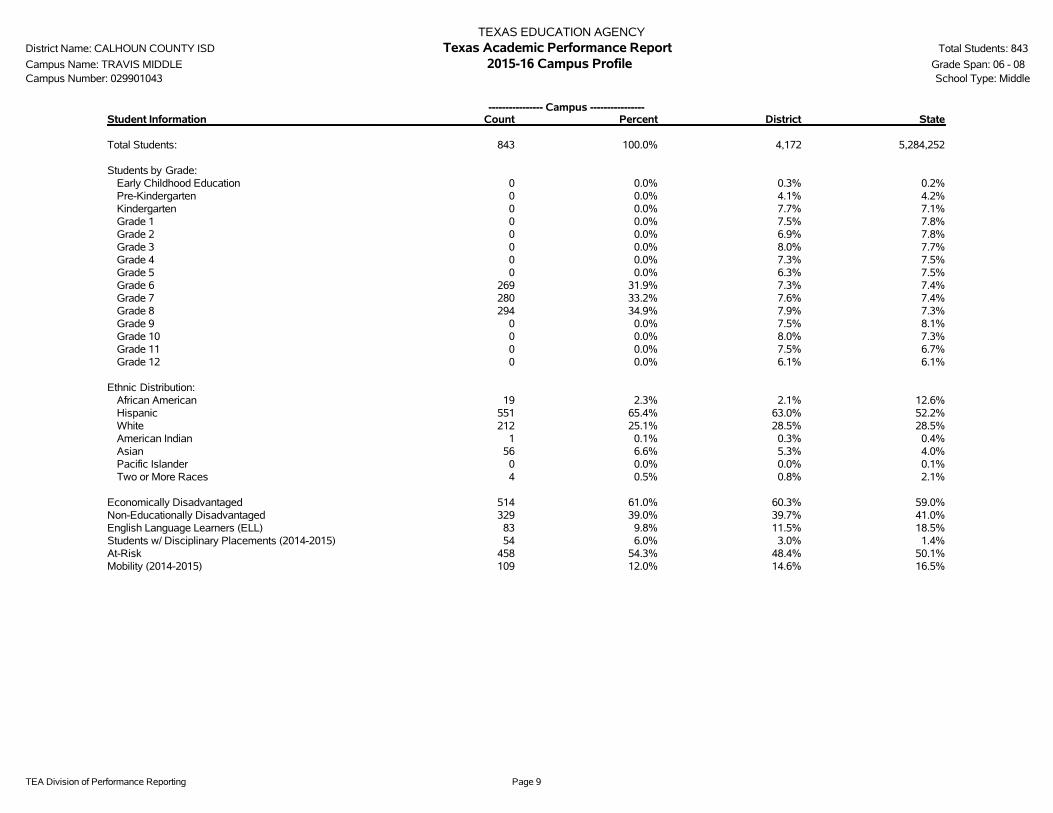
TEA Division of Performance Reporting Page 9
TEXAS EDUCATION AGENCYDistrict Name: CALHOUN COUNTY ISD Texas Academic Performance Report Total Students: 843
Campus Name: TRAVIS MIDDLE 2015-16 Campus Profile Grade Span: 06 - 08Campus Number: 029901043 School Type: Middle
---------------- Campus ----------------Student Information Count Percent District State
Total Students: 843 100.0% 4,172 5,284,252
Students by Grade:Early Childhood Education 0 0.0% 0.3% 0.2%Pre-Kindergarten 0 0.0% 4.1% 4.2%Kindergarten 0 0.0% 7.7% 7.1%Grade 1 0 0.0% 7.5% 7.8%Grade 2 0 0.0% 6.9% 7.8%Grade 3 0 0.0% 8.0% 7.7%Grade 4 0 0.0% 7.3% 7.5%Grade 5 0 0.0% 6.3% 7.5%Grade 6 269 31.9% 7.3% 7.4%Grade 7 280 33.2% 7.6% 7.4%Grade 8 294 34.9% 7.9% 7.3%Grade 9 0 0.0% 7.5% 8.1%Grade 10 0 0.0% 8.0% 7.3%Grade 11 0 0.0% 7.5% 6.7%Grade 12 0 0.0% 6.1% 6.1%
Ethnic Distribution:African American 19 2.3% 2.1% 12.6%Hispanic 551 65.4% 63.0% 52.2%White 212 25.1% 28.5% 28.5%American Indian 1 0.1% 0.3% 0.4%Asian 56 6.6% 5.3% 4.0%Pacific Islander 0 0.0% 0.0% 0.1%Two or More Races 4 0.5% 0.8% 2.1%
Economically Disadvantaged 514 61.0% 60.3% 59.0%Non-Educationally Disadvantaged 329 39.0% 39.7% 41.0%English Language Learners (ELL) 83 9.8% 11.5% 18.5%Students w/ Disciplinary Placements (2014-2015) 54 6.0% 3.0% 1.4%At-Risk 458 54.3% 48.4% 50.1%Mobility (2014-2015) 109 12.0% 14.6% 16.5%

TEA Division of Performance Reporting Page 10
TEXAS EDUCATION AGENCYDistrict Name: CALHOUN COUNTY ISD Texas Academic Performance Report Total Students: 843
Campus Name: TRAVIS MIDDLE 2015-16 Campus Profile Grade Span: 06 - 08Campus Number: 029901043 School Type: Middle
--------- Non-Special Education Rates --------- ------------- Special Education Rates -------------Student Information Campus District State Campus District State
Retention Rates by Grade:
Kindergarten - 10.5% 1.9% - 6.3% 8.2%Grade 1 - 14.6% 4.1% - 15.4% 7.4%Grade 2 - 6.5% 2.7% - 0.0% 3.4%Grade 3 - 2.9% 2.0% - 3.7% 1.6%Grade 4 - 2.1% 1.0% - 0.0% 0.8%Grade 5 - 0.4% 0.9% - 0.0% 1.0%Grade 6 0.0% 0.0% 0.6% 3.7% 3.3% 0.8%Grade 7 0.0% 0.7% 0.8% 0.0% 0.0% 0.9%Grade 8 0.0% 0.0% 0.8% 0.0% 0.0% 1.3%
Class Size Information Campus District State
Class Size Averages by Grade and Subject (Derived from teacher responsibility records):
Elementary:Kindergarten - 18.7 18.9Grade 1 - 17.9 19.1Grade 2 - 17.6 19.1Grade 3 - 17.1 19.1Grade 4 - 17.5 19.0Grade 5 - 16.4 20.8Grade 6 20.1 19.6 20.4
Secondary:English/Language Arts 21.8 16.3 17.1Foreign Languages 28.0 17.4 19.1Mathematics 20.1 15.7 18.1Science 22.8 16.6 19.1Social Studies 23.7 18.0 19.5

TEA Division of Performance Reporting Page 11
TEXAS EDUCATION AGENCYDistrict Name: CALHOUN COUNTY ISD Texas Academic Performance Report Total Students: 843
Campus Name: TRAVIS MIDDLE 2015-16 Campus Profile Grade Span: 06 - 08Campus Number: 029901043 School Type: Middle
---------------- Campus ----------------Staff Information Count/Average Percent District State
Total Staff 71.0 100.0% 100.0% 100.0%
Professional Staff: 59.0 83.0% 58.4% 64.3%Teachers 52.1 73.3% 47.5% 50.5%Professional Support 3.4 4.8% 7.5% 9.8%Campus Administration (School Leadership) 3.5 4.9% 2.5% 2.9%
Educational Aides: 12.1 17.0% 10.5% 9.6%
Total Minority Staff: 22.2 31.3% 38.1% 48.2%
Teachers by Ethnicity and Sex:African American 0.3 0.5% 1.2% 10.1%Hispanic 10.3 19.8% 20.8% 26.0%White 41.5 79.7% 77.2% 60.8%American Indian 0.0 0.0% 0.0% 0.4%Asian 0.0 0.0% 0.7% 1.5%Pacific Islander 0.0 0.0% 0.0% 0.2%Two or More Races 0.0 0.0% 0.0% 1.1%
Males 15.3 29.3% 23.7% 23.5%Females 36.8 70.7% 76.3% 76.5%
Teachers by Highest Degree Held:No Degree 0.3 0.5% 1.1% 1.0%Bachelors 42.9 82.3% 86.2% 74.7%Masters 8.9 17.1% 12.7% 23.6%Doctorate 0.0 0.0% 0.0% 0.6%
Teachers by Years of Experience:Beginning Teachers 6.7 12.8% 9.0% 8.1%1-5 Years Experience 13.4 25.8% 24.6% 27.3%6-10 Years Experience 8.8 16.9% 14.7% 21.7%11-20 Years Experience 15.0 28.8% 32.1% 27.3%Over 20 Years Experience 8.2 15.8% 19.6% 15.7%
Number of Students per Teacher 16.2 n/a 15.4 15.2
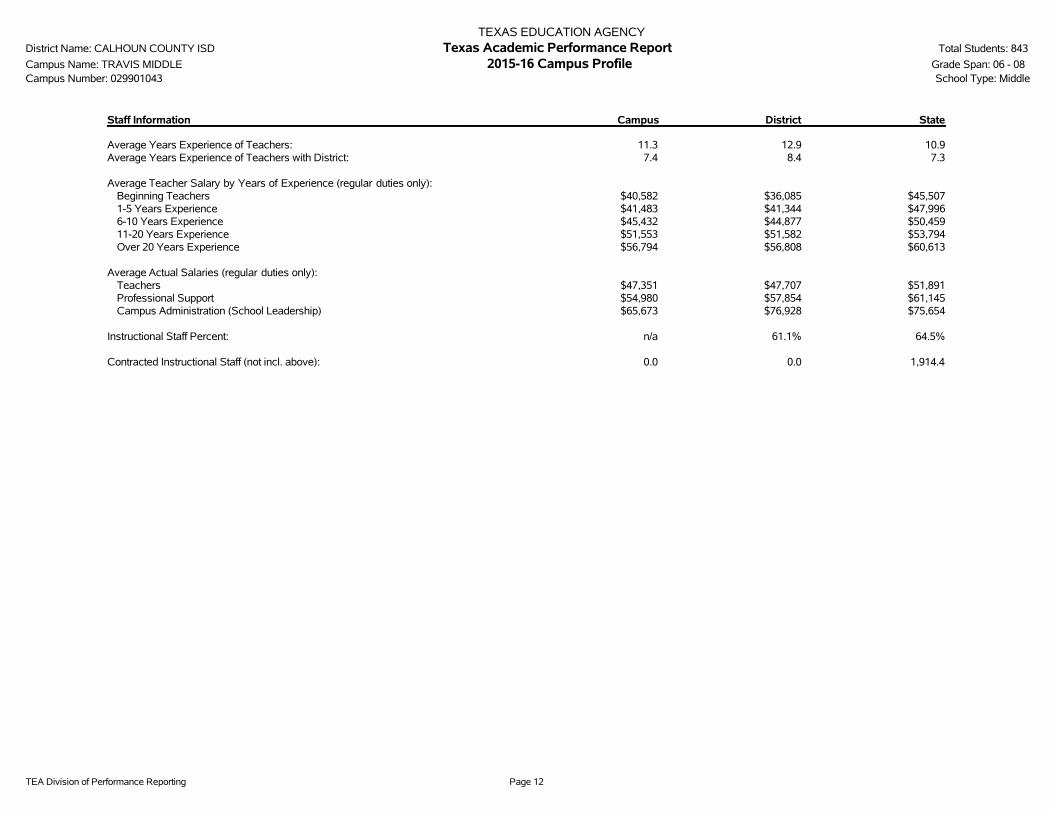
TEA Division of Performance Reporting Page 12
TEXAS EDUCATION AGENCYDistrict Name: CALHOUN COUNTY ISD Texas Academic Performance Report Total Students: 843
Campus Name: TRAVIS MIDDLE 2015-16 Campus Profile Grade Span: 06 - 08Campus Number: 029901043 School Type: Middle
Staff Information Campus District State
Average Years Experience of Teachers: 11.3 12.9 10.9Average Years Experience of Teachers with District: 7.4 8.4 7.3
Average Teacher Salary by Years of Experience (regular duties only):Beginning Teachers $40,582 $36,085 $45,5071-5 Years Experience $41,483 $41,344 $47,9966-10 Years Experience $45,432 $44,877 $50,45911-20 Years Experience $51,553 $51,582 $53,794Over 20 Years Experience $56,794 $56,808 $60,613
Average Actual Salaries (regular duties only):Teachers $47,351 $47,707 $51,891Professional Support $54,980 $57,854 $61,145Campus Administration (School Leadership) $65,673 $76,928 $75,654
Instructional Staff Percent: n/a 61.1% 64.5%
Contracted Instructional Staff (not incl. above): 0.0 0.0 1,914.4
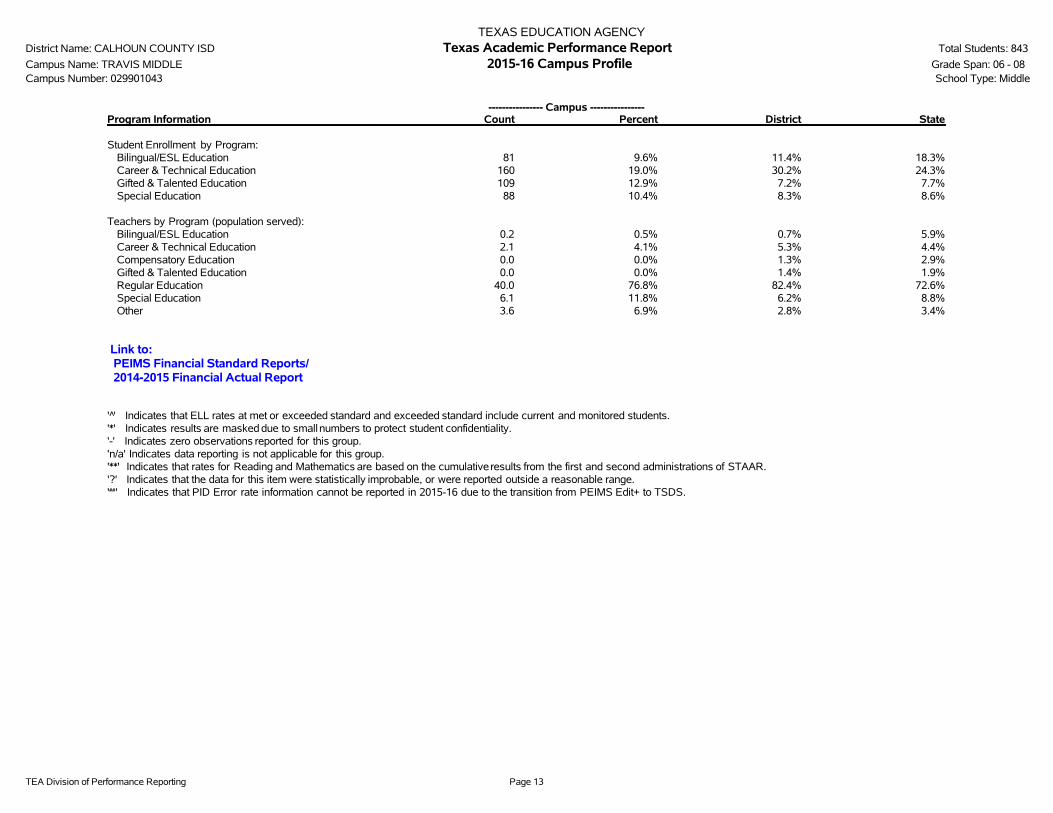
TEA Division of Performance Reporting Page 13
TEXAS EDUCATION AGENCYDistrict Name: CALHOUN COUNTY ISD Texas Academic Performance Report Total Students: 843
Campus Name: TRAVIS MIDDLE 2015-16 Campus Profile Grade Span: 06 - 08Campus Number: 029901043 School Type: Middle
---------------- Campus ----------------Program Information Count Percent District State
Student Enrollment by Program:Bilingual/ESL Education 81 9.6% 11.4% 18.3%Career & Technical Education 160 19.0% 30.2% 24.3%Gifted & Talented Education 109 12.9% 7.2% 7.7%Special Education 88 10.4% 8.3% 8.6%
Teachers by Program (population served):Bilingual/ESL Education 0.2 0.5% 0.7% 5.9%Career & Technical Education 2.1 4.1% 5.3% 4.4%Compensatory Education 0.0 0.0% 1.3% 2.9%Gifted & Talented Education 0.0 0.0% 1.4% 1.9%Regular Education 40.0 76.8% 82.4% 72.6%Special Education 6.1 11.8% 6.2% 8.8%Other 3.6 6.9% 2.8% 3.4%
Link to: PEIMS Financial Standard Reports/ 2014-2015 Financial Actual Report
' '̂ Indicates that ELL rates at met or exceeded standard and exceeded standard include current and monitored students.'*' Indicates results are masked due to small numbers to protect student confidentiality.'-' Indicates zero observations reported for this group.'n/a' Indicates data reporting is not applicable for this group.'**' Indicates that rates for Reading and Mathematics are based on the cumulative results from the first and second administrations of STAAR.'?' Indicates that the data for this item were statistically improbable, or were reported outside a reasonable range.'##' Indicates that PID Error rate information cannot be reported in 2015-16 due to the transition from PEIMS Edit+ to TSDS.

This page intentionally left blank.
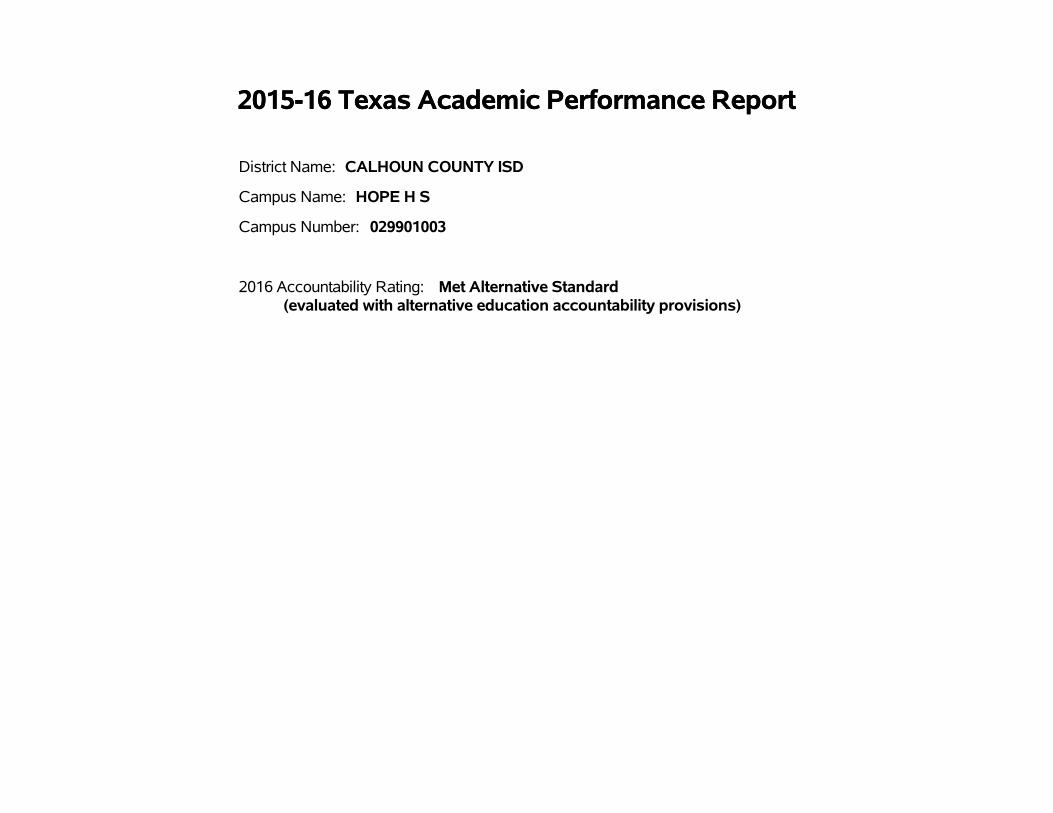
2015-16 Texas Academic Performance Report2015-16 Texas Academic Performance Report
District Name: CALHOUN COUNTY ISD
Campus Name: HOPE H S
Campus Number: 029901003
2016 Accountability Rating: Met Alternative Standard(evaluated with alternative education accountability provisions)

This page intentionally left blank.
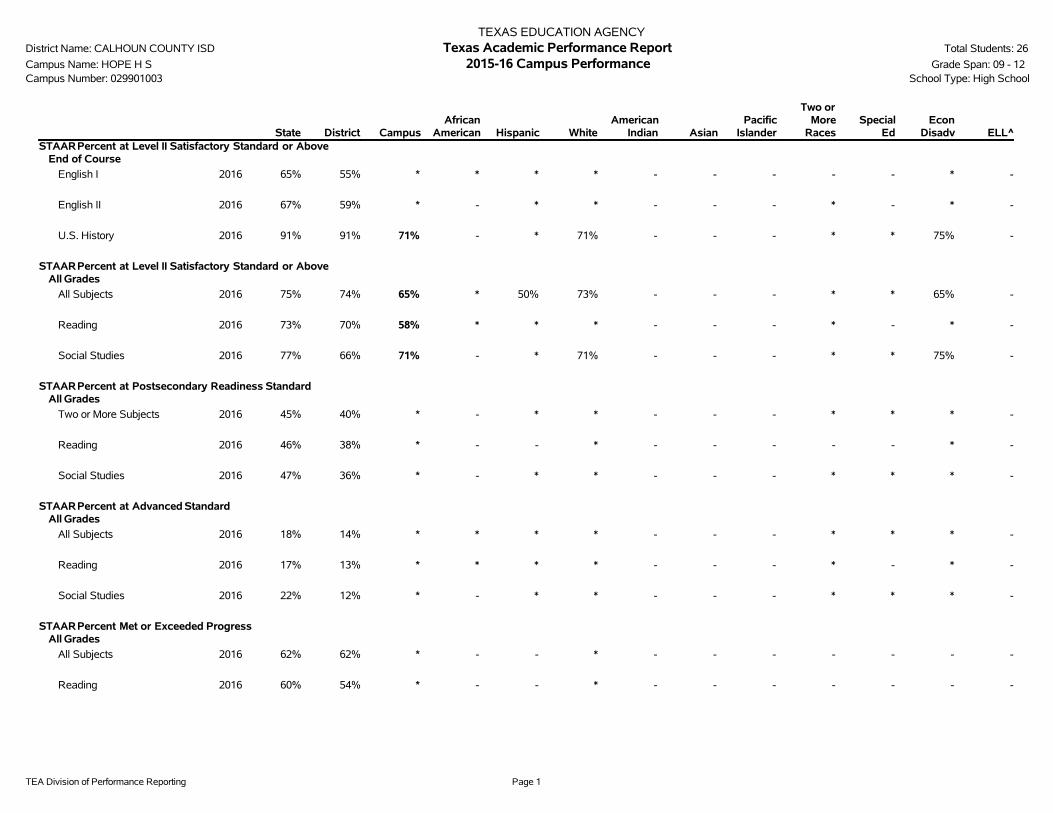
TEA Division of Performance Reporting Page 1
TEXAS EDUCATION AGENCYDistrict Name: CALHOUN COUNTY ISD Texas Academic Performance Report Total Students: 26
Campus Name: HOPE H S 2015-16 Campus Performance Grade Span: 09 - 12Campus Number: 029901003 School Type: High School
State District CampusAfrican
American Hispanic WhiteAmerican
Indian AsianPacific
Islander
Two orMore
RacesSpecial
EdEcon
Disadv ELL^STAARPercent at Level II Satisfactory Standard or Above
End of Course
English I 2016 65% 55% * * * * - - - - - * -
English II 2016 67% 59% * - * * - - - * - * -
U.S. History 2016 91% 91% 71% - * 71% - - - * * 75% -
STAARPercent at Level II Satisfactory Standard or AboveAll Grades
All Subjects 2016 75% 74% 65% * 50% 73% - - - * * 65% -
Reading 2016 73% 70% 58% * * * - - - * - * -
Social Studies 2016 77% 66% 71% - * 71% - - - * * 75% -
STAARPercent at Postsecondary Readiness StandardAll Grades
Two or More Subjects 2016 45% 40% * - * * - - - * * * -
Reading 2016 46% 38% * - - * - - - - - * -
Social Studies 2016 47% 36% * - * * - - - * * * -
STAARPercent at Advanced StandardAll Grades
All Subjects 2016 18% 14% * * * * - - - * * * -
Reading 2016 17% 13% * * * * - - - * - * -
Social Studies 2016 22% 12% * - * * - - - * * * -
STAARPercent Met or Exceeded ProgressAll Grades
All Subjects 2016 62% 62% * - - * - - - - - - -
Reading 2016 60% 54% * - - * - - - - - - -

TEA Division of Performance Reporting Page 2
TEXAS EDUCATION AGENCYDistrict Name: CALHOUN COUNTY ISD Texas Academic Performance Report Total Students: 26
Campus Name: HOPE H S 2015-16 Campus Performance Grade Span: 09 - 12Campus Number: 029901003 School Type: High School
State District CampusAfrican
American Hispanic WhiteAmerican
Indian AsianPacific
Islander
Two orMore
RacesSpecial
EdEcon
Disadv ELL^STAARPercent Exceeded Progress
All Grades
All Subjects 2016 17% 17% * - - * - - - - - - -
Reading 2016 16% 13% * - - * - - - - - - -

TEA Division of Performance Reporting Page 3
TEXAS EDUCATION AGENCYDistrict Name: CALHOUN COUNTY ISD Texas Academic Performance Report Total Students: 26
Campus Name: HOPE H S 2015-16 Campus Performance Grade Span: 09 - 12Campus Number: 029901003 Bilingual Education/English as a Second Language (Current Year ELL Students)
State District CampusBilingual
EducationBE-TransEarly Exit
BE-TransLate Exit
BE-DualTwo-Way
BE-DualOne-Way ESL
ESLContent
ESLPull-Out
LEP NoServices
LEP WithServices
TotalELL
STAARPercent at Level II Satisfactory Standard or AboveAll Grades
All Subjects 2016 75% 74% 65% - - - - - - - - - - -
Reading 2016 73% 70% 58% - - - - - - - - - - -
Social Studies 2016 77% 66% 71% - - - - - - - - - - -
STAARPercent at Postsecondary Readiness StandardAll Grades
Two or More Subjects 2016 45% 40% * - - - - - - - - - - -
Reading 2016 46% 38% * - - - - - - - - - - -
Social Studies 2016 47% 36% * - - - - - - - - - - -
STAARPercent at Advanced StandardAll Grades
All Subjects 2016 18% 14% * - - - - - - - - - - -
Reading 2016 17% 13% * - - - - - - - - - - -
Social Studies 2016 22% 12% * - - - - - - - - - - -
STAARPercent Met or Exceeded ProgressAll Grades
All Subjects 2016 62% 62% * - - - - - - - - - - -
Reading 2016 60% 54% * - - - - - - - - - - -
STAARPercent Exceeded ProgressAll Grades
All Subjects 2016 17% 17% * - - - - - - - - - - -
Reading 2016 16% 13% * - - - - - - - - - - -
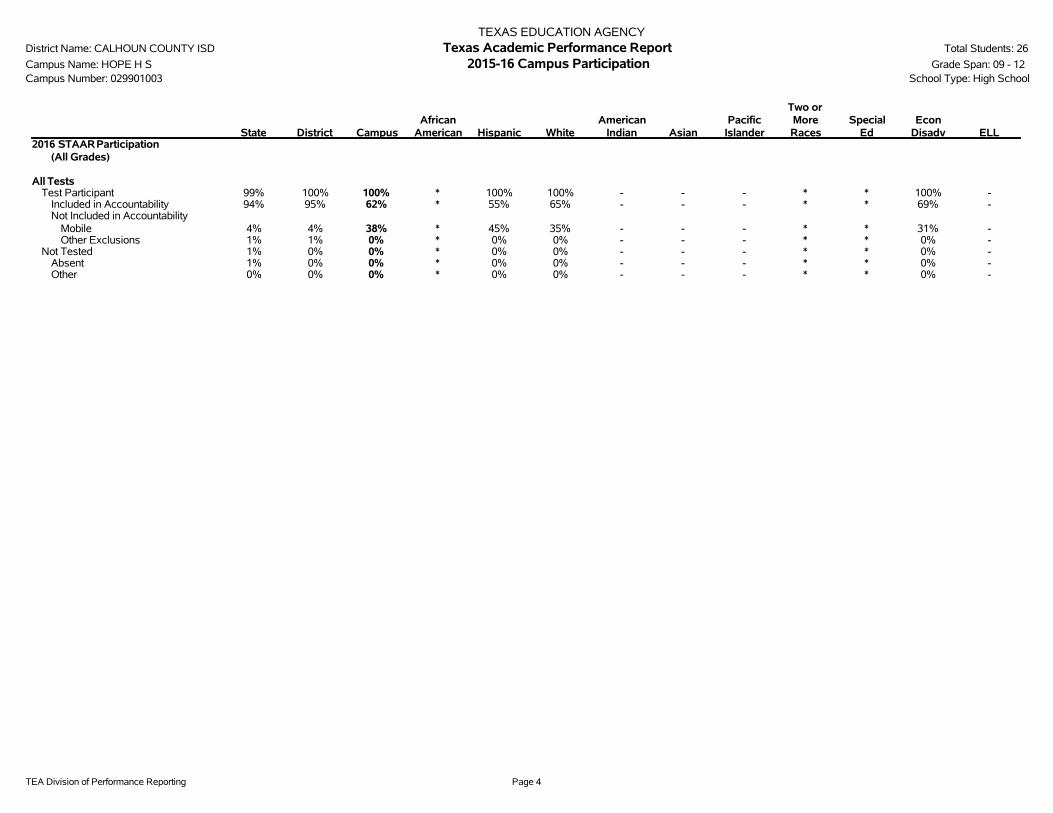
TEA Division of Performance Reporting Page 4
TEXAS EDUCATION AGENCYDistrict Name: CALHOUN COUNTY ISD Texas Academic Performance Report Total Students: 26
Campus Name: HOPE H S 2015-16 Campus Participation Grade Span: 09 - 12Campus Number: 029901003 School Type: High School
State District CampusAfrican
American Hispanic WhiteAmerican
Indian AsianPacific
Islander
Two orMoreRaces
SpecialEd
EconDisadv ELL
2016 STAARParticipation(All Grades)
All TestsTest Participant 99% 100% 100% * 100% 100% - - - * * 100% -
Included in Accountability 94% 95% 62% * 55% 65% - - - * * 69% -Not Included in Accountability
Mobile 4% 4% 38% * 45% 35% - - - * * 31% -Other Exclusions 1% 1% 0% * 0% 0% - - - * * 0% -
Not Tested 1% 0% 0% * 0% 0% - - - * * 0% -Absent 1% 0% 0% * 0% 0% - - - * * 0% -Other 0% 0% 0% * 0% 0% - - - * * 0% -

TEA Division of Performance Reporting Page 5
TEXAS EDUCATION AGENCYDistrict Name: CALHOUN COUNTY ISD Texas Academic Performance Report Total Students: 26
Campus Name: HOPE H S 2015-16 Campus Attendance and Postsecondary Readiness Grade Span: 09 - 12Campus Number: 029901003 School Type: High School
State District CampusAfrican
American Hispanic WhiteAmerican
Indian AsianPacific
IslanderTwo or
More RacesSpecial
EdEcon
Disadv ELL
Attendance Rate2014-15 95.7% 95.0% 84.0% * 83.7% * * - - * 86.1% 84.2% *2013-14 95.9% 95.2% 83.6% * 83.7% 84.9% - * - - 86.1% 82.9% -
Annual Dropout Rate (Gr 9-12)2014-15 2.1% 0.5% 3.4% - 0.0% 12.5% * - - * 8.3% 4.5% *2013-14 2.2% 1.0% 6.1% 20.0% 1.6% 7.1% - * - - 0.0% 2.9% -
4-Year Longitudinal Rate (Gr 9-12)Class of 2015
Graduated 89.0% 92.8% 82.5% - 83.7% 78.9% - - - * 100.0% 86.4% -Received GED 0.6% 2.3% 11.1% - 14.0% 5.3% - - - * 0.0% 9.1% -Continued HS 4.1% 2.3% 1.6% - 2.3% 0.0% - - - * 0.0% 0.0% -Dropped Out 6.3% 2.6% 4.8% - 0.0% 15.8% - - - * 0.0% 4.5% -Graduates and GED 89.6% 95.1% 93.7% - 97.7% 84.2% - - - * 100.0% 95.5% -Grads, GED, & Cont 93.7% 97.4% 95.2% - 100.0% 84.2% - - - * 100.0% 95.5% -
Class of 2014Graduated 88.3% 95.4% 87.0% * 92.0% 81.3% - - - * 100.0% 88.9% -Received GED 0.8% 2.1% 6.5% * 4.0% 12.5% - - - * 0.0% 7.4% -Continued HS 4.3% 0.4% 0.0% * 0.0% 0.0% - - - * 0.0% 0.0% -Dropped Out 6.6% 2.1% 6.5% * 4.0% 6.3% - - - * 0.0% 3.7% -Graduates and GED 89.1% 97.5% 93.5% * 96.0% 93.8% - - - * 100.0% 96.3% -Grads, GED, & Cont 93.4% 97.9% 93.5% * 96.0% 93.8% - - - * 100.0% 96.3% -
5-Year Extended Longitudinal Rate (Gr 9-12)Class of 2014
Graduated 90.4% 95.8% 87.0% * 92.0% 81.3% - - - * 100.0% 88.9% -Received GED 1.0% 2.1% 6.5% * 4.0% 12.5% - - - * 0.0% 7.4% -Continued HS 1.3% 0.0% 0.0% * 0.0% 0.0% - - - * 0.0% 0.0% -Dropped Out 7.2% 2.1% 6.5% * 4.0% 6.3% - - - * 0.0% 3.7% -Graduates and GED 91.5% 97.9% 93.5% * 96.0% 93.8% - - - * 100.0% 96.3% -Grads, GED, & Cont 92.8% 97.9% 93.5% * 96.0% 93.8% - - - * 100.0% 96.3% -
Class of 2013Graduated 90.4% 97.8% 92.2% * 89.3% 95.2% * - - - 100.0% 90.0% *Received GED 1.1% 1.5% 5.9% * 7.1% 4.8% * - - - 0.0% 6.7% *Continued HS 1.3% 0.0% 0.0% * 0.0% 0.0% * - - - 0.0% 0.0% *Dropped Out 7.2% 0.7% 2.0% * 3.6% 0.0% * - - - 0.0% 3.3% *Graduates and GED 91.5% 99.3% 98.0% * 96.4% 100.0% * - - - 100.0% 96.7% *Grads, GED, & Cont 92.8% 99.3% 98.0% * 96.4% 100.0% * - - - 100.0% 96.7% *
6-Year Extended Longitudinal Rate (Gr 9-12)Class of 2013
Graduated 90.9% 97.5% 90.4% * 89.3% 90.9% * - - - 100.0% 87.1% *Received GED 1.4% 1.8% 7.7% * 7.1% 9.1% * - - - 0.0% 9.7% *Continued HS 0.6% 0.0% 0.0% * 0.0% 0.0% * - - - 0.0% 0.0% *Dropped Out 7.2% 0.7% 1.9% * 3.6% 0.0% * - - - 0.0% 3.2% *Graduates and GED 92.3% 99.3% 98.1% * 96.4% 100.0% * - - - 100.0% 96.8% *Grads, GED, & Cont 92.8% 99.3% 98.1% * 96.4% 100.0% * - - - 100.0% 96.8% *

TEA Division of Performance Reporting Page 6
TEXAS EDUCATION AGENCYDistrict Name: CALHOUN COUNTY ISD Texas Academic Performance Report Total Students: 26
Campus Name: HOPE H S 2015-16 Campus Attendance and Postsecondary Readiness Grade Span: 09 - 12Campus Number: 029901003 School Type: High School
State District CampusAfrican
American Hispanic WhiteAmerican
Indian AsianPacific
IslanderTwo or
More RacesSpecial
EdEcon
Disadv ELL
6-Year Extended Longitudinal Rate (Gr 9-12)Class of 2012
Graduated 90.9% 95.0% 92.3% - 96.2% 88.5% - - - - 92.3% 96.7% -Received GED 1.5% 3.5% 5.8% - 0.0% 11.5% - - - - 7.7% 0.0% -Continued HS 0.6% 0.4% 0.0% - 0.0% 0.0% - - - - 0.0% 0.0% -Dropped Out 7.0% 1.1% 1.9% - 3.8% 0.0% - - - - 0.0% 3.3% -Graduates and GED 92.4% 98.6% 98.1% - 96.2% 100.0% - - - - 100.0% 96.7% -Grads, GED, & Cont 93.0% 98.9% 98.1% - 96.2% 100.0% - - - - 100.0% 96.7% -
4-Year Federal Graduation Rate Without Exclusions (Gr 9-12)Class of 2015 89.0% 92.6% 83.1% * 84.1% 78.9% - - - * 100.0% 86.4% -Class of 2014 88.3% 94.4% 83.7% * 92.3% 81.3% - * - * 100.0% 89.3% *
5-Year Extended Federal Graduation Rate Without Exclusions (Gr 9-12)Class of 2014 90.4% 94.8% 83.7% * 92.3% 81.3% - * - * 100.0% 89.3% *Class of 2013 90.4% 97.5% 92.2% * 89.3% 95.2% * - - - 100.0% 90.0% *
RHSP/DAP Graduates (Longitudinal Rate)Class of 2015 86.1% 70.8% 5.9% - 2.9% 13.3% - - - * 0.0% 2.7% -Class of 2014 85.5% 74.0% 2.5% * 4.3% 0.0% - - - * 0.0% 4.2% -
FHSP-E Graduates (Longitudinal Rate)Class of 2015 3.5% 0.0% * - * - - - - - - * -
FHSP-DLA Graduates (Longitudinal Rate)Class of 2015 38.7% 0.0% * - * - - - - - - * -
RHSP/DAP/FHSP-E/FHSP-DLA Graduates (Longitudinal Rate)Class of 2015 84.1% 69.0% 5.8% - 2.8% 13.3% - - - * 0.0% 2.6% -
RHSP/DAP Graduates (Annual Rate)2014-15 84.3% 73.3% 7.5% * 3.4% 28.6% * - - * * 0.0% -2013-14 83.8% 68.9% 1.7% * 2.6% 0.0% - - - - 0.0% 2.4% -
FHSP-E Graduates (Annual Rate)2014-15 3.5% 0.0% * - * * - - - - - * -
FHSP-DLA Graduates (Annual Rate)2014-15 37.3% 0.0% * - * * - - - - - * -
RHSP/DAP/FHSP-E/FHSP-DLA Graduates (Annual Rate)2014-15 82.2% 70.1% 6.8% * 3.2% 22.2% * - - * * 0.0% -
Advanced Course/Dual Credit Course Completion (Grades 11-12)Any Subject
2014-15 54.5% 54.5% 27.1% * 27.3% 36.4% * - - * 16.7% 29.0% *2013-14 53.2% 51.3% 9.2% * 7.5% 15.8% - * - - 6.7% 13.8% -

TEA Division of Performance Reporting Page 7
TEXAS EDUCATION AGENCYDistrict Name: CALHOUN COUNTY ISD Texas Academic Performance Report Total Students: 26
Campus Name: HOPE H S 2015-16 Campus Attendance and Postsecondary Readiness Grade Span: 09 - 12Campus Number: 029901003 School Type: High School
State District CampusAfrican
American Hispanic WhiteAmerican
Indian AsianPacific
IslanderTwo or
More RacesSpecial
EdEcon
Disadv ELL
Advanced Course/Dual Credit Course Completion (Grades 11-12)English Language Arts
2014-15 29.0% 20.6% 21.3% * 24.2% 20.0% * - - * 16.7% 26.7% *2013-14 28.9% 22.4% 8.2% * 5.1% 15.8% - - - - 7.7% 10.3% -
Mathematics2014-15 43.8% 57.5% 10.3% * 5.0% 33.3% * - - * 0.0% 5.3% *2013-14 42.4% 48.6% 2.4% * 4.0% 0.0% - * - - 0.0% 4.3% -
Science2014-15 12.7% 28.5% 0.0% * 0.0% 0.0% * - - * 0.0% 0.0% -2013-14 13.4% 19.8% 0.0% - 0.0% 0.0% - * - - * 0.0% -
Social Studies2014-15 28.4% 19.8% 0.0% * 0.0% 0.0% * - - * 0.0% 0.0% *2013-14 27.8% 21.9% 0.0% * 0.0% 0.0% - * - - 0.0% 0.0% -
Advanced Course/Dual Credit Course Completion (Grades 9-12)Any Subject
2014-15 34.6% 27.3% 24.5% * 25.7% 28.6% * - - * 15.4% 27.3% *2013-14 33.1% 30.6% 7.9% * 6.1% 14.3% - * - - 5.6% 11.4% -
English Language Arts2014-15 15.7% 9.3% 20.4% * 23.5% 18.2% * - - * 16.7% 25.8% *2013-14 15.4% 10.4% 7.1% * 4.3% 14.3% - - - - 6.7% 8.8% -
Mathematics2014-15 19.4% 24.5% 9.7% * 4.8% 28.6% * - - * 0.0% 5.3% *2013-14 18.8% 22.3% 2.1% * 3.4% 0.0% - * - - 0.0% 3.8% -
Science2014-15 5.2% 8.8% 0.0% * 0.0% 0.0% * - - * 0.0% 0.0% -2013-14 5.6% 7.1% 0.0% - 0.0% 0.0% - * - - * 0.0% -
Social Studies2014-15 19.5% 10.8% 0.0% * 0.0% 0.0% * - - * 0.0% 0.0% *2013-14 18.3% 15.8% 0.0% * 0.0% 0.0% - * - - 0.0% 0.0% -
College-Ready GraduatesEnglish Language Arts
2014-15 42.0% 55.0% * - * - - - - * - * -Mathematics
2014-15 38.0% 47.0% * - * - - - - * - * -Both Subjects
2014-15 35.0% 45.0% * - * - - - - * - * -Either Subject
2014-15 45.0% 58.0% * - * - - - - * - * -
College and Career Ready Graduates2014-15 74.5% 85.6% 56.8% * 58.1% 66.7% * - - * * 60.0% -
Texas Success Initiative Assessment (TSIA)English Language Arts
2014-15 10.6% 14.4% 2.3% * 0.0% 0.0% * - - * * 3.3% -

TEA Division of Performance Reporting Page 8
TEXAS EDUCATION AGENCYDistrict Name: CALHOUN COUNTY ISD Texas Academic Performance Report Total Students: 26
Campus Name: HOPE H S 2015-16 Campus Attendance and Postsecondary Readiness Grade Span: 09 - 12Campus Number: 029901003 School Type: High School
State District CampusAfrican
American Hispanic WhiteAmerican
Indian AsianPacific
IslanderTwo or
More RacesSpecial
EdEcon
Disadv ELL
Texas Success Initiative Assessment (TSIA)Mathematics
2014-15 7.1% 10.1% 0.0% * 0.0% 0.0% * - - * * 0.0% -
Completion of Two or More Advanced/Dual Credit Courses in Current and/or Prior Year (Annual Graduates)2014-15 48.1% 38.5% 13.6% * 9.7% 33.3% * - - * * 13.3% -
Completion of Twelve or More Hours of Postsecondary Credit (Annual Graduates)Any Subject
2014-15 10.6% 11.9% 0.0% * 0.0% 0.0% * - - * * 0.0% -
AP/IB Course Completion (Annual Graduates)2014-15 43.4% 38.5% 6.8% * 3.2% 22.2% * - - * * 3.3% -
CTE Coherent Sequence (Annual Graduates)2014-15 46.6% 72.3% 47.7% * 51.6% 44.4% * - - * * 50.0% -2013-14 46.4% 53.7% 3.4% * 1.7% 1.7% - - - - 0.0% 0.0% -
AP/IB Results (Participation)All Subjects
2015 24.9% 17.6% 4.8% - 0.0% 20.0% - - - - n/a 0.0% n/a2014 23.5% 23.8% 0.0% * 0.0% 0.0% - - - - n/a 0.0% n/a
English Language Arts2015 15.1% 9.6% 4.8% - 0.0% 20.0% - - - - n/a 0.0% n/a2014 15.0% 14.9% 0.0% * 0.0% 0.0% - - - - n/a 0.0% n/a
Mathematics2015 6.8% 4.7% 0.0% - 0.0% 0.0% - - - - n/a 0.0% n/a2014 6.5% 2.6% 0.0% * 0.0% 0.0% - - - - n/a 0.0% n/a
Science2015 10.2% 11.3% 0.0% - 0.0% 0.0% - - - - n/a 0.0% n/a2014 6.9% 10.8% 0.0% * 0.0% 0.0% - - - - n/a 0.0% n/a
Social Studies2015 14.4% 10.0% 4.8% - 0.0% 20.0% - - - - n/a 0.0% n/a2014 13.8% 12.5% 0.0% * 0.0% 0.0% - - - - n/a 0.0% n/a
AP/IB Results (Examinees >= Criterion)All Subjects
2015 49.1% 33.0% * - - * - - - - n/a - n/a2014 51.3% 25.0% - - - - - - - - n/a - n/a
English Language Arts2015 43.7% 30.2% * - - * - - - - n/a - n/a2014 44.7% 22.5% - - - - - - - - n/a - n/a
Mathematics2015 51.7% 23.1% - - - - - - - - n/a - n/a

TEA Division of Performance Reporting Page 9
TEXAS EDUCATION AGENCYDistrict Name: CALHOUN COUNTY ISD Texas Academic Performance Report Total Students: 26
Campus Name: HOPE H S 2015-16 Campus Attendance and Postsecondary Readiness Grade Span: 09 - 12Campus Number: 029901003 School Type: High School
State District CampusAfrican
American Hispanic WhiteAmerican
Indian AsianPacific
IslanderTwo or
More RacesSpecial
EdEcon
Disadv ELL
AP/IB Results (Examinees >= Criterion)Mathematics
2014 53.6% 14.3% - - - - - - - - n/a - n/aScience
2015 35.4% 22.6% - - - - - - - - n/a - n/a2014 45.7% 17.2% - - - - - - - - n/a - n/a
Social Studies2015 40.1% 21.8% * - - * - - - - n/a - n/a2014 41.6% 11.9% - - - - - - - - n/a - n/a
SAT/ACT ResultsTested
Class of 2015 68.3% 38.5% 0.0% * 0.0% 0.0% * - - * n/a 0.0% n/aClass of 2014 66.3% 32.4% 0.0% * 0.0% 0.0% - - - - n/a 0.0% n/a
Graduates Enrolled in TX Institution of Higher Education (IHE)2013-14 57.5% 41.5% * n/a n/a n/a n/a n/a n/a n/a n/a n/a n/a2012-13 56.9% 41.8% * n/a n/a n/a n/a n/a n/a n/a n/a n/a n/a
Graduates in TX IHE Completing One Year Without Remediation2013-14 70.5% 72.6% * n/a n/a n/a n/a n/a n/a n/a n/a n/a n/a2012-13 70.8% 79.5% * n/a n/a n/a n/a n/a n/a n/a n/a n/a n/a

TEA Division of Performance Reporting Page 10
TEXAS EDUCATION AGENCYDistrict Name: CALHOUN COUNTY ISD Texas Academic Performance Report Total Students: 26
Campus Name: HOPE H S 2015-16 Campus Profile Grade Span: 09 - 12Campus Number: 029901003 School Type: High School
---------------- Campus ----------------Student Information Count Percent District State
Total Students: 26 100.0% 4,172 5,284,252
Students by Grade:Early Childhood Education 0 0.0% 0.3% 0.2%Pre-Kindergarten 0 0.0% 4.1% 4.2%Kindergarten 0 0.0% 7.7% 7.1%Grade 1 0 0.0% 7.5% 7.8%Grade 2 0 0.0% 6.9% 7.8%Grade 3 0 0.0% 8.0% 7.7%Grade 4 0 0.0% 7.3% 7.5%Grade 5 0 0.0% 6.3% 7.5%Grade 6 0 0.0% 7.3% 7.4%Grade 7 0 0.0% 7.6% 7.4%Grade 8 0 0.0% 7.9% 7.3%Grade 9 1 3.8% 7.5% 8.1%Grade 10 8 30.8% 8.0% 7.3%Grade 11 11 42.3% 7.5% 6.7%Grade 12 6 23.1% 6.1% 6.1%
Ethnic Distribution:African American 2 7.7% 2.1% 12.6%Hispanic 11 42.3% 63.0% 52.2%White 12 46.2% 28.5% 28.5%American Indian 0 0.0% 0.3% 0.4%Asian 0 0.0% 5.3% 4.0%Pacific Islander 0 0.0% 0.0% 0.1%Two or More Races 1 3.8% 0.8% 2.1%
Economically Disadvantaged 20 76.9% 60.3% 59.0%Non-Educationally Disadvantaged 6 23.1% 39.7% 41.0%English Language Learners (ELL) 0 0.0% 11.5% 18.5%Students w/ Disciplinary Placements (2014-2015) 0 0.0% 3.0% 1.4%At-Risk 21 80.8% 48.4% 50.1%Mobility (2014-2015) 55 98.2% 14.6% 16.5%
Graduates (Class of 2015):Total Graduates 44 100.0% 278 313,397
By Ethnicity (incl. Special Ed.):African American 1 2.3% 8 39,692Hispanic 31 70.5% 156 148,966White 9 20.5% 100 104,377American Indian 1 2.3% 1 1,335Asian 0 0.0% 11 13,090Pacific Islander 0 0.0% 0 486Two or More Races 2 4.5% 2 5,451

TEA Division of Performance Reporting Page 11
TEXAS EDUCATION AGENCYDistrict Name: CALHOUN COUNTY ISD Texas Academic Performance Report Total Students: 26
Campus Name: HOPE H S 2015-16 Campus Profile Grade Span: 09 - 12Campus Number: 029901003 School Type: High School
---------------- Campus ----------------Student Information Count Percent District State
By Graduation Type (incl. Special Ed.):Minimum H.S. Program 37 84.1% 71 46,723Recommended H.S. Program/DAP 3 6.8% 195 251,524Foundation High School Plan (No Endorsement) 4 9.1% 12 8,982Foundation High School Plan (Endorsement) 0 0.0% 0 523Foundation High School Plan (DLA) 0 0.0% 0 5,645
Special Education Graduates 4 9.1% 29 23,541

TEA Division of Performance Reporting Page 12
TEXAS EDUCATION AGENCYDistrict Name: CALHOUN COUNTY ISD Texas Academic Performance Report Total Students: 26
Campus Name: HOPE H S 2015-16 Campus Profile Grade Span: 09 - 12Campus Number: 029901003 School Type: High School
Class Size Information Campus District State
Class Size Averages by Grade and Subject (Derived from teacher responsibility records):
Elementary:Kindergarten - 18.7 18.9Grade 1 - 17.9 19.1Grade 2 - 17.6 19.1Grade 3 - 17.1 19.1Grade 4 - 17.5 19.0Grade 5 - 16.4 20.8Grade 6 - 19.6 20.4
Secondary:English/Language Arts 11.8 16.3 17.1Foreign Languages - 17.4 19.1Mathematics 8.6 15.7 18.1Science 18.4 16.6 19.1Social Studies 14.7 18.0 19.5
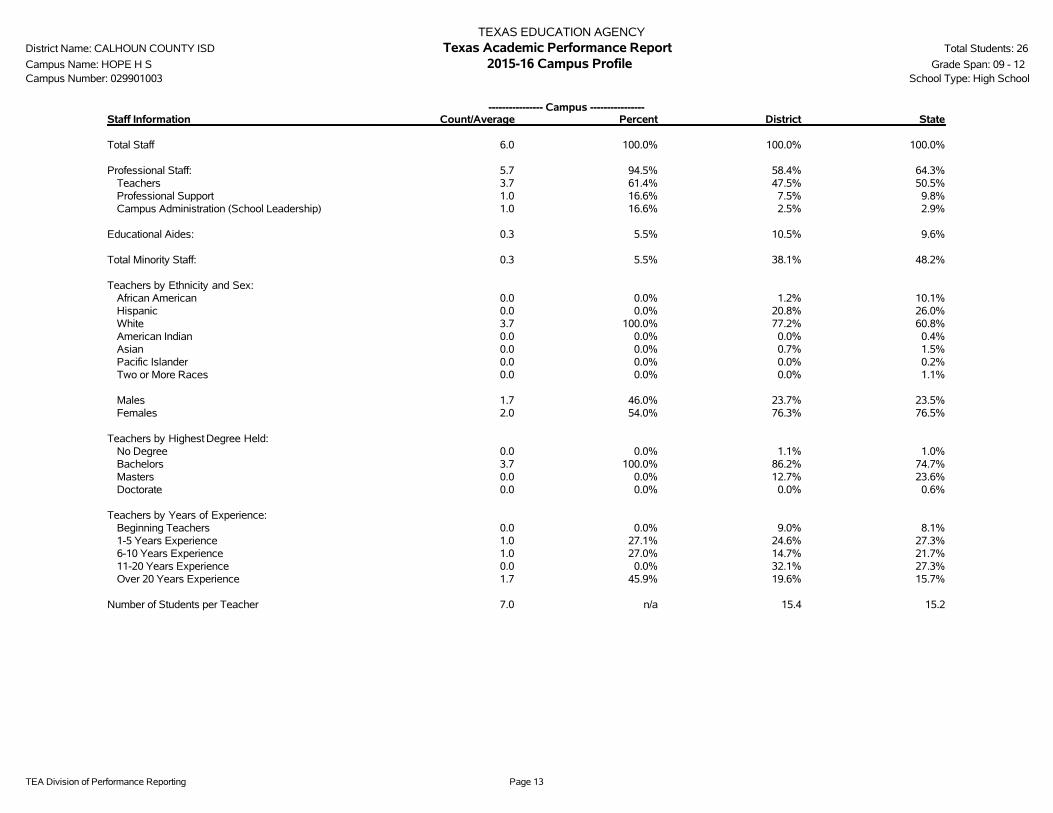
TEA Division of Performance Reporting Page 13
TEXAS EDUCATION AGENCYDistrict Name: CALHOUN COUNTY ISD Texas Academic Performance Report Total Students: 26
Campus Name: HOPE H S 2015-16 Campus Profile Grade Span: 09 - 12Campus Number: 029901003 School Type: High School
---------------- Campus ----------------Staff Information Count/Average Percent District State
Total Staff 6.0 100.0% 100.0% 100.0%
Professional Staff: 5.7 94.5% 58.4% 64.3%Teachers 3.7 61.4% 47.5% 50.5%Professional Support 1.0 16.6% 7.5% 9.8%Campus Administration (School Leadership) 1.0 16.6% 2.5% 2.9%
Educational Aides: 0.3 5.5% 10.5% 9.6%
Total Minority Staff: 0.3 5.5% 38.1% 48.2%
Teachers by Ethnicity and Sex:African American 0.0 0.0% 1.2% 10.1%Hispanic 0.0 0.0% 20.8% 26.0%White 3.7 100.0% 77.2% 60.8%American Indian 0.0 0.0% 0.0% 0.4%Asian 0.0 0.0% 0.7% 1.5%Pacific Islander 0.0 0.0% 0.0% 0.2%Two or More Races 0.0 0.0% 0.0% 1.1%
Males 1.7 46.0% 23.7% 23.5%Females 2.0 54.0% 76.3% 76.5%
Teachers by Highest Degree Held:No Degree 0.0 0.0% 1.1% 1.0%Bachelors 3.7 100.0% 86.2% 74.7%Masters 0.0 0.0% 12.7% 23.6%Doctorate 0.0 0.0% 0.0% 0.6%
Teachers by Years of Experience:Beginning Teachers 0.0 0.0% 9.0% 8.1%1-5 Years Experience 1.0 27.1% 24.6% 27.3%6-10 Years Experience 1.0 27.0% 14.7% 21.7%11-20 Years Experience 0.0 0.0% 32.1% 27.3%Over 20 Years Experience 1.7 45.9% 19.6% 15.7%
Number of Students per Teacher 7.0 n/a 15.4 15.2

TEA Division of Performance Reporting Page 14
TEXAS EDUCATION AGENCYDistrict Name: CALHOUN COUNTY ISD Texas Academic Performance Report Total Students: 26
Campus Name: HOPE H S 2015-16 Campus Profile Grade Span: 09 - 12Campus Number: 029901003 School Type: High School
Staff Information Campus District State
Average Years Experience of Teachers: 15.3 12.9 10.9Average Years Experience of Teachers with District: 10.0 8.4 7.3
Average Teacher Salary by Years of Experience (regular duties only):Beginning Teachers - $36,085 $45,5071-5 Years Experience $41,140 $41,344 $47,9966-10 Years Experience $45,540 $44,877 $50,45911-20 Years Experience - $51,582 $53,794Over 20 Years Experience $56,849 $56,808 $60,613
Average Actual Salaries (regular duties only):Teachers $49,545 $47,707 $51,891Professional Support $55,480 $57,854 $61,145Campus Administration (School Leadership) $84,928 $76,928 $75,654
Instructional Staff Percent: n/a 61.1% 64.5%
Contracted Instructional Staff (not incl. above): 0.0 0.0 1,914.4

TEA Division of Performance Reporting Page 15
TEXAS EDUCATION AGENCYDistrict Name: CALHOUN COUNTY ISD Texas Academic Performance Report Total Students: 26
Campus Name: HOPE H S 2015-16 Campus Profile Grade Span: 09 - 12Campus Number: 029901003 School Type: High School
---------------- Campus ----------------Program Information Count Percent District State
Student Enrollment by Program:Bilingual/ESL Education 0 0.0% 11.4% 18.3%Career & Technical Education 12 46.2% 30.2% 24.3%Gifted & Talented Education 0 0.0% 7.2% 7.7%Special Education 3 11.5% 8.3% 8.6%
Teachers by Program (population served):Bilingual/ESL Education 0.0 0.0% 0.7% 5.9%Career & Technical Education 0.4 9.8% 5.3% 4.4%Compensatory Education 0.0 0.0% 1.3% 2.9%Gifted & Talented Education 0.0 0.0% 1.4% 1.9%Regular Education 2.7 72.8% 82.4% 72.6%Special Education 0.6 17.4% 6.2% 8.8%Other 0.0 0.0% 2.8% 3.4%
Link to: PEIMS Financial Standard Reports/ 2014-2015 Financial Actual Report
' '̂ Indicates that ELL rates at met or exceeded standard and exceeded standard include current and monitored students.'*' Indicates results are masked due to small numbers to protect student confidentiality.'-' Indicates zero observations reported for this group.'n/a' Indicates data reporting is not applicable for this group.'**' Indicates that rates for Reading and Mathematics are based on the cumulative results from the first and second administrations of STAAR.'?' Indicates that the data for this item were statistically improbable, or were reported outside a reasonable range.'##' Indicates that PID Error rate information cannot be reported in 2015-16 due to the transition from PEIMS Edit+ to TSDS.

This page intentionally left blank.
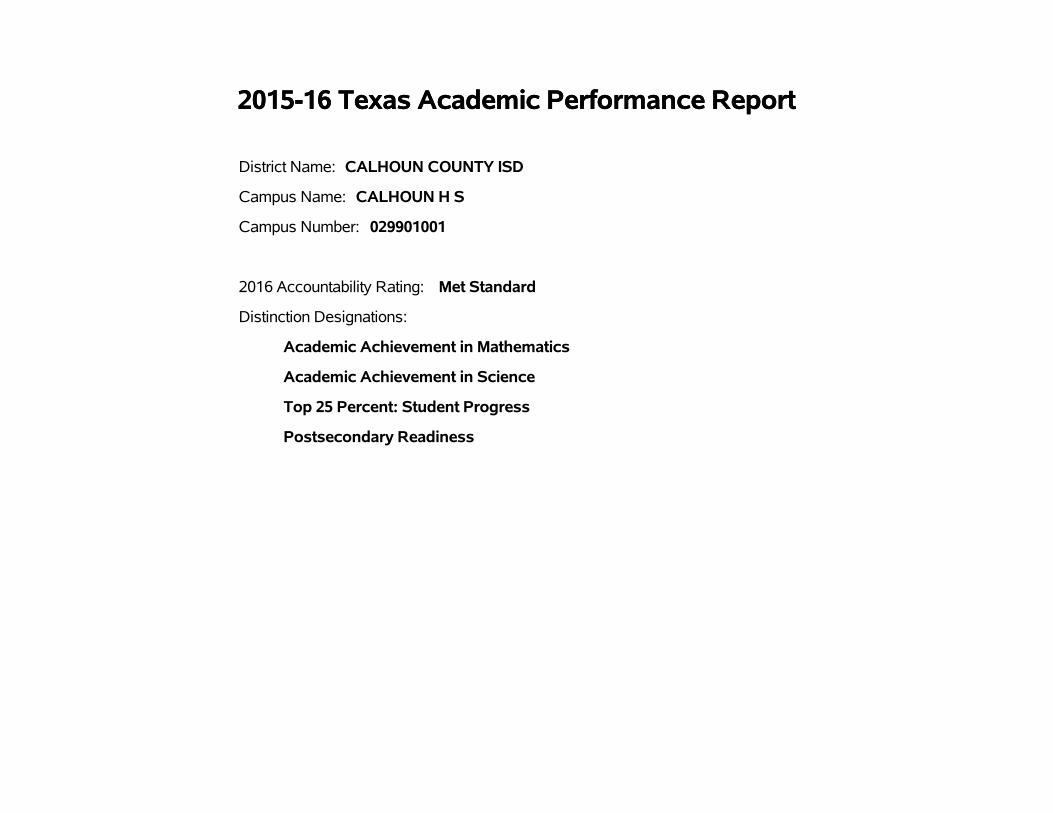
2015-16 Texas Academic Performance Report2015-16 Texas Academic Performance Report
District Name: CALHOUN COUNTY ISD
Campus Name: CALHOUN H S
Campus Number: 029901001
2016 Accountability Rating: Met Standard
Distinction Designations:
Academic Achievement in Mathematics
Academic Achievement in Science
Top 25 Percent: Student Progress
Postsecondary Readiness

This page intentionally left blank.
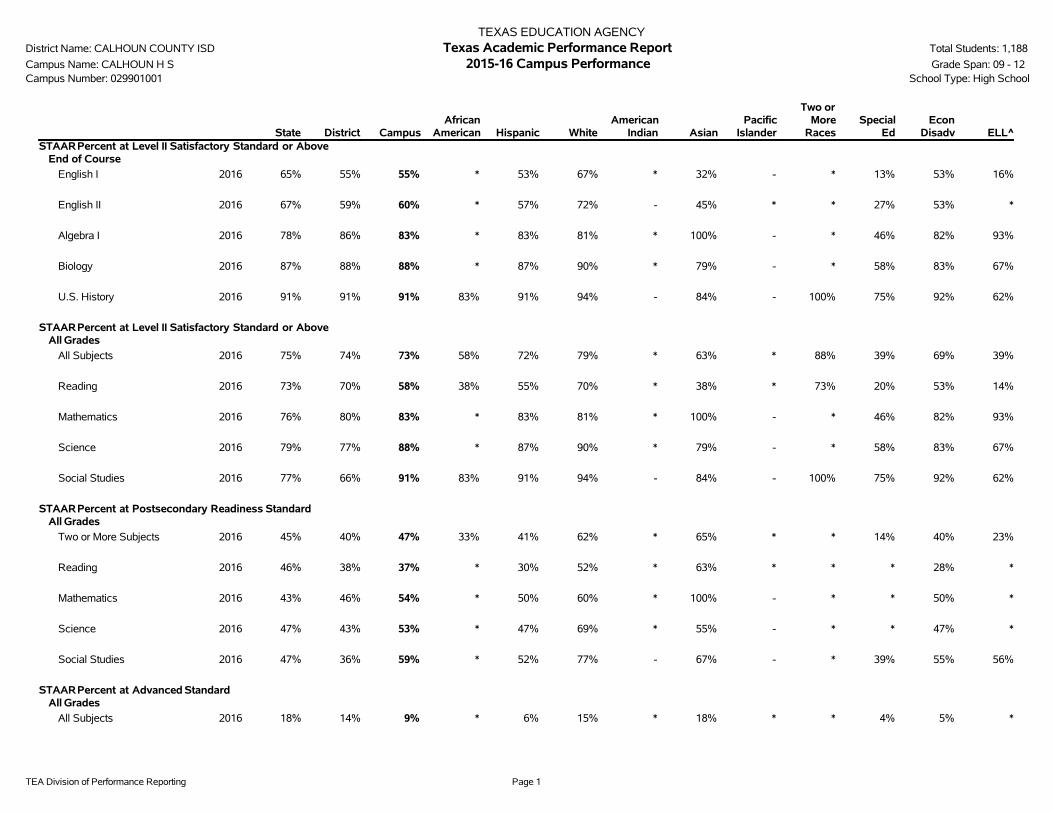
TEA Division of Performance Reporting Page 1
TEXAS EDUCATION AGENCYDistrict Name: CALHOUN COUNTY ISD Texas Academic Performance Report Total Students: 1,188
Campus Name: CALHOUN H S 2015-16 Campus Performance Grade Span: 09 - 12Campus Number: 029901001 School Type: High School
State District CampusAfrican
American Hispanic WhiteAmerican
Indian AsianPacific
Islander
Two orMore
RacesSpecial
EdEcon
Disadv ELL^STAARPercent at Level II Satisfactory Standard or Above
End of Course
English I 2016 65% 55% 55% * 53% 67% * 32% - * 13% 53% 16%
English II 2016 67% 59% 60% * 57% 72% - 45% * * 27% 53% *
Algebra I 2016 78% 86% 83% * 83% 81% * 100% - * 46% 82% 93%
Biology 2016 87% 88% 88% * 87% 90% * 79% - * 58% 83% 67%
U.S. History 2016 91% 91% 91% 83% 91% 94% - 84% - 100% 75% 92% 62%
STAARPercent at Level II Satisfactory Standard or AboveAll Grades
All Subjects 2016 75% 74% 73% 58% 72% 79% * 63% * 88% 39% 69% 39%
Reading 2016 73% 70% 58% 38% 55% 70% * 38% * 73% 20% 53% 14%
Mathematics 2016 76% 80% 83% * 83% 81% * 100% - * 46% 82% 93%
Science 2016 79% 77% 88% * 87% 90% * 79% - * 58% 83% 67%
Social Studies 2016 77% 66% 91% 83% 91% 94% - 84% - 100% 75% 92% 62%
STAARPercent at Postsecondary Readiness StandardAll Grades
Two or More Subjects 2016 45% 40% 47% 33% 41% 62% * 65% * * 14% 40% 23%
Reading 2016 46% 38% 37% * 30% 52% * 63% * * * 28% *
Mathematics 2016 43% 46% 54% * 50% 60% * 100% - * * 50% *
Science 2016 47% 43% 53% * 47% 69% * 55% - * * 47% *
Social Studies 2016 47% 36% 59% * 52% 77% - 67% - * 39% 55% 56%
STAARPercent at Advanced StandardAll Grades
All Subjects 2016 18% 14% 9% * 6% 15% * 18% * * 4% 5% *
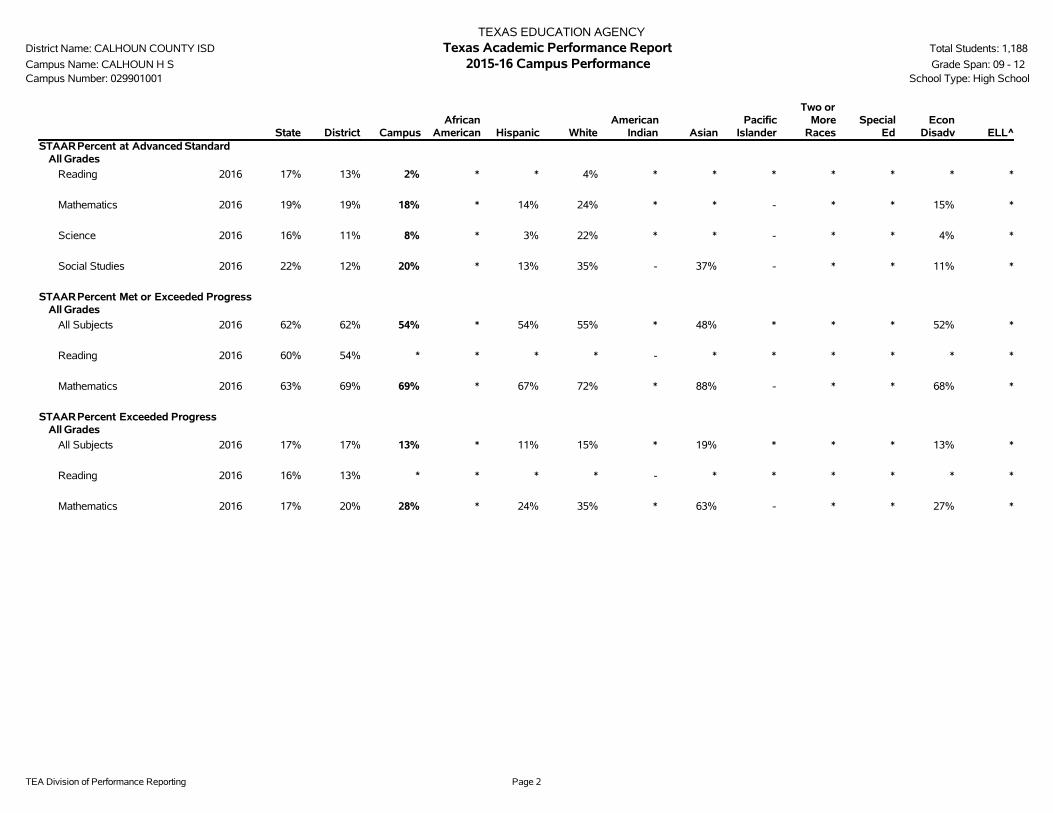
TEA Division of Performance Reporting Page 2
TEXAS EDUCATION AGENCYDistrict Name: CALHOUN COUNTY ISD Texas Academic Performance Report Total Students: 1,188
Campus Name: CALHOUN H S 2015-16 Campus Performance Grade Span: 09 - 12Campus Number: 029901001 School Type: High School
State District CampusAfrican
American Hispanic WhiteAmerican
Indian AsianPacific
Islander
Two orMore
RacesSpecial
EdEcon
Disadv ELL^STAARPercent at Advanced Standard
All Grades
Reading 2016 17% 13% 2% * * 4% * * * * * * *
Mathematics 2016 19% 19% 18% * 14% 24% * * - * * 15% *
Science 2016 16% 11% 8% * 3% 22% * * - * * 4% *
Social Studies 2016 22% 12% 20% * 13% 35% - 37% - * * 11% *
STAARPercent Met or Exceeded ProgressAll Grades
All Subjects 2016 62% 62% 54% * 54% 55% * 48% * * * 52% *
Reading 2016 60% 54% * * * * - * * * * * *
Mathematics 2016 63% 69% 69% * 67% 72% * 88% - * * 68% *
STAARPercent Exceeded ProgressAll Grades
All Subjects 2016 17% 17% 13% * 11% 15% * 19% * * * 13% *
Reading 2016 16% 13% * * * * - * * * * * *
Mathematics 2016 17% 20% 28% * 24% 35% * 63% - * * 27% *

TEA Division of Performance Reporting Page 3
TEXAS EDUCATION AGENCYDistrict Name: CALHOUN COUNTY ISD Texas Academic Performance Report Total Students: 1,188
Campus Name: CALHOUN H S 2015-16 Campus Performance Grade Span: 09 - 12Campus Number: 029901001 School Type: High School
State District CampusAfrican
American Hispanic WhiteAmerican
Indian AsianPacific
Islander
Two orMore
RacesSpecial
EdEcon
Disadv ELLStudent Success Initiative
Grade 8 Reading
STAARMet Standard (Non-Proficient in Previous Year)
Promoted to Grade 9
2016 12% * * - * - - - - - - * -

TEA Division of Performance Reporting Page 4
TEXAS EDUCATION AGENCYDistrict Name: CALHOUN COUNTY ISD Texas Academic Performance Report Total Students: 1,188
Campus Name: CALHOUN H S 2015-16 Campus Performance Grade Span: 09 - 12Campus Number: 029901001 Bilingual Education/English as a Second Language (Current Year ELL Students)
State District CampusBilingual
EducationBE-TransEarly Exit
BE-TransLate Exit
BE-DualTwo-Way
BE-DualOne-Way ESL
ESLContent
ESLPull-Out
LEP NoServices
LEP WithServices
TotalELL
STAARPercent at Level II Satisfactory Standard or AboveAll Grades
All Subjects 2016 75% 74% 73% - - - - - 40% 83% 37% * 40% 39%
Reading 2016 73% 70% 58% - - - - - 14% * 11% * 14% 14%
Mathematics 2016 76% 80% 83% - - - - - 93% * 92% - 93% 93%
Science 2016 79% 77% 88% - - - - - 67% - 67% - 67% 67%
Social Studies 2016 77% 66% 91% - - - - - 62% * 55% - 62% 62%
STAARPercent at Postsecondary Readiness StandardAll Grades
Two or More Subjects 2016 45% 40% 47% - - - - - 23% * 25% - 23% 23%
Reading 2016 46% 38% 37% - - - - - * * * - * *
Mathematics 2016 43% 46% 54% - - - - - * - * - * *
Science 2016 47% 43% 53% - - - - - * - * - * *
Social Studies 2016 47% 36% 59% - - - - - 56% * 63% - 56% 56%
STAARPercent at Advanced StandardAll Grades
All Subjects 2016 18% 14% 9% - - - - - * * * * * *
Reading 2016 17% 13% 2% - - - - - * * * * * *
Mathematics 2016 19% 19% 18% - - - - - * * * - * *
Science 2016 16% 11% 8% - - - - - * - * - * *
Social Studies 2016 22% 12% 20% - - - - - * * * - * *
STAARPercent Met or Exceeded ProgressAll Grades
All Subjects 2016 62% 62% 54% - - - - - * * * * * *

TEA Division of Performance Reporting Page 5
TEXAS EDUCATION AGENCYDistrict Name: CALHOUN COUNTY ISD Texas Academic Performance Report Total Students: 1,188
Campus Name: CALHOUN H S 2015-16 Campus Performance Grade Span: 09 - 12Campus Number: 029901001 Bilingual Education/English as a Second Language (Current Year ELL Students)
State District CampusBilingual
EducationBE-TransEarly Exit
BE-TransLate Exit
BE-DualTwo-Way
BE-DualOne-Way ESL
ESLContent
ESLPull-Out
LEP NoServices
LEP WithServices
TotalELL
STAARPercent Met or Exceeded ProgressAll Grades
Reading 2016 60% 54% * - - - - - * * * * * *
Mathematics 2016 63% 69% 69% - - - - - * - * - * *
STAARPercent Exceeded ProgressAll Grades
All Subjects 2016 17% 17% 13% - - - - - * * * * * *
Reading 2016 16% 13% * - - - - - * * * * * *
Mathematics 2016 17% 20% 28% - - - - - * - * - * *

TEA Division of Performance Reporting Page 6
TEXAS EDUCATION AGENCYDistrict Name: CALHOUN COUNTY ISD Texas Academic Performance Report Total Students: 1,188
Campus Name: CALHOUN H S 2015-16 Campus Participation Grade Span: 09 - 12Campus Number: 029901001 School Type: High School
State District CampusAfrican
American Hispanic WhiteAmerican
Indian AsianPacific
Islander
Two orMoreRaces
SpecialEd
EconDisadv ELL
2016 STAARParticipation(All Grades)
All TestsTest Participant 99% 100% 99% 100% 99% 99% 100% 99% * 100% 99% 99% 99%
Included in Accountability 94% 95% 94% 83% 94% 95% 100% 94% * 100% 92% 93% 85%Not Included in Accountability
Mobile 4% 4% 5% 10% 5% 4% 0% 1% * 0% 6% 5% 2%Other Exclusions 1% 1% 1% 8% 1% 0% 0% 4% * 0% 0% 1% 12%
Not Tested 1% 0% 1% 0% 1% 1% 0% 1% * 0% 1% 1% 1%Absent 1% 0% 1% 0% 1% 1% 0% 0% * 0% 1% 0% 0%Other 0% 0% 0% 0% 0% 0% 0% 1% * 0% 0% 0% 1%

TEA Division of Performance Reporting Page 7
TEXAS EDUCATION AGENCYDistrict Name: CALHOUN COUNTY ISD Texas Academic Performance Report Total Students: 1,188
Campus Name: CALHOUN H S 2015-16 Campus Attendance and Postsecondary Readiness Grade Span: 09 - 12Campus Number: 029901001 School Type: High School
State District CampusAfrican
American Hispanic WhiteAmerican
Indian AsianPacific
IslanderTwo or
More RacesSpecial
EdEcon
Disadv ELL
Attendance Rate2014-15 95.7% 95.0% 94.4% 93.0% 94.1% 94.5% * 98.3% - 92.6% 93.0% 92.9% 96.7%2013-14 95.9% 95.2% 94.6% 93.6% 94.1% 95.3% * 96.9% * 92.4% 93.2% 93.2% 94.4%
Annual Dropout Rate (Gr 9-12)2014-15 2.1% 0.5% 0.3% 0.0% 0.5% 0.0% * 0.0% - 0.0% 0.0% 0.3% 2.0%2013-14 2.2% 1.0% 0.6% 3.7% 0.4% 0.7% * 0.0% * 0.0% 1.3% 0.7% 0.0%
4-Year Longitudinal Rate (Gr 9-12)Class of 2015
Graduated 89.0% 92.8% 95.5% 100.0% 96.2% 97.8% - 73.3% - - 83.9% 95.7% 77.8%Received GED 0.6% 2.3% 0.0% 0.0% 0.0% 0.0% - 0.0% - - 0.0% 0.0% 0.0%Continued HS 4.1% 2.3% 2.5% 0.0% 0.8% 1.1% - 26.7% - - 9.7% 1.1% 22.2%Dropped Out 6.3% 2.6% 2.1% 0.0% 3.1% 1.1% - 0.0% - - 6.5% 3.2% 0.0%Graduates and GED 89.6% 95.1% 95.5% 100.0% 96.2% 97.8% - 73.3% - - 83.9% 95.7% 77.8%Grads, GED, & Cont 93.7% 97.4% 97.9% 100.0% 96.9% 98.9% - 100.0% - - 93.5% 96.8% 100.0%
Class of 2014Graduated 88.3% 95.4% 97.0% * 97.7% 96.3% * 92.9% - * 89.3% 98.9% *Received GED 0.8% 2.1% 1.3% * 1.5% 1.2% * 0.0% - * 7.1% 0.0% *Continued HS 4.3% 0.4% 0.4% * 0.0% 1.2% * 0.0% - * 0.0% 0.0% *Dropped Out 6.6% 2.1% 1.3% * 0.8% 1.2% * 7.1% - * 3.6% 1.1% *Graduates and GED 89.1% 97.5% 98.3% * 99.2% 97.5% * 92.9% - * 96.4% 98.9% *Grads, GED, & Cont 93.4% 97.9% 98.7% * 99.2% 98.8% * 92.9% - * 96.4% 98.9% *
5-Year Extended Longitudinal Rate (Gr 9-12)Class of 2014
Graduated 90.4% 95.8% 97.4% * 97.7% 97.5% * 92.9% - * 89.3% 98.9% *Received GED 1.0% 2.1% 1.3% * 1.5% 1.2% * 0.0% - * 7.1% 0.0% *Continued HS 1.3% 0.0% 0.0% * 0.0% 0.0% * 0.0% - * 0.0% 0.0% *Dropped Out 7.2% 2.1% 1.3% * 0.8% 1.2% * 7.1% - * 3.6% 1.1% *Graduates and GED 91.5% 97.9% 98.7% * 99.2% 98.8% * 92.9% - * 96.4% 98.9% *Grads, GED, & Cont 92.8% 97.9% 98.7% * 99.2% 98.8% * 92.9% - * 96.4% 98.9% *
Class of 2013Graduated 90.4% 97.8% 99.1% 100.0% 99.2% 100.0% * 93.3% - * 100.0% 97.8% *Received GED 1.1% 1.5% 0.4% 0.0% 0.8% 0.0% * 0.0% - * 0.0% 1.1% *Continued HS 1.3% 0.0% 0.0% 0.0% 0.0% 0.0% * 0.0% - * 0.0% 0.0% *Dropped Out 7.2% 0.7% 0.4% 0.0% 0.0% 0.0% * 6.7% - * 0.0% 1.1% *Graduates and GED 91.5% 99.3% 99.6% 100.0% 100.0% 100.0% * 93.3% - * 100.0% 98.9% *Grads, GED, & Cont 92.8% 99.3% 99.6% 100.0% 100.0% 100.0% * 93.3% - * 100.0% 98.9% *
6-Year Extended Longitudinal Rate (Gr 9-12)Class of 2013
Graduated 90.9% 97.5% 99.1% 100.0% 99.2% 100.0% * 93.3% - * 100.0% 97.8% *Received GED 1.4% 1.8% 0.4% 0.0% 0.8% 0.0% * 0.0% - * 0.0% 1.1% *Continued HS 0.6% 0.0% 0.0% 0.0% 0.0% 0.0% * 0.0% - * 0.0% 0.0% *Dropped Out 7.2% 0.7% 0.4% 0.0% 0.0% 0.0% * 6.7% - * 0.0% 1.1% *Graduates and GED 92.3% 99.3% 99.6% 100.0% 100.0% 100.0% * 93.3% - * 100.0% 98.9% *Grads, GED, & Cont 92.8% 99.3% 99.6% 100.0% 100.0% 100.0% * 93.3% - * 100.0% 98.9% *
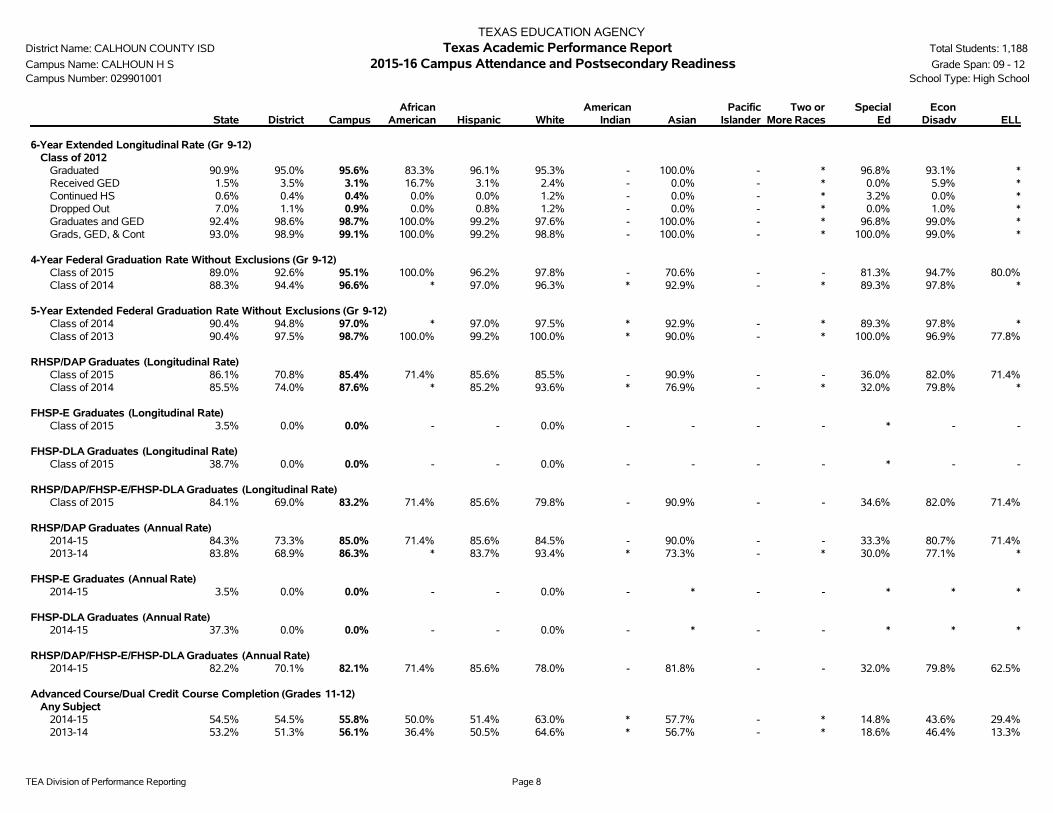
TEA Division of Performance Reporting Page 8
TEXAS EDUCATION AGENCYDistrict Name: CALHOUN COUNTY ISD Texas Academic Performance Report Total Students: 1,188
Campus Name: CALHOUN H S 2015-16 Campus Attendance and Postsecondary Readiness Grade Span: 09 - 12Campus Number: 029901001 School Type: High School
State District CampusAfrican
American Hispanic WhiteAmerican
Indian AsianPacific
IslanderTwo or
More RacesSpecial
EdEcon
Disadv ELL
6-Year Extended Longitudinal Rate (Gr 9-12)Class of 2012
Graduated 90.9% 95.0% 95.6% 83.3% 96.1% 95.3% - 100.0% - * 96.8% 93.1% *Received GED 1.5% 3.5% 3.1% 16.7% 3.1% 2.4% - 0.0% - * 0.0% 5.9% *Continued HS 0.6% 0.4% 0.4% 0.0% 0.0% 1.2% - 0.0% - * 3.2% 0.0% *Dropped Out 7.0% 1.1% 0.9% 0.0% 0.8% 1.2% - 0.0% - * 0.0% 1.0% *Graduates and GED 92.4% 98.6% 98.7% 100.0% 99.2% 97.6% - 100.0% - * 96.8% 99.0% *Grads, GED, & Cont 93.0% 98.9% 99.1% 100.0% 99.2% 98.8% - 100.0% - * 100.0% 99.0% *
4-Year Federal Graduation Rate Without Exclusions (Gr 9-12)Class of 2015 89.0% 92.6% 95.1% 100.0% 96.2% 97.8% - 70.6% - - 81.3% 94.7% 80.0%Class of 2014 88.3% 94.4% 96.6% * 97.0% 96.3% * 92.9% - * 89.3% 97.8% *
5-Year Extended Federal Graduation Rate Without Exclusions (Gr 9-12)Class of 2014 90.4% 94.8% 97.0% * 97.0% 97.5% * 92.9% - * 89.3% 97.8% *Class of 2013 90.4% 97.5% 98.7% 100.0% 99.2% 100.0% * 90.0% - * 100.0% 96.9% 77.8%
RHSP/DAP Graduates (Longitudinal Rate)Class of 2015 86.1% 70.8% 85.4% 71.4% 85.6% 85.5% - 90.9% - - 36.0% 82.0% 71.4%Class of 2014 85.5% 74.0% 87.6% * 85.2% 93.6% * 76.9% - * 32.0% 79.8% *
FHSP-E Graduates (Longitudinal Rate)Class of 2015 3.5% 0.0% 0.0% - - 0.0% - - - - * - -
FHSP-DLA Graduates (Longitudinal Rate)Class of 2015 38.7% 0.0% 0.0% - - 0.0% - - - - * - -
RHSP/DAP/FHSP-E/FHSP-DLA Graduates (Longitudinal Rate)Class of 2015 84.1% 69.0% 83.2% 71.4% 85.6% 79.8% - 90.9% - - 34.6% 82.0% 71.4%
RHSP/DAP Graduates (Annual Rate)2014-15 84.3% 73.3% 85.0% 71.4% 85.6% 84.5% - 90.0% - - 33.3% 80.7% 71.4%2013-14 83.8% 68.9% 86.3% * 83.7% 93.4% * 73.3% - * 30.0% 77.1% *
FHSP-E Graduates (Annual Rate)2014-15 3.5% 0.0% 0.0% - - 0.0% - * - - * * *
FHSP-DLA Graduates (Annual Rate)2014-15 37.3% 0.0% 0.0% - - 0.0% - * - - * * *
RHSP/DAP/FHSP-E/FHSP-DLA Graduates (Annual Rate)2014-15 82.2% 70.1% 82.1% 71.4% 85.6% 78.0% - 81.8% - - 32.0% 79.8% 62.5%
Advanced Course/Dual Credit Course Completion (Grades 11-12)Any Subject
2014-15 54.5% 54.5% 55.8% 50.0% 51.4% 63.0% * 57.7% - * 14.8% 43.6% 29.4%2013-14 53.2% 51.3% 56.1% 36.4% 50.5% 64.6% * 56.7% - * 18.6% 46.4% 13.3%
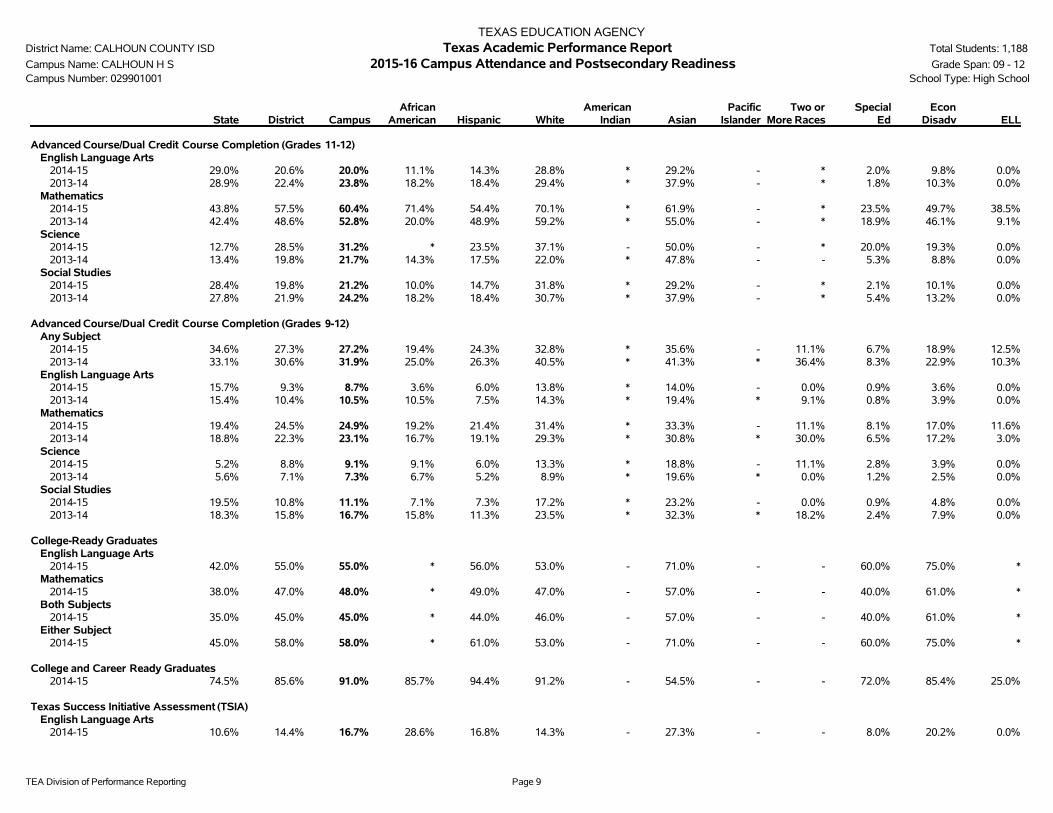
TEA Division of Performance Reporting Page 9
TEXAS EDUCATION AGENCYDistrict Name: CALHOUN COUNTY ISD Texas Academic Performance Report Total Students: 1,188
Campus Name: CALHOUN H S 2015-16 Campus Attendance and Postsecondary Readiness Grade Span: 09 - 12Campus Number: 029901001 School Type: High School
State District CampusAfrican
American Hispanic WhiteAmerican
Indian AsianPacific
IslanderTwo or
More RacesSpecial
EdEcon
Disadv ELL
Advanced Course/Dual Credit Course Completion (Grades 11-12)English Language Arts
2014-15 29.0% 20.6% 20.0% 11.1% 14.3% 28.8% * 29.2% - * 2.0% 9.8% 0.0%2013-14 28.9% 22.4% 23.8% 18.2% 18.4% 29.4% * 37.9% - * 1.8% 10.3% 0.0%
Mathematics2014-15 43.8% 57.5% 60.4% 71.4% 54.4% 70.1% * 61.9% - * 23.5% 49.7% 38.5%2013-14 42.4% 48.6% 52.8% 20.0% 48.9% 59.2% * 55.0% - * 18.9% 46.1% 9.1%
Science2014-15 12.7% 28.5% 31.2% * 23.5% 37.1% - 50.0% - * 20.0% 19.3% 0.0%2013-14 13.4% 19.8% 21.7% 14.3% 17.5% 22.0% * 47.8% - - 5.3% 8.8% 0.0%
Social Studies2014-15 28.4% 19.8% 21.2% 10.0% 14.7% 31.8% * 29.2% - * 2.1% 10.1% 0.0%2013-14 27.8% 21.9% 24.2% 18.2% 18.4% 30.7% * 37.9% - * 5.4% 13.2% 0.0%
Advanced Course/Dual Credit Course Completion (Grades 9-12)Any Subject
2014-15 34.6% 27.3% 27.2% 19.4% 24.3% 32.8% * 35.6% - 11.1% 6.7% 18.9% 12.5%2013-14 33.1% 30.6% 31.9% 25.0% 26.3% 40.5% * 41.3% * 36.4% 8.3% 22.9% 10.3%
English Language Arts2014-15 15.7% 9.3% 8.7% 3.6% 6.0% 13.8% * 14.0% - 0.0% 0.9% 3.6% 0.0%2013-14 15.4% 10.4% 10.5% 10.5% 7.5% 14.3% * 19.4% * 9.1% 0.8% 3.9% 0.0%
Mathematics2014-15 19.4% 24.5% 24.9% 19.2% 21.4% 31.4% * 33.3% - 11.1% 8.1% 17.0% 11.6%2013-14 18.8% 22.3% 23.1% 16.7% 19.1% 29.3% * 30.8% * 30.0% 6.5% 17.2% 3.0%
Science2014-15 5.2% 8.8% 9.1% 9.1% 6.0% 13.3% * 18.8% - 11.1% 2.8% 3.9% 0.0%2013-14 5.6% 7.1% 7.3% 6.7% 5.2% 8.9% * 19.6% * 0.0% 1.2% 2.5% 0.0%
Social Studies2014-15 19.5% 10.8% 11.1% 7.1% 7.3% 17.2% * 23.2% - 0.0% 0.9% 4.8% 0.0%2013-14 18.3% 15.8% 16.7% 15.8% 11.3% 23.5% * 32.3% * 18.2% 2.4% 7.9% 0.0%
College-Ready GraduatesEnglish Language Arts
2014-15 42.0% 55.0% 55.0% * 56.0% 53.0% - 71.0% - - 60.0% 75.0% *Mathematics
2014-15 38.0% 47.0% 48.0% * 49.0% 47.0% - 57.0% - - 40.0% 61.0% *Both Subjects
2014-15 35.0% 45.0% 45.0% * 44.0% 46.0% - 57.0% - - 40.0% 61.0% *Either Subject
2014-15 45.0% 58.0% 58.0% * 61.0% 53.0% - 71.0% - - 60.0% 75.0% *
College and Career Ready Graduates2014-15 74.5% 85.6% 91.0% 85.7% 94.4% 91.2% - 54.5% - - 72.0% 85.4% 25.0%
Texas Success Initiative Assessment (TSIA)English Language Arts
2014-15 10.6% 14.4% 16.7% 28.6% 16.8% 14.3% - 27.3% - - 8.0% 20.2% 0.0%
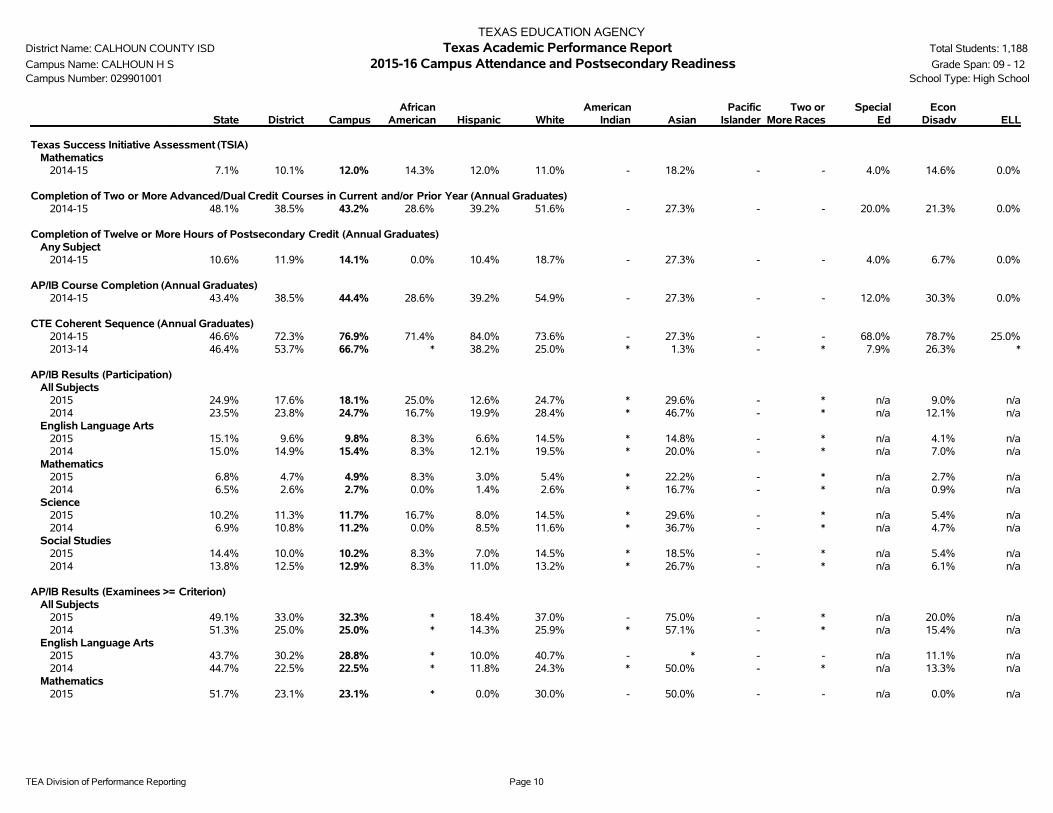
TEA Division of Performance Reporting Page 10
TEXAS EDUCATION AGENCYDistrict Name: CALHOUN COUNTY ISD Texas Academic Performance Report Total Students: 1,188
Campus Name: CALHOUN H S 2015-16 Campus Attendance and Postsecondary Readiness Grade Span: 09 - 12Campus Number: 029901001 School Type: High School
State District CampusAfrican
American Hispanic WhiteAmerican
Indian AsianPacific
IslanderTwo or
More RacesSpecial
EdEcon
Disadv ELL
Texas Success Initiative Assessment (TSIA)Mathematics
2014-15 7.1% 10.1% 12.0% 14.3% 12.0% 11.0% - 18.2% - - 4.0% 14.6% 0.0%
Completion of Two or More Advanced/Dual Credit Courses in Current and/or Prior Year (Annual Graduates)2014-15 48.1% 38.5% 43.2% 28.6% 39.2% 51.6% - 27.3% - - 20.0% 21.3% 0.0%
Completion of Twelve or More Hours of Postsecondary Credit (Annual Graduates)Any Subject
2014-15 10.6% 11.9% 14.1% 0.0% 10.4% 18.7% - 27.3% - - 4.0% 6.7% 0.0%
AP/IB Course Completion (Annual Graduates)2014-15 43.4% 38.5% 44.4% 28.6% 39.2% 54.9% - 27.3% - - 12.0% 30.3% 0.0%
CTE Coherent Sequence (Annual Graduates)2014-15 46.6% 72.3% 76.9% 71.4% 84.0% 73.6% - 27.3% - - 68.0% 78.7% 25.0%2013-14 46.4% 53.7% 66.7% * 38.2% 25.0% * 1.3% - * 7.9% 26.3% *
AP/IB Results (Participation)All Subjects
2015 24.9% 17.6% 18.1% 25.0% 12.6% 24.7% * 29.6% - * n/a 9.0% n/a2014 23.5% 23.8% 24.7% 16.7% 19.9% 28.4% * 46.7% - * n/a 12.1% n/a
English Language Arts2015 15.1% 9.6% 9.8% 8.3% 6.6% 14.5% * 14.8% - * n/a 4.1% n/a2014 15.0% 14.9% 15.4% 8.3% 12.1% 19.5% * 20.0% - * n/a 7.0% n/a
Mathematics2015 6.8% 4.7% 4.9% 8.3% 3.0% 5.4% * 22.2% - * n/a 2.7% n/a2014 6.5% 2.6% 2.7% 0.0% 1.4% 2.6% * 16.7% - * n/a 0.9% n/a
Science2015 10.2% 11.3% 11.7% 16.7% 8.0% 14.5% * 29.6% - * n/a 5.4% n/a2014 6.9% 10.8% 11.2% 0.0% 8.5% 11.6% * 36.7% - * n/a 4.7% n/a
Social Studies2015 14.4% 10.0% 10.2% 8.3% 7.0% 14.5% * 18.5% - * n/a 5.4% n/a2014 13.8% 12.5% 12.9% 8.3% 11.0% 13.2% * 26.7% - * n/a 6.1% n/a
AP/IB Results (Examinees >= Criterion)All Subjects
2015 49.1% 33.0% 32.3% * 18.4% 37.0% - 75.0% - * n/a 20.0% n/a2014 51.3% 25.0% 25.0% * 14.3% 25.9% * 57.1% - * n/a 15.4% n/a
English Language Arts2015 43.7% 30.2% 28.8% * 10.0% 40.7% - * - - n/a 11.1% n/a2014 44.7% 22.5% 22.5% * 11.8% 24.3% * 50.0% - * n/a 13.3% n/a
Mathematics2015 51.7% 23.1% 23.1% * 0.0% 30.0% - 50.0% - - n/a 0.0% n/a
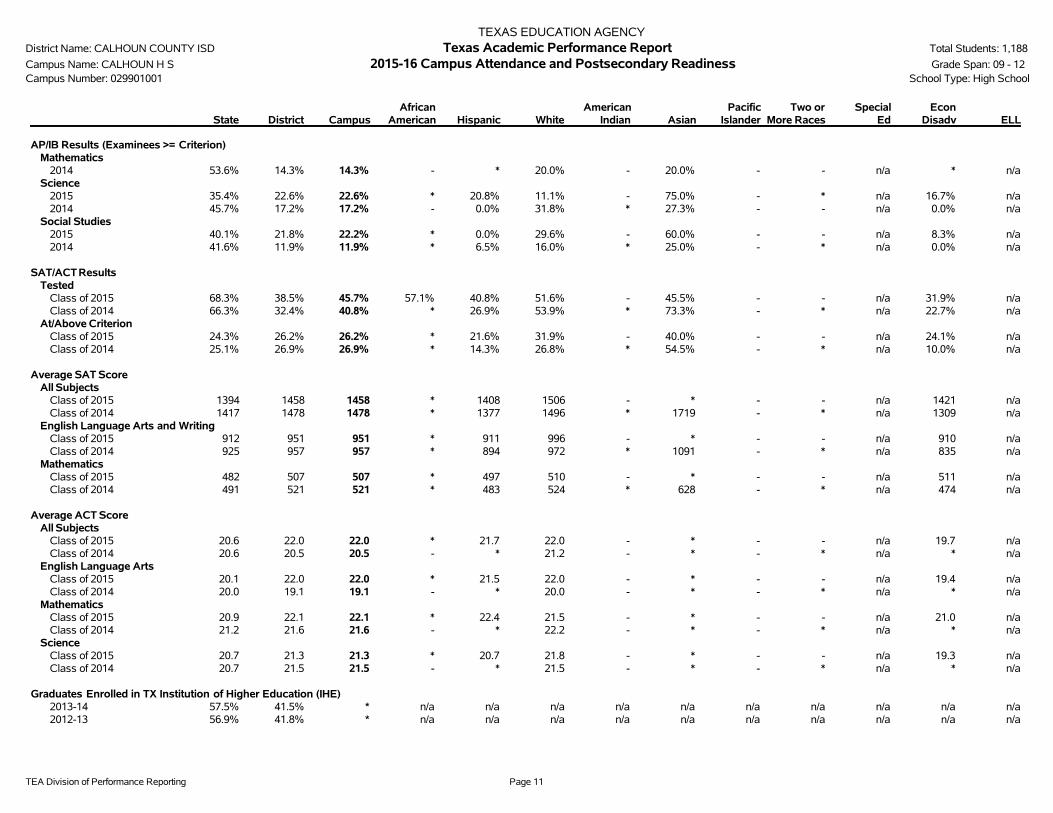
TEA Division of Performance Reporting Page 11
TEXAS EDUCATION AGENCYDistrict Name: CALHOUN COUNTY ISD Texas Academic Performance Report Total Students: 1,188
Campus Name: CALHOUN H S 2015-16 Campus Attendance and Postsecondary Readiness Grade Span: 09 - 12Campus Number: 029901001 School Type: High School
State District CampusAfrican
American Hispanic WhiteAmerican
Indian AsianPacific
IslanderTwo or
More RacesSpecial
EdEcon
Disadv ELL
AP/IB Results (Examinees >= Criterion)Mathematics
2014 53.6% 14.3% 14.3% - * 20.0% - 20.0% - - n/a * n/aScience
2015 35.4% 22.6% 22.6% * 20.8% 11.1% - 75.0% - * n/a 16.7% n/a2014 45.7% 17.2% 17.2% - 0.0% 31.8% * 27.3% - - n/a 0.0% n/a
Social Studies2015 40.1% 21.8% 22.2% * 0.0% 29.6% - 60.0% - - n/a 8.3% n/a2014 41.6% 11.9% 11.9% * 6.5% 16.0% * 25.0% - * n/a 0.0% n/a
SAT/ACT ResultsTested
Class of 2015 68.3% 38.5% 45.7% 57.1% 40.8% 51.6% - 45.5% - - n/a 31.9% n/aClass of 2014 66.3% 32.4% 40.8% * 26.9% 53.9% * 73.3% - * n/a 22.7% n/a
At/Above CriterionClass of 2015 24.3% 26.2% 26.2% * 21.6% 31.9% - 40.0% - - n/a 24.1% n/aClass of 2014 25.1% 26.9% 26.9% * 14.3% 26.8% * 54.5% - * n/a 10.0% n/a
Average SAT ScoreAll Subjects
Class of 2015 1394 1458 1458 * 1408 1506 - * - - n/a 1421 n/aClass of 2014 1417 1478 1478 * 1377 1496 * 1719 - * n/a 1309 n/a
English Language Arts and WritingClass of 2015 912 951 951 * 911 996 - * - - n/a 910 n/aClass of 2014 925 957 957 * 894 972 * 1091 - * n/a 835 n/a
MathematicsClass of 2015 482 507 507 * 497 510 - * - - n/a 511 n/aClass of 2014 491 521 521 * 483 524 * 628 - * n/a 474 n/a
Average ACT ScoreAll Subjects
Class of 2015 20.6 22.0 22.0 * 21.7 22.0 - * - - n/a 19.7 n/aClass of 2014 20.6 20.5 20.5 - * 21.2 - * - * n/a * n/a
English Language ArtsClass of 2015 20.1 22.0 22.0 * 21.5 22.0 - * - - n/a 19.4 n/aClass of 2014 20.0 19.1 19.1 - * 20.0 - * - * n/a * n/a
MathematicsClass of 2015 20.9 22.1 22.1 * 22.4 21.5 - * - - n/a 21.0 n/aClass of 2014 21.2 21.6 21.6 - * 22.2 - * - * n/a * n/a
ScienceClass of 2015 20.7 21.3 21.3 * 20.7 21.8 - * - - n/a 19.3 n/aClass of 2014 20.7 21.5 21.5 - * 21.5 - * - * n/a * n/a
Graduates Enrolled in TX Institution of Higher Education (IHE)2013-14 57.5% 41.5% * n/a n/a n/a n/a n/a n/a n/a n/a n/a n/a2012-13 56.9% 41.8% * n/a n/a n/a n/a n/a n/a n/a n/a n/a n/a

TEA Division of Performance Reporting Page 12
TEXAS EDUCATION AGENCYDistrict Name: CALHOUN COUNTY ISD Texas Academic Performance Report Total Students: 1,188
Campus Name: CALHOUN H S 2015-16 Campus Attendance and Postsecondary Readiness Grade Span: 09 - 12Campus Number: 029901001 School Type: High School
State District CampusAfrican
American Hispanic WhiteAmerican
Indian AsianPacific
IslanderTwo or
More RacesSpecial
EdEcon
Disadv ELL
Graduates in TX IHE Completing One Year Without Remediation2013-14 70.5% 72.6% * n/a n/a n/a n/a n/a n/a n/a n/a n/a n/a2012-13 70.8% 79.5% * n/a n/a n/a n/a n/a n/a n/a n/a n/a n/a

TEA Division of Performance Reporting Page 13
TEXAS EDUCATION AGENCYDistrict Name: CALHOUN COUNTY ISD Texas Academic Performance Report Total Students: 1,188
Campus Name: CALHOUN H S 2015-16 Campus Profile Grade Span: 09 - 12Campus Number: 029901001 School Type: High School
---------------- Campus ----------------Student Information Count Percent District State
Total Students: 1,188 100.0% 4,172 5,284,252
Students by Grade:Early Childhood Education 0 0.0% 0.3% 0.2%Pre-Kindergarten 0 0.0% 4.1% 4.2%Kindergarten 0 0.0% 7.7% 7.1%Grade 1 0 0.0% 7.5% 7.8%Grade 2 0 0.0% 6.9% 7.8%Grade 3 0 0.0% 8.0% 7.7%Grade 4 0 0.0% 7.3% 7.5%Grade 5 0 0.0% 6.3% 7.5%Grade 6 0 0.0% 7.3% 7.4%Grade 7 0 0.0% 7.6% 7.4%Grade 8 0 0.0% 7.9% 7.3%Grade 9 312 26.3% 7.5% 8.1%Grade 10 325 27.4% 8.0% 7.3%Grade 11 302 25.4% 7.5% 6.7%Grade 12 249 21.0% 6.1% 6.1%
Ethnic Distribution:African American 23 1.9% 2.1% 12.6%Hispanic 744 62.6% 63.0% 52.2%White 345 29.0% 28.5% 28.5%American Indian 2 0.2% 0.3% 0.4%Asian 57 4.8% 5.3% 4.0%Pacific Islander 1 0.1% 0.0% 0.1%Two or More Races 16 1.3% 0.8% 2.1%
Economically Disadvantaged 582 49.0% 60.3% 59.0%Non-Educationally Disadvantaged 606 51.0% 39.7% 41.0%English Language Learners (ELL) 55 4.6% 11.5% 18.5%Students w/ Disciplinary Placements (2014-2015) 84 6.6% 3.0% 1.4%At-Risk 633 53.3% 48.4% 50.1%Mobility (2014-2015) 176 13.9% 14.6% 16.5%
Graduates (Class of 2015):Total Graduates 234 100.0% 278 313,397
By Ethnicity (incl. Special Ed.):African American 7 3.0% 8 39,692Hispanic 125 53.4% 156 148,966White 91 38.9% 100 104,377American Indian 0 0.0% 1 1,335Asian 11 4.7% 11 13,090Pacific Islander 0 0.0% 0 486Two or More Races 0 0.0% 2 5,451

TEA Division of Performance Reporting Page 14
TEXAS EDUCATION AGENCYDistrict Name: CALHOUN COUNTY ISD Texas Academic Performance Report Total Students: 1,188
Campus Name: CALHOUN H S 2015-16 Campus Profile Grade Span: 09 - 12Campus Number: 029901001 School Type: High School
---------------- Campus ----------------Student Information Count Percent District State
By Graduation Type (incl. Special Ed.):Minimum H.S. Program 34 14.5% 71 46,723Recommended H.S. Program/DAP 192 82.1% 195 251,524Foundation High School Plan (No Endorsement) 8 3.4% 12 8,982Foundation High School Plan (Endorsement) 0 0.0% 0 523Foundation High School Plan (DLA) 0 0.0% 0 5,645
Special Education Graduates 25 10.7% 29 23,541

TEA Division of Performance Reporting Page 15
TEXAS EDUCATION AGENCYDistrict Name: CALHOUN COUNTY ISD Texas Academic Performance Report Total Students: 1,188
Campus Name: CALHOUN H S 2015-16 Campus Profile Grade Span: 09 - 12Campus Number: 029901001 School Type: High School
Class Size Information Campus District State
Class Size Averages by Grade and Subject (Derived from teacher responsibility records):
Elementary:Kindergarten - 18.7 18.9Grade 1 - 17.9 19.1Grade 2 - 17.6 19.1Grade 3 - 17.1 19.1Grade 4 - 17.5 19.0Grade 5 - 16.4 20.8Grade 6 - 19.6 20.4
Secondary:English/Language Arts 15.4 16.3 17.1Foreign Languages 16.5 17.4 19.1Mathematics 14.7 15.7 18.1Science 14.1 16.6 19.1Social Studies 16.8 18.0 19.5
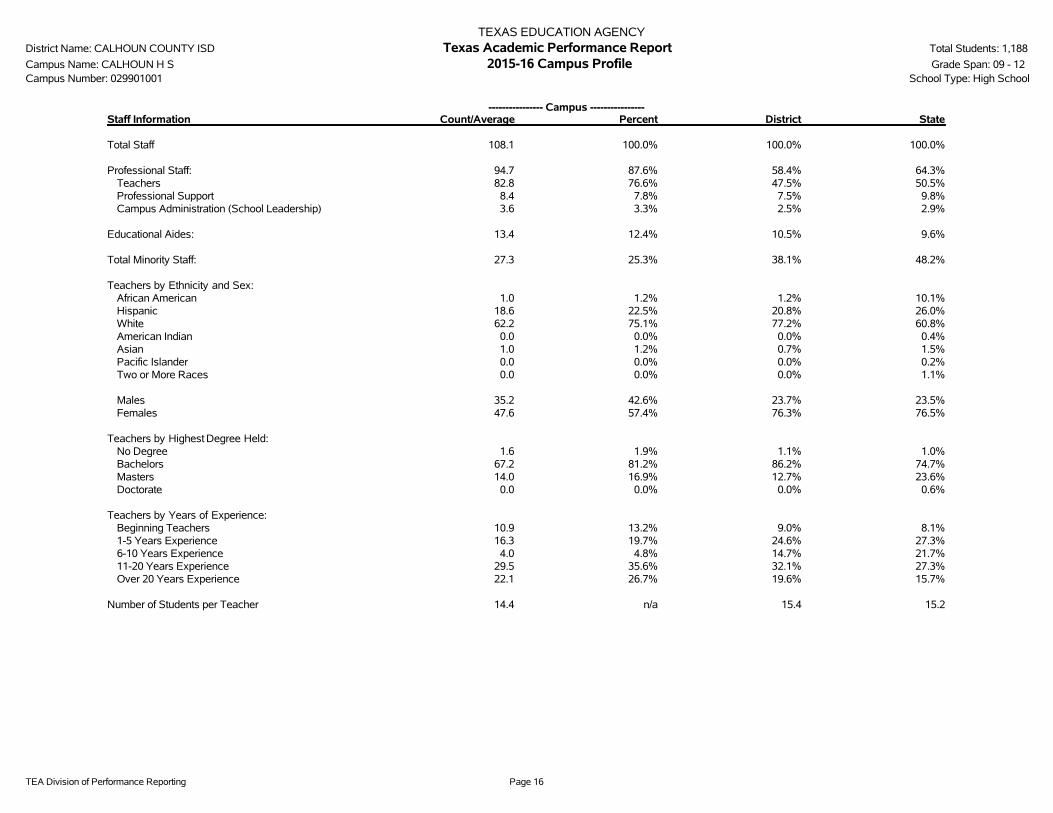
TEA Division of Performance Reporting Page 16
TEXAS EDUCATION AGENCYDistrict Name: CALHOUN COUNTY ISD Texas Academic Performance Report Total Students: 1,188
Campus Name: CALHOUN H S 2015-16 Campus Profile Grade Span: 09 - 12Campus Number: 029901001 School Type: High School
---------------- Campus ----------------Staff Information Count/Average Percent District State
Total Staff 108.1 100.0% 100.0% 100.0%
Professional Staff: 94.7 87.6% 58.4% 64.3%Teachers 82.8 76.6% 47.5% 50.5%Professional Support 8.4 7.8% 7.5% 9.8%Campus Administration (School Leadership) 3.6 3.3% 2.5% 2.9%
Educational Aides: 13.4 12.4% 10.5% 9.6%
Total Minority Staff: 27.3 25.3% 38.1% 48.2%
Teachers by Ethnicity and Sex:African American 1.0 1.2% 1.2% 10.1%Hispanic 18.6 22.5% 20.8% 26.0%White 62.2 75.1% 77.2% 60.8%American Indian 0.0 0.0% 0.0% 0.4%Asian 1.0 1.2% 0.7% 1.5%Pacific Islander 0.0 0.0% 0.0% 0.2%Two or More Races 0.0 0.0% 0.0% 1.1%
Males 35.2 42.6% 23.7% 23.5%Females 47.6 57.4% 76.3% 76.5%
Teachers by Highest Degree Held:No Degree 1.6 1.9% 1.1% 1.0%Bachelors 67.2 81.2% 86.2% 74.7%Masters 14.0 16.9% 12.7% 23.6%Doctorate 0.0 0.0% 0.0% 0.6%
Teachers by Years of Experience:Beginning Teachers 10.9 13.2% 9.0% 8.1%1-5 Years Experience 16.3 19.7% 24.6% 27.3%6-10 Years Experience 4.0 4.8% 14.7% 21.7%11-20 Years Experience 29.5 35.6% 32.1% 27.3%Over 20 Years Experience 22.1 26.7% 19.6% 15.7%
Number of Students per Teacher 14.4 n/a 15.4 15.2

TEA Division of Performance Reporting Page 17
TEXAS EDUCATION AGENCYDistrict Name: CALHOUN COUNTY ISD Texas Academic Performance Report Total Students: 1,188
Campus Name: CALHOUN H S 2015-16 Campus Profile Grade Span: 09 - 12Campus Number: 029901001 School Type: High School
Staff Information Campus District State
Average Years Experience of Teachers: 14.7 12.9 10.9Average Years Experience of Teachers with District: 7.6 8.4 7.3
Average Teacher Salary by Years of Experience (regular duties only):Beginning Teachers $34,987 $36,085 $45,5071-5 Years Experience $42,415 $41,344 $47,9966-10 Years Experience $47,133 $44,877 $50,45911-20 Years Experience $53,059 $51,582 $53,794Over 20 Years Experience $57,443 $56,808 $60,613
Average Actual Salaries (regular duties only):Teachers $49,466 $47,707 $51,891Professional Support $59,557 $57,854 $61,145Campus Administration (School Leadership) $88,457 $76,928 $75,654
Instructional Staff Percent: n/a 61.1% 64.5%
Contracted Instructional Staff (not incl. above): 0.0 0.0 1,914.4

TEA Division of Performance Reporting Page 18
TEXAS EDUCATION AGENCYDistrict Name: CALHOUN COUNTY ISD Texas Academic Performance Report Total Students: 1,188
Campus Name: CALHOUN H S 2015-16 Campus Profile Grade Span: 09 - 12Campus Number: 029901001 School Type: High School
---------------- Campus ----------------Program Information Count Percent District State
Student Enrollment by Program:Bilingual/ESL Education 55 4.6% 11.4% 18.3%Career & Technical Education 1,071 90.2% 30.2% 24.3%Gifted & Talented Education 76 6.4% 7.2% 7.7%Special Education 120 10.1% 8.3% 8.6%
Teachers by Program (population served):Bilingual/ESL Education 1.7 2.1% 0.7% 5.9%Career & Technical Education 11.7 14.1% 5.3% 4.4%Compensatory Education 0.0 0.0% 1.3% 2.9%Gifted & Talented Education 3.7 4.4% 1.4% 1.9%Regular Education 59.6 72.0% 82.4% 72.6%Special Education 2.2 2.7% 6.2% 8.8%Other 3.9 4.7% 2.8% 3.4%
Link to: PEIMS Financial Standard Reports/ 2014-2015 Financial Actual Report
' '̂ Indicates that ELL rates at met or exceeded standard and exceeded standard include current and monitored students.'*' Indicates results are masked due to small numbers to protect student confidentiality.'-' Indicates zero observations reported for this group.'n/a' Indicates data reporting is not applicable for this group.'**' Indicates that rates for Reading and Mathematics are based on the cumulative results from the first and second administrations of STAAR.'?' Indicates that the data for this item were statistically improbable, or were reported outside a reasonable range.'##' Indicates that PID Error rate information cannot be reported in 2015-16 due to the transition from PEIMS Edit+ to TSDS.
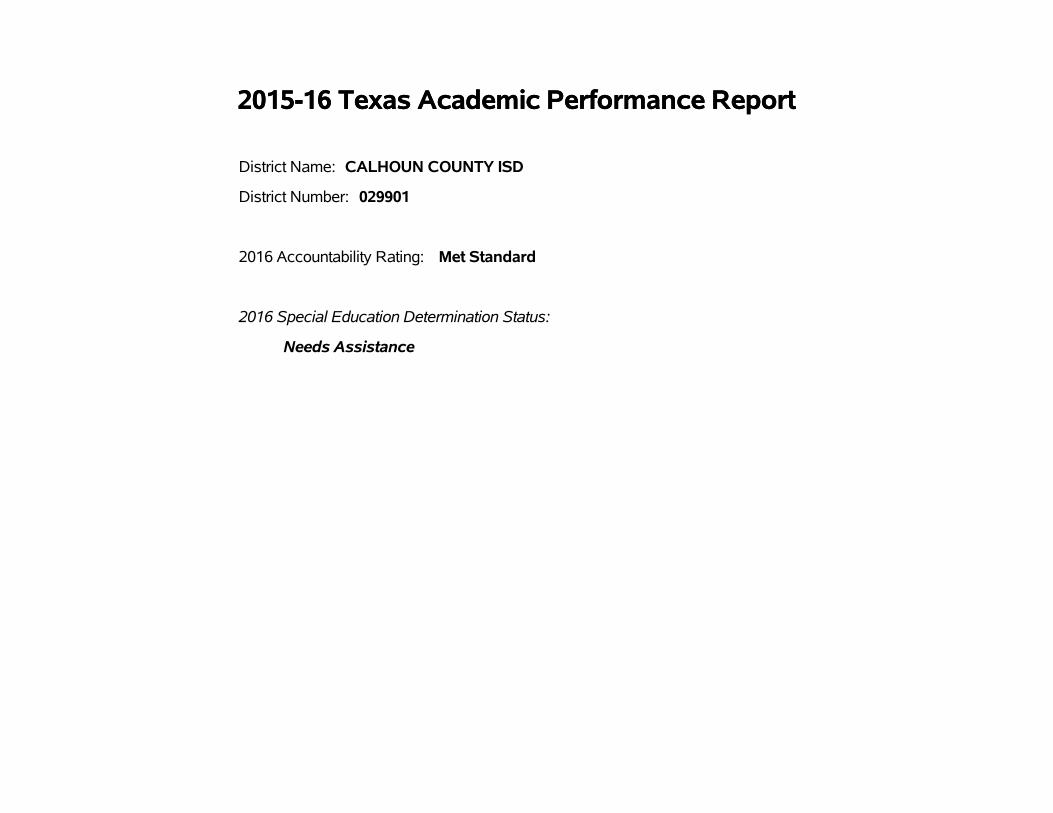
2015-16 Texas Academic Performance Report2015-16 Texas Academic Performance Report
District Name: CALHOUN COUNTY ISD
District Number: 029901
2016 Accountability Rating: Met Standard
2016 Special Education Determination Status:
Needs Assistance

This page intentionally left blank.

TEA Division of Performance Reporting Page 1
TEXAS EDUCATION AGENCYDistrict Name: CALHOUN COUNTY ISD Texas Academic Performance ReportCounty Name: CALHOUN 2015-16 District PerformanceDistrict Number: 029901
StateRegion
03 DistrictAfrican
American Hispanic WhiteAmerican
Indian AsianPacific
Islander
Two orMore
RacesSpecial
EdEcon
Disadv ELL^STAARPercent at Level II Satisfactory Standard or Above
Grade 3
Reading 2016 73% 69% 84% 78% 81% 88% * 86% - * 50% 81% 83%
Mathematics 2016 75% 73% 87% 67% 86% 90% * 93% - * 75% 84% 83%
STAARPercent at Level II Satisfactory Standard or AboveGrade 4
Reading 2016 75% 70% 82% * 78% 91% * 75% - - 41% 74% 67%
Mathematics 2016 73% 67% 80% * 77% 87% * 88% - - 52% 75% 76%
Writing 2016 69% 63% 78% * 74% 88% * 75% - - 57% 69% 65%
STAARPercent at Level II Satisfactory Standard or AboveGrade 5 **
Reading 2016 81% 76% 84% * 79% 95% - 86% - * 42% 76% 72%
Mathematics 2016 86% 84% 90% * 87% 98% - 95% - * 42% 85% 88%
Science 2016 74% 68% 82% * 76% 95% - 86% - * 42% 74% 70%
STAARPercent at Level II Satisfactory Standard or AboveGrade 6
Reading 2016 69% 62% 62% * 55% 79% * 73% - * * 50% 39%
Mathematics 2016 72% 66% 68% * 64% 77% * 77% - * 26% 59% 56%
STAARPercent at Level II Satisfactory Standard or AboveGrade 7
Reading 2016 71% 66% 63% 67% 57% 67% * 95% - * * 49% 36%
Mathematics 2016 69% 62% 66% 56% 63% 69% * 82% - * 23% 54% 48%
Writing 2016 69% 65% 62% 50% 55% 71% * 90% - * * 49% 33%
STAARPercent at Level II Satisfactory Standard or AboveGrade 8 **
Reading 2016 87% 83% 81% 100% 73% 94% * 93% - * 29% 73% 41%
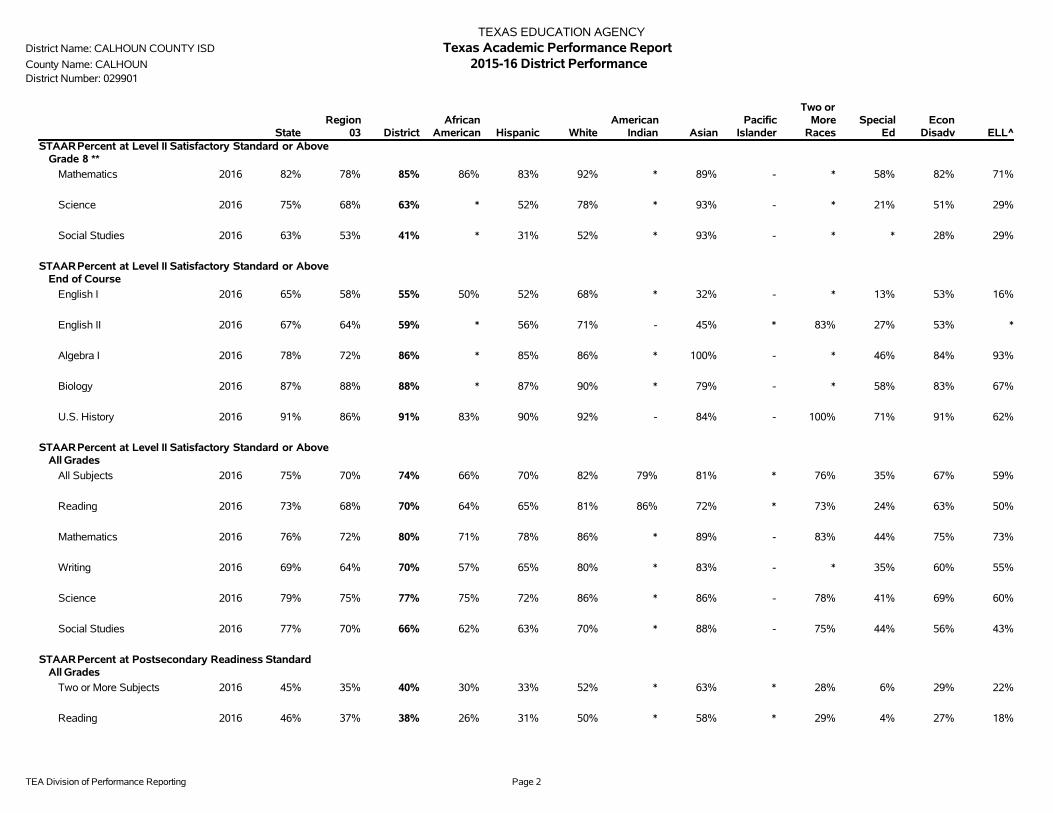
TEA Division of Performance Reporting Page 2
TEXAS EDUCATION AGENCYDistrict Name: CALHOUN COUNTY ISD Texas Academic Performance ReportCounty Name: CALHOUN 2015-16 District PerformanceDistrict Number: 029901
StateRegion
03 DistrictAfrican
American Hispanic WhiteAmerican
Indian AsianPacific
Islander
Two orMore
RacesSpecial
EdEcon
Disadv ELL^STAARPercent at Level II Satisfactory Standard or Above
Grade 8 **
Mathematics 2016 82% 78% 85% 86% 83% 92% * 89% - * 58% 82% 71%
Science 2016 75% 68% 63% * 52% 78% * 93% - * 21% 51% 29%
Social Studies 2016 63% 53% 41% * 31% 52% * 93% - * * 28% 29%
STAARPercent at Level II Satisfactory Standard or AboveEnd of Course
English I 2016 65% 58% 55% 50% 52% 68% * 32% - * 13% 53% 16%
English II 2016 67% 64% 59% * 56% 71% - 45% * 83% 27% 53% *
Algebra I 2016 78% 72% 86% * 85% 86% * 100% - * 46% 84% 93%
Biology 2016 87% 88% 88% * 87% 90% * 79% - * 58% 83% 67%
U.S. History 2016 91% 86% 91% 83% 90% 92% - 84% - 100% 71% 91% 62%
STAARPercent at Level II Satisfactory Standard or AboveAll Grades
All Subjects 2016 75% 70% 74% 66% 70% 82% 79% 81% * 76% 35% 67% 59%
Reading 2016 73% 68% 70% 64% 65% 81% 86% 72% * 73% 24% 63% 50%
Mathematics 2016 76% 72% 80% 71% 78% 86% * 89% - 83% 44% 75% 73%
Writing 2016 69% 64% 70% 57% 65% 80% * 83% - * 35% 60% 55%
Science 2016 79% 75% 77% 75% 72% 86% * 86% - 78% 41% 69% 60%
Social Studies 2016 77% 70% 66% 62% 63% 70% * 88% - 75% 44% 56% 43%
STAARPercent at Postsecondary Readiness StandardAll Grades
Two or More Subjects 2016 45% 35% 40% 30% 33% 52% * 63% * 28% 6% 29% 22%
Reading 2016 46% 37% 38% 26% 31% 50% * 58% * 29% 4% 27% 18%
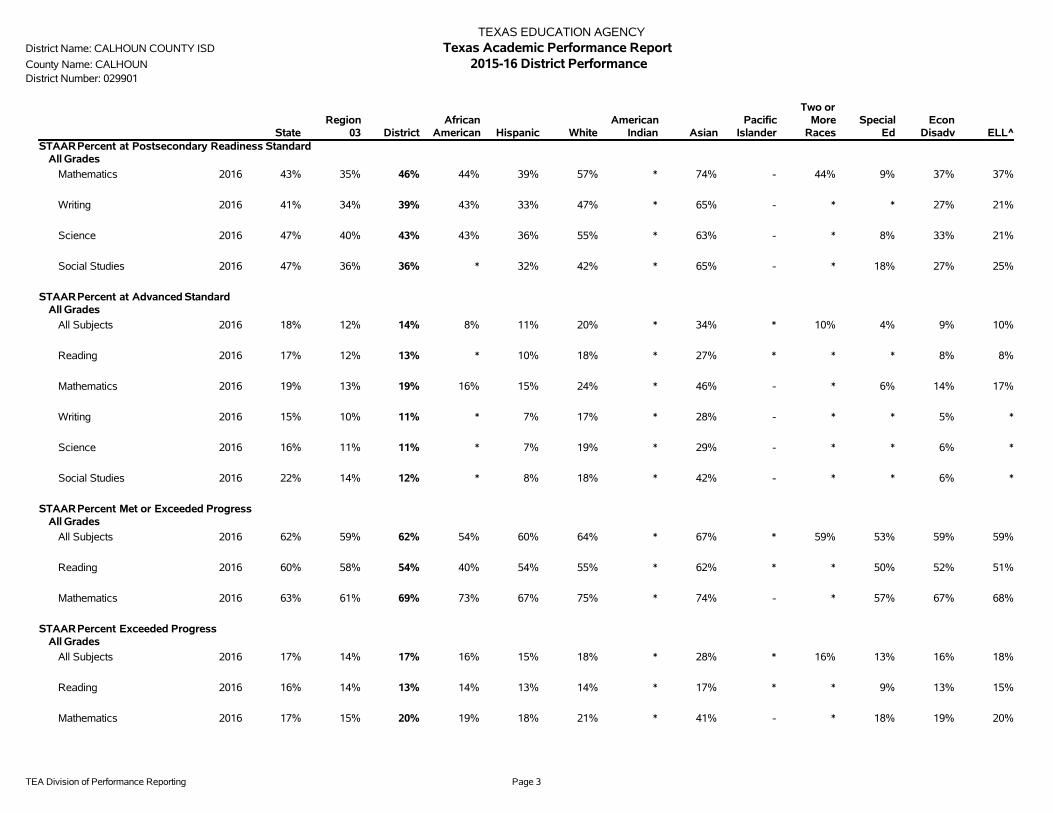
TEA Division of Performance Reporting Page 3
TEXAS EDUCATION AGENCYDistrict Name: CALHOUN COUNTY ISD Texas Academic Performance ReportCounty Name: CALHOUN 2015-16 District PerformanceDistrict Number: 029901
StateRegion
03 DistrictAfrican
American Hispanic WhiteAmerican
Indian AsianPacific
Islander
Two orMore
RacesSpecial
EdEcon
Disadv ELL^STAARPercent at Postsecondary Readiness Standard
All Grades
Mathematics 2016 43% 35% 46% 44% 39% 57% * 74% - 44% 9% 37% 37%
Writing 2016 41% 34% 39% 43% 33% 47% * 65% - * * 27% 21%
Science 2016 47% 40% 43% 43% 36% 55% * 63% - * 8% 33% 21%
Social Studies 2016 47% 36% 36% * 32% 42% * 65% - * 18% 27% 25%
STAARPercent at Advanced StandardAll Grades
All Subjects 2016 18% 12% 14% 8% 11% 20% * 34% * 10% 4% 9% 10%
Reading 2016 17% 12% 13% * 10% 18% * 27% * * * 8% 8%
Mathematics 2016 19% 13% 19% 16% 15% 24% * 46% - * 6% 14% 17%
Writing 2016 15% 10% 11% * 7% 17% * 28% - * * 5% *
Science 2016 16% 11% 11% * 7% 19% * 29% - * * 6% *
Social Studies 2016 22% 14% 12% * 8% 18% * 42% - * * 6% *
STAARPercent Met or Exceeded ProgressAll Grades
All Subjects 2016 62% 59% 62% 54% 60% 64% * 67% * 59% 53% 59% 59%
Reading 2016 60% 58% 54% 40% 54% 55% * 62% * * 50% 52% 51%
Mathematics 2016 63% 61% 69% 73% 67% 75% * 74% - * 57% 67% 68%
STAARPercent Exceeded ProgressAll Grades
All Subjects 2016 17% 14% 17% 16% 15% 18% * 28% * 16% 13% 16% 18%
Reading 2016 16% 14% 13% 14% 13% 14% * 17% * * 9% 13% 15%
Mathematics 2016 17% 15% 20% 19% 18% 21% * 41% - * 18% 19% 20%
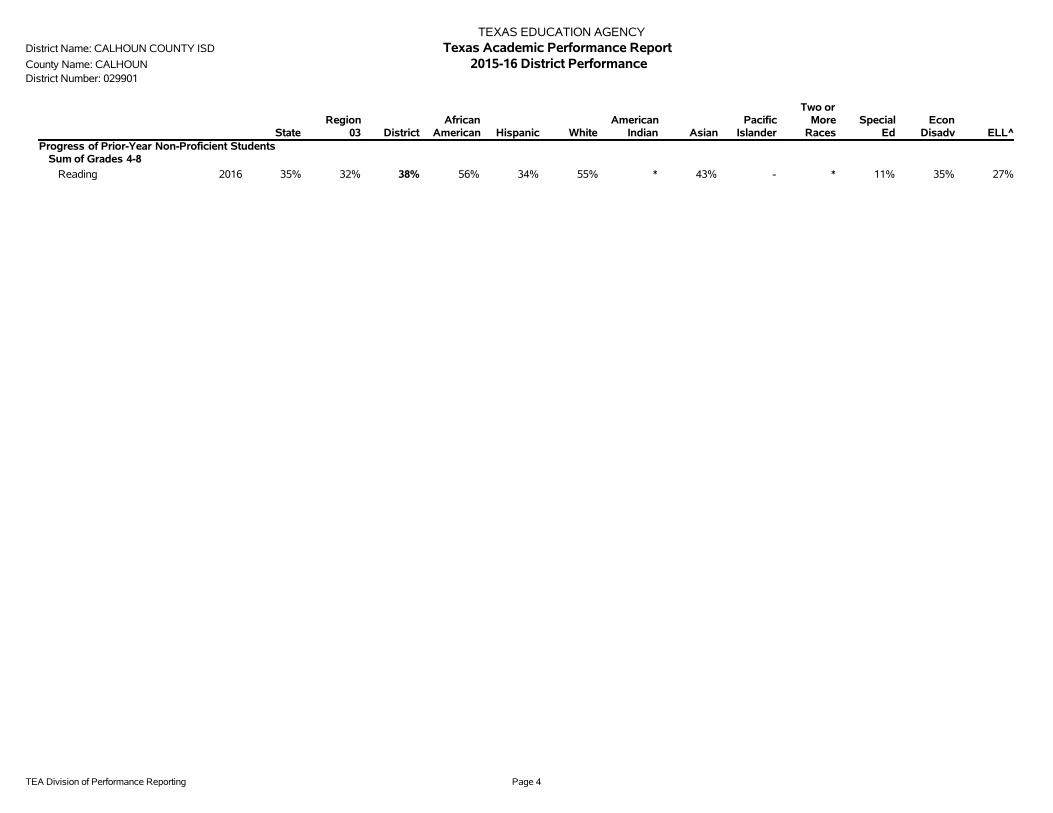
TEA Division of Performance Reporting Page 4
TEXAS EDUCATION AGENCYDistrict Name: CALHOUN COUNTY ISD Texas Academic Performance ReportCounty Name: CALHOUN 2015-16 District PerformanceDistrict Number: 029901
StateRegion
03 DistrictAfrican
American Hispanic WhiteAmerican
Indian AsianPacific
Islander
Two orMore
RacesSpecial
EdEcon
Disadv ELL^Progress of Prior-Year Non-Proficient Students
Sum of Grades 4-8
Reading 2016 35% 32% 38% 56% 34% 55% * 43% - * 11% 35% 27%
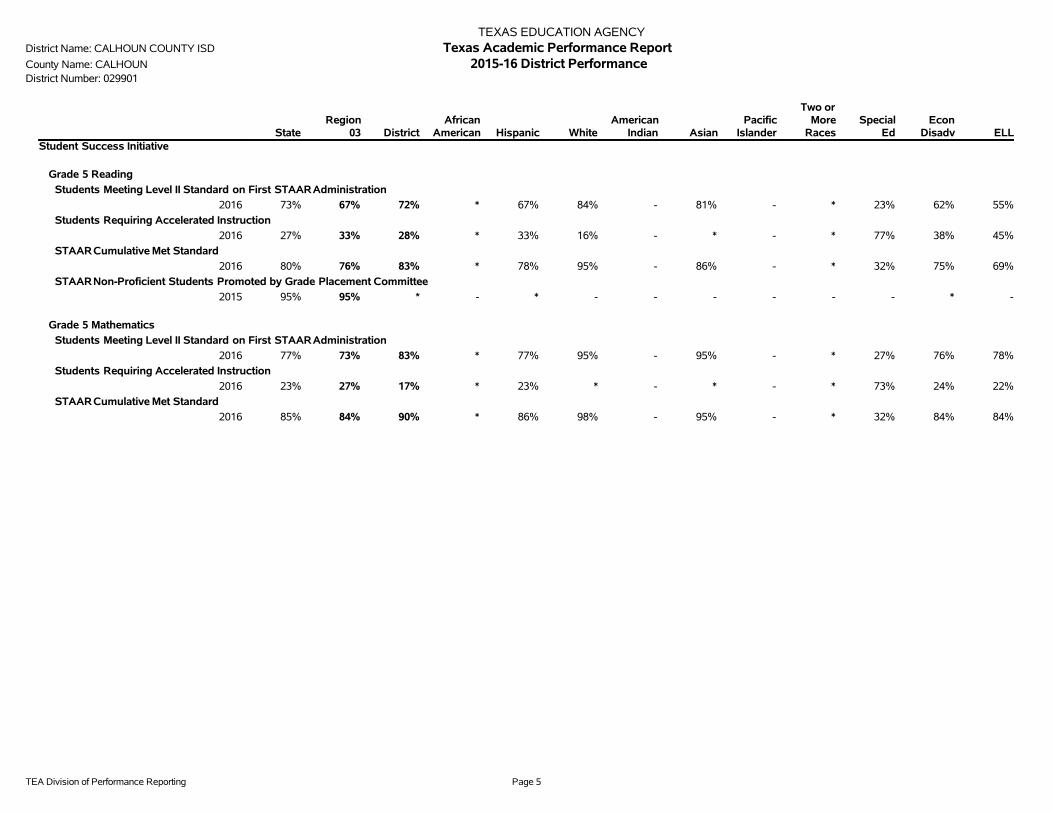
TEA Division of Performance Reporting Page 5
TEXAS EDUCATION AGENCYDistrict Name: CALHOUN COUNTY ISD Texas Academic Performance ReportCounty Name: CALHOUN 2015-16 District PerformanceDistrict Number: 029901
StateRegion
03 DistrictAfrican
American Hispanic WhiteAmerican
Indian AsianPacific
Islander
Two orMore
RacesSpecial
EdEcon
Disadv ELLStudent Success Initiative
Grade 5 Reading
Students Meeting Level II Standard on First STAARAdministration
2016 73% 67% 72% * 67% 84% - 81% - * 23% 62% 55%
Students Requiring Accelerated Instruction
2016 27% 33% 28% * 33% 16% - * - * 77% 38% 45%
STAARCumulative Met Standard
2016 80% 76% 83% * 78% 95% - 86% - * 32% 75% 69%
STAARNon-Proficient Students Promoted by Grade Placement Committee
2015 95% 95% * - * - - - - - - * -
Grade 5 Mathematics
Students Meeting Level II Standard on First STAARAdministration
2016 77% 73% 83% * 77% 95% - 95% - * 27% 76% 78%
Students Requiring Accelerated Instruction
2016 23% 27% 17% * 23% * - * - * 73% 24% 22%
STAARCumulative Met Standard
2016 85% 84% 90% * 86% 98% - 95% - * 32% 84% 84%
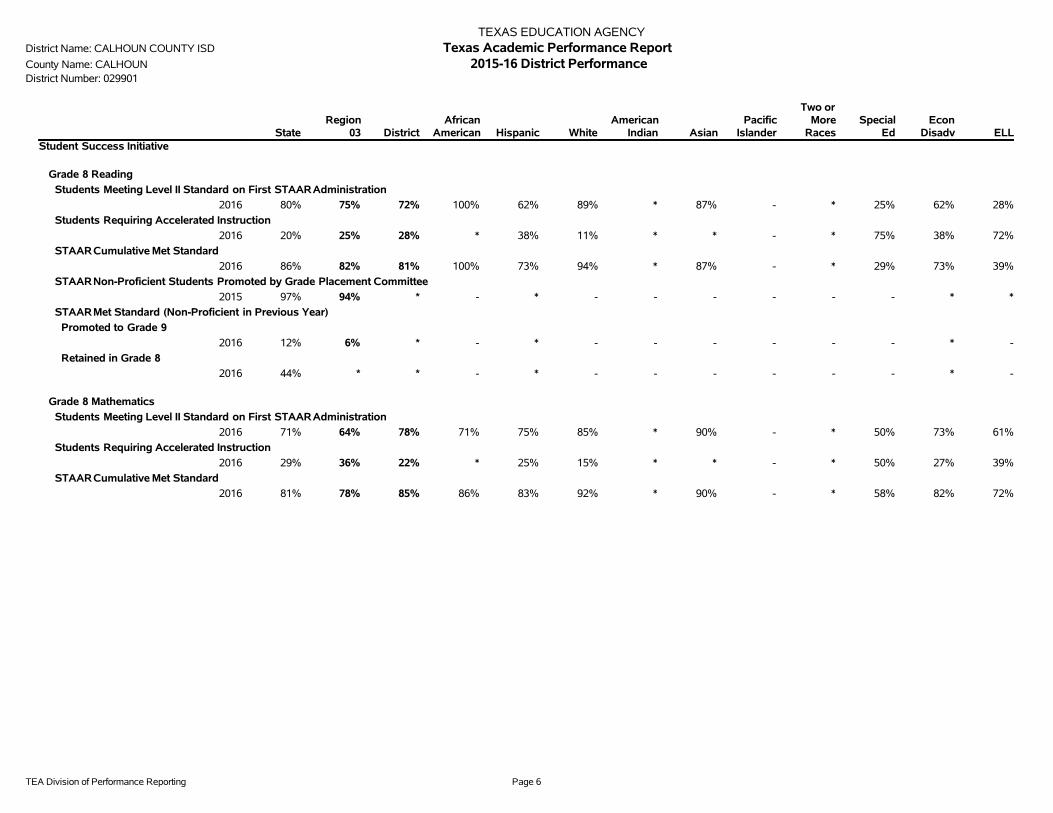
TEA Division of Performance Reporting Page 6
TEXAS EDUCATION AGENCYDistrict Name: CALHOUN COUNTY ISD Texas Academic Performance ReportCounty Name: CALHOUN 2015-16 District PerformanceDistrict Number: 029901
StateRegion
03 DistrictAfrican
American Hispanic WhiteAmerican
Indian AsianPacific
Islander
Two orMore
RacesSpecial
EdEcon
Disadv ELLStudent Success Initiative
Grade 8 Reading
Students Meeting Level II Standard on First STAARAdministration
2016 80% 75% 72% 100% 62% 89% * 87% - * 25% 62% 28%
Students Requiring Accelerated Instruction
2016 20% 25% 28% * 38% 11% * * - * 75% 38% 72%
STAARCumulative Met Standard
2016 86% 82% 81% 100% 73% 94% * 87% - * 29% 73% 39%
STAARNon-Proficient Students Promoted by Grade Placement Committee
2015 97% 94% * - * - - - - - - * *
STAARMet Standard (Non-Proficient in Previous Year)
Promoted to Grade 9
2016 12% 6% * - * - - - - - - * -
Retained in Grade 8
2016 44% * * - * - - - - - - * -
Grade 8 Mathematics
Students Meeting Level II Standard on First STAARAdministration
2016 71% 64% 78% 71% 75% 85% * 90% - * 50% 73% 61%
Students Requiring Accelerated Instruction
2016 29% 36% 22% * 25% 15% * * - * 50% 27% 39%
STAARCumulative Met Standard
2016 81% 78% 85% 86% 83% 92% * 90% - * 58% 82% 72%

TEA Division of Performance Reporting Page 7
TEXAS EDUCATION AGENCYDistrict Name: CALHOUN COUNTY ISD Texas Academic Performance ReportCounty Name: CALHOUN 2015-16 District PerformanceDistrict Number: 029901 Bilingual Education/English as a Second Language (Current Year ELL Students)
StateRegion
03 DistrictBilingual
EducationBE-TransEarly Exit
BE-TransLate Exit
BE-DualTwo-Way
BE-DualOne-Way ESL
ESLContent
ESLPull-Out
LEP NoServices
LEP WithServices
TotalELL
STAARPercent at Level II Satisfactory Standard or AboveAll Grades
All Subjects 2016 75% 70% 74% 71% 71% - - - 57% 63% 47% * 60% 59%
Reading 2016 73% 68% 70% 73% 73% - - - 45% 57% 28% * 50% 50%
Mathematics 2016 76% 72% 80% 74% 74% - - - 74% 75% 70% * 74% 73%
Writing 2016 69% 64% 70% 60% 60% - - - 55% 58% 46% * 56% 55%
Science 2016 79% 75% 77% 73% 73% - - - 57% 52% 61% - 60% 60%
Social Studies 2016 77% 70% 66% - - - - - 43% * 50% - 43% 43%
STAARPercent at Postsecondary Readiness StandardAll Grades
Two or More Subjects 2016 45% 35% 40% 27% 27% - - - 20% 14% 36% * 22% 22%
Reading 2016 46% 37% 38% 27% 27% - - - 15% 13% 21% * 18% 18%
Mathematics 2016 43% 35% 46% 30% 30% - - - 39% 34% 59% * 37% 37%
Writing 2016 41% 34% 39% 28% 28% - - - 19% 14% * * 22% 21%
Science 2016 47% 40% 43% * * - - - 21% * 33% - 21% 21%
Social Studies 2016 47% 36% 36% - - - - - 25% * 56% - 25% 25%
STAARPercent at Advanced StandardAll Grades
All Subjects 2016 18% 12% 14% 16% 16% - - - 8% 9% 7% * 10% 10%
Reading 2016 17% 12% 13% 22% 22% - - - 5% 5% * * 8% 8%
Mathematics 2016 19% 13% 19% 16% 16% - - - 17% 16% 19% * 17% 17%
Writing 2016 15% 10% 11% * * - - - * * * * * *
Science 2016 16% 11% 11% * * - - - * * * - * *

TEA Division of Performance Reporting Page 8
TEXAS EDUCATION AGENCYDistrict Name: CALHOUN COUNTY ISD Texas Academic Performance ReportCounty Name: CALHOUN 2015-16 District PerformanceDistrict Number: 029901 Bilingual Education/English as a Second Language (Current Year ELL Students)
StateRegion
03 DistrictBilingual
EducationBE-TransEarly Exit
BE-TransLate Exit
BE-DualTwo-Way
BE-DualOne-Way ESL
ESLContent
ESLPull-Out
LEP NoServices
LEP WithServices
TotalELL
STAARPercent at Advanced StandardAll Grades
Social Studies 2016 22% 14% 12% - - - - - * * * - * *
STAARPercent Met or Exceeded ProgressAll Grades
All Subjects 2016 62% 59% 62% 70% 70% - - - 55% 61% 43% * 58% 58%
Reading 2016 60% 58% 54% 63% 63% - - - 46% 56% * * 50% 49%
Mathematics 2016 63% 61% 69% 78% 78% - - - 65% 65% 64% * 68% 67%
STAARPercent Exceeded ProgressAll Grades
All Subjects 2016 17% 14% 17% 26% 26% - - - 16% 18% 12% * 18% 18%
Reading 2016 16% 14% 13% 33% 33% - - - 11% 14% * * 16% 16%
Mathematics 2016 17% 15% 20% 18% 18% - - - 22% 22% 20% * 21% 21%
Progress of Prior-Year Non-Proficient StudentsSum of Grades 4-8
Reading 2016 35% 32% 38% * * - - - 27% 29% 24% * 27% 27%
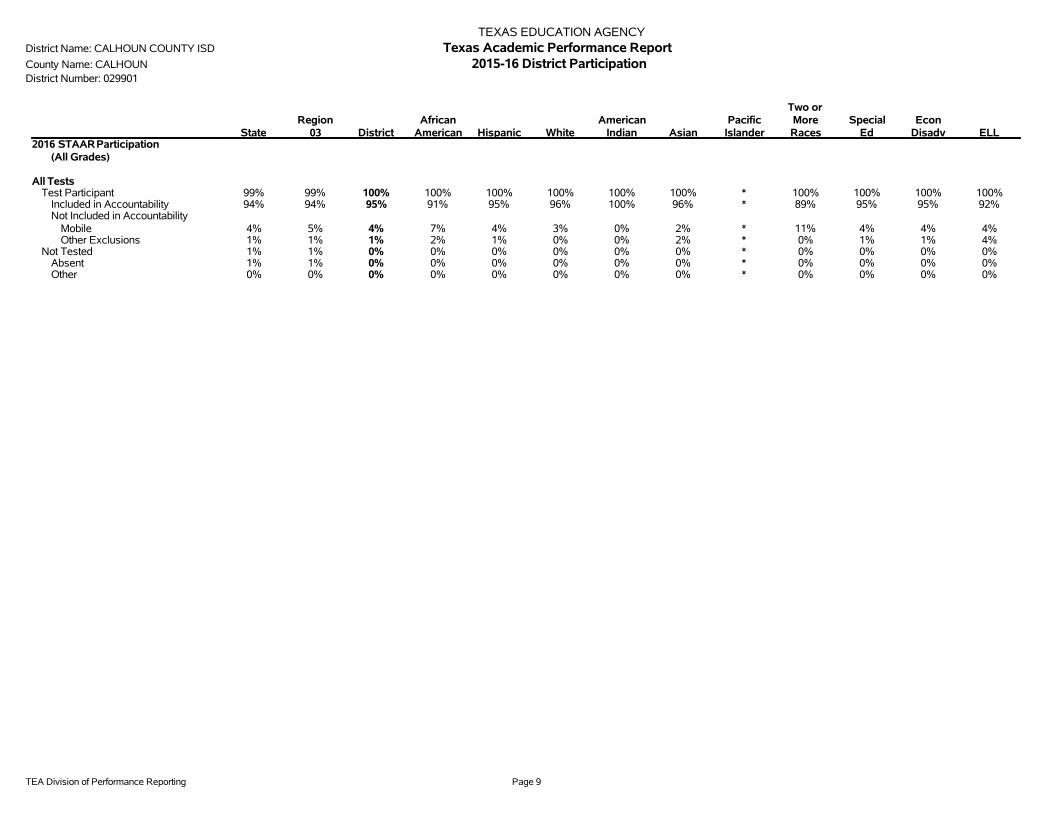
TEA Division of Performance Reporting Page 9
TEXAS EDUCATION AGENCYDistrict Name: CALHOUN COUNTY ISD Texas Academic Performance ReportCounty Name: CALHOUN 2015-16 District ParticipationDistrict Number: 029901
StateRegion
03 DistrictAfrican
American Hispanic WhiteAmerican
Indian AsianPacific
Islander
Two orMoreRaces
SpecialEd
EconDisadv ELL
2016 STAARParticipation(All Grades)
All TestsTest Participant 99% 99% 100% 100% 100% 100% 100% 100% * 100% 100% 100% 100%
Included in Accountability 94% 94% 95% 91% 95% 96% 100% 96% * 89% 95% 95% 92%Not Included in Accountability
Mobile 4% 5% 4% 7% 4% 3% 0% 2% * 11% 4% 4% 4%Other Exclusions 1% 1% 1% 2% 1% 0% 0% 2% * 0% 1% 1% 4%
Not Tested 1% 1% 0% 0% 0% 0% 0% 0% * 0% 0% 0% 0%Absent 1% 1% 0% 0% 0% 0% 0% 0% * 0% 0% 0% 0%Other 0% 0% 0% 0% 0% 0% 0% 0% * 0% 0% 0% 0%
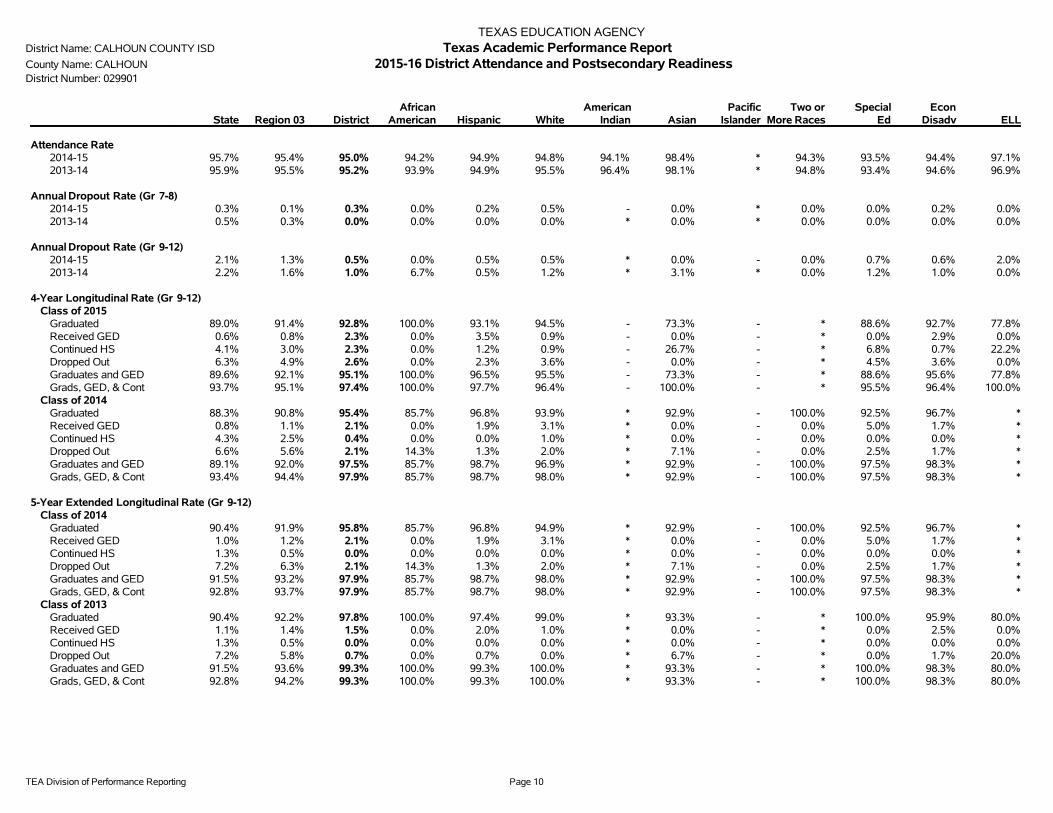
TEA Division of Performance Reporting Page 10
TEXAS EDUCATION AGENCYDistrict Name: CALHOUN COUNTY ISD Texas Academic Performance ReportCounty Name: CALHOUN 2015-16 District Attendance and Postsecondary ReadinessDistrict Number: 029901
State Region 03 DistrictAfrican
American Hispanic WhiteAmerican
Indian AsianPacific
IslanderTwo or
More RacesSpecial
EdEcon
Disadv ELL
Attendance Rate2014-15 95.7% 95.4% 95.0% 94.2% 94.9% 94.8% 94.1% 98.4% * 94.3% 93.5% 94.4% 97.1%2013-14 95.9% 95.5% 95.2% 93.9% 94.9% 95.5% 96.4% 98.1% * 94.8% 93.4% 94.6% 96.9%
Annual Dropout Rate (Gr 7-8)2014-15 0.3% 0.1% 0.3% 0.0% 0.2% 0.5% - 0.0% * 0.0% 0.0% 0.2% 0.0%2013-14 0.5% 0.3% 0.0% 0.0% 0.0% 0.0% * 0.0% * 0.0% 0.0% 0.0% 0.0%
Annual Dropout Rate (Gr 9-12)2014-15 2.1% 1.3% 0.5% 0.0% 0.5% 0.5% * 0.0% - 0.0% 0.7% 0.6% 2.0%2013-14 2.2% 1.6% 1.0% 6.7% 0.5% 1.2% * 3.1% * 0.0% 1.2% 1.0% 0.0%
4-Year Longitudinal Rate (Gr 9-12)Class of 2015
Graduated 89.0% 91.4% 92.8% 100.0% 93.1% 94.5% - 73.3% - * 88.6% 92.7% 77.8%Received GED 0.6% 0.8% 2.3% 0.0% 3.5% 0.9% - 0.0% - * 0.0% 2.9% 0.0%Continued HS 4.1% 3.0% 2.3% 0.0% 1.2% 0.9% - 26.7% - * 6.8% 0.7% 22.2%Dropped Out 6.3% 4.9% 2.6% 0.0% 2.3% 3.6% - 0.0% - * 4.5% 3.6% 0.0%Graduates and GED 89.6% 92.1% 95.1% 100.0% 96.5% 95.5% - 73.3% - * 88.6% 95.6% 77.8%Grads, GED, & Cont 93.7% 95.1% 97.4% 100.0% 97.7% 96.4% - 100.0% - * 95.5% 96.4% 100.0%
Class of 2014Graduated 88.3% 90.8% 95.4% 85.7% 96.8% 93.9% * 92.9% - 100.0% 92.5% 96.7% *Received GED 0.8% 1.1% 2.1% 0.0% 1.9% 3.1% * 0.0% - 0.0% 5.0% 1.7% *Continued HS 4.3% 2.5% 0.4% 0.0% 0.0% 1.0% * 0.0% - 0.0% 0.0% 0.0% *Dropped Out 6.6% 5.6% 2.1% 14.3% 1.3% 2.0% * 7.1% - 0.0% 2.5% 1.7% *Graduates and GED 89.1% 92.0% 97.5% 85.7% 98.7% 96.9% * 92.9% - 100.0% 97.5% 98.3% *Grads, GED, & Cont 93.4% 94.4% 97.9% 85.7% 98.7% 98.0% * 92.9% - 100.0% 97.5% 98.3% *
5-Year Extended Longitudinal Rate (Gr 9-12)Class of 2014
Graduated 90.4% 91.9% 95.8% 85.7% 96.8% 94.9% * 92.9% - 100.0% 92.5% 96.7% *Received GED 1.0% 1.2% 2.1% 0.0% 1.9% 3.1% * 0.0% - 0.0% 5.0% 1.7% *Continued HS 1.3% 0.5% 0.0% 0.0% 0.0% 0.0% * 0.0% - 0.0% 0.0% 0.0% *Dropped Out 7.2% 6.3% 2.1% 14.3% 1.3% 2.0% * 7.1% - 0.0% 2.5% 1.7% *Graduates and GED 91.5% 93.2% 97.9% 85.7% 98.7% 98.0% * 92.9% - 100.0% 97.5% 98.3% *Grads, GED, & Cont 92.8% 93.7% 97.9% 85.7% 98.7% 98.0% * 92.9% - 100.0% 97.5% 98.3% *
Class of 2013Graduated 90.4% 92.2% 97.8% 100.0% 97.4% 99.0% * 93.3% - * 100.0% 95.9% 80.0%Received GED 1.1% 1.4% 1.5% 0.0% 2.0% 1.0% * 0.0% - * 0.0% 2.5% 0.0%Continued HS 1.3% 0.5% 0.0% 0.0% 0.0% 0.0% * 0.0% - * 0.0% 0.0% 0.0%Dropped Out 7.2% 5.8% 0.7% 0.0% 0.7% 0.0% * 6.7% - * 0.0% 1.7% 20.0%Graduates and GED 91.5% 93.6% 99.3% 100.0% 99.3% 100.0% * 93.3% - * 100.0% 98.3% 80.0%Grads, GED, & Cont 92.8% 94.2% 99.3% 100.0% 99.3% 100.0% * 93.3% - * 100.0% 98.3% 80.0%
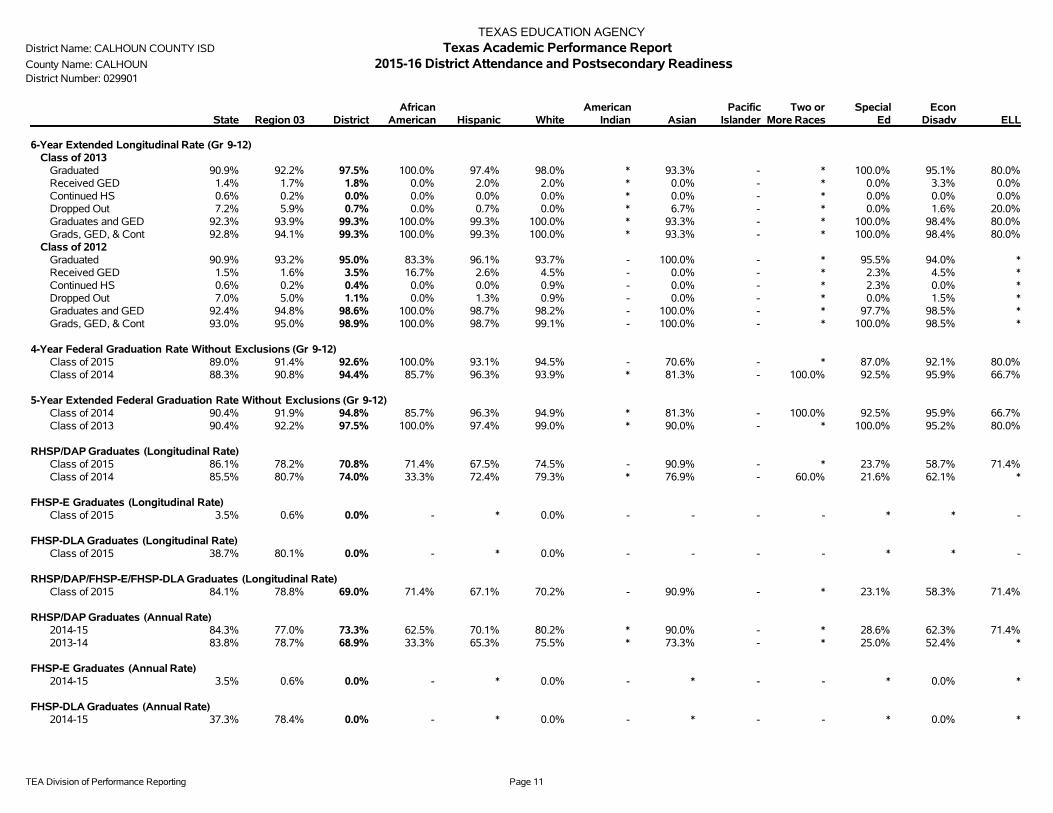
TEA Division of Performance Reporting Page 11
TEXAS EDUCATION AGENCYDistrict Name: CALHOUN COUNTY ISD Texas Academic Performance ReportCounty Name: CALHOUN 2015-16 District Attendance and Postsecondary ReadinessDistrict Number: 029901
State Region 03 DistrictAfrican
American Hispanic WhiteAmerican
Indian AsianPacific
IslanderTwo or
More RacesSpecial
EdEcon
Disadv ELL
6-Year Extended Longitudinal Rate (Gr 9-12)Class of 2013
Graduated 90.9% 92.2% 97.5% 100.0% 97.4% 98.0% * 93.3% - * 100.0% 95.1% 80.0%Received GED 1.4% 1.7% 1.8% 0.0% 2.0% 2.0% * 0.0% - * 0.0% 3.3% 0.0%Continued HS 0.6% 0.2% 0.0% 0.0% 0.0% 0.0% * 0.0% - * 0.0% 0.0% 0.0%Dropped Out 7.2% 5.9% 0.7% 0.0% 0.7% 0.0% * 6.7% - * 0.0% 1.6% 20.0%Graduates and GED 92.3% 93.9% 99.3% 100.0% 99.3% 100.0% * 93.3% - * 100.0% 98.4% 80.0%Grads, GED, & Cont 92.8% 94.1% 99.3% 100.0% 99.3% 100.0% * 93.3% - * 100.0% 98.4% 80.0%
Class of 2012Graduated 90.9% 93.2% 95.0% 83.3% 96.1% 93.7% - 100.0% - * 95.5% 94.0% *Received GED 1.5% 1.6% 3.5% 16.7% 2.6% 4.5% - 0.0% - * 2.3% 4.5% *Continued HS 0.6% 0.2% 0.4% 0.0% 0.0% 0.9% - 0.0% - * 2.3% 0.0% *Dropped Out 7.0% 5.0% 1.1% 0.0% 1.3% 0.9% - 0.0% - * 0.0% 1.5% *Graduates and GED 92.4% 94.8% 98.6% 100.0% 98.7% 98.2% - 100.0% - * 97.7% 98.5% *Grads, GED, & Cont 93.0% 95.0% 98.9% 100.0% 98.7% 99.1% - 100.0% - * 100.0% 98.5% *
4-Year Federal Graduation Rate Without Exclusions (Gr 9-12)Class of 2015 89.0% 91.4% 92.6% 100.0% 93.1% 94.5% - 70.6% - * 87.0% 92.1% 80.0%Class of 2014 88.3% 90.8% 94.4% 85.7% 96.3% 93.9% * 81.3% - 100.0% 92.5% 95.9% 66.7%
5-Year Extended Federal Graduation Rate Without Exclusions (Gr 9-12)Class of 2014 90.4% 91.9% 94.8% 85.7% 96.3% 94.9% * 81.3% - 100.0% 92.5% 95.9% 66.7%Class of 2013 90.4% 92.2% 97.5% 100.0% 97.4% 99.0% * 90.0% - * 100.0% 95.2% 80.0%
RHSP/DAP Graduates (Longitudinal Rate)Class of 2015 86.1% 78.2% 70.8% 71.4% 67.5% 74.5% - 90.9% - * 23.7% 58.7% 71.4%Class of 2014 85.5% 80.7% 74.0% 33.3% 72.4% 79.3% * 76.9% - 60.0% 21.6% 62.1% *
FHSP-E Graduates (Longitudinal Rate)Class of 2015 3.5% 0.6% 0.0% - * 0.0% - - - - * * -
FHSP-DLA Graduates (Longitudinal Rate)Class of 2015 38.7% 80.1% 0.0% - * 0.0% - - - - * * -
RHSP/DAP/FHSP-E/FHSP-DLA Graduates (Longitudinal Rate)Class of 2015 84.1% 78.8% 69.0% 71.4% 67.1% 70.2% - 90.9% - * 23.1% 58.3% 71.4%
RHSP/DAP Graduates (Annual Rate)2014-15 84.3% 77.0% 73.3% 62.5% 70.1% 80.2% * 90.0% - * 28.6% 62.3% 71.4%2013-14 83.8% 78.7% 68.9% 33.3% 65.3% 75.5% * 73.3% - * 25.0% 52.4% *
FHSP-E Graduates (Annual Rate)2014-15 3.5% 0.6% 0.0% - * 0.0% - * - - * 0.0% *
FHSP-DLA Graduates (Annual Rate)2014-15 37.3% 78.4% 0.0% - * 0.0% - * - - * 0.0% *
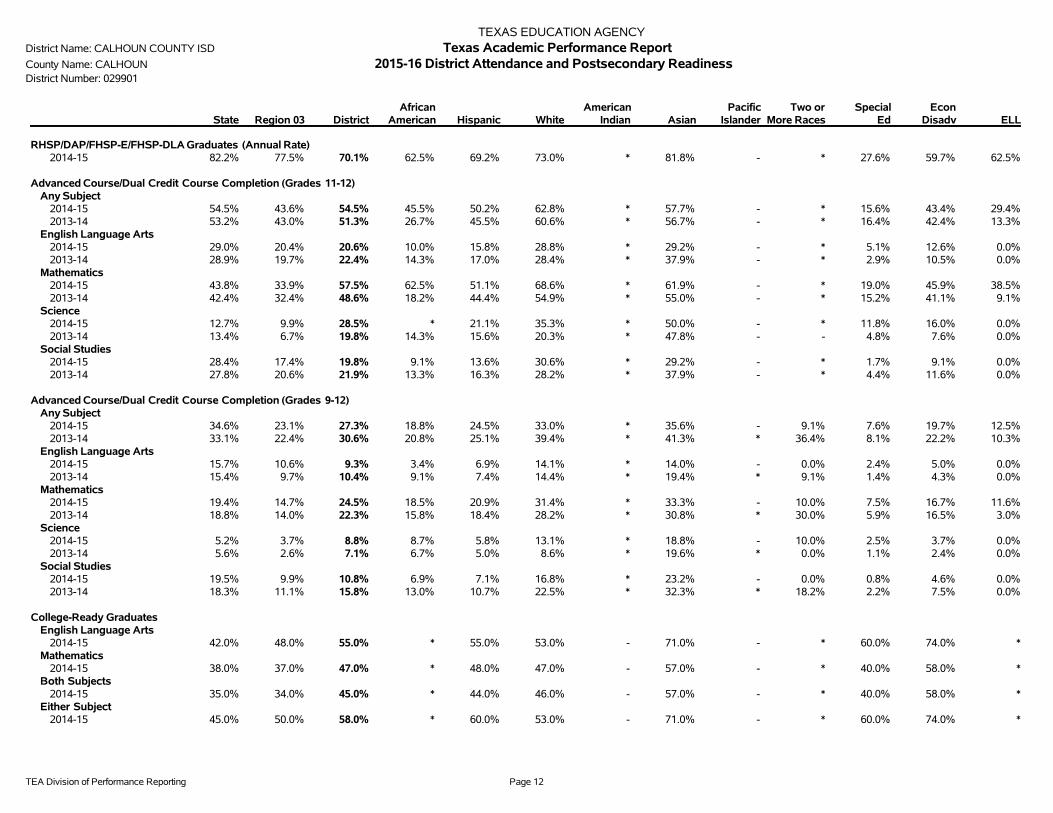
TEA Division of Performance Reporting Page 12
TEXAS EDUCATION AGENCYDistrict Name: CALHOUN COUNTY ISD Texas Academic Performance ReportCounty Name: CALHOUN 2015-16 District Attendance and Postsecondary ReadinessDistrict Number: 029901
State Region 03 DistrictAfrican
American Hispanic WhiteAmerican
Indian AsianPacific
IslanderTwo or
More RacesSpecial
EdEcon
Disadv ELL
RHSP/DAP/FHSP-E/FHSP-DLA Graduates (Annual Rate)2014-15 82.2% 77.5% 70.1% 62.5% 69.2% 73.0% * 81.8% - * 27.6% 59.7% 62.5%
Advanced Course/Dual Credit Course Completion (Grades 11-12)Any Subject
2014-15 54.5% 43.6% 54.5% 45.5% 50.2% 62.8% * 57.7% - * 15.6% 43.4% 29.4%2013-14 53.2% 43.0% 51.3% 26.7% 45.5% 60.6% * 56.7% - * 16.4% 42.4% 13.3%
English Language Arts2014-15 29.0% 20.4% 20.6% 10.0% 15.8% 28.8% * 29.2% - * 5.1% 12.6% 0.0%2013-14 28.9% 19.7% 22.4% 14.3% 17.0% 28.4% * 37.9% - * 2.9% 10.5% 0.0%
Mathematics2014-15 43.8% 33.9% 57.5% 62.5% 51.1% 68.6% * 61.9% - * 19.0% 45.9% 38.5%2013-14 42.4% 32.4% 48.6% 18.2% 44.4% 54.9% * 55.0% - * 15.2% 41.1% 9.1%
Science2014-15 12.7% 9.9% 28.5% * 21.1% 35.3% * 50.0% - * 11.8% 16.0% 0.0%2013-14 13.4% 6.7% 19.8% 14.3% 15.6% 20.3% * 47.8% - - 4.8% 7.6% 0.0%
Social Studies2014-15 28.4% 17.4% 19.8% 9.1% 13.6% 30.6% * 29.2% - * 1.7% 9.1% 0.0%2013-14 27.8% 20.6% 21.9% 13.3% 16.3% 28.2% * 37.9% - * 4.4% 11.6% 0.0%
Advanced Course/Dual Credit Course Completion (Grades 9-12)Any Subject
2014-15 34.6% 23.1% 27.3% 18.8% 24.5% 33.0% * 35.6% - 9.1% 7.6% 19.7% 12.5%2013-14 33.1% 22.4% 30.6% 20.8% 25.1% 39.4% * 41.3% * 36.4% 8.1% 22.2% 10.3%
English Language Arts2014-15 15.7% 10.6% 9.3% 3.4% 6.9% 14.1% * 14.0% - 0.0% 2.4% 5.0% 0.0%2013-14 15.4% 9.7% 10.4% 9.1% 7.4% 14.4% * 19.4% * 9.1% 1.4% 4.3% 0.0%
Mathematics2014-15 19.4% 14.7% 24.5% 18.5% 20.9% 31.4% * 33.3% - 10.0% 7.5% 16.7% 11.6%2013-14 18.8% 14.0% 22.3% 15.8% 18.4% 28.2% * 30.8% * 30.0% 5.9% 16.5% 3.0%
Science2014-15 5.2% 3.7% 8.8% 8.7% 5.8% 13.1% * 18.8% - 10.0% 2.5% 3.7% 0.0%2013-14 5.6% 2.6% 7.1% 6.7% 5.0% 8.6% * 19.6% * 0.0% 1.1% 2.4% 0.0%
Social Studies2014-15 19.5% 9.9% 10.8% 6.9% 7.1% 16.8% * 23.2% - 0.0% 0.8% 4.6% 0.0%2013-14 18.3% 11.1% 15.8% 13.0% 10.7% 22.5% * 32.3% * 18.2% 2.2% 7.5% 0.0%
College-Ready GraduatesEnglish Language Arts
2014-15 42.0% 48.0% 55.0% * 55.0% 53.0% - 71.0% - * 60.0% 74.0% *Mathematics
2014-15 38.0% 37.0% 47.0% * 48.0% 47.0% - 57.0% - * 40.0% 58.0% *Both Subjects
2014-15 35.0% 34.0% 45.0% * 44.0% 46.0% - 57.0% - * 40.0% 58.0% *Either Subject
2014-15 45.0% 50.0% 58.0% * 60.0% 53.0% - 71.0% - * 60.0% 74.0% *
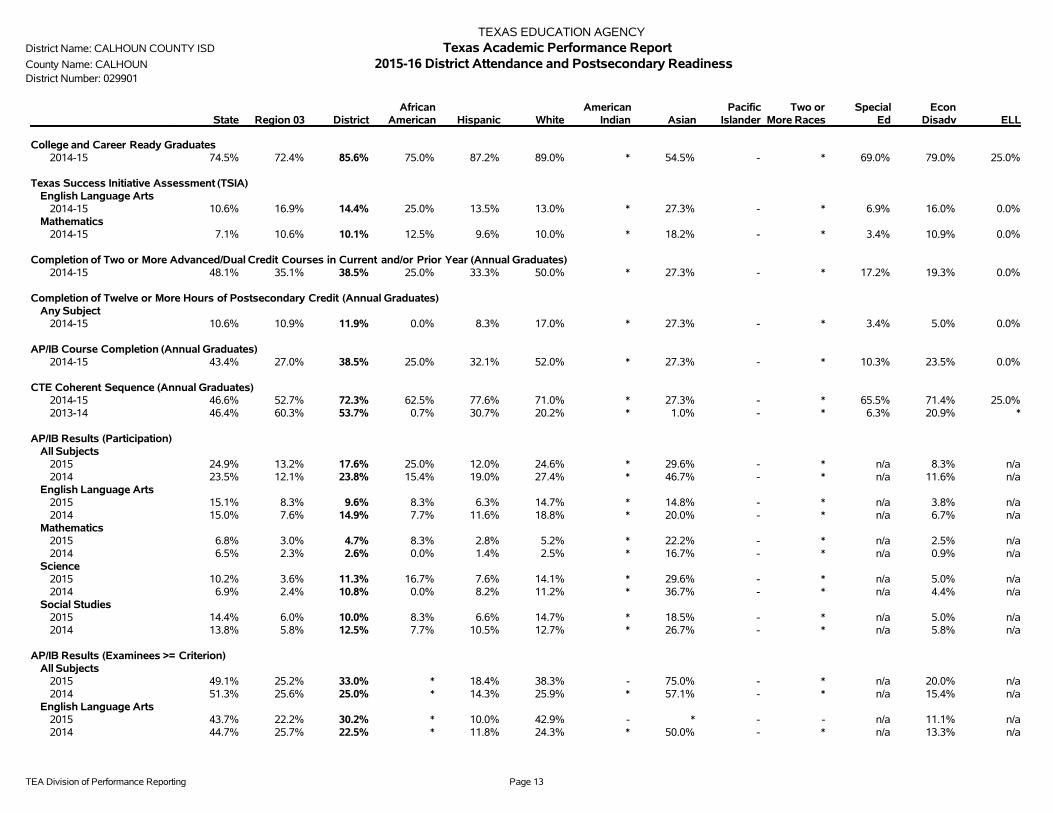
TEA Division of Performance Reporting Page 13
TEXAS EDUCATION AGENCYDistrict Name: CALHOUN COUNTY ISD Texas Academic Performance ReportCounty Name: CALHOUN 2015-16 District Attendance and Postsecondary ReadinessDistrict Number: 029901
State Region 03 DistrictAfrican
American Hispanic WhiteAmerican
Indian AsianPacific
IslanderTwo or
More RacesSpecial
EdEcon
Disadv ELL
College and Career Ready Graduates2014-15 74.5% 72.4% 85.6% 75.0% 87.2% 89.0% * 54.5% - * 69.0% 79.0% 25.0%
Texas Success Initiative Assessment (TSIA)English Language Arts
2014-15 10.6% 16.9% 14.4% 25.0% 13.5% 13.0% * 27.3% - * 6.9% 16.0% 0.0%Mathematics
2014-15 7.1% 10.6% 10.1% 12.5% 9.6% 10.0% * 18.2% - * 3.4% 10.9% 0.0%
Completion of Two or More Advanced/Dual Credit Courses in Current and/or Prior Year (Annual Graduates)2014-15 48.1% 35.1% 38.5% 25.0% 33.3% 50.0% * 27.3% - * 17.2% 19.3% 0.0%
Completion of Twelve or More Hours of Postsecondary Credit (Annual Graduates)Any Subject
2014-15 10.6% 10.9% 11.9% 0.0% 8.3% 17.0% * 27.3% - * 3.4% 5.0% 0.0%
AP/IB Course Completion (Annual Graduates)2014-15 43.4% 27.0% 38.5% 25.0% 32.1% 52.0% * 27.3% - * 10.3% 23.5% 0.0%
CTE Coherent Sequence (Annual Graduates)2014-15 46.6% 52.7% 72.3% 62.5% 77.6% 71.0% * 27.3% - * 65.5% 71.4% 25.0%2013-14 46.4% 60.3% 53.7% 0.7% 30.7% 20.2% * 1.0% - * 6.3% 20.9% *
AP/IB Results (Participation)All Subjects
2015 24.9% 13.2% 17.6% 25.0% 12.0% 24.6% * 29.6% - * n/a 8.3% n/a2014 23.5% 12.1% 23.8% 15.4% 19.0% 27.4% * 46.7% - * n/a 11.6% n/a
English Language Arts2015 15.1% 8.3% 9.6% 8.3% 6.3% 14.7% * 14.8% - * n/a 3.8% n/a2014 15.0% 7.6% 14.9% 7.7% 11.6% 18.8% * 20.0% - * n/a 6.7% n/a
Mathematics2015 6.8% 3.0% 4.7% 8.3% 2.8% 5.2% * 22.2% - * n/a 2.5% n/a2014 6.5% 2.3% 2.6% 0.0% 1.4% 2.5% * 16.7% - * n/a 0.9% n/a
Science2015 10.2% 3.6% 11.3% 16.7% 7.6% 14.1% * 29.6% - * n/a 5.0% n/a2014 6.9% 2.4% 10.8% 0.0% 8.2% 11.2% * 36.7% - * n/a 4.4% n/a
Social Studies2015 14.4% 6.0% 10.0% 8.3% 6.6% 14.7% * 18.5% - * n/a 5.0% n/a2014 13.8% 5.8% 12.5% 7.7% 10.5% 12.7% * 26.7% - * n/a 5.8% n/a
AP/IB Results (Examinees >= Criterion)All Subjects
2015 49.1% 25.2% 33.0% * 18.4% 38.3% - 75.0% - * n/a 20.0% n/a2014 51.3% 25.6% 25.0% * 14.3% 25.9% * 57.1% - * n/a 15.4% n/a
English Language Arts2015 43.7% 22.2% 30.2% * 10.0% 42.9% - * - - n/a 11.1% n/a2014 44.7% 25.7% 22.5% * 11.8% 24.3% * 50.0% - * n/a 13.3% n/a

TEA Division of Performance Reporting Page 14
TEXAS EDUCATION AGENCYDistrict Name: CALHOUN COUNTY ISD Texas Academic Performance ReportCounty Name: CALHOUN 2015-16 District Attendance and Postsecondary ReadinessDistrict Number: 029901
State Region 03 DistrictAfrican
American Hispanic WhiteAmerican
Indian AsianPacific
IslanderTwo or
More RacesSpecial
EdEcon
Disadv ELL
AP/IB Results (Examinees >= Criterion)Mathematics
2015 51.7% 25.9% 23.1% * 0.0% 30.0% - 50.0% - - n/a 0.0% n/a2014 53.6% 30.3% 14.3% - * 20.0% - 20.0% - - n/a * n/a
Science2015 35.4% 18.9% 22.6% * 20.8% 11.1% - 75.0% - * n/a 16.7% n/a2014 45.7% 22.5% 17.2% - 0.0% 31.8% * 27.3% - - n/a 0.0% n/a
Social Studies2015 40.1% 18.3% 21.8% * 0.0% 28.6% - 60.0% - - n/a 8.3% n/a2014 41.6% 12.5% 11.9% * 6.5% 16.0% * 25.0% - * n/a 0.0% n/a
SAT/ACT ResultsTested
Class of 2015 68.3% 51.5% 38.5% 50.0% 32.7% 47.0% * 45.5% - * n/a 23.6% n/aClass of 2014 66.3% 51.4% 32.4% 50.0% 20.8% 43.6% * 73.3% - * n/a 15.6% n/a
At/Above CriterionClass of 2015 24.3% 17.1% 26.2% * 21.6% 31.9% - 40.0% - - n/a 24.1% n/aClass of 2014 25.1% 18.9% 26.9% * 14.3% 26.8% * 54.5% - * n/a 10.0% n/a
Average SAT ScoreAll Subjects
Class of 2015 1394 1400 1458 * 1408 1506 - * - - n/a 1421 n/aClass of 2014 1417 1397 1478 * 1377 1496 * 1719 - * n/a 1309 n/a
English Language Arts and WritingClass of 2015 912 916 951 * 911 996 - * - - n/a 910 n/aClass of 2014 925 908 957 * 894 972 * 1091 - * n/a 835 n/a
MathematicsClass of 2015 482 484 507 * 497 510 - * - - n/a 511 n/aClass of 2014 491 489 521 * 483 524 * 628 - * n/a 474 n/a
Average ACT ScoreAll Subjects
Class of 2015 20.6 19.7 22.0 * 21.7 22.0 - * - - n/a 19.7 n/aClass of 2014 20.6 19.5 20.5 - * 21.2 - * - * n/a * n/a
English Language ArtsClass of 2015 20.1 19.2 22.0 * 21.5 22.0 - * - - n/a 19.4 n/aClass of 2014 20.0 18.9 19.1 - * 20.0 - * - * n/a * n/a
MathematicsClass of 2015 20.9 19.8 22.1 * 22.4 21.5 - * - - n/a 21.0 n/aClass of 2014 21.2 20.1 21.6 - * 22.2 - * - * n/a * n/a
ScienceClass of 2015 20.7 19.9 21.3 * 20.7 21.8 - * - - n/a 19.3 n/aClass of 2014 20.7 19.7 21.5 - * 21.5 - * - * n/a * n/a
Graduates Enrolled in TX Institution of Higher Education (IHE)2013-14 57.5% 56.3% 41.5% n/a n/a n/a n/a n/a n/a n/a n/a n/a n/a2012-13 56.9% 55.0% 41.8% n/a n/a n/a n/a n/a n/a n/a n/a n/a n/a

TEA Division of Performance Reporting Page 15
TEXAS EDUCATION AGENCYDistrict Name: CALHOUN COUNTY ISD Texas Academic Performance ReportCounty Name: CALHOUN 2015-16 District Attendance and Postsecondary ReadinessDistrict Number: 029901
State Region 03 DistrictAfrican
American Hispanic WhiteAmerican
Indian AsianPacific
IslanderTwo or
More RacesSpecial
EdEcon
Disadv ELL
Graduates in TX IHE Completing One Year Without Remediation2013-14 70.5% 68.4% 72.6% n/a n/a n/a n/a n/a n/a n/a n/a n/a n/a2012-13 70.8% 71.6% 79.5% n/a n/a n/a n/a n/a n/a n/a n/a n/a n/a

TEA Division of Performance Reporting Page 16
TEXAS EDUCATION AGENCYDistrict Name: CALHOUN COUNTY ISD Texas Academic Performance ReportCounty Name: CALHOUN 2015-16 District ProfileDistrict Number: 029901
---------------- District ---------------- ------------------ State ------------------Student Information Count Percent Count Percent
Total Students: 4,172 100.0% 5,284,252 100.0%
Students by Grade:Early Childhood Education 13 0.3% 13,009 0.2%Pre-Kindergarten 169 4.1% 220,390 4.2%Kindergarten 323 7.7% 376,505 7.1%Grade 1 312 7.5% 409,767 7.8%Grade 2 289 6.9% 411,080 7.8%Grade 3 335 8.0% 409,157 7.7%Grade 4 305 7.3% 396,895 7.5%Grade 5 264 6.3% 393,941 7.5%Grade 6 303 7.3% 390,379 7.4%Grade 7 315 7.6% 389,411 7.4%Grade 8 330 7.9% 386,455 7.3%Grade 9 313 7.5% 428,470 8.1%Grade 10 333 8.0% 386,290 7.3%Grade 11 313 7.5% 351,888 6.7%Grade 12 255 6.1% 320,615 6.1%
Ethnic Distribution:African American 87 2.1% 666,933 12.6%Hispanic 2,630 63.0% 2,760,302 52.2%White 1,187 28.5% 1,507,225 28.5%American Indian 11 0.3% 20,855 0.4%Asian 223 5.3% 212,973 4.0%Pacific Islander 1 0.0% 7,392 0.1%Two or More Races 33 0.8% 108,572 2.1%
Economically Disadvantaged 2,515 60.3% 3,118,758 59.0%Non-Educationally Disadvantaged 1,657 39.7% 2,165,494 41.0%English Language Learners (ELL) 480 11.5% 979,868 18.5%Students w/ Disciplinary Placements (2014-2015) 137 3.0% 76,611 1.4%At-Risk 2,021 48.4% 2,645,402 50.1%
Graduates (Class of 2015):Total Graduates 278 100.0% 313,397 100.0%
By Ethnicity (incl. Special Ed.):African American 8 2.9% 39,692 12.7%Hispanic 156 56.1% 148,966 47.5%White 100 36.0% 104,377 33.3%American Indian 1 0.4% 1,335 0.4%Asian 11 4.0% 13,090 4.2%Pacific Islander 0 0.0% 486 0.2%Two or More Races 2 0.7% 5,451 1.7%
TEA Division of Performance Reporting Page 17
TEXAS EDUCATION AGENCYDistrict Name: CALHOUN COUNTY ISD Texas Academic Performance ReportCounty Name: CALHOUN 2015-16 District ProfileDistrict Number: 029901
---------------- District ---------------- ------------------ State ------------------Student Information Count Percent Count Percent
By Graduation Type (incl. Special Ed.):Minimum H.S. Program 71 25.5% 46,723 14.9%Recommended H.S. Program/DAP 195 70.1% 251,524 80.3%Foundation High School Plan (No Endorsement) 12 4.3% 8,982 2.9%Foundation High School Plan (Endorsement) 0 0.0% 523 0.2%Foundation High School Plan (DLA) 0 0.0% 5,645 1.8%
Special Education Graduates 29 10.4% 23,541 7.5%

TEA Division of Performance Reporting Page 18
TEXAS EDUCATION AGENCYDistrict Name: CALHOUN COUNTY ISD Texas Academic Performance ReportCounty Name: CALHOUN 2015-16 District ProfileDistrict Number: 029901
- Non-Special Education Rates - - Special Education Rates -Student Information District State District State
Retention Rates by Grade:
Kindergarten 10.5% 1.9% 6.3% 8.2%Grade 1 14.6% 4.1% 15.4% 7.4%Grade 2 6.5% 2.7% 0.0% 3.4%Grade 3 2.9% 2.0% 3.7% 1.6%Grade 4 2.1% 1.0% 0.0% 0.8%Grade 5 0.4% 0.9% 0.0% 1.0%Grade 6 0.0% 0.6% 3.3% 0.8%Grade 7 0.7% 0.8% 0.0% 0.9%Grade 8 0.0% 0.8% 0.0% 1.3%
---------------- District ---------------- ------------------ State ------------------Count Percent Count Percent
Data Quality:PID Errors (students) ## - - - -Underreported Students 11 0.6% 7,834 0.3%
Class Size Information District State
Class Size Averages by Grade and Subject (Derived from teacher responsibility records):
Elementary:Kindergarten 18.7 18.9Grade 1 17.9 19.1Grade 2 17.6 19.1Grade 3 17.1 19.1Grade 4 17.5 19.0Grade 5 16.4 20.8Grade 6 19.6 20.4
Secondary:English/Language Arts 16.3 17.1Foreign Languages 17.4 19.1Mathematics 15.7 18.1Science 16.6 19.1Social Studies 18.0 19.5

TEA Division of Performance Reporting Page 19
TEXAS EDUCATION AGENCYDistrict Name: CALHOUN COUNTY ISD Texas Academic Performance ReportCounty Name: CALHOUN 2015-16 District ProfileDistrict Number: 029901
---------------- District ---------------- ------------------ State ------------------Staff Information Count Percent Count Percent
Total Staff 570.6 100.0% 688,142.2 100.0%
Professional Staff: 333.5 58.4% 442,538.0 64.3%Teachers 270.8 47.5% 347,272.1 50.5%Professional Support 42.7 7.5% 67,755.2 9.8%Campus Administration (School Leadership) 14.1 2.5% 20,170.5 2.9%Central Administration 6.0 1.1% 7,340.2 1.1%
Educational Aides: 59.8 10.5% 65,803.2 9.6%
Auxiliary Staff: 177.3 31.1% 179,800.9 26.1%
Total Minority Staff: 217.1 38.1% 331,599.3 48.2%
Teachers by Ethnicity and Sex:African American 3.3 1.2% 34,949.8 10.1%Hispanic 56.4 20.8% 90,214.9 26.0%White 209.1 77.2% 211,190.4 60.8%American Indian 0.0 0.0% 1,242.9 0.4%Asian 2.0 0.7% 5,134.3 1.5%Pacific Islander 0.0 0.0% 819.3 0.2%Two or More Races 0.0 0.0% 3,720.6 1.1%
Males 64.2 23.7% 81,756.8 23.5%Females 206.6 76.3% 265,515.3 76.5%
Teachers by Highest Degree Held:No Degree 2.9 1.1% 3,524.0 1.0%Bachelors 233.5 86.2% 259,559.7 74.7%Masters 34.4 12.7% 82,029.5 23.6%Doctorate 0.0 0.0% 2,158.9 0.6%
Teachers by Years of Experience:Beginning Teachers 24.3 9.0% 27,995.4 8.1%1-5 Years Experience 66.7 24.6% 94,786.9 27.3%6-10 Years Experience 39.8 14.7% 75,285.1 21.7%11-20 Years Experience 86.9 32.1% 94,649.7 27.3%Over 20 Years Experience 53.0 19.6% 54,555.0 15.7%
Number of Students per Teacher 15.4 n/a 15.2 n/a
TEA Division of Performance Reporting Page 20
TEXAS EDUCATION AGENCYDistrict Name: CALHOUN COUNTY ISD Texas Academic Performance ReportCounty Name: CALHOUN 2015-16 District ProfileDistrict Number: 029901
Staff Information District State
Average Years Experience of Teachers: 12.9 10.9Average Years Experience of Teachers with District: 8.4 7.3
Average Teacher Salary by Years of Experience (regular duties only):Beginning Teachers $36,085 $45,5071-5 Years Experience $41,344 $47,9966-10 Years Experience $44,877 $50,45911-20 Years Experience $51,582 $53,794Over 20 Years Experience $56,808 $60,613
Average Actual Salaries (regular duties only):Teachers $47,707 $51,891Professional Support $57,854 $61,145Campus Administration (School Leadership) $76,928 $75,654Central Administration $92,319 $99,111
Instructional Staff Percent: 61.1 64.5
Turnover Rate for Teachers: 22.2 16.5
Staff Exclusions:Shared Services Arrangement Staff:
Professional Staff 0.0 1,116.6Educational Aides 0.0 230.6Auxiliary Staff 0.0 493.6
Contracted Instructional Staff: 0.0 1,914.4

TEA Division of Performance Reporting Page 21
TEXAS EDUCATION AGENCYDistrict Name: CALHOUN COUNTY ISD Texas Academic Performance ReportCounty Name: CALHOUN 2015-16 District ProfileDistrict Number: 029901
---------------- District ---------------- ------------------ State ------------------Program Information Count Percent Count Percent
Student Enrollment by Program:Bilingual/ESL Education 474 11.4% 968,569 18.3%Career & Technical Education 1,260 30.2% 1,284,748 24.3%Gifted & Talented Education 301 7.2% 404,540 7.7%Special Education 345 8.3% 453,955 8.6%
Teachers by Program (population served):Bilingual/ESL Education 2.0 0.7% 20,650.0 5.9%Career & Technical Education 14.3 5.3% 15,311.2 4.4%Compensatory Education 3.5 1.3% 10,066.4 2.9%Gifted & Talented Education 3.7 1.4% 6,656.1 1.9%Regular Education 223.1 82.4% 252,100.4 72.6%Special Education 16.7 6.2% 30,567.0 8.8%Other 7.5 2.8% 11,921.0 3.4%
Link to: PEIMS Financial Standard Reports/ 2014-2015 Financial Actual Report
' '̂ Indicates that ELL rates at met or exceeded standard and exceeded standard include current and monitored students.'*' Indicates results are masked due to small numbers to protect student confidentiality.'-' Indicates zero observations reported for this group.'n/a' Indicates data reporting is not applicable for this group.'**' Indicates that rates for Reading and Mathematics are based on the cumulative results from the first and second administrations of STAAR.'?' Indicates that the data for this item were statistically improbable, or were reported outside a reasonable range.'##' Indicates that PID Error rate information cannot be reported in 2015-16 due to the transition from PEIMS Edit+ to TSDS.

This page intentionally left blank.

1/25/2017 Texas Education Agency 2015 2016 Accreditation Statuses
http://ritter.tea.state.tx.us/accountability/accreditation/2015_2016_accreditation_statuses.html 1/1
Home / Student Testing and Accountability / Accountability / Accreditation Status
20152016 Accreditation StatusesThe Texas Education Agency awards an accreditation status to each public school district and charter school. The accreditationstatus is based on the academic accountability rating and financial ratings from the Financial Integrity Rating System of Texas. Adistrict or charter must be accredited by the state to operate as a public school.
The district accreditation statuses for 20152016 are listed below:
Show/Hide columns: CDN | Name | ESC | District Type | 2011 FIRST Rating | 2011 Accountability Rating | 2012 FIRST Rating | 2012 AccountabilityRating | 2013 FIRST Rating | 2013 Accountability Rating | 2014 FIRST Rating | 2014 Accountability Rating | 2015 FIRST Rating |2015 Accountability Rating | 20152016 Accreditation Status | Reason For Status | Notes
Show 100 entries Search: calhoun
Showing 1 to 1 of 1 entries (filtered from 1,205 total entries) Previous 1 Next
CDN Name ESC2015FIRSTRating
2015Accountability
Rating
20152016Accreditation
Status
ReasonFor
StatusNotes
029901 CALHOUN COUNTYISD 3 Pass Met Standard ACCREDITED

Calhoun County ISD
Calhoun County ISD
2014 -2015 PEIMS FINANCIAL REPORT
1/18/2017 2014-2015 Actual Financial data
https://rptsvr1.tea.texas.gov/cgi/sas/broker?_service=marykay&_program=sfadhoc.actual_report_2015.sas&_service=appserv&_debug=0&who_box=&who_list=029901 1/4
2014-2015 Actual Financial dataTotals for Calhoun County ISD (029901)
Total Membership: 4,216
District StateGeneral Fund % Per Student All Funds % Per Student All Funds % Per Student
ReceiptsTotal Revenue 33,212,538 100.00% 7,878 46,623,404 100.00% 11,059 56,133,489,714 100.00% 10,774Local Tax 28,977,435 87.25% 6,873 37,788,441 81.05% 8,963 25,280,136,712 45.04% 4,852Other Local and Intermediate 942,407 2.84% 224 1,893,998 4.06% 449 2,184,020,956 3.89% 419State 3,194,416 9.62% 758 3,548,750 7.61% 842 22,814,894,859 40.64% 4,379Federal 98,280 0.30% 23 3,392,215 7.28% 805 5,854,437,187 10.43% 1,124
Total Receipts 42,415,172 100.00% 10,061 55,826,038 100.00% 13,241 78,601,559,619 100.00% 15,086Total Revenue 33,212,538 78.30% 7,878 46,623,404 83.52% 11,059 56,133,489,714 100.00% 10,774Equity Transfers 9,202,634 21.70% 2,183 9,202,634 16.48% 2,183 1,496,609,416 1.90% 287Total Other Resources 0 0.00% 0 0 0.00% 0 20,971,460,489 26.68% 4,025
Fund Balances (for ISDs)Total Fund Balance** 24,455,136 73.63% 5,801 79,629,802 170.79% 18,888 29,561,641,503 54.77% 5,927Nonspendable Fund Balance 93,887 0.28% 22 117,036 0.25% 28 308,398,318 0.57% 62Restricted Fund Balance 0 0.00% 0 2,185,223 4.69% 518 13,254,233,291 24.56% 2,657Commi�ed Fund Balance 14,449,000 43.50% 3,427 67,415,294 144.60% 15,990 3,257,809,183 6.04% 653Assigned Fund Balance 0 0.00% 0 0 0.00% 0 2,102,056,286 3.89% 421Unassigned Fund Balance 9,912,249 29.84% 2,351 9,912,249 21.26% 2,351 10,639,144,425 19.71% 2,133
DisbursementsTotal ExpendituresBY OBJECT 32,224,870 100.00% 7,643 53,219,969 100.00% 12,623 60,977,192,546 100.00% 11,704
Payroll (Objects 6100) 26,375,001 81.85% 6,256 28,588,603 53.72% 6,781 37,049,271,624 60.76% 7,111Other Opera�ng (Objects 6200-6400) 5,313,162 16.49% 1,260 8,079,222 15.18% 1,916 10,508,649,793 17.23% 2,017
Debt Service (Objects 6500) 0 0.00% 0 8,313,712 15.62% 1,972 7,236,507,503 11.87% 1,389Capital Outlay (Objects 6600) 536,707 1.67% 127 8,238,432 15.48% 1,954 6,182,763,626 10.14% 1,187

1/18/2017 2014-2015 Actual Financial data
https://rptsvr1.tea.texas.gov/cgi/sas/broker?_service=marykay&_program=sfadhoc.actual_report_2015.sas&_service=appserv&_debug=0&who_box=&who_list=029901 2/4
BY FUNCTION (Objects 6100-6400only)
Debt Service (71) 0 0 0 0 494,213 0Facili�es Acquisi�on &Construc�on (81) 0 0 547,223 130 329,486,348 63
Total Opera�ng Expenditures 31,688,163 100.00% 7,516 36,120,602 100.00% 8,568 47,227,940,856 100.00% 9,065Instruc�on (11,95) 18,053,005 56.97% 4,282 19,843,026 54.94% 4,707 26,871,610,227 56.90% 5,158Instruc�onal Res Media (12) 341,568 1.08% 81 345,801 0.96% 82 586,142,869 1.24% 113Curriculum/Staff Develop (13) 33,350 0.11% 8 178,704 0.49% 42 1,001,022,261 2.12% 192Instruc�onal Leadership (21) 379,312 1.20% 90 459,473 1.27% 109 718,051,639 1.52% 138School Leadership (23) 2,088,601 6.59% 495 2,095,680 5.80% 497 2,722,138,250 5.76% 522Guidance Counseling Svcs (31) 855,861 2.70% 203 1,044,104 2.89% 248 1,668,235,063 3.53% 320Social Work Services (32) 38,961 0.12% 9 40,752 0.11% 10 128,116,298 0.27% 25Health Services (33) 230,287 0.73% 55 230,287 0.64% 55 473,216,577 1.00% 91Transporta�on (34) 985,824 3.11% 234 989,230 2.74% 235 1,347,546,868 2.85% 259Food (35) 0 0.00% 0 2,032,207 5.63% 482 2,699,811,544 5.72% 518Extracurricular (36) 1,285,837 4.06% 305 1,384,157 3.83% 328 1,367,198,521 2.89% 262General Administra�on(41,92) 1,411,523 4.45% 335 1,442,433 3.99% 342 1,475,276,145 3.12% 283
Plant Maint/Opera�on (51) 5,027,443 15.87% 1,192 5,031,423 13.93% 1,193 4,693,527,961 9.94% 901Security/Monitoring (52) 120,364 0.38% 29 120,364 0.33% 29 413,839,438 0.88% 79Data Processing Services (53) 735,362 2.32% 174 735,362 2.04% 174 841,708,130 1.78% 162Community Services (61) 100,865 0.32% 24 147,599 0.41% 35 220,499,065 0.00% 42
Total Disbursements 41,940,023 100.00% 9,948 62,935,122 100.00% 14,928 75,481,160,718 100.00% 14,487Total Expenditures 32,224,870 76.84% 7,643 53,219,969 84.56% 12,623 60,977,192,546 100.00% 11,704Equity Transfers 9,202,634 21.70% 2,183 9,202,634 16.48% 2,183 1,496,609,416 1.90% 287Total Other Uses 0 0.00% 0 0 0.00% 0 12,392,399,682 16.42% 2,379Intergovernmental Charge 512,519 1.22% 122 512,519 0.81% 122 614,959,074 1.30% 118
Program ExpendituresOpera�ng Expenditures - Program 23,331,123 100.00% 5,534 25,631,408 100.00% 6,080 35,244,680,101 100.00% 6,765Regular 12,329,884 52.85% 2,925 12,685,357 49.49% 3,009 21,166,857,496 60.06% 4,063Gi�ed and Talented 707,821 3.03% 168 707,821 2.76% 168 398,047,499 1.13% 76Career and Technical 926,821 3.97% 220 978,852 3.82% 232 1,293,287,689 3.67% 248Students with Disabili�es 3,425,507 14.68% 813 4,127,038 16.10% 979 5,342,939,885 15.16% 1,025Accelerated Educa�on 903,256 3.87% 214 1,250,513 4.88% 297 1,785,245,681 5.07% 343Bilingual 1,140,318 4.89% 270 1,208,228 4.71% 287 871,163,578 2.47% 167Nondisc Alt Ed-AEP Basic Serv 257,804 1.10% 61 261,808 1.02% 62 133,254,572 0.38% 26Disc Alt Ed-DAEP Basic Serv 54,122 0.23% 13 54,122 0.21% 13 214,449,433 0.61% 41

1/18/2017 2014-2015 Actual Financial data
https://rptsvr1.tea.texas.gov/cgi/sas/broker?_service=marykay&_program=sfadhoc.actual_report_2015.sas&_service=appserv&_debug=0&who_box=&who_list=029901 3/4
Disc Alt Ed-DAEP Basic Serv 54,122 0.23% 13 54,122 0.21% 13 214,449,433 0.61% 41
Disc Alt Ed-DAEP Supplemental 0 0.00% 0 0 0.00% 0 24,917,911 0.07% 5T1 A Schoolwide-St Comp>=40% 1,158,323 4.96% 275 1,785,466 6.97% 423 1,857,002,479 5.27% 356Athle�cs/Related Ac�vi�es 1,187,744 5.09% 282 1,277,741 4.99% 303 919,076,645 2.61% 176High School Allotment 683,811 2.93% 162 683,811 2.67% 162 406,767,398 1.15% 78Prekindergarten 555,712 2.38% 132 610,651 2.38% 145 831,669,835 2.36% 160
District State
Instruc�onal Expenditure Ra�o 59.3% 63.8%
Tax Rates2014 (current tax year) Tax RatesMaintenance and Opera�ons 1.0401 1.0741Interest and Sinking Funds 0.2368 0.1897Total Tax Rate 1.2769 1.2638
2013 Tax Year State Cer�fied Property ValuesAmount Percent Amount Percent
Property Value 3,585,973,219 N/A 1,871,511,130,244 N/AProperty Value per pupil 850,563 N/A 375,792 N/AProperty Value by category:Business 2,706,570,072 69.16% 734,946,454,778 35.98%Residen�al 962,189,248 24.59% 1,104,324,234,295 54.06%Land 165,908,931 4.24% 58,742,939,046 2.88%Oil and Gas 58,651,703 1.50% 133,469,263,469 6.53%Other 19,943,834 0.51% 11,225,667,994 0.55%
Unassigned Fund Balance percentage of total budgeted expenditures2014-2015 School Districts' GeneralFund Unassigned Fund Balance*** 9,912,249 10,667,062,944
2014-2015 School Districts' GeneralFund Total Budgeted Expenditures 34,309,168 40,721,513,562
2014-2015 School Districts' Percent ofTotal Budgeted Expenditures 28.9% 26.2%
** Fund balance percentages are calculated by dividing the fund balance by either the general revenue or all funds. The percentages illustrate the size of the fund balance in relation to total revenues. Charter schools report net assets rather than fund balances. *** The TEA does not have encumbrance data to subtract from the fund balances.

1/18/2017 2014-2015 Actual Financial data
https://rptsvr1.tea.texas.gov/cgi/sas/broker?_service=marykay&_program=sfadhoc.actual_report_2015.sas&_service=appserv&_debug=0&who_box=&who_list=029901 4/4
2016-2017 DISTRICT AND CAMPUS IMPROVEMENT
PLANS
Calhoun County ISD

Calhoun County Independent School District
District Improvement Plan
2016-2017Accountability Rating: Met Standard
Calhoun County Independent School DistrictGenerated by Plan4Learning.com 1 of 54 District #901
January 26, 2017 11:09 am
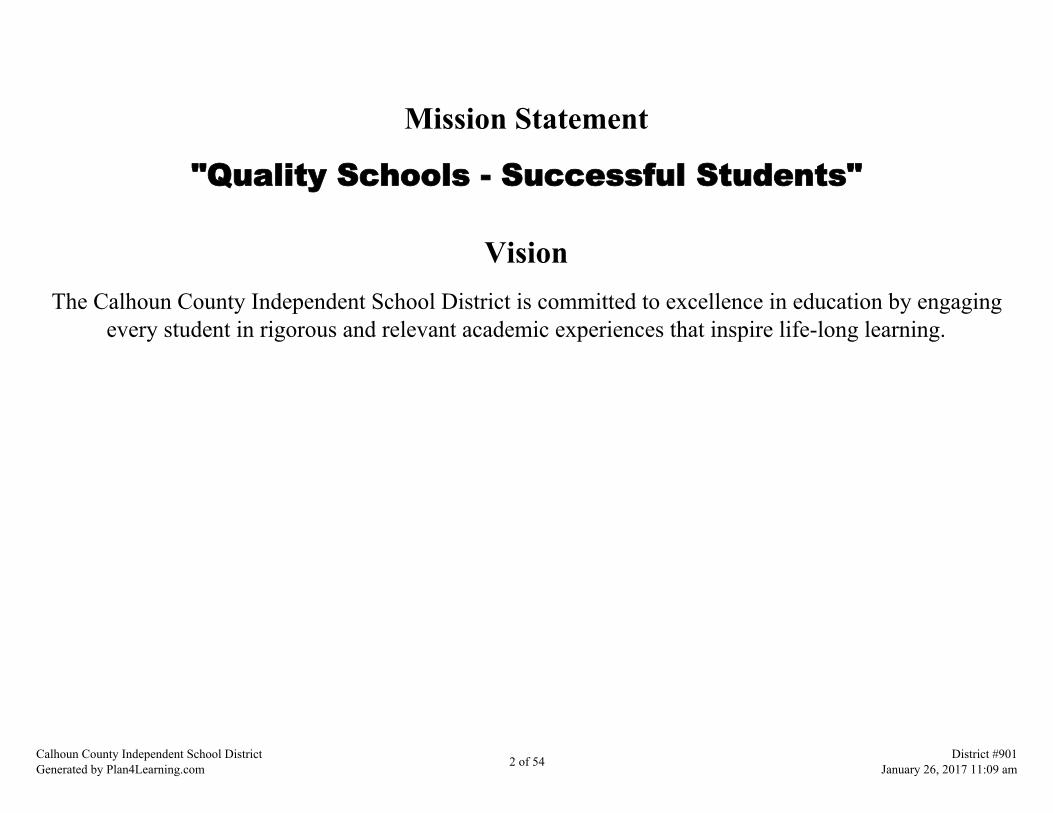
Mission Statement
"Quality Schools - Successful Students"
VisionThe Calhoun County Independent School District is committed to excellence in education by engaging
every student in rigorous and relevant academic experiences that inspire life-long learning.
Calhoun County Independent School DistrictGenerated by Plan4Learning.com 2 of 54 District #901
January 26, 2017 11:09 am
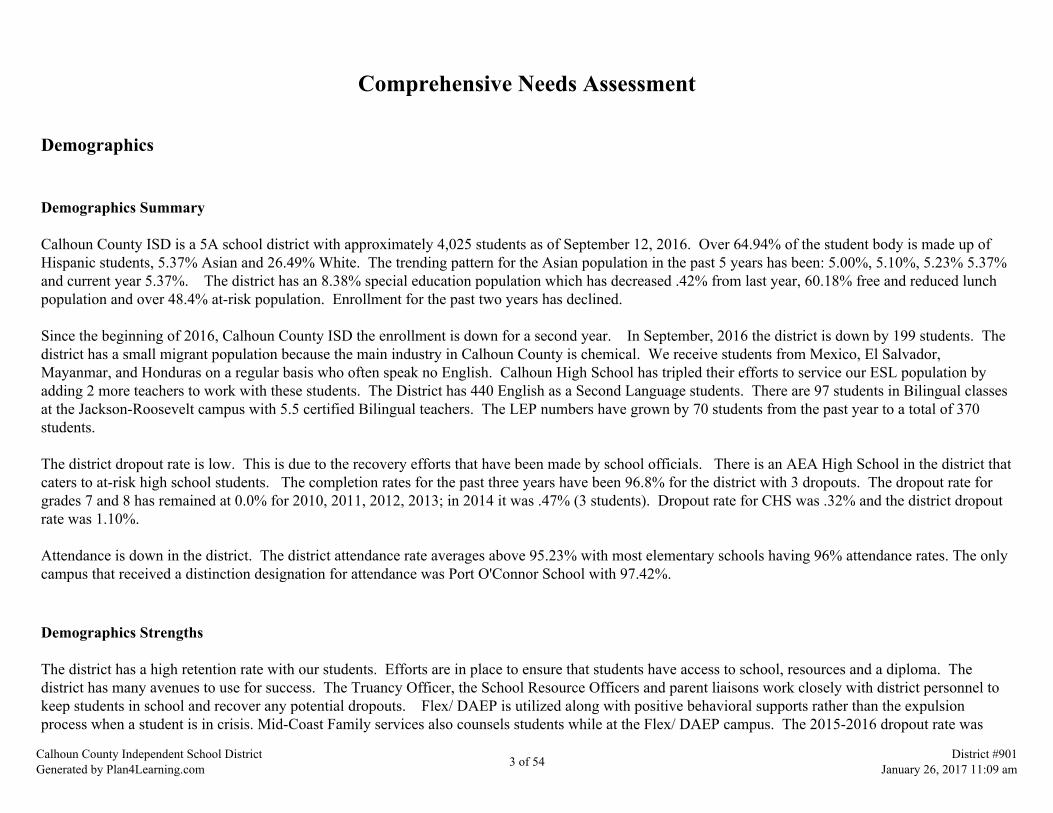
Comprehensive Needs Assessment
Demographics
Demographics Summary
Calhoun County ISD is a 5A school district with approximately 4,025 students as of September 12, 2016. Over 64.94% of the student body is made up ofHispanic students, 5.37% Asian and 26.49% White. The trending pattern for the Asian population in the past 5 years has been: 5.00%, 5.10%, 5.23% 5.37%and current year 5.37%. The district has an 8.38% special education population which has decreased .42% from last year, 60.18% free and reduced lunchpopulation and over 48.4% at-risk population. Enrollment for the past two years has declined.
Since the beginning of 2016, Calhoun County ISD the enrollment is down for a second year. In September, 2016 the district is down by 199 students. Thedistrict has a small migrant population because the main industry in Calhoun County is chemical. We receive students from Mexico, El Salvador,Mayanmar, and Honduras on a regular basis who often speak no English. Calhoun High School has tripled their efforts to service our ESL population byadding 2 more teachers to work with these students. The District has 440 English as a Second Language students. There are 97 students in Bilingual classesat the Jackson-Roosevelt campus with 5.5 certified Bilingual teachers. The LEP numbers have grown by 70 students from the past year to a total of 370students.
The district dropout rate is low. This is due to the recovery efforts that have been made by school officials. There is an AEA High School in the district thatcaters to at-risk high school students. The completion rates for the past three years have been 96.8% for the district with 3 dropouts. The dropout rate forgrades 7 and 8 has remained at 0.0% for 2010, 2011, 2012, 2013; in 2014 it was .47% (3 students). Dropout rate for CHS was .32% and the district dropoutrate was 1.10%.
Attendance is down in the district. The district attendance rate averages above 95.23% with most elementary schools having 96% attendance rates. The onlycampus that received a distinction designation for attendance was Port O'Connor School with 97.42%.
Demographics Strengths
The district has a high retention rate with our students. Efforts are in place to ensure that students have access to school, resources and a diploma. Thedistrict has many avenues to use for success. The Truancy Officer, the School Resource Officers and parent liaisons work closely with district personnel tokeep students in school and recover any potential dropouts. Flex/ DAEP is utilized along with positive behavioral supports rather than the expulsionprocess when a student is in crisis. Mid-Coast Family services also counsels students while at the Flex/ DAEP campus. The 2015-2016 dropout rate was
Calhoun County Independent School DistrictGenerated by Plan4Learning.com 3 of 54 District #901
January 26, 2017 11:09 am
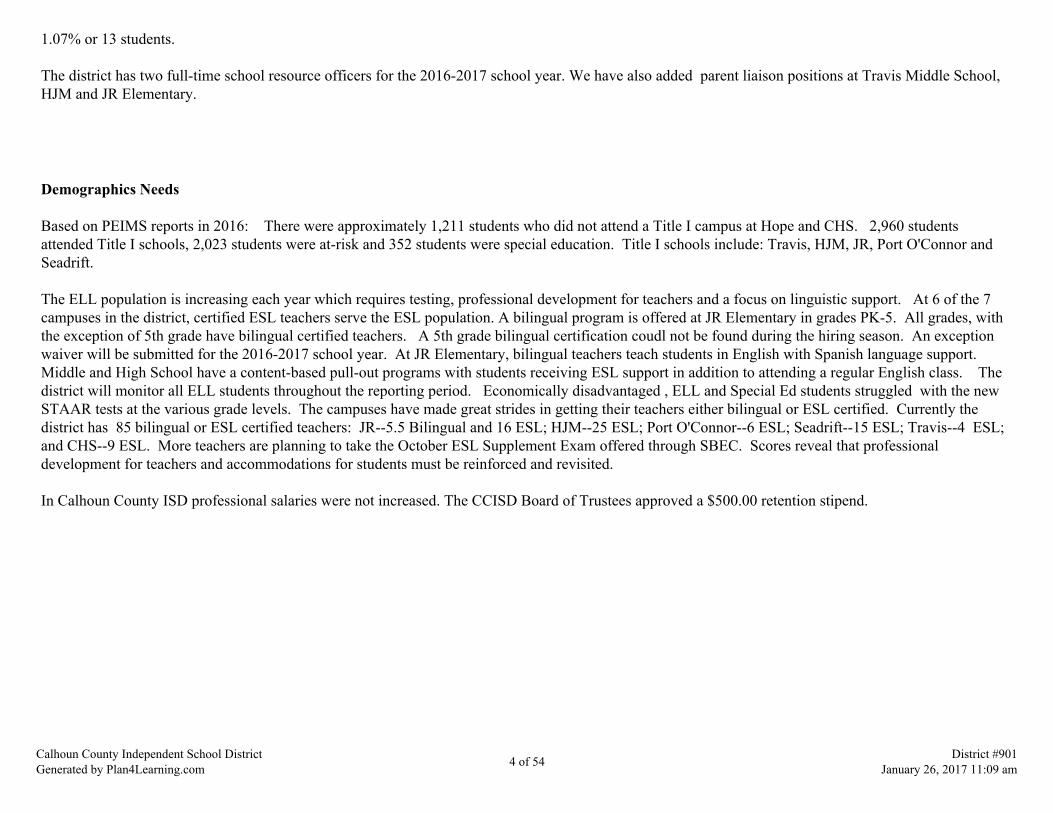
1.07% or 13 students.
The district has two full-time school resource officers for the 2016-2017 school year. We have also added parent liaison positions at Travis Middle School,HJM and JR Elementary.
Demographics Needs
Based on PEIMS reports in 2016: There were approximately 1,211 students who did not attend a Title I campus at Hope and CHS. 2,960 studentsattended Title I schools, 2,023 students were at-risk and 352 students were special education. Title I schools include: Travis, HJM, JR, Port O'Connor andSeadrift.
The ELL population is increasing each year which requires testing, professional development for teachers and a focus on linguistic support. At 6 of the 7campuses in the district, certified ESL teachers serve the ESL population. A bilingual program is offered at JR Elementary in grades PK-5. All grades, withthe exception of 5th grade have bilingual certified teachers. A 5th grade bilingual certification coudl not be found during the hiring season. An exceptionwaiver will be submitted for the 2016-2017 school year. At JR Elementary, bilingual teachers teach students in English with Spanish language support. Middle and High School have a content-based pull-out programs with students receiving ESL support in addition to attending a regular English class. Thedistrict will monitor all ELL students throughout the reporting period. Economically disadvantaged , ELL and Special Ed students struggled with the newSTAAR tests at the various grade levels. The campuses have made great strides in getting their teachers either bilingual or ESL certified. Currently thedistrict has 85 bilingual or ESL certified teachers: JR--5.5 Bilingual and 16 ESL; HJM--25 ESL; Port O'Connor--6 ESL; Seadrift--15 ESL; Travis--4 ESL;and CHS--9 ESL. More teachers are planning to take the October ESL Supplement Exam offered through SBEC. Scores reveal that professionaldevelopment for teachers and accommodations for students must be reinforced and revisited.
In Calhoun County ISD professional salaries were not increased. The CCISD Board of Trustees approved a $500.00 retention stipend.
Calhoun County Independent School DistrictGenerated by Plan4Learning.com 4 of 54 District #901
January 26, 2017 11:09 am

Student Achievement
Student Achievement Summary
All campuses exceeded the state performance indexes. Each campus has a Met Standard rating from TEA.
In 2016, the district and all campuses Met Standard in all 4 performance indexes: Student Achievement, Student Progress, Closing Performance Gaps, andPostsecondary Readiness. Listed below is the Academic Achievement Scores for INDEX 1 for all tests taken at a specific campus:
CCISD 2015-2016 STAAR RESULTS
Grades 3-8 - % MET STANDARD
SUBJECT GRADE DISTRICT HJM JR POC SEAD TRAVIS
READING3
83 79 85 100 83
MATH 87 94 79 100 86
READING
4
83 79 80 100 88
MATH 80 87 69 100 88
WRITING 79 79 70 100 83
Calhoun County Independent School DistrictGenerated by Plan4Learning.com 5 of 54 District #901
January 26, 2017 11:09 am
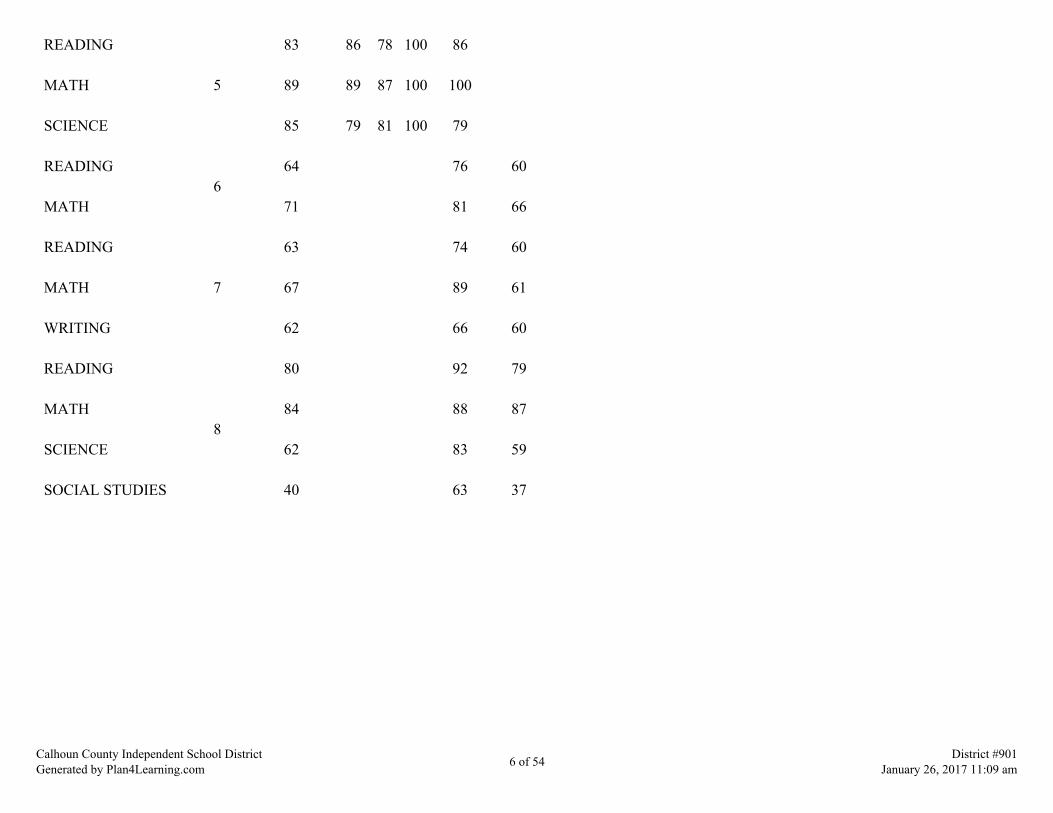
READING
5
83 86 78 100 86
MATH 89 89 87 100 100
SCIENCE 85 79 81 100 79
READING6
64 76 60
MATH 71 81 66
READING
7
63 74 60
MATH 67 89 61
WRITING 62 66 60
READING
8
80 92 79
MATH 84 88 87
SCIENCE 62 83 59
SOCIAL STUDIES 40 63 37
Calhoun County Independent School DistrictGenerated by Plan4Learning.com 6 of 54 District #901
January 26, 2017 11:09 am

CCISD 2015-2016 STAAR RESULTS
EOC - % MET STANDARD
SUBJECT DISTRICT CHS HOPE SEADRIFT TRAVIS
ENGLISH I 55 55 0
ENGLISH II 56 56 27
BIOLOGY 89 89
U.S. HISTORY 92 92 83
ALGEBRA I 89 87 100 100 100
(See Addendum)
172 AP exams were taken in 2016 down by 73 exams from 2015. The percentage of students scoring 3-5 on the AP exams is as follows: 100% Spanish;42% Biology; 20% Chemistry; 24% English Language Comp; 73% English Literature Comp; 0% Calculus AB; 100% Chinese; 43% U.S. History; 71%Physics C; 41% World History; 0% United States Government & Politics, 67% Computer Science; 80% Calculus BC and 7% Macroeconomics.
ACT scores posted for 2016 were as follows: English 20.9; Math 21.4; Reading 22.3; Science 21.4 and Composite 21.5. Calhoun ACT scores were higherthan state scores in all tested areas. These scores indicate that CHS students at who took ACT were college ready.
The district tested 444 ESL students on the Texas English Language Proficiency Assessment System (TELPAS). The scores were as follows: K-2 AverageComprehension: 2.6%; Average Composite: 2.5% (up from last year); 70 students (72%) progressed at least one proficiency level from 2015-2016. Grades3-12: Average Comprehension: 3.2%; Average Composite 3.1% (down from last year). 164 students or 62% of students progressed at least one proficiencylevel from 2015-2016.
Student Achievement StrengthsCalhoun County Independent School DistrictGenerated by Plan4Learning.com 7 of 54 District #901
January 26, 2017 11:09 am

District personnel is continually revising the district scope and sequences with aligned Common Assessments to be given during the 2016-2017 school yearand disaggregated using a district program. The results are posted within hours onto the district testing site so that teachers and campus administrators canaccess their scores. These tests are used to continuously improve the development of curriculum, scope and sequences and scaffolding of expectations. Tutorials are developed using the results of district Curriculum Assessments and class grades. Tests are given in all four content areas with teacher's anddistrict specialists' input. The Hispanic and economically disadvantaged populations have narrowed the achievement gap over the past five years. Response to Intervention teams are fully developed at the elementary schools and targeted assistance is available for the at-risk students. Materials areprovided as needed for academic success. New CA's will be written to align with scope and sequences.
Distinction Designations for 2016 Accountability Summary:
Calhoun County ISD: Met Standard Calhoun High School: Met Standard, Awarded 4 Distinction Designations (Academic Achievement in Mathematics, Academic Achievement in Science,Top 25% Student Progress, Postsecondary Readiness) Hope High School: Met Alternative Standard (Not Eligible for any Distinction Designations, did earn all points possible for Postsecondary readiness) Travis Middle School: Met Standard (100% participation rate) Harrison/Jefferson/Madison: Met Standard, Awarded 4 Distinction Designations (Academic Achievement in Mathematics, Academic Achievement inScience, Top 25% Closing Performance Gap, Postsecondary Readiness) Jackson/Roosevelt: Met Standard, Awarded 1 Distinction Designation (Top 25% Student Progress) Port O'Connor Elementary: Met Standard, Awarded 4 Distinction Designations (Academic Achievement in Mathematics, Top 25% Student Progress, Top25% Closing Performance Gap, Postsecondary Readiness) Seadrift School: Met Standard (100% participation rate)The system safeguards are the sub categories campuses are rated on.
2015 2016HS met 36 out of 40 safeguards or 90% 31 out of 39 or 79%Travis met 19 out of 28% at 68% 27 out of 40 or 68%Seadrift met 13 out of 17 safeguards at 76% 24 out of 24 or 100%
Calhoun County Independent School DistrictGenerated by Plan4Learning.com 8 of 54 District #901
January 26, 2017 11:09 am
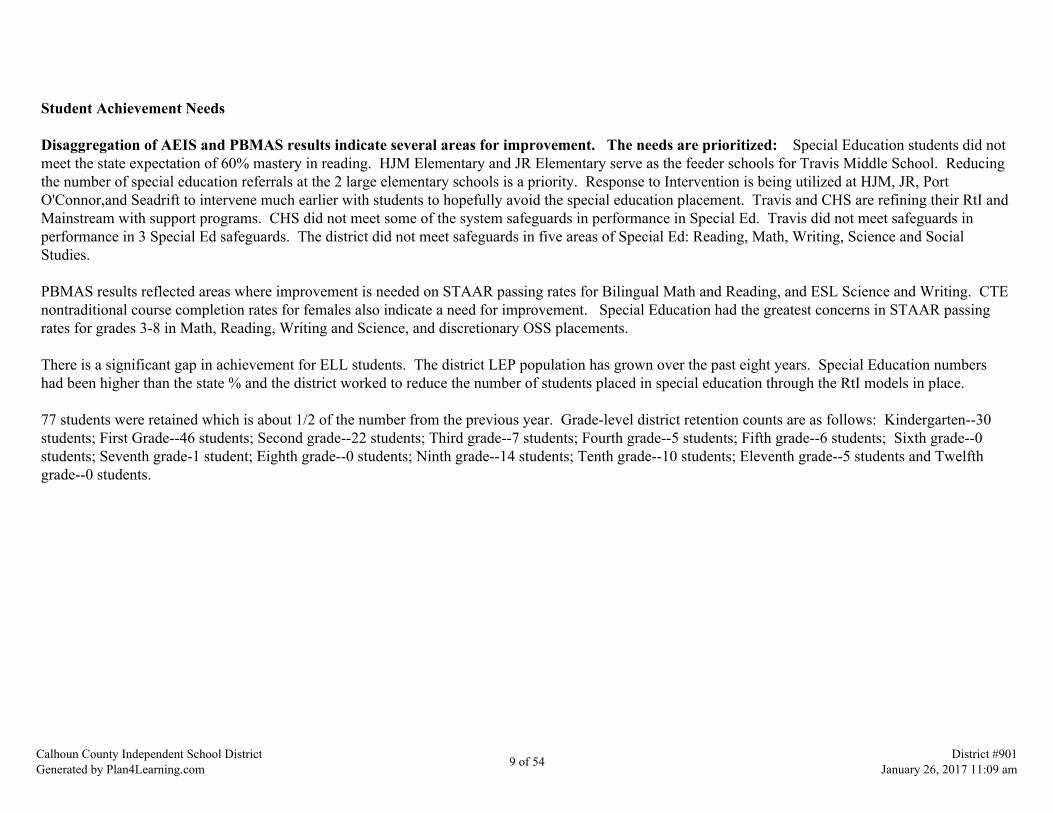
Student Achievement Needs
Disaggregation of AEIS and PBMAS results indicate several areas for improvement. The needs are prioritized: Special Education students did notmeet the state expectation of 60% mastery in reading. HJM Elementary and JR Elementary serve as the feeder schools for Travis Middle School. Reducingthe number of special education referrals at the 2 large elementary schools is a priority. Response to Intervention is being utilized at HJM, JR, PortO'Connor,and Seadrift to intervene much earlier with students to hopefully avoid the special education placement. Travis and CHS are refining their RtI andMainstream with support programs. CHS did not meet some of the system safeguards in performance in Special Ed. Travis did not meet safeguards inperformance in 3 Special Ed safeguards. The district did not meet safeguards in five areas of Special Ed: Reading, Math, Writing, Science and SocialStudies.
PBMAS results reflected areas where improvement is needed on STAAR passing rates for Bilingual Math and Reading, and ESL Science and Writing. CTEnontraditional course completion rates for females also indicate a need for improvement. Special Education had the greatest concerns in STAAR passingrates for grades 3-8 in Math, Reading, Writing and Science, and discretionary OSS placements.
There is a significant gap in achievement for ELL students. The district LEP population has grown over the past eight years. Special Education numbershad been higher than the state % and the district worked to reduce the number of students placed in special education through the RtI models in place.
77 students were retained which is about 1/2 of the number from the previous year. Grade-level district retention counts are as follows: Kindergarten--30students; First Grade--46 students; Second grade--22 students; Third grade--7 students; Fourth grade--5 students; Fifth grade--6 students; Sixth grade--0students; Seventh grade-1 student; Eighth grade--0 students; Ninth grade--14 students; Tenth grade--10 students; Eleventh grade--5 students and Twelfthgrade--0 students.
Calhoun County Independent School DistrictGenerated by Plan4Learning.com 9 of 54 District #901
January 26, 2017 11:09 am
District Culture and Climate
District Culture and Climate Summary
Calhoun County ISD serves over 4,000 students and is located in the Region III ESC area. Over the last 3 years, the district leadership and structure haschanged. Out of 7 of CCISD schools have welcomed new principals. Many new teachers have joined CCISD. The culture continues to focus on studentsuccess, community connections and opportunities for students to prepare for life after high school. A rich CTE program supports a school to work forcevision for students in CCISD. This vision includes CTE certification, college entrance, serving in the armed forces or preparing for the competitive jobmarket.
District Culture and Climate Strengths
The district continues to retain and hire highly qualified teachers. Teachers at the elementary level participate actively in campus and district professionaldevelopment. At the secondary level, principals have embraced the T-TESS model and have initiated campus based professional development that increasedthe understanding of the model that articulates and evaluates best practices evidenced in classroom planning and instruction. All levels have had T-TESStraining.
District Culture and Climate Needs
CCISD continues to seek out opportunities to work in partnership with Region III to ensure that practitioners at all levels have access to the most currentlegal, compliance and reporting guidelines. It is critical to foster the Region III partnership to create opportunities for professional development and exposureto research-based, best-practice instructional models.
Calhoun County Independent School DistrictGenerated by Plan4Learning.com 10 of 54 District #901
January 26, 2017 11:09 am
Staff Quality, Recruitment, and Retention
Staff Quality, Recruitment, and Retention Summary
Calhoun County ISD Personnel Director conducts recruitment activities to ensure that highly qualified personnel are hired for all positions. Activitiesinclude participating in job fairs, posting vacancies in multiple sites/organizations and maintaining webpage. The district analyzes data from all teachers'certifications, testing, staff development, and service records to ensure that all meet highly qualified status. The district also assists teachers in maintainingor attaining certification through alternative programs, GT certification, ESL certification, coursework and TExES testing in order to assure that all staff ishighly qualified. The District used an on-line application program during the summer.
Staff Quality, Recruitment, and Retention Strengths
Calhoun County ISD teaching staff is highly qualified except at the elementary level. The personnel department reviews teacher qualifications every year toensure that our students are taught by highly qualified teachers. Deputy Superintendent, Debbie Swope, will report to TEA the HQ information inNovember. Title II money is used to pay for training, content tests, and certification in other fields especially ESL certifications and training to help teacherswho are moved to other positions. New teachers are assigned a mentor for their first year along with certain trainings required of all new staff to CCISD. The district also offers stipends for teachers in critical need areas of Math, Science, Foreign Language, Bilingual and Special Education.
CCISD teachers are dedicated to their students and work hard to create a classroom environments that promote creativity and problem-solving. TheCurriculum and Federal Program departments maintain an online Staff Development program, SimpleK12 licenses. The on-line program is a TeacherLearning Community helping teachers succeed in their 21st century classrooms. The program contains interactive training, information webinars, peersupport, lesson plan ideas, resources from teachers, and new tools for student engagement. Our partner private school, OLG, also use some of the SimpleK12 licenses to fulfill their staff development obligations.
Starting in 2016-2017, teachers new to CCID participated in a New Teacher Orientation that included professional development in professionalism, schoollaw, best practices and how to use district systems.
Staff Quality, Recruitment, and Retention Needs
The district ensures that each new teacher is assigned a campus mentor. Currently the district does not have a formal district program in place. Theprincipals assign a mentor to each new teacher on their campus.
Calhoun County Independent School DistrictGenerated by Plan4Learning.com 11 of 54 District #901
January 26, 2017 11:09 am

The district curriculum specialists serve as mentors and instructional leaders to the new teachers. The principals often ask for the specialists to work withtheir teachers at grade level or department meetings on curriculum, testing, instructional strategies and ways to teach a content.
The district hired 34 certified and highly qualified teachers. Teachers new to CCISD have varying levels of experience.
Calhoun County Independent School DistrictGenerated by Plan4Learning.com 12 of 54 District #901
January 26, 2017 11:09 am
Curriculum, Instruction, and Assessment
Curriculum, Instruction, and Assessment Summary
The curriculum used in Calhoun County ISD is a combination of teacher and district staff generated and purchased curriculum from a variety of resources. The district has four content specialists who write and revise the district scope and sequence each summer along with teacher input. The scope and sequenceis completely aligned with the TEKS and the new STAAR readiness and supporting standards. Kindergarten through high school teachers also writeinstructional calendars for their classes to guide the instruction throughout the nine-week reporting period. Each nine weeks the specialists facilitate teacherdriven common assessments for the scope and sequence for each subject. Common Assessments are scanned or electronically submitted and results aresent out to principals and teachers immediately after scanning through Eduphoria. Principals, Instructional Specialists, Department Chairs and teachersdissagregate campus results and discuss strengths and weakness. District specialists also follow the same procedures. Principals hold individual conferenceswith teachers whose scores do not seem to reflect student mastery of content. Campus scores are discussed in an accountability meeting/ data coaching each reporting period between the superintendent, curriculum director, personnel director and the campus administrator. Assistance is offered to thecampuses in the needed areas. This process is used to measure the instructional success of the scope and sequence and leads to scaffolding and spiraling ofproblem TEKS into future scope and sequences, instructional calendars and common assessments. The district used IMA funds to adopt new secondaryMath textbooks and newly adopted Kindergarten through grade 12 Social Studies textbooks and materials in 2015-2016. The Instructional MaterialsAllotment (IMA) is used to replaced damage or lost textbooks throughout the adoption process. Additionally, the IMA fund will pay for supplementarymaterials, chrome carts, calculators and other approved instructional materials.
Curriculum, Instruction, and Assessment Strengths
In Calhoun County students are taught and tested over the curriculum created through a collaborative process. CCISD has been successful on the stateaccountability measures by using a combination of resources written and purchased. There are no surprises on the scope and sequences or the assessments. There are student expectations per nine weeks and each teacher has been given those expectations. The district is data-driven and uses Aware throughEduphoria to assist in disaggregating assessment data. Other sources are also used. Year at a glance ( YAGS)are written at each grade level and/or course toencourage teachers to work through their scope and sequence at the appropriate pace.
CCISD uses Title II federal monies to bring in staff development workshops that offer proven lessons in helping students grow. The district brought intextbook publishers to train the teachers on the new secondary Math and Social Studies textbooks and the online subscriptions. Each summer the districtalso provides a GT 6 hour update for the elementary and secondary GT certified staff. Between 65 and 80 teachers take advantage of this summer update. By providing the update in summer the district saves on substitutes and individual cost per teacher.
All district personnel have received professional development in the areas of special education accommodations, English Language Proficiency(ELPS) standards and Eduphoria Lesson planning ( Forethought). All district personnel have been offered Eduphoria Aware training so that commonassessments can be constructed electronically and with immediate data for interventions.
Calhoun County Independent School DistrictGenerated by Plan4Learning.com 13 of 54 District #901
January 26, 2017 11:09 am
Curriculum, Instruction, and Assessment Needs
Teachers are encouraged to use research-based best practices to present material to the varied learning characteristics of their students. The scope andsequence must be covered in order to determine mastery of the concepts through teacher-generated assessments as well as common assessments. CalhounCounty ISD and all campuses met the new state standards on the STAAR assessments in Spring and Summer of 2016. The district will continue to moveforward to meet the next phase II standard by providing the guidance and resources to our teachers and students. The district and campus administrators areseeking updated materials to meet the rigor of the new Social Studies requirements and secondary Math TEKS. The district is working diligently to buildbackground knowledge in Social Studies to improve Social Studies scores at the 8th grade by reviewing schedules to assure Social Studies and Science arebeing taught daily. Social Studies common assessments are being implemented in grades 3-5 based on TEKS aligned high interest social studies readers.Travis Middle School began the year with a first quarter benchmark to assess skills immediately and begin curricular interventions.
Scores reveal a performance gap between sub-pops including ESL and special education. 100% of district teachers need research based best practice trainingto assist students who struggle with content and /or language in the content area.
Additionally, campus leaders need professional development in the areas of state and federal accountability, curriculum alignment and serving specialpopulations.
Calhoun County Independent School DistrictGenerated by Plan4Learning.com 14 of 54 District #901
January 26, 2017 11:09 am
Family and Community Involvement
Family and Community Involvement Summary
The district has five Title I school-wide campuses - HJM, JR, POC, Seadrift, and Travis. They have excellent participation in school related activities duringthe day and at night. The two high schools have also increased their parental involvement through their websites, home mailouts, and electronic parentletters. The district website posts the district scope and sequences for teacher use along with district and school calendars, gradebook portals for parents,menus, accountability information, letters to parents, and many other required postings. Each campus holds at least 2 open houses per year for parents andcommunity members. Jackson-Roosevelt holds two bilingual parent meetings with one in the fall and one in the spring semester.
Calhoun County ISD participated in the Texas Education Code 39.0545 which required all districts to evaluate the district's performance and theperformance of each campus in community and student engagement. Performance ratings of exemplary, recognized, acceptable or unacceptable were givenin each of the following areas: Fine Arts, Wellness and Physical Education; Community and Parental Involvement; The 21st Century DevelopmentProgram; The Second Language Acquisition Program; The Digital Learning Environment; Dropout Prevention Strategies; and Educational Programs forGifted and Talented Students.
Overall Ratings were: CCISD (recognized); CHS (recognized); Hope (acceptable); Travis (recognized); HJM (exemplary); JR (exemplary); Port O'Connor(exemplary) and Seadrift (recognized).
Family and Community Involvement Strengths
The district has a Partners in Education (PIE) committee comprised of the five major industries in Calhoun County. This committee has a full-time PIEcoordinator. PIE coordinates a mentor and tutor program for the campuses, has career fairs for students and promotes academic excellence through theindustry partners. The Texas Scholars' program is one of the initiatives of the PIE committee. PIE members work with CCISD staff to implement STEMexpectations for high school students. They also secure grants for different community projects which promote math and science skills. Outside counselingentities such as Mid-Coast Counseling Services and The Harbor visit our schools to share information about drug and gang awareness, alcohol use, and notbeing a victim of sexual violence. The Ministerial Alliance organization is available for grief counseling in case of the death of a faculty member or student. The Boy and Girl Scouts along with the YMCA, The Journeys Club and 4-H clubs offer programs for our youth in and outside of the school day.
Family and Community Involvement Needs
Calhoun County Independent School DistrictGenerated by Plan4Learning.com 15 of 54 District #901
January 26, 2017 11:09 am

The district needs more parental involvement. While many parents attend school functions, a large number of Calhoun students have parents who work atnight and are not at home during critical evening hours. Schools try to assist students with afternoon tutorials and homework assistance to accommodatestudents and their parents. Elementary schools use daily homework folders to communicate with parents about grades, behavior and school events. Thedistrict and campus administrators are making every effort to use technology to reach families in our community through the web-pages, Face-book andinstant message systems.
The district is still trying to improve parental involvement opportunities by making sure all of the district's parents feel welcome at the campuses and knowwhere to seek answers to their questions. We appreciate our parent and community volunteers. Our students benefit from their participation in the schoolroutine. All district personnel continue to utilize methods that will inform parents and connect home to school.
Calhoun County Independent School DistrictGenerated by Plan4Learning.com 16 of 54 District #901
January 26, 2017 11:09 am
Technology
Technology Summary
The district has a Technology Committee and a full-time Technology Director. The district also employees 3 full-time technology specialists who maintainthe district's infrastructure. This year the district employees 1 IT specialists to work with teachers at the secondary and elementary level to help teachersintegrate technology into their classes.
Local budget along with the use of some funds from the Instructional Materials Allotment (IMA) are used for district projects. Each elementary classroomteacher is expected to teach the Technology TEKS to all their students and produce a technology project by the end of the year.
CCISD recognizes that technologically literate students and staff are the catalyst to the development of future learning skills, knowledge, and application tosociety. TEA has dropped IStation for Reading intervention 3-5 and Think Through Math for improving Math concepts grades K-8. The district (Title I/III)has purchased IStation for PK-2 (Seadrift) and grades 3-5 at HJM, JR, and POC until the state offers something in its' place . The district also purchasedThink Through Math through December 2015 in hopes that by January, 2016 the state will have accepted bids from Reading and Math vendors forremediation.
IMA money will be used to increase the number of chrome-books and carts in each elementary campus. Additionally, Travis Middle School is piloting achrome book initiative where each student carries a device throughout the school day. Calhoun High School will continue to create lessons that utilizedistrict technology.
The district has implemented full use of the Eduphoria lesson planning, test construction and data analysis system. 100% of teachers have receivedprofessional development in this area to ensure they are ready to meet the new Texas Teacher Standards.
Technology Strengths
All teachers in Calhoun County are expected to be technology proficient within the first semester of employment. The district has implemented use ofEduphoria for planning and assessment. The district has begun to coordinate programs and funding to get better prices such as Successmaker, DynEd,Waterford, and other on-line programs.
CCISD maintains a technological foundation, training, and implementation for students and staff, including a long-term upgradeable infrastructure. Academic excellence will occur by involving students, staff and community, thereby empowering all stakeholders to achieve success.
All stakeholders will apply information-age technology skills. The district and federal programs directors combined money to provide a staff developmentprogram for staff. Title II continues to support 50 licenses for Simple K12 for the private school partnership (Our Lady of the Gulf School) and 23 CCISD
Calhoun County Independent School DistrictGenerated by Plan4Learning.com 17 of 54 District #901
January 26, 2017 11:09 am
teacher licenses. These licenses are awarded to teachers requesting this form of staff development. The licenses is under review for renewal.
G-Suite (Google Apps for Education) training will continue through online and face-to-face training sessions for teachers and CCISD staff.
Technology Department has purchased 35 Chromecarts (1020 Chromebooks) for Travis and 42 Chromecarts (1220 Chromebooks) for Calhoun HighSchool. These carts were purchased with bond monies and local budgets. Other campuses using chromecarts and chromebooks are: Hope High School--2carts with 55 chromebooks and Seadrift School--4 carts with 110 chromebooks. Travis Middle School and CHS have a 1 to 1 ratio of students toChromebooks.
In the summer of 2015, the technology department began the process of upgrading the infrastructure at CHS to support wireless usage for the chromebooks. This upgrade will be a year long process. The next infrastructure project was initiated in the summer of 2016 to update the grid and improve connectivity.
The district also launched new, customer-friendly website that offers a variety of information on Calhoun County ISD.
Technology Needs
Every student should have equal access to the same hardware and softwareProvide professional development for teachers so that student technology use is a seamless part of instructionTraining on any new program or software for teachers and studentsResearch for technology grants that will help provide Calhoun students with state of the art technology equipmentIncreased bandwidth, improved/additional backup equipment and a replacement cycle for outdated equipmentContinued use/maintenance of distance learning classes to make course offerings equal throughout the districtEducate the parents on ways they can monitor their child's progress by workshops and open campus labs especially our non-English speaking parents
Calhoun County Independent School DistrictGenerated by Plan4Learning.com 18 of 54 District #901
January 26, 2017 11:09 am
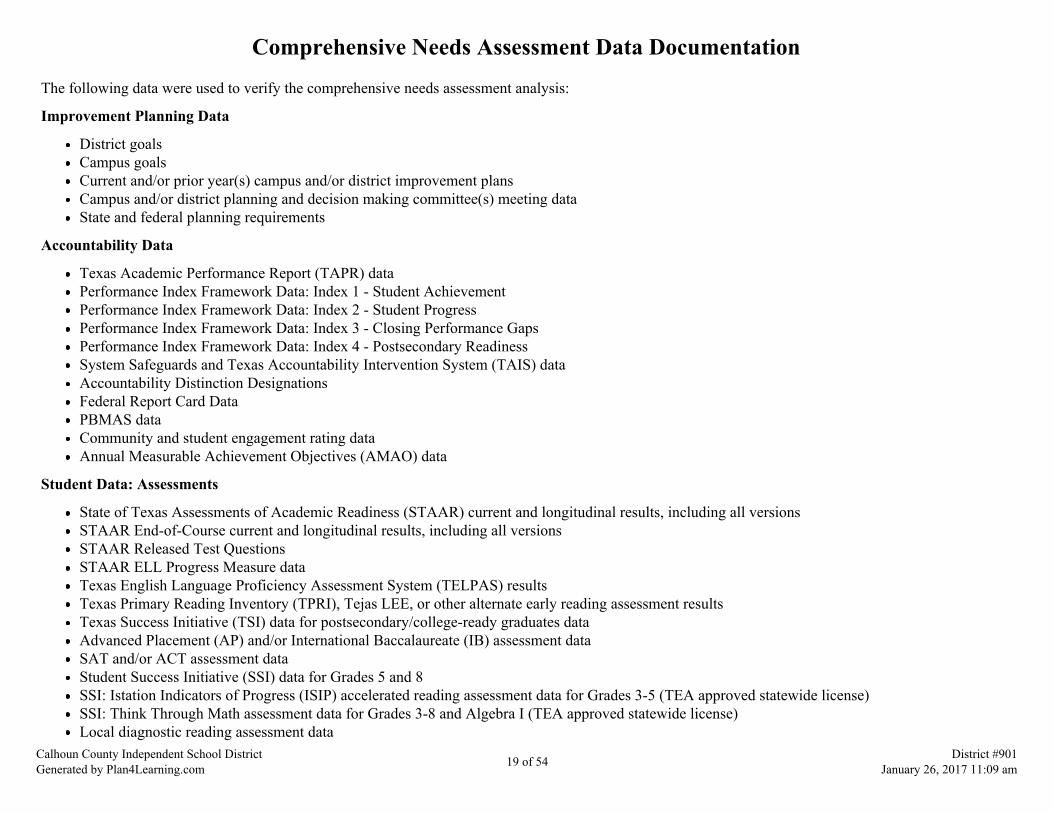
Comprehensive Needs Assessment Data Documentation
The following data were used to verify the comprehensive needs assessment analysis:
Improvement Planning Data
District goalsCampus goalsCurrent and/or prior year(s) campus and/or district improvement plansCampus and/or district planning and decision making committee(s) meeting dataState and federal planning requirements
Accountability Data
Texas Academic Performance Report (TAPR) dataPerformance Index Framework Data: Index 1 - Student AchievementPerformance Index Framework Data: Index 2 - Student ProgressPerformance Index Framework Data: Index 3 - Closing Performance GapsPerformance Index Framework Data: Index 4 - Postsecondary ReadinessSystem Safeguards and Texas Accountability Intervention System (TAIS) dataAccountability Distinction DesignationsFederal Report Card DataPBMAS dataCommunity and student engagement rating dataAnnual Measurable Achievement Objectives (AMAO) data
Student Data: Assessments
State of Texas Assessments of Academic Readiness (STAAR) current and longitudinal results, including all versionsSTAAR End-of-Course current and longitudinal results, including all versionsSTAAR Released Test QuestionsSTAAR ELL Progress Measure dataTexas English Language Proficiency Assessment System (TELPAS) resultsTexas Primary Reading Inventory (TPRI), Tejas LEE, or other alternate early reading assessment resultsTexas Success Initiative (TSI) data for postsecondary/college-ready graduates dataAdvanced Placement (AP) and/or International Baccalaureate (IB) assessment dataSAT and/or ACT assessment dataStudent Success Initiative (SSI) data for Grades 5 and 8SSI: Istation Indicators of Progress (ISIP) accelerated reading assessment data for Grades 3-5 (TEA approved statewide license)SSI: Think Through Math assessment data for Grades 3-8 and Algebra I (TEA approved statewide license)Local diagnostic reading assessment data
Calhoun County Independent School DistrictGenerated by Plan4Learning.com 19 of 54 District #901
January 26, 2017 11:09 am

Local diagnostic math assessment dataLocal benchmark or common assessments dataStudent failure and/or retention rates
Student Data: Student Groups
Number of students assigned to each special program, including analysis of academic achievement, race, ethnicity, gender, etcEconomically Disadvantaged / Non-economically disadvantaged performance and participation dataSpecial education population, including performance, discipline, attendance, and mobilityAt-Risk population, including performance, discipline, attendance and mobilityELL or LEP data, including academic achievement, support and accommodation needs, race, ethnicity, gender, etcCareer and Technical Education (CTE) data, including academic achievement, program growth, race, ethnicity, gender, etcSection 504 dataHomeless dataGifted and talented dataResponse to Intervention (RtI) student achievement data
Student Data: Behavior and Other Indicators
Completion rates and/or graduation rates dataAnnual dropout rate dataAttendance dataDiscipline recordsViolence and/or violence prevention recordsTobacco, alcohol, and other drug-use dataStudent surveys and/or other feedback
Employee Data
Staff surveys and/or other feedbackHighly qualified staff dataCampus leadership dataCampus department and/or faculty meeting discussions and dataProfessional development needs assessment dataPDAS and/or T-TESS
Parent/Community Data
Parent surveys and/or other feedbackParent Involvement Rate
Support Systems and Other Data
Calhoun County Independent School DistrictGenerated by Plan4Learning.com 20 of 54 District #901
January 26, 2017 11:09 am

Processes and procedures for teaching and learning, including program implementationCommunications dataBudgets/entitlements and expenditures dataStudy of best practices
Calhoun County Independent School DistrictGenerated by Plan4Learning.com 21 of 54 District #901
January 26, 2017 11:09 am
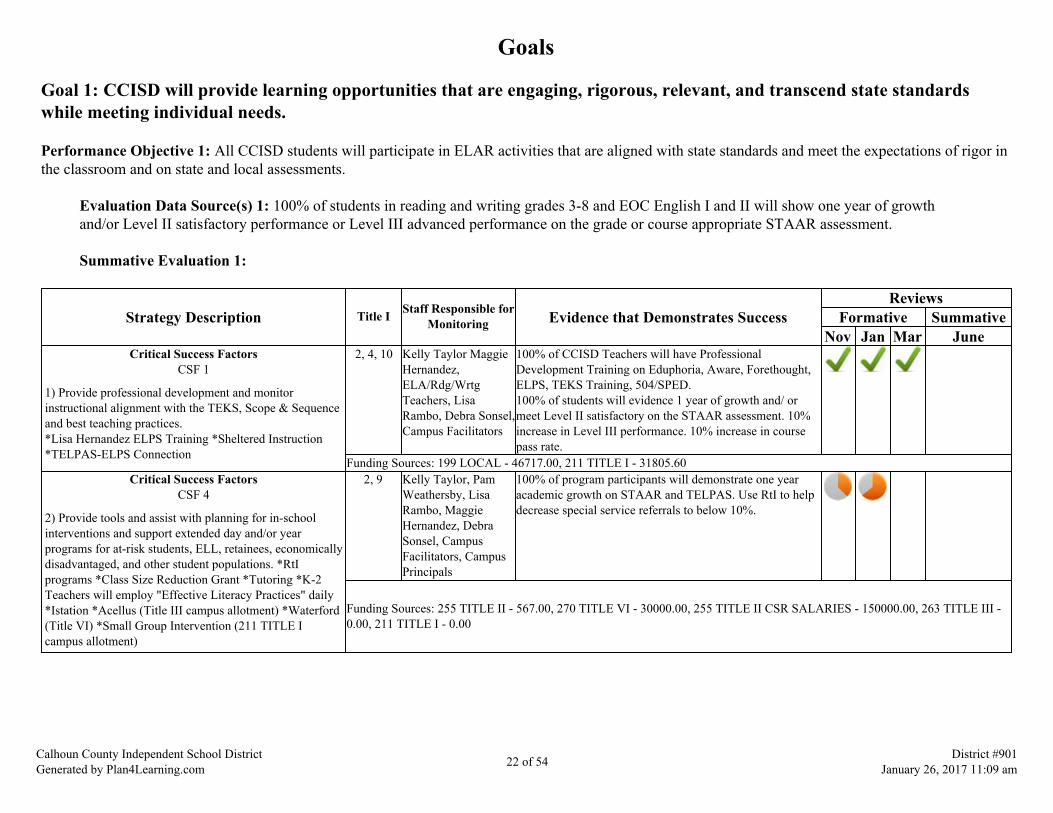
Goals
Goal 1: CCISD will provide learning opportunities that are engaging, rigorous, relevant, and transcend state standardswhile meeting individual needs.
Performance Objective 1: All CCISD students will participate in ELAR activities that are aligned with state standards and meet the expectations of rigor inthe classroom and on state and local assessments.
Evaluation Data Source(s) 1: 100% of students in reading and writing grades 3-8 and EOC English I and II will show one year of growthand/or Level II satisfactory performance or Level III advanced performance on the grade or course appropriate STAAR assessment.
Summative Evaluation 1:
Strategy Description Title I Staff Responsible forMonitoring Evidence that Demonstrates Success
ReviewsFormative Summative
Nov Jan Mar JuneCritical Success Factors
CSF 1
1) Provide professional development and monitorinstructional alignment with the TEKS, Scope & Sequenceand best teaching practices.*Lisa Hernandez ELPS Training *Sheltered Instruction*TELPAS-ELPS Connection
2, 4, 10 Kelly Taylor MaggieHernandez,ELA/Rdg/WrtgTeachers, LisaRambo, Debra Sonsel,Campus Facilitators
100% of CCISD Teachers will have ProfessionalDevelopment Training on Eduphoria, Aware, Forethought,ELPS, TEKS Training, 504/SPED.100% of students will evidence 1 year of growth and/ ormeet Level II satisfactory on the STAAR assessment. 10%increase in Level III performance. 10% increase in coursepass rate.
Funding Sources: 199 LOCAL - 46717.00, 211 TITLE I - 31805.60Critical Success Factors
CSF 4
2) Provide tools and assist with planning for in-schoolinterventions and support extended day and/or yearprograms for at-risk students, ELL, retainees, economicallydisadvantaged, and other student populations. *RtIprograms *Class Size Reduction Grant *Tutoring *K-2Teachers will employ "Effective Literacy Practices" daily*Istation *Acellus (Title III campus allotment) *Waterford(Title VI) *Small Group Intervention (211 TITLE Icampus allotment)
2, 9 Kelly Taylor, PamWeathersby, LisaRambo, MaggieHernandez, DebraSonsel, CampusFacilitators, CampusPrincipals
100% of program participants will demonstrate one yearacademic growth on STAAR and TELPAS. Use RtI to helpdecrease special service referrals to below 10%.
Funding Sources: 255 TITLE II - 567.00, 270 TITLE VI - 30000.00, 255 TITLE II CSR SALARIES - 150000.00, 263 TITLE III -0.00, 211 TITLE I - 0.00
Calhoun County Independent School DistrictGenerated by Plan4Learning.com 22 of 54 District #901
January 26, 2017 11:09 am

Critical Success FactorsCSF 1 CSF 2
3) Support LEP/language arts programs by acquiring andupgrading materials/software and offering tutorialopportunities. *ESL Reading Smart for ELL (TITLE III$6,850) *Project ELL (TITLE III Campus allotments)*Tutoring Program *Accelerated Reader (211 TITLE I)*BrainPop (270 Title VI ) *ESL JR/Travis Aides *SchoolSpecialty
2, 9 Kelly Taylor, PamWeathersby, MaggieHernandez, DebraSonsel, CampusPrincipals, Teachers
100% of the LEP student population will achieve 1 year ofgrowth on oral language and writing proficiency, achieveadvanced high status on TELPAS after 3-4 years ofinstruction, and meet AMAO standards for 2017.
Funding Sources: 263 TITLE III - 6850.00, 211 TITLE I - 16922.68, 255 TITLE II - 2500.00, 270 TITLE VI - 0.00
Critical Success FactorsCSF 1
4) Provide a high quality pre-school experience to CCISD4 year old students enrolled on campuses. *HeadstartPartnership" Pre-K teachers will receive PD and materialsfrom Pre-K grant.
7 Kelly Taylor, PamWeathersby, Dr. D.Freeman, LisaRambo, CampusPrincipals andInstructionalSpecialists.
100% of pre-kindergarten students are classified as schoolready for full day kindergarten in 2017.100% of pre-kindergarten teacher will receive training inProgress Monitoring and Circle Assessment.
Critical Success FactorsCSF 2
5) Provide professional development in Aware andfacilitate planning to monitor student mastery of TEKS sothat curricular adjustments and targeted interventions are inplace for all students including students who receivespecial services.
2 Kelly Taylor, PamWeathersby, LisaRambo, MaggieHernandez,InstructionalSpecialists,Department Chairsand ESL Teachers
100% of students will make 1 year of growth evidenced bystudent performance on TPRI, TELPAS, and STAAR and/or meet Level II satisfactory on the STAAR assessment.10% increase in Level III performance. 10% increase incourse pass rate.
Funding Sources: 199 LOCAL - 45000.00Critical Success Factors
CSF 1 CSF 2
6) Implement and improve high quality reading andwriting instruction for ELL and other diverse learnerpopulations through training opportunities for all contentteachers. *SIOP (263 TITLE III $2100) *ELPS training*Project ELL (263 Title III $2,000) *BIL/ESL BestPractices * Region 3 Training
2, 4, 8, 9 Kelly Taylor, PamWeathersby,Principals, MaggieHernandez,InstructionalSpecialists, DebraSonsel, DepartmentChairs and ESLTeachers
100% of students will evidence 1 year of growth and/ ormeet Level II satisfactory on the STAAR assessment. 10%increase in Level III performance. 10% increase in coursepass rate.
Funding Sources: 263 TITLE III - 4100.00Critical Success Factors
CSF 1
7) Implement and assess short answer and essay responsesacross curriculum areas to enhance student's ability tointerpret text and support it with textual evidence throughuse of 2016 STAAR released essay and responses.
2 Kelly Taylor, PamWeathersby, MaggieHernandez, LisaRambo ,CampusPrincipals
100% of students will evidence 1 year of growth and/ ormeet Level II satisfactory on the STAAR assessment. 10%increase in Level III performance.
Calhoun County Independent School DistrictGenerated by Plan4Learning.com 23 of 54 District #901
January 26, 2017 11:09 am
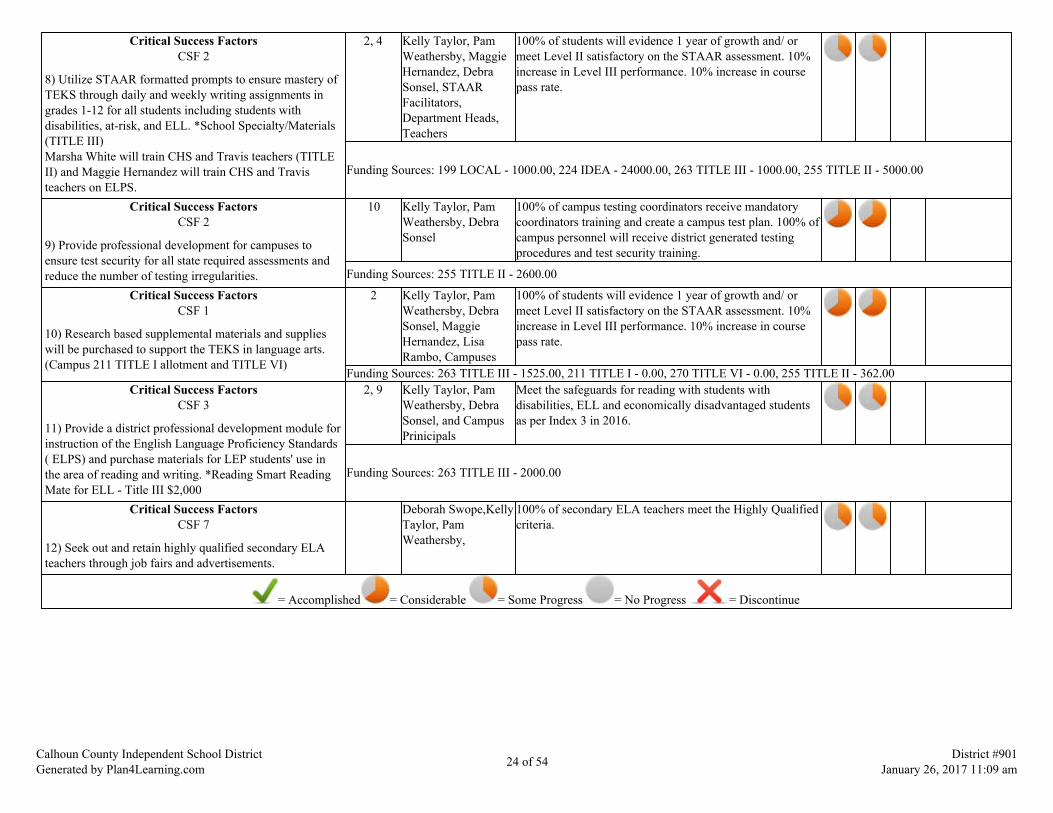
Critical Success FactorsCSF 2
8) Utilize STAAR formatted prompts to ensure mastery ofTEKS through daily and weekly writing assignments ingrades 1-12 for all students including students withdisabilities, at-risk, and ELL. *School Specialty/Materials(TITLE III)Marsha White will train CHS and Travis teachers (TITLEII) and Maggie Hernandez will train CHS and Travisteachers on ELPS.
2, 4 Kelly Taylor, PamWeathersby, MaggieHernandez, DebraSonsel, STAARFacilitators,Department Heads,Teachers
100% of students will evidence 1 year of growth and/ ormeet Level II satisfactory on the STAAR assessment. 10%increase in Level III performance. 10% increase in coursepass rate.
Funding Sources: 199 LOCAL - 1000.00, 224 IDEA - 24000.00, 263 TITLE III - 1000.00, 255 TITLE II - 5000.00
Critical Success FactorsCSF 2
9) Provide professional development for campuses toensure test security for all state required assessments andreduce the number of testing irregularities.
10 Kelly Taylor, PamWeathersby, DebraSonsel
100% of campus testing coordinators receive mandatorycoordinators training and create a campus test plan. 100% ofcampus personnel will receive district generated testingprocedures and test security training.
Funding Sources: 255 TITLE II - 2600.00
Critical Success FactorsCSF 1
10) Research based supplemental materials and supplieswill be purchased to support the TEKS in language arts.(Campus 211 TITLE I allotment and TITLE VI)
2 Kelly Taylor, PamWeathersby, DebraSonsel, MaggieHernandez, LisaRambo, Campuses
100% of students will evidence 1 year of growth and/ ormeet Level II satisfactory on the STAAR assessment. 10%increase in Level III performance. 10% increase in coursepass rate.
Funding Sources: 263 TITLE III - 1525.00, 211 TITLE I - 0.00, 270 TITLE VI - 0.00, 255 TITLE II - 362.00Critical Success Factors
CSF 3
11) Provide a district professional development module forinstruction of the English Language Proficiency Standards( ELPS) and purchase materials for LEP students' use inthe area of reading and writing. *Reading Smart ReadingMate for ELL - Title III $2,000
2, 9 Kelly Taylor, PamWeathersby, DebraSonsel, and CampusPrinicipals
Meet the safeguards for reading with students withdisabilities, ELL and economically disadvantaged studentsas per Index 3 in 2016.
Funding Sources: 263 TITLE III - 2000.00
Critical Success FactorsCSF 7
12) Seek out and retain highly qualified secondary ELAteachers through job fairs and advertisements.
Deborah Swope,KellyTaylor, PamWeathersby,
100% of secondary ELA teachers meet the Highly Qualifiedcriteria.
= Accomplished = Considerable = Some Progress = No Progress = Discontinue
Calhoun County Independent School DistrictGenerated by Plan4Learning.com 24 of 54 District #901
January 26, 2017 11:09 am
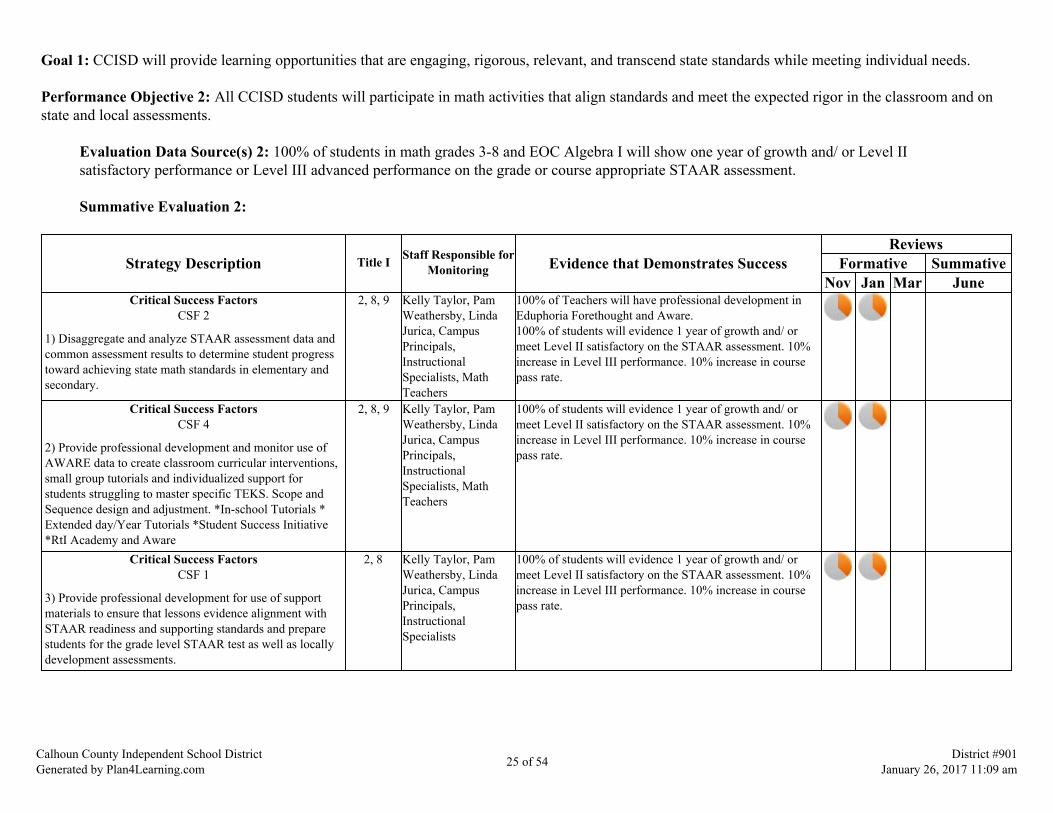
Goal 1: CCISD will provide learning opportunities that are engaging, rigorous, relevant, and transcend state standards while meeting individual needs.
Performance Objective 2: All CCISD students will participate in math activities that align standards and meet the expected rigor in the classroom and onstate and local assessments.
Evaluation Data Source(s) 2: 100% of students in math grades 3-8 and EOC Algebra I will show one year of growth and/ or Level IIsatisfactory performance or Level III advanced performance on the grade or course appropriate STAAR assessment.
Summative Evaluation 2:
Strategy Description Title I Staff Responsible forMonitoring Evidence that Demonstrates Success
ReviewsFormative Summative
Nov Jan Mar JuneCritical Success Factors
CSF 2
1) Disaggregate and analyze STAAR assessment data andcommon assessment results to determine student progresstoward achieving state math standards in elementary andsecondary.
2, 8, 9 Kelly Taylor, PamWeathersby, LindaJurica, CampusPrincipals,InstructionalSpecialists, MathTeachers
100% of Teachers will have professional development inEduphoria Forethought and Aware.100% of students will evidence 1 year of growth and/ ormeet Level II satisfactory on the STAAR assessment. 10%increase in Level III performance. 10% increase in coursepass rate.
Critical Success FactorsCSF 4
2) Provide professional development and monitor use ofAWARE data to create classroom curricular interventions,small group tutorials and individualized support forstudents struggling to master specific TEKS. Scope andSequence design and adjustment. *In-school Tutorials *Extended day/Year Tutorials *Student Success Initiative*RtI Academy and Aware
2, 8, 9 Kelly Taylor, PamWeathersby, LindaJurica, CampusPrincipals,InstructionalSpecialists, MathTeachers
100% of students will evidence 1 year of growth and/ ormeet Level II satisfactory on the STAAR assessment. 10%increase in Level III performance. 10% increase in coursepass rate.
Critical Success FactorsCSF 1
3) Provide professional development for use of supportmaterials to ensure that lessons evidence alignment withSTAAR readiness and supporting standards and preparestudents for the grade level STAAR test as well as locallydevelopment assessments.
2, 8 Kelly Taylor, PamWeathersby, LindaJurica, CampusPrincipals,InstructionalSpecialists
100% of students will evidence 1 year of growth and/ ormeet Level II satisfactory on the STAAR assessment. 10%increase in Level III performance. 10% increase in coursepass rate.
Calhoun County Independent School DistrictGenerated by Plan4Learning.com 25 of 54 District #901
January 26, 2017 11:09 am

Critical Success FactorsCSF 3
4) Facilitate vertical alignment between high school,middle school, and elementary math programs andprerequisite courses to increase STAAR Math (grades 3-Algebra II) readiness.Vertical Alignment in scope and sequence for advancemath 6th-12th.
8 Kelly Taylor,LindaJurica, Joan Sassman,Andreanna Martinez,Melissa Hoggett,MikeTorres, InstructionalSpecialists,
100% of students will evidence 1 year of growth and/ ormeet Level II satisfactory on the STAAR assessment. 10%increase in Level III performance.
Critical Success FactorsCSF 3
5) Facilitate Math Department/Grade Level professionaldevelopment to ensure that the readiness and supportingstandards are taught at the appropriate level andinterventions are initiated to support students who arestruggling to master TEKS including students who receivespecial services including LEP, Special Education and At-risk groups. The Pre-AP/AP curriculum will promotecollege readiness and ensure preparation for the collegeboard exams.
8, 9 Kelly Taylor, LindaJurica, DepartmentHeads, InstructionalSpecialists, Grade-Level Leaders,Campus Principals
100% of students will evidence 1 year of growth and/ ormeet Level II satisfactory on the STAAR assessment. 10%increase in Level III performance. 10% increase in coursepass rate. 5% increase in Advance Placement Scores inMath subject areas.
Funding Sources: 199 LOCAL - 68290.00
6) Utilize technology based lessons in math classes andintervention sessions through the use of online resources.*MStar *Ipad *BrainPop (TITLE VI) *Think ThroughMath, Textbook Online Support
2, 4, 9 Kelly Taylor, PamWeathersby, LindaJurica, Jeana Bethany,Debra Sonsel
100% of students will evidence 1 year of growth and/ ormeet Level II satisfactory on the STAAR assessment. 10%increase in Level III performance. 10% increase in coursepass rate.
Funding Sources: 255 TITLE II - 5790.00, 211 TITLE I - 0.00, 270 TITLE VI - 0.00Critical Success Factors
CSF 7
7) Seek out and retain highly qualified secondary mathteachers through job fairs, advertisements, and stipendincentives.
5 Debbie Swope, KellyTaylor, PamWeathersby, LindaJurica, NicoleAmason, MichaelTorres
100% of secondary math teachers meet the Highly Qualifiedcriteria.
Critical Success FactorsCSF 3
8) Monitor math instruction to ensure best practices areutilized, pacing/sequencing and materials are used andconfirm that Eduphoria is utilized for shared lesson plansand data analysis.
2 Kelly Taylor, PamWeathersby, LindaJurica, CampusPrincipals,InstructionalSpeciialists
100% of students will evidence 1 year of growth and/ ormeet Level II satisfactory on the STAAR assessment. 10%increase in Level III performance. 10% increase in coursepass rate.
Calhoun County Independent School DistrictGenerated by Plan4Learning.com 26 of 54 District #901
January 26, 2017 11:09 am

Critical Success FactorsCSF 1
9) Research based supplemental materials and supplies willbe purchased to support math instruction designed to betterprepare students for the STAAR assessment as well aslocally developed assessments (Campus 211 TITLE Iallotment and TITLE VI)
2 Kelly Taylor, PamWeathersby, LindaJurica, Debra Sonsel,InstructionalSpecialists
100% of students will evidence 1 year of growth and/ ormeet Level II satisfactory on the STAAR assessment. 10%increase in Level III performance. 10% increase in coursepass rate.t.
Funding Sources: 211 TITLE I - 0.00, 270 TITLE VI - 0.00
Critical Success FactorsCSF 3
10) Use Eduphoria AWARE to monitor studentperformance and initiate interventions for students withdisabilities each grading period.
9 Kelly Taylor, PamWeathersby, JeanaBethany, DebraSonsel, NicoleAmason, InstructionalSpecialists
Meet safeguards for math growth with all students withdisabilities as per Index 3 in 2017. Increase course pass ratesby 10% as a result of targeted interventions.
= Accomplished = Considerable = Some Progress = No Progress = Discontinue
Calhoun County Independent School DistrictGenerated by Plan4Learning.com 27 of 54 District #901
January 26, 2017 11:09 am
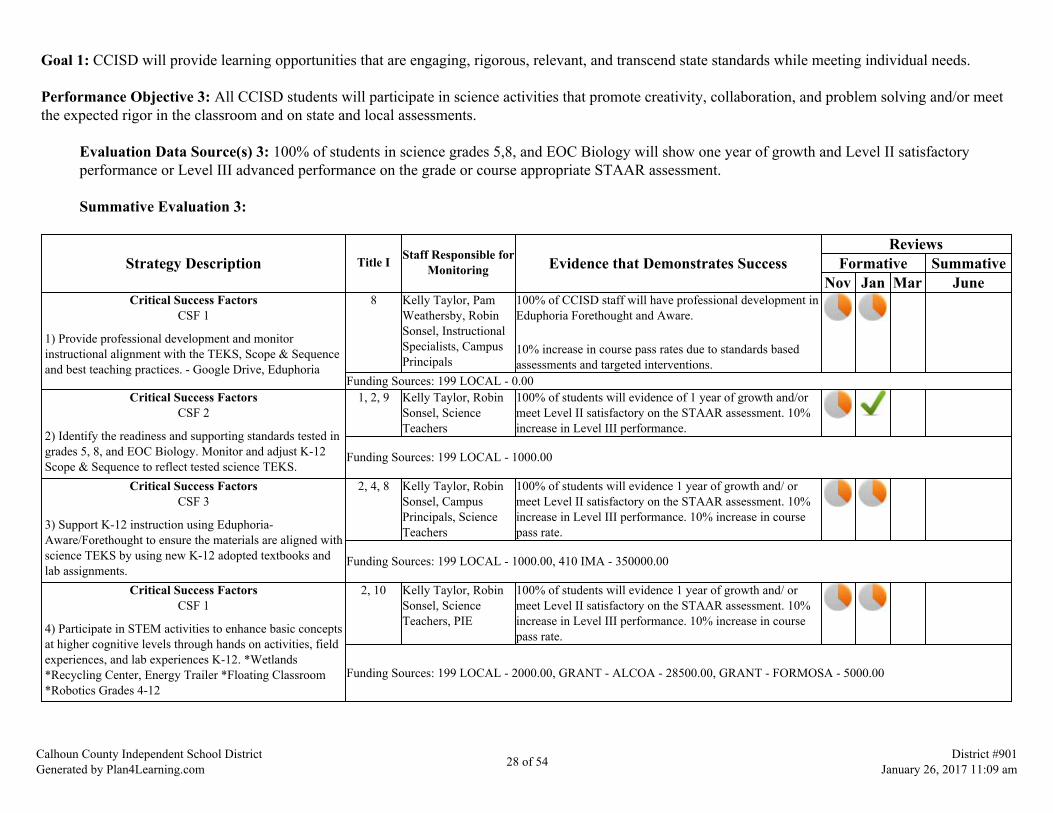
Goal 1: CCISD will provide learning opportunities that are engaging, rigorous, relevant, and transcend state standards while meeting individual needs.
Performance Objective 3: All CCISD students will participate in science activities that promote creativity, collaboration, and problem solving and/or meetthe expected rigor in the classroom and on state and local assessments.
Evaluation Data Source(s) 3: 100% of students in science grades 5,8, and EOC Biology will show one year of growth and Level II satisfactoryperformance or Level III advanced performance on the grade or course appropriate STAAR assessment.
Summative Evaluation 3:
Strategy Description Title I Staff Responsible forMonitoring Evidence that Demonstrates Success
ReviewsFormative Summative
Nov Jan Mar JuneCritical Success Factors
CSF 1
1) Provide professional development and monitorinstructional alignment with the TEKS, Scope & Sequenceand best teaching practices. - Google Drive, Eduphoria
8 Kelly Taylor, PamWeathersby, RobinSonsel, InstructionalSpecialists, CampusPrincipals
100% of CCISD staff will have professional development inEduphoria Forethought and Aware.
10% increase in course pass rates due to standards basedassessments and targeted interventions.
Funding Sources: 199 LOCAL - 0.00Critical Success Factors
CSF 2
2) Identify the readiness and supporting standards tested ingrades 5, 8, and EOC Biology. Monitor and adjust K-12Scope & Sequence to reflect tested science TEKS.
1, 2, 9 Kelly Taylor, RobinSonsel, ScienceTeachers
100% of students will evidence of 1 year of growth and/ormeet Level II satisfactory on the STAAR assessment. 10%increase in Level III performance.
Funding Sources: 199 LOCAL - 1000.00
Critical Success FactorsCSF 3
3) Support K-12 instruction using Eduphoria-Aware/Forethought to ensure the materials are aligned withscience TEKS by using new K-12 adopted textbooks andlab assignments.
2, 4, 8 Kelly Taylor, RobinSonsel, CampusPrincipals, ScienceTeachers
100% of students will evidence 1 year of growth and/ ormeet Level II satisfactory on the STAAR assessment. 10%increase in Level III performance. 10% increase in coursepass rate.
Funding Sources: 199 LOCAL - 1000.00, 410 IMA - 350000.00
Critical Success FactorsCSF 1
4) Participate in STEM activities to enhance basic conceptsat higher cognitive levels through hands on activities, fieldexperiences, and lab experiences K-12. *Wetlands*Recycling Center, Energy Trailer *Floating Classroom*Robotics Grades 4-12
2, 10 Kelly Taylor, RobinSonsel, ScienceTeachers, PIE
100% of students will evidence 1 year of growth and/ ormeet Level II satisfactory on the STAAR assessment. 10%increase in Level III performance. 10% increase in coursepass rate.
Funding Sources: 199 LOCAL - 2000.00, GRANT - ALCOA - 28500.00, GRANT - FORMOSA - 5000.00
Calhoun County Independent School DistrictGenerated by Plan4Learning.com 28 of 54 District #901
January 26, 2017 11:09 am

Critical Success FactorsCSF 2
5) Dissaggregate and review reporting STAAR categoriesand common assessments for all grade levels especiallyreviewing economically disadvantaged students and otherunder performing sub pops in order to initiate and monitortargeted interventions.
2, 8, 9 Kelly Taylor, PamWeathesby RobinSonsel, CampusPrincipals,Department Chairsand InstructionalSpecialists
100% of students will evidence 1 year of growth and/ ormeet Level II satisfactory on the STAAR assessment. 10%increase in Level III performance. 10% increase in coursepass rate.
Funding Sources: 199 LOCAL - 500.00Critical Success Factors
CSF 2
6) Facilitate planning to initiate and monitor targetedinterventions based on Common Assessment data andcourse assessment data.
2, 8, 9 Kelly Taylor, PamWeathersby, RobinSonsel, CampusPrincipals,InstructionalSpecialists andDepartment Chairs.
100% of students will evidence 1 year of growth and/ ormeet Level II satisfactory on the STAAR assessment. 10%increase in Level III performance. 10% increase in coursepass rate.
Critical Success FactorsCSF 1
7) Research based supplemental materials and supplies willbe leased to support the academic goals in science. *StarLab - Region 3 (local), (Campus TITLE I allotment andTITLE VI)
2 Kelly Taylor, PamWeathersby, RobinSonsel, Debra Sonsel,Campus Principals,InstructionalSpecialists andDepartment Chairs.
100% of students will evidence 1 year of growth and/ ormeet Level II satisfactory on the STAAR assessment. 10%increase in Level III performance. 10% increase in coursepass rate.
Funding Sources: 199 LOCAL - 150.00, 211 TITLE I - 0.00, 270 TITLE VI - 0.00
= Accomplished = Considerable = Some Progress = No Progress = Discontinue
Calhoun County Independent School DistrictGenerated by Plan4Learning.com 29 of 54 District #901
January 26, 2017 11:09 am
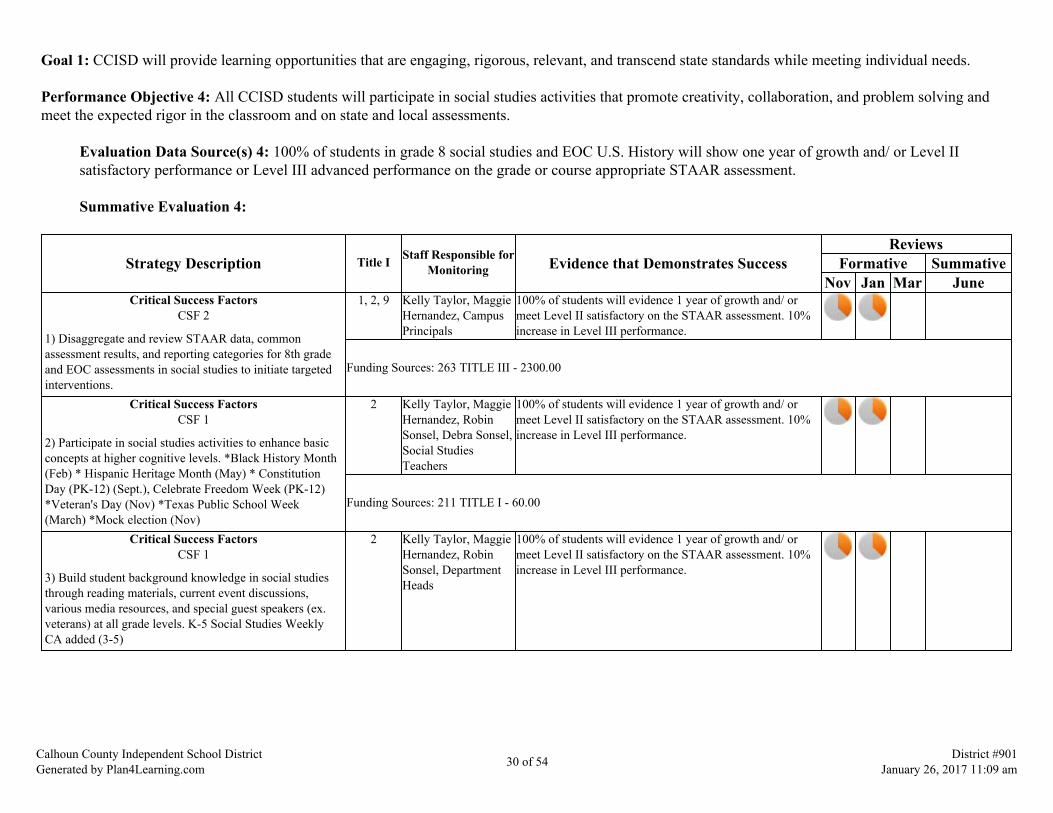
Goal 1: CCISD will provide learning opportunities that are engaging, rigorous, relevant, and transcend state standards while meeting individual needs.
Performance Objective 4: All CCISD students will participate in social studies activities that promote creativity, collaboration, and problem solving andmeet the expected rigor in the classroom and on state and local assessments.
Evaluation Data Source(s) 4: 100% of students in grade 8 social studies and EOC U.S. History will show one year of growth and/ or Level IIsatisfactory performance or Level III advanced performance on the grade or course appropriate STAAR assessment.
Summative Evaluation 4:
Strategy Description Title I Staff Responsible forMonitoring Evidence that Demonstrates Success
ReviewsFormative Summative
Nov Jan Mar JuneCritical Success Factors
CSF 2
1) Disaggregate and review STAAR data, commonassessment results, and reporting categories for 8th gradeand EOC assessments in social studies to initiate targetedinterventions.
1, 2, 9 Kelly Taylor, MaggieHernandez, CampusPrincipals
100% of students will evidence 1 year of growth and/ ormeet Level II satisfactory on the STAAR assessment. 10%increase in Level III performance.
Funding Sources: 263 TITLE III - 2300.00
Critical Success FactorsCSF 1
2) Participate in social studies activities to enhance basicconcepts at higher cognitive levels. *Black History Month(Feb) * Hispanic Heritage Month (May) * ConstitutionDay (PK-12) (Sept.), Celebrate Freedom Week (PK-12)*Veteran's Day (Nov) *Texas Public School Week(March) *Mock election (Nov)
2 Kelly Taylor, MaggieHernandez, RobinSonsel, Debra Sonsel,Social StudiesTeachers
100% of students will evidence 1 year of growth and/ ormeet Level II satisfactory on the STAAR assessment. 10%increase in Level III performance.
Funding Sources: 211 TITLE I - 60.00
Critical Success FactorsCSF 1
3) Build student background knowledge in social studiesthrough reading materials, current event discussions,various media resources, and special guest speakers (ex.veterans) at all grade levels. K-5 Social Studies WeeklyCA added (3-5)
2 Kelly Taylor, MaggieHernandez, RobinSonsel, DepartmentHeads
100% of students will evidence 1 year of growth and/ ormeet Level II satisfactory on the STAAR assessment. 10%increase in Level III performance.
Calhoun County Independent School DistrictGenerated by Plan4Learning.com 30 of 54 District #901
January 26, 2017 11:09 am
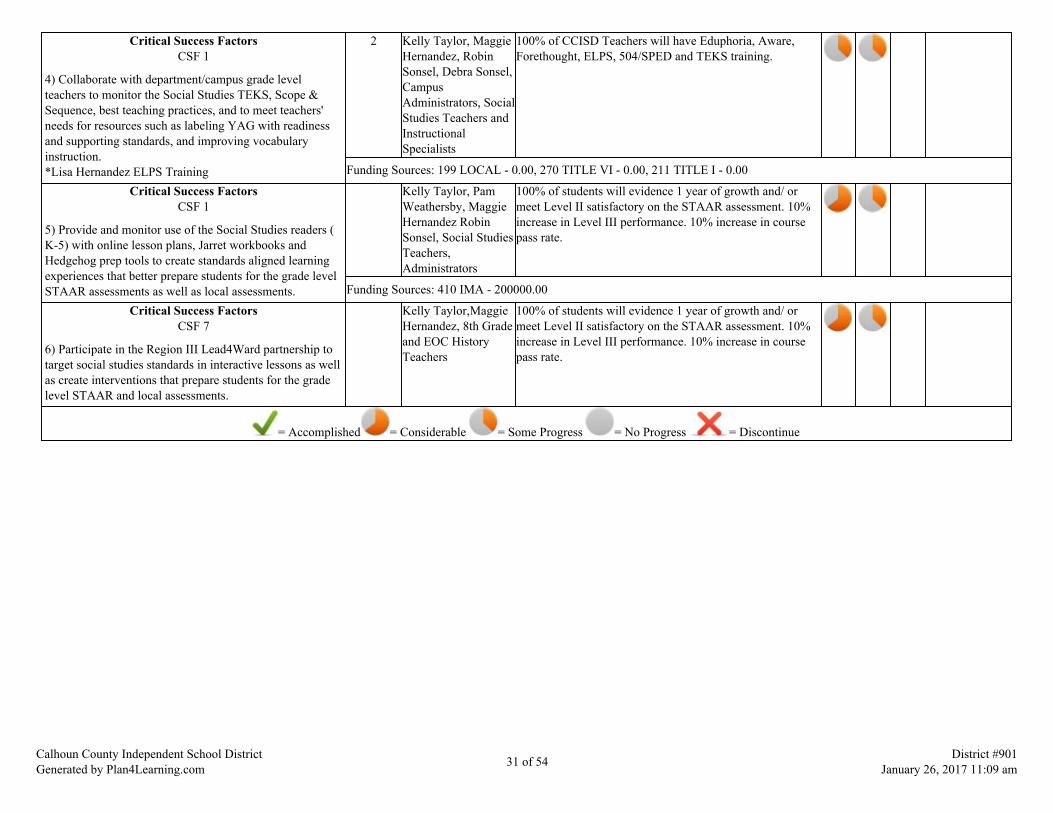
Critical Success FactorsCSF 1
4) Collaborate with department/campus grade levelteachers to monitor the Social Studies TEKS, Scope &Sequence, best teaching practices, and to meet teachers'needs for resources such as labeling YAG with readinessand supporting standards, and improving vocabularyinstruction.*Lisa Hernandez ELPS Training
2 Kelly Taylor, MaggieHernandez, RobinSonsel, Debra Sonsel,CampusAdministrators, SocialStudies Teachers andInstructionalSpecialists
100% of CCISD Teachers will have Eduphoria, Aware,Forethought, ELPS, 504/SPED and TEKS training.
Funding Sources: 199 LOCAL - 0.00, 270 TITLE VI - 0.00, 211 TITLE I - 0.00
Critical Success FactorsCSF 1
5) Provide and monitor use of the Social Studies readers (K-5) with online lesson plans, Jarret workbooks andHedgehog prep tools to create standards aligned learningexperiences that better prepare students for the grade levelSTAAR assessments as well as local assessments.
Kelly Taylor, PamWeathersby, MaggieHernandez RobinSonsel, Social StudiesTeachers,Administrators
100% of students will evidence 1 year of growth and/ ormeet Level II satisfactory on the STAAR assessment. 10%increase in Level III performance. 10% increase in coursepass rate.
Funding Sources: 410 IMA - 200000.00
Critical Success FactorsCSF 7
6) Participate in the Region III Lead4Ward partnership totarget social studies standards in interactive lessons as wellas create interventions that prepare students for the gradelevel STAAR and local assessments.
Kelly Taylor,MaggieHernandez, 8th Gradeand EOC HistoryTeachers
100% of students will evidence 1 year of growth and/ ormeet Level II satisfactory on the STAAR assessment. 10%increase in Level III performance. 10% increase in coursepass rate.
= Accomplished = Considerable = Some Progress = No Progress = Discontinue
Calhoun County Independent School DistrictGenerated by Plan4Learning.com 31 of 54 District #901
January 26, 2017 11:09 am
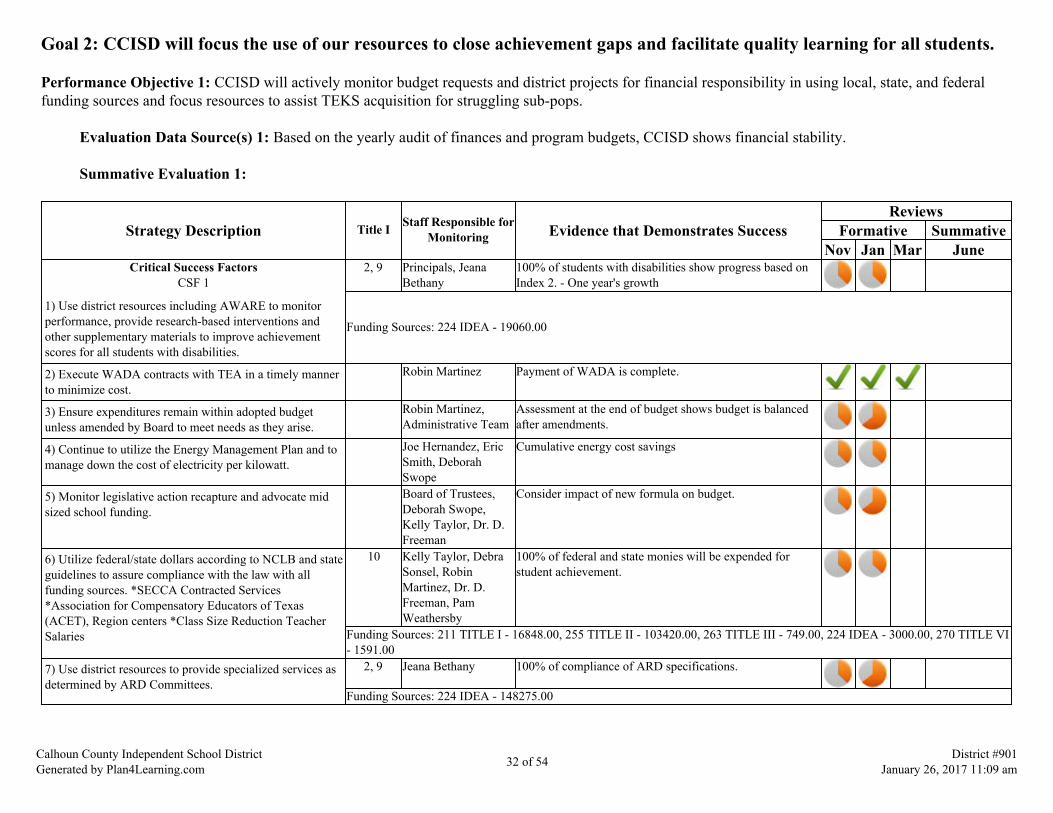
Goal 2: CCISD will focus the use of our resources to close achievement gaps and facilitate quality learning for all students.
Performance Objective 1: CCISD will actively monitor budget requests and district projects for financial responsibility in using local, state, and federalfunding sources and focus resources to assist TEKS acquisition for struggling sub-pops.
Evaluation Data Source(s) 1: Based on the yearly audit of finances and program budgets, CCISD shows financial stability.
Summative Evaluation 1:
Strategy Description Title I Staff Responsible forMonitoring Evidence that Demonstrates Success
ReviewsFormative Summative
Nov Jan Mar JuneCritical Success Factors
CSF 1
1) Use district resources including AWARE to monitorperformance, provide research-based interventions andother supplementary materials to improve achievementscores for all students with disabilities.
2, 9 Principals, JeanaBethany
100% of students with disabilities show progress based onIndex 2. - One year's growth
Funding Sources: 224 IDEA - 19060.00
2) Execute WADA contracts with TEA in a timely mannerto minimize cost.
Robin Martinez Payment of WADA is complete.
3) Ensure expenditures remain within adopted budgetunless amended by Board to meet needs as they arise.
Robin Martinez,Administrative Team
Assessment at the end of budget shows budget is balancedafter amendments.
4) Continue to utilize the Energy Management Plan and tomanage down the cost of electricity per kilowatt.
Joe Hernandez, EricSmith, DeborahSwope
Cumulative energy cost savings
5) Monitor legislative action recapture and advocate midsized school funding.
Board of Trustees,Deborah Swope,Kelly Taylor, Dr. D.Freeman
Consider impact of new formula on budget.
6) Utilize federal/state dollars according to NCLB and stateguidelines to assure compliance with the law with allfunding sources. *SECCA Contracted Services*Association for Compensatory Educators of Texas(ACET), Region centers *Class Size Reduction TeacherSalaries
10 Kelly Taylor, DebraSonsel, RobinMartinez, Dr. D.Freeman, PamWeathersby
100% of federal and state monies will be expended forstudent achievement.
Funding Sources: 211 TITLE I - 16848.00, 255 TITLE II - 103420.00, 263 TITLE III - 749.00, 224 IDEA - 3000.00, 270 TITLE VI- 1591.00
7) Use district resources to provide specialized services asdetermined by ARD Committees.
2, 9 Jeana Bethany 100% of compliance of ARD specifications.
Funding Sources: 224 IDEA - 148275.00
Calhoun County Independent School DistrictGenerated by Plan4Learning.com 32 of 54 District #901
January 26, 2017 11:09 am
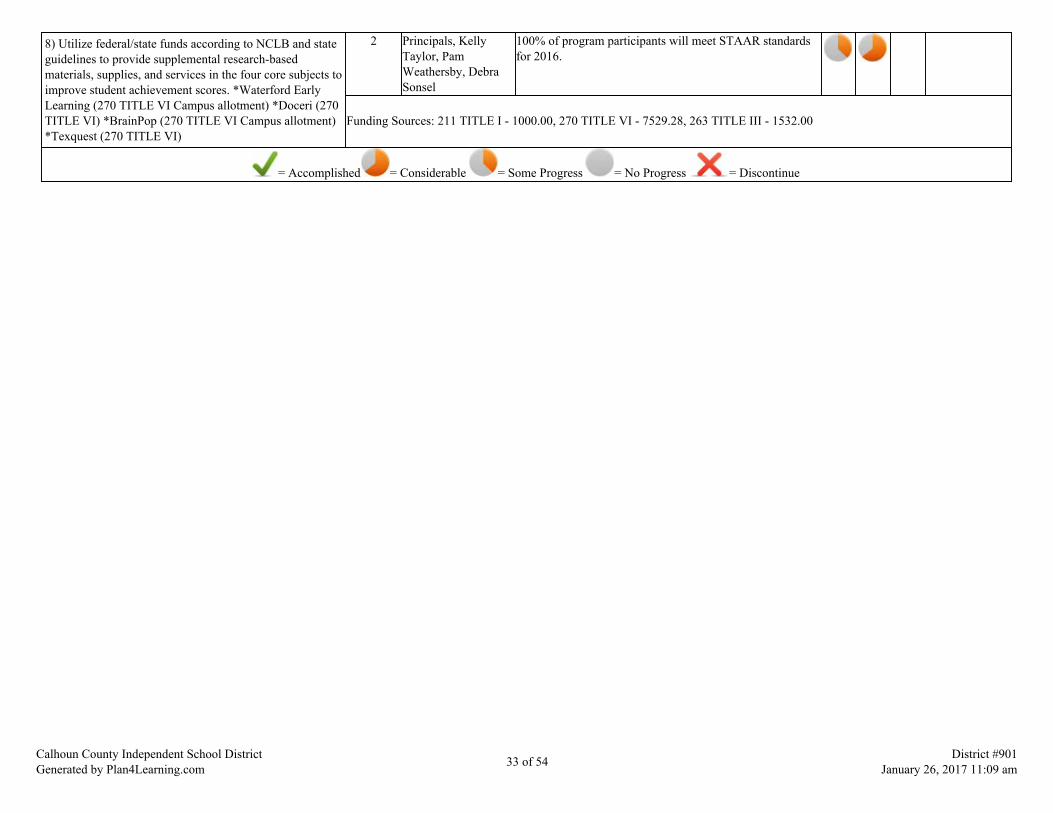
8) Utilize federal/state funds according to NCLB and stateguidelines to provide supplemental research-basedmaterials, supplies, and services in the four core subjects toimprove student achievement scores. *Waterford EarlyLearning (270 TITLE VI Campus allotment) *Doceri (270TITLE VI) *BrainPop (270 TITLE VI Campus allotment)*Texquest (270 TITLE VI)
2 Principals, KellyTaylor, PamWeathersby, DebraSonsel
100% of program participants will meet STAAR standardsfor 2016.
Funding Sources: 211 TITLE I - 1000.00, 270 TITLE VI - 7529.28, 263 TITLE III - 1532.00
= Accomplished = Considerable = Some Progress = No Progress = Discontinue
Calhoun County Independent School DistrictGenerated by Plan4Learning.com 33 of 54 District #901
January 26, 2017 11:09 am

Goal 3: CCISD will ensure a compassionate, effective, innovative, and highly motivated staff to accomplish our mission.
Performance Objective 1: All CCISD teachers and instructional paraprofessionals are certified by SBEC standards and are effective in their performance.
Evaluation Data Source(s) 1: 100% of students testing in all subject areas will make one year of growth and achieve Level II satisfactory orLevel III advanced performance based on effective use of technology in the classrooms and best practice professional development that meetsthe needs of the CCISD students and teachers.
Summative Evaluation 1:
Strategy Description Title I Staff Responsible forMonitoring Evidence that Demonstrates Success
ReviewsFormative Summative
Nov Jan Mar JuneCritical Success Factors
CSF 7
1) Coordinate professional development activities andtraining materials for all staff, including non-coreprofessionals with federal, state, and local programs.*Region Center workshops *Eduphoria, Aware,Forethought *Catapult training (OLG - 211 TITLE Iallotment $575.00) *School Counselor Conference*Special Ed Access *ELPS Training
4 Kelly Taylor, DebraSonsel, PamWeathersby, DistrictCurriculumSpecialists.
100% of staff has access to research based staffdevelopment opportunities.
Funding Sources: 211 TITLE I - 5985.00, 255 TITLE II - 30000.00, 224 IDEA - 1075.00, 263 TITLE III - 5880.00, 270 TITLE VI -1750.00, 199 LOCAL - 2990.00
Critical Success FactorsCSF 7
2) Hire and retain highly qualified staff in all content areas.*Stipends offered in high demand positions
3, 5 Deborah Swope,Campus Principals
100% of CCISD have certification in the subjects theyteach.
Critical Success FactorsCSF 7
3) Increase the effectiveness of teacher instruction andclassroom management on student achievement throughtechnology training and standardization of classroomtechnology.*Google Apps *TCEA *Chromebooks *ChromebookTraining *Instructional Technology Specialist
4 Kelly Taylor, MarcusMartinez, DebraSonsel, Barbara Sides,CurriculumDepartment
100% of CCISD teachers will integrate technology intolessons as evidenced in walkthroughs, student products, andlab schedules.
Funding Sources: 270 TITLE VI - 34000.00, 211 TITLE I - 86707.87, 199 LOCAL - 33800.00
Critical Success FactorsCSF 7
4) Assistance and training given to staff in order to observeTechnology Applications TEKS throughout the curriculumaddressing the varied needs and characteristics of alllearners.
Kelly Taylor, MarcusMartinez, CampusAdministrators,CurriculumDepartment
100% of teachers show proficiency in technology asobserved through T-TESS process.
Calhoun County Independent School DistrictGenerated by Plan4Learning.com 34 of 54 District #901
January 26, 2017 11:09 am

Critical Success FactorsCSF 4
5) Evaluate student use of Technology Applications TEKSthroughout the curriculum K-12 including properkeyboarding techniques grades K-9. *Report 8th gradeTechnology Assessment to TEA
4 Kelly Taylor, MarcusMartinez, DebraSonsel, CurriculumDepartment, CampusAdministrators
Principals will reflect use in documented walkthroughs andappraisals and observe completed student products.Documented on T-TESS
Funding Sources: 410 IMA - 5000.00
Critical Success FactorsCSF 4
6) Support Gradpoint curriculum for credit recovery andfor alternate approach based on individual needs at CHSand Hope High School. *Utilize Gradpoint for the HopeGED Program *30 Core/Elective Licenses
9 Marcus Martinez,Nicole Amason,Dwana Finster
Credit recovery and graduation rate will reflect an increase.
Funding Sources: SCE - 15647.50
7) Purchase technology hardware and software as needed. 2 Marcus Martinez,Campus Principals
100% of CCISD computers to Windows & to meet TEKS incontent areas.
Funding Sources: 410 IMA - 50000.00, 270 TITLE VI - 0.00Critical Success Factors
CSF 5
8) Maintain the district web site to meet postingrequirements, communicate with parents, and providepublic information. *Gradebook *My School Bucks*Social Media * E-mail * Remind
6 Deborah Swope,Marcus Martinez,Sean Tynes, AmyBoone, CampusPrincipals and Staff,District Office Staff
CCISD staff will provide current information throughwebsite.
Funding Sources: 199 LOCAL - 115500.00Critical Success Factors
CSF 7
9) Assist teachers in attaining certification to meet theneeds of identified student subpopulations throughcoursework, staff development, and TExES testing.
3 Deborah Swope,Deborah Sonsel,Kelly Taylor
100% of staff who work with district students are certifiedin the subject or specialization they teach.
Funding Sources: 255 TITLE II - 854.00, 263 TITLE III - 3574.00
Critical Success FactorsCSF 6
10) Continue to teach an abstinence curriculum inappropriate grades and character education to build self-esteem and motivate students to stay in school. *CharacterEducation *Additional programs as scheduled on drugs,alcohol, sexually related topics, internet safety, andbullying provided by The Harbor. *SHAC *Mid-CoastCounseling Services
10 Deborah Swope,Kelly Taylor,Principals, Counselors
100% of campuses will provide character education,abstinence program, and self-esteem activities.
Funding Sources: 199 LOCAL - 100.00
Calhoun County Independent School DistrictGenerated by Plan4Learning.com 35 of 54 District #901
January 26, 2017 11:09 am

Critical Success FactorsCSF 6
11) Offer awareness instruction on drug & violenceprevention for grades K-12. *Red Ribbon Week *DrugAwareness Curriculum *Bullying *Stranger Danger *GangInvolvement *Mid-Coast Counseling Services *CounselorCo-op Participation *The Harbor
CampusAdministrators,Counselors, SchoolResource Officers
Evidence of program participation, renewal, and reportsprovided by campuses.
Funding Sources: 199 LOCAL - 1000.00
Critical Success FactorsCSF 7
12) Conduct parent awareness sessions regarding studentprogress and expected course of action for graduationbeginning in Grade K through Grade 12 *Kudor *CollegeReadiness *Financial Aid *Bilingual Parent Meetings at JR*Watchdogs Program *ELL Parent Workshops
6 CampusAdministrators,Counselors, Teachers
Meeting agendas and sign in sheets, Publish calendar ofmeetings
Critical Success FactorsCSF 3
13) Track each group entering ninth grade to report thestatus of students expected to graduate with a specific classplan.*Personal Graduation Plan *Credit Recovery *Tutorials(9-11) *Credit by Exam Co-op Fee *TxVSN *Meet withLEP parents to explain graduation requirements.
2 Kelly Taylor, NicoleAmason, Counselors,Dwana Finster, Dr. D.Freeman
Personal graduation plans will be developed for all studentsin grades 6-12. Increase completion rate from CHSAcademy to 95% or better.
Funding Sources: 199 LOCAL - 1000.00
Critical Success FactorsCSF 1
14) Increase enrollment and interest in Pre-AP/AP courses,dual credit, and the Texas Scholar Degree Program as wellas taking AP exams for college credit. *TSI *FinancialAssistance *Victoria College *Inventory for CollegeReadiness *TxVSN Agreement
Nicole Amason, KellyTaylor, Counselors,Mike Torres, MarkRouse, DwanaFinster, CurriculumSpecialists
AP roster reflects increased student participation. Collegecredit hours will increase through AP testing & on campuscollege classes through MOU's with college campuses.
= Accomplished = Considerable = Some Progress = No Progress = Discontinue
Calhoun County Independent School DistrictGenerated by Plan4Learning.com 36 of 54 District #901
January 26, 2017 11:09 am

Goal 4: The district and each campus will provide learning environments that are safe and positive behavior support for allstudents, faculty, and staff.
Performance Objective 1: The district will ensure a safe and positive learning environment.
Evaluation Data Source(s) 1: Attendance will reach 97% with a 10% decline in discipline referrals and Out of School Suspensions.
Summative Evaluation 1:
Strategy Description Title I Staff Responsible forMonitoring Evidence that Demonstrates Success
ReviewsFormative Summative
Nov Jan Mar JuneCritical Success Factors
CSF 6
1) Utilize programs that deliver a message to studentsabout bullying, cyber bullying, wellness, and personalprotection through community programs, SHAC, and TheHarbor. *Bullying, Character Education *InstructionalTechnology Specialists
10 Administrators, Dr.Freeman, Counselors,Community Agencies,Barbara Sides
Curriculum on file at district office and report on studentsserved. Bullying policy procedures posted on districtwebsite. Report made to Board on presentations.
Critical Success FactorsCSF 5
2) Communicate with the Emergency Management in thecounty to coordinate safe school concepts. Fire, Police,EMT, Sheriff Departments, Industry Liaisons, Red Cross
Kelly Taylor, CalhounResponders
Evidence that campuses and district are in compliance withrequirements.
3) Maintain facilities in excellent condition for maximumstudent success and safety.
MaintenanceDepartment, Board ofTrustees
District facilities are safe and reflect pride.
Funding Sources: BOND - 65000000.00Critical Success Factors
CSF 6
4) Require new ID's with the new keyless system for alldistrict personnel and secondary students in grades 6-12.
CampusAdministrators
100% of secondary students and district staff will wear IDbadges.
Critical Success FactorsCSF 6
5) Implement safety precautions at campuses for parentsand community members to interact with students.*Volunteer Forms *Fingerprinting *Background Checks*Driver's License Scanner
CampusAdministrators,Deborah Swope
Procedures are in place at all campuses to identify visitorson school property.
Calhoun County Independent School DistrictGenerated by Plan4Learning.com 37 of 54 District #901
January 26, 2017 11:09 am
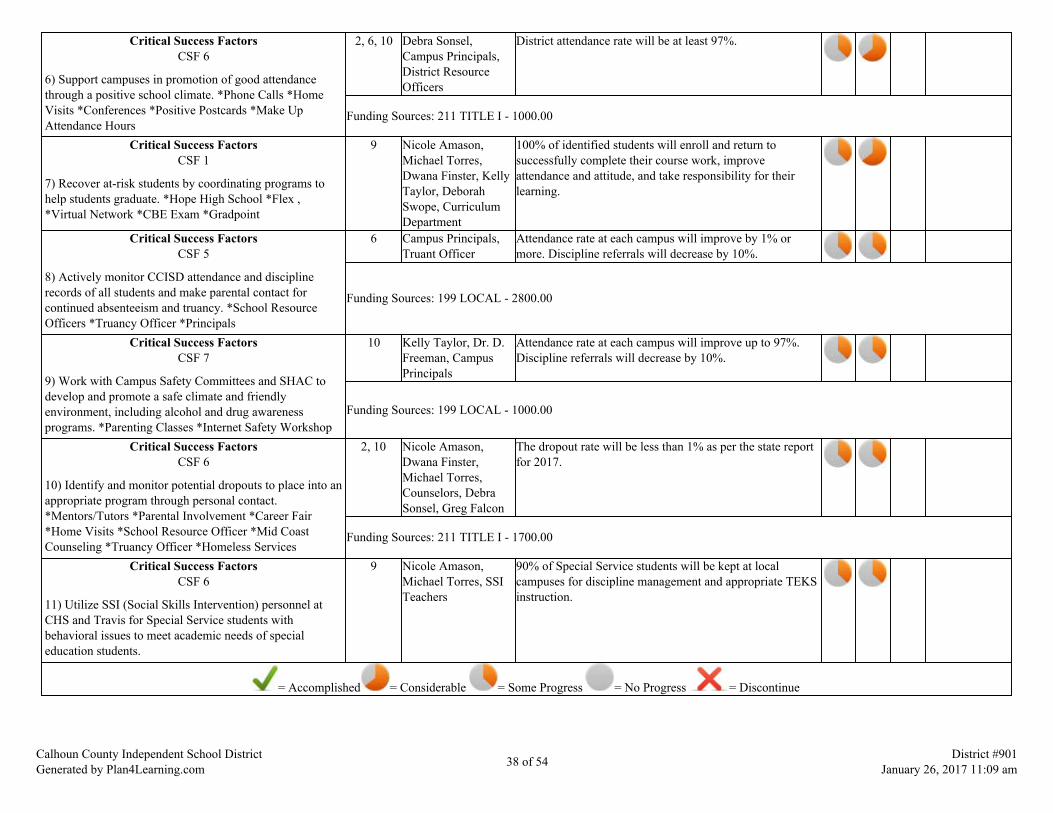
Critical Success FactorsCSF 6
6) Support campuses in promotion of good attendancethrough a positive school climate. *Phone Calls *HomeVisits *Conferences *Positive Postcards *Make UpAttendance Hours
2, 6, 10 Debra Sonsel,Campus Principals,District ResourceOfficers
District attendance rate will be at least 97%.
Funding Sources: 211 TITLE I - 1000.00
Critical Success FactorsCSF 1
7) Recover at-risk students by coordinating programs tohelp students graduate. *Hope High School *Flex ,*Virtual Network *CBE Exam *Gradpoint
9 Nicole Amason,Michael Torres,Dwana Finster, KellyTaylor, DeborahSwope, CurriculumDepartment
100% of identified students will enroll and return tosuccessfully complete their course work, improveattendance and attitude, and take responsibility for theirlearning.
Critical Success FactorsCSF 5
8) Actively monitor CCISD attendance and disciplinerecords of all students and make parental contact forcontinued absenteeism and truancy. *School ResourceOfficers *Truancy Officer *Principals
6 Campus Principals,Truant Officer
Attendance rate at each campus will improve by 1% ormore. Discipline referrals will decrease by 10%.
Funding Sources: 199 LOCAL - 2800.00
Critical Success FactorsCSF 7
9) Work with Campus Safety Committees and SHAC todevelop and promote a safe climate and friendlyenvironment, including alcohol and drug awarenessprograms. *Parenting Classes *Internet Safety Workshop
10 Kelly Taylor, Dr. D.Freeman, CampusPrincipals
Attendance rate at each campus will improve up to 97%.Discipline referrals will decrease by 10%.
Funding Sources: 199 LOCAL - 1000.00
Critical Success FactorsCSF 6
10) Identify and monitor potential dropouts to place into anappropriate program through personal contact.*Mentors/Tutors *Parental Involvement *Career Fair*Home Visits *School Resource Officer *Mid CoastCounseling *Truancy Officer *Homeless Services
2, 10 Nicole Amason,Dwana Finster,Michael Torres,Counselors, DebraSonsel, Greg Falcon
The dropout rate will be less than 1% as per the state reportfor 2017.
Funding Sources: 211 TITLE I - 1700.00
Critical Success FactorsCSF 6
11) Utilize SSI (Social Skills Intervention) personnel atCHS and Travis for Special Service students withbehavioral issues to meet academic needs of specialeducation students.
9 Nicole Amason,Michael Torres, SSITeachers
90% of Special Service students will be kept at localcampuses for discipline management and appropriate TEKSinstruction.
= Accomplished = Considerable = Some Progress = No Progress = Discontinue
Calhoun County Independent School DistrictGenerated by Plan4Learning.com 38 of 54 District #901
January 26, 2017 11:09 am

Goal 5: CCISD will develop and implement a parent and community involvement program that promotes all stakeholders aspartners in the education of our students.
Performance Objective 1: CCISD parent and community involvement will be promoted at all CCISD campuses and departments.
Evaluation Data Source(s) 1: Parent participation has increased by 10% based on campus sign-in sheets from campus activity or eventsinvolving parents.
Summative Evaluation 1:
Strategy Description Title I Staff Responsible forMonitoring Evidence that Demonstrates Success
ReviewsFormative Summative
Nov Jan Mar JuneCritical Success Factors
CSF 5
1) Continue to seek ways to communicate regularly withparents and promote parental involvement in theeducational process. *Open House *Campus/DistrictCommittees *Parent workshops *Newsletters *PTA/PTO*Booster Clubs *Parent Compacts *Campus Calendars*Parent Conferences *Fall/Spring Parent InvolvementActivities *CCISD Website, *Social Media, *PublicAccountability Hearings *Parent Liaisons (Campus 211TITLE I allotment)(OLG $116) *LEP Parents
6 Campus Principals,Counselors, DebraSonsel
10% increase in parental involvement by campus asevidenced by sign-in sheets/logs. Parental Involvementdocumentation is kept on campuses and Federal ProgramsCoordinator's office.
Funding Sources: 211 TITLE I - 43105.00, 224 IDEA - 1000.00
Critical Success FactorsCSF 5
2) Utilize the local newspapers, social media, and districtwebsite to recognize and inform parents, volunteers, staff,and students to seek input on various issues. *Advertiseschool events *Test schedules * Public AccountabilityHearing *GT nominations *District-wide results * SpellingBee
6, 10 Deborah Swope,Debra Sonsel,Campus Principals
Article/photo will be printed for all campuses each nineweeks and kept on file. Website will post currentinformation.
Funding Sources: 199 LOCAL - 2500.00
Critical Success FactorsCSF 5
3) Host parent workshops in dual language whenappropriate and offer dual language handbook and memosat campuses where needed.
6 Sherry Phillips Workshop information will reflect dual language whenneeded.
Calhoun County Independent School DistrictGenerated by Plan4Learning.com 39 of 54 District #901
January 26, 2017 11:09 am
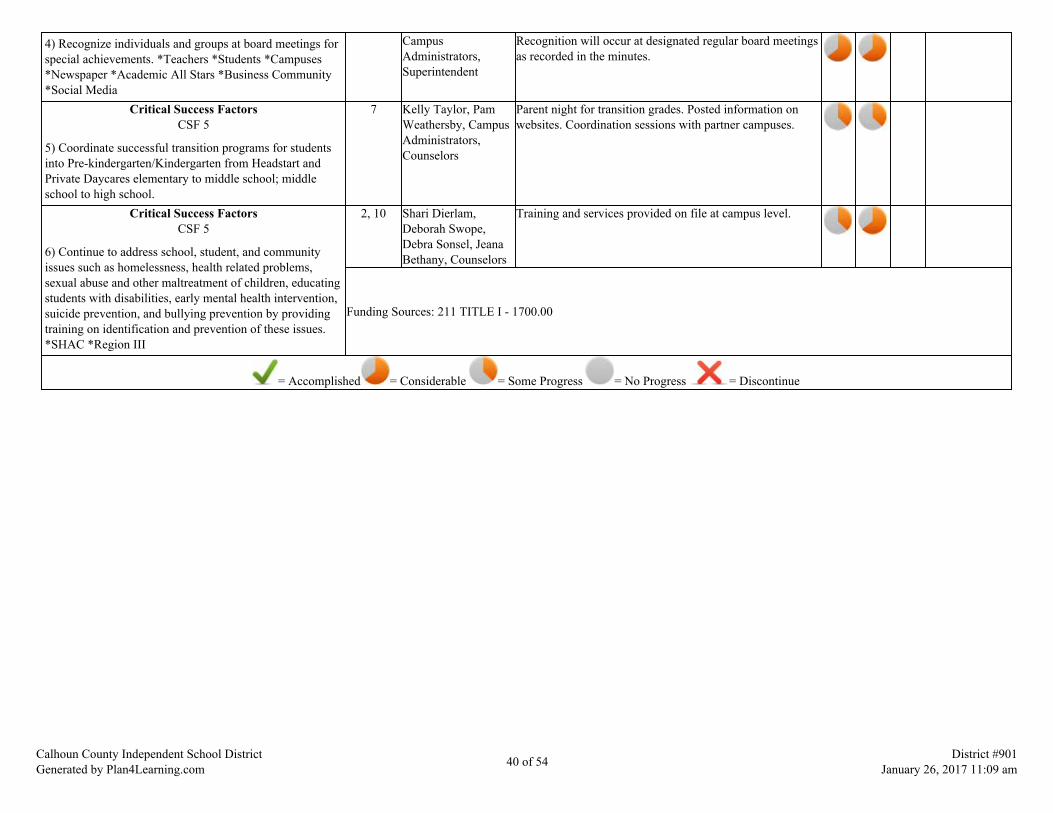
4) Recognize individuals and groups at board meetings forspecial achievements. *Teachers *Students *Campuses*Newspaper *Academic All Stars *Business Community*Social Media
CampusAdministrators,Superintendent
Recognition will occur at designated regular board meetingsas recorded in the minutes.
Critical Success FactorsCSF 5
5) Coordinate successful transition programs for studentsinto Pre-kindergarten/Kindergarten from Headstart andPrivate Daycares elementary to middle school; middleschool to high school.
7 Kelly Taylor, PamWeathersby, CampusAdministrators,Counselors
Parent night for transition grades. Posted information onwebsites. Coordination sessions with partner campuses.
Critical Success FactorsCSF 5
6) Continue to address school, student, and communityissues such as homelessness, health related problems,sexual abuse and other maltreatment of children, educatingstudents with disabilities, early mental health intervention,suicide prevention, and bullying prevention by providingtraining on identification and prevention of these issues.*SHAC *Region III
2, 10 Shari Dierlam,Deborah Swope,Debra Sonsel, JeanaBethany, Counselors
Training and services provided on file at campus level.
Funding Sources: 211 TITLE I - 1700.00
= Accomplished = Considerable = Some Progress = No Progress = Discontinue
Calhoun County Independent School DistrictGenerated by Plan4Learning.com 40 of 54 District #901
January 26, 2017 11:09 am

State Compensatory
Budget for District Improvement Plan:
Account Code Account Title Budget
6100 Payroll Costs199-11-6118-99-699-6-24 6118 Extra Duty Stipend - Locally Defined $17,674.44199-23-6118-99-699-6-24 6118 Extra Duty Stipend - Locally Defined $1,500.00199-11-6128-99-699-6-24 6128 Overtime Pay - Locally Defined $158.90199-11-6141-99-699-6-24 6141 Social Security/Medicare $256.65199-23-6141-99-699-6-24 6141 Social Security/Medicare $20.32199-11-6143-99-699-6-24 6143 Workers' Compensation $203.55199-23-6143-99-699-6-24 6143 Workers' Compensation $17.25199-11-6145-99-699-6-24 6145 Unemployment Compensation $14.16199-23-6145-99-699-6-24 6145 Unemployment Compensation $1.20199-11-6146-99-699-6-24 6146 Teacher Retirement/TRS Care $1,269.14199-23-6146-99-699-6-24 6146 Teacher Retirement/TRS Care $90.00
6100 Subtotal: $21,205.61 6300 Supplies and Services199-11-6399-00-699-6-24 6399 General Supplies $200.00
6300 Subtotal: $200.00 6400 Other Operating Costs199-11-6412-00-699-6-24 6412 Student Travel $800.00
6400 Subtotal: $800.00
Calhoun County Independent School DistrictGenerated by Plan4Learning.com 41 of 54 District #901
January 26, 2017 11:09 am

Personnel for District Improvement Plan:
Name Position Program FTE
Andria Munsch Secretary Federal Programs .10Mary Martinez Truancy Officer Attendance/Truancy 1
Calhoun County Independent School DistrictGenerated by Plan4Learning.com 42 of 54 District #901
January 26, 2017 11:09 am
Title I
1: Comprehensive Needs Assessment
A comprehensive needs assessment of the entire school (including taking into account the needs of migratory children as defined in section 1309(2)) that isbased on information which includes the achievement of children in relation to the State academic content standards and the State student academicachievement standards described in section 1111(b)(1).
Activities:
Planning team of educators, parents, community members, and business representatives meet during Spring semester.Comprehensive Needs Assessment of campuses and district completed based on student data.Comprehensive Needs Assessment of Professional Development opportunitiesComprehensive Needs Assessment of Parental Involvement activities
2: Schoolwide Reform Strategies
Schoolwide reform strategies that provide opportunities for all children to meet the State's proficient and advanced levels of student academic achievement,use effective methods and instructional strategies that are based on scientifically based research, and that include strategies to address the needs of allchildren in the school, but particularly the needs of low-achieving children and those who are at risk of not meeting the State student academic achievementstandards who are members of the target population of any program that is included in the schoolwide program.
Activities:
Review all program documentation to ensure that all instructional programs/instructional strategies are supported by scientifically-based research.Identify and investigate programs and strategies that are support by scientifically-based research.Identify programs within the schools that address meeting the needs of underserved populations.Determine the effectiveness of programs by reviewing disaggregated performance data of student sub-groups.
3: Instruction by highly qualified professional teachers
Instruction by highly qualified teachers.
Activities:
Calhoun County Independent School District strives to maintain a 100% Highly Qualified staff.Calhoun County Independent School DistrictGenerated by Plan4Learning.com 43 of 54 District #901
January 26, 2017 11:09 am
Record highly qualified status of teachers, their teaching position, the course(s) they teach, and their service records.Record highly qualified status of paraprofessionals, their assignments, and their service records.Provide time for professional development.Professional development of school programs prior to the school year with ongoing evaluation of effectiveness.Monitor teacher effectiveness by making walk-throughs.Provide opportunities for teacher collaboration.
4: High-quality and ongoing professional development for teachers, principals, and paraprofessionals and, if appropriate, student servicespersonnel, parents, and other staff
In accordance with section 1119 and subsection (a)(4), highly-quality and ongoing professional development for teachers, principals, and paraprofessionalsand, if appropriate, pupil services personnel, parents, and other staff to enable all children in the school to meet the State's student academic achievementstandards.
Activities:
Select professional development to meet the needs of all principals, teachers, paraprofessionals, parents, and others as appropriate.Utilize book study groups and department led training.Provide opportunities for all employees to obtain training in programs and initiatives already in place.Utilize videoconferencing equipment and/or online training to meet the schedules of teachers.Provide professional development opportunities for all personnel to meet the identified needs of all student populations to increase studentperformance.Allow teachers to attend professional development in content areas specific to the teacher's assignment.Schedule art, music, computer, group counseling, etc. during the same time blocks so teachers have time to collaborate or receive training.
5: Strategies to attract highly qualified teachers
Strategies to attract high-quality teachers to high-need schools.
Activities:
Advertise in the newspaper and on the web.Attend college and ESC job fairs.Provide salary based incentives for high need areas such as math and science.Provide on-going and refresher training for programs that are in place in the District for both teachers and instructional paraprofessionals.Promote quality leadership.Provide opportunities for teacher input in developing local policies and procedures.
Calhoun County Independent School DistrictGenerated by Plan4Learning.com 44 of 54 District #901
January 26, 2017 11:09 am
6: Strategies to increase parental involvement
Strategies to increase parental involvement in accordance with section 1118, such as family literary services.
Activities:
Schools shall send information to parents in a language and format they can understand, including: parent's right to know teacher qualifications,parent's right to know non-highly qualified teacher, annual report cards, reports regarding student achievement, parental involvement policy andschool-parent compact.Schools shall include parents in the development of the parental involvement policy and school-parent compact, seek input from parents to evaluatethe parental involvement program, and have face-to-face parent teacher conferences at least at the elementary grade level.Schools shall assist parents in understanding the state's academic content and achievement standards and requirements of the Title 1 program. Schoolsshall provide materials and training in areas such as literacy or technology.
7: Plans for assisting preschool children in the transition from early childhood programs to elementary school programs
Plans for assisting preschool children transition form early childhood programs, such as Head Start, Even Start, Early Reading First, or a State-run preschoolprogram, to local elementary school programs.
Activities:
Coordinate the professional development activities of preschool and kindergarten teachers in order to align prekindergarten and kindergarten curriculaand goals.Arrange for kindergarten and preschool teachers to visit each other's classrooms.Instruction is guided by a coherent curriculum that includes meaningful content and has a strong and systematic focus on cognitive skills, includinglanguage, early reading, writing skills and math skills children need to develop before they enter kindergarten.Instruction is always intentional with a balance between individual, small-group, and large-group activities.The classroom environment is one where children feel well cared for and safe.Teachers frequently check children's progress.The preschool staff regularly communicates with parents and caregivers.
8: Measures to include teachers in the decisions regarding the use of academic assessments in order to improve the achievement of individualstudents and the overall instructional program
Measures to include teachers in the decisions regarding the use of academic assessments described in section 1111(b)(3) in order to provide information on,and to improve, the achievement of individual students and the overall instructional program.
Activities:
Calhoun County Independent School DistrictGenerated by Plan4Learning.com 45 of 54 District #901
January 26, 2017 11:09 am

Provide opportunities for teachers to work together in developing student assessments.Provide opportunities for teachers to meet for collaboration and evaluation of assessments.Provide opportunities for teachers to use assessment data to determine gaps in curriculum and evaluate teaching strategies.Provide professional development on using data to make instructional decisions, improve curriculum, and design assessments.
9: Activities to ensure effective timely assistance for students who experience difficulty mastering the proficient or advanced levels of academicachievement standards
Activities to ensure that students who experience difficulty mastering the proficient or advanced levels of academic achievement standards required bysection 1111(b)(1) shall be provided with effective, timely additional assistance which shall include measures to ensure that student difficulties are identifiedon a timely basis and to provide sufficient information on which to base effective assistance.
Activities:
Analyze individual student data and/or student work to determine appropriate activities.Provide for extended learning opportunities such as tutorials and summer school.Provide a rich curriculum that includes real world connections and enrichment activities.Incorporate computer assisted learning.Incorporate modifications/accommodations for curriculum activities.Conduct parent/teacher conferences to keep parents informed.Provide school counseling services.Link parents to appropriate resources such as: counseling services, out-reach programs, community agencies, etc.Provide professional development in effective teaching strategies or best practices, and implement strategies for appropriate activities.
10: Coordination and integration of federal, state and local services and programs
Coordination and integration of Federal, State, and local services and programs, including programs supported under this Act, violence prevention programs,housing programs, Head Start, adult education, vocational and technical education, and job training.
Activities:
Document the Federal, State, and local services and programs at each schoolwide campus such as:Title Programs, materials, and equipment; Homeless Programs; GED; Private NonProfit School; Free and reduced lunch.Provide resource and service information for: Professional Development, Parental Involvement, Violence Prevention.Determine where coordination and integration can occur based on program intent and purpose.Document all coordinated programs, services, and funds in the correct location on the District Improvement Plan and School Improvement Plans toshow intent and purpose.
Calhoun County Independent School DistrictGenerated by Plan4Learning.com 46 of 54 District #901
January 26, 2017 11:09 am

Title I Personnel
Name Position Program FTE
ANDRIA MUNSCH FEDERAL PROGRAMS SECRETARY FEDERAL PROGRAMS .60AUDELIA SANCHEZ AIDE JR ELEMENTARY .5CAROL COWLEY COUNSELOR FEDERAL PROGRAMS 1COURTNEY HERREN COUNSELOR TRAVIS MIDDLE SCHOOL 1CYNTHIA LUNA PARENT LIAISON TRAVIS MIDDLE SCHOOL 1DAWN BROWN INSTRUCTIONAL SPECIALIST JR ELEMENTARY 1DEBRA SONSEL FEDERAL PROGRAMS COORDINATOR FEDERAL PROGRAMS .60DENISE HENK INSTRUCTIONAL SPECIALIST HJM ELEMENTARY 1DOLORES MENDEZ AIDE SEADRIFT SCHOOL 1LAURA DE LA GARZA PARENT LIAISON HJM ELEMENTARY 1MARK ROUSE INSTRUCTIONAL SPECIALIST TRAVIS MIDDLE SCHOOL 1MARTHA VALERO PARENT LIAISON JR ELEMENTARY 1MISTY RICHTER AIDE PORT O'CONNOR .5SAMANTHA JUDD COUNSELOR JR ELEMENTARY 1SKYELEIGH FICKLEN AIDE HJM ELE,MENTARY 1TAMMY BOEHL COUNSELOR HJM ELEMENTARY 1
Calhoun County Independent School DistrictGenerated by Plan4Learning.com 47 of 54 District #901
January 26, 2017 11:09 am
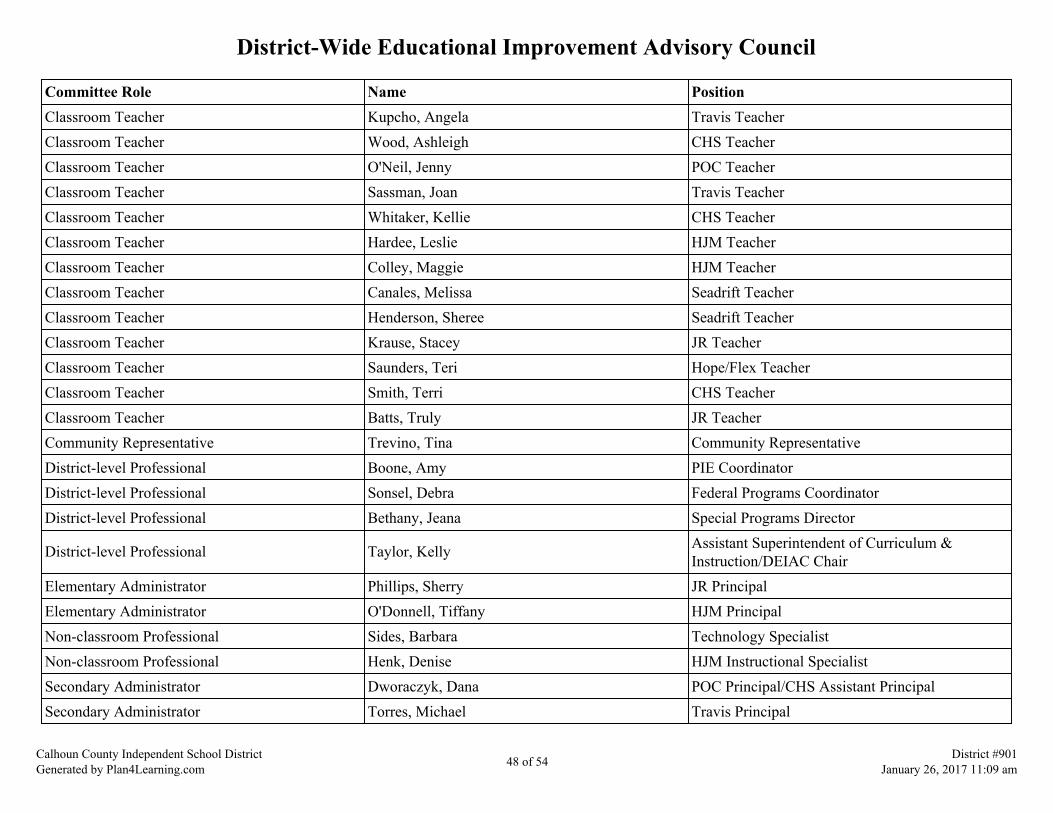
District-Wide Educational Improvement Advisory Council
Committee Role Name PositionClassroom Teacher Kupcho, Angela Travis TeacherClassroom Teacher Wood, Ashleigh CHS TeacherClassroom Teacher O'Neil, Jenny POC TeacherClassroom Teacher Sassman, Joan Travis TeacherClassroom Teacher Whitaker, Kellie CHS TeacherClassroom Teacher Hardee, Leslie HJM TeacherClassroom Teacher Colley, Maggie HJM TeacherClassroom Teacher Canales, Melissa Seadrift TeacherClassroom Teacher Henderson, Sheree Seadrift TeacherClassroom Teacher Krause, Stacey JR TeacherClassroom Teacher Saunders, Teri Hope/Flex TeacherClassroom Teacher Smith, Terri CHS TeacherClassroom Teacher Batts, Truly JR TeacherCommunity Representative Trevino, Tina Community RepresentativeDistrict-level Professional Boone, Amy PIE CoordinatorDistrict-level Professional Sonsel, Debra Federal Programs CoordinatorDistrict-level Professional Bethany, Jeana Special Programs Director
District-level Professional Taylor, Kelly Assistant Superintendent of Curriculum &Instruction/DEIAC Chair
Elementary Administrator Phillips, Sherry JR PrincipalElementary Administrator O'Donnell, Tiffany HJM PrincipalNon-classroom Professional Sides, Barbara Technology SpecialistNon-classroom Professional Henk, Denise HJM Instructional SpecialistSecondary Administrator Dworaczyk, Dana POC Principal/CHS Assistant PrincipalSecondary Administrator Torres, Michael Travis Principal
Calhoun County Independent School DistrictGenerated by Plan4Learning.com 48 of 54 District #901
January 26, 2017 11:09 am

District Funding Summary
199 LOCALGoal Objective Strategy Resources Needed Account Code Amount
1 1 1 Teacher Schedules, Agendas, Scope & Sequence $46,717.001 1 5 $45,000.001 1 8 $1,000.001 2 5 $68,290.001 3 1 $0.001 3 2 $1,000.001 3 3 $1,000.001 3 4 $2,000.001 3 5 $500.001 3 7 Region 3 - Star Lab $150.001 4 4 $0.003 1 1 $2,990.003 1 3 Salaries $33,800.003 1 8 $115,500.003 1 10 $100.003 1 11 $1,000.003 1 13 $1,000.004 1 8 $2,800.004 1 9 $1,000.005 1 2 $2,500.00
Sub-Total $326,347.00255 TITLE IIGoal Objective Strategy Resources Needed Account Code Amount
1 1 2 $567.00
Calhoun County Independent School DistrictGenerated by Plan4Learning.com 49 of 54 District #901
January 26, 2017 11:09 am

1 1 3 $2,500.001 1 8 $5,000.001 1 9 $2,600.001 1 10 $362.001 2 6 $5,790.002 1 6 $4,976.002 1 6 Salaries $98,444.003 1 1 $30,000.003 1 9 $854.00
Sub-Total $151,093.00263 TITLE IIIGoal Objective Strategy Resources Needed Account Code Amount
1 1 2 Istation $0.001 1 3 DynEd, Rosetta Stone, School Specialty $6,850.001 1 6 $4,100.001 1 8 $1,000.001 1 10 $1,525.001 1 11 $2,000.001 4 1 $2,300.002 1 6 $749.002 1 8 $1,532.003 1 1 $5,880.003 1 9 $3,574.00
Sub-Total $29,510.00211 TITLE IGoal Objective Strategy Resources Needed Account Code Amount
1 1 1 Reading Recovery $31,805.601 1 2 $0.00
Calhoun County Independent School DistrictGenerated by Plan4Learning.com 50 of 54 District #901
January 26, 2017 11:09 am

1 1 3 $16,922.681 1 10 $0.001 2 6 $0.001 2 9 $0.001 3 7 $0.001 4 2 $60.001 4 4 $0.002 1 6 211-21-6291-00-872-6-24-000 $16,848.002 1 8 872 $1,000.003 1 1 211-21-6399-00-872-6-24-000 $5,985.003 1 3 Salaries $86,707.874 1 6 $1,000.004 1 10 $1,700.005 1 1 $43,105.005 1 6 $1,700.00
Sub-Total $206,834.15SCEGoal Objective Strategy Resources Needed Account Code Amount
3 1 6 Novanet $15,647.50Sub-Total $15,647.50
224 IDEAGoal Objective Strategy Resources Needed Account Code Amount
1 1 8 $24,000.002 1 1 $19,060.002 1 6 $3,000.002 1 7 $148,275.003 1 1 $1,075.005 1 1 $1,000.00
Calhoun County Independent School DistrictGenerated by Plan4Learning.com 51 of 54 District #901
January 26, 2017 11:09 am
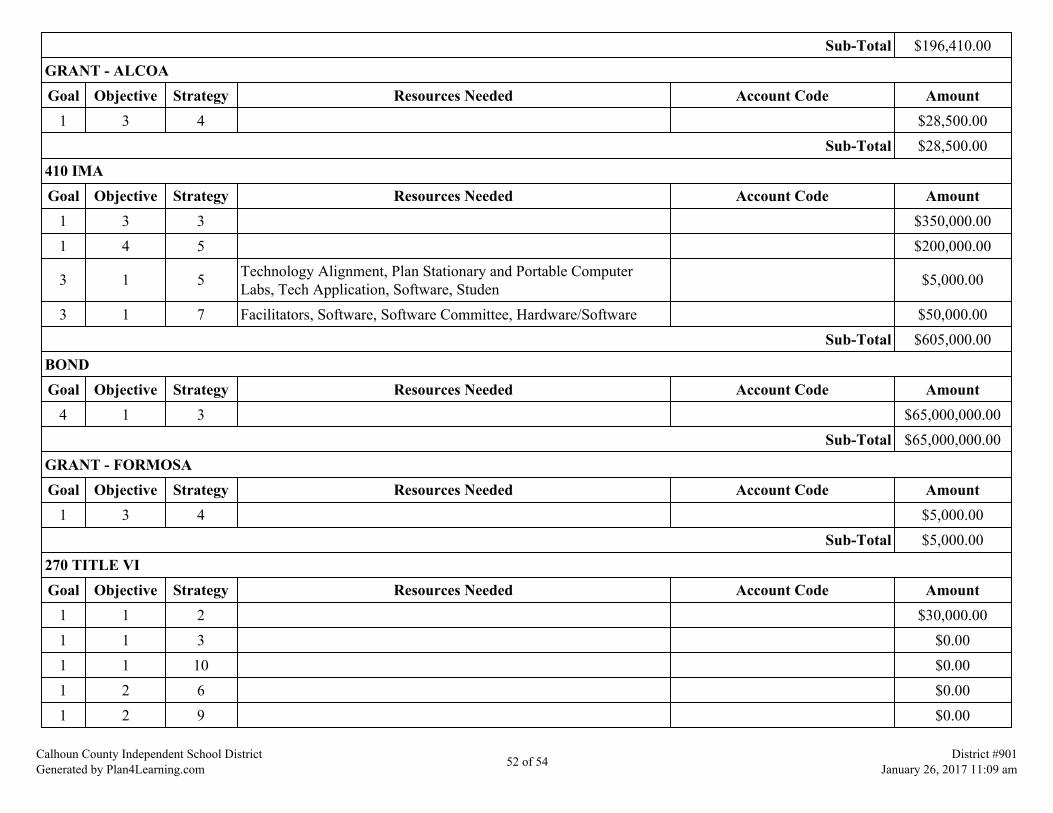
Sub-Total $196,410.00GRANT - ALCOAGoal Objective Strategy Resources Needed Account Code Amount
1 3 4 $28,500.00Sub-Total $28,500.00
410 IMAGoal Objective Strategy Resources Needed Account Code Amount
1 3 3 $350,000.001 4 5 $200,000.00
3 1 5 Technology Alignment, Plan Stationary and Portable ComputerLabs, Tech Application, Software, Studen $5,000.00
3 1 7 Facilitators, Software, Software Committee, Hardware/Software $50,000.00Sub-Total $605,000.00
BONDGoal Objective Strategy Resources Needed Account Code Amount
4 1 3 $65,000,000.00Sub-Total $65,000,000.00
GRANT - FORMOSAGoal Objective Strategy Resources Needed Account Code Amount
1 3 4 $5,000.00Sub-Total $5,000.00
270 TITLE VIGoal Objective Strategy Resources Needed Account Code Amount
1 1 2 $30,000.001 1 3 $0.001 1 10 $0.001 2 6 $0.001 2 9 $0.00
Calhoun County Independent School DistrictGenerated by Plan4Learning.com 52 of 54 District #901
January 26, 2017 11:09 am
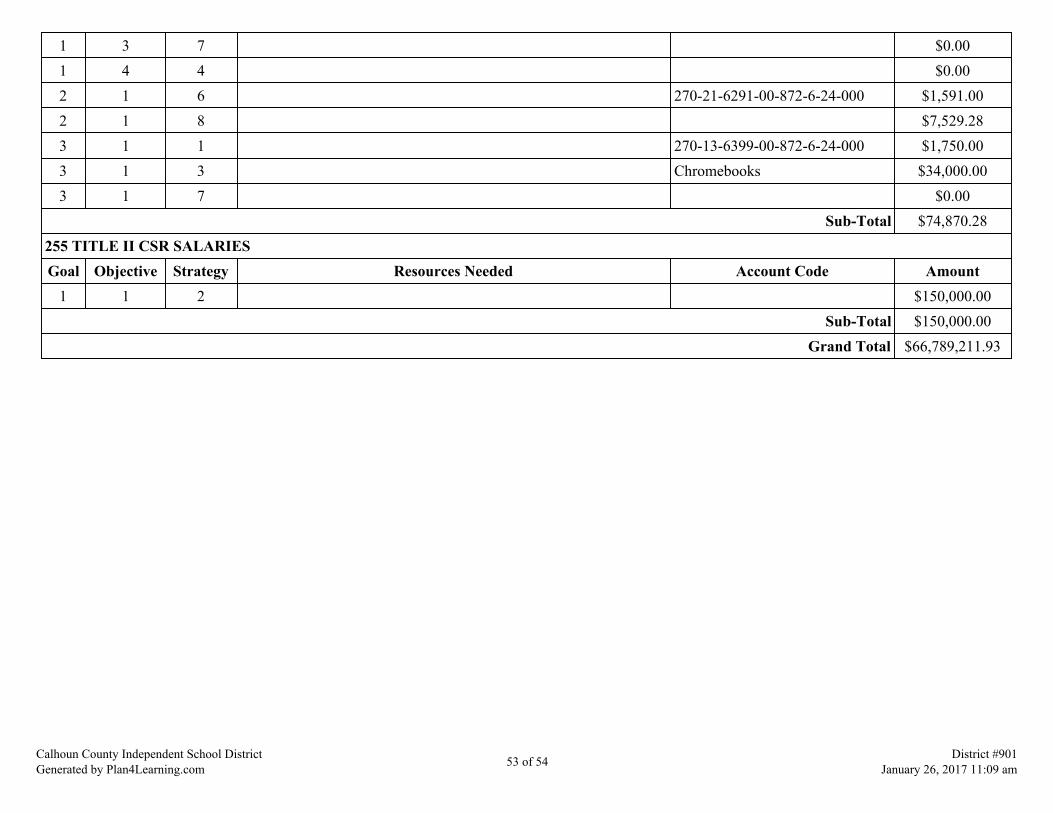
1 3 7 $0.001 4 4 $0.002 1 6 270-21-6291-00-872-6-24-000 $1,591.002 1 8 $7,529.283 1 1 270-13-6399-00-872-6-24-000 $1,750.003 1 3 Chromebooks $34,000.003 1 7 $0.00
Sub-Total $74,870.28255 TITLE II CSR SALARIESGoal Objective Strategy Resources Needed Account Code Amount
1 1 2 $150,000.00Sub-Total $150,000.00
Grand Total $66,789,211.93
Calhoun County Independent School DistrictGenerated by Plan4Learning.com 53 of 54 District #901
January 26, 2017 11:09 am

Addendums
Calhoun County Independent School DistrictGenerated by Plan4Learning.com 54 of 54 District #901
January 26, 2017 11:09 am
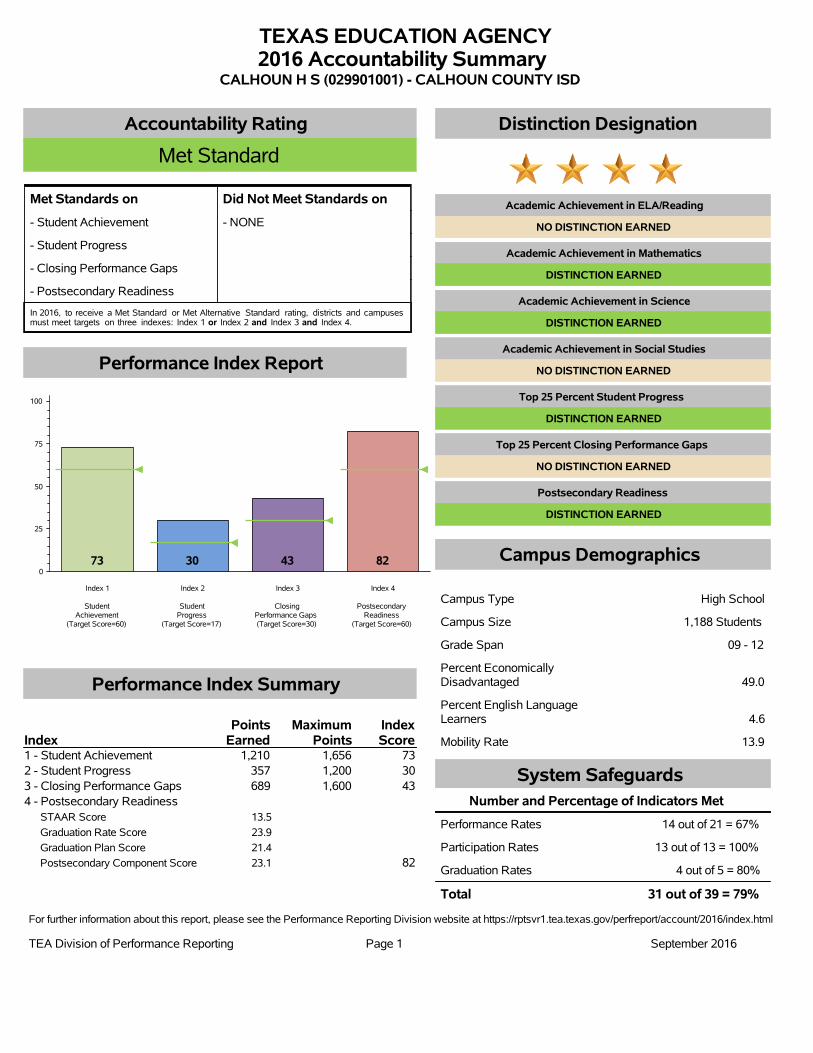
TEXAS EDUCATION AGENCY2016 Accountability Summary
CALHOUN H S (029901001) - CALHOUN COUNTY ISD
Accountability Rating
Met Standard
Met Standards on Did Not Meet Standards on
- Student Achievement - NONE
- Student Progress
- Closing Performance Gaps
- Postsecondary Readiness
In 2016, to receive a Met Standard or Met Alternative Standard rating, districts and campusesmust meet targets on three indexes: Index 1 or Index 2 and Index 3 and Index 4.
Performance Index Report
0
25
50
75
100
Index 1
StudentAchievement
(Target Score=60)
Index 2
StudentProgress
(Target Score=17)
Index 3
ClosingPerformance Gaps(Target Score=30)
Index 4
PostsecondaryReadiness
(Target Score=60)
73 30 43 82
Performance Index Summary
IndexPoints
EarnedMaximum
PointsIndexScore
1 - Student Achievement 1,210 1,656 73
2 - Student Progress 357 1,200 30
3 - Closing Performance Gaps 689 1,600 43
4 - Postsecondary Readiness
STAAR Score 13.5
Graduation Rate Score 23.9
Graduation Plan Score 21.4
Postsecondary Component Score 23.1 82
Distinction Designation
Academic Achievement in ELA/Reading
NO DISTINCTION EARNED
Academic Achievement in Mathematics
DISTINCTION EARNED
Academic Achievement in Science
DISTINCTION EARNED
Academic Achievement in Social Studies
NO DISTINCTION EARNED
Top 25 Percent Student Progress
DISTINCTION EARNED
Top 25 Percent Closing Performance Gaps
NO DISTINCTION EARNED
Postsecondary Readiness
DISTINCTION EARNED
Campus Demographics
Campus Type High School
Campus Size 1,188 Students
Grade Span 09 - 12
Percent EconomicallyDisadvantaged 49.0
Percent English LanguageLearners 4.6
Mobility Rate 13.9
System Safeguards
Number and Percentage of Indicators Met
Performance Rates 14 out of 21 = 67%
Participation Rates 13 out of 13 = 100%
Graduation Rates 4 out of 5 = 80%
Total 31 out of 39 = 79%
For further information about this report, please see the Performance Reporting Division website at https://rptsvr1.tea.texas.gov/perfreport/account/2016/index.html
TEA Division of Performance Reporting Page 1 September 2016
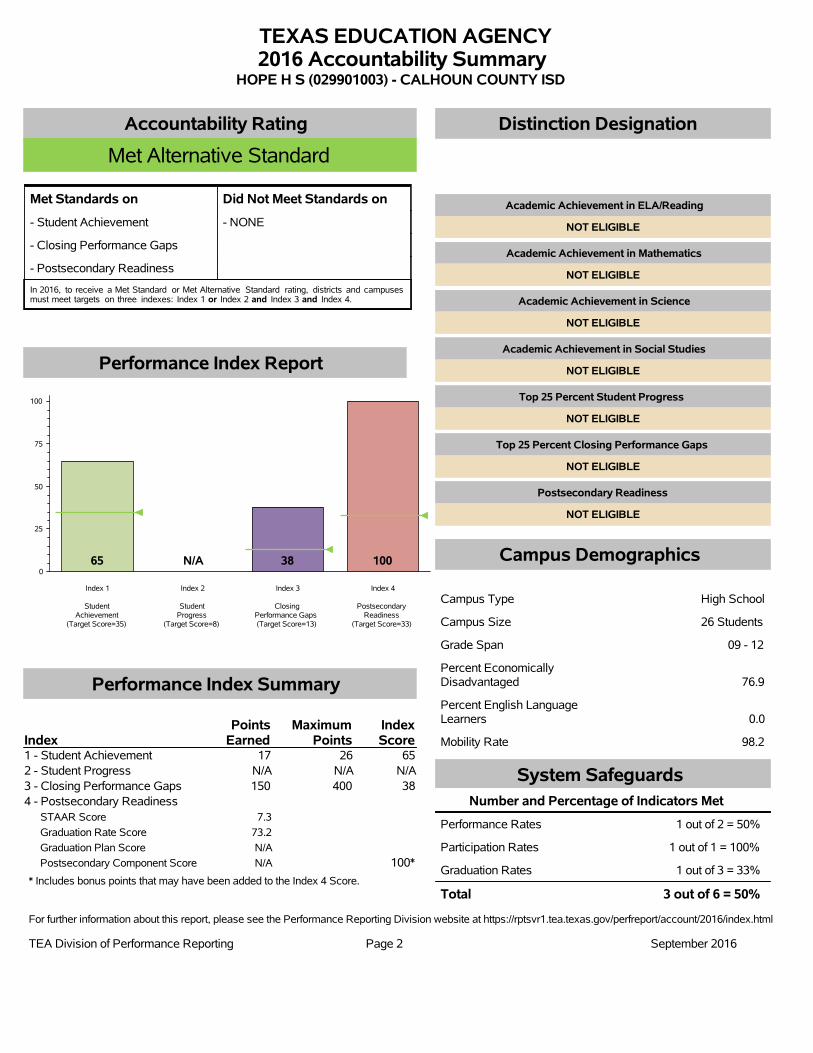
TEXAS EDUCATION AGENCY2016 Accountability Summary
HOPE H S (029901003) - CALHOUN COUNTY ISD
Accountability Rating
Met Alternative Standard
Met Standards on Did Not Meet Standards on
- Student Achievement - NONE
- Closing Performance Gaps
- Postsecondary Readiness
In 2016, to receive a Met Standard or Met Alternative Standard rating, districts and campusesmust meet targets on three indexes: Index 1 or Index 2 and Index 3 and Index 4.
Performance Index Report
0
25
50
75
100
Index 1
StudentAchievement
(Target Score=35)
Index 2
StudentProgress
(Target Score=8)
Index 3
ClosingPerformance Gaps(Target Score=13)
Index 4
PostsecondaryReadiness
(Target Score=33)
65 N/A 38 100
Performance Index Summary
IndexPoints
EarnedMaximum
PointsIndexScore
1 - Student Achievement 17 26 65
2 - Student Progress N/A N/A N/A
3 - Closing Performance Gaps 150 400 38
4 - Postsecondary Readiness
STAAR Score 7.3
Graduation Rate Score 73.2
Graduation Plan Score N/A
Postsecondary Component Score N/A 100*
* Includes bonus points that may have been added to the Index 4 Score.
Distinction Designation
Academic Achievement in ELA/Reading
NOT ELIGIBLE
Academic Achievement in Mathematics
NOT ELIGIBLE
Academic Achievement in Science
NOT ELIGIBLE
Academic Achievement in Social Studies
NOT ELIGIBLE
Top 25 Percent Student Progress
NOT ELIGIBLE
Top 25 Percent Closing Performance Gaps
NOT ELIGIBLE
Postsecondary Readiness
NOT ELIGIBLE
Campus Demographics
Campus Type High School
Campus Size 26 Students
Grade Span 09 - 12
Percent EconomicallyDisadvantaged 76.9
Percent English LanguageLearners 0.0
Mobility Rate 98.2
System Safeguards
Number and Percentage of Indicators Met
Performance Rates 1 out of 2 = 50%
Participation Rates 1 out of 1 = 100%
Graduation Rates 1 out of 3 = 33%
Total 3 out of 6 = 50%
For further information about this report, please see the Performance Reporting Division website at https://rptsvr1.tea.texas.gov/perfreport/account/2016/index.html
TEA Division of Performance Reporting Page 2 September 2016

TEXAS EDUCATION AGENCY2016 Accountability Summary
TRAVIS MIDDLE (029901043) - CALHOUN COUNTY ISD
Accountability Rating
Met Standard
Met Standards on Did Not Meet Standards on
- Student Achievement - NONE
- Student Progress
- Closing Performance Gaps
- Postsecondary Readiness
In 2016, to receive a Met Standard or Met Alternative Standard rating, districts and campusesmust meet targets on three indexes: Index 1 or Index 2 and Index 3 and Index 4.
Performance Index Report
0
25
50
75
100
Index 1
StudentAchievement
(Target Score=60)
Index 2
StudentProgress
(Target Score=30)
Index 3
ClosingPerformance Gaps(Target Score=26)
Index 4
PostsecondaryReadiness
(Target Score=13)
64 36 33 40
Performance Index Summary
IndexPoints
EarnedMaximum
PointsIndexScore
1 - Student Achievement 1,510 2,351 64
2 - Student Progress 507 1,400 36
3 - Closing Performance Gaps 985 3,000 33
4 - Postsecondary Readiness
STAAR Score 40.0
Graduation Rate Score N/A
Graduation Plan Score N/A
Postsecondary Component Score N/A 40
Distinction Designation
Academic Achievement in ELA/Reading
NO DISTINCTION EARNED
Academic Achievement in Mathematics
NO DISTINCTION EARNED
Academic Achievement in Science
NO DISTINCTION EARNED
Academic Achievement in Social Studies
NO DISTINCTION EARNED
Top 25 Percent Student Progress
NO DISTINCTION EARNED
Top 25 Percent Closing Performance Gaps
NO DISTINCTION EARNED
Postsecondary Readiness
NO DISTINCTION EARNED
Campus Demographics
Campus Type Middle School
Campus Size 843 Students
Grade Span 06 - 08
Percent EconomicallyDisadvantaged 61.0
Percent English LanguageLearners 9.8
Mobility Rate 12.0
System Safeguards
Number and Percentage of Indicators Met
Performance Rates 13 out of 26 = 50%
Participation Rates 14 out of 14 = 100%
Graduation Rates N/A
Total 27 out of 40 = 68%
For further information about this report, please see the Performance Reporting Division website at https://rptsvr1.tea.texas.gov/perfreport/account/2016/index.html
TEA Division of Performance Reporting Page 3 September 2016

TEXAS EDUCATION AGENCY2016 Accountability Summary
HARRISON/JEFFERSON/MADISON COMPLEX (029901101) - CALHOUN COUNTY ISD
Accountability Rating
Met Standard
Met Standards on Did Not Meet Standards on
- Student Achievement - NONE
- Student Progress
- Closing Performance Gaps
- Postsecondary Readiness
In 2016, to receive a Met Standard or Met Alternative Standard rating, districts and campusesmust meet targets on three indexes: Index 1 or Index 2 and Index 3 and Index 4.
Performance Index Report
0
25
50
75
100
Index 1
StudentAchievement
(Target Score=60)
Index 2
StudentProgress
(Target Score=32)
Index 3
ClosingPerformance Gaps(Target Score=28)
Index 4
PostsecondaryReadiness
(Target Score=12)
85 46 50 55
Performance Index Summary
IndexPoints
EarnedMaximum
PointsIndexScore
1 - Student Achievement 745 875 85
2 - Student Progress 556 1,200 46
3 - Closing Performance Gaps 1,009 2,000 50
4 - Postsecondary Readiness
STAAR Score 55.0
Graduation Rate Score N/A
Graduation Plan Score N/A
Postsecondary Component Score N/A 55
Distinction Designation
Academic Achievement in ELA/Reading
NO DISTINCTION EARNED
Academic Achievement in Mathematics
DISTINCTION EARNED
Academic Achievement in Science
DISTINCTION EARNED
Academic Achievement in Social Studies
NOT ELIGIBLE
Top 25 Percent Student Progress
NO DISTINCTION EARNED
Top 25 Percent Closing Performance Gaps
DISTINCTION EARNED
Postsecondary Readiness
DISTINCTION EARNED
Campus Demographics
Campus Type Elementary
Campus Size 767 Students
Grade Span EE - 05
Percent EconomicallyDisadvantaged 71.6
Percent English LanguageLearners 17.2
Mobility Rate 12.8
System Safeguards
Number and Percentage of Indicators Met
Performance Rates 18 out of 20 = 90%
Participation Rates 14 out of 14 = 100%
Graduation Rates N/A
Total 32 out of 34 = 94%
For further information about this report, please see the Performance Reporting Division website at https://rptsvr1.tea.texas.gov/perfreport/account/2016/index.html
TEA Division of Performance Reporting Page 4 September 2016
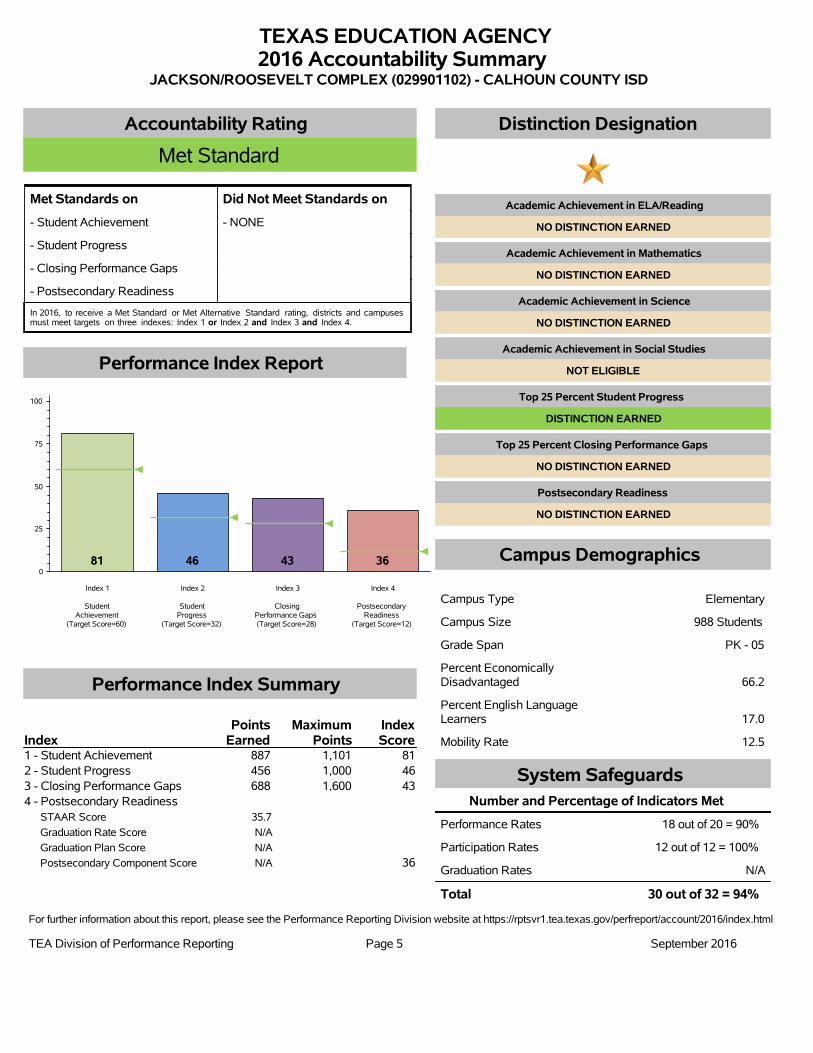
TEXAS EDUCATION AGENCY2016 Accountability Summary
JACKSON/ROOSEVELT COMPLEX (029901102) - CALHOUN COUNTY ISD
Accountability Rating
Met Standard
Met Standards on Did Not Meet Standards on
- Student Achievement - NONE
- Student Progress
- Closing Performance Gaps
- Postsecondary Readiness
In 2016, to receive a Met Standard or Met Alternative Standard rating, districts and campusesmust meet targets on three indexes: Index 1 or Index 2 and Index 3 and Index 4.
Performance Index Report
0
25
50
75
100
Index 1
StudentAchievement
(Target Score=60)
Index 2
StudentProgress
(Target Score=32)
Index 3
ClosingPerformance Gaps(Target Score=28)
Index 4
PostsecondaryReadiness
(Target Score=12)
81 46 43 36
Performance Index Summary
IndexPoints
EarnedMaximum
PointsIndexScore
1 - Student Achievement 887 1,101 81
2 - Student Progress 456 1,000 46
3 - Closing Performance Gaps 688 1,600 43
4 - Postsecondary Readiness
STAAR Score 35.7
Graduation Rate Score N/A
Graduation Plan Score N/A
Postsecondary Component Score N/A 36
Distinction Designation
Academic Achievement in ELA/Reading
NO DISTINCTION EARNED
Academic Achievement in Mathematics
NO DISTINCTION EARNED
Academic Achievement in Science
NO DISTINCTION EARNED
Academic Achievement in Social Studies
NOT ELIGIBLE
Top 25 Percent Student Progress
DISTINCTION EARNED
Top 25 Percent Closing Performance Gaps
NO DISTINCTION EARNED
Postsecondary Readiness
NO DISTINCTION EARNED
Campus Demographics
Campus Type Elementary
Campus Size 988 Students
Grade Span PK - 05
Percent EconomicallyDisadvantaged 66.2
Percent English LanguageLearners 17.0
Mobility Rate 12.5
System Safeguards
Number and Percentage of Indicators Met
Performance Rates 18 out of 20 = 90%
Participation Rates 12 out of 12 = 100%
Graduation Rates N/A
Total 30 out of 32 = 94%
For further information about this report, please see the Performance Reporting Division website at https://rptsvr1.tea.texas.gov/perfreport/account/2016/index.html
TEA Division of Performance Reporting Page 5 September 2016
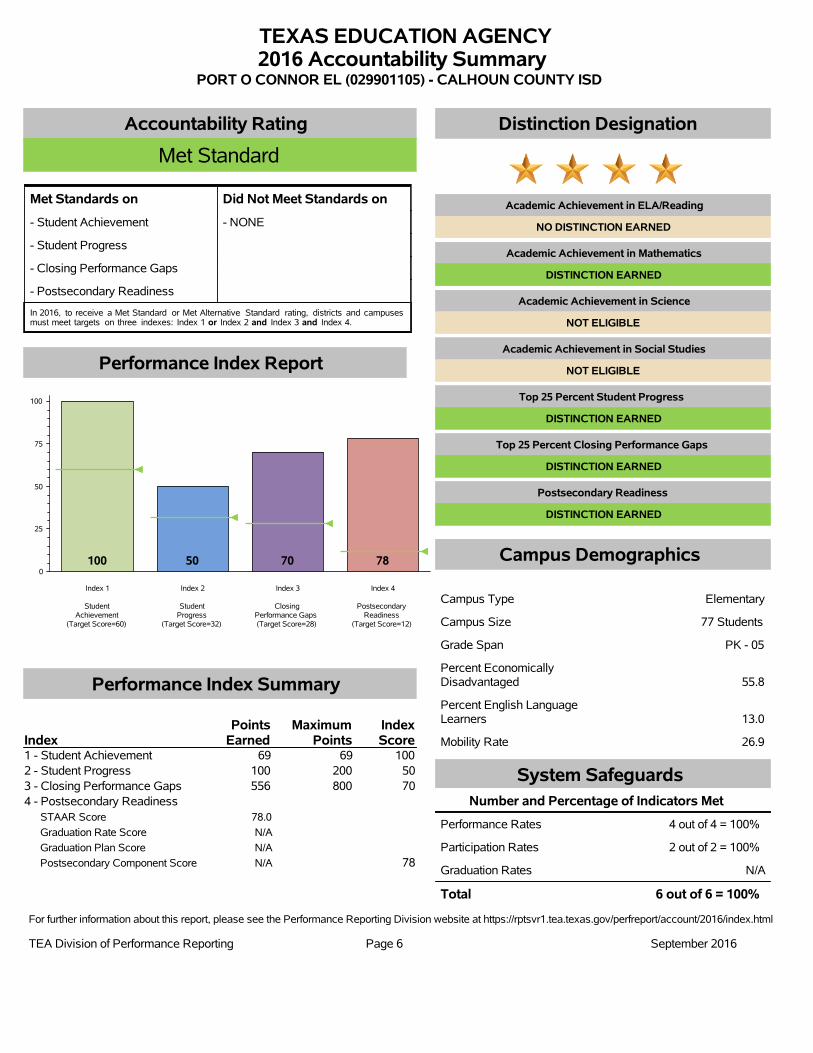
TEXAS EDUCATION AGENCY2016 Accountability Summary
PORT O CONNOR EL (029901105) - CALHOUN COUNTY ISD
Accountability Rating
Met Standard
Met Standards on Did Not Meet Standards on
- Student Achievement - NONE
- Student Progress
- Closing Performance Gaps
- Postsecondary Readiness
In 2016, to receive a Met Standard or Met Alternative Standard rating, districts and campusesmust meet targets on three indexes: Index 1 or Index 2 and Index 3 and Index 4.
Performance Index Report
0
25
50
75
100
Index 1
StudentAchievement
(Target Score=60)
Index 2
StudentProgress
(Target Score=32)
Index 3
ClosingPerformance Gaps(Target Score=28)
Index 4
PostsecondaryReadiness
(Target Score=12)
100 50 70 78
Performance Index Summary
IndexPoints
EarnedMaximum
PointsIndexScore
1 - Student Achievement 69 69 100
2 - Student Progress 100 200 50
3 - Closing Performance Gaps 556 800 70
4 - Postsecondary Readiness
STAAR Score 78.0
Graduation Rate Score N/A
Graduation Plan Score N/A
Postsecondary Component Score N/A 78
Distinction Designation
Academic Achievement in ELA/Reading
NO DISTINCTION EARNED
Academic Achievement in Mathematics
DISTINCTION EARNED
Academic Achievement in Science
NOT ELIGIBLE
Academic Achievement in Social Studies
NOT ELIGIBLE
Top 25 Percent Student Progress
DISTINCTION EARNED
Top 25 Percent Closing Performance Gaps
DISTINCTION EARNED
Postsecondary Readiness
DISTINCTION EARNED
Campus Demographics
Campus Type Elementary
Campus Size 77 Students
Grade Span PK - 05
Percent EconomicallyDisadvantaged 55.8
Percent English LanguageLearners 13.0
Mobility Rate 26.9
System Safeguards
Number and Percentage of Indicators Met
Performance Rates 4 out of 4 = 100%
Participation Rates 2 out of 2 = 100%
Graduation Rates N/A
Total 6 out of 6 = 100%
For further information about this report, please see the Performance Reporting Division website at https://rptsvr1.tea.texas.gov/perfreport/account/2016/index.html
TEA Division of Performance Reporting Page 6 September 2016

TEXAS EDUCATION AGENCY2016 Accountability Summary
SEADRIFT SCHOOL (029901107) - CALHOUN COUNTY ISD
Accountability Rating
Met Standard
Met Standards on Did Not Meet Standards on
- Student Achievement - NONE
- Student Progress
- Closing Performance Gaps
- Postsecondary Readiness
In 2016, to receive a Met Standard or Met Alternative Standard rating, districts and campusesmust meet targets on three indexes: Index 1 or Index 2 and Index 3 and Index 4.
Performance Index Report
0
25
50
75
100
Index 1
StudentAchievement
(Target Score=60)
Index 2
StudentProgress
(Target Score=32)
Index 3
ClosingPerformance Gaps(Target Score=28)
Index 4
PostsecondaryReadiness
(Target Score=12)
83 43 41 34
Performance Index Summary
IndexPoints
EarnedMaximum
PointsIndexScore
1 - Student Achievement 406 489 83
2 - Student Progress 342 800 43
3 - Closing Performance Gaps 661 1,600 41
4 - Postsecondary Readiness
STAAR Score 33.7
Graduation Rate Score N/A
Graduation Plan Score N/A
Postsecondary Component Score N/A 34
Distinction Designation
Academic Achievement in ELA/Reading
NO DISTINCTION EARNED
Academic Achievement in Mathematics
NO DISTINCTION EARNED
Academic Achievement in Science
NO DISTINCTION EARNED
Academic Achievement in Social Studies
NO DISTINCTION EARNED
Top 25 Percent Student Progress
NO DISTINCTION EARNED
Top 25 Percent Closing Performance Gaps
NO DISTINCTION EARNED
Postsecondary Readiness
NO DISTINCTION EARNED
Campus Demographics
Campus Type Elementary
Campus Size 283 Students
Grade Span PK - 08
Percent EconomicallyDisadvantaged 54.1
Percent English LanguageLearners 11.3
Mobility Rate 16.5
System Safeguards
Number and Percentage of Indicators Met
Performance Rates 16 out of 16 = 100%
Participation Rates 8 out of 8 = 100%
Graduation Rates N/A
Total 24 out of 24 = 100%
For further information about this report, please see the Performance Reporting Division website at https://rptsvr1.tea.texas.gov/perfreport/account/2016/index.html
TEA Division of Performance Reporting Page 7 September 2016
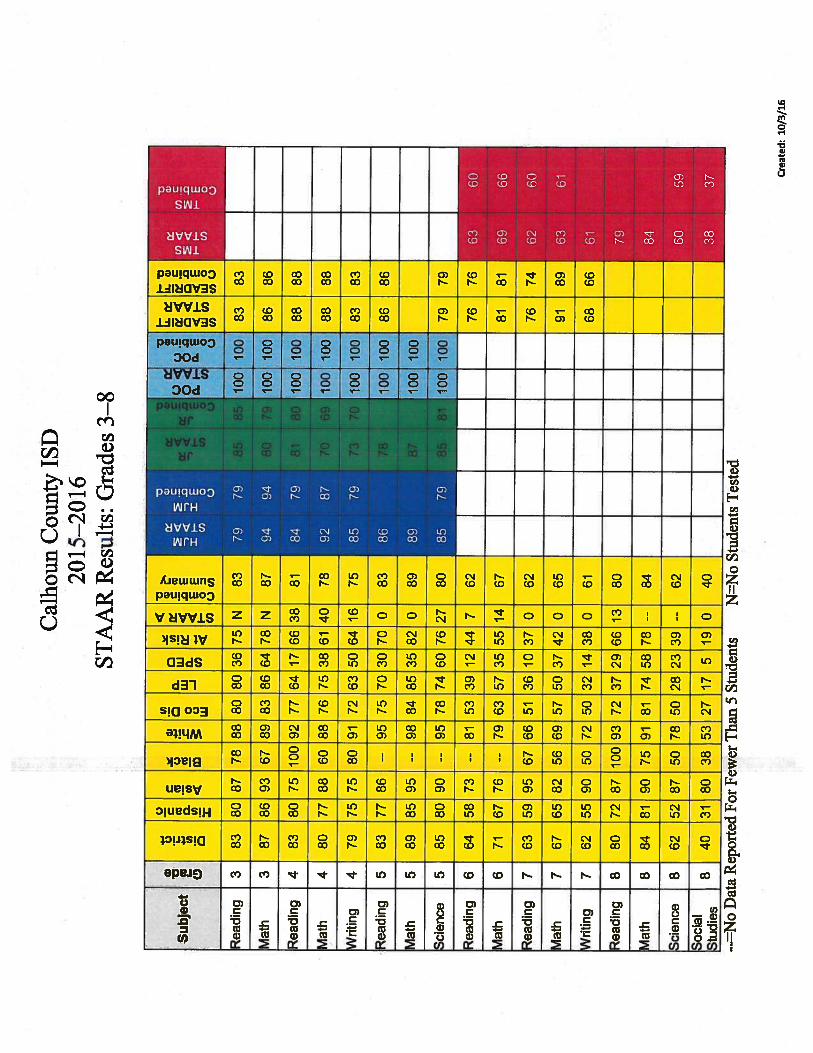

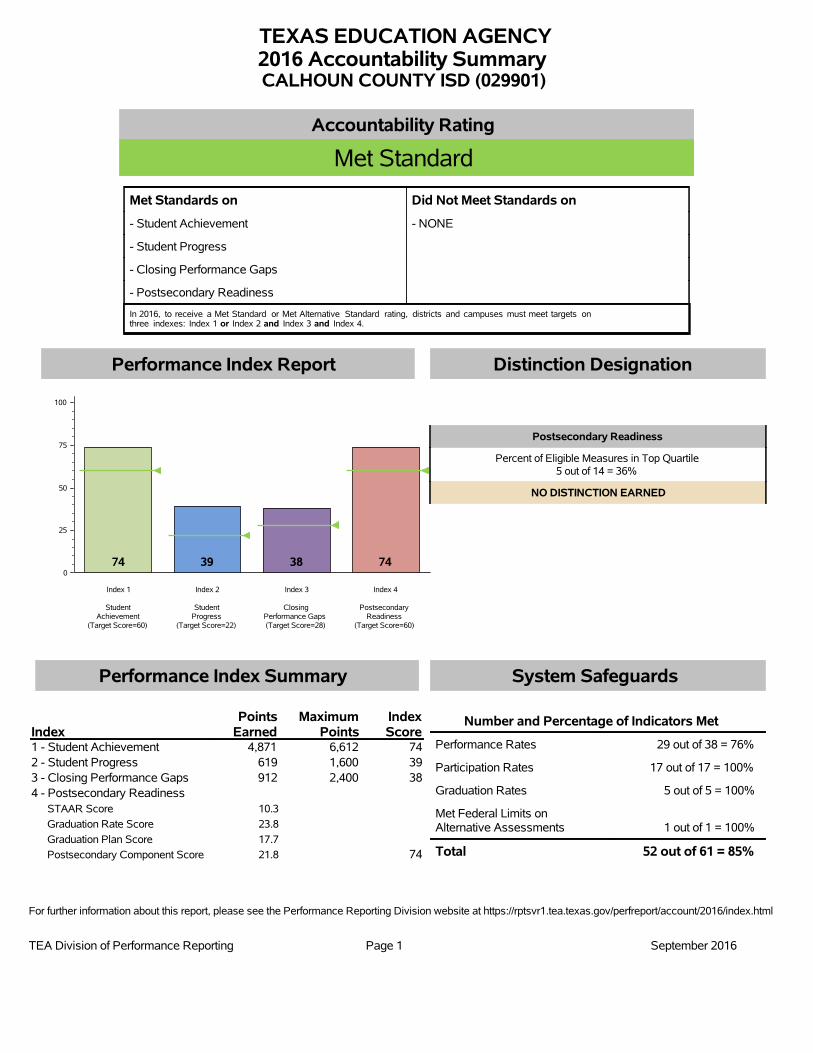
TEXAS EDUCATION AGENCY2016 Accountability SummaryCALHOUN COUNTY ISD (029901)
Accountability Rating
Met Standard
Met Standards on Did Not Meet Standards on
- Student Achievement - NONE
- Student Progress
- Closing Performance Gaps
- Postsecondary Readiness
In 2016, to receive a Met Standard or Met Alternative Standard rating, districts and campuses must meet targets onthree indexes: Index 1 or Index 2 and Index 3 and Index 4.
Performance Index Report
0
25
50
75
100
Index 1
StudentAchievement
(Target Score=60)
Index 2
StudentProgress
(Target Score=22)
Index 3
ClosingPerformance Gaps(Target Score=28)
Index 4
PostsecondaryReadiness
(Target Score=60)
74 39 38 74
Performance Index Summary
IndexPoints
EarnedMaximum
PointsIndexScore
1 - Student Achievement 4,871 6,612 74
2 - Student Progress 619 1,600 39
3 - Closing Performance Gaps 912 2,400 38
4 - Postsecondary Readiness
STAAR Score 10.3
Graduation Rate Score 23.8
Graduation Plan Score 17.7
Postsecondary Component Score 21.8 74
Distinction Designation
Postsecondary Readiness
Percent of Eligible Measures in Top Quartile5 out of 14 = 36%
NO DISTINCTION EARNED
System Safeguards
Number and Percentage of Indicators Met
Performance Rates 29 out of 38 = 76%
Participation Rates 17 out of 17 = 100%
Graduation Rates 5 out of 5 = 100%
Met Federal Limits onAlternative Assessments 1 out of 1 = 100%
Total 52 out of 61 = 85%
For further information about this report, please see the Performance Reporting Division website at https://rptsvr1.tea.texas.gov/perfreport/account/2016/index.html
TEA Division of Performance Reporting Page 1 September 2016

Calhoun County Independent School District Office of the Assistant Superintendent of Curriculum & Instruction
525 N. Commerce Street Port Lavaca, Texas 77979 361-552-9728 (phone)
361-551-2648 (fax)
The District Improvement Plan (DIP) has been updated to reflect state
accountability measures including Indexes I-IV while continuing to support our
district goals.
The Student Progress Measure has been designated as a focus to ensure
that each child will evidence one year of growth after one year of
instruction.
100% of CCISD teachers have participated in professional development
for use of Eduphoria as a tool for standards based lessons, assessment
construction and analysis of student data to ensure that students are served
using relevant performance data.
Targeted Intervention is identified in every academic area as a strategy to
support to student progress and academic performance.
100% of teachers have gained access to the Eduphoria AWARE system as
well as training regarding the disaggregation of data so that immediate
supports can be initiated after each standards aligned assessment.
Best Practice Instruction and Targeted Intervention drive the curriculum
sections of the DIP.
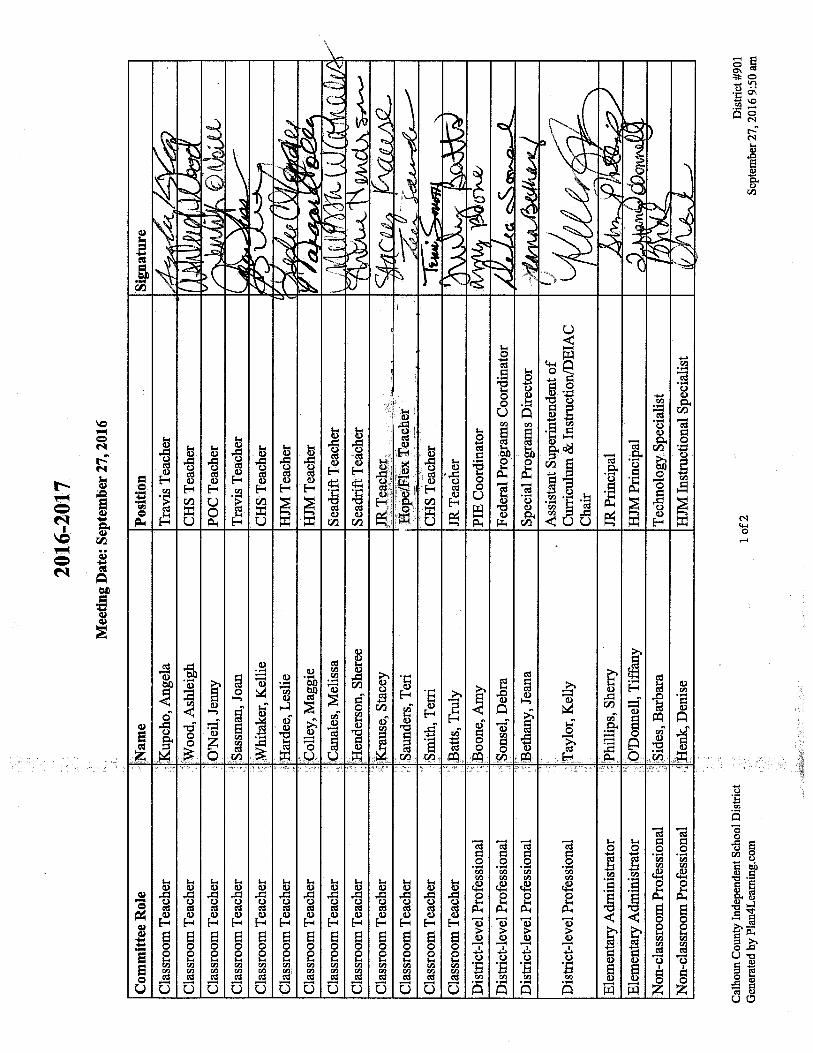

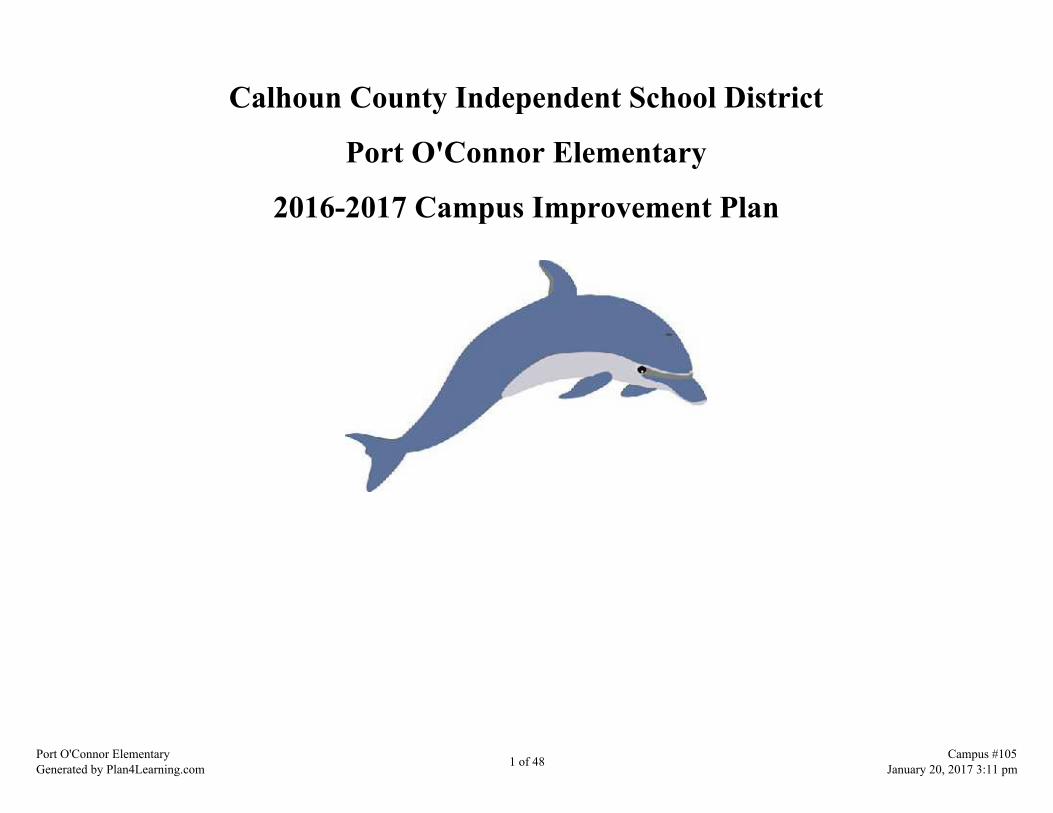
Calhoun County Independent School District
Port O'Connor Elementary
2016-2017 Campus Improvement Plan
Port O'Connor ElementaryGenerated by Plan4Learning.com 1 of 48 Campus #105
January 20, 2017 3:11 pm

Mission StatementPOC Elementary will inspire students to achieve their personal BEST through collaborative,
innovative, and engaging educational experiences while building positive relationships and fosteringhigh achievement.
Port O'Connor ElementaryGenerated by Plan4Learning.com 2 of 48 Campus #105
January 20, 2017 3:11 pm
Comprehensive Needs Assessment
Demographics
Demographics Summary
Port O'Connor Elementary has not seen a substantial change in demographics in the last five years. The school is currently59% Anglo, 41% Hispanic, 7% ELL/LEP, 6% Special Ed, 5% 504, 7% GT, 8% homeless, 26.9% mobility rate, 62% at-risk,and 67% low socio-economic.
Demographics Strengths
The following are identified as demographic strengths:
At-risk students are doing as well as the any other students on STAAR.ELL, SpEd, 504, and low socio-economic students are doing as well as all other populations on STAAR.
Demographics Needs
The following demographic needs are listed in priority order:
We will continue to improve instruction by identifying students that need targeted (tier II) and intensive (tier III)instruction. Our RtI committee will meet frequently to review data and monitor growth. This will drive our decisions onwhat systematic research based interventions students will receive.Continue to promote writing in all subject areas and grade levels; the goal is to increase scores across ethnicitygroups, as well as subject areas.Continue to work with ELL students to exit them before they leave POC.Continue to plan and work in small groups for our at-risk population.
Port O'Connor ElementaryGenerated by Plan4Learning.com 3 of 48 Campus #105
January 20, 2017 3:11 pm

Student Achievement
Student Achievement Summary
Port O'Connor Elementary is an outstanding campus with many amazing achievements.
As reported on the 2016 Accountability Summary, in 2015-2016, the campus earned Distinction Designations in the areas ofMathematics, Top 25 Percent Student Progress, Top 25 Percent Closing Performance Gap, and Postsecondary Readiness.This is largely due to a rigorous curriculum in addition to teacher-led initiatives focusing on high-performance, commonassessments, and the use of effective teaching strategies.
In index 1 referring to Student Achievement we earned 100 (target is 60). The purpose of this index is to provide asnapshot of performance across subjects, on both general and alternative assessments, at the satisfactory performancestandard.
In Index 2 referring to Student Progress we earned 50 (target is 32). The purpose of this index is to provide a measure ofstudent progress by subject and student group independent of overall student achievement levels. Growth is evaluated bysubject and student group. The growth measure is based on a change score that is the difference between the student'scurrent and prior year scores. The target for index 2 is set at the 5th percentile because the commissioner determined thatcampuses that are the lowest fifth percentile should receive the appropriate interventions needed to be successful in futureyears.
In index 3 referring to Closing Performance Gaps we earned 70 (target is 28). The purpose of index 3 is to emphasizeadvanced academic achievement of the economically disadvantaged student group and the lowest performing race/ethnicitystudent groups. Index 3 is designed to compare the performance of the lower performing student group to an externaltarget. The external target is one that allows the state to meet the statutory and accountability goal that Texas will beamong the top ten states in post secondary readiness by 2020 with no significant achievement gaps by race, ethnicity orsocioeconomic status.
In index 4 we earned 78 (target is 12). The purpose of Index 4 is to emphasize the importance for students to receive ahigh school diploma that provides them with the foundation necessary for success in college, the workforce, job trainingprograms, or the military.
Student Achievement Strengths
Port O'Connor ElementaryGenerated by Plan4Learning.com 4 of 48 Campus #105
January 20, 2017 3:11 pm

No Students Failing STAAR:
In 3rd grade Reading 100% met satisfactory level 2 and 50% met advanced level 3. In 3rd grade Math 100% met satisfactory level 2 and 42% met advanced level 3. In 4th grade Reading 100% met satisfactory level 2 and 44% met advanced level 3.In 4th grade Writing 100% met satisfactory level 2 and 11% met advanced level 3In 4th grade Math 100% met satisfactory level 2 and 78% met advanced level 3.In 5th grade Reading 100% met level 2 satisfactory and 33% met advanced level 3. In 5th grade Science 100% met satisfactory level 2. In 5th grade Math 100% met satisfactory level 2 and 67% met advanced level 3.
Attendance: Attendance Goal was 97% and POC was 97.4% in 2015-16. POC staff strongly believe attendance isimperative to student sucess.
Student Achievement Needs
Disaggregation of 2016 STAAR data indicates several areas to target for improvement. The needs are listed in priorityorder:
5th grade Science had about 80% of the questions correct on the STAAR test but none of the students scored up to the Level 3. Even though this groupof students is moving on to middle school, the science curriculum will be revised based on which objectives are identified in Aware as needingintervention. In 4th Writing, 100% met satisfactory level 2; however, only 11% met advanced level 3. We need to keep focusingon this population of students who are now in 5th grade, as well as the deliverance of Reading curriculum in 4th grade. Students who scored in quintile 1 and quintile 2 are receiving intense interventions so that we can bring these studentsup in the area of Reading.In 3rd grade Math 100% of students met satisfactory level 2; however, only 42% met advanced level 3. Weare providing small group instruction and intense interventions to all these students. In addition, we are working toincrease the performance at the advanced level (level 3).K-5 will spend more time on Writing. We are continuing our writing buddy program so that all students will be exposed to writing on a daily basis. In all subjects we are striving to maintain the rigor and complexity of the curriculum in order to increase our advancedperformance level. K-5 students need more work in Reading in the category of Understanding/Analysis of Literary Texts (because the 3-5students had only about 80% of the questions correct on STAAR in this area. In the area of Understanding/Analysis of
Port O'Connor ElementaryGenerated by Plan4Learning.com 5 of 48 Campus #105
January 20, 2017 3:11 pm
Information Text, 80% of the questions were answered correctly. These two areas remain the weakest reportingcategories in reading for POC.K-5 students in Math need to focus on the reporting categories: computations and algebraic relationships (81%) andgeometry and measurement (79%). Continue to monitor Attendance to reach the 97.5% goal. Continue to increase the use of Technology in all subjects for instruction, including intervention programs, andstudent projects.
Port O'Connor ElementaryGenerated by Plan4Learning.com 6 of 48 Campus #105
January 20, 2017 3:11 pm
School Culture and Climate
School Culture and Climate Summary
POC Elementary has created a strong partnership between the community and the school. The school is the heart of thecommunity and members take pride in playing an active role in supporting school initiatives . We have many retiredcommunity members who come regularly to mentor and tutor students. There is a shared vision that promotes a positiveschool climate. It is a team effort to create a safe, supportive, engaging learning environment for our children.
School Culture and Climate Strengths
POC Elementary promotes a positive school climate by engaging families and community members in school activities. Many community organizations are involved with the school. The sheriff's department is very involved with the school andregularly arrives as students are coming and leaving the school.
Some of the activities with strong community involvement include:
PTO CarnivalOpen houseRed Ribbon WeekGrandparent breakfastVeterans Day ProgramBook FairChristmas StoreChristmas MusicalWarriors WeekendScience FairMentoring/tutoring program100th day of school celebrationScience fairBluebonnet book reception
Port O'Connor ElementaryGenerated by Plan4Learning.com 7 of 48 Campus #105
January 20, 2017 3:11 pm
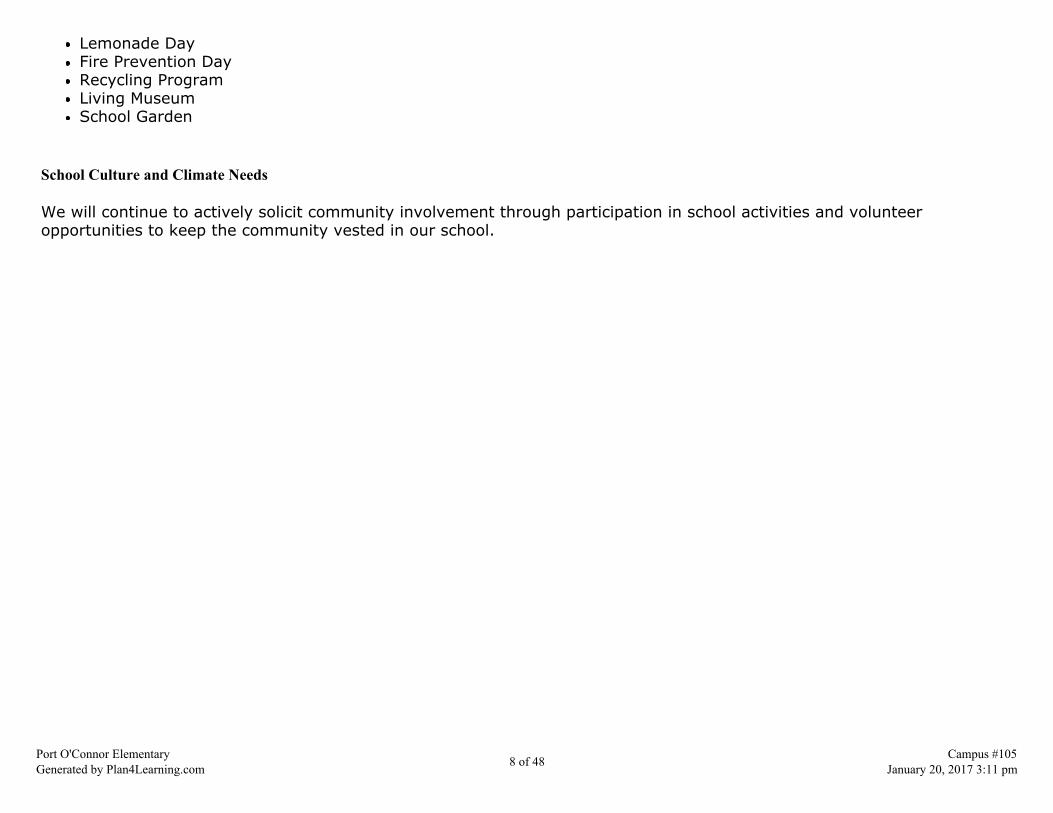
Lemonade DayFire Prevention DayRecycling ProgramLiving MuseumSchool Garden
School Culture and Climate Needs
We will continue to actively solicit community involvement through participation in school activities and volunteeropportunities to keep the community vested in our school.
Port O'Connor ElementaryGenerated by Plan4Learning.com 8 of 48 Campus #105
January 20, 2017 3:11 pm
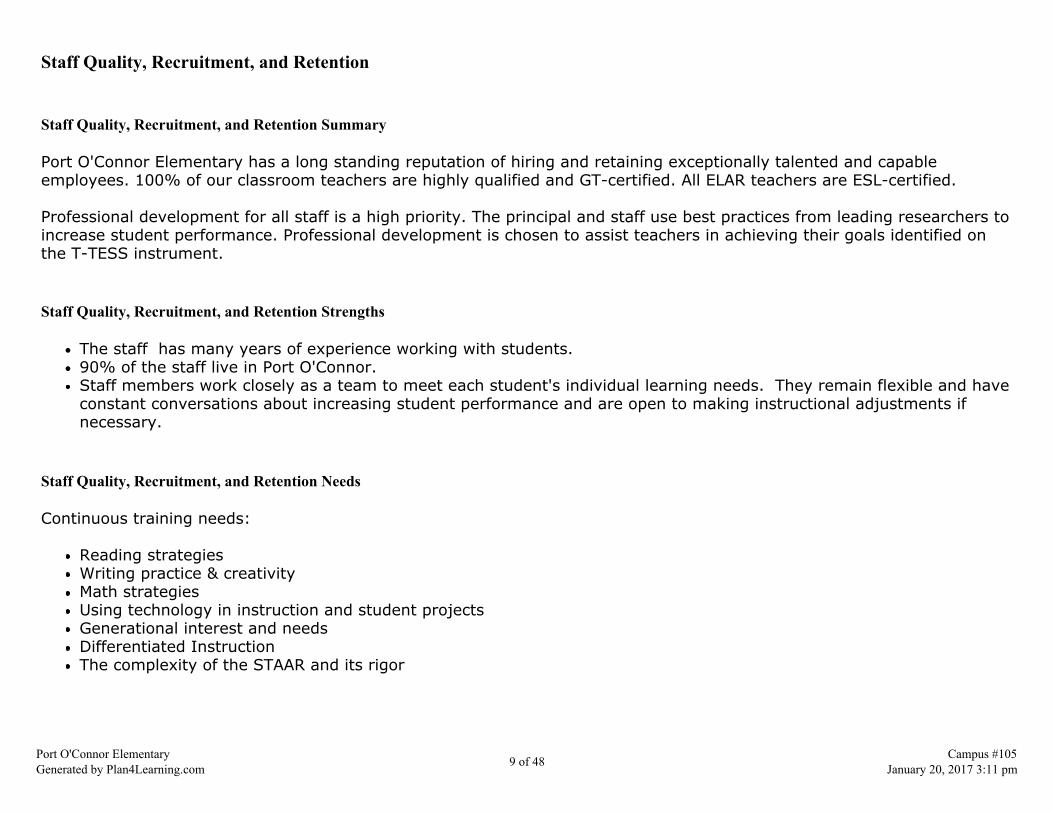
Staff Quality, Recruitment, and Retention
Staff Quality, Recruitment, and Retention Summary
Port O'Connor Elementary has a long standing reputation of hiring and retaining exceptionally talented and capableemployees. 100% of our classroom teachers are highly qualified and GT-certified. All ELAR teachers are ESL-certified.
Professional development for all staff is a high priority. The principal and staff use best practices from leading researchers toincrease student performance. Professional development is chosen to assist teachers in achieving their goals identified onthe T-TESS instrument.
Staff Quality, Recruitment, and Retention Strengths
The staff has many years of experience working with students. 90% of the staff live in Port O'Connor. Staff members work closely as a team to meet each student's individual learning needs. They remain flexible and haveconstant conversations about increasing student performance and are open to making instructional adjustments ifnecessary.
Staff Quality, Recruitment, and Retention Needs
Continuous training needs:
Reading strategiesWriting practice & creativityMath strategiesUsing technology in instruction and student projectsGenerational interest and needsDifferentiated InstructionThe complexity of the STAAR and its rigor
Port O'Connor ElementaryGenerated by Plan4Learning.com 9 of 48 Campus #105
January 20, 2017 3:11 pm
Curriculum, Instruction, and Assessment
Curriculum, Instruction, and Assessment Summary
Continuous and focused data analysis is recognized as an essential process at Port O'Connor Elementary. Since all staff aredata driven we strive for continuous improvement in all populations and student groups. Full implementation of thedistrict's curriculum is expected in every classroom and is closely monitored. Teachers experiencing difficulty withdistrict/campus expectations will be identified and given support.
Common formative assessments are used across the district as a teaching tool used to generate data. District CurriculumBased Assessments are rigorous and they raise expectations for student achievement. Another assessment regularlymonitored are weekly reports from our intervention programs, Think Through Math and Istations. The district and campusgoals reflect its commitment to increasing student performance for all students while closing the gap in achievement byethnicity and other student groups such as special education, at-risk, economically disadvantaged, and limited Englishproficient.
Curriculum, Instruction, and Assessment Strengths
The following strengths have been identified:
The implementation of the district's Scope and Sequence is very consistent. Teachers understand the value ofproviding a guaranteed and viable curriculum.Teachers use the data from the Common Assessments to plan tutorials and small group lessons for the students tomake sure they learn the skills for the nine weeks.Teachers are willing to integrate technology in their instruction and expect students to work with technology to prepareprojects, homework and communicate with the teacher.Data from Aware was disaggreagated from 2015-16 STAAR assessment.Interventions of identified students take place during and after school using computer programs and/or teacher-developed materials.
Curriculum, Instruction, and Assessment Needs
The following needs have been identified and are listed in priority order:
Port O'Connor ElementaryGenerated by Plan4Learning.com 10 of 48 Campus #105
January 20, 2017 3:11 pm

Student engagement and excitement for learning is always a top priority.Continued Professional Development for teachers to acquire innovative teaching strategies in order to teach our diversepopulation of students.Continued data collection and training to improve student achievement in all core subjects.Continue to grow and learn along with our students so that the curriculum is relevant and connections are constantlybeing made.
Port O'Connor ElementaryGenerated by Plan4Learning.com 11 of 48 Campus #105
January 20, 2017 3:11 pm

Family and Community Involvement
Family and Community Involvement Summary
POC Elementary has a shared vision and plan for promoting, enhancing, and sustaining parental involvement wherestudents have all the opportunities and resources necessary to be successful. Since every school is unique it is important toconsider its history, community, strengths and needs in order to encourage parental involvement. Our vision is for ourchildren to achieve lifelong success.
Family and Community Involvement Strengths
We take pride in our family and community partnership. Below are some of our school activities that strengthen the tiesbetween our school and our families:
PTO CarnivalOpen houseGrandparent breakfastVeterans Day ProgramBook FairChristmas StoreChristmas MusicalWarriors WeekendScience FairMentoring/tutoring programGirl ScoutsHunter Safety courses4-H meetings
Family and Community Involvement Needs
We would like to increase the number of tutors especially in the area of Math and Science.
Port O'Connor ElementaryGenerated by Plan4Learning.com 12 of 48 Campus #105
January 20, 2017 3:11 pm
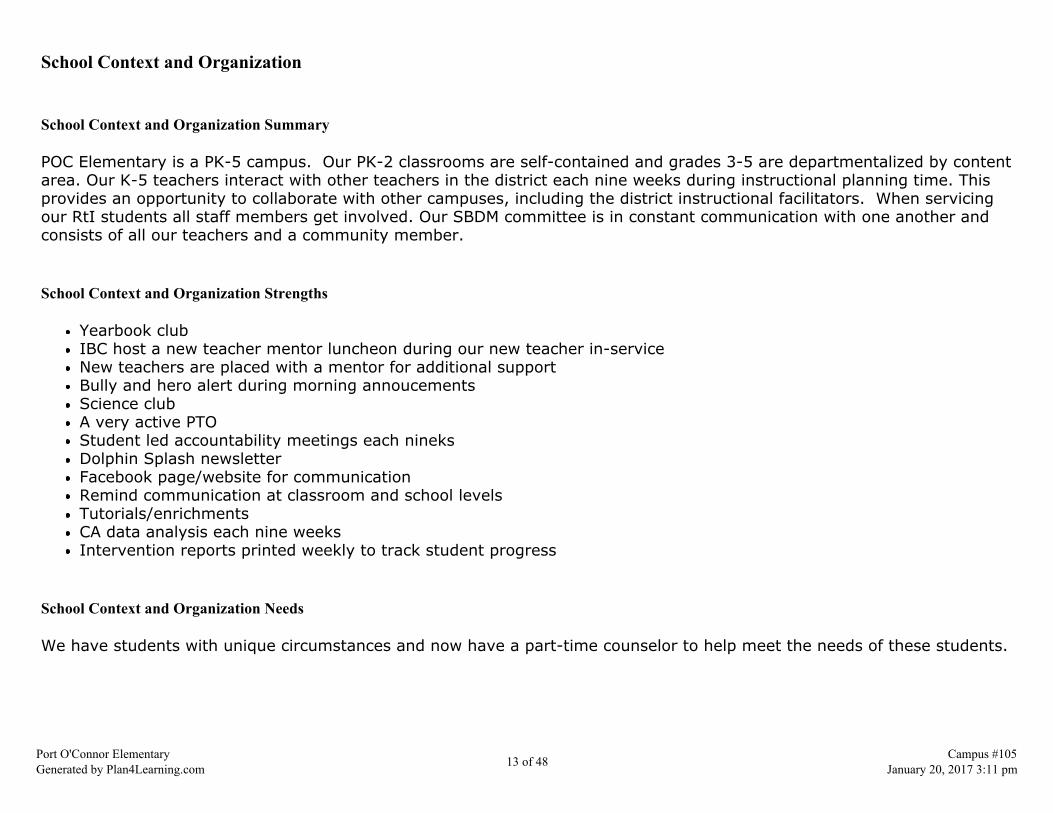
School Context and Organization
School Context and Organization Summary
POC Elementary is a PK-5 campus. Our PK-2 classrooms are self-contained and grades 3-5 are departmentalized by contentarea. Our K-5 teachers interact with other teachers in the district each nine weeks during instructional planning time. Thisprovides an opportunity to collaborate with other campuses, including the district instructional facilitators. When servicingour RtI students all staff members get involved. Our SBDM committee is in constant communication with one another andconsists of all our teachers and a community member.
School Context and Organization Strengths
Yearbook clubIBC host a new teacher mentor luncheon during our new teacher in-serviceNew teachers are placed with a mentor for additional supportBully and hero alert during morning annoucementsScience clubA very active PTOStudent led accountability meetings each nineksDolphin Splash newsletterFacebook page/website for communicationRemind communication at classroom and school levelsTutorials/enrichmentsCA data analysis each nine weeksIntervention reports printed weekly to track student progress
School Context and Organization Needs
We have students with unique circumstances and now have a part-time counselor to help meet the needs of these students.
Port O'Connor ElementaryGenerated by Plan4Learning.com 13 of 48 Campus #105
January 20, 2017 3:11 pm
Technology
Technology Summary
POC Elementary has a focused vision when it comes to technology. The staff have tablets, Chromebooks, smart boards,dance mats, IPAD's, ELMO's, LCD projectors, and Mobis for classroom use. Students are engrossed with technologyexperiences and are provided with many activities centered around technology. Many of our teachers have grade levelblogs, facebook pages, and parents have the opportunity to take advantage of extending classroom learning into theirhomes. Students also participate in blogs and have email accounts to complete assignments.
Technology Strengths
At POC elementary each grade level visits the computer lab daily and technology is integrated in all core subjects. One ofthe major benefits of using technology in classrooms and computer lab is the ability to differentiate instruction so that allstudent needs can be individualized and targeted. Just as every student grows and develops at different rates, they learnin different ways and at different speeds. Technology makes it possible to pace lessons appropriately for each student’slearning level and can be used to promote learning in multiple learning styles.
Technology Needs
POC Elementary will contact district technology specialist with requests for assistance as they move toward more integratedtechnology levels in their classrooms.
Port O'Connor ElementaryGenerated by Plan4Learning.com 14 of 48 Campus #105
January 20, 2017 3:11 pm
Comprehensive Needs Assessment Data Documentation
The following data were used to verify the comprehensive needs assessment analysis:
Improvement Planning Data
District goalsCampus goalsCurrent and/or prior year(s) campus and/or district improvement plansCampus and/or district planning and decision making committee(s) meeting dataState and federal planning requirements
Accountability Data
Texas Academic Performance Report (TAPR) dataFederal Report Card DataAnnual Measurable Achievement Objectives (AMAO) data
Student Data: Assessments
State and federally required assessment information (e.g. curriculum, eligibility, format, standards, accommodations, TEA information)State of Texas Assessments of Academic Readiness (STAAR) current and longitudinal results, including all versionsSTAAR Released Test QuestionsTexas English Language Proficiency Assessment System (TELPAS) resultsTexas Primary Reading Inventory (TPRI), Tejas LEE, or other alternate early reading assessment resultsStudent Success Initiative (SSI) data for Grades 5 and 8Local diagnostic reading assessment dataLocal diagnostic math assessment dataLocal benchmark or common assessments dataStudent failure and/or retention ratesRunning Records resultsObservation Survey results
Student Data: Student Groups
Race and ethnicity data, including number of students, academic achievement, discipline, attendance, and rates of progress between groupsNumber of students assigned to each special program, including analysis of academic achievement, race, ethnicity, gender, etcMale / Female performance and participation dataSpecial education population, including performance, discipline, attendance, and mobilityAt-Risk population, including performance, discipline, attendance and mobilityELL or LEP data, including academic achievement, support and accommodation needs, race, ethnicity, gender, etcSection 504 data
Port O'Connor ElementaryGenerated by Plan4Learning.com 15 of 48 Campus #105
January 20, 2017 3:11 pm
Gifted and talented dataDyslexia DataResponse to Intervention (RtI) student achievement data
Student Data: Behavior and Other Indicators
Attendance dataDiscipline recordsViolence and/or violence prevention recordsStudent surveys and/or other feedback
Employee Data
Staff surveys and/or other feedbackCampus department and/or faculty meeting discussions and dataProfessional development needs assessment dataPDAS and/or T-TESS
Parent/Community Data
Parent surveys and/or other feedback
Support Systems and Other Data
Budgets/entitlements and expenditures dataStudy of best practices
Port O'Connor ElementaryGenerated by Plan4Learning.com 16 of 48 Campus #105
January 20, 2017 3:11 pm
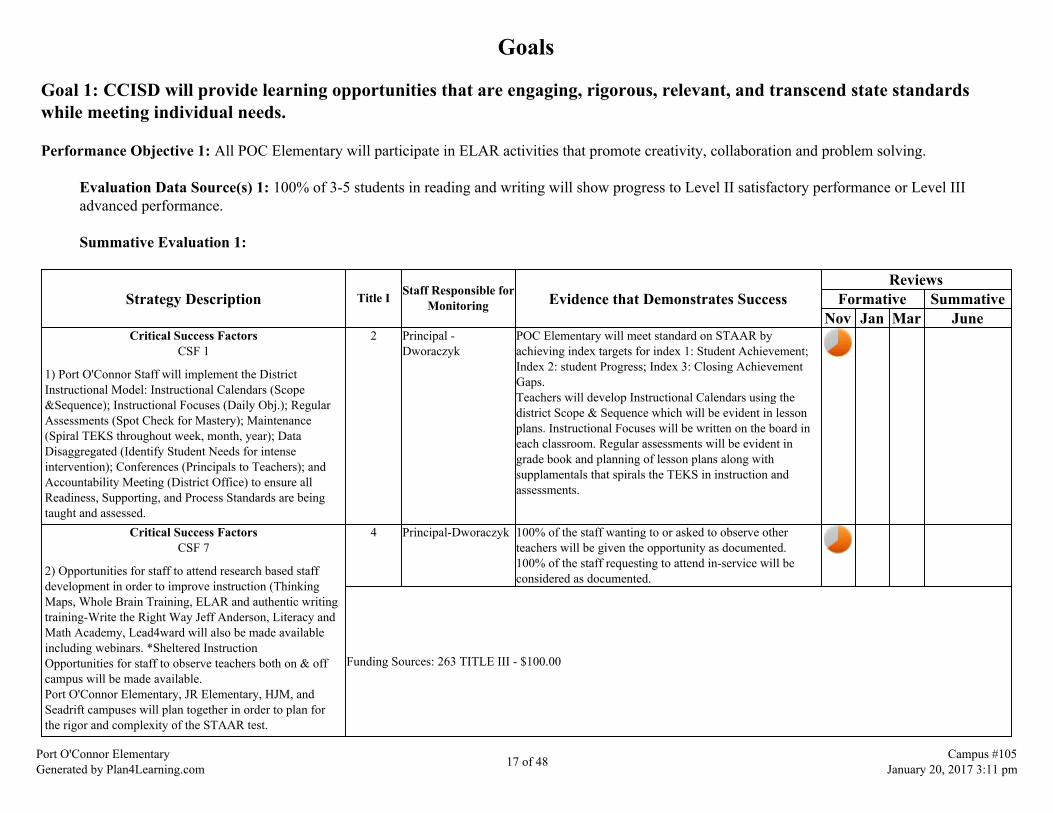
Goals
Goal 1: CCISD will provide learning opportunities that are engaging, rigorous, relevant, and transcend state standardswhile meeting individual needs.
Performance Objective 1: All POC Elementary will participate in ELAR activities that promote creativity, collaboration and problem solving.
Evaluation Data Source(s) 1: 100% of 3-5 students in reading and writing will show progress to Level II satisfactory performance or Level IIIadvanced performance.
Summative Evaluation 1:
Strategy Description Title I Staff Responsible forMonitoring Evidence that Demonstrates Success
ReviewsFormative Summative
Nov Jan Mar JuneCritical Success Factors
CSF 1
1) Port O'Connor Staff will implement the DistrictInstructional Model: Instructional Calendars (Scope&Sequence); Instructional Focuses (Daily Obj.); RegularAssessments (Spot Check for Mastery); Maintenance(Spiral TEKS throughout week, month, year); DataDisaggregated (Identify Student Needs for intenseintervention); Conferences (Principals to Teachers); andAccountability Meeting (District Office) to ensure allReadiness, Supporting, and Process Standards are beingtaught and assessed.
2 Principal -Dworaczyk
POC Elementary will meet standard on STAAR byachieving index targets for index 1: Student Achievement;Index 2: student Progress; Index 3: Closing AchievementGaps.Teachers will develop Instructional Calendars using thedistrict Scope & Sequence which will be evident in lessonplans. Instructional Focuses will be written on the board ineach classroom. Regular assessments will be evident ingrade book and planning of lesson plans along withsupplamentals that spirals the TEKS in instruction andassessments.
Critical Success FactorsCSF 7
2) Opportunities for staff to attend research based staffdevelopment in order to improve instruction (ThinkingMaps, Whole Brain Training, ELAR and authentic writingtraining-Write the Right Way Jeff Anderson, Literacy andMath Academy, Lead4ward will also be made availableincluding webinars. *Sheltered InstructionOpportunities for staff to observe teachers both on & offcampus will be made available.Port O'Connor Elementary, JR Elementary, HJM, andSeadrift campuses will plan together in order to plan forthe rigor and complexity of the STAAR test.
4 Principal-Dworaczyk 100% of the staff wanting to or asked to observe otherteachers will be given the opportunity as documented.100% of the staff requesting to attend in-service will beconsidered as documented.
Funding Sources: 263 TITLE III - $100.00
Port O'Connor ElementaryGenerated by Plan4Learning.com 17 of 48 Campus #105
January 20, 2017 3:11 pm
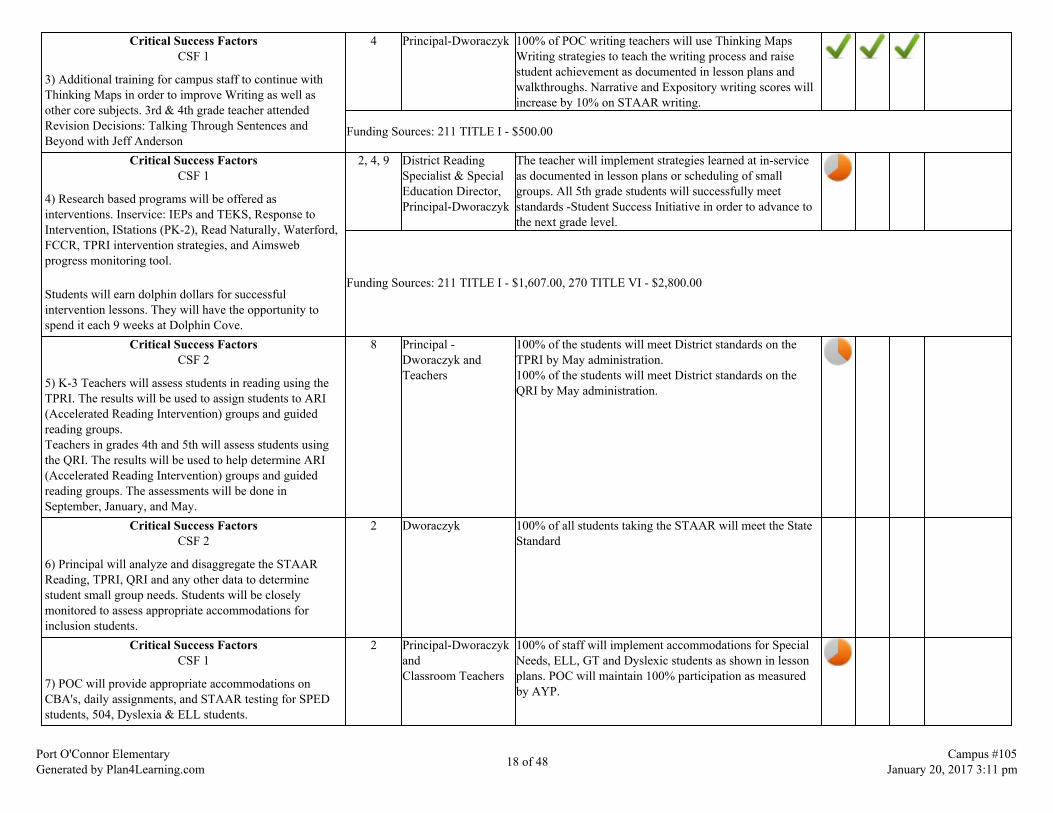
Critical Success FactorsCSF 1
3) Additional training for campus staff to continue withThinking Maps in order to improve Writing as well asother core subjects. 3rd & 4th grade teacher attendedRevision Decisions: Talking Through Sentences andBeyond with Jeff Anderson
4 Principal-Dworaczyk 100% of POC writing teachers will use Thinking MapsWriting strategies to teach the writing process and raisestudent achievement as documented in lesson plans andwalkthroughs. Narrative and Expository writing scores willincrease by 10% on STAAR writing.
Funding Sources: 211 TITLE I - $500.00
Critical Success FactorsCSF 1
4) Research based programs will be offered asinterventions. Inservice: IEPs and TEKS, Response toIntervention, IStations (PK-2), Read Naturally, Waterford,FCCR, TPRI intervention strategies, and Aimswebprogress monitoring tool.
Students will earn dolphin dollars for successfulintervention lessons. They will have the opportunity tospend it each 9 weeks at Dolphin Cove.
2, 4, 9 District ReadingSpecialist & SpecialEducation Director,Principal-Dworaczyk
The teacher will implement strategies learned at in-serviceas documented in lesson plans or scheduling of smallgroups. All 5th grade students will successfully meetstandards -Student Success Initiative in order to advance tothe next grade level.
Funding Sources: 211 TITLE I - $1,607.00, 270 TITLE VI - $2,800.00
Critical Success FactorsCSF 2
5) K-3 Teachers will assess students in reading using theTPRI. The results will be used to assign students to ARI(Accelerated Reading Intervention) groups and guidedreading groups.Teachers in grades 4th and 5th will assess students usingthe QRI. The results will be used to help determine ARI(Accelerated Reading Intervention) groups and guidedreading groups. The assessments will be done inSeptember, January, and May.
8 Principal -Dworaczyk andTeachers
100% of the students will meet District standards on theTPRI by May administration.100% of the students will meet District standards on theQRI by May administration.
Critical Success FactorsCSF 2
6) Principal will analyze and disaggregate the STAARReading, TPRI, QRI and any other data to determinestudent small group needs. Students will be closelymonitored to assess appropriate accommodations forinclusion students.
2 Dworaczyk 100% of all students taking the STAAR will meet the StateStandard
Critical Success FactorsCSF 1
7) POC will provide appropriate accommodations onCBA's, daily assignments, and STAAR testing for SPEDstudents, 504, Dyslexia & ELL students.
2 Principal-DworaczykandClassroom Teachers
100% of staff will implement accommodations for SpecialNeeds, ELL, GT and Dyslexic students as shown in lessonplans. POC will maintain 100% participation as measuredby AYP.
Port O'Connor ElementaryGenerated by Plan4Learning.com 18 of 48 Campus #105
January 20, 2017 3:11 pm

8) POC will provide before and after school extended Dayprograms for targeted K-5 grade students.
2 Principal-Dworaczykand Teachers
Teachers will keep attendance sheets for Extended Day ofstudents targeted. 100% of the program participants willmeet the State Standard on the STAAR.
9) The Wilson Language Program & Foundations will beimplemented in K - 5th grade using small group instructionand coordinating with RtI for targeted students (tier2 andtier 3).
2 Principal -Dworaczyk
100% of students in the program will increase their readinglevel by at least 1 grade each year.
Critical Success FactorsCSF 1
10) Istations will be used for English Language Learners toincrease reading fluency, comprehension, and vocabularydevelopment.
2 Principal-Dworaczyk& Title I Para-professional-MistyRichter
100% of ELL students will score 90% or better onassessment data to test out of ELL sessions.
Funding Sources: 211 TITLE I - $1,357.00
11) IStations, and Read Naturally will be used withtargeted RtI students to improve reading skills and increasefluency.
2 Title I Aide-MistyRichter
100% of the students using the software will meet the goalset for them in reading as shown on growth graphs.
12) Use volunteers to help listen to students read, help inthe library, and help teachers prepare materials forinterventions and lessons.
6 Principal-Dworaczyk& VolunteerChairman - AmberFerrell
100% of the students targeted will have tutors listen to them.100% of the teachers needing help with students will receiveit as shown on sign in sheet. Students will show growth andconfidence in their reading & fluency as shown on TPRI &QRI.
13) Purchase instructional reading materials & technologyto help improve student achievement: A-Z subscription,ebooks, AR Web-Based, library books, Vocabulary, quickword books, Scholastic news magazine, Scholastic read-aloud plays for fluency practice, sentence strips, trace/write alphabetic center, and others.
2 Principal-Dworaczyk 100% of purchased Instructional materials and technologywill be used by teachers & students.
Funding Sources: 211 TITLE I - $1,500.00
14) A half day Title I Aide will be utilized to help with I-Stations, SuccessMaker, Waterford, Ellis and any othertutorial programs in the computer lab or library.
3 Principal-Dworaczyk Student progress reports from the specific programs thestudents are scheduled to work in will be reviewed. Increasein reading skills for targeted students QRI, report cardgrades and Nine Weeks test scores.
Funding Sources: 211 TITLE I - $6,538.4615) Students will go to the ballet "The Nutcracker" afterthey have read the story.
2 Principal Dworaczykand 3rd gradeTeacher-Haynes
Students will be able to visualize and answer questionsabout the story of the Nutcracker.
Funding Sources: 199 LOCAL - $600.00Critical Success Factors
CSF 1
16) Focus on Student's Scale Score and provide STAARtalks, focusing on threshold performances and reachingLevel III. This includes visiting with specific studentsabout CBA scores. Individual growth plans will be createdby teachers.
3-5 Teachers andPrincipal Dworaczyk
100% POC students will improve their score by a least 5points on each district nine weeks test as documented ondata collection for each student.
Port O'Connor ElementaryGenerated by Plan4Learning.com 19 of 48 Campus #105
January 20, 2017 3:11 pm

17) POC will implement a Writing Buddy program toenhance writing across ALL grade levels.Ink, chart paper, laminating film and writing camp supplieswill be purchased for this program as well.
Principal-DworaczykTeachers-Andersonand Dawson
Increase in writing scores.
Funding Sources: 211 TITLE I - $400.00
18) POC will incorporate literacy events: grandparentscelebration, 50th day celebration, 100th day celebration,Texas Independence, Veterans Day Program, livingmuseum, Dr. Suess birthday, Valentines Day Store topromote a love for Reading.
Principal-Dworaczyk Increase in Reading scores on end of year assessments 10%.
19) Continue to work toward school improvement (AYP)at campuses for students with disabilities and ELLstudents. *Project ELL (TItle III)
Principal-Dworaczyk Meet the safeguards for reading with special ed and ELLstudents as per Index 3 in 2016.
Funding Sources: 263 TITLE III - $179.00
20) Grades K-5th will implement a Reading Buddyprogram twice a week. A comprehension component willbe included during this time.
Classroom Teachers
Chariman-Anderson
Enhance Reading/Writing scores
21) POC will promote writing by displaying student workon our "Writers Wall of Fame." Teachers will change outstudent work every 2 weeks.
Principal- Dworaczyk Increased Writing scores on EOY assesments
= Accomplished = Considerable = Some Progress = No Progress = Discontinue
Port O'Connor ElementaryGenerated by Plan4Learning.com 20 of 48 Campus #105
January 20, 2017 3:11 pm
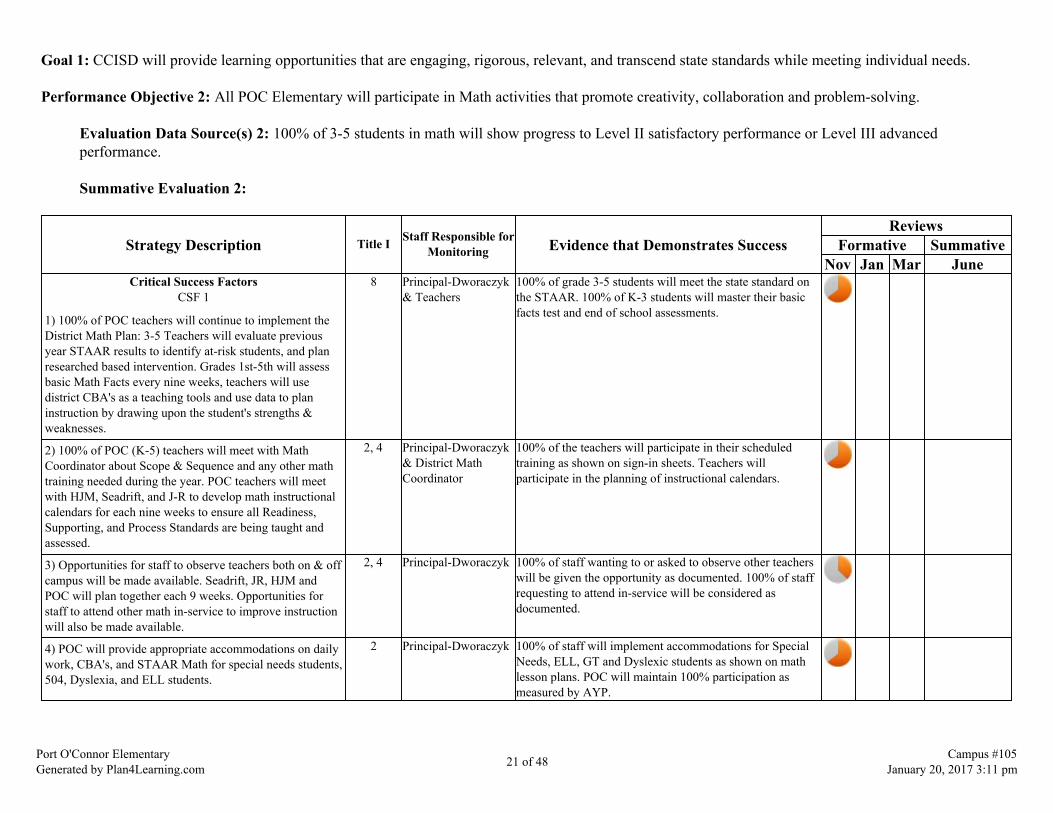
Goal 1: CCISD will provide learning opportunities that are engaging, rigorous, relevant, and transcend state standards while meeting individual needs.
Performance Objective 2: All POC Elementary will participate in Math activities that promote creativity, collaboration and problem-solving.
Evaluation Data Source(s) 2: 100% of 3-5 students in math will show progress to Level II satisfactory performance or Level III advancedperformance.
Summative Evaluation 2:
Strategy Description Title I Staff Responsible forMonitoring Evidence that Demonstrates Success
ReviewsFormative Summative
Nov Jan Mar JuneCritical Success Factors
CSF 1
1) 100% of POC teachers will continue to implement theDistrict Math Plan: 3-5 Teachers will evaluate previousyear STAAR results to identify at-risk students, and planresearched based intervention. Grades 1st-5th will assessbasic Math Facts every nine weeks, teachers will usedistrict CBA's as a teaching tools and use data to planinstruction by drawing upon the student's strengths &weaknesses.
8 Principal-Dworaczyk& Teachers
100% of grade 3-5 students will meet the state standard onthe STAAR. 100% of K-3 students will master their basicfacts test and end of school assessments.
2) 100% of POC (K-5) teachers will meet with MathCoordinator about Scope & Sequence and any other mathtraining needed during the year. POC teachers will meetwith HJM, Seadrift, and J-R to develop math instructionalcalendars for each nine weeks to ensure all Readiness,Supporting, and Process Standards are being taught andassessed.
2, 4 Principal-Dworaczyk& District MathCoordinator
100% of the teachers will participate in their scheduledtraining as shown on sign-in sheets. Teachers willparticipate in the planning of instructional calendars.
3) Opportunities for staff to observe teachers both on & offcampus will be made available. Seadrift, JR, HJM andPOC will plan together each 9 weeks. Opportunities forstaff to attend other math in-service to improve instructionwill also be made available.
2, 4 Principal-Dworaczyk 100% of staff wanting to or asked to observe other teacherswill be given the opportunity as documented. 100% of staffrequesting to attend in-service will be considered asdocumented.
4) POC will provide appropriate accommodations on dailywork, CBA's, and STAAR Math for special needs students,504, Dyslexia, and ELL students.
2 Principal-Dworaczyk 100% of staff will implement accommodations for SpecialNeeds, ELL, GT and Dyslexic students as shown on mathlesson plans. POC will maintain 100% participation asmeasured by AYP.
Port O'Connor ElementaryGenerated by Plan4Learning.com 21 of 48 Campus #105
January 20, 2017 3:11 pm

5) Kindergarten thru fifth grade math time will continue tobe 90 minutes (in addition to tutoring & enrichments).
2 Principal-Dworaczykand Teachers
100% of the 3-5 grade students will meet the state Standardon the STAAR. 100% of K-2 students will master 85% ofthe skills on the EOY test.
6) STAAR Math data will be analyzed to implementsuccessful inclusive practices and develop challengingIEPS. SPED teacher will work with classroom teacher toplan small groups that focus on strengths and weaknesses,as well as ways to foster collaborative co-teaching.
8 Principal-Dworaczykand SPED teacher
100% of all special needs students will meet the StateStandard on STAAR.
7) POC will provide extended day programs after schoolfor targeted students K-5 on benchmark test, nine weektests, achiever Ipad app, & STAAR Math.
Principal-Dworaczyk& Teachers
100% of the targeted students will show improvement onSix Weeks Test.
8) POC will purchase Waterford, Rigorous ProblemSolving, Monkey Math, Show What You Know flashcards, manipulatives, and place value flip chart tosupplement the Go-Math program. Other materials andtechnology will be purchased as needed to enhance themath program and meet the rigor of the new TEKS (timers,geometric solids).
2 Principal-Dworaczyk 100% of the students will reach state standard on STAAR.
Funding Sources: 270 TITLE VI - $2,800.00, 211 TITLE I - $500.00
9) Focus on Student's Scale Score and provide STAAR talkand focus on specific areas to improve scores to Level III.This includes visiting with specific students about 9 weekstest scores. Individual growth plans will be created byteachers.
3-5 Teachers andPrincipal-Dworaczyk
100% POC students will improve their score by a least 5points on each district nine weeks test as documented ondata collection for each student.
10) Continue to work toward school improvement (AYP)at campuses for students with disabilities and ELLstudents.
Principal- Dworaczyk Meet the safeguards for reading with special ed and ELLstudents as per Index 3 in 2016.
= Accomplished = Considerable = Some Progress = No Progress = Discontinue
Port O'Connor ElementaryGenerated by Plan4Learning.com 22 of 48 Campus #105
January 20, 2017 3:11 pm
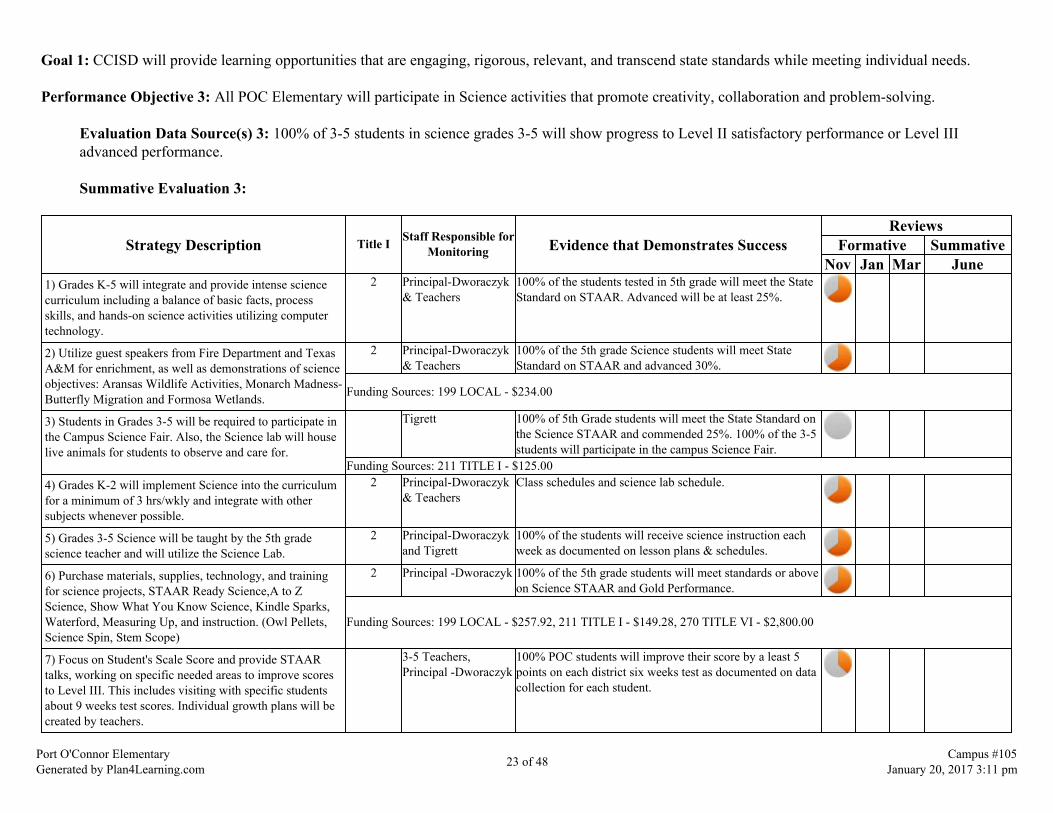
Goal 1: CCISD will provide learning opportunities that are engaging, rigorous, relevant, and transcend state standards while meeting individual needs.
Performance Objective 3: All POC Elementary will participate in Science activities that promote creativity, collaboration and problem-solving.
Evaluation Data Source(s) 3: 100% of 3-5 students in science grades 3-5 will show progress to Level II satisfactory performance or Level IIIadvanced performance.
Summative Evaluation 3:
Strategy Description Title I Staff Responsible forMonitoring Evidence that Demonstrates Success
ReviewsFormative Summative
Nov Jan Mar June1) Grades K-5 will integrate and provide intense sciencecurriculum including a balance of basic facts, processskills, and hands-on science activities utilizing computertechnology.
2 Principal-Dworaczyk& Teachers
100% of the students tested in 5th grade will meet the StateStandard on STAAR. Advanced will be at least 25%.
2) Utilize guest speakers from Fire Department and TexasA&M for enrichment, as well as demonstrations of scienceobjectives: Aransas Wildlife Activities, Monarch Madness-Butterfly Migration and Formosa Wetlands.
2 Principal-Dworaczyk& Teachers
100% of the 5th grade Science students will meet StateStandard on STAAR and advanced 30%.
Funding Sources: 199 LOCAL - $234.00
3) Students in Grades 3-5 will be required to participate inthe Campus Science Fair. Also, the Science lab will houselive animals for students to observe and care for.
Tigrett 100% of 5th Grade students will meet the State Standard onthe Science STAAR and commended 25%. 100% of the 3-5students will participate in the campus Science Fair.
Funding Sources: 211 TITLE I - $125.004) Grades K-2 will implement Science into the curriculumfor a minimum of 3 hrs/wkly and integrate with othersubjects whenever possible.
2 Principal-Dworaczyk& Teachers
Class schedules and science lab schedule.
5) Grades 3-5 Science will be taught by the 5th gradescience teacher and will utilize the Science Lab.
2 Principal-Dworaczykand Tigrett
100% of the students will receive science instruction eachweek as documented on lesson plans & schedules.
6) Purchase materials, supplies, technology, and trainingfor science projects, STAAR Ready Science,A to ZScience, Show What You Know Science, Kindle Sparks,Waterford, Measuring Up, and instruction. (Owl Pellets,Science Spin, Stem Scope)
2 Principal -Dworaczyk 100% of the 5th grade students will meet standards or aboveon Science STAAR and Gold Performance.
Funding Sources: 199 LOCAL - $257.92, 211 TITLE I - $149.28, 270 TITLE VI - $2,800.00
7) Focus on Student's Scale Score and provide STAARtalks, working on specific needed areas to improve scoresto Level III. This includes visiting with specific studentsabout 9 weeks test scores. Individual growth plans will becreated by teachers.
3-5 Teachers,Principal -Dworaczyk
100% POC students will improve their score by a least 5points on each district six weeks test as documented on datacollection for each student.
Port O'Connor ElementaryGenerated by Plan4Learning.com 23 of 48 Campus #105
January 20, 2017 3:11 pm

= Accomplished = Considerable = Some Progress = No Progress = Discontinue
Port O'Connor ElementaryGenerated by Plan4Learning.com 24 of 48 Campus #105
January 20, 2017 3:11 pm

Goal 1: CCISD will provide learning opportunities that are engaging, rigorous, relevant, and transcend state standards while meeting individual needs.
Performance Objective 4: All POC Elementary will participate in Social Studies activities that promote creativity, collaboration and problem solving.
Evaluation Data Source(s) 4: 100% of students in grade 8 social studies and EOC U.S. History will show progress to Level II satisfactoryperformance or Level III advanced performance.
Summative Evaluation 4:
Strategy Description Title I Staff Responsible forMonitoring Evidence that Demonstrates Success
ReviewsFormative Summative
Nov Jan Mar June1) Grades PK-5 will integrate and provide Social Studiescurriculum including a balance of historical facts, processskills, and hands-on activities utilizing computertechnology.
Principal Dworaczykand Teachers
100% of POC students will score 80 or above on SocialStudies 9 weeks assessment generated by teacher.
2) Purchase materials, supplies, and Weekly Reader.Students will participate in a Medieval fair and anInternational Food Festival.
2 Principal-DworaczykDawson -Teacher
100% of POC students will be successful and 9 weekassessments.
Funding Sources: 211 TITLE I - $500.00
3) POC Elementary will recognize and honor our Veterans. Principal-DworaczykMisty Richter
100% of students will participate and attend program.
4) POC 2nd grade will have a "Living Museum" event.Parents and students will be invited.
LeaAnn Ragusin-Teacher
100% of 2nd grade will participate.
= Accomplished = Considerable = Some Progress = No Progress = Discontinue
Port O'Connor ElementaryGenerated by Plan4Learning.com 25 of 48 Campus #105
January 20, 2017 3:11 pm
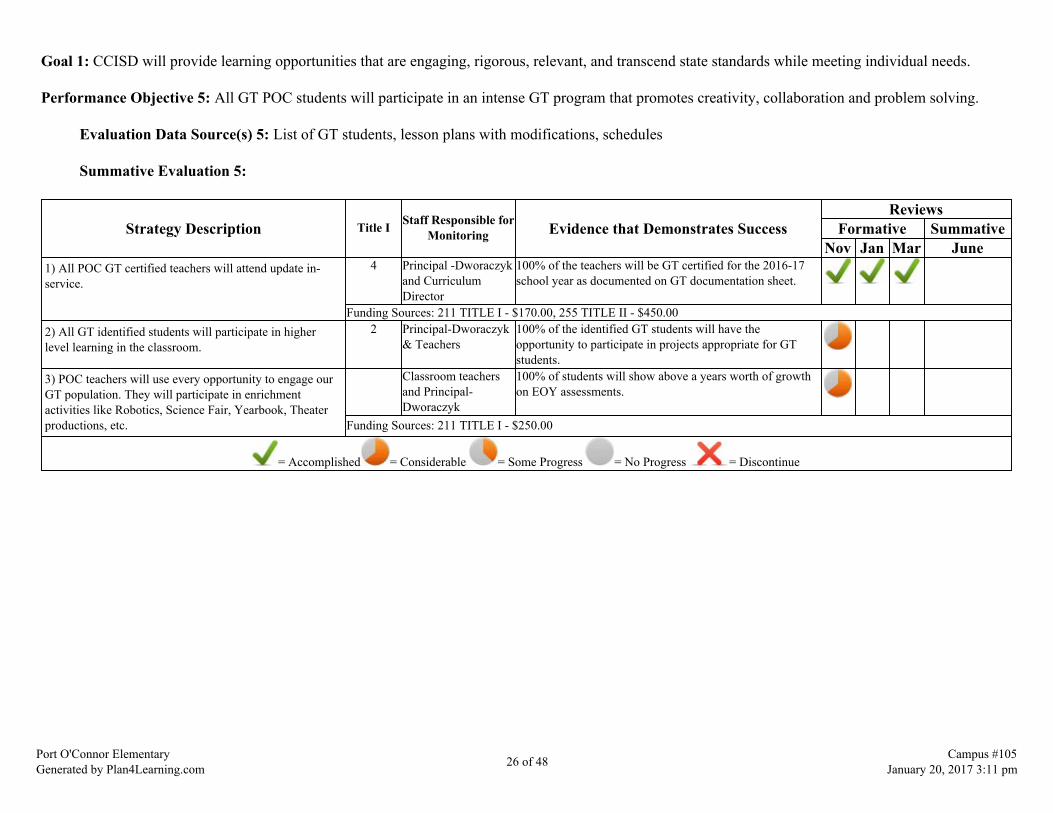
Goal 1: CCISD will provide learning opportunities that are engaging, rigorous, relevant, and transcend state standards while meeting individual needs.
Performance Objective 5: All GT POC students will participate in an intense GT program that promotes creativity, collaboration and problem solving.
Evaluation Data Source(s) 5: List of GT students, lesson plans with modifications, schedules
Summative Evaluation 5:
Strategy Description Title I Staff Responsible forMonitoring Evidence that Demonstrates Success
ReviewsFormative Summative
Nov Jan Mar June1) All POC GT certified teachers will attend update in-service.
4 Principal -Dworaczykand CurriculumDirector
100% of the teachers will be GT certified for the 2016-17school year as documented on GT documentation sheet.
Funding Sources: 211 TITLE I - $170.00, 255 TITLE II - $450.002) All GT identified students will participate in higherlevel learning in the classroom.
2 Principal-Dworaczyk& Teachers
100% of the identified GT students will have theopportunity to participate in projects appropriate for GTstudents.
3) POC teachers will use every opportunity to engage ourGT population. They will participate in enrichmentactivities like Robotics, Science Fair, Yearbook, Theaterproductions, etc.
Classroom teachersand Principal-Dworaczyk
100% of students will show above a years worth of growthon EOY assessments.
Funding Sources: 211 TITLE I - $250.00
= Accomplished = Considerable = Some Progress = No Progress = Discontinue
Port O'Connor ElementaryGenerated by Plan4Learning.com 26 of 48 Campus #105
January 20, 2017 3:11 pm

Goal 1: CCISD will provide learning opportunities that are engaging, rigorous, relevant, and transcend state standards while meeting individual needs.
Performance Objective 6: By the spring of 2017, Port O'Connor School will meet or exceed an attendance rate of 97%.
Evaluation Data Source(s) 6: 100% of all AEIS student groups will have 97% attendance for Gold Performance acknowledgement.
Summative Evaluation 6:
Strategy Description Title I Staff Responsible forMonitoring Evidence that Demonstrates Success
ReviewsFormative Summative
Nov Jan Mar June1) Incentives will be provided to students for perfectattendance each nine weeks. Students will receive dolphindollars for perfect attendance each 9 week period and adrink coupon from Speedy Stop.
2 Principal-Dworaczyk 100% of the students with perfect attendance will berewarded as shown on perfect attendance list.
Funding Sources: 199 LOCAL - $500.00
2) Teachers will keep track of tardies and absences andsend names to the office by 8:15 each morning. Secretarywill call parents to get students to school or find out whythey are absent.
2 School Secretary-Rosenboom &Principal-Dworaczyk
100% of the students absent will be called and parentstalked to about the importance of getting students to school
3) POC will partner with Speedy Stop for incentivecoupons to be given during our 9 weeks award ceremony.
Carol Rosenboom Attendance increases
= Accomplished = Considerable = Some Progress = No Progress = Discontinue
Port O'Connor ElementaryGenerated by Plan4Learning.com 27 of 48 Campus #105
January 20, 2017 3:11 pm

Goal 2: CCISD will focus the use of our resources to close achievement gaps and facilitate quality learning for all students.
Performance Objective 1: POC Elementary will actively monitor budget requests and district projects for financial responsibility in using local, state, andfederal funding sources.
Evaluation Data Source(s) 1: Based on the yearly audit of finances and program budgets, POC shows financial stability.
Summative Evaluation 1:
Strategy Description Title I Staff Responsible forMonitoring Evidence that Demonstrates Success
ReviewsFormative Summative
Nov Jan Mar June1) POC will work with the Special Education departmentto purchase needed materials and services for our SPEDstudents.
SPED teacher andDworaczyk-Principal
100% of SPED students will be provided with 100% of theresources they need in order to ensure their success.
Funding Sources: 199 LOCAL - $50.00, 224 IDEA - $500.00
2) POC Elementary will exercise fiscal responsibilitytowards current resources, as well as additional resourcesthat will be purchased to ensure student success.*BrainPop (Title VI), *Waterford (Title VI)
2 Principal-Dworaczykand Secretary-Rosenboom
100% students will be provided with necessary tools inorder to ensure their success.
Funding Sources: 270 TITLE VI - $3,206.00
3) POC Elementary will utilize Title I Aide to overseestudents receiving tier 2 and tier 3 interventions in thecomputer lab.
Principal-DworaczykMisty Richter
10% increase in STAAR test results
4) Student's with all A's & AB's will receive certificateseach nine weeks and special awards will be given for allA's for the whole year. Incentives will be purchased toencourage high achievement. POC will Partner withSpeedy Stop, Subway and Kiwanis to reward students forimprovement in grades and attendance.
2 Principal -DworaczykKiwanis Club - JaneDanielsSubway-MargaretClaiborneSpeedy stop-JohnHribek
100% of all students receiving all A's and AB's will receivecertificates as documented by the nine weeks list, semester& end of school.
Funding Sources: 199 LOCAL - $100.005) Title I Funds will be used to pay substitutes so teacherscan attend staff development.
Principal-Dworaczyk Teachers will document training in order to demonstrateunderstanding.
Funding Sources: 211 TITLE I - $450.00
= Accomplished = Considerable = Some Progress = No Progress = Discontinue
Port O'Connor ElementaryGenerated by Plan4Learning.com 28 of 48 Campus #105
January 20, 2017 3:11 pm

Goal 2: CCISD will focus the use of our resources to close achievement gaps and facilitate quality learning for all students.
Performance Objective 2: All students in grades 3-5 will reach and/or exceed performance standards in STAAR Reading and the current AYP standard atthe campus level.
Evaluation Data Source(s) 2: POC will have 100% of the students meet the performance standard on STAAR Reading and the campus willmeet AYP as documented by STAAR Scores.
Summative Evaluation 2:
Strategy Description Title I Staff Responsible forMonitoring Evidence that Demonstrates Success
ReviewsFormative Summative
Nov Jan Mar June1) High expectations will be set by teachers andadministrator so that 100% of our students will surpassSTAAR standards in Reading. Administrator will attendLead4Ward training for school leaders.
2, 3, 8, 9 Principal-Dworaczyk& Teachers
100% of the POC students will meet the STAAR standard inReading
Funding Sources: 199 LOCAL - $80.00
2) Instructional coaching techniques will be provided inorder to make a positive impact on instruction.
Principal-Dworaczyk 100% of students will meet the STAAR standard inReading.
3) All 3-5 students will be provided breakfast prior totaking the STAAR test. Students will also be providedsnacks and water during testing.
Principal-Dworaczyk Meet standards on STAAR test.
Funding Sources: 199 LOCAL - $75.00
4) AIMS Web progress monitoring will be used to trackthe progress of identified RtI at at-risk students.
Principal-Dworaczyk Decreased SPED referrals and increase in Reading STAARresults.
= Accomplished = Considerable = Some Progress = No Progress = Discontinue
Port O'Connor ElementaryGenerated by Plan4Learning.com 29 of 48 Campus #105
January 20, 2017 3:11 pm
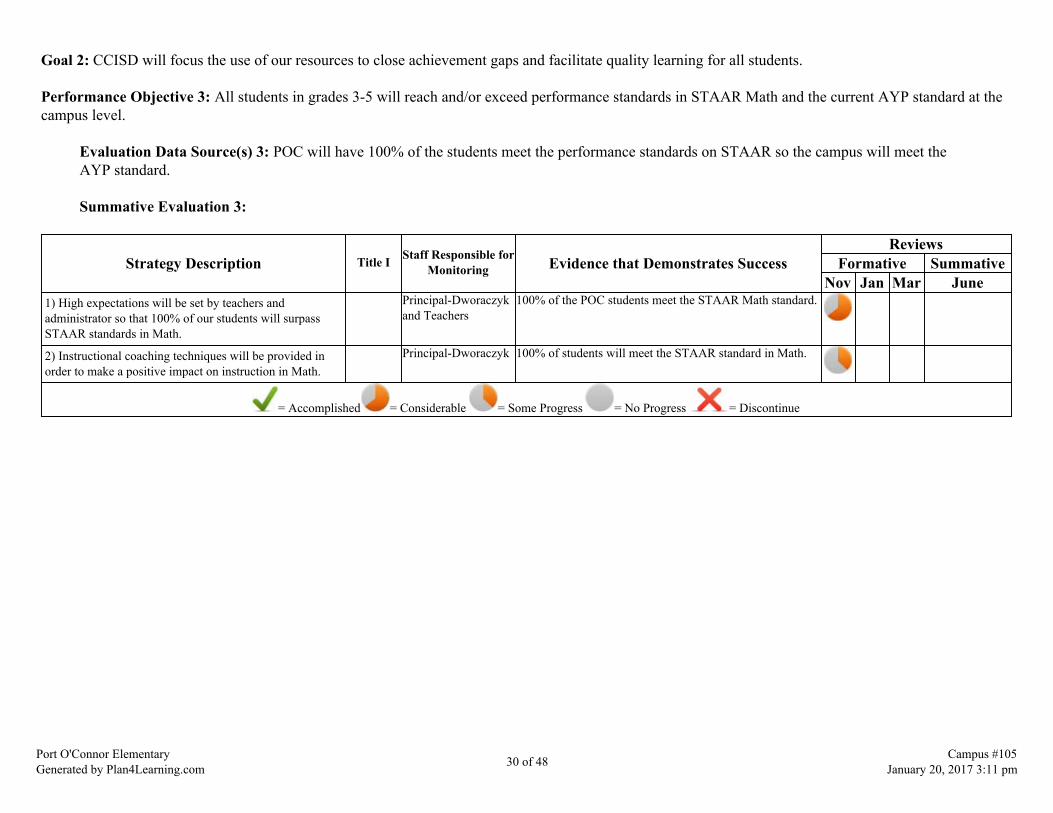
Goal 2: CCISD will focus the use of our resources to close achievement gaps and facilitate quality learning for all students.
Performance Objective 3: All students in grades 3-5 will reach and/or exceed performance standards in STAAR Math and the current AYP standard at thecampus level.
Evaluation Data Source(s) 3: POC will have 100% of the students meet the performance standards on STAAR so the campus will meet theAYP standard.
Summative Evaluation 3:
Strategy Description Title I Staff Responsible forMonitoring Evidence that Demonstrates Success
ReviewsFormative Summative
Nov Jan Mar June1) High expectations will be set by teachers andadministrator so that 100% of our students will surpassSTAAR standards in Math.
Principal-Dworaczykand Teachers
100% of the POC students meet the STAAR Math standard.
2) Instructional coaching techniques will be provided inorder to make a positive impact on instruction in Math.
Principal-Dworaczyk 100% of students will meet the STAAR standard in Math.
= Accomplished = Considerable = Some Progress = No Progress = Discontinue
Port O'Connor ElementaryGenerated by Plan4Learning.com 30 of 48 Campus #105
January 20, 2017 3:11 pm
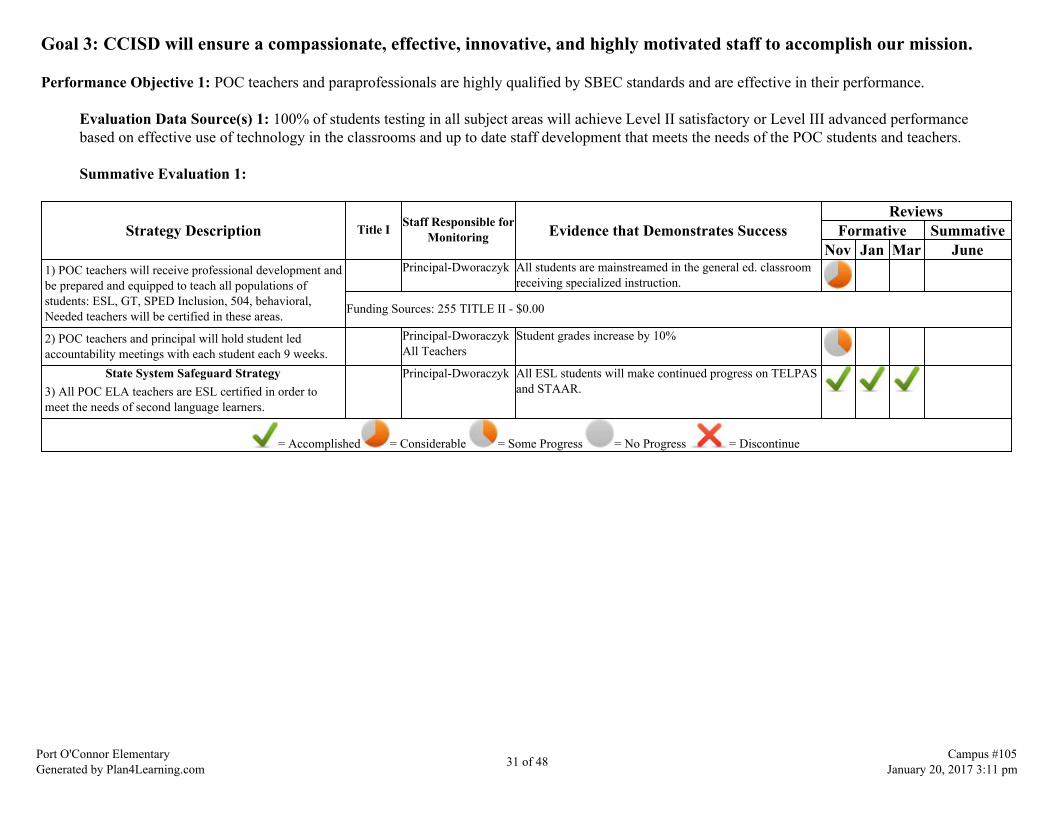
Goal 3: CCISD will ensure a compassionate, effective, innovative, and highly motivated staff to accomplish our mission.
Performance Objective 1: POC teachers and paraprofessionals are highly qualified by SBEC standards and are effective in their performance.
Evaluation Data Source(s) 1: 100% of students testing in all subject areas will achieve Level II satisfactory or Level III advanced performancebased on effective use of technology in the classrooms and up to date staff development that meets the needs of the POC students and teachers.
Summative Evaluation 1:
Strategy Description Title I Staff Responsible forMonitoring Evidence that Demonstrates Success
ReviewsFormative Summative
Nov Jan Mar June1) POC teachers will receive professional development andbe prepared and equipped to teach all populations ofstudents: ESL, GT, SPED Inclusion, 504, behavioral,Needed teachers will be certified in these areas.
Principal-Dworaczyk All students are mainstreamed in the general ed. classroomreceiving specialized instruction.
Funding Sources: 255 TITLE II - $0.00
2) POC teachers and principal will hold student ledaccountability meetings with each student each 9 weeks.
Principal-DworaczykAll Teachers
Student grades increase by 10%
State System Safeguard Strategy3) All POC ELA teachers are ESL certified in order tomeet the needs of second language learners.
Principal-Dworaczyk All ESL students will make continued progress on TELPASand STAAR.
= Accomplished = Considerable = Some Progress = No Progress = Discontinue
Port O'Connor ElementaryGenerated by Plan4Learning.com 31 of 48 Campus #105
January 20, 2017 3:11 pm
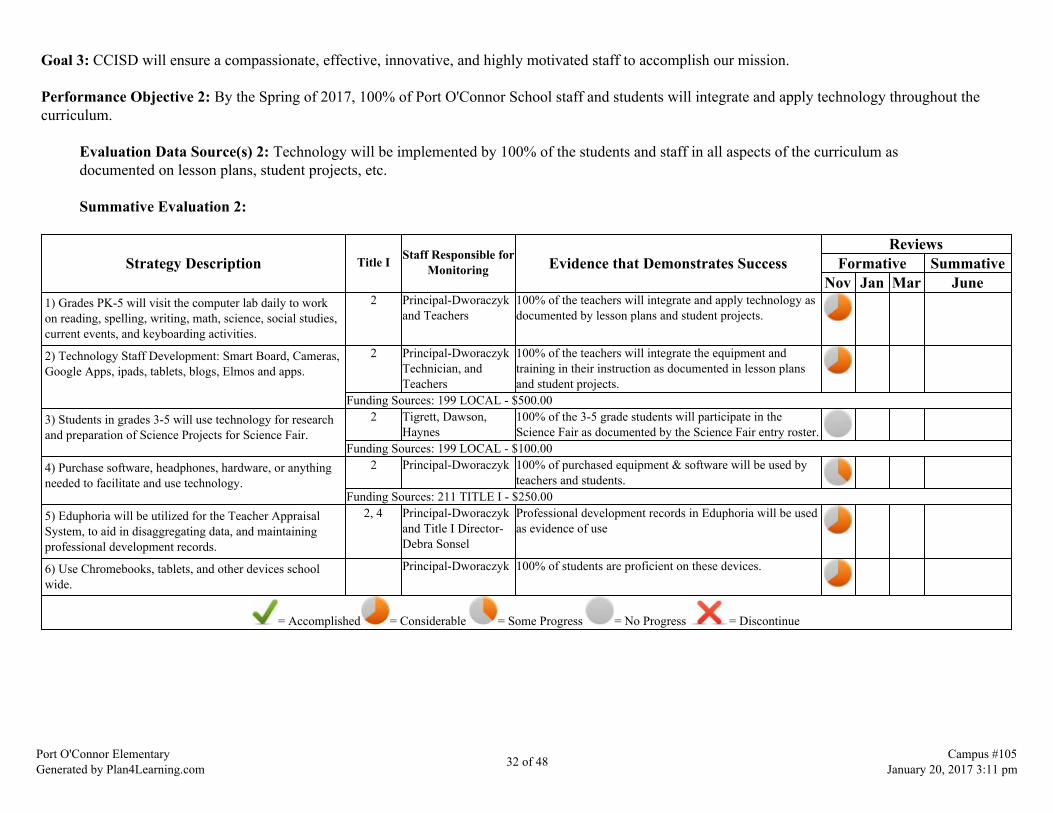
Goal 3: CCISD will ensure a compassionate, effective, innovative, and highly motivated staff to accomplish our mission.
Performance Objective 2: By the Spring of 2017, 100% of Port O'Connor School staff and students will integrate and apply technology throughout thecurriculum.
Evaluation Data Source(s) 2: Technology will be implemented by 100% of the students and staff in all aspects of the curriculum asdocumented on lesson plans, student projects, etc.
Summative Evaluation 2:
Strategy Description Title I Staff Responsible forMonitoring Evidence that Demonstrates Success
ReviewsFormative Summative
Nov Jan Mar June1) Grades PK-5 will visit the computer lab daily to workon reading, spelling, writing, math, science, social studies,current events, and keyboarding activities.
2 Principal-Dworaczykand Teachers
100% of the teachers will integrate and apply technology asdocumented by lesson plans and student projects.
2) Technology Staff Development: Smart Board, Cameras,Google Apps, ipads, tablets, blogs, Elmos and apps.
2 Principal-DworaczykTechnician, andTeachers
100% of the teachers will integrate the equipment andtraining in their instruction as documented in lesson plansand student projects.
Funding Sources: 199 LOCAL - $500.003) Students in grades 3-5 will use technology for researchand preparation of Science Projects for Science Fair.
2 Tigrett, Dawson,Haynes
100% of the 3-5 grade students will participate in theScience Fair as documented by the Science Fair entry roster.
Funding Sources: 199 LOCAL - $100.004) Purchase software, headphones, hardware, or anythingneeded to facilitate and use technology.
2 Principal-Dworaczyk 100% of purchased equipment & software will be used byteachers and students.
Funding Sources: 211 TITLE I - $250.005) Eduphoria will be utilized for the Teacher AppraisalSystem, to aid in disaggregating data, and maintainingprofessional development records.
2, 4 Principal-Dworaczykand Title I Director-Debra Sonsel
Professional development records in Eduphoria will be usedas evidence of use
6) Use Chromebooks, tablets, and other devices schoolwide.
Principal-Dworaczyk 100% of students are proficient on these devices.
= Accomplished = Considerable = Some Progress = No Progress = Discontinue
Port O'Connor ElementaryGenerated by Plan4Learning.com 32 of 48 Campus #105
January 20, 2017 3:11 pm
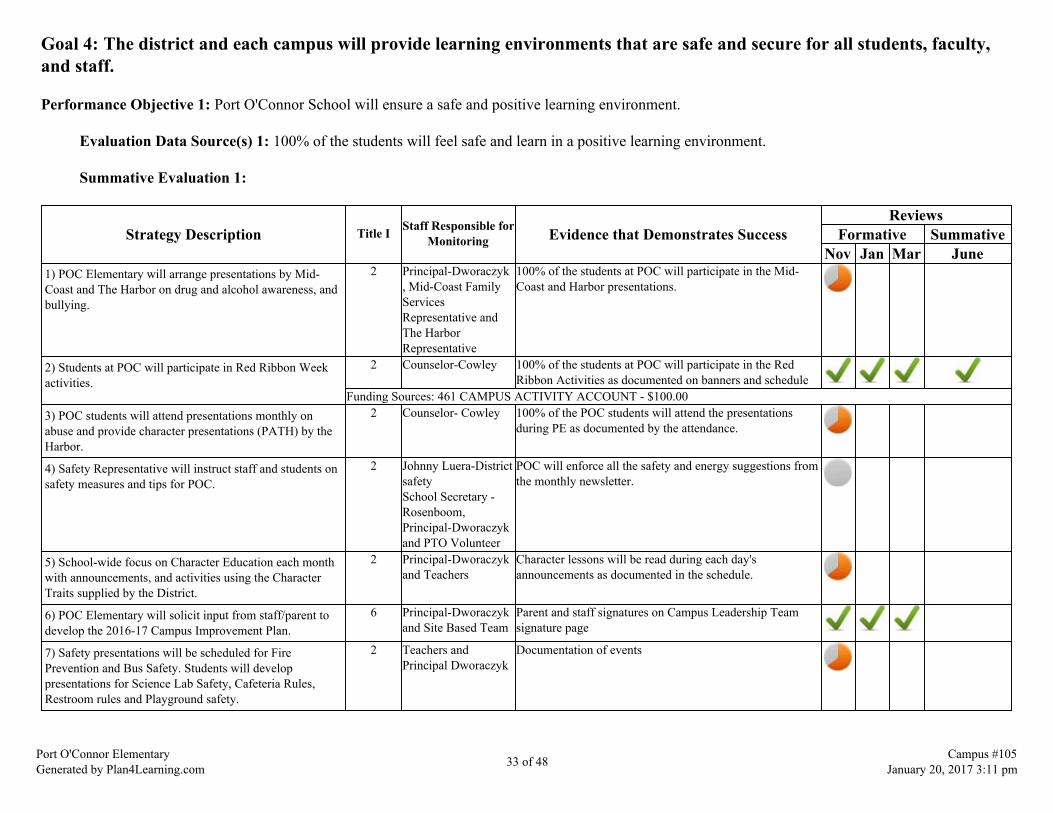
Goal 4: The district and each campus will provide learning environments that are safe and secure for all students, faculty,and staff.
Performance Objective 1: Port O'Connor School will ensure a safe and positive learning environment.
Evaluation Data Source(s) 1: 100% of the students will feel safe and learn in a positive learning environment.
Summative Evaluation 1:
Strategy Description Title I Staff Responsible forMonitoring Evidence that Demonstrates Success
ReviewsFormative Summative
Nov Jan Mar June1) POC Elementary will arrange presentations by Mid-Coast and The Harbor on drug and alcohol awareness, andbullying.
2 Principal-Dworaczyk, Mid-Coast FamilyServicesRepresentative andThe HarborRepresentative
100% of the students at POC will participate in the Mid-Coast and Harbor presentations.
2) Students at POC will participate in Red Ribbon Weekactivities.
2 Counselor-Cowley 100% of the students at POC will participate in the RedRibbon Activities as documented on banners and schedule
Funding Sources: 461 CAMPUS ACTIVITY ACCOUNT - $100.003) POC students will attend presentations monthly onabuse and provide character presentations (PATH) by theHarbor.
2 Counselor- Cowley 100% of the POC students will attend the presentationsduring PE as documented by the attendance.
4) Safety Representative will instruct staff and students onsafety measures and tips for POC.
2 Johnny Luera-DistrictsafetySchool Secretary -Rosenboom,Principal-Dworaczykand PTO Volunteer
POC will enforce all the safety and energy suggestions fromthe monthly newsletter.
5) School-wide focus on Character Education each monthwith announcements, and activities using the CharacterTraits supplied by the District.
2 Principal-Dworaczykand Teachers
Character lessons will be read during each day'sannouncements as documented in the schedule.
6) POC Elementary will solicit input from staff/parent todevelop the 2016-17 Campus Improvement Plan.
6 Principal-Dworaczykand Site Based Team
Parent and staff signatures on Campus Leadership Teamsignature page
7) Safety presentations will be scheduled for FirePrevention and Bus Safety. Students will developpresentations for Science Lab Safety, Cafeteria Rules,Restroom rules and Playground safety.
2 Teachers andPrincipal Dworaczyk
Documentation of events
Port O'Connor ElementaryGenerated by Plan4Learning.com 33 of 48 Campus #105
January 20, 2017 3:11 pm

8) Lessons on Bullying and Heroes will be broadcast onthe announcements on Tuesdays and Thursdays.
2 Principal -Dworaczyk Schedule of lessons and decrease in bullying incidences asdocumented by Behavior Notices to the office.
9) All teachers will use the behavioral strategies focusingon classroom management.
2 Principal Dworaczyk 10% fewer referrals
10) With bond initiative support surveillance cameras, anddigital visitors passes (drivers license checks) will beimplemented.
Principal-Dworaczyk All students and faculty are safe and secure.
11) Students will display their dolphin pride by wearingschool spirit shirts every Friday. They will receive aneducational incentive each week.
Principal-Dworaczyk Strengthened relationships between students and teachers.
Funding Sources: 211 TITLE I - $135.00
= Accomplished = Considerable = Some Progress = No Progress = Discontinue
Port O'Connor ElementaryGenerated by Plan4Learning.com 34 of 48 Campus #105
January 20, 2017 3:11 pm

Goal 5: CCISD will develop and implement a parent and community involvement program that promotes all stakeholders aspartners in the education of our students.
Performance Objective 1: POC parents and community involvement will be promoted at all CCISD campuses and departments.
Evaluation Data Source(s) 1: Parental and community involvement has increased by 10% based on campus sign-in sheets from campusactivity or events involving parents.
Summative Evaluation 1:
Strategy Description Title I Staff Responsible forMonitoring Evidence that Demonstrates Success
ReviewsFormative Summative
Nov Jan Mar June1) A newsletter, "The Dolphin Splash" will be published,put on web-site and sent to parents & volunteers at the endof each month.
6 Teachers. Secretary-Rosenboom & MistyRichter
100% of the parents will receive a newsletter from POC.
2) Articles will be put in "The Dolphin" and "The Wave"newspapers. We will also update the website periodically.
6 PTO Volunteer, CarolRosenboom andTeachers
100% of the school events will be featured in the papers andon-line.
3) POC staff will work with District Technology Team tokeep the POC web-site up dated with information forparents.
6 Principal-Dworaczyk,Technician and MistyRichter-Library Para-professional
100% of parents with computers will be able to checkcalendar and important activities on the web-site.
4) POC will work with Partners in Education to get judgesfor the Science Fair and Spelling Bee.
6 Principal-Dworaczykand Boone
PIE will help attain 100% of the judges needed for the listedcontest as documented by the list of judges used.
5) POC staff will work closely with the PTO to have 3meetings: 1 Open House, Fall carnival, ChristmasProgram, Reading Night at the Book Fair, and Schoolboard meeting in POC where staff/students shareoutstanding programs being implemented. Parent meetingswill be held throughout the year and supplies will bepurchased.
6 Principal-Dworaczykand PTO President
At least 50% of parents will attend each event asdocumented on sign-in sheets and agendas.
Funding Sources: 211 TITLE I - $100.00
6) POC will work with Partners in Education to obtainTutors, Mentors and Volunteers to work with students andteachers.
6 Principal-Dworaczyk,Boone--Partners InEducation
POC will use 100% of the Tutors, Mentors, and Volunteersas documented on the schedule and sign-in sheets.
7) POC will offer parental training at Region 3 & materialsfrom the Harbor, Care, & Region 3, etc.
6 Principal-Dworaczyk A subset of parents will attend at least 1 training asdocumented by the sign-in sheets.
8) POC will purchase technology as budget allows in orderto stay current. All will be maintained by the campus.
6 Principal Dworaczyk& TechnologyFacilitator
Inventory list of equipment designated for parent,community and volunteer use.
Port O'Connor ElementaryGenerated by Plan4Learning.com 35 of 48 Campus #105
January 20, 2017 3:11 pm

9) Use volunteers from the community/service club to tutorstudents in math, reading and science. Appoint a chairmanto organize the volunteers
6 Principal-Dworaczyk Volunteer sign-in sheets, lunches
Funding Sources: 211 TITLE I - $50.00
10) Utilize "Remind.com" to notify parents of events,absences, etc.
6 Principal-Dworaczyk List of messages & information sent out
11) POC Elementary will work with the Food Bank toimplement the backpack program.
Jill Goode-Nurse andCarol Rosenboom-Secretary
POC will provide food for 100% of the eligible students.
12) Various non-profit organizations use our facility topromote a positive partnership between school and thecommunity. The POC PTO will keep community informedusing a variety of methods including a facebook page thatpromotes upcoming school events.
Principal-Dworaczyk Positive input from community and 10% increase involunteers.
13) POC will host a "Mommy Make-Over" event in thespring.
Lead Teacher JudyAnderson
Positive input from community
= Accomplished = Considerable = Some Progress = No Progress = Discontinue
Port O'Connor ElementaryGenerated by Plan4Learning.com 36 of 48 Campus #105
January 20, 2017 3:11 pm

State System Safeguard Strategies
Goal Objective Strategy Description3 1 3 All POC ELA teachers are ESL certified in order to meet the needs of second language learners.
Port O'Connor ElementaryGenerated by Plan4Learning.com 37 of 48 Campus #105
January 20, 2017 3:11 pm

State Compensatory
Budget for Port O'Connor Elementary:
Account Code Account Title Budget
6100 Payroll Costs30 6112 Salaries or Wages for Substitute Teachers or Other Professionals $300.00199 11 6119 99 6119 Salaries or Wages - Teachers and Other Professional Personnel $241,622.0030 6129 Salaries or Wages for Support Personnel $7,867.0030 6141 Social Security/Medicare $602.0030 6142 Group Health and Life Insurance $2,075.0030 6143 Workers' Compensation $91.0030 6145 Unemployment Compensation $6.0030 6146 Teacher Retirement/TRS Care $615.00
6100 Subtotal: $253,178.00 6200 Professional and Contracted Services30 6239 ESC Services $30.0030 6299 Miscellaneous Contracted Services $225.00
6200 Subtotal: $255.00 6300 Supplies and Services199-12-6329 6329 Reading Materials $400.0030 6399 General Supplies $6,023.00
6300 Subtotal: $6,423.00 6400 Other Operating Costs6412 6412 Student Travel $1,000.00
Port O'Connor ElementaryGenerated by Plan4Learning.com 38 of 48 Campus #105
January 20, 2017 3:11 pm

6400 Subtotal: $1,000.00
Port O'Connor ElementaryGenerated by Plan4Learning.com 39 of 48 Campus #105
January 20, 2017 3:11 pm
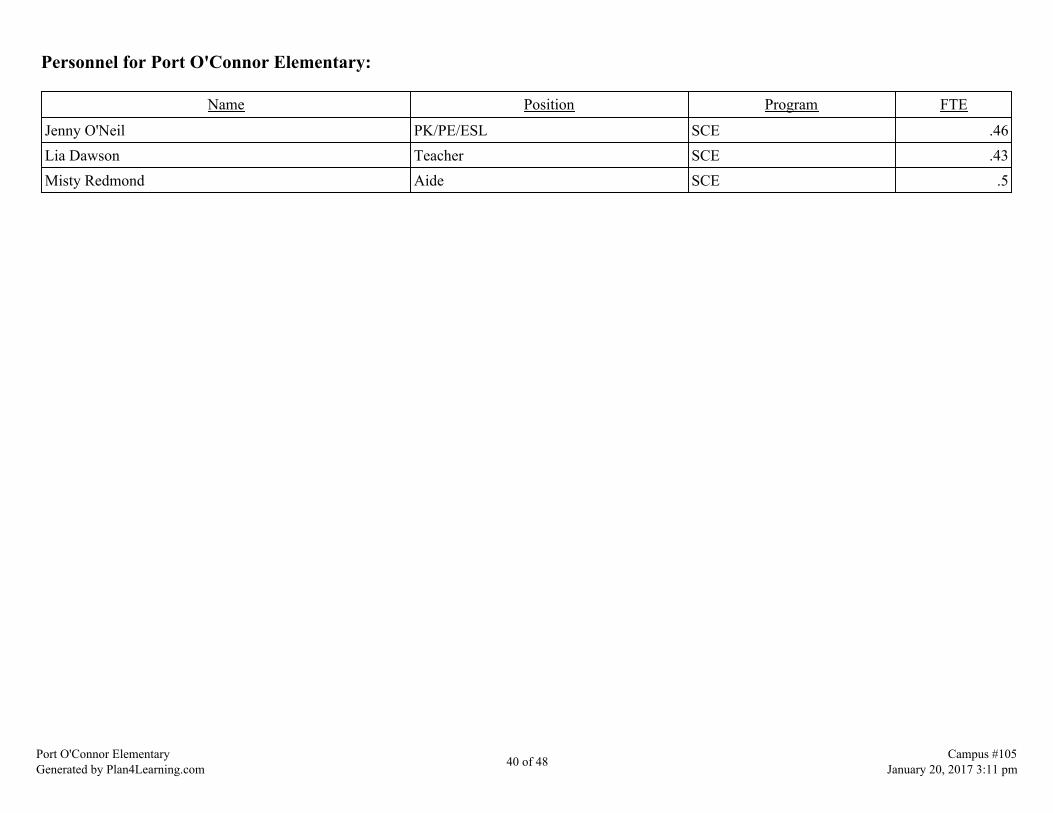
Personnel for Port O'Connor Elementary:
Name Position Program FTE
Jenny O'Neil PK/PE/ESL SCE .46Lia Dawson Teacher SCE .43Misty Redmond Aide SCE .5
Port O'Connor ElementaryGenerated by Plan4Learning.com 40 of 48 Campus #105
January 20, 2017 3:11 pm

Title I
Schoolwide Program Plan
Port O'Connor's school wide Title I program allows the school to address the educational needs of children living in impoverished communities withcomprehensive strategies for improving the entire school so every student achieves high levels of academic proficiency. The purpose is to generate highlevels of academic achievement in core subject areas for all students, especially those students most in need. This is achieved at POC elementary throughhigh quality instruction, comprehensive reform strategies, methods that are based on the use of scientifically based research, strategies and methods toimprove teacher quality through professional development, and a consolidated use of funds. Data from teacher generated test, nine weeks test, daily work,and TPRI is disaggregated and students are placed in small groups to receive intense interventions in needed areas. We will use research based curriculum,including technology to improve student performance.
Our Parental Involvement Policy aims at developing a strong partnership with parents and community members. Teachers are professionals who manage avariety of instructional resources. Parents are an essential resource in the learning process of their children. Organizational support from the Board ofTrustees, district administrators, and campus administrator enable teachers to effectively develop the partnership. Together we can ensure an exceptionaleducation for all children.
Ten Schoolwide Components
1: Comprehensive Needs Assessment
The POC Comprehensive Needs Assessment shows that POC has been very successful in identifying and addressing the needs of students. The programsevaluation measures show how successful the campus is in meeting the needs of our students. The staff will continue to use data collection in planning forclassroom instruction and small group.
2: Schoolwide Reform Strategies
POC school wide initiatives in order to gain schoolwide reform are based on scientifically-based research interventions and address the learning needs of allstudents. Our goals of using the district Scope and Sequence and curriculum along with using innovative technologies such as SMART Boards and ChromeBooks in complex and meaningful ways have worked together to strengthen our core academic programs.
3: Instruction by highly qualified professional teachers
The goal at POC is to have instruction by highly qualified professional teachers who live in POC. We want them to be involved in the community becausethis will help us retain the teachers we have hired and trained.
Port O'Connor ElementaryGenerated by Plan4Learning.com 41 of 48 Campus #105
January 20, 2017 3:11 pm
4: High-quality and ongoing professional development for teachers, principals, and paraprofessionals and, if appropriate, student servicespersonnel, parents, and other staff
The staff at POC will have ongoing high-quality professional development in all core areas: math, reading, writing, science and social studies. Additionally,whole brain teaching, thinking maps, think through math, IStations, and the STAAR test rigor.
6: Strategies to increase parental involvement
POC staff will continue to have activities to improve communication with parents and to train parents and community members to help students withreading, math and all other academics.
8: Measures to include teachers in the decisions regarding the use of academic assessments in order to improve the achievement of individualstudents and the overall instructional program
Teachers disaggregate their data from teacher generated test, Intervention programs (TTM and IStations), TPRI, STAAR, benchmark test, end of yeartest,nine weeks test, etc. These tools will drive the planning process and will help determine the need for tutorials. Teachers on the SBDM committee willstudy school wide data to plan professional development in order to raise student achievement.
9: Activities to ensure effective timely assistance for students who experience difficulty mastering the proficient or advanced levels of academicachievement standards
Maintaining high teacher expectations and continuously addressing student needs will help students master the skills. The goal at POC is for each student toshow a year’s worth of growth, and beyond. By differentiating instruction teachers will be able to address the needs of a wide range oflearners. Differentiation is a comprehensive and flexible process that includes the planning, preparation, and implementation of instruction utilizing ongoingassessments in order to individualize student learning.
Port O'Connor ElementaryGenerated by Plan4Learning.com 42 of 48 Campus #105
January 20, 2017 3:11 pm

Title I Personnel
Name Position Program FTE
Misty Richter Aide Title I .5
Port O'Connor ElementaryGenerated by Plan4Learning.com 43 of 48 Campus #105
January 20, 2017 3:11 pm
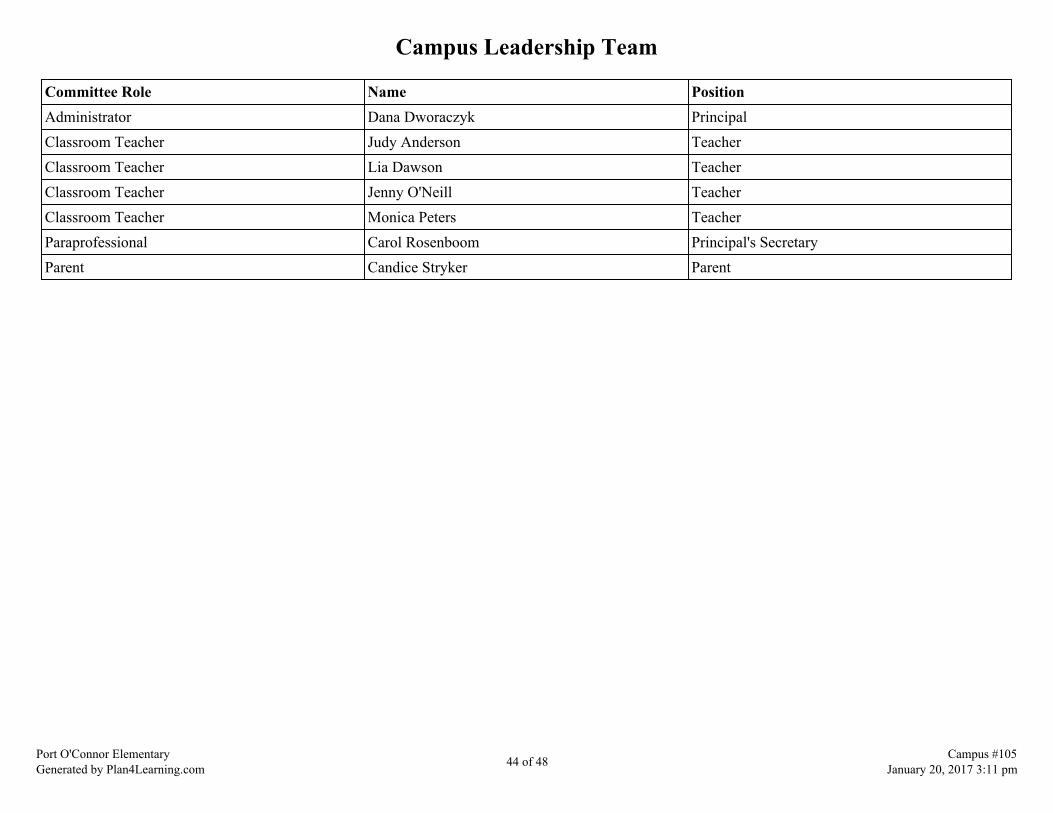
Campus Leadership Team
Committee Role Name PositionAdministrator Dana Dworaczyk PrincipalClassroom Teacher Judy Anderson TeacherClassroom Teacher Lia Dawson TeacherClassroom Teacher Jenny O'Neill TeacherClassroom Teacher Monica Peters TeacherParaprofessional Carol Rosenboom Principal's SecretaryParent Candice Stryker Parent
Port O'Connor ElementaryGenerated by Plan4Learning.com 44 of 48 Campus #105
January 20, 2017 3:11 pm
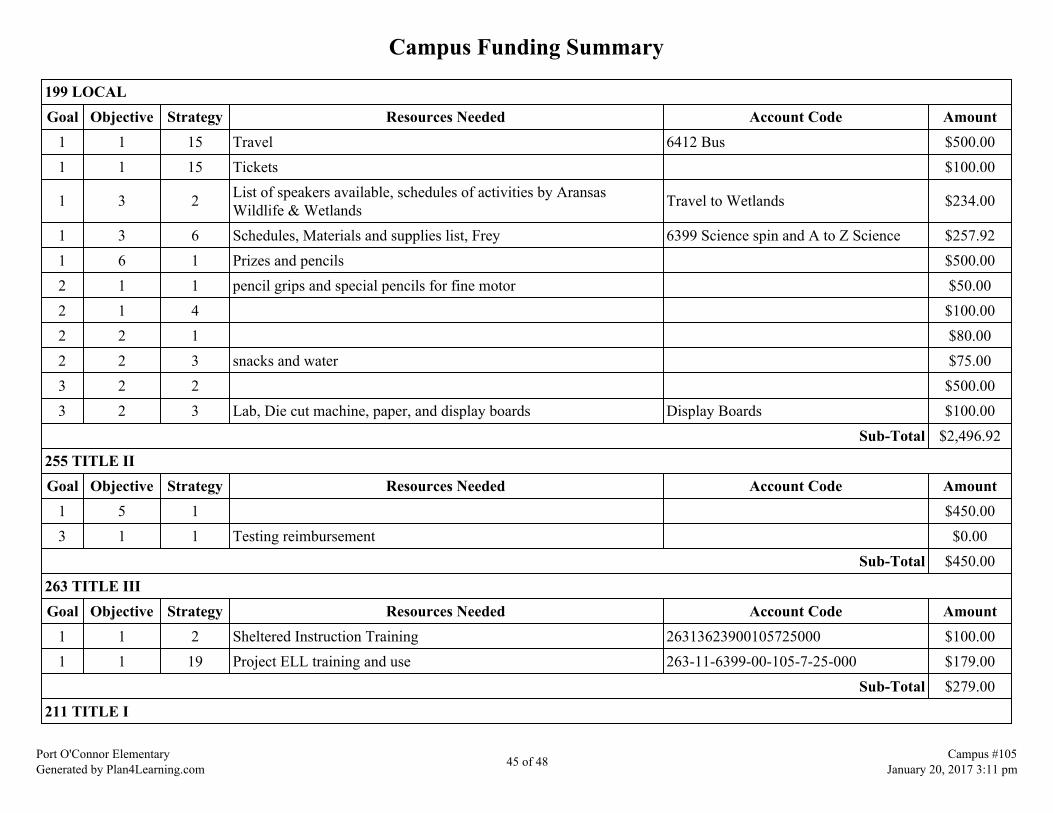
Campus Funding Summary
199 LOCALGoal Objective Strategy Resources Needed Account Code Amount
1 1 15 Travel 6412 Bus $500.001 1 15 Tickets $100.00
1 3 2 List of speakers available, schedules of activities by AransasWildlife & Wetlands Travel to Wetlands $234.00
1 3 6 Schedules, Materials and supplies list, Frey 6399 Science spin and A to Z Science $257.921 6 1 Prizes and pencils $500.002 1 1 pencil grips and special pencils for fine motor $50.002 1 4 $100.002 2 1 $80.002 2 3 snacks and water $75.003 2 2 $500.003 2 3 Lab, Die cut machine, paper, and display boards Display Boards $100.00
Sub-Total $2,496.92255 TITLE IIGoal Objective Strategy Resources Needed Account Code Amount
1 5 1 $450.003 1 1 Testing reimbursement $0.00
Sub-Total $450.00263 TITLE IIIGoal Objective Strategy Resources Needed Account Code Amount
1 1 2 Sheltered Instruction Training 26313623900105725000 $100.001 1 19 Project ELL training and use 263-11-6399-00-105-7-25-000 $179.00
Sub-Total $279.00211 TITLE I
Port O'Connor ElementaryGenerated by Plan4Learning.com 45 of 48 Campus #105
January 20, 2017 3:11 pm
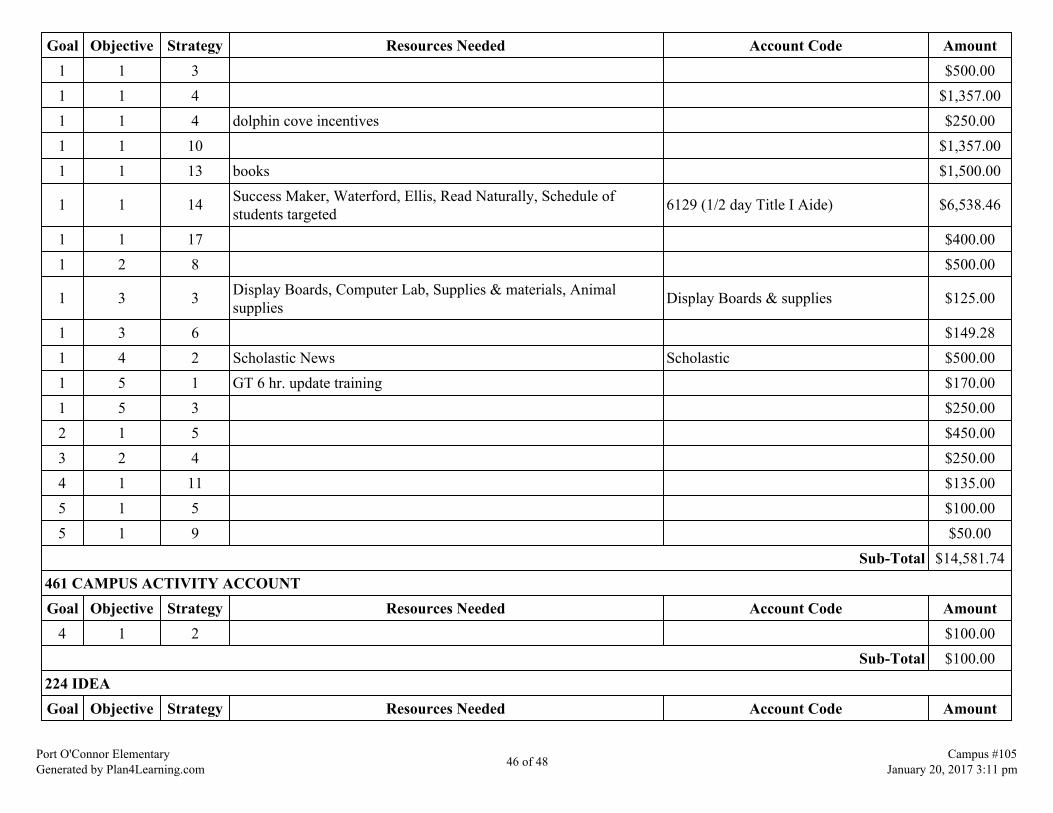
Goal Objective Strategy Resources Needed Account Code Amount1 1 3 $500.001 1 4 $1,357.001 1 4 dolphin cove incentives $250.001 1 10 $1,357.001 1 13 books $1,500.00
1 1 14 Success Maker, Waterford, Ellis, Read Naturally, Schedule ofstudents targeted 6129 (1/2 day Title I Aide) $6,538.46
1 1 17 $400.001 2 8 $500.00
1 3 3 Display Boards, Computer Lab, Supplies & materials, Animalsupplies Display Boards & supplies $125.00
1 3 6 $149.281 4 2 Scholastic News Scholastic $500.001 5 1 GT 6 hr. update training $170.001 5 3 $250.002 1 5 $450.003 2 4 $250.004 1 11 $135.005 1 5 $100.005 1 9 $50.00
Sub-Total $14,581.74461 CAMPUS ACTIVITY ACCOUNTGoal Objective Strategy Resources Needed Account Code Amount
4 1 2 $100.00Sub-Total $100.00
224 IDEAGoal Objective Strategy Resources Needed Account Code Amount
Port O'Connor ElementaryGenerated by Plan4Learning.com 46 of 48 Campus #105
January 20, 2017 3:11 pm
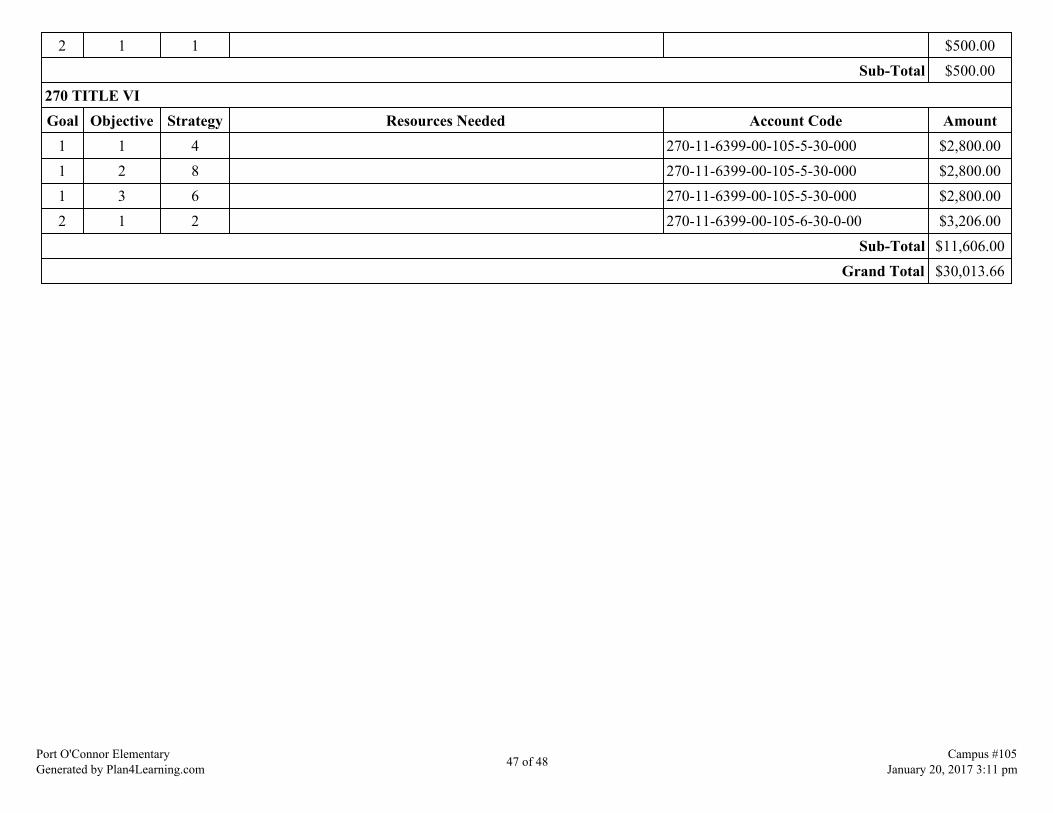
2 1 1 $500.00Sub-Total $500.00
270 TITLE VIGoal Objective Strategy Resources Needed Account Code Amount
1 1 4 270-11-6399-00-105-5-30-000 $2,800.001 2 8 270-11-6399-00-105-5-30-000 $2,800.001 3 6 270-11-6399-00-105-5-30-000 $2,800.002 1 2 270-11-6399-00-105-6-30-0-00 $3,206.00
Sub-Total $11,606.00Grand Total $30,013.66
Port O'Connor ElementaryGenerated by Plan4Learning.com 47 of 48 Campus #105
January 20, 2017 3:11 pm

Addendums
Port O'Connor ElementaryGenerated by Plan4Learning.com 48 of 48 Campus #105
January 20, 2017 3:11 pm
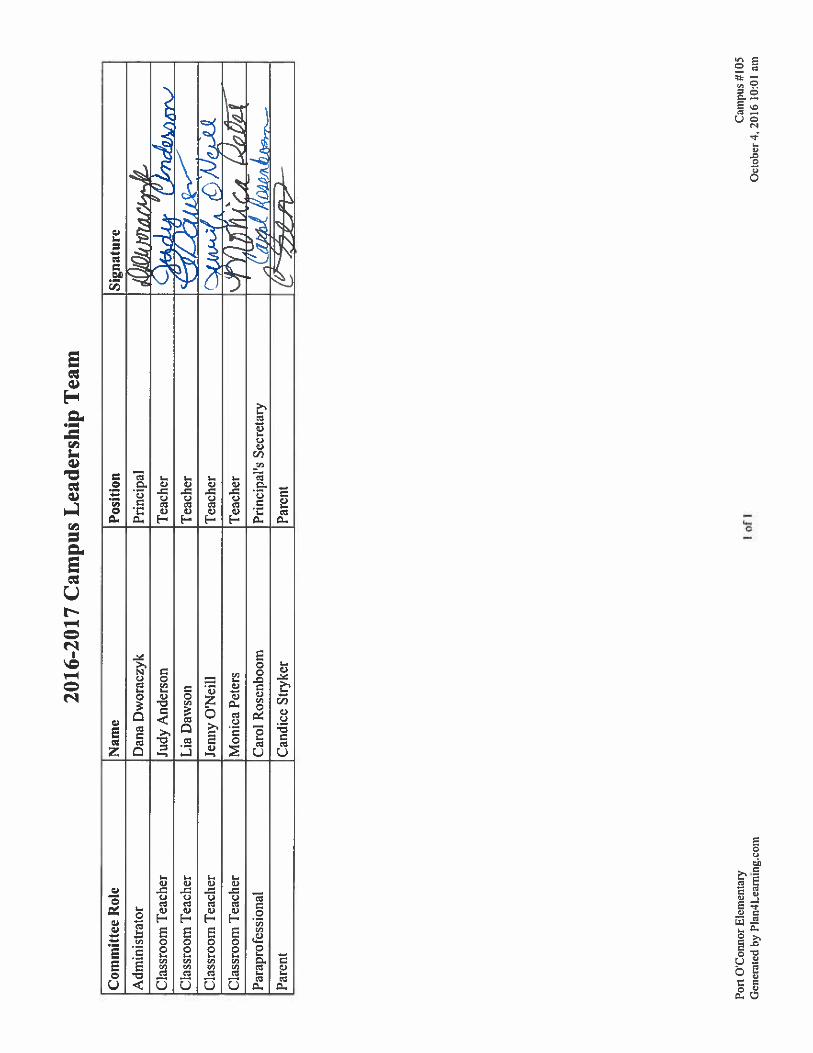

TEXAS EDUCATION AGENCY2016 Accountability Summary
PORT O CONNOR EL (029901105) - CALHOUN COUNTY ISD
Accountability Rating
Met Standard
Met Standards on Did Not Meet Standards on
- Student Achievement - NONE
- Student Progress
- Closing Performance Gaps
- Postsecondary Readiness
In 2016, to receive a Met Standard or Met Alternative Standard rating, districts and campusesmust meet targets on three indexes: Index 1 or Index 2 and Index 3 and Index 4.
Performance Index Report
0
25
50
75
100
Index 1
StudentAchievement
(Target Score=60)
Index 2
StudentProgress
(Target Score=32)
Index 3
ClosingPerformance Gaps(Target Score=28)
Index 4
PostsecondaryReadiness
(Target Score=12)
100 50 70 78
Performance Index Summary
IndexPoints
EarnedMaximum
PointsIndexScore
1 - Student Achievement 69 69 100
2 - Student Progress 100 200 50
3 - Closing Performance Gaps 556 800 70
4 - Postsecondary Readiness
STAAR Score 78.0
Graduation Rate Score N/A
Graduation Plan Score N/A
Postsecondary Component Score N/A 78
Distinction Designation
Academic Achievement in ELA/Reading
NO DISTINCTION EARNED
Academic Achievement in Mathematics
DISTINCTION EARNED
Academic Achievement in Science
NOT ELIGIBLE
Academic Achievement in Social Studies
NOT ELIGIBLE
Top 25 Percent Student Progress
DISTINCTION EARNED
Top 25 Percent Closing Performance Gaps
DISTINCTION EARNED
Postsecondary Readiness
DISTINCTION EARNED
Campus Demographics
Campus Type Elementary
Campus Size 77 Students
Grade Span PK - 05
Percent EconomicallyDisadvantaged 55.8
Percent English LanguageLearners 13.0
Mobility Rate 26.9
System Safeguards
Number and Percentage of Indicators Met
Performance Rates 4 out of 4 = 100%
Participation Rates 2 out of 2 = 100%
Graduation Rates N/A
Total 6 out of 6 = 100%
For further information about this report, please see the Performance Reporting Division website at https://rptsvr1.tea.texas.gov/perfreport/account/2016/index.html
TEA Division of Performance Reporting Page 1 September 2016
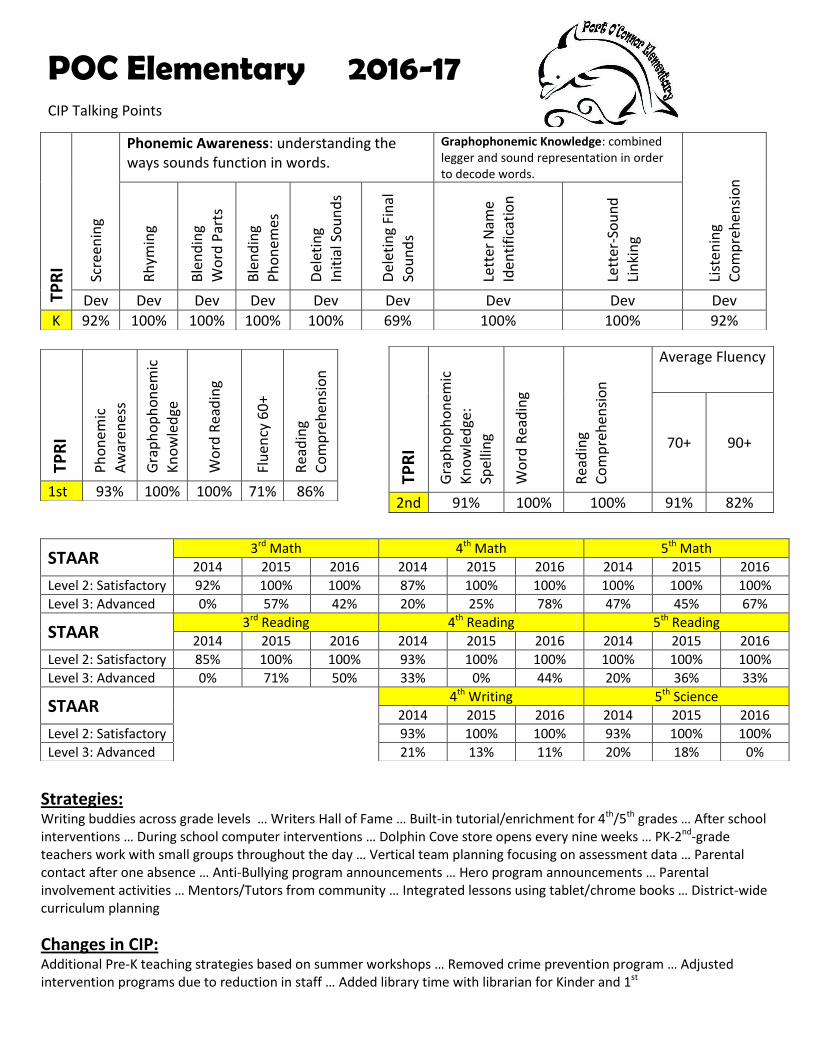
Strategies: Writing buddies across grade levels … Writers Hall of Fame … Built-in tutorial/enrichment for 4
th/5
th grades … After school
interventions … During school computer interventions … Dolphin Cove store opens every nine weeks … PK-2nd
-grade
teachers work with small groups throughout the day … Vertical team planning focusing on assessment data … Parental
contact after one absence … Anti-Bullying program announcements … Hero program announcements … Parental
involvement activities … Mentors/Tutors from community … Integrated lessons using tablet/chrome books … District-wide
curriculum planning
Changes in CIP: Additional Pre-K teaching strategies based on summer workshops … Removed crime prevention program … Adjusted
intervention programs due to reduction in staff … Added library time with librarian for Kinder and 1st
POC Elementary 2016-17
CIP Talking Points
TP
RI
Scr
ee
nin
g
Phonemic Awareness: understanding the
ways sounds function in words.
Graphophonemic Knowledge: combined
legger and sound representation in order
to decode words.
List
en
ing
Co
mp
reh
en
sio
n
Rh
ym
ing
Ble
nd
ing
Wo
rd P
art
s
Ble
nd
ing
Ph
on
em
es
De
leti
ng
Init
ial
So
un
ds
De
leti
ng
Fin
al
So
un
ds
Lett
er
Na
me
Ide
nti
fica
tio
n
Lett
er-
So
un
d
Lin
kin
g
Dev Dev Dev Dev Dev Dev Dev Dev Dev
K 92% 100% 100% 100% 100% 69% 100% 100% 92%
TP
RI
Ph
on
em
ic
Aw
are
ne
ss
Gra
ph
op
ho
ne
mic
Kn
ow
led
ge
Wo
rd R
ea
din
g
Flu
en
cy 6
0+
Re
ad
ing
Co
mp
reh
en
sio
n
1st 93% 100% 100% 71% 86%
TP
RI
Gra
ph
op
ho
ne
mic
Kn
ow
led
ge
:
Sp
ell
ing
Wo
rd R
ea
din
g
Re
ad
ing
Co
mp
reh
en
sio
n
Average Fluency
70+ 90+
2nd 91% 100% 100% 91% 82%
STAAR 3
rd Math 4
th Math 5
th Math
2014 2015 2016 2014 2015 2016 2014 2015 2016
Level 2: Satisfactory 92% 100% 100% 87% 100% 100% 100% 100% 100%
Level 3: Advanced 0% 57% 42% 20% 25% 78% 47% 45% 67%
STAAR 3
rd Reading 4
th Reading 5
th Reading
2014 2015 2016 2014 2015 2016 2014 2015 2016
Level 2: Satisfactory 85% 100% 100% 93% 100% 100% 100% 100% 100%
Level 3: Advanced 0% 71% 50% 33% 0% 44% 20% 36% 33%
STAAR 4
th Writing 5
th Science
2014 2015 2016 2014 2015 2016
Level 2: Satisfactory 93% 100% 100% 93% 100% 100%
Level 3: Advanced 21% 13% 11% 20% 18% 0%
Calhoun County Independent School District
HJM Elementary
2016-2017 Campus Improvement Plan
HJM ElementaryGenerated by Plan4Learning.com 1 of 46 Campus #101
January 19, 2017 12:58 pm

Mission StatementHJM students, staff, and parents will work hand in hand to be the best that we can be.
HJM ElementaryGenerated by Plan4Learning.com 2 of 46 Campus #101
January 19, 2017 12:58 pm
Comprehensive Needs Assessment
Demographics
Demographics Summary
HJM Elementary serves students in Pre-Kindergarten through grade five. In addition to the regular classroom, HJM has EarlyChildhood Education for three and four year old children with special needs. The composition of students consists of approximately:Male 51%, Female 49%, Asian 10%, Black 3%, Hispanic 68%, and White 18%. Twenty nine percent (29%) received services through theschool's student tutorial programs; 79% participate in Young Astronauts, Safety Patrol, Newspaper, Sharktown, Banking, Wal-Mart,Future Teachers, Future Librarians, Shark Bite Cove, H.E.B., Post Office, JAWS Center 25, Recycling and Student Council through ourenrichment programs; and less than 2% received additional support through the school's summer school program.
Demographics Strengths
Declining number of students referred to special programs due to Response to Intervention and Positive Intervention Teams. Tier 3students are monitored closely and are pulled to work with our RTI Intervention specialist.
Tier 2 RtI students are monitored closely and teachers are providing those additional minutes during small group instruction.
I-Stations, Think Thru Math, Waterford will be utilized to meet individual needs and scaffold learning.
Our struggling ESL students are pulled for language rich support.
Demographics Needs
We lost a content mastery para-professional position and a PK para-professional position. These cuts have created many challenges andwe are having to make constant adjustments in order to meet the needs of our students.
HJM ElementaryGenerated by Plan4Learning.com 3 of 46 Campus #101
January 19, 2017 12:58 pm

A 5th grade teaching position was cut therefore class sizes increased. Two 5th grade teachers are now self contained and teachingevery subject. This has created some challenges for this grade level.
Continue to promote writing in all subject areas and grade levels; the goal is to increase scores across ethnicity groups, as well assubject areas.
67% of the student population is at-risk and 70% of the student population is on free or reduced meals; counselors will work closelywith these students to ensure basic needs are met in order to foster academic achievement in the classroom.
HJM ElementaryGenerated by Plan4Learning.com 4 of 46 Campus #101
January 19, 2017 12:58 pm

Student Achievement
Student Achievement Summary
HJM Elementary is an outstanding achieving campus. In 2015-2016 HJM earned 4 Distinctions Designations in the area of AcademicAchievement in Math, Academic Achievement in Science, top 25 percent in closing performance gaps, and Post Secondary Readiness. This is largely due to a viable curriculum along with initiatives focusing on high performance, common assessments, and the use ofeffective teaching strategies. In index 1 referring to Student Achievement we earned 85 (target is 60). The purpose of this index isto provide a snapshot of performance across the content areas on both general and alternative assessments, at the satisfactoryperformance standard. In Index 2 referring to Student Progress we earned 46 (target is 32). The purpose of this index is to providea measure of student progress by subject and content area and student group independent of overall student achievement levels. Growth is evaluated by subject and student group. The growth measure is based on a change score that is the difference betweenthe student's current and prior year scores. The target for index 2 is set at the percentile because the commissioner determinedthat campuses that are the lowest fifth percentile should receive the appropriate interventions needed to be successful in futureyears. In index 3 referring to closing performance gaps we earned 50 (target 28). The purpose of index 3 is to emphasize advancedacademic achievement of the economically disadvantaged student group and the lowest performing race/ethnicity student groups. Index 3 is designed to compare the performance of the lower performing student group to an external target. The external target isone that allows the state to meet the statutory and accountability goal that Texas will be among the top ten states in post secondaryreadiness by 2020 with no significant achievement gaps by race, ethnicity or socioeconomic status. In index 4 we earned 55 (target12). The purpose of Index 4 is to emphasize the importance for students to receive a high school diploma that provides them with thefoundation necessary for success in college, the workforce, job training programs, or the military.
Student Achievement Strengths
In 3rd grade Math 94% met satisfactory level 2 and 28% met advanced level 3In 4th grade Math 92% met satisfactory level 2 and 33% met advanced level 3In 5th grade Math 98% met satisfactory level 2 and 40% met advanced level 3In 4th grade Writing 85% met satisfactory level 2 and 19% met advanced level 3In 5th grade Reading 85% met satisfactory level 2 and 37% met advanced level 3In 5th grade Science 85% met satisfactory level 2 and 24% met advanced level 3Interventions are provided for the students as needed to ensure they are being successful.Instructional calendars are developed by the grade level teachers for the entire district.Special Education teachers are included in conference and block time with their regular education teaching team.Special Education teachers monitor all mainstream students and ensure the regular education teacher have the tools necessaryfor the students to be successful.
HJM ElementaryGenerated by Plan4Learning.com 5 of 46 Campus #101
January 19, 2017 12:58 pm

Most staff members have autism certifications
Student Achievement Needs
In 3rd grade Reading 79% met satisfactory level 2 and 24% met advanced level 3. We are working with 2nd grade teachers and3rd grade to evaluate curricular needs. In 4th grade Reading 84% met satisfactory level 2 and 20% met advanced level 3. We are working with these students as 5thgraders and 4th grade teachers to evaluate curricular needs.Additional chrome books neededClassroom instruction needs to reach the depth and complexity of rigor that is needed for STAAR.Waterford lab for ELL population and K-2 at Risk students close the achievement gap for ELL students.The majority of ELLs entering our schools face a variety of obstacles, their need for systemic instructional support issignificant. Our teachers provide an effective framework that can be extremely helpful for assessing and understanding theneeds of ELLs and they have done an excellent job daily using some of the following to help reach our ELL students: pairedreading, choral reading, drill and practice, repeated reading, combine verbal directions with visual aids, picture supports, modelingpeers, teacher demonstration, teacher modifications of questions to match level of English acquisition, Florida Center forReading Research and many more. We have used Waterford for the past 7 years and have had tremendous success with ourstudents.In 5th grade Reading, 57% met the progress measure of 1 or greater.
HJM ElementaryGenerated by Plan4Learning.com 6 of 46 Campus #101
January 19, 2017 12:58 pm
School Culture and Climate
School Culture and Climate Summary
HJM Elementary serves students beginning at 3 years of age through 5th grade. Students recite the mission statement each dayduring morning announcements. "HJM students, staff, and parents will work hand in hand to be the best we can be." HJM stressesthe importance of being at school everyday. Teachers call home during the 1st absence and will work closely with students/parentsregarding the importance of attendance. We have implemented a new discipline plan this year (5 phase process). It has beensuccessful and parents/teachers/students are communicating regularly. Parental involvement has increased and our parent liaison isworking hard to help bridge that gap.
School Culture and Climate Strengths
HJM staff works with parents to maintain the open door policy and have an open communication between home and school.Teachers call the parents each day when a student is absent from school.School Remind, campus website, social media, and marque is used to contact parents for events at school.HJM Counselors work with students to prevent bullying and various groups are scheduled to present programs.HJM has a highly qualified, motivated, and devoted staff.Our PTO host chili supper eventBook Fair night promotes positive family interactionsGrandparent breakfast was a big successWatch DOGS program Meet the teacherSharktownChoir enrichmentMuffins with daddiesRed Ribbon WeekVeterans Day ProgramChristmas StoreChristmas musicalMentoring ProgramLemonade Day
HJM ElementaryGenerated by Plan4Learning.com 7 of 46 Campus #101
January 19, 2017 12:58 pm
School Culture and Climate Needs
HJM has a population of Karen students that need additional help transitioning due to language and culture differences.
HJM has a population of special needs students, beginning at three years old and continuing through age 12. Some of these studentshave emotional needs and require additional staff, so they can be successful in the public school environment.
HJM ElementaryGenerated by Plan4Learning.com 8 of 46 Campus #101
January 19, 2017 12:58 pm
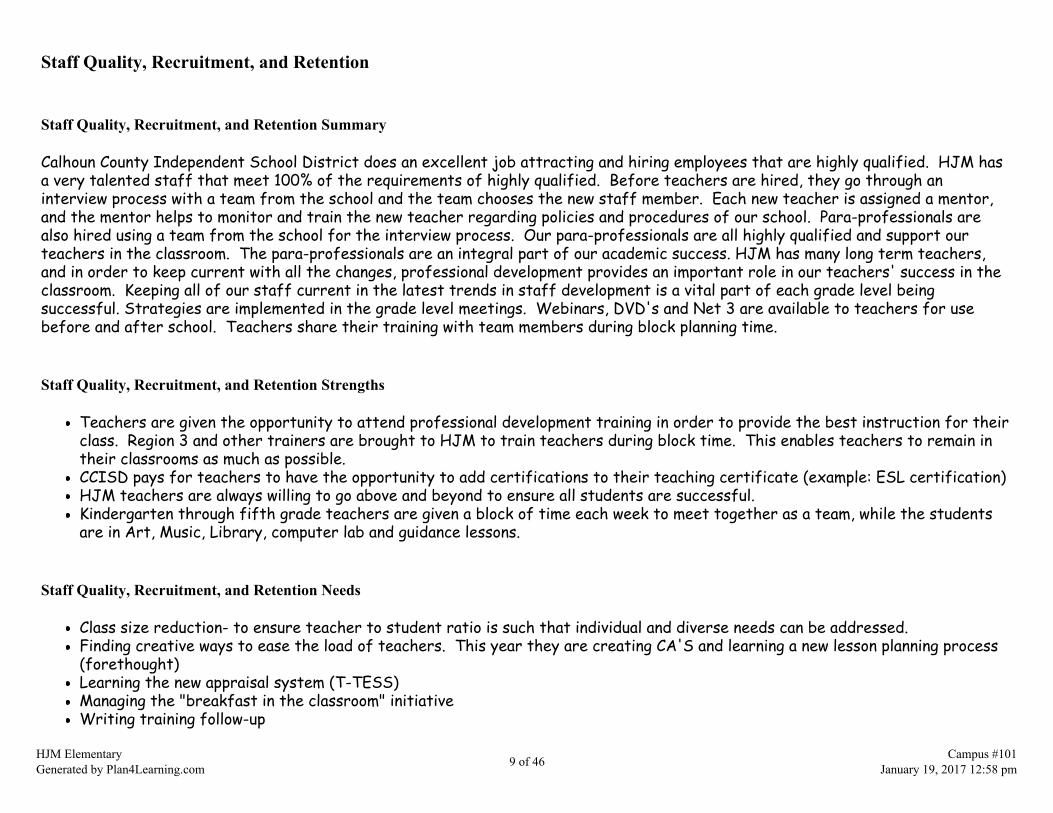
Staff Quality, Recruitment, and Retention
Staff Quality, Recruitment, and Retention Summary
Calhoun County Independent School District does an excellent job attracting and hiring employees that are highly qualified. HJM hasa very talented staff that meet 100% of the requirements of highly qualified. Before teachers are hired, they go through aninterview process with a team from the school and the team chooses the new staff member. Each new teacher is assigned a mentor,and the mentor helps to monitor and train the new teacher regarding policies and procedures of our school. Para-professionals arealso hired using a team from the school for the interview process. Our para-professionals are all highly qualified and support ourteachers in the classroom. The para-professionals are an integral part of our academic success. HJM has many long term teachers,and in order to keep current with all the changes, professional development provides an important role in our teachers' success in theclassroom. Keeping all of our staff current in the latest trends in staff development is a vital part of each grade level beingsuccessful. Strategies are implemented in the grade level meetings. Webinars, DVD's and Net 3 are available to teachers for usebefore and after school. Teachers share their training with team members during block planning time.
Staff Quality, Recruitment, and Retention Strengths
Teachers are given the opportunity to attend professional development training in order to provide the best instruction for theirclass. Region 3 and other trainers are brought to HJM to train teachers during block time. This enables teachers to remain intheir classrooms as much as possible.CCISD pays for teachers to have the opportunity to add certifications to their teaching certificate (example: ESL certification)HJM teachers are always willing to go above and beyond to ensure all students are successful.Kindergarten through fifth grade teachers are given a block of time each week to meet together as a team, while the studentsare in Art, Music, Library, computer lab and guidance lessons.
Staff Quality, Recruitment, and Retention Needs
Class size reduction- to ensure teacher to student ratio is such that individual and diverse needs can be addressed.Finding creative ways to ease the load of teachers. This year they are creating CA'S and learning a new lesson planning process(forethought)Learning the new appraisal system (T-TESS)Managing the "breakfast in the classroom" initiativeWriting training follow-up
HJM ElementaryGenerated by Plan4Learning.com 9 of 46 Campus #101
January 19, 2017 12:58 pm
Integrating technology in the classroomIn depth teaching
HJM ElementaryGenerated by Plan4Learning.com 10 of 46 Campus #101
January 19, 2017 12:58 pm
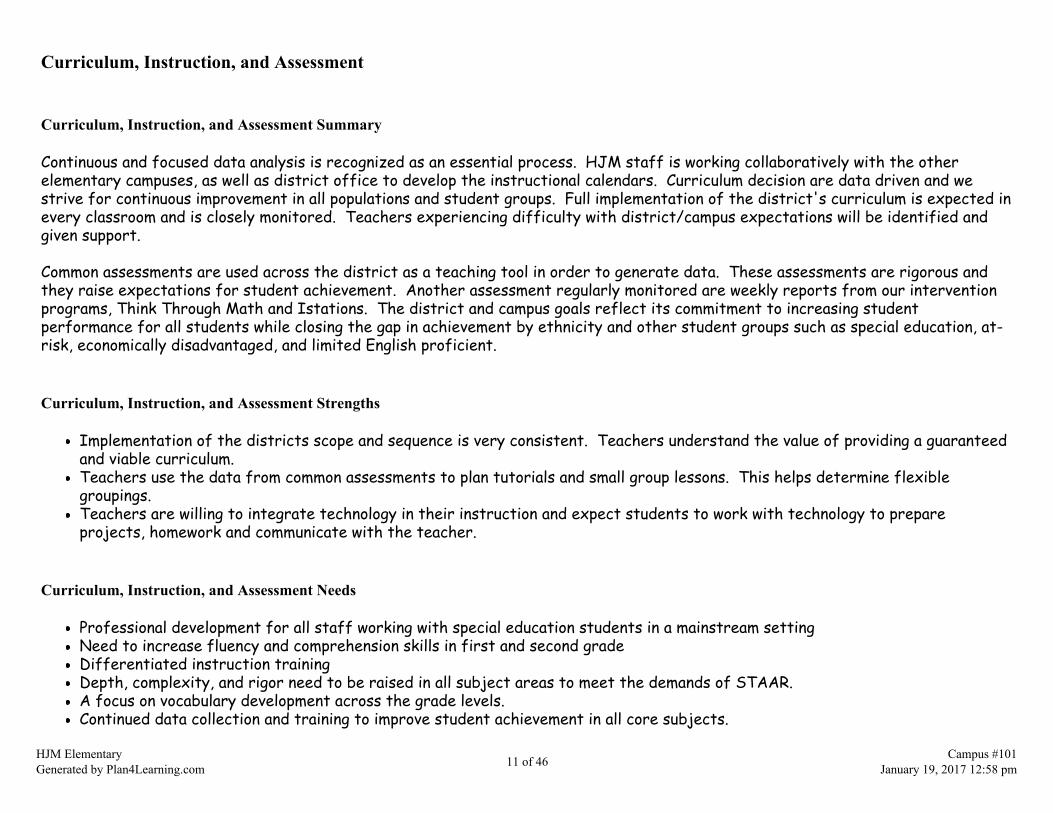
Curriculum, Instruction, and Assessment
Curriculum, Instruction, and Assessment Summary
Continuous and focused data analysis is recognized as an essential process. HJM staff is working collaboratively with the otherelementary campuses, as well as district office to develop the instructional calendars. Curriculum decision are data driven and westrive for continuous improvement in all populations and student groups. Full implementation of the district's curriculum is expected inevery classroom and is closely monitored. Teachers experiencing difficulty with district/campus expectations will be identified andgiven support.
Common assessments are used across the district as a teaching tool in order to generate data. These assessments are rigorous andthey raise expectations for student achievement. Another assessment regularly monitored are weekly reports from our interventionprograms, Think Through Math and Istations. The district and campus goals reflect its commitment to increasing studentperformance for all students while closing the gap in achievement by ethnicity and other student groups such as special education, at-risk, economically disadvantaged, and limited English proficient.
Curriculum, Instruction, and Assessment Strengths
Implementation of the districts scope and sequence is very consistent. Teachers understand the value of providing a guaranteedand viable curriculum.Teachers use the data from common assessments to plan tutorials and small group lessons. This helps determine flexiblegroupings.Teachers are willing to integrate technology in their instruction and expect students to work with technology to prepareprojects, homework and communicate with the teacher.
Curriculum, Instruction, and Assessment Needs
Professional development for all staff working with special education students in a mainstream settingNeed to increase fluency and comprehension skills in first and second gradeDifferentiated instruction trainingDepth, complexity, and rigor need to be raised in all subject areas to meet the demands of STAAR.A focus on vocabulary development across the grade levels.Continued data collection and training to improve student achievement in all core subjects.
HJM ElementaryGenerated by Plan4Learning.com 11 of 46 Campus #101
January 19, 2017 12:58 pm

HJM ElementaryGenerated by Plan4Learning.com 12 of 46 Campus #101
January 19, 2017 12:58 pm

Family and Community Involvement
Family and Community Involvement Summary
HJM Elementary has a shared vision and plan for promoting, enhancing, and sustaining parental involvement where students have all theopportunities and resources necessary to be successful. We have an open door policy and have a large number of volunteers that are atschool on a regular basis to help teachers and students. Since every school is unique, it is important to consider its history,community, strengths, and needs in order to encourage parental involvement. Our vision is for our children to achieve lifelong success.
Family and Community Involvement Strengths
HJM is excited to have a metropolis within our school that includes help from our partners in the community, such as H.E.B.,I.B.C., Walmart, U.S. Post Office, Utilities, I.R.S. and JAWS Channel 25. Students receive incentives for attendance andbehavior.We are implementing a 9 weeks awards assembly every 9 weeksThe Port Lavaca Kiwanis Club, "Bringing Up Grades" (BUGS), visits each six weeks and rewards students that are not on the A/Bhonor roll, but have improved their grades. Remind is used to contact parents about upcoming events.Teachers are in constant contact with parents regarding academic concerns/successesMentors and tutors assist students with academic and behavioral challenges through Partners in Education.Chili SupperGrandparent breakfastVeterans Day ProgramBook FairChristmas Store
Family and Community Involvement Needs
HJM ElementaryGenerated by Plan4Learning.com 13 of 46 Campus #101
January 19, 2017 12:58 pm

Due to work, limited resources, priorities, many parents find it difficult to spend adequate time preparing their childrenacademically and socially. Teachers send an information folder home each day with every student, parents are asked to look at the information and sign thefolder indicating they have read it. This daily communication is a challenge for many of our teachers because parents are notwilling to sign the folder on a daily basis. Due to the mobility of our families within our community, and the excess use of prepaidphones it is a challenge to keep current, adequate address and phone numbers.Our non-English speaking parents, from the 10 different languages spoken at home, offer a challenge for communication fromschool to home.
HJM ElementaryGenerated by Plan4Learning.com 14 of 46 Campus #101
January 19, 2017 12:58 pm
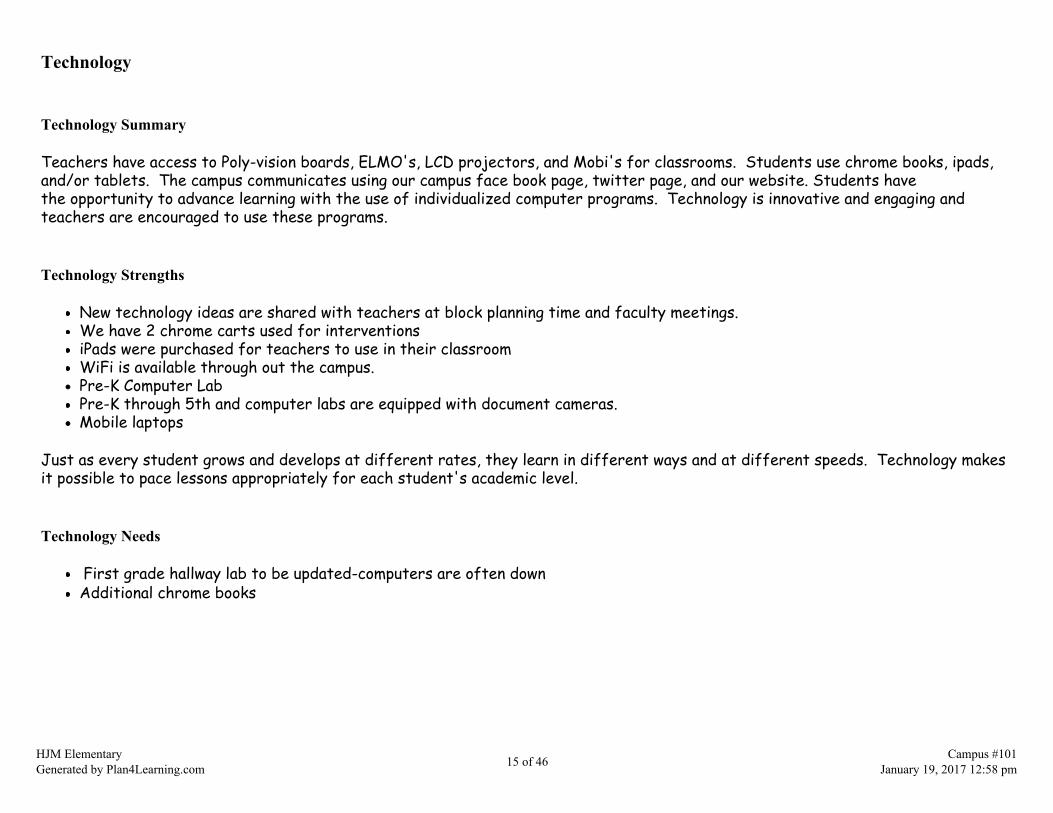
Technology
Technology Summary
Teachers have access to Poly-vision boards, ELMO's, LCD projectors, and Mobi's for classrooms. Students use chrome books, ipads,and/or tablets. The campus communicates using our campus face book page, twitter page, and our website. Students havethe opportunity to advance learning with the use of individualized computer programs. Technology is innovative and engaging andteachers are encouraged to use these programs.
Technology Strengths
New technology ideas are shared with teachers at block planning time and faculty meetings.We have 2 chrome carts used for interventionsiPads were purchased for teachers to use in their classroomWiFi is available through out the campus.Pre-K Computer Lab Pre-K through 5th and computer labs are equipped with document cameras.Mobile laptops
Just as every student grows and develops at different rates, they learn in different ways and at different speeds. Technology makesit possible to pace lessons appropriately for each student's academic level.
Technology Needs
First grade hallway lab to be updated-computers are often downAdditional chrome books
HJM ElementaryGenerated by Plan4Learning.com 15 of 46 Campus #101
January 19, 2017 12:58 pm

Comprehensive Needs Assessment Data Documentation
The following data were used to verify the comprehensive needs assessment analysis:
Improvement Planning Data
District goalsCampus goalsCurrent and/or prior year(s) campus and/or district improvement plansCampus and/or district planning and decision making committee(s) meeting dataState and federal planning requirements
Accountability Data
Texas Academic Performance Report (TAPR) dataFederal Report Card Data
Student Data: Assessments
State and federally required assessment information (e.g. curriculum, eligibility, format, standards, accommodations, TEA information)State of Texas Assessments of Academic Readiness (STAAR) current and longitudinal results, including all versionsSTAAR Released Test QuestionsTexas English Language Proficiency Assessment System (TELPAS) resultsTexas Primary Reading Inventory (TPRI), Tejas LEE, or other alternate early reading assessment resultsStudent Success Initiative (SSI) data for Grades 5 and 8Local diagnostic reading assessment dataLocal diagnostic math assessment dataLocal benchmark or common assessments dataStudent failure and/or retention ratesRunning Records results
Student Data: Student Groups
Number of students assigned to each special program, including analysis of academic achievement, race, ethnicity, gender, etcMale / Female performance and participation dataSpecial education population, including performance, discipline, attendance, and mobilityMigrant population, including performance, discipline, attendance and mobilityAt-Risk population, including performance, discipline, attendance and mobilityELL or LEP data, including academic achievement, support and accommodation needs, race, ethnicity, gender, etcCareer and Technical Education (CTE) data, including academic achievement, program growth, race, ethnicity, gender, etcSection 504 dataHomeless data
HJM ElementaryGenerated by Plan4Learning.com 16 of 46 Campus #101
January 19, 2017 12:58 pm
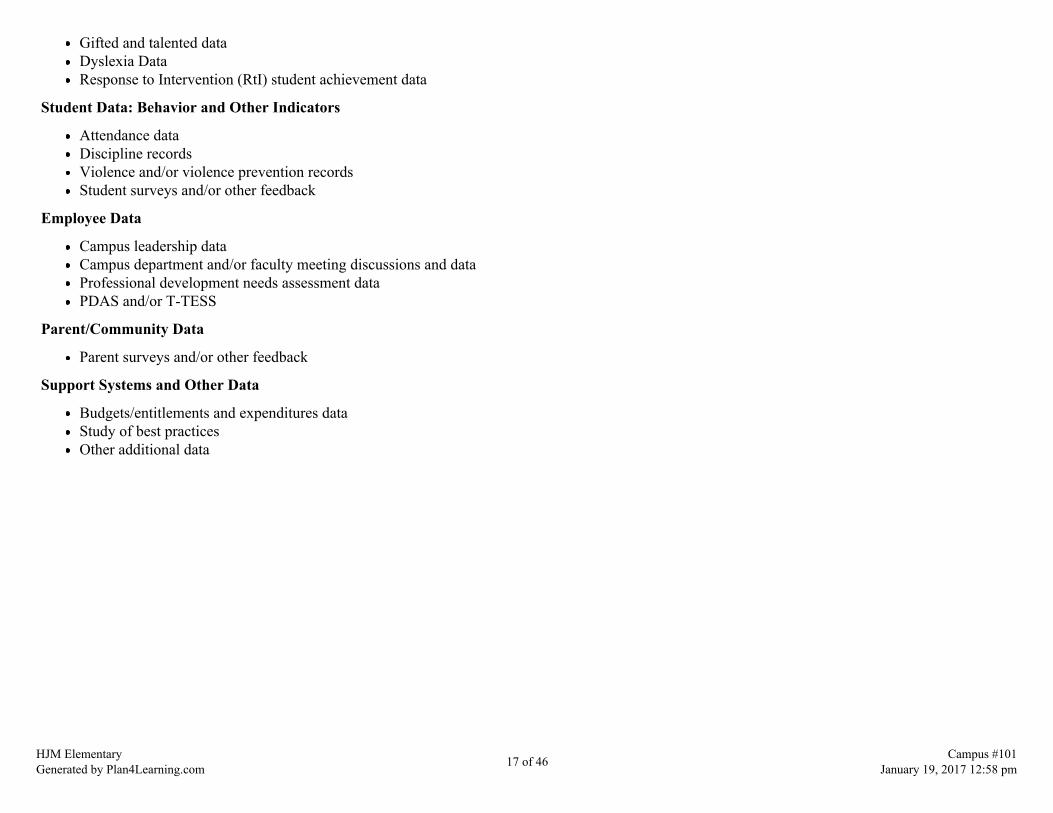
Gifted and talented dataDyslexia DataResponse to Intervention (RtI) student achievement data
Student Data: Behavior and Other Indicators
Attendance dataDiscipline recordsViolence and/or violence prevention recordsStudent surveys and/or other feedback
Employee Data
Campus leadership dataCampus department and/or faculty meeting discussions and dataProfessional development needs assessment dataPDAS and/or T-TESS
Parent/Community Data
Parent surveys and/or other feedback
Support Systems and Other Data
Budgets/entitlements and expenditures dataStudy of best practicesOther additional data
HJM ElementaryGenerated by Plan4Learning.com 17 of 46 Campus #101
January 19, 2017 12:58 pm

Goals
Goal 1: CCISD will provide learning opportunities that are engaging, rigorous, relevant, and transcend state standardswhile meeting individual needs.
Performance Objective 1: All CCISD will participate in ELAR activities that promote creativity, collaboration and problem-solving.
Evaluation Data Source(s) 1: 100% of HJM students will show one or more years growth and/or meet the state standards on Reading andWriting STAAR/Cumulative Assessments.
Summative Evaluation 1:
Strategy Description Title I Staff Responsiblefor Monitoring Evidence that Demonstrates Success
ReviewsFormative Summative
Nov Jan Mar June1) Will provide relevant student services including tutorials for targeted subpopulations to address achievement gaps.
1, 2, 3, 8,9
Admistration andTeachers
100 % of all students will meet minimum statestandards on STAAR and EOY testing
2) Grade levels will meet together once a week during scheduled block timeto evaluate students and plan instruction to increase student achievementand knowledge.
1, 2, 3, 8,9
Teachers, STAARFacilitator, andAdministration
Common Assesment (CA), weekly assessments,TPRI, STAAR, EOY assessments and UniversalScreener, progress monitoring.
3) HJM will implement the district Instructional Model: InstructionalCalendars (Scope &Sequence): Instructional focuses (daily Obj.): RegularAssessments (Spot Check for Mastery); Maintenance (Spiral TEKSthroughout the week, month, year): Conferences (Principals to Teachers):and Accountability Meetings (District Office) to ensure all Readiness,Supporting, and Process Standards are being taught and assessed.Instructional Specialist will assist teachers.
1, 2, 3, 8,9
Teachers,InstructionalFacilitator, andAdministration
Instructional Specialist will use CA, weekly basedassessments, TPRI, STAAR, EOY assessments andUniversal Screener, progress monitoring.
Funding Sources: 211 TITLE I - $47,150.00
4) Teachers will use rigorous research based materials such as: MotivationalReading, Mentoring Minds, State adopted curriculum, Guided Readingtechniques, Accelerated Reader, Writing to Read lab, Brain Pop, Focus onthe STAAR, Saxon Phonics and Spelling, Thinking Maps, I-station,Waterford and computers to achieve performance objectives. Instructionalsupplies, materials and support services will be purchased to support theacademic and social goals of the campus to promote creativity,collaboration, and problem solving.Students will earn shark dollars for successful intervention lessons. Theywill have the opportunity to spend it each 9 weeks at shark bite cove.
1, 2, 3, 8,9
Teachers,InstructionalFacilitator,counselors
CA, weekly assessments, TPRI, STAAR, EOYTesting Data
Funding Sources: 211 TITLE I - $5,000.00, 270 TITLE VI - $12,000.00
HJM ElementaryGenerated by Plan4Learning.com 18 of 46 Campus #101
January 19, 2017 12:58 pm

Critical Success FactorsCSF 2
5) Teachers will review and dissaggregate CA and STAAR test data toidentify the academic needs of students and use research based monitoringto meet academic needs.
1, 2, 3, 8,9
Teachers,Instructionalfacilitator,Administration
CA, weekly assessments, TPRI, STAAR, EOYTesting Data
6) Read Naturally, I-Station Reading, and Waterford will be used byteachers and staff to help develop comprehension and fluency.
1, 2, 3, 8,9
Denise Henk andTeachers
Teachers will test fluency in assessments conducted.
7) K-5 students will be screened and provided differentiated readinginstruction. Students will be progress monitored.
1, 3, 8, 9 RtI Students will be reading on grade level.
8) A Response to Intervention teacher will provide intensive systematicinstruction using Handwriting without Tears, and Wilson to strengthen thefoundation of reading development and fine motor skills.
2, 3, 8, 9RtI, ElizabethGrubbs and EmilyOndreas
Students will be reading on grade level.
9) Homeless students will meet district criteria. They will be provided withsupplies, clothing, and necessities needed to ensure success academicallyand socially.
1, 2, 9 Teachers,Counselors andAdministration
Monitoring of student's needs.
Funding Sources: 211 TITLE I - $0.0010) Instructional materials including additional stories for listening centerswill be purchased to support the academic and social goals of the campus.Replacement headphones and will also be purchased as needed.
1, 2 Administration andTeachers
Students will be reading on grade level.
Funding Sources: 211 TITLE I - $500.00
11) Students will also be provided snacks and water during testing. 1, 2, 8, 9 Denise Henk Students meet state standard on STAAR test
Funding Sources: 461 CAMPUS ACTIVITY ACCOUNT - $600.0012) Each nine weeks, the grade level Reading teachers will meet togetherwith other teachers from the district along with the district instructionalspecialist to create a reading calendar for the district and campus generatedCA.
1, 2, 4, 5 Tiffany O'Donnell,Julie Duckett-Casey,Denise Henk, andTeachers
Lesson plans will be monitored to demonstrate theuse of effective reading instruction methods withinthe classroom.
Critical Success FactorsCSF 1
13) 5th grade students who do not meet satisfactory performance on STAARReading will receive intense interventions after STAAR results from 1st and2nd testing and during Summer School.
1, 2, 9 Tiffany O'Donnell,Julie Duckett-Casey, andTeachers
Students will be reading on grade level.
14) Will provide relevant student services including GT instruction forstudents that exceed expectations on TPRI and STAAR assessment.
1, 2, 3, 4,5
Tiffany O'Donnell,Julie Duckett-Casey, andTeachers
Reading above grade level on end of year TPRI andreceive advanced scores on STAAR assessments.
15) PLC's will provide collaboration and professional development to staffduring block planning time.
1, 2, 3, 4 Denise Henk Teachers will be provided with professional skillsnecessary to succeed in a 21st Century classroom.
HJM ElementaryGenerated by Plan4Learning.com 19 of 46 Campus #101
January 19, 2017 12:58 pm
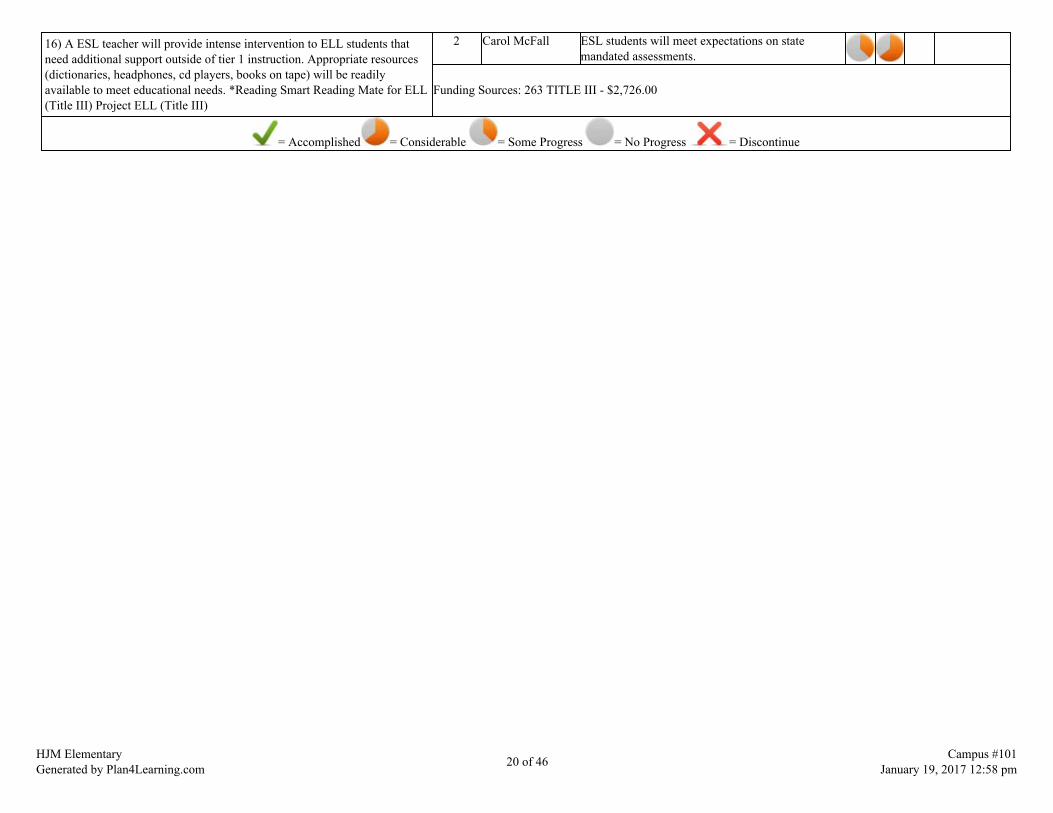
16) A ESL teacher will provide intense intervention to ELL students thatneed additional support outside of tier 1 instruction. Appropriate resources(dictionaries, headphones, cd players, books on tape) will be readilyavailable to meet educational needs. *Reading Smart Reading Mate for ELL(Title III) Project ELL (Title III)
2 Carol McFall ESL students will meet expectations on statemandated assessments.
Funding Sources: 263 TITLE III - $2,726.00
= Accomplished = Considerable = Some Progress = No Progress = Discontinue
HJM ElementaryGenerated by Plan4Learning.com 20 of 46 Campus #101
January 19, 2017 12:58 pm

Goal 1: CCISD will provide learning opportunities that are engaging, rigorous, relevant, and transcend state standards while meeting individual needs.
Performance Objective 2: All CCISD will participate in Math activities that promote creativity, collaboration and problem solving.
Evaluation Data Source(s) 2: 100% of HJM students will show one or more years growth and/or meet the state standards on MathSTAAR/Cumulative Assessments.
Summative Evaluation 2:
Strategy Description Title I Staff Responsiblefor Monitoring Evidence that Demonstrates Success
ReviewsFormative Summative
Nov Jan Mar June1) Will provide relevant student services including tutorials for targetedsub populations to address achievement gaps.
1, 2, 3,8, 9
Aministration andTeachers
100% of all students will be at minimum statestandards on STAAR and EOY testing
2) Grade levels will meet together once a week during scheduled blocktime to evaluate students and plan instruction to increase studentachievement and knowledge.
1, 2, 3,8, 9
Teachers,InstructionalFacilitator, andAdministration
CA, weekly assessments, STAAR, EOYassessments
3) Instructional Specialist will assist teachers in the use of instructionalcalendars, regular assessments, and Common Assessments (CA) toensure all Readiness, Supporting, and Process Standards are being taughtand assessed.
1, 2, 3,8, 9
Teachers,InstructionalFacilitator, andAdministration
CA, weekly asessements, STAAR, EOY TestingData
Funding Sources: 211 TITLE I - $0.004) Teachers will use rigorous research based materials such asMotivational Math, Lone STAAR Math, Kim Sutton, Motivational MathClassroom Assessment Packs, Countdown to STAAR daily rigor, StateAdopted Curriculum, STAAR Ready, Math Academy, Brain Pop, MarcyCook, Splash Math, Waterford and computers to achieve performanceobjectives. Instructional supplies, hands on activities and materials andsupport services will be purchased to support the academic and socialgoals of the campus to promote creativity, collaboration and problemsolving.
1, 2, 3,8, 9
Teachers,InstructionalFacilitator,Administration
CA, weekly assessments, TPRI, STAAR, EOYTesting Data
Funding Sources: 211 TITLE I - $500.00, 270 TITLE VI - $12,000.00
Critical Success FactorsCSF 2
5) Teachers will review and disaggregate CA and STAAR data toidentify the academic needs of students and use research based materialsto meet academic needs.
1, 2, 3,8, 9
Teachers,Instructionalfacilitator,Administration
CA, weekly assessments, STAAR, EOY TestingData
HJM ElementaryGenerated by Plan4Learning.com 21 of 46 Campus #101
January 19, 2017 12:58 pm

6) Each nine weeks, the grade level math teachers will meet together withother teachers from the district along with the district instructionalspecialist to create a math calendar for the district.
1, 2, 3,4, 5, 8, 9
TiffanyO'Donnell, JulieDuckett-Casey,Denise Henk, andTeachers
Lesson plans will be monitored in EduphoriaForethought to demonstrate the use of effectivemath instructional methods and experimentswithin the classroom.
7) Will provide relevant student services for students that exceedexpectations STAAR assessment.
1, 2, 3,4, 5, 8
TiffanyO'Donnell, JulieDuckett-Casey,and Teachers
Receiving advanced scores on STAARassessments and EOY assessments.
8) PLC's will be implemented to provide collaboration and professionaldevelopment to staff.
1, 2, 8,9, 10
Denise Henk Students will be above grade level on EOY mathassessments and will score advanced on theSTAAR assessment.
9) Students will be provided breakfast prior to taking the STAAR test.Students will also be provided snacks and water during testing.
1, 2, 9 Denise Henk Students meet state standard on STAAR tests.
Funding Sources: 461 CAMPUS ACTIVITY ACCOUNT - $600.00Critical Success Factors
CSF 1
10) 5th grade students who do not meet satisfactory performance onSTAAR Math will receive intense interventions after STAAR resultsfrom 1st and 2nd testing and during Summer School.
1, 2, 9 TiffanyO'Donnell, JulieDuckett-Casey,and Teachers
Students meeting state standards
= Accomplished = Considerable = Some Progress = No Progress = Discontinue
HJM ElementaryGenerated by Plan4Learning.com 22 of 46 Campus #101
January 19, 2017 12:58 pm
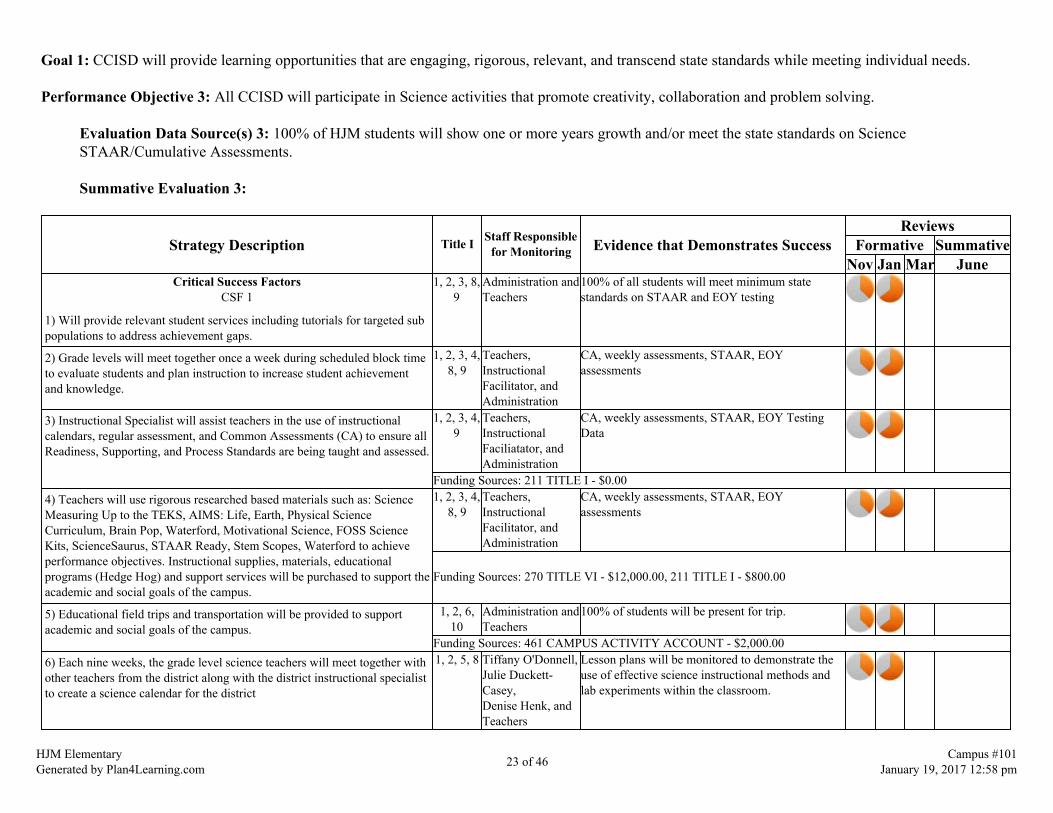
Goal 1: CCISD will provide learning opportunities that are engaging, rigorous, relevant, and transcend state standards while meeting individual needs.
Performance Objective 3: All CCISD will participate in Science activities that promote creativity, collaboration and problem solving.
Evaluation Data Source(s) 3: 100% of HJM students will show one or more years growth and/or meet the state standards on ScienceSTAAR/Cumulative Assessments.
Summative Evaluation 3:
Strategy Description Title I Staff Responsiblefor Monitoring Evidence that Demonstrates Success
ReviewsFormative Summative
Nov Jan Mar JuneCritical Success Factors
CSF 1
1) Will provide relevant student services including tutorials for targeted subpopulations to address achievement gaps.
1, 2, 3, 8,9
Administration andTeachers
100% of all students will meet minimum statestandards on STAAR and EOY testing
2) Grade levels will meet together once a week during scheduled block timeto evaluate students and plan instruction to increase student achievementand knowledge.
1, 2, 3, 4,8, 9
Teachers,InstructionalFacilitator, andAdministration
CA, weekly assessments, STAAR, EOYassessments
3) Instructional Specialist will assist teachers in the use of instructionalcalendars, regular assessment, and Common Assessments (CA) to ensure allReadiness, Supporting, and Process Standards are being taught and assessed.
1, 2, 3, 4,9
Teachers,InstructionalFaciliatator, andAdministration
CA, weekly assessments, STAAR, EOY TestingData
Funding Sources: 211 TITLE I - $0.004) Teachers will use rigorous researched based materials such as: ScienceMeasuring Up to the TEKS, AIMS: Life, Earth, Physical ScienceCurriculum, Brain Pop, Waterford, Motivational Science, FOSS ScienceKits, ScienceSaurus, STAAR Ready, Stem Scopes, Waterford to achieveperformance objectives. Instructional supplies, materials, educationalprograms (Hedge Hog) and support services will be purchased to support theacademic and social goals of the campus.
1, 2, 3, 4,8, 9
Teachers,InstructionalFacilitator, andAdministration
CA, weekly assessments, STAAR, EOYassessments
Funding Sources: 270 TITLE VI - $12,000.00, 211 TITLE I - $800.00
5) Educational field trips and transportation will be provided to supportacademic and social goals of the campus.
1, 2, 6,10
Administration andTeachers
100% of students will be present for trip.
Funding Sources: 461 CAMPUS ACTIVITY ACCOUNT - $2,000.006) Each nine weeks, the grade level science teachers will meet together withother teachers from the district along with the district instructional specialistto create a science calendar for the district
1, 2, 5, 8 Tiffany O'Donnell,Julie Duckett-Casey,Denise Henk, andTeachers
Lesson plans will be monitored to demonstrate theuse of effective science instructional methods andlab experiments within the classroom.
HJM ElementaryGenerated by Plan4Learning.com 23 of 46 Campus #101
January 19, 2017 12:58 pm
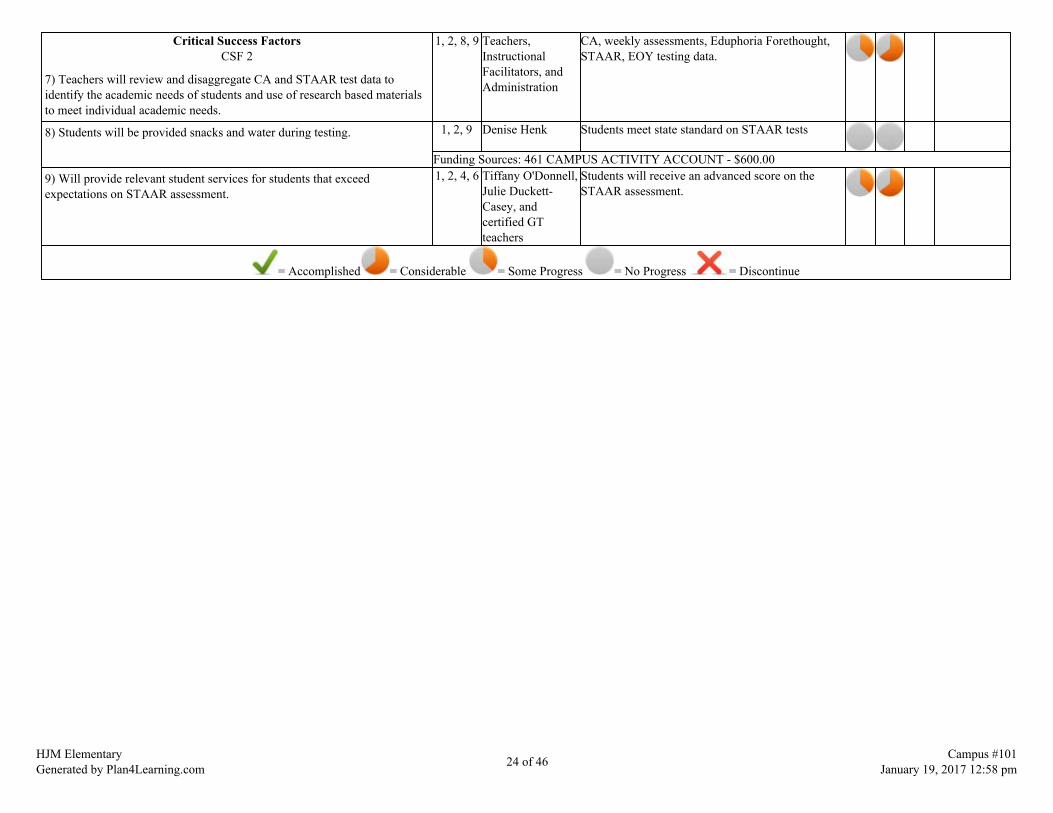
Critical Success FactorsCSF 2
7) Teachers will review and disaggregate CA and STAAR test data toidentify the academic needs of students and use of research based materialsto meet individual academic needs.
1, 2, 8, 9 Teachers,InstructionalFacilitators, andAdministration
CA, weekly assessments, Eduphoria Forethought,STAAR, EOY testing data.
8) Students will be provided snacks and water during testing. 1, 2, 9 Denise Henk Students meet state standard on STAAR tests
Funding Sources: 461 CAMPUS ACTIVITY ACCOUNT - $600.009) Will provide relevant student services for students that exceedexpectations on STAAR assessment.
1, 2, 4, 6 Tiffany O'Donnell,Julie Duckett-Casey, andcertified GTteachers
Students will receive an advanced score on theSTAAR assessment.
= Accomplished = Considerable = Some Progress = No Progress = Discontinue
HJM ElementaryGenerated by Plan4Learning.com 24 of 46 Campus #101
January 19, 2017 12:58 pm

Goal 1: CCISD will provide learning opportunities that are engaging, rigorous, relevant, and transcend state standards while meeting individual needs.
Performance Objective 4: All CCISD will participate in Social Studies activities that promote creativity, collaboration and problem-solving.
Evaluation Data Source(s) 4: 100% of HJM students will show one or more years growth and/or meet the state standards on Social StudiesCumulative Assessments.
Summative Evaluation 4:
Strategy Description Title I Staff Responsiblefor Monitoring Evidence that Demonstrates Success
ReviewsFormative Summative
Nov Jan Mar June1) Will provide student services including tutorials for targeted students inareas of Social Studies.
1, 2, 3, 8,9
Administration andTeachers
100% of all students will meet minimum statestandards on 8th grade STAAR and EOY testing.
2) Grade levels will meet together once a week during scheduled block timeto evaluate students and plan instruction to increase student achievementand knowledge.
1, 2, 3, 8,9
Teachers andAdministration
Weekly Assessments
3) Teachers will use rigorous research based materials such as instructionalcalendars, Social Studies Weekly, CA, and Brain Pop to ensure readiness,supporting, and process standards are being taught and assessed.Instructional supplies, and relevant resources will be purchased to supportthe academic and social goals of the campus to promote creativity,collaboration and problem solving. Lessons will reflect a diverse range ofteaching techniques and approaches. *Mock election
1, 2, 3, 8,9
Teachers andAdministration
Weekly Assessments
Funding Sources: 211 TITLE I - $300.00
4) Educational field trips and transportation will be provided to meetacademic and social goals of the campus.
1, 2, 3, 6,9
Administration andTeachers
100% of students will be present on trips.
Funding Sources: 461 CAMPUS ACTIVITY ACCOUNT - $2,000.005) Each nine weeks, the grade level Social Studies teachers will meettogether with other teachers from the district along with the districtinstructional specialist to create a Social Studies calendar for the district.
1, 2, 5, 8,9
Tiffany O'Donnell,Julie Duckett-Casey, DeniseHenk, and SocialStudies teachers
Lesson plans will be monitored to demonstrate theuse of effective Social Studies instructional methodsand experiments within the classroom.
Funding Sources: 211 TITLE I - $0.00
= Accomplished = Considerable = Some Progress = No Progress = Discontinue
HJM ElementaryGenerated by Plan4Learning.com 25 of 46 Campus #101
January 19, 2017 12:58 pm
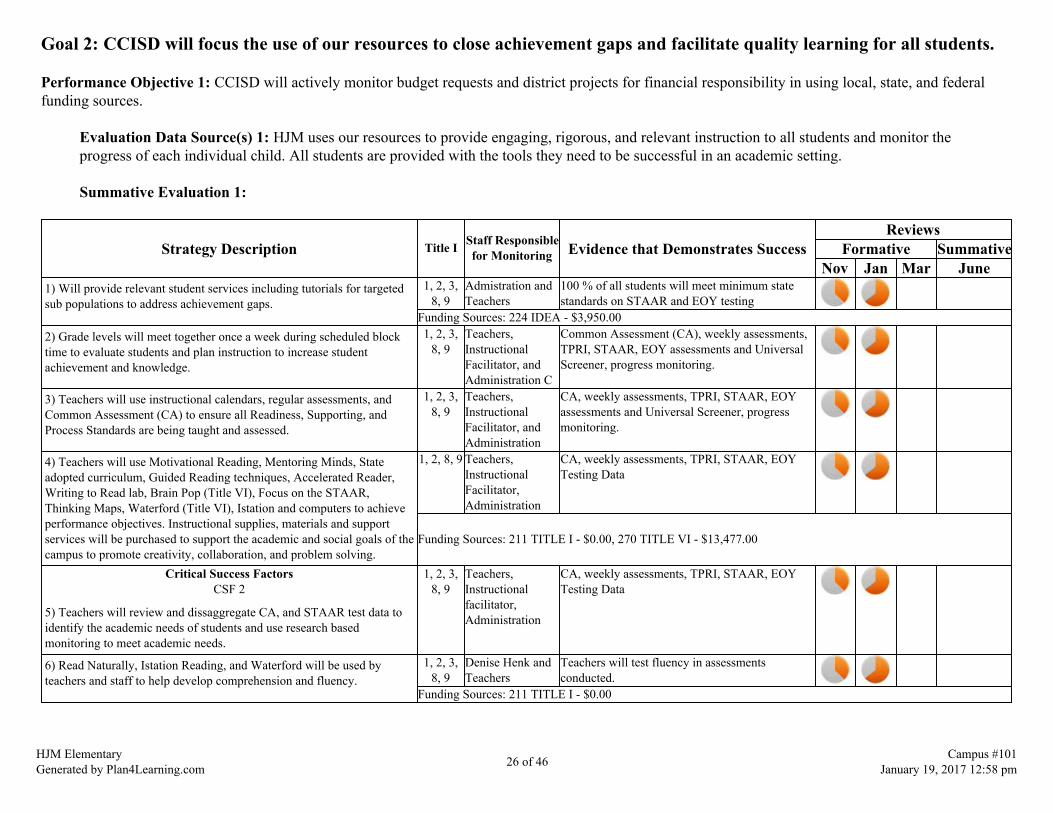
Goal 2: CCISD will focus the use of our resources to close achievement gaps and facilitate quality learning for all students.
Performance Objective 1: CCISD will actively monitor budget requests and district projects for financial responsibility in using local, state, and federalfunding sources.
Evaluation Data Source(s) 1: HJM uses our resources to provide engaging, rigorous, and relevant instruction to all students and monitor theprogress of each individual child. All students are provided with the tools they need to be successful in an academic setting.
Summative Evaluation 1:
Strategy Description Title I Staff Responsiblefor Monitoring Evidence that Demonstrates Success
ReviewsFormative Summative
Nov Jan Mar June1) Will provide relevant student services including tutorials for targetedsub populations to address achievement gaps.
1, 2, 3,8, 9
Admistration andTeachers
100 % of all students will meet minimum statestandards on STAAR and EOY testing
Funding Sources: 224 IDEA - $3,950.002) Grade levels will meet together once a week during scheduled blocktime to evaluate students and plan instruction to increase studentachievement and knowledge.
1, 2, 3,8, 9
Teachers,InstructionalFacilitator, andAdministration C
Common Assessment (CA), weekly assessments,TPRI, STAAR, EOY assessments and UniversalScreener, progress monitoring.
3) Teachers will use instructional calendars, regular assessments, andCommon Assessment (CA) to ensure all Readiness, Supporting, andProcess Standards are being taught and assessed.
1, 2, 3,8, 9
Teachers,InstructionalFacilitator, andAdministration
CA, weekly assessments, TPRI, STAAR, EOYassessments and Universal Screener, progressmonitoring.
4) Teachers will use Motivational Reading, Mentoring Minds, Stateadopted curriculum, Guided Reading techniques, Accelerated Reader,Writing to Read lab, Brain Pop (Title VI), Focus on the STAAR,Thinking Maps, Waterford (Title VI), Istation and computers to achieveperformance objectives. Instructional supplies, materials and supportservices will be purchased to support the academic and social goals of thecampus to promote creativity, collaboration, and problem solving.
1, 2, 8, 9 Teachers,InstructionalFacilitator,Administration
CA, weekly assessments, TPRI, STAAR, EOYTesting Data
Funding Sources: 211 TITLE I - $0.00, 270 TITLE VI - $13,477.00
Critical Success FactorsCSF 2
5) Teachers will review and dissaggregate CA, and STAAR test data toidentify the academic needs of students and use research basedmonitoring to meet academic needs.
1, 2, 3,8, 9
Teachers,Instructionalfacilitator,Administration
CA, weekly assessments, TPRI, STAAR, EOYTesting Data
6) Read Naturally, Istation Reading, and Waterford will be used byteachers and staff to help develop comprehension and fluency.
1, 2, 3,8, 9
Denise Henk andTeachers
Teachers will test fluency in assessmentsconducted.
Funding Sources: 211 TITLE I - $0.00
HJM ElementaryGenerated by Plan4Learning.com 26 of 46 Campus #101
January 19, 2017 12:58 pm

7) K-5 students will be screened and provided differentiated readinginstruction. Prescribed interventions will be individualized and trackedthrough progress monitoring and cumulative assessments.
1, 2, 3,8, 9
RtI Students will be reading on grade level.
8) A Response to Intervention teacher will provide intensive systematicinstruction using Wilson, and Handwriting Without Tears.
1, 2, 8, 9 RtI, ElizabethGrubbs, andEmily Ondreas
Students will be reading on grade level.
9) Homeless students will meet district criteria. They will be providedwith supplies, clothing, and necessities needed to ensure successacademically and socially.
1, 2, 9 Teachers,Counselors, ParentLiaison, andAdministration
Monitoring of student's needs.
Funding Sources: 211 TITLE I - $0.0010) Instructional materials, including additional stories for listeningcenters, will be purchased to support the academic and social goals of thecampus. Replacement headphones will also be purchased as needed.
1, 2 Administrationand Teachers
Funding Sources: 211 TITLE I - $0.00
11) All 3-5 students will be provided breakfast prior to taking theSTAAR test. Students will also be provided snacks and water duringtesting.
1, 2, 8, 9 Denise Henk Students meet state standard on STAAR test
Funding Sources: 461 CAMPUS ACTIVITY ACCOUNT - $600.00
12) Each nine weeks, grade level teachers will collaborate with otherteachers from the district, along with the district instructional specialists,to create an instructional calendar for each subject.
1, 2, 4, 5 TiffanyO'Donnell, JulieDuckett-Casey,Denise Henk, andTeachers
Lesson plans will be monitored to demonstrate theuse of effective reading instruction methodswithin the classroom.
13) 5th grade students not meeting satisfactory performance on STAARReading will receive interventions during summer school.
1, 2, 9 TiffanyO'Donnell, JulieDuckett-Casey,and summerschool Teacher
100% of all students will meet minimum statestandards on STAAR and EOY testing.
14) Will provide relevant student services for students that exceedexpectations on TPRI and STAAR assessment.
1, 2, 3,4, 5
TiffanyO'Donnell, JulieDuckett-Casey,and GT Teachers
Reading above grade level on end of year TPRIand receive advanced scores on STAARassessments.
15) PLC's will be implemented to provide collaboration and professionaldevelopment to staff.
1, 2, 3, 4 Denise Henk Teachers will be provided with professional skillsnecessary to succeed in a 21st century classroom.
16) Teachers will use rigorous research based materials, such asMotivational Math, Lone STAAR Math, Kim Sutton, Motivational MathClassroom Assessment Packs, State Adopted Curriculum, Waterford,STAAR Ready, Brain Pop, Marcy Cook, Splash Math, and computers toachieve performance objectives. Instructional supplies, hands onactivities and materials, and support services will be purchased to supportthe academic and social goals of the campus to promote creativity,collaboration and problem solving.
1, 2, 8, 9 Teachers,InstructionalFacilitator,Administration
CA, weekly assessments, TPRI, STAAR, EOYTesting Data
Funding Sources: 211 TITLE I - $2,000.00
HJM ElementaryGenerated by Plan4Learning.com 27 of 46 Campus #101
January 19, 2017 12:58 pm
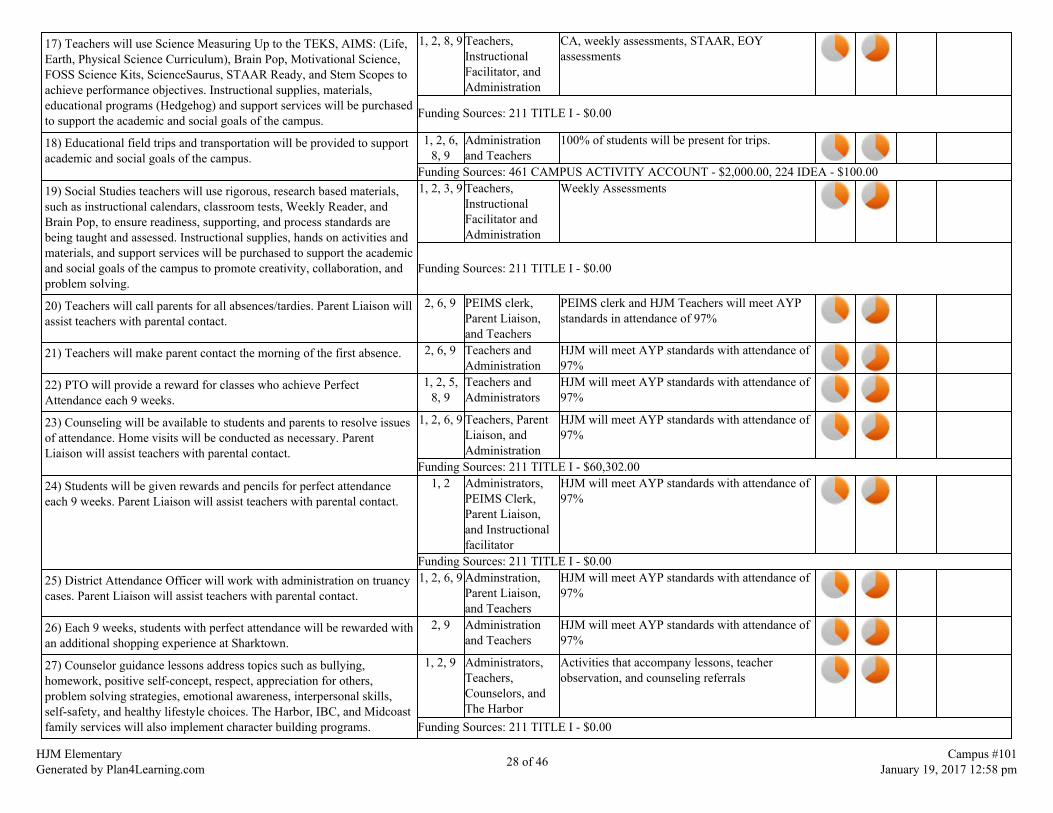
17) Teachers will use Science Measuring Up to the TEKS, AIMS: (Life,Earth, Physical Science Curriculum), Brain Pop, Motivational Science,FOSS Science Kits, ScienceSaurus, STAAR Ready, and Stem Scopes toachieve performance objectives. Instructional supplies, materials,educational programs (Hedgehog) and support services will be purchasedto support the academic and social goals of the campus.
1, 2, 8, 9 Teachers,InstructionalFacilitator, andAdministration
CA, weekly assessments, STAAR, EOYassessments
Funding Sources: 211 TITLE I - $0.00
18) Educational field trips and transportation will be provided to supportacademic and social goals of the campus.
1, 2, 6,8, 9
Administrationand Teachers
100% of students will be present for trips.
Funding Sources: 461 CAMPUS ACTIVITY ACCOUNT - $2,000.00, 224 IDEA - $100.0019) Social Studies teachers will use rigorous, research based materials,such as instructional calendars, classroom tests, Weekly Reader, andBrain Pop, to ensure readiness, supporting, and process standards arebeing taught and assessed. Instructional supplies, hands on activities andmaterials, and support services will be purchased to support the academicand social goals of the campus to promote creativity, collaboration, andproblem solving.
1, 2, 3, 9 Teachers,InstructionalFacilitator andAdministration
Weekly Assessments
Funding Sources: 211 TITLE I - $0.00
20) Teachers will call parents for all absences/tardies. Parent Liaison willassist teachers with parental contact.
2, 6, 9 PEIMS clerk,Parent Liaison,and Teachers
PEIMS clerk and HJM Teachers will meet AYPstandards in attendance of 97%
21) Teachers will make parent contact the morning of the first absence. 2, 6, 9 Teachers andAdministration
HJM will meet AYP standards with attendance of97%
22) PTO will provide a reward for classes who achieve PerfectAttendance each 9 weeks.
1, 2, 5,8, 9
Teachers andAdministrators
HJM will meet AYP standards with attendance of97%
23) Counseling will be available to students and parents to resolve issuesof attendance. Home visits will be conducted as necessary. ParentLiaison will assist teachers with parental contact.
1, 2, 6, 9 Teachers, ParentLiaison, andAdministration
HJM will meet AYP standards with attendance of97%
Funding Sources: 211 TITLE I - $60,302.0024) Students will be given rewards and pencils for perfect attendanceeach 9 weeks. Parent Liaison will assist teachers with parental contact.
1, 2 Administrators,PEIMS Clerk,Parent Liaison,and Instructionalfacilitator
HJM will meet AYP standards with attendance of97%
Funding Sources: 211 TITLE I - $0.0025) District Attendance Officer will work with administration on truancycases. Parent Liaison will assist teachers with parental contact.
1, 2, 6, 9 Adminstration,Parent Liaison,and Teachers
HJM will meet AYP standards with attendance of97%
26) Each 9 weeks, students with perfect attendance will be rewarded withan additional shopping experience at Sharktown.
2, 9 Administrationand Teachers
HJM will meet AYP standards with attendance of97%
27) Counselor guidance lessons address topics such as bullying,homework, positive self-concept, respect, appreciation for others,problem solving strategies, emotional awareness, interpersonal skills,self-safety, and healthy lifestyle choices. The Harbor, IBC, and Midcoastfamily services will also implement character building programs.
1, 2, 9 Administrators,Teachers,Counselors, andThe Harbor
Activities that accompany lessons, teacherobservation, and counseling referrals
Funding Sources: 211 TITLE I - $0.00
HJM ElementaryGenerated by Plan4Learning.com 28 of 46 Campus #101
January 19, 2017 12:58 pm

28) Campus will meet the needs of Special Education students in lifeskills and those with severe behavior issues.
1, 2, 4, 9 TiffanyO'Donnell, JeanaBethany
100% of life skills and severe behavior studentswill be successful.
Funding Sources: 224 IDEA - $4,400.0029) Accelerated Reading Instruction (ARI) and Accelerated MathInstruction (AMI) will be provided to students that meet the districtcriteria for eligibility. These students will receive small group Readingand Math instruction during the day.
1, 2, 5, 9 Administrators,ReadingSpecialist, MathSpecialist,InstructionalFacilitator, andTeachers
CA, TPRI, QRI, daily instrucitonal assessments,STAAR data
30) Monitor identified Special Education students closely in order toassure STAAR testing accommodations are appropriate and adequate forthe individual learner.
1, 2, 9 Administration,Diagnostician,Special EducationTeam, Teachers
Decreased testing accommodations
Critical Success FactorsCSF 1
31) HJM will surpass the state average in the sub-pop areas of ourHispanic and Economically Disadvantaged population through tutorialsand small group instruction. Peer tutoring will be utilized to improvestudent scores for ELL students.
2, 8, 9 Administrators,Teachers andInstructionalSpecialist
Increase in AYP Campus Scores
32) RtI process will continue in order to decrease the number of studentsneeding special education assistance.
1, 2, 8, 9 Administration,ReadingSpecialist,InstructionalSpecialist, andTeachers
Decrease in Special Education Referrals
33) HJM will use a class size reduction teacher in First to lower the classsize.
1, 2, 4, 9 Administraion 90% of students will be developed in TPRITesting and 90% will read 60 wpm
Funding Sources: 255 TITLE II - $49,051.0034) Waterford lab to be used for ELL and at risk students. Teachers,
InstructionalSpecialist, andAdministration
ELL students and at risk students will be on gradelevel
= Accomplished = Considerable = Some Progress = No Progress = Discontinue
HJM ElementaryGenerated by Plan4Learning.com 29 of 46 Campus #101
January 19, 2017 12:58 pm

Goal 2: CCISD will focus the use of our resources to close achievement gaps and facilitate quality learning for all students.
Performance Objective 2: CCISD will apply technology usage in curriculum through updated training, personal usage, and integrating technologyexpectations on a weekly basis for students.
Evaluation Data Source(s) 2: HJM provides support to teachers dealing with new technology. All staff members have the opportunity toadvance themselves in technology.
Summative Evaluation 2:
Strategy Description Title I Staff Responsiblefor Monitoring Evidence that Demonstrates Success
ReviewsFormative Summative
Nov Jan Mar June1) Purchase replacement Elmos and chrome books for classrooms forinstructional and educational usage.
1, 2 Technology andAdministration
Students and teachers actively using new technologyin classrooms.
Funding Sources: 211 TITLE I - $0.00, 199 LOCAL - $2,700.002) Instructional assistant will help facilitate instruction in computer labs. 1, 2 Administration and
InstructionalAssistants
RtI process, TPRI scores, STAAR testing, EOY test
Funding Sources: 211 TITLE I - $25,228.003) Read Naturally, Istations, and Waterford will be used for Rtl mandates.Headphones and supplies will be purchased for these technology programs.
1, 2, 9 Instructionalassistant,Administration andReading Specialist
RtI process, weekly assessments, TPRI, STAAR,EOY testing data.
Funding Sources: 211 TITLE I - $200.004) Eduphoria will be utilized for the teacher appraisal system and to aid indis aggregating data and maintaining professional development records.
1, 2, 4, 8 Tiffany O'Donnelland Julie Duckett-Casey
Teachers will show instructional growth as needed,CA, weekly assessments, TPRI, STAAR, EOYTesting data, professional development records inEduphoria will be used.
= Accomplished = Considerable = Some Progress = No Progress = Discontinue
HJM ElementaryGenerated by Plan4Learning.com 30 of 46 Campus #101
January 19, 2017 12:58 pm
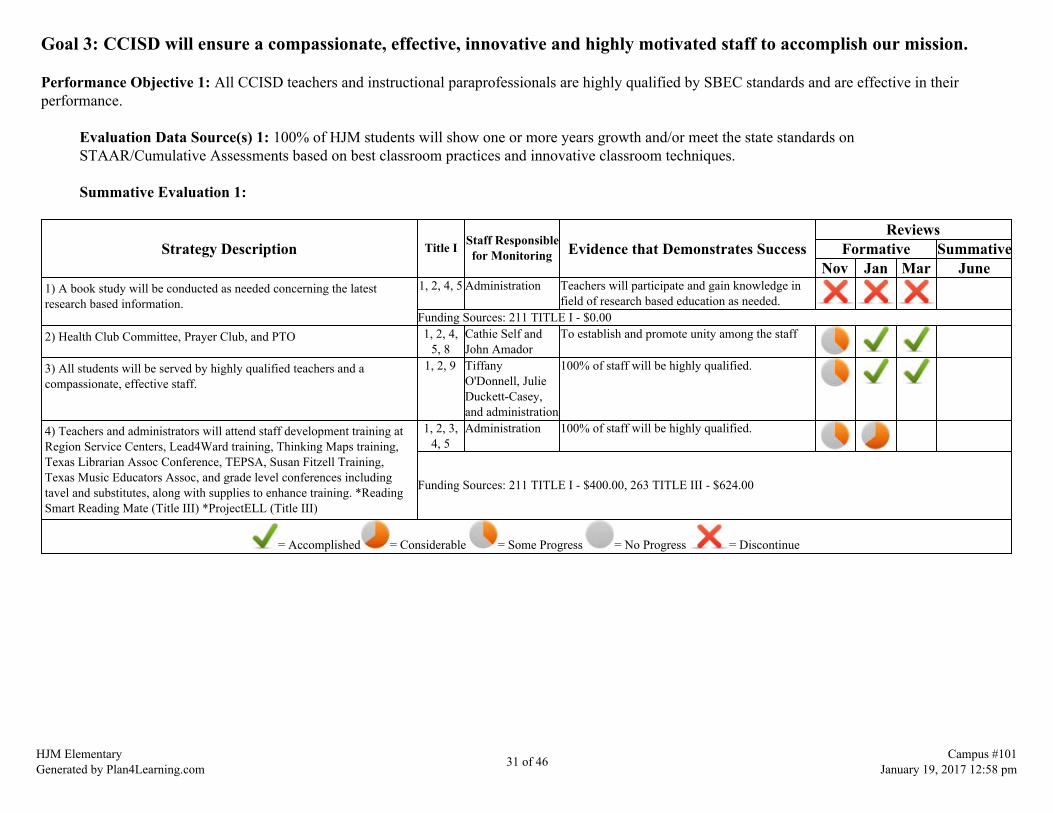
Goal 3: CCISD will ensure a compassionate, effective, innovative and highly motivated staff to accomplish our mission.
Performance Objective 1: All CCISD teachers and instructional paraprofessionals are highly qualified by SBEC standards and are effective in theirperformance.
Evaluation Data Source(s) 1: 100% of HJM students will show one or more years growth and/or meet the state standards onSTAAR/Cumulative Assessments based on best classroom practices and innovative classroom techniques.
Summative Evaluation 1:
Strategy Description Title I Staff Responsiblefor Monitoring Evidence that Demonstrates Success
ReviewsFormative Summative
Nov Jan Mar June1) A book study will be conducted as needed concerning the latestresearch based information.
1, 2, 4, 5 Administration Teachers will participate and gain knowledge infield of research based education as needed.
Funding Sources: 211 TITLE I - $0.002) Health Club Committee, Prayer Club, and PTO 1, 2, 4,
5, 8Cathie Self andJohn Amador
To establish and promote unity among the staff
3) All students will be served by highly qualified teachers and acompassionate, effective staff.
1, 2, 9 TiffanyO'Donnell, JulieDuckett-Casey,and administration
100% of staff will be highly qualified.
4) Teachers and administrators will attend staff development training atRegion Service Centers, Lead4Ward training, Thinking Maps training,Texas Librarian Assoc Conference, TEPSA, Susan Fitzell Training,Texas Music Educators Assoc, and grade level conferences includingtavel and substitutes, along with supplies to enhance training. *ReadingSmart Reading Mate (Title III) *ProjectELL (Title III)
1, 2, 3,4, 5
Administration 100% of staff will be highly qualified.
Funding Sources: 211 TITLE I - $400.00, 263 TITLE III - $624.00
= Accomplished = Considerable = Some Progress = No Progress = Discontinue
HJM ElementaryGenerated by Plan4Learning.com 31 of 46 Campus #101
January 19, 2017 12:58 pm

Goal 4: The district and each campus will provide learning environments that are safe and secure for all students, faculty,and staff.
Performance Objective 1: The district will ensure a safe and positive learning environment.
Evaluation Data Source(s) 1: HJM staff members serve the needs of all students and provide an environment that promotes learning andsuccess; Attendance will increase by .5% (96.9%), Discipline Referrals will decrease.
Summative Evaluation 1:
Strategy Description Title I Staff Responsiblefor Monitoring Evidence that Demonstrates Success
ReviewsFormative Summative
Nov Jan Mar June1) Safety Committee will implement daily safety tips on announcements,safety wall displays, and marquee tips for parents. Student safety patrolcommittee will work hand and hand with administration to help ensurethe safety of all students. Safety supplies and material will be purchasedto support the safety and social goals of the campus.
1, 2, 6 Mr. Tompkins,Administration,Staff and students
District feedback from safety meetings, as well asstudent and staff feedback
Funding Sources: 211 TITLE I - $0.00
2) School-wide Character Education focus through daily announcements,and special activities.
1, 2 Administrationand Counselors
Decreased discipline referrals
3) Drug Awareness Programs (Red Ribbon Week). Many activities willtake place during Red Ribbon Week including "Career Day".
1, 2 Administrationand Counselors
At the elementary level, this program is proactiverather than reactive. Our goal is to increase ourstudents' awareness of the dangers of using drugs,in an age appropriate manner, and promotepositive self-concept.
4) Educational Motivator for grades PK-5. Promoting self awareness,respect for others, healthy life and anti-bullying.
1, 2 Administrationand Counselors
Positive peer relations
Funding Sources: 461 CAMPUS ACTIVITY ACCOUNT - $645.005) Officers from the Port Lavaca Police Department, SheriffsDepartment, Fire Department will play an active role in the 9 weeksawards assembly recognizing perfect attendance, citizenship andacademic success.
1, 2, 9 Administratorsand Counselors
Students reaffirm their pledge to remain drug-freeand not take part in bullying others.
6) Counselor guidance lessons, Midcoast, and The Harbor address topicssuch as bullying, homework, positive self-concept, respect, appreciationfor others, problem solving strategies, emotional awareness, interpersonalskills, self-safety, and healthy lifestyle choices during block time.
1, 2, 4, 9 Administratorsand Counselors
Activities that accompany lessons, teacherobservation, and counseling referrals
Funding Sources: 211 TITLE I - $0.00
7) The Port Lavaca Fire Department will speak with students about fireprevention and safety in the school and in the home.
1, 2, 4, 9 Administratorsand Teachers
Classroom activities and student participation infire drills exhibit age-appropriate understanding.
HJM ElementaryGenerated by Plan4Learning.com 32 of 46 Campus #101
January 19, 2017 12:58 pm

8) Local Agencies will provide information to students about theimportance of hygiene to keep their bodies healthy and our livingenvironment clean.
1, 2, 9 Administrators Increased awareness of the importance of personalhygiene
9) The local Rotary Club will work with HJM staff to implement thecharacter ed program in all classrooms.
1, 2, 6, 9 TiffanyO'Donnell, JulieDuckett-Casey,Tammy Boehl,and Teachers
Reduction in office referrals
= Accomplished = Considerable = Some Progress = No Progress = Discontinue
HJM ElementaryGenerated by Plan4Learning.com 33 of 46 Campus #101
January 19, 2017 12:58 pm
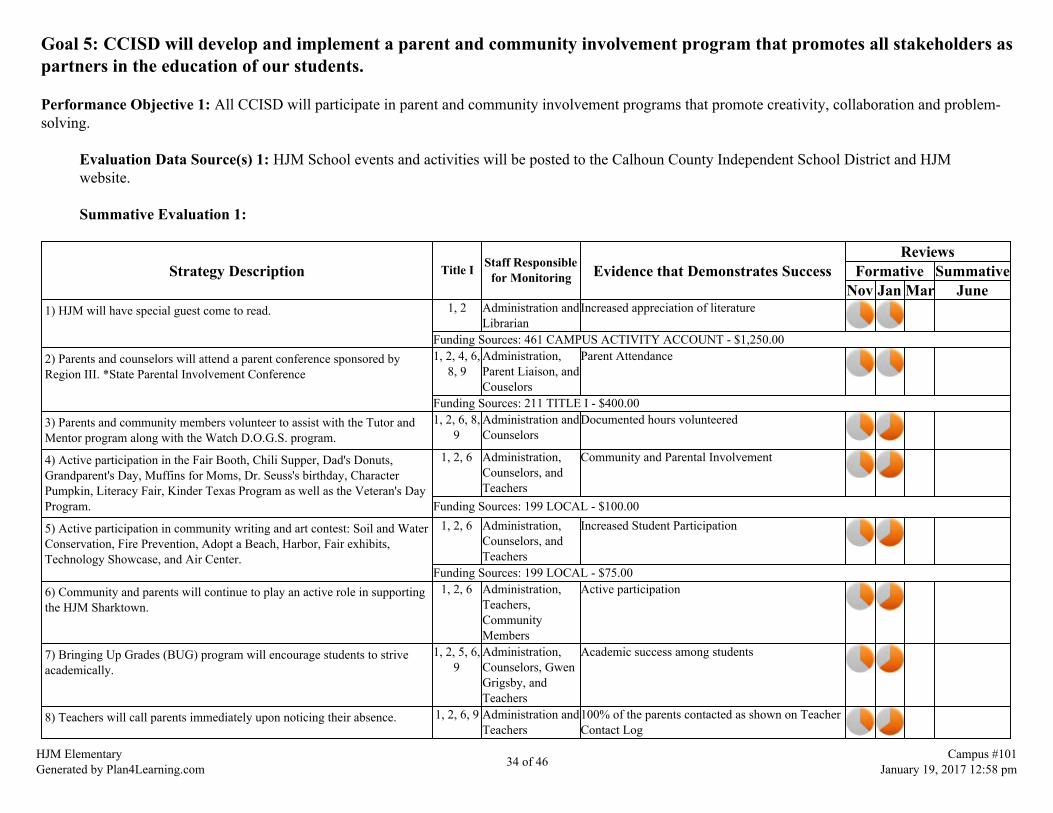
Goal 5: CCISD will develop and implement a parent and community involvement program that promotes all stakeholders aspartners in the education of our students.
Performance Objective 1: All CCISD will participate in parent and community involvement programs that promote creativity, collaboration and problem-solving.
Evaluation Data Source(s) 1: HJM School events and activities will be posted to the Calhoun County Independent School District and HJMwebsite.
Summative Evaluation 1:
Strategy Description Title I Staff Responsiblefor Monitoring Evidence that Demonstrates Success
ReviewsFormative Summative
Nov Jan Mar June1) HJM will have special guest come to read. 1, 2 Administration and
LibrarianIncreased appreciation of literature
Funding Sources: 461 CAMPUS ACTIVITY ACCOUNT - $1,250.002) Parents and counselors will attend a parent conference sponsored byRegion III. *State Parental Involvement Conference
1, 2, 4, 6,8, 9
Administration,Parent Liaison, andCouselors
Parent Attendance
Funding Sources: 211 TITLE I - $400.003) Parents and community members volunteer to assist with the Tutor andMentor program along with the Watch D.O.G.S. program.
1, 2, 6, 8,9
Administration andCounselors
Documented hours volunteered
4) Active participation in the Fair Booth, Chili Supper, Dad's Donuts,Grandparent's Day, Muffins for Moms, Dr. Seuss's birthday, CharacterPumpkin, Literacy Fair, Kinder Texas Program as well as the Veteran's DayProgram.
1, 2, 6 Administration,Counselors, andTeachers
Community and Parental Involvement
Funding Sources: 199 LOCAL - $100.00
5) Active participation in community writing and art contest: Soil and WaterConservation, Fire Prevention, Adopt a Beach, Harbor, Fair exhibits,Technology Showcase, and Air Center.
1, 2, 6 Administration,Counselors, andTeachers
Increased Student Participation
Funding Sources: 199 LOCAL - $75.006) Community and parents will continue to play an active role in supportingthe HJM Sharktown.
1, 2, 6 Administration,Teachers,CommunityMembers
Active participation
7) Bringing Up Grades (BUG) program will encourage students to striveacademically.
1, 2, 5, 6,9
Administration,Counselors, GwenGrigsby, andTeachers
Academic success among students
8) Teachers will call parents immediately upon noticing their absence. 1, 2, 6, 9 Administration andTeachers
100% of the parents contacted as shown on TeacherContact Log
HJM ElementaryGenerated by Plan4Learning.com 34 of 46 Campus #101
January 19, 2017 12:58 pm

9) Parents will have a choice of receiving a hard copy of the CCISDhandbook or viewing it online at the beginning of year or as registeringthroughout the year.
1, 2, 6 Carolina Dowell 100% of parents will sign documentation indicatingthey have either viewed the handbook online orreceived a hard copy. Parents who request a hardcopy will be given one.
10) Attendance letters will be mailed out to parents of students exceedingattendance policy. Postcards will be mailed out at the beginning of school topromote positive communications between the parents and school. Postagewill be provided for letters and postcards.
1, 2, 6, 9 Administration andTeachers
Increase positive parental response to, Remind App,documented attendance letters, and open houseparticipation
Funding Sources: 211 TITLE I - $200.00
11) Grandparents's Day Breakfast will be hosted every year. 1, 2, 6 Counselors Grandparent participation
12) Communicate regularly with parents through open house, Title Icompacts, newsletters, parent conferences, fall/spring parent involvementconference, CCISD website, Social Media, and public accountabilityhearings.
1, 2, 6, 8,9
Administration,Counselors, andTeachers
Parental involvement through awareness
Funding Sources: 211 TITLE I - $0.00
= Accomplished = Considerable = Some Progress = No Progress = Discontinue
HJM ElementaryGenerated by Plan4Learning.com 35 of 46 Campus #101
January 19, 2017 12:58 pm
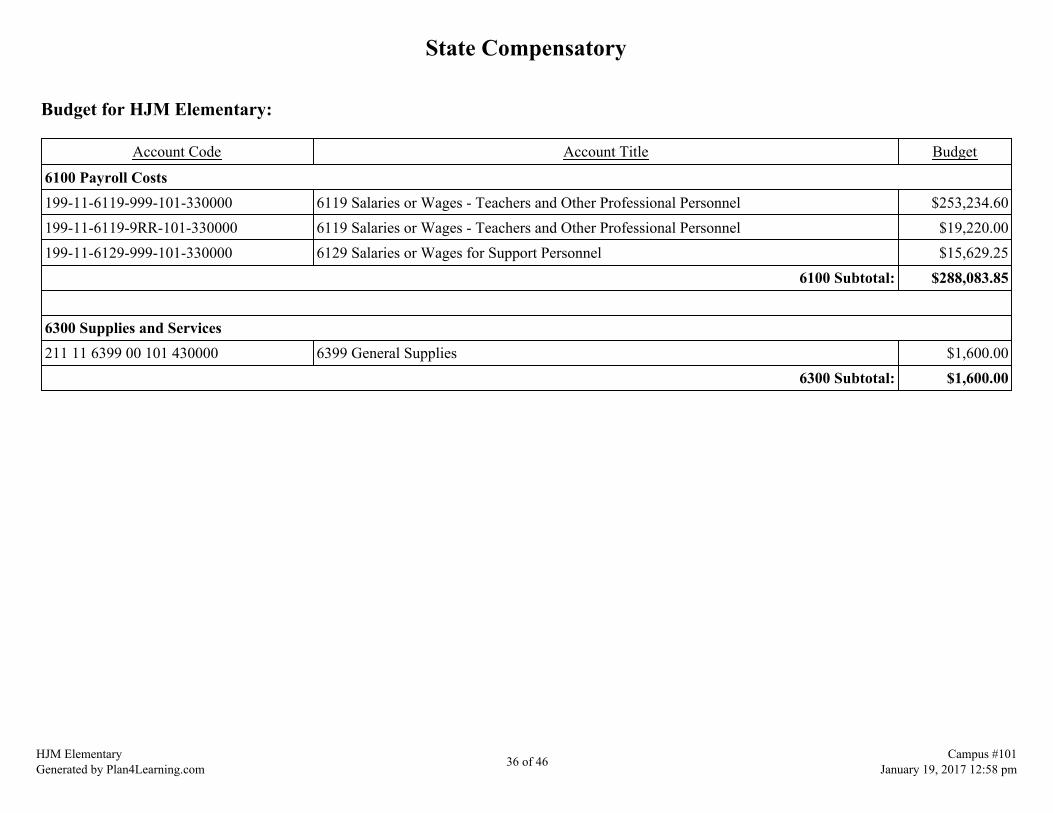
State Compensatory
Budget for HJM Elementary:
Account Code Account Title Budget
6100 Payroll Costs199-11-6119-999-101-330000 6119 Salaries or Wages - Teachers and Other Professional Personnel $253,234.60199-11-6119-9RR-101-330000 6119 Salaries or Wages - Teachers and Other Professional Personnel $19,220.00199-11-6129-999-101-330000 6129 Salaries or Wages for Support Personnel $15,629.25
6100 Subtotal: $288,083.85 6300 Supplies and Services211 11 6399 00 101 430000 6399 General Supplies $1,600.00
6300 Subtotal: $1,600.00
HJM ElementaryGenerated by Plan4Learning.com 36 of 46 Campus #101
January 19, 2017 12:58 pm
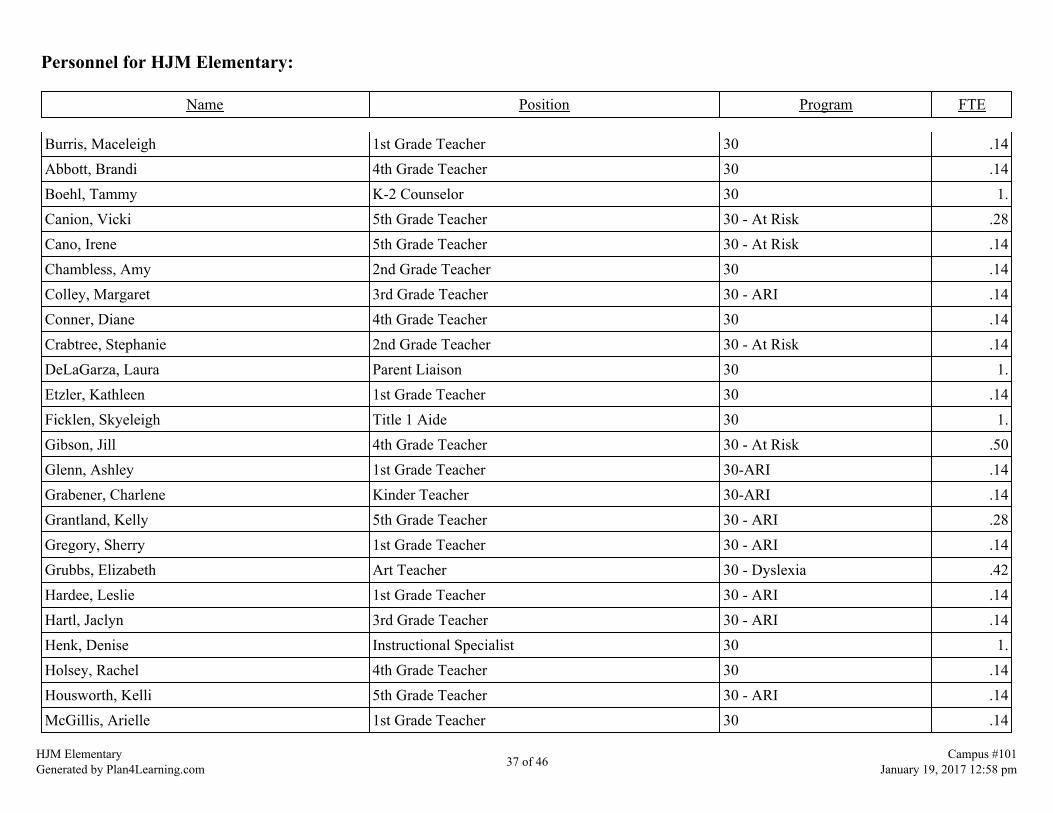
Personnel for HJM Elementary:
Name Position Program FTE
Burris, Maceleigh 1st Grade Teacher 30 .14Abbott, Brandi 4th Grade Teacher 30 .14Boehl, Tammy K-2 Counselor 30 1.Canion, Vicki 5th Grade Teacher 30 - At Risk .28Cano, Irene 5th Grade Teacher 30 - At Risk .14Chambless, Amy 2nd Grade Teacher 30 .14Colley, Margaret 3rd Grade Teacher 30 - ARI .14Conner, Diane 4th Grade Teacher 30 .14Crabtree, Stephanie 2nd Grade Teacher 30 - At Risk .14DeLaGarza, Laura Parent Liaison 30 1.Etzler, Kathleen 1st Grade Teacher 30 .14Ficklen, Skyeleigh Title 1 Aide 30 1.Gibson, Jill 4th Grade Teacher 30 - At Risk .50Glenn, Ashley 1st Grade Teacher 30-ARI .14Grabener, Charlene Kinder Teacher 30-ARI .14Grantland, Kelly 5th Grade Teacher 30 - ARI .28Gregory, Sherry 1st Grade Teacher 30 - ARI .14Grubbs, Elizabeth Art Teacher 30 - Dyslexia .42Hardee, Leslie 1st Grade Teacher 30 - ARI .14Hartl, Jaclyn 3rd Grade Teacher 30 - ARI .14Henk, Denise Instructional Specialist 30 1.Holsey, Rachel 4th Grade Teacher 30 .14Housworth, Kelli 5th Grade Teacher 30 - ARI .14McGillis, Arielle 1st Grade Teacher 30 .14
HJM ElementaryGenerated by Plan4Learning.com 37 of 46 Campus #101
January 19, 2017 12:58 pm
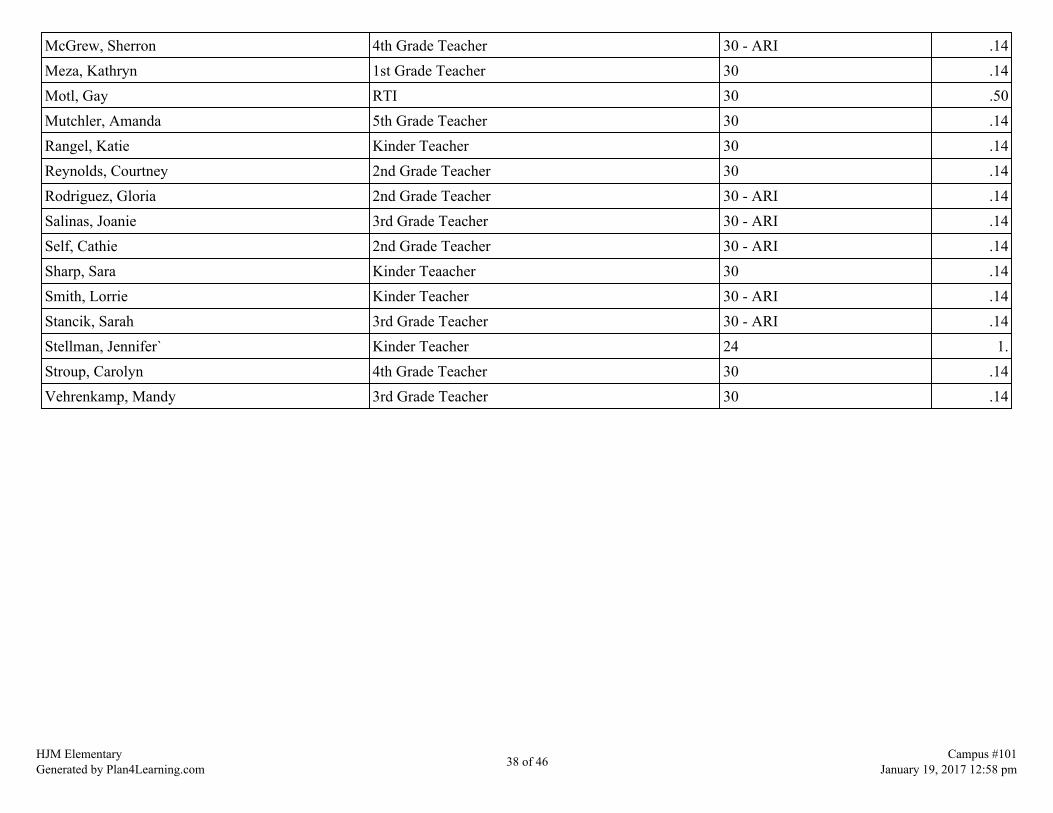
McGrew, Sherron 4th Grade Teacher 30 - ARI .14Meza, Kathryn 1st Grade Teacher 30 .14Motl, Gay RTI 30 .50Mutchler, Amanda 5th Grade Teacher 30 .14Rangel, Katie Kinder Teacher 30 .14Reynolds, Courtney 2nd Grade Teacher 30 .14Rodriguez, Gloria 2nd Grade Teacher 30 - ARI .14Salinas, Joanie 3rd Grade Teacher 30 - ARI .14Self, Cathie 2nd Grade Teacher 30 - ARI .14Sharp, Sara Kinder Teaacher 30 .14Smith, Lorrie Kinder Teacher 30 - ARI .14Stancik, Sarah 3rd Grade Teacher 30 - ARI .14Stellman, Jennifer` Kinder Teacher 24 1.Stroup, Carolyn 4th Grade Teacher 30 .14Vehrenkamp, Mandy 3rd Grade Teacher 30 .14
HJM ElementaryGenerated by Plan4Learning.com 38 of 46 Campus #101
January 19, 2017 12:58 pm
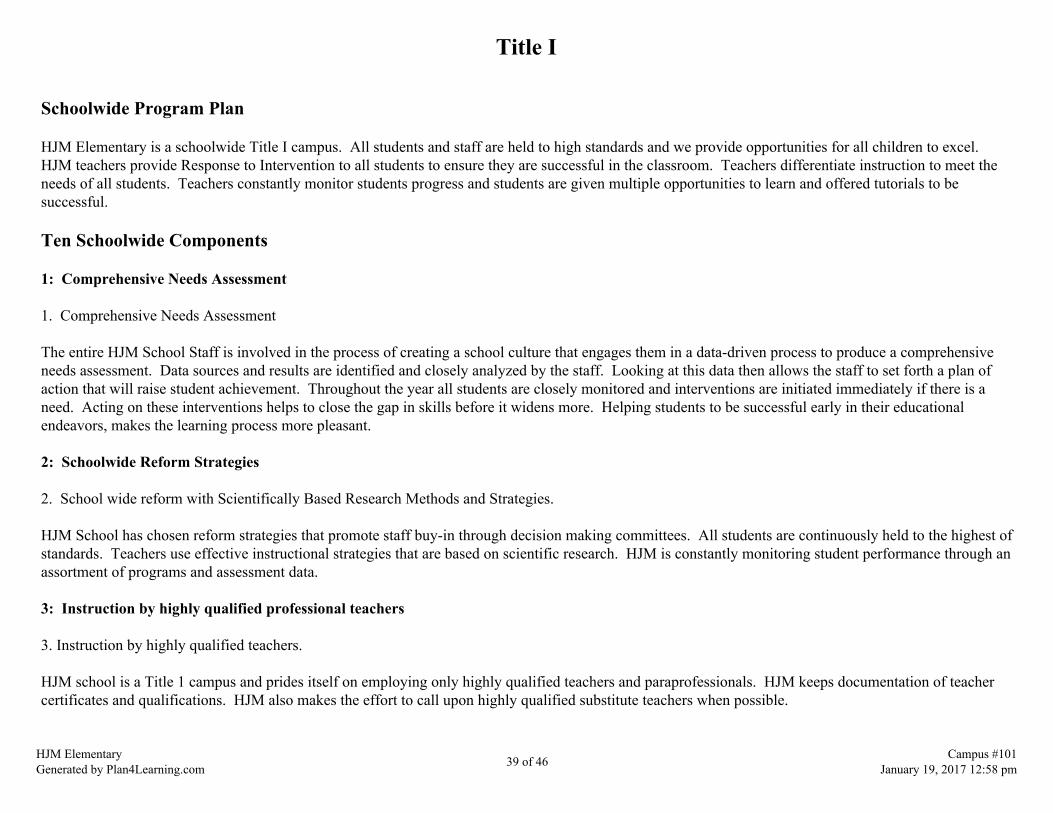
Title I
Schoolwide Program Plan
HJM Elementary is a schoolwide Title I campus. All students and staff are held to high standards and we provide opportunities for all children to excel. HJM teachers provide Response to Intervention to all students to ensure they are successful in the classroom. Teachers differentiate instruction to meet theneeds of all students. Teachers constantly monitor students progress and students are given multiple opportunities to learn and offered tutorials to besuccessful.
Ten Schoolwide Components
1: Comprehensive Needs Assessment
1. Comprehensive Needs Assessment
The entire HJM School Staff is involved in the process of creating a school culture that engages them in a data-driven process to produce a comprehensiveneeds assessment. Data sources and results are identified and closely analyzed by the staff. Looking at this data then allows the staff to set forth a plan ofaction that will raise student achievement. Throughout the year all students are closely monitored and interventions are initiated immediately if there is aneed. Acting on these interventions helps to close the gap in skills before it widens more. Helping students to be successful early in their educationalendeavors, makes the learning process more pleasant.
2: Schoolwide Reform Strategies
2. School wide reform with Scientifically Based Research Methods and Strategies.
HJM School has chosen reform strategies that promote staff buy-in through decision making committees. All students are continuously held to the highest ofstandards. Teachers use effective instructional strategies that are based on scientific research. HJM is constantly monitoring student performance through anassortment of programs and assessment data.
3: Instruction by highly qualified professional teachers
3. Instruction by highly qualified teachers.
HJM school is a Title 1 campus and prides itself on employing only highly qualified teachers and paraprofessionals. HJM keeps documentation of teachercertificates and qualifications. HJM also makes the effort to call upon highly qualified substitute teachers when possible.
HJM ElementaryGenerated by Plan4Learning.com 39 of 46 Campus #101
January 19, 2017 12:58 pm

4: High-quality and ongoing professional development for teachers, principals, and paraprofessionals and, if appropriate, student servicespersonnel, parents, and other staff
Staff members at HJM are encouraged to attend high quality professional development sessions. All teachers attend at least one per year. Staff developmentis based on a comprehensive needs assessment. Staff members are given the opportunity to discuss the implementation of new programs based on the staffdevelopment they have attended. Administrators monitor the effectiveness of the professional development by observing the implementation of strategies inthe classroom.
5: Strategies to attract highly qualified teachers
HJM provides teachers with ample planning time through conference periods and block. The atmosphere at HJM is team-oriented. Teachers are given theopportunity to voice their concerns and ideas.
6: Strategies to increase parental involvement
At HJM, teachers are provided with tools to provide them with the skills and knowledge to work appropriately with the parents of their students. Parents arealso encouraged to join PTO and volunteer during school functions. Parents are sent home reminders and calendars highlighting student events.
7: Plans for assisting preschool children in the transition from early childhood programs to elementary school programs
HJM Pre-Kindergarten teachers have been trained in e-circle curriculum to help with the transition to Kindergarten. HJM counselors always work withHeadstart to invite those teachers over for a school visit. HJM holds a "Meet Your Teacher" the Thursday before school begins.
8: Measures to include teachers in the decisions regarding the use of academic assessments in order to improve the achievement of individualstudents and the overall instructional program
HJM teachers meet weekly to discuss student progress with team members and administration. Test data drives the decisions that are made in theclassroom. Teachers are provided with all the tools necessary to identify needs.
9: Activities to ensure effective timely assistance for students who experience difficulty mastering the proficient or advanced levels of academicachievement standards
At the beginning of the year, HJM uses the state criteria to code students as at-risk. Students are also tested with TPRI and QRI to check for needs. Thestudents that need extra assistance are monitored carefully and provided with a multitude of programs to increase academic proficiency. HJM also providestutorials to students who need extra help in academic areas. All are held to the highest of expectations.
10: Coordination and integration of federal, state and local services and programs
At HJM, we feel it is imperative to use all our resources to aid in the education of children. Therefore, we continue to utilize services such as Mid CoastHJM ElementaryGenerated by Plan4Learning.com 40 of 46 Campus #101
January 19, 2017 12:58 pm

Family services (Drug and alcohol awareness), The Harbor (character education), and Partners in Education (mentors and tutors). The Kiwanis Club, LionsClub, Law Enforcement agencies, HEB, IBC and Walmart also provide services for HJM Elementary. We understand the importance of community andbusiness involvement in education. The benefits are priceless.
HJM ElementaryGenerated by Plan4Learning.com 41 of 46 Campus #101
January 19, 2017 12:58 pm

Site-Based Decision Making Committee
Committee Role Name PositionAdministrator Tiffany O'Donnell PrincipalAdministrator Julie Duckett-Casey Assistant PrincipalBusiness Representative Janie Garza Business RepresentativeClassroom Teacher Vicki Canion 5th teacherClassroom Teacher Stephanie Crabtree 2nd teacherClassroom Teacher Kathy Etzler 1st teacherClassroom Teacher Jaclyn Hartl 3rd teacherClassroom Teacher Rachel Holsey 4th teacherClassroom Teacher Cindy Mutchler Pre-K teacherClassroom Teacher Emily Ondreas Special ServicesClassroom Teacher Lorrie Smith Kinder teacherCommunity Representative Laura Crain Community RepresentativeDistrict-level Professional Linda Jurica District Math SpecialistNon-classroom Professional Tammy Boehl CounselorNon-classroom Professional Denise Henk Instructional SpecialistParaprofessional Sherry Roberts SecretaryParent Jennifer Morales Parent
HJM ElementaryGenerated by Plan4Learning.com 42 of 46 Campus #101
January 19, 2017 12:58 pm

Campus Funding Summary
199 LOCALGoal Objective Strategy Resources Needed Account Code Amount
2 2 1 $2,700.005 1 4 $100.005 1 5 $75.00
Sub-Total $2,875.00255 TITLE IIGoal Objective Strategy Resources Needed Account Code Amount
2 1 33 $49,051.00Sub-Total $49,051.00
263 TITLE IIIGoal Objective Strategy Resources Needed Account Code Amount
1 1 16 26311639900101725000 $2,726.003 1 4 Training for Reading Smart Reading Mate 263136299001017250000 $524.003 1 4 Sheltered Instruction training 263136239001017250000 $100.00
Sub-Total $3,350.00211 TITLE IGoal Objective Strategy Resources Needed Account Code Amount
1 1 3 $47,150.001 1 4 211-11-6399-00-101-430000 $5,000.001 1 9 211-11-6399-00-101-430000 $0.001 1 10 211-11-6399-00-101-430000 $500.001 2 3 211-11-6399-00-101-430000 $0.001 2 4 211-11-6399-00-101-430000 $500.001 3 3 $0.001 3 4 $800.00
HJM ElementaryGenerated by Plan4Learning.com 43 of 46 Campus #101
January 19, 2017 12:58 pm

1 4 3 211-11-6399-00-101-4-30-000 $300.001 4 5 $0.002 1 4 211-11-6119-99-101-43-0-999 $0.002 1 6 211-11-6399-00-101-430000 $0.002 1 9 211-11-6399-00-101-43-000 $0.002 1 10 211-11-6399-00-101-43-000 $0.002 1 16 211-11-6399-00-101-4-3000 $2,000.002 1 17 211-11-6399-00-101-4-3-000 $0.002 1 19 211-11-6399-00-101-4-30-000 $0.002 1 23 211-31-6119-99-101-4-30-000 $58,774.002 1 23 211-31-6141-99-101-4-30-000 $852.002 1 23 211-31-6143-99-101-4-30-000 $676.002 1 24 $0.002 1 27 $0.002 2 1 $0.002 2 2 211-11-6129-99-101-4-40-000 $25,228.002 2 3 $200.003 1 1 $0.003 1 4 $400.004 1 1 $0.004 1 6 $0.005 1 2 $400.005 1 10 $200.005 1 12 $0.00
Sub-Total $142,980.00461 CAMPUS ACTIVITY ACCOUNTGoal Objective Strategy Resources Needed Account Code Amount
1 1 11 461-11-6499-00-101-411-000 $600.00
HJM ElementaryGenerated by Plan4Learning.com 44 of 46 Campus #101
January 19, 2017 12:58 pm

1 2 9 $600.001 3 5 461-11-6412-00-101-4-11-000 $2,000.001 3 8 461-11-6499-00-101-4-11000 $600.001 4 4 461-11-6412-00-101-4-11-000 $2,000.002 1 11 461-11-6499-00-101-4-1100 $600.002 1 18 461-11-6412-00-101-4-11-000 $2,000.004 1 4 $645.005 1 1 $1,250.00
Sub-Total $10,295.00224 IDEAGoal Objective Strategy Resources Needed Account Code Amount
2 1 1 $3,950.002 1 18 $100.002 1 28 $4,400.00
Sub-Total $8,450.00270 TITLE VIGoal Objective Strategy Resources Needed Account Code Amount
1 1 4 270-11-6399-00-101-530000 $12,000.001 2 4 270-11-6399-00-101-530000 $12,000.001 3 4 270-11-6399-00-101-530000 $12,000.002 1 4 270-11-6399-00-101-6-30-0-00 $13,477.00
Sub-Total $49,477.00Grand Total $266,478.00
HJM ElementaryGenerated by Plan4Learning.com 45 of 46 Campus #101
January 19, 2017 12:58 pm

Addendums
HJM ElementaryGenerated by Plan4Learning.com 46 of 46 Campus #101
January 19, 2017 12:58 pm

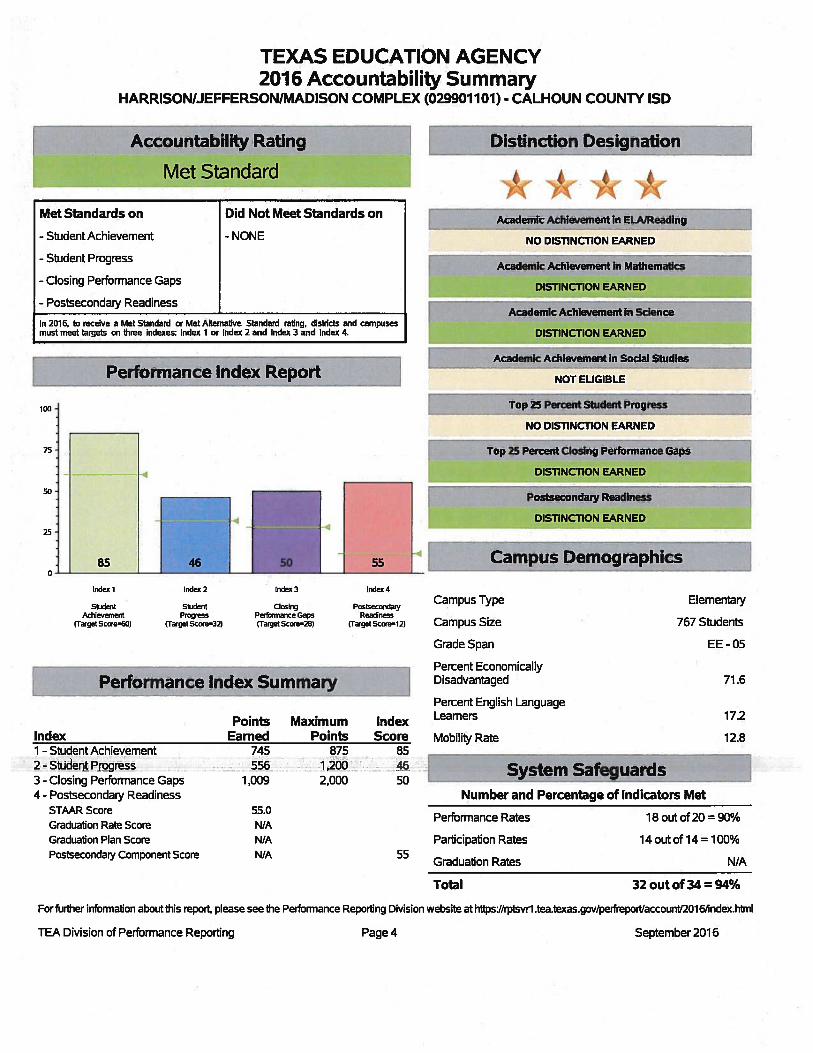
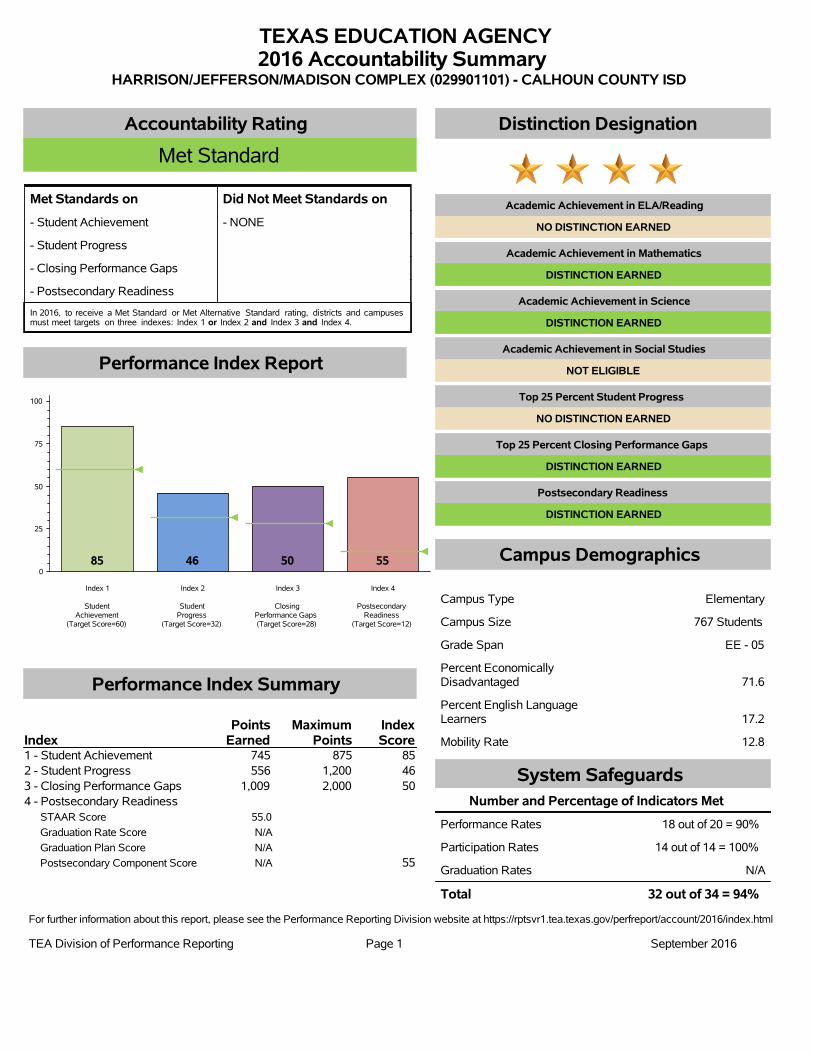
TEXAS EDUCATION AGENCY2016 Accountability Summary
HARRISON/JEFFERSON/MADISON COMPLEX (029901101) - CALHOUN COUNTY ISD
Accountability Rating
Met Standard
Met Standards on Did Not Meet Standards on
- Student Achievement - NONE
- Student Progress
- Closing Performance Gaps
- Postsecondary Readiness
In 2016, to receive a Met Standard or Met Alternative Standard rating, districts and campusesmust meet targets on three indexes: Index 1 or Index 2 and Index 3 and Index 4.
Performance Index Report
0
25
50
75
100
Index 1
StudentAchievement
(Target Score=60)
Index 2
StudentProgress
(Target Score=32)
Index 3
ClosingPerformance Gaps(Target Score=28)
Index 4
PostsecondaryReadiness
(Target Score=12)
85 46 50 55
Performance Index Summary
IndexPoints
EarnedMaximum
PointsIndexScore
1 - Student Achievement 745 875 85
2 - Student Progress 556 1,200 46
3 - Closing Performance Gaps 1,009 2,000 50
4 - Postsecondary Readiness
STAAR Score 55.0
Graduation Rate Score N/A
Graduation Plan Score N/A
Postsecondary Component Score N/A 55
Distinction Designation
Academic Achievement in ELA/Reading
NO DISTINCTION EARNED
Academic Achievement in Mathematics
DISTINCTION EARNED
Academic Achievement in Science
DISTINCTION EARNED
Academic Achievement in Social Studies
NOT ELIGIBLE
Top 25 Percent Student Progress
NO DISTINCTION EARNED
Top 25 Percent Closing Performance Gaps
DISTINCTION EARNED
Postsecondary Readiness
DISTINCTION EARNED
Campus Demographics
Campus Type Elementary
Campus Size 767 Students
Grade Span EE - 05
Percent EconomicallyDisadvantaged 71.6
Percent English LanguageLearners 17.2
Mobility Rate 12.8
System Safeguards
Number and Percentage of Indicators Met
Performance Rates 18 out of 20 = 90%
Participation Rates 14 out of 14 = 100%
Graduation Rates N/A
Total 32 out of 34 = 94%
For further information about this report, please see the Performance Reporting Division website at https://rptsvr1.tea.texas.gov/perfreport/account/2016/index.html
TEA Division of Performance Reporting Page 1 September 2016

Calhoun County Independent School District
JR Elementary
2016-2017 Campus Improvement Plan
JR ElementaryGenerated by Plan4Learning.com 1 of 50 Campus #102
January 19, 2017 9:44 am
Comprehensive Needs Assessment
Demographics
Demographics Summary
Jackson Roosevelt Elementary School has a large student population. JR is the second largest campus in the districtwith an enrollment of over 956 students. Our extremely large student population has become more diverse. We have alarge ELL population which now consists of Spanish, Chinese, Karen, and Taiwanese speakers. This presents a challengefor teachers and staff to meet the needs of these students as they learn the English language. As a Title I campus, ourpopulation is approximately 67% economically disadvantaged.
Demographics Strengths
Highly Qualified Bilingual and ESL certified TeachersThe teacher to student ratio is 11 to one in PK.The teacher to student ratio is 22 to one or lower in grades 1-4.The teacher to student ratio is 23 to one in grade 5. A school environment where all children and parents are welcome.
JR ElementaryGenerated by Plan4Learning.com 2 of 50 Campus #102
January 19, 2017 9:44 am
Demographics Needs
There is a need for intense interventions for students who have recently moved to the area and are learning theEnglish language.Large LEP populations in each grade level. Actual subpops in grades: Kinder, 1st grade, 3rd grade, 4th grade, and5th grade
Prekindergarten- 81.Kindergarten- 292.1st Grade- 273.2nd Grade- 234.3rd Grade- 265.4th Grade- 326.5th Grade- 317.
Bilingual population per grade level
Prekindergarten- 61.Kindergarten- 212.1st Grade- 183.2nd Grade- 174.3rd Grade- 135.4th Grade- 186.5th Grade- 07.
ESL population per grade level
Prekindergarten- 01.Kindergarten- 82.1st Grade- 93.2nd Grade- 64.
JR ElementaryGenerated by Plan4Learning.com 3 of 50 Campus #102
January 19, 2017 9:44 am
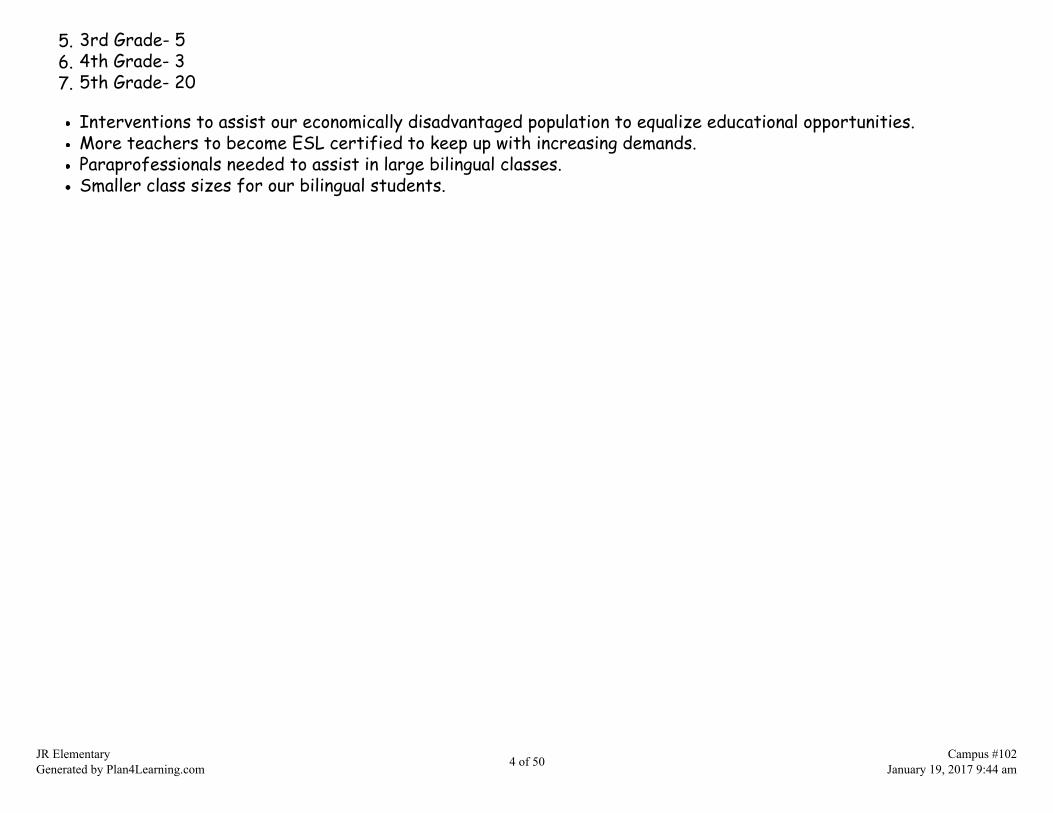
3rd Grade- 55.4th Grade- 36.5th Grade- 207.
Interventions to assist our economically disadvantaged population to equalize educational opportunities.More teachers to become ESL certified to keep up with increasing demands.Paraprofessionals needed to assist in large bilingual classes.Smaller class sizes for our bilingual students.
JR ElementaryGenerated by Plan4Learning.com 4 of 50 Campus #102
January 19, 2017 9:44 am
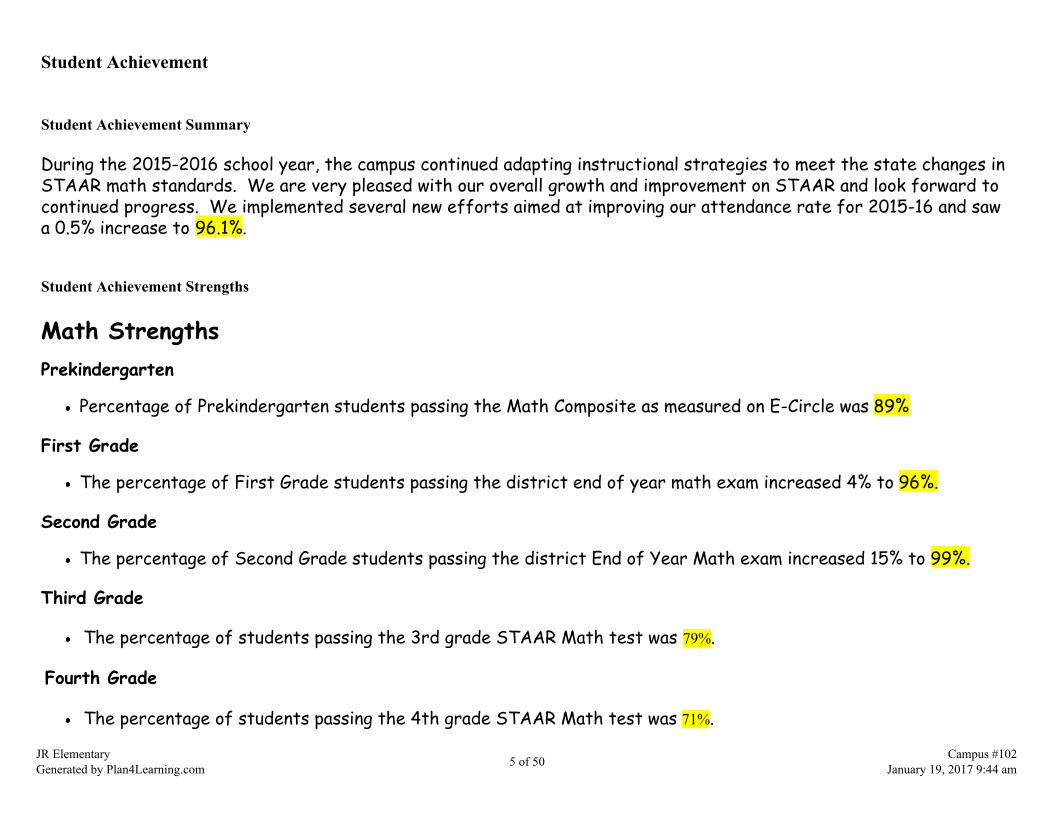
Student Achievement
Student Achievement Summary
During the 2015-2016 school year, the campus continued adapting instructional strategies to meet the state changes inSTAAR math standards. We are very pleased with our overall growth and improvement on STAAR and look forward tocontinued progress. We implemented several new efforts aimed at improving our attendance rate for 2015-16 and sawa 0.5% increase to 96.1%.
Student Achievement Strengths
Math StrengthsPrekindergarten
Percentage of Prekindergarten students passing the Math Composite as measured on E-Circle was 89%
First Grade
The percentage of First Grade students passing the district end of year math exam increased 4% to 96%.
Second Grade
The percentage of Second Grade students passing the district End of Year Math exam increased 15% to 99%.
Third Grade
The percentage of students passing the 3rd grade STAAR Math test was 79%.
Fourth Grade
The percentage of students passing the 4th grade STAAR Math test was 71%.
JR ElementaryGenerated by Plan4Learning.com 5 of 50 Campus #102
January 19, 2017 9:44 am

Fifth Grade
The percentage of students passing the 5th grade STAAR Math test was 87%.
Special Education
Mainstream with support Math Instruction in Grades 2-5 as much as possible according to ARD.
Reading Strengths Prekindergarten
The percentage of Prekindergarten students passing the EOY Phonological Awareness Composite as measured on E-Circle was 89%.
Kindergarten
The percentage of Kindergarten students scoring developed on the district end of year TPRI was 95%.
First Grade
The percentage of First Grade students scoring developed on the district end of year TPRI test was 72%The percentage of First Grade students passing the district EOY Reading Test was 84%.
Second Grade
The percentage of Second Grade students passing the district EOY TPRI Reading Test increased to 97%.The percentage of Second Grade students passing the district EOY Reading Test incraesed to 94%.
JR ElementaryGenerated by Plan4Learning.com 6 of 50 Campus #102
January 19, 2017 9:44 am

Third Grade
The percentage of students passing 3rd Grade STAAR Reading Test increased almost 10% to 85.5%.
Fourth Grade
The passing rate percentage on the 4th Grade STAAR Reading test was 82%.
Special Education
Special Education referrals kept to minimum and follow RTI and special service guidelines closely.
Science Strengths Fifth Grade
86% of all fifth grade students passed STAAR Science.
Special Education
Full inclusion of all special education students in regular education science classes with modifications andaccommodations as per ARD decision.Full inclusion of all bilingual students in regular education science classes with accommodations as per LPACminutes.
Writing Strengths JR ElementaryGenerated by Plan4Learning.com 7 of 50 Campus #102
January 19, 2017 9:44 am
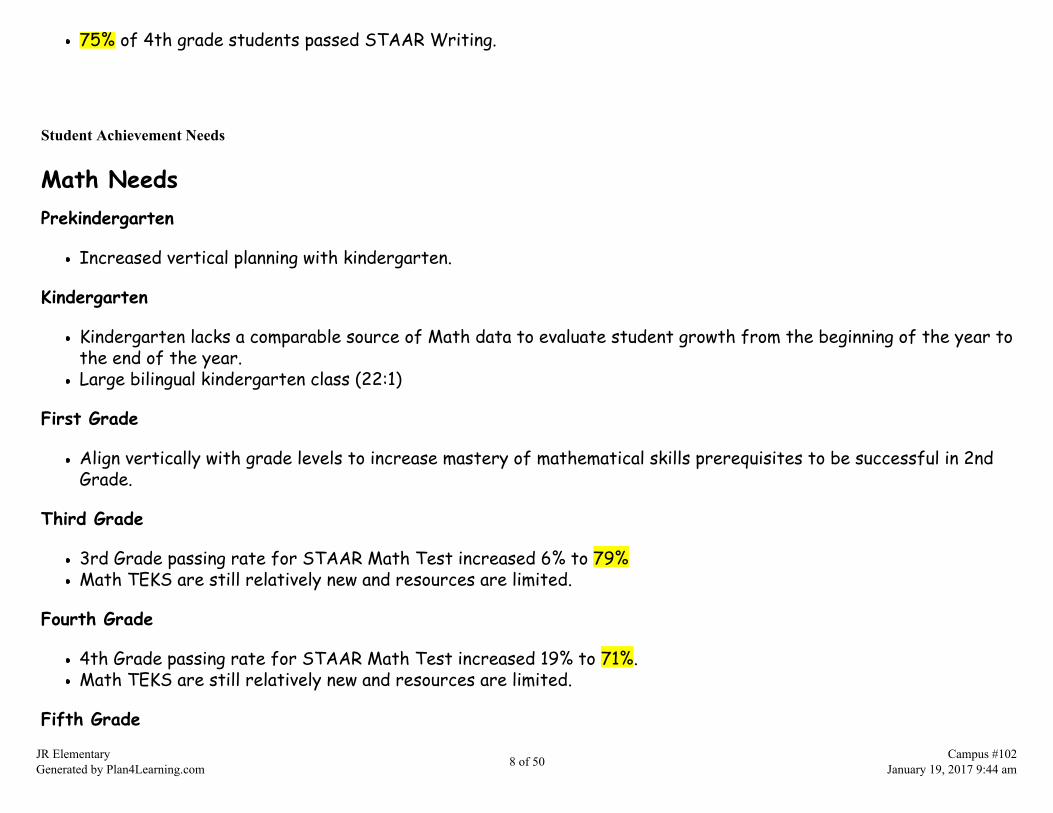
75% of 4th grade students passed STAAR Writing.
Student Achievement Needs
Math Needs Prekindergarten
Increased vertical planning with kindergarten.
Kindergarten
Kindergarten lacks a comparable source of Math data to evaluate student growth from the beginning of the year tothe end of the year.Large bilingual kindergarten class (22:1)
First Grade
Align vertically with grade levels to increase mastery of mathematical skills prerequisites to be successful in 2ndGrade.
Third Grade
3rd Grade passing rate for STAAR Math Test increased 6% to 79%Math TEKS are still relatively new and resources are limited.
Fourth Grade
4th Grade passing rate for STAAR Math Test increased 19% to 71%. Math TEKS are still relatively new and resources are limited.
Fifth Grade
JR ElementaryGenerated by Plan4Learning.com 8 of 50 Campus #102
January 19, 2017 9:44 am

Math TEKS are still relatively new and resources are limited.5th Grade passing rate for STAAR Math Test increased to 87%.
Reading NeedsPreKindergarten
The percentage of Prekindergarten students mastering vocabulary was 66%. This percentage includes ELLpopulation.The percentage of Prekindergarten students mastering letter identification was 70%. This percentage includesELL population.
Kindergarten
Increased use of Texas Treasures resourcesUsing testing teams to improve assessment of student masteryIncreased vertical planning with PK and 1st gradeCreation of Waterford lab to ensure participation for all kindergartenersAR Program used with advanced early readersLarge bilingual kindergarten class (22:1)
First Grade
Increased use of AR programIncreased vertical planning with K and 2ndCreation of Waterford lab to ensure participation for all kindergartenersUsing testing teams to improve assessment of student mastery
Second Grade
Increased use of AR programThe percentage of second grade students passing the EOY District Reading Test was 94%.Increase the use of Waterford in individual classrooms for struggling students.
JR ElementaryGenerated by Plan4Learning.com 9 of 50 Campus #102
January 19, 2017 9:44 am
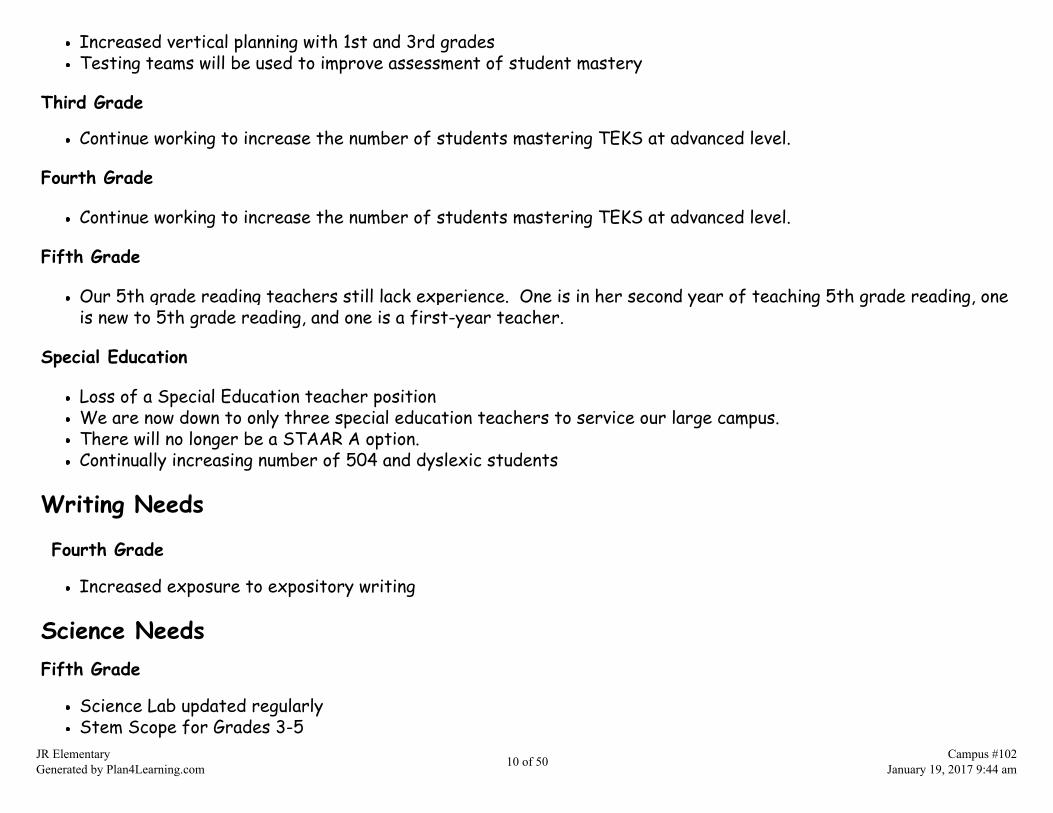
Increased vertical planning with 1st and 3rd gradesTesting teams will be used to improve assessment of student mastery
Third Grade
Continue working to increase the number of students mastering TEKS at advanced level.
Fourth Grade
Continue working to increase the number of students mastering TEKS at advanced level.
Fifth Grade
Our 5th grade reading teachers still lack experience. One is in her second year of teaching 5th grade reading, oneis new to 5th grade reading, and one is a first-year teacher.
Special Education
Loss of a Special Education teacher positionWe are now down to only three special education teachers to service our large campus.There will no longer be a STAAR A option.Continually increasing number of 504 and dyslexic students
Writing Needs
Fourth Grade
Increased exposure to expository writing
Science NeedsFifth Grade
Science Lab updated regularlyStem Scope for Grades 3-5
JR ElementaryGenerated by Plan4Learning.com 10 of 50 Campus #102
January 19, 2017 9:44 am

Attendance NeedsKindergarten
Kindergarten attendance was 94.62% for the year.Prekindergarten and kindergarten will be held to the same attendance guidelines as other grade levels this year.
First Grade
Average first grade student attendance for the year was 96.3%.
Second Grade
Average second grade student attendance for the year was 96.11%.
Third Grade
Third grade student attendance was 96.47%.
Fourth Grade
Fourth grade student attendance was 97.25%.
Fifth Grade
Fifth grade student attendance was 96.48% for the year.
JR ElementaryGenerated by Plan4Learning.com 11 of 50 Campus #102
January 19, 2017 9:44 am
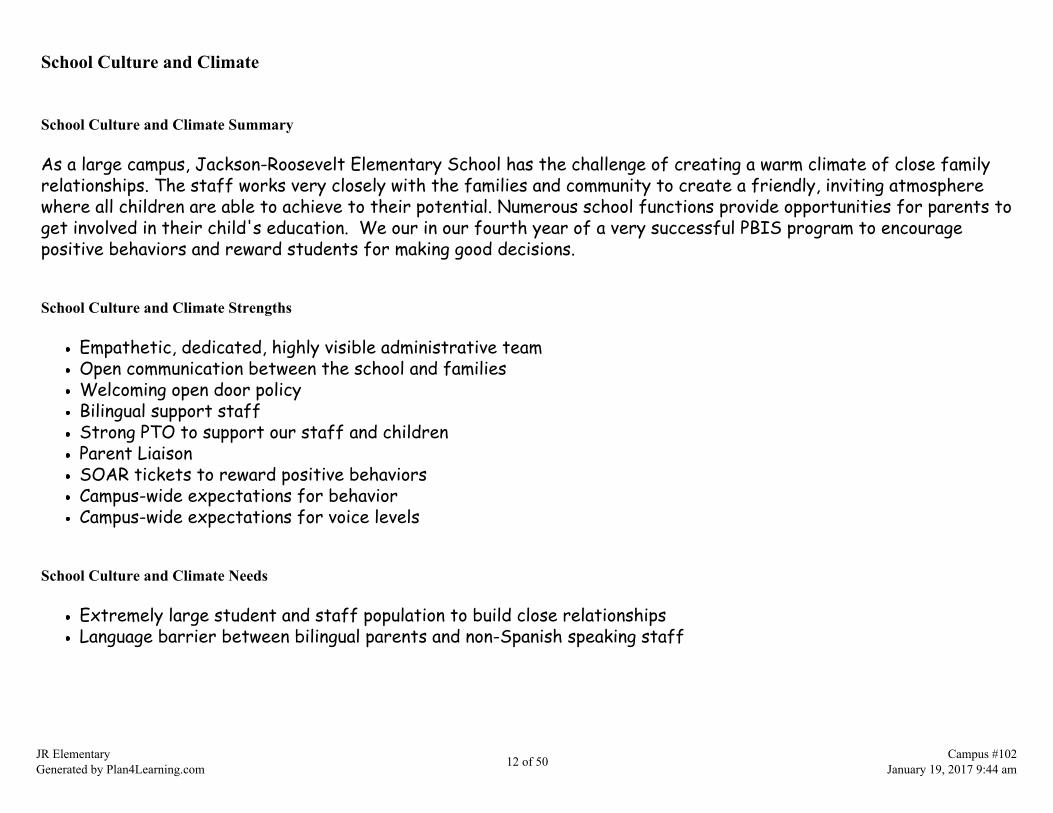
School Culture and Climate
School Culture and Climate Summary
As a large campus, Jackson-Roosevelt Elementary School has the challenge of creating a warm climate of close familyrelationships. The staff works very closely with the families and community to create a friendly, inviting atmospherewhere all children are able to achieve to their potential. Numerous school functions provide opportunities for parents toget involved in their child's education. We our in our fourth year of a very successful PBIS program to encouragepositive behaviors and reward students for making good decisions.
School Culture and Climate Strengths
Empathetic, dedicated, highly visible administrative teamOpen communication between the school and familiesWelcoming open door policyBilingual support staffStrong PTO to support our staff and childrenParent LiaisonSOAR tickets to reward positive behaviorsCampus-wide expectations for behaviorCampus-wide expectations for voice levels
School Culture and Climate Needs
Extremely large student and staff population to build close relationshipsLanguage barrier between bilingual parents and non-Spanish speaking staff
JR ElementaryGenerated by Plan4Learning.com 12 of 50 Campus #102
January 19, 2017 9:44 am

Staff Quality, Recruitment, and Retention
Staff Quality, Recruitment, and Retention Summary
At Jackson-Roosevelt Elementary School, we are very blessed with an amazing staff. Out of our 55 classroomteachers, 47 from the 2015-2016 school year have returned to instruct again this year. Schoolwide expectations havebeen established and continue to be in place. We have a successful PBIS system and look for applicants that embracethese beliefs.
Staff Quality, Recruitment, and Retention Strengths
Close faculty with administrative and parent supportOpen Door Policy with administrationTeacher Surveys to determine staff needsMorale building activities to encourage family atmosphereAdministration visibility and team effort to work together in all areasRecognition and rewards for staff
Staff Quality, Recruitment, and Retention Needs
New staff to be trained in Aware, Forethought, and "Thinking Maps"Budgetary restraintsESL Certifications neededClassroom Management Training with PBISOverall shortage of qualified applicants for regular education, special education, and bilingual education
JR ElementaryGenerated by Plan4Learning.com 13 of 50 Campus #102
January 19, 2017 9:44 am

Curriculum, Instruction, and Assessment
Curriculum, Instruction, and Assessment Summary
The Jackson-Roosevelt staff works very closely with the district office personnel to make sure that the curriculumtaught is current and meets the needs of the individual students. This year the four elementary schools continue towork collaboratively to create consistent instructional calendars which will ensure the curriculum is taught in the samesequence throughout the district.
Curriculum, Instruction, and Assessment Strengths
Strong classroom teachers throughout the district working together and sharing insructional strategies for thegood of all CCISD students Block instructional planning time to allow quality planning time and discussion of Tier I interventions for RTIWilson instruction for our identified dyslexic students and selected Tier III RtI students by anintervention/Wilson teacher
Curriculum, Instruction, and Assessment Needs
Budget restraints have limited our ability to purchase STAAR-based instructional materials and other suppliesused to improve student achievement.Common planning time for all four campusesDistance between campuses for planning sessionsSTAAR materials and updated practice testing materialsProfessional development in the area of working with special programs students in an inclusion classroomAdditional support for our English Language Learners
JR ElementaryGenerated by Plan4Learning.com 14 of 50 Campus #102
January 19, 2017 9:44 am

Family and Community Involvement
Family and Community Involvement Summary
Jackson-Roosevelt Elementary School is a large elementary school with 55 teachers, 5 professional staff, and 16 aidesserving over 950 students PK - 5th grade. We work together as a staff to get to know the families and childrenpersonally and try to make them feel comfortable and welcome in the school setting. We strive to create a small, familyatmosphere in a large school setting.
Family and Community Involvement Strengths
Administrative team dedicated to helping the children and staff of Jackson-Roosevelt Elementary School besuccessful.Positive, highly motivated teaching staff Strong, extremely supportive PTOWatch Dog ProgramParent LiaisonBilingual teachers and office staffCounseling staff devoted to working with our families and children to assist children to be successful in theclassroom and in society.
Family and Community Involvement Needs
Growing ELL population outside of the Spanish languageFamily mobilityEconomic challenges
JR ElementaryGenerated by Plan4Learning.com 15 of 50 Campus #102
January 19, 2017 9:44 am

School Context and Organization
School Context and Organization Summary
JR Elementary is a large PK-5 campus with nearly one thousand students. Our campus has self-contained classroomsfor students in grades PK-2. In grades 3-5, our teachers are departmentalized by content area. We have three specialeducation teachers that service grades 2-5 Language Arts, grades 2-5 Math/Behavior Unit, and a K-1/Life Skills classrespectively. Our K-5 teachers have a weekly block time to create instructional calendars and plan as a grade level. Itis consistent with other CCISD elementary campuses and provides an opportunity to collaborate with other campusesand the instructional facilitators for the district. Our administrative team has weekly faculty meetings to communicateregularly with staff and provide support as needed. Our SBDM committee consists of our five administrative teammembers, a representative from each grade level, elective teachers, and special education teachers.
School Context and Organization Strengths
New teachers receive support from a mentorPrincipals hosted a new teacher mentor luncheon during new teacher inserviceMonthly meeting with teachers new to our campus with administrators and instructional facilitorBallet Folklorico dance groupChoir EnrichmentsDance EnrichmentsArt EnrichmentsPersonnel adjustments to support academic growthFriday Focus e-mailed weekly to improve communication with faculty, staff and district administrationTeachers utilize our "What Do The Eagles Do?" music video modeling and encouraging appropriate behaviorsTutorials are within the school day to ensure every child has the opportunity to receive the support needed
School Context and Organization Needs
As the bilingual campus for district, we struggle to provide the necessary support to ensure the success of ourELL students.Our administrative team is stretched thin trying to accommodate the needs of nearly one thousand students and a
JR ElementaryGenerated by Plan4Learning.com 16 of 50 Campus #102
January 19, 2017 9:44 am

staff of close to one hundred.
JR ElementaryGenerated by Plan4Learning.com 17 of 50 Campus #102
January 19, 2017 9:44 am
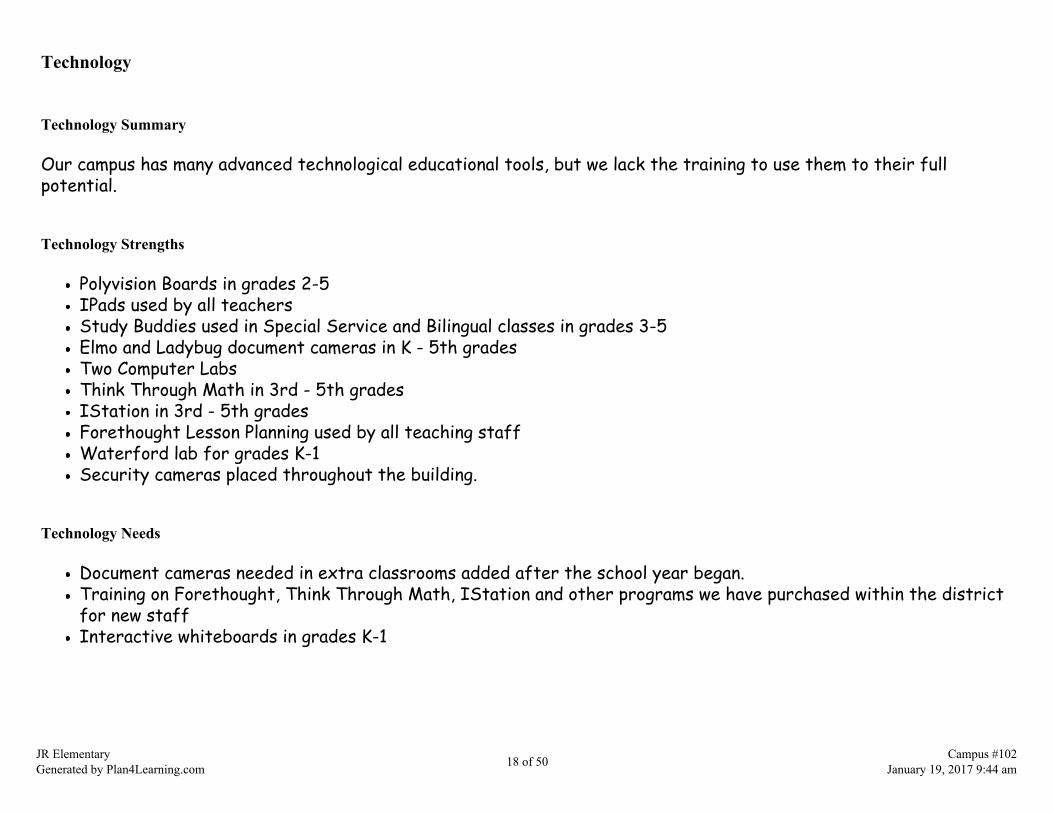
Technology
Technology Summary
Our campus has many advanced technological educational tools, but we lack the training to use them to their fullpotential.
Technology Strengths
Polyvision Boards in grades 2-5IPads used by all teachersStudy Buddies used in Special Service and Bilingual classes in grades 3-5Elmo and Ladybug document cameras in K - 5th gradesTwo Computer LabsThink Through Math in 3rd - 5th gradesIStation in 3rd - 5th gradesForethought Lesson Planning used by all teaching staffWaterford lab for grades K-1Security cameras placed throughout the building.
Technology Needs
Document cameras needed in extra classrooms added after the school year began.Training on Forethought, Think Through Math, IStation and other programs we have purchased within the districtfor new staffInteractive whiteboards in grades K-1
JR ElementaryGenerated by Plan4Learning.com 18 of 50 Campus #102
January 19, 2017 9:44 am

Comprehensive Needs Assessment Data Documentation
The following data were used to verify the comprehensive needs assessment analysis:
Improvement Planning Data
District goalsCampus goalsCurrent and/or prior year(s) campus and/or district improvement plansCampus and/or district planning and decision making committee(s) meeting dataState and federal planning requirements
Accountability Data
Texas Academic Performance Report (TAPR) dataPerformance Index Framework Data: Index 1 - Student AchievementPerformance Index Framework Data: Index 2 - Student ProgressPerformance Index Framework Data: Index 3 - Closing Performance GapsPerformance Index Framework Data: Index 4 - Postsecondary ReadinessAccountability Distinction DesignationsFederal Report Card DataPBMAS data
Student Data: Assessments
State and federally required assessment information (e.g. curriculum, eligibility, format, standards, accommodations, TEA information)State of Texas Assessments of Academic Readiness (STAAR) current and longitudinal results, including all versionsSTAAR ELL Progress Measure dataTexas English Language Proficiency Assessment System (TELPAS) resultsTexas Primary Reading Inventory (TPRI), Tejas LEE, or other alternate early reading assessment resultsStudent Success Initiative (SSI) data for Grades 5 and 8Local benchmark or common assessments dataStudent failure and/or retention ratesRunning Records results
Student Data: Student Groups
Race and ethnicity data, including number of students, academic achievement, discipline, attendance, and rates of progress between groupsNumber of students assigned to each special program, including analysis of academic achievement, race, ethnicity, gender, etcEconomically Disadvantaged / Non-economically disadvantaged performance and participation dataSpecial education population, including performance, discipline, attendance, and mobilityMigrant population, including performance, discipline, attendance and mobility
JR ElementaryGenerated by Plan4Learning.com 19 of 50 Campus #102
January 19, 2017 9:44 am
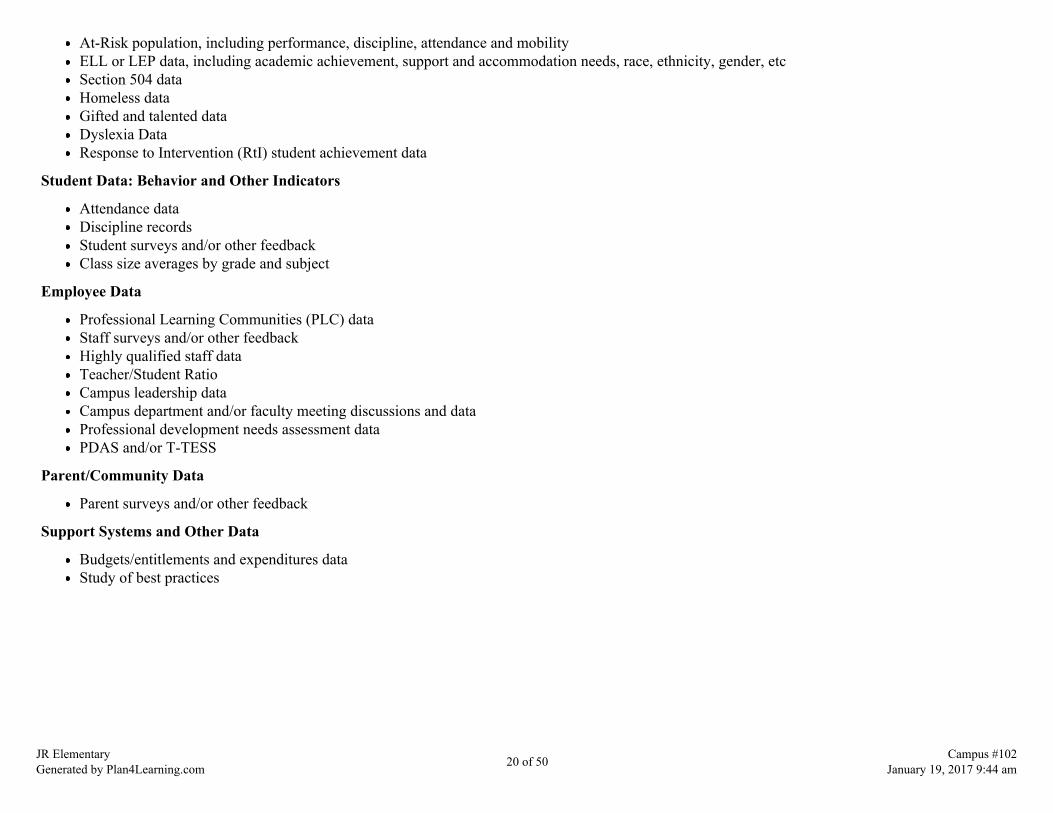
At-Risk population, including performance, discipline, attendance and mobilityELL or LEP data, including academic achievement, support and accommodation needs, race, ethnicity, gender, etcSection 504 dataHomeless dataGifted and talented dataDyslexia DataResponse to Intervention (RtI) student achievement data
Student Data: Behavior and Other Indicators
Attendance dataDiscipline recordsStudent surveys and/or other feedbackClass size averages by grade and subject
Employee Data
Professional Learning Communities (PLC) dataStaff surveys and/or other feedbackHighly qualified staff dataTeacher/Student RatioCampus leadership dataCampus department and/or faculty meeting discussions and dataProfessional development needs assessment dataPDAS and/or T-TESS
Parent/Community Data
Parent surveys and/or other feedback
Support Systems and Other Data
Budgets/entitlements and expenditures dataStudy of best practices
JR ElementaryGenerated by Plan4Learning.com 20 of 50 Campus #102
January 19, 2017 9:44 am

Goals
Goal 1: CCISD will provide learning opportunities that are engaging, rigorous, relevant, and transcend state standardswhile meeting individual needs.
Performance Objective 1: All CCISD will participate in ELAR activities that promote creativity, collaboration, and problem solving.
Evaluation Data Source(s) 1: 100% of students will show one or more years growth and or meet standard on Writing and Reading STAAR(Level II) and EOY Assessments.
Summative Evaluation 1:
Strategy Description Title I Staff Responsiblefor Monitoring Evidence that Demonstrates Success
ReviewsFormative Summative
Nov Jan Mar June1) Instructional supplies, materials and support services will be purchased tosupport the academic and social goals of the campus in Reading.
1, 2, 9 Sherry Phillips,Dawn BrownAmber Caylor
100% of students will show one or more yearsgrowth and or meet standard on Reading STAAR orEOY assessments.
Funding Sources: 211 TITLE I - $2,500.00, 199 LOCAL - $300.002) Title I funds will be used to order STAAR resources and interventionmaterials for the regular and tutorial programs.
1, 2, 9 Sherry Phillips,Amber Caylor,Dawn Brown
100% of students will show one or more yearsgrowth and or meet standard on Reading STAAR orEOY assessments.
Funding Sources: 211 TITLE I - $1,500.00, 199 LOCAL - $155.003) JR will continue to aggressively pursue the implementation of newtechnology to support the academic program through the purchasing ofequipment, programs (Accelerated Reader) and training (professional andparaprofessional). Accelerated Reader will be utilized in grades 1 - 5 topromote reading inside and outside the classroom. It will be purchased forkindergarteners who have demonstrated above level reading skills as anenrichment. Library will encourage competitions between classrooms.
1, 2, 9 Sherry Phillips,Dorinda Skipper,Amber Caylor
100% of the reading teachers in grades 1-5 willimplement the Accelerated Reader Program.Students will strive to exceed their 2015-2016 pointtotals. Reading fluency and comprehension willincrease on TPRI and QRI EOY tests.
Funding Sources: 211 TITLE I - $500.00
4) An Instructional Facilitator will be available to provide instructionalsupport to teachers and students during the school day and summer.(STAARadministration, tutorials, etc.)
1, 2, 3, 8,9
Sherry PhillipsAmber Caylor
100% of students will show one or more yearsgrowth and or meet standard on Reading STAAR orEOY assessments.
Funding Sources: 211 TITLE I - $16,075.005) Reading materials and supplies will be purchased for the school libraryand classrooms for support.
1, 2 Dorinda Skipper Reading fluency rates will improve for all studentsas compared to BOY reading assessment results.Circulation of library materials will increase fromthe 2015-2016 school year.
JR ElementaryGenerated by Plan4Learning.com 21 of 50 Campus #102
January 19, 2017 9:44 am
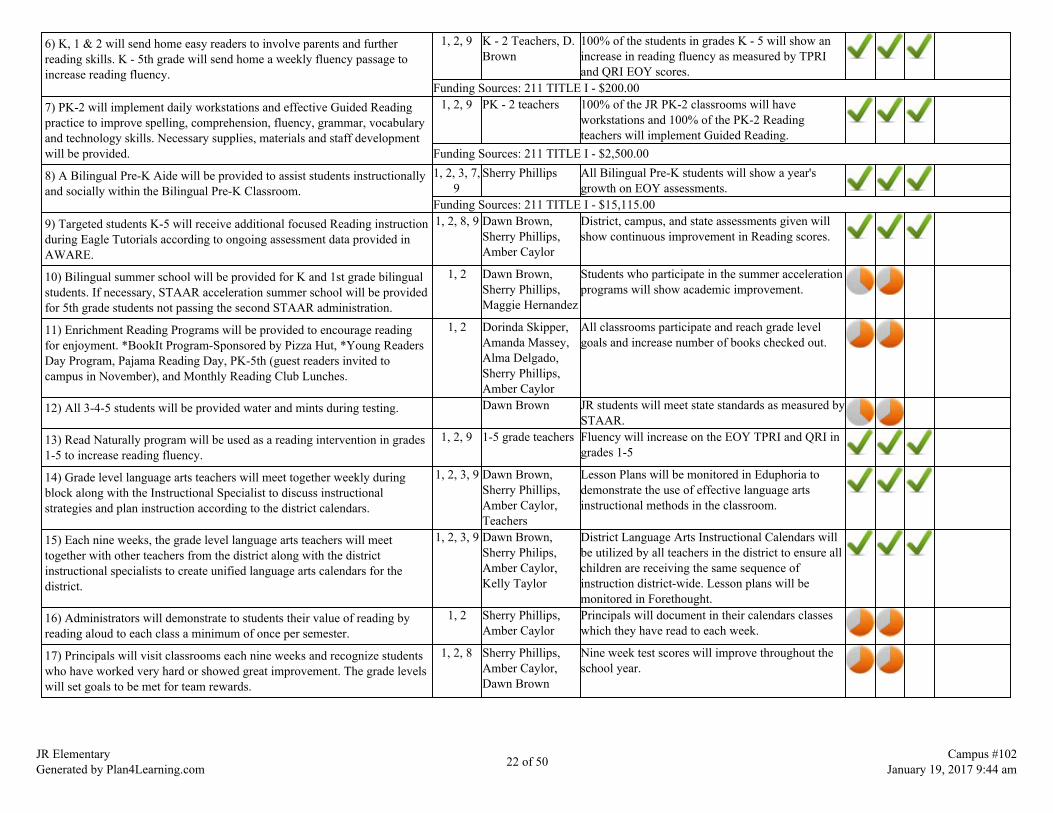
6) K, 1 & 2 will send home easy readers to involve parents and furtherreading skills. K - 5th grade will send home a weekly fluency passage toincrease reading fluency.
1, 2, 9 K - 2 Teachers, D.Brown
100% of the students in grades K - 5 will show anincrease in reading fluency as measured by TPRIand QRI EOY scores.
Funding Sources: 211 TITLE I - $200.007) PK-2 will implement daily workstations and effective Guided Readingpractice to improve spelling, comprehension, fluency, grammar, vocabularyand technology skills. Necessary supplies, materials and staff developmentwill be provided.
1, 2, 9 PK - 2 teachers 100% of the JR PK-2 classrooms will haveworkstations and 100% of the PK-2 Readingteachers will implement Guided Reading.
Funding Sources: 211 TITLE I - $2,500.00
8) A Bilingual Pre-K Aide will be provided to assist students instructionallyand socially within the Bilingual Pre-K Classroom.
1, 2, 3, 7,9
Sherry Phillips All Bilingual Pre-K students will show a year'sgrowth on EOY assessments.
Funding Sources: 211 TITLE I - $15,115.009) Targeted students K-5 will receive additional focused Reading instructionduring Eagle Tutorials according to ongoing assessment data provided inAWARE.
1, 2, 8, 9 Dawn Brown,Sherry Phillips,Amber Caylor
District, campus, and state assessments given willshow continuous improvement in Reading scores.
10) Bilingual summer school will be provided for K and 1st grade bilingualstudents. If necessary, STAAR acceleration summer school will be providedfor 5th grade students not passing the second STAAR administration.
1, 2 Dawn Brown,Sherry Phillips,Maggie Hernandez
Students who participate in the summer accelerationprograms will show academic improvement.
11) Enrichment Reading Programs will be provided to encourage readingfor enjoyment. *BookIt Program-Sponsored by Pizza Hut, *Young ReadersDay Program, Pajama Reading Day, PK-5th (guest readers invited tocampus in November), and Monthly Reading Club Lunches.
1, 2 Dorinda Skipper,Amanda Massey,Alma Delgado,Sherry Phillips,Amber Caylor
All classrooms participate and reach grade levelgoals and increase number of books checked out.
12) All 3-4-5 students will be provided water and mints during testing. Dawn Brown JR students will meet state standards as measured bySTAAR.
13) Read Naturally program will be used as a reading intervention in grades1-5 to increase reading fluency.
1, 2, 9 1-5 grade teachers Fluency will increase on the EOY TPRI and QRI ingrades 1-5
14) Grade level language arts teachers will meet together weekly duringblock along with the Instructional Specialist to discuss instructionalstrategies and plan instruction according to the district calendars.
1, 2, 3, 9 Dawn Brown,Sherry Phillips,Amber Caylor,Teachers
Lesson Plans will be monitored in Eduphoria todemonstrate the use of effective language artsinstructional methods in the classroom.
15) Each nine weeks, the grade level language arts teachers will meettogether with other teachers from the district along with the districtinstructional specialists to create unified language arts calendars for thedistrict.
1, 2, 3, 9 Dawn Brown,Sherry Philips,Amber Caylor,Kelly Taylor
District Language Arts Instructional Calendars willbe utilized by all teachers in the district to ensure allchildren are receiving the same sequence ofinstruction district-wide. Lesson plans will bemonitored in Forethought.
16) Administrators will demonstrate to students their value of reading byreading aloud to each class a minimum of once per semester.
1, 2 Sherry Phillips,Amber Caylor
Principals will document in their calendars classeswhich they have read to each week.
17) Principals will visit classrooms each nine weeks and recognize studentswho have worked very hard or showed great improvement. The grade levelswill set goals to be met for team rewards.
1, 2, 8 Sherry Phillips,Amber Caylor,Dawn Brown
Nine week test scores will improve throughout theschool year.
JR ElementaryGenerated by Plan4Learning.com 22 of 50 Campus #102
January 19, 2017 9:44 am
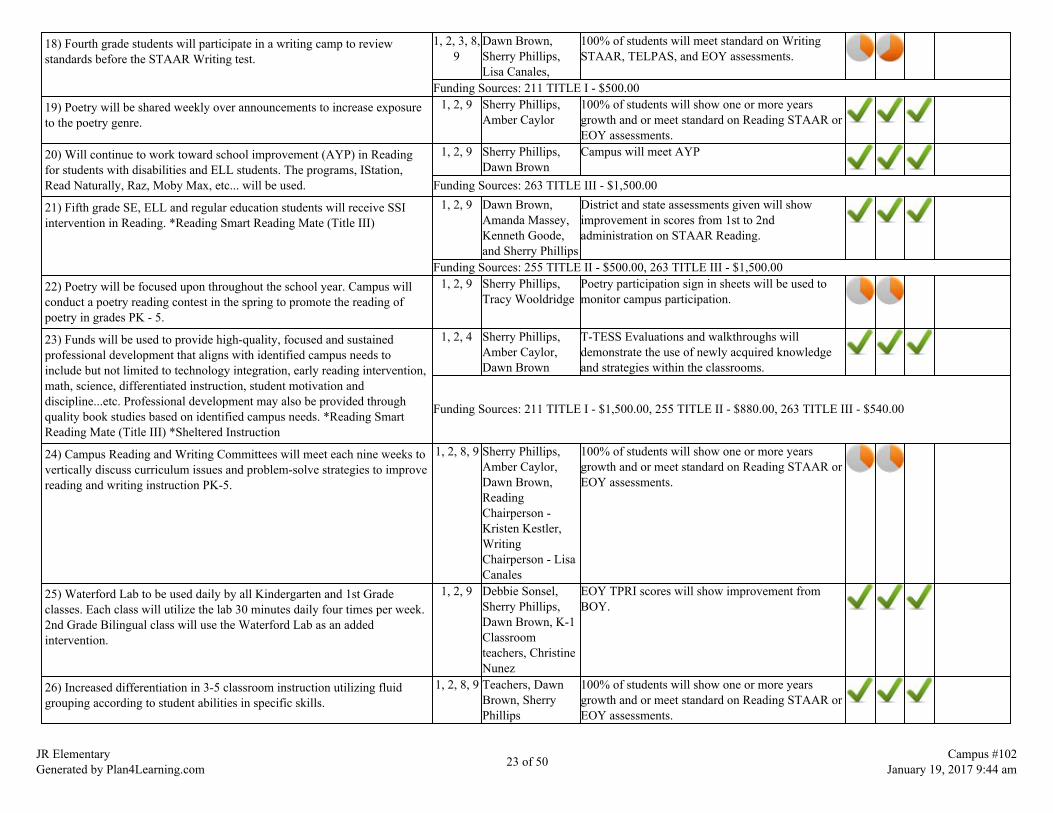
18) Fourth grade students will participate in a writing camp to reviewstandards before the STAAR Writing test.
1, 2, 3, 8,9
Dawn Brown,Sherry Phillips,Lisa Canales,
100% of students will meet standard on WritingSTAAR, TELPAS, and EOY assessments.
Funding Sources: 211 TITLE I - $500.0019) Poetry will be shared weekly over announcements to increase exposureto the poetry genre.
1, 2, 9 Sherry Phillips,Amber Caylor
100% of students will show one or more yearsgrowth and or meet standard on Reading STAAR orEOY assessments.
20) Will continue to work toward school improvement (AYP) in Readingfor students with disabilities and ELL students. The programs, IStation,Read Naturally, Raz, Moby Max, etc... will be used.
1, 2, 9 Sherry Phillips,Dawn Brown
Campus will meet AYP
Funding Sources: 263 TITLE III - $1,500.00
21) Fifth grade SE, ELL and regular education students will receive SSIintervention in Reading. *Reading Smart Reading Mate (Title III)
1, 2, 9 Dawn Brown,Amanda Massey,Kenneth Goode,and Sherry Phillips
District and state assessments given will showimprovement in scores from 1st to 2ndadministration on STAAR Reading.
Funding Sources: 255 TITLE II - $500.00, 263 TITLE III - $1,500.0022) Poetry will be focused upon throughout the school year. Campus willconduct a poetry reading contest in the spring to promote the reading ofpoetry in grades PK - 5.
1, 2, 9 Sherry Phillips,Tracy Wooldridge
Poetry participation sign in sheets will be used tomonitor campus participation.
23) Funds will be used to provide high-quality, focused and sustainedprofessional development that aligns with identified campus needs toinclude but not limited to technology integration, early reading intervention,math, science, differentiated instruction, student motivation anddiscipline...etc. Professional development may also be provided throughquality book studies based on identified campus needs. *Reading SmartReading Mate (Title III) *Sheltered Instruction
1, 2, 4 Sherry Phillips,Amber Caylor,Dawn Brown
T-TESS Evaluations and walkthroughs willdemonstrate the use of newly acquired knowledgeand strategies within the classrooms.
Funding Sources: 211 TITLE I - $1,500.00, 255 TITLE II - $880.00, 263 TITLE III - $540.00
24) Campus Reading and Writing Committees will meet each nine weeks tovertically discuss curriculum issues and problem-solve strategies to improvereading and writing instruction PK-5.
1, 2, 8, 9 Sherry Phillips,Amber Caylor,Dawn Brown,ReadingChairperson -Kristen Kestler,WritingChairperson - LisaCanales
100% of students will show one or more yearsgrowth and or meet standard on Reading STAAR orEOY assessments.
25) Waterford Lab to be used daily by all Kindergarten and 1st Gradeclasses. Each class will utilize the lab 30 minutes daily four times per week.2nd Grade Bilingual class will use the Waterford Lab as an addedintervention.
1, 2, 9 Debbie Sonsel,Sherry Phillips,Dawn Brown, K-1Classroomteachers, ChristineNunez
EOY TPRI scores will show improvement fromBOY.
26) Increased differentiation in 3-5 classroom instruction utilizing fluidgrouping according to student abilities in specific skills.
1, 2, 8, 9 Teachers, DawnBrown, SherryPhillips
100% of students will show one or more yearsgrowth and or meet standard on Reading STAAR orEOY assessments.
JR ElementaryGenerated by Plan4Learning.com 23 of 50 Campus #102
January 19, 2017 9:44 am

27) Staff will promote reading independently for the joy of reading afterparticipating in a book study of The Book Whisperer. Reading will bepraised and recognized and grade level reading clubs will be formed to sharebooks monthly.
1, 2, 9 Dorinda Skipper,Sherry Phillips
Book Whisperer Slide Show and Reading Club signin sheets will be used to demonstratesuccess.Walkthroughs will document studentsreading silently upon completion of lesson activities.
= Accomplished = Considerable = Some Progress = No Progress = Discontinue
JR ElementaryGenerated by Plan4Learning.com 24 of 50 Campus #102
January 19, 2017 9:44 am

Goal 1: CCISD will provide learning opportunities that are engaging, rigorous, relevant, and transcend state standards while meeting individual needs.
Performance Objective 2: All CCISD will participate in Math activities that promote creativity, collaboration, and problem solving.
Evaluation Data Source(s) 2: 100% of students will show one or more years growth and or meet standard on Math STAAR (Level II) and EOYAssessments.
Summative Evaluation 2:
Strategy Description Title I Staff Responsiblefor Monitoring Evidence that Demonstrates Success
ReviewsFormative Summative
Nov Jan Mar June1) Instructional supplies, materials and support services will be purchased tosupport the academic and social goals of the campus in Math.
1, 2, 9 Sherry Phillips 100% of students will show one or more yearsgrowth and or meet standard on Math STAAR orEOY assessments.
Funding Sources: 211 TITLE I - $2,500.00, 199 LOCAL - $100.002) Title I funds will be used to order STAAR resource and interventionmaterials for the regular and tutorial programs.
1, 2, 9 Sherry Phillips,Dawn Brown
100% of students will show one or more yearsgrowth and or meet standard on Math STAAR orEOY assessments.
Funding Sources: 211 TITLE I - $2,000.00, 199 LOCAL - $150.003) Targeted students K-5 will receive additional focused Math instructionduring Eagle Tutorials.
1, 2, 8, 9 Dawn Brown District, campus, and state assessments given willshow continuous improvement in Math scores.
4) K-5 teachers will meet regularly with the district math coordinator todissaggregate data and plan for the next nine weeks.
1, 2, 3, 8,9
Dawn Brown andK-5 Teachers
100% of students will show one or more yearsgrowth and or meet standard on Math STAAR orEOY assessments.
5) K-5 Math teachers will continue to implement the district developed 90minute structured lesson plan. All teachers will work on basic math factsdaily and administer a math facts quiz each 9 weeks.
1, 2, 3, 8,9
Dawn Brown 100% of students will show one or more yearsgrowth and or meet standard on Math STAAR orEOY assessments.
6) All 3-4-5 students will be provided water during STAAR testing. Dawn Brown 100% of students will show one or more yearsgrowth and or meet standard on Math STAAR orEOY assessments.
7) Grade level Math teachers will meet together weekly during block alongwith the Instructional Specialist to discuss instructional strategies and planinstruction according to the district calendars.
1, 2, 3, 8,9
Sherry Phillips,Amber Caylor,Dawn Brown
Lesson plans will be monitored in Eduphoria todemonstrate the use of effective mathematicsinstructional methods within the classroom.
8) Each nine weeks, the grade level math teachers will meet together withother teachers from the district along with the district instructionalspecialists to create unified math calendars for the district.
1, 2, 3, 8,9
Sherry Phillips,Amber Caylor,Dawn Brown
District Mathematics Instructional Calendars will beutilized by all teachers in the district to ensure allchildren are receiving the same sequence of mathinstruction district-wide.
JR ElementaryGenerated by Plan4Learning.com 25 of 50 Campus #102
January 19, 2017 9:44 am
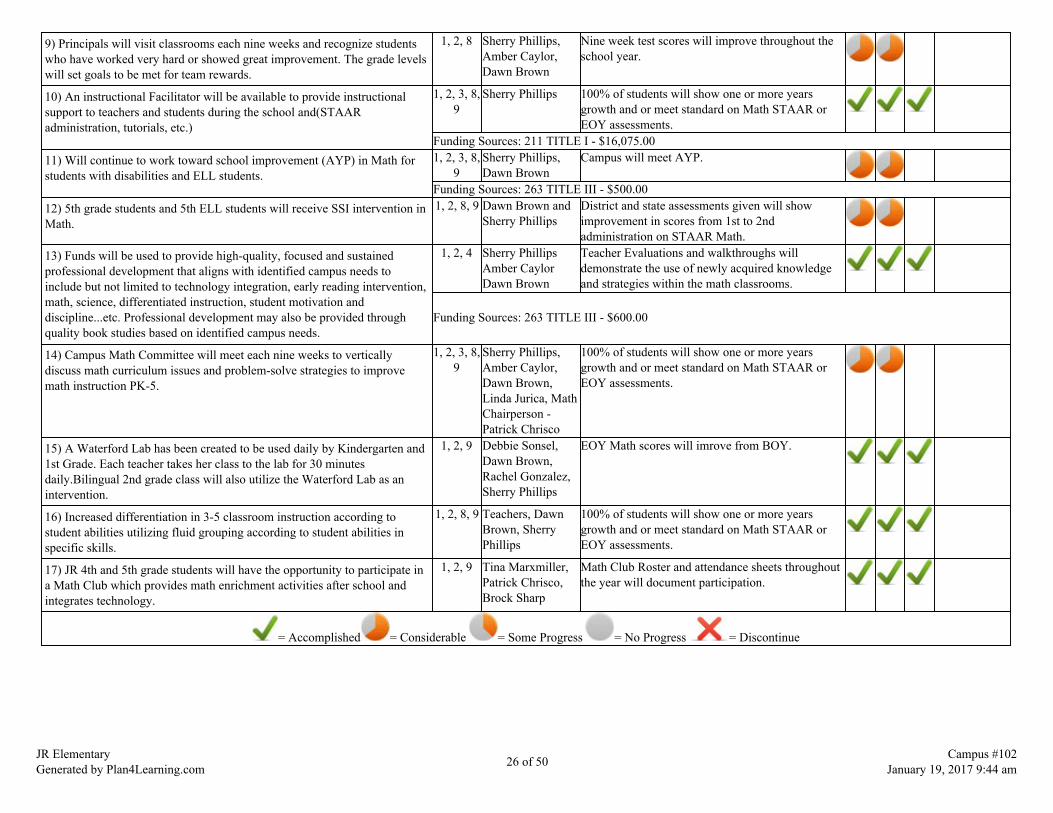
9) Principals will visit classrooms each nine weeks and recognize studentswho have worked very hard or showed great improvement. The grade levelswill set goals to be met for team rewards.
1, 2, 8 Sherry Phillips,Amber Caylor,Dawn Brown
Nine week test scores will improve throughout theschool year.
10) An instructional Facilitator will be available to provide instructionalsupport to teachers and students during the school and(STAARadministration, tutorials, etc.)
1, 2, 3, 8,9
Sherry Phillips 100% of students will show one or more yearsgrowth and or meet standard on Math STAAR orEOY assessments.
Funding Sources: 211 TITLE I - $16,075.0011) Will continue to work toward school improvement (AYP) in Math forstudents with disabilities and ELL students.
1, 2, 3, 8,9
Sherry Phillips,Dawn Brown
Campus will meet AYP.
Funding Sources: 263 TITLE III - $500.0012) 5th grade students and 5th ELL students will receive SSI intervention inMath.
1, 2, 8, 9 Dawn Brown andSherry Phillips
District and state assessments given will showimprovement in scores from 1st to 2ndadministration on STAAR Math.
13) Funds will be used to provide high-quality, focused and sustainedprofessional development that aligns with identified campus needs toinclude but not limited to technology integration, early reading intervention,math, science, differentiated instruction, student motivation anddiscipline...etc. Professional development may also be provided throughquality book studies based on identified campus needs.
1, 2, 4 Sherry PhillipsAmber CaylorDawn Brown
Teacher Evaluations and walkthroughs willdemonstrate the use of newly acquired knowledgeand strategies within the math classrooms.
Funding Sources: 263 TITLE III - $600.00
14) Campus Math Committee will meet each nine weeks to verticallydiscuss math curriculum issues and problem-solve strategies to improvemath instruction PK-5.
1, 2, 3, 8,9
Sherry Phillips,Amber Caylor,Dawn Brown,Linda Jurica, MathChairperson -Patrick Chrisco
100% of students will show one or more yearsgrowth and or meet standard on Math STAAR orEOY assessments.
15) A Waterford Lab has been created to be used daily by Kindergarten and1st Grade. Each teacher takes her class to the lab for 30 minutesdaily.Bilingual 2nd grade class will also utilize the Waterford Lab as anintervention.
1, 2, 9 Debbie Sonsel,Dawn Brown,Rachel Gonzalez,Sherry Phillips
EOY Math scores will imrove from BOY.
16) Increased differentiation in 3-5 classroom instruction according tostudent abilities utilizing fluid grouping according to student abilities inspecific skills.
1, 2, 8, 9 Teachers, DawnBrown, SherryPhillips
100% of students will show one or more yearsgrowth and or meet standard on Math STAAR orEOY assessments.
17) JR 4th and 5th grade students will have the opportunity to participate ina Math Club which provides math enrichment activities after school andintegrates technology.
1, 2, 9 Tina Marxmiller,Patrick Chrisco,Brock Sharp
Math Club Roster and attendance sheets throughoutthe year will document participation.
= Accomplished = Considerable = Some Progress = No Progress = Discontinue
JR ElementaryGenerated by Plan4Learning.com 26 of 50 Campus #102
January 19, 2017 9:44 am

Goal 1: CCISD will provide learning opportunities that are engaging, rigorous, relevant, and transcend state standards while meeting individual needs.
Performance Objective 3: All CCISD will participate in Science activities that promote creativity, collaboration, and problem solving.
Evaluation Data Source(s) 3: 100% of students will meet standard on Science STAAR (Level II) and EOY Assessments.
Summative Evaluation 3:
Strategy Description Title I Staff Responsiblefor Monitoring Evidence that Demonstrates Success
ReviewsFormative Summative
Nov Jan Mar June1) Instructional supplies, materials and support services will be purchased tosupport the academic and social goals of the campus in science.
2 Sherry Phillips,Amber Caylor,Dawn Brown
100% of students will meet standard on ScienceSTAAR or EOY assessments.
Funding Sources: 211 TITLE I - $2,500.00, 199 LOCAL - $1,000.002) Title I funds will be used to order STAAR resource and interventionmaterials for the regular and tutorial programs to include, but not limited toStem Scopes
2 Sherry Phillips,Dawn Brown
100% of the classrooms will have necessarymaterials. 100% of students successful on STAARScience and EOY assessment.s.
Funding Sources: 211 TITLE I - $1,500.003) An Instructional Facilitator will be available to provide instructionalsupport to teachers and students during school and (STAAR administration,tutorials, etc.)
Sherry Phillips JR students will meet state standards on STAAR.
Funding Sources: 211 TITLE I - $16,075.00
4) Targeted 5th grade students will receive additional focused Scienceinstruction during tutorials.
Dawn Brown District and state assessments given will showcontinuous improvement in Science scores.
5) 3rd - 5th grade will meet regularly with the district science coordinator todissaggregate data and plan for the next nine weeks.
Dawn Brown,Robin Sonsel
100% passing science STAAR.
6) 5th grade Science teachers will work with 5th Special Education teachersto incorporate a mainstream with support Science program for all 5th graderesource students.
5th grade Scienceteachers and 5thgrade SpecialEducation aides.
100% passing Science STAAR.
7) Funds will be used to provide high-quality, focused and sustainedprofessional development that aligns with identified campus needs toinclude but not limited to technology integration, early reading intervention,math, science, differentiated instruction, student motivation anddiscipline...etc. Professional development may also be provided throughquality book studies based on identified campus needs.
Sherry Phillips,Amber Caylor,Dawn Brown
Teacher Evaluations and walkthroughs willdemonstrate the use of newly acquired knowledgeand strategies within the science classrooms.
Funding Sources: 211 TITLE I - $350.00
8) Grade level Science teachers will meet together weekly during blockalong with the Instructional Specialist to discuss instructional strategies andplan instruction according to the district calendars.
Sherry Phillips,Amber Caylor,Dawn Brown
Lesson plans will be monitored in Eduphoria todemonstrate the use of effective scienceinstructional methods and lab experiments withinthe classroom.
JR ElementaryGenerated by Plan4Learning.com 27 of 50 Campus #102
January 19, 2017 9:44 am
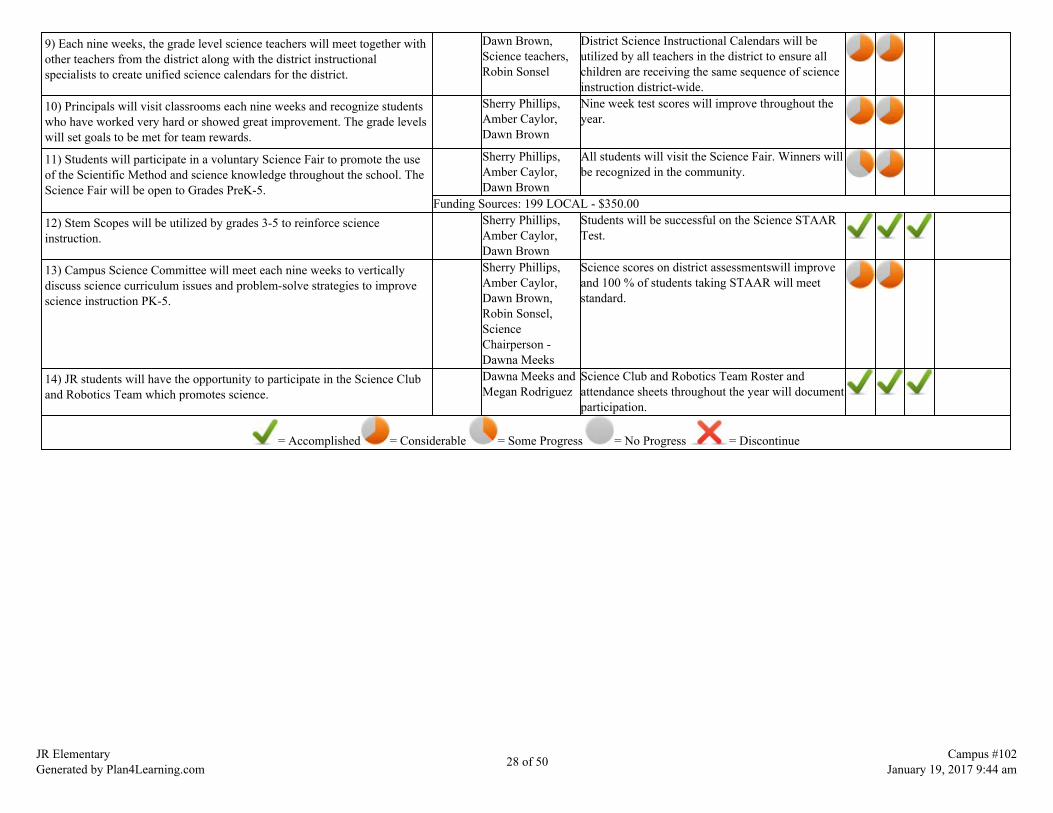
9) Each nine weeks, the grade level science teachers will meet together withother teachers from the district along with the district instructionalspecialists to create unified science calendars for the district.
Dawn Brown,Science teachers,Robin Sonsel
District Science Instructional Calendars will beutilized by all teachers in the district to ensure allchildren are receiving the same sequence of scienceinstruction district-wide.
10) Principals will visit classrooms each nine weeks and recognize studentswho have worked very hard or showed great improvement. The grade levelswill set goals to be met for team rewards.
Sherry Phillips,Amber Caylor,Dawn Brown
Nine week test scores will improve throughout theyear.
11) Students will participate in a voluntary Science Fair to promote the useof the Scientific Method and science knowledge throughout the school. TheScience Fair will be open to Grades PreK-5.
Sherry Phillips,Amber Caylor,Dawn Brown
All students will visit the Science Fair. Winners willbe recognized in the community.
Funding Sources: 199 LOCAL - $350.0012) Stem Scopes will be utilized by grades 3-5 to reinforce scienceinstruction.
Sherry Phillips,Amber Caylor,Dawn Brown
Students will be successful on the Science STAARTest.
13) Campus Science Committee will meet each nine weeks to verticallydiscuss science curriculum issues and problem-solve strategies to improvescience instruction PK-5.
Sherry Phillips,Amber Caylor,Dawn Brown,Robin Sonsel,ScienceChairperson -Dawna Meeks
Science scores on district assessmentswill improveand 100 % of students taking STAAR will meetstandard.
14) JR students will have the opportunity to participate in the Science Cluband Robotics Team which promotes science.
Dawna Meeks andMegan Rodriguez
Science Club and Robotics Team Roster andattendance sheets throughout the year will documentparticipation.
= Accomplished = Considerable = Some Progress = No Progress = Discontinue
JR ElementaryGenerated by Plan4Learning.com 28 of 50 Campus #102
January 19, 2017 9:44 am
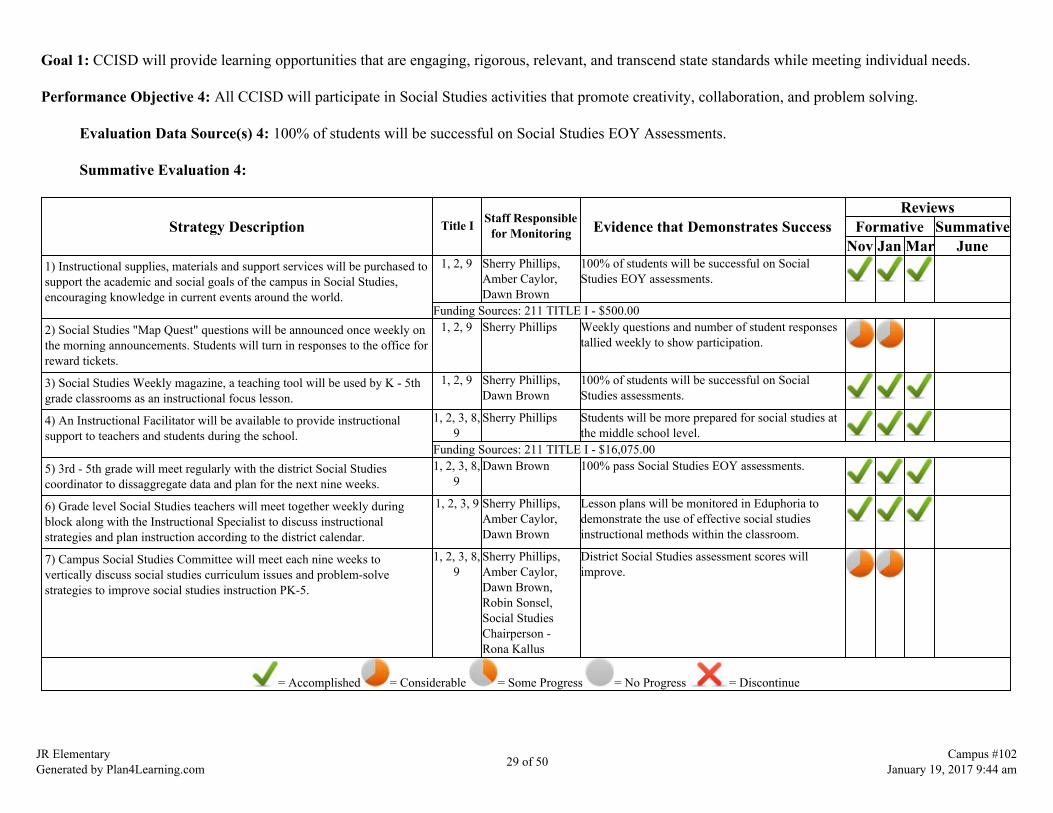
Goal 1: CCISD will provide learning opportunities that are engaging, rigorous, relevant, and transcend state standards while meeting individual needs.
Performance Objective 4: All CCISD will participate in Social Studies activities that promote creativity, collaboration, and problem solving.
Evaluation Data Source(s) 4: 100% of students will be successful on Social Studies EOY Assessments.
Summative Evaluation 4:
Strategy Description Title I Staff Responsiblefor Monitoring Evidence that Demonstrates Success
ReviewsFormative Summative
Nov Jan Mar June1) Instructional supplies, materials and support services will be purchased tosupport the academic and social goals of the campus in Social Studies,encouraging knowledge in current events around the world.
1, 2, 9 Sherry Phillips,Amber Caylor,Dawn Brown
100% of students will be successful on SocialStudies EOY assessments.
Funding Sources: 211 TITLE I - $500.002) Social Studies "Map Quest" questions will be announced once weekly onthe morning announcements. Students will turn in responses to the office forreward tickets.
1, 2, 9 Sherry Phillips Weekly questions and number of student responsestallied weekly to show participation.
3) Social Studies Weekly magazine, a teaching tool will be used by K - 5thgrade classrooms as an instructional focus lesson.
1, 2, 9 Sherry Phillips,Dawn Brown
100% of students will be successful on SocialStudies assessments.
4) An Instructional Facilitator will be available to provide instructionalsupport to teachers and students during the school.
1, 2, 3, 8,9
Sherry Phillips Students will be more prepared for social studies atthe middle school level.
Funding Sources: 211 TITLE I - $16,075.005) 3rd - 5th grade will meet regularly with the district Social Studiescoordinator to dissaggregate data and plan for the next nine weeks.
1, 2, 3, 8,9
Dawn Brown 100% pass Social Studies EOY assessments.
6) Grade level Social Studies teachers will meet together weekly duringblock along with the Instructional Specialist to discuss instructionalstrategies and plan instruction according to the district calendar.
1, 2, 3, 9 Sherry Phillips,Amber Caylor,Dawn Brown
Lesson plans will be monitored in Eduphoria todemonstrate the use of effective social studiesinstructional methods within the classroom.
7) Campus Social Studies Committee will meet each nine weeks tovertically discuss social studies curriculum issues and problem-solvestrategies to improve social studies instruction PK-5.
1, 2, 3, 8,9
Sherry Phillips,Amber Caylor,Dawn Brown,Robin Sonsel,Social StudiesChairperson -Rona Kallus
District Social Studies assessment scores willimprove.
= Accomplished = Considerable = Some Progress = No Progress = Discontinue
JR ElementaryGenerated by Plan4Learning.com 29 of 50 Campus #102
January 19, 2017 9:44 am
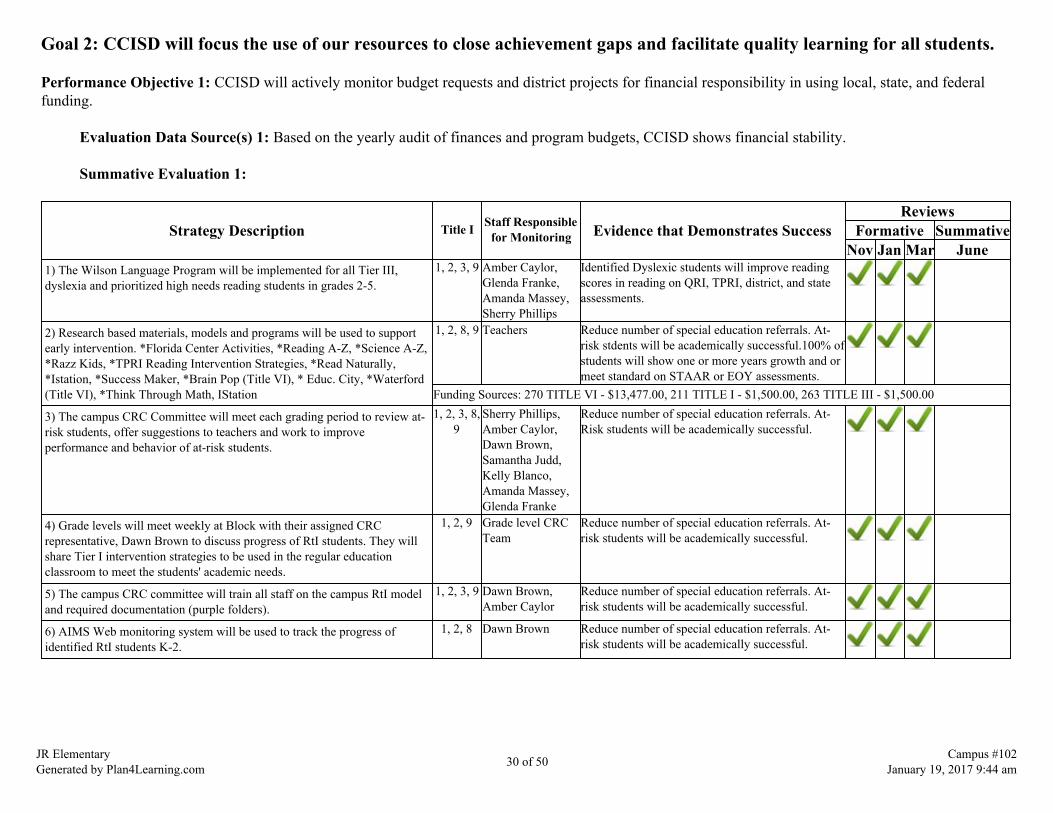
Goal 2: CCISD will focus the use of our resources to close achievement gaps and facilitate quality learning for all students.
Performance Objective 1: CCISD will actively monitor budget requests and district projects for financial responsibility in using local, state, and federalfunding.
Evaluation Data Source(s) 1: Based on the yearly audit of finances and program budgets, CCISD shows financial stability.
Summative Evaluation 1:
Strategy Description Title I Staff Responsiblefor Monitoring Evidence that Demonstrates Success
ReviewsFormative Summative
Nov Jan Mar June1) The Wilson Language Program will be implemented for all Tier III,dyslexia and prioritized high needs reading students in grades 2-5.
1, 2, 3, 9 Amber Caylor,Glenda Franke,Amanda Massey,Sherry Phillips
Identified Dyslexic students will improve readingscores in reading on QRI, TPRI, district, and stateassessments.
2) Research based materials, models and programs will be used to supportearly intervention. *Florida Center Activities, *Reading A-Z, *Science A-Z,*Razz Kids, *TPRI Reading Intervention Strategies, *Read Naturally,*Istation, *Success Maker, *Brain Pop (Title VI), * Educ. City, *Waterford(Title VI), *Think Through Math, IStation
1, 2, 8, 9 Teachers Reduce number of special education referrals. At-risk stdents will be academically successful.100% ofstudents will show one or more years growth and ormeet standard on STAAR or EOY assessments.
Funding Sources: 270 TITLE VI - $13,477.00, 211 TITLE I - $1,500.00, 263 TITLE III - $1,500.00
3) The campus CRC Committee will meet each grading period to review at-risk students, offer suggestions to teachers and work to improveperformance and behavior of at-risk students.
1, 2, 3, 8,9
Sherry Phillips,Amber Caylor,Dawn Brown,Samantha Judd,Kelly Blanco,Amanda Massey,Glenda Franke
Reduce number of special education referrals. At-Risk students will be academically successful.
4) Grade levels will meet weekly at Block with their assigned CRCrepresentative, Dawn Brown to discuss progress of RtI students. They willshare Tier I intervention strategies to be used in the regular educationclassroom to meet the students' academic needs.
1, 2, 9 Grade level CRCTeam
Reduce number of special education referrals. At-risk students will be academically successful.
5) The campus CRC committee will train all staff on the campus RtI modeland required documentation (purple folders).
1, 2, 3, 9 Dawn Brown,Amber Caylor
Reduce number of special education referrals. At-risk students will be academically successful.
6) AIMS Web monitoring system will be used to track the progress ofidentified RtI students K-2.
1, 2, 8 Dawn Brown Reduce number of special education referrals. At-risk students will be academically successful.
JR ElementaryGenerated by Plan4Learning.com 30 of 50 Campus #102
January 19, 2017 9:44 am

7) Tutorial program will be included in the regular school day schedule.Tutorials will be fluid and based on the instructional needs of the students.Academic enrichment programs will be used to provide a smallerteacher/student ratio during the tutorial program. This is being done to maketutorials more readily available to the students.
1, 2, 9 Sherry Phillips,Amber Caylor,Dawn Brown
Tutorial attendance sheets and classroom masteryreports will reflect improvement of student scores.Walkthroughs will be done weekly during tutorialsto ensure quality small group instruction and will bedocumented in Eduphoria.
8) Teachers of bilingual and ESL students will meet with administrationafter each nine weeks period to discuss student progress and needs in orderto assist students successfully advance levels on TELPAS and to meetSTAAR requirements.
1, 2, 3, 8,9
Sherry Phillips,Dawn Brown,LPAC Committee
Sign in sheets from teacher meetings. TELPASscores will rise and students will demostrate successon STAAR. JR will meet ELL subpopulation AYPgoals.
9) Teachers of bilingual and ESL students will keep profiles of studentsaccording to TELPAS ratings. They will meet with administration to discussgoals and strategies used to ensure the students advance levels on TELPASand perform successfully on district and state assessments.
1, 2, 3, 8,9
Sherry Phillips,Dawn Brown
Sign in sheets from teacher meetings. TELPASscores will rise and students will demostrate successon STAAR. JR will meet ELL subpopulation AYPgoals.
10) Research based materials, models and programs will be used to supportearly intervention. *Waterford, *Success Maker, *Think Through Math,*IStation.
1, 2, 8, 9 Sherry Phillips At-risk students will be academically successful.
11) Orchard program will be utilized within the special service classroomand will also be available as an intervention to be used with mainstreamedand inclusion students.
1, 2, 8, 9 Jeana Bethany,Amanda Massey,Kenneth Goode
100% Special Education sudents successful onSTAAR Math.
12) All Bond funds will be managed effectively to enhance the instructionof all students. Items purchased will include but not limited to student desks,keyless entry and communication digital sign.
1, 2, 6 Sherry Phillips,Amber Caylor
Bond passed and work continues.
13) All Federal and District funds will be managed effectively to enhanceinstruction of all students.
1, 2, 10 Sherry Phillips Balance Budget
14) A class size reduction teacher will be used in grade 4. 1, 2, 3 Sherry Phillips 4th grade meets the number necessary to qualify.
Funding Sources: 255 TITLE II - $40,020.0015) Provide materials and services to meet the diverse needs of all learners 2 Sherry Phillips,
Amber Cayor andJeanna Bethany
Increase student achievement with 100% of studentsin Special Ed and/or at risk students,improving/passing STAAR
Funding Sources: 255 TITLE II - $500.00
= Accomplished = Considerable = Some Progress = No Progress = Discontinue
JR ElementaryGenerated by Plan4Learning.com 31 of 50 Campus #102
January 19, 2017 9:44 am

Goal 3: CCISD will ensure a compassionate, effective, innovative, and highly motivated staff to accomplish our mission.
Performance Objective 1: All CCISD teachers and instructional paraprofessionals are highly qualified by SBEC standards and are effective in theirperformance.
Evaluation Data Source(s) 1: 100% of students testing in all subject areas will make one year or more of growth and or meet standard (LevelII) on STAAR based on effective use of technology in the classrooms and up to date staff development that meets the needs of the CCISDstudents and teachers.
Summative Evaluation 1:
Strategy Description Title I Staff Responsiblefor Monitoring Evidence that Demonstrates Success
ReviewsFormative Summative
Nov Jan Mar June1) JR will continue to aggressively pursue the implementation of newtechnology to support the academic program through the purchasing ofequipment, programs, and training. (IPads, Elmos, Ladybugs, etc...)
1, 2, 8, 9 Sherry Phillips,Amber Caylor,Dawn Brown
Teachers will attend staff development fortechnology.
2) JR staff will be provided opportunities to attend state/regional academicconference and staff development. To include but not limited to: *Region 3,*Reading/Math/Science, and TMEA Conference
1, 2, 4 Sherry Phillips,Dawn Brown,Amber Caylor
Teacher lesson plans and walkthroughs willdemonstrate use of newly gained knowledge andskills.
Funding Sources: 211 TITLE I - $500.00, 255 TITLE II - $1,500.003) Counselors will be provided opportunities to attend regional staffdevelopment to at Region 3.
1, 2, 4 Sherry Phillips,Samantha Judd,Kelly Blanco
Counselor Evaluation
4) Teachers will be trained to use the AWARE program to review their nineweek test results and disaggregate student data.
1, 2, 4, 8 Sherry Phillips,Dawn Brown, PamSnyder
Teachers able to review data in a timely manner.Data will be used to create monitor lists and identifytutorial groups weekly.
5) Staff technology skills and awareness will be enhanced through the JRshared folder, Google training, and assistance will be provided regularly toall staff. *IStation, Think Through Math
1, 2, 4, 8,9
Dawn Brown,Barbara Sides,Marcus Martinez
Staff sign in sheets for trainings.
6) Eduphoria Forethought program will be utilized by all staff to submitlesson plans as istructional grade level teams. Continued training of newstaff on the Forethought program.
1, 2, 4 Sherry Phillips,Amber Caylor,Dawn Brown
Lesson plans in Eduphoria will be used as evidenceof its use.
7) Eduphoria will be utilized for the Teacher Appraisal System, to aid indisaggregating data, and maintaining professional development records.
1, 2, 4, 8 Debra Sonsel,Sherry Phillips,Amber Caylor
Professional development records in Eduphoria willbe used as evidence of use.
JR ElementaryGenerated by Plan4Learning.com 32 of 50 Campus #102
January 19, 2017 9:44 am
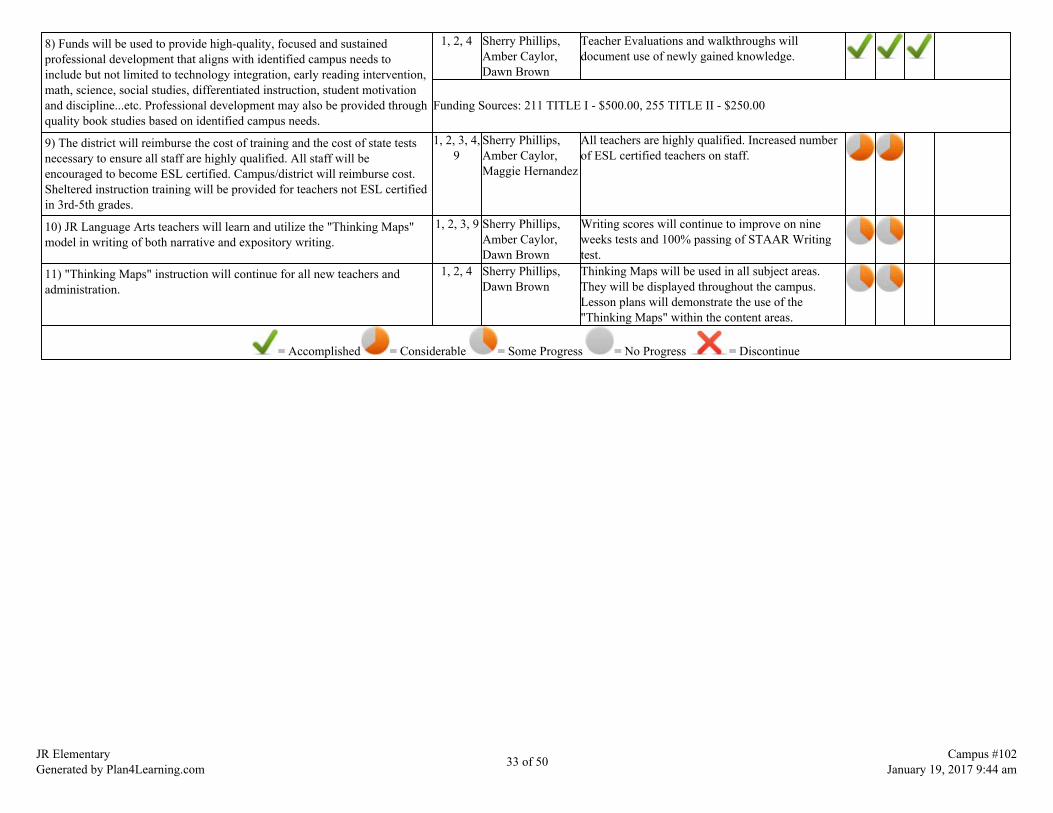
8) Funds will be used to provide high-quality, focused and sustainedprofessional development that aligns with identified campus needs toinclude but not limited to technology integration, early reading intervention,math, science, social studies, differentiated instruction, student motivationand discipline...etc. Professional development may also be provided throughquality book studies based on identified campus needs.
1, 2, 4 Sherry Phillips,Amber Caylor,Dawn Brown
Teacher Evaluations and walkthroughs willdocument use of newly gained knowledge.
Funding Sources: 211 TITLE I - $500.00, 255 TITLE II - $250.00
9) The district will reimburse the cost of training and the cost of state testsnecessary to ensure all staff are highly qualified. All staff will beencouraged to become ESL certified. Campus/district will reimburse cost.Sheltered instruction training will be provided for teachers not ESL certifiedin 3rd-5th grades.
1, 2, 3, 4,9
Sherry Phillips,Amber Caylor,Maggie Hernandez
All teachers are highly qualified. Increased numberof ESL certified teachers on staff.
10) JR Language Arts teachers will learn and utilize the "Thinking Maps"model in writing of both narrative and expository writing.
1, 2, 3, 9 Sherry Phillips,Amber Caylor,Dawn Brown
Writing scores will continue to improve on nineweeks tests and 100% passing of STAAR Writingtest.
11) "Thinking Maps" instruction will continue for all new teachers andadministration.
1, 2, 4 Sherry Phillips,Dawn Brown
Thinking Maps will be used in all subject areas.They will be displayed throughout the campus.Lesson plans will demonstrate the use of the"Thinking Maps" within the content areas.
= Accomplished = Considerable = Some Progress = No Progress = Discontinue
JR ElementaryGenerated by Plan4Learning.com 33 of 50 Campus #102
January 19, 2017 9:44 am

Goal 4: The district and each campus will provide learning environments that are safe and secure for all students, faculty,and staff.
Performance Objective 1: The district will ensure a safe and positive learning environment.
Evaluation Data Source(s) 1: Completed strategies will increase student safety awareness. Attendance will be at 97% with a reduction indiscipline referrals from 2013-2014 to 2014-2015.
Summative Evaluation 1:
Strategy Description Title I Staff Responsiblefor Monitoring Evidence that Demonstrates Success
ReviewsFormative Summative
Nov Jan Mar June1) Outside speakers and resources will be secured for CharacterEducation Programs to include but not limited to Mid-Coast, TheHarbor.etc... A counselor will attend the sessions and elaborate on themessage.
1, 2 Sherry Phillips,Amber Caylor,Kelly Blanco,Samantha Judd
Number of discipline referrals and/or bullyingcomplaints will decrease from 2015-2016 to 2016-2017.
Funding Sources: 255 TITLE II - $5,000.002) A counselor will be available to assist students, parents and staff withsupport and materials as needed.
1, 2, 6, 9 Kelly Blanco,Samantha Judd
Positive feedback from students, parents and staffwill be demonstrated on a counselor survey at theend of the school year.
Funding Sources: 211 TITLE I - $30,976.003) K-5 students meeting the Academic Enrichment Guidelines will haveopportunities to participate in the JR enrichment programs; enrichmentmusic, special art classes, and computer.
1, 2, 8, 9 Sherry Phillips,Amber Caylor,Debbie Dawdy,Amy Watts andenrichmentparaprofessionals
The JR enrichment program will continue to be apositive motivator for students to improveacademic performances.
4) JR will continue the 3rd-5th Student Council Program. 2016-2017 willbe open enrollment for students who meet the academic and disciplineguidelines. Officers will be elected from the members by the studentbody.
Ashley Silvas,Emma Hernandez,Tina Marxmiller
Increased student participation in student council.
5) JR Student Council leaders and student officers will attend the October"Leaders R Us" Student Council area conference.
Emma Hernandez,Teresa Gutierrez
Student Council officers will return with positiveideas to implement on campus
6) Discipline committee will meet to evaluate and improve on thecampus PBIS system of rewards, using tickets to promote and reinforceproper school behavior.
Sherry Phillips,Amber Caylor andDisciplineCommitteeMembers
Discipline referrals for 2016-2017 will decreasewhen compared to 2015-2016.
7) Principals will review student behavioral expectations using JRstudent videos.
Sherry Phillips,Amber Caylor
Number of discipline referrals will decrease 10%from prior year.
JR ElementaryGenerated by Plan4Learning.com 34 of 50 Campus #102
January 19, 2017 9:44 am

8) October Red Ribbon Week will be used to promote a safe and drugfree school with daily participatory activities. Mid-Coast CounselingServices will participate in pep rally activities.
Kelly Blanco,Samantha Judd
Students will participate in daily Red RibbonWeek Activities
9) Character Education will be stressed weekly through morningannouncements using The Character Network Materials.
Amber Caylor,Kelly Blanco,Samantha Judd
Reduction in the number of office referrals relatedto bullying.
10) The Eagle Pledge will be a part of daily announcements and recitedby all students to reinforce good character choices.
Sherry Phillips,Amber Caylor
Pledge said daily on announcements.
11) The Harbor will present a Bullying/Character program to all gradelevels during Block once a month throughout the duration of the schoolyear.
Kelly Blanco,Samantha Judd
Reduction in the number of office referrals relatedto bullying.
12) A counselor sponsored by Mid-Coast Family Services will present an8 week "life skills" program to 5th grade.
Kelly Blanco Positive feedback from teachers and students.
13) The campus safety coordinator will work to keep safety in theforefront by collaboratively developing a safety plan that includesstudents, training, announcements, JR Flyer, hall displays...etc. thecoordinator will keep a scrapbook of all events.
Amber Caylor JR will again be the #1 CCISD safety Team.
14) School safety procedures will be annually evaluated and clearlydefined. Plans for 2016-2017 school year include: Driver's LicenseScanner to identify sexual offenders, Locked doors, Visitor/Staff I.D.procedures, Crisis Plan, and Student/Staff Awareness.
Amber Caylor,Sherry Phillips
There will be zero incidents that occur at JR wherestaff or student safety will be compromised.
15) The campus safety coordinator will schedule a variety of safetyevents, activities and programs for students and staff - fire prevention -bus safety - safety danger - bicycle safety.
Amber Caylor,Samantha Judd
Completed activities will increase student safetyawareness.
16) Weekend Food Backpacks will be provided to all homeless studentscourtesy of The Golden Crescent Food Bank.
Martha Valero Students will receive a backpack of non-perishable food for the weekend.
17) Funds will be used to provide high-quality, focused and sustainedprofessional development for counselors to provide a positive, safeenvironment for JR students.
4 Sherry Phillips Counselor Evaluations
18) Special Ed teachers will colaborate with counselors to developebehavior plans for challenging students
3 Sherry Phillips,Amber Caylor,Amanda Massey,Kenneth Goode,Kelly Blanco,Samantha Judd
Discipline referrals for 2016-2017 will decreasewhen compared to 2015-2016.
19) Remind, JR Facebook, and JR Campus Website will be used toinform parents and students of school events.
6 Amber Caylor,Sherry Phillips
Positive feedback from parents during campusevents. Favorable response on the parent surveyconcerning its use.
JR ElementaryGenerated by Plan4Learning.com 35 of 50 Campus #102
January 19, 2017 9:44 am
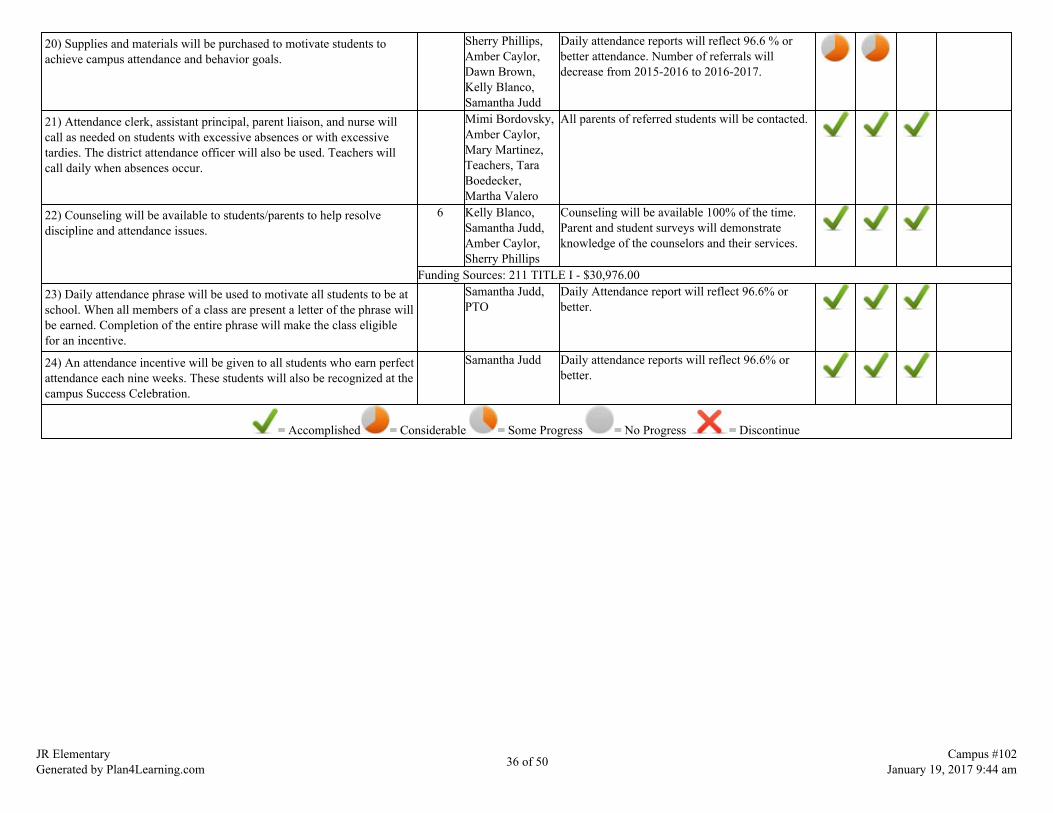
20) Supplies and materials will be purchased to motivate students toachieve campus attendance and behavior goals.
Sherry Phillips,Amber Caylor,Dawn Brown,Kelly Blanco,Samantha Judd
Daily attendance reports will reflect 96.6 % orbetter attendance. Number of referrals willdecrease from 2015-2016 to 2016-2017.
21) Attendance clerk, assistant principal, parent liaison, and nurse willcall as needed on students with excessive absences or with excessivetardies. The district attendance officer will also be used. Teachers willcall daily when absences occur.
Mimi Bordovsky,Amber Caylor,Mary Martinez,Teachers, TaraBoedecker,Martha Valero
All parents of referred students will be contacted.
22) Counseling will be available to students/parents to help resolvediscipline and attendance issues.
6 Kelly Blanco,Samantha Judd,Amber Caylor,Sherry Phillips
Counseling will be available 100% of the time.Parent and student surveys will demonstrateknowledge of the counselors and their services.
Funding Sources: 211 TITLE I - $30,976.0023) Daily attendance phrase will be used to motivate all students to be atschool. When all members of a class are present a letter of the phrase willbe earned. Completion of the entire phrase will make the class eligiblefor an incentive.
Samantha Judd,PTO
Daily Attendance report will reflect 96.6% orbetter.
24) An attendance incentive will be given to all students who earn perfectattendance each nine weeks. These students will also be recognized at thecampus Success Celebration.
Samantha Judd Daily attendance reports will reflect 96.6% orbetter.
= Accomplished = Considerable = Some Progress = No Progress = Discontinue
JR ElementaryGenerated by Plan4Learning.com 36 of 50 Campus #102
January 19, 2017 9:44 am

Goal 5: CCISD will develop and implement a parent and community involvement program that promotes all stake holdersas partners in the education of our students.
Performance Objective 1: CCISD parent and community involvement will be promoted at all CCISD campuses and departments.
Evaluation Data Source(s) 1: Campus will host a minimum of ten campus activities which encourages family participation.
Summative Evaluation 1:
Strategy Description Title I Staff Responsiblefor Monitoring Evidence that Demonstrates Success
ReviewsFormative Summative
Nov Jan Mar June1) A JR events calendar will be sent home monthly. The Eagle Flyer willbe sent home monthly. The Eagle Flyer will also be posted on the JRWeb page. The JR Website will be kept current with an up to datecalendar and events posted regularly with pictures. The JR FacebookPage will post current events and pictures of students and familiesweekly.
6 Sherry Phillips,Mary LouRodriguez, AmberCaylor
Annual parent survey will reflect approval ofcampus parent communication.
Funding Sources: 211 TITLE I - $600.00
2) A bilingual parent liaison will continue to work between the schooland home.
6 Martha Valero 100% contact with referred parents.
Funding Sources: 211 TITLE I - $15,006.963) The Parent Center will be utilized by parents as a Make-It, Take-ItCenter. Basic home manipulatives will be made by parents. A check outcenter for education games and materials is also available for parents.
6 Martha Valero Parent volunteer hours will increase.
Funding Sources: 211 TITLE I - $700.00
4) The staff will identify and provide available services to homelessstudents.
Kelly Blanco,Samantha Judd
Identified homeless students will receivenecessary services.
5) A grade level nine weeks newsletter will be sent to all parents and willcommunicate academic assurances for the nine weeks. (Bilingual gradelevel teachers will provide a Spanish copy). Pk, K and 1st will sendnewsletters bi-weekly.
6 Sherry Phillips,Amber Caylor
Parents indicate they are satisfied with increasedschool communication.
Funding Sources: 211 TITLE I - $300.00
6) An after school Ballet Folklorico program will be made available for3-5 JR students.
6 Sherry Phillips Increased student enrollment. Increased parentinvolvement.
7) All teachers will have at least two positive and informative parentconferences with each parent. K, 1 & 2 will have beginning of the yearand mid year TPRI conference.
6 Sherry Phillips,Amber Caylor
All parents will be personally contacted by theirchildren's classroom teacher(s). Parent ContactLogs will be turned in each six weeks.
JR ElementaryGenerated by Plan4Learning.com 37 of 50 Campus #102
January 19, 2017 9:44 am
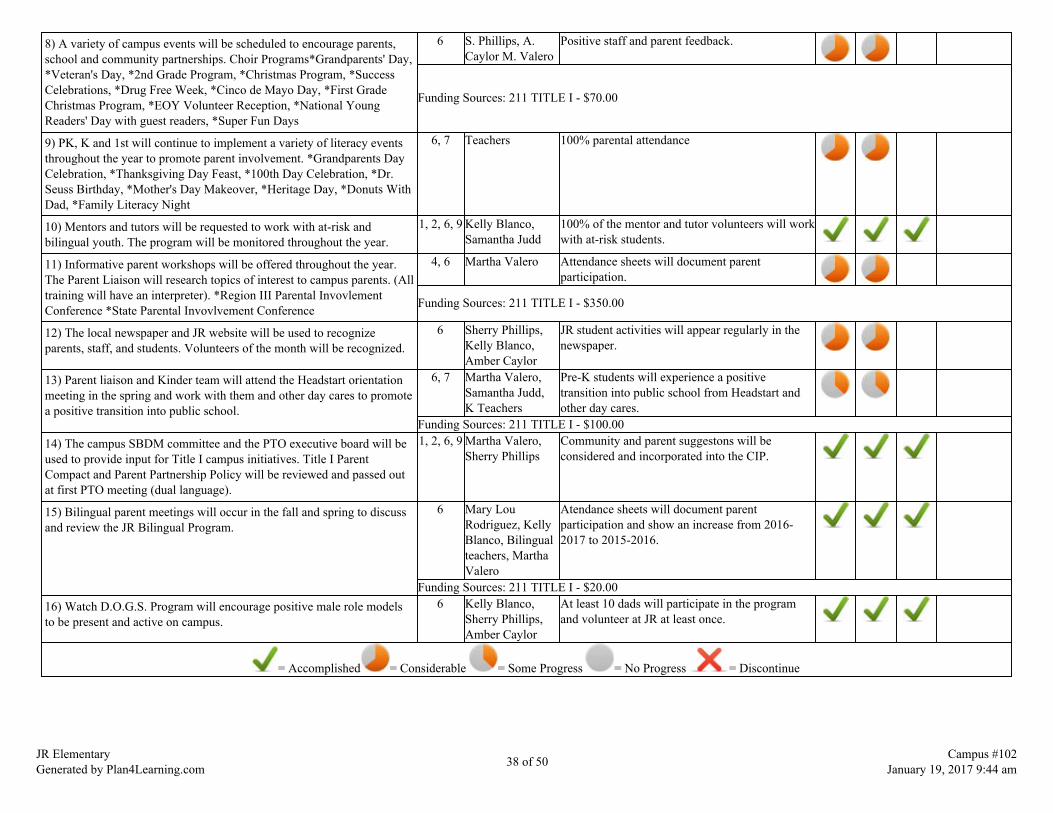
8) A variety of campus events will be scheduled to encourage parents,school and community partnerships. Choir Programs*Grandparents' Day,*Veteran's Day, *2nd Grade Program, *Christmas Program, *SuccessCelebrations, *Drug Free Week, *Cinco de Mayo Day, *First GradeChristmas Program, *EOY Volunteer Reception, *National YoungReaders' Day with guest readers, *Super Fun Days
6 S. Phillips, A.Caylor M. Valero
Positive staff and parent feedback.
Funding Sources: 211 TITLE I - $70.00
9) PK, K and 1st will continue to implement a variety of literacy eventsthroughout the year to promote parent involvement. *Grandparents DayCelebration, *Thanksgiving Day Feast, *100th Day Celebration, *Dr.Seuss Birthday, *Mother's Day Makeover, *Heritage Day, *Donuts WithDad, *Family Literacy Night
6, 7 Teachers 100% parental attendance
10) Mentors and tutors will be requested to work with at-risk andbilingual youth. The program will be monitored throughout the year.
1, 2, 6, 9 Kelly Blanco,Samantha Judd
100% of the mentor and tutor volunteers will workwith at-risk students.
11) Informative parent workshops will be offered throughout the year.The Parent Liaison will research topics of interest to campus parents. (Alltraining will have an interpreter). *Region III Parental InvovlementConference *State Parental Invovlvement Conference
4, 6 Martha Valero Attendance sheets will document parentparticipation.
Funding Sources: 211 TITLE I - $350.00
12) The local newspaper and JR website will be used to recognizeparents, staff, and students. Volunteers of the month will be recognized.
6 Sherry Phillips,Kelly Blanco,Amber Caylor
JR student activities will appear regularly in thenewspaper.
13) Parent liaison and Kinder team will attend the Headstart orientationmeeting in the spring and work with them and other day cares to promotea positive transition into public school.
6, 7 Martha Valero,Samantha Judd,K Teachers
Pre-K students will experience a positivetransition into public school from Headstart andother day cares.
Funding Sources: 211 TITLE I - $100.0014) The campus SBDM committee and the PTO executive board will beused to provide input for Title I campus initiatives. Title I ParentCompact and Parent Partnership Policy will be reviewed and passed outat first PTO meeting (dual language).
1, 2, 6, 9 Martha Valero,Sherry Phillips
Community and parent suggestons will beconsidered and incorporated into the CIP.
15) Bilingual parent meetings will occur in the fall and spring to discussand review the JR Bilingual Program.
6 Mary LouRodriguez, KellyBlanco, Bilingualteachers, MarthaValero
Atendance sheets will document parentparticipation and show an increase from 2016-2017 to 2015-2016.
Funding Sources: 211 TITLE I - $20.0016) Watch D.O.G.S. Program will encourage positive male role modelsto be present and active on campus.
6 Kelly Blanco,Sherry Phillips,Amber Caylor
At least 10 dads will participate in the programand volunteer at JR at least once.
= Accomplished = Considerable = Some Progress = No Progress = Discontinue
JR ElementaryGenerated by Plan4Learning.com 38 of 50 Campus #102
January 19, 2017 9:44 am

State Compensatory
Budget for JR Elementary:
Account Code Account Title Budget
6100 Payroll Costs199-11-6119-99-102-6-30-000 6119 Salaries or Wages - Teachers and Other Professional Personnel $44,960.00199-11-6119-99-102-6-34-000 6119 Salaries or Wages - Teachers and Other Professional Personnel $109,734.00199-31-6119-99-102-6-30-000 6119 Salaries or Wages - Teachers and Other Professional Personnel $47,750.00199-11-6129-99-102-6-30-000 6129 Salaries or Wages for Support Personnel $7,617.00199-11-6129-99-102-6-34-000 6129 Salaries or Wages for Support Personnel $37,620.00199-11-6119-99-102-6-30-000 6141 Social Security/Medicare $652.00199-11-6119-99-102-6-34-000 6141 Social Security/Medicare $1,591.00199-11-6129-99-102-6-30-000 6141 Social Security/Medicare $583.00199-11-6129-99-102-6-34-000 6141 Social Security/Medicare $2,878.00199-31-6119-99-102-6-30-000 6141 Social Security/Medicare $692.32199-11-6119-99-102-6-30-000 6143 Workers' Compensation $665.41199-11-6119-99-102-6-34-000 6143 Workers' Compensation $1,624.00199-11-6129-99-102-6-30-000 6143 Workers' Compensation $113.00199-11-6129-99-102-6-34-000 6143 Workers' Compensation $3,435.00199-31-6119-99-102-6-30-000 6143 Workers' Compensation $706.70199-11-6119-99-102-6-30-000 6145 Unemployment Compensation $37.27199-11-6119-99-102-6-34-000 6145 Unemployment Compensation $91.00199-11-6129-99-102-6-30-000 6145 Unemployment Compensation $7.00199-11-6129-99-102-6-34-000 6145 Unemployment Compensation $31.00199-31-6119-99-102-6-30-000 6145 Unemployment Compensation $39.58199-11-6129-99-102-6-34-000 6146 Teacher Retirement/TRS Care $2,836.00
JR ElementaryGenerated by Plan4Learning.com 39 of 50 Campus #102
January 19, 2017 9:44 am

199-31-6119-99-102-6-30-000 6146 Teacher Retirement/TRS Care $4,152.00199-11-6119-99-102-6-30-000 6146 Teacher Retirement/TRS Care $4,152.00199-11-6119-99-102-6-34-000 6146 Teacher Retirement/TRS Care $12,456.00199-11-6129-99-102-6-30-000 6146 Teacher Retirement/TRS Care $560.00
6100 Subtotal: $284,983.28
JR ElementaryGenerated by Plan4Learning.com 40 of 50 Campus #102
January 19, 2017 9:44 am
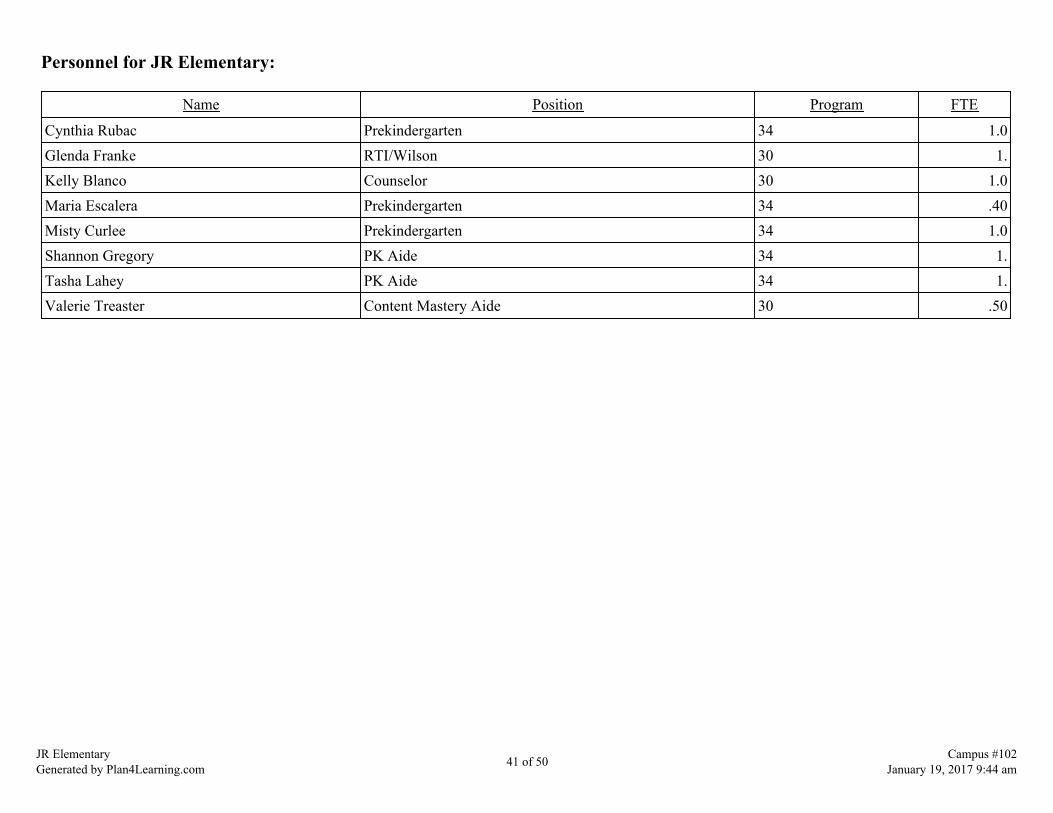
Personnel for JR Elementary:
Name Position Program FTE
Cynthia Rubac Prekindergarten 34 1.0Glenda Franke RTI/Wilson 30 1.Kelly Blanco Counselor 30 1.0Maria Escalera Prekindergarten 34 .40Misty Curlee Prekindergarten 34 1.0Shannon Gregory PK Aide 34 1.Tasha Lahey PK Aide 34 1.Valerie Treaster Content Mastery Aide 30 .50
JR ElementaryGenerated by Plan4Learning.com 41 of 50 Campus #102
January 19, 2017 9:44 am

Title I
Schoolwide Program Plan
As a Title I campus, Jackson/Roosevelt Elementary School Staff strives daily to meet the academic, social, and emotional needs of allstudents in Prekindergarten through Fifth grade. We have very high student expectations and use data gained from STAAR rawscores, district assessments, teacher-made tests, TPRI, QRI and teacher observation to adjust instruction and intervention tomaximize student success and reduce student referrals to special programs.
Jackson/Roosevelt Elementary School strongly encourages parental involvement on campus by providing a friendly bilingual receptionistin the front office and a wonderful parent center equipped with a fantastic parent liaison. We listen to parents and work to create asafe, warm, accepting school atmosphere in which all children and their parents feel welcome and valued. We survey opinions of allpopulations and use the data in campus decision-making.
Ten Schoolwide Components
1: Comprehensive Needs Assessment
Jackson/Roosevelt Elementary School Needs Assessment identified academic areas of weakness in reading, writing, mathematics andscience. As a staff, we addressed the needs and provided interventions to meet the needs of our diverse population. Theadministration and staff will continue to actively monitor student progress in order to provide meaningful professional developmentand effective student interventions to improve student progress.
2: Schoolwide Reform Strategies
Jackson/Roosevelt works closely with district facilitators and collaborates with other elementary campuses to efficiently utilize ourprofessional resources. We have increased the use of innovative technology and research-based programs to enhance instruction andstrengthen our academic program.
3: Instruction by highly qualified professional teachers
Jackson/Roosevelt Elementary's Instructional Staff is highly qualified in all areas. Staff members are encouraged to growprofessionally and teacher morale is nurtured to create a work environment in which the teachers feel valued as professionals.
4: High-quality and ongoing professional development for teachers, principals, and paraprofessionals and, if appropriate, student servicespersonnel, parents, and other staff
JR ElementaryGenerated by Plan4Learning.com 42 of 50 Campus #102
January 19, 2017 9:44 am

Jackson/Roosevelt Elementary Staff will continue to provide professional development in Thinking Maps, technology, reading, writing,math, science, and social studies according to the needs of our changing student population.
5: Strategies to attract highly qualified teachers
With a growing shortage of bilingual teachers, Jackson-Roosevelt will aggressively pursue avenues of attracting quality bilingualcertified teachers to our district and campus.
6: Strategies to increase parental involvement
Jackson Roosevelt Elementary School Staff will utilize the JR campus website, JR Facebook page, and Remind along with daily studentfolders to actively communicate with parents and the community. We will provide opportunities for parents to become involved in theirchild's educational process and will involve them in the campus decision-making process through parent surveys and the SBDMCommittee.
7: Plans for assisting preschool children in the transition from early childhood programs to elementary school programs
Jackson Roosevelt Parent Liaison and Counselors will coordinate Headstart and local daycare facility campus tours and provide welcomeinformation packets to parents.
8: Measures to include teachers in the decisions regarding the use of academic assessments in order to improve the achievement of individualstudents and the overall instructional program
Teachers, Instructional facilitator, and administrators will collaboratively disaggregate campus data from STAAR, TPRI, QRI, districtcurriculum assessments, teacher-made tests, etc... to adjust instruction according to the students' academic needs.Jackson/Roosevelt Elementary School SBDM will meet regularly to discuss campus goals and assess progress towards them.
9: Activities to ensure effective timely assistance for students who experience difficulty mastering the proficient or advanced levels of academicachievement standards
Jackson/Roosevelt Elementary School CRC Committee and Staff will regularly meet to evaluate individual student progress and provideintense intervention in response to student needs. AWARE will be utilized by staff and administration to disaggregate data and makeinstructional decisions to positively impact instruction.
10: Coordination and integration of federal, state and local services and programs
Jackson-Roosevelt will collaboratively work with district personnel to ensure compliance with all local, state and federal regulationsand mandates.
JR ElementaryGenerated by Plan4Learning.com 43 of 50 Campus #102
January 19, 2017 9:44 am

JR ElementaryGenerated by Plan4Learning.com 44 of 50 Campus #102
January 19, 2017 9:44 am

Title I Personnel
Name Position Program FTE
Brown, Dawn Instructional Facilitator 1.0Judd, Samantha Counselor 1.0Sanchez, Audelia PK Aide 1.0Valero, Martha Parent Liaison 1.0
JR ElementaryGenerated by Plan4Learning.com 45 of 50 Campus #102
January 19, 2017 9:44 am
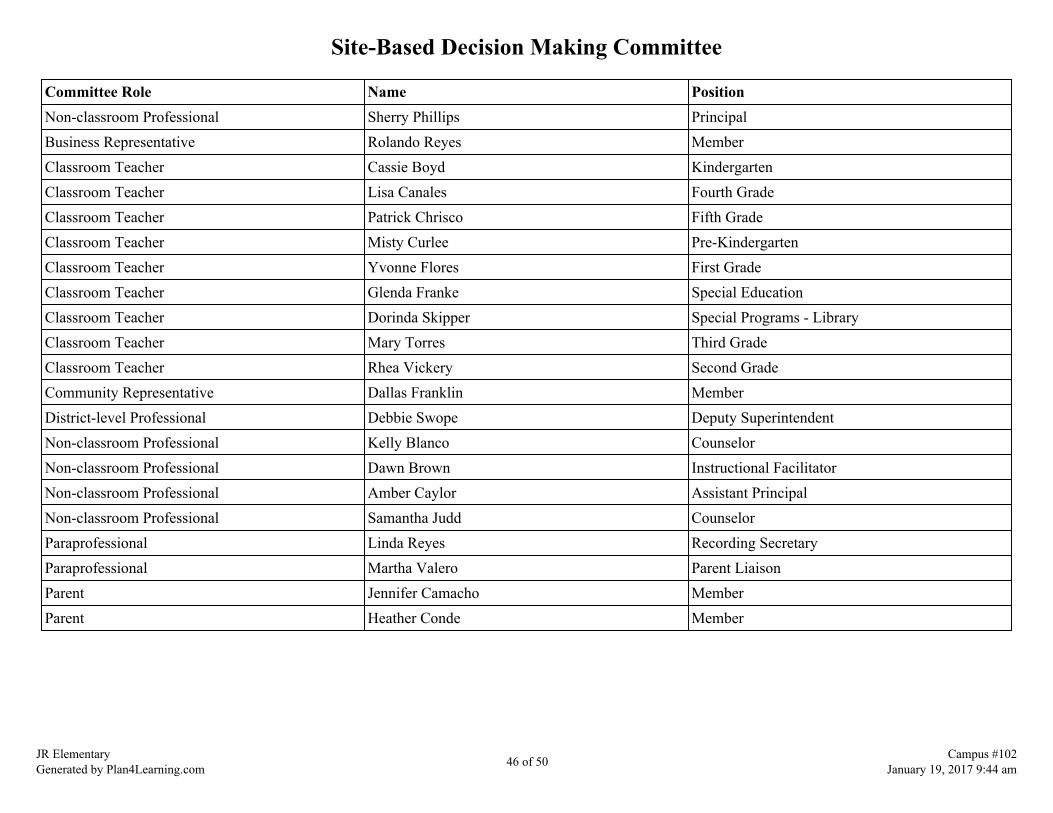
Site-Based Decision Making Committee
Committee Role Name PositionNon-classroom Professional Sherry Phillips PrincipalBusiness Representative Rolando Reyes MemberClassroom Teacher Cassie Boyd KindergartenClassroom Teacher Lisa Canales Fourth GradeClassroom Teacher Patrick Chrisco Fifth GradeClassroom Teacher Misty Curlee Pre-KindergartenClassroom Teacher Yvonne Flores First GradeClassroom Teacher Glenda Franke Special EducationClassroom Teacher Dorinda Skipper Special Programs - LibraryClassroom Teacher Mary Torres Third GradeClassroom Teacher Rhea Vickery Second GradeCommunity Representative Dallas Franklin MemberDistrict-level Professional Debbie Swope Deputy SuperintendentNon-classroom Professional Kelly Blanco CounselorNon-classroom Professional Dawn Brown Instructional FacilitatorNon-classroom Professional Amber Caylor Assistant PrincipalNon-classroom Professional Samantha Judd CounselorParaprofessional Linda Reyes Recording SecretaryParaprofessional Martha Valero Parent LiaisonParent Jennifer Camacho MemberParent Heather Conde Member
JR ElementaryGenerated by Plan4Learning.com 46 of 50 Campus #102
January 19, 2017 9:44 am

Campus Funding Summary
199 LOCALGoal Objective Strategy Resources Needed Account Code Amount
1 1 1 $300.001 1 2 $155.001 2 1 $100.001 2 2 $150.001 3 1 $1,000.001 3 11 $350.00
Sub-Total $2,055.00255 TITLE IIGoal Objective Strategy Resources Needed Account Code Amount
1 1 21 $500.001 1 23 $880.002 1 14 $40,020.002 1 15 $500.003 1 2 $1,500.003 1 8 $250.004 1 1 $5,000.00
Sub-Total $48,650.00263 TITLE IIIGoal Objective Strategy Resources Needed Account Code Amount
1 1 20 $1,500.001 1 21 26311639900102725000 $1,500.001 1 23 Training for Reading Smart Reading Mate 26313629900102725000 $440.001 1 23 Sheltered Instruction training 26313623900102725000 $100.001 2 11 $500.00
JR ElementaryGenerated by Plan4Learning.com 47 of 50 Campus #102
January 19, 2017 9:44 am
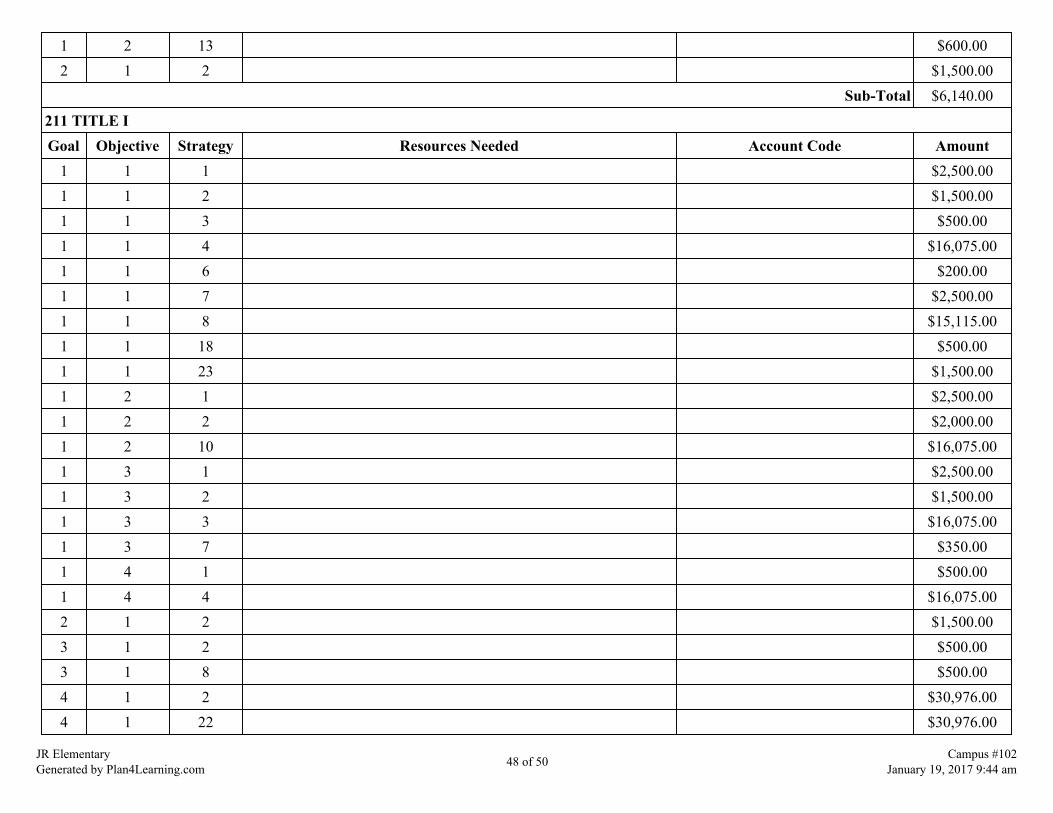
1 2 13 $600.002 1 2 $1,500.00
Sub-Total $6,140.00211 TITLE IGoal Objective Strategy Resources Needed Account Code Amount
1 1 1 $2,500.001 1 2 $1,500.001 1 3 $500.001 1 4 $16,075.001 1 6 $200.001 1 7 $2,500.001 1 8 $15,115.001 1 18 $500.001 1 23 $1,500.001 2 1 $2,500.001 2 2 $2,000.001 2 10 $16,075.001 3 1 $2,500.001 3 2 $1,500.001 3 3 $16,075.001 3 7 $350.001 4 1 $500.001 4 4 $16,075.002 1 2 $1,500.003 1 2 $500.003 1 8 $500.004 1 2 $30,976.004 1 22 $30,976.00
JR ElementaryGenerated by Plan4Learning.com 48 of 50 Campus #102
January 19, 2017 9:44 am
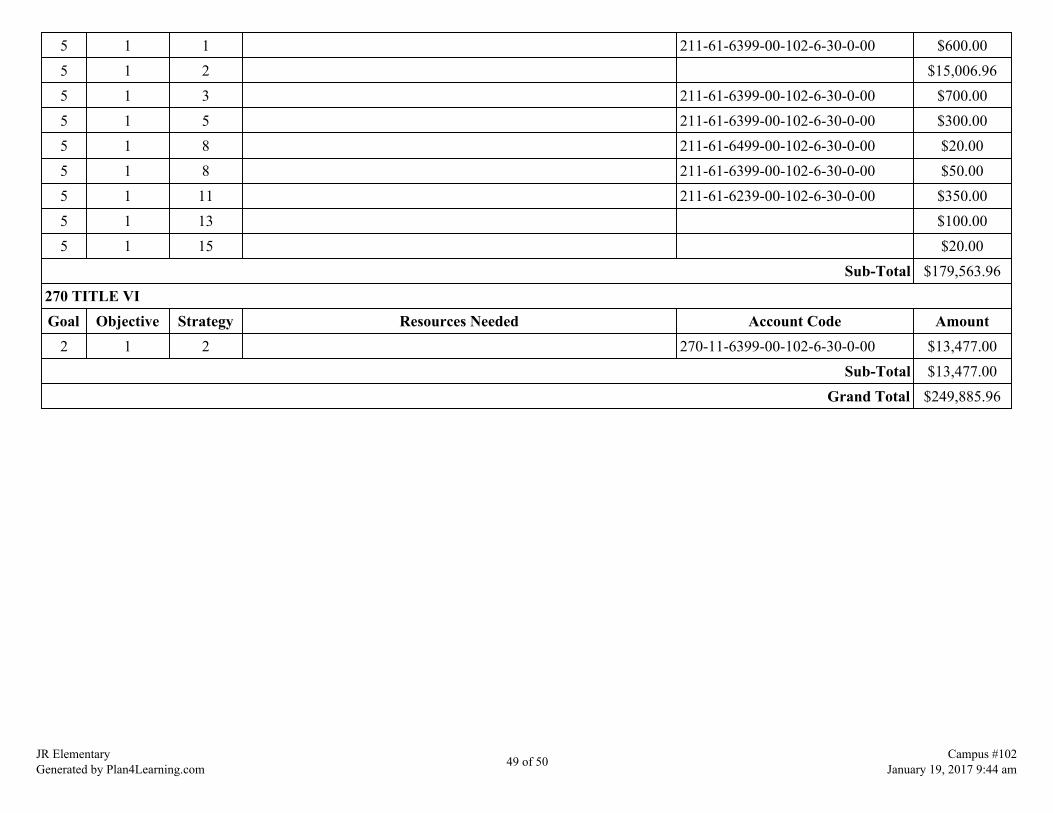
5 1 1 211-61-6399-00-102-6-30-0-00 $600.005 1 2 $15,006.965 1 3 211-61-6399-00-102-6-30-0-00 $700.005 1 5 211-61-6399-00-102-6-30-0-00 $300.005 1 8 211-61-6499-00-102-6-30-0-00 $20.005 1 8 211-61-6399-00-102-6-30-0-00 $50.005 1 11 211-61-6239-00-102-6-30-0-00 $350.005 1 13 $100.005 1 15 $20.00
Sub-Total $179,563.96270 TITLE VIGoal Objective Strategy Resources Needed Account Code Amount
2 1 2 270-11-6399-00-102-6-30-0-00 $13,477.00Sub-Total $13,477.00
Grand Total $249,885.96
JR ElementaryGenerated by Plan4Learning.com 49 of 50 Campus #102
January 19, 2017 9:44 am

Addendums
JR ElementaryGenerated by Plan4Learning.com 50 of 50 Campus #102
January 19, 2017 9:44 am
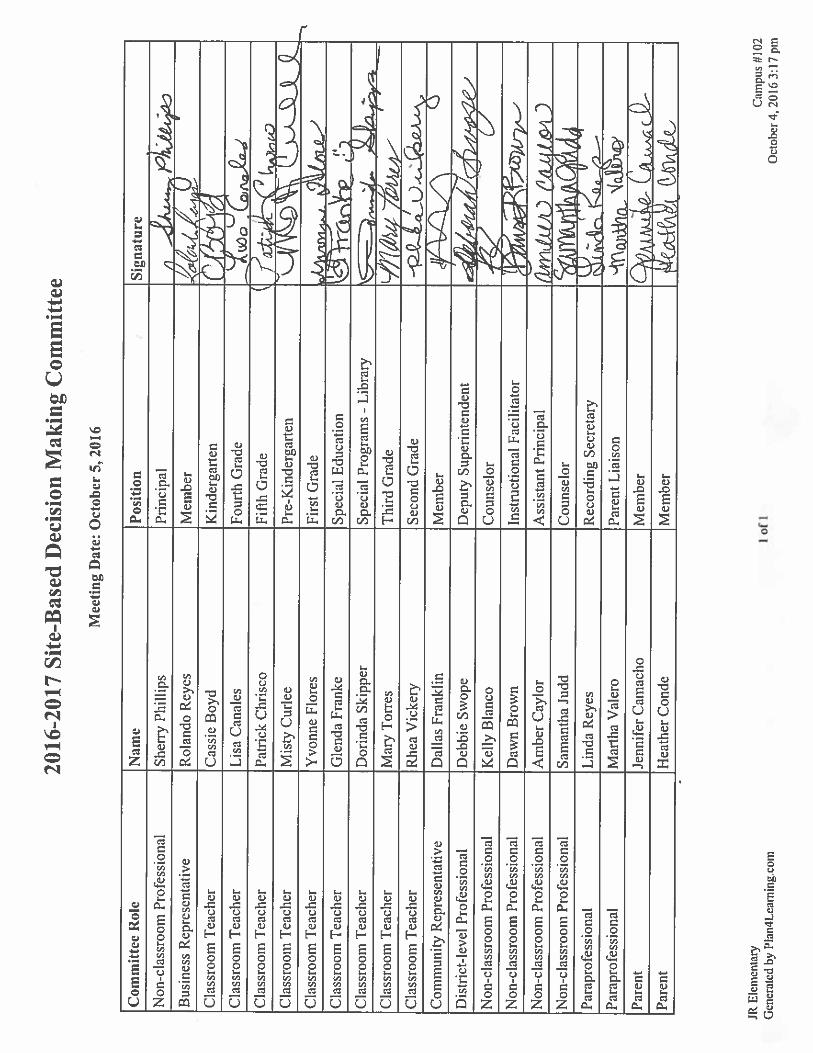
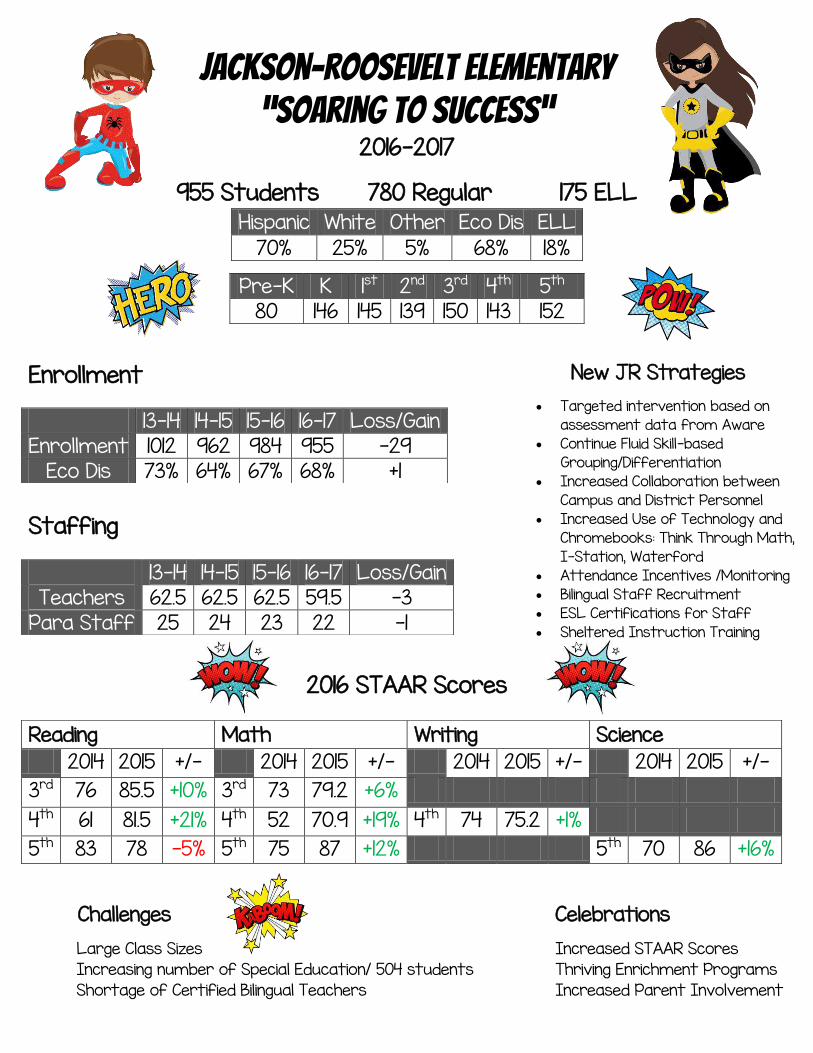
Jackson-roosevelt elementary
“soaring to success” 2016-2017
955 Students 780 Regular 175 ELL
Enrollment
Staffing
2016 STAAR Scores
Challenges Celebrations
Large Class Sizes Increased STAAR Scores
Increasing number of Special Education/ 504 students Thriving Enrichment Programs
Shortage of Certified Bilingual Teachers Increased Parent Involvement
Hispanic White Other Eco Dis ELL
70% 25% 5% 68% 18%
Pre-K K 1st 2nd 3rd 4th 5th 80 146 145 139 150 143 152
13-14 14-15 15-16 16-17 Loss/Gain Enrollment 1012 962 984 955 -29
Eco Dis 73% 64% 67% 68% +1
13-14 14-15 15-16 16-17 Loss/Gain Teachers 62.5 62.5 62.5 59.5 -3
Para Staff 25 24 23 22 -1
Reading Math Writing Science
2014 2015 +/- 2014 2015 +/- 2014 2015 +/- 2014 2015 +/-
3rd 76 85.5 +10% 3rd 73 79.2 +6%
4th 61 81.5 +21% 4th 52 70.9 +19% 4th 74 75.2 +1%
5th 83 78 -5% 5th 75 87 +12% 5th 70 86 +16%
New JR Strategies
Targeted intervention based on
assessment data from Aware
Continue Fluid Skill-based
Grouping/Differentiation
Increased Collaboration between
Campus and District Personnel
Increased Use of Technology and
Chromebooks: Think Through Math,
I-Station, Waterford
Attendance Incentives /Monitoring
Bilingual Staff Recruitment
ESL Certifications for Staff
Sheltered Instruction Training


Calhoun County Independent School District
Seadrift Schools
2016-2017 Campus Improvement PlanAccountability Rating: Met Standard
Seadrift SchoolsGenerated by Plan4Learning.com 1 of 60 Campus #107
January 19, 2017 1:00 pm

Mission Statement
Embrace Opportunities… Unlock Potential… Inspire Excellence!
Vision"At Seadrift School, every day in every way we get a little better."
The goal of Seadrift School, a community campus with approximately 300 students, is to help allchildren learn in a safe and positive environment so they may grow into adults that are productiveand contributing members of their community. All staff members guide the students to strive forknowledge, goals, truths, and outstanding character. The Seadrift staff play an important part by
inspiring students to take learning to heart.
Seadrift SchoolsGenerated by Plan4Learning.com 2 of 60 Campus #107
January 19, 2017 1:00 pm

Comprehensive Needs Assessment
Demographics
Demographics Summary
Seadrift School is located in the Calhoun County Independent School District. It is the only school in Seadrift, Texas and serves studentsin pre-kindergarten through eighth grade. Seadrift, Texas is located on the San Antonio Bay, and the town has a population ofapproximately 1,400 residents. Fifty-four percent of the students at Seadrift School are low socio-economic. Eleven percent of thestudent population is Limited English proficent. Enrollment numbers at the school remain consistent from year to year. Our enrollment thisyear is 286. The drop out rate is 0%. Four percent of the student population is labeled gifted and talented, and 7% of our students areidentified as special education students. Twenty-one percent of Seadrift students are at-risk.
Demographics Strengths
There has been a decline in the number of students referred to special programs because of Response to Intervention.The attendance zone is easily accessible, making home visits more readily accomplished. The majority of the teachers are ESL certified and GT certified.A welcoming school environment makes Seadrift School a positive environment for staff, students, parents and community members.All teaching areas have highly qualified teachers.I-station, ThinkThroughMath and Compass Learning are interventions used to equalize educational opportunities for all learners.
Demographics Needs
Some teachers need to become ESL certified, and all teachers should be provided staff development in order to meet the needs of theSeadrift SchoolsGenerated by Plan4Learning.com 3 of 60 Campus #107
January 19, 2017 1:00 pm

EL students.Twenty-one percent of the student population is at-risk.Seadrift staff will research programs that could be used with EL students to close the gaps in their learning of the English language.The students at Seadrift School are lacking vocabulary skills which significantly affects all subject areas.Teachers need specific staff development on techniques to implement ELPS in their lesson plans.
Seadrift SchoolsGenerated by Plan4Learning.com 4 of 60 Campus #107
January 19, 2017 1:00 pm
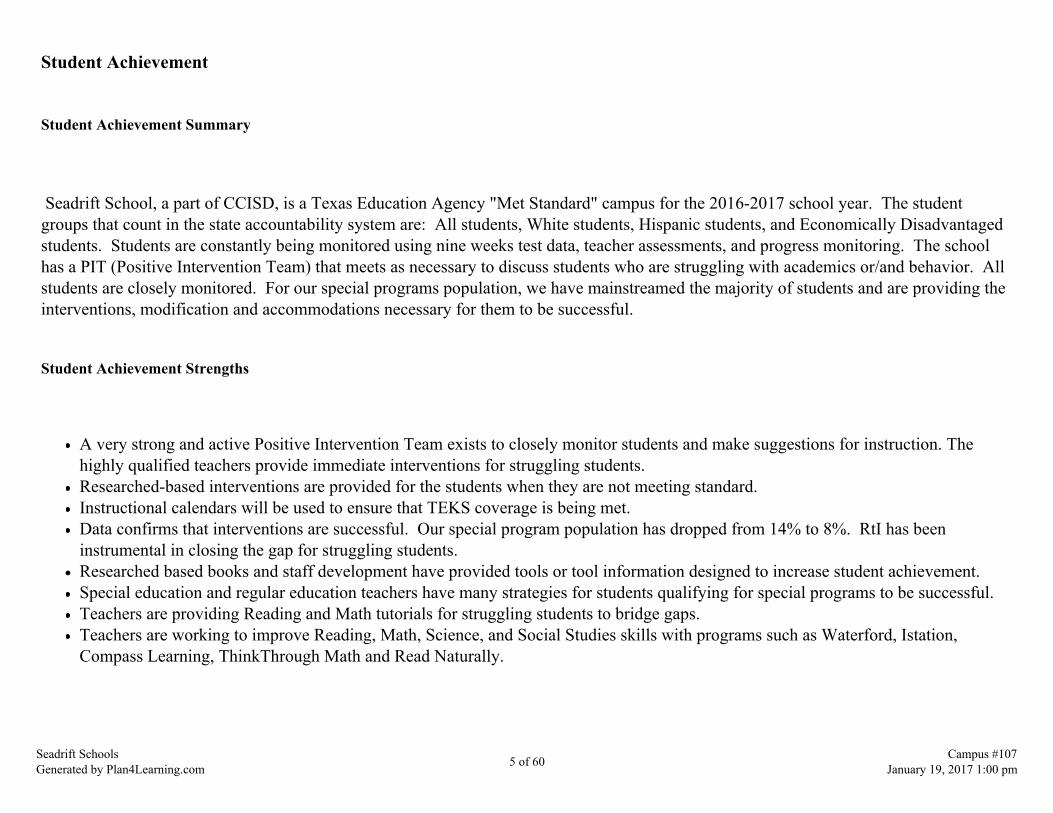
Student Achievement
Student Achievement Summary
Seadrift School, a part of CCISD, is a Texas Education Agency "Met Standard" campus for the 2016-2017 school year. The studentgroups that count in the state accountability system are: All students, White students, Hispanic students, and Economically Disadvantagedstudents. Students are constantly being monitored using nine weeks test data, teacher assessments, and progress monitoring. The schoolhas a PIT (Positive Intervention Team) that meets as necessary to discuss students who are struggling with academics or/and behavior. Allstudents are closely monitored. For our special programs population, we have mainstreamed the majority of students and are providing theinterventions, modification and accommodations necessary for them to be successful.
Student Achievement Strengths
A very strong and active Positive Intervention Team exists to closely monitor students and make suggestions for instruction. Thehighly qualified teachers provide immediate interventions for struggling students.Researched-based interventions are provided for the students when they are not meeting standard.Instructional calendars will be used to ensure that TEKS coverage is being met.Data confirms that interventions are successful. Our special program population has dropped from 14% to 8%. RtI has beeninstrumental in closing the gap for struggling students.Researched based books and staff development have provided tools or tool information designed to increase student achievement. Special education and regular education teachers have many strategies for students qualifying for special programs to be successful.Teachers are providing Reading and Math tutorials for struggling students to bridge gaps.Teachers are working to improve Reading, Math, Science, and Social Studies skills with programs such as Waterford, Istation,Compass Learning, ThinkThrough Math and Read Naturally.
Seadrift SchoolsGenerated by Plan4Learning.com 5 of 60 Campus #107
January 19, 2017 1:00 pm

Student Achievement Needs
At-risk students are not meeting the current rigorous standards.The Hispanic population is not meeting the current rigorous standards.Special Program student success needs to increase. All subject areas need to concentrate classroom instruction on STAAR depth and complexity.Classroom instruction needs depth and complexity of rigor that is needed for STAAR.Staff development emphasizing rigor and higher order thinking is needed.Instruction methods for teachers to use in the classroom to increase student progress measure.
Seadrift SchoolsGenerated by Plan4Learning.com 6 of 60 Campus #107
January 19, 2017 1:00 pm

School Culture and Climate
School Culture and Climate Summary
Seadrift School is a small (300 students) community school that provides opportunities in academics, athletics, and otherextracurricular activities. Pride in yourself, your school, your community, and your town are stressed daily. Daily attendance is necessaryfor students to be successful learners. Seadrift staff consistently stresses the importance of attendance. Discipline referrals are very lowwith DAEP placement being very rare. Safety audits have shown Seadrift School to be a safe learning environment for the students andstaff.
School Culture and Climate Strengths
Seadrift School is small enough that teachers know all students; thus, no child goes unnoticed.Parental support with discipline, daily communication, and extracurricular activities is very high.An after-school homework club to help students complete their homework will be made available.The community and businesses support the school.Bilingual staff members are able to communicate with non-English speaking parents.A proactive plan has been implemented to prevent bullying and encourage every-day heroes.Parents are welcome at Seadrift School and encouraged to be a contributing member to their child's education.Parents of absent students are called every day.
School Culture and Climate Needs
Many students come from dysfunctional homes and are being raised by grandparents or other family members.Many parents are non-English speakers; therefore, they cannot assist their children with homework or projects.Intercoms and bells are needed outside for effective communication in case of emergencies and for daily school activities.
Seadrift SchoolsGenerated by Plan4Learning.com 7 of 60 Campus #107
January 19, 2017 1:00 pm
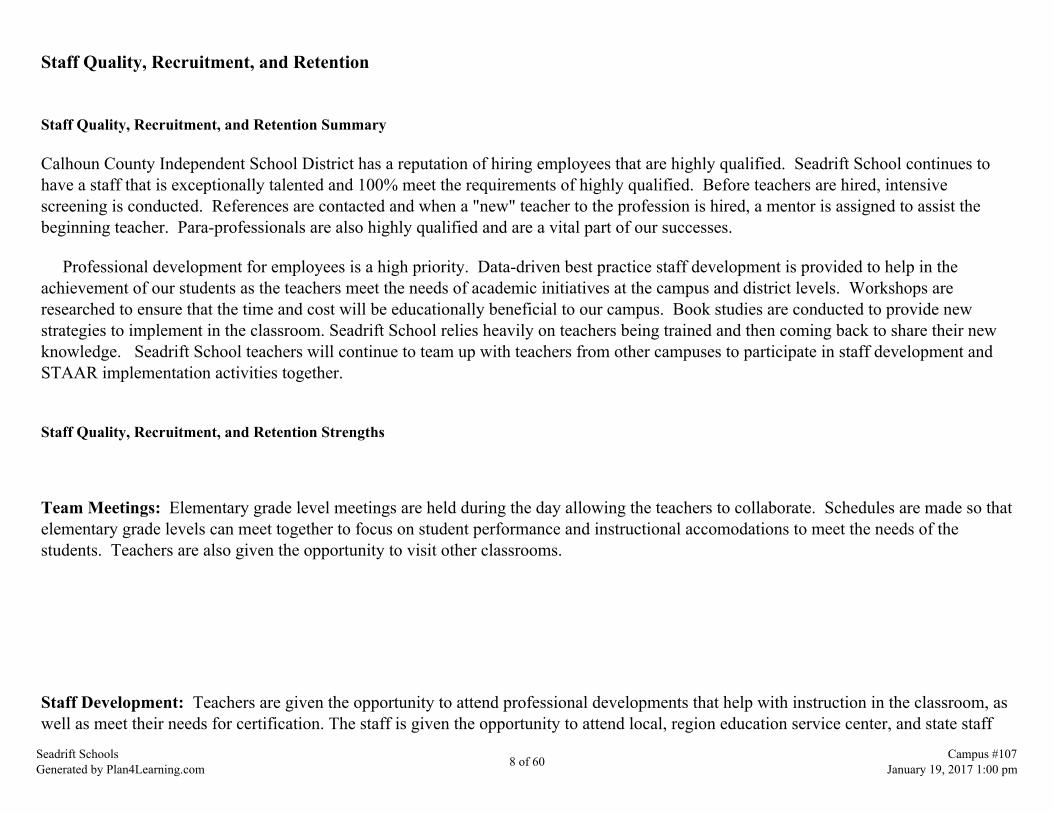
Staff Quality, Recruitment, and Retention
Staff Quality, Recruitment, and Retention Summary
Calhoun County Independent School District has a reputation of hiring employees that are highly qualified. Seadrift School continues tohave a staff that is exceptionally talented and 100% meet the requirements of highly qualified. Before teachers are hired, intensivescreening is conducted. References are contacted and when a "new" teacher to the profession is hired, a mentor is assigned to assist thebeginning teacher. Para-professionals are also highly qualified and are a vital part of our successes.
Professional development for employees is a high priority. Data-driven best practice staff development is provided to help in theachievement of our students as the teachers meet the needs of academic initiatives at the campus and district levels. Workshops areresearched to ensure that the time and cost will be educationally beneficial to our campus. Book studies are conducted to provide newstrategies to implement in the classroom. Seadrift School relies heavily on teachers being trained and then coming back to share their newknowledge. Seadrift School teachers will continue to team up with teachers from other campuses to participate in staff development andSTAAR implementation activities together.
Staff Quality, Recruitment, and Retention Strengths
Team Meetings: Elementary grade level meetings are held during the day allowing the teachers to collaborate. Schedules are made so thatelementary grade levels can meet together to focus on student performance and instructional accomodations to meet the needs of thestudents. Teachers are also given the opportunity to visit other classrooms.
Staff Development: Teachers are given the opportunity to attend professional developments that help with instruction in the classroom, aswell as meet their needs for certification. The staff is given the opportunity to attend local, region education service center, and state staff
Seadrift SchoolsGenerated by Plan4Learning.com 8 of 60 Campus #107
January 19, 2017 1:00 pm
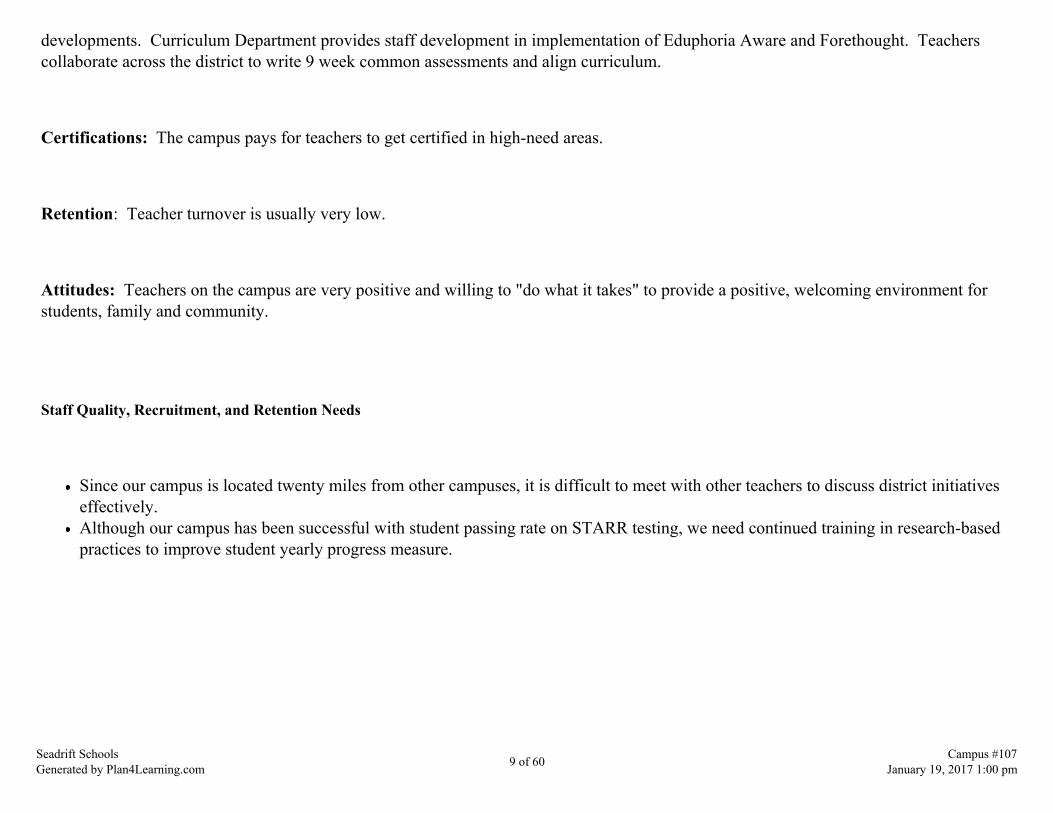
developments. Curriculum Department provides staff development in implementation of Eduphoria Aware and Forethought. Teacherscollaborate across the district to write 9 week common assessments and align curriculum.
Certifications: The campus pays for teachers to get certified in high-need areas.
Retention: Teacher turnover is usually very low.
Attitudes: Teachers on the campus are very positive and willing to "do what it takes" to provide a positive, welcoming environment forstudents, family and community.
Staff Quality, Recruitment, and Retention Needs
Since our campus is located twenty miles from other campuses, it is difficult to meet with other teachers to discuss district initiativeseffectively. Although our campus has been successful with student passing rate on STARR testing, we need continued training in research-basedpractices to improve student yearly progress measure.
Seadrift SchoolsGenerated by Plan4Learning.com 9 of 60 Campus #107
January 19, 2017 1:00 pm

Curriculum, Instruction, and Assessment
Curriculum, Instruction, and Assessment Summary
Seadrift School is working collaboratively with district office and other campuses to develop the instructional calendars to ensure thecurriculum is taught and meets the students' needs. All teachers and paraprofessionals are highly qualified. The plan provides forflexibility in combining resources serving all students. A district assessment is given four times per year. This assessment allows forcontinuous self-assessment and improvement for the students. When results are returned, each teacher shares the information with thestudents. Then, there is a conference with administration and the teacher. The administration participates in an accountability meeting withdistrict office. At this meeting, test scores and areas of improvement are discussed. Seadrift School holds all students accountable andexpects academic improvement by all.
Curriculum, Instruction, and Assessment Strengths
The school has highly-qualified teachers and para-professionals.The school district has central office facilitators that provide training as needed.The curriculum and assessments are written by a group of teachers and facilitators, then reviewed by all teachers.CIRCLE, TPRI, Aims Web, QRI, and Gates assessments help to plan instruction and receive assistance. Our district makes every effort for our teachers to receive staff development to improve instruction. Wilson instruction is provided for our identified dyslexic students and selected Tier III RtI students by an intervention/Wilson teacher.Read Naturally instruction is provided for k-2 for ARI instruction.
Curriculum, Instruction, and Assessment Needs
Professional development for all staff working with special education students in an inclusion setting is needed.Fluency scores in the elementary grades have not met campus expectations. Fluency and comprehension skills in first and second grades have to increase.The staff needs to monitor at-risk, low socio-economic, Special Programs, and Hispanic students whose STAAR scores were lower
Seadrift SchoolsGenerated by Plan4Learning.com 10 of 60 Campus #107
January 19, 2017 1:00 pm

than other populations. Depth, complexity, and rigor need to be implemented in all subject areas to meet the demands of STAAR.Staff needs to focus on vocabulary development. Block planning time needs to be implemented for Seadrift.Seadrift students need to be offered more electives to pick from when making class selections.
Seadrift SchoolsGenerated by Plan4Learning.com 11 of 60 Campus #107
January 19, 2017 1:00 pm

Family and Community Involvement
Family and Community Involvement Summary
Family and community involvement is very important for the well-being of our school. The school is the "hub" of the community. Parentsand community members are involved in the decision making process of the campus. The campus has an "open door" policy and invitesparents and guardians to visit. We also encourage community attendance in programs (Veteran's Day,Texas Public School week,Christmas etc.). Seadrift School assists parents and the community in understanding the state academic requirements and explains theschool report card in a public meeting. Parent contact and conferences are conducted on a regular basis.
Family and Community Involvement Strengths
Administrative team is dedicated to helping the children and staff of Seadrift School be successful.Counseling staff is devoted to working with our families and children to assist children to be successful in the classroom and insociety.Seadrift has a positive, highly motivated teaching staff.Mentorship and tutoring programs through Partners in Education allow business and industry leaders to assist students with academicor behavioral challenges.Monthly calendars and Facebook are used to notify parents of school events.School personnel and parents communicate through multiple media sources.Parents as well as community members are given many opportunties to visit the school and assist classroom teachers. Parents are able to use the district website to check on their child's grades.Remind is used to communicate with parents about activities and other information that needs to be shared on a regular basis.
Family and Community Involvement Needs
Our non-English speaking parents offer a challenge to communication between teachers and parents.Many parents work and are unable to get involved in the education of their child to the level that would benefit the school andstudent.
Seadrift SchoolsGenerated by Plan4Learning.com 12 of 60 Campus #107
January 19, 2017 1:00 pm

Seadrift SchoolsGenerated by Plan4Learning.com 13 of 60 Campus #107
January 19, 2017 1:00 pm
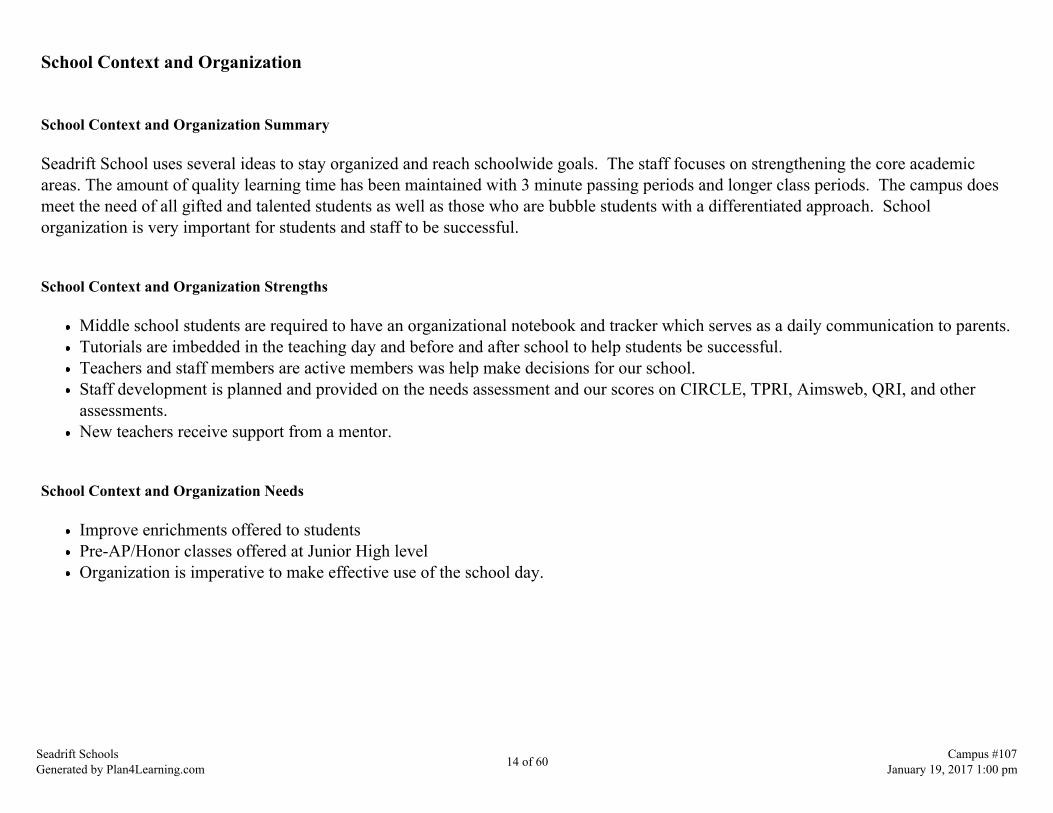
School Context and Organization
School Context and Organization Summary
Seadrift School uses several ideas to stay organized and reach schoolwide goals. The staff focuses on strengthening the core academicareas. The amount of quality learning time has been maintained with 3 minute passing periods and longer class periods. The campus doesmeet the need of all gifted and talented students as well as those who are bubble students with a differentiated approach. Schoolorganization is very important for students and staff to be successful.
School Context and Organization Strengths
Middle school students are required to have an organizational notebook and tracker which serves as a daily communication to parents.Tutorials are imbedded in the teaching day and before and after school to help students be successful.Teachers and staff members are active members was help make decisions for our school.Staff development is planned and provided on the needs assessment and our scores on CIRCLE, TPRI, Aimsweb, QRI, and otherassessments.New teachers receive support from a mentor.
School Context and Organization Needs
Improve enrichments offered to studentsPre-AP/Honor classes offered at Junior High levelOrganization is imperative to make effective use of the school day.
Seadrift SchoolsGenerated by Plan4Learning.com 14 of 60 Campus #107
January 19, 2017 1:00 pm

Technology
Technology Summary
Expectations are high with the available technology. Our campus has many advanced technological educational tools, but we lack thetraining to use them to their full potential. Teachers receive direct staff development on new technology, as well as staff members trainingtheir peers. The Seadrift School staff has Chrome carts, Polyvision boards, ELMOs, LCD projectors, Mobis and clickers for classrooms.
Technology Strengths
New technology and programs are being purchased when funds are available.The District has purchased several intervention programs that students work on daily and have proven to be successful.Teachers make effective use of available resources.Two computer labs are available to meet the needs of our students. Wifi is now available on campus. The technology director works closely with Seadrift administration to solve problems.Class size Chrome books were purchased for middle school students.Class size Chrome book cart is available for elementary students.All teachers have iPads. Forethought lesson planning is used by all teaching staff.Aware is used for assessment writing and diagnostic testing.
Technology Needs
Computer Upgrades and schedule for replacement neededWiFi/internet service reliabilityTeacher training needs to be done more frequently as new "technology" is purchased. Funds limit the technology programs that we can purchase for our students.
Seadrift SchoolsGenerated by Plan4Learning.com 15 of 60 Campus #107
January 19, 2017 1:00 pm
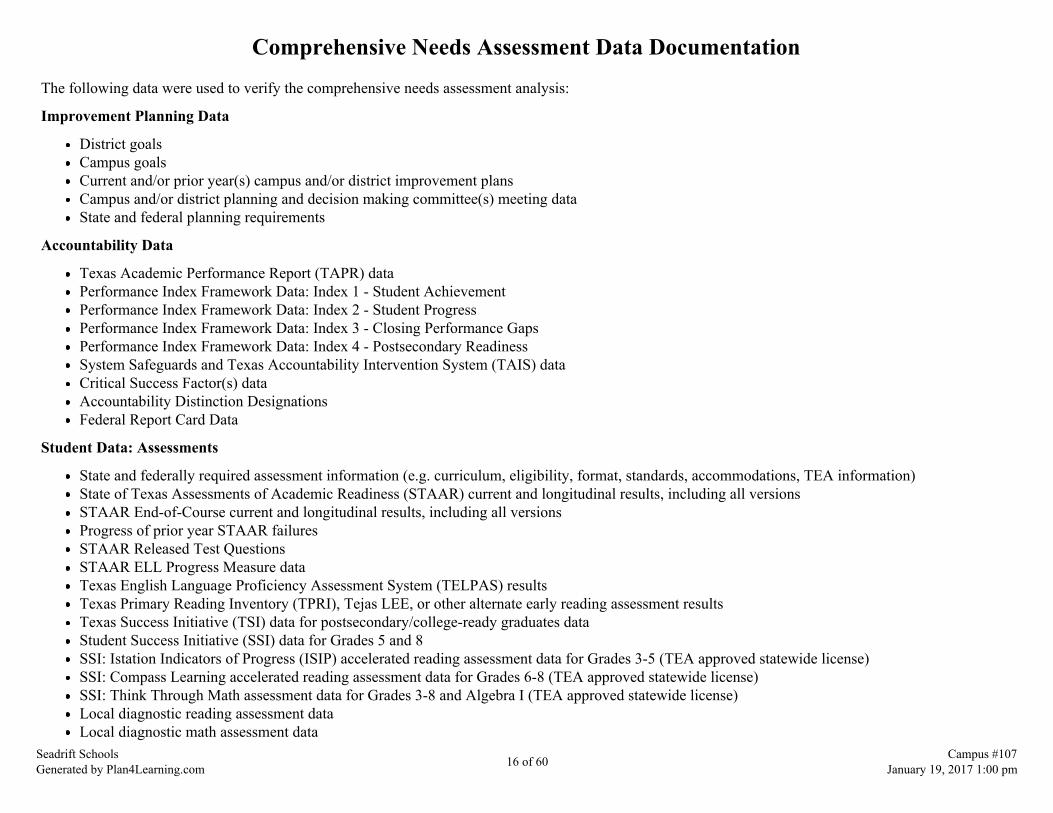
Comprehensive Needs Assessment Data Documentation
The following data were used to verify the comprehensive needs assessment analysis:
Improvement Planning Data
District goalsCampus goalsCurrent and/or prior year(s) campus and/or district improvement plansCampus and/or district planning and decision making committee(s) meeting dataState and federal planning requirements
Accountability Data
Texas Academic Performance Report (TAPR) dataPerformance Index Framework Data: Index 1 - Student AchievementPerformance Index Framework Data: Index 2 - Student ProgressPerformance Index Framework Data: Index 3 - Closing Performance GapsPerformance Index Framework Data: Index 4 - Postsecondary ReadinessSystem Safeguards and Texas Accountability Intervention System (TAIS) dataCritical Success Factor(s) dataAccountability Distinction DesignationsFederal Report Card Data
Student Data: Assessments
State and federally required assessment information (e.g. curriculum, eligibility, format, standards, accommodations, TEA information)State of Texas Assessments of Academic Readiness (STAAR) current and longitudinal results, including all versionsSTAAR End-of-Course current and longitudinal results, including all versionsProgress of prior year STAAR failuresSTAAR Released Test QuestionsSTAAR ELL Progress Measure dataTexas English Language Proficiency Assessment System (TELPAS) resultsTexas Primary Reading Inventory (TPRI), Tejas LEE, or other alternate early reading assessment resultsTexas Success Initiative (TSI) data for postsecondary/college-ready graduates dataStudent Success Initiative (SSI) data for Grades 5 and 8SSI: Istation Indicators of Progress (ISIP) accelerated reading assessment data for Grades 3-5 (TEA approved statewide license)SSI: Compass Learning accelerated reading assessment data for Grades 6-8 (TEA approved statewide license)SSI: Think Through Math assessment data for Grades 3-8 and Algebra I (TEA approved statewide license)Local diagnostic reading assessment dataLocal diagnostic math assessment data
Seadrift SchoolsGenerated by Plan4Learning.com 16 of 60 Campus #107
January 19, 2017 1:00 pm
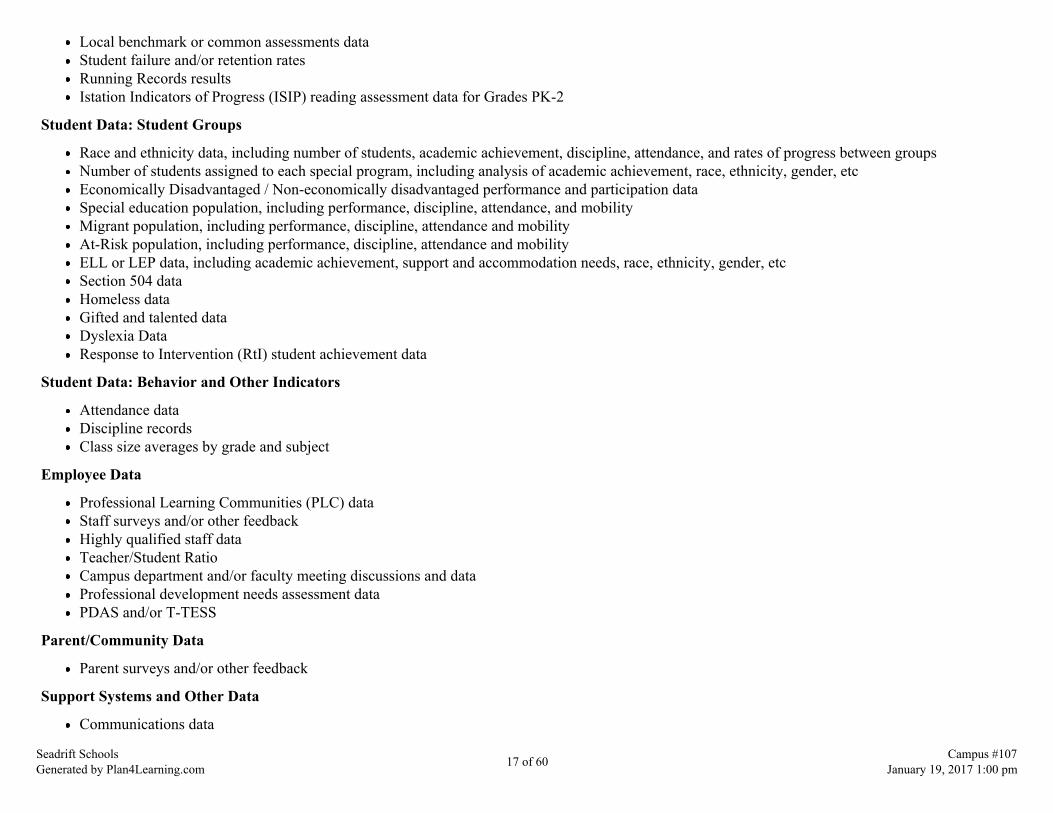
Local benchmark or common assessments dataStudent failure and/or retention ratesRunning Records resultsIstation Indicators of Progress (ISIP) reading assessment data for Grades PK-2
Student Data: Student Groups
Race and ethnicity data, including number of students, academic achievement, discipline, attendance, and rates of progress between groupsNumber of students assigned to each special program, including analysis of academic achievement, race, ethnicity, gender, etcEconomically Disadvantaged / Non-economically disadvantaged performance and participation dataSpecial education population, including performance, discipline, attendance, and mobilityMigrant population, including performance, discipline, attendance and mobilityAt-Risk population, including performance, discipline, attendance and mobilityELL or LEP data, including academic achievement, support and accommodation needs, race, ethnicity, gender, etcSection 504 dataHomeless dataGifted and talented dataDyslexia DataResponse to Intervention (RtI) student achievement data
Student Data: Behavior and Other Indicators
Attendance dataDiscipline recordsClass size averages by grade and subject
Employee Data
Professional Learning Communities (PLC) dataStaff surveys and/or other feedbackHighly qualified staff dataTeacher/Student RatioCampus department and/or faculty meeting discussions and dataProfessional development needs assessment dataPDAS and/or T-TESS
Parent/Community Data
Parent surveys and/or other feedback
Support Systems and Other Data
Communications data
Seadrift SchoolsGenerated by Plan4Learning.com 17 of 60 Campus #107
January 19, 2017 1:00 pm

Budgets/entitlements and expenditures dataStudy of best practices
Seadrift SchoolsGenerated by Plan4Learning.com 18 of 60 Campus #107
January 19, 2017 1:00 pm
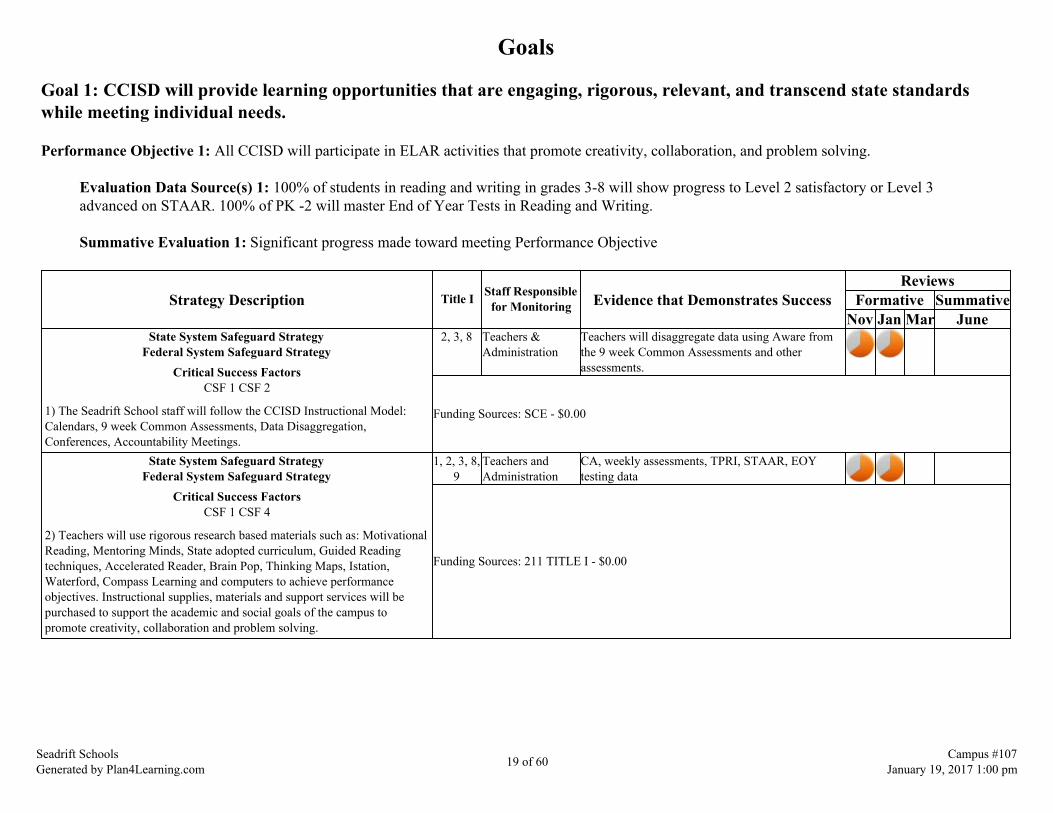
Goals
Goal 1: CCISD will provide learning opportunities that are engaging, rigorous, relevant, and transcend state standardswhile meeting individual needs.
Performance Objective 1: All CCISD will participate in ELAR activities that promote creativity, collaboration, and problem solving.
Evaluation Data Source(s) 1: 100% of students in reading and writing in grades 3-8 will show progress to Level 2 satisfactory or Level 3advanced on STAAR. 100% of PK -2 will master End of Year Tests in Reading and Writing.
Summative Evaluation 1: Significant progress made toward meeting Performance Objective
Strategy Description Title I Staff Responsiblefor Monitoring Evidence that Demonstrates Success
ReviewsFormative Summative
Nov Jan Mar JuneState System Safeguard Strategy
Federal System Safeguard StrategyCritical Success Factors
CSF 1 CSF 2
1) The Seadrift School staff will follow the CCISD Instructional Model:Calendars, 9 week Common Assessments, Data Disaggregation,Conferences, Accountability Meetings.
2, 3, 8 Teachers &Administration
Teachers will disaggregate data using Aware fromthe 9 week Common Assessments and otherassessments.
Funding Sources: SCE - $0.00
State System Safeguard StrategyFederal System Safeguard Strategy
Critical Success FactorsCSF 1 CSF 4
2) Teachers will use rigorous research based materials such as: MotivationalReading, Mentoring Minds, State adopted curriculum, Guided Readingtechniques, Accelerated Reader, Brain Pop, Thinking Maps, Istation,Waterford, Compass Learning and computers to achieve performanceobjectives. Instructional supplies, materials and support services will bepurchased to support the academic and social goals of the campus topromote creativity, collaboration and problem solving.
1, 2, 3, 8,9
Teachers andAdministration
CA, weekly assessments, TPRI, STAAR, EOYtesting data
Funding Sources: 211 TITLE I - $0.00
Seadrift SchoolsGenerated by Plan4Learning.com 19 of 60 Campus #107
January 19, 2017 1:00 pm

State System Safeguard StrategyFederal System Safeguard Strategy
Critical Success FactorsCSF 1 CSF 2
3) K-5 students will be screened for potential reading problems andprovided differentiated reading instruction. Students falling below 50thpercentile will be progress monitored more frequently. Teachers willprovide relevant student services including tutorials for targeted subpopulations to address achievement gaps. *Reading Smart Reading Mate(Title III)
1, 2, 3, 8,9
Administration On-going monitoring will take place.
Funding Sources: 199 LOCAL - $0.00, 263 TITLE III - $850.00
State System Safeguard StrategyFederal System Safeguard Strategy
Critical Success FactorsCSF 1 CSF 2 CSF 6
4) The campus will provide relevant student services including GTinstruction for students who exceed expectations on TPRI and STAARAssessment.
1, 2, 3, 4,5
Administration Reading above grade level on end of year TPRI adreceive advanced scores on STAAR Assessmets
Funding Sources: 199 LOCAL - $0.00
State System Safeguard StrategyFederal System Safeguard Strategy
Critical Success FactorsCSF 1 CSF 2
5) A Response to Intervention teacher will provide intensive systematicinstruction using the Wilson Dyslexia Program, Waterford, Istation andRead Naturally which will provide a strong foundation in reading skills andmeet the needs of our dyslexic students and ARI students.
2, 3, 8, 9 AdministrationKelly Hataway
Wilson program will be continued with the needs ofstudents being met and documented. Students willread on grade level.
Funding Sources: SCE - $0.00
Critical Success FactorsCSF 1 CSF 2
6) The campus will participate in the program/material that the state fundsfor the Student Success Initiative. Istation will be purchased for K-2 to beused by students.
2, 6, 9 AdministrationClassroomReading Teachers
Log-in documentation will show participation.
Funding Sources: 410 IMA - $0.00
Critical Success FactorsCSF 7
7) All students will be taught ELA by a highly qualified teacher.
3 Administration Documentation of certificates.
Funding Sources: 199 LOCAL - $0.00
State System Safeguard StrategyFederal System Safeguard Strategy
Critical Success FactorsCSF 1 CSF 2
8) The staff will disaggregate STAAR, TELPAS, TPRI, and district nineweeks CA test results to adjust instruction and set goals for higher standards.*Project ELL (Title III)
2, 9 AdministrationClassroomTeachers
100% of students will meet standards.
Funding Sources: 199 LOCAL - $0.00, 263 TITLE III - $388.00
Seadrift SchoolsGenerated by Plan4Learning.com 20 of 60 Campus #107
January 19, 2017 1:00 pm

State System Safeguard StrategyCritical Success Factors
CSF 1
9) The staff will implement and assess short answer and essay responsesacross curriculum areas to enhance student's ability to interpret text.
2 AdministrationClassroomTeachers
Examples of the short answer and essay responsesbeing used in all areasWalk throughs
Critical Success FactorsCSF 1 CSF 4
10) Students in grades 5 and 8 will be closely monitored. They will beoffered summer school and another opportunity to pass STAAR if they arenot successful in passing the first two administrations of STAAR.
1, 3 AdministrationClassroom Teacher
Students will pass the STAAR and show progress.
Funding Sources: 199 LOCAL - $0.00
State System Safeguard StrategyFederal System Safeguard Strategy
Critical Success FactorsCSF 1 CSF 2
11) Students in grades 6th-8th whose STAAR scores were low will bescheduled into tutorials.
1, 2, 3 AdministrationClassroom teachers
All identified students will be scheduled in totutorials.
Funding Sources: SCE - $0.00
State System Safeguard StrategyCritical Success Factors
CSF 1 CSF 7
12) Elementary classroom teachers will work with teachers from otherschools to develop instructional calendars, Common Assessments anddiscuss instructional strategies.
1, 2, 3 AdministationCurriculumDepartment
Lesson plans, walk throughs
State System Safeguard StrategyFederal System Safeguard Strategy
Critical Success FactorsCSF 1 CSF 3 CSF 5
13) Homeless students will meet district criteria. They will be provided withsupplies, clothing and necessities needed to ensure the child's success ineducation.
1, 2, 9 AdministrationCounselor
Monitoring of student's needs
State System Safeguard StrategyFederal System Safeguard Strategy
Critical Success FactorsCSF 1 CSF 6
14) All students being STAAR tested will be provided snacks and waterduring testing.
1, 2, 8, 9 Administration Students meet standard on STAAR test
= Accomplished = Considerable = Some Progress = No Progress = Discontinue
Seadrift SchoolsGenerated by Plan4Learning.com 21 of 60 Campus #107
January 19, 2017 1:00 pm
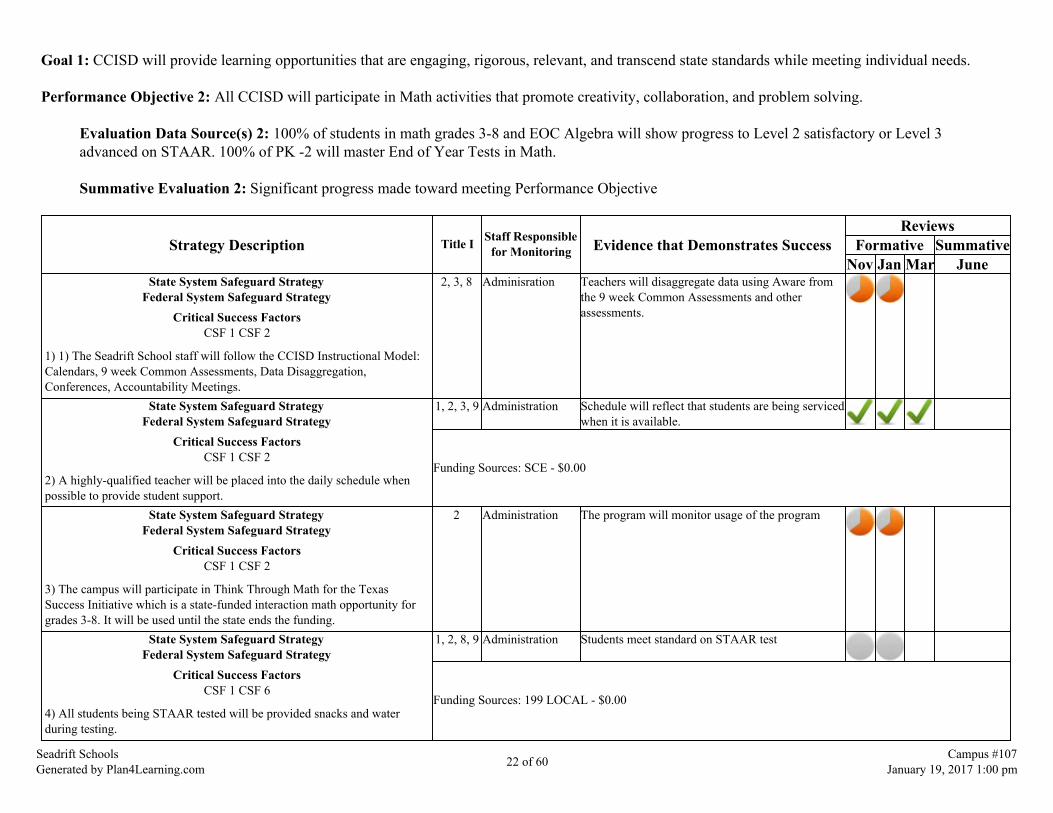
Goal 1: CCISD will provide learning opportunities that are engaging, rigorous, relevant, and transcend state standards while meeting individual needs.
Performance Objective 2: All CCISD will participate in Math activities that promote creativity, collaboration, and problem solving.
Evaluation Data Source(s) 2: 100% of students in math grades 3-8 and EOC Algebra will show progress to Level 2 satisfactory or Level 3advanced on STAAR. 100% of PK -2 will master End of Year Tests in Math.
Summative Evaluation 2: Significant progress made toward meeting Performance Objective
Strategy Description Title I Staff Responsiblefor Monitoring Evidence that Demonstrates Success
ReviewsFormative Summative
Nov Jan Mar JuneState System Safeguard Strategy
Federal System Safeguard StrategyCritical Success Factors
CSF 1 CSF 2
1) 1) The Seadrift School staff will follow the CCISD Instructional Model:Calendars, 9 week Common Assessments, Data Disaggregation,Conferences, Accountability Meetings.
2, 3, 8 Adminisration Teachers will disaggregate data using Aware fromthe 9 week Common Assessments and otherassessments.
State System Safeguard StrategyFederal System Safeguard Strategy
Critical Success FactorsCSF 1 CSF 2
2) A highly-qualified teacher will be placed into the daily schedule whenpossible to provide student support.
1, 2, 3, 9 Administration Schedule will reflect that students are being servicedwhen it is available.
Funding Sources: SCE - $0.00
State System Safeguard StrategyFederal System Safeguard Strategy
Critical Success FactorsCSF 1 CSF 2
3) The campus will participate in Think Through Math for the TexasSuccess Initiative which is a state-funded interaction math opportunity forgrades 3-8. It will be used until the state ends the funding.
2 Administration The program will monitor usage of the program
State System Safeguard StrategyFederal System Safeguard Strategy
Critical Success FactorsCSF 1 CSF 6
4) All students being STAAR tested will be provided snacks and waterduring testing.
1, 2, 8, 9 Administration Students meet standard on STAAR test
Funding Sources: 199 LOCAL - $0.00
Seadrift SchoolsGenerated by Plan4Learning.com 22 of 60 Campus #107
January 19, 2017 1:00 pm

State System Safeguard StrategyFederal System Safeguard Strategy
Critical Success FactorsCSF 1 CSF 4
5) Students in grades 5 and 8 will be closely monitored. They will be offeredsummer school and another opportunity to pass STAAR if they are notsuccessful in passing the first two administrations of STAAR.
1, 3 AdministrationClassroomTeachers
Students will pass the STAAR and show progress
State System Safeguard StrategyFederal System Safeguard Strategy
Critical Success FactorsCSF 1 CSF 2 CSF 4
6) Students in grades 6th-8th whose STAAR scores were low will be placedin tutorials
1, 2, 3 Administration All identified students will be scheduled in totutorials.
Funding Sources: SCE - $0.00
State System Safeguard StrategyFederal System Safeguard Strategy
Critical Success FactorsCSF 1 CSF 2
7) The staff will disaggregate STAAR and 9 week common assessmentresults to adjust instruction and set goals for higher standards.
1, 2, 3 AdministrationClassroomTeachers
100% of students will meet standards.
Critical Success FactorsCSF 7
8) All students will be taught Math by a highly qualified teacher.
3 Administration Documentation of certificates
Funding Sources: 199 LOCAL - $0.00
State System Safeguard StrategyCritical Success Factors
CSF 1
9) Math instruction will be monitored to assure effective teaching strategiesand utilization of materials to close achievement gaps and increaseperformance.
1, 2, 3 Administration Scores will show achievement gaps decreasing andstudent performance increasing.
State System Safeguard StrategyFederal System Safeguard Strategy
Critical Success FactorsCSF 1 CSF 7
10) Elementary classroom teachers will work with teachers from otherschools to develop instructional calendars, Common Assessments anddiscuss instructional strategies.
1, 2, 3 AdministrationCurriculumDepartment
Lesson plans, walk throughs
Funding Sources: 199 LOCAL - $0.00
Critical Success FactorsCSF 1 CSF 2 CSF 7
11) Teachers will attend any Math staff development that will increasestudent performance when funds are available.
2, 3, 4, 9 Administration Math STAAR scores will increase.
Funding Sources: 263 TITLE III - $0.00
Seadrift SchoolsGenerated by Plan4Learning.com 23 of 60 Campus #107
January 19, 2017 1:00 pm
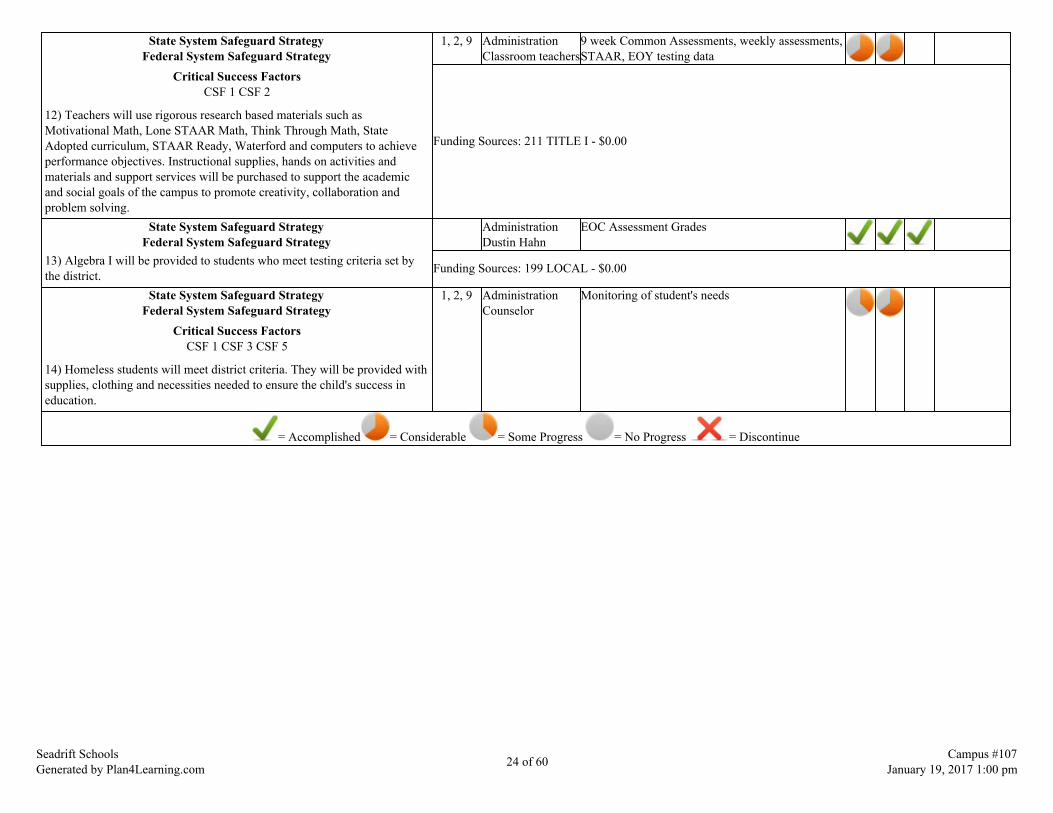
State System Safeguard StrategyFederal System Safeguard Strategy
Critical Success FactorsCSF 1 CSF 2
12) Teachers will use rigorous research based materials such asMotivational Math, Lone STAAR Math, Think Through Math, StateAdopted curriculum, STAAR Ready, Waterford and computers to achieveperformance objectives. Instructional supplies, hands on activities andmaterials and support services will be purchased to support the academicand social goals of the campus to promote creativity, collaboration andproblem solving.
1, 2, 9 AdministrationClassroom teachers
9 week Common Assessments, weekly assessments,STAAR, EOY testing data
Funding Sources: 211 TITLE I - $0.00
State System Safeguard StrategyFederal System Safeguard Strategy
13) Algebra I will be provided to students who meet testing criteria set bythe district.
AdministrationDustin Hahn
EOC Assessment Grades
Funding Sources: 199 LOCAL - $0.00
State System Safeguard StrategyFederal System Safeguard Strategy
Critical Success FactorsCSF 1 CSF 3 CSF 5
14) Homeless students will meet district criteria. They will be provided withsupplies, clothing and necessities needed to ensure the child's success ineducation.
1, 2, 9 AdministrationCounselor
Monitoring of student's needs
= Accomplished = Considerable = Some Progress = No Progress = Discontinue
Seadrift SchoolsGenerated by Plan4Learning.com 24 of 60 Campus #107
January 19, 2017 1:00 pm
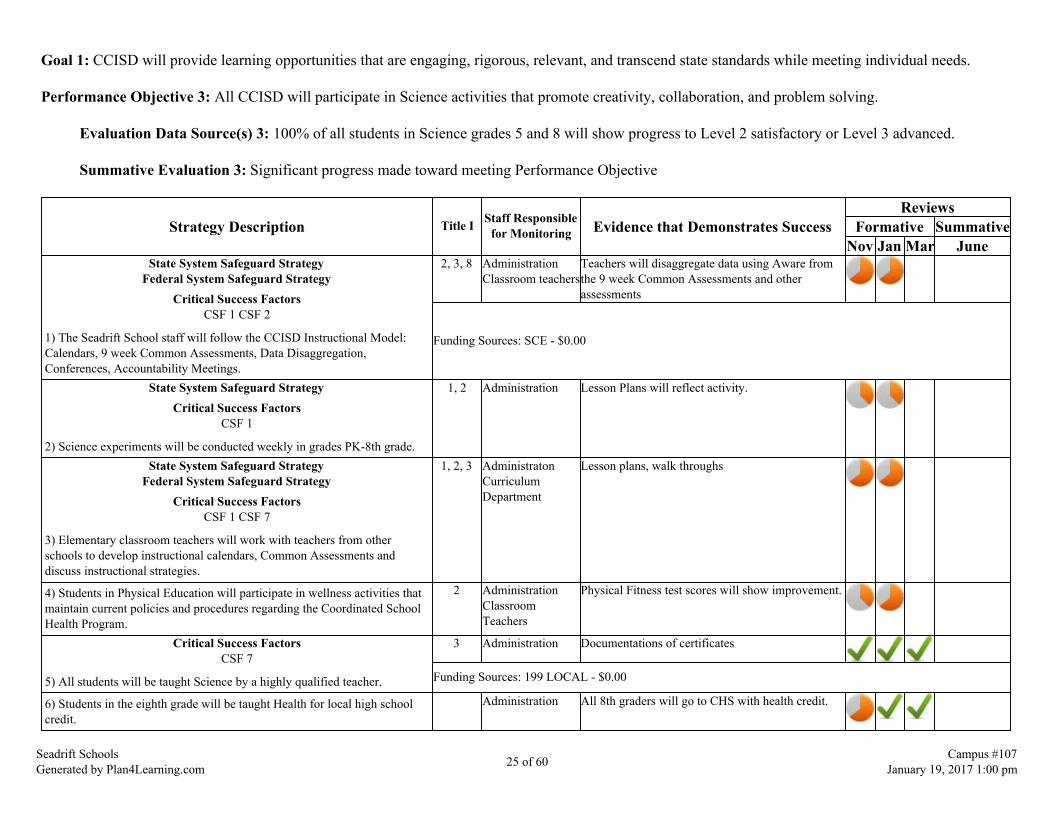
Goal 1: CCISD will provide learning opportunities that are engaging, rigorous, relevant, and transcend state standards while meeting individual needs.
Performance Objective 3: All CCISD will participate in Science activities that promote creativity, collaboration, and problem solving.
Evaluation Data Source(s) 3: 100% of all students in Science grades 5 and 8 will show progress to Level 2 satisfactory or Level 3 advanced.
Summative Evaluation 3: Significant progress made toward meeting Performance Objective
Strategy Description Title I Staff Responsiblefor Monitoring Evidence that Demonstrates Success
ReviewsFormative Summative
Nov Jan Mar JuneState System Safeguard Strategy
Federal System Safeguard StrategyCritical Success Factors
CSF 1 CSF 2
1) The Seadrift School staff will follow the CCISD Instructional Model:Calendars, 9 week Common Assessments, Data Disaggregation,Conferences, Accountability Meetings.
2, 3, 8 AdministrationClassroom teachers
Teachers will disaggregate data using Aware fromthe 9 week Common Assessments and otherassessments
Funding Sources: SCE - $0.00
State System Safeguard StrategyCritical Success Factors
CSF 1
2) Science experiments will be conducted weekly in grades PK-8th grade.
1, 2 Administration Lesson Plans will reflect activity.
State System Safeguard StrategyFederal System Safeguard Strategy
Critical Success FactorsCSF 1 CSF 7
3) Elementary classroom teachers will work with teachers from otherschools to develop instructional calendars, Common Assessments anddiscuss instructional strategies.
1, 2, 3 AdministratonCurriculumDepartment
Lesson plans, walk throughs
4) Students in Physical Education will participate in wellness activities thatmaintain current policies and procedures regarding the Coordinated SchoolHealth Program.
2 AdministrationClassroomTeachers
Physical Fitness test scores will show improvement.
Critical Success FactorsCSF 7
5) All students will be taught Science by a highly qualified teacher.
3 Administration Documentations of certificates
Funding Sources: 199 LOCAL - $0.00
6) Students in the eighth grade will be taught Health for local high schoolcredit.
Administration All 8th graders will go to CHS with health credit.
Seadrift SchoolsGenerated by Plan4Learning.com 25 of 60 Campus #107
January 19, 2017 1:00 pm

7) Educational field trips and transportation will be provided to supportacademic and social goals of the campus.
AdministrationScience Teachers
100% of students will be present for the field trips.
Funding Sources: 199 LOCAL - $0.00State System Safeguard Strategy
Federal System Safeguard StrategyCritical Success Factors
CSF 1 CSF 2
8) Science teachers will review and disaggregate CA and STAAR data toidentify academic needs of students and use of research based materials tomeet individual academic needs.
AdministrationClassroom teachers
Lesson plans
Funding Sources: 199 LOCAL - $0.00
Critical Success FactorsCSF 1 CSF 3 CSF 5
9) ) Homeless students will meet district criteria. They will be provided withsupplies, clothing and necessities needed to ensure the child's success ineducation
1, 2, 9 AdministrationCounselor
Monitoring of student's needs
State System Safeguard StrategyFederal System Safeguard Strategy
Critical Success FactorsCSF 1 CSF 2 CSF 4
10) Students in grades 5 and 8 will be closely monitored. They will beplaced in tutorials if they are not performing to standard to ensure theirsuccess on STAAR.
3, 8, 9 AdministrationClassroom teacher
Common AssessmentWeekly AssessmentSTAAR scores
11) All students being STAAR tested will be provided snacks and waterduring testing.
1, 2, 8, 9 Administration Students meet standard on STAAR test
State System Safeguard StrategyFederal System Safeguard Strategy
Critical Success FactorsCSF 1 CSF 4
12) Teachers will use rigorous researched based materials such as: ScienceMeasuring Up to the TEKS, state adopted curriculum, Brain Pop, FossScience Kits and other sources to achieve performance objectives.Instructional supplies, materials, educational programs and support serviceswill be purchased to support the academic ad social goals of the campus.
1, 2, 3, 4,8, 9
AdministrationClassroom teachers
CA, Weekly assessments, STAAR
Funding Sources: 211 TITLE I - $1,000.00
= Accomplished = Considerable = Some Progress = No Progress = Discontinue
Seadrift SchoolsGenerated by Plan4Learning.com 26 of 60 Campus #107
January 19, 2017 1:00 pm
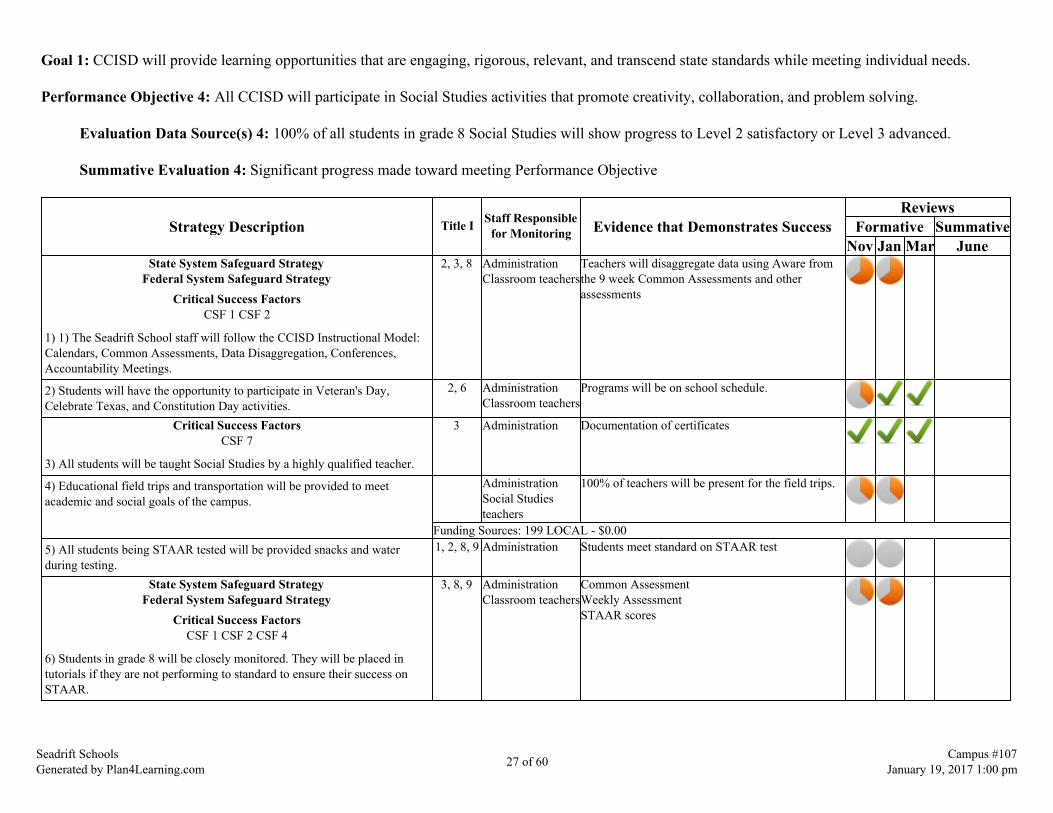
Goal 1: CCISD will provide learning opportunities that are engaging, rigorous, relevant, and transcend state standards while meeting individual needs.
Performance Objective 4: All CCISD will participate in Social Studies activities that promote creativity, collaboration, and problem solving.
Evaluation Data Source(s) 4: 100% of all students in grade 8 Social Studies will show progress to Level 2 satisfactory or Level 3 advanced.
Summative Evaluation 4: Significant progress made toward meeting Performance Objective
Strategy Description Title I Staff Responsiblefor Monitoring Evidence that Demonstrates Success
ReviewsFormative Summative
Nov Jan Mar JuneState System Safeguard Strategy
Federal System Safeguard StrategyCritical Success Factors
CSF 1 CSF 2
1) 1) The Seadrift School staff will follow the CCISD Instructional Model:Calendars, Common Assessments, Data Disaggregation, Conferences,Accountability Meetings.
2, 3, 8 AdministrationClassroom teachers
Teachers will disaggregate data using Aware fromthe 9 week Common Assessments and otherassessments
2) Students will have the opportunity to participate in Veteran's Day,Celebrate Texas, and Constitution Day activities.
2, 6 AdministrationClassroom teachers
Programs will be on school schedule.
Critical Success FactorsCSF 7
3) All students will be taught Social Studies by a highly qualified teacher.
3 Administration Documentation of certificates
4) Educational field trips and transportation will be provided to meetacademic and social goals of the campus.
AdministrationSocial Studiesteachers
100% of teachers will be present for the field trips.
Funding Sources: 199 LOCAL - $0.005) All students being STAAR tested will be provided snacks and waterduring testing.
1, 2, 8, 9 Administration Students meet standard on STAAR test
State System Safeguard StrategyFederal System Safeguard Strategy
Critical Success FactorsCSF 1 CSF 2 CSF 4
6) Students in grade 8 will be closely monitored. They will be placed intutorials if they are not performing to standard to ensure their success onSTAAR.
3, 8, 9 AdministrationClassroom teachers
Common AssessmentWeekly AssessmentSTAAR scores
Seadrift SchoolsGenerated by Plan4Learning.com 27 of 60 Campus #107
January 19, 2017 1:00 pm
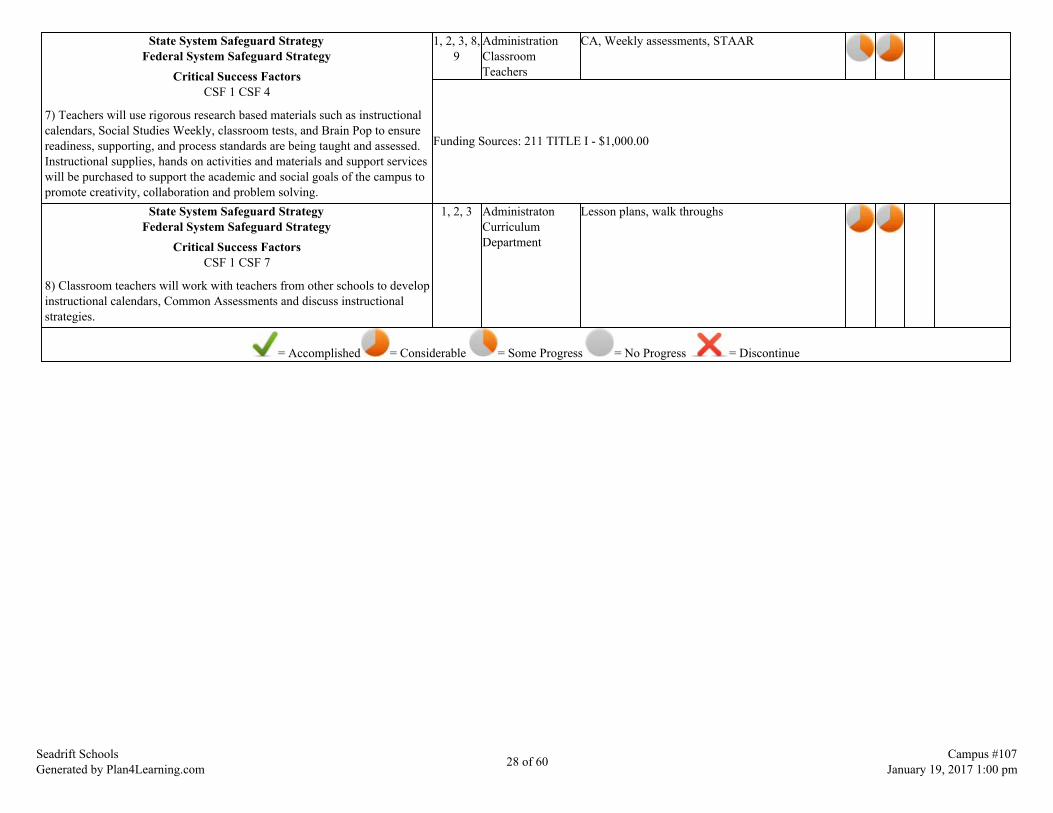
State System Safeguard StrategyFederal System Safeguard Strategy
Critical Success FactorsCSF 1 CSF 4
7) Teachers will use rigorous research based materials such as instructionalcalendars, Social Studies Weekly, classroom tests, and Brain Pop to ensurereadiness, supporting, and process standards are being taught and assessed.Instructional supplies, hands on activities and materials and support serviceswill be purchased to support the academic and social goals of the campus topromote creativity, collaboration and problem solving.
1, 2, 3, 8,9
AdministrationClassroomTeachers
CA, Weekly assessments, STAAR
Funding Sources: 211 TITLE I - $1,000.00
State System Safeguard StrategyFederal System Safeguard Strategy
Critical Success FactorsCSF 1 CSF 7
8) Classroom teachers will work with teachers from other schools to developinstructional calendars, Common Assessments and discuss instructionalstrategies.
1, 2, 3 AdministratonCurriculumDepartment
Lesson plans, walk throughs
= Accomplished = Considerable = Some Progress = No Progress = Discontinue
Seadrift SchoolsGenerated by Plan4Learning.com 28 of 60 Campus #107
January 19, 2017 1:00 pm

Goal 1: CCISD will provide learning opportunities that are engaging, rigorous, relevant, and transcend state standards while meeting individual needs.
Performance Objective 5: All students will attend school regularly in order to be provided learning opportunities that are engaging, rigorous, relevant, andtranscend state standards while meeting individual needs.
Evaluation Data Source(s) 5: Seadrift School attendance will meet 98%.
Summative Evaluation 5: Significant progress made toward meeting Performance Objective
Strategy Description Title I Staff Responsiblefor Monitoring Evidence that Demonstrates Success
ReviewsFormative Summative
Nov Jan Mar JuneState System Safeguard Strategy
Critical Success FactorsCSF 1 CSF 5
1) Campus administration will exhaust all legal remedies for nonattendancestudents and tardy students.
6, 10 AdministrationRobin GuiceMary Martinez
Student attendance will increase
Critical Success FactorsCSF 6
2) Students will be recognized by their homeroom teacher and at school forperfect attendance each nine weeks.
AdministrationClassroom teachers
Student attendance will increase
3) Teachers will send a list of students who are not present to the office by8:15 each morning. The office will call home to check on the child.
6 AdministrationRobin Guice
Student attendance will increase
4) Local newspapers will be used to recognize students with perfectattendance each nine weeks.
10 AdministrationRobin Guice
Newspaper articles will reflect recognition ofstudents.
5) Teachers and the office will monitor student tardies in first period classes.Middle school students will be monitored each period.
AdministrationClassroomTeachers
Teachers and the principal will compare tardies eachnine weeks and have parent conferences if needed.
6) The campus will use the district attendance forms created to meet thestate requirements.
AdministrationCarol CowleyRobin Guice
All forms will be completed for truancy preventionmeasures.
Funding Sources: 199 LOCAL - $0.00Critical Success Factors
CSF 1 CSF 3 CSF 5
7) Counseling will be available to students and parents to resolve issues ofattendance. Home visits will be conducted as necessary.
1, 2, 6, 9 AdministrationCounselor
Fewer attendance/truancy hearings
= Accomplished = Considerable = Some Progress = No Progress = Discontinue
Seadrift SchoolsGenerated by Plan4Learning.com 29 of 60 Campus #107
January 19, 2017 1:00 pm
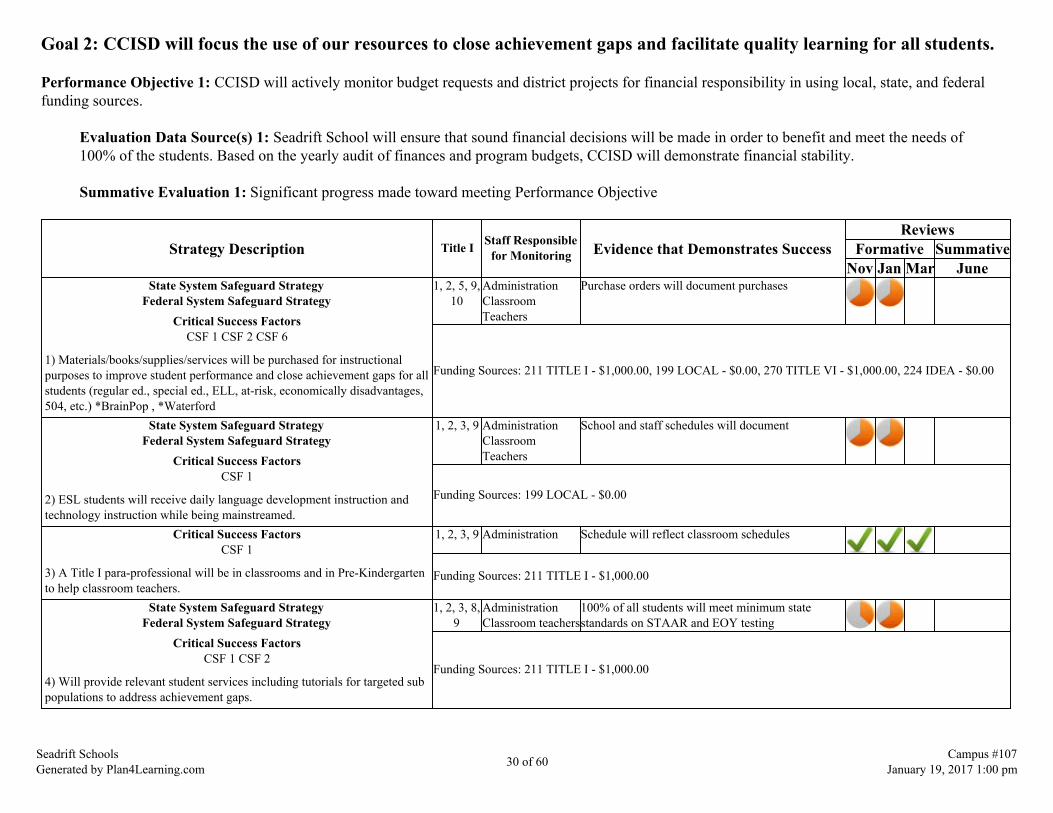
Goal 2: CCISD will focus the use of our resources to close achievement gaps and facilitate quality learning for all students.
Performance Objective 1: CCISD will actively monitor budget requests and district projects for financial responsibility in using local, state, and federalfunding sources.
Evaluation Data Source(s) 1: Seadrift School will ensure that sound financial decisions will be made in order to benefit and meet the needs of100% of the students. Based on the yearly audit of finances and program budgets, CCISD will demonstrate financial stability.
Summative Evaluation 1: Significant progress made toward meeting Performance Objective
Strategy Description Title I Staff Responsiblefor Monitoring Evidence that Demonstrates Success
ReviewsFormative Summative
Nov Jan Mar JuneState System Safeguard Strategy
Federal System Safeguard StrategyCritical Success Factors
CSF 1 CSF 2 CSF 6
1) Materials/books/supplies/services will be purchased for instructionalpurposes to improve student performance and close achievement gaps for allstudents (regular ed., special ed., ELL, at-risk, economically disadvantages,504, etc.) *BrainPop , *Waterford
1, 2, 5, 9,10
AdministrationClassroomTeachers
Purchase orders will document purchases
Funding Sources: 211 TITLE I - $1,000.00, 199 LOCAL - $0.00, 270 TITLE VI - $1,000.00, 224 IDEA - $0.00
State System Safeguard StrategyFederal System Safeguard Strategy
Critical Success FactorsCSF 1
2) ESL students will receive daily language development instruction andtechnology instruction while being mainstreamed.
1, 2, 3, 9 AdministrationClassroomTeachers
School and staff schedules will document
Funding Sources: 199 LOCAL - $0.00
Critical Success FactorsCSF 1
3) A Title I para-professional will be in classrooms and in Pre-Kindergartento help classroom teachers.
1, 2, 3, 9 Administration Schedule will reflect classroom schedules
Funding Sources: 211 TITLE I - $1,000.00
State System Safeguard StrategyFederal System Safeguard Strategy
Critical Success FactorsCSF 1 CSF 2
4) Will provide relevant student services including tutorials for targeted subpopulations to address achievement gaps.
1, 2, 3, 8,9
AdministrationClassroom teachers
100% of all students will meet minimum statestandards on STAAR and EOY testing
Funding Sources: 211 TITLE I - $1,000.00
Seadrift SchoolsGenerated by Plan4Learning.com 30 of 60 Campus #107
January 19, 2017 1:00 pm

Critical Success FactorsCSF 6
5) The principal and teachers will brainstorm measures to make best use ofmoney available.
8, 9, 10 School staff Purchase Orders
Critical Success FactorsCSF 1 CSF 2
6) Teachers will use rigorous research based materials such as: MotivationalReading, Mentoring Minds, State adopted curriculum, Guided Readingtechniques, Accelerated Reader, Brain Pop, Thinking Maps, Istation,Waterford, Compass Learning and computers to achieve performanceobjectives. Instructional supplies, materials and support services will bepurchased to support the academic and social goals of the campus topromote creativity, collaboration and problem solving.
1, 2, 8, 9,10
AdministrationClassroom teachers
CA, weekly assessments, TPRI, STAAR, EOYtesting data
Funding Sources: 211 TITLE I - $0.00, 199 LOCAL - $0.00
7) All four year olds will be able to attend Pre-Kindergarten regardless ofeligibility.
2, 3, 6, 7,10
Administration Registration will show all students can attendinstead of only those that qualify.
Critical Success FactorsCSF 1
8) The Seadrift School staff will follow the CCISD Instructional Model:Calendars, Common Assessments, Data Disaggregation, Conferences,Accountability Meetings.
1, 2, 3, 8,9
AdministrationClassroom teachers
Teachers will disaggregate data using Aware fromthe 9 week Common Assessments and otherassessments
Funding Sources: 211 TITLE I - $1,000.00
9) Trackers will be used in grades 4th-8th. They will be taken home dailyand signed by parents.
1, 6 AdministrationClassroomTeachers
All students will have a tracker.
Critical Success FactorsCSF 1 CSF 2
10) The administration and counselor will review previous STAAR results,nine weeks data, report card grades, and benchmark testing with all studentsin grades 3rd-8th in STAAR Talks. Personal goals will be set.
1, 2 AdministrationCarol Cowley
Schedule will show when talks are done
11) An adult will mentor with each 8th grade student entering the 9th gradeto review STAAR results, attendance, high school credit requirements, andcareer pathways.
2, 9 AdministrationCHS Counselor
Documentation of high school schedules
State System Safeguard StrategyCritical Success Factors
CSF 1
12) Mentors and tutors will work with students to increase studentachievement.
10 AdministrationPartners inEducation
Volunteer log-in will document
Critical Success FactorsCSF 1 CSF 2
13) The staff will focus on exceeding expectations for students in Algebraand identified gifted and talented.
1, 3 Administration STAAR scores will show an increase
Seadrift SchoolsGenerated by Plan4Learning.com 31 of 60 Campus #107
January 19, 2017 1:00 pm

Critical Success FactorsCSF 1 CSF 2
14) Will provide relevant student services including GT instruction forstudents who exceed expectations on TPRI and STAAR assessment.
1, 2, 3, 4,5
AdministrationTeachers
Reading above grade level on end of year TPRI andreceive advanced scores on STAAR assessments.
Funding Sources: 199 LOCAL - $0.00
State System Safeguard StrategyCritical Success Factors
CSF 1 CSF 2
15) The Seadrift School staff will use the CCISD Instructional Model:Calendars, and Common Assessments to ensure all Readiness, Supportingand Process Standards are being taught and assessed.
1, 2, 3, 8,9
AdministrationClassroom teachers
Progress monitoring, CA, STAAR, Weeklyassessments, EOY assessments, TPRI
Funding Sources: 211 TITLE I - $1,000.00
Critical Success FactorsCSF 1 CSF 2
16) Teachers will use rigorous research based materials such asMotivational Math, Lone STAAR Math, Think Through Math, StateAdopted curriculum, STAAR Ready, Waterford and computers to achieveperformance objectives. Instructional supplies, hands on activities andmaterials and support services will be purchased to support the academicand social goals of the campus to promote creativity, collaboration andproblem solving.
1, 2, 9 AdministrationClassroom teachers
9 week Common Assessments, weekly assessments,STAAR, EOY testing data
Funding Sources: 211 TITLE I - $0.00
Critical Success FactorsCSF 1 CSF 2
17) ) Teachers will use rigorous research based materials such asinstructional calendars, Social Studies Weekly, classroom tests, and BrainPop to ensure readiness, supporting, and process standards are being aughtand assessed. Instructional supplies, hands on activities and materials andsupport services will be purchased to support the academic and social goalsof the campus to promote creativity, collaboration and problem solving
1, 2, 9 AdministrationClassroom teachers
9 week Common Assessments, weekly assessments,STAAR, EOY testing data
Funding Sources: 211 TITLE I - $0.00
Critical Success FactorsCSF 1 CSF 2
18) Teachers will use rigorous researched based materials such as: ScienceMeasuring Up to the TEKS state adopted curriculum, Brain Pop, FossScience Kits and other sources to achieve performance objectivesInstructional supplies, materials, educational programs and support serviceswill be purchased to support the academic ad social goals of the campus.
1, 2, 9 AdministrationClassroom teachers
9 week Common Assessments, weekly assessments,STAAR, EOY testing data
Funding Sources: 211 TITLE I - $0.00
Seadrift SchoolsGenerated by Plan4Learning.com 32 of 60 Campus #107
January 19, 2017 1:00 pm

State System Safeguard StrategyFederal System Safeguard Strategy
Critical Success FactorsCSF 1 CSF 2
19) Teachers will review and dissaggregate CA and STAAR test data toidentify the academic needs of students and use research based monitoringto ensure needs are being met.
1, 2, 3, 8,9
AdministrationClassroom teachers
9 week Common Assessments, weekly assessments,TPRI, STAAR, EOY testing data
State System Safeguard StrategyFederal System Safeguard Strategy
Critical Success FactorsCSF 1 CSF 2
20) A Response to Intervention teacher will provide intensive systematicinstruction using the Wilson Dyslexia Program, Waterford, Istation, andRead Naturally which will provide a strong foundation in reading skills andmeet the needs of our dyslexic students.
2, 3, 8, 9 AdministrationKelly Hataway
Wilson program will be continued with the needs ofstudents being met and documented. Students willread on grade level.
State System Safeguard StrategyFederal System Safeguard Strategy
Critical Success FactorsCSF 1 CSF 3 CSF 5
21) Homeless students will meet district criteria. They will be provided withsupplies, clothing and necessities needed to ensure the child's success ineducation
1, 2, 9 AdministrationCounselor
Monitoring of student's needs
22) All students being STAAR tested will be provided snacks and waterduring testing.
1, 2, 8, 9 Administration Students will meet standards on STAAR test
State System Safeguard StrategyFederal System Safeguard Strategy
Critical Success FactorsCSF 1 CSF 4
23) Students in grades 5 and 8 will be closely monitored. They will beoffered summer school and another opportunity to pass STAAR if they arenot successful in passing the first two administrations of STAAR
1, 3 AdministrationClassroom teachers
Students will pass the STAAR and show progress
Critical Success FactorsCSF 1 CSF 4
24) Educational field trips and transportation will be provided to supportacademic and social goals of the campus
1, 2, 6, 8,9
AdministrationClassroom teachers
100% of students will be present for trips.
Funding Sources: 199 LOCAL - $0.00
Seadrift SchoolsGenerated by Plan4Learning.com 33 of 60 Campus #107
January 19, 2017 1:00 pm

State System Safeguard StrategyFederal System Safeguard Strategy
Critical Success FactorsCSF 1 CSF 4
25) Accelerated Reading Instruction (ARI) and Accelerated MathInstruction (AMI) will be provided to students that meet the district criteriafor eligibility. These students will receive small group reading and mathinstruction during the day.
1, 2, 5, 9 AdministrationClassroom teachers
9 week Common Assessments, weekly assessments,TPRI, STAAR, EOY testing data
= Accomplished = Considerable = Some Progress = No Progress = Discontinue
Seadrift SchoolsGenerated by Plan4Learning.com 34 of 60 Campus #107
January 19, 2017 1:00 pm
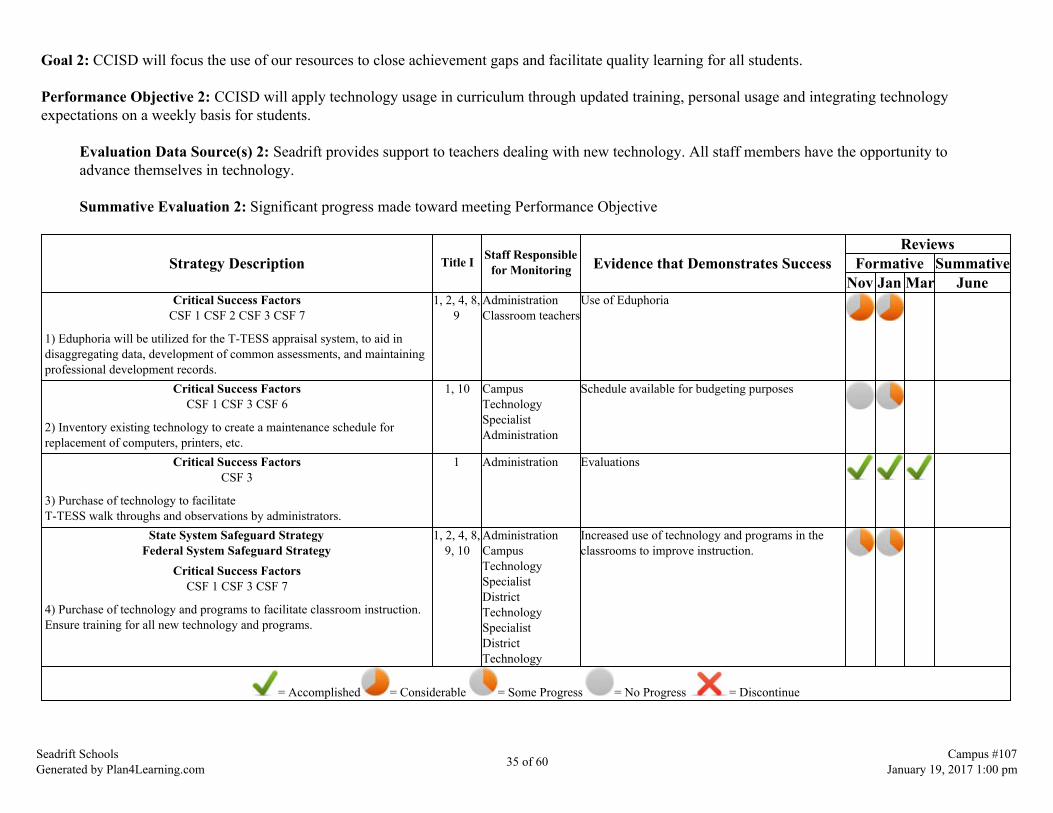
Goal 2: CCISD will focus the use of our resources to close achievement gaps and facilitate quality learning for all students.
Performance Objective 2: CCISD will apply technology usage in curriculum through updated training, personal usage and integrating technologyexpectations on a weekly basis for students.
Evaluation Data Source(s) 2: Seadrift provides support to teachers dealing with new technology. All staff members have the opportunity toadvance themselves in technology.
Summative Evaluation 2: Significant progress made toward meeting Performance Objective
Strategy Description Title I Staff Responsiblefor Monitoring Evidence that Demonstrates Success
ReviewsFormative Summative
Nov Jan Mar JuneCritical Success Factors
CSF 1 CSF 2 CSF 3 CSF 7
1) Eduphoria will be utilized for the T-TESS appraisal system, to aid indisaggregating data, development of common assessments, and maintainingprofessional development records.
1, 2, 4, 8,9
AdministrationClassroom teachers
Use of Eduphoria
Critical Success FactorsCSF 1 CSF 3 CSF 6
2) Inventory existing technology to create a maintenance schedule forreplacement of computers, printers, etc.
1, 10 CampusTechnologySpecialistAdministration
Schedule available for budgeting purposes
Critical Success FactorsCSF 3
3) Purchase of technology to facilitateT-TESS walk throughs and observations by administrators.
1 Administration Evaluations
State System Safeguard StrategyFederal System Safeguard Strategy
Critical Success FactorsCSF 1 CSF 3 CSF 7
4) Purchase of technology and programs to facilitate classroom instruction.Ensure training for all new technology and programs.
1, 2, 4, 8,9, 10
AdministrationCampusTechnologySpecialistDistrictTechnologySpecialistDistrictTechnology
Increased use of technology and programs in theclassrooms to improve instruction.
= Accomplished = Considerable = Some Progress = No Progress = Discontinue
Seadrift SchoolsGenerated by Plan4Learning.com 35 of 60 Campus #107
January 19, 2017 1:00 pm
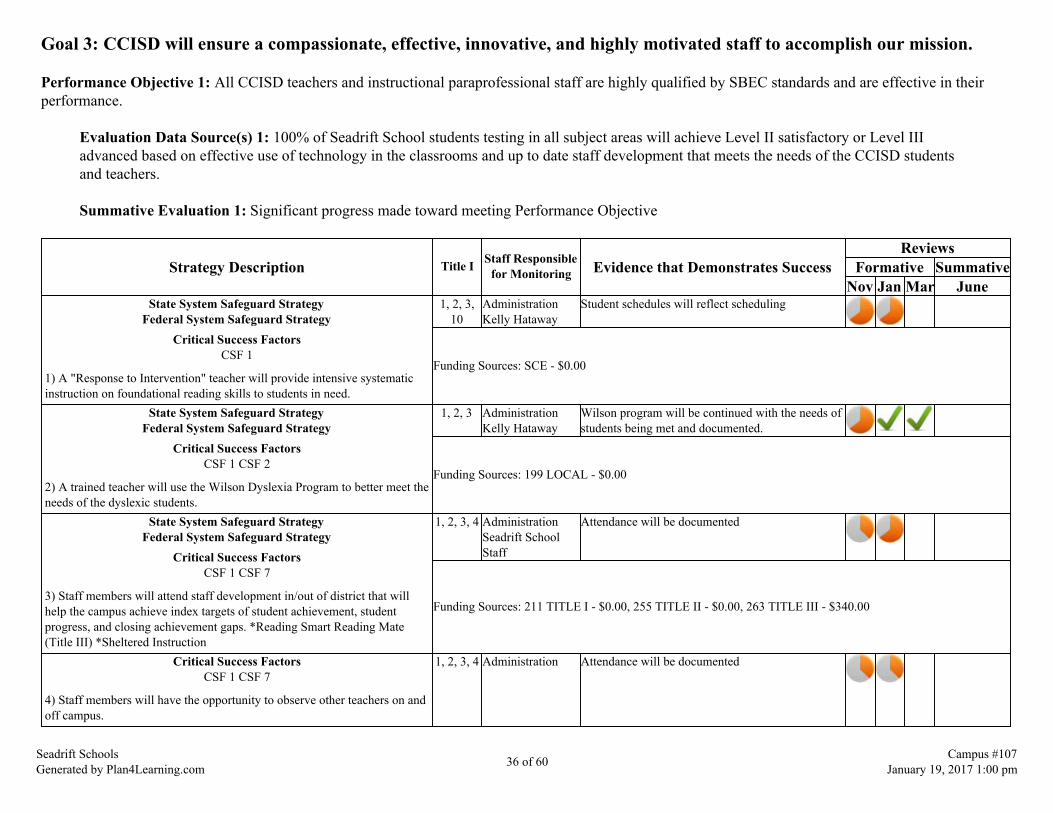
Goal 3: CCISD will ensure a compassionate, effective, innovative, and highly motivated staff to accomplish our mission.
Performance Objective 1: All CCISD teachers and instructional paraprofessional staff are highly qualified by SBEC standards and are effective in theirperformance.
Evaluation Data Source(s) 1: 100% of Seadrift School students testing in all subject areas will achieve Level II satisfactory or Level IIIadvanced based on effective use of technology in the classrooms and up to date staff development that meets the needs of the CCISD studentsand teachers.
Summative Evaluation 1: Significant progress made toward meeting Performance Objective
Strategy Description Title I Staff Responsiblefor Monitoring Evidence that Demonstrates Success
ReviewsFormative Summative
Nov Jan Mar JuneState System Safeguard Strategy
Federal System Safeguard StrategyCritical Success Factors
CSF 1
1) A "Response to Intervention" teacher will provide intensive systematicinstruction on foundational reading skills to students in need.
1, 2, 3,10
AdministrationKelly Hataway
Student schedules will reflect scheduling
Funding Sources: SCE - $0.00
State System Safeguard StrategyFederal System Safeguard Strategy
Critical Success FactorsCSF 1 CSF 2
2) A trained teacher will use the Wilson Dyslexia Program to better meet theneeds of the dyslexic students.
1, 2, 3 AdministrationKelly Hataway
Wilson program will be continued with the needs ofstudents being met and documented.
Funding Sources: 199 LOCAL - $0.00
State System Safeguard StrategyFederal System Safeguard Strategy
Critical Success FactorsCSF 1 CSF 7
3) Staff members will attend staff development in/out of district that willhelp the campus achieve index targets of student achievement, studentprogress, and closing achievement gaps. *Reading Smart Reading Mate(Title III) *Sheltered Instruction
1, 2, 3, 4 AdministrationSeadrift SchoolStaff
Attendance will be documented
Funding Sources: 211 TITLE I - $0.00, 255 TITLE II - $0.00, 263 TITLE III - $340.00
Critical Success FactorsCSF 1 CSF 7
4) Staff members will have the opportunity to observe other teachers on andoff campus.
1, 2, 3, 4 Administration Attendance will be documented
Seadrift SchoolsGenerated by Plan4Learning.com 36 of 60 Campus #107
January 19, 2017 1:00 pm

Critical Success FactorsCSF 1 CSF 7
5) Supplies will be purchased for staff development needs.
2, 3, 4, 5,10
Administration Purchase orders will reflect purchasing
State System Safeguard StrategyFederal System Safeguard Strategy
Critical Success FactorsCSF 1 CSF 3 CSF 7
6) Staff members will receive technology training, software and equipmentto use in the classroom and labs.
1, 2, 4, 8,9, 10
AdministrationCampusTechnologySpecialistDistrictTechnologySpecialistDistrictTechnology
Increased use of technology and programs in theclassrooms to improve instruction.
Critical Success FactorsCSF 1 CSF 3 CSF 7
7) Eduphoria will be utilized for the T-TESS appraisal system, to aid indisaggregating data, development of common assessments, and maintainingprofessional development records.
1, 2, 4, 8,9
AdministrationClassroom teachers
Use of Eduphoria
8) The secretary and attendance clerk will attend training for PEIMS data. 4 AdministrationOffice Staff
Attendance will be documented with certificates
Funding Sources: 199 LOCAL - $0.00Critical Success Factors
CSF 1 CSF 3 CSF 7
9) Staff members will attend staff development that will help the campusachieve index targets of student achievement, student progress, and closingachievement gaps.
3, 4 Administration Attendance at workshops will be logged.
Funding Sources: 199 LOCAL - $0.00
= Accomplished = Considerable = Some Progress = No Progress = Discontinue
Seadrift SchoolsGenerated by Plan4Learning.com 37 of 60 Campus #107
January 19, 2017 1:00 pm

Goal 4: CCISD will provide learning environments that are safe and secure for all students, faculty, and staff.
Performance Objective 1: The district will ensure a safe and positive learning environment.
Evaluation Data Source(s) 1: 100% of the students will feel safe and learn in a positive learning environment.
Summative Evaluation 1: Significant progress made toward meeting Performance Objective
Strategy Description Title I Staff Responsiblefor Monitoring Evidence that Demonstrates Success
ReviewsFormative Summative
Nov Jan Mar JuneCritical Success Factors
CSF 1 CSF 4 CSF 6
1) The staff will use a consistent campus discipline plan/code of conduct.
2 Administration Discipline referrals will document the code is beingfollowed.
2) Seadrift School will have a safety coordinator and participate in theCCISD Safety Incentive Program.
AdministrationRobin Guice
Safety coordinator will share information
Funding Sources: 199 LOCAL - $0.003) Pre-Kindergarten-8th grade students will attend presentations on safetyand staying drug-free when available.
Administration All students will participate.
4) School personnel will stress and reward positive student behavior andattendance. All students will have an opportunity to be a part of theprogram.
AdministrationClassroomTeachers
Student of the week will be given each Friday.
5) All students will have the opportunity to participate in Red Ribbon Weekactivities.
AdministrationClassroomTeachersCarol Cowley
Schedule of events will be documented on calendar.
6) Seadrift will identify and provide available services to homeless students.They will be provided with supplies, clothing and necessities needed toensure the child's success in education
10 AdministrationClassroomTeachersCounselor
PEIMS will identify students
7) The campus staff will receive training on bullying, school safety, childabuse/neglect, etc. when available.
10 Administration Sign-in will document
8) The campus will have a counselor on campus 3 days a week. AdministrationCarol Cowley
Counselor documentation of student activities
= Accomplished = Considerable = Some Progress = No Progress = Discontinue
Seadrift SchoolsGenerated by Plan4Learning.com 38 of 60 Campus #107
January 19, 2017 1:00 pm

Goal 5: CCISD will develop and implement a parent and community involvement program that promotes all stakeholders aspartners in the education of our students.
Performance Objective 1: CCISD parent and community involvement will be promoted at all CCISD campuses and departments.
Evaluation Data Source(s) 1: Seadrift School events and activities will be sent home in newsletters, posted on web-site, advertised innewspapers, and sent in School Messenger. Parent participation will increase based on sign-in sheets and school messenger messages received.
Summative Evaluation 1: Significant progress made toward meeting Performance Objective
Strategy Description Title I Staff Responsiblefor Monitoring Evidence that Demonstrates Success
ReviewsFormative Summative
Nov Jan Mar JuneCritical Success Factors
CSF 5
1) A parent monthly calendar of events will be sent home with all students.
6 Administration Calendar will be displayed at Seadrift School andsent home monthly
Critical Success FactorsCSF 5
2) The campus will host "Meet Your Teacher" before school starts in Augustto allow parents and students to meet their new teacher.
6 Administration Sign-in sheets will be kept
Critical Success FactorsCSF 5
3) Seadrift School staff will host a family night for all students and parentsin the school library.
6 AdministrationD. Skipper
Calendar will show date
4) Remind will be used as a means to communicate with parents foremergencies, activities, and other informational items.
6 Administration Remind log
Critical Success FactorsCSF 5
5) All homeroom teachers will conference with every parent at least twiceduring the school year. The beginning of the year conference will be toreview and sign the Title 1 compacts.
6 Administration Parent contact sheets and Title 1 compacts will bekept
6) The campus report card and test results will be reviewed in a publicforum.
6 Administration Sign-in sheet
7) A survey will be sent home to parents to get input. 6 Administration Survey results will be documented.
8) The Harbor will visit weekly and monthly and provide parent informationon topics.
6, 10 Administration Schedule of events will be made
Seadrift SchoolsGenerated by Plan4Learning.com 39 of 60 Campus #107
January 19, 2017 1:00 pm
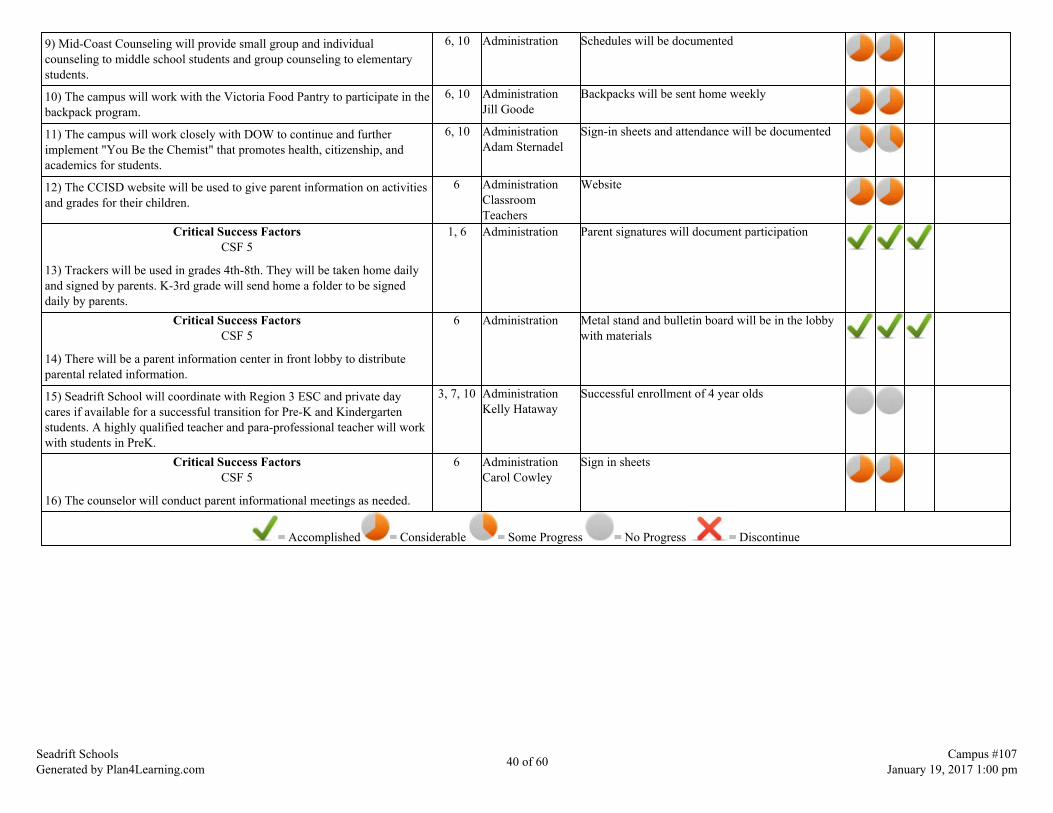
9) Mid-Coast Counseling will provide small group and individualcounseling to middle school students and group counseling to elementarystudents.
6, 10 Administration Schedules will be documented
10) The campus will work with the Victoria Food Pantry to participate in thebackpack program.
6, 10 AdministrationJill Goode
Backpacks will be sent home weekly
11) The campus will work closely with DOW to continue and furtherimplement "You Be the Chemist" that promotes health, citizenship, andacademics for students.
6, 10 AdministrationAdam Sternadel
Sign-in sheets and attendance will be documented
12) The CCISD website will be used to give parent information on activitiesand grades for their children.
6 AdministrationClassroomTeachers
Website
Critical Success FactorsCSF 5
13) Trackers will be used in grades 4th-8th. They will be taken home dailyand signed by parents. K-3rd grade will send home a folder to be signeddaily by parents.
1, 6 Administration Parent signatures will document participation
Critical Success FactorsCSF 5
14) There will be a parent information center in front lobby to distributeparental related information.
6 Administration Metal stand and bulletin board will be in the lobbywith materials
15) Seadrift School will coordinate with Region 3 ESC and private daycares if available for a successful transition for Pre-K and Kindergartenstudents. A highly qualified teacher and para-professional teacher will workwith students in PreK.
3, 7, 10 AdministrationKelly Hataway
Successful enrollment of 4 year olds
Critical Success FactorsCSF 5
16) The counselor will conduct parent informational meetings as needed.
6 AdministrationCarol Cowley
Sign in sheets
= Accomplished = Considerable = Some Progress = No Progress = Discontinue
Seadrift SchoolsGenerated by Plan4Learning.com 40 of 60 Campus #107
January 19, 2017 1:00 pm

State System Safeguard Strategies
Goal Objective Strategy Description
1 1 1 The Seadrift School staff will follow the CCISD Instructional Model: Calendars, 9 week Common Assessments, DataDisaggregation, Conferences, Accountability Meetings.
1 1 2
Teachers will use rigorous research based materials such as: Motivational Reading, Mentoring Minds, State adopted curriculum,Guided Reading techniques, Accelerated Reader, Brain Pop, Thinking Maps, Istation, Waterford, Compass Learning andcomputers to achieve performance objectives. Instructional supplies, materials and support services will be purchased to supportthe academic and social goals of the campus to promote creativity, collaboration and problem solving.
1 1 3K-5 students will be screened for potential reading problems and provided differentiated reading instruction. Students fallingbelow 50th percentile will be progress monitored more frequently. Teachers will provide relevant student services includingtutorials for targeted sub populations to address achievement gaps. *Reading Smart Reading Mate (Title III)
1 1 4 The campus will provide relevant student services including GT instruction for students who exceed expectations on TPRI andSTAAR Assessment.
1 1 5A Response to Intervention teacher will provide intensive systematic instruction using the Wilson Dyslexia Program,Waterford, Istation and Read Naturally which will provide a strong foundation in reading skills and meet the needs of ourdyslexic students and ARI students.
1 1 8 The staff will disaggregate STAAR, TELPAS, TPRI, and district nine weeks CA test results to adjust instruction and set goalsfor higher standards. *Project ELL (Title III)
1 1 9 The staff will implement and assess short answer and essay responses across curriculum areas to enhance student's ability tointerpret text.
1 1 11 Students in grades 6th-8th whose STAAR scores were low will be scheduled into tutorials.
1 1 12 Elementary classroom teachers will work with teachers from other schools to develop instructional calendars, CommonAssessments and discuss instructional strategies.
1 1 13 Homeless students will meet district criteria. They will be provided with supplies, clothing and necessities needed to ensure thechild's success in education.
1 1 14 All students being STAAR tested will be provided snacks and water during testing.
1 2 1 1) The Seadrift School staff will follow the CCISD Instructional Model: Calendars, 9 week Common Assessments, DataDisaggregation, Conferences, Accountability Meetings.
1 2 2 A highly-qualified teacher will be placed into the daily schedule when possible to provide student support.
1 2 3 The campus will participate in Think Through Math for the Texas Success Initiative which is a state-funded interaction mathopportunity for grades 3-8. It will be used until the state ends the funding.
Seadrift SchoolsGenerated by Plan4Learning.com 41 of 60 Campus #107
January 19, 2017 1:00 pm
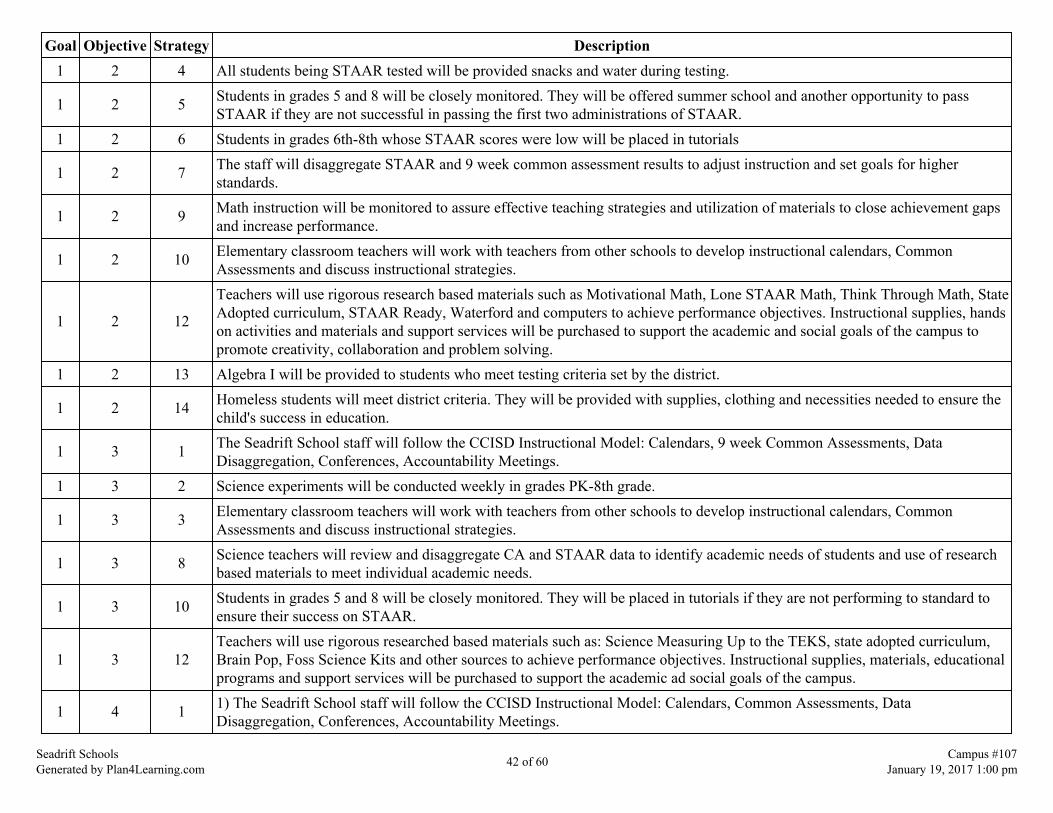
Goal Objective Strategy Description1 2 4 All students being STAAR tested will be provided snacks and water during testing.
1 2 5 Students in grades 5 and 8 will be closely monitored. They will be offered summer school and another opportunity to passSTAAR if they are not successful in passing the first two administrations of STAAR.
1 2 6 Students in grades 6th-8th whose STAAR scores were low will be placed in tutorials
1 2 7 The staff will disaggregate STAAR and 9 week common assessment results to adjust instruction and set goals for higherstandards.
1 2 9 Math instruction will be monitored to assure effective teaching strategies and utilization of materials to close achievement gapsand increase performance.
1 2 10 Elementary classroom teachers will work with teachers from other schools to develop instructional calendars, CommonAssessments and discuss instructional strategies.
1 2 12
Teachers will use rigorous research based materials such as Motivational Math, Lone STAAR Math, Think Through Math, StateAdopted curriculum, STAAR Ready, Waterford and computers to achieve performance objectives. Instructional supplies, handson activities and materials and support services will be purchased to support the academic and social goals of the campus topromote creativity, collaboration and problem solving.
1 2 13 Algebra I will be provided to students who meet testing criteria set by the district.
1 2 14 Homeless students will meet district criteria. They will be provided with supplies, clothing and necessities needed to ensure thechild's success in education.
1 3 1 The Seadrift School staff will follow the CCISD Instructional Model: Calendars, 9 week Common Assessments, DataDisaggregation, Conferences, Accountability Meetings.
1 3 2 Science experiments will be conducted weekly in grades PK-8th grade.
1 3 3 Elementary classroom teachers will work with teachers from other schools to develop instructional calendars, CommonAssessments and discuss instructional strategies.
1 3 8 Science teachers will review and disaggregate CA and STAAR data to identify academic needs of students and use of researchbased materials to meet individual academic needs.
1 3 10 Students in grades 5 and 8 will be closely monitored. They will be placed in tutorials if they are not performing to standard toensure their success on STAAR.
1 3 12Teachers will use rigorous researched based materials such as: Science Measuring Up to the TEKS, state adopted curriculum,Brain Pop, Foss Science Kits and other sources to achieve performance objectives. Instructional supplies, materials, educationalprograms and support services will be purchased to support the academic ad social goals of the campus.
1 4 1 1) The Seadrift School staff will follow the CCISD Instructional Model: Calendars, Common Assessments, DataDisaggregation, Conferences, Accountability Meetings.
Seadrift SchoolsGenerated by Plan4Learning.com 42 of 60 Campus #107
January 19, 2017 1:00 pm
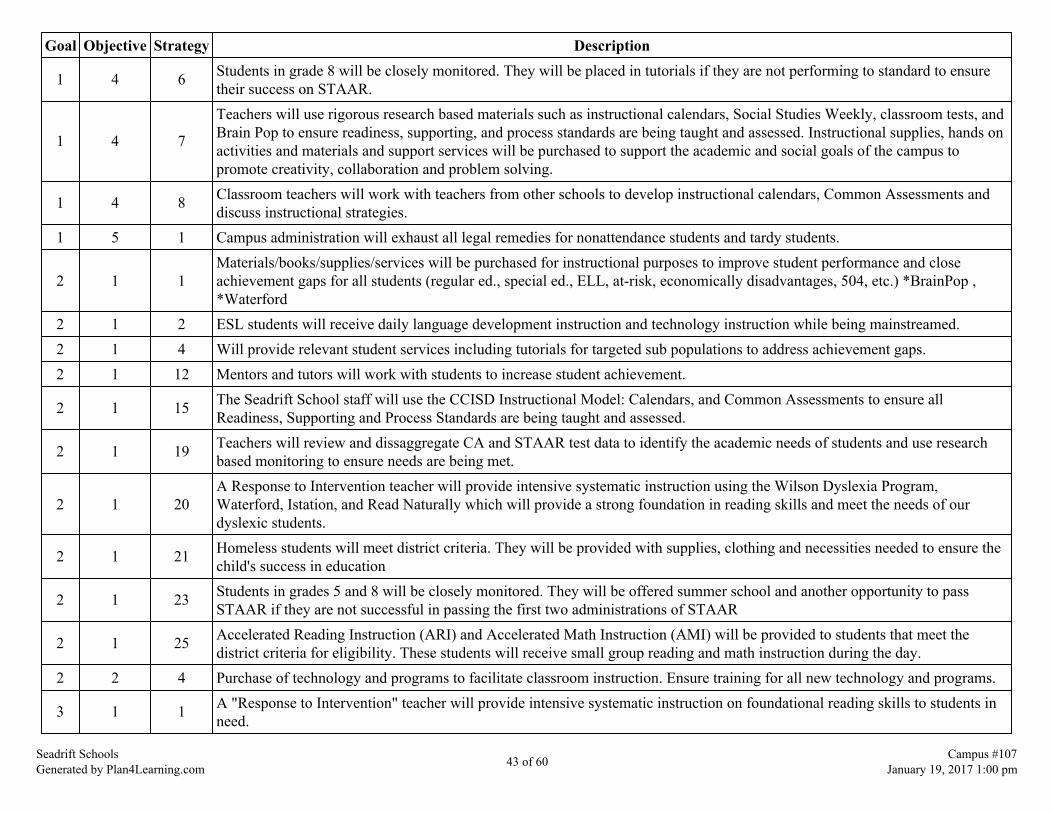
Goal Objective Strategy Description
1 4 6 Students in grade 8 will be closely monitored. They will be placed in tutorials if they are not performing to standard to ensuretheir success on STAAR.
1 4 7
Teachers will use rigorous research based materials such as instructional calendars, Social Studies Weekly, classroom tests, andBrain Pop to ensure readiness, supporting, and process standards are being taught and assessed. Instructional supplies, hands onactivities and materials and support services will be purchased to support the academic and social goals of the campus topromote creativity, collaboration and problem solving.
1 4 8 Classroom teachers will work with teachers from other schools to develop instructional calendars, Common Assessments anddiscuss instructional strategies.
1 5 1 Campus administration will exhaust all legal remedies for nonattendance students and tardy students.
2 1 1Materials/books/supplies/services will be purchased for instructional purposes to improve student performance and closeachievement gaps for all students (regular ed., special ed., ELL, at-risk, economically disadvantages, 504, etc.) *BrainPop ,*Waterford
2 1 2 ESL students will receive daily language development instruction and technology instruction while being mainstreamed.2 1 4 Will provide relevant student services including tutorials for targeted sub populations to address achievement gaps.2 1 12 Mentors and tutors will work with students to increase student achievement.
2 1 15 The Seadrift School staff will use the CCISD Instructional Model: Calendars, and Common Assessments to ensure allReadiness, Supporting and Process Standards are being taught and assessed.
2 1 19 Teachers will review and dissaggregate CA and STAAR test data to identify the academic needs of students and use researchbased monitoring to ensure needs are being met.
2 1 20A Response to Intervention teacher will provide intensive systematic instruction using the Wilson Dyslexia Program,Waterford, Istation, and Read Naturally which will provide a strong foundation in reading skills and meet the needs of ourdyslexic students.
2 1 21 Homeless students will meet district criteria. They will be provided with supplies, clothing and necessities needed to ensure thechild's success in education
2 1 23 Students in grades 5 and 8 will be closely monitored. They will be offered summer school and another opportunity to passSTAAR if they are not successful in passing the first two administrations of STAAR
2 1 25 Accelerated Reading Instruction (ARI) and Accelerated Math Instruction (AMI) will be provided to students that meet thedistrict criteria for eligibility. These students will receive small group reading and math instruction during the day.
2 2 4 Purchase of technology and programs to facilitate classroom instruction. Ensure training for all new technology and programs.
3 1 1 A "Response to Intervention" teacher will provide intensive systematic instruction on foundational reading skills to students inneed.
Seadrift SchoolsGenerated by Plan4Learning.com 43 of 60 Campus #107
January 19, 2017 1:00 pm

Goal Objective Strategy Description3 1 2 A trained teacher will use the Wilson Dyslexia Program to better meet the needs of the dyslexic students.
3 1 3 Staff members will attend staff development in/out of district that will help the campus achieve index targets of studentachievement, student progress, and closing achievement gaps. *Reading Smart Reading Mate (Title III) *Sheltered Instruction
3 1 6 Staff members will receive technology training, software and equipment to use in the classroom and labs.
Seadrift SchoolsGenerated by Plan4Learning.com 44 of 60 Campus #107
January 19, 2017 1:00 pm
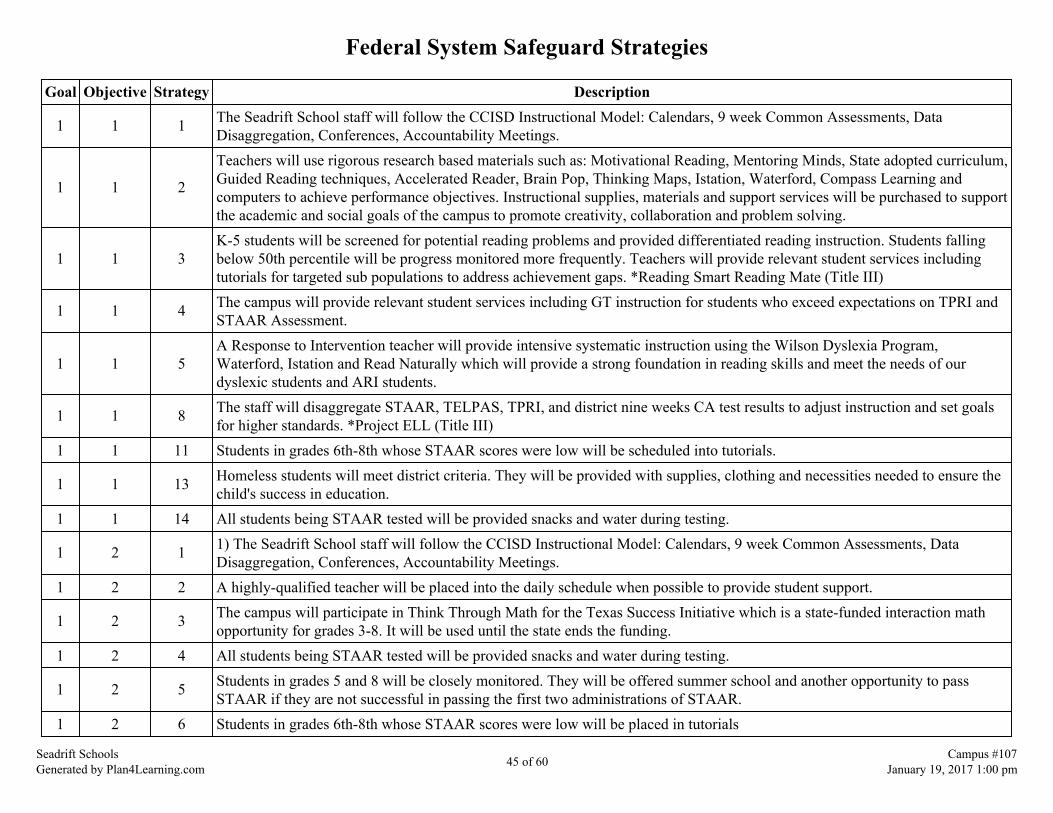
Federal System Safeguard Strategies
Goal Objective Strategy Description
1 1 1 The Seadrift School staff will follow the CCISD Instructional Model: Calendars, 9 week Common Assessments, DataDisaggregation, Conferences, Accountability Meetings.
1 1 2
Teachers will use rigorous research based materials such as: Motivational Reading, Mentoring Minds, State adopted curriculum,Guided Reading techniques, Accelerated Reader, Brain Pop, Thinking Maps, Istation, Waterford, Compass Learning andcomputers to achieve performance objectives. Instructional supplies, materials and support services will be purchased to supportthe academic and social goals of the campus to promote creativity, collaboration and problem solving.
1 1 3K-5 students will be screened for potential reading problems and provided differentiated reading instruction. Students fallingbelow 50th percentile will be progress monitored more frequently. Teachers will provide relevant student services includingtutorials for targeted sub populations to address achievement gaps. *Reading Smart Reading Mate (Title III)
1 1 4 The campus will provide relevant student services including GT instruction for students who exceed expectations on TPRI andSTAAR Assessment.
1 1 5A Response to Intervention teacher will provide intensive systematic instruction using the Wilson Dyslexia Program,Waterford, Istation and Read Naturally which will provide a strong foundation in reading skills and meet the needs of ourdyslexic students and ARI students.
1 1 8 The staff will disaggregate STAAR, TELPAS, TPRI, and district nine weeks CA test results to adjust instruction and set goalsfor higher standards. *Project ELL (Title III)
1 1 11 Students in grades 6th-8th whose STAAR scores were low will be scheduled into tutorials.
1 1 13 Homeless students will meet district criteria. They will be provided with supplies, clothing and necessities needed to ensure thechild's success in education.
1 1 14 All students being STAAR tested will be provided snacks and water during testing.
1 2 1 1) The Seadrift School staff will follow the CCISD Instructional Model: Calendars, 9 week Common Assessments, DataDisaggregation, Conferences, Accountability Meetings.
1 2 2 A highly-qualified teacher will be placed into the daily schedule when possible to provide student support.
1 2 3 The campus will participate in Think Through Math for the Texas Success Initiative which is a state-funded interaction mathopportunity for grades 3-8. It will be used until the state ends the funding.
1 2 4 All students being STAAR tested will be provided snacks and water during testing.
1 2 5 Students in grades 5 and 8 will be closely monitored. They will be offered summer school and another opportunity to passSTAAR if they are not successful in passing the first two administrations of STAAR.
1 2 6 Students in grades 6th-8th whose STAAR scores were low will be placed in tutorials
Seadrift SchoolsGenerated by Plan4Learning.com 45 of 60 Campus #107
January 19, 2017 1:00 pm

Goal Objective Strategy Description
1 2 7 The staff will disaggregate STAAR and 9 week common assessment results to adjust instruction and set goals for higherstandards.
1 2 10 Elementary classroom teachers will work with teachers from other schools to develop instructional calendars, CommonAssessments and discuss instructional strategies.
1 2 12
Teachers will use rigorous research based materials such as Motivational Math, Lone STAAR Math, Think Through Math, StateAdopted curriculum, STAAR Ready, Waterford and computers to achieve performance objectives. Instructional supplies, handson activities and materials and support services will be purchased to support the academic and social goals of the campus topromote creativity, collaboration and problem solving.
1 2 13 Algebra I will be provided to students who meet testing criteria set by the district.
1 2 14 Homeless students will meet district criteria. They will be provided with supplies, clothing and necessities needed to ensure thechild's success in education.
1 3 1 The Seadrift School staff will follow the CCISD Instructional Model: Calendars, 9 week Common Assessments, DataDisaggregation, Conferences, Accountability Meetings.
1 3 3 Elementary classroom teachers will work with teachers from other schools to develop instructional calendars, CommonAssessments and discuss instructional strategies.
1 3 8 Science teachers will review and disaggregate CA and STAAR data to identify academic needs of students and use of researchbased materials to meet individual academic needs.
1 3 10 Students in grades 5 and 8 will be closely monitored. They will be placed in tutorials if they are not performing to standard toensure their success on STAAR.
1 3 12Teachers will use rigorous researched based materials such as: Science Measuring Up to the TEKS, state adopted curriculum,Brain Pop, Foss Science Kits and other sources to achieve performance objectives. Instructional supplies, materials, educationalprograms and support services will be purchased to support the academic ad social goals of the campus.
1 4 1 1) The Seadrift School staff will follow the CCISD Instructional Model: Calendars, Common Assessments, DataDisaggregation, Conferences, Accountability Meetings.
1 4 6 Students in grade 8 will be closely monitored. They will be placed in tutorials if they are not performing to standard to ensuretheir success on STAAR.
1 4 7
Teachers will use rigorous research based materials such as instructional calendars, Social Studies Weekly, classroom tests, andBrain Pop to ensure readiness, supporting, and process standards are being taught and assessed. Instructional supplies, hands onactivities and materials and support services will be purchased to support the academic and social goals of the campus topromote creativity, collaboration and problem solving.
1 4 8 Classroom teachers will work with teachers from other schools to develop instructional calendars, Common Assessments anddiscuss instructional strategies.
Seadrift SchoolsGenerated by Plan4Learning.com 46 of 60 Campus #107
January 19, 2017 1:00 pm
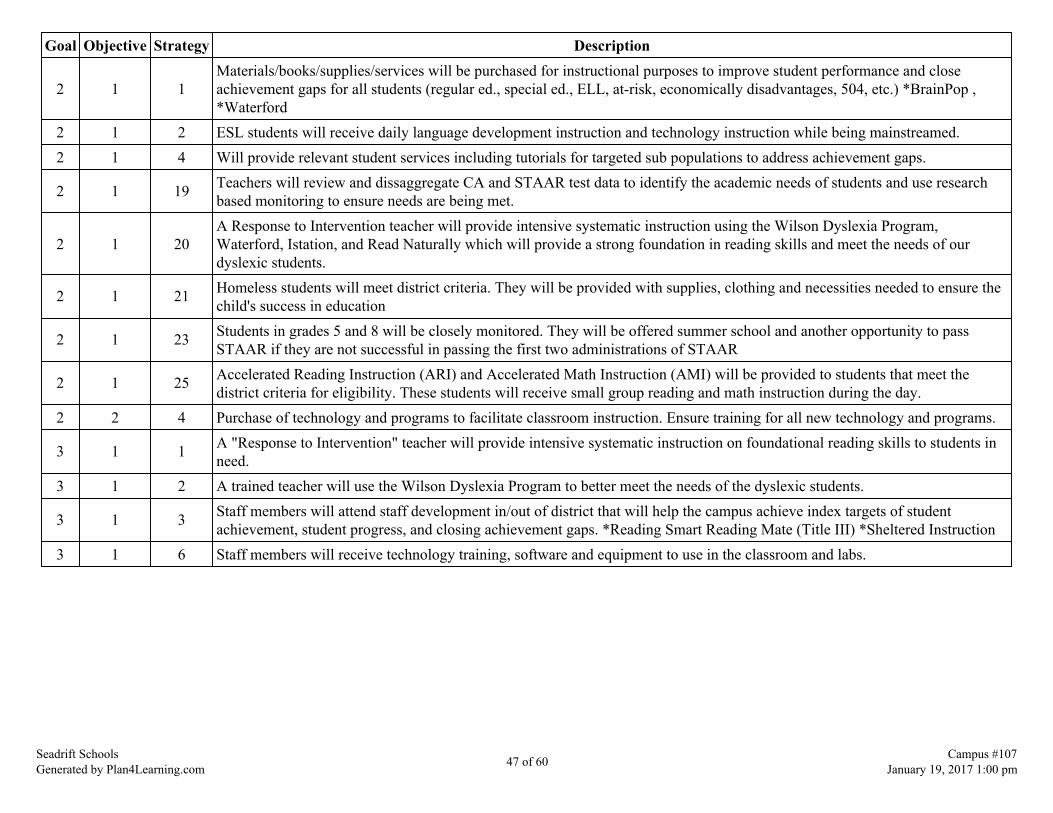
Goal Objective Strategy Description
2 1 1Materials/books/supplies/services will be purchased for instructional purposes to improve student performance and closeachievement gaps for all students (regular ed., special ed., ELL, at-risk, economically disadvantages, 504, etc.) *BrainPop ,*Waterford
2 1 2 ESL students will receive daily language development instruction and technology instruction while being mainstreamed.2 1 4 Will provide relevant student services including tutorials for targeted sub populations to address achievement gaps.
2 1 19 Teachers will review and dissaggregate CA and STAAR test data to identify the academic needs of students and use researchbased monitoring to ensure needs are being met.
2 1 20A Response to Intervention teacher will provide intensive systematic instruction using the Wilson Dyslexia Program,Waterford, Istation, and Read Naturally which will provide a strong foundation in reading skills and meet the needs of ourdyslexic students.
2 1 21 Homeless students will meet district criteria. They will be provided with supplies, clothing and necessities needed to ensure thechild's success in education
2 1 23 Students in grades 5 and 8 will be closely monitored. They will be offered summer school and another opportunity to passSTAAR if they are not successful in passing the first two administrations of STAAR
2 1 25 Accelerated Reading Instruction (ARI) and Accelerated Math Instruction (AMI) will be provided to students that meet thedistrict criteria for eligibility. These students will receive small group reading and math instruction during the day.
2 2 4 Purchase of technology and programs to facilitate classroom instruction. Ensure training for all new technology and programs.
3 1 1 A "Response to Intervention" teacher will provide intensive systematic instruction on foundational reading skills to students inneed.
3 1 2 A trained teacher will use the Wilson Dyslexia Program to better meet the needs of the dyslexic students.
3 1 3 Staff members will attend staff development in/out of district that will help the campus achieve index targets of studentachievement, student progress, and closing achievement gaps. *Reading Smart Reading Mate (Title III) *Sheltered Instruction
3 1 6 Staff members will receive technology training, software and equipment to use in the classroom and labs.
Seadrift SchoolsGenerated by Plan4Learning.com 47 of 60 Campus #107
January 19, 2017 1:00 pm

State Compensatory
Budget for Seadrift Schools:
Account Code Account Title Budget
6100 Payroll Costs199,11,6119,999,107,7,30 6112 Salaries or Wages for Substitute Teachers or Other Professionals $73,689.68
6100 Subtotal: $73,689.68
Seadrift SchoolsGenerated by Plan4Learning.com 48 of 60 Campus #107
January 19, 2017 1:00 pm

Personnel for Seadrift Schools:
Name Position Program FTE
Aimee Strendadel Teacher Academic .28Carol Cowley Counselor Counselor 1.Dolores Mendez Para-Professional PreKindergarten .50Kelly Hataway Teacher RtI/Wilson 1.Kelly Lillge Teacher RtI .28Robert Anderson Teacher Academics .14Sheree Henderson Teacher Reading .14Tanya Cady Teacher Math .14
Seadrift SchoolsGenerated by Plan4Learning.com 49 of 60 Campus #107
January 19, 2017 1:00 pm

Title I
Schoolwide Program Plan
Seadrift School is a schoolwide Title I campus. The benefit of being school wide is that all students are able to participate in the learningprocess. The Seadrift School campus is continuously planning for current as well as long-term improvement. All students are held to highstandards as well as all staff members. The school provides for continuous learning for students, staff, and parents if they choose toparticipate. Staff development is attended to assist with student achievement and allow the staff members to grow professionally. Ourschoolwide program plan is one that involves the process of planning, instructing, checking progress, and acting on the assessments. Ourhope is to meet the needs of all students to make them successful.
Ten Schoolwide Components
1: Comprehensive Needs Assessment
The entire Seadrift School staff is involved in the process of creating a school culture that engages them in a data-driven process to producea comprehensive needs assessment. Data sources and results are identified and closely analyzed by the staff. Looking at this data thenallows the staff to set forth a plan of action that will raise student achievement. Throughout the year all students are closely monitored andinterventions are initiated immediately if there is a need. Acting on these interventions helps to close the gap in skills before it widens. Helping students to be successful early in their educational endeavors, makes the learning process more pleasant.
2: Schoolwide Reform Strategies
Seadrift School has chosen reform strategies that provide opportunities for all children to be successful and meet the proficient standards setby guidelines. Student achievement is the number one goal that the staff has when making decisions for instruction. The decisions that wemake ensure that all students are held to high expectations. The staff begins by looking at data of all grade levels, disaggregating the datain every possible way (sub-pops, male/female, at risk, gifted and talented, special programs, ELL, etc.) and then reviewing the data closely. The strategies and programs that are then discussed to be implemented are those that are directly related to our needs and are researchedbased. As progress monitoring takes place, RtI strategies and processes are implemented to improve the quality of learning or discontinuedwhen no longer effective or needed. Student achievement is measured by assessment on a continual basis. The staff is working closelywith other campuses to grow professionally to meet the demands of STAAR. The entire staff is involved in the decision making process ofdata disaggregation and discussing/making educational decisions for the campus.
Seadrift SchoolsGenerated by Plan4Learning.com 50 of 60 Campus #107
January 19, 2017 1:00 pm
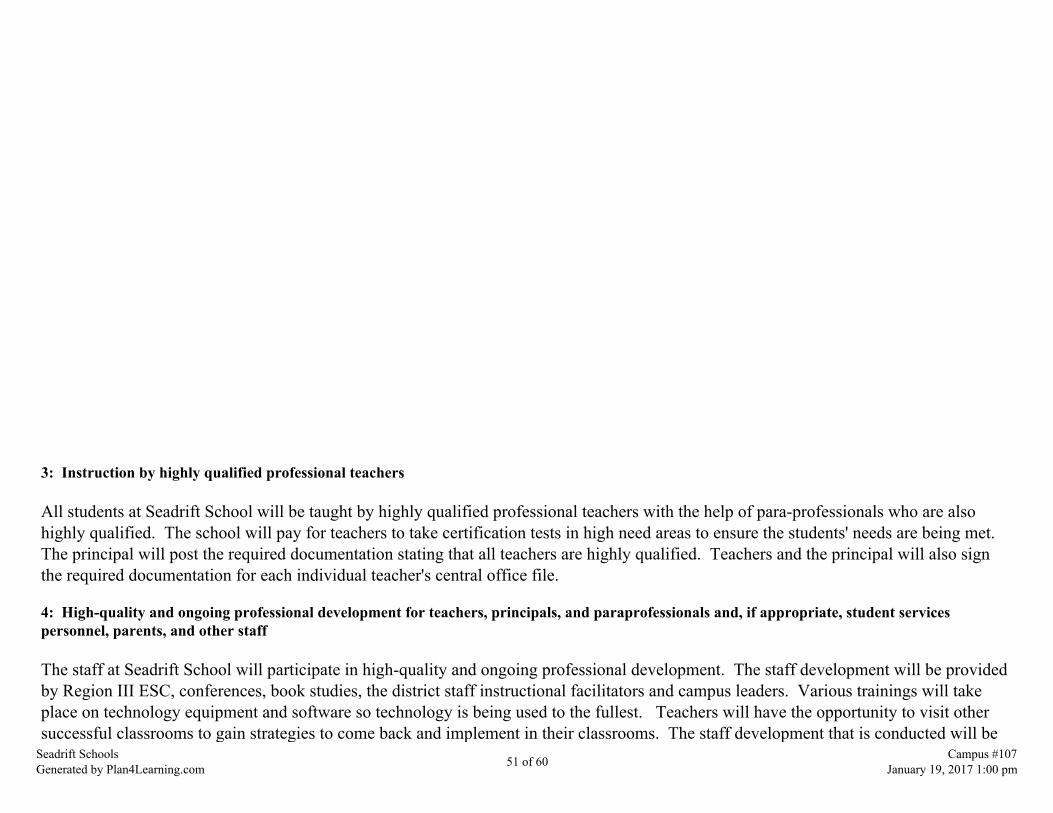
3: Instruction by highly qualified professional teachers
All students at Seadrift School will be taught by highly qualified professional teachers with the help of para-professionals who are alsohighly qualified. The school will pay for teachers to take certification tests in high need areas to ensure the students' needs are being met. The principal will post the required documentation stating that all teachers are highly qualified. Teachers and the principal will also signthe required documentation for each individual teacher's central office file.
4: High-quality and ongoing professional development for teachers, principals, and paraprofessionals and, if appropriate, student servicespersonnel, parents, and other staff
The staff at Seadrift School will participate in high-quality and ongoing professional development. The staff development will be providedby Region III ESC, conferences, book studies, the district staff instructional facilitators and campus leaders. Various trainings will takeplace on technology equipment and software so technology is being used to the fullest. Teachers will have the opportunity to visit othersuccessful classrooms to gain strategies to come back and implement in their classrooms. The staff development that is conducted will be
Seadrift SchoolsGenerated by Plan4Learning.com 51 of 60 Campus #107
January 19, 2017 1:00 pm

high quality and aim toward increasing student achievement and meeting the rigorous demands of STAAR.
5: Strategies to attract highly qualified teachers
Strategies will be used to attract highly qualified teachers. Seadrift School is the only school in the community and many teacherschoose to drive to get to work. The small classroom size (1:16) makes it attractive. Teachers are provided with materials needed to besuccessful in the classroom. New teachers are assigned a mentor and given support by all staff. Staff development is provided for the staffto stay current with new educational trends and ideas. The on-going positive environment at the school helps keep teacher turnover verylow.
6: Strategies to increase parental involvement
Parental involvement is the process of communicating and getting parents involved in the activities that the campus conducts. The staff atSeadrift School will make opportunities available to parents that will help with communication. Students at all grade levels(PreKindergarten-8th Grade) must get a folder or notebook signed each day. This increases the communication between school and parentsand gets them involved on a daily basis with the school. Teachers are encouraged to call parents for good news to keep a positive rapport. Parents are always welcome to come visit their child's classroom. Remind will also be used as a communication tool.
7: Plans for assisting preschool children in the transition from early childhood programs to elementary school programs
Seadrift School has a Pre-Kindergarten program that works very closely with the Kindergarten teacher to ensure that the transition intoelementary school is smooth and successful for the students. There is not a daycare located in Seadrift so parents and future Pre-K studentsare all shown the school and introduced to the teacher during the registration period. A "Meet Your Teacher" is also held before schoolstarts to help with this transition.
8: Measures to include teachers in the decisions regarding the use of academic assessments in order to improve the achievement of individualstudents and the overall instructional program
Teachers are a vital part of the success of the students at Seadrift School. They are involved in reviewing the data from the assessmentsthat are given to students. When students are not being successful, the teachers bring their concerns to the Positive Intervention Team thatis made up of staff memebers (principal, instructional facilitator, diagnostician, lower elementary teacher, intermediate teacher, middleschool teacher, RtI teacher, and two special education teachers). Past experiences and knowledge is used to discuss each child fully andinput is used to help the teachers make academic decisions for their student. Teachers are involved with the campus improvement planningfrom initial planning, to revising to implementation.
Seadrift SchoolsGenerated by Plan4Learning.com 52 of 60 Campus #107
January 19, 2017 1:00 pm

9: Activities to ensure effective timely assistance for students who experience difficulty mastering the proficient or advanced levels of academicachievement standards
The Seadrift School staff is very proud of the students' accomplishments. Students at all grade levels are closely monitored andinterventions begin with the earliest sign of difficulty. The school uses many forms of assessments to monitor progress. The staff iscontinuously looking at data and making decisions, changing schedules to meet the needs of students, and progress monitoring to see ifinterventions are being successful. The campus has a very strong RtI Positive Intervention team that meets weekly or on an as-needed basisto discuss students referred by teachers for academic or behavioral difficulties.
10: Coordination and integration of federal, state and local services and programs
Seadrift School is part of Calhoun County ISD. Since we are a school-wide Title I campus, it is essential that the campus works veryclosely with both the state and federal programs. Guidelines are followed to ensure that funds received are being used correctly and tobenefit the students and staff as much as possible. The school works very hard to meet the academic achievement standards that local,state, and federal services require. Seadrift School is also very fortunate that the district works closely with Mid-Coast Family Services andThe Harbor to assist with class counseling sessions on drug prevention. The school also has assistance from local businesses with mentorsand tutors. The Kiwanis Club, the Lions Club, and DOW also have programs to help students. Coordination between all citizens benefitsour students' educational environment as well as our school and community.
Seadrift SchoolsGenerated by Plan4Learning.com 53 of 60 Campus #107
January 19, 2017 1:00 pm

Title I Personnel
Name Position Program FTE
Dolores Mendez Instructional Aide Pre Kindergarten .50
Seadrift SchoolsGenerated by Plan4Learning.com 54 of 60 Campus #107
January 19, 2017 1:00 pm
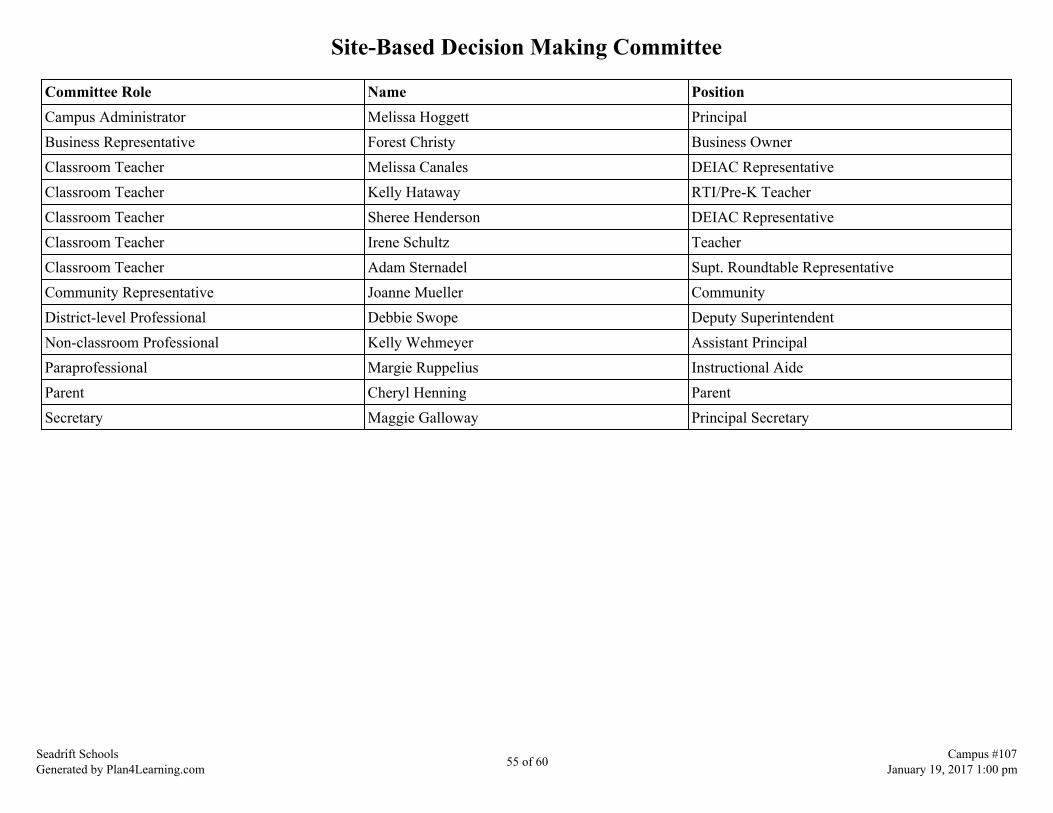
Site-Based Decision Making Committee
Committee Role Name PositionCampus Administrator Melissa Hoggett PrincipalBusiness Representative Forest Christy Business OwnerClassroom Teacher Melissa Canales DEIAC RepresentativeClassroom Teacher Kelly Hataway RTI/Pre-K TeacherClassroom Teacher Sheree Henderson DEIAC RepresentativeClassroom Teacher Irene Schultz TeacherClassroom Teacher Adam Sternadel Supt. Roundtable RepresentativeCommunity Representative Joanne Mueller CommunityDistrict-level Professional Debbie Swope Deputy SuperintendentNon-classroom Professional Kelly Wehmeyer Assistant PrincipalParaprofessional Margie Ruppelius Instructional AideParent Cheryl Henning ParentSecretary Maggie Galloway Principal Secretary
Seadrift SchoolsGenerated by Plan4Learning.com 55 of 60 Campus #107
January 19, 2017 1:00 pm
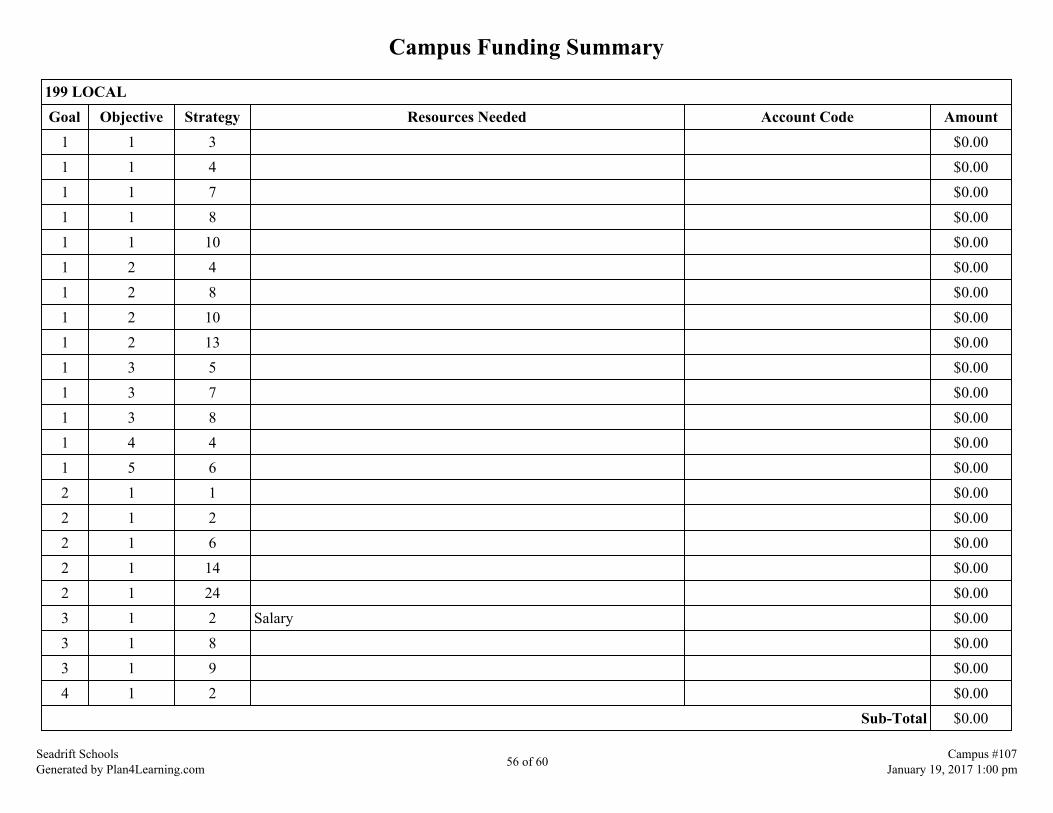
Campus Funding Summary
199 LOCALGoal Objective Strategy Resources Needed Account Code Amount
1 1 3 $0.001 1 4 $0.001 1 7 $0.001 1 8 $0.001 1 10 $0.001 2 4 $0.001 2 8 $0.001 2 10 $0.001 2 13 $0.001 3 5 $0.001 3 7 $0.001 3 8 $0.001 4 4 $0.001 5 6 $0.002 1 1 $0.002 1 2 $0.002 1 6 $0.002 1 14 $0.002 1 24 $0.003 1 2 Salary $0.003 1 8 $0.003 1 9 $0.004 1 2 $0.00
Sub-Total $0.00
Seadrift SchoolsGenerated by Plan4Learning.com 56 of 60 Campus #107
January 19, 2017 1:00 pm
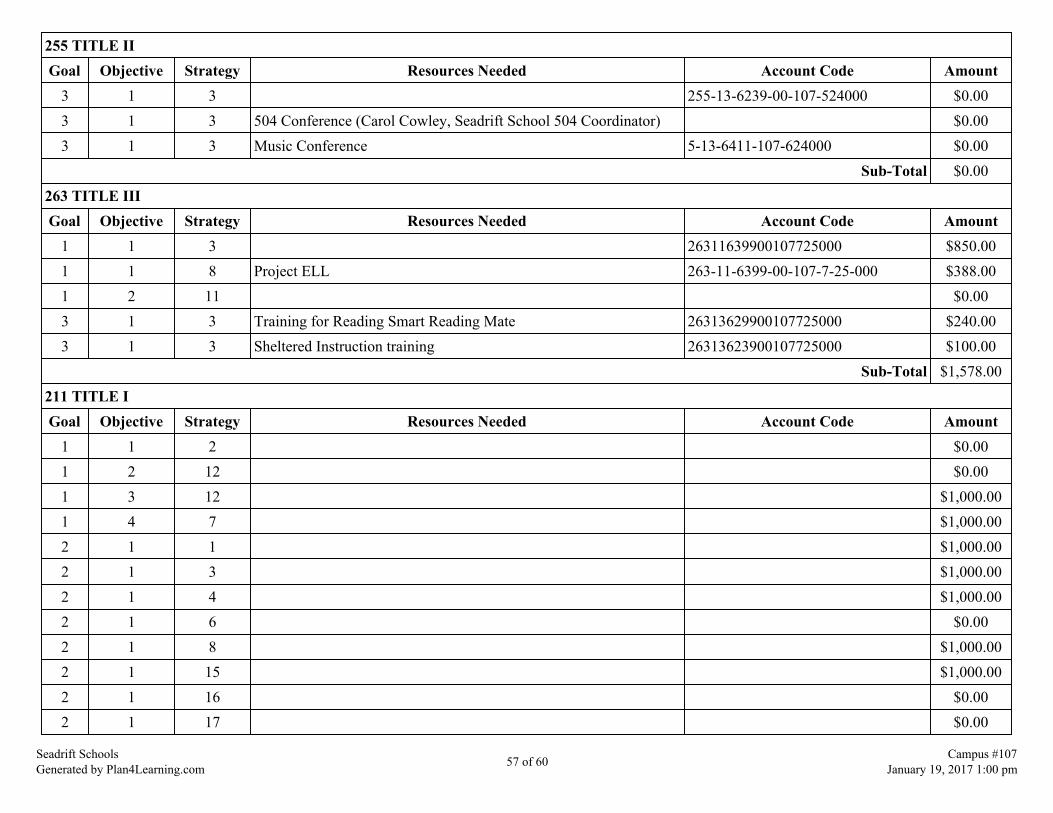
255 TITLE IIGoal Objective Strategy Resources Needed Account Code Amount
3 1 3 255-13-6239-00-107-524000 $0.003 1 3 504 Conference (Carol Cowley, Seadrift School 504 Coordinator) $0.003 1 3 Music Conference 5-13-6411-107-624000 $0.00
Sub-Total $0.00263 TITLE IIIGoal Objective Strategy Resources Needed Account Code Amount
1 1 3 26311639900107725000 $850.001 1 8 Project ELL 263-11-6399-00-107-7-25-000 $388.001 2 11 $0.003 1 3 Training for Reading Smart Reading Mate 26313629900107725000 $240.003 1 3 Sheltered Instruction training 26313623900107725000 $100.00
Sub-Total $1,578.00211 TITLE IGoal Objective Strategy Resources Needed Account Code Amount
1 1 2 $0.001 2 12 $0.001 3 12 $1,000.001 4 7 $1,000.002 1 1 $1,000.002 1 3 $1,000.002 1 4 $1,000.002 1 6 $0.002 1 8 $1,000.002 1 15 $1,000.002 1 16 $0.002 1 17 $0.00
Seadrift SchoolsGenerated by Plan4Learning.com 57 of 60 Campus #107
January 19, 2017 1:00 pm
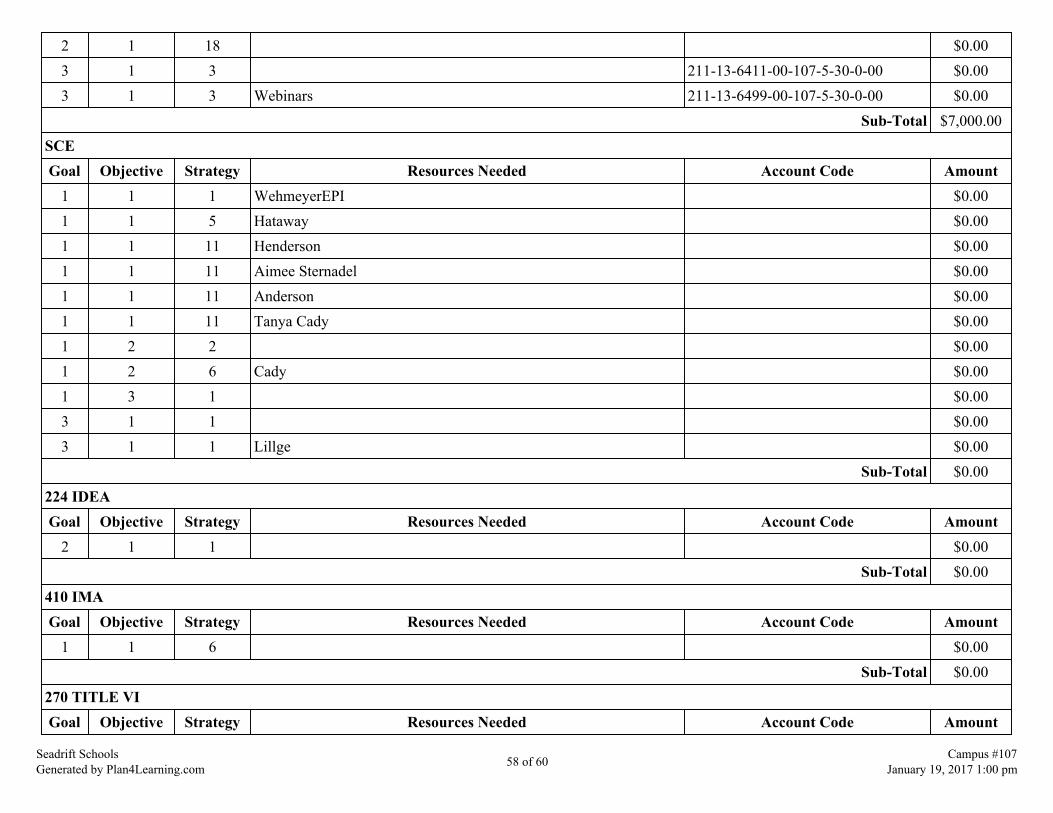
2 1 18 $0.003 1 3 211-13-6411-00-107-5-30-0-00 $0.003 1 3 Webinars 211-13-6499-00-107-5-30-0-00 $0.00
Sub-Total $7,000.00SCEGoal Objective Strategy Resources Needed Account Code Amount
1 1 1 WehmeyerEPI $0.001 1 5 Hataway $0.001 1 11 Henderson $0.001 1 11 Aimee Sternadel $0.001 1 11 Anderson $0.001 1 11 Tanya Cady $0.001 2 2 $0.001 2 6 Cady $0.001 3 1 $0.003 1 1 $0.003 1 1 Lillge $0.00
Sub-Total $0.00224 IDEAGoal Objective Strategy Resources Needed Account Code Amount
2 1 1 $0.00Sub-Total $0.00
410 IMAGoal Objective Strategy Resources Needed Account Code Amount
1 1 6 $0.00Sub-Total $0.00
270 TITLE VIGoal Objective Strategy Resources Needed Account Code Amount
Seadrift SchoolsGenerated by Plan4Learning.com 58 of 60 Campus #107
January 19, 2017 1:00 pm
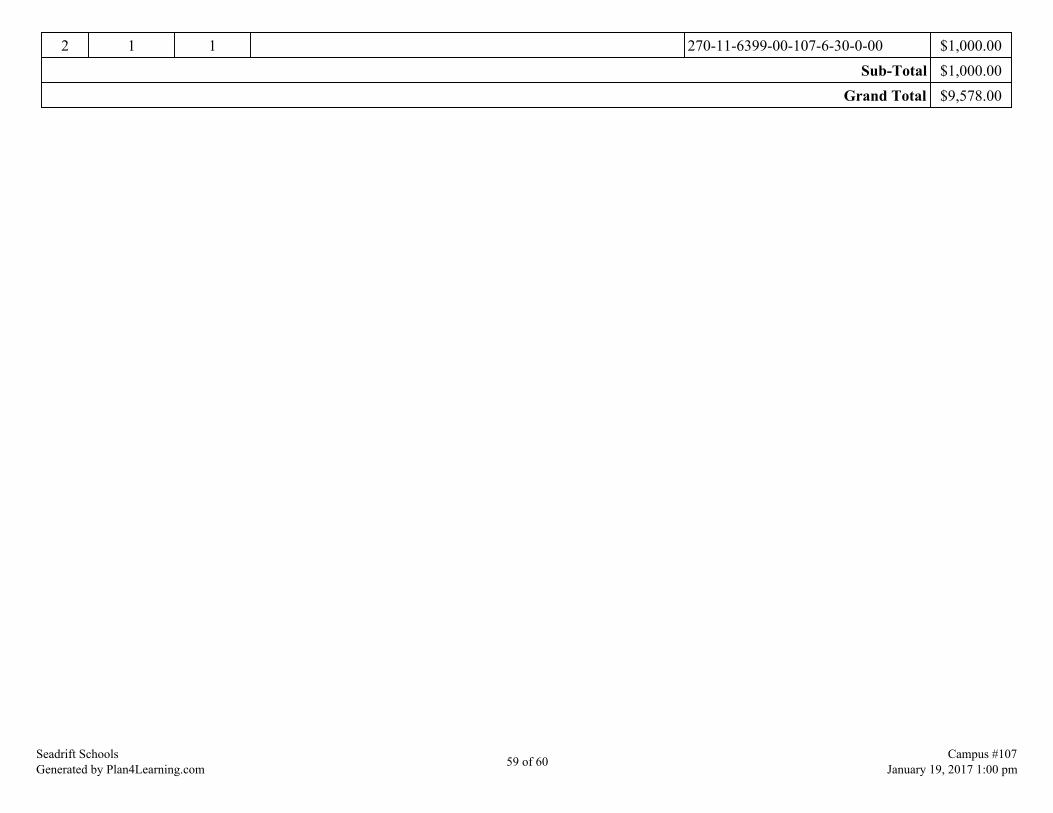
2 1 1 270-11-6399-00-107-6-30-0-00 $1,000.00Sub-Total $1,000.00
Grand Total $9,578.00
Seadrift SchoolsGenerated by Plan4Learning.com 59 of 60 Campus #107
January 19, 2017 1:00 pm

Addendums
Seadrift SchoolsGenerated by Plan4Learning.com 60 of 60 Campus #107
January 19, 2017 1:00 pm
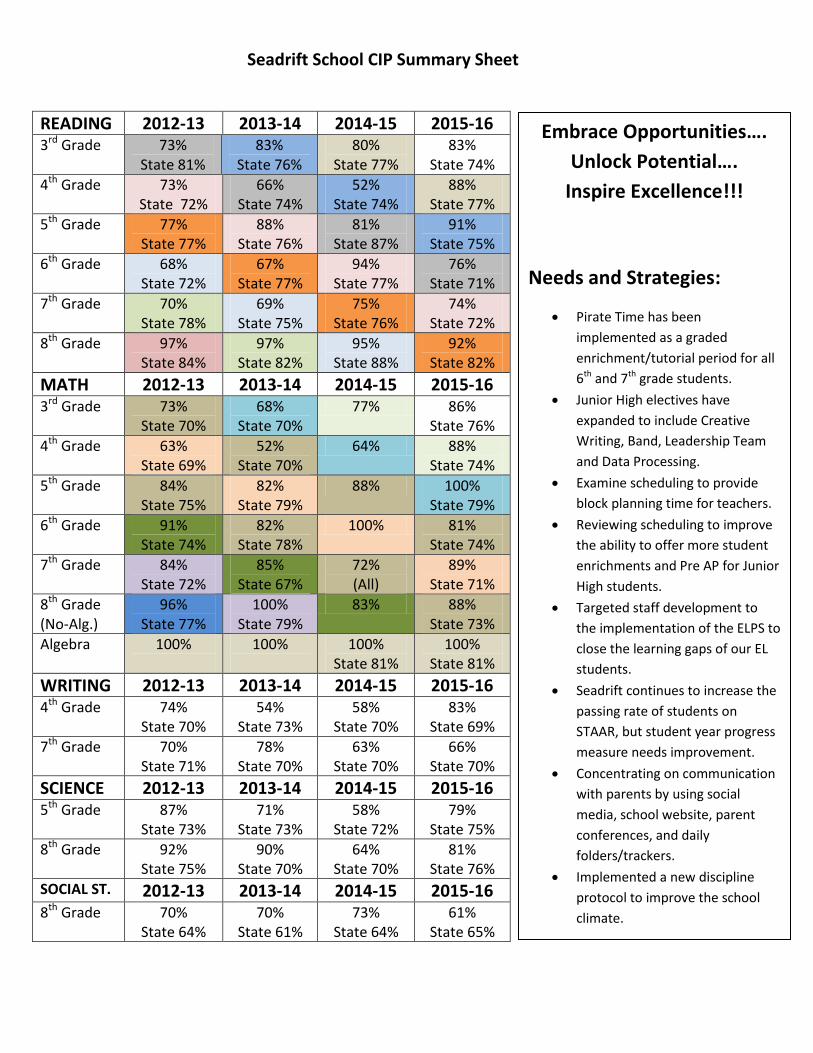
Seadrift School CIP Summary Sheet
READING 2012-13 2013-14 2014-15 2015-16 3
rd Grade 73%
State 81%
83%
State 76%
80%
State 77%
83%
State 74%
4th
Grade 73%
State 72%
66%
State 74%
52%
State 74%
88%
State 77%
5th
Grade 77%
State 77%
88%
State 76%
81%
State 87%
91%
State 75%
6th
Grade 68%
State 72%
67%
State 77%
94%
State 77%
76%
State 71%
7th
Grade 70%
State 78%
69%
State 75%
75%
State 76%
74%
State 72%
8th
Grade 97%
State 84%
97%
State 82%
95%
State 88%
92%
State 82%
MATH 2012-13 2013-14 2014-15 2015-16
3rd
Grade 73%
State 70%
68%
State 70%
77% 86%
State 76%
4th
Grade 63%
State 69%
52%
State 70%
64% 88%
State 74%
5th
Grade 84%
State 75%
82%
State 79%
88% 100%
State 79%
6th
Grade 91%
State 74%
82%
State 78%
100% 81%
State 74%
7th
Grade 84%
State 72%
85%
State 67%
72%
(All)
89%
State 71%
8th
Grade
(No-Alg.)
96%
State 77%
100%
State 79%
83% 88%
State 73%
Algebra 100%
100%
100%
State 81%
100%
State 81%
WRITING 2012-13 2013-14 2014-15 2015-16
4th
Grade 74%
State 70%
54%
State 73%
58%
State 70%
83%
State 69%
7th
Grade 70%
State 71%
78%
State 70%
63%
State 70%
66%
State 70%
SCIENCE 2012-13 2013-14 2014-15 2015-16
5th
Grade 87%
State 73%
71%
State 73%
58%
State 72%
79%
State 75%
8th
Grade 92%
State 75%
90%
State 70%
64%
State 70%
81%
State 76%
SOCIAL ST. 2012-13 2013-14 2014-15 2015-16
8th
Grade 70%
State 64%
70%
State 61%
73%
State 64%
61%
State 65%
E ra e Opportu ities…. U lo k Pote tial….
Inspire Excellence!!!
Needs and Strategies:
Pirate Time has been
implemented as a graded
enrichment/tutorial period for all
6th
and 7th
grade students.
Junior High electives have
expanded to include Creative
Writing, Band, Leadership Team
and Data Processing.
Examine scheduling to provide
block planning time for teachers.
Reviewing scheduling to improve
the ability to offer more student
enrichments and Pre AP for Junior
High students.
Targeted staff development to
the implementation of the ELPS to
close the learning gaps of our EL
students.
Seadrift continues to increase the
passing rate of students on
STAAR, but student year progress
measure needs improvement.
Concentrating on communication
with parents by using social
media, school website, parent
conferences, and daily
folders/trackers.
Implemented a new discipline
protocol to improve the school
climate.
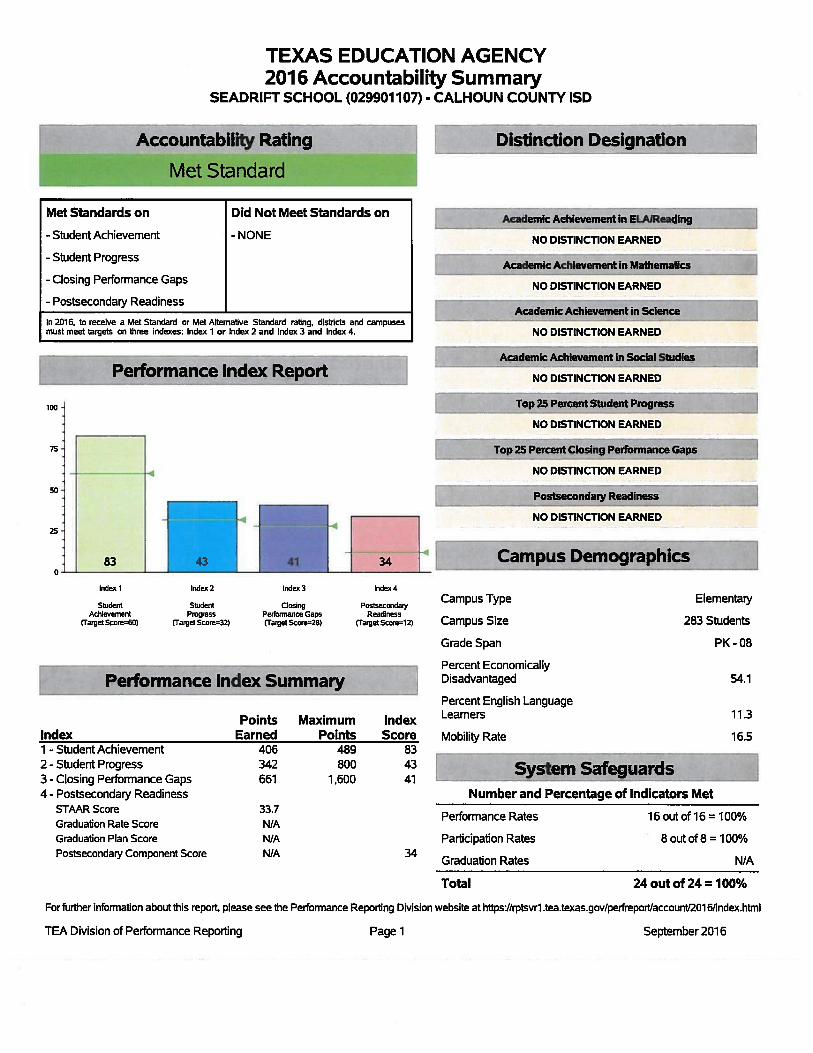

Calhoun County Independent School District
Travis Middle School
2016-2017 Campus Improvement Plan
Travis Middle SchoolGenerated by Plan4Learning.com 1 of 43 Campus #043
January 19, 2017 1:01 pm

Mission Statement"Turning Fiddlers into Sandcrabs one student at a time." - Mark McCarthy
VisionToday's Champions, Tomorrow's Leaders.
Value Statement
PRIDE:Perseverance
Respect
Integrity
Discipline
Excellence
Travis Middle SchoolGenerated by Plan4Learning.com 2 of 43 Campus #043
January 19, 2017 1:01 pm

Comprehensive Needs Assessment
Demographics
Demographics Summary
Travis Middle School is one of two middle schools in Calhoun County Independent School District. Travis Middle School serves approximately 750students in grades 6 to 8. Travis Middle School receives students from 3 elementary schools.
Student PopulationHispanics 66%Anglo 24%Asian 6%African Am 3%Other 1%Females 49%Males 51%
Staff PopulationAnglo 75%Hispanic 22%Asian 0%African Am 3%Female 78%Male 22%
Travis Middle SchoolGenerated by Plan4Learning.com 3 of 43 Campus #043
January 19, 2017 1:01 pm
Our current drop-out rate is 0%. The average daily attendance rate for students is approximately 95.5%
Our State Compensatory Program (SCE) consists of math and reading intervention classes that are provided to students who did not meet minimumstandards on the state assessment.
Demographics Strengths
Low student failure rate, less than 10%Students receive supportive ELAR and Math via block schedulingIncreased mainstream of students served through Special programs
Demographics Needs
Improve At-Risk program to include addressing over-aged studentsProvide Professional Development for teachers in increasing services with our English Language Learners.Focus on differentiated instructionIncrease vertical alignment in core content areasIncrease parental involvement
Travis Middle SchoolGenerated by Plan4Learning.com 4 of 43 Campus #043
January 19, 2017 1:01 pm
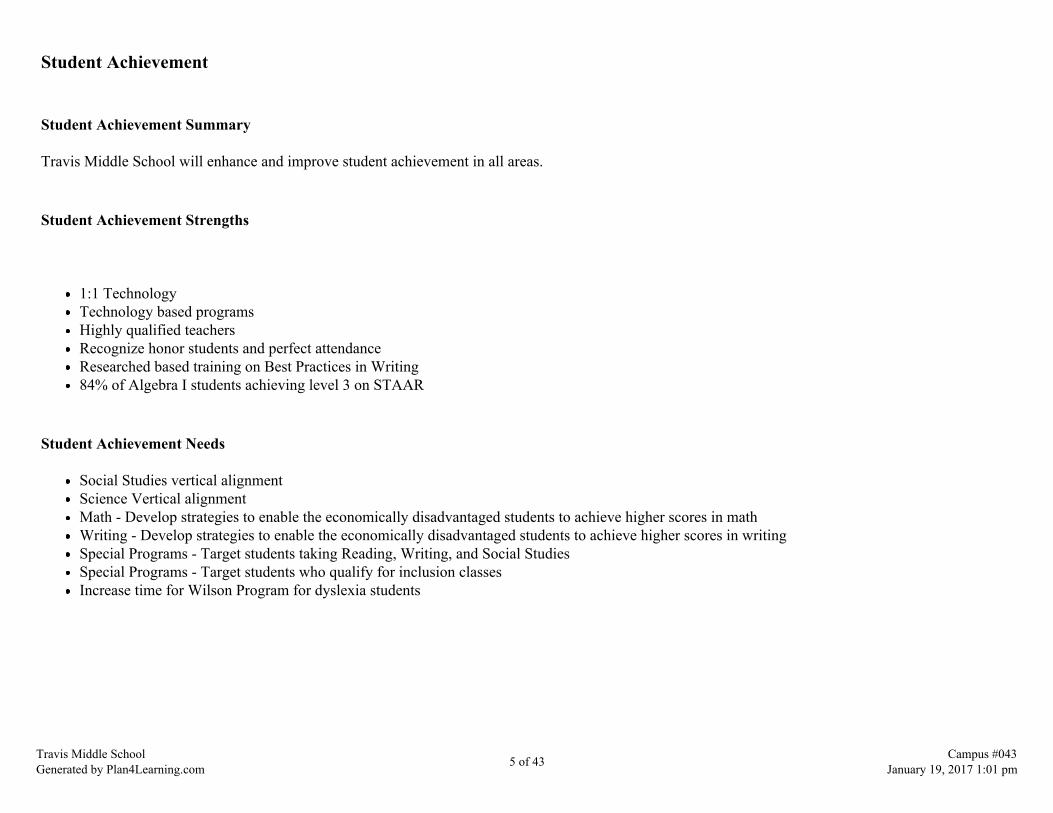
Student Achievement
Student Achievement Summary
Travis Middle School will enhance and improve student achievement in all areas.
Student Achievement Strengths
1:1 TechnologyTechnology based programsHighly qualified teachersRecognize honor students and perfect attendanceResearched based training on Best Practices in Writing84% of Algebra I students achieving level 3 on STAAR
Student Achievement Needs
Social Studies vertical alignmentScience Vertical alignmentMath - Develop strategies to enable the economically disadvantaged students to achieve higher scores in mathWriting - Develop strategies to enable the economically disadvantaged students to achieve higher scores in writingSpecial Programs - Target students taking Reading, Writing, and Social StudiesSpecial Programs - Target students who qualify for inclusion classesIncrease time for Wilson Program for dyslexia students
Travis Middle SchoolGenerated by Plan4Learning.com 5 of 43 Campus #043
January 19, 2017 1:01 pm

School Culture and Climate
School Culture and Climate Summary
Travis Middle School will provide a safe, disciplined, and drug-free school environment and implement programs to reduce violence.
School Culture and Climate Strengths
Police officer and administrator at all extracurricular activitiesDrug dogsCounselors - students in needBullying Program: Strategies to Reduce Bullying and Social Aggression/ Anti-bully Club - Fiddlers Against Bullying StudentsConfidential system for reporting bullying incidentsTravis Campus Staff Survey - safety issues40 + working surveillance camerasSchool Resource Officer (SRO)WATCH D.O.G.S. -- Dad's of Great StudentsDevelopment of Fiddler Friends Program
School Culture and Climate Needs
Implement programs to reduce discipline referrals compared to previous yearConduct campus crisis plan to include training, drills, and audit to ensure coordination with all emergency operation plansReview student discipline procedures each semester; ISS, MAU, Lunch Detention, FLEXImplement programs to increase students awareness of climateImplement strategies for Character Education
Travis Middle SchoolGenerated by Plan4Learning.com 6 of 43 Campus #043
January 19, 2017 1:01 pm
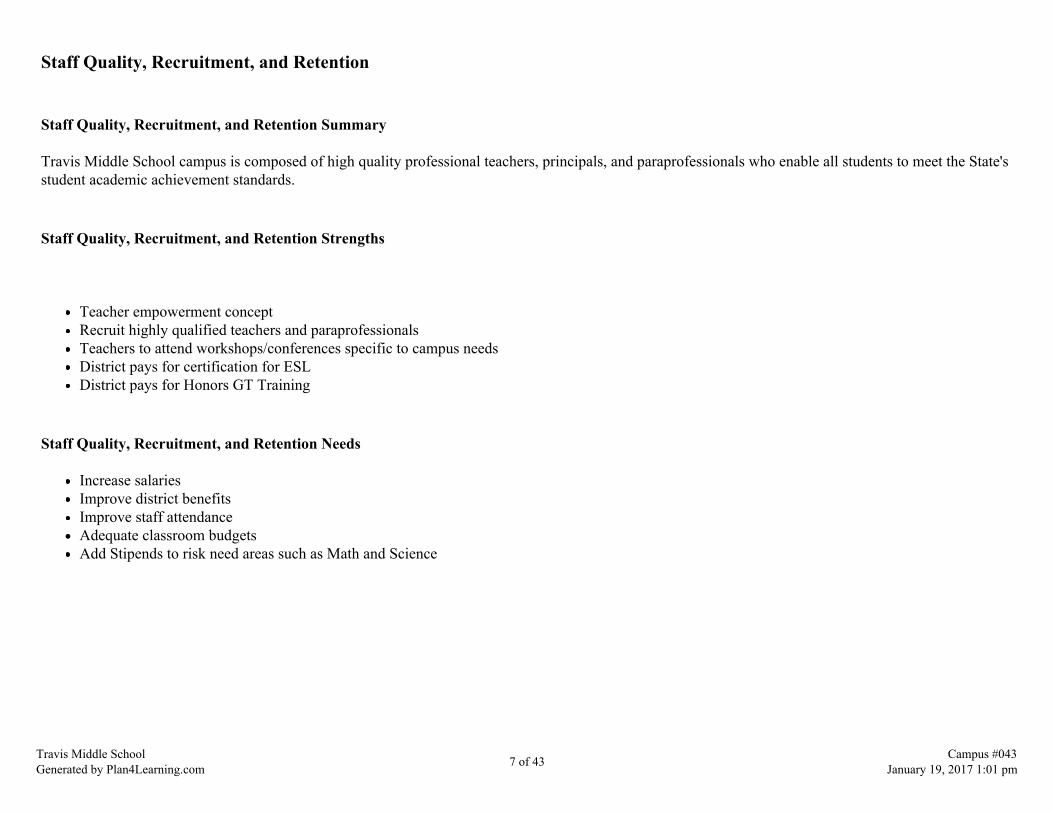
Staff Quality, Recruitment, and Retention
Staff Quality, Recruitment, and Retention Summary
Travis Middle School campus is composed of high quality professional teachers, principals, and paraprofessionals who enable all students to meet the State'sstudent academic achievement standards.
Staff Quality, Recruitment, and Retention Strengths
Teacher empowerment conceptRecruit highly qualified teachers and paraprofessionalsTeachers to attend workshops/conferences specific to campus needsDistrict pays for certification for ESLDistrict pays for Honors GT Training
Staff Quality, Recruitment, and Retention Needs
Increase salariesImprove district benefitsImprove staff attendanceAdequate classroom budgets Add Stipends to risk need areas such as Math and Science
Travis Middle SchoolGenerated by Plan4Learning.com 7 of 43 Campus #043
January 19, 2017 1:01 pm
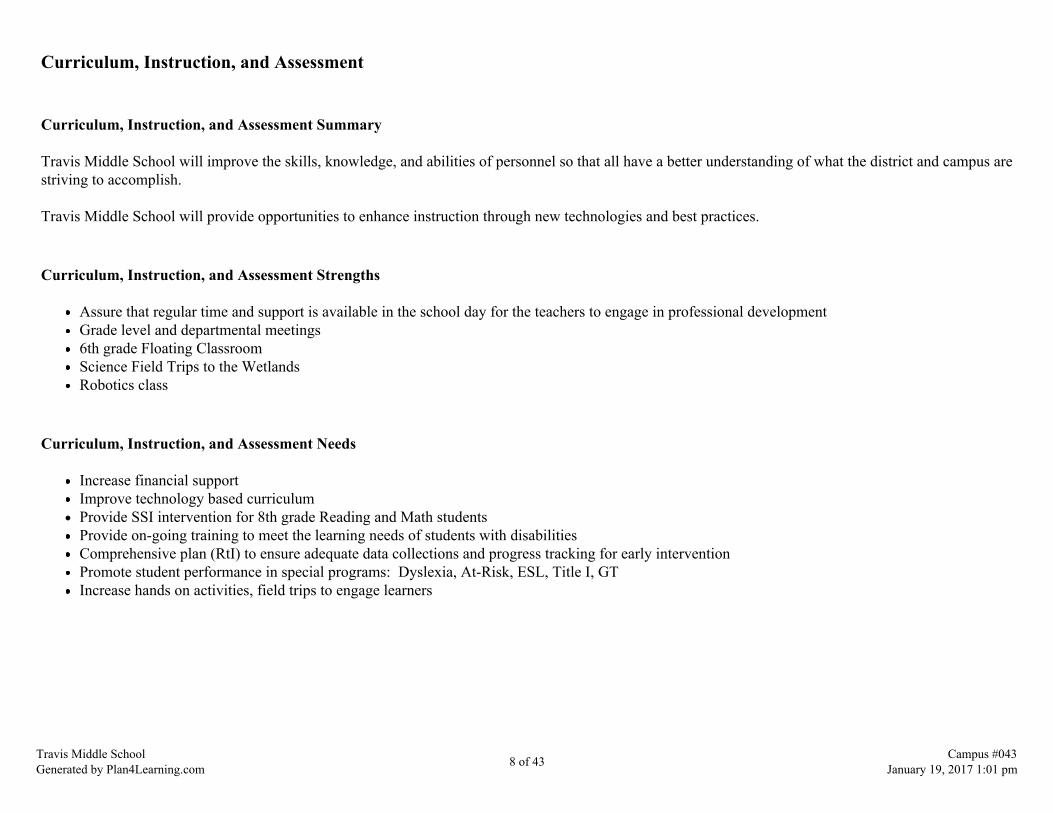
Curriculum, Instruction, and Assessment
Curriculum, Instruction, and Assessment Summary
Travis Middle School will improve the skills, knowledge, and abilities of personnel so that all have a better understanding of what the district and campus arestriving to accomplish.
Travis Middle School will provide opportunities to enhance instruction through new technologies and best practices.
Curriculum, Instruction, and Assessment Strengths
Assure that regular time and support is available in the school day for the teachers to engage in professional developmentGrade level and departmental meetings6th grade Floating ClassroomScience Field Trips to the WetlandsRobotics class
Curriculum, Instruction, and Assessment Needs
Increase financial supportImprove technology based curriculumProvide SSI intervention for 8th grade Reading and Math students Provide on-going training to meet the learning needs of students with disabilitiesComprehensive plan (RtI) to ensure adequate data collections and progress tracking for early interventionPromote student performance in special programs: Dyslexia, At-Risk, ESL, Title I, GTIncrease hands on activities, field trips to engage learners
Travis Middle SchoolGenerated by Plan4Learning.com 8 of 43 Campus #043
January 19, 2017 1:01 pm
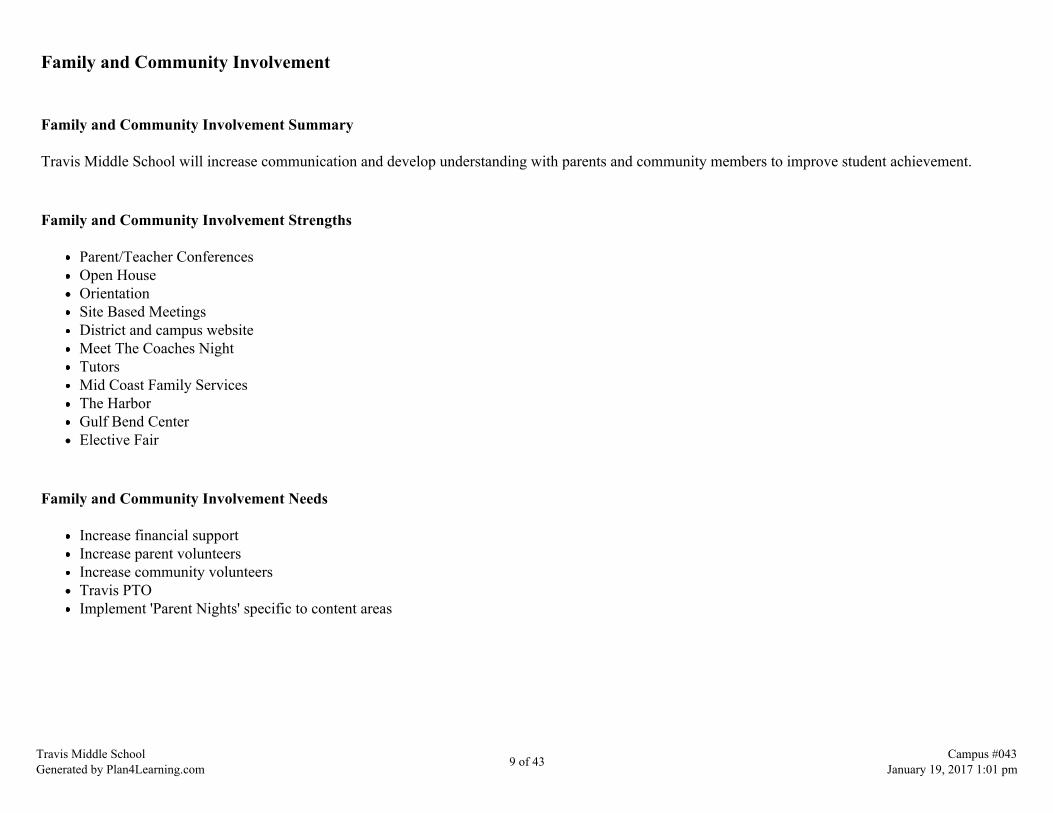
Family and Community Involvement
Family and Community Involvement Summary
Travis Middle School will increase communication and develop understanding with parents and community members to improve student achievement.
Family and Community Involvement Strengths
Parent/Teacher ConferencesOpen HouseOrientation Site Based MeetingsDistrict and campus websiteMeet The Coaches NightTutorsMid Coast Family ServicesThe HarborGulf Bend CenterElective Fair
Family and Community Involvement Needs
Increase financial supportIncrease parent volunteersIncrease community volunteersTravis PTO Implement 'Parent Nights' specific to content areas
Travis Middle SchoolGenerated by Plan4Learning.com 9 of 43 Campus #043
January 19, 2017 1:01 pm
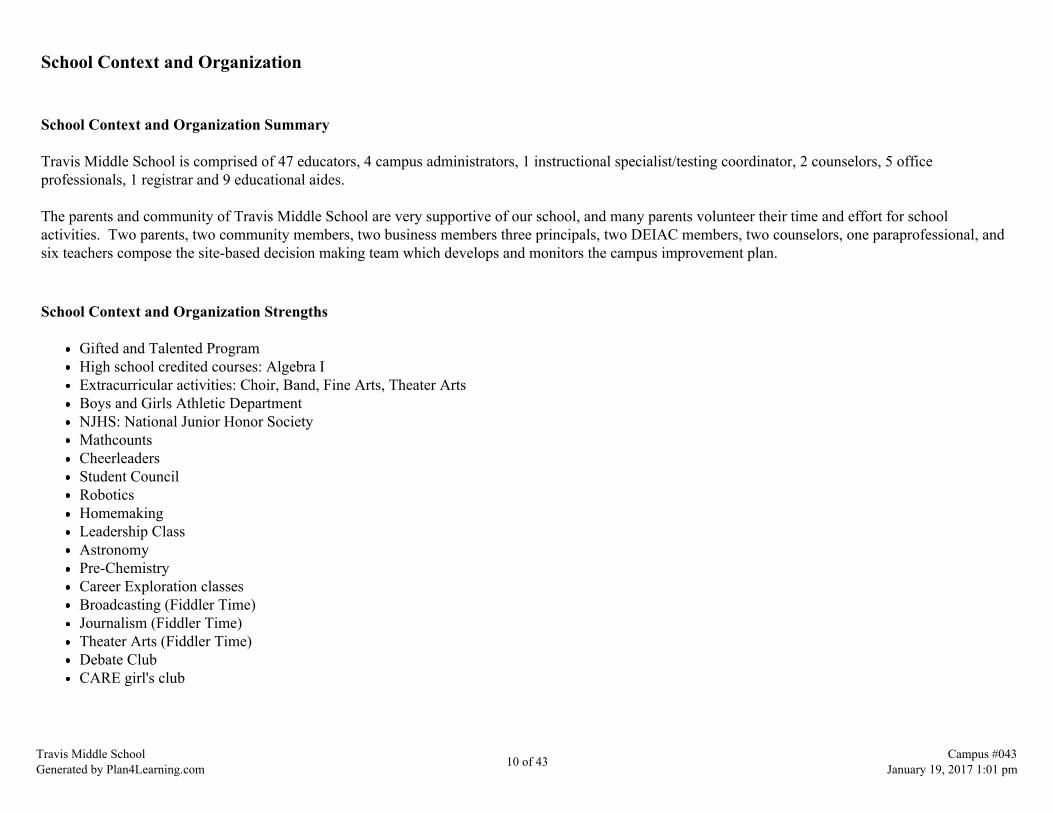
School Context and Organization
School Context and Organization Summary
Travis Middle School is comprised of 47 educators, 4 campus administrators, 1 instructional specialist/testing coordinator, 2 counselors, 5 officeprofessionals, 1 registrar and 9 educational aides.
The parents and community of Travis Middle School are very supportive of our school, and many parents volunteer their time and effort for schoolactivities. Two parents, two community members, two business members three principals, two DEIAC members, two counselors, one paraprofessional, andsix teachers compose the site-based decision making team which develops and monitors the campus improvement plan.
School Context and Organization Strengths
Gifted and Talented ProgramHigh school credited courses: Algebra IExtracurricular activities: Choir, Band, Fine Arts, Theater ArtsBoys and Girls Athletic DepartmentNJHS: National Junior Honor SocietyMathcountsCheerleadersStudent CouncilRoboticsHomemakingLeadership ClassAstronomyPre-ChemistryCareer Exploration classesBroadcasting (Fiddler Time)Journalism (Fiddler Time)Theater Arts (Fiddler Time)Debate ClubCARE girl's club
Travis Middle SchoolGenerated by Plan4Learning.com 10 of 43 Campus #043
January 19, 2017 1:01 pm

School Context and Organization Needs
Increase financial supportIncrease community/business involvementIncrease parental involvementIncrease Electives (ie: Theater Arts and Science, specific Fiddler Time per need)Increase Club opportunities and UIL
Travis Middle SchoolGenerated by Plan4Learning.com 11 of 43 Campus #043
January 19, 2017 1:01 pm
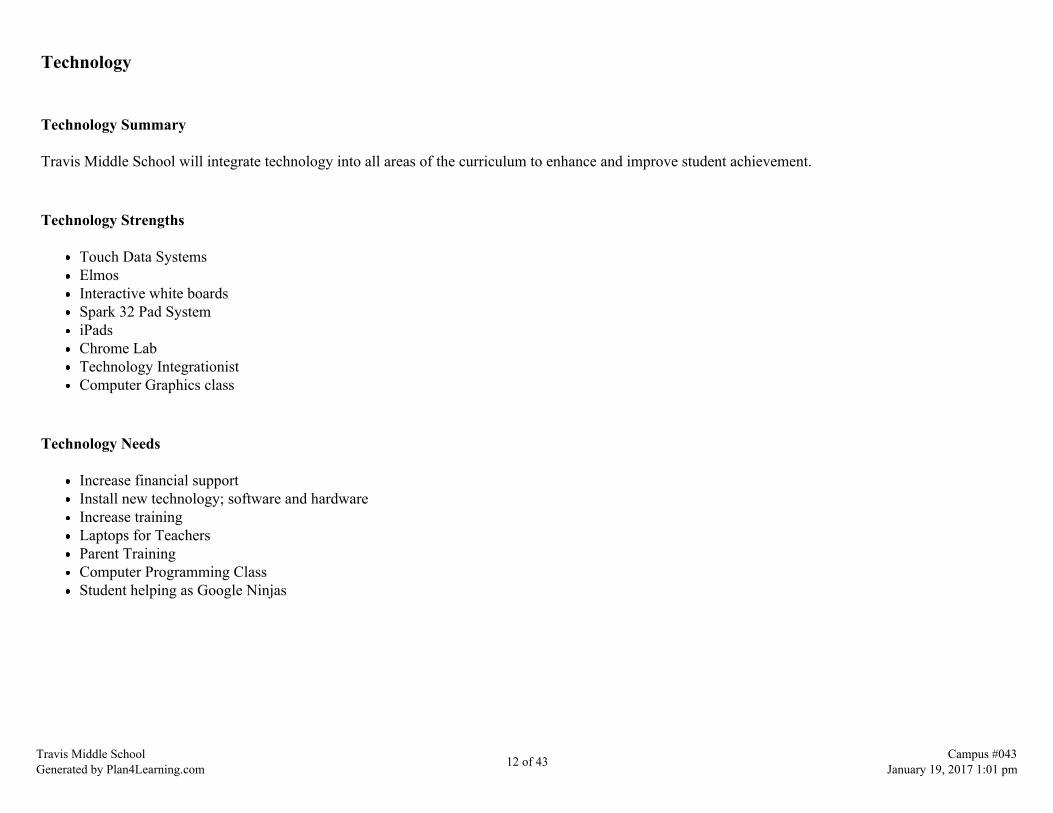
Technology
Technology Summary
Travis Middle School will integrate technology into all areas of the curriculum to enhance and improve student achievement.
Technology Strengths
Touch Data SystemsElmosInteractive white boardsSpark 32 Pad SystemiPadsChrome LabTechnology IntegrationistComputer Graphics class
Technology Needs
Increase financial supportInstall new technology; software and hardwareIncrease trainingLaptops for TeachersParent TrainingComputer Programming ClassStudent helping as Google Ninjas
Travis Middle SchoolGenerated by Plan4Learning.com 12 of 43 Campus #043
January 19, 2017 1:01 pm

Community Involvement
Community Involvement Summary
Travis Middle School will support, and encourage community participation in the educational environment. Proactively communicate through various mediawith community to encourage involvement and partnerships.
Community Involvement Strengths
FacebookSchool websitePartners In EducationTwitter
Community Involvement Needs
Involve community members
Travis Middle SchoolGenerated by Plan4Learning.com 13 of 43 Campus #043
January 19, 2017 1:01 pm
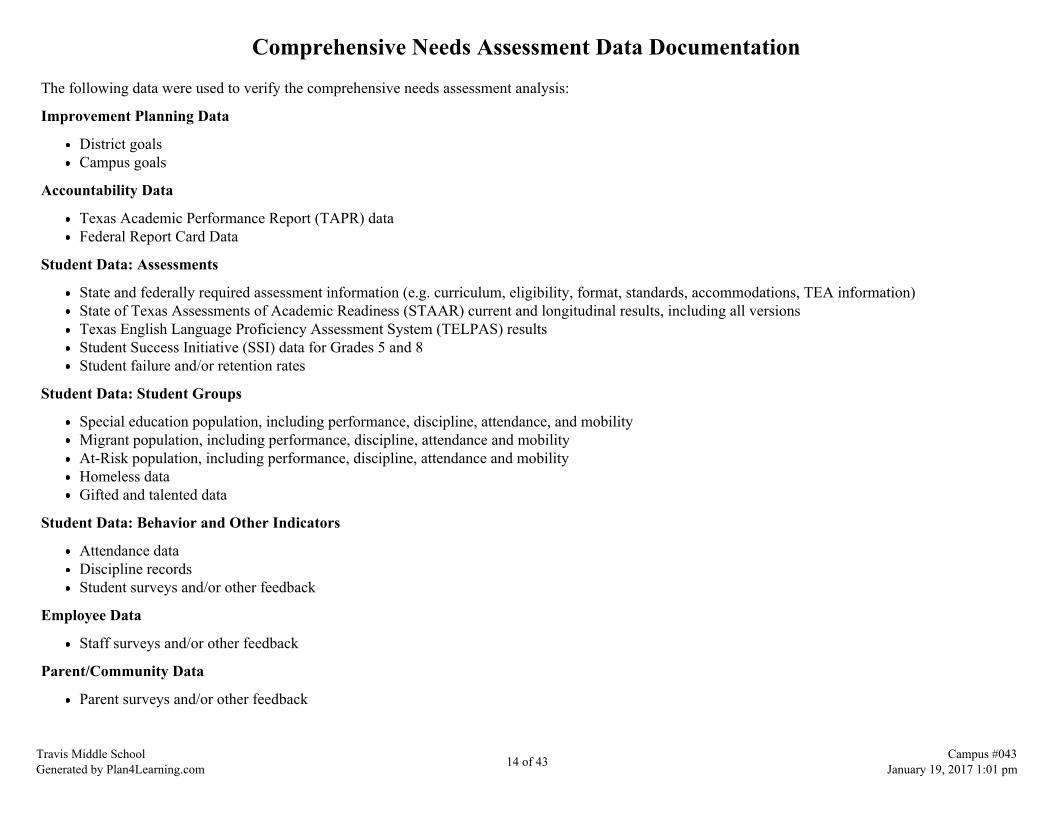
Comprehensive Needs Assessment Data Documentation
The following data were used to verify the comprehensive needs assessment analysis:
Improvement Planning Data
District goalsCampus goals
Accountability Data
Texas Academic Performance Report (TAPR) dataFederal Report Card Data
Student Data: Assessments
State and federally required assessment information (e.g. curriculum, eligibility, format, standards, accommodations, TEA information)State of Texas Assessments of Academic Readiness (STAAR) current and longitudinal results, including all versionsTexas English Language Proficiency Assessment System (TELPAS) resultsStudent Success Initiative (SSI) data for Grades 5 and 8Student failure and/or retention rates
Student Data: Student Groups
Special education population, including performance, discipline, attendance, and mobilityMigrant population, including performance, discipline, attendance and mobilityAt-Risk population, including performance, discipline, attendance and mobilityHomeless dataGifted and talented data
Student Data: Behavior and Other Indicators
Attendance dataDiscipline recordsStudent surveys and/or other feedback
Employee Data
Staff surveys and/or other feedback
Parent/Community Data
Parent surveys and/or other feedback
Travis Middle SchoolGenerated by Plan4Learning.com 14 of 43 Campus #043
January 19, 2017 1:01 pm

Goals
Goal 1: CCISD will provide learning opportunities that are engaging, rigorous, relevant, and transcend state standardswhile meeting individual needs.
Performance Objective 1: All CCISD will participate in ELAR activities that promote creativity, collaboration and problem-solving.
Evaluation Data Source(s) 1: 100% of students reading and writing grades 3-8 and EOC English I and II will show progress to Level IIsatisfactory performance or Level III advanced performance.
Summative Evaluation 1:
Strategy Description Title I Staff Responsiblefor Monitoring Evidence that Demonstrates Success
ReviewsFormative Summative
Nov Jan Mar June1) Develop student growth plans for ELAR objectives not mastered and setindividualized goals.
2 ELARDepartment,Campus Teachers,Special ProgramsStaff
100% of low performing students will haveindividualized plans that will increase the masterylevel of TEKS and increase performance onSTAAR.
2) Vertically and horizontally align ELAR curriculum and TEKS. 2 ELARDepartment,Campus Teachers,Central OfficeStaff
100% of district ELAR curriculum will be alignedwith TEKS.
Funding Sources: 199 LOCAL - $1,000.00State System Safeguard Strategy
3) Provide ELA staff with research-based practices and training to assist inmeeting the diverse needs of all learners. Track all Special Ed and ELLstudents. *Region III workshops
4 CampusAdministrators,Central OfficeStaff
100% of ELAR teachers will be trained in areas ofneed and classroom monitoring of implementation.
4) Assess 7th grade students using Texas Middle School FluencyAssessment tool as required for RTI.
2 7th grade ELARteachers
100% of students will achieve Level II on theReading STAAR.
Funding Sources: 199 LOCAL - $600.005) Provide STAAR remediation classes for 8th grade ELAR students whodid not meet the state standards.
2 STAAR CampusCoordinator,Campus Teachers
100% of 8th grade students taking state assessmentwill reach and/or exceed the performance standards.
Travis Middle SchoolGenerated by Plan4Learning.com 15 of 43 Campus #043
January 19, 2017 1:01 pm

State System Safeguard Strategy6) Provide intervention for Special Programs students showing the greatestgaps in reading assessments.
2 STAAR CampusCoordinator,Campus Teachers,Special ProgramsStaff
100% of students in Special Programs willdemonstrate improvement on reading assessments.
7) Provide appropriate staff with instructional materials, supplies, andmanipulatives.
2 CampusAdministrators,Campus Personnel
100% of teachers will receive instructional materialsfor ELAR, which will increase student academicperformance.
Funding Sources: 211 TITLE I - $1,450.008) Provide SSI for all 8th grade students that did not meet state standards onfirst and second administration of STAAR.
8th grade ELARteachers, CampusAdministrators,CampusCounselors andneeded campuspersonnel
100% of identified students will be enrolled in SSIremediation.
State System Safeguard Strategy9) Provide English Second Language (ESL) classes to address the readingneeds of limited English proficient students to work toward schoolimprovement (AYP). *Reading Smart Reading Mate (Title III) *Acellus(Title III)
2, 9 CampusAdministrators,Campus Teachers,ELL Staff
100% of students in ESL program will demonstrateimprovement/meet standards on Readingassessments.
Funding Sources: 255 TITLE II - $505.00, 263 TITLE III - $3,568.00
10) Provide Professional Development for teachers to enhance expectationsfor the Pre AP program to focus on Level III: Advanced status of students.
ELAR teachersCampusAdministrators
100% of students in advanced classes will achieveLevel III Advanced status on STAAR.
State System Safeguard Strategy11) Provide intervention for Special Programs students showing the greatestgaps in writing assessments.
CampusAdministration andELAR teachers.
100% of students in Special Programs willdemonstrate improvement on writing assessments.
State System Safeguard Strategy12) Provide Professional Development on strategies to utilize in addressingthe needs/student achievement with our ESL population. Increase number ofteachers with ESL certification. *Reading Smart Reading Mate (Title III)*Sheltered Instruction (Title III) *Acellus (Title III) *Project ELL (Title III)
4 ELAR teachers,campusadministration andDistrict specialist.
Increase students in ESL program performance onassessments. 100% of ELAR teachers to obtain ESLcertification by May 2017.
Funding Sources: 263 TITLE III - $1,643.00
13) Provide Students with instructional materials ClassroomTeachers
100% of students will receive instructional materialsfor ELAR Classes.
Funding Sources: 211 TITLE I - $1,000.0014) Provide opportunities for English as a Second Language (ESL) studentsto utilize writing across the curriculum based on TELPAS.
CampusAdministrators,Campus Teachers,ELL staff
100% of students in ESL program will demonstrategrowth based on previous year's TELPAS.
= Accomplished = Considerable = Some Progress = No Progress = Discontinue
Travis Middle SchoolGenerated by Plan4Learning.com 16 of 43 Campus #043
January 19, 2017 1:01 pm
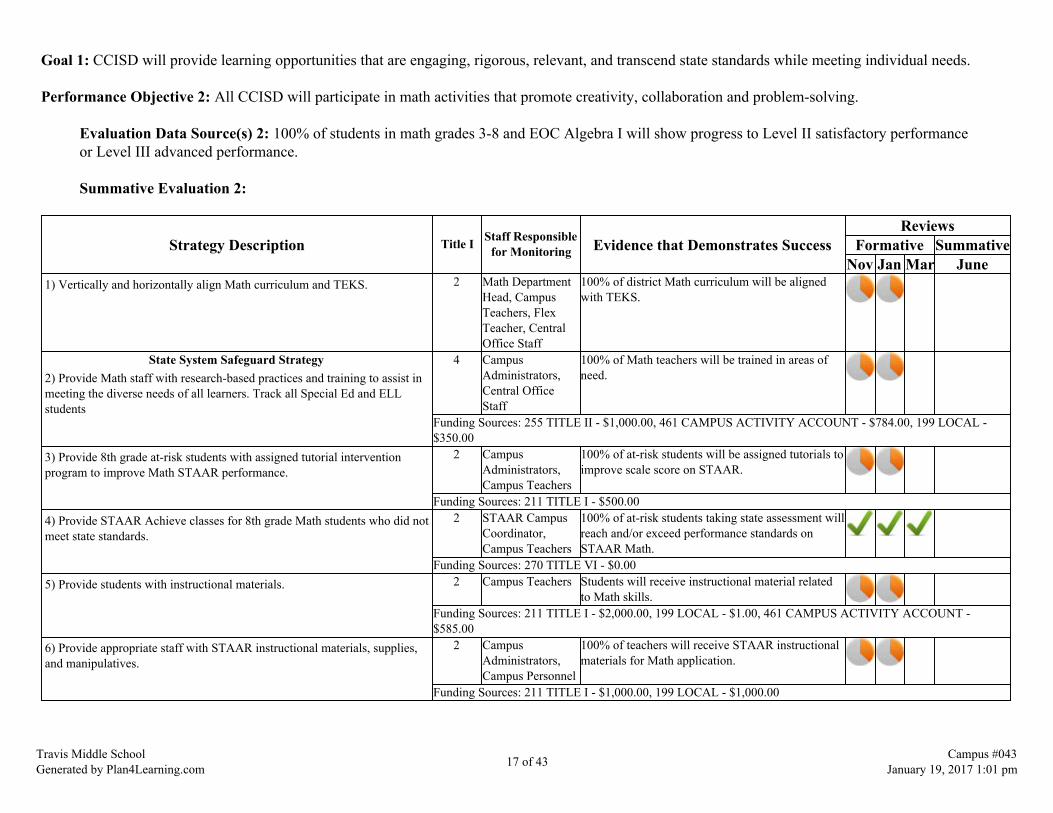
Goal 1: CCISD will provide learning opportunities that are engaging, rigorous, relevant, and transcend state standards while meeting individual needs.
Performance Objective 2: All CCISD will participate in math activities that promote creativity, collaboration and problem-solving.
Evaluation Data Source(s) 2: 100% of students in math grades 3-8 and EOC Algebra I will show progress to Level II satisfactory performanceor Level III advanced performance.
Summative Evaluation 2:
Strategy Description Title I Staff Responsiblefor Monitoring Evidence that Demonstrates Success
ReviewsFormative Summative
Nov Jan Mar June1) Vertically and horizontally align Math curriculum and TEKS. 2 Math Department
Head, CampusTeachers, FlexTeacher, CentralOffice Staff
100% of district Math curriculum will be alignedwith TEKS.
State System Safeguard Strategy2) Provide Math staff with research-based practices and training to assist inmeeting the diverse needs of all learners. Track all Special Ed and ELLstudents
4 CampusAdministrators,Central OfficeStaff
100% of Math teachers will be trained in areas ofneed.
Funding Sources: 255 TITLE II - $1,000.00, 461 CAMPUS ACTIVITY ACCOUNT - $784.00, 199 LOCAL -$350.00
3) Provide 8th grade at-risk students with assigned tutorial interventionprogram to improve Math STAAR performance.
2 CampusAdministrators,Campus Teachers
100% of at-risk students will be assigned tutorials toimprove scale score on STAAR.
Funding Sources: 211 TITLE I - $500.004) Provide STAAR Achieve classes for 8th grade Math students who did notmeet state standards.
2 STAAR CampusCoordinator,Campus Teachers
100% of at-risk students taking state assessment willreach and/or exceed performance standards onSTAAR Math.
Funding Sources: 270 TITLE VI - $0.005) Provide students with instructional materials. 2 Campus Teachers Students will receive instructional material related
to Math skills.Funding Sources: 211 TITLE I - $2,000.00, 199 LOCAL - $1.00, 461 CAMPUS ACTIVITY ACCOUNT -$585.00
6) Provide appropriate staff with STAAR instructional materials, supplies,and manipulatives.
2 CampusAdministrators,Campus Personnel
100% of teachers will receive STAAR instructionalmaterials for Math application.
Funding Sources: 211 TITLE I - $1,000.00, 199 LOCAL - $1,000.00
Travis Middle SchoolGenerated by Plan4Learning.com 17 of 43 Campus #043
January 19, 2017 1:01 pm
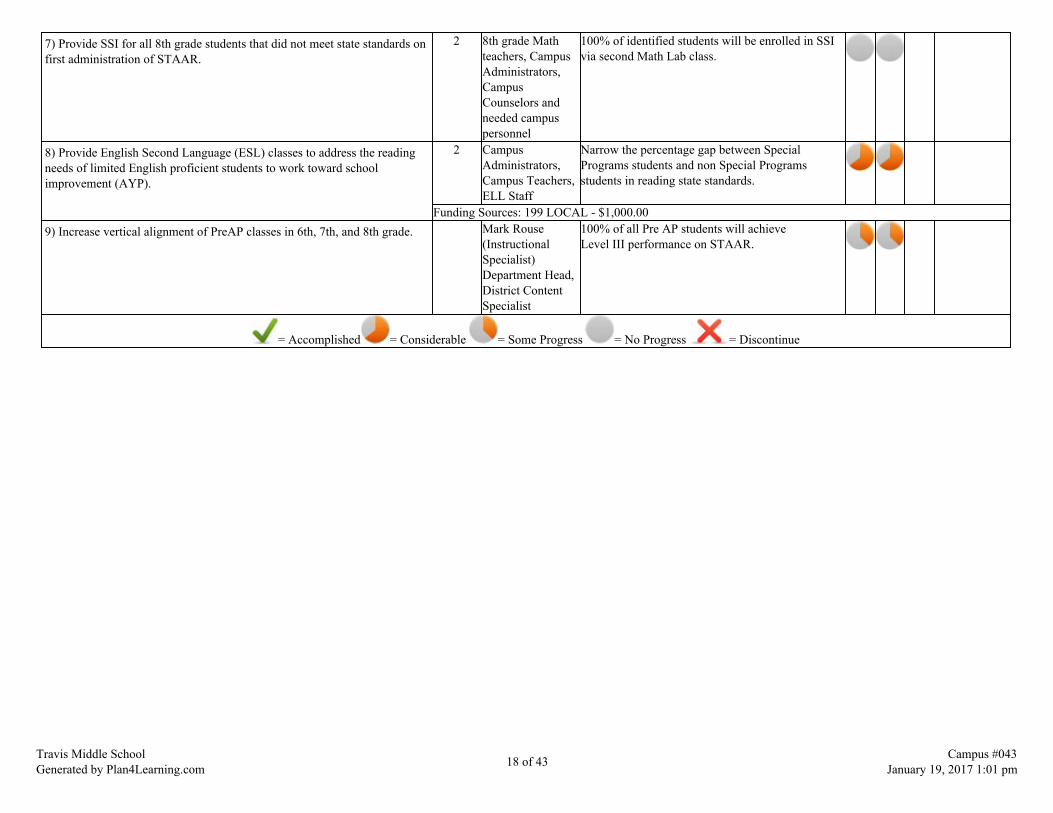
7) Provide SSI for all 8th grade students that did not meet state standards onfirst administration of STAAR.
2 8th grade Mathteachers, CampusAdministrators,CampusCounselors andneeded campuspersonnel
100% of identified students will be enrolled in SSIvia second Math Lab class.
8) Provide English Second Language (ESL) classes to address the readingneeds of limited English proficient students to work toward schoolimprovement (AYP).
2 CampusAdministrators,Campus Teachers,ELL Staff
Narrow the percentage gap between SpecialPrograms students and non Special Programsstudents in reading state standards.
Funding Sources: 199 LOCAL - $1,000.009) Increase vertical alignment of PreAP classes in 6th, 7th, and 8th grade. Mark Rouse
(InstructionalSpecialist)Department Head,District ContentSpecialist
100% of all Pre AP students will achieveLevel III performance on STAAR.
= Accomplished = Considerable = Some Progress = No Progress = Discontinue
Travis Middle SchoolGenerated by Plan4Learning.com 18 of 43 Campus #043
January 19, 2017 1:01 pm

Goal 1: CCISD will provide learning opportunities that are engaging, rigorous, relevant, and transcend state standards while meeting individual needs.
Performance Objective 3: All CCISD will participate in science activities that promote creativity, collaboration and problem-solving.
Evaluation Data Source(s) 3: 100% of students in science 5, 8 and EOC Biology will show progress to Level II satisfactory performance orLevel III advanced performance.
Summative Evaluation 3:
Strategy Description Title I Staff Responsiblefor Monitoring Evidence that Demonstrates Success
ReviewsFormative Summative
Nov Jan Mar June1) Maintain and use vertically and horizontally aligned Science curriculumand TEKS.
2 ScienceDepartment Head,Campus Teachers,Central OfficeStaff
100% of district Science curriculum will be alignedwith TEKS.
2) Provide Science staff with research-based practices and training to assistin meeting the diverse needs of all learners. Track all Special Ed and ELLstudents.
4 CampusAdministrators,Central OfficeStaff
100% of Science teachers will be trained in areas ofneed.
Funding Sources: 211 TITLE I - $1,000.00, 461 CAMPUS ACTIVITY ACCOUNT - $200.00State System Safeguard Strategy
3) Provide intervention to students showing the greatest gaps in scienceachievement among subgroups: Hispanics and EconomicallyDisadvantaged.
2 CampusAdministrators,Campus Teachers
Narrow the gap between percentage of subgroupspassing the STAAR
Funding Sources: 461 CAMPUS ACTIVITY ACCOUNT - $200.00
4) Provide intervention for all students showing the greatest gaps in scienceassessments: from 5th grade STAAR results.
2 CampusAdministrators,Campus Teachers,Special ProgramsStaff
Narrow the gap between the percent of SpecialPrograms students and non Special Programsstudents meeting the passing standard on 8th gradeScience STAAR.
Funding Sources: 461 CAMPUS ACTIVITY ACCOUNT - $500.005) Provide appropriate staff with STAAR instructional materials, supplies,and manipulatives.
2 CampusAdministrators,Campus Personnel
100% of teachers will receive STAAR instructionalmaterials for Science application.
6) Provide students with instructional materials. 2 Campus Teachers Students will receive instructional materials forScience.
Funding Sources: 211 TITLE I - $700.007) Provide Professional Development for teachers to enhance expectationsfor the honors program to focus on Level III: Advanced status of students.
1 CampusAdministrators,Math teachers
100% of students in advanced classes will achieveLevel III: Advanced status on STAAR.
Travis Middle SchoolGenerated by Plan4Learning.com 19 of 43 Campus #043
January 19, 2017 1:01 pm
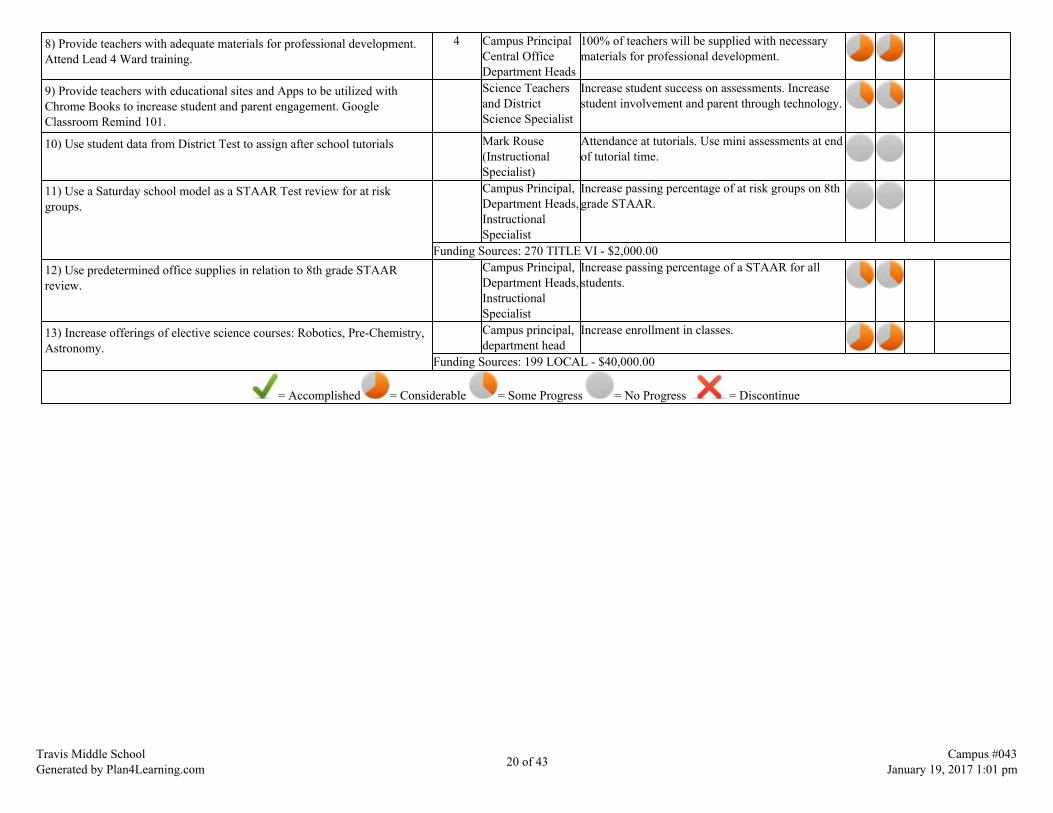
8) Provide teachers with adequate materials for professional development.Attend Lead 4 Ward training.
4 Campus PrincipalCentral OfficeDepartment Heads
100% of teachers will be supplied with necessarymaterials for professional development.
9) Provide teachers with educational sites and Apps to be utilized withChrome Books to increase student and parent engagement. GoogleClassroom Remind 101.
Science Teachersand DistrictScience Specialist
Increase student success on assessments. Increasestudent involvement and parent through technology.
10) Use student data from District Test to assign after school tutorials Mark Rouse(InstructionalSpecialist)
Attendance at tutorials. Use mini assessments at endof tutorial time.
11) Use a Saturday school model as a STAAR Test review for at riskgroups.
Campus Principal,Department Heads,InstructionalSpecialist
Increase passing percentage of at risk groups on 8thgrade STAAR.
Funding Sources: 270 TITLE VI - $2,000.0012) Use predetermined office supplies in relation to 8th grade STAARreview.
Campus Principal,Department Heads,InstructionalSpecialist
Increase passing percentage of a STAAR for allstudents.
13) Increase offerings of elective science courses: Robotics, Pre-Chemistry,Astronomy.
Campus principal,department head
Increase enrollment in classes.
Funding Sources: 199 LOCAL - $40,000.00
= Accomplished = Considerable = Some Progress = No Progress = Discontinue
Travis Middle SchoolGenerated by Plan4Learning.com 20 of 43 Campus #043
January 19, 2017 1:01 pm
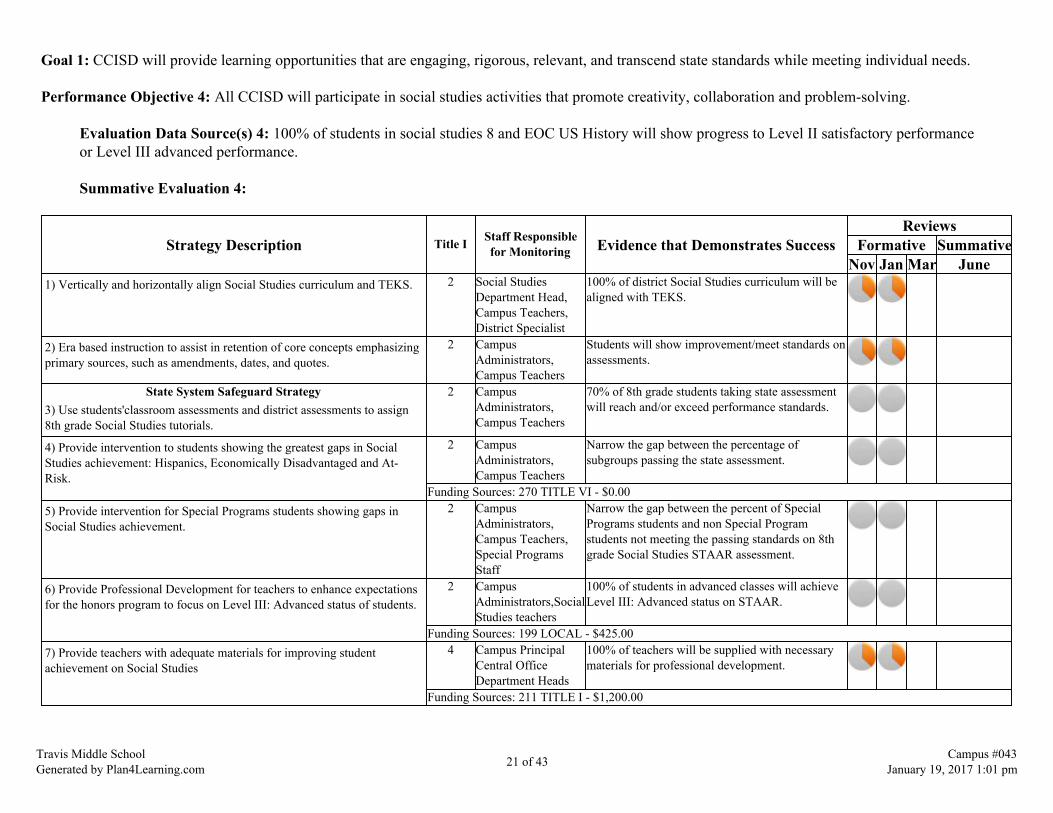
Goal 1: CCISD will provide learning opportunities that are engaging, rigorous, relevant, and transcend state standards while meeting individual needs.
Performance Objective 4: All CCISD will participate in social studies activities that promote creativity, collaboration and problem-solving.
Evaluation Data Source(s) 4: 100% of students in social studies 8 and EOC US History will show progress to Level II satisfactory performanceor Level III advanced performance.
Summative Evaluation 4:
Strategy Description Title I Staff Responsiblefor Monitoring Evidence that Demonstrates Success
ReviewsFormative Summative
Nov Jan Mar June1) Vertically and horizontally align Social Studies curriculum and TEKS. 2 Social Studies
Department Head,Campus Teachers,District Specialist
100% of district Social Studies curriculum will bealigned with TEKS.
2) Era based instruction to assist in retention of core concepts emphasizingprimary sources, such as amendments, dates, and quotes.
2 CampusAdministrators,Campus Teachers
Students will show improvement/meet standards onassessments.
State System Safeguard Strategy3) Use students'classroom assessments and district assessments to assign8th grade Social Studies tutorials.
2 CampusAdministrators,Campus Teachers
70% of 8th grade students taking state assessmentwill reach and/or exceed performance standards.
4) Provide intervention to students showing the greatest gaps in SocialStudies achievement: Hispanics, Economically Disadvantaged and At-Risk.
2 CampusAdministrators,Campus Teachers
Narrow the gap between the percentage ofsubgroups passing the state assessment.
Funding Sources: 270 TITLE VI - $0.005) Provide intervention for Special Programs students showing gaps inSocial Studies achievement.
2 CampusAdministrators,Campus Teachers,Special ProgramsStaff
Narrow the gap between the percent of SpecialPrograms students and non Special Programstudents not meeting the passing standards on 8thgrade Social Studies STAAR assessment.
6) Provide Professional Development for teachers to enhance expectationsfor the honors program to focus on Level III: Advanced status of students.
2 CampusAdministrators,SocialStudies teachers
100% of students in advanced classes will achieveLevel III: Advanced status on STAAR.
Funding Sources: 199 LOCAL - $425.007) Provide teachers with adequate materials for improving studentachievement on Social Studies
4 Campus PrincipalCentral OfficeDepartment Heads
100% of teachers will be supplied with necessarymaterials for professional development.
Funding Sources: 211 TITLE I - $1,200.00
Travis Middle SchoolGenerated by Plan4Learning.com 21 of 43 Campus #043
January 19, 2017 1:01 pm

8) Provide students with instructional materials. *Mock election 2 Campus Teachers,Debra Sonsel
Students will receive instructional materials forSocial Studies
Funding Sources: 199 LOCAL - $880.00, 211 TITLE I - $60.009) Use a Saturday school model as a STAAR Test review for at riskgroups.
Campus Principal,Department Heads,InstructionalSpecialist
Increase passing percentage of at risk groups on 8thgrade STAAR.
Funding Sources: 270 TITLE VI - $2,000.00
= Accomplished = Considerable = Some Progress = No Progress = Discontinue
Travis Middle SchoolGenerated by Plan4Learning.com 22 of 43 Campus #043
January 19, 2017 1:01 pm
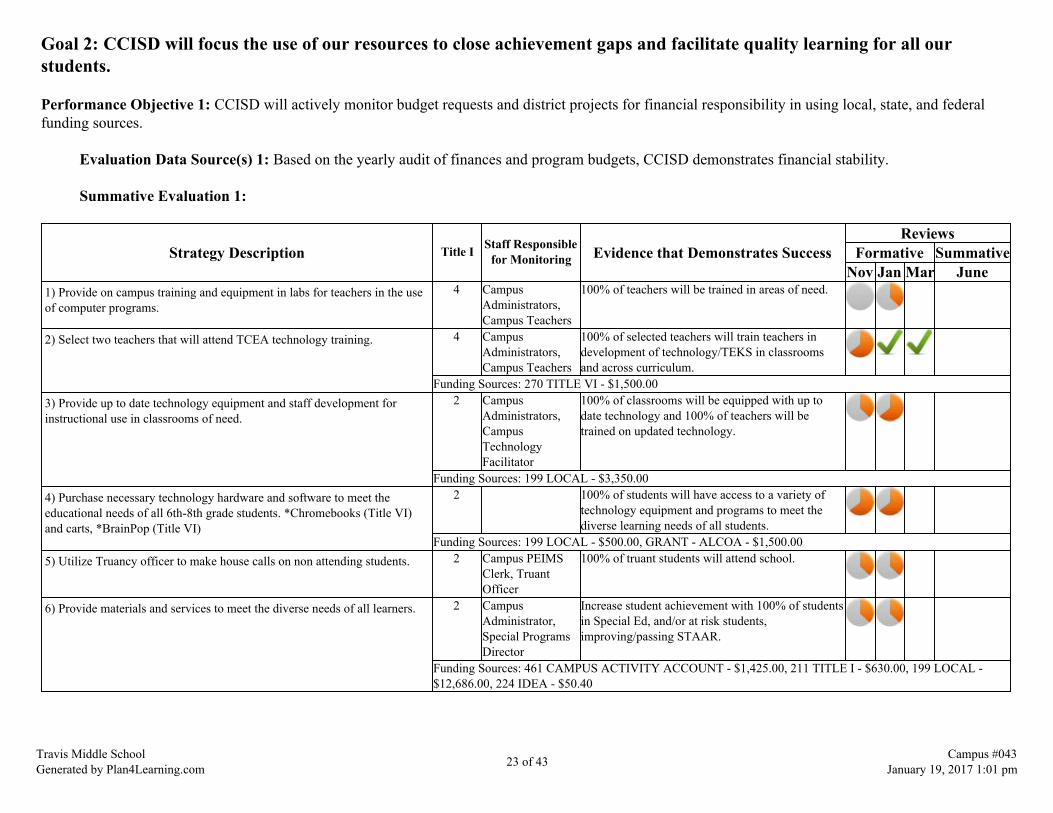
Goal 2: CCISD will focus the use of our resources to close achievement gaps and facilitate quality learning for all ourstudents.
Performance Objective 1: CCISD will actively monitor budget requests and district projects for financial responsibility in using local, state, and federalfunding sources.
Evaluation Data Source(s) 1: Based on the yearly audit of finances and program budgets, CCISD demonstrates financial stability.
Summative Evaluation 1:
Strategy Description Title I Staff Responsiblefor Monitoring Evidence that Demonstrates Success
ReviewsFormative Summative
Nov Jan Mar June1) Provide on campus training and equipment in labs for teachers in the useof computer programs.
4 CampusAdministrators,Campus Teachers
100% of teachers will be trained in areas of need.
2) Select two teachers that will attend TCEA technology training. 4 CampusAdministrators,Campus Teachers
100% of selected teachers will train teachers indevelopment of technology/TEKS in classroomsand across curriculum.
Funding Sources: 270 TITLE VI - $1,500.003) Provide up to date technology equipment and staff development forinstructional use in classrooms of need.
2 CampusAdministrators,CampusTechnologyFacilitator
100% of classrooms will be equipped with up todate technology and 100% of teachers will betrained on updated technology.
Funding Sources: 199 LOCAL - $3,350.004) Purchase necessary technology hardware and software to meet theeducational needs of all 6th-8th grade students. *Chromebooks (Title VI)and carts, *BrainPop (Title VI)
2 100% of students will have access to a variety oftechnology equipment and programs to meet thediverse learning needs of all students.
Funding Sources: 199 LOCAL - $500.00, GRANT - ALCOA - $1,500.005) Utilize Truancy officer to make house calls on non attending students. 2 Campus PEIMS
Clerk, TruantOfficer
100% of truant students will attend school.
6) Provide materials and services to meet the diverse needs of all learners. 2 CampusAdministrator,Special ProgramsDirector
Increase student achievement with 100% of studentsin Special Ed, and/or at risk students,improving/passing STAAR.
Funding Sources: 461 CAMPUS ACTIVITY ACCOUNT - $1,425.00, 211 TITLE I - $630.00, 199 LOCAL -$12,686.00, 224 IDEA - $50.40
Travis Middle SchoolGenerated by Plan4Learning.com 23 of 43 Campus #043
January 19, 2017 1:01 pm
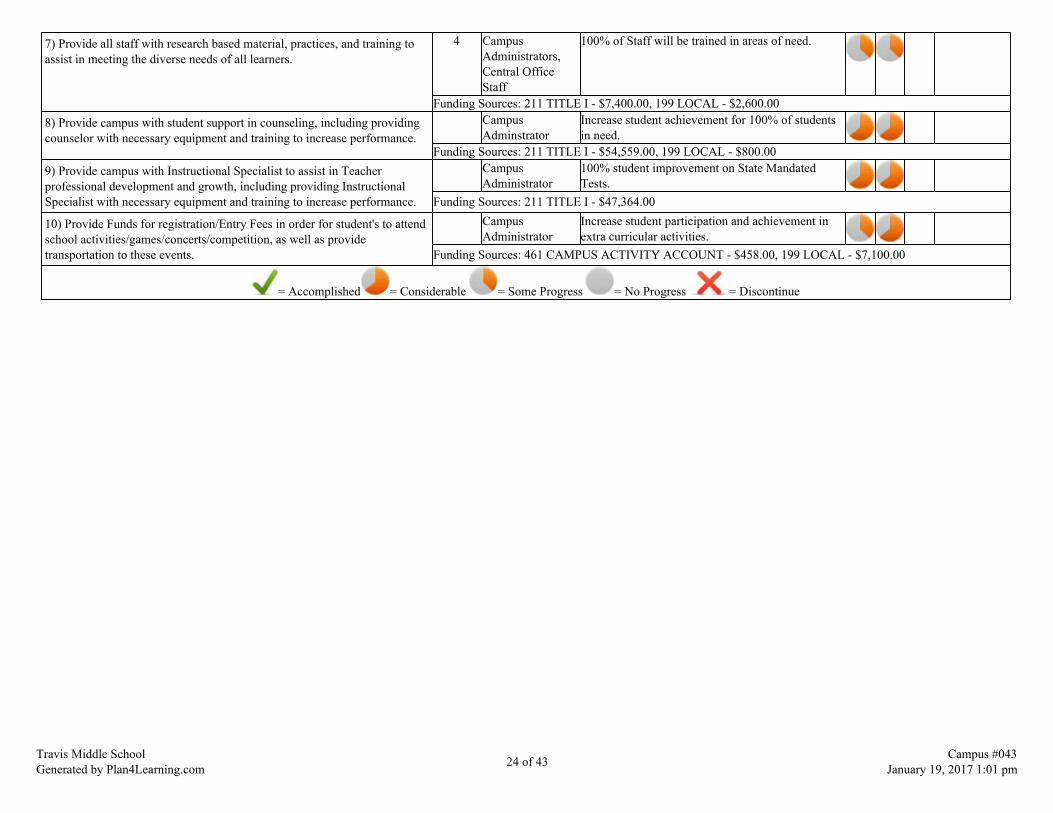
7) Provide all staff with research based material, practices, and training toassist in meeting the diverse needs of all learners.
4 CampusAdministrators,Central OfficeStaff
100% of Staff will be trained in areas of need.
Funding Sources: 211 TITLE I - $7,400.00, 199 LOCAL - $2,600.008) Provide campus with student support in counseling, including providingcounselor with necessary equipment and training to increase performance.
CampusAdminstrator
Increase student achievement for 100% of studentsin need.
Funding Sources: 211 TITLE I - $54,559.00, 199 LOCAL - $800.009) Provide campus with Instructional Specialist to assist in Teacherprofessional development and growth, including providing InstructionalSpecialist with necessary equipment and training to increase performance.
CampusAdministrator
100% student improvement on State MandatedTests.
Funding Sources: 211 TITLE I - $47,364.00
10) Provide Funds for registration/Entry Fees in order for student's to attendschool activities/games/concerts/competition, as well as providetransportation to these events.
CampusAdministrator
Increase student participation and achievement inextra curricular activities.
Funding Sources: 461 CAMPUS ACTIVITY ACCOUNT - $458.00, 199 LOCAL - $7,100.00
= Accomplished = Considerable = Some Progress = No Progress = Discontinue
Travis Middle SchoolGenerated by Plan4Learning.com 24 of 43 Campus #043
January 19, 2017 1:01 pm

Goal 3: CCISD will ensure a compassionate, effective, innovative and highly motivated staff to accomplish our mission.
Performance Objective 1: All CCISD teachers and instructional paraprofessionals are highly qualified by SBEC standards and are effective in theirperformance.
Evaluation Data Source(s) 1: 100% of students testing in all subject areas will achieve Level II satisfactory or Level III advanced based oneffective use of technology in the classrooms and up to date staff development that meets the needs of the CCISD students and teachers.
Summative Evaluation 1:
Strategy Description Title I Staff Responsiblefor Monitoring Evidence that Demonstrates Success
ReviewsFormative Summative
Nov Jan Mar June1) Call students/parents or guardians on the third day of absence. Campus
Administrators,Campus PEIMSClerk, CampusStaff
Increase of student attendance by two percent fromprevious year.
2) Train staff on Classroom Management Through Effective InstructionalStrategies and Student Motivation using resources such as FundamentalFive and Teach like a Champion Books.
Campus Principal,Campus Staff
100% of faculty will attend training on ClassroomManagement Through Instructional Strategies andStudent Motivation.
Funding Sources: 211 TITLE I - $1,785.003) Provide materials needed Staff Development Meetings and Training. Campus Principal,
Newly hired toTMS, First YearTeachers
100% of new teachers will attend teacherorientation and scheduled meetings.
Funding Sources: 461 CAMPUS ACTIVITY ACCOUNT - $500.00, 199 LOCAL - $850.004) Attend TASSP Conference, CAST Conference, TMEA and utilize ideasand strategies to advance staff development.
4 Campus PrincipalCampus Teachers
100% of teachers will be informed and updated onteaching strategies, effective behaviormanagement, and student apathy.
Funding Sources: 199 LOCAL - $2,800.00, 255 TITLE II - $1,000.005) Attend TXLA (Texas Library Association Annual Conference) toadvance staff development.
Campus PrincipalCampus Librarian
100% of teachers and students will be prepared forweb tools, technology, and library programs forReading.
Funding Sources: 211 TITLE I - $645.00, 255 TITLE II - $563.006) Assist teachers in attaining certification to serve any populationincluding Special Ed, GT, and ESL certification, coursework, staffdevelopment, and TEXES testing in order to assure all staff is highlyqualified.
Campus Principaland CampusCounselors
100% of identified Teachers will obtaincertification.
Funding Sources: 255 TITLE II - $1,000.00
7) Staff Development: Provide Teacher/Staff of the MonthAwards/Plaques
Campus Principal Increase overall faculty performance
Funding Sources: 199 LOCAL - $600.00
Travis Middle SchoolGenerated by Plan4Learning.com 25 of 43 Campus #043
January 19, 2017 1:01 pm

= Accomplished = Considerable = Some Progress = No Progress = Discontinue
Travis Middle SchoolGenerated by Plan4Learning.com 26 of 43 Campus #043
January 19, 2017 1:01 pm
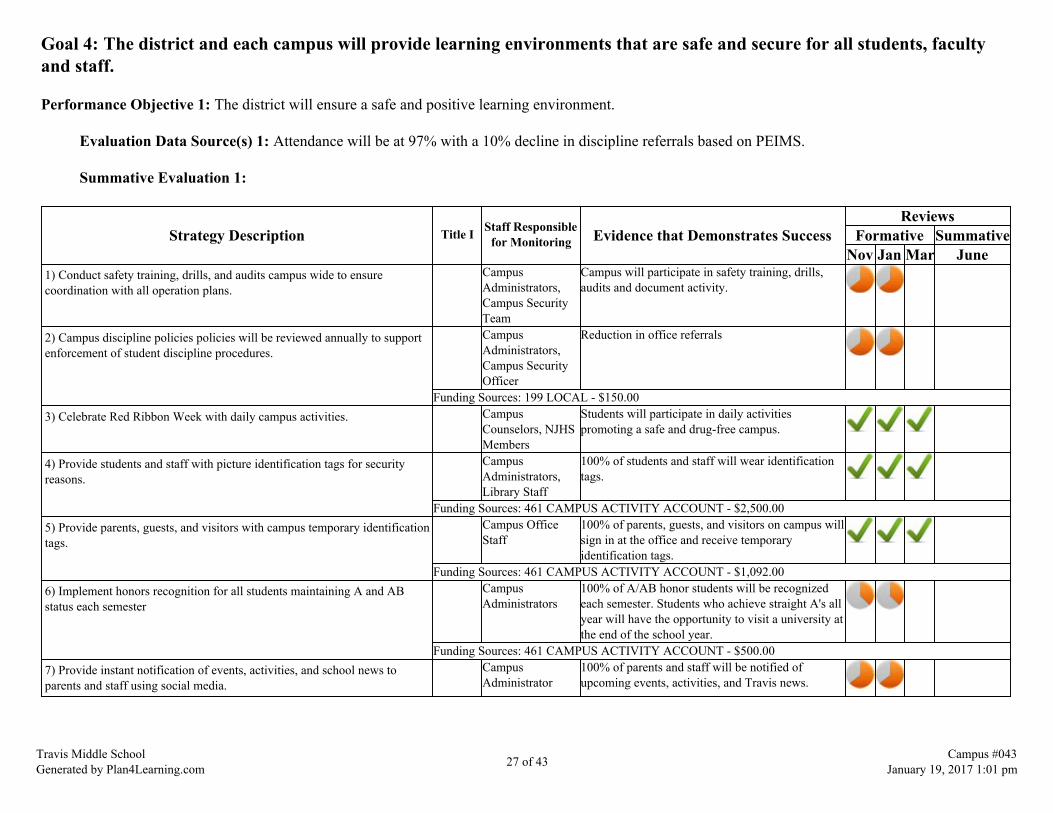
Goal 4: The district and each campus will provide learning environments that are safe and secure for all students, facultyand staff.
Performance Objective 1: The district will ensure a safe and positive learning environment.
Evaluation Data Source(s) 1: Attendance will be at 97% with a 10% decline in discipline referrals based on PEIMS.
Summative Evaluation 1:
Strategy Description Title I Staff Responsiblefor Monitoring Evidence that Demonstrates Success
ReviewsFormative Summative
Nov Jan Mar June1) Conduct safety training, drills, and audits campus wide to ensurecoordination with all operation plans.
CampusAdministrators,Campus SecurityTeam
Campus will participate in safety training, drills,audits and document activity.
2) Campus discipline policies policies will be reviewed annually to supportenforcement of student discipline procedures.
CampusAdministrators,Campus SecurityOfficer
Reduction in office referrals
Funding Sources: 199 LOCAL - $150.003) Celebrate Red Ribbon Week with daily campus activities. Campus
Counselors, NJHSMembers
Students will participate in daily activitiespromoting a safe and drug-free campus.
4) Provide students and staff with picture identification tags for securityreasons.
CampusAdministrators,Library Staff
100% of students and staff will wear identificationtags.
Funding Sources: 461 CAMPUS ACTIVITY ACCOUNT - $2,500.005) Provide parents, guests, and visitors with campus temporary identificationtags.
Campus OfficeStaff
100% of parents, guests, and visitors on campus willsign in at the office and receive temporaryidentification tags.
Funding Sources: 461 CAMPUS ACTIVITY ACCOUNT - $1,092.006) Implement honors recognition for all students maintaining A and ABstatus each semester
CampusAdministrators
100% of A/AB honor students will be recognizedeach semester. Students who achieve straight A's allyear will have the opportunity to visit a university atthe end of the school year.
Funding Sources: 461 CAMPUS ACTIVITY ACCOUNT - $500.007) Provide instant notification of events, activities, and school news toparents and staff using social media.
CampusAdministrator
100% of parents and staff will be notified ofupcoming events, activities, and Travis news.
Travis Middle SchoolGenerated by Plan4Learning.com 27 of 43 Campus #043
January 19, 2017 1:01 pm
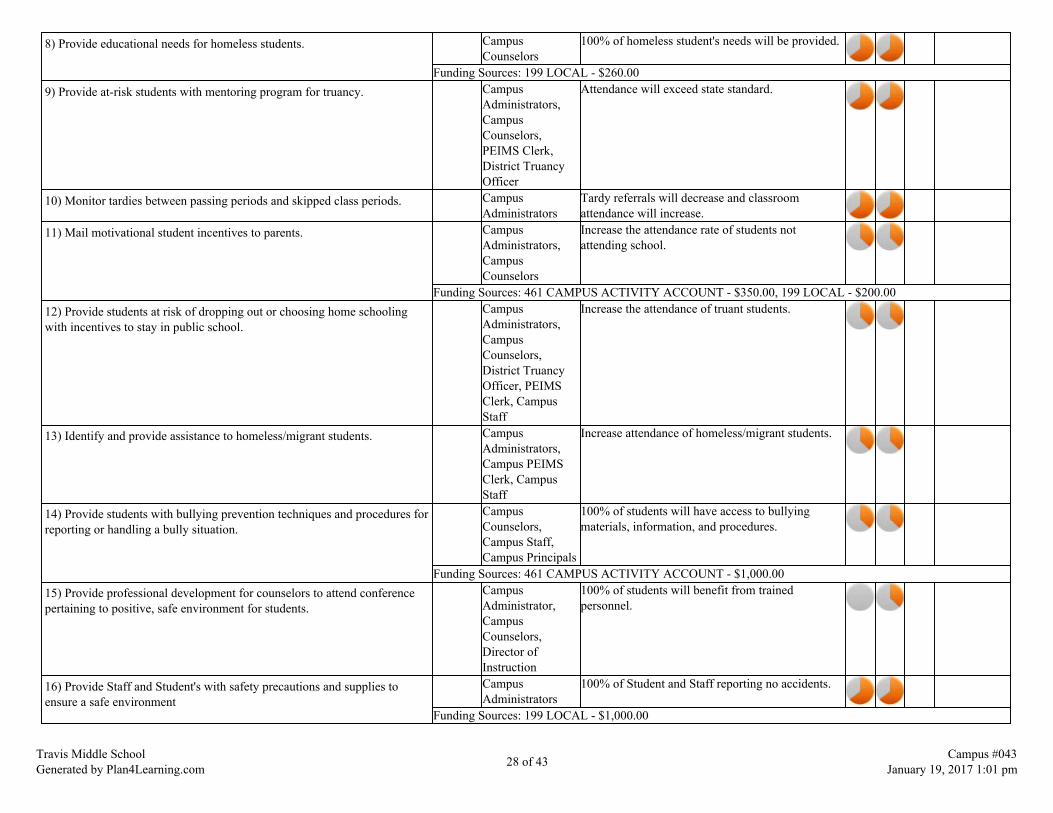
8) Provide educational needs for homeless students. CampusCounselors
100% of homeless student's needs will be provided.
Funding Sources: 199 LOCAL - $260.009) Provide at-risk students with mentoring program for truancy. Campus
Administrators,CampusCounselors,PEIMS Clerk,District TruancyOfficer
Attendance will exceed state standard.
10) Monitor tardies between passing periods and skipped class periods. CampusAdministrators
Tardy referrals will decrease and classroomattendance will increase.
11) Mail motivational student incentives to parents. CampusAdministrators,CampusCounselors
Increase the attendance rate of students notattending school.
Funding Sources: 461 CAMPUS ACTIVITY ACCOUNT - $350.00, 199 LOCAL - $200.0012) Provide students at risk of dropping out or choosing home schoolingwith incentives to stay in public school.
CampusAdministrators,CampusCounselors,District TruancyOfficer, PEIMSClerk, CampusStaff
Increase the attendance of truant students.
13) Identify and provide assistance to homeless/migrant students. CampusAdministrators,Campus PEIMSClerk, CampusStaff
Increase attendance of homeless/migrant students.
14) Provide students with bullying prevention techniques and procedures forreporting or handling a bully situation.
CampusCounselors,Campus Staff,Campus Principals
100% of students will have access to bullyingmaterials, information, and procedures.
Funding Sources: 461 CAMPUS ACTIVITY ACCOUNT - $1,000.0015) Provide professional development for counselors to attend conferencepertaining to positive, safe environment for students.
CampusAdministrator,CampusCounselors,Director ofInstruction
100% of students will benefit from trainedpersonnel.
16) Provide Staff and Student's with safety precautions and supplies toensure a safe environment
CampusAdministrators
100% of Student and Staff reporting no accidents.
Funding Sources: 199 LOCAL - $1,000.00
Travis Middle SchoolGenerated by Plan4Learning.com 28 of 43 Campus #043
January 19, 2017 1:01 pm

= Accomplished = Considerable = Some Progress = No Progress = Discontinue
Travis Middle SchoolGenerated by Plan4Learning.com 29 of 43 Campus #043
January 19, 2017 1:01 pm
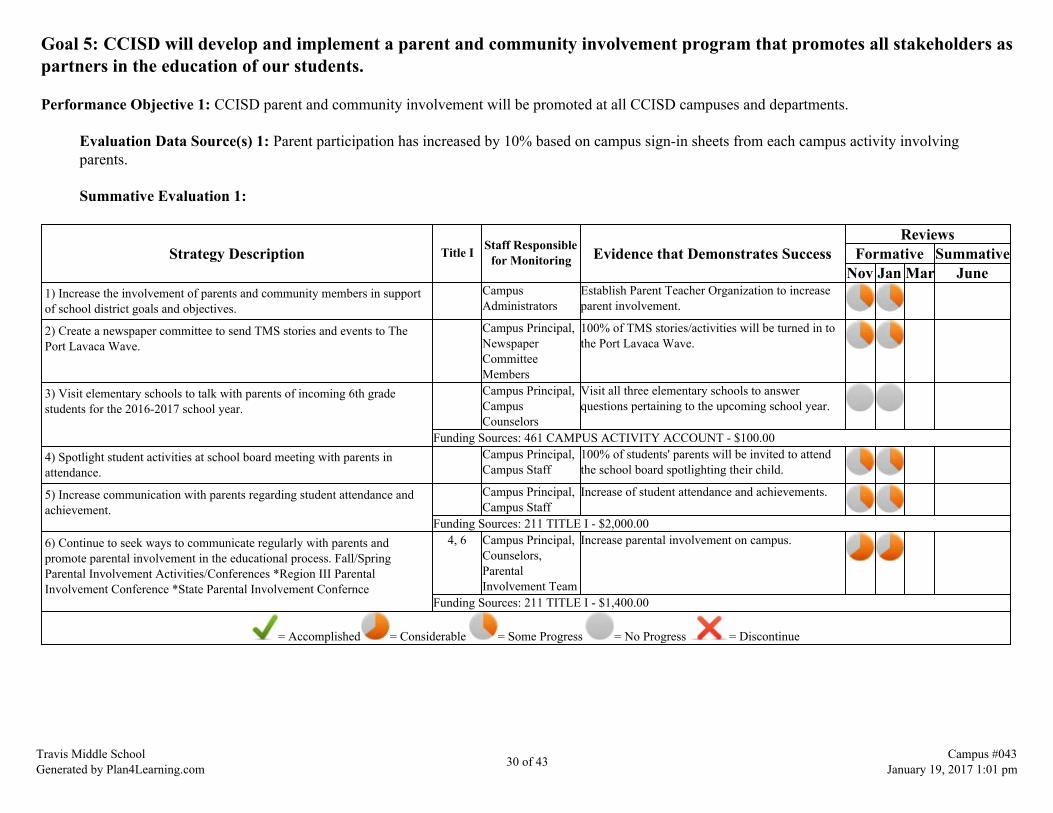
Goal 5: CCISD will develop and implement a parent and community involvement program that promotes all stakeholders aspartners in the education of our students.
Performance Objective 1: CCISD parent and community involvement will be promoted at all CCISD campuses and departments.
Evaluation Data Source(s) 1: Parent participation has increased by 10% based on campus sign-in sheets from each campus activity involvingparents.
Summative Evaluation 1:
Strategy Description Title I Staff Responsiblefor Monitoring Evidence that Demonstrates Success
ReviewsFormative Summative
Nov Jan Mar June1) Increase the involvement of parents and community members in supportof school district goals and objectives.
CampusAdministrators
Establish Parent Teacher Organization to increaseparent involvement.
2) Create a newspaper committee to send TMS stories and events to ThePort Lavaca Wave.
Campus Principal,NewspaperCommitteeMembers
100% of TMS stories/activities will be turned in tothe Port Lavaca Wave.
3) Visit elementary schools to talk with parents of incoming 6th gradestudents for the 2016-2017 school year.
Campus Principal,CampusCounselors
Visit all three elementary schools to answerquestions pertaining to the upcoming school year.
Funding Sources: 461 CAMPUS ACTIVITY ACCOUNT - $100.004) Spotlight student activities at school board meeting with parents inattendance.
Campus Principal,Campus Staff
100% of students' parents will be invited to attendthe school board spotlighting their child.
5) Increase communication with parents regarding student attendance andachievement.
Campus Principal,Campus Staff
Increase of student attendance and achievements.
Funding Sources: 211 TITLE I - $2,000.006) Continue to seek ways to communicate regularly with parents andpromote parental involvement in the educational process. Fall/SpringParental Involvement Activities/Conferences *Region III ParentalInvolvement Conference *State Parental Involvement Confernce
4, 6 Campus Principal,Counselors,ParentalInvolvement Team
Increase parental involvement on campus.
Funding Sources: 211 TITLE I - $1,400.00
= Accomplished = Considerable = Some Progress = No Progress = Discontinue
Travis Middle SchoolGenerated by Plan4Learning.com 30 of 43 Campus #043
January 19, 2017 1:01 pm
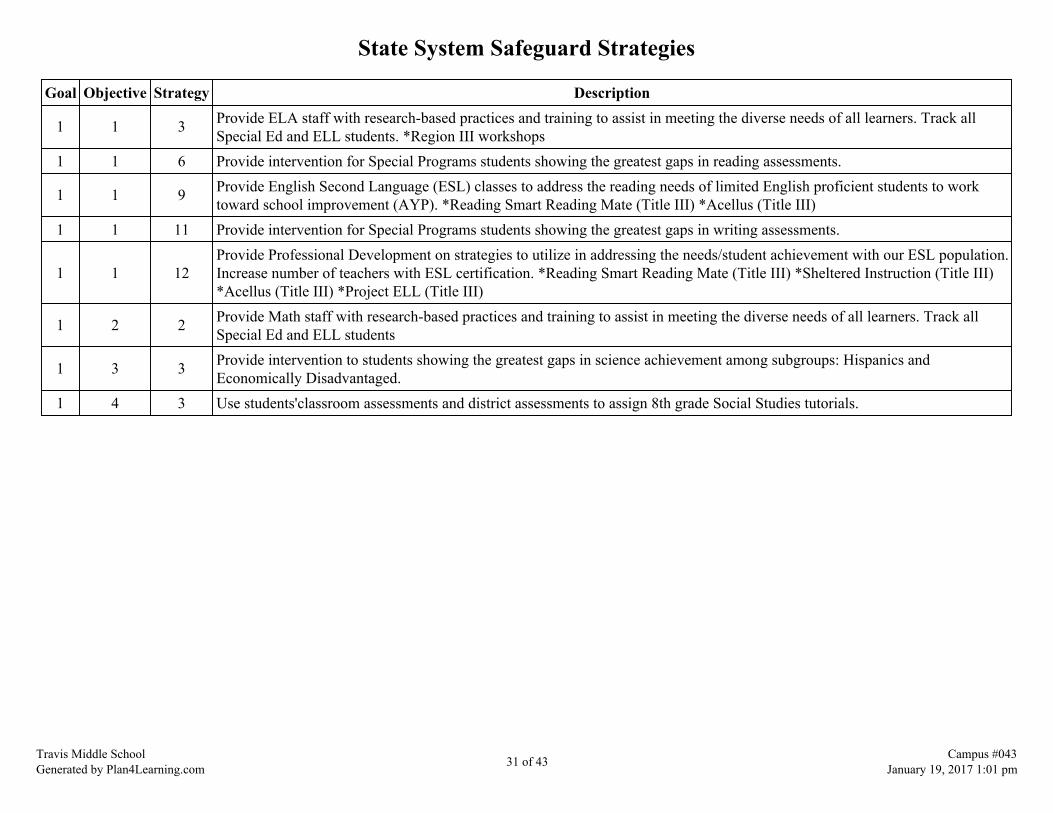
State System Safeguard Strategies
Goal Objective Strategy Description
1 1 3 Provide ELA staff with research-based practices and training to assist in meeting the diverse needs of all learners. Track allSpecial Ed and ELL students. *Region III workshops
1 1 6 Provide intervention for Special Programs students showing the greatest gaps in reading assessments.
1 1 9 Provide English Second Language (ESL) classes to address the reading needs of limited English proficient students to worktoward school improvement (AYP). *Reading Smart Reading Mate (Title III) *Acellus (Title III)
1 1 11 Provide intervention for Special Programs students showing the greatest gaps in writing assessments.
1 1 12Provide Professional Development on strategies to utilize in addressing the needs/student achievement with our ESL population.Increase number of teachers with ESL certification. *Reading Smart Reading Mate (Title III) *Sheltered Instruction (Title III)*Acellus (Title III) *Project ELL (Title III)
1 2 2 Provide Math staff with research-based practices and training to assist in meeting the diverse needs of all learners. Track allSpecial Ed and ELL students
1 3 3 Provide intervention to students showing the greatest gaps in science achievement among subgroups: Hispanics andEconomically Disadvantaged.
1 4 3 Use students'classroom assessments and district assessments to assign 8th grade Social Studies tutorials.
Travis Middle SchoolGenerated by Plan4Learning.com 31 of 43 Campus #043
January 19, 2017 1:01 pm
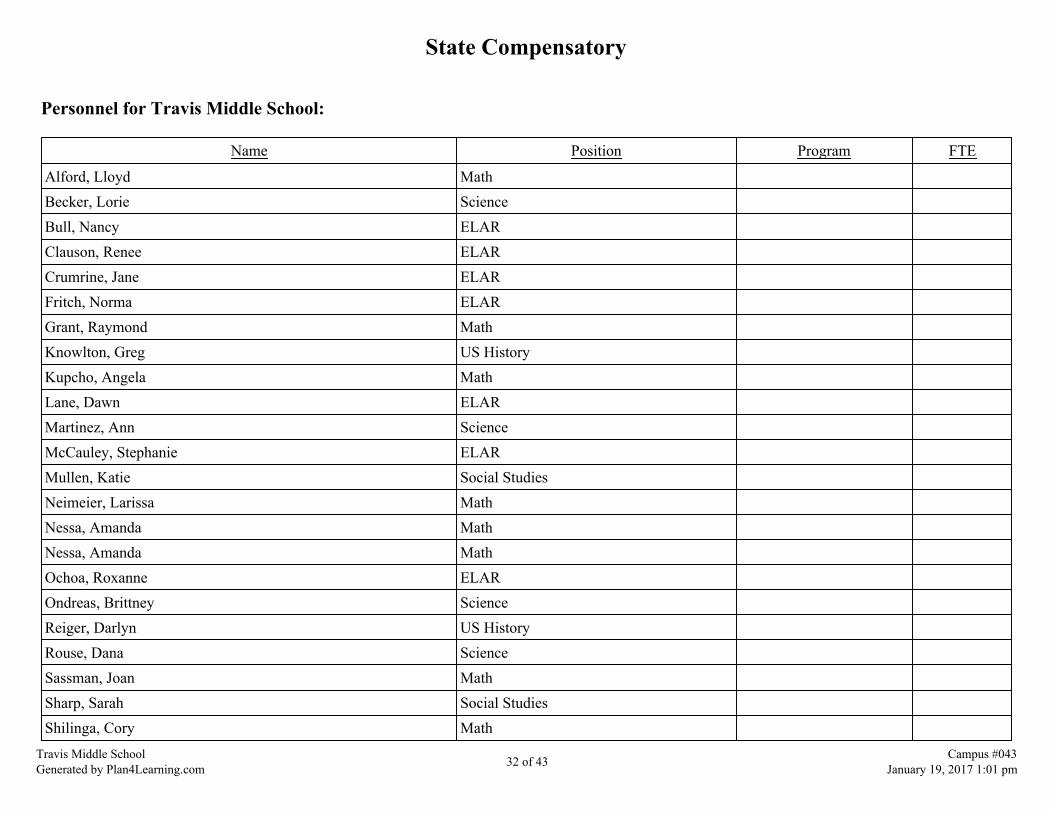
State Compensatory
Personnel for Travis Middle School:
Name Position Program FTE
Alford, Lloyd MathBecker, Lorie ScienceBull, Nancy ELARClauson, Renee ELARCrumrine, Jane ELARFritch, Norma ELARGrant, Raymond MathKnowlton, Greg US HistoryKupcho, Angela MathLane, Dawn ELARMartinez, Ann ScienceMcCauley, Stephanie ELARMullen, Katie Social StudiesNeimeier, Larissa MathNessa, Amanda MathNessa, Amanda MathOchoa, Roxanne ELAROndreas, Brittney ScienceReiger, Darlyn US HistoryRouse, Dana ScienceSassman, Joan MathSharp, Sarah Social StudiesShilinga, Cory Math
Travis Middle SchoolGenerated by Plan4Learning.com 32 of 43 Campus #043
January 19, 2017 1:01 pm
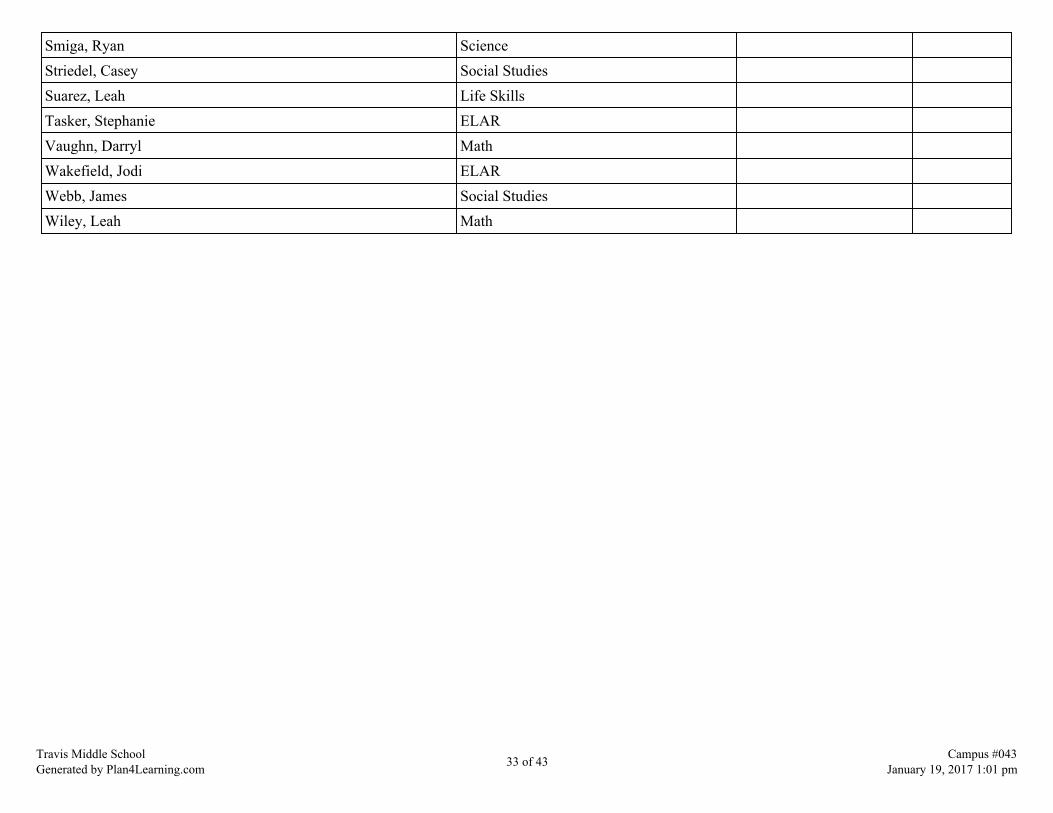
Smiga, Ryan ScienceStriedel, Casey Social StudiesSuarez, Leah Life SkillsTasker, Stephanie ELARVaughn, Darryl MathWakefield, Jodi ELARWebb, James Social StudiesWiley, Leah Math
Travis Middle SchoolGenerated by Plan4Learning.com 33 of 43 Campus #043
January 19, 2017 1:01 pm

Title I
Schoolwide Program Plan
Travis Middle School will improve student performance and exceed state standards in all core areas.
Travis Middle school will involve parents and community members in campus partnerships.
Ten Schoolwide Components
1: Comprehensive Needs Assessment
Comprehensive Needs Assessment Focus on: Student Support, Teacher Support, Parent InvolvementReform StrategiesHighly Qualified StaffProfessional DevelopmentHigh Quality Teachers in High Need SchoolsParent InvolvementEffective Timely AssistanceMeasures to Include Teachers in Assessment DecisionsCoordination of Services, Funds, and Programs
2: Schoolwide Reform Strategies
Improve STAAR academic performanceIncrease quality of student performance on state assessmentsClose the gap between Special Programs students and non Special Programs studentsIntegrate technology into all areas of curriculumImprove the average daily attendance and maintain 0% drop out rateMaintain a safe, disciplined, and drug-free environment for students and staffImplement quality programs to reduce school violence: bullying/sexual harassmentSupport and encourage parental and community participation
3: Instruction by highly qualified professional teachers
Travis Middle school will recruit highly qualified personnel in all positions.
Travis Middle SchoolGenerated by Plan4Learning.com 34 of 43 Campus #043
January 19, 2017 1:01 pm

Require new-hires to become ESL endorsedEnsure paraprofessionals meet district requirementsConduct TELPAS training for all ELA teachers Participate in book study to increase instructional strategiesELPS training for core teachers
4: High-quality and ongoing professional development for teachers, principals, and paraprofessionals and, if appropriate, student servicespersonnel, parents, and other staff
Travis Middle School will promote professional development for campus personnel.
Instructional planningContent knowledge enhancementDifferential instructionIntegration of technologyVertical teamingClassroom managementContinuing Education hours
5: Strategies to attract highly qualified teachers
Travis Middle School will recruit highly qualified teachers.
Implement placement of student teachersProvide professional developmentContinue campus "Teacher of the Year" programProvide support/mentorship for new teachers
6: Strategies to increase parental involvement
Travis Middle will involve parents as active partners in the education of their children.
Conduct Parent/Teacher conferencesSite Based MeetingsConduct Open HouseHost a Meet the Teachers day before school starts Hold regular parent/teacher/organizational meetingsMaintain parent contact log
Travis Middle SchoolGenerated by Plan4Learning.com 35 of 43 Campus #043
January 19, 2017 1:01 pm

Disperse information through School MessengerFacebook
7: Plans for assisting preschool children in the transition from early childhood programs to elementary school programs
Travis Middle School will coordinate visitation with feeder schools to ensure easy transition.
Feeder schools visitationHigh School visitationOrientation Day8th grade preregistration for high school via Career Exploration Class
8: Measures to include teachers in the decisions regarding the use of academic assessments in order to improve the achievement of individualstudents and the overall instructional program
Travis Middle School will provide opportunities for staff involvement regarding planning, modification, and student achievement.
Departmental meetingsDistrict curriculum meetingsSite-Based meetingsFaculty meetingsSpecial Programs trainingARD meetings
9: Activities to ensure effective timely assistance for students who experience difficulty mastering the proficient or advanced levels of academicachievement standards
Travis Middle School will assist in a timely manner to provide services and interventions to ensure student success.
Tutorials: before and after schoolTutorials scheduled during class timeSTAAR BenchmarksInstructional Aides
10: Coordination and integration of federal, state and local services and programs
Travis Middle School will coordinate programs, services, and funds to increase program effectiveness.
Violence preventionTravis Middle SchoolGenerated by Plan4Learning.com 36 of 43 Campus #043
January 19, 2017 1:01 pm

HomelessSpecial Education ProgramsGifted and Talented ProgramsDyslexia ProgramsAYPTitle IDepartment budgets
Travis Middle SchoolGenerated by Plan4Learning.com 37 of 43 Campus #043
January 19, 2017 1:01 pm
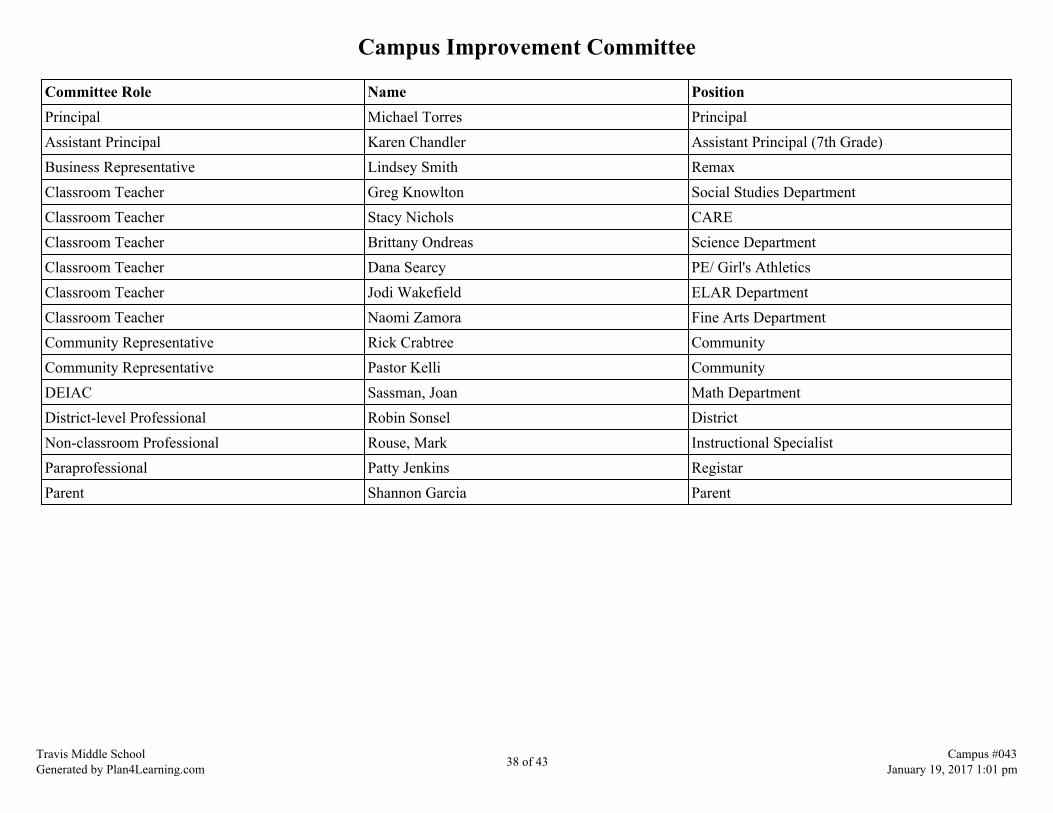
Campus Improvement Committee
Committee Role Name PositionPrincipal Michael Torres PrincipalAssistant Principal Karen Chandler Assistant Principal (7th Grade)Business Representative Lindsey Smith RemaxClassroom Teacher Greg Knowlton Social Studies DepartmentClassroom Teacher Stacy Nichols CAREClassroom Teacher Brittany Ondreas Science DepartmentClassroom Teacher Dana Searcy PE/ Girl's AthleticsClassroom Teacher Jodi Wakefield ELAR DepartmentClassroom Teacher Naomi Zamora Fine Arts DepartmentCommunity Representative Rick Crabtree CommunityCommunity Representative Pastor Kelli CommunityDEIAC Sassman, Joan Math DepartmentDistrict-level Professional Robin Sonsel DistrictNon-classroom Professional Rouse, Mark Instructional SpecialistParaprofessional Patty Jenkins RegistarParent Shannon Garcia Parent
Travis Middle SchoolGenerated by Plan4Learning.com 38 of 43 Campus #043
January 19, 2017 1:01 pm
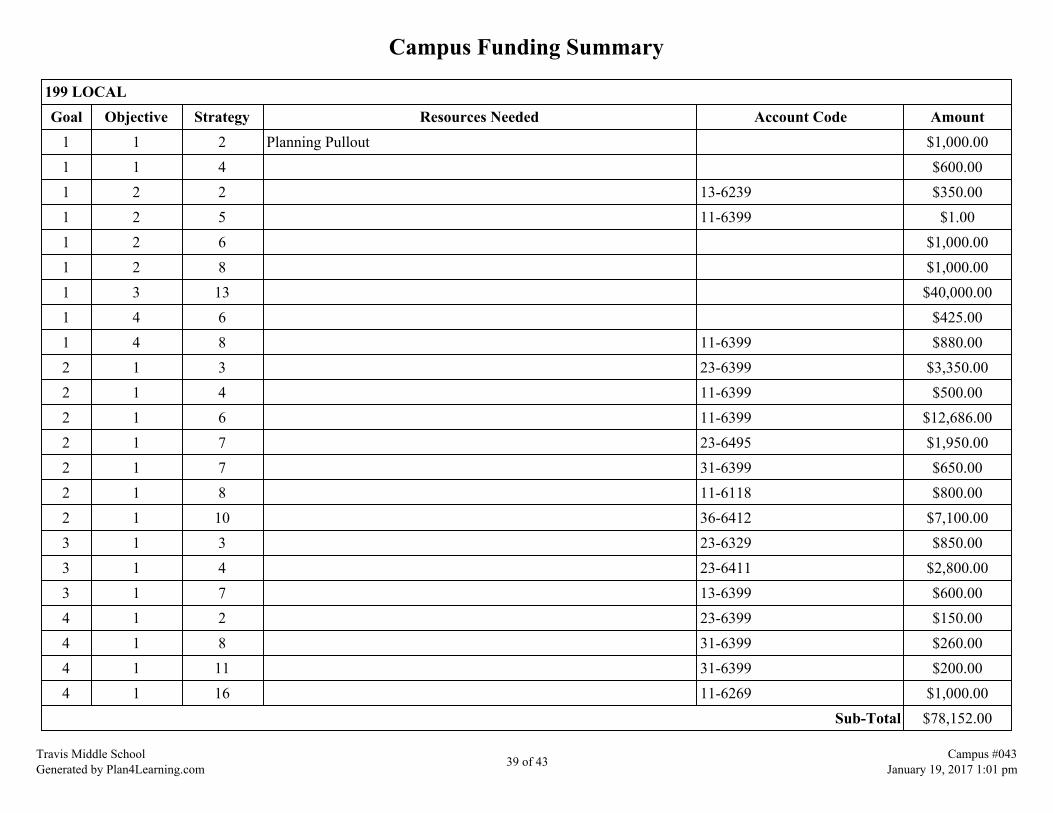
Campus Funding Summary
199 LOCALGoal Objective Strategy Resources Needed Account Code Amount
1 1 2 Planning Pullout $1,000.001 1 4 $600.001 2 2 13-6239 $350.001 2 5 11-6399 $1.001 2 6 $1,000.001 2 8 $1,000.001 3 13 $40,000.001 4 6 $425.001 4 8 11-6399 $880.002 1 3 23-6399 $3,350.002 1 4 11-6399 $500.002 1 6 11-6399 $12,686.002 1 7 23-6495 $1,950.002 1 7 31-6399 $650.002 1 8 11-6118 $800.002 1 10 36-6412 $7,100.003 1 3 23-6329 $850.003 1 4 23-6411 $2,800.003 1 7 13-6399 $600.004 1 2 23-6399 $150.004 1 8 31-6399 $260.004 1 11 31-6399 $200.004 1 16 11-6269 $1,000.00
Sub-Total $78,152.00
Travis Middle SchoolGenerated by Plan4Learning.com 39 of 43 Campus #043
January 19, 2017 1:01 pm
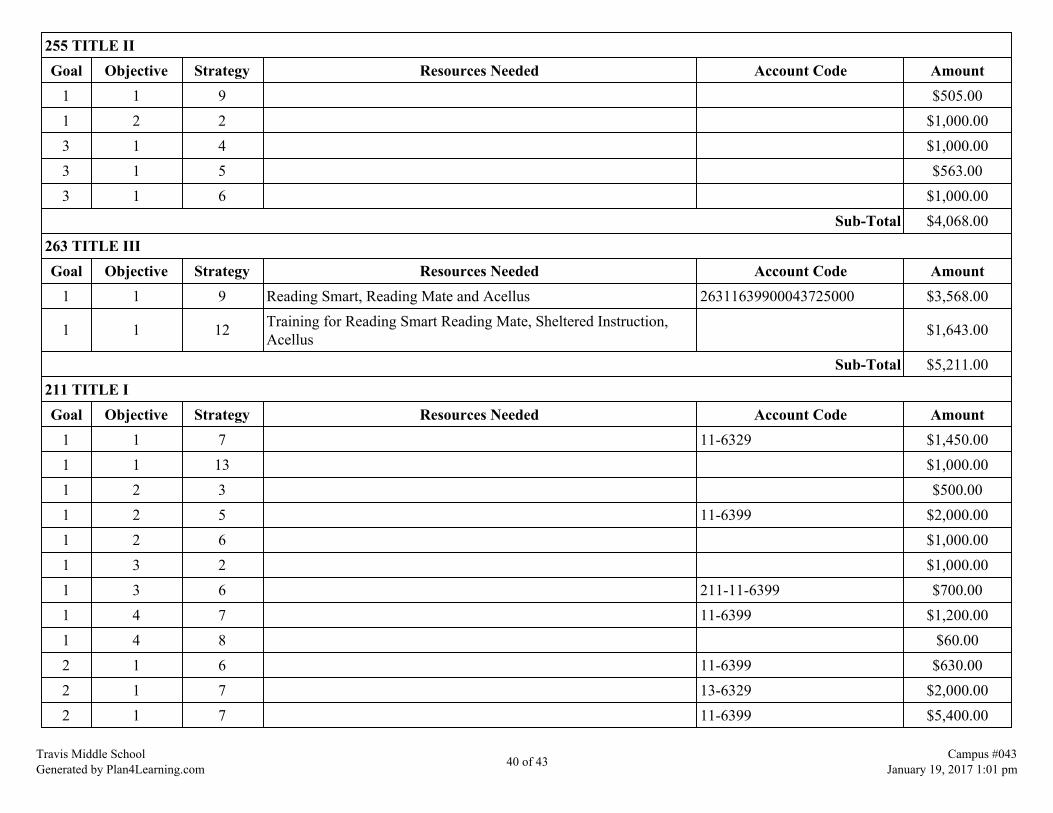
255 TITLE IIGoal Objective Strategy Resources Needed Account Code Amount
1 1 9 $505.001 2 2 $1,000.003 1 4 $1,000.003 1 5 $563.003 1 6 $1,000.00
Sub-Total $4,068.00263 TITLE IIIGoal Objective Strategy Resources Needed Account Code Amount
1 1 9 Reading Smart, Reading Mate and Acellus 26311639900043725000 $3,568.00
1 1 12 Training for Reading Smart Reading Mate, Sheltered Instruction,Acellus $1,643.00
Sub-Total $5,211.00211 TITLE IGoal Objective Strategy Resources Needed Account Code Amount
1 1 7 11-6329 $1,450.001 1 13 $1,000.001 2 3 $500.001 2 5 11-6399 $2,000.001 2 6 $1,000.001 3 2 $1,000.001 3 6 211-11-6399 $700.001 4 7 11-6399 $1,200.001 4 8 $60.002 1 6 11-6399 $630.002 1 7 13-6329 $2,000.002 1 7 11-6399 $5,400.00
Travis Middle SchoolGenerated by Plan4Learning.com 40 of 43 Campus #043
January 19, 2017 1:01 pm

2 1 8 31-6395 $587.002 1 8 31-6119 $53,972.002 1 9 11-6119 $47,364.003 1 2 13-6329 $1,785.003 1 5 $645.005 1 5 $2,000.005 1 6 61-6239, 6399, 6411 $1,400.00
Sub-Total $124,693.00461 CAMPUS ACTIVITY ACCOUNTGoal Objective Strategy Resources Needed Account Code Amount
1 2 2 11-6399 $784.001 2 5 11-6399 $585.001 3 2 13-6239 $200.001 3 3 13-6239 $200.001 3 4 11-6499 $500.002 1 6 11-6399 $1,425.002 1 10 11-6412 $458.003 1 3 23-6499 $500.004 1 4 $2,500.004 1 5 $1,092.004 1 6 $500.004 1 11 11-6499 $350.004 1 14 $1,000.005 1 3 $100.00
Sub-Total $10,194.00224 IDEAGoal Objective Strategy Resources Needed Account Code Amount
2 1 6 $50.40
Travis Middle SchoolGenerated by Plan4Learning.com 41 of 43 Campus #043
January 19, 2017 1:01 pm

Sub-Total $50.40GRANT - ALCOAGoal Objective Strategy Resources Needed Account Code Amount
2 1 4 $1,500.00Sub-Total $1,500.00
270 TITLE VIGoal Objective Strategy Resources Needed Account Code Amount
1 2 4 $0.001 3 11 $2,000.001 4 4 $0.001 4 9 $2,000.002 1 2 $1,500.00
Sub-Total $5,500.00Grand Total $229,368.40
Travis Middle SchoolGenerated by Plan4Learning.com 42 of 43 Campus #043
January 19, 2017 1:01 pm

Addendums
Travis Middle SchoolGenerated by Plan4Learning.com 43 of 43 Campus #043
January 19, 2017 1:01 pm
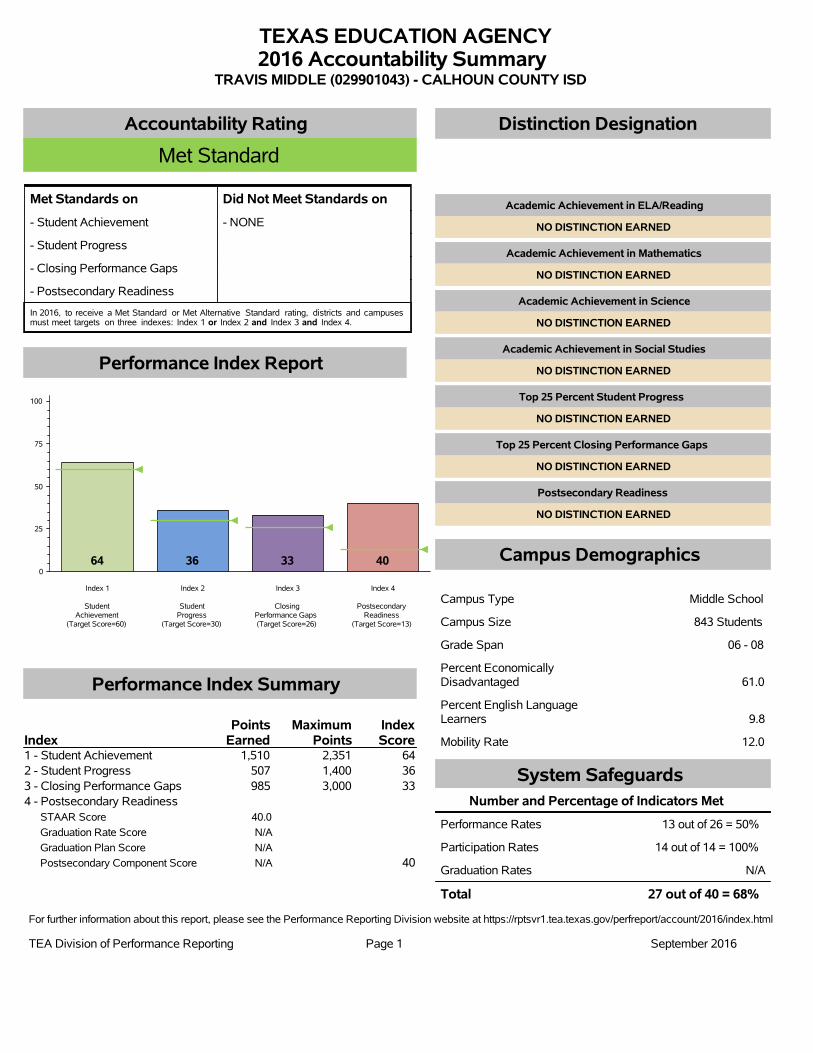
TEXAS EDUCATION AGENCY2016 Accountability Summary
TRAVIS MIDDLE (029901043) - CALHOUN COUNTY ISD
Accountability Rating
Met Standard
Met Standards on Did Not Meet Standards on
- Student Achievement - NONE
- Student Progress
- Closing Performance Gaps
- Postsecondary Readiness
In 2016, to receive a Met Standard or Met Alternative Standard rating, districts and campusesmust meet targets on three indexes: Index 1 or Index 2 and Index 3 and Index 4.
Performance Index Report
0
25
50
75
100
Index 1
StudentAchievement
(Target Score=60)
Index 2
StudentProgress
(Target Score=30)
Index 3
ClosingPerformance Gaps(Target Score=26)
Index 4
PostsecondaryReadiness
(Target Score=13)
64 36 33 40
Performance Index Summary
IndexPoints
EarnedMaximum
PointsIndexScore
1 - Student Achievement 1,510 2,351 64
2 - Student Progress 507 1,400 36
3 - Closing Performance Gaps 985 3,000 33
4 - Postsecondary Readiness
STAAR Score 40.0
Graduation Rate Score N/A
Graduation Plan Score N/A
Postsecondary Component Score N/A 40
Distinction Designation
Academic Achievement in ELA/Reading
NO DISTINCTION EARNED
Academic Achievement in Mathematics
NO DISTINCTION EARNED
Academic Achievement in Science
NO DISTINCTION EARNED
Academic Achievement in Social Studies
NO DISTINCTION EARNED
Top 25 Percent Student Progress
NO DISTINCTION EARNED
Top 25 Percent Closing Performance Gaps
NO DISTINCTION EARNED
Postsecondary Readiness
NO DISTINCTION EARNED
Campus Demographics
Campus Type Middle School
Campus Size 843 Students
Grade Span 06 - 08
Percent EconomicallyDisadvantaged 61.0
Percent English LanguageLearners 9.8
Mobility Rate 12.0
System Safeguards
Number and Percentage of Indicators Met
Performance Rates 13 out of 26 = 50%
Participation Rates 14 out of 14 = 100%
Graduation Rates N/A
Total 27 out of 40 = 68%
For further information about this report, please see the Performance Reporting Division website at https://rptsvr1.tea.texas.gov/perfreport/account/2016/index.html
TEA Division of Performance Reporting Page 1 September 2016

TRAVIS UNDER CONSTRUCTION
Our mantra this year aligns with the saying “The Road to Success is always under Construction” we continue to collaborate as a campus in meeting the needs of our students. While our physical building is under construction at Travis we continually work on improving our ability to develop the whole child in “Turning Fiddlers into Sandcrabs, one student at a Time”. ELAR – 6th & 7th grade students have a 103 minute block time. 8th grade students who did not meet Satisfactory Level 2 on 7th grade Reading STAAR also have a 103 minute block time which has been designated as an ELAR Achieve class with a focus to increase student achievement on the 8th grade Reading STARR as well as continued success in their 9th grade ELA class and the English End of Course exam. Mathematics: 6th, 7th, and 8th grade students who did not meet Satisfactory Level 2 on the previous year Math STAAR have a 103 minute block of time for Math Achieve class. 6th, 7th, and 8th grade students who are “bubble” students have a Regular Math class with a Math Lab elective class to provide additional support. We have continued with two types of resource classes as we transition our students into mainstream classes. We have increased our support of students whose academic need warrants the personalization via Resource 2 classes. We have provided two SPED teachers allocated time to work with students who have been assigned ISS consequences to assist in meeting their needs on a daily basis. The support given to our students during their ELAR and Math time will allow us to provide tutoring for 8th grade Social Studies and 8th grade Science as they prepare to take the STAAR in May 2017. Our vision at Travis is Today’s Champions, Tomorrow’s Leaders and we are working on accomplishing these goals via increasing our electives choices to develop the whole child. Leadership classes and Robotics classes were started last year as well as Fiddler Time Journalism, Fiddler Time Broadcasting class, and Fiddler Time Theater Arts class. We have added Pre-Chemistry and Astronomy classes, PE Soccer, and Dance class. In supporting teachers in campus and district endeavors we have arranged for half day planning in September and working on doing the same in October. We are incorporating Lead4ward for data disaggregation and lesson planning to increase the capacity in meeting students’ needs.
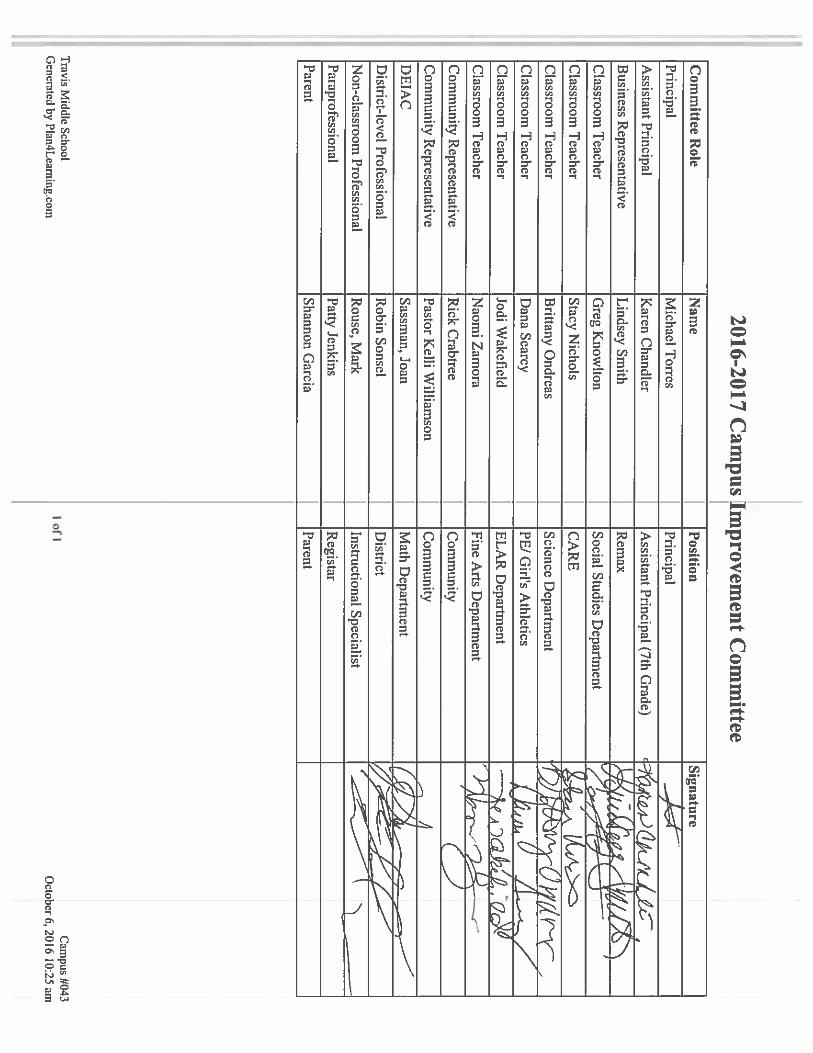
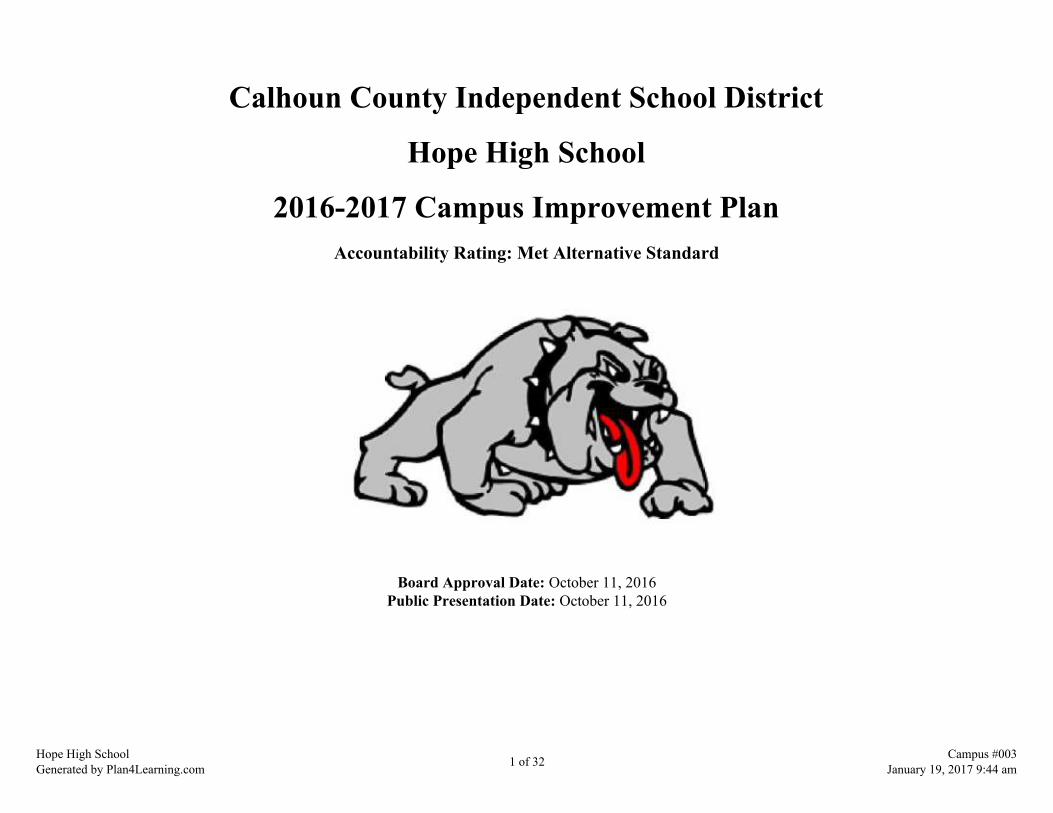
Calhoun County Independent School District
Hope High School
2016-2017 Campus Improvement PlanAccountability Rating: Met Alternative Standard
Board Approval Date: October 11, 2016Public Presentation Date: October 11, 2016
Hope High SchoolGenerated by Plan4Learning.com 1 of 32 Campus #003
January 19, 2017 9:44 am

Mission Statement
All students will develop academic skills with the social andcultural awareness necessary for successful transition from
school to work and/or higher learning.
Vision
Excellence is not an act but a habit!
Value Statement
We WILL make a difference!
Hope High SchoolGenerated by Plan4Learning.com 2 of 32 Campus #003
January 19, 2017 9:44 am

Comprehensive Needs Assessment
Needs Assessment Overview
Hope High School is a non-traditional campus where students complete all graduation requirements through an individualized planresulting in a traditional diploma. Students work independently as well as in small groups to master state standards and earn the creditsrequired for graduation. STAAR End of Course preparation is also embedded in the Hope curriculum. Students who meet one or more at-risk indicators as well as students who have dropped out and are returning to school are supported through academic intervention andfaculty mentorship. Hope High School provides a dynamic and innovative approach to curriculum and instruction that requires non-traditional planning. Our faculty is committed to providing an academically rich and emotionally supportive environment focused ongraduation and post high school success. We will continue to seek out these approaches as well as creating opportunities for students toengage in community activities.
Hope High SchoolGenerated by Plan4Learning.com 3 of 32 Campus #003
January 19, 2017 9:44 am
Demographics
Demographics Summary
Hope has enrolled students who are pregnant/parents, work to support a family, or students who have been unsuccessful completing agraduation plan in a traditional setting. As an Alternative Education program, 75% of students must meet one or more of the thirteen at-riskcriteria. Additionally, 50% must be 17 years of age or older.
Demographics Strengths
For the 2016-2017 school year, students must complete an application for admission, update a personal resume and create anindividualized data sheet to monitor progress. Students are making progress on a personalized path to graduation and meeting with teachersand the principal regularly to monitor performance. Students are encouraged to maintain the momentum needed to complete an acceleratedgraduation plan through constant feedback, counsel and support.
Demographics Needs
Students at Hope struggle with attendance due to outside factors. Additionally, students struggle creating the momentum needed tocomplete an accelerated graduation plan. To meet these challenges, Hope creates a positive, nurturing environment that communicates dailyregarding absences, personal progress and options for success. All faculty and staff have received professional development regardingstrategies that will motivate and assist at-risk students. More professional development is needed in the area of curriculum development fora more strategic approach to accelerated credit acquisition. Incentives have been initiated to motivate students who struggle with attendanceand endurance in a rigorous academic environment.
Hope High SchoolGenerated by Plan4Learning.com 4 of 32 Campus #003
January 19, 2017 9:44 am
Student Achievement
Student Achievement Summary
Hope exists to meet the needs of the individual student. Each student enrolled at Hope HS has a unique set of circumstances, bothacademically and personally. Some are homeless, some are single parents, some are supporting or helping to support their families, someare several years behind their age-group peers but have finally reached a state of maturity that allows them to recognize the need for a highschool diploma. Each student's circumstance is different, but each has a common goal: earning and receiving a Texas high school diploma. The Hope faculty is focused on identifying student needs and charting a course and a schedule for graduation. A priority in planning is theSTAAR End-of-Course exams that must be taken and passed before graduation and providing intense instruction and/or remediation priorto testing. The second goal is the completion of the academic course credits necessary to meet graduation requirements. Once all testinghas been satisfactorily completed, the primary focus becomes mastering the TEKS and earning the course credits required by the TEA. AtHope High School, student success is measured by the percentage of students who enroll and complete the program with a high schoolcompletion credential, a Hope High School diploma. By those criteria, Hope High has been extraordinarily successful. Since 1997, 888students have earned a high school diploma through Hope High School.
Student Achievement Strengths
For the 2015-2016 school year, Hope High School presented 35 diplomas. Most, if not all, of those students, would have otherwise beendropouts. The Hope High School program stands as the strongest possible evidence of CCISD's commitment to the success of each studententrusted to our care. Students were proud to return to attend a meaningful Hope graduation that celebrated their accomplishments. Manywere the first in their family to graduate from high school.
Student Achievement Needs
Most students come to Hope High School relatively late in their high school careers, often after having been an actual dropout for a periodof time. Many have been at multiple schools in multiple districts, and there are often substantial gaps in their graduation plans. Weidentify gaps, both in terms of mastery of the TEKS as well as in academic credits and design individual graduation plans to address those
Hope High SchoolGenerated by Plan4Learning.com 5 of 32 Campus #003
January 19, 2017 9:44 am

needs. The mission of Hope High School is to address each student's need so that graduation is possible. Professional development forinstructors in the area of curriculum development is necessary to create innovative options for success. Understanding by Designcurriculum writing, the Fundamental Five text and Marzano's Strategies that Work are all supports that would improve the faculty's abilityto meet the needs of students. Additionally, the TAAE conference is needed for all faculty and staff so that available resources are knownand accessed.
Hope High SchoolGenerated by Plan4Learning.com 6 of 32 Campus #003
January 19, 2017 9:44 am

Staff Quality, Recruitment, and Retention
Staff Quality, Recruitment, and Retention Summary
The faculty and staff at Hope are committed to a shared mission of service. All are highly qualified. The faculty's commitment to meetstudent's needs is critical to the success of the program. The intensity of the program is demanding for all professionals. One of the threeteachers is new to Hope this year.
Staff Quality, Recruitment, and Retention Strengths
With the commitment to a shared mission to meet the needs of all students, the faculty is eager and willing to get certified in various areasto give a wider variety of courses that can be offered to the students.
Hope High SchoolGenerated by Plan4Learning.com 7 of 32 Campus #003
January 19, 2017 9:44 am

Curriculum, Instruction, and Assessment
Curriculum, Instruction, and Assessment Summary
The staff at Hope High School is working closely with the counselors and central office curriculum department to meet the needs of thestudents. The Flex staff works closely with the curriculum department and the teachers at the home campus of the students to ensure thatthe students are receiving what they need so the transition back is simple.
Curriculum, Instruction, and Assessment Needs
The 2015-2016 STAAR EOC English results revealed a high priority need for improvement. Research- based resources have beenpurchased to more suitably help meet the needs of the students. As well as the new resources, small group and individual writingassignments, peer editing and small group instruction are being utilized to improve skills.
Hope High SchoolGenerated by Plan4Learning.com 8 of 32 Campus #003
January 19, 2017 9:44 am
Family and Community Involvement
Family and Community Involvement Summary
Family and community involvement is very important for the success of our students. Parents are encouraged to attend the acceptance meeting to know whatis expected from their child.
Family and Community Involvement Strengths
Mid-coast, Gulf Bend and Probation mentors visit FLEX students on the Hope campus. Their support addresses anger management, grades,attendance and successful strategies that will help students transition to their home campus. Hope students have participated in the outdoorclassroom, the Calhoun County Fair and a beach clean up as community service projects. This year a counselor was added to the staff forfour half-days per week to better meet the needs of the students.
Family and Community Involvement Needs
Hope and FLEX students need better access to social services and crisis management. A family specialist or behavior interventionist would beneficiallyconnect students to successful strategies and support agencies.
Hope High SchoolGenerated by Plan4Learning.com 9 of 32 Campus #003
January 19, 2017 9:44 am

Technology
Technology Summary
Hope High School classrooms were moved this summer to the classrooms that were abundantly equipped for the technology usage that isneeded on a non-traditional alternative high school program.
Technology Strengths
Chromecarts are available and are being used in the classrooms.
Technology Needs
The campus is working with Federal Programs to acquire funding for better internet access so that Grad-Point can be more efficientlyaccessed and used to support credit acquisition.
Hope High SchoolGenerated by Plan4Learning.com 10 of 32 Campus #003
January 19, 2017 9:44 am

Comprehensive Needs Assessment Data Documentation
The following data were used to verify the comprehensive needs assessment analysis:
Improvement Planning Data
District goalsCampus goalsCurrent and/or prior year(s) campus and/or district improvement plansCampus and/or district planning and decision making committee(s) meeting data
Accountability Data
Texas Academic Performance Report (TAPR) dataPerformance Index Framework Data: Index 1 - Student AchievementPerformance Index Framework Data: Index 2 - Student ProgressPerformance Index Framework Data: Index 3 - Closing Performance GapsPerformance Index Framework Data: Index 4 - Postsecondary ReadinessPBMAS data
Student Data: Assessments
State and federally required assessment information (e.g. curriculum, eligibility, format, standards, accommodations, TEA information)State of Texas Assessments of Academic Readiness (STAAR) current and longitudinal results, including all versionsSTAAR End-of-Course current and longitudinal results, including all versionsSTAAR Released Test Questions
Student Data: Student Groups
Number of students assigned to each special program, including analysis of academic achievement, race, ethnicity, gender, etcSpecial education population, including performance, discipline, attendance, and mobilityMigrant population, including performance, discipline, attendance and mobilityAt-Risk population, including performance, discipline, attendance and mobilityELL or LEP data, including academic achievement, support and accommodation needs, race, ethnicity, gender, etcSection 504 dataHomeless data
Student Data: Behavior and Other Indicators
Completion rates and/or graduation rates dataAnnual dropout rate dataAttendance dataDiscipline records
Hope High SchoolGenerated by Plan4Learning.com 11 of 32 Campus #003
January 19, 2017 9:44 am

Employee Data
Campus leadership dataProfessional development needs assessment dataPDAS and/or T-TESS
Support Systems and Other Data
Budgets/entitlements and expenditures dataStudy of best practices
Hope High SchoolGenerated by Plan4Learning.com 12 of 32 Campus #003
January 19, 2017 9:44 am

Goals
Goal 1: CCISD will provide learning opportunities that are engaging, rigorous, relevant, and transcend state standardswhile meeting the unique needs of each student on the alternative high school campus.
Performance Objective 1: When appropriate for the HHS student's graduation plan, the student will participate in ELAR activities that promote creativity,collaboration, and problem solving.
Evaluation Data Source(s) 1: ELA EOC and (where appropriate) Exit TAKS test results.
Summative Evaluation 1:
Strategy Description Staff Responsiblefor Monitoring Evidence that Demonstrates Success
ReviewsFormative Summative
Nov Jan Mar JuneState System Safeguard Strategy
1) Teachers will analyze STAAR ELAR EOC data to focus, revise, and improveinstruction.
Finster, Offutt,Tinsley, andDerosia.
Individualized instruction in the ELAR area thatreflects appropriate rigor for STAAR prep.
2) HHS teachers will assess each incoming student. An individual graduationplan will be provided to each student, identifying areas of academic strengthsand addressing individual areas of need.
Finster, Derosia,Tinsley, HighSchool Counselor
Diagnostic tests and STAAR EOC exam scores,analysis of prior academic performance (transcripts,gradebook, etc.) Individual graduation plan for eachHope High School student will be on file in the office.
State System Safeguard Strategy3) Students will write 6-10 expository essays from various media (newspapers,magazines, internet, etc.), including who, what, when, where, and identifyingcommon themes.
Derosia, Weaver,Smith
Diagnostic tests; teacher analysis of student writingsamples. Increase STAAR passing rate to 100% LevelI
STAAR Scores reveal a need for better writingpreparation.
State System Safeguard Strategy4) Generate research/ writing assignments in the social studies class that buildbackground knowledge and meet TEKS for ELA/US History/Governmentcourse.
Derosia, Weaver Measureable progress on graduation plan electivecredit for all students enrolled. Improve expositorywriting skills .
Students acquiring ELAR III and IV credit throughcompletion of accelerated course requirements.
State System Safeguard Strategy5) Teach techniques for writing open-ended responses.
Weaver, Smith,Derosia, Tinsley
10% increase in average student performance on theopen-ended response on STAAR EOC, benchmark,and practice exams.
Funding Sources: 199 LOCAL - 500.00
Hope High SchoolGenerated by Plan4Learning.com 13 of 32 Campus #003
January 19, 2017 9:44 am

State System Safeguard Strategy6) Provide focused preparation/remediation daily until the HHS student haspassed the Eng I and Eng II STAAR EOC exams.
Derosia Student success on the Eng I and Eng II STAAR EOCexams.
Intervention based on student STAAR data.7) Utilize technology to the maximum extent possible to expand opportunitiesfor learning and communication. Students will become thoroughly familiar andcomfortable with digital media (Chromebooks, United Streaming, Google Apps,You-Tube, Google Classroom, online journalism, etc.) for research and lifeskills.
All staff Quality and facility of student presentations usingdigital media.
Funding Sources: 199 LOCAL - 2500.00
State System Safeguard Strategy8) Edit 3-5 essays and other written materials prior to taking the Eng I and EngII STAAR EOC exams.
Derosia Demonstrable improvement in student's daily writingproducts.
9) Purchase and maintain high interest novels and other written materials usedfor English I-IV and reading classes. Utilize online media as a resource.
Tinsley, Derosia,Finster
Book reports, grades, course completion.
Funding Sources: 199 LOCAL - 1000.0010) Maximize efficient use of time and material resources by taking advantageof cross-curriculum opportunities. For example, a written Social Studiesassignment can also be assessed as an ELA writing assignment or a Chemistryand Math lesson can be combined, addressing the TEKS in both areassimultaneously.
Smith, Weaver,Derosia
Reduced time to complete graduation requirementswhile mastering and applying the appropriate TEKS.
State System Safeguard Strategy11) Hope High School ELA teacher(s) will continue to participate in CCISD andHHS programs to assist teachers in planning and implementing curriculumimprovements necessary to complete the transition to ELA STAAR EOCstandards.
Finster, Derosia Feedback from teachers and facilitator; ELA EOCscores
Funding Sources: 199 LOCAL - 800.00
= Accomplished = Considerable = Some Progress = No Progress = Discontinue
Hope High SchoolGenerated by Plan4Learning.com 14 of 32 Campus #003
January 19, 2017 9:44 am

Goal 1: CCISD will provide learning opportunities that are engaging, rigorous, relevant, and transcend state standards while meeting the unique needs ofeach student on the alternative high school campus.
Performance Objective 2: When appropriate for the HHS student's graduation plan, the student will participate in Math activities that promote creativity,collaboration, and problem solving.
Evaluation Data Source(s) 2: Math (Algebra I) EOC and (where appropriate) Math Exit TAKS test results.
Summative Evaluation 2:
Strategy Description Staff Responsiblefor Monitoring Evidence that Demonstrates Success
ReviewsFormative Summative
Nov Jan Mar June1) Teachers will analyze STAAR Math EOC data to focus, revise, and improveinstruction.
Finster, Smith Individualized instruction in the Math area that reflectsappropriate rigor and details.
2) HHS teachers will assess each incoming student. An individual graduationplan will be provided to each student, identifying areas of academic strength andaddressing individual areas of need.
Finster, Smith,Tinsley, Counselor
Diagnostic tests and STAAR EOC exam scores,analysis of prior academic performance (transcripts,gradebook, etc.) Individual graduation plan for eachHope High School student will be on file in the office.
3) Provide daily practice using calculator functions to solve problems. Smith Alg I EOC results, credit acquisition in acceleratedMath Models, Algebra II.
Funding Sources: 199 LOCAL - 800.004) Analyze Algebra I EOC math data item analysis results to revise and improvelesson plans.
Finster, Smith Individualized lesson plans to address identified areasrequiring intervention.
5) Maximize efficient use of time and material resources by taking advantage ofcross-curriculum opportunities. For example, a Chemistry and Math lesson canbe combined, addressing the TEKS in both areas simultaneously.
Finster, Smith,Derosia, Weaver
Reduced time to complete graduation requirementswhile mastering and applying the appropriate TEKS.
6) Utilize technology to the maximum extent possible to expand opportunitiesfor learning and communication. Students will become thoroughly familiar andcomfortable with digital media (Chromebooks, United Streaming, Google Apps,You-Tube, online journalism, etc.) for research and life skills.
Finster, Smith ,Weaver , Derosia
Quality and facility of student presentations usingdigital media. Accelerated credit acquisition inBIM/CTE .
Funding Sources: 199 LOCAL - 2500.00
7) Focus Math activities on practical life skills to ensure that HHS graduatespossess the knowledge and skills to confidently use math in financial andvocational settings.
Finster, Smith Student participation in Wells Fargo financial literacyprogram as well as accelerated credit acquisition inEconomics.
8) Hope High School Math teacher(s) will continue to participate in CCISD andHHS programs to assist teachers in planning and implementing curriculumimprovements necessary to complete the transition to Math STAAR EOCstandards.
Finster, Smith,Jurica
Accelerated credit acquisition in ALG, math Models,Geometry and Algebra II. Increase in the number ofrecommended graduation plans.
Hope High SchoolGenerated by Plan4Learning.com 15 of 32 Campus #003
January 19, 2017 9:44 am

= Accomplished = Considerable = Some Progress = No Progress = Discontinue
Hope High SchoolGenerated by Plan4Learning.com 16 of 32 Campus #003
January 19, 2017 9:44 am

Goal 1: CCISD will provide learning opportunities that are engaging, rigorous, relevant, and transcend state standards while meeting the unique needs ofeach student on the alternative high school campus.
Performance Objective 3: When appropriate for the HHS student's graduation plan, the student will participate in Science activities that promote creativity,collaboration, and problem solving.
Evaluation Data Source(s) 3: Science (Biology) EOC and (where appropriate) Exit TAKS test results.
Summative Evaluation 3:
Strategy Description Staff Responsiblefor Monitoring Evidence that Demonstrates Success
ReviewsFormative Summative
Nov Jan Mar June1) Teachers will analyze STAAR Science (Biology I) EOC data to focus, revise,and improve instruction.
Finster, Weaver Individualized instruction in the Science area thatreflects appropriate rigor and details.
2) HHS teachers will assess each incoming student. An individual graduationplan will be provided to each student, leveraging areas of academic strength andaddressing individual areas of need.
Finster, Weaver,Tinsley, Counselor
Diagnostic tests and STAAR EOC exam scores,analysis of prior academic performance (transcripts,gradebook, etc.) Individual graduation plan for eachHope High School student will be on file in the office.
3) Provide bi-weekly hands-on science experiences in a laboratory setting. Weaver Observation of student understanding, classroom testresults
4) Continue to update and improve Science laboratory and add to availableequipment.
Finster, Weaver,Paterson
Use of lab and mastery of lab skills by students.
Funding Sources: 199 LOCAL - 1000.005) Take a field trip to Palacios or Point Comfort to monitor local waterways atleast once a semester using water testing kits, taking depth measurements, andusing seining and plankton nets.
Weaver Students consistently use learned procedures correctlyand are able to apply the data collected to address real-world situations.
Funding Sources: 199 LOCAL - 200.006) Whenever appropriate, use computer simulations for lab activities for whichactual materials are problematic (e.g.: dissections) or are unavailable ordangerous (e.g.: toxins, flammables).
Weaver andPaterson
Demonstrated mastery of laboratory skills, Quiz/testresults
Funding Sources: 199 LOCAL - 1000.00
7) HHS will instill and enhance student environmental awareness through fieldtrips to the Calhoun County Recycling Center and school-wide recyclingactivities.
Finster and Weaver Student participation.
Funding Sources: 199 LOCAL - 200.00
8) Hope High School Science teacher(s) will continue to participate in CCISDand HHS programs to assist teachers in planning and implementing curriculumimprovements necessary to master the Science (Biology I) STAAR EOCstandards.
Finster, Weaver,Paterson and Sonsel
Feedback from teachers and facilitator; Science EOCscores
Funding Sources: 199 LOCAL - 500.00
Hope High SchoolGenerated by Plan4Learning.com 17 of 32 Campus #003
January 19, 2017 9:44 am

= Accomplished = Considerable = Some Progress = No Progress = Discontinue
Hope High SchoolGenerated by Plan4Learning.com 18 of 32 Campus #003
January 19, 2017 9:44 am
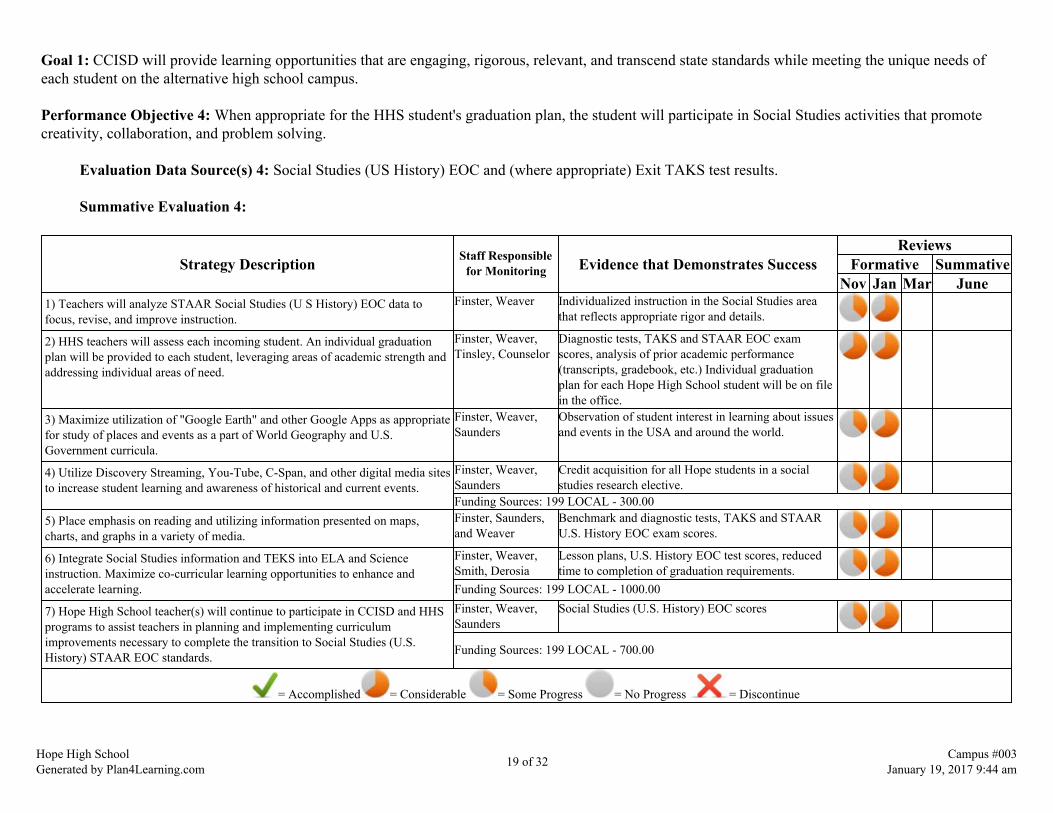
Goal 1: CCISD will provide learning opportunities that are engaging, rigorous, relevant, and transcend state standards while meeting the unique needs ofeach student on the alternative high school campus.
Performance Objective 4: When appropriate for the HHS student's graduation plan, the student will participate in Social Studies activities that promotecreativity, collaboration, and problem solving.
Evaluation Data Source(s) 4: Social Studies (US History) EOC and (where appropriate) Exit TAKS test results.
Summative Evaluation 4:
Strategy Description Staff Responsiblefor Monitoring Evidence that Demonstrates Success
ReviewsFormative Summative
Nov Jan Mar June1) Teachers will analyze STAAR Social Studies (U S History) EOC data tofocus, revise, and improve instruction.
Finster, Weaver Individualized instruction in the Social Studies areathat reflects appropriate rigor and details.
2) HHS teachers will assess each incoming student. An individual graduationplan will be provided to each student, leveraging areas of academic strength andaddressing individual areas of need.
Finster, Weaver,Tinsley, Counselor
Diagnostic tests, TAKS and STAAR EOC examscores, analysis of prior academic performance(transcripts, gradebook, etc.) Individual graduationplan for each Hope High School student will be on filein the office.
3) Maximize utilization of "Google Earth" and other Google Apps as appropriatefor study of places and events as a part of World Geography and U.S.Government curricula.
Finster, Weaver,Saunders
Observation of student interest in learning about issuesand events in the USA and around the world.
4) Utilize Discovery Streaming, You-Tube, C-Span, and other digital media sitesto increase student learning and awareness of historical and current events.
Finster, Weaver,Saunders
Credit acquisition for all Hope students in a socialstudies research elective.
Funding Sources: 199 LOCAL - 300.005) Place emphasis on reading and utilizing information presented on maps,charts, and graphs in a variety of media.
Finster, Saunders,and Weaver
Benchmark and diagnostic tests, TAKS and STAARU.S. History EOC exam scores.
6) Integrate Social Studies information and TEKS into ELA and Scienceinstruction. Maximize co-curricular learning opportunities to enhance andaccelerate learning.
Finster, Weaver,Smith, Derosia
Lesson plans, U.S. History EOC test scores, reducedtime to completion of graduation requirements.
Funding Sources: 199 LOCAL - 1000.00
7) Hope High School teacher(s) will continue to participate in CCISD and HHSprograms to assist teachers in planning and implementing curriculumimprovements necessary to complete the transition to Social Studies (U.S.History) STAAR EOC standards.
Finster, Weaver,Saunders
Social Studies (U.S. History) EOC scores
Funding Sources: 199 LOCAL - 700.00
= Accomplished = Considerable = Some Progress = No Progress = Discontinue
Hope High SchoolGenerated by Plan4Learning.com 19 of 32 Campus #003
January 19, 2017 9:44 am
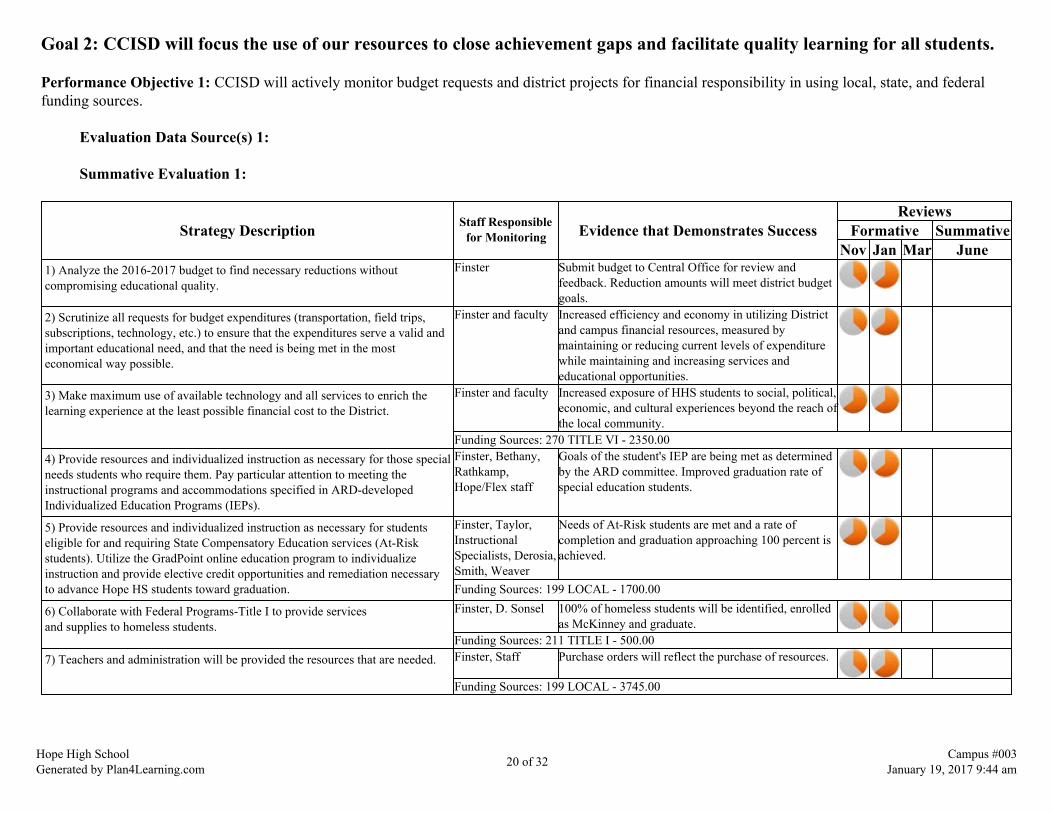
Goal 2: CCISD will focus the use of our resources to close achievement gaps and facilitate quality learning for all students.
Performance Objective 1: CCISD will actively monitor budget requests and district projects for financial responsibility in using local, state, and federalfunding sources.
Evaluation Data Source(s) 1:
Summative Evaluation 1:
Strategy Description Staff Responsiblefor Monitoring Evidence that Demonstrates Success
ReviewsFormative Summative
Nov Jan Mar June1) Analyze the 2016-2017 budget to find necessary reductions withoutcompromising educational quality.
Finster Submit budget to Central Office for review andfeedback. Reduction amounts will meet district budgetgoals.
2) Scrutinize all requests for budget expenditures (transportation, field trips,subscriptions, technology, etc.) to ensure that the expenditures serve a valid andimportant educational need, and that the need is being met in the mosteconomical way possible.
Finster and faculty Increased efficiency and economy in utilizing Districtand campus financial resources, measured bymaintaining or reducing current levels of expenditurewhile maintaining and increasing services andeducational opportunities.
3) Make maximum use of available technology and all services to enrich thelearning experience at the least possible financial cost to the District.
Finster and faculty Increased exposure of HHS students to social, political,economic, and cultural experiences beyond the reach ofthe local community.
Funding Sources: 270 TITLE VI - 2350.004) Provide resources and individualized instruction as necessary for those specialneeds students who require them. Pay particular attention to meeting theinstructional programs and accommodations specified in ARD-developedIndividualized Education Programs (IEPs).
Finster, Bethany,Rathkamp,Hope/Flex staff
Goals of the student's IEP are being met as determinedby the ARD committee. Improved graduation rate ofspecial education students.
5) Provide resources and individualized instruction as necessary for studentseligible for and requiring State Compensatory Education services (At-Riskstudents). Utilize the GradPoint online education program to individualizeinstruction and provide elective credit opportunities and remediation necessaryto advance Hope HS students toward graduation.
Finster, Taylor,InstructionalSpecialists, Derosia,Smith, Weaver
Needs of At-Risk students are met and a rate ofcompletion and graduation approaching 100 percent isachieved.
Funding Sources: 199 LOCAL - 1700.00
6) Collaborate with Federal Programs-Title I to provide servicesand supplies to homeless students.
Finster, D. Sonsel 100% of homeless students will be identified, enrolledas McKinney and graduate.
Funding Sources: 211 TITLE I - 500.007) Teachers and administration will be provided the resources that are needed. Finster, Staff Purchase orders will reflect the purchase of resources.
Funding Sources: 199 LOCAL - 3745.00
Hope High SchoolGenerated by Plan4Learning.com 20 of 32 Campus #003
January 19, 2017 9:44 am
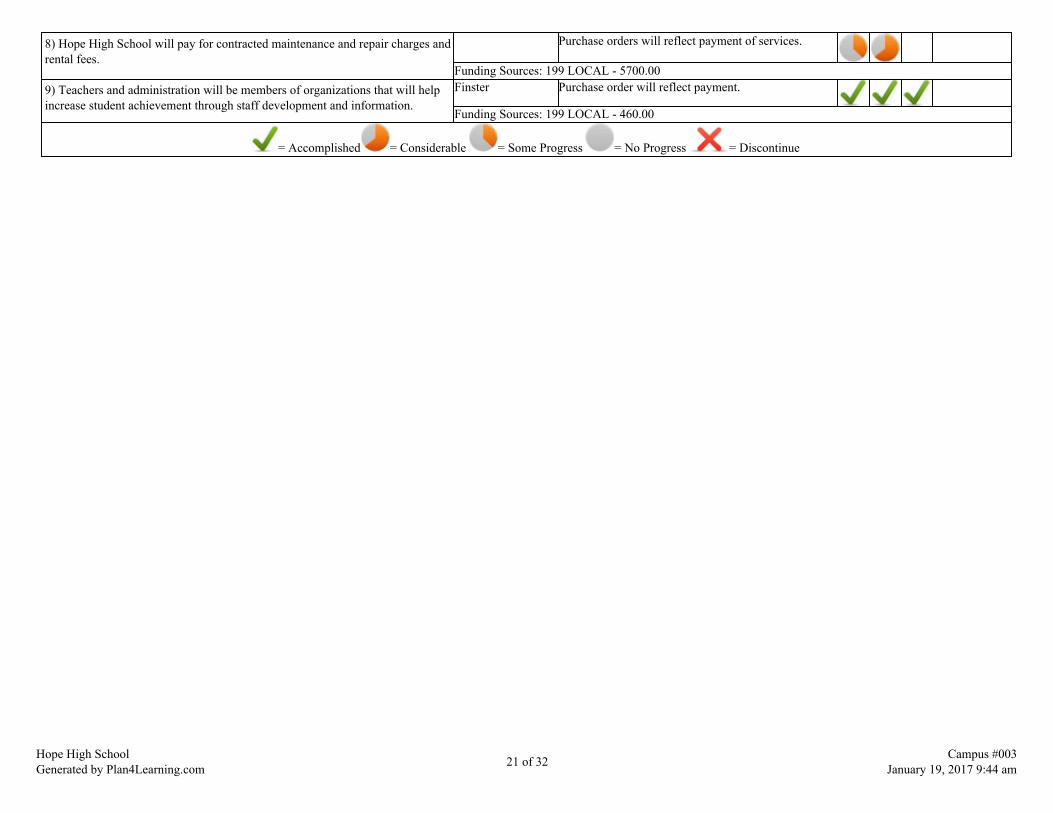
8) Hope High School will pay for contracted maintenance and repair charges andrental fees.
Purchase orders will reflect payment of services.
Funding Sources: 199 LOCAL - 5700.009) Teachers and administration will be members of organizations that will helpincrease student achievement through staff development and information.
Finster Purchase order will reflect payment.
Funding Sources: 199 LOCAL - 460.00
= Accomplished = Considerable = Some Progress = No Progress = Discontinue
Hope High SchoolGenerated by Plan4Learning.com 21 of 32 Campus #003
January 19, 2017 9:44 am
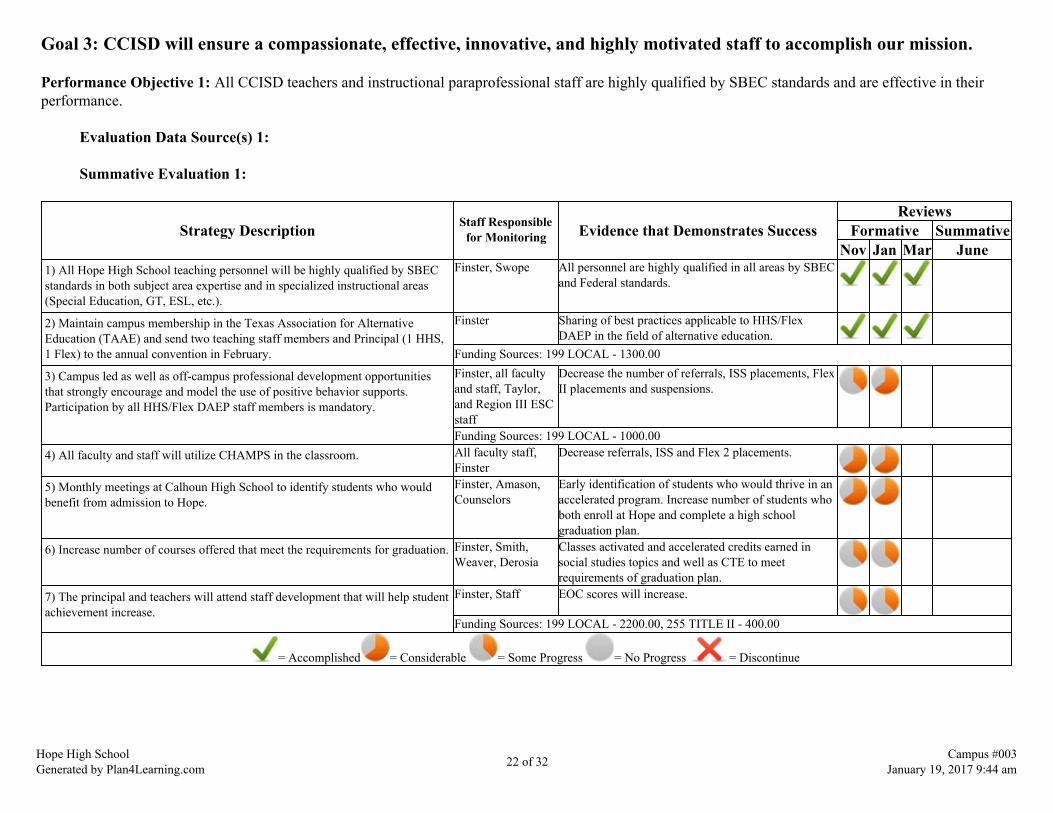
Goal 3: CCISD will ensure a compassionate, effective, innovative, and highly motivated staff to accomplish our mission.
Performance Objective 1: All CCISD teachers and instructional paraprofessional staff are highly qualified by SBEC standards and are effective in theirperformance.
Evaluation Data Source(s) 1:
Summative Evaluation 1:
Strategy Description Staff Responsiblefor Monitoring Evidence that Demonstrates Success
ReviewsFormative Summative
Nov Jan Mar June1) All Hope High School teaching personnel will be highly qualified by SBECstandards in both subject area expertise and in specialized instructional areas(Special Education, GT, ESL, etc.).
Finster, Swope All personnel are highly qualified in all areas by SBECand Federal standards.
2) Maintain campus membership in the Texas Association for AlternativeEducation (TAAE) and send two teaching staff members and Principal (1 HHS,1 Flex) to the annual convention in February.
Finster Sharing of best practices applicable to HHS/FlexDAEP in the field of alternative education.
Funding Sources: 199 LOCAL - 1300.00
3) Campus led as well as off-campus professional development opportunitiesthat strongly encourage and model the use of positive behavior supports.Participation by all HHS/Flex DAEP staff members is mandatory.
Finster, all facultyand staff, Taylor,and Region III ESCstaff
Decrease the number of referrals, ISS placements, FlexII placements and suspensions.
Funding Sources: 199 LOCAL - 1000.004) All faculty and staff will utilize CHAMPS in the classroom. All faculty staff,
FinsterDecrease referrals, ISS and Flex 2 placements.
5) Monthly meetings at Calhoun High School to identify students who wouldbenefit from admission to Hope.
Finster, Amason,Counselors
Early identification of students who would thrive in anaccelerated program. Increase number of students whoboth enroll at Hope and complete a high schoolgraduation plan.
6) Increase number of courses offered that meet the requirements for graduation. Finster, Smith,Weaver, Derosia
Classes activated and accelerated credits earned insocial studies topics and well as CTE to meetrequirements of graduation plan.
7) The principal and teachers will attend staff development that will help studentachievement increase.
Finster, Staff EOC scores will increase.
Funding Sources: 199 LOCAL - 2200.00, 255 TITLE II - 400.00
= Accomplished = Considerable = Some Progress = No Progress = Discontinue
Hope High SchoolGenerated by Plan4Learning.com 22 of 32 Campus #003
January 19, 2017 9:44 am

Goal 4: CCISD will provide learning environments that are safe and secure for all students, faculty, and staff.
Performance Objective 1: The district will ensure a safe and positive learning environment.
Evaluation Data Source(s) 1:
Summative Evaluation 1:
Strategy Description Staff Responsiblefor Monitoring Evidence that Demonstrates Success
ReviewsFormative Summative
Nov Jan Mar June1) Maintain existing campus-wide video surveillance system. Finster, Hernandez All cameras operational, properly oriented, and
recording.Funding Sources: 199 LOCAL - 1000.00
2) Replace and/or re-key all classroom and entry door locks campus-wide. Finster andHernandez
Doors will be secure and a coherent, consistent systemof key accountability will be in place
Funding Sources: 199 LOCAL - 1000.003) Conduct fire, tornado, and/or intruder drills at least monthly. Finster Demonstrated teacher and student knowledge of and
adherence to emergency procedures4) Make an all-out effort to make the Hope High School graduation ceremonyand associated events (graduation breakfast, barbeque, pictures, announcements,engraved diplomas) a positive and memorable event for both graduates and theirfamilies.
Finster, Smith ,Weaver , Derosia,Key and CCISDBoard of Trustees
Feedback from graduates and the community
Funding Sources: 461 CAMPUS ACTIVITY ACCOUNT - 1000.005) Campus wide use of CHAMPS positive behavior supports with green, yellowand red levels.
Finster, Smith,Weaver, Offutt,Key, Falcon,Saunders,Havranek, Paterson,Derosia, Carreon,Tinsley, Olascuaga
Decrease in number of suspensions, FLEX 2placements and teacher referrals.
Funding Sources: 199 LOCAL - 200.006) A good behavior and good attendance incentive will be given each Friday forthe Flex students. A good attendance incentive will be given to the Hope HighSchool students.
Finster, Staff Attendance will increase
Funding Sources: 461 CAMPUS ACTIVITY ACCOUNT - 680.00
= Accomplished = Considerable = Some Progress = No Progress = Discontinue
Hope High SchoolGenerated by Plan4Learning.com 23 of 32 Campus #003
January 19, 2017 9:44 am

Goal 5: CCISD will develop and implement a parent and community involvement program that promotes all stakeholders aspartners in the education of our students.
Performance Objective 1: Parent and community involvement will be promoted at the Hope High School campus.
Evaluation Data Source(s) 1:
Summative Evaluation 1:
Strategy Description Staff Responsiblefor Monitoring Evidence that Demonstrates Success
ReviewsFormative Summative
Nov Jan Mar June1) All students and parents will meet with the principal for pre-orientationsession and review of data for graduation plan. The student will participate in anorientation.
Finster, Weaver,Smith, Derosia,Counselor
A personalized graduation plan with data sheet for100% of Hope students. Improved weekly progress ongraduation plan.
Funding Sources: 199 LOCAL - 100.002) HHS students will be actively involved in recycling and beach clean-upefforts under the auspices of the HHS Environmental club.
Finster, Smith,Derosia, Weaver
Student participation
Funding Sources: 461 CAMPUS ACTIVITY ACCOUNT - 100.003) HHS students will organize and participate in volunteer blood and food drivesto support the Red Cross and the local food pantry.
Finster andHope/Flex staff
Student and faculty participation
4) Teachers and principal will contact parents when students are absent or failingto make progress on their weekly goal calendar. Individual conference will beheld to improve performance.
Finster and allfaculty/staff
Time clock (attendance), Daily logs, Phone logs
5) The outdoor basketball court and yard on the HHS campus will be open andavailable for use by the community evenings and weekends.
Finster and CCISDsecurity staff
Positive use of the facility without damage orvandalism.
6) HHS students will invite American Legion Post 167 to participate in thegraduation ceremony.
Finster Observation
7) Discipline conferences address student data including attendance, grades,teacher reports and a plan for success while at FLEX.
Finster, Falcon,Saunders, Offutt,Havranek, Paterson,Tinsley
Fewer disciplinary incidents while at FLEX. Reductionin referrals, ISS placements, FLEX II placements andsuspensions.
= Accomplished = Considerable = Some Progress = No Progress = Discontinue
Hope High SchoolGenerated by Plan4Learning.com 24 of 32 Campus #003
January 19, 2017 9:44 am

State System Safeguard Strategies
Goal Objective Strategy Description1 1 1 Teachers will analyze STAAR ELAR EOC data to focus, revise, and improve instruction.
1 1 3 Students will write 6-10 expository essays from various media (newspapers, magazines, internet, etc.), including who, what,when, where, and identifying common themes.
1 1 4 Generate research/ writing assignments in the social studies class that build background knowledge and meet TEKS forELA/US History/Government course.
1 1 5 Teach techniques for writing open-ended responses.1 1 6 Provide focused preparation/remediation daily until the HHS student has passed the Eng I and Eng II STAAR EOC exams.1 1 8 Edit 3-5 essays and other written materials prior to taking the Eng I and Eng II STAAR EOC exams.
1 1 11 Hope High School ELA teacher(s) will continue to participate in CCISD and HHS programs to assist teachers in planning andimplementing curriculum improvements necessary to complete the transition to ELA STAAR EOC standards.
Hope High SchoolGenerated by Plan4Learning.com 25 of 32 Campus #003
January 19, 2017 9:44 am
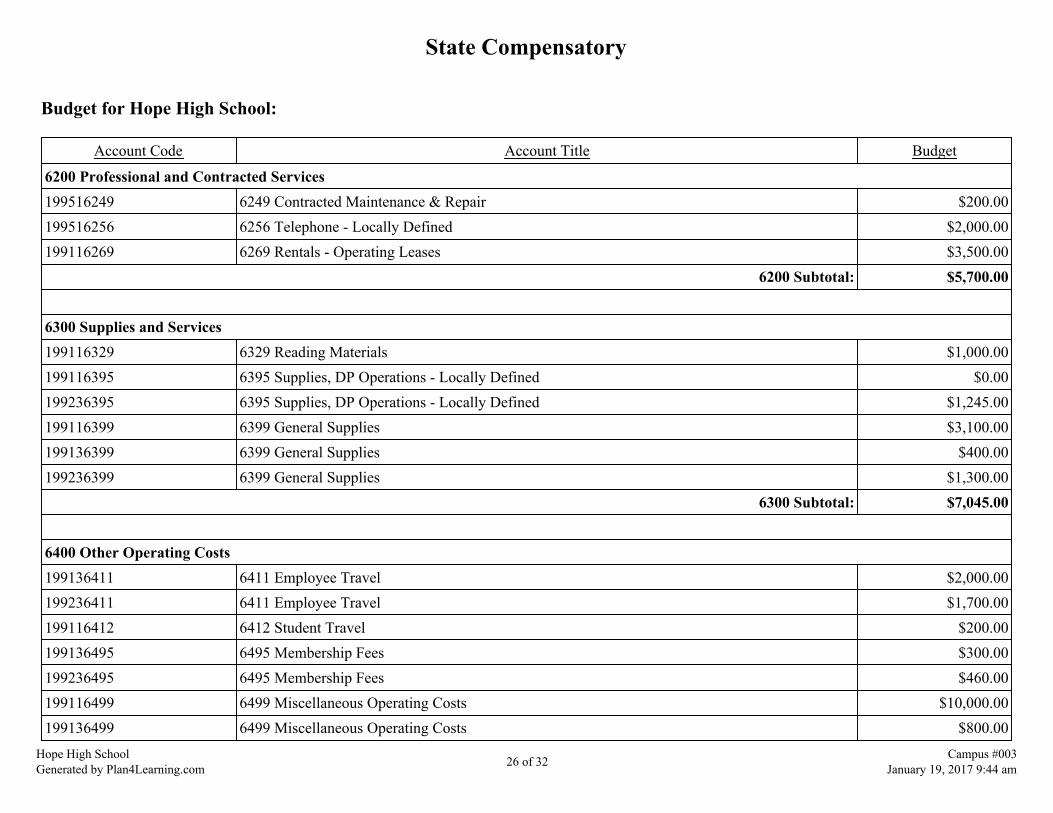
State Compensatory
Budget for Hope High School:
Account Code Account Title Budget
6200 Professional and Contracted Services199516249 6249 Contracted Maintenance & Repair $200.00199516256 6256 Telephone - Locally Defined $2,000.00199116269 6269 Rentals - Operating Leases $3,500.00
6200 Subtotal: $5,700.00 6300 Supplies and Services199116329 6329 Reading Materials $1,000.00199116395 6395 Supplies, DP Operations - Locally Defined $0.00199236395 6395 Supplies, DP Operations - Locally Defined $1,245.00199116399 6399 General Supplies $3,100.00199136399 6399 General Supplies $400.00199236399 6399 General Supplies $1,300.00
6300 Subtotal: $7,045.00 6400 Other Operating Costs199136411 6411 Employee Travel $2,000.00199236411 6411 Employee Travel $1,700.00199116412 6412 Student Travel $200.00199136495 6495 Membership Fees $300.00199236495 6495 Membership Fees $460.00199116499 6499 Miscellaneous Operating Costs $10,000.00199136499 6499 Miscellaneous Operating Costs $800.00
Hope High SchoolGenerated by Plan4Learning.com 26 of 32 Campus #003
January 19, 2017 9:44 am

199236499 6499 Miscellaneous Operating Costs $500.006400 Subtotal: $15,960.00
Hope High SchoolGenerated by Plan4Learning.com 27 of 32 Campus #003
January 19, 2017 9:44 am
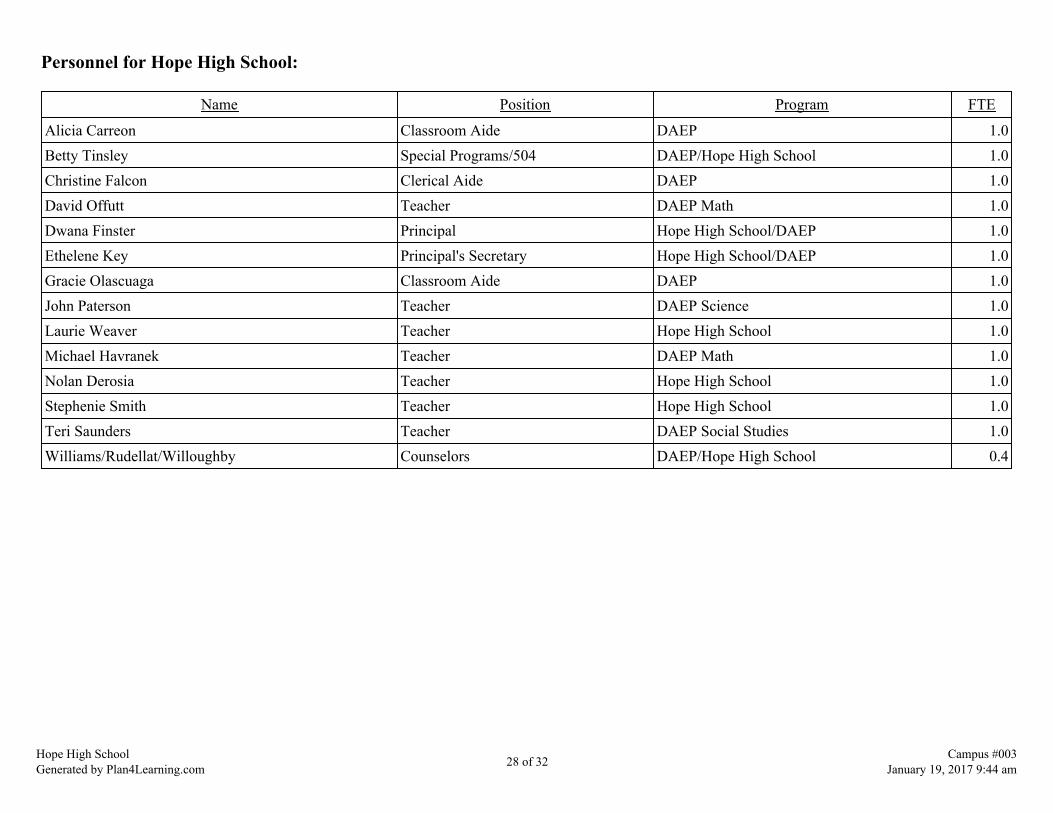
Personnel for Hope High School:
Name Position Program FTE
Alicia Carreon Classroom Aide DAEP 1.0Betty Tinsley Special Programs/504 DAEP/Hope High School 1.0Christine Falcon Clerical Aide DAEP 1.0David Offutt Teacher DAEP Math 1.0Dwana Finster Principal Hope High School/DAEP 1.0Ethelene Key Principal's Secretary Hope High School/DAEP 1.0Gracie Olascuaga Classroom Aide DAEP 1.0John Paterson Teacher DAEP Science 1.0Laurie Weaver Teacher Hope High School 1.0Michael Havranek Teacher DAEP Math 1.0Nolan Derosia Teacher Hope High School 1.0Stephenie Smith Teacher Hope High School 1.0Teri Saunders Teacher DAEP Social Studies 1.0Williams/Rudellat/Willoughby Counselors DAEP/Hope High School 0.4
Hope High SchoolGenerated by Plan4Learning.com 28 of 32 Campus #003
January 19, 2017 9:44 am

Campus Improvement Team
Committee Role Name PositionAdministrator Dwana Finster PrincipalClassroom Teacher Nolan Derosia Hope HS ELA TeacherClassroom Teacher John Paterson Flex Science TeacherClassroom Teacher Teri Saunders Social Studies Flex TeacherClassroom Teacher Stephenie Smith Hope HS Math/CTE TeacherClassroom Teacher Betty Tinsley Special Programs/504/AdministratorClassroom Teacher Laurie Weaver Hope HS Science/Social Studies TeacherCommunity Representative Marsha Sells Community
Hope High SchoolGenerated by Plan4Learning.com 29 of 32 Campus #003
January 19, 2017 9:44 am

Campus Funding Summary
199 LOCALGoal Objective Strategy Resources Needed Account Code Amount
1 1 5 STAAR remediation materials 199116399 $500.001 1 7 Expansion and maintenance of digital hardware and software. 199116499 $2,500.001 1 9 Novels and resource materials 199116329 $1,000.001 1 11 199116399 $800.001 2 3 Maintain/replace graphing calculators 116399 $800.001 2 6 199116499 $2,500.001 3 4 Replace consumables. $1,000.001 3 5 Transportation, testing kits, supplies 199116412 $200.001 3 6 199116399 $1,000.001 3 7 Transportation, recycling containers $200.001 3 8 199116399 $500.001 4 4 Digital media subscriptions as required. $300.001 4 6 199116399 $1,000.001 4 7 199116399 $700.002 1 5 199116499 $1,700.002 1 7 Resources 199136499 $800.002 1 7 199236395 $1,245.002 1 7 199136399 $400.002 1 7 199236399 $1,300.002 1 8 199516249 $200.002 1 8 199516256 $2,000.002 1 8 199116269 $3,500.002 1 9 199236495 $460.003 1 2 TAAE membership fee, Workshop registration fees, Travel, Lodging $1,300.00
Hope High SchoolGenerated by Plan4Learning.com 30 of 32 Campus #003
January 19, 2017 9:44 am
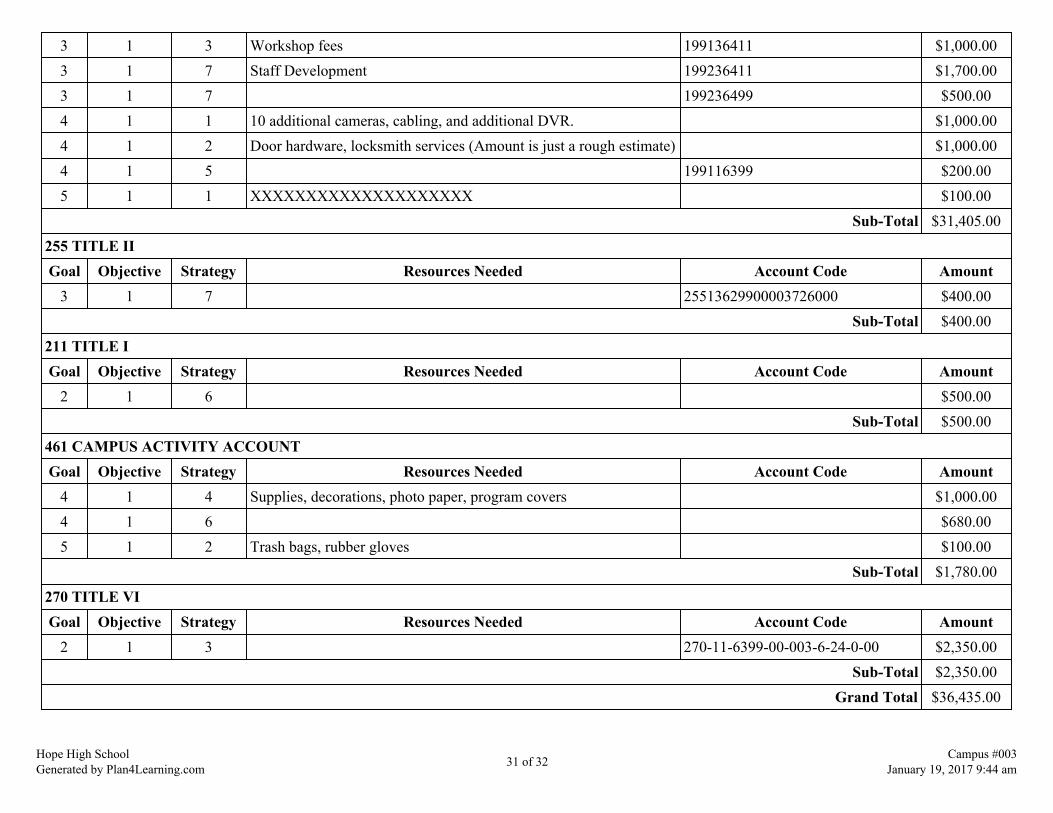
3 1 3 Workshop fees 199136411 $1,000.003 1 7 Staff Development 199236411 $1,700.003 1 7 199236499 $500.004 1 1 10 additional cameras, cabling, and additional DVR. $1,000.004 1 2 Door hardware, locksmith services (Amount is just a rough estimate) $1,000.004 1 5 199116399 $200.005 1 1 XXXXXXXXXXXXXXXXXXXX $100.00
Sub-Total $31,405.00255 TITLE IIGoal Objective Strategy Resources Needed Account Code Amount
3 1 7 25513629900003726000 $400.00Sub-Total $400.00
211 TITLE IGoal Objective Strategy Resources Needed Account Code Amount
2 1 6 $500.00Sub-Total $500.00
461 CAMPUS ACTIVITY ACCOUNTGoal Objective Strategy Resources Needed Account Code Amount
4 1 4 Supplies, decorations, photo paper, program covers $1,000.004 1 6 $680.005 1 2 Trash bags, rubber gloves $100.00
Sub-Total $1,780.00270 TITLE VIGoal Objective Strategy Resources Needed Account Code Amount
2 1 3 270-11-6399-00-003-6-24-0-00 $2,350.00Sub-Total $2,350.00
Grand Total $36,435.00
Hope High SchoolGenerated by Plan4Learning.com 31 of 32 Campus #003
January 19, 2017 9:44 am

Addendums
Hope High SchoolGenerated by Plan4Learning.com 32 of 32 Campus #003
January 19, 2017 9:44 am
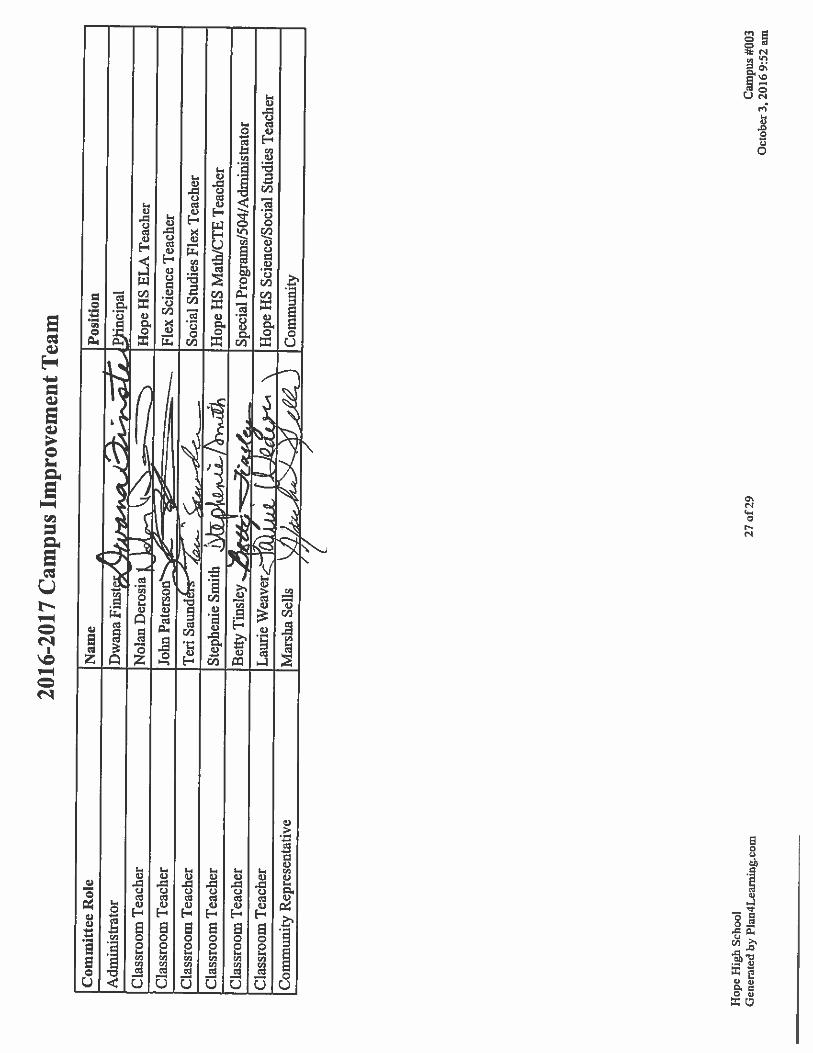
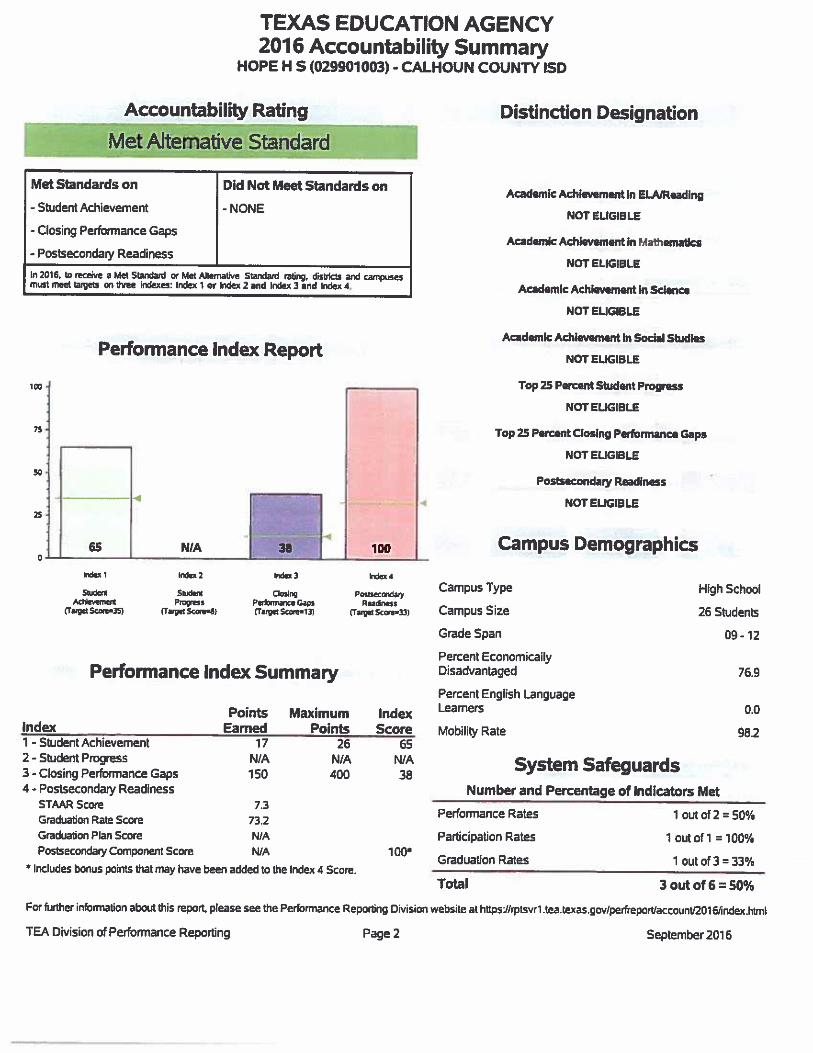

HOPE HIGH SCHOOL 900 N. Virginia St. Rm 10 Port Lavaca, Texas 77979
Phone: 361-552-7084 Fax: 361-551-2677
Hope High School is a non-traditional campus where students complete all graduation requirements through an individualized plan that may include acceleration, credit recovery, computer based instruction, individualized instruction as well as whole group classroom instruction. All students and parents/guardians must commit to an accelerated plan that results in a high school diploma. Our faculty commits to providing an academically rich and emotionally supportive environment focused on graduation and post high school success.
Monthly meetings at Calhoun High School with counselors and principals are held for early identification of students. An application process, student/parent meetings and an intensive orientation are all critical components for admission to Hope. This ensures commitment to an accelerated graduation plan.
An increased focus on data based decisions, graduation plans, accelerated credit
acquisition and STAAR EOC success has been implemented. We feel that this will help us reach a goal of having more Recommended graduates and Foundation with Endorsement graduates.
Hope High School attendance was 79% for last year. This year to increase attendance, an incentive is given each Friday to a student that has been present all week. Principal/student conferences are held as well.
On the DAEP side of the campus, positive behavior strategies are being continued from last year. CHAMPS, a discipline step process, is used. On Friday afternoon, a positive team-building activity is built into the schedule. An incentive is given to a student that has good behavior and perfect attendance for the week.
The campus has a counselor that is present for four ½ days. My expectation is that they will become familiar with the Flex students so that the transition back to the home campus is easier.
Hope and DAEP teachers have been trained with the new district curriculum implementations and have been working closely with other teachers.

Calhoun County Independent School District
Calhoun High School
2016-2017 Campus Improvement PlanAccountability Rating: Met Standard
Distinction Designations:Academic Achievement in Mathematics
Academic Achievement in ScienceTop 25% Student ProgressPostsecondary Readiness
Calhoun High SchoolGenerated by Plan4Learning.com 1 of 49 Campus #001
January 19, 2017 9:44 am

Mission Statement
Calhoun High School will prepare allstudents to be competent, confidentcontributors to our technologically
advancing and rapidly changingmulticultural society.
Calhoun High SchoolGenerated by Plan4Learning.com 2 of 49 Campus #001
January 19, 2017 9:44 am
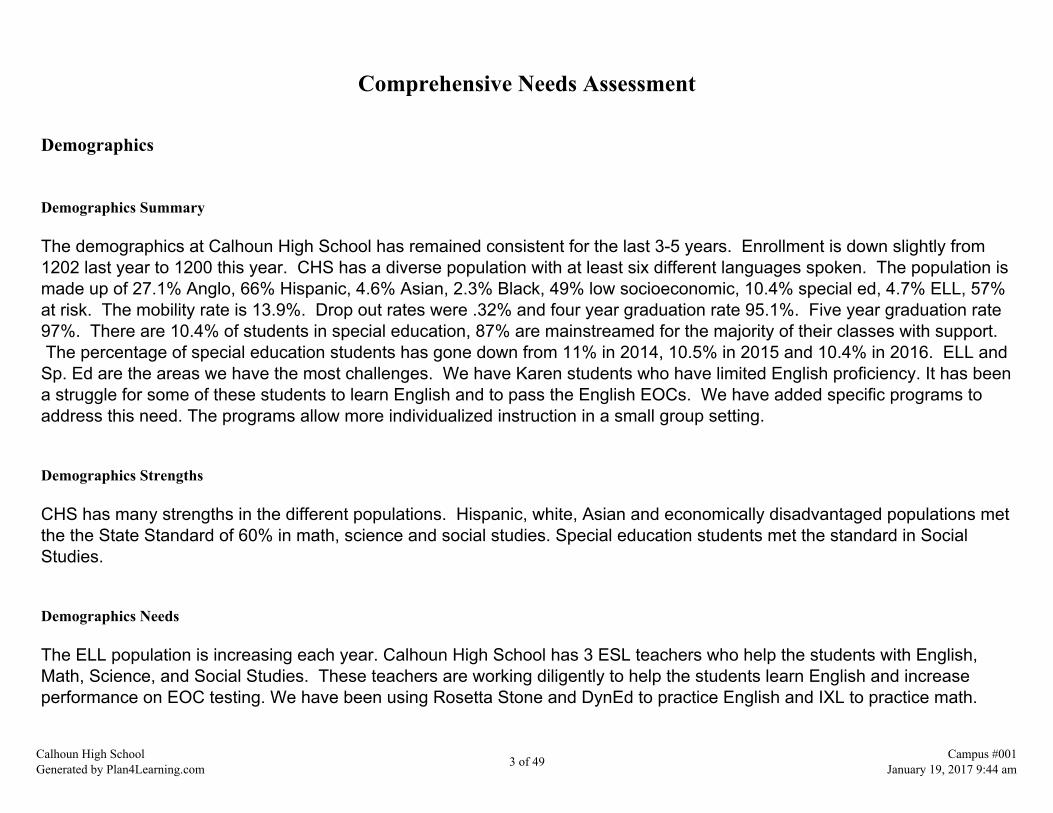
Comprehensive Needs Assessment
Demographics
Demographics Summary
The demographics at Calhoun High School has remained consistent for the last 3-5 years. Enrollment is down slightly from1202 last year to 1200 this year. CHS has a diverse population with at least six different languages spoken. The population ismade up of 27.1% Anglo, 66% Hispanic, 4.6% Asian, 2.3% Black, 49% low socioeconomic, 10.4% special ed, 4.7% ELL, 57%at risk. The mobility rate is 13.9%. Drop out rates were .32% and four year graduation rate 95.1%. Five year graduation rate97%. There are 10.4% of students in special education, 87% are mainstreamed for the majority of their classes with support. The percentage of special education students has gone down from 11% in 2014, 10.5% in 2015 and 10.4% in 2016. ELL andSp. Ed are the areas we have the most challenges. We have Karen students who have limited English proficiency. It has beena struggle for some of these students to learn English and to pass the English EOCs. We have added specific programs toaddress this need. The programs allow more individualized instruction in a small group setting.
Demographics Strengths
CHS has many strengths in the different populations. Hispanic, white, Asian and economically disadvantaged populations metthe the State Standard of 60% in math, science and social studies. Special education students met the standard in SocialStudies.
Demographics Needs
The ELL population is increasing each year. Calhoun High School has 3 ESL teachers who help the students with English,Math, Science, and Social Studies. These teachers are working diligently to help the students learn English and increaseperformance on EOC testing. We have been using Rosetta Stone and DynEd to practice English and IXL to practice math.
Calhoun High SchoolGenerated by Plan4Learning.com 3 of 49 Campus #001
January 19, 2017 9:44 am

For our Special Ed. population, our students are mainstreamed into regular classrooms with support. We have an Excel classfor our Special Ed. students who are behind on credits due to behavior and excessive absences.
Calhoun High SchoolGenerated by Plan4Learning.com 4 of 49 Campus #001
January 19, 2017 9:44 am
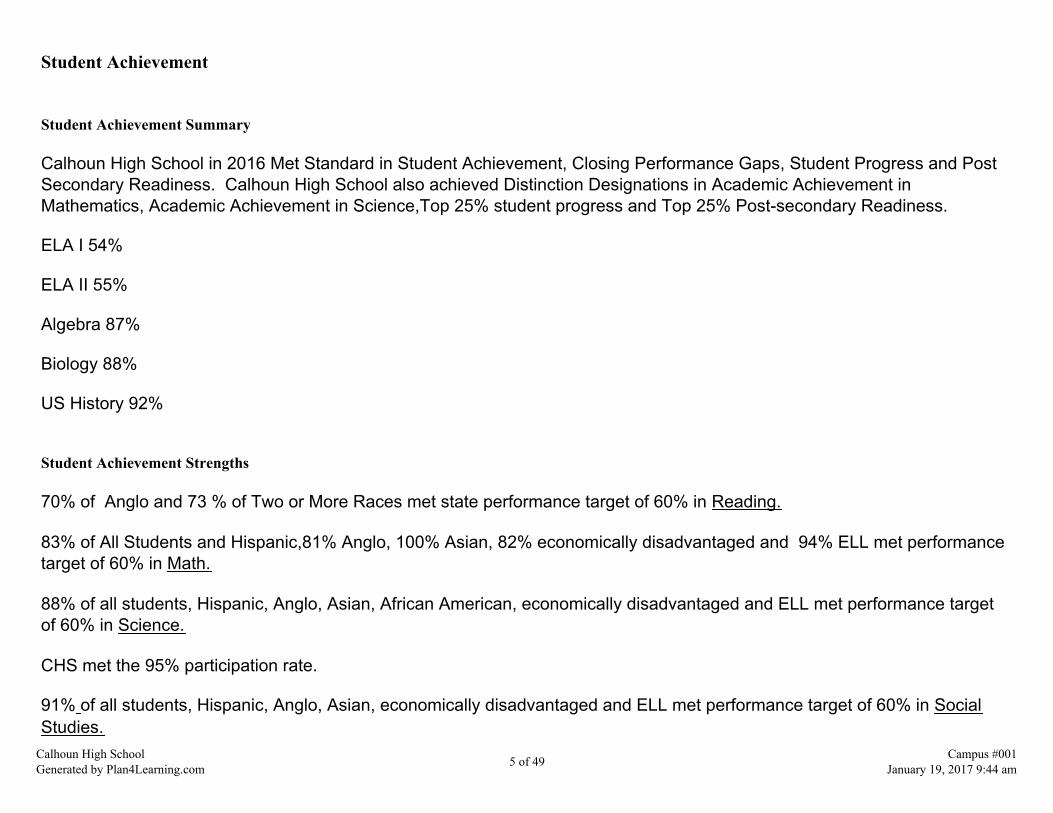
Student Achievement
Student Achievement Summary
Calhoun High School in 2016 Met Standard in Student Achievement, Closing Performance Gaps, Student Progress and PostSecondary Readiness. Calhoun High School also achieved Distinction Designations in Academic Achievement inMathematics, Academic Achievement in Science,Top 25% student progress and Top 25% Post-secondary Readiness.
ELA I 54%
ELA II 55%
Algebra 87%
Biology 88%
US History 92%
Student Achievement Strengths
70% of Anglo and 73 % of Two or More Races met state performance target of 60% in Reading.
83% of All Students and Hispanic,81% Anglo, 100% Asian, 82% economically disadvantaged and 94% ELL met performancetarget of 60% in Math.
88% of all students, Hispanic, Anglo, Asian, African American, economically disadvantaged and ELL met performance targetof 60% in Science.
CHS met the 95% participation rate.
91% of all students, Hispanic, Anglo, Asian, economically disadvantaged and ELL met performance target of 60% in SocialStudies.
Calhoun High SchoolGenerated by Plan4Learning.com 5 of 49 Campus #001
January 19, 2017 9:44 am

99% of all students met participation target of 95% in Reading. 99% of all students met participation target of 95% in Math
All Students, Hispanic, Anglo, and Economically Disadvantaged met Federal Graduation rate.
Student Achievement Needs
All Students Hispanic Asian Econ. Disad. Sp. Ed. ELL
Reading State 60% 58% 55% 38% 53% 20% 18%
Reading Federal 87% 58% 55% 38% 53% 20% 18%
Math State 60% 46%
Math Federal 87% 83% 83% 82% 46%
Calhoun High SchoolGenerated by Plan4Learning.com 6 of 49 Campus #001
January 19, 2017 9:44 am

School Culture and Climate
School Culture and Climate Summary
CHS has an amazing faculty who are driven to ensure student success. Each year, we ask more from our faculty with lesstime to prepare. They have stepped up to the plate and are in full swing of implementing district initiatives. Our studentbody excels at providing campus and community support. CHS has a Council of Councils: a group of student leaders whomeet with the Principal to learn ways to blend our student groups and provide support to all to ensure school unity.
School Culture and Climate Strengths
The office administrators are baking cupcakes and treating each teacher with a cupcake and birthday card on a monthlybasis. Also little cards of appreciation for a job well done are given to the staff that have made a positive impact on students.Teachers receive ice cream passes for appreciation. Students receive ice cream passes from the principal for being a good citizen.Blood drives on campusSchool supply drive for Louisiana schoolsRed Ribbon WeekVeterans Day programBand and Choir community performancesFall Play
School Culture and Climate Needs
Fewer support teachers for mainstreamed classrooms due to budget cutsT-TESS implementationWriting CAs
Calhoun High SchoolGenerated by Plan4Learning.com 7 of 49 Campus #001
January 19, 2017 9:44 am

Staff Quality, Recruitment, and Retention
Staff Quality, Recruitment, and Retention Summary
The District uses an on-line application program which gave us an increase in applications. We use the information aboutcertifications, testing, staff development and service records to ensure that the people we hire meet the highly qualified status.The school district Personnel Director conducts recruitment activities to ensure that highly qualified personnel are hired for allpositions. Participating in job fairs, posting vacancies at multiple sites/organizations and maintaining an active web page helpto spread the word of vacancies.
Staff Quality, Recruitment, and Retention Strengths
100% of our teachers will be highly qualified by the end of the year. We review teacher qualifications every year to ensure thatour students are taught by highly qualified teachers. District Title II money is used to help teachers who are moved to otherpositions to pay for training, content tests, and certification in other fields especially ELL certifications and training. Newteachers are assigned a mentor for the entire year along with certain trainings required of all new staff to CCISD. The districtalso offers stipends for teachers in critical need areas of Math, Science, Foreign Language, Bilingual and Special Education.
CCISD teachers are dedicated to their students and work hard to create a classroom environments that promote creativity andproblem-solving.
Staff Quality, Recruitment, and Retention Needs
The district needs to improve their mentoring program. Currently the district does not have a formal program in place. Theprincipals assign a mentor to each new teacher on their campus. The mentor should have time to work with the new teacherduring a common planning period or same schedule. There has not been enough money to provide for mentoring trainingoutside the district.
The district curriculum specialists serve as mentors and instructional leaders to the new teachers. Principals ask for thespecialists to work with their teachers at department meetings on Common Assessments and instructional strategies.
Calhoun High SchoolGenerated by Plan4Learning.com 8 of 49 Campus #001
January 19, 2017 9:44 am

Calhoun High SchoolGenerated by Plan4Learning.com 9 of 49 Campus #001
January 19, 2017 9:44 am

Curriculum, Instruction, and Assessment
Curriculum, Instruction, and Assessment Summary
The curriculum used at Calhoun High School is a combination of teacher and district staff generated and purchased curriculumfrom a variety of resources. Teachers and the district content specialists write and revise the district scope and sequence eachsummer. The scope and sequence is completely aligned with the TEKS and the new STAAR readiness and supportingstandards. All departments develop instructional calendars and YAGs for their classes to guide the instruction throughout thenine week period and year. Each nine weeks the teachers develop Common Assessments from the scope and sequence thatis taken by each student. The data from the assessments is used to plan the next nine weeks and tutorials. The data on eachstudent shows the teacher the progress for the EOC test.
Curriculum, Instruction, and Assessment Strengths
CHS is data driven and the data from the nine weeks Common Assessments helps teachers plan for each grading period.They use the data to improve instruction, plan tutorials and judge the progress of the students towards the EOC tests. Alongwith lesson plans, instructional calendars and Common Assessment data, the teachers do all the planning for each gradingperiod.
Curriculum, Instruction, and Assessment Needs
Teachers are allowed to use many different strategies to present material to the varied learning styles of their students. Thescope and sequence must be covered in order to determine mastery of the concepts tested on the Common Assessments.The challenge is moving from district generated tests by curriculum specialists to teacher generated tests with no commonplanning period.
Calhoun High SchoolGenerated by Plan4Learning.com 10 of 49 Campus #001
January 19, 2017 9:44 am

Family and Community Involvement
Family and Community Involvement Summary
Calhoun High School has increased parental involvement through websites, home mail outs, and electronic parent letters.CHS is personally calling home when students are absent. The district website posts the district scope and sequences forteacher use along with district and school calendars, grade-book portals for parents, menus, AYP letters to parents and manyother required postings. We have two open houses for parents and community members. The first will be October 19 to meetthe teachers and distribute report cards. We have Josten's come to talk to parents about rings and graduation supplies. Thesecond is in March during Public School Week.
Family and Community Involvement Strengths
The district has a Partners in Education (PIE) committee comprised of the five major industries in Calhoun County. Thecommittee has a full-time PIE coordinator. PIE coordinates a mentor and tutor program for the campuses, has career fairs forstudents and promotes academic excellence through the industry partners. The Texas Scholars' program is one of theinitiatives of the PIE Committee. Currently they are working with CCISD staff to implement STEM expectations for high schooland middle school students. They also secure grants for different community projects which promote math and science skills.CHS also has an active Facebook page with over 1000 followers.
Family and Community Involvement Needs
Calhoun High School needs more parental involvement. While many parents attend school functions, a large number ofCalhoun students have parents who work at night and are not at home during critical evening hours. CHS tries to assiststudents with morning tutorials to accommodate students and their parents.
Calhoun High SchoolGenerated by Plan4Learning.com 11 of 49 Campus #001
January 19, 2017 9:44 am

Technology
Technology Summary
All of our core classrooms have chrome-carts. We have four computers labs for classroom use. We are upgrading our librarycomputer lab and GradPoint computer lab. We have added four scanners to enable teachers to utlize the Aware testingcapabilities.
Technology Strengths
CHS is getting upgraded computers and upgraded wiring with more access points to improve our wifi experience.
Calhoun High SchoolGenerated by Plan4Learning.com 12 of 49 Campus #001
January 19, 2017 9:44 am
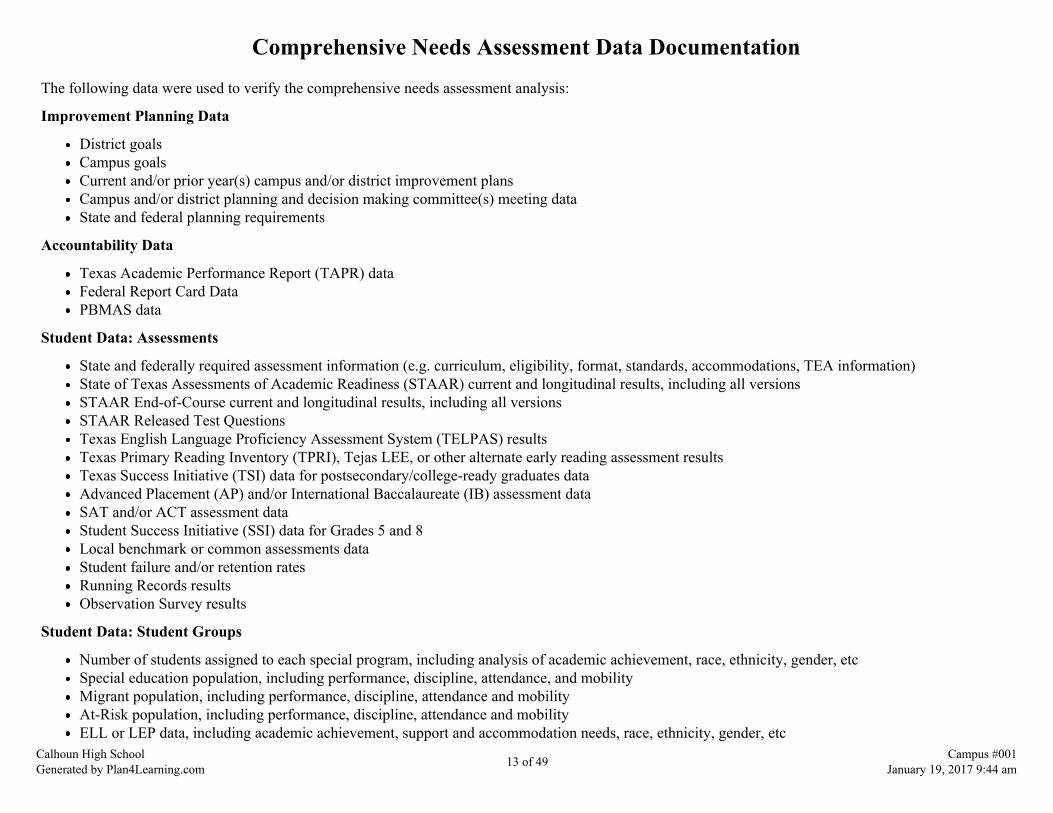
Comprehensive Needs Assessment Data Documentation
The following data were used to verify the comprehensive needs assessment analysis:
Improvement Planning Data
District goalsCampus goalsCurrent and/or prior year(s) campus and/or district improvement plansCampus and/or district planning and decision making committee(s) meeting dataState and federal planning requirements
Accountability Data
Texas Academic Performance Report (TAPR) dataFederal Report Card DataPBMAS data
Student Data: Assessments
State and federally required assessment information (e.g. curriculum, eligibility, format, standards, accommodations, TEA information)State of Texas Assessments of Academic Readiness (STAAR) current and longitudinal results, including all versionsSTAAR End-of-Course current and longitudinal results, including all versionsSTAAR Released Test QuestionsTexas English Language Proficiency Assessment System (TELPAS) resultsTexas Primary Reading Inventory (TPRI), Tejas LEE, or other alternate early reading assessment resultsTexas Success Initiative (TSI) data for postsecondary/college-ready graduates dataAdvanced Placement (AP) and/or International Baccalaureate (IB) assessment dataSAT and/or ACT assessment dataStudent Success Initiative (SSI) data for Grades 5 and 8Local benchmark or common assessments dataStudent failure and/or retention ratesRunning Records resultsObservation Survey results
Student Data: Student Groups
Number of students assigned to each special program, including analysis of academic achievement, race, ethnicity, gender, etcSpecial education population, including performance, discipline, attendance, and mobilityMigrant population, including performance, discipline, attendance and mobilityAt-Risk population, including performance, discipline, attendance and mobilityELL or LEP data, including academic achievement, support and accommodation needs, race, ethnicity, gender, etc
Calhoun High SchoolGenerated by Plan4Learning.com 13 of 49 Campus #001
January 19, 2017 9:44 am

Career and Technical Education (CTE) data, including academic achievement, program growth, race, ethnicity, gender, etcHomeless dataGifted and talented dataResponse to Intervention (RtI) student achievement data
Student Data: Behavior and Other Indicators
Completion rates and/or graduation rates dataAnnual dropout rate dataAttendance dataDiscipline recordsViolence and/or violence prevention recordsTobacco, alcohol, and other drug-use dataStudent surveys and/or other feedback
Employee Data
Professional Learning Communities (PLC) dataStaff surveys and/or other feedbackCampus leadership dataCampus department and/or faculty meeting discussions and dataProfessional development needs assessment data
Parent/Community Data
Parent surveys and/or other feedback
Support Systems and Other Data
Budgets/entitlements and expenditures dataStudy of best practicesAction research resultsOther additional data
Calhoun High SchoolGenerated by Plan4Learning.com 14 of 49 Campus #001
January 19, 2017 9:44 am

Goals
Goal 1: CCISD will provide learning opportunities that are engaging, rigorous, relevant, and transcend state standardswhile meeting individual needs.
Performance Objective 1: All CHS students will participate in ELAR activities that promote creativity, collaboration, and problem solving.
Evaluation Data Source(s) 1: 100% of 9 & 10th grade students at CHS will meet the passing standard for level II and increase level III by 10%on Reading, Writing, and ELA and meet the AYP standard of participation and performance.
Summative Evaluation 1: Met Performance Objective
Strategy Description Title I Staff Responsiblefor Monitoring Evidence that Demonstrates Success
ReviewsFormative Summative
Nov Jan Mar JuneState System Safeguard Strategy
Critical Success FactorsCSF 1
1) Department Head will have a planning period to work with Admin andDistrict Office Team so there can be coordination of planning for ELL,Mainstream with support, GT and tutorials.
Amason,Dworaczyk
100% of the ELA students will meet the EOC levelII standard and raise the Advanced by 10%.
State System Safeguard StrategyCritical Success Factors
CSF 1 CSF 2
2) All departments/subjects will develop Instructional Calendars for eachnine weeks following the Scope & Sequence. The calendars will be leveledwith readiness and supporting standards and focus on vocabulary.
Amason,Dworaczyk,Teachers
100% of CHS students will meet Level II EOC andAYP Reading, Writing, & ELA standards in 2017and a 10% increase in Level III.
State System Safeguard StrategyCritical Success Factors
CSF 7
3) Implement and improve high quality reading and writing instruction forELL's and other diverse learner populations through training opportunitiesfor all content teachers. *Reading Smart Reading Mate for ELL (Title III)*Reg. 3 Sheltered Instruction (Title 3)
2 Amason, Maggieand Lisa
100% of all students will meet or exceed the reading& writing standards and increase Advanced by 10%.
Funding Sources: 255 TITLE II - $102.50, 263 TITLE III - $540.00
Calhoun High SchoolGenerated by Plan4Learning.com 15 of 49 Campus #001
January 19, 2017 9:44 am
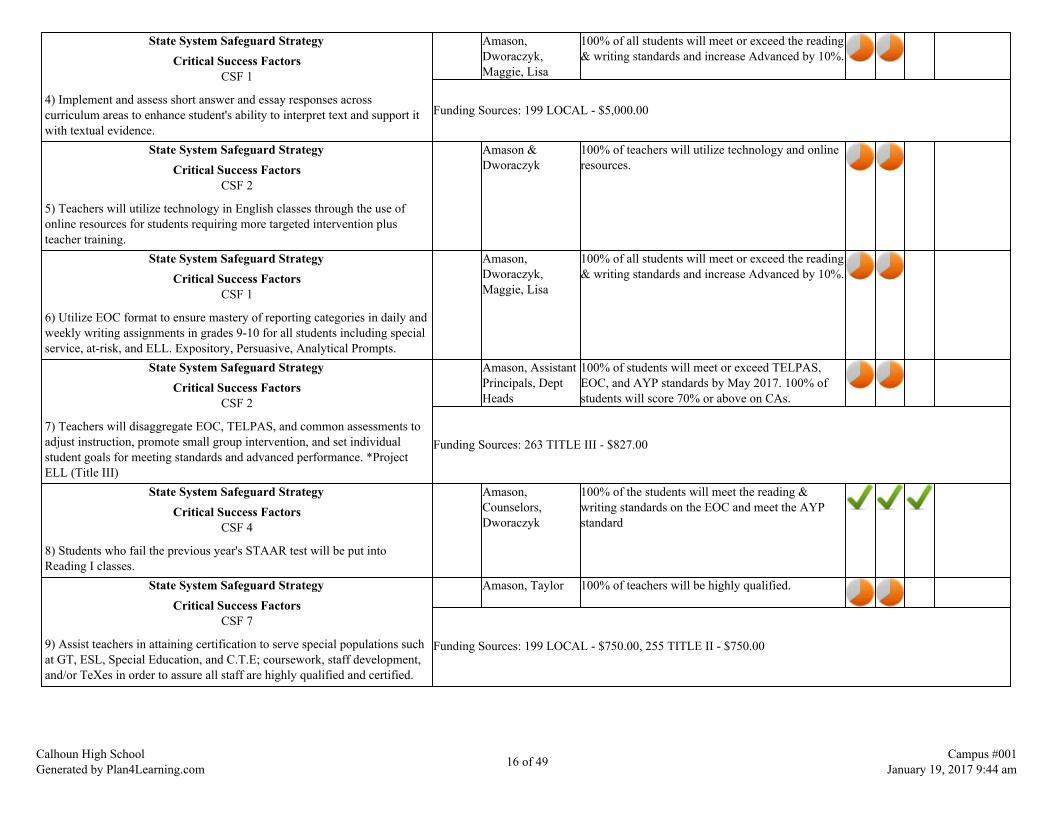
State System Safeguard StrategyCritical Success Factors
CSF 1
4) Implement and assess short answer and essay responses acrosscurriculum areas to enhance student's ability to interpret text and support itwith textual evidence.
Amason,Dworaczyk,Maggie, Lisa
100% of all students will meet or exceed the reading& writing standards and increase Advanced by 10%.
Funding Sources: 199 LOCAL - $5,000.00
State System Safeguard StrategyCritical Success Factors
CSF 2
5) Teachers will utilize technology in English classes through the use ofonline resources for students requiring more targeted intervention plusteacher training.
Amason &Dworaczyk
100% of teachers will utilize technology and onlineresources.
State System Safeguard StrategyCritical Success Factors
CSF 1
6) Utilize EOC format to ensure mastery of reporting categories in daily andweekly writing assignments in grades 9-10 for all students including specialservice, at-risk, and ELL. Expository, Persuasive, Analytical Prompts.
Amason,Dworaczyk,Maggie, Lisa
100% of all students will meet or exceed the reading& writing standards and increase Advanced by 10%.
State System Safeguard StrategyCritical Success Factors
CSF 2
7) Teachers will disaggregate EOC, TELPAS, and common assessments toadjust instruction, promote small group intervention, and set individualstudent goals for meeting standards and advanced performance. *ProjectELL (Title III)
Amason, AssistantPrincipals, DeptHeads
100% of students will meet or exceed TELPAS,EOC, and AYP standards by May 2017. 100% ofstudents will score 70% or above on CAs.
Funding Sources: 263 TITLE III - $827.00
State System Safeguard StrategyCritical Success Factors
CSF 4
8) Students who fail the previous year's STAAR test will be put intoReading I classes.
Amason,Counselors,Dworaczyk
100% of the students will meet the reading &writing standards on the EOC and meet the AYPstandard
State System Safeguard StrategyCritical Success Factors
CSF 7
9) Assist teachers in attaining certification to serve special populations suchat GT, ESL, Special Education, and C.T.E; coursework, staff development,and/or TeXes in order to assure all staff are highly qualified and certified.
Amason, Taylor 100% of teachers will be highly qualified.
Funding Sources: 199 LOCAL - $750.00, 255 TITLE II - $750.00
Calhoun High SchoolGenerated by Plan4Learning.com 16 of 49 Campus #001
January 19, 2017 9:44 am
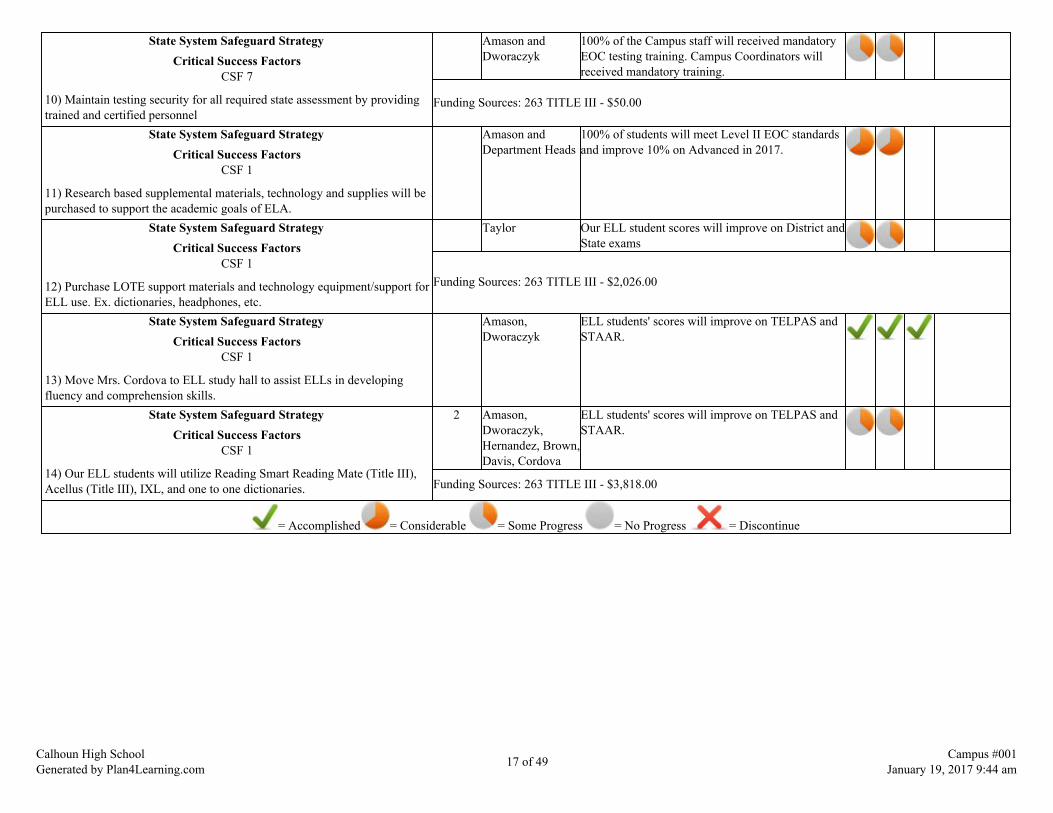
State System Safeguard StrategyCritical Success Factors
CSF 7
10) Maintain testing security for all required state assessment by providingtrained and certified personnel
Amason andDworaczyk
100% of the Campus staff will received mandatoryEOC testing training. Campus Coordinators willreceived mandatory training.
Funding Sources: 263 TITLE III - $50.00
State System Safeguard StrategyCritical Success Factors
CSF 1
11) Research based supplemental materials, technology and supplies will bepurchased to support the academic goals of ELA.
Amason andDepartment Heads
100% of students will meet Level II EOC standardsand improve 10% on Advanced in 2017.
State System Safeguard StrategyCritical Success Factors
CSF 1
12) Purchase LOTE support materials and technology equipment/support forELL use. Ex. dictionaries, headphones, etc.
Taylor Our ELL student scores will improve on District andState exams
Funding Sources: 263 TITLE III - $2,026.00
State System Safeguard StrategyCritical Success Factors
CSF 1
13) Move Mrs. Cordova to ELL study hall to assist ELLs in developingfluency and comprehension skills.
Amason,Dworaczyk
ELL students' scores will improve on TELPAS andSTAAR.
State System Safeguard StrategyCritical Success Factors
CSF 1
14) Our ELL students will utilize Reading Smart Reading Mate (Title III),Acellus (Title III), IXL, and one to one dictionaries.
2 Amason,Dworaczyk,Hernandez, Brown,Davis, Cordova
ELL students' scores will improve on TELPAS andSTAAR.
Funding Sources: 263 TITLE III - $3,818.00
= Accomplished = Considerable = Some Progress = No Progress = Discontinue
Calhoun High SchoolGenerated by Plan4Learning.com 17 of 49 Campus #001
January 19, 2017 9:44 am

Goal 1: CCISD will provide learning opportunities that are engaging, rigorous, relevant, and transcend state standards while meeting individual needs.
Performance Objective 2: All CHS students will participate in Math activities that promote creativity, collaboration, and problem solving
Evaluation Data Source(s) 2: 100% of Algebra 1 students will meet the EOC level II standard and increase level III by 10% and meet the AYPstandard of participation and performance.
Summative Evaluation 2: Met Performance Objective
Strategy Description Title I Staff Responsiblefor Monitoring Evidence that Demonstrates Success
ReviewsFormative Summative
Nov Jan Mar JuneState System Safeguard Strategy
Critical Success FactorsCSF 1 CSF 2
1) Department Head will have a planning period to work with Admin andDistrict Office Team so there can be coordination of planning for ELL,Mainstream with support, GT and tutorials.
Amason,Dworaczyk
100% of the Algebra I students will meet the EOClevel II standard & raise Advanced by 10%. 100%of the math students will score 70% or above on theDistrict CAs.
State System Safeguard StrategyCritical Success Factors
CSF 1
2) All departments/subjects will develop Instructional calendars for eachnine weeks following the scope and sequence. The calendars leveled withreadiness and supporting standards and focus on vocabulary
Teachers,Dworaczyk,Amason
100% of CHS students will meet Level II EOC andincrease Advanced by 10%.
State System Safeguard StrategyCritical Success Factors
CSF 1
3) Math teachers will work with the district math person during Departmentmeetings to ensure that the readiness and supporting standards are taught atthe appropriate level throughout the curriculum especially addressing LEP,Spec. Ed, GT and at- risk students.
Amason, APs,Dept Head
100% of Math students will pass CommonAssessments. 100% of Algebra 1 students will reachlevel II standards and improve Advanced by 10% onEOC.
Funding Sources: 255 TITLE II - $200.00
State System Safeguard StrategyCritical Success Factors
CSF 2
4) Teachers will disaggregate and analyze STAAR assessment data andcommon assessment results to determine student progress toward achievingthe state math standards.
Amason 100% of students will meet the level II standard onAlgebra 1 EOC and improve Advanced by 10%.100% of the students will score at least 70 or aboveon CAs.
Calhoun High SchoolGenerated by Plan4Learning.com 18 of 49 Campus #001
January 19, 2017 9:44 am
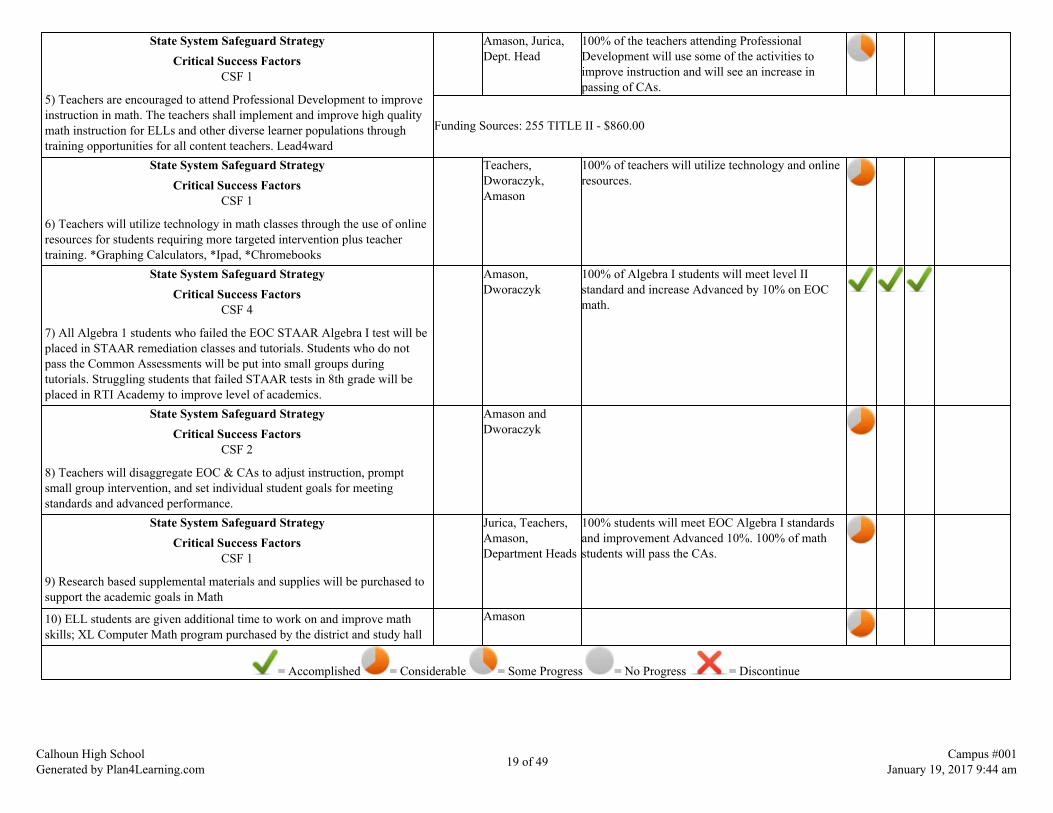
State System Safeguard StrategyCritical Success Factors
CSF 1
5) Teachers are encouraged to attend Professional Development to improveinstruction in math. The teachers shall implement and improve high qualitymath instruction for ELLs and other diverse learner populations throughtraining opportunities for all content teachers. Lead4ward
Amason, Jurica,Dept. Head
100% of the teachers attending ProfessionalDevelopment will use some of the activities toimprove instruction and will see an increase inpassing of CAs.
Funding Sources: 255 TITLE II - $860.00
State System Safeguard StrategyCritical Success Factors
CSF 1
6) Teachers will utilize technology in math classes through the use of onlineresources for students requiring more targeted intervention plus teachertraining. *Graphing Calculators, *Ipad, *Chromebooks
Teachers,Dworaczyk,Amason
100% of teachers will utilize technology and onlineresources.
State System Safeguard StrategyCritical Success Factors
CSF 4
7) All Algebra 1 students who failed the EOC STAAR Algebra I test will beplaced in STAAR remediation classes and tutorials. Students who do notpass the Common Assessments will be put into small groups duringtutorials. Struggling students that failed STAAR tests in 8th grade will beplaced in RTI Academy to improve level of academics.
Amason,Dworaczyk
100% of Algebra I students will meet level IIstandard and increase Advanced by 10% on EOCmath.
State System Safeguard StrategyCritical Success Factors
CSF 2
8) Teachers will disaggregate EOC & CAs to adjust instruction, promptsmall group intervention, and set individual student goals for meetingstandards and advanced performance.
Amason andDworaczyk
State System Safeguard StrategyCritical Success Factors
CSF 1
9) Research based supplemental materials and supplies will be purchased tosupport the academic goals in Math
Jurica, Teachers,Amason,Department Heads
100% students will meet EOC Algebra I standardsand improvement Advanced 10%. 100% of mathstudents will pass the CAs.
10) ELL students are given additional time to work on and improve mathskills; XL Computer Math program purchased by the district and study hall
Amason
= Accomplished = Considerable = Some Progress = No Progress = Discontinue
Calhoun High SchoolGenerated by Plan4Learning.com 19 of 49 Campus #001
January 19, 2017 9:44 am

Goal 1: CCISD will provide learning opportunities that are engaging, rigorous, relevant, and transcend state standards while meeting individual needs.
Performance Objective 3: All CHS students will participate in Science activities that promote creativity, collaboration, and problem solving.
Evaluation Data Source(s) 3: 100% of Biology students will meet the EOC level II standard and increase Advanced by 10%.
Summative Evaluation 3: Met Performance Objective
Strategy Description Title I Staff Responsiblefor Monitoring Evidence that Demonstrates Success
ReviewsFormative Summative
Nov Jan Mar JuneState System Safeguard Strategy
Critical Success FactorsCSF 1 CSF 2
1) Department Head will have a planning period to work with Admin andDistrict Office Team so there can be coordination of planning for ELL,Mainstream with support, GT and tutorials.
Amason, Weaver,teachers
100% of Biology students meet level II standards onEOC and Advanced increases by 10%. 100% ofstudents will make 70 or above on CommonAssessments in Science subjects.
State System Safeguard StrategyCritical Success Factors
CSF 1
2) Teachers will use Science TEKS, Scope & Sequence, best teachingpractices, CCISD Instructional Model to develop Instructional Calendarswith readiness and supporting standards.
Sonsel, Amason,Dworaczyk,Niemeier
100% of science students will make 70% or aboveon Common Assessments each six weeks. 100% ofBiology students will meet level II standard andraise Advanced by 10%.
State System Safeguard StrategyCritical Success Factors
CSF 1
3) Biology teachers with Mr. Sonsel will identify the readiness andsupporting standards tested on EOC.
Amason, Sonsel,teachers
100% of Biology students will meet level IIstandards on EOC and increase Advanced by 10%.
State System Safeguard StrategyCritical Success Factors
CSF 1
4) CHS will have main streamed with support classes with special ed.teachers helping in the regular classrooms to help students with specialneeds.
Amason,Diagnosticians,Counselors
100% of special education students will passSTAAR and STAAR A/Alt. 100% of Special Edstudents will score 70 or above on CAs.
Calhoun High SchoolGenerated by Plan4Learning.com 20 of 49 Campus #001
January 19, 2017 9:44 am
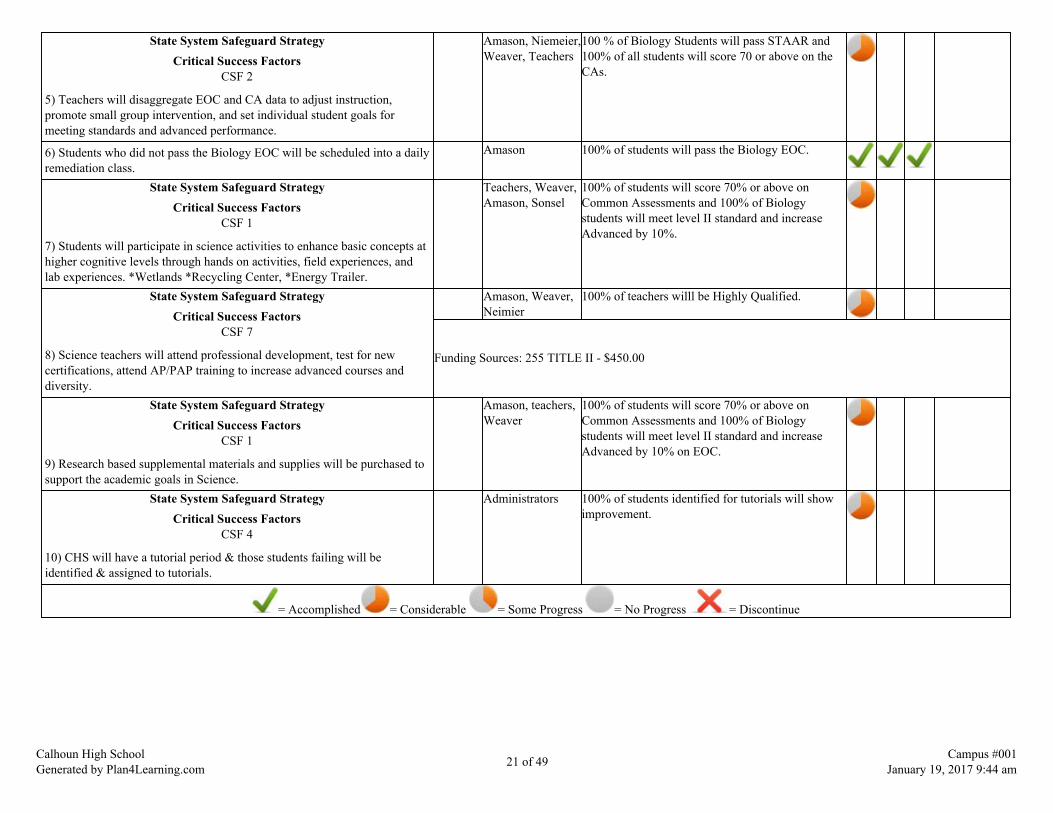
State System Safeguard StrategyCritical Success Factors
CSF 2
5) Teachers will disaggregate EOC and CA data to adjust instruction,promote small group intervention, and set individual student goals formeeting standards and advanced performance.
Amason, Niemeier,Weaver, Teachers
100 % of Biology Students will pass STAAR and100% of all students will score 70 or above on theCAs.
6) Students who did not pass the Biology EOC will be scheduled into a dailyremediation class.
Amason 100% of students will pass the Biology EOC.
State System Safeguard StrategyCritical Success Factors
CSF 1
7) Students will participate in science activities to enhance basic concepts athigher cognitive levels through hands on activities, field experiences, andlab experiences. *Wetlands *Recycling Center, *Energy Trailer.
Teachers, Weaver,Amason, Sonsel
100% of students will score 70% or above onCommon Assessments and 100% of Biologystudents will meet level II standard and increaseAdvanced by 10%.
State System Safeguard StrategyCritical Success Factors
CSF 7
8) Science teachers will attend professional development, test for newcertifications, attend AP/PAP training to increase advanced courses anddiversity.
Amason, Weaver,Neimier
100% of teachers willl be Highly Qualified.
Funding Sources: 255 TITLE II - $450.00
State System Safeguard StrategyCritical Success Factors
CSF 1
9) Research based supplemental materials and supplies will be purchased tosupport the academic goals in Science.
Amason, teachers,Weaver
100% of students will score 70% or above onCommon Assessments and 100% of Biologystudents will meet level II standard and increaseAdvanced by 10% on EOC.
State System Safeguard StrategyCritical Success Factors
CSF 4
10) CHS will have a tutorial period & those students failing will beidentified & assigned to tutorials.
Administrators 100% of students identified for tutorials will showimprovement.
= Accomplished = Considerable = Some Progress = No Progress = Discontinue
Calhoun High SchoolGenerated by Plan4Learning.com 21 of 49 Campus #001
January 19, 2017 9:44 am
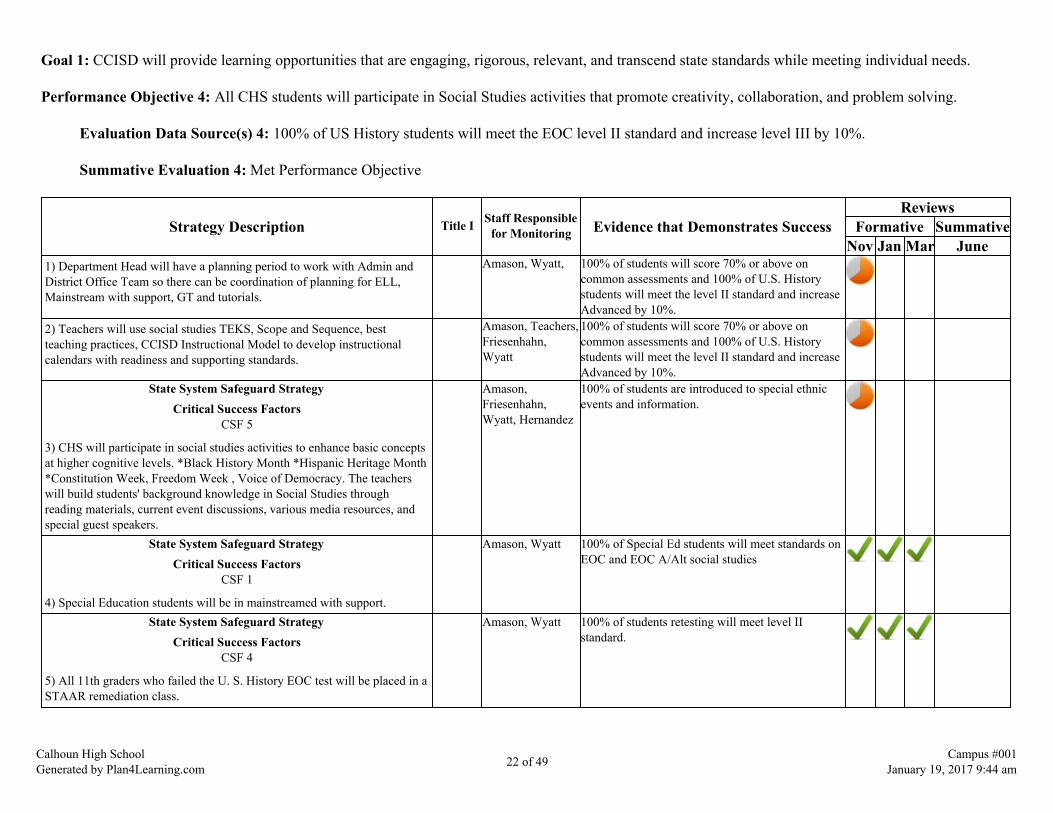
Goal 1: CCISD will provide learning opportunities that are engaging, rigorous, relevant, and transcend state standards while meeting individual needs.
Performance Objective 4: All CHS students will participate in Social Studies activities that promote creativity, collaboration, and problem solving.
Evaluation Data Source(s) 4: 100% of US History students will meet the EOC level II standard and increase level III by 10%.
Summative Evaluation 4: Met Performance Objective
Strategy Description Title I Staff Responsiblefor Monitoring Evidence that Demonstrates Success
ReviewsFormative Summative
Nov Jan Mar June1) Department Head will have a planning period to work with Admin andDistrict Office Team so there can be coordination of planning for ELL,Mainstream with support, GT and tutorials.
Amason, Wyatt, 100% of students will score 70% or above oncommon assessments and 100% of U.S. Historystudents will meet the level II standard and increaseAdvanced by 10%.
2) Teachers will use social studies TEKS, Scope and Sequence, bestteaching practices, CCISD Instructional Model to develop instructionalcalendars with readiness and supporting standards.
Amason, Teachers,Friesenhahn,Wyatt
100% of students will score 70% or above oncommon assessments and 100% of U.S. Historystudents will meet the level II standard and increaseAdvanced by 10%.
State System Safeguard StrategyCritical Success Factors
CSF 5
3) CHS will participate in social studies activities to enhance basic conceptsat higher cognitive levels. *Black History Month *Hispanic Heritage Month*Constitution Week, Freedom Week , Voice of Democracy. The teacherswill build students' background knowledge in Social Studies throughreading materials, current event discussions, various media resources, andspecial guest speakers.
Amason,Friesenhahn,Wyatt, Hernandez
100% of students are introduced to special ethnicevents and information.
State System Safeguard StrategyCritical Success Factors
CSF 1
4) Special Education students will be in mainstreamed with support.
Amason, Wyatt 100% of Special Ed students will meet standards onEOC and EOC A/Alt social studies
State System Safeguard StrategyCritical Success Factors
CSF 4
5) All 11th graders who failed the U. S. History EOC test will be placed in aSTAAR remediation class.
Amason, Wyatt 100% of students retesting will meet level IIstandard.
Calhoun High SchoolGenerated by Plan4Learning.com 22 of 49 Campus #001
January 19, 2017 9:44 am
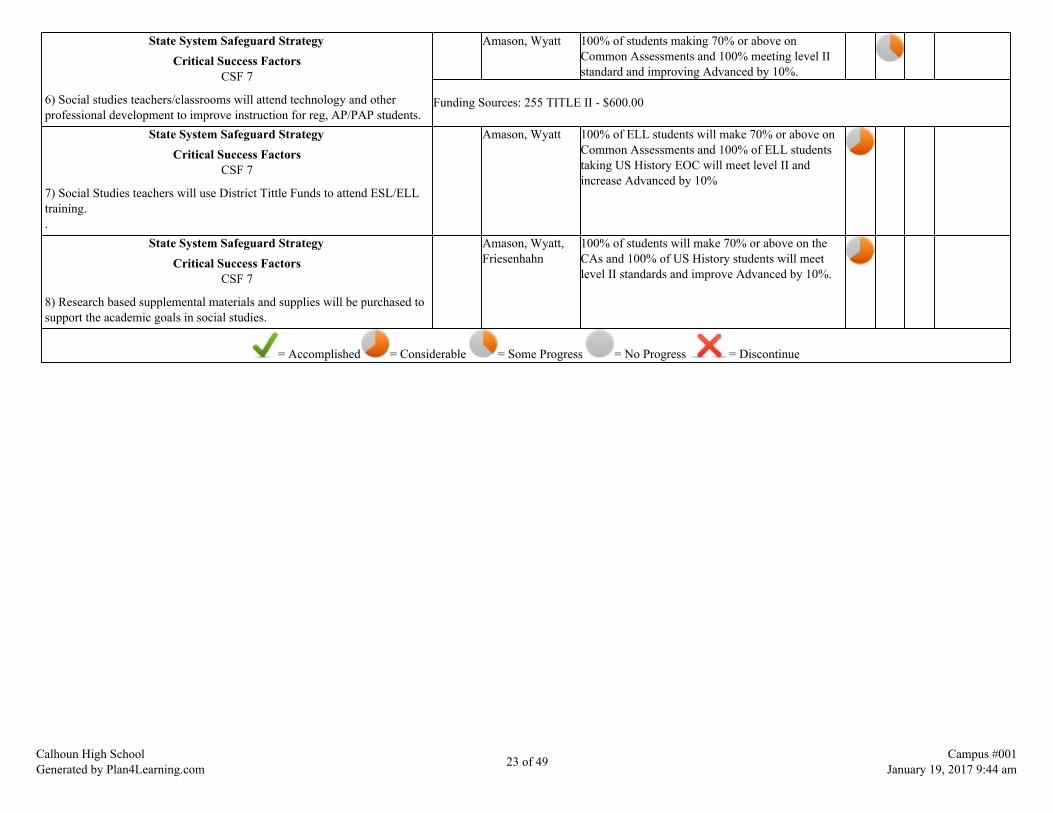
State System Safeguard StrategyCritical Success Factors
CSF 7
6) Social studies teachers/classrooms will attend technology and otherprofessional development to improve instruction for reg, AP/PAP students.
Amason, Wyatt 100% of students making 70% or above onCommon Assessments and 100% meeting level IIstandard and improving Advanced by 10%.
Funding Sources: 255 TITLE II - $600.00
State System Safeguard StrategyCritical Success Factors
CSF 7
7) Social Studies teachers will use District Tittle Funds to attend ESL/ELLtraining..
Amason, Wyatt 100% of ELL students will make 70% or above onCommon Assessments and 100% of ELL studentstaking US History EOC will meet level II andincrease Advanced by 10%
State System Safeguard StrategyCritical Success Factors
CSF 7
8) Research based supplemental materials and supplies will be purchased tosupport the academic goals in social studies.
Amason, Wyatt,Friesenhahn
100% of students will make 70% or above on theCAs and 100% of US History students will meetlevel II standards and improve Advanced by 10%.
= Accomplished = Considerable = Some Progress = No Progress = Discontinue
Calhoun High SchoolGenerated by Plan4Learning.com 23 of 49 Campus #001
January 19, 2017 9:44 am

Goal 1: CCISD will provide learning opportunities that are engaging, rigorous, relevant, and transcend state standards while meeting individual needs.
Performance Objective 5: The student graduation rate will meet and/or exceed the state standard as outlined by TEA. 100% of CHS students will completethe required course sequence and meet EOC satisfactory standards as determined per TEA graduation requirements.
Evaluation Data Source(s) 5: 100% of students will complete high school on time.
Summative Evaluation 5: Significant progress made toward meeting Performance Objective
Strategy Description Title I Staff Responsiblefor Monitoring Evidence that Demonstrates Success
ReviewsFormative Summative
Nov Jan Mar JuneState System Safeguard Strategy
Critical Success FactorsCSF 2
1) CHS principal will receive a leaver list. The leaver list will be reviewedby CHS administrators, CHS registrar, Hope administration, CHScounselors and district attendance officer. An attempt will be made torecover each person on the list.
Amason,Dworaczyk, Wyatt,Hermes, Martinez
Identified and contacted dropouts will be recovered100%.
State System Safeguard StrategyCritical Success Factors
CSF 2
2) Develop criteria and identify 1/6 of at-risk 9th grade class who need theAcademy. There will be a certified teacher and 1 paraprofessional teacherfor five periods.
Amason, Jr. HighCounselors, HighSchool Counselors,Spencer andCaraway
100% of identified 9th grade population will havesuccess and will promote to 10th grade.
State System Safeguard StrategyCritical Success Factors
CSF 1
3) One on one counseling will be done with each "at risk" student to fullyexplain consequences and encourage them to commit to improving theirperformance. This will be done prior to the end of the 1st nine weeks.
Amason,Counselors,Spencer
100% of at-risk students will score 70% or above onDistrict CAs and 100% will reach level II standardand increase Advanced by 10% on their EOCs.
State System Safeguard StrategyCritical Success Factors
CSF 1
4) CHS counselors will develop a Personal Graduation Plan for studentswho have failed the STAAR test.
CHS Counselors 100% of students who have failed STAAR will haveGraduation Plans and meet level II standards onEOC.
Calhoun High SchoolGenerated by Plan4Learning.com 24 of 49 Campus #001
January 19, 2017 9:44 am
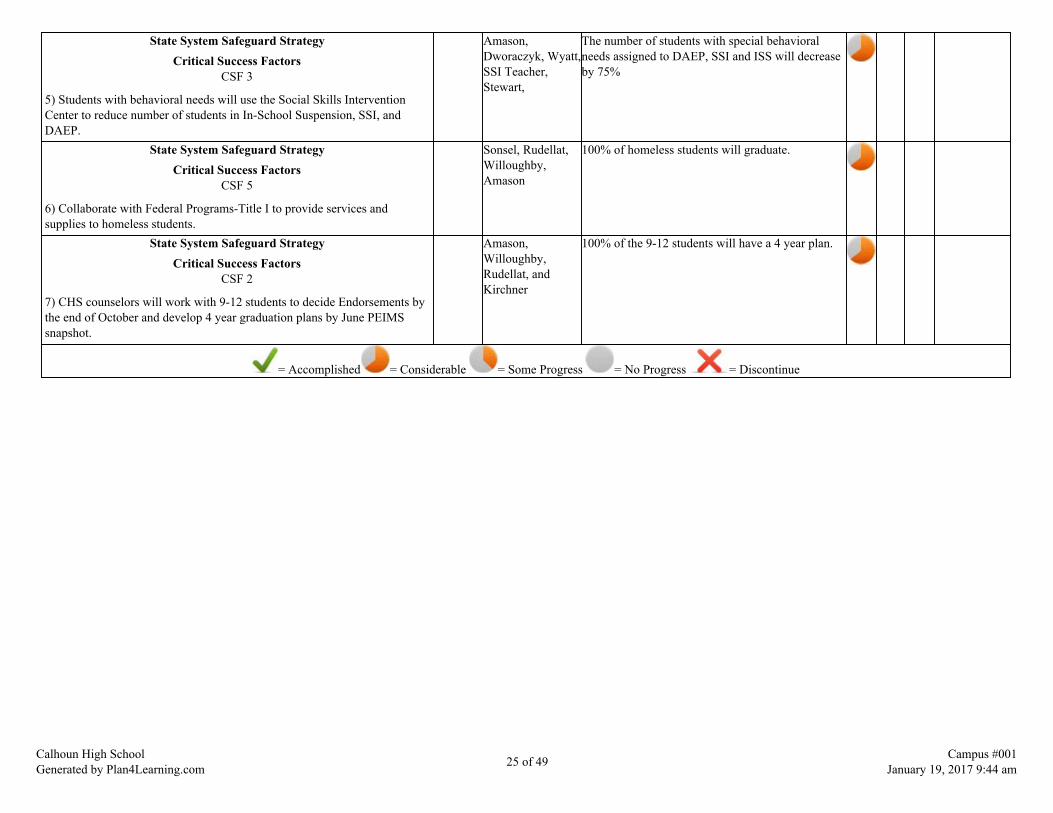
State System Safeguard StrategyCritical Success Factors
CSF 3
5) Students with behavioral needs will use the Social Skills InterventionCenter to reduce number of students in In-School Suspension, SSI, andDAEP.
Amason,Dworaczyk, Wyatt,SSI Teacher,Stewart,
The number of students with special behavioralneeds assigned to DAEP, SSI and ISS will decreaseby 75%
State System Safeguard StrategyCritical Success Factors
CSF 5
6) Collaborate with Federal Programs-Title I to provide services andsupplies to homeless students.
Sonsel, Rudellat,Willoughby,Amason
100% of homeless students will graduate.
State System Safeguard StrategyCritical Success Factors
CSF 2
7) CHS counselors will work with 9-12 students to decide Endorsements bythe end of October and develop 4 year graduation plans by June PEIMSsnapshot.
Amason,Willoughby,Rudellat, andKirchner
100% of the 9-12 students will have a 4 year plan.
= Accomplished = Considerable = Some Progress = No Progress = Discontinue
Calhoun High SchoolGenerated by Plan4Learning.com 25 of 49 Campus #001
January 19, 2017 9:44 am

Goal 1: CCISD will provide learning opportunities that are engaging, rigorous, relevant, and transcend state standards while meeting individual needs.
Performance Objective 6: The average student attendance will meet and/exceed the state standard.
Evaluation Data Source(s) 6: Student attendance will increase to 97%.
Summative Evaluation 6: Significant progress made toward meeting Performance Objective
Strategy Description Title I Staff Responsiblefor Monitoring Evidence that Demonstrates Success
ReviewsFormative Summative
Nov Jan Mar JuneState System Safeguard Strategy
Critical Success FactorsCSF 1
1) CHS will record accurate daily attendance records and complete the finaldaily attendance sheet by 10 am the next day.
Smalley .5% increase in attendance per grade level from theprevious year each six weeks with the exception ofthe first.
State System Safeguard StrategyCritical Success Factors
CSF 1
2) CHS will have an exemption policy in place to encourage betterattendance.
Amason,Dworaczyk,Willoughby,Rudellat
.5% increase in attendance per grade level from theprevious year each nine weeks.
State System Safeguard StrategyCritical Success Factors
CSF 1
3) CHS will notify parents by phone after the first absence.
Amason, Wyatt,Martinez,Niemeier, Smalleyand Hamilton
5% decrease in the need to refer to truancy court.
State System Safeguard StrategyCritical Success Factors
CSF 1
4) Students absent during 2nd period will be called when necessary byattendance clerk.
Smalley andHamilton
.5% increase in attendance per grade level from theprevious year each nine weeks.
State System Safeguard StrategyCritical Success Factors
CSF 1
5) CHS will begin implementing a reward/incentive system to encouragebetter/perfect attendance.
Amason, Smalley,Wyatt, Niemeier,Dworaczyk
.5% increase in attendance per grade level from theprevious year.
Calhoun High SchoolGenerated by Plan4Learning.com 26 of 49 Campus #001
January 19, 2017 9:44 am
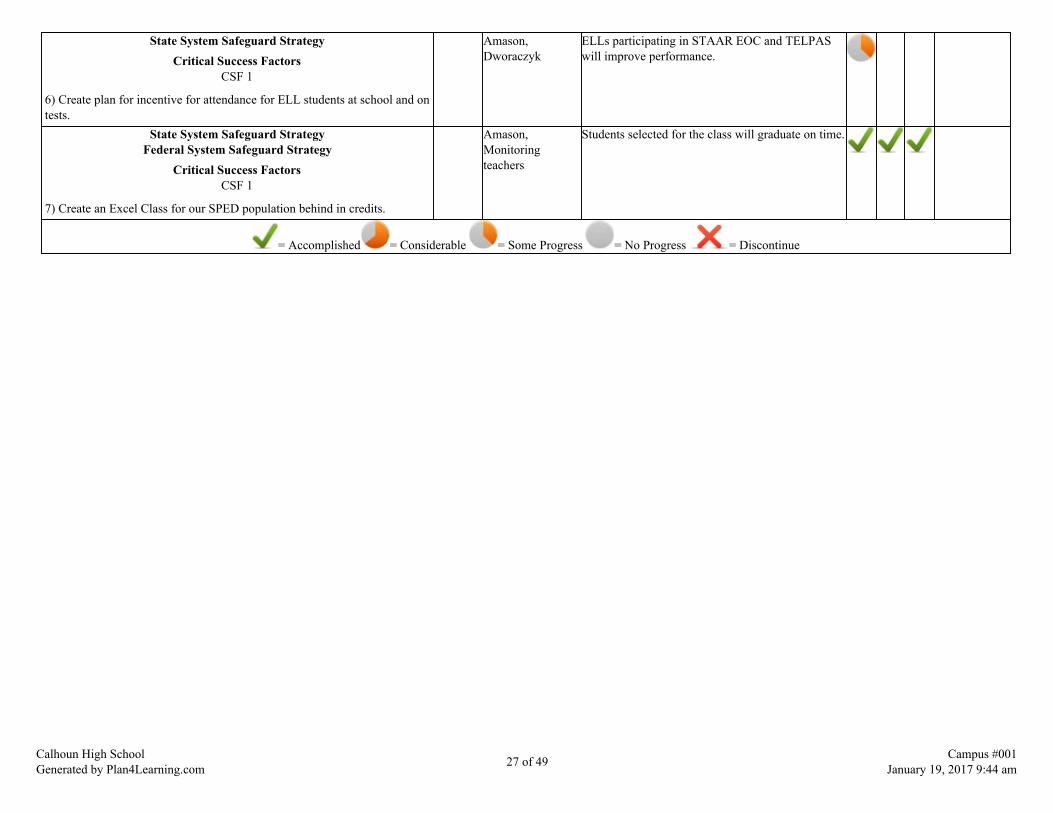
State System Safeguard StrategyCritical Success Factors
CSF 1
6) Create plan for incentive for attendance for ELL students at school and ontests.
Amason,Dworaczyk
ELLs participating in STAAR EOC and TELPASwill improve performance.
State System Safeguard StrategyFederal System Safeguard Strategy
Critical Success FactorsCSF 1
7) Create an Excel Class for our SPED population behind in credits.
Amason,Monitoringteachers
Students selected for the class will graduate on time.
= Accomplished = Considerable = Some Progress = No Progress = Discontinue
Calhoun High SchoolGenerated by Plan4Learning.com 27 of 49 Campus #001
January 19, 2017 9:44 am
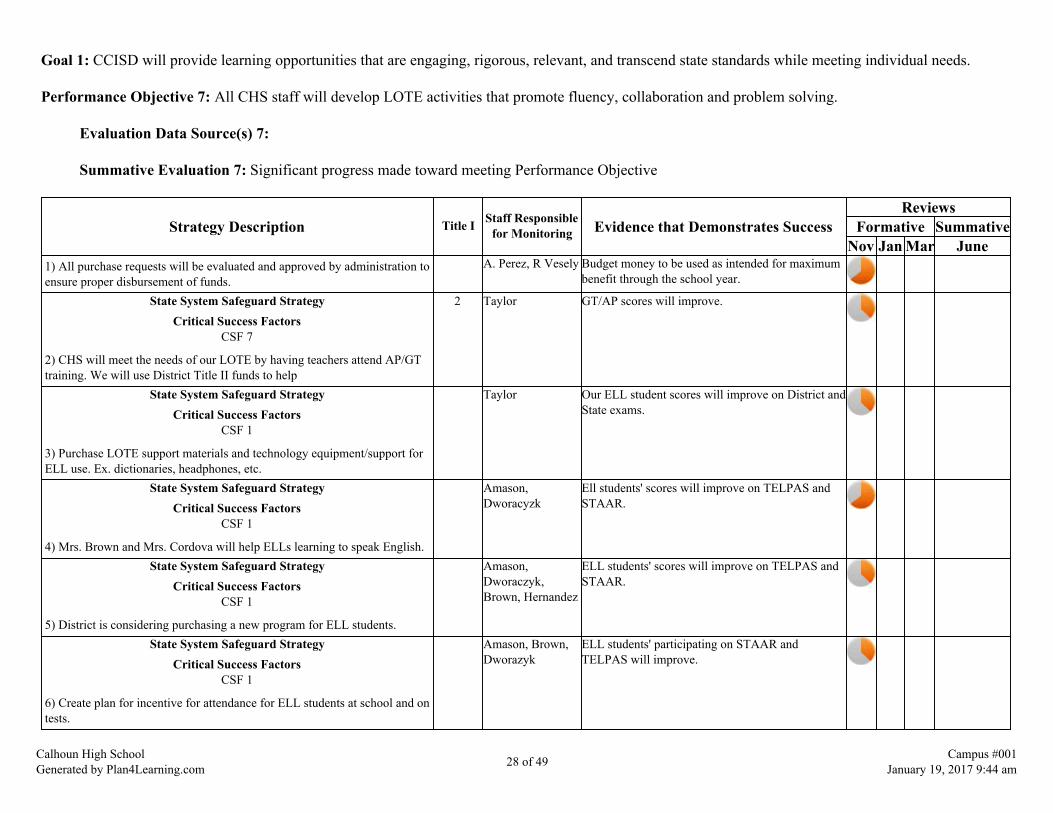
Goal 1: CCISD will provide learning opportunities that are engaging, rigorous, relevant, and transcend state standards while meeting individual needs.
Performance Objective 7: All CHS staff will develop LOTE activities that promote fluency, collaboration and problem solving.
Evaluation Data Source(s) 7:
Summative Evaluation 7: Significant progress made toward meeting Performance Objective
Strategy Description Title I Staff Responsiblefor Monitoring Evidence that Demonstrates Success
ReviewsFormative Summative
Nov Jan Mar June1) All purchase requests will be evaluated and approved by administration toensure proper disbursement of funds.
A. Perez, R Vesely Budget money to be used as intended for maximumbenefit through the school year.
State System Safeguard StrategyCritical Success Factors
CSF 7
2) CHS will meet the needs of our LOTE by having teachers attend AP/GTtraining. We will use District Title II funds to help
2 Taylor GT/AP scores will improve.
State System Safeguard StrategyCritical Success Factors
CSF 1
3) Purchase LOTE support materials and technology equipment/support forELL use. Ex. dictionaries, headphones, etc.
Taylor Our ELL student scores will improve on District andState exams.
State System Safeguard StrategyCritical Success Factors
CSF 1
4) Mrs. Brown and Mrs. Cordova will help ELLs learning to speak English.
Amason,Dworacyzk
Ell students' scores will improve on TELPAS andSTAAR.
State System Safeguard StrategyCritical Success Factors
CSF 1
5) District is considering purchasing a new program for ELL students.
Amason,Dworaczyk,Brown, Hernandez
ELL students' scores will improve on TELPAS andSTAAR.
State System Safeguard StrategyCritical Success Factors
CSF 1
6) Create plan for incentive for attendance for ELL students at school and ontests.
Amason, Brown,Dworazyk
ELL students' participating on STAAR andTELPAS will improve.
Calhoun High SchoolGenerated by Plan4Learning.com 28 of 49 Campus #001
January 19, 2017 9:44 am
= Accomplished = Considerable = Some Progress = No Progress = Discontinue
Calhoun High SchoolGenerated by Plan4Learning.com 29 of 49 Campus #001
January 19, 2017 9:44 am

Goal 1: CCISD will provide learning opportunities that are engaging, rigorous, relevant, and transcend state standards while meeting individual needs.
Performance Objective 8: As measured by Performance-Based Monitoring and Analysis System, CTE students will increase English Language Artspassing rate to 75%, increase mathematics passing rate to 95%, and maintain science and social studies passing rates at 95%. The nontraditional coursecompletion rate will increase to 55% for males and 35% for females.
Evaluation Data Source(s) 8: The percent of CTE students passing STAAR EOC Assessments will increase to the stated goal amount, and thepercent of nontraditional course completers will increase to the stated goal amounts.
Summative Evaluation 8: Significant progress made toward meeting Performance Objective
Strategy Description Title I Staff Responsiblefor Monitoring Evidence that Demonstrates Success
ReviewsFormative Summative
Nov Jan Mar JuneState System Safeguard Strategy
Critical Success FactorsCSF 7
1) CTE teachers will complete and maintain appropriate certification.
Amason, Freeman Teacher certification records, alternativecertification program enrollment.
Funding Sources: 255 TITLE II - $514.00
2) CTE course offerings will be expanded and sequences will be aligned tomeet the needs of the community.
Freeman,Counselors
CTE Course Description Guide listing courses andcoherent sequences.
3) CTE teachers will make at least one personal , positive parent contacteach week.
CTE Teachers Parent contact log.
4) CTE teachers will design the instructional calendars and lesson plans fortheir courses to meet the requirements and rigor of the TEKS.
CTE Teachers,Freeman
Instructional Calendars, lesson plans.
5) Students will be recruited and encouraged to complete gender non-traditional courses.
CTE Teachers,Freeman
Percentage of male and female students completingnon-traditional courses.
6) CTE teachers will incorporate ELA, math, science, and social studiesTEKS in lesson plans as appropriate
CTE Teachers,Freeman
Lesson plans
= Accomplished = Considerable = Some Progress = No Progress = Discontinue
Calhoun High SchoolGenerated by Plan4Learning.com 30 of 49 Campus #001
January 19, 2017 9:44 am

Goal 2: CCISD will focus the use of our resources to close achievement gaps and facilitate quality learning for all students
Performance Objective 1: CHS will actively monitor budget requests and campus projects for financial responsibility in using local, state, and federalfunding sources.
Evaluation Data Source(s) 1: CHS will stay 100% with in budget
Summative Evaluation 1: Met Performance Objective
Strategy Description Title I Staff Responsiblefor Monitoring Evidence that Demonstrates Success
ReviewsFormative Summative
Nov Jan Mar June1) Look at all budget items to cut or combine expenses to meet needs. Perez, Amason CHS will stay within their budget in all departments.
2) Coordinate professional development activities for all staff with federal,state and local program funds, Examples: AP/GT trainings/institutes, RegionIII.
Amason, Taylor,Sonsel
Increase scores on STAAR & AYP.
3) Provide all supplies, materials and services to Special Education studentsincluding CBI and Academic Field Trips
Amason, Bethany Special Education students are provided servicesdecided in ARD meetings and make progress onSTAAR.
4) CHS will create plans to find teachers in areas of need for 2017-2018 Amason,Dworaczyk
ALL positions will be filled with highly qualifiedteachers.
= Accomplished = Considerable = Some Progress = No Progress = Discontinue
Calhoun High SchoolGenerated by Plan4Learning.com 31 of 49 Campus #001
January 19, 2017 9:44 am
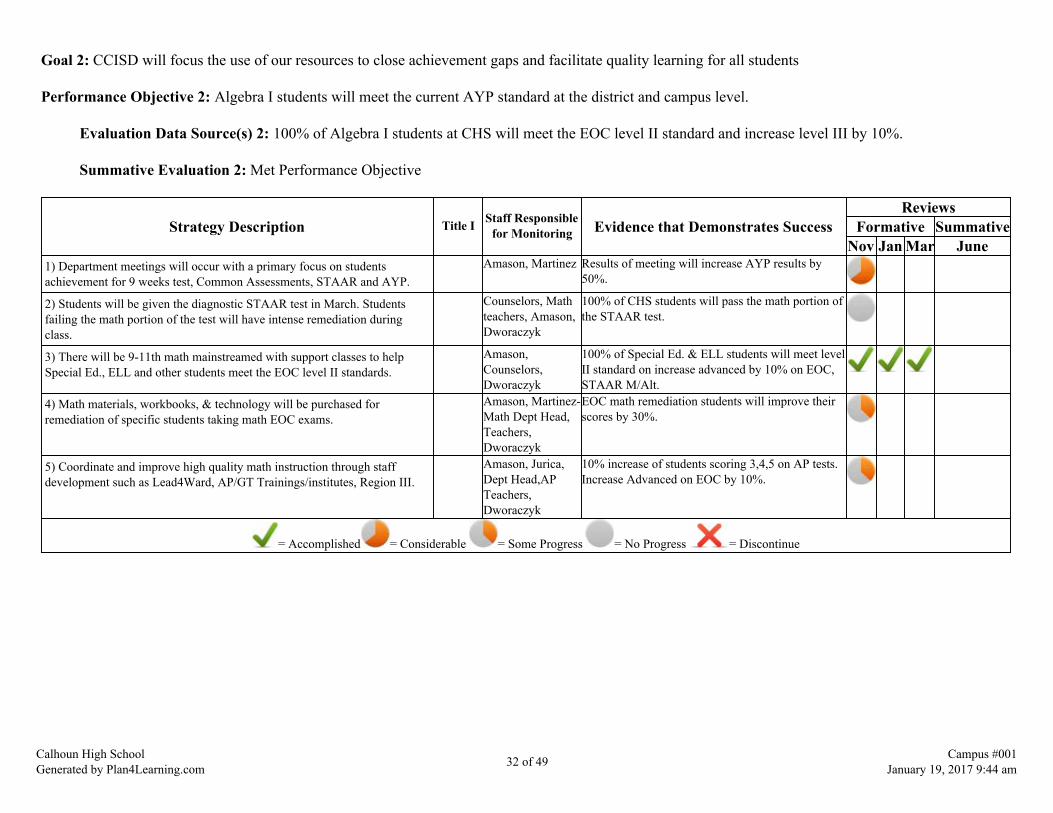
Goal 2: CCISD will focus the use of our resources to close achievement gaps and facilitate quality learning for all students
Performance Objective 2: Algebra I students will meet the current AYP standard at the district and campus level.
Evaluation Data Source(s) 2: 100% of Algebra I students at CHS will meet the EOC level II standard and increase level III by 10%.
Summative Evaluation 2: Met Performance Objective
Strategy Description Title I Staff Responsiblefor Monitoring Evidence that Demonstrates Success
ReviewsFormative Summative
Nov Jan Mar June1) Department meetings will occur with a primary focus on studentsachievement for 9 weeks test, Common Assessments, STAAR and AYP.
Amason, Martinez Results of meeting will increase AYP results by50%.
2) Students will be given the diagnostic STAAR test in March. Studentsfailing the math portion of the test will have intense remediation duringclass.
Counselors, Mathteachers, Amason,Dworaczyk
100% of CHS students will pass the math portion ofthe STAAR test.
3) There will be 9-11th math mainstreamed with support classes to helpSpecial Ed., ELL and other students meet the EOC level II standards.
Amason,Counselors,Dworaczyk
100% of Special Ed. & ELL students will meet levelII standard on increase advanced by 10% on EOC,STAAR M/Alt.
4) Math materials, workbooks, & technology will be purchased forremediation of specific students taking math EOC exams.
Amason, Martinez-Math Dept Head,Teachers,Dworaczyk
EOC math remediation students will improve theirscores by 30%.
5) Coordinate and improve high quality math instruction through staffdevelopment such as Lead4Ward, AP/GT Trainings/institutes, Region III.
Amason, Jurica,Dept Head,APTeachers,Dworaczyk
10% increase of students scoring 3,4,5 on AP tests.Increase Advanced on EOC by 10%.
= Accomplished = Considerable = Some Progress = No Progress = Discontinue
Calhoun High SchoolGenerated by Plan4Learning.com 32 of 49 Campus #001
January 19, 2017 9:44 am

Goal 3: CCISD will ensure a compassionate, effective, innovative, and highly motivated staff to accomplish our mission.
Performance Objective 1: All CHS teachers and instructional paraprofessionals are highly qualified by SBEC standards and are effective in theirperformance.
Evaluation Data Source(s) 1: 100% of the teachers will have the professional development and certifications they need to teach the CHSstudents and be highly motivated and qualified staff.
Summative Evaluation 1: Met Performance Objective
Strategy Description Title I Staff Responsiblefor Monitoring Evidence that Demonstrates Success
ReviewsFormative Summative
Nov Jan Mar June1) All CHS teachers will incorporate technology into their daily lessonswhere appropriate. Technology specialist will assist teachers withintegrating technology into lessons.
Amason, Sides,Dworaczyk, Wyatt,Niemeier,Teachers, D.Sonsel
100% of the teachers will use technology in theirinstruction as documented in summative evaluationsand walk throughs.
Funding Sources: 410 IMA - $2,042.952) Eduphoria, Aware, STAAR Data Analysis for all CHS teachers availablewith training.
Amason,Dworaczyk, Wyatt,Niemeier,Teachers
100% of the teachers will use Eduphoria Aware toretrieve data about their students to use for planningand tutorials.
3) Eduphoria Forethought will be used by teachers for lesson plans. Amason,Dworaczyk, Wyatt,Niemeier
100% of the teachers will use Forethought asdocumented on the appraisers Eduphoria account.
4) Chromebooks and storage carts will be utilized in the classrooms to havemore technology available for students. English, Math, Science, and SocialStudies rooms will have class sets of Chromebooks.
Amason, Thomae,Teachers,Dworaczyk, Wyatt,Niemeier,TechnologyDevelopment
100% of students will have the availability ofcomputers for school and projects as documented inwalk-throughs and appraisals.
5) 33% of all lessons will be required to involve/embed current technologyavailable for instruction.
Amason,Dworaczyk, Wyatt,Niemeier
100% of the teachers will use technology forinstruction and student use as documented in lessonplans, walk-throughs, appraisals.
6) All teachers will be trained to use Google for email, calendar, classroom,and homework assignments.
Amason,Dworaczyk
100% of CHS teachers will have Google Training.
7) All teachers will be trained to use the Txeis Gradebook. Amason,Trousdale,Dworaczyk
100% of the teachers will use Gradebook fordocumentation of grades and assignments asdocumented on Gradebook.
Calhoun High SchoolGenerated by Plan4Learning.com 33 of 49 Campus #001
January 19, 2017 9:44 am
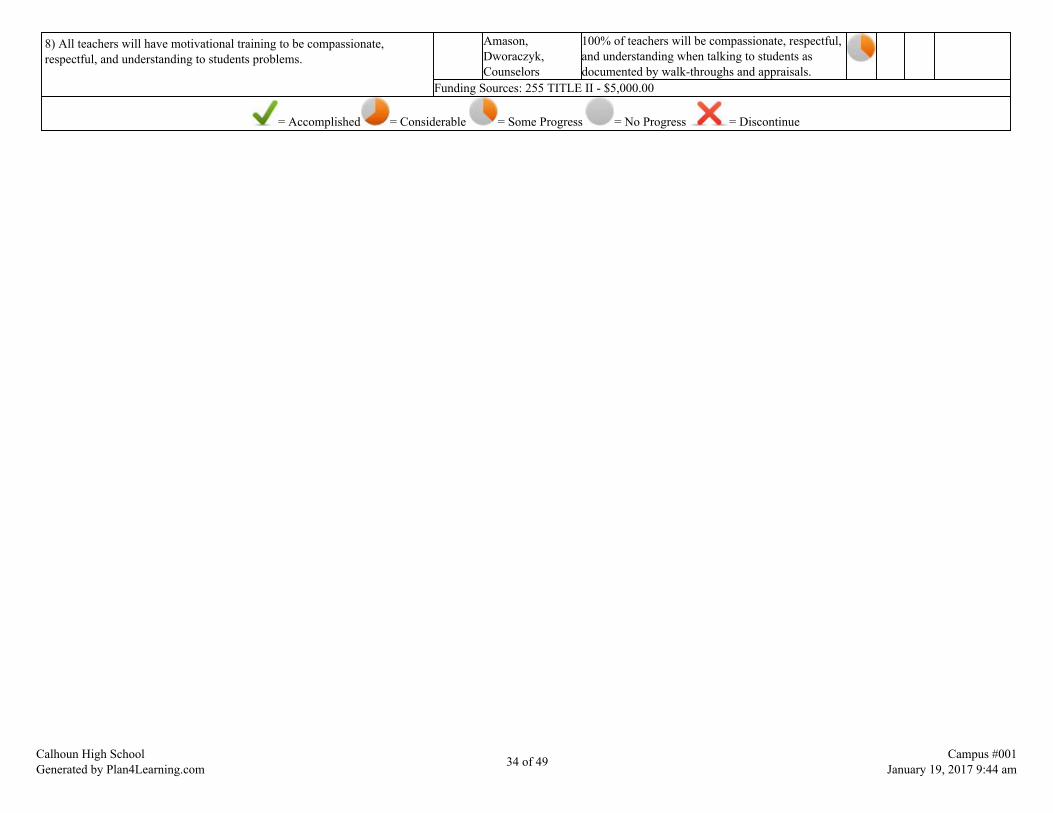
8) All teachers will have motivational training to be compassionate,respectful, and understanding to students problems.
Amason,Dworaczyk,Counselors
100% of teachers will be compassionate, respectful,and understanding when talking to students asdocumented by walk-throughs and appraisals.
Funding Sources: 255 TITLE II - $5,000.00
= Accomplished = Considerable = Some Progress = No Progress = Discontinue
Calhoun High SchoolGenerated by Plan4Learning.com 34 of 49 Campus #001
January 19, 2017 9:44 am
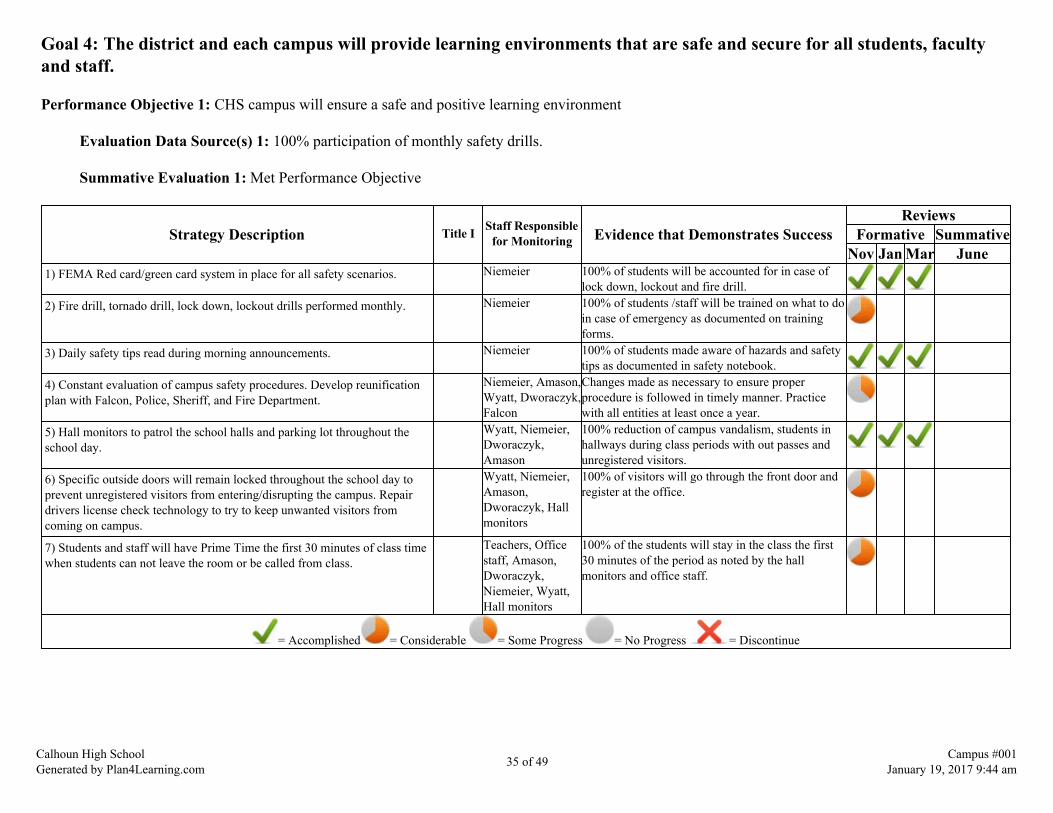
Goal 4: The district and each campus will provide learning environments that are safe and secure for all students, facultyand staff.
Performance Objective 1: CHS campus will ensure a safe and positive learning environment
Evaluation Data Source(s) 1: 100% participation of monthly safety drills.
Summative Evaluation 1: Met Performance Objective
Strategy Description Title I Staff Responsiblefor Monitoring Evidence that Demonstrates Success
ReviewsFormative Summative
Nov Jan Mar June1) FEMA Red card/green card system in place for all safety scenarios. Niemeier 100% of students will be accounted for in case of
lock down, lockout and fire drill.2) Fire drill, tornado drill, lock down, lockout drills performed monthly. Niemeier 100% of students /staff will be trained on what to do
in case of emergency as documented on trainingforms.
3) Daily safety tips read during morning announcements. Niemeier 100% of students made aware of hazards and safetytips as documented in safety notebook.
4) Constant evaluation of campus safety procedures. Develop reunificationplan with Falcon, Police, Sheriff, and Fire Department.
Niemeier, Amason,Wyatt, Dworaczyk,Falcon
Changes made as necessary to ensure properprocedure is followed in timely manner. Practicewith all entities at least once a year.
5) Hall monitors to patrol the school halls and parking lot throughout theschool day.
Wyatt, Niemeier,Dworaczyk,Amason
100% reduction of campus vandalism, students inhallways during class periods with out passes andunregistered visitors.
6) Specific outside doors will remain locked throughout the school day toprevent unregistered visitors from entering/disrupting the campus. Repairdrivers license check technology to try to keep unwanted visitors fromcoming on campus.
Wyatt, Niemeier,Amason,Dworaczyk, Hallmonitors
100% of visitors will go through the front door andregister at the office.
7) Students and staff will have Prime Time the first 30 minutes of class timewhen students can not leave the room or be called from class.
Teachers, Officestaff, Amason,Dworaczyk,Niemeier, Wyatt,Hall monitors
100% of the students will stay in the class the first30 minutes of the period as noted by the hallmonitors and office staff.
= Accomplished = Considerable = Some Progress = No Progress = Discontinue
Calhoun High SchoolGenerated by Plan4Learning.com 35 of 49 Campus #001
January 19, 2017 9:44 am
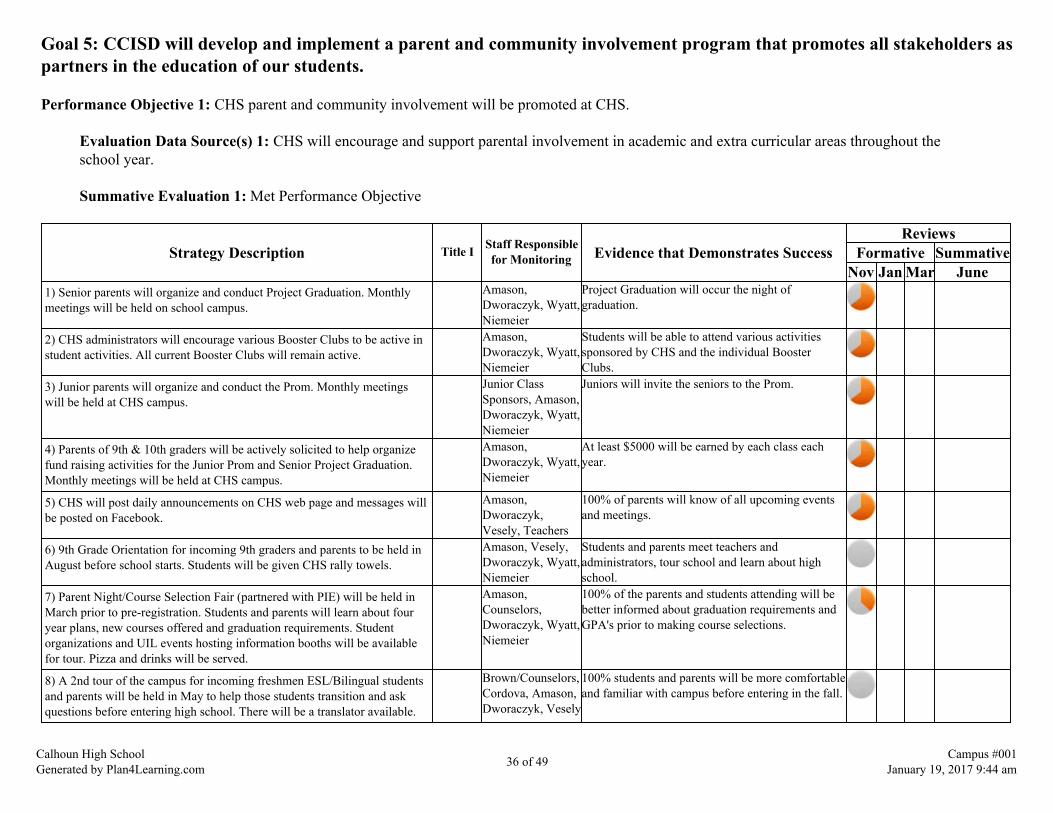
Goal 5: CCISD will develop and implement a parent and community involvement program that promotes all stakeholders aspartners in the education of our students.
Performance Objective 1: CHS parent and community involvement will be promoted at CHS.
Evaluation Data Source(s) 1: CHS will encourage and support parental involvement in academic and extra curricular areas throughout theschool year.
Summative Evaluation 1: Met Performance Objective
Strategy Description Title I Staff Responsiblefor Monitoring Evidence that Demonstrates Success
ReviewsFormative Summative
Nov Jan Mar June1) Senior parents will organize and conduct Project Graduation. Monthlymeetings will be held on school campus.
Amason,Dworaczyk, Wyatt,Niemeier
Project Graduation will occur the night ofgraduation.
2) CHS administrators will encourage various Booster Clubs to be active instudent activities. All current Booster Clubs will remain active.
Amason,Dworaczyk, Wyatt,Niemeier
Students will be able to attend various activitiessponsored by CHS and the individual BoosterClubs.
3) Junior parents will organize and conduct the Prom. Monthly meetingswill be held at CHS campus.
Junior ClassSponsors, Amason,Dworaczyk, Wyatt,Niemeier
Juniors will invite the seniors to the Prom.
4) Parents of 9th & 10th graders will be actively solicited to help organizefund raising activities for the Junior Prom and Senior Project Graduation.Monthly meetings will be held at CHS campus.
Amason,Dworaczyk, Wyatt,Niemeier
At least $5000 will be earned by each class eachyear.
5) CHS will post daily announcements on CHS web page and messages willbe posted on Facebook.
Amason,Dworaczyk,Vesely, Teachers
100% of parents will know of all upcoming eventsand meetings.
6) 9th Grade Orientation for incoming 9th graders and parents to be held inAugust before school starts. Students will be given CHS rally towels.
Amason, Vesely,Dworaczyk, Wyatt,Niemeier
Students and parents meet teachers andadministrators, tour school and learn about highschool.
7) Parent Night/Course Selection Fair (partnered with PIE) will be held inMarch prior to pre-registration. Students and parents will learn about fouryear plans, new courses offered and graduation requirements. Studentorganizations and UIL events hosting information booths will be availablefor tour. Pizza and drinks will be served.
Amason,Counselors,Dworaczyk, Wyatt,Niemeier
100% of the parents and students attending will bebetter informed about graduation requirements andGPA's prior to making course selections.
8) A 2nd tour of the campus for incoming freshmen ESL/Bilingual studentsand parents will be held in May to help those students transition and askquestions before entering high school. There will be a translator available.
Brown/Counselors,Cordova, Amason,Dworaczyk, Vesely
100% students and parents will be more comfortableand familiar with campus before entering in the fall.
Calhoun High SchoolGenerated by Plan4Learning.com 36 of 49 Campus #001
January 19, 2017 9:44 am
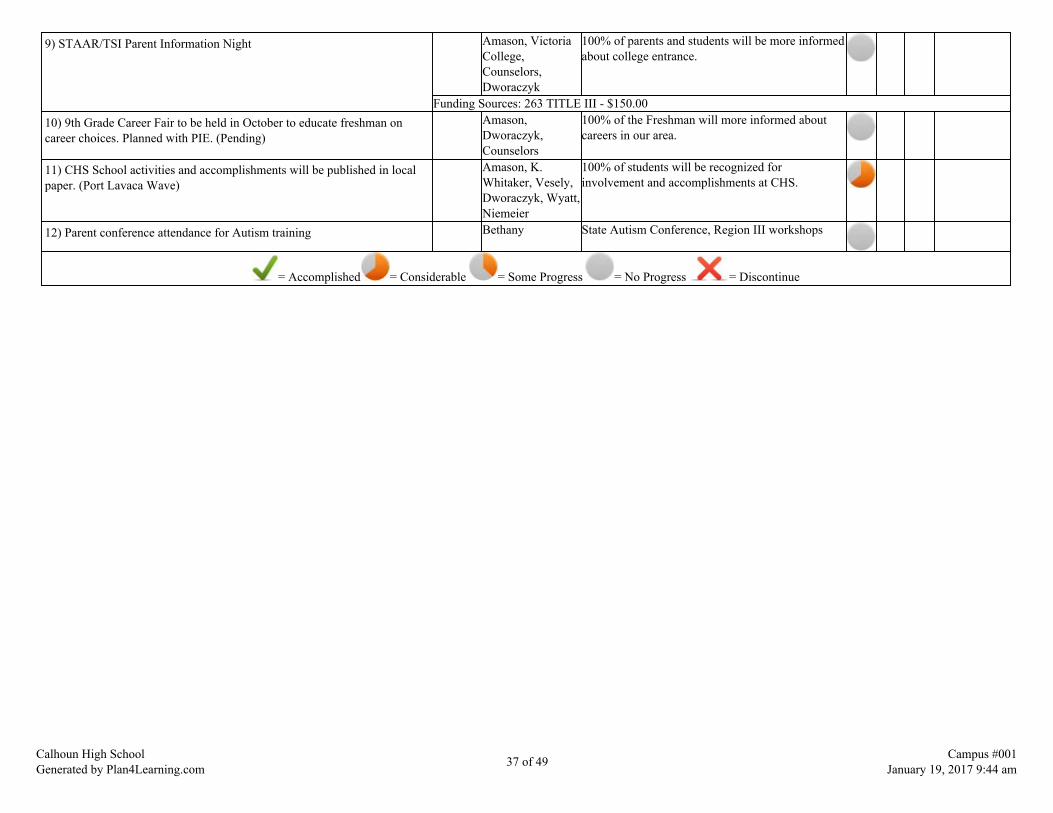
9) STAAR/TSI Parent Information Night Amason, VictoriaCollege,Counselors,Dworaczyk
100% of parents and students will be more informedabout college entrance.
Funding Sources: 263 TITLE III - $150.0010) 9th Grade Career Fair to be held in October to educate freshman oncareer choices. Planned with PIE. (Pending)
Amason,Dworaczyk,Counselors
100% of the Freshman will more informed aboutcareers in our area.
11) CHS School activities and accomplishments will be published in localpaper. (Port Lavaca Wave)
Amason, K.Whitaker, Vesely,Dworaczyk, Wyatt,Niemeier
100% of students will be recognized forinvolvement and accomplishments at CHS.
12) Parent conference attendance for Autism training Bethany State Autism Conference, Region III workshops
= Accomplished = Considerable = Some Progress = No Progress = Discontinue
Calhoun High SchoolGenerated by Plan4Learning.com 37 of 49 Campus #001
January 19, 2017 9:44 am
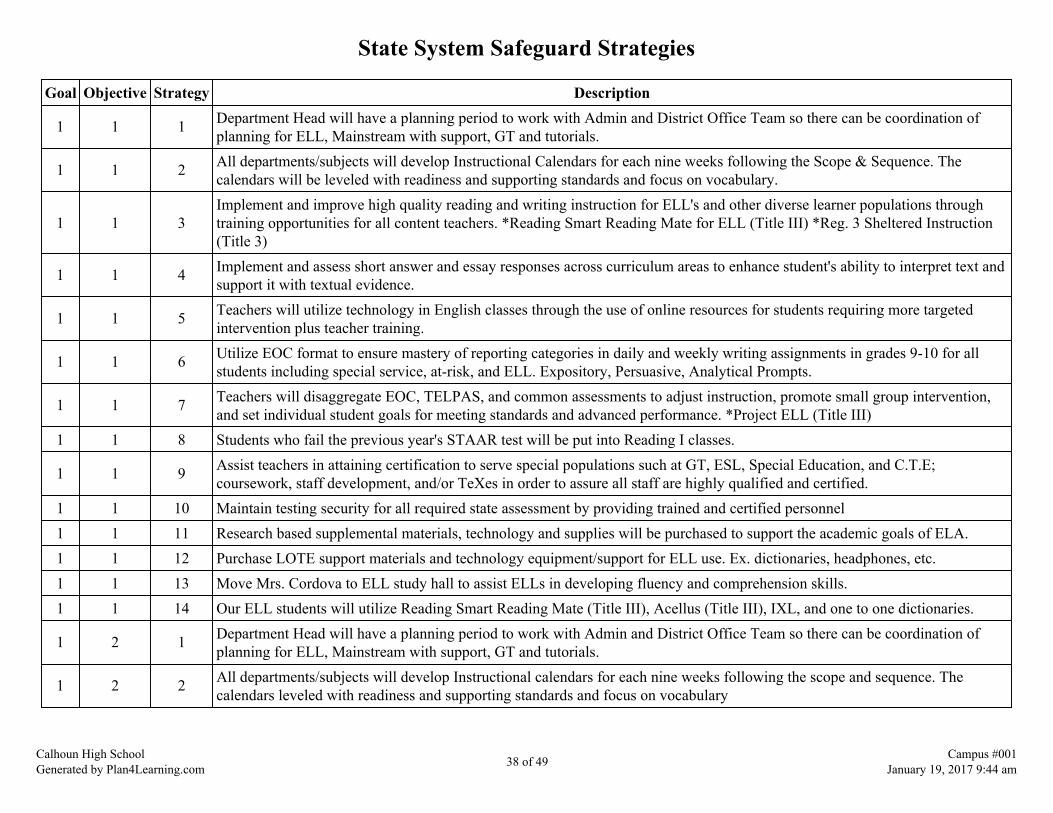
State System Safeguard Strategies
Goal Objective Strategy Description
1 1 1 Department Head will have a planning period to work with Admin and District Office Team so there can be coordination ofplanning for ELL, Mainstream with support, GT and tutorials.
1 1 2 All departments/subjects will develop Instructional Calendars for each nine weeks following the Scope & Sequence. Thecalendars will be leveled with readiness and supporting standards and focus on vocabulary.
1 1 3Implement and improve high quality reading and writing instruction for ELL's and other diverse learner populations throughtraining opportunities for all content teachers. *Reading Smart Reading Mate for ELL (Title III) *Reg. 3 Sheltered Instruction(Title 3)
1 1 4 Implement and assess short answer and essay responses across curriculum areas to enhance student's ability to interpret text andsupport it with textual evidence.
1 1 5 Teachers will utilize technology in English classes through the use of online resources for students requiring more targetedintervention plus teacher training.
1 1 6 Utilize EOC format to ensure mastery of reporting categories in daily and weekly writing assignments in grades 9-10 for allstudents including special service, at-risk, and ELL. Expository, Persuasive, Analytical Prompts.
1 1 7 Teachers will disaggregate EOC, TELPAS, and common assessments to adjust instruction, promote small group intervention,and set individual student goals for meeting standards and advanced performance. *Project ELL (Title III)
1 1 8 Students who fail the previous year's STAAR test will be put into Reading I classes.
1 1 9 Assist teachers in attaining certification to serve special populations such at GT, ESL, Special Education, and C.T.E;coursework, staff development, and/or TeXes in order to assure all staff are highly qualified and certified.
1 1 10 Maintain testing security for all required state assessment by providing trained and certified personnel1 1 11 Research based supplemental materials, technology and supplies will be purchased to support the academic goals of ELA.1 1 12 Purchase LOTE support materials and technology equipment/support for ELL use. Ex. dictionaries, headphones, etc.1 1 13 Move Mrs. Cordova to ELL study hall to assist ELLs in developing fluency and comprehension skills.1 1 14 Our ELL students will utilize Reading Smart Reading Mate (Title III), Acellus (Title III), IXL, and one to one dictionaries.
1 2 1 Department Head will have a planning period to work with Admin and District Office Team so there can be coordination ofplanning for ELL, Mainstream with support, GT and tutorials.
1 2 2 All departments/subjects will develop Instructional calendars for each nine weeks following the scope and sequence. Thecalendars leveled with readiness and supporting standards and focus on vocabulary
Calhoun High SchoolGenerated by Plan4Learning.com 38 of 49 Campus #001
January 19, 2017 9:44 am
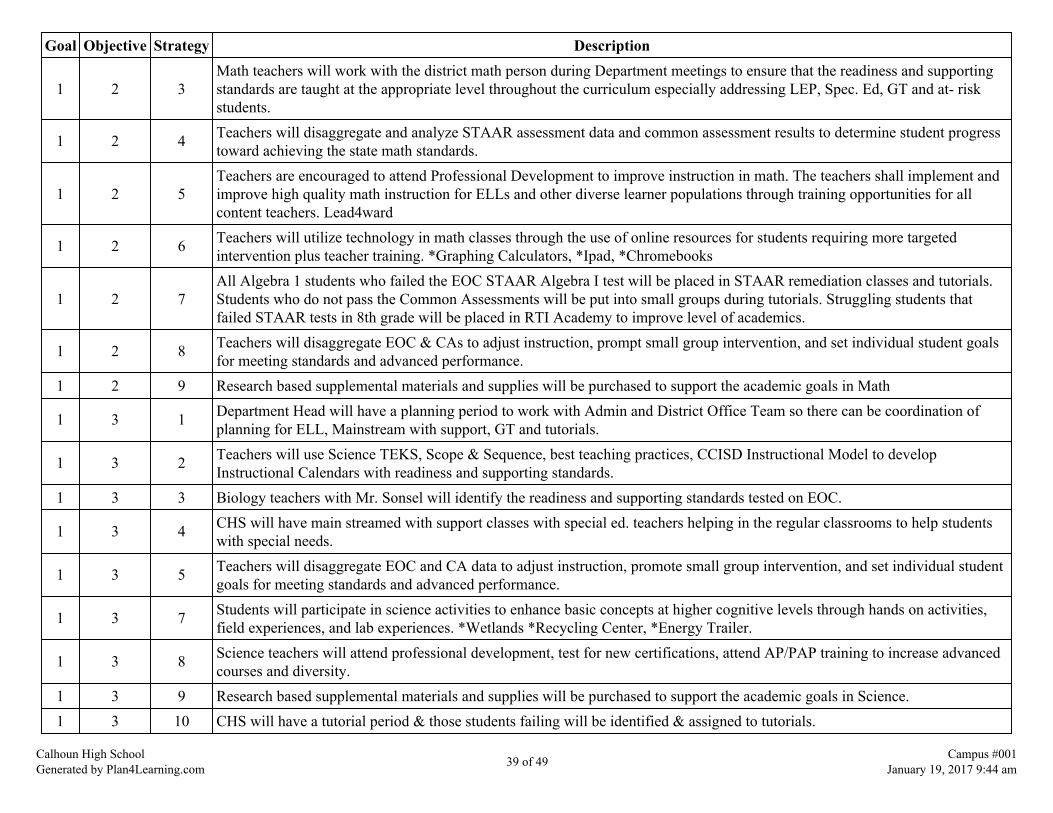
Goal Objective Strategy Description
1 2 3Math teachers will work with the district math person during Department meetings to ensure that the readiness and supportingstandards are taught at the appropriate level throughout the curriculum especially addressing LEP, Spec. Ed, GT and at- riskstudents.
1 2 4 Teachers will disaggregate and analyze STAAR assessment data and common assessment results to determine student progresstoward achieving the state math standards.
1 2 5Teachers are encouraged to attend Professional Development to improve instruction in math. The teachers shall implement andimprove high quality math instruction for ELLs and other diverse learner populations through training opportunities for allcontent teachers. Lead4ward
1 2 6 Teachers will utilize technology in math classes through the use of online resources for students requiring more targetedintervention plus teacher training. *Graphing Calculators, *Ipad, *Chromebooks
1 2 7All Algebra 1 students who failed the EOC STAAR Algebra I test will be placed in STAAR remediation classes and tutorials.Students who do not pass the Common Assessments will be put into small groups during tutorials. Struggling students thatfailed STAAR tests in 8th grade will be placed in RTI Academy to improve level of academics.
1 2 8 Teachers will disaggregate EOC & CAs to adjust instruction, prompt small group intervention, and set individual student goalsfor meeting standards and advanced performance.
1 2 9 Research based supplemental materials and supplies will be purchased to support the academic goals in Math
1 3 1 Department Head will have a planning period to work with Admin and District Office Team so there can be coordination ofplanning for ELL, Mainstream with support, GT and tutorials.
1 3 2 Teachers will use Science TEKS, Scope & Sequence, best teaching practices, CCISD Instructional Model to developInstructional Calendars with readiness and supporting standards.
1 3 3 Biology teachers with Mr. Sonsel will identify the readiness and supporting standards tested on EOC.
1 3 4 CHS will have main streamed with support classes with special ed. teachers helping in the regular classrooms to help studentswith special needs.
1 3 5 Teachers will disaggregate EOC and CA data to adjust instruction, promote small group intervention, and set individual studentgoals for meeting standards and advanced performance.
1 3 7 Students will participate in science activities to enhance basic concepts at higher cognitive levels through hands on activities,field experiences, and lab experiences. *Wetlands *Recycling Center, *Energy Trailer.
1 3 8 Science teachers will attend professional development, test for new certifications, attend AP/PAP training to increase advancedcourses and diversity.
1 3 9 Research based supplemental materials and supplies will be purchased to support the academic goals in Science.1 3 10 CHS will have a tutorial period & those students failing will be identified & assigned to tutorials.
Calhoun High SchoolGenerated by Plan4Learning.com 39 of 49 Campus #001
January 19, 2017 9:44 am

Goal Objective Strategy Description
1 4 3
CHS will participate in social studies activities to enhance basic concepts at higher cognitive levels. *Black History Month*Hispanic Heritage Month *Constitution Week, Freedom Week , Voice of Democracy. The teachers will build students'background knowledge in Social Studies through reading materials, current event discussions, various media resources, andspecial guest speakers.
1 4 4 Special Education students will be in mainstreamed with support.1 4 5 All 11th graders who failed the U. S. History EOC test will be placed in a STAAR remediation class.
1 4 6 Social studies teachers/classrooms will attend technology and other professional development to improve instruction for reg,AP/PAP students.
1 4 7 Social Studies teachers will use District Tittle Funds to attend ESL/ELL training. .1 4 8 Research based supplemental materials and supplies will be purchased to support the academic goals in social studies.
1 5 1 CHS principal will receive a leaver list. The leaver list will be reviewed by CHS administrators, CHS registrar, Hopeadministration, CHS counselors and district attendance officer. An attempt will be made to recover each person on the list.
1 5 2 Develop criteria and identify 1/6 of at-risk 9th grade class who need the Academy. There will be a certified teacher and 1paraprofessional teacher for five periods.
1 5 3 One on one counseling will be done with each "at risk" student to fully explain consequences and encourage them to commit toimproving their performance. This will be done prior to the end of the 1st nine weeks.
1 5 4 CHS counselors will develop a Personal Graduation Plan for students who have failed the STAAR test.
1 5 5 Students with behavioral needs will use the Social Skills Intervention Center to reduce number of students in In-SchoolSuspension, SSI, and DAEP.
1 5 6 Collaborate with Federal Programs-Title I to provide services and supplies to homeless students.
1 5 7 CHS counselors will work with 9-12 students to decide Endorsements by the end of October and develop 4 year graduationplans by June PEIMS snapshot.
1 6 1 CHS will record accurate daily attendance records and complete the final daily attendance sheet by 10 am the next day.1 6 2 CHS will have an exemption policy in place to encourage better attendance.1 6 3 CHS will notify parents by phone after the first absence.1 6 4 Students absent during 2nd period will be called when necessary by attendance clerk.1 6 5 CHS will begin implementing a reward/incentive system to encourage better/perfect attendance.1 6 6 Create plan for incentive for attendance for ELL students at school and on tests.1 6 7 Create an Excel Class for our SPED population behind in credits.
Calhoun High SchoolGenerated by Plan4Learning.com 40 of 49 Campus #001
January 19, 2017 9:44 am

Goal Objective Strategy Description1 7 2 CHS will meet the needs of our LOTE by having teachers attend AP/GT training. We will use District Title II funds to help1 7 3 Purchase LOTE support materials and technology equipment/support for ELL use. Ex. dictionaries, headphones, etc.1 7 4 Mrs. Brown and Mrs. Cordova will help ELLs learning to speak English.1 7 5 District is considering purchasing a new program for ELL students.1 7 6 Create plan for incentive for attendance for ELL students at school and on tests.1 8 1 CTE teachers will complete and maintain appropriate certification.
Calhoun High SchoolGenerated by Plan4Learning.com 41 of 49 Campus #001
January 19, 2017 9:44 am

Federal System Safeguard Strategies
Goal Objective Strategy Description1 6 7 Create an Excel Class for our SPED population behind in credits.
Calhoun High SchoolGenerated by Plan4Learning.com 42 of 49 Campus #001
January 19, 2017 9:44 am
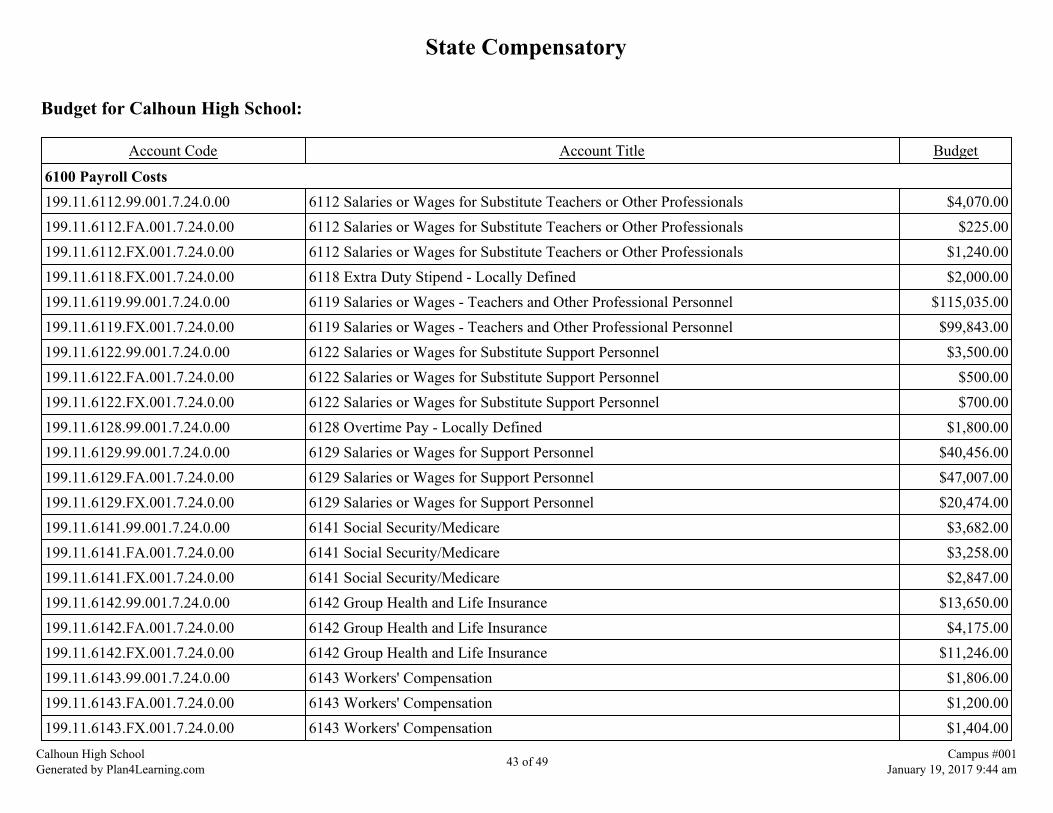
State Compensatory
Budget for Calhoun High School:
Account Code Account Title Budget
6100 Payroll Costs199.11.6112.99.001.7.24.0.00 6112 Salaries or Wages for Substitute Teachers or Other Professionals $4,070.00199.11.6112.FA.001.7.24.0.00 6112 Salaries or Wages for Substitute Teachers or Other Professionals $225.00199.11.6112.FX.001.7.24.0.00 6112 Salaries or Wages for Substitute Teachers or Other Professionals $1,240.00199.11.6118.FX.001.7.24.0.00 6118 Extra Duty Stipend - Locally Defined $2,000.00199.11.6119.99.001.7.24.0.00 6119 Salaries or Wages - Teachers and Other Professional Personnel $115,035.00199.11.6119.FX.001.7.24.0.00 6119 Salaries or Wages - Teachers and Other Professional Personnel $99,843.00199.11.6122.99.001.7.24.0.00 6122 Salaries or Wages for Substitute Support Personnel $3,500.00199.11.6122.FA.001.7.24.0.00 6122 Salaries or Wages for Substitute Support Personnel $500.00199.11.6122.FX.001.7.24.0.00 6122 Salaries or Wages for Substitute Support Personnel $700.00199.11.6128.99.001.7.24.0.00 6128 Overtime Pay - Locally Defined $1,800.00199.11.6129.99.001.7.24.0.00 6129 Salaries or Wages for Support Personnel $40,456.00199.11.6129.FA.001.7.24.0.00 6129 Salaries or Wages for Support Personnel $47,007.00199.11.6129.FX.001.7.24.0.00 6129 Salaries or Wages for Support Personnel $20,474.00199.11.6141.99.001.7.24.0.00 6141 Social Security/Medicare $3,682.00199.11.6141.FA.001.7.24.0.00 6141 Social Security/Medicare $3,258.00199.11.6141.FX.001.7.24.0.00 6141 Social Security/Medicare $2,847.00199.11.6142.99.001.7.24.0.00 6142 Group Health and Life Insurance $13,650.00199.11.6142.FA.001.7.24.0.00 6142 Group Health and Life Insurance $4,175.00199.11.6142.FX.001.7.24.0.00 6142 Group Health and Life Insurance $11,246.00199.11.6143.99.001.7.24.0.00 6143 Workers' Compensation $1,806.00199.11.6143.FA.001.7.24.0.00 6143 Workers' Compensation $1,200.00199.11.6143.FX.001.7.24.0.00 6143 Workers' Compensation $1,404.00
Calhoun High SchoolGenerated by Plan4Learning.com 43 of 49 Campus #001
January 19, 2017 9:44 am
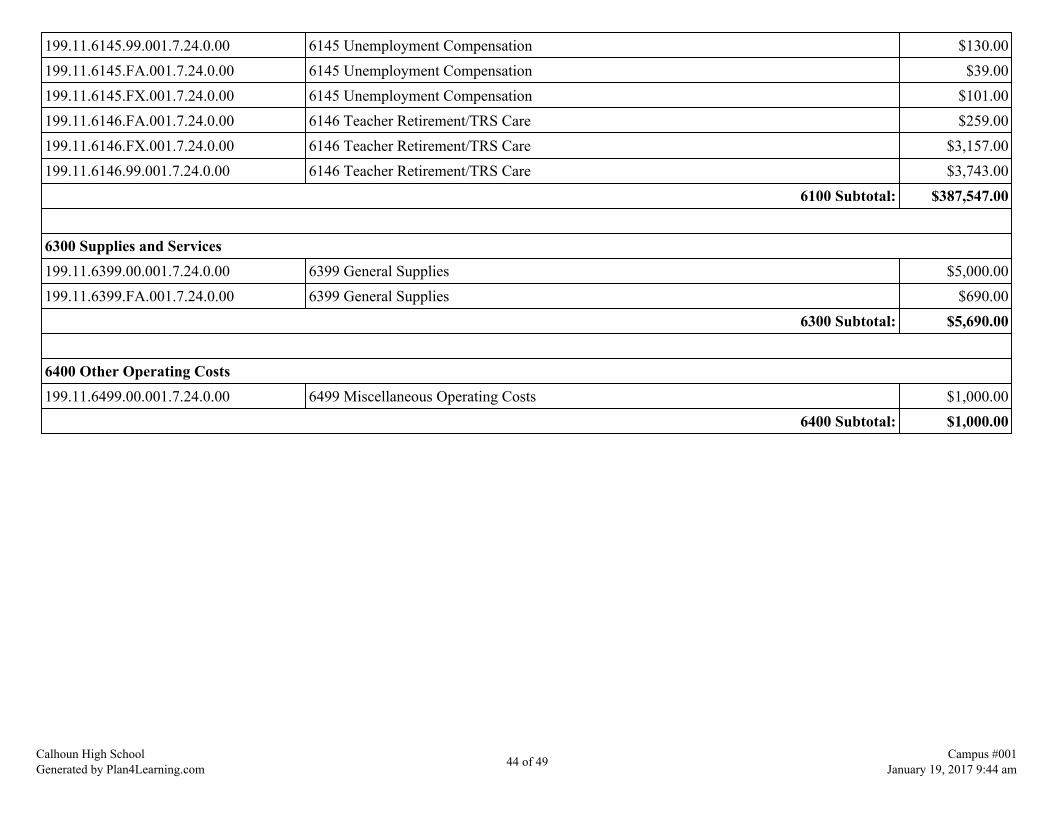
199.11.6145.99.001.7.24.0.00 6145 Unemployment Compensation $130.00199.11.6145.FA.001.7.24.0.00 6145 Unemployment Compensation $39.00199.11.6145.FX.001.7.24.0.00 6145 Unemployment Compensation $101.00199.11.6146.FA.001.7.24.0.00 6146 Teacher Retirement/TRS Care $259.00199.11.6146.FX.001.7.24.0.00 6146 Teacher Retirement/TRS Care $3,157.00199.11.6146.99.001.7.24.0.00 6146 Teacher Retirement/TRS Care $3,743.00
6100 Subtotal: $387,547.00 6300 Supplies and Services199.11.6399.00.001.7.24.0.00 6399 General Supplies $5,000.00199.11.6399.FA.001.7.24.0.00 6399 General Supplies $690.00
6300 Subtotal: $5,690.00 6400 Other Operating Costs199.11.6499.00.001.7.24.0.00 6499 Miscellaneous Operating Costs $1,000.00
6400 Subtotal: $1,000.00
Calhoun High SchoolGenerated by Plan4Learning.com 44 of 49 Campus #001
January 19, 2017 9:44 am

Personnel for Calhoun High School:
Name Position Program FTE
Abraham, Allyson Aide Novanet 1.0%Alvarado, Santos Teacher Inclusion .28%Caraway, Jeanette Aide RTI Academy 1.0%Clark, Kay Teacher Applied Algebra I .42%Innerarity, Michael Teacher ISS .72%Machicek, Kelly Aide Content Mastery 1.0%Rothbauer, Devra Teacher STAAR Biology .14%Saenz, Roger Teacher Inclusion .14%Spencer, Kristin Teacher RTI Academy 1.0%Swope, Phillip Teacher STAAR History .14%Torres, Mary Lori Teacher STAAR Math .28%
Calhoun High SchoolGenerated by Plan4Learning.com 45 of 49 Campus #001
January 19, 2017 9:44 am

Site-Based Decision Making Committee
Committee Role Name PositionAssistant Principal Dana DworaczykAssistant Principal Brent NiemeierAssistant Principal Wes WyattBusiness Representative Sarita BonuzClassroom Teacher Lauree AschenClassroom Teacher John FergusonClassroom Teacher Rebecca FriesenhahnClassroom Teacher Sheryl HouseClassroom Teacher Dee AnnaClassroom Teacher Andreanna MartinezClassroom Teacher Felix SalinasClassroom Teacher Erin WeaverCounselor Sandra RudellatCounselor Blan WilloughbyParaprofessional Renee McCarthyParent Melinda CainPrincipal Nicole Amason
Calhoun High SchoolGenerated by Plan4Learning.com 46 of 49 Campus #001
January 19, 2017 9:44 am

Campus Funding Summary
199 LOCALGoal Objective Strategy Resources Needed Account Code Amount
1 1 4 19913629900001724000 $5,000.001 1 9 19913623900874721000 $750.00
Sub-Total $5,750.00255 TITLE IIGoal Objective Strategy Resources Needed Account Code Amount
1 1 3 25513639900874624000 $102.501 1 9 25513623900001724000 $750.001 2 3 $200.001 2 5 25513623900001624000 $280.001 2 5 25513623900001624000 $280.001 2 5 25513623900001724000 $300.001 3 8 25513623900001724000 $450.001 4 6 25513623900001624000 $150.001 4 6 2513623900001724000 $450.001 8 1 25511649900001624000 $197.001 8 1 25511649900001624000 $120.001 8 1 25511649900001624000 $197.003 1 8 25513629900001624000 $5,000.00
Sub-Total $8,476.50263 TITLE IIIGoal Objective Strategy Resources Needed Account Code Amount
1 1 3 Training for Reading Smart Reading Mate 26313629900001725000 $440.001 1 3 Sheltered Instruction training 26313623900001725000 $100.001 1 7 $827.00
Calhoun High SchoolGenerated by Plan4Learning.com 47 of 49 Campus #001
January 19, 2017 9:44 am

1 1 10 26313623900001625000 $50.001 1 12 26311639900001625000 $187.501 1 12 26311639900001625000 $187.501 1 12 26311639900001625000 $1,378.001 1 12 26311639900001625000 $273.001 1 14 26311639900001725000 $3,818.005 1 9 26311639900001625000 $75.005 1 9 26311649900001625000 $75.00
Sub-Total $7,411.00410 IMAGoal Objective Strategy Resources Needed Account Code Amount
3 1 1 410-11-6399.00-001-711000 $1,873.003 1 1 410-11-6399.00-001-711000 $169.95
Sub-Total $2,042.95Grand Total $23,680.45
Calhoun High SchoolGenerated by Plan4Learning.com 48 of 49 Campus #001
January 19, 2017 9:44 am

Addendums
Calhoun High SchoolGenerated by Plan4Learning.com 49 of 49 Campus #001
January 19, 2017 9:44 am


2016-2017
You Matter!
Celebrations Distinction Designations in Mathematics, Science, Top 25% Student Progress and College Readiness One student was Commended by the National Merit Scholarship Corporation CHS students scored above the State and National average on the ACT test Increased focus on College and Career Readiness Upgrades to CHS
Opportunities Reading
o Economically disadvantaged o Special Education o ELL o African American, Hispanic and Asian
Math o Special Education
Attendance Budget – Lost/absorbed positions
Changes in CIP ELL study hall specializing in Literacy ESOL class in addition to English class SIOP professional development for English and Special Education Teachers Consultant Marsha White for English Department Removal of planning periods except for Department Heads Decrease Support Teachers in Mainstreamed classrooms Scheduled Tutorials before school The Academy is five periods with increased class sizes Attendance Incentives
o Weekly and Long Term drawings for attendance prizes o Daily personal phone calls to students who are absent
Met level 2 & above
Reading
Math
Science Social Studie
Target State/Feder
All Students 58% 83% 88% 91% 60/87% African American 38% * * 83% 60/87% Hispanic 55% 83% 87% 91% 60/87% White 70% 81% 90% 94% 60/87% Asian 38% 100% 79% 84% 60/87% Econ. Disadv. 53% 82% 83% 92% 60/87% Special Education 20% 46% 58% 75% 60/87% ELL 18% 94% 73% 62% 60/87%

TEXAS EDUCATION AGENCY2016 Accountability Summary
CALHOUN H S (029901001) - CALHOUN COUNTY ISD
Accountability Rating
Met Standard
Met Standards on Did Not Meet Standards on
- Student Achievement - NONE
- Student Progress
- Closing Performance Gaps
- Postsecondary Readiness
In 2016, to receive a Met Standard or Met Alternative Standard rating, districts and campusesmust meet targets on three indexes: Index 1 or Index 2 and Index 3 and Index 4.
Performance Index Report
0
25
50
75
100
Index 1
StudentAchievement
(Target Score=60)
Index 2
StudentProgress
(Target Score=17)
Index 3
ClosingPerformance Gaps(Target Score=30)
Index 4
PostsecondaryReadiness
(Target Score=60)
73 30 43 82
Performance Index Summary
IndexPoints
EarnedMaximum
PointsIndexScore
1 - Student Achievement 1,210 1,656 73
2 - Student Progress 357 1,200 30
3 - Closing Performance Gaps 689 1,600 43
4 - Postsecondary Readiness
STAAR Score 13.5
Graduation Rate Score 23.9
Graduation Plan Score 21.4
Postsecondary Component Score 23.1 82
Distinction Designation
Academic Achievement in ELA/Reading
NO DISTINCTION EARNED
Academic Achievement in Mathematics
DISTINCTION EARNED
Academic Achievement in Science
DISTINCTION EARNED
Academic Achievement in Social Studies
NO DISTINCTION EARNED
Top 25 Percent Student Progress
DISTINCTION EARNED
Top 25 Percent Closing Performance Gaps
NO DISTINCTION EARNED
Postsecondary Readiness
DISTINCTION EARNED
Campus Demographics
Campus Type High School
Campus Size 1,188 Students
Grade Span 09 - 12
Percent EconomicallyDisadvantaged 49.0
Percent English LanguageLearners 4.6
Mobility Rate 13.9
System Safeguards
Number and Percentage of Indicators Met
Performance Rates 14 out of 21 = 67%
Participation Rates 13 out of 13 = 100%
Graduation Rates 4 out of 5 = 80%
Total 31 out of 39 = 79%
For further information about this report, please see the Performance Reporting Division website at https://rptsvr1.tea.texas.gov/perfreport/account/2016/index.html
TEA Division of Performance Reporting Page 1 September 2016

2015-2016 REPORT ON VIOLENT/CRIMINAL INCIDENTS
Calhoun County ISD
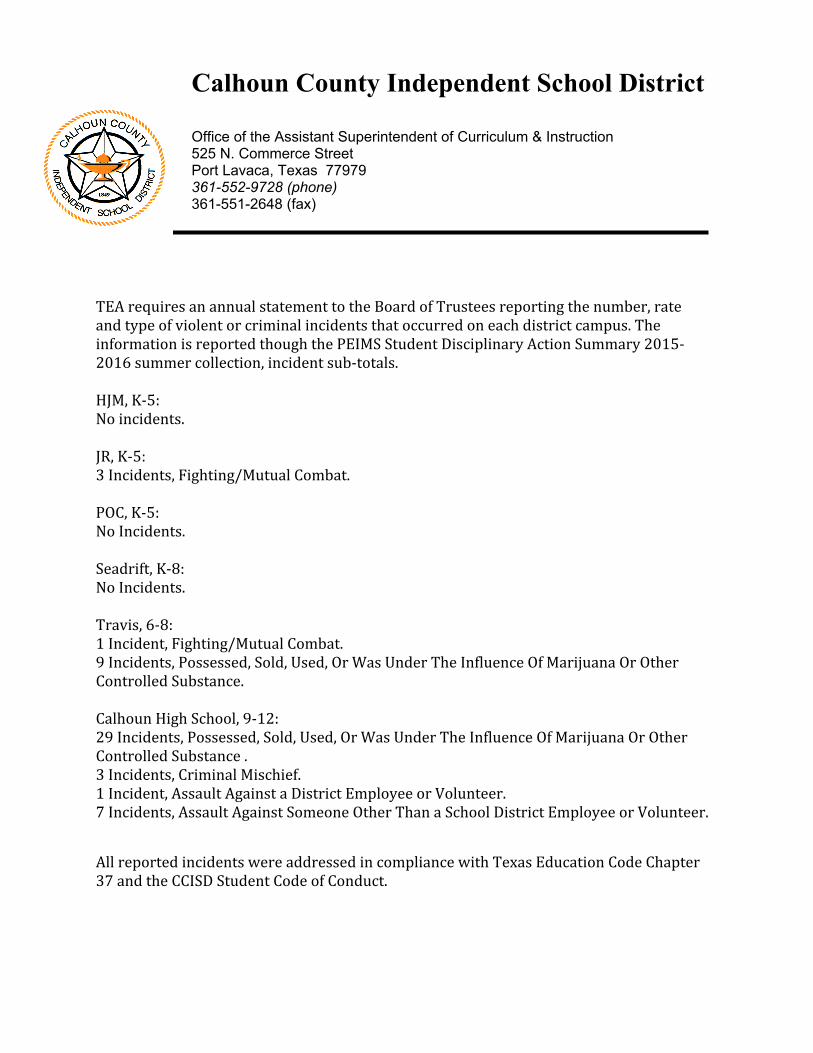
Calhoun County Independent School District
Office of the Assistant Superintendent of Curriculum & Instruction525 N. Commerce StreetPort Lavaca, Texas 77979361-552-9728 (phone)361-551-2648 (fax)
TEA requires an annual statement to the Board of Trustees reporting the number, rate and type of violent or criminal incidents that occurred on each district campus. The information is reported though the PEIMS Student Disciplinary Action Summary 2015-2016 summer collection, incident sub-totals.
HJM, K-5: No incidents.
JR, K-5:3 Incidents, Fighting/Mutual Combat.
POC, K-5: No Incidents.
Seadrift, K-8:No Incidents. Travis, 6-8: 1 Incident, Fighting/Mutual Combat. 9 Incidents, Possessed, Sold, Used, Or Was Under The Influence Of Marijuana Or Other Controlled Substance.
Calhoun High School, 9-12:29 Incidents, Possessed, Sold, Used, Or Was Under The Influence Of Marijuana Or Other Controlled Substance .3 Incidents, Criminal Mischief.1 Incident, Assault Against a District Employee or Volunteer. 7 Incidents, Assault Against Someone Other Than a School District Employee or Volunteer.
All reported incidents were addressed in compliance with Texas Education Code Chapter 37 and the CCISD Student Code of Conduct.
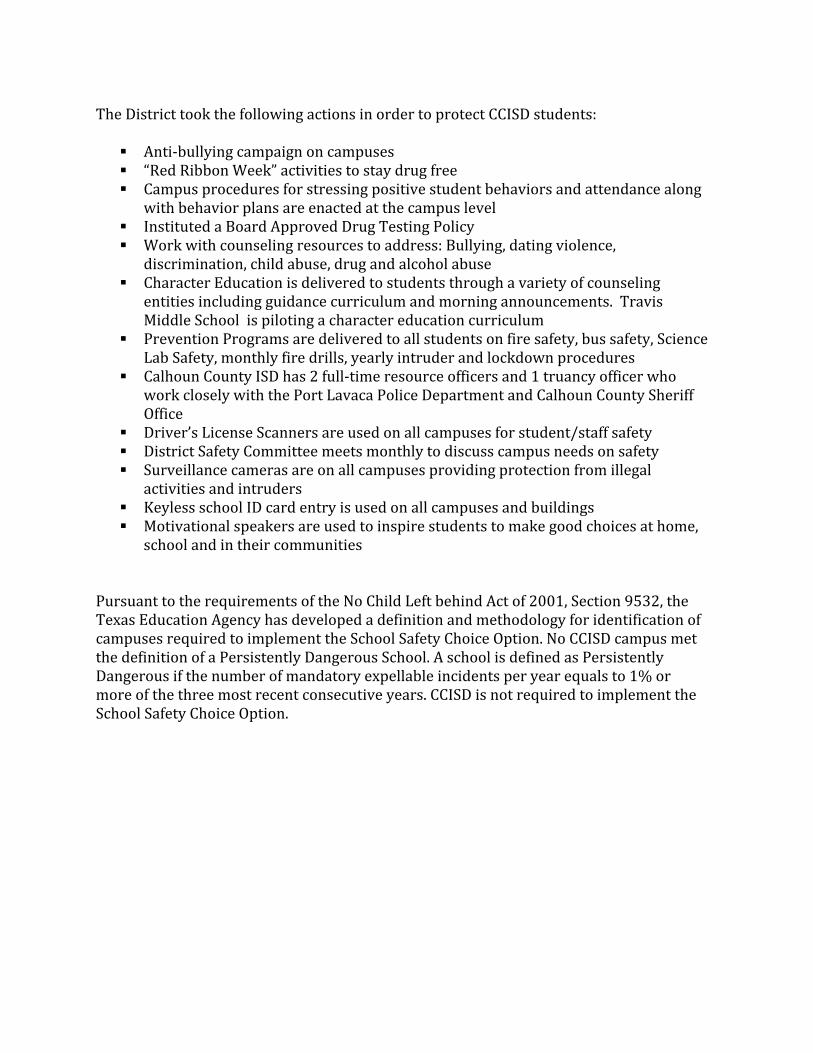
The District took the following actions in order to protect CCISD students:
Anti-bullying campaign on campuses “Red Ribbon Week” activities to stay drug free Campus procedures for stressing positive student behaviors and attendance along
with behavior plans are enacted at the campus level Instituted a Board Approved Drug Testing Policy Work with counseling resources to address: Bullying, dating violence,
discrimination, child abuse, drug and alcohol abuse Character Education is delivered to students through a variety of counseling
entities including guidance curriculum and morning announcements. Travis Middle School is piloting a character education curriculum
Prevention Programs are delivered to all students on fire safety, bus safety, Science Lab Safety, monthly fire drills, yearly intruder and lockdown procedures
Calhoun County ISD has 2 full-time resource officers and 1 truancy officer who work closely with the Port Lavaca Police Department and Calhoun County Sheriff Office
Driver’s License Scanners are used on all campuses for student/staff safety District Safety Committee meets monthly to discuss campus needs on safety Surveillance cameras are on all campuses providing protection from illegal
activities and intruders Keyless school ID card entry is used on all campuses and buildings Motivational speakers are used to inspire students to make good choices at home,
school and in their communities
Pursuant to the requirements of the No Child Left behind Act of 2001, Section 9532, the Texas Education Agency has developed a definition and methodology for identification of campuses required to implement the School Safety Choice Option. No CCISD campus met the definition of a Persistently Dangerous School. A school is defined as Persistently Dangerous if the number of mandatory expellable incidents per year equals to 1% or more of the three most recent consecutive years. CCISD is not required to implement the School Safety Choice Option.

2015-2016 ACADEMIC PERFORMANCE/
HIGHER EDUCATION
Calhoun County ISD
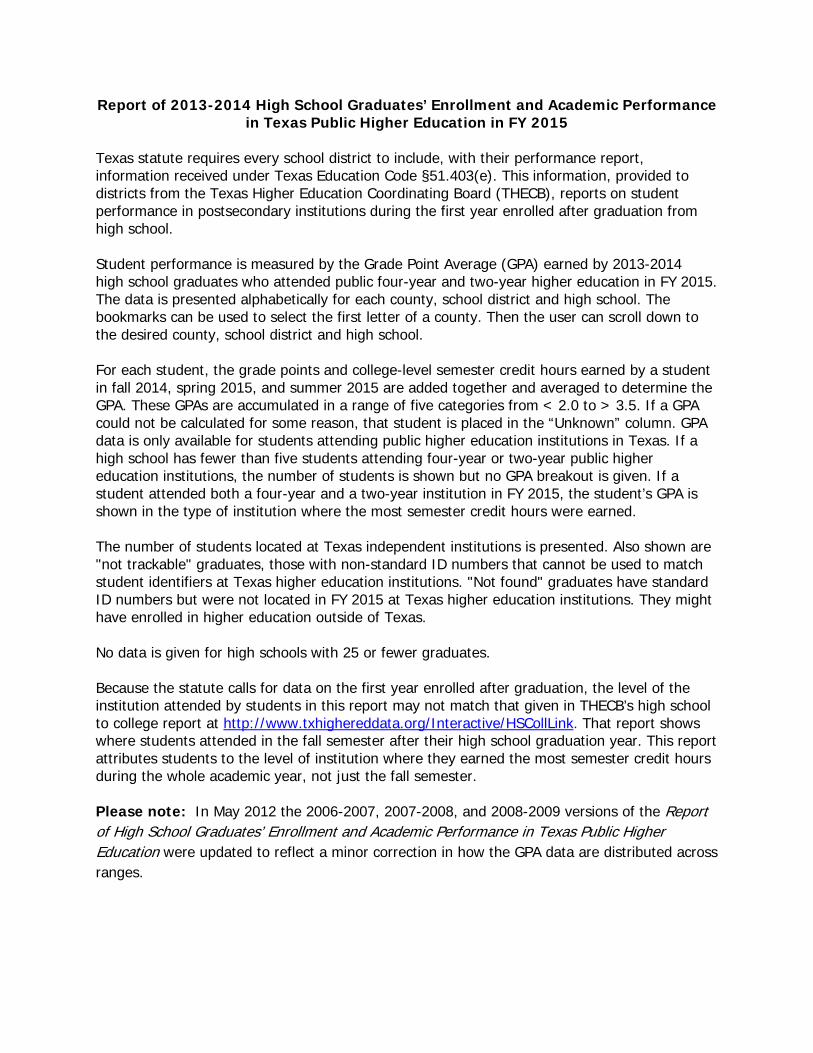
Report of 2013-2014 High School Graduates’ Enrollment and Academic Performance in Texas Public Higher Education in FY 2015
Texas statute requires every school district to include, with their performance report, information received under Texas Education Code §51.403(e). This information, provided to districts from the Texas Higher Education Coordinating Board (THECB), reports on student performance in postsecondary institutions during the first year enrolled after graduation from high school.
Student performance is measured by the Grade Point Average (GPA) earned by 2013-2014 high school graduates who attended public four-year and two-year higher education in FY 2015. The data is presented alphabetically for each county, school district and high school. The bookmarks can be used to select the first letter of a county. Then the user can scroll down to the desired county, school district and high school.
For each student, the grade points and college-level semester credit hours earned by a student in fall 2014, spring 2015, and summer 2015 are added together and averaged to determine the GPA. These GPAs are accumulated in a range of five categories from < 2.0 to > 3.5. If a GPA could not be calculated for some reason, that student is placed in the “Unknown” column. GPA data is only available for students attending public higher education institutions in Texas. If a high school has fewer than five students attending four-year or two-year public higher education institutions, the number of students is shown but no GPA breakout is given. If a student attended both a four-year and a two-year institution in FY 2015, the student’s GPA is shown in the type of institution where the most semester credit hours were earned.
The number of students located at Texas independent institutions is presented. Also shown are "not trackable" graduates, those with non-standard ID numbers that cannot be used to match student identifiers at Texas higher education institutions. "Not found" graduates have standard ID numbers but were not located in FY 2015 at Texas higher education institutions. They might have enrolled in higher education outside of Texas.
No data is given for high schools with 25 or fewer graduates.
Because the statute calls for data on the first year enrolled after graduation, the level of the institution attended by students in this report may not match that given in THECB’s high school to college report at http://www.txhighereddata.org/Interactive/HSCollLink. That report shows where students attended in the fall semester after their high school graduation year. This report attributes students to the level of institution where they earned the most semester credit hours during the whole academic year, not just the fall semester.
Please note: In May 2012 the 2006-2007, 2007-2008, and 2008-2009 versions of the Report of High School Graduates’ Enrollment and Academic Performance in Texas Public Higher Education were updated to reflect a minor correction in how the GPA data are distributed across ranges.

Texas High School Graduates from FY2014
Enrolled in Texas Public or Independent Higher Education in FY 2015
GPA for 1st Year in Public Higher Education in Texas
Total 2.0- 2.5- 3.0-County District Graduates <2.0 2.49 2.99 3.49 >3.5 Unk
CALHOUN CALHOUN COUNTY ISD
029901001 CALHOUN H S Four-Year Public University 32 4 4 6 6 12 0 Two-Year Public Colleges 78 29 13 13 11 10 2 Independent Colleges & Universities 6 Not Trackable 7 Not Found 105 Total High School Graduates 228
HOPE H S 029901003 Four-Year Public University 1 Two-Year Public Colleges 2 Independent Colleges & Universities 0 Not Trackable 3 Not Found 53 Total High School Graduates 59
Source: Texas Higher Education Coordinating Board and Texas Education Agency
"Not found" graduates have standard ID numbers that were not found in the specified year at Texas higher education institutions. "Not trackable" graduates have non-standard ID numbers that will not find a match at Texas higher education institutions. Includes high schools with more than 25 graduates. If enrolllment in public higher education less than 5, the GPA data is omitted.

2015-2016 ACADEMIC PERFORMANCE/
HIGHER EDUCATION
Calhoun County ISD

Report of 2013-2014 High School Graduates’ Enrollment and Academic Performance in Texas Public Higher Education in FY 2015
Texas statute requires every school district to include, with their performance report, information received under Texas Education Code §51.403(e). This information, provided to districts from the Texas Higher Education Coordinating Board (THECB), reports on student performance in postsecondary institutions during the first year enrolled after graduation from high school.
Student performance is measured by the Grade Point Average (GPA) earned by 2013-2014 high school graduates who attended public four-year and two-year higher education in FY 2015. The data is presented alphabetically for each county, school district and high school. The bookmarks can be used to select the first letter of a county. Then the user can scroll down to the desired county, school district and high school.
For each student, the grade points and college-level semester credit hours earned by a student in fall 2014, spring 2015, and summer 2015 are added together and averaged to determine the GPA. These GPAs are accumulated in a range of five categories from < 2.0 to > 3.5. If a GPA could not be calculated for some reason, that student is placed in the “Unknown” column. GPA data is only available for students attending public higher education institutions in Texas. If a high school has fewer than five students attending four-year or two-year public higher education institutions, the number of students is shown but no GPA breakout is given. If a student attended both a four-year and a two-year institution in FY 2015, the student’s GPA is shown in the type of institution where the most semester credit hours were earned.
The number of students located at Texas independent institutions is presented. Also shown are "not trackable" graduates, those with non-standard ID numbers that cannot be used to match student identifiers at Texas higher education institutions. "Not found" graduates have standard ID numbers but were not located in FY 2015 at Texas higher education institutions. They might have enrolled in higher education outside of Texas.
No data is given for high schools with 25 or fewer graduates.
Because the statute calls for data on the first year enrolled after graduation, the level of the institution attended by students in this report may not match that given in THECB’s high school to college report at http://www.txhighereddata.org/Interactive/HSCollLink. That report shows where students attended in the fall semester after their high school graduation year. This report attributes students to the level of institution where they earned the most semester credit hours during the whole academic year, not just the fall semester.
Please note: In May 2012 the 2006-2007, 2007-2008, and 2008-2009 versions of the Report of High School Graduates’ Enrollment and Academic Performance in Texas Public Higher Education were updated to reflect a minor correction in how the GPA data are distributed across ranges.
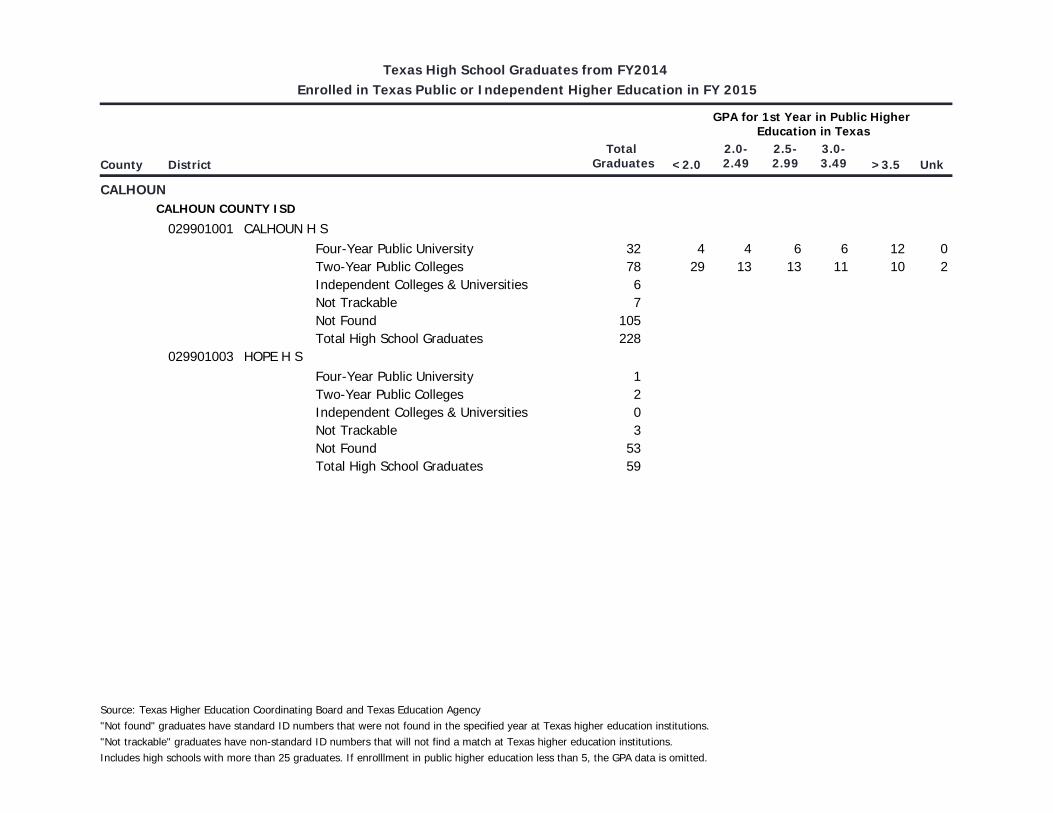
Texas High School Graduates from FY2014
Enrolled in Texas Public or Independent Higher Education in FY 2015
GPA for 1st Year in Public Higher Education in Texas
Total 2.0- 2.5- 3.0-County District Graduates <2.0 2.49 2.99 3.49 >3.5 Unk
CALHOUN CALHOUN COUNTY ISD
029901001 CALHOUN H S Four-Year Public University 32 4 4 6 6 12 0 Two-Year Public Colleges 78 29 13 13 11 10 2 Independent Colleges & Universities 6 Not Trackable 7 Not Found 105 Total High School Graduates 228
HOPE H S 029901003 Four-Year Public University 1 Two-Year Public Colleges 2 Independent Colleges & Universities 0 Not Trackable 3 Not Found 53 Total High School Graduates 59
Source: Texas Higher Education Coordinating Board and Texas Education Agency
"Not found" graduates have standard ID numbers that were not found in the specified year at Texas higher education institutions. "Not trackable" graduates have non-standard ID numbers that will not find a match at Texas higher education institutions. Includes high schools with more than 25 graduates. If enrolllment in public higher education less than 5, the GPA data is omitted.
2015 -
2016
ACADEMIC PERFORMANCE/
HIGHER EDUCATION
Calhoun County ISD

Report of 2013-2014 High School Graduates’ Enrollment and Academic Performance in Texas Public Higher Education in FY 2015
Texas statute requires every school district to include, with their performance report,
information received under Texas Education Code §51.403(e). This information, provided to
districts from the Texas Higher Education Coordinating Board (THECB), reports on student
performance in postsecondary institutions during the first year enrolled after graduation from
high school.
Student performance is measured by the Grade Point Average (GPA) earned by 2013-2014 high
school graduates who attended public four-year and two-year higher education in FY 2015. The
data is presented alphabetically for each county, school district and high school. The bookmarks
can be used to select the first letter of a county. Then the user can scroll down to the desired
county, school district and high school.
For each student, the grade points and college-level semester credit hours earned by a student
in fall 2014, spring 2015, and summer 2015 are added together and averaged to determine the
GPA. These GPAs are accumulated in a range of five categories from < 2.0 to > 3.5. If a GPA
could not be calculated for some reason, that student is placed in the “Unknown” column. GPA
data is only available for students attending public higher education institutions in Texas. If a
high school has fewer than five students attending four-year or two-year public higher
education institutions, the number of students is shown but no GPA breakout is given. If a
student attended both a four-year and a two-year institution in FY 2015, the student’s GPA is
shown in the type of institution where the most semester credit hours were earned.
The number of students located at Texas independent institutions is presented. Also shown are
"not trackable" graduates, those with non-standard ID numbers that cannot be used to match
student identifiers at Texas higher education institutions. "Not found" graduates have standard
ID numbers but were not located in FY 2015 at Texas higher education institutions. They might
have enrolled in higher education outside of Texas.
No data is given for high schools with 25 or fewer graduates.
Because the statute calls for data on the first year enrolled after graduation, the level of the
institution attended by students in this report may not match that given in THECB’s high school
to college report at http://www.txhighereddata.org/Interactive/HSCollLink. That report shows
where students attended in the fall semester after their high school graduation year. This report
attributes students to the level of institution where they earned the most semester credit hours
during the whole academic year, not just the fall semester.
Please note: In May 2012 the 2006-2007, 2007-2008, and 2008-2009 versions of the Report
of High School Graduates’ Enrollment and Academic Performance in Texas Public Higher
Education were updated to reflect a minor correction in how the GPA data are distributed
across ranges.

Texas High School Graduates from FY2014 Enrolled in Texas Public or Independent Higher Education in FY 2015
GPA for 1st Year in Public Higher
Education in Texas Total 2.0- 2.5- 3.0- County District Graduates <2.0 2.49 2.99 3.49 >3.5 Unk
CALHOUN
CALHOUN COUNTY ISD 029901001 CALHOUN H S
Four-Year Public University 32 4 4 6 6 12 0
Two-Year Public Colleges 78 29 13 13 11 10 2
Independent Colleges & Universities 6
Not Trackable 7
Not Found 105
Total High School Graduates 228
029901003 HOPE H S
Four-Year Public University 1
Two-Year Public Colleges 2
Independent Colleges & Universities 0
Not Trackable 3
Not Found 53
Total High School Graduates 59
Source: Texas Higher Education Coordinating Board and Texas Education Agency "Not found" graduates have standard ID numbers that were not found in the specified year at Texas higher education institutions. "Not trackable" graduates have non-standard ID numbers that will not find a match at Texas higher education institutions.

Includes high schools with more than 25 graduates. If enrolllment in public higher education less than 5, the GPA data is omitted.