Testing for the Existence of Noise in Financial Statement ...
69
TESTING FOR THE EXISTENCE OF NOISE IN FINANCIAL STATEMENT BASED MEASURES OF PERFORMANCE FOR COMPANIES LISTED AT THE NAIROBI STOCK EXCHANGE. By Winfred W. Njiraini vjtyafHTT of naitw* SawseEUBJUBs A Projcci Report submitted in partial fulfillment of the requirements for the award of a Degree of Master of Business Administration, School of Business, University of Nairobi November, 2007 «»«*•* ■ » •*»•<» Lecw,
-
Upload
khangminh22 -
Category
Documents
-
view
6 -
download
0
Transcript of Testing for the Existence of Noise in Financial Statement ...
TESTING FOR THE EXISTENCE OF NOISE IN FINANCIAL STATEMENT BASED MEASURES OF PERFORM ANCE FOR COMPANIES LISTED AT THE NAIROBI STOCK EXCHANGE.
By
Winfred W. Njiraini
vjtyafHTT of naitw*S a w s e E U B J U B s
A Projcci Report submitted in partial fulfillment o f the requirements for the award of a Degree o f Master o f Business Administration, School o f Business, University
o f Nairobi
November, 2007
«»«*•* ■ » •*»•<» Lecw,

Declaration
THIS IS MY ORIGINAL WORK AND HAS NOT BEEN PRESENTED FOR A DEGREE IN ANY OTHER UNIVERSITY
SIGNED............ ......................................................... DATE
WINFRED W. NJIRAIM
KEG NO: D61/P/8533/04
THIS PROJECT' HAS BEEN SUBMITIT.D FOR EXAMINATION WITH APPROVAL AS UNIVERSITY SUPERVISOR
SIGNED:..............O r^ T r r r r r r r r rT ^ ^ ............DATE: 7
MOSES ANYANGU
LECTURER, DEPARTMENT Ol ACCOUNTING AND FINANCE. SCHOOI OF BUSINESS
ii

Dedication
1 dedicate this paper to my husband Richard and daughters Lisa and Tyna.
iii

Acknowledgements
My sincere gratitude to my supervisor. Moses Anyangu for his tireless and dedicated
guidance to the completion of this paper.
My friends and colleagues at Corporate Planning & Stategy division who gave me
considerable encouragement and input to the paper.
My husband Richard, daughters l isa and Tyna for unequalled support and
encouragement.
My parents and siblings, without whom I would never have come this far.
tv

Declaration......................
Dedication........................
A cknow ledgem ents...........
List of Abbreviations......
List of Tables...................
List of Figures.................
Abstract...........................
CH A PTER O N E ....
t a b l e o f c o n t e n t s
...ii
..iii
..iv• • .VII
viii
..lx
...x
. . . I
I. INTRODUCTION ••••••••t•••••••• I
1.1 Background.....................1.2. Statement of the problem1.3. Objectives of the study....1.4. Importance of the study ..
C H A PTE R T W O .... •••••••••••••••••••••••••••••••••••••••••••••••••••a
.. i
..9 10 10
II
2. LITERATURE REVIEW II
2.1 Qualitative characteristics of financial information............................................... 112.2 l imitations of financial reports as traditionally constructed.................................132.3 Kenyan companies compliance with accounting standards and financial reporting........... .............................................................................................................................152.4 F.mpirical l iterature................................................................................................. 16
CH APTER TH R E E 21
3. RESEARCH METHODOLOGY .21
3.1 Research design.........3.2 Population..................3.3 Sampling....................3.4 Data Collection..........3.5 Data Analysis.............3.6 Correlation Analysis ...3.7 Statistical Significance
C H A P T E R FOUR
2121222223252526
4. DATA ANALYSIS AND FINDINGS 26
v

4.1 Introduction........................................................................................................4.2 Preliminary Analysis.........................................................................................4.3 Relationship between financial statement based measures of performance undmarket based measures of performance..................................................................4.4 Correlation Matrix............................................................................................4.5 Regression Relationship....................................................................................
C H A PTER FIVE
2626
31343536
5. CONCLUSIONS AND RECOM MENDATIONS.................................. 36
5.1 Recommendations for further research....................................................................375.2 Limitations of the study...........................................................................................37
6. RF.KFRFNCFS 38
APPENDIX I 42
APPENDIX I I .....................................................................................................43
APPENDIX I I I : ..................................................................................................44
APPENDIX IV ....................................................................................................49
VI

List of AbbreviationsAICPA: American Institute of Certified Public Accountant
NSE: Nairobi Stock Exchange
ICPAK: Institute of Certified Public Accountants
Pi Re: Financial Reporting
GAAP: Generally Accepted Accounting Principles
EPS: Earnings per Share
ROA: Return on Assets
ROE: Return on Equity
HRS: Financial Reporting Standards (IFRS)
CMA: Capital Market Authority
UNCTAD: United Nations Conference on Trade and Development
SPSS: Statistical Package for the Social Sciences
ANOVA: Analysis of Variance
vii

u« l of Tobies
Table I : Firm compliance levels................................................................................. 15
Table 2: Trend of Market Return and return on Equity................................................32
Table 3: Trend of Market Return and return on Assets................................................33
Table 4: Trend of Market Return and Famings per Share............................................34
Table 5: Correlation Matrix...........................................................................................35
Table 6: Regression Analysis.........................................................................................36
viii

List of Figure*
Figure 1: Mean Market Return by sector.................................................................... 27
Figure 2: Trend of Market Return................................................................................28
Figure 3: Mean Famings per share by sector...............................................................28
Figure 4: Trend of framings per Share........................................................................ 29
Figure 5: Comparing mean Return on Equity and Return on Assets by sector............30
Figure 6: Trend of Return on Equity............................................................................30
Figure 7: Mean Return on Assets by sector...................................................................31
Figure 8: Trend of mean Return on Assets....................................................................32
Figure 9: Trend of Market Return and Return on Equity.............................................33
Figure 10: Trend of Market Return and Return on Assets...........................................34
Figure 11: Trend of Market Return and Famings per Share........................................35
ix

Abstract
In Kenya, firms listed at the Nairobi Stock Exchange are required to publish their annual
results to keep shareholders informed on their performance The firms performance is
also captured through trading at the Nairobi Stock Exchange where firms perceived
performance is indicated on the share prices, among other factors, which results from the
forces of demand and supply for the stock. Financial statement and financial market
forms of reporting for listed firms is anticipated to have a positive correlation. Whereas
market based variables reflect future expectations of comings, accounting data reflect
past performance. Positive correlation is expected on the variables
Efficient markets assume that security prices at any time reflect all available information
on a company. Tins means that the information contained in financial statements is
already incorporated in the stock prices hence no room lor abnormal returns.
This study tested the existence of noise in financial statement based reporting for firms
listed at the Nairobi Stock Exchange. It sought to test the reporting efficiency of these
listed firms, given the efficiency levels that stem from numerous independent market
operators to obtain an efficient market performance indicator. The study used a sample of
20 firms out of a tolal of 52 listed firms as at 30L'' December 2006. The study period was
years 2001 to 2005.
Market Return, computed from beginning and end of year share prices adjusted lor
annual dividend was gauged independently against Return on Assets. Return on Equity
and Earnings Per Share.
A positive correlation was found to exist between Market Return and all the other three
financial statement based variables. The relationship between Market Return and Return
on Assets was found to be more significant than with Return on Equity and Earnings Per
Share. This relationship signifies a good level of performance reporting for firms listed at
the NSE. The financial statement based reporting is in tandem, to a large extent with
market based performance reporting.
x

C H A P T E R ONE
1. INTRODUCTION
l.l Background
Source of information on performance for listed firms is normally two-fold; financial
statement based (accounting measures) and market based measures. Generally, market
based variables reflect future expectations of earnings whereas accounting data reflect
past performance The change in a firm’s market prices is n response to a wide set of
information that reflect revision to the capital market’s expectation in relation to future
cash flows. In comparison, accounting variables express the relationship between two or
more financial figures in the form of percentages or fractions. Odhiambo (2005) contends
that accounting variables have only a limited ability to reflect revision of the capital
market's expectation in relation to future cash flows. This is because objectivity,
verifiability and other conventions that underlie Generally Accepted Accounting
Principles (GAAP) limit the ability of accounting earnings to reflect the market's revision
of expectations for future net cash flows.
Recent studies have put in question the value-relevance of accounting information to
providers of capital Although the brunt of the assault has focused mostly on the
relevance to providers of equity capital with a vast body of literature finding temporal
declines in the power of accounting data to explain equity prices (e.g. Lev and Zarawin.
I‘>99; Francis and Schippcr, 1999; relevance to the credit markets has not remained
unscathed. In particular, the class of models using accounting variables in the modeling
of default (notably. Altman. 1968; Ohlson, 1980) have been challenged by two new
classes of models, so-called structural and reduced-form, that rely exclusively on market
data. On one hund, structural models (Merton. 1974) use option pricing methods to
compute a probability of default from the level and volatility of market value of assets.
On the other hand, reduced-form models (Jarrow and Turnbull. 1995; Duffic and
Singleton. 1999) explicitly define debt value as a function of the default intensity
allowing the latter to be extracted from calibration using bond prices. Market-based
approaches to pricing distress have been embraced by academics mid the public at large.
OF NAIHftf
Despite the popularity of market-based default metrics, anecdotal evidence suggests that
accounting information has a potentially important role to play in predicting distress, l or
example, the case of Enron is indicative of the possible pitfalls of relying exclusively on
market information. Moreover, regardless of the quality of market based information,
many companies are privately held and thus by necessity accounting information must be
used to estimate the probability of default on their (sometimes public) debt. Estimating
the relevance of accounting information in the pricing of default risk is therefore an
important exercise in its own right.
Accounting numbers have lost value relevance. This phenomenon is frequently attributed
to the incomplete recording of intangible value drivers in financial statements. Standard
setters' reluctance to change capitalization rules for intangible assets is. however, well
founded on economic grounds.
Accounting rules, so the well-known complaint, have ignored in many respects the
dramatic changes of economic environments and remain at an inferior stage of
development The complaint is supplied by numerous empiricul studies which (i) indicate
that the book to market ratios have declined dramatically during the last years and thus,
the balance sheet equity numbers are failing more and more to represent the real value of
u company, and which (li) indicate that accounting numbers and particularly earnings
figures have lost ‘value relevance', i.c. predictive power for the explanation of abnormal returns.
1.1.1 Financial reporting for companies
Companies utilise a wide variety of media to disseminate information to the investment
community such as in-person briefing, interim publications and the Internet. However,
financial reports have historically been the primary vehicle by which public companies
communicate with shareholders, customers and a host of other stakeholders.
PriceWaterHou.se annual report (1999) cited that the financial report supplements
historical financial detail with information about a company's strategy, its management,
current position and future prospects, it is not surprising that it should be relied on so
heavily by investors and analysts to asses value.
2

A (inn's communication to outside interest groups, especially to the capital markets,
represents an essential part o f financial accounting. The response of actors in the
marketplace to interim and annual accounting earnings announcements has interested
both practitioners and academics lor decades. The major issue has been the information
value of these disclosures. Announcements are said to contain information if they alter
investors' beliefs about the value of an asset (Beaver 1968:117). In the course of the
years since then, researchers have become convinced that the releases are associated with
both increased security price variability and increased trading volume. Ball and Brown
(1968) were the first to report drift in stock returns after earnings announcements and
Beaver (1968) reported increase in volume following announcements.
Disclosure requirements set out the rules and guidelines governing listed companies to
enhance information dissemination to the shareholders. According to Gray et al (1995).
Ndubizu (1992). Mealy and Palepu (2000). disclosure reduces information asymmetry in
the market and thus uncertainty that, in turn, prevents market failure and increases market
liquidity. Increasing the level of disclosure increases the level of transparency between
the firm and outside investors, reduces the problem of agency cost, and consequently
improves the valuation of the firm’s stock price. Issuers of publicly traded securities have
an obligation to disclose decisions and other circumstances which have u material impact
on the value of the securities. This information must be disclosed without undue delay.
The disclosure requirements arc designed to ensure that investors have equal and
simultaneous access to information, fhc information must therefore be reliable,
comprehensive, timely, accurate, comparable and transparent. The objective is to provide
investors with material and adequate information as the basis lor an informed assessment
of the value of the securities and the issuer.
Providing sufficient and high-quality information to investors has been the main concern
of all national and international accounting organizations. This is to ensure an optimal
allocation of investment resources in the capital market, where existence of information
asymmetry creates the problem of mismatching resources to business investment
opportunities. In the Kenyan system, companies list at the Nairobi Stock Lxchangc. All
those listed are required to publish their accounts annually as well as provide financial
disclosures to the shareholders
3

A growing body of evidence indicates that companies that fall short of shareholder
expectation with regard to disclosure risk an erosion of confidence that can. in turn, do
damage to market capitalisation, credit, and liquidity. But along with negative pressures,
there are also positive reasons for going transparent. The company's non-financial assets
such as brands, market share, customer retention levels, and intellectual capital arc of
intense interest to investors. Companies that report more comprehensively on these
important non-financial assets can often improve their valuation in the capital markets.
1.1.2. Users of financial information
These statements are used by management, labour leaders, investors, creditors and
government regulatory agencies, primarily. Financial statements may be drawn up for
private individuals, non-profit organizations, retailers, wholesalers, manufacturers and
service industries. The namre of the enterprise involved dramatically affects the kind of
data available in the financial statements. The purpose of the user dramatically affects the
data he or she will seek.
Government officials arc generally concerned that reporting and valuation regulations
have been complied with and that taxable income is fairly represented. labor leaders pay
particular attention to sources of increased wages and the strength and adequacy of
pension plans. Owners, shareholders and potential investors tend to he most interested in
profitability. Many investors look for a high payout ratio (cash dividend/nct income).
Speculators pay more attention to stock value, as growth companies lend to have a low
payout ratio because they reinvest their earnings.
1.1.3 The Financial Stock Market
I he stock market is a good source of information and it helps firm and firm owners to
achieve an appropriate debt equity ratio. In order to reflect a true financial performance
of an enterprise, it is important that all firms generate objective financial statements that
reflect the true financial statement as at particular financial period. This is particularly
important for listed firms in which various shareholders invest on the basis of information
availed to them to aid decision-making.
4
Efficient markets assume that security prices at any time reflect all available information
on a company. This means that the information contained in financial statements is
already incorporated in the stock prices hence no room for abnormal returns. The Nairobi
Stock Exchange deals with the exchange of securities issued by publicly quoted
companies and the government. The major role of the stock exchange is that it provides a
mechanism where savers can safely invest their money and in addition earn a return, and
thus is an incentive to people to consume less and save more. Listed companies in Kenya
face dual or multiple reporting requirements in International Financial Reporting
Standards (IFRS). Capital Market Authority (CMA) and the Nairobi Slock Exchange
(NSE).
1.1.4 Financial Market Efficiency
Primarily, the term efficiency is used to describe a market in which relevant information
is impounded into the price of financial assets. The concept of market efficiency lud been
anticipated at the beginning of the century in the dissertation submitted by Bachclicr
(1900) to the Sorbonnc for his PhD in mathematics. In his opening paragraph. Bachclicr
recognises that "past, present and even discounted future events are reflected in market
price, but often show no apparent relation to price changes". This recognition of the
informational efficiency of the market leads Baehelier to continue, in his opening
paragraphs that "if the market, in effect, docs not predict its fluctuations, it docs assess
them as being more or less likely, and this likelihood can be evaluated mathematically".
This gives rise to a brilliant analysis that anticipates not only Albert Einstein's subsequent
derivation of the Einstein-Wiener process of Brownian motion, but also many of the
analytical results that were rediscovered by finance academics in the second half of the
century.
I he efficient markets hypothesis is simple in principle, but remains elusive. Evolving
from an initially puzzling set of observations about the random character of security
prices, it became the dominant paradigm in finance during the 1970s During its heyday,
the efficient markets hypothesis came to be supported by a growing body of empirical
research demonstrating the difficulty of beating the market, whether by analysing
publicly available information or by employing professional investment advisors.
5
Cowles (1933) found that there was no disccmablc evidence of any ability to outguess the
market. Subsequently, Cowles (1944) provided corroborative results for a large number
of forecasts over a much longer sample period. By the 1940s. there was therefore
scattered evidence in favour of the weak and strong form efficiency of the market, though
these terms were not yet in use.
The strong form suggests that securities prices reflect all available information, even
private information. Seyhun (1986. 1998) provides sufficient evidence that insiders profit
from trading on information not already incorporated into prices, lienee the strong form
does not hold in a world with an uneven play ing field. The semi-strong form of FMII
asserts that security prices reflect all publicly available information. Ihere are no
undervalued or overvalued securities and thus, trading rules are incapable of producing
superior returns. When new information is released, it is fully incorporated into the price
rather speedily. The availability of intraday data enabled tests which offer evidence of
public information impacting stock prices within minutes (Patell and Woll'son, 1984.
Gosnell. Keown and Pinkerton. 1996).
Because all information is contained in stock prices it is impossible to beat the market
over time without taking on excess risk. If capital markets arc sufficiently competitive,
then simple microeconomics indicates that investors cannot expect to achieve superior
profits from their investment strategies.
Competition between rational investors keeps prices about where they should be As all
information that determines stock prices arc analyzed by numbers of investors, stock
quotes reflect the best estimates of their value. Prices may not always be right, but they
are unbiased. So if they're wrong, they're just as likely to be too high as too low compared
to a kind of optimal value.Because the market is efficient, investors should expect only a
fair return relative to the risk of purchasing a particular stock. Leif Eric sxen (2000)
l ama (1997) takes issue with the view that apparent anomalies require new bchaviourally
based theories of the stock market. Rather, they are indicative of u need to continue the
search for better models of asset pricing.
lhc last two decades have witnessed an onslaught against the efficient markets
hypothesis. Yet as Roll (1994) observes, it is remarkably hard to profit from even the
6
most extreme violations of market efficiency. Stock market anomalies are only too often
chance events that do not persist into the future. 1 he importance of the efficient markets
hypothesis is demonstrated by the fact that apparently profitable investment opportunities
arc still referred to as "anomalies". Tltc efficient markets model continues to provide a
framework that is widely used by financial economists.
1.1.5 Behavioral FinanceBehavioral finance is a field that has evolved and attempts to better understand and
explain how emotions and cognitive errors influence investors and the decision-making
process. Many researchers believe that the study of psychology and other social sciences
can shed considerable light on the efficiency of financial markets as well as explain many
stock market anomalies, market bubbles, and crashes. As an example, some believe that
the outperformance of value investing results from investor’s irrational overconfidence in
exciting growth companies and from the fact that investors generate pleasure and pride
from owning growth stocks. Many researchers believe that these humans flaws are
consistent, predictable, and can be exploited for profit.
Recently investors' buying, holding, and selling decisions have also been considered
using behavioral models as a result of a substantial number of observations of apparent
anomalies (from the standpoint of the efficient markets* hypothesis) in the financial
markets. These anomalies suggest that the underlying principles of rational behavior
underlying the efficient markets hypothesis arc not entirely correct and that it is also
necessary to consider other models of human behavior, such us in the other social
sciences. One of the most controversial issues among researchers has been whether
investors overreact, and thus behave irrationally, to new information, a subject spurred by
De Dondt and 1 haler's (1985). lhcse behavioral models may also make it easier to
understand the extraordinary degree of trading activity. Shillcr (1997) connects the
origins of differences of opinion among investors to excessive confidence about
investors’ own judgements. This may produce, for example, as suggested by Tvcrsky and
Kahncman (1974), a tendency for people to see patterns in data that arc purely random
Suggestions may also affect investors’ assessments, producing a so-called anchoring
effect. Overconfidence connected to anchoring may he one source of the high volume of
7

trading aiming investors. This is widely evident at the NSF in the recent Initial Public
OlTcrs (IPO’s) of various firms, in which many investors* overconfidence of making
huge returns caused them to invest in firms regardless of the underlying fundamentals.
Phis may suggest abnormality in firms financial market reporting in such instances,
however the market forces always counter these discrepancies in the medium term by self
correction, leaving the stock market prices on a normal average. When taken over a long
time, market based reporting is a good measure of a firms performance.
1.1.6 Noise in Financial StatementsFinancial noise is the effect of complex and extensive accounting rules that regulate
financial statement reporting and are thought to distort a company's true operating
performance. Accounting noise can be seen as either a consequence of necessary rules
regarding generally accepted principles or a result of management's attempt to massage
the numbers to present a rosier financial picture of the firm.
In spite of the high levels of noise, financial data are among the best application domains
for intelligent processing and advanced learning techniques, l'hcse data have been
recorded very accurately for very long periods of time. They arc available on different
time scales and are simultaneously available in many different markets. This provides a
very rich environment for analysis and experimentation using advanced processing
techniques. Moreover, the payoff for even small, hut consistent, improvements in
performance is huge. Magdon-Ismail et al. (1998)
In addition to being a nuisance that complicates the processing of financial data, noise
plays u role as a tradable commodity in its own right. Indeed, market volatility is the basis
for a number of financial instruments, such as options, whose price explicitly depends on
the level of volatility in the underlying market. For this reason, it is of economic value to
be able to predict the changes in the noise level in financial time series as these changes
are reflected in the price changes in tradable instruments. Magdon-Ismail et al. (1998)
8
1 2. Statement of the problem
In efficient capital markets, us defined by l ama (1965), prices reflect all available
information promptly and correctly, including the information comprised in financial
reports. However, as both theoretical (c.g., Grossman (1976), Grossman and Slight/
(1976. 1980). and Diamond and Verrecchia (1991)) and empirical (c.g.. Ou and Penman
(1989) studies have shown, financial statements may not fully reflect nil the information
pertaining to its performance at a particular period. These may be reflected in lack of
relation between financial statements and market performance of individual firms
Despite the expectation that earnings response coefficient for companies can be regarded
as reliable predictor of individual company’s future returns, Jindrichovska (2001) found
an empirical evidence to suggest that a relationship exists in the response coefficients of
returns and annual earnings on the emerging Czech market. It was. albeit, rather unstable
and vague and not statistically significant for a period of one year and longer. I he
increase in the main response coefficient reported in the study suggested sensitivity of
returns to annual earnings changes. It could not he inferred with a degree of confidence
that the Czech capital market views earnings changes to be largely permanent.
Salmi ct. Al (1997) find that there exists a general association hetween the firm’s
accounting ratios and its slock return and risk. When taken alone, both the accrual-based
and the cash-based variables are significantly associated with the market-based variables
However, due to various management and accounting issues, financial reporting in some
firms is distorted and does not reflect the actual performance, leading to wrong or
distorted decision-making based on the reported output. Die difference that may exist
between the performance of a firm as provided by the companies in the annual financial
statements and the quoted market performance can be described as noise in the financial statements.
It is important that a firm's reported performance tils well with the actual performance.
Increased transparency and higher-quality reporting enhance credibility and allow
investors, analysts and other consumers of company information to better understand
long-term strategy. However, most financial measures focus on short-term
accountabilities and leave out intangible factors that directly affect the customer, supplier

and employee. The same financial results lead to situations that are narrow in focus and
set up adversarial environments based on irrelevant data. Financial measures can be
manipulated to meet the outcomes desired by the party reporting them.
Coleman and Ecclcs. (1999) argue that current financial reporting is unduly focused on
historical performance. There is a substantial scope for companies to improve the way in
which they report their financial performance. Ideally, companies should provide the
market with future-oriented information on current anticipated performance over a rnngc
of financial and non-iinancial variables. Research shows that this information will help
investors gain insights into the quantum and quality of shareholder value being created.
Factors captured in the financial statements do not always capture all the issues that arc
relevant for shareholder decision-making.
This study will test the existence of noise in the financial statement based measures of
performance of publicly listed companies in Kenya.
13. Objectives of the study
The objective of the study is to determine the existence of noise in the financial statement
based measures of performance lor firms listed at the Nairobi Slock Exchange.
1.4. Importance of the study
The findings of the study are to;
a) Provide a better understanding of noise in the financial statement-based measures
of performance for firms listed at the NSE it any.
b) Enable CMA, NSF. and other financial market participants assess the efficacy of
financial market operations in Kenya.
c) Provide a body of knowledge to the academic community.
10

C H A PTE R TW O
2. LITERATURE REVIEWW ith ihe advent of the Sarbancs-Oxley Act. corporate business activities and the
reporting of them have become more transparent than ever before.
After decades of increasingly complex reporting requirements, disclosures have become
difficult for even the most sophisticated users to understand. Multiple reporting
jurisdictions have created redundant disclosure requirements and reporting processes
have become inefficient and error-prone.
Listed companies have various disclosure requirements in order to keep their
shareholders well informed of the operations of the firms at any particular time. Good
quality financial information must possess attributes that validate its use by the various
stakeholders that employ it for various functions,
I.ych (2001) describes various desirable qualitative characteristics of financial
information. These arc discussed below;
2.1 Qualitative characteristics of financial information
Qualitative characteristics are the characteristics that make the information provided in
the financial statements useful to users lor assessing the financial position, performance
and financial adaptability of an enterprise.
a) Relevance
Relevant information has the ability to influence the economic decisions of users and is
provided in time to influence those decisions
Information that is relevant has predictive value or confirmatory value. It has predictive
value if it enables users to assess past, present or future events. It will have confirmatory
value if it helps users confirm or correct their past evaluations and assessments
Information may have hoth predictive and confirmatory value.
II
^ s r a r a n r o f n a ir u tKM ETE LIBRAW
t» ReliabilityInformation is reliable when it can be depended upon by users to represent faithfully what
it purports to represent or could reasonably be expected to represent. It is necessary that
the information is accounted for and presented in accordance with their substance and
economic reality and not merely their legal form.
c) C omparability
Users must be able to compare the financial statement of an entity over time to identify
trends in its financial position and performance. Users must also be able to compare the
financial statements of different entities to evaluate their relative financial position,
performance and financial adaptability. Consistency and disclosure are therefore
required.
d) llnderstandability
Arthur Harris (1979), confers that the degree to which accounting messages contained in
financial reports are understood and convey the exact meanings which were intended by
their senders seem a natural issue of interest. A fundamental issue is whether the
expression of agreement or disagreement with an intended message by sender or receiver
does, in fact, lead to distortions in the intended decisions the messages were intended to
induce.
e) Materiality
According to the FASB statement of Financial Accounting Concepts No.2, “The
omission of misstatement of an item in a financial report is material if. in the light of
surrounding circumstances, the magnitude of the item is such that it is probable that the
judgement of a reasonable person relying on the report would have been changed or
influenced by the inclusion or correction of the items”.
T.F.. McKee and Lilifscn.A (2000) state that sound materiality judgments are an
important clement of maintaining investor confidence in the public reporting system
currently used by capital markets. Verities J.B, (2005) illustrates that materiality is not a
simple calculation. Rather it is a determination of whnt will vs. what will not affect the
decision ol a knowledgeable investor given a specific sci of circumstances related to the
12

fair presentation of a company’s financial statements and disclosures concerning existing
or future debt and equity instruments.
f) TimelinessFinancial information which is relevant und reliable and which passes the materiality lest
may lose its relevance if there is undue delay in it being reported. Thus, the time available
to gather und report financial information is a constraint on providing relevant
information.
2.2 Limitation* of financial reports as traditionally constructed
Lych (2001) describes the limitations of financial statements as traditionally constructed.
These arc discussed below;
2.2.1 Allocation into different periods.
Financial reports involve a substantial degree of classification and aggregation and the
allocation of the effects of continuous operations to discrete reporting periods. This
requirement creates discontinuity and overlaps in continuous processes when some parts
of job processes are reported in one period and the bulance in another.
Information presented to the user is of necessity summarised in some form. The
summarisation process may have the effect of distorting the nature of some of the
information. For example creditors will he classified into those payable within one year
and those puyable beyond on year. Two loans that have two days difference in their
payment date may well as a consequence be classified under different headings. ITic user,
unless he is provided with further information, will tend to lake the two resultant totals at face value.
Revenue and costs arc also inequitably distributed between periods, this causes
imbalanced reporting for projects that go beyond one reporting period due to
overstatement in one period and understatement in another.
2.2.2 Historically based
Financial reports provide information that is largely historical. They do not reflect future
events or transactions, nor do they anticipate the impact of changes in the economic or
13
potential environment. They arc not always useful in the forward planning process of a business especially in changed operational circumstances.
Because of its inherent limitations, internal control over financial reporting may not
prevent or detect misstatements, financial reports tend to he historically directed,
therefore projections of any evaluation of effectiveness to future periods arc subject to the
risk that controls may become inadequate because of changes in conditions, or that the
degree of compliance with the policies or procedures may deteriorate.
Historical reporting may also overstate profits when prices are rising through inflation
since as inflation pushes prices up. the true value to lire business on the use of the asset
becomes progressively more than the depreciation charge
2.2.3 Lack of non-finunciul outlouk
Financial reports are usually based on conventionalised representation of transactions and
focus on financial effects of transactions und do not locus to any significant extent on
their non-financial effects or on non-linancial information in general. Various studies
have proved that non-financial aspects of a business contribute very largely to the
performance of any existing business enterprise, making it compulsory lor any well
performing institution to pay special attention to it Financial reports do not have special focus on non-linaneial issues.
2.2.4 Kxtra information requirement
Often, financial statements require accompanying financial information and
supplementary special reports. Ihcsc entail a lot of time and manpower as well as
specialised skills to prepare to required standards Money is also spent on the preparation
of the reports. All these additional requirements minimise the convenience of preparation of the financial reports.
2.2.5 Lack of information on Board and Management
l argely, there is scepticism about the utility of financial reports. For example, where
shareholders are to vote on issues as board elections, financial information is less relevant
tlian information on individual members, composition, structure and functioning of the
14

bo irJ Financial reports do not provide for the most necessary information, therefore, do
not address the main issue ut such points.
Financial information determines self-dealing hut shareholders also need specific
information on management’s integrity and loyalty.
2 J Kenyan companies compliance with accounting standards and financial reporting.
A study of the Kenyan companies by IC'PAK. the accountant’s body in 2005. noted that a
lot of companies do not apply the mandatory standards in preparation of financial
statements, some companies even doctor the figures they report. This is supported by
findings from the annual Financial Reporting (FiRe) award. “In 2005. six years after
implementation of the IFRS (International Standards of Accounting and Reporting) in
Kenya, there was no single company that exhibited 100 per cent compliance with IFRS
out of a total of 84 that submitted their financial statements for review. 45 of these are
listed at the Nairobi Stock Exchange” says the report released towards the end of 2006.
This is dangerous for investors who rely on financial statements to make investment
decisions, especially on companies listed at the Nairobi Stock Exchange.
Ihc table below indicates the compliance levels attained by several firms that participated
in the 2005 FiRe awards.
Table I: Firm compliance levels
IFRS: COMPLIANCE RECOGNIZED IN THE 2005 FIRE AWARDSCompliance levels achieved
Insurancesector
Bankingsector
All other companies
lotalNo.
In per cent
Above 80 per cent 3 0 10 13 1660 to 79 per cent 12 10 15 37 4450 to 59 per cent 7 J J 3 11 13Below 50 per cent 3 15 5 23 27
[Total No. 25 26 33 84 10UH4%rd oa tlala lompllril b) llir In.titolr of rrttifkd Public ArcouuUuU if Krn>« for 1-iRr iwmilt
According to ICPAK, areas of significant non-compliance include presenting profit from
associated companies as part of income in the additional notes and failure to disclose
compensation tor key managers as well ns non-disclosure on defined benefit plans. This
denies an investor the benefit of a comparative analysis.
15

include companies’ failure to disclose information relevant to assess interest rate
risk and credit risk, hiding movements in insurance assets and liabilities and presenting
proposed dividends as a liability and offsetting liabilities from assets. The last three
distort balance sheet information.
It is noteworthy that even in the case of full compliance, financial statements may not
capture all aspects captured by the market.
2.4 Empirical LiteratureTimo et al (1997) concluded that there exists a general association between a firm’s
accounting ratios and its stock return and risk. In their study, the nature of the association
between the firm’s accounting and market-based variables was investigated using
canonical correlation analysis. Ifiey found a significant association between accrual-
based accounting variables and market based variables in the USA. However, the
accounting variables making up the relationship varied along time. Hie decomposed
analysis of the association suggested that when taken alone, both the accrual based and
cash based variables are significantly associated with market-based variables and that the
accrual-based variable set has a stronger relationship with the market-based set than the
cash-based set.
Jindrichovska (2001) investigated the nature of the relationship between accounting
earnings and returns on the Czech market. It was conducted using a data sample covering
the yean 1993-1998. I he results of firm-specific and pooled regression models suggested
that for a short estimation window of up to three quarters, there is statistically significant
relationship between studies on earnings to price ratios and price relatives. However, the
cocllicients estimated from pooled regression did not behave as expected. The one-
quarter coefficient was by far the biggest, whereas the following two quarters were much
smaller. In the case of firm-specific estimates, the differences were much smaller but the
general pattern of non-monotonic remained the same. The earnings response coefficient
for indiv idual companies could not he regarded, as a reliable predictor of individual
companies’ future eamings. but it was significant for the sample as a whole.
One oi the limitations of this study was that during the period under rev iew (1993-1998).
prices on the Prague stock exchange was mostly falling. That trend may have influenced
16

lJ)C famings'rctiim relation, which had been central to the analysis. Such a trend was
unlikely to persist and. when a similar analysis was repeated later (and on a market which
^ jj,cn may be consolidated and hence more tractable), one could expect to find that
more pronounced and stable results were obtained. Another limitation was that, the
analysis was performed on a relatively short time series, and due to that the sample si/e
decreased us the lag between observed price response coefficients increased.
Rosenberg. Reid and l.anstcin (1 *>85) found out that the average return on US stocks are
positively related to the ratio of a linn’s book value to the market value. 1 heir study
examined the proposition that stocks with low price book value should outperform high
price book value stocks and found out that those stocks with lov\ price book value ratios
experienced significantly higher risk adjusted rates of return than the average stock
Harris and Marston (1993) showed that the price book value ratio is positively impacted
by future growth prospects and risk factors similar to the price earnings ratio.
Fairfield (1994) examined the characteristics and usefulness of the price hook value ratio
by using accounting information to show that the price book value ratio is a function of
the expected level of profitability on hook value, which is known to he related to return
on equity. Fairfield's valuation model illustrates in accounting terms that the price book
value ratio depends on the expected changes in future profitability
Jones (2003) suggested that risk is an important factor in the setting of market prices. As
risk increases, a firm's value declines so that risk averse investors arc rewarded for luking
on additional risk with a greater return on their investment. The study used the Residual
Income Valuation model (RIM) to demonstrate empirically that os the riskiness of a
linn’s earnings increases, its market value declined. I he RIM had been used by
accounting researchers in the USA to study firm value because it was consistent with well
accepted theories in finance and its primary inputs were familiar accounting measures.
RIM showed that firm value was equal to the present value of a firm’s expected future
residual income flow. Empirical implementations of RIM typically expressed stock price
as a lunetion of hook value earnings and/or earnings forecasts. The study added to the
literature by more vigorously incorporating earnings risk into the RIM. The RIM
proposed included several indicators or earnings risk; the variability in analyst forecasts.
17

short term refinancing exposure, geographical diversification, operating leverage and
jjjze Ihe results confirmed that earnings risk was an important component on the market
valuation process.
('sing a sample of more than twenty thousand firms over the 1083 to 2001 time period,
analysts found that the additional earnings risk measures significantly improve RIM’s
ability to explain market prices. In addition, the evidence showed that each risk measure
conveys meaningful information about the pricing process. It was found that variability
of earnings expectations, exposure to interest rate fluctuations, geographical
diversification, operating leverage, and size, all significantly affect stock prices. The
evidence suggested that while operational diversification did not have an overall impact
on firm value, it did significantly affect how the market individually priced earnings and
earnings forecasts. Hie study explained how earnings and earnings risk factors created
value in the eyes of the investor.
Lawson (2003) claimed that a number of firm characteristics explain the cross section of
common stock returns. These characteristics cither arc functions of stock prices, or are
net functions of stock prices and hence depend only on accounting disclosures.
Characteristics in the first class reflected and summarized investors' risk opinions while
characteristics in the second class contributed to the determination of investors’ risk
opinions. The study drew a distinction between the two classes in order to characterize
the accounting disclosures that determined investors' opinions of risk and to evaluate the
importance of accounting disclosures for determining investors' opinions relative to non-
accounting information. I he results showed that investors' opinions about systematic risk
arc determined by profitability, firm size and the growth of firm size and that there are
strong seasonal patterns in the expected return premia of the accounting determinants of opinions.
lhc I aw son (2003) study suggested that, although investors opinions depended on non
accounting information, investors opinions are determined primarily by accounting
disclosures and that the cross sectional variation that accounting determinants did not
explain had implications for risk measurement; its magnitude indicated that accounting

disclosures did not contain sufficient information about investors’ opinions to measure
the risk o f equities with extreme exposure to non-accounting determinants.
Shuetrim (1998) set to find out what could be inferred about the behaviour of publicly
listed corporations from the beha\iour of their security returns. The focus was on how the
degree of co-movement changes through time and on how it was related to observed
characteristics of the firms. The evidence strongly suggested that the degree of co-
niovcment associated with a given firm's equity converges, through time, to the market
average degree of co-movemcnt.
Giner et al (1997) analyzed the information content of operating cash flow considering
the association between expected cash (lows and abnormal returns and found out that
share prices depend on firm's expected future cash flows and risk.
Davis (2001) examined the claim dial the hook to market ratio no longer contains any
information that can be used to identify value stocks. Book to market ratio is the ratio of a
firm’s book value of equity to its market value of equity. Ihe study determined book
value of equity using historic cost information. Uu\crs and sellers of the stock using
current information determined market value of equity.
Clark (2000). disputed many investors and financial commentators belief that high
earnings growth rates and high rates of return arc synonymous. Wluil is true he claimed
was that the differences in earnings growth rates influence the breakdown of expected
rates of return into their capital gain and dividend components and that although equal, u
higher rale of earnings growth produces relatively more capital appreciation and less
dividend yield. Homings growth, he concluded docs not affect the expected total rates of return.
tiilari (1990) found that companies quoted in the Nairobi Stock Exchange do exhibit a
positive relationship between systematic risk and return. This relationship though was not
statistically significant thereby suggesting llial investors may either he over or under
compensated for taking high risk The results also indicate negative but statistically insignificant relationship.

Savvayn (20(H)) set oul to determine to what extent market risk as measured by relating
returns of individual securities to returns of the market is a useful indicator in analyzing
risk characteristics of firms quoted at The Nairobi Stock Exchange. He set to find
answers to whether the NSL derived beta contains sufficient information and if the
relationship between return and risk is linear and positive. I he objective was to establish
whether beta calculated is not zero and whether there is a relationship between return on
security that is linear and positive. He observed that stocks with below average risk have
higher returns than those with above average risk and concluded that there is a positive
relationship between asset return and beta.
Studies analyzed indicate correlation between various aspects of market based and
financial statement based reporting. This study tests this aspect at the Nairohi Stock
Exchange for the variables defined in the study.
20

C H A PTE R TH REE
3. RESEARCH M ETHODOLOGY
3.1 Research design
This study examined the correlation between various financial aspects; as provided by
companies in the annual accounts and other company publications on the one hand and
market information available on the companies on the other hand. The correlation
coefficient measures the existence and degree to which the movements of two variables
are related. Correlation was used to evaluate the relationship between two variables; i.e..
how closely they match each other in terms of their individual mathematical change The
question the study addressed is: if one variable (X), representing financial statement
measure of a company’s comparable performance, moves or changes in a certain
direction, does the second comparable variable (Y). representing the same company's
market performance, also move or change in a similar or complementary direction?
Hie direction of the dependent variable's change depends on the sign of the coefficient. If
the coefficient is a positive number, then the dependent variable is moving in the same
direction as the independent variable; if the coefficient is negative, then the dependent
variable moves in the opposite direction of the independent variable.
3.2 Population
The population of the study consisted of companies listed at the Nairobi Stock Exchange,
fhc Nairobi Stock Exchange had a total of fifty-two listed firms as at 31" December
2006. The market is classified into three main market segments; 1 he Main Investment
Market Segment. The Alternative Investment Market Segment and The Fixed Income
Securities Market Segment.
Hie details of this classification are in Appendix I.
Ihc use of listed firms for the study was selected for several reasons;
All these firms arc publicly listed and therefore information on them is available
for public information and scrutiny.
21
jj The performance of listed companies is captured by annual accounts as well as
market-based reports, and this information is available on the listed companies.
lhe study period was five years between 2001 and 2005, with 2005 being the most recent
year. The five-year period was considered adequate to derive conclusive results.
33 Sampling
The choice of sampling process to select units from the population was taken as the
method gives a fair chance of selection for all items in the population, so that by studying
the sample we may fairly generalize our results back to the population from which they
were chosen. This ensures a fair representation of the population in the sample selected.
All the firms were split into five strata, from the various market segments. Sampling was
used within the strata, to pick on the listed companies to be used for the study. Out of a
total of 52 listed companies at the Nairobi Stock Exchange. 20 were selected for the study
across all the market segments (strata). Four firms were selected from each market
segment. Firms listed in less than the last five years were not incorporated, as the
financial market information on them is not adequate to cover the period of study. In
market segments that have only lour listed companies, all the firms were considered as
part of the sample, for example the agricultural market segment. The list of selected firms
is attached in Appendix II.
3.4 Data Collection
Secondary data was used- in the study. The sources were NSF and Annual Company
reports. Data for the study was collected from annual reports for 5 years, between 2001 and 2005.
lhe data was collected by use of information tables drawn up by the researcher and filled
for all the companies sampled for the study to aid in collection and collating of the data
required to draw up conclusive results.
Secondary data was collected from the annual reports of twenty listed companies sampled
*or lhe study. Various performance indicators were collected for analysis of the
22
performance of the firms over time in various aspects. These parameters arc Profit after
(aX jor each year. Iotal Assets for each year over a five-year period and Total Lquity for
each balance sheet date.
Market based data was collected from the NSK handbook. 2005. Stock price at the
beginning of the year, end of the ycur und dividend for the year was collected.
3.5 Data Analy sis
Data analysis tools in Microsoft Fxccl and SPSS were used to analyse the dutn. I he
underlying goal was to search for trends in financial statement performance measures of
firms in the population of study and make a comparison against the market returns of the
same firms.
The analysis tested the directional movement of the variables to test whether the variables
moved together and if not. whether the departure is significant.
Various financial ratios were computed over the five-year period of analysis in order to
analyse the trend performance of the firms over time. Warnings per share, dividend per
share, return on investment, share price at the beginning and end of year, including the
dividend paid within the year were collected and analyzed to determine the market return.
Firm performance indicators were used to measure the overall profitability and overall
performance of a company. The measures used market-based performance indicators to
highlight performance attained at given financial periods. Data analysis was done to
establish interrelationships between various indicators. The parameters are outlined below;
a) Share price
A listed company’s sluuv price movement is determined by several firm and market
factors. I he price is assumed to be a rcllcction of a firm's financial health and
performance level. The stability or otherwise of the share price depends on among other
things, die activities the firm is involved in and the analysis and future prediction of market operators.
23

fhc beginning of year and end of year share price of sampled firms, including the total
dividend in an year was obtained from the NSH over a five-year period in order to
compute the market return.
b) Earnings per share (EPS)
l-PS was obtained by a division of net profit or loss due to shareholders by the weighted
average number of ordinary shares outstanding in a period. Weighting was done to
incorporate changes in outstanding shares due to new issues or buy backs.
c) Return on Assets (RQA)
ROA was estimated by a division of net income by total assets. A comparison was made
against market return to determine correlation of the two variables.
d) Return on Equity (ROE)
ROE was computed by dividing total net income by total equity. I his was then compared
against market return to determine existence of correlation between the variables as well
as the significance ot the rate of change.
c) Market Return
This is the measure of investment return us measured by the niurket also defined as the
gain or loss for a security in a particular period, consisting of income plus capital gains
relative to investment. This shall be measured by;
i^ J lo + D LHo
Where PI Share price at the end of year
PO Share price at the beginning of year
DL - Total dividend in an year
24

I he return shall assume a single holding period; otherwise we must consider the time
value of money.
3.6 Correlation Analysis
Correlation Analysis evaluates the relationship between/among two or more variables.
Correlation is used to reveal the magnitude and direction of relationships. Magnitude
reveals the degree a variable moves in the same or opposite direction while direction is
indicated by whether a variable has a positive or negative relationship.
Correlation Coefficients have been used to indicate the strength and direction of a linear
relationship between two variables, the financial statement-based and the market-based
variables. Return as measured by the financial statements was compared against market
return to determine whether the movement of the variables was in the same direction and
if they were correlated.
3.7 Statistical Significance
The T-test was carried out to establish if the differences revealed by the profiles and the
gap between the financial statement-based and market-based variables was statistically
significant.
Tests of significance were carried out on the variables. Existence or non-existence of
noise in financial statement based performance of listed companies in Kenya was
determined. Existence of correlation indicated a relationship between the variables. This
relationship when positive indicated movement of variables in the same direction. A
negative relationship indicated movement of the variables in different directions..
25
w i r B is r r r o f t u i m *K A B E J E LIBRA*

C H A P T E R FOUR
4. DATA ANALYSIS AND FINDINGS
4.1 Introduction
phis chapter discusses the findings of the research study. Preliminary analysis of all the
variables is discussed in section 4.2. In the next section, a comparison between financial
statement based and market based performance is made. I he correlation matrix outlines
the relationship between Market Return and three other variables, Famings Per Share.
Return on Assets and Return on liquity. Stepwise regression analysis is analyzed to show
the variable that best describes Market Return movement.
4.2 Preliminary Analysis
4.2.1 Market ReturnAccording to figure 1 below, the value of market return analyzed by sector shows that
over the years. Commercial Sector (0.676) has had the highest mean value of market
return followed by Industrial and Allied Sector (0 601) and then by f inance & Investment
Sector. Alternative Investment Sector has hud the least mean value of Market Return
(0.237) while Agricultural Sector had a low Market Return mean value o f0.272.Figure I : Menu M nrkct Return by Sector (2001-2005)
IN
«»*tec
i -!•*
o»O'OON
Dm
MMti mum tt: ro» imiihii
««1 (run NSI handbook :005.
26
In order to establish if there exists a difference in Market Return by Sector, analysis of
Variance (ANOVA) was carried out and the results showed no significant difference in
the mean Market Return by sector since the p-valuc=0.664 is much greater than 0.05 at
5% level of significance.
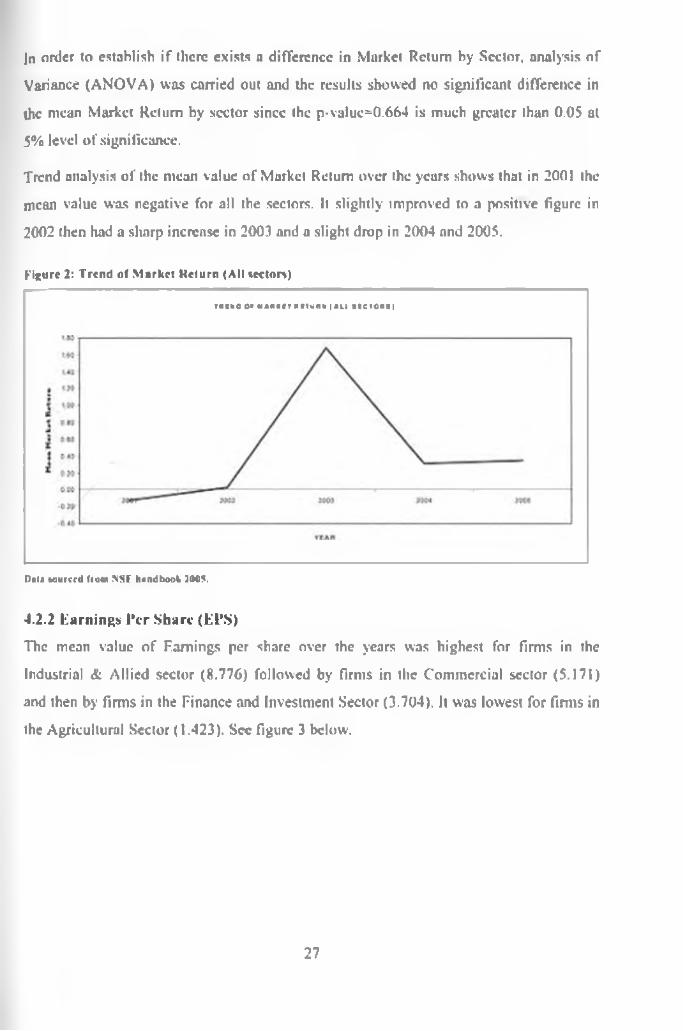
Trend analysis of the mean value of Market Return over the years shows that in 2001 the
mean value was negative for all the sectors. It slightly improved to a positive figure in
2002 then had a sharp increase in 2003 and a slight drop in 2004 and 2005.
Figure 2: T re n d of M arket K clu rn (A ll sectors)
rucNO o* ■•Karr » n u » « i * u atciONii
Dm* Muffed fto«n > S f handbook JOGS.
4.2.2 learnings l*cr Share (EPS)
The mean value of Famings per share over the years was highest for firms in the
Industrial & Allied sector (8.776) followed by firms in the Commercial sector (5.171)
and then by firms in the Finance and Investment Sector (3.704). It was lowest for firms in
the Agricultural Sector (1.423). Sec figure 3 below.
27

f ig u r e 3 : M e a n F a m i n e s P e r S h a r e b y S e c to r (2 0 0 1 -2 0 0 5 )
KAIUltKO reft 1 NAMC ST ICC VCM { Jl«»-1C«11
MVM VdMMMM CMMKiW rtUMaAlliMnail tUMiiMiAilHlItCVOM
lu u «u«icrd from NSE handbook 2005-
I he study also revealed that there existed significant differences in the mean learnings per
Share by sector. Through ANOVA test a p-value of 0.003 was realized which was less
than 0.05 at 5% level of significance. Further analysis (Post hoc test) revealed that these
difference was between Agricultural Sector and Industrial (p-value=0.002) and between
Alternative Investment and Industrial Sector (p-value 0 042).Figure 4: T re n d of Fam ines Per Share (A ll sectors)
TREND OF EARNING PER SHARE (EPS))
2001 2002 JOOJ 2004 2005YEAR
Dll* luuucJ from SS L hind took 2005,
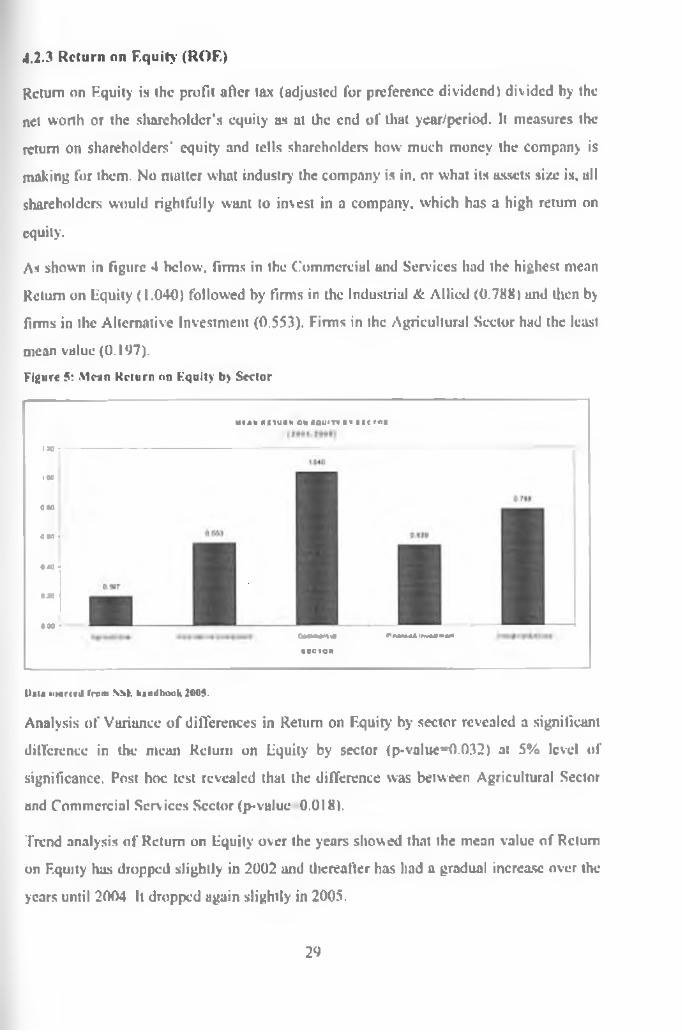
4.2.3 Return on Equity (ROE)
Return on Fquity is the profit after tax (adjusted for preference dividend) divided by the
net worth or the shareholder’s equity us at the end of llial year/period. It measures the
return on shareholders' equity and tells shareholders how much money the company is
making for them. No matter what industry the company is in. or what its assets size is, all
shareholders would rightfully want to invest in a company, which has a high return on
equity.
As shown in figure 4 hclow. firms in the Commercial and Services had the highest mean
Return on Equity (1.040) followed by firms in the Industrial & Allied (0.788) and then by
firms in the Alternative Investment (0.553). Firms in the Agricultural Sector had the least
mean value (0.197).Figure 5: Mean Return on Fquity t>> Sector
mcah nr Tuan on cquitv a v arc row
120 r
ICO
010
000 •
#40i9»
#W - 0Mw«r*« riwMliwanni(ECTOR
t>«U tikitoJ fmhi NSfc haoilbook 2005.
Analysis of Variance of differences in Return on Equity by sector revealed a significant
difference in the mean Return on Equity by sector (p-valuc"0.032) at 5% level of
significance. Post hoc lest revealed that the difference was between Agricultural Sector
and Commercial Services Sector (p-value 0.018).
Trend analysis of Return on Equity over the years showed that the mean value of Return
on F.quity has dropped slightly in 2002 and thereafter has had a gradual increase over the
years until 2004 It dropped again slightly in 2005.
29
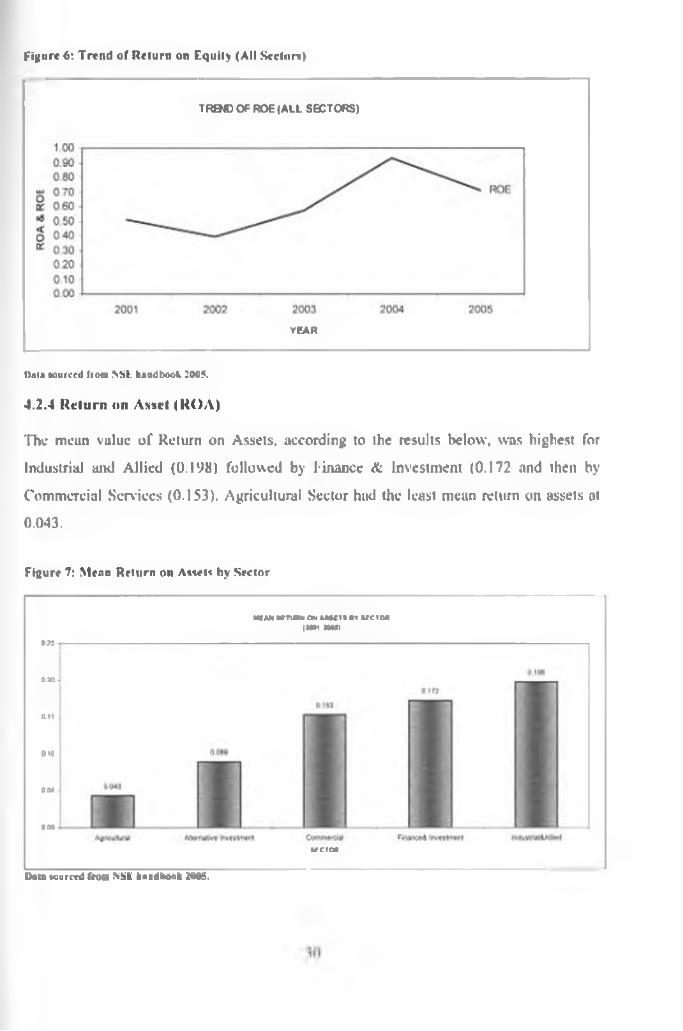
F ig u r e 6 : T r e n d o f R e t u r n o n E q u i t y ( A l l S ector*)
TREND OF ROE (ALL SECTORS)
TEAR
Data *oufCcd from SSL handbook 2005.
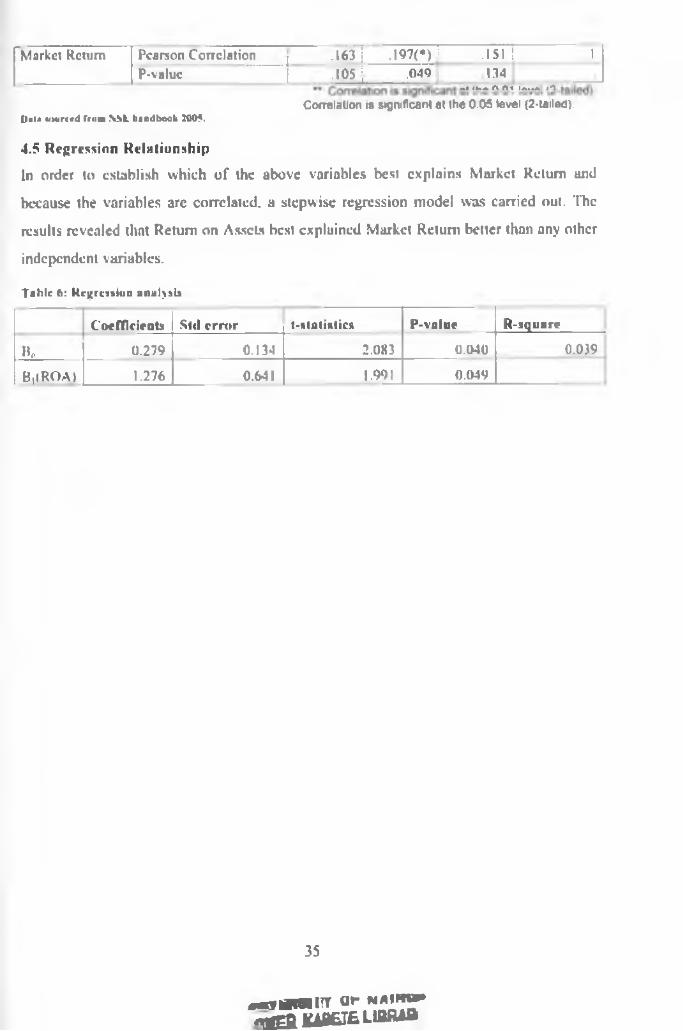
4.2.4 Return on Asscl (KOA)
The mean value of Return on Assets, according to the results below, was highest for
Industrial and Allied (0.198) followed by finance & Investment (0.172 and then by
Commercial Services (0.153). Agricultural Sector had the least mean return on assets at
0.043.
Figure 7: Mean Return on Awet* by Sector
MTAM WTUBH CM MWII BY U C t t mIHB »»»»
CIO
6.14
6 «0
DM
000
Data wuretd frOM SSL handbook 2005.
U-CTCM

The results also revealed a significant difference in the Return on Assets by sector
through Analysis of Variance (p-value 0.015) at 5% significance level. This difference
was between Agricultural Sector and Industrial Sector (p-value'0.020). (Appendix IV)
Trend analysis of Return on Assets in figure 7 above shows that it has been increasing
steadily over the years except for 2005 when it slightly dropped.Figure 8: T re n d of Mean Return on Assets (A ll Sectors)
TREND OF ROA (A LL SEC TO R S)
Uat* soiirtfd from NSE handbook 2005.4.3 Relationship between financial statement based measures of performance and market based measures of performance Ta b ic 2: T re n d of M arket Return and R O E
S e c to r ROEMarketR e tu rn
Agriculture Mean 0.197 0.272 :Sid. Deviation 1.091 0.626 :
Alternative Investment Mean 0.553 0.237 ■Std. Deviation 0.937 0.826 •
Commercial Services Mean 1.040 0.676 •Std. Deviation 0.703 1.515 :
f inance & Investment Mean 0.539 0.448Std. Deviation 0.744 0.858
Industrial & Allied Mean 0.788 0.601Std. Deviation 0.681 1.258
Total Mean 0.624 0.447Std. Deviation 0.876 1.060
n»t» tmirccit from NSC hiadbook 2005
31

F ig u r e V : T r e n d o f M a r k e t R e t u r n a n d R O F .
D au w>urc<d from NSII handbook 1005.
In Figure 9 above. Market return and Return on Equity arc positively correlated between
2001 and 2002. Between 2002 and 2003, Market Return accelerates faster than ROE, hut
still maintains a positive correlation. In 2003. Market Return decelerates at a high rate,
while ROE accelerates at a moderate rate. Between 2004 and 2005. the two variables
indicate a stable positive correlation as the movement is closely linked.
Table 3: Tre n d of M arket Return and R O A
Sector ROAMarketReturn
Agriculture Mean 0.043 0.272 :Std. Deviation 0.108 0.626 i
Alternative Investment Mean 0.089 0.237 iStd. Deviation 0.130 0.826 j
Commercial Services Mean 0.153 0.676 :Std. Deviation 0 110 1.515 :
Finance & Investment Mean 0.172 0.448Std. Deviation 0 22V 0.858
Industrial & Allied Mean 0.1 V8 0.601Std. Deviation 0.173 1.258
Total Mean 0.131 0.447Std. Deviation 0.164 1.060
0«t» lourtfd from NSF. handbook 2(M>5.
32

F ig u r e 10: T r e n d o f M a r k e t R e l u r n i in d R O A
R O A - - - Market Return
2 0
1.6
1.0
0.5
%* \
' %' \
* %
• •« %
9 4- * , M arket Return
_________________ _______________________________________________ ROA0 0
-0.5
----- — - ; - v • ■ -i---------------------- •
2001 2002 2003 2004 2005
Year
l)*U touiccd (loin NSf handbook 2005.
4.3.2 Tre n d of M arket Relurn and R O A
Market return and Return on Assets move have a positive correlation between 2001 and
2002. between 2002 and 2003. Market Return accelerates at a very high rate, while ROA
remains stable. In 2003. Market Return decelerates at a high rate but the relationship of
the variables is very stable between 2004 and 2005.
Ta b le 4: t rend of M arket Return and EPS
Sector F.PS Market ReturnAgriculture Mean 1.423 0.272
Std Deviation 5.669 0.626Alternative Investment Mean 3.399 0.237
Std. Deviation 6.461 0.826Commercial Services Mean 5.171 0.676 :
Std. Deviation 3.631 1.515Finance & Investment Mean 3.704 0.448 j
Std. Deviation 3.714 0.858Industrial & Allied Mean S.776 0.601 1
Sid. Deviation 8.799 1.258Total Mean 4.494 0.447
Std. Deviation 6.347 1 060 |l)ala Miurcrd from NSfc handbook 21)05.
33

F ig u r e I I : T r e n d n f M a r k e t R e t u r n a n d K P S
tonrred fro» NSf handbook 1005.
4.3.3 Trend of M arket Return and EPS
Market return and F.PS generally have positive correlation, moving in the same direction
over the five years. A slight discrepancy is observed between 2003 and 2004. where KPS
accelerates, while Market Return decelerates. Between 2004 and 2005. KPS decelerates
while Market Return accelerates moderately.
4.4 Correlation Matrix
According to the results in lablc 5 below, there exists a positive relationship between
Famings per Share and market Return (0.163), Return on Kquity and Market Return
(0.151), and u significant positive relationship between Return on Assets and Market
Return (0.197). A significant positive relationship also exists between Famings per Share
and Return on -Assets (R 0.680, p-vuluc-0.000); and between Famings Per Share and
Return on Equity (R-0.745. p-valuc=0.000). There also exists a significant positive
relationship between Market Return and Return on Assets (R-0.197, p-vnlue 0.049) and
also between Return on Assets and Return on F.quity (R=0.665. p-value 0.000).
Tublc 5: ( orrilulIon Matrix
EPS ROA ROF. MarkclRclKPS Pearson Correlation 1 | ,68<X**) .745<**> .163
P-value .000 .000 .105ROA Pearson Correlation .6K(K**>| 1 .665(**) .I97(*)
P-value .00011 " 111
.000 .049ROE Pearson Correlation .745(**)j 66S<**) 1 .151
P-value .000 | .000 . .134
34
rMarket Return Pearson Correlation ,1631 .I97(*)1 .151! 1
1 P-valuc 1 •«o iL .040 134At IKih A At Iaua /O
Halt KMiridl frum NSfc handbook 2409.Correlation 1$ sjgmficant at the 0.05 level (2-tailed).
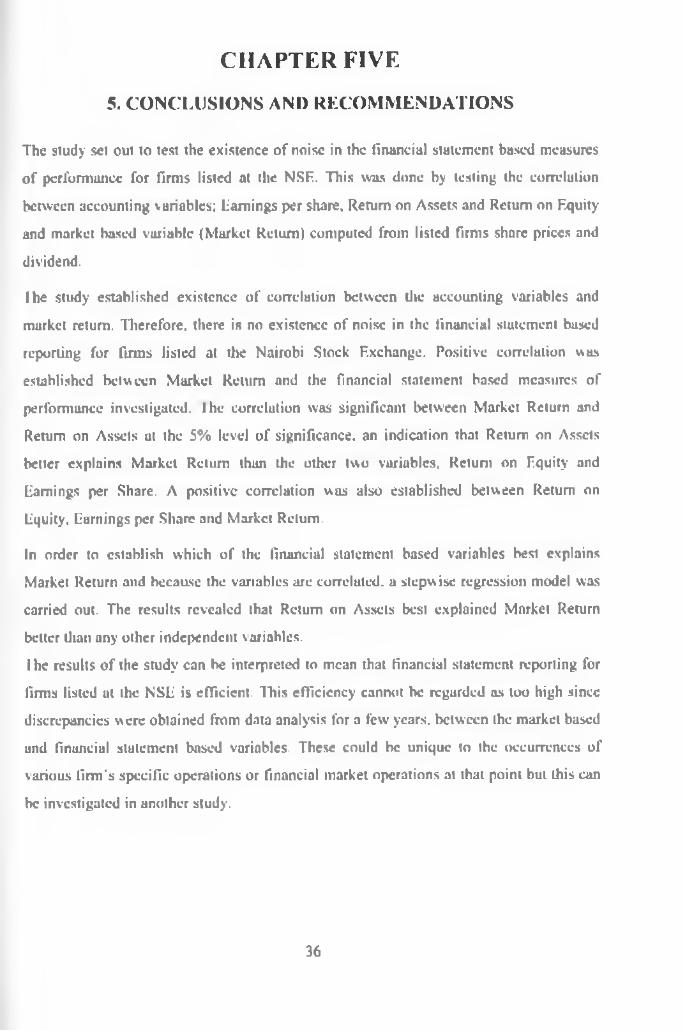
4.5 Regression RelationshipIn order to establish which of the above variables best explains Market Return and
because the variables are correlated, a stepwise regression model was carried out. The
results revealed that Return on Assets best explained Market Return better than any other
independent variables.
Table 6: Regression analysis
Coefficients Stil error t-slatistics P-valuc R-squarr
n„ 0.279 0.134 2.083 0.040 0.039
B|(ROA) 1.276 0.641 1.991 0.049
35
•«vkiio im r u r naphiw* r r g & M E » LlBRAa
C H A P T E R FIVE
5. CONCLUSIONS AND RECOMMENDATIONS
The study set out to test the existence of noise in the financial statement bused measures
of performance for firms listed at the NSF. This was done by testing the correlation
between accounting variables; Turnings per share. Return on Assets and Return on Equity
and market based variable (Market Return) computed from listed firms share prices and
dividend.
lhe study established existence of correlation between die accounting variables and
market return. Therefore, there is no existence of noise in the financial statement based
reporting for firms listed at the Nairobi Stock Exchange. Positive correlation was
established between Market Return and the financial statement based measures of
performance investigated, lhe correlation was significant between Market Return and
Return on Assets at the 5% level of significance, an indication that Return on Assets
better explains Market Return than the other two variables. Return on Equity and
Tamings per Share. A positive correlation was also established between Return on
Equity, Earnings per Share and Market Return.
In order to establish which of the financial statement based variables best explains
Market Return and because the variables are correlated, a stepwise regression model was
carried out. The results revealed that Return on Assets best explained Market Return
belter tluui any other independent variables.
l he results of the study can be interpreted to mean that financial statement reporting for
firms listed at the NST is efficient. This efficiency cannot be regarded as too high since
discrepancies were obtained from data analysis for a few years, between the market based
and financial statement based variables. These could be unique to the occurrences of
various firm's specific operations or financial market operations at that point but this can
be investigated in another study.
36
5.1 Recommendations for further research
The study cun be enhanced by furtherance of correlation analysis for firms that arc not
listed at the Nairobi Stock Exchange, litis will attest the cflicacy of financial reporting
for non-listcd firms whose reporting requirements may not be us stringent as those of
listed firms.
5.2 1.imitations of the study
Hie study period of live years may not be adequate to draw conclusions of the correlation
between accounting based and market based measures of performance for all firms due to
the differences in various firm's operations and experiences during this period. Any
unusual occurrences for some firms would distort the final outcome of the analysis.
The study only covered companies listed at the NSH. it would be important to have a
research identify1 a variable for non-listed firms for comparison against the firm's
accounting variables.
37

6. REFERENCES
AICPA (1994) " Im p ro v in g B u s in ess R e p o r tin g A C u s to m e r F ocus. S p e c ia l C o m m ittee on F in a n c ia l R e /x ir tin g ," American Institute of Certified Public Accountants. New York. NY.
Arthur Harris Adelberg, “A M e th o d o lo g y fo r M e a s u r in g th e U n d e rs ta n d a h iU ty o f F in a n c ia l R e p o r t M e s s a g e s Journal of Accounting Research. Vol. 17. No. 2 (Autumn. 1979). pp. 565-592
Ball R & Brown P (1968) " A n e m p ir ic a l e v a lu a tio n o f a c c o u n tin g in c o m e n u m b e r s " . Journal of Accounting Research 6: 159-178.
Ball. Ray (1978,/ " A n o m a lie s in R e la tio n sh ip s B e tw e e n S e c u r i t ie s ' Y ie ld s a n d Y ie ld - S u rro g a te s" . J o u r n a l o f F in a n c ia l E c o n o m ic s , 6. p p . 103-26.
Beaver WH. (1968; " T h e in fo r m a tio n c o n te n t o f a n n u a l e a r n in g s a n n o u n c e m e n ts ". Journal of Accounting Research 6 (Supplement): 67-92.
Blocdom. J.L). and P.T. Chingos. 1991. E x e c u tiv e P a y a n d C o m p a n y P e r fo r m a n c e ' Scottsdale, Arizona: American Compensation Association.
Clark A. Human (2000). " E a r n in g s G r o w th a n d S to c k R e tu rn s ’, Unpublished manuscript 2000.
Coleman and Ectiles, 1999. " D e te rm in a n ts o f P e r fo r m a n c e M e a s u r e C h o ic e s in W o rker In c e n tiv e P la n s ." Journal of Labor Economics, volume 20 (2002), pages S58-S90
Cowles. A. 1933. " C a n S to c k M a r k e t F o r e c a s te r s F o r e c a s t? " E c o n o m e tr ic a . vol. I. no.3 (July):309—324.
Davis L. James (2001). " Is th e r e s t i l l v a lu e in th e B o o k to M a rk e t R a tio ? Unpublished manuscript 2001.
De Bondi W & Thaler R (1985) " D o e s th e s to c k m a r k e t o v e r r e a c t? " Journal of Finance 40: 793-805.
Diamond DW & Verrecchia RF (1991). " D isc lo su re l iq u id ity a n d th e c o s t o f c a p i ta l" . Jo
F.ugcne F. Fama, " E ff ic ie n t C a p i ta l M a rk e ts " : II T he J o u r n a l o f F in a n c e . Vol. 46. No. 5 (Dec.. 1991). pp. 1575-1617 doi:10.2307/2328565umal of Finance 46(4): 1325-1358.
l airfield. M. Patricia (1994). “P r ic e B o o k V a lu e a n d th e P r e s e n t V a lu e o f F u tu re D iv id e n d s " . Journal of Financial Analysis 50.23-31
lama L.F and K.R French (1992). “T h e C r o s s S e c tio n o f E x p e c te d S to c k R e tu r n s ." Journal of Finance 47.427-465.
38
Fama E.F mid K.R French (1995). "S ize a n d B o n k to M a r k e t F a c to r s in E a r n in g s a n d
R etu rn s. " Journal of Finance 50. 131-155
Fama. Eugene (1997). " M a rk e t E ffic ie n c y . L o n g -T e r m R e tu r n s a n d B e h a v io u r a l F in a n c e" . CRSP Working Paper 448. University of Chicago
Fama EF (1965), “ T he b e h a v io r o f s to c k m a r k e t p r ic e s " . Journal of Business 38: 34-105.
Francis. Jennifer/Schipper. Catherine: " H a v e F in a n c ia l S ta te m e n ts L o s t T h e ir R e le v a n c e ? ." Journal of Accounting Research, vol. 37 (1999). pp. 319-352.
Foulks l.ych. 2001. "A C C A . p r e p a r in g f in a n c ia l s ta te m e n ts "
Gitari K. (1990), ' R e la tio n s h ip b e tw e e n s y s te m a tic r is k a n d r e tu r n " Unpublished MBA Thesis (1990)
Giner B, l.affarga J and Lamm M (1997). " T h e A s s o c ia t io n B e tw e e n A c c o u n tin g V a ria b le s w ith th e p r e s e n t a n d F u tu re S y s te m a tic R isk A s tu d y o f th e M a d r id S to c k
E x c h a n g e ", Unpublished manuscript 1997.
Gray. S.J.. Meek. G.K... Roberts, C.B., 1995, " In te r n a tio n a l C a p i ta l M a rk e t p r e s s u r e s a n d v o lu n ta r y a n n u a l r e p o r ts d is c lo s u r e s b y U .S a n d U K m u lt in a tio n a ls . Journal of International Financial Management and Accounting 6(1). 43-68.
Grossman SJ (1976). O n th e e f f ic ie n c y o f c o m p e tit iv e s to c k m a r k e ts w h e re tra d e r s h a v e d iv e r s e in fo r m a tio n " , Journal of Finance 31: 573-585.
Grossman SJ & Stiglitz JE (1980). " O n th e im p o s s ib i l i ty o f in fo r m a tio n e ff ic ie n t m a r k e ts " . American Economic Review 70(3): 393-408.
Hcaly, P.M.. Palepu. K.G., 2000. "A re v ie w o f th e e m p ir ic a l d is c lo s u r e l i te r a tu r e .” working paper. Graduate School of Business. Harvard University.
IASC Board. " F r a m e w o r k f o r th e P re p a r a tio n a n d P r e s e n ta tio n o f F in a n c ia l S ta te m e n ts
( th e F ra m e w o rk ) . “ April 1989.
International Auditing Practices Committee (2000) Audit Material. " In te r n a tio n a l S ta n d a rd s o n A u d itin g . " Section 320.
Jahera, John S., Lloyd. William P. & Page, Daniel F.. (1987)"T h e r e la t io n s h ip b e tw e e n f in a n c ia l p e r fo r m a n c e a n d s to c k m a r k e t b a s e d m e a su re s o f
c o r p o ra te d iv e r s if ic a tio n . " Financial Review 22 (4), 379-389.
Jindrichovska 1. (2001). " E a r n in g s R e sp o n se C o e ffic ie n ts in th e C z e c h M a rk e t" . Research Paper 2001.
39

Jones A.. “E a r n in g s R is k in e s s a n d R e s id u a l In c o m e V a lu a tio n " , Unpublished DBA Dissertation 2003.
Lawson A.. (2003). " E v id e n c e o n th e fu n d a m e n ta l d e te r m in a n ts o f in v e s to r s e x p e c ta tio n s o f r is k " . Unpublished PHD Dissertation 2003.
L e if F .ricssen (2 0 0 0 ) H o w e ff ic ie n t a r e m a rk e ts?
l ev and P. Zarowin, " T h e B o u n d a r ie s o f f in a n c ia l R e p o r tin g a n d H o w to E x te n d Them . Journal of Accounting Research, vol. 37 (1999), Supplement, pp. 353-385.
Malik Magdon-Ismail. Alexander Nicholson, and Yaser S. Abu Mostafa." f in a n c ia l M a rk e ts : V ery N o is y In fo rm a tio n P r o c e s s in g ," Invited Paper I E E E ( In s titu te o f E le c tr ic a l a n d E le c tr o n ic s E n g in e e r s ) J o u r n a l V O L 8 6 . N O . I I . N O V E M B E R 19 9 8
Mwangi P.N " T e s tin g w h e th e r p r ic e /e a r n in g r a tio is a n in d ic a to r o f in v e s tm e n t p e r fo r m a n c e o f o r d in a r y s h a r e s o n th e N a ir o b i S ic k E x c h a n g e MBA project. University of Nairobi, unpublished. 1999.
Ndubizu. G.A.. 1992. " A c c o u n tin g d isc lo s u re m e th o d s a n d e c o n o m ic d e v e lo p m e n t A c r ite r io n f o r g lo b a l iz in g c a p ita l m a rk e ts . " lltc International Journal of Accounting 27, .151-163.
Odhiombo I.A (2005). “A n e m p ir ic a l in v e s t ig a tio n o f th e c o r r e la tio n b e tw e e n a c c o u n tin g b a s e d a n d m a r k e t b a s e d p e r fo r m a n c e m e a su re s f o r c o m p a n ie s l i s t e d a t th e N S E "
Ou JA & Penman Sll (1989), “F in a n c ia l s ta te m e n t a n a ly s is a n d th e p r e d ic t io n o f s to c k r e tu r n s " . Journal of Accounting and Fconomics 295-329
Patch. J. and M. NVolfson (1984) "T h e in tr a d a y s p e e d o f a d ju s tm e n t o f s to c k p r ic e s to e a r n in g s a n d d iv id e n d a n n o u n c e m e n ts ." J o u r n a l o f f i n a n c i a l E c o n o m ic s 13. 223 -2 5 2 .
PriceWaterIIou.se annual report (1999)
Roll. Richard (1994). "W h a t E v e r y ( 'E O S h o u ld K n o w A b o u t S c ie n t i f ic P r o g re ss in E c o n o m ic s : l l 'h a l is K n o w n a n d W h a t R e m a in s to b e R e so lv e d " , f i n a n c ia l M a n a g em e n t. 23. p p . 69-75 .
Rosenberg. Barr. Kenneth Reid and Ronald Lanstein, (1985). " P e r s u a s iv e E v id e n c e o f M a rk e t In e f f ic ie n c y " , Journal of Portfolio Management, 9-17.
Sawaya A.N (2000). " M a r k e t R is k a s a u s e fu l in d ic a to r in a n a ly z in g r is k c h a r a c te r is tic s o f f i r m s q u o te d a t th e N S E " Unpublished MBA thesis 2000.
40
Scyhun, N [1986./ " In s id e r s ' p r o fi ts , c o s ts o f tra d in g , a n d m a r k e t e f f ic ie n c y ." J o u r n a l o f F in a n c ia l E c o n o m ic s 16. ISO -212 . (IO O SJ In v e s tm e n t in te ll ig e n c e fr o m in s id e r tra d in g .
M IT P re ss
Shiller RJ (1997) " H u m a n B e h a v io r a n d th e e ff ic ie n c y o f th e f in a n c ia l s y s t e m " Working paper. Yale University.
Shuctrim G.. (1998). "Systematic risk characteristics of corporate equity", Research Paper 1998.
Spcrber. D. & D. Wilson (1986/1995) “R e le v a n c e C o m m u n ic a tio n a n d C o g n itio n . 2nd edition.
I . Salmi. I. Virtancn. P. Yli-Olli. J.K. Kallunki (1997). A s s o c ia t io n b e tw e e n A c c o u n tin g a n d M a r k e t -b a s e d V a ria b le s . A C a n o n ic a l C o r r e la tio n A p p r o a c h w ith U S d a ta " U n p u b lis h e d R e s e a rc h P a p e r 100".
Thomas F.. McKee and Aasmund Eilifsen, July 200U " c u rre n t m a te r ia l i ty fo r a u d ito rs . Foundation lor research in Economic & Business Administration. Bergen. September 2000. ISSN 0803-4028.
1 versky A & Kahncman L) (1974) " J u d g e m e n t U n d e r U n c e r ta in ty H e u r is t ic s a n d B ia ses ", Science 185: 1124-1131.
Vorhies, Juines Brady, 'Th e H e w Im p o r ta n c e o f M a te r ia l i ty ." 199(5) Journal of Accountancy 53 (May 2005).
41
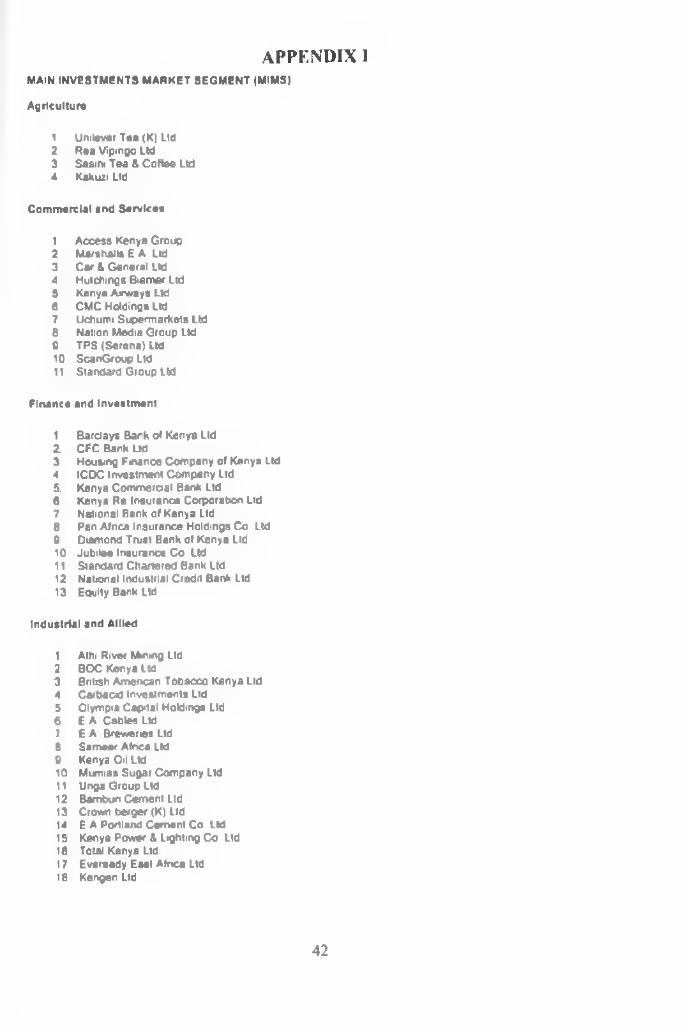
APPENDIX IMAIN INVESTMENTS MARKET SEGMENT <MIMS)
Agriculture
1 Unilever Tea (K) Ltd2 Rea Vipingo Ltd3 Sasim Tea & Coffee Ltd.4. Kakuzi Ltd
Commercial and Services
1 Access Kenya Group2 Marshalls E A Ltd3 Car & General Ltd4 Hutchings Bierner Ltd5 Kenya Airways Ltd6 CMC Holdings Ltd7 Uehumi Supermarkets Ltda Nation Media Group Ltd9 TPS (Sorona) Ltd10 ScanGroup Ltdi i . Standard Group Ltd
Firunco and Investment
1 Barclays Bank of Kenya Ltd2 CFC Bank Ud3 Housing Finance Company of Kenya Ltd ■1 ICDC Investment Company Ltd5. Kenya Commercial Bank Ltd6 Kenya Re insurance Corporation Ltd7 National Bank of Kenya Ltd6 Pan Afnca Insurance Holdings Co Ltd 0 Diamond Trust Bank of Konya Ltd tO Jubilee Insurance Co Ltd11 Standard Chartered Bank Ltd12 Notional Industrial Credit Bank Ltd13 Equity Bank Ltd
Industrial and Allied
t Athi River Mmmg Ltd2 BOC Kenya Ltd3 8ritish Amencan I obacco Kenya Ltd4 Corbacid Investments Ltd5 Olympia Capital Holdings Ltd6 E A Cables Ltd/ E A Breweries Ltd6 Someer Africa Ltd9 Kenya Oil Ltd10 Mumias Sugar Company Ltd11 Unga Group Ltd12 Bambun Cement Ltd13 Crown berger (K) Ltd14 E A Portland Cement Co Ltd15 Kenya Power & Lighting Co Ltd16 Total Kenya Ltd.17 Eveready East Afnca Ltd18 Kengen Ltd
42
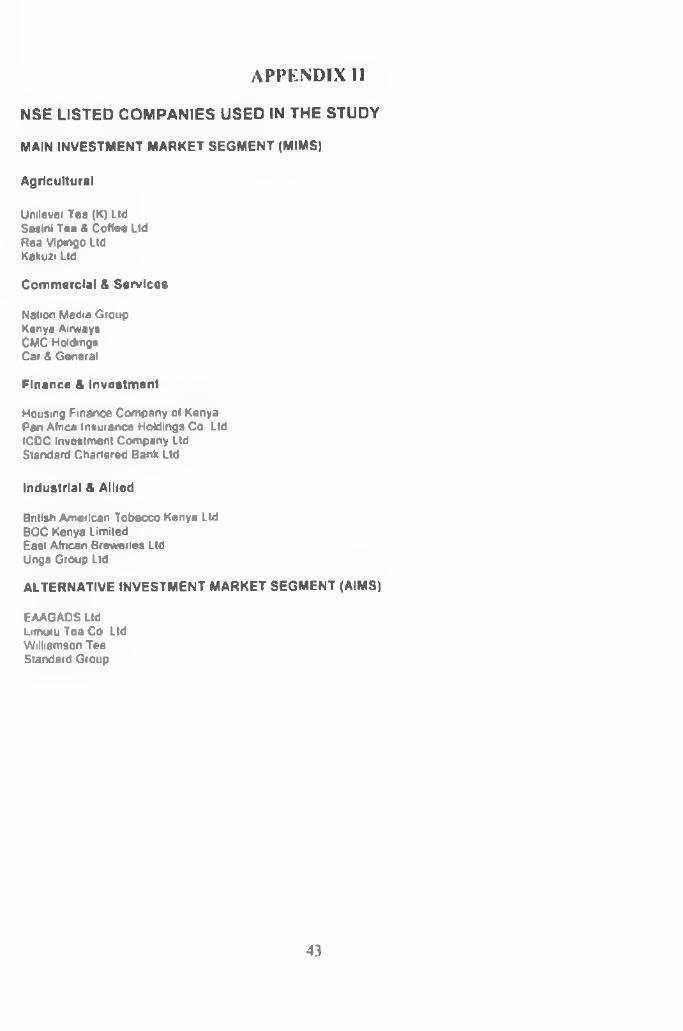
A P PE N D IX II
NSE LISTED COMPANIES USED IN THE STUDY
MAIN IN V E S T M E N T M A R K E T S E G M E N T (M IM S)
Agricultural
Unilever Tea (K) Ltd Saslni Tea & Coffee Lid Roa Vlpingo Ltd Kakuzi Ltd
Com m ercial & Sorvicos
Nation Media Group Kenya Airways CMC Holdings Car & General
Finance & Investm ent
Housing Finance Company of Kenya Pan Africa Insurance Holdings Co Ltd ICDC Investment Company Ltd Standard Chartered Bank Ltd
Industrial & Allied
British American Tobacco Kenya Ltd BOC Kenya Limited East African Breweries Ltd Unga Group Ltd
A L T E R N A T IV E IN V E S T M E N T M A R K E T S E G M E N T (A IM S)
EAAGADS Ltd Lim uruToaCo Ltd Williamson Tea Standard Group
43

A P P E N D IX IIICOMPANY NAME N E T A N N U A L E A R N I N G S
2001 2002 2003 2004 2006
M AIN IN V E S TM E N T M A R K E T S E G M E N T (M IM S)Agricultural
Undever Tea (K) Ltd 723,274.000 124 029.000 62.254 000 360 946 DOO 67 603 000
S&s.m Tea & Coffee Lid 15.390.000 <6.940.000) (67.224 000) 771.162 000 (366 594 000)
Rea Vpingo Ltd 3.966 000 24.609.000 3 725.000 126.666.000 124 462 000
Kafcun Ltd <45 223,000) 7,593 000 (11 795 000) 83 733.000 (73.767.000)
Com m ercial & ServicesNaton Media Grou> 256.700.000 403.600 000 602 600.000 641 400.000 716.200.000
Kenya Airways 1.357.000 000 669.000 000 400 000.000 1.302 000.000 3 020.000 000
CMC Holdings 66 662.CC0 152.760 000 176.966.000 262 962.000 339.967 000
Car & General (5.670 0001 7 451.000 60.679.000 36.544 000 193 945 000
Finance & Investm entHousing FVtance Company o f Kenya (186.543 000) 55 651.000 51,647 000 59.976 000 58 799.003
Pan Africa Insurance Hotongs Co Ltd 163 911.000 (15614.000) (23.443 000) 93.811 000 176 605 000
ICOC Investment Company Ltd 154.334.000 246 522.000 159,149 000 241.350 000 295234 OOO
Standard Chartered Bank Ltd 2243.C62.0CO 2.206 127.0CO 2.788.717 000 1 832.647 000 2 452.174 000
Industrial & AlliedBntish American Tobacco Kenya Ltd 604.109 000 623.120 000 1.140.021 000 1 210.164 OOO 1 362 036 OOO
BOC Kenya United 75.050 000 105.491 000 152 619,000 160 117.000 207 446 000
East African Breweries Ltd 1.573.406.000 2 319.915 000 1.500 008.000 1.649 056.000 4 769 912 OOO
Unga Group Ltd (116 566.000) 156.813000) (27 046.000) (101 949.000) 72 542 000
A L T E R N A T IV E IN V E S TM E N T M A R K E T S E G M E N T (A IM S)
EAAGADS Ltd 547.000 3 861.000 (4.273 0001 (1.434 000) 6 802 000
Um uruTeaCo Ltd <2.963 000! 2077.0CO 6.047 000 9.659 000 (3 159 000)
Williamson Tea 136 236.0CO (26 922.000) 64.354 000 80.421 000 66231000
Stanoard Group - 149,463 OOC) 77.790 000 66 406 00020 COMPANY AVERAGE 326.664,tM 362.306.660 346.373.360 S54.962.660 676.743 400
4 4

COMPANY NAME2001
M AIN IN V E S T M E N T M A R K E T S E G M E N T (M IM S)
AgriculturalUnilever Tea <K) Ltd 48,875 000Sasir* Tea & Coffee Ud 30.009 240Rea Vpingo LM 60.000 OOO
Kafcuzi Ltd >9 599 999
Com m ercial & ServicesNat on Media Group S3 478.M5Kenya Amvays *81 815.4*4CMC Holding* 26279.560Car & General 22279.616
Finance & Investm entHousing Finance Company of Kenya 115.000.000Pan Africa Insurance Holdings Co Lid 46.000 000ICOC Investment Company Ltd 46.031291Standard Chartered Bank Ltd 247.243.000
Industrial & AlliedBritish American Tobacco Kenya Ltd 100.000 000BOC Kenya Landed 19 525 446East African Breeenes Ltd 105.733 961
Unga Group Ltd 52 954 466
A L T E R N A T IV E IN V E S T M E N T M A R K E T S E G M E N T (A IM S)
EAAGADSLM 8,039,250Um uruTeaCo Ltd 6COOOOWilliamson Tea 8.756.320
Standard Group 12.811.85920 COMPANY AVERAGE 74.841.872
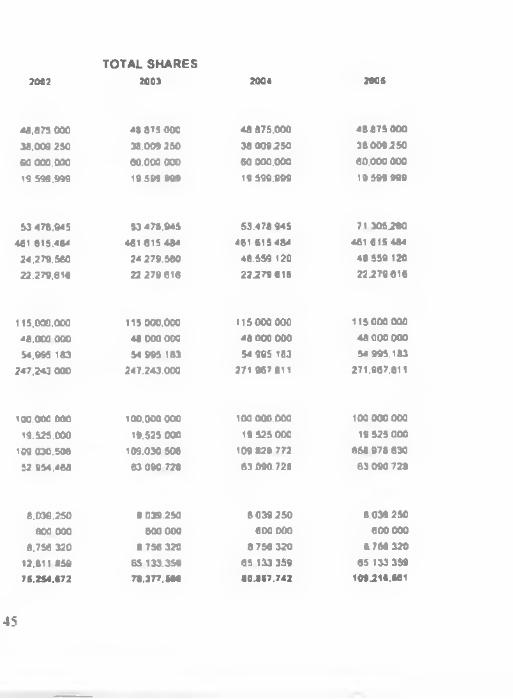
2002
<4,825 000 38.009 250 60 000,000 19 599.999
53 478.0*5 461 615.48*24,279.56022.279,616
115,000.000 *8,000 000 54,995 183
247.243 000
100.000 000
59.525.000 109 030.506 52 954.468
8,039.250 600 000
8.756 320 12,811 859 75,254.672
T O T A L S H A R E S
2003 2004 2005
48 875 OOC 38.009 25060.000 000 19.59* 999
48 875.000 38 009250 60 000.000 19 599.999
48 875 OOO 3800925060.000 OOO 19 599 999
53 478,945 481 815 48*24 279.560 22 279 616
115 000,00048.000 OOC 5*995 183
247.243.000
53478 945 461 615 484 48.559 120 22279 616
115000 OOO 48 000 000 54 995 183
271 967 811
71 305260 461 615 484 46 559 120 22279616
115 000 COO 48 OOO OOO 54 995.183
271.967.811
100.000 OOC 19,525 OOO
109.030 506 63 090 776
100 000.000 19 525 003
109 829 772 63 090.726
100 000 000 19 525000
856 976 830 63 090 728
6 039.250 600 000
• 758 320 65 133.359 78.377.590
8 039250 600 000
8 758 320 86 133 359 80867.742
8.039 250 600 000
8.768 320 65 133 359
109216.501
45

COMPANY NAME2001
M AIN IN V E S TM E N T M A R K E T S E G M E N T (M IM S) AgriculturalUnlever Tea (X) Ud 6.5*7 642.000Sas.™ Tea 4 Coflee Ltd 1 930,674 000Rea Voirigo Ltd 612 225.000KaxuziUd 2.269 765.000
C om m ercia l & ServicesNation Media Group 2.150 500.000Kenya Airway* 16.569 000.000CM C Holdings 2.370 346.000Car & General 340 939.000
Finance & Investm entHousing ftn&nce Company of Kenya 965 420.000Pan Africa insurance Holang* Co Lto 1.601 823.0COICOC Investment Company Ud 2219 > 06.000Standard Chartered Bank Ltd 5.619 317 000
Industrial & AlliedBrtaii American Tobacco Kenya Ltd 4.672 791.000BOC Kenya Limited 1.029 J65.0COEast African Breweries Ltd 11.369 191.000Unga Group Ud 2.157 524.OCO
A L T E R N A T IV E IN V E S TM E N T M A R K E T S E G M E N T (AJMS)EAAGADS LIO 193.733.000U n u ru Te a C o Ltd 36.669 000Wdiameon Tea 2.162 ' 42.000Standard Group 64261 OOO20 COMPANY AVERAGE 3200.157.550
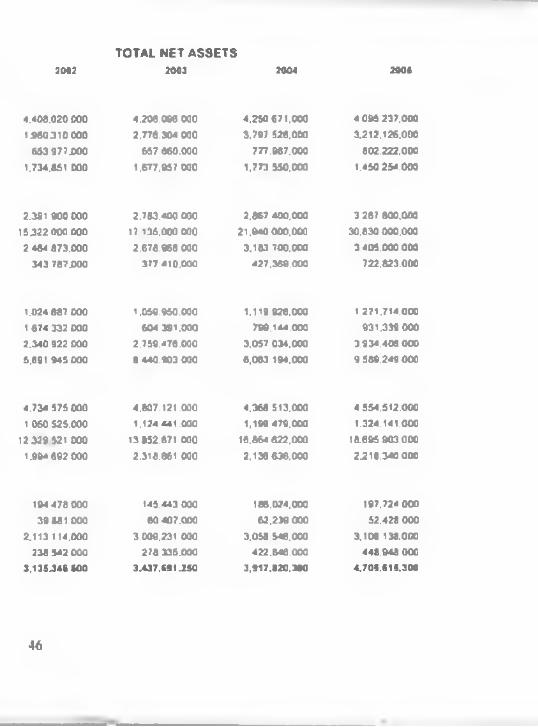
T O T A L N E T A S S E T S
2002 2003 2004
4.406.020 COO 1060310 COO 653977000
1.734.851000
2.391 900 COO 15322 003 COO 2 464 373.000
343 787.000
1.024 687 000 1 674 332 000 2.340 922 000 5,691 945 000
4.734 575 COO 1050 525.000
12 329 521 OOO 1.994 692 000
194 476 000 39 681 000
2.113 114.000 238 542 000
3.135346 *00
4.206.096 000 2,776.304 000
657 660.000 1.677,957 000
2.783.400 000 17 135.000 000 2.676.966 MO
377 410.000
1.059.950.000 504 391.000
2.759.476.000 8 440.903 000
4.607.121.000 1.124 441.000
13 852.671 COO 2318.661 MO
145.443 000 60 407.000
3.009.231 000 278 335.000
3.437.691.250
4,250 671, OM 3,797 526,010
777.987.000 1.773 550,OM
2.867 400,OM 21,940 000,000 3.183 700,000
427,389,000
1,119 926.0M799.144,000
3,057 034.0M 6,063.m,0M
4,368 S13.0M 1,199 479.0M
16,864 622,000 2.136 636.0M
186.024.000 62.239 000
3.058 546.0M422.646.000
3,917.820,300
2005
4 095 237,0003.212.126.000
802.222.000 1.460 254.000
3 26? 800.000 30.830 000.000 3 405,000 000
722.823.000
1 271,714.000 931.339 000
3.934.408 000 9 569.249 000
4 554.512.0001.324.141.000
16.695 903.000 2.218.340 000
197,724 000 52.428 000
3.106 138.000 446.948 OOO
4.705.615.300
46

C O M P A N Y N A M E
M AIN IN V E S TM E N T M A R K E T S E G M E N T (M IM S) Agricultural
2001
Uwever Tea (K) Ud 491 740.000Sasini Tea & Coflea ltd 190 046 0CORea Vpingo Ud 384 4 % . OCOKakuzi Ud 98 000 000
C om m ercia l & ServicesNation Media Group 178 300.000Kenya Airway* 2.308 000.000CM C Hottngs 121 398,000Car & General 111 308000
Finance & Investm entHousing Finance Company of Kenya 576000.003Pan Afnca Insurance HokSng* Co Ud 604 431 000ICOC investment Company Ltd 564 257 003Standard Chartered Bank Ltd 1 236217 OCO
Industrial & AlliedBrtish American Tobacco Kenya Ltd 10,000 023,000BOC Kenya bmited 100.1B1.000East African Breweries Ltd 3 278 839.000Unga Group Ud 337 920 003
A L T E R N A T IV E IN V E S TM E N T M A R K E T S E G M E N T (AIM S)
EAAGADS Ltd 10.049 000bmuru Tea Co Ud 12.000 000WHiamson Tea 43,782 000Standard Group 04.161 OOO20 COMPANY AVERAGE i.ess.su .900

2005SHARE CAP ITAL ♦ SHARE PREMIUM
2002 2003 200*
*917*0.000 190 046 000 344 .496.000 98.0CO 000
491.7*0.000 190,046 000 384,496.000 98.000.000
491.740.000190.048.000364.496.000 96,000 000
267.5CO.OOO 2 308.000,000
121.398.000111.398.000
267.500 000 2.308,000 000
121.398.000111.398.000
267.500.000 2.308,000,000
121.398.000111.398.000
576.0CO.OOO 604.431 000 864.729.000
1 236 217,000
575.000.000604.431.000684.729.COO
1.238,217.000
575.COO.OOO604.431.000884.729.000
1.359.839.000 1
10 000.023,000 10 000.023 M0 10,000.023.000 10,100.181 000 1CO.181.000 100.181 000
3 278,839 000 3.278,839.000 3.278.639.000 3337.920.000 337.920.000 337.920.000
10,049 000 12,000 000 43.782 000 64,161 000
1,054.995,500
'0 049,000
12 .OOO.OCO43 782.0C0 64.181.OCO
1,054.995.500
10,049 000 12,000 000 43.782 000 84.161 000
1,061.176,600 1,
§ § § § § § § §
§ 1 § § §
§§
§
§ § § i §s 1 * §
§ §1
1 §
i s; i
% § s § i §»;
11
5
cf s" «
f' op
—
—
in -r
i
»
o
9 e
t
o
«»i « »’
■»

COMPANY NAME MAIN IN V ESTM EN T M ARKET SE G M E N T (MIMS)AgriculturalUmfever Tea <K) Ltd Sasun Tea & Codee LW Rea V-pingo Ltd Kakun Ltd
Commercial & ServicesNaton Media Group Kenya Airway*CMC Holding*Car & General
Finance & InvestmentHousing Finance Company of Kenya Pan A/rica Insurance HokSngs Co Ltd ICDC Investment Company Ltd Standard Chartered Ban* Ltd
Industrial & AlliedBntish American Tobacco Kenya Ltd BOO Kenya United East African Breweries Lid Unga Group Ltd
2001 2002 2003
Pt2004
72 00 64.00 MOO 90 401140 1320 17.J0 20 40
2*0 2.4* 4 14 44016 00 1466 14.45 40 00
43.24 44.00 1*1.00 170 007 5$ 7*5 5.74 940900 17.24 •4.00 45 00
1000 10.00 MOO 14.00
600 5.20 12.04 45011 10 700 23.40 21 0047 00 19.00 41.00 87 0047 00 42 00 191 00 122.00
49 00 54.00 275.00 200 0030 00 20.75 99 50 137 0079 50 12 50 226 00 445 00
7.74 4.10 12.05 14 50
ALTER N A TIV E IN V ESTM EN T M AR K ET S EG M EN T (AIMS)EAAGADS Lid 20.40 19.00 14.44 17 00Umuru Tea Co Ltd 194 00 344 00 1M.00 345.00Williamson Tea 100 00 51.00 70.00 80 00Standard Group 540 9.40 19.74 43.40

2005 2001 2002 2003Po
2004 2005 2001 2002 2003Do
2004 2005
•0 50 m .oo 72.00 54 00 MOO 90 50 2.00 250 600 6.00 2.0032.50 347$ 19*0 13.20 17.30 20 50 100 050 000 2.50 0.0020 50 3.70 2.90 2.55 5.15 950 000 025 040 0.80 0804*25 5500 35 00 14(5 14.6$ 40.00 000 000 000 1.00 0.00
190.00 (9.00 4325 •4.00 191.00 170 00 1 (0 2-SO 500 600 (.002400 7.50 7.56 7.85 575 960 126 0(0 0 50 0.75 1.2647 25 1(00 9.00 17.25 MOO 65.00 0.75 1 00 1.00 1.00 1.6029.00 19.00 1000 10.00 MOO 1600 0.00 000 0.67 0(7 0.(7
1395 5.50 6.00 5.20 12 05 • 50 OK 000 000 0.00 0.0040.00 11.00 13 10 7 00 23 50 2100 000 000 0 00 1.00 1.20M SO 49.50 47.00 1900 51 00 67 00 2.00 200 2.20 3.00 3.00
139 00 49 SO 47 00 62 00 19100 122 00 825 • 26 8.50 (.50 7 SO
204 00 60.50 4900 54 00 77(00 200 00 790 900 12 50 16.50 12.50145.00 43 00 30 00 26.75 99.50 137 00 3 56 4.36 4.36 4.50 6.50149.00 (5 50 79 50 82.50 226.00 445 00 9 00 11.50 15.00 18.00 4 501940 15.40 7.76 4.10 1205 14.50 0.00 0 00 000 0.00 0.00
17.00 25.00 20 50 19.00 1595 17.00 0.60 050 • 00 0.00 1.25347.00 (50 00 394.00 394.00 1(0 00 356 00 000 300 1800 15.00 500119.00 •7.00 100.00 51.00 70 00 80 00 600 050 375 3.7* 5.0040.25 740 550 9.40 39 75 4350 000 000 000 000 000
48

APPENDIX IV CORRELATION RESULTS
T«M« • AM)\ A I n l h r l W i l l r r w w S t r t e r
Sum of Squares
1
df Moan Square _____ F____ S*Market Return Between
Groups3 025 4 758 664 618
Wlthm Groups 108 124 95 1.138Total 111 149 99
EPS BnhvoonGroups
600936 4 150 234 4 213 003
Within G'oups 3387 519 95 35 658
Total 3988 455 99ROA Between
Groups321 4 .080 3 269 015
Within Groups 2335 95 025
Total 2656 99
ROE BetweenGroups
7 865 4 1 971 2 753 032
Within Groups 68 033 95 716Total 75 918 99
'laMr 2 r* a hot tot
DependentVariable
(1)sector
(A)sector
MeanDifference
<w>
Std.Error Sig
95% Confidence Inters j I
LowerRound
UpperRound
IPS Agri Alt -1.97650 1.88833 833 -72277 32747
Comm -3.74850 1.888.33 281 -8.9997 1.5027
Finn -2.28150 1,88833 .747 -7.5327 2.9697^
Ind -7.3530CK *) 1.8X8.33 .002 -126042 -2.1018
Alt Agrl 1.97650 1 88X33 .833 •3.2747 72277Comm -1 77200 1 88833 881 •7.0232 .3.4792Finn -.30500 1 8883.3 1.000 -5.5562 1 9462Ind -5 376500 1.88833 042 • 10.6277 -.1253
Comm Agri 3.74850 1.88833 281 -1.5027 8 9997
Alt 1.77200 1.88833 881 -3.4792 7.0232Finn 1.46700 1 8883J .9.37 -3.7842 6.7182
Ind -3.60450 1 88X33 J20 -8.1557 1.6467linn Agri 228150 1 888.33 .747 -2.9697 7.5327
Alt .30500 1.88833 1000 -4.9462 5.5562
Comm -1.46700 1.888.3.3 .937 -6.7182 3.7842
Ind •5.07 ISO 1.88833 064 -10.3227 .1797
Ind Agri 7 ,353000 1 8883.3 .002 2.1018 12 6042 «Alt 5 3765W*) 1 888.3.3 042 .1253 10 6277Comm 3 60450 1.8X833 .320 -1.6467 8 8557
Finn 5 07150 1.88833 064 -.17*37 10.3227
ROA Agri Alt -.0459411 .0495754 8X6 -.183804 .091921
Conun -.1098697 .0495754 183 -.247732 .027993Finn -.1289636 .0495754 .078 -26682b .008899
Ind15433640
.0495754 .020 -292199 -.016474
Ah Agri .0459411 .0495754 .886 -.091921 .183801
4 9
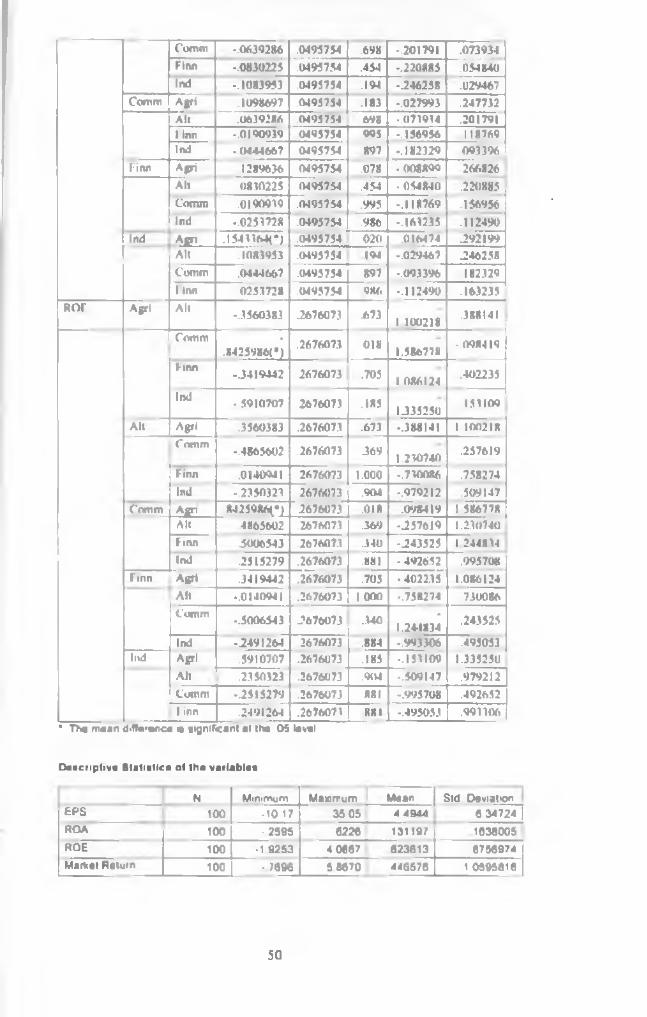
Comm •.06392X6 .0495754 .698 -.201791 .073934Finn -.0X30225 .0495754 .454 -.220885 .054840Ind -.1083953 .0495754 .194 -.246258 .029467
Comm Agri .1098697 .0495754 .183 -.027993 .247732All .0639286 .0495754 698 -.073934 .2017911 Inn -.0190939 .0495754 995 -.156956 118769Ind -0444667 0495754 897 -.182329 093396
Finn Agri 1289636 0495754 .078 -008899 266826Alt 0830225 13495754 .454 -054840 220885Comm .0190939 .0495754 .995 -.118769 .156956Ind -.0253728 .0495754 .986 -.163235 .112490
Ind Agn .1543364<*) .0495754 020 .011.474 292199All .10X3953 .0495754 .194 -.029467 246258Comm .0444667 .0495754 897 -.093396 1823291 inn 0253728 .0495754 986 -.112490 .163235
ROF Agri All -.3560383 .2676073 .6731 100218
.388141
Comm ••8425986C)
.2676073 018 1.586778 -098419
Finn0419442 2676073 .705 1 086124 .402235
Ind - 5910707 2676073 .185 1.335250153109
All Agri .3560383 .267607.1 .673 -.388141 1 100218Comm
-.4865602 .2676073 J69 1.230740 257619
Finn .0140941 2676073 1.000 -.730086 .758274Ind -.2350323 2676073 .904 -.979212 .509147
Comm Agri 8425986)^ 2676073 .018 .098419 1 586778All 4865602 .2676073 .369 -257619 1230740Finn .5006543 .267607.3 .340 -243525 1 244834Ind .2515279 .2676073 .881 •492652 .995708
Finn Agri .3419442 .2676073 .705 - 402235 1.0X6124All -.0140911 .2676073 1000 -.758274 .730086Comm -.5006543 2*676073 .340
•124-1834 .243525
Ind -.2491264 2676073 .884 -.993306 .495053livd Agri .5910707 .2676073 .185 -.153109 1.335250
All .2350323 .2676073 .904 -.509147 .979212Comm -.2515279 .2676073 881 -.993708 .492652linn .2491264 .2676073 881 -.495033 .993106 |
• The moon d.ffo'onco « tigni6canl at the 05 lovol
Descriptive Statistics of Iho variobloo
N Minimum Maximum Mean Std Deviat'd"EPS 100 -1017 35 05 4 4944 6 34724 !ROA 100 ■2595 0226 131197 1036005ROE 100 -1 9253 4 0667 623613 8756974Market Return 100 - 7696 56670 44G576 1 0595816
50
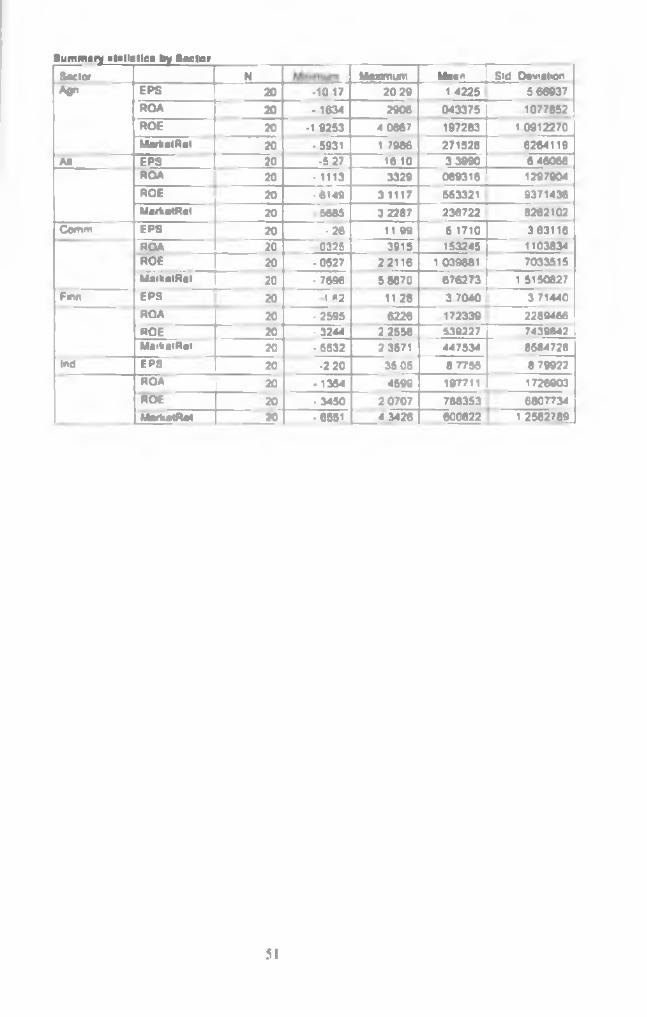
Summary ataltatlca by Sac tor
Sactor N Maximum Mean T Sid Daviat>onAgn EPS 20 -1017 20 29 1 4225 5 66937
ROA 20 -1634 2908 043375 1077852ROE 20 -1 9253 4 0867 197283 1 0912270MartetRet 20 -5931 1 7986 271528 6264119
An EPS 20 -527 16 10 3 3990 6 46008ROA 20 • 1113 3329 089316 1297904ROE 20 -6149 3 1117 553321 9371438MarVatRal 20 5665 3 2287 236722 8262102
Comm EPS 20 •26 11 99 5 1710 3 63116ROA 20 0325 3915 153245 1103834ROE 20 -0527 22116 1 039881 7033515MarkeiRet 20 • 7696 58670 676273 1 5150827
Finn EPS 20 1 *2 11 28 3 7040 3 71440ROA 20 -2595 6226 172339 2289466ROE 20 ■ 3244 2 2558 539227 7439842Ma'kotRol 20 - 5632 2 3571 447534 8584728
Ind EPS 20 •2 20 35 05 8 7755 8 79922ROA 20 • 1354 4599 197711 1726903ROE 20 • 3450 2 07071 788353 6807734MarkatRat 20 •6551 L ___4 3426 600822 1 2582789_
51
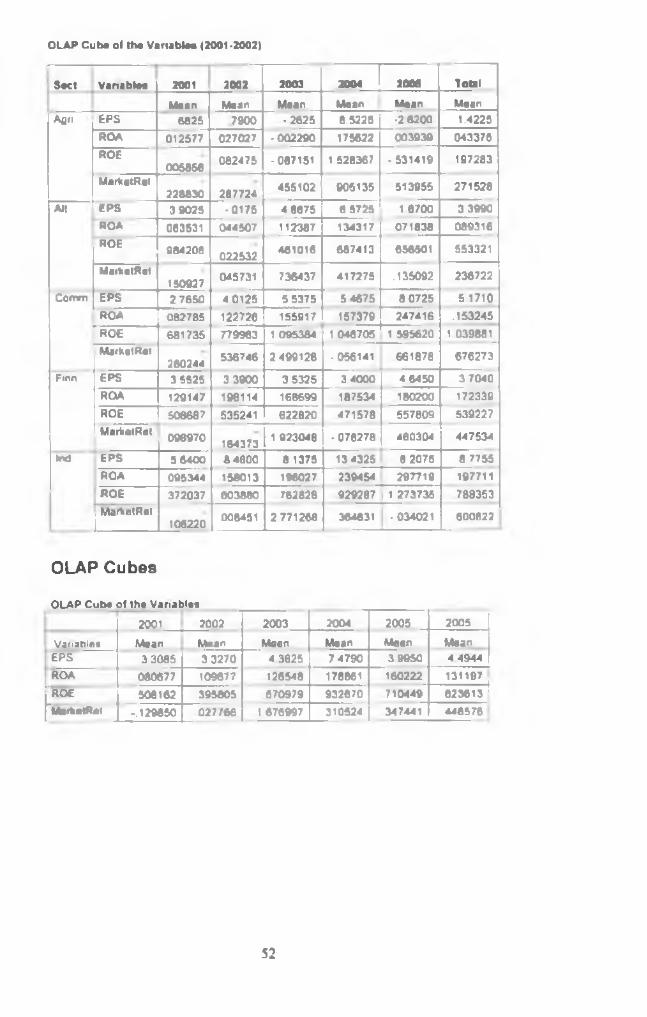
OLAP Cub® of the Variables (2001-2002)
Sect Variable* 2001 2002 2003 2004 2005 Total
Mean Mean Mean Mean Mean MeanAgn EPS 6825 7900 -2625 8.5225 •26200 1.4225
ROA 012577 027027 •002290 175622 003939 043375ROE
005858 082475 -087151 1 528367 -531419 197283
MarketRot228830 287724 455102 905135 513955 271528
Alt EPS 3 9025 •0175 4 8875 6 5725 1 8700 3 3990ROA 083531 044507 112387 134317 071838 089316ROE 984208 022532 461016 687413 656501 553321
MarketRol150927 045731 736437 417275 .135092 236722
Convn EPS 2 7650 4 0125 5 5375 5 4675 8 0725 5 1710ROA 082785 122726 155917 157379 247416 .153245ROE 681735 779963 1 095384 1.046705 1 595620 1 039881_MarkotRet
260244 536746 2 499128 -056141 661878 676273
Finn EPS 3 5526 3 3900 3 5325 3 4000 4 6450 3 7040ROA 129147 196114 168699 187534 180200 172339ROE 508687 535241 622820 471578 557809 539227MarkotRet 096970 104373 1 923048 - 078278 460304 447534
Md EPS 56400 8 4000 8 1375 13 4325 8 2075 8 7755ROA 095344 158013 198027 239454 297719 197711ROE 372037 603880 762828 929287 1 273735 788353MarkotRet
1 106220 008451 2 771268 364631 • 034021 600827
OLAP Cubes
OLAP Cube of the Variable*
2001 2002 2003 2004 2005 2005
Variables Mean Mean Mean Moan Mean Moan| EPS 33085 3 3270 4 3625 74790 3 9950 4 4944
ROA .080677 109677 126548 178861 160222 131197[ROE 508162 395805 570979 932870 710449 623613 1["MarkotRet -.129850 027766 1 676997 310524 347441 446576
52

Corre la tio n s M atrix of the variables
— —-----------------------EPS ROA ROE MarketRet
EPS PearsonCorrelation 1 eaoo .7 4 5 0 163
Sig (2-UWed) 000 OCO 105ROA Pearson
Correlation 680("> 1 665f> .1970
r Sig (2-taiied) 000 000 049
ROE PearsonCorrelation 7 4 5 0 6 6 5 0 1 151
Sig (2-tailed) 000 000 134MarketRet Pearson
Correlation 163 1970 161 1
Sig (2-tailod) 105 049 134*• Correlation is significant at the 0 01 level (2-tailed) • Correlation is significant at the 0 05 level (2-urned)
Regression
Variables Entere<PRemoved(a)
ModelVariablesEntored
VariablesRemoved Method
1
ROA
Stepwise (Critena
Probability -of-F-to- enter <=
050, Probability
-of-F-to- temove »•
100)
a Dependent VanaPle: .larketRet
Model Summary(b)
Model R R Squat*Ad|U Sled R
SquareSid. Error of the Esbmsto Durbin-Woteon
1 197(a) 039 029 1 0440650 1 394
a Predictors (Constant) RQA b Dependent VanaWe MarketRet
5 3

ANOVA(b)
Mode!Sum of
Squares df Moan Square F1 Regress»o
n 0 2 2 1 4 322 3 964 049(a)
Residual 106 827 98 1 090Total 111 149 99
o Predictors (Constant). ROA t> Dependent Variable: MarketRet
Coefftcients(a)
Unstandardized Coefficients
Model e Std Error 1 S>fl1 (Constant) ?Z?J 134 2 083 040
ROA 1 276 641 1 991 049a Dependent Variable MarketRet
OnewayANOVA
Sum ol Squares df Mean Sqoa'o F s.a.
MarketRet BetweenGroups 3 025 4 756 664 618
Within Groups 108 124~1 95 1 130Total 111 149 99
EPS BetweenGroups Withm Groups
600 038 4 150 234 4 213 003
3387 519 95 35.658Total 3988 455 99
ROA Qahuaan
Groups .321 4 080 3 269 015
Within Groups 2.335 95 025Total 2 656 99
HOE BetweenGroups 7885 4 1 971 2 753 032
Within Groups 68 033 95 716Total 75 918 99
54
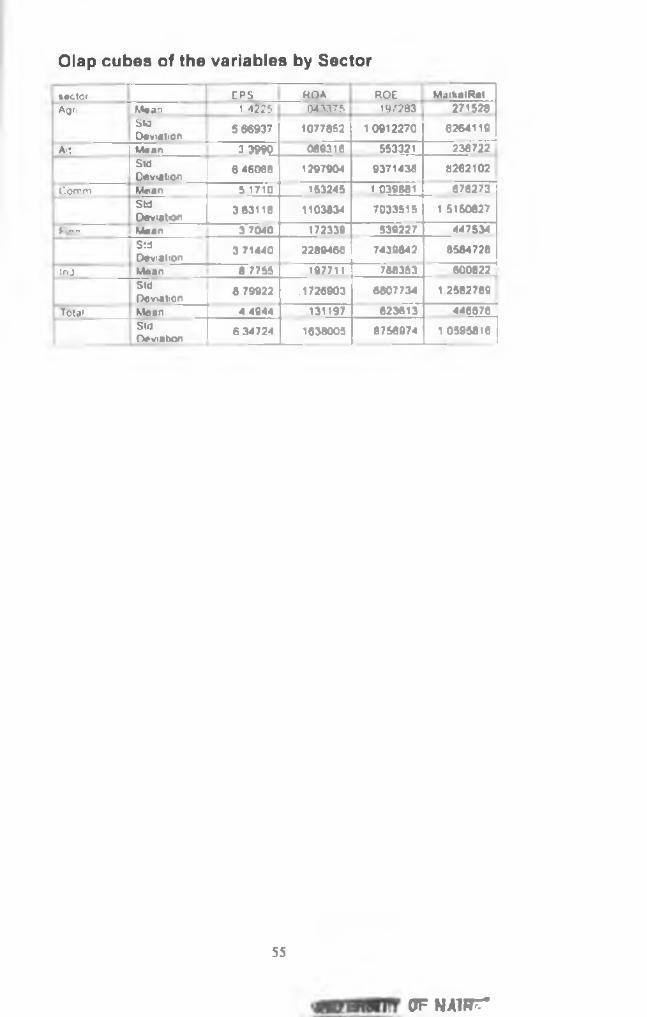
Olap cubes of the variables by Sector
Motor CPS ROA RO£ MaiKeiRalAon Moan 1 4225 1 043375 197283 271528
StdDeviation 5 66937 1077852 1 0912270 6264119
— ............mmlAlt Mean 3 3990 089316 553321.. 236722
StdDeviation 6 46068 1297904 9371438 8262102
1 Comm Mean 5 1710 153245 1 039661 676273StdDeviation 3 63116 1103834 7033515 1 5150627
Finn Moon 3 7040 172339 539227 447534StdDeviation 3 71440 2289466 7439842 8584728
Ind Mean 8 7755 197711 788353 600822.1StdDeviation 8 79922 .1726903 6807734 1 2582789
Total Mean d 4944 131197 623613 440576StdOeviaton
634724 1638005 8756974 1 0595616
55
of NAirrr