Current and Recent Historical Mussel Assemblages in the Gulf Coastal Plains

Testing congruency of geographic and geneticpopulation structure for a freshwater mussel(Bivalvia: Unionoida) and its host fish
DAVID T. ZANATTA1* and CHRIS C. WILSON2
1Central Michigan University, Biology Department, Brooks Hall 156, Mount Pleasant, MI 48859,USA2Aquatic Biodiversity and Conservation Unit, Ontario Ministry Of Natural Resources, TrentUniversity, 2140 East Bank Drive, Peterborough, ON K9J 7B8, Canada
Received 11 August 2010; revised 21 September 2010; accepted for publication 22 September 2010bij_1596 669..685
The macrogeographic dispersal of unionoid mussels is largely dependent on movement by their host fish. Thesnuffbox mussel Epioblasma triquetra (Unionoida) and other congeners use a novel trapping behaviour toparasitize potential host fish with their larvae (glochidia). Common logperch (Percina caprodes) trapped by E.triquetra survive the trapping behaviour, whereas other darter species (Etheostoma and Percina) do not, thus,making the P. caprodes–E. triquetra relationship a good candidate system for a coevolutionary study. Wehypothesized that the geographic genetic structure of E. triquetra should closely match that of its host, albeit withgreater interpopulation divergences as a result of its dependency on the host for dispersal. Mantel tests of parallelpairwise matrices of population divergence (Jost’s D) and genetic assignment tests based on microsatellite DNAdata showed that the genetic population structures of both species were broadly, but not perfectly, congruent.Therefore, it appears that P. caprodes are not solely responsible for the genetic population structure observed forsnuffbox and may not necessarily be the mussel’s only host across its entire range. This suggests the potential fora geographic mosaic for coevolution in unionoids and darters. The findings of the present study reinforce the needfor a joint study and conservation of unionoids and host fish aiming to protect these coevolved taxa. © 2011 TheLinnean Society of London, Biological Journal of the Linnean Society, 2011, 102, 669–685.
ADDITIONAL KEYWORDS: Epioblasma – host–parasite coevolution – geographic structure – Percina –post-glacial recolonization.
INTRODUCTION
The adaptive interplay between species across spaceand time is a central tenet of evolutionary biology(Thompson, 1994). The central basin of NorthAmerica, with its vast network of highly dendriticrivers, is an ideal location for studying evolutionaryrelationships within its diverse freshwater fauna atboth recent and ancient timescales. The effects ofancient features such as the Appalachian and Ozarkmountain ranges and recent glaciations have influ-enced the biogeography and biodiversity of the entire
region (Benke & Cushing, 2005; Soltis et al., 2006).Two particularly speciose aquatic groups with a highdegree of endemism are the darters (Euteleostei: Per-cidae) and freshwater mussels (Bivalvia: Unionoida)(Banarescu, 1991; Near & Benard, 2004; Bogan &Roe, 2008). Both groups date back to the Tertiaryepoch and show substantial diversification related toPleistocene glacial events (Banarescu, 1991; Wiley,1992; Bogan & Roe, 2008). Despite this wealth ofevolutionary diversification, mussels have the unfor-tunate distinction of being among the most endan-gered organisms on Earth (Ricciardi & Rasmussen,1999; Lydeard et al., 2004).
It is likely the declines of freshwater mussels aredue in part to their specialized life cycle involving a*Corresponding author. E-mail: [email protected]
Biological Journal of the Linnean Society, 2011, 102, 669–685. With 6 figures
© 2011 The Linnean Society of London, Biological Journal of the Linnean Society, 2011, 102, 669–685 669

parasitic stage on fish. Fish are critical to the survivalof unionoid mussels because reproductive failure willoccur without the presence of an appropriate host fish(Bogan, 1993). Unionoids appear intrinsically linkedto the evolution of their hosts because speciation inunionoids often appears to be in lock-step to specia-tion and/or changes in hosts (Graf, 1997; Zanatta &Murphy, 2006; Bogan & Roe, 2008). Thompson (1994)argued that parasitism was a special case of coevolu-tion and organisms with a parasitic life stage providefertile opportunities for investigating coevolution. Formembers of the unionid genus Epioblasma and darterhosts, research by Jones et al. (2006) demonstratedclose coevolutionary relationships with regards togenetics and host usage and geographic variation inparasite–host relationships. The obligate parasiticlarval stage and potential host specificity makesmussel–host pairs very interesting for phylogeo-graphic and coevolutionary studies (Jones et al., 2006;Zanatta & Murphy, 2006; Bogan & Roe, 2008). Under-standing the biology, ecology, and geographic geneticstructure of host fish species is critically important forthe conservation of imperiled unionoid mussels(Bogan, 1993; Bogan & Roe, 2008).
Of all the North American freshwater musselgroups, the genus Epioblasma (Rafinesque, 1831) isthe most endangered (Bogan, 1993). Of the approxi-mately 20 species in the genus, 14 are considered tobe extinct and the status of the remaining taxa arethreatened or uncertain (Williams et al., 1993; Graf &Cummings, 2007). Because the members of this genusprefer small to medium size, silt-free streams, theyare considered to be more sensitive to human medi-ated disturbances than other mussels native to thecentral basin of North America (Peacock, Haag &Melvin, 2005). The snuffbox mussel, Epioblasma tri-quetra (Rafinesque, 1820) is the most widely distrib-uted member of the genus (Johnson, 1978), whichmay in part be responsible for its persistence. Extantpopulations of E. triquetra are generally small andfragmented and the potential for their loss as a resultof catastrophic accidents is possible (Butler, 2007). Ifefforts are not made to preserve this species and itscongeners, it is conceivable Epioblasma may be thefirst genus of North American unionoid mussel to goextinct.
Host fish suitability testing for E. triquetra hasbeen undertaken at several laboratories. These testshave identified several potential host fish species foruse in artificial propagation, including common log-perch, Percina caprodes (Rafinesque, 1818). Percinacaprodes was confirmed as a host for E. triquetrapopulations in the Ohio River basin (OSU Division ofMolluscs, 2009), the Tennessee River basin, the UpperMississippi (Hillegass & Hove, 1997), the Ozarks(North and South slope) (Barnhart, Riusech & Baird,
1998), and the Great Lakes (McNichols, Mackie &Ackerman, 2004). The P. caprodes and E. triquetraspecies pair are often found in close association withone another (Butler, 2007; Barnhart, Haag & Roston,2008). It has been reported that E. triquetra andother congeners use a fascinating behaviour to infesta potential host fish (Barnhart et al., 2008). Gravidfemale E. triquetra gape with their valves openwaiting for a fish to insert its rostrum into the gap.The mussel’s valves rapidly close upon rostrum inser-tion, trapping the fish. The mussel forms a ‘gasket’with its mantle flesh around the mouth of the fish andpumps glochidial larvae into the fish’s buccal cavity,enabling the glochidia to attach to the fish’s gills(video clips of this behaviour and logperch foragingare accessible at: http://unionid.missouristate.edu/gallery/Epioblasma/default.htm; Barnhart et al.,2008). The majority of darter species examined byBarnhart et al. (2008) were unsuitable hosts, withglochidial infestation being unsuccessful or fish dyingof crushed skulls. By contrast, the long conical snoutand strong skull of P. caprodes enable this species tosurvive capture and infestation (Barnhart et al.,2008). In addition, the foraging behaviour of P.caprodes (rooting in the substrate with its rostrum)renders them particularly susceptible to snuffboxparasitism (Scott & Crossman, 1973; Barnhart et al.,2008).
This co-adapted relationship between E. triquetraand P. caprodes make an excellent system for study-ing coevolution, and has the potential to influencerates of speciation in both genera (Thompson, 1994;Near & Benard, 2004; Bogan & Roe, 2008). On thebasis of distributional and genetic data, E. triquetradispersed from a Mississippian refugium via hostfish following Pleistocene deglaciation (Zanatta &Murphy, 2008). Percina caprodes (sensu lato) waspreviously thought to be a single species (Scott &Crossman, 1973) but now appears to be a speciescomplex with P. caprodes s.s. similarly dispersingfrom a Mississippian refugium (Near, 2008). A phy-logeographic study of E. triquetra documentedsignificant population structure and genetic differen-tiation across the species range, with a population inthe Ozark Highlands (St Francis River, Missouri)qualifying as a distinct species (Zanatta & Murphy,2008).
The present study seeks to test the congruency ofgenetic population structure found in E. triquetra(Zanatta & Murphy, 2008) with the genetic populationstructure of its putative natural host, P. caprodes.Coevolutionary theory and empirical studies showthat the phylogeny, population structure, and localadaptations of a parasitic species are highly corre-lated (sometimes inversely) to that of its host species(Dybdahl & Lively, 1996; Nuismer, Thompson &
670 D. T. ZANATTA and C. C. WILSON
© 2011 The Linnean Society of London, Biological Journal of the Linnean Society, 2011, 102, 669–685

Gomulkiewicz, 2003; Noel, Angers & Lapointe, 2005;Whiteman & Parker, 2005; Criscione & Blouin, 2007;Gomez-Diaz et al., 2007; Whiteman, Kimball &Parker, 2007; Geist & Kuehn, 2008). Because union-oid mussels are parasitic in their larval stage (viahost-vector), it is logical to study and understand themovement and genetic population structure of theirassumed hosts.
Host–parasite relationships can also be indicativeof potential conservation units (Whiteman & Parker,2005; Criscione & Blouin, 2007; Geist & Kuehn,2008). On the basis of coevolutionary theory and astudy on the interactions of genetic structure of theEuropean Pearl Mussel (Margaritifera margaritiferaL.) and its host brown trout (Salmo trutta L.; Geist& Kuehn, 2008), we expect the genetic populationstructure (using microsatellite genotyping) of P.caprodes to closely match E. triquetra (Zanatta &Murphy, 2008). Logperch populations, the mobilehost (independent) species, are predicted to showreduced geographic structure and higher levels ofgene flow. Despite its widespread use for phylogeo-graphic studies, mitochondrial DNA sequence analy-sis was not used to compare the comparativephylogeographic structure of E. triquetra and P.caprodes because both species show limited mito-chondrial geographic structure or diversity (Turneret al., 1996; Zanatta & Murphy, 2008). If the twospecies show congruent or covarying populationstructure, geographic genetic patterns in P. caprodescan be used to predict and guide the identificationand management of distinct conservation unitswithin E. triquetra (Zanatta & Murphy, 2008). Forexample, if populations of P. caprodes in the StFrancis River (Missouri) were significantly divergentfrom other populations, it would support the taxo-nomic distinctiveness of E. triquetra in the StFrancis River (Zanatta & Murphy, 2008). Becauselogperch are still common in many places snuffboxpopulations have been extirpated, the genetic struc-ture of P. caprodes can be used to assist in inform-ing reintroductions of snuffbox mussels.
MATERIAL AND METHODSSAMPLE LOCALITIES AND TISSUE COLLECTION
Nonlethal tissue samples were collected from bothspecies at six localities in the USA and one in Canada(Fig. 1) comprising the most robust populations of E.triquetra. Tissue collection and genetic methods anddata for E. triquetra are provided in Zanatta &Murphy (2008). To parallel the data for E. triquetra(Zanatta & Murphy, 2008), 310 specimens of P.caprodes were collected from the seven sites: 21 indi-viduals from the Bourbeuse River (BR) at Reiker
Ford, Missouri; 57 individuals from the Clinch River(CR) at Brooks Island near Sneedville, Tennessee; 29individuals from Davis Creek/Huron River (HR) nearAnn Arbor, Michigan; 22 individuals from FrenchCreek (FC), upstream of Cambridge Springs, VenangoCounty, Pennsylvania; 77 individuals from the StCroix River (SC) at Interstate Park, Wisconsin; 20individuals from the St Francis River (SF), nearPatterson, Missouri; and 84 individuals from theSydenham River (SYD) near Florence, Ontario(Fig. 1). Fin tissue was nonlethally excised using asmall (2 mm diameter) caudal fin punch and pre-served in 95% ethanol. Vouchers from each samplinglocality are available from the authors.
DNA EXTRACTION AND GENETIC ANALYSIS
Genomic DNA was extracted from P. caprodes finsamples using a simple lysis extraction method.Approximately 10 mg of fin tissue per fish were indi-vidually lysed in 96-well plates using 250 mL lysisbuffer per well (50 mM Tris, pH 8, 100 mM NaCl,1 mM ethylenediaminetetraacetic acid (EDTA), 1%sodium dodecyl sulphate, and 100 mg proteinase K),and incubated 8–12 h at 37 °C. Genomic DNA anddegraded proteins were precipitated using 500 mL of80% isopropanol per well and centrifuged at 13 000 gfor 45 min. After removing the supernatant, DNApellets were rinsed with 1 mL of 70% ethanol andre-centrifuged, air-dried at room temperature for20 min, and resuspended in 50–200 mL of TE buffer(10 mM Tris pH 8, 1 mM EDTA). Extraction yieldsand quality were assessed using horizontal electro-phoresis in 1% agarose gels alongside a Fermentas™molecular mass ladder.
Microsatellites developed for the Roanoke log-perch, Percina rex (Jordan and Jenkins, 1889)(Dutton et al., 2008) were used because no species-specific microsatellite markers have been developedfor P. caprodes. The 16 loci developed for P. rex weretested on the P. caprodes samples collected fromthe seven localities using polymerase chain reaction(PCR) and thermocycler conditions sensu Duttonet al. (2008). Primers for optimized loci were labeledwith either 5′-HEX or -NED fluorescent labels andamplified using Eppendorf Mastercycler and MJResearch PTC-100 thermocyclers. Double-strandedPCR products were stained with SYBR Green andvisualized in 1% agarose gels alongside a 1KB+ladder to estimate product quality and size. Non-overlapping amplified microsatellite loci were pooledby size class and dye colour and genotyped usingan Applied Biosystems (ABI) 3730 automatedsequencer and ROX-500 size standard (ABI dye setDS-32), and scored using SoftGenetics GEN-EMARKER® software.
CONGRUENT MUSSEL AND HOST POPULATION STRUCTURE 671
© 2011 The Linnean Society of London, Biological Journal of the Linnean Society, 2011, 102, 669–685

STATISTICAL ANALYSIS
Multilocus genotypic data collected for E. triquetra(15 microsatellite loci) and P. caprodes (eight micro-satellite loci) were analyzed as described in Zanatta &Murphy (2008). Some of the genotypic data for E.triquetra from Zanatta & Murphy (2008) had addi-tional statistical analyses conducted to assist in com-parisons with the P. caprodes dataset. The statisticalapproaches for both species are summarizesd below.
Microsatellite data were tested for potential geno-typing errors as a result of stuttering, short alleledominance, and null alleles (Pompanon et al., 2005)using a Monte Carlo simulation of expected allele size
differences using MICROCHECKER (Van Oosterhoutet al., 2004). Allele frequencies were determined todeviate from expectations if they fell outside theBonferroni-corrected 95% confidence interval gener-ated by the simulation. Predicted frequencies of nullalleles were calculated sensu Brookfield (1996).Genetic diversity within each geographic sample wassummarized as allelic richness (A) (measured as themean number of alleles per locus after correcting forsample size) and expected and observed heterozygos-ity (HE, HO). Allelic richness was calculated in FSTAT,version 2.9.3.2 (Goudet, 1995). Data were standard-ized for sample size using a process of rarefaction
Figure 1. The distribution of populations where tissue collections were made for Epioblasma triquetra (historical rangeshaded in light grey) and Percina caprodes (not shown, although much more widely distributed; Scott & Crossman, 1973).Sample site localities: Bourbeuse River (BR), at Reiker Ford near Union, MO (38.3856 °N, 91.0729 °W); Clinch River (CR),at Upper Brooks Island near Sneedville, TN (36.5378 °N, 83.1152 °W); Huron River (HR), near Ann Arbor, MI (42.4678 °N,83.7444 °W); French Creek (FC), upstream of Cambridge Springs, PA (41.9689 °N, 79.8653 °W); St Croix River (SC), atInterstate Park, MN/WI (45.3932 °N, 92.6646 °W); St Francis River (SF), upstream of Wappapello Reservoir, MO(37.2369 °N, 90.4885 °W); Sydenham River (SYD), near Florence, ON (42.6912 °N, 82.9892 °W). Inset shows key map ofNorth America.
672 D. T. ZANATTA and C. C. WILSON
© 2011 The Linnean Society of London, Biological Journal of the Linnean Society, 2011, 102, 669–685

(Petit, El-Mousadik & Pons, 1998). Detection of devia-tions from Hardy–Weinberg equilibrium (HWE) andrandomization tests for linkage disequilibria wereconducted using GENEPOP, version 3.4 (Raymond &Rousset, 1995).
Genetic variance partitioning within and amongpopulations was assessed using analysis of molecularvariance (AMOVA) (Excoffier, Smouse & Quattro,1992) in GENALEX software (Peakall & Smouse,2006). Pairwise divergences among conspecific popu-lations were estimated using FST (Weir & Cockerham,1984) and D (Jost, 2008; Jost, 2009; Crawford, 2010).The corresponding P-values for FST and D were cal-culated to test the null hypothesis of panmictic popu-lations by permuting genotypes among populations tocalculate the probability of obtaining equal or greaterFST or D by chance distribution of genotypes. The Dmeasure is analogous to a standardized FST, althoughit is better suited for interspecific comparisons aspartitioning variance into a and b diversity compo-nents (Jost, 2008, 2009). FST estimates were calcu-lated using FSTAT (Goudet, 1995); values of D werecalculated using the Internet-based software SMOGD(Crawford, 2010; http://www.ngcrawford.com/django/jost/).
Individual-based analysis using STRUCTURE 2.2(Pritchard, Stephens & Donnelly, 2000) assessed rela-tionships among conspecific populations of both E.triquetra and P. caprodes. The number of distinctpopulations (K) represented in the set of samples wasestimated for each species, using model conditions (1)of no admixture among genetic groups as a result ofthe substantial geographic separation between sam-pling sites and (2) uncorrelated allele frequencies(assumed independent loci). Ten replicate trials wererun for values of K (number of genetic groups) fromone to ten. This allowed for a range of hypothesesfrom panmixia to substructure within sampling loca-tions (Pritchard et al., 2000). This procedure calcu-lates Pr(X|K) (the posterior probability of K) that theobserved set of genotypes (X) would occur across adesignated range of hypotheses or possible values of K(Pritchard et al., 2000) and for determining theoptimal solution for the number of genetic groupspresent within each dataset. Model outcomes includethe inferred proportional membership (q) of indi-vidual genotypes to each identified group (Pritchardet al., 2000). Each trial used an initial burn-in of50 000 iterations followed by 50 000 additional itera-tions. To further evaluate the geographic geneticstructure among sampling localities, principal coordi-nate analysis (PCA) (GENALEX; Peakall & Smouse,2006) was used to ordinate genetic distance estimates(Nei, 1972, 1978) calculated for the genotypic data ofboth individuals and sampling localities of E. trique-tra and P. caprodes. The use of multivariate ordina-
tion rather than phonetic clustering of geneticdistances enables greater retention of informationand patterns, and avoids potential phylogenetic mis-interpretations (Lessa, 1990).
Genetic isolation by distance within each specieswas measured by comparing genetic divergence[FST/(1 - FST)] (or D) to geographic distances measuredin river kilometers for pairs of populations. Geo-graphic distances among populations were measuredin ARCVIEW GIS, version 3.2 (EnvironmentalSystems Research Institute, 2001). The distancebetween the Great Lakes drainage and the Ohio Riverdrainage was estimated by measuring modern landdistance between the Maumee and Wabash Rivers.These rivers were connected at the end of the lastPleistocene glaciation (Calkin & Feenstra, 1985) andwere the hypothesized vector for the post-glacial rein-vasion of the Lake Erie drainage for freshwatermussel species originating from the Mississippi basin(Graf, 2002). The statistical significance of the corre-lation between geographic and genetic distance matri-ces within each species were tested using a Manteltest (Mantel, 1967) in GENEPOP, version 3.4(Raymond & Rousset, 1995).
Correlations between the geographic and geneticpopulation structures of E. triquetra and P. caprodeswere assessed via Mantel tests (Mantel, 1967) inGENEPOP, version 3.4 (Raymond & Rousset, 1995).The statistical significance of correlations betweenpairwise matrices of genetic divergence (D) for E.triquetra and P. caprodes were tested using 10 000permutation Markov chains in GENEPOP. The pre-diction that genetic structuring would be more pro-nounced in the parasitic (E. triquetra) versus hostspecies (P. caprodes) was tested using a Wilcoxonpaired-sample test (Zar, 1996). Population-levelgenetic diversity (allelic diversity and heterozygos-ity) for E. triquetra and P. caprodes were alsoregressed.
RESULTSE. TRIQUETRA
Genetic and statistical analyses for geographicallyrepresentative healthy populations of E. triquetrawere previously reported by Zanatta & Murphy(2008). Summary statistics for the E. triquetramicrosatellite dataset remain identical to thosereported by Zanatta & Murphy (2008) and are notrepeated here.
Significant structuring was evident among popula-tions of E. triquetra. Of the total variation, 18.3% wasthe result of differences among populations (AMOVA:FST = 0.284). All pairs of populations exhibited signifi-cant FST differences after correcting for multiple
CONGRUENT MUSSEL AND HOST POPULATION STRUCTURE 673
© 2011 The Linnean Society of London, Biological Journal of the Linnean Society, 2011, 102, 669–685

comparisons (Table 1). Pairwise values of D (Jost,2008, 2009) similarly showed substantial pairwisedivergence among populations, with values typicallytwo- to four-fold higher than FST estimates (Table 1).These differences were most pronounced for popula-tion pairs with relatively low FST estimates (e.g.CR–SYD pair).
As previously reported by Zanatta & Murphy(2008), the branching pattern formed in theNeighbour-joining network of Nei’s DA genetic dis-tances (Fig. 2A) closely resembled the branchingpattern of the rivers of origin among the sampledpopulations (Fig. 1).
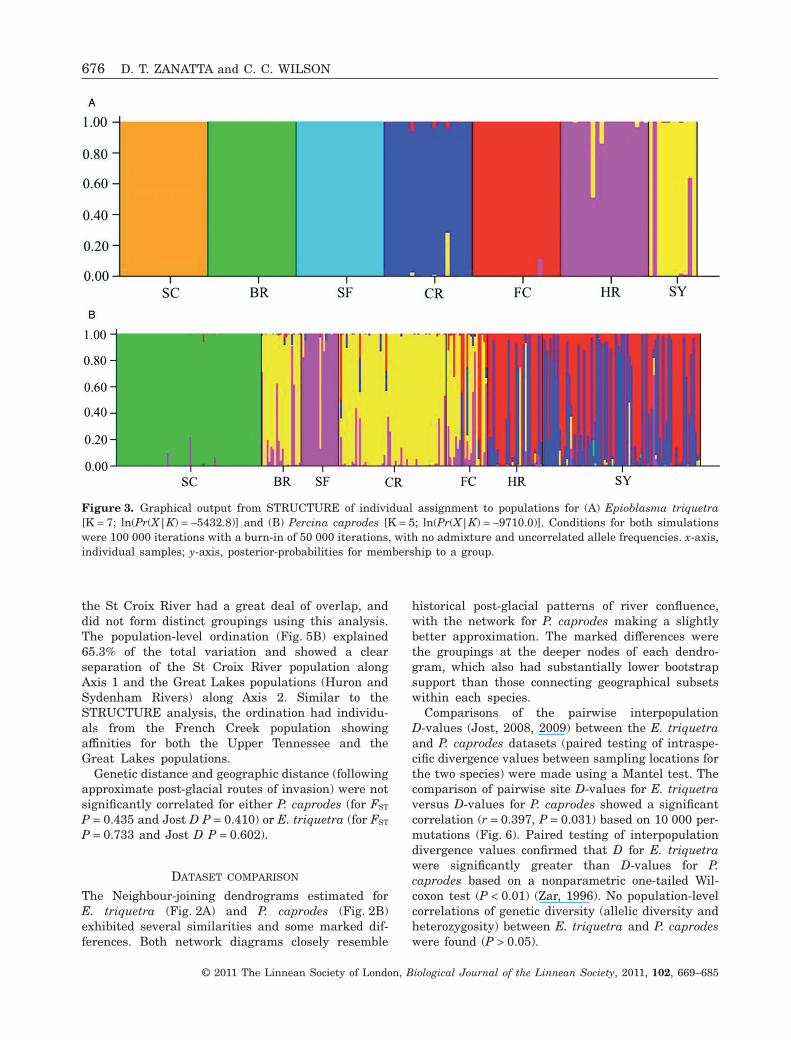
The optimal solution for number of populationspredicted in the simulation implemented inSTRUCTURE was K = 7, with a probability ofLn[Pr(X|K)] = -5432.8. The seven predicted popula-tions exactly matched the seven sampling localities(Fig. 3A), with strong concordance between individualassignments (group membership) and their samplinglocations.
Nei’s genetic distances (Nei, 1972, 1978) amongindividuals and populations for the 15 microsatelliteloci were ordinated using PCA. Axis 1 and 2accounted for 52.4% (34.5% and 17.9%, respectively)of the total variation (Fig. 4A). Axis 1 of the PCAseparated individuals from the St Francis River fromthe other six populations and Axis 2 secondarilygrouped individuals from the St Croix River apartfrom the other populations (Fig. 4A). A population-level ordination for E. triquetra revealed similarresults, with the first two axes accounting for 65.8%
of the total variation, with the St Francis and StCroix River populations again showing as distinct forAxis 1 and Axis 2, respectively (Fig. 4B).
P. CAPRODES
Eight of 16 published loci for P. rex (Dutton et al., 2008)amplified consistently for P. caprodes across all locali-ties. All eight loci were polymorphic, with a total of 174alleles observed (6–35 alleles/locus, mean = 22).Genetic diversity, as measured by allelic richness (A),varied somewhat by population (6.9–10.9 alleles/locus), with the lowest allelic richness occurring in theSt Francis River and the highest in the SydenhamRiver (Table 2). Expected heterozygosities were in therange 0.67–0.76 and varied somewhat betweenpopulations (Table 2). Analysis of the microsatellitedataset with MICROCHECKER showed no evidencefor genotyping errors as a result of stuttering orlarge-allele dropout, suggesting the potential for non-amplifying (null) alleles in the dataset. All of the lociexhibited significant deviation from HWE expecta-tions, although only two loci showed any signs of nullalleles (Table 2). Only one locus (Prex44) consistentlyshowed substantial heterozygosity deficits across allsampled populations, with significant deficits at five ofthe seven locales (Table 2). For the remaining loci,deviation from HWE largely occurred within indi-vidual sites, suggesting local substructure rather thansystemic null alleles. Randomization tests for linkagedisequilibrium by locus and population did not indicateany significant linkage disequilibria for any of the 196di-locus combinations in P. caprodes.
Table 1. Pairwise FST (Weir & Cockerham, 1984; above diagonal) and D (Jost, 2008) for seven populations of Epioblasmatriquetra and Percina caprodes from the same geographic locations
BR CR HR FC SC SF SYD
Epioblasma triquetraBR – 0.146 0.163 0.164 0.193 0.336 0.172CR 0.420 – 0.125 0.084 0.170 0.189 0.078HR 0.400 0.445 – 0.109 0.150 0.289 0.066FC 0.407 0.326 0.359 – 0.191 0.226 0.071SC 0.331 0.490 0.359 0.538 – 0.322 0.138SF 0.661 0.505 0.649 0.589 0.675 – 0.290SYD 0.373 0.299 0.190 0.253 0.408 0.690 –
Percina caprodesBR – 0.054 0.079 0.049 0.125 0.073 0.090CR 0.271 – 0.065 0.033 0.145 0.080 0.085HR 0.366 0.364 – 0.038 0.116 0.084 0.025FC 0.257 0.218 0.232 – 0.127 0.056 0.045SC 0.366 0.522 0.437 0.452 – 0.124 0.123SF 0.400 0.378 0.400 0.295 0.465 – 0.101SYD 0.339 0.365 0.065 0.198 0.435 0.425 –
Sample sites and abbreviations are shown in Fig. 1.
674 D. T. ZANATTA and C. C. WILSON
© 2011 The Linnean Society of London, Biological Journal of the Linnean Society, 2011, 102, 669–685

Significant population structuring was evident forP. caprodes. This significant structure was founddespite the limited sampling of P. caprodes associatedwith the need to match populations with sampling ofE. triquetra (see above). Of the total variation, 9.5%was the result of differences among populations(FST = 0.153). Similar to the results obtained for E.triquetra, all pairwise FST and D divergence estimatesamong P. caprodes populations were significantafter correcting for multiple comparisons (Table 1).D-values were comparable to FST, although generallyhigher (Table 1).
As with the dendrogram of genetic distances for E.triquetra (Fig. 2A), the branching pattern formed inthe NJ network of Nei’s DA genetic distances for P.caprodes (Fig. 2B) also closely resembles the branch-ing pattern of the rivers of origin among the samplepopulations (Fig. 1).
The most probable number of genetic groups withinthe P. caprodes sample set predicted using STRUC-TURE was K = 5 with a ln[Pr(X|K)] = -9710.0. Thefive predicted populations showed varying degrees ofcongruence with the seven sampling localities(Fig. 3B). Individuals from the St Croix and StFrancis rivers were predicted to have high member-
ship coefficients to their sampling locations as a resultof their geographical isolation (Fig. 1). All individualsfrom the St Croix River and all but one from the StFrancis River were assigned to their sampling loca-tions; the mis-assigned individual from the St FrancisRiver was more similar to the Ohio/Tennessee/Northern Ozark populations (Fig. 3B). Individualsfrom the Great Lakes (Sydenham River and HuronRiver) showed evidence of two mixed or indetermi-nate populations and showed varying membershipprobabilities to either or both. Individuals from theClinch River and Bourbeuse River overlapped in theirpredicted population of origin. Finally, individualsfrom French Creek were assigned to the GreatLakes, the Bourbeuse/Clinch River and the St Francispopulations.
PCA ordination of Nei’s genetic distances (Nei,1972, 1978) among P. caprodes individuals andpopulations each resulted in two significant axes(Fig. 5). For the individual-based ordination, Axis 1and Axis 2 accounted for 51.9% (27.8% and 24.0%,respectively) of the total variation. Axis 1 of thePCA separated individual P. caprodes from the StCroix River apart from the other populations(Fig. 5A). Individuals from populations other than
Figure 2. Unrooted Neighbour-joining network based on Nei’s DA (Nei, Tajima & Tateno, 1983) genetic distance for (A)seven populations of Epioblasma triquetra (Zanatta & Murphy, 2008) and (B) seven populations Percina caprodes.Numbers indicate nodes with bootstrap support of more than 50% for 1000 replications. Location abbreviations aredefined in Fig. 1.
CONGRUENT MUSSEL AND HOST POPULATION STRUCTURE 675
© 2011 The Linnean Society of London, Biological Journal of the Linnean Society, 2011, 102, 669–685
the St Croix River had a great deal of overlap, anddid not form distinct groupings using this analysis.The population-level ordination (Fig. 5B) explained65.3% of the total variation and showed a clearseparation of the St Croix River population alongAxis 1 and the Great Lakes populations (Huron andSydenham Rivers) along Axis 2. Similar to theSTRUCTURE analysis, the ordination had individu-als from the French Creek population showingaffinities for both the Upper Tennessee and theGreat Lakes populations.
Genetic distance and geographic distance (followingapproximate post-glacial routes of invasion) were notsignificantly correlated for either P. caprodes (for FST
P = 0.435 and Jost D P = 0.410) or E. triquetra (for FST
P = 0.733 and Jost D P = 0.602).
DATASET COMPARISON
The Neighbour-joining dendrograms estimated forE. triquetra (Fig. 2A) and P. caprodes (Fig. 2B)exhibited several similarities and some marked dif-ferences. Both network diagrams closely resemble
historical post-glacial patterns of river confluence,with the network for P. caprodes making a slightlybetter approximation. The marked differences werethe groupings at the deeper nodes of each dendro-gram, which also had substantially lower bootstrapsupport than those connecting geographical subsetswithin each species.
Comparisons of the pairwise interpopulationD-values (Jost, 2008, 2009) between the E. triquetraand P. caprodes datasets (paired testing of intraspe-cific divergence values between sampling locations forthe two species) were made using a Mantel test. Thecomparison of pairwise site D-values for E. triquetraversus D-values for P. caprodes showed a significantcorrelation (r = 0.397, P = 0.031) based on 10 000 per-mutations (Fig. 6). Paired testing of interpopulationdivergence values confirmed that D for E. triquetrawere significantly greater than D-values for P.caprodes based on a nonparametric one-tailed Wil-coxon test (P < 0.01) (Zar, 1996). No population-levelcorrelations of genetic diversity (allelic diversity andheterozygosity) between E. triquetra and P. caprodeswere found (P > 0.05).
Figure 3. Graphical output from STRUCTURE of individual assignment to populations for (A) Epioblasma triquetra[K = 7; ln(Pr(X|K) = -5432.8)] and (B) Percina caprodes [K = 5; ln(Pr(X|K) = -9710.0)]. Conditions for both simulationswere 100 000 iterations with a burn-in of 50 000 iterations, with no admixture and uncorrelated allele frequencies. x-axis,individual samples; y-axis, posterior-probabilities for membership to a group.
676 D. T. ZANATTA and C. C. WILSON
© 2011 The Linnean Society of London, Biological Journal of the Linnean Society, 2011, 102, 669–685

Figure 4. Results of a principal coordinate analysis based on multilocus genotypes of individuals of Epioblasma triquetrafrom seven populations (Zanatta & Murphy, 2008), showing ordination results for (A) individuals and (B) populations.
CONGRUENT MUSSEL AND HOST POPULATION STRUCTURE 677
© 2011 The Linnean Society of London, Biological Journal of the Linnean Society, 2011, 102, 669–685

DISCUSSION
The results obtained in the present study conform toexpectations for closely coevolved species (Thompson,1994). Both the mussel and its host show stronggeographic structuring, with marginally concordantgeographic patterns of genetic structure and diversity.The results have important conservation implicationsbecause they uncover additional population structur-ing for an imperiled species (E. triquetra), which was
previously revealed when analyzing the mussel alone(Zanatta & Murphy, 2008).
This is the first genetic study to investigatecoevolution in an obligate parasitic unionoid musseland its host fish in North America. A recent study(Geist & Kuehn, 2008) on European Pearl Mussel(M. margaritifera) and its host, brown trout (S. trutta),in Central Europe also found broad congruence ingenetic differentiation among populations with higherdifferentiation in the parasitic mussel. By contrast
Table 2. Locus name with number of alleles (private alleles in parentheses), observed (HO) and expected (HE) heterozy-gosities, and estimated frequency of a null allele (for each locus across all populations), for Percina caprodes by locus andpopulation. Italicized numbers in parentheses indicate the number of private alleles
Locus BR CR HR FC SC SF SYD
Prex31Estimated null alleleFrequency = 0.015
Number of alleles 3 (0) 7 (2) 4 (0) 3 (0) 3 (0) 4 (0) 3 (0)HO 0.67 0.65 0.19* 0.32* 0.46 0.55 0.10HE 0.62 0.61 0.43 0.56 0.48 0.70 0.12N 21 54 21 22 70 20 83
Prex33Estimated null alleleFrequency = 0.000
Number of alleles 6 (1) 5 (0) 5 (0) 5 (0) 7 (2) 5 (0) 7 (0)HO 0.48 0.23* 0.36* 0.55 0.29 0.55* 0.75HE 0.48 0.63 0.77 0.68 0.28 0.66 0.79N 21 52 28 22 77 20 84
Prex35Estimated null alleleFrequency = 0.000
Number of alleles 3 (0) 5 (0) 4 (0) 4 (0) 4 (0) 3 (0) 5 (0)HO 0.29 0.14* 0.34 0.23 0.06 0.05* 0.39HE 0.38 0.31 0.31 0.29 0.06 0.14 0.40N 21 50 29 22 77 20 84
Prex36Estimated null alleleFrequency = 0.087
Number of alleles 7 (0) 9 (0) 10 (0) 7 (0) 15 (1) 7 (0) 12 (1)HO 0.62 0.80 0.93 0.68 0.70* 0.45* 0.79HE 0.79 0.81 0.82 0.80 0.87 0.75 0.81N 21 45 28 22 77 20 84
Prex41Estimated null alleleFrequency = 0.000
Number of alleles 16 (0) 23 (1) 19 (0) 18 (1) 17 (0) 10 (0) 27 (4)HO 0.90 0.93 0.93 0.95 0.94 1.00 0.94HE 0.94 0.94 0.94 0.92 0.92 0.84 0.95N 21 54 27 22 77 20 84
Prex42Estimated null alleleFreq = 0.004
Number of alleles 15 (1) 16 (1) 13 (0) 14 (0) 23 (12) 8 (0) 22 (0)HO 1.00 0.91 0.86 0.77 0.92 0.70 0.71*HE 0.92 0.92 0.87 0.92 0.94 0.82 0.93N 21 56 28 22 77 20 84
Prex44Estimated null alleleFrequency = 0.041
Number of alleles 14 (0) 17 (1) 13 (0) 15 (1) 22 (1) 8 (0) 273 (2)HO 0.53* 0.49* 0.44* 0.43* 0.82 0.70 0.59*HE 0.91 0.82 0.87 0.93 0.91 0.81 0.94N 19 51 27 21 74 20 83
Prex46Estimated null alleleFrequency = 0.038
Number of alleles 14 (1) 18 (0) 15 (1) 18 (1) 26 (8) 11 (0) 223 (1)HO 0.57* 0.82 0.86 1 0.84* 0.75 0.89HE 0.90 0.88 0.93 0.95 0.92 0.85 0.94N 21 57 28 21 76 20 84
Mean HE 0.74 0.74 0.74 0.76 0.67 0.70 0.73
Allelic richness 9.52 9.32 9.40 10.18 10.10 6.90 10.90
Sample sites and abbreviations are shown in Fig. 1.*Indicates locus–population combinations with Ho significantly different from HE after sequential Bonferroni correction(Rice, 1989), experiment-wide a = 0.05.
678 D. T. ZANATTA and C. C. WILSON
© 2011 The Linnean Society of London, Biological Journal of the Linnean Society, 2011, 102, 669–685

Figure 5. Results of a principal coordinates analysis based on multilocus genotypes of individuals of Percina caprodesfrom seven populations, showing ordination results for (A) individuals and (B) populations.
CONGRUENT MUSSEL AND HOST POPULATION STRUCTURE 679
© 2011 The Linnean Society of London, Biological Journal of the Linnean Society, 2011, 102, 669–685

to the M. margaritifera–S. trutta study (Geist &Kuehn, 2008), significant population-level correlationsbetween genetic diversity metrics (allelic richness andobserved heterozygosities) were not found in thepresent study. Although both obligate parasiticsystems are between a freshwater mussel and a hostfish, they are vastly different in ecology and behaviour.Margaritifera margaritifera can reach densities in thetens to hundreds per square meter in highly olig-otrophic systems and are often the only unionoidpresent, whereas E. triquetra are found at low densi-ties (usually less than 0.1/m2), in highly productive,and highly diverse systems with > 20 unionoid speciesin the community (Butler, 2007; Metcalfe-Smith et al.,2007). The host infection strategies of the two musselsalso are extremely different; M. margaritifera broad-casts its glochidia, whereas E. triquetra uses host-capture (Barnhart et al., 2008). The hosts also differ intheir ecology and behaviour: P. caprodes is a warm-water benthic omnivore and S. trutta is a cold-waterpredator (Scott & Crossman, 1973). Geist & Kuehn(2008) found an interesting relationship betweenpopulation-level genetic diversity for M. margaritiferaand densities of S. trutta. Unfortunately, these data forE. triquetra and P. caprodes are not available, althoughthey may be interesting to investigate in futurestudies. It appears S. trutta may be the only host forM. margaritifera in the Central European streamssampled by Geist & Kuehn (2008). Salmo trutta isprobably solely responsible for the genetic structure ofthe mussel in the region studied by Geist & Kuehn(2008) [Atlantic salmon (Salmo salar L.), is known toact as a host in Atlantic coastal drainages; Machordomet al., 2003; Bouza et al., 2007; OSU Division of Mol-
luscs, 2009. By contrast, E. triquetra is likely to haveadditional hosts (discussed further below); thus,their genetic structure may not be completely depen-dant on P. caprodes. Contrasting the study onM. margaritifera–S. trutta by Geist & Kuehn (2008)and the present study on the E. triquetra–P. caprodesrelationship reveals the need for additional researchon these unique relationships.
GENETIC STRUCTURE IN P. CAPRODES
The analysis of the microsatellite DNA dataset pro-duced some interesting population structure resultsfor P. caprodes. Significant structure was founddespite the limited sampling of P. caprodes. The StCroix River population was clearly distinct from allother logperch populations and may represent anas-yet undescribed taxon (Near, 2008). Recent phylo-genetic analysis using sequence data from two mito-chondrial genes (cytochrome b and NADH subunit 2)and nuclear DNA (S7 ribosomal protein intron 1)found that Upper Mississippi P. cf. caprodes, includ-ing samples from St Croix River, were a distinctspecies from P. caprodes s.s. Thus, P. caprodes s.s. isin need of description (Near, 2008). In support of thishypothesis, the results from the individual- andpopulation-based analyses provide evidence of adivergent genetic lineage concordant with the phylog-eny of Near (2008).
Other populations of P. caprodes showed substan-tial geographic structure with all analyticalapproaches. As noted above, the St Croix River P. cf.caprodes population was most distinct in all of theanalyses. The St Francis River population showed the
Figure 6. Covariation of pairwise intraspecific population divergence values (D-values; Jost, 2008) for Epioblasmatriquetra and Percina caprodes based on 15 and eight microsatellite loci, respectively. Correlation and P-values werecalculated using a Mantel test (10 000 permutations).
680 D. T. ZANATTA and C. C. WILSON
© 2011 The Linnean Society of London, Biological Journal of the Linnean Society, 2011, 102, 669–685

next greatest degree of divergence in terms of geneticdistance, and showed substantial differentiationfrom all other study populations. These findings arecongruent with other studies reporting thatdistinct, drainage-specific genetic patterns for fishand unionoid species in the geologically ancientsouthern Ozarks (Turner et al., 1996; Turner &Trexler, 1998; Serb, 2006; Serb & Barnhart, 2008). Inparticular, the results of the present study are con-sistent with those observed for other species of darter(Percidae: Etheostomatinae). For example, the green-side darter (Etheostoma blennoides) complex (Piller,Bart & Hurley, 2008); rainbow darter, Etheo-stoma caeruleum (Ray, Wood & Simons, 2006); andcrystal darter, Crystallaria asprella (Morrison et al.,2006) showed similar population structuring in theUpper Mississippi and Ozark Mountains.
The remaining P. caprodes populations showedvarying amounts of distinctiveness. The BourbeuseRiver (Meramec River drainage) and Clinch River(Tennessee River drainage) populations appear toform a single population in the STRUCTURE analy-sis (Fig. 3B). This pattern is indicative that thesepopulations, connected by the Tennessee River, OhioRiver, and Mississippi River (several hundredriver kilometers) have maintained a relatively highlevel of gene flow for millennia. The Huron Riverand Sydenham River (Great Lakes) populationsshow similar patterns in the STRUCTURE analysis,although individuals are predicted to belong to twodistinct populations. This result is harder to explainbut could be the signature of two glacial refuges forP. caprodes in the Great Lakes: one via the MaumeeRiver–Wabash River spillway and the other via theIllinois River–Chicago River spillway (Bailey &Smith, 1981). Conversely, the observed pattern couldreflect the more recent post-glacial separation andlower founding diversity of these populations (Ber-natchez & Wilson, 1998). Individuals from FrenchCreek (Upper Ohio River drainage) show affinities tothe Bourbeuse/Clinch and the Huron/Sydenhampopulations. This result is indicative of recent geneflow between the Bourbeuse/Clinch and the GreatLakes populations.
COMPARISON OF P. CAPRODES AND E. TRIQUETRA
GENETIC STRUCTURES
The covarying genetic patterning between P. caprodesand E. triquetra suggests shared history and potentialcoevolutionary relationship between the two species.The use of more variable and faster-evolving geneticmicrosatellite DNA markers was essential for eluci-dating patterns of geographic structure to test forcovariation as both species show limited phylogeo-graphic structure based on mitochondrial DNA
(Turner et al., 1996; Zanatta & Murphy, 2008).Although the two species exhibited similar geographi-cal patterns, their population structures were weaklycorrelated and not perfectly congruent. Although thegeographic genetic structure of the two species mightshow chance similarity as a result of a shared hydro-graphic history within major drainages (regional phy-logeography; Avise, 1992), the biological relationshipbetween the two species (Barnhart et al., 1998)strongly suggests that P. caprodes is an important, ifnot exclusive, dispersal host for E. triquetra. Theimperfect congruency of host and parasite supportsthe geographic mosaic concept of coevolution (Thomp-son, 1994), indicating that coevolutionary dynamicsoccur at a geographic scale greater than local popu-lations but below the species level. Thus, although P.caprodes may be the primary host for E. triquetraacross most of their sympatric range, historical eventsrelated to Pleistocene disturbances may have resultedin alternate adaptive trajectories in the western por-tions of both species’ distribution.
Although P. caprodes is a known host for E. trique-tra (Hillegass & Hove, 1997; Barnhart et al., 1998,2008; Butler, 2007), differences in the basic biologyand ecological tolerances of E. triquetra and P.caprodes may be responsible for the imperfect fit oftheir respective genetic population structures. Com-parative studies of geographic genetic structure andgene flow show that P. caprodes has limited phylogeo-graphic structure and high levels of gene flow com-pared to other darters (Turner et al., 1996; Turner &Trexler, 1998). By contrast, E. triquetra has extremelyrestricted mobility for most of its life cycle, and dis-persal via glochidial transport by host fish is depen-dent on successful infection of a suitable host(Barnhart et al., 1998). As such, dispersal of E. tri-quetra is limited to successfully encountering andinfecting a fish host within a finite seasonal window,whereas P. caprodes is not limited to life stage orseason for movement and dispersal. In addition, E.triquetra, similar to other members of its genus, islargely restricted to riffles and other highly oxygen-ated, high-flow areas of streams and rivers (Parmalee& Bogan, 1998; Williams, Bogan & Garner, 2008),whereas P. caprodes is a habitat generalist (Scott &Crossman, 1973). Extant populations of E. triquetraare often separate by large areas of unsuitable habi-tats, whereas P. caprodes may be able to disperse andsurvive through these habitats unsuitable for E. tri-quetra. Percina caprodes infected with glochidia willnot disperse entirely across large areas of unsuitablehabitat and newly metamorphosed juvenile E. trique-tra will not survive. These pronounced ecological dif-ferences may account for much of the observed higherFST and D-values and greater geographic subdivisionfor E. triquetra, and highlight the importance of P.
CONGRUENT MUSSEL AND HOST POPULATION STRUCTURE 681
© 2011 The Linnean Society of London, Biological Journal of the Linnean Society, 2011, 102, 669–685

caprodes as a dispersal vector and coevolutionary host(Turner et al., 1996; Turner & Trexler, 1998).
Another factor leading to incomplete congruency ofthe genetic population structures may be the use ofhost(s) by E. triquetra. For example, Percina macu-lata (blackside darter [Girard, 1859]) and severalsculpins (Cottus spp.) are confirmed as a hosts(Hillegass & Hove, 1997; Barnhart et al., 1998; OSUDivision of Molluscs, 2009). Cottids are not a probablenatural host for E. triquetra and other rifflehsells(genus Epioblasma) because they are not found insame habitats (Rogers, Watson & Neves, 2001; Joneset al., 2006). Other darters are similarly not hostsbecause Barnhart et al. (2008) reported that theheads of darters from the genus Etheostoma werecrushed upon capture by E. triquetra, whereas most P.caprodes survived. However, testing the survival ofP. maculata or other congeners after E. triquetraparasitism (capture) was not mentioned (Barnhartet al., 2008). Geographic analysis of the genetic popu-lation structure for P. maculata (in addition to that ofP. caprodes reported in the present study) may beinformative for further resolving historical dispersaland gene flow of E. triquetra.
IMPLICATIONS FOR EVOLUTION AND CONSERVATION
The combined datasets for E. triquetra and P. caprodesprovide evidence for their coevolutionary history. Thebroadly congruent phylogeographic patterns of P.caprodes and E. triquetra suggest additional conser-vation units in the latter that were not consideredfully by Zanatta & Murphy (2008). As the sole memberof its genus not yet threatened with imminent extinc-tion, E. triquetra is on the verge of Federal listing inthe USA (Butler, 2007) and is already listed underCanada’s Species at Risk Act (Environment Canada,2007). Ecologically and evolutionarily sound decisionsneed to be made not only to manage, but also torestore populations across the range of E. triquetra.The conservation units identified by Zanatta &Murphy (2008) are consistent with the results of thepresent study; however, the distinct taxonomic unit ofP. cf. caprodes in the St Croix River (Upper Mississippidrainage) suggests that the St Croix E. triquetradeserve similar consideration to St Francis River E.triquetra (southern Ozarks) as a potentially distincttaxonomic unit (Zanatta & Murphy, 2008). Otherpopulations of E. triquetra should be managed sepa-rately, although it appears that P. caprodes hosts couldbe used for propagation from other drainages withinthe Great Lakes and Ohio/Tennessee/Middle Missis-sippi drainages. The results of this molecular studyshould be further tested using a reciprocal hosttesting experiment (Zale & Neves, 1982) to determinewhether hosts from genetically distinct drainages act
as similarly effective hosts across drainages (Joneset al., 2006). The present study reinforces the findingof Geist & Kuehn (2008) proposing that an under-standing of the genetic structure of both mussel andhost is critical in conservation planning and thatsingle species analyses are not sufficient when consid-ering co-adapted species.
CONCLUSIONS
The study of host–parasite relationships can be apowerful tool in evolutionary studies and the conser-vation of biodiversity (Thompson, 1994). The geneticpopulation structure relationships between host andparasite have been investigated in other systems(Dybdahl & Lively, 1996; Nuismer et al., 2003; Noelet al., 2005; Whiteman & Parker, 2005; Criscione &Blouin, 2007; Gomez-Diaz et al., 2007; Whitemanet al., 2007). By contrast to the studies listed above,which used parasites to delineate genetic populationstructure in their host species, we have assessed thegeographic genetic structure of the host fish (P.caprodes) to help resolve its shared history with E.triquetra. This is the first genetic study of its kind inNorth America involving a unionoid mussel and itshost, and has reinforced the findings that diversity isnot recognized when investigating the genetic diver-sity and structure of the mussel alone (Geist &Kuehn, 2008). Studying the relationships in geneticpopulation structure of other mussel–host relation-ships will be extremely valuable for enhancing ourunderstanding of the coevolutionary history anddynamics between these parallel species flocks, aswell as aiding unionoid conservation in better deter-mining which are the best natural hosts (Geist &Kuehn, 2008). Comparative phylogeographic andgenetic studies should be complemented by behav-ioural and ecological studies to assess the extent ofhost specificity within and among unionoid mussels,as well as to experimentally evaluate coevolutionaryrelationships between mussel species and host fish(Jones et al., 2006).
The present study demonstrates and reinforces thatunionoids and their host fish make a unique modelsystem for the study of host–parasite coevolution andcomparative phylogeography, and that further inves-tigation is warranted. Understanding the geneticpopulation structure of unionoids and their host fishspecies will shed light on their coevolutionary history.This will also assist in the management and restora-tion of populations of unionoids where the originalpopulation has been lost but the host remains andalso will assist managers in the determination ofwhich source populations to use to augment or rein-troduce extirpated populations. As such, understand-ing the coevolutionary history of mussels and their
682 D. T. ZANATTA and C. C. WILSON
© 2011 The Linnean Society of London, Biological Journal of the Linnean Society, 2011, 102, 669–685

hosts should prove to be a valuable tool for helping toensure their evolutionary legacy.
ACKNOWLEDGEMENTS
This work was supported by the Ontario Ministry ofNatural Resources (OMNR), a Natural Sciences andEngineering Research Council of Canada (NSERC)postdoctoral fellowship to D.T.Z., and a FacultyResearch and Creative Endeavors (FRCE) grant fromCentral Michigan University’s Office of Research andSponsored Programs. For assistance with field collec-tions and molecular laboratory work, we thank Dr D.Woolnough, B. Boetcher, C. Finch, A. Harris, T.Neuman, J. Sherman, and J. Morey (Central Michi-gan University); T. Smith (Western PennsylvaniaConservancy); S. McMurray (Missouri Department ofConservation); M. Hove (University of Minnesota), B.Sietman and M. Davis (Minnesota Department ofNatural Resources); and Dr A. George and Dr D.Neely (Tennessee Aquarium). K. Wozney (OMNRAquatic Biodiversity and Conservation Unit) providedvaluable laboratory assistance. Tissue collectionswere made under scientific collection permits issuedto the collectors by the responsible state and provin-cial agencies.
REFERENCES
Avise JC. 1992. Molecular population structure and the bio-geographic history of a regional fauna: a case history withlessons for conservation biology. Oikos 63: 62–76.
Bailey RM, Smith GR. 1981. Origin and geography of thefish fauna of the Laurentian Great Lakes Basin. CanadianJournal of Fisheries and Aquatic Sciences 38: 1539–1561.
Banarescu P. 1991. Zoogeography of fresh waters, volume 2:distribution and dispersal of freshwater animals in NorthAmerica and Eurasia. Wiesbaden: AULA-Verlag.
Barnhart C, Riusech F, Baird M. 1998. Hosts of the sala-mander mussel (Simpsonaias ambigua) and snuffbox (Epio-blasma triquetra) from the Meramec River system,Missouri. Triannual Unionid Report 16: 34.
Barnhart MC, Haag WR, Roston WN. 2008. Adaptations tohost infection and larval parasitism in Unionoida. Journalof the North American Benthological Society 27: 370–394.
Benke AC, Cushing CE, eds. 2005. Rivers of North America.San Diego, CA: Academic Press.
Bernatchez L, Wilson CC. 1998. Comparative phylogeogra-phy of Nearctic and Palearctic fishes. Molecular Ecology 7:431–452.
Bogan AE. 1993. Freshwater bivalve extinctions (Mollusca:Unionoida): a search for causes. American Zoologist 33:599–609.
Bogan AE, Roe KJ. 2008. Freshwater bivalve (Unioni-formes) diversity, systematics, and evolution: status andfuture directions. Journal of the North American Bentho-logical Society 27: 349–369.
Bouza C, Castro J, Martinez P, Amaro R, Fernandez C,Ondina P, Outeiro A, San Miguel E. 2007. Threatenedfreshwater pearl mussel Margaritifera margaritifera L. inNW Spain: low and very structured genetic variation insouthern peripheral populations assessed using microsatel-lite markers. Conservation Genetics 8: 937–948.
Brookfield JFY. 1996. A simple new method for estimatingnull allele frequency from heterozygote deficiency. Molecu-lar Ecology 5: 453–455.
Butler RS. 2007. Status assessment report for the snuffbox,Epioblasma triquetra, a freshwater mussel occurring in theMississippi and Great Lakes Basins. Prepared for the OhioRiver Valley Ecosystem Team, Mollusk Subgroup. Asheville,NC: US Fish and Wildlife Service.
Calkin PE, Feenstra BH. 1985. Evolution of the erie-basingreat lakes. In: Karrow PF, Calkin PE, eds. Quarternaryevolution of the great lakes. Ottawa: Geological Associationof Canada Special Paper 30. 149–170.
Crawford N. 2010. SMOGD: software for the measurementof genetic diversity. Molecular Ecology Resources 10: 556–557.
Criscione CD, Blouin MS. 2007. Parasite phylogeographicalcongruence with salmon host evolutionarily significantunits: implications for salmon conservation. MolecularEcology 16: 993–1005.
Dutton DJ, Roberts JH, Angermeier PL, Hallerman EM.2008. Microsatellite markers for the endangered Roanokelogperch, Percina rex (Percidae) and their potential utilityfor other darter species. Molecular Ecology Resources 8:831–834.
Dybdahl MF, Lively CM. 1996. The geography of coevolu-tion: comparative population structures for a snail and itstrematode parasite. Evolution 50: 2264–2275.
Environment Canada. 2007. Species at Risk Act – PublicRegistry. List of Wildlife Species at Risk. Available at:http://www.sararegistry.gc.ca/species/schedules_e.cfm?id=1[Accessed 10 May 2007].
Environmental Systems Research Institute. 2001.Arcview 3.2a. Redlands, CA: ESRI, Inc.
Excoffier L, Smouse PE, Quattro JM. 1992. Analysis ofmolecular variance inferred from metric distances amongDNA haplotypes: application to human mitochondrial DNArestriction data. Genetics 131: 479–491.
Geist J, Kuehn R. 2008. Host-parasite interactions inoligotrophic stream ecosystems: the roles of life-historystrategy and ecological niche. Molecular Ecology 17: 997–1008.
Gomez-Diaz E, Gonzalez-Solis J, Peinado MA, PageRDM. 2007. Lack of host-dependent genetic structure inectoparasites of Calonectris shearwaters. Molecular Ecology16: 5204–5215.
Goudet J. 1995. FSTAT (Version 1.2): a computer program tocalculate F-statistics. Journal of Heredity 86: 485–486.
Graf DL. 1997. Sympatric speciation of freshwater mussels(Bivalvia: Unionoidea): a model. American MalacologicalBulletin 14: 35–40.
Graf DL. 2002. Historical biogeography and late glacialorigin of the freshwater pearly mussel (Bivalvia: Unionidae)
CONGRUENT MUSSEL AND HOST POPULATION STRUCTURE 683
© 2011 The Linnean Society of London, Biological Journal of the Linnean Society, 2011, 102, 669–685

faunas of Lake Erie, North America. Occasional Papers onMollusks, The Department of Mollusks, Museum of Com-parative Zoology, Harvard University, Cambridge, MA 6:175–211.
Graf DL, Cummings KS. 2007. Review of the systematicsand global diversity of freshwater mussel species (Bivalvia:Unionoida). Journal of Molluscan Studies 73: 291–314.
Hillegass KR, Hove MC. 1997. Suitable fish hosts forglochidia of three freshwater mussels: strange floater,ellipse, and snuffbox. Triannual Unionid Report 13: 25.
Johnson RI. 1978. Systematics and zoogeography of Plagiola(= Dysnomia = Epioblasma), an almost extinct genus offreshwater mussels (Bivalvia: Unionidae) from MiddleNorth America. Bulletin of the Museum of ComparativeZoology 148: 239–321.
Jones JW, Neves RJ, Ahlstedt SA, Hallerman EM. 2006.A holistic approach to taxonomic evaluation of two closelyrelated endangered freshwater mussel species, the oystermussel Epioblasma capsaeformis and tan riffleshell Epio-blasma florentina walkeri (Bivalvia: Unionidae). Journal ofMolluscan Studies 72: 267–283.
Jost L. 2008. GST and its relatives do not measure differen-tiation. Molecular Ecology 17: 4015–4026.
Jost L. 2009. D vs. GST: response to Heller and Siegismund(2009) and Ryman and Leimar (2009). Molecular Ecology18: 2088–2091.
Lessa EP. 1990. Multidimensional analysis of geographicgenetic structure. Systematic Zoology 39: 242–252.
Lydeard C, Cowie RH, Ponder WF, Bogan AE, BouchetP, Clark SA, Cummings KS, Frest TJ, Gargonminy O,Herbert DG, Hershler R, Perez KE, Roth B, Seddon M,Strong EE, Thompson FG. 2004. The global decline ofnonmarine mollusks. BioScience 54: 321–330.
McNichols KA, Mackie GL, Ackerman JD. 2004. FishHost Determination of Endangered Freshwater mussels inthe Sydenham River Ontario, Canada. Final Report for astudy funded by Endangered Species Recovery Fund in2004.
Machordom A, Araujo R, Erpenbeck D, Ramos M-A.2003. Phylogeography and conservation genetics of endan-gered European Margaritiferidae (Bivalvia: Unionoidea).Biological Journal of the Linnean Society 78: 235–252.
Mantel N. 1967. The detection of disease clustering and ageneralized regression approach. Cancer Research 27: 209–220.
Metcalfe-Smith JL, McGoldrick DJ, Zanatta DT, Grap-entine LC. 2007. Development of a monitoring program fortracking the recovery of endangered freshwater mussels inthe Sydenham River, Ontario. Burlington, ON: Environ-ment Canada, WSTD Contribution No. 07-510.
Morrison CL, Lemarie DP, Wood RM, King TL. 2006.Phylogeographic analyses suggest multiple lineages of Crys-tallaria asprella (Percidae: Etheostominae). ConservationGenetics 7: 129–147.
Near T, Benard M. 2004. Rapid allopatric speciation inlogperch darters (Percidae: Percina). Evolution 58: 2798–2808.
Near TJ. 2008. Rescued from synonymy: a redescription of
Percina bimaculata Haldemann and a molecular phyloge-netic analysis of logperch darters (Percidae: Etheostomati-nae). Bulletin of the Peabody Museum of Natural History 49:3–19.
Nei M. 1972. Genetic distance between populations. AmericanNaturalist 106: 283–292.
Nei M. 1978. Genetic distance from a small number of indi-viduals. Genetics 89: 583–590.
Nei M, Tajima F, Tateno Y. 1983. Accuracy of geneticdistances and phylogenetic trees from molecular data.Journal of Molecular Evolution 19: 153–170.
Noel S, Angers B, Lapointe FJ. 2005. Peromyscus popula-tions and their Cuterebra parasites display congruent phy-logeographical structure. Parasitology 131: 237–245.
Nuismer SL, Thompson JN, Gomulkiewicz R. 2003.Coevolution between hosts and parasites with partiallyoverlapping geographic ranges. Journal of EvolutionaryBiology 16: 1337–1345.
Ohio State University (OSU) Division of Molluscs. 2009.Unionoid host-parasite database. Available at: http://128.146.250.235/MusselHost/ [Accessed September 3, 2009].
Parmalee PW, Bogan AE. 1998. The freshwater mussels ofTennessee. Knoxville, TN: University of Tennessee Press.
Peacock E, Haag WR, Melvin L. 2005. Prehistoric declinein freshwater mussels coincident with the advent of maizeagriculture. Conservation Biology 19: 547–551.
Peakall R, Smouse PE. 2006. GENALEX 6: genetic analysisin Excel. Population genetic software for teaching andresearch. Molecular Ecology Notes 6: 288–295.
Petit RJ, El-Mousadik A, Pons O. 1998. Identifying popu-lations for conservation on the basis of genetic markers.Conservation Biology 12: 844–855.
Piller KR, Bart HL, Hurley DL. 2008. Phylogeography ofthe greenside darter complex, Etheostoma blennioides(Teleostomi: Percidae): a wide-ranging polytypic taxon.Molecular Phylogenetics and Evolution 46: 974–985.
Pompanon F, Bonin A, Bellemain E, Taberlet P. 2005.Genotyping errors: causes, consequences and solutions.Nature Reviews Genetics 6: 847–859.
Pritchard JK, Stephens M, Donnelly P. 2000. Inference ofpopulation structure using multilocus genotype data. Genet-ics 155: 945–959.
Ray JM, Wood RM, Simons AM. 2006. Phylogeography andpost-glacial colonization patterns of the rainbow darter,Etheostoma caeruleum (Teleostei: Percidae). Journal of Bio-geography 33: 1550–1558.
Raymond M, Rousset F. 1995. GENEPOP (version 1.2):population genetics software for exact tests and ecumeni-cism. Journal of Heredity 86: 248–249.
Ricciardi A, Rasmussen JB. 1999. Extinction rates ofNorth American freshwater fauna. Conservation Biology 13:230–237.
Rice WR. 1989. Analyzing tables of statistical tests. Evolu-tion 43: 223–225.
Rogers SO, Watson BT, Neves RJ. 2001. Life history andpopulation biology of the endangered tan riffleshell (Epio-blasma florentina walkeri) (Bivalvia: Unionidae). Journal ofthe North American Benthological Society 20: 582–594.
684 D. T. ZANATTA and C. C. WILSON
© 2011 The Linnean Society of London, Biological Journal of the Linnean Society, 2011, 102, 669–685

Scott WB, Crossman EJ. 1973. Freshwater fishes of Canada.Bull. Fish. Res. Board Can., 184.
Serb JM. 2006. Discovery of genetically distinct sympatriclineages in the freshwater mussel Cyprogenia aberti(Bivalvia: Unionidae). Journal of Molluscan Studies 72:425–434.
Serb JM, Barnhart MC. 2008. Congruence and conflictbetween molecular and reproductive characters whenassessing biological diversity in the western fanshell Cypro-genia aberti (Bivalvia: Unionidae). Annals of the MissouriBotanical Garden 95: 248–261.
Soltis DE, Morris AB, McLachlan JS, Manos PS, SoltisPS. 2006. Comparative phylogeography of unglaciatedeastern North America. Molecular Ecology 15: 4261–4293.
Thompson JN. 1994. The coevolutionary process. Chicago,IL: University of Chicago Press.
Turner TF, Trexler JC. 1998. Ecological and historical asso-ciations of gene flow in darters (Teleostei: Percidae). Evolu-tion 52: 1781–1801.
Turner TF, Trexler JC, Kuhn DN, Robinson HW. 1996.Life-history variation and comparative phylogeography ofdarters (Pisces: Percidae) from the North American CentralHighlands. Evolution 50: 2023–2036.
Van Oosterhout C, Hutchinson WF, Willis DPM, ShipleyP. 2004. MICRO-CHECKER: software for identifying andcorrecting genotyping errors in microsatellite data. Molecu-lar Ecology Notes 4: 535–538.
Weir BS, Cockerham CC. 1984. Estimating F-statistics forthe analysis of population structure. Evolution 38: 1358–1370.
Whiteman NK, Parker PG. 2005. Using parasites to inferhost population history: a new rationale for parasite con-servation. Animal Conservation 8: 175–181.
Whiteman NK, Kimball RT, Parker PG. 2007.Co-phylogeography and comparative population geneticsof the threatened Galapagos hawk and threeectoparasite species: ecology shapes population historieswithin parasite communities. Molecular Ecology 16: 4759–4773.
Wiley EO. 1992. Phylogenetic relationships of the Percidae(Teleostei: Perciformes): a preliminary hypothesis. In:Mayden RL, ed. Systematics, historical ecology, and NorthAmerican freshwater fishes. Stanford, CA: Stanford Univer-sity Press, 247–267.
Williams JD, Warren ML, Cummings KS, Harris JL,Neves RJ. 1993. Conservation status of freshwatermussels of the United States and Canada. Fisheries 18:6–22.
Williams JD, Bogan AE, Garner JT. 2008. Freshwatermussels of Alabama and the Mobile Basin in Georgia,Mississippi, and Tennessee. Tuscaloosa, AL: University ofAlabama Press.
Zale AV, Neves RJ. 1982. Reproductive biology of four fresh-water mussel species (Mollusca: Unionidae) in Virginia.Freshwater Invertebrate Biology 1: 17–28.
Zanatta DT, Murphy RW. 2006. The evolution of activehost-attraction strategies in the freshwater mussel tribeLampsilini (Bivalvia: Unionidae). Molecular Phylogeneticsand Evolution 41: 195–208.
Zanatta DT, Murphy RW. 2008. The phylogeographic andmanagement implications of genetic population structurein the imperiled snuffbox mussel, Epioblasma triquetra(Bivalvia: Unionidae). Biological Journal of the LinneanSociety 93: 371–384.
Zar JH. 1996. Biostatistical analysis, 3rd edn. Princeton, NJ:Prentice Hall.
CONGRUENT MUSSEL AND HOST POPULATION STRUCTURE 685
© 2011 The Linnean Society of London, Biological Journal of the Linnean Society, 2011, 102, 669–685
Copyright © 2022 FDOKUMEN