TESTING AND ANALYSIS OF THE BANGLADESHI TREADLE ...
96
TESTING AND ANALYSIS OF THE BANGLADESHI TREADLE PUMP By MURRAY GEORGE KROEKER B.Sc.Ag.Eng., The University of Manitoba, 1987 A THESIS SUBMITTED IN PARTIAL FULFILLMENT OF THE REQUIREMENTS FOR THE DEGREE OF MASTER OF APPLIED SCIENCE in THE FACULTY OF GRADUATE STUDIES (Department of Applied Science, Civil Engineering) We accept this thesis as conforming to the required standard THE UNIVERSITY OF BRITISH COLUMBIA March 1989 (cj Murray George Kroeker, 1989
-
Upload
khangminh22 -
Category
Documents
-
view
0 -
download
0
Transcript of TESTING AND ANALYSIS OF THE BANGLADESHI TREADLE ...

TESTING AND ANALYSIS OF THE
BANGLADESHI TREADLE PUMP
By
MURRAY GEORGE KROEKER
B.Sc.Ag.Eng., The University of Manitoba, 1987
A THESIS SUBMITTED IN PARTIAL FULFILLMENT OF
THE REQUIREMENTS FOR THE DEGREE OF
MASTER OF APPLIED SCIENCE
i n
THE FACULTY OF GRADUATE STUDIES
(Department of Applied Science, C i v i l Engineering)
We accept t h i s thesis as conforming
to the required standard
THE UNIVERSITY OF BRITISH COLUMBIA
March 1989
(cj Murray George Kroeker, 1989

In presenting this thesis in partial fulfilment of the requirements for an advanced degree at the University of British Columbia, I agree that the Library shall make it freely available for reference and study. I further agree that permission for extensive copying of this thesis for scholarly purposes may be granted by the head of my department or by his or her representatives. It is understood that copying or publication of this thesis for financial gain shall not be allowed without my written permission.
Department of C I V I L ENGINEERING
The University of British Columbia Vancouver, Canada
D A T E A P R I L 2 0 , 1 9 B 9
DE-6 (2/88)

ABSTRACT
The Treadle pump was invented i n 1980 by development
workers to provide low cost, low technology and l o c a l l y
manufacturable i r r i g a t i o n for farmers i n northern
Bangladesh. The twin cylinder steel-bodied suction pump,
c a l l e d the Treadle pump, operated by a walking motion upon
two c e n t r a l l y pivoted levers, i s well suited to the high
water tables of much of Bangladesh.
The increased popularity of the pump, r e s u l t i n g from
extensive marketing e f f o r t s , with annual sales of over
50,000 units i n 1987/88, has prompted suggestions f o r design
a l t e r a t i o n s , s p e c i f i c a l l y pump material changes to decrease
costs and increase sales. A technical f i e l d and laboratory
study supported by calc u l a t i o n s from hydraulic theory was
required as a basis upon which to s t a r t design a l t e r a t i o n s .
In laboratory t e s t s , d i f f e r e n t pump body configurations
were found to have n e g l i g i b l e impact on o v e r a l l pump
performance c h a r a c t e r i s t i c s . These findings were supported
by r e s u l t s obtained from cal c u l a t i o n s of f r i c t i o n and
turbulent l o s s . Any worthwhile a l t e r a t i o n s must rather be
j u s t i f i e d by cost and manufacturing benefits.
The combination of computer-aided instrumentation and
high speed data c o l l e c t i o n i n laboratory t e s t i n g ,
i i

t h e o r e t i c a l analysis, and f i e l d t e s t i n g i n Bangladesh
revealed that the losses i n pump performance are a r e s u l t of
poor valve sealing, valve opening and cl o s i n g delays and
leakage past the piston se a l , r e s u l t i n g i n lower discharges
than had been previously assumed. The reduced discharge for
i r r i g a t i o n and the operator power input l i m i t , measured at
the pump, of 55 watts r e s u l t s i n a four meter maximum depth
of water table to which the standard 89 mm (3.5 inch) pump
can be used, with some v a r i a t i o n due to i r r i g a t i o n
requirements and operator strengths.
Improvements to piston valve and foot valve design to
reduce leakage and valve-delay times and the use of a
smaller 77 mm (3 inch) cylinder diameter, are achievable and
are recommended. These improvements combine to permit
operation of the pump to nearly s i x meters without exceeding
the l i m i t of input power or reducing the discharge below the
crop i r r i g a t i o n requirements.

TABLE OF CONTENTS
PAGE
ABSTRACT i i
LIST OF TABLES v i
LIST OF FIGURES v i i
ACKNOWLEDGEMENT i x
1 INTRODUCTION 1
2 BACKGROUND 3 2.1 TREADLE PUMP DEVELOPMENT AND IMPACT 3 2.2 PREVIOUS TEST RESULTS 8
3 DESCRIPTION OF THE TREADLE PUMP 14 3.1 PHYSICAL DESCRIPTION 14 3.2 PUMP OPERATION 19
4 PUMP OPERATION MODEL 23 4.1 OPERATIONAL CONSTRAINTS 23 4.2 CALCULATION OF UNBALANCED HEAD 24
4.2.1 MINOR LOSSES 24 4.2.2 VALVE TIMING AND LEAKAGE 25 4.2.3 INERTIA 26 4.2.4 MECHANICAL LOSSES 29
4.3 GOVERNING EQUATIONS 3 0
5 LABORATORY TESTING 35 5.1 APPARATUS DESIGN CONSIDERATIONS 35 5.2 TESTING PROCEDURE 3 9 5.3 DATA REDUCTION AND ANALYSIS . . . . . 41
6 FIELD TESTING 43 6.1 APPARATUS DESIGN CONSIDERATIONS 4 3 6.2 TEST LOCATIONS AND PROCEDURE 45 6.3 DATA ANALYSIS 49
i v

V
7 RESULTS 51 7.1 PUMP FORCES 51 7.2 VALVE CLOSURE DELAYS 56 7.3 THE EFFECT OF WATER TABLE DEPTH ON APPLIED FORCE 60 7.4 THE EFFECT OF WATER TABLE DEPTH ON DISCHARGE AND
VOLUMETRIC EFFICIENCY 60 7.5 POWER INPUT REQUIREMENTS 63 7.6 THE EFFECT OF PUMP AGE ON DISCHARGE AND VOLUMETRIC
EFFICIENCY 67 7.7 THE EFFECT OF PUMP BODY CONFIGURATION ON
VOLUMETRIC EFFICIENCY, POWER REQUIREMENTS AND DISCHARGES 68
8 DISCUSSION 71 8.1 VALIDATION OF THEORETICAL MODEL BY LABORATORY
TESTS 71 8.2 COMPARISON OF LABORATORY AND FIELD TEST RESULTS 72 8.3 IMPLICATIONS OF THE RESULTS ON PUMP RE-DESIGN . 74
9 CONCLUSION 79
LIST OF REFERENCES 82
APPENDIX 1: AVERAGED LABORATORY TEST DATA 85 APPENDIX 2: AVERAGED FIELD TEST DATA 86
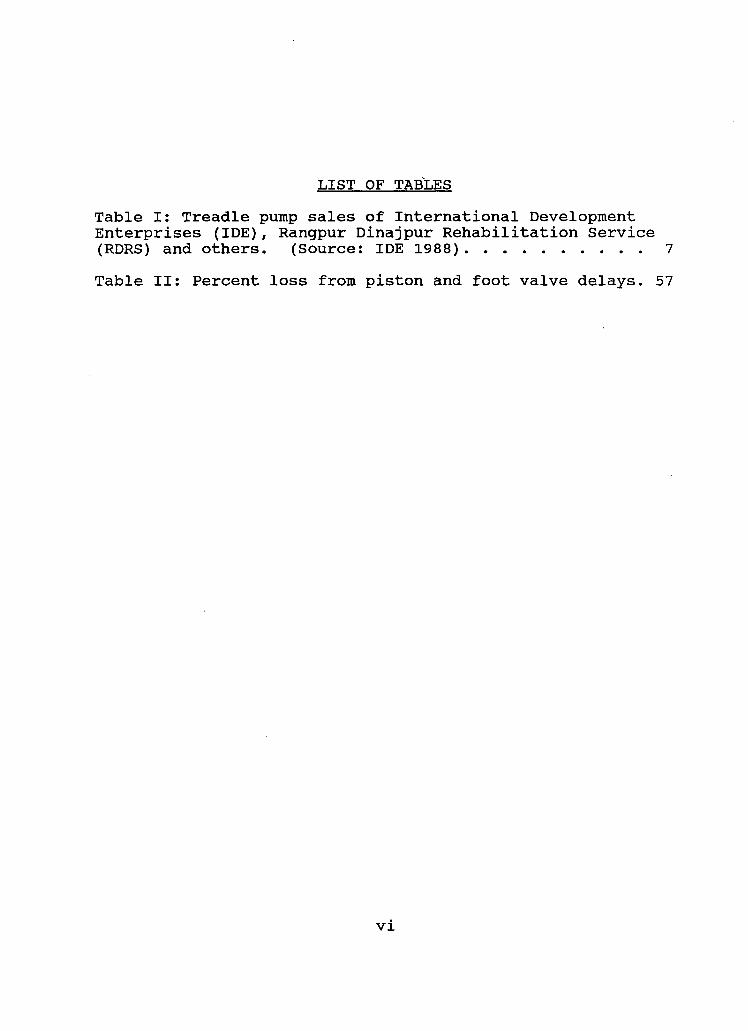
LIST OF TABLES
Table I: Treadle pump sales of International Development Enterprises (IDE), Rangpur Dinajpur R e h a b i l i t a t i o n Service (RDRS) and others. (Source: IDE 1988) 7
Table I I : Percent loss from piston and foot valve delays. 57
v i

LIST OF FIGURES
Figure 1: Geographical location of Bangladesh 5
Figure 2: Water table depths i n Bangladesh 6
Figure 3: Rope and pulley type Treadle operation 8
Figure 4: Centrally pivoted "dheki" type Treadle operation.9
Figure 5: "Dheki" s t y l e f i e l d i n s t a l l a t i o n of the Treadle pump 15
Figure 6: The two piston configurations, the two-plate design and the No. 6 s t y l e piston, and the two types of junctions tested 16
Figure 7: F i e l d operation of Treadle pump i n Bangladesh 18
Figure 8: The pump cycle defined by valve p o s i t i o n s . . 19
Figure 9: C h a r a c t e r i s t i c piston motion parameters. . . 27
Figure 10: An example of calculated force r e s u l t s with
laboratory measured parameters 34
Figure 11: Instrumentation for the laboratory t e s t s . . . 36
Figure 12: Laboratory apparatus 38
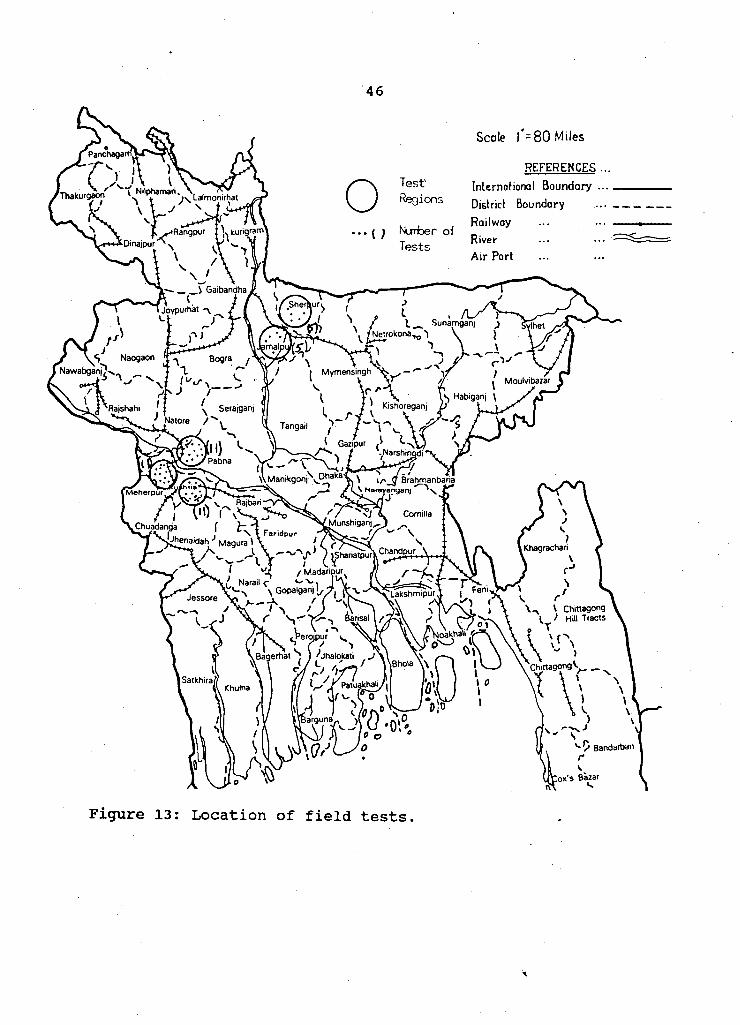
Figure 13: Location of f i e l d t e s t s . 46
Figure 14: Force-displacement loop using the two-plate type pistons 52
Figure 15: Force-displacement loop using the No. 6 type piston 53
Figure 16: Variations i n force with water table depth. 61
Figure 17: The e f f e c t of water table depth on volumetric e f f i c i e n c y 62
v i i

v i i i
Figure 18: Laboratory and estimated f i e l d power input requirements 65
Figure 19: E f f e c t of pump age on volumetric e f f i c i e n c y and discharge from f i e l d t e sts 67
Figure 20: E f f e c t of pump configuration on laboratory measured volumetric e f f i c i e n c y and discharge. . . . 69
Figure 21: Comparison of calculated and laboratory r e s u l t s 71

ACKNOWLEDGEMENT
I g r a t e f u l l y acknowledge the Canadian International
Development Agency (CIDA) for f i n a n c i a l support through the
Awards for Canadians Program. I also would l i k e to
acknowledge Bob Nanes and the res t of the s t a f f of
International Development Enterprises i n Bangladesh, Canada
and the United States for t h e i r assistance, valuable
in s i g h t s and l o g i s t i c a l support, Dr. Stephen V. A l l i s o n ,
previously Director of Operations f o r IDE and currently
consultant for the World Bank, for h i s guidance and help as
program supervisor and Dr. M. C. Quick of the C i v i l
Engineering department at the University of B r i t i s h Columbia
for h i s support i n arranging laboratory space and equipment
and f o r h i s i n t e r e s t i n the project.
i x

1 INTRODUCTION
This t h e s i s examines the performance of two
configurations of s t e e l Treadle pump bodies and piston
configurations, including the designs currently marketed for
use i n Bangladesh. Investigation of the pumps by intensive
laboratory t e s t i n g and data analysis, f i e l d t e s t s , and
analysis from hydraulic theory provides a basis f o r
evaluating the pump design and a l t e r a t i o n a l t e r n a t i v e s .
An i n i t i a l study of the pump uses, proposed design
a l t e r a t i o n s and pump theory was conducted i n Bangladesh
during the summer of 1987, followed by laboratory t e s t i n g of
alternate pump and piston designs at the University of
B r i t i s h Columbia at Vancouver, Canada, i n mid-1988. F i e l d
t e s t i n g of Treadle pumps, using the currently marketed
configuration of pump body and pistons, was conducted i n the
ce n t r a l , eastern and northern regions of Bangladesh at the
s t a r t of i r r i g a t i o n for the 1988-89 dry season crops i n la t e
November and December 1988.
Included i s a hi s t o r y and description of the Treadle
pump, to f a m i l i a r i z e readers with t h i s technology, and an
examination of the pump hydraulics to describe the pump
operation i n more d e t a i l and provide the basis f o r the
1

2
analysis of laboratory and f i e l d t e s t s . Adescription of the
laboratory and f i e l d t e s t s and the presentation of the t e s t
r e s u l t s , as well as those from the theory based
c a l c u l a t i o n s , provides a comprehensive view of the pump
performance c h a r a c t e r i s t i c s . The r e s u l t s also i d e n t i f y the
mechanisms a f f e c t i n g pump performance as well as providing
the basis f o r proposed design a l t e r a t i o n s .
The t e s t i n g and study included i s based on the Treadle
pump designs and operation configuration described i n
section two. This uses c e n t r a l l y pivoted levers to operate
the pump, referred to as the "dheki" operation structure, as
i s p r i m a r i l y used i n Bangladesh at t h i s time. The t e s t i n g
parameters and design alt e r n a t i v e s examined are l i m i t e d to
those manufacturable with materials and technology available
i n Bangladesh.

2 BACKGROUND
2.1 TREADLE PUMP DEVELOPMENT AND IMPACT
The Treadle pump was invented i n 1980 by Gunnar Barnes
and Dan Jenkins, development workers with the non
governmental organizations (NGOs), the Rangpur-Dinajpur
R e h a b i l i t a t i o n Service (RDRS) and USAid respectively,
operating i n northern Bangladesh (RDRS 1984).
Bangladesh, located east of India and north-west of
Burma, encompassing the Ganges and Brahmaputra r i v e r deltas
where they enter the Bay of Bengal, i l l u s t r a t e d i n figure 1,
i s well suited to human powered i r r i g a t i o n because:
a) Labor i s widely available, e i t h e r by the pump owner
or at low cost.
b) The high water table throughout most of the country
i s within the 10 meter l i m i t of suction pumps, as shown i n
the water table depth map i n figure 2 and,
c) farm pl o t s are t y p i c a l l y so small that the quantities
of water required d a i l y are within the l i f t i n g capacity of a
single human operator.
The s i z e of plots i r r i g a t e d by manual i r r i g a t i o n range i n
s i z e from 0.25 to 1 hectare (Orr and Islam 1988). High
value crops such as vegetables, spices and tobacco are grown
as they generally have lower i r r i g a t i o n requirements, less
3

4
than 6 mm/day on average (EPC 1988 Tables 24-26), and
greater f i n a n c i a l return than r i c e crops. Given these
parameters, the i r r i g a t i o n water requirements vary from 15
to 60 cubic meters per day for 0.25 and 1 hectare i r r i g a t e d
area respectively. In more understandable terms f o r the
physical e f f o r t needed to meet these requirements using
manual i r r i g a t i o n , t h i s equates to l i f t i n g from 15 to 60
tonnes of water a v e r t i c a l distance of up to four meters
every day during periods of peak i r r i g a t i o n requirements.
The o r i g i n a l aim i n designing the pump was to provide low
cost manual i r r i g a t i o n , to benefit low income farmers i n the
Rangpur and Dinajpur regions of northern Bangladesh. Since
i t s introduction, use of the pump has spread to many other
new regions of Bangladesh previously without i r r i g a t i o n or
i r r i g a t e d by more expensive or les s appropriate means. In a
recent socio-economic study of the treadle pump, the low
cost of 1488 taka ($60 CAD) (EPC 1988, table 29), including
i n s t a l l a t i o n on an unplasticized Polyvinyl Chloride (uPVC)
tubewell, was found to provide 100% investment return i n one
season with a minimum i r r i g a t e d area of 0.08 hectares (.16
acres) (Orr and Islam 1988), proving that the aim of the
o r i g i n a l design has been achieved.
Benefits of Treadle pump i r r i g a t i o n include dry season
cropping, previously not possible f o r lack of i r r i g a t i o n ,
d i v e r s i f i c a t i o n of crops to modern high y i e l d r i c e v a r i e t i e s

5
and vegetables, job creation, with 30% of pumping labour
being hired, and increased s e l f s u f f i c i e n c y i n r i c e (Orr and
Islam 1988).
Figure 1: Geographical location of Bangladesh.

Figure 2: Water table depths i n Bangladesh. (Source: United Nations 1982, Plate 7)

7
Sales of the Treadle pump have increased dramatically i n
the past four years as i s shown i n table 1.
YEAR IDE RDRS OTHERS TOTAL
1980-85 1985- 86 1986- 87 1987- 88
0 120
12,000 12,000
39,870 10,316 3,000 3,000
4,000 16,000 27,000
0 39,870 14,436 30,000 43,938
Table I: Treadle pump sales of International Development Enterprises (IDE), Rangpur Dinajpur R e h a b i l i t a t i o n Service (RDRS) and others. (Source: IDE 1988)
The large and increasing sales of the Treadle pump are
at t r i b u t a b l e to the low i n i t i a l cost, the ease of
maintenance and repair, comfort of operation, the
a v a i l a b i l i t y of replacement parts and the a b i l i t y to make
some repairs using salvaged parts such as inner tube rubber.
Although i n i t i a l l y i n s t a l l e d on bamboo tubewells, the
increased a v a i l a b i l i t y and increased market demand for uPVC
pipe has resulted i n increasing uPVC usage f o r manual pump
tubewells. This has resulted i n more consistent well l i f e
and increased benefits but at an increase i n cost and a
greater dependence upon imported materials. In addition to
the obvious benefits of the pump, increasingly focused
marketing e f f o r t s throughout Bangladesh by various Non-
Governmental Organizations (NGO's) and Bangladeshi private
businessmen have contributed greatly to the a v a i l a b i l i t y and

8 qual i t y of the pumps sold, and have further increased sales.
2.2 PREVIOUS TEST RESULTS
The increase i n popularity of manual i r r i g a t i o n i n
Bangladesh and the concern with drinking water supply world
wide, brought on i n part by the United Nations declared
Decade of Sanitation and Water Supply i n 1980, has resulted
i n increased t e s t i n g and documentation of pump performance
throughout the world. Although the primary focus has been
on drinking water pumps, manual i r r i g a t i o n pumps, such as
the Treadle, Rower and No. 6 pumps used i n Bangladesh, have
received attention from regional NGOs, farmers and small
business i n t e r e s t s .
Figure 3: Rope and pulley type Treadle operation. (Source: Barnes 1985)

Figure 4: Centrally pivoted "dheki" type Treadle operation. (Source: Stickney, R.E., et a l . 1987)
Over the past four years, the Treadle pump has been
tested by RDRS, the Mennonite Central Committee (MCC), the
International Rice Research I n s t i t u t e (IRRI), the Bangladesh
University of Engineering and Technology (BUET), and most
recently by Engineering and Planning Consultants Limited of
Dhaka, Bangladesh (EPC) on contract with the Bangladesh
Rural Development Board (BRDB) and the World Bank.
The f i v e t ests have varied i n focus as follows:

10
1) The RDRS tes t s dealt with depth to water table to
discharge r e l a t i o n s h i p of the o r i g i n a l pump design and
larger piston diameter prototypes f o r use at shallower
depths (RDRS 1983).
2) The MCC t e s t s focused on the impact of pump i n s t a l l a t i o n
parameters, such as tubewell length, diameter and f i l t e r
length, on the Rower, Treadle and No. 6 pumps from a
p r i m a r i l y s t a t i s t i c a l analysis of a small s i z e t e s t sample
(Spare and Pritchard 1981).
3) The IRRI te s t s focused on the adaptation and i n i t i a l
promotion of the Treadle pump i n the P h i l i p p i n e s .
Comparisons of the power input requirements f o r the rope and
pulley and the c e n t r a l l y pivoted "dheki" s t y l e s of Treadle
pump i n s t a l l a t i o n s , shown i n figures 3 and 4, indicated no
s i g n i f i c a n t differences between them (Stickney et a l . 1987).
The "dheki" s t y l e operation was, however, found to more
comfortable to operate, which i s also the reason for the
large increase i n "dheki" s t y l e i n s t a l l a t i o n s over rope and
pulley s t y l e i n s t a l l a t i o n s i n Bangladesh.
4) The BUET t e s t s concentrated on the r e l a t i o n of power
e f f i c i e n c y and discharge to operator c h a r a c t e r i s t i c s (Bureau
of Research Testing and Consultation. 1986). The use of
hir e d urban operators (rickshaw operators) i n the laboratory
t e s t s , the lack of comparable f i e l d t e s t s , the use of
observational recording of force transducer readings to
c a l c u l a t e power input at the pump, and the lack of
11
t h e o r e t i c a l analysis to support the laboratory data, a l l
reduced confidence i n the report's conclusions.
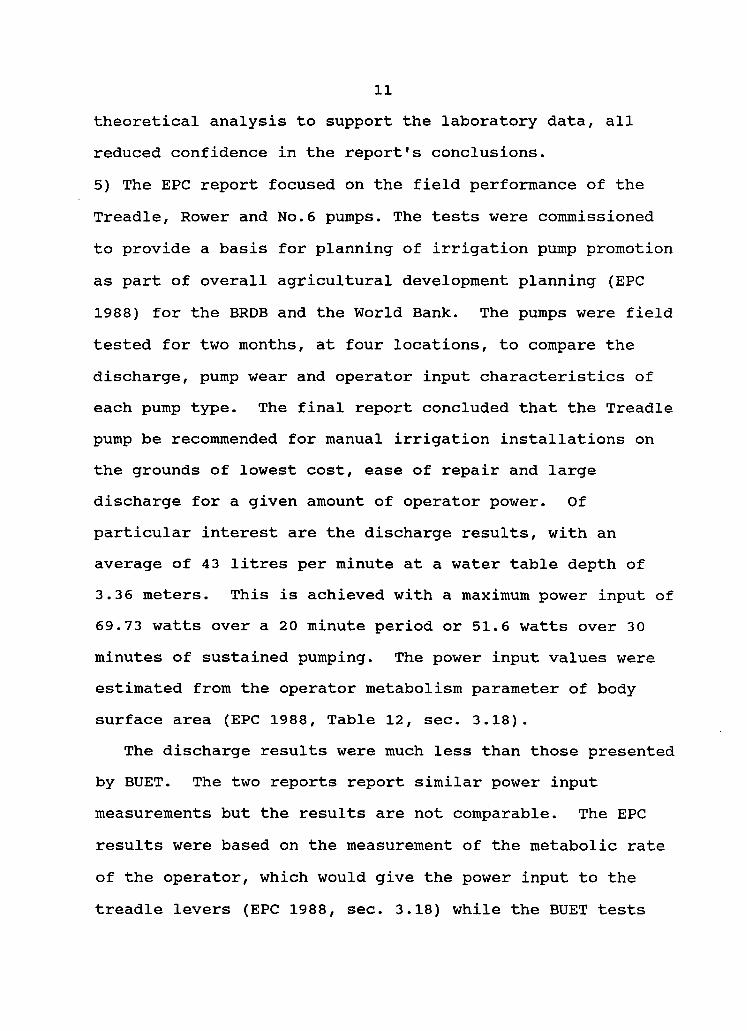
5) The EPC report focused on the f i e l d performance of the
Treadle, Rower and No.6 pumps. The te s t s were commissioned
to provide a basis f o r planning of i r r i g a t i o n pump promotion
as part of o v e r a l l a g r i c u l t u r a l development planning (EPC
1988) f o r the BRDB and the World Bank. The pumps were f i e l d
tested f o r two months, at four locations, to compare the
discharge, pump wear and operator input c h a r a c t e r i s t i c s of
each pump type. The f i n a l report concluded that the Treadle
pump be recommended for manual i r r i g a t i o n i n s t a l l a t i o n s on
the grounds of lowest cost, ease of repair and large
discharge for a given amount of operator power. Of
p a r t i c u l a r i n t e r e s t are the discharge r e s u l t s , with an
average of 4 3 l i t r e s per minute at a water table depth of
3.3 6 meters. This i s achieved with a maximum power input of
69.73 watts over a 20 minute period or 51.6 watts over 30
minutes of sustained pumping. The power input values were
estimated from the operator metabolism parameter of body
surface area (EPC 1988, Table 12, sec. 3.18).
The discharge r e s u l t s were much less than those presented
by BUET. The two reports report s i m i l a r power input
measurements but the r e s u l t s are not comparable. The EPC
r e s u l t s were based on the measurement of the metabolic rate
of the operator, which would give the power input to the
treadle levers (EPC 1988, sec. 3.18) while the BUET te s t s

12
measured the average force input to the piston rod giving
the power input to the pump (Bureau of Research Testing and
Consultation, sec. 3.3). The power at the operator and at
the pump can not be equal due to f r i c t i o n losses between the
treadle levers, axle pin and between the rope and pulley
system used with these t e s t s , as well as unmonitored
metabolic losses. Given the differences between the
discharge measurements, power input r e s u l t s , the more
representative f i e l d t e s t conditions and the large number of
te s t s , the EPC report seems to provide a more complete
i n d i c a t i o n of f i e l d Treadle pump performance.
A l l of the Treadle pump te s t s to date used the o r i g i n a l
design rope-pulley s t y l e treadle lever configuration, shown
i n f i g u r e 3, as opposed to the c e n t r a l l y pivoted "dheki"
s t y l e configuration used on most i n s t a l l a t i o n s since 1986,
shown i n figures 3,4 and 6.
The "dheki" s t y l e operation has been adopted by the
Bangladeshi farmer i n an e f f o r t to reduce the number of
moving parts subjected to wear and requiring p e r i o d i c
replacement and to increase operator comfort. Unfortunately,
the shorter stroke lengths of the "dheki" s t y l e r e s u l t s i n
lower discharge and greater losses with the increases i n
comfort. The increase i n operator comfort and ease of
operation has been obtained from the change of pumping s t y l e
to a s h i f t i n g of body weight from side to side, pivoting at
the hips and without bending the knees, from the the longer

13
bent-knee s t e p - l i k e operation of rope and pulley s t y l e . The
large popularity of the "dheki" s t y l e operation c l e a r l y
i l l u s t r a t e s the greater importance of comfort and ease of
operation to the Bangladeshi pump operator compared to the
mechanical e f f i c i e n c y of the pump mechanism. This p r i o r i t y
of operator comfort over mechanical e f f i c i e n c y i n the case
of the operation configuration, c l e a r l y shows that
c h a r a t e r i s t i c s of the Treadle pump that must be c a r e f u l l y
considered i n any design a l t e r a t i o n s extend beyond the
purely technical performance c h a r a c t e r i s t i c s .
The lower discharge data given i n the EPC report i s
contrary to previous pump performance assumptions. The lack
of agreement between t h e o r e t i c a l analysis, laboratory and
f i e l d t e s t r e s u l t s i n a l l of the above reports precludes
t h e i r use as a basis for design improvements and comparisons
of a l t e r n a t i v e pump designs.
The need f o r further technical knowledge was i d e n t i f i e d
i n 1988 by the MPG, an organization comprised of
manufacturers and marketers of manual i r r i g a t i o n pumps i n
Bangladesh.

3 DESCRIPTION OF THE TREADLE PUMP
3.1 PHYSICAL DESCRIPTION
The Treadle pump i s a two cylind e r manual suction pump
constructed from sheet s t e e l . I t i s t y p i c a l l y mounted on a
sing l e 40 mm (1.5 inch) diameter tubewell, also referred to
as the r i s i n g main or r i s e r . Attached to the bottom of the
r i s i n g main i s a s l o t t e d unplasticized p o l y v i n y l - c h l o r i d e
(uPVC) or poly-propylene c l o t h covered s l o t t e d bamboo screen
located below the water table, as shown i n figure 5.
The pump body consists of two p a r a l l e l s t e e l cylinders
made from r o l l e d and welded sheet attached to the top of a Y
or box shaped junction. A short s t e e l 40 mm (1.5 inch) pipe
i s welded to the bottom of the junction to connect the pump
to the uPVC or bamboo tubewell.
P l a s t i c tubewell components predominate i n the more
recent pump i n s t a l l a t i o n s i n most of Bangladesh due to the
superior d u r a b i l i t y and sealing of the r i s e r , although the
cost of the p l a s t i c components are greater than the bamboo
components.
Two designs of piston were tested:
(a) The o r i g i n a l two-plate piston design which consists of a
perforated plate mounted on a s t e e l pump rod above a s o l i d
plate with a p l a s t i c i z e d p o l y - v i n y l chloride (pPVC) cup seal
14

15
T R E A D L E
PUMP
BODY
- PUMP S U P E R S T R U C T U R E C B A M B O C Q
> H A N D H O L D
A X L E P I N C C E N T R A L P I V O T ^
T R E A D L E L E V E R S C B A M B O C O
T U B E W E L L C A S I N G OR R I S I N G M A I N C u P V C }
S I L T
V W A T E R T A B L E
— 1 . • - -4 . o m e t e r
F I N E S A N D
C O U R S E S A N D 7 . 0 - 2 0 . • m e t e r s
S C R E E N
Figure 5: "Dheki" s t y l e f i e l d i n s t a l l a t i o n of the
Treadle pump.

placed between them and,
(b) the No. 6 piston, adapted for use i n the Treadle pump.
The No. 6 piston consists of a molded uPVC poppet valve,
used with the same type of pPVC cup seal as used i n the two
plate design, sandwiched between a threaded upper cage,
attached to the pump rod, and a s i m i l a r l y threaded lower
plate. The poppet valve, seal and valve seat are configured
as shown i n figure 6. I t i s c a l l e d the No.6 piston because
of i t s use i n the widely used cast iron Number 6 drinking
water pump, which i s s i m i l a r to the hand pump s t i l l used for
most manual pump applications i n North America.
STANDARD CONFIGURATI ON
Figure 6: The two piston configurations, the two-plate
design and the No. 6 s t y l e piston, and the two types of
junctions.

17
Both piston types are connected to the horizontal bamboo
rods, c a l l e d treadles, by a hook and pin arrangement at the
top of the piston rod.
The lower valves, or foot valves, consist of weighted
inner-tube rubber flaps mounted at the base of the
cylinder s , where the cylinders j o i n to the smaller diameter
junction box. Connection of the fl a p to the pump body i s by
nuts and bo l t s to the cylinder base plate.
The box shaped junction and the two-plate piston design
are the standard configuration used i n Bangladesh due to the
low cost and ease of manufacture.
As shown i n figure 7, the pump i s operated by the
treading action of the operator on the opposite side of the
central pivot from the pump. The energy exerted by the
operator i s used i n three ways, to pump water, to overcome
f r i c t i o n at the central pivot and the piston rod
connections, and to increase the pot e n t i a l energy of the
treadle levers by l i f t i n g the treadle mass on the pump side
of the pivot not balanced by the mass on the operator side.
This difference i n treadle mass on the pump side of the
central pivot i s termed the unbalanced treadle mass. I f the
pump i s properly set up, the energy used to r a i s e the
treadle lever w i l l be equal the energy required for the
downward stroke of the piston and minimal energy i s wasted.
In actual practice, many of the pumps are i n s t a l l e d with
increased unbalanced treadle mass to increase the upward

18
p r e s s u r e on the o p e r a t o r ' s f o o t d u r i n g the r e t u r n s t r o k e o f
the p i s t o n . T h i s i n c r e a s e s o p e r a t o r c o n t r o l over the l o o s e
a c t i o n o f the l e v e r and i n c r e a s e s the speed o f t h e r e t u r n
s t r o k e . In extreme cases, the l e v e r s may be s e t up so t h a t
the end of the l e v e r s on the op e r a t o r ' s s i d e o f t h e c e n t r a l
p i v o t touch the ground a t the lower end o f t h e o p e r a t o r
s t r o k e and h i t the pump a t the upward end. Alt h o u g h t h i s
r e s u l t s i n wasted energy as a r e s u l t o f h i t t i n g t he pump and
ground and a l s o i n c r e a s e s wear on the t r e a d l e l e v e r s , p i v o t s
and the pump body r e s u l t i n g i n rough o p e r a t i o n , i t has the
b e n i f i t t h a t i t decreases the s e n s i t i v i t y and s k i l l r e q u i r e d
o f the o p e r a t o r t o o b t a i n the c o r r e c t b a l a n c e i n the t r e a d l e
l e v e r s and the more optimal smooth o p e r a t i o n . T h i s shows
t h a t g r e a t e r s i m p l i c i t y o f o p e r a t i o n can take precedence
over e f f i c i e n c y and smoothness w i t h some o p e r a t o r s .
The pump can a l s o be operated u s i n g two o p e r a t o r s , one on
each s i d e o f the s u p e r s t r u c t u r e , but t h i s i s not common
p r a c t i c e .
F i g u r e 7: F i e l d o p e r a t i o n o f the T r e a d l e pump i n Bangladesh. (Photo by Author)

19
3.2 PUMP OPERATION
There are four d i s t i n c t stages i n the stroke cycle of the
Treadle pump, which consists of a single up and down stroke
cycle i n both cylinders, with a h a l f cycle phase difference
between cy l i n d e r s . The stage of the cycle can be defined by
the p o s i t i o n and d i r e c t i o n of movement of the piston at any
point i n time. The four stages, for one cyl i n d e r i n the
pump cycle using the two-plate piston, i s shown i n figure 8.
S T A G E 1 S T A G E 2 S T A G E 3 S T A G E A Figure 8: The pump cycle defined by valve p o s i t i o n s .
In the f i r s t stage, occurring with the i n i t i a l upward
movement of the piston from the lowered p o s i t i o n , the piston
valve closes with the upward movement of the piston plate to
connect with the pPVC cup sea l . When no water i s l i f t e d
above the piston by the piston movement, only the f r i c t i o n
20
f o r c e o f t h e cup s e a l moving a g a i n s t the c y l i n d e r and the
drag f o r c e of the p i s t o n moving upward through th e water are
e x e r t e d on the p i s t o n . The power i n p u t i n t h i s stage i s
v e r y s m a l l .
In the second stage, f u r t h e r upward movement causes a
decrease i n p r e s s u r e immediately below the p i s t o n and the
l i f t i n g o f water above the p i s t o n t o the d i s c h a r g e spout.
The combination of the low p r e s s u r e below the p i s t o n and
atmospheric p r e s s u r e a c t i n g on the water t a b l e r e s u l t s i n a
net p o s i t i v e d i f f e r e n t i a l p r e s s u r e , c a u s i n g flow from the
water t a b l e through the r i s i n g main and i n t o the c y l i n d e r .
The i n i t i a l flow, w i t h the c l o s i n g o f the p i s t o n v a l v e ,
causes the f o o t v a l v e t o open and remain open f o r the
d u r a t i o n o f the upward s t r o k e . Force i s r e q u i r e d t o produce
the low p r e s s u r e below the p i s t o n and t o overcome both the
p i s t o n s e a l f r i c t i o n f o r c e and the drag f o r c e through the
f o o t - v a l v e , and t h i s f o r c e remains c l o s e t o c o n s t a n t
throughout t h i s s t r o k e stage. The a d d i t i o n a l f o r c e r e q u i r e d
t o a c c e l e r a t e the water i n the r i s i n g main t o equal the
motion of t h e p i s t o n and t o l i f t t he water t o the d i s c h a r g e
spout from above the p i s t o n are a t a maximum a t the
b e g i n n i n g of t h i s stage w i t h a r e d u c t i o n towards the top of
the s t r o k e . The r e d u c t i o n i n f o r c e i s a r e s u l t of reduced
p i s t o n and water column a c c e l e r a t i o n w i t h the s l o w i n g o f the
p i s t o n toward the top of the s t r o k e and the r e d u c t i o n of the
mass a c c e l e r a t e d w i t h the d i s c h a r g e of the water from above

the piston. An additional force i s required i n t h i s stage
to accelerate and l i f t the unbalanced mass of the treadle
lever, used as the actuating force i n stages three and four,
the return stroke. The magnitude of t h i s force depends on
the p o s i t i o n of the central pivot on the treadle levers.
The degree of unbalance r e s u l t s from the qu a l i t y of
i n s t a l l a t i o n and, i d e a l l y , should nearly equal the force
required to move the piston downward during the return
stroke. The major portion of work and the maximum power i s
imparted to the pump i n t h i s stage.
In stage three, the downward return stroke begins with
the opening of the piston valve. The upwards movement of
the valve i s l i m i t e d by the upper perforated plate. This
r e s u l t s i n a d i f f e r e n t i a l pressure across the piston and
forces water to flow through the perforated plate and the
annulus between the lower plate and the cy l i n d e r wall
previously sealed by the pPVC cup sea l . The downward
movement of the water i n the cylinder caused by the
increased pressure causes the foot valve to close, stopping
the reverse flow of water from the cylind e r into the r i s i n g
main. Only the f r i c t i o n force of the cup seal r e s u l t i n g
from the piston motion, the drag force of the water through
the piston, and the i n i t i a l drag force through the foot-
valve, need to be overcome during t h i s stage. The force for
the downward movement of the piston i n stages three and four

i s provided by the unbalanced mass of the treadle lever
which was raised i n stages one and two.
In stage four, the piston returns to the bottom of the
stroke, i n h i b i t e d only by the resistance of flow through the
piston valve and the f r i c t i o n of the cup seal against the
cylinde r wall. Some water i s discharged by displacement from
the piston and piston rod.
The second cylin d e r follows the same cycle as the f i r s t ,
but i s o f f s e t one h a l f cycle, r e s u l t i n g i n a continuous flow
of water from the pump.

4 PUMP OPERATION MODEL
4.1 OPERATIONAL CONSTRAINTS
As b r i e f l y described i n section three, the operation of
the Treadle pump u t i l i z e s the difference between atmospheric
pressure, and the low pressure created below the piston to
provide flow from the water table to the pump. Atmospheric
pressure, at 20 degrees Celsius, i s 101 kPa. When expressed
i n height of water over a unit area, termed atmospheric
head, i s equal to 10.23 meters. The pressure d i f f e r e n t i a l
between atmospheric and that produced below the piston i s
termed unbalanced head (UH). Ideally, when the depth to the
water table equals atmospheric head, the unbalanced head and
r e s u l t i n g l i f t i n g force are reduced to zero. This r e s u l t s
i n the t h e o r e t i c a l maximum height f o r the operation of the
Treadle pump being constrained to the 10.23 meter l i m i t of
atmospheric head.
In p r a c t i c e , the actual vapour pressure of water and the
use of a portion of the unbalanced head to overcome
turbulence, f r i c t i o n and to accelerate the water column with
the piston, the l i m i t of water table depth to which the
unbalanced head remains p o s i t i v e i s about 7 meters (World
Health Organization 1977).
23

24
Further constraints on the operation of the Treadle pump
include the l i m i t s of operator c a p a b i l i t i e s such as power
input, which varies with weight, d i e t , conditioning, health
and environmental conditions such as temperature and
humidity. The condition and design of the pump seals and
valves, which can influence the amount of s l i d i n g f r i c t i o n
and leakage past the piston and the amount of suction head
attainable, also constrain pump operation.
4.2 CALCULATION OF UNBALANCED HEAD
4.2.1 MINOR LOSSES
Minor losses are those caused by the f r i c t i o n and
turbulence of water against components of the pump system.
Included are those from when i t enters the pump system at
the f i l t e r u n t i l i t i s discharged at the pump spout.
The losses from turbulent flow through the expansions,
contractions and f i t t i n g s were calculated using tabulated
loss c o e f f i c i e n t s (Roberson and Crowe 1985, 377), calculated
as a proportion of v e l o c i t y head, and added to the t o t a l
head loss of the system.
Losses r e s u l t i n g from the f r i c t i o n between the water flow
and the uPVC r i s e r pipe and the s t e e l pump body were
calculated using the Darcy-Weisbach equation with a f r i c t i o n
factor of 0.005 derived from the Moody diagram (Roberson and
Crowe 1985, 368).

Although there are va r i a t i o n s i n i n s t a l l a t i o n such as
r i s e r pipe and f i l t e r q u a l i t i e s that can a f f e c t the amount
losses that occur, the losses i n the laboratory t e s t
apparatus were kept constant from t e s t to t e s t using a
single r i s e r to pump system. This allowed comparison of the
measured losses to those calculated.
4.2.2 VALVE TIMING AND LEAKAGE
Valve timing and leakage i n a constant d i f f e r e n t i a l
manual pump system a f f e c t s pump performance by decreasing
discharge f o r a given energy input.
In the Treadle pump, delays i n piston valve closure
r e s u l t s i n the operator exerting e f f o r t to the pump without
l i f t i n g any water and reduces the volume of water above the
piston f o r discharge. This delay reduces the force
required, with the reduction i n discharge, but consequently
increases the time pumping time required to meet the
i r r i g a t i o n requirements. Delays i n foot valve closure allow
water i n the piston to return to the r i s e r pipe reducing the
discharge on the following stroke. This has the e f f e c t of
increasing the energy requirement, as a reduced amount of
water remains i n the pump as compared to the amount for
which energy was expended.
Leakage through the valves and past the piston cup seal
also reduces pump e f f i c i e n c y . The leakage past the piston
cup seal during the upward stroke r e s u l t s i n a reduction of

26
the suction head created below the piston and also reduces
the volume of water above the piston to be discharged. From
examination of the valve l i f t distances, the valve opening
and c l o s i n g times, and the t o t a l losses through laboratory
experiments, the proportion of loss through leakage past the
piston seal can be compared to that from valve c l o s i n g
delays.
A measure for the amount of water l o s t by valve delays
and leakage i s termed volumetric e f f i c i e n c y , defined as the
r a t i o of the volume of water discharged to the volume swept
by the piston i n the same time period. Although i t i s
possible to obtain volumetric e f f i c i e n c i e s of greater than
one, from the momentum e f f e c t s of a water column, i t i s not
common i n manual pumps which have small input power and
r e l a t i v e l y small water column momentum.
4.2.3 INERTIA
The suction head required to accelerate the column of
water i n the r i s e r pipe i s dependent upon the length of the
pipe and the acceleration. As the r i s e r length i s fixed and
sealed, the acceleration of the water column i s a d i r e c t
r e s u l t of the acceleration of the pistons, but l i m i t e d by
the t o t a l unbalanced head av a i l a b l e .
The piston motion c h a r a c t e r i s t i c s of the Treadle pump
were assumed to be perio d i c with respect to time. To f i n d
the general shape and timing of the acceleration curve, an

27
cm m/s : m/s"2
0.05 0.25 0.5 TIME (Seconds)
Figure 9: C h a r a c t e r i s t i c piston motion parameters.
approximation of the form:
Y(t) = ^avg + A s:"-n (w"t)
where y(t) =
avg A
w =
piston displacement with respect to
time (centimeters)
median distance of piston t r a v e l (cm)
Amplitude of piston displacement about
Y a v g (cm).
Angular v e l o c i t y (as i f piston was
connected to a c i r c u l a r crank mechanism)
(radians/second)

28
t = time (seconds)
was assumed to be s u f f i c i e n t given the motion v a r i a t i o n s due
to operator and pump i r r e g u l a r i t i e s . The piston motion, for
one piston, measured i n the laboratory i s shown i n figure 9.
I r r e g u l a r i t i e s from operator and pump va r i a t i o n s are
e s p e c i a l l y evident i n the calculated acceleration curve. The
small v a r i a t i o n s i n p o s i t i o n over time, that are not evident
with the res o l u t i o n of p o s i t i o n graph, are revealed. An
approximation of the motion shown i n figure 9, given below
using the assumed sinusoidal form, could be used to
mathematically model the pump c h a r a c t e r i s t i c s .
y(t) = 3.6 + 1.5 s i n (14t - 2.6)
Although the approximation i s not a precise f i t to the
measured motion parameters, i t i s s u f f i c i e n t l y accurate
given the v a r i a t i o n s i n motion from the pump and operator.
Mathematically, t h i s should r e s u l t i n a maximum or minimum
acceleration, the second deri v a t i v e of the p o s i t i o n
equation, when the p o s i t i o n of the piston i s at a minimum or
maximum respectively. At the same minimum or maximum piston
p o s i t i o n , the v e l o c i t y , the f i r s t d e r i v a t i v e of the po s i t i o n
equation, should be zero. The p l o t of laboratory measured
po s i t i o n , v e l o c i t y and acceleration versus time, figure 9,
shows close agreement on the maximums and minimums to the

29
those expected from the mathematical derivations. As such,
the assumption as to the periodic nature of the Treadle pump
motion c h a r a c t e r i s t i c s was considered v a l i d .
However, for the purposes of accurately p r e d i c t i n g the
forces i n the pump from c a l c u l a t i o n , inputs f o r po s i t i o n ,
v e l o c i t y and acceleration were taken from the laboratory
data rather than from the mathematical expressions. This
assured that the c a l c u l a t i o n of the force inputs could be
compared d i r e c t l y with the measured r e s u l t s without any
errors induced by breaks or i r r e g u l a r i t i e s i n the laboratory
stroke motion.
4.2.4 MECHANICAL LOSSES
The one mechanical loss accounted f o r i n the pump model
was the s l i d i n g f r i c t i o n between the pPVC piston seal and
the s t e e l c y l i n d e r . Variations i n the form, consistency and
dimensions of the piston cup seals and pump cylinders
r e s u l t i n g from the manufacturing process, made a n a l y t i c a l
c a l c u l a t i o n of the s l i d i n g f r i c t i o n d i f f i c u l t . Given the
inexactness of the pump and the inconsistency between pumps,
an empirical approximation of 15 newtons, taken from
laboratory data of dry pump tes t s , was adopted.
Other mechanical losses, such as the f r i c t i o n i n the hook
and p in piston connection to the bamboo treadles, and the
f r i c t i o n of the central s t e e l axle treadle pivot against the
o s c i l l a t i n g treadles, also reduce the power e f f i c i e n c y from

30
the operator to the pump. The separate measurement of these
losses was beyond the scope of t h i s t h e s i s but are estimated
i n the assessment of the t o t a l losses occurring i n the
Treadle pump.
4.3 GOVERNING EQUATIONS
For stage one of the pump cycle, previously described i n
section 3.2 and shown i n figure 8, the force applied to the
piston i s the sum of the l i f t i n g of the piston mass, the
s l i d i n g f r i c t i o n between the piston seal and the c y l i n d e r
wall and the drag force from the water flow through the
piston. I t i s assumed that no water above the piston i s
l i f t e d by the small upward piston movement i n t h i s stage
which occurs before the piston seal seals against the lower
piston plate, i . e . no discharge i s produced. The force
required to l i f t the piston i s dependent upon the mass of
the piston, the unbalanced mass of the treadle lever and the
acceleration imparted to them, the c o e f f i c i e n t of f r i c t i o n
of the seal against the c y l i n d e r wall and the v e l o c i t y of
the piston through the water. The equation to c a l c u l a t e the
force required i s :
F = ((M+Mt)*ap) + (Hd*w*ap) + F f (1)
where F = force applied to the piston (newtons)
M = the piston mass (kg)

31
= unbalanced mass of the treadle lever (kg) 2
a = the acceleration of the piston (m/s )
H d = head loss r e s u l t i n g from the drag forces (m)
F f = s l i d i n g f r i c t i o n force 3
w = s p e c i f i c weight of water (newtons/m )
with c d * v 2
H = E — ( 2 ) 2*g
where
C d = drag c o e f f i c i e n t
V = v e l o c i t y of the piston (m/s)
g = g r a v i t a t i o n a l constant = 9.81 m/s2
For stage two, the completion of the upstroke, the piston
must produce s u f f i c i e n t suction to overcome the minor
losses, accelerate the water column and maintain s u f f i c i e n t
unbalanced head to produce flow from the water table to the
pump. This suction, expressed i n meters of water, i s
refe r r e d to a suction head (H). The force applied to the
piston also includes the force required to l i f t and
accelerate the unbalanced t r e a l e lever mass, and i s
calculated using the equation:
F = (H*Ap*w) + F f + ((M+Mt)*ap) (3)

32
where
Ap = cross-sectional piston area (m2)
and
H = - WT - h - h a *1 r r (4) 1 d g g
where
H = suction head (m) AH = atmospheric head (m) WT = depth to water table (m) h-̂ = t o t a l minor head losses h H = t o t a l head loss from drag
= head required to accelerate the water g column
a *1 — E _ - head required to accelerate water i n the g cylinder
In the t h i r d stage, from the end of the upstroke to the
closure of the foot-valve, the forces acting on the piston
include the f r i c t i o n force of the seal against the cylinder
and the drag force, from water escaping through the cl o s i n g
foot valve, at the same rate as the piston downward
movement. The force acting on the piston i s a r e s u l t of
gravity acting upon the unbalanced mass of the treadle lever
raised i n stage one and two.
In the fourth stage, the piston continues downward a f t e r
the c l o s i n g of the foot-valve. The forces from the s l i d i n g
f r i c t i o n and the drag of the piston through the water are

33
calculated using the sum of the constant f r i c t i o n force and
the drag force from equation (2), with the piston v e l o c i t y
substituted f o r the r i s e r flow v e l o c i t y . This force i s also
supplied by the unbalanced treadle lever mass.
As stated, the forces i n stages three and four are not
exerted by the operator but rather by gravity acting on the
mass of the unbalanced portion of the treadle lever, the
piston and the connecting pin. The unbalanced mass of the
second treadle i s simultaneously being l i f t e d by the
operator when the f i r s t i s exerting downward force.
I t was included i n the force c a l c u l a t i o n s f o r the upward
portion of the stroke where the force i s exerted but because
the force transducer was located at the piston rod and
measured the force exerted at the piston, not the force
exerted by the operator to the treadle levers. The force
exerted to r a i s e the unbalanced mass of the treadle lever
was included i n the force and power input measurements by
measuring the force exerted on the downward portion of the
stroke by the unbalanced treadle mass. This was added into
the power ca l c u l a t i o n s to account f o r the l i f t i n g force not
measured on the upward stroke. The method of adding the
e f f o r t exerted by unbalanced treadle lever mass on the
downward stroke does not take into account the force
differences between the upward and downward lever
acceleration. I t was assumed that i f the pump i s properly
i n s t a l l e d , the difference between the two i s minimal.

From the above equations, cal c u l a t i o n s f o r the forces at
d i f f e r e n t piston positions, based on one tenth of a second
measurement increments, were conducted with the r e s u l t s
shown i n figure 9. A water table depth of 3.34 meters, an
abrupt i n l e t , 6.37 meters of uPVC r i s e r pipe with a f r i c t i o n
c o - e f f i c i e n t of f=0.0005, a box type junction and the two
plate standard piston loss c h a r a c t e r i s t i c s and the motion
parameters taken from laboratory t e s t s were used i n the
c a l c u l a t i o n s .
400
300
5TN0 CONFIGURATION : DEPTH TO VT=3.34 M
200 -
150 -
100 -
PISTON POSTION ccentimeterS3
Figure 10: An example of calculated force r e s u l t s with
laboratory measured input parameters.

5 LABORATORY TESTING
5.1 APPARATUS DESIGN CONSIDERATIONS
The laboratory apparatus design required a c a r e f u l mix of
strength and s e n s i t i v i t y to balance the imprecise
c h a r a c t e r i s t i c s of the Treadle pump, r e s u l t i n g from
manufacture and design for operation i n Bangladesh, and the
pr e c i s i o n required for accurate measurement of performance
c h a r a c t e r i s t i c s . Obtaining a measurement accuracy of twenty
newtons, without the destruction of the s e n s i t i v e measuring
apparatus by the large force and displacement fluctuations
inherent i n the pump, involved the design of a s p e c i a l i z e d
force transducer.
This was achieved through repeated design and t e s t i n g of
alternate designs over a period of three months to obtain
the correct balance between s e n s i t i v i t y and d u r a b i l i t y . The
addition of sign a l amplification and conditioning f i n a l l y
enabled the t e s t i n g to be conducted within the required
parameters. In addition, the use of a highly stable
superstructure and wide range input transducers f o r l i n e a r
motion measurement was also necessary to ensure accuracy and
a high degree of s e n s i t i v i t y .
The modified s t e e l superstructure, pump attachment and
well structure increased s t a b i l i t y compared to the bamboo
35

commonly used i n Bangladesh. Used i n conjunction with
pumps, seals and pistons unaltered from manufacture i n
Bangladesh, the force and displacement fluctuations were
minimized without compromising the operating c h a r a c t e r i s t i c s
of the pump.
Force inputs to the pump v i a the pistons were measured
using a tubular s t r a i n gauge force transducer with reduced
Figure 11: Instrumentation for the laboratory t e s t s .

wall thickness to obtain maximum s e n s i t i v i t y mounted as part
of the piston rod as shown i n figure 11. The tubular
transducer was machined from aluminum, providing maximum
s t a b i l i t y against bending and buckling from large loads but
reta i n i n g the s e n s i t i v i t y required to accurately read the
small force changes occurring during the pump cycle. Two
dia m e t r i c a l l y opposed s t r a i n gauges were a f f i x e d to the
transducer and connected i n opposite arms of the wheatstone
bridge c i r c u i t .
This cancelled the bending forces r e s u l t i n g from the
often eccentric nature of the piston to cylind e r s l i d i n g
forces, the roughness of the hook pin connection of the
piston to the treadle and the arced motion of the c e n t r a l l y
pivoted treadle lever which resulted i n angular displacement
of the piston through the pump cycle. The force transducer
was also temperature compensated using two 12 0 ohm r e s i s t o r s
mounted beside the transducer on the pump frame and
connected to adjacent arms of the bridge c i r c u i t from the
s t r a i n gauges. The bridge c i r u i t was balanced by the use of
a va r i a b l e resistance c i r c u i t connected i n serie s with one
of the temperature compensating r e s i s t o r s .
The stroke p o s i t i o n was instrumented using a l i n e a r
v a r i a b l e distance transducer (LVDT) mounted between the
ri g h t hand side (from the operator) piston pin and the
v e r t i c a l upright posts of the pump structure. I t was

38
Figure 12: Laboratory apparatus.
mounted with pivot connections at both ends to prevent
bending of the transducer due to the arc of the treadle
lever throughout the stroke. The LVDT was supplied with a
ten v o l t e x c i t a t i o n voltage from a regulated d i r e c t current
power supply.
The data from the transducers was conditioned using an
am p l i f i e r to boost the force transducer sig n a l 1000 times,
to a l e v e l usable by the analog to d i g i t a l converter. The
analog to d i g i t a l converter allowed for data c o l l e c t i o n and
storage by a personal computer. Using a Basic language
computer program, data input timing was c o n t r o l l e d and data

39
was c o l l e c t e d from the analog to d i g i t a l conversion board
into the computer memory at a rate of 10 readings per
second.
The use of a high c o l l e c t i o n rate enabled the force peaks
and delays at the p i s t i o n to be detected and analyzed but
resulted i n very large data sets. Analysis of the data
using spreadsheet based programs became very time consuming
and was somewhat li m i t e d due to the large s i z e of each of
the 64 data sets. The duration of each t e s t was l i m i t e d to
f i v e minutes, at the ten hertz c o l l e c t i o n rate, by the
amount of in t e r n a l memory availa b l e i n the personal computer
and by the storage media where the data was stored f o r l a t e r
processing. The Basic language program was also used to
convert the data from raw converter readings to data
sui t a b l e output f o r l a t e r analysis u t i l i z i n g previously
measured c a l i b r a t i o n factors. The o v e r a l l t e s t i n g structure
i s shown i n figure 12.
Using free weights and a measuring scale, the force and
distance instrumentation was i n i t i a l l y c a l i b r a t e d and the
c a l i b r a t i o n factors re-checked a f t e r every four t e s t s .
5.2 TESTING PROCEDURE
The f i v e steps of the procedure for the laboratory tests
were:

40
1) Inspection of pump components and t r i a l pump operation
to check f o r worn out components, any problems such as
leakage and to obtain uniform pump operation.
2) The computer data c o l l e c t i o n channels were zeroed
where appropriate and the i n i t i a l l e v e l of water i n the
discharge c o l l e c t i o n tank was read and recorded.
3) With data c o l l e c t i o n started, the zero readings f o r
the force and p o s i t i o n transducers were recorded followed by
priming of the pump. Af t e r a pause, to indicate the
beginning of discharge i n the c o l l e c t e d data set, the pump
was operated f o r between 4 and 6 minutes, during which time
the data was c o l l e c t e d from the force transducer, the LVDT,
the LVDT and s t r a i n gauge voltage supplies and the computer
timer at a rate of ten readings per second.
4) On completion of pumping, the data c o l l e c t i o n program
was stopped and the data down loaded to a data f i l e on
floppy disk f o r conversion from raw readings and analysis
using a spreadsheet based program.
5) The water l e v e l i n the discharge c o l l e c t i o n tank was
read and recorded along with the number of readings taken by
the data c o l l e c t i o n system and the elapsed r e a l time f o r
comparison and error checking of the computer c o l l e c t e d
data.
The t o t a l time that data could be c o l l e c t e d i n one te s t
was constrained by the in t e r n a l memory l i m i t s of the
computer used and by the si z e of data f i l e storable on a

41
single data storage diskette and readable by the spreadsheet
program used f o r data analysis. C o l l e c t i o n times longer
than f i v e minutes were found to exceed these constraints.
5.3 DATA REDUCTION AND ANALYSIS
The data f i l e s r e s u l t i n g from the data c o l l e c t i o n
computer program were transferred to a spreadsheet program
using floppy disks. Using the spreadsheet functions, the
data was imported, reduced and analyzed using the following
steps:
1) The f i r s t portion of c o l l e c t e d data, taken with the
pump at rest , was averaged to obtain a raw data reading
equating to the zero point f o r each c o l l e c t e d v a r i a b l e .
These i n i t i a l zero readings were also used to check for
deviations i n data caused by va r i a t i o n s i n e x c i t a t i o n
voltage supply or c i r c u i t r y voltage v a r i a t i o n . I f the
average of the data c o l l e c t e d with the pump at re s t varied
more than 10% from the average of the complete data set,
normalized to the average supply voltage, then the t e s t was
repeated. Usually only the i n i t i a l t e s t i n a given series
was prone to large supply voltage and subsequent data
v a r i a t i o n s due to c i r c u i t r y heating within the voltage
supply, force transducer amplifier and s t r a i n gauge bridge
c i r c u i t s . Small v a r i a t i o n s i n the data set about the
average were permitted, as the area under the force-
displacement curve remained constant. The small p o s i t i v e
42 and negative v a r i a t i o n s cancel each other out i n the
c a l c u l a t i o n of the o v e r a l l area encompassed by the curve.
2) I f the data was within the acceptable l i m i t s f o r
v a r i a t i o n , then the zero readings were recorded and the data
c o l l e c t e d during zeroing, priming and between the completion
of pumping and the stopping of data c o l l e c t i o n , was removed.
3) The force and p o s i t i o n data was then converted to
appropriate units from the raw data readings, using the
c a l i b r a t i o n factors and zero point data.
4) Calculations f o r work and power were then calculated
on a time incremental basis from the piston p o s i t i o n , time
and force inputs. The c a l c u l a t i o n of power used to l i f t the
unbalanced treadle lever mass during the piston upstroke,
l a t e r providing the force for the downstroke, was calculated
from the force measured at the piston during the downstroke
and added to that calculated for the upstroke. The stroke
rate, t o t a l swept volume and average stroke length was
calculated using the e n t i r e data set.
Using the discharge data, calculated from the readings
taken on the c a l i b r a t e d discharge c o l l e c t i o n tank, the
piston p o s i t i o n and timing values, the volumetric
e f f i c i e n c y , power output and, using the average of the
calculated power values, power e f f i c i e n c y r e s u l t s were
calculated.

6 FIELD TESTING
6.1 APPARATUS DESIGN CONSIDERATIONS
The apparatus design for the f i e l d t e s t s was constrained
by four factors.
F i r s t l y , the l i m i t e d a c c e s s i b i l i t y of the t e s t s i t e s .
A l l equipment and personnel reached the s i t e s by a
combination of r i v e r boats, motorcycles and walking.
Secondly, the u n a v a i l a b i l i t y and u n s u i t a b i l i t y of
sophisticated t e s t equipment such as that used i n the
laboratory due to extreme environmental conditions and the
lack of t r a n s p o r t a b i l i t y , repair, component f a b r i c a t i o n
f a c i l i t i e s and power a v a i l a b i l i t y .
T h i r d l y , the v a r i a b i l i t y of pump i n s t a l l a t i o n s i n terms
of o v e r a l l condition, set-up dimensions and operation
parameters and fourthly, the l i m i t to disruption of pumping
a c t i v i t i e s f o r t e s t i n g i n terms of both time and a l t e r a t i o n
of the pump f i e l d s i t u a t i o n . Any undue disruption could
have had the e f f e c t of minor crop damage due to non-
i r r i g a t i o n , loss of income f o r the hired labour operating
the pump i f hired labour was used, and undue expenditure by
l o c a l farmers f o r food and drinks i n t h e i r e f f o r t s to
befriend and impress the te s t e r s .
43

44
The r e s u l t i n g apparatus design u t i l i z e d two, t h i r t y l i t r e
measurement pans, an e l e c t r i c a l water l e v e l sensor c i r c u i t
attached to a tape measure, a two hole o f f s e t clamp to
attach a pen to the piston rod, a clipboard/paper holder and
four a d d i t i o n a l personnel.
As i n the laboratory t e s t s , parameters for discharge,
stroke length, stroke number and t e s t time needed to be
measured. Discharge was measured by alternate f i l l i n g and
dumping of the two measuring pans, stroke length was
measured by repeatedly s l i d i n g the clipboard held paper
along the holder and measuring the r e s u l t i n g traces from a
pen or marker mounted to the piston rod. This method for
measured stroke length was altered somewhat from pump to
pump depending upon the ground surface surrounding the pump,
the pump i n s t a l l a t i o n , the a p p l i c a b i l i t y of using the
clipboard holder and the d i f f i c u l t i e s i n a f f i x i n g the pen or
marker to the piston rod. In a few cases, the stroke length
was measured by observation of the stroke against a
measuring tape as the i n s t a l l a t i o n d i d not allow f o r
a f f i x i n g a marker to the piston rod without i t s rapid
destruction. Stroke number was counted by one of the
additio n a l personnel and the te s t was timed from s t a r t to
stop by a stop watch.
The apparatus was simple i n design and was found to be
very adaptable to var i a t i o n s i n t e s t s i t u a t i o n s and e a s i l y
understood by the t e s t personnel. The apparatus was labour

45
intensive, by North American standards, but was appropriate
for use i n Bangladesh, where labour i s r e a d i l y a v a i l a b l e and
less expensive than the cost with increased apparatus
complexity. Given the conditions f o r the t e s t i n g , the
apparatus was found to be appropriate.
6.2 TEST LOCATIONS AND PROCEDURE
Forty-one Treadle pumps were tested i n the f i e l d t e s t s ,
ten i n the Jamalpur and Sherpur regions i n north central
Bangladesh, and t h i r t y - t h r e e i n the Kushtia and Pabna
regions i n western Bangladesh as shown i n figure 11.
Research into pump design and alt e r n a t i v e s was conducted i n
the Kurigram region i n Northern Bangladesh and i n the
Shonargoan region j u s t south of Dhaka.
The t e s t procedure varied somewhat from s i t e to s i t e
depending upon how the pump was situated and set up i n the
f i e l d and the degree of co-operation from the farmer owner-
operator or hired operator. In general, the procedure was
as follows:
1) With permission from the owner and operator, s o i l
below the pump spout was removed, i f necessary, to permit
placement and removal of the discharge measurement pans
below the discharge spout.
46
Partchagarti
,ni*,' iNiiphama.
Scale l'= 80 Miles
REFERENCES .
InternoHonal Boundary . .
District Boundary
RaiJwoy
Rivei-
Air Port
vlhet
Moulvi bazar
\VManikgonj\D|}al"i'i. \ ?/, rf Brahmanbaria
'Munshigani
IMeherpur^r-r. ••.17
^huadanga f tA Faridpur
•jfJhenaidah J Magura 1 \ [ _ , , ^ ^
Jessore ' Narailc X\.
x Gopalgan, \/7^ J t A . ^ N ^ j
£_Perojpur v. 1 ( ' "»
tSatkhira
Figure 13: Location of f i e l d tests,

47
2) The owner of the pump was asked about the age of the
pump, dates of most recent component replacements, depth
and type of r i s e r and f i l t e r , and i f any problems had been
encountered with the pump. The pump operator, often the
owner, was asked h i s or her age, weight and number of hours
the pump was operated per day during the dry season to gain
i n s i g h t into operators t y p i c a l l y using the pump. The
responses were recorded to provide information to a s s i s t i n
design a l t e r a t i o n considerations and to sign a l any
s i g n i f i c a n t deviations from t y p i c a l pump usage which might
a f f e c t the data c o l l e c t e d .
3) The pump cylinders, pistons, cup seals and foot-valves
were inspected f o r signs of undue wear and improper
operation. I f the components were i n such poor condition as
to be non-representative of normally used and maintained
pumps, then the t e s t was abandoned and the t e s t moved to the
next s i t e .
4) A f t e r f i v e to ten minutes of pumping to obtain as
normal a sustainable pumping rate as possible, the depth to
water table was measured using the e l e c t r i c a l measuring tape
lowered into the r i s i n g main through the foot-valve and
junction box. The measuring of the water table depth a f t e r
the i n i t i a l pumping and draw down resulted a depth that
would be consistent with sustained pump operation.
5) The clamping mechanism that attached the pen or marker
to the piston rod was attached on the upper portion of the

48
piston, so as not to i n t e r f e r e with pump operation, and a
pen was also attached at r i g h t angles to the piston.
6) The operator was instructed to pump as i f the t e s t was
four hours i n duration, to obtain usual sustainable pumping
rates. A f t e r f i v e minutes of pumping or when the stroke
rate slowed and became consistent, the timing and stroke
counting was started and the discharge measuring pan was
placed under the spout.
7) At l e a s t four traces of the stroke motion were made,
spaced at about one minute i n t e r v a l s , the discharge
measuring pans were removed and emptied when f u l l with as
l i t t l e s p i l l a g e as possible and the timing and stroke
counting were continued. The minimum t e s t duration was four
minutes and the maximum was ten minutes.
8) I f the stroke rate and length were consistent over the
f i r s t four minutes of te s t i n g , then the data c o l l e c t i o n was
stopped at the next f u l l measuring pan. I f not, then the
t e s t was continued for as long as 10 minutes with
incremental data values recorded to obtain the data for the
most consistent pumping.
9) Following completion of the t e s t , the data was
recorded on data c o l l e c t i o n sheets f o r future analysis. I f
the pump was mounted on an uPVC r i s e r and f i l t e r , then the
tes t s were repeated using the author as the operator f o r
comparison to the laboratory data.

49
10) Upon completion of the t e s t i n g , the owner was advised
of any repairs or maintenance required on the pump to
improve performance and the pump set up was returned to as
near i t s o r i g i n a l configuration as possible, unless asked to
do otherwise, before leaving the t e s t l o c a t i o n .
6.3 DATA ANALYSIS
The data from the f i e l d t e s t s had large v a r i a t i o n s due to
differences i n pump condition, operator s i z e and motivation
and turnover i n c o l l e c t i o n personnel. In analyzing the data,
only severe o u t - l i e r s , those not p h y s i c a l l y possible, were
removed.
The stroke lengths were measured using the v e r t i c a l
distance from the trough to the peak on the trace. The
multiple traces for each t e s t were averaged to obtain the
stroke length used i n calcu l a t i o n s to determine the t o t a l
swept volume necessary f o r c a l c u l a t i n g the volumetric
e f f i c i e n c y of the pump.
The discharge volume was calculated from the number of
discharge pans f i l l e d and the respective volumes of the
pans. The pan volume was adjusted based on observation of
how f u l l the pans were f i l l e d during the t e s t and on how
much unmeasured discharge occurred on the switching of the
pans. T y p i c a l l y t h i s adjustment ranged from a seven to
twenty percent reduction i n the measured discharge, as the

50
pans were r a r e l y completely f u l l on removal and l i t t l e water
was l o s t during the switching of the pans. The v a r i a t i o n i n
adjustment was dependent upon the performance of the
personal removing and replacing the pans during a p a r t i c u l a r
t e s t , which was recorded for each t e s t .
The volumetric e f f i c i e n c y was calculated using the r a t i o
of the t o t a l swept volume, calculated from the number of
strokes and the stroke lengths to the measured discharge.
Using the depth to water table and the discharge data
c o l l e c t e d , the input power to the pump was estimated based
on the depth-discharge-power output r e s u l t s from the
laboratory t e s t s .

7 RESULTS
7.1 PUMP FORCES
The force displacement curves, generated from the
laboratory t e s t s , are useful f o r measuring the changes i n
forces applied to the piston throughout the four stages of
the piston stroke. These changes are a r e s u l t of variatio n s
i n f r i c t i o n , acceleration of the water column i n the r i s e r
pipe, formation of the unbalanced head, and the use of the
pot e n t i a l energy stored i n the raised treadle lever mass to
provide the energy for the downward piston stroke. Pump
configuration, piston and foot-valve design also cause force
v a r i a t i o n s that are of p a r t i c u l a r i n t e r e s t i n pump design.
Taking a de t a i l e d look at the i n i t i a l portion of the
force curves, the large forces at the s t a r t of the upstroke,
evident i n figures 14 and 15, r e s u l t from the large forces
required to accelerate the water column i n the r i s e r pipe
and the water above the piston from rest, or nearly so, to
equal the v e l o c i t y of the piston at that same point i n the
stroke. In comparing t e s t s using the standard two plate
piston and the No.6 piston, shown i n figures 14 and 15
respectively, two differences i n acceleration forces are
evident.
51

52
WATER TABLE DEPTH: 3.36 meters 400
2.3 3.3 4.5 3.3 6.5
PISTON POST I ON ccentlmeters}
Figure 14: Force-displacement loop using the two-plate
type piston.
F i r s t l y , the peak accelerating force occurs much more
ra p i d l y a f t e r the valve c l o s i n g i n the standard two-plate
piston compared to the smaller slope following valve closure
with the No. 6 piston. However, the maximum forces
r e s u l t i n g from acceleration of the water columns are close
to equal, given operator v a r i a t i o n s , and also occur at the
same p o s i t i o n i n the stroke. The difference i n the slopes

i n the i n i t i a l portion of the curves i s a r e s u l t of the
combined e f f e c t of the fast e r valve c l o s i n g time of the No.6
400
330
WATER TABLE DEPTH : 5.34 meters
<J 200 -
130
100
_ 5 ° "1 1 1 1 1 1 1 1 1 r 2.6 3 3.4 3.B 4.2 4.6
PISTON POSITION ccentlmetere}
~ i 1 1 1 1 r— 5 5.4 5.B 5.2
Figure 15: Force-displacement loop using the No.6 type
pistons.
piston, indicated by the rapid increase i n piston force
e a r l i e r i n the stroke, and the e f f e c t of greater i n i t i a l
leakage through and by the No. 6 piston, which i s indicated
by the f l a t t e r slope of the force curve f o r the No. 6
piston. The equivelent maximum forces indicates that the
two pistons seal equally by the end of the stroke.
Secondly, the standard piston shows a sharp decrease i n
force of 100 to 150 newtons at mid-upstroke followed by an

54
increase i n force of 50 to 100 newtons at the completion of
the upstroke. This i s not evident with the No. 6 piston,
which has a more constant force throughout the stroke. Two
explanations of t h i s force v a r i a t i o n are:
1) That the water column and piston rod exhib i t e l a s t i c
properties r e s u l t i n g from the rapid valve closure and
r e s u l t i n g shock forces. This e l a s t i c e f f e c t i s much l i k e a
stretching and subsequent rebounding. The e l a s t i c e f f e c t s
of a manual pump water column was documented, to explain
s i m i l a r force v a r i a t i o n behavior, i n the t e s t i n g of deep set
hand-pumps (Yau 1985). Although the documented force
v a r i a t i o n i s s i m i l a r to that measured on the Treadle pump,
the much shorter piston rod of the Treadle pump and the
r e s u l t i n g e l a s t i c e f f e c t of the pump rod i s n e g l i g i b l e ,
compared to the ten meter rod used i n the analysis by Yau.
The r e s u l t s are s t i l l useful however. The report (Yau 1985)
concluded that the magnitude of the large force increase was
required for the design of pump components to withstand the
shock loading, but that the o v e r a l l area under the force
displacement curve did not to change. S i m i l a r l y f o r the
analysis of the Treadle pump force displacement curves, the
reductions i n piston forces were found to be e f f e c t i v e l y
cancelled by the increases, measured over the en t i r e stroke
length, r e s u l t i n g i n a consistent work input measurement.
55
2) The force v a r i a t i o n could also be caused by the
deformation of the piston seal i n the two plate standard
piston. This would cause binding of the seal against the
c y l i n d e r wall as the piston cup seal would deform under the
maximum combined forces of head loss, head requirements and
acceleration. The unrestricted piston seal i s able to
rotate about i t s leading edge, the upper circumference, from
the combined moment created by the downward forces of
f r i c t i o n , unbalanced suction head and acceleration forces
acting on the outer edge of the seal and the upward l i f t i n g
motion of the piston acting on the inward edge. The large
and sudden acceleration force, evident with the standard two
plate piston, i s followed by a sudden reduction i n force,
caused by poor sealing and loss of suction from seal
deformation. The increase i n force a few centimeters l a t e r
i n the stroke could be caused by the cup seal re-sealing
against the c y l i n d e r and regaining the suction forces. The
re- s e a l i n g occurs as the downward deforming forces on the
seal are reduced and the shape memory inherent with
temperature set p l a s t i c s , such as pPVC, return the seal to
i t s o r i g i n a l un-deformed shape. In comparison, deformation
of the seal by r o t a t i o n about i t s circumference edge i s not
possible with the No. 6 piston as the seal i s s o l i d l y fixed
between two threaded f i t t i n g s .
Given that the force reductions and increases through the
stroke are not constant with the fixed r i s e r length used i n

56
the laboratory t e s t s , and that the No. 6 piston d i d not show
t h i s c h a r a c t e r i s t i c curve when maximum sealing and steep
acceleration force curves occurred i n some t e s t s , the second
explanation, that of the deformation of the piston seal, i s
the most probable. This i s not conclusively provable with
the t e s t apparatus and r e s u l t s of t h i s t h e s i s .
More importantly, to the improvement of the pump design,
the force curve when using the No.6 piston i s smoother with
le s s shock loading on the piston than with two-plate design,
due to shorter valve c l o s i n g times and probably l e s s seal
deformation. The smoother force t r a n s i t i o n s also lessen the
sudden loads on the pump superstructure, extending the
working l i f e and improving structure s t a b i l i t y .
7.2 VALVE CLOSURE DELAYS
The opening and c l o s i n g of the piston and foot valves are
evident from the tension or compression forces measured at
the piston rod. Examination of the time and distance
t r a v e l l e d by the piston from the beginning of a stroke stage
to the beginning of associated forces, indicates the delays
i n valve opening and c l o s i n g . This i s useful i n analyzing
the proportion of volumetric losses a t t r i b u t a b l e to valve
delays as opposed to leakage past the piston s e a l .
The piston valve closure delay, shown by the more
hori z o n t a l portion of the force curve at the beginning of
the stroke, i s about two times greater with the two-plate

57
piston than with the No. 6 piston. The average 1.0 cm
stroke length delay of the two-plate piston valve
e f f e c t i v e l y reduces the stroke length used f o r pumping by
25% i n the laboratory t e s t s and an estimated 8% i n the f i e l d
t e s t s . The difference between the laboratory and f i e l d
t e s t s i s a r e s u l t of the longer stroke lengths of the
Bangladeshi operators i n the f i e l d t e s t s . The proportion of
the stroke used for valve closure becomes smaller with the
longer stroke. In eithe r case, the valve delay r e s u l t s i n
reduced discharge and lower volumetric e f f i c i e n c y . The 0.5
cm delay with the No.6 piston reduces the useable stroke
length by 12.5 percent and an estimated 4 percent i n the
laboratory and f i e l d t e sts respectively.
F i e l d Tests
Standard Piston
No. 6 Piston
Lab. Tests
Standard Piston
No. 6 Piston
Piston Foot-valve Total
8
25
12.5
13
13
40
40
21
17
65
52.5
Table I I : Percent loss from piston and foot-valve
delays.

58
I t should also be noted that the looseness of the piston
to treadle lever connection often r e s u l t s i n a longer
treadle lever stroke length than piston stroke length. As
such, the strokes seemed longer to the operator than those
measured.
Delays i n foot-valve c l o s i n g are indicated by the
downward distance t r a v e l l e d by the piston before compressive
forces which indicate movement of water through the piston
rather than through the foot-valve, are exerted'on the
piston. As seen i n figures 14 and 15, the delay i n foot-
valve c l o s i n g i s large, taking up as much as 1.6 cm of
stroke length. This delay represents an average of 40% of
the stroke length i n the laboratory t e s t s and an estimated
average of 13% i n the f i e l d t e s t s .
The cumulative e f f e c t s of valve closure delays are
given i n Table I I .
As previously mentioned, the differences i n operating
s t y l e s i n the f i e l d t e s t s r e s u l t i n the v a r i a t i o n between
the losses calculated from the laboratory and averaged f i e l d
t e s t values. The primary cause for the difference i s the
three times longer average stroke length of 13 cm for the
Bangladeshi operated f i e l d t e s ts as opposed to the 4 cm
length f o r the author operated laboratory t e s t s . The longer
stroke lengths used by the Bangladeshi farmers i n the f i e l d
t e s t s reduces the o v e r a l l e f f e c t of valve closure delays.
Although the percentage losses are not as great i n the f i e l d

59
t e s t s , the closure delays s t i l l represent a major loss i n
the short strokes as compared to the f u l l c y l i n d e r length
strokes of the o r i g i n a l rope and pulley system shown i n
figure 3. The s h i f t to the "dheki" operating system that
has resulted i n the shorter stroke lengths was i n i t i a t e d by
Bangladeshi farmers to increase operator comfort. They
found that the weight s h i f t i n g , non-knee bending s t y l e of
operating the "dheki" system was more comfortable than the
stepping action of the rope and pulley system. In e i t h e r
system, the operator w i l l move towards or away from the pump
to achieve the most comfortable stroke length and power
input requirement. With the non-knee bending s t y l e of the
"dheki" operation, the changes i n stroke length are l i m i t e d
by the hip j o i n t motion and as such the range of stroke
length i s small. For the analysis of the pump, i t was
assumed that the stroke length i s u n l i k e l y to increase
beyond the extremes measured i n the f i e l d . For the most
part, the longer stroke lengths i n the f i e l d t e s t s over the
laboratory t e s t s are a r e s u l t of many hours of pumping
experience by the Bangladeshi operators. The laboratory
operator, operating pumps i n Bangladesh, consistently had
shorter stroke lengths, further i n d i c a t i n g that the
difference l i e s with the operator rather than the pump
i n s t a l l a t i o n .

60
7.3 THE EFFECT OF WATER TABLE DEPTH ON APPLIED FORCE
As the force applied to the piston i s the sum of
providing the unbalanced head to provide water flow,
overcoming losses, accelerating the water column and
increasing the pot e n t i a l energy of the treadle lever, an
increase i n water table depth with no increase i n o v e r a l l
r i s e r length, a f f e c t s only the force required to create the
unbalanced head needed fo r water flow. The increase i n
force, as shown i n figure 16, from 230 to 350 newtons, a
differe n c e of 120 newtons, with an increase from 3.44 to
5.36 meters respectively, i s , for a l l intents and purposes,
equal to the t h e o r e t i c a l difference of 123 newtons
calculated using equation 1 and 2 from section 4.3, for the
same depth increase. This shows that the acceleration and
head losses are dependent upon r i s e r length and not the
water table depth.
As the area under the force displacement loop equals
the work done, the increase i n force with an increase i n
water table depth, increases the work done provided the
stroke length and stroke rate are constant.
7.4 THE EFFECT OF WATER TABLE DEPTH ON DISCHARGE AND
VOLUMETRIC EFFICIENCY
The e f f e c t of water table depth on volumetric
e f f i c i e n c y was found to be a reduction of volumetric

61
e f f i c i e n c y with increasing depth, as shown i n figure 17.
This indicates that valve and seal leakage, responsible for
poor volumetric e f f i c i e n c y , i s a function of water table
depth and thus the magnitude of the suction below the
piston.
The curves presented f o r the f i e l d t e s t s represent
averaged volumetric e f f i c i e n c i e s from the raw t e s t r e s u l t s .
The values vary from 35 to 73 percent, with averages of 55%
percent over a range of water table depths from 2.05 to 4.13
meters. The wide v a r i a t i o n was a r e s u l t of a wide range of

62
Figure 17: The e f f e c t of water table depth on volumetric
e f f i c i e n c y .
pump conditions, operational stroke lengths and cylinder
conditions, r e s u l t i n g i n va r i a t i o n s i n foot valve and piston
seal leakage.
The laboratory r e s u l t s for the same configuration of
pump as used i n the f i e l d , but tested over a greater range
of water table depths, indicated volumetric e f f i c i e n c i e s
ranging from 55 to 41 percent at 1.51 to 6.22 meters
respectively. The small reduction i n volumetric e f f i c i e n c y
through the t e s t range was primarily due to increased
63
leakage and piston and foot-valve delays, as seen by the
force-displacement curves. This indicates that the
volumetric e f f i c i e n c y c h a r a c t e r i s t i c s of the pump are more
dependent on the motion c h a r a c t e r i s t i c s of the piston rather
than an increase i n water table depth.
The longer average stroke i n the f i e l d t e s t s produced
reduced losses due to valve closure delays. The v a r i a t i o n
i n stroke length between operators also caused increased
data spread as the longer strokes decreased the proportion
of the stroke taken up by valve opening and closings. This
e f f e c t i v e l y increased the volumetric e f f i c i e n c y of the pump.
The s i m i l a r i t y of the volumetric e f f i c i e n c i e s i n the
laboratory and f i e l d t e s t s indicated much greater losses
past the piston buckets i n the f i e l d t e s ts as the proportion
of losses due to valve opening and cl o s i n g were les s with
the longer stroke length.
7.5 POWER INPUT REQUIREMENTS
The power for the Treadle pump, being supplied by human
operators, varies with the condition and surroundings of
both the pump and operator. The laboratory t e s t s , using the
same pump configuration as tested i n the f i e l d , were
conducted using shorter strokes at roughly the same stroke
rate, r e s u l t i n g i n lower discharges. The shorter stroke
length used i n the laboratory was a r e s u l t of the pump
operation being c o n t r o l l e d according to operator comfort, as

65
POWER INPUT (watts)
1.51 2.57 3.34 3.62 4.09 5.36 DEPTH TO WATER TABLE (meters)
^ LAB. RESULTS ••+•- EST. FIELD RESULTS
Figure 18: Laboratory and estimated f i e l d power input
requirements.
The laboratory measured and estimated f i e l d t e s t power
requirements both indicate that there i s an upper maximum
power output a b i l i t y f o r operators of the Treadle pump.
This value was measured as 50 watts at the pump head with
some v a r i a t i o n with operator and pump i n s t a l l a t i o n . Adding
the losses r e s u l t i n g from f r i c t i o n i n the superstucture not
measured by the laboratory instrumentation, the actual l i m i t
f o r power input i s closer to 55 watts. Although i t i s
possible to produce much more power than t h i s over a short
period of time, the often malnourished Bangladeshi operator,

64
i s done by the Bangladeshi farmer. The difference between
what was comfortable to the North American laboratory
operator and the Bangladeshi farmer operators was the cause
of the differences i n stroke length. Assuming the losses
remained constant between the laboratory t e s t s and the f i e l d
t e s t s , the power input should be proportional to the
discharge i n both t e s t s . Using the laboratory discharge and
power input measurements, including the power required to
ra i s e the treadle lever estimated by the amount of work done
by the lever during the piston downstoke, estimates were
made f o r the power input from the f i e l d t e s t s , shown i n
figure 18, using the f i e l d discharge measurements. The
estimates do not f u l l y take into account the i n e f f i c i e n c i e s
of the superstructure, which include the f r i c t i o n at the
central axle pivot and at the piston to treadle lever
connection, occurring between the operator and the pistons
where the data was c o l l e c t e d .
As with the measured laboratory data, the f i e l d power
inputs r i s e sharply with an increase i n depth to the water
table, as a r e s u l t of the increased force required create
the unbalanced head required for.water flow from the water
table. Corresponding to t h i s increasing power requirement,
the pump discharge decreases due to increased losses from
pipe f r i c t i o n and leakage through the valves and piston
seals as described i n section 7.4.

pumping fo r periods of at le a s t 30 minutes duration and a
t o t a l d a i l y pumping requirement often between 8 and 10 hours
per day, w i l l not exceed t h i s value. The t e s t i n g by EPC
(EPC 1988), which measured power input using operator
metabolic measurments, states maximum power operator output
values as 69.73 and 51.7 watts for pumping durations of 20
and 30 minutes respectively, c l o s e l y agrees with the res u l t s
obtained by c a l c u l a t i o n from the laboratory and f i e l d t e s t s .
This l i m i t of power has implications to area i r r i g a b l e from
a given depth. The area must remain above the minumum found
by Orr (Orr and Islam 1988) to be the minimum fo r economic
v i a b i l i t y and yet remain within the power c a p a b i l i t i e s of
the operator.
For example, the minimum discharge required to supply
an average farmer's 0.24 Ha (0.65 acre) crop, with a
consumptive use of 6 mm/day, using one pump and a maximum
pumping time of 8 hours per day, i s 28 1/min. The maximum
depth to water table s t i l l able to meet the i r r i g a t i o n
requirements would be 3.8 meters and would require a
constant power input of 40 watts, using the laboratory based
f i e l d estimates of input power requirements and f i e l d
discharge r e s u l t s .
Regions where marketing of the pump has been less
successful have water table depths of 4 meters and greater.
The d i f f i c u l t y i n maintaining the 28 litre/minute i r r i g a t i o n
requirement without exceeding the power input l i m i t of 55

67
watts at these depths, i s for the most part, the cause for
the poor sales.
7.6 PUMP AGE EFFECTS ON DISCHARGE AND VOLUMETRIC EFFICIENCY
The age of the treadle pumps f i e l d tested i n Bangladesh
had l i t t l e e f f e c t on the discharge and volumetric e f f i c i e n c y
c h a r a c t e r i s t i c s measured as shown i n figure 19.
VOLUMETRIC EFFICIENCY DISCHARGE (L/min)
10 20 30 PUMP AGE (months)
40
• DISCHARGE - f - BEST FIT DISCH.CURVE
* VOL. EFFICIENCY - B - BEST FIT V.E. CURVE
Figure 19: E f f e c t of pump age on volumetric e f f i c i e n c y
and discharge from f i e l d t e s t s .

68
The large v a r i a t i o n s i n owner maintenance and care of
the pumps observed and tested, overshadowed any long term
e f f e c t s from age as can be seen by the large degree of
scatter i n the data. Variations of component wear were
widely observed, with some pumps requiring replacement
piston buckets and foot-valve flaps a f t e r two or three
months and others not u n t i l a f t e r 2 or 3 years. Major wear
i n the s t e e l pump body was comparatively minimal by v i s u a l
inspection compared to the obvious wear of the cup seals and
valves.
7.7 EFFECTS OF PUMP BODY CONFIGURATION ON VOLUMETRIC
EFFICIENCY, POWER REQUIREMENTS AND DISCHARGES
E f f e c t s from alternate pump configurations, the
combinations of the two piston and two pump body types, were
most evident i n the laboratory r e s u l t s f o r force inputs,
volumetric e f f i c i e n c i e s , discharges and input power
requirements as shown i n figure 20.
The volumetric e f f i c i e n c y i s much lower when the No. 6
piston i s used as compared to the standard two plate piston,
with e i t h e r pump body at the same water table depth. This
i s a t t r i b u t a b l e to poor sealing of the poppet valve i n the
No. 6 piston. The r e s u l t of t h i s leakage i s a loss of
suction c a p a b i l i t y and the p a r t i a l l y the lower discharges
indicated i n figure 20.

69
1
0.9
0.8 --
0.7 --
0.6
0.5 --
0.4 --
0.3 --
0.2 --
D.l --0
VOLUMETRIC EFF'Y
0.
DISCHARGE (L/mln) T 30
-- 25
+ + 2 3 4 5
WATER TABLE DEPTH (maters)
20
15
-- 10
-- 5
— - BOX:5
HOX:S
BOX; 6
-0-- BOX: 6
YiSTND
"A- YiSTND
"B - Y:N0.6
-X- Y:N0.6
Figure 20: E f f e c t of pump configuration on laboratory
measured volumetric e f f i c i e n c y and discharge.
The e f f e c t s of pump body type are s i m i l a r to those of
the pistons, but the reasons f o r the poorer performance of
the Y-style pump are less obvious. As shown i n figure 20,
the volumetric e f f i c i e n c i e s and discharges f o r the Y-style
pump are a l l lower than f o r a s i m i l a r l y configured box
manifold pump. The lower volumetric e f f i c i e n c y when using
the same set of pistons i n each configuration, gives a clear
i n d i c a t i o n that the foot-valve on the Y-style pump tested i n
the laboratory was operating poorly, as no other change was

70
made which could a f f e c t leakage losses. As a r e s u l t , l i t t l e
can be said about the e f f e c t s of the Y-style Treadle pump,
except that any increases i n performance a t t r i b u t a b l e to the
manifold design, e i t h e r Y-style or box, must be minimal to
be overshadowed by va r i a t i o n s i n foot-valve performance.
The alternate pump configurations were not f i e l d tested
so no comparison i s possible to the performance the pumps
would have i n Bangladesh. Given the poor laboratory t e s t
r e s u l t s , an assumption of s i m i l a r f i e l d performance would be
reasonable given the close agreement i n laboratory and f i e l d
r e s u l t s of the configuration widely used i n Bangladesh, the
box manifold and two-plate piston.

8 DISCUSSION
8.1 VALIDATION OF THEORETICAL MODEL BY LABORATORY TESTS
The governing equations presented i n section 4.3
produced a force displacement curve that compares c l o s e l y
with the laboratory r e s u l t s as shown i n figure 21,
Figure 21: Comparison of calculated and laboratory
r e s u l t s .
which i s for a model with the box-type manifold Treadle pump
using the standard two-plate piston. Values for mechanical
f r i c t i o n and piston motion c h a r a c t e r i s t i c s used i n the
cal c u l a t i o n s where taken from the laboratory t e s t data, not
from the derived motion equations. The close agreement of
the laboratory and calculated force curves shown i n figure
21 i s l a r g e l y due to using measured piston motion rather
than the t h e o r e t i c a l values. This i s because the measured
values account for i r r e g u l a r i t i e s present i n the laboratory
t e s t s that would not be accounted for i n the t h e o r e t i c a l
motion values.
The laboratory and t h e o r e t i c a l r e s u l t s f o r the other
three pump configurations are also i n close agreement. This
i s to be expected because the a l t e r a t i o n s from the standard
configuration are primarily i n valve delay and leakage
parameters, which were derived from the laboratory data.
8.2 COMPARISON OF LABORATORY AND FIELD TEST RESULTS
The inconsistency of f i e l d operators and pumps made the
comparison between laboratory and f i e l d t e s t r e s u l t s
d i f f i c u l t . Averaged f i e l d r e s u l t s , used for comparison at
0.2 meter increments of water table depth, showed that the
shorter stroke lengths and the equal or slower stroke rates
used i n the laboratory, as an estimation of how a
Bangladeshi farmer would operate the pump over long

durations, produced lower discharge than f o r s i m i l a r f i e l d
configurations. The shorter stroke lengths used i n the
laboratory t e s t s were a r e s u l t of what was comfortable for
the operator. The Bangladeshi farmers are more comfortable
with the s l i g h t l y longer stroke length but they s t i l l prefer
the much shorter stroke of the "dheki" s t y l e superstructure
to the f u l l length strokes of the rope-pulley
superstructure. The f i e l d t e s t operators pumped with longer
strokes and often a faster stroke rates than were assumed
for the laboratory t e s t s , but tended to pump fo r shorter
durations, about 1/2 hour rather than continuous pumping, as
they reached the l i m i t of t h e i r power output c a p a b i l i t i e s .
The shorter pumping duration, the motivation of
i r r i g a t i n g the sole source of income f o r the family group,
and a v a i l a b i l i t y and a f f o r d a b i l i t y of food and medicine may
r e s u l t i n higher power inputs than anticipated from the
laboratory t e s t s .
The volumetric e f f i c i e n c y r e s u l t s were widely spread i n
the f i e l d data but the averaged r e s u l t s agreed c l o s e l y with
the laboratory data. This close agreement i n volumetric
e f f i c i e n c y and thus losses, allowed for the c a l c u l a t i o n of
input power for the f i e l d t e s t s to be scaled from the
discharge measurements from the laboratory t e s t s .
The close agreement between the t h e o r e t i c a l
c a l c u l a t i o n s and the laboratory r e s u l t s , and the s i m i l a r
values f o r volumetric e f f i c i e n c y i n the laboratory and f i e l d

74
r e s u l t s , provide a basis for design a l t e r a t i o n s v a l i d for
f i e l d a p p l i c a t i o n based on the t h e o r e t i c a l and laboratory
r e s u l t s .
8.3 IMPLICATIONS OF THE RESULTS ON PUMP RE-DESIGN
Over the past few years, since the s t a r t of the rapid
increase i n popularity and sales of the Treadle pump, many
suggestions have been made to a l t e r the pump design. Part
of the purpose of t e s t i n g the Treadle pump was to form a
basis f o r evaluating these suggestions. Some of pump re
design suggestions have included changes to:
1. Pump body materials, including PVC, concrete, f i b e r g l a s s ,
juteglass and cast iron.
2. Piston configurations, including r e t a i n i n g the standard
two-plate piston or using the No.6 piston tested.
3. Cylinder s i z e , with 76 mm (3 inch), 64 mm (2 1/2 inch)
and 51 mm (2 inch) diameters suggested.
4. Cylinder length, such as a 203 mm (8 inch) or 254 mm (10
inch) c y l i n d e r to replace the current 356 mm (14 inch)
length.
5. The s t y l e of pump to r i s e r junction, with the o r i g i n a l
box-style and the Y-style suggested.
The t e s t r e s u l t s have indicated that, i n the case of
a l t e r i n g pump material, the f r i c t i o n force of the seal
against the cylinder would change marginally with a cylinder
material change, as the pressure of the seal against the
75
cylinde r would remain constant and the c o e f f i c i e n t of
f r i c t i o n between the seal and any of the materials l i s t e d
does not vary greatly. With the marginal scope f o r
improvement from a hydraulics view, the reasoning f o r a
change i n pump materials must rather be based upon economic
or manufacturing benefits. In b r i e f , given the current
development strategy to promote small scale decentralized
manufacturing of treadle pumps i n Bangladesh and the more
pragmatic reasons including the a v a i l a b i l i t y of machine
tools f o r working with s t e e l and the a v a i l a b i l i t y , wide
acceptance and re-sale value of s t e e l products throughout
Bangladesh, the use of s t e e l for the treadle pump provides
the best solu t i o n i n terms of the development and economic
c r i t e r i o n at the present time. The use of s t e e l also
reduces the rel i a n c e on new, more expensive imported
materials, products and cent r a l i z e d production technology
required f o r many of the alternate materials.
In the case of piston design a l t e r a t i o n , both of the
two piston configurations tested, the two-plate piston and
the No. 6 piston, have advantages. The two-plate piston i s
more widely used, e a s i l y f i x e d and provides better piston
valve sealing than the No. 6 piston, which benefits from
wide a v a i l a b i l i t y , shorter valve delays and a non-rusting
pPVC construction. Optimally, a combination of the small
c l o s i n g time of the No.6 and p o s i t i v e sealing of the two
plate design should be used.

76
In the case of the cyli n d e r s i z e , discharge and power
input requirements are primarily affected by any a l t e r a t i o n .
A decrease i n cyli n d e r diameter would reduce the discharge
i n comparison to the present 89 mm (3.5 inch) design. This
would allow use of the pump to a greater depth without
exceeding a power input l i m i t a t i o n of 55 watts, which
corresponds to a hydraulic output of 25.3 watts, i n normal
use. As a r u l e of thumb, an increase i n water table depth
a c c e s s i b i l i t y of 1.4 meters per 13 mm (1/2 inch) reduction
i n c y l i n d e r diameter. The 13 mm reduction i n diameter i s
accompanied by a 27% decrease i n discharge, assuming losses
are the same as those occurring i n the current pump design,
with the 55 watt input l i m i t a t i o n .
For example, using a discharge requirement of 25 L/min
as the minimum to meet i r r i g a t i o n requirements, the maximum
depth of a p p l i c a t i o n for a 102 mm (4 inch) c y l i n d e r diameter
Treadle pump would be 3.86 meters, l i m i t e d by power input.
The 89 mm (3.5 inch) treadle was found to have a maximum
water table depth application of 4.09 meters, l i m i t e d by
discharge below the requirement and near the l i m i t of power
input. A 76 mm (3 inch) Treadle pump would have a maximum
app l i c a t i o n depth of 5.88 meters, l i m i t e d by discharge below
the i r r i g a t i o n requirement. A 64 mm (2.5 inch) Treadle
would have a maximum of 4.3 meters, l i m i t e d by discharge
below the requirement.

77
From these c a l c u l a t i o n s , the optimum cy l i n d e r diameter,
assuming operating losses, power inputs and pumping
operating parameters remain unchanged from those measured i n
the f i e l d and laboratory t e s t i n g , i s 76 mm (3 inches). This
s i z e would allow Treadle pump usage to a maximum water table
depth and remain within the l i m i t s of power input and
i r r i g a t i o n requirements. Any increase i n e f f i c i e n c y would
increase the power output for the 55 watt l i m i t of power
input and increase the optimum cylin d e r s i z e within the 6
meter water table l i m i t .
In the case of cylind e r length, a reduction would
reduce the pump cost by about 8 Taka (0.32 CAD) per
centimetre. Although on average only 140 mm of the 356 mm
(14 inch) c y l i n d e r i s used during the pump stroke, the
portion of cylind e r used varies between i n s t a l l a t i o n s .
F i e l d t r i a l s conducted by IDE with the 305 mm (12 inch)
c y l i n d e r pump, found that the reduction i n length required
greater accuracy of superstructure placement at
i n s t a l l a t i o n . This reduced pump popularity due to the l i m i t
of i n s t a l l a t i o n v a r i a t i o n possible.
In the case of the junction s t y l e , from the calculated
r e s u l t s , i t was determined that the power losses r e s u l t i n g
from turbulence through the manifold account for l e s s than
12% of the t o t a l head losses, not including valve delay and
leakage losses, at maximum water v e l o c i t y i n the piston and
r i s e r , at a head of 3.34 meters. The a l t e r a t i o n i n type of

78
junction manifold from the box-style to the Y-style suffers
from increased manufacturing complexity and cost with l i t t l e
or no savings from reduced losses. The benefit from the
smoother junction would reduce suction head requirements by
0.03 meters at maximum flow. This represents a 6.4%
reduction i n hydraulic losses but i s only 1% of the t o t a l
head losses i n the whole system, including valve and leakage
losses, and i s not worth the increase i n cost and
manufacturing d i f f i c u l t y .

10 CONCLUSION
In conclusion, the Treadle pump performance can be best
improved by design a l t e r a t i o n s to the piston and foot-valves
as indicated by the low discharges and volumetric
e f f i c i e n c i e s measured i n the laboratory and f i e l d t e s t s , and
by a reduction i n cylind e r diameter to permit pump use i n
areas with greater water table depths.
The comparatively small losses caused by turbulence and
f r i c t i o n indicate that a l t e r a t i o n s to the pump material and
configuration, as shown i n the laboratory and t h e o r e t i c a l
r e s u l t s , are not warranted on the basis of improved pump
performance, but must be decided from economic and
development strategy benefits.
The primary problems i d e n t i f i e d from the laboratory and
f i e l d t e s t i n g of the "dheki" s t y l e Treadle pump
i n s t a l l a t i o n s were the leakage through the piston and foot-
valves and the large valve closure delay times. Although
the longer stroke lengths of the f i e l d t e s t s reduced the
e f f e c t of the valve delays, even at the maximum comfortable
stroke lengths recorded the minimum loss r e s u l t i n g from
valve delays i s 17%. For example, i f both the piston and
foot-valve closure delay times where halved, the decrease i n
leakage represents a pot e n t i a l increase i n volumetric
79

80
e f f i c i e n c y of 46%, r e s u l t i n g i n increased discharge and use
to greater water table depths.
The water table depth to which the Treadle pump i s
usable i s l i m i t e d by eithe r i n s u f f i c i e n t discharge or large
input power requirements, depending upon cy l i n d e r s i z e and
depth to water table. The current 89 mm (3.5 inch) cylinder
diameter pump i s li m i t e d to a water table depth of 4 meters,
due to the sustainable power input l i m i t of 55 watts
indicated by the f i e l d and laboratory r e s u l t s . The
d i f f i c u l t y of s e l l i n g the pumps i n regions with water table
depths deeper than 4 meters and the EPC t e s t r e s u l t s also
indicate a water table depth l i m i t of 4 meters. A reduction
i n c y l i n d e r s i z e to 76 mm (3 inch) would increase the water
table depths accessible to the Treadle pump within the
l i m i t a t i o n s of power input and maintain enough discharge to
meet i r r i g a t i o n requirements. The 76 mm pump would be most
suita b l e f o r water table depths i n the 4 to 5.5 meter range,
to assure that the power input required does not exceed 55
watts. Any further reduction i n diameter past 76 mm would
reduce the discharge below the i r r i g a t i o n requirements f o r
the 0.24 Ha (0.6 acre) minimum i r r i g a t e d area required for
pump repayment. The use of the widely a v a i l a b l e 89 mm (3.5
inch) pPVC piston cup seal, manufactured f o r use i n the
ubiquitous No.6 pump, and the poor a v a i l a b i l i t y of the 76 mm
(3 inch) pPVC seal reduces the d e s i r a b i l i t y of the 76 mm
81
pump at the present time, but more work i n manufacturing
a l t e r n a t i v e s may y i e l d more options.
Overall, the study of the piston force c h a r a c t e r i s t i c s
and the use of va r i a t i o n s between f i e l d and laboratory
r e s u l t s to analyze the pump design, c l e a r l y shows the
benefits of the combined use of laboratory, a n a l y t i c a l and
f i e l d r e s u l t s as the basis for design a l t e r a t i o n s . The
study also indicated the strength of the design and the
innovation by the aid workers who o r i g i n a l l y developed the
Treadle pump, as very l i t t l e a l t e r a t i o n i s required to
optimize the operation of the Treadle pump.

LIST OF REFERENCES
A l l i s o n , Stephen V. 1986. Handpump I r r i g a t i o n i n Bangladesh. Vancouver: International Development Enterprises
Barnes, Gunnar. 1985. The Development of a Manual I r r i g a t i o n Device: The Twin Treadle Pump, Manilla, P h i l i p p i n e s : International Rice Research I n s t i t u t e . Photocopied.
Barnes, Gunnar. 1981. Low Cost I r r i g a t i o n ( A g r i c u l t u r a l Programme of RDRS). Association of Development Agencies i n Bangladesh News. March/April.
Baumann, E r i c h and Richard J . F u l l e r . 1984. Manual I r r i g a t i o n i n Bangladesh. Dhaka: Swiss Development Cooperation.
Bos, M.G., ed. 1976. Discharge Measurement Structures. New Delhi: Oxford & IBH Publishing Co.
Bureau of Research Testing and Consultation. 1986. Laboratory Testing of Treadle Pump. Dhaka: Bangladesh Unive r s i t y of Engineering and Technology
Consumers' Association Testing and Research Laboratories, Rural Water Supply Handpumps Project. Laboratory Testing of Handpumps fo r Developing Countries. World Bank Technical Report No. 19.
Engineering and Planning Consultants Ltd. 1988. Testing of Handpumps under IDA Assisted HTW Project (Credit 1140-BD). Dhaka: Bangladesh Rural Development Board
Gibson, A.H. 1925. Hydraulics and i t s Applications. 4th ed. New York: D. Van Nostrand Company Inc.
G i s s e l q u i s t , David, ed. 1985. Report on BARC Sponsored Course on: Manual and Animal Powered Pumps for I r r i g a t i o n . Dhaka: Bangladesh A g r i c u l t u r a l Research Council.
Hahn, Robert. 1984. Handpump Testing and Development. Part 4, The F i r s t Year - Results of Completed and Ongoing Tests. Stockholm: Lund I n s t i t u t e of Technology.
82

83
Hyde, Charlotte. 1987. A Mathematical Modelling Simulation of Rower Pump Performance. B.A.Sc. th e s i s , University of B r i t i s h Columbia.
International Development Enterprises. 1988. Annual Report. Dhaka: International Development Enterprises.
. 1988. Pump sales figures. Dhaka: International Development Enterprises. Typewritten.
K r i s t a l , Frank A. and F.A. Annett. 1940. Pumps: Types. Selection, Operation, and Maintenance. New York: McGraw-Hill Book Company Inc.
Manual Pump Group. 1987. Long-range Strategic Issues. Dhaka: Manual Pump Group. Typewritten.
. 1988. Annual Report. Dhaka: International Development Enterprises.
. 1988. Bangladesh Handtubewells II Project. Recommendations of the Manual Pump Group. Dhaka: Manual Pump Group. Massey, B.S. 1968. Mechanics of Fl u i d s . London: D. Van Nostrand Company Ltd.
Orr, A l a s t a i r and A.S.M. Nazrul Islam. 1988. The Socio- Economic Impact of the Treadle Pump. Dhaka: Bangladesh Rice Research I n s t i t u t e .
Rangpur Dinajpur R e h a b i l i t a t i o n Service. 1983. I r r i g a t i o n Manual. Revised ed. Rangpur: RDRS.
. 1984. Lutheran World Service Bangladesh Annual Report. Dhaka: RDRS.
. 1984. Twin Treadle Pump and Drinking Pump Manufacturer's Guide. Revised ed., Dhaka: RDRS.
. 1985. Lutheran World Service Bangladesh Annual Report. Dhaka: RDRS. Roberson, John A. and Clayton T. Crowe. 1985. Engineering F l u i d Mechanics. 3rd Ed. Boston: Houghton M i f f l i n Company.
Spare, Dan and Doug Pritchard. 1981. Three Hand Pumps Tested Against Tubewell Conditions. Dhaka: Mennonite Central Committee.

84
Stickney, R.E., C. Abrina, R.L. Bacalocos, J.A. Damian, R. Domingo, B.C. Gonzalo, V.N. Piamonte, Q. deSagun and I. Ventura. 1987. Human-Powered Pump for Lo w - l i f t I r r i g a t i o n . Manila: International Rice Research I n s t i t u t e .
The World Bank. 1981. Bangladesh Hand Tubewells Project S t a f f Appraisal Report. 3280-BD.
The World Health Organization International Reference Centre for Community Water Supply. 1977. Handpumps fo r use i n Drinking Water Supplies i n Developing Countries. The Hague: The World Health Organization.
Todd, David K. 1959. Ground Water Hydrology. New York: John Wiley and Sons Inc.
United Nations. United Nations Development Programme. 1982. Ground Water Survey - The Hydrogeologic Conditions of Bangladesh.
U.S. Bureau of Reclamation. 1975. Water Measurement Manual. 2nd ed. Denver.
WHO. 1977. See The World Health Organization International Reference Center for Community Water Supply. 1977.
Yaw, Goh Sing. 1985. Laboratory and F i e l d Testing of Handpumps. Ottawa: International Development Research Council. IDRC-TS51e.

APPENDIX 1: AVERAGED FIELD TEST DATA
TESTS CONDUCTED IN THE JAMALPUR AND KUSHTIA REGIONS OF BANGLADESH
OPERATOR PUMP W. T. STROKE VOL. STROKE POWER :ST AGE WEIGHT AGE DEPTH LENGTH DISCHARGE EFF'Y RATE OUTPUT
# (yrs) (lbs) (yrs) (m> (cm) (1/min) (/mi n) (watts)
21 27 125 1 2.05 12.32 39. 22 0.66 39.02 13. 14 42 40 110 1 2.20 16.06 33. 12 0.35 47.51 11.91 11 28 130 1 2.23 9.57 36.59 0.73 42.26 13.34 16 18 90 12 2.29 13.75 30. 30 0.44 40. 61 11. 35 17 25 150 12 2.29 9.02 23.32 0. 63 32.95 8. 73 19 30 150 12 2.37 11.11 35. 35 0.72 35.76 13.70 18 25 95 12 2.47 15.62 27.27 0.38 36. 55 11.01 22 31 100 12 2.59 9.79 37. 15 0.63 48.48 15. 73 39 25 100 2 2.73 14.85 43.83 0.54 44. 42 19.56 32 18 95 24 2. 78 15. 73 41.93 0.52 41.55 19.06 41 18 90 2 2.79 12.98 45.00 0.61 46.00 20.53 13 22 120 12 2.86 12.54 40. 82 0.60 43.67 19. 09 40 40 130 1 2.88 18.92 22.52 0. 36 26.31 10.61 43 37 125 3 2.97 11.99 39.22 0.55 28.04 19.04
35 50 120 12 3. 13 11.66 29.51 0.62 33.05 15. 10 9 40 125 2 3. 25 15.73 60.89 0.51 61.33 32. 35 10 25 150 __. 2 3. 25 8.47 32.97 0.67 46.81 17.52 36 18 100 2 3. 56 13.97 39.60 0.57 39.80 23.05 37 30 120 2 3. 61 13.64 46.23 0.58 46.85 27.29 27 28 126 12 3. 73 6.27 23.96 0.57 54.25 14.61 29 14 80 24 3. 83 12.76 28.57 0.45 40.00 17.89 33 25 130 12 3. 85 10. 12 27.86 0.51 43. 10 17.54 31 35 125 36 3. 97 9. 13 36.92 0.70 46.34 23.97
28 23 115 36 4. 01 6.82 27. 19 0.46 70.33 17.83 23 24 110 36 4. 13 16. 28 43.23 0.54 39. 77 29. 19 24 25 150 36 4. 13 9.24 25. 17 0.51 43.09 16.99 25 45 110 3 4. 28 5.94 24. 19 0.86 38. 13 16. 93 26 25 150 3 4. 28 5.72 22.73 0.89 36. 06 15.90
85

APPENDIX 2: AVERAGED LABORATORY DATA
-TESTS CONDUCTED AT THE UNIVERSITY DF BRITISH COLUMBIA, CANADA
NOTE: THE FIRST TWO DIGITS OF THE TEST CODE INDICATE CONFIGURATION 01:BOX MANIFOLD, 2-PLATE PISTON 02:BOX MANIFOLD, NO. 6 PISTON 03:Y-MANIFOLD, 2-PLATE PISTON 04:Y-MANIFOLD, NO. 6 PISTON
TEST STROKE VOL. POWER POWER POWER CODE HEAD LENGTH DISCHARGE EFF' Y RATE OUTPUT INPUT EPF' Y
(m) (cm) ( l/iiiin) (/mi n) (watts) (watts)
TO1021 1. 51 4. 04 25. 06 0.68 73.41 6. 11 26.55 0. 23 TO1022 1. 51 3.35 25. 04 0. 41 73.72 6. 15 23.64 0.26 TO1041 3. 34 3.56 24.07 0. 60 45.52 13. 15 50.56 0.26 TO1042 3. 34 4.24 12.36 0. 41 57. 07 6.69 31.88 0.21 TO1061 5. 36 3. 30 16.63 0. 58 70. 20 14.58 64.80 0.23 TO1062 5. 36 1.91 6.27 0. 30 87. 94 5.49 35.44 0. 16 TO1081 6. 22 4.32 34.54 0. 55 60. 00 34. 51 95.85 0.36 TO1082 6. 22 4.84 20.85 0.41 41.81 21. 17 81.44 0.26
T02021 1. 51 4.08 42.60 1.08 77.99 10. 56 45.92 0.23 T02022 1. 51 2.78 28.44 0. 49 91.72 7.57 37.85 0.20 T02041 3. 34 3.28 24.53 0.43 69.30 13.50 42. 19 0.32 T02042 3. 34 2. 94 15.13 0. 33 63.84 8.28 30. 68 0.27 T02061 5. 36 2.79 16. 14 0.34 67. 73 13.92 51.57 0.27 T02062 5. 36 3. 02 9.03 0.23 53.50 8.00 40. 00 0. 20 T02081 6. 22 4.69 28.70 0.33 74.00 30. 16 115.99 0.26 T02082 6. 22 3.61 12.21 0. 23 58.30 12. 13 86.63 0. 14
T03021 1. 51 4.57 35.54 0. 54 58. 17 8.75 29. 18 0.30 T03041 3. 34 3.68 15.77 0. 28 61.81 8.71 39.60 0.22 T03061 5. 36 1.88 12.97 0.23 60. 08 11.44 54.46 0.21 T03081 6. 22 4.21 9. 72 0. 17 54.56 9.94 99.44 0. 10
T04021 1. 51 4.94 25.84 0. 33 63. 55 6.53 40.84 0. 16 T04022 1. 51 3.72 27. 19 0. 41 72. 13 6.87 42.92 0. 16 T04041 3. 34 4.49 15.67 0. 21 65. 66 8.71 67.01 0. 13 T04042 3. 34 4. 11 19. 10 0.27 68.35 10.55 70.35 0. 15 T04061 5. 36 6.71 17. 15 0. 18 56. 14 15.51 129.28 0. 12 T04062 5. 36 4.31 11.44 0. 17 63. 17 9.53 105.87 0.09 T04081 6. 22 7.65 5.80 0. 10 39. 20 5.61 93.58 0.06 T04082 6. 22 4.77 11. 03 0. 17 55.88 10.91 121.21 0.09
86