Bangladeshi Consumers' Purchase Intention toward Global ...
200
Developing Country Studies www.iiste.org ISSN 2224-607X (Paper) ISSN 2225-0565 (Online) Vol.4, No.26, 2014 1 Bangladeshi Consumers’ Purchase Intention toward Global Brands over Local Brands Shehrin Ahmed School of Business, East Delta University, Chittagong, Bangladesh E-mail of the corresponding author: [email protected] Abstract In present time, purchase intention is more complex and more substantial for consumers than in the earlier period. The current globalization has directed to increase international Business activities, with many global brands competing with local brands in different countries. The purpose of the study is to identify the effects of global brands toward local brands in host countries from the perspective consumers in the under developed and developing countries like, Bangladesh. This article of Bangladeshi consumer’s analyses the impact of individual characteristics (For example, consumer's desire for distinctiveness and price satisfaction to global brands) and brand-specific variables (For example, performance quality and brand origin) on purchase intention toward global brands versus a local brand. A structured questionnaire with 5 point Likert scale has been used to collect the data by conducting survey. The sample size is 100 and is chosen on a convenient basis. Data has been analyzed by using SPSS software (version: 16). Result of the study showed that Bangladeshi consumers' need for uniqueness, perception of quality, huge media exposure and price have positively high influences toward global brands. Positive attitude towards the performance quality of a global products increase consumer purchase intention onward global brands and has a negative impact on local brands of Bangladesh. Keywords: Purchase intention, global brands, need for uniqueness, Bangladesh, multiple regression, SPSS 1. Introduction Globalization is a foreseeable trend that is leading the entire world to become one universal market, a global village. Even if still a long way to go for the "global village" that (Levitt 1983) predicted over a decade ago, a growing number of consumer markets are characterized by global competition and challenges. The increasing tendency of globalization and advance technology in transportation and communication enable the consumers to access and be uncovered to a great variety of products and services from different countries. Within the same product category some consumers have different perceptions and attitudes towards global and local brands (Herche, 1992).To be precise, consumers in the developed countries have a general inclination for their local made products because that are high quality over global products whereas consumers in undeveloped and developing countries are more likely to favor global products than local ones as they assumed global products are more superior than domestic products in quality performance and using global brands will electrify others as they are related with high style and fashion or high prestige issue (Wang, Siu & Hui, 2004). The developing countries consumers such as Iran, India, Sri-Lanka and Bangladesh have increasing choice products from domestic and global brands. In this competitive and challenging situation, both global and local marketers must understand why and how consumers markets make their brand and product choices (Kearney, 2006).consumers select products or brands to obtain functional benefits (e.g., good quality, ease of use and low price) as well as emotional benefits (e.g., exhibit of social status, wealth, and prestige) (Batra et al., 2000). Using global brands to exhibit one’s position is more outstanding in the developing countries where higher income disparities and status ups and downs present (Kottak, 1900). According to Ukpebor and Ipogah (2008), a powerful brand is boosting a customer’s attitude strength of products alliance of a particular brand. Campbell & LeVine (1972) and Boush& Marshall (2001) stated that because of easy flow of communication of information and education between individual belongs to various cultures found them more knowledgeable and this also lower the levels of cognitive prejudice that might negatively affects their attitude towards global options. In today’s competitive market the rivalry between domestic brands and global brands has rising up than ever before. This competition between global and local brands has become head to head in some popular products categories especially in Bangladesh. As a promising developing market of the world, Bangladeshi consumers are showing tendency in support of global brands in most of the product line especially in cosmetic and garments sector. In Bangladesh, like all other developing countries consumers perceive that global products are superior to domestic products. Prior research also supports that native customers generally favor foreign products or brands (Ahmed & d’Astous, 1999). Literature suggests that in two ways global brands inspire consumer motives, first by offering good quality products and second is about prestige issue (Kwak, Jaju, & Larson, 2006).Quality matters a lot for consumers while they purchasing anything for personal use and they have a strong opinion that global brands have top quality products.
-
Upload
khangminh22 -
Category
Documents
-
view
3 -
download
0
Transcript of Bangladeshi Consumers' Purchase Intention toward Global ...
Developing Country Studies www.iiste.org
ISSN 2224-607X (Paper) ISSN 2225-0565 (Online)
Vol.4, No.26, 2014
1
Bangladeshi Consumers’ Purchase Intention toward Global
Brands over Local Brands
Shehrin Ahmed
School of Business, East Delta University, Chittagong, Bangladesh
E-mail of the corresponding author: [email protected]
Abstract
In present time, purchase intention is more complex and more substantial for consumers than in the earlier
period. The current globalization has directed to increase international Business activities, with many global
brands competing with local brands in different countries. The purpose of the study is to identify the effects of
global brands toward local brands in host countries from the perspective consumers in the under developed and
developing countries like, Bangladesh. This article of Bangladeshi consumer’s analyses the impact of individual
characteristics (For example, consumer's desire for distinctiveness and price satisfaction to global brands) and
brand-specific variables (For example, performance quality and brand origin) on purchase intention toward
global brands versus a local brand. A structured questionnaire with 5 point Likert scale has been used to collect
the data by conducting survey. The sample size is 100 and is chosen on a convenient basis. Data has been
analyzed by using SPSS software (version: 16). Result of the study showed that Bangladeshi consumers' need for
uniqueness, perception of quality, huge media exposure and price have positively high influences toward global
brands. Positive attitude towards the performance quality of a global products increase consumer purchase
intention onward global brands and has a negative impact on local brands of Bangladesh.
Keywords: Purchase intention, global brands, need for uniqueness, Bangladesh, multiple regression, SPSS
1. Introduction
Globalization is a foreseeable trend that is leading the entire world to become one universal market, a global
village. Even if still a long way to go for the "global village" that (Levitt 1983) predicted over a decade ago, a
growing number of consumer markets are characterized by global competition and challenges. The increasing
tendency of globalization and advance technology in transportation and communication enable the consumers to
access and be uncovered to a great variety of products and services from different countries. Within the same
product category some consumers have different perceptions and attitudes towards global and local brands
(Herche, 1992).To be precise, consumers in the developed countries have a general inclination for their local
made products because that are high quality over global products whereas consumers in undeveloped and
developing countries are more likely to favor global products than local ones as they assumed global products
are more superior than domestic products in quality performance and using global brands will electrify others as
they are related with high style and fashion or high prestige issue (Wang, Siu & Hui, 2004).
The developing countries consumers such as Iran, India, Sri-Lanka and Bangladesh have increasing
choice products from domestic and global brands. In this competitive and challenging situation, both global and
local marketers must understand why and how consumers markets make their brand and product choices
(Kearney, 2006).consumers select products or brands to obtain functional benefits (e.g., good quality, ease of use
and low price) as well as emotional benefits (e.g., exhibit of social status, wealth, and prestige) (Batra et al.,
2000). Using global brands to exhibit one’s position is more outstanding in the developing countries where
higher income disparities and status ups and downs present (Kottak, 1900). According to Ukpebor and Ipogah
(2008), a powerful brand is boosting a customer’s attitude strength of products alliance of a particular brand.
Campbell & LeVine (1972) and Boush& Marshall (2001) stated that because of easy flow of
communication of information and education between individual belongs to various cultures found them more
knowledgeable and this also lower the levels of cognitive prejudice that might negatively affects their attitude
towards global options. In today’s competitive market the rivalry between domestic brands and global brands has
rising up than ever before.
This competition between global and local brands has become head to head in some popular products
categories especially in Bangladesh. As a promising developing market of the world, Bangladeshi consumers are
showing tendency in support of global brands in most of the product line especially in cosmetic and garments
sector.
In Bangladesh, like all other developing countries consumers perceive that global products are superior
to domestic products. Prior research also supports that native customers generally favor foreign products or
brands (Ahmed & d’Astous, 1999). Literature suggests that in two ways global brands inspire consumer motives,
first by offering good quality products and second is about prestige issue (Kwak, Jaju, & Larson, 2006).Quality
matters a lot for consumers while they purchasing anything for personal use and they have a strong opinion that
global brands have top quality products.
Developing Country Studies www.iiste.org
ISSN 2224-607X (Paper) ISSN 2225-0565 (Online)
Vol.4, No.26, 2014
2
For this study the researcher select consumer products such as apparels, cosmetics, food items,
electronics goods in both global and local categories.
2. Research Objectives
Based on the above discussion the major objectives of this study are given below:
1. To find out the factor affecting consumer preference towards global brands over local brands.
2. The product attributes that are mostly considered by consumers when buying a brand.
3. To put forward some possible recommendation to the marketers of local brands as well as global
brands.
3. Literature Review
3.1 Brand
Brands have been constantly reviewed and redefined in the marketing literature and there are numerous
definitions for ‘brand’. A definition of a brand by The American Marketing Association (AMA) in the 1960s
(Keller, 2001) is “a name, term, sign, symbol, or design, or a combination of them, intended to identify the goods
and services of one seller or group of sellers and differentiate them from those of competitors.”
In accordance with classified definitions of brands, two approaches of defining a brand are derived.
The traditional and well-known one is a practical view which pronounces a brand as a product identifier,
including the origin of the product (Aaker, 1991). According to him, “a brand is a distinguishing name and/or
symbol which intended to identify the goods, services of either one seller or group of sellers and to differentiate
those goods or services from those of competitors”. Another approach, as general view, considers a brand as
more than just the product (Styles & Ambler, 1995). “This defines brand as the promise of the bundles of
attributes that someone buys which provides satisfaction and attributes that make up a brand” (Ambler, 1992). It
is seen that personality and attitude of the users with specific lifestyle represent through the brands. It also helps
to express a sense of fit in to a specific reference group (Murphy, 1990).
3.2 Consumer Perceptions of Global and Local Brands
A local brand can be distinct as a brand that exists in a particular country boundary or in a confined geographical
border (Wolfe, 1991).Schuiling &Jean (2004) point out that local, international, or a global firm may be the
owner of a local brand, they also share a connection between national economy and individual welfare. Several
researchers define global brands as “a brand that is marketed under the same name in multiple countries with
similar and centrally located coordinated marketing strategies”.
3.3 Purchase Intention
Purchase intention means a consumer has a particular need for a product or service and then he prefers to buy a
product or service to meet that need, or even attitude towards a product and awareness of product. In other sense,
purchase intention means consumer will rebuy a product after she or he evaluates a product and discovers that
the product worth buying. The ultimate decision on accepting a product to buy or rejecting it is rest on
consumer’s personal intention (Keller, 2001).
Purchase intention refers to a consumer propensity to purchase the brand consistently in the future and
resists switching to other brands (Yoo, Donthu N & Lee, 2000). When consumer perceives that the brands
provide high quality or features than they may be interested to purchase those brands. Consumers normally
identify the superiority and differentiation of particular brands through the performance quality and that
encourage them to select that brands over the competing brands (McConnell, 1968; Yoo, Donthu N & Lee,
2000). This positive relationship between performance quality and purchase intention should apply irrespective
of whether the product is a global brand or a local brand.
Other than the desire to conform to social standards, when individuals perceive that they are highly
similar to others than they may feel threats for their identities (Snyder & Fromkin, 1977).In order to lessen the
identity threat, individuals tend to involve in self-distinguishing behaviors, and NFU refers to the characteristics
of trailing differences among the others. Because material possessions are often expression of the self (Belk,
1988), one way to stand out oneself in a crowd is to purchase and have unique products (Snyder, 1992). Unique
products are usually innovative, relatively uncommon among mass people, or limited, and used by a very
particular types of consumers (Tian, Bearden & Hunter,2001).Researchers also find that consumers are ready to
buy expensive and exclusive products because they believe it possess unique characteristics (Amaldoss & Jain,
2005).
Many researchers mention that purchase behavior is influence by cognitive and affective states (Li,
Monroe & Chan., 1994; Zajonc, 1984). This statement communicates to the basic understanding that consumers
are emotional and rational as well (Holbrook& Hirschman, 1982; Zajonc & Markus, 1982).
Brand equity is the added value awarded to a product as a result of long term relationship to the

Developing Country Studies www.iiste.org
ISSN 2224-607X (Paper) ISSN 2225-0565 (Online)
Vol.4, No.26, 2014
3
customer and in the marketing of the brand. Added value of a brand is created in the mind of consumers as a
result of observed performance on various marketing heights (Keller, 1993).Further, the confidence that
consumers place in one brand over another develops brand equity (Kamakura & Russell, 1991). This confidence
and believe leads to the benefit for both the firm and the customer (Aaker, 1991). The advantages that a brand
enjoys with higher equity are increased brand loyalty, premium pricing, lower promotion-to-sales ratios,
customer confidence and more market share (Keller, 1993).
According to Kapferer (1997), if a brand is presentable as globally available, According to Kirmani &
Baumgartner (2000), the evaluation of a brand’s overall excellence based on intrinsic (e.g. performance,
durability, satisfaction) and extrinsic cues (e.g. brand name, warranty, after sales service) is known as perceived
quality from consumers perspective.
Demography (age, gender, race, income, family size and education) is one of the most important
features that influence consumer purchase intention. Consumers behave differently as they have age variation. A
twelve years old consumer may behave in a different way than a forty five years old consumer. For example,
some young consumers are more focused on the branded products that other consumer on their same age (Nabil
&Imed, 2010).The influence of gender depends on some factors. For example, females are more concerned about
the products that they are using for their household uses and family purposes, here the quality of the products is
more important for them compared to men. Another study shows that female are more rely on reference groups
and magazines while making purchase decision than males because they are less experienced with online
purchasing (Chiao & Yang, 2010).
Holbrook and Hirschman (1982) recommend that individual differences have an effect on cognitive
and affective factors, which in turn influence behavior. Individuals have some inherent personal characteristics
or trait, among them need of uniqueness is one, (Tian et al., 2001); consumers develop outlooks over time (Wells
and Prensky, 1996) and become more vulnerable to marketing efforts (Roper,1966).Consumer’s evaluation of a
brand of a particular product category also affected by which type attitude consumers hold for the country of
origin of the product (Häubl, 1996).This study proposes that need for uniqueness (inherent characteristic)
influences attitudes toward global products, which in turn influence the cognitive and affective responses toward
a global versus a Bangladeshi local brand.
Fig. 1 shows the conceptual model
In the cognitive–affective model, researchers identify perceived quality as a cognitive response to a
product, which influences product purchase. Many authors relate perceived quality with a brand's home country.
Cordell (1992) finds that U.S. consumers perceive products originated from industrialized countries such as
England and Canada as higher quality than those from less developed countries such as Indonesia and Bolivia
but now they are purchasing products from China also. Jaffe and Martinez (1995) find that Mexicans rate
American and Japanese electronic products much more positively than Mexican brands; Mexican consumers'
positive attitudes toward developed countries products lead to this positive perception of quality.
Studies have found that gender differences exist in patriotism, ethnocentrism, and evaluation of local
versus global products; females tend to be more conservative, more patriotic, and more ethnocentric than males,
resulting in females rating local products more favorably (Han, 1988). By holding and displaying original,
unusual and exclusive consumer products and brands consumers portray their unique characteristics. For
expressing one’s individuality profoundly clothing and accessories are well known examples in that cases (Kron,
1983).
Some studies also indicate that consumers’ value global brands especially for their anticipated believe
Developing Country Studies www.iiste.org
ISSN 2224-607X (Paper) ISSN 2225-0565 (Online)
Vol.4, No.26, 2014
4
of high quality and prestigious image (Nguyen, Barrett & Miller 2005; Steenkamp, Batra & Alden 2003). A
universally well-established brand name can act as a "halo" constructs that effects quality beliefs (Han 1989).
Brand loyalty is described as the tendency to be loyal to a fixed brand such that the consumer intends to purchase
the brand consistently and resists switching to competitors brands (Yoo, Donthu N & Lee, 2000).
The country of origin effect has been defined as “the positive and negative influence that a product’s
country of manufacture may have on consumers’ decision making processes or subsequent behavior” (Elliott and
Cameron, 1994). In fact in the words of Nagashima (1970), country of origin can be defined as “the picture, the
reputation, and the stereotype that businessmen and consumers attach to products or brands of a specific country.
This image is created by such variables as representative products, national characteristics, economic and
political background, history, and traditions”.
Reference groups include friends, family, colleagues, neighbor or any social groups whom one can
direct guidance and help by their opinion. Reference group include friends and family who motives to change
ones buying decisions due to special skills, ability, knowledge, personality and sometimes relationship. If a
friend had shared their bad experience with a product, it is more likely that one will abstain from buying it
(Steenkamp, Batra, & Alden, 2003).Researchers found out that once consumers observe a price difference
between local-owned and global owned brands, price dissimilarities begin to affect their preference for local-
owned brands. Therefore, since price is also one of the most important extrinsic cues that consumers use when
evaluating the product/brand (Hansen, 2005).
In this challenging market promotion is a successful element to create a position in consumer’s mind.
Consumers today are bombarded by commercial messages from a broad range of sources. Companies must
communicate their value propositions to customers, and what they communicate should not be left to chance. in
this cases global brands are more successful than local brands to reach at mass levels (Kotler, Armstrong,
Agnihotri & Haque, 2010).
6. Research hypothesis
As per the objectives of the study, the following hypothesis was developed for testing:
H1: There is significant impact of global brands on consumer purchase decision than local brands
HO: Global brands have no significant impact on consumer purchase decision
HA: Global brands have significant impact on consumer purchase decision
5. Methodology
Research methodology is defined as the common approaches the researcher uses in carrying out the research
project (Leedy & Ormrod, 2005). Research methodologies of this present study are outlined below.
5.1 Sample
In the present study, in order to more assurance a total number of 120 questionnaires were distributed among
consumers. Some of questionnaires were excluded due to wrong and incomplete responses and finally 100
questionnaires were analyzed for data analysis.
5.2 Data Collection
In the present study the researcher investigated the effects global brands toward local brands in host countries
from the perspective consumers in Bangladesh. The current study, according to its purpose, is an applied
research and also is kind of descriptive surveys of the area of field studies considering the data collection
method. For this reason, questionnaire survey method was conducted to gather data in the present study. A
convenience sampling process has been used to collect data for this research. All questions are closed-ended
because all possible answers were given to the respondents. The five-point Likert scale (where 1=strongly
disagree to 5=strongly agree) has been used for research questions.
5.3 Analysis
A quantitative analysis has been used to test research data. All statistical calculations were carried out by SPSS
version 16. SPSS automatically calculates the significance value (or p-value). Hence the level of probability of
5% or less is commonly taken as an appropriate level foe most general research including this study. In order to
prove internal reliability, the researcher has performed Cronbach’s Alpha Test of Reliability. Applying this test
specifies whether the items pertaining to each dimension are internally consistent and whether they can be used
to measure the same construct or dimension of consumer purchase intention. According to Nunnally (1978)
Cronbach’s alpha should be 0.700 or above. But some of studies 0.600 also considered acceptable (Gerrard, et al,
2006)in this study; the value of Cronbach’s alpha for 8 items is 0.68.Thus it can be concluded that the measures
used in this study are valid and highly reliable.
Developing Country Studies www.iiste.org
ISSN 2224-607X (Paper) ISSN 2225-0565 (Online)
Vol.4, No.26, 2014
5
6. Findings and Discussion
6.1 Respondents’ Socio-Demographic Background
In the present study, in order to more assurance a total number of 120 questionnaires were distributed among
consumers and finally 100 questionnaires were analyzed for data analysis.
Table 1: Profile of the Respondents
No. Variable Category Frequency
(%) 1 Gender Male
Female
53
47
2 Age 15-20
21-30
31-40
41-50
51 above
7
39
28
19
7
3 Occupation Student
Business
Doctors
Service
holder
Home wife
others
31
13
11
27
12
6
4 Monthly
expenditure
5k-10k
10k-15k
15k-20k
20k-25k
Above 25k
21
26
15
12
26
Note: Data have been compiled by the researchers
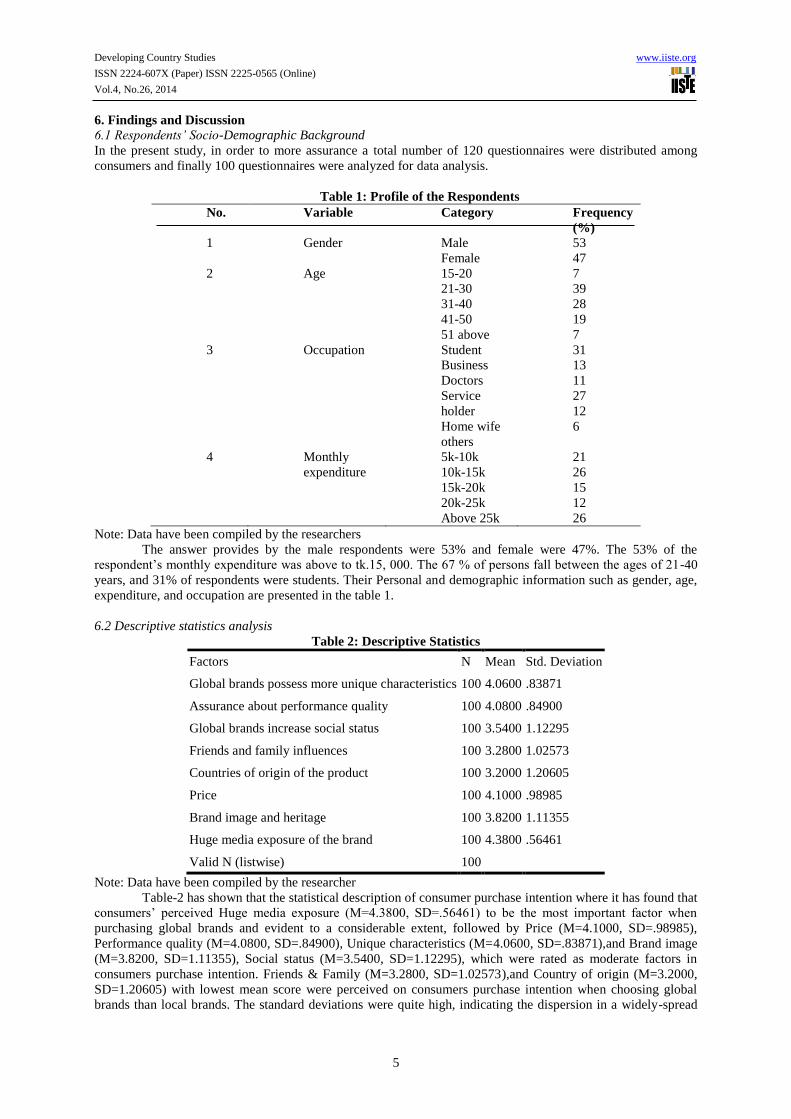
The answer provides by the male respondents were 53% and female were 47%. The 53% of the
respondent’s monthly expenditure was above to tk.15, 000. The 67 % of persons fall between the ages of 21-40
years, and 31% of respondents were students. Their Personal and demographic information such as gender, age,
expenditure, and occupation are presented in the table 1.
6.2 Descriptive statistics analysis
Table 2: Descriptive Statistics
Factors N Mean Std. Deviation
Global brands possess more unique characteristics 100 4.0600 .83871
Assurance about performance quality 100 4.0800 .84900
Global brands increase social status 100 3.5400 1.12295
Friends and family influences 100 3.2800 1.02573
Countries of origin of the product 100 3.2000 1.20605
Price 100 4.1000 .98985
Brand image and heritage 100 3.8200 1.11355
Huge media exposure of the brand 100 4.3800 .56461
Valid N (listwise) 100
Note: Data have been compiled by the researcher
Table-2 has shown that the statistical description of consumer purchase intention where it has found that
consumers’ perceived Huge media exposure (M=4.3800, SD=.56461) to be the most important factor when
purchasing global brands and evident to a considerable extent, followed by Price (M=4.1000, SD=.98985),
Performance quality (M=4.0800, SD=.84900), Unique characteristics (M=4.0600, SD=.83871),and Brand image
(M=3.8200, SD=1.11355), Social status (M=3.5400, SD=1.12295), which were rated as moderate factors in
consumers purchase intention. Friends & Family (M=3.2800, SD=1.02573),and Country of origin (M=3.2000,
SD=1.20605) with lowest mean score were perceived on consumers purchase intention when choosing global
brands than local brands. The standard deviations were quite high, indicating the dispersion in a widely-spread
Developing Country Studies www.iiste.org
ISSN 2224-607X (Paper) ISSN 2225-0565 (Online)
Vol.4, No.26, 2014
6
distribution. This means that the effects of global brands on consumers purchase intention than local brands are
an approximation to a normal distribution. This also indicates that respondents were in favor of global brands.
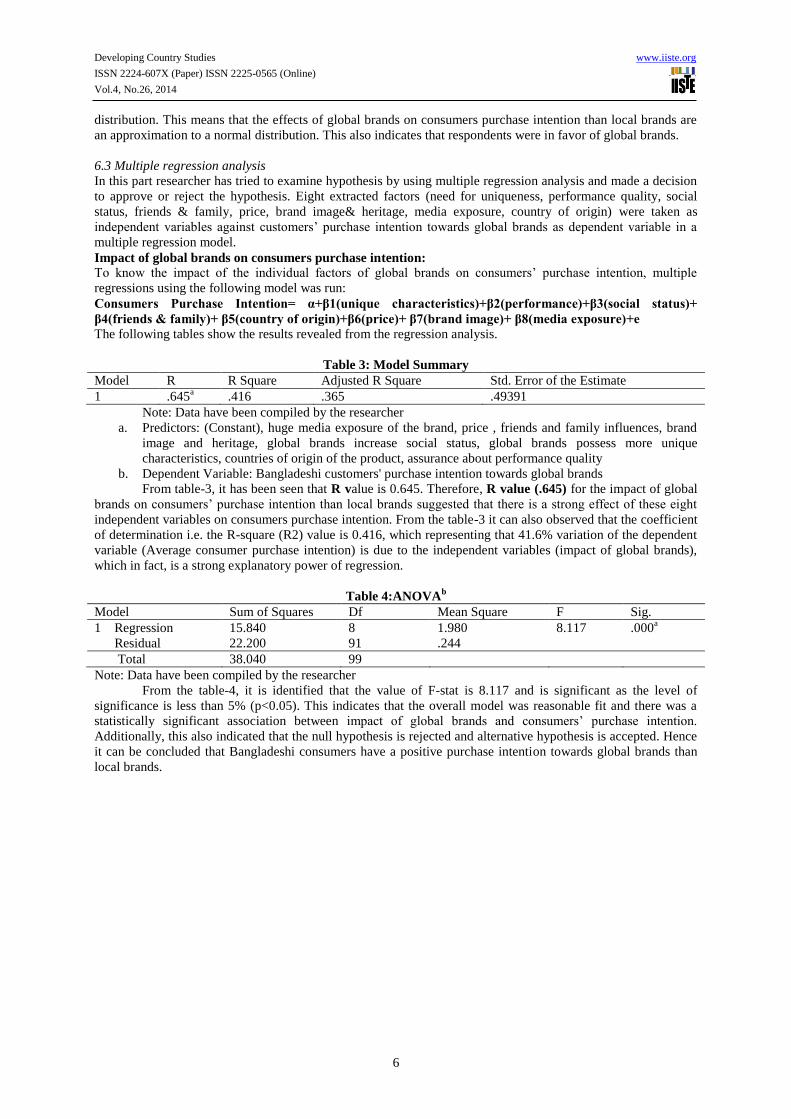
6.3 Multiple regression analysis
In this part researcher has tried to examine hypothesis by using multiple regression analysis and made a decision
to approve or reject the hypothesis. Eight extracted factors (need for uniqueness, performance quality, social
status, friends & family, price, brand image& heritage, media exposure, country of origin) were taken as
independent variables against customers’ purchase intention towards global brands as dependent variable in a
multiple regression model.
Impact of global brands on consumers purchase intention:
To know the impact of the individual factors of global brands on consumers’ purchase intention, multiple
regressions using the following model was run:
Consumers Purchase Intention= α+β1(unique characteristics)+β2(performance)+β3(social status)+
β4(friends & family)+ β5(country of origin)+β6(price)+ β7(brand image)+ β8(media exposure)+e
The following tables show the results revealed from the regression analysis.
Table 3: Model Summary
Model R R Square Adjusted R Square Std. Error of the Estimate
1 .645a .416 .365 .49391
Note: Data have been compiled by the researcher
a. Predictors: (Constant), huge media exposure of the brand, price , friends and family influences, brand
image and heritage, global brands increase social status, global brands possess more unique
characteristics, countries of origin of the product, assurance about performance quality
b. Dependent Variable: Bangladeshi customers' purchase intention towards global brands
From table-3, it has been seen that R value is 0.645. Therefore, R value (.645) for the impact of global
brands on consumers’ purchase intention than local brands suggested that there is a strong effect of these eight
independent variables on consumers purchase intention. From the table-3 it can also observed that the coefficient
of determination i.e. the R-square (R2) value is 0.416, which representing that 41.6% variation of the dependent
variable (Average consumer purchase intention) is due to the independent variables (impact of global brands),
which in fact, is a strong explanatory power of regression.
Table 4:ANOVAb
Model Sum of Squares Df Mean Square F Sig.
1 Regression
Residual
15.840
22.200
8
91
1.980
.244
8.117 .000a
Total 38.040 99
Note: Data have been compiled by the researcher
From the table-4, it is identified that the value of F-stat is 8.117 and is significant as the level of
significance is less than 5% (p<0.05). This indicates that the overall model was reasonable fit and there was a
statistically significant association between impact of global brands and consumers’ purchase intention.
Additionally, this also indicated that the null hypothesis is rejected and alternative hypothesis is accepted. Hence
it can be concluded that Bangladeshi consumers have a positive purchase intention towards global brands than
local brands.

Developing Country Studies www.iiste.org
ISSN 2224-607X (Paper) ISSN 2225-0565 (Online)
Vol.4, No.26, 2014
7
Table 5: Coefficientsa
Model
Unstandardized Coefficients
Standardized
Coefficients
t Sig. B Std. Error Beta
1 (Constant) 2.573 .535 4.812 .000
Global brands possess more
unique characteristics .482 .075 .630 6.446 .000
Assurance about
performance quality .046 .085 .059 .542 .589
Global brands increase social
status .120 .057 .203 2.098 .039
Friends and family
influences .088 .057 .139 1.549 .125
Countries of origin of the
product .136 .056 .253 2.425 .017
Price .057 .057 .088 1.001 .319
Brand image and heritage .110 .062 .190 1.765 .081
Huge media exposure of the
brand .113 .112 .102 1.006 .317
a. Dependent Variable: Bangladeshi customers' purchase intention towards global brands
Note: Data have been compiled by the researcher
In the table-5, unstandardized coefficients indicated how much the dependent variable varies with an
independent variable, when all other independent variables are held constant. The beta coefficients indicated that
how and to what extent independent variables unique characteristics, performance quality, social status, friends
& family, price, brand image& heritage, media exposure, country of origin influence consumers purchase
intention towards global brands. It has been found that, need for uniqueness(beta =.630, t=6.446, p<0.000),
country of origin(beta=.253, t=2.425, p<0.017) and social status (beta =.203, t=2.098, p<0.039), have the
highest influence or significant impact on consumers’ purchase intention, whereas, brand image (beta =.190,
t=1.765, p<0.081), friends & family(beta=.139, t=1.549, p<0.125), huge media exposure (beta =.113, t=1.006,
p<0.317), price (beta=.088, t=1.001, p<0.319), performance quality (beta=.059, t=0.542, p<0.589), have a
relatively lower impact on consumers’ purchase intention towards global brands.
The Regression Model is:
Consumers Purchase Intention= 2.573+.630(unique characteristics) +.059(performance quality)
+.203(social status)+ .139(friends & family)+ .253(country of origin) +.088(price)+ .190(brand image)+
.102(media exposure)
7. Conclusion
Because of the globalization waves consumers are now exposed to and are selecting from animmense range of
local versus global products and brands than ever before. This situation is attributable to the decreasing of trade
barriers, the development of communication and transportation technologies, increased global competition,
coupled with the increased standards of living and improved lifestyles of consumers around the globe (Kaynak
and Kara 2002).In this challenging environment, both global and local manufacturer, retailers must understand
why and how consumers in Bangladesh markets make theirbrand choices. The purpose of this study was assesses
Bangladeshi consumers' purchase intention toward global brands. This article of Bangladeshi consumers
examined the impact of individual characteristics and brand-specific variables on purchase intention toward
global brands versus a local brand. By analyzing the impact of global brands on Bangladeshi Consumers’
Purchase Intention, it is observed that out of eight factors, Huge Media Exposure is having a high Mean score
(M=4.38)and this result also supported as per survey of Cox Direct (1998) on Promotional Practices suggest that
many companies spend as much as 75% on sales promotion and 25% on advertising of their total promotional
budget to influence consumer purchase decision (Dotson and Hyatt, 2012). Bangladeshi consumers’ considered
price and unique design or styles of brands are respectively second and fourth important factors when choosing
global brands. For unique style and price, similar result was found in Taylor and Cosenza’s (2002) study. The
researchers mentioned that unique design, style, look and price are the four most important attributes assessed
when shopping for female teen. Besides, other researches also supported that price is the attribute most
frequently used by consumers in evaluating the value of a clothing product (Eckman, Damhorst, and Kadolph,
1990). The third important factor is perceived quality of global brand that similar result was found in Hasan and
Developing Country Studies www.iiste.org
ISSN 2224-607X (Paper) ISSN 2225-0565 (Online)
Vol.4, No.26, 2014
8
Ali study (2013). The researcher noted that Iranian consumer also possessed a great important on global brand
performance quality than local one. Hence, there is a need for global managers to establish a wide-ranging
understanding about attitudes of consumers in developing and transition economies toward imported products
(Klein, Ettenson, and Krishnan, 2006). So, to create popular local brands manufacturer should focus on the
factors that influence consumers’ purchase intention towards global brands.
8. Recommendations for the marketers
In this section, a list of recommendations has been presented based on the findings of the survey conducted on
consumers’ purchase intention towards global brands. In relation to the findings, the study came up with
following recommendations:
Bangladeshi marketers must note that attitudes toward global brands have a negative effect on
perceived quality for the local brand. Considering that a positive perception of quality is important for
the long-term success of a brand, Bangladeshi marketers need to reshape their consumers' attitudes
toward local brands through marketing and promotional campaigns.
The results of this study should guide multinational companies who are planning to enter or are already
exporting products to Bangladesh and other Asian countries by further identifying the target consumers’
characteristics, nature, perceptions, attitudes and preferences for global brands. Consumers’ positive
and negative purchase intention attitude towards global brands help to develop a marketing strategy
(Wang & Heitmeyer 2006).
Companies from countries enjoying a favorable country-of-origin preference (such as America, Britain,
France, Japan and Italy) may emphasis on the phrase ‘made in ...’on their products (Mohamad, ,
Ahmed, Honeycutt, & Tyebkhan, 2000).Bangladeshi local brands manufacturer also need to work on
this; how to improve the value of “Made in Bangladesh” tag. Moreover, positive country-of-origin than
allows the companies to adopt premium pricing.
Local manufacturers of Bangladesh should more focus on identifying the needs of consumers and try to
meet this better than global companies. So that they can make a strong brand image for their products
and compete in the global market.
Local companies should improve the unique characteristics and brand image of their products so that
consumers purchasing intention increase towards local brands. More significantly, they should improve
the performance quality level, emphasize more on brand logo, name and continue the innovation of
their product.
References
1. Aaker. (1991) Managing Brand Equity: Capitalizing on the Value of a Brand Name.The Free Press. New
York, NY.
2. Ahmed, S. & d'Astous, A. (1999) Product-country images in Canada and in the People's Republic of China.
Journal of International Consumer Marketing.11 (1).pp. 5-22.
3. Amaldoss, W, & Jain, S. (2005) Pricing of conspicuous goods: a competitive analysis of social effects.
Journal of Marketing. 42(1). pp. 30–42.
4. Ambler. (1992) Need-to-know Marketing. Century Business. London.
5. Batra R, Ramaswamy V, Alden DL, Steenkamp J-BEM, &Ramachander S. (2000) Effects of brandlocal and
non-local origin on consumer attitudes in developing countries. Journal of Consumer Psychology. 9(2). pp.
83–5.
6. Belk R. (1988) Possessions and the extended self. Journal of Consumer Research. 15(2).pp. 139–68.
7. Chiao, C. C., & Yang, C. C. (2010) The impact of recommendation sources on online purchase intentions:
Themoderating effects of gender and perceived risk. World Academy of Science, Engineering and
Technology. 6.pp. 111-114.
8. Cordell VV. (1992) Effects of consumer preferences for foreign sourced products. Journal of International
Business Studies. 23(2). pp.251–69.
9. Dotson M. J. & Hyatt, E. (2012) Sales Promotion Preferences: A Demographic Analysis. Society for
Marketing Advances.1(4). pp.123-131
10. Eckman, M., Damhorst, M.L. and Kadolph, S.J. (1990) Toward a model of the in store purchase decision
process: consumer use of criteria for evaluating women’s apparel. Clothing and Textiles Research
Journal.8(2). pp. 13-22.
11. Elliott, G.R. &Camoron, R.C. (1994) Consumer perception of product quality and the country of origin
effect. Journal of International Marketing.2(2). pp. 49-62.
12. Gerrard, P., Cunningham, J.B. & Devlin, J.F. (2006) Why Consumers are not using internet banking: a
qualitative study.Journal of Service Marketing. 20(3). pp. 160-168.
13. Han, C. M. (1989) Country Image: Country Image: Halo or Summary Construct. Journal of Marketing

Developing Country Studies www.iiste.org
ISSN 2224-607X (Paper) ISSN 2225-0565 (Online)
Vol.4, No.26, 2014
9
Research. 26(May).pp. 222-229.
14. Han, YJ,Nunes, JC. &Drèze, X. (2010)Signalingstatus with luxury goods: the role of brand prominence
Mark. 74(4). pp.15–30.
15. Hansen, T. (2005) Perspectives on consumer decision making: An integrated approach. Journal of
Consumer Behaviour. 4 (6). pp.420-437
16. Hasan, S., &Ali, M. (2013) Iranian consumers' purchase intention toward global brands. Interdisciplinary
Journal of Contemporary Research inBusiness.5 (8). pp. 361-371.
17. Häubl, G. (1996) A cross-national investigation of the effects of country of origin and brand name on the
evaluation of a new car. International Marketing Review. 13(5). pp. 76–97.
18. Herche, J. (1992) A note on the predictive validity of the CETSCALE.Journal of the Academy of Marketing
Science. 20(3). pp. 261-4.
19. Holbrook, M.B. & Hirschman, E.C. (1982)The experiential aspects of consumption: consumer fantasies,
feelings and fun.Journal of Consumer Research. 9(2). pp. 132-40.
20. Kamakura, W.A. & Russell, G.J. (1991) Measuring Consumer Perceptions of Brand Quality with Scanner
Data: Implications for Brand Equity.Marketing Science Institute. Cambridge, MA.
21. Kapferer, J.N. (1997) Strategic Brand Management. 2nd ed, Kogan Page: Dover, NH.
22. Kearney, A.T. (2006) Emerging market priorities for global retailers [Online]
http://www.atkearney.com/shared_res/pdf/GRDI_2006.pdf 2006. (August 30, 2014)
23. Keller, K.L. (2001) Strategic Brand Management: Building, Measuring, and Managing Brand Equity.
Prentice-Hall, Upper Saddle River, NJ.
24. Keller, L. (1993) Conceptualizing, measuring, and managing customer-based brand equity. Journal of
Marketing. 57(1). pp. 1-22.
25. Kirmani, A. and Baumgartner, H. (2000) Reference Points Used in Quality and Value Judgements.
Marketing Letters.11 (4). pp. 299-310.
26. Klein, J.G., Ettenson, R. and Krishnan, B.C. (2006) Extending the construct of consumer ethnocentrism:
when foreign products are preferred.International Marketing Review. 23(3). pp. 304-321.
27. Kotler, P. Armstrong, G. Agnihotri, P.Y &Haque, E.U. (2010) Principles of Marketing: South Asian
Perspective. 13th ed. Singapore: Pearson Education
28. Kottak, CP. (1990) Prime Time Society. CA: Wadsworth.
29. Kron, J.V. (1983) Home-Psych: The Social Psychology of Home and Decoration. NY: Potter.
30. Kwak, H., Jaju, A., & Larson, T. (2006) Consumer ethnocentrism offline and online: the mediating role of
marketing efforts and personality traits in the United States, South Korea and India. Journal of the Academy
of Marketing Science. 34(3). pp. 367-385.
31. Leedy, P.D., &Ormrod, J.E. (2005) Practical Research. USA: Pearson.
32. LeVine, R. A. & Campbell, D. T. (1972) Ethnocentrism: Theories of Conflict, Ethnic Attitudes, and Group
Behavior. London: John Wiley & Sons.
33. Levitt, T. (1983) The Globalization of Markets. Harvard Business Review. 61 (May-June). pp. 92-102.
34. Li W-K, Monroe KB, &Chan DKS. (1994) The effects of country of origin, brand, and price information: a
cognitive–affective model of buying intentions. Adv consumer Res. 21. pp. 449–57.
35. Marshall, S. R. & David, M. B. (2001) Dynamic Decision-Making: A Cross-Cultural Comparison of U.S.
and Peruvian Export Managers. Journal of International Business Studies. 32(4).pp.873–93.
36. Mohamad, O., Ahmed, Z.U., Honeycutt, E.D.Jr.&Tyebkhan, T.H. (2000) Does “Make In…” Matter to
Consumers? A Malaysian Study of Country of Origin Effect. Multinational Business Review. Fall. pp. 69-
73.
37. Murphy (1990) Assessing the value of brands. Long Range Planning. 23(3).pp.23-29.
38. Nabil, J., &Imed, Z. (2010)The impact of label perception on the consumer’s purchase intention: an
application on food products. IBIMA Business Review. 2.pp.2-14.
39. Nagashima, A. (1970) A Comparison of Japanese and U.S. Attitudes towards Foreign Products. Journal of
Marketing. 34(January). pp. 68-74.
40. Nguyen, T., Barrett, N., Miller, K. (2005) Perceived Brand Globalness: Antecedents and Out-come – The
Case of Vietnamese Consumers. Proceedings of the 34th EMAC Conference.pp.24-27,
UniversitàCommerciale Luigi Bocconi, Milan, Italy.
41. Nunnally, J. (1978) Psychometric Theory. 2nd ed. McGraw-Hill, New York.
42. Roper, B. (1966)The importance of attitudes, the difficulty of measurement. In: Wright JS, Gold, strucker,
editors. NewIdeas for Successful Marketing. Chicago: American Marketing Association.
43. Safiek, M. (2009)An investigation of consumer decision-making styles of young-adults in Malaysia.
International Journal of Business and Management.4(4).Pp.140-148.
44. Schuiling, I. & Jean, N. K. (2004) Real Differences between Local andInternational Brands: Strategic
Implications for International Marketers. Journal of International Marketing. 12 (4). pp. 97-112.

Developing Country Studies www.iiste.org
ISSN 2224-607X (Paper) ISSN 2225-0565 (Online)
Vol.4, No.26, 2014
10
45. Snyder CR, &Fromkin, HL. (1977) Abnormality as a positive characteristic: the development and validation
of a scale measuring need for uniqueness. Journal ofAbnormal Psychology. 86(5).pp.518–27.
46. Steenkamp, J-B., Batra, R., & Alden, D. L. (2003)How perceived brand globalness creates brand value.
Journal of International. Business .Studies, 34. pp. 53-65.
47. Styles, Ambler. (1995) Brand Management. Financial Times Handbook of Management. Pitman, London,
581-93.
48. Taylor, S.L. and Cosenza, R.M. (2002) Profiling later aged female teems: mall shopping behavior and
clothing choice. Journal of Consumer Marketing. 19(5). pp. 393-408.
49. Tian, KT, Bearden, WO, &Hunter, GL. (2001) Consumers' need for uniqueness: scale development and
validation. Journal of Consumer Research. 28(1).pp. 50–66.
50. Ukpebor, P.,&Ipogah, B. (2008) A Study to Indicate the Importance of Consumer Based Brand Equity
onConsumer Perception of Brand. (A Case Study of Fast Food Restaurants). Journal of Consumer
Psychology.
51. Wang C.L., Siu N.Y.M., &Hui, A. S. Y. (2004) Consumer decision-making styles on domestic and imported
brand clothing.European Journal of Marketing. 38(1/2). pp. 239-252
52. Wang, Y. &Heitmeyer, J. (2006) Consumer attitude toward US versus domestic apparel in
Taiwan.International Journal of Consumer Studies. 30(1). pp. 64-74.
53. Wells, W.D. &Prensky, D. (1996)Consumer Behavior. John Wiley & Sons, New York, NY.
54. Wolfe, A. (1991)The Single European Market: National of Euro- Brands. International Journal of
Advertising. 10 (1).pp. 49-58.
55. Yoo B, Donthu N, &Lee S. (2000)An examination of selected marketing mix elements and brand equity.
Journal of the Academy of Marketing Science. 28(2).pp. 195–211.
56. Zajonc, RB, &Markus, H. (1982) Affective and cognitive factors in preferences. Journal of Consumer
Research. 9(2). pp.123–31.
57. Zajonc, RB. (1984)On the primacy of affect. Journal of Abnormal Psychology. 39. pp.124–9.

Developing Country Studies www.iiste.org
ISSN 2224-607X (Paper) ISSN 2225-0565 (Online)
Vol.4, No.26, 2014
11
Press Coverage of Government in 1998 and 2002
Content Analysis of Selected Ghanaian Newspapers
Osei Aaron Debrah
Liberal Studied Department, Accra Polytechnic, Accra, Ghana
E-Mail: [email protected]
Abstract
The sturdy examined the coverage of government in 1998 and 2002 by two state-owned and two privately-
owned newspapers against the backdrop of frosty relationship that had historically existed between government
and particularly the privately-owned media in Ghana. Coverage was defined as number and slant of news stories,
editorials and pictorial representation of government. The findings generally supported literature and theories
which suggest that the state-owned newspapers would normally support the political establishment and that they
are always inclined towards “order” and are hardly disruptive of the status quo. It emerged that coverage by the
private press was motivated largely by economics and ownership; and they acted differently under different
political administrations. The coverage by the privately-owned press gave credence to the fact that the media
would normally react to the posturing of the government in power. In fact a more positive coverage was given to
the New Patriotic Party government that was perceived to be media-friendly in 2002. The opposite was true of
the National Democratic government which was seen to be unfriendly to the media.
Keywords: Opposition, Journalistic, Government, Media
1.0 Introduction
Political reporting by the media has always been a contentious issue in Ghana as in many other countries.
Politicians have often accused the media of either biased coverage or non-coverage of their activities. The
Politician’s desire for positive media coverage stems perhaps from the idea or perception that the media have an
influence on their audience. As a result, whether in government or in opposition, politicians and political parties
have always lobbied for positive coverage, which they believe, would translate into favorable voting patterns
during elections. The political history of Ghana indicates that the president of the First Republic, Osagyefo Dr.
Kwame Nkrumah had a firm belief in the effectiveness of the press to “conscientise the people; mobilize them;
and prepare them for swift change” Asante (1996:13). Nkrumah’s use of the press to serve his political interest
before and after independence was phenomenal, according to Asante (1996). Nkrumah believed in absolute
control of the press by the state when he assumed power. He therefore pursued media policies that ensured that
the media did the bidding of the government. In a speech delivered to a conference of African journalists in
Accra on November 11, 1963, Nkrumah is quoted as having declared:
“The truly African revolutionary press doses not exist for the purpose of enriching its
proprietors or entertaining its readers. It is an integral part of our society, with which its
purpose is in consonance. Just as in the capitalist countries the Press represents and carries
out the purpose of capitalism, so in revolutionary African our revolutionary African press must
present and carry forward our revolutionary purpose. This is to establish a progressive
political and economic system that will free men from want. Ainslie (1966:19)”
The role that Nkrumah expected the media, particularly the press to play pushed him to dominate the
press. He did not hide his intense disdain for private ownership of the press. On the question of ownership of
the press, Nkrumah is quoted in Asante (1996:23) as having declared:
“It is part of our revolutionary credo that within the competitive system of capitalism, the
press cannot function in accordance with a strict regard for the sacredness of facts and that
the press, therefore should not remain in private hands.”
Nkrumah therefore did not countenance a dissenting press. He enforced strict censorship of the media,
both local and foreign, in order to suppress all negative opinions and attacks on his government. He expected the
press to be an integral part of his political and economic ideology and expected journalists to co-operate fully in
the onerous task of nation building. Editors of newspapers, which published injurious things about Nkrumah or
his government, were swiftly punished. For example, Bankole Timothy, the Sierra Leonean, acting editor of the
Daily Graphic was deported for daring to question the embossment of Nkrumah’s head on the new Ghanaian
coins. Like Bankole Timothy, all other journalists who criticized Nkrumah, flagrantly questioned his actions, or
challenged his political authority were promptly disciplined, that is, banned, jailed and or deported (in the case of
foreign journalists) (Asante and Gadzekpo, 2000). Hulteng and Paul Nelson (1971:45) had said of authoritarian
regimes: “the media are usually the first to be controlled by them” and that, “once the press is under control, the
people are exposed to only propaganda from government.” This assertion by Hulteng and Nelson (1971) appears
to explain Nkrumah’s press policies.

Developing Country Studies www.iiste.org
ISSN 2224-607X (Paper) ISSN 2225-0565 (Online)
Vol.4, No.26, 2014
12
The successive government after Dr. Nkrumah’s largely continued with media policies that were no
different from that of Nkrumah’s convention People’s Party Press policy. Laws were enacted to gag and punish
dissenting voices. In fact the media suffered under all manner of governments; civilian “democratic” ones as
well as military “dictatorial” regimes. In fact it took a milestone judgment of the Ghana’s Supreme Court in
1993 to compel for example the state-owned television station (GTV) to give all political parties ‘equal’ access
to airtime to put their cases before the electorate. Since that historic ruling, the media in Ghana appeared to have
gown from strength to strength. The privately-owned media particularly found a new strength in the ruling to
really serve the mandate of the media as the fourth estate of the realm by putting government on its toes. Even
the state-owned media also began to wriggle itself out of, (at times self-inflicted) unalloyed and unflinching
support for government. Whether or not the privately-owned and state-owned dichotomy in terms of news
coverage vis-avis government, did change substantially after the highly-touted Supreme Court of Ghana ruling
in 1993 could only be tested through a research like this that looks at the nature of coverage government enjoyed
from the state-owned and the privately-owned newspapers after that historic ruling. The study therefore
examines critically what has changed since the Court’s declaration. It examines two regimes in Ghana, that of
the New Patriotic Party touted as Press-friendly fared with the Press in their mid-year of 2002 as opposed to
what had happened also in the mid-year of the regime of the National Democratic Congress (seen as anti-press)
in 1998 also fared with the Press. Four newspapers; two state-owned and two privately-owned were used for the
analysis.
1.2 Problem Definition
Despite the constitutional provisions and the Supreme Court’s historic ruling of 1995, to the effect that the state
media (GTV), had no discretion in giving equal airtime access to all political parties, there still have been
criticisms on the issue of biased coverage by the state media in favour of the party in government especially
during election periods. For example, even though, the Commonwealth (election) Observer Group (COG) had
declared the 1996 Presidential and parliamentary elections free and fair, they also catalogued concerns of the
opposition parties which were mainly on the unfair use of the media by the incumbent government. The
criticisms included marginalisation of the smaller parties, in terms of placement of stories, and pictorial coverage
of their rallies (The COG report, 1996). The state-owned presses especially are still seen as pro-government
despite constitutional provisions to insulate them from governmental control and the privately-owned press are
often labeled anti-government mostly because of their perceived slanted coverage of government. There has also
been the argument that the privately-owned press were particularly hard on the NDC government because of the
latter’s hostility towards the media and that a lot was going to change with the seemingly media-friendly New
Patriotic Party government in power. This article therefore, critically examines what has changed since the
ruling of the Supreme Court of 1995, which in substance advocated fair coverage of all diverse and contesting
views. Have the state-owned media continued to give only positive coverage to government as it ignores other
contesting opinions? In a reversal of roles, the elected party in 1996, the National Democratic Congress (NDC)
lost the 2000 elections to the main opposition party, The New Patriotic Party (NPP). How have the press in
general (privately-owned and state-owned) covered the different governments in 1998 and 2002? The years
1998 and 2002 were midterms for the NDC and the NPP regimes when politicking was generally on the wane.
This article is therefore interested in the nature of coverage by the state-owned and the privately owned press
under different administrations during such periods.
1.3 Research Objectives
The study specifically seeks to determine whether there is a difference in coverage of government (in terms of
the number and tone of stories carried) between the privately owned and the state press in 1998 and 2002. It also
seeks to establish how the state press covered two different regimes in 1998 and 2002 in terms of news stories
and features, readers’ letters, editorials and pictorial representation and to find out how the privately owned press
also covered the different governments in 1998 and 2002. For example, how many positive stories as against
negative ones did the papers carry on the different regimes?
1.3.2 Significance of the Study
The study aims at deepening knowledge of the trend of political reporting by the media in general and the press
in particular. The study also presents an opportunity to learn if there has been any change in the historical
relationship between government of the day and that of the privately-owned and the state-owned press. It could
also generate interest for further studies into the subject matter in the years ahead.
2.0 THEORETICAL FRAMEWORK AND LITERATURE REVIEW
Agenda Setting, Gatekeeping and Media Ownership theories have been used to provide a framework for the
study. The media are generally acknowledged as having the resources to at least influence what the mass of
people consider as being the main issues at a particular period in time. The controversy over access to media and
Developing Country Studies www.iiste.org
ISSN 2224-607X (Paper) ISSN 2225-0565 (Online)
Vol.4, No.26, 2014
13
coverage of political activitities of politicians usually results from the perceived media influence on the
electorate. The Agenda Setting theory propounded by Maxwell McCombs and Donald L. Shaw (19973)
suggests that the media do wield a powerful influence on what is put out there in the public domain for
discussion. The theory posits that the media are not always successful at telling us what to think, but they are
quite successful at telling us what to think about. The mainstay of the theory is that the media determine or
significantly affect the structure and content of audience perception of message. In effect, the media set the
agenda of the issues for public discussion that over 60 percent of their front page stories came from events such
as press conferences, press releases, background briefings, which are staged managed usually by government
officials. The study also revealed that although 25 percent of the sampled stories were attributed to reporters’
enterprise, over 90 percent of the stories came from interviews with high level government officials. Neumann et
al (1992) also observed that news directly supports the establishment by espousing its values and allowing its
press agents to define the problem of the citizenry and monopolise the public options available. Judith
Lichtenber (1991) comments that the media play directly into the belief that it is always biased in favour of the
powers-that-be. She asserts that a commitment to journalistic objectivity may create biases in favour of the
conservation of political power. She also notes that the reporter’s over-reliance on “credible sources” to enhance
the ideals of objectivity makes him vulnerable to official sources as major news source. In fact, Lichtenberg
(1991) admits that going by the canons of journalistic objectivity, governments and important decision-makers in
society come with ready-made credentials as authentic and reliable attributable sources. The sources, she
acknowledges, are not typically disinterested observers motivated only by a love of the truth. Their prime
motive is to manipulate the media and the news to their own advantage.
2.1 Order/Solidarity
McQuail (1997) explains the social order in two ways. First, he asserts that the media are often viewed as
potentially disruptive of the normal order although they are also indispensable to the maintenance of order in the
wider sense of social harmony. A key consideration is given to restraining any impulse to individual or
collective disorder and the protection of children and other vulnerable groups by the media from moral or
cultural harm. Social order, and maintenance of societal/national cohesion is reflected mainly in the mission and
policies of news media particularly, the state-owned media. The editorial policy of the Daily Graphic and the
Ghanaian Times consider the national interest as paramount. The Ghanaian Times for instance would not use
certain news items because the paper is obliged by its perception of national interest not to cause unrest and
uneasiness (Denkabe and Gadzekpo, 1996).
2.1.2 Media ownership
Michael Schudson (1998) also maintains that both state and market can limit free expression but their motive for
doing so may differ. He further asserts that public criticism of state policy is invariably easier in liberal societies
with privately owned news outlets than in authoritarian societies with state or private ownership. China is cited
as an example of an authoritarian society where published criticism of state is tightly constrained. The media
culture is nonetheless affected by the undisputable assertion that a nation’s press or media system and policies
are closely tied to the political system. Scruton (1982:76) emphasized this notion when he notes that the “media
will remain integral to its political system”. Governments whether authoritarian or liberal affect the media
landscape of their respective countries in one-way or the other. The evolution of Ghana’s media culture and
policies had a direct relationship with the political governance of the day.
Ownership of the media also confers control over the nature of the information disseminated. Those
who argue for public ownership of the media assert that information is a public good, but private owners
unfortunately tend to provide less information than would be socially desirable, according to Islam (2002). They
also argue that with private ownership, the media industry runs the risk of representing the views of only a
narrow group in society. Edward Horman and Noam Chomsky (1988) see the privately owned media as
instruments of class domination. They argue that the powerful are able to fix the premises of discourse to decide
what the general populace is allowed to see, hear and think about and to manage public opinion by regular
propaganda. Rupert Murdock agreed to the suggestion of his personal influence on the editorial posture of his
newspapers. He confirmed: “The buck stops on my desk. My editors have inputs, but I make the final decision”
Davis (1994:74). Otis Candler, publisher of the Los Angeles Times, readily admitted that there existed an
ideological selection process. He opines: “I am the executive. I set policy and I am not going to surround myself
with people who disagree with me. I surround myself with people who generally see things the way I do”
(Davis, 1994:83). Hulteng and Nelson (1992) admit that at times materials likely to be offensive to a principal
sponsor are usually rejected. The principal actors in the media today are to be found in commerce and
government. While an incumbent government sees the media as a friend or a foe in the re-election bid,
commercial moguls are interested in how the mass appeal that the media enjoy could be manipulated to serve
their commercial interests.
According to Bagdikian (1998), Rupert Murdock stopped the publishing of the memoirs of Chris
Developing Country Studies www.iiste.org
ISSN 2224-607X (Paper) ISSN 2225-0565 (Online)
Vol.4, No.26, 2014
14
Patten (the last Governor of the then British administered Hong Kong) in his influential newspapers simply
because Patten’s rather critical memoirs were going to hurt his (Murdock’s) business interest in the People’s
Republic of China. This is an example of how financially powerful individuals can affect the news as published
by media houses they own. Various studies in Africa suggest that government always had preferred newspaper
coverage, particularly with the state-owned newspapers. For example, a study by Akirinade (1979), established
a relationship between newspaper ownership and tone of news coverage on government. According to the study,
where government owned a newspaper, there was an increased loyalty for the paper to cover government in a
very favourable light and a conscious diminution of news considered negative to government. According to the
study, two state-owned newspapers, the Daily Times and the New Nigerian, both printed more favourable items
on government than the independently-owned Nigerian Tribune and the Daily Sketch. Another study on the
influence of press ownership on editorial policies of Ghanaian newspapers, Akordor (1994), found that while
majority of the editorials in the state-owned Daily Graphic and the Ghanaian Times were either favourable to the
policies, programmes and action of government, or chose to be neutral, The Free Press and the Ghanaian
Chronicle’s editorials were mostly unfavourable or critical of government’s policies, programmes and actions.
Akanbong (1996), concluded in a comparative study of editorials of the Ghanaian Times and the Free Press, that,
the editorial direction of The Times contrasted sharply with that of the Free Press. The Ghanaian Times was
pro-government in all respect; the Free Press was devoted to the publication of anti-Rawlings (government)
sentiments and used its editorials to pursue that agenda. Akanbong (1996) also noted that the number of readers’
letters published also reflected the polarized stance of the two papers.
In yet another unpublished work, Bonsu (1996, studied how the media covered the 1996 election
campaign. Her concern was whether it was wholly true that the state media were totally biased against the
opposition parties. She discovered that the state press made conscious efforts to cover activities of the
opposition. However, the privately owned press chose to slant stories to the advantage of the opposition and to
the disadvantage of the incumbent government. Most of the privately owned press presented government in a
negative light and chose not to publish the constitutionally-mandated rejoinders. Bonsu (1996) observed that the
government had no choice than to rely on the state-owned media to state its case. However, the government also
over-used and even abused the use of the state-owned media for this purpose. In fact, editorials and readers’
letters allowed by the state press tended to be highly complimentary of the incumbent government and
disadvantaged the opposition parties. Other studies looked at what usually inspired coverage by newspapers. For
example, Louis da Costa (1980), in his study of African media in 15 countries found that private newspapers
seemed to apply a commercial criterion in selecting news, unlike government newspapers.
3.0 METHODOLOGY
The methodology for this research was content analysis, which is useful in the evaluation of public information
(Hiebert and Rabin 1981). It focuses primarily on characteristics of content messages, determining what kind of
“meanings” the words may represent.
Krippendorf (1980:21) defined content analysis as “a research technique for making replicable and
valid inferences from data to their context”. Hsia (1998:28) sees content analysis as simply the analysis of what
is said, printed, broadcast or written” Hsia further observes that content analysis does not only examine content
but infers underlying intent, motivation, orientation and effects, either implicit or manifest. This work content
analysed four Ghanaian newspapers (two privately-owned and two-state owned) on their coverage of
government in 1998 and 2002. The Daily Graphic and The Ghanaian Times, representing the state owned
newspapers; and The Ghanaian Chronicle and The Independent representing the privately owned newspapers,
were selected for the study. Currently, The Ghanaian Times and the Daily Graphic are the only state-owned
daily newspapers available, hence their choice for the study. The Ghanaian Chronicle and the Independent have
come out consistently since the early 1990’s when they started appearing on the newsstands. The years 1998 and
2002 were chosen because they presented the researcher with an opportunity to compare press coverage of two
different regimes in their midterms. The year 1998 was a mid-term year for the then ruling National Democratic
Congress (NDC) government, while 2002, was the mid-term for the New Patriotic Party (NPP) government,
which assumed the reins of governance after the 2000 general elections.
3.1 Sampling
The universe for the study comprised of all the 1998 and 2000 editions of the four newspapers, which totaled
1875 issues. Stratified sampling with randomness was used to select the sample for the study. To ensure that all
days and months were fairly represented in the sample, serial numbers for all Monday issues, for example of the
Graphic in January, were written on pieces of paper and put in a cup. One of the issues was randomly selected to
be part of the sample (for month January). The process was repeated for all the days of the week excluding
Sunday (because the papers do not appear on Sundays) for a particular month. This selection process was also
repeated for all 12 months of the chosen year. The total sample for the Graphic for 1998 came up to 72 copies.

Developing Country Studies www.iiste.org
ISSN 2224-607X (Paper) ISSN 2225-0565 (Online)
Vol.4, No.26, 2014
15
The process was adopted for 2002 as well. This meant that, 144 copies for the Graphic were selected for the
study. Since the Ghanaian Times is also a daily, the same selection procedure was repeated to select another 144
copies. Together, therefore, 288 copies for the study represented the state-owned newspapers. The Chronicle
and the Independent were irregular in terms of how many times they appeared on the newsstand per week in
1998. Averagely, they appeared four times in a week. The Chronicle however, became a daily in 2002. The
average appearance of four per week in 1998 for the two privately owned press was used to select the sample.
Consequently, all editions for the month for each paper were numbered and put in a bowl. Four numbers were
picked for each month. The corresponding editions were selected as part of the sample for every month. This
yielded 96 copies each for the Chronicle and the Independent. In total, the privately-owned press had 192 copies
as a sample for the study.
3.2 Coding Procedure
In coding, coverage meant all stories, pictures and articles carried by the newspapers on activities of government.
Theses included news stories, readers letters, editorials, feature articles, opinions and pictorial representation of
the Presidency and ministers of state. These stories or articles were categorized as positive when they supported
government programmes and actions. The stories or articles were deemed negative where they were critical of
government’s programmes or activities. Neutral stories were those stories that neither criticized nor
complimented efforts or activities of government. At times such stories or articles balanced criticisms with
praise of government actions. This dimension of coverage was included to facilitate comparison between the two
different regimes on the extent to which the press gave them privileged front-page treatment. The study also
noted whether these pictures accompanied positive or negative stories.
3.3 Data Analysis
The study was a purely quantitative content analysis of the selected newspapers. Units of the analysis were:
stories, defined as straight news stories, readers’ letters, opinions, features, and the newspapers’ editorials on the
government. The units were categorized into positive, negative and neutral and the data were genera.
4.0 FINDINGS AND DISCUSSION
The study was interested primarily in how the press (i.e. privately-owned versus state-owned) covered two
different democratic regimes, in 1998 and 2002. The data generally reflect the nature of difference in coverage
between the two types of press ownership. Graphs, frequency and percentage tables have been used to present
the primary field data. Frequency tables measured how often a government was covered in terms of news
stories, pictures or editorials. Tone measured the slant the coverage was given, whether positive or negative.
The 1998 data have also been contrasted with that of 2002 to establish differences if any, in coverage.
GRAPH 1
Frequency distribution of news stories carried on government by four newspapers in 1998 and 2002.
Graph 1 clearly indicates that all four papers carried more stories on government in 1998 than in 2002. The 32-
page Graphic is the largest (in terms of volume) of the four newspapers under study. It is therefore, not
surprising that the paper covered more stories on government than the other papers. This was followed by the
Ghanaian Times, which is a daily and has broader sheets.
The privately owned newspapers, put together, also had fewer stories on government in 2002 than in
1998. In fact, 176 news stories were published by the private press on government in 1998 as against a total of
127 in 2002. However, while the Chronicle maintained almost the same level of interest in government in both
1998 and 2002, (i.e. 95 and 82 stories respectfully) the Independent appeared to be far less interested in
Developing Country Studies www.iiste.org
ISSN 2224-607X (Paper) ISSN 2225-0565 (Online)
Vol.4, No.26, 2014
16
government affairs in 2002 than was the case in 1998 (45 stories and 81 respectfully). However, given the
smaller sample size of the privately-owned newspapers coupled with the fact that they have fewer pages, their
general coverage of government particularly, in 1998, was relatively speaking, higher than that of the state
presses which have more pages and were represented by a larger sample size.
GRAPH 2
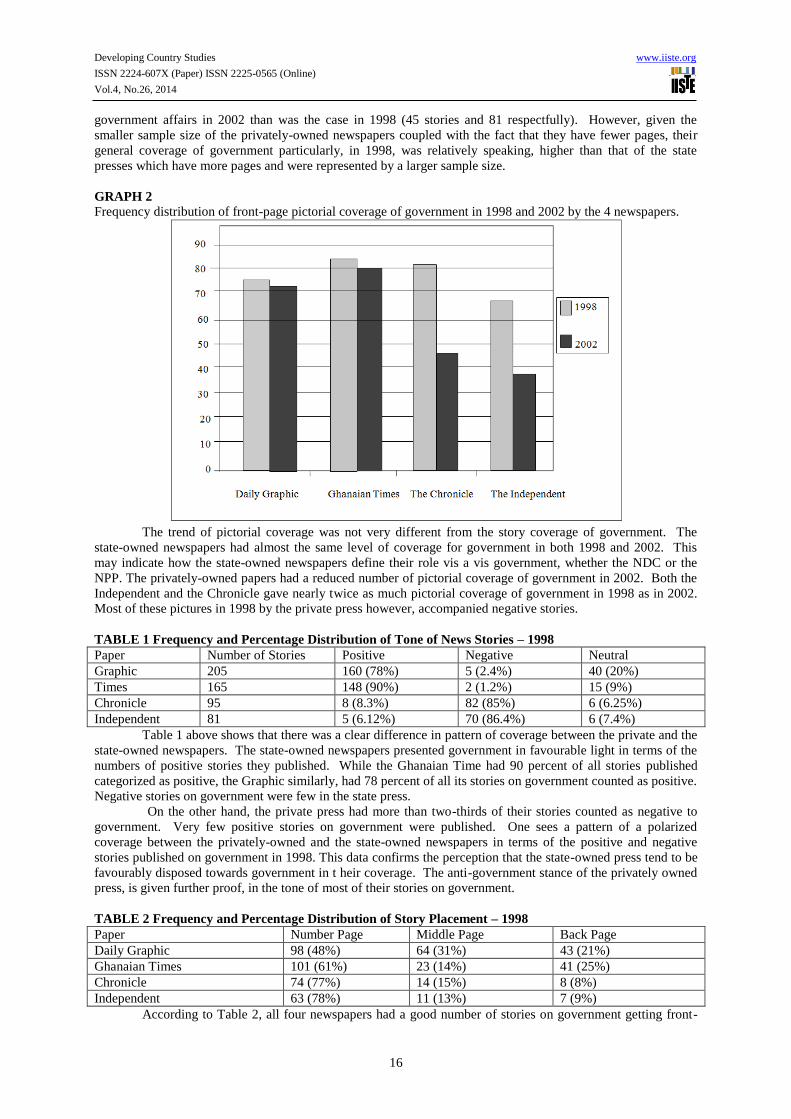
Frequency distribution of front-page pictorial coverage of government in 1998 and 2002 by the 4 newspapers.
The trend of pictorial coverage was not very different from the story coverage of government. The
state-owned newspapers had almost the same level of coverage for government in both 1998 and 2002. This
may indicate how the state-owned newspapers define their role vis a vis government, whether the NDC or the
NPP. The privately-owned papers had a reduced number of pictorial coverage of government in 2002. Both the
Independent and the Chronicle gave nearly twice as much pictorial coverage of government in 1998 as in 2002.
Most of these pictures in 1998 by the private press however, accompanied negative stories.
TABLE 1 Frequency and Percentage Distribution of Tone of News Stories – 1998
Paper Number of Stories Positive Negative Neutral
Graphic 205 160 (78%) 5 (2.4%) 40 (20%)
Times 165 148 (90%) 2 (1.2%) 15 (9%)
Chronicle 95 8 (8.3%) 82 (85%) 6 (6.25%)
Independent 81 5 (6.12%) 70 (86.4%) 6 (7.4%)
Table 1 above shows that there was a clear difference in pattern of coverage between the private and the
state-owned newspapers. The state-owned newspapers presented government in favourable light in terms of the
numbers of positive stories they published. While the Ghanaian Time had 90 percent of all stories published
categorized as positive, the Graphic similarly, had 78 percent of all its stories on government counted as positive.
Negative stories on government were few in the state press.
On the other hand, the private press had more than two-thirds of their stories counted as negative to
government. Very few positive stories on government were published. One sees a pattern of a polarized
coverage between the privately-owned and the state-owned newspapers in terms of the positive and negative
stories published on government in 1998. This data confirms the perception that the state-owned press tend to be
favourably disposed towards government in t heir coverage. The anti-government stance of the privately owned
press, is given further proof, in the tone of most of their stories on government.
TABLE 2 Frequency and Percentage Distribution of Story Placement – 1998
Paper Number Page Middle Page Back Page
Daily Graphic 98 (48%) 64 (31%) 43 (21%)
Ghanaian Times 101 (61%) 23 (14%) 41 (25%)
Chronicle 74 (77%) 14 (15%) 8 (8%)
Independent 63 (78%) 11 (13%) 7 (9%)
According to Table 2, all four newspapers had a good number of stories on government getting front-

Developing Country Studies www.iiste.org
ISSN 2224-607X (Paper) ISSN 2225-0565 (Online)
Vol.4, No.26, 2014
17
page placement. At least the placement distribution suggests that stories on government enjoyed prominence.
With the exception of the Graphic, which had less than 50 percent of its stories on government placed on its
front-page, the rest placed more than 60 percent of all their stories on government on their front pages. This may
give an indication that news on government enjoyed wide readership. The distribution of the stories with regard
to placement also reveals that the state press had a fairer spread of news on government in their pages than the
privately owned press. The concentration of stories on government was mostly on the front page of the private
papers.
TABLE 3 Frequency Distribution of Tone of Editorials on Government (1998)
Paper Frequency Positive Negative Neutral
Daily Graphic 10 8 (80%) 0 2 (20%)
Times 8 8(100%) 0 0
The Chronicle 12 1 (8%) 10 (84%) 1 (8%)
Independent 9 0 9 (100%) 0
Table 3 establishes the fact that newspapers selected for the study devoted few of their editorials to
government. The Chronicle had the highest, which were 12 editorials, followed by The Daily Graphic with 10
editorials. The trend of the editorials followed the now familiar pattern. As expected, the state-owned
newspapers had no negative editorials on government. Sixteen out of the total 18 editorials they did on
government were categorized as positive. The Chronicle and the Independent on the other hand had virtually all
their 21 editorials uncomplimentary of government and were thus categorized as negative.
5.0 CONCLUSION AND RECOMMENDATIONS
Examined theories supporting the study have sought to give the rationale behind media coverage of news.
Media ownership, news values, journalistic ethics, media gate keeping and agenda setting and economics have
all been identified as impinging on what finally gets published as news. The study looked at press coverage of
two different democratic regimes in Ghana, in 1998 and 2002. Four broad questions were examined and
addressed by the work:
1. How the privately-owned newspapers differed from the state-owned newspaper, when it comes
to what really makes news and how news is reported or published;
2. What influences there are that affected the tone of news as published by the press divide;
3. The nature of press coverage of government in non-election years against the backdrop of the
often-alleged incumbency abuse of the press in election years; and
4. Whether the assertion by Majid (1991) that press systems are usually defined by the character
of political regimes, held true.
The history of the press in Ghana supports the view that the privately-owned presses have always been
more critical of government than the state-owned press, in terms of the slant of their news coverage or reportage.
The private presses have always been critical of governments with scathing editorials. Indeed, the private-press
is perceived as conduits through which “dissenting” views are expressed. This study confirmed the assertion.
For example, more than 60 percent of all readers’ letters allowed for publication in 1998, by the privately-owned
press were counted as negative to government) compared to the state owned press which had less than 5 percent
of all readers’ letters published classified as negative. The picture painted here is in consonance with what has
always been suggested by theories on media ownership and the news, that some newspapers would deliberately
refuse to publish materials that are at odds with the interest of a major sponsor (of the paper). The publication of
low levels of critical readers’ letters by the state owned press could therefore, be explained by the fact that
government remains a “major sponsor” of the papers” Even though, there is a constitutional body like the
National Media Commission that has been put in place to check undue influence that government might want to
exert on the state media, governments have always had alternative ways of exerting pressure on state-owned
media.
Davis (1994) argued that government could act in a manner that can harm the economic interests of a
press house. It can be a withholding (denial) of advertisements from the paper and or imposing higher tariffs on
newsprint generally. The private presses in Ghana, have in the past risked covert or overt governmental action
against their interests, when perceived to be antagonistic to government (Asante, 1996). It was also concluded
from the data collected that, the privately-owned papers gave prominence to stories that were critical of
government, particularly in 1998. This was expected, given the fact that the NDC regime was perceived to be
anti-media freedoms. The 2002 picture was somewhat different. In fact, the Independent, (a privately-owned
paper), published more positive front-page stories than negative ones on government. The Chronicle, the other
privately owned paper also published a lot more positive stories on government on the paper’s front-page in
2002, when the administration had changed from NDC to NPP than was the case in 1998. The Graphic
published as many as 11 negative stories on government in 2002 on its front page from a low of five in 1998.
Developing Country Studies www.iiste.org
ISSN 2224-607X (Paper) ISSN 2225-0565 (Online)
Vol.4, No.26, 2014
18
The deduction here could be that, the media atmosphere appeared to be freer in 2002 than 1998. Apart from the
perception that the NPP regime appeared more media friendly, democracy in the country had grown further by
2002. This empowered the state media to perform their duty with less self-inflicted restraint. The fact that the
NDC government which was in power in 1998, was an offshoot of the dictatorial PNDC regime, made the
private press particularly continue to see the democratic NDC in the same light as the “PNDC”. Some actions by
the NDC government also exacerbated the perception. For example, during the NDC regime (1993 – 2000), the
then Attorney General and Minister of Justice, Dr. Obed Asamoah is on record as having stated his opposition to
the repeal of the criminal libel law. Indeed, the law was used against some perceived anti-government
journalists, notably, Nana Kofi Coomson, then Editor of the Ghanaian Chronicle and Thommy Thompson who
was publisher of the Free Press newspaper. The NPP repealed the criminal libel law when they came into power
in 2001 and generally courted the friendship of the press by appointing some journalists to positions in
government. This gesture by the NPP administration was a factor that made the press friendlier towards them.
Akhavan Majid’s (1991) suggestion that a nation’s press would respond to the political order of the day therefore
holds true here. As part of its grievances to the Commonwealth observer group (COG) in 1996, the opposition
had complained about the incumbent government’s abuse of the state-owned media not only in an election year,
but also in the build-up to the election, particularly, in the preceding non-election years. Even though the study
did not compare coverage of government and the opposition, one thing was clear: that government in both 1998
and 2002 enjoyed a great deal of prominent coverage of their activities by the state-owned press. Even the
privately owned newspapers gave government prominent space (i.e. front-page coverage) in their papers. This
undoubtedly made government a big news source for the media in general. There was ample evidence also to
suggest that the state-owned press continued to be non-disruptive of the established order, while the private press
tended to stoke the fire. This assertion is supported not only by the difference in number of positive and negative
stories published by the state-owned press and the privately owned press, but also by their editorial posture. For
the most part, the editorials in the state-run papers tended to be complimentary of government actions, while the
reverse was true of the privately run newspapers.
5.1 RECOMMENDATIONS
The media have globally been acknowledged as a particularly important institution for democracy and political
pluralism. Society is made up of individuals with diverse views and opinions on issues that crop up everyday.
The media are generally looked upon to give voice to these diverse ideas, so that citizens can have informed
choices. On this score, the media generally need balance in their reportage in order to play the aforementioned
role.
It is recommended that the state-owned press should have more confidence in themselves to criticize
government when necessary, in much the same way as the privately-owned newspapers could also compliment
good governmental actions by publication of such news without any restraint.
There is therefore the need for the press, particularly, the state owned to reflect diverse opinions and
thinking by publishing a lot more critical readers’ letters and news stories on government than they are currently
doing. The importance of the readers’ column has been acknowledged by Lander (1968) who observed that,
columns of readers’ letters in a newspaper serve as a platform for debates and discussions on various issues
including government policies, societal issues as well as a forum for rejoinders. Such letters, according to
Lander (1968), could serve as a kind of index for gauging public interest in national affairs. The issue of media
ownership certainly has a role to play in the way press in general and the state-owned press in particular fulfills
their mandate of keeping the government on her toes. The ability of the papers to generate enough funds to run
their business (especially when government is not seen as a major sponsor) would help the effort of the National
Media Commission to achieve a more vibrant media, independent of governmental influence.
The privately-owned media do have the right to choose what they publish, however, they must also be
alive to their social responsibility by giving prominence from time to time to stories which may not have the
desired commercial value but could promote the good of society in one way or the other. There is also the need
to erase the age-old mutual suspicion between government and the private press through conscious effort on the
part of government to cultivate them (the private press). Even though reasons have been advanced as to why the
private press was particularly hostile to the NDC regime, the continued mutual suspicion would not serve the
national interest. This is because, media criticisms are supposed to help government to govern effectively,
however because of the suspicion that the private-press is out there to cause mischief against government,
genuine criticisms could be overlooked. The small change, in media coverage of government particularly by the
private press in 2002 should be encouraged and built upon. It is envisaged that as democracy grows and
deepens, the media would also be enabled to play its watchdog role more effectively.
Bibliography
Ainslie R., (1996). The Press in Africa: communications past and present. New York: Walker.

Developing Country Studies www.iiste.org
ISSN 2224-607X (Paper) ISSN 2225-0565 (Online)
Vol.4, No.26, 2014
19
Akirinade, Olusogi, D. (1987). Ownership control versus Editorial content: A study of Nigerian Daily
Newspapers (an un published work) University of Gerogia, in Anthony Bonnah Koomson: A content analytic
study of the West Africa. Editorials) during military rule 1966 – 1985. Ph.D thesis, University of Ohio, 1987.
Akordor Stephen, Kofi. (1994). Press ownership and editorial Policy: An assessment of the image of the
government of Ghana in the state owned and privately owned newspapers. (Graduate Diploma dissertation,
School of Communication Studies, U niversity of Ghana).
Applegate E., (1998). Print and Broadcast Journalism New York: Hastings House.
Asante C. and Gadzekpo. (1998). Media and Politics in Ghana. In Mbayo, R., Onwumechili, C, and Nwanko, R.
(eds) 2000. Press and Politics in Africa. The Edwm Mellen Press, Lewiston, Queenston, Lampeter.
Asante Clement E. (1986). The press in Ghana, problems and prospects: University press of America, New
York inc. Lanham.
Asher Herbert (1983): Presidential Elections and American politics; Homewood, Dorsey.
Bagdikian, B. (1983). The Media Monopoly. Boston, Beacon Press.
Barber D. James (1978). Race for the Presidency; the media and the hommating Process (Englewood cliffs, NJ,
Prentice – Hall). As in Journalism Quarterly (Spring to Winter, 1993).
Belsey, Andrew (1992). “Privacy Publicity and Politics”, in Ethical issues in Journalism and the Media (ed).
Andrew Belsey and Ruth Chadwick, New York: Routledge.
Berger and Chaffee (1987). Eds., Handbook of Communication Science, Newbury Park, CA: Sage.

Developing Country Studies www.iiste.org
ISSN 2224-607X (Paper) ISSN 2225-0565 (Online)
Vol.4, No.26, 2014
20
Food Security Incidences Based on Monetary and Caloric Poverty
Lines in Mbeya and Makete Districts, Tanzania
Dorah H. Mende1 Kim A. Kayunze
2 Maulid Mwatawala
3
1.Agricultural Research Institute Uyole (ARI-Uyole), P. O. Box 400, Mbeya , Tanzania
2.Development Studies Institute, Sokoine University of Agriculture, P. O. Box 3024, Morogoro, Tanzania
3.Crop Science Department, Sokoine University of Agriculture, P. O. Box 3005, Morogoro, Tanzania
*Email of corresponding author: [email protected]
The research was financed by Commission for Science and Technology Tanzania (COSTECH)
Abstract
In Tanzania, a food monetary poverty line of TZS1 10,219 per adult equivalent for 28 days in 2007 prices and a
caloric poverty line of 2,200 kcal per adult equivalent per day are used. However, it is not known where their
uses give similar incidences of food security. Generation of empirical information on this was worthwhile to
inform choices of which of the lines should be more preferable. This study sought to determine food security
based on monetary and caloric poverty lines in Mbeya and Makete Districts. The specific objectives of the study
were to: (1) Determine food security based on the national monetary poverty line, (2) Determine food security
based on caloric food poverty line, and (3) Compare food security incidences based on the two poverty lines.
Multistage sampling was used to select 233 households. The research was a cross-sectional one and was
conducted through structured interviews using a questionnaire, focus group discussions and key informant
interviews. Using the national food monetary and calorific food poverty lines, it was found that 82.8% and
79.0% of the 233 sampled households were food secure in Mbeya and Makete respectively. Monetary and
caloric food poverty lines gave almost similar results of food security incidences, albeit the monetary food
poverty line gives slightly higher food security incidences. It is concluded that the two poverty lines give almost
similar food security incidences and have good potential to give reasonable results of food security status. It is
recommended that the government and other stakeholders dealing with food security should use both food
poverty lines almost equally since they give almost the same results.
Keywords: Food security, monetary, calorific, poverty line, Southern Highlands, Tanzania
1.0 Introduction
Food security and poverty are defined in different ways by international organizations and researchers. A
number of attempts have been made to define and clarify dimensions and the key features of food security and
poverty. “Food security, at the individual, household, national, regional and global levels exists when all people,
at all times, have physical and economic access to sufficient, safe and nutritious food that meets their dietary
needs and food preferences for an active and healthy life” (FAO, 1996, cited by Pottier, 1999). Food security is a
development issue since food insecurity impacts negatively on many other indicators of wellbeing. While
developed countries of Europe, North America and Northern Asia hardly have the problem of food insecurity,
most developing countries especially in Sub-Saharan Africa (SSA), South Eastern Asia and Pacific have it.
While poverty is conceived as a lack of enough income necessary to buy a bundle of goods to guarantee the
survival of a person, food insecurity is implicitly assumed as a sub-category of poverty (Sibrian, 2008). Poverty
is also considered as a basic deprivation of well-being to live comfortably and includes lack of adequate food,
shelter, education, health and vulnerability to natural disasters such as floods and droughts (Namara et al., 2010).
In an attempt to define poverty, researchers associate it with the causes or manifestations of food insecurity.
Indeed there are variations and/or different views on how poverty should be defined and what it means to be
poor. Poverty is caused by lack of adequate resources and capabilities to acquire basic needs. Poverty tends to
increase food insecurity; ignorance; and prevalence of diseases. However, the most commonly used definition
emphasises the income dimension of poverty because all indicators listed earlier, for instance food insecurity and
malnutrition, ignorance, and prevalence of diseases are translated through inadequate income flow. In other
words, income is regarded as a relevant wellbeing indicator and therefore poverty occurs when one is unable to
attain a minimum standard of living. Following this definition, poverty is measured by income or expenditure
level that can sustain a minimum standard of living (Msambichaka, et al., 2003). However, it is argued that
income is a poor indicator of wellbeing (Greeley, 1994) because one having much income may not use it to
acquire other necessities. Therefore, besides income, some other non-income aspects are used to supplement
income as a measure of poverty.
The multi-dimensional characteristics of poverty have prompted scholars to construct two poverty
1 USD 1 equals about TZS 1784 in November 2014
Developing Country Studies www.iiste.org
ISSN 2224-607X (Paper) ISSN 2225-0565 (Online)
Vol.4, No.26, 2014
21
lines namely food expenditure poverty line and basic needs poverty line. Food expenditure poverty line is
associated with expenditure on food (consumption) and/or food poverty, which is generally defined as a
condition of lacking the resources necessary to acquire a nutritionally adequate diet. The food poverty line is the
estimated cost of acquiring the amount of recommended calories and/or nutritional requirements at the
subsistence level. The basic needs poverty line is the minimum cost of living that specifies the consumption
bundle deemed to be adequate for basic consumption needs (NBS, 2009). In Tanzania, two food poverty lines
are used: the monetary food poverty line of TZs 10,219 per adult equivalent for 28 days in 2007 prices, and the
caloric poverty line 2,200 kcal per adult equivalent per day. According to NBS (2009) the proportion of
population below the monetary food poverty line was 16.6% in 2007. However, the proportion of the population
below the caloric poverty line was not estimated.
Smallholder farmers in Mbeya and Makete Districts recognise food insecurity and poverty as problems
affecting them in many aspects, such as having less than three meals per day, less frequencies of protein food
intake, particularly meat and fish per week, malnutrition among children and lack of income to buy other
foodstuffs (Socio-economic profiles; Mbeya Rural 2003, Makete 2008). Mbeya and Makete Districts have good
climate and high agricultural potential and suitable environment which enable people to undertake various
agricultural and non-agricultural activities. The districts are suitable for production of food and cash crops,
presence of land suitable for irrigation and excellent local, national and border market demands. Besides farm
activities, smallholder farmers are also involved in various non-agricultural activities to increase their incomes. It
would be expected that most of households would increase crop production and incomes from non-agricultural
activities and eventually become food secure.
Evaluation of various methods of food security determination has been done. For example, a study
report by Kayunze et al. (2010) compared food security incidences in terms of dietary energy consumed per
adult equivalent and per capita, both per day, based on data covering seven days, one month and one year in
Rufiji District, Tanzania. However, comparing food security incidences based on monetary values of food and
dietary energy consumed has not been done. Accordingly, it was not known which of the two methods was better
than the other one. Therefore, the specific objectives of this paper were to: a) determine food security based on
monetary poverty line, b) determine food security based on caloric poverty line and c) compare food security
incidences based on the two methods in the study area. The study had potential to generate empirical
information on which of the two poverty lines is better in explaining incidences of food security.
2.0 Methodology
2.1 Description of the Study Area
The research on which this paper is based was conducted in Mbeya Rural and Makete Districts, Mbeya and
Njombe regions. Mbeya District is among the eight districts of Mbeya Region. The district covers an area of
2,432 square kilometres of which 1,898 square kilometres is arable land ideal for agricultural production (Socio-
economic profile; Mbeya District, 2003). The district is administratively divided into three divisions namely
Tembela, Isangati and Usongwe having 25 wards, and 148 villages, but the research was confined to two
divisions: Tembela and Isangati from which two wards namely Tembela and Santilya were selected. Four
villages, two from each of the two selected wards, were selected for the research. The villages were Ilembo
Usafwa, Shibolya, Sanje and Mpande.
Makete District is one of three districts in the newly established (October 2013) Njombe Region. The
district covers an area of 5,800 square kilometres of which 4,195 square kilometres is arable land ideal for
agricultural production (Socio-economic profile; Makete District, 2008). The District is administratively divided
into six divisions namely Ikuwo, Ukwama, Lupalilo, Bulongwa, Magoma and Matamba having 17 wards and 97
villages. As for Mbeya District, the research was confined to two divisions: Bulongwa and Lupalilo from which
two wards namely Isapulano and Kipagilo were selected. Four villages, two from each of the two selected wards,
were selected for the research. The villages selected were Ivilikinge, Isapulano, Kitula and Iyoka. The basis for
selecting the villages was their high and low production of round potatoes in some of them and their production
of other cash crops besides round potatoes and production of food crops particularly maize, wheat and beans.
2.2 Research Design
The target population was all households in areas where agricultural production and other economic activities
were common in Mbeya Rural and Makete Districts. A cross-sectional design was used and data were collected
once. Multistage sampling was used in selection of respondents. The first stage involved selection of two
divisions per district based on the number of major food and cash crops grown. The second stage involved
selection of one ward from each division from each of the two divisions per district making four wards,
depending on above criteria. The third stage involved random selection of two villages from each ward making a
total of eight villages. That means four villages per district were selected. The last stage was sampling of
respondents using systematic sampling. The sampling frame was households which were involved in agricultural
Developing Country Studies www.iiste.org
ISSN 2224-607X (Paper) ISSN 2225-0565 (Online)
Vol.4, No.26, 2014
22
production and other economic activities.
2.3 Data Collection
Primary data were collected through interview schedules using a structured questionnaire. Both quantitative and
qualitative information types were collected. Key informant interviews were held with people who had in-depth
understanding and knowledge on food security in the respective districts. Key informants included District
Agricultural and Livestock District Officers (DALDOs), village and ward extension officers, village government
leaders, leaders of farmer groups and traditional elders. The information collected was compared and contrasted
with the literature which was reviewed in the Ministry of Agriculture, Food and Cooperatives; District
Agricultural and Livestock Development Offices (DALDOs) in Mbeya Rural and Makete Districts; Agricultural
Research Institute–Uyole, Mbeya; Sokoine National Agricultural Library (SNAL); and websites. The
information collected included major crops grown and production trends, production technologies, production
constraints, opportunities, food security status, major causes of food insecurity and poverty, current food security
improvement and poverty reduction programmes.
2.4 Data Processing and Analysis
The primary quantitative data collected were analysed using the Statistical Package for Social Sciences (SPSS)
software. Data were analysed by computing descriptive statistics to determine frequencies, percentages,
statistical means, and standard deviations of individual variables. Moreover, inferential analysis was done by
using one-way ANOVA to compare levels of food security based on (i) kCal consumed and (ii) monetary value
of food consumed. In the first case, the grouping variable was age category: young age (19-35), middle age (36-
50) and old (51-71). In the second case, the grouping variable was household size: small (1-3), medium (4-6) and
large (7 to highest). In the third case, the grouping variable was land size: small (0.5 – 5.0 acres); medium (5.1 –
10.0 acres) and large (10.1 acres to the highest). Lastly, the grouping variable was acreage under potato
production: small acreage with non-agricultural activities, small acreage without non-agricultural activities, large
acreage with non-agricultural activities and large acreage without non-agricultural activities.
2.5 Adjustment of the Food Monetary Poverty Line and Various Monetary Values
Due to the fact that the same amount of money has different values in different periods of time, the food
monetary poverty line was expressed in real terms in the year 2012 prices when data for the research were
collected. This was done using average seasonally adjusted consumer price indices for the years concerned as
illustrated in (Table 1). Seasonally adjusted consumer price indices were used because they are identical to
patterns that a time series appears to follow during corresponding months of successive years (BoT, 2012).
2.6 Adult Equivalent Units Computation
Cognisant of the fact that if variables like income and dietary energy consumed are expressed per capita they do
not reflect good comparative figures in households with different sizes and composition by age and sex, dietary
energy consumed was expressed per adult equivalent following the procedure used by Collier et al. (1990). In
order to calculate adult equivalent units, the sex and age of every household member were recorded. A two-step
procedure was followed whereby in the first step adult equivalent scales for East Africa by age and sex were
added up for all household members to get all the household members in terms of adult equivalents. The
equivalent scales are presented in Table 2. The second step involved adjusting the above adult equivalents for
economies of scale due to the fact that larger households need fewer resources per person due to sharing some
facilities. The economies of scale are taken into account by multiplying the adult equivalent units by the average
cost (Table 2) corresponding to the number of people in the household. The adjusted adult equivalent units were
used as denominators for calculating values per adult equivalent in particular households.
2.7 Food Security Based on Monetary Poverty Line Determination
Monetary values of various foodstuffs eaten by all members of household were determined. The food items
included home produced items, food received as gifts and food payments in kind for work done. Both quantities
and monetary values for each food item consumed were recorded. Some food items which were in local units
were converted using appropriate conversion factors prepared by Lukmanji et al. (2008). Monetary values of all
food items consumed by all households were expressed per adult equivalent units for 28 days. The food poverty
line in Tanzania, according to Household Budget Survey 2007 (NBS, 2009), was 10,219 per adult equivalent for
28 days in 2007 prices. Therefore, expressing monetary values of food types eaten for 28 days was aimed at
obtaining results which are comparable with national data of food security. In this research the poverty line of
10,219 of 2007 was adjusted to its equivalent in 2010 prices by multiplying the 2007 monetary food poverty line
of TZs 10,219 by a factor of 1.3259943. This factor was obtained by applying cross-multiplication to the
seasonally adjusted consumer indices of 2007 and 2010 as illustrated in Table 1. Then the 2010 equivalent
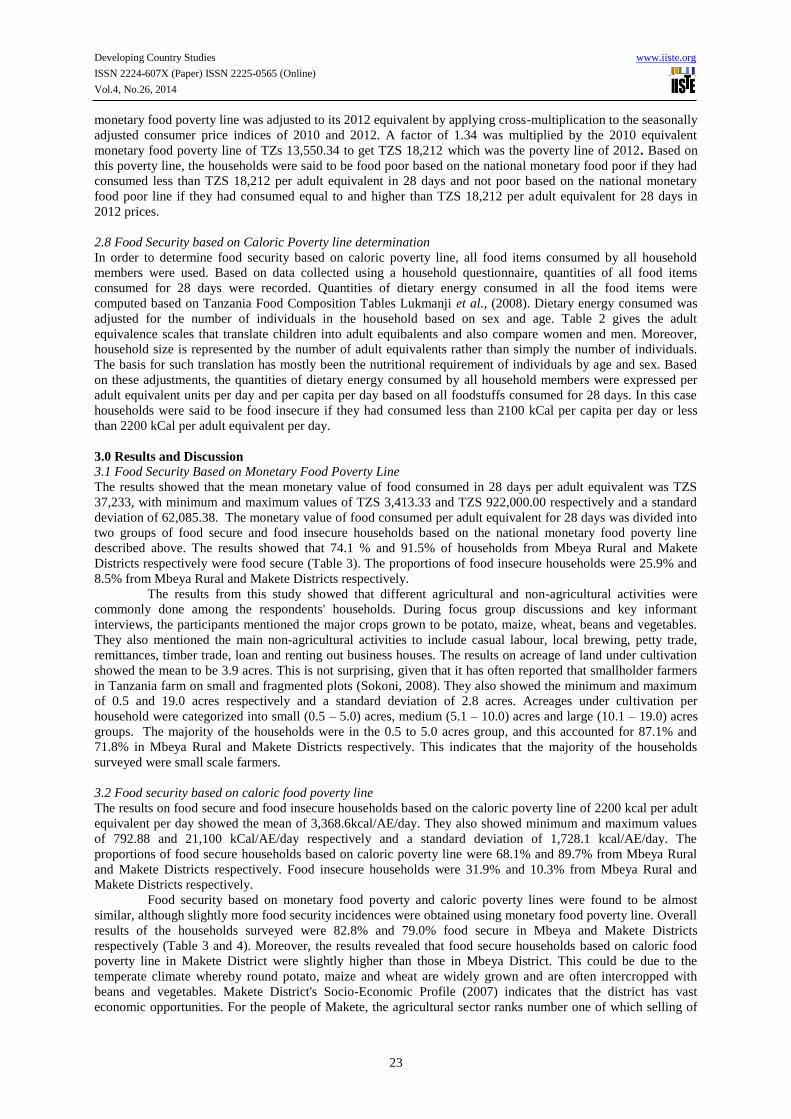
Developing Country Studies www.iiste.org
ISSN 2224-607X (Paper) ISSN 2225-0565 (Online)
Vol.4, No.26, 2014
23
monetary food poverty line was adjusted to its 2012 equivalent by applying cross-multiplication to the seasonally
adjusted consumer price indices of 2010 and 2012. A factor of 1.34 was multiplied by the 2010 equivalent
monetary food poverty line of TZs 13,550.34 to get TZS 18,212 which was the poverty line of 2012. Based on
this poverty line, the households were said to be food poor based on the national monetary food poor if they had
consumed less than TZS 18,212 per adult equivalent in 28 days and not poor based on the national monetary
food poor line if they had consumed equal to and higher than TZS 18,212 per adult equivalent for 28 days in
2012 prices.
2.8 Food Security based on Caloric Poverty line determination
In order to determine food security based on caloric poverty line, all food items consumed by all household
members were used. Based on data collected using a household questionnaire, quantities of all food items
consumed for 28 days were recorded. Quantities of dietary energy consumed in all the food items were
computed based on Tanzania Food Composition Tables Lukmanji et al., (2008). Dietary energy consumed was
adjusted for the number of individuals in the household based on sex and age. Table 2 gives the adult
equivalence scales that translate children into adult equibalents and also compare women and men. Moreover,
household size is represented by the number of adult equivalents rather than simply the number of individuals.
The basis for such translation has mostly been the nutritional requirement of individuals by age and sex. Based
on these adjustments, the quantities of dietary energy consumed by all household members were expressed per
adult equivalent units per day and per capita per day based on all foodstuffs consumed for 28 days. In this case
households were said to be food insecure if they had consumed less than 2100 kCal per capita per day or less
than 2200 kCal per adult equivalent per day.
3.0 Results and Discussion
3.1 Food Security Based on Monetary Food Poverty Line
The results showed that the mean monetary value of food consumed in 28 days per adult equivalent was TZS
37,233, with minimum and maximum values of TZS 3,413.33 and TZS 922,000.00 respectively and a standard
deviation of 62,085.38. The monetary value of food consumed per adult equivalent for 28 days was divided into
two groups of food secure and food insecure households based on the national monetary food poverty line
described above. The results showed that 74.1 % and 91.5% of households from Mbeya Rural and Makete
Districts respectively were food secure (Table 3). The proportions of food insecure households were 25.9% and
8.5% from Mbeya Rural and Makete Districts respectively.
The results from this study showed that different agricultural and non-agricultural activities were
commonly done among the respondents' households. During focus group discussions and key informant
interviews, the participants mentioned the major crops grown to be potato, maize, wheat, beans and vegetables.
They also mentioned the main non-agricultural activities to include casual labour, local brewing, petty trade,
remittances, timber trade, loan and renting out business houses. The results on acreage of land under cultivation
showed the mean to be 3.9 acres. This is not surprising, given that it has often reported that smallholder farmers
in Tanzania farm on small and fragmented plots (Sokoni, 2008). They also showed the minimum and maximum
of 0.5 and 19.0 acres respectively and a standard deviation of 2.8 acres. Acreages under cultivation per
household were categorized into small (0.5 – 5.0) acres, medium (5.1 – 10.0) acres and large (10.1 – 19.0) acres
groups. The majority of the households were in the 0.5 to 5.0 acres group, and this accounted for 87.1% and
71.8% in Mbeya Rural and Makete Districts respectively. This indicates that the majority of the households
surveyed were small scale farmers.
3.2 Food security based on caloric food poverty line
The results on food secure and food insecure households based on the caloric poverty line of 2200 kcal per adult
equivalent per day showed the mean of 3,368.6kcal/AE/day. They also showed minimum and maximum values
of 792.88 and 21,100 kCal/AE/day respectively and a standard deviation of 1,728.1 kcal/AE/day. The
proportions of food secure households based on caloric poverty line were 68.1% and 89.7% from Mbeya Rural
and Makete Districts respectively. Food insecure households were 31.9% and 10.3% from Mbeya Rural and
Makete Districts respectively.
Food security based on monetary food poverty and caloric poverty lines were found to be almost
similar, although slightly more food security incidences were obtained using monetary food poverty line. Overall
results of the households surveyed were 82.8% and 79.0% food secure in Mbeya and Makete Districts
respectively (Table 3 and 4). Moreover, the results revealed that food secure households based on caloric food
poverty line in Makete District were slightly higher than those in Mbeya District. This could be due to the
temperate climate whereby round potato, maize and wheat are widely grown and are often intercropped with
beans and vegetables. Makete District's Socio-Economic Profile (2007) indicates that the district has vast
economic opportunities. For the people of Makete, the agricultural sector ranks number one of which selling of

Developing Country Studies www.iiste.org
ISSN 2224-607X (Paper) ISSN 2225-0565 (Online)
Vol.4, No.26, 2014
24
crops was the main source of income. This might mean that they have enough food to eat and cash for other
household needs throughout the year. This was evidenced by the respondents during focus group discussion and
key informant interviews. They pointed out that for them cash and food crops are sold interchangeably to
enhance their incomes and ensure food availability throughout the year.
3.3 Comparisons of Food Security Based on the two Poverty Lines
The amounts of kCal consumed per adult equivalent per day were significantly different (F=7.424, p < 0.001)
among households with heads of different age categories (Table 5). In households headed by young (19-39)
years household heads the highest levels of kCal were consumed compared to households headed by middle (36-
50) years and old (51-71) aged household heads. The results might imply that young household heads are
stronger and are expected to cultivate larger farms than middle and old aged household heads. Similarly, in
households headed by young household heads foodstuffs with the highest monetary value were consumed
compared to the other households. However, the differences were not significantly different (F = 2.17, p > 0.05).
Food security based on kilocalories consumed per adult equivalent per day was also compared by household size
categories. The results showed that small households consumed the highest amounts of kilocalories and the
kilocalories consumed among small, medium and large households differed significantly (F = 25.537, p < 0.001)
(Table 5. However, there was no significant difference (F = 2.42, p > 0.05) in monetary values of foodstuffs
consumed among the three categories of household. These results are contrary to results of some previous
researches, e.g. by Kayunze (2000) and Kamuzora (2001) that in rural areas the larger the household size, the
higher people are better off, including being more food secure. The explanation for these findings was that it
happens more where households have more labour force in terms of a larger proportion of adult members who
work either on farm or otherwise.
Food security based on caloric poverty line was also compared among households with different land
size categories (Table 5). The land size categories were between 0.5 – 5 acres, 5.1 – 10 acres and 10.1 to the
highest. The results indicate that there was no significant difference in the kilocalories consumed among the
three categories of household (F = 0.816, p > 0.05). This might imply that most of the farmers were not using
improved agricultural technologies. Other studies, for example by Reddy et al. (2004) and Asogwa et al. (2012),
reported that households with larger farm sizes tend to be more food secure than those with smaller farm sizes.
Food security based on monetary poverty line was compared by land size categories. The results indicated that
there were no statistically significant differences (F = 0.254, p > 0.05) among households with different land size
categories in the study area.
Acreage under potato production per household was divided into four categories as follows: 1) Small
acreage with non-agricultural activities, 2) Small acreage without non-agricultural activities, 3) Large acreage
with non-agricultural activities, and 4) Large acreage without non-agricultural activities. The four categories
were compared based on the two poverty lines, that is caloric and monetary poverty lines. The results showed
that, based on caloric poverty line there were no significant differences (F = 2.435, p > 0.05) among the four
categories. Moreover, based on monetary poverty line, there were no significant differences among the four
categories (F = 2.276, p > 0.05)
4.0 Conclusion and recommendations
Based on the national monetary and the national caloric poverty lines the study concludes that the majority of the
sampled households in the study area are food secure. Based on this conclusion, the two poverty lines give
almost similar food security incidences and have potential to give good results of food security status, albeit the
monetary food poverty line gives slightly higher food security incidences. It is recommended that the
government and other stakeholders dealing with food security should use both food poverty lines almost equally
since they give almost the same results.
Based on caloric poverty line, there were significant differences between households with different
household heads age and household size categories in the study area. However, contrary to prior expectations,
food security was not significantly different by land size under cultivation, which means that land size cultivated
is not a good predictor of food security status in the study area. Based on this conclusion, farmers are urged to
improve their land productivity in order to improve their food security statuses rather than increasing land size.
Moreover, the government and policy makers are urged to help farmers of Mbeya and Makete Districts improve
land productivities through provision of inputs at subsidized prices.
References
Asogwa B. C, Umeh J. C (2012). Food insecurity determinants among rural farm households in Nigeria.
Proceedings of International Conference of Ecology, Agriculture and Chemical Engineering (ICEACS
2012), Phuket (Thailand), December 18th
– 19th
2012.
Babatunde R. O, Omotesho O. A and Sholotan O. S (2007) Socio-Economic Characteristics and Food Security
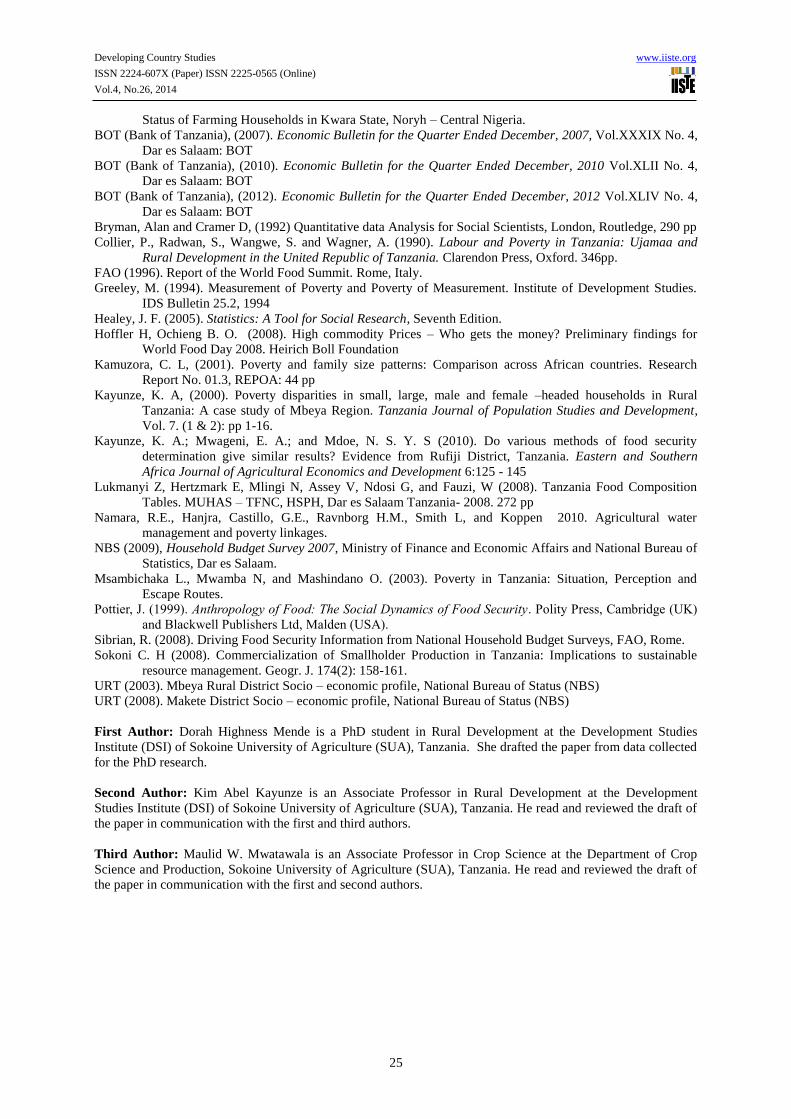
Developing Country Studies www.iiste.org
ISSN 2224-607X (Paper) ISSN 2225-0565 (Online)
Vol.4, No.26, 2014
25
Status of Farming Households in Kwara State, Noryh – Central Nigeria.
BOT (Bank of Tanzania), (2007). Economic Bulletin for the Quarter Ended December, 2007, Vol.XXXIX No. 4,
Dar es Salaam: BOT
BOT (Bank of Tanzania), (2010). Economic Bulletin for the Quarter Ended December, 2010 Vol.XLII No. 4,
Dar es Salaam: BOT
BOT (Bank of Tanzania), (2012). Economic Bulletin for the Quarter Ended December, 2012 Vol.XLIV No. 4,
Dar es Salaam: BOT
Bryman, Alan and Cramer D, (1992) Quantitative data Analysis for Social Scientists, London, Routledge, 290 pp
Collier, P., Radwan, S., Wangwe, S. and Wagner, A. (1990). Labour and Poverty in Tanzania: Ujamaa and
Rural Development in the United Republic of Tanzania. Clarendon Press, Oxford. 346pp.
FAO (1996). Report of the World Food Summit. Rome, Italy.
Greeley, M. (1994). Measurement of Poverty and Poverty of Measurement. Institute of Development Studies.
IDS Bulletin 25.2, 1994
Healey, J. F. (2005). Statistics: A Tool for Social Research, Seventh Edition.
Hoffler H, Ochieng B. O. (2008). High commodity Prices – Who gets the money? Preliminary findings for
World Food Day 2008. Heirich Boll Foundation
Kamuzora, C. L, (2001). Poverty and family size patterns: Comparison across African countries. Research
Report No. 01.3, REPOA: 44 pp
Kayunze, K. A, (2000). Poverty disparities in small, large, male and female –headed households in Rural
Tanzania: A case study of Mbeya Region. Tanzania Journal of Population Studies and Development,
Vol. 7. (1 & 2): pp 1-16.
Kayunze, K. A.; Mwageni, E. A.; and Mdoe, N. S. Y. S (2010). Do various methods of food security
determination give similar results? Evidence from Rufiji District, Tanzania. Eastern and Southern
Africa Journal of Agricultural Economics and Development 6:125 - 145
Lukmanyi Z, Hertzmark E, Mlingi N, Assey V, Ndosi G, and Fauzi, W (2008). Tanzania Food Composition
Tables. MUHAS – TFNC, HSPH, Dar es Salaam Tanzania- 2008. 272 pp
Namara, R.E., Hanjra, Castillo, G.E., Ravnborg H.M., Smith L, and Koppen 2010. Agricultural water
management and poverty linkages.
NBS (2009), Household Budget Survey 2007, Ministry of Finance and Economic Affairs and National Bureau of
Statistics, Dar es Salaam.
Msambichaka L., Mwamba N, and Mashindano O. (2003). Poverty in Tanzania: Situation, Perception and
Escape Routes.
Pottier, J. (1999). Anthropology of Food: The Social Dynamics of Food Security. Polity Press, Cambridge (UK)
and Blackwell Publishers Ltd, Malden (USA).
Sibrian, R. (2008). Driving Food Security Information from National Household Budget Surveys, FAO, Rome.
Sokoni C. H (2008). Commercialization of Smallholder Production in Tanzania: Implications to sustainable
resource management. Geogr. J. 174(2): 158-161.
URT (2003). Mbeya Rural District Socio – economic profile, National Bureau of Status (NBS)
URT (2008). Makete District Socio – economic profile, National Bureau of Status (NBS)
First Author: Dorah Highness Mende is a PhD student in Rural Development at the Development Studies
Institute (DSI) of Sokoine University of Agriculture (SUA), Tanzania. She drafted the paper from data collected
for the PhD research.
Second Author: Kim Abel Kayunze is an Associate Professor in Rural Development at the Development
Studies Institute (DSI) of Sokoine University of Agriculture (SUA), Tanzania. He read and reviewed the draft of
the paper in communication with the first and third authors.
Third Author: Maulid W. Mwatawala is an Associate Professor in Crop Science at the Department of Crop
Science and Production, Sokoine University of Agriculture (SUA), Tanzania. He read and reviewed the draft of
the paper in communication with the first and second authors.
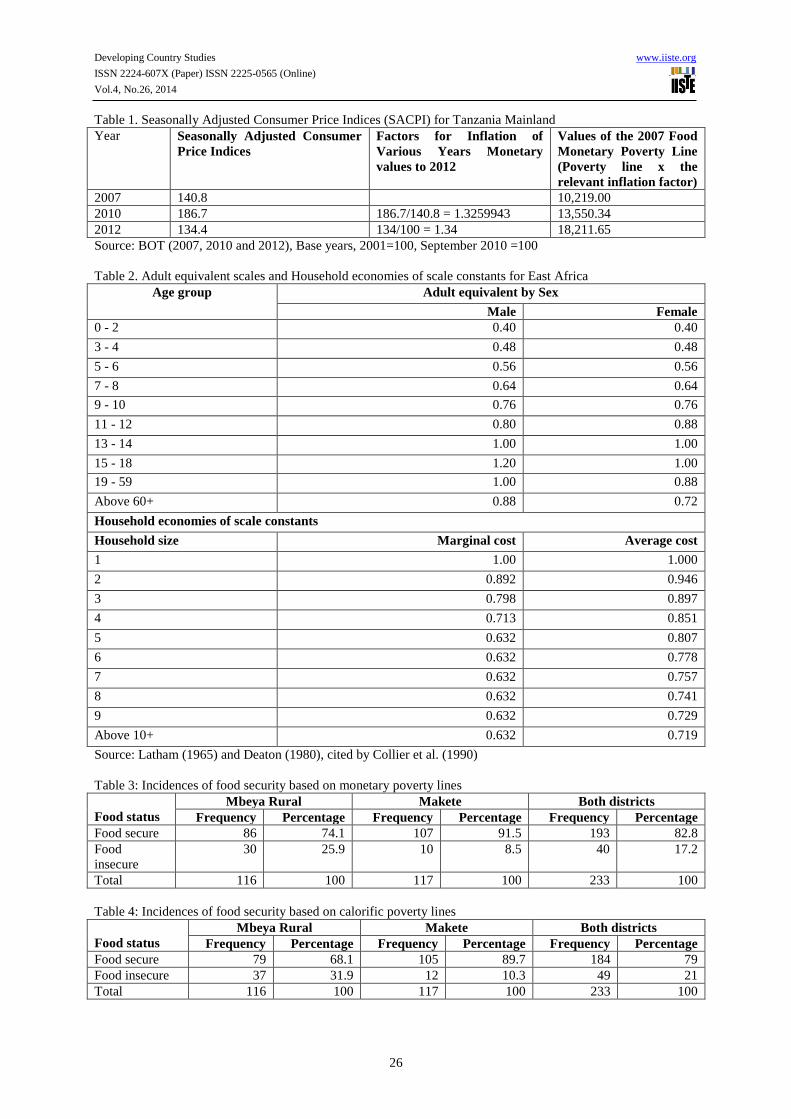
Developing Country Studies www.iiste.org
ISSN 2224-607X (Paper) ISSN 2225-0565 (Online)
Vol.4, No.26, 2014
26
Table 1. Seasonally Adjusted Consumer Price Indices (SACPI) for Tanzania Mainland
Year Seasonally Adjusted Consumer
Price Indices
Factors for Inflation of
Various Years Monetary
values to 2012
Values of the 2007 Food
Monetary Poverty Line
(Poverty line x the
relevant inflation factor)
2007 140.8 10,219.00
2010 186.7 186.7/140.8 = 1.3259943 13,550.34
2012 134.4 134/100 = 1.34 18,211.65
Source: BOT (2007, 2010 and 2012), Base years, 2001=100, September 2010 =100
Table 2. Adult equivalent scales and Household economies of scale constants for East Africa
Age group Adult equivalent by Sex
Male Female
0 - 2 0.40 0.40
3 - 4 0.48 0.48
5 - 6 0.56 0.56
7 - 8 0.64 0.64
9 - 10 0.76 0.76
11 - 12 0.80 0.88
13 - 14 1.00 1.00
15 - 18 1.20 1.00
19 - 59 1.00 0.88
Above 60+ 0.88 0.72
Household economies of scale constants
Household size Marginal cost Average cost
1 1.00 1.000
2 0.892 0.946
3 0.798 0.897
4 0.713 0.851
5 0.632 0.807
6 0.632 0.778
7 0.632 0.757
8 0.632 0.741
9 0.632 0.729
Above 10+ 0.632 0.719
Source: Latham (1965) and Deaton (1980), cited by Collier et al. (1990)
Table 3: Incidences of food security based on monetary poverty lines
Food status
Mbeya Rural Makete Both districts
Frequency Percentage Frequency Percentage Frequency Percentage
Food secure 86 74.1 107 91.5 193 82.8
Food
insecure
30 25.9 10 8.5 40 17.2
Total 116 100 117 100 233 100
Table 4: Incidences of food security based on calorific poverty lines
Food status
Mbeya Rural Makete Both districts
Frequency Percentage Frequency Percentage Frequency Percentage
Food secure 79 68.1 105 89.7 184 79
Food insecure 37 31.9 12 10.3 49 21
Total 116 100 117 100 233 100
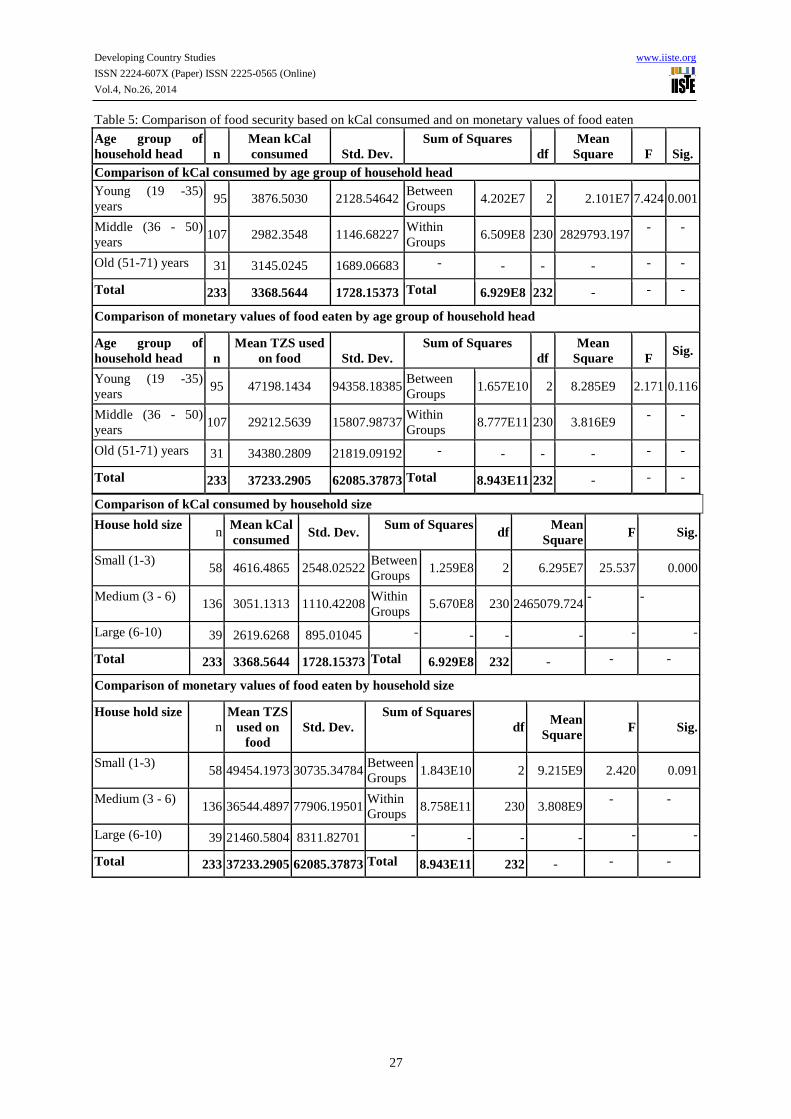
Developing Country Studies www.iiste.org
ISSN 2224-607X (Paper) ISSN 2225-0565 (Online)
Vol.4, No.26, 2014
27
Table 5: Comparison of food security based on kCal consumed and on monetary values of food eaten
Age group of
household head n
Mean kCal
consumed Std. Dev.
Sum of Squares
df
Mean
Square F Sig.
Comparison of kCal consumed by age group of household head
Young (19 -35)
years 95 3876.5030 2128.54642
Between
Groups 4.202E7 2 2.101E7 7.424 0.001
Middle (36 - 50)
years 107 2982.3548 1146.68227
Within
Groups 6.509E8 230 2829793.197
- -
Old (51-71) years 31 3145.0245 1689.06683 - - - - - -
Total 233 3368.5644 1728.15373 Total 6.929E8 232 - - -
Comparison of monetary values of food eaten by age group of household head
Age group of
household head n
Mean TZS used
on food Std. Dev.
Sum of Squares
df
Mean
Square F Sig.
Young (19 -35)
years 95 47198.1434 94358.18385
Between
Groups 1.657E10 2 8.285E9 2.171 0.116
Middle (36 - 50)
years 107 29212.5639 15807.98737
Within
Groups 8.777E11 230 3.816E9
- -
Old (51-71) years 31 34380.2809 21819.09192 - - - - - -
Total 233 37233.2905 62085.37873 Total 8.943E11 232 - - -
Comparison of kCal consumed by household size
House hold size n
Mean kCal
consumed Std. Dev.
Sum of Squares df
Mean
Square F Sig.
Small (1-3) 58 4616.4865 2548.02522
Between
Groups 1.259E8 2 6.295E7 25.537 0.000
Medium (3 - 6) 136 3051.1313 1110.42208
Within
Groups 5.670E8 230 2465079.724
- -
Large (6-10) 39 2619.6268 895.01045 - - - - - -
Total 233 3368.5644 1728.15373 Total 6.929E8 232 - - -
Comparison of monetary values of food eaten by household size
House hold size
n Mean TZS
used on
food
Std. Dev.
Sum of Squares
df Mean
Square F Sig.
Small (1-3) 58 49454.1973 30735.34784
Between
Groups 1.843E10 2 9.215E9 2.420 0.091
Medium (3 - 6) 136 36544.4897 77906.19501
Within
Groups 8.758E11 230 3.808E9
- -
Large (6-10) 39 21460.5804 8311.82701 - - - - - -
Total 233 37233.2905 62085.37873 Total 8.943E11 232 - - -

Developing Country Studies www.iiste.org
ISSN 2224-607X (Paper) ISSN 2225-0565 (Online)
Vol.4, No.26, 2014
28
Impact of National Minimum Wage on Low Income Workers in
Calabar Municipality, Nigeria
Atseye Fidelis Anake1*
Takon, Samuel Manyo2 Ogar, Ogar Ajom
3
1.Government Technical College Mayne Avenue, Calabar, Nigeria
2.Department of Banking and Finance, Caritas University, Enugu, Nigeria
3.Begastone Nig. Limited, Plot 28 Peace Estate, Ekorinim, Calabar, Nigeria
*E-mail of corresponding author: [email protected]
Abstract
The study examined the impact of the National Minimum wage on the socio-economic characteristics of low
income workers in Calabar Municipal Council Area of Cross River State, Nigeria. Ex post facto research design
was adopted for the study. A random sample was conducted to select 305 respondents across government
ministries, departments, agencies and parastatals. The study utilized two theoretical frameworks: Relative
Deprivation Theory and Public Interest Theory. The major instrument of data collection was questionnaire
structured to reflect Likert Scale with 25 items. Data collated were analysed using mean statistics. Hypotheses
test statistics was Pearson Product Moment Correlation coefficient. The results show that The National
Minimum Wage has not significantly impacted on poverty, employment, income stability and saving of low-
wage earners in the public sector. The results provide empirical evidence to support theoretical expectations and
existing research findings in socio-economic literature. Based on the findings, it was recommended that public–
private partnership should formulate policies and programmes to alleviate the burden of poverty among the
citizens for the betterment of the society.
Keywords: national minimum wage, low in workers, wages, savings, poverty.
1. Introduction
Wages increase is aimed at placing the workers in a favourable economic position by increasing their purchasing
power in order to surmount their economic problems arising from high cost of consumer goods which has eroded
the value of their wages. The prices of goods and services are sky-rocketing. Little wonder therefore, that
workers wages are not able to absolve the gargantuan costs of living.
The fixing of minimum wage prevents the exploitation of weak, ill-informed or isolated groups of
individuals. Minimum wage affords such people a more comprehensive protection than is available through
existing voluntary bargaining machinery (Fapohunda, et al, 2013).
Another argument is that by the introduction of Minimum Wage employers are not only hindered from
using unreasonably cheap labour, they are encouraged to use human resources more effectively and therefore,
raise productivity.
The issue of minimum wage has assumed an intractable dimension. As a result, it gave birth to four
district conventions at the international labour organisation, the conventions variously adopted in 1928, 1949,
1951 and 1970. All the essence was to strengthen the minimum wage and devising procedures for fixing,
reviewing and also avoiding necessary legalistic ambiguity (Ratnam, 2006).
There are dissenting views among scholars, researchers and policy makers on the impact of minimum
wage on the citizenry. Their arguments resolve around employment, income distribution and wage stability. For
instance, Stigler (1964) observed that the minimum can have a positive impact on employment. According to
Mario, Claude and Alvan (2010), economists believe that on the long-run, the minimum wage can have a
negative impact on employment.
In a developing economy such as Nigeria’s, the employer has a significant market power and is able to
control the wage that he pays. A legal imposition of the minimum wage may increase the level of employment
(Mario, et al, 2010). The employer has the monopoly power to pay wages below workers productivity. In a
situation where the government increases the wage paid (but not above productivity), the employer still has the
incentive to keep the worker.
Ultimately, the sign of the impact of the minimum wage on employment is an empirical question. The
minimum wage has a political dimension.
The main political goal of the minimum wage is to redistribute income to low-paid workers. As a
supplement to the conventions, the international Labour Organization has also passed recommendations to help
explain. In one such recommendation, Prasad (1970), addressed particularly developing countries that minimum
wage system is meant to and should be an effective instrument of social protection and an element in the strategy
of economic and social development. For clarity, the body further emphasized that minimum wage fixing should
constitute one element in a policy designed by nations to overcome poverty and to ensure the satisfaction of the
needs of all workers and families (Ratman, 2006).
Developing Country Studies www.iiste.org
ISSN 2224-607X (Paper) ISSN 2225-0565 (Online)
Vol.4, No.26, 2014
29
Fundamentally, wage fixing according to International labour Organization (ILO) should be to ‘give
wage earners necessary social protection as regards minimum permissible level of wages’ to be based on
prevailing cost of living, among other things. Ogunnlana (1978), suggested a standing policy on wages and
salary review to conform with the guideline of International Labour Organization. One of such International
Labour organization guideline is that salaries should be reviewed whenever consumer price index rises. In other
countries, salaries are reviewed along this International Labour organization line. In Gabon, for example, salaries
are reviewed whenever consumer price index rises up to 2 percent; same is applicable in India where proper
legislation is being made as regards the minimum wages of various sectors in the economy (Ratman, 2006).
The equity or fairness of wage and salary increase are also important to employees, higher wage
increase the purchasing power or workers, accelerates demand for goods and services, thereby learning the stock
of goods in warehouses and shops. Top officials of the Nigerian Labour congress (NLC) during the reign of
Comrade Adams Oshiomole and then secretary , Comrade Nuhu Mohammed have argued that in spite of the
stagnation of worker’s salaries, price of goods and cost of living have been galloping and have zoomed beyond
unimaginable ratio a few years back, (Lawal, 1998). As the congress president puts it “viewed in the light of the
cost of living, it is intriguing how the average Nigerian worker make ends meet”(Lawal, 1998). The congress
then, also provided statistics on the cost of living to back up its negotiation demand for a new minimum wage
per month. In September 2, 1998 the Head of State, General Abdusalami Abubakar, blazed the trail when he
announced a national Minimum Wage of N3,000 to state workers and N3, 500 to federal workers in Nigeria.
Similarly, president Olusegun Obasenjo on 1st May 2000 announced a national Minimum Wage of N5,000 to
State workers and N7,500 to federal workers. Later, the National Assembly passed into law the National
Minimum Wage Act in March, 2011. Therefore, the law mandates President Goodluck Jonathan to follow suit.
Accordingly, Nigerian workers are to be paid the sum of N18,000 as minimum wage.
One of the compelling arguments used by proponents of a higher national minimum wage for Nigerian
workers is the pitiable level of minimum wage in Nigeria, not only when compared to the actual cost of living,
but when examined against the minimum wage in other developing countries. In Africa, countries like Gabon,
Algeria, Tunisia and Bostwana have minimum wages higher than Nigeria. For instance, in Bostwana minimum
wage is pecked at 3.8 Bostwana Pula (N465. 50k) per hour. Industrial experts and researchers alike agree that
relatively high minimum wage motivates employees towards productivity and commitment to work.
What is the influence of the National Minimum Wage on variables such as poverty, employment, income/wage
stability and the capacity of low-wage earners to save?
2.0 Review of Related Literature
2.1 Minimum Wage: Conceptual Definition
The term “minimum wage” has come under close scrutiny in recent times, acquiring an increasingly but
strangely controversial status both in terms of usage and policy objectives especially in the 1980s.
The concept of minimum wage is often used in a variety of ways in many countries and by different
individuals. It is essentially an expression used in a number of circumstances in which a worker’s remuneration
is not allowed to fall below a given amount. Minimum wage may be defined as the least monetary wage
prescribed to be paid to workers in both the private and public sectors of an economy. In the words of
Fapohunda, Atiku and Lawal (2013: 20), “Minimum wage can simply be defined as the smallest hourly wage
that an employee may be paid as mandated b Federal Law.
According to the Cain Labour Standard Act of 1938 in the USA, Minimum Wage is the minimum
hourly rate of compensation for labour as established by Federal Statute and refined by employers engaged in
businesses that affect interstate commerce. It may alo be defined as the rate of pay fixed either by a collective
bargaining agreement or by government enactment as the lowest wage payable to specified categories of
employees (Fapohunda, et al, 2013).
The ILO (1996), General Survey of Reports pointed of that denotes the minimum sum payable to a
worker for work. Performed or services rendered within a given period, whether calculated on the basis of time
or output, which may not be reduced either by individual or collective agreement, which is guaranteed by law
and which may be fixed in such a way as to cover the minimum need of the worker and his/her family, in the
light of national economic and social conditions.
However, in 1967, the ILO meeting of experts on minimum wage fixing and related problems explained
that the concept of Minimum Wage contains 3 basic ideas: (i) The wage should charter for the basic needs of
food, clothing, housing, education and recreation of the workers, taking into account the economic and cultural
development of each country, (ii) Minimum Wage covers the lowest level of remuneration prescribed by
regardless of the workers’ qualification, (iii) Minimum Wage is the wage which each country can enforce with
penalty and sanctions. One argument is that fixing the Minimum Wage affords workers a reasonable income to
meet their basic needs and raise their standard of standard of living.

Developing Country Studies www.iiste.org
ISSN 2224-607X (Paper) ISSN 2225-0565 (Online)
Vol.4, No.26, 2014
30
2.2 Effect of Minimum Wage on Poverty
Minimum Wage is aimed at reducing poverty by distributing the national income to low income workers.
However, evidence from a large number of academic studies suggests that minimum wage increase do not
reduce poverty levels. For instance, Burkhauser and Sabia (2010) pointed out that an increase in minimum wage
will lift some families out of poverty, other low-skilled workers may lose their jobs, which reduces their income
and drops their families into poverty. Even among the working poor, the relationship between earning a low
hourly wage rate and living in poverty is weak and has become weaker overtime. That is because most workers
who gain from a minimum wage increase live in non poor families and most of the working poor already have
wages above the required minimums (Burkhauser and Sabia, 2007).
Since 1995, eight studies have examined the income and poverty effects of minimum wage increases,
and all but one have found that past minimum wage hikes had no effect on poverty (Wilson, 2012). Burkhauser
and Sabia (2010) argued further that state and federal minimum wage increases do not have significant effect on
state poverty rate, therefore, low-skilled living poor families who remain employed do see their incomes rise.
However, other low-skilled workers lose their jobs or have their work hours substantially reduced, which causes
income losses and increased poverty.
2.2.1 Minimum Wage and Employment
Despite the use of different theoretical models to understand the effects of minimum wages on different
macroeconomic variable such as inflation, employment, unemployment, poverty and growth, all economists
agree that business will make changes to adapt to the higher labour costs after a minimum wage increase.
Empirical research seeks to determine what changes to variables such as employment and prices firms will make,
and how large those changes will be. The higher costs will be passed onto someone in the long run. Policy
makers must remember that a decision to increase the minimum wage comes with a cost; someone has to pay for
it (Wilson, 2012). The researcher further explained that the main finding of economic theory and empirical
research over the past 70 years is that minimum wage increases tend to reduce employment. The higher the
minimum wage relative to competitive market wage levels, the greater the employment loss that occurs.
Centero, Duarte and Novo (2012) examined the impact of increases in the minimum wage on
employment stability, wages and income inequality in Portugal spanning 2002 – 2010. They found the
detrimental effect on minimum wage increases for employment stability of low-wage workers, with only minor
gains in terms of wages.
Research consensus for other countries seems to evolve around the following conclusion: the impact on
employment is a debate around zero (Freeman, 1996). The minimum wage seems to have some impact on the
wage distribution, but a much smaller impact (if any) on the income distribution (for a detailed discussion see
Brown, 1999, Card and Krueger, 1995 and Nevmark and Wascher, 2008). In any case, the initial level and the
dimension of the increase in the minimum wage seem to be relevant to set the case. Low increases in the
minimum wage are certainly much more employment friendly. What would be difficult after that is to define
what a “low increase” is.
2.2.2 Minimum Wage and Income Stability
It is the thinking of the policy maker that wage increase will bring stability to the income of low paid workers, at
least in the short run. Centeno et al (2012) found a positive correlation between minimum wage increase and
relative income stability for low-wage earners. Much of the empirical research has focused on estimating how
much an increase in the minimum wage will reduce employment in affected industries and affect groups of
workers. Other researches have examined the effects of minimum wages on the number of hours worked, firm
profits, worker training, level of work effort, human resource practices, operational efficiencies, internal wage
structures, and other parameters. The important thing to understand is that markets often respond to changes in
mandatory minimum wages in ways that create negative effects that are unplanned and are not desired by policy
makers or the general public (Wilson, 2012).
Empirical evidence has also shown that wage increase leads to unemployment hence, job loss. For
instance, Burhauser and Sabia (2010) pointed out that an increase in minimum wage will lift some families out
of poverty, other low-skilled workers may lose their jobs, which reduces their income and drops their families
into poverty.
2.2.3 Minimum wage and saving capacity of low income earners
The lifecycle theory of saving and consumption predicts that changes in an economy’s rate of economic growth
will affect its aggregate saving rate (Deaton and Paxson, 2000).
Individuals save in different ways and accumulate different types of assets. For example, they may store tangible
goods, they may invest in human capital, they may store tangible goods, they may invest is human capital, or
they may loan money or in-kind resources to members of their social network (Sheraden, Schreiner and Beverly,
2001). Economic theory predicts that the absolute amount of saving will increase with income. This is because
people with more income have more resources available to save. Theory also predicts that savings relative to
income, the savings rate, will increase with income (Deaton, 1992). This occurs because people with more
Developing Country Studies www.iiste.org
ISSN 2224-607X (Paper) ISSN 2225-0565 (Online)
Vol.4, No.26, 2014
31
income also tend to consume more. As they consume more, the marginal benefit from additional consumption
decreases. The current cost of saving, in terms of foregone benefits from consumption is lower for people who
consume more, and this increases savings. Empirical evidence clearly indicates that higher-income households
save a larger portion of their incomes and accumulate greater wealth, than lower-income households. In fact
most low-income households have very low or negative saving rates and very limited or negative asset
accumulation (Bernheim and Scholz, 1993; Bunting, 1991; Carney and Gale, 2001; Hubbard, Skinner and
Zeldes, 1994; Wolff, 1998).
Like all theory, however, this ignores some important issues. For example, the level and rate of saving
also depend on expected variation in income and subsistence requirements. The poor face greater risk, and this
tends to increase their saving, both absolutely and relative to their income. Of course, the poor likely saved less
in the past; if not, then they would not be poor. However, they may have saved at higher rates relative to
resources available.
2.3 Theoretical Framework
2.3.1. Deprivation Theory of Poverty
Relative Deprivation Theory of poverty have been adopted to buttress the analysis and to make the work
empirically relevant. This theory was prefunded by Peter Townsend in 1979, Townsend asserts. “Poverty can be
defined objectively and applied consistently only in terms of the concept of relative deprivation. He justifies this
claim on the grounds that society determines people’s needs for example it determines and conditions even the
need for food (Haralambos and Holbom, 2008).
Townsend also believes that poverty affect the amount of energy that deferent sections of the population
habitually expend not only at work but in community and family pursuits, their individual obligations as parents,
wives or husbands, friends or neighbours, as well as the work they have to do, influence how many calories they
have to consume each day. He was also a leading supporter of defining poverty in terms of relative deprivation,
he stress that poverty should be defined in relation to standard of a particular society at a particular time, he
believes strongly that poverty extended beyond a simple lack of material resources (Haralambos and Holbom,
2008).
Furthermore, he argues that the concept of relative deprivation should be though terms of the resources
available to the individuals and households and the styles of living that governs how those resources are used. He
believes that concentrating exclusively on income to assess a household’s material situation ignores other types
of resources that may be available. It neglects capital assets (those who own their home may be better up than
those who rent), and ignores occupational fringe benefits, gifts and the value of public social services such as an
education and health care (Haralambos and Holbom, 2008).
Lastly, Townsend also believes it necessary to move beyond consumption (the purchase of goods) to an
examination of how resources affect participation in the lifestyle of the community. He argues that poverty
involves an inability to participate in approved social activities that are considered normal, such as visiting
friends or relatives having birthday parties for children, and going on holiday, to Townsend individuals suffer
deprivation if they cannot afford even the cheapest form of activities. On the basis of this argument Townsend
defined poverty as follows;
Individuals, families and groups in the population can be said to be in poverty when they lack the
resources to obtain the types of diet, participate in the activities and have the living condition and amenities
which are customary, or at least widely encouraged or approved, in the societies to which they belong. Their
resources are so seriously below those commanded by the average individual or family that are, in effect,
excluded from ordinary living patterns, customs and activities (Haralambos and Holbom, 2008).
Same is applicable in Calabar, a situation where low income workers salaries cannot afford them basic
necessities of life such as television, children fees, house rent, and money for their aged parents. Salary increase
is intended to reduce the economic hardship of the people and keep them economically afloat.
2.3.2. Public Interest Theory
This theory was postulated to correct the imperfections in the market-driven economy. Peltzman (1989) in his
path-breaking paper presented at Brookins Institute provided a formal proposition to the economic theory of
public interest regulation. This theory holds that regulation of public activities is supplied in response to the
demand of the public for the correction of inefficient or inequitable market practices. An implicit assumption of
the public interest theory according to Uche (2000) is that regulation is in the main, aimed at protecting the
public. To achieve its aim, regulation based on the above principle should aim at equipping the public with
relevant information necessary for decision making. Regulation in the public interest should also strive to protect
the public from monopolies and industries that generate substantial external costs and benefits (Uche, 2000).
Further assumption is that some forms of activities, businesses or otherwise do not always function in
the interest of the public without supervision and control. This view has a historical antecedent regulation in the
past (and even today) had almost always followed some form of crisis or public dissent. Example, in Nigeria the
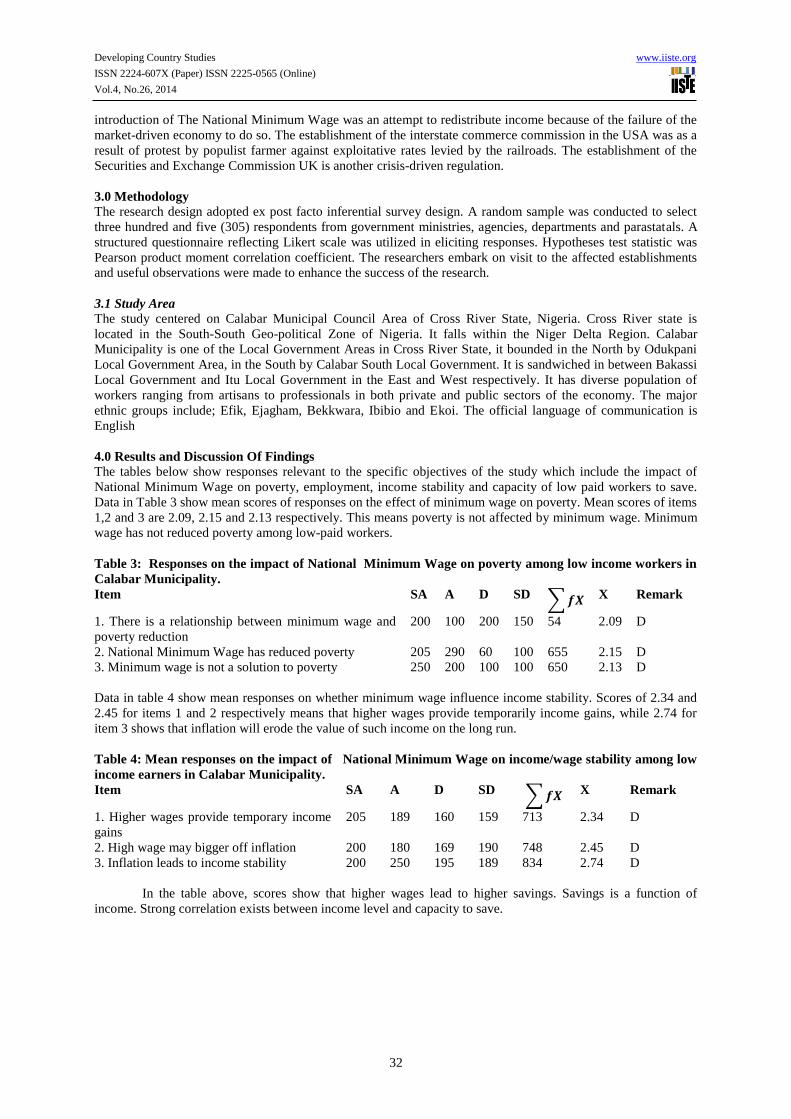
Developing Country Studies www.iiste.org
ISSN 2224-607X (Paper) ISSN 2225-0565 (Online)
Vol.4, No.26, 2014
32
introduction of The National Minimum Wage was an attempt to redistribute income because of the failure of the
market-driven economy to do so. The establishment of the interstate commerce commission in the USA was as a
result of protest by populist farmer against exploitative rates levied by the railroads. The establishment of the
Securities and Exchange Commission UK is another crisis-driven regulation.
3.0 Methodology
The research design adopted ex post facto inferential survey design. A random sample was conducted to select
three hundred and five (305) respondents from government ministries, agencies, departments and parastatals. A
structured questionnaire reflecting Likert scale was utilized in eliciting responses. Hypotheses test statistic was
Pearson product moment correlation coefficient. The researchers embark on visit to the affected establishments
and useful observations were made to enhance the success of the research.
3.1 Study Area
The study centered on Calabar Municipal Council Area of Cross River State, Nigeria. Cross River state is
located in the South-South Geo-political Zone of Nigeria. It falls within the Niger Delta Region. Calabar
Municipality is one of the Local Government Areas in Cross River State, it bounded in the North by Odukpani
Local Government Area, in the South by Calabar South Local Government. It is sandwiched in between Bakassi
Local Government and Itu Local Government in the East and West respectively. It has diverse population of
workers ranging from artisans to professionals in both private and public sectors of the economy. The major
ethnic groups include; Efik, Ejagham, Bekkwara, Ibibio and Ekoi. The official language of communication is
English
4.0 Results and Discussion Of Findings
The tables below show responses relevant to the specific objectives of the study which include the impact of
National Minimum Wage on poverty, employment, income stability and capacity of low paid workers to save.
Data in Table 3 show mean scores of responses on the effect of minimum wage on poverty. Mean scores of items
1,2 and 3 are 2.09, 2.15 and 2.13 respectively. This means poverty is not affected by minimum wage. Minimum
wage has not reduced poverty among low-paid workers.
Table 3: Responses on the impact of National Minimum Wage on poverty among low income workers in
Calabar Municipality.
Item SA A D SD ∑𝒇𝑿 X Remark
1. There is a relationship between minimum wage and
poverty reduction
200 100 200 150 54 2.09 D
2. National Minimum Wage has reduced poverty 205 290 60 100 655 2.15 D
3. Minimum wage is not a solution to poverty 250 200 100 100 650 2.13 D
Data in table 4 show mean responses on whether minimum wage influence income stability. Scores of 2.34 and
2.45 for items 1 and 2 respectively means that higher wages provide temporarily income gains, while 2.74 for
item 3 shows that inflation will erode the value of such income on the long run.
Table 4: Mean responses on the impact of National Minimum Wage on income/wage stability among low
income earners in Calabar Municipality.
Item SA A D SD ∑𝒇𝑿 X Remark
1. Higher wages provide temporary income
gains
205 189 160 159 713 2.34 D
2. High wage may bigger off inflation 200 180 169 190 748 2.45 D
3. Inflation leads to income stability 200 250 195 189 834 2.74 D
In the table above, scores show that higher wages lead to higher savings. Savings is a function of
income. Strong correlation exists between income level and capacity to save.
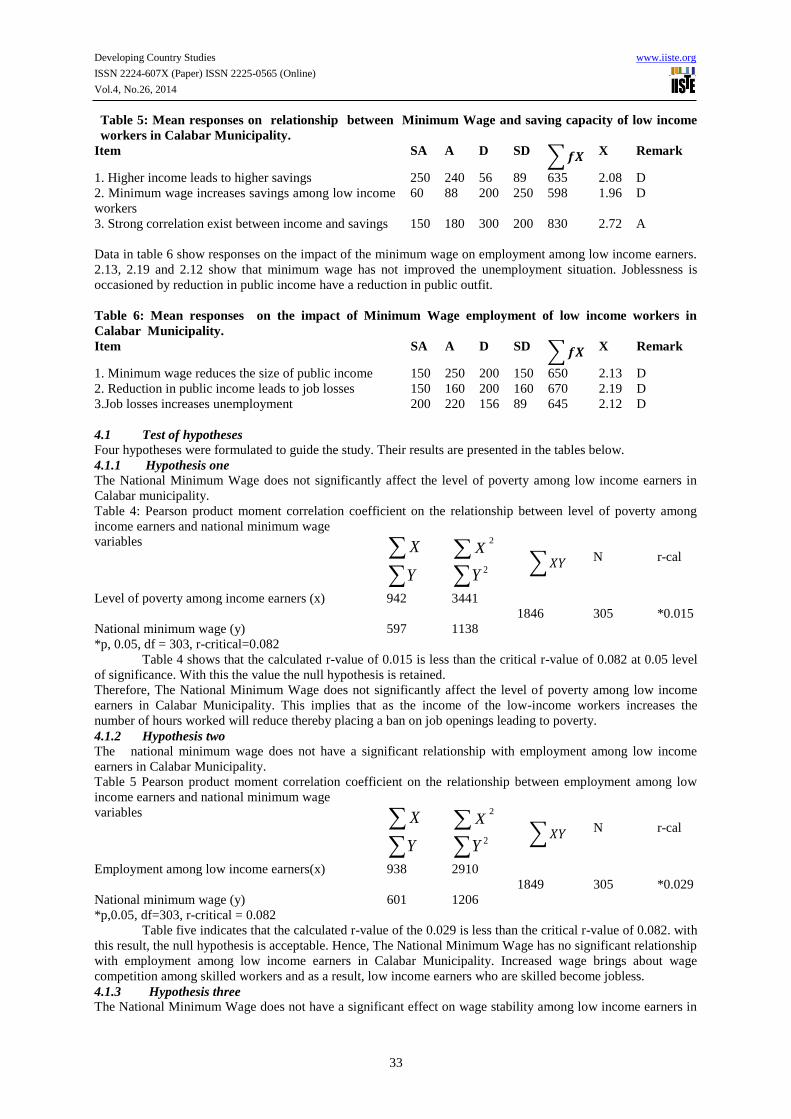
Developing Country Studies www.iiste.org
ISSN 2224-607X (Paper) ISSN 2225-0565 (Online)
Vol.4, No.26, 2014
33
Table 5: Mean responses on relationship between Minimum Wage and saving capacity of low income
workers in Calabar Municipality.
Item SA A D SD ∑𝒇𝑿 X Remark
1. Higher income leads to higher savings 250 240 56 89 635 2.08 D
2. Minimum wage increases savings among low income
workers
60 88 200 250 598 1.96 D
3. Strong correlation exist between income and savings 150 180 300 200 830 2.72 A
Data in table 6 show responses on the impact of the minimum wage on employment among low income earners.
2.13, 2.19 and 2.12 show that minimum wage has not improved the unemployment situation. Joblessness is
occasioned by reduction in public income have a reduction in public outfit.
Table 6: Mean responses on the impact of Minimum Wage employment of low income workers in
Calabar Municipality.
Item SA A D SD ∑𝒇𝑿 X Remark
1. Minimum wage reduces the size of public income 150 250 200 150 650 2.13 D
2. Reduction in public income leads to job losses 150 160 200 160 670 2.19 D
3.Job losses increases unemployment 200 220 156 89 645 2.12 D
4.1 Test of hypotheses
Four hypotheses were formulated to guide the study. Their results are presented in the tables below.
4.1.1 Hypothesis one
The National Minimum Wage does not significantly affect the level of poverty among low income earners in
Calabar municipality.
Table 4: Pearson product moment correlation coefficient on the relationship between level of poverty among
income earners and national minimum wage
variables X
Y
2
X
2Y
∑𝑋𝑌
N
r-cal
Level of poverty among income earners (x) 942 3441
1846 305 *0.015
National minimum wage (y) 597 1138
*p, 0.05, df = 303, r-critical=0.082
Table 4 shows that the calculated r-value of 0.015 is less than the critical r-value of 0.082 at 0.05 level
of significance. With this the value the null hypothesis is retained.
Therefore, The National Minimum Wage does not significantly affect the level of poverty among low income
earners in Calabar Municipality. This implies that as the income of the low-income workers increases the
number of hours worked will reduce thereby placing a ban on job openings leading to poverty.
4.1.2 Hypothesis two
The national minimum wage does not have a significant relationship with employment among low income
earners in Calabar Municipality.
Table 5 Pearson product moment correlation coefficient on the relationship between employment among low
income earners and national minimum wage
variables X
Y
2
X
2Y
∑𝑋𝑌
N
r-cal
Employment among low income earners(x) 938 2910
1849 305 *0.029
National minimum wage (y) 601 1206
*p,0.05, df=303, r-critical = 0.082
Table five indicates that the calculated r-value of the 0.029 is less than the critical r-value of 0.082. with
this result, the null hypothesis is acceptable. Hence, The National Minimum Wage has no significant relationship
with employment among low income earners in Calabar Municipality. Increased wage brings about wage
competition among skilled workers and as a result, low income earners who are skilled become jobless.
4.1.3 Hypothesis three
The National Minimum Wage does not have a significant effect on wage stability among low income earners in
Developing Country Studies www.iiste.org
ISSN 2224-607X (Paper) ISSN 2225-0565 (Online)
Vol.4, No.26, 2014
34
Calabar municipality
Table 6: Pearson product moment correlation coefficient on the relationship between wage stability and national
minimum wage
variables X
Y
2
X
2Y
∑𝑋𝑌
N
r-cal
Wage stability among low income earners(x) 940 3176
1847 305 *0.070
National minimum wage (y) 599 1177
*p,0.05, df=303, r-critical = 0.082
The results in table 6 shows that the calculated r-value of 0.070 is less than the critical r-value of 0.082.
therefore, the null hypothesis is retained. This means that The National Minimum Wage does not have a
significant effect on wage stability among low income earners in Calabar municipality. This implies that higher
income may trigger off inflation and inflation leads to income instability.
4.1.4 Hypothesis four
There is no significant relationship between national minimum wage and savings capacity of low income earners
in Calabar Municipality.
Table 7: Pearson product moment correlation coefficient on the relationship between savings capacity among
low income earners in Calabar municipality.
variables X
Y
2
X
2Y
∑𝑋𝑌
N
r-cal
Savings capacity among low income earners(x) 914 3342
1788 305 *0.068
National minimum wage (y) 596 1166
*p<0.05, df=303, r-critical = 0.082
Table 7 above shows that the calculated r-value of 0.068 is less than the critical r-vale of 0.082. with
this result, the null hypothesis is therefore retained. Hence, there is no significant relationship between national
minimum wage and savings capacity of low income earners in Calabar Municipality. This means that savings
depend on the level of income and low income earners lack the capacity to save as a little increment in wages
will lead to an increase in the prices of goods and services.
4.2 Summary of findings
i. The National Minimum Wage has not significantly affected the level of poverty among low income
earners in Calabar Municipality. Therefore, low paid workers need more than minimum wage increases
to alleviate their poverty. This finding is in agreement with the works of Burkhause and Sabia (2010),
Wilson (2012) who found that national minimum wage does not have any significant effect on level of
poverty of low income earners. With The National Minimum Wage, low income earners will either lose
their jobs or have their work hours substantially reduced, which causes income loses and increases
poverty.
ii. The National Minimum Wage does not have a significant relationship with employment among low
income earners in Calabar Municipality. Wilson (2012) agreed with this finding and found that the
higher the minimum wage relative to competitive market wage levels, the greater the employment loss
that can occur. See also for example Centeno et al(2012), they found that minimum wage increase is
detrimental to employment stability. However, they argued that wage increases provide minor gains in
the short run.
iii. The National Minimum Wage does not have a significant impact on wage stability among low income
earners in Calabar Municipality. Again, this is in line with Centeno et al(2012), they found a positive
correlation between income stability and minimum wage increases. See also for example Wilson (2012)
and Burkhauser and Sabia (2010). According to Burkhauser and Sabia (2010), an increase in minimum
wage will lift some families out of poverty, other low-skilled workers may lose their jobs, which
reduces their income and drops their families into poverty.
iv. There is no significant relationship between national minimum wage and saving capacity of low income
earners in Calabar Municipality. Low paid workers lack the capacity to save. Low paid workers lack the
capacity to save. This result collaborates most empirical evidence. Empirical evidence clearly indicates
that higher income households save a larger portion of their incomes and accumulate greater wealth
than lower-income households. In fact, most low-income households have very low or negative saving
rates and very limited or negative asset accumulation (Bernheim and Scholz, 1993; Bunting, 1991;
Developing Country Studies www.iiste.org
ISSN 2224-607X (Paper) ISSN 2225-0565 (Online)
Vol.4, No.26, 2014
35
Carney and Gale, 2001; Hubbard, Skinner and Zeldes, 1994; Wolff, 1998).
5.1 Conclusion and Recommendations
Policy makers and researchers have not found a common ground on the impact of higher national wages on
socio-economic characteristics of employees in the private and public sectors. Policy makers advocate for
income redistribution to low-paid workers which is the main goal of the National Minimum Wage. The trickle
down hypothesis which allows income to flow from the top to the bottom on income ladder is a pointer to this
argument. There are risks inherent in this school of thought. Income is taken from some citizens and paid to
others. This may reduce national output. After all, income may not get to the ultimate low paid workers because
of frictions in the economy such as taxes, inflation, and other counter government policies low income workers
in the Nigerian economy are suffering from disguised unemployment, hence their inability to meet their basic
needs of life.
Evidence from empirical literature suggests that minimum wage increases do not reduce poverty,
unemployment and income inequality. Stipulation of minimum wage may provide temporal income gains, but on
the long run, inflation and other macro economic variables may flush out such gains. Arguments on minimum
wage have always revolved around poverty, employment, income stability and ability to save for the future. An
increase in minimum wage will lift some families out of poverty; other low-skilled workers may lose their jobs,
which reduces their income and drops their families into poverty. Therefore, minimum wage increase attempts to
solve socio-economic problems in one hand and create multiple problems on the other hand. This is true of the
economic adage, “the solution to one economic problem is the beginning of another economic problem”.
The research work has policy implications. The following recommendations were put up:
i. Government should partner with the private sector to create employment for the citizenry, since
minimum wage increases do not solve the problem of unemployment.
ii. Employment creation will alleviate the burden of poverty and enhance the living conditions of members
of the society irrespective of the sector.
iii. Wage increases lead to competition in the labour market and only skilled workers have the edge.
Therefore, the government and the private sector should put in place policies and programmes that will
upgrade the capacity of low skilled employees.
iv. The government should continue to pursue macroeconomic objectives of price stability, employment
and growth in domestic product. This will enhance income stability of workers.
v. Employers of labour are responsible for workers minimum wage determination. Therefore, they have to
create the enabling atmosphere for negotiation on wages and other conditions of employment.
vi. In the same vein, amidst string argument that wage increases accompany inflation and that wages paid
to workers at any given time in Nigeria and when compared to other countries are not well above
inflationary trend, government and employers of labour in both private and public enterprises should
through collective bargaining process fix wages whose values would not be easily eaten up by
inflationary conditions.
References
Bernheim, B.D., and Scholz, J.K. (1993). Private Saving and Public Policy Tax Policy and the Economy, 7,
73 – 110.
Bunting, D. (1991). Savings and the Distribution of Income. Journal of Post Reynesian Economics, 14, (1),
3-22.
Card, D. And Krueger, A. (1995). “Myth and Measurement: The New Economics of the Minimum Wage”,
Princeton university Press.
Carney, S. And Gale, W. (2001). Asset Accumulation among Low-Income Households. In T. Shapiro and F.
Wolff (ed), Asset for the poor: The benefits of spreading asset ownership (pp. 165 -205). New York: Russel
Sage Foundation.
Centeno, M. Duarte, C. And Novo, A.A. (2012). The Impact of the Minimum Wage on Low-wage Earners
Banco de Portuga, Economics and Research Department. Staff Working Paper Series.
Deaton, A. And Paxson, C. (2000). Growth and saving among Individuals and Households. The Review of
Economics and Statics, 82(2): 212 -225.
Freeman, R. (1996), “The Minimum Wage as a Resdistributive Tool”, Economic Journal, 106:639-649.
Haralambos, M. (1980). Sociology: Themes and Perspective, Slough: University Tutorial Press Limited.
Hubbard, R.G., Skinner, J. And Zeldes, S.P. (1994). The importance of precautionary motives in explaining
individual and aggregate saving. Carnegie-Rochester Conference Series on Public Policy, 40, 59 – 125.
International Labour Organization (1982). Wages: A Worker’s Educational Manual, Geneva: 70
International Labour Organization’s (ILO) Report VII (1) (1968) on Minimum Wage Fixing Machinery and
Developing Country Studies www.iiste.org
ISSN 2224-607X (Paper) ISSN 2225-0565 (Online)
Vol.4, No.26, 2014
36
Related Problems with Special Reference to developing Countries, Geneva:8.
Lawal, B. (1998). The Nigerian and New Minimum Wage, A Paper presented on Labour Day, May 1, 1998.
Mark, W. (2012). The Negative Effects of Minimum Wage Laws. Cato Institute, Policy Analysis, no.701 (1-
13).
Miller, D,C. (1968). Handbook of Research Design and Social Measurement, New York: David Mckay Co.
Inc.
Neumart, D. And Wascher, W. (2008). “Minimum Wages”, MIT Press, Cambridge.
NLC, NLC Position on Labour Compensation and Collective Bargaining: Minimum Wage, Deregulation of
Wages and Collective Bargaining – Aspect of the 1991 Budget Speech, Lagos.
Ogunlana, A. (1978). Wages: A Handbook of Industrial Relations Practioners, Lagos: Longman Nigeria
Limited.
Peltzman, S. (1989). “The Economic Theory of Regulation after a Decade of Deregulation in Bailey, M.N.
and Wanston (eds), “The Brookins papers of Economic Activity” Brookklin Institute, Washigton p.4 (1994)
op.cit p.15.
Ratnam, C.S.V. (2006). Industrial Relations. New York: Oxford University Press.
Richard, V. Burkhauser and Joseph, J. Sabia, “Minimum Wages and Poverty:Will a $9.50 Federal Minimum
Wage Really help the Working Poor?” Southern Economic Journal 77, no.3 (January 2010).
Richard, V. Burkhauser and Joseph, J. Sabia, “The Effectiveness of Minimum Wage Increases in Reducing
Poverty: Past, Present and Future” Contemporary Economic Policy 25, no.2 (April 2007).
Steers, R.M. (1982). Employee-Organization Linkages: The Psychology of Commitment, Absenteeism and
Turnover, New York: Academic Press.
Stigler, G(1964), “Public regulation of the Securities markets”. The Journal of business, 37 (1) 117 – 142.
Stigler, G. (1946), “The Economic of Minimum Wage Legislation”, American Economic Review, 36, 358-
365.
Uche, C.U. (2000). “The Theory of regulation a Review Article” Journal of Financial Regulation and
Compliance 10(1) (1-15).
Usman, G.A. (1988). The Worker and Productivity, Proceedings of a National Conference, Ibadan: 4th
– 6th
Dec., 1988 (NPC).
Weihrich, H., Cannice, M. And Koontz, H. (2008). Management: A Global and Entrepreneurial Perspective.
New Delhi: McGraw-Hill Publishing Company Limited.
Wolff, E.N. (2001). Recent trends in Wealth ownership, from 1983 to 1998. In T.M. Shapiro and E.N. Wolff
(eds), Assets for the poor: Benefits and Mechanism of spreading asset ownership. (pp. 34 – 73). New York:
Russell Sage Foundation.
Yesufu, T.M. (1962). An Introduction to Industrial Relations in Nigeria, OUP/NISER, London.
Yesufu, T.M. (1984). The Dynamics of Industrial Relations: The Nigerian Experience, Ibadan: University
Press Limited.
The Punch, Thursday November 11, 2010, Vol. 20, P.4.
The Nation, Monday July 18, 2011, Vol. 05, P.3.
The Nation, Saturday Oct. 8, 2011, Vol. 05, P.4.
London Times, October 5, 1997.
Fapohunda, T. M., Atika. S.O. and Lawal, I.O. (2013). Minimum Wage Implementation and management in
a post-recession Economy; The Nigerian Experience. European Scientific Journal, 8(7): 18 -35.
ILO (2008), Global Wage Report 2008/2009. Geneva, 2008), P.35.
ILO (2009), Update on Minimum Wage Development. ILO Committee on Employment and Social Policy
ILO Geneva.

Developing Country Studies www.iiste.org
ISSN 2224-607X (Paper) ISSN 2225-0565 (Online)
Vol.4, No.26, 2014
37
Opportunities and Challenges of Regionalism: Zimbabwe in the
Comesa Customs Union
Kumbirai Ngwaru1 Veronica Mufudza
1 Shupikai Zebron
2 Zadzisai Machingambi
1
1.Zimbabwe Open University, Department of Peace Studies, Masvingo Regional Campus.
2.Zimbabwe Open University, Department of Counselling, Mashonaland West Regional Campus
*Email of corresponding author: [email protected]
Abstract
A case study of Zimbabwe in the COMESA customs union is given to analyse the opportunities and challenges
countries may face from different Regional Integration Agreements (RIA). The tools that are used to assess the
costs and benefits of the COMESA customs union are applicable to any regional trade agreement; therefore,
many countries who want to evaluate their membership gains and losses from various regional groups may find
this study very useful.
Keywords: Regionalism, Opportunities, Challenges Custom Union, Economic Communities.
1. INTRODUCTION The past 20 years, or so, have seen a great explosion of Regional Economic Communities. Almost all countries
in the world belong to one or more RECs; often known as regional trading blocs. In Africa the highest is D. R.
Congo who has membership in four blocs. Do such blocs allow countries to obtain benefits that cannot be
achieved through autonomous actions or multilateral cooperation and how can countries rate the contribution of
these blocs to their economies?
With deepening integration within the different economic groups, there is a stage where countries are
forced to choose one group to belong to and forgo the rest. Such a stage is when regional trading blocs want to
form a customs union. Zimbabwe is a member of both COMESA and SADC regional trading blocs. However,
with COMESA aiming for a Customs Union by 2008 and SADC by 2010, Zimbabwe had to choose which
customs union to join since it is not possible for her to be a member of both customs unions.
2. PROBLEM STATEMENT
By the end of year 2007, it was announced that Zimbabwe has decided to join the COMESA customs union. The
Zimbabwean export sector approached the economic officer in the Ministry of Industry and International Trade
asking for justification of this decision arguing that SADC presents a better and viable market for Zimbabwean
commodities than COMESA. The researchers decided to use the TRAINS Database and Literature review, to
measure the amount of gains and losses Zimbabwe accrues by belonging to COMESA customs union so that she
can provide informed explanations to the business community. The results will also be used to comment on
whether the decision to join COMESA customs union was an informed decision.
3. OBJECTIVES
This paper examines the gains and losses Zimbabwe derive from being a member of the COMESA Customs
union. The paper also seeks to highlight the factors that should be considered when assessing the contribution of
each bloc to member states.
4. LITERATURE REVIEW
A customs union is an agreement between two or more member states to facilitate trade between them through
removal of tariffs levied on imports from members of the union (Viner 1950: Meade 1956), the member nations
establish a free trade zone amongst themselves and a common external tariffon non-member nations. Economic
effects of this movement are assessed on the basis of the degree to which ‘trade creation’ outweighs ‘trade
diversion’.
4.1 Trade Creation
Trade creation refers to a situation where a country moves from an expensive source outside the economic
grouping to a less expensive source within the grouping. In other words, it is the creation of trade that would not
have existed otherwise.

Developing Country Studies www.iiste.org
ISSN 2224-607X (Paper) ISSN 2225-0565 (Online)
Vol.4, No.26, 2014
38
S= supply curve
D= demand curve
P= price of imports
PB= price of imports of country B
PC= price of imports of country C
PB
T= price of imports of country B plus tariffs
PB
C= price of imports of country C plus tariffs
Figure1: Trade creation effects of Free Trade Agreement (FTA)
In the absence of a FTA, country A imposes tariffs on imports from her trading partners, in this case
country B and C. This raises the prices of imports from PB to P
BT and P
C to P
CT respectively (see figure 1 above).
These prices are higher than the domestic price PA
, therefore, country A will import nothing from either B or C.
If A enters into a FTA with B, imports from B will become cheaper by PB
T- PB. Consumers in country A will
now shift their demand from domestic products to imports from country B because of this new price reduction.
Since trade now occurs within the FTA, and it did not occur before, trade is said to be created.
4.2 Trade Diversion
Trade diversion occurs when a FTA diverts trade away from a cheaper source outside the customs union,
towards an expensive supplier within the integrating countries.
Figure 2: Trade Diversion effects of a FTA
In figure 2, in the absence of FTA country A will trade with country C which presents relatively
cheaper goods than those from B. If A signs an FTA with B, tariffs formally imposed on products from B are
eroded and products from B will become cheaper than those from C. Demand will now shift to imports from
country B. Since the non-distorted price in country C, that is PC
T, is less than the price in country B - PB
T, trade is
said to be diverted. The larger the difference between the non-distorted prices in the FTA partner country and in
the rest of the world, the more likely that trade diversion will reduce national welfare.
4.3 Aggregate effects of trade creation and trade diversion
The aggregate welfare effect for the country is found by summing the gains and losses to consumers and
producers. The net effect consists of two positive components: a positive production efficiency gain, (b in Figure
1) and a positive consumption efficiency gain (c in Figure 1). This means that if trade creation arises when a
FTA is formed, it must result in net national welfare gains. Imagine that a country entering a FTA may have
some import markets in which trade creation would occur and other markets in which trade diversion would
occur. The markets with trade creation would definitely generate national welfare gains while the markets with
trade diversion may generate national welfare losses. When the positive effects from trade creation surpass the
negative effects from trade diversion, then the FTA will improve national welfare and vice versa. The concepts
of trade creation and trade diversion are central to the evaluation of import side impacts of discriminatory trade
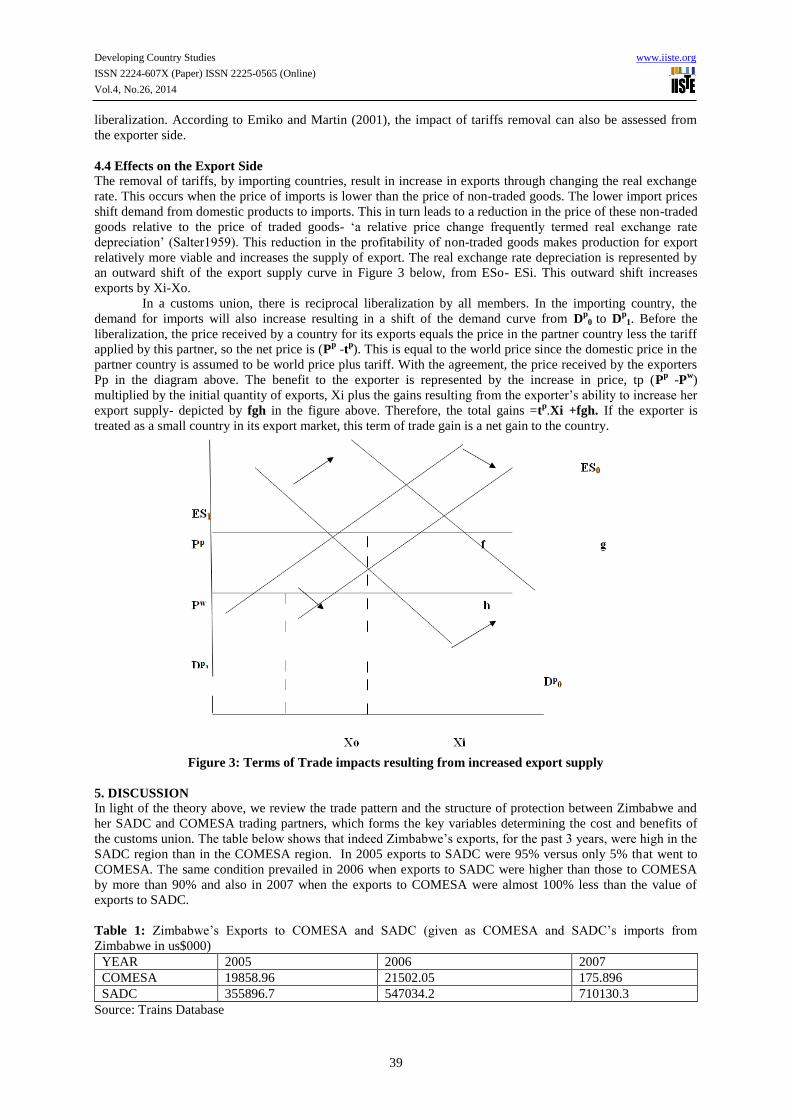
Developing Country Studies www.iiste.org
ISSN 2224-607X (Paper) ISSN 2225-0565 (Online)
Vol.4, No.26, 2014
39
liberalization. According to Emiko and Martin (2001), the impact of tariffs removal can also be assessed from
the exporter side.
4.4 Effects on the Export Side The removal of tariffs, by importing countries, result in increase in exports through changing the real exchange
rate. This occurs when the price of imports is lower than the price of non-traded goods. The lower import prices
shift demand from domestic products to imports. This in turn leads to a reduction in the price of these non-traded
goods relative to the price of traded goods- ‘a relative price change frequently termed real exchange rate
depreciation’ (Salter1959). This reduction in the profitability of non-traded goods makes production for export
relatively more viable and increases the supply of export. The real exchange rate depreciation is represented by
an outward shift of the export supply curve in Figure 3 below, from ESo- ESi. This outward shift increases
exports by Xi-Xo.
In a customs union, there is reciprocal liberalization by all members. In the importing country, the
demand for imports will also increase resulting in a shift of the demand curve from Dp
0 to Dp
1. Before the
liberalization, the price received by a country for its exports equals the price in the partner country less the tariff
applied by this partner, so the net price is (Pp -t
p). This is equal to the world price since the domestic price in the
partner country is assumed to be world price plus tariff. With the agreement, the price received by the exporters
Pp in the diagram above. The benefit to the exporter is represented by the increase in price, tp (Pp -P
w)
multiplied by the initial quantity of exports, Xi plus the gains resulting from the exporter’s ability to increase her
export supply- depicted by fgh in the figure above. Therefore, the total gains =tp.Xi +fgh. If the exporter is
treated as a small country in its export market, this term of trade gain is a net gain to the country.
Figure 3: Terms of Trade impacts resulting from increased export supply
5. DISCUSSION
In light of the theory above, we review the trade pattern and the structure of protection between Zimbabwe and
her SADC and COMESA trading partners, which forms the key variables determining the cost and benefits of
the customs union. The table below shows that indeed Zimbabwe’s exports, for the past 3 years, were high in the
SADC region than in the COMESA region. In 2005 exports to SADC were 95% versus only 5% that went to
COMESA. The same condition prevailed in 2006 when exports to SADC were higher than those to COMESA
by more than 90% and also in 2007 when the exports to COMESA were almost 100% less than the value of
exports to SADC.
Table 1: Zimbabwe’s Exports to COMESA and SADC (given as COMESA and SADC’s imports from
Zimbabwe in us$000)
YEAR 2005 2006 2007
COMESA 19858.96 21502.05 175.896
SADC 355896.7 547034.2 710130.3
Source: Trains Database

Developing Country Studies www.iiste.org
ISSN 2224-607X (Paper) ISSN 2225-0565 (Online)
Vol.4, No.26, 2014
40
According to the literature review, the larger the exports to the importing partner, the larger the scope for
improvement in the terms of trade to the exporting country resulting from the importing country’s tariff
concessions.
However, this is not true in the case of Zimbabwe versus SADC and COMESA. Although exports are
higher in SADC than in COMESA, Zimbabwe does not gain much in terms of trade from joining the SADC
customs union. This is because the gains to Zimbabwe also depend on the current MFN protection level of
countries in either COMESA or SADC and the concessions they give. Clearly, the higher the initial protection
level, the larger the scope of export side gains.
From further analyses of the statistics from TRAINS data, it is evident that more than 90% of Zimbabwe’s
exports to SADC for the given period went to South Africa. (See figure 4 below).
Figure 4: Zimbabwe’s exports to SADC countries; 2005-2007
Zimbabwe and South Africa signed a Preferential Trade Agreement in 1993. This means that because of
the existence of this agreement, most of the goods that were exported to South Africa were enjoying lower tariffs
and a further reduction/ elimination of these tariffs in form of a customs union will add little to Zimbabwe’s
exports to this region. Therefore, Zimbabwe will gain more from a COMESA customs union where the MFN
tariffs are remarkably higher than the preferential trade tariffs.
According to figure 3 above, the removal of tariffs on exports from Zimbabwe to COMESA raises the
prices of Zimbabwe’s exports to the region as well as export volumes. The increase in the volume of exports
generates welfare gain to Zimbabweans through trade creation. High export earnings imply that the country’s
foreign currency reserves improve. This can be used to increase government expenditure as well as reducing
government debt. The government can also use part of this amount to offset its BOP deficit. Zimbabwe will also
be exposed to a wider market for her products which implies that producers will benefit from economies of scale.
6. RECOMMENDATIONS AND CONCLUSION Based on the review, we may recommend that Zimbabwe should consider the degree to which trade creation
outweighs trade diversion when evaluating the contribution of different economic blocs to her economy.
From the exporter side, Zimbabwe has to consider three basic factors when rating the possible gains
from each bloc that is the level of tariffs imposed by member countries against their exports, the price elasticity
of their exports as well as the magnitude of existing trade flows with the different partners.
Although Zimbabwe will lose in form of trade diversion, COMESA has a large membership than
SADC and therefore, the total trade created will be higher than trade diverted. Zimbabwe will, therefore, benefit
more from joining the COMESA customs union through the multiplier effect. Zimbabwean exporters will benefit
from the creation of a larger market for their exports. Therefore, Zimbabwean policy makers made an informed
decision when they decided that Zimbabwe will join the COMESA customs union.
REFERENCES
Emiko Fukase and Will Martin (2001). Free Trade Area Membership as a stepping stone to Development: The
Case of ASEAN. Washington, D.C., The World Bank.
0
100000
200000
300000
400000
500000
600000
700000
800000
2005
2006
2007

Developing Country Studies www.iiste.org
ISSN 2224-607X (Paper) ISSN 2225-0565 (Online)
Vol.4, No.26, 2014
41
Gote Hansson (1993). Trade, Growth and Development: The Role of Politics and Institutions. London,
Routledge.
Viner Jacob (1950). The Customs Union Issue. Washington, D.C.; Carnegie Endowment for International Peace.
Stefan D. Vylder (2007). The Least Developed Countries and World Trade. Second Edition, Sida Studies no.19,
Sida.
Meade, J.E. (1956). The Theory of the Customs Unions. Amsterdam: North- Holland.
Salter, W. E. G. (1959). International and External Balance: the Role of Price and Expenditure Effects.
Economic Record 35 (71).
Trade Blocs (2000). A World Bank policy research report. New York, Oxford University Press.
Steven M. Suranovic(1997-2008).International Trade Theory and Policy - Chapter 110-2A: Last Updated on
4/1/98

Developing Country Studies www.iiste.org
ISSN 2224-607X (Paper) ISSN 2225-0565 (Online)
Vol.4, No.26, 2014
42
Psychosocial Determinant of Creativity among Secondary School
Students in Saki, Oyo State, Nigeria
OFOLE Ndidi. M. (PhD)1 Ezeokoli R. N. (PhD)
2
1.Department of Guidance & Counselling, Faculty of Education, University of Ibadan
2.Ezeokoli R. N. (PhD)2 Department of Public Health, Babkok University, Ilisan, Ogun
Email: [email protected];[email protected]
Abstract
Correlational research design was adopted to examine the extent to which psychosocial factors predicted
creativity among secondary school students in Saki, Oyo State, Nigeria. Six hundred and seventy-seven
respondents (female=312; male=365) whose age ranged from 12 to 22 with mean age of 5.17 drawn using
multistage sampling technique participated in the study. Three research questions guilded the study. Data
collected using Animashaun (2007) was analyzed with Pearson Product Moment Correlation (PPMC) and
Multiple Regression at 0.05 level of significance. Results show that emotional intelligence and parental
involvement have positive relationship with creativity level (r= 0.194, P<.05) and (r= 0.172, P<.05)
respectively, while peer group influence has negative correlation with creativity level. The three independent
variables jointly accounted for 21.2% of the variance in the prediction of creativity. There is need for teachers,
parents, counselling psychologists and other stakeholders to design activities and leaning experinces that will
make new ideas are to be generated, developed and transformed into value.
Keywords: Psychosocial, emotional, parental involvement, creativity, Saki, Oyo Nigeria
1.1 Introduction
Today’s world of work is very dynamic because of the incessant need for businesses to develop new products
and services. Therefore, for individuals to survive, they require creative abilities needed for a new generation of
high-tech, high-skills industries and provision of quality services of various kinds. Thus, any adolescent that
depends on old methods to tackle today’s challenges may end up having an unfulfilled dream. The complexity of
life challenges demands that one is forward looking in approach to issues; as the solutions to yesterday’s
problems may be inadequate and misleading in tackling today’s problems (Runco, 2004). With rapid changes in
technology and global competition in all facets of human endeavour, it is crucial than ever that adolescents who
are the hopes of tomorrow are fully equipped with creative skills that will make them relevant, and be able to
subdue hindrances capable of preventing them from translating their dreams to realities (Hassan & Ogunyemi,
2008). When these requisites skills are lacking, it has a great economical, political and social consequences for a
nation like Nigeria where the adolescents and youth make up over a third (31.6 percent) of Nigeria’s large and
growing population (National Population Commission, 2013).
Creative thinking is the basis of all human actions which leads to decision that prompts a consequent
action (Kirton, 2003; Cropely, 2006; Lubart & Sternberg, 1995; Runco, Johnson, & Gaynor, 1996). Thus, there
is no decision without thinking and if anything is wrong at this perceptual thinking and decision-making stage,
the consequent action would also be in the wrong direction. If properly done, rational, constructive, creative,
realistic, productive and responsible behaviour will be the outcome, if otherwise, muddled, illogical, irrational,
subjective, unrealistic, unproductive will be the case. Creativity can mean different things to different
people. For some it means being imaginative or inventive, taking risks or challenging convention. For others it is
about original thinking or producing something that nobody has come up with before. Some believe that the term
'creativity' only applies to those who possess artistic talents. Consequently, the range of scholarly interest in
creativity includes a multitude of definitions and approaches involving several disciplines. Kao (1997) defines
creativity as ‘the entire process by which ideas are generated, developed and transformed into value. It
comprises what people commonly mean by innovation and entrepreneurship. Similarly, Robinson (2001) posited
that creativity is the process of developing ideas that are original and of value. The above definitions may have
informed Animasahun (2013) observation that lack of creative potentials amount to foolish and irresponsible
behaviours occasioned by poor thinking.
Despite the potentials of creativity to transform a nation, there is growing concern on the
underdevelopment of creativity in the society including Nigeria. In pre-colonial Nigeria for example, pot
making, gold smiting, crafting, molding and other forms of creative arts were transmitted from one generation to
the other. This practice over a decade is increasingly dying out. One 2012 study on creativity shows that 8 in
10 people feel that unlocking creativity is critical to economic growth and nearly two-thirds of respondents feel
creativity is valuable to society, yet a striking minority – only 1 in 4 people- believe they are living up to their
own creative potential. This observation was corroborated by Animasahun (2013) when the scholar reported that
pinging has replaced thinking among sampled school-going adolescents in Nigeria who spend much time on

Developing Country Studies www.iiste.org
ISSN 2224-607X (Paper) ISSN 2225-0565 (Online)
Vol.4, No.26, 2014
43
their cell phones pinging rather than engaging in creative thinking (Animasahun, 2013). Perhaps, what Nigerian
society lacks is productive thinking which accounts for the aggravated social menaces including high crime rate
in the society. As a result of unproductive thinking Animasun (2013) posited that adolescents resort to crime and
the subsequently drop out of school. Other researchers (Nwazueke 1989; Hassan & Ogunyemi, 2008) observed
that development of creative talents in the society has been on the decline, and if nothing is done to halt the trend
it might eventually lead to recycling old products and offering services using old pattern.
A study by George Land (1968) cited in George & Jarman (1993) reveals that creativity is an unequally
distributed traits and that non-creative behaviour is learned just as creative behaviour is also learnt. Some
scholars suggests that creativity is a product of ordinary cognitive processes, which to some extent may be
influenced, prompted, enhanced, fostered and facilitated (e.g., Bink & Marsh, 2000; Ward, Smith, & Vaid,
1997). Given that creativity is a skill that can be developed through some formal and informal processes, the
formal processes in schools begins with a foundation of knowledge, learning a discipline, and mastering a way of
thinking. Creativity as a skill is thus learnt by experimenting, exploring, questioning assumptions, using
imagination and synthesing information. Learning to be creative is akin to learning a sport. It requires practice to
develop the right muscles, and a supportive environment in which to flourish. Regretably, the various
educational reforms, policies and curriculum in Nigeria did not properly make provisons for the stimulation of
creative potentials among young learners in the various eduactional system starting from the primary to tertiary
institution levels. These flaws in the educational sector have culminated to the recently high level of
unempolyement, increased rate of graduates who are unemploybale, high incidence of unproductivity among
youths in Nigeria.
Recently researchers and educational writers have extended the general meaning of creativity so that it
is not simply about coming up with big ideas, but coming up with practical solutions to everyday problems and
then applying them to real life situations. Everything around Nigerians-homes, education, medical services,
transport and communication systems requires creative inputs. For this reason, attentions of previous researchers
have been drawn to this highly essential construct. For instance, Kwanashie, Aremu, Okoi and Oladokun (2009)
examined the impact of arts, culture and creativity on Nigeria’s economy. Similarly, Olatoye, Akintunde, and
Ogunsanya (2010) reported a positive relationship between creativity and academic achievements. For any
intervention or programme to be successful in enhancing creativity among students, there is need to understand
the role of sociological and psychological factors in facilitating or inhibiting creativity. Regretably, there is
paucity of researches that attempted to assess how psychosocial factors predict creativtivity. This study
therefore, examined the extent to which psychosocial factors prediected creativity among in-school adolescents
in Saki, Oyo state secondary schools. The outcome of this study will undoubtedly benefit stakeholders such as
the parents, educators, counsellors and policy makers in the process of stimulating, encouraging and sustaining
creativity among learners.
1.2 The Cocept of Creativity
The main source of growth in the 21st century is not competition, knowledge and technology, rather the
fundamental drive to economical growth is identified as implemented human creativity (Florida, 2002).
Creativity is the tendency to generate or recognize new ideas, alternatives, or possibilities that may be useful in
solving problems, communicating with others, entertaining ourselves and others. Thinking is the highest of
mental function and creative production, the peak of human achievement (Getzels, 2003). Creativity is an
individual ability to produce novel things (Perry-Smith & Shalley, 2003; Wai, Lubinski, & Benbow, 2005), an
imaginative process with outcomes that are original and of value (Robinson, 2001) and generally the most
mysterious and critical human trait necessary for the advancement of humanity (Kerr & Gagliardi, 2003). Thus,
Problem finding is one of the primary components of creativity thinking. According to Runco and Dow (1999)
problem finding is being “sensitivity to problems”. Problem finding is an act where individuals feel a challenge
in discovering and formulating a problem that is to be solved.
Many studies have supported the view that highly creative individuals are open to new experiences,
self-confident, eager to cooperate, less conforming, autonomous, and have high self-esteem (Dollinger, Urban &
James, 2004; Shimonaka & Nakazato, 2007; Prabhu, Sutton, & Sauser, 2008; Lee, 2005). A researcher was of
the opinon that creativity is much sought after thought process (Sutton, 2001). There were other currents
postions in the creativity literature suggesting that creativity was not a fixed, trait-like quality of individuals
but, rather, a skill that might be taught, learned, practiced, and improved (Amabile & Pillemer, 2011).
Unfortunately, while the importance of cognitive development has become widespread, critical thinking is not.
Most students do not score well on tests that measure ability to recognise assumptions, evaluate arguments and
appraise inference (Cropely, 2006).
Students’ performance on measures of higher order thinking ability has displayed a critical need for
students to develop the skills and attitudes of effective thinking (Robinson, 1980). Recent research findings by
(Amabile, Mueller, Simpson, Hadley, Kramer & Fleming 2003; Parker, Summerfeldt, Hogan & Majeski, 2004)
Developing Country Studies www.iiste.org
ISSN 2224-607X (Paper) ISSN 2225-0565 (Online)
Vol.4, No.26, 2014
44
has indicated that cognitive intelligence, academic degree and other documentation of accomplishments do not
ensure success in life. Rather, creative thinking competence skills are among the core keys identified as sources
of viable ideas which form the building blocks for human success. Creativity skills are the engines that can drive
sustainable human development. It is well documented that creativity propels organization, catapult careers, and
generate potent growth and viable outcome. The more creative a person is, the more self-reliant he becomes to
enrich the quality of his own life, family, group and society at large (Akinboye, 2003). Teaching critical
thinking skills therefore becomes the single most important thing that any country can do to enhance the
development of her citizens.
1.3 Emotional intelligence
According to Douglas, Frink and Ferris (2000) creativite skills or thinking need emotional intelligence.
Expectedly, emotional intelligence is one of the factors that can affect creativity because EI has a set of skills
that enables one to read and understand others emotions and utilize such knowledge to influence others in the
pursuits of individual and organizational goals. Emotional intelligence refers to the ability to recognize and
regulate emotions in ourselves and others (Goleman, 2001). EI is thus the ability to perceive emotions, to
access and generate emotions so as to assist thought, to understand emotions and emotional knowledge, and to
reflectively regulate emotions so as to promote emotional and intellectual growth (Mayer & Salovey 1997).
There is growing recognition of the key role that emotions play in our lives. We are generally realising the limit
of our minds and the need to balance intellect with feeling and emotion. The rapid change and the growing
complexity of life challenges have made understanding and mastery of the emotions increasingly important.
Castella (2001) observed that what really matters for success, character, happiness and lifelong achievement is a
definable set of emotional skills. Emotional mastery is the ability to process our emotions so that their message
gets to us and their energy is used for appropriate actions (Steve,2001). It requires gaining an understanding of
how our emotions affect us and how we can use them to improve the quality of our lives. Emotions are generated
from the brain and the brain drives the body. This is probably why anytime people need creativity they tend to be
in an emotional state. Creativity is tied to strong emotions, which both give it power and make it challenging
(Akinboye 2003). Studies (Delroy & Gordon 1996; Echeveria 1997; Akinboye 2003) confirmed that it is within
the area of emotional life that a sort of creativity is released and that there is a relationship between creativity
and emotions.
Goleman (1999) posited that for creativity to occur the following five components of emotional
intelligence are essential. First, self-awareness which is the ability to recognize and understand personal moods
and emotions and drives, as well as their effect on others. To achieve this state, one must be able to monitor
one’s own emotional state and identify one own emotions. The second is self-regulation which is the ability to
control or redirect disruptive impulses and moods, and the propensity to suspend judgment and to think before
acting. Third is the internal motivation which is the passion to work for internal reasons that go beyond money
and status which are external rewards, such as an inner vision of what is important in life, a joy in doing
something, curiosity in learning, a flow that comes with being immersed in an activity, that is the propensity to
pursue goals with energy and persistence. Fouth, is empathy which is the ability to understand the emotional
makeup of other people. It involves skill in treating people according to their emotional reactions. This is only
possible when one has achieved self-awareness—as one cannot understand others until they understand
themselves. Finally is Social skill which is the proficiency in managing relationships and building networks, and
ability to find creative common ground and build rapport for the commercialization of the newly created dea.
1.4 Parental involvement
According to contemporary research parental involvement is another variable which is documented to have
decisive impact in the development of creative potential in a child. Parental involvement defined as engaged
participation by parent in a consistent, organized & meaningful way in the consultation, planning,
implementation and evaluation of pragrammes and activities that assist their childrens development. It include
regular two-way and meaningful communication between parents and children in decision making (Barnarvdos
National Children Resources Center, 2006). Studies show that among other things, parental attitudes can serve as
stimulators or inhibitors of creative attitudes. Parents are the chief architects in shaping the personality of an
individual as such their reactions to successes or failures of children are the basis for children’s self-estimation
and creativity.
1.5 Peer group
Peer group also has a strong influence on the pattern of creativity of young people. This is due to the fact that
peers interact to share and develop ideas as well as intergrate different components of a task that were developed
independently. Thus creativity can occur as members interact with each other as they build upon and crtique or
filter ideas. According to Castrogiovanni (2002) a peer group is defined as a small group of similarly aged, fairly

Developing Country Studies www.iiste.org
ISSN 2224-607X (Paper) ISSN 2225-0565 (Online)
Vol.4, No.26, 2014
45
close friends, sharing the same activities. Member of a particular peer group often have similar interests and
background, bonded by the premise of sameness. They are likely to influence the beliefs and patterns of
behaviour which can also influence level of creativity among each other. Brown and Klute (2003) posited that
peer groups are networks of interacting individuals who spent time together and share activities. In line with the
above definition of peers as a team, West (1990) identified four team climate for creativity and innovation;
1).vision, refering to a shared commitment to clear objectives; 2).partipative safety, a sense that team memebrs
can partcipate in decision making and can share ideas without fear, ridicule or ostracism; 3). Task orientation,
which refers to a shared concern of team members for achieving a good standard of performmance and 4)
support for innovation, which refers to the expectation of –and support for the team. These factors have been
found to predict creative performance in a number of empirical studies
(Agrell& Gustafson, 1994; Bain et al. 2001; Burningham & West,1995).
1.6 Purpose of Study
The broad objective of this study is to examine the extent to which Psychosocial factors predicted creativity
among secondary school students in Saki West and East Local Government of Oyo State, Nigeria. Specifically,
the study will;
1. Assess if there is relationship between the independent variables (emotional intelligence, parents
involvement & peer group influence) and the dependent variable (creativity).
2. Establish the composite contribution of the independent variables to the prediction of dependent
variable.
3. Determine the contribution of each of the independent variables to the prediction of the dependent
variable.
1.7 Research Questions
The following research questions generated from reviewed literatures guided the study;
1. Is there any relationships between the independent variables (emotional intelligence, parents
involvement & peer group influence) and the dependent variable (creativity)?
2. What is the joint contribution of the independent variables to the prediction of the dependent variable?
3. What is the relative contribution of the independent variables to the prediction of the dependent
variable?
2.0 Methodology
2.1 Study design
correlational survey design was adopted for the study. This is considered appropriate since information is
collected without changing the environment (i.e., nothing is manipulated). Studies show that it is the best method
for collecting information that will demonstrate relationships and describe phenomen as it exists. Bickman and
Rog (1998) suggest that descriptive surveys can answer questions such as “what is” or “what was.”
2.2 Study Site
The study site is Shaki West and East (also spelt as Saki) Local Government Areas of Oyo state. It has an area
of 1,569 km² and a population of 110,223 as at the 2006 census. Saki East Local Government Area has five
major communities which are Ago-Amodu, Sepeteri, Ogbooro, Oje-Owode and Agbonle. Of these the LGA
capital is at Ago-Amodu while Sepeteri is the largest community. Saki West headquarters is in the town of Saki
and it has an area of 2,014 km² and a population of 278,002 as at the 2006 census. The town lies near the
source of the Ofiki River, the chief tributary of the Ogun River, about 40 miles (60 km) from the Benin border.
Saki is referred to as the food basket of Oyo State because of its agricultural activities. Shaki is an exporter of
cotton, swamp rice, teak, and tobacco. Indigo is grown in the area for local dyeing, and the town is a centre of
cotton weaving. Yams, cassava, corn (maize), sorghum, beans, shea nuts, and okra are grown for subsistence.
Saki was puposively selected for the study because out of the 33 Local Gorvenment areas in Oyo state Saki
inidigenes are said to be highly creative which culminated to their ability to mould aluminum pots (Ikoko) or
(Ape Irin) used for large sacle cooking. Users of pots and sellers from far and near visit the town to purchase the
well designed pots from their popupar market -Shaki Sango every Thursday.
2.3 Sample and Sampling Technique Multi-stage sampling technique was used to draw a sample size of 677 from Saki West and East Local
Government areas of Oyo state. In the first stage, stratified sampling technique was adopted in assigning the
secondary students to two different strata of private and public schools. In the second stage, simple random
sampling was used in selecting eight secondary schools, four from each stratum to ensure adequate
representation. In the third and final stage, simple random sampling was used to draw 10% of the total

Developing Country Studies www.iiste.org
ISSN 2224-607X (Paper) ISSN 2225-0565 (Online)
Vol.4, No.26, 2014
46
population from each selected secondary schools. The sample was representive in terms of gender, age, religion,
class and school. Out of 850 questionnaires distributed by the researches, 677 were correcltly filled, thereby
making the return rate to be 79.6% which was considerd satisfactory for the present study.
2.4 Ethical issues
Prior to the commencement of the research approval was sought from the principals of the partcipating schools.
The principals gave their consent after being satisfied with the objective of the research and the content of the
protocol. Thereafter, the principal informed the parents about the research at a Parent-Teachers Forum (PPF)
where they unanimiously consented since it does not expose their wards to any form of danger. To ensure
confidentiality of responses, the researchers did not include any identifiaction data such as name, phone number,
or contact address.
2.5 Instrumentation
A self-report questionnaire titled ‘Success Potential Battery’ (SPB) was adopted for data collection study. The
scale was developed and validated by Animashaun (2007). The battery has 16 test on various subjects areas.
However, for the purpose of this study five sections which were considered relevant was used. They are Section
A which sought information on the participants’ demographic characteristics such as age, gender, class, religion,
school. The other three sections contained information on the three independent variables namely, emotional
intelligence, parental involvement and peer group. The dependent variable was measured with test 6 which is a
33 item question to measure the creativity level of the respondents. Typical items on this section include; ‘I
bother to look cortically at what people don’t normally notice’. I like to generate new ideas all the time. The
questionnaire was designed on five point Likert scale format of strongly disagree, disagree, not sure, agree,
strongly agree. The scoring was done using the manual since some statements were positively worded while
others were negatively worded. The SPB demonstrated high internal consistency. The questionnaire is culturally
approprtate hence it was specifically developed and validated using Nigerian samples. The author gave the
following reliability index for the sections as follows; Emotional intelligence (0.75), parental involement(0.66),
peer group (0.775), creativity (0.72). To ensure that the instrument is reliable for the present study, it was pilot
tested on 25 randomly selected students from different schools Ibadan, Oyo state, test restest within a week
interval show a reliability index of 0.73. The instrument is therefore considered to have satisfactory
psychometric properties.
3.1 Results
Descriptive and inferential statistics were used to anayse the respondents’ demographic characteristics as
presented on table 1. Results of Pearson Product Moment Correlation (PPMC) and multiple Regression Analysis
(MCA) are presented on tables 2 to 4.
Sample characteristics
The demographic charatersitics of the respondents anaysed with descriptive statistics is presented on table 1
Table 1: Participants’ Demographic Results
SN Variable Frequency %
1 Gender: 1. Female
2. Male
312
365
46.1
53.9
2 School 1. Private
2. Public
288
389
42.5
57.5
3 Class: 1. SS 1
2. SS 2
3. SS 3
28
57
115
14.0
28.5 57,5
4 Age: 1. 0-12
2. 13-15
3. 16-22
188
368
121
27.8
54.4
17.9
5 Religion
1 Islam
2 Christianity
3 Traditional
284
194
199
42.5
28.7
29.4
The participants’ demographic results revealed that 312 (46.1%) of the sampled population were
female while the remaining 365 (53.1%) were male respondents. Two hundred and ten (31%) were in senior
secondary school 1 (SS1), two hundred and five (30.3%) were in senior SS2, while two hundred and sixty-two
(57,5%) were in senior secondary school 3. Respondents within the age bracket of 0 and 12years of age were 188

Developing Country Studies www.iiste.org
ISSN 2224-607X (Paper) ISSN 2225-0565 (Online)
Vol.4, No.26, 2014
47
(27.8%) while those between 13 and 15 years were 368 (54.4%) and those between 16 and 22 years were 121
(17.9%). The Table revealed further that 284 (42.5%) of the respondents were muslems, chritains (28.7) were
christians, while the remaining 199 (29.4%) were practising traditional religion.
3.2 Research Question one: Pearson Product Moment Correlation(PPMC) was used to assess if there is
any relationship between the independent variables (emotional intelligence, parental involvement & peer group
influence and the dependent variable (creativity).
Table: 2 showingCorrelation of independent variables and dependent variable
Variables N Mean Std. Dev. R P Sig
Ceativity level
Emotional intelligence
Parental involvement
Peer Group inflence
677
677
677
677
51.28
32.13
29.59
27.82
13.14
8.08
5.88
6.83
-
.194**
.172*
.094
-0.006
0.015
0.187
-
Sig
Sig
Ns
Correlation is significant at the 0.05 level (2-tailed).
The result from table 2 shows that there is a positive relationship between emotional intelligence,
parental involvement and creativity level (r= 0.194, P<.05) and (r= 0.172, P<.05) respectively. On the other
hand, there was negative relationship between peer group influence and creativity level at (r= .094, P>.05), it
implies therefore, that an increase in emotional intelligence as well as an enhanced parental involvement
would definitely impact on creativity level of the respondents. While peer group influence will negatively
impact creativity level of the respondents as evident from results on table 3.
3.3 Research Question Two: In order to determine the composite contribution of the independent
variables to the prediction of the dependent variable, Multiple regression Analysis was used and the result is
presented on table 3.
Table 3: Regression Summary of Relationship Between the independent variable and the Dependent variable
R= 0.212
R Square= 0.045
Adjusted R Square= 0.030
Std. Error of the Estimate= 12.94115
Model Sum of Squares Df Mean square F P value Remark
Regression 1543.999 3 514.666 3.073 0.029 Sig.
Residual 32824.756 673 167.473
Total 34368.755 676
Table 3 shows the Multiple Regression Correlation Coefficient (R), indicating there was joint
contribution of the independent variables on the creativity level (i.e 0.0212). This implies that there is a joint
contribution of emotional intelligence, parent’s involvement and peer group influence on creativity level. The
independent variables contributed 21.2% of the variance in the prediction of creativity while 89.8% is accounted
for by other variables not included in this study. Further verification to test the significance of the relationship
using Regression ANOVA produced F(3/196), = 3.073, p<0.05. Since P value is less than 0.05 alpha levels, it
confirmed that emotional intelligence, parent involvement and peer group have joint contribution to the
prediction of creativity level of respondents.
3.4 Research Question Three: To assess the relative contribution of the independent
variables to the prediction of the dependent variable MCA was also used, the result is presented on table 4.
Table 4: Relative’s contributions of the Independent variables to the prediction of the Dependent variable
Variable Unstandardized Coefficients (B) Standardized
Coefficients
Model (B) Std. Error Beta T P Remark
Emotional
intelligence
.235 .134 .145 1.759 0.008 S*
Parental involvement .257 .216 .115 1.189 0.024 S*
Peer group influence -5.892 .170 -.031 -.345 0.730 NS
Constant 37.771 5.029 - 7.510 0.000
Table 4 reveals the relative contribution of the three independent variables to the prediction of the
dependent variable as expressed by weights. The unstandadized regression coefficients was used to determine
Developing Country Studies www.iiste.org
ISSN 2224-607X (Paper) ISSN 2225-0565 (Online)
Vol.4, No.26, 2014
48
the relative contributions of the independent variables to the explanation of the dependent variable,the result
shows that emotional intelligence made the highest contribution (β=0.145, t= 1.759, P<0.05) followed by
parental involvement (β=0.115, t=1.189, P< 0.05) were significant, while peer group influence made the least
contribution (β= -0.031, t= -0.345, P>0.05).
4.0 Discussion The outcome of this study showed a positive relationship between emotional intelligence, parent involvement
and creativity level while peer group influence has no relationship with creativity level.This findings coroborates
several previous studies (Mohammadi, 2008; Mayer, Brackett & Warner, 2004; Douglas, Frink & ferris, 2000),
who reported a close relationship between creativity and some psychosocial variables. This finding is plusible
when one considers that creative process involves developing confidence in ourselves; developing good
relationships with those we are being creative with; finding out what our talents and strengths are and increasing
our positive emotion.
The second and third research questions showed that emotional intelligence, parent involvement and
peer group influence have joint and relative contribution to the prediction of creativity. This outcome gave
credence to previous findings ( Hill & Tyson, 2009; Avvisati, Besbas & Guyon,2010) who reported that
parental attitude, behavious and actions have substantial impact on children’s learning. This is result is probably
based on the fact that parents are the chief architects in shaping the personality of their children. The quality of
relationship with parents is key factor for the wholesome development of an individual. Secure bonds between
parents and their children allow them the freedom to grow, explore, gain experience and become creative. This
assertion of the role of parents on creativity of their children is in agreement with child development theory of
Bronfenbrenner (1979) which describes how individuals, families, schools and communities interact through the
education process to contribute in diferent ways to children learning outcomes.
Finally, Peer group also has a influence though not signifcant on the pattern of creativity of
adolescents as evident on the results presented on tables 2 to 4. This corroborates . Castrogiovanni (2002) and
(Brown & Klute, 2003) who reported that creative work is sensitive to the social context of the creator. Peer
social processes influence children's creative activity in classroom contexts. According to researchers, peer
group is a small group of similarly aged, fairly close friends, sharing the same activities the members are likely
to influence the beliefs and patterns of individual behaviours including their creativty. Creativity happens
between people not, just between the ears. Whatever drives us as individuals, something magical and
unpredictable happens when talented creative people get together. However, children and adults alike are higly
influenced by their peers, but children who are still in the process of developing a value system especially with
regards to creativity are more vulnerable to negative influences. Parents should take a proactive position in
discussions about friendships during their children early childhood to lay the foundation for children making
good choices later to enhance creativity.
5.0 Conclusion
This study has provided empirical evidence to suggest that emotional intelligence and paretant involvement in
the activities of their children have positive realtionship with creativty. This outcome has implication for
counselling psychologists, educators and policy makers to incorporate emotional intelligence components in
the school curriclum in order to stimulate creative potentials of learners. The role of parents, the broader family,
peer groups, neighbourhood influences and schools in fostering creative potentials of learners were also
implicated in the study. This study has thus provided a spring board for further studies on varaibles that
facilitate or inhibit creativty among young people in Nigeria. It is however suggested that researchers should
conduct interventions applying principles of behavioural modifications in other to experimentally enhance
creativty among adolescents in Nigeria.
6.0 Recommendations
Based on the results of this study the following recommendations are made in order to enhance to creativity
among in-school adolescents;
1. In contrast, to learning by authority which requires students to use thinking skills such as recognition,
memory, and logical reasoning abilities which are most frequently assessed by traditional tests of
intelligence and scholastic aptitude. Teachers should stimulate creative thinking and learning in the
students and this involve such abilities as evaluation (especially the ability to sense problems,
inconsistencies, and missing elements); divergent production (e.g., fluency, flexibility, originality, and
elaboration); and redefinition.
2. Teachers should also offer a lesson plan with plenty of opportunities for creative behaviors. They can
make assignments that call for original work, independent learning, self-initiated projects, and
experimentation. Teachers should have materials that provide progressive warm- up experiences,

Developing Country Studies www.iiste.org
ISSN 2224-607X (Paper) ISSN 2225-0565 (Online)
Vol.4, No.26, 2014
49
procedures that permit one thing to lead to another and activities that make creative thinking both
legitimate and rewarding.
3. Parents should remove restrictions on children’s desire to explore the world by not using discouraging
words such as “curiosity killed the cat.” They should be taught to learn by exploring, risking,
manipulating, testing, and modifying ideas. Children should be taught to appreciate and be pleased
with their own creative efforts. Unusual questions children ask should be respected.
4. Parents can show children that their ideas have value by listening to their ideas and considering them.
Overly detailed supervision, too much reliance on prescribed curricula, failure to appraise learning
resulting from a child’s own initiative should be discouraged.
5. Opportunity should be provided for children to learn, think, and discover without threats of immediate
evaluation. Constant evaluation, especially during practice and initial learning, makes children afraid to
use creative ways to learn. Children’s honest errors should be accepted as part of the creative process.
6. Policy makers should review the curriculum and incoporate components capable of stimulating the
emotional intelligence of learners which is desired for creative endeaviours.
7. The school authority and parents should make provision for environment that nurtures creativity.
References Akinboye, J. O. (2003). Creativity, Innovation and Success, Ibadan. Nigeria: Stirling-Horden Publishers Nigeria.
Amabile, T. M. & Pillemer J. (2011). Perspectives on the Social Psychology of Creativity. Journal of Creative
Behavior. 1-25
Amabile, T.M, Mueller, J.S, Simpson, W.B, Hadley, C.N, Kramer, S.J, & Fleming, L.(2003).Time pressures and creativity
in organizations: A longitudinal field study. HBS Working Paper. 02 – 073.
Animasahun, R. A. (2013). Teaching thinking: using creativity technique for the eradication of truancy among students to
enhance the success of Universal Basic Education in Nigeria. British Journal of Education, Society and
Behavioural Science 3.4: 560-573.
Animasaun, R.A. (2007). Success potential battery (Ed.) Ibadan: Scavert Enterprises
Atiku, A. (1999). Universal Basic Education for Nigeria. Welcome Address by the Vice- President of the Federal Republic of
Nigeria. Proceedings of the Federation Mini- Summit, Federal Ministry of Education, Abuja,(viii-ix).
Barnavardos National Children’s Resource Centre (2006). Parental involvement-a handbook for childcare providers.
Published by The National Children’s Resource Centre, Barnavardous.
Bink, M. L., & Marsh, R. L. (2000). Cognitive Regularities in Creative Activity. Review of General Psychology 4.1: 59-78.
Bronfenbrenner, U. (1979), The ecology of human Developmenet. Experiment by Nature and Design. Cambridge, MA:
Harvard University, press.
Castella, D.N. (2001). Mastering our emotions, The Master Facilitator Journal, 4.2: 21-24
Castrogiovanni, D. (2002). Adolescence: Peer groups. Retrieved October, 24, 2014, from:
http://inside.bard.edu/academic/specialproj/darling/adolesce.htm.
Cropley, A. J. (2006). In praises of convergent thinking, Creativity Research Journal, 18, 391-404.
Delroy, S. & Gordon C (1996). Emotional Intelligence, England: Debro Publishing.
Dollinger, S. J., Urban, K. K., & James, T. A. (2004). Creativity and openness: further validation of two creative
product measures, Creativity Research Journal, 16, 35- 47.
Douglas, C., Frink, D. D., & Ferris, G.R. (2003). Emotional intelligence as a moderator of the conscientiousness—
performance relationship. Paper presented at the 18th Annual Conference of the Society for Industrial and
Organizational Psychology, Orlando, FL.
Echeveria, R (1997). Emotions: At the heart of business practice. Centre for Quality of Management Journal, 6.2: 157 – 176.
Florida, R. (2002). The rise of the creative class: And how it’s transforming work, leisure, community and everyday life. New
York, Basic Books.
Francesco Avvisati, Marc Gurgand, Nina Guyon, Eric Maurin Paris School of EconomicsGetting Parents Involved: A Field
Experiment in Deprived Schools.http://www.ewi-ssl.pitt. edu/econ/ files/ seminars/ 130118_sem_Nina%20
Guyon.pdf
Geroge, L. & Beth, J. (1993).Breaking point and beyond. San Francisico HarperBusiness.
Getzels, J.W. (2003). The highly intelligent and highly creative adolescents. A summary of some
`research findings, Pp1-470.
Goleman. D. (2001). HBR primal leadership freen download as text file (txt), PDF file (pdf).
Goleman, D. (1998). working with emotional intelligence: Bantam.
Hassan, T. & Ogunyemi, A.O (2008).Differential effectiveness of provocation, brainstorming emotional mastery in fostering
creativity among Nigerian adolescents, the African
Hill, N. E. & Tyson, L.C. (2009). Parental involvement in middle school: A meta-anlytic assessment of the strategies that
promote achievement. Developmental Psychology 45.3: 740-763.
Kwanashie, M, Aremu J.A, Okoi, K & Oladokun, K. (2009), Research into the impact of Arts, culture and creative industries
on Nigeria’s economy. Retrieved on September, 23, 2014 from http//www.creative-africa.org. Symposium, 8.2: 32-
43
Kao, J. (1997). ‘Jammy the Arts and Discipline of Business Creativity’ New York: Harper, Collins.
Kerr, B. & Gagliardi, C. (2003). Measuring creativity in research and practice. In S. J. Lopez & C. R. Snyder (Eds.) Positive
Psychological Assessment: A Handbook of Models and Measures. Washington D.C: American Psychological
Developing Country Studies www.iiste.org
ISSN 2224-607X (Paper) ISSN 2225-0565 (Online)
Vol.4, No.26, 2014
50
Association.
Lee, K. H. (2005). The relationship between creative thinking ability and creative personality of preschoolers, International
Education Journal, 6, 194-199.
Lubart, T. I., & Sternberg, R. J. (1995). An investment approach to creativity: theory and data. In S. M. Smith, T. B. Ward,
& R. A. Finke (Eds.) the creative cognition approach. Cambridge, MA: The MIT Press. Pp. 271-302.
Mayer J.D, Brackett M,Warner R.M (2004). Emotional Intelligence and the Prediction of Behaviour. Personality and
Individual difference, 36: 1387-1402.
Mayer J.D & Salovey P (1997). "What is Emotional Intelligence?” in Emotional Development and Emotional Intelligence., I.
P. S. D. J. S. (Eds.), Ed: New York: Basic Books.
Meyer, J.D & Salovey, D.J. (1997). What is emotional intelligence? In P. Salovey & D.T Sluyter (eds) Emotional
Development and Emotional Intelligence. Basic Books, New York
Mohammadi, S. Y., (2008). Emotional Intelligence. Publisher: Samt. Tehran, Iran..
National Population Commission (NPC) [Nigeria] and ICF International (2013).
Nwazuoke, I. A.(1989), The nature and creativity methods of assessment creative production: A paper presented atthe
intensive training workshop for teachers of gifted children at suleja academy.
NIPOST.(2009),"Post Offices- with map of LGA" Retrieved 2009-10-20. http://en.wikipedia.org/wiki/Saki_West
Ogunyemi, A.O (2010).Provocation and Emotional Mastery Techniques as Strategies for Fostering Creative Thinking
Competence among Nigerian Adolescents, Journal of Social Science, 22.1: 25-32.
Olatoye, R. A., S. O. Akintunde, & M. I. Yakasai. (2010). “Emotional intelligence, creativity and academic achievement of
Business Administration students.” Electronic Journal of Research in Educational Psychology, 8 2: 763-786.
Parker ,J.D.A., Summerfeldt L.J., Hogan M.J. & Majeski S.A. (2004), Emotional Intelligence and Academic Success:
Examining the transition from high School to University. Journal of Personality and Individual Differences, 36.1:
163-172.
Perry-Smith, J. E., & Shalley, C. E. (2003). The social side of creativity: a static and dynamic social network perspective.
Academy of Management Review, 28, 89- 106.
Prabhu, V., Sutton, C., & Sauser, W. (2008). Creativity and certain personality traits: understanding the mediating effect of
intrinsic motivation. Creativity Research Journal, 20, 53-66.
Robinson, K. (2001), Out of our minds: learning to be creative. Oxford, UK: Capstone Publication.
Runco, M.A (2004).Creativity, Annual Review of psychology, 55, 657-687
Runco, M.A & Dow, G (1999). Problem finding In M.A. Runco, & S.R Pritzker (Eds), Encyclopedia of creativity vol 2
(pp433-436), San Diego, Caliornia: Academic Press.
Runco, M. A. (1986). Divergent thinking and creative performance in gifted and non- gifted children. Educational and
Psychological Measurement, 46, 375-384.
Runco, M. A. (1992). Children’s divergent thinking and creative ideation. Developmental Review, 12, 233-264.
Runco, M. A., Johnson, D., & Gaynor, J. R. (1996). The judgmental bases of creativity and implications for the study of
gifted youth. In A. Fishkin, & P. Olszewski- Kubilius (Eds.), Creativity in youth: research and methods. Cresskill,
NJ: Hampton Press. Pp. 23-36.
Shimonaka, Y., & Nakazato, K. (2007). Creativity and factors affecting creative ability in adulthood and old age, Japanese
Journal of Educational Psychology, 55, 231- 243.
Steve, D. (2001). Practice emotional practice. The Master facilitator Journal, Retrieved April, 2004 from science direct data
base.
Sutton, R. I. (2001). The Weird Rules of Creativity: You know how to manage for efficiency and productivity, but if itÕs
creativity you want, chances are you ‘re doing it all wrong. Harvard Business Review Sept.: 94-103.
Wai, J., Lubinski, D., & Benbow, C. (2005). Creativity and occupational accomplishments among intellectually precocious
youths: an age 13 to age 33 longitudinal study, Journal of Educational Psychology, 97, 484-492.
Ward, T. B., Smith, S. M.,& Vaid, J. (Eds.). (1997). Creative Thought: An investigation of conceptual structures and
processes. Washington, D.C.:American Psychological Association.
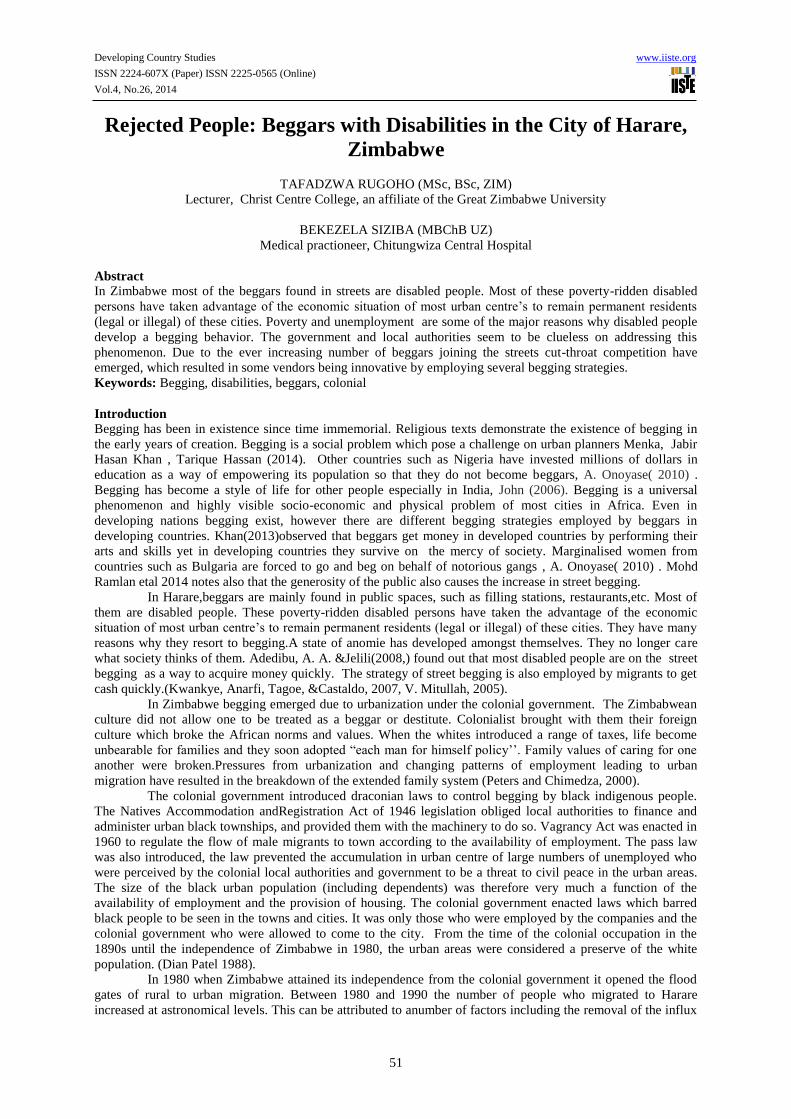
Developing Country Studies www.iiste.org
ISSN 2224-607X (Paper) ISSN 2225-0565 (Online)
Vol.4, No.26, 2014
51
Rejected People: Beggars with Disabilities in the City of Harare,
Zimbabwe
TAFADZWA RUGOHO (MSc, BSc, ZIM)
Lecturer, Christ Centre College, an affiliate of the Great Zimbabwe University
BEKEZELA SIZIBA (MBChB UZ)
Medical practioneer, Chitungwiza Central Hospital
Abstract
In Zimbabwe most of the beggars found in streets are disabled people. Most of these poverty-ridden disabled
persons have taken advantage of the economic situation of most urban centre’s to remain permanent residents
(legal or illegal) of these cities. Poverty and unemployment are some of the major reasons why disabled people
develop a begging behavior. The government and local authorities seem to be clueless on addressing this
phenomenon. Due to the ever increasing number of beggars joining the streets cut-throat competition have
emerged, which resulted in some vendors being innovative by employing several begging strategies.
Keywords: Begging, disabilities, beggars, colonial
Introduction
Begging has been in existence since time immemorial. Religious texts demonstrate the existence of begging in
the early years of creation. Begging is a social problem which pose a challenge on urban planners Menka, Jabir
Hasan Khan , Tarique Hassan (2014). Other countries such as Nigeria have invested millions of dollars in
education as a way of empowering its population so that they do not become beggars, A. Onoyase( 2010) .
Begging has become a style of life for other people especially in India, John (2006). Begging is a universal
phenomenon and highly visible socio-economic and physical problem of most cities in Africa. Even in
developing nations begging exist, however there are different begging strategies employed by beggars in
developing countries. Khan(2013)observed that beggars get money in developed countries by performing their
arts and skills yet in developing countries they survive on the mercy of society. Marginalised women from
countries such as Bulgaria are forced to go and beg on behalf of notorious gangs , A. Onoyase( 2010) . Mohd
Ramlan etal 2014 notes also that the generosity of the public also causes the increase in street begging.
In Harare,beggars are mainly found in public spaces, such as filling stations, restaurants,etc. Most of
them are disabled people. These poverty-ridden disabled persons have taken the advantage of the economic
situation of most urban centre’s to remain permanent residents (legal or illegal) of these cities. They have many
reasons why they resort to begging.A state of anomie has developed amongst themselves. They no longer care
what society thinks of them. Adedibu, A. A. &Jelili(2008,) found out that most disabled people are on the street
begging as a way to acquire money quickly. The strategy of street begging is also employed by migrants to get
cash quickly.(Kwankye, Anarfi, Tagoe, &Castaldo, 2007, V. Mitullah, 2005).
In Zimbabwe begging emerged due to urbanization under the colonial government. The Zimbabwean
culture did not allow one to be treated as a beggar or destitute. Colonialist brought with them their foreign
culture which broke the African norms and values. When the whites introduced a range of taxes, life become
unbearable for families and they soon adopted “each man for himself policy’’. Family values of caring for one
another were broken.Pressures from urbanization and changing patterns of employment leading to urban
migration have resulted in the breakdown of the extended family system (Peters and Chimedza, 2000).
The colonial government introduced draconian laws to control begging by black indigenous people.
The Natives Accommodation andRegistration Act of 1946 legislation obliged local authorities to finance and
administer urban black townships, and provided them with the machinery to do so. Vagrancy Act was enacted in
1960 to regulate the flow of male migrants to town according to the availability of employment. The pass law
was also introduced, the law prevented the accumulation in urban centre of large numbers of unemployed who
were perceived by the colonial local authorities and government to be a threat to civil peace in the urban areas.
The size of the black urban population (including dependents) was therefore very much a function of the
availability of employment and the provision of housing. The colonial government enacted laws which barred
black people to be seen in the towns and cities. It was only those who were employed by the companies and the
colonial government who were allowed to come to the city. From the time of the colonial occupation in the
1890s until the independence of Zimbabwe in 1980, the urban areas were considered a preserve of the white
population. (Dian Patel 1988).
In 1980 when Zimbabwe attained its independence from the colonial government it opened the flood
gates of rural to urban migration. Between 1980 and 1990 the number of people who migrated to Harare
increased at astronomical levels. This can be attributed to anumber of factors including the removal of the influx
Developing Country Studies www.iiste.org
ISSN 2224-607X (Paper) ISSN 2225-0565 (Online)
Vol.4, No.26, 2014
52
control legislation, the fact that average incomes for blacks in the urban areas were much higher than in the
communal lands, and opportunities for employment were perceived to be greater in the urban areas and the
impact of the drought on the rural areas. The bright city of Harare attracted the youth and disabled people from
the rural areas.
In the 1990s due to economic hardships in Zimbabwe, the management of disability issues also shifted
from institutionalization to community based care. Disabled people in Zimbabwe were being kept by
organizations such as Jairos Jiri, Leonard Cheshire Homes and many others. In the mid 1990 these homes started
removing this disabled people from their homes back to their communities. Some could not be taken back by
their families. Some were released from these homes without livelihoods options and companies were shutting
down to employ those with skills. Faced with no option street begging become the only option for survival.
Negative attitudes towards people with disabilities are still prevalent in Zimbabwe, Tsitsi Choruma(
2006). People with disabilities in Zimbabwe are marginalized and treated as if they are not capable of
functioning on their own. Disability is equated with inability (Peters and Chimedza, 2000). People with
disabilities treated from two viewpoints in Zimbabwe. The first one is the medical model, which views them as
sick, as requiring medical attention to help improve them. And the community should pity them. The second
view point is the curse phenomena. Disabled people are viewed as a result of curse of the family. It is seem as
bad omen to give birth to a disable child. Those who give birth to a disabled child try to hide it from the
community. Or the birth of a disabled child can result in the break of the family. The wife is usually divorced
being accused of promiscuity or witchcraft.
As one of many developing countries, Zimbabwe is facing a variety of differing social and economic
problems. Some of the most serious problems are high degree of poverty and unemployment, rampant HIV/
AIDS infection, rapid population growth and migration on a massive scale (Mulat, 2002). The collapse of the
economy also lead to the collapse of social protection grants for disabled people. People with disabilities used
to access a monthly grant to cushion them from the economic challenges. Though the money was not much, but
it contributed towards the buying of food for the family. Its demise also contributed to an influx of vulnerable
people into urban centers and in particular to the streets of Harare.
Zimbabwe has become a country of confounding paradoxes where poverty has become one of the chief
social problems, especially for the vulnerable such as the disabled people (Raftopolous(2009). In particular, the
dollarization of the economy in 2009 left many disabled people in the city of Harare in particular and Zimbabwe
in general with a myriad of challenges (Hanke, 2009). According to World Health Organization estimates, there
are about 1,3million people with disabilities in Zimbabwe, which is about 10% of the total population (Economic
Commission for Africa, 2011). In common with the fate of people with disabilities the world over, people with
disabilities in Zimbabwe suffer from widespread violation of their fundamental freedoms and rights.
In 2004, the country’s unemployment rate stood at 80%, and the deteriorating economic meltdown led
to many companies closing their businesses (Mpofu, 2008). Ligthelm (2008) suggest that the rise in
unemployment is a result of the country’s formal sector incapacity to have new businesses. According to
Dhemba (2011), in June 2009, about 3 to 4 million Zimbabweans were in the informal sector employment,
supporting another 6 million people. With the highest unemployment rate in the region, Zimbabwe’s disabled
people are usually the last to be hired and as a result most of them resort to begging, selling items such as cell
phones, airtime, sweets, clothes, watches and fruit from the pavements, mixing with able-bodied fellow vendors
(Bloch, 2009). As noted by National Association for the Societies of the Care and Handicapped (NASCOH) the
aggressiveness of disabled beggars emanates from desperation from the shaky economic times (The Standard,
September 2011)
Paradoxically, Non Governmental Organisations and other donor agencies have focused their poverty
alleviation strategies and programmes principally on rural areas, thereby ignoring the urban poor and disabled.
For instance, a survey by Together for Justice and Peace (CTJP) in Harare townships revealed that more than 55
percent of family households lived on a single meal a day (Jones, 2009). Additionally, Ndlovu (2008) points out
that the disabled people in the towns face exclusion from education and employment and hence become more
vulnerable to poverty, lack of access to health care, and neglect. Researches by Mpofu (2011) found that only
33% of children with disabilities in Zimbabwe have access to education, compared with over 90% for the able-
bodied populace. Thus, persons with disabilities have found it difficult to enter into the job market due to lack of
education. Ampofo et.al (2004) elucidate that the absence of education and training acts as stumbling blocks
that limit the disabled persons from getting formal sector employment.
The concept of in Zimbabwe
Begging is generally viewed as an activity emanated from poverty and destitution. One is useless to fend for
himself hence need the mercy of other for survival. Begging is an indicator of abject poverty (Kennedy and
Fitzpatrick , 2011). It is a major way out for the helpless poor. Nora Groce and Barbara Murray ( 2012) also
supports that begging is a result of poverty.The presence of beggars is perceived to be indicative of larger social
Developing Country Studies www.iiste.org
ISSN 2224-607X (Paper) ISSN 2225-0565 (Online)
Vol.4, No.26, 2014
53
ills orissues and can cause others to avoid beggar-inhabited areas(Clapper 2012, 1). Begging is commonly
defined as the act ofstopping people on the street to ask for assistance, for example in the form of food or money
(Bose and Hwang 2002, ; Collins and Blomley 2003, ). It is a request directed to the rest of the society to bring
oneself out of misery and poverty. Ahamdi (2010), states that begging is a social problem which has not only
psychological consequences such as the development of inferiority complex in the beggars’ family members and
their network of kinship, but also problem of begging will affect , as an unpleasant problem, the geographical
and social structure of the urban areas. Begging is also associated with other social ills such as stealing, violent
and criminal behaviour Menka, Jabir Hasan Khan , Tarique Hassan (2014)
Molsa (1992:2) defined begging as a method of earning one's living from the income obtained from
other sectors of society using age, health and economic conditions as a means of gaining sympathy. O. A.
Fawole1, D. V. Ogunkan and A. Omoruan, (2011) treat begging a social deviance. For the purpose of this study,
however, the concept of begging or beggary can be conceptualized as an act of asking gifts as a means of
livelihood and hence is essential for survival. It is not possible to attribute begging to a single cause.
Legislation in empowering people with disabilities
The constitution of Zimbabwe is the supreme law of the land. In it exists the Education
Act of 1987 with amendments of 1986 and 2006. The disabled Persons Act of 1992 with amendment
1994 and the empowerment act. The country recently adopted a new constitution. and signed the united nation
convention These laws were meant to protect and empower the disabled people.Existing legislation appears not
to be effectively cushioning people with disabilities as far as empowering them through various programmes is
concerned. This may be because the legislative provisions are not comprehensive enough or that persons with
disabilities are not taking advantage of the legislation. Nyathi (1984) expressed concern that despite this
commitment Zimbabwe’s approach to empowerment and employmentissues of people with disabilities remained
lukewarm.Despite the fact that the Government of Zimbabwe has indeed enacted disability legislation, disability
issues, when compared with other competing economic and developmental challenges, remains a low priority.
However, in recent months the President has appointed a special adviser on disabilityissues, but it remains very
unclear what is his mandate, and what strategies
The extent to which disability is really prioritized by the Governmentof Zimbabwe is unclear. The
Government perceives disability as a non–threatening and non-political issue. Disability issues are the last to be
addressed. Therefore, it welcomes the involvement of non-governmental organizations in the disability sector.
This is somewhat ironic, considering that the international disability movement, which in the past has been
spearheaded by some veryprominent Zimbabwean disabled people, has a very strong, overt politicalagenda,
which places a great deal of emphasis on human rights, nondiscrimination,empowerment and choice.
Theoretical framework
The study employed the two theoretical framework vicious circle of poverty and livelihoods theory. The “vicious
circle of poverty” theory seeks to explain the perpetuation of poverty in communities and indicates that poverty
as a subculture, passes from one generation to another and becomes institutionalized amongst the poor
(Namwata, 2012). The poor end up being trapped by their poverty. It is one of the factors which condition
someone to the phenomenon of begging. The theory emphasizes on people’s inability to manage risk rather than
their attitude to risk as a way of breaking the vicious circle of poverty. Other characteristics of poverty which
make escape difficult are low levels of education, low self esteem, poor health, lack of skills, absence of
support mechanism, remoteness from market, lack of physical asset or borrowing power, malnourishments or
combination of the above (Ogunkan and Fawole, 2009). As a result, the poor are trapped in the situation with
little chance of escaping such that in a vicious process, poverty is maintained among the poor across the
generations. Therefore, in order for the poor to meet their basic needs, they have to resort into begging. The
vicious circle of poverty helps to explain the existence of begging across the generations (Jelili, 2006).
Livelihood is the recognition of multiple activities and assets that are available to a person that can be
engaged to ensure survival and well-being. At the centre of the theory are the different kinds of assets a person
can draw from to build their livelihoods. These are influenced by the context, which refers to the sources of
insecurity to which people and their assets are vulnerable. Access to and the use of assets is influenced by
policies, organizations and relationships towards and between individuals and organizations. To use the words
assets and access when describing the livelihood strategies of very poor people feels weird because being
deprived.
THE LOCATION AND METHODOLOGY OF THE STUDY
This study was conducted in Harare central Business. The study targeted buys street roads, entrance of
supermarkets and food outlets. As observed by beggars frequently these areas with high population density. The
beggary problem in the Harare has a lot to do with poverty, high employment rate , the collapse of the social
disability fund and failure of social institutions to address social disorder like street begging. This study has been
Developing Country Studies www.iiste.org
ISSN 2224-607X (Paper) ISSN 2225-0565 (Online)
Vol.4, No.26, 2014
54
done by employing a cross-sectional research design. Semi -structured questionnaire was used to collect data;
focus group discussions (FGDs), key informant interview and observation were also used. The data was
collected from 63 people with disabilities and16 key informants from shop owners and municipal police.
Primary data were collected from street beggars found in any public area begging for alms; using convenience or
accidental sampling method. Since the street beggars keep on moving from here and there, it would have been
very difficult to prepare any sampling framework, out of which to select the desired sample by applying
principles of random method. Instead, selection of the interviewee was based on their easy accessibility or their
availability on the streets. The focus groups were stratified into men adults, women adults and youth group. Each
group consisted of 8 to 13 members separately from the municipal police and shop owners . In total 5 focus
groups were established for discussions.
Secondary data were derived from the findings stated in published and unpublished documents related
to the research problem. These were based from the recent literatures related to street begging and the concepts
cited by the respondents. The secondary data were collected from various documentary sources such as journal
papers, internet materials and other documents relevant for the study. Qualitative and quantitative data were
analyzed separately in order to complement and supplement each other. Qualitative data obtained from
observation, focus group discussions (FGDs) and interview with key informants were analyzed through themes
and contents. Subsequently, responses from questionnaires were coded, summarized and analyzed using the
excel package. Descriptive statistics was used to obtain frequency and percentages of coded responses.
Discussion of Findings
Young males dominate street begging. Those with the ages between 15 to 24 demonstrate that there are more
male beggars. However as people become old it is female numbers increase more than their male counterparts.
This is as a result of many factors. In Zimbabwe life expectancy of females is higher than males. Women tend to
have more responsibilities as they get older as they have to take care of their orphaned grand children. Beggar
use their processed to buy food, paying rentals, medication,entertainment ,payment of fees and with 16% using
alcohol. These group claims that the reason of buying alcohol is to manage stress. One beggar claimed that
begging is stressing. Being seen by all the people as a useless person who only can survive from hand outs from
the members of the society. It shows that you have no capacity to look after yourself.
People with physical disabilities dominated begging in Harare. They constitute 57% of beggars in
Harare. The number also reflects world disability trends. Worldwide there are more people with physical
disabilities than other types of disabilities. 33 percent are vsisually impaired people. Only ten percent are
mentally disabled.The research revealed that in Harare there exits three categories of begging namely passive
begging, active begging and aggressive begging. The three categories were also identified by (Burke, 1999,
Horn& Cooke, 2001. Passive beggars involve a person either sitting or standing in one place with a sign or
receptacle entreating donations. The receptacle are purported to have been written by organization representing
persons with disabilities. These cards claim that the individual is suffering from a disease which needs operation
to be undertaken. This category is dominated by those aged 45 years and above. 67 % consist of active beggars.
This group is dominated by 15 to 44 years. There is also a group which constitutes 5% which I called the
aggressive beggars. This group constitutes those who are aged between 15 and 19. This group is still young and
do not understand the dynamics of building relationships.
Beggars with disabilities have low level of education. Forty seven have no formal education. These
are also supported with Tsitsi Choruma who observed that a good number of disabled people do not receive
education and this have made it difficult for them to get employed. A SINTEF study conducted in 2003
(SINTEF,2003a and 2003b) indicated that 32 per cent of peoplewith disabilities in Zimbabwe have had no
schooling.World-wide, the vast majority of adolescents and youth with disabilities do not attend school.Many
have never attend school or attended only once in a while, a fact reflected in UNESCO's estimate that the literacy
rate for those with disabilities world-wide is only 3 per cent. The rate for girls and women with disabilities
hovers closer to 1 per cent.
The major causes of begging disabled people in Harare are poverty and unemployment.89% cited
poverty as one major cause that have driven them to begging. 96 agreed that begging is the only available to
them to earning living because they are not employed. They agreed that if they are given employment
opportunities they are willing to quit vending.16% agreed that they beg for extra cash.One of the strategies used
by vendors is that one of showing the disabled part. Showing the public the disabled part wipes their emotions.
They began to see that you are disabled. Those with prostheses limps remove them and hide them somewhere
during the times of begging. Crutches and white cans are displayed in front so that the public can see them.
Vendors usually get gift in form of money. Coins are dropped into their begging plates. Depending on
the place one is begging from. Those who beg from the entrance of food outlets and supermarkets usually get
gifts in form of food. They will in turn sell this food to other beggars and get money. There is cut-throat
competition at busy places and these are dominated by men while women are found on the outskirt of the central
Developing Country Studies www.iiste.org
ISSN 2224-607X (Paper) ISSN 2225-0565 (Online)
Vol.4, No.26, 2014
55
business district. Vendors have got a strong communication network. Over the years they have known each other
and were that vending begs from. Verbal war erupts when enters the territory of the other. It is only in small
incidences that such verbal laws result in physical fights.
Conclusion and recommendations
The research has demonstrated that people with disabilities in Harare engage in begging a result of poverty.
Disabled people had been neglected both by government and society. The government does not have any active
policy to promote the livelihoods of disabled people. Society in turn condemns them and does not offer them
opportunities to exploit their potential. There is need for companies and government to employ people with
disabilities with skills and to equip those without skills so that they can be employed. The government should
resuscitate the social grants which are meant to cushion the disabled from the economic hardships.
References
A. B. M. L. Namwata. Categories of street beggars and factors influencing street begging in central Tanzania.
African Study Monographs, 2 (33), pp. 133-134. 2012.
Adedibu AA (1989). “Begging and Poverty in Third World Cities” A case study of Ilorin, Nigeria” Ilorin J. Bus.
Soc. Sci. (IJBSS), 1: 25-40.
Block E,( 2009) Atheist in Christianity, London :Verso
Bose, Rohit, and Stephen W. Hwang (2002 ), "Income and spending patterns among panhandlers." Canadian
Medical Association Journal 167:477-479.
Collins, D. and Blomley, N., (2003). “Private Needs and Public Space: Politics, Poverty, and Anti- Panhandling
By-Laws in Canadian Cities,” In Law Commission of Canada (Ed.), New Perspectives on the Public–Private
Divide, Vancouver: UBC Press, p.1.
Dhemba .J (2009) ,Informal Sector Development: A Strategy for Alleviating Urban Poverty in Zimbabwe,
Journal of Social Development in Africa,14,
Fawole, D. V. Ogunkan, and A. Omoruan (2010). The Menace of Begging in Nigerian cities: A Sociological
Analysis. International Journal of Sociology and Anthropology Vol. 3(1), pp. 9-14 January 2011 Available
online http://www.academicjournals.org/ijsa. ISSN 2006- 988x ©2011 Academic Journals
Horn, M., & Cooke, M. (2002). Understanding Begging in our Public Spaces’.Parity, 15(1), 10.
Horn, M., & Cooke, M. (2001). A question of Begging: a Study of the Extent and Nature of Begging in the city
of Melbourne. In P. Lynch (ed.), Critique and Comment: understanding and responding to begging.Australian
journals
Jelili M.O. 2006. “Environmental and Socio- economic Dimensions of Begging in Ilorin and Ogbomoso.
Unpublished M.Tech dissertation, Department of Urban Regional Planning, LadokeAkintola University of
Technology, Ogbomoso, Nigeria
Peters, S. &Chimedza, R. (2000).Conscientization and the cultural politics of education: A radical minority
perspective? Comparative Education Review, 44 (3), 245-271.).
Ligthelm, A.A. 2008b. Small Business Success and Failure in Soweto: A Longitudinal Analysis,Research Report
No. 377. Pretoria: Bureau of Market Research, University of South, Africa.
Menka, Jabir Hasan Khan , Tarique Hassan (2014) Economic Life of Beggars in Aligarh District, Quest
Journals, Journal of Research in Humanities and Social Science Volume 2 ~ Issue 9 (2014) pp: 01-08
ISSN(Online) : 2321-9467
Menka, Jabir Hasan Khan and Shamshad (2013) Problems of Beggars: A Case Study, International Journal of
Management and Social Sciences Research (IJMSSR) ISSN: 2319-4421 Volume 2, No. 12, December 2013
Mitullah, W. (2003). “Understanding Slums: Case Studies for the Global Report on Human Settlements 2003:
The Case of Nairobi, Kenya”. UNHABITAT, Nairobi
Namwata, B.M.L., M.R. Mgabo& P. Dimoso 2010. Dynamics of Street Beggars and Begging Life in Urban
Areas of Central Zone Tanzania: The Case of Dodoma and SingidaMunicipalities.Draft report submitted to
Research on Poverty Alleviation (REPOA), Dar EsSalaam, Tanzania.
— 2011. Demographic dimensions and their implications on the incidence of street begging in urban areas of
Central Tanzania: The case of Dodoma and SingidaMunicipalities.Global Journal of Human Social Science,
11(4): 53–60.
O. A. Fawole1, D. V. Ogunkan2*, and A. Omoruan 2011, The menace of begging in Nigerian cities: A
sociological analysis, International Journal of Sociology and Anthropology Vol. 3(1), pp. 9-14 January 2011
Available online http://www.academicjournals.org/ijsa ISSN 2006- 988x ©2011 Academic Journals
Ogunkan D. V and M. O. Jelili 2010. The Influence of Land Use on the Spatial Variation of Begging in
Ogbomoso, Nigeria. Journal of Geography and Regional Planning Vol. 3(4), pp. 73-83. Available online at
http://www.academicjournals.org/JGRP retrieved on December 2010
Ogunkan, D.V. & O.A. Fawole 2009. Incidence and socio-economic dimensions of begging in Nigerian cities:

Developing Country Studies www.iiste.org
ISSN 2224-607X (Paper) ISSN 2225-0565 (Online)
Vol.4, No.26, 2014
56
The case of Ogbomoso. International NGO Journal, 4(12): 498–503.
Patel, Diana (1988).“Government Policy and Squatter Settlements in Harare, Zimbabwe”, In R. A. Obudo and
Constance C. Mhlanga (eds),Slum and Squatter Settlements in Sub-Saharan Africa: Towards a Planning
Strategy , 205-218, New York: Praege
Prichard ,D (1963) Handicapped Children –Education History. Reutledge and Kegan Paul, London
RiddellJ.B, 1980. Is Continuing Urbanization Possible in West Africa? African Studies Review , Vol. 23, No. 1.
pp. 69

Developing Country Studies www.iiste.org
ISSN 2224-607X (Paper) ISSN 2225-0565 (Online)
Vol.4, No.26, 2014
57
Techno-Scientific Temper of Three Nigerian Newspapers
Herbert Batta* Ita Ekanem Nevelyn Udousoro
Department of Communication Arts, Faculty of Arts, University of Uyo, PMB 1017, Uyo, Nigeria *Corresponding Author’s E-mail: [email protected]
Abstract
The culture of science and science communication in Nigeria are deemed as fragile compelling researchers to
interrogate how, say newspapers contribute to creating awareness and knowledge of techno-science matters.
Research data on this is scanty in Nigeria thus necessitating this study which examines the character and extent
of techno-science coverage in three select Nigerian newspapers to determine the frequency of coverage,
orientation of the reports, genre or formats of reporting, sourcing of information and depth of reportage. The
discourse is hinged on the agenda setting theory while the research method is a content analysis of 156 issues of
The Guardian, Leadership, and Daily Trust newspapers for the year 2012. The findings show that of the 329
techno-science stories captured in the study, biomedicine was the most frequently reported topic at 26.44%;
routine reporting (65.96%) exceeded event-specific reporting (34.04%); the news format (54.71%) was the more
common genre of reportage; foreign sourced stories (54.10%) outnumbered locally sourced reports (45.90%) and
in terms of depth, 42.25% of the stories were briefs. The study recommends that for the analysed newspapers to
set meaningful agenda on techno-science in Nigeria, they need to broaden their scope of coverage beyond
biomedicine and the news format of presentation; deepen the discourse/content of techno-science information by
becoming more deliberative; consolidate on routine science coverage as well as pay more attention to local
sourcing of techno-science information.
Keywords: Science Journalism, Content Analysis, Agenda Setting, Africa.
1. Introduction
Science, technology and innovation are key aspects of a modern society. Indeed, the level of the development of
science, technology and innovation is significantly related to the general development of a country. Africa,
including Nigeria is not categorised as an advanced or developed continent. Much of this categorisation is due
principally to the parlous state of science, technology and innovation. In the same vein, the communication of
science whether in the media or outside has a great bearing on the public understanding, popularisation, and
utilisation of science. More importantly, science communication helps to improve science literacy. Outlining the
six parameters with which we measure science communication culture, the European Union (2012) identifies the
following: the national communication infrastructure, political attention, the actors involved, the academic
tradition, and the science journalism situation. Using these six parameters, a country can be said to have (a)
consolidated, (b) developing, or (c) fragile science communication culture. We think that Africa including
Nigeria has a fragile science communication culture. It would be interesting to see it this fragility shows up in
the coverage of science and technology in three Nigerian dailies.
Science communication is an emerging multidisciplinary field of study which is gathering momentum in recent
times. Its major aim is to link the science community with the public and other critical stakeholders such as
government, non-governmental agencies, communities, families, individuals and the society at large. It serves to
deepen public appreciation and understanding of science though science popularisation and dissemination.
We live in a techno-scientific world where science and technology assume a focal point in the lives of citizens.
For, as the National Science and Technology Centre, Australia puts it, “Science is not just functional – it helps to
illuminate the world in new and unexpected ways… science also offers profound challenges and uncertainties.
The role of science communicators is often to help make these hidden dimensions more visible and better
understood – enabling science to be seen in its social and cultural contexts, and facilitating conversations about
its meaning and significance” (anzSKA 2010). It is also true that in no aspect of science are the issues of
challenges and uncertainties as pervasive as in the field of nano-science and technology. Perhaps this is why
Kennedy (2010) observes that, “knowledge about the natural world is a mainstream of the culture…”, that, “a
broadly spread citizen understanding of science and technology is a public good”, and that, scientific
understanding is a precious resource for society…”
Science journalism, an aspect of science communication is also fraught with challenges and matters arising as
Dunwoody (2008) notes to include the following: (a) Science news is overwhelmingly print-oriented and
focused on biomedical topics; (b) television science reinforces the legitimacy and sacredness of science; (c)
coverage of science follows journalistic rather than scientific norms; (d) accuracy of science news stories is a
contested arena; and (e) appropriate training for science journalism remains a contested topic. This study affords
us the opportunity to make data-based observations about how science and technology are covered by select
Nigerian newspapers.
2. Review of Related Literature
Developing Country Studies www.iiste.org
ISSN 2224-607X (Paper) ISSN 2225-0565 (Online)
Vol.4, No.26, 2014
58
This section deals with aspects such as the issues surrounding science and technology, media coverage of the
subject matter as well as related research in science communication. The import of the review is to enhance a
more robust understanding and appreciation of the state of research on the subject particularly for those who are
not familiar with techno-science communication.
Science writing certainly brings up several issues. Particularly concerning sciences such as stem cell research,
evolution, or climate change; Kennedy and Overholser (2010) observe that there is an interweaving with moral
or ethical controversy. They add that the journalistic norm of objectivity – the practice of assigning equal
attention to contentious views makes the coverage of science and technology more challenging. Indeed, Hellsten
and Nerlich (2008) affirm that, “moral and ethical questions… may result from increasing competition within the
science, between research teams and between science communicators themselves, including scientists’ increased
need to seek public recognition via the mass media and the internet…”
In their study of the framing of science and technology ethics in the Chinese newspaper press, Xie, Tang and Xie
(2012) explain science and technology ethics to mean, “standards or principles that the society and public use to
appraise the science and technology activity as right or wrong, and the awareness of considering the sci-tech
activities… . This means that science and technology do have important societal implications.
To Roco and Bainbridge (2005), the aim of the societal implications should be that of maximizing human
benefit. Considering the communications angle, they observe that, “media analyses show that groups with views
at the extremes of the spectrum of opinions, either exaggerating the benefits of or mistrusting nanotechnology,
have a disproportionate voice in the mass media, which impedes public understanding of both potential benefits
and possible risks”. They caution that nanoscientists, engineers, and technologists must show true respect for
inter-disciplinary discussion of ethical and social dimensions. Additionally, reputable science-savvy
organisations are required to articulate clearly the diverse methods and principles of nano-technology as well as
their short and long term benefits and uncertainties of nano-technology to engender public trust and encourage
people to make reasonable nano-technology decisions.
In the earlier days of the development of nano-science and technology, the Royal society of and The Royal
Academy of Engineering (2004) pointed out that developments in science and technology hardly occur “in a
social and ethical vacuum”. They state that, “some nano-technologies will raise significant social and ethical
concerns” some of which include:
(a) Disagreement about how much of an economic impact, nano-technologies will have.
(b) The potential for nano-technologies to intensify the gap between rich and poor countries because of
their different capacities to develop and exploit nanotechnologies – a ‘nanodivide’.
(c) Nano-technologies e.g. sensing devices… used to achieve greater safety, security and individualised
healthcare…might be used in ways that limit individual or group privacy by covert surveillance, etc.
(d) Nano-technologies that enhance human capacities e.g. improved cochlear and retinal implants to
improve or restore hearing and eyesight worry disability rights groups on the grounds that this might lead to
stigmatisation of those without enhanced capacities.
(e) Military developments in the area of nano-technologies raise obvious social and ethical issues e.g.
manipulation of biological and chemical agents using nano-technologies resulting in new threats difficult to
detect and counter.
The significance of this knowledge is so that the discerning science communicator may become alive to the
issues of communicated messages which must be complete and effective.
2.1 Media Coverage of Science and Nano-Technology
The media see themselves as having the obligation to inform, create awareness, influence opinion, affect
perception, increase knowledge though media education and play an advocacy role to influence policy and
decision making for individuals, groups, and society. The media do this by giving attention, according
prominence, setting and building agenda on a wide range of issues including science and technology. Let us now
take a look at the character of this coverage in Africa and elsewhere.
A team of researchers led by George Lugalambi, domiciled at the Makerere University, Uganda and sponsored
by Unesco (2011) conducted a study on the coverage of science and technology in Africa. The study content-
analysed newspapers in Cameroon, Ghana, Kenya, Namibia, South Africa, and Uganda. Some of the results of
the study were that, about 85% of the articles were in the news category while 15% were features. Also, 69% of
the stories were written by local journalists and 6% by foreign writers. As to the origin of the stories, 68%
originated locally while 25% and 6% had foreign and mixed origins respectively.
Other findings were that, of the 15 fields of science and technology categorised, environment/ecology accounted
for 19%, biomedicine 15%, technology 13%, and food and nutrition 9%. The majority of the stories (43%) had a
positive tone, 15% was negative and 28% neutral. Also, 52% of the articles emphasised benefits, 17% risks and
31% mixed; 80% of the stories were on controversies; 72% were event-based while 25% were process-based;
45% of the stories were attributed to local sources; 30% to foreign sources and 25% mixed sources. Also, 40% of

Developing Country Studies www.iiste.org
ISSN 2224-607X (Paper) ISSN 2225-0565 (Online)
Vol.4, No.26, 2014
59
the stories had male sources while 9% featured female sources. The study recommended among others a close
working relationship with, “training institutions to introduce science curricular as a way of improving the
understanding of science and technology… and coverage.”
In Germany, Guenther and Ruhramnn (2013) focused on science journalists’ selection criteria and depiction of
nanotechnology in the German media. It was a face-to-face survey of science journalists from different German
media outlets. The findings showed that professional role conception, personal interest, news factors, and
organisational process were the major influences. Journalists also showed high, positive attitudes towards
nanoscience and technology. However, an observation was that, the coverage of scientific evidence was mainly
dictated by the science journalists’ focus on beneficial or risky aspects of the emerging technology. They were
more likely to stress scientific uncertainty in their coverage of risk. The authors made use of the five levels of
gate keeping influences namely: individual factors, communication routines, organisational level, the social and
institutional level as well as the society system level, all visualised with the help of Weischenberg’s Onion
Model.
In Slovenia, Groboljsek and Mali (2012) sought to, “explore the ways national newspapers in Slovenia cover
issues on nano-technology and how scientists in the field of nanotechnology in Slovenia perceive media
coverage of the issues.” They conducted a content analysis of articles in three key Slovenian newspapers from
2004 to 2009. They concluded based on their findings that, “nano-technology is poorly presented in Slovenian
newspapers…. A significant proportion of articles were identified in science section coverage, but in general, the
articles were dispersed across different sections of the newspapers and merely emphasised positive aspects of
nano-technology. Yet the overall impression was that news concerning this area receives an insufficient amount
of media attention”. On the perceptions of media reporting of nano-technology, the authors state: “their
responses reflect considerable dissatisfaction with the level and quality of media reporting…”. The rationale for
this state of affairs is that, “nano-technology seems to be still a novelty…partly due to the fact that this emerging
technology is significantly converging with other research fields and hence in Slovenia, has not yet received the
status of a scientific discipline.
Concerning the European media generally, Murphy and DelleCave (2010) examined the ways in which concepts
of risk are excluded from nano-technology discourses in policy and news media domains via discursive
techniques with consensus as the assumption. They analysed their sample based on a five-point dialogicality
model of openness to difference, conflict emphasised, conflict resolution, conflict downplayed and consensus.
The study involved 488 articles from the UK, Italian, French, and Irish newspapers. The results indicated a
general increasing coverage trend though with national differences, twice as many background articles as
foreground, a greater tendency to source nano news from the scientific field and a small amount of articles
featuring risk. The main issues under the risk subject are human health, environmental pollution, ethics of
science and economic consequences. One of the notable conclusions of the study is that, “there is a marked
absence of NGOs, or risk experts as sources or experts in risk talk, these places taken instead by business
leaders.
In a multinational study involving the United States, Japan, Germany, the United Kingdom and France, Peters
(2013) studied the gap between science and media. He noted that, “the relationship between science and the
public – or, more specifically, that between science and the media – has been characterised by “… terms such as
…distance…gap…barrier… fence…”. The study noted among others that researchers from the humanities and
social sciences tend to have more interactions with the media than those from the sciences.
It is true as seen above that scientists, the media and the public are key elements in science communication.
Kurath and Gisler (2009) give detailed expression to the notion of upstream public engagement. In their article:
Informing, involving or engaging? Science communication, in the ages of atom-, bio and nanotechnology, they
used literature analysis, participant observation and document–based analysis of communication and
participation process as well as documented public engagement projects in the US, the UK, Switzerland and the
EU. The authors saw upstream engagement as aiming at engaging public knowledge as a central factor in
emerging science and technology related decision making and it entails a genuine and democratic science–
society interaction enabling mutual learning”. They concluded that in spite of promoting upstream engagement
as a more participatory method, most projects “did not go beyond the epistemic basis of consensus formation or
measuring public opinion.” The solution is to, “create collective or socially robust knowledge and consider all
actors as members of sophisticated civic cultures”.
Regarding how scientific uncertainty of nano particle research is communicated by journalists and scientists,
Heidmann and Milde (2013) observe that, “the fast growing area of research concerning the environmental fate
of nano particles and the high level of uncertainty creates a high challenge for describing clearly the recent state
of the current scientific knowledge”. The result of this study showed that nanotechnology, “was often framed as
rather certain and the media coverage emphasises positive aspects and benefits”.
In an earlier study, this time a comparison of the UK and US newspaper articles on whether nanotechnology
risks were discussed; Friedman and Egolf (2005) found a low coverage of nano-technology, health and
Developing Country Studies www.iiste.org
ISSN 2224-607X (Paper) ISSN 2225-0565 (Online)
Vol.4, No.26, 2014
60
environmental risks. They also observed that UK articles were a little more negative and included some higher
levels of concerns about nano-technology’s effects on society. Their conclusion was that, “U.S. or UK
newspapers and wire services published articles from 2000 and 2004 that would negatively influence public
opinion about nano-technology.
In Faber’s (2006) study of written popular media representations of nanoscale science and technology, the period
of study was much earlier: 1986 to 1999. Faber stated that during this period, nano-technology was introduced to
the public through articles in newspapers, magazines, and other general interest publications. At this time, the
field had a fragmented public image as promoters of different representations of the field competed for
legitimacy through a transitional social-rhetorical process mediated by biographical and other social renderings
of the research.
Besides media coverage of nano-technology, Leinonen and Kivisaari (2010) also dealt extensively on nano-
technology perceptions. Domiciled in Finland, the study also conducted an indepth literature review of public
opinion and NGO perspectives including those of Friends of the Earth, Greenpeace, ETC group, Which? etc.
They noted the importance of the ethical, financial, social, political, environmental and health/safety implications
of nano-technology observing that, “general knowledge of nano-technology among lay people is very low,”
Leinonen and Kivisaari (2010) challenge science communicators to: (i) provide a clear definition of nano-
technology in order to establish a common ground for building the conversation; (ii) limit the number of key
concepts to two or three as more concepts tend to over-whelm and confuse the audience; (iii) clearly
distinguished between fact and fiction in communicating nano-technology; (iv) make use of analogies,
demonstrations, and animations as well as interactive engagements to achieve better understanding; (v) effective
message framing, as well as contextual, qualitative and dialogical approaches which work better on opinion,
attitudes, and perception.
Addressing another key point in communicating with citizens about nano-technologies, Petersen, Seear, and
Bowman (2010) who studied the views of key stakeholders in Australia note that, “while the popular press – in
all its forms…have a role to play in conveyance of information to the public, the majority of respondents noted
that the media was (sic) only one of the many avenues that should be utilised to provide the public with
information about nano-technology”. Additionally, the European Union (2010) in its Code of Conduct for
responsible nano-research outlined a set of principles for stakeholders to respect. These deal with meaning,
sustainability, precaution, inclusiveness, excellence, innovation and accountability. Those who communicate
nano-science and nano-technology including science journalists would do well to study those principles and
adapt them to their work.
A fitting conclusion to this section and harping on the need for effectively communicating nano-scale science
and engineering concepts may be captured in these words of Castellini et al. (2007), “engaging the public in
conversations about nano-technology research can be valuable and rewarding experience for both researchers
and their audience. Not only will it bolster public science literacy, and understanding of nano-technology, but it
will also pave the way for more favourable public policy on nano-technology-related issues”. And on science
communication generally, Wilson and Batta (2013) state that, “a knowledgeable corps of science journalists, a
surfeit of media of communication, communication-savvy scientists, and a vibrant public interest in science are
the conditions needed for science communication to blossom.
3. Objectives of the Study and Research Questions
The main purpose of this study was that of examining the character and extent of science and technology
coverage in three select Nigerian newspapers. The specific objectives included the investigation of (a) the
frequency of coverage of science and nano-technology issues, (b) the news orientation of science reports, (c) the
format of reporting science and technology reports, (d) the sourcing of science information in the newspapers,
and (e) the depth of reportage of science and technology issues in the newspapers. To realise this purpose and
objectives, the following research questions were set:
(i) What is the frequency or incidence of science and technology news in The Guardian, Leadership and
Daily Trust newspapers?
(ii) How are science and technology reports in The Guardian, Leadership, and Daily Trust oriented? Are
they event-specific or routine?
(iii) In which formats are science and technology reports mostly presented in The Guardian, Leadership,
and Daily Trust?
(iv) How is science and technology information sourced in The Guardian, Leadership and Daily Trust?
(v) What is the depth of coverage of science and technology issues in The Guardian, Leadership, and Daily
Trust?
4. Statement of the Problem
It is indubitable that we live in a world of science. The role, import, significance and contributions and perhaps
Developing Country Studies www.iiste.org
ISSN 2224-607X (Paper) ISSN 2225-0565 (Online)
Vol.4, No.26, 2014
61
the dysfunctions of science in society are well documented. Most countries of the world strive to accord science
and technology a prominent spot in the scheme of things. The European Union (2010) defines a science
communication culture and delineates countries in the region into consolidated, developing, and fragile science
communication cultures.
In Africa, the state of science and technology is less than salutary yet there are attempts to boost science and the
public understanding of the field. In Nigeria, science education is paid some attention in terms of funding,
enrolment of learners, recruitment of teachers, and establishment of science learning centres. There is a Science,
Technology and Innovation Policy (2012) which places a certain role on the media for science information
dissemination and popularisation.
On their part, the Nigerian media, particularly the print press have been known to engage in science
communication. However, studies on print media coverage of techno-science issues are said to be fraught with
problems generally. Dunwoody (2008) writes about science news being overwhelmingly focused on biomedical
topics, a coverage that follows journalistic rather than scientific norms, the accuracy of science news being a
contested arena and the appropriate training for science journalists remaining a contentions topic.
Similarly Kennedy (2010) quizzes: “is science writing a disappearing culture?” This laments the decline of
sections or departments dedicated to science in major American metropolitan dailies. In Africa, a UNESCO
(2011) concluded that there is the dearth of science and technology issues in the African media.
Given the above background, and having observed the paucity of studies on science coverage by the Nigerian
press, this study sets out to determine the extent to which techno-science is accorded place in three Nigerian
newspapers. The foci of investigation are frequency of coverage, format of stories, sources of stories, field of
science covered, orientation of the reports, and depth of coverage.
5. Theoretical Framework
It is a recurring reality that the communications media including newspapers in modern times are pivotal in
organizing all segments of contemporaneous life (Deacon, Pickering, Golding and Murdock 2010). This explains
why researchers invest enormous resources to investigate the media in order to understand how man interacts,
uses and learns from them. One of the ways researchers employ in probing the media including newspapers is
the content analysis.
In carrying out content studies as the present one, researchers are guided by some theoretical framework. This is,
“an abstract system of concepts and their relationships that helps us to understand a phenomenon” (West and
Turner 2010). Indeed, Kirby (2008) observes that science communication researchers, “have relied mainly on
content analysis of newspapers to determine what science, and how much of it, appears in the news media”.
Clearly, in the study of science coverage in newspapers, the agenda setting theory becomes handy. Baran and
Davis (2006) explain that the press is great at giving readers what to think about based on the map that is drawn
for them by the writers, editors and publishers of the papers they read. By doing this, the media help people learn
about a given issue, and the importance attached to such issues is judged by the way the issues are framed,
displayed, positioned or quantified.
What this means is that the reading public that gets much of its information, knowledge, opinion, and perspective
from newspapers may be helped to do so for science, technology and nanotechnology from the way the issues
are reported, couched, framed, displayed, placed or given depth. It means that if newspapers place science and
technology matters high on their news agenda, the readers may be constrained to view them as important and if
the issues are low on their agenda, the public may interpret them as unimportant.
6. Method
This study adopted the content analysis research technique to determine the manifest (visible) content of science
and technology issues in The Guardian, Leadership and Daily Trust newspapers in terms of frequency, news
orientation, format of presenting information, sourcing and depth of reportage. The relevance of content analysis
is to, “quantify salient and manifest features of a large number of texts, and the statistics are used to make
broader inferences about the politics of representation” (Deacon, Pickering, Golding and Murdock, 2010).
The three newspapers mentioned above were selected purposively. The Guardian is a national (flagship)
newspaper with its base in southern Nigeria. It has a serious tone and tends towards the elite, the business, upper
and middle classes. The Leadership and Daily Trust newspapers are based in northern Nigerian and tend to
popular readership. The study covered the period between January 1 to December 31, 2012. That year was
deliberately selected given that it was the year Nigeria revised its Science, Technology and Innovation Policy, it
was reasoned that science and technology issues would attract increased media attention.
The newspaper article in the form of news, column, feature, or interview constituted the unit of analysis. Science
and Technology issues were categorised into ten areas namely: nano-science and technology, health/medicine,
natural sciences, energy/environment, space/astronomy, agric/crop/animal sciences, etc. for the purpose of
determining their frequencies. To gauge the orientation of science reports, the contents were sub categorised into

Developing Country Studies www.iiste.org
ISSN 2224-607X (Paper) ISSN 2225-0565 (Online)
Vol.4, No.26, 2014
62
event-specific and routine reports. For format of report presentation, the sub categories were news,
opinion/column, and feature/interviews. The sub-categories for determining news sourcing were foreign and
local while those for determining depth were full page, half page, quarter page and brief reports.
In all, 52 weekly publications of science pull outs, sections or dedicated page(s) were involved in the study. The
total amounted to 156 issues of the three newspapers while the sum of science and technology stories which
occurred was 329.
7. Data Presentation and Discussion of Findings
The data presented here and the ensuing discussions are in tandem with the objectives and research questions
formulated earlier in the study.
7.1 What is the frequency or incidence of science and technology issues in The Guardian, Leadership and
Daily Trust newspapers?
Table 1: Fields of Techno-Science and Frequency of Coverage in Three Newspapers.
Fields of Techno-Science Newspapers Total
The Guardian Leadership Daily Trust
n % n % n % n %
Nanotechnology 4 3.60 2 1.08 0 0 6 1.82
Biomedicine 28 25.23 27 14.67 32 94.12 87 26.44
Natural Sciences 21 18.91 6 3.26 0 0 27 8.20
Energy/Environment 10 9.00 23 12.5 0 0 33 10.03
Space/Astronomy 20 18.01 17 9.23 0 0 37 11.24
Agric, Crop, Animal Science 0 0 14 7.60 0 0 14 4.25
Geology Earth Science 7 6.30 2 1.08 0 0 9 2.73
ICT, Biotech Robotics, HTec 13 11.71 53 28.80 1 2.94 67 20.36
R/D, SC Policy, Funding, Training 6 5.40 29 15.76 1 2.94 36 10.94
Others 2 1.80 11 5.97 0 0 13 3.95
Total 111 33.74 184 55.93 34 10.33 329 100
Table 1 gives a clear indication of the fields of techno-science frequently covered by the three newspapers.
Overall, the most frequently covered field was biomedicine which dealt with health and medical issues at 26.44
percent. This was followed by ICT, biotech and robotics which polled 20.36 percent. Science matters concerning
space and astronomy occurred at 11.24 percent to position third while issues on science research and
development, policy, funding and training took the fourth position at 10.94 percent. Energy and environmental
issues had the incidence of 10.03 percent making the fifth rank in science coverage in the three newspapers. On
the other hand, nano-science, the natural sciences, agric sciences and the earth sciences received lower frequency
of coverage. Looking at the individual newspapers, the data show that The Guardian, Nigeria’s flagship daily,
accorded more attention to biomedicine (25.23%), natural sciences (18.91%), space sciences (18.01%) and ICT,
biotech, and robotics (11.71%). On its part, Leadership gave prominent coverage to ICT, biotech, and robotics
(28.80%), research and development, policy, funding and training (15.76%) followed by biomedicine (14.07%),
and energy/environment sciences (12.5%). However, Daily Trust focused its coverage mainly on biomedicine at
94.12 percent and scarcely accorded other areas of science meaningful newshole.
The full import of these findings is that the three analysed newspapers did not spread their reportorial attention to
all areas of techno-science. While prominence was accorded health/medicine, ICTs/biotech, energy and
environment, space sciences and research, policy, funding and training issues, other important areas of techno-
science were neglected principally nano-science and nanotechnology, agricultural sciences, natural sciences and
the earth sciences.
The observations of this study can be placed in the context of other studies. Dunwoody (2008) noted that, “the
bulk of what passes for science writing is about medicine and health”. Dunwoody cites studies by Bauer (1998)
which tended to confirm the notion of the medicialisation of science news; Pellechia’s (1997) study which found
that a set of elite US newspapers focused on medicine and health in over 70 percent of their science based
stories; Jerome’s’ (1992) and Einsiedel’s (1992) studies equally demonstrated the dominance of health issues in
an analysis of science stories in seven Canadian newspapers. Dunwoody also noted that in spite of television’s
eclectic nature and their proclivities for covering natural history and the ecology, Gregory and Miller, (1998)
also discovered the preponderance of biomedical topics. However, the UNESCO–sponsored (2011) study on the
media coverage of science and technology in Africa found that in a classification of 15 areas of science, the four
must covered sciences were environment and ecology (19%), biomedicine (15%), technology (13%) and
nutrition and food sciences (9%).
The reasons for this character of reporting science are attributable to knowledge deficits among journalists (Khan
Developing Country Studies www.iiste.org
ISSN 2224-607X (Paper) ISSN 2225-0565 (Online)
Vol.4, No.26, 2014
63
2006), the demise of science page due to the decline in the section/department dedicated to science (Kennedy
2010), as well as the complexity of science and technology, minimal investment by the media to improve the
capacity of journalists, and lack of cooperation and trust between scientists and journalists (UNESCO 2011). To
these we may add the lack of interest, passion, curiosity and enthusiasm for science journalism among
correspondents, lack of commitment on the part of editors to assign and allot space, and the (mis)conception that
science does not interest the public and may not improve sales or attract advertisers.
7.2 How are Science and Technology reports in The Guardian, Leadership and Daily Trust oriented? Are they
event- dependent or routine?
Event-dependent coverage relies on occurrences whether spontaneous or planned and in that sense, the report is
reactive. On the other hand, routine reports are presented as of course, deliberately offered at regular or frequent
periods by the news organisation. In this sense, they are proactive. The following table shows data to help us
determine the orientation of science reports in the three Nigerian newspapers.
Table 2: Orientation of Techno-Science Reports
Fields of Techno-Science Newspapers Total
The Guardian Leadership Daily Trust
n % n % n % n %
Event-specific reports 36 32.43 76 41.30 0 0 112 54.04
Routine Reports 75 67.57 108 58.70 34 100 217 65.96
Total 111 100 185 100 34 100 329 100
Table 2 shows that the majority of science reports in the three analysed newspapers were carried as routine
reports at the rate of 65% percent whereas the reports which were instigated by events amounted to 34.04
percent. For the three individual newspapers, routine reports out-numbered event-generated ones. This finding is
significant in the sense that there was a deliberate attempt by the three newspapers to initiate science and
technology reports without waiting for events, functions, speeches, conferences, and pronouncements to trigger
them. This orientation is proactive and positive and spells good for techno-science journalism. However,
UNESCO (2011) found out in its study on media coverage of science and technology in Africa that 72% of the
science and technology-based stories were event-based whereas process-based stories scored 28%.
7. 3 What formats are techno-science reports mostly presented in The Guardian, Leadership and Daily Trust?
The formats of presenting journalistic messages are instrumental in determining the rationale, motivation, and
utility of the messages. News articles are often written as reports of all past or future events to share information
and intelligence and to enlighten. Editorials, opinions and columns are often scripted to contest, argue, persuade,
disagree, agree and generally deepen discourses through analysis, interpretation, synthesis, backgrounding,
localisation, forecasting, etc. Features, supplements, sections, interviews, and pullouts have the additional aim of
exploration of the subject, education, and entertainment. Table 3 depicts how techno-science contents were
presented in terms of format in the three newspapers.
Table 3: Format of Presenting Techno-Science Reports
Formats of Reports Newspapers Total
n % The Guardian
n %
Leadership
n %
Daily Trust
n %
News 57 51.35 119 64.67 4 11.76 180 54.71
Opinions/Columns 10 9.01 2 1.09 1 2.94 13 3.95
Features/Interviews 44 39.64 63 34.24 29 85.30 136 41.34
Total 111 100 185 100 34 100 329 100
Table 3 indicates that the three newspapers presented techno-science stories through the news format at the rate
of about 55 percent whereas the feature/interview format scored 41.34 percent and 3.95 percent for opinion and
column formats. The data also show that apart from Daily Trust which presented more features/interviews
(85.30%) than news and opinions, the two other newspapers: The Guardian and Leadership formatted their
techno-science stories as news (51% and 64.67%) respectively.
The significance of this finding is that the three newspapers tended to give more information (news) than
discussion, deliberation, analysis (features, opinion, column, etc.). This indeed has implications for depth. In a
departure from this finding, the UNESCO (2011) study found, “evidence of a significant relationship between
the articles and nature of stories, implying that news article were more likely to be event–oriented (82.3%) while
features were more likely to be process–oriented (85.7%). Similarly, Anderson, Allan, Peterson and Williamson
(2005) investigating the framing of nanotechnologies in the British press observed that, stories were not typified
as belonging to a specific news genre, but rather were positioned across a range of … hard news, science, health,

Developing Country Studies www.iiste.org
ISSN 2224-607X (Paper) ISSN 2225-0565 (Online)
Vol.4, No.26, 2014
64
educational, and business sections”.
7.4 How is science and technology information sourced in The Guardian, Leadership and Daily Trust?
Journalists obtain information from several sources. Similarly, science correspondents obtain information for
their stories from a variety of sources – scientists, other experts, publications, other media, and conferences, both
foreign and local. This study concentrated on foreign and local variables. News sourcing provides a template for
determining the participation, involvement and engagement of stakeholders in science communication. Table 4
gives specific insights into sourcing of techno-science issues in the three newspapers.
Table 4: Sourcing of Techno-Science Reports
Sources of Reports Newspapers Total
n % The Guardian
n %
Leadership
n %
Daily Trust
n %
Foreign 68 61.26 76 41.30 34 100 178 54.10
Local 43 38.74 108 58.70 0 0 151 45.90
Total 111 100 185 100 34 100 329 100
The data in Table 4 indicate that cumulatively, the three newspapers obtained their techno-science stories from
foreign sources at 54.10 percent while the local sources accounted for 45.90 percent. It is also clear from the data
that The Guardian and Daily Trust obtained more of their stories from abroad whereas Leadership generated
more of its science stories locally. It is fair to conclude that the three newspapers drew inspiration for the science
stories almost equally from both foreign and local sources. What it means is that there were both local and
foreign voices in science journalism in the three papers.
This finding can be compared with Dutt and Garg (2012) who conducted a study on science and technology
coverage in English language Indian dailies. They found out that science news stories were sourced 50 percent
from Indian news agencies and the other 50 percent from Europe and America. They also found out that science
was not accorded prominent placement in the Indian newspapers and that dominant topics of coverage were
health, environment, space science and technology and astronomy. In a related study involving the British press,
Anderson et al. (2005) found out that general correspondents most often authored articles with only 13 percent
of the sample written by science correspondents or editors.
In the UNESCO (2011) study, 45% of the articles included local sources, 50% foreign sources and 25%, a
combination of the two sources. Also in terms of gendered sourcing, 40% were males, 9% females, 30% of
mixed gender.
7.5 What is the depth of coverage of techno-science issues in The Guardian, Leadership, and Daily Trust?
Depth is a measure of seriousness, importance or prominence accorded an issue. Kobre’s (1981) idea of depth
reporting means revealing new aspects, giving perspectives, presenting causes, showing recommendations, etc.
To MacDougall (1977), a much earlier writer, it means giving substance, factual background, localisation,
interpretation, forecasts, etc. Table 5 presents the data on the depth of techno-science coverage in the three
newspapers.
Table 5: Depth of Techno-science Coverage
Depth of Reports Newspapers Total
The Guardian Leadership Daily Trust
n % n % n % n %
Full pg 3 2.70 42 22.83 6 17.65 51 15.10
Half pg 39 35.14 28 15.22 16 47.05 83 95.23
Quatre 14 12.61 35 19.02 7 20.50 56 17.02
Briefs 55 49.55 79 42.93 5 14. 70 139 42.25
Total 111 100 185 100 34 100 329 100
Data in Table 5 show that the three newspapers had a greater portion of their techno-science stories in brief
measures. Stories were evaluated on the basis of full page, half-page, quarter page, and brief reports. It can be
seen that 42.25 percent of the science stories were brief reports of several paragraphs. For The Guardian and
Leadership newspapers, the measures were 49.55 percent and 42.93 percent respectively. However, Daily Trust
had 47.25 percent of its science reports in half the pages of the paper.
Depth of coverage does have consequences for agenda setting and framing of issues in the press. The quantum of
space or airtime allotted an issue, where, and how often it is placed allows the public to gauge its relevance,
salience, prominence, significance and importance. Dekel (2010) lamented that one sees more coverage of the
modern dance than science in Israeli newspapers. In India interestingly, Dutt and Garg (2012) concluded that
about half of the science news articles had a depth of three or more columns and were enriched with paragraphs
Developing Country Studies www.iiste.org
ISSN 2224-607X (Paper) ISSN 2225-0565 (Online)
Vol.4, No.26, 2014
65
or other illustrative devices to attract readers.
8. Summary of Findings and Conclusion
It is apparent that techno-science journalism is steeped in problems not only in Africa or Nigeria. To buttress this
point, Claassen (2011) writing on science and the media in South Africa notes as follows: (a) the coverage of
science and technology in the South African press is insufficient, (b) citing Rooyen (2004), less than 2% of
editorial space in South Africa’s top publications is awarded science and technology topics, (c) citing Mooney
and Larshenbaum (2009), the number of U.S newspapers featuring weekly science or science related sections
shrank by nearly two-thirds between 1989 and 2005, (d) only one South African newspaper (Business Day),
magazine, broadcast station or Internet news site has a properly programmed science desk. In the light of these
realities the present study is summarised as follows:
(a) For the period of this study, a total of 329 techno-science stories occurred in the three Nigerian
newspapers analysed. Of the 10 science fields classified in the study, biomedicine (26.44%), ICTs, biotech,
robotics (20.36%), research and development, policy, funding and training issues (10.94%), space science
(11.24%) and energy and environment received more than 10% coverage. Other important areas of science such
as nano-science/technology, agricultural sciences, natural sciences and earth sciences were accorded less
attention.
(b) In the coverage of techno-science issues, the newspapers oriented their stories towards more of routine
reporting (65.96%) than event-specific reporting (34.04%). This can be said to be a positive tendency because it
conveys a proclivity for proactive rather than reactive techno-science coverage.
(c) Concerning the genre in which techno-science reports are formatted and presented in the three analysed
newspapers, the study shows that the news genre was more common at 54.71% followed by the feature/interview
format at 41.34% while the opinion/column genre occurred the least at a mere 3.95%. This means that the three
newspapers tended to provide straight information more than engaging in more deliberative discourse afforded
by depth opinion/editorial columns. This latter genre is critical in a democracy and a techno-scientific world
where the citizen is expected to participate in the national science discourse as well as make informed choices.
(d) Regarding the sourcing of techno-science information for reportorial offerings, this study found that the
three newspapers were almost equally given to sourcing their science stories from foreign (54.10%) and local
(45.90%) sources. What needs to be said here is that in as much as it is necessary to present a cosmopolitan
flavor of the news, it is critically important to give local authorities, scientists, experts, publications, and other
such sources more voice in the news.
(e) In terms of how the three Nigerian newspapers gave depth or otherwise to techno-scientific stories, the
study shows that 42.25% of published stories were in the form of brief reports. Full page stories amounted to
15.50%, half page stories got 25.23% while quarter page scored 17.02%. The conclusion that can be drawn from
this finding is that more frequent full page, half page or quarter page stories would conduce to better, deeper,
fuller, and more significant coverage of techno-science.
9. Implications for Theory and Practice
Following the literature reviewed in the course of this study and the findings that have become apparent herein, it
can be deduced that for the newspapers involved in this study to set meaningful agenda on techno-science in
Nigeria, they would require to broaden the scope of their coverage of techno-science beyond biomedicine, ICTs,
biotech, space science and ecology to other important science topics including crop, animal, and agricultural
sciences, nano-science and technology, natural sciences, the earth sciences, etc. For, as far as the tenets of the
agenda setting/agenda building theory/hypothesis go, the public appears to take more seriously what the media
pay more attention to.
This study also implies that for newspapers to be seen to contribute significantly to techno-science awareness,
understanding, and knowledge, they should move beyond mere provision of information in news articles to
deliberative discourses afforded by features, opinions, editorials, supplements, and columns. They should also
engage local sources in the reportorial process to facilitate national public involvement, participation and
engagement in techno-science.
Apart from this, sundry stakeholders – governments, scientists, research institutions, non-governmental
organisations, communities, international agencies, professional bodies should commit to training, funding,
research and all other activities that should generally help to uplift the science communication culture of Nigeria
from its fragile state to a consolidated one. This naturally, according to the European Union (2012) involves
improving the national science communication infrastructure, greater political attention to science, deeper
commitment of all science and science communication actors and more solid academic tradition in science
communication, an improved public attitude to science knowledge acquisition, and a more congenial science
journalism situation.
Developing Country Studies www.iiste.org
ISSN 2224-607X (Paper) ISSN 2225-0565 (Online)
Vol.4, No.26, 2014
66
References
Anderson, A; Allan, S., Peterson, A., & Wilkinson, C. (2005), The framing of nanotechnologies in the British
newspapers press, Science Communication 27 (2), 220 – 220. DoI:10.1177/1075547005281472.
anzSKA (2010), Engaging the world: Science communication in Australia and New Zealand, Kingston, ACT:
The National Science and Technology Centre.
Baran, S. J. & Davis, D. K. (2006), Mass Communication Theory, Foundation, Ferment and Future, (4th ed),
California: Thomson Wadsworth.
Bauer, M. (1998), The Medicalisation of Science News – from the “Rocket-scalpel” to the “gene-meteorite”
Complex”, Social Science Information 37, 731 – 751.
Castellini, O. M., Walejko, G. K., Holladay, C. E. et. al. (2007), Nanotechnology and the public: Effectively
Communicating Nanoscale Science and Engineering Concepts, Journal of Nanopraticle Research 9, 83-189.
DOI: 10.1007/s11051-006-9160-z.
Claassen, G. (2011), Science and the Media in South Africa: Reflecting a ‘dirty mirror” Communicatio: South
African Journal for Communication Theory and Research 37, (3), 351 – 366.
Deacon, D., Pickering, M., Golding, P., and Murdock, G. (2007). Researching Communications. A Practical
Guide to Methods in Media and Cultural Analysis, (2nd
ed.). London: Bloomsbury Academic.
Dekel, A. (2010), Science Communication in Israel, www. Midnighteast.com. Accessed July 11, 2012.
Dutt, B. & Garg, K. C. (2012), S & T Coverage in English Language Indian Dailies, Journal of Science
Communication II, (3). http://jcom.sissa.it (Accessed September 4, 2012).
Dutta, A. & Batta, H. (2013). Theoretical & Practical Perspectives on Science Communication Around the
World: A Literature Review. In D. Wilson & H. Batta (Eds). Science, Health and Environmental
Communication: Global Issues & Local perspectives. Ibadan: Ibadan University Press, 1 – 53.
Einsiedel, E. F. (1992), Framing Science and Technology in the Canadian Press”, Public Understanding of
Science 1, 89 – 101.
European Commission (2010), Communicating nanotechnology: why to whom, saying what and how? Brussels:
Communication Unit, Directorate, General for Research, European Commission.
European Union (2012), Monitoring Policy and Research Activities on Science in Society in Europe (MASIS): A
Final Synthesis Reports, Brussels: Directorate General for Research and Innovation.
Faber, B. (2006), Written Popular Media Representations of Nanoscale Science and Technology, Technical
Communication Quarterly, then forthcoming, Spring.
Federal Ministry of Science and Technology. (2012), National Science, Technology and Innovation Policy 2012,
Abuja: Federal Ministry of Science and Technology. Downloaded on 22 November, 2013 at fmst.gov.ng.
Friedman, S. N. & Egoff, N. P. (2005), Nanotechnology: Risks and the Media, IEEE Technology and society
Magazine, (writer), 5 – 11. Downloaded on 22 November, 2013 at www. Lehigh.ed/usmfb/IEECfinal article.pdf.
Gregory, J. & Miller, S. (1998), Science in Public Communication Culture, and Credibility, Cambridge, MA:
Basic Books.
Groboljsek, B. & Mali, F. (2012), Daily Newspapers Views on Nanotechnology in Slovenia, Science
communication 34 (1), 30 – 56. DoI: 10.1177/1075547011427974.
Guenther, L. & Ruhrman, G. (2013), Science Journalists’ Selection Criteria and Depiction of Nanotechnology in
German Media, Journal of Science Communication 12 (3), AOI.
Heidmann, I. & Milder, J. (2013), Communication about Scientific Uncertainty; How Scientists and Science
Journalists Deal with uncertainiteis in Nanopractice Research, Environmental Sciences Europe, 25 (25), - 11.
Downloaded on November 11, 203 at http://www.enenrope.com/content/25/1/25.
Hellsten, I. S. Nerlich, B. (2008), Genetics and Genomics and Ethics of Metaphorical Framing”. In M. Bucchi &
B. Trench (Eds) Handbook of Public Communication of Science and Technology, Oxford: Routledge, 93 – 100.
Kennedy, D. (2010), Science and the Media. In D. Kennedy & G. Overholser (Eds), Science and the Media.
Cambridge: American Academy of Arts and Science, 1 -9.
Jerome, F. (Fall, 1992), For Newspaper Science Sections: Hard Times, Spscope. 20, 1 – 9.
Kennedy, D. Overholser, G. (Eds), (2010). Science and the Media, Cambridge: American Academy of Arts and
Science.
Khan, A. (2006), Closing Africa’s Journalism Deficit, Financial Standard, June 19, 69.
Kirby, D. A. (2008), Cinematic Science, Handbook of Public Communication of Science and Technology, M.
Bucchi & B. Trench (Eds), Oxford; Routledge, 41 – 50.
Kobre, S. (1981), Reporting New in Depth, Washington AC: University Press of America.
Kurath, M. & Gisler, P. (2009), Informing, Involving or Engaging? Science Communication, in the Ages of
Atom -, Bio – and Nanotechnology, Public Understanding of Science 18 (5), 559 573. DOI:
10.1177/0963662509104723.
Leinonen, A. & Kivisaari, S. (2010), Nanotechnology perceptions. Literature Review on Media Coverage,
Public Opinion, and NGO Perspectives, VTT Research Notes 2559, Helsinki: Jukaisija – Utgivarre.
Developing Country Studies www.iiste.org
ISSN 2224-607X (Paper) ISSN 2225-0565 (Online)
Vol.4, No.26, 2014
67
MacDougall, G. D. (1977), Interpretative Reporting, (7th ed.), New York: Macmillian.
Mooney, C. & Kirshenbaum, S. (2009), Unscientific America: How Scientific Literacy Threatens Our Future,
New York: Basic Books.
Murphy, P. & Delle Cave, V. (2010), Nanotechnology Discourses and the Politics of Risk in European Media, In
Y. Fiedeler et. al. (Eds). Understanding Nanotechnology, Heidelberg: AKA Verlay, 71 -83.
Pellechia, M. (1997), Trends in Science Coverage: A Content Analysis of Three US Newspapers, Public
Understanding of Science 6, 49 -68.
Peters, H. P. (2013). Gap Between Science and Media Revisited Scientists as Public”, In Proceedings of the
National Academy of Science, 110, (3), August 20, 14102-14109. Downloaded on 11 November, 2013 at
www.pnas.org/igi/doi/10.1073/pnas.1212745110.
Peterson, A., Seear, K., Bownan, D. (July 2010), Communication with Citizens About Nanotechnologies: Views
of Key Stakeholders in Australia. Final Report, Clayton, Victoria: Monash University.
Roco, M. C. & Bainbridge, W. S. (2005), Societal implications of nanoscience and nanotechnology:
maximisings Human Benefit, Journal of Nanoparticle research 7, 1 -13. DOi: 10.1007/s11051-004-2336-5.
The Royal Society and the Royal Academy of Engineering (2004), “Nanotechnology: 6 Social and ethical
issues”, Nanoscience and Nanotechnologies, July, 5 – 57. Download on 2 September, 2015 at
www.nanotec.org.uk/report/chapter 6.pdf.
Unesco/Makereke University (2011), Media Coverage of Science and Technology in Africa. G. W. Lugalambi:
Principal Investigator. Downloaded on 27 July 2013 at www.unesco.org/new file admin/MULTIMEDIA.
Van Rooyen, C. (2004), Science not a priority for S A Press.
http//www.scienceinafrica.co.za/2004/april/prescience.htm (accessed is October 2010).
West, R. & Turner, L. H. (2010), Introduction to Communication Theory. Analysis and Application, New York:
McGraw-Hill.
Xie, Q., Tang, S., & Xie Z. (2012), The Framing of Science and technology ethics in the Chinese newspapers
press. IPEDR 56 (24). DOI: 10.7763/IPEDR. 2012. V56.24. Downloaded on 22 November, 2013 at
www.ipedr.com/vol56/024-ICOSH 2012-F10038pdf.

Developing Country Studies www.iiste.org
ISSN 2224-607X (Paper) ISSN 2225-0565 (Online)
Vol.4, No.26, 2014
68
The Use of Online Tools by Information Professionals in Medical
Libraries in Oman
Salim Said AlKindi
Assistant Professor
Department of Information Studies, College of Arts and Social Sciences, Sultan Qaboos University
EMAIL: [email protected] or [email protected]
Mohammed Nasser Al-Suqri
Assistant Professor & Head of the Department
Department of Information Studies, College of Arts and Social Sciences, Sultan Qaboos University
EMAIL: [email protected] or [email protected]
Abdullah Hamood Zaher Al-Sarmi
Training Supervisor
Department of Information Studies, College of Arts and Social Sciences, Sultan Qaboos University
Email: [email protected]
Abstract
Rapid development of the Internet and the emergence of a new generation of the Internet within different social
software offer advantages to medical libraries in terms of their services and marketing. Medical libraries need to
change the ways they provide their services based on changes in users’ needs in the digital world. The main
purpose of this study is to explore the perception/attitude of information professionals in Medical libraries in
Oman towards use of various online tools or so-called Web2.0. The study also intends to highlight the main
challenges that prevent libraries from using these tools and applications in providing services. An online survey
was used as a data collection method. Survey Monkey software was used to design the questionnaire. The survey
included all medical libraries (16) in Oman. The study found that the majority of information professionals in
medical libraries in Oman are aware of Web 2.0 and the majority of them use its tools within library services.
The majority of information professionals reported positively regarding the use of these tools in library services.
However, several challenges were identified regarding using and adopting online tools within library services.
This study tried to provide a clear understanding of the ways that online tools are used and adopted by
information professionals in medical libraries. It is hoped that it will make a contribution to the future
development of this subject area.
Keywords: Oman, Online Tools, Information Professionals, Medical Libraries, Web 2.0, Library 2.0, Librarian
2.0
Introduction
Various Internet technologies and/or Web 2.0 can help organizations to be more effective and support them in
the promotion of their services. These tools and technologies, such as social networking software, help users to
create and share new content. In an organisation, Web 2.0 can facilitate learning and increase participation and
contributions online. It can facilitate the gaining of new knowledge and foster effective interaction by exploiting
these new technologies. For these reasons and others, companies and/or organisations are exploring new online
tools and/orWeb2.0 and its applications to enhance their services and to expand their employees’ knowledge.
Information institutions, such as universities, are starting to recognise the importance of harnessing these tools
for different purposes. ‘Libraries and other information organisations are beginning to incorporate these
applications as a means of creating more interactive, user cantered library and information services’ (Suraweera
et al., 2010, p.2).
Many studies have reported on the use of Web2.0 in libraries and are moving to Library 2.0 and Librarian 2.0
(Linh, 2008; Al-Daibani, 2009; Alkindi & Al-Suqri, 2012; Alkindi & Al-Suqri, 2013). Medical libraries are
expected to provide users with good facilities and services in the digital world. Library service aims to
complement the needs of the community, whether those users work within the organisations or are members of
the public. The Information professionals should play an important role in harnessing and using these
technologies in the library. However, the attitude/perception of Information professionals in medical libraries in
Oman towards use of Web 2.0 technologies and other online tools is unclear. Additionally, the ways they use
these technologies to support library services and users are unclear. Therefore, the objectives of this research are
to:
Understand the context of Web 2.0 or online tools in medical libraries in Oman
Determine perception/attitude of information professionals in medical libraries in Oman towards use of Web 2.0

Developing Country Studies www.iiste.org
ISSN 2224-607X (Paper) ISSN 2225-0565 (Online)
Vol.4, No.26, 2014
69
technologies
Identify online tools that are used by information professionals
Explore the use of online tools or/and Web 2.0 technologies by Information professionals in supporting library
services
Explore the main challenges, if any, to adopting these applications and tools in library services
Among other things, the study attempts to answer the following questions:
To what extent are medical libraries aware of Web2.0?
How do Information professionals use online tools in supporting libraries services?
What Web 2.0 technologies do they use?
What is the attitude/perception of information professionals in medical libraries in Oman towards Web 2.0
technologies?
What are the main challenges, if any, to adopting these online tools in library services?
This research is very important for several reasons. It will provide a clear map of the use of Web 2.0
technologies in medical libraries in Oman. The result will show the applications and tools that are used by some
medical libraries in Oman. Other libraries can benefit from this by collaborating with these libraries in regards to
the use of these applications. The study will also address the challenges in adopting these applications to
understand the medical library’s need, if any, for technology skills, Internet access and other needs that can
improve library services. More importantly, this research will contribute new knowledge in this field regarding
the adoption and use of Web 2.0 technologies in libraries, as there is not much discussion about adoption these
technologies for the provision of library services in the Gulf Cooperation Council (GCC).
Review of the Literature Web 2.0 and the concept of Librarian 2.0
The term ‘Web 2.0’has widely used by many scholars in different fields of the studies. The concept of Web 2.0
was introduced in a conference by O'Reilly and Media Live International (O’Reilly, 2005). Web 2.0 has many
definitions, depending on the viewpoints of various authors and scholars in diverse fields, but it is considered to
have a positive impact on people’s life and work. It was described as a new Internet collaborative application
(Sendall, Ceccucci & Peslak, 2008). It can be described as "a way of creating webpages focusing on micro
content and social connection between people" (Alexander, 2008, p. 151). As such, Web2.0 refers to different
terms, such as collaboration, communication, information, and knowledge sharing and content creating. One of
the most significant definitions was introduced by Anderson (2008) who summarised Web 2.0 as: user generated
content in which users can share and create new content; the power of the crowd; data on an epic scale in which
users can make and create data; architecture of participate on; a network effect and openness (see Anderson,
2008). Another definition was given by Franklin and Harmelen (2007) as an "increased emphasis on user
generated content, data and content sharing and collaborative effort, together with the use of various kinds of
social software, new ways of interacting with web-based applications, and the use of the web as a platform for
generating, re-purposing and consuming content" (p.4).
Therefore, this current study uses the term ‘online tools’ or ‘online technologies’ to indicate Web 2.0 and its
application. It is also worth providing a brief description of the terms ‘Librarian 2.0’ and ‘Library 2.0’.The
concept of Library 2.0 has developed from the use of Web2.0 technologies by librarians (Al-Daibani, 2009). It
was coined by Michael Casey in his Library Crunch blog (Miller, 2005)."Library 2.0 is not about searching, but
finding; not about access, but sharing. Library 2.0 recognises that human beings do not seek and utilize
information as individuals, but as communities" (Maness, 2006). As such, Library 2.0 is about a social network
interface in which users can interact and design their own pages. In Library 2.0, users have the ability to interact
with databases and have the ability to blog, share, participate, and communicate more effectively. In other words,
the term ‘Library 2.0’ exploits Web2.0 technologies to enhance library services, and prepares librarians for the
digital world in order to serve digital users. Library 2.0needs to have a new way to interact with users; for
example, it provides a multi-media experience like video, really simple syndication (RSS), blogs to publish
frequently updated works and news, social bookmarking (share bookmarks and bookmarked collections), wikis
and other applications to support library services. Using these technologies in libraries will add new value and
help libraries to find a place in the digital world, as change is essential for survival.
Online Tools in Libraries
A lot of studies have discussed the use of Web 2.0 technologies in libraries. Some of these studies tend to
investigate the use of these technologies according to participants surveyed, while others tend to analyse the
library’s home page or Facebook page. Some of these studies reported high use of these technologies, while
others reported less use of these technologies. For example, a study by Al-Daibani (2009) explored the
perception of Library 2.0 of academic librarians in a Kuwaiti university. The study was conducted in four
universities in Kuwait. The study showed these libraries made little use of Web2.0 applications and tools. The
Developing Country Studies www.iiste.org
ISSN 2224-607X (Paper) ISSN 2225-0565 (Online)
Vol.4, No.26, 2014
70
majority of these libraries did not use applications like social networking, bookmarking and collaborative
authoring. However, the study showed that there was a positive attitude to the optional use of Library 2.0 in
academic libraries. Chawner (2008) conducted a study of information management professions in New Zealand
libraries to explore the usage of Web2.0 technologies. According to that study, the majority of information
management professions had experience with Web 2.0 technologies, such as using RSS and reading blogs.
However, librarians were less familiar with content creation and generating, such as adding or updating content
in a wiki. Another study by Kelly et al. (2009) intended to explore the use of Web 2.0 in the library sector and
found that many libraries use it. For example, the national library used Web 2.0 applications, such as Facebook,
YouTube and wikis.
Many Web 2.0 technologies can be used effectively in the libraries. The most common technologies are RSS,
blogs, instant messaging (IM), podcasts and social networking sites (SNS), such as Facebook. For example, Linh
(2008) conducted a study among Australian university libraries to provide a clear map of Web 2.0 application
use. The study found that nearly a half of the libraries (47%) used Web 2.0. The study showed that four types of
Web 2.0 technologies were used by these libraries: RSS, blogs, IM and podcasts. Another study by Xua,
Ouyanga and Chua (2009) explored the use and adoption of Web2.0 applications in 81 academic libraries in the
New York State by visiting their sites. The study found that half of them adopted and used Web2.0 technologies;
"they collectively implemented, albeit on varying scales, IM, blogs, RSS, tagging, wikis, social networks, and
podcasts to enhance their library operations and services"(p.330). However, Chua, Goh and Lee (2008), who
analysed 90 libraries’ websites in North America, Europe and Asia, found that that blogs, RSS and IM were most
popular applications used, whereas wikis, social networking services and social tagging were less used. Kim and
Abbas (2010) found that RSS and blogs are widely used by these libraries. Others found that IM, Blog, SNS and
wikis are used less frequently (Nielsen, 2009).
Many studies indicated the way Web 2.0 technologies are used in the libraries. An example of the best practise
of Web 2.0 technologies was offered by Stephens and Collins (2007) who stated that libraries can use blogs for
marketing by offering blogs on new materials, resources and library events. They can use RSS to offer feeds of
new materials, event information and blog posts. They can use podcasting to record library’s services and
programs, book reviews and others. They provided many examples of the Web2.0 technologies used by
librarians, for example, librarians at Butler University used wikis to build reference resources for libraries, and to
allow easy access to the site by staff, students and the librarians. Librarians at the St. Joseph County Public
Library in South Bend used wikis to discuss the library, and they created subject guides for their users. Central
Reference Services at the University of Illinois at Urbana-Champaign used IM for reference service purposes
like answer students’ questions. Nielsen (2009) noted that IM can be used as a library service to communicate
with users outside a library context.
Another example is a study by Han and Liu (2009), which was conducted on 38 top Chinese university libraries’
web sites to identify the Web 2.0 technologies applied in these libraries. According to that study, most of these
libraries used some Web2.0 technologies, such as Catalog 2.0, RSS, IM, Blog, SNS and wikis in their services.
The study indicated that Catalog 2.0 and RSS are the most widely used technologies. The libraries used Catalog
2.0 to allow users contribute to the book record, provide links to other websites and mine "valuable information
from book record databases" (p.52). RSS was used by the libraries for book information, library news, database
feeds and others purposes. Blogs were used for marketing library events and resources; IM was used for
reference services on library’s web site; SNS was used for publicising library’s events, providing reference
services and accessing library’s resources; wikis were used for training resources, resource listings and project
progression. Rutherford (as cited in Winston, 2009) conducted a study among seven librarians from public
libraries in New Zealand and the United States to assess their experience using Web 2.0. The study found that
librarians benefitted from using Web 2.0. They used it to "promote communication, interactivity, and sharing;
[it] reaches remote users better than traditional library services; [it] empowers users to control their library
experience and provides valuable metrics through which they can evaluate the quality of service" (p.11).
Another study by Chua, Goh and Lee (2008) explored the prevalence and use of Web 2.0 in libraries by
analysing 90 libraries’ websites from North America, Europe and Asia. In these libraries, blogs were used to
engage users and to generate interest in subject-specific topics, and IM, such as Yahoo Instant Messenger, MSN
Messenger, ICQ and Skype, were used for users’ enquiries. The libraries used SNS, such as Facebook and
MySpace, to communicate with their users. A recent study conducted by Kim and Abbas (2010) based on 230
academic library web sites and 184 randomly chosen users investigated the adoption of Web 2.0 in academic
libraries. According to that study, RSS was used to "inform users about library news, such as changed library
hours, new books, and/or special events" (p.215), and blogs allowed users to "comment on books or issues and
making communication a two-way exchange" (p. 215). Another study by Linh (2008) found that libraries used
RSS for announcing new books in specific fields, subjects or branch libraries. They used blogs for library
services and library news and events. They used podcasts to provide guidance for resources, advice on library
skills and library orientation tours. They used IM as a tool for virtual reference services in terms of chat services.

Developing Country Studies www.iiste.org
ISSN 2224-607X (Paper) ISSN 2225-0565 (Online)
Vol.4, No.26, 2014
71
Another recent study by Al Kindi and Al-Suqri (2012, 2013) explored the use of SNS as marketing and outreach
tools by library and information services. Twenty public libraries that have Facebook pages were selected as
subject samples. The study found that the libraries used these technologies for marketing purposes, including
marketing the library itself, marketing information services, marketing information resources, and marketing
people knowledge and skills. As previous studies have shown, some libraries were more aware than others of
Web2.0 technologies. Furthermore, most of these libraries adopted SNS, blog, RSS, IM and wikis in their
services, and they used them to provide and enhance their services.
It is also worth noting that the libraries faced challenges in adopting and using these technologies. Some of these
challenges and barriers are: lack of training (Al-Daibani, 2009); personal barriers, such as lack of time and lack
of confidence/skills; technical barriers, such as slow dial up access, and organisational barriers, such as limited
access to firewalls or filtering software services (Chawner, 2008). Aharony (2008) pointed out other challenges
and barriers related to personality characteristics, such as resistance to change, cognitive appraisal,
empowerment, and extroversion or introversion. He also added that computer expertise and motivation is another
challenge to use of these tools.
Medical Libraries and Online Tools
A number of studies focused more on using these technologies in medical libraries. For example, Gavgani and
Mohan (2008) identified many online services provided by medical libraries through Web 2.0, such as medical
blogs, wikis, slide shares, video shares, folksonomy and RSS. They stated that medical/hospital library blogs can
be a place to present and share patient education, patient discharge information, doctors’ schedules, patient
guides in hospitalisation, common diseases, prevention of common diseases, seasonal diseases, list of doctors
based on specialty, insurance and information about diseases caused by climate changes. They added that
librarians can use wikis to support medical sciences by creating a special case study wiki for any specialty of
medicine. They can use other applications, such as community tools, such as slide shares, video shares and photo
shares to share medical images, atlases and educational video clips in medical libraries. Other applications
mentioned by Gavgani and Mohan (2008) are podcasts and RSS, which are used to keep user communities up-
to-date, and folksonomy, which helps librarians to organise information efficiently and support the search
engines’ indexing tools.
Another study by Barsky and Giustini (2007) showed that wikis offer a number of marketing and teaching
opportunities for medical libraries. The authors explored several features of a wiki. Wikis provide the
opportunity to share original content that is difficult to find elsewhere, and anyone can add the content. They
introduced some applications that can be used in medical libraries, such as subject guides, project planning,
policy manuals and training resources. Lambert (2009) found several applications can be used in medical
libraries to service health sciences and provide information easily and quickly. Some of these applications are:
podcasts, RSS feeds, blogs, wikis, social tagging and Mashup. Other studies introduce and discuss the use of
online tools and/or Web 2.0 in medical libraries (see Philbrick, Cleveland & Pan, 2009; Barsk, 2006; Barsky&
Purdon, 2006; Connor, 2007; Lemley& Burnham, 2009). However, the use and adoption of these applications in
medical libraries in Oman needs to be addressed. The study will attempt to explore the Information professionals
awareness of the various online tools include Web 2.0 concepts and applications, how they are used in their
libraries and barriers that could prevent them librarians from using these applications. The study was conducted
in 50 Information professionals in different areas in Oman.
Research Design
Objectives
The main objective of this study is to explore information professionals’ attitude towards online technologies use
in medical libraries in Oman. The study also aims to outline the main challenges, if any, to adopting these
technologies in library services and to identify the most popular applications used.
Method
The study used an online survey in order to explore the attitude of Information professionals towards using Web
2.0 technologies in medical libraries. The questionnaire consisted of five parts: demographic information;
Internet use, which was sought to explore their experience in using the Internet; Web 2.0 and its applications,
which sought to explore Information professionals awareness of such applications and the term Web 2.0;
challenges to adopting these technologies in the library; attitudes towards use of these technologies in the library.
The questionnaire was developed on the basis of the literature review and initial investigation. The researchers
used Survey Monkey (online software for designing surveys) to design an online survey. The survey was
available online for four weeks. A total of 29 questionnaires were filled online of which 50 were completed
successfully and were useful for data analysis.
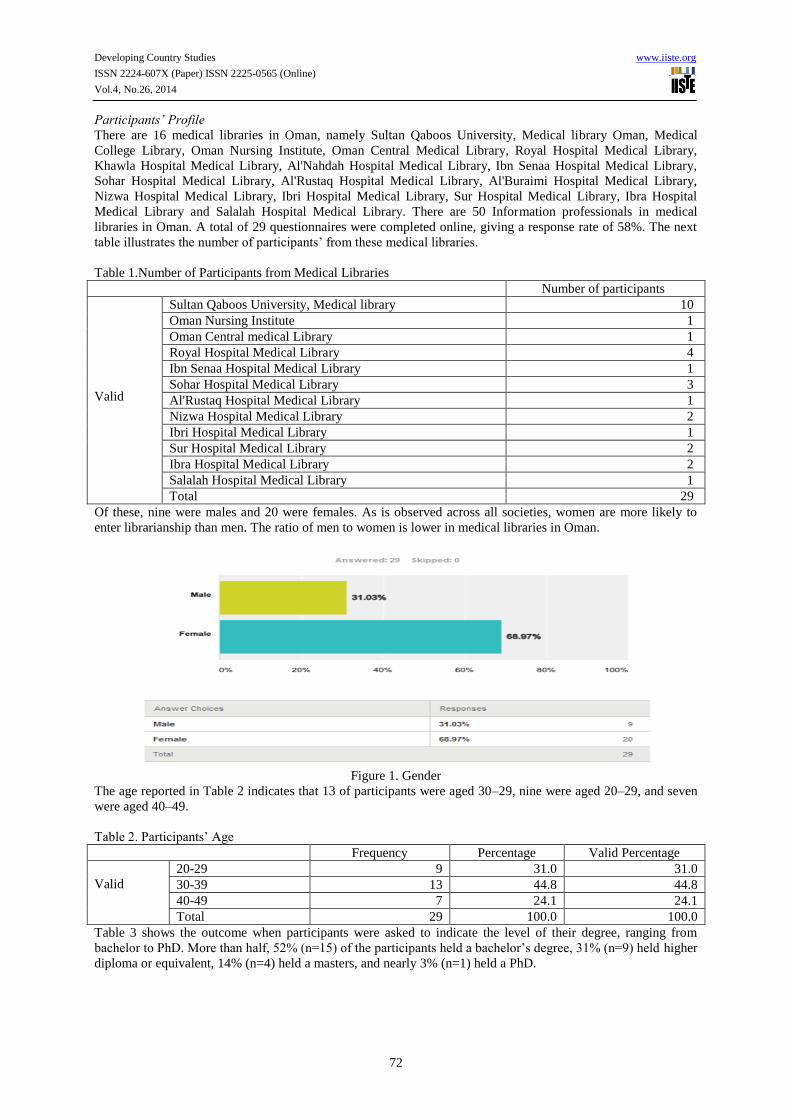
Developing Country Studies www.iiste.org
ISSN 2224-607X (Paper) ISSN 2225-0565 (Online)
Vol.4, No.26, 2014
72
Participants’ Profile
There are 16 medical libraries in Oman, namely Sultan Qaboos University, Medical library Oman, Medical
College Library, Oman Nursing Institute, Oman Central Medical Library, Royal Hospital Medical Library,
Khawla Hospital Medical Library, Al'Nahdah Hospital Medical Library, Ibn Senaa Hospital Medical Library,
Sohar Hospital Medical Library, Al'Rustaq Hospital Medical Library, Al'Buraimi Hospital Medical Library,
Nizwa Hospital Medical Library, Ibri Hospital Medical Library, Sur Hospital Medical Library, Ibra Hospital
Medical Library and Salalah Hospital Medical Library. There are 50 Information professionals in medical
libraries in Oman. A total of 29 questionnaires were completed online, giving a response rate of 58%. The next
table illustrates the number of participants’ from these medical libraries.
Table 1.Number of Participants from Medical Libraries
Number of participants
Valid
Sultan Qaboos University, Medical library 10
Oman Nursing Institute 1
Oman Central medical Library 1
Royal Hospital Medical Library 4
Ibn Senaa Hospital Medical Library 1
Sohar Hospital Medical Library 3
Al'Rustaq Hospital Medical Library 1
Nizwa Hospital Medical Library 2
Ibri Hospital Medical Library 1
Sur Hospital Medical Library 2
Ibra Hospital Medical Library 2
Salalah Hospital Medical Library 1
Total 29
Of these, nine were males and 20 were females. As is observed across all societies, women are more likely to
enter librarianship than men. The ratio of men to women is lower in medical libraries in Oman.
Figure 1. Gender
The age reported in Table 2 indicates that 13 of participants were aged 30–29, nine were aged 20–29, and seven
were aged 40–49.
Table 2. Participants’ Age
Frequency Percentage Valid Percentage
Valid
20-29 9 31.0 31.0
30-39 13 44.8 44.8
40-49 7 24.1 24.1
Total 29 100.0 100.0
Table 3 shows the outcome when participants were asked to indicate the level of their degree, ranging from
bachelor to PhD. More than half, 52% (n=15) of the participants held a bachelor’s degree, 31% (n=9) held higher
diploma or equivalent, 14% (n=4) held a masters, and nearly 3% (n=1) held a PhD.
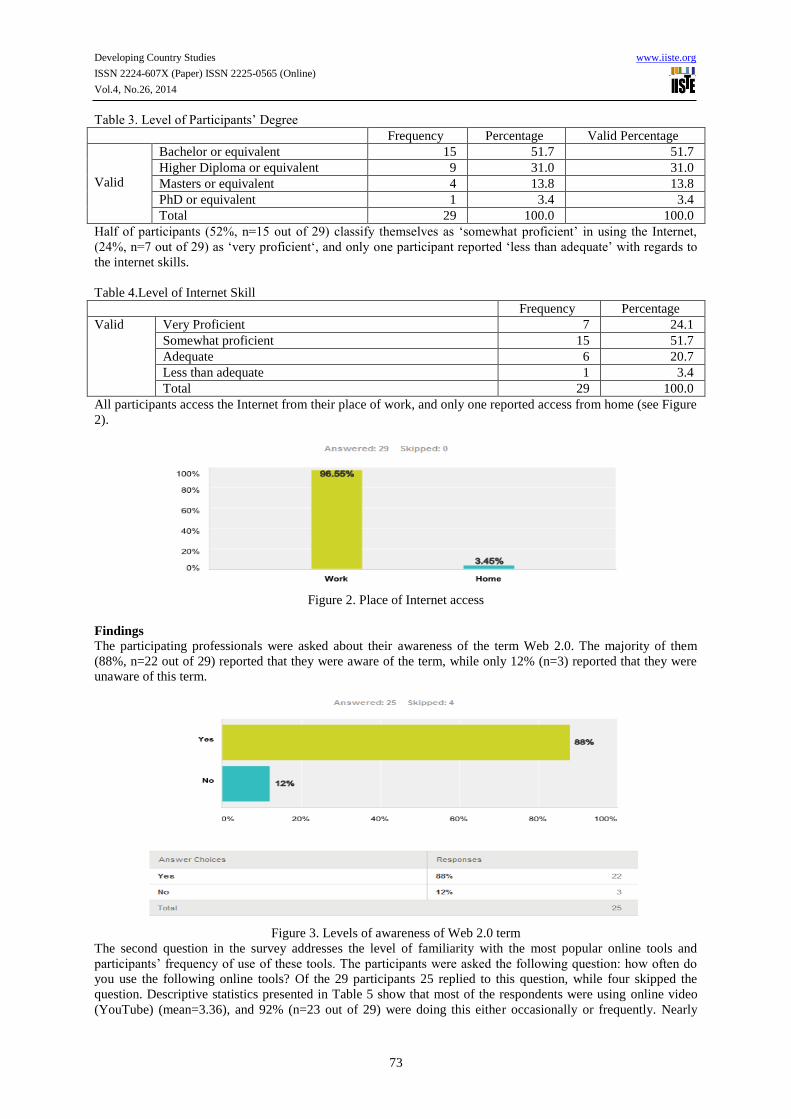
Developing Country Studies www.iiste.org
ISSN 2224-607X (Paper) ISSN 2225-0565 (Online)
Vol.4, No.26, 2014
73
Table 3. Level of Participants’ Degree
Frequency Percentage Valid Percentage
Valid
Bachelor or equivalent 15 51.7 51.7
Higher Diploma or equivalent 9 31.0 31.0
Masters or equivalent 4 13.8 13.8
PhD or equivalent 1 3.4 3.4
Total 29 100.0 100.0
Half of participants (52%, n=15 out of 29) classify themselves as ‘somewhat proficient’ in using the Internet,
(24%, n=7 out of 29) as ‘very proficient‘, and only one participant reported ‘less than adequate’ with regards to
the internet skills.
Table 4.Level of Internet Skill
Frequency Percentage
Valid Very Proficient 7 24.1
Somewhat proficient 15 51.7
Adequate 6 20.7
Less than adequate 1 3.4
Total 29 100.0
All participants access the Internet from their place of work, and only one reported access from home (see Figure
2).
Figure 2. Place of Internet access
Findings
The participating professionals were asked about their awareness of the term Web 2.0. The majority of them
(88%, n=22 out of 29) reported that they were aware of the term, while only 12% (n=3) reported that they were
unaware of this term.
Figure 3. Levels of awareness of Web 2.0 term
The second question in the survey addresses the level of familiarity with the most popular online tools and
participants’ frequency of use of these tools. The participants were asked the following question: how often do
you use the following online tools? Of the 29 participants 25 replied to this question, while four skipped the
question. Descriptive statistics presented in Table 5 show that most of the respondents were using online video
(YouTube) (mean=3.36), and 92% (n=23 out of 29) were doing this either occasionally or frequently. Nearly

Developing Country Studies www.iiste.org
ISSN 2224-607X (Paper) ISSN 2225-0565 (Online)
Vol.4, No.26, 2014
74
half of the respondents (44%) reported frequent use of SNS. The other favourite online tools according to the
usage scale were podcasts (video podcast, audio podcast). It also important to note that 40% of the respondents
reported that they rarely used RSS, and 24% (n=6 out of 25) never used it. Social bookmarking was also used
less by respondents, 32% (n=8 out of 25) never used them and 32% rarely used it. These results were
unsurprising—SNS are popular tools used around the world, and many studies have reported more infrequent
use of bookmarking tools.
Table 5.Frequency of Online Tools Usage among Information professionals
Nev
er
Use
d
Rar
ely
Occ
asio
nal
ly
Fre
qu
entl
y
Mea
ns
To
tal
Online video (YouTube) 4%(1) 4%(1) 44%(11) 48%(12) 3.36 25
Social networking sites (e. g.,
Facebook, and MySpace)
16%(4) 24%(6) 16%(4) 44%(11) 2.88 25
Podcasts (video podcast, audio
podcast)
16%
(4)
20%
(5)
52%
(13)
12%
(3)
2.60 25
wikis (e.g., Wikipedia) 20%(5) 32%(8) 44%(11) 4%(1) 2.32 25
Blogs or/and micro blogging 24%(6) 32%(8) 40%(10) 4%(1) 2.24 25
RSS (Really Simple Syndication) 24%(6) 40%(10) 36%(9) 0%(0) 2.12 25
Social bookmarking (delicious) 32%(8) 32%(8) 32%(8) 4%(1) 2.08 25
The respondents were asked: are you using one or more of the following applications: blogs/weblogs; social
networking sites, such as Facebook, LinkedIn, MySpace, Twitter; RSS feeds; social bookmarking, such as
CiteULike; podcasts; wikis and YouTube at work and within library services? The majority of them (88%, 22
out of 25) reported that they use one or more of these applications as indicated in Table 6. This shows that
Information professionals attempt to gain possible advantages from use of these tools, and they shape them to
support library services.
Table 6.Use of Online Tools in the Workplace
Answer Choices Responses
Yes 88% (22)
No 12% (3)
Total 100% 25
The results presented in Table6 shows that only three of the respondents did not use these tools in the workplace.
The reasons are shown in Table 7. The most significant reasons reported by two of three participants were: lack
of interest, workload and insufficient time to become familiar with these applications, lack of information
technology skills and lack of training in using these applications. No participants mentioned the following
factors as barriers: lack of Internet access and support, limited access to firewalls or filtering software services,
resistance to change or staff commitment and cooperation. As mentioned by other studies (see Al-Daibani, 2009;
Aharony, 2008), lack of information technology skills and training in using these tools are two important factors.
Table 7. Reasons for Not Using Online Tools in the Workplace
Answer Choices Responses
Lack of interest 66.67% (2)
Workload and insufficient time to become familiar with these applications 66.67% (2)
Lack of information technology skills 66.67% (2)
Lack of training in using these applications 66.67% (2)
Lack of encouragement and motivation 33.33% (1)
Insufficient number of computers at library 33.33% (1)
Librarians' awareness of these technologies 33.33% (1)
Lack of Internet access and support 0% 0
Limited access to firewalls or filtering software services 0% 0
Resistance to change 0% 0
Staff commitment and cooperation 0% 0
Total Respondents: 3
The respondents were provided with a list of 15activities regarding using blogs/weblogs; social networking, sites
such as Facebook, LinkedIn, MySpace, Twitter; RSS feeds; social bookmarking, such as CiteULike; podcasts;
wikis and YouTube within the library services. Out of 22, 19 answered this question. More than half of the
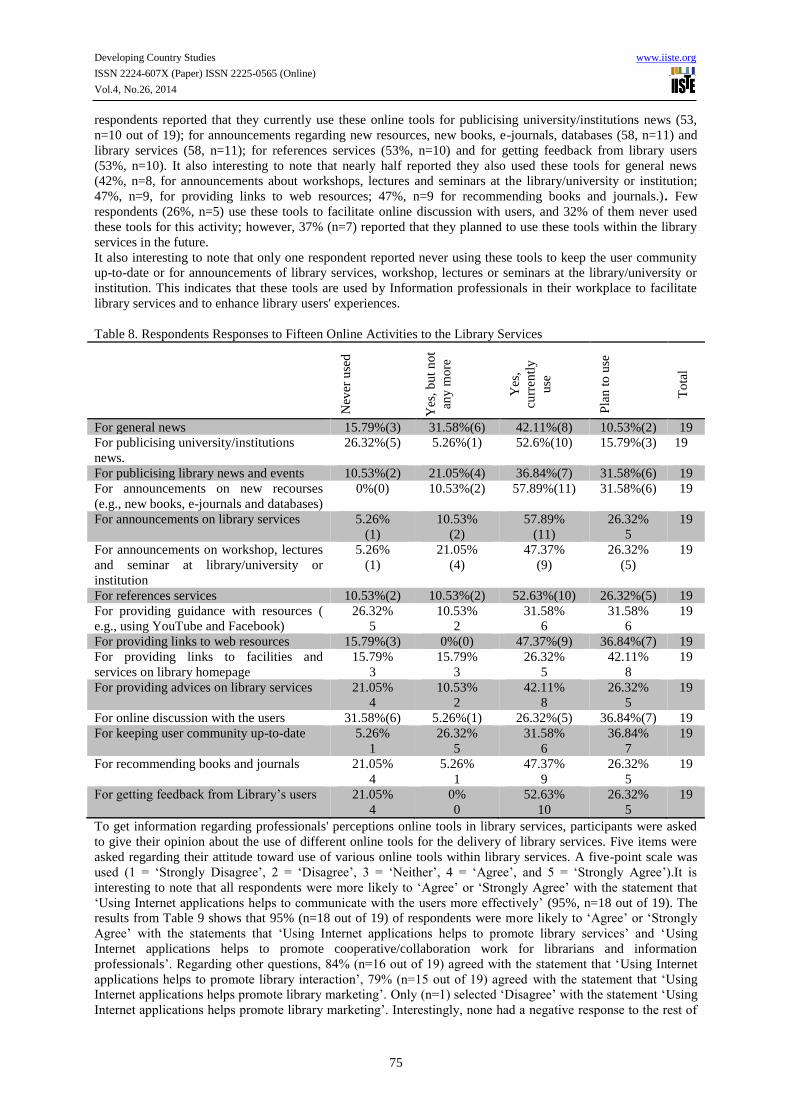
Developing Country Studies www.iiste.org
ISSN 2224-607X (Paper) ISSN 2225-0565 (Online)
Vol.4, No.26, 2014
75
respondents reported that they currently use these online tools for publicising university/institutions news (53,
n=10 out of 19); for announcements regarding new resources, new books, e-journals, databases (58, n=11) and
library services (58, n=11); for references services (53%, n=10) and for getting feedback from library users
(53%, n=10). It also interesting to note that nearly half reported they also used these tools for general news
(42%, n=8, for announcements about workshops, lectures and seminars at the library/university or institution;
47%, n=9, for providing links to web resources; 47%, n=9 for recommending books and journals.). Few
respondents (26%, n=5) use these tools to facilitate online discussion with users, and 32% of them never used
these tools for this activity; however, 37% (n=7) reported that they planned to use these tools within the library
services in the future.
It also interesting to note that only one respondent reported never using these tools to keep the user community
up-to-date or for announcements of library services, workshop, lectures or seminars at the library/university or
institution. This indicates that these tools are used by Information professionals in their workplace to facilitate
library services and to enhance library users' experiences.
Table 8. Respondents Responses to Fifteen Online Activities to the Library Services
N
ever
use
d
Yes
, b
ut
no
t
any
more
Yes
,
curr
entl
y
use
Pla
n t
o u
se
To
tal
For general news 15.79%(3) 31.58%(6) 42.11%(8) 10.53%(2) 19
For publicising university/institutions
news.
26.32%(5) 5.26%(1) 52.6%(10) 15.79%(3) 19
For publicising library news and events 10.53%(2) 21.05%(4) 36.84%(7) 31.58%(6) 19
For announcements on new recourses
(e.g., new books, e-journals and databases)
0%(0) 10.53%(2) 57.89%(11) 31.58%(6) 19
For announcements on library services 5.26%
(1)
10.53%
(2)
57.89%
(11)
26.32%
5
19
For announcements on workshop, lectures
and seminar at library/university or
institution
5.26%
(1)
21.05%
(4)
47.37%
(9)
26.32%
(5)
19
For references services 10.53%(2) 10.53%(2) 52.63%(10) 26.32%(5) 19
For providing guidance with resources (
e.g., using YouTube and Facebook)
26.32%
5
10.53%
2
31.58%
6
31.58%
6
19
For providing links to web resources 15.79%(3) 0%(0) 47.37%(9) 36.84%(7) 19
For providing links to facilities and
services on library homepage
15.79%
3
15.79%
3
26.32%
5
42.11%
8
19
For providing advices on library services 21.05%
4
10.53%
2
42.11%
8
26.32%
5
19
For online discussion with the users 31.58%(6) 5.26%(1) 26.32%(5) 36.84%(7) 19
For keeping user community up-to-date 5.26%
1
26.32%
5
31.58%
6
36.84%
7
19
For recommending books and journals 21.05%
4
5.26%
1
47.37%
9
26.32%
5
19
For getting feedback from Library’s users 21.05%
4
0%
0
52.63%
10
26.32%
5
19
To get information regarding professionals' perceptions online tools in library services, participants were asked
to give their opinion about the use of different online tools for the delivery of library services. Five items were
asked regarding their attitude toward use of various online tools within library services. A five-point scale was
used (1 = ‘Strongly Disagree’, 2 = ‘Disagree’, 3 = ‘Neither’, 4 = ‘Agree’, and 5 = ‘Strongly Agree’).It is
interesting to note that all respondents were more likely to ‘Agree’ or ‘Strongly Agree’ with the statement that
‘Using Internet applications helps to communicate with the users more effectively’ (95%, n=18 out of 19). The
results from Table 9 shows that 95% (n=18 out of 19) of respondents were more likely to ‘Agree’ or ‘Strongly
Agree’ with the statements that ‘Using Internet applications helps to promote library services’ and ‘Using
Internet applications helps to promote cooperative/collaboration work for librarians and information
professionals’. Regarding other questions, 84% (n=16 out of 19) agreed with the statement that ‘Using Internet
applications helps to promote library interaction’, 79% (n=15 out of 19) agreed with the statement that ‘Using
Internet applications helps promote library marketing’. Only (n=1) selected ‘Disagree’ with the statement ‘Using
Internet applications helps promote library marketing’. Interestingly, none had a negative response to the rest of
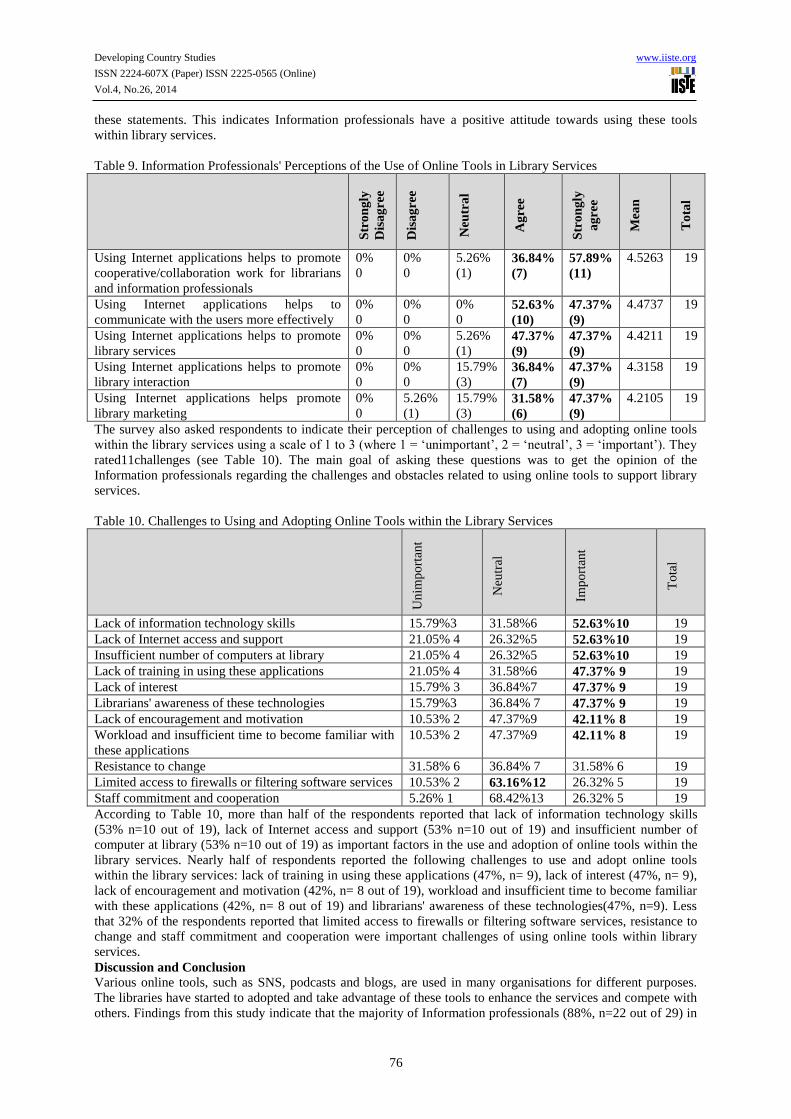
Developing Country Studies www.iiste.org
ISSN 2224-607X (Paper) ISSN 2225-0565 (Online)
Vol.4, No.26, 2014
76
these statements. This indicates Information professionals have a positive attitude towards using these tools
within library services.
Table 9. Information Professionals' Perceptions of the Use of Online Tools in Library Services
Str
on
gly
Dis
ag
ree
Dis
ag
ree
Neu
tra
l
Ag
ree
Str
on
gly
ag
ree
Mea
n
To
tal
Using Internet applications helps to promote
cooperative/collaboration work for librarians
and information professionals
0%
0
0%
0
5.26%
(1) 36.84%
(7)
57.89%
(11)
4.5263 19
Using Internet applications helps to
communicate with the users more effectively
0%
0
0%
0
0%
0 52.63%
(10)
47.37%
(9)
4.4737 19
Using Internet applications helps to promote
library services
0%
0
0%
0
5.26%
(1) 47.37%
(9)
47.37%
(9)
4.4211 19
Using Internet applications helps to promote
library interaction
0%
0
0%
0
15.79%
(3) 36.84%
(7)
47.37%
(9)
4.3158 19
Using Internet applications helps promote
library marketing
0%
0
5.26%
(1)
15.79%
(3) 31.58%
(6)
47.37%
(9)
4.2105 19
The survey also asked respondents to indicate their perception of challenges to using and adopting online tools
within the library services using a scale of 1 to 3 (where 1 = ‘unimportant’, 2 = ‘neutral’, 3 = ‘important’). They
rated11challenges (see Table 10). The main goal of asking these questions was to get the opinion of the
Information professionals regarding the challenges and obstacles related to using online tools to support library
services.
Table 10. Challenges to Using and Adopting Online Tools within the Library Services
Un
imp
ort
ant
Neu
tral
Imp
ort
ant
To
tal
Lack of information technology skills 15.79%3 31.58%6 52.63%10 19
Lack of Internet access and support 21.05% 4 26.32%5 52.63%10 19
Insufficient number of computers at library 21.05% 4 26.32%5 52.63%10 19
Lack of training in using these applications 21.05% 4 31.58%6 47.37% 9 19
Lack of interest 15.79% 3 36.84%7 47.37% 9 19
Librarians' awareness of these technologies 15.79%3 36.84% 7 47.37% 9 19
Lack of encouragement and motivation 10.53% 2 47.37%9 42.11% 8 19
Workload and insufficient time to become familiar with
these applications
10.53% 2 47.37%9 42.11% 8 19
Resistance to change 31.58% 6 36.84% 7 31.58% 6 19
Limited access to firewalls or filtering software services 10.53% 2 63.16%12 26.32% 5 19
Staff commitment and cooperation 5.26% 1 68.42%13 26.32% 5 19
According to Table 10, more than half of the respondents reported that lack of information technology skills
(53% n=10 out of 19), lack of Internet access and support (53% n=10 out of 19) and insufficient number of
computer at library (53% n=10 out of 19) as important factors in the use and adoption of online tools within the
library services. Nearly half of respondents reported the following challenges to use and adopt online tools
within the library services: lack of training in using these applications (47%, n= 9), lack of interest (47%, n= 9),
lack of encouragement and motivation (42%, n= 8 out of 19), workload and insufficient time to become familiar
with these applications (42%, n= 8 out of 19) and librarians' awareness of these technologies(47%, n=9). Less
that 32% of the respondents reported that limited access to firewalls or filtering software services, resistance to
change and staff commitment and cooperation were important challenges of using online tools within library
services.
Discussion and Conclusion
Various online tools, such as SNS, podcasts and blogs, are used in many organisations for different purposes.
The libraries have started to adopted and take advantage of these tools to enhance the services and compete with
others. Findings from this study indicate that the majority of Information professionals (88%, n=22 out of 29) in

Developing Country Studies www.iiste.org
ISSN 2224-607X (Paper) ISSN 2225-0565 (Online)
Vol.4, No.26, 2014
77
medical libraries in Oman are aware of the Web 2.0 term, while only 12% (n=3) of them are not. This study
found that the majority (88%, 22 out of 25) reported that they use one or more of these online tools including
blogs/weblogs, SNS, RSS feeds, social bookmarking, podcasts, wikis and YouTube within library services. It
seems that Information professionals have started to take advantage of these tools to support their work.
Various online tools have seen a substantial increase in use across many libraries. For example, the national
library uses Web 2.0 applications, such as Facebook, YouTube and Wikipedia (Kelly et al., 2009). Other studies
also show that various online tools are used by librarians, such as RSS, blogs, IM and podcasts (see Linh, 2008;
Xua, Ouyanga and Chua, 2009). However, others studies reported infrequent use of these tools; for example, a
study by Chua, Goh and Lee (2008),whichanalysed90 libraries’ websites from North America, Europe and Asia,
found that blogs, RSS and IM were the most popular, whereas wikis, SNS and social tagging were used less
frequently. Al-Daibani (2009) explored the perceptions of academic librarians in a Kuwaiti university regarding
Library 2.0. The study was conducted in four universities in Kuwait. The results show that these libraries had a
lower use of Web2.0 applications and tools. The majority of these libraries did not use applications such as SNS,
bookmarking and collaborative authoring. Findings from the current study found that Information professionals
most frequently use SNS and podcasts, while they use RSS and social bookmarking tools less frequency. This
indicates that Information professionals in Oman reported positively on their knowledge and use of these tools.
They are most knowledgeable about YouTube and SNS. This can be explained by the fact that these tools have
rapidly gained worldwide popularity, which is consistent with the findings of other researchers.
The study shows a positive use of these tools within library services. The responses received showed that more
than half (58, n=11) of the respondents used these tools for announcements of new resources, new books, e-
journals and databases and library services. The study also found that (53%, n=10) of Information professionals
use these tools for references services and for getting feedback from library users. It seems that libraries are
marketing their resources by making announcements by using various online tools to distribute messages,
notifications and emails to their users or to a specific group. This is also indicated by Al Kindi& Al-Suqri (2012,
2013) who analysed 20 public libraries that use Facebook pages to support library services. Four main activities
were found in that study; marketing the library itself, marketing information services, marketing information
resources, and marketing people’s knowledge and skills. This also shows that Information professionals have a
high awareness of the importance of these tools in marketing and library services.
The study also explored perceptions of the use of various online tools or internet applications in supporting
library services. It is interesting to conclude that none of Information professionals reported negatively regarding
use of these tools in library services. Most of them were likely to agree or strongly agree to use these tools within
library services. It seems that these tools support and help Information professionals to collaborate and
communicate effectively. While most of them,18 out of 19, were likely to agree or strongly agree that using
internet applications and tools helps to promote cooperative/collaboration work and to communicate with users
more effectively. The use of these tools at libraries facilitates communication and collaboration and can also
promote library services.
The research also revealed that out of 25 participants only three did not use these applications within the library
service. Two of them reported reasons such as lack of interest, workload and insufficient time to become familiar
with these applications, lack of information technology skills and lack of training in using these applications.
Interestingly, the same questions were asked to those who use these tools within library services to explore
challenges to the use and adoption of online tools within the library services. More than half of Information
professionals reported the same reasons: lack of information technology skills, lack of Internet access and
support, insufficient number of computers at the library and lack of training in using these applications. It seems
that lack of information technology skills and training in use of these applications are very important factors in
terms of the adoption and use of these tools within library services. As Al-Daibani (2009) found, lack of training
was an obstacle or challenge to using these tools among academic librarians in a Kuwaiti university. It is very
important to consider these factors, as Internet skills and training are important for Information professionals to
survive in the digital world and meet the needs of the market. Training Information professionals in new trends
in libraries and the Internet will help them to provide the services that user’s needs.
In conclusion, this research has shown that the majority of information professionals in medical libraries in
Oman are familiar with and use online tools. Avery high percentage indicated use of SNS and YouTube—
popular online tools used for different purposes. Information professionals showed a positive attitude towards
use of these tools and applications in the library services. Information professionals in medical libraries in Oman
showed their willingness to use these tools within library services. Providing Information professionals with
training and skills is necessary to help them adopt and use these application and tools in the workplace in the
future.
Future Research Directions
The impact of online tools on library and information services and the way they facilitate information access is
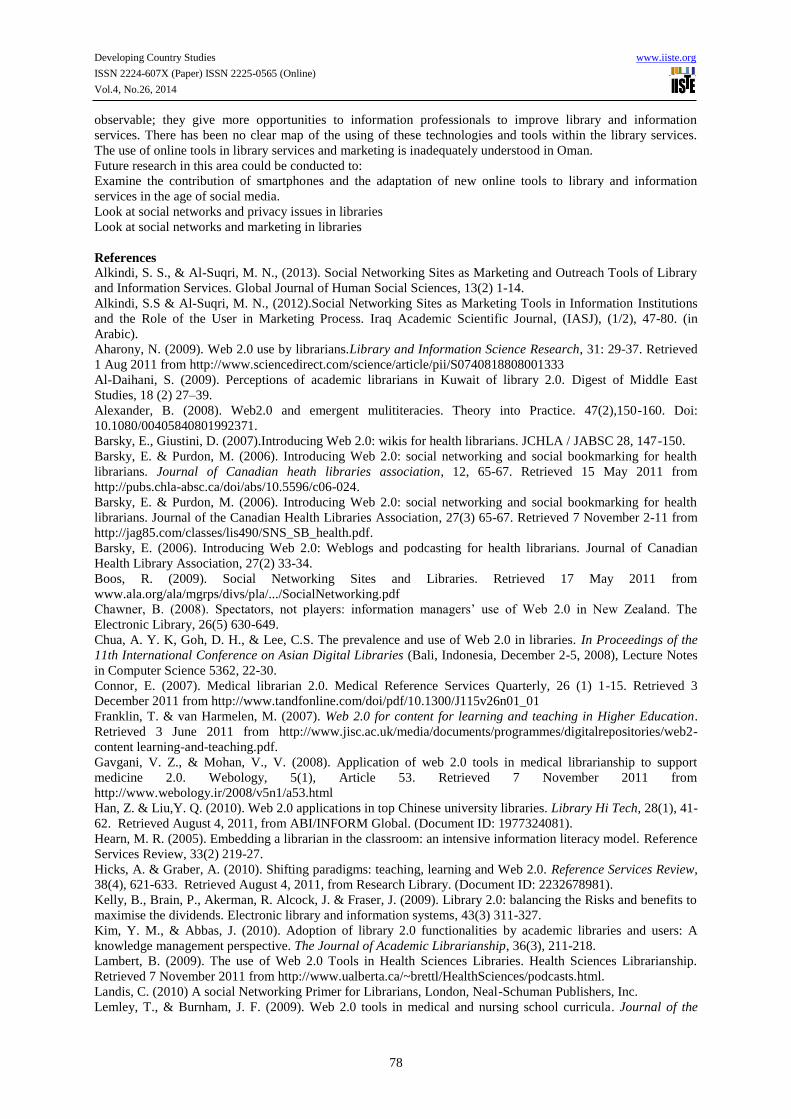
Developing Country Studies www.iiste.org
ISSN 2224-607X (Paper) ISSN 2225-0565 (Online)
Vol.4, No.26, 2014
78
observable; they give more opportunities to information professionals to improve library and information
services. There has been no clear map of the using of these technologies and tools within the library services.
The use of online tools in library services and marketing is inadequately understood in Oman.
Future research in this area could be conducted to:
Examine the contribution of smartphones and the adaptation of new online tools to library and information
services in the age of social media.
Look at social networks and privacy issues in libraries
Look at social networks and marketing in libraries
References
Alkindi, S. S., & Al-Suqri, M. N., (2013). Social Networking Sites as Marketing and Outreach Tools of Library
and Information Services. Global Journal of Human Social Sciences, 13(2) 1-14.
Alkindi, S.S & Al-Suqri, M. N., (2012).Social Networking Sites as Marketing Tools in Information Institutions
and the Role of the User in Marketing Process. Iraq Academic Scientific Journal, (IASJ), (1/2), 47-80. (in
Arabic).
Aharony, N. (2009). Web 2.0 use by librarians.Library and Information Science Research, 31: 29-37. Retrieved
1 Aug 2011 from http://www.sciencedirect.com/science/article/pii/S0740818808001333
Al-Daihani, S. (2009). Perceptions of academic librarians in Kuwait of library 2.0. Digest of Middle East
Studies, 18 (2) 27–39.
Alexander, B. (2008). Web2.0 and emergent mulititeracies. Theory into Practice. 47(2),150-160. Doi:
10.1080/00405840801992371.
Barsky, E., Giustini, D. (2007).Introducing Web 2.0: wikis for health librarians. JCHLA / JABSC 28, 147-150.
Barsky, E. & Purdon, M. (2006). Introducing Web 2.0: social networking and social bookmarking for health
librarians. Journal of Canadian heath libraries association, 12, 65-67. Retrieved 15 May 2011 from
http://pubs.chla-absc.ca/doi/abs/10.5596/c06-024.
Barsky, E. & Purdon, M. (2006). Introducing Web 2.0: social networking and social bookmarking for health
librarians. Journal of the Canadian Health Libraries Association, 27(3) 65-67. Retrieved 7 November 2-11 from
http://jag85.com/classes/lis490/SNS_SB_health.pdf.
Barsky, E. (2006). Introducing Web 2.0: Weblogs and podcasting for health librarians. Journal of Canadian
Health Library Association, 27(2) 33-34.
Boos, R. (2009). Social Networking Sites and Libraries. Retrieved 17 May 2011 from
www.ala.org/ala/mgrps/divs/pla/.../SocialNetworking.pdf
Chawner, B. (2008). Spectators, not players: information managers’ use of Web 2.0 in New Zealand. The
Electronic Library, 26(5) 630-649.
Chua, A. Y. K, Goh, D. H., & Lee, C.S. The prevalence and use of Web 2.0 in libraries. In Proceedings of the
11th International Conference on Asian Digital Libraries (Bali, Indonesia, December 2-5, 2008), Lecture Notes
in Computer Science 5362, 22-30.
Connor, E. (2007). Medical librarian 2.0. Medical Reference Services Quarterly, 26 (1) 1-15. Retrieved 3
December 2011 from http://www.tandfonline.com/doi/pdf/10.1300/J115v26n01_01
Franklin, T. & van Harmelen, M. (2007). Web 2.0 for content for learning and teaching in Higher Education.
Retrieved 3 June 2011 from http://www.jisc.ac.uk/media/documents/programmes/digitalrepositories/web2-
content learning-and-teaching.pdf.
Gavgani, V. Z., & Mohan, V., V. (2008). Application of web 2.0 tools in medical librarianship to support
medicine 2.0. Webology, 5(1), Article 53. Retrieved 7 November 2011 from
http://www.webology.ir/2008/v5n1/a53.html
Han, Z. & Liu,Y. Q. (2010). Web 2.0 applications in top Chinese university libraries. Library Hi Tech, 28(1), 41-
62. Retrieved August 4, 2011, from ABI/INFORM Global. (Document ID: 1977324081).
Hearn, M. R. (2005). Embedding a librarian in the classroom: an intensive information literacy model. Reference
Services Review, 33(2) 219-27.
Hicks, A. & Graber, A. (2010). Shifting paradigms: teaching, learning and Web 2.0. Reference Services Review,
38(4), 621-633. Retrieved August 4, 2011, from Research Library. (Document ID: 2232678981).
Kelly, B., Brain, P., Akerman, R. Alcock, J. & Fraser, J. (2009). Library 2.0: balancing the Risks and benefits to
maximise the dividends. Electronic library and information systems, 43(3) 311-327.
Kim, Y. M., & Abbas, J. (2010). Adoption of library 2.0 functionalities by academic libraries and users: A
knowledge management perspective. The Journal of Academic Librarianship, 36(3), 211-218.
Lambert, B. (2009). The use of Web 2.0 Tools in Health Sciences Libraries. Health Sciences Librarianship.
Retrieved 7 November 2011 from http://www.ualberta.ca/~brettl/HealthSciences/podcasts.html.
Landis, C. (2010) A social Networking Primer for Librarians, London, Neal-Schuman Publishers, Inc.
Lemley, T., & Burnham, J. F. (2009). Web 2.0 tools in medical and nursing school curricula. Journal of the
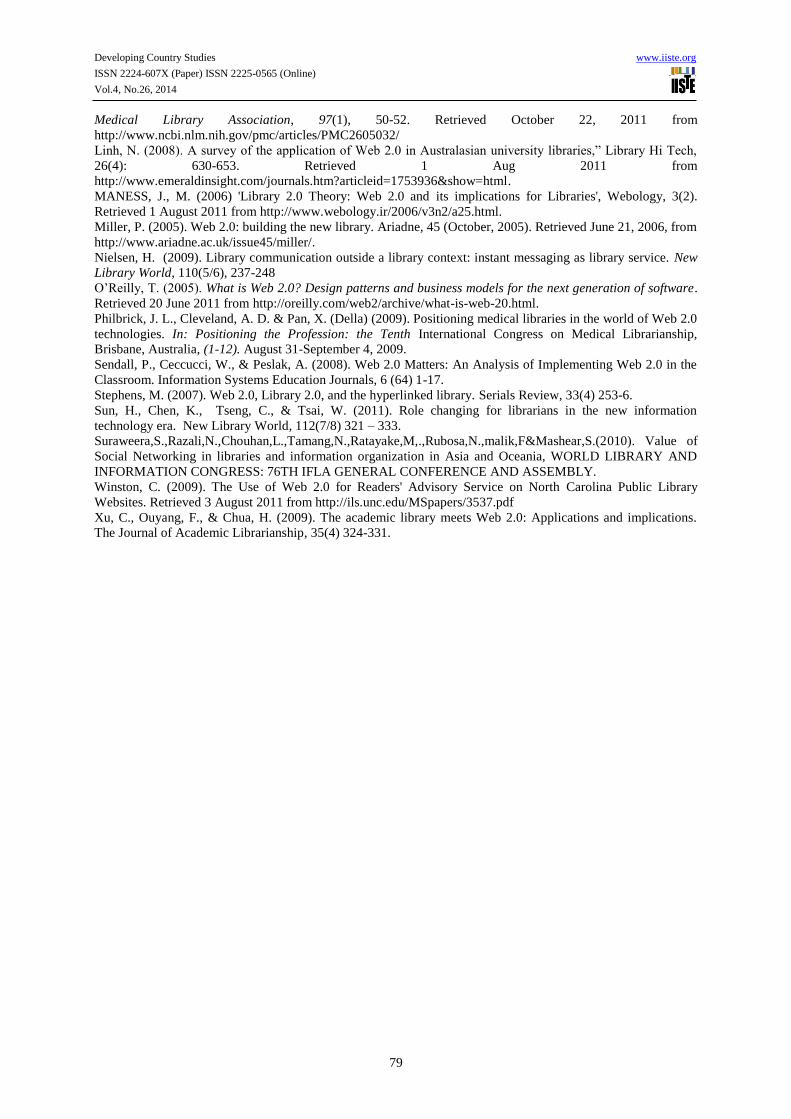
Developing Country Studies www.iiste.org
ISSN 2224-607X (Paper) ISSN 2225-0565 (Online)
Vol.4, No.26, 2014
79
Medical Library Association, 97(1), 50-52. Retrieved October 22, 2011 from
http://www.ncbi.nlm.nih.gov/pmc/articles/PMC2605032/
Linh, N. (2008). A survey of the application of Web 2.0 in Australasian university libraries,” Library Hi Tech,
26(4): 630-653. Retrieved 1 Aug 2011 from
http://www.emeraldinsight.com/journals.htm?articleid=1753936&show=html.
MANESS, J., M. (2006) 'Library 2.0 Theory: Web 2.0 and its implications for Libraries', Webology, 3(2).
Retrieved 1 August 2011 from http://www.webology.ir/2006/v3n2/a25.html.
Miller, P. (2005). Web 2.0: building the new library. Ariadne, 45 (October, 2005). Retrieved June 21, 2006, from
http://www.ariadne.ac.uk/issue45/miller/.
Nielsen, H. (2009). Library communication outside a library context: instant messaging as library service. New
Library World, 110(5/6), 237-248
O’Reilly, T. (2005). What is Web 2.0? Design patterns and business models for the next generation of software.
Retrieved 20 June 2011 from http://oreilly.com/web2/archive/what-is-web-20.html.
Philbrick, J. L., Cleveland, A. D. & Pan, X. (Della) (2009). Positioning medical libraries in the world of Web 2.0
technologies. In: Positioning the Profession: the Tenth International Congress on Medical Librarianship,
Brisbane, Australia, (1-12). August 31-September 4, 2009.
Sendall, P., Ceccucci, W., & Peslak, A. (2008). Web 2.0 Matters: An Analysis of Implementing Web 2.0 in the
Classroom. Information Systems Education Journals, 6 (64) 1-17.
Stephens, M. (2007). Web 2.0, Library 2.0, and the hyperlinked library. Serials Review, 33(4) 253-6.
Sun, H., Chen, K., Tseng, C., & Tsai, W. (2011). Role changing for librarians in the new information
technology era. New Library World, 112(7/8) 321 – 333.
Suraweera,S.,Razali,N.,Chouhan,L.,Tamang,N.,Ratayake,M,.,Rubosa,N.,malik,F&Mashear,S.(2010). Value of
Social Networking in libraries and information organization in Asia and Oceania, WORLD LIBRARY AND
INFORMATION CONGRESS: 76TH IFLA GENERAL CONFERENCE AND ASSEMBLY.
Winston, C. (2009). The Use of Web 2.0 for Readers' Advisory Service on North Carolina Public Library
Websites. Retrieved 3 August 2011 from http://ils.unc.edu/MSpapers/3537.pdf
Xu, C., Ouyang, F., & Chua, H. (2009). The academic library meets Web 2.0: Applications and implications.
The Journal of Academic Librarianship, 35(4) 324-331.
Developing Country Studies www.iiste.org
ISSN 2224-607X (Paper) ISSN 2225-0565 (Online)
Vol.4, No.26, 2014
80
The Technical and Vocational Education and Training (TVET)
Stigma in Developing Countries
The Case of the Furniture Sector in Ghana
Agyei-Boakye Isaac Quayson Ebenezer Nutassey Kennedy Newton
Department of Furniture Design and Production, School of Engineering, Accra Polytechnic, P.O.Box 561, Accra
* E-mail : [email protected]
Abstract
In Ghana the role and importance of technical and vocational education and training ( TVET) are not clearly
understood by the citizenry. This has led to misconceptions and poor public image of TVET because many
people still hold the view that TVET is good for students who cannot use their brains or students who do not
qualify for admission into the universities. Consequently, furniture design and production programme at the pre-
and tertiary levels institutions in Ghana are frowned upon even among technical and vocational graduates.
This is indicated by the dwindling number of students patronizing wood work and furniture design programmes
at these levels of training in recent times. The purpose of the study is the explore the nature and impact of TVET
stigma on the performance of the furniture trade and the trend of enrolment in both Technical and Polytechnic
institutions. Using convenience sampling technique, data were collected from graduates from pre-tertiary
Technical and vocational institutions in the southern part of the country. The study revealed that
guardian’s/parent’s dislike and low public image as some of the stigma for the furniture profession.
Furthermore, less than 50% of the respondents would be motivated to opt for the programme even if an offer of
full scholarship is made. The general negative societal perception about the furniture trade persist and that incites
even graduates of technical and vocational institution not to opt for the programme.
Keywords: technical and vocational education and training ( TVET), furniture, pre-tertiary and tertiary, stigma.
Introduction
Globally, countries that have seen economic relief, and have chalked success in technological development owe
it greatly to the trained manpower resource both within or without. It is a common knowledge that in the
advanced countries (such as United States of America (U.S.A), Canada, and Australia), in order to prevent a
major shortfall in the provision of skilled middle-level labour, have cautiously created a window of opportunity
to people in the developing countries to migrate together with their (nuclear) families to settle permanently over
there. For instance, in Australia and Canada, special visas are continually issued to skilled workers who would
like to move in temporary or reside permanently. The bane of the developing countries is that because of
economic depravity, attracting skillfully trained manpower from without to fill the middle-level income hands-
on trained workforce gap, is almost impossible. There is therefore the need to look solely within for the
enhanced skillfully trained technical human resource who will serve as pivots to all our developmental quests.
According to Nsiah-Gyabaah (2009), ‘TVET is the sector that produces the requisite skilled technical and
professional manpower in adequate numbers for sustainable national development’. He further stressed that
TVET remains the Country’s hope of reducing the high level of widespread poverty and deprivation. It has been
mentioned that the provision of TVET globally is an intervention to empower people so as to reduce poverty;
especially the marginalized and vulnerable groups( Akplu and Amankrah, 2008).They further indicated that in
Ghana, the major goal being part of the Scholand Pact is the use of TVET to achieve Millennium Development
Goals (MDGs) No. 1,3 and 8, which are poverty reduction, gender equality and empowerment of women, and
the development of a global partnership for development. Ethiopia, Ghana, Kenya and Zambia have been
selected under the Pact for the North-South cooperation among vocational education providers towards capacity
building and improvement in access to good quality TVET (Knight 2006).Despite the acclaimed set objective of
the government to reduce poverty through reforms in the TVET system by ensuring greater employability, the
over-all citizenry’s reaction to it often appear not responsive. This sector is still not clearly understood as many
people hold the view that TVET is good for students who cannot use their ‘brains’ ( Nsiah-Gyabaah, 2009). It
needs however be mentioned that other donor countries are showing keen interest in sponsoring TVET
programmes. These include the Dutch Government, those of India and China, and the Japanese International
Cooperation Agency (JICA).The reduction in the enrolment of students into the woodworking departments of
technical and polytechnic schools in the country in recent times is of equal concern. The absence of quality and
skilled woodworkers may lead to poor quality products, low productivity and loss of market and the eventual
collapse of the sector. It is therefore obvious that if steps are not taken, the country will be faced with a huge
dependence on imports and thus creating unemployment situation with consequent socio-economic problems, the
continual depreciation of the cedi being eminent and youth unemployment being crucial.

Developing Country Studies www.iiste.org
ISSN 2224-607X (Paper) ISSN 2225-0565 (Online)
Vol.4, No.26, 2014
81
The specific objectives are to :
i. assess the impact of the TVET stigma on the performance of the furniture trade.
ii. confirm or otherwise find out why technical students opt out of the furniture craft.
iii. determine the trend of enrolments in the technical and polytechnic institutions in recent times.
TVET is a means of acquiring skills that can stand the test of time in the provision of Goods and Services; a tool
for meeting often conflicting economic and social goals. The government of Ghana demands the operation of
the TVET system such that it is seen as a credible alternative to general education. This expectation is the
brainchild of COTVET in 2006, which brought about the Competency- Based Training (CBT) concept as the
mode of delivery( COTVET Report of Ghana, 2010). Notwithstanding these reforms in TVET, its low status
continue to affect students intake in both the pre-tertiary and the tertiary institutions. Peoples negative view of
such graduates, in terms of their worth as professionals is often very discouraging. Perhaps the double agony of
the furniture craft is the scare that the future and survival of the wood industry appears to be very bleak and may
collapse as recent occurrences indicate; the repercussions of which, would be very serious. FIRA (2010), in its
study on the competitiveness of the UK furniture industry noted the low enrolment in training institutions. When
the question -“Does the furniture industry represent an attractive career for young managers?”- was posed; a
whopping 63% responded in the negative as against 58% in a previous res and the reasons given included:
• Manufacturing is seen as a disappearing trade in the United Kingdom due to pressure from imports.
• There are too many small companies not able to offer a career progression.
• Low salary levels.
• Furniture manufacturing is perceived as less exciting than other manufacturing industries.
• Lack of promotion of the industry.
According to TEDD Gazette (2000), the furniture and wood working sector has a great potential to contribute to
the export earnings and the GDP of the country. However in recent times, many of the once leading local
furniture manufacturing firms have either closed down or operating at a very low capacity. Local leading firms
(such as Peewood Limited in Takoradi, Ekuaba Limited (Accra), Scanstyle Mim Limited, and others) have
completely folded up or at the brink of folding up. In the late 1990s and around the early 2000’s, Scanstyle
Company had been exporting added value timber products (all-weather-garden- furniture in the Knock Down
(KD) form) to UK, Ireland, Italy, Germany ,Denmark, Sweden, the Middle East and the USA. This Company in
particular, provided employment to 650 people and also educational facilities in the township of Mim ( Ghana
TEDD Gazette, 2000). The few leading firms currently in operation are serving as conduit for sale of foreign
manufactured furniture as they have reduced their manufacturing capacity drastically and resorted to importation
of office and household furniture. This is substantiated by the report from United Nations Commodity Trade
(UNCT) statistics database that recorded that furniture imports into the country increased nearly by 400%
between 2005 and 2011( UNCT,2011). Furniture is part of the human life in totality; from the cradle to the
grave. There is therefore the need to unravel all the myths that surrounds the unwillingness of wards to pursue
carriers in this all important professional field. This is what this study sought to do.
1.1 Human Resource (Technical and Professional Manpower) for the Furniture Industry.
1.1.1 Informal Sector
The main mode of skills acquisition in the woodworking industry is the apprentice system. Their level of
performance varies depending on which workshop or master-craftsman they worked with. If one wish to enter
the woodworking field as a skilled craftsman, one must be able to use hand and machine tools for cutting,
shaping, fitting, and assembling parts made of wood and related materials ( Feirer, 1970). He continued that
having the basic ‘know how’ in the use of tools and machines to fabricate wood products is advantageous in
other careers like interior design and the building-construction industry. But the youth are frowning on
woodworking as a career, hence the low enrolment.
1.1.2 Technical Schools
According to Feirer (1970), a good general education which includes the ability to read technical literature and
prints, and do mathematics through algebra, in addition to two (2) to four(4) years specialized education in the
vocational or technical schools is necessary for enhanced skill in the woodworking sector. TVET is the sector
that produces the requisite skilled technical and professional manpower to the economy. At the pre-tertiary level,
the TVET is offered at Technical Institutes and Secondary/ Technical Schools, Vocational Institutes and
Apprentice Training Centres. For best advantage in one of the professional careers in the wood industry, one
must plan to complete a college degree in a programme such as Industrial Education, General Forestry, Wood
Technology, Furniture Manufacturing, Wood Products Engineering, or Architecture (Feirer, 1970). At the
tertiary level in Ghana, the Polytechnics mostly act as the apex of TVET, charged with providing hands-on
training and skills development. They all have a general goal of putting emphasis on practical skills acquisition
for the individual and for direct employment and entrepreneurship. The additional challenge facing the HND
Furniture Design and Production programmes at the polytechnics in the country is the observed dwindling in

Developing Country Studies www.iiste.org
ISSN 2224-607X (Paper) ISSN 2225-0565 (Online)
Vol.4, No.26, 2014
82
number of enrolment of students. Currently the furniture departments in the local polytechnics are having the
worst student-to-lecturer ratio ever recorded, a woefully average ratio of about 3:1 (as the case in Accra
Polytechnic), against the institutional average of about 50:1. The economic justification for the continuous
running of the HND Furniture Design and Production Programme in the polytechnics is becoming difficult and
the supply of future skilled and middle level manpower to the industry for the optimum utilization of the nation’s
wood resources, cannot be guaranteed. It is worth noting that, the timber industry in Ghana, is known to
contribute about six percent (6%) to the Gross Domestic Product (GDP). ( Bank of Ghana, 2004). According to
Acquah and Whyte (1998), the timber industry contributes 11% to the total export earnings in the country. Also
the industry employs about 100,000 workers directly and close to 2,000,000 people depend on the industry for
their livelihood. ( Agyarko 2001; Bank of Ghana Report, 2004).The existence of world markets for wood will
continue and it will be a disaster if Ghana was unable to take advantage of this, especially that of our
neighbouring African countries lacking forest resources ( Ghana Gazette, 2004).
However, according to Budu-Smith (2005), there is a gross mismatch between institutional training and the
needs of industry which has serious implications for the employability of graduates from the TVET institutions
especially the polytechnics and technical institutes. The reasons being that of years of poor resource allocation to
the TVET sector, `notably obsolete and inadequate training equipment and tools, lack of training materials,
inadequate number of qualified instructors with requisite industrial practical experience, and lack of linkages
between the training institutions and the industries.
Method of Study
The purpose of the study was to explore the nature and impact of TVET stigma on the performance of the
furniture trade and the trend of enrolment in pre- and tertiary levels of Accra and its environs. A survey study
was conducted using self-administered questionnaire to collect the primary data for analysis. Secondary data
were obtained though desk –top study.
2.1 Population and sampling technique:
The study targeted graduates from the technical and vocational who are seeking to pursue further technical
studies at the pre-tertiary and tertiary levels. The study was conducted on 2014 cohort of graduates from the
technical and vocational institutions within Accra and its environs who were pursuing National Board for
Professional and Technical Examinations (NABPTEX) access course [Pre-HND] into the Higher National
Diploma (HND) programmes in Ghana. Using convenience sampling technique 200 of the graduates were
selected to express their opinion using the questionnaire. 150 of the respondents returned the questionnaire but
3 were rejected . Hence 147 responses representing 73.5% response rate were used for the analysis.
2.2 Data Analysis:
Using SPSS software [model 16], descriptive statistics were used to analyse the data with respect to the
objectives of the study.
Results and Discussions
3.1 Trend of Enrolment in the Technical Training Institutions
3.1.1 Technical Schools that Offer Wood Work:
Fig a(i): The enrolled students at Accra Technical Training Centre (A.T.T.C) over the years.
From the above figure, one observes a sharp drop of over 50% from 2007/2008 to 2008/2009; there was no rise
in enrolment subsequently.

Developing Country Studies www.iiste.org
ISSN 2224-607X (Paper) ISSN 2225-0565 (Online)
Vol.4, No.26, 2014
83
Fig. a(ii) Students enrolled at Anglo Technical School at the indicated academic years.
The trend of the enrolment in figure a(ii) above, even though no consistency is being portrayed, looks more
encouraging. However the highest number nine (9) enrolled is still not high enough.
Fig. a(iii) Students enrolled at Have at the indicated academic years.
The trend at Have shown above portray a very discouraging one. With no enrolment in 2010/2011 and a single
person in the subsequent academic year.
Fig. a(iv) Students enrolled at Kpando Technical School at the indicated academic years.
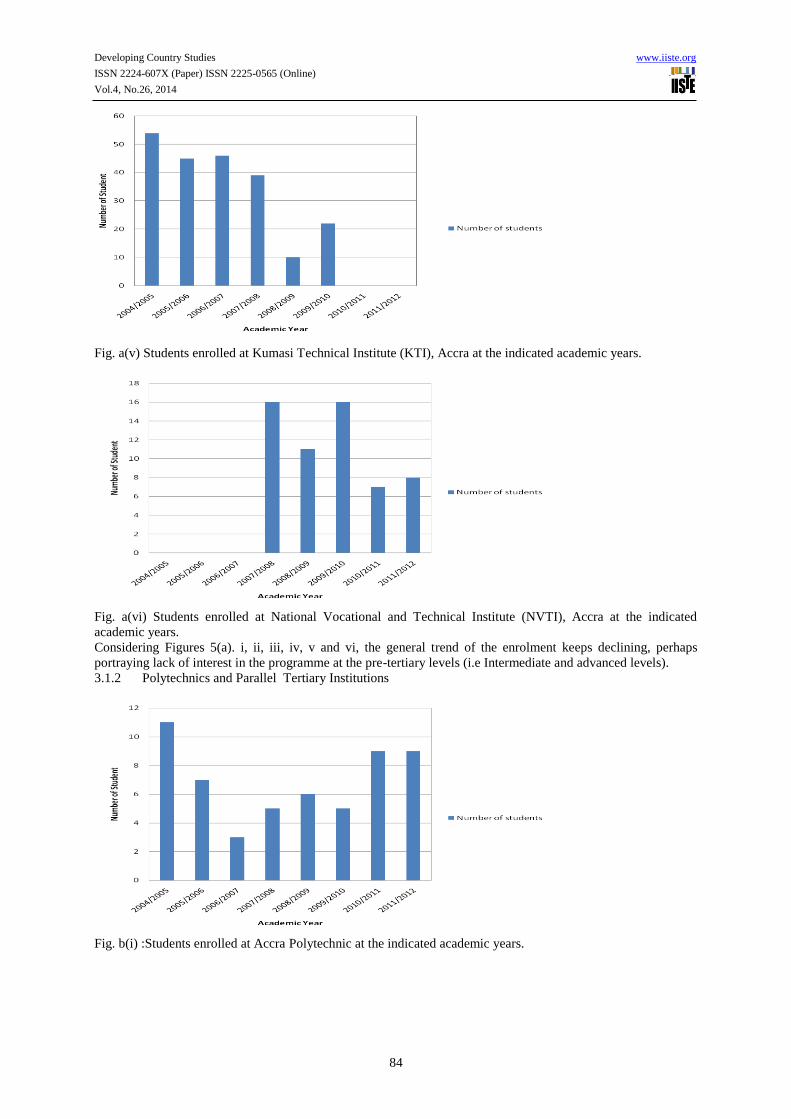
Developing Country Studies www.iiste.org
ISSN 2224-607X (Paper) ISSN 2225-0565 (Online)
Vol.4, No.26, 2014
84
Fig. a(v) Students enrolled at Kumasi Technical Institute (KTI), Accra at the indicated academic years.
Fig. a(vi) Students enrolled at National Vocational and Technical Institute (NVTI), Accra at the indicated
academic years.
Considering Figures 5(a). i, ii, iii, iv, v and vi, the general trend of the enrolment keeps declining, perhaps
portraying lack of interest in the programme at the pre-tertiary levels (i.e Intermediate and advanced levels).
3.1.2 Polytechnics and Parallel Tertiary Institutions
Fig. b(i) :Students enrolled at Accra Polytechnic at the indicated academic years.

Developing Country Studies www.iiste.org
ISSN 2224-607X (Paper) ISSN 2225-0565 (Online)
Vol.4, No.26, 2014
85
Fig. b(ii):Students enrolled at Kumasi Polytechnic at the indicated academic years.
Fig. b(iii):Students enrolled at Takoradi Polytechnic at the indicated academic years.
Fig. b(iv):Students enrolled at WITC at the indicated academic years.
The above figure indicate the abrupt end in the enrolment. Perhaps a nose-dive in the operations of the leading
companies in the industry might have contributed to this.
The trend of enrolment in the tertiary level (Fig. 5(b)i, ii, iii and iv is also not at variance with those of the pre-
tertiary levels. It needs not be over-emphasized that, usually the pre-tertiary programmes serve as a feed to the
tertiary enrolment. Hence the trend of enrolment not being enviable. In 1992, the Polytechnics in Ghana were
established with the clear objective of delivering on applied science, technology, arts and social sciences. The
emphasis on applied suggests that the students, after going through the programmes in polytechnics, must
immediately demonstrate functional, hands-on work practise, suggesting that the polytechnic graduates must
become the task-oriented workforce, especially in the industrial sector. The preamble to the Curriculum for the
HND in Furniture Design and Production (FDP), outlines the aim of this programme as “to prepare graduates to
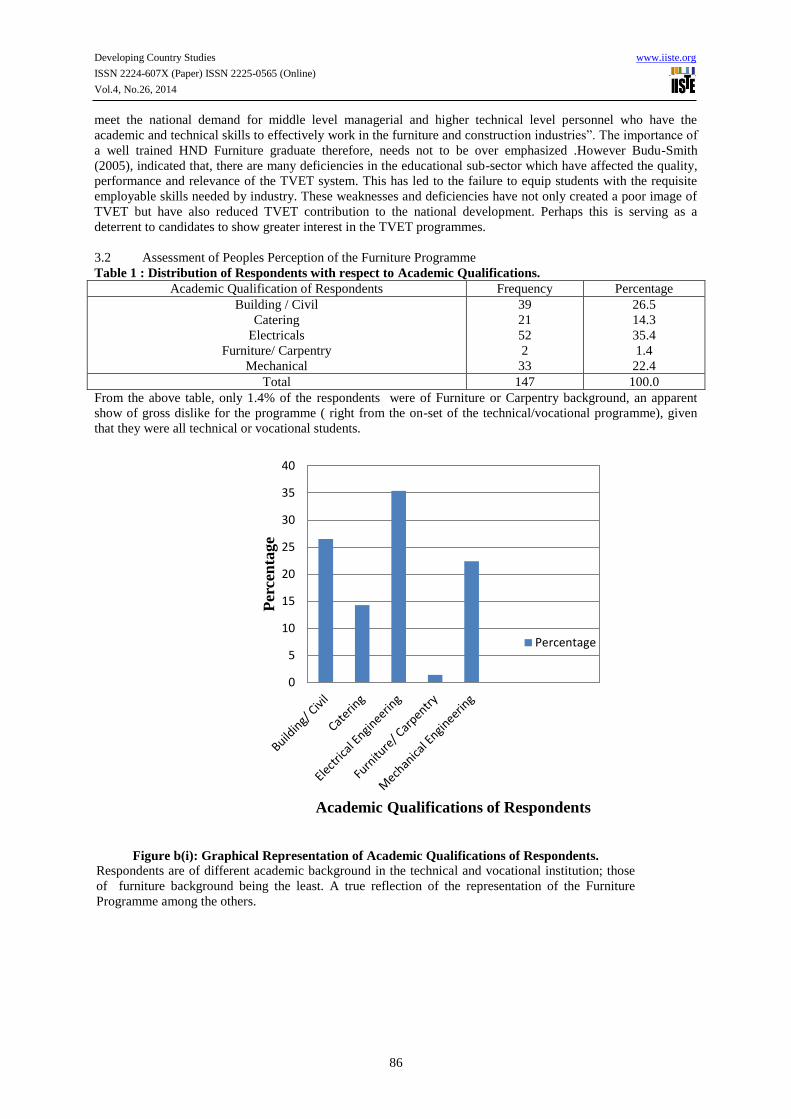
Developing Country Studies www.iiste.org
ISSN 2224-607X (Paper) ISSN 2225-0565 (Online)
Vol.4, No.26, 2014
86
meet the national demand for middle level managerial and higher technical level personnel who have the
academic and technical skills to effectively work in the furniture and construction industries”. The importance of
a well trained HND Furniture graduate therefore, needs not to be over emphasized .However Budu-Smith
(2005), indicated that, there are many deficiencies in the educational sub-sector which have affected the quality,
performance and relevance of the TVET system. This has led to the failure to equip students with the requisite
employable skills needed by industry. These weaknesses and deficiencies have not only created a poor image of
TVET but have also reduced TVET contribution to the national development. Perhaps this is serving as a
deterrent to candidates to show greater interest in the TVET programmes.
3.2 Assessment of Peoples Perception of the Furniture Programme
Table 1 : Distribution of Respondents with respect to Academic Qualifications.
Academic Qualification of Respondents Frequency Percentage
Building / Civil
Catering
Electricals
Furniture/ Carpentry
Mechanical
39
21
52
2
33
26.5
14.3
35.4
1.4
22.4
Total 147 100.0
From the above table, only 1.4% of the respondents were of Furniture or Carpentry background, an apparent
show of gross dislike for the programme ( right from the on-set of the technical/vocational programme), given
that they were all technical or vocational students.
Figure b(i): Graphical Representation of Academic Qualifications of Respondents.
Respondents are of different academic background in the technical and vocational institution; those
of furniture background being the least. A true reflection of the representation of the Furniture
Programme among the others.
0
5
10
15
20
25
30
35
40
Per
cen
tage
Academic Qualifications of Respondents
Percentage

Developing Country Studies www.iiste.org
ISSN 2224-607X (Paper) ISSN 2225-0565 (Online)
Vol.4, No.26, 2014
87
Figure b (ii) : Respondents Preferred Alternate Choice of Programme.
From the above chart, only 6% of the respondents selected the Furniture Programme as a second Choice.
Majority preferred the ‘ more respectable courses’ as the alternatives.
Table 2: Respondents Opinion on the attractiveness of the Furniture Programme(s) as a career to the
Youth.
Response Frequency Percentage
Yes
No
60
87
40.9
59.1
Total 147 100.0
The indication that 59.1% of the respondents see the Furniture Programme as not being attractive a career to the
youth is quite close to the findings of FIRA (2010), which recorded 63% in UK. This sounds an alarm situation
to the future of the programme.
Table 3: Respondents Opinion on Making the Furniture Programme(s) a First Choice if Full Scholarship
Package is added.
Response Frequency Percentage
Yes
No
69
78
46.9
53.1
Total 147 100.0
In Table 3 above, the offer of full scholarship package could not entice more than 50% of the respondents to opt
for the Furniture Programme. Only 46.9% of them will give it a consideration. Even though they are of technical
background, the stigma of Furniture still looms in their mind.
Table 4: Respondents Opinion on Public View on the Furniture Programmes in General
Response Frequency Percentage
Good
Not Good
43
104
29.3
70.7
Total 147 100.0
The above table denotes that, the respondents see majority of the general public as having bad perception of the
programme.
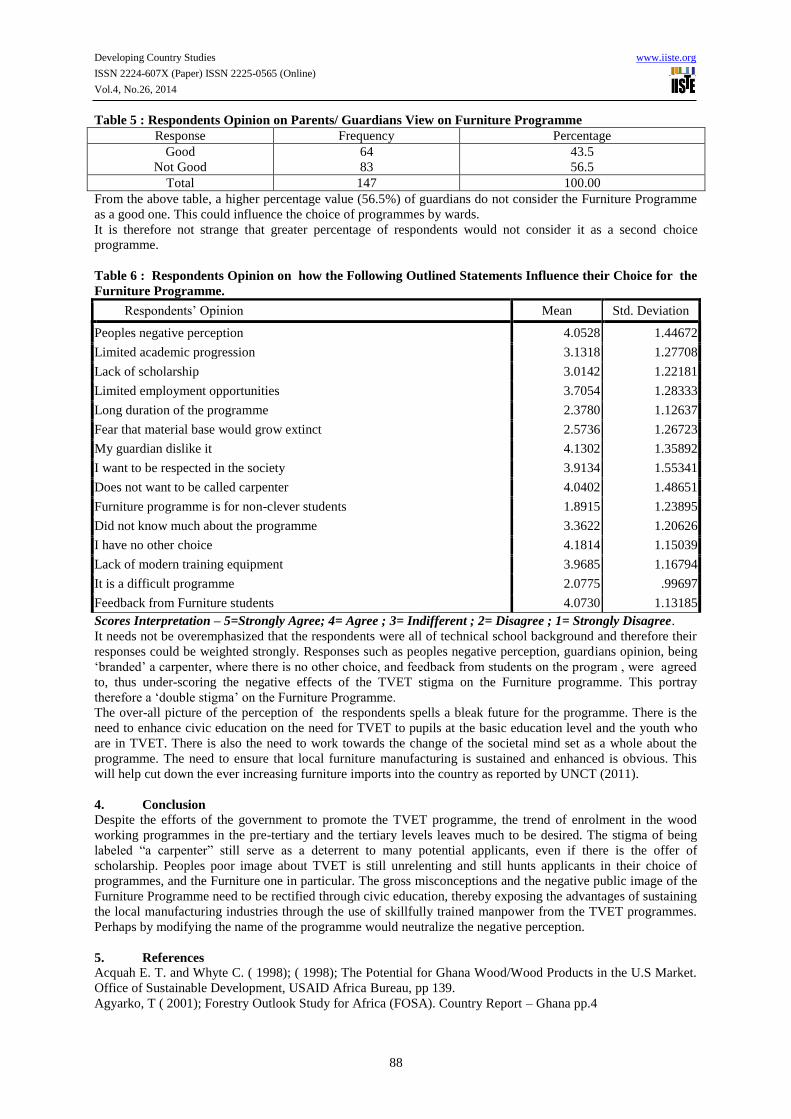
Developing Country Studies www.iiste.org
ISSN 2224-607X (Paper) ISSN 2225-0565 (Online)
Vol.4, No.26, 2014
88
Table 5 : Respondents Opinion on Parents/ Guardians View on Furniture Programme
Response Frequency Percentage
Good
Not Good
64
83
43.5
56.5
Total 147 100.00
From the above table, a higher percentage value (56.5%) of guardians do not consider the Furniture Programme
as a good one. This could influence the choice of programmes by wards.
It is therefore not strange that greater percentage of respondents would not consider it as a second choice
programme.
Table 6 : Respondents Opinion on how the Following Outlined Statements Influence their Choice for the
Furniture Programme.
Respondents’ Opinion Mean Std. Deviation
Peoples negative perception 4.0528 1.44672
Limited academic progression 3.1318 1.27708
Lack of scholarship 3.0142 1.22181
Limited employment opportunities 3.7054 1.28333
Long duration of the programme 2.3780 1.12637
Fear that material base would grow extinct 2.5736 1.26723
My guardian dislike it 4.1302 1.35892
I want to be respected in the society 3.9134 1.55341
Does not want to be called carpenter 4.0402 1.48651
Furniture programme is for non-clever students 1.8915 1.23895
Did not know much about the programme 3.3622 1.20626
I have no other choice 4.1814 1.15039
Lack of modern training equipment 3.9685 1.16794
It is a difficult programme 2.0775 .99697
Feedback from Furniture students 4.0730 1.13185
Scores Interpretation – 5=Strongly Agree; 4= Agree ; 3= Indifferent ; 2= Disagree ; 1= Strongly Disagree.
It needs not be overemphasized that the respondents were all of technical school background and therefore their
responses could be weighted strongly. Responses such as peoples negative perception, guardians opinion, being
‘branded’ a carpenter, where there is no other choice, and feedback from students on the program , were agreed
to, thus under-scoring the negative effects of the TVET stigma on the Furniture programme. This portray
therefore a ‘double stigma’ on the Furniture Programme.
The over-all picture of the perception of the respondents spells a bleak future for the programme. There is the
need to enhance civic education on the need for TVET to pupils at the basic education level and the youth who
are in TVET. There is also the need to work towards the change of the societal mind set as a whole about the
programme. The need to ensure that local furniture manufacturing is sustained and enhanced is obvious. This
will help cut down the ever increasing furniture imports into the country as reported by UNCT (2011).
4. Conclusion
Despite the efforts of the government to promote the TVET programme, the trend of enrolment in the wood
working programmes in the pre-tertiary and the tertiary levels leaves much to be desired. The stigma of being
labeled “a carpenter” still serve as a deterrent to many potential applicants, even if there is the offer of
scholarship. Peoples poor image about TVET is still unrelenting and still hunts applicants in their choice of
programmes, and the Furniture one in particular. The gross misconceptions and the negative public image of the
Furniture Programme need to be rectified through civic education, thereby exposing the advantages of sustaining
the local manufacturing industries through the use of skillfully trained manpower from the TVET programmes.
Perhaps by modifying the name of the programme would neutralize the negative perception.
5. References
Acquah E. T. and Whyte C. ( 1998); ( 1998); The Potential for Ghana Wood/Wood Products in the U.S Market.
Office of Sustainable Development, USAID Africa Bureau, pp 139.
Agyarko, T ( 2001); Forestry Outlook Study for Africa (FOSA). Country Report – Ghana pp.4
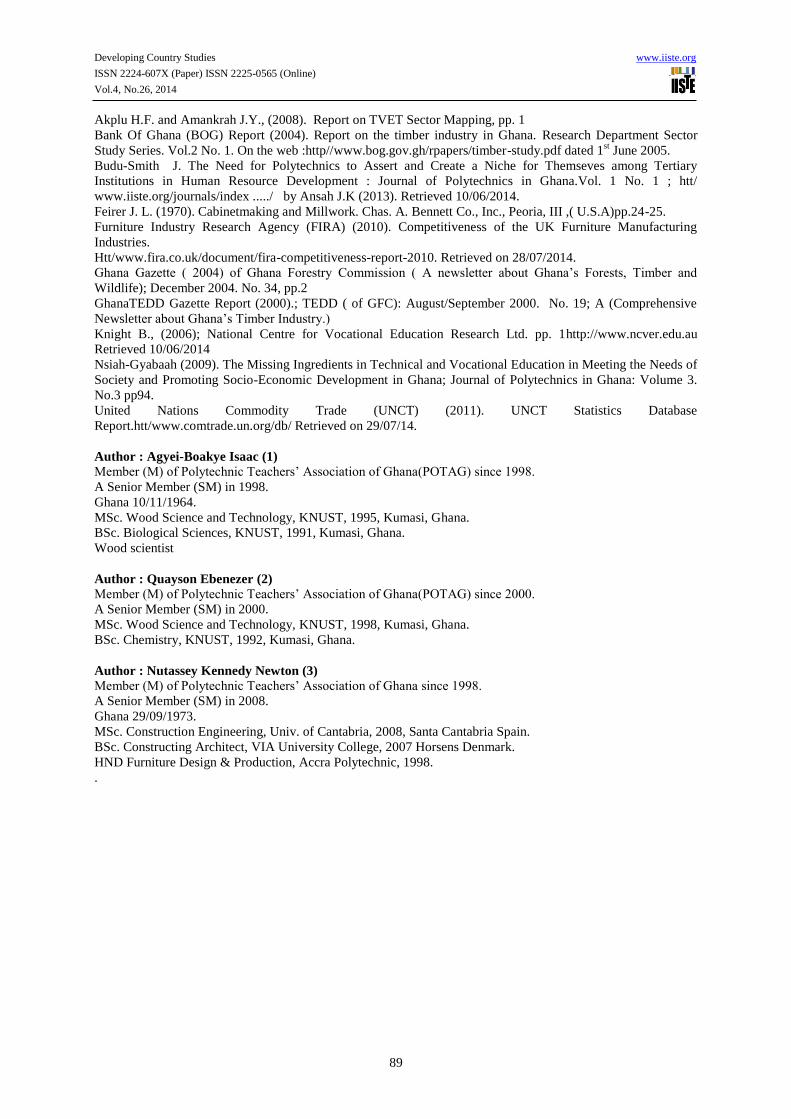
Developing Country Studies www.iiste.org
ISSN 2224-607X (Paper) ISSN 2225-0565 (Online)
Vol.4, No.26, 2014
89
Akplu H.F. and Amankrah J.Y., (2008). Report on TVET Sector Mapping, pp. 1
Bank Of Ghana (BOG) Report (2004). Report on the timber industry in Ghana. Research Department Sector
Study Series. Vol.2 No. 1. On the web :http//www.bog.gov.gh/rpapers/timber-study.pdf dated 1st June 2005.
Budu-Smith J. The Need for Polytechnics to Assert and Create a Niche for Themseves among Tertiary
Institutions in Human Resource Development : Journal of Polytechnics in Ghana.Vol. 1 No. 1 ; htt/
www.iiste.org/journals/index ...../ by Ansah J.K (2013). Retrieved 10/06/2014.
Feirer J. L. (1970). Cabinetmaking and Millwork. Chas. A. Bennett Co., Inc., Peoria, III ,( U.S.A)pp.24-25.
Furniture Industry Research Agency (FIRA) (2010). Competitiveness of the UK Furniture Manufacturing
Industries.
Htt/www.fira.co.uk/document/fira-competitiveness-report-2010. Retrieved on 28/07/2014.
Ghana Gazette ( 2004) of Ghana Forestry Commission ( A newsletter about Ghana’s Forests, Timber and
Wildlife); December 2004. No. 34, pp.2
GhanaTEDD Gazette Report (2000).; TEDD ( of GFC): August/September 2000. No. 19; A (Comprehensive
Newsletter about Ghana’s Timber Industry.)
Knight B., (2006); National Centre for Vocational Education Research Ltd. pp. 1http://www.ncver.edu.au
Retrieved 10/06/2014
Nsiah-Gyabaah (2009). The Missing Ingredients in Technical and Vocational Education in Meeting the Needs of
Society and Promoting Socio-Economic Development in Ghana; Journal of Polytechnics in Ghana: Volume 3.
No.3 pp94.
United Nations Commodity Trade (UNCT) (2011). UNCT Statistics Database
Report.htt/www.comtrade.un.org/db/ Retrieved on 29/07/14.
Author : Agyei-Boakye Isaac (1)
Member (M) of Polytechnic Teachers’ Association of Ghana(POTAG) since 1998.
A Senior Member (SM) in 1998.
Ghana 10/11/1964.
MSc. Wood Science and Technology, KNUST, 1995, Kumasi, Ghana.
BSc. Biological Sciences, KNUST, 1991, Kumasi, Ghana.
Wood scientist
Author : Quayson Ebenezer (2)
Member (M) of Polytechnic Teachers’ Association of Ghana(POTAG) since 2000.
A Senior Member (SM) in 2000.
MSc. Wood Science and Technology, KNUST, 1998, Kumasi, Ghana.
BSc. Chemistry, KNUST, 1992, Kumasi, Ghana.
Author : Nutassey Kennedy Newton (3)
Member (M) of Polytechnic Teachers’ Association of Ghana since 1998.
A Senior Member (SM) in 2008.
Ghana 29/09/1973.
MSc. Construction Engineering, Univ. of Cantabria, 2008, Santa Cantabria Spain.
BSc. Constructing Architect, VIA University College, 2007 Horsens Denmark.
HND Furniture Design & Production, Accra Polytechnic, 1998.
.

Developing Country Studies www.iiste.org
ISSN 2224-607X (Paper) ISSN 2225-0565 (Online)
Vol.4, No.26, 2014
90
Virtue Ethics in Marketing FMCGs in East African Common
Market
John Yabs * Victor Ndambuki
Lecturer, School of Business, University of Nairobi, P. O. Box 30197-00100, Nairobi
Abstract
The existing disparities in ethical standards of Fast Moving Consumer Goods (FMCGs) in East AfricanCountries
(EAC) and the ethical difficulties in distribution, is underpinned by little understanding of our ethical needs by
manufacturers and distributors. Current production of FMCGs were based on ethical standards formulated
elsewhere, and it is only after 2010 that some goods appeared that conform to EAC ethical standards. This study
was anchored on environmental dependency theory. We undertook to study the ethical dilemmas facing the
producers and distributors of FMGs in EAC from 2005 to 2013. We sampled fifteen manufacturers of FMGs in
EAC, ten distributers, and interviewed five border officials in Namanga, Mwanza, Mbamba Bay, Busia and
Kigoma. The results of our study indicated that manufacturer’s produce goods without thorough research on the
qualities, aesthetics and ethical considerations.Distributors have little regard to business ethics, forgetting about
their moral obligation to our ethical existence as consumers. They are run after profit in whatever means with
less regard to customer ethical demands. We posit that there is need to raise ethical awareness in the production
of goods and their distribution in EAC and ethical considerations should be inbuilt at the point of creating the
product.
Keywords; Fast Moving Consumer Goods; In-build ethical considerations; Ethical awareness; Aesthetics of
packaging; Ethical goods.
1. Introduction
International firms operate within the wider international business environment that is influenced by various
factors (Cherunilam, 2007). Before investing in international business, international firms scan the environment
to see if their chances are favorable. Most firms look at the major economic indicators to gage the performance
of an economy before they make the final decision to invest. This study was anchored on the environment
dependency theory (Ansoff, 1987) which states that firms scan the environment before they make decisions to
invest.
2. Major Economic indicators influencing decisions in international firms
Each international firms is interested in certain economic indicators in a target country. Most firms look for
positive performance of economic indicators in target countries. They use this to gauge their possible chances of
success if they invest in those countries. Table 1 indicate the major economic indicators in East African
Countries (EAC) that show the performance of the economies of each country. This information is used by both
EMNCs and MNCs to make strategic decisions.
Table 1: Economic Growth, Real GDP annual percentage change
Country Ave. 1999-2000 2006 2007 2008 2009 2010 2011 2015
Burundi 1.3 5.1 3.6 4.5 3.5 3.9 4.5 4.9
Kenya 2.1 6.4 7.0 1.5 2.1 4.1 5.8 6.5
Rwanda 0.1 8.6 5.5 11.2 4.1 5.4 5.9 7.1
Tanzania 3.1 6.7 7.1 7.4 5.5 6.3 6.7 7.0
Uganda 6.3 10.8 8.4 8.7 7.1 5.6 6.4 7.5
Source: World Economic Outlook, IMF 2010
Table 1 show Gross Domestic product as the major economic indicator, tabulating the performance of
the economy of each of EAC country over the period 2000 to estimated 2015. It also show trends of economic
performance for the same period. International firms, including Kenyan EMNCs can use these figures to make
appropriate strategies to expand or even understand the reasons behind such a performance by GDP.
Accordingly, Rwanda, Tanzania and Uganda’s economies are expected to perform better in 2014-2015. This will
influence investment decisions EMNs and MNCs. Economies performance of these countries will improve the
standard of living and quality of life and therefore there will be an expected increase in the consumption of
FMCG.
Developing Country Studies www.iiste.org
ISSN 2224-607X (Paper) ISSN 2225-0565 (Online)
Vol.4, No.26, 2014
91
Table 2: Contribution of manufacturing goods and services as percentage of GDP
Contribution to GDP Burundi Kenya Rwanda Tanzania Uganda
Manufacturing as % of GDP 10.5 11.0 6.9 8.6 7.6
Services as % of GDP 36.5 56.2 46.1 46.7 51.3
Source: World Bank Outlook, IMF 2010
Table two indicate contribution to GDP by manufacturing and the service sector. This showed that
manufacturing and service sectors contributed different proportions, indication the different levels of EAC
economies. This information can be used by international investors to formulate appropriate strategies.
Distribution of goods and provision of commercial services will exponentially grow, while contribution by
manufacturing sector will grow marginally.This background information can be used by MNCs and EMNCs to
identify their target market, but they must exhibitethical behavior in their international business. Business ethics
can enhance performance of firms in regional markets, and the ethical behavior of all those who facilitate
international business will enhance development of inter-country trade.
3. Literature Review
Virtue ethics refers to the ethical conduct of all participants in the entire value chain from production to
consumption (McCloskey, 2008).Virtues are qualities of high moral standards that influence the behavior of an
individual when rendering a service. The cardinal virtues that every individual worker or manager ought to
practice include temperance, fortitude, honesty, prudence, charity, justice, and courage (Kreeft, 2013). Each
individual is endowed to have these virtues in different proportions, and managers of international businesses
must be people of upright virtues, who recognize the need to do just business.
This requirement of practicing ethical behavior applies to buyers, sellers, intermediaries and facilitators. The
practice of temperance, for instance, behooves every participant in the distribution chain from production to
consumption. Virtue ethics in international business has attracted a lot of attention since 2000 onwards,
particularly in its contribution to the understanding of evaluating and guiding business consumption practices
(Hanley, 2009. The practice of good business ethics can ease the conduct of cross border trade throughout the
world. Ethics can bring together firms as well as neighboring countries, and by extension, unite nations.
International business virtue ethics focuses more on the integrity of all officers dealing with inter border trade
rather than the morality of their decisions or behavior. Although virtue ethics as a philosophical tradition had
been relegated to back events, business and other contemporary ethicists have brought it to the forefront of
business ethical thinking.
At the point of starting to conduct fundamental research to introduce new products, firms should include the
ethical requirements of the consumers in a particular location, be it a town, a country or a new market altogether.
Most of FMCGs that are consumed today originated from different countries, where fundamental as well as
applied research were conducted. These researches conducted resulted in new products that were introduced and
which followed the product life cycle path. Globalizations and internationalization of firm activities have made
many goods origination from different countries end up being consumed in the most unlikely markets of the
world. Therefore manufacturers of FMCGs should include as in-built all the ethical requirements of the
consumers. Originally imported products that are intended to be manufactured locally, should be modified in
order that they may conform to the local ethical standards. Most FMCGs traded in EAC countries originated
from different countries and have been produced in member states with the support of the owners through the
use of patents, trademarks, and franchises. Majority of goods meet the ethical standards and cultural demands of
EAC member states, but the few that do not meet these ethical standards, should be modified to conform fully to
the EAC ethical requirements.
4. Research Problem
Consumers of FMCGs are aware of the ethical requirements of goods provided to them. They must meet certain
minimum ethical standards in their utility or usefulness and in ethical packaging. But it is not very clear what
ethical standards are needed by consumers in, say, Rwanda, or in Democratic Republic of Congo, or in Southern
Sudan. A relatively developed market like Kenya may need different criteria for judging standards of ethics of
goods. It is assumed by manufacturers that human needs are universal, and that industrial tools and small
frequently used instruments have been standardized then consumers in EAC may not have different standards
from those of the rest of the world. The problem of this study therefore was to determine ethical standards of
FMCGs in EAC and to find out how producers of such goods can include ethical requirements at the point of
manufacturing of those goods. We also undertook to find out what ethical dilemmas face distributors in the
supply chain from manufacturing toconsumption in EAC market.
Most consumers in EAC market just use the goods as given and do not have their own standards or even
understand the mechanisms of raising complaints on defective goods. Many a time most of us buy goods at
department stores or super markets, and when we find them defective we never bother to go and complain,
Developing Country Studies www.iiste.org
ISSN 2224-607X (Paper) ISSN 2225-0565 (Online)
Vol.4, No.26, 2014
92
preferring to keep quiet. It is the right of the consumer to demand quality and value for money. If goods fall short
of aesthetical of utility standards, then consumers must reject and return them to the seller. On the other hand,
manufacturers and distributors must be interested on the performance of their goods in the market and
periodically check on the satisfaction of consumers. It there is any complaint it should be passed on to the
manufacturer who may be in another country.
The onus is on the manufacturer to educate and inform consumers on the mechanisms of handling complaints.
Manufacturers of FMCGs should conduct periodic research of the performance of their goods in the market.
5. Methodology of Research
Research objectives we set for our study were three: first, we had to establish the ethical standards required by
EAC consumers of FMCGs and to establish if they are different from ethical requirements of global goods.
Secondly, we had set to determine how manufacturers of FMCHs can include ethical needs of consumers into
the products at the stage of manufacturing them, what we have called in-build ethical considerations. And
thirdly, we wanted to find out if officials in the entire supply chain from manufacturers to consumers practice
business ethics at company level, at distribution level, by exporters, by customs officials at border points and
eventually by businessmen themselves. Ethical behavior cuts across the entire spectrum of supply chain within
one country and across all the EAC countries.
We adopted a survey methodology since the population was scattered in different EAC countries. We relied on
the information obtained through interviews that we contacted in meetings with respondents at border points and
at Nairobi offices of the freight companies. We also collected information from exporters, freight forwarders,
clearing agents, business organizations like Chamber of Commerce and confederation of industries. Most
manufacturers of FMCGs were found in Nairobi, and they gave us valuable information. We used emails to
distant border points in Uganda, Tanzania, Rwanda and Burundi. We even extended our efforts to collect
information from EAC neighboring countries of Democratic Republic of Congo, Southern Sudan, Ethiopia and
Malawi.Of particular interest were the information we got concerning goods crossing over Lake Victoria to the
ports of Mwanza, Kisumu, Musoma, Bukoba and Entebbe. On Lake Tanganyika, the ports of Bujumbura,
Rumonge, Kigoma and Baraka. There is unrecorded trade across the Lake Tanganyika to Democratic Republic
of Congo port of Baraka and Kalemie. The border trade between Kenya and Southern Sudan passes through
Uganda due to poor road network, and crosses Ugandan border at Kaya and Nimule. The shortest and direct
route from Kenya to Southern Sudan is through Nakodok in Turkana County. The nature of the information
collected was qualitative, and hence we used content analysis.
6. Virtue ethics and exporters of FMCGs
Fast moving consumer goods refer to the products that are sold quickly and at relatively low cost. These products
include cleaning materials, disinfectants, and soft or frisk drinks, un-prescribed or off the counter medicines,
toiletries, tools, toys, processed foods, and many more that are frequently used at home and at place of work.
They include consumer electronics such as mobile phones, MP3 players, game players, digital cameras, floppy
discs and drives. One of the characteristics of FMCGs is that profit margins are relatively small and those who
deal in them gain in volume because they are sold in large quantities. Another characteristic is that most FMCGs
are used for fairly a short period due to wear and tear, and therefore are replace frequently. Some of the FMCGs
are used within one year. In contrast, goods that are used for longer periods are durable goods. Most of them
form the basis or the bedrock on which FMCGs are used. There are industrial durable goods and domestic
durable goods. Industrial durable goods include machinery, instruments, facilities and equipment to serve for
several years. Domestic durable goods include refrigerators, ovens, cookers, refrigerators and furniture.
Exporting countries and marketers ought to understand their importers and customers in terms in terms of their
culture, patterns of consumption and how they see the products being offered.
Manufacturing firms must check if consumption patterns and purchasing behavior in EAC is homogeneous
across the region. Cultural practices and hence consumer patterns are almost predictable. All countries are very
close in the level of economic sophistication. Countries of the same level of economic development have similar
patterns of demand.
Consumers in EAC countries are aware of the ethical requirements of FMCGs and can change their tastes, use
and consumption of goods that do not meet the ethical thresholds. EAC consumers must have a liking to “ethical
goods” that do not offend their traditions and customs. Processed food items, for instance, may be boycotted or
appreciated if they conform to a community’s culture.
The ethical dilemmas that face all those who are concerned with distribution of FMCGs in the entire supply
chain from production to consumption in EAC include the FMCGs as understood in EAC. Value ethics sets the
normative limits of required behavior of officials at every stage in the long chain of distribution from producing
country or firm to the consumers either in the same country or in the neighboring countries. Facilitators of goods
along the way must practice good business ethics.

Developing Country Studies www.iiste.org
ISSN 2224-607X (Paper) ISSN 2225-0565 (Online)
Vol.4, No.26, 2014
93
7. Results of the study
After considering all the information obtained from the respondents, it was clear that majority of problems
encountered at border points emanate from human behavior, either influenced by personal interests or by fear for
not conforming to what everybody else does. In Busia there were incidences when KRA officials were slow in
approving documents while they notice that such moves were increasing traffic jams on the road. At Bukoba
Port in LakeVictoria there were delays caused by different clearing procedures from the standard used in other
ports. Distributors, freight forwarders and exporters were facing difficulties in forwarding goods that were not
standardized. There were problems with defective documents that could be rectified, but there were delays in
affecting such corrections. Most border officers sometimes deliberately delay approvals because they want
something, forgetting that they have ethical and moral responsibility to society in their duties.
8. Conclusions
The results of our study indicated that manufacturing firms in EAC go into production using existing patents and
trademarks that were researched in other countries. They produce goods that have been accepted by consumers
in EAC market because it is cheaper and easier for them. Few companies have started to conduct their own
funded research on the qualities and aesthetics of goods as required by consumers. Those distributing these
goods also have little regard to business ethics, forgetting about their moral obligation to our ethical existence as
consumers. They are ruthless and run after profit in whatever means. We posit that there is need to raise ethical
awareness of all those who are engaged in the supply chain of FMCGs right from production to consumption.
Ethical considerations should be inbuilt at the point of creating the product.
References
“African Statistical Yearbook 2009”, African Development Bank.
Ansoff, H. I. (1987). The emerging paradigm of strategic behavior. Strategic Management Journal, 8: 501-515’
Cherunilam, Francis (2007). International Business. Texts and Cases, Fourth Edition. Prentice-Hall, Private
Limited, New Delhi, 2007.
Calderisi, Robert (2006), “The Trouble with Africa: Why Foreign Aid Isn’t Working”, Yale University Press.
Cohen Jessica, and W.Easterly (2009, “What Works in Development: Thinking big and Thinking Small”,
Brookings Institution Press, Washington DC. “Doing Business 2010” The World Bank.
Easterly, William (2006), “The White Man’s Burden: Why the West’s Efforts to aid the Rest have done so much
ill and so little good”, The Penguin Press.
Fraedrich, J. Ferrell, L, Ferrell O.C. (2013) Ethical decision making in business: A managerial approach, South
Western
“Freedom in the World 2010” Freedom House.
“Global Education Digest 2009” UNESCO.
“Global Competitiveness Index 2009‐2010” World Economic Forum.
“Global Corruption Perceptions 2009” Transparency International.
Guest, Robert (2004), “The Shackled Continent”, Macmillan Press.
Hanley.R (2009) Adam Smith and the character of virtue, Cambridge University press, Cambridge.
Hubbard, R. Glenn and W. Duggan (2009), “The Aid Trap: Hard Truths About Ending Poverty”, Columbia
Business School.
Kinzer, Stephen (2008), “A Thousand Hills: Rwanda’s Rebirth and the Man Who Dreamed It”,John Wiley &
Sons.
Kivuva A. and Magara Z. (2012). Agricultural cross border trade between Kenya, Uganda and Tanzania,
Ministry of agriculture 2012.
Kreeft, Peter (2013). Justice, Wisdom, Courage and Moderation: The Four Cardinal Virtues
Lemarchand, René (2009), “The Dynamics of Violence in Central Africa”, University of Pennsylvania Press.
Mahajan, Vijay (2009), “Africa Rising: How 900 million African Consumers Offer more than you think”,
Pearson Education Inc.
McCloskey, D (2008). Adam smith: The last of the former virtue Ethicists,” History of political economy.
Meredith, Martin (2005), “The Fate of AFRICA – A History of Fifty Years of Independence”,Perseus Books
Group, New York.
Moore, G. (2010) Fairness in international Trade, ISBEE.
Sou Ayittey, George B.N. (2005), “Africa Unchained – The Blueprint for Africa’s Future”, Palgrave, Macmillan,
London.
“Selected Statistics on African Countries 2008” African Development Bank.
“The World Fact Book 2010”, CIA.
“Trade Statistics 2009” WTO.

Developing Country Studies www.iiste.org
ISSN 2224-607X (Paper) ISSN 2225-0565 (Online)
Vol.4, No.26, 2014
94
“World Development Indicators 09” The World Bank.
“World Economic Outlook” IMF October 2009 and April 2010.
“World Investment Report 2009” UNCTAD.

Developing Country Studies www.iiste.org
ISSN 2224-607X (Paper) ISSN 2225-0565 (Online)
Vol.4, No.26, 2014
95
The Role of Investment Law in Housing Construction in Duhok
City, Kurdistan Region
Halima A. Othman
Petroleum Engineering Department, University of Zakho, Duhok, Kurdistan region, Iraq
E-mail of the author: [email protected]
Abstract
Duhok has a strategic location because it lies between two mountains ranges and at the junction of the borders of
Iraq, in the heart of Iraqi Kurdistan Region. The city has a significant position from the dawn of history to the
present time. In addition to the relative peace in the region, it has an advantage to develop the economy relatively
fast in comparison to other parts of Iraq. Due to the above reasons, The City witnessed a rapid population growth
during the last decades and the fast growing population led to further urbanization growth in the city. Duhok’s
urbanization growth areas expanded at a rate 2.2 times faster than population growth, Giving rise to an
increasing density of settlements and creation of informal settlement patterns, in addition to lack of new housing
delivery systems. The Kurdistan Regional Government recognized that the regional government alone could not
reconstruct Kurdistan without active participation from the private sector; therefore, Private investors especially
from foreign resources been promoted to contribute towards economic development. The government, issued
investment-law to remove any legal obstacles, focusing in construction sector especially housing projects. This
paper discusses the role investment law in eliminating housing shortage in the city of Duhok to address the key
bottlenecks in housing sector through better understanding of the potential and weaknesses of the existing
situation.
Keywords: Duhok city, Kurdistan Regional Government, Investment law, Housing, Population
Introduction
Since 1992 and especially since the fall of the Ba'athist regime in 2003, the Kurdistan Region is relatively stable
and peaceful compared to the rest of Iraq. The security situation has consolidated by the recent unification in
1997of the two KRG administrations and the exercise of joint control between the Patriotic Union of Kurdistan
(PUK), and the Kurdistan Democratic Party (KDP) (Martina, 2007).
Iraqi Kurdistan in general has remained the only safe places for foreigners. However, reconstruction was
necessary as no fighting occurred there while there has been considerable foreign investment, especially from
Turkish businesses. Today, many new buildings, shops and malls can be seen unlike areas outside Kurdish
control (Bastorayee, 2008).
The reconstruction in urban management sectors tied closely to the policy positions of the new government as
regards decentralization, privatization and popular participation. While the form and scope of these policies may
vary significantly, in all cases the result will be a need for training and capacity building (UN-HABITAT, 2002).
The public sector has recognized its inability to deliver the increasing demand of sufficient services and
infrastructure. Inaugurating the private sector role was the central issue to remedies this deficit. Contraction
boom was the major outcome of the new policy; Bridges, shopping malls, private parks and housing project
contributed to eliminate the shortage in of service delivery. However, the economic development is still
handicapped by the lack of information and transparency, the absence of an effective modern banking sector, an
educational system that meets the demands of a market economy and the lack of adequate infrastructure
(International, 2008).
Statement of problem
Duhok City witnessed a rapid population growth during the last decades, which led to deficiency in affordable
residential units in the Kurdistan Region led to rapid increase in perches and rent prices in the three northern
governorates. Despite the economic boom in Kurdistan region.
The housing situation in the three northern governorates is a major crisis, there is a serious shortage of
accommodation, and families live in shared apartments.
In parallel to the rapid urbanization process that took place in the KRG districts, there were obstacles hindering
the role of investment in alleviating housing deficiency. This paper will focus on the housing problem and define
the main reasons, which face housing construction in Duhok city.
Objective of Study
The main objective of the study is to re-evaluate the role of investment law in housing construction in the city of
Duhok. This will be followed by suggesting an alternative polices of housing delivery, which will better serve
the requirements of urban development in the city of Duhok. The specific objectives of this study are :-
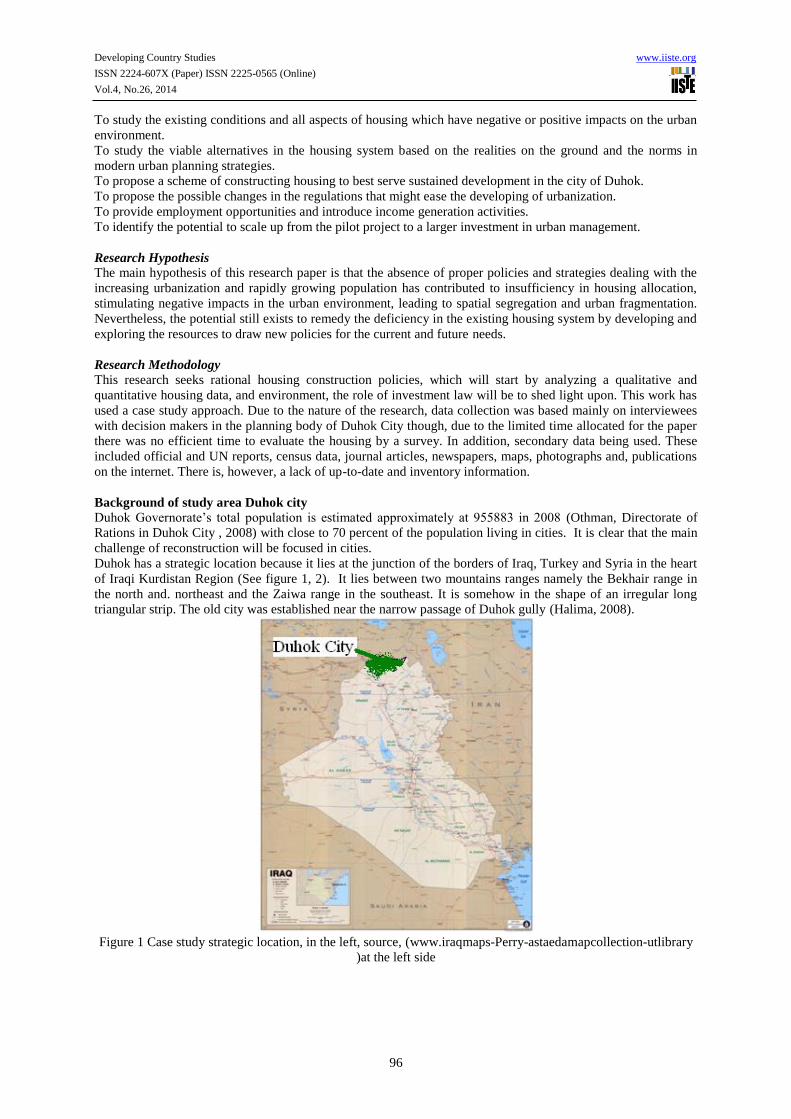
Developing Country Studies www.iiste.org
ISSN 2224-607X (Paper) ISSN 2225-0565 (Online)
Vol.4, No.26, 2014
96
To study the existing conditions and all aspects of housing which have negative or positive impacts on the urban
environment.
To study the viable alternatives in the housing system based on the realities on the ground and the norms in
modern urban planning strategies.
To propose a scheme of constructing housing to best serve sustained development in the city of Duhok.
To propose the possible changes in the regulations that might ease the developing of urbanization.
To provide employment opportunities and introduce income generation activities.
To identify the potential to scale up from the pilot project to a larger investment in urban management.
Research Hypothesis
The main hypothesis of this research paper is that the absence of proper policies and strategies dealing with the
increasing urbanization and rapidly growing population has contributed to insufficiency in housing allocation,
stimulating negative impacts in the urban environment, leading to spatial segregation and urban fragmentation.
Nevertheless, the potential still exists to remedy the deficiency in the existing housing system by developing and
exploring the resources to draw new policies for the current and future needs.
Research Methodology
This research seeks rational housing construction policies, which will start by analyzing a qualitative and
quantitative housing data, and environment, the role of investment law will be to shed light upon. This work has
used a case study approach. Due to the nature of the research, data collection was based mainly on interviewees
with decision makers in the planning body of Duhok City though, due to the limited time allocated for the paper
there was no efficient time to evaluate the housing by a survey. In addition, secondary data being used. These
included official and UN reports, census data, journal articles, newspapers, maps, photographs and, publications
on the internet. There is, however, a lack of up-to-date and inventory information.
Background of study area Duhok city
Duhok Governorate’s total population is estimated approximately at 955883 in 2008 (Othman, Directorate of
Rations in Duhok City , 2008) with close to 70 percent of the population living in cities. It is clear that the main
challenge of reconstruction will be focused in cities.
Duhok has a strategic location because it lies at the junction of the borders of Iraq, Turkey and Syria in the heart
of Iraqi Kurdistan Region (See figure 1, 2). It lies between two mountains ranges namely the Bekhair range in
the north and. northeast and the Zaiwa range in the southeast. It is somehow in the shape of an irregular long
triangular strip. The old city was established near the narrow passage of Duhok gully (Halima, 2008).
Figure 1 Case study strategic location, in the left, source, (www.iraqmaps-Perry-astaedamapcollection-utlibrary
)at the left side

Developing Country Studies www.iiste.org
ISSN 2224-607X (Paper) ISSN 2225-0565 (Online)
Vol.4, No.26, 2014
97
Figure 2 Case study strategic location at the center of Duhok governorate, source, (ww.eduhok.net), up
The existing remains close to the city show that the city has a significant location from the dawn of history to the
present time. Duhok is an important historical city because of its strategic position between narrow passages
(Gully Duhok, Kashafer) which lead to (Dargala Sheikha) narrow passage in which roads and paths passed, it
connected the Assyrian state in Ninevah and the kingdoms of Urartu, Kutians and Meetanians.
Duhok is a multi-culture and religion city with a population of approximately 262640 in 2006 inhabitants
(Halima, 2008). Ethnically the majority of the populations are Kurds, with minority groups of Assyrians,
Chaldeans, Arabs and Armenians. The dominant religion is Sunni Moslem, and a minority of Iyzdi and
Christians living in a very peaceful and integrative life style. The population records show an unprecedented
growth during the last two decades due to the rural- urban migration and returning refugees.
The rapid population growth during the last decades in Duhok City resulted from several reasons. It is not only
the high growth rate but also returning refugees together with internally displaced people by the last regime. In
addition to that, rural-urban migration contributed to rapid urbanization process in the cities, which led to
deficiency in physical and social infrastructure delivery.
Figure 3 Duhok City Populations Dynamic During the Last Three Decades. (Halima, 2008)
Figure three shows the growth of the city in relation to the governorate, Duhok city is about 30 % of the
population living in Duhok governorate. Notably Duhok has been quite impressive population growth in the last
30 years ago. Population estimates show remarkable growth in the city, the growth rate is about 6.8%,
(Directorate of statistic in Duhok City).
Figure 4 shows that rapid Rural-urban migration, which resulted from several reasons; fist, the last regime’s
policy of village destruction. In addition to the increasing disparities between urban and rural areas, another
reason is the absence of efficient policies to improve the economic situation of rural areas.
Dohuk Population Change
184.237
262.640
36.512
235.412
105.834
0.000
100.000
200.000
300.000
400.000
500.000
600.000
700.000
800.000
900.000
1000.000
1977
1979
1981
1983
1985
1987
1989
1991
1993
1995
1997
1999
2001
2003
2005
2007
Year
Pop
ula
tion
Dohuk City pop.
Dohuk governorate pop.

Developing Country Studies www.iiste.org
ISSN 2224-607X (Paper) ISSN 2225-0565 (Online)
Vol.4, No.26, 2014
98
Figure 4 Urban and Rural Population percentage Dynamic in Duhok City. Data Sources Statistical Office in
Duhok City analyzed by the writer
Duhok City is a center for prosperity in the governorate; Duhok governorate had the unemployment rate at 13.2
in 2002. It has the lowest percentage for unemployment rates among the government’s cities (Hassan, 2004).
Housing in Duhok City
Housing profile in Duhok city
According to rations1 office in Duhok city 2008 there are 52488 families living in the city of Duhok, while the
municipality of Duhok registers 30027 a licensed built up houses in 2008, this fact implies that 22461 families
live in slums or in overcrowded housing units, which highlights the affordable housing even for rent is
inefficient.
Figure 6 shows that (43%) of Duhok’s population live in slums or overcrowded housing units. the informal
settlements in Duhok City are mainly characterized by the weak housing structures, over-crowding, faulty
alignment of streets, inadequate lighting, lack of safe drinking water, water logging during rains, and deficiency
of the basic physical and social services (See figure 7).
Figure 5 Housing affordability in Duhok City. Data Sources 2007 Rations office in Duhok city, license
department in Duhok municipality (Othman, Duhok City Municipality , 2009), analyzed by the writer
On the other side of the spectrum, there is a lack of small, affordable residential units for young people in the
Kurdistan Region. There is a need for planned unit developments of different sizes and price ranges that are
accessible for people with different income levels.
Significant proportion of informal settlement’s populations is a low-income group constituting about 88% while
the remainder divided between the middle and high-income groups. The illiteracy rate in slums relatively high
1 The rations office is the most reliable source for population statistic data the data base had been organized by WFP
0%
10%
20%
30%
40%
50%
60%
70%
80%
90%
100%
1947 1957 1977 1987 1996 2006
Rural population %
Urban population %
43%
57%
Housing in Duhok city
slums orovercrowdedhouses
own or renthouse

Developing Country Studies www.iiste.org
ISSN 2224-607X (Paper) ISSN 2225-0565 (Online)
Vol.4, No.26, 2014
99
compared to the other settlements especially among women. (Othman, Duhok City Municipality , 2006)
Figure 6 Informal settlements location in Duhok City (Othman, Duhok City Municipality , 2009), source
prepared by the writer
Housing Conditions, Quality and Tenure
This dysfunctional system of housing and land delivery has resulted in a deficiency in housing needs.
Infrastructure and service problems are a key concern among households. A majority of households complain
about the quality of their drinking water and almost 40 percent report daily problems with the supply of their
water. Sewage network unreliable, and 34 percent of households are not connected to the public sewerage
system. Moreover, 34 percent of households have raw sewage in the streets around their houses. Electricity
supply is another key problem. While virtually all urban households have connection to the public electrical
supply network, it typically works for few hours per day. Almost all households surveyed depend on up to three
sources of electricity (Technology, 2006).
Estimated housing needs in Duhok city
Population of Duhok city will grow to be 425,000 inhabitants in 2030, which reveals Duhok population increase
by 125,000 inhabitants during next 20 years (Malallah, 2009). The medium size of a single-family household is
about 5.2 people per family (Othman, Directorate of Rations in Duhok City , 2008).
With an estimated housing need over the twenty-year period from 2010 to 2030 of around roughly 52000 units in
Duhok City to be offer, it is necessary to scale up the current level of housing production.
The estimated need for new housing in Duhok city—52000 units—is broken down in response to (See figure 7);1
New housing construction (26520)
Reduction of overcrowding to acceptable numbers of households per dwelling unit Replacement of units in the
existing housing stock that becomes obsolete (3120)
Replacement of non-upgradeable units (1580 units)
Upgrading of those units that considered Informal settlements (7280 units).
1 The division relied on a survey made by the source (Technology, 2006)
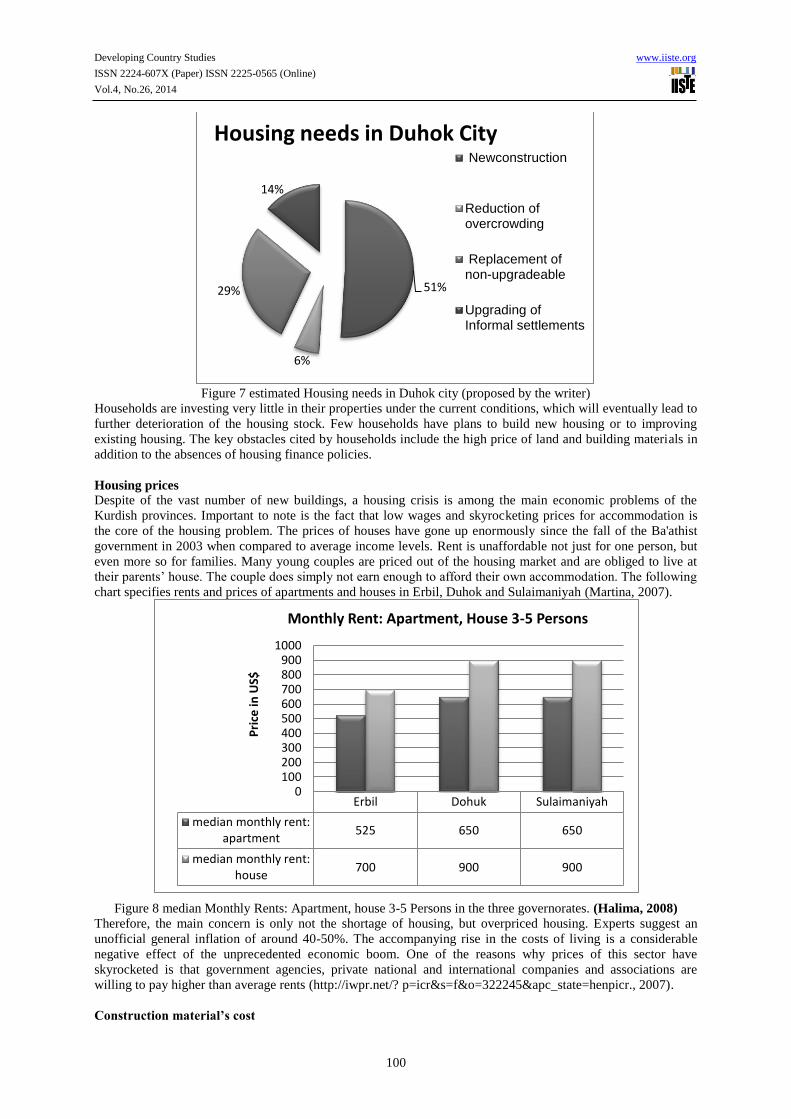
Developing Country Studies www.iiste.org
ISSN 2224-607X (Paper) ISSN 2225-0565 (Online)
Vol.4, No.26, 2014
100
Figure 7 estimated Housing needs in Duhok city (proposed by the writer)
Households are investing very little in their properties under the current conditions, which will eventually lead to
further deterioration of the housing stock. Few households have plans to build new housing or to improving
existing housing. The key obstacles cited by households include the high price of land and building materials in
addition to the absences of housing finance policies.
Housing prices
Despite of the vast number of new buildings, a housing crisis is among the main economic problems of the
Kurdish provinces. Important to note is the fact that low wages and skyrocketing prices for accommodation is
the core of the housing problem. The prices of houses have gone up enormously since the fall of the Ba'athist
government in 2003 when compared to average income levels. Rent is unaffordable not just for one person, but
even more so for families. Many young couples are priced out of the housing market and are obliged to live at
their parents’ house. The couple does simply not earn enough to afford their own accommodation. The following
chart specifies rents and prices of apartments and houses in Erbil, Duhok and Sulaimaniyah (Martina, 2007).
Figure 8 median Monthly Rents: Apartment, house 3-5 Persons in the three governorates. (Halima, 2008)
Therefore, the main concern is only not the shortage of housing, but overpriced housing. Experts suggest an
unofficial general inflation of around 40-50%. The accompanying rise in the costs of living is a considerable
negative effect of the unprecedented economic boom. One of the reasons why prices of this sector have
skyrocketed is that government agencies, private national and international companies and associations are
willing to pay higher than average rents (http://iwpr.net/? p=icr&s=f&o=322245&apc_state=henpicr., 2007).
Construction material’s cost
51%
6%
29%
14%
Housing needs in Duhok City Newconstruction
Reduction ofovercrowding
Replacement ofnon-upgradeable
Upgrading ofInformal settlements
Erbil Dohuk Sulaimaniyah
median monthly rent:apartment
525 650 650
median monthly rent:house
700 900 900
0100200300400500600700800900
1000
Pri
ce in
US$
Monthly Rent: Apartment, House 3-5 Persons

Developing Country Studies www.iiste.org
ISSN 2224-607X (Paper) ISSN 2225-0565 (Online)
Vol.4, No.26, 2014
101
As in most parts of the world, building costs have been rising significantly in the Kurdistan Region as a result of
rising prices for fuel, labor, and materials. For example, since 2000 cement prices have increased from $25 per
long ton to $125–$150 per ton, regardless of origin, and rebar steel has increased from $200 per ton to $700–
$800 per ton. The Kurdistan Contractors’ Union states that institutional construction costs have increased 5%–
600% over the last 10 years (International, 2008).
The construction materials, including steel reinforcing bar, fixtures, wiring, tile, and finishing products, are
imported. The Kurdistan Regional Government’s (KRG) Ministry of Industry lists 204 firms, of which over 100
are Turkish, that are supplying products to the construction industry in the Region. The lack of testing facilities
in the Region, however, hinders the industry’s ability to ensure the quality of building materials (Heshmati,
2007).
Key Bottlenecks in Housing Sector
Results from studies for the three KGR’s cities show existing housing conditions that are comparable to those
found by earlier studies and reports. All of these studies indicate a housing situation that appears to be relatively
normal but in reality suffers from a number of major problems. Poor housing production and current level of
disruption have seriously deteriorated both the quantity and quality of housing throughout the country. Housing
delivery systems have underperformed for many years, due in large part to the sector’s insufficient access to
human, financial and material resources.
The key bottlenecks of housing development are as follows:
Poorly Targeted and Reduced Subsidies for Housing Finance
Inefficient Use of State Building Materials and Public Sector Professionals
Uncertain Planning and Land Management policies
Insufficient Legal, Institutional and Policy Frameworks for Private Sector Housing (Housing, 2009) (Nations,
2008 - 2010) (PADCO, 2006) (Trade, 2008) (United Nations Human Settlements Programme, 2009)
KRG policies to eliminate housing problem
Investment law
In 2006, the investment law issued by the KRG government, with the view to creating a climate promoting
investment in the Iraqi Kurdistan region, removing any legal obstacles, and permitting the investment of national
and foreign capital collectively or individually in investment projects. Construction is one sign of the economic
boom in the KRG area. This and other business activities are helping the economy to expand at an estimated 10
percent annually (Corporation, 2007). The new legislation gives foreign investors the same rights as Iraqi
investors, including full ownership of the project. It also provides incentives, which favors investment in
construction projects, such as comprehensive tax exemptions.
Investment generally viewed as critical for economic development. Investment from abroad can bring the
benefits of technology transfer, new know-how, improvements to the quality of products and services and new
export opportunities. Yet foreign investment also has the potential to damage national economies, jeopardizing
growth and resulting in net outflows of capital for development. Whether or not investment benefits national
economies therefore depends critically on the terms under which it takes place (Trade, 2008).
Foreign companies and their non-Iraqi staff may freely transfer their profits or income abroad without paying
taxes or customs. In addition, imported equipment, furniture, machinery, and raw materials are under certain
conditions, exempt from taxes, duties, and import licenses.
According to Duhok trade chamber, the numbers of investors have increased significantly in Duhok city after
2006, figure 8 shows the number registered investors per year.
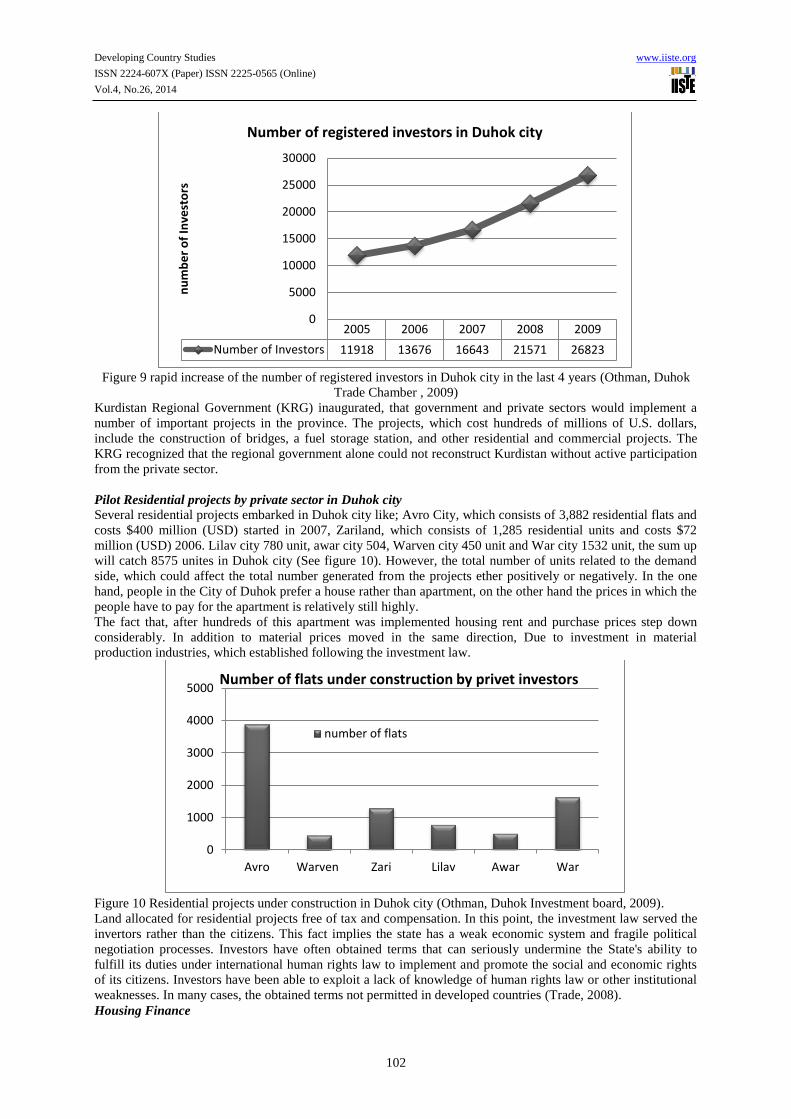
Developing Country Studies www.iiste.org
ISSN 2224-607X (Paper) ISSN 2225-0565 (Online)
Vol.4, No.26, 2014
102
Figure 9 rapid increase of the number of registered investors in Duhok city in the last 4 years (Othman, Duhok
Trade Chamber , 2009)
Kurdistan Regional Government (KRG) inaugurated, that government and private sectors would implement a
number of important projects in the province. The projects, which cost hundreds of millions of U.S. dollars,
include the construction of bridges, a fuel storage station, and other residential and commercial projects. The
KRG recognized that the regional government alone could not reconstruct Kurdistan without active participation
from the private sector.
Pilot Residential projects by private sector in Duhok city
Several residential projects embarked in Duhok city like; Avro City, which consists of 3,882 residential flats and
costs $400 million (USD) started in 2007, Zariland, which consists of 1,285 residential units and costs $72
million (USD) 2006. Lilav city 780 unit, awar city 504, Warven city 450 unit and War city 1532 unit, the sum up
will catch 8575 unites in Duhok city (See figure 10). However, the total number of units related to the demand
side, which could affect the total number generated from the projects ether positively or negatively. In the one
hand, people in the City of Duhok prefer a house rather than apartment, on the other hand the prices in which the
people have to pay for the apartment is relatively still highly.
The fact that, after hundreds of this apartment was implemented housing rent and purchase prices step down
considerably. In addition to material prices moved in the same direction, Due to investment in material
production industries, which established following the investment law.
Figure 10 Residential projects under construction in Duhok city (Othman, Duhok Investment board, 2009).
Land allocated for residential projects free of tax and compensation. In this point, the investment law served the
invertors rather than the citizens. This fact implies the state has a weak economic system and fragile political
negotiation processes. Investors have often obtained terms that can seriously undermine the State's ability to
fulfill its duties under international human rights law to implement and promote the social and economic rights
of its citizens. Investors have been able to exploit a lack of knowledge of human rights law or other institutional
weaknesses. In many cases, the obtained terms not permitted in developed countries (Trade, 2008).
Housing Finance
2005 2006 2007 2008 2009
Number of Investors 11918 13676 16643 21571 26823
0
5000
10000
15000
20000
25000
30000
nu
mb
er
of
Inve
sto
rs
Number of registered investors in Duhok city
0
1000
2000
3000
4000
5000
Avro Warven Zari Lilav Awar War
Number of flats under construction by privet investors
number of flats
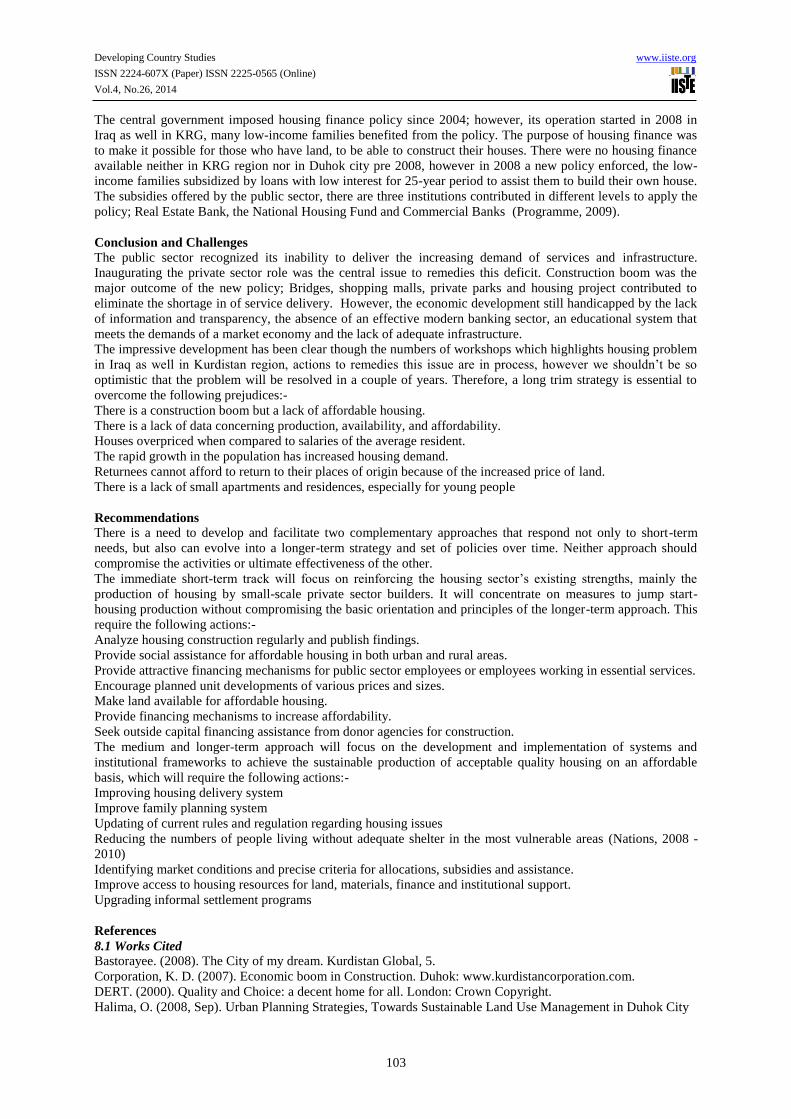
Developing Country Studies www.iiste.org
ISSN 2224-607X (Paper) ISSN 2225-0565 (Online)
Vol.4, No.26, 2014
103
The central government imposed housing finance policy since 2004; however, its operation started in 2008 in
Iraq as well in KRG, many low-income families benefited from the policy. The purpose of housing finance was
to make it possible for those who have land, to be able to construct their houses. There were no housing finance
available neither in KRG region nor in Duhok city pre 2008, however in 2008 a new policy enforced, the low-
income families subsidized by loans with low interest for 25-year period to assist them to build their own house.
The subsidies offered by the public sector, there are three institutions contributed in different levels to apply the
policy; Real Estate Bank, the National Housing Fund and Commercial Banks (Programme, 2009).
Conclusion and Challenges
The public sector recognized its inability to deliver the increasing demand of services and infrastructure.
Inaugurating the private sector role was the central issue to remedies this deficit. Construction boom was the
major outcome of the new policy; Bridges, shopping malls, private parks and housing project contributed to
eliminate the shortage in of service delivery. However, the economic development still handicapped by the lack
of information and transparency, the absence of an effective modern banking sector, an educational system that
meets the demands of a market economy and the lack of adequate infrastructure.
The impressive development has been clear though the numbers of workshops which highlights housing problem
in Iraq as well in Kurdistan region, actions to remedies this issue are in process, however we shouldn’t be so
optimistic that the problem will be resolved in a couple of years. Therefore, a long trim strategy is essential to
overcome the following prejudices:-
There is a construction boom but a lack of affordable housing.
There is a lack of data concerning production, availability, and affordability.
Houses overpriced when compared to salaries of the average resident.
The rapid growth in the population has increased housing demand.
Returnees cannot afford to return to their places of origin because of the increased price of land.
There is a lack of small apartments and residences, especially for young people
Recommendations
There is a need to develop and facilitate two complementary approaches that respond not only to short-term
needs, but also can evolve into a longer-term strategy and set of policies over time. Neither approach should
compromise the activities or ultimate effectiveness of the other.
The immediate short-term track will focus on reinforcing the housing sector’s existing strengths, mainly the
production of housing by small-scale private sector builders. It will concentrate on measures to jump start-
housing production without compromising the basic orientation and principles of the longer-term approach. This
require the following actions:-
Analyze housing construction regularly and publish findings.
Provide social assistance for affordable housing in both urban and rural areas.
Provide attractive financing mechanisms for public sector employees or employees working in essential services.
Encourage planned unit developments of various prices and sizes.
Make land available for affordable housing.
Provide financing mechanisms to increase affordability.
Seek outside capital financing assistance from donor agencies for construction.
The medium and longer-term approach will focus on the development and implementation of systems and
institutional frameworks to achieve the sustainable production of acceptable quality housing on an affordable
basis, which will require the following actions:-
Improving housing delivery system
Improve family planning system
Updating of current rules and regulation regarding housing issues
Reducing the numbers of people living without adequate shelter in the most vulnerable areas (Nations, 2008 -
2010)
Identifying market conditions and precise criteria for allocations, subsidies and assistance.
Improve access to housing resources for land, materials, finance and institutional support.
Upgrading informal settlement programs
References
8.1 Works Cited
Bastorayee. (2008). The City of my dream. Kurdistan Global, 5.
Corporation, K. D. (2007). Economic boom in Construction. Duhok: www.kurdistancorporation.com.
DERT. (2000). Quality and Choice: a decent home for all. London: Crown Copyright.
Halima, O. (2008, Sep). Urban Planning Strategies, Towards Sustainable Land Use Management in Duhok City
Developing Country Studies www.iiste.org
ISSN 2224-607X (Paper) ISSN 2225-0565 (Online)
Vol.4, No.26, 2014
104
Kurdistan Region, Iraq: Master thesis.
Hassan, K. G. (2004). Estimating and Analyzing the Gross Domestic Products of Duhok Governorate in 2001-
2002. Dissertation submitted to the College of Administration and Economics Council. University of
Salahaddin- Erbil, Kurdisatn Region.
Heshmati, A. (2007, Dec). A Model for Industrial Development of the Federal Region of Kurdistan. Science and
Technology Policy, Instruments and Institutions. Seoul National University: http://ssrn.com/abstract=1136375 or
DOI: 10.1111/j.0042-7092.2007.00700.x.
Housing, I. M. (2009). First Iraqi National Housing Conference. Final Recommendations.
http://iwpr.net/? p=icr&s=f&o=322245&apc_state=henpicr. (2007, Jul 12).
International, R. (2008). Kurdistan Region, Economic Development Assessment. Iraq: USAID .
Malallah, A. S. (2009, aug). Distribution of Health Facilities: Present, and Future Demands in Duhok City. A
Dissertation Submitted to the Higher Institute of Planning. Duhok, Iraq.
Martina, G. (2007). The Socio-Economic Situation in the KRG. Iraq: http://old.krg.org/docs/K_Const.asp.
Nations, M. S.-U. (2008 - 2010). United Nations, Iraq Assistance Strategy. Iraq: United Nations.
Othman, H. (2006, dec). Duhok City Municipality . Duhok, , Iraq .
Othman, H. (2008, April). Directorate of Rations in Duhok City . Iraq, Duhok.
Othman, H. (2009, feb 25). Duhok City Municipality . Duhok .
Othman, H. (2009, nov 5). Duhok Investment board. Duhok.
Othman, H. (2009, nov). Duhok Trade Chamber . Duhok, Iraq.
PADCO. (2006, Dec 6). Proceedings Iraq Housing Sector Analysis. Policy Directions Workshop. Amman,
Jordan: Iraqi Central Office of Statistics & Information Technology.
Programme, T. U. (2009). Supporting Recovery and Development in the Kurdistan Region. IRAQ:
http://www.iq.undp.org.
Programme, T. U. (2009). Supporting Recovery and Development in the Kurdistan Region. IRAQ: UNDP.
S. Lenferink, J. L. (2006). Urban Regeneration for Istanbul’s Golden Horn. Groningen: University of Groningen.
Technology, I. C. (2006). Iraq Housing Market Study. Iraq: Ministry of Construction & Housing.
Trade, K. R. (2008). Investment Agreements and Human Rights. ERBIL: KURDISTAN REGIONAL
GOVERNMENT MINISTRY OF TRADE.
TRADE, K. R. (2008). Investment Agreements And Human Rights. Erbil: Kurdistan Regional Government
Ministry Of Trade.
Tsenkova, S. (2002). Urban regeneration: learning from the British experience. Canada: Faculty of
Environmental Design University of Calgary.
UN-HABITAT. (2002). The world urban forum Nairobi. Nairobi: UN.
United Nations Human Settlements Programme, R. O. (2009). Country Programme Document, IRAQ. Nairobi,
Kenya: http://www.un-habitat.org.
United Nations Human Settlements Programme, R. O. (2009). COUNTRY PROGRAMME DOCUMENT,
IRAQ. Nairobi, Kenya: http://www.un-habitat.org.
ww.eduhok.net. (n.d.). Retrieved Aug 24, 2008, from ww.eduhok.net.
www.iraqmaps-Perry-astaedamapcollection-utlibrary . (n.d.). Retrieved sep 12, 2008, from www.iraqmaps.com.
Author’s bibliography:-
The author Graduated as architect engineer in 1992 from University of Mosel, Iraq. In 2007 obtained Diploma
from University of Dortmund, International Association of Development Planners. In 2009 obtained MSc from
university of Duhok. Thesis entitled Urban Planning Strategies, Towards Sustainable Land Use Management in
Duhok City Kurdistan Region, Iraq” was the first research discussing planning stagnation in Duhok City and
Kurdistan in general. Worked with private sector in construction projects especially in housing projects, started
work in Kurdistan in 2000 with urban planning office and Duhok Governorate’s engineering office, in additional
to work with world health organization (WHO).
The author Participated in several workshop in and outside Iraq with different subjects including Planning and
Management, Planning Network Middle East in Amman, Intercultural Dialogue in Germany, ITC 2009 remote
sensing and GIS in Duhok and women conference THINK BIG in 2009 Erbil.
The author has the position of Assistant lecturer in petroleum Engineering department, University of Zakho, in
additional to supervising universities’ construction projects.

Developing Country Studies www.iiste.org
ISSN 2224-607X (Paper) ISSN 2225-0565 (Online)
Vol.4, No.26, 2014
105
Analyzing Strategies and Measures for Inclusive, Sustainable and
Shared Growth: Egypt After the Uprisings
Dr. Sherifa Fouad Sherif
Associate Professor, Faculty of Economics and Political Science, Department of Public Administration
Cairo University
E-mail: [email protected]
Abstract
Economic Growth with the overuse of resources has come largely at the expense of the environment,
inclusive green growth ensures that economic and environmental sustainability are compatible. Growth is
necessary, but it will be unsustainable unless it is both socially inclusive and environmentally sound. Inclusive
green growth requires tackling political and economic constraints, overcoming deeply entrenched behaviors and
social norms, and developing innovative financing instruments to change incentives and promote innovation and
thus address the market, policy, and institutional failures that lead to the overuse of natural assets. Economic and
social sustainability, on the one hand, and social and environmental sustainability, on the other, have been found
to be not only compatible, but also largely complementary. This paper attempts to introduce the importance of
inclusive green growth with a direct focus on the implications of economic development and its impact on the
environment. Focusing on Egypt as its case study and addressing the severe repercussions of the two Egyptian
revolutions January 25 and June 30th from 2011 to date on the economy and what the government is attempting
to do to recover. While looking into the current economic reform measures the Egyptian Government is
introducing, this paper is providing a number of measures or recommendations to be taken in to consideration
during policy formulation and if administered will facilitate and ensure a more equitable sustainable future for
Egypt.
Statement of the Problem:
Egypt has gone through a major economic downfall and sever political instability as a result of two
revolutions, January 25th, 2011 and June 30th, 2013. Both resulting in the call for social justice, employment ,
freedom and democracy. The aftermath of these revolutions requires a severe economic reform plan. To be able
to ensure a better more sustainable future for Egypt that includes economic, social and environmental
development alike, the implementation of Inclusive Green Growth is essential. Growth has often come at the
expense of the environment, applying inclusive green growth may directly result in sustainable development and
a brighter future for Egypt.
Objectives of the Study:
1. Understanding what is meant by Inclusive Green Growth.
2. Looking into the political and economic constraints facing Egypt after the revolutions.
3. Promoting the use of Inclusive Green Growth as a mechanism for improving economic development.
4. Focusing on measures to be taken by the Egyptian Government to ensure a more sustainable future.
Questions of the Study:
1. What is Inclusive Green Growth?
2. How can Egypt move towards economic development without further harming of the environment?
3. Is Inclusive Green Growth the answer for economic, environmental and social sustainability?
4. What should the Egyptian Government do to implement Inclusive Green Growth?
Methodology: The methodology of this paper realizes on the qualitative approach to research, methods of
collection of data mainly using secondary data, interviews, analyzing existing data, such as archival documents.
Key Words: Environmental Degradation, Sustainability, Inclusive Green Growth, Economic Growth, Social
Equity, Public Policies
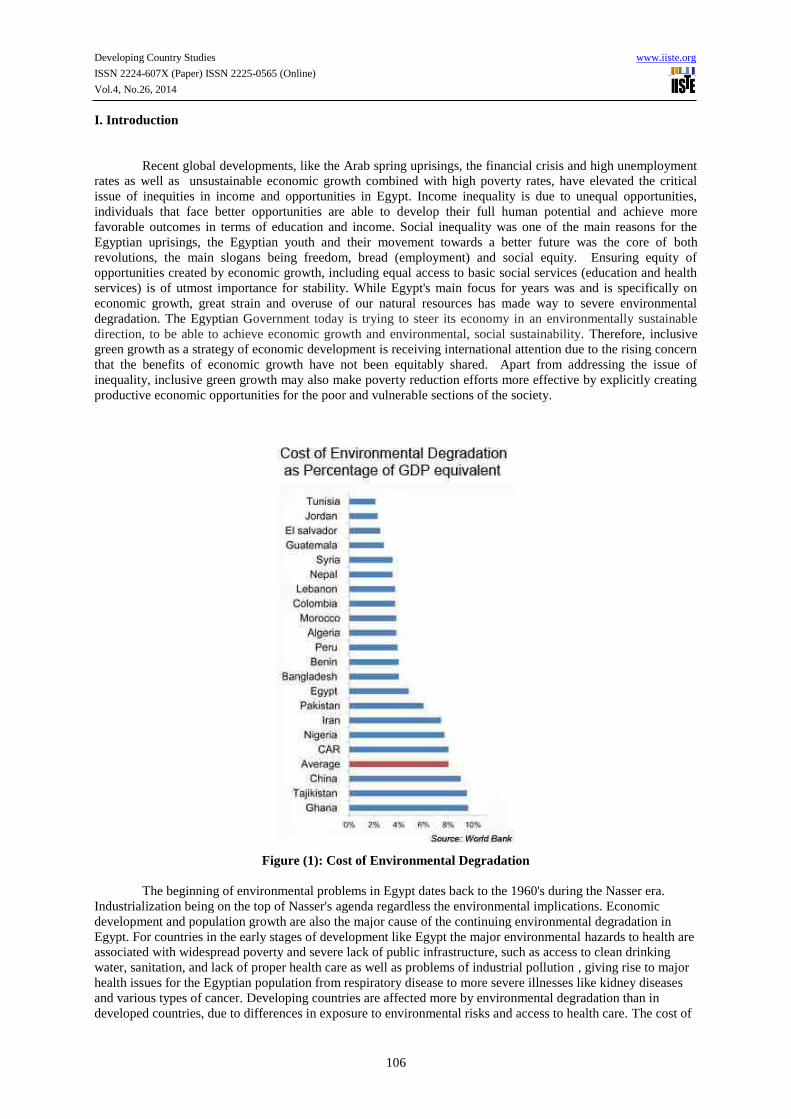
Developing Country Studies www.iiste.org
ISSN 2224-607X (Paper) ISSN 2225-0565 (Online)
Vol.4, No.26, 2014
106
I. Introduction
Recent global developments, like the Arab spring uprisings, the financial crisis and high unemployment
rates as well as unsustainable economic growth combined with high poverty rates, have elevated the critical
issue of inequities in income and opportunities in Egypt. Income inequality is due to unequal opportunities,
individuals that face better opportunities are able to develop their full human potential and achieve more
favorable outcomes in terms of education and income. Social inequality was one of the main reasons for the
Egyptian uprisings, the Egyptian youth and their movement towards a better future was the core of both
revolutions, the main slogans being freedom, bread (employment) and social equity. Ensuring equity of
opportunities created by economic growth, including equal access to basic social services (education and health
services) is of utmost importance for stability. While Egypt's main focus for years was and is specifically on
economic growth, great strain and overuse of our natural resources has made way to severe environmental
degradation. The Egyptian Government today is trying to steer its economy in an environmentally sustainable
direction, to be able to achieve economic growth and environmental, social sustainability. Therefore, inclusive
green growth as a strategy of economic development is receiving international attention due to the rising concern
that the benefits of economic growth have not been equitably shared. Apart from addressing the issue of
inequality, inclusive green growth may also make poverty reduction efforts more effective by explicitly creating
productive economic opportunities for the poor and vulnerable sections of the society.
Figure (1): Cost of Environmental Degradation
The beginning of environmental problems in Egypt dates back to the 1960's during the Nasser era.
Industrialization being on the top of Nasser's agenda regardless the environmental implications. Economic
development and population growth are also the major cause of the continuing environmental degradation in
Egypt. For countries in the early stages of development like Egypt the major environmental hazards to health are
associated with widespread poverty and severe lack of public infrastructure, such as access to clean drinking
water, sanitation, and lack of proper health care as well as problems of industrial pollution , giving rise to major
health issues for the Egyptian population from respiratory disease to more severe illnesses like kidney diseases
and various types of cancer. Developing countries are affected more by environmental degradation than in
developed countries, due to differences in exposure to environmental risks and access to health care. The cost of

Developing Country Studies www.iiste.org
ISSN 2224-607X (Paper) ISSN 2225-0565 (Online)
Vol.4, No.26, 2014
107
environmental degradation in Egypt is on the rise, as seen in the above figure being just above average. The
impact of environmental degradation in Egypt is devastating, resulting in an increase in the mortality rate, the
increase in the probability of premature death, health cost as well as decrease in productivity. Before tackling the
Egyptian case further the next section of this paper is devoted to introducing and defining inclusive growth.
sustainability and inclusive green growth.
II. Defining Inclusive Growth
According to Aghion and Howitt (1992), Inclusive growth is a concept which advances equitable opportunities
for economic participants during the process of economic growth with benefits incurred by every section of
society. The definition of inclusive growth implies direct links between the macroeconomic and microeconomic
determinants of the economy and economic growth. The microeconomic dimension captures the importance of
structural transformation for economic diversification and competition, while the macro dimension refers to
changes in economic aggregates such as the country’s gross national product (GNP) or gross domestic
product (GDP).
Sustainability as defined by the Environmental Protection Agency (EPA) is everything that we need
for our survival and well-being depends, either directly or indirectly, on our natural environment. Sustainability
creates and maintains the conditions under which humans and nature can exist in productive harmony, that
permit fulfilling the social, economic requirements of present and future generations. Sustainability ensures that
we will continue to have, the water, materials, and resources to protect human health and our environment.
(What is sustainability?, 2013).
Figure (2): The Three Spheres of Sustainability
Inclusive growth allows people to contribute to and benefit from economic growth, reducing the gap between the
rich and the poor. Rapid pace of growth is unquestionably necessary for substantial poverty reduction, but for
this growth to be sustainable in the long run and have that trickledown effect reaching the poor, also known as
pro-poor growth, it should be broad-based across all sectors. Inclusive growth refers both to the pace and pattern
of growth, which are considered interlinked, and therefore in need to be addressed together. "Both the pace and
pattern of growth are critical for achieving a high, sustainable growth as well as poverty reduction. Inclusiveness
is a concept that encompasses equity, equality of opportunity. The inclusive growth approach takes a short and
longer term perspective as the focus is on productive employment rather than on direct income redistribution, as
a means of increasing incomes for excluded groups." (Barro, R. 2000).
In the short run, governments could use income distribution schemes to attenuate negative impacts on the poor,
policies are intended to jump start growth. In poor countries such schemes can impose significant burdens on
already stretched budgets, and it is theoretically impossible to reduce poverty through redistribution in countries
where average income falls below US$ 700 per year. According to a recent OECD study, even in developed
countries, redistribution schemes cannot be the only response to rising poverty rates in certain segments of the
population. (A Toolkit of Policy Options to Support Inclusive Green Growth ,2012)
The inclusive growth definition is synonymous with pro-poor growth, growth is considered to be pro-poor as
long as poor people benefit in absolute terms. Growth is “pro-poor” if and only if the incomes of poor people
Developing Country Studies www.iiste.org
ISSN 2224-607X (Paper) ISSN 2225-0565 (Online)
Vol.4, No.26, 2014
108
grow faster than those of the population as a whole in this case inequality declines. However, while pro-poor
growth can be the result of direct income redistribution schemes, for growth to be inclusive, productivity must be
improved and new employment opportunities created. Therefore, inclusive growth is about raising the pace of
growth and enlarging the size of the economy, encouraging investment and increasing productive and
employment opportunities. Various definitions of “inclusive growth” all focus on the need for new approaches
to addressing economic, social and environmental issues, including inequalities in income, assets, financial and
human capital, education, health, and economic opportunities. "The international community is, therefore,
refocusing on “inclusive,” “sustainable,” and “shared” growth. These trio-objectives have become more apparent
in the wake of recent global economic, food and fuel crises and how these have affected the poor." (A Toolkit of
Policy Options to Support Inclusive Green Growth, 2012).
III. Policies for Inclusive Growth: Private Sector and Public Sector
"Policies for inclusive growth are an important component of most government strategies for sustainable growth.
For instance, a country that has grown rapidly over a decade, but has not seen substantial reduction in poverty
rates may need to focus specifically on the inclusiveness of its growth strategy, i.e. on the equality of opportunity
for individuals." (Barro, 2000) In countries starting at a very low income level and low growth, an inclusive
growth approach would be very close to an approach for speeding up the pace of growth, as the main focus
should be on getting the fundamentals for growth right. Therefore, great emphasis is being re-directed on the
private sector as a major force in development. They drive economic growth through investment, employment
and business creation, innovation and knowledge transfer. Ensuring that this growth is likely to contribute to
long-term poverty reduction requires private companies to include the poor as producers, suppliers, employees
and consumers. Under the right circumstances, public-private partnerships that are based on the identification of
complementary expertise and shared commercial and development interests are also an important tool that can
harness the private sector’s contribution to inclusive growth. (Barro,2000)
Public sector performs another key function in the pursuit of inclusive economic growth, there is a key link
between government institutions and development. Public institutions create the conditions and rules within
which sustained and inclusive economic growth driven by the private sector is possible. Strong public sector
capacity is needed to ensure that authorities are able to deliver services and carry out their regulatory and other
responsibilities in a transparent manner that strengthens the accountability ties between them and their citizens.
The combination of increased private sector activity alongside good public policies and robust institutions will
likely to lead to success. Achieving inclusive growth, accelerating growth and creating enough jobs for countries
with growing populations, governments must work to simplifying foreign direct investment and expand access to
banking to more of the population through micro financing, encouraging SME's (Small Medium Enterprises). In
addition, "governments should also reform the tax system and introduce a unified, national goods and services
tax, while doubling its spending on infrastructure. The governments objective should be to harness growth and
make the development process more inclusive and by doing so government's must focus on public policies."
(Alesina, A.& R. Perotti, 1996)
IV. Inclusive Green Growth: Taking the Environment Into Consideration
Inclusive green growth is a means to sustainable economic growth, by using natural resources in a
sustainable manner. The focus is for governments to come up with a strategy that synthesizes economic growth
and environmental protection. Building a green economy means proper management of a countries natural
resources taking into consideration resources consumption and environmental impacts. The scarcity of natural
and economic resources restoring GDP growth alone will not in itself permit us to overcome these social and
environmental threats. Environmental and social sustainability of modern economies have been exacerbated by
major threats we are facing, by 2030, average temperatures may increase by 1 ° C, global warming and climate
change being the number one environmental problem the world is shedding light on. In response to global
warming, resource depletion, economic downturns, high levels of poverty, wasteful settlement and urbanization
patterns, and a scarcity of adequate, affordable housing and services, twenty-first century public and private
decision-makers are focusing on sustainable development policies and programs designed to meet goals for a
shared prosperity that encompasses economic, social, environmental issues.

Developing Country Studies www.iiste.org
ISSN 2224-607X (Paper) ISSN 2225-0565 (Online)
Vol.4, No.26, 2014
109
Source: worldbank.org (2012)
Figure (3) Sustainable Development
Growth has often come at the expense of the environment. A variety of market, policy and institutional
failures means that the Earth’s natural capital tends to be used in ways that are economically inefficient and
wasteful, without sufficient reckoning of the true social costs of resource depletion. These failures threaten the
long-run sustainability of growth and progress made on social welfare (Alesina, A. & R. Perotti.1996). Inclusive
green growth aims to ensure that economic and environmental sustainability are compatible. During the past
decade developing countries have been acting according to the notion that it's not a problem to “grow dirty and
clean up later.” Committing to “clean up later,” comes at the expense of the irreversibility of environmental
damages like the loss of biodiversity and ozone depletion which will make subsequent shifts to more
environmentally benign structures and processes extremely costly. (Poverty in Egypt, 2012) Inclusive green
growth or green growth also offers competitive advantage to countries that are committing to policy innovations
that adapt to the international markets. The global market for green goods and services is vast and growing
offering the benefit of prosperity and job creation. To achieve sustainable development a country needs well
designed inclusive green growth policies that improves social welfare and promotes proper management of
natural resources.
V. Inclusive Green Policies: What should governments do?
The policy considerations needed to implement inclusive green growth differs across countries
depending upon their level of development. Poorer countries are more likely to find sustainable agriculture than
improved industrial practices at the heart of inclusive green growth. The economies of developing countries like
Egypt, especially low income countries (LICs), frequently exhibit characteristics that can hinder the
implementation of inclusive green growth policies. (A Toolkit of Policy Options to Support Inclusive Green
Growth, 2012). These characteristics often include the following:
• High dependence on natural resources for both livelihoods and economic growth
• High degree of vulnerability to climate change
• Lack of basic infrastructure and services
• High levels of poverty and inequality
• High population growth rates
• Rapid urbanization processes and growth of urban areas
• Severe economic, social and ecological threats from energy, food and water security
(Deininger, K., and L. Squire,1996)
Generic and specific policies are needed in all areas environmental, economic and social. For policies to
work, appropriate policy frameworks and governance arrangements must be in place. Capacity building and
knowledge sharing is also required as well as essential, the following are examples of instruments or
mechanisms that can facilitate the implementation and formulation of policies that will in turn lead to the
inclusive green growth:

Developing Country Studies www.iiste.org
ISSN 2224-607X (Paper) ISSN 2225-0565 (Online)
Vol.4, No.26, 2014
110
1. Environmental Reform and Charges: A range of taxation and pricing measures which can potentially raise
fiscal revenues, increase efficiency and improve social equity while furthering environmental goals.
2. Public Environmental Expenditure Review: Examining resource allocation among all sectors of the
government the efficiency and effectiveness of those allocations in the context of environmental priorities.
3. Sustainable Public Procurement: A process whereby organizations meet their needs for goods, services,
works and utilities in a way that achieves value for money on a whole life basis in terms of generating benefits
not only to the organization but also to society and the economy, whilst minimizing damage to the environment.
4. Strategic Environmental Assessment: integrate environmental considerations into policies and evaluate the
inter linkages with economic, social, and climate change considerations.
5. Social Protection Instruments: Social protection instruments ensure the provision of essential services and
transfers for individuals in need of protection in an effort to prevent them from falling into poverty or to assist
them out of poverty.
6. Certification for Sustainable Production: Certification identifies goods and services that have potential to
reduce adverse environmental and social impacts. Differentiating between green products can increase the
market value.
7. Green accounting: Green accounting extends national accounts to include the value of the damage and
depletion of the natural assets that affect production and human well-being. Adjusting for the depreciation of
assets and the depletion and degradation of the environment. (A Toolkit of Policy Options to Support Inclusive
Green Growth, 2012)
Well-designed inclusive green policies improve social welfare, taking into account not only present but
also future generations. Yet policy makers are also naturally concerned with the potential trade-offs and costs, as
well as the potential co-benefits of green policies for near-term growth and employment. Green growth can
provide a pathway to more sustainable development that reconciles the urgent need for sustained growth with the
imperative of avoiding lock-in to unsustainable growth patterns and irreversible environmental damages.
Inclusive green growth is not anti-growth; rather, it represents a change in how we manage economies to reflect
a broader conception of what constitutes effective and sustainable growth. "Environmental assets like water,
land, air, ecosystems and the services they provide represent a significant share of a country’s wealth. Just like
physical and human capital, natural capital requires investment, maintenance, and good management if it is to be
productive and fully contribute to prosperity. To accurately measure progress toward greener growth, countries
will find it useful to implement comprehensive wealth accounting and valuation of ecosystems alongside their
more conventional measures like GDP. "(A Toolkit of Policy Options to Support Inclusive Green Growth, 2012)
IV. Inclusive Green Growth Strategy: A World Bank Perspective
Inclusive green growth requires policies that are on their own terms good for growth, as well as for the
environment, examples of these policies are reforming energy subsidies or trade barriers that protect pollution-
intensive sectors. It entails politically difficult reforms in the patterns of pricing, regulation, and public
investment, and it calls for complex changes in behaviors and social norms. The World Bank’s report on
Inclusive Green Growth: The Pathway to Sustainable Development, outlines three strategies to be implemented
for pursuing greener growth:
1 – Tailor national inclusive green growth strategies to a country’s circumstances, with an emphasis on
maximizing local and immediate benefits. Optimal solutions will differ across countries with varying degrees of
institutional capacity, transparency, accountability, and civil society capacity.
2 – Promote efficient and sustainable decision-making by policymakers, consumers, and the private sector. The
use of pollution charges and other market-based instruments are important because they help incentivize
efficiency and spur innovation. An array of complementary approaches will be needed to nudge individuals
toward better behaviors and to unleash the power of the private sector. Critically, while we are still far from
accurate pricing for ecosystem services, they are clearly valuable. Natural assets should be systematically
incorporated into national accounts. The UN Statistical Commission adopted the System of Environmental and
Economic Accounting as an international standard in February 2012, providing a broadly agreed methodology.
Neglecting natural capital, like neglecting human and physical capital, is bad economics and bad for growth.
3 – Meet up-front capital needs with innovative financing tools. Given the scarcity of fiscal resources,
governments and multilateral financial institutions must work urgently to increase the role of the private sector in
green investment. Private-public partnerships are crucial, as is increasing access to financing for small and
medium enterprises. (Poverty in Egypt, 2012)
Developing Country Studies www.iiste.org
ISSN 2224-607X (Paper) ISSN 2225-0565 (Online)
Vol.4, No.26, 2014
111
VII. International Organizations Supporting Inclusive Green Growth
1.The African Development Bank (AfDB) is taking inclusive green growth to the heart of its long
term strategy and designing its operations to account for the African specificities, notably addressing the
infrastructure gap as a fundamental enabler for economic growth, managing more efficiently Africa’s natural
resources as its stock of wealth and main source of income, and boosting economic and social resilience. In
addition to its suite of green financing instruments such as ClimDev-Africa, Congo Basin Forest Fund (CBFF),
African Water Facility (AWF) and Sustainable Energy Fund for Africa (SEFA), AfDB is developing an Africa
Green Growth Facility for upstream work and capacity development on inclusive green growth. (Poverty in
Egypt, 2012)
2. The OECD (Organization for Economic Cooperation and Development) is actively engaged with
developing countries in many areas closely related to inclusive green growth. It has synthesized good practices
on topics such as Environmental Fiscal Reform, Strategic Environmental Assessment, Climate Change
Adaptation, and Capacity Development for Environmental Management and Governance to support efforts
towards inclusive green growth. OECD tracks development co-operation support with environmental objectives
and is currently also working with its members to mainstream green growth in areas of development co-
operation as diverse as private sector development, infrastructure investment, and trade-related assistance.
(Poverty in Egypt, 2012)
3. The UN (United Nations) system is a major provider of support; the system itself represents the
different elements of inclusive green growth—for example, with IFAD (International Fund for Agriculture
Development) focusing specifically on eradicating rural poverty, FAO (Food and Agriculture Organization)
promoting sustainable agricultural practices, WFP (World Food Program) fighting hunger worldwide, ILO
(International Labor Organization) promoting green job creation, UNEP (United Nations Environmental
Program) protecting the environment and providing advisory services on green economy, UNDP (United
Nations Development Program) working to reduce poverty and inequality and strengthen governance and
environmental sustainability, UNICEF (United Nations Children's Fund) and UNFPA (United Nations Fund for
Population Activities) promoting youth empowerment, UNIDO (United Nations Industrial Development)
supporting sustainable industrial development, and WHO (World Health Organization) addressing health issues.
(Poverty in Egypt, 2012)
4. The World Bank is working to mainstream inclusive green growth in its operations and knowledge
activities. The World Bank has launched a series of complementary activities with partners. Such initiatives
include: WAVES (Wealth Accounting and the Valuation of Ecosystem Services), LEDs (Low Emission
Development), Climate Finance Options Knowledge Platform, to name a few. In addition, the Global Green
Growth Institute (GGGI), the OECD, UNEP and the World Bank jointly launched in early 2012 a global network
of researchers and development experts seeking to identify and address major knowledge gaps in green growth
theory and practice. (Poverty in Egypt, 2012)
VIII. Inclusive Green Growth: Egypt's Sustainable Future
Egypt is suffering its worst economic crisis since the 1930's, managing to draw international attention to
its reforms and recovery. Four years have passed after the first revolution that swept away a 60-year-old
autocratic system, Egypt needs a new economic vision based on more inclusive growth and greater social justice.
Economic policies before the revolution achieved high growth, but they failed to be inclusive as they left about
45 million Egyptians trapped in lower middle class status living on $2-$4 a day and provided few opportunities
for youth who felt economically and socially excluded. (Ghanem, H, 2014)
"Amid the political turmoil, economic growth remains weak with a high fiscal deficit and gross public
debt (domestic and external) rising to nearly 100% of GDP at the end of June 2013. Low growth rates posed the
danger of fuelling social frustration as they could not deliver the numbers of jobs and opportunities needed.
Unemployment reached over 13% in June 2013. Critically, more than three-quarters of the unemployed are
between 15 and 29 years of age." (Ghanem, H. 2014) Inclusiveness would require a more participatory decision-
making process, as well as a shift away from a system of crony capitalism to one that focuses on developing
small businesses and on creating more opportunities for the youth. The government is currently under pressure to
adopt measures to stabilize the economy. Articulating a vision for future growth with economic development,
social justice, and taking steps to implement it, could make such measures more acceptable to the majority of
Egyptians.
Taking difficult stabilization measures is necessary because Egypt is facing a macroeconomic crisis.
The fiscal deficit is about 12 percent of GDP, the public debt has increased to 80 percent of GDP, international

Developing Country Studies www.iiste.org
ISSN 2224-607X (Paper) ISSN 2225-0565 (Online)
Vol.4, No.26, 2014
112
reserves barely cover three months of imports and the Egyptian pound is under increasing pressure. As a result
investment and growth are down, unemployment is up, prices of basic necessities are rising, and fuel shortages
and electricity blackouts are common occurrences. Egyptian being worse off today than from the beginning of
the uprisisngs. "They have been patient, and have accepted temporary economic hardship as the price of freedom
and democracy." (Ghanem, H, 2014)
For four years economic issues have been put aside while Egyptians focused on politics and questions
of religion and national identity. As a result, the economic situation has seriously deteriorated and aspirations for
better living standards and greater equity are far from being met. The Government decided to launch a broad
economic dialogue. This dialogue needs to be institutionalized and extended beyond stabilization to include
strategies to achieve inclusive growth. A strategy to achieve inclusive growth and social justice is one of the
outcomes of such a dialogue. (Ghanem, H, 2014)
Programs to encourage youth entrepreneurship and develop small businesses should be part of such an
inclusive growth strategy. It has become increasingly hard for educated young people to find jobs, and youth
with secondary education or above represent about 95 percent of the unemployed in Egypt. The problem is
particularly acute for young women who are 3.8 times more likely to be unemployed than young men. Of the
young men and women who do find jobs, only 28 percent find formal sector jobs, 18 percent in the public sector
and 10 percent in the formal private sector. The vast majority, 72 percent, end up working in the informal micro
and small enterprise sector, often as unpaid family workers. For those who are paid, many have no labor
contract, no job security or social benefits. (Poverty in Egypt, 2012).
Therefore, it seems quite clear that policies and programs that aim at expanding and modernizing small
business, and encouraging educated youth to start their own enterprises would have a significant impact on
employment, and would contribute to growth and social justice. The challenges facing Egypt with the structural
imbalances facing the economy over decades, which is linked to environmental degradation is not only
threatening growth but the continuity of human life in Egypt. Continuous and widespread variety of development
programs streamline the joint interests of stakeholders, inviting participation nationwide. (Soliman, S. 2014) For
this to be achieved the Egyptian government must look into both short-term and long term reforms for not
Inclusive Growth but Inclusive Green Growth. After the second revolution and presidential elections resulting in
Abdel Fatah El- Sisi taking office, his main focus is on Egypt's economic crisis and how to jump start and rescue
the economy after two revolutions, January 25th and June 30th. Egypt's current economic reform plan is
considered by many moving towards a new record pace, reaching the lowest unemployment rate 12.3% since
2011. Since Sisi's election and the introduction of a rigorous reform, there has been some economic
improvement with the introduction of ambitious projects like the $8.5 billion new Suez Canal, re-directing of
subsidies as well as focusing on renewable energy sources. The following are short and long term
recommendations to be taken into consideration that will eventually lead to Inclusive Green Growth and a
sustainable future for Egypt.
Short-Term Reform:
1. Reassure low income groups by guaranteeing the basic and strategic goods.
2. Apply minimum and maximum wage in both sectors. (currently being applied)
3. Alleviate poverty through cash transfers, subsidies and strict control over prices of basic goods and services.
4. Financial and marketing facilities for small and micro projects to create opportunities and incentives for new
ones.
5. Provide credit and financial facilities to troubled sectors for recovery.(tourism, agricultural)
6. Upgrade technology to increase exports as well as environmentally friendly production.
(Soliman, S. 2014)
Long-Term Reforms:
1. Widening of industrial export base.
2. Dealing with productive sector bottle necks co-existing with unemployment and inflationary pressures.
3.Widespread corruption, poverty and unemployment lie behind the waste of resources and low productivity.
Therefore administrative, regulatory and legal measures are essential.
4. Lack of strategic economic security with respect to Egypt's three basic needs food, energy and water.
5. Strong and efficient executive, legislative, judicial and regulatory coordinated institutions.
6. Work closely together with localities, NGO's and international institutions.
(Soliman. S ,2014)
Developing Country Studies www.iiste.org
ISSN 2224-607X (Paper) ISSN 2225-0565 (Online)
Vol.4, No.26, 2014
113
The new Egypt requires an administration with a vision to be able to raise the standard of living,
provide social equity and justice with the implementation of inclusive green growth. Reducing the gap between
the rich and the poor, focusing on pro-poor growth as well as achieving the trickledown effect which is the
essence of inclusive green growth. The new administration must take into consideration inclusive green growth
policies and strategy as well as implementing both the short-term and long-term reforms. These strategies must
include problems of regional inequalities and rural poverty. By doing so Egypt will get closer to Inclusive Green
Growth, thus providing a sustainable future for all Egyptians. The following table tries to put Egypt's future on
the grid which abides by Inclusive Green Growth.
Table 1
Egypt 2020: The Future
Targets
-Increase employment for age groups between 20-65 -Raising minimum wage - Reduce the number of Egyptians living under poverty line -Social Justice through proper pension plans and consumer subsidies -Enhancing education -Health care plan for all Egyptians -Decrease of Greenhouse Gas emissions -Increase energy efficiency and use of renewable energy sources
Smart Growth Sustainable Growth Inclusive Growth
Innovation and education: Focusing on research and innovation, strengthening the innovation chain and boosting investment. Enhance the performance of the educational s system.
Climate and Energy: 'Resource Efficient Egypt" Developing economic growth increase the use of renewable sources. Modernizing of transport sector and promoting energy efficiency.
Skills and Employment: Labor mobility and the development of skills better matching of labor demand and supply.
Digital Society: high speed internet benefiting from the digital market and focusing on enhancing e-government
Competitiveness: Improving the business environment especially for SME's (Small, Medium Enterprises). Developing a strong and sustainable base being able to compete globally.
Fighting and Poverty: ensure social and territorial cohesion benefits of growth and jobs are widely shared and people experiencing poverty and social exclusion are able to live in dignity.
Source: Researcher
Developing Country Studies www.iiste.org
ISSN 2224-607X (Paper) ISSN 2225-0565 (Online)
Vol.4, No.26, 2014
114
IX. Conclusion
Inclusive green growth has a distinct character focusing on both the pace and pattern of growth. Rapid pace of
growth is unquestionably necessary for substantial poverty reduction, but for this growth to be sustainable in the
long run, it should be increasingly broad-based across sectors, and inclusive of the large part of the country’s
labor force. Inclusive green growth is not only about the pace of growth and enlarging the size of the economy,
while leveling the playing field for investment and increasing productive employment opportunities. It focuses
on constraints to sustained, high growth, and not only on one group – the poor. Policies for inclusive growth are
an important component of any government strategy for sustainable growth and the frameworks for inclusive
green growth. The inclusive green growth approach takes a longer term perspective. With this longer term
perspective, it is important to recognize the time lag between reforms and outcomes. Inclusive green growth
analytics is about policies that should be implemented in the short run, but for sustainable inclusive green growth
in the future.
The social revolutions in the Middle East have brought inclusiveness to the center of debates, often with
(youth) unemployment as a key concern, especially in the case of Egypt. Therefore, inclusive and pro-poor
growth should be seen as fundamental to the Egyptian government’s goals, with raising minimum wages, giving
permanent status to temporary workers, consumer subsidies and pensions as key channels to enhance social
justice. Thus, calling for not only inclusive growth but inclusive green growth, promoting sustainability and a
better future for Egypt for generations to come. Green growth policies vary across countries depending on
political, economic realities, resources and challenges. But in all cases, care must be taken that these policies
further goals of inclusiveness and poverty reduction so they can contribute to achieving sustainable
development. Finally, success in reaching inclusive green growth will require that policies be based on sound
knowledge and be matched to local capacities, revolving around proper use of our natural resources. Knowledge
and capacity building initiatives are therefore needed to produce results on the ground, providing a basis for
greening economies through policies that drive green and inclusive growth.
References Aghion, P., N. Bloom, R. Blundell, R. Griffith, and P. Howitt (2005) “Competition and Innovation: an Inverted
Relationship” Quarterly Journal of Economics.
Aghion, P., and P. Howitt (1992) A Model of Growth through Creative Destruction. Econometrica, Econometric
Society 60(2) (March).
Alesina, A. and R. Perotti (1996) “Income Distribution, Political Instability, and Investment.” European
Economic Review. Alesina, A. and D. Rodrik (1994) “Distributive Policies and Economic Growth.” Quarterly
Journal of Economic.
Barro, R. (2000). “Inequality and Growth in a Panel of Countries.” Journal of Economic Growth.
Birdsall N. and J. Londono (1997) “Asset Inequality Matters: An Assessment of the World Bank’s Approach to
Poverty Reduction”. American Economic Review Papers and Proceeding.
Bourguignon, F. (2003) “The Growth Elasticity of Poverty Reduction; Explaining Heterogeneity Across
Countries and Time Periods.” In Inequality and Growth: Theory and Policy Implications, ed.
Eicher and S. Turnovsky. Cambridge, MA: MIT Press. Deininger, K., and L. Squire (1996) “A New Data Set
Measuring Income Inequality.” World Bank Economic Review.
Ghanem H. (2014) "Improving Regional and Rural Development for Inclusive Growth in Egypt" Working Paper
67, Brookings Institution, Washington D.C.
Soliman, S (2014) "A Perspective for Inclusive Growth in Egypt", FEPS, Faculty of Economic and Political
Science, Cairo University, Annual Conference.
Rodregez S. and Roman S. (2002) "Sustainability Assessment and Reporting for the University of Michigan's
Ann Arbor Campus", Center for Sustainable Systems, University of Michigan.
World Bank (2011) "Poverty in Egypt" Report No. 60249-EG, Washington D.C. Retrieved from:
http://www.worldbank.org/en/news/feature/2012/05/09/growth-to-inclusive-green-growth-economics-
sustainable-development
"A Toolkit of Policy Options to Support Inclusive Green Growth" (2012) Retrieved from:
http://www.oecd.org/greengrowth/toolkit/2012
What is Sustainability? (2013). Retrieved from:
http :// www.epa.gov/sustainability/2013

Developing Country Studies www.iiste.org
ISSN 2224-607X (Paper) ISSN 2225-0565 (Online)
Vol.4, No.26, 2014
115
An Exploratory Factor Analysis of the Revision Strategies
Questionnaire in an Underachieved ESL Writers’ Context
Wardatul Akmam Din (Corresponding author)
Centre for the Promotion of Knowledge and Language Learning,
Universiti Malaysia Sabah, 88400 , Kota Kinabalu, Sabah, Malaysia
Tel: +6088320000 ext 5145 E-mail: [email protected]
Siti Jamilah Bidin
School of Education and Modern Languages, UUM CAS
Universiti Utara Malaysia, 06010 , UUM Sintok, Kedah, Malaysia.
Tel: +6049285533 Email: [email protected]
ABSTRACT
Although various aspects of the writing process have been studied extensively of late,
research on weak students’ revision strategies has been notably lacking. This paper focuses on
the first of three parts involved in this research. It is the scale development stage in which the
scales used in the study were validated mainly through confirmatory factor analysis (CFA).
Then a model was hypothesized and tested through structural equation modelling
approach to reflect the relationships between students’ writing attitude, behaviour and
difficulties in ESL writing. Finally an ESL writing strategies training program would be
conducted to the participants to explore whether the writing strategies training programme
embedded in a ‘normal’ course curriculum would have any impact on the students’ ESL
writing performance. For the purpose of this paper, CFA was performed to test the reliability
and validity of the constructs, including item loading, construct reliability, and average
variance extracted (AVE). CFA was executed via Structural Equation Modelling (SEM)
technique utilizing Analysis of Moment Structure (AMOS) computer programme version 21.
It is a requirement that item loadings for every factor to exceed 0.50 to be considered as items
having sufficient loading values to represent its expected factor (Hair, et al., 2010). There
were three sets of CFA that had been examined: (i) writing attitude, (ii) writing behaviour, and
(iii) writing difficulties. Results demonstrate that the standardized loadings for each item were
above 0.50, Cronbach’s Alpha and composite reliability exceeded 0.70 and AVE values
beneath 0.50 (Hair et al., 2010). Hence, the factors are reliable, and have a good convergent
validity and reasonable to be used for the further analysis, that is in the structural model.
INTRODUCTION
A significant number of research and theoretical studies have been conducted on the topic of
composing process in writing. It is generally accepted that writing is a complex skill, and
concerns about how to teach it are not new. Various teaching strategies have been introduced
and tried by second language educators to allay these concerns. In composition, second
language educators have been moving towards an emphasis on process, rather than product,
and in consequence, there are a variety of available sources providing research findings on
how students learn to write, suggesting new teaching strategies, and arguing for curricular
changes. All these are carried out in the interest of second language writing.
This new focus on the learners and what they do to learn the L2 more effectively is
encouraging. Even more heartening are the studies that report positive interactions between
Developing Country Studies www.iiste.org
ISSN 2224-607X (Paper) ISSN 2225-0565 (Online)
Vol.4, No.26, 2014
116
strategy use and language test performance (Cohen, 1987; Gu & Johnson, 1996; Huang & Van
Naerssen, 1987; Park, 1996, Ghafournia & Afghari, 2013). The time is, therefore, for more
research into the investigation of relationships between writing strategy use and L2 writing
ability, given the crucial role played by the latter in the academic success and, by extension,
the educational and career prospects of L2 learners. This emphasis on L2 writing ability
underscores the need for studies that empirically investigate the relationships between L2
writing strategy use and L2 writing ability.
In order to fully understand the complexity of the writing skill, the current theory of
composition instruction, namely the process approach will be considered first. It was not until
the early 1970s that teachers and educators gave proper consideration to why some writers
were good and others were not. This, in a way, was a recognition of the weaknesses in the
product approach (Raimes, 1983) and thus signaled the emergence of the process approach,
with its emphasis on writing as a process rather than a product. In relation to this, Hairston
(1982: 85) noted that:
[Writing] is messy, recursive, convoluted, and uneven. Writers write, plan, revise,
anticipate, and review throughout the writing process, moving back and forth among
the different operations involved in writing without any apparent plan.
Hedge (2000: 359) stated that the focus of a process approach ‘is not so much on what
learners need to cover but on how they acquire language through performing it in the
classroom’. The process approach generally considers writing to be a learner-focused
cognitive activity (e.g., composing processes or strategies). Writing is essentially a cognitive
activity, completely under the control of the individual learner and used primarily to impart
information. Advocates of process pedagogy emphasise that writing is not a product but a
process: one that helps students discover their own voice and helps others to recognise that
students have something important to say. The process approach involves allowing students to
choose their own topics; provides teacher and peer feedback; encourages revision; and uses
student writing as the primary text of the course. As time progressed, research on the act of
composing began to appear, providing empirical support for the teaching of writing as a
process.
Following this developing research, an increasing number of teachers and programs began to
emphasise what Susser (1994) identified as the two essential features of process pedagogy:
awareness and intervention. Hairston (1982:122) characterised the move as “a process-
centered theory of teaching writing’’ and thus gave rise to the thought that the composition
studies are probably in the first stages of a paradigm shift. There is no doubt that the process
movement helped to call for attention to aspects of writing that had been neglected in many
writing classrooms; it also contributed to the professionalisation of composition studies.
The purpose of the study was to examine the relationships between writing behaviour, attitude
and difficulties, and second language (L2) writing ability in academic writing. This study
utilized a questionnaire to gather writing strategy use, attitude and difficulties, and writing
ability data from 800 undergraduate ESL participants. Exploratory factor analysis (EFA) will
be used to identify the latent factors the students’ writing behaviour, attitudes and difficulties.
METHOD FOR FACTOR ANALYSIS
Analysis of measurement model is achieved by inspecting the item loadings for exploratory
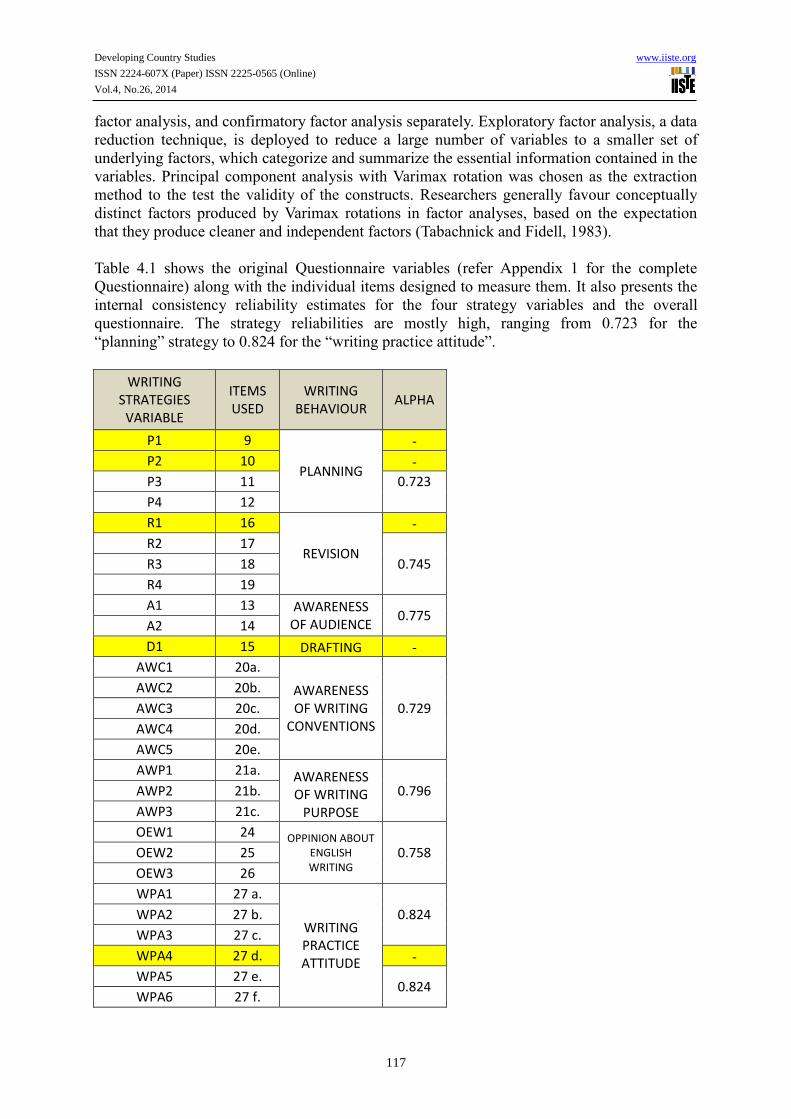
Developing Country Studies www.iiste.org
ISSN 2224-607X (Paper) ISSN 2225-0565 (Online)
Vol.4, No.26, 2014
117
factor analysis, and confirmatory factor analysis separately. Exploratory factor analysis, a data
reduction technique, is deployed to reduce a large number of variables to a smaller set of
underlying factors, which categorize and summarize the essential information contained in the
variables. Principal component analysis with Varimax rotation was chosen as the extraction
method to the test the validity of the constructs. Researchers generally favour conceptually
distinct factors produced by Varimax rotations in factor analyses, based on the expectation
that they produce cleaner and independent factors (Tabachnick and Fidell, 1983).
Table 4.1 shows the original Questionnaire variables (refer Appendix 1 for the complete
Questionnaire) along with the individual items designed to measure them. It also presents the
internal consistency reliability estimates for the four strategy variables and the overall
questionnaire. The strategy reliabilities are mostly high, ranging from 0.723 for the
“planning” strategy to 0.824 for the “writing practice attitude”.
WRITING STRATEGIES
VARIABLE
ITEMS USED
WRITING BEHAVIOUR
ALPHA
P1 9
PLANNING
-
P2 10 -
P3 11 0.723
P4 12
R1 16
REVISION
-
R2 17
0.745 R3 18
R4 19
A1 13 AWARENESS OF AUDIENCE
0.775 A2 14
D1 15 DRAFTING -
AWC1 20a.
AWARENESS OF WRITING
CONVENTIONS 0.729
AWC2 20b.
AWC3 20c.
AWC4 20d.
AWC5 20e.
AWP1 21a. AWARENESS OF WRITING
PURPOSE
0.796 AWP2 21b.
AWP3 21c.
OEW1 24 OPPINION ABOUT ENGLISH WRITING
0.758 OEW2 25
OEW3 26
WPA1 27 a.
WRITING PRACTICE ATTITUDE
0.824 WPA2 27 b.
WPA3 27 c.
WPA4 27 d. -
WPA5 27 e. 0.824
WPA6 27 f.
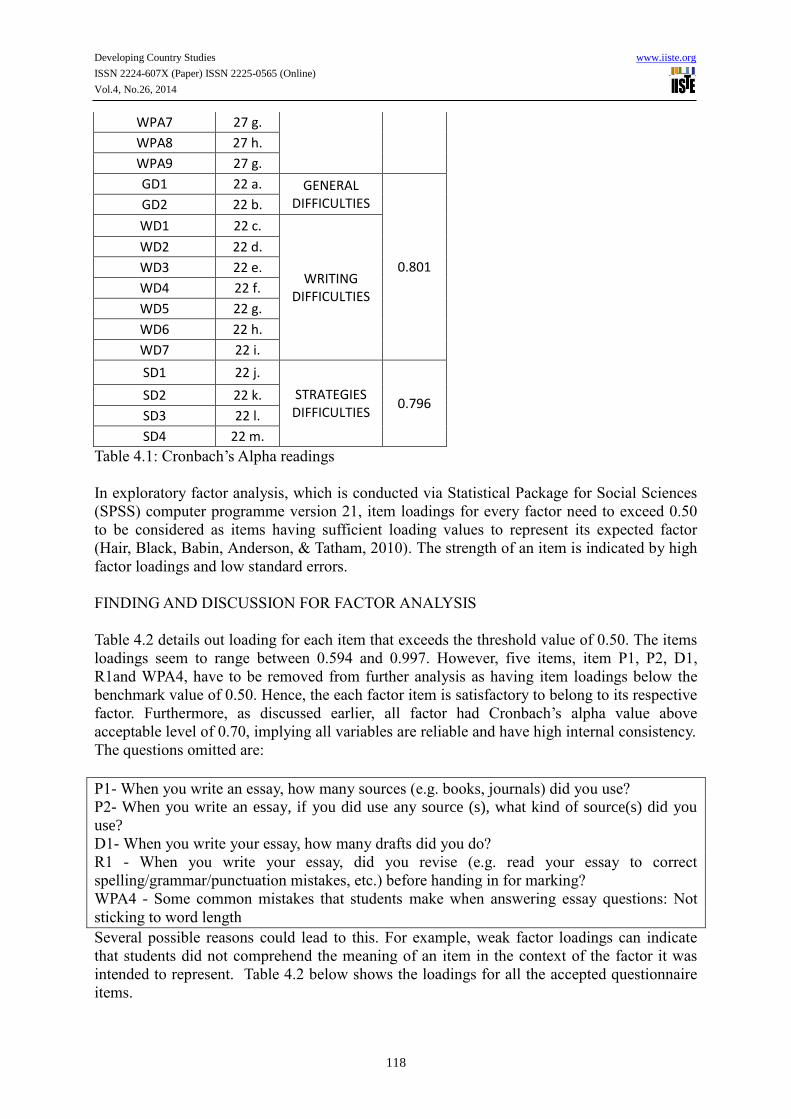
Developing Country Studies www.iiste.org
ISSN 2224-607X (Paper) ISSN 2225-0565 (Online)
Vol.4, No.26, 2014
118
WPA7 27 g.
WPA8 27 h.
WPA9 27 g.
GD1 22 a. GENERAL DIFFICULTIES
0.801
GD2 22 b.
WD1 22 c.
WRITING DIFFICULTIES
WD2 22 d.
WD3 22 e.
WD4 22 f.
WD5 22 g.
WD6 22 h.
WD7 22 i.
SD1 22 j.
STRATEGIES DIFFICULTIES
0.796 SD2 22 k.
SD3 22 l.
SD4 22 m.
Table 4.1: Cronbach’s Alpha readings
In exploratory factor analysis, which is conducted via Statistical Package for Social Sciences
(SPSS) computer programme version 21, item loadings for every factor need to exceed 0.50
to be considered as items having sufficient loading values to represent its expected factor
(Hair, Black, Babin, Anderson, & Tatham, 2010). The strength of an item is indicated by high
factor loadings and low standard errors.
FINDING AND DISCUSSION FOR FACTOR ANALYSIS
Table 4.2 details out loading for each item that exceeds the threshold value of 0.50. The items
loadings seem to range between 0.594 and 0.997. However, five items, item P1, P2, D1,
R1and WPA4, have to be removed from further analysis as having item loadings below the
benchmark value of 0.50. Hence, the each factor item is satisfactory to belong to its respective
factor. Furthermore, as discussed earlier, all factor had Cronbach’s alpha value above
acceptable level of 0.70, implying all variables are reliable and have high internal consistency.
The questions omitted are:
P1- When you write an essay, how many sources (e.g. books, journals) did you use?
P2- When you write an essay, if you did use any source (s), what kind of source(s) did you
use?
D1- When you write your essay, how many drafts did you do?
R1 - When you write your essay, did you revise (e.g. read your essay to correct
spelling/grammar/punctuation mistakes, etc.) before handing in for marking?
WPA4 - Some common mistakes that students make when answering essay questions: Not
sticking to word length
Several possible reasons could lead to this. For example, weak factor loadings can indicate
that students did not comprehend the meaning of an item in the context of the factor it was
intended to represent. Table 4.2 below shows the loadings for all the accepted questionnaire
items.

Developing Country Studies www.iiste.org
ISSN 2224-607X (Paper) ISSN 2225-0565 (Online)
Vol.4, No.26, 2014
119
Table 4.2: Item Loadings
Items Label Loadings Total
Variance
Explained
Percentage
Variance
Explained
Cronbach’s
Alpha
Planning P 1.825 45.621 0.723
When you write an essay, did you make a
rough plan before starting to write?
P3 0.946
If your answer to Question 11 was YES,
what type of plan did you make?
P4 0.933
Awareness of Audience AAD 1.871 62.374 0.775
When you write your essay, did you have
an audience (readers of your essay) in mind
when writing?
A1 0.960
If your answer to question 9 was YES,
which audience did you have in mind?
A2 0.956
Revision R 1.675 41.874 0.745
If your answer to question 16 was YES,
how important were the following when
revising your last essay?.
R2 0.594
Did you have others to help you revise
(e.g. read your essay to check
spelling/grammar/punctuation mistakes,
etc.) your last essay before handing in for
marking?
R3 0.823
If your answer to question 18 was YES,
who helped you revise your last essay?
R4 0.740
Awareness of Writing Conventions AWC 2.418 48.361 0.729
Proper referencing AWC1 0.613
Organizing/structuring ideas AWC2 0.727
Using appropriate academic language AWC3 0.683
Engaging/interacting with content/subject
Matter
AWC4 0.713
Develop understanding of content/subject
matter
AWC5 0.734
Awareness of Writing Purpose AWP 1.667 55.579 0.796
To summarize the available literature
(information on a particular topic)
AWP1 0.649
To summarize the available literature and
add your own comments/criticisms /
AWP2 0.821
To use literature in order to generate your
own comments, ideas or response to the
topic in general
AWP3 0.756
Opinion about English Writing OEW 1.796 59.877 0.758
Do you enjoy writing essays? OEW1 0.833
How confident are you in essay writing? OEW2 0.786
To what extent does essay writing help you
understand the content (subject matter) of
what you are writing?
OEW3 0.696
Writing Practice Attitude WPA 3.788 42.084 0.824
Plagiarizing (using someone’s ideas
without saying so
WPA1 0.677
Improper referencing format format WPA2 0.567
Little or no use of references WPA3 0.598
Not sticking to word length WPA5 0.757
Poor essay organization (no introduction,
main body, and conclusion)
WPA6 0.682
No evidence of research WPA7 0.738
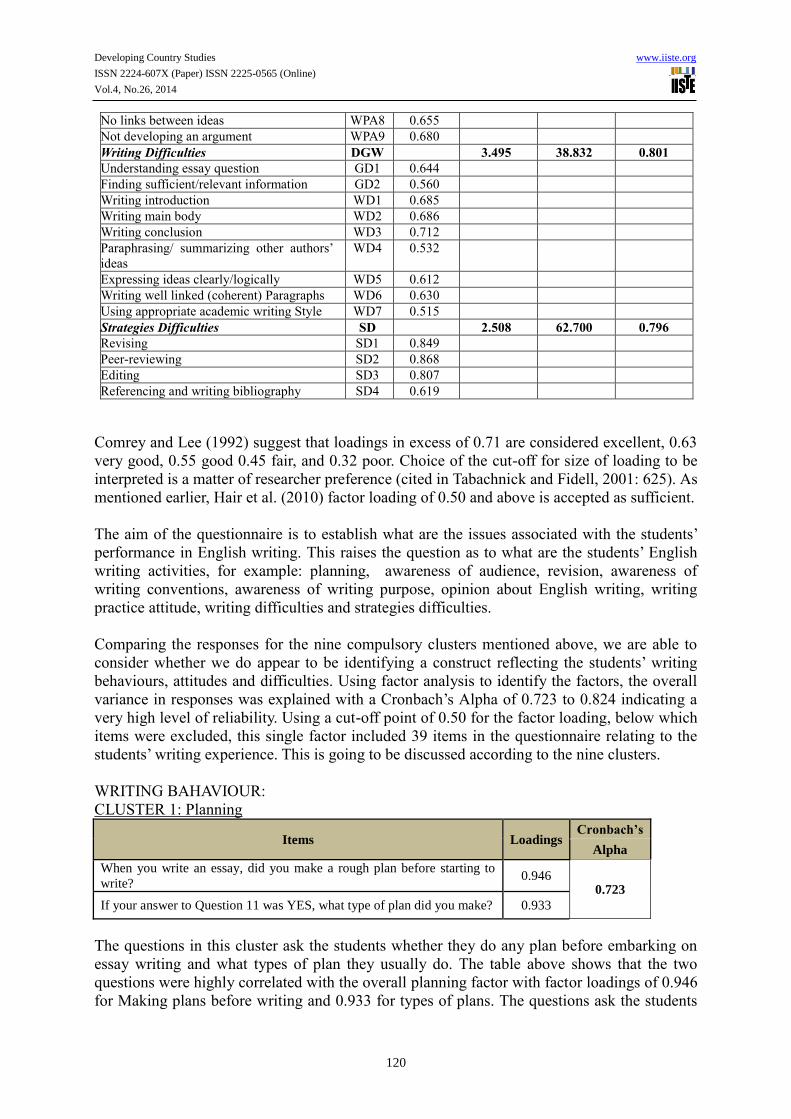
Developing Country Studies www.iiste.org
ISSN 2224-607X (Paper) ISSN 2225-0565 (Online)
Vol.4, No.26, 2014
120
No links between ideas WPA8 0.655
Not developing an argument WPA9 0.680
Writing Difficulties DGW 3.495 38.832 0.801
Understanding essay question GD1 0.644
Finding sufficient/relevant information GD2 0.560
Writing introduction WD1 0.685
Writing main body WD2 0.686
Writing conclusion WD3 0.712
Paraphrasing/ summarizing other authors’
ideas
WD4 0.532
Expressing ideas clearly/logically WD5 0.612
Writing well linked (coherent) Paragraphs WD6 0.630
Using appropriate academic writing Style WD7 0.515
Strategies Difficulties SD 2.508 62.700 0.796
Revising SD1 0.849
Peer-reviewing SD2 0.868
Editing SD3 0.807
Referencing and writing bibliography SD4 0.619
Comrey and Lee (1992) suggest that loadings in excess of 0.71 are considered excellent, 0.63
very good, 0.55 good 0.45 fair, and 0.32 poor. Choice of the cut-off for size of loading to be
interpreted is a matter of researcher preference (cited in Tabachnick and Fidell, 2001: 625). As
mentioned earlier, Hair et al. (2010) factor loading of 0.50 and above is accepted as sufficient.
The aim of the questionnaire is to establish what are the issues associated with the students’
performance in English writing. This raises the question as to what are the students’ English
writing activities, for example: planning, awareness of audience, revision, awareness of
writing conventions, awareness of writing purpose, opinion about English writing, writing
practice attitude, writing difficulties and strategies difficulties.
Comparing the responses for the nine compulsory clusters mentioned above, we are able to
consider whether we do appear to be identifying a construct reflecting the students’ writing
behaviours, attitudes and difficulties. Using factor analysis to identify the factors, the overall
variance in responses was explained with a Cronbach’s Alpha of 0.723 to 0.824 indicating a
very high level of reliability. Using a cut-off point of 0.50 for the factor loading, below which
items were excluded, this single factor included 39 items in the questionnaire relating to the
students’ writing experience. This is going to be discussed according to the nine clusters.
WRITING BAHAVIOUR:
CLUSTER 1: Planning
Items Loadings Cronbach’s
Alpha
When you write an essay, did you make a rough plan before starting to
write? 0.946
0.723
If your answer to Question 11 was YES, what type of plan did you make? 0.933
The questions in this cluster ask the students whether they do any plan before embarking on
essay writing and what types of plan they usually do. The table above shows that the two
questions were highly correlated with the overall planning factor with factor loadings of 0.946
for Making plans before writing and 0.933 for types of plans. The questions ask the students

Developing Country Studies www.iiste.org
ISSN 2224-607X (Paper) ISSN 2225-0565 (Online)
Vol.4, No.26, 2014
121
to choose either they do a mental, a basic plan, an extended plan, a rearranged plan or an
evolving plan. The results suggest that planning is a performance indicator for the students’
English writing skill.
CLUSTER 2: Awareness of Audience
Items Loadings Cronbach’s
Alpha
When you write your essay, did you have an audience (readers of your
essay) in mind when writing? 0.96
0.775 If your answer to question 9 was YES, which audience did you have in
mind? 0.956
As for the second cluster, again the loading are both very high, i.e. 0.96 for having an
audience in their mind while writing and 0.956 for the types of audience. These results also
suggest that awareness of audience is another performance indicator for the students’ English
writing skill.
CLUSTER 3: Revision
Items Loadings Cronbach’s
Alpha
Did you have others to help you revise (e.g. read your essay to check
spelling/grammar/punctuation mistakes, etc.) your last essay before
handing in for marking?
0.823
0.745 If your answer to question 18 was YES, who helped you revise your last
essay? 0.74
If your answer to question 16 was YES, how important were the
following when revising your last essay?. 0.594
Revision is the next factor and the loadings for this factor differs quite significantly but still
above 0.50. The first question in this cluster asks whether the writers gauge the help of their
friends to revise their essay and the loadings is the highest at 0.823. In second place is the
people that help them to revise at 0.74 and the final question, at 0.594, asks whether revision
is important. In other words, revision is another performance indicator for students’ English
writing skill.
CLUSTER 4: Awareness of Writing Conventions
Items Loadings Cronbach’s
Alpha
Develop understanding of content/subject matter 0.734
0.729
Organizing/structuring ideas 0.727
Engaging/interacting with content/subject Matter 0.713
Using appropriate academic language 0.683
Proper referencing 0.613
The students were then asked to rate the five aspects of writing conventions. They are,
according to loadings weight, understanding of contents, organizing ideas, interacting with the
essay topic, importance of using appropriate academic language and proper referencing. Thus,
awareness of writing convention is also another performance indicator for students’ English

Developing Country Studies www.iiste.org
ISSN 2224-607X (Paper) ISSN 2225-0565 (Online)
Vol.4, No.26, 2014
122
writing skill.
CLUSTER 5: Awareness of Writing Purpose
Items Loadings Cronbach’s
Alpha
To summarize the available literature and add your own
comments/criticisms / 0.821
0.796 To use literature in order to generate your own comments, ideas or
response to the topic in general 0.756
To summarize the available literature (information on a particular topic) 0.649
The fifth cluster is awareness of writing purpose. The loadings for all the three questions
were also considered excellent (Comrey and Lee, 1992) because they are between 0.649 and
0.821. The questions ask the students whether they summarize literature and add their own
comments, use the literature to generate their own comments or only summarize the available
literature. The one with the highest loading is they summarize literature and add their own
comments. Therefore, awareness of writing purpose is another performance indicator for
students’ English writing skill.
WRITING ATTITUDE:
CLUSTER 6: Opinion about English Writing
Items Loadings Cronbach’s
Alpha
Do you enjoy writing essays? 0.833
0.758 How confident are you in essay writing? 0.786
To what extent does essay writing help you understand the content
(subject matter) of what you are writing? 0.696
The questions in this cluster ask for the students’ opinion on whether they enjoy writing
English essays, confident in writing the essays and also the extent the essay writing help them
to understand the content of what they are writing. The loadings show that the students’
opinion about English writing is also another performance indicator for students’ English
writing skill.
CLUSTER 7: Writing Practice Attitude
Items Loadings Cronbach’s
Alpha
Not sticking to word length 0.757
0.824
No evidence of research 0.738
Poor essay organization (no introduction, main body, and conclusion) 0.682
Not developing an argument 0.68
Plagiarizing (using someone’s ideas without saying so 0.677
No links between ideas 0.655
Little or no use of references 0.598
Improper referencing format format 0.567
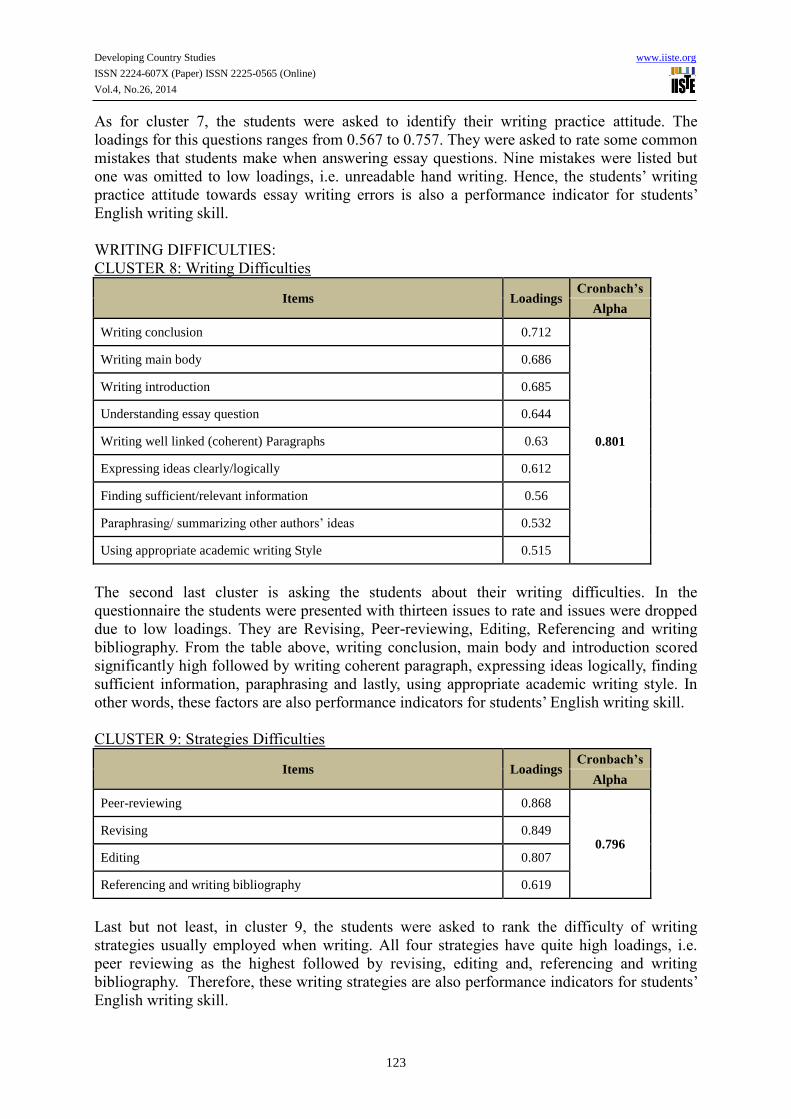
Developing Country Studies www.iiste.org
ISSN 2224-607X (Paper) ISSN 2225-0565 (Online)
Vol.4, No.26, 2014
123
As for cluster 7, the students were asked to identify their writing practice attitude. The
loadings for this questions ranges from 0.567 to 0.757. They were asked to rate some common
mistakes that students make when answering essay questions. Nine mistakes were listed but
one was omitted to low loadings, i.e. unreadable hand writing. Hence, the students’ writing
practice attitude towards essay writing errors is also a performance indicator for students’
English writing skill.
WRITING DIFFICULTIES:
CLUSTER 8: Writing Difficulties
Items Loadings Cronbach’s
Alpha
Writing conclusion 0.712
0.801
Writing main body 0.686
Writing introduction 0.685
Understanding essay question 0.644
Writing well linked (coherent) Paragraphs 0.63
Expressing ideas clearly/logically 0.612
Finding sufficient/relevant information 0.56
Paraphrasing/ summarizing other authors’ ideas 0.532
Using appropriate academic writing Style 0.515
The second last cluster is asking the students about their writing difficulties. In the
questionnaire the students were presented with thirteen issues to rate and issues were dropped
due to low loadings. They are Revising, Peer-reviewing, Editing, Referencing and writing
bibliography. From the table above, writing conclusion, main body and introduction scored
significantly high followed by writing coherent paragraph, expressing ideas logically, finding
sufficient information, paraphrasing and lastly, using appropriate academic writing style. In
other words, these factors are also performance indicators for students’ English writing skill.
CLUSTER 9: Strategies Difficulties
Items Loadings Cronbach’s
Alpha
Peer-reviewing 0.868
0.796 Revising 0.849
Editing 0.807
Referencing and writing bibliography 0.619
Last but not least, in cluster 9, the students were asked to rank the difficulty of writing
strategies usually employed when writing. All four strategies have quite high loadings, i.e.
peer reviewing as the highest followed by revising, editing and, referencing and writing
bibliography. Therefore, these writing strategies are also performance indicators for students’
English writing skill.

Developing Country Studies www.iiste.org
ISSN 2224-607X (Paper) ISSN 2225-0565 (Online)
Vol.4, No.26, 2014
124
CONCLUSION
The current study concentrates primarily on the performance indicators of these
underachieved writers when writing in English. The Cronbach’s Alpha indicate that for this
group of students the hampering factors are their writing practice attitude that came first,
followed by writing difficulties, awareness of writing purpose, strategies difficulties, opinion
about English writing, revision and lastly, awareness of writing convention.
However, when analyzed according to the average factor loadings or each items, their writing
strategies difficulties came first, followed by opinion about English writing, awareness of
writing purpose, revision, awareness of writing conventions, writing practice attitude and
writing difficulties coming as the last factor.
Therefore, the results of this study should be beneficial to teachers of English writing because
it is based on an extensive data involving 1400 student scoring from MUET band 1 to MUET
band 5 and all of them are from the state of Sabah. The issues mentioned above should be
taken into consideration in the teachers’ course plans.
Strategies Difficulties 0.786
Opinion about English Writing 0.772
Awareness of Writing Purpose 0.742
Revision 0.719
Awareness of Writing Conventions 0.694
Writing Practice Attitude 0.669
Writing Difficulties 0.62
Items Average Loadings

Developing Country Studies www.iiste.org
ISSN 2224-607X (Paper) ISSN 2225-0565 (Online)
Vol.4, No.26, 2014
125
Local Revenue Mobilization Mechanisms: Evidence from the
Abura-Asebu-Kwamankese District in Ghana
Ernest Opoku1 Christian Kyeremeh
2* Daniel Odoom
3
1, 3
Institute for Development Studies, University of Cape Coast, Cape Coast, Ghana 2School of Business and Management Studies, Sunyani Polytechnic, Sunyani, Ghana
* Email of the corresponding author: [email protected] Abstract
This paper examined the local revenue mobilization mechanisms in the Abura-Asebu-Kwamankese District in
Ghana. A total of 214 respondents made up of 20 officials of the Assembly and 194 tax payers were involved in
the study. The study demonstrated that despite the availability of other sources of local revenue, the Assembly
was yet to take advantage of them. The strength of the Assembly’s local revenue collection measures included
revenue collectors’ inclusion in tax decisions, house-to-house collection, and database. However, the weaknesses
included poor taxpayer participation in tax decisions, inadequate personnel for revenue mobilization and poor
cash management systems and accountability mechanisms at the Assembly. Some of the challenges the
Assembly faced in improving local revenue generation were unwillingness on the part of the taxpayers to meet
tax obligation, low pace of development and political considerations. It is recommended that the Assembly
should put in place strong monitoring and supervisory mechanisms to check the revenue collectors, sanctions
defaulting collectors, and also create room for private participation in local revenue collection.
Keywords: Decentralization, revenue mobilization, subsidiarity principle, fiscal decentralization
1.0 Introduction
Development seeks to bring about quality improvement in the lives of the citizenry. Its outcome is not merely
growth in the economic sense but is closely related to the notion of quality of life (Ruttan, 2001). It is a dynamic
process which empowers people and promotes important changes in their lives. However, for development to
occur, it requires an educated population, physical and financial resources. In pursuance of this, governments, all
over the world, have initiated several approaches aimed at improving the wellbeing of its people. One such
approach is the adoption of centralisation which focuses all political power and government responsibility into
the hands of a single authority (Falleti, 2005). The apparent deficiencies of centralised delivery system including
waste of resource, low productivity as well as inadequate personnel pushed the need to look for other approach
to development, hence the idea decentralisation (Government of Tanzania, 2009).
As an approach, decentralisation which is theoretically rooted within the principle of subsidiarity devolves
administrative, political, and financial responsibilities to sub-national governments to deliver improved public
services to the people in an efficient and accountable manner (Gibson, 2005; Stigler, 1957). The subsidiarity
principle, as Gibson (2005) submits, advocates that when governance is brought to the lowest units of
government undertakings, people better participate in the very process that ought to enhance their own
wellbeing. The principle gains even greater prominence in an era of globalization which keeps increasing the gap
between the very rich and the very poor among and within nations as material and human resources continue to
flow from the poor to the rich (Pablong, 2006).
The need to ensure financial autonomy at all levels of government is the basis of fiscal decentralisation (Parker,
1995). Fiscal decentralization is about empowering people to actively influence the decisions made within their
own community (Inter-American Development Bank, 1997). Theoretically, fiscal decentralization advocates that
each public service must be provided by the jurisdiction having control over the minimum geographic area that
would internalize benefits and costs of such provision. This enables the local governments (LGs) to have enough
resources to be able to deliver meaningful services that improve the lives of the people (Ebel & Yilanmaz, 2001).
In the views of Tetteh (2006), District Assemblies (DAs) are expected to identify revenue structures which can
provide sufficient financial resources necessary for effective local service delivery. The three main sources of
revenue for the DAs are the local revenue, transfers from higher-level institutions, and loans and grants (Ahwoi,
2010).
According to Asibuo (1998), the DAs need revenue to be able to provide schools, hospital, and a healthy socio
economic environment for development. From the standpoint of public finance theory, governments are expected
to use revenues generated to provide services that the citizens value. Thus, when the DAs are able to carry out
development projects to all their areas they tend to receive the cooperation of the citizens in terms of revenue
Developing Country Studies www.iiste.org
ISSN 2224-607X (Paper) ISSN 2225-0565 (Online)
Vol.4, No.26, 2014
126
mobilization (Atakora, 2006; Ndulue, 2005). With more revenue sources available to them, the assemblies can
improve and increase their revenue mobilization to facilitate development (Armah, 2003; Ndulue, 2005). Quality
internal mechanisms will help bring about proper identification, information, collection, recording, management
and monitoring of the respective tax base registers system for tax compliance (Kelly, Montes, Maseya, Nkankha
and Tombere, 2001).
Following Ghana’s transition into democracy in 1992, Articles 240 (c & e) and 245 (a & b) of the 1992
Constitution endorsed the fiscal decentralisation policy in Ghana which led to the establishment of the LG
systems, provided legal backing for their sound financial base, and also mandated DAs to mobilize revenues for
development through levies, taxes, rates, fees and fines (Ghana Government, 1992). The 1992 constitution of
Ghana therefore enjoins the DAs to ensure an adequate financial base to facilitate the delivery of development
programmes and projects (Fynn, 2011).
1.1 Statement of the problem
The LG Act 1961 (Act 54) gives authority to the DAs to mobilize and manage revenues locally to fund their
developmental projects and other operations. In support, the Ministry of Local Government and Rural
Development (MLGRD, 2008) indicates that Internally Generated Funds (IGFs) are the only funds which the
DAs have total control over. It is believed that since the District Assemblies Common Fund (DACF) and most
development partner funds are targeted toward development and cannot be used for recurrent expenditures, the
ability of the assemblies to maintain existing, new and on-going infrastructure has become more difficult (Fynn,
2011). This necessitates the need to improve upon IGFs. Despite several workshops and seminars organized with
the aim of improving the assemblies’ local revenue capacity, most of the DAs, according to Tetteh (2006),
continue to experience huge gaps between reported and projected local revenues over the years. Funding has
therefore become one of the most crucial factors hampering successful implementation of the decentralization
policy in Ghana simply because functions allocated to DAs units do not often correspond to their financial
resources (Yankson, 2008).
The effect of this problem in some districts including the Abura-Asebu-Kwamankese has been the delay in the
implementation of development programmes and projects which has serious implications on the standard of
living of the people (Central Regional Coordinating Council [CRCC], 2009). Egbenya (2010) lists inadequate
funds as a factor responsible for low level of development of the AAK District Assembly. The situation in the
AAK District compels one to question the mechanisms the Assembly has put in place to mobilize revenue
locally for development. There is also the need to appreciate the challenges the Assembly faces in its attempt to
improve upon its local revenue generation. This study, therefore, focused on examining the local revenue
mobilization mechanisms of the AAK District Assembly in order to suggest measures for improvement. The
specific objectives were to determine the various sources of revenue available to the AAK District Assembly;
examine the local revenue mobilization measures at the Assembly; and ascertain the challenges the Assembly
faces in terms of local revenue generation.
2. Literature Review
2.1 Revenue sources for District Assemblies in Ghana
At the heart of intergovernmental matters in all countries, including Ghana is adequate funding. Local
governments will therefore be useless unless they possess the relevant financial capacity to support the onerous
responsibilities devolved to them (Ayee, 1996). It is from this backdrop that various governments take steps
toward revolutionalising the financial viability so as to accelerate development at the local level. The Provisional
National Defense Council (PNDC) government, under the Local Government Law 1988, took a step to
strengthen the financial arrangements of the DAs in order to smoothen local-level development. Articles 245 and
253 of the 1992 Constitution of Ghana and Section 34 (parts vii, viii, ix and x) contain the financial provisions
for the DAs. Revenue from these sources may be grouped into two, namely central government revenue transfers
and locally generated revenue (Kodobisa, 2008).
Central government revenue transfers are revenues transferred from the national or central government to LG
units (Nkrumah, 1992; Nsarkoh, 1992). In Ghana, central government revenues transferred to LGs include
recurrent expenditure transfers, ceded revenue, the DACF and the District Development Fund (Zanu, 1996). The
recurrent expenditure involves the responsibility in the forms of salaries, operational and administrative expenses
of civil servants and other remunerations, including pensions of staff of the DAs and the payments of the wages
of locally recruited staff like revenue staff (MLGRD, 2002). Ceded revenues are derived from some selected
revenue sources which initially were tapped by the national government through the Internal Revenue Service.

Developing Country Studies www.iiste.org
ISSN 2224-607X (Paper) ISSN 2225-0565 (Online)
Vol.4, No.26, 2014
127
But as part of strengthening decentralization, central government has ceded this revenue source to the DAs.
Included in this source are Entertainment Duty Act 1962 (Act 150), casino revenue under the Casino Revenue
Tax Decree, 1973(NRCD 200), Income Tax Law 1986 (PNDCL 177) and advertisement tax under the
Advertisement Tax Decree, 1976 (SNCD 50).
The Ghana Constitution of 1992 established the District Assembly Common Fund (DACF) under which
provision was made for five percent of government revenue to be transferred to the DAs for development. The
amount is paid to the DACF in quarterly installments (Ghana Government, 1992). The DACF serves as a
channel to encourage the DAs to mobilize revenues locally. But only about a quarter of district revenue is locally
generated with the rest coming from the DACF and other external sources. External financial sources available
to DAs include special transfers such as stool land and timber royalties, mineral development funds, and
revenues from lotto operators derived from the Weekly Lotto Amendment Law, 1990 (PNDCL 233). Other
agencies operating in the districts sometimes pay gratuity as a mark of good corporate relationship with
communities (Bandie, 2003; Ghana Government, 1993). In his view, Tetteh (2006) asserts that at DA levels
reform of property taxation coupled with increasing discretion over user charging may provide sufficient
enhancement of local accountability. By far the greatest scope for increasing fiscal independence lies, however,
with the substitution of surcharges for shares of personal income tax. This might be particularly suitable for
upper tiers of local government which generally lack taxing power at present (Atakora, 2006).
Locally generated sources of revenue are derived from six main sources, namely rates, land, fees, licenses,
trading services, and miscellaneous sources. But Ahwoi (1992) believes that the major local revenue sources in
Ghana have been the basic rates, user charges, grants and loans. The local revenue sources appear to be erratic
and undependable. This leads to low level of development at the local level (Smoke, 2001). To strengthen the
revenue generation powers of the DAs in Ghana, Articles 245 and 252 of the 1992 Constitution designate DAs as
the sole rating authorities at the local level and empower them to levy and collect taxes. The criterion for rating,
types of properties to be rated and the general sources of revenues mandated to be raised locally by the DAs are
provided in the 6th Schedule of Act 462 (Ghana Government, 1992; 1993). MMDAs are therefore to mobilise
revenue in the form of fees and taxes, rents, royalties, registration and licenses for local level development. In
the views of the Institute of Chartered Accountants Ghana (2002), rates especially property rates, licenses and
fees contribute the greater proportion of local revenues of MMDAs while fees, especially market fees and
licenses, yield the greater part of local revenue collected by the DAs (Bandie, 2003; Resource Watch Agenda,
2009).
2.2 Systems and measures for District Assemblies local revenue mobilization
A number of mechanisms and strategies are crucial in ensuring effective local revenue mobilization. For
instance, the DAs are mandated to create revenue generation sub-committees and establish ratio assessment
committees (Ayee, 1996; Buhari, 1993). The DAs are also expected to recruit permanent and commission
earning revenue collectors as well as revenue supervisors to help mobilize revenues to undertake development
services in the district. In Ghana, the staffing situation of revenue collectors differs from one district to another.
Unlike other DAs, assemblies with huge financial muzzle recruit more revenue collectors and supervisors to
maximize revenue generation (Ahwoi, 2010).
In order to deal with the difficulty associated with getting the commitment of revenue collectors and
supervisors, the Office of the Head of Civil Service (OHCS) requested all the DAs in Ghana to provide
particulars on projected revenue for the past three years, revenues actually collected for the same period, and the
proportion of revenue collected by collectors on salary (Nkrumah, 1992). The Office also requested the DAs to
provide proportion of revenue collected by collectors on commission basis, and the number of revenue collectors
on commission and those on salary (Korda, 1992; Tettey, 2006). Notwithstanding these arrangements, Nkrumah
(1992) believes that issues of staff qualification and training have been a challenge at the DAs. Besides, staff
motivation, capacity development, monitoring and supervision are all fraught with a myriad of problems. Also,
the assemblies often organize workshops to sensitize and equip their revenue collectors about new strategies for
enhanced revenue collection (Mensah, 2005). Antwi, Analoui and Cusworth (2007) found that in most cases the
issues of poor staff motivation at the DAs leads to corrupt practices which are detrimental to successful
decentralization. Besides, effective revenue mobilization depends on the tax base of the assembly and the extent
to which the tax objects captured on the tax rolls is monitored (Kelly et. al, 2001). Where it is difficult to
determine information on property or businesses operating in the jurisdiction or there is incomplete, outdated and
or uncoordinated tax base, data on these operations becomes limited (Allers, de Haan & Sterks, 2001).
Additionally, Section 116 (1) of Act 462 mandates rating authorities to appoint agents for collection of rates in
Ghana. The Act stipulates the contractual obligations of the agent towards the principal (rating authorities) and

Developing Country Studies www.iiste.org
ISSN 2224-607X (Paper) ISSN 2225-0565 (Online)
Vol.4, No.26, 2014
128
mode of remunerations (Ghana Government, 1993). Specifically, section 116 (1) indicates that ‘‘without
prejudice to section 111 of this Act, a rating authority may by notice in writing, appoint any person holding
monies for or from whom any monies are due to any other person or class of persons specified in the notice, to
be its agents for collection of any specified basic rates, which is payable by that person or persons of that class
(Ahwoi, 2010; Ghana Government, 2010a). In order to enhance efficiency in the collection of local revenues,
some LGs in Kenya and Uganda have contracted-out some of the local revenue collection functions to the
private sector (Farazmand, 2001).
In their attempt to compare revenue performance between rich and poor countries, Keen and Mansour (2010)
contend that not only has there been massively greater volatility of receipts in the former but also tax ratios have
increased over recent years in non-resource countries too. The type of business should be recorded, together with
the size category, and the amount payable. All businesses, commercial and professional activities that are within
the jurisdiction are covered in the database (Keen & Mansour, 2010). The system of issuing receipts and
recording money received in a register, with details of the receipt number and date work reasonably well,
enabling cash received to be checked against receipts. In addition to the chronological register of cash received,
revenue receipts should be recorded in the register specified against the plot number, so that non-payers can
immediately be identified (Atakora, 2006; Koranteng, 2006). Ahmed (2010) is of the view that in the case of
business tax licences, database and internal control system at the DAs must have a comprehensive list of all
businesses in the locality. Ahmed opines further that there must be field inspection to cross-check tax collections
against the holding tax register for non-domestic properties.
3. Methodology
The population for the study consisted of the officials of the Assembly and the taxpayers in the AAK District.
Taxpayers consisted of persons who pay property rate, license, fines, user charges, royalties, rents, and fees
including fishmongers, hairdressers, taxi drivers, property owners and other business operators.
Purposive sampling technique was used to select the officials of the Assembly while quota sampling technique
was used to select the taxpayers based on the seven collection zones in the district. There were 20 officials of the
Assembly made up of the District Chief Executive, District Coordinating Director, District Budget Analyst,
District Finance Officer, District Planning Officer, District Assembly Auditor, Revenue Superintendent,
Accountant, and 12 Revenue Collectors.
The total population for the seven revenue collection zones was 12179. According to Cochran (1963), for a
population of 12179 taxpayers, 387 should be selected at (5%) error margin with 95 percent confidence level.
This formula has also been supported by Krejcie and Morgan (1970). However, due to the nature of the research
instruments used for the study, the researcher used 194 (50.13%) of the statistically required sample size.
Additionally, time and financial constraints influenced the choice of sample size (Babbie, 2004). In order to
ensure a fair representation of quotas within each population sub-group, the researcher ensured that collection
zones with a relatively larger population sub-groups had larger quotas than those with a relatively small
population sub-groups. In all, a total of 214 respondents made up of 20 officials of the Assembly and 194
taxpayers in the district were involved in the study.
Both primary and secondary data collection methods were used in gathering the relevant data for the study.
Primary data were obtained with the use of structured interviews and interview guides. The instruments sought to
gather data on the demographic features of the respondents, the sources of the Assembly’s local revenue, local
revenue collection mechanisms and the challenges associated with local revenue generation.
4. Results and Discussion
The demographic characteristics of the respondents studied were age, sex, marital status and educational levels.
These characteristics were studied to serve as bases for differentiation with regard to the views of taxpayers and
the factors that affect local revenue mobilization in the AAK district.
Out of the 214 respondents, 55.2 percent of them were males while 44.8 percent were females. Bird and Smart
(2002) argue that differences in demographic factors such as sex in the jurisdiction of the LGs have effects on
the base and capacity of local revenue mobilization options. From public finance principle, the higher labour
supply elasticities of women suggest that they should be taxed at lower rates than men (Blau & Kahn, 2007;
Buhari, 1993). The age distribution of the respondents was informed by section 28 (5) of the 1992 Constitution
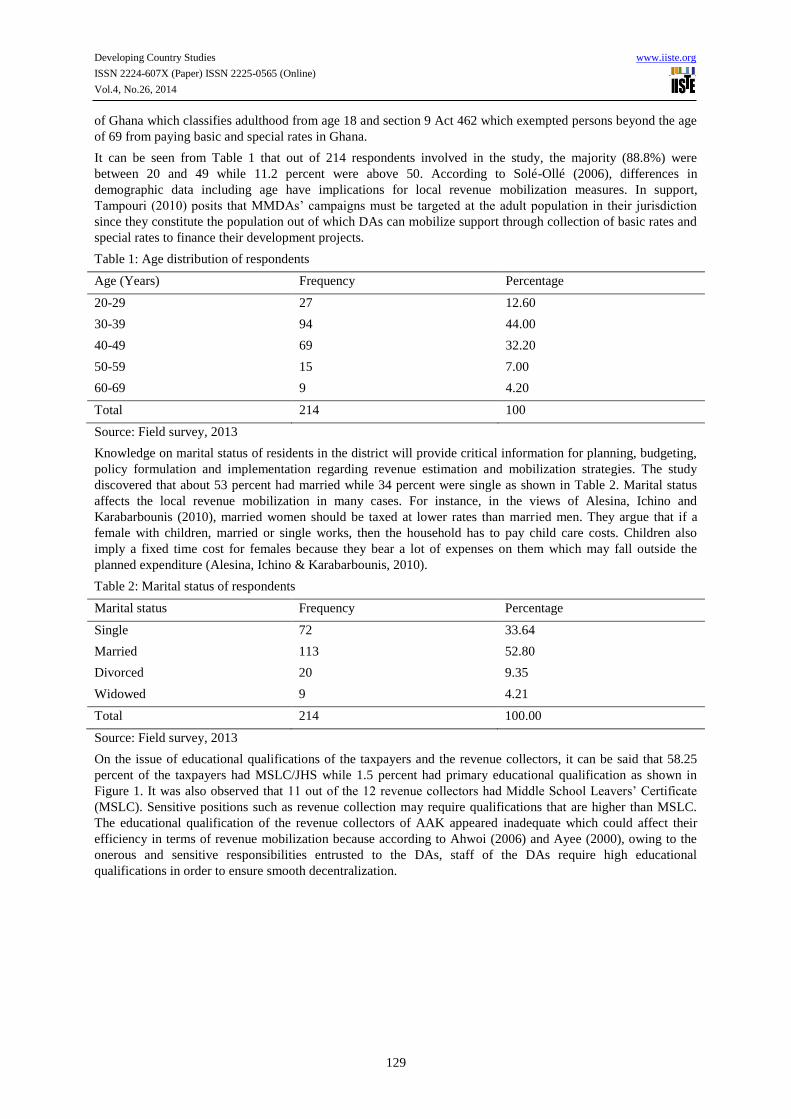
Developing Country Studies www.iiste.org
ISSN 2224-607X (Paper) ISSN 2225-0565 (Online)
Vol.4, No.26, 2014
129
of Ghana which classifies adulthood from age 18 and section 9 Act 462 which exempted persons beyond the age
of 69 from paying basic and special rates in Ghana.
It can be seen from Table 1 that out of 214 respondents involved in the study, the majority (88.8%) were
between 20 and 49 while 11.2 percent were above 50. According to Solé-Ollé (2006), differences in
demographic data including age have implications for local revenue mobilization measures. In support,
Tampouri (2010) posits that MMDAs’ campaigns must be targeted at the adult population in their jurisdiction
since they constitute the population out of which DAs can mobilize support through collection of basic rates and
special rates to finance their development projects.
Table 1: Age distribution of respondents
Age (Years) Frequency Percentage
20-29 27 12.60
30-39 94 44.00
40-49 69 32.20
50-59 15 7.00
60-69 9 4.20
Total 214 100
Source: Field survey, 2013
Knowledge on marital status of residents in the district will provide critical information for planning, budgeting,
policy formulation and implementation regarding revenue estimation and mobilization strategies. The study
discovered that about 53 percent had married while 34 percent were single as shown in Table 2. Marital status
affects the local revenue mobilization in many cases. For instance, in the views of Alesina, Ichino and
Karabarbounis (2010), married women should be taxed at lower rates than married men. They argue that if a
female with children, married or single works, then the household has to pay child care costs. Children also
imply a fixed time cost for females because they bear a lot of expenses on them which may fall outside the
planned expenditure (Alesina, Ichino & Karabarbounis, 2010).
Table 2: Marital status of respondents
Marital status Frequency Percentage
Single 72 33.64
Married 113 52.80
Divorced 20 9.35
Widowed 9 4.21
Total 214 100.00
Source: Field survey, 2013
On the issue of educational qualifications of the taxpayers and the revenue collectors, it can be said that 58.25
percent of the taxpayers had MSLC/JHS while 1.5 percent had primary educational qualification as shown in
Figure 1. It was also observed that 11 out of the 12 revenue collectors had Middle School Leavers’ Certificate
(MSLC). Sensitive positions such as revenue collection may require qualifications that are higher than MSLC.
The educational qualification of the revenue collectors of AAK appeared inadequate which could affect their
efficiency in terms of revenue mobilization because according to Ahwoi (2006) and Ayee (2000), owing to the
onerous and sensitive responsibilities entrusted to the DAs, staff of the DAs require high educational
qualifications in order to ensure smooth decentralization.

Developing Country Studies www.iiste.org
ISSN 2224-607X (Paper) ISSN 2225-0565 (Online)
Vol.4, No.26, 2014
130
Figure 1: Educational qualification of taxpayers
Source: Field survey, 2013
This study supports Antwi and Analoui (2008) who found that the skills of most staff of the DAs were low
which affect the quality of service delivery. The educational level of the revenue collectors is even more
necessary in a situation where regular training programs are not organized for the staff. The low level of
education can hinder their knowledge and skills in human relations, clients’ records keeping, basic accounting
and organizational procedures as well as their relationship with taxpayers in the district which could affect their
performance in terms of revenue generation.
In line with the fee-fixing resolutions of the District Assembly in Ghana, the internal revenue sources of AAK
were grouped into six revenue items. These are fees, licenses, rates, royalty, trading services and miscellaneous
sources. This study is consistent with the views of Ayee (2000) and Ghana Government (1992) that sources of
local revenues in Ghana include fees, rates, licenses, trading services, royalty and miscellaneous sources. It was
observed that the basic rates in the district targeted all resident adult population from 18 to 69 years with the
exception of students. There were special rates levied over specified areas in the district for the purpose of
undertaking special development services approved by the Assembly for those areas. Property rates were levied
on immovable properties such as residential, commercial and industrial properties. The kinds of local revenue
collected by the Assembly were found to be consistent with the general local revenue sources of MMDAs in
Ghana as indicated in Act 461 and Articles 245 and 252 of the 1992 Constitution of Ghana as expressed by
Kodobisa (2008) and Tetteh (2006).
Section 86 of Ghana's Local Government Act, 1993 (Act 462) authorizes the various local governments to
collect the following: Entertainment duty (Act 150 1962); Casino revenue (NRCD 200 1973); Betting Act (Act
268 1965); Registration of trade, Business profession or vocation (PNDCL 156 1986); and Gambling tax (NRCD
174, 1973) (Ahwoi, 1992). It also includes rates and levies on crops other than cocoa, coffee, cotton and shear
nuts; fees on graveyards, conservancy service, advertisement, lorry park; licences such as dog licences, beer and
wine cellars, hawkers, taxi cabs, self-employed artisans, birth and deaths as well as miscellaneous revenues
including fees for dislodging latrines, community centre receipts, slot machines and collection sand (AAK
District Assembly, 2013). The study however, discovered that in pursuance of section 99 (1) (a-e) of Act 462,
the Assembly did not include registered burial grounds and cemeteries, charitable organizations, worships
centers, public educational institutions and public hospitals and clinics in the payment of property rates.
The scope, levels of fees, levies, among others, and modes of collection vary from one LG administration to the
other. Davey (2003) opines that different jurisdictions have different local revenue sources which are
administered differently. People in the district engaged in services or businesses including barbering shops,
carpentry, masonry, drug stores, and electronics and chop bar operations. Others were fitting, hotel, hair
dressing, dressmaking, stationery, rents and petty trading. The respondents had engaged in these services or
businesses for varying number of years in the district. For instance, 35.57 percent had engaged in businesses or
services between six and 10 years; 33.0 percent had engaged in businesses or services between one and five
1.5
58.25
33.5
6.7
0
10
20
30
40
50
60
70P
erce
nta
ge
Educational Level
Primary
MSLC/JHS
SSCE/Technical
Tertiary
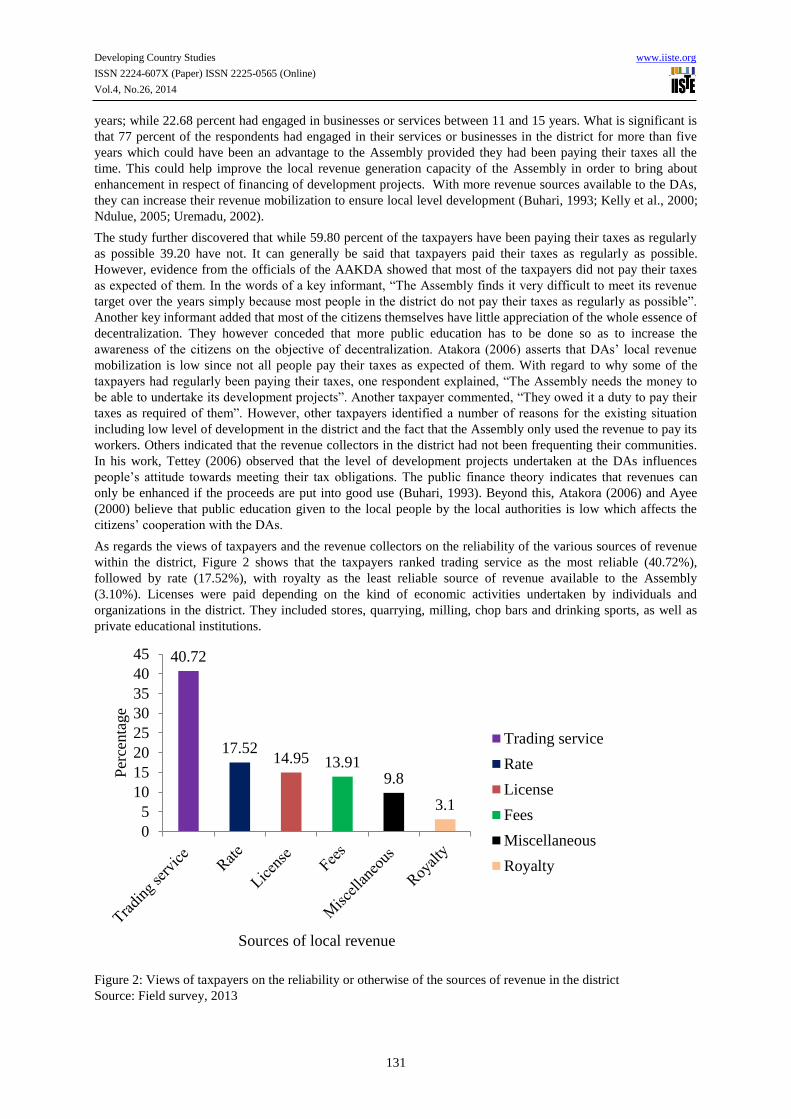
Developing Country Studies www.iiste.org
ISSN 2224-607X (Paper) ISSN 2225-0565 (Online)
Vol.4, No.26, 2014
131
years; while 22.68 percent had engaged in businesses or services between 11 and 15 years. What is significant is
that 77 percent of the respondents had engaged in their services or businesses in the district for more than five
years which could have been an advantage to the Assembly provided they had been paying their taxes all the
time. This could help improve the local revenue generation capacity of the Assembly in order to bring about
enhancement in respect of financing of development projects. With more revenue sources available to the DAs,
they can increase their revenue mobilization to ensure local level development (Buhari, 1993; Kelly et al., 2000;
Ndulue, 2005; Uremadu, 2002).
The study further discovered that while 59.80 percent of the taxpayers have been paying their taxes as regularly
as possible 39.20 have not. It can generally be said that taxpayers paid their taxes as regularly as possible.
However, evidence from the officials of the AAKDA showed that most of the taxpayers did not pay their taxes
as expected of them. In the words of a key informant, “The Assembly finds it very difficult to meet its revenue
target over the years simply because most people in the district do not pay their taxes as regularly as possible”.
Another key informant added that most of the citizens themselves have little appreciation of the whole essence of
decentralization. They however conceded that more public education has to be done so as to increase the
awareness of the citizens on the objective of decentralization. Atakora (2006) asserts that DAs’ local revenue
mobilization is low since not all people pay their taxes as expected of them. With regard to why some of the
taxpayers had regularly been paying their taxes, one respondent explained, “The Assembly needs the money to
be able to undertake its development projects”. Another taxpayer commented, “They owed it a duty to pay their
taxes as required of them”. However, other taxpayers identified a number of reasons for the existing situation
including low level of development in the district and the fact that the Assembly only used the revenue to pay its
workers. Others indicated that the revenue collectors in the district had not been frequenting their communities.
In his work, Tettey (2006) observed that the level of development projects undertaken at the DAs influences
people’s attitude towards meeting their tax obligations. The public finance theory indicates that revenues can
only be enhanced if the proceeds are put into good use (Buhari, 1993). Beyond this, Atakora (2006) and Ayee
(2000) believe that public education given to the local people by the local authorities is low which affects the
citizens’ cooperation with the DAs.
As regards the views of taxpayers and the revenue collectors on the reliability of the various sources of revenue
within the district, Figure 2 shows that the taxpayers ranked trading service as the most reliable (40.72%),
followed by rate (17.52%), with royalty as the least reliable source of revenue available to the Assembly
(3.10%). Licenses were paid depending on the kind of economic activities undertaken by individuals and
organizations in the district. They included stores, quarrying, milling, chop bars and drinking sports, as well as
private educational institutions.
Figure 2: Views of taxpayers on the reliability or otherwise of the sources of revenue in the district
Source: Field survey, 2013
40.72
17.52 14.95 13.91
9.8
3.1
0
5
10
15
20
25
30
35
40
45
Per
centa
ge
Sources of local revenue
Trading service
Rate
License
Fees
Miscellaneous
Royalty
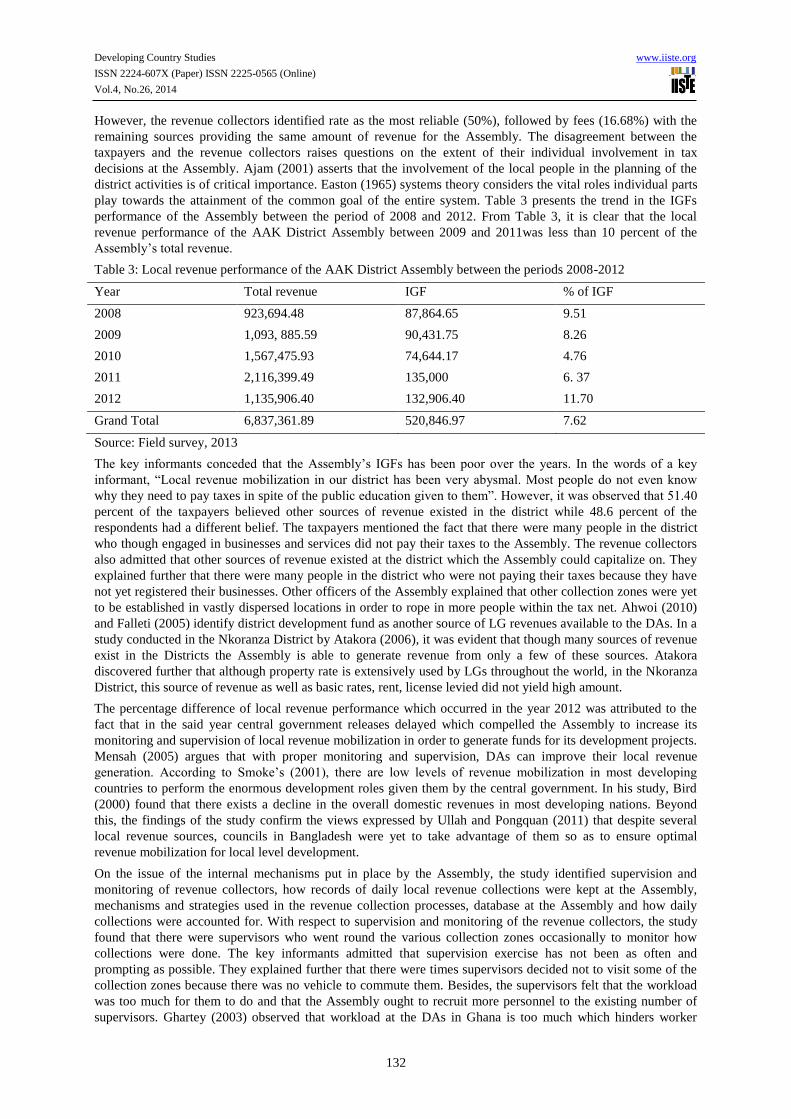
Developing Country Studies www.iiste.org
ISSN 2224-607X (Paper) ISSN 2225-0565 (Online)
Vol.4, No.26, 2014
132
However, the revenue collectors identified rate as the most reliable (50%), followed by fees (16.68%) with the
remaining sources providing the same amount of revenue for the Assembly. The disagreement between the
taxpayers and the revenue collectors raises questions on the extent of their individual involvement in tax
decisions at the Assembly. Ajam (2001) asserts that the involvement of the local people in the planning of the
district activities is of critical importance. Easton (1965) systems theory considers the vital roles individual parts
play towards the attainment of the common goal of the entire system. Table 3 presents the trend in the IGFs
performance of the Assembly between the period of 2008 and 2012. From Table 3, it is clear that the local
revenue performance of the AAK District Assembly between 2009 and 2011was less than 10 percent of the
Assembly’s total revenue.
Table 3: Local revenue performance of the AAK District Assembly between the periods 2008-2012
Year Total revenue IGF % of IGF
2008 923,694.48 87,864.65 9.51
2009 1,093, 885.59 90,431.75 8.26
2010 1,567,475.93 74,644.17 4.76
2011 2,116,399.49 135,000 6. 37
2012 1,135,906.40 132,906.40 11.70
Grand Total 6,837,361.89 520,846.97 7.62
Source: Field survey, 2013
The key informants conceded that the Assembly’s IGFs has been poor over the years. In the words of a key
informant, “Local revenue mobilization in our district has been very abysmal. Most people do not even know
why they need to pay taxes in spite of the public education given to them”. However, it was observed that 51.40
percent of the taxpayers believed other sources of revenue existed in the district while 48.6 percent of the
respondents had a different belief. The taxpayers mentioned the fact that there were many people in the district
who though engaged in businesses and services did not pay their taxes to the Assembly. The revenue collectors
also admitted that other sources of revenue existed at the district which the Assembly could capitalize on. They
explained further that there were many people in the district who were not paying their taxes because they have
not yet registered their businesses. Other officers of the Assembly explained that other collection zones were yet
to be established in vastly dispersed locations in order to rope in more people within the tax net. Ahwoi (2010)
and Falleti (2005) identify district development fund as another source of LG revenues available to the DAs. In a
study conducted in the Nkoranza District by Atakora (2006), it was evident that though many sources of revenue
exist in the Districts the Assembly is able to generate revenue from only a few of these sources. Atakora
discovered further that although property rate is extensively used by LGs throughout the world, in the Nkoranza
District, this source of revenue as well as basic rates, rent, license levied did not yield high amount.
The percentage difference of local revenue performance which occurred in the year 2012 was attributed to the
fact that in the said year central government releases delayed which compelled the Assembly to increase its
monitoring and supervision of local revenue mobilization in order to generate funds for its development projects.
Mensah (2005) argues that with proper monitoring and supervision, DAs can improve their local revenue
generation. According to Smoke’s (2001), there are low levels of revenue mobilization in most developing
countries to perform the enormous development roles given them by the central government. In his study, Bird
(2000) found that there exists a decline in the overall domestic revenues in most developing nations. Beyond
this, the findings of the study confirm the views expressed by Ullah and Pongquan (2011) that despite several
local revenue sources, councils in Bangladesh were yet to take advantage of them so as to ensure optimal
revenue mobilization for local level development.
On the issue of the internal mechanisms put in place by the Assembly, the study identified supervision and
monitoring of revenue collectors, how records of daily local revenue collections were kept at the Assembly,
mechanisms and strategies used in the revenue collection processes, database at the Assembly and how daily
collections were accounted for. With respect to supervision and monitoring of the revenue collectors, the study
found that there were supervisors who went round the various collection zones occasionally to monitor how
collections were done. The key informants admitted that supervision exercise has not been as often and
prompting as possible. They explained further that there were times supervisors decided not to visit some of the
collection zones because there was no vehicle to commute them. Besides, the supervisors felt that the workload
was too much for them to do and that the Assembly ought to recruit more personnel to the existing number of
supervisors. Ghartey (2003) observed that workload at the DAs in Ghana is too much which hinders worker

Developing Country Studies www.iiste.org
ISSN 2224-607X (Paper) ISSN 2225-0565 (Online)
Vol.4, No.26, 2014
133
efficiency. Ahwoi (2006) contends that poor logistics was a critical factor that derails effective service delivery
at the DAs in Ghana. The present study supports that of Mensah (2005) who posits that inadequate revenue
supervisors in most DAs in Ghana have negative implications for monitoring, reporting and accountability at the
DAs. The existing situation, in Tetteh’s (2006) view, leads to poor revenue assessment, poor revenue collection
and unmet revenue targets which eventually derail efforts to effectively undertake development. In his work,
Ahwoi (2010) found that in Ghana, the staffing situations of revenue collectors vary from one DA to another.
However, the staff situation at the AAK District Assembly is a confirmation of the observation made by Odoom,
Kyeremeh and Opoku (2014) in respect of the inadequate human resource at the DAs in Ghana. Odoom et al.
(2014) add that most DAs in Ghana do not have the financial muzzle to recruit more well-qualified revenue
personnel for improved local revenue generation.
Regarding how records on daily collections were kept at the Assembly, the key informants stated that collected
revenues were deposited at the bank and the receipts were presented to the Assembly for consideration. When
they were asked why they decided to deposit daily collections at the banks, the collectors commented that they
had been instructed by the Assembly to do so. An official at the Assembly remarked, “There were times the
Assembly had to bear certain losses because of delayed submission of monies collected. Could you imagine that
the collectors felt they could bring the monies they had collected anytime they wanted, forgetting that the
Assembly needed the monies urgently?” This means that the Assembly must put in place a cash management
office.
The study discovered that internal revenue mobilization mechanisms at AAK included house to house collection
(17.65%), public sensitization and educational campaigns (9.80%), building capacity of revenue supervisors and
collectors (7.4%), and collection machinery (15.69%). Others were collection machinery (17.65%), road block
(17.65%), radio announcements (5.88%), visitation to market centers and business sites (21.57%) as well as the
networking with philanthropists (3.92%). This is seen in Table 4. The key informants asserted that direct
payment to the Assembly was virtually non-existing because the citizens were not willing to pay their taxes as
anticipated by Section 86 of Ghana's Local Government Act 1993 (Act 462). As an alternative local revenue
collection mechanism, Tettey (2006) suggested outsourcing of revenue collection exercise to private individuals
as done by other DAs such as Accra Metropolitan Assembly and Kumasi Metropolitan Assembly.
Table 4: Local revenue collection measures of the Assembly
Revenue collection measure Frequency Percentage
House to house collection 9 17.65
Public sensitization and educational campaigns 5 9.80
Building capacity of revenue supervisors and collectors 4 7.84
Collection machinery 8 15.69
Road blocks 9 17.65
Radio announcements 3 5.88
Visitation to market centers and business sites 11 21.57
Networking with philanthropists 2 3.92
Total 51 100
Note: Frequencies are multiple responses
Source: Field survey, 2013
There were some internal capabilities and resources that helped the Assembly’s internal revenue operations and
sustained its efforts of generating economic value and competitive advantage over other districts. For instance,
the study found that there were cassava processing centers and domestic marketing centers for fish products.
According to the key informants, the Assembly had seven revenue collection zones, with the eighth zone created
recently but yet to be inaugurated. They added that some of the measures the Assembly had undertaken to
improve upon its local revenue generation included organizing seminars and workshops for revenue collectors.
The revenue collectors stated that their occasional involvement in decision-making enabled the Assembly to
receive the necessary feedback from the various collection zones in the district. The study further discovered that
the Assembly had a database in the form of manual documentation of all the taxpayers and their monthly as well
as quarterly payments. The Assembly maintained a log of all monies received, the amount received, the name of

Developing Country Studies www.iiste.org
ISSN 2224-607X (Paper) ISSN 2225-0565 (Online)
Vol.4, No.26, 2014
134
the payment and purpose of the payment. Besides, it was found that the taxpayers were given receipts to
acknowledge payment and that receipts were pre-numbered and were in two-part. One copy was provided to the
payer while the other copy was kept on file. Total deposits could be verified independently by another person by
accounting for each sequentially numbered receipt to ensure reconciliation in collection systems. This practice
demonstrates the relevance of Kelly et al. (1999) position which shows that revenue reconciliation is essential to
improved revenue mechanisms. However, according to the key informants, the existing database cannot ensure
proper monitoring and accountability. They stated that they could not be sure whether receipts for payment were
given immediately. In the words of a key informant, “We at the Assembly cannot be sure whether revenue
collectors are doing what they are supposed to do. What we can at best do is to monitor their activities which we
do sometimes”. Another key informant intimated, “The revenue collectors are given stamp to endorse payments
but there are times they complain that receipts are not stamped because of shortage of the liquid required to
facilitate the exercise”. The stamp could not indicate the date in which payment is done. In a study conducted by
Pablong (2006), it was observed that for LGs to maximize their internally generated funds, it is important for
them to put in place certain measures. For instance, Pablong (2006) indicates that there should be a sound
database of their clients to make collection and enforcement for payment of the amounts to be paid periodically
easier. Pablong adds that the DAs must have very strong collection and recording processes of internally
generated funds so as to eliminate the leakages in the collection and recoding processes. In addition, the DAs
must set realistic targets based on their local revenue potentials. This will make the targets challenging and
achievable.
Direct payment is also an important way of avoiding theft in revenue collections. This can be done by either the
taxpayers coming to the Assembly to make payment themselves or the Assembly providing them with mails in
which payment could be made. By so doing, Audit and Management Advisory Services Report (2009)
establishes that if cash or checks are received regularly in the mail, two persons should be present when the mail
is opened. One person should total the remittances and the other, the payments. The totals should then be agreed
and the remittances forwarded to the appropriate area for data entry. The Report adds that a deposit slip should
be prepared and forwarded with the cash/checks to revenue department. The deposit slips should be reconciled
by a third person to the general ledger as expressed by Kelly et al. (2000). Despite the instructions that bank
deposits be done on daily basis, the study discovered that there were times this was not done because either there
was no easy and close access to the designated bank or time could not permit the revenue collectors to do so. The
existing practice is a departure from the position of Kelly (1999) which acknowledges the need for timely
deposits. The sooner you deposit cash/checks the less exposure to theft or loss of funds. Ideally, deposits should
be made within 24 hours. Duties should be segregated, meaning that the person recording the receipt should not
be the same as that making the deposit. Additionally, a person independent of recorder and depositor
responsibilities should reconcile the deposit to the general ledger (Kelly & Montes, 2001). One of the key
informants was dissatisfied with the way daily revenue collections were accounted for. The reasons given
included the huge differences that exist in the amounts of revenue collected by various collectors from the same
collection points at different times within the same month. The key informant added that the differences in the
actual amount of revenue presented and the value of tickets or receipts issued sometimes also create doubts
which made collection mechanisms at the Assembly a suspect. In their study, Kelly and Montes (2001)
discovered that the existing administrative procedures must be comprehensive which cover all revenue
administration functions-from database maintenance to cash office management. However, the administrative
systems in most DAs are outdated, incomplete and complex making it difficult to effectively implement revenue
systems which hinders local revenue mobilisation (Atakora, 2006). According to Darison (2011), the
introduction of Information Communication Technology (ICT) system will vitally decrease the number of
human errors by making it possible to pay tax anytime and anywhere.
Regarding the challenges the Assembly faces in terms of local revenue generation, the study discovered that
some of the taxpayers were unwilling to pay their taxes (Uremadu, 2008b). For instance, while 68.6 percent
stated that they had not been paying their tax willingly, 27.3 percent indicated that they had been doing it
willingly. The reason given for their unwillingness to pay their tax was that they knew the monies were supposed
to be used for development projects but this did not happen. In the words of an apparently frustrated taxpayer,
“The people at the Assembly do not use the money for any development. They just collect the money and share
it over there”. Though some of the officials stated that the Assembly within the past five years had provided
some development projects for the people in the district, they failed to provide a specific account of the number
of projects undertaken within the period in question. The key informants admitted that the pace of development
in the district has been very slow. Atakora (2006) asserts that revenues generated from the taxes at the DAs
should be used to provide projects such as schools, potable water, sanitation, roads and health facilities. This, it

Developing Country Studies www.iiste.org
ISSN 2224-607X (Paper) ISSN 2225-0565 (Online)
Vol.4, No.26, 2014
135
is believed, will boost the morale of taxpayers in the district. In the views of Tetteh (2006), there is a strong
relationship between revenue generation and local level development. If revenue generation is effective, the pace
of development can be effective leading to a rise in the provision of services and projects and vice versa. The
public finance theory expects governments to use revenues generated to provide services that the citizens value
(Buhari, 1993; Ndulue, 2005; Uremadu & Nwufor, 2005).
The study tried to determine the views of taxpayers on how convenient or otherwise the time for payment was to
them. The result shows that 29.4 percent of the taxpayers believed the time for payment was convenient to them;
while 70.6 percent believed the time was not convenient to them. In the words of a taxpayer, “They come at any
time to collect the money. They will not even inform us before they come. This is not fair to us.” The revenue
collectors admitted that there were some occasions they had to urgently move in to collect the taxes without any
notification. One revenue collector intimated, “Some of the taxpayers are very smart. They may run away if they
hear that we are coming”. Despite the views expressed by the revenue collectors, the situation in AAK district
departs from the expectation of Adam Smith’s cannon of taxation which recognizes the role of time convenience
in effective revenue mobilization (Ndule, 2005; Uremadu, 2004). It was again found that while the majority
(72.7%) of the taxpayers stated that the amount they were made to pay was not clear to them, while 26.3 had a
contrary view. However, 66.7 percent of the revenue collectors were of the view that the amount the taxpayers
paid was clear to them while 33.3 percent had a contrary view. According to Adam Smith, the time of payment,
the manner of payment and the amount of tax to be paid should be clear to the taxpayer as well as to the taxing
authorities (Kelly, 1999; Uremadu, 2000). If the tax paid is clear to the people it becomes easy for them to
cooperate.
Taxpayers’ level of awareness of how tax decisions are made will help them to cooperate with tax authorities
and subsequently contribute towards tax payments and obligations (Tetteh, 2006). Again, the study revealed that
the majority (86.6%) of the taxpayers were not aware of how tax decisions in the district were made. When they
were asked why they were not aware, the taxpayers indicated that the Assembly did not create any platform for
them where they could be made to know what happened in terms of taxes in the district. In the words of one
taxpayer, “They don’t invite us when they are taking decisions on taxes in the district. Funny enough, they think
we are all illiterate and so will accept whatever they tell us without complaining”. The taxpayers however,
admitted that their awareness could rather help them to understand tax issues and increase the confidence that
they might have in tax authorities in the district. This means that the little awareness among taxpayers could lead
to poor understanding of tax laws, hence evasion of taxes. This was supported by one revenue collector who
bemoaned, “The people don’t want to pay their tax. They seem to have little regard for tax laws in the district”.
Slemrod, as cited in Karin, Dele and Robert (2006), believes that involvement in tax decisions ensures trust and
voluntary compliance in tax payment. It also brings about diverse views among local people and may create a
sense of ownership and commitment towards local level development (Buhari, 1993; Musgrave, 1959; Uremadu,
2002).
Tax evasion becomes even more serious when sanctions are not given to the defaulters. Given this premise, the
study sought to determine whether or not appropriate sanctions were given to tax defaulters in the district. The
study further observed that 65.5 percent of the taxpayers stated that tax defaulters in the district were not
sanctioned by the Assembly while 35.5 percent said that there were sanctions given by the Assembly. They went
on to mention closure of stores, fines and imprisonment as some of the sanctions given by the Assembly. They
however said that the sanctions were not properly enforced. The existing situation in the district could generally
discourage other taxpayers from fulfilling their tax obligations. In the words of one taxpayer, “Why must I
continue to pay when other people who refuse to pay are not punished?” During the interview, all the revenue
collectors indicated that sanctions existed for tax defaulters but they admitted that enforcing these sanctions has
become a challenge to the Assembly. Further interviews with other key informants revealed that though
sanctions existed for non-compliance of tax regulations, they were poorly enforced by the Assembly. One key
informant intimated that, “My brother tax issues are of serious political implications for the government. I hope
you know that! Even the central government relents in its efforts to enforce tax laws”. This means that some of
the taxpayers evaded tax for political reasons while the local authorities also failed to sanction tax defaulters for
a similar consideration. In their study, Uremadu and Ndulue (2011) found that tax avoidance and evasion exist at
the LGs which affect the quantum of local revenue mobilization. They, however, advocate that proper penalties
should be meted out to tax defaulters. Political consideration affects tax decisions (Allers et al., 2001; Mogues,
Benin & Cudjoe, 2009). Other challenges that the officials of the Assembly identified included inadequate
personnel in charge of revenue mobilization, illiteracy and inadequate economic activities in the district. When
the officials were asked why had not employed more personnel for revenue generation, they commented that
they did not have the autonomy to do so. They explained that the central government usually recruited and

Developing Country Studies www.iiste.org
ISSN 2224-607X (Paper) ISSN 2225-0565 (Online)
Vol.4, No.26, 2014
136
posted personnel to the Assembly. This was a clear violation of the Civil Service Law (PNDCL 327) which
enjoins the assemblies to take control of their own human resources.
5. Conclusions and Recommendations
The study demonstrated that the internal revenue collected by the AAK Assembly was consistent with the
general local revenue sources of MMDAs in Ghana as indicated in Act 461 and Articles 245 and 252 of the 1992
Constitution of Ghana. However, it was discovered that in pursuance of section 99 (1) (a-e) of Act 462, the
Assembly did not include registered burial grounds and cemeteries, charitable organizations, worships centers,
public educational institutions and public hospitals and clinics in the payment of property rates. The study
showed that despite the availability of many sources of local revenue and the number of years taxpayers had
been undertaking their services or businesses, not all the taxpayers have been paying their taxes as regularly as
possible for improved revenue mobilization. The strength of the Assembly’s internal revenue collection
measures included participation of revenue collectors and leaders of associations, capacity building, public
education, and database. However, the weaknesses included poor taxpayer participation, inadequate personnel,
poor database and poor accountability mechanisms at the Assembly. Some of the challenges the Assembly faced
in terms of raising improved local revenue were unwillingness on the part of the taxpayers to meet tax
obligation, poor involvement of taxpayers in tax decisions, and low pace of development. Others included poor
sanctions of tax defaulters, political factors and inadequate personnel in charge of local revenue mobilization.
The Assembly should institute measures to ensure proper accountability in terms of daily collections.
Specifically, the Assembly should put in place strong and adequate monitoring teams to constantly check the
revenue collectors, sanctions defaulting collectors, and also employ competent people who have the requisite
skills. The Assembly should undertake periodic realistic assessment of the revenue potential using scientific
methods and enter into performance contracts with all the collectors. The Assembly should put in place
appropriate measures to improve upon the willingness of taxpayers to meet their tax obligation. This can be done
by providing adequate public education to taxpayers on the need to meet their obligation to the Assembly, and
involve the taxpayers in setting the annual revenue targets. The Assembly should also create room for private
participation in local revenue collection, organize taxpayers into groups, and undertake development projects
that benefit taxpayers. In order to meet the local revenue targets of the Assembly, the Assembly should involve
the more of the revenue collectors and taxpayers in setting revenue targets. This will make them feel that they
are actually part of the team in setting the revenue targets and therefore be motivated to work hard to actualize
the targets. The Assembly should put in place measures to motivate the personnel in charge of revenue
collection. In order to achieve this, the personnel especially the collectors should be adequately protected by the
law enforcement agencies against attacks by the clients. The government should effectively collaborate with the
Assembly and NGOs in order to establish annual revenue performance awards. These awards can be in the form
of cash, motor bikes, fridges, television and scholarships for children. The Assembly should ensure better
salaries and conditions of service for the collectors.
References
Abura-Asebu-Kwamankese District Assembly (2011). The composite budget of the Abura-Asebu-Kwamankese
District Assembly for the 2011 fiscal year. Abura Dunkwa: AAKDA.
Abura-Asebu-Kwamankese District Assembly (2012). The composite budget of the Abura-Asebu-Kwamankese
District Assembly for the 2012 fiscal year. Abura Dunkwa: AAKDA.
Ahwoi, K. (2010). Local government and decentralisation in Ghana. Accra: Unimax Macmillan.
Atakora, A. N. (2006). ‘Decentralization and effective revenue mobilization: A case study of the Nkoranza
District
Assembly’. Journal of Leadership, Management and Administration, 4 (2), pp. 92-124.
Bird, R. M. (2000). Inter-governmental fiscal relations: Universal principles, local applications. Atlanta:
Georgia
State University.
Buhari, A. L. (1993). Public finance. Ilorin: University of Ilorin Press Ltd.
Falleti, T. G. (2005). ‘A sequential theory of decentralization: Latin American cases in comparative perspective’.
American Political Science Review Journal, 99, pp. 3-17.
Developing Country Studies www.iiste.org
ISSN 2224-607X (Paper) ISSN 2225-0565 (Online)
Vol.4, No.26, 2014
137
Government of Ghana (2010a). Medium-term national development policy framework: Ghana shared growth
and
development agenda, 2010-2013. Accra: NDPC.
Kelly, R. (1999). ‘Intergovernmental revenue allocation theory and practice: An application to NEPAL’. Asian
Journal of Public Administrations.
Kelly, R., Montes, M., Maseya, E., Nkankha, K., & K. Tombere (2001). Improving revenue mobilization in
Malawi:
Study on business licensing and property rates. Final Report in Lilongwe.
Kodobisa, I. (2008). Decentralization in Ghana. Ho: Ho Municipal Assembly.
Koranteng, R. O. (2006). ‘The politics behind the decentralization policies in Ghana’. Journal of Leadership,
Management and Administration, 4 (2), pp. 124-161.
Musgrave, R. A. (1959). The theory of public finance. New York: McGraw-Hill.
Ndulue, J. C. (2005). The privates sector and generation of tax revenue in the FCT. Abuja: Abuja J. Adm.
Manage.
Odoom, D., Kyeremeh, C., & Opoku, E. (2014). ‘Human Resource Capacity Needs at the District Assemblies: A
Study at Assin South District Assembly in Ghana’. Journal of Sustainable Development, 7(5), pp. 177-188.
Smoke, P. (2001). Fiscal decentralization in developing countries: A review of current concepts and practices.
Geneva: United Nations Research Institute for Social Development.
Timbergen, J. (1956). Economic policy: Principles and design. New York: McGraw-Hill Book Co. Inc.
Uremadu, S. O. (2000). ‘Comparative analysis between liquidity and profitability for three selected indigenous
commercial banks in Nigeria’. Journal of Economics and Allied Fields, 1(1), pp. 87-99.
Uremadu, S. O. (2002). Introduction to finance. Benin: Mindex Publishing Company Ltd.
Uremadu, S. O. (2004). Financial management: Concepts, analysis and application. Enugu: Precision Publishers
Ltd.
Uremadu, S. O., & Nwufor, C. I. (2005). Domestic money markets in Nigeria: Implications for liquidity and
profitability. In the K. I. Dandago & K. I. Hamid (2005) (eds), Honesty and integrity. Department of
Accounting, BUK, Kano.
Developing Country Studies www.iiste.org
ISSN 2224-607X (Paper) ISSN 2225-0565 (Online)
Vol.4, No.26, 2014
138
Due Process Compliance in Capital Projects Execution In
Tertiary Institutions In Southwest Nigeria
1Kareem, W.A.,
1Asa, Olusola Adekunle. &
2Lawal, Musediq Olufemi
1. Department of Architectural Technology, The Federal Polytechnic, Ede
2. Department of Sociology, Osun State University, Osogbo, Nigeria
Abstract The study is an exploratory study of Project execution within tertiary institutions in the southwest part of
Nigeria. It specifically has as its focus the role of due process in projects handling in the selected educational
institutions. Part of the concern of this study is to bring to the fore the roles being played by the due process
mechanism in the timely completion and abandonment of capital projects in educational institutions since the
inception of due process in the award of construction projects in the country. A total of 15 tertiary educational
institutions that are under the control of the federal and state governments in Nigeria were considered for this
study. From these institutions, 74 completed, on-going and abandoned building projects were studied. The
findings revealed that though due process mechanisms were observed in the award process, many of the projects
were either completed off time schedule and above cost estimate or abandoned out rightly due to lack of
promptness in bid evaluation, contract award and certificate honouring, lack of compliance with due process
provisions on advance payment deduction form valuations, fraudulence and corrupt practices in bid analysis and
evaluation among others. The paper concludes by stressing the need for sincerity in the implementation of due
process mechanisms by all concerned.
Keywords: Due process, construction cost, practical completion, building project, tertiary institution
Introduction In Nigeria, the relatively long period of military rule had almost eroded the basic economic structures that had
been developed since independence. Consequently, the Obasanjo administration was faced with the task of
seeking ways of reversing the trend of decadence in the nation. At the inception of his government in 1999, the
president emphasized that his administration had adopted transparency, equity, justice and accountability as its
guiding principles and policy imperatives. These principles are to ensure commitment to public policies and
good governance (Nwankwo, 2004). This is premised on the fact that the country has gone through all the
phases of business cycle-decline over the years such as depression (recession), recovery and boom. In the case of
the boom, each of such booms came and disappeared without being linked to the real sector, no significant
restructuring and transformation of the economy took place since then and none of the benefits associated with
the booms was maximized.
Nigeria, especially since the early 80s has been confronted with a magnitude of economic problems. These
economic problems, in brief, include stagnant growth, rising inflation, unemployment, food shortage and
mounting external debt. Nigeria therefore like most other nations, has been battling with how to achieve its
major economic objectives of full employment for the citizenry, price stability, economic growth and healthy
balance of payments. Series of factors have been identified as responsible for the inability of Nigeria as a nation
in realizing the above objectives. These factors include (1) Poor Performance of the preferred sectors
(Agriculture and Manufacturing sectors). These sectors are not doing well because of the following reasons (a)
Unwillingness of investors to invest in our manufacturing sector due to political instability (b) Misplacement of
Priorities (c) Shortage of Basic infrastructural amenities and utilities (d) Problems of raw Materials. Other
factors responsible for realization of major economic objectives in the country are (2) Over dependence of
Nigerian Economy on a single commodity i.e. oil (3) Management problems (4) Social problems (5) Inadequate
statistical data for policy formulation (6) Inadequate infrastructural amenities (7) Gaps in the judicial and law
enforcement agents (8) Lack of effective implementation policy (9) Lack of enabling environment. Corruption
was equally noted as constituting the base of these problems. Prior to 1999, Nigeria had practically
institutionalized corruption as the foundation of governance. Hence institutions of society easily decayed to
unprecedented proportions as opportunities were privatized by the powerful. This process was accompanied, as
to be expected, by the intimidation of the judiciary, the subversion of due process, the manipulation of existing
laws and regulations, the suffocation of civil society, and the containment of democratic values and institutions.
Power became nothing but a means of accumulation and subversion as productive initiatives were abandoned for
purely administrative and transactional activities. The legitimacy and stability of the state became compromised
as citizens began to devise extra-legal and informal ways of survival (Obasanjo, 2004). The need to address
these ugly trends underscores an urgent call for Procurement Reforms and enthronement of Due Process in the
Nigerian public Sector. In 2001, the Federal Government issued New Policy Guidelines for procurement and
award of contracts in Government Ministries/Parastatals. Public Procurement as a business process within a
given political system has capacity to ensure distinct considerations of integrity, accountability, national interest
Developing Country Studies www.iiste.org
ISSN 2224-607X (Paper) ISSN 2225-0565 (Online)
Vol.4, No.26, 2014
139
and effectiveness. These business operations of government, as controlled by public procurement, usually affect
many different elements of society. The procuring entities for instance have needs for material support like
roads, hospitals, etc. to help in fulfilling their designated national mission (Ekpenkhio, 2003). The business
communities of actual or potential suppliers on the other hand need to satisfy government procurement
requirement. There are also other interested parties like professional bodies, various agencies, interested public,
etc who are all affected or influenced in one way or the other by public procurement.
Due Process implies that governmental activities and businesses can be carried out openly, economically and
transparently without favouritism and corruptible tendencies (Ezekwesilli, 2004a). The essence of this is to
ensure that rules and procedures for procurement are made in such a way as to be implementable and
enforceable. It is hoped that this Due Process should put an end to “the Business as Usual Syndrome” in Nigeria.
Due Process is a mechanism that certifies for public funding only those projects that have passed the test of
proper implementation packaging and that adhere stringently to the international competitive bid approach in the
award process (Ezekwesilli, 2005; Obasanjo, 2003). The expectation is that improved Public Procurement
systems would have a beneficial effect on economic condition of the nation (Ezekwesilli, 2005).
Due process is a new reform or policy in procurement or bid for government contracts to restore openness,
transparency, competence, best practices, efficiency and value for money. Before Nigerian attained democracy in
1999, there was no hard rules in awarding contracts at any level both local, state and federal government levels.
There was low productivity in the construction industry. Also, micro-economic policies had been highly
circumscribed by inefficiency, highly volatile and unsustainable public sector spending. However, to prevent or
to eliminate favoritism, nepotism, corruption and to encourage hard work, productivity and innovation, the
government has transformed the process by which companies have to bid for government contracts. The Budget
Monitoring and Price Intelligence Unit (BMPIU) now Bureau of Public Procurement (BPP) was created in 2001
to implement public procurement Reforms as one of the transparency pillars in the overall Federal government
economic reform programmes. From all available records and statistics, the management of the nation’s
abundant resources was shrouded in mystery and secrecy, the nation has the years witnessed corruption,
conflicts, misrule and misery. People were kept in the dark on the issues that naturally would have concerned
them. This made it impossible for Nigerians (182 millions people) to benefit from their natural resources towards
the development and growth of their economy. The people lost confidence in government activities for they were
done in secretary and this brings corruption according to transparency international sources is a major cause of
poverty.
Esenwa (2004) highlighted eight (8) major defects of previous procurement systems which include (a) Lack of
efficient and effective project monitoring aimed at ascertaining compliance with original project plans and
target; (b) Budget proposals from ministries/parastatals are unrelated to justifiable needs; (c) Budgetary
processes lacked up to date plans, in-fact it was simply wish list officials; (d) There is lack/or absence of
economic cost/benefit analysis of projects; (e) There is lack of competition and transparency in project
procurement leading to high cost of projects and where advertisement was made, the applicable rules were titled
in favour of a predetermined winner; (f) Projects were not prioritized and harmonized, consequently several
ministries were pursuing supposed needs simultaneously; (g) Unjustifiable gab exit between budget and actual
fund release leading to underfunding thereby leading to delayed completion, price fluctuation and project
abandonment; (h) Preference for new projects at the expertise for refurbishment and completion of existing
projects.
The idea behind the creation of the BMPIU popularly called “Due Process” was aimed at curbing open abuses of
rules and procedures in the award and execution of public contracts at all levels of government. These abuses
were evidence in inflation of cost, award of contracts to friends, relations and associates with little or no regards
to merit, competence, effective completion and other public priorities. Public funds were diverted to private
pockets through proliferation of white elephant projects and creation of ghost contracts. This situation was a
source of poor image for the country which also created all kinds of credibility problems for mode of awarding
contracts.
The budget monitoring and price intelligence unit in the last few years have pursued aggressively a robust
procurement reform programme designed to restore the nation to a business friendly environment where only the
best in term of quality, cost and prompt services as regards the completion period/practical completion in all
procurements are good enough.
In spite of all these laudable and robust procurement reform programme of BMPIU, many capital and education
tax fund (ETF) projects in various tertiary institutions were still not completed on schedule, within cost estimates
or out-rightly abandoned. It is therefore become necessary to investigate the working of the BMPIU on the
management of capital and ETF projects in the south western Nigeria which is a good representation of the
population of tertiary institutions in the country.
Developing Country Studies www.iiste.org
ISSN 2224-607X (Paper) ISSN 2225-0565 (Online)
Vol.4, No.26, 2014
140
Due Process Mechanism, Objectives and Emergence in Nigeria
The Obasanjo-led administration set up the BMPIU in June 2003 that commenced a process of contract award
review, oversight and certification commonly referred to as “Due Process”. It is a simple mechanism that
certifies public funding only for those projects that have passed the test of proper project implementation
packaging. Such packaging must have adhered stringently to the international competitive approach in the award
process. Through the instrument of certification value for money is once again returning as the fundamental
premises for public expenditure. The BMPIU is being run as operational independent body. The staff comprises
of experts with a bias for project management, building construction and procurement (Olaleye, 2006). The unit
was designed to act as the clearing-house for all government contract and procurement of goods and services
(Wahab, 2006)
Goal and objectives of BMPIU The goal of BMPIU is to ensure full compliance with laid down guidelines and procedures for the procurement
of capital and minor capital projects as well as associated goods and services. Its objectives include: (i)
Harmonization of existing government policies/practices and update same on public procurement (ii) To
determine whether or not due process has been observed in the procurement of services and contracts (iii) To
introduce more honesty, accountability and transparency into the procurement process (iv) To establish and
update pricing standards and benchmarks for all supplies to government (v) To monitor the implementation of
projects during execution with a view to providing information on performance, output and compliance with
specifications and targets (vi) To ensure that only projects which have been budgeted for are admitted execution.
Implementation Strategies: In the full realization of BMPIU goal and objectives, the organization operates
within the specified guidelines, which include (a) Regulatory Functions (b) Certification Functions (c)
Monitoring Functions, (d) Bid Evaluation (e) Contract Award (f) Notice of Award (g) Advance Payment (h)
Retention. Each of these according to their expectation are hereunder enumerated:
Regulatory Functions: To regulate and set standards, including the enforcement of harmonized bidding and
tender documents.
i. To formulate the general policies and guidelines related to public sector procurement.
ii. To develop, update and maintain a related system wide database and technology.
iii. To undertake procurement research and survey in order to determine information needs and project
costing.
iv. To enforce professional ethics and sanction erring officers professionals.
Certification Functions: The unit certifies all federal-wide procurements under the following guidelines:
i. Resident due process team certification for projects below N50 million.
ii. Full due process certification for a projects above N500 million at various stages such as “Contract Award
Certificate” and “Payment Certificates”
Monitoring Functions: The specific expectations of these functions are:
a) To supervise the implementation of established policies.
b) To monitor the prices of tendered items.
c) To perform procurement audits.
d) To undertake the monitoring of capital projects that has exceeded 50% of contract sum before release of
further funds.
e) To document all projects at award and completion stages, and publish same in designated journals.
Bid Evaluation: It is required to keep bids valid for a specific period to allow the Procuring Entity to examine
and evaluate them, select the lowest evaluation bid, obtain the necessary approval from different authorities.
Thus bid evaluation shall be undertake expeditiously leaving ample time to seek all the requisite formal
approvals. Hence bids shall be evaluated within the period specified in the agreed time schedule that the
Procurement Time Schedule. To enable the procuring entity to award the contract within such bid validity period
after carrying out the other procedures, it is required that Technical Evaluation Committee should complete the
evaluation report generally within 50% of the bid period.
Where there is a delay in bid evaluation so that above requirement is unlikely to be achieved, the procuring
entity with the concurrence of the respective procurement committee shall request the bidders to extend the
period of bid validity of their bids. However, when such a request is made in the case of fixed-price bids, bidders
have to choose between (a) Refusing to grant extension of bid validity of their bids: and (b) Absorbing any cost
increases that might occur during such extension (bidders are not allowed to increase theirs bid prices as a
Developing Country Studies www.iiste.org
ISSN 2224-607X (Paper) ISSN 2225-0565 (Online)
Vol.4, No.26, 2014
141
condition of extending the validity of their bids). Due to the above reasons a bidder who has submitted a low bid
may refuse to extend their bid validity resulting in additional cost to the Procuring Entity. Hence the extension of
bid validity should be requested only under exceptional situation.
Contract Award: According to BMPIU, a contract shall be awarded to the contractor/tendered whose offer is
substantially responsive to the Tender Document and that has been determined to be the lowest evaluated Tender
provided that the Tender is determined to be qualified to perform the contract satisfactorily.
Notice of Award: Prior to the expiration of the period of Tender validity the employer shall notify the successful
tender, in writing that it’s tender has been accepted. Until a formal contract is prepared and executed, the Notice
of Award shall constitute a binding contract.
Advance Payment: If so specified in the Special Condition of Contracts (SCC), the employer shall make
advance payment on the Contractor in the amounts and by the dates stated in the SCC against provision by the
Contractor of an Unconditional Bank Guarantee in a form and by a bank acceptable to the Employer in an
amount equal to the advance payment. The Guarantee shall be progressively reduced by the amounts repaid by
the Contractor. Interest will not be charged on the advance payment. The Contractor is to use the advance
payment only to pay for Equipment, Plant, Materials and mobilization expenses required specifically for the
execution of the Contract. The Contractor shall demonstrate that the advance payment has been used in this way
by supplying copies of invoices or other documents to the Employer.
The advance payment shall be repaid by deducting proportionate amounts from payments otherwise due to the
Contractor, following the schedule of completed percentages of the Works on a payment basis. No account shall
be taken of the advance payment or its repayment in assessing valuations of work done, variations of work done,
variations, claims or any amount payable due to failure to complete.
Retention: The employer shall retain from each payment due to the contractor the proportion stated in the SCC
until the completion of the whole of the works. On completion of the whole of the works, half the total amount
retained shall be repaid to the contractor (first moity), the remaining half (second moity) when the defects
liability period has passed and the Engineer/Architect has certified that all Defects notified by the
Engineer/Architect to the contractor before the end of this period have been corrected a certificate of completion
of making good all defects issued to the contractor.
Research Methodology
On-going and completed capital projects in tertiary institutions in the Southwest Nigeria viz-a-viz Ekiti Lagos,
Ogun, Ondo, Osun, and Oyo states were the focus of the study. On-going and completed capital projects in the
past five years since the inception of BMPIU 2003-2006 were investigated through the physical planning units
and works and services departments of the selected institutions. The condition of award and due process
provision compliance were duly investigated. A total number of 15 tertiary institutions in the selected states were
under-studied. Their breakdown is as shown in table 1.
Table 1: States and Number of Institutions Studied
S/N Location/
State
Ownership Status and Number in the
State
Number
Studied
Percentage
Studied
Federal State
1 Lagos 2 2 3 20.00
2 Ogun 2 1 3 20.00
3 Oyo 1 1 2 13.33
4 Osun 2 1 3 20.00
5 Ekiti 1 1 2 13.33
6 Ondo 1 1 2 13.33
Total 9 7 15 100.00
A total of one hundred and twenty (120) questionnaires were administrated on respondents comprising staff of
the physical planning units (45); works and services department of the selected institutions (45), contractors (15)
and consultants (15) on the projects. On-going, competed or abandoned projects as at the time of this study were
investigated (see table 2). Tender processes that ushered in the contractors handling the projects were
scrutinized. The actual cost/completion time of the projects were compared with estimated costs and completion
periods. For ethical reasons, no specific issue is being linked or traced to any of the institutions under focus in
Developing Country Studies www.iiste.org
ISSN 2224-607X (Paper) ISSN 2225-0565 (Online)
Vol.4, No.26, 2014
142
this work. At the same time, effort was made not list the names of the tertiary institutions considered within the
states of southwest geopolitical zones of Nigeria.
Table 2: Number of projects considered in the studied institutions
S/N Location/
State
Number of
Institutions
Total Number of
Projects Executed
Number of Projects
Studied
1 Lagos 3 25 12
1 Ogun 3 20 15
3 Oyo 2 15 11
4 Osun 3 22 18
5 Ekiti 2 15 10
6 Ondo 2 12 8
Total 15 109 74
Results and discussion`
Of all the tertiary institution enumerated almost everyone of them was included as the study site, exempt in
Lagos State where only 3 out of the available institutions were considered due to the need for time and resources
management. The tertiary institutions in Lagos State have the highest number of projects being executed as at
the time of this study, this was followed by Osun and Ogun States (see table 2). However, Osun State has the
highest number of projects being considered for study. The main reason behind this is the proximity factor.
Ondo State has the least of the number of projects being considered for study.
Table 3: Contract Awards and Tendering Processes
Whether contracts were Awarded under Due process Yes (%) No (%) Total
Whether the contractors were Pre-qualified 120 (100%) - 120
Whether there was Tender process before Contracts
Award
120 (100%) - 120
Contract Awarded to Lowest bidder 79 (66.2%) 41 (33.8%) 120
Contracts Awarded to lowest bidder within (-) 10% 41 (33.8%) 79 (66.2%) 120
Contracts Awarded too highest bidders - 120 120
It was observed that the contracts were awarded through due processes of pre-qualification, tendering and
analysis. Many of the contracts (66.2%) were awarded to the lowest bidder and (33.8%) were awarded to lowest
bidder within - 10% as shown in the table above.
Table 4: Project Cost and Contract Completion
Level of Completion Cost and Duration Frequency Percentage
Completed within cost estimate and time schedule 33 27.0
Completed outside cost estimate and time schedule 63 52.7
Abandoned 24 20.3
Total 120 100.0
Majority of the projects (52.7%) according to table 4 were completed after the completion dates and with cost
overrun, 27% were completed on schedule and within cost estimate. About 20.3% of the projects were
abandoned. The implication of this is that there are still holes in the due process mechanisms. Bid valuation may
have been done to favour some of the contractors that were awarded the contracts or their rates were ridiculously
low compared with what is generally obtainable from the market this not withstanding they were awarded the
contract because they were the lowest bidder.
Table 5: Source of Project Financing
Source of finance Frequency Percentage
Internally generated fund 24 20.3
Education Tax Fund 31 25.7
Capital Grant 65 54.0
Total 120 100.0
Developing Country Studies www.iiste.org
ISSN 2224-607X (Paper) ISSN 2225-0565 (Online)
Vol.4, No.26, 2014
143
Capital grant (54%) formed the major source of project financing in virtually all the institution being studied;
this was followed by financial assistance from the Education Tax Fund (25.7%) and internally generated fund
(20.3%).
Table 6: Contractors’ of Advance Payment for Projects Financing
Contractors’ disposition to advance payment Frequency Percentage
Collected advance payment before mobilization
to site
107 89.0
Mobilization to site without advance payment 13 11.0
Total 120 100.0
Most of the contractors (89%) that handled 74 projects under focus in this study collected advance payment after
provision of the advance payment due to guarantee from reputable banks while only 11% of the contractors
mobilized to site without any mobilization fee. Those who opted out from being mobilized may have been
discourage by unnecessary administrative bottleneck of the banks and mode of deduction of the advance
payment by the clients in which 100% of the advanced payment is deducted from the first valuation (see Table
6). Comparing table 4 and 6, some of the contractors who collected advanced payment also end up in
abandoning the project due to the latter reason adduced above.
Discussion and Conclusion
Inference from this study revealed that bid evaluation period and the time to obtain necessary approval from
different authorities dragged too long despite the fact that due process guidelines were followed in pre-
qualification, tender and tender analysis, and award of contracts,. These erode the validity of the rates quoted
against most of the key materials in the bid due to inflation. Time lag between tendering and contract award and
mobilization to site of the contractors for some of the projects and tender were more than 12 months in many
instances.
Information from all sources showed that virtually all the provisions of Bureau of Public Procurement were not
adhered with. These include the positions (of the Bureau of public procurement on advance payment), that
advance payment shall be repaid by the contractor by deducting proportionate amounts from the payments
otherwise due to the contactor; following the schedule of completed percentage of the work on a payment basis;
Not taking account of the advance payment or its repayment in assessing valuations of work done; variation of
work done, various price adjustments, compensation events, Bonuses or liquidated damages. These provisions
were observed not to be followed by most clients as the advance payment is deducted in whole from the first
valuation. This tells greatly on the finances and liquidity of the company. Honouring of valuations was not done
promptly and this hampered the cash flow of the contractors and unnecessary delay of work on site. In
conclusion it is therefore obvious that delay in valuation honouring is a major factor which contributes to the
delay of the project duration. This however negated the rationale for prioritization of due process in project
initiation, processing and implementation. Failure on the part of the government of the day to look into these
anomalies speaks volume of its sincerity about the policy. This revelation therefore affirms poor political will on
the part of the government in the sustenance of ‘promising’ state policies in Nigeria. Going by the popularity the
‘due process’ policy generated at its onset and the subsequent setbacks like the one revealed in this study, it is
obvious that fantastic policies in Nigeria are almost always ideological motives initiated to arrest the populace
attention in order to smokescreen certain government agenda that may attract severe criticism from the public.
Social and Economic Importance of the Findings
The construction industry in Nigeria today as confirmed by Mshelbwala (2005) is characterized by a wide range
of problems including high cost of procurement, substandard products, project collapse and abandonment. The
general problem of construction industry in Nigeria have been traced to non-adherence to processes and
procedures involved in the procurement system especially in the building industry that are physical in nature and
capital intensive (Ayangade, et al., 2009). As a departure to these practices, various methods have emerged and
used for procuring projects; some of the procurement methods have been amended and updated to form
standards for client who intends to construct (BMPIU, 2005). With enforcement of due process, the current
trends include reliance on the experience and advice of relevant professionals in the selection of a procurement
method by the client and prevention of dual roles by the professionals on the same project. In the course of this,
the clients will equally benefit from the wealth of experience of building contractors (Rowlinson, 1987).
Awareness has been created in the minds of the Nigerian populace about the necessity of Due Process thereby
sensitizing, promoting and educating the public on public procurement issues and in area of organizing training
and workshops to promote capacity building of public procurement personnel.

Developing Country Studies www.iiste.org
ISSN 2224-607X (Paper) ISSN 2225-0565 (Online)
Vol.4, No.26, 2014
144
Inference into the findings of this study equally pointed out that the Due Process mechanism has the capability of
bringing among other things the sanity to public procurement system in the country through the attainment of
performance targets, such as ensuring sustainable participation by reputable, competent and reliable contractors;
settlement of contract price at near marginal cost; faith by tenders in the tendering mechanism and value for
money in projects execution and delivery. The mechanism will also go a long way to strengthen its functions
such as regulating and setting standards to enforce harmonized bidding and tender documents; formulation of
general policies and guidelines on public sector procurement and upholding professional ethics and reporting
erring personnel amongst other statutory functions.
With its in-built mechanism for positive results, adoption of due process mechanism (for the execution of capital
project when implemented properly) while complementing the position of Bamisile (2004) will go a long way to
assist in the improvement of current procurement systems and by extension assist in improving the products of
the industry and the image of the professionals.
It has the ability to infuse the needed fiscal discipline and sound economic principles to ensure transparency,
accountability and rebuild public trust in governance by attacking the much abused processes in the past
(Ezekwezilli, 2004b). The process therefore has what it takes to help put checks on the huge loss of public fund.
Recommendations
Bid evaluation should be definite, prompt and fast tracked, devoid of corruption and fraudulent practice so
that the right evaluated contractor could emerge within a reasonable time lag between tender and award.
Valuation of progress of work should be carried out as at when due and interim certificate resulting from
such valuation honoured without unnecessary delay. It should be made as part of the condition of contract
that any employer that delays honouring of interim or final certificate should be made to pay interest on
the amount of the valuation at the prevailing interest rate for such a period of delay as contained in the
mechanism of due process.
If delay in practical completion period of the project is caused by factors that can be attributed to the
contactor, Bureau of public procurement recommendation of payment of a certain and calculated damages
should be enforced as enshrined in the contract agreement.
Advance payment repayment should be spread over the entire valuations of the contractors’ duration to
improve cash flow contractors.
No contractor should be allowed to bid for a new project especially within an organization if such a
contractor is yet to complete a project he is currently undertaking.
The variation of contracts during the implementations stage cause very high burden on the procurement
entity and to the government. It is advisable that the variation is limited to 10% maximum which can be
taken care of by contingency provisions.
Indigenous contracting firms should have in their teams qualified professionals in the construction
industry viz-a-viz, Architects, Builders, Engineers etc before they are awarded contracts. The said
professionals physically to discharge their roles in respect of the awarded contracts.
References
Alan, E.T. (1997), Building Procurement, 2nd
Edition. Macmillan Press Limited, London.
Ashworth, A (2001), Contractual Procedures in the Construction Industry 3rd
Edition Addison Wesley Longman,
England
Ayangade, J. A., Wahab, A.B., and Alake, O. (2009), An Investigation of the Performance of Due Process
Mechanism in the Execution of Construction Projects in Nigeria, Civil Engineering Dimension, Vol. 11, No. 1,
pp. 1-7
Bamisile, A. (2004), Building Production Management, Foresight Press Limited, Lagos, Nigeria, pp. 1-12
Budget Monitoring and Price Intelligent Unit (BMPIU, 2005), A Manual on Public Procurement Reform
Programme in Nigeria, State House, Abuja, Nigeria,
Budget Monitoring and Price Intelligent Unit (BMPIU, 2006), The ABC of the contract Due Process (A Manual
on Public Procurement Reform Programme in Nigeria) 2nd
Edition, State House Abuja
Bureau of Public Procurement (2007), Procurement Procedures Manual for Public Procurement in Nigeria,
Ekpenkhio S.A. (2003), Public Sector Procurement Reforms: The Nigerian Experience (A paper presented to the
Government of the Federation at the Regional Workshop on Procurement Reforms and Transparency in
Government Procurement for Anglophone African Countries in Tanzania.
Esenwa, F.O (2004), Project Procurement Method in Due Process. Department of Physical Planning and
Development, National University of Abuja, Nigeria
Ezekwesilli, O. (2004a), Public procurement Reform: The Search for Transparency and Value for money.
Budget monitoring and Price Unit, Abuja
Ezekwezilli, O. (2004b), Understanding Due Process, Villascope, Vol. 4(2)

Developing Country Studies www.iiste.org
ISSN 2224-607X (Paper) ISSN 2225-0565 (Online)
Vol.4, No.26, 2014
145
Ezekwesilli, O. (2005), Due Process Mechanism and Digital Opportunities (Paper Presented to the University
Community at Princess Alexandria Auditorium, University of Nigeria, Nsukka
Mshelbwala, T. (2005), Pre-qualification Selection of Consultants and Contractors under Due Process,
Proceedings of the 35th Annual Conference of the Nigerian Institute of Building, Aba, Abia State, August 10-14,
pp. 13-22.
Nwankwo, S. (2004), Due Process in Public Accounting, The Nigerian Accountant 5(2), 34-42.
Obasanjo O. (2003), Nigeria: From Pond of Corruption to Island of Integrity (Lecture Delivered at the 10th
Anniversary Celebration of Transparency International Berlin).
Obasanjo O. (2004), Due Process Saves Nigeria N102 bn, This Day, Nigeria.
Olaleye, V.O. (2006), Implementation f Due Process, Policy, Federal ministry of solid Minerals, Abuja.
Rowlinson, S.M. (1987), Comparison of Contracting Systems for Industrial Buildings, in Lansley, P. R. and
Harlow, P.A. (eds.), Managing Construction Worldwide: The Organisation and Management of Construction,
CIB W-65, Vol. 1, pp. 55-65.
Wahab, K.A. (2006), Budget Monitoring and Price Intelligence Units, State House, Abuja.
Developing Country Studies www.iiste.org
ISSN 2224-607X (Paper) ISSN 2225-0565 (Online)
Vol.4, No.26, 2014
146
Resources Conservation and Waste Management Practices in
Construction Industry
1Kareem, W.A.,
1Asa, Olusola Adekunle. &
2Lawal, Musediq Olufemi
3. Department of Architectural Technology, The Federal Polytechnic, Ede
4. Department of Sociology, Osun State University, Osogbo, Nigeria
Abstract
Changing people’s wasteful behaviour can make a significant contribution for sustainable growth. This is
because wastes are often hazardous in nature thereby making them potentially hazardous to human health and/or
the environment. Sustainable livelihood within the environment where the presence of wastes has become a
phenomenon makes efforts at addressing this menace a central issue. In the light of this, a strategic solid waste
resource management planning approach has been identified as capable of enhancing plausible solutions to take
care of its menace. Such planning has to take into cognizance a comprehensive strategy that can remain flexible
in light of changing economic, social, material (products and packaging) and environmental conditions. In
relation to the present study, the need for resource conservation in order to minimise the rate of waste generation
is being emphasized. The necessity of this revolves around the environmental benefits inherent in such efforts
and economic gains it will bestow on the construction industry and other stakeholders within the society. This
paper investigates the management of wastes generated from construction and demolition activities that has
wide-ranging impacts on the environment. Waste management is perceived as a low project priority, and there is
an absence of appropriate resources and incentives support it. A theory of waste behaviour is proposed for the
construction industry, and recommendations are made to help managers improve workers’ attitudes towards
waste.
Keyword: Resource Conservation, Waste Management, Construction Industry
Introduction Waste, which is also known as rubbish, trash, refuse, garbage, junk, litter is unwanted or useless materials. In
biology, waste is any of the many unwanted substances or toxins that are expelled from living organisms; such as
urea, sweat or faeces. Litter is waste which has been disposed of improperly. Waste is directly linked to human
development, both technologically and socially. The compositions of different wastes have varied over time and
location with industrial development and innovation being directly linked to waste materials such as plastics and
nuclear technology. In recent time, large chunk of waste is generated as a result of development and urbanization
processes. Typical in this case is construction waste. The Construction industry, while contributing to overall
socio-economic development of any country, is a major exploiter of natural non-renewable resources and a
polluter of the environment whereby it contributes to the environmental degradation through resource depletion,
energy consumption air pollution and generation of waste in the acquisition of raw materials (Watuka and
Aligula, 2003).
The construction industry produces around 120 million tonnes of construction, demolition and
excavation waste per year with only half of this currently being recycled or reclaimed. Waste management
involves taking action to reduce the volume of construction waste being sent to landfill. Through the
identification of potential waste streams, setting targets for the recovery of materials and the process to ensure
that these targets are met a range of benefits can be achieved. Construction clients and developers are
increasingly looking to set targets and requirements for waste management and to move the industry from
standard through to good and best practice in waste management.
To have a deep understanding of waste particularly within construction industry, it is important that we
define what is meant by the concept of construction waste. The Building Research Establishment defined
building waste as the difference between materials ordered and those placed for fixing on building projects. The
Honk Kong Polytechnic (1993) defined construction waste as the bye-products generated and removed from
construction, renovation and demolition sites of building and civil engineering structures’. In environmental
terms, the latter definition produces the better description as it identifies clearly materials that must be either
recycled or re-used or disposed of.
The extensive building and infrastructure development projects as well as redevelopment of old areas in
many developing countries particularly in Nigerian cities and towns have led to a significant increase in
construction waste generation in the last few decades since our experience of oil boom. In advanced countries
like USA approximately 29% of overall landfill volumes is from construction waste; in the United Kingdom it is
about 50% and in Australia it is about 20% - 30% (Rogoth and Williams, 1994). Due to the enormous amount of
waste generated in construction sites activities, it can be seen that any substantial reduction in construction waste
will inevitably lead to a considerable reduction in the overall waste stream. In spite of significant impact of this
source of waste generation, little consideration has been given to how to control the generation of construction
Developing Country Studies www.iiste.org
ISSN 2224-607X (Paper) ISSN 2225-0565 (Online)
Vol.4, No.26, 2014
147
and demolition wastes in building projects in Nigeria. This may be attributed to the availability of relatively
inexpensive means of waste disposal and the generally low environmental awareness of the construction industry
in Nigeria. The present effort is an attempt at domesticating the findings of Teo and Loosemore (2001) on
theory of waste behaviour in the construction industry in geopolitical entity called Nigeria.
Waste Management Practices in the Construction Industry
Past research into the causes of waste in construction project indicates that waste do arise at any stage of the
construction process from inception, right through the design, construction and operation of the built facility
(Spivey, 1974; Faniran and Caban, 1998), Waste management is made difficult in the construction due to the
unique nature of each project, the hostility and unpredictability of the production environment, and the intense
cost and time pressure that characterize many construction projects.
In reducing waste, two principles prevail: first reduce the qualities of waste generated and second adopt
an effective system for managing the unavoidable waste produced. In managing the unavoidable waste, there are
three options in order to reference, namely, ‘refuse’, ‘recycle’ or ‘disposal’. The balance between the three will
depend upon the nature of the materials wasted. The cost will in turn depend upon the availability of reusing and
recycling options and the opportunities for reuse on a specific project (Chun et al., 1994).
It should be noted that waste management activities were merely another workload burden perceived to
be irrelevant to contractor job. This defeatist mindset represents a psychological barrier to the adoption of
positive attitudes, and indicates that waste reduction depends upon the ability of managers to install the value
that operatives attach to construction materials. If perception of economic viability change, then so could
attitudes. This can be achieved through measures such as (a) education (training) programmes to increase
knowledge levels, (b) incentives to operatives to engage in less wasteful practices, and (c) development of more
efficient and convenient ways of dealing with waste to make its generation less of a certainty.
Theory of Waste Behaviour
There are three most prominent theories in the environmental research that emerged to explain waste behaviour.
These are (1) Schwartz’s norm-activation theory which states that environmentally conscious behaviour depends
directly on the activation of altruistic moral norms rather than on general environmental concern (Schwartz,
1977).
(2) Ipsative Theory of Behaviour; this focus on how intervening factors such as resource constraints can prevent
pro-environmental attitudes being expressed in people’s behaviour (Frey, 1988); and (3) Theory of planned
behaviour- this is the ‘behavioural intention’ of an individual which reflects how motivated he/she is to behave
in a certain way. This is determined by three factors such as attitudinal, social and perceptual (Ajzen, 2001, 1993
& 1991).
In 1977 Schwartz developed a model of altruism which assumed that altruistic behavior will increase
when a person becomes aware of another’s suffering and, at the same time, feels responsibility for this suffering
(Kollmuss & Agyeman, 2002). Schwartz explained behavior in terms of an interrelationship between four major
constructs: awareness of consequences, ascription of responsibility, social norms and personal norms. This
model predicted that the activation of moral norms results in altruistic behavior. This moral norm-activation
occurs “when an individual becomes aware that his or her behavior has possible negative consequences for
others and is willing to take personal responsibility for the others’ well-being” (Allen & Ferrand, 1999, p. 340).
Therefore, the central idea in this model is the indirect influence of social norms on an individual’s behavior.
Awareness of consequences and assumed responsibility are variables that influence the implementation of norms
on actual behavior. If an individual experiences high levels of awareness of responsibility, and high levels of
assumed responsibility, norms will guide behavior (Fransson & Garling, 1999). Schwartz’s model insists that
norms activation is more likely when the actor has two types of beliefs. First, the acting individual should be
aware of the consequences of his act towards the subject of norm (Mustapha, 2010). Then, the individual has to
feel responsible for causing or preventing these consequences (Bleamey, 1998, p48). However, if the individual
perceives that his respect of norms might seriously harm his personal interest, he adopts defensive strategies.
Then, he can either reject the consequences of the behaviour or his own responsibility in order to neutralize the
norm (Schwartz, 1977). Besides, the model of the norm activation proved its efficacy for the study of several
ecological behaviours: the important change in environmental attitudes (Heberlein, 1972), the emergence of an
environmental ethic (Vandenbergh, 2005), the explanation of the individual consumption of energy (Black, et
al., 1985) and so on.
Methodology
This research is being anchored on Ajzen’s theory of planned behaviour in order to provide insight into
operative’s attitudes towards waste as well as providing a conceptual vocabulary to help organize empirical
observations. The research involved three phases of data collection and analysis. The first phase involved an

Developing Country Studies www.iiste.org
ISSN 2224-607X (Paper) ISSN 2225-0565 (Online)
Vol.4, No.26, 2014
148
attitudinal survey, the second phase involved focus group interview, while the third phase made use of both
participant and non-participant observation. The three-phase approach was necessary to enhance an avenue for
reflection upon and response to the unexpected ‘leads’ which emerged in the phase one of the process. The first
phase of data collection involved an attitudinal survey designed around the attitudinal factors identified in
Ajzen’s theory of planned behaviour.
The objectives of the study include examination of (a) operatives’ belief and perceptions towards waste
and to determine the influences that shape them; (b) the knowledge-based and awareness of their role in the
waste generation process, and (c) the impediments to the effective adoption of waste management practices on
construction sites. The survey consisted of open ended questions and takes the form of categorical or rating
scale answers ascertain the intensity of a respondent’s attitudinal response on a native or positive evaluation. The
survey instrument was administered to 50 operatives from two construction sites in Nigeria. Effort was made to
ensure fairness in distribution of the respondents, so that the results are not skewed towards ideas from those
within a particular company out of those selected. In this process, the selection of the respondents cut across five
occupational groups such as supervisors, leading-hands, tradesmen, labourers and others working in a technical
capacity.
The second phase based its analytical activities on the outcome of the findings from phase one. These
were arranged under five main headings such as management support, common perceptions of waste, waste
management training, incentives and employee involvement. This structured approach ensured uniformity in the
order of discussions, which in turn facilitated easier analytical comparison. Observation of construction
activities and subsequent generated waste management was also utilized to complement the other methods. The
observation entailed both participant and non-participant techniques.
Table 1: Focus Group Propositions
Category Participant Position Recommendations
Management support Waste management is a low project
priority.
Not enough is done to reduce waste.
Insufficient recycling facilities are
provided.
Managers need to demonstrate
greater commitment to waste
management
Common perception of
waste
There is little recycling or re-use value
in construction materials.
Waste is an inevitable by-product on
construction projects.
Restore value to materials by
developing more efficient ways
of dealing with waste.
Waste management
training
Waste management training is
insufficient.
Knowledge about waste reduction
techniques lacking
Effective waste management has other
benefits such as improving safety.
More high quality training is
needed across a wider range of
occupational groups.
Incentives Cost savings are the most attractive
benefits to reducing waste.
Site staff and management should both
benefit from the potential cost savings
of waste reduction.
Create greater awareness of the
economic benefits of waste
reduction.
Employee No encouragement to provide feedback
on how waste can be reduced.
Position that waste reduction is not part
of assigned job.
Install a sense of collective
responsibility for waste
management.
Overall, this research into the nature and determinants of operatives’ attitudes rewards waste indicated that they
are not negative but that any goodwill is impeded by a lack of managerial commitment to the issue of waste
reduction. Current efforts to reduce waste are in their infancy, with many respondents reporting low adoption of
waste reduction activities on their sites. In terms of the factors that shape attitude, the main areas of concern for
managers are in the areas of knowledge, values and building project constraints. In particular, five key issues
emerged as impeding the adoption of positive attitudes to waste on construction projects.

Developing Country Studies www.iiste.org
ISSN 2224-607X (Paper) ISSN 2225-0565 (Online)
Vol.4, No.26, 2014
149
Sites observation
Causes of Construction waste
Based on site observations, it was noted that a significant amount of building materials ended up as waste on the
sites studied, including: timber, metal, concrete, brick, sand, etc. there are many contributory factors to this,
including human and mechanical, and these are identified in table 2 below. The observations showed that timber
boards from timber formwork was the most significant waste type requiring disposal (about 50%), and steel from
metal formwork had the highest recovery level of about 100%. Improper preparation and handling, misuse, and
incorrect processing were the major cause of material wastage on construction sites. Generally speaking, more
management attention was given to the materials that have a significant impact on the project cost, for example,
steel reinforcement, and little attention was paid on controlling wastage of other materials.
Table 2: Causes of Building Waste Generated from Various site activities
Site Activities Material Causes of Wastage Generated
Timber formwork Timber board Cutting scrap striking of form work
Metal formwork Iron bars Striking of formwork
Reinforcement fixing Iron bars Cutting scrap
Abortive work (e.g. drawings modified
by structural engineer)
In-situ concreting Concrete Leftover on the mixing platform lump
test
Trial panel (if any)
Work
Bricks & blocks
Cutting waste
Damage due to improper stacking
Damage due to careless handling by
workers during work
Abortive work
Excessive mixing
Dry wall Light weight concrete Cutting waste
Wall & floor screeding On site mix cement Broken bags due to careless handling
unloading stage
Broken bags due to careless left-over
Abortive work
Wall & ceiling Plaster Broken bags due to careless
Handling during unloading stage
Broken bags due to careless handling
during transportation
Lost while applying
Over-mixing
Floor & wall tilling Tile Cutting waste
Damage due to improper stacking
Damage by workers from other trades
after installation
Installation of sanitary
fittings
Damage due to careless handling by
workers during work sanitary fittings
Damage due to improper stacking
Damage due to careless handling during
installation
Damage by workers from other trades
after installation
Waste handling Methods
Generally, inert and non-inert waste on building sites was delivered to the ground floor refuse hips mixed up.
Then transported by trucks and disposed of at land fills without sorting. It was found that metal was the only
waste material worth recycling. This is because, little income is generated for recycled wood, concrete, and most
other building materials. Therefore, most contractors (operatives) generally do not have the practice of

Developing Country Studies www.iiste.org
ISSN 2224-607X (Paper) ISSN 2225-0565 (Online)
Vol.4, No.26, 2014
150
reuse/recycling of these materials nor on-site sorting. Figure 1 below, shows the flow chart recommended for
waste handling on sites.
Obstacles to Waste Reduction in Construction Industry in Developing Nations
In spite of the beauty inherent in waste reduction in the construction industry particularly in the developing
nations, certain obstacles were identified as militating against effective adherence. The findings here
corroborated most of the discoveries in the earlier study by Teo and Loosemore (2001). These include (a) a lack
of managerial commitment and support for the issue of waste, resulting in inadequate resources, man-power and
time for waste management activities in comparison with other issues, such as safety, (b) lack of performance
standard for managing waste, (c) difficulties in changing existing work practices and an informed and indifferent
workforce, (d) a lack of integration of expertise and experience in the waste management of process, (e) action to
reduce waste are predominantly profit motivated, and there is a perception that waste reduction activities are
cost-effective, efficient, practical or compatible with core construction activities. Environmental issues currently
have little effect on motivating operatives’ adoption of waste reduction behavior, (f) a wide spread belief that
waste reduction efforts will never be sufficient to completely eliminate waste, which has been accepted as an
inevitable by-product of construction activity.
Waste generated on site
working level
Wastes generated on site
Reusable and
recyclable
materials
transported
through chute
Reusable and recyclable
materials e.g. pallets, metal
collected
Waste materials
transported to the
surrounding of
the refuse dump
without sorting
Reusable and recyclable materials
e.g. pallets, reinforcements,
collected
Waste
materials are
transported to
refuse dump
without
sorting
Reusable
materials stored
and used in other
working area on
site
Mixed inert and
non-inert wastes
transported to
landfill by truck
without sorting
when site is full
Recyclable
materials sold or
returned to
supplier
Fig. 1: Flowchart Showing Suggested Waste Handling Method

Developing Country Studies www.iiste.org
ISSN 2224-607X (Paper) ISSN 2225-0565 (Online)
Vol.4, No.26, 2014
151
Social, Economic and Systemic Implication
The social, economic and systemic implications of resource conservation in construction industry manifest in
terms of its revolving benefits covers issues that range from Economics and Business performance. Also not left
behinds are the triple bottom line benefits of this activity as well as its percolating effects that trickles down to
the owner of the properties, the developers and contractors, the designers, the occupiers and the managers. For
instance, improvement in the efficiency and effectiveness of materials flow can generate economic benefits. A
typical case as revealed by Miller et al. (2005) was waste minimisation strategies developed for the Australian
where the budgeted amount for waste removal was reduced by approximately 50%. In addition to the potential
economic benefits, the practices of resource conservation are noted as contributing to reducing risk and
enhancing social and corporate responsibility. They also generate good public relations and may improve an
organisation's business continuity by attracting like-minded clients, customers and employees. The cost
reduction benefits are a small component of operational costs, but tracking and controlling waste is part of the
overall strategy to improve organisational performance and outcomes.
Implementing waste reduction, avoidance and management strategies can generate cost savings, and
can result in resource conservation, pollution and emissions prevention and landfill reduction benefits. Taking
part in waste programs also raises awareness and generates behaviour change across industry groups. This may
include improving an individual's understanding of the waste implications of purchasing decisions, not only
related to their professional activities, but also to their personal purchasing habits. The after effects of this is
entrenchment of behaviours that reduce waste streams and divert materials and products to appropriate recycling
and re-use pathways, resulting in closure on materials loops.
Building owners equally have a lot to benefit in waste avoidance, reduction and management at the
operational phase due to its long-term implications in the forms of building maintenance and service life. Also
significant are decisions made at the design, major refurbishment and demolition phases. This will positively
enhance a good corporate management message as well as asset procurement and facility management strategy
that addresses waste for design and construction practices with the attendant significant financial advantages.
The construction and demolition phases are important for developers and contractors because they generate a
significant one-off volume of waste, either from new building or from refurbishment and fit-out. Both waste
sources need to be effectively managed and controlled in order to optimize contract performance and time, cost
and quality outcomes, and to derive optimal financial returns and risk management, particularly in light of the
space and time constraints associated with refurbishment. The implications of waste management here include
better execution of site management plans (including site control) and performance reporting, reduced costs for
waste disposal, less space requirements and reduction in time spent on dealing with waste. If waste management
strategies are undertaken well, cost avoidance is generated from appropriate purchasing decisions, and cost
reductions are generated with reduced waste volume and mix.
It is important for the designer to align all parties to the design intent of waste minimisation, in order to
optimise the benefits. The designers have the role of turning requirements that may be explicit or implicit in the
brief into effective full life cycle strategies and, at least in capital construction stages, quantifiable outcomes and
reporting requirements. The benefits of waste minimisation for designers therefore entail design finesse relating
to a more informed relationship between good design and materials and products selection. It also improves the
collaborative relationship between designers and suppliers, which, in turn, greens the supply chain and
minimises local impacts and compliance costs. For building occupants, waste management is associated
primarily with business activities and business costs. Important objectives are to optimize space utilisation,
minimise furniture and equipment churn, and minimise activity-related waste generation. The importance of
waste management for managers relates to operational effectiveness, satisfying tenants' requirements, and
fulfilling the building owner's sustainability mandate. Cost-effectiveness is not seen as a primary motivator, as
waste collection and removal represent a small proportion of the maintenance budget; nevertheless, cost savings
can still be achieved.
Conclusion and Recommendations
In view of its size, the construction industry as a complex organization usually consists of large construction
companies and numerous subcontracted small and medium enterprises, which are also known as Small and
Medium Enterprises (SMEs). This therefore informed the regularity of waste generation within the industry.
Going by the socio-economic, structural and environmental implication of waste generation in construction
industry, concerns of avoidance of the waste has remained constant phenomenon. Waste avoidance, reduction
and management are strategies that are increasingly becoming important across industry groups. The degree and
relevance differs for each group, but the rationale of efficiency and effectiveness across economic, social and
environmental arenas is a common driver. Measures towards the realization of this were highlighted as
necessary most especially at the planning stage, construction stage and at the end of construction processes.
Concise efforts at planning stage of construction will lead to avoidance and minimization of waste generation

Developing Country Studies www.iiste.org
ISSN 2224-607X (Paper) ISSN 2225-0565 (Online)
Vol.4, No.26, 2014
152
through preparation of a detailed waste management plan. At construction stage good surround keeping and non-
site sorting of wastes to enable reuse and recycling. Finally, at the end of construction the waste data should be
calculated and used for future waste estimation.
The following waste management strategies were deduced from the study as ways forwards towards a
cost-effective construction industry and for socio-economic sustainability. These strategies come in the form of
recommendations that apply to every stakeholder within construction industry, while the other specifically
focused on steps needed on how to minimize waste generated from each of the construction activities.
Educational institutions should include the teachings of sustainable construction in the curriculum of
professionals in the construction industry. Also, professional bodies should use conferences and workshops
to educate practicing professionals.
Government should introduce specific legislation governing the handling and disposal of construction
wastes and follow up with strict monitoring to ensure compliance.
Incentive schemes should be set up by Government to reward firms who embrace construction waste
management wholly.
Managers need to demonstrate commitment to the issue of waste and to provide the necessary waste
infrastructure to help workers reduce it.
The cost benefits of waste reduction must exist.
More educational activities are needed to help raise workers’ consciousness of the longer term social and
ethical implication if their activities on site.
Instruct workers about proper material handling and stacking method e.g. maximum height of stacked
materials, tidy working and storage environment
Store materials on firm, level base, especially when they are stacked.
Better material supervision can reduce the amount of damage.
Provide centralized area for storage.
When mixing plaster, mix less needed towards the end of the day work.
Provide storage for off cuts for reuse where needed.
Better material protection and supervision can reduce wastage caused by workers and demand after
installation on fittings.
References
Ajzen, I. (1991), The theory of planned behavior. Organ. Behaviour and Human Decision Processes, 50, 179–
211.
Ajzen, I. (1993), Attitude theory and the attitude–behaviour relation, In Krebs, D. & Schmidt, P. (eds.), New
Directions in Attitude Measurement, Walter de Gruyter, Berlin, pp. 41–57
Ajzen, I. (2001), Nature and operation of attitudes, Annual Review of Psychology, 52: 27–58.
Alexander, J. (1993), Make Job-site recycle work, Journal of Light Construction, 28-29
Black, J., Stern P. C. & Elworth J. (1985), Personal and contextual influences on household energy adaptations,
Journal of Applied Psychology, 70, 1, 3-21
Bleamey, R. (1998), Analysis contingent valuation and the activation of environmental norms, Ecological
Economics, 24, 47–72
Developing Country Studies www.iiste.org
ISSN 2224-607X (Paper) ISSN 2225-0565 (Online)
Vol.4, No.26, 2014
153
Chun, L.P., Grosskopf, K.R. & Kibert, C. J. (1994), Construction waste management and recycling strategies in
the United States, in Kibert, C. J. (ed.), Sustainable Construction, Center for Construction and
Environment, Gainesville, FL, pp. 689–96
Faniran, O.O. and Caban, G. (1998), Minimizing waste on construction project sites, Engineering, Construction
and Architectural Management, 5(2), 182–8
Ferguson, J., Kermode, N., C. L., Sketch, W. A. J. and Huxfort, R. P. (1995), Managing and Minimizing
Construction Waste: A Practical Guide, Institute of Civil Engineers, London.
Frey, B.S. (1988) Ipsative and objective limits to human behaviour, The Journal of Behavioural Economics,
17(4):229–48
Gavilan, R. M. and Bernold, L.E. (1994), Source evaluation of solid waste in building construction. Journal of
Construction Engineering and Management, 536- 555.
Heberlein, T.A. (1972), The land ethic realized: Some social psychological explanations for changing
environmental attitudes, Journal of Social Issues 28, 4, 79-87
Johnston, H and Minck W. R. (1995), Cost-effective waste minimization for construction managers. 31-40
Kollmuss, A. & Agyeman, J. (2002), Mind the gap: Why do people act environmentally and what are the barriers
to proenvironmental behavior? Environmental Education Resource, 8: 239–260.
Miller, G., Khan, S. et al. (2005), Guidelines for waste minimisation in office building refurbishments: task 4 ¿
Waste minimisation in construction, Brisbane: CRC Construction Innovation.
Mustapha, H.I. (2010), Application of Value Beliefs Norms Theory to the Energy Conservation Behaviour,
Journal of Sustainable Development Vol. 3, No. 2
Rogoff, M.J. and Williams, J.F. (1994), Approaches to Implementing Solid Waste Recycling Facilities, Noyes,
ParkRidge, New Jersey
Schwartz, S. (1977), Normative Influences on Altruism, Advances in Experimental Social Psychology, 10:222-
279
Spivey, D.A. (1974), Construction solid waste, Journal of the Construction Division, ASCE, 100: 501–6
Teo, M.M.M. and M. Loosemore, (2001), A theory of waste behaviour in the construction industry, Construction
Management and Economics, 19:741–751
The Honk Kong Polytechnic (1993), Reduction of Construction Wastes: Final Report, The Hong Kong
Construction Association Ltd, Hong Kong
Vandenbergh, M.P. (2005), Order without social norms: How personal norm activation can protect the
Environment, Northwestern University Law Review, 99, 3, 1101-1166.
Watuka, J., and Aligula, E. M., (2002), Sustainable Construction Practices in the Kenyan Construction Industry:
The Need for a Facilitative Regulatory Environment, Proceedings of the CIB W107 1st International
Conference: Creating a Sustainable Construction Industry in Developing Countries, 11 – 13 November,
Stellenbosch, South Africa

Developing Country Studies www.iiste.org
ISSN 2224-607X (Paper) ISSN 2225-0565 (Online)
Vol.4, No.26, 2014
154
Examining the Effect of E-Commerce on Business Performance in
A Business Environment
ANTHONY IGWE
Department of Management, University of Nigeria, Enugu Campus, Enugu, Nigeria
J. U. J ONWUMERE
Department of Banking and Finance, University of Nigeria, Enugu Campus, Enugu, Nigeria
OBIAMAKA P. EGBO
Department of Banking and Finance, University of Nigeria, Enugu Campus, Enugu, Nigeria
Abstract
In this exercise, the effects tof electronic commerce in the light of business to business transaction are examined.
Our assessments result in the development of four propositions regarding the impact of electronic commerce on
business performance. Our propositions link the adoption of electronic commerce through information flow and
speed of decision making to business performance. From these propositions, we have suggested a model of the
impact of electronic commerce adoption on business performance, the benefit of the buyers, the suppliers and the
customers. The model implies a mediated link between electronic commerce and business performance. It is our
view that the adoption of this model will enhance business activity and its overall performance.
Keywords: E-Commerce, Business Performance, Environment
INTRODUCTION
Among the most powerful forces affecting the world’s economy and commerce today is the substantial increase
in globalisation through the use of Information and Communications Technologies (ICTs). Kaynak et al (2005)
suggest that the rapid emergence of E-commerce has changed the nature of business so quickly and pervasively
that where once it was revolutionary, now, it is simply evolutionary. Many authors have stated that e-commerce
provides many opportunities to create better business economics (Oliver, 1999) and some have gone as far as
indicating that e-commerce is the “great equalizer” (Quinn, 1999).If these statements are true then it would mean
that businesses should be receiving some sort of benefit from the implementation of these technologies. The
ability of the World Wide Web (WWW) to facilitate communication has triggered the need for businesses to
think about new ways of conducting their affairs (Herbig and Hale, 1997; Pattinson and Brown 1996; Hamill,
1997). As the medium has been suffering from substantial hype, it would appear that business operators have
been reluctant to participate in the e-commerce environment, although various researchers are predicting
phenomenal growth in the near future. If the existing ratio between business to consumer (B2C) and business to
business (B2B) markets holds in the “new economy” then it is expected that the (B to B) market should be 100
times larger than the (B2C) market (Caralli, 1995). Against this background of uncertainty and potential
(Venkatesh 1998), is an opportunity to conduct extensive academic research into ecommerce from the
perspective of the B2B operation. This paper explores current theory on B2B transactions in the “old economy”
and then translates them into an e-commerce setting.
These translations are then examined for their likely impact on businesses that adopt the “new economy”
approach in their activities. There are nearly as many definitions of E-commerce as there are contributions in the
literature. The World Trade Organisation (WTO) defines E-commerce as “.. the production, distribution,
marketing, sale or delivery of goods and services by electronic means” (Baker & McKenzie 2001 cited Kaynak
et al 2005). Shultz & Baumgartner (2001) define the concept as: “the buying and selling of information,
products, and services via computer networks”. As there are no commonly agreed to definitions of Ecommerce
for E-commerce, the definition provided by Globerman et al (2001 cited Kaynak et al 2005) will be adopted in
this paper, viz., “any economic transaction where the buyer and the seller come together through the electronic
media of the Internet, form contractual agreement concerning pricing and delivery of particular goods and
services and complete the transaction through the delivery of payments and good or service as contracted”.
However, the definition by Kalakota and Whinston (1997) has four distinguishing perspectives. They include (1)
Communication perspective – E-Commerce is the delivery of information, products/services or payments over
telephone lines, computer networks or any other electronic means; (2) Business process perspective – E-
Commerce is the application of technology towards the automation of business transactions and workflows; (3).
Service perspective – E-Commerce is a tool that addresses the desire of firms, consumers and management to cut
service costs while improving the quality of goods and increasing the speed of service delivery; and (4) Online

Developing Country Studies www.iiste.org
ISSN 2224-607X (Paper) ISSN 2225-0565 (Online)
Vol.4, No.26, 2014
155
perspective – E-Commerce provides the capacity to buy and sell products and information on the Internet as well
as other online services.
CONCEPTUAL FRAMEWORK
In order to assess the effect of electronic commerce on business to business dealings, we need to first start with
the already well established literature on buyer behaviour. Starting in the late sixties (Strauss 1962;(Robinson,
Farris and Wind 1967), organisational buyer behaviour has been dissected and analysed in great detail. One of
the main thrusts of the more recent works has been to examine the effect of information on the buying process.
Duncan and Moriarty (1998) discuss the relationship between the notions of exchange, communication and
technology setting, the stage for more detailed investigation in the future. Earlier work (Larson 1994) indicated
that there was a strong relationship between information flow and business performance. When this work is held
up beside the recent trend toward electronic commerce, it begs the question of the impact of WWW on
communications. If increased communication sparks increased performance, then a communication revolution
should revolutionize performance. Dawes, Lee and Dowling (1998) suggest that information will have an impact
on performance only when there is a differential in the amount of information available to various firms. This
implies that the WWW might well be a zero sum game. However, others such asLilien et al. (1998) suggest that
any increase in information, and more importantly, information use, will result in a net gain in overall efficiency
allowing all participants to prosper. Clearly, there is confusion as to the effect of information on businesses. To
make matters worse, the type of industrial purchase is also likely to moderate the informational effect with
Duncan and Moriarty (1998) suggesting that technology based information improvements would help mainly
transactional purchases.
Specifically, Electronic Data Interchange systems have immediate effects on the performance of a business such
as:
(a) Faster transmission;
(b) Greater accuracy of data interchange;
(c) More complete information about the transactions
d) Provide what telephone or fax services could not provide
e) Increase in communication flow
f) Provides what telephone or fax services could not provide
THE SIGNIFICANCE OF ELECTRONIC COMMERCE
Electronic Commerce has made an impact on virtually every business after years of exploration. Online
booksellers and music stores such as Amazon, Barnes and Noble, and Borders, to name several, have connected
with a significant consumer segment. Traditional retailers such as Wal-Mart have established an on-line
presence, and the personal computer industry exemplifies a range of business models on the World Wide Web:
Developing Country Studies www.iiste.org
ISSN 2224-607X (Paper) ISSN 2225-0565 (Online)
Vol.4, No.26, 2014
156
from simple distributors-integrator-catalog models such as NECX, Microwarehouse, and PCMall to make-to
order PC manufacturers such as Dell and Gateway. Even on-line groceries shopping which was originally being
thought of as not likely to bloom has become common enough to attract $456 million in gross revenues for 1998
(Kirsner, 1999). And banking, taking full advantage of the information flow through the World Wide Web
(WWW), has practically extended most of its function onto Internet. As a recent BusinessWeek article (Robert D
Hof, 2000) predicts: buyers (of all corporations) using net marketplaces will grow from about 28% in 2000 to
estimated 70% in 2002; and sellers (of all corporations) using net marketplaces will grow from about 8% in 2000
to estimated 72% in 2002.
However, conducting business on-line does not necessarily guarantee savings or better service, nor does it
guarantee competitiveness. Rapid-growing technology and technology adoption makes estimates understanding
of the web-enhanced capabilities difficult. Fundamental changes in competition, strategy, information structure,
and organizational design represent some of the probable changes this medium will inevitably bring. Moreover,
there also exists urgent needs for greater speed and efficiency, corporate decentralization, incentives to control
purchasing costs, and the growth in electronic commerce.
WEB-ENHANCED CAPABILITIES
What indeed are the competitive advantages EC can provide that traditional firms don’t have? Watson et al.
(1998) offer five reasons to participate in electronic commerce: (1) to reduce search and transactions costs; (2) to
promote the image of a leading-edge corporation and increase visibility; (3) to improve customer service; (4) to
enable market expansion; (5) to lower stakeholder communication costs through on-line transactions and global
information distribution. Ghosh (1998) identifies four opportunities created by electronic commerce. Each
opportunity explains feasible and compelling uses of electronic commerce: (1) establishing direct links with
customers: sample activities include on-line ordering, providing new services; benefits for firms include lower
interaction (operating) costs, developing loyalty; and benefits for customer include speed, lower cost, and
availability of valuable information. (2) Circumventing other members of value chain: sample activities include
ordering on-line from source with both physical and virtual resources; benefits for the firms includes reducing
nodes in information and material flow in supply chain; and benefits for customers include lower cost, valuable
information, and customization. (3) Developing new products and services: sample activities include creating
new product/service by the aid of Internet; benefits for the firms include building loyalty, better use of resources;
and benefits for customers include, again, lower cost, speed, valuable information, customization, and integrated
offerings. (4) Becoming the dominant electronic presence within an industry: sample activities include becoming
the pioneers in the industry to provide e-channels; benefits for the firms include superior competitive position
from scale, scope, and integration; and benefits for customers include cost, speed, valuable information, and
market dominance. Rayport and Sviokla (1995) develop a framework for thinking of marketspace, a “virtual
realm” where products and services are delivered through information-based channels. The authors propose three
sequential value-adding information processes created by EC: (1) visibility, referring to the easiness of managing
existing operations efficiently, such as ERP; (2) mirroring capabilities, referring to substituting virtual activities
for physical activities, particularly in enhancing speed, flexibility, cost, and quality; (3) customer relationships,
referring to improving customer relationship through web-based advertising, service, knowledge base
information, and ordering and fulfillment. Integrating the concepts, we can see that EC can enhance traditional
capabilities such as cost, quality, flexibility, and delivery, as well as innovation and technology, and more
importantly, knowledge. EC also succeeds in shortening the distance between customers and the firm through the
use new information to tailor products/services to customers’ needs and develops new, technology-based
relationships with them. Although electronic commerce offers new, exciting, and potentially revolutionary
strategic choices, forms, and implementations, it does not transcend extant frameworks and conceptions.
Extensive literature review indicates that the implications for electronic commerce comprise many of the
concepts of competitive capabilities found in operations strategy literature such as neo-operations strategy (Roth,
1996), and the Service Factory (Chase, 1989). However, how do these similarities and differences influence
business performance? Naturally, our first step is to search answers from different traditional Operations
Management literature.
BENEFITS TO THE BUYERSS:
Purchasers could view a product using the convenience and the flexibility of the Internet to locate and view
product and its features from various organizations, examine the price request modifications to the product and
order the product by completing the required formalities without having to leave the office. A higher degree of
adoption of electronic commerce and its associated increase in asynchronous data/image transmission will
augment business performance. Bloch, Pigneur and Segev (1996) argue that electronic commerce provides
information to customers through on-line electronic brochures or buying guides. This can be seen as an

Developing Country Studies www.iiste.org
ISSN 2224-607X (Paper) ISSN 2225-0565 (Online)
Vol.4, No.26, 2014
157
additional marketing channel, allowing for a global reach.
The advantages of electronic commerce as a way to deliver marketing mix information and its ability to be
available in real time, anywhere provided the customer has the right infrastructure to access this information will
have effect on business performance. As information is transacted electronically, ordering of good and services
are made economically and easily.
As information is transacted electronically, ordering of goods and services are made economically and easily.
From the demand side the potential benefits from electronic commerce include the information on the
procurement process, where the process can be streamlined and trading procedures can be standardized through
computerization. Delays and errors in procurement can be reduced. Information that is provided by various
businesses in an electronic commerce environment on goods and services that the buying organisation can
compare would prove more efficient and informative for matchmaking with the requirements and allow for
competitive rates for procurement. Some argue that electronic commerce has the capacity to empower small
businesses by providing equal opportunity to gain and transfer or exchange information.
Bloch, et al. (1996) argues that a large source of the business value that electronic commerce can provide comes
from changing the products themselves in addition to the way they are advertised, ordered or delivered. Database
marketing techniques can then be used to analyze this information, in order to improve new product development
and target specific offers to certain customers (Berry, 1994). This is mainly due to the potential of collecting
information that will be used to customize products.
A higher degree of adoption of electronic commerce and its associated economical information sharing will
increase the speed of the decision making process. The advent of the computer and the implementation of
subsequent management information system programs have had a greater effect on industrial purchasing than
has anything else in the past. Not only has the computer served as an important tool for the use in purchasing but
also the purchase of that computer required a purchasing decision of intense complexity for each business
(Bonoma, 1977). The authors found that as purchasing departments’ use of computers increased they were able
to off-load routine tasks of ordering and were able to focus on looking for suppliers and bargain better deals. The
electronic commerce environment allows economical interactive search to look for bargains at reduce cost. An
electronic commerce environment purchasing organizations will need on-line facilities that will not only help
them in locating resources but also provide help in locating products and services that match certain customized
requirements within a certain price range.
BENEFITS TO THE SUPPLIERS
Suppliers who are contacted to meet various specific requirements required by the purchasing organisation can
provide specific information to the purchasing organisation in real time in order to speed up the purchaser’s
decision making process. Economical interactive search also provides the purchasing organisation to look for
similar organisation that can provide products with similar specification and use the information to bargain price.
From the supplier side the supplier can also search intellectively for purchasing organisation that require
particular products and try to supply information to the buyer in order to speed up the purchaser’s decision
making process.
BENEFITS TO THE CUSTOMERS
Mass customization has been used for some time now (Pine, 1993); it endeavours to create specific products for
each customer, based on his or her exact needs. Customization to create specific products for customers can now
be possible for the information bank of electronic commerce. In the future, electronic commerce links between
customers and suppliers will suppress the need for an infrastructure to gather customer data, and will allow
customers to do it from home, their office or on the road. This direct link also allows the supplier to gather very
detailed data on customer profiles, their needs, patterns of buying etc.
CONCLUSION
There has been a lot of hype associated with virtual environments and in particular the electronic commerce
environment. Of late, the literature has begun to identify the ways in which this environment is important and the
measures that need to be developed to ascertain the effect of electronic commerce on business performance in a
business environment. Virtual markets are technological environments of a particular kind and the measurement
of these business-to-business markets in an electronic commerce environment has not been established in
literature. To this end the theory of Industrial Buying Behaviour has been used as a basis to identify factors for
various constructs and add to it other factors and to develop a number of proposals based on the developed

Developing Country Studies www.iiste.org
ISSN 2224-607X (Paper) ISSN 2225-0565 (Online)
Vol.4, No.26, 2014
158
conceptual framework. A higher degree of adoption of electronic commerce and its associated increase in
interactive search will increase the speed of the decision making process. The proposed future research in this
area is to expand the application of channel performance in electronic commerce and measure the improvement
in effectiveness that organizations would realize by conducting business in this environment.
REFERENCES
Berry, J. (1994). "A potent new tool for selling: Database Marketing". Business Week. 56-62.
Bonoma, T. (1977) “Industrial Buying Behaviour”, Cambridge Mass.
Bloch, M., Y. Pigneur, and A. Segev (1996). "On the Road of Electronic Commerce”. A Business Value
Framework, Gaining Competitive advantage and Some Research Issues".
[Online] Available www:http//www.stern.nyu.edu/mbloch/docs/roadtoec/htm. [16 Dec. 1998].
Caralli, A (1995)."Electronic Commerce over the Internet and the Increasing Need for Security". Trade Wave
Corporation of Austin White Paper.Austin, Texas. December 8. 2.
Chase, Richard.(1998) “Service Factory”, Harvard Business Review, pp. 61-69.
Dawes, P., D. Y. Lee and G. Dowling (1998). “Information Control and Influences in Emergent Buying Centers.”
Journal of Marketing (July): 55-68.
Duncan, T., and S. E. Moriarty (1998). "A Communication-Based Marketing Model for Managing
Relationships" Journal of Marketing, 62: 1-13.
Ghosh, Shikhar.(1998) “Making Business Sense of the Internet”, Business Horizons, pp. 126-135.
Heidelberg, Springer-Varlag.
Hamill, J (1997) "The Internet and International Marketing". International Marketing Review, 14(4/5):300-323.
Herbig, P. and B. Hale (1997) "Internet: The marketing challenge of the twentieth century", Internet Research:
Electronic Networking Application and Policy 7(2): 95-100
Kalakota R and Whinston AB. Electronic Commerce: a managers guide. Reading, MA: Addison-Wesley, 1997.
Kaynak E, Tatoglu E & Kula V (2005) An analysis of the factors affecting the adoption of electronic commerce
by SMEs: Evidence from an emerging market International Market Review vol. 22, no. 6, pp 623 – 640.
Kirsner, Scott.(1999) “Express Lane”, Wired, pp. 112-122
Larson, P.D. (1994), “Buyer/Supplier Cooperation, Product Quality, and Total Costs,” International Journal of
Physical Distribution & Logistics Management, 24(6), 4-10
Lilien, G. and Rangaswamy, A. (1998), “Marketing Engineering”, Addison Wesley Longman Reading MA,
USA
O'Callaghan, R., P. Kaufmann, and B. Konsynski (1992). "Adoption Correlates and Share Effects of Electronic
Data Interchange Systems in Marketing Channels". Journal of Marketing, 56: 45-56.
Oliver, R.W. (1999) Channels unlimited. Management Review, 88(9), 12-13.
Pattison, H., and L. Brown (1996) "Chameleons in Marketplace, Industry Transformation in New Electronic
Marketing Environment", Journal of Marketing Practices: Applied Marketing Science 2(1): 7-21.
Pine, J. B. (1993) Mass Communication, the new frontier in business competition, Harvard Business School
Press.
Poon, S. and P. Swatman (1997). “Small business use of the Internet.” International Marketing Review 14(4):
385-402.
Quinn, C. (1999) How leading edge companies are marketing, selling, and fulfilling over the Internet. Journal of
Interactive Marketing, 13, 39-50.
Rayport, J. and J. Sviokla (1995). "Exploiting the virtual value chain". Harvard Business Review. 73: 75-85.
Robinson, P. J., C. W. Farris and Y. Wind (1967). Industrial Buying and Creative Marketing. Boston, Allyn and
Bacon.
Roth, Aleda.(1996) “Chapter 38: Neo-operations Strategy: Linking capabilities-based Competition to
Technology”, Handbook of Technology Management (G. Gaynor), McGraw-Hill, pp.38.1-38.43.
Schulze C. & Baumgartner J (2001) Don’t Panic, Do E-commerce, A Beginner’s Guide to European Law
Affecting Ecommerce European Commission’s Electronic Commerce Team.
Stern, L. W. and P. Kaufmann (1985). Electronic Data Interchange in Selected Consumer Goods Industries: An
Interorganizational Perspective, Marketing in an Electronic Age, Harvard Business School Press.
Strauss, G. (1962). “Tactics of Lateral Relationships: The Purchasing Agent.” Administrative Science Quarterly
7: 161-186.
Venkatesh, A. (1998) "Editorial". European Journal of Marketing. 32(7): 600-602.
Watson, Richard, Sigmund Akselsen, and Leyland Pitt.(1998) “Attractors: Building Mountains in the Flat
Landscape of the World Wide Web”, California Management Review, Vol. 40, No. 2, pp. 36-55, Winter.
Developing Country Studies www.iiste.org
ISSN 2224-607X (Paper) ISSN 2225-0565 (Online)
Vol.4, No.26, 2014
159
Human Resource Management, International Labour Standards
and Globalization
ANTHONY IGWE
Department of Management, University of Nigeria, Enugu Campus, Enugu, Nigeria
J. U. J ONWUMERE
Department of Banking and Finance, University of Nigeria, Enugu Campus, Enugu, Nigeria
OBIAMAKA P. EGBO
Department of Banking and Finance, University of Nigeria, Enugu Campus, Enugu, Nigeria
Abstract
Human resource is one of the eight inputs of the systems cybernetic model. The other inputs are materials,
money, time, energy, knowledge, information and infrastructure. These inputs are transformed by the process to
get the output with feedback and control. The human resource is considered as the most important resource even
in automated systems. There is a need to have the human element to trigger production. This is because all other
inputs are inert. Management has the responsibility to ensure that organizational objectives and goals are
achieved by utilizing both human and material resources. Human resource management is that aspect of
management that handles the management of people at work. It is a very important managerial function just like
production, finance, marketing, research and development and innovation. It handles such activities like
recruitment, selection, placement, orientation, induction, training and development, wage administration,
industrial relations management and employee welfare management and motivation. There are many
international benchmarks that are needed for effective human resource management. This study therefore
undertakes a review of human resource management within the context of international labour standards and
globalization.
Keywords: Human Resource Management, Labour Standards, Globalization
1.0 INTRODUCTION
Strategic human resource management is largely about integration and adaptation. Its concern is to ensure that:
(1) human resource (HR) management is fully integrated with the strategy and the strategic needs of the firm; (2)
HR policies cohere both across policy areas and across hierarchies; and (3) HR practices are adjusted, accepted
and used by line managers and employers as part of their everyday work”. Throughout the world, the HR
profession has to respond to increased competition for globally mobile talents, changes in both workforce
attitudes and composition, shifts in the employer/worker relationship and rapid advances in human resource
technology. New kinds of technical knowledge, skills and abilities would require human resource practitioners in
future who are flexible and willing to deal with the ever accelerating pace and often unpredictable changes in the
global workplace, especially in technology (Mayrhofer and Brewster, 2005). The human resource profession
needs to evaluate the implications of a movement into an era of decentralization, which if used properly, may
lead to liberation. The era will require a new kind of business, based on a different paradigm that can bring
together the contributions of autonomous individuals in a socially sustainable way. It is thus clear that a new way
to manage human resource as a paradigm is emerging, as well as new human resource managers should manage
themselves (Limerick et al, 2002). The main focus for managers of this century is the urgency to manage change
speedily and efficiently in a human resource management context with appropriate competencies. Issues like
international human resource management, diversity, employment equity, generation Y, reputation management
and corporate ethics amongst others must be factored regarding future identification of human resource
professionals’ role and capabilities.
Various authors (Kane, 2006; Burton, 2003; Swanepol et al, 2002 and Nel et al, 2005) have identified factors
which act as barriers to effective human resource management. Some of the pertinent issues are: top
management has a low priority, and offer a short-term view of what the real issues in human resource
management and the profession are. According to various researchers (Parmenter, 2002; Burton, 2003), human
resource management practitioners are perceived to lack sufficient knowledge and skills necessary to implement
effective human resource management practices at various levels in their organizations (Burton, 2003). Human
resource professionals have not been assertive enough to be present in the boardroom to guide human resource
programmes to achieve long-term impacts on human resource initiatives. This probably points to a lack of
adequate drive and communication to apply strategic human resource management (SHRM) fully (Kane, 2001).
Developing Country Studies www.iiste.org
ISSN 2224-607X (Paper) ISSN 2225-0565 (Online)
Vol.4, No.26, 2014
160
Many international benchmarks that are needed for effective human resource management now exist. This study
therefore undertakes a review of human resource management within the context of international labour
standards and globalization. It is divided into five sections. Apart from section one which is our introduction,
section two discusses strategic human resource as a response to the challenges of globalization. Section three
presents some relevant tenets of the international labour standards Act. Section four X-rays globalization and
decent work while section five contains our conclusion.
2.0 STRATEGIC HUMAN RESOURCE AS A RESPONSE TO THE CHALLENGES OF
GLOBALIZATION
Strategic Human Resource Management (SHRM) involves a set of internally consistent policies and practices
designed and implemented to ensure that a firm’s human capital (Employees) contributes to the achievement of
its business objectives (Baird and Meshoulam, 1988; Delery and Doty, 1996; Huselid et al., 1997; Jackson and
Schuler, 1995), Schuler (1992: 18) has developed a more comprehensive academic definition of SHRM:
Theoretical Foundation of Strategic HRM
Several theoretical perspectives have been developed to organize knowledge of how HRM practices are
impacted by strategic considerations as briefly described below. Wrigth and McMahan (1992) have developed a
comprehensive theoretical framework consisting of six theoretical influences. Four of these influences provide
explanations for practices resulting from strategy considerations. These include, among others, the resource
based view of the firm and behavioural view. The two other theories provide explanations for HR practices that
are not driven by strategy considerations: (a) resource dependent and (2) institutionary theory.
Implications for HRM Practice
The idea that individual HR practices impact on performance in an additive fashion (Delery and Doty, 1996) is
inconsistent with the emphasis on internal fit in the resource-based view of the firm. With its implicit systems
perspective, the resource based view suggests the importance of “complementary resources”, the notion that
individual policies or practices “have limited ability to generate competitive advantage” (Barney, 1995:56) This
idea, that is system of HR practices may be more than the sum of the parts, appears to be consistent with
discussions of synergy, configurations, contingency factors, external and internal fit, holistic approach, etc
(Delery and Doty, 1996; Huselid, 1995). Drawing on the theoretical work of Osterman (1987, Sonnenfeld and
Peiperl (1988), Kerr and Slocum (1987) and Miles and Snow (1984); Delery and Doty (1996) identified seven
practices that are consistently considered strategic HR practices. These are (1) internal career opportunity (2)
formal training systems (3) appraisal measures (4) profit sharing (5) employment security (6) voice mechanisms
and (7) job definition. There are other SHRM practices that might affect organizational performance. For
example, Schuler and Jackson (1987) presented a very comprehensive list of HR practices. However, the seven
practices listed by Delery and Doty(1996) above appear to have the greatest support across a diverse literature.
For example, nearly all of these are also among Pfeffer’s (1994) 16 most effective practices for managing people.
3.0 THE INTERNATIONAL LABOUR ORGANIZATION’S CORE LABOUR STANDARDS AND
THE WORKPLACE RELATIONS ACT 1996.
Constitution of the International Labour Organization, Article 7
The governing body is the executive council of the International Labour Organization (ILO) and meets three
times a year in Geneva. It comprises 56 members, of whom 28 represent governments, 14 represent workers and
14 represent employers. Ten of the 28 government seats are reserved for the states of chief industrial importance.
The governing body takes decisions on ILO policy and establishes the programme and the budget, which it then
submits to the conference for adoption.
The international labour office is the administrative arm of the ILO. It is headed by the Director General who is
elected by the governing body for a renewable term of five years. The office is answerable to the governing body
through the director general.
Creating International Standards
The ILO formulates instruments that set minimum standards for basic labour rights. These instruments are
generally conventions, which are legally binding international treaties that may be ratified by member states.
The ILO also uses other mechanisms to establish important standards or principles, such as declarations adopted
by its conference (for example, the 1944 Declaration of Philadelphia and the 1998 declaration on Fundamental
Principles and Rights at Work). The ILO formulates recommendations, which serve as non-binding guidelines
Developing Country Studies www.iiste.org
ISSN 2224-607X (Paper) ISSN 2225-0565 (Online)
Vol.4, No.26, 2014
161
that complement its conventions.
International labour standards generally result from international concern that action needs to be taken on a
particular issue. As a first step, the Governing Body agreed to put an issue on the agenda of a future International
Labour Conference. The International Labour Office then prepares a report that analyses the laws and practices
of member states with regard to the issue. The report is circulated to member states and to workers’ and
employers’ organizations for comment and is discussed at the International Labour Conference. A second report
is then prepared by the Office with a draft instrument for comment and submitted for discussion at the following
conference where the draft is amended as necessary and proposed for adoption. This double discussion process
gives conference participants time to examine the draft instrument and provide comments.
A two-thirds majority of votes by delegates is required for an international labour standard to be adopted. This
has a number of benefits, as Creighton and Steward note. It means that; “…a standard cannot be adopted in the
face of concerted opposition from government delegates. It also means that a standard is unlikely to be adopted
in the face of the concerted opposition of employer or union delegates… This sometimes means that standards
which are adopted represent the ‘lowest common denominator”.
The Application of International Labour Standards
ILO member states are required to submit any convention adopted at the international labour conference to their
national competent authority(s) – generally their parliament(s) – for the enactment of relevant legislation or other
action, including ratification. They are required to do this: “…within the period of one year at most from the
closing of the session of the conference, or if it is impossible owing to circumstances to do so within the period
of one year, then at the earliest practicable moment and no later than 18 months from the closing of the session
of the conference …”
The Supervision of International Labour Standards
Member states are required to report to the ILO on the measures they have taken to give effect to ratified
conventions, according to the type of instrument and the schedule notified by the International Labour Office.
Every two years, governments must submit reports detailing the steps they have taken in law and practice to
apply any of the eight fundamental and four priority conventions that they have ratified. For all other
conventions, reports must be submitted every five years; except for conventions that have been shelved (these
are no longer supervised on a regular basis). Reports on the application of conventions may also be requested at
shorter intervals. In addition, each year a general survey is conducted on one or more conventions or
recommendations relating to a particular subject and all member states are required to report, irrespective of
whether they have ratified the instruments concerned. Representative worker and employer organizations have
the opportunity to comment before government reports are sent to the ILO.
Observations are assessments of a government’s compliance with a convention, which are published in the report
of the Committee of Experts. They generally only occur when the committee is not satisfied with the progress of
the closed process of dialogue through direct requests. It should be noted that observations are not legal
determinations and are not finally binding. Only the International Court of Justice can provide a definitive view
of the meaning of a convention. However, observations are authoritative in the sense that they represent the
considered views of a panel of eminent jurists elected for the purpose of providing an impartial, technical
evaluation of the application of the ILO’s conventions. The reports of the Committee of Experts provide the
basis for discussion at the Conference Committee on the Application of Standards. Representation and compliant
procedures can also be initiated for states that fail to comply with conventions they have ratified.
International Labour Standards through fundamental conventions
The mid of late 1990s marked a new phase for the ILO, which sought to reposition itself in the multilateral arena
and re-establish its credibility as an influential international agency. It did this by refocusing the attention of its
member states on the implementation of a set of core labour standards contained in conventions identified as
fundamental. These instruments were concerned with the protection of fundamental human rights that were seen
to attain heightened importance in the context of globalization. The ILO has been successful in having its revised
agenda endorsed by a number of international organizations.
This Declaration has been recognized as marking ‘a new and important step in the ongoing struggle to develop
multilateral instruments that will reconcile the globalization process with the need to preserve the core rights of

Developing Country Studies www.iiste.org
ISSN 2224-607X (Paper) ISSN 2225-0565 (Online)
Vol.4, No.26, 2014
162
labour. In relation to these core rights, their recognition was not to be governed by the national context or the
level of economic development. Further, as already noted , the source of the obligation to implement these
principles and fundamental rights was said to lie in membership of the ILO, not ratification of the convention. A
follow-up to the Declaration established arrangements to encourage member states to promote the fundamental
principles and rights enshrined in the Declaration. These include technical cooperation, simplified annual
reporting requirements in relation to unratified fundamental conventions, and global reports. The latter are
reports submitted to the ILO’s annual conference by the Director General and focus on a different fundamental
convention each year.
Founding of the ILO
The ILO was founded in 1919, in the wake of the First World War. In 1919, the achievement of social justice was
seen as essential prerequisite for the maintenance of world peace. The ILO was entrusted with working towards
this objective and was given the task of adopting international labour standards as its principal means of action.
This vision was set out in the preamble to the ILO’s constitution, which also identified priorities in carrying out
this program: as earlier said, according Mark Levin at the recently held ILO cooperative Branch conference in
Johannesburg, South Africa, the ILO is a specialized agency of the United Nations established in 1919 to
promote social justice and internationally recognized human and labour rights. Today, the ILO has a total of 176
member states from across the globe. The ILO has a tripartite structure – its governing institutions, the
International Labour Conference and the Governing Body, reach decisions on the basis of discussion and
negotiation between government, employer and worker representatives. The ILO provides unique opportunities
for different views on the social and economic challenges of the day to be aired – and for decisions affecting the
working lives of billions of people worldwide to be taken through consensus. We consider that the breadth of
opinion expressed within the ILO is a valuable asset.
Clearly, globalization has brought widening opportunities, great prosperity and development for some
economies. Economies and individuals that have been able to take advantage of the expanding global
marketplace have benefited considerably – as a result many see globalization as an instrument of progress.
However, we should also be cognizant of some unpleasant facts from the world of work – the ILO estimates that
more than a billion women and men are unemployed, underemployed or what we term the working poor. Some
120 million migrant workers and their families have left their homes in search of finding a job elsewhere. The
information economy absorbs six out of every 10 new jobs created globally, mostly in unprotected, low-income,
self employed service sector occupations. Everywhere, the cost of occupational injuries and illnesses is heavy.
Blatant violations of trade union rights are a sad reality in many countries and more than 120 million children
aged 5-14 years are working full time in developing economies .
Is globalization to blame for all this? Clearly not, but to quote the ILO Director-General’s statement to the recent
world summit on Sustainable Development in Johannesburg, “the present form of globalization is exacerbating
rather than bridging social division within and between countries”. He continued: “Many throughout the world
are deeply disturbed, and downright angry, at the failure to reverse these trends. Many people believe that
globalization itself has raised insecurity, eroded rights and created increased fears of exclusion and vulnerability.
In order to study these issues in depth, to move the debate forward from conflict to consensus and to ensure that
process of globalization works for all, the ILO has established a world commission on the social Dimension of
Globalization. The 25 member commission is co-chaired by Ms. Tarja Halohen, president of the Republic of
Finiland, and Mr Benjamin William Mkapa, president of the united R epublic of Tanzania. Members of the
commission include distinguished individuals from around the globe and from a variety of constituencies. From
the United States we have Ms. Ann Mclaughlin Korologos, Professor Joseph Stiglitz and Mr.John Sweeney. The
commission began its work in early 2002 and is expected to release its final report during the course of 2003. In
common with other international commissions of this nature, its deliberations will remain private for the
moment to allow the members to develop their ideas freely. It will be drawing on expertise from around the
world, including from the multilateral system, but also from a wide range of actors through consultations at
regional and country level. The task of the co9mmission is to consider how to make globalization a more
inclusive process that promotes development. Issues of concern to people in their daily lives such as work and
unemployment, poverty and deprivation, economic development and social justice are being addressed. We can
expect the commission to come up with ideas about how to promote greater policy coherence among global
development actors. In this context, I read recently that the newly elected Director-General of the World Trade
Organization, Dr Supachai Panitchpakdi, has said that he would seek to achieve global coherence between the
Developing Country Studies www.iiste.org
ISSN 2224-607X (Paper) ISSN 2225-0565 (Online)
Vol.4, No.26, 2014
163
WTO and other international bodies, including the ILO a statement that bodies well for the future although we
see how this pans out in reality.
4.0 GLOBALIZATION AND DECENT WORK
It is against the background of the challenges and opportunities posed by globalization that the ILO has
developed the concept of Decent Work to encapsulate our primary goal today which is to promote opportunities
for women and men to obtain decent and productive work, in conditions of freedom, equity, security and human
dignity. Thus Decent Work implies access to employment in conditions of freedom, the recognition of basic
rights at work which guarantee the absence of discrimination or harassment, an income enabling one to satisfy
basic economic, social and family needs and responsibilities, an adequate level of social protection for the
worker and family members, and the exercise of voice and participation at work, directly or indirectly through
self-chosen representation organization.
How can the Decent Work agenda serve as a platform for thinking about globalization and about the needs of
developing countries? Ina recent article in the international Herald Tribune, the Director-Gneral of the ILO
outlined what he called some “common sense approaches that can make globalization more equitable”. Here
they are:
Concentrate on creating opportunities for decent work and income in areas and large cities through an
enabling environment for investment and skills development, particularly for self-employment and for
micro, small and medium enterprises.
Move away from the bubble and speculation of the casino economy fuelled by primary financial
markets, toward a real economy based on saving, investment and creativity that generate solid
companies and quality jobs.
Promote social entrepreneurship and socially responsible investment funds. Put strict limitations on the
linkage between pension funds and stock markets. Protect the value of savings.
De-link economic growth from environmental degradation by investment strategies for sustainable
development made possible by new environment-friendly technologies.
Invest heavily in information technologies and, through development cooperation, enable poor countries
to access these techniques.
Place policy options on a sound footing by promoting social dialogue among workers and employers
and civil dialogue with representative voices of society.
Inject fairness and accountability into the international trading and financial systems.
Much of this is indeed “common sense”, or should be, but regrettably the promotion of this agenda is an uphill
struggle. Employment promotion is far from being at the top of the list of many of the major multilateral
development frameworks. The ILO faces a major challenge, for example, to ensure that employment concerns
are taken account of in the World Bank-driven “Poverty Reduction Strategy Papers” (PRSPs) which, in the
words of the Bank. “describe a country’s macro-economic, structural and social policies and programs to
promote growth and reduce poverty, as well as associated external financing needs. PRSPs are prepared by
governments through a participatory process involving civil society and development partners”. Many major
donor countries are committed to this process, as well as the UN and its specialized agencies. The ILO is mainly
concerned with what we call “mainstreaming the Decent work agenda” which involves pushing ILO concerns
about workers’ rights, employment creation, social protection and social dialogue onto national policy agendas.
The ILO has specifically focused on strengthening the ability of the social partners (employers’ and workers’
organizations) to participate more effectively in the PRSP process. The ILO is also active in contributing towards
the achievement of the UN’s Millennium Development Goals which aim to halve by 2015 the proportion of
people whose income is less than $1 a day.
Globalization, Decent Work and Ownership
What have all these got to do with ownership? Everything Quality job creation and retention argument is based
on these six key ideas:
1) Workers’ ownership saves jobs by preventing enterprise closure
2) Workers’ ownership motivates people to be more productive
3) Companies with substantial workers’ ownership out-perform those without it
4) Workers’ ownership enables people to participate
5) Participation contributes to creating healthier communities
6) Broadened ownership of capital has the potential to mitigate some of the negative effect of globalization
Developing Country Studies www.iiste.org
ISSN 2224-607X (Paper) ISSN 2225-0565 (Online)
Vol.4, No.26, 2014
164
by anchoring the ownership of productive assets at the community level.
In general terms, the greater the degree of ownership and participation in decision-making, the more likely it is
that workers’ ownership will achieve these goals. All things being equal therefore, if we look along a spectrum of
ownership models, genuine workers’ cooperatives would probably demonstrate the highest degree of ownership
and participation in decision-making, while minority employee share-holding with little participation would
probably be the least. This perhaps explains why the ILO has traditionally been mainly engaged at the
cooperative end of the workers’ ownership discussion.
In terms of the ILO’s Decent work agenda, therefore, worker’s ownership provides “productive work in
conditions of freedom, equity, security and human dignity” while anchoring capital locally and increasing
economic democracy. For this reason the ILO has been actively engaged in supporting cooperative development
since the establishment of a cooperative technical service in 1920, deriving its mandate from the ILO’s
Constitution which provides for consultations with recognized non-governmental international organizations
including those of agriculturists and cooperators. It is interesting to note that the first ILO Director-General, Mr.
Albert Thomas, was a member of the Executive Committee of the International Co-operative Alliance, which as
the global voice of the cooperative movement maintains a consultative status with the ILO.
The ILO, then and now, has viewed cooperatives as important tools for improving the living and working
conditions of both women and men. The ILO sees cooperatives as businesses that are based on a broad set of
democratic and egalitarian values. Since cooperatives are owned by the users of the services they provide, they
make decisions that balance the need for profitability with the welfare of their members and the community,
which they serve. As cooperatives foster economies of scope and scale, they increase the bargaining power their
members providing them, among others benefits, higher income and social protection. Hence, cooperatives
accord members opportunity, protection and empowerment – essential elements in uplifting them from
degradation and poverty. The ILO has thus always supported the development of cooperatives as important
vehicles in meeting its goals and has the largest technical cooperation programme on cooperative within the UN
system.
With the ILO’s recent consolidation of its focus on Decent Work, the Cooperative Branch has placed greater
emphasis on the employment creation activities of cooperatives and their capacity to provide social protection,
especially to the marginalized sectors of society. The organizational flexibility of cooperatives to reach out to the
informal economy provides a good opportunity to improve the conditions of work in this otherwise unprotected
sector. It is noteworthy that the very equality, equity, solidarity, social responsibility and caring for others – find
congruence with the notion of Decent Work.
At the International Labour Conference in Geneva, the ILO adopted a new international labour standard on the
promotion of cooperatives – Recommendation No. 193. A Recommendation is a policy guide to member States
and is not legally binding as in the case of a convention. Nevertheless, from past experience we know that ILO
recommendations find their way into the law books and government policies of many of member countries. The
main features of Recommendation No. 193 are as follows:
Recognition of the global importance of cooperatives in economic and social development
(cooperatives are after all the largest non-governmental movement on the planet with nearly 800 million
individual members).
Reaffirmation of the cooperative identity based on values and principles.
Equal treatment for cooperatives vis-à-vis other types of enterprise.
Definition of the government’s role in creating a supportive policy and legal framework and in
facilitating access to support services and finance, without interference framework, and in facilitating
access to support services and finance, without interference.
An active promotional role for employers’, workers’ and cooperative organizations.
Encouragement of international cooperation.
5.0 CONCLUSION
This paper set out as a contribution to the current discourse on the interaction of globalization, human resource
management and business performance especially with a flavor of the challenges from the perspectives of
developing countries. The paper presents a framework for Strategic Human Resource Management as a response
to prepare organizations for the challenges of globalization. It has been observed that by and large, organizations

Developing Country Studies www.iiste.org
ISSN 2224-607X (Paper) ISSN 2225-0565 (Online)
Vol.4, No.26, 2014
165
have achieved relatively low levels of effectiveness in implementing Strategic Human Resources Management
(SHRM) practices (Huselid, et. al., 1997). If the propositions outlined above are supported, then the real
challenge for organizations in the era of globalization is to pay particular emphasis on strengthening their human
resources by upgrading the relevant competencies.
As governments and corporate bodies brace up for the new millennium characterized by an ever-increasing
global challenge, developing countries have no choice but to develop and continuously upgrade the human
resource and business competencies of their workforce. Again, distinct competencies are important to deal with
not only the HR /issues but also others including partnerships in economic recovery especially in South East Asia
and Africa, dealing with the “big boys”, the fund managers, concerns over possibility of fraud in E-commerce
with fast spread of Information Technology and last but not least, implementing prescriptions for recovery and
growth taking in to consideration the development agenda and unique circumstances of individual countries.
Addressing these issues is a necessary step towards facing the challenges of globalization in the next
millennium.
REFERENCES
Burton, L. (2003) “The Next Big Thing”, People Dynamics 21(2).
Cutcher-Gershenfeld, J. (1991). The Impact on Economic Performance of a Transformation in Workplace
Relations. Industrial and Labor Relations Review, 44: 241 – 60.
Delery, J.E. and Doty, D.H. (1996). Modes of Theorizing in Strategic Human Resource Management: Tests of
universalistic, Contingency and Configurationally Performance Predictions. Academy of Management Journal,
39(4): 802 – 835.
Dowling, P.J., Schuler, R.S. and Welch, D.E. (1994). International Dimensions of Human Resource
Management, Belmont, CA: Wadsworth.
Gerhart, B. Milkovich, G.T. (1990). Organizational Differences in Managerial Compensation and Financial
Performance. Academy of Management Journal, 33: 663 – 91.
Golden, K.A. and Ramanujam, V. (1985). Between a Dream and a Nightmare: On the Integration of Human
Resource Management and Strategic Business Planning. Human Resource Management, 24(4): 429 – 452.
Kane, B. (2001) “HRM and Trends in Management: Travelling a Well-worn Path?” New Zealand: Auckland:
Paper Presented to 15th Annual ANZAM Conference, 6-8 Dec.
Limerick, D; Cunnington, B. and Crowther, F. (2002) Managing the New Organization: Collaboration and
Sustainability in the Post-corporate World (2nd ed.), Crows Nest: Allen and Unwin.
Mayrhofer, W. and Brewster, C. (2005) “European Human Resource Management Researching Developments
over Time”, The International Review of Management Studies 16(1).
Nel, P.S., Marx, A.E. and Du Plessis A.J. (2005) “The Future Context of Work in the Business Environment in
South Africa: Some Empirical Evidence” South African Journal of Economic and Management Sciences 8(2).
Parmenter, D. (2002) “How HR adds Value”, New Zealand Management 49 (10).
Swanepoel, B.J. (ed.); Erasmus, B.J., Van Wyk, M. and Schenk, H. (2003) South African Hyman Resources
Management: theory and Practice (3rd ed.) Cape Town: Juta.
Developing Country Studies www.iiste.org
ISSN 2224-607X (Paper) ISSN 2225-0565 (Online)
Vol.4, No.26, 2014
166
Competency Development Model for Agricultural Instructors in
Gorontalo Province, Indonesia
Mohamad Ikbal Bahua
Faculty of Agriculture, State University of Gorontalo, Indonesia
*E-mail : [email protected]
Abstract
The purposes of this study are to analyze internal factors that can formulate a model of competence development
of agriculture instructor in Gorontalo Province and to analyze the degree of relationship of internal factors that
can formulate a model of competence development of agriculture instructor in Gorontalo Province. The research
applied survey method. The model is verified by using analytical SEM (Structural Equation Model) through the
LISREL (Linear Structural Relationships) program. The results show that there is an influence of variable
characteristics, motivation and self-reliance towards agriculture instructor’s competency. Simultaneously, these
three variables influence the competency of agriculture instructor as 0.74 units (74%) at significant α = 0.05.
There is a coefficient of relationship between variables, that is; the coefficient of relationship between the
characteristics and self-reliance of extension agent, the coefficient of relationship between the characteristics and
the motivation of extension agent and the motivation and self-reliance of the extension agent.
Keyword: Competency, Characteristics, Motivation, Self-reliance, Agricultural Extension
Introduction
Agriculture instructors are people who play a role in empowering the farmers as the main subject of
agribusiness, so that the farmers are able to develop the agribusiness based on the capability and local resources
they have. The agricultural extension, which has been given through the adult education system, aims to develop
the farmers’ behavior in order they can farm well, have a better live, and carry out the business properly.
The success of an agriculture instructor is determined by his competency in giving the information to the
farmers, such as cultivation technology, price, market access and capital, also the agricultural development
policy in the working area of the agriculture instructor. Therefore, an agriculture instructor should have a good
ability in communication, have broad knowledge, be independent, and be able to adjust himself based on the
characteristic of the farmer. In this case, the agriculture instructor should be able to arrange the lesson plan that
will be implemented through an effective and efficient learning method and media based on the need of the
society.
The competency of the agriculture instructor is explained in the duties and functions of an agriculture instructor
in supporting the farmers in developing their agribusiness, because a competency is an ability that the agriculture
instructor should have, whether it is a technical competency, or a managerial competency. The competency of an
agriculture instructor should be supported by the cognitive, affective, and psychomotor ability. With the
competency that the agriculture instructor has, it is expected that the agriculture instructor will be able to
complete the task properly in carrying out the agricultural extension.
In the reality, there are a lot of agriculture instructors who have low competency in doing their job as agents of
change in the development of agricultural sector. This reality is affected by several policies which require an
agriculture instructor do not work in field based on their competency. Tjiropranoto (2005) said that the
agriculture instructors are not able or even have no chance to develop their professional ability as the functional
officers of agriculture instructor because there are a lot of activities under their responsibility, and sometimes
they are not appropriate with the job as a professional agriculture instructor. Sumardjo (2008) explained that the
lack of competency of agriculture instructor is estimated related to the process of learning which law of quality,
because the agriculture instructor is stuck on the formality demands for certificate adjustment for agriculture
instructor functional position.
Developing Country Studies www.iiste.org
ISSN 2224-607X (Paper) ISSN 2225-0565 (Online)
Vol.4, No.26, 2014
167
The research result of World Bank (Hadi, 2000) concluded that, the competency of Field Agriculture Instructor
is very low.This is caused by several factors, such us: (1) the knowledge and skill of the agriculture instructor,
which are very low, sometimes are not appropriate with the farmers’ need, (2) The Field Agriculture Instructors
are not prepared and trained to carry out the agricultural extension. If there is a training for Field Agriculture
Instructor, the training is not relevant with their job as Field Agriculture Instructor in their working area, and (3)
in many things, the Field Agriculture Instructors have missed the information from the farmers and fisherman
whom are handled by him.
The research result of Muliady (2009) concluded that the competency of the agriculture instructor in developing
the agribusiness lowland rice farming in three districts of West Java (Karwang, Subang, and Sukabumi) is
categorized as low (25%) in agricultural information and agriculture instructor leadership’s management. Bahua
(2010) in his result of research stated that the competency of the agriculture instructors in Gorontalo Province
should be developed in the sector of agricultural extension program planning and agriculture instructor
leadership.
Based on the previous explanation, the research of the competency development of agriculture instructors in
Gorontalo Province is important to be done as an effort to develop the process of learning to the farmers in
producing the agribusiness and to help the government in planning the program of the agriculture
professionalism development, by increasing the level of education and training of agriculture instructors which
related to the jobs in work area. This research will uncover the empirical facts related to the competency of the
agriculture instructors in carrying out their duty in supporting the farmers that will produce a model of
development competency of agriculture instructor in succeeding the program of agricultural development in
Gorontalo Province.
Methodology of Research
Research Site
The research was conducted in Gorontalo Province which has five districts and one city. The reasons of
determining research site, were (1) Gorontalo is a province which programming the agropolitan with maize as
the main crop, (2) the amount of agriculture instructors are dominated by the agriculture instructors of crops, (3)
the farmers in Gorontalo Province, generally, cultivate the maize as the main crop to develop the family
economic level. The research was conducted from April to August 2013. The research wasex post facto. Ex post
facto is a research model that assesses the events that have occurred or an evaluation of factual condition in the
field.
Variables
The variables of research were Independent variables (X) were characteristics of agricultural instructor (X1),
motivation of agricultural instructor (X2), independence of agricultural instructor (X3), while the dependent
variable was competency of agricultural instructor (Y).
Population and Sample
The analysis unit of the research was agricultural instructor numbered to 481 instructors and numbers of assisted
farmers were 45.409 farmers, with assumption that the main duty and role of the agriculture instructors are the
same, and, generally, the agriculture instructors in Gorontalo Province are the civil servants. The sampling was
done through “proportional random sampling,” from the list of the names of agriculture instructors in Gorontalo
Province. The number of the agriculture instructors’ population is described on Table 1.
Tabel 1. The numbers of the population of the agriculture instructors
District/City Number of agriculture instructor (people)
District of Gorontalo 174
District of Bone Bolango 91
District of Boalemo 83
District of Pohuwato 79
District of Gorontalo Utara 29
Gorontalo City 25
Total of Gorontalo Province 481
Developing Country Studies www.iiste.org
ISSN 2224-607X (Paper) ISSN 2225-0565 (Online)
Vol.4, No.26, 2014
168
By using Solvin’s formula (Sevilla, 1993), the number of agriculture instructor sample of this research in error
standard as 8% is:
By knowing the number of research sample, then, proportionally, the number of agriculture instructors sample in
each district/city of Gorontalo Province is explained in Table 2.
Tabel 2. Number of agriculture instructor sample in each district/city
No District/City Number of sample (people)
1 District of Gorontalo 43
2 District of Bone Bolango 22
3 District of Boalemo 20
4 District of Pohuwato 20
5 District of Gorontalo Utara 7
6 Gorontalo City 6
Total 118
Research Method
This research applied survey method through interview and questionnaire. The design of research is structural
equation model of factors influence the competency of agriculture instructor. It uses the hypothesis frame to
investigate the influence of independent variable towards dependent variable. Then, the hypothesis frame is
implemented to formulate the measurement model and structural equation model based on SEM (Structural
Equation Model). The equation model and hypothesis frame can be seen as follow:
(a) Measurement equation model
(1) The measurement of characteristic variable
(2) The measurement of motivation variable
(3) Pengukuran peubah kemandirian
481
n = -------------------- = 118
1 + 481 (0,08)²
N
n = ------------
1+ N(e)² + N(e)²
Ni
ni = -------- x n
N
Note:
n = number of sample
N = number of population
e = error standard ni = number of sample strata i
Ni = number ofpopulation strata i
X1.1 = λ1 X1 + δ1
X1.2 = λ2 X1 + δ2
X1.3 = λ3 X1 + δ3
X1.4 = λ4 X1 + δ4
X1.5 = λ5 X1 + δ5
X1.6 = λ6 X1 + δ6
X1.7 = λ7 X1 + δ7
X1.8 = λ8 X1 + δ8
X1.9 = λ9 X1 + δ9
X2.1 = λ10 X2 + δ10
X2.2 = λ11 X2 + δ11
X2.3 = λ12 X2 + δ12
X2.4 = λ13 X2 + δ13
X2.5 = λ14 X2 + δ14
X2.6 = λ15 X3 + δ15
X3.1 = λ16 X2 + δ16
X3.2 = λ17 X4 + δ17
X3.3 = λ18 X4 + δ18
X3.4 = λ19 X4 + δ19

Developing Country Studies www.iiste.org
ISSN 2224-607X (Paper) ISSN 2225-0565 (Online)
Vol.4, No.26, 2014
169
(4) The measurement of competency variable
(b)Structural equation model
Agriculture instructor competency model
Y1 = γ1 X1 + γ2 X2 + γ3 X3 + ζ1
Result and Discussion
Result of Research
The Condition of Agriculture Instructor
The age of agriculture instructors in Gorontalo Province are around 38 to 58 years old, with the average of age as
50.44 years. Most of the agriculture instructors (63.6%) are around 50 to 58. It means that almost of agriculture
instructors are elderly people. If it is connected with the agriculture instructors’ retirement age as 60 years of
age, then it is estimated that within ten years from now, the number of agriculture instructors in Gorontalo
Province will decrease as 63 percent.
The agriculture instructors’ working period in Gorontalo Province is around 7 to 37 years, with the average as
24.7 years. Almost of the agriculture instructors’ working period is around 21 to 37 years. This shows that the
agriculture instructors in Gorontalo Province generally are elder and already saturated to their profession as the
field agriculture instructor, so that they are not able to find out the information and the innovation of agricultural
technology which can be a material of agricultural extension to the farmers. This condition causes the lack of the
agriculture instructors’ competency in developing the learning to the farmers.
The numbers of assisted farmers in Gorontalo Province are around 45 to 412 people; with the average are 209
people. Some of agriculture instructors (35.6%) have 238 to 412 assisted farmers. According to the regulations
issued by the Ministry of Agriculture (2004), the ideal numbers of farmer groups which can be fostered by the
agriculture instructor are 6 – 8 groups of farmers or 150 – 200 farmers. It means that numbers of assisted farmers
in Gorontalo province is more than 8 groups of farmers.
Therefore, it affects the decrease of the agriculture instructors’ competency in developing the farmers in the
target area. 65% of agriculture instructor in Gorontalo Province are the Diploma 3, and the remaining 35% are
Senior High School. The functional and technical training that have been followed by the agriculture instructors
in last 10 years is education and training of the development of crops in 2008 – 2009. The working territories of
agriculture instructors in Gorontalo Province are generally located in the lowlands, ramps, and hills. The
working territories generally are related to the cultivation developed by the farmers which are crops (rice and
maize). The frequency of the interaction of agriculture instructor with the assisted farmers is 3 times in one
growing season, they are the first planting, maintenance and harvesting.
The Agriculture Instructor Competency Model
After analyzing the variable which affects the agriculture instructor’s competency, it is found that the structural
model of agriculture instructor’s competency as in the Picture 1. It shows that the influence track of each
variable can be formulated through the equation of structural model as follow: Y = -0.30X1 + 0.088X2 + 0.22X3.
The result of analysis showed that the relation and the influence of each variable/sub-variable on agriculture
instructors’ performance model in Table 3.
Y1 = λ20 Y1 + ε1
Y2 = λ21 Y1 + є2
Y3 = λ22 Y1 + є3
Y4 = λ23 Y1 + є4
Y1.5 = λ24 Y1 + є5
Y6 = λ25 Y1 + є6
Y7 = λ26Y1 + є7
Y8 = λ27 Y1 + є8
Y9 = λ28 Y1 + є9
Y10= λ29Y1 + є10
Y11 = λ30 Y1 + є11

Developing Country Studies www.iiste.org
ISSN 2224-607X (Paper) ISSN 2225-0565 (Online)
Vol.4, No.26, 2014
170
Table 3. Decomposition of the influence of each variable/sub-variable of agriculture instructor’s competency variable
The relationship between variables/sub-variables Influence
t-count Directly Indirectly Total
Characteristics of
Agriculture Instructor
Competency of
Agriculture Instructor -0,30 - -0,30 -2,58
Characteristics of Agriculture
instructor
Expressing cultural
diversity - -0,18 -0,18 -3,12
Characteristics of Agriculture
instructor
Processing the
information of
agricultural extension
- -0,15 -0,15 -2,94
Motivation of Agriculture
Instructor Competency of
Agriculture Instructor 0,88 - 0,88 3,34
Motivation of agriculture
instructor
Expressing cultural
diversity - 0,52 0,52 5,17
Motivation of agriculture
instructor
Processing the
information of
agricultural extension
- 0,44 0,44 4,45
Independence of Agriculture
Instructor
Competency of
Agriculture Instructor 0,22 - 0,22 2,19
Independence of agriculture
instructor
Expressing cultural
diversity - 0,13 0,13 2,37
Independence of agriculture
instructor
Processing the
information of
agricultural extension
- 0,11 0,11 2,29
Remark: t0.05 table = 1.96
Chi-Square=71,12, df=55, P-value=0,07076, RMSEA=0,050, CFI=0,97
Picture 1.Parameter of Agriculture Instructor Competency Structural Model
0,77 Characteristic of
agriculture instructor
(X1)
0,96
0,72
Motivation
agriculture instructor
(X2)
1,00
0,64
0,50
-0,11
0,25
Competency of
agriculture instructor
(Y)
(R2= 0,74)
0,88
-0,30
0,22
age (X1.1)
Work period
(X1.2)
Number of assited
farmers (X1.8)
Keb.untukberafili
asi (X3.5)
Development
of self potency
(X2.1)
Desire of
affiliation (X2.5)
Intellectual
independence
(X3.1)
Social independence
(X3.2)
0,78
0,92
Appreciating the
cultural diversity
(Y2)
Processing the
information of
agricultural extension (Y5)
0,59
0,49
Independence of
agriculture instructor
(X3)
Developing Country Studies www.iiste.org
ISSN 2224-607X (Paper) ISSN 2225-0565 (Online)
Vol.4, No.26, 2014
171
Based on the model suitability test, the tested model is able to estimate the population covariance matrix or the
model parameter estimation result can be enforced to the research population. Thus, the result of the model
suitability test showed the measurement model is fit with the data.
The equation of measurement model and structural equation model in this research is explained as follow:
A. The equation of measurement model:
(1) The loading of the agricultur instructor’s characteristic variable (X1):
X1.1 = 0,96 X1
X1.2 = 0,77 X1
X1.8 = 0,72 X1
(2) The loading of agriculture instructor’s motivation (X2):
X2.1 = 1,00 X3
X2.5 = 0,64 X3
(3) The loading of agriculture instructor’s independence variable (X3):
X3.1 = 0,78 X4
X3.2 = 0,92 X4
(4) The loading of agriculture instructor’s performance (Y):
Y2 = 0,59 Y
Y5 = 0,49 Y
B. The Equation of Structural Model:
Y = -0,30X1 + 0,88X2 + 0,22X3
Discussion
A. The Influence of Characteristic toward The Competency of Agriculture Instructor
The result of research shows that the characteristic variable directly influenced significantly the competency of
agriculture instructors. It means that the characteristic of the agriculture instructors will determine the merits of
the agriculture instructors’ competency with the influential coefficient value as -0.30 significantly in α = 0.05.
The influence of agriculture instructors’ characteristic appears in the merits of the agriculture instructors’
competency in appreciating the cultural diversity and the in processing the information of agricultural extension
(Table 3). It indicates that if there is an increasing of a unit of the agriculture instructors’ characteristic, it will
decrease the competency of agriculture instructor in appreciating the cultural diversity as 0.18 units, and it will
decrease the competency of agriculture instructor in processing the information of agricultural extension as 0.15
units.
The decreasing of the competency of agriculture instructor in appreciating the cultural diversity includes the lack
of the agricultural extension’s material that is suitable with the local wisdom and the lack of the agricultural
extension’s media that is suitable with the local wisdom. The decreasing of processing the information of
agricultural extension includes the lack of agricultural extension’s media, the lack of the use of computer to
search for and to deliver the information, and the lack of the use of learning method in each extension.
The research result suits to the research result of World Bank in Hadi (2000) which concluded that, the
performance of Field Agriculture Instructor is very low, it is showed by: (1) the knowledge and skills of the
agriculture instructors is very low; (2) Field Agriculture Instructor is not prepared and trained to do the
agricultural extension activity. If there is training for Field Agriculture Instructor, the training is not relevant
with their job as Field Agriculture Instructor in their work area; and (3) in many things, the Field Agriculture
Instructors have missed the information from the farmers and fisherman whom are handled by him.
B. The Influence of Motivation towards the Competency of Agriculture Instructor
The result of research shows that motivation variable influences significantly the competency of the agriculture.
It means that the agriculture instructors’ motivation will determine the merits of the competency of the
agriculture instructors with the influence coefficient as 0.88 significantly in α = 0.05.
The influence of agriculture instructors’ motivation appears in the merits of the agriculture instructors’
competency in appreciating the cultural diversity and in processing the information of agricultural extension

Developing Country Studies www.iiste.org
ISSN 2224-607X (Paper) ISSN 2225-0565 (Online)
Vol.4, No.26, 2014
172
(Table 3). It indicates that if there is an increasing of a unit of the agriculture instructors’ motivation, it will
decrease the competency of agriculture instructor in appreciating the cultural diversity as 0.52 units, and it will
decrease the competency of agriculture instructor in processing the information of agricultural extension as 0.44
units.
The developing of the competency of agriculture instructor in appreciating the cultural diversity includes the
increasing of the agricultural extension’s material that is suitable with the local wisdom and the increasing of the
agricultural extension’s media that is suitable with the local wisdom. The increasing of processing information of
agricultural extension includes the increasing of agricultural extension’s media, the increasing of the use of
computer to search for and to deliver the information, and the increasing of the use of learning method in each
extension.
The dimensions of agriculture instructors’ motivation, which is closely related to the competency of agriculture
instructors, are: (1) the development of self-potential includes the expectation to follow a formal education,
training, and conduct the field trials of location specific technology, and (2) a need for affiliating, includes:
desire to be accepted by others in the live and work’s environment, desire to be respected, the desire to move
forward and not fail, and the desire to participate.
A research of Elton Mayo at General Electric Company, in Hawthorn, Chicago, has an effect to the work group’s
motivation and the employees’ attitude in working. The contributions of the result of research for the
development of motivation theory are: (1) a desire to be respected as a human evidently is more important in
developing the motivation and productivity of the employees’ performance than the working environment
condition, (2) the employees’ attitude is influenced by current condition, either it is inside or outside the working
environment, (3) the informal groups in work environment have an important role in forming the habit and the
attitude of the employees, and (4) groups’ cooperation do not occur accidentally, but it should be planed and
developed (Yusuf, 2008).
The research result shows that there is a significant influence of agriculture instructors’ motivation to the
agriculture instructors’ competency from the dimension of self-potential and a desire to be affiliated. Thus, the
research can help the Department of Agricultural and the local government in developing the competency of
agriculture instructor by developing the motivation of agriculture instructors from the dimension of self-
development and a desire to be affiliated.
It can be done by increasing the formal education level of the agriculture instructors, facilitating the agriculture
instructor in training activities, and repairing the administration system of agricultural extension department,
either in evaluating the agriculture instructors’ performance, communication, and cooperation among the
agriculture instructors as an effort in increasing the process of learning for the farmers to develop their
agribusiness productivity.
C. The Influence of Independence towards the Competency of Agriculture Instructor
The result of research shows that independence variable influences significantly the competency of the
agriculture. It means that the agriculture instructors’ independence will determine the merits of the competency
of the agriculture instructors with the influential coefficient as 0.22significantly in α = 0.05.
The influence of agriculture instructors’ independence appears in the merits of the agriculture instructors’
competency in appreciating the cultural diversity and the agriculture instructors’ competency in processing the
information of agricultural extension (Table 3). It indicates, if there is an increasing of a unit of the agriculture
instructors’ independence, it will decrease the competency of agriculture instructor in appreciating the cultural
diversity as 0.52 units, and it will decrease the competency of agriculture instructor in processing the information
of agricultural extension as 0.44 units.
The developing of the competency of agriculture instructor in appreciating the cultural diversity includes the
increasing of the agricultural extension’s material that is suitable with the local wisdom and the increasing of the
agricultural extension’s media that is suitable with the local wisdom. The increasing of processing information of
agricultural extension includes the increasing of agricultural extension’s media, the use of computer to search for
and to deliver the information, and the use of learning method in each extension.

Developing Country Studies www.iiste.org
ISSN 2224-607X (Paper) ISSN 2225-0565 (Online)
Vol.4, No.26, 2014
173
The dimensions of agriculture instructors’ independence, which is closely related to the competency of
agriculture instructors, are: (1) the intellectual independency, includes the independence in planning the
agribusiness, deciding the cultivation area, deciding the production way, making decision of problem-solving of
the farmers, deciding the market for marketing of the crop, and (2) social independency, includes the
independence of the agriculture instructor in keeping the independency, the relationship between the maize
farmers, relationship between a group of farmers except the maize farmers, the relationship with a group of
leaders, and the independence of the agriculture instructor in developing strategy of adaptation.
The result is suitable with the research result of Mardin (2009) of factors influence the independence of
fisherman in Wangi-Wangi sub-district of South East Sulawesi, which concludes that the fisherman’s
experience, the pioneer characteristic of the fisherman, and the competency of the fisherman simultaneously
influence the independence of the fisherman with the coefficient determination as 54.5 percent, in α = 0.05.
A research of Merliati (2008) about the empowering of farmers in fulfilling a desire of agriculture farmers’
independence capacity development at District of Kampar, Riau Province, concludes that the desire fulfillment
level of agribusiness farmers development, the performance of agriculture instructor in empowering the farmers,
the characteristic of the farmers (Formal and informal education of farmers) simultaneously influence directly
the independence of agribusiness farmers with the coefficient determination as 95 percent significantly in α =
0.05.
The research result shows that there is a significant influence of agriculture instructors’ independence towards
the competency of agriculture instructors from intellectual and social independence, which means that the
agriculture instructor has been independent or do not need a help of intellectual and social independence. It
indicates that the agriculture instructors’ intellectual independence is a success of the agriculture instructors in
handling the problem of farmers based on capability and knowledge they have. Moreover, in social
independence side, the agriculture instructors are able to communicate with the farmers, community leaders,
government, and non-governmental organizations, without depending on and waiting for another action in
implementing the program of agricultural extension to help developing the productivity of agribusiness.
Regarding to the previous explanation, the result of this research can be a reference to the Department of
Agricultural and local government in making policy related to the independence of the agriculture instructors
which necessary to be directed to the dimension of emotional and economic independence, in order to develop
the competency of the agriculture instructors to help the learning process of the farmers in doing their
agribusiness.
D. The Influence of Characteristic, Motivation, and Independence to the Competency of Agriculture
Instructors.
The result of research shows that characteristic, motivation, and independence of agriculture instructors variable
influences significantly the competency of agriculture instructor with the coefficient determination (R2) as 74%
in significance level α = 0.05 (Table 3). It means that the three dependent variables (X) simultaneously influence
significantly the competency of agriculture instructors (Y) as 74% and the remaining as 26% have been
influenced by another variable which is not included in this research.
The influence of agriculture instructor’s characteristic, motivation, and independence variable is a significant
contribution from several sub-variables/dimensions of research. It will be explained as follow:
(1) The significant influence of agriculture instructor’s characteristic variable is determined by three
dimensions, such as age, working period, and number of assisted farmers (Picture 1). It indicates that the
increasing of age, work period, and number of assisted farmers will cause the competency of agriculture
instructors be decreased, while another six dimensions of agriculture instructors’ characteristic, such as
formal education, functional training, technical training, working area, the scope of working area, and
interaction frequency of agriculture instructors to the farmers in this research have coefficient estimation of
weight factor less than 0.40 insignificantly in α = 0.05. It means that the six dimensions are not valid in
measuring the competency of the agriculture instructor.
(2) The significant influence of agriculture instructor’s motivation variable is determined by two dimensions,
such as self-potential development and the desire to be affiliated (Picture 1). It indicates that the increasing
Developing Country Studies www.iiste.org
ISSN 2224-607X (Paper) ISSN 2225-0565 (Online)
Vol.4, No.26, 2014
174
of self-potential and the desire to be affiliated of agriculture instructor will increase the competency of
agriculture instructor, while another four dimensions such as recognition of farmers, income, desire for
achievement, and desire for power in this research have coefficient estimation of weight factor less than 0.40
insignificantly in α = 0.05. It means that the four dimensions are not valid in measuring the competency of
the agriculture instructor.
(3) The significant influence of agriculture instructor’s independence variable is determined by two dimensions,
such as intellectual and social independence (Picture 1). It indicates that the increasing of intellectual and
social independence of agriculture instructor will increase the competency of agriculture instructor, while
another two dimensions of agriculture instructor’s independence such as emotional and economic
independence in this research have coefficient estimation of weight factor less than 0.40 insignificantly in α
= 0.05. It means that the two of agriculture instructor’s independence dimensions are not valid in measuring
the competency of the agriculture instructor.
The developing of the agriculture instructor’s competency can be seen by the increasing of the agriculture
instructors in appreciating the cultural diversity and the processing of agricultural extension information. The
developing of the competency of agriculture instructor in appreciating the cultural diversity includes the
increasing of the agricultural extension’s material that is suitable with the local wisdom and the increasing of the
agricultural extension’s media that is suitable with the local wisdom. The increasing of processing information of
agricultural extension includes the increasing of agricultural extension’s media, the use of computer to search for
and to deliver the information, and the use of learning method in each extension.
The influence of agriculture instruction’s characteristic, motivation, and independence variable has the
coefficient determination (R2) as 74%, which means that the influence of external variables as 26% is quite low
to develop the competency of agriculture instructor. Thus, characteristic, motivation, and independence of
agriculture instructor are internal factors that dominant in developing the competency of agriculture instructor to
help the farmers in increasing the agribusiness productivity which affect the increasing of farmers’ income and
prosperity.
E. The relationship between Variables which Influence the Competency of Agriculture Instructor
The result of research shows that there is a relationship between agriculture instructor’s characteristic and
motivation variable and between agriculture instructor’s motivation and independence variable significantly in α
= 0.05 (Table 6). It can be explained that the significant relationship between characteristic and motivation
variable of agriculture instructors is categorized as high with the coefficient relation as 0.50 units. It means that
if there is a change on agriculture instructor’s characteristic in age, working period, and number of assisted
farmers’ dimension, it will increase the development of self-potency and the desire for affiliation.
The relationship between characteristic and independence variable of agriculture instructor is categorized as low
with the coefficient relation as 0.11 units. It means that the if there is a change on agriculture instructor’s
characteristic in age, working period, and number of assisted farmers’ dimension, then it will not increase the
agriculture instructor’s independence in intellectual and social independent. The relationship between motivation
and independence variable of agriculture instructor is categorized as low with the coefficient relation as 0.25
units. It means that the if there is a change on agriculture instructor’s motivation in self-potency and the desire of
affiliation dimension, it will increase the instructor’s independence in intellectual and social dimension.
Theoretically, the result of this research is in line with Lusthaus et al., (2002) which stated that the organization
performance is influenced by three factors, such the organization’s capacity, the organization’s motivation, and
the organization’s environment that related each other. The organization’s capacity is an ability of an
organization in using the available resources. Organization’s motivation showed the basic characteristic of an
organization. External environment is a key factor in determining the level of resources availability and activities
that can be completed.
Conclusions
Based on the research result and discussion, it can be concluded that:
Developing Country Studies www.iiste.org
ISSN 2224-607X (Paper) ISSN 2225-0565 (Online)
Vol.4, No.26, 2014
175
1. Internal factors that influence the formulating process of competency development model of agriculture
instructor are age, working period, number of assisted farmers, self-potential development, a desire of
affiliation, and intellectual and social independence.
2. The degree of the relation between characteristic and independence variable of agriculture instructor is
categorized as low and does not influence the competency development model of agriculture instructor. The
degree of the relation between characteristic and motivation variable of agriculture instructor is categorized
as high and influences the competency development model of agriculture instructor. The degree of the
relation between motivation and independence variable of agriculture instructor is categorized as low and
does not influence the competency development model of agriculture instructor.
Suggestions
Based on the research result and discussion, it is suggested that:
1. The agriculture instructors should increase the motivation of self-potential development and the desire of
affiliation to develop the competency of agriculture instructor in helping the farmers to carry out the
agribusiness.
2. The agriculture instructors should develop the intellectual and social independence in developing the
competency of agriculture instructor in helping the farmers to carry out the agribusiness.
3. It is necessary to follow-up the implementation of competency development model of agriculture instructor
in agriculture extension based on the location and crops cultivated by the farmers.
Acknowledgement
I would like to express my gratitude to The Ministry of Education and Culture of Indonesia particularly The
Directorate of Research and Community Service which supported me financially through BOPTN funding in
conducting this research based on the specified mechanism.
Bibliography
Bahua, MI. (2010). Faktor-Faktor yang Mempengaruhi Kinerja Penyuluh Pertanian dan Dampaknya pada
Perilaku Petani Jagung di Provinsi Gorontalo. Unpublished Dissertation. Institute Pertanian Bogor.
Departemen Pertanian RI. (2004). Pedoman Pengelolaan Balai Penyuluhan Pertanian. Jakarta: Departemen
Pertanian.
Hadi, AP. (2000). Strategi Komunikasi dalam Mengantisipasi Kegagalan Penerapan Teknologi oleh Petani.
Artikel Hasil Penelitian. NTB: Fakultas Pertanian Universitas Mataram.
http://suniscome.50webs.com/data/download/025%20Strategi%20Komunikasi.pdf. Retrieved on 19/9/2013.
Lusthaus C, Adrien M, Anderson G, Carden FM. (2002). Organizational Assessment: A framework for
improving performance. IDRC. http://www.idrc.ca/en/ev-30266-201-1-do. Html. Retrieved 10/10/2013.
Mardin. (2009). Faktor-Faktor yang Berpengaruh pada Kemandirian Nelayan Ikan Demersal di Kecamatan
Wangi-Wangi Selatan Kabupaten Wakatobi Sulawesi Tenggara. Unpublished Thesis. Institut Pertanian
Bogor.
Muliady, T.R. (2009). Faktor-Faktor yang Berpengaruh pada Kinerja Penyuluh Pertanian dan Dampaknya pada
Perilaku Petani Padi di Jawa Barat. Unpublished Dissertation. Institute Pertanian Bogor.
Sumardjo, M., Pang S. Asngari, Tjitropranoto, P. & Saefuddin, A. (2008). Faktor-Faktor Penentu Peningkatan
Kinerja Penyuluh Pertanian dalam Memberdayakan Petani (Kasus di Kabupaten Kampar Riau). Jurnal
Penyuluhan. Volume 1 Nomor 1. September 2008. Hal: 6 – 10.
Tjitropranoto, P. (2005). Penyuluhan Pertanian: Masa Kini dan Masa Depan dalam Membentuk Pola Perilaku
Manusia Pembangunan. Edited by: Ida Yustina dan Adjat Sudradjat. Bogor: IPB Press.
Yusuf, AE. (2008). Pengaruh Motivasi terhadap Peningkatan Kinerja.
http://teknologikinerja.wordpress.com/2008/05/06/pengaruh-motivasi-terhadap-peningkatan-kinerja/.
Retrieved on 19/10/2013

Developing Country Studies www.iiste.org
ISSN 2224-607X (Paper) ISSN 2225-0565 (Online)
Vol.4, No.26, 2014
176
Of Marriage, HIV-test Certificate, and the Church: What does
the Youth Say?
Emmanuel Baffour-Awuah
Mechanical Engineering Department, Cape Coast Polytechnic, P. O. Box AD 50, Cape Coast, Ghana
Email: [email protected]
Abstract
Matrimony is a universally cultural relationship between two persons with the aim of committing each other and
their relations. In Ghana it is the tradition that parents should initiate the process. With modernity, peers and
other bodies have taken over this responsibility. To ensure its members are well protected and safeguard its
interest, the church needs to assume this noble but difficult role. It appears the church in Ghana has therefore
added to its responsibility by demanding HIV-test certificate before approving marriages. This study sought to
find out the extent to which this philosophy has permeated through the Christian domain. As a case study, 466
students from Cape Coast Polytechnic were sampled. Quantitative methods were applied. Questionnaires with
closed-ended questions were administered to the sampled population. The random stratified sampling method
was employed. Gender, age, religious denomination and marital status were analyzed in relation to students’
opinions and perceptions regarding the role of the church in marriage and its demand of HIV test certificate from
about-to-be-wedded couples. SPSS version 17 was used to analyze data while tables with frequencies and
percentages were also utilized to display same. Cross-tabulations and chi-square were employed in the analysis.
The study found that majority of students (63 percent) support the philosophy that churches should demand HIV-
test certificate before approving marriages of about-to-be-wedded couples. In spite of this, it is recommended
that churches should be cautious in exercising their authority in this regard so that the rights of the minority
within flock are not infringed upon.
Key words: Christian, churchian, HIV/AIDS, religious denomination, wedlock
1. Introduction
Marriage, also referred to as matrimony or wedlock may be defined as a legal contract or a union socially or
ritually recognized between spouses with the aim of instituting obligations, commitments and rights, duties and
responsibilities between them, them and their children and them and their relatives (Haviland, William, Prins,
Herald, McBride & Bunny (2011). Broadly speaking marriage is a universally cultural relationship (United
Nations 1990; United Nations 1988). Although there are many accepted definitions, it is basically an institution
that deals with intimate and sexual interpersonal relationships between couples and those related to them. It is
practiced universally in all societies of the world.
In Ghana the marriage initiation is very important to both couples and their relatives. Marriage is expected to be
long-lasting in Ghanaian societies. Care is therefore taken before parents of spouses would agree for wards to
marry. Parents would normally investigate the background of the other potential spouse before acceptance is
made for the initiation ceremony. Things are however changing now with the advent of migration, urbanization
and population increase. For this reason the church in Ghana appears to be taken over the traditional roles of
parents in marriage. Among these is the investigation of the background of the other potential spouse including
the demand for HIV test certificate before marriage is allowed (Staff, 2011).
HIV is a particular virus, Human Immunodeficiency Virus that only infects human beings, weakening the
immune system by destroying the very important cells that fight diseases and infection. The virus takes over host
cells in the individual by reproducing itself rendering the host cells deficient to protect the person. There is no
safe and effective cure for HIV in existence today, though ways of managing it through anti-retroviral doses are
used in its treatment (Sepkowitz, 2001; Khan & Walker, 1998).
Various societies and its people therefore consider HIV, which finally leads to AIDS as a very repulsive disease.
Nations, cultures, clans, races and even churches now look at HIV with scorn and are skeptical of its spread. For
this reason it appears churches are demanding HIV test certificates before allowing potential spouses to marry in
their parishes. It may seem this role of the church is over-utilization of authority.
If the church is equally accountable to the state and to its members, then professed Christians are the ones who
should judge the church as to whether the demand of HIV-test certificate constitutes responsibility to man and to
the state (Neibuhr, 1946).
Developing Country Studies www.iiste.org
ISSN 2224-607X (Paper) ISSN 2225-0565 (Online)
Vol.4, No.26, 2014
177
In a BBC Africa living interactive programme there was a debate on this topic as to whether the church has the
right to demand from about-to-be-wedded couples to do HIV test before getting married in church. It is on record
too that in Botswana, the Catholic Church issued a statement that potential spouses should take a compulsory
HIV test before they are allowed to be wedded in the church (Staff, 2011). In Ghana this practice appears to be
gaining roots.
When it comes to the issue of marriage, it is the youth who are affected most, particularly females; for the
Ghanaian culture believes that there is an “expiry date” for women as far as marriage is concerned. Fortunately,
the youth particularly those in tertiary institutions are the best potential spouses since they have the hope of
getting better jobs and better living conditions which puts them in a better position to marry. However it appears
there are no data base that guides ecumenical decision-makers to take decisions on HIV viruses when it comes to
marriages and weddings within the church that will be in the interest of Christians, churchians (those who only
go to church but do not live the principles of Christ) and the general society at large.
The purpose of this study is therefore to access the opinion of the youth in tertiary institutions in Ghana in terms
of the position of the church in demanding HIV-test certificate before allowing potential spouses to be wedded in
the church.
The study will attempt to answer the following questions: Should churches demand HIV test certificates before
approving the marriage of about-to-be-wedded couples? Do churches of students demand HIV-test certificate
before approving of the marriage of about-to-be- wedded couples? In their view is this discriminatory? Does this
position constitute discrimination against people living with HIV? Will students choose religious denomination
that discriminates against HIV victims? Will they voluntarily disclose their HIV-status if infected? Will they go
for HIV test on church demand when about to marry? Will they go for HIV test upon church request when not-
about-to-wed? Will the youth voluntarily go for HIV test? Do they subscribe to sex before marriage? What
would they recommend by the state to be doing to churches that discriminate against people living with HIV?
Findings from the study is hoped to make the church better informed of its position for the flock they are
supposed to superintend, protect and love. Suggestions and recommendations from the study are also expected to
shape church policy on the matter. It is also hoped that the study will provide a data base for ecumenical
decisions which shall be in the interest of the flock and the wellbeing of its members. In terms of human rights, it
is hoped that findings and recommendation from the study will help activists in their activities either for or
against this position of the church in the interest of the general and larger society.
2. Literature review
This section visits literature concerning the study. It looks at marriage in general and Ghana in particular. It also
dilates on the role of the church and its responsibility in fighting against stigmatization and discrimination
against persons living with HIV. Finally it describes the nature of HIV/AIDS, from infection to the final stage.
2.1. Marriage in Ghana
Different cultures have different definitions for marriage. Basically marriage in an institution concerned with
intimate, sexual and interpersonal relationships accepted by society (Zimbardo & Ruch, 1980; Schneider, 1976;
Yorburg, 1993; Foster, 1960; Powell, 1983). Dyer (1983) defines marriage as a dyadic relationship between
husband and wife bounded by the status and role of "wife" in exchange with the status and role of "husband".
Marriage may also be defined as a legal contract, a socially or ritually acceptable union that constitutes rights,
obligations, duties and responsibilities between spouses, the spouses and their children and their relatives.
(Haviland et al, 2011). Broadly defined, marriage is culturally universal; it cuts across cultural boundaries; it is
practiced among all cultures in the world. Non-ethnocentrically, marriage is defined by Haviland et al, (2011) as
a culturally sanctioned union between two or more people that establishes certain rights and obligations between
the people, between them and their children, and between them and their in-laws.
The reasons for marriage are therefore manifold. This may include any or more of the following, but not limited
to, financial, social, emotional, libidinal, spiritual and religious (USDS, 2008). In modern Ghana, however
financial gains, and respect within society appears to be the very dominant factors for marriage.
The choice of spouse one makes may depend on marriage rules prescribed by society, culture, rules of incest
outlined by society, individual preference, desire and taste and potential choice. In the developed world marriage
and the choice of a marriage partner has been legally guided by human rights dimensions to the extent that some
jurisdictions now recognize same-sex marriage. Conversely, in developing countries such as in Africa,
polygamy, child marriage, arranged marriage and even forced marriage are culturally acceptable norms in certain
Developing Country Studies www.iiste.org
ISSN 2224-607X (Paper) ISSN 2225-0565 (Online)
Vol.4, No.26, 2014
178
traditions (USDS, 2008). Various bodies or individuals can therefore recognize the institution of marriage
between persons.
Marriage may therefore be civil or religious. A civil marriage is one performed by a representative of a
government or state and therefore has a legal contract disposition. It is guided by marriage laws within the
particular jurisdiction; rights and obligations thereof pertaining should therefore govern the marriage according
to the marriage laws of the land. On the other hand, religious marriages are established through weddings in the
religious settings, particularly, the church as the religious ceremony of marriage. The church must give its
approval before the wedding ceremony is performed. Rules and regulations in this regard are and must be
enshrined in the Holy Book of Christians, the Holy Bible (Vucheva, 2003). Tribal groups, local communities,
ethnic groups, peers and organizations may also give recognition to marriage. This is also a universal practice.
Marriage could also be traditional. Tribal groups, local communities and ethnic groups belong to this category.
In Ghana traditional marriages are guided by the laws and regulations within the cultural setup of the people,
particularly the woman who is to be married. It has no legal connotations. Tribal and ethnic culture based on
traditional common law and equity thus guides the traditional marriage institution.
In Africa the marriage initiation ceremony is usually an unforgettable moment in the lives of spouses with the
main aim of being begetting children; and in Ghana, traditional, civil and religious marriages are fortunately
recognized by the constitution. Marriage partners are therefore chosen using several means. Generally, partners
are chosen by parents. In the Ghanaian culture it is the father who scouts for a female partner for the son to
marry. The converse is also true for the female child though it is customarily unacceptable, “tabooistic” for that
matter, for a woman to propose to a man. However, when a man proposes, it becomes incumbent on the mother
of the woman to investigate as to whether the man is good for the daughter.
Another way of marrying is through betrothal where a young girl, under the age of marriage, is customarily
married to an aged man, though there is no sexual intimacy until the girl is of age. The primary aim of marriage
by betrothal is to take advantage of the man to take care of the girl thus rendering her parents free of
responsibility of their daughter. Such a marriage does not take into consideration the consent of the female child.
It has its own later implications.
Of late, the youth may make own choice and inform parents for the marriage rights to be performed. In such
situations also, the families of both parties would attempt to investigate the background of the other couple. The
investigations include, but not constrained to the man’s ability to take care of the wife; the woman’s capability to
take care of her family such as cooking, washing, caring, etc., the quarrelsome nature of the family members,
criminal record of couples and family members and above all, whether any family member has had any supposed
communicable or hereditary disease before.
Marriages backed and supported by peers is a recent practice. With the advent of migration, over-population and
urbanization, parental influence in marriage in Ghana appears to be dwindling. Peers are now supporting friends
and acquaintances to marry. The church is therefore of the view that it could take the place of parents and
perform the role of parents when it comes to marriage better than their peers. It is for this reason that most
churches are assuming this role with the aim of ensuring the permanency of marriage relationships between
spouses, both in the interest of the flock and in the interest of the church.
2.2. The role of the church
In the history of Christianity the issue of the role of the church has been a necessary but difficult for both church,
society and nation to contend with (Niebuhr, 1946). The church’s role in keeping the institutions of the church,
nation and flock on one hand and societal culture on the other has not been easy. Thus the organization and
defense, for instance, of nations and states and their functional cultural values continues to be a challenge for the
church. Though the church itself has developed a tendency with the need to solve societal and national problems
there is evidence of its own weakness in dealing with the life of its members and communities within which they
exist (Viser and Oldham, 1937).
In the view of Neibuhr, (1946), the churches are now apprehensive of calamities in one form or the other thus
eroding progressive hopes of both mood and dynamism in dealing with issues; such as the HIV/AIDS scourge.
He continues that with haste, therefore, some decisions are taken with uncertainty. In his view, however, the
church continues to play important role in shaping modern society, though its role may be different from those
obligated during the early years of Christianity. It is not gainsaying the modern responsibility and roles of the
church include teaching and guidance of an officially integrated large institution with civilized dynamics,
though. Certainly, therefore, he continues that the church views it urgent and sad-feeling from the point of view
that nations and societies are undergoing great tribulations and this threatens the very survival of the present
Developing Country Studies www.iiste.org
ISSN 2224-607X (Paper) ISSN 2225-0565 (Online)
Vol.4, No.26, 2014
179
generation. It sees it a responsibility to deal with this situation in the society which it is associated with.
Christians must therefore solve their problems. Hence there is the need for profound and continuous thought in
dealing with such national and cultural issues that confront mankind in such a manner as not to create confusion
in the minds of the very people the churches are trying to protect and guide. This calls for great responsibility
from the churches today.
It appears stigmatization and discrimination has crept into the church domain. But they have been found to be a
cause of the spread of HIV and its consequence of the AIDS disease. This may not to be responsible enough. In
order to be responsible, one need to be able to give account of something to someone and responsibility demands
of this account. According to Neibuhr (1946) responsibility means freedom and obligation. It requires
stewardship or trusteeship on issues involved with the lifestyles of individuals.
It is the responsibility of the church therefore, to see to it that the lifestyles of its members, the flock and the state
are improved in the lifetime of the church. The church cannot fail the people in this regard. Its existence and
survival needs to be continuous. It needs to be responsible.
The church may be responsible to its members, the flock and the state though the quantum and quality of
responsibility depends on societal nature (Ehrenstrom, 1938). Thus individuals understanding of the kind of
society they belong to are a factor as to the portion of that universal responsibility that should be involved to deal
with their situations. This call for, though, moral dimensions in being responsible.
Also, in spite of liberty, responsibility requires obligations. In being responsible the church must show love and
mercy, exhibiting the nature of neighborliness and goodness (Temple, 1942) considering the fact that the
Christian community is in the mist of men, society and nations and therefore required to perform its
responsibilities for the common welfare of its people and the state (Brunner, 1937). Responsibilities include; in
time of financial, physical and health needs. These may arise from the current tribulations of modern societies
such as the HIV/AIDS pandemic.
In the area of health needs the scourge of HIV has become very difficult to contend with. Going close to people
with HIV infection particularly in the context of marriage could create a higher chance of getting infected too.
Moving too far away from such persons may be tantamount to stigmatization and discrimination. Thus there
arises the dilemma of the HIV pandemic. The fact that there is no cure for HIV makes dealing with it a difficult
issue to grapple with, particularly on the part of the church whose responsibility is to protect its members and the
state but at the same time, show the heart of love, mercy, sympathy and neighborliness.
2.3. The church and people living with HIV (PLWH)
In a study carried by the Norwegian Church Aid (2006) in Malawi, three phases of the HIV/AIDS pandemic
were identified. The first phase involves the silent creeping of the virus into communities. The second is where
life-threatening infections are physically observed and the third and final is the stigmatization and discrimination
stage. According to the study this is the most challenging.
The study showed that there is still stigma and discrimination among congregants against PLWHA, including
religious leaders, due to insufficient education on issues concerning HIV/AIDS. It also showed that
stigmatization and discrimination are as a result of theological orientations and practices that bring about
judgementalism. Both churchians and Christians stigmatize and discriminate when they learn of HIV/AIDS
status of their fellow members. This makes people afraid to be tested and when they do so, feel reluctant to
declare their status (Guardian Media Limited, 2012).
In spite of this, the church is making efforts to end stigmatization and discrimination. For example, Faith-based
Organizations (FBOs) in Trinidad and Tobago signed a declaration of commitment, calling to action-response to
HIV/AIDS. Twenty-eight organizations took part comprising of Christians, Muslims and Hindu faith (Guardian
Median Limited, 2012). The declaration acknowledged the quantum of the HIV/AIDS challenge and its impacts
on both human lives and faith communities. It appreciated that negative attitudes could be alleviated through
education, compassion and intolerance to stigmatization and discrimination against PLWHA. The declaration
also appreciated that using a holistic approach by FBOs through moral and civic responsible behavior is a
proactive technique in the HIV/AIDS prevention.
The World Council of Churches (WCC) which brings together over 340 churches, denominations and church
fellowships in more than 100 countries and territories globally, representing over 560 million Christians has also
been very active in WCC Ecumenical HIV/AIDS Initiative in Africa (EHAIA). Launched in 2002, emphasis was
laid on HIV-competency as a way of combating stigma and discrimination through pastoral, cultural and gender
education. Care, counseling and support for PLWHA were also on the agenda (Kobia, 2006).

Developing Country Studies www.iiste.org
ISSN 2224-607X (Paper) ISSN 2225-0565 (Online)
Vol.4, No.26, 2014
180
Christian aid is also doing its part to deal with stigma and discrimination, particularly in countries where HIV
levels are high such as Sudan and South Sudan. It has been working with faith leaders in challenging
stigmatization and discrimination in religious communities in these countries (Christian Aid, 2011).
Some movements in Christian communities are supporting the use of condom among married couples in a bid to
curb transmission from spouse to another as a preventive measure of stigmatization and discrimination. Though
this has not gone far, it has become one major source of conflict in many marriages (The United Methodist
Church, 2004). Many churches appreciate condemnation instead of compassion. This may lead to discrimination.
The fact that certificates of HIV test are demanded before approval of wedding of married couple may also lead
to discrimination if not discrimination itself; for there are equally dangerous and frightened incurable diseases
such as cancer, diabetes, hypertension, and the like that exist. Compulsory HIV testing as a condition of
approving marriage may also be tantamount to infringement on the rights of church members. As to whether the
church has the right to do so also invite questioning. These issues call for investigation from the youth as now
and future potential marriage couples within the flock.
2.4 The Human Immunodeficiency Virus
Acquired Immune Deficiency Syndrome (AIDS) is a disease that affects the human immune system, caused by
the Human Immunodeficiency Virus (HIV) (Sepkowitz, 2001). The initial infection is fret with short influenza-
type of experience. This is followed by non-sympathetic experience that could last for a number of years. Within
this period the virus antagonizes with the immune system of the individual until a time it overcomes it. Followed
are opportunistic infections and tumors (Mandell, Bennet and Dolin, 2010). The major means of transmission of
HIV is through unprotected sexual intercourse, contaminated blood transmissions, hypodermic needles, from
mother to child during pregnancy, child delivery and or breastfeeding (Markowitz, 2007). According to
UNAIDS/WHO (2007) there is no cure for HIV, though it can be treated using anti-retroviral drugs. These drugs
are able to slow the normal course of the disease such that average life expectancy could be realized. However,
the drugs are expensive. They also have side effects. A person infected with the virus has a survival time within
9 to 11 years if not treated.
HIV was first recognized by the United States Center for Disease Control and Prevention in 1981; the cause of
the infection being identified between 1981 and 1984 (Gallo, 2006). Since this period the global infection has
reached 35.3 million by 2012 and continuously spreading (Kallings, 2008). For example, According to Cu-Uvin,
DeLong, Venkatesh, Hogan, Ingersoll, Kurpewski et al (2010) and UN (2012), HIV directly or indirectly
contributes toward many deaths, not excluding maternal cases. For instance between 6 and 18% of global
maternal death is connected to HIV. The influence of HIV epidemic on maternal death and pregnancy-related
mortality is therefore quite significant (Rosen, de Zoysa, Dehne, Mangiaterra and Abdool-Karim (2002).
However, only 64% pregnant women in sub Saharan Africa receive anti-retrovirals while the global average in
pregnant women is 62% (UNAIDS, 2013).
As a pandemic, the disease has had an unimaginable impact on the global society. It is a medical problem,
creating societal stigma and discrimination. Its political and religious web within society has also been on
frightening scale since it was first discovered in 1981 (Harden, 2012).
From Mandell et at (2010), the frightening nature of HIV is manifested in the initial to its final stages; having
developed into AIDS and the consequential demise of the individual. During the initial acute HIV, primary or
acute retroviral syndrome stage most people experience mononucleosis-like symptoms 2 to 4 weeks after
infection (Mandell et at, 2010; Khan & Walker, 1998). In between 40 and 90% infections, symptoms include
fever, large tender lymph nodes, throat inflammation, rashes, headache and sores of the mouth and genitals
(Mandell et al, 2010; WHO, 2007). The rashes occur in 20-50% cases, developing on the human trunk and being
maculopapular, classically (Vogel, Schwarze-Zanier, Wasmuth, Spengler, Sauerbruch & Rockstroh, 2010).
Opportunistic symptoms including gastrointestinal symptoms belonging to peripheral neuropathy or Guillain-
Barre Syndrome may also be developed at the initial stages lapsing between one and two weeks (Mandell et al,
2010). It has been difficult to medical officials to diagnose HIV due to its nonspecific characteristic symptoms
that resemble other diseases, except through laboratory tests (Vogel, Schwarze-Zanier, Wasmuth, Spengler,
Sauerbruch & Rockstroh, 2010). The next stage of HIV infection could therefore be more frightening.
The clinical latency, symptomatic HIV or chronic HIV being the secondary stage of the infection may last
between three and twenty years if not treated (Evian, 2006; Radiology of Aids 2001; Sepkowitz, 2001). The final
of this stage is characterized with fever, weight loss, gastrointestinal problems and muscle pains, with between
50 and 70 percent of victims developing persistent generalized lymphadenopathy (PGL). It is characterized by
unexplained, non-painful enlargement of more than one group of lymph nodes for more than three to six months.
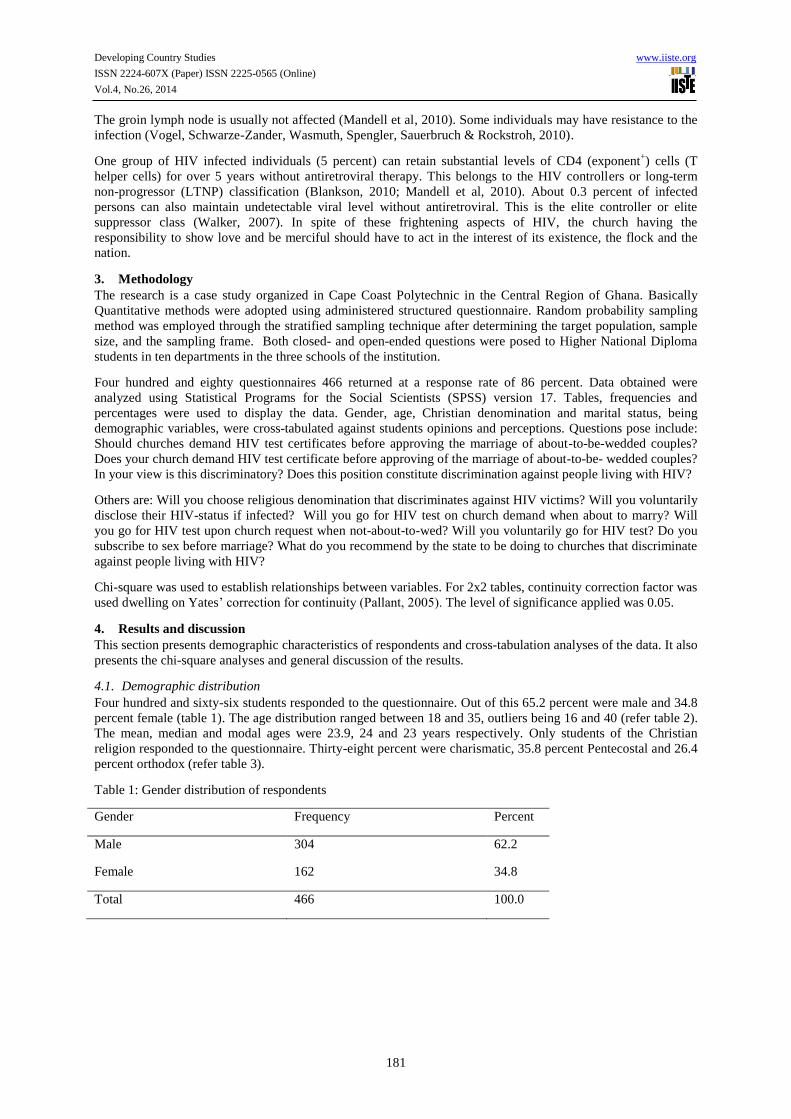
Developing Country Studies www.iiste.org
ISSN 2224-607X (Paper) ISSN 2225-0565 (Online)
Vol.4, No.26, 2014
181
The groin lymph node is usually not affected (Mandell et al, 2010). Some individuals may have resistance to the
infection (Vogel, Schwarze-Zander, Wasmuth, Spengler, Sauerbruch & Rockstroh, 2010).
One group of HIV infected individuals (5 percent) can retain substantial levels of CD4 (exponent+) cells (T
helper cells) for over 5 years without antiretroviral therapy. This belongs to the HIV controllers or long-term
non-progressor (LTNP) classification (Blankson, 2010; Mandell et al, 2010). About 0.3 percent of infected
persons can also maintain undetectable viral level without antiretroviral. This is the elite controller or elite
suppressor class (Walker, 2007). In spite of these frightening aspects of HIV, the church having the
responsibility to show love and be merciful should have to act in the interest of its existence, the flock and the
nation.
3. Methodology
The research is a case study organized in Cape Coast Polytechnic in the Central Region of Ghana. Basically
Quantitative methods were adopted using administered structured questionnaire. Random probability sampling
method was employed through the stratified sampling technique after determining the target population, sample
size, and the sampling frame. Both closed- and open-ended questions were posed to Higher National Diploma
students in ten departments in the three schools of the institution.
Four hundred and eighty questionnaires 466 returned at a response rate of 86 percent. Data obtained were
analyzed using Statistical Programs for the Social Scientists (SPSS) version 17. Tables, frequencies and
percentages were used to display the data. Gender, age, Christian denomination and marital status, being
demographic variables, were cross-tabulated against students opinions and perceptions. Questions pose include:
Should churches demand HIV test certificates before approving the marriage of about-to-be-wedded couples?
Does your church demand HIV test certificate before approving of the marriage of about-to-be- wedded couples?
In your view is this discriminatory? Does this position constitute discrimination against people living with HIV?
Others are: Will you choose religious denomination that discriminates against HIV victims? Will you voluntarily
disclose their HIV-status if infected? Will you go for HIV test on church demand when about to marry? Will
you go for HIV test upon church request when not-about-to-wed? Will you voluntarily go for HIV test? Do you
subscribe to sex before marriage? What do you recommend by the state to be doing to churches that discriminate
against people living with HIV?
Chi-square was used to establish relationships between variables. For 2x2 tables, continuity correction factor was
used dwelling on Yates’ correction for continuity (Pallant, 2005). The level of significance applied was 0.05.
4. Results and discussion
This section presents demographic characteristics of respondents and cross-tabulation analyses of the data. It also
presents the chi-square analyses and general discussion of the results.
4.1. Demographic distribution
Four hundred and sixty-six students responded to the questionnaire. Out of this 65.2 percent were male and 34.8
percent female (table 1). The age distribution ranged between 18 and 35, outliers being 16 and 40 (refer table 2).
The mean, median and modal ages were 23.9, 24 and 23 years respectively. Only students of the Christian
religion responded to the questionnaire. Thirty-eight percent were charismatic, 35.8 percent Pentecostal and 26.4
percent orthodox (refer table 3).
Table 1: Gender distribution of respondents
Gender Frequency Percent
Male
Female
304
162
62.2
34.8
Total 466 100.0
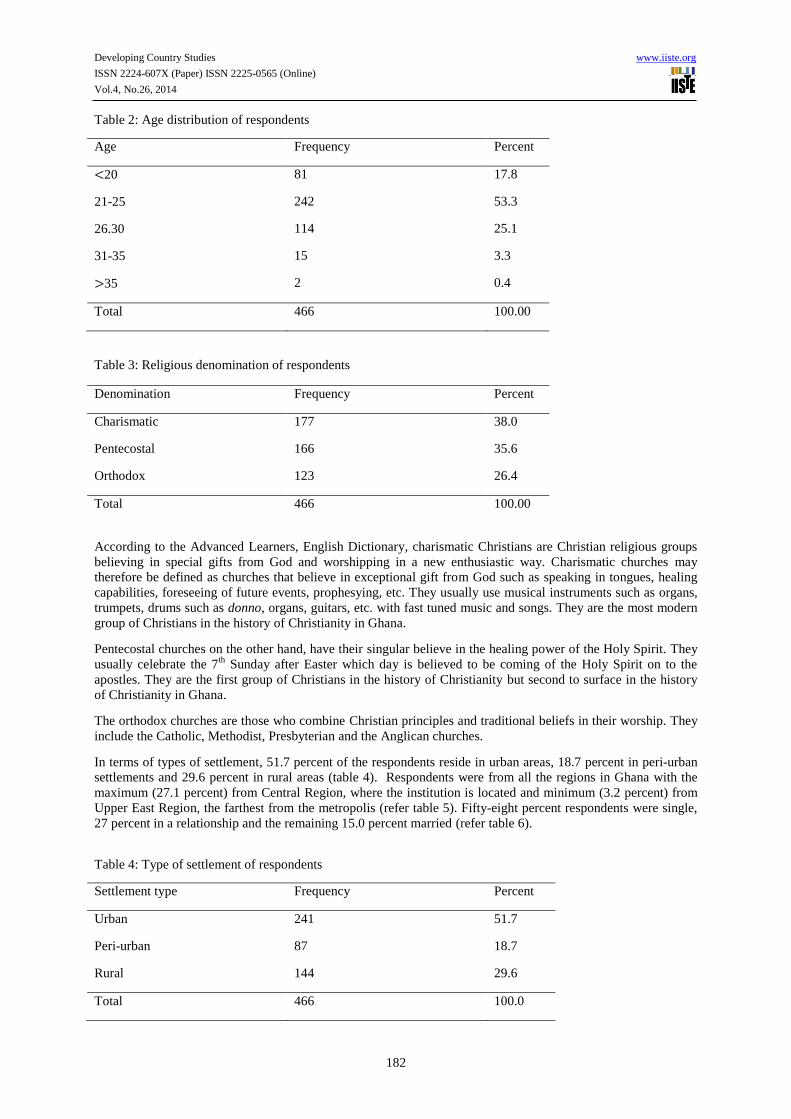
Developing Country Studies www.iiste.org
ISSN 2224-607X (Paper) ISSN 2225-0565 (Online)
Vol.4, No.26, 2014
182
Table 2: Age distribution of respondents
Age Frequency Percent
<20
21-25
26.30
31-35
>35
81
242
114
15
2
17.8
53.3
25.1
3.3
0.4
Total 466 100.00
Table 3: Religious denomination of respondents
According to the Advanced Learners, English Dictionary, charismatic Christians are Christian religious groups
believing in special gifts from God and worshipping in a new enthusiastic way. Charismatic churches may
therefore be defined as churches that believe in exceptional gift from God such as speaking in tongues, healing
capabilities, foreseeing of future events, prophesying, etc. They usually use musical instruments such as organs,
trumpets, drums such as donno, organs, guitars, etc. with fast tuned music and songs. They are the most modern
group of Christians in the history of Christianity in Ghana.
Pentecostal churches on the other hand, have their singular believe in the healing power of the Holy Spirit. They
usually celebrate the 7th
Sunday after Easter which day is believed to be coming of the Holy Spirit on to the
apostles. They are the first group of Christians in the history of Christianity but second to surface in the history
of Christianity in Ghana.
The orthodox churches are those who combine Christian principles and traditional beliefs in their worship. They
include the Catholic, Methodist, Presbyterian and the Anglican churches.
In terms of types of settlement, 51.7 percent of the respondents reside in urban areas, 18.7 percent in peri-urban
settlements and 29.6 percent in rural areas (table 4). Respondents were from all the regions in Ghana with the
maximum (27.1 percent) from Central Region, where the institution is located and minimum (3.2 percent) from
Upper East Region, the farthest from the metropolis (refer table 5). Fifty-eight percent respondents were single,
27 percent in a relationship and the remaining 15.0 percent married (refer table 6).
Table 4: Type of settlement of respondents
Settlement type Frequency Percent
Urban
Peri-urban
Rural
241
87
144
51.7
18.7
29.6
Total 466 100.0
Denomination Frequency Percent
Charismatic
Pentecostal
Orthodox
177
166
123
38.0
35.6
26.4
Total 466 100.00

Developing Country Studies www.iiste.org
ISSN 2224-607X (Paper) ISSN 2225-0565 (Online)
Vol.4, No.26, 2014
183
Ten out of thirteen programmes were sampled ranging from Mechanical Engineering to Accountancy with
respondent percentages ranging from 2.8 percent and 17.0 percent for Statistics and Marketing Departments
respectively (refer tables 7). Majority of the respondents were in level 200 while level 300 was the minimum
(refer table 8). Respondents from the three schools took part in the study (refer table 9).
Table 5: Regional distribution of respondents
Region Frequency Percent
Upper East
Upper West
Northern
Bono-Ahafo
Asante
Volta
Western
Eastern
Greater Accra
Central
15
29
41
20
17
38
91
40
49
126
3.2
6.2
8.8
4.3
3.6
8.2
19.5
8.6
10.5
27.1
Total 466 100.0
Table 6: Marital status of respondents
Marital status Frequency Percent
Married
Single
In a relationship
70
270
126
15.0
58
27
Total 466 100.0
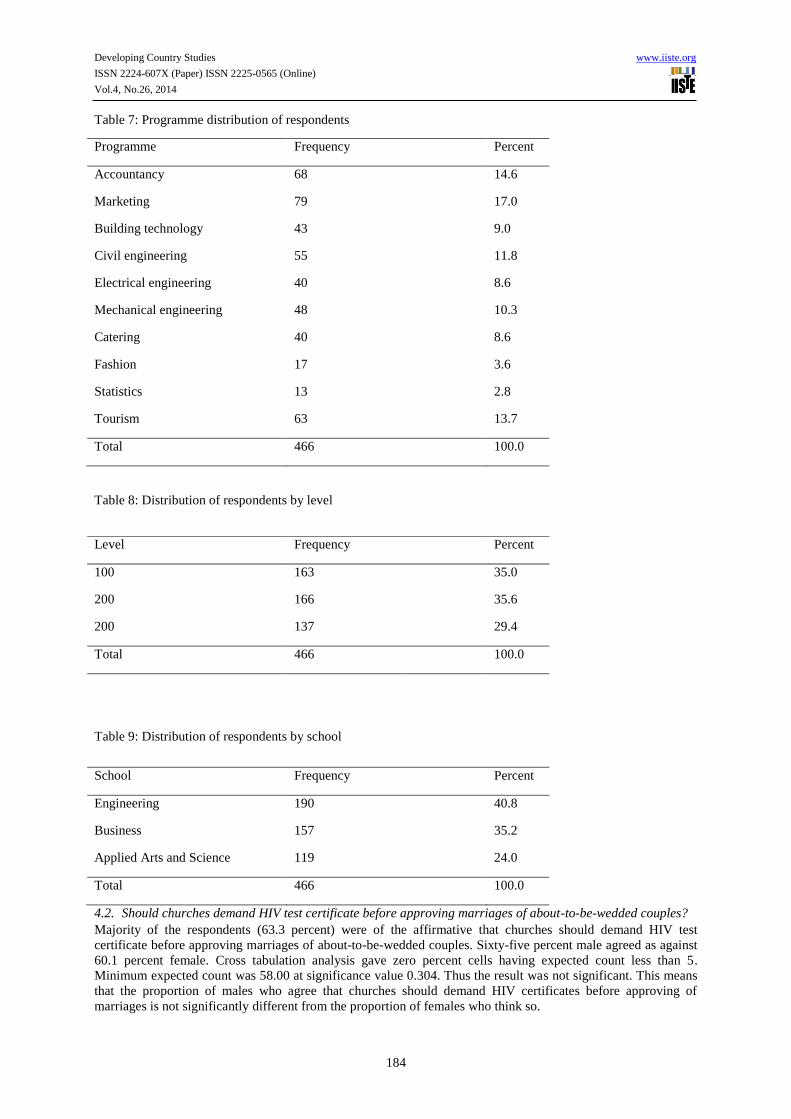
Developing Country Studies www.iiste.org
ISSN 2224-607X (Paper) ISSN 2225-0565 (Online)
Vol.4, No.26, 2014
184
Table 7: Programme distribution of respondents
Programme Frequency Percent
Accountancy
Marketing
Building technology
Civil engineering
Electrical engineering
Mechanical engineering
Catering
Fashion
Statistics
Tourism
68
79
43
55
40
48
40
17
13
63
14.6
17.0
9.0
11.8
8.6
10.3
8.6
3.6
2.8
13.7
Total 466 100.0
Table 8: Distribution of respondents by level
School Frequency Percent
Engineering
Business
Applied Arts and Science
190
157
119
40.8
35.2
24.0
Total 466 100.0
4.2. Should churches demand HIV test certificate before approving marriages of about-to-be-wedded couples?
Majority of the respondents (63.3 percent) were of the affirmative that churches should demand HIV test
certificate before approving marriages of about-to-be-wedded couples. Sixty-five percent male agreed as against
60.1 percent female. Cross tabulation analysis gave zero percent cells having expected count less than 5.
Minimum expected count was 58.00 at significance value 0.304. Thus the result was not significant. This means
that the proportion of males who agree that churches should demand HIV certificates before approving of
marriages is not significantly different from the proportion of females who think so.
Level Frequency Percent
100
200
200
163
166
137
35.0
35.6
29.4
Total 466 100.0
Table 9: Distribution of respondents by school
Developing Country Studies www.iiste.org
ISSN 2224-607X (Paper) ISSN 2225-0565 (Online)
Vol.4, No.26, 2014
185
In terms of age, 52.6, 70.8, 68.6, 42.9 and 50.0 percent of very low, low, average, high and very-high-aged
respondents respectively affirmed to the question. However chi- square analysis yielded 20 percent cells having
expected count less than 5 and minimum expected count 0.72. No association could therefore be established.
About 60 percent of charismatics, 68.6 percent Pentecostals and 61.7 percent orthodox Christians were of the
affirmative to the question. With zero percent cells having expected count less than 5, minimum expected count
of 41.89 and 0.260 significance value, the result was not significant. It can therefore be deduced that the
proportions of the respondents in terms of denomination who agreed that churches should demand HIV
certificates before approving of marriages are not significantly different from each other.
From the marital point of view, 51.5 percent of married couples, 67.8 percent singles and 63.3 percent of those in
a relationship said churches should demand HIV test certificate before approving marriages of about-to-be-
wedded couples. Chi-square analysis gave zero percent cells having expected count less than 5; minimum
expected count 24.2 and significance value 0.034. Thus the result was significant. The implication is that the
proportions of respondents in terms of marital status are significantly different from each other. Church leaders
may therefore adopt different strategies to convince to-be couples whose relatives may be married church
members to accept the idea of presenting HIV test certificate before approving of the marriage.
4.3. Does your church demand HIV test certificate before approving marriages of about to be wedded
couples?
Results from the study indicates that 40.4 percent of the respondents affirmed their churches demand HIV test
certificate as a condition to wed about-to-be-married couples while 58.5 disagreed. Among the charismatic 41.5
agreed that their churches do so. With the Pentecostals, 40.5 affirmed while 33.6 percent of the orthodox
Christians also affirmed. It may therefore be surmised that the number of those who affirmed increased with the
age of denominations in Ghana. The reason is that the orthodox churches are the oldest (Catholic, Methodist
Anglican and Presbyterian), followed by Pentecostals and charismatic in that order as far as the history of
Christianity in Ghana is concerned (Bob-Miller and Bob-Miller, 2007).
However, chi-square analysis yielded zero percent cells having expected count less than 5 with minimum
expected count being 41.78 at 0.402 significance value. Thus the result was not significant. This implies that the
proportions of respondents in the three denominations who affirmed their churches demand HIV certificates
before approving marriages are not significantly different from each other.
4.4. Is the churches’ demand for HIV certificate before approving weddings discriminatory?
The study revealed that 65.5 percent male and 63 percent female disagreed that the act of church’s demand for
HIV certificate before approving weddings is discriminatory. Association test yielded minimum expected count
of 54.62 with 0.619 significance value. This implies that the value was not significant. Thus the proportion of
females who support the act is not significantly different from the proportion of males who do so.
There appears to be a mix response when age was considered. About 57 percent of very low-aged, 68.1 percent
of low-aged.64.8 percent medium-aged, 42.9 percent high-aged and 50 percent very high-aged respondents
disagreed to the question. However Association could not be established between the two variables. The cross-
tabulation analysis showed that 59 percent charismatic, 69.2 Pentecostal and 69.5 percent orthodoxies share the
same view. Chi-square association value was 0.138. Thus the result was not significant. This means that the
proportions of the elements are not significantly different from each other when it comes to respondents’
agreement as to whether churches demand for HIV certificate before approving weddings is discriminatory.
In terms of relationships, married couples (60 percent) singles (68.3 percent) and those in relationships (65.4)
disagreed with the question. The result was not significant since the minimum expected count was 20.19 with
0.464 significance value. The proportion of the elements in the relationships variable are therefore not
significantly different from each other as to whether the demand of HIV certificates by churches before
approving of weddings is discriminatory. The churches assumed role of demanding HIV test certificate before
marriage may therefore be a step in the right direction in protecting its members from HIV infection.
4.5. Choosing religious denomination that discriminates against HIV victims
About 80% male and 80% female would not choose any Christian denomination that discriminates against
PLWHA. Chi-square analysis between gender and this attitude yielded zero cells having expected count less than
5 and significance value of unity. This implies that there is no significant difference between gender and attitude.
Thus the proportion of males with this attitude is not different from that of females.
Developing Country Studies www.iiste.org
ISSN 2224-607X (Paper) ISSN 2225-0565 (Online)
Vol.4, No.26, 2014
186
From age point of view 80% percent of respondents aged below 21 years would not choose a denomination that
discriminates against PLWHA. Also 78% of those between 21 and 25 years, 80.5 percent of those between 25
and 30 years; 86.7 percent of those between 31 and 35 and 100 percent of those above 35 years would not do so.
Interestingly, no association could be established between age and this attitude with 30% cells having expected
count less than 5.
In terms of religious denomination, 80 percent of charismatic, 84.3 percent Pentecostal and 73.5 percent
orthodox Christians would not choose any religious denomination that discriminates against PLWHA. Chi-
square analyses yielded zero percent cells having expected count less than 5 with significant value of 0.088. This
means that there is no significant difference between the proportions of charismatic, Pentecostal and orthodox
Christians in terms of choosing religious denomination that discriminate against PLWH.
Cross-tabulation analysis showed that 87.0 percent married persons, 77.2 percent singles and 82.9 percent of
those in a relationship would not choose religious denomination that discriminates against PLWH. With the
minimum expected count of 13.68 and significant value of 0.128, there was significant difference between the
proportions of married persons, unmarried persons and those in a relationship that would not choose
denomination that discriminates against PLWH.
4.6. Voluntarily disclosing HIV-status if infected
Cross tabulation results showed that majority of respondents would not voluntarily disclose their HIV status.
About 80 percent male and 61.8 female would not do so. Association test revealed zero cells with expected count
less than 5 and significance value 0.661. This implies that the proportion of males who would not voluntarily
disclose their HIV-status is not different from the proportion of females who would neither do so.
The results also showed that 72.4 percent very low-aged, 59.9 low-aged, 56.1 medium-aged, 42.9 percent high-
aged and 100 percent very high-aged respondents would voluntarily disclose their HIV status. Nevertheless, chi-
square test gave minimum expected count of 0.078. Thus association could not be established between the two
variables.
The results further showed that charismatic (58.1 percent), Pentecostals (66.2 percent) and orthodoxies (57.9
percent) would voluntarily disclose their HIV status. With the minimum expected count of 23.61 and
significance of 0.088 the result was not significant. This means that the proportion of charismatic Christians is
neither different from proportion of Pentecostals nor different from that of orthodoxies, and vice versa, who
would voluntarily disclose their HIV status.
The study additionally showed that married persons (51.5 percent), singles (60.7) and those in a relationship
(64.5 percent) would voluntarily disclose their HIV status. Chi-square test indicated a minimum expected count
of 26.16 and significance value of 0.221. This implies that the proportions of married, singles and those in
relationships are not significantly different in terms of voluntarily disclosing one’s HIV status. The result was
therefore not significant.
4.7. Going for HIV test on church demand for about-to-be-wedded couples
Majority of the respondents would go for HIV test on church demand if about to wed. About 73 percent of male
and 63.6 percent would do so. However, 27.4 percent and 36.4 percent were not ready to do. Chi-square analysis
gave a minimum expected count of 47.09 and a significance value of 0.067. The result was therefore not
significant. This implies that the proportion of male who would go for HIV test on church demand when about to
wed is not significantly different from the proportion of female who would do so.
The results also revealed that majority of respondents in terms of age would go for HIV test on church demand
when about to wed. Thus 72 percent of very low-aged, 71.4 percent of low-aged, 65.4 percent of medium-aged,
64.3 percent of high-aged and 100 percent very high aged respondents would go the test. However the chi-square
test yielded a minimum expected count of 0.60. No association could therefore be established between the two
variables.
The results further revealed that 68.8 percent charismatic Christians, 72.7 percent Pentecostals and 63.0 percent
orthodoxies will go for HIV test upon church demand if about to wed. Chi-square test yielded zero percent
expected count less than 5 and 0.244 significance value. The result was therefore not significant. This implies
that the proportions of charismatic, Pentecostal and orthodox Christians who would go for HIV test are not
significantly different from each other.
Furthermore, the results revealed that 58.8 percent married persons, 78.1 percent singles and 69 percent of those
in a relationship would go for HIV test if churches ask them to do so when about to marry. Analysis gave zero
Developing Country Studies www.iiste.org
ISSN 2224-607X (Paper) ISSN 2225-0565 (Online)
Vol.4, No.26, 2014
187
cells having expected count less than 5. The significant value was 0.123 indicating that the result was not
significant. Thus the proportions of elements in this variable are not significantly different when it comes to
going for HIV test when the church demands HIV certificates before approving weddings.
4.8. Going for HIV test upon church request when not-about-to-wed
The study indicated that 55.7 male and 48.4 percent female will go for HIV test upon church request when they
don’t intend marrying. The chi-square test run gave zero cells having expected count less than 5 with 0.165
significance value. The result was therefore not significant. Thus the proportions of females who will go for HIV
test when the church requests, though they don’t intend to marry, is not significantly different from the
proportion of males who would do so.
The study also indicated that 65.8 percent very low-aged, 53.0 percent low-aged, 47.2 percent medium-aged,
42.9 percent high-aged and 50 percent very high-aged respondents would go for HIV test if their church leader
asks them to do so though they don’t intend marrying. It appears the willingness to do so reduce as age increases.
However chi-square test analysis yielded a minimum expected count of 0.93. An association could therefore not
be established between the two variables.
The study revealed that 52.5 percent charismatic, 57.2 percent Pentecostal and 44.6 percent orthodox Christians
will go for HIV test upon church request even when they do not intend marrying. Chi-square analysis yielded a
minimum expected count of 53.2 and 0.123 significance value. The result was therefore not significant. This is
an indication that the proportion of charismatic Christians is neither different from that of Pentecostal Christians
nor different from the proportion of orthodox Christians, and vice versa, in this regard.
About 62 percent married respondents said they will not go for HIV test when requested by church leaders.
However majority (54.6 percent) of singles and (58.3 percent) of those in a relationship would do so when even
if they don’t intend getting married. The association test gave 31.93 minimum expected count and 0.024
significance value. The result is significant. It can therefore be deduced that there is significant difference
between the proportions of elements in the charismatic denomination variable in going for HIV test even when
one does not intend getting married. Hence in designing strategies for education more attention should be given
to singles.
4.9. Voluntarily going for HIV
When asked whether they would go for HIV test on their own accord, 87.7 percent male and 77.6 percent female
answered in the affirmative. The chi-square test yielded zero percent cells having expected count less than 5.
The significance value was 0.060. The result was therefore not significant indicating that the proportion of
females who would not go for HIV test on their own is not significantly different from the proportion of their
male counterparts.
The study has also showed that majority of respondents; 86.1 percent of very low-aged, 52.9 percent low-aged,
78.9 percent medium-aged, 78.6 percent high-aged and 100 percent very high-aged would go for HIV test on
their own. It appears the desire to do so decreases with age. However, chi-square association test could not
establish a relationship between the variables.
Majority of respondents would also go for HIV test on their own in terms of religious denominations. Thus 79.9
charismatic, 88.7 percent Pentecostals and 75 percent orthodoxies will go for HIV tests on their own. Chi-square
analysis gave a minimum expected count of 20.32 while the significance value was 0.011. The result was
significant. Thus the proportions of elements in the religious denomination variable are different in terms of
respondent’s unwillingness to go for HIV test on their own. Different strategies should therefore be adopted for
different denominations when adopting strategies to encourage students to go for HIV test.
In terms of marital status 67.6 percent, 85.6 percent and 83.5 percent of respondents would go for HIV test on
their own. Chi-square test showed that the result was significant with 0 cells having expected count less than 5
and significance value 0.003. It can therefore be deduced that the proportions of married, single and students in a
relationship is significantly different when it comes to going for HIV test on one’s own. Similarly different
strategies should be adopted in dealing with the relationship variable.
4.10. Subscribing to sex before marriage
Majority of respondents, 62.2 percent males and 72.8 percent female do not subscribe to sex before marriage,
though many of them could be in such a relationship. According to Woode and Ahorlu (2005) a study entitled
“the effect of HIV/AIDS awareness on the attitude and behavior of polytechnic students-a case study of Accra
Polytechnic” in Ghana, 30.5 percent of the students were in sexual relationship. Seventy four percent
respondents did not know the HIV status of their sexual partners with 79.2 percent having at least one sexual

Developing Country Studies www.iiste.org
ISSN 2224-607X (Paper) ISSN 2225-0565 (Online)
Vol.4, No.26, 2014
188
partner and 8.3 percent several. Though all respondents were aware of condom use only 65.33 understood the
usage of condom (Achio 2007).
Chi-square analysis from this study gave zero percent cells having expected count less than 5. The significant
value was 0.027 indicating that the result was significant. It could therefore be concluded that the proportion of
female who subscribe to sex before marriage is significantly different from proportion of male who subscribe to
sex before marriage.
Majority of very low aged (63.2 percent), low aged (69.2 percent), medium of aged (59.6 percent) high aged
(58.3) percent and very high- aged (100 percent) would not subscribe to sex before marriage. An association
could however not be established between age and subscribing to sex before marriage.
About 69 percent of charismatic, 66.9 percent Pentecostals and 56.7 percent orthodox Christians do not
subscribe to sex before marriage. Analysis showed that the result was significant with 36.5 minimum expected
count at 0.127 significance value. Thus the proportion of respondents who are charismatic, Pentecostal and
orthodox Christians are not significantly different from each other.
The study further revealed that majority of unmarried Christians subscribe to sex before marriage while majority
of married ones did not. In terms of figures, 38.2 percent married, 54.6 percent single and 58.3 percent of those
in a relationship will subscribe to sex before marriage. The chi-square test therefore yielded 0.024 significance
value with 31.93 minimum expected count. This implies that the proportions of elements in the marital status
variable are significantly different from each other in terms of subscribing to sex before marriage. Thus the result
was significant. Different strategies should therefore be adopted for different groups.
4.11 General discussion
Majority of the respondents (66 percent) who would voluntarily disclose their HIV status, support the idea that
religious denominations demand HIV test certificates before marriages. For those who will not voluntarily
disclose their HIV status 59.7 percent support the idea that religious denominations should demand HIV
certificates before approving marriages. Chi-square analysis, gave zero cells expected count and 0.209
significance value. Thus the proportion of those who would disclose their HIV status and supports the idea is not
significantly different from the proportion that would not disclose their HIV status
For this reason 83.1 percent of those who would not voluntarily disclose their HIV status would not choose any
religious denomination that discriminates against HIV/AIDS persons. Chi-square analysis between students who
would voluntarily disclose their HIV status and those who would not choose religious denominations that
discriminates against HIV/AIDS persons gave an insignificant value. The significant value was 0.243 with 35.32
minimum expected counts. Thus the proportion of those who would voluntarily disclose and not choose a
religious denomination that discriminate against HIV/AIDS victims is not significantly different from those who
would voluntarily disclose their HIV status and choose religious denominations that discriminates against
HIV/AIDS patients (83.1). Even those who would voluntarily disclose their HIV status 78.1 percent would not
choose any religious denomination that discriminates against HIV victims.
It is interesting to note that majority of the students were of the view that demanding HIV certificate by the
church is not discriminatory. In spite of this, the percentage of those who were of different opinion cannot be
swept under the carpet; 34.6 percent male and 37 percent female belong to this category. The church must also
satisfy this category of the flock.
If discrimination is any concept to consider in terms of PLWHA, then the church in its capacity to stem up the
fight against HIV/AIDS should intensify its education campaign (Guardian Ghana Limited, 2012). In standing in
for parents and peers to safeguard the marriage institution (Vucheva, 2013), it cannot marginalize the rights and
privileges bestowed unto some of its members by the originator of the church and the architect and designer of
the marriage institution itself (Millikan, 1950). The mercy, sympathy and love it must show then becomes
missing. The church must not be judgmental and condemning PLWHA. This will thus thwart the efforts of the
World Council of Churches (WCC) and some other bodies including NGOs to uproot discrimination and
stigmatization within the church (Kobia, 2006). The question is, why should the church not demand certificates
of other diseases with similar curing difficulties but HIV/AIDS? The HIV dilemma must therefore be tackled
with thoughtfulness, diplomacy and great wisdom.
Though HIV is incurable and deadly and can be transmitted from mother to child during pregnancy, child
delivery and or breast feeding (Markowitz, 2007) discriminating against infected persons is not a way of
curtailing its spread. Rather this could spark a vicious cycle thus perpetuating its tentacles within society. In

Developing Country Studies www.iiste.org
ISSN 2224-607X (Paper) ISSN 2225-0565 (Online)
Vol.4, No.26, 2014
189
order to stop its continuous spread (Kallings, 2008) this last stage of the spread of the infection and disease
(Norwegian church Aid, 2008) must be attacked with the ultimate compassion, mercy and love.
One weakness of the church, according to Viser, & Oldham (1937) has been observed in its tendency to solve
life problems of members of the church and society at large. But the AIDS/HIV pandemic can reduce the
lifespan of individuals substantially (UNAIDS/WHO, 2007) and has killed many individuals in several countries
(Kallings, 2008) and therefore needs to be checked. However dealing with it should not infringe on the human
rights of the minority. The minorities who may have to abide by the will of the church against their desire should
be taken into consideration by the church. The long term psychological effects and moral effects of such victims
if they should know are HIV-positive could be a long-lasting stigma on the individual, assuming a person
decides not to marry a prospective spouse because the other is HIV-positive after the compulsory test as
demanded by the church is accomplished. The everlasting repercussion could be disastrous if such information
should trickle down to members of the church, which is more probable. The psychological harm to the victim
could be metallic. Such a policy by the church should therefore be looked into again. It must be redesigned and
restructured if it is even necessary and beneficial in the long term for those who would be found positive after
the test. If between 34.7 and 37 percent church members would not voluntarily go for such test then the third-
thought must be invoked by the church to deal with the issues of preventing the spread of HIV/AIDS within its
flock using this “controversial” technique.
Results from the study support the fact that many Ghanaians are prepared to help prevent the spread of
HIV/AIDS. It is therefore not surprising that the prevalence rate has reduced to about 0.8 percent as at 2014. For
those who would voluntarily disclose their HIV status 88.1 percent would go for HIV test on their own. Even
those who would not voluntarily disclose their status, 72.2 percent would be ready to do so. Thus between 11.9
and 27.8 percent of students who would voluntarily disclose their HIV status would not go for HIV test on their
own. This proportion is substantial considering the dread of HIV/AIDS (Kallings 2008). Chi-square test showed
that the proportion of students who would voluntarily disclose their HIV status and does not support the idea that
demanding HIV certificate before churches approve marriages is discriminatory (63 percent), is not significantly
different from the proportion who would voluntarily disclose their HIV status and support the idea that the
church’s demand of HIV certificates before approving marriage is discriminatory (69.3 percent). Zero cells had
expected count less than 5 with 0.223 significance value.
Going for HIV/AIDS test is one way by which the spread could be contained. However, the church in its
capacity to help suppress the spread of the infection needs to be responsible though, by respecting the freedoms
of the flock and demanding the obligations of its leaders (Niebuhr, 1946). The proportion of students who would
voluntarily disclose their HIV status and would go for HIV test on their own (88.1%) was not significantly
different from those who would voluntarily disclose their HIV status but would not go for HIV test on their own
(72.2%). The significance value was 0.000 and the minimum expected count 30.66. With zero percent expected
count less than 5 and 0.02 significance value, the proportion of students who would voluntarily disclose their
HIV status and subscribe to sex before marriage (29.6 %) was significantly different from those who would
voluntarily disclose their HIV and not subscribe to sex before marriage. If 29.6 percent and 41.3 percent of those
who would voluntarily disclose their HIV status subscribes to sex before marriage then the church has a
gargantuan duty to perform. The church must rather use proactive means by preaching sexual abstinence before
marriage and ensure Christian discipline, instead of demanding HIV certificates as a condition for approving
wedding in the church to the disadvantage of the silent minority. The rights of all must be respected by the
church.
5. Conclusion
Based on the findings of the study it was found that majority comprising:
Sixty-three (63) percent of the students were of the view that churches should demand HIV test
certificates before approving marriages of about-to-be- wedded couples
Sixty (60) percent of respondents’ churches demand HIV test certificated before approving marriages of
about-to-be-wedded couples
Sixty-five (65) percent were of the view that such demand is not discriminatory
Eighty (80) percent would not choose religious denominations that discriminate against PLWHA
Sixty-one (61) percent would voluntarily disclose their HIV status
Sixty-nine (69) percent would go for HIV test on church demand when about to wed
Fifty-three (53) percent would go for HIV test upon church demand when not about to wed
Developing Country Studies www.iiste.org
ISSN 2224-607X (Paper) ISSN 2225-0565 (Online)
Vol.4, No.26, 2014
190
Eighty-two (82) percent would go for HIV test voluntarily
Sixty-six (66) percent subscribe to sex before marriage
Marriage as a universally cultural institution cannot be dealt away with in modern society. It must be protected
for the common good of individuals, the flock, the society and the state. The role of the church in Ghana as
caretaker parent and peers is a step in the right direction. However, in dispensing this role, the responsibilities of
church should not be committed with discrimination against some of its members no matter how few they may
be. The rights of the members should be respected in spite of the majority who might feel otherwise.
For denominations that discriminate against PLWHA, it is recommended that the state should invoke its
responsibility as the papa of the citizenry by introducing laws to protect their rights. Educating church leaders
through workshops, retreats, seminars and conferences could go a long way to adjust their mentality on the
subject.
References
Blankson, J. N. (2010), Control of HIV-1 Replication in Elite Suppressors. Discovery Medicine 9 (46): 261-266
PMID 20350494.
Bob-Miller, G. M. and Bob-Miller, G.K. (2007, February, 28) Christianity in the Ghanaian State in the Past Fifty
Years. GhanaWeb.
Brunner, E. (1937). The Devine Imperative. New York. The McMillan Company.
Christian Aid, (2011) Faith Leaders Challenge HIV Stigma and Discrimination.
http://www.christianaid.org.uk/whatwedo/in-focus/hiv-malaria-health/sudan-faith-leaders-HIV.aspx.
Cu-Uvin S., DeLong, A. K., Venkatesh, K. K., Hogan, J. W., Ingersoll, J., Kurpewski, J., De Pasquale, M. P.,
D'Aquila R. and Caliendo A. M. (2010) Genital Tract HIV-1 RNA Shedding among Women with Below
Detectable Plasma Viral Load. AIDS. London, England. 24 (16) 2489-97.
Dyer, E. D. (1983) Courtship, Marriage, & Family: American Style. Homewood, Illinois.
Ehrenstrom, N. (1938) Christian Faith and Common Life. London. George and Union Ltd.
Evian, C. (2006) Primary HIV/AIDS Care; a Practical Guide for Primary Health Care Personnel in a Clinical
and Supportive Setting (4th
Ed.): Houghton, South Africa, Jacana, p 29.
Foster, R. G. (1960) Marriage and Family Relationship. New York: The Macmillan Company.
Gallo, R. C. (2006) A reflection on HIV/AIDS research after 25 years. Retro Virology 3;72. doi 10.1186/1742-
4690-3-72 PMC 1629027. PMID 17054781.
Harden, V. A. (2012) AIDS at 30: A History. Potomac Books Inc. P.324.
Haviland, W. A, Prins, H. E. L., McBride, B., Walrath, D. (2011) Cultural Anthropology: The Human
Challenge, (13th
ed.) Cengage Learning.
HIV Surveilance Report (2011) Diagnoses of HIV Infection in the United States and Dependent Areas, 2011.
Vol. 23 pp 1-16. http://www.cdc.gov/hiv/pdf/statistics_2011_HIV_Surveillance_Report_vol_23.pdf. 17/12/14.
Kahn, J. O. and Walker, B. D. (1998) Acute Human Immunodefiency Virus Type 1 Infection N. Engl. J. Med.
311: (1) 33-39.
Kallings, L. O. (2008) The First Postmodern Pandemic: 25 years of HIV/AIDS. Journal of Internal Medicine,
263 (3) 218243. doi: 10.1111/j.1363-2796.2007.01910.x.PMID 18205763.
Kobia, S. (2006) Address Given to the Indigenous People’s Pre-assembly Meeting in February, 2006. World
Council of Churches, Porto Alegre, Brazil.
http://wcc2006.info/fileadmin/files/wccassembly/newspaper/14feb_o_mundo.pdf. 11/11/14.
Loubon, M. (2012) Churches Join HIV/AIDS Fight to End Stigma and Discrimination. Guardian Media Limited.
http://www.duardian.co.tt/news/2012-12-30/churches-join-hivaids-fight-end-stigma-and-discrimination. 17/12/14.
Mandell, L. G., Bennet, J. E. and Dolin, R. (2010) Principles and Practice of Infectious Diseases, 7th
ed.
Churchill, Livingston, Elsevier. (Chp. 18). http://www1.hu.usp.br/biblioteca/Novidades_Acervo/novidadesjulho10/Livro%2097%20-
%20Principles%20and%20practice%20of%20infectious.pdf.Mandell,
Markowitz, Edited by Rom, W. N. and Steven, B. (2007) Environmental and Occupational Medicine (4th
Ed.)
Philadelphia. Walters Kluwer/Lippincott, Williams and Wilkins. P745.
Millikan, R. A. (1950) 277-278: In Dimitrov, T. (1995-2008) 50 Nobel Laureates and Other Great Scientists who
Believe in God. (PDF) Pg 15.
Neibuhr, R. (1944). The Children of Light and the Children of Darkness. New York. Charles Scribner’s Sons.
Niebuhr, H. R (1946) The Gospel, the World and the Church, (Chp. 5), Ed. Latourette, K. S. Harper Bros.
Developing Country Studies www.iiste.org
ISSN 2224-607X (Paper) ISSN 2225-0565 (Online)
Vol.4, No.26, 2014
191
Norwegian Church Aids (2006) HIV and AIDS related stigma and discrimination within the faith communities in
Malawi. Malawi Inter-faith AIDS Association. www.christianaid.uk/whatwedo/in/focus/hiv-maleria-
health/sudan-faith-leaders-HIV.aspx. 17/12/14.
Powell, D. H. (1983) Understanding Human Adjustment. Boston: Little, Brown and Company.
Radiology of AIDS. (2001) Berlin [u.a] Springler. 2000, p 19.
Rosen, J. E., de Zoysa, I., Dehne, K., Mangiaterra, V., and Abdool-Karim, Q. (2012) Understanding Methods for
Estimating HIV-associated Maternal Mortality. Journal of Pregnancy, 958262.
Schneider, D. J. (1976) Social Psychology: Readings. Massachusetts: Addison-Wesley Publishing Company.
Sepkowitz, K. A. (2001) AIDS-the first 20 years. N Engl. J. Med. 344 (23): 1764-72. doi.1056/NEIM
200106073442306. PMID 11396444.
Staff, K. (2011) Marriage in Ghana. http://www.articles.ghananation.com/marriage-rites-in-Ghana/index.1.html.
08/05/14
Temple, W. (1942) Christianity and the Social Order, New York, Pengium Books, Inc.
The Dorsey Press.
The United Methodist Church (2004) Responsible Parenthood: In The Book of Resolutions of The United
Methodist Church. The United Methodist Publishing House.
http://archives.umc.org/interior_print.asp?ptid=4&mid=991. 17/12/14.
UN (2012) UNAIDS World AIDS Day Report, 2012
http://www.unaids.org/sites/default/files/media_asset/JC2434_WorldAIDSday_results_en_1.pdf. 17/12/14.
UNAIDS (2013) UNAIDS Report on the Global AIDS Epidemic 2013. New York: UNAIDS.
http://www.unaids.org/sites/default/files/en/media/unaids/contentassets/documents/epidemiology/2013/gr2013/U
NAIDS_Global_Report_2013_en.pdf. 17/12/14.
UNAIDS, WHO (2007) 2007 AIDS Epidemic Update.
http://data.unaids.org/pub/EPISlides/2007/2007_epiupdate_en.pdf. 11/11/14.
United Nations (1988) First Marriage: Patterns and Determinants. New York.
United Nations (1990) Patterns of First Marriage: Timing and Prevalence. New York.
USDS (2008) Country Reports on Human Rights for 2008. United States, Department of State. Vol. 1, p 1353.
Viser, T., Hooft, W. A. and Oldham, J. H. (1937) The Church and its Functions in Society. Chicago.Willet,
Clark and Company.
Vogel, M. Schwarze-Zender, C., Wasmuth, J. C., Spengler, U., Sauerbruch, T, and Rockstroh, J. K. (2010) The
Treatment of Patients with HIV. Dentsches Arzteblatt International 107 (28-29) 509-515. Quiz 516. doi:
10.3238/arztebl.2014.0507. PMC 2915483. PMID 20703338.
Vucheva, E. (30th
July, 2013) European Marry Older, Less Often, Social
Affairs. http://euobserver.com/social/27161. 08/05/14.
Walker, B. D. (2007) Elite Control of HIV Infection; Implications for Vaccines and Treatment. Topics in HIV
Medicine. A Publication of the International Aids Society, USA 15 (4) 134-136. PMID 17720999.
WHO (2007) WHO Case Definitions of HIV for Surveillance and Raised Clinical Staging and Immunological
Classification of HIV-related Disease in Adults and Children. Geneva, World Health Organization, pp 6-16.
http://www.who.int/hiv/pub/guidelines/HIVstaging150307.pdf. 11/11/14.
Yorburg, B. (1993) Family Relationships. New York: St. Martin’s Press.
Zimbardo, P. G. and Ruch, F. L. (1980) Essentials of Psychology and Life. Glenview, Illinois: Scott, Foresman
and Company.

Developing Country Studies www.iiste.org
ISSN 2224-607X (Paper) ISSN 2225-0565 (Online)
Vol.4, No.26, 2014
192
Rebasing of the Nigerian Economy and the Real Imperatives of
Development: A Case for Agricultural Renaissance in Nigeria.
Uduakobong S. Inam
Department of Economics, Faculty of Social Sciences, University of Uyo, P.M.B. 1017, Uyo, Akwa Ibom State
Nigeria
Abstract
The major focus of this study is to analyze the relationship between agricultural output and government
expenditure on agriculture, over the period 1970 to 2011. Specifically, it sought to: investigate the existence of
long-term relationship between agricultural output and government expenditure on agriculture; and also to
determine the nature and direction of causality between both variables. We employed simple OLS Regression
Technique and Granger Causality Test. The Study revealed that Government expenditure on Agriculture has a
positive and significant influence on Agricultural output. Government effort should be aimed at revitalizing the
Agricultural sector in Nigeria through the approach of increasing its spending on Agriculture.
Keywords: Rebasing, Development, Agricultural Output, Government Expenditure
1. Introduction
The growth of Gross Domestic Product (GDP) is one of the major macroeconomic objectives of any government
in the global economy. Indeed, from time immemorial it has been a regular feature in the policy-making agenda
of successive governments in both the developed and developing countries. This is moreso given the fact that
GDP is internationally recognized as not only a long-standing measure of the size and strength of an economy,
but also as a potent and veritable tool for high-powered net-workings and negotiations in diverse international
form. Thus, in view of the significant nature of GDP in the socio-economic and political life of any country, it is
important to have an up- to date and reliable information of its value.
Recently, the National Bureau of statistics (NBS) in Nigeria rebased the country’s GDP (using expenditure
approach) from N42.4 trillion naira ($270 billion) to 80.2 trillion naira ($510 billion), an 89% increase (The
Economist, 2014). This was achieved by changing the base year of measuring GDP from 1990 to 2010. The
increase of about 89% is as a result of factoring in economic activities such as internet, telecoms, e-commerce,
and entertainment amongst others that were not previously captured in the old computational framework. As a
result of the rebasing, Nigeria is now Africa’s largest economy and the 24th
in the list of the world’s big
economies (The Economist, 2014).
To the Nigerian government, the report of the rebasing exercise is good news, but to the ordinary Nigerian
citizen it probably means nothing. The realities that abound are poles apart from the lofty numbers assigned to
GDP. The level of infrastructure and standard of living remain far below what is
obtained in the developed world. This strongly indicates that the growth in GDP is non-inclusive as the country
still witnesses high unemployment rate, a poverty persistence and massive infrastructural decay. The economic
growth so achieved appears not to have led to economic development. Albeit, it is quite tempting for anyone to
think that Nigeria just achieved growth by simple arithmetic. This is informed by the fact that we may have
experienced what is usually known in economic parlance as “growth without development”
What really is development? According to Todaro and Smith (2009), development has traditionally meant the
capacity of a national economy, whose initial economic condition has been more or less static for a long time, to
generate and sustain an annual increase in its gross national income (GNI) at rates of 5% to 7% or more.
Economic development in the past has also been typically seen in terms of planned alteration of the structure of
production and employment so that agriculture’s share of both declines and that of the manufacturing and
service industries increase. Development strategies have therefore usually focused on rapid industrialization,
often at the expense of agriculture and rural development. The experience of the 1950s and 1960s when many
developing nations did reach their economic growth targets but the levels of living of the masses of people
remained for the most part unchanged, signaled that something was very wrong with this narrow definition of
development. Thus, during the 1970s economic development came to be redefined in terms of the reduction or
elimination of poverty, inequality, and unemployment within the context of a growing economy. Thus,
“Redistribution from growth” became a common Slogan (Todaro and Smith, 2009).
Developing Country Studies www.iiste.org
ISSN 2224-607X (Paper) ISSN 2225-0565 (Online)
Vol.4, No.26, 2014
193
A crucial question that arises as a result of the impressive report of the recent rebasing exercise in Nigeria is that:
How well has the growth in GDP been redistributed? What has happened to poverty, unemployment and
inequality in Nigeria? The realities that abound indicate that these problems are still prevalent and at very high
level in Nigeria. It is absolutely imperative to note that poverty reduction, reduction in unemployment rate and
inequality are some of the real imperatives of development in any country. It is also very necessary to note that
one of the most effective ways of tackling these issues is through agricultural development, unfortunately, recent
rebasing exercise in Nigeria shows a downward turn in agricultural contribution to GDP. The NBS reports that
over the period, the service sector grew by an average of 7.72%, followed by industry sectors growth rate of
7.19%, while the Agricultural sector, the erstwhile growth driver is estimated to have grown by a mere average
of 2.61% per annum. Specifically, the contribution of the agricultural sector to GDP fell from 33.3% (1990 base
year) to 24% (2010 base year) while that of the industrial sector fell from 46.1% to 25.8%. Surprisingly,
contribution of the service sector rose from 23.6% to 51%. These results reveal that Nigeria is now more of a
service economy than an agrarian as hitherto thought of.
Therefore, it is very disheartening to note that, whereas agriculture is capable of tackling the twin devils of
unemployment and poverty in Nigeria besides serving as a solid springboard from which any meaningful
industrialization can take off, it is being relegated to the background. Do we sit and watch in glorified silence the
slow, painful, gradual dissent and eventual dearth of agricultural activities in Nigeria?
What caused the downward turn in agricultural contribution to GDP in Nigeria? What are the core determinants
of agricultural productivity in Nigeria? Does government expenditure on agriculture determine agricultural
productivity in Nigeria? Is there any long-term relationship between agricultural productivity and government
expenditure on agriculture? What is the nature and direction of causality between both variables? These are the
questions that this paper seeks to answer.
Thus, the major objective of this paper is to analyze the relationship between agricultural output and government
expenditure on agriculture, over the period 1970 to 2011. Specifically, it seeks to: investigate the existence of
long-term relationship between agricultural output and government expenditure on agriculture; and also to
determine the nature and direction of causality between both variables.
This study is very important because it serves as a clarion call to the government to revive the agricultural sector
if it wants to achieve any meaningful results in Nigeria. It will also offer useful information to policy makers that
will enable them to increase agricultural productivity level by increasing government expenditure on the sector
in order to boost agricultural contribution to GDP in Nigeria.The paper is divided into five sections, section 1 is
the introduction, section 2 contains the literature review while section 3 contains the methodology of Research.
In section 4, the Empirical results are presented and discussed while section 5 embodies the policy
recommendations and conclusions.
2. 0 Literature Review
2.1 Theoretical Literature Review
Ahmed (1993) defines agriculture as the production of food and livestock and the purposeful tendering of plants
and animals. Olajide, Akinlabi and Tijani (2014) define agriculture as the systematic growing and harvesting of
plants and animals. Similarly, Akinboyo (2008) also defines agriculture as the Science of making use of the land
to raise plants and animals.
Prior to the recent rebasing exercise, the agricultural sector was viewed as the largest sector in the Nigerian
economy with its dominant share of the GDP, employment of more than 70% of the active labour force and the
generation of about 88% of non-oil foreign exchange earnings. (Oji-Okoro, 2011). Thus, a strong and efficient
agricultural sector would enable a country to feed its growing population, generate employment earn foreign
exchange and provide raw materials for industries (Olajide et al, 2014). The agricultural sector has a multiplier
effect on any nation’s socio-economic and industrial farbric because of the multifunctional nature of agriculture
(Ogen, 2007).
Gunnar Myrdal, Nobel Laureate in Economics is quoted in Todaro and Smith (2009) as saying that “It is in the
agricultural sector that the battle for long-term economic development will be won or lost”. Furthermore,
Francis Blanchard, a former Director General of the International Labour Organization (Wikipedia.org, 2014) is
also quoted in Todaro and Smith (2009) as saying that ‘‘the main burden of development and employment
creation will have to be borne by the part of the economy in which agriculture is the predominant activity, that
is, the rural sector’’.

Developing Country Studies www.iiste.org
ISSN 2224-607X (Paper) ISSN 2225-0565 (Online)
Vol.4, No.26, 2014
194
Jhingan (2004) elucidates in great detail the five stages of economic growth and development as proposed by
Rostow (1960). These stages are: the traditional stage, the pre-conditions for take-off, the take-off stage, the
drive to maturity stage and the high mass consumption stage. Agriculture played crucial roles in the first three
stages (traditional stage, the preconditions for take-off and take-off states). The agricultural sector has the
potential to be the industrial and economic springboard from which a country’s development can take off. (Oji-
Okoro 2011).
In view of the importance of agriculture to the economic growth and development of any nation, it is therefore
absolutely imperative that governments in the global economy take concrete and effective steps to continuously
develope the sector to ensure high productivity levels. One of the most effective ways of intervening in the
agricultural sector is through the area of increased government expenditure. The idea of government
intervention through spending is often traced to an Economist called John Maynard Keynes (1883-1941). In his
book "The General Theory of Employment, Interest and Money (1936), Keynes advocated deficit financing by
the State as a means of overcoming the Great Depression of the 1930s. He postulated that, the deficiency of
effective demand causes unemployment and thus, cyclical depression (Mithani, 2010). He therefore suggested
that, since the free enterprise economic system (the market mechanism) was unable to deal with the
worsening unemployment problems of the time, it was therefore necessary for the government to intervene
through a vigorous use of fiscal policy. Keynes, therefore suggested pump-priming programme of
government spending through creation of new money which would stimulate private investment by revising
the marginal efficiency of capital through consumption multiplier effect in income generation, which would
uplift the level of employment in the country's economy (Mithani, 2010).
Agricultural output is one of the components of the Gross domestic product of a nation. Thus, theories of output
growth (economic growth) can be applied to explain the changes in agricultural output. Of great importance to
this research is the neoclassical theory of Growth and the Endogenous growth theory. The Neoclassical growth
model uses the following production function: Y= AF (K,L)Where y is Gross Domestic product (GDP), K is the
stock of capital, L is the amount of unskilled labour and A is exogenously determined level of technology. Note
that change in this exogenous variable, technology, will cause a shift in the production function (Ahuja, 2010).
This theory dominated the economic thinking for three decades (1955-1985), it had a lot of shortcomings that
hindered its ability to explain the real growth phenomenon. One of such shortcomings worthy of mention is that,
neoclassical growth theory explained that long run rate of economic growth depended on technological change
which was considered as exogenous. By treating technological change as exogenous, neoclassical growth theory
could not focus on the fundamental forces which determine long-run growth of nations (Ahuja 2010). Thus, by
the late 1980s, a new growth theory was propounded.
The new growth theory, otherwise called, the Endogenous growth theory, extends the neoclassical theory by
making the rate of technological progress or rate of population growth or both as endogenous factors. The new
growth theory goes more deeply into ultimate sources of growth. Its main motive is to explain the differences in
the growth rates among countries and also explain the contributions of different factors to rates of growth
observed in them. Thus, the underlying theory of growth for the purpose of this research is the endogenous
growth theory.
2.2. Empirical Literature Review
There are several empirical studies that have found that agriculture plays an important role in the economic
growth and development of Nigeria. There are also other works that reveal that government expenditure on
agriculture is a key factor that causes agricultural productivity. Imahe and Alabi (2005) examined the
determinants of agricultural productivity in Nigeria and found that the determinant variables are: arable land per
capita, average rainfall, fertilizer distribution, value of food imports, agriculture capital expenditure and the loans
by commercial banks to agricultural sector.
Similarly, Iganiga and Unemhilin (2011) analysed the impact of Federal Government Agricultural Expenditure
on agricultural output in Nigeria. The equality identified and examined other determinants of agricultural output
such as: total commercial credits to agriculture, consumer price index, annual average rainfall, population growth
rate, food importation and GDP growth rate. Their findings shared that these variables explained variations in
agricultural output in Nigeria.
Adofu, et al (2012) have established that two factors that influence agricultural output are: government
budgetary allocation to agriculture and commercial bank credit to the agricultural sector. Furthermore, Ajaero, et
Developing Country Studies www.iiste.org
ISSN 2224-607X (Paper) ISSN 2225-0565 (Online)
Vol.4, No.26, 2014
195
al (2013) found that the three factors that together account for 76.44% variation in agricultural output are: access
to agricultural capital, availability of motivated agricultural workforce and provision of infrastructural facilities.
Furthermore, Omojimite (2002) examined the impact of institutional support and macroeconomic policy on the
growth performance of the agricultural sector in Nigeria using data covering the period of 1970 to 2008.
employing co-integration techniques, the results indicate that the volume of credit to the agricultural sector,
deficit financing income and institutional reform positively and significantly accounted for innovations in
agricultural output for the period studied. On the other hand, interest rate spread was found to have a negative
but insignificant relationship with agricultural output.
Ekbom (1998) studied the determinants of agricultural productivity in Kenya and found that farm size and
distance contribute to explain farm performance by correlating negatively, and statistically significant to
agricultural productivity. Further, labour availability, costs of production inputs such as fertilizers and improved
seeds, and soil conservation quality correlate positively, and statistically significant with agricultural
productivity.Positive but insignificant inter-temporal impacts of soil capital investments on agricultural
productivity was also found. Similarly, capital assets proxied by value of domestic animals, access to credits, and
on-farm non-agricultural incomes contribute positively to agricultural productivity.
Hye, Malik and Mashkwr (2010) Studied the link between Agricultural product prices, government expenditure
an the performance of agricultural sector in Pakistan. Using Bounds test approach, the study revealed that price
policy and government expenditure policy are both vital for expediting agricultural sector growth.
Nuruden and Usman (2010) analyzed the relationship between government expenditure and economic growth in
Nigeria. Employing a disaggregated approach and also using co integration and error correction techniques, they
found that there is a negative and insignificant relationship between government expenditure on agriculture and
economic growth.
Loto (2011) also investigated the effect of government expenditure on economic growth in Nigeria over the
period 1980 to 2008. Using co-integration and error correction techniques, the study revealed that expenditure on
agriculture is negatively related to economic growth.
Udoh (2011) examined the relationship between public expenditures, private investment and agricultural output
growth in Nigeria over the period 1970-2008. Employing Bounds test and Autoregressive Distributive Lag
(ARDL) techniques, the results show that increase in public expenditure has a positive influence on the growth
of the agricultural output.
Lawal (2011) analysed government spending on Agricultural sector and its consequential effect on the Gross
domestic product(GDP) in Nigeria. The study revealed an irregular pattern of spending on the
agricultural sector and that the contribution of the agricultural sector to GDP is positively related to government
spending on agriculture.
Okezie, Nwosu and Njoku (2013) analyzed the relationship between Nigerian government expenditure on the
agricultural sector and its contribution to economic growth in Nigeria using time series data from 1980 to 2011.
Employing Granger Causality, Cointegration, and Error Correction Techniques, the findings indicate that
agricultural contribution to GDP and total government expenditure on Agriculture are cointegrated. The paper
also found that there exists a very weak causality between the two variables.
The summary of the empirical literature reviewed is that the determinants of agricultural output are: inflation
rate, Exchange rate, changes in credit to Agriculture, changes in weather conditions, changes in total land area
under agricultural cultivation, changes in Rural aggregate agricultural producer price and Structural Adjustment
Programme (SAP)
3.0 Methodology
3.1 Model Specification
This study employs an Ordinary least square regression analysis in order to find out if there is any relationship
between Agricultural Output (AGDP) and Total Government Expenditure on Agriculture (TGEA). Specifically,
this study proposes a framework based on the endogenous growth model. Thus, the researcher specifies a model
in which Agricultural Output (AGDP) is expressed as a function of Total Government Expenditure on
Agriculture(TGEA) as in equation 3.1.1
Developing Country Studies www.iiste.org
ISSN 2224-607X (Paper) ISSN 2225-0565 (Online)
Vol.4, No.26, 2014
196
AGDP = f (TGEA) - - - - - - - 3.1.1
However, it is absolutely imperative to take cognizance of the fact that form literature, there are other factors
other than total government expenditure on agriculture which exert much influence on agricultural output. Thus,
in order that the agricultural output model specified for purposes of this research is not under-specified, other
variables such as: Commercial Bank loans and Advances to Agriculture (CBLA), inflation rate (INF), and
Population growth rate (POP), are included in the model. Thus, the Agricultural output model is specified as:
AGDP = f(TGEA, CBLA, INF, ER) - - - - - - - - - 3.1.2
(+) (+) (-) (+)
Where:
AGDP = Agricultural Output
TGEA = Total government spending on agriculture.
CBLA = Commercial Bank Loans and advances to agriculture
INF = Inflation Rate
POP = Population growth rate
A Priori Expectations
The figures in parentheses represent a priori expectations about the signs of the coefficients.
3.2. Data
The series employed are annual observations of Agricultural Output (AGDP), Total government expenditure to
agriculture (TGEA), Commercial bank loans and advances to agriculture(CBLA), Inflation rate (INF) and
Population growth rate (POP) for the period 1970-2011. They were sourced from various issues of the Central
Bank of Nigeria (CBN) statistical Bulletin
3.3. Estimation Techniques
3.3.1 Unit Root Test
The Unit Root test involves testing for the order of integration of each time series (variable) A series is said to
be integrated of order I(1) if it needs to be differenced once to become stationary. The same holds for an I(2)
series which will need to be differenced twice to become stationary. Thus a stationary series is integrated of
order zero I(0) (i.e, no differencing is necessary). Both the Augmented Dickey-Fuller (ADF) (Dickey and Fuller,
1979,1981), and the Philips-Perron (Philip and Perron, 1988) “unit root” tests, are employed to determine the
order of integration of each series.
3.3.2 The Ordinary Least Square regression
This involves specifying a model in which the dependent variable is regressed on the independent variables to
test for the existence or otherwise of direct or inverse, significant or insignificant relationship between the series
employed for the study. that have the same order of integration.
3.3.3 Granger Causality Test
The Granger causality test is used to detect the nature and direction of influence or causality between two
variables. If two variables are co-integrated then the causality of the co-integrated variables are captured in a
vector error correction model (VECM).
4.0 Analysis and Discussion of Results
4.1 Unit Root Tests
Table 4.1a Result of Unit Root Test Based on Augmented Dickey-Fuller (Constant, time and trend included)
Variables ADF statistic 1%
critical level
5%
critical level
10% critical
level
Order of
integration
AGDP -5.362063 -3.605593 -2.936942 -2.606857 I(1)
TGEA 4.931628 -3.653730 -2.957110 -2.617434 I(0)
CBLA -6.904458 -3.626784 -2.945842 -2.611531 I(0)
INF -6.414470 -3.610453 --2.938987 -2.607932 I(1)
POP -5.213498 -3.605593 -2.936942 -2.606857 I(1)
Source: Computed Result (E-view 5.0)
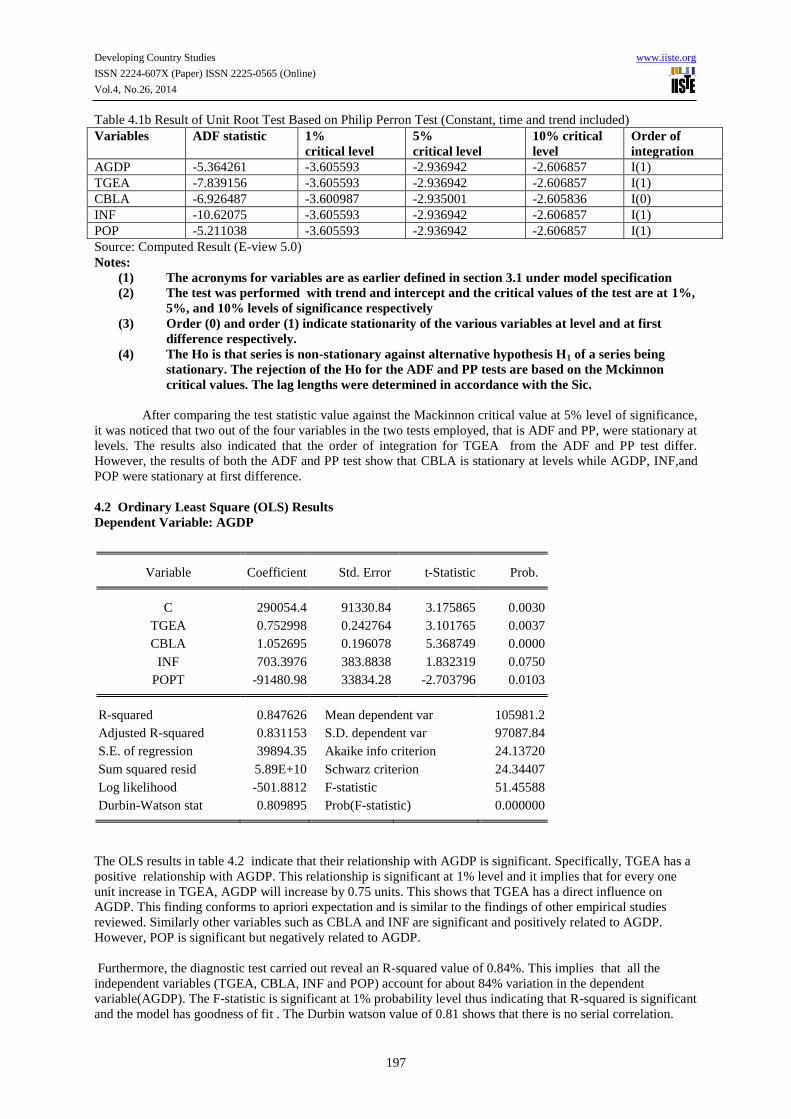
Developing Country Studies www.iiste.org
ISSN 2224-607X (Paper) ISSN 2225-0565 (Online)
Vol.4, No.26, 2014
197
Table 4.1b Result of Unit Root Test Based on Philip Perron Test (Constant, time and trend included)
Variables ADF statistic 1%
critical level
5%
critical level
10% critical
level
Order of
integration
AGDP -5.364261 -3.605593 -2.936942 -2.606857 I(1)
TGEA -7.839156 -3.605593 -2.936942 -2.606857 I(1)
CBLA -6.926487 -3.600987 -2.935001 -2.605836 I(0)
INF -10.62075 -3.605593 -2.936942 -2.606857 I(1)
POP -5.211038 -3.605593 -2.936942 -2.606857 I(1)
Source: Computed Result (E-view 5.0)
Notes:
(1) The acronyms for variables are as earlier defined in section 3.1 under model specification
(2) The test was performed with trend and intercept and the critical values of the test are at 1%,
5%, and 10% levels of significance respectively
(3) Order (0) and order (1) indicate stationarity of the various variables at level and at first
difference respectively.
(4) The Ho is that series is non-stationary against alternative hypothesis H1 of a series being
stationary. The rejection of the Ho for the ADF and PP tests are based on the Mckinnon
critical values. The lag lengths were determined in accordance with the Sic.
After comparing the test statistic value against the Mackinnon critical value at 5% level of significance,
it was noticed that two out of the four variables in the two tests employed, that is ADF and PP, were stationary at
levels. The results also indicated that the order of integration for TGEA from the ADF and PP test differ.
However, the results of both the ADF and PP test show that CBLA is stationary at levels while AGDP, INF,and
POP were stationary at first difference.
4.2 Ordinary Least Square (OLS) Results
Dependent Variable: AGDP
Variable Coefficient Std. Error t-Statistic Prob.
C 290054.4 91330.84 3.175865 0.0030
TGEA 0.752998 0.242764 3.101765 0.0037
CBLA 1.052695 0.196078 5.368749 0.0000
INF 703.3976 383.8838 1.832319 0.0750
POPT -91480.98 33834.28 -2.703796 0.0103
R-squared 0.847626 Mean dependent var 105981.2
Adjusted R-squared 0.831153 S.D. dependent var 97087.84
S.E. of regression 39894.35 Akaike info criterion 24.13720
Sum squared resid 5.89E+10 Schwarz criterion 24.34407
Log likelihood -501.8812 F-statistic 51.45588
Durbin-Watson stat 0.809895 Prob(F-statistic) 0.000000
The OLS results in table 4.2 indicate that their relationship with AGDP is significant. Specifically, TGEA has a
positive relationship with AGDP. This relationship is significant at 1% level and it implies that for every one
unit increase in TGEA, AGDP will increase by 0.75 units. This shows that TGEA has a direct influence on
AGDP. This finding conforms to apriori expectation and is similar to the findings of other empirical studies
reviewed. Similarly other variables such as CBLA and INF are significant and positively related to AGDP.
However, POP is significant but negatively related to AGDP.
Furthermore, the diagnostic test carried out reveal an R-squared value of 0.84%. This implies that all the
independent variables (TGEA, CBLA, INF and POP) account for about 84% variation in the dependent
variable(AGDP). The F-statistic is significant at 1% probability level thus indicating that R-squared is significant
and the model has goodness of fit . The Durbin watson value of 0.81 shows that there is no serial correlation.
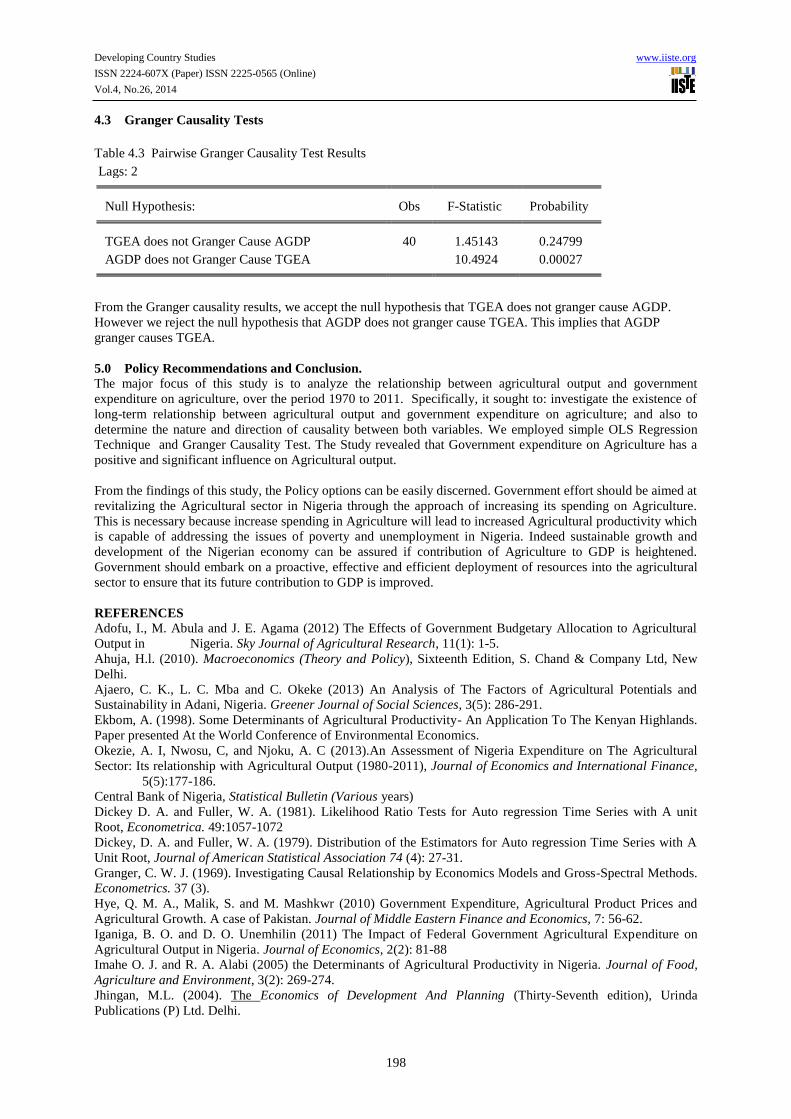
Developing Country Studies www.iiste.org
ISSN 2224-607X (Paper) ISSN 2225-0565 (Online)
Vol.4, No.26, 2014
198
4.3 Granger Causality Tests
Table 4.3 Pairwise Granger Causality Test Results
Lags: 2
Null Hypothesis: Obs F-Statistic Probability
TGEA does not Granger Cause AGDP 40 1.45143 0.24799
AGDP does not Granger Cause TGEA 10.4924 0.00027
From the Granger causality results, we accept the null hypothesis that TGEA does not granger cause AGDP.
However we reject the null hypothesis that AGDP does not granger cause TGEA. This implies that AGDP
granger causes TGEA.
5.0 Policy Recommendations and Conclusion.
The major focus of this study is to analyze the relationship between agricultural output and government
expenditure on agriculture, over the period 1970 to 2011. Specifically, it sought to: investigate the existence of
long-term relationship between agricultural output and government expenditure on agriculture; and also to
determine the nature and direction of causality between both variables. We employed simple OLS Regression
Technique and Granger Causality Test. The Study revealed that Government expenditure on Agriculture has a
positive and significant influence on Agricultural output.
From the findings of this study, the Policy options can be easily discerned. Government effort should be aimed at
revitalizing the Agricultural sector in Nigeria through the approach of increasing its spending on Agriculture.
This is necessary because increase spending in Agriculture will lead to increased Agricultural productivity which
is capable of addressing the issues of poverty and unemployment in Nigeria. Indeed sustainable growth and
development of the Nigerian economy can be assured if contribution of Agriculture to GDP is heightened.
Government should embark on a proactive, effective and efficient deployment of resources into the agricultural
sector to ensure that its future contribution to GDP is improved.
REFERENCES
Adofu, I., M. Abula and J. E. Agama (2012) The Effects of Government Budgetary Allocation to Agricultural
Output in Nigeria. Sky Journal of Agricultural Research, 11(1): 1-5.
Ahuja, H.l. (2010). Macroeconomics (Theory and Policy), Sixteenth Edition, S. Chand & Company Ltd, New
Delhi.
Ajaero, C. K., L. C. Mba and C. Okeke (2013) An Analysis of The Factors of Agricultural Potentials and
Sustainability in Adani, Nigeria. Greener Journal of Social Sciences, 3(5): 286-291.
Ekbom, A. (1998). Some Determinants of Agricultural Productivity- An Application To The Kenyan Highlands.
Paper presented At the World Conference of Environmental Economics.
Okezie, A. I, Nwosu, C, and Njoku, A. C (2013).An Assessment of Nigeria Expenditure on The Agricultural
Sector: Its relationship with Agricultural Output (1980-2011), Journal of Economics and International Finance,
5(5):177-186.
Central Bank of Nigeria, Statistical Bulletin (Various years)
Dickey D. A. and Fuller, W. A. (1981). Likelihood Ratio Tests for Auto regression Time Series with A unit
Root, Econometrica. 49:1057-1072
Dickey, D. A. and Fuller, W. A. (1979). Distribution of the Estimators for Auto regression Time Series with A
Unit Root, Journal of American Statistical Association 74 (4): 27-31.
Granger, C. W. J. (1969). Investigating Causal Relationship by Economics Models and Gross-Spectral Methods.
Econometrics. 37 (3).
Hye, Q. M. A., Malik, S. and M. Mashkwr (2010) Government Expenditure, Agricultural Product Prices and
Agricultural Growth. A case of Pakistan. Journal of Middle Eastern Finance and Economics, 7: 56-62.
Iganiga, B. O. and D. O. Unemhilin (2011) The Impact of Federal Government Agricultural Expenditure on
Agricultural Output in Nigeria. Journal of Economics, 2(2): 81-88
Imahe O. J. and R. A. Alabi (2005) the Determinants of Agricultural Productivity in Nigeria. Journal of Food,
Agriculture and Environment, 3(2): 269-274.
Jhingan, M.L. (2004). The Economics of Development And Planning (Thirty-Seventh edition), Urinda
Publications (P) Ltd. Delhi.
Developing Country Studies www.iiste.org
ISSN 2224-607X (Paper) ISSN 2225-0565 (Online)
Vol.4, No.26, 2014
199
Johansen, S. and Juselius, K. (1990). Maximum Likelihood Estimation and Inference on Co integration with
Applications to the Demand for Money. Oxford Bulletin of Economics and Statistics. 52:169-201.
Keynes, J. M (1936). The General Theory of Employment, Interest And Money, Macmillan Cambridge
University Press. UK.
Lawal, A. W. (2011). An Analysis of Government spending on Agricultural sector and its contribution to GDP in
Nigeria. International Journal of Business And Social Science, 2(20): 244-250.
Loto, M. A (2011) Impact of Government Sectoral expenditure on Economic Growth. Journal of Economics and
International Finance, 3(11):646-652.
Mithani, D. M. (2010). Money, Banking, International Trade and Public Finance. 16th
edition, Himalaya
Publishing House PVT Ltd., Mumbai.
National Bureau of Statistics (2014).
Nuruden, A., and A. Usman (2010). Government Expenditure and Economic Growth in Nigeria 1970-2008: A
Disaggregated Analysis, Business and Economics Journal 52(1)1-11.
Ogen, O. (2007) The Agricultural sector and Nigeria’s Development: Comparative Perspective from the
Brazilian Agro-Industrial Sector Economy (1960-1995), Nebula March 2007 @ Noble World Achives.
Oji- Okoro, 1 (2011) Analysis of The Contribution of Agricultural Sector on The Nigerian Economic
Development. World Review of Business Research 1 (1): 191-200.
Oladije, O.T., Akinlabi, B. H. and Tijani, A. A. (2014) Agriculture Resource and Economic Growth In
Nigeria. European Scientific Journal, 8 (22): 103-115.
Omojimite, B. U. (2012) Institutions, Macroeconomic Policy and Growth of the Agricultural Sector in Nigeria.
Global Journal of Human Social Science, 12(1): 1-9
Philips, P. C. B and Perron, P. (1988). Testing for A Unit Root in Time Series, Journal of Monetary
Economics.9:141-143
Rostow, W. W. (1960). The Stages of Economic growth: a non communist manifesto. London: Cambridge
University Press.
Saad, W., Kalakech, K., (2009) The nature of Government Expenditure And its impact on Sustainable
Economic Growth, Middle Eastern Finance and Economics 1(4); 39-47.
Todaro, M. P. and Smith, S. C (2009) Economic Developemnt (Tenth Edition), Pearson Education Limited,
Edinburg, England.
Udoh, E. (2011) An Examination of Public Expenditure, private investment and Agricultural Sector Growth in
Nigeria: Bounds Test Approach, International Journal of Business and Social Science 2(13) 295-292.
Ukoha, O. O. (2013). The Response of the Nigerian Economy To Policy Variables: Issues and the Way Forward.
18th
Inaugural Lecture Michael Okpara University of Agriculture, Umudike. Abia, Nigeria.
Wikipedia (2014) http:enwww.wikipedia.org.

The IISTE is a pioneer in the Open-Access hosting service and academic event management.
The aim of the firm is Accelerating Global Knowledge Sharing.
More information about the firm can be found on the homepage:
http://www.iiste.org
CALL FOR JOURNAL PAPERS
There are more than 30 peer-reviewed academic journals hosted under the hosting platform.
Prospective authors of journals can find the submission instruction on the following
page: http://www.iiste.org/journals/ All the journals articles are available online to the
readers all over the world without financial, legal, or technical barriers other than those
inseparable from gaining access to the internet itself. Paper version of the journals is also
available upon request of readers and authors.
MORE RESOURCES
Book publication information: http://www.iiste.org/book/
Academic conference: http://www.iiste.org/conference/upcoming-conferences-call-for-paper/
IISTE Knowledge Sharing Partners
EBSCO, Index Copernicus, Ulrich's Periodicals Directory, JournalTOCS, PKP Open
Archives Harvester, Bielefeld Academic Search Engine, Elektronische Zeitschriftenbibliothek
EZB, Open J-Gate, OCLC WorldCat, Universe Digtial Library , NewJour, Google Scholar