Temperature reconstruction in the Ob River valley based on ring widths of three coniferous tree...
8
Dendrochronologia 30 (2012) 302–309 Contents lists available at SciVerse ScienceDirect Dendrochronologia Original article Temperature reconstruction in the Ob River valley based on ring widths of three coniferous tree species Marina Gurskaya a,b,∗ , Martin Hallinger a , Jayendra Singh a,c , Leonid Agafonov b , Martin Wilmking a a Institute for Botany and Landscape Ecology, Greifswald University, Grimmerstr. 88, Ernst Moritz Arndt University Greifswald, 17487 Greifswald, Germany b Institute of Plant and Animal Ecology, UD RAS, 8 Marta Str. 202, Yekaterinburg 620144, Russia c Wadia Institute of Himalayan Geology, 33 General Mahadeo Singh Road, Dehradun 248001, Uttarakhand, India a r t i c l e i n f o Article history: Received 13 January 2012 Accepted 13 April 2012 Keywords: Siberian northern taiga The low Ob River Coniferous Tree-ring chronologies Temperature reconstructions a b s t r a c t Tree core samples of larch (Larix sibirica Ledeb.), spruce (Picea obovata Ledeb.) and pine (Pinus sibirica Du-Tour.) from the northern taiga of West Siberia were collected to assess their potential for sum- mer temperature reconstructions in the Ob River region. Bootstrapped response functions showed that annual growth was mainly influenced by May to June temperatures in pine and by June to July tempera- tures in spruce and larch. Spruce and pine chronologies showed high positive correlations with previous October temperature. June–July temperatures were reconstructed based on spruce (1795–1996) and larch (1615–1999) tree ring chronologies. The pine chronology could not be used for a reliable temperature reconstruction, due to low values of explained May–June temperature variance (11–15%) but the species has a high potential to help clarify the May–June and October climatic influence on ring width observed in all three species. We explained the effect of the early vegetation period (May–July) and the differences in the temperature signals between spruce and larch tree ring chronologies with the influence of pre- vious September and October temperature on tree growth with the warming effect of the Ob River and differences of the species’ photosynthetic possibilities and the activity of chloroplasts and bud meristem tissues. © 2012 Elsevier GmbH. All rights reserved. Introduction As meteorological stations are rare and available meteorolog- ical records do not extend further back in time as to the 1930s and are often characterized by frequently missing data, climate reconstructions are necessary for the understanding of temper- ature fluctuations in Northwest Siberia. Climate reconstructions based on tree rings would be an important source of annually or seasonally resolved past climatic variability in this region. The June–July temperature reconstructions closest to our study site come from places situated north of our research area in the forest – tundra region (∼300 km northeast to our study site) and the Polar Ural mountains (∼150 km to our study site); in both cases larch tree ring chronologies were used. These chronologies show a very strong temperature signal of up to 72% of explained tree ring width variability (Vaganov et al., 1996; Shiyatov et al., 2002; Briffa et al., 1998, 2001, 2002a,b, 2004, 2008; Esper et al., 2010). ∗ Corresponding author at: Institute of Plant and Animal Ecology, UD RAS, 8 Marta Str. 202, Yekaterinburg 620144, Russia. Tel.: +7 343 2606494; fax: +7 3432606500. E-mail address: [email protected] (M. Gurskaya). So far, coniferous tree rings from the lower Ob River have not been investigated and can be expected to be profoundly differ- ent from the temperature reconstructions already existent: The amount of Ob River runoff is a main factor influencing environ- mental conditions, especially the summer temperature. Over the whole period of instrumental records (1934–2000), the level of the Ob River runoff is negatively correlated with summer air tem- perature (Agafonov, 1998, 1999; Agafonov, 2010). While mainly hydrological reconstructions from the Ob River using tree ring width and stable carbon isotopes have been done (Waterhouse et al., 2000), there are only a few temperature reconstructions that have been made for the northern taiga zone in Western Siberia. These reconstructions are based on broadleaved trees only and do not exceed a time span of 120 years (Agafonov, 1995). In this paper we reconstructed summer temperatures based on trees growing in the Ob valley near the Ust-Voykar settlement and thereby the deviation from summer average temperatures. To account for differences in the biological and physiological processes in the different species present at the study site, we based our anal- ysis on three coniferous northern taiga species: Siberian larch (Larix sibirica Ledeb.), Siberian spruce (Picea obovata Ledeb.) and Siberian pine (Pinus sibirica Du-Tour.). 1125-7865/$ – see front matter © 2012 Elsevier GmbH. All rights reserved. http://dx.doi.org/10.1016/j.dendro.2012.04.002
Transcript of Temperature reconstruction in the Ob River valley based on ring widths of three coniferous tree...

O
Tc
Ma
b
c
a
ARA
KSTCTT
I
iarabs
sftlvwe
S
1h
Dendrochronologia 30 (2012) 302– 309
Contents lists available at SciVerse ScienceDirect
Dendrochronologia
riginal article
emperature reconstruction in the Ob River valley based on ring widths of threeoniferous tree species
arina Gurskayaa,b,∗, Martin Hallingera, Jayendra Singha,c, Leonid Agafonovb, Martin Wilmkinga
Institute for Botany and Landscape Ecology, Greifswald University, Grimmerstr. 88, Ernst Moritz Arndt University Greifswald, 17487 Greifswald, GermanyInstitute of Plant and Animal Ecology, UD RAS, 8 Marta Str. 202, Yekaterinburg 620144, RussiaWadia Institute of Himalayan Geology, 33 General Mahadeo Singh Road, Dehradun 248001, Uttarakhand, India
r t i c l e i n f o
rticle history:eceived 13 January 2012ccepted 13 April 2012
eywords:iberian northern taigahe low Ob Riveroniferous
a b s t r a c t
Tree core samples of larch (Larix sibirica Ledeb.), spruce (Picea obovata Ledeb.) and pine (Pinus sibiricaDu-Tour.) from the northern taiga of West Siberia were collected to assess their potential for sum-mer temperature reconstructions in the Ob River region. Bootstrapped response functions showed thatannual growth was mainly influenced by May to June temperatures in pine and by June to July tempera-tures in spruce and larch. Spruce and pine chronologies showed high positive correlations with previousOctober temperature. June–July temperatures were reconstructed based on spruce (1795–1996) and larch(1615–1999) tree ring chronologies. The pine chronology could not be used for a reliable temperaturereconstruction, due to low values of explained May–June temperature variance (11–15%) but the species
ree-ring chronologiesemperature reconstructions
has a high potential to help clarify the May–June and October climatic influence on ring width observedin all three species. We explained the effect of the early vegetation period (May–July) and the differencesin the temperature signals between spruce and larch tree ring chronologies with the influence of pre-vious September and October temperature on tree growth with the warming effect of the Ob River anddifferences of the species’ photosynthetic possibilities and the activity of chloroplasts and bud meristemtissues.
beamwtphwetSo1
ntroduction
As meteorological stations are rare and available meteorolog-cal records do not extend further back in time as to the 1930snd are often characterized by frequently missing data, climateeconstructions are necessary for the understanding of temper-ture fluctuations in Northwest Siberia. Climate reconstructionsased on tree rings would be an important source of annually oreasonally resolved past climatic variability in this region.
The June–July temperature reconstructions closest to our studyite come from places situated north of our research area in theorest – tundra region (∼300 km northeast to our study site) andhe Polar Ural mountains (∼150 km to our study site); in both casesarch tree ring chronologies were used. These chronologies show aery strong temperature signal of up to 72% of explained tree ring
idth variability (Vaganov et al., 1996; Shiyatov et al., 2002; Briffat al., 1998, 2001, 2002a,b, 2004, 2008; Esper et al., 2010).
∗ Corresponding author at: Institute of Plant and Animal Ecology, UD RAS, 8 Martatr. 202, Yekaterinburg 620144, Russia. Tel.: +7 343 2606494; fax: +7 3432606500.
E-mail address: [email protected] (M. Gurskaya).
oaaiysp
125-7865/$ – see front matter © 2012 Elsevier GmbH. All rights reserved.ttp://dx.doi.org/10.1016/j.dendro.2012.04.002
© 2012 Elsevier GmbH. All rights reserved.
So far, coniferous tree rings from the lower Ob River have noteen investigated and can be expected to be profoundly differ-nt from the temperature reconstructions already existent: Themount of Ob River runoff is a main factor influencing environ-ental conditions, especially the summer temperature. Over thehole period of instrumental records (1934–2000), the level of
he Ob River runoff is negatively correlated with summer air tem-erature (Agafonov, 1998, 1999; Agafonov, 2010). While mainlyydrological reconstructions from the Ob River using tree ringidth and stable carbon isotopes have been done (Waterhouse
t al., 2000), there are only a few temperature reconstructionshat have been made for the northern taiga zone in Westerniberia. These reconstructions are based on broadleaved treesnly and do not exceed a time span of 120 years (Agafonov,995).
In this paper we reconstructed summer temperatures basedn trees growing in the Ob valley near the Ust-Voykar settlementnd thereby the deviation from summer average temperatures. Toccount for differences in the biological and physiological processes
n the different species present at the study site, we based our anal-sis on three coniferous northern taiga species: Siberian larch (Larixibirica Ledeb.), Siberian spruce (Picea obovata Ledeb.) and Siberianine (Pinus sibirica Du-Tour.).
M. Gurskaya et al. / Dendrochron
F(
M
S
SsTatWwcmmtB(icswthiclwOtlsaaad(m
6sppl
sbctg
S
SVmlttpsalaa
C
mSlt
T
pw0swCiiiws
nwbotc(
C
tfabture and precipitation) from previous September to current August
ig. 1. Research area: study sites (black circle) and Salekhard meteorological stationgrey triangle) in West Siberia.
aterials and methods
tudy area
The research area is situated in the northern taiga of Westerniberia (Fig. 1). Permafrost is well represented in this area andeasonal thawing of soil ice does not exceed 50–150 cm in depth.he climatic conditions are on the one hand influenced by arcticir masses, which come from the Arctic Ocean and move acrosshe Ural Mountains without any topographic barrier far away into
estern Siberia. On the other hand, the Ob River carries warmater masses from the South to the North and plays a signifi-
ant role to make the regional floodplain climate comparativelyild. The level of water runoff can indirectly influence the for-ation of annual growth rings of trees in the region by changing
he air temperature and microclimatic conditions (Agafonov, 1995;ogdanov and Agafonov, 2001): The Ob River water year dischargerunoff) is positively correlated with the amount of precipitationn its drainage basin (MacDonald et al., 2007). Water discharge cal-ulations for the hydrological stations of Muzhi and of Salekhardhowed that in years with an increasing amount of discharge,armer May and October and lower June and July air tempera-
ures were observed regularly (Agafonov and Mazepa, 2001). Aigh runoff usually corresponds to a narrow ring: not only is an
ncreasing amount of precipitation positively correlated with aolder vegetation period but it also eventually leads to a water-ogged situation for the trees’ roots and thus limits the amount of
ood production in that year and hence leads to a narrow ring.n the other hand, a warm summer results in a higher amount of
hermal energy stored in the water of the river and thereby pro-ongs the vegetation period. The average July air temperature of thetudy area is 14.9 ◦C; the one for January −22.0 ◦C with an averagennual temperature of −4.8 ◦C. The number of days with temper-tures above 0 ◦C is 135 on average, the ones with temperaturesbove 10 ◦C is 67 on average. The snow cover lasts for about 220ays (Agafonov et al., 2004). Within the study area, Siberian sprucearound 50%), Siberian larch (30%) and Siberian pine (10%) are the
ost widespread coniferous tree species.An ancient wooden settlement called Ust-Voykar (65◦40′N,
4◦30′E) is located about 10 km afar on the opposite side of ourtudy site across the Ust-Voykar Lake. The last felling of trees hap-
ened in the first half of the 19th century (Gurskaya, 2006). Areliminary larch tree-ring chronology has been developed usingiving trees and archeological wood samples from the Ust-Voykar
w
w
ologia 30 (2012) 302– 309 303
ettlement (Gurskaya, 2007). Spruce wood remains have alloweduilding a floating tree ring chronology. In order to develop longlimate reconstructions for this site, we investigated the climate-ree growth relationships of all coniferous trees species which arerowing at the study site today.
ite characteristics
We sampled a total of 40 larch, 24 pine and 15 spruce trees.ampling was done in 1996 and 2000 at the southwest side of theojkar Sor Lake (65◦39′N, 64◦20′E). The trees were growing in aixed larch–pine and spruce–larch forests on a moist habitat with
oamy and sandy soil, covered by underbrush of Marsh Labradorea (Ledum palustre L.). In the early 1980s, a fire has occurred inhe pine forest, burning most of the young pine trees but the oldine trees survived. The majority of the larch trees were growingpatially separate from the pine trees, closer to the river and only
few larch trees in the transitional part of the forest experiencedow severity fire, if any. All sampled trees were living trees andppeared to be in good physical condition. On average they werebout 15–17 m in height and 40–45 cm in diameter at breast height.
limate data
We used mean monthly temperature (AD 1883–1997) andean monthly precipitation data (AD 1890–1997) from the
alekhard meteorological station (66◦32′N 66◦32′E, 16 m a.s.l.),ocated 120 km north of our study area. The Salekhard record ishe longest continuous meteorological observation in this area.
ree-ring data processing
We employed standard dendrochronological techniques in therocessing of tree cores (Cook and Kairiukstis, 1990). Tree-ringidths of individual series were measured with an accuracy of
.01 mm (Lintab-5, Rinntech) and cross-dated using the TSAPdosoftware (Rinn, 1996). Dating quality and measurement accuracyere cross-checked visually with TSAPdos and statistically usingOFECHA (Holmes, 1983). If a sequence of several years with miss-
ng rings was revealed during cross-dating, we divided the seriesn parts and used only the series before and after the row of miss-ng rings. Only tree-ring series with an interserial correlation >0.65
ere used for chronology building. Therefore, one pine and fourpruce tree-ring series were excluded from further analysis.
Individual growth curves were detrended using negative expo-ential curves to develop ring-width chronologies. In some cases,here the growth trend differed from the general trend displayed
y the majority of the trees, cubic smoothing splines with a cut-ff at 2/3 of the individual length of the series, were applied usinghe program ARSTAN (Cook and Holmes, 1986). The quality of thehronologies was assessed with the expressed population signalEPS, Wigley et al., 1984).
limatic responses and climate reconstruction
To assess the climatic signal in the tree-ring chronologies andheir stability over time, we performed bootstrapped responseunction analyses using the program Dendroclim2002 (Biondind Waikul, 2004). We computed sliding correlation coefficientsetween tree-ring chronologies and climate data (mean tempera-
ith a 50-year window and a lag of one year.Months with high and stable moving regression coefficients
ere then combined into a seasonal temperature index and, if
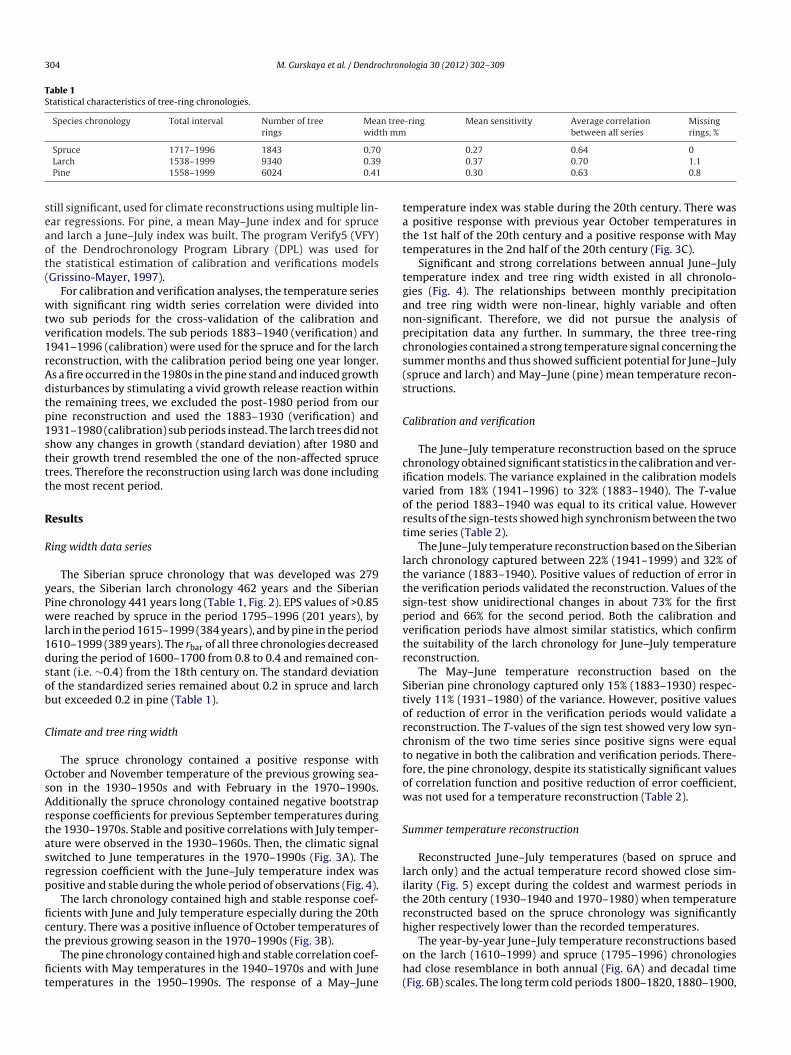
304 M. Gurskaya et al. / Dendrochronologia 30 (2012) 302– 309
Table 1Statistical characteristics of tree-ring chronologies.
Species chronology Total interval Number of treerings
Mean tree-ringwidth mm
Mean sensitivity Average correlationbetween all series
Missingrings, %
seaot(
wtv1rAdtp1sttt
R
R
yPwl1dsob
C
OsArtasrp
fict
fit
tatt
tganpcs(s
C
civort
lttspvtr
Storctfow
S
litrh
Spruce 1717–1996 1843 0.70Larch 1538–1999 9340 0.39Pine 1558–1999 6024 0.41
till significant, used for climate reconstructions using multiple lin-ar regressions. For pine, a mean May–June index and for sprucend larch a June–July index was built. The program Verify5 (VFY)f the Dendrochronology Program Library (DPL) was used forhe statistical estimation of calibration and verifications modelsGrissino-Mayer, 1997).
For calibration and verification analyses, the temperature seriesith significant ring width series correlation were divided into
wo sub periods for the cross-validation of the calibration anderification models. The sub periods 1883–1940 (verification) and941–1996 (calibration) were used for the spruce and for the larcheconstruction, with the calibration period being one year longer.s a fire occurred in the 1980s in the pine stand and induced growthisturbances by stimulating a vivid growth release reaction withinhe remaining trees, we excluded the post-1980 period from ourine reconstruction and used the 1883–1930 (verification) and931–1980 (calibration) sub periods instead. The larch trees did nothow any changes in growth (standard deviation) after 1980 andheir growth trend resembled the one of the non-affected sprucerees. Therefore the reconstruction using larch was done includinghe most recent period.
esults
ing width data series
The Siberian spruce chronology that was developed was 279ears, the Siberian larch chronology 462 years and the Siberianine chronology 441 years long (Table 1, Fig. 2). EPS values of >0.85ere reached by spruce in the period 1795–1996 (201 years), by
arch in the period 1615–1999 (384 years), and by pine in the period610–1999 (389 years). The rbar of all three chronologies decreaseduring the period of 1600–1700 from 0.8 to 0.4 and remained con-tant (i.e. ∼0.4) from the 18th century on. The standard deviationf the standardized series remained about 0.2 in spruce and larchut exceeded 0.2 in pine (Table 1).
limate and tree ring width
The spruce chronology contained a positive response withctober and November temperature of the previous growing sea-
on in the 1930–1950s and with February in the 1970–1990s.dditionally the spruce chronology contained negative bootstrapesponse coefficients for previous September temperatures duringhe 1930–1970s. Stable and positive correlations with July temper-ture were observed in the 1930–1960s. Then, the climatic signalwitched to June temperatures in the 1970–1990s (Fig. 3A). Theegression coefficient with the June–July temperature index wasositive and stable during the whole period of observations (Fig. 4).
The larch chronology contained high and stable response coef-cients with June and July temperature especially during the 20thentury. There was a positive influence of October temperatures of
he previous growing season in the 1970–1990s (Fig. 3B).The pine chronology contained high and stable correlation coef-cients with May temperatures in the 1940–1970s and with Juneemperatures in the 1950–1990s. The response of a May–June
oh(
0.27 0.64 00.37 0.70 1.10.30 0.63 0.8
emperature index was stable during the 20th century. There was positive response with previous year October temperatures inhe 1st half of the 20th century and a positive response with Mayemperatures in the 2nd half of the 20th century (Fig. 3C).
Significant and strong correlations between annual June–Julyemperature index and tree ring width existed in all chronolo-ies (Fig. 4). The relationships between monthly precipitationnd tree ring width were non-linear, highly variable and oftenon-significant. Therefore, we did not pursue the analysis ofrecipitation data any further. In summary, the three tree-ringhronologies contained a strong temperature signal concerning theummer months and thus showed sufficient potential for June–Julyspruce and larch) and May–June (pine) mean temperature recon-tructions.
alibration and verification
The June–July temperature reconstruction based on the sprucehronology obtained significant statistics in the calibration and ver-fication models. The variance explained in the calibration modelsaried from 18% (1941–1996) to 32% (1883–1940). The T-valuef the period 1883–1940 was equal to its critical value. Howeveresults of the sign-tests showed high synchronism between the twoime series (Table 2).
The June–July temperature reconstruction based on the Siberianarch chronology captured between 22% (1941–1999) and 32% ofhe variance (1883–1940). Positive values of reduction of error inhe verification periods validated the reconstruction. Values of theign-test show unidirectional changes in about 73% for the firsteriod and 66% for the second period. Both the calibration anderification periods have almost similar statistics, which confirmhe suitability of the larch chronology for June–July temperatureeconstruction.
The May–June temperature reconstruction based on theiberian pine chronology captured only 15% (1883–1930) respec-ively 11% (1931–1980) of the variance. However, positive valuesf reduction of error in the verification periods would validate aeconstruction. The T-values of the sign test showed very low syn-hronism of the two time series since positive signs were equalo negative in both the calibration and verification periods. There-ore, the pine chronology, despite its statistically significant valuesf correlation function and positive reduction of error coefficient,as not used for a temperature reconstruction (Table 2).
ummer temperature reconstruction
Reconstructed June–July temperatures (based on spruce andarch only) and the actual temperature record showed close sim-larity (Fig. 5) except during the coldest and warmest periods inhe 20th century (1930–1940 and 1970–1980) when temperatureeconstructed based on the spruce chronology was significantlyigher respectively lower than the recorded temperatures.
The year-by-year June–July temperature reconstructions basedn the larch (1610–1999) and spruce (1795–1996) chronologiesad close resemblance in both annual (Fig. 6A) and decadal timeFig. 6B) scales. The long term cold periods 1800–1820, 1880–1900,

M. Gurskaya et al. / Dendrochronologia 30 (2012) 302– 309 305
s of A:
1sdmussde
D
C
tyaOe
cJleEofrcrwticl
TCc
Fig. 2. Tree-ring chronologie
970–1980 were similar in both reconstructions. However, severalhort cold periods (1830s, 1850s, 1880s, 1920s, 1930s and 1970s)id not match well at the decadal scale. Also, at the annual scale,aximum and minimum temperature anomalies reconstructed
sing spruce occurred one year later compared to the larch recon-truction. Additionally, temperature reconstructions based on larchhowed a cold period from 1640 to 1680 with an extremely coldecade (1660–1670) and another cold period (1730–1780) withxtremely cold decades (1745–1755 and 1765–1775).
iscussion
limate-growth relationships and interspecific comparisons
Spruce, pine and larch tree-ring chronologies in the northernaiga of the Ob River valley show strong correlations to current
ear summer temperatures. June–July temperature signals havelso been found before in deciduous trees and in larch in the lowerb River floodplain (Agafonov, 1995; Mazepa, 1999; MacDonaldt al., 2007).Tp
s
able 2alibration and verification of reconstructed temperature rows. R2 – correlation. Squaronfidence T-value > 1.67.
Spruce (June–July) Larch (Ju
Period Period Period
Calibration 1883–1940 1941–1996 1883–19R2 0.20 0.24 0.34
R2adj 0.18 0.23 0.32
Verificationr2 0.48 0.45 0.48
RE 0.22 0.19 0.28
T-value 1.61 3.34 2.7
Sign-test +40/−16 +36/−22 +42/−15
spruce, B: larch and C: pine.
However, probably due to the influence of the river on the locallimate, the obtained bootstrapped response coefficients for May,une and July were lower than expected at these high northernatitudes (Briffa et al., 1990, 1998, 2008; Vaganov, 1996; Vaganovt al., 1996; Hantemirov and Shiyatov, 2002; Sidorova et al., 2007;sper et al., 2010; Linderholm et al., 2010). The strong relationshipsf June–July temperature with spruce and larch were exploitedor climatic reconstructions. In general, the spruce reconstructionepeated most dynamics of the larch reconstruction, but did notapture its complete temperature amplitude: the spruce basedeconstruction underestimated the temperatures reconstructedith larch by 1–2 ◦C for the period 1820–1850, could not capture
he warm period in 1920–1930 and over predicted temperaturesn the 1930s, while the larch based reconstructed temperatureso-varied with the meteorological data. This might be due to theower overall correlation scores or the lower sample size of spruce.
hus, we assume that the better temperature reconstruction of thiseriod was based on the larch tree-ring chronology.Our results also confirm the findings that seasonal growth ofpruce and larch on one site can show similar patterns (Panarin,
ed R2adj – correlation adjusted squared, r2 – correlation, RE – reduction of error,
ne–July) Pine (May–June)
Period Period Period
40 1941–1999 1883–1930 1931–19800.23 0.17 0.120.22 0.15 0.11
0.58 0.41 0.350.35 0.12 0.84.82 1.98 3.1
+38/−20 +27/−21 +29/−21

306 M. Gurskaya et al. / Dendrochronologia 30 (2012) 302– 309
Fig. 3. Response functions over time of standard ring-width chronologies of spruce (A), larch (B) (common period for each: 1883–1996) and pine (common period: 1883–1980)(C) and mean monthly temperature (black) and precipitation (grey). Significant values are above the upper and below the lower horizontal line.
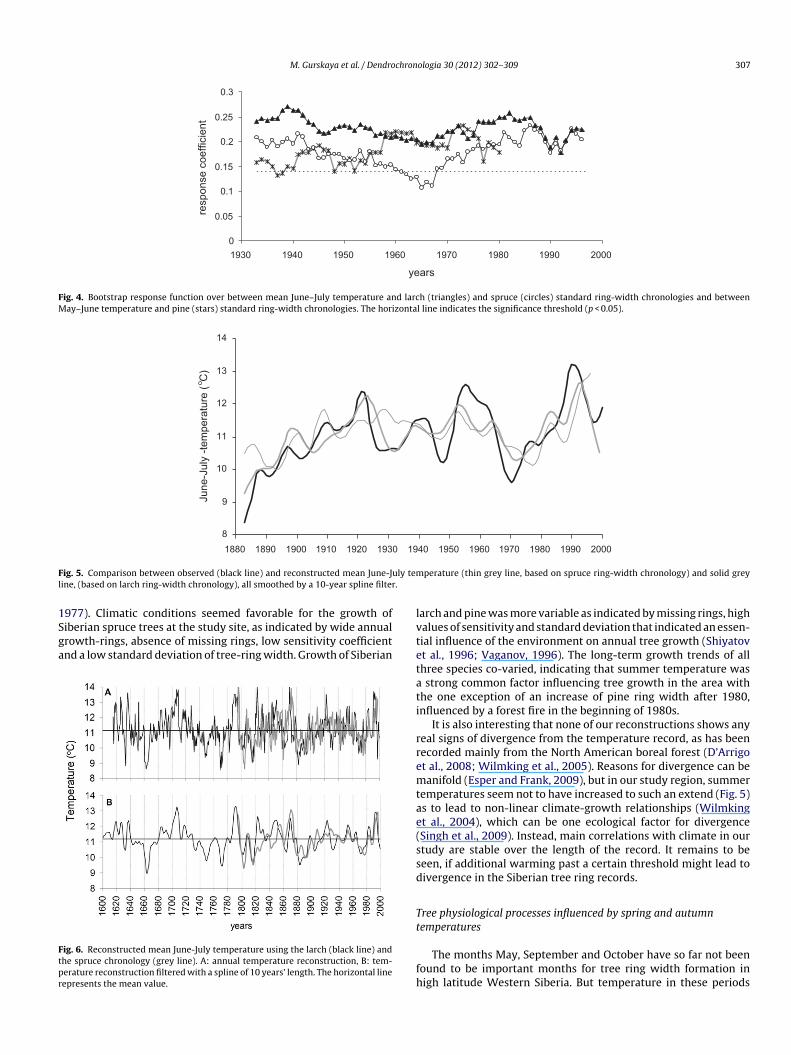
M. Gurskaya et al. / Dendrochronologia 30 (2012) 302– 309 307
0
0.05
0.1
0.15
0.2
0.25
0.3
20001990198019701960195019401930
years
resp
onse
coe
ffici
ent
Fig. 4. Bootstrap response function over between mean June–July temperature and larch (triangles) and spruce (circles) standard ring-width chronologies and betweenMay–June temperature and pine (stars) standard ring-width chronologies. The horizontal line indicates the significance threshold (p < 0.05).
8
9
10
11
12
13
14
2000199019801970196019501940193019201910190018901880
June
-Jul
y -te
mpe
ratu
re (
o C)
F ly teml .
1Sga
Ftpr
ig. 5. Comparison between observed (black line) and reconstructed mean June-Juine, (based on larch ring-width chronology), all smoothed by a 10-year spline filter
977). Climatic conditions seemed favorable for the growth ofiberian spruce trees at the study site, as indicated by wide annualrowth-rings, absence of missing rings, low sensitivity coefficientnd a low standard deviation of tree-ring width. Growth of Siberian
ig. 6. Reconstructed mean June-July temperature using the larch (black line) andhe spruce chronology (grey line). A: annual temperature reconstruction, B: tem-erature reconstruction filtered with a spline of 10 years’ length. The horizontal lineepresents the mean value.
lvtetati
rremtae(ssd
Tt
fh
perature (thin grey line, based on spruce ring-width chronology) and solid grey
arch and pine was more variable as indicated by missing rings, highalues of sensitivity and standard deviation that indicated an essen-ial influence of the environment on annual tree growth (Shiyatovt al., 1996; Vaganov, 1996). The long-term growth trends of allhree species co-varied, indicating that summer temperature was
strong common factor influencing tree growth in the area withhe one exception of an increase of pine ring width after 1980,nfluenced by a forest fire in the beginning of 1980s.
It is also interesting that none of our reconstructions shows anyeal signs of divergence from the temperature record, as has beenecorded mainly from the North American boreal forest (D’Arrigot al., 2008; Wilmking et al., 2005). Reasons for divergence can beanifold (Esper and Frank, 2009), but in our study region, summer
emperatures seem not to have increased to such an extend (Fig. 5)s to lead to non-linear climate-growth relationships (Wilmkingt al., 2004), which can be one ecological factor for divergenceSingh et al., 2009). Instead, main correlations with climate in ourtudy are stable over the length of the record. It remains to beeen, if additional warming past a certain threshold might lead toivergence in the Siberian tree ring records.
ree physiological processes influenced by spring and autumnemperatures
The months May, September and October have so far not beenound to be important months for tree ring width formation inigh latitude Western Siberia. But temperature in these periods
3 chron
maocisf1wO
fRNttplp
sioi
Oam2aOai1b
mpee(tpamftrtsac
Tr
rftePe
w
lfiftUdtt11ssdet(btfldde
co11Vlccwvcot(b
cth(bnotuwot
C
ltrss
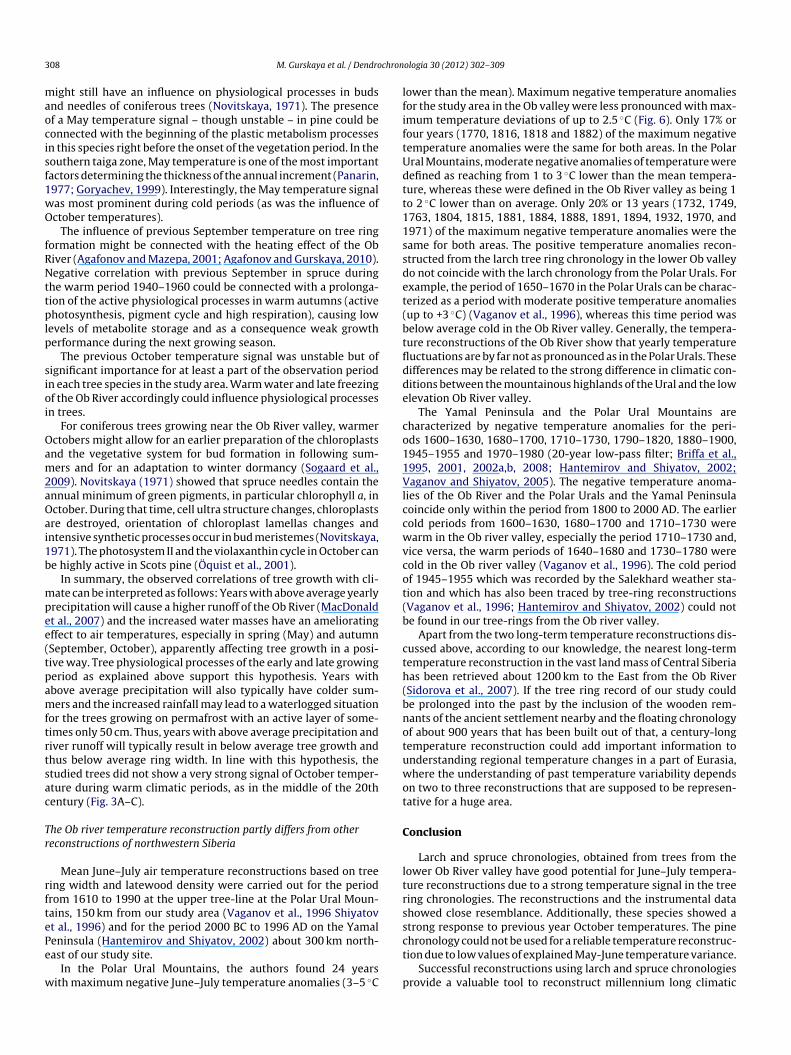
08 M. Gurskaya et al. / Dendro
ight still have an influence on physiological processes in budsnd needles of coniferous trees (Novitskaya, 1971). The presencef a May temperature signal – though unstable – in pine could beonnected with the beginning of the plastic metabolism processesn this species right before the onset of the vegetation period. In theouthern taiga zone, May temperature is one of the most importantactors determining the thickness of the annual increment (Panarin,977; Goryachev, 1999). Interestingly, the May temperature signalas most prominent during cold periods (as was the influence ofctober temperatures).
The influence of previous September temperature on tree ringormation might be connected with the heating effect of the Obiver (Agafonov and Mazepa, 2001; Agafonov and Gurskaya, 2010).egative correlation with previous September in spruce during
he warm period 1940–1960 could be connected with a prolonga-ion of the active physiological processes in warm autumns (activehotosynthesis, pigment cycle and high respiration), causing low
evels of metabolite storage and as a consequence weak growtherformance during the next growing season.
The previous October temperature signal was unstable but ofignificant importance for at least a part of the observation periodn each tree species in the study area. Warm water and late freezingf the Ob River accordingly could influence physiological processesn trees.
For coniferous trees growing near the Ob River valley, warmerctobers might allow for an earlier preparation of the chloroplastsnd the vegetative system for bud formation in following sum-ers and for an adaptation to winter dormancy (Sogaard et al.,
009). Novitskaya (1971) showed that spruce needles contain thennual minimum of green pigments, in particular chlorophyll a, inctober. During that time, cell ultra structure changes, chloroplastsre destroyed, orientation of chloroplast lamellas changes andntensive synthetic processes occur in bud meristemes (Novitskaya,971). The photosystem II and the violaxanthin cycle in October cane highly active in Scots pine (Öquist et al., 2001).
In summary, the observed correlations of tree growth with cli-ate can be interpreted as follows: Years with above average yearly
recipitation will cause a higher runoff of the Ob River (MacDonaldt al., 2007) and the increased water masses have an amelioratingffect to air temperatures, especially in spring (May) and autumnSeptember, October), apparently affecting tree growth in a posi-ive way. Tree physiological processes of the early and late growingeriod as explained above support this hypothesis. Years withbove average precipitation will also typically have colder sum-ers and the increased rainfall may lead to a waterlogged situation
or the trees growing on permafrost with an active layer of some-imes only 50 cm. Thus, years with above average precipitation andiver runoff will typically result in below average tree growth andhus below average ring width. In line with this hypothesis, thetudied trees did not show a very strong signal of October temper-ture during warm climatic periods, as in the middle of the 20thentury (Fig. 3A–C).
he Ob river temperature reconstruction partly differs from othereconstructions of northwestern Siberia
Mean June–July air temperature reconstructions based on treeing width and latewood density were carried out for the periodrom 1610 to 1990 at the upper tree-line at the Polar Ural Moun-ains, 150 km from our study area (Vaganov et al., 1996 Shiyatovt al., 1996) and for the period 2000 BC to 1996 AD on the Yamal
eninsula (Hantemirov and Shiyatov, 2002) about 300 km north-ast of our study site.In the Polar Ural Mountains, the authors found 24 yearsith maximum negative June–July temperature anomalies (3–5 ◦C
ct
p
ologia 30 (2012) 302– 309
ower than the mean). Maximum negative temperature anomaliesor the study area in the Ob valley were less pronounced with max-mum temperature deviations of up to 2.5 ◦C (Fig. 6). Only 17% orour years (1770, 1816, 1818 and 1882) of the maximum negativeemperature anomalies were the same for both areas. In the Polarral Mountains, moderate negative anomalies of temperature wereefined as reaching from 1 to 3 ◦C lower than the mean tempera-ure, whereas these were defined in the Ob River valley as being 1o 2 ◦C lower than on average. Only 20% or 13 years (1732, 1749,763, 1804, 1815, 1881, 1884, 1888, 1891, 1894, 1932, 1970, and971) of the maximum negative temperature anomalies were theame for both areas. The positive temperature anomalies recon-tructed from the larch tree ring chronology in the lower Ob valleyo not coincide with the larch chronology from the Polar Urals. Forxample, the period of 1650–1670 in the Polar Urals can be charac-erized as a period with moderate positive temperature anomaliesup to +3 ◦C) (Vaganov et al., 1996), whereas this time period waselow average cold in the Ob River valley. Generally, the tempera-ure reconstructions of the Ob River show that yearly temperatureuctuations are by far not as pronounced as in the Polar Urals. Theseifferences may be related to the strong difference in climatic con-itions between the mountainous highlands of the Ural and the lowlevation Ob River valley.
The Yamal Peninsula and the Polar Ural Mountains areharacterized by negative temperature anomalies for the peri-ds 1600–1630, 1680–1700, 1710–1730, 1790–1820, 1880–1900,945–1955 and 1970–1980 (20-year low-pass filter; Briffa et al.,995, 2001, 2002a,b, 2008; Hantemirov and Shiyatov, 2002;aganov and Shiyatov, 2005). The negative temperature anoma-
ies of the Ob River and the Polar Urals and the Yamal Peninsulaoincide only within the period from 1800 to 2000 AD. The earlierold periods from 1600–1630, 1680–1700 and 1710–1730 werearm in the Ob river valley, especially the period 1710–1730 and,
ice versa, the warm periods of 1640–1680 and 1730–1780 wereold in the Ob river valley (Vaganov et al., 1996). The cold periodf 1945–1955 which was recorded by the Salekhard weather sta-ion and which has also been traced by tree-ring reconstructionsVaganov et al., 1996; Hantemirov and Shiyatov, 2002) could note found in our tree-rings from the Ob river valley.
Apart from the two long-term temperature reconstructions dis-ussed above, according to our knowledge, the nearest long-termemperature reconstruction in the vast land mass of Central Siberiaas been retrieved about 1200 km to the East from the Ob RiverSidorova et al., 2007). If the tree ring record of our study coulde prolonged into the past by the inclusion of the wooden rem-ants of the ancient settlement nearby and the floating chronologyf about 900 years that has been built out of that, a century-longemperature reconstruction could add important information tonderstanding regional temperature changes in a part of Eurasia,here the understanding of past temperature variability depends
n two to three reconstructions that are supposed to be represen-ative for a huge area.
onclusion
Larch and spruce chronologies, obtained from trees from theower Ob River valley have good potential for June–July tempera-ure reconstructions due to a strong temperature signal in the treeing chronologies. The reconstructions and the instrumental datahowed close resemblance. Additionally, these species showed atrong response to previous year October temperatures. The pine
hronology could not be used for a reliable temperature reconstruc-ion due to low values of explained May-June temperature variance.Successful reconstructions using larch and spruce chronologiesrovide a valuable tool to reconstruct millennium long climatic

chron
rvcs
A
apGvpH
R
A
A
A
A
A
A
A
B
B
B
B
B
B
B
B
B
B
C
C
D
E
E
G
G
G
G
H
H
L
M
M
N
Ö
P
R
S
S
S
S
S
V
V
V
W
W
W
M. Gurskaya et al. / Dendro
econstructions. The ancient settlement Ust-Voykar in the Ob Riveralley promises great potential for developing a millennium longlimatic reconstruction using ancient timber for a better under-tanding of past climatic variability.
cknowledgments
The work was supported by an Alfried Krupp Junior Fellowship, Russian Foundation of Basic Research grant No. 10-05-00778,rogram KAT 12-П-4-1073, program UB RAS 12-C-4-1038 to M.urskaya, a Sofja Kovalevskaja Research Award by the Alexanderon Humboldt Foundation to M. Wilmking, and by the scholarshiprogramme of the German Federal Environmental Foundation (M.allinger, 20008/983).
eferences
gafonov, L., Strunk, H., Nuber, T., 2004. Thermokarst dynamics in Western Siberia:insights from dendrochronological research. Palaeogeography Palaeoclimatol-ogy Palaeoecology 209, 183–196.
gafonov, L.I., 1995. Influence of hydrological and temperature conditions on radialstem growth in foliage trees in the floodplain of the lower Ob River. RussianJournal of Ecology 26, 406–413.
gafonov, L.I., 1998. Indication of hydrological regime changes of the lower Ob Riverby tree ring analysis. Russian Journal of Ecology 5, 311–317.
gafonov, L.I., 1999. Radial growth of wooden plant in the Ob River floodplain.Sibirskii Ecologicheskii Journal 2, 135–144 (in Russian).
gafonov, L.I., 2010. The low Ob River runoff and its changes in XX century. IzvestiaRAN. Seria Geograficheskaya 4, 68–76 (in Rusian).
gafonov, L.I., Gurskaya, M.A., 2010. Influence of the Ob river runoff to tree ringincrement. Lesovedenie 4, 9–18 (in Russian).
gafonov, L.I., Mazepa, V.S., 2001. Water runoff of the Ob river and summerair temperature on the North-West Siberia. Izvetiya Akademii Nauk. Seriageograficheskaya 1, 80–92 (in Russian).
iondi, F., Waikul, K., 2004. DENDROCLIM2002: a C++ program for statistical cali-bration of climate signals in tree-ring chronologies. Computers & Geosciences30, 303–311.
ogdanov, V.D., Agafonov, L.I., 2001. Influence of hydrologic conditions of the LowerOb floodplain on reproduction in coregonids. Russian Journal of Ecology 1,45–51.
riffa, K.R., Jones, P.D., Shiyatov, S.G., Schweingruber, F.H., Cook, E.R., 1995. Unusualtwentieth-century summer warmth in a 1000-year temperature record fromSiberia. Nature 376, 156–159.
riffa, K.R., Osborn, T.J., Schweingruber, F.H., 2004. Large-scale temperature infer-ences from tree rings: a review. Global and Planetary Change 40 (1–2), 11–26.
riffa, K.R., Bartholin, T.S., Eckstein, D., Jones, P.D., Karlen, W., Schweingruber, F.H.,Zetterberg, P., 1990. A 1400-year tree-ring record of summer temperatures inFennoscandia. Nature 346, 434–439.
riffa, K.R., Jones, P.D., Schweingruber, F.H., Osborn, T.J., 1998. Influence of vol-canic eruptions on Northern Hemisphere summer temperature over the past600 years. Nature 393, 450–455.
riffa, K.R., Osborn, T.J., Schweingruber, F.H., Jones, P.D., Shiyatov, S.G., Vaganov, E.A.,2002b. Tree-ring width and density data around the Northern Hemisphere: Part2, spatio-temporal variability and associated climate patterns. Holocene 12 (6),759–789.
riffa, K.R., Osborn, T.J., Schweingruber, F.H., Jones, P.D., Shiyatov, S.G., Vaganov, E.A.,2002a. Tree-ring width and density data around the Northern Hemisphere: Part1, local and regional climate signals. Holocene 12 (6), 737–757.
riffa, K.R., Osborn, T.J., Schweingruber, F.H., Harris, I.C., Jones, P.D., Shiyatov, S.G.,Vaganov, E.A., 2001. Low-frequency temperature variations from a northern treering density network. Journal of Geophysical Research-Atmospheres 106 (D3),2929–2941.
riffa, K.R., Shishov, V.V., Melvin, T.M., Vaganov, E.A., Grudd, H., Hantemirov, R.M.,Eronen, M., Naurzbaev, M.M., 2008. Trends in recent temperature and radial treegrowth spanning 2000 years across northwest Eurasia. Philosophical Transac-tions of the Royal Society B 363, 2271–2284.
ook, E., Kairiukstis, L., 1990. Methods of Dendrochronology: Applications in theEnvironmental Sciences. Kluwer Academic Publishers, Dordrecht, 304 pp.
ook, E., Holmes, R., 1986. Guide for Computer Program ARSTAN, Adapted fromUsers Manual for Program ARSTAN, Laboratory of Tree-Ring Research. Univer-sity of Arizona, 50-65.
W
ologia 30 (2012) 302– 309 309
’Arrigo, R., Wilson, R., Liepert, B., Cherubini, P., 2008. On the ‘Divergence Problem’in Northern Forests: a review of the tree-ring evidence and possible causes.Global and Planetary Change 60, 289–305.
sper, J., Frank, D.C., 2009. Divergence pitfalls in tree-ring research. Climatic Change94, 261–266.
sper, J., Frank, D.C., Büntgen, U., Verstege, A., Hantemirov, R.M., Kirdyanov, A.V.,2010. Trends and uncertainties in Siberian indicators of 20th century warming.Global Change Biology 16, 386–398.
oryachev, V.M., 1999. The effect of spatial distribution of trees in communities onthe formation of annual tree rings in conifers of the Ural Southern Taiga forests.Russian Journal of Ecology 30, 6–15.
rissino-Mayer, H., 1997. Computer assisted independent observer verification oftree-ring measurements. Tree-Ring Bulletin 54, 29–41.
urskaya, M.A., 2006. Preliminary tree-ring dating of historical wood from Ust-Voykar settlement (15th–20th centuries), North-Western Siberia. In: Tree-ringsin Archaeology, Climatology and Ecology. Proc. of Dendrosymposium, Freibourg,Switzerland, pp. 236–243.
urskaya, M.A., 2007. A 900-years larch chronology for north-western Siberia on thebasis of archaeological wood of the Ust-Voykar settlement. Geochronometria 8,67–72.
antemirov, R.M., Shiyatov, S.G., 2002. A continuous multimillennial ring-widthchronology in Yamal, northwestern Siberia. Holocene 12, 717–726.
olmes, R.L., 1983. Computer-assisted quality control in tree-ring dating and mea-surement. Tree-Ring Bulletin 43, 69–78.
inderholm, H.W., Björklund, J.A., Seftigen, K., Gunnarson, B.E., Grudd, H., Jeong, J.-H., Drobyshev, I., Liu, Y., 2010. Dendroclimatology in Fennoscandia – from pastaccomplishments to future potential. Climate of the Past 6, 93–114.
acDonald, G.M., Kremenetski, K.V., Smith, L.C., Hidalgo, H.G., 2007. Recent Eurasianriver discharge to the Arctic Ocean in the context of longer-term dendrohydro-logical records. Journal of Geophysical Research 112, G04s50.
azepa, V.S., 1999. Effect of precipitation on the dynamics of the radial increment ofconifers in the sub-arctic regions of Eurasia. Lesovedenie 6, 14–21 (in Russian).
ovitskaya, Yu.E., 1971. Physiological and Biochemical Peculiarities of Needles andShoots of Spruce in Northern Condition. Leningrad, Nauka, p. 117 (in Russian).
quist, G., Gardeström, P., Huner, N.A., 2001. Metabolic changes during cold accli-mation and subsequent freezing and thawing. In: Bigras, F.J., Colombo, S.J. (Eds.),Conifer Cold Hardiness. Kluwer Academic Publ, Dordrecht, pp. 137–165.
anarin, I., 1977. Forests of the Chita Region of Transbaikalia. Nauka, Novosibirsk, p.232 (in Russian).
inn, F., 1996. TSAP Time Series Analysis and Presentation. Version 3.0. ReferenceManual. Heidelberg, p. 262.
hiyatov, S., Hantemirov, R., Gorlanova, L., 2002. Millennial reconstruction of thesummer temperature in the Polar Urals: tree-ring data from Siberian juniperand Siberian larch. Archaeology, Ethnology & Anthropology of Eurasia 1, 1–5 (inRussian).
hiyatov, S.G., Mazepa, V.S., Vaganov, E.A., Schweingruber, F.H., 1996. Summer tem-perature variations reconstructed by tree-ring data at the polar timberline inSiberia. In: Dean, J.S., Meko, D.M., Swetnam, T.W. (Eds.), Tree Rings, Environmentand Humanity. Radiocarbon, Tucson, pp. 61–70.
idorova, O.V., Vaganov, E.A., Naurzbaev, M.M., Shishov, V.V., Hughes, M.K., 2007.Regional features of the radial growth of larch in North Central Siberia accordingto millennial tree-ring chronologies. Russian Journal of Ecology 38, 90–93.
ingh, J., Yadav, R.R., Wilmking, M., 2009. A 694 year tree-ring based rainfall recon-struction from Himachal Pradesh, India. Climate Dynamics 33 (7–8), 1149–1158.
ogaard, G., Granhus, A., Johnsen, O., 2009. Effect of frost nights and day and nighttemperature during dormancy induction on frost hardiness, tolerance to coldstorage and bud burst in seedlings of Norway spruce. Trees – Structure andFunction 23, 1295–1307.
aganov, E.A., 1996. Recording of warming in current century by tracheids of theannual tree rings. Doklady Akademii Nauk 351, 281–283 (in Russian).
aganov, E.A., Shiyatov, S.G., 2005. Dendroclimatic and dendroecological studies inNorthern Eurasia. Lesovedenie 4, 18–27 (in Russian).
aganov, E.A., Shiyatov, S.G., Mazepa, V.S., 1996. Dendroclimatic study in Uralo-Siberian Subarctic. Novosibirsk, Nauka, p. 246 (in Russian).
aterhouse, J.S., Agafonov, L.I., Barker, A.C., Carter, A.H.C., Loader, N.J., 2000. Stablecarbon isotopes in Scots pine tree rings preserve a record of flow of the river Ob.Geophysical Research Letters 27, 3529–3532.
igley, T.M.L., Briffa, K.R., Jones, P.D., 1984. On the average value of correlated time-series, with applications in dendroclimatology and hydrometeorology. Journalof Climate and Applied Meteorology 23, 201–213.
ilmking, M., Juday, G.P., Barber, V.A., Zald, H.S.J., 2004. Recent climate warm-
ing forces contrasting growth responses of white spruce at treeline in Alaskathrough temperature thresholds. Global Change Biology 10 (10), 1724–1736.ilmking, M., D’Arrigo, R., Jacoby, G.C., Juday, G.P., 2005. Increased temperature sen-sitivity and divergent growth trends in circumpolar boreal forests. GeophysicalResearch Letters 32, L15715.