Temperature patterns over the past eight centuries in Northern Fennoscandia inferred from...
9
Temperature patterns over the past eight centuries in Northern Fennoscandia inferred from sedimentary diatoms Jan Weckström a, ⁎ , Atte Korhola a , Panu Erästö b , Lasse Holmström c a Environmental Change Research Unit (ECRU), Department of Biological and Environmental Sciences, P.O. Box 65, FIN-00014, University of Helsinki, Finland b Department of Mathematics and Statistics, P.O. Box 68, FIN-00014, University of Helsinki, Finland c Department of Mathematical Sciences, P.O. Box 3000, FIN-90014, University of Oulu, Finland Received 14 June 2005 Available online 9 March 2006 Abstract Establishing natural climate variability becomes particularly important in remote polar regions, especially when considering questions regarding higher than average warming. We present a high-resolution record of temperature variability for the past 800 yr based on sedimentary diatoms from a treeline lake in Finnish Lapland. The BSiZer multiscale smoothing technique is applied to the data to identify significant features in the record at different temporal levels. The overall reconstruction shows relatively large multi-centennial temperature variability with a total range of about 0.6–0.8°C. At millennial scales, the temperatures exhibit a statistically significant long-term cooling trend prior to industrialization (ΔT = −0.03°C/century). At the centennial timescale, three warm time intervals were identified around AD 1200–1300 (terminal phase of the Medieval Warm Period, MWP), 1380–1550 and from 1920 until the present. Pronounced coolness occurred between AD 1600 and 1920, indicative of the Little Ice Age (LIA). At the decadal level, certain shorter-term climate excursions were revealed. The warmest ∼10–30 yr, non- overlapping periods occurred in AD 1220–1250, 1470–1500 and 1970–2000, respectively. The classic events of MWP and LIA are evident in our record, as is also the 20th century warming. © 2006 University of Washington. All rights reserved. Keywords: Diatoms; Paleoclimatology; Climate variability; Temperature; BSiZer; Northern Fennoscandia; Medieval Warm Period; Little Ice Age Introduction Global land surface temperatures have increased by ca. 0.8°C since the late 19th century, and the warming trend has increased to 0.17°C/decade during the past 25-yr period (1979– 2004) (http://lwf.ncdc.noaa.gov/oa/climate/research/trends. html). According to model simulations, large changes in temperatures and precipitation patterns are predicted to continue in the future. Although there are slight differences in the model outcomes regarding the amplitude and speed of the changes, all models agree that the temperature increases will be much greater in the Arctic than in areas of lower latitudes (ACIA, 2004). However, long-term instrumental or historical climate records from high latitudes, which can be used for validation of climate models, are scarce. Instrumental records therefore need to be extended in time using data from proxy sources such as tree rings and marine and lake sediments. Temperature records of the past centuries can be used as analogues of the expected natural variation in the future. The rapid development of quantitative paleoecology has increased the use of sedimentary diatoms as tools in reconstructing past environments. In addition to the common use of diatom algae as indicators of changes in water pH (e.g., Birks et al., 1990a; Weckström et al., 2003), nutrients (e.g., Bennion et al., 1996) and salinity (e.g., Fritz et al., 1991; Laird et al., 1996), they have lately also been used as proxy indicators in paleoclimatological studies (e.g., Korhola et al., 2000; Rosén et al., 2001; Bigler et al., 2002; Wolfe, 2003). Korhola et al. (2000) published the first diatom-based quantitative climate record covering the entire Holocene for northwestern Finnish Lapland. Their results were generally in a good agreement with the known or assumed climate history of the area. Especially for the last ca. 1000 yr, the record seemed to mimic well the known Quaternary Research 66 (2006) 78 – 86 www.elsevier.com/locate/yqres ⁎ Corresponding author. Fax: +358 9 191 57788. E-mail address: [email protected] (J. Weckström). 0033-5894/$ - see front matter © 2006 University of Washington. All rights reserved. doi:10.1016/j.yqres.2006.01.005
-
Upload
independent -
Category
Documents
-
view
1 -
download
0
Transcript of Temperature patterns over the past eight centuries in Northern Fennoscandia inferred from...
6 (2006) 78–86www.elsevier.com/locate/yqres
Quaternary Research 6
Temperature patterns over the past eight centuries in NorthernFennoscandia inferred from sedimentary diatoms
Jan Weckström a,⁎, Atte Korhola a, Panu Erästö b, Lasse Holmström c
a Environmental Change Research Unit (ECRU), Department of Biological and Environmental Sciences, P.O. Box 65, FIN-00014, University of Helsinki, Finlandb Department of Mathematics and Statistics, P.O. Box 68, FIN-00014, University of Helsinki, Finland
c Department of Mathematical Sciences, P.O. Box 3000, FIN-90014, University of Oulu, Finland
Received 14 June 2005Available online 9 March 2006
Abstract
Establishing natural climate variability becomes particularly important in remote polar regions, especially when considering questionsregarding higher than average warming. We present a high-resolution record of temperature variability for the past 800 yr based on sedimentarydiatoms from a treeline lake in Finnish Lapland. The BSiZer multiscale smoothing technique is applied to the data to identify significant featuresin the record at different temporal levels. The overall reconstruction shows relatively large multi-centennial temperature variability with a totalrange of about 0.6–0.8°C. At millennial scales, the temperatures exhibit a statistically significant long-term cooling trend prior to industrialization(ΔT = −0.03°C/century). At the centennial timescale, three warm time intervals were identified around AD 1200–1300 (terminal phase of theMedieval Warm Period, MWP), 1380–1550 and from 1920 until the present. Pronounced coolness occurred between AD 1600 and 1920,indicative of the Little Ice Age (LIA). At the decadal level, certain shorter-term climate excursions were revealed. The warmest ∼10–30 yr, non-overlapping periods occurred in AD 1220–1250, 1470–1500 and 1970–2000, respectively. The classic events of MWP and LIA are evident in ourrecord, as is also the 20th century warming.© 2006 University of Washington. All rights reserved.
Keywords: Diatoms; Paleoclimatology; Climate variability; Temperature; BSiZer; Northern Fennoscandia; Medieval Warm Period; Little Ice Age
Introduction
Global land surface temperatures have increased by ca.0.8°C since the late 19th century, and the warming trend hasincreased to 0.17°C/decade during the past 25-yr period (1979–2004) (http://lwf.ncdc.noaa.gov/oa/climate/research/trends.html). According to model simulations, large changes intemperatures and precipitation patterns are predicted to continuein the future. Although there are slight differences in the modeloutcomes regarding the amplitude and speed of the changes, allmodels agree that the temperature increases will be muchgreater in the Arctic than in areas of lower latitudes (ACIA,2004). However, long-term instrumental or historical climaterecords from high latitudes, which can be used for validation ofclimate models, are scarce. Instrumental records therefore need
⁎ Corresponding author. Fax: +358 9 191 57788.E-mail address: [email protected] (J. Weckström).
0033-5894/$ - see front matter © 2006 University of Washington. All rights reservdoi:10.1016/j.yqres.2006.01.005
to be extended in time using data from proxy sources such astree rings and marine and lake sediments. Temperature recordsof the past centuries can be used as analogues of the expectednatural variation in the future.
The rapid development of quantitative paleoecology hasincreased the use of sedimentary diatoms as tools inreconstructing past environments. In addition to the commonuse of diatom algae as indicators of changes in water pH (e.g.,Birks et al., 1990a; Weckström et al., 2003), nutrients (e.g.,Bennion et al., 1996) and salinity (e.g., Fritz et al., 1991; Lairdet al., 1996), they have lately also been used as proxy indicatorsin paleoclimatological studies (e.g., Korhola et al., 2000; Rosénet al., 2001; Bigler et al., 2002; Wolfe, 2003). Korhola et al.(2000) published the first diatom-based quantitative climaterecord covering the entire Holocene for northwestern FinnishLapland. Their results were generally in a good agreement withthe known or assumed climate history of the area. Especially forthe last ca. 1000 yr, the record seemed to mimic well the known
ed.
79J. Weckström et al. / Quaternary Research 66 (2006) 78–86
climatic events, such as the Medieval Warm Period (MWP), theLittle Ice Age (LIA), and the post-industrial climate warming(Korhola et al., 2000).
However, the temporal resolution in the Korhola et al. studywas rather coarse (50–70 yr), for which reason detection of anyshorter-term climate patterns was not possible. Here we presenta more detailed analysis of these climatic shifts to determine ifsignificant short-term variability occurs within the long-termtrend. Moreover, because of the time-consuming nature ofanalyzing the biota from long sediment cores, quantitativereconstructions are often based on only a single stratigraphicsequence. This can provoke questions about the representative-ness and reliability of the reconstruction. Therefore, we sampleda new shorter sediment core, comprising the last ca. 800 yr,from the same lake (Tsuolbmajavri) in March 2001 with the aimof gathering higher-frequency information about climatepatterns from the area. We then applied the sophisticatedBSiZer multiscale smoothing technique to the data to explorestatistically significant features in the record at differenttemporal levels (millennial, centennial and decadal timescales).The new core also allowed us to examine if the same climatesignal can be observed in a replicate core from one and the samelake. Finally, this new study made it possible to explore morecarefully the response of diatom algal flora to climate from anecological point of view.
Materials and methods
Study site and coring
In our previous studies (Seppä and Weckström, 1999;Korhola et al., 2000), Lake Tsuolbmajavri (68°41′N, 22°05′E;526 m a.s.l.; Zmax = 5.4 m) in Finnish Lapland has been shownto contain a representative undisturbed and continuousHolocene stratigraphical record. Due to its location in theclimatically sensitive northern treeline area (Fig. 1) and itsrelatively uniform sedimentation rates, the lake is extremelysuitable for paleoclimatic studies. The climate in the area iscontinental, with mean July temperature of 11.0°C, meanJanuary temperature of −14.5°C, and annual precipitation of ca.450 mm yr−1. The lake is frozen for up to 8 months of the year.For more information about the site and its catchmentproperties, see Seppä and Weckström (1999). Lake Tsuolbma-javri was revisited in March 2001, and a sediment core(27.5 cm) was derived from the deepest part of the basin using aLimnos-type® gravity corer. The core was sub-sampled for loss-on-ignition (LOI) and diatom analysis at intervals of 5 mm,representing a temporal resolution of 5 to 20 yr.
Sediment dating
Sediment samples were analyzed for 210Pb, 226Ra and 137Csby gamma spectrometry in the Environmental RadioactivityLaboratory of the Liverpool University. The 210Pb chronologieswere calculated using both the Constant Rate of Supply (CRS)and Constant Initial Concentration (CIC) dating models(Appleby and Oldfield, 1978) together with chrono-stratigraph-
ic dates determined from the 137Cs record. Due to generallyslow sediment accumulation rates in sub-arctic lakes of FinnishLapland (often less than 0.5 mm yr−1; see Korhola andWeckström, 2004), these dating methods gave age estimates foronly the topmost 9 cm in the case of Lake Tsuolbmajavri (withthe equilibrium of 210Pb and supporting 226Ra occurring at thislevel). To extend the chronology farther down in the core, oneAMS 14C date (HELA-676) was obtained at 26.0–26.5 cm fromremains of Drepanocladus mosses (terrestrial macrofossilswere absent). However, the comparison between this date(1615 ± 40 14C yr B.P.) with the age of the lowest 210Pb sampleat 9 cm (AD 1905) and with the linear regression curve of theentire Holocene sequence of the lake [based on 14 AMS 14Cdates (Seppä and Weckström, 1999)] suggests that the radio-carbon dating of this new sample yields far too old an age. Thisold date is presumably the result of contamination by old carbon.Soils and peats are a major source of ancient carbon, and inoligotrophic Arctic lakes, where sediment accumulation ratesare slow, the addition of 14C-depleted organic carbon from soilsand peats can form a significant fraction of the total organicmatter deposited on the lake floor (Abbott and Stafford, 1996).
Following Jones et al. (1993) and Fallu et al. (2004), we alsotried to pick up sedimentary chironomid head capsules for theAMS dating, but this approach proved to be too laborious sinceeven 2000 head capsules did not provide enough carbon for theAMS inventory (HELA-677).
We therefore disregarded the new radiocarbon date anddecided to extend the age estimates for the sediment samplesolder than ca. 150 yr by extrapolation. To do this, three separateage-depth models based on different assumptions of thesediment accumulation rates in the lower part of the 210Pbdated sequence were created (Fig. 2). The regression slopes ofthese models were then compared with the slope of the age-depth model by Seppä and Weckström (1999). The slope ofmodel three for the post-150-yr samples fitted best with theslope of the Holocene age-depth model and was thereforeemployed in the present study. However, this exercise suggeststhat the age-depth model used in Seppä and Weckström (1999)and Korhola et al. (2000) is possibly proposing ages too old forthe uppermost part of the Holocene core.
The combining of 210Pb and AMS 14C dates in a singlecore is usually problematic because of their different half-lives of 22.3 and ca. 5730 yr, respectively. Hence, 210Pbdating is relatively accurate only for samples younger than200 yr, whereas the slow decay of 14C makes the radiocarbonmethod more reliable for dating samples with ages closer toits half-life. Moreover, as the sedimentation rate is usuallymuch higher at the top of a core than in the bottom of thecore due to the presence of incompletely decomposed organicmatter, the extrapolation of 210Pb ages on the basis ofsedimentation rates of the top of the core may give ages thatare too young.
Diatom analyses and zoning of the core data
Diatoms were prepared using H2O2 digestion and HCltreatment, and cleaned diatoms were mounted in Naphrax®. A
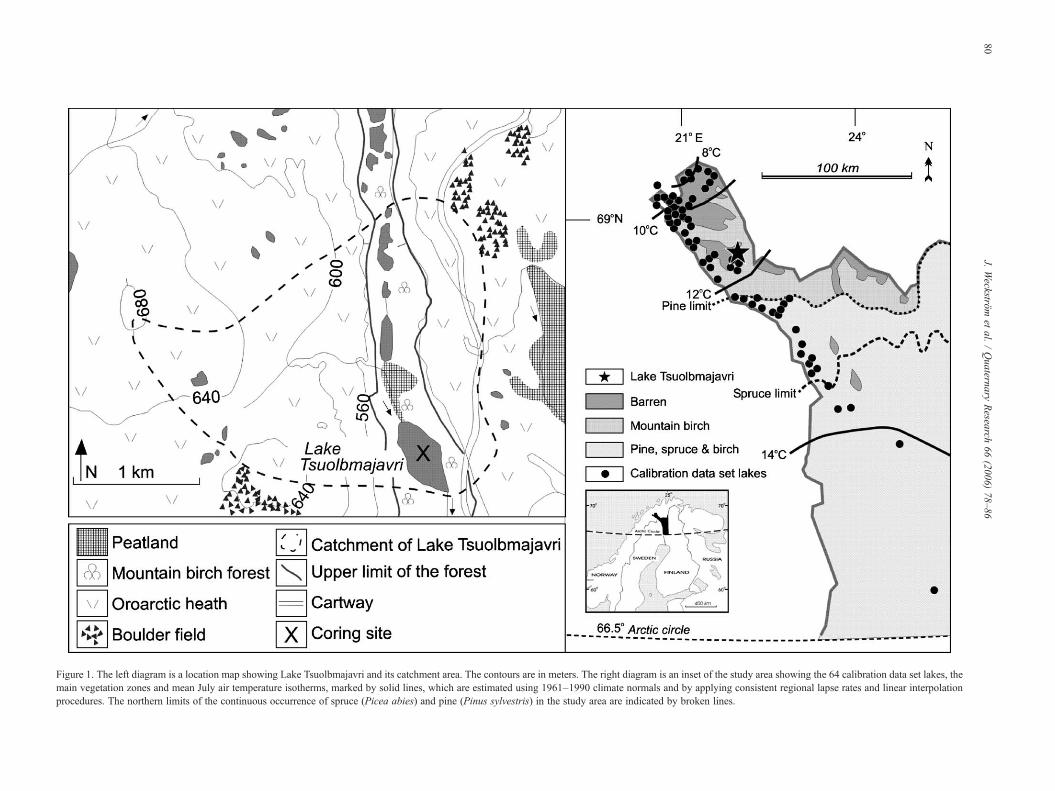
Figure 1. The left diagram is a location map showing Lake Tsuolbmajavri and its catchment area. The contours are in meters. The right diagram is an inset of the study area showing the 64 calibration data set lakes, themain vegetation zones and mean July air temperature isotherms, marked by solid lines, which are estimated using 1961–1990 climate normals and by applying consistent regional lapse rates and linear interpolationprocedures. The northern limits of the continuous occurrence of spruce (Picea abies) and pine (Pinus sylvestris) in the study area are indicated by broken lines.
80J.
Weckström
etal.
/Quaternary
Research
66(2006)
78–86
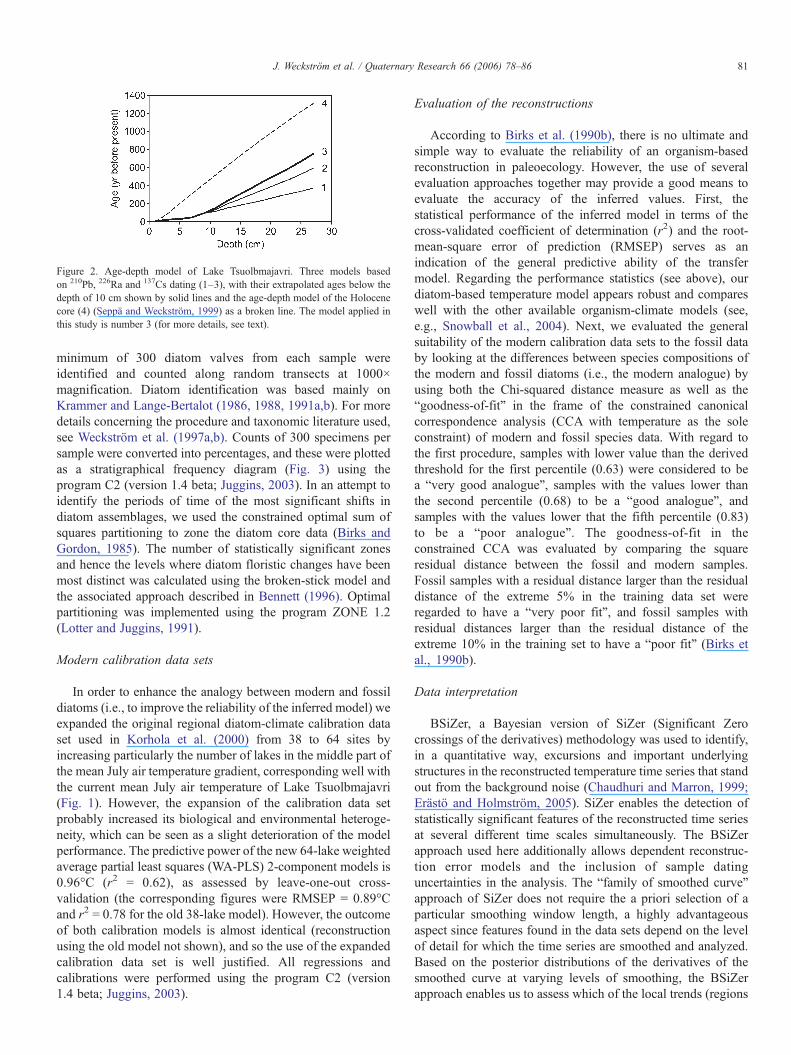
Figure 2. Age-depth model of Lake Tsuolbmajavri. Three models basedon 210Pb, 226Ra and 137Cs dating (1–3), with their extrapolated ages below thedepth of 10 cm shown by solid lines and the age-depth model of the Holocenecore (4) (Seppä and Weckström, 1999) as a broken line. The model applied inthis study is number 3 (for more details, see text).
81J. Weckström et al. / Quaternary Research 66 (2006) 78–86
minimum of 300 diatom valves from each sample wereidentified and counted along random transects at 1000×magnification. Diatom identification was based mainly onKrammer and Lange-Bertalot (1986, 1988, 1991a,b). For moredetails concerning the procedure and taxonomic literature used,see Weckström et al. (1997a,b). Counts of 300 specimens persample were converted into percentages, and these were plottedas a stratigraphical frequency diagram (Fig. 3) using theprogram C2 (version 1.4 beta; Juggins, 2003). In an attempt toidentify the periods of time of the most significant shifts indiatom assemblages, we used the constrained optimal sum ofsquares partitioning to zone the diatom core data (Birks andGordon, 1985). The number of statistically significant zonesand hence the levels where diatom floristic changes have beenmost distinct was calculated using the broken-stick model andthe associated approach described in Bennett (1996). Optimalpartitioning was implemented using the program ZONE 1.2(Lotter and Juggins, 1991).
Modern calibration data sets
In order to enhance the analogy between modern and fossildiatoms (i.e., to improve the reliability of the inferred model) weexpanded the original regional diatom-climate calibration dataset used in Korhola et al. (2000) from 38 to 64 sites byincreasing particularly the number of lakes in the middle part ofthe mean July air temperature gradient, corresponding well withthe current mean July air temperature of Lake Tsuolbmajavri(Fig. 1). However, the expansion of the calibration data setprobably increased its biological and environmental heteroge-neity, which can be seen as a slight deterioration of the modelperformance. The predictive power of the new 64-lake weightedaverage partial least squares (WA-PLS) 2-component models is0.96°C (r2 = 0.62), as assessed by leave-one-out cross-validation (the corresponding figures were RMSEP = 0.89°Cand r2 = 0.78 for the old 38-lake model). However, the outcomeof both calibration models is almost identical (reconstructionusing the old model not shown), and so the use of the expandedcalibration data set is well justified. All regressions andcalibrations were performed using the program C2 (version1.4 beta; Juggins, 2003).
Evaluation of the reconstructions
According to Birks et al. (1990b), there is no ultimate andsimple way to evaluate the reliability of an organism-basedreconstruction in paleoecology. However, the use of severalevaluation approaches together may provide a good means toevaluate the accuracy of the inferred values. First, thestatistical performance of the inferred model in terms of thecross-validated coefficient of determination (r2) and the root-mean-square error of prediction (RMSEP) serves as anindication of the general predictive ability of the transfermodel. Regarding the performance statistics (see above), ourdiatom-based temperature model appears robust and compareswell with the other available organism-climate models (see,e.g., Snowball et al., 2004). Next, we evaluated the generalsuitability of the modern calibration data sets to the fossil databy looking at the differences between species compositions ofthe modern and fossil diatoms (i.e., the modern analogue) byusing both the Chi-squared distance measure as well as the“goodness-of-fit” in the frame of the constrained canonicalcorrespondence analysis (CCA with temperature as the soleconstraint) of modern and fossil species data. With regard tothe first procedure, samples with lower value than the derivedthreshold for the first percentile (0.63) were considered to bea “very good analogue”, samples with the values lower thanthe second percentile (0.68) to be a “good analogue”, andsamples with the values lower that the fifth percentile (0.83)to be a “poor analogue”. The goodness-of-fit in theconstrained CCA was evaluated by comparing the squareresidual distance between the fossil and modern samples.Fossil samples with a residual distance larger than the residualdistance of the extreme 5% in the training data set wereregarded to have a “very poor fit”, and fossil samples withresidual distances larger than the residual distance of theextreme 10% in the training set to have a “poor fit” (Birks etal., 1990b).
Data interpretation
BSiZer, a Bayesian version of SiZer (Significant Zerocrossings of the derivatives) methodology was used to identify,in a quantitative way, excursions and important underlyingstructures in the reconstructed temperature time series that standout from the background noise (Chaudhuri and Marron, 1999;Erästö and Holmström, 2005). SiZer enables the detection ofstatistically significant features of the reconstructed time seriesat several different time scales simultaneously. The BSiZerapproach used here additionally allows dependent reconstruc-tion error models and the inclusion of sample datinguncertainties in the analysis. The “family of smoothed curve”approach of SiZer does not require the a priori selection of aparticular smoothing window length, a highly advantageousaspect since features found in the data sets depend on the levelof detail for which the time series are smoothed and analyzed.Based on the posterior distributions of the derivatives of thesmoothed curve at varying levels of smoothing, the BSiZerapproach enables us to assess which of the local trends (regions
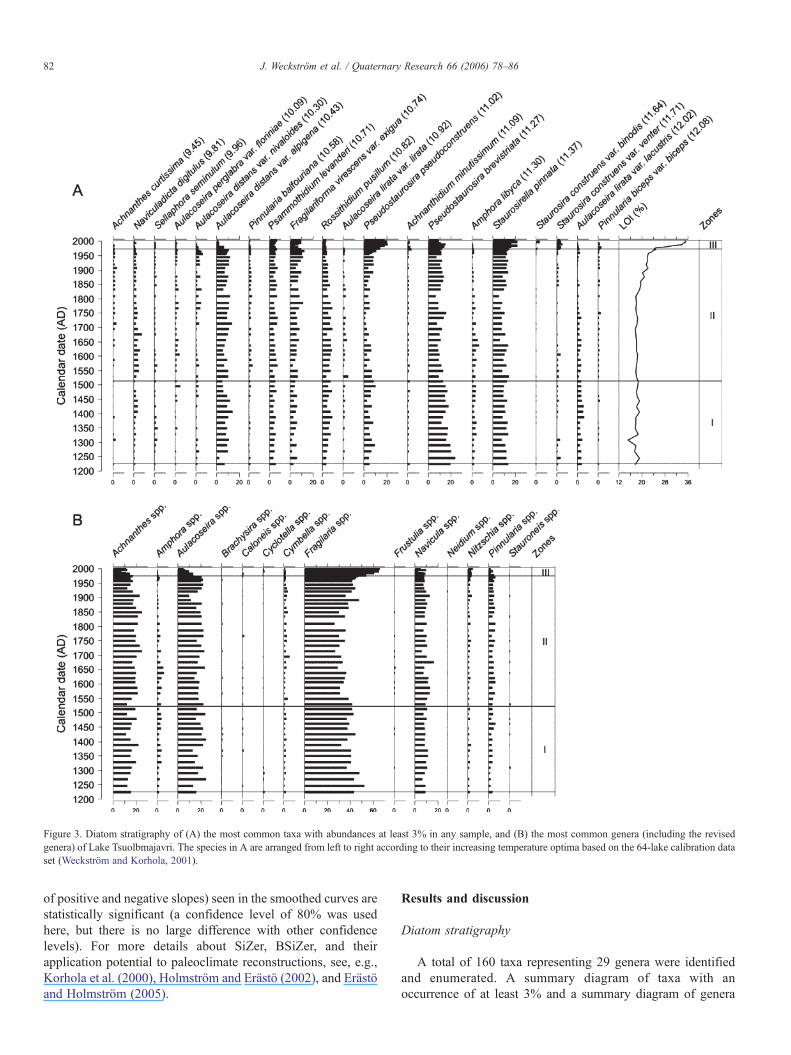
Figure 3. Diatom stratigraphy of (A) the most common taxa with abundances at least 3% in any sample, and (B) the most common genera (including the revisedgenera) of Lake Tsuolbmajavri. The species in A are arranged from left to right according to their increasing temperature optima based on the 64-lake calibration dataset (Weckström and Korhola, 2001).
82 J. Weckström et al. / Quaternary Research 66 (2006) 78–86
of positive and negative slopes) seen in the smoothed curves arestatistically significant (a confidence level of 80% was usedhere, but there is no large difference with other confidencelevels). For more details about SiZer, BSiZer, and theirapplication potential to paleoclimate reconstructions, see, e.g.,Korhola et al. (2000), Holmström and Erästö (2002), and Erästöand Holmström (2005).
Results and discussion
Diatom stratigraphy
A total of 160 taxa representing 29 genera were identifiedand enumerated. A summary diagram of taxa with anoccurrence of at least 3% and a summary diagram of genera
83J. Weckström et al. / Quaternary Research 66 (2006) 78–86
(including the revised genera) with an occurrence of at least 1%in any sample are shown in Figures 3A and B, respectively.The diatom stratigraphy is relatively featureless and ischaracterized by subtle changes rather than abrupt shifts.Nevertheless, three statistically significant zones [zone markersat 4.5 cm (ca. AD 1970) and 19.5 cm (ca. AD 1530)] were foundby optimal partitioning. The core is dominated by speciesbelonging to the genus Fragilaria with relative abundances upto 60% in zone III (ca. AD 1970 to the present). These taxa areoften pioneer forms in sediments deposited immediately afterdeglaciation (see, e.g., Korhola and Weckström, 2004), but dueto their large tolerance along several environmental gradientsthey have been shown to occur in great numbers in variouskinds of environments (e.g., Denys, 1990; Weckström andKorhola, 2001). Taxa belonging to the genera Achnanthes,Aulacoseira and Navicula occurred in higher numbers through-out the core.
Zone I (ca. AD 1220–1520) was characterized by a relativelystable diatom community, the dominant taxa being Pseudos-taurosira brevistriata, Staurosirella pinnata and Aulacoseiradistans var. alpigena (Fig. 3A). The most abundant genera wereFragilaria, Achnanthes and Aulacoseira, together composingca. 70% of all taxa. Although there occurred, according tooptimal partitioning, a statistically significant zone at 19.5 cm,no major visible changes in the relative frequencies of the mostabundant taxa can be seen in this horizon.
In zone II (ca. AD 1520–1970), the same taxa were moredominant than in zone I, although the frequencies ofPseudostaurosira pseudoconstruens were increasing and Ros-
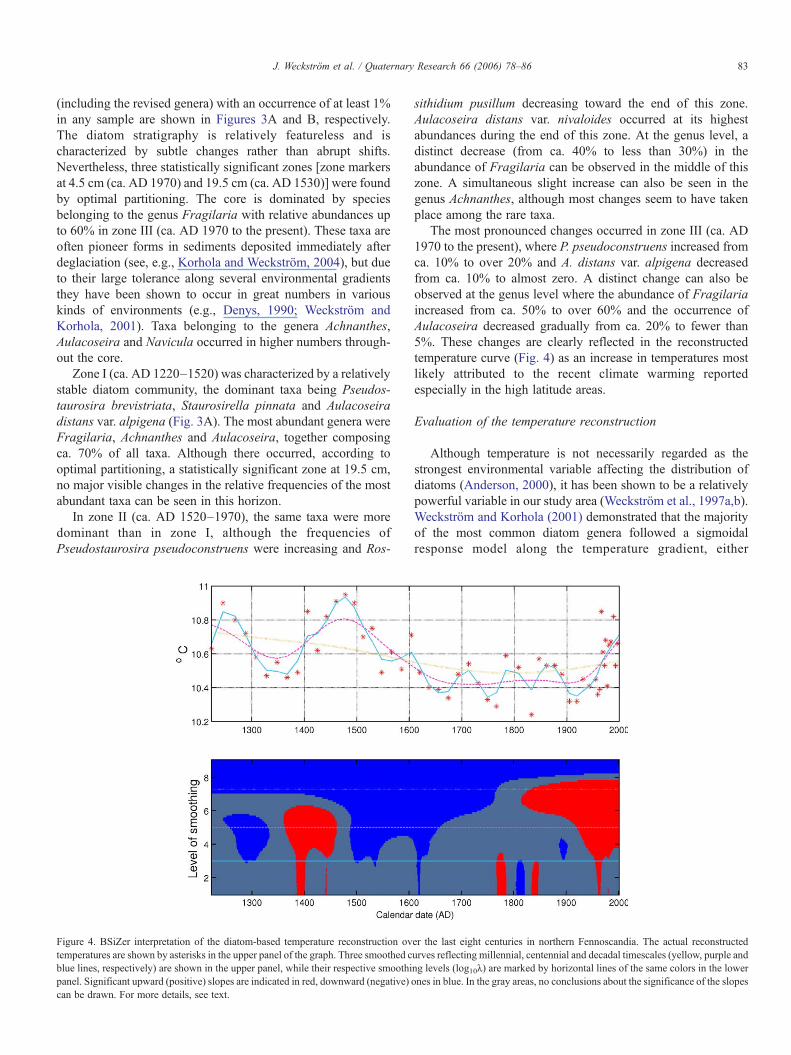
Figure 4. BSiZer interpretation of the diatom-based temperature reconstruction ovtemperatures are shown by asterisks in the upper panel of the graph. Three smoothed cblue lines, respectively) are shown in the upper panel, while their respective smoothipanel. Significant upward (positive) slopes are indicated in red, downward (negative)can be drawn. For more details, see text.
sithidium pusillum decreasing toward the end of this zone.Aulacoseira distans var. nivaloides occurred at its highestabundances during the end of this zone. At the genus level, adistinct decrease (from ca. 40% to less than 30%) in theabundance of Fragilaria can be observed in the middle of thiszone. A simultaneous slight increase can also be seen in thegenus Achnanthes, although most changes seem to have takenplace among the rare taxa.
The most pronounced changes occurred in zone III (ca. AD1970 to the present), where P. pseudoconstruens increased fromca. 10% to over 20% and A. distans var. alpigena decreasedfrom ca. 10% to almost zero. A distinct change can also beobserved at the genus level where the abundance of Fragilariaincreased from ca. 50% to over 60% and the occurrence ofAulacoseira decreased gradually from ca. 20% to fewer than5%. These changes are clearly reflected in the reconstructedtemperature curve (Fig. 4) as an increase in temperatures mostlikely attributed to the recent climate warming reportedespecially in the high latitude areas.
Evaluation of the temperature reconstruction
Although temperature is not necessarily regarded as thestrongest environmental variable affecting the distribution ofdiatoms (Anderson, 2000), it has been shown to be a relativelypowerful variable in our study area (Weckström et al., 1997a,b).Weckström and Korhola (2001) demonstrated that the majorityof the most common diatom genera followed a sigmoidalresponse model along the temperature gradient, either
er the last eight centuries in northern Fennoscandia. The actual reconstructedurves reflecting millennial, centennial and decadal timescales (yellow, purple andng levels (log10l) are marked by horizontal lines of the same colors in the lowerones in blue. In the gray areas, no conclusions about the significance of the slopes
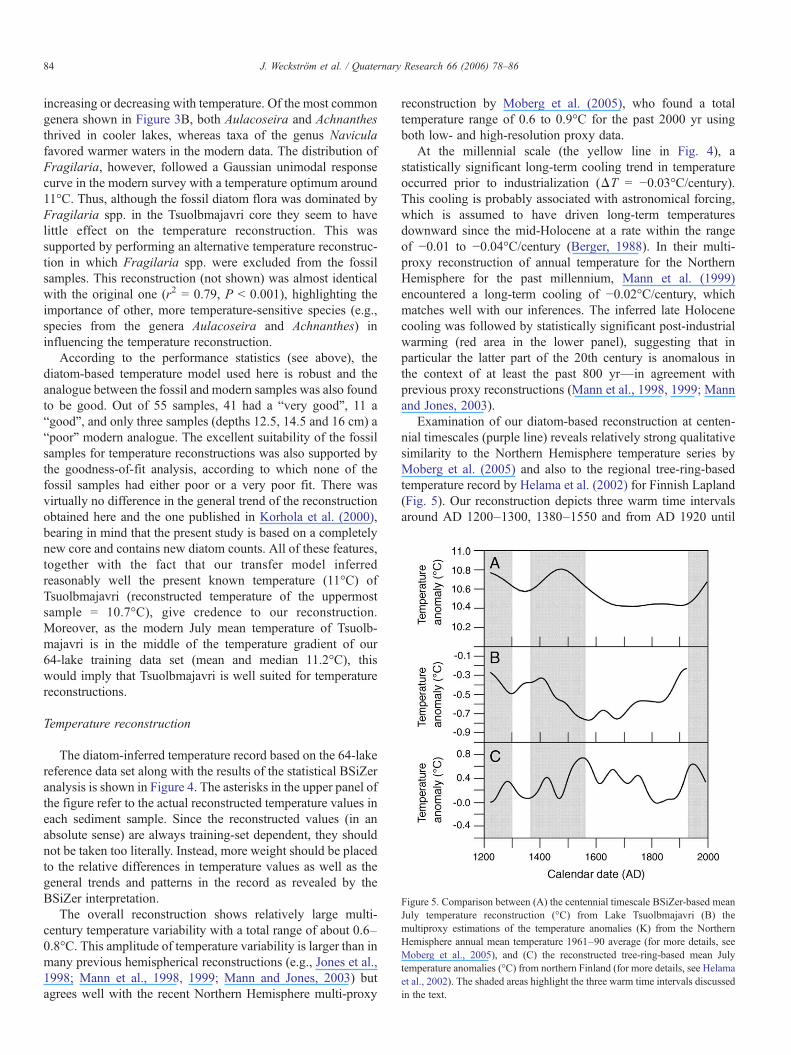
Figure 5. Comparison between (A) the centennial timescale BSiZer-based meanJuly temperature reconstruction (°C) from Lake Tsuolbmajavri (B) themultiproxy estimations of the temperature anomalies (K) from the NorthernHemisphere annual mean temperature 1961–90 average (for more details, seeMoberg et al., 2005), and (C) the reconstructed tree-ring-based mean Julytemperature anomalies (°C) from northern Finland (for more details, see Helamaet al., 2002). The shaded areas highlight the three warm time intervals discussedin the text.
84 J. Weckström et al. / Quaternary Research 66 (2006) 78–86
increasing or decreasing with temperature. Of the most commongenera shown in Figure 3B, both Aulacoseira and Achnanthesthrived in cooler lakes, whereas taxa of the genus Naviculafavored warmer waters in the modern data. The distribution ofFragilaria, however, followed a Gaussian unimodal responsecurve in the modern survey with a temperature optimum around11°C. Thus, although the fossil diatom flora was dominated byFragilaria spp. in the Tsuolbmajavri core they seem to havelittle effect on the temperature reconstruction. This wassupported by performing an alternative temperature reconstruc-tion in which Fragilaria spp. were excluded from the fossilsamples. This reconstruction (not shown) was almost identicalwith the original one (r2 = 0.79, P b 0.001), highlighting theimportance of other, more temperature-sensitive species (e.g.,species from the genera Aulacoseira and Achnanthes) ininfluencing the temperature reconstruction.
According to the performance statistics (see above), thediatom-based temperature model used here is robust and theanalogue between the fossil and modern samples was also foundto be good. Out of 55 samples, 41 had a “very good”, 11 a“good”, and only three samples (depths 12.5, 14.5 and 16 cm) a“poor” modern analogue. The excellent suitability of the fossilsamples for temperature reconstructions was also supported bythe goodness-of-fit analysis, according to which none of thefossil samples had either poor or a very poor fit. There wasvirtually no difference in the general trend of the reconstructionobtained here and the one published in Korhola et al. (2000),bearing in mind that the present study is based on a completelynew core and contains new diatom counts. All of these features,together with the fact that our transfer model inferredreasonably well the present known temperature (11°C) ofTsuolbmajavri (reconstructed temperature of the uppermostsample = 10.7°C), give credence to our reconstruction.Moreover, as the modern July mean temperature of Tsuolb-majavri is in the middle of the temperature gradient of our64-lake training data set (mean and median 11.2°C), thiswould imply that Tsuolbmajavri is well suited for temperaturereconstructions.
Temperature reconstruction
The diatom-inferred temperature record based on the 64-lakereference data set along with the results of the statistical BSiZeranalysis is shown in Figure 4. The asterisks in the upper panel ofthe figure refer to the actual reconstructed temperature values ineach sediment sample. Since the reconstructed values (in anabsolute sense) are always training-set dependent, they shouldnot be taken too literally. Instead, more weight should be placedto the relative differences in temperature values as well as thegeneral trends and patterns in the record as revealed by theBSiZer interpretation.
The overall reconstruction shows relatively large multi-century temperature variability with a total range of about 0.6–0.8°C. This amplitude of temperature variability is larger than inmany previous hemispherical reconstructions (e.g., Jones et al.,1998; Mann et al., 1998, 1999; Mann and Jones, 2003) butagrees well with the recent Northern Hemisphere multi-proxy
reconstruction by Moberg et al. (2005), who found a totaltemperature range of 0.6 to 0.9°C for the past 2000 yr usingboth low- and high-resolution proxy data.
At the millennial scale (the yellow line in Fig. 4), astatistically significant long-term cooling trend in temperatureoccurred prior to industrialization (ΔT = −0.03°C/century).This cooling is probably associated with astronomical forcing,which is assumed to have driven long-term temperaturesdownward since the mid-Holocene at a rate within the rangeof −0.01 to −0.04°C/century (Berger, 1988). In their multi-proxy reconstruction of annual temperature for the NorthernHemisphere for the past millennium, Mann et al. (1999)encountered a long-term cooling of −0.02°C/century, whichmatches well with our inferences. The inferred late Holocenecooling was followed by statistically significant post-industrialwarming (red area in the lower panel), suggesting that inparticular the latter part of the 20th century is anomalous inthe context of at least the past 800 yr—in agreement withprevious proxy reconstructions (Mann et al., 1998, 1999; Mannand Jones, 2003).
Examination of our diatom-based reconstruction at centen-nial timescales (purple line) reveals relatively strong qualitativesimilarity to the Northern Hemisphere temperature series byMoberg et al. (2005) and also to the regional tree-ring-basedtemperature record by Helama et al. (2002) for Finnish Lapland(Fig. 5). Our reconstruction depicts three warm time intervalsaround AD 1200–1300, 1380–1550 and from AD 1920 until
85J. Weckström et al. / Quaternary Research 66 (2006) 78–86
the present, with statistically significant warming and coolingtrends prior and after these intervals (lower panel). We associatethe warmth in the 13th century with the termination phase of theMWP and the rapid post-AD 1920 temperature increase withthe industrially induced anthropogenic warming. It is interestingto note that at centennial timescale, the 20th century warming iscomparable to the warming trend in the late 14th and early 15thcenturies, although the latter warming does not show up assignificant in the millennial time scale. According to Helama etal. (2002), the warmest non-overlapping 100-yr period in thelate Holocene occurred in Finnish Lapland between AD 1501and 1600, which is temporally quite close to the warm intervalAD 1380–1550 detected in our study. However, uncertainties inthe dating should be taken into account when making suchdirect comparisons (see Fig. 2).
Pronounced coolness occurred between AD 1600 and 1920,reflecting the LIA. Traditionally, AD 1550–1850 has beenassigned for the duration of the LIA (Jones and Bradley, 1992),but glacier-margin variations and temperature records fromScandinavia suggest that the LIA lasted until ca. AD 1920(Nesje and Dahl, 2003), which agrees well with our results. Thecentennial time scale curve of the reconstructed temperaturesshows the short-term temperature variations and suggests thatthe climate was cool throughout the LIA. However, the LIAincludes warmer periods, some of which are highlighted in thedecadal timescale reconstruction.
At the decadal level (blue line), our reconstruction identifiescertain shorter-term climate excursions that stand out assignificant in the BSiZer dissection (preceding and followingby significant increasing/decreasing trend). The warmest ∼10–30-yr non-overlapping periods occurred in AD 1220–1250,1470–1500 and 1970–2000, respectively. The latter is the timeperiod during which diatom assemblages experienced the mostpronounced change according to the optimal partitioning (seeabove). Due to possible dating errors in our reconstruction, it isdifficult to contrast these shorter climate fluctuations with otherproxy records (Fig. 5). However, all these warm periods areseen in the previous reconstruction by Briffa et al. (1995) basedon Russian tree-ring data. Particularly cold decades wereobserved at AD 1640–1670, 1750–1780 and 1900–1920,respectively.
Conclusions
(1) Diatom stratigraphy from Lake Tsuolbmajavri revealschanges, with the most distinct compositional change occurringca. AD 1970. Since then, the increase of taxa either beingtemperature indifferent or favoring warmer waters, and thereciprocal decrease of taxa adapted to more cooler waters in thestudy area, most likely reflect recent climate warming.
(2) The diatom-based temperature reconstruction over thepast eight centuries mimics well the previously publishedHolocene temperature reconstruction from a separate core of thesame lake, increasing the credibility of our results.
(3) The overall temperature reconstruction shows relativelylarge multi-century temperature variability with a total range ofabout 0.6–0.8°C. Using BSiZer multiscale smoothing tech-
nique, significant features in the reconstruction can bedetected.
(4) The temperature exhibits a statistically significant long-term cooling trend of ca. 0.03°C/century prior to theindustrialization and is superimposed by shorter-term climatefluctuations.
(5) Several features are clear in the reconstruction: thetermination phase of the MWP in the 13th century, thesubsequent LIA between AD 1600 and 1920, and the recentwarming since 1920.
(6) Three warm time intervals occurred around AD 1200–1300 and 1380–1550, and from AD 1920 until the present. Thewarmest ∼10–30-yr non-overlapping periods occurred in AD1220–1250, 1470–1500 and 1970–2000.
(7) These results demonstrate that diatoms are powerfulpaleoclimatological indicators in lakes of the climaticallysensitive treeline region of northern Fennoscandia.
Acknowledgments
We would like to thank Tuomas Perkkiö for help in the fieldsampling, Samuli Helama for kindly providing the data forFigure 5, and Gina Clarke and an anonymous reviewer forvaluable comments on the manuscript. This research wasfunded by the Academy of Finland (Grant 204291 to JW andGrant 50557 to AK).
References
Abbott, M.B., Stafford, T.W., 1996. Radiocarbon chemistry of modern andancient Arctic lake systems, Baffin Island, Canada. Quaternary Research 45,300–311.
ACIA, 2004. Impacts of a warming Arctic: Arctic climate impacts assessment.Cambridge Univ. Press.
Anderson, N.J., 2000. Diatoms, temperature and climate change. EuropeanJournal of Phycology 35, 307–314.
Appleby, P.G., Oldfield, F., 1978. The calculation of 210Pb dates assuming aconstant rate of supply of unsupported 210Pb to the sediment. Catena 5, 1–8.
Bennett, K., 1996. Determination of the number of zones in a biostratigraphicalsequence. New Phytologist 132, 155–170.
Bennion, H., Juggins, S., Anderson, N.J., 1996. Predicting epilimneticphosphorus concentrations using improved diatom-based transfer functionand its application to lake eutrophication management. EnvironmentalScience and Technology 30, 2004–2007.
Berger, A., 1988. Milankovitch theory and climate. Review of Geophysics 26,624–657.
Bigler, C., Larocque, I., Peglar, S., Birks, H.J.B., Hall, R., 2002. Quantitativemultiproxy assessment of long-term patterns of Holocene environmentalchange from a small lake near Abisko, northern Sweden. The Holocene 12,481–496.
Birks, H.J.B., Gordon, A.D., 1985. Numerical methods in Quaternary pollenanalysis. Academic Press, London (317 pp).
Birks, H.J.B., Line, L.M., Juggins, S., Stevenson, A.C., ter Braak, C.J.F., 1990a.Diatoms and pH reconstruction. Philosophical Transactions of the RoyalSociety of London, Ser. B 327, 263–278.
Birks, H.J.B., Juggins, S., Line, J.M., 1990b. Lake surface-water chemistryreconstructions from palaeolimnological data. In: Mason, B.J. (Ed.),The Surface Waters Acidification Programme. Cambridge Univ. Press,pp. 301–313.
Briffa, K.R., Jones, P.D., Schweingruber, F.H., Shiyatov, S.G., Cook, E.R.,1995. Unusual twentieth-century summer warmth in a 1000-year temper-ature record from Siberia. Nature 376, 156–159.
86 J. Weckström et al. / Quaternary Research 66 (2006) 78–86
Chaudhuri, P., Marron, J.S., 1999. SiZer for exploration of structures in curves.Journal of the American Statistical Association 94, 807–823.
Denys, L., 1990. Fragilaria blooms in the Holocene of the western coastal plainof Belgia. In: Simola, H. (Ed.), Proceedings of the Tenth InternationalDiatom Symposium, Joensuu, Finland, 28th August–2nd September 1988.Koeltz Scientific Books, Koenigstein, pp. 397–406.
Erästö, P., Holmström, L., 2005. Bayesian multiscale smoothing for makinginferences about features in scatter plots. Journal of Computational andGraphical Statistics 14, 569–589.
Fallu, M.-A., Pienitz, R., Walker, I.R., Overpeck, J.T., 2004. AMS 14C dating oftundra lake sediments using chironomid head capsules. Journal ofPaleolimnology 31, 11–22.
Fritz, S.C., Juggins, S., Battarbee, R.W., Engstrom, D.R., 1991. Reconstructionof past changes in salinity and climate using a diatom-based transferfunction. Nature 352, 706–708.
Helama, S., Lindholm, M., Timonen, M., Meriläinen, J., Eronen, M., 2002. Thesupra-long Scots pine tree-ring record for Finnish Lapland: Part II. inter-annual to centennial variability in summer temperatures for 7500 years. TheHolocene 12, 681–687.
Holmström, L., Erästö, P., 2002. Making inferences about past environmentalchange using smoothing in multiple time scales. Computational Statisticsand Data Analysis 41, 289–309.
Jones, P.D., Bradley, R.S., 1992. Climatic variations over the last 500 years. In:Bradley, R.S., Jones, P.D. (Eds.), Climate Since AD 1500. Routledge,London, pp. 649–665 (New York).
Jones, V.J., Battarbee, R.W., Hedges, R.E.M., 1993. The use of chironomidremains for AMS 14C dating of lake sediments. The Holocene 3, 161–163.
Jones, P.D., Briffa, K.R., Barnett, T.P., Tett, S.F.B., 1998. High-resolutionpalaeoclimatic records for the last millennium: interpretation, integrationand comparison with General Circulation Model control-run temperatures.The Holocene 8, 455–471.
Juggins, S., 2003. C2 user guide. Software for ecological and paleoecologicaldata analysis and visualization. University of Newcastle. Newcastle UponTyne, UK (69 pp).
Korhola, A., Weckström, J., 2004. Paleolimnological studies in ArcticFennoscandia and the Kola Peninsula (Russia). In: Pienitz, R., Douglas,M.S.V., Smol, J.P. (Eds.), Long-Term Environmental Change in Arcticand Antarctic Lakes, vol. 8. Kluwer Academic Publishers, Dordrecht,pp. 381–418.
Korhola, A., Weckström, J., Holmström, L., Erästö, P., 2000. A quantitativeHolocene climatic record from diatoms in northern Fennoscandia.Quaternary Research 54, 284–294.
Krammer, K., Lange-Bertalot, H., 1986. Bacillariophyceae. In: Ettl, H., Gerloff,J., Heynig, H., Mollenhauer, D. (Eds.), Süβwasserflora von Mitteleuropa,vol. 2/1. Gustav Fisher, Stuttgart/Jena (876 pp).
Krammer, K., Lange-Bertalot, H., 1988. Bacillariophyceae. In: Ettl, H., Gerloff,J., Heynig, H., Mollenhauer, D. (Eds.), Süβwasserflora von Mitteleuropa,vol. 2/2. Gustav Fisher, Stuttgart/Jena (596 pp).
Krammer, K., Lange-Bertalot, H., 1991a. Bacillariophyceae. In: Ettl, H.,Gerloff, J., Heynig, H., Mollenhauer, D. (Eds.), Süβwasserflora vonMitteleuropa, vol. 2/3. Gustav Fisher, Stuttgart/Jena (576 pp).
Krammer, K., Lange-Bertalot, H., 1991b. Bacillariophyceae. In: Ettl, H.,Gärtner, G., Gerloff, J., Heynig, H., Mollenhauer, D. (Eds.), Süβwasserfloravon Mitteleuropa, vol. 2/4. Gustav Fisher, Stuttgart/Jena (437 pp).
Laird, K.R., Fritz, S.C., Maasch, K.A., Cumming, B.F., 1996. Greater droughtintensity and frequency before AD 1200 in the Northern Great Planes, USA.Nature 384, 552–555.
Lotter, A.F., Juggins, S., 1991. PLOPROF, TRAN and ZONE. Programs forplotting, editing and zoning of pollen and diatom data. INQUA Commissionfor the study of the Holocene, Working Group on Data Handling Methods,Newsletter 6.
Mann, M.E., Jones, P.D., 2003. Global surface temperatures over the past twomillennia. Geophysical Research Letters 30, 1820–1824.
Mann, M.E., Bradley, R.S., Hughes, M.K., 1998. Global-scale temperaturepatterns and climate forcing over the past six centuries. Nature 392,779–787.
Mann, M.E., Bradley, R.S., Hughes, M.K., 1999. Northern Hemispheretemperatures during the past Millennium: inferences, uncertainties, andlimitations. Geophysical Research Letters 26, 759–762.
Moberg, A., Sonechkin, D.M., Holmgren, K., Datsenko, N.M., Karlén,W., 2005. Highly variable Northern Hemisphere temperatures recon-structed from low- and high-resolution proxy data. Nature 433,613–617.
Nesje, A., Dahl, S.O., 2003. The ‘Little Ice Age’-only temperature? The Holo-cene 13, 139–145.
Rosén, P., Segerström, U., Eriksson, L., Renberg, I., Birks, H.J.B., 2001.Holocene climatic change reconstructed from diatoms, chironomids, pollenand near-infrared spectroscopy (NIRS) at an alpine lake (Sjuodjijaure) innorthern Sweden. The Holocene 11, 551–562.
Seppä, H., Weckström, J., 1999. Holocene vegetational and limnologicalchanges in the Fennoscandian tree-line area as documented by pollen anddiatom records from Lake Tsuolbmajavri, Finland. Écoscience 6,621–635.
Snowball, I., Korhola, A., Briffa, K., Koç, N., 2004. Holocene climate dynamicsin high latitude Europe and the North Atlantic. In: Battarbee, R.W., Gasse,F., Stickling, C. (Eds.), Past Climate variability through Europe and Africa.Kluwer Academic Publishers, pp. 465–494.
Weckström, J., Korhola, A., 2001. Patterns in the distribution, composition anddiversity of diatom assemblages in relation to ecoclimatic factors in ArcticLapland. Journal of Biogeography 28, 31–45.
Weckström, J., Korhola, A., Blom, T., 1997a. The relationship between diatomsand water temperature in thirty subarctic Fennoscandian lakes. Arctic andAlpine Research 29, 75–92.
Weckström, J., Korhola, A., Blom, T., 1997b. Diatoms as quantitative indicatorsof pH and water temperature in subarctic Fennoscandian lakes. Hydro-biologia 347, 171–184.
Weckström, J., Snyder, J.A., Korhola, A., Laing, T.E., MacDonald, G.M., 2003.Diatom inferred acidity history of 32 lakes on the Kola Peninsula, Russia.Water, Air and Soil Pollution 149, 339–361.
Wolfe, A.P., 2003. Diatom community responses to late-Holocene climaticvariability, Baffin Island, Canada: a comparison of numerical approaches.The Holocene 13, 29–37.