Temperature and polarization angular power spectra of Galactic dust radiation at 353 GHz as...
11
arXiv:astro-ph/0501427v1 20 Jan 2005 1 Astronomy & Astrophysics manuscript no. polar˙spectrum February 2, 2008 (DOI: will be inserted by hand later) Temperature and polarization angular power spectra of Galactic dust radiation at 353 GHz as measured by Archeops N. Ponthieu 1, 2 , J. F. Mac´ ıas–P´ erez 2 , M. Tristram 2 , P. Ade 3 , A. Amblard 4 , R. Ansari 5 , J. Aumont 2 , ´ E. Aubourg 6, 7 , A. Benoˆ ıt 8 , J.–Ph. Bernard 9 , A. Blanchard 10 , J. J. Bock 11, 12 , F. R. Bouchet 13 , A. Bourrachot 5 , P. Camus 8 , J.-F. Cardoso 14, 7 , F. Couchot 5 , P. de Bernardis 15 , J. Delabrouille 14, 7 , F.–X. D´ esert 16 , M. Douspis 10 , L. Dumoulin 17 , Ph. Filliatre 18 , P. Fosalba 19 , M. Giard 9 , Y. Giraud–H´ eraud 14, 7 , R. Gispert 1† ⋆ , J. Grain 2 , L. Guglielmi 14, 7 , J.–Ch. Hamilton 20 , S. Hanany 21 , S. Henrot–Versill´ e 5 , J. Kaplan 14, 7 , G. Lagache 1 , A. E. Lange 12 , K. Madet 8 , B. Maffei 3 , S. Masi 15 , F. Mayet 2 , F. Nati 15 , G. Patanchon 22 , O. Perdereau 5 , S. Plaszczynski 5 , M. Piat 14, 7 , S. Prunet 13 , J.–L. Puget 1 , C. Renault 2 , C. Rosset 14, 7 , D. Santos 2 , D. Vibert 13 , and D. Yvon 6, 7 1 Institut d’Astrophysique Spatiale, Bˆat. 121, Universit´ e Paris XI, 91405 Orsay Cedex, France 2 Laboratoire de Physique Subatomique et de Cosmologie, 53 Avenue des Martyrs, 38026 Grenoble Cedex, France 3 Cardiff University, Physics Department, PO Box 913, 5, The Parade, Cardiff, CF24 3YB, UK 4 University of California, Berkeley, Dept. of Astronomy, 601 Campbell Hall, Berkeley, CA 94720-3411, U.S.A. 5 Laboratoire de l’Acc´ el´ erateur Lin´ eaire, BP 34, Campus Orsay, 91898 Orsay Cedex, France 6 CEA-CE Saclay, DAPNIA, Service de Physique des Particules, Bat 141, F-91191 Gif sur Yvette Cedex, France 7 F´ ed´ eration de Recherche APC, Universit´ e Paris 7, Paris, France 8 Centre de Recherche sur les Tr` es Basses Temp´ eratures, BP166, 38042 Grenoble Cedex 9, France 9 Centre d’ ´ Etude Spatiale des Rayonnements, BP 4346, 31028 Toulouse Cedex 4, France 10 Laboratoire d’Astrophysique de l’Obs. Midi-Pyr´ en´ ees, 14 Avenue E. Belin, 31400 Toulouse, France 11 California Institute of Technology, 105-24 Caltech, 1201 East California Blvd, Pasadena CA 91125, USA 12 Jet Propulsion Laboratory, 4800 Oak Grove Drive, Pasadena, California 91109, USA 13 Institut d’Astrophysique de Paris, 98bis, Boulevard Arago, 75014 Paris, France 14 Physique Corpusculaire et Cosmologie, Coll` ege de France, 11 pl. M. Berthelot, F-75231 Paris Cedex 5, France 15 Gruppo di Cosmologia Sperimentale, Dipart. di Fisica, Univ. “La Sapienza”, P. A. Moro, 2, 00185 Roma, Italy 16 Laboratoire d’Astrophysique, Obs. de Grenoble, BP 53, 38041 Grenoble Cedex 9, France 17 CSNSM–IN2P3, Bt 108, 91405 Orsay Campus, France 18 CEA-CE Saclay, DAPNIA, Service d’Astrophysique, Bat 709, F-91191 Gif sur Yvette Cedex, France 19 Institute for Astronomy, University of Hawaii, 2680 Woodlawn Dr, Honolulu, HI 96822, USA 20 LPNHE, Universit´ es Paris VI et Paris VII, 4 place Jussieu, Tour 33, 75252 Paris Cedex 05, France 21 School of Physics and Astronomy, 116 Church St. S.E., University of Minnesota, Minneapolis MN 55455, USA 22 Department of Physics & Astronomy, University of British Columbia, 6224 Agricultural Road, Vancouver, BC V6T 1Z1, Canada February 2, 2008 Abstract. We present the first measurement of temperature and polarization angular power spectra of the diffuse emission of Galactic dust at 353 GHz as seen by Archeops on 20% of the sky. The temperature angular power spectrum is compatible with that provided by the extrapolation to 353 GHz of IRAS and DIRBE maps using Finkbeiner et al. 1999 model number 8. For Galactic latitudes |b|≥ 5 deg we report a 4 sigma detection of large scale (3 ≤ ℓ ≤ 8) temperature-polarization cross-correlation (ℓ + 1)C TE ℓ /2π = 76 ± 21 μKRJ 2 and set upper limits to the E and B modes at 11 μKRJ 2 . For Galactic latitudes |b|≥ 10 deg, on the same angular scales, we report a 2 sigma detection of temperature-polarization cross-correlation (ℓ + 1)C TE ℓ /2π = 24 ± 13 μKRJ 2 . These results are then extrapolated to 100 GHz to estimate the contamination in CMB measurements by polarized diffuse Galactic dust emission. The TE signal is then 1.7 ± 0.5 and 0.5 ± 0.3 μK 2 CMB for |b|≥ 5 and 10 deg. respectively. The upper limit on E and B becomes 0.2 μK 2 CMB (2σ). If polarized dust emission at higher Galactic latitude cuts is similar to the one we report here, then dust polarized radiation will be a major foreground for determining the polarization power spectra of the CMB at high frequencies above 100 GHz. Key words. Cosmic Microwave Background – Cosmology – Observations – Submillimetre – Polarization – Dust – Extinction – Foreground
-
Upload
independent -
Category
Documents
-
view
4 -
download
0
Transcript of Temperature and polarization angular power spectra of Galactic dust radiation at 353 GHz as...

arX
iv:a
stro
-ph/
0501
427v
1 2
0 Ja
n 20
051Astronomy & Astrophysics manuscript no. polar˙spectrum February 2, 2008
(DOI: will be inserted by hand later)
Temperature and polarization angular power spectra of Galactic
dust radiation at 353 GHz as measured by Archeops
N. Ponthieu1, 2, J. F. Macıas–Perez2 , M. Tristram2, P. Ade3, A. Amblard4, R. Ansari5, J. Aumont2, E.Aubourg6, 7, A. Benoıt8, J.–Ph. Bernard9, A. Blanchard10, J. J. Bock11, 12, F. R. Bouchet13, A.
Bourrachot5, P. Camus8, J.-F. Cardoso14, 7, F. Couchot5, P. de Bernardis15, J. Delabrouille14, 7, F.–X.Desert16, M. Douspis10, L. Dumoulin17, Ph. Filliatre18, P. Fosalba19, M. Giard9, Y. Giraud–Heraud14, 7, R.
Gispert1†⋆, J. Grain2, L. Guglielmi14, 7, J.–Ch. Hamilton20, S. Hanany21, S. Henrot–Versille5 , J.Kaplan14, 7, G. Lagache1, A. E. Lange12, K. Madet8, B. Maffei3, S. Masi15, F. Mayet2, F. Nati15, G.
Patanchon22, O. Perdereau5, S. Plaszczynski5, M. Piat14, 7, S. Prunet13, J.–L. Puget1, C. Renault2, C.Rosset14, 7, D. Santos2, D. Vibert13, and D. Yvon6, 7
1 Institut d’Astrophysique Spatiale, Bat. 121, Universite Paris XI, 91405 Orsay Cedex, France2 Laboratoire de Physique Subatomique et de Cosmologie, 53 Avenue des Martyrs, 38026 Grenoble Cedex, France3 Cardiff University, Physics Department, PO Box 913, 5, The Parade, Cardiff, CF24 3YB, UK4 University of California, Berkeley, Dept. of Astronomy, 601 Campbell Hall, Berkeley, CA 94720-3411, U.S.A.5 Laboratoire de l’Accelerateur Lineaire, BP 34, Campus Orsay, 91898 Orsay Cedex, France6 CEA-CE Saclay, DAPNIA, Service de Physique des Particules, Bat 141, F-91191 Gif sur Yvette Cedex, France7 Federation de Recherche APC, Universite Paris 7, Paris, France8 Centre de Recherche sur les Tres Basses Temperatures, BP166, 38042 Grenoble Cedex 9, France9 Centre d’Etude Spatiale des Rayonnements, BP 4346, 31028 Toulouse Cedex 4, France
10 Laboratoire d’Astrophysique de l’Obs. Midi-Pyrenees, 14 Avenue E. Belin, 31400 Toulouse, France11 California Institute of Technology, 105-24 Caltech, 1201 East California Blvd, Pasadena CA 91125, USA12 Jet Propulsion Laboratory, 4800 Oak Grove Drive, Pasadena, California 91109, USA13 Institut d’Astrophysique de Paris, 98bis, Boulevard Arago, 75014 Paris, France14 Physique Corpusculaire et Cosmologie, College de France, 11 pl. M. Berthelot, F-75231 Paris Cedex 5, France15 Gruppo di Cosmologia Sperimentale, Dipart. di Fisica, Univ. “La Sapienza”, P. A. Moro, 2, 00185 Roma, Italy16 Laboratoire d’Astrophysique, Obs. de Grenoble, BP 53, 38041 Grenoble Cedex 9, France17 CSNSM–IN2P3, Bt 108, 91405 Orsay Campus, France18 CEA-CE Saclay, DAPNIA, Service d’Astrophysique, Bat 709, F-91191 Gif sur Yvette Cedex, France19 Institute for Astronomy, University of Hawaii, 2680 Woodlawn Dr, Honolulu, HI 96822, USA20 LPNHE, Universites Paris VI et Paris VII, 4 place Jussieu, Tour 33, 75252 Paris Cedex 05, France21 School of Physics and Astronomy, 116 Church St. S.E., University of Minnesota, Minneapolis MN 55455, USA22 Department of Physics & Astronomy, University of British Columbia, 6224 Agricultural Road, Vancouver, BC
V6T 1Z1, Canada
February 2, 2008
Abstract. We present the first measurement of temperature and polarization angular power spectra of the diffuseemission of Galactic dust at 353 GHz as seen by Archeops on 20% of the sky. The temperature angular powerspectrum is compatible with that provided by the extrapolation to 353 GHz of IRAS and DIRBE maps usingFinkbeiner et al. 1999 model number 8. For Galactic latitudes |b| ≥ 5 deg we report a 4 sigma detection of largescale (3 ≤ ℓ ≤ 8) temperature-polarization cross-correlation (ℓ+ 1)CTE
ℓ /2π = 76± 21 µKRJ2 and set upper limits
to the E and B modes at 11 µKRJ2. For Galactic latitudes |b| ≥ 10 deg, on the same angular scales, we report a 2
sigma detection of temperature-polarization cross-correlation (ℓ + 1)CTE
ℓ /2π = 24 ± 13 µKRJ2. These results are
then extrapolated to 100 GHz to estimate the contamination in CMB measurements by polarized diffuse Galacticdust emission. The TE signal is then 1.7 ± 0.5 and 0.5 ± 0.3 µK2
CMB for |b| ≥ 5 and 10 deg. respectively. Theupper limit on E and B becomes 0.2 µK2
CMB (2σ). If polarized dust emission at higher Galactic latitude cuts issimilar to the one we report here, then dust polarized radiation will be a major foreground for determining thepolarization power spectra of the CMB at high frequencies above 100 GHz.
Key words. Cosmic Microwave Background – Cosmology – Observations – Submillimetre – Polarization – Dust –Extinction – Foreground

1. Introduction
The Cosmic Microwave Background (CMB) is now con-sidered as one of the most sensitive probes to the physicsof the early Universe. A great number of experimentshave measured its temperature anisotropy power spec-trum over a wide range of angular scales (for a review,see Wang et al. 2003) until WMAP recently gave a cos-mic variance limited estimate up to the rise of the secondacoustic peak (Bennett et al. 2003a).
CMB polarization provides a wealth of complemen-tary information. First, it allows to break degenera-cies that remain in the determination of cosmologi-cal parameters with temperature anisotropy data alone(see e.g. Zaldarriaga et al. 1997). Perhaps more impor-tantly, it sheds light directly on inflation through the Bmode that is generated only by primordial gravity wavesproduced during that era (Seljak & Zaldarriaga 1997,Kamionkowski et al. 1997). Distortions of the E mode bylarge scales structures weak lensing also induce a BWL
signal, distinguishable from the primordial B by its non-gaussianity. This BWL component in turn provides use-ful information about the dark matter distribution (e.g.Benabed et al. 2001) and the mass of neutrinos at the pre-cision of 0.04 eV for an experiment e.g. 20 times moresensitive than Planck (Kaplinghat et al. 2003).
CMB polarization is however 2 to 5 orders of magni-tude smaller than temperature anisotropies and thereforestill remains to be accurately measured. It is now becom-ing accessible thanks to improved instrumental sensitivi-ties. The first detection of the E mode has been reportedby DASI (Kovac et al. 2002). This result has been con-firmed by the same team (Leitch et al. 2004), CAPMAP(Barkats et al. 2004) and CBI (Readhead et al. 2004).WMAP has also provided an estimate of the TE corre-lation spectrum (Kogut et al. 2003) fully compatible withan inflationary scenario.
Instrumental sensitivity is not the only issue in the de-termination of the power spectrum of the polarized CMBanisotropies. Other astrophysical components also con-tribute to the sky brightness and polarization at the wave-lengths of interest and must be subtracted. These fore-
grounds, mainly dominated by the diffuse Galactic emis-sion and the one of extragalactic point sources, are oftennot well constrained or even not experimentally measuredin the case of polarization.
Ground based experiments such as those mentionnedabove observe small regions of the sky. They can thenchoose them where foregrounds are weak and are lessprone to contamination by Galactic emission. It is notthe case for full sky experiments such as WMAP andPlanck. At the Planck–HFI frequencies and for futurebolometer experiments, the dominant component is theradiation from Galactic Interstellar Dust (ISD). The sub-
Send offprint requests to: [email protected]⋆ Richard Gispert passed away few weeks after his return
from the early mission to Trapani
Correspondence to: [email protected]
millimetre and millimetre (hereafter submm) intensity ofthe ISD emission can be inferred from IRAS and COBE–DIRBE extrapolations (e.g. Finkbeiner et al. 1999, here-after FDS) and has been measured on large scales byCOBE–FIRAS (Reach et al. 1995, Boulanger et al. 1996,Lagache et al. 1998). However, little is known about ISDpolarization emission on scales larger than 10 arcmin,i.e. that are the most relevant for current CMB studies.Indeed, ground–based observations of submm ISD polar-ization are concentrated on high angular resolution (ar-cminute scale) star formation regions. Indirect evidencefor large scale polarization comes from the polarization ofstarlight in extinction (Serkowski et al. 1975), but as re-viewed by Goodman (1996), these measurements of back-ground starlight polarization lead to ambiguous interpre-tation. In particular, the visible data are biased by low col-umn density lines of sight and do not fairly sample moreheavily reddened ones. Direct submm measurements aretherefore highly required both for Galactic studies of thelarge scale coherence of the magnetic field and in the fieldof CMB polarization, but are rather challenging as theyrequire sensitivities comparable to those of CMB studies.
Recently, Benoıt et al. 2004a have reported the firstmeasurement of the submillimetre diffuse polarized emis-sion by interstellar dust in the vicinity of the Galacticplane using the Archeops experiment. They show thatthe Galactic plane is significantly polarized at the 3–5%level and that dense clouds can be polarized up to 10%or more. This indicates that the dust intrinsic radiation ishighly polarized and that the grain alignment mechanismis very effective. Considered with the possible large scalecoherence of the polarization orientation, it shows that thedust polarized emission could be an important foregroundfor CMB polarization studies, especially on large angularscales.
Here, we wish to give a first answer to this questionwith the evaluation of the dust polarization power spec-tra away from the Galactic plane and in diffuse regions,on angular scales ranging from ℓ = 3 to ℓ = 70. Section 2briefly introduces Archeops and its polarization capabili-ties. Section 3 presents the processing applied to the dataand Sect. 4 describes the evaluation of the polarized angu-lar power spectra. Section 5 presents our main results. Weconclude in Sect. 6 with the extrapolation of our resultsto lower frequencies where the CMB dominates, to give anestimate of the dust contamination in the measurementsof the CMB polarization power spectra.
2. The Archeops instrument
Archeops 1 is a balloon borne bolometer experiment thataimed at measuring the CMB temperature anisotropyover large and small angular scales. It provided thefirst determination of the Cℓ spectrum from the COBEmultipoles (Smoot et al. 1992) to the first acoustic peak(Benoıt et al. 2003a) from which it gave a precise deter-
1 http://www.archeops.org.

N. Ponthieu, J.F. Macıas–Perez et al.: Dust temperature and polarization power spectra 3
mination of the main cosmological parameters, such asthe total density of the Universe and the baryon frac-tion (Benoıt et al. 2003b). Archeops was also designed asa test bed for Planck–HFI and therefore shared the sametechnological design: a Gregorian off–axis telescope witha 1.5 m primary mirror, bolometers operating at commonfrequencies (143, 217, 353 and 545 GHz) cooled down at100 mK by a 3He/4He dilution designed to work at zerogravity and similar scanning strategy. A detailed descrip-tion of the instrument and its performances can be foundin (Benoıt et al. 2002) and (Benoıt et al. 2003b).
At 353 GHz where dust thermal radiation is dominant,Archeops has 6 bolometers mounted in 3 Ortho ModeTransducer2 (hereafter OMT) pairs that are sensitive topolarization in order to study the properties of the polar-ized dust diffuse radiation. The three OMTs are orientedat 60 degrees from each other to enable the full recovery ofthe Q and U Stokes parameters and to minimize the corre-lations in their determination. Archeops was launched onFebruary 7th, 2002, from the CNES/Swedish facility ofEsrange, near Kiruna (Sweden). The flight brought about12 hours of high quality night data.
3. Data processing and map making
A detailed description of the data processing and the po-larization map making is given in (Benoıt et al. 2003b)and (Benoıt et al. 2004a).
The main steps on the Archeops data processing arethe followings. First, the reconstruction of the point-ing during flight, with rms error better than 1 arcmin(Bourrachot 2004), is performed using the data from abore–sight mounted optical star sensor aligned to eachphotometer using Jupiter observations. Second, corrupteddata (including glitches and bursts of noise) in the TimeOrdered Information (TOI), representing less than 1.5%,are flagged and not considered in the following process-ing. Third, low frequency drifts on the data, generallycorrelated to house-keeping information (altitude, atti-tude, cryostat temperatures, the CMB dipole) are re-moved using the latter as templates. Fourth, high fre-quency decorrelation is performed in few chosen frequencyintervals of ∼ 1 Hz width to remove non-stationary high-frequency noise. Sixth, the corrected timelines are thendeconvolved from the bolometer time constant and theflagged corrupted data are replaced by a constrained real-ization of noise. Finally, low frequency atmospheric resid-uals and noise are subtracted using a destriping proce-dure which preserves the sky signal to better than 2% onlarge angular scales (Bourrachot 2004). To improve thequality of the removal of atmospheric residuals we havealso performed a component separation analysis in thetime ordered data using the SMICA-MCMD algorithm(Delabrouille et al. 2003) over all the Archeops channels.From this analysis we have constructed a template of the
2 Planck-HFI has since changed for the Polarized SensitiveBolometer technology to measure polarization of radiation
atmospheric contribution to the Archeops data which hasbeen fit and removed from each of 353 GHz bolometerspreserving the dust emission to better than 5%.
The six bolometers are cross-calibrated as discussedon Sect. 4.3.2. The absolute calibration is obtained froma correlation between the Galactic latitude profiles fromFIRAS “dust spectrum” maps and those of Archeops. Ithas an absolute accuracy of about 12%. This affects onlythe absolute values of I, Q, U but neither the degree ofpolarization nor its orientation. A detailed description ofthe calibration is given in Benoıt et al. 2003b.
The data processed and calibrated as above havebeen projected into polarization maps using the algo-rithm described in Ponthieu 2003. The maps producedare shown on Figs. 1, 2, 3. A significant polarizationlevel in the Galactic plane was first reported by Archeops(Benoıt et al. 2004a) for regions with longitudes between100 and 120 degrees and between 180 and 200 degrees. Thenew data processing allows us to reconstruct polarizationon all the Galactic plane observed by Archeops and to fillthe gap between 120 and 180 degrees.
The noise correlation matrix on those maps have beencomputed using pure noise simulations which are de-scribed in Sect. 4.2.
Fig. 1. Total unpolarized intensity I measured byArcheops at 353 GHz. Map centered on Galactic longi-tude l = 120 in Galactic coordinates. The pixel size is27 arcmin smoothed by a 2 deg beam FWHM to matchthe 1.88 deg pixel size (HEALPix parameter nside = 32)used throughout the analysis. Grid lines are spaced by20 deg.
4 N. Ponthieu, J.F. Macıas–Perez et al.: Dust temperature and polarization power spectra
Fig. 2. Stokes parameter Q measured by Archeops at353 GHz. Map centered on Galactic longitude l = 120 inGalactic coordinates. The pixel size is 27 arcmin smoothedby a 2 deg beam FWHM. Grid lines are spaced by 20 deg.
Fig. 3. Stokes parameter U measured by Archeops at353 GHz. Map centered on Galactic longitude l = 120 inGalactic coordinates. The pixel size is 27 arcmin smoothedby a 2 deg beam FHWM. Grid lines are spaced by 20 deg.
4. Evaluation of the polarization power spectra
4.1. Formalism
For a direction of observation n, we define the Stokes pa-rameters I, Q and U in the tangential plane with respectto (−eθ, eϕ). The angle of the polarization is orientedfrom the North Galactic pole through East to the SouthGalactic pole (counterclockwise).
For statistical analysis, the use of E and B(Seljak & Zaldarriaga 1997) is however more suitable be-cause these quantities are scalar and independent of thecoordinate system. We here estimate these quantities andthe correlation between E and T using the method de-scribed in Chon et al. 2004. The spin-2 nature of Stokesparameters leads us to define
P ≡ Q + iU. (1)
When the polarized two point correlation functions areestimated in real space between two directions n1 and n2,one has to rotate P by angles α1 and α2 respectively toalign the axes defining Q for each direction of observationwith the geodesic connecting n1 and n2 such that
P (n1) ≡ e2iα1P (n1) (2)
P (n2) ≡ e2iα2P (n2). (3)
We then define the correlation functions
ξ−(θ) ≡ 〈P (n1)P (n2)〉
=∑
ℓ
2ℓ + 1
4π(CEE
ℓ − CBBℓ ) dℓ
2−2(θ) , (4)
ξ+(θ) ≡ 〈P∗
(n1)P (n2)〉
=∑
ℓ
2ℓ + 1
4π(CEE
ℓ + CBBℓ ) dℓ
22(θ) , (5)
ξ×(θ) ≡ 〈T (n1)P (n2)〉
=∑
ℓ
2ℓ + 1
4πCTE
ℓ dℓ20(θ) , (6)
where n1 · n2 = cos θ and dlmm′ are the reduced Wigner
D-matrices. The Cℓs angular power spectra are then ob-tained by the following integration:
CEEℓ − CB
ℓ − 2iCEBℓ = 2π
∫ 1
−1
ξ−(θ)dℓ2−2(θ)d cos θ , (7)
CEEℓ + CB
ℓ = 2π
∫ 1
−1
ξ+(θ)dℓ22(θ)d cos θ , (8)
CTEℓ + iCTB
ℓ = 2π
∫ 1
−1
ξ×(θ)dℓ20d cos θ . (9)
We estimate those quantities with the softwareSpicePol (Chon et al. 2004) that uses the HEALPix pack-age (Gorski et al. 1998) to compute the pseudo-Cℓs fromthe raw maps : CTE
ℓ , CEEℓ , CBB
ℓ , from which we obtainan estimate of the signal plus noise angular power spec-tra. The noise contribution is estimated through Monte-Carlo simulations (Sect. 4.2) and subtracted, producingestimates of the angular polarized power spectra. Becauseof approximations used by SpicePol it can not produceestimates of CTB
ℓ and CEBℓ .
The total uncertainty on the determination of thepower spectrum CTT
ℓ includes both the variance of the
N. Ponthieu, J.F. Macıas–Perez et al.: Dust temperature and polarization power spectra 5
noise and the variance of the signal itself. In the case ofGalactic dust, there is no cosmic variance stricto sensu.Indeed, the dust distribution in the sky and its proper-ties are not a particular realization of a Gaussian randomfield like in the case of the CMB anisotropies. Therefore,we compute the variance of the polarized power spectraconsidering only the noise-noise and the signal-noise con-tributions, and not the signal-signal covariance (samplevariance) as follows
σ2(CXXℓ ) =
2
(2l + 1)fsky
NXX 2ℓ (10)
σ2(CTEℓ ) =
1
(2l + 1)fsky
[
NTE 2ℓ + NTT
ℓ CEEℓ
+NEEℓ CTT
ℓ + NTTℓ NEE
ℓ
]
(11)
where X stands for T , E or B, N is the noise andfsky is the fraction of the sky taken for the analysis. Thedominant term in Eq. (11) is the product of the covarianceof temperature by the polarization noise NEE
ℓ CTTℓ . These
relations are however only handy approximations to thetrue uncertainties and need an empirical adjustment of thefsky parameter that is performed using the simulationsdescribed in Sect. 4.2. These simulations are also used tocompute the noise power spectra.
The temperature power spectrum CTTℓ and its
error bars are computed using the Xspect method(Tristram et al. 2004) which uses 15 cross power spectrafrom the six detectors and no auto power spectrum in or-der to avoid corrections induced by the detector noise.
4.2. Instrumental noise
The noise power spectrum of the bolometers is es-timated from a four step process already applied inBenoıt et al (2003a) in the context of the CTT
ℓ evaluation.First, the Galactic plane region is masked and interpo-lated in the time domain with slowly varying functions.Secondly, these timelines are projected onto maps thatare deprojected to obtain a second timeline with a highersignal to noise ratio. We then subtract this second time-line from the original one to obtain a noise dominatedtimeline and compute its time domain power spectrum.Simulations including realistic noise and Galactic contam-ination show that this process allows the recovery of thetrue noise power spectrum at the 5% level.
From these time domain noise power spectra, we gen-erate noise timelines for the six polarized bolometers andproject them onto maps in the same way as the real data.The same statistical analysis as the one applied to the datais performed on 250 of such noise maps to have a good es-timate of the noise angular power spectra. These powerspectra are then subtracted from the Archeops polarizedangular power spectra in order to correct them from thenoise bias. Finally, we compute the uncertainties on thepolarization power spectra using equations (10) and (11).
4.3. Systematic effects
Three main sources of systematic effects are likely to af-fect the evaluation of the polarization correlations: thefiltering applied to the data, the uncertainty on the cross-calibration between the detectors and the uncertainty onthe knowledge of the exact orientation of the polarizers onthe focal plane. We address these three issues separately.
4.3.1. Filtering
A bandpass filtering is applied to the data. The lower fre-quency bound is 0.033 Hz, which corresponds to the firstharmonic fspin of the rotation of the gondola (2 rpm).Because of the spinning of the instrument, few physicalcomponents at frequencies below fspin in the timeline areprojected on the map. The high pass therefore ensuresthat no physically irrelevant and dipole-like componentsremain in the timelines. A low pass filtering is then appliedto the timelines at 38 Hz to remove high frequency noise.To correct from this effect on the angular power spectrawe have computed an effective filtering function Fℓ in themultipole space from simulations of temperature Gaussianfields with a flat power spectrum. The maximum correc-tion is at low ℓ and is less than 2%.
We have also checked that the filtering did not induceany spurious polarization such as leaks from total intensityinto polarization. For this we have applied the bandpassfilter to simulated timelines, deprojected from the FDStemplate at 353GHz, for the six bolometers involved inthe determination of the angular power spectra. Then, wehave reconstructed I, Q and U maps for which we haveextracted the temperature and polarization power spec-tra. No spurious polarization was produced at the level of0.1%.
4.3.2. Cross calibration
Stokes parameters are mainly estimated from the differ-ences of the outputs of bolometers that measure orthog-onal polarization states. An error in the cross calibrationbetween detectors generates a systematic leak of total in-tensity into polarization. The cross calibration of Archeopschannels is described in details in Benoıt et al. 2004a andrelies on the scaling of Galactic intensity profiles computedfrom each bolometer. The cross calibration coefficients arethen determined at the 2% level. In order to give a con-servative upper limit to the effect of this uncertainty onthe angular power spectra, we forced the cross calibrationcoefficients to values which deviate by 2% and maximizedthe relative difference between two orthogonal photome-ters. The angular power spectra were then estimated withthis new set of coefficients and the error bars were derivedfrom the standard deviation of 200 simulations, assuminga symmetric uncertainty. This uncertainty is about 5% ofthe statistical error bars.
6 N. Ponthieu, J.F. Macıas–Perez et al.: Dust temperature and polarization power spectra
4.3.3. Polarizer relative orientation
The accurate positioning of the polarizers in the fo-cal plane is made difficult by the complexity of the in-strument. We therefore checked that they were correctlyplaced during the pre–flight ground calibrations and foundthat they were indeed in their nominal configuration witha 1 σ uncertainty of 3 degrees. A mismatch between theassumed and the real orientations of the polarizers gener-ates a relative error of a few percents on the reconstructedStokes parameters (Kaplan et al. 2001). In order to esti-mate the error induced by the uncertainty of the knowl-edge of the accurate positionning of the polarizers, we haveperformed simulations in which these angles are forced torandom values different from those used for the I, Q, Ureconstruction. The resulting uncertainty is of the sameorder as that of the cross calibration uncertainty, that isto say about 5% of the statistical error bars.
5. Results
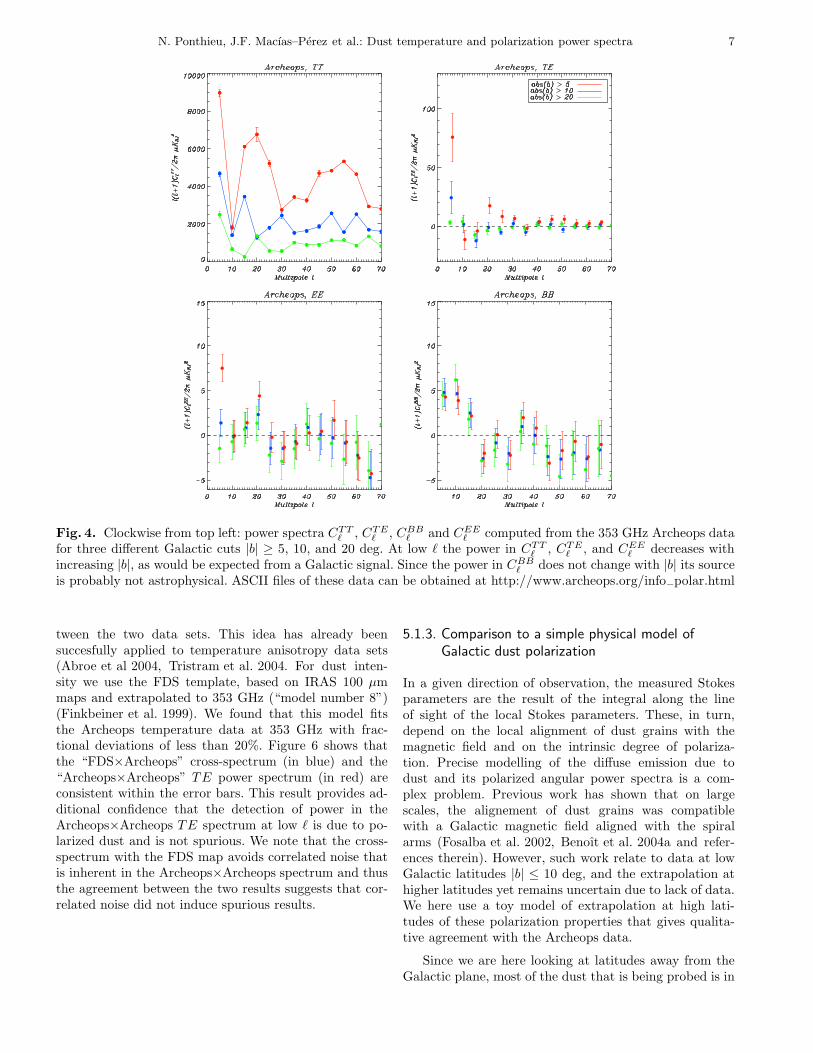
We estimate the angular power spectra as a function ofcuts of the data in Galactic latitude in order to remove theeffects of regions with the strongest dust emission alongthe Galactic plane. Figure 4 gives the power spectra for|b| ≥ 5, |b| ≥ 10, and |b| ≥ 20. The spectrum for CTT
ℓ oscil-lates as a function of ℓ, with the amplitude of oscillationincreasing with decreasing ℓ. These features are consis-tent with a Galactic origin for the signal as discussed inSect. 5.1.1.
The TE Spectrum: on large angular scales 3 ≤ ℓ ≤ 8there is a ∼ 4σ detection for |b| ≥ 5 with a magntidue of(ℓ + 1)CTE
ℓ /2π = 76 ± 21 µKRJ2 and a ∼ 2σ detection
for |b| ≥ 10 with a magnitude of (ℓ + 1)CTEℓ /2π = 24 ±
13 µKRJ2. For |b| ≥ 5 there is also a ∼ 2 σ detection for
18 ≤ ℓ ≤ 23, corresponding to a peak in the temperaturespectrum at the same ℓ bin.
The EE Spectrum: on large angular scales 3 ≤ ℓ ≤ 8there is a ∼ 5σ detection for |b| ≥ 5 with a magnitudeof (ℓ + 1)CEE
ℓ /2π = 7.5 ± 1.5 µKRJ2 and a ∼ 2 σ for
18 ≤ ℓ ≤ 23. Otherwise, the power in the EE spectra isconsistent with zero for all ℓ’s for |b| ≥ 10 and for |b| ≥ 20and at 20 ≤ ℓ ≤ 70 for all latitude cuts. Similar to theTE spectrum, the power measured for EE on all scalesdecreases with increasing latitude, which is consistent witha Galactic origin for the signal.
The BB Spectrum: there are detections of power inthe first few ℓ bins and the spectrum is consistent withno power for ℓ ≥ 19. The power at the low ℓ bins doesnot depend on Galactic latitude cut. We argue below thatmodels of polarization from dust emission predict a de-crease of power in both the EE and BB spectra withGalactic latitude cut and therefore the BB signal at lowℓ is probably spurious. Unlike the CMB for which E andB have different physical sources, dust is expected to pro-duce comparable amounts of E and B. Assuming a similarlevel of E and B and interpreting the data in terms of up-per limits we provide a common 2σ upper limit to both
modes at (ℓ + 1)CEE,BBℓ /2π < 11 µKRJ
2 at 353 GHz for|b| ≥ 5.
Since the Archeops data probe the dust diffuse emis-sion and not local clouds in the Galactic plane it is likelythat the orientation and coherence of the magnetic field issimilar for latitudes larger than 5 and larger than 10 deg.Therefore, the more dust there is along the line of sight,the more intense the emission should be, and the morepower we expect in the temperature and polarizationspectra. According to these arguments there should bea monotonous decrease of power in the spectra with in-creasing latitude cuts, as observed for the TT , TE andEE data.
5.1. Comparison with models
In this section we compare our results to models of diffuseGalactic dust emission. First, we compare the TT powerspectrum to those expected using a Galactic cosecant-lawmodel and using the FDS model. Second, we obtain an al-ternative estimate of the TE spectrum by cross-correlatingthe FDS template with the Archeops Q and U maps.Finally, we compare the measured spectra to those cal-culated on the basis of a simplified physical model of po-larized emission from dust.
5.1.1. Pure cosecant-law Galactic emission
Due to the disk geometry of the Galaxy, the integratedemission along a given line of sight increases as the abso-lute value of the latitude decreases. This is well approx-imated by a cosecant law of the form I(b) ∝ 1/ sin(b).When this Galactic contribution is subtracted, the angu-lar power spectrum of the remaining diffuse dust has theform Cℓ ∝ ℓ−3 (Gautier et al. 1992, Wright 1998).
We choose to leave the Galactic contribution in ourdata such that we can assess its magnitude and its poten-tial contamination of CMB polarization experiments. (seeSect. 6). In order to estimate the influence of a cosecantlaw component in our data, we simulate such an emis-sion analytically and with an amplitude compatible withthe FDS template. The results are presented on Fig. 5where we plot the TT angular power spectrum at differ-ent Galactic latitude cuts for the Archeops data, for thecosecant-law model and for the FDS template. There is aqualitative agreement between the oscillation pattern ofthe Archeops data for low Galactic latitude cuts and thepattern present for the cosecant-law model and for theFDS template. The agreement suggests that the cosecant-law emission dominates the observed Galactic dust emis-sion at large angular scales.
5.1.2. FDS-Archeops correlation
It is interesting to correlate the Archeops Q and Udata with available dust intensity maps. We quantifythe correlation by calculating the cross-spectrum be-
N. Ponthieu, J.F. Macıas–Perez et al.: Dust temperature and polarization power spectra 7
Fig. 4. Clockwise from top left: power spectra CTTℓ , CTE
ℓ , CBBℓ and CEE
ℓ computed from the 353 GHz Archeops datafor three different Galactic cuts |b| ≥ 5, 10, and 20 deg. At low ℓ the power in CTT
ℓ , CTEℓ , and CEE
ℓ decreases withincreasing |b|, as would be expected from a Galactic signal. Since the power in CBB
ℓ does not change with |b| its sourceis probably not astrophysical. ASCII files of these data can be obtained at http://www.archeops.org/info−polar.html
tween the two data sets. This idea has already beensuccesfully applied to temperature anisotropy data sets(Abroe et al 2004, Tristram et al. 2004. For dust inten-sity we use the FDS template, based on IRAS 100 µmmaps and extrapolated to 353 GHz (“model number 8”)(Finkbeiner et al. 1999). We found that this model fitsthe Archeops temperature data at 353 GHz with frac-tional deviations of less than 20%. Figure 6 shows thatthe “FDS×Archeops” cross-spectrum (in blue) and the“Archeops×Archeops” TE power spectrum (in red) areconsistent within the error bars. This result provides ad-ditional confidence that the detection of power in theArcheops×Archeops TE spectrum at low ℓ is due to po-larized dust and is not spurious. We note that the cross-spectrum with the FDS map avoids correlated noise thatis inherent in the Archeops×Archeops spectrum and thusthe agreement between the two results suggests that cor-related noise did not induce spurious results.
5.1.3. Comparison to a simple physical model of
Galactic dust polarization
In a given direction of observation, the measured Stokesparameters are the result of the integral along the lineof sight of the local Stokes parameters. These, in turn,depend on the local alignment of dust grains with themagnetic field and on the intrinsic degree of polariza-tion. Precise modelling of the diffuse emission due todust and its polarized angular power spectra is a com-plex problem. Previous work has shown that on largescales, the alignement of dust grains was compatiblewith a Galactic magnetic field aligned with the spiralarms (Fosalba et al. 2002, Benoıt et al. 2004a and refer-ences therein). However, such work relate to data at lowGalactic latitudes |b| ≤ 10 deg, and the extrapolation athigher latitudes yet remains uncertain due to lack of data.We here use a toy model of extrapolation at high lati-tudes of these polarization properties that gives qualita-tive agreement with the Archeops data.
Since we are here looking at latitudes away from theGalactic plane, most of the dust that is being probed is in

8 N. Ponthieu, J.F. Macıas–Perez et al.: Dust temperature and polarization power spectra
Fig. 5. Temperature angular power spectrum of Archeops data (upper left diagram), of a pure Galactic cosecantemission law simulation (upper right diagram) and of a FDS template (bottom diagram) computed using Xspect forfive different Galactic cuts.
Fig. 6. TE angular power spectra for |b| ≥ 5 either with Archeops data alone (red, circles) or with Archeops Q and Udata and I from the FDS template (blue, diamonds) on the Archeops region of observation extrapolated to 353 GHz(Finkbeiner et al. 1999).
our vicinity. Typically, if we take the Galactic disk to be200 pc thick, a line of sight at b = 5 deg exits the planeat ∼ 1.1 kpc from the observer. This is small comparedto the size of the spiral arm in which we are located, and
we therefore assume that the large scale magnetic fieldcomponent aligned with the local spiral arm is along aconstant direction on this portion of space. A realisticmodel would of course consider turbulence, but we are

N. Ponthieu, J.F. Macıas–Perez et al.: Dust temperature and polarization power spectra 9
only interested here in a first order approximation. Basedon Benoıt et al. 2004a who showed that dust diffuse emis-sion in the vicinity of the Galactic plane was polarized atthe 5% level, and that some dense clouds were polarizedat more than 10%, we present in Fig. 7 results with threeassumptions for the level of polarization of Galactic dust:p(x) = 5, 10, and 15%. We have only considered latitudecuts of |b| ≥ 5 deg. Given the simplicity of the model, therelative agreement between the data and the shape andamplitude of the models is encouraging.
6. Dust contamination in CMB polarization
estimates
Our results can be used to estimate the contamination ofdust to CMB polarized angular power spectra. For this weneed to extrapolate our measurements at 353 GHz to lowerfrequencies where the CMB is usually measured since it iswhere it is more intense.
Note that this extrapolation concerns large dust grainsonly. It does not take into account the so-called “anoma-lous emission”, since (1) the latter does not contribute sig-nificantly at 353 GHz and (2) it is likely not to be polarized(e.g. Lazarian & Prunet 2001). Dust thermal radiation isthe dominant foreground at frequencies above ≃ 90 GHz.At high frequencies it has long been described by a singlegrey body at a temperature of 17.5 K with a ν2 emissiv-ity (Boulanger et al. 1996). At low frequencies (∼ 300 to∼ 100 GHz), the spectrum is not well constrained due tothe lack of accurate measurements. We need to use theFIRAS and WMAP data jointly. The FIRAS data areused to compute the intensity value at 353 GHz and theWMAP data give the intensity value at 94 GHz. This thenallows to derive the dust radiation spectral index.
To determine these dust intensities we use the methoddescribed in Lagache (2003) and derive the spectrum ofthe dust whose emission is correlated with the HI gas,using FIRAS and WMAP data in the Archeops region.We obtain a ratio Iν(353)/Iν(94) = 134 correspondingto a spectral index of 1.7 that we use in the following.Note that this value is very stable when different (large)regions of the sky are averaged. This is also the same valueas the one obtained by Finkbeiner et al (1999) in thisfrequency range (see discussion in Finkbeiner 2004). Usingthis spectral index of 1.7, we find for the largest angularscales (3 ≤ ℓ ≤ 8), (ℓ + 1)CTE
ℓ /2π = 1.7 ± 0.5 and 0.5 ±0.3 µK2
CMB for |b| ≥ 5 and 10 deg. respectively at 100 GHz.These results suggest that dust may be a very signif-
icant foreground for measurements of the CMB polariza-tion angular power spectra, particularly if they includeGalactic latitudes below |b| < 10 degrees. However, thesemeasurements must be interpreted with care when con-sidering the entire sky. Our data includes only 20% of thesky and generalization to the entire sky is questionablebecause of the complexity of the statistical properties ofdust.
It is interesting to consider the relation between ourresults and those of the WMAP team. By combining data
from five frequency bands at lower frequencies (23, 33,41, 61 and 94 GHz) and for the entire sky the WMAPteam has computed a value for the TE spectrum at3 ≤ ℓ ≤ 8 of 1.72 ± 0.50 µK2
CMB. Accurate extrapola-tion of the Archeops results into the WMAP data is com-plicated and is beyond the scope of this paper. (For ex-ample, it would require a detailed knowledge of the com-ponent separation methods, the relative weighting of thefrequency bands and the shape of the beam). However, itis easy to illustrate that combining data at lower frequen-cies reduces the effects of dust substantially. We extrap-olate our results to the WMAP frequency bands with aconstant emissivity spectral index of 1.7 in antenna tem-perature. We use an equal weight per frequency and useonly the area of the sky that overlaps the Archeops dataand WMAP’s Kp2 mask. The result of this extrapolationis presented on Fig. 8. On scales of 3 ≤ ℓ ≤ 8 we find(ℓ + 1)CTE
ℓ /2π = 0.17 ± 0.06 µK2CMB, which is about a
factor of 10 smaller than both our estimate at 100 GHz,and WMAP’s reported result.
When extrapolated to 100 GHz the upper limits thatwe found on the E and B modes for |b| ≥ 5 become0.2 µK2
CMB. We note that the CMB B mode is expected tobe at most ∼ 10−3 µK2
CMB at ℓ ≃ 5, if the reionization op-tical depth is as high as τ = 0.17 (Spergel et al. 2003) andif the tensor to scalar ratio T/S is the highest compatiblewith current CMB temperature anisotropy measurements.If the actual level of polarized dust over most of the sky isclose to the upper limit we found in this work then a sub-traction of a large foreground signal will be necessary evenat 100 GHz in order to detect the primordial gravitationalwaves on large angular scales.
7. Conclusions
In this paper we have presented the first measurementsof the angular power spectra of the Galactic dust polar-ized diffuse emission on approximately 20% of the skyat 353 GHz by Archeops. On angular scales 3 ≤ ℓ ≤ 8,we obtain a 4 σ detection of (ℓ + 1)CTE
ℓ (dust)/2π =76 ± 21 µKRJ
2 for |b| ≥ 5 deg. On the same angu-lar scales and for |b| ≥ 10, we have a 2 σ detection(ℓ + 1)CTE
ℓ (dust)/2π = 24 ± 13 µKRJ2. This decrease in
power is expected from the cosecant behaviour of the largescale component of the total intensity, which is shown todominate the total intensity angular power spectrum.
On the same sky coverage and for all angular scales3 ≤ ℓ ≤ 70, we set upper limits to the E and B polar-ization at (ℓ + 1)CEE,BB
ℓ (dust)/2π ≤ 11 µKRJ2. These
results have been confirmed by using a template of theGalactic dust intensity from Finkbeiner et al (1999) inplace of the Archeops total intensity map to compute theTE angular power spectrum. This spectrum agrees withthe one derived from Archeops data alone on all angularscales within 1 σ.
Furthermore, the high degree of polarization seen inthe Galactic plane by Benoıt et al (2004a) together with asimple model of the Galactic magnetic field and the align-

10 N. Ponthieu, J.F. Macıas–Perez et al.: Dust temperature and polarization power spectra
Fig. 7. Comparison between Archeops polarized angular power spectra and those of a simple model of the Galacticmagnetic field for all latitudes |b| ≥ 5. The large scale magnetic field is assumed to be constant and oriented alongthe local spiral arm. Dust is assumed to be aligned orthogonaly to it. The effective degree of alignment of the grainstogether with the dust intrinsic polarized emissivitiy is assumed to lead to 5 (blue), 10 (red) and 15% (green) effectivedegree of polarization.
ment of dust grains, leads to estimates that are compatiblewith the data.
To estimate the contribution of Galactic dust to themeasurement of polarized CMB anisotropies, we have ex-trapolated our results to the reference frequency 100 GHz,using a spectral index of 1.7, derived from FIRAS andWMAP data on the Archeops sky coverage. The TEmode becomes (ℓ + 1)CTE
ℓ (dust)/2π = 1.7 ± 0.5 and0.5±0.3 µK2
CMB on 3 ≤ ℓ ≤ 8 for |b| ≥ 5 and 10 deg respec-tively. The upper limit on the E and B modes becomes0.2 µK2
CMB. These values show that even at 100 GHzwhere dust radiation is expected to be lower than theCMB, its polarization may be very significant comparedto the CMB and should be subtracted with care from theobservations.
The effects of the polarization of dust are less severe atlow frequencies. When extrapolating our measurements at353 GHz to 20 GHz with the constant spectral index 1.7and weighting the 5 WMAP frequencies equally we finda level of (ℓ + 1)CTE
ℓ (dust)/2π = 0.17 ± 0.06 µK2CMB for
3 ≤ ℓ ≤ 8 on the intersection between WMAP’s Kp2 mask
and Archeops sky coverage. This is about a factor of 10smaller then the WMAP team results.
The high level of polarization measured at 353 GHzby Archeops and anticipated at the reference frequency of100 GHz, together with the uncertainties on dust spectralindex and the extrapolation of its statistical properties tothe whole sky call for further precise studies in order tosubtract it precisely from CMB data. This is even morecritical for the detection of the imprint of the primordialgravitational waves on the CMB B mode, that is expectedto be much smaller than the present upper limit on dustB polarization.
Acknowledgements. We would like to pay tribute to the mem-ory of Pierre Faucon who led the CNES team on this successfulflight. The HEALPix package was used throughout the dataanalysis Gorski et al. 1998. We also thank A. Starobinsky forfruitful discussions.
References
Abroe, M. E., Borrill, J., Ferreira, P. G., et al, 2004, ApJ, 605,607-613

N. Ponthieu, J.F. Macıas–Perez et al.: Dust temperature and polarization power spectra 11
Fig. 8. Dust TE angular power spectrum in CMB tem-perature units as measured by Archeops at 353 GHz on theintersection of WMAP’s Kp2 mask and the Archeops skycoverage, extrapolated down to the 5 WMAP frequencybands 23, 33, 41, 61 and 94 GHz (red) with a constantspectral index of 1.7 and averaged with an equal weightfor each frequency (see Sect. 6 for details). WMAP’s data(first year results) have been rebinned to match Archeopsbinning.
Barkats, D., Bischoff, C., Farese, P., et al., astro-ph/0409380Benabed, K., Bernardeau, F., van Waerbeke, L., 2001, Phys.
Rev. D, 63, 043501Bennett, C. L., Hinshaw, G., Spergel, D. N, et al., 2003, ApJS,
148, 135HBennett, C. L., Hill, R. S., Hinshaw, G., et al., 2003, ApJS,
148, 97BBenoıt, A., Ade, P., Amblard, A., et al., 2002, Astropart. Phys.
17, 101Benoıt, A., Ade, P., Amblard, A., et al. 2003a, A&A. 399, L25Benoıt, A., Ade, P., Amblard, A., et al. 2003b, A&A. 399, L19Benoıt, A., Ade, P., Amblard, A., et al., 2004, A&A, 424, 571Benoıt, A., Ade, P., Amblard, A., et al. 2004b, in preparationBoulanger, F.; Abergel, A.; Bernard, J.-P, et al., 1996,
A&A.,312, 256Bourrachot, A., 2004, PhD thesis, Universite Paris VIIChon, G., Challinor, A., Prunet, S., Hivon, E., Szapudi, I.,
2004, MNRAS, 350, 914Delabrouille, J., Cardoso, J. F. and Patanchon, G., 2003,
MNRAS, 346, 1089Fosalba P., Lazarian A., Prunet S., Tauber J. A, 2002, ApJ,
564, 762Gautier, T. N.I., Boulanger, F., Perault, M., Puget, J.L., 1992,
ApJ, 103, 1313.Goodman A. A., 1996, in Proc. Polarimetry of the Interstellar
Medium, ASP Conference Series, eds. W. G. Roberge andD. C. B. Whittet, Vol. 97, 325.
Gorski, K. M. , Hivon, E., Wandelt, B. D., et al. 1998,Proceedings of the MPA/ESO Conferece on Evolutionof Large-Scale Structure: from Recombination toGarching 2-7 August 1998; eds. A.J. Banday,R.K. Sheth and L. Da Costa, astro-ph/9812350,
http://www.eso.org/science/healpixHeiles, C., in ASP Conf. Ser. 97, Polarimetry of the Interstellar
Medium, ed. W. G. Roberge & D. C. B. Whittet, (SanFrancisco:ASP), 457
Finkbeiner, D. P., Davis, M., Schlegel, D., 1999, ApJ, 524, 867Finkbeiner, D. P., 2004, ApJ, 614, 186M. Kamionkowski, A. Kosowsky, A. Stebbins, Phys. Rev. D,
55, 7368, (1997)J. Kaplan, J. Delabrouille, Proceedings of the “Astrophysical
Polarized Foregrounds”, 6-12 October 2001, Bologna, ItalyKaplinghat, M., Knox, L., Song, Y.-S., 2003, Phys. Rev. Lett.,
91, 241301Kogut, A., Spergel, D. N., Barnes, C., 2003, ApJ Suppl. 148,
161J. Kovac, E. M. Leitch, C. Pryke, et al., Nature, 420, 772,
(2002)Lagache, G., Abergel, A., Boulanger, F., Puget, J. L., 1998,
A& A, 333, 709Lagache, G., 2003, A& A, 2003, 405, 813LLeitch, E., Kovac, J., Halverson, N., et al., astro-ph/0409357Lesgourgues, J., Polarski, D., Prunet, S., Starobinsky, A., 2000,
AA, 359, 414N. Ponthieu, On behalf of Archeops collaboration, proceedings
of the Workshop “The Cosmic Microwave Background andits Polarization”, Minneaolis, March 2003, New AstronomyReviews, Eds. S. Hanany and K. Olive.
Lazarian, A., Prunet, S., 2001, Astrophysical PolarizedForegrounds, AIP conf. proceedings, eds. S. Cecchini,S. Cortiglioni, R. Sault, and C. Sbarra.
Reach, W. T., Dwek, E., Fixsen, D. J., et al., 1995, ApJ, 451,188
Readhead, A., Myers, S., Pearson, T., et al., Science, 306:836–844, astro-ph/0409569
Seljak, U., Zaldarriaga, M., 1997, PRD 55, 1830Serkowski, K., Mathewson, D. S., Ford, V. L., 1975, ApJ. 196,
261Smoot, G. F., Bennett, C. L., Kogut, ., et al., 1992, ApJ, 396,
L1Spergel, D. N., Verde, L., Peiris, H. V., et al., 2003, ApJS, 148,
175M. Tristram, J. F. Macıas-Perez, C. Renault, D. Santos,
astro-ph/0405575
M. Tristram, G. Patanchon, J. F. Macıas-Perez, et al,astro-ph/0411633
Wang, X., Tegmark, M., Jain, B., Zaldarriaga, M., 2003,Phys. Rev. D., 68, 123001
Wright, E.L., 1998, ApJ, 496, 1.Zaldarriaga, M., Spergel, D. N., Seljak, U., 1997, ApJ, 488, 1