
Telling the Story and Re-Living the Past: How Speech Analysis Can Reveal Emotions in Post-traumatic...
28
Chapter 10 Telling the Story and Re-Living the Past: How Speech Analysis Can Reveal Emotions in Post-traumatic Stress Disorder (PTSD) Patients Egon L. van den Broek, Frans van der Sluis, and Ton Dijkstra Abstract A post-traumatic stress disorder (PTSD) is a severe stress disorder and, as such, a severe handicap in daily life. To this date, its treatment is still a big endeavor for therapists. This chapter discusses an exploration towards automatic assistance in treating patients suffering from PTSD. Such assistance should enable objective and unobtrusive stress measurement, provide decision support on whether or not the level of stress is excessive, and, consequently, be able to aid in its treatment. Speech was chosen as an objective, unobtrusive stress indicator, considering that most therapy sessions are already recorded anyway. Two studies were conducted: a (controlled) stress-provoking story telling (SPS) and a(n ecologically valid) re- living (RL) study, each consisting of a “happy” and an “anxiety triggering” session. In both studies the same 25 PTSD patients participated. The Subjective Unit of Distress (SUD) was determined as a subjective measure, which enabled the valida- tion of derived speech features. For both studies, a Linear Regression Model (LRM) was developed, founded on patients’ average acoustic profile. It used five speech features: amplitude, zero crossings, power, high-frequency power, and pitch. From each feature, 13 parameters were derived; hence, in total 65 parameters were cal- culated. Using LRMs, respectively 83 and 69% of the variance was explained for the SPS and RL study. Moreover, a set of generic speech signal parameters was presented. Together, the models created and parameters identified can serve as the foundation for future artificial therapy assistants. No laga duele bieu: Skavisábo di nobo. Let not woes of old enslave you anew. – Nydia Ecury E.L. van den Broek (B ) Human Media Interaction (HMI), University of Twente, 7500 AE, Enschede, The Netherlands; Karakter University Center, Radboud University Medical Center Nijmegen, 6500 HB Nijmegen, The Netherlands e-mail: [email protected] 153 J. Westerink et al. (eds.), Sensing Emotions, Philips Research Book Series 12, DOI 10.1007/978-90-481-3258-4_10, C Springer Science+Business Media B.V. 2011
Transcript of Telling the Story and Re-Living the Past: How Speech Analysis Can Reveal Emotions in Post-traumatic...
Chapter 10Telling the Story and Re-Living the Past:How Speech Analysis Can Reveal Emotionsin Post-traumatic Stress Disorder (PTSD)Patients
Egon L. van den Broek, Frans van der Sluis, and Ton Dijkstra
Abstract A post-traumatic stress disorder (PTSD) is a severe stress disorder and, assuch, a severe handicap in daily life. To this date, its treatment is still a big endeavorfor therapists. This chapter discusses an exploration towards automatic assistancein treating patients suffering from PTSD. Such assistance should enable objectiveand unobtrusive stress measurement, provide decision support on whether or notthe level of stress is excessive, and, consequently, be able to aid in its treatment.Speech was chosen as an objective, unobtrusive stress indicator, considering thatmost therapy sessions are already recorded anyway. Two studies were conducted:a (controlled) stress-provoking story telling (SPS) and a(n ecologically valid) re-living (RL) study, each consisting of a “happy” and an “anxiety triggering” session.In both studies the same 25 PTSD patients participated. The Subjective Unit ofDistress (SUD) was determined as a subjective measure, which enabled the valida-tion of derived speech features. For both studies, a Linear Regression Model (LRM)was developed, founded on patients’ average acoustic profile. It used five speechfeatures: amplitude, zero crossings, power, high-frequency power, and pitch. Fromeach feature, 13 parameters were derived; hence, in total 65 parameters were cal-culated. Using LRMs, respectively 83 and 69% of the variance was explained forthe SPS and RL study. Moreover, a set of generic speech signal parameters waspresented. Together, the models created and parameters identified can serve as thefoundation for future artificial therapy assistants.
No laga duele bieu: Skavisábo di nobo.Let not woes of old enslave you anew.– Nydia Ecury
E.L. van den Broek (B)Human Media Interaction (HMI), University of Twente, 7500 AE, Enschede, The Netherlands;Karakter University Center, Radboud University Medical Center Nijmegen, 6500 HB Nijmegen,The Netherlandse-mail: [email protected]
153J. Westerink et al. (eds.), Sensing Emotions, Philips Research Book Series 12,DOI 10.1007/978-90-481-3258-4_10, C© Springer Science+Business Media B.V. 2011
154 E.L. van den Broek et al.
10.1 Introduction
In our modern society, many people experience stress, sometimes for just a briefmoment, at other times for prolonged periods of time. Stress can be defined as afeeling of pressure or tension, caused by influences of the outside world. It can beaccompanied by positive and by negative feelings. It affects our physical state, forinstance by increasing our heart rate and blood pressure, and freeing stress hor-mones like (nor)adrenaline and (nor)epinephrine (Kosten et al., 1987), stimulatingautonomic nerve action. Stress may become harmful if it occurs for too long or toofrequently, or if it occurs during a traumatic experience. It may result, for instance,in depression, insomnia, or Post-Traumatic Stress Disorders (PTSD) (Ehlers et al.,2010; L. Mevissen, 2010; Ray, 2008; Rubin et al., 2008). To make it even worse,such stress related disorders stigmatize the people suffering from them, which initself is an additional stressor (Rüscha et al., 2009a, b).
Depression cannot always be related to a specific cause, though several contribut-ing factors have been identified: e.g., genetic vulnerability and unavoidability ofstress (Greden, 2001). More specifically, certain stressful life events (e.g., job loss,widowhood) can lead to a state of depression. Furthermore, chronic role-relatedstress is significantly associated with chronically depressed mood (Kessler, 1997).Note that the experience of stress is associated with the onset of depression, and notwith the symptoms of depression.
Insomnia often has a fairly sudden onset caused by psychological, social, or med-ical stress (Healey et al., 1981). Nevertheless, in some cases, it may develop gradu-ally and without a clear stressor. Insomnia is characterized by sleep deprivation, andassociated with increased physiological, cognitive, or emotional arousal in com-bination with negative conditioning for sleep (American Psychiatric Association,2000).
Traumas can originate from a range of situations, such as warfare, natural dis-aster, and interpersonal violence such as sexual, physical, and emotional abuse,intimate partner violence, or collective violence (e.g., experiencing a bank rob-bery) (Ray, 2008). In such cases, a posttraumatic stress disorder (PTSD) may arise,which can be characterized by a series of symptoms and causes (Ehlers et al., 2010;L. Mevissen, 2010; Ray, 2008; Rubin et al., 2008), summarized in Table 10.1.
10.2 Post-traumatic Stress Disorder (PTSD)
In our study, we studied the emotions in Post-traumatic Stress Disorder (PTSD)patients, who suffered from Panic Attacks, Agoraphobia, and Panic Disorder withAgoraphobia (L. Mevissen, 2010; Sánchez-Meca et al., 2010).
A Panic Attack is a discrete period in which there is a sudden onset of intenseapprehension, fearfulness or terror, often associated with feelings of impendingdoom. During these Panic Attacks, symptoms such as shortness of breath, palpi-tations, chest pain or discomfort, choking or smothering sensations, and fear of
10 Telling the Story and Re-Living the Past: How Speech Analysis Can Reveal . . . 155
Table 10.1 Introduction on (the DSM-IV TR (American Psychiatric Association, 2000) criteriafor) posttraumatic stress disorder (PTSD)
Trauma can cause long-term physiological and psychological problems. This has been recognizedfor centuries. Such suffering (e.g., accompanying a posttraumatic stress disorder, PTSD), canbe characterized in terms of series of symptoms and causes. Traumas can originate from arange of situations, either short or long lasting; e.g., warfare, natural disasters such asearthquakes, interpersonal violence such as sexual, physical, and emotional abuse, intimatepartner violence, and collective violence
Diagnostic criteria as defined by the DSM-IV TR (American Psychiatric Association, 2000)comprise six categories, each denoting their various indicators:
1. Exposure of the person to a traumatic event2. Persistent reexperience of the traumatic event3. Persistent avoidance of stimuli, associated with the trauma, and numbing of general
responsiveness (not present before the trauma)4. Persistent symptoms of increased arousal, not present before the trauma5. Duration of the disturbance (symptoms in criteria 2, 3, and 4) is more than one month6. The disturbance causes clinically significant distress or impairment in social, occupational,
or other important areas of functioning
Many other symptoms have also been mentioned; e.g., weakness, fatigue, loss of will power, andpsychophysiological reactions such as gastrointestinal disturbances. However, these are notincluded in the DSM-IV TR diagnostic criteria
Additional diagnostic categories are also suggested for victims of prolonged interpersonal trauma,particularly early in life. These concern problems are related to: (1) regulation of affect andimpulses, (2) memory and attention, (3) self-perception, (4) interpersonal relations, (5)somatization, and (6) systems of meaning. Taken together, PTSD includes a broad variety ofsymptoms and diagnostic criteria. Consequently, the diagnosis is hard to make, as is also thecase for various other mental disorders
“going crazy” or losing control are present. The Panic Attack has a sudden onset andbuilds rapidly to a peak (usually in 10 min or less). Panic Attacks can be unexpected(uncued), situationally bound (cued), or situationally predisposed (Sánchez-Mecaet al., 2010).
Agoraphobia is anxiety about, or avoidance of, places or situations from whichescape might be difficult (or embarrassing), or in which help may not be availablein the event of having a panic attack or panic-like symptoms (Sánchez-Meca et al.,2010).
Panic Disorder with Agoraphobia is characterized by both recurrent and unex-pected Panic Attacks, followed by at least one month of persistent concern abouthaving another Panic Attack, worries about the possible implications or conse-quences of such attacks, or a significant behavioral change related to these attacks.The frequency and severity of Panic Attacks vary widely, but Panic Disorder asdescribed here has been found in epidemiological studies throughout the world.Panic Disorders Without and With Agoraphobia are diagnosed two to three timesas often in women than in men. The age of onset of Panic Disorders varies consid-erably, but most typically lies between late adolescence and the mid-thirties. Some
156 E.L. van den Broek et al.
individuals may have episodic outbreaks with years of remission in between, andothers may have continuous severe symptomatology (Sánchez-Meca et al., 2010).
Due to its large inter-individual variability and its broad variety of symptoms,the diagnosis of PTSD is hard to make (Ehlers et al., 2010; L. Mevissen, 2010; Ray,2008; Rubin et al., 2008). At the same time, it is clear that an efficient treatmentof PTSD requires an objective and early diagnosis of the patients’ problems andtheir therapeutic progress. Assessing the emotional distress of a patient is there-fore of the utmost importance. Therapists have developed a range of questionnairesand diagnostic measurement tools for this purpose, e.g., (Knapp and VandeCreek,1994; Sánchez-Meca et al., 2010). Regrettably, these may be experienced as a bur-den by clients, because it takes the time and willingness of the clients to completethem.
In addition, several other problems arise when a clinician tries to assess thedegree of stress in the patient. First, during the appraisal of a stress response, astressor may not always be seen as stressful enough to be a cause for the mentalillness. In other words, although the client may experience it as hugely stressful,the clinician might not always acknowledge it as such. Second, when measuringthe response to a stressor, the clinician may rely on introspection and expertise, butthese are always to some extent subjective and they also rely on the communica-tive abilities, truthfulness, and compliance of the client in question. Third, at timesit may not be completely clear which (aspect of) the experienced stressor led tothe excessive stress response. Finally, the evaluation of the progress in treatment iscomplicated by its gradualness and relativity.
10.3 Developing an Artificial Therapy Assistant
Given these considerations, it is abundantly clear why researchers have searched formore objective, unobtrusive ways to measure emotions in patient populations. Inother words, in addition to standardizing their professional approaches, therapistshave sought for new sorts of therapy evaluation methods that are applicable to real-life situations and measure real emotions.
In our own study, we have made an attempt to develop an artificial therapy assis-tant for patients with a PTSD in terms of an analysis of characteristics of the speechof such patients during two tasks: their telling of a stress-provoking story, or theirverbally reliving of the traumatic event. In addition, we linked the emotions thatwe measured in these two speech circumstances to those that were reported bythe PTSD patients using the more standard measurement of the Subjective Unitof Distress, based on Likert scale questionnaire data.
In the following sections, we will first describe both the story telling and traumareliving techniques themselves. They provided us with stretches of speech, whichwe analyzed with respect to a series of signal characteristics to detect emotions.After discussing our speech analysis technique, we will explain how the SubjectiveUnit of Distress is standardly measured. This will then be followed by a more
10 Telling the Story and Re-Living the Past: How Speech Analysis Can Reveal . . . 157
detailed report of our experimental study. We will end the chapter with an evaluationof our novel approach to stress and emotion measurement.
10.4 Story Telling and Reliving the Past
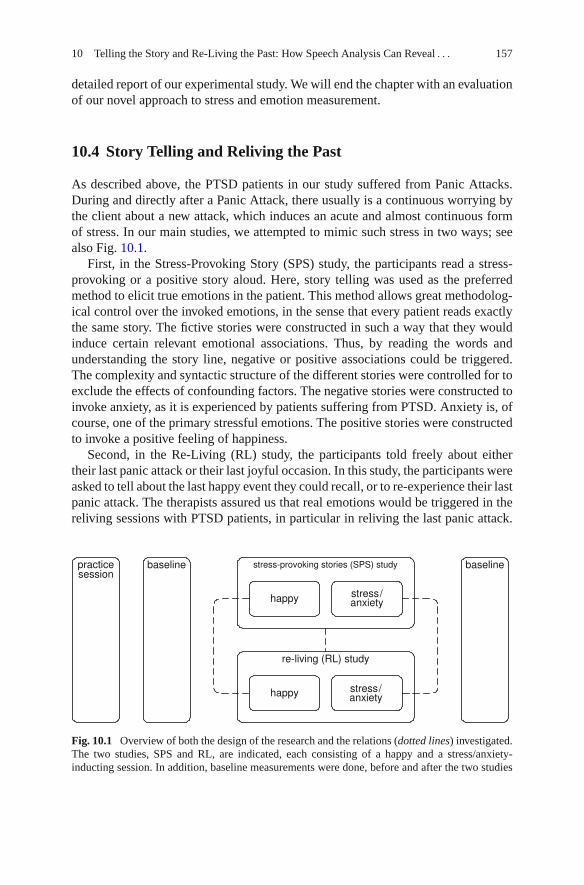
As described above, the PTSD patients in our study suffered from Panic Attacks.During and directly after a Panic Attack, there usually is a continuous worrying bythe client about a new attack, which induces an acute and almost continuous formof stress. In our main studies, we attempted to mimic such stress in two ways; seealso Fig. 10.1.
First, in the Stress-Provoking Story (SPS) study, the participants read a stress-provoking or a positive story aloud. Here, story telling was used as the preferredmethod to elicit true emotions in the patient. This method allows great methodolog-ical control over the invoked emotions, in the sense that every patient reads exactlythe same story. The fictive stories were constructed in such a way that they wouldinduce certain relevant emotional associations. Thus, by reading the words andunderstanding the story line, negative or positive associations could be triggered.The complexity and syntactic structure of the different stories were controlled for toexclude the effects of confounding factors. The negative stories were constructed toinvoke anxiety, as it is experienced by patients suffering from PTSD. Anxiety is, ofcourse, one of the primary stressful emotions. The positive stories were constructedto invoke a positive feeling of happiness.
Second, in the Re-Living (RL) study, the participants told freely about eithertheir last panic attack or their last joyful occasion. In this study, the participants wereasked to tell about the last happy event they could recall, or to re-experience their lastpanic attack. The therapists assured us that real emotions would be triggered in thereliving sessions with PTSD patients, in particular in reliving the last panic attack.
Fig. 10.1 Overview of both the design of the research and the relations (dotted lines) investigated.The two studies, SPS and RL, are indicated, each consisting of a happy and a stress/anxiety-inducting session. In addition, baseline measurements were done, before and after the two studies
158 E.L. van den Broek et al.
Because the reliving blocks were expected to have a high impact on the patient’semotional state, a therapist was present for each patient and during all sessions.The two RL sessions were chosen to resemble two phases in therapy: the start andthe end of it. Reliving a panic attack resembles the trauma in its full strength, asat the moment of intake of the patient. Telling about the last happy event a patientexperienced, resembles a patient who is relaxed or (at least) in a “normal” emotionalcondition. This should resemble the end of the therapy sessions, when the PTSD hasdisappeared or is diminished.
10.5 Emotion Detection by Means of Speech Signal Analysis
The emotional state that people are in (during telling a story or reliving the past) canbe detected by measuring various signals, such as physiological states, movements,pupil dilation, computer vision techniques, and speech signals. Due to technologicaldevelopments, some biosignals can now be monitored through ring-like and earring-like devices. However, these and other devices to record biosignals must be attachedto a patient’s body (van den Broek et al., 2009a, 2010a, b, d).
In our research, we focussed on speech analysis, because this type of analysisis completely unobtrusive (van den Broek et al., 2009a, 2010a, b, d; Zeng et al.,2009). In addition, the communication in therapy sessions is often recorded anyway.Hence, no additional technical effort has to be made on the part of the therapists.Furthermore, because therapy sessions are generally held under controlled con-ditions in a room shielded from noise, the degree of speech signal distortion islimited.
There is a vast literature on the relationship between speech and emotion. Variousspeech features have been shown to be sensitive to experienced emotions; see,e.g., (Cowie et al., 2001; Murray and Arnott, 1993; Scherer, 2003; Ververidisand Kotropoulos, 2006; Zeng et al., 2009). In this research, we measured fivecharacteristics of speech:
1. the power (or intensity or energy) of the speech signal; e.g., see Table 10.2 and(Cowie et al., 2001; Murray and Arnott, 1993);
2. its fundamental frequency (F0) or pitch, see also Table 10.2 and (Cowie et al.,2001; Ladd et al., 1985; Murray and Arnott, 1993; Scherer, 2003; Ververidis andKotropoulos, 2006);
3. the zero-crossings rate (Kedem, 1986; Rothkrantz et al., 2004);4. its raw amplitude (Murray and Arnott, 1993; Scherer, 2003); and5. the high-frequency power (Banse and Scherer, 1996; Cowie et al., 2001; Murray
and Arnott, 1993; Rothkrantz et al., 2004).
All of these have been considered as useful, for the measurement of experienceemotions. Moreover, we expect them to be complementary to a high extent.
10 Telling the Story and Re-Living the Past: How Speech Analysis Can Reveal . . . 159
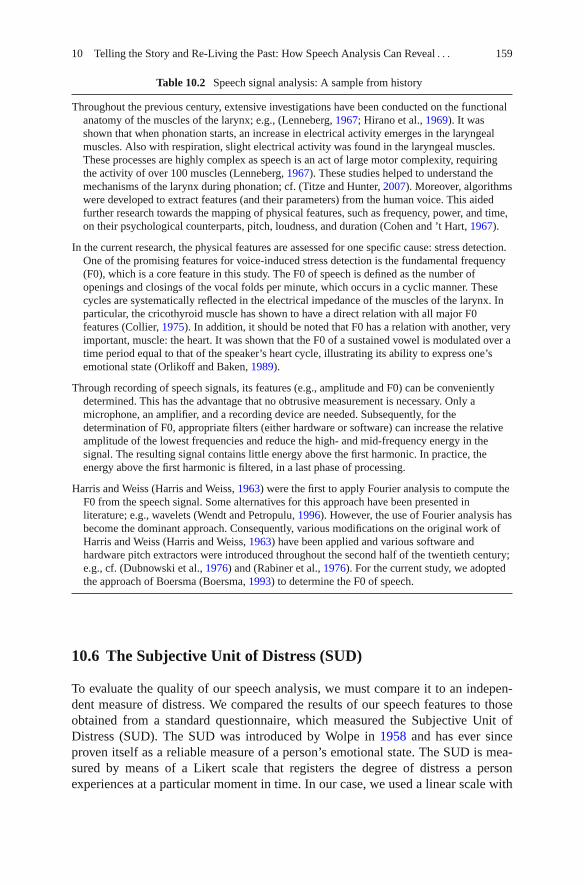
Table 10.2 Speech signal analysis: A sample from history
Throughout the previous century, extensive investigations have been conducted on the functionalanatomy of the muscles of the larynx; e.g., (Lenneberg, 1967; Hirano et al., 1969). It wasshown that when phonation starts, an increase in electrical activity emerges in the laryngealmuscles. Also with respiration, slight electrical activity was found in the laryngeal muscles.These processes are highly complex as speech is an act of large motor complexity, requiringthe activity of over 100 muscles (Lenneberg, 1967). These studies helped to understand themechanisms of the larynx during phonation; cf. (Titze and Hunter, 2007). Moreover, algorithmswere developed to extract features (and their parameters) from the human voice. This aidedfurther research towards the mapping of physical features, such as frequency, power, and time,on their psychological counterparts, pitch, loudness, and duration (Cohen and ’t Hart, 1967).
In the current research, the physical features are assessed for one specific cause: stress detection.One of the promising features for voice-induced stress detection is the fundamental frequency(F0), which is a core feature in this study. The F0 of speech is defined as the number ofopenings and closings of the vocal folds per minute, which occurs in a cyclic manner. Thesecycles are systematically reflected in the electrical impedance of the muscles of the larynx. Inparticular, the cricothyroid muscle has shown to have a direct relation with all major F0features (Collier, 1975). In addition, it should be noted that F0 has a relation with another, veryimportant, muscle: the heart. It was shown that the F0 of a sustained vowel is modulated over atime period equal to that of the speaker’s heart cycle, illustrating its ability to express one’semotional state (Orlikoff and Baken, 1989).
Through recording of speech signals, its features (e.g., amplitude and F0) can be convenientlydetermined. This has the advantage that no obtrusive measurement is necessary. Only amicrophone, an amplifier, and a recording device are needed. Subsequently, for thedetermination of F0, appropriate filters (either hardware or software) can increase the relativeamplitude of the lowest frequencies and reduce the high- and mid-frequency energy in thesignal. The resulting signal contains little energy above the first harmonic. In practice, theenergy above the first harmonic is filtered, in a last phase of processing.
Harris and Weiss (Harris and Weiss, 1963) were the first to apply Fourier analysis to compute theF0 from the speech signal. Some alternatives for this approach have been presented inliterature; e.g., wavelets (Wendt and Petropulu, 1996). However, the use of Fourier analysis hasbecome the dominant approach. Consequently, various modifications on the original work ofHarris and Weiss (Harris and Weiss, 1963) have been applied and various software andhardware pitch extractors were introduced throughout the second half of the twentieth century;e.g., cf. (Dubnowski et al., 1976) and (Rabiner et al., 1976). For the current study, we adoptedthe approach of Boersma (Boersma, 1993) to determine the F0 of speech.
10.6 The Subjective Unit of Distress (SUD)
To evaluate the quality of our speech analysis, we must compare it to an indepen-dent measure of distress. We compared the results of our speech features to thoseobtained from a standard questionnaire, which measured the Subjective Unit ofDistress (SUD). The SUD was introduced by Wolpe in 1958 and has ever sinceproven itself as a reliable measure of a person’s emotional state. The SUD is mea-sured by means of a Likert scale that registers the degree of distress a personexperiences at a particular moment in time. In our case, we used a linear scale with
160 E.L. van den Broek et al.
a range between 0 and 10 on which the experienced degree of distress could be indi-cated by a dot or cross. The participants in our study were asked to fill in the SUDtest once every minute; therefore, it became routine during the experimental session.
10.7 Design and Procedure
In our study, 25 female Dutch PTSD patients (mean age: 36) participated of theirfree will. All patients signed an informed consent and all were aware of the tasksincluded. The experiment began with a practice session, during which the partic-ipants learned to speak continuously for longer stretches of time, because duringpiloting it was noticed that participants had difficulty in doing this. In addition, thepractice session offered them the opportunity to become more comfortable withthe experimental setting. Next, the main research started, which consisted of twostudies and two baseline sessions. The experiment began and ended with the estab-lishment of the baselines, in which speech and SUD were recorded. Between thetwo baseline blocks, the two studies, the Stress-Provoking Stories (SPS) study andthe Re-Living (RL) study, were presented. The two studies were counterbalancedacross participants.
The SPS study aimed at triggering two different affective states in the patient.It involved the telling of two stories, which were meant to induce either fear or aneutral feeling. From each of the sessions, three minutes in the middle of the sessionwere used for analysis. The order of the two story sessions was counterbalanced overparticipants. Both speech and SUD scores (once per minute) were collected.
The RL study also involved two sessions of three minutes. In one of these, thepatients were asked to re-experience their last panic attack. In the other, the patientswere asked to tell about the last happy event they could recall. Again, the order ofsessions was counterbalanced over participants.
With both studies, problems occurred with one patient. In both cases, the data ofthis patient were omitted from further analysis. Hence, in both conditions, the dataof 24 patients were used for further analysis.
10.8 Features Extracted from the Speech Signal
Recording speech was done using a personal computer, a microphone preamplifier,and a microphone. The sample rate of the recordings was 44.1 kHz, mono channel,with a resolution of 16 bits. All recordings were divided in samples of approximatelyone minute of speech.
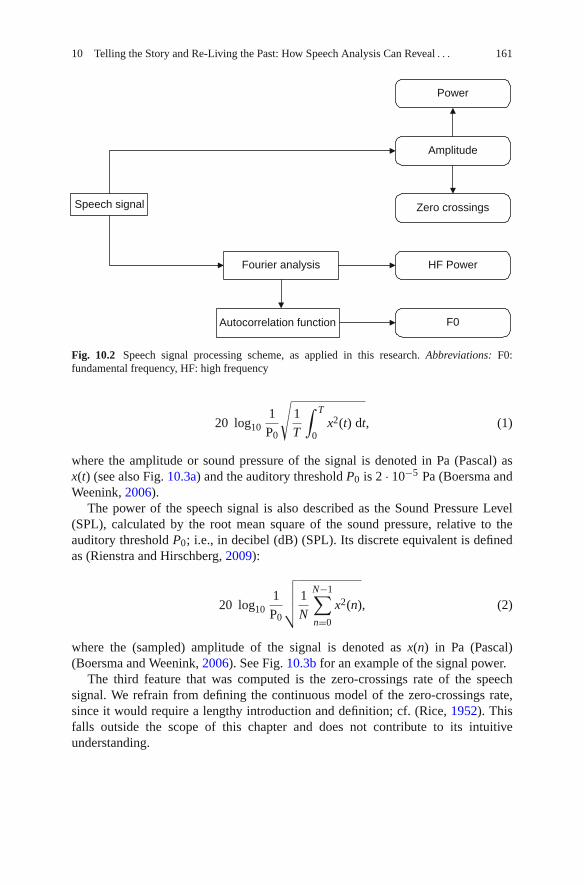
Five features were derived from the samples of recorded speech: raw amplitude,power, zero-crossings, high-frequency power, and fundamental frequency; see alsoFig. 10.2. Here, we will give a definition of these five features.
The term power is often used interchangeably with energy and intensity. In thischapter, we will follow (Lyons, 2004) in using the term power. For a domain [0, T],the power of the speech signal is defined:
10 Telling the Story and Re-Living the Past: How Speech Analysis Can Reveal . . . 161
Speech signal
Power
Amplitude
F0
HF PowerFourier analysis
Zero crossings
Autocorrelation function
Fig. 10.2 Speech signal processing scheme, as applied in this research. Abbreviations: F0:fundamental frequency, HF: high frequency
20 log101
P0
√1
T
∫ T
0x2(t) dt, (1)
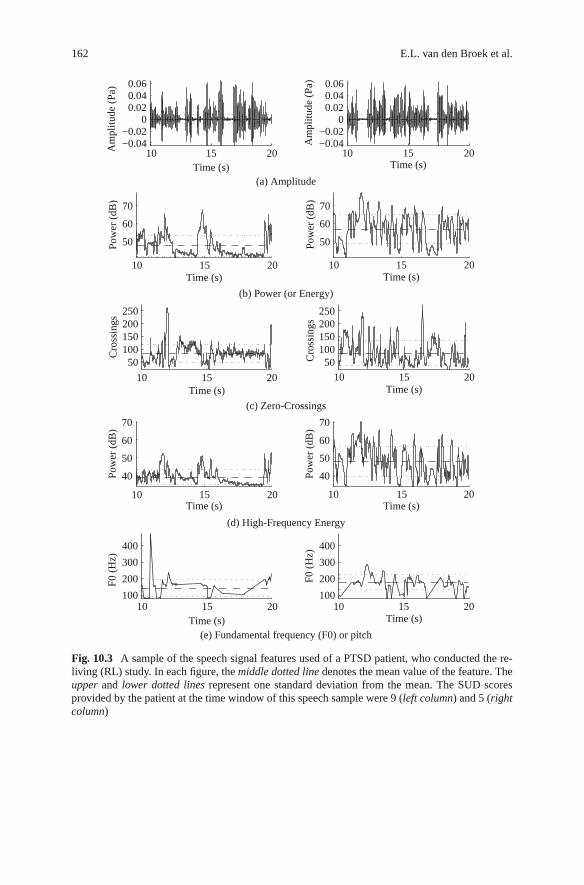
where the amplitude or sound pressure of the signal is denoted in Pa (Pascal) asx(t) (see also Fig. 10.3a) and the auditory threshold P0 is 2 · 10−5 Pa (Boersma andWeenink, 2006).
The power of the speech signal is also described as the Sound Pressure Level(SPL), calculated by the root mean square of the sound pressure, relative to theauditory threshold P0; i.e., in decibel (dB) (SPL). Its discrete equivalent is definedas (Rienstra and Hirschberg, 2009):
20 log101
P0
√√√√ 1
N
N−1∑
n=0
x2(n), (2)
where the (sampled) amplitude of the signal is denoted as x(n) in Pa (Pascal)(Boersma and Weenink, 2006). See Fig. 10.3b for an example of the signal power.
The third feature that was computed is the zero-crossings rate of the speechsignal. We refrain from defining the continuous model of the zero-crossings rate,since it would require a lengthy introduction and definition; cf. (Rice, 1952). Thisfalls outside the scope of this chapter and does not contribute to its intuitiveunderstanding.
162 E.L. van den Broek et al.
10 15 20−0.04−0.02
00.020.040.06
Time (s)
Am
plitu
de (
Pa)
10 15 20−0.04−0.02
00.020.040.06
Time (s)
Am
plitu
de (
Pa)
(a) Amplitude
10 15 20
50
60
70
Time (s)
Pow
er (
dB)
10 15 20
50
60
70
Time (s)
Pow
er (
dB)
(b) Power (or Energy)
10 15 20
50100150200250
Time (s)
Cro
ssin
gs
10 15 2050
100150200250
Time (s)
Cro
ssin
gs
(c) Zero-Crossings
10 15 20
40
50
60
70
Time (s)
Pow
er (
dB)
10 15 20
40
50
60
70
Time (s)
Pow
er (
dB)
(d) High-Frequency Energy
10 15 20100
200
300
400
Time (s)
F0 (
Hz)
10 15 20100
200
300
400
Time (s)
F0 (
Hz)
(e) Fundamental frequency (F0) or pitch
Fig. 10.3 A sample of the speech signal features used of a PTSD patient, who conducted the re-living (RL) study. In each figure, the middle dotted line denotes the mean value of the feature. Theupper and lower dotted lines represent one standard deviation from the mean. The SUD scoresprovided by the patient at the time window of this speech sample were 9 (left column) and 5 (rightcolumn)
10 Telling the Story and Re-Living the Past: How Speech Analysis Can Reveal . . . 163
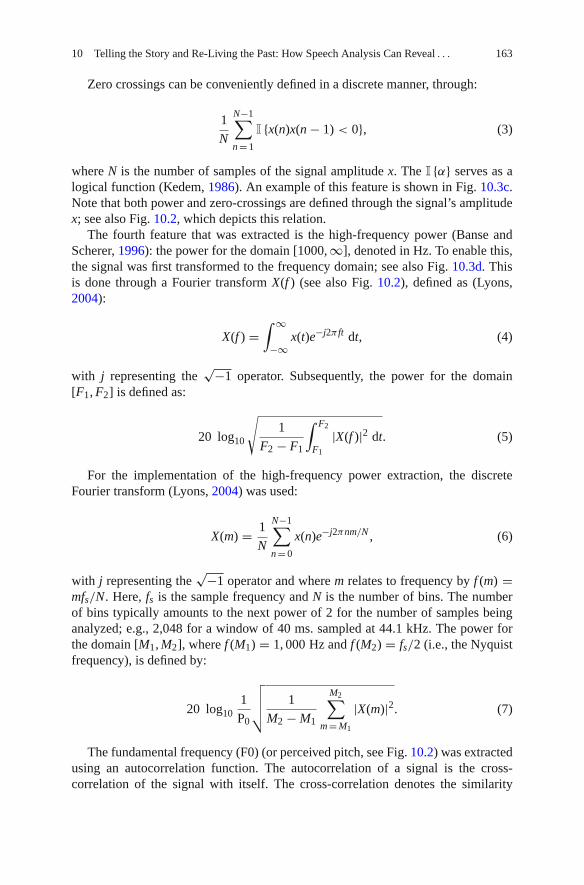
Zero crossings can be conveniently defined in a discrete manner, through:
1
N
N−1∑
n = 1
I {x(n)x(n − 1) < 0}, (3)
where N is the number of samples of the signal amplitude x. The I {α} serves as alogical function (Kedem, 1986). An example of this feature is shown in Fig. 10.3c.Note that both power and zero-crossings are defined through the signal’s amplitudex; see also Fig. 10.2, which depicts this relation.
The fourth feature that was extracted is the high-frequency power (Banse andScherer, 1996): the power for the domain [1000, ∞], denoted in Hz. To enable this,the signal was first transformed to the frequency domain; see also Fig. 10.3d. Thisis done through a Fourier transform X(f ) (see also Fig. 10.2), defined as (Lyons,2004):
X(f ) =∫ ∞
−∞x(t)e−j2π ft dt, (4)
with j representing the√−1 operator. Subsequently, the power for the domain
[F1, F2] is defined as:
20 log10
√1
F2 − F1
∫ F2
F1
|X(f )|2 dt. (5)
For the implementation of the high-frequency power extraction, the discreteFourier transform (Lyons, 2004) was used:
X(m) = 1
N
N−1∑
n = 0
x(n)e−j2πnm/N , (6)
with j representing the√−1 operator and where m relates to frequency by f (m) =
mfs/N. Here, fs is the sample frequency and N is the number of bins. The numberof bins typically amounts to the next power of 2 for the number of samples beinganalyzed; e.g., 2,048 for a window of 40 ms. sampled at 44.1 kHz. The power forthe domain [M1, M2], where f (M1) = 1, 000 Hz and f (M2) = fs/2 (i.e., the Nyquistfrequency), is defined by:
20 log101
P0
√√√√ 1
M2 − M1
M2∑
m = M1
|X(m)|2. (7)
The fundamental frequency (F0) (or perceived pitch, see Fig. 10.2) was extractedusing an autocorrelation function. The autocorrelation of a signal is the cross-correlation of the signal with itself. The cross-correlation denotes the similarity
164 E.L. van den Broek et al.
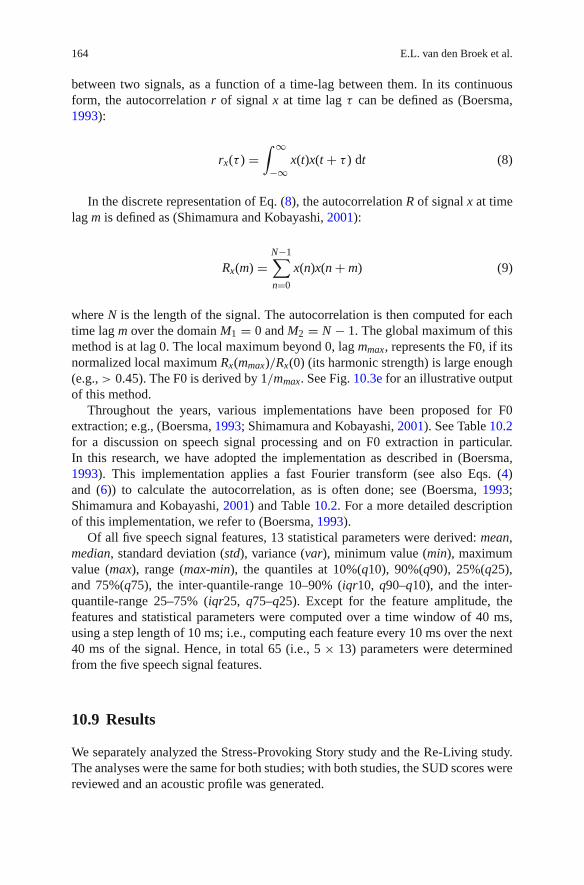
between two signals, as a function of a time-lag between them. In its continuousform, the autocorrelation r of signal x at time lag τ can be defined as (Boersma,1993):
rx(τ ) =∫ ∞
−∞x(t)x(t + τ ) dt (8)
In the discrete representation of Eq. (8), the autocorrelation R of signal x at timelag m is defined as (Shimamura and Kobayashi, 2001):
Rx(m) =N−1∑
n=0
x(n)x(n + m) (9)
where N is the length of the signal. The autocorrelation is then computed for eachtime lag m over the domain M1 = 0 and M2 = N − 1. The global maximum of thismethod is at lag 0. The local maximum beyond 0, lag mmax, represents the F0, if itsnormalized local maximum Rx(mmax)/Rx(0) (its harmonic strength) is large enough(e.g., > 0.45). The F0 is derived by 1/mmax. See Fig. 10.3e for an illustrative outputof this method.
Throughout the years, various implementations have been proposed for F0extraction; e.g., (Boersma, 1993; Shimamura and Kobayashi, 2001). See Table 10.2for a discussion on speech signal processing and on F0 extraction in particular.In this research, we have adopted the implementation as described in (Boersma,1993). This implementation applies a fast Fourier transform (see also Eqs. (4)and (6)) to calculate the autocorrelation, as is often done; see (Boersma, 1993;Shimamura and Kobayashi, 2001) and Table 10.2. For a more detailed descriptionof this implementation, we refer to (Boersma, 1993).
Of all five speech signal features, 13 statistical parameters were derived: mean,median, standard deviation (std), variance (var), minimum value (min), maximumvalue (max), range (max-min), the quantiles at 10%(q10), 90%(q90), 25%(q25),and 75%(q75), the inter-quantile-range 10–90% (iqr10, q90–q10), and the inter-quantile-range 25–75% (iqr25, q75–q25). Except for the feature amplitude, thefeatures and statistical parameters were computed over a time window of 40 ms,using a step length of 10 ms; i.e., computing each feature every 10 ms over the next40 ms of the signal. Hence, in total 65 (i.e., 5 × 13) parameters were determinedfrom the five speech signal features.
10.9 Results
We separately analyzed the Stress-Provoking Story study and the Re-Living study.The analyses were the same for both studies; with both studies, the SUD scores werereviewed and an acoustic profile was generated.
10 Telling the Story and Re-Living the Past: How Speech Analysis Can Reveal . . . 165
The acoustic profiles were created with an LRM (Harrell, Jr., 2001). For moreinformation on LRM, we refer to Appendix 1. It was expected that the acoustic pro-files would benefit from a range of parameters derived from the five features, as itis known that various features and their parameters have independent contributionsto the speech signal (Ladd et al., 1985). In order to create a powerful LRM, back-ward elimination/selection was applied to reduce the number of predictors. Withbackward elimination/selection, first all relevant features/parameters are added aspredictors to the model (the so-called enter method), followed by multiple iterationsremoving each predictor for which p < α does not hold (Derksen and Keselman,1992; Harrell, Jr., 2001). In this research, we chose α = 0.1, as the threshold fordetermining whether or not a variable had a significant contribution to predictingsubjective stress.
The backward elimination/selection stops when for all remaining predictors inthe model, p < α is true. As the backward method uses the relative contributionto the model as selection criteria, the interdependency of the features is taking intoaccount as well. This makes it a robust method for selecting the most relevant fea-tures and their parameters. This is crucial for creating a strong model, because it hasbeen shown that inclusion of too many features can reduce the power of a model(Dash and Liu, 1997). Because the general practice of reporting the explained vari-ance of a regression model, R2, does not take this into account, the adjusted R2,
R2
was computed as well. The R2
penalizes the addition of extra predictors to themodel, and, therefore, is always equal to or lower than R2.
10.9.1 Results of the Stress-Provoking Story (SPS) Sessions
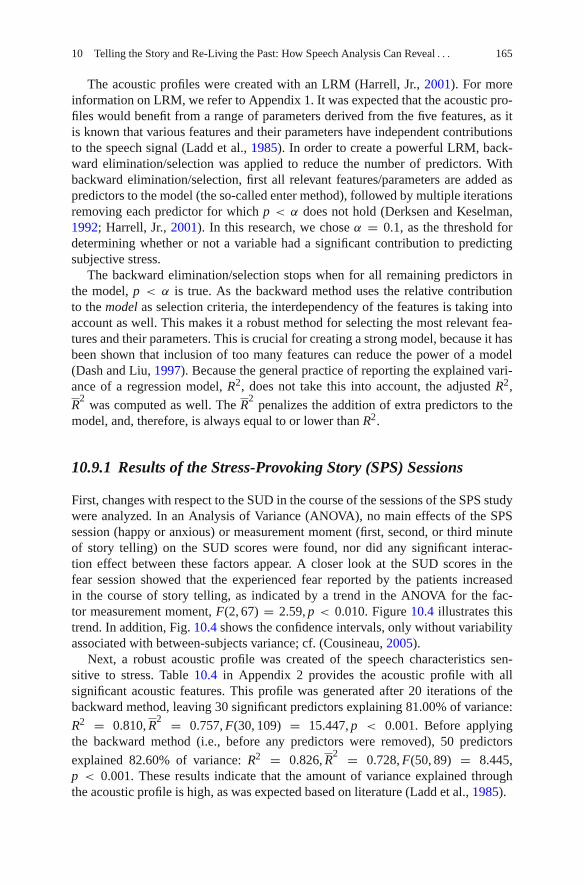
First, changes with respect to the SUD in the course of the sessions of the SPS studywere analyzed. In an Analysis of Variance (ANOVA), no main effects of the SPSsession (happy or anxious) or measurement moment (first, second, or third minuteof story telling) on the SUD scores were found, nor did any significant interac-tion effect between these factors appear. A closer look at the SUD scores in thefear session showed that the experienced fear reported by the patients increasedin the course of story telling, as indicated by a trend in the ANOVA for the fac-tor measurement moment, F(2, 67) = 2.59, p < 0.010. Figure 10.4 illustrates thistrend. In addition, Fig. 10.4 shows the confidence intervals, only without variabilityassociated with between-subjects variance; cf. (Cousineau, 2005).
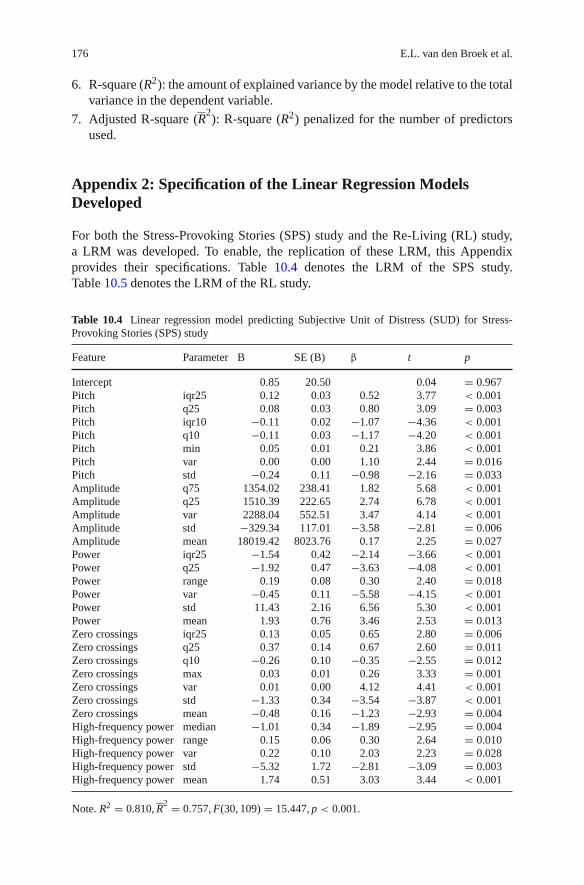
Next, a robust acoustic profile was created of the speech characteristics sen-sitive to stress. Table 10.4 in Appendix 2 provides the acoustic profile with allsignificant acoustic features. This profile was generated after 20 iterations of thebackward method, leaving 30 significant predictors explaining 81.00% of variance:
R2 = 0.810, R2 = 0.757, F(30, 109) = 15.447, p < 0.001. Before applying
the backward method (i.e., before any predictors were removed), 50 predictors
explained 82.60% of variance: R2 = 0.826, R2 = 0.728, F(50, 89) = 8.445,
p < 0.001. These results indicate that the amount of variance explained throughthe acoustic profile is high, as was expected based on literature (Ladd et al., 1985).
166 E.L. van den Broek et al.
1
2
3
4
5
1 2 3
SUD
Time (minutes)
AnxietyHappy
Fig. 10.4 Reported stressover time per session (i.e.,anxiety triggering and happy)for the Stress-ProvokingStories (SPS) study
10.9.2 Results of the Re-Living (RL) Sessions
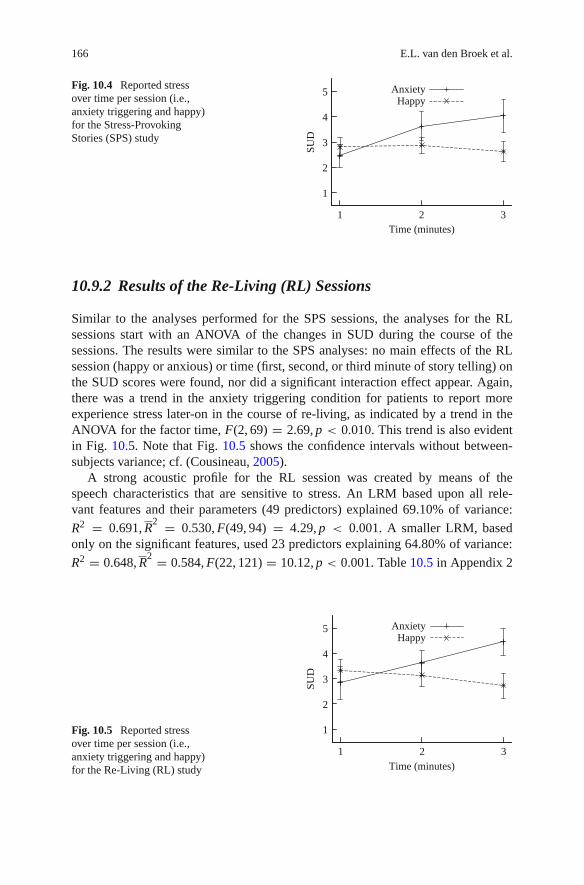
Similar to the analyses performed for the SPS sessions, the analyses for the RLsessions start with an ANOVA of the changes in SUD during the course of thesessions. The results were similar to the SPS analyses: no main effects of the RLsession (happy or anxious) or time (first, second, or third minute of story telling) onthe SUD scores were found, nor did a significant interaction effect appear. Again,there was a trend in the anxiety triggering condition for patients to report moreexperience stress later-on in the course of re-living, as indicated by a trend in theANOVA for the factor time, F(2, 69) = 2.69, p < 0.010. This trend is also evidentin Fig. 10.5. Note that Fig. 10.5 shows the confidence intervals without between-subjects variance; cf. (Cousineau, 2005).
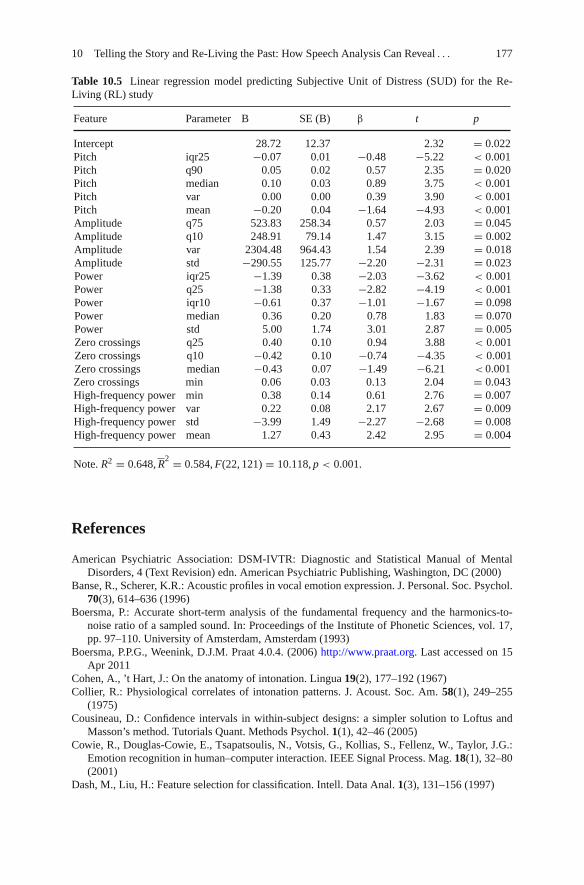
A strong acoustic profile for the RL session was created by means of thespeech characteristics that are sensitive to stress. An LRM based upon all rele-vant features and their parameters (49 predictors) explained 69.10% of variance:
R2 = 0.691, R2 = 0.530, F(49, 94) = 4.29, p < 0.001. A smaller LRM, based
only on the significant features, used 23 predictors explaining 64.80% of variance:
R2 = 0.648, R2 = 0.584, F(22, 121) = 10.12, p < 0.001. Table 10.5 in Appendix 2
1
2
3
4
5
1 2 3
SUD
Time (minutes)
AnxietyHappy
Fig. 10.5 Reported stressover time per session (i.e.,anxiety triggering and happy)for the Re-Living (RL) study
10 Telling the Story and Re-Living the Past: How Speech Analysis Can Reveal . . . 167
shows this acoustic profile with all its significant acoustic features. These resultsindicate that, for the RL sessions, the subjectively reported stress could be explainedvery well, as was expected based on literature (Ladd et al., 1985). However, theexplained variance was lower than for the SPS sessions.
10.9.2.1 Overview of the Features
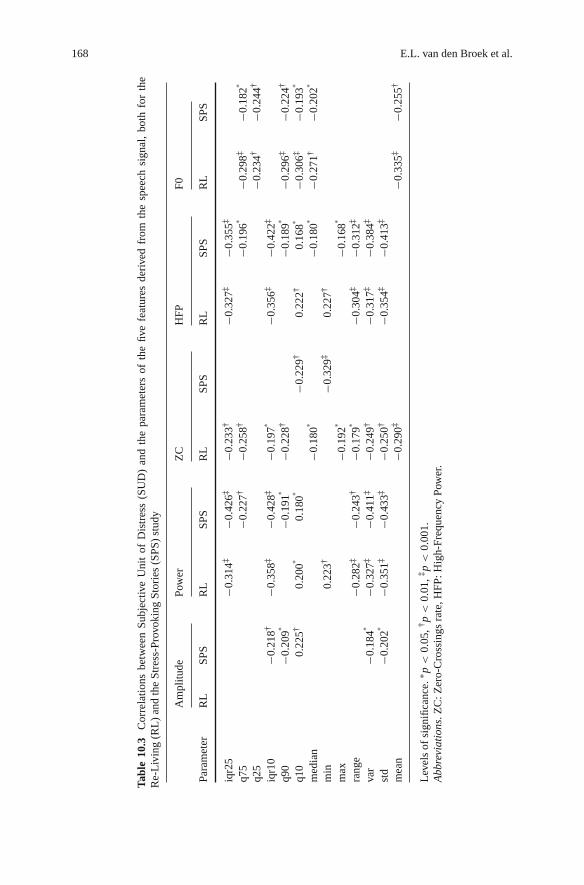
A comparison of the LRM of the RL sessions and the SPS sessions shows there are13 shared predictors: pitch iqr25 and var; amplitude q75, var, and std; power iqr25,q25, and std; zero-crossings q25 and q10; high-frequency power var, std, and mean.However, this comparison is misleading due to the role of the interdependency ofthe predictors in specifying whether or not it has a significant contribution to theestimate. Hence, for a more appropriate comparison, we used a simpler approach;namely, by computing the linear correlation of each feature and its parameters inde-pendent of each other for both data sets (i.e., the RL and SPS data). See Table 10.3for the results.
Table 10.3 shows which predictors are robust for both data sets and which arenot; i.e., which features show a significant linear correlation for the RL as well asthe SPS sessions. The F0 is uniformly robust, namely on its mean and cumulativedistribution (q10, q25, median, q75, q90). Power and high-frequency power showsimilar patterns, though more towards parameters describing the lower part of thecumulative distribution (q10, iqr10, iqr25) and more general statistical parametersused to describe the distribution (std, var, range), only without the mean. There isa perfect similarity between power and high-frequency power in which parame-ters are relevant for both data sets. The features amplitude and zero-crossings haveno parameters relevant for both data sets. Concluding, it seems that especially F0,power, and high-frequency power, are robust features for both data sets.
10.10 Discussion
In this section, we will first briefly discuss the results of both the SPS and RL studies.Next, the results on both studies will be compared to each other. Moreover, theresults of both studies will be related to relevant theory.
10.10.1 Stress-Provoking Stories (SPS) Study
Using the telling of a carefully created story to induce an affective state, stress wassuccessfully induced in and reported by our PTSD patients. By comparing speechcharacteristics to a subjective report of stress, we were able to define and evaluatean acoustic profile of stress features in speech. The acoustic profile was shown toexplain at best 82.60% of variance of subjectively reported experienced stress.
168 E.L. van den Broek et al.
Tabl
e10
.3C
orre
latio
nsbe
twee
nSu
bjec
tive
Uni
tof
Dis
tres
s(S
UD
)an
dth
epa
ram
eter
sof
the
five
feat
ures
deri
ved
from
the
spee
chsi
gnal
,bo
thfo
rth
eR
e-L
ivin
g(R
L)
and
the
Stre
ss-P
rovo
king
Stor
ies
(SPS
)st
udy
Am
plitu
dePo
wer
ZC
HFP
F0
Para
met
erR
LSP
SR
LSP
SR
LSP
SR
LSP
SR
LSP
S
iqr2
5−0
.314
‡−0
.426
‡−0
.233
†−0
.327
‡−0
.355
‡
q75
−0.2
27†
−0.2
58†
−0.1
96∗
−0.2
98‡
−0.1
82∗
q25
−0.2
34†
−0.2
44†
iqr1
0−0
.218
†−0
.358
‡−0
.428
‡−0
.197
∗−0
.356
‡−0
.422
‡
q90
−0.2
09∗
−0.1
91∗
−0.2
28†
−0.1
89∗
−0.2
96‡
−0.2
24†
q10
0.22
5†0.
200∗
0.18
0∗−0
.229
†0.
222†
0.16
8∗−0
.306
‡−0
.193
∗
med
ian
−0.1
80∗
−0.1
80∗
−0.2
71†
−0.2
02∗
min
0.22
3†−0
.329
‡0.
227†
max
−0.1
92∗
−0.1
68∗
rang
e−0
.282
‡−0
.243
†−0
.179
∗−0
.304
‡−0
.312
‡
var
−0.1
84∗
−0.3
27‡
−0.4
11‡
−0.2
49†
−0.3
17‡
−0.3
84‡
std
−0.2
02∗
−0.3
51‡
−0.4
33‡
−0.2
50†
−0.3
54‡
−0.4
13‡
mea
n−0
.290
‡−0
.335
‡−0
.255
†
Lev
els
ofsi
gnifi
canc
e.∗ p
<0.
05,†
p<
0.01
,‡p
<0.
001.
Abb
revi
atio
ns.Z
C:Z
ero-
Cro
ssin
gsra
te,H
FP:H
igh-
Freq
uenc
yPo
wer
.
10 Telling the Story and Re-Living the Past: How Speech Analysis Can Reveal . . . 169
In interpreting the results, two factors will be differentiated: the experienced andthe expressed emotions. In essence, the experienced emotions were targeted by theSUD. Although there was quite some substantial variability in the reported experi-ence, the SUD seemed to have uncovered some expected effects; e.g., the stress inthe fear inducing story appeared to develop through the course of telling the story.The substantial variability can be considered a good thing as well, as it might hint atinter-personal differences which were not evidently expected from the highly stan-dardized stimuli, but which the SUD was able to measure; cf. (Lacey et al., 1953;Lacey, 1967). Furthermore, another issue can be noted in the experience of the sto-ries; namely, stories develop over time, which implies that a build-up is necessarybefore an affective state is induced.
As indicated by the explained variance of the acoustic profile, the expressedemotions seem to reflect the experienced emotions very well. In other words, usingtriangulation through various speech characteristics and the SUD scores indicatedthat true emotions were indeed triggered and expressed. Hence, although storytelling is only one of many ways to induce emotions, it was particularly useful increating an emotion-induced speech signal. Contrary to many other methods, thismethod is likely to have created true emotions.
10.10.2 Re-Living (RL) Study
Apart from the Stress-Provoking Story (SPS) study, our research included a studyin which participants re-lived their traumatic event. As such, this research presentsunique data, containing very rare displays of intense, real, emotions; hence, a dataset with high ecological validity.
Using the RL data set, a Linear Regression Model (LRM) was generated whichexplained at best 69.10% of variance in SUD scores. Although lower than in theSPS study, it is still a very high percentage of explained variance. In interpret-ing these results, again, we differentiate between the experienced and expressedemotion and used the SUD scores to capture the experienced emotions. The sameissues can be denoted as for the SPS study: the SUD scores tended to varyquite substantial across patients, and both showed a build-up in affective statethroughout the session. Hence, the experienced emotions varied between patients,which can be expected as the sessions were relatively less standardized (Laceyet al., 1953; Lacey, 1967); i.e., the patients were merely guided in experienc-ing true emotions. Furthermore, the latter issue is in line with what is known onemotions and their accompanying reactions; that emotions can (indeed) accumu-late over time (Geenen and van de Vijver, 1993; van den Broek and Westerink,2009).
The expressed emotions are intense displays of emotions; as such, parts of thespeech signal even had to be cleaned from non-speech expressions (e.g., crying).Hence, the speech signal clearly reflected emotions. As such, the presented LRM isa rare and clear acoustic profile of true emotions.
170 E.L. van den Broek et al.
10.10.3 Stress-Provoking Stories (SPS) Versus Re-Living (RL)
In comparing the studies, several differences were found: the SUD scores for the RLsessions were not significantly higher than for the SPS sessions, and the explainedvariance of the acoustic profiles was 13.50% lower for the RL study than for theSPS study. Moreover, when comparing the features by their simple linear correla-tion with the SUD data, it showed that some features were clearly robust for bothstudies (i.e., power, high-frequency power, and F0), whereas some were not (i.e.,amplitude and zero-crossings rate). In sum, there were 22 parameters (of which 17were in the amplitude and zero-crossings rate features) which worked for only one ofthe data sets and 18 parameters which worked for both data sets. The robust param-eters could be grouped into specific meaningful parts of the features: for the F0 itsmean and cumulative distribution (q10, q25, median, q75, q90), and for power andhigh-frequency power their lower part of the cumulative distribution (q10, iqr10,iqr25) and more general statistical parameters used to describe the variation of thedistribution (std, var, range). Concluding, there were substantial similarities as wellas differences between the studies, which will be discussed next.
Considering the experienced emotions, the results were counter-intuitive: Thereported stress was not significantly higher in the RL study than in the SPS study.Hence, either the experience was indeed not different from the SPS studies, or intro-spection is fallible. There were, of course, differences in the experienced emotionsbetween the studies; i.e, the stimuli were different. Story telling was used as a highlystandardized laboratory method, whereas the re-living sessions were indeed closerto the patient’s experience. Moreover, this view is also supported by the differencesbetween the acoustic profiles and, by qualitative judgements of the patient’s psy-chiatrists also present during the studies. Hence, this would indicate that the SUDscores were a non-perfect mapping on the truly experienced stress. Even if theactual experienced emotions differed between studies, this should not have causedany differences, as the SUD was designed to query this exact experience. Hence,introspection seems to be fallible. Of course, the problems with introspection arenot new; tackling them is one of the core motivations for this study. Moreover,we analyzed the SUD scores as an interval scale, an assumption that might not becorrect.
The differences between the SPS and the RL study can also be explained bythe notion of emotion specifity or cognitive versus emotional stress (Lacey, 1967;Lively et al., 1993; Rüscha et al., 2009a, b). Cognitive stress is defined as the infor-mation processing load placed on the human operator while performing a task.Emotional stress is the psychological and physiological arousal due to emotionstriggered before or during a task. Both the research setting and the therapeutic set-ting could have caused cognitive stress; so, this would not discriminate between bothstudies. However, possibly the cognitive stress had a higher impact on the speechsignal obtained with the SPS study than on that obtained with the RL study, whereemotional stress was dominant.
Part of the explanation may also be at the expression of emotions. Already morethan a century ago (Marty, 1908), the differentiation between emotional and emotive
10 Telling the Story and Re-Living the Past: How Speech Analysis Can Reveal . . . 171
communication was noted. Emotional communication is a type of spontaneous,unintentional leakage or bursting out of emotion in speech. In contrast, emotivecommunication has no automatic or necessary relation to “real” inner affectivestates. Emotive communication is a strategic signaling of affective information inspeaking to interaction partners that is widespread in interactions. It uses signal pat-terns that differ strongly from spontaneous, emotional expressions and can be bothintentionally and unintentionally accessed (Banse and Scherer, 1996). It is plausiblethat in the RL study relatively more emotional communication took place, whileemotional expressions in the SPS study were based more on features of emotivecommunication.
When the differences in results between the SPS and the RL study are explainedin terms of the distinction between emotional and emotive communication (Banseand Scherer, 1996; Khalil, 2006; Marty, 1908), interesting conclusions can bedrawn. The intersection of the parameter sets of both studies should then reflectthe aspects of the speech signal that are used in emotional communication. The RLstudy triggered “real” emotions and in the SPS study probably also “real” emotionswere revealed in addition to the emotive communication. Consequently, the param-eters unique for the SPS study should reflect characteristics of the speech signalthat represent emotive communication. Additionally, the parameters unique for theRL study should reflect characteristics of the speech signal that represent emotionalcommunication. Further research investigating this hypothesis is desirable.
Having discussed hypotheses based on both the distinction between cognitiveand emotional stress and the theory on emotive and emotional communication, bothnotions should also be taken together. Communication as expressed with emotionalstress (Lacey, 1967; Lively et al., 1993; Rüscha et al., 2009a, b) and emotionalcommunication (Banse and Scherer, 1996; Marty, 1908) could point to the sameunderlying construct of emotionally loaded communication. However, this does nothold for cognitive stress (Lacey, 1967; Lively et al., 1993; Rüscha et al., 2009a, b)and emotive communication (Banse and Scherer, 1996; Khalil, 2006; Marty, 1908).It is possible that both cognitive stress and emotive communication have playeda significant role in the SPS study. This would then involve a complex, unknowninteraction.
10.11 Reflection: Methodological Issues and Suggestions
The design of this research makes it unique in its kind; see also Fig. 10.1. Twostudies were conducted, which were both alike and at the same time completelydifferent. The Stress-Provoking Stories (SPS) study comprised a controlled experi-mental method intended to elicit both stress and more happy feelings. Within theRe-Living (RL) study, true emotions linked to personally experienced situationswere facilitated. In both studies the same patients participated. The studies wereexecuted sequentially, in a counterbalanced order.
A question which is often posed is whether “true” emotions can be triggeredin controlled research environments. Moreover, if emotions can be triggered in
172 E.L. van den Broek et al.
controlled research, how do they relate to emotions experienced in everyday life?Is it only the intensity in which they differ or do different processes underly real-lifesituations? These questions are hard to answer solely based on a review of literature.Problems arise when one compares empirical studies. Recently, a set of prereq-uisites for affective signal processing (ASP) have been presented (van den Broeket al., 2009a; van den Broek et al., 2010a, b, d). Although these prerequisites wereintroduced as guidelines to process biosignals it is posed that they also hold forspeech signals, computer vision techniques, and brain-computer interfaces that aimto determine emotions (van den Broek et al., 2010c, 2010).
In total 10 prerequisites for ASP have been proposed: (i) validation (e.g., map-ping of constructs on signals), (ii) triangulation, (iii) a physiology-driven approach,(iv) contributions of the signal processing community, (v) identification of users,(vi) temporal construction, (vii) theoretical specification, (viii) integration of biosig-nals, (ix) physical characteristics, and (x) reflection: a historical perspective (van denBroek et al., 2009a, 2010a, b, d). These will serve as guidelines in our discussion onthe pros and cons of this research.
The validity of the current research is high. Content validity is high as (a) theresearch aimed at a specific group of patients, (b) the SUD as well as the speechsignal features and their parameters are chosen with care, all denoted repeatedly inliterature; see also Section 10.5, and (c) the SUD in combination with the speech sig-nal features chosen provide a complete image of the patients emotional state, as hasbeen shown. Criteria-related validity is also high as speech was the preferred mea-surement, being robust and unobtrusive. Moreover, we were able to record emotionsreal-time. The SUD was provided each minute, which can also be considered asaccurate, given the context. The construct validity is limited since for both stress andemotions various definitions exist and no general consensus is present. Moreover,no relations are drawn between emotion, stress, psychological changes, physiolog-ical changes, and the speech signal. The ecological validity is high, at least for oneof both studies. For the other study the ecological validity is limited, as illustratedby the difference in results between both studies.
The principle of triangulation is applied; that is, multiple operationalizations ofconstructs were used. The distinct speech signal features could be validated againsteach other and against the SUD. Extrapolations were made using the data setsof both studies and a set of common discriminating speech features have beenidentified. Moreover, the SUD was used as ground truth. However, this requiredintrospection of the patients, which is generally not considered as the most reliablemeasure.
This research did not have the specific aim to employ a physiology-drivenapproach. However, in practice it could be baptized as such. Solely the speech signalis needed to enable automatic therapy assistance.
Various contributions from the signal processing community have been incor-porated in the current research, as is denoted in Section 10.5 and in Table 10.2.However, much more expertise from the signal processing community could beemployed with follow-up research.
The users of the envisioned artificial therapy assistant were clearly defined: ther-apists that treat patients suffering from a PTSD. Possibly, the models developed
10 Telling the Story and Re-Living the Past: How Speech Analysis Can Reveal . . . 173
and features identified in this research can also show their use for other groups ofpatients.
For speech signal processing the temporal construction is not as crucial as it isfor biosignal processing. Due to their nature, various biosignals have different delays(van den Broek et al., 2010a, b, d). In contrast, the speech signal hardly suffers froma delay and all its features have the same latency.
The theoretical specification of the features used is mentioned; e.g., see Sections10.5 and 10.6, and Table 10.2. However, this chapter did not have the aim to elabo-rate exhaustively on this issue. Hence, as such, the theoretical specification providedhere is limited.
This research has used one signal; hence, no integration of signals have beenapplied. However, for both studies, the features and their parameters were all inte-grated in one LRM. Additional other signals were omitted on purpose since theycould contaminate the ecological validity of the research, as they would interferewith the actual tasks the patients had to perform.
This chapter did not specify any physical characteristics, as they are of little inter-est. The artificial therapy assistant should be able to function in a setting as in whichthis research was conducted; hence, having the same physical characteristics. Ingeneral, these are average office settings. Within reason, the speech signal process-ing scheme 2 should be able to handle changing physical characteristics of an office,which could influence the room’s acoustics. However, there are no indications forany problems that could occur as a results of this.
Throughout the chapter, repeatedly, an historical perspective is taken intoaccount. Table 10.2 is even devoted to this. Moreover, for the various speech signals(see Section 10.5) and for the SUD (see Section 10.6), their origins are denoted.
The list of prerequisites is probably not complete. However, it provides an indi-cation for the quality of the methodological foundation of this research and showswhere there is room for improvement.
10.12 Conclusions
This chapter has presented two studies in which the same Post-Traumatic StressDisorder (PTSD) patients participated. This provided us with two unique data sets.Moreover, these data sets could be compared with each other and the influenceof SPS and RL could be compared, because except for the task (i.e., resp. storytelling and re-living) both studies were the same. This has revealed interestingcommon denominators as well as differences between both studies, which are ofconcern for several theoretical frameworks. Moreover, a thorough discussion hasbeen presented, in two phases. First, the results of both studies were discussedand, subsequently, related to each other. Second, a range of aspects concerningthe complete research were discussed, using a set of 10 prerequisites. This empha-sized the strength of the research presented and also provided interesting pointersfor follow-up research.
174 E.L. van den Broek et al.
Derived from the data of each of the studies, a Linear Regression Model (LRM)was developed. These LRMs explained respectively 83% of the variance for theSPS study and 69% of the variance for the RL study, which is both high. Foundedon the results of both studies, a set of generic features has been defined; see alsoTable 10.3. This set could serve as the foundation for the development of modelsthat enable stress identification in a robust and generic manner.
It would be of interest to apply such a model also on patients suffering fromother related psychiatric disorders, such as depression (Kessler, 1997; AmericanPsychiatric Association, 2000) and insomnia (Healey et al., 1981; AmericanPsychiatric Association, 2000). Probably, for even less related psychiatric disor-ders, the current approach would be a good starting point. In such a case, the generalframework and speech signal processing scheme (see Fig. 10.2), as presented in thischapter, could be employed. Most likely, only the set of parameters used for theLRM should have to be tailored to the specific disorders.
The speech signal processing approach used in this research could also be linkedto approaches that measure physiological responsiveness of PTSD in other ways;e.g., using biosignals (van den Broek et al., 2009a; 2010a, b) or computer visiontechniques (Cowie et al., 2001; Zeng et al., 2009). This would facilitate a triangula-tion of the construct under investigation, providing even more reliable results (vanden Broek et al., 2009a). Furthermore, more specific analyses can be conducted,for example, in terms of either the valence and arousal model or discrete emotioncategories (van den Broek et al., 2009a). However, it also has its disadvantages, asdiscussed in the previous section.
The models developed and features and their parameters identified in thisresearch could also be of use for other application areas than psychiatry. It hasalready been posed that consumer electronics (van den Broek and Westerink, 2009)and artificial intelligence (Picard, 1997) could benefit from (unobtrusive) emotiondetection. But also ambient intelligence (van den Broek et al., 2009b), man-machineinteraction (van den Broek et al., 2010c), and robotics (Rani et al., 2002; vanden Broek, 2010) will certainly benefit from the introduction of such techniques.However, in these cases, the group of people to be analyzed is even more diverse.Hence, obtaining robust results in such settings would be even more challengingthan was the case with the current research.
Apart from being unobtrusive, the speech signal processing approach, as appliedin the current research, has another major advantage. It enables the remote deter-mination of people’s emotional state. This feature enables its use in yet anotherrange of contexts; for example, in telepsychiatry (Hilty et al., 2004) and call-centers(Morrison et al., 2007) that frequently have to cope with highly agitated customers.However, as with the different psychiatric disorders and the other application areasmentioned, also in this case the LRM should be adapted to this task.
Taken together, an important and significant step has been made towards aartificial therapy assistant for treatment of patients suffering from a PTSD inparticular and stress-related psychiatric disorders in general. Through the design ofthe research, it was made sure that “real” emotions were measured. Subsequently,their objective measurement through speech signal processing was shown to be
10 Telling the Story and Re-Living the Past: How Speech Analysis Can Reveal . . . 175
feasible. Models were constructed, founded on a selection from 65 parameters offive speech features. With up to 83% explained variance, the models showed to pro-vide reliable, robust classification of stress. As such, the foundation was developedfor an objective, easily usable, unobtrusive, and powerful artificial therapy assistant.
Acknowledgements Most important, we gratefully acknowledge the voluntary participation ofthe post-traumatic stress disorder (PTSD) patients in this research. Further, we acknowledge PaulBoersma (Institute of Phonetic Sciences, University of Amsterdam, NL) for his work on the pro-gram Praat and for his helpful comments in the initial phase of this project. Bert Cranen (Dept. ofLanguage and Speech, Radboud University Nijmegen, NL) is acknowledged for his comments, inparticular on Table 10.2.
Appendix 1: Introduction on Linear Regression Models
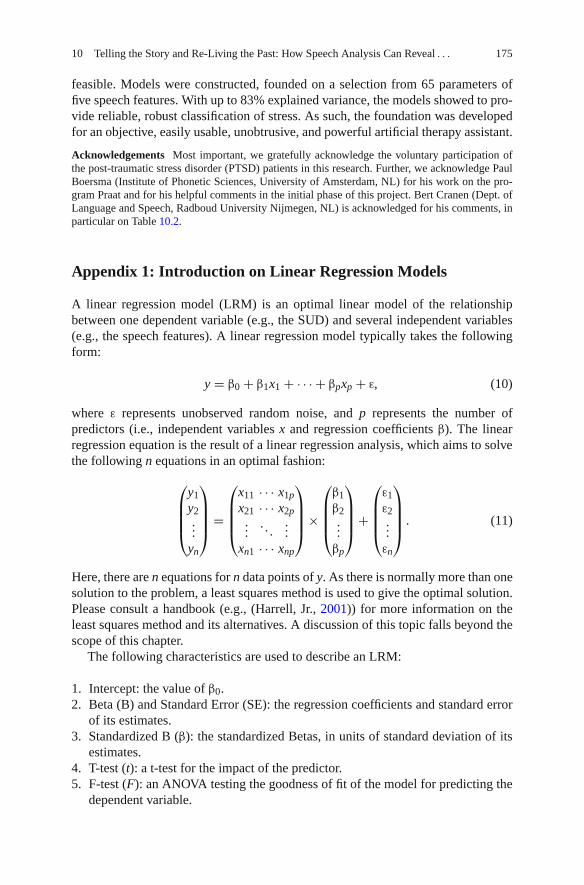
A linear regression model (LRM) is an optimal linear model of the relationshipbetween one dependent variable (e.g., the SUD) and several independent variables(e.g., the speech features). A linear regression model typically takes the followingform:
y = β0 + β1x1 + · · · + βpxp + ε, (10)
where ε represents unobserved random noise, and p represents the number ofpredictors (i.e., independent variables x and regression coefficients β). The linearregression equation is the result of a linear regression analysis, which aims to solvethe following n equations in an optimal fashion:
⎛
⎜⎜⎜⎝
y1y2...
yn
⎞
⎟⎟⎟⎠
=
⎛
⎜⎜⎜⎝
x11 · · · x1p
x21 · · · x2p...
. . ....
xn1 · · · xnp
⎞
⎟⎟⎟⎠
×
⎛
⎜⎜⎜⎝
β1β2...
βp
⎞
⎟⎟⎟⎠
+
⎛
⎜⎜⎜⎝
ε1ε2...εn
⎞
⎟⎟⎟⎠
. (11)
Here, there are n equations for n data points of y. As there is normally more than onesolution to the problem, a least squares method is used to give the optimal solution.Please consult a handbook (e.g., (Harrell, Jr., 2001)) for more information on theleast squares method and its alternatives. A discussion of this topic falls beyond thescope of this chapter.
The following characteristics are used to describe an LRM:
1. Intercept: the value of β0.2. Beta (B) and Standard Error (SE): the regression coefficients and standard error
of its estimates.3. Standardized B (β): the standardized Betas, in units of standard deviation of its
estimates.4. T-test (t): a t-test for the impact of the predictor.5. F-test (F): an ANOVA testing the goodness of fit of the model for predicting the
dependent variable.
176 E.L. van den Broek et al.
6. R-square (R2): the amount of explained variance by the model relative to the totalvariance in the dependent variable.
7. Adjusted R-square (R2): R-square (R2) penalized for the number of predictors
used.
Appendix 2: Specification of the Linear Regression ModelsDeveloped
For both the Stress-Provoking Stories (SPS) study and the Re-Living (RL) study,a LRM was developed. To enable, the replication of these LRM, this Appendixprovides their specifications. Table 10.4 denotes the LRM of the SPS study.Table 10.5 denotes the LRM of the RL study.
Table 10.4 Linear regression model predicting Subjective Unit of Distress (SUD) for Stress-Provoking Stories (SPS) study
Feature Parameter B SE (B) β t p
Intercept 0.85 20.50 0.04 = 0.967Pitch iqr25 0.12 0.03 0.52 3.77 < 0.001Pitch q25 0.08 0.03 0.80 3.09 = 0.003Pitch iqr10 −0.11 0.02 −1.07 −4.36 < 0.001Pitch q10 −0.11 0.03 −1.17 −4.20 < 0.001Pitch min 0.05 0.01 0.21 3.86 < 0.001Pitch var 0.00 0.00 1.10 2.44 = 0.016Pitch std −0.24 0.11 −0.98 −2.16 = 0.033Amplitude q75 1354.02 238.41 1.82 5.68 < 0.001Amplitude q25 1510.39 222.65 2.74 6.78 < 0.001Amplitude var 2288.04 552.51 3.47 4.14 < 0.001Amplitude std −329.34 117.01 −3.58 −2.81 = 0.006Amplitude mean 18019.42 8023.76 0.17 2.25 = 0.027Power iqr25 −1.54 0.42 −2.14 −3.66 < 0.001Power q25 −1.92 0.47 −3.63 −4.08 < 0.001Power range 0.19 0.08 0.30 2.40 = 0.018Power var −0.45 0.11 −5.58 −4.15 < 0.001Power std 11.43 2.16 6.56 5.30 < 0.001Power mean 1.93 0.76 3.46 2.53 = 0.013Zero crossings iqr25 0.13 0.05 0.65 2.80 = 0.006Zero crossings q25 0.37 0.14 0.67 2.60 = 0.011Zero crossings q10 −0.26 0.10 −0.35 −2.55 = 0.012Zero crossings max 0.03 0.01 0.26 3.33 = 0.001Zero crossings var 0.01 0.00 4.12 4.41 < 0.001Zero crossings std −1.33 0.34 −3.54 −3.87 < 0.001Zero crossings mean −0.48 0.16 −1.23 −2.93 = 0.004High-frequency power median −1.01 0.34 −1.89 −2.95 = 0.004High-frequency power range 0.15 0.06 0.30 2.64 = 0.010High-frequency power var 0.22 0.10 2.03 2.23 = 0.028High-frequency power std −5.32 1.72 −2.81 −3.09 = 0.003High-frequency power mean 1.74 0.51 3.03 3.44 < 0.001
Note. R2 = 0.810, R2 = 0.757, F(30, 109) = 15.447, p < 0.001.
10 Telling the Story and Re-Living the Past: How Speech Analysis Can Reveal . . . 177
Table 10.5 Linear regression model predicting Subjective Unit of Distress (SUD) for the Re-Living (RL) study
Feature Parameter B SE (B) β t p
Intercept 28.72 12.37 2.32 = 0.022Pitch iqr25 −0.07 0.01 −0.48 −5.22 < 0.001Pitch q90 0.05 0.02 0.57 2.35 = 0.020Pitch median 0.10 0.03 0.89 3.75 < 0.001Pitch var 0.00 0.00 0.39 3.90 < 0.001Pitch mean −0.20 0.04 −1.64 −4.93 < 0.001Amplitude q75 523.83 258.34 0.57 2.03 = 0.045Amplitude q10 248.91 79.14 1.47 3.15 = 0.002Amplitude var 2304.48 964.43 1.54 2.39 = 0.018Amplitude std −290.55 125.77 −2.20 −2.31 = 0.023Power iqr25 −1.39 0.38 −2.03 −3.62 < 0.001Power q25 −1.38 0.33 −2.82 −4.19 < 0.001Power iqr10 −0.61 0.37 −1.01 −1.67 = 0.098Power median 0.36 0.20 0.78 1.83 = 0.070Power std 5.00 1.74 3.01 2.87 = 0.005Zero crossings q25 0.40 0.10 0.94 3.88 < 0.001Zero crossings q10 −0.42 0.10 −0.74 −4.35 < 0.001Zero crossings median −0.43 0.07 −1.49 −6.21 < 0.001Zero crossings min 0.06 0.03 0.13 2.04 = 0.043High-frequency power min 0.38 0.14 0.61 2.76 = 0.007High-frequency power var 0.22 0.08 2.17 2.67 = 0.009High-frequency power std −3.99 1.49 −2.27 −2.68 = 0.008High-frequency power mean 1.27 0.43 2.42 2.95 = 0.004
Note. R2 = 0.648, R2 = 0.584, F(22, 121) = 10.118, p < 0.001.
References
American Psychiatric Association: DSM-IVTR: Diagnostic and Statistical Manual of MentalDisorders, 4 (Text Revision) edn. American Psychiatric Publishing, Washington, DC (2000)
Banse, R., Scherer, K.R.: Acoustic profiles in vocal emotion expression. J. Personal. Soc. Psychol.70(3), 614–636 (1996)
Boersma, P.: Accurate short-term analysis of the fundamental frequency and the harmonics-to-noise ratio of a sampled sound. In: Proceedings of the Institute of Phonetic Sciences, vol. 17,pp. 97–110. University of Amsterdam, Amsterdam (1993)
Boersma, P.P.G., Weenink, D.J.M. Praat 4.0.4. (2006) http://www.praat.org. Last accessed on 15Apr 2011
Cohen, A., ’t Hart, J.: On the anatomy of intonation. Lingua 19(2), 177–192 (1967)Collier, R.: Physiological correlates of intonation patterns. J. Acoust. Soc. Am. 58(1), 249–255
(1975)Cousineau, D.: Confidence intervals in within-subject designs: a simpler solution to Loftus and
Masson’s method. Tutorials Quant. Methods Psychol. 1(1), 42–46 (2005)Cowie, R., Douglas-Cowie, E., Tsapatsoulis, N., Votsis, G., Kollias, S., Fellenz, W., Taylor, J.G.:
Emotion recognition in human–computer interaction. IEEE Signal Process. Mag. 18(1), 32–80(2001)
Dash, M., Liu, H.: Feature selection for classification. Intell. Data Anal. 1(3), 131–156 (1997)

178 E.L. van den Broek et al.
Derksen, S., Keselman, H.J.: Backward, forward and stepwise automated subset selection algo-rithms: Frequency of obtaining authentic and noise variables. Br. J. Math. Stat. Psychol. 45(2),265–282 (1992)
Dubnowski, J., Schafer, R., Rabiner, L.: Real-time digital hardware pitch detector. IEEE Trans.Acoust. Speech Signal Process. 24(1), 2–8 (1976)
Ehlers, A., Bisson, J., Clark, D.M., Creamer, M., Pilling, S., Richards, D., Schnurr, P.P., Turner, S.,Yule, W.: Do all psychological treatments really work the same in posttraumatic stress disorder?Clin. Psychol. Rev. 30(2), 269–276 (2010)
Geenen, R., van de Vijver, F.J.R.: A simple test of the law of initial values. Psychophysiology30(5), 525–530 (1993)
Greden, J.F.: The burden of recurrent depression: causes, consequences, and future prospects. J.Clin. Psychiatr. 62(S22), 5–9 (2001)
Harrell, F.E., Jr.: Regression Modeling Strategies – with Applications to Linear Models, LogisticRegression, and Survival Analysis. Springer Series in Statistics, 1st (6th printing) edn. Springer,New York, NY (2001)
Harris, C.M., Weiss, M.R.: Pitch extraction by computer processing of high-resolution Fourieranalysis data. J. Acoust. Soc. Am. 35(3), 339–343 (1963)
Healey, E.S., Kales, A., Monroe, L.J., Bixler, E.O., Chamberlin, K., Soldatos, C.R.: Onset ofinsomnia: role of life-stress events. Psychosom. Med. 43(5), 439–451 (1981)
Hilty, D.M., Marks, S.L., Urness, D., Yellowlees, P.M., Nesbitt, T.S.: Clinical and educationaltelepsychiatry applications: a review. Can. J. Psychiatr. 49(1), 12–23 (2004)
Hirano, M., Ohala, J., Vennard, W.: The function of laryngeal muscles in regulating fundamentalfrequency and intensity of phonation. J. Speech Hear. Res. 12(3), 616–628 (1969)
Kedem, B.: Spectral analysis and discrimination by zero-crossings. Proc. IEEE 74(11), 1477–1493(1986)
Kessler, R.C.: The effects of stressful life events on depression. Annu. Rev. Psychol. 48(1), 191–214 (1997)
Khalil, E.N.: Communicating affect in news stories: the case of the lead sentence. Text TalkInterdiscip. J. Lang. Discourse Commun. Stud. 26(3), 329–349 (2006)
Knapp, S., VandeCreek, L.: Anxiety Disorders: A Scientific Approach for Selecting the MostEffective Treatment. US: Professional Resource Press/Professional Resource Exchange,Sarasota (1994)
Kosten, T.R., Mason, J.W., Giller, E.L., Ostroff, R.B., Harkness, L.: Sustained urinarynorepinephrine and epinephrine elevation in post-traumatic stress disorder. Psychoneuro-endocrinology 12(1), 13–20 (1987)
Lacey, J.I.: Somatic response patterning and stress: some revisions of activation theory, pp. 14–42.Appleton-Century-Crofts, New York, NY (1967)
Lacey, J.I., Bateman, D.E., VanLehn, R.: Autonomic response specifity: an experimental study.Psychosomat. Med. 15(1), 8–21 TL1 (1953)
Ladd, D.R., Silverman, K.E.A., Tolkmitt, F., Bergmann, G., Scherer, K.R.: Evidence for the inde-pendent function of intonation contour type, voice quality, and F0 range in signalling speakeraffect. J. Acoustic. Soc. Am. 78(2), 435–444 (1985)
Lenneberg, E.H.: Biological Foundation of Language. Wiley, New York, NY (1967)Lively, S.E., Pisoni, D.B., van Summers, W., Bernacki, R.H.: Effects of cognitive workload on
speech production: acoustic analyses and perceptual consequences. J. Acoust. Soc. Am. 93(5),2962–2973 (1993)
Lyons, R.G.: Understanding Digital Signal Processing, 2nd edn. Prentice Hall PTR, Upper SaddleRiver (2004)
Marty, A.: Untersuchungen zur allgemeinen grundlegung der Grammatik und sprachphilosophie.Niemeyer, Halle/Saale (1908). Translation of title: Investigations on the general foundations ofgrammar and the philosophy of language
Mevissen, L., De Jongh, A.: PTSD and its treatment in people with intellectual disabilities: a reviewof the literature. Clin. Psychol. Rev. 30(3), 308–316 (2010)
10 Telling the Story and Re-Living the Past: How Speech Analysis Can Reveal . . . 179
Morrison, D., Wang, R., De Silva, L.C.: Ensemble methods for spoken emotion recognition incall-centres. Speech Commun. 49(2), 98–112 (2007)
Murray, I.R., Arnott, J.L.: Toward the simulation of emotion in synthetic speech: a review of theliterature on human vocal emotion. J. Acoust. Soc. Am. 93(2), 1097–1108 (1993)
Orlikoff, R.F., Baken, R.J.: Fundamental frequency modulation of the human voice by the heart-beat: preliminary results and possible mechanisms. J. Acoust. Soc. Am. 85(2), 888–893(1989)
Picard, R.W.: Affective Computing. MIT Press, Boston, MA (1997)Rabiner, L., Cheng, M., Rosenberg, A., McGonegal, C.: A comparative performance study of sev-
eral pitch detection algorithms. IEEE Trans. Acoust. Speech Signal Process. 24(5), 399–418(1976)
Rani, P., Sims, J., Brackin, R., Sarkar, N.: Online stress detection using psychophysiological signalsfor implicit human-robot cooperation. Robotica 20(6), 673–685 (2002)
Ray, S.L.: Evolution of posttraumatic stress disorder and future directions. Arch. Psychiatr. Nurs.22(4), 217–225 (2008)
Rice, S.O.: Mathematical Analysis of Random Noise. ATI 162 535Monograph B-1589. BellTelephone Labs, New York, NY (1952)
Rienstra, S., Hirschberg, A.: An Introduction to Acoustics, 5th edn. Extended and revised editionof IWDE 92-06 (TU/e). Eindhoven University of Technology, Eindhoven, The Netherlands(2009)
Rothkrantz, L.J.M., Wiggers, P., vanWees, J.-W.A.„ van Vark, R.J.: Voice stress analysis. Lect.Notes Comput. Sci. (Text, Speech Dialog.) 3206, 449–456 (2004)
Rubin, D.C., Berntsen, D., Klindt Bohni, M.: A memory-based model of posttraumatic stressdisorder: evaluating basic assumptions underlying the PTSD diagnosis. Psychol. Rev. 115(4),985–1011 (2008)
Rüscha, N., Corrigan, P.W., Powell, K., Rajah, A., Olschewski, M., Wilkniss, S., Batia, K.: Astress-coping model of mental illness stigma: II. Emotional stress responses, coping behaviorand outcome. Schizophr. Res. 110(1–3), 65–71 (2009a)
Rüscha, N., Corrigan, P.W., Wassel, A., Michaels, P., Olschewski, M., Wilkniss, S., Batia, K.:A stress-coping model of mental illness stigma: I. Predictors of cognitive stress appraisal.Schizophr. Res. 110(1–3), 59–64 (2009b)
Scherer, K.R.: Vocal communication of emotion: a review of research paradigms. Speech Commun.40(1–2), 227–256 (2003)
Shimamura, T., Kobayashi, H.: Weighted autocorrelation for pitch extraction of noisy speech. IEEETrans. Speech Audio Process. 9(7), 727–730 (2001)
Sánchez-Meca, J., Rosa-Alcázar, A.I., Marín-Martínez, F., Gómez-Conesa, A.: Psychologicaltreatment of panic disorder with or without agoraphobia: a meta-analysis. Clin. Psychol. Rev.30(1), 37–50 (2010)
Titze, I.R., Hunter, E.J.: A two-dimensional biomechanical model of vocal fold posturing. J.Acoust. Soc. Am. 121(4), 2254–2260 (2007)
van den Broek, E.L.: Robot nannies: future or fiction? Interact. Stud. 11(2), 274–282 (2010)van den Broek, E.L., Janssen, J.H., Healey, J.A.„ van der Zwaag, M.D.: Prerequisites for Affective
Signal Processing (ASP) – Part II. In: Fred, A., Filipe, J., Gamboa, H. (eds.) Biosignals 2010:Proceedings of the International Conference on Bio-Inspired Systems and Signal Processing,pp. 188–193. Valencia, Spain (2010a)
van den Broek, E.L., Janssen, J.H., Westerink, J.H.D.M., Healey, J.A. Prerequisites for AffectiveSignal Processing (ASP). In: Encarnação, P., Veloso, A. (eds.) Biosignals 2009: Proceedingsof the International Conference on Bio-Inspired Systems and Signal Processing, pp. 426–433.Porto – Portugal (2009a)
van den Broek, E.L., Janssen, J.H., van der Zwaag, M.D., Healey, J.A. Prerequisits for AffectiveSignal Processing (ASP) – Part III. In: Fred, A., Filipe, J., Gamboa, H. (eds.) Biosignals 2010:Proceedings of the International Conference on Bio-Inspired Systems and Signal Processing,pp. 432–435. Valencia – Spain (2010b)

180 E.L. van den Broek et al.
van den Broek, E.L., Lisý, V., Janssen, J.H., Westerink, J.H.D.M., Schut, M.H., Tuinenbreijer,K.: Affective Man-Machine Interface: Unveiling Human Emotions Through Biosignals,Volume 52 of Communications in Computer and Information Science, pp. 21–47. Springer,Berlin/Heidelberg (2010c)
van den Broek, E.L., Schut, M.H., Westerink, J.H.D.M., Tuinenbreijer, K.: Unobtrusive sensing ofemotions (USE). J. Ambient Intell. Smart Environ. 1(3), 287–299 (2009b)
van den Broek, E.L., Westerink, J.H.D.M.: Considerations for emotion-aware consumer products.Appl. Ergon. 40(6), 1055–1064 (2009)
van den Broek, E.L., van der Zwaag, M.D., Healey, J.A., Janssen, J.H., Westerink, J.H.D.M.Prerequisits for Affective Signal Processing (ASP) – Part IV. In: Kim, J., Karjalainen, P. (eds.)Proceedings of the 1st International Workshop on Bio-Inspired Human-Machine Interfaces andHealthcare Applications – B-Interface, pp. 59–66. Valencia – Spain (2010d)
Ververidis, D., Kotropoulos, C.: Emotional speech recognition: Resources, features, and methods.Speech Commun. 48(9), 1162–1181 (2006)
Wendt, C., Petropulu, A.P. Pitch determination and speech segmentation using the discrete wavelettransform. In: IEEE International Symposium on Circuits and Systems: Connecting the World,vol. 2, pp. 45–48. IEEE Computer Society, Atlanta, GA, New York, NY (1996)
Wolpe, J.: Psychotherapy by Reciprocal Inhibition. Stanford University Press, Stanford (1958)Zeng, Z., Pantic, M., Roisman, G.I., Huang, T.S.: A survey of affect recognition methods: audio,
visual, and spontaneous expressions. IEEE Trans. Pattern Anal. Mach. Intell. 31(1), 39–58(2009)