Television Food Advertising to Children: A Global Perspective
7
Television Food Advertising to Children: A Global Perspective Bridget Kelly, MPH, Jason C.G. Halford, PhD, Emma J. Boyland, MSc, MBA, Kathy Chapman, MS, Inmaculada Bautista-Castan ˜o, MD, PhD, Christina Berg, PhD, Margherita Caroli, MD, PhD, Brian Cook, PhD, Janine G. Coutinho, MSc, Tobias Effertz, PhD, Evangelia Grammatikaki, MSc, Kathleen Keller, PhD, Raymond Leung, M Med, Yannis Manios, PhD, Renata Monteiro, PhD, Claire Pedley, MSc, Hillevi Prell, MSc, Kim Raine, PhD, Elisabetta Recine, PhD, Lluis Serra-Majem, PhD, Sonia Singh, MS, and Carolyn Summerbell, PhD Excess weight in children is a significant global public health issue: 10% of school-aged chil- dren, 1 and a further 22 million children younger than 5 years, 2 are estimated to be overweight or obese. Although the absolute prevalence of childhood obesity varies between and within countries, 3 obesity levels are rising across the globe. 4 Food marketing to children has been recog- nized as 1 factor contributing to the obesity- promoting environment, and it is considered an important arena for action in the prevention of obesity. 5 Systematic reviews have found that marketing generates positive beliefs about ad- vertised foods and influences children’s food preferences, purchase requests, and consump- tion. 6–8 These findings are a concern because advertised foods are typically the antithesis of dietary recommendations. 9 Evidence from psychological research indi- cates that children, particularly those younger than 8 years, are not fully aware of the persuasive intent of food marketing and tend to accept advertising as truthful, accurate, and unbiased. 8,10 Older children, although they may understand that advertising is intended to sell a product, may not be able to interpret these messages critically. 10 Only a few studies have compared interna- tional patterns of television food advertising to children. One of these found that food and beverages were the most highly advertised products and that confectionery, presugared breakfast cereals and fast-food restaurants accounted for over half of all food advertise- ments. 11 Analyses of persuasive marketing tech- niques, such as the use of promotional charac- ters and premiums in television advertising from individual countries, have found them to be concentrated in advertisements for unhealthy food products and during the broadcast periods most popular with children. An Australian study found that the rate of unhealthy food advertisements containing premiums was 18 times as high and the rate of advertisements containing promotional char- acters was twice as high during the most popular children’s programs as during adults’ popular programs. 12 We determined and compared the fre- quency and nature of television food advertis- ing to children in a range of countries. We also assessed food advertising during children’s peak viewing periods and the use of persuasive marketing techniques. METHODS We undertook a collaboration among 13 independent research groups in 11 countries. The groups were based in Sydney, Australia; Brasilı ´a, Brazil; Edmonton, Alberta; Toronto, Ontario; Hong Kong, China; Hamburg, Ger- many; Athens, Greece; Brindisi, Italy; Las Palmas de Gran Canaria, Spain; Gothenburg, Sweden; Liverpool and Durham, United King- dom; and New York City. Sampling Each research group recorded television data for 2 weekdays and 2 weekend days between 6:00 and 22:00, for the 3 channels most popular with children younger than 13 years. Each group analyzed 192 hours of television broadcasting from an overall sample of 2496 hours. For countries with a high penetration of cable or pay TV (‡ 50%), these channels were con- sidered for inclusion. Where cable or pay TV penetration was less than 50% of households, only free-to-air channels were considered. Channels were selected according to audience measurement data. Where these data were not available, we consulted with experts in the field and searched recognized sources of children’s television viewing to ensure that we selected the most appropriate channels. Objectives. We compared television food advertising to children in several countries. Methods. We undertook a collaboration among 13 research groups in Australia, Asia, Western Europe, and North and South America. Each group recorded programming for 2 weekdays and 2 weekend days between 6:00 and 22:00, for the 3 channels most watched by children, between October 2007 and March 2008. We classified food advertisements as core (nutrient dense, low in energy), noncore (high in undesirable nutrients or energy, as defined by dietary standards), or miscellaneous. We also categorized thematic content (promo- tional characters and premiums). Results. Food advertisements composed 11% to 29% of advertisements. Noncore foods were featured in 53% to 87% of food advertisements, and the rate of noncore food advertising was higher during children’s peak viewing times. Most food advertisements containing persuasive marketing were for noncore products. Conclusions. Across all sampled countries, children were exposed to high volumes of television advertising for unhealthy foods, featuring child- oriented persuasive techniques. Because of the proven connections between food advertising, preferences, and consumption, our findings lend support to calls for regulation of food advertising during children’s peak viewing times. (Am J Public Health. 2010;100:1730–1736. doi:10.2105/AJPH.2009. 179267) RESEARCH AND PRACTICE 1730 | Research and Practice | Peer Reviewed | Kelly et al. American Journal of Public Health | September 2010, Vol 100, No. 9
Transcript of Television Food Advertising to Children: A Global Perspective
Television Food Advertising to Children: A Global PerspectiveBridget Kelly, MPH, Jason C.G. Halford, PhD, Emma J. Boyland, MSc, MBA, Kathy Chapman, MS, Inmaculada Bautista-Castano, MD, PhD, Christina Berg,PhD, Margherita Caroli, MD, PhD, Brian Cook, PhD, Janine G. Coutinho, MSc, Tobias Effertz, PhD, Evangelia Grammatikaki, MSc, Kathleen Keller, PhD,Raymond Leung, M Med, Yannis Manios, PhD, Renata Monteiro, PhD, Claire Pedley, MSc, Hillevi Prell, MSc, Kim Raine, PhD, Elisabetta Recine, PhD,Lluis Serra-Majem, PhD, Sonia Singh, MS, and Carolyn Summerbell, PhD
Excess weight in children is a significant globalpublic health issue: 10% of school-aged chil-dren,1 and a further 22 million children youngerthan 5 years,2 are estimated to be overweight orobese. Although the absolute prevalence ofchildhood obesity varies between and withincountries,3 obesity levels are rising across theglobe.4
Food marketing to children has been recog-nized as 1 factor contributing to the obesity-promoting environment, and it is considered animportant arena for action in the prevention ofobesity.5 Systematic reviews have found thatmarketing generates positive beliefs about ad-vertised foods and influences children’s foodpreferences, purchase requests, and consump-tion.6–8 These findings are a concern becauseadvertised foods are typically the antithesis ofdietary recommendations.9
Evidence from psychological research indi-cates that children, particularly those youngerthan 8 years, are not fully aware of thepersuasive intent of food marketing and tend toaccept advertising as truthful, accurate, andunbiased.8,10 Older children, although they mayunderstand that advertising is intended to sella product, may not be able to interpret thesemessages critically.10
Only a few studies have compared interna-tional patterns of television food advertising tochildren. One of these found that food andbeverages were the most highly advertisedproducts and that confectionery, presugaredbreakfast cereals and fast-food restaurantsaccounted for over half of all food advertise-ments.11
Analyses of persuasive marketing tech-niques, such as the use of promotional charac-ters and premiums in television advertisingfrom individual countries, have found themto be concentrated in advertisements forunhealthy food products and during thebroadcast periods most popular with children.An Australian study found that the rate of
unhealthy food advertisements containingpremiums was 18 times as high and the rate ofadvertisements containing promotional char-acters was twice as high during the mostpopular children’s programs as during adults’popular programs.12
We determined and compared the fre-quency and nature of television food advertis-ing to children in a range of countries. We alsoassessed food advertising during children’speak viewing periods and the use of persuasivemarketing techniques.
METHODS
We undertook a collaboration among 13independent research groups in 11 countries.The groups were based in Sydney, Australia;Brasilıa, Brazil; Edmonton, Alberta; Toronto,Ontario; Hong Kong, China; Hamburg, Ger-many; Athens, Greece; Brindisi, Italy; LasPalmas de Gran Canaria, Spain; Gothenburg,
Sweden; Liverpool and Durham, United King-dom; and New York City.
Sampling
Each research group recorded televisiondata for 2 weekdays and 2 weekend daysbetween 6:00 and 22:00, for the 3 channelsmost popular with children younger than 13years. Each group analyzed 192 hours oftelevision broadcasting from an overall sampleof 2496 hours.
For countries with a high penetration of cableor pay TV (‡50%), these channels were con-sidered for inclusion. Where cable or pay TVpenetration was less than 50% of households,only free-to-air channels were considered.Channels were selected according to audiencemeasurement data. Where these data werenot available, we consulted with experts inthe field and searched recognized sources ofchildren’s television viewing to ensure thatwe selected the most appropriate channels.
Objectives. We compared television food advertising to children in several
countries.
Methods. We undertook a collaboration among 13 research groups in
Australia, Asia, Western Europe, and North and South America. Each group
recorded programming for 2 weekdays and 2 weekend days between 6:00 and
22:00, for the 3 channels most watched by children, between October 2007 and
March 2008. We classified food advertisements as core (nutrient dense, low in
energy), noncore (high in undesirable nutrients or energy, as defined by dietary
standards), or miscellaneous. We also categorized thematic content (promo-
tional characters and premiums).
Results. Food advertisements composed 11% to 29% of advertisements.
Noncore foods were featured in 53% to 87% of food advertisements, and the
rate of noncore food advertising was higher during children’s peak viewing
times. Most food advertisements containing persuasive marketing were for
noncore products.
Conclusions. Across all sampled countries, children were exposed to high
volumes of television advertising for unhealthy foods, featuring child-
oriented persuasive techniques. Because of the proven connections between
food advertising, preferences, and consumption, our findings lend support
to calls for regulation of food advertising during children’s peak viewing
times. (Am J Public Health. 2010;100:1730–1736. doi:10.2105/AJPH.2009.
179267)
RESEARCH AND PRACTICE
1730 | Research and Practice | Peer Reviewed | Kelly et al. American Journal of Public Health | September 2010, Vol 100, No. 9

Television data were recorded onto DVDsor hard disks. Where possible, we recordeddata for all channels simultaneously. Other-wise, we recorded over successive weeks, witheach channel recorded on the same days of theweek to avoid any differences in advertisingpatterns between weekdays.
We collected data between October 2007and March 2008. The data collection periodexcluded national holidays, large sportingcompetitions, special events, and holiday pe-riods, to ensure that data represented typicalbroadcasting.
Coding
Overall advertisements. Each group scanned,logged, and classified recorded programmingfor advertisements according to predefinedcriteria. Criteria included the program categoryin which the advertisement was shown, theadvertised product type, and the period whenthe advertisement was broadcast, as eitherchildren’s peak or nonpeak viewing times.Children’s peak viewing times were defined asperiods when the number of children watchingtelevision (all channels combined) was greaterthan a quarter of the maximum child audiencerating for the day. Data on children’s peakviewing times were derived from the averagechild audience viewing pattern over the pre-vious year, given separately for weekdays andweekend days. This definition was used pre-viously to classify children’s peak viewingtimes.12 Where these data were not available, wetried to obtain representative data.
Food and beverage advertisements. Food andbeverage advertisements were categorized aseither core, for items that were nutrient denseand low in discretionary energy; noncore, forproducts that were relatively high in undesir-able nutrients, including fat and sodium, orenergy (according to the Australian DietaryGuidelines,13 which are similar to those of manyof the countries in the study); or miscellaneous.We further subdivided the advertised productsinto 28 categories according to a food classifica-tion system used in previous research on foodadvertising to children (Table 1).12,14–16
For food-coding ambiguities, we developedstandard coding procedures. Where multiplefood products were shown in an advertisement,we coded the most dominant product. Whereequal weight was given to 2 or more products,
we used the first product shown. If the adver-tisement was for a brand name only, weconsidered the nature of the products pro-moted by the advertised company (e.g., anadvertisement for a fast-food brand was codedas a fast-food restaurant meal).
We screened food advertisements for 2persuasive marketing techniques: premiums,including competitions, giveaways, rebates, andvouchers, and promotional characters, includ-ing celebrities, sports figures, cartoon charac-ters, and spokesperson or branded characters.
Reliability. We assessed reliability of codingwith a random 1-hour test sample of televisionrecording. To determine within-group reliabil-ity, where more than 1 person performed thedata coding, each person coded the test sampleand the correlation between individuals’ re-sults (person 1 divided by person 2) was calcu-lated. Agreement between coders ranged from87% to 100% for food versus nonfood classi-fication and 94% to 100% for food categoryclassification.
For between-group reliability, the Australiangroup recoded the test sample from each group(Australian group’s coding/other group’s cod-ing). Cohen’s j statistic assessed the correlationbetween groups’ coding. The j statistic for theclassification of advertisements as for eitherfood or nonfood products between groups wasbetween 0.81 and 1.00, indicating almost per-fect agreement.17
For a comparison of food category coding,we derived a j statistic of 0.33 for Germany,indicating fair agreement.17 The lower correla-tion between Germany and the reference groupwas attributable to differences in coding of only1advertisement, for a probiotic drink, which wasrepeated during the test recording period (codedas sugar-sweetened drink by the German groupand as low-fat dairy by the reference group).For all other groups, the j statistic for food cat-egory coding ranged between 0.74 (substantialagreement) and 1.0 (almost perfect agreement).
Analysis
We analyzed data descriptively overall andfor individual groups with SPSS version 14.0for Windows (SPSS Inc, Chicago, IL). Data forthe 2 groups from Canada and from the UnitedKingdom were merged so that results couldbe presented for each country overall. Pearsonc2 tests were applied to determine significant
differences in the proportion of food adver-tisements for different viewing periods and theuse of persuasive marketing. We consideredresults significant at the a=.05 level.
RESULTS
We recorded a total of 2448.5 hours ofprogramming. Because of recording errors, weomitted 2 hours from Alberta, 21.5 hours fromOntario, and 24 hours from New York City.
Overall Food Advertising
Across countries, 68462 advertisementswere identified, of which 18% were for food.Overall, food was the second most frequentlyadvertised product, after channel promotions(23%); in each country, food products were inthe top 3 advertised products, contributingbetween 11% (Brazil, n=454) and 29%(Greece, n=1816, and Italy, n=732) of ad-vertisements.
The overall rate of food advertising acrossthe sample was 5 food advertisements per hourper channel. Greece had the highest rate offood advertising: 9 food advertisements perhour per channel. Brazil had the lowest: 2 foodadvertisements per hour per channel.
For all countries, the majority of food ad-vertisements were for noncore foods (67%).Germany had the highest proportion of non-core food advertisements (87%; Figure 1).
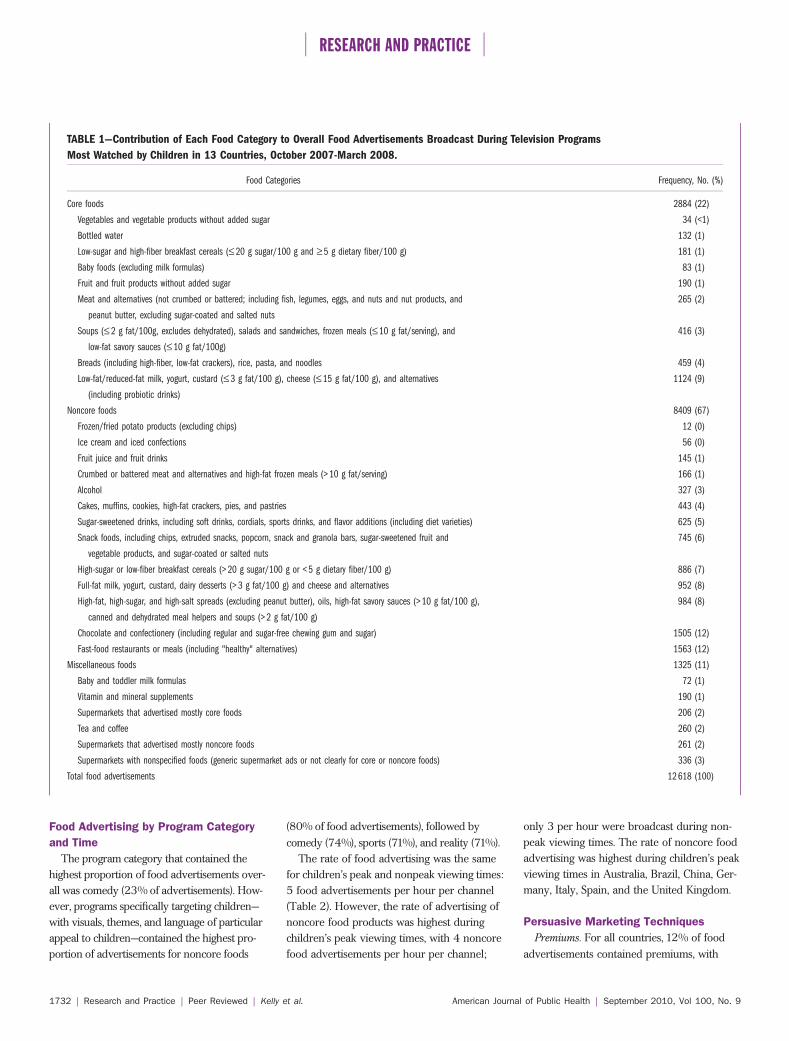
The most frequently advertised food groupswere fast-food restaurant meals (12% of foodadvertisements), chocolate and confectionery(12%), low-fat dairy products (9%), high-fat,high-sugar, or high-salt spreads and sauces(8%), and full-fat dairy products (8%; Table 1).
Fast-food restaurant meals were the mostfrequently advertised food products in theUnited States (32% of food advertisements),Canada (24%), Sweden (15%), and Australia(14%). Chocolate and confectionery was themost frequently advertised food product inGermany (26%), China (17%), and Italy (17%),and full-fat dairy products were the mostadvertised products in Greece (21%). Low-fatdairy foods were the most frequently adver-tised food products in Spain (30%) and theUnited Kingdom (14%); the most frequentlyadvertised food or food-related item for Brazilwas supermarkets (miscellaneous).
RESEARCH AND PRACTICE
September 2010, Vol 100, No. 9 | American Journal of Public Health Kelly et al. | Peer Reviewed | Research and Practice | 1731
Food Advertising by Program Category
and Time
The program category that contained thehighest proportion of food advertisements over-all was comedy (23% of advertisements). How-ever, programs specifically targeting children—with visuals, themes, and language of particularappeal to children—contained the highest pro-portion of advertisements for noncore foods
(80% of food advertisements), followed bycomedy (74%), sports (71%), and reality (71%).
The rate of food advertising was the samefor children’s peak and nonpeak viewing times:5 food advertisements per hour per channel(Table 2). However, the rate of advertising ofnoncore food products was highest duringchildren’s peak viewing times, with 4 noncorefood advertisements per hour per channel;
only 3 per hour were broadcast during non-peak viewing times. The rate of noncore foodadvertising was highest during children’s peakviewing times in Australia, Brazil, China, Ger-many, Italy, Spain, and the United Kingdom.
Persuasive Marketing Techniques
Premiums. For all countries, 12% of foodadvertisements contained premiums, with
TABLE 1—Contribution of Each Food Category to Overall Food Advertisements Broadcast During Television Programs
Most Watched by Children in 13 Countries, October 2007-March 2008.
Food Categories Frequency, No. (%)
Core foods 2884 (22)
Vegetables and vegetable products without added sugar 34 (<1)
Bottled water 132 (1)
Low-sugar and high-fiber breakfast cereals (£ 20 g sugar/100 g and ‡ 5 g dietary fiber/100 g) 181 (1)
Baby foods (excluding milk formulas) 83 (1)
Fruit and fruit products without added sugar 190 (1)
Meat and alternatives (not crumbed or battered; including fish, legumes, eggs, and nuts and nut products, and
peanut butter, excluding sugar-coated and salted nuts
265 (2)
Soups (£ 2 g fat/100g, excludes dehydrated), salads and sandwiches, frozen meals (£ 10 g fat/serving), and
low-fat savory sauces (£ 10 g fat/100g)
416 (3)
Breads (including high-fiber, low-fat crackers), rice, pasta, and noodles 459 (4)
Low-fat/reduced-fat milk, yogurt, custard (£ 3 g fat/100 g), cheese (£ 15 g fat/100 g), and alternatives
(including probiotic drinks)
1124 (9)
Noncore foods 8409 (67)
Frozen/fried potato products (excluding chips) 12 (0)
Ice cream and iced confections 56 (0)
Fruit juice and fruit drinks 145 (1)
Crumbed or battered meat and alternatives and high-fat frozen meals (> 10 g fat/serving) 166 (1)
Alcohol 327 (3)
Cakes, muffins, cookies, high-fat crackers, pies, and pastries 443 (4)
Sugar-sweetened drinks, including soft drinks, cordials, sports drinks, and flavor additions (including diet varieties) 625 (5)
Snack foods, including chips, extruded snacks, popcorn, snack and granola bars, sugar-sweetened fruit and
vegetable products, and sugar-coated or salted nuts
745 (6)
High-sugar or low-fiber breakfast cereals (> 20 g sugar/100 g or < 5 g dietary fiber/100 g) 886 (7)
Full-fat milk, yogurt, custard, dairy desserts (> 3 g fat/100 g) and cheese and alternatives 952 (8)
High-fat, high-sugar, and high-salt spreads (excluding peanut butter), oils, high-fat savory sauces (> 10 g fat/100 g),
canned and dehydrated meal helpers and soups (> 2 g fat/100 g)
984 (8)
Chocolate and confectionery (including regular and sugar-free chewing gum and sugar) 1505 (12)
Fast-food restaurants or meals (including "healthy" alternatives) 1563 (12)
Miscellaneous foods 1325 (11)
Baby and toddler milk formulas 72 (1)
Vitamin and mineral supplements 190 (1)
Supermarkets that advertised mostly core foods 206 (2)
Tea and coffee 260 (2)
Supermarkets that advertised mostly noncore foods 261 (2)
Supermarkets with nonspecified foods (generic supermarket ads or not clearly for core or noncore foods) 336 (3)
Total food advertisements 12 618 (100)
RESEARCH AND PRACTICE
1732 | Research and Practice | Peer Reviewed | Kelly et al. American Journal of Public Health | September 2010, Vol 100, No. 9

a range of 2% (Greece) to 34% (United States).Significantly more food advertisements con-taining premiums were for noncore foods(75% vs 13% for core and 12% for miscella-neous foods; c2
1=93.28; P< .001). We ob-served this tendency across all countries,with the exception of China, where 54% ofall food advertisements featuring premiums
were for miscellaneous food products (Fig-ure 2). Notably, all food advertisementscontaining premiums in Germany (n=338)and Sweden (n=48) were for noncore foodproducts.
Overall, a significantly higher proportion offood advertisements containing premiumswere aired during children’s peak viewing
times than during nonpeak times (17% vs 8%;c2
1=199.48; P<.001).Promotional characters. In all countries, 23%
of all food advertisements contained promo-tional characters, with a range of 9% (Italy) to49% (United States). Significantly more adver-tisements featuring promotional characterswere for noncore foods (79% vs 15% for coreand 6% for miscellaneous; c2
1=268.71;P< .001). In all countries, the highest propor-tion of all food advertisements containing pro-motional characters were for noncore foods,with the exception of China (49% for corefoods) and Italy (36% for miscellaneous foods;Figure 2).
Overall, similar proportions of food adver-tisements containing promotional characterswere aired during children’s peak (23%) andnonpeak viewing times (22%; not significant).
DISCUSSION
We compared television food advertisingpatterns in 13 countries across 5 continents.We observed wide variability in the rate offood advertising in each country—between 2and 9 food advertisements per hour per chan-nel. We also found variation in the rate of foodadvertising during children’s peak viewingtimes, with between 3 and 9 food advertise-ments per hour per channel.
Our findings suggest that if children watchtelevision only 2 hours per day (a conservativefigure) and if this viewing takes place during themost popular broadcast periods for children,they are exposed to between 56 and 126 foodadvertisements per week (median=70), in-cluding 28 to 84 noncore food advertisements(median=56). Greece has the highest rate offood to noncore food advertising, approxi-mately 3 times that of Brazil, with the lowestrate. Previous research has identified associa-tive effects between the frequency of unhealthyfood advertising on television and the preva-lence of children’s excess weight.18 The vari-ability in food advertising patterns that we foundmay contribute to differences in children’s weightstatus between countries, although this ques-tion requires further study.
Across our sample, the majority of adver-tised food products were noncore, with fast-food restaurant meals and chocolate andconfectionery the most frequently advertised
FIGURE 1—Proportion of major food groups advertised, by country.
TABLE 2—Rate of Advertising of Food and Noncore Foods During
Children’s Peak and Nonpeak Viewing Times by Country
Peak Viewing Times, Ads Per Hour Per Channel Nonpeak Viewing Times, Ads Per Hour Per Channel
Country Food, Rate Noncore Food, Rate Food, Rate Noncore Food, Rate
Greece 9 5 10 6
Germany 7 6 4 4
China 7 4 3 2
Spain 6 5 6 3
Sweden 6 4 6 4
United States 5 4 5 4
Australia 5 3 5 2
United Kingdom 5 3 3 2
Canada 4 3 6 5
Italy 4 3 3 2
Brazil 4 2 1 0
Overall 5 4 5 3
Note. Noncore foods include products relatively high in undesirable nutrients, including fat and sodium, or energy (as definedin dietary guidelines).
RESEARCH AND PRACTICE
September 2010, Vol 100, No. 9 | American Journal of Public Health Kelly et al. | Peer Reviewed | Research and Practice | 1733

food groups. Although the high frequencyof advertisements for low-fat dairy productsand the presence of advertisements for corefood products in some countries were posi-tive factors, the frequency of noncore foodsfar outweighed these healthy food advertise-ments.
Analyses from individual countries alsosupport the finding that unhealthy foods dom-inate television advertising to children. Forexample, Australian research from 2006 to2007 showed that noncore food advertisingwas consistently highest during programs mostpopular with children.19,20 Similarly, researchfrom the United Kingdom in 2005 found thatthe most frequently advertised products ontelevision were sugary breakfast cereals, confec-tionery, and soft drinks.21 Longitudinal researchon food advertising during Saturday morningprograms for the previous 3 decades in theUnited States indicated an increasing frequencyof fast-food restaurant advertisements and a con-sistently high rate of advertising for other high-fat, high-sugar foods.22 In Brazil, a 2006 analysisof 1040 hours of broadcasting from cable andpay-TV channels directed to children found that72% of food advertisements were for unhealthyfoods.23 Finally, an analysis of 31290 hours of
television broadcasting in Greece in 2007 and2008 showed that 65% of food advertisementspromoted foods high in fat or sugar.24
The use of persuasive marketing techniquesin food advertising also varied between coun-tries. Notably, these techniques were used mostoften in advertisements for noncore foodproducts in all countries except China (for bothpremiums and promotional characters) andItaly (for promotional characters).
The endorsement of food products by pro-motional characters and offers of premiums areused to attract children’s attention and per-suade them to request or buy an advertisedproduct. Evidence suggests that young childrenlack the cognitive development to discriminatebetween a premium and an advertised food.25
Behavioral outcomes, such as purchasing re-quests, have been shown to be modified bypremiums.8 Research also indicates that the useof characters in television advertisements, par-ticularly cartoons, attracts children’s attention,creates positive attitudes toward products, andimproves children’s product recall.26
The many perspectives from which weanalyzed our data (e.g., peak viewing times,overall advertising, program types) providean opportunity to explore possible policy
implications for different countries. Previousresearch suggests that regulation of televisionadvertising directed toward children couldfocus on the type of programs in which adver-tisements are broadcast (such as dedicatedchildren’s programs), the type of product(restricting all food and beverage advertising oronly unhealthy foods), the target audience(restricting food advertising directed at chil-dren), the time of day (when a high number ofchildren are watching), and the content ofadvertisements (persuasive marketing tech-niques).27
Our study, which identified a higher rate ofnoncore food advertising during children’speak viewing times, highlights the need fortelevision food advertising regulations specifi-cally during these times. Although our defini-tion of children’s peak viewing times repre-sented the broadcast periods when the highestnumbers of children were watching for mostcountries, some country-specific adjustment ofthis definition may be required. For example, inGermany children watch television equallyacross the day, until 18:00 to 22:00, when thechildren’s audience doubles.28 Recalculatingthe proportion of noncore food advertisementsduring this restricted peak viewing time yields
FIGURE 2—Proportion of major food groups advertised with persuasive marketing, by country.
RESEARCH AND PRACTICE
1734 | Research and Practice | Peer Reviewed | Kelly et al. American Journal of Public Health | September 2010, Vol 100, No. 9

a slightly higher proportion of noncore foodadvertising during this viewing period than atother times (88% vs 86%).
In Australia, Canada, China, Greece, Spain,and the United States, children’s programswere among the programs with the highestfrequency of food advertising. It may be pru-dent for these countries to consider food-advertising restrictions during such programs.However, television audience data indicate thatchildren also watch programs that are notcreated primarily for them. Finally, restrictingthe content of food advertisements may beespecially effective in countries with a highlevel of persuasive marketing.
The countries in our sample had a range ofregulatory systems; many, such as Australiaand Germany, had both (limited) governmentregulation and industry self-regulation, pre-dominantly focusing on misleading and de-ceptive conduct in advertising. In Sweden andthe United Kingdom, government regulation oftelevision advertising limited the volume andnature of food advertising targeted towardchildren. In Sweden, the Radio and TelevisionAct stipulated that commercial television ad-vertising must not be designed to attract theattention of children younger than 12 years.29
However, these regulations only applied to ter-restrial channels broadcast from within Sweden;only 1 of the 3 channels that were the mostpopular with children during our study fell underthis rule.
In the United Kingdom, the Office of Com-munications introduced restrictions to reducetelevision advertising of high-fat, high-sugar,and high-salt food and drink products to youngpeople. Beginning in January 2008 (after ourdata collection period for the United Kingdom)this legislation prohibited advertisements forthese products in or around programs specifi-cally made for, or of particular appeal to,children younger than16 years.30 The nutrient-profiling system used in this legislation to definethe restricted foods may provide a useful mod-el for similar restrictions in other countries.However, consumer groups argue that the waythe restrictions apply is flawed, because theyare triggered by the proportion of childrenwatching rather than the actual number. In 1analysis, none of the 5 most popular programswatched by children were covered by the re-strictions.31
Both Sweden and the United Kingdom hada higher rate of noncore food advertisingduring children’s peak viewing times than mostother countries in our sample and a compara-ble proportion of noncore food advertisements,suggesting that their regulations may not ef-fectively limit children’s exposure to televisionadvertisements for unhealthy food.
Limitations
Because our study was designed to be simplein methodology and broad in scope, to generatea general picture of international food adver-tising patterns, we did not assess all facets ofadvertising. For example, we did not collectdata on the duration of advertisements. How-ever, research indicates that the frequency andduration of food advertising follow similarpatterns: increased advertising frequency leadsto increased advertising duration.32 The con-tribution of food advertisements to overall ad-vertising was also lower than some other studieshave found, because we included channel pro-motions, including advertisements for otherprograms, in our sample. The exclusion of theseadvertisements would result in an even highercontribution of food advertisements to overalladvertising.
We defined children as younger than 13years. Definitions of childhood in broadcastingregulatory frameworks vary considerably be-tween countries, from ages 12 to 16 years.33
Although our more narrow definition of child-hood excluded the analysis of food advertise-ments broadcast during peak broadcast periodsfor adolescents, the overall rates of food adver-tising and persuasive marketing across the sam-ple remain unchanged.
We tested intercoder reliability betweengroups and found a high level of codingagreement for all countries except Germany,which can be explained by a single advertise-ment.
The representativeness of our data and thestatistical power in our study expand on find-ings from previous international comparisonsof food advertising to children. Although themagnitude of our significance tests reflected thelarge sample size, differences between groupsappeared to be real. The recording durationexceeded that used in previous internationalstudies, which have collected between 2011 and4034 hours of television data from each country.
Previous research by Dibb only analyzed ad-vertisements in programs specifically aimed atchildren.11 It is clear from audience viewing datathat children’s television viewing is not confinedto designated children’s programs.
Conclusions
Internationally, children are exposed to highvolumes of food advertising on television.Although the absolute frequency of this ad-vertising varies by country, its aim is consistent:the marketing of unhealthy products. Thetargeted broadcasting of unhealthy food ad-vertisements when the highest numbers ofchildren are watching and the use of child-oriented persuasive marketing techniques de-fine a media environment in which children arefrequently and deliberately targeted withcommercial messages that run counter to nu-tritional recommendations.
Considerable scientific evidence establishesa link between unhealthy food marketing andchildren’s food choices, purchases, and con-sumption.6–8 Limiting this food marketing isan important preventive strategy against child-hood obesity, and the development or extensionof statutory regulations to prohibit unhealthyfood advertising when a significant numberof children are watching could be a useful firststep. j
About the AuthorsBridget Kelly and Kathy Chapman are with the CancerCouncil New South Wales, Sydney, Australia. Jason C. G.Halford and Emma J. Boyland are with the School ofPsychology, University of Liverpool, UK. InmaculadaBautista-Castano and Lluis Serra-Majem are with theDepartment of Clinical Sciences, University of Las Palmasde Gran Canaria, Spain. Christina Berg and Hillevi Prellare with the Department of Food Health and Environment,University of Gothenburg, Sweden. Margherita Caroli iswith the Department of Prevention, Azienda SanitariaLocale Brindisi, Italy. Brian Cook is with Toronto PublicHealth, Canada. Janine G. Coutinho, Renata Monteiro, andElisabetta Recine are with the Nutrition Department, Foodand Nutrition Security Policies Observatory, University ofBrasılia, Brazil. Tobias Effertz is with the Institute forCommercial Law and Economics, University of Hamburg,Germany. Evangelia Grammatikaki and Yannis Maniosare with the Department of Nutrition and Dietetics, Har-okopio University, Athens, Greece. Kathleen Keller andSonia Singh are with the New York Obesity ResearchCenter, St Luke’s Hospital, New York, NY. Claire Pedleyand Carolyn Summerbell are with the School of Medicineand Health, Durham University, UK. Raymond Leung iswith the Central Health Education Unit, Department ofHealth, Hong Kong Special Administrative Region, China.Kim Raine is with the Centre for Health Promotion Studies,University of Alberta, Edmonton, Canada.
RESEARCH AND PRACTICE
September 2010, Vol 100, No. 9 | American Journal of Public Health Kelly et al. | Peer Reviewed | Research and Practice | 1735
Correspondence should be sent to Bridget Kelly, Pre-vention Research Collaboration, Level 2, K25 MedicalFoundation Building, University of Sydney NSW 2006Australia (e-mail: [email protected]). Reprintscan be ordered at http://www.ajph.org by clicking the‘‘Reprints/Eprints’’ link.
This article was accepted January 4, 2010.
ContributorsB. Kelly helped originate the study, coordinate researchgroups, perform reliability testing, analyze data, anddevelop the article. J. C. E Halford, E. J Boyland, and K.Chapman helped conceptualize the research, recruitresearch groups, collect data, and interpret results. Allother authors helped collect data for their own jurisdic-tions, interpret results, perform reliability testing, anddevelop the article.
AcknowledgmentsInfrastructure funding to support this research was pro-vided by the New South Wales Health Department. TheSwedish part of this study was funded by FAS (SwedishCouncil for Working Life and Social Research).
We thank all research partners and their collaboratingorganizations for their participation. Special thanks toRahila Umar for her assistance in collating and analyzingthe data and to Cassandra Johnson for her assistance incoding the data for the United States.
Human Participant ProtectionNo protocol approval was required because no humanparticipants were involved in the study.
References1. Lobstein T, Baur L, Uauy R. Obesity in children andyoung people: a crisis in public health. Obes Rev. 2004;5(Suppl 1):4–104.
2. Diet, Nutrition, and the Prevention of Chronic Diseases.Geneva, Switzerland: World Health Organization; 2003.Report 916.
3. Swinburn BA, Caterson I, Seidell JC, James WP. Diet,nutrition and the prevention of excess weight gain andobesity. Public Health Nutr. 2004;7(1A):123–146.
4. Foresight. Tackling obesities: future choices—projectreport. Government Office for Science. 2007. Avail-able at: http://www.foresight.gov.uk/OurWork/ActiveProjects/Obesity/KeyInfo/Index.asp. Accessed July 13,2009.
5. Marketing of Food and Non-alcoholic Beverages toChildren: Report of WHO Forum and Technical Meeting.Oslo, Norway: World Health Organization; 2006.Available at: http://www.who.int/dietphysicalactivity/publications/Oslo%20meeting%20layout%2027%20NOVEMBER.pdf. Accessed July 13, 2009.
6. Cairns G, Angus K, Hastings G. The extent, natureand effects of food promotion to children: a reviewof the evidence to December 2008. World HealthOrganization. 2009. Available at: http://www.who.int/dietphysicalactivity/Evidence_Update_2009.pdf.Accessed November 23, 2009.
7. Livingstone S, Helsper E. Advertising Foods toChildren: Understanding Promotion in the Context ofChildren’s Daily Lives. London, UK: Dept of Media andCommunications, London School of Economics andPolitical Science; 2004.
8. Committee on Food Marketing and the Diets ofChildren and Youth, Institute of Medicine. Food Market-ing to Children and Youth: Threat or Opportunity?McGinnis JM, Gootman JA, Kraak VI, eds. Washington,DC: National Academies Press; 2006.
9. Hastings G, Stead M, McDermott L, et al. Review of theResearch on the Effects of Food Promotion to Children.Glasgow, Scotland: Centre for Social Marketing; 2003.
10. Kunkel D, Wilcox B, Cantor J, Palmer E, Linn S,Dowrick P. Report of the APA Task Force on Advertisingand Children. Washington, DC: American PsychologicalAssociation; 2004.
11. Dibb S. A Spoonful of Sugar: Television Food Adver-tising Aimed at Children. An International ComparativeSurvey. London, UK: Consumers International; 1996.
12. Kelly B, Hattersley L, King L, Flood V. Persuasivefood marketing to children: use of cartoons and compe-titions in Australian commercial television advertise-ments. Health Promot Int. 2008;23(4):337–344.
13. Australian Dept of Health and Aging. Australianguide to healthy eating. 2001. Available at: http://www.health.gov.au/internet/wcms/Publishing.nsf/Content/health-pubhlth-strateg-food-guide-index.htm.Accessed May 13, 2010.
14. Kelly B, Chapman K. Food references and marketingto children in Australian magazines: a content analysis.Health Promot Int. 2007;22(4):284–291.
15. Kelly B, Cretikos M, Rogers K, King L. Thecommercial food landscape: outdoor food advertisingaround primary schools in Australia. Aust N Z J PublicHealth. 2008;32(6):522–528.
16. Kelly B, Bochynska K, Kornman K, Chapman K.Internet food marketing on popular children’s websitesand food product websites in Australia. Public HealthNutr. 2008;11(11):1180–1187.
17. Landis JR, Koch GG. The measurement of observeragreement for categorical data. Biometrics. 1977;33(1):159–174.
18. Lobstein T, Dibb S. Evidence of a possible linkbetween obesogenic food advertising and child over-weight. Obes Rev. 2005;6(3):203–208.
19. Kelly B, Smith B, King L, Flood V, Bauman A.Television food advertising to children: the extent andnature of exposure. Public Health Nutr. 2007;10(11):1234–1240.
20. Hattersley L, Kelly B, King L. Food Advertising onSydney Commercial Television: The Extent and Natureof Children’s Exposure 2006–2007. Sydney, Australia:New South Wales Centre for Overweight and Obesity;2007.
21. Rodd HD, Patel V. Content analysis of children’stelevision advertising in relation to dental health. Br DentJ. 2005;199(11):710–712.
22. Byrd-Bredbenner C. Saturday morning children’stelevision advertising: a longitudinal content analysis.Fam Consum Sci Res J. 2002;30(3):382–403.
23. Monteiro R, Coutinho J, Recine E. Monitoracxao dePropaganda de Alimentos Visando a Pratica da Alimen-tacxao Saudavel [Monitoring of food advertising aimed atthe practice of healthy eating]. Brasılia, Brazil: Universi-dade de Brasılia Observatorio de Polıticas de SegurancxaAlimentar e Nutricxao; 2008.
24. Grammatikaki E, Moschonis G, Kantilafti M, et al.Food advertisements in Greece: their role in food choicesand obesity in schoolchildren. Amsterdam, Holland:
Seventeenth European Congress on Obesity; May 6-9,2009.
25. Carruth B. Preschoolers’ food product choices ata simulated point of purchase and mothers’ consumerpractices. J Nutr Educ. 2000;32(3):146–151.
26. Neeley S, Schumann D. Using animated spokes-characters in advertising to children. J Advert. 2004;33:7–23.
27. Handsley E, Mehta K, Coveney J, Nehmy C.Regulatory axes on food advertising to children ontelevision. Aust New Zealand Health Policy. 2009;6:1.
28. Association of Television Research. Audience. AGF/GfK Fernsehforschung. 2008. Available at: http://www.agf.de/daten/zuschauermarkt/sehbeteiligung.Accessed June 15, 2009.
29. Swedish Radio and TV Authority. The radio andtelevision act (1996:844). Available at: http://www.rtvv.se/_upload/Publikationer/Radio%20and%20TV%20act%20_2008.pdf. Accessed June 9, 2009.
30. Television Advertising of Food and Drink Products toChildren: Final Statement. London, UK: Office of Com-munications; 2007. Available at: http://www.ofcom.org.uk/consult/condocs/foodads_new/statement/statement.pdf. Accessed May 13, 2010.
31. Which? TV food advertising restrictions: time to fin-ish the job. September 2008. Available at: http://www.childrensfoodcampaign.net/WhichTVadrestrictionsSept08.pdf. Accessed May 13, 2010.
32. Australian Centre for Health Promotion. FoodAdvertising on Sydney Television: The Extent of Children’sExposure. Sydney, Australia: University of Sydney; 2006.
33. Hawkes C. Marketing Food to Children: The GlobalRegulatory Environment. Geneva, Switzerland: WorldHealth Organization; 2004.
34. Easy Targets: A Survey of Television Food and ToyAdvertising to Children in Four Central European Coun-tries. London, UK: Consumers International; 1999.
RESEARCH AND PRACTICE
1736 | Research and Practice | Peer Reviewed | Kelly et al. American Journal of Public Health | September 2010, Vol 100, No. 9