The Influence of National Culture on the Use of Celebrity Endorsement in Television Advertising: A...
14
THE INFLUENCE OF NATIONAL CULTURE ON THE USE OF CELEBRITY ENDORSEMENT IN TELEVISION ADVERTISING: A MULTI-COUNTRY STUDY Carolus Praet, Otaru University of Commerce, Japan Corresponding author: Carolus Praet Otaru University of Commerce 3-5-21 Midori 047-8501 Otaru Japan Email: [email protected] Tel: +81-134-27-5349 (Fax: +81-134-27-5349)
Transcript of The Influence of National Culture on the Use of Celebrity Endorsement in Television Advertising: A...
THE INFLUENCE OF NATIONAL CULTURE ON THE USE OF CELEBRITY ENDORSEMENT IN TELEVISION ADVERTISING: A MULTI-COUNTRY STUDY
Carolus Praet, Otaru University of Commerce, Japan Corresponding author: Carolus Praet Otaru University of Commerce 3-5-21 Midori 047-8501 Otaru Japan Email: [email protected] Tel: +81-134-27-5349 (Fax: +81-134-27-5349)

2
THE INFLUENCE OF NATIONAL CULTURE ON THE USE OF CELEBRITY ENDORSEMENT IN TELEVISION ADVERTISING: A MULTI-COUNTRY STUDY
ABSTRACT
This study examines worlwide use of celebrities in advertising. Based on a content analysis of television advertising from 25 countries, the findings support a negative correlation between national indices of Hofstede’s individualism dimension and quantitative use of celebrities in advertising. Hofstede’s power distance, uncertainty avoidance, and masculinity dimensions are not found to be significantly correlated with the use of celebrities. In addition, economic variables do not explain international variation in the use of celebrity endorsement in advertising. The author discusses the implications of these results, limitations of the study, and directions for future research.
INTRODUCTION The use of celebrity endorsers is one of the most popular advertising strategies in the United States (Agrawal and Kamakura, 1995; Miciak and Shanklin, 1994). Miciak and Shanklin (1994), report that the use of celebrity endorsement is also becoming more common in other countries. Celebrities include well-known people from the world of sports, movies, entertainment, art, music, and media, and thus they are generally associated with a positive image. They are employed in a number of ways: to endorse a product, to act as a company spokesperson, to make the advertisement stand out among the clutter, or to convey a positive image for the company or its products. Empirical studies have demonstrated that the use of celebrity endorsers is associated with positive effects (e.g., Atkin and Block, 1983; Freiden, 1984; Petty et al., 1983). Many studies conducted in the U.S. have examined celebrity endorser effectiveness and consumer response (e.g., Goldsmith et al., 2000; Kahle and Homer, 1985; Kamins, 1989; 1990). However, little is known about how celebrity endorsements correlate with cultural factors. McCracken (1989) explains that the success of celebrity-endorsed advertisements depends on whether the celebrity is meaningful to consumer values and norms within the culture. Other authors argue that celebrities and megastars with worldwide popularity transcend national boundaries and can help companies break through cultural barriers (Kaikati, 1987; Miciak and Shanklin, 1994). Still others point out the importance of understanding what celebrity endorsers mean to consumers across cultures (Paek, 2003). There is however, very little empirical research on the extent of celebrity endorsement across cultures. Research has revealed that celebrities are used in U.S. television advertising more than 10%, up to approximately 25% of the time (Erdogan 1999; Erdogan et al., 2001, Walker et al., 1992). Similarly, marketing campaigns feature celebrities 20% of the time in the United Kingdom (Erdogan et al., 2001). However, there is a relative absence of research pertaining to the use of celebrity endorsement in other countries. Exceptions include Paek (2003), who reports research from Korea indicating that 32% of TV commercials, and 59% of prime time TV commercials employ celebrities, and Kilburn (1998) who reports that more than 70% of Japanese television ads feature celebrities. In addition to the relative lack of single country empirical evidence, few studies have compared the use of celebrities in advertising across a wide range of countries. A study by Lin (1993), absent concrete percentages, found that male celebrities were more often present in Japanese than in U.S. television advertising, although no such difference was evident for female celebrities. Belk and Bryce (1986) report that 41.3% of Japanese television advertising versus 11.8% of US advertising used high status spokespeople. Praet (2001) reports on the

3
use of celebrity endorsement in Japan (47.62%), the U.S. (20.69%), France (15.57%), Germany (9.64%), Spain (6.90%), and the Netherlands (3.92%). Paek (2003) found that newspaper ads in Korea featured a greater number of celebrity endorsers (24.1%) than those in the US (9.9%) and attributes this finding to Korea’s higher scores on Hofstede’s (2001) uncertainty avoidance and power distance dimensions of culture. In this study I hope to contribute to the literature in three ways: First, by providing additional information on the extent of celebrity endorsement across national markets; second, by developing a more comprehensive understanding of how differentiated national cultures influence the use of celebrity endorsement; and third, by empirically verifying hypotheses linking Hofstede’s dimensions of culture with the use of celebrity endorsement in advertising in many nations.
THEORETICAL BACKGROUND Four of Hofstede’s dimensions of national culture may affect perceptions and attitudes regarding celebrities, and consequently may affect the use of celebrity endorsement in advertising. Hypotheses Development Individualism (IDV) and celebrity In contrast to people from collectivist cultures, people from individualist cultures are generally more self-oriented and less easily influenced by other than their close friends and nuclear family members (Hofstede, 2001). Results of a meta-analysis study by Bond and Smith (1996) of 133 studies drawn from 17 countries examining the effects of conformity show that it was higher in collectivist than in individualist countries. Celebrities can be thought of as opinion leaders and role models, whose behavior people seek to emulate or imitate through a process of identification. Since people in individualist cultures are less inclined to conform, we can expect that consumers in individualist cultures will be less influenced by celebrity endorsement. Conversely, we may expect that in collectivist societies, consumers will perceive celebrities to be opinion leaders and role models. Further, these consumers may choose to use celebrity behavior as a social ‘template’ for their own behavior. Hofstede (2001) reports strong correlation between his individualism-collectivism dimension and Hall’s (1976) typology of low-high context communication. Gudykunst and Ting-Toomey (1988) argue that the low-high context concept and the individualism-collectivism dimension overlap each other. In collectivist cultures, the speaker is part of the context of the message, so the source of communication is more likely to be used as a clue for making judgments about the meaning (Triandis, 2004). Thus, we can expect the source of the advertising message in collectivist cultures to be more important than the verbal message. The above arguments increase the likelihood of advertisers in collectivist cultures using celebrities as endorsers. Based on the above reasoning, I propose the following hypothesis:
H1: The cultural dimension of individualism is negatively correlated with the use of celebrities in advertising.
Masculinity (MAS) and celebrity People in masculine cultures tend to place higher value on winning, success, and status than people in feminine cultures do. Celebrities are widely admired; they have social status, and are perceived as successful. In the United States, a masculine culture, predominant popular culture is characterized by the cult of personality and obsession with celebrity and stardom. In feminine cultures, for example Scandinavian countries, people frown upon the conspicuous

4
display of success, status, or wealth. Modesty for all, including successful people, is much more valued as an admirable character trait in these feminine cultures (De Mooij, 2005). I therefore formulate the following hypothesis:
H2: The cultural dimension of masculinity is positively correlated with the use of celebrities in advertising.
Uncertainty avoidance (UAI) and celebrity People in low uncertainty avoidance cultures are relatively comfortable with ambiguity and are tolerant of behaviors and opinions of others. Uncertainty avoidance is also relevant to the behavior of consumers. Where uncertainty avoidance is high, consumers rely more on the advice of people they consider experts (Hofstede, 2001). Zandpour et al. (1994) analyzed the content of TV commercials collected from cultures in the U.S., Mexico, the U.K., France, Germany, Spain, Taiwan, and Korea. They found that the need for logical reasoning and visual information in cultures with high uncertainty avoidance led consumers to rely more frequently on trustworthy sources of information. Thus, consumers in high uncertainty avoidance cultures may perceive that uncertainty is ameliorated when communication comes from the celebrity endorser, in their minds, a credible, trustworthy, and knowledgeable source. The following hypothesis follows:
H3: The cultural dimension of uncertainty avoidance is positively correlated with the use of celebrities in advertising.
Power distance (PDI) and celebrity Power distance characterizes social tolerance for unequal distribution of power in society and organizations (Hofstede, 2001), or the tolerance of authority as a basic facet of one’s society (Gudykunst et al., 1996). When compared to a low power distance culture, people in a high power distance culture tend to obey the recommendations of public and authority figures such as celebrities and high-status figures (Zandpour et al., 1994). In these societies, the judgments of people who hold power are considered correct; these people function as referent groups (Albers-Miller and Gelb, 1996). Hofstede (2001) writes that, in countries of high power distance, this ‘referent power’ causes the less powerful to be influenced by personal charisma of the powerful. The above reasoning leads to the following hypothesis:
H4: The cultural dimension of power distance is positively correlated with the use of celebrities in advertising.
METHOD
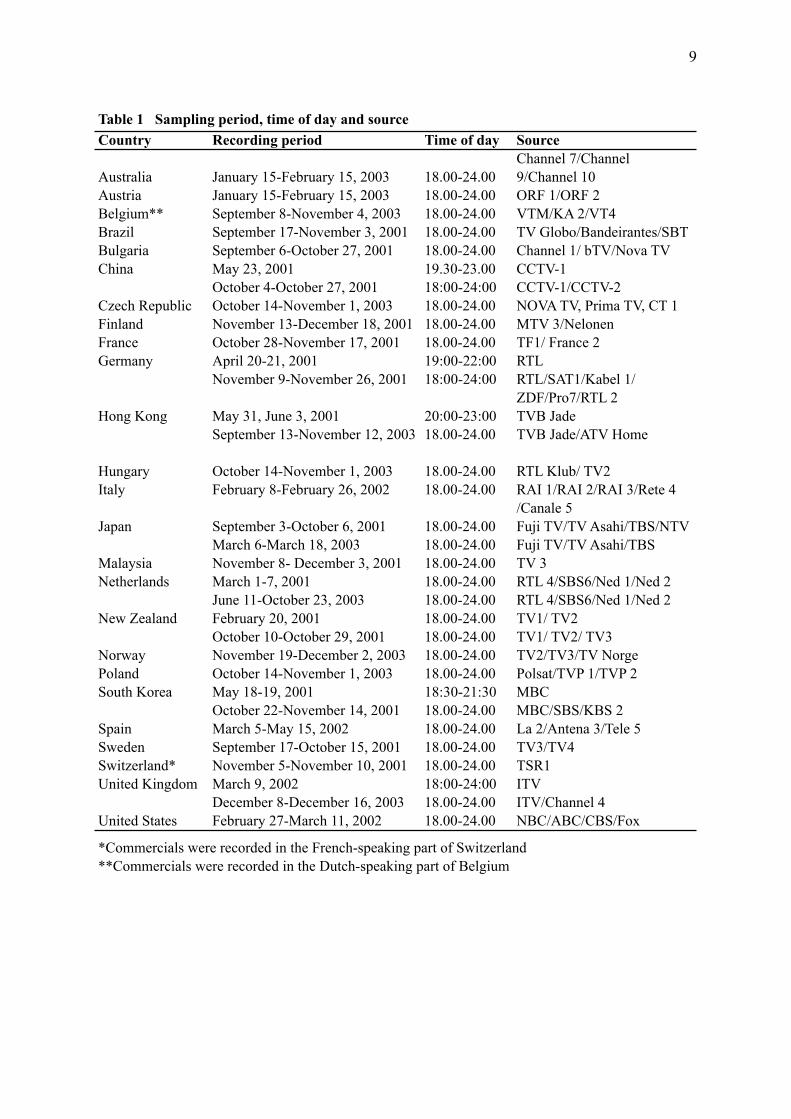
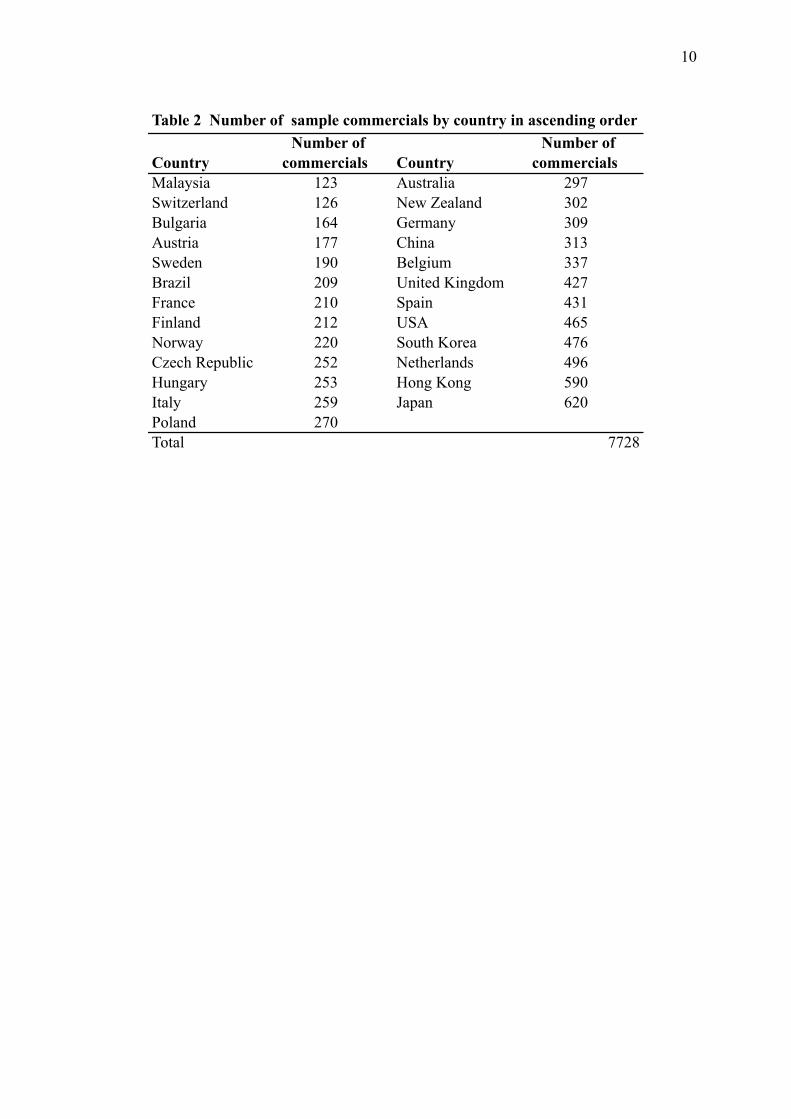
Sample The author and assistants recorded 7728 unduplicated television commercials in 25 countries between February 2001 and December 2003. Television channels and days of the week were randomly selected and rotated between the hours of 18:00 and 24:00. To ensure statistical integrity, we collected a sufficient sample size of commercials from each country that ranged from a minimum of 123 for Malaysia to a maximum of 620 for Japan. Dates of recording, times, television channels, and sample sizes for each country are shown respectively in Tables 1 and 2.

5
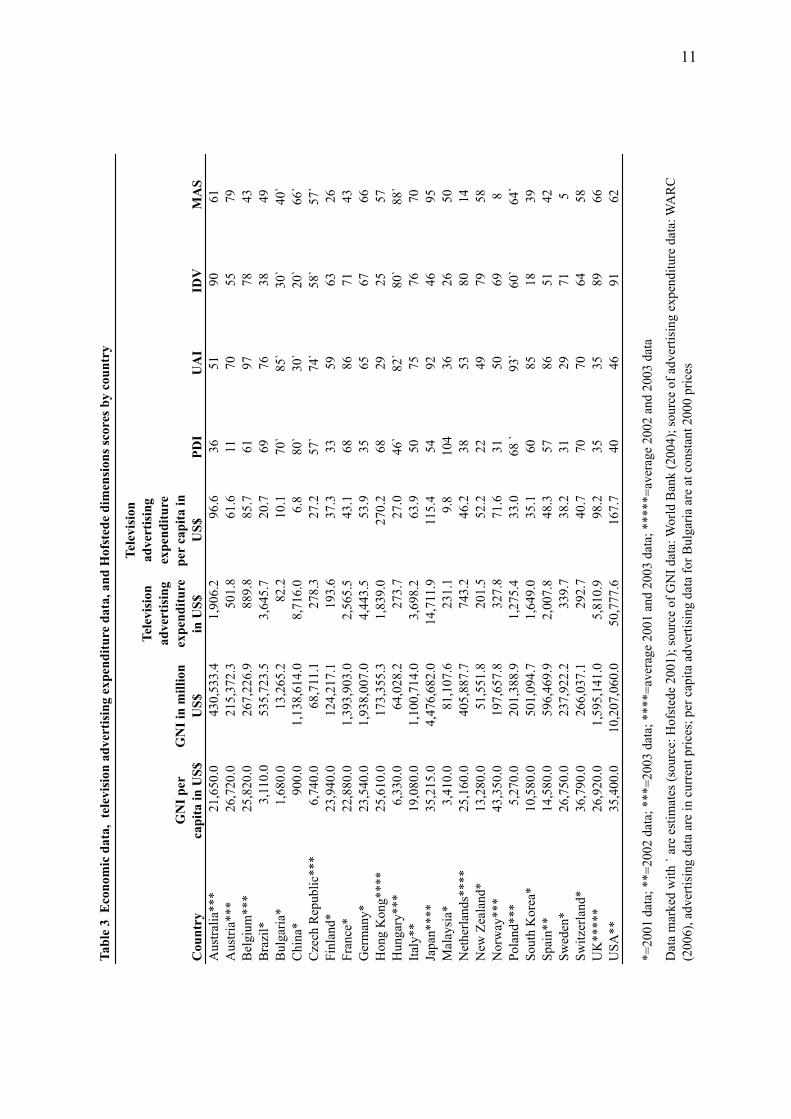
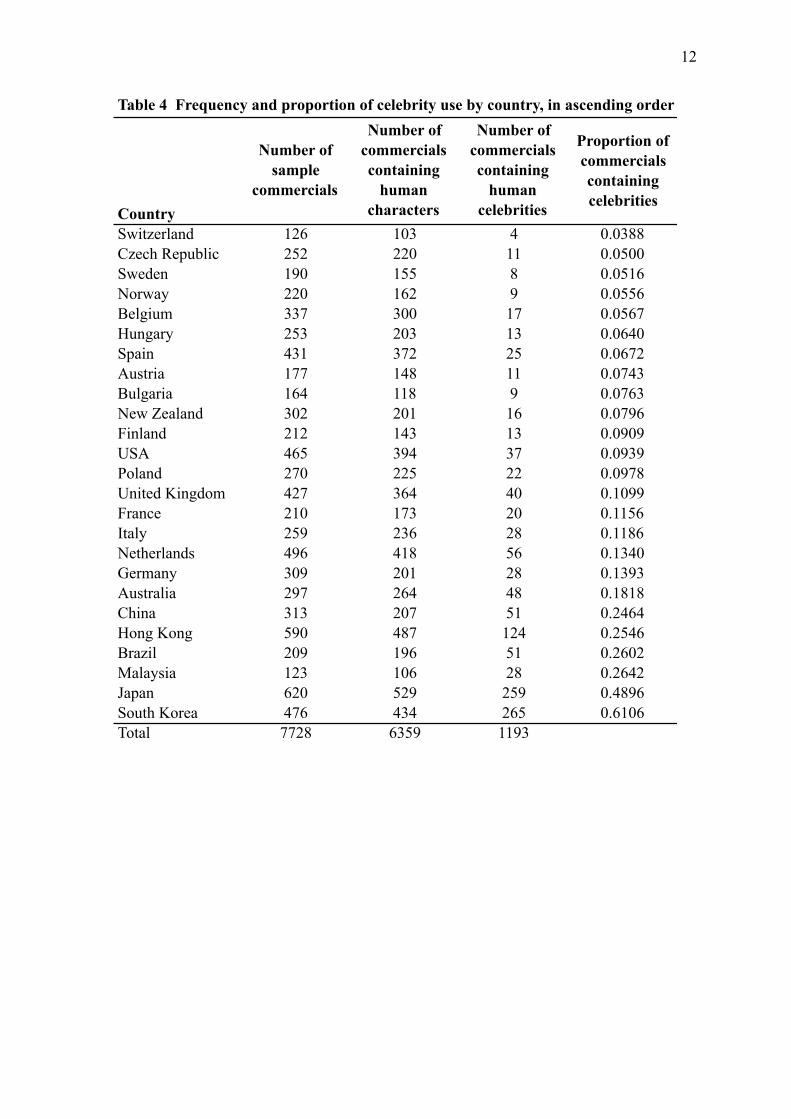
Coding Procedure Coders received written instructions in English containing coding procedures and detailed written explanations and definitions of all variables used in the study. Each commercial was coded for the following variables: company, brand name, and the use of characters, human characters, and celebrities. For each commercial that used one or more celebrities, we coded the number of celebrities, the type and gender of celebrity, celebrity nationality, and celebrity name. Celebrities are defined as “famous people or people whose name or face is widely known by the general population of a given country”. Two native coders independently coded a portion of the sample from their respective country, containing 30 to 40 commercials. Intercoder agreement was generally high among coder pairs for all countries and across variables. A resolution procedure was used to resolve coder disagreements. Each of the coders then coded half of the sample. Dependent variables, independent variables and control variables For each of the 25 countries in the sample, a country-level measure of the use of celebrities was constructed by dividing the number of celebrity commercials by the total number of unduplicated commercials featuring human characters. The total number of unduplicated sample commercials featuring human characters and retained for analysis was 6359. This measure was used as the dependent variable in the regression analysis. Four independent variables, one for each of Hofstede’s four dimensions, and three control variables were used in the regression analysis. The controls are Gross National Income (GNI), GNI per capita (World Bank, 2004), and per capita television advertising expenditure (WARC, 2006). Control variables were selected for years or averages of years that match the periods of data collection. Hofstede (2001) suggests to always routinely control for GNP per capita when studying the influence of cultural variables on social phenomena across cultures. Since using celebrities is more expensive than using people unknown to the general public this suggests that advertisers in wealthier per capita nations may be more celebrity dependent. Table 3 shows the cultural, economic and advertising expenditure input data by country.
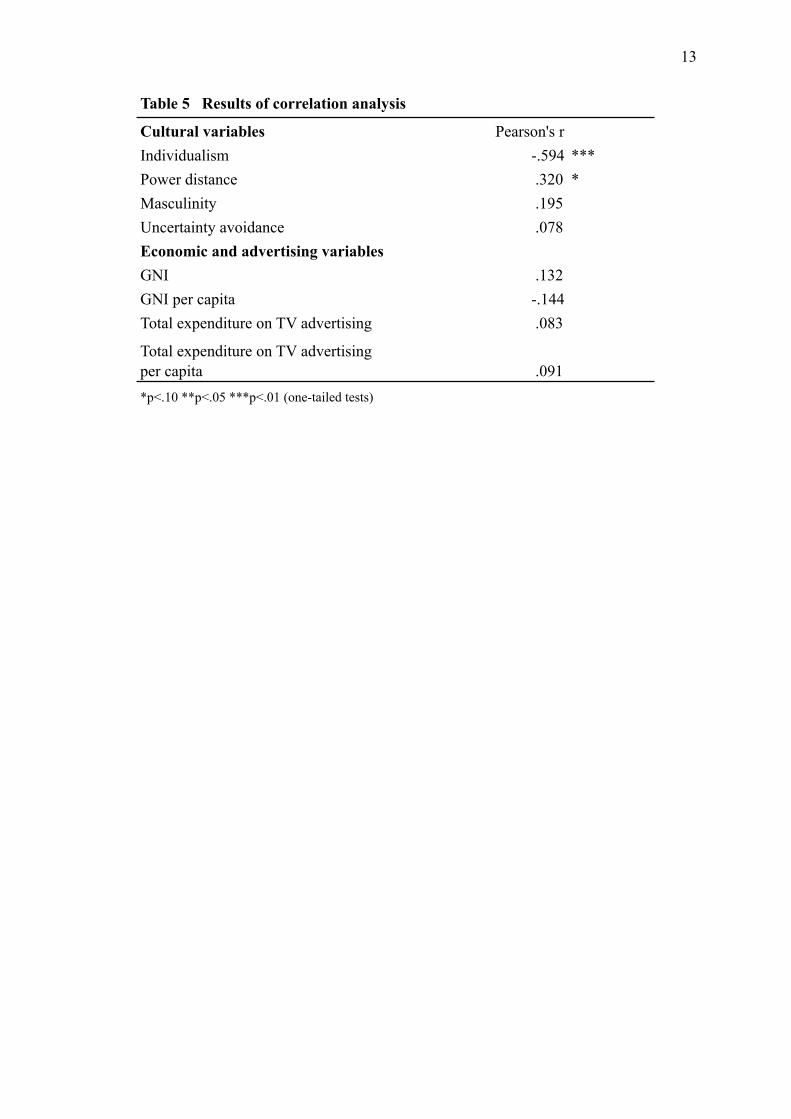
RESULTS Celebrity use ranged from 4% for Switzerland, US 9%, UK 11%, Germany 14%, Australia 18%, China 25%; Hong Kong 25%; Malaysia 26%, Brazil 26%, Japan 49%, to South Korea 61% (percentages rounded to the nearest whole number). Table 4 shows celebrity use by country. To test the hypotheses I first conducted a correlation analysis, results of which are presented in Table 5. Individualism (r = -.594, p = .001, one-tailed) correlated significantly in the expected direction, whereas power distance (r = .320, p = .060, one-tailed) also correlated positively in the expected direction, and was marginally significant at the 10% level. Masculinity (r= .195, p= .175, one-tailed) and uncertainty avoidance (r= .078, p = .355, one-tailed) correlated weakly in the expected direction, but were not significant. GNI (r = .132, p = .265, one-tailed) correlated weakly in the expected direction, but was not significant. GNI/capita (r = -.144, p = .246, one-tailed) correlated weakly but in the opposite direction of the one hypothesized, and was not significant. Finally, total television advertising expenditure (r = .083, p = .347, one-tailed) and television advertising expenditure per capita (r = .091, p = .332, one-tailed) correlated weakly in the expected direction, but were not significant. Closer inspection revealed that individualism significantly correlated with power distance (r = -.628, p = .000, one-tailed). To further test the hypotheses, I use an ordinary least squares regression model. In the full model, the first variable, individualism is highly significant in the expected direction (β = -.770, p = .005). The three remaining variables power distance (β

6
= -.096, p = .697), masculinity (β = .125, p = .562), and uncertainty avoidance (β = .078, p = .696) were not significant. A smaller model that contains only individualism and the three control variables is also significant for Hofstede’s first dimension, individualism (β = -.707, p = .002). Further, the adjusted R2 for this smaller model is .333, higher than the full model, which suggests some evidence of multicollinearity in the full model. Regression results support H1 and do not support H2, H3, or H4. These results and values for the economic and advertising control variables are presented in Table 6.
DISCUSSION
First, this research finds that compared to other countries, the frequency of celebrity advertising is relatively limited in continental Europe and other western countries, with the exception of Australia, where it is rather common. In contrast, advertisers in Brazil, China, Hong Kong and Malaysia use celebrities in about 25% of all advertisements, whereas advertisers in Japan and Korean make extensive use of celebrities in almost 50% or over 60% respectively, of all advertisements featuring human characters. This suggests that it may be useful for international advertisers to distinguish three groups of countries characterized by different levels of quantitative use of celebrities. Second, the findings suggest that the use of celebrity endorsement may be lower in the U.S. and the U.K. than most of the estimates and findings quoted in prior studies. A recent study by Choi et al. (2005) that compared celebrity endorsement in U.S. and Korean television advertising, sampled television advertising around the same period as this study. Despite differences in methodology, (analyzing duplicated ads versus unduplicated ads in the current study), Choi et al. report celebrity frequency percentages similar to the findings of this study: for Korea, they report 57% versus 61% (this study); for the U.S., they report between 8.9% and 9.6%, versus 9% (this study). This lends further support to the findings of this research, at least for these two countries. Third, the findings of this research suggest that Hofstede’s individualism dimension can be useful for predicting the actual frequency of celebrity use in advertising around the world. The more collectivist national cultures are the more advertisers tend to use celebrities in advertising. This knowledge, combined with a classification into the three groups of countries identified above, may assist international advertisers in their decision making regarding the cultural and market acceptance of using celebrities in different country markets. Fourth, and perhaps surprisingly, the use of economic and advertising expenditure variables does not predict the extent to which advertisers employ celebrities across national markets. Finally, it is important to note that, contrary to the hypotheses, Hofstede’s masculinity, uncertainty avoidance, and power distance dimensions were not significantly related to quantitative measures of celebrity advertising. There are several possible explanations for this finding. A first explanation is that these three cultural dimensions do not affect the quantitative use of celebrity endorsement. A second explanation is that in particular power distance was not a significant predictor of celebrity use, as a result of its intercorrelation with individualism. A third explanation is that these dimensions may influence the use of celebrity endorsement only at a qualitative level, which was not the focus of this study. A fourth explanation is that the results reflect that especially international and global advertisers currently may not sufficiently understand and adjust to the cultural differences among local consumers when using celebrities in their global or pan-regional advertising campaigns.
7
LIMITATIONS AND FUTURE RESEARCH Although this exploratory study featured a relatively large sample of countries, and recent empirical studies report similar percentages of celebrity endorsement for some of the sample countries, its findings cannot be generalized. The possibility of sampling error for countries with small sample sizes should be considered. Future studies should validate these findings and sample additional countries. Perhaps variables other than those used in this study can offer alternative explanations for the findings. This study also did not address the influence of pan-regional advertising campaigns, which are not designed to reflect individual country cultures, but rather reflect the culture of the advertiser or advertising agency. Also, within-regional analyses may uncover different links between cultural and economic variables and the use of celebrity endorsement. Future studies also need to address the qualitative aspects of celebrity endorsement across cultures as well as the influence of product category, as in research by Choi et al. (2005). Finally, in order to derive more implications for advertisers, future research should supplement the results of the current study by exploring perception, acceptance and liking of celebrity endorsement advertising among consumers in different cultures.
REFERENCES
Agrawal, J., Kamakura, W. (1995). The Economic Worth of Celebrity Endorsers: An Event
Study Analysis, Journal of Marketing, 59 (3), 56-62. Albers-Miller, N., Gelb, B. (1996). Business Advertising Appeals as a Mirror of Cultural
Dimensions: A Study of Eleven Countries, Journal of Advertising, 25(4), 57-70. Atkin, C., Block, M. (1983). Effectiveness of Celebrity Endorsers, Journal of Advertising
Research, 23(1), 57-61 Belk, R., Bryce, W. (1986). Materialism and Individual Determinism in U.S. and Japanese
Print and Television Advertising, Advances in Consumer Research, 13(1), 568-572. Bond, R., Smith, P (1996). Culture and conformity: a meta-analysis of studies using Asch's
(1952b, 1956) Line Judgment Task, Psychology Bulletin, 119(1), 111-137. Choi, S., Lee, W., Kim, H. (2005). LESSONS FROM THE RICH AND FAMOUS - A Cross-
Cultural Comparison of Celebrity Endorsement in Advertising, Journal of Advertising, 34(2), 85-98.
De Mooij, M. (2005). Global Marketing and Advertising - Understanding Cultural Paradoxes, 2nd ed., Thousand Oaks: Sage Publications.
Erdogan, B., (1999). Celebrity Endorsement: A Literature Review, Journal of Marketing Management, 15(4), 291-314.
, B., Baker, M., Tagg S. (2001). Selecting Celebrity Endorsers: The Practitioner's Perspective, Journal of Advertising Research, 41(3), 39-48.
Freiden, J. (1984). Advertising Spokesperson Effects: An Examination of Endorser Type and Gender on Two Audiences, Journal of Advertising Research, 24(5), 33-41.
Goldsmith, R., Lafferty, B., Newell, S. (2000). The impact of corporate credibility and celebrity credibility on consumer reaction to advertisements and brands, Journal of Advertising, 29(3), 43-54.
Gudykunst, W., Ting-Toomey, S. (1988). Culture and Interpersonal communication, Newbury Park: Sage Publications.
, Matsumoto, Y., Ting-Toomey, S., Nishida, T., Kim, K., Seyman, S. (1996). The influence of cultural individualism-collectivism, self construals, and individual values on communication styles across cultures, Human Communication Research, 22(6), 510-543.

8
Hall, E. (1976), Beyond Culture, New York: Anchor Books/Doubleday. Hofstede, G. (2001), Culture’s consequences: Comparing values, behaviors, institutions, and
organizations across nations, 2nd ed., London: Sage Publications Kaikati, J. (1987). Celebrity Advertising: A Review and Synthesis, International Journal of
Advertising, 6(2), 93-105. Kahle, L., Homer P. (1985). Physical Attractiveness of the Celebrity Endorser: A Social
Adaptation Perspective, Journal of Consumer Research, 11(4), 954-961. Kamins, M. (1989). Celebrity and noncelebrity advertising in a two-sided context, Journal of
Advertising Research, 29(2), 24-42. (1990). An investigation into the `match-up' hypothesis in celebrity advertising:
when beauty may be only skin deep, Journal of Advertising, 19(1), 4-13. Kilburn, D. (1998). Star Power, Adweek, January 12, 20. Lin, C. (1993). Cultural Differences in Message Strategies: A Comparison Between American
and Japanese TV Commercials, Journal of Advertising Research, 33(5), 40-48. McCracken, G. (1989). Who is the celebrity endorser? Cultural foundations of the
endorsement process, Journal of Consumer Research, 16(12), 310-321. Miciak, A., Shanklin W. (1994). Choosing celebrity endorsers, Marketing Management, 3(3),
50-59. Paek, H. (2003). Understanding Celebrity Endorsers in Cross-Cultural Contexts: An
Exploratory Analysis of South Korean and US Advertising, paper submitted to the Association for Education in Journalism and Mass Communication 2003 Annual Conference--Advertising Division, Kansas City, MO, retrieved from http://list.msu.edu/cgibin/wa?A2=ind0309c&L=aejmc&F=&S=&P=1518
Petty, R., Cacioppo J., Schumann D. (1983). Central and peripheral routes to advertising effectiveness: the moderating role of involvement, Journal of Consumer Research, 10(2), 135-146.
Praet, C. (2001). Japanese Advertising, the World's Number One Celebrity Showcase? A Cross-Cultural Comparison of the Frequency of Celebrity Appearances in TV Advertising, in: M. Roberts and R. King (Eds.) International Conference Proceedings of the American Academy of Advertising, Gainesville, FL: American Academy of Advertising, 6-13.
Triandis, H. (2004). Dimensions of culture beyond Hofstede, in: H. Vinken, J. Soeters, P. Ester (eds.): Comparing cultures: dimensions of culture in a comparative perspective, Brill: Leiden-Boston, 28-43,
Walker, M., Langmeyer, L., Langmeyer D. (1992). Celebrity endorsers: do you get what you pay for?, The Journal of Services Marketing, 6(4), 35-42.
WARC (World Advertising Research Center) (2006). World Advertising Trends 2006, Henley-on-Thames, Oxon.
World Bank (2004). World Development Indicators database, http://devdata.worldbank.org/dataquery/
Zandpour, F., Campos V., Catalano, J., Chang C., Cho, Y., Hoobyar, R., Jiang, S., Lin, M., Madrid, S., Scheideler, H., Osborn S. (1994). Global Reach and Local Touch: Achieving Cultural Fitness in TV Advertising, Journal of Advertising Research, 34(5), 35-63.
9
Country Recording period Time of day Source
Australia January 15-February 15, 2003 18.00-24.00
Channel 7/Channel
9/Channel 10
Austria January 15-February 15, 2003 18.00-24.00 ORF 1/ORF 2
Belgium** September 8-November 4, 2003 18.00-24.00 VTM/KA 2/VT4
Brazil September 17-November 3, 2001 18.00-24.00 TV Globo/Bandeirantes/SBT
Bulgaria September 6-October 27, 2001 18.00-24.00 Channel 1/ bTV/Nova TV
China May 23, 2001 19.30-23.00 CCTV-1
October 4-October 27, 2001 18:00-24:00 CCTV-1/CCTV-2
Czech Republic October 14-November 1, 2003 18.00-24.00 NOVA TV, Prima TV, CT 1
Finland November 13-December 18, 2001 18.00-24.00 MTV 3/Nelonen
France October 28-November 17, 2001 18.00-24.00 TF1/ France 2
Germany April 20-21, 2001 19:00-22:00 RTL
November 9-November 26, 2001 18:00-24:00 RTL/SAT1/Kabel 1/
ZDF/Pro7/RTL 2
Hong Kong May 31, June 3, 2001 20:00-23:00 TVB Jade
September 13-November 12, 2003 18.00-24.00 TVB Jade/ATV Home
Hungary October 14-November 1, 2003 18.00-24.00 RTL Klub/ TV2
Italy February 8-February 26, 2002 18.00-24.00 RAI 1/RAI 2/RAI 3/Rete 4
/Canale 5
Japan September 3-October 6, 2001 18.00-24.00 Fuji TV/TV Asahi/TBS/NTV
March 6-March 18, 2003 18.00-24.00 Fuji TV/TV Asahi/TBS
Malaysia November 8- December 3, 2001 18.00-24.00 TV 3
Netherlands March 1-7, 2001 18.00-24.00 RTL 4/SBS6/Ned 1/Ned 2
June 11-October 23, 2003 18.00-24.00 RTL 4/SBS6/Ned 1/Ned 2
New Zealand February 20, 2001 18.00-24.00 TV1/ TV2
October 10-October 29, 2001 18.00-24.00 TV1/ TV2/ TV3
Norway November 19-December 2, 2003 18.00-24.00 TV2/TV3/TV Norge
Poland October 14-November 1, 2003 18.00-24.00 Polsat/TVP 1/TVP 2
South Korea May 18-19, 2001 18:30-21:30 MBC
October 22-November 14, 2001 18.00-24.00 MBC/SBS/KBS 2
Spain March 5-May 15, 2002 18.00-24.00 La 2/Antena 3/Tele 5
Sweden September 17-October 15, 2001 18.00-24.00 TV3/TV4
Switzerland* November 5-November 10, 2001 18.00-24.00 TSR1
United Kingdom March 9, 2002 18:00-24:00 ITV
December 8-December 16, 2003 18.00-24.00 ITV/Channel 4
United States February 27-March 11, 2002 18.00-24.00 NBC/ABC/CBS/Fox
*Commercials were recorded in the French-speaking part of Switzerland
**Commercials were recorded in the Dutch-speaking part of Belgium
Table 1 Sampling period, time of day and source
10
Table 2 Number of sample commercials by country in ascending order
Country
Number of
commercials Country
Number of
commercials
Malaysia 123 Australia 297
Switzerland 126 New Zealand 302
Bulgaria 164 Germany 309
Austria 177 China 313
Sweden 190 Belgium 337
Brazil 209 United Kingdom 427
France 210 Spain 431
Finland 212 USA 465
Norway 220 South Korea 476
Czech Republic 252 Netherlands 496
Hungary 253 Hong Kong 590
Italy 259 Japan 620
Poland 270
Total 7728
11
Ta
ble
3
Eco
no
mic
da
ta,
tel
evis
ion
ad
ver
tisi
ng
ex
pen
dit
ure
da
ta,
an
d H
ofs
ted
e d
imen
sio
ns
sco
res
by
co
un
try
Co
un
try
GN
I p
er
cap
ita
in
US
$
GN
I in
mil
lio
n
US
$
Tel
evis
ion
ad
ver
tisi
ng
exp
end
itu
re
in U
S$
Tel
evis
ion
ad
ver
tisi
ng
exp
end
itu
re
per
ca
pit
a i
n
US
$P
DI
UA
IID
V M
AS
Au
stra
lia*
**
21
,65
0.0
4
30
,53
3.4
1,9
06
.2
9
6.6
36
51
90
61
Au
stri
a**
*2
6,7
20
.0
21
5,3
72
.3
5
01
.8
61
.6
11
70
55
79
Bel
giu
m*
**
25
,82
0.0
2
67
,22
6.9
88
9.8
8
5.7
61
97
78
43
Bra
zil*
3,1
10
.0
5
35
,72
3.5
3,6
45
.7
2
0.7
69
76
38
49
Bu
lgar
ia*
1,6
80
.0
1
3,2
65
.2
82
.2
1
0.1
70
`8
5`
30
`4
0`
Ch
ina*
90
0.0
1
,13
8,6
14
.0
8,7
16
.0
6
.8
8
0`
30
`2
0`
66
`
Cze
ch R
epu
bli
c**
*6
,74
0.0
68
,711
.1
27
8.3
2
7.2
57
`7
4`
58
`5
7`
Fin
lan
d*
23
,94
0.0
1
24
,21
7.1
19
3.6
3
7.3
33
59
63
26
Fra
nce
*2
2,8
80
.0
1,3
93
,90
3.0
2
,56
5.5
43
.1
6
88
67
14
3
Ger
man
y*
23
,54
0.0
1
,93
8,0
07
.0
4,4
43
.5
5
3.9
35
65
67
66
Ho
ng
Ko
ng
**
**
25
,61
0.0
1
73
,35
5.3
1,8
39
.0
2
70
.2
68
29
25
57
Hu
ng
ary
**
*6
,33
0.0
64
,02
8.2
2
73
.7
27
.0
4
6`
82
`8
0`
88
`
Ital
y*
*1
9,0
80
.0
1,1
00
,71
4.0
3
,69
8.2
63
.9
5
07
57
67
0
Jap
an*
**
*3
5,2
15
.0
4,4
76
,68
2.0
1
4,7
11
.9
11
5.4
5
49
24
69
5
Mal
aysi
a*3
,41
0.0
81
,10
7.6
2
31
.1
9.8
10
43
62
65
0
Net
her
lan
ds*
**
*2
5,1
60
.0
40
5,8
87
.7
7
43
.2
46
.2
3
85
38
01
4
New
Zea
lan
d*
13
,28
0.0
5
1,5
51
.8
20
1.5
5
2.2
22
49
79
58
No
rway
**
*4
3,3
50
.0
19
7,6
57
.8
3
27
.8
71
.6
3
15
06
98
Po
lan
d*
**
5,2
70
.0
2
01
,38
8.9
1,2
75
.4
3
3.0
68
`9
3`
60
`6
4`
So
uth
Ko
rea*
10
,58
0.0
5
01
,09
4.7
1,6
49
.0
3
5.1
60
85
18
39
Sp
ain
**
14
,58
0.0
5
96
,46
9.9
2,0
07
.8
4
8.3
57
86
51
42
Sw
eden
*2
6,7
50
.0
23
7,9
22
.2
3
39
.7
38
.2
3
12
97
15
Sw
itze
rlan
d*
36
,79
0.0
2
66
,03
7.1
29
2.7
4
0.7
70
70
64
58
UK
**
**
*2
6,9
20
.0
1,5
95
,14
1.0
5
,81
0.9
98
.2
3
53
58
96
6
US
A*
*3
5,4
00
.0
10
,20
7,0
60
.0
5
0,7
77
.6
16
7.7
4
04
69
16
2
*=
20
01
dat
a; *
*=
20
02
dat
a; *
**
=2
00
3 d
ata;
**
**
=av
erag
e 2
00
1 a
nd
20
03
dat
a; *
**
**
=av
erag
e 2
00
2 a
nd
20
03
dat
a
Dat
a m
ark
ed w
ith
` a
re e
stim
ates
(so
urc
e: H
ofs
ted
e 2
00
1);
so
urc
e o
f G
NI
dat
a: W
orl
d B
ank
(2
00
4);
so
urc
e o
f ad
ver
tisi
ng
ex
pen
dit
ure
dat
a: W
AR
C
(20
06
), a
dv
erti
sin
g d
ata
are
in c
urr
ent
pri
ces;
per
cap
ita
adv
erti
sin
g d
ata
for
Bu
lgar
ia a
re a
t co
nst
ant
20
00
pri
ces
12
Table 4 Frequency and proportion of celebrity use by country, in ascending order
Country
Number of
sample
commercials
Number of
commercials
containing
human
characters
Number of
commercials
containing
human
celebrities
Proportion of
commercials
containing
celebrities
Switzerland 126 103 4 0.0388
Czech Republic 252 220 11 0.0500
Sweden 190 155 8 0.0516
Norway 220 162 9 0.0556
Belgium 337 300 17 0.0567
Hungary 253 203 13 0.0640
Spain 431 372 25 0.0672
Austria 177 148 11 0.0743
Bulgaria 164 118 9 0.0763
New Zealand 302 201 16 0.0796
Finland 212 143 13 0.0909
USA 465 394 37 0.0939
Poland 270 225 22 0.0978
United Kingdom 427 364 40 0.1099
France 210 173 20 0.1156
Italy 259 236 28 0.1186
Netherlands 496 418 56 0.1340
Germany 309 201 28 0.1393
Australia 297 264 48 0.1818
China 313 207 51 0.2464
Hong Kong 590 487 124 0.2546
Brazil 209 196 51 0.2602
Malaysia 123 106 28 0.2642
Japan 620 529 259 0.4896
South Korea 476 434 265 0.6106
Total 7728 6359 1193
13
Table 5 Results of correlation analysis
Cultural variables Pearson's r
Individualism -.594 ***
Power distance .320 *
Masculinity .195
Uncertainty avoidance .078
Economic and advertising variables
GNI .132
GNI per capita -.144
Total expenditure on TV advertising .083
Total expenditure on TV advertising
per capita .091
*p<.10 **p<.05 ***p<.01 (one-tailed tests)

14
Table 6 Regression Analysis Results
Independent Variable ! (Standardized) p-Value VIF
Model 1 Power Distance -.096 .697 1.894
Individualism -.770*** .005 1.863
Masculinity .125 .562 1.449
Uncertainty Avoidance .078 .696 1.237
GNI .237 .290 1.510
GNI per capita .121 .653 2.239
TV advertising expenditure per
capita .008 .973 1.898
Total adjusted R2 .254
model F value 2.170*
Model 2 Individualism -.707*** .002 1.356
GNI .265 .189 1.370
GNI per capita .087 .697 1.740
TV advertising expenditure per
capita .026 .904 1.570
Total adjusted R2 .333
model F value 4.002***p < .10 (one tailed tests)
***p < .01 (one tailed tests)
**p < .05 (one tailed tests)