Teleconference Use among Office Workers: An Interorganizational Comparison of an Extended Theory of...
20
Adm. Sci. 2014, 4, 51–70; doi:10.3390/admsci4010051 administrative sciences ISSN 2076-3387 www.mdpi.com/journal/admsci Article Teleconference Use among Office Workers: An Interorganizational Comparison of an Extended Theory of Planned Behavior Model Siu Hing Lo 1, *, Gerard J.P. van Breukelen 2 , Gjalt-Jorn Y. Peters 3 and Gerjo Kok 2 1 University College London, Gower Street, London WC1E 6BT, UK 2 Maastricht University, P.O. Box 616, 6200 MD Maastricht, The Netherlands; E-Mails: [email protected] (G.J.P.V.B); [email protected] (G.K.) 3 Open University of the Netherlands, P.O. Box 2960, 6401 DL Heerlen, The Netherlands; E-Mail: [email protected] (G.J.Y.P.) * Author to whom correspondence should be addressed; E-Mail: [email protected]; Tel.: +44-20-3108-3099; Fax: +44-20-767-98354. Received: 25 September 2013; in revised form: 3 January 2014 / Accepted: 30 January 2014 / Published: 19 February 2014 Abstract: From a corporate social responsibility perspective, there are many reasons to promote teleconference use as an alternative to business travel. The present study examines psychosocial and organizational factors relevant to teleconference use. We tested an extended Theory of Planned Behavior model of teleconference use among office workers of four organizations. Results indicate that intention was the strongest direct predictor of teleconference use. Habit and perceived norm, in turn, were the strongest predictors of intention to use teleconference. In contrast, attitude was only weakly predictive and perceived control not predictive at all of intention to use teleconference. We also examined how this model was influenced by the organizational context by comparing organizations from two different regions, and organizations from the private vs. the public sector. Most teleconference-related beliefs differed between regions and organizational sectors. The relevance of specific attitudinal and normative beliefs to the overall attitude and perceived norm also differed between organizational sectors. Implications for practice and future research are discussed. OPEN ACCESS
Transcript of Teleconference Use among Office Workers: An Interorganizational Comparison of an Extended Theory of...
Adm. Sci. 2014, 4, 51–70; doi:10.3390/admsci4010051
administrative
sciences ISSN 2076-3387
www.mdpi.com/journal/admsci
Article
Teleconference Use among Office Workers:
An Interorganizational Comparison of an Extended Theory of
Planned Behavior Model
Siu Hing Lo 1,*, Gerard J.P. van Breukelen
2, Gjalt-Jorn Y. Peters
3 and Gerjo Kok
2
1 University College London, Gower Street, London WC1E 6BT, UK
2 Maastricht University, P.O. Box 616, 6200 MD Maastricht, The Netherlands;
E-Mails: [email protected] (G.J.P.V.B);
[email protected] (G.K.) 3 Open University of the Netherlands, P.O. Box 2960, 6401 DL Heerlen, The Netherlands;
E-Mail: [email protected] (G.J.Y.P.)
* Author to whom correspondence should be addressed; E-Mail: [email protected];
Tel.: +44-20-3108-3099; Fax: +44-20-767-98354.
Received: 25 September 2013; in revised form: 3 January 2014 / Accepted: 30 January 2014 /
Published: 19 February 2014
Abstract: From a corporate social responsibility perspective, there are many reasons to
promote teleconference use as an alternative to business travel. The present study examines
psychosocial and organizational factors relevant to teleconference use. We tested an
extended Theory of Planned Behavior model of teleconference use among office workers
of four organizations. Results indicate that intention was the strongest direct predictor of
teleconference use. Habit and perceived norm, in turn, were the strongest predictors of
intention to use teleconference. In contrast, attitude was only weakly predictive and
perceived control not predictive at all of intention to use teleconference. We also examined
how this model was influenced by the organizational context by comparing organizations
from two different regions, and organizations from the private vs. the public sector. Most
teleconference-related beliefs differed between regions and organizational sectors. The
relevance of specific attitudinal and normative beliefs to the overall attitude and perceived
norm also differed between organizational sectors. Implications for practice and future
research are discussed.
OPEN ACCESS
Adm. Sci. 2014, 4 52
Keywords: teleconference use; organizational sector; region; office workers; theory of
planned behavior; multigroup structural equation modeling
1. Introduction
Teleconference use has long been heralded as an alternative to physical business travel and a
valuable addition to the range of tools used to communicate over distance [1–3]. Under the right
conditions, teleconference meetings can be of equal quality to face-to-face meetings and substitute
some business travel [3–6]. From an organizational point of view, reasons to promote teleconference
use include time and money spent on traveling [1,7–9], physical and emotional toll caused by
traveling [1], and greenhouse gas emissions [10]. Substituting business travel with teleconference use
would therefore be an ideal corporate social responsibility goal.
However teleconference facilities remain underused, as evidenced by persistently high
transportation costs [11]. Previous studies have compared user’s views on specific features of
computer-mediated versus face-to-face communication [3,5,6,12,13]. In addition to objective features
of technological facilities, these studies have shown that attitudes towards and perceptions of such
facilities are important influences on teleconference’s success as an alternative to face-to-face
meetings. Effective promotion of teleconference use thus requires a comprehensive understanding of
relevant beliefs and psychosocial factors [14], as well as the organizational, cultural context in which it
is used [15]. However, to our knowledge, no studies have examined teleconference use within a
psychosocial framework of behavior or how the organizational context influences relevant employee
perceptions and behavior. The current study addresses these research gaps by examining
teleconference use within an extended Theory of Planned Behavior (TPB) framework among office
workers of four organizations in the Netherlands. We tested our psychosocial model of teleconference
use across a range of organizations from the private and public sector in two regions of the
Netherlands. The first study aim was to test specific hypotheses (as outlined below). A secondary aim
was to explore whether the TPB model applied equally to each organization, and if not, whether
differences could be explained by organizational sector or region.
1.1. Theory of Planned Behavior
The Theory of Planned Behavior (TPB) is a generic model of social behavior that has proven useful
in explaining a wide range of behaviors [16,17], including travel behaviors [18–20].
The TPB postulates that behavior is predicted by intention, which in turn is predicted by three
social-cognitive factors: attitude, perceived norm and perceived behavioral control. Attitudes are an
individual’s overall evaluation of a behavior, which are informed by behavioral beliefs concerning a
behavior's outcome (instrumental attitude) and behavioral beliefs pertaining to the experience
(experiential attitude) of a behavior [17]. Perceived norms reflect the perception of other people’s
behavior (descriptive norms) and others’ approval or disapproval (injunctive norms) of the behavior [21].
Most TPB research has employed a forced-choice format for measuring specific normative beliefs and
thereby assumed familiarity with the relevant norms, but some previous research emphasized that an
Adm. Sci. 2014, 4 53
absence of relevant normative beliefs is also possible [22]. Perceived behavioral control, or self-efficacy,
refers to a person’s perception of the available skills and resources to perform a behavior and are
reflected in an individual’s control beliefs [23,24]. Relevant behavioral, normative, and control beliefs
for a given behavior of interest need to be identified through pilot work [17].
However, as behaviors are performed repeatedly, they require less deliberative evaluation and
eventually become habits, which are characterized by a large degree of automaticity and/or
unconsciousness [17,25]. In this phase, contextual cues like time and place may play a more salient
role in the continued performance of a behavior than social-cognitive factors [26]. For this reason,
some TPB-based studies have also included habit as a predictor of behavior (e.g., [27]).
Previous TPB-based studies on travel behavior have shown that evidence generally supports the
relevance of both TPB constructs and habit. A meta-analysis of psychological correlates of car use
found that TPB constructs and habit were much more strongly associated with car use than
pro-environmental cognitions [18]. Another study reported stronger effects of cognitive and habitual
factors than socio-economic factors on travel mode choice [20].
The Technology Acceptance Model (TAM) is a simplified adaptation of the TPB aimed at
explaining technology use specifically [28,29]. Unlike the TPB, which requires pilot work to identify
relevant beliefs, the TAM specifies the beliefs that are relevant to technology use. It only includes
perceived usefulness (PU) and perceived ease of use (PEOU) as cognitive predictors and therefore
disregards the role perceived norms could potentially play. Although TAM is more parsimonious,
studies comparing TAM and TPB have emphasized the ability of TPB to provide a more
comprehensive understanding of technology usage in real-world, organizational settings [30,31].
Another advantage of using a generic TPB framework is that it allows for a better comparison with
alternatives to teleconference use, e.g., face-to-face meetings involving travel behaviors. For these
reasons, the present study will use a TPB framework. We therefore hypothesized that:
(H1) Attitude, perceived norms, perceived control and habit would together be good predictors of
intention to use teleconference facilities and teleconference use (i.e., the behavior).
1.2. Organizational Context
Teleconference use occurs within an organizational context. There is little research on the role of
organizational factors in teleconference use specifically; although the wider business travel literature
suggests that organizational sector and region are particularly relevant [7,9,32].
An important feature of organizations is whether they are public or private. Roughly speaking, the
primary aim of public and non-profit organizations is to provide services for society or the world at
large and companies aim to generate profit. Previous research provides evidence that personal values
and norms differ between decision-makers of private and public sector organizations [33]. In addition,
the relevance of personal values and norms to decision-making varied. In Nilsson and colleagues’
study, private sector decision-makers put greater value on self-interest, although these personal values
and norms were less relevant to their organizational decision-making [33]. We, thus, hypothesized that:
(H2) Beliefs related to self-interest would be better indicators of private sector than public sector
employees’ attitude towards teleconference use.
Adm. Sci. 2014, 4 54
Regional characteristics such as the quality of the infrastructure and travel distances can also
affect business travel and teleconference use. In the Netherlands, public transport connections are often
better and distances shorter in the region Zuid-Holland (the most densely-populated province and
centrally-located within the Netherlands) compared with the region Limburg (one of the less populated
provinces bordering Belgium and Germany; [34]). Previous TPB studies have observed regional
differences in TPB and habit measures, confirming that regional characteristics influence travel-related
beliefs [19,35]. Based on the features of the Zuid-Holland and Limburg regions outlined above and
theoretical predictions derived from the TPB, we hypothesized that:
(H3a) Teleconference use would be higher among Limburg employees than Zuid-Holland employees.
(H3b) These organizational-level differences in employee teleconference use would be mediated
through psychosocial factors included in the extended TPB model [17].
(H3c) Behavioral, normative and control beliefs among employees from Limburg would also be
more favorable towards teleconference use compared with employees from Zuid-Holland.
2. Methods
2.1. Participants and Procedure
Employees from four organizations located in cities from the Dutch provinces Zuid-Holland (ZH)
and Limburg (LB) were approached to participate in an online survey study about energy consumption
among office workers. Questions about teleconference use were part of this larger survey. The sample
of organizations consisted of two companies (company ZH; company LB), a public university
(university LB), and a non-governmental organization (NGO ZH), each participating with one to three
office buildings located in the same city. Thus, the sample consisted of one private and one public
organization in each region. The private-public divide also corresponded to the companies being more
geographically dispersed within the Netherlands than the public organizations, both of which had their
office building(s) in only one city. All organizations had some form of public commitment to
environmental sustainability, but none had energy conservation as their primary organizational aim.
However, the NGO’s core task, development aid, was increasingly perceived to be related to
environmental sustainability because climate change had become a pressing issue in the countries
where the NGO operated [36]. Company ZH and LB were both multinational companies, which were
geographically dispersed within the Netherlands. Each company participated in the study with one
office building (i.e., one location) only. Company ZH employees included in this study predominantly
traveled in the Netherlands and neighboring Belgium. Company LB’s employee business
travel patterns varied more widely between participating employees, ranging from domestic to
intercontinental travel. In contrast to the companies, the vast majority of NGO ZH’s participating
employees were based in one office building. However, the NGO’s core activity, international
development aid, meant that many employees were involved in overseas activities. The university was
located in one city only, but participated in the study with three office buildings.
Employees were approached by their own organization with the request to fill out the online
questionnaire. It was stressed that the study was conducted by independent researchers and only the
general anonymized results would be reported to the organization. Except for employees in company
Adm. Sci. 2014, 4 55
LB, respondents were given the chance to participate in a raffle contest for €20 gift vouchers. Only
respondents who traveled a minimum number of business trips per year were included in the sample to
ensure that teleconference use had relevance to their business travel frequency. The inclusion criteria
for domestic teleconferencing and international teleconferencing were ≥4 domestic trips (57.2% of
respondents) and ≥1 trip (51.1% of respondents) per year, respectively. Although strictly speaking, the
cut-off points introduced a selection bias in the sample, qualitative data from the same organizations
indicated there was a broad consensus on travel frequencies around the cut-off points being
unproblematic and unavoidable. Employees who traveled at frequencies below the cut-off points also
perceived questions about teleconference use to be largely irrelevant to themselves. The average
number of domestic trips among the total sample, 22.8 domestic trips, also suggests the domestic
cut-off point was low [36].
In total, 686 respondents indicated at the beginning of the survey that they traveled at least 4 times a
year within the Netherlands and 499 indicated they traveled at least 1 time a year to an international
destination. Of the eligible respondents, 404 (59%) completed the survey section on domestic
teleconferencing and 321 (64%) completed all questions on international teleconferencing. Two
respondents were removed from the analysis for domestic teleconferencing because they had partially
completed the relevant survey section. Of the total sample, 54% was female, the mean age was 42
(SD = 10.91) and 69% had received higher education. Sociodemographic descriptives of each
organization’s respondents are presented in Table 1.
Table 1. Sample characteristics by organization.
Total NGO ZH Company ZH University LB Company LB
Sex (% female) 54% 62% 41% 69% 44%
Education
(% higher education) 79% 81% 78% 82% 75%
Age (years) 42 43 42 40 46
SD 10.9 9.8 10.9 11.5 10.3
2.2. Measures
Teleconference use and the measures of psychosocial factors were chosen based on findings from
an earlier qualitative study conducted in the same organizations [36]. Interviews and focus groups with
key informants and employees of the four organizations were conducted to identify contextual and
psychosocial factors relevant to office workers’ teleconference use. Based on these findings, we
selected relevant adjectives for the semantic differential scales for behavioral belief measures, social
referents for normative belief measures and beliefs to measure other psychosocial factors. Due to
survey-length constraints, some psychosocial factors were measured with only one item. Unless stated
otherwise, all measures were rated on a five-point scale ranging from 1 to 5.
2.2.1. Teleconference Use
We examined both domestic and international teleconference use. Behavior—the dependent
variable—was measured with one item beginning with ―The past year, I have used teleconference
Adm. Sci. 2014, 4 56
facilities to communicate with domestic/international contacts‖, rated on a scale ranging from never to
very often. It should be noted that behavior, intention, and other psychosocial factors were measured
concurrently. Although it is a limitation of the study design, previous research has shown that past
behavior is generally a good proxy for future behavior in an unchanged environment [27,37].
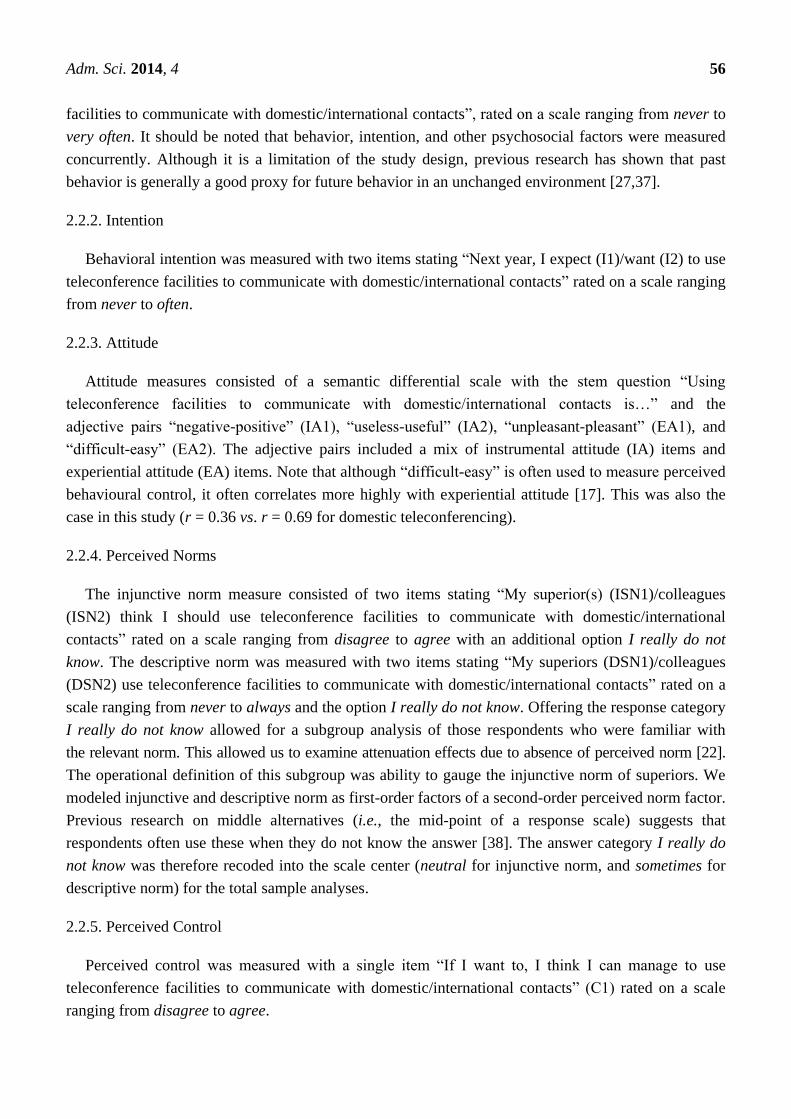
2.2.2. Intention
Behavioral intention was measured with two items stating ―Next year, I expect (I1)/want (I2) to use
teleconference facilities to communicate with domestic/international contacts‖ rated on a scale ranging
from never to often.
2.2.3. Attitude
Attitude measures consisted of a semantic differential scale with the stem question ―Using
teleconference facilities to communicate with domestic/international contacts is…‖ and the
adjective pairs ―negative-positive‖ (IA1), ―useless-useful‖ (IA2), ―unpleasant-pleasant‖ (EA1), and
―difficult-easy‖ (EA2). The adjective pairs included a mix of instrumental attitude (IA) items and
experiential attitude (EA) items. Note that although ―difficult-easy‖ is often used to measure perceived
behavioural control, it often correlates more highly with experiential attitude [17]. This was also the
case in this study (r = 0.36 vs. r = 0.69 for domestic teleconferencing).
2.2.4. Perceived Norms
The injunctive norm measure consisted of two items stating ―My superior(s) (ISN1)/colleagues
(ISN2) think I should use teleconference facilities to communicate with domestic/international
contacts‖ rated on a scale ranging from disagree to agree with an additional option I really do not
know. The descriptive norm was measured with two items stating ―My superiors (DSN1)/colleagues
(DSN2) use teleconference facilities to communicate with domestic/international contacts‖ rated on a
scale ranging from never to always and the option I really do not know. Offering the response category
I really do not know allowed for a subgroup analysis of those respondents who were familiar with
the relevant norm. This allowed us to examine attenuation effects due to absence of perceived norm [22].
The operational definition of this subgroup was ability to gauge the injunctive norm of superiors. We
modeled injunctive and descriptive norm as first-order factors of a second-order perceived norm factor.
Previous research on middle alternatives (i.e., the mid-point of a response scale) suggests that
respondents often use these when they do not know the answer [38]. The answer category I really do
not know was therefore recoded into the scale center (neutral for injunctive norm, and sometimes for
descriptive norm) for the total sample analyses.
2.2.5. Perceived Control
Perceived control was measured with a single item ―If I want to, I think I can manage to use
teleconference facilities to communicate with domestic/international contacts‖ (C1) rated on a scale
ranging from disagree to agree.
Adm. Sci. 2014, 4 57
2.2.6. Habit
For teleconferencing, habit was measured with two items adapted from Verplanken’s index of habit
strength: ―I automatically think of the possibility to use teleconference when I need to communicate
with domestic/international contacts‖ (H1) and ―I routinely use teleconference to communicate with
domestic/international contacts‖ (H2) rated on a scale ranging from disagree to agree [25].
3. Results
The overall aim was to test an extended TPB model for teleconference use and examine how this
model differed between regions and organizational sectors for domestic teleconferencing. Due to the
smaller number of respondents who make international business trips in all organizations and company
ZH and university LB especially, we were unable to conduct interorganizational analyses for
international teleconferencing. We also conducted various preliminary tests to test the robustness of
our conclusions.
3.1. Domestic and International Teleconference Use: Theory of Planned Behavior
First, we tested the extended TPB model of teleconference use. We used confirmatory factor
analysis (CFA) and structural equation modeling (SEM) with MPlus version 6 [39]. We verified
whether the baseline model was supported by data from the total sample (H1). We also tested the
baseline model on the subgroup of employees who were all familiar with the social norm to examine
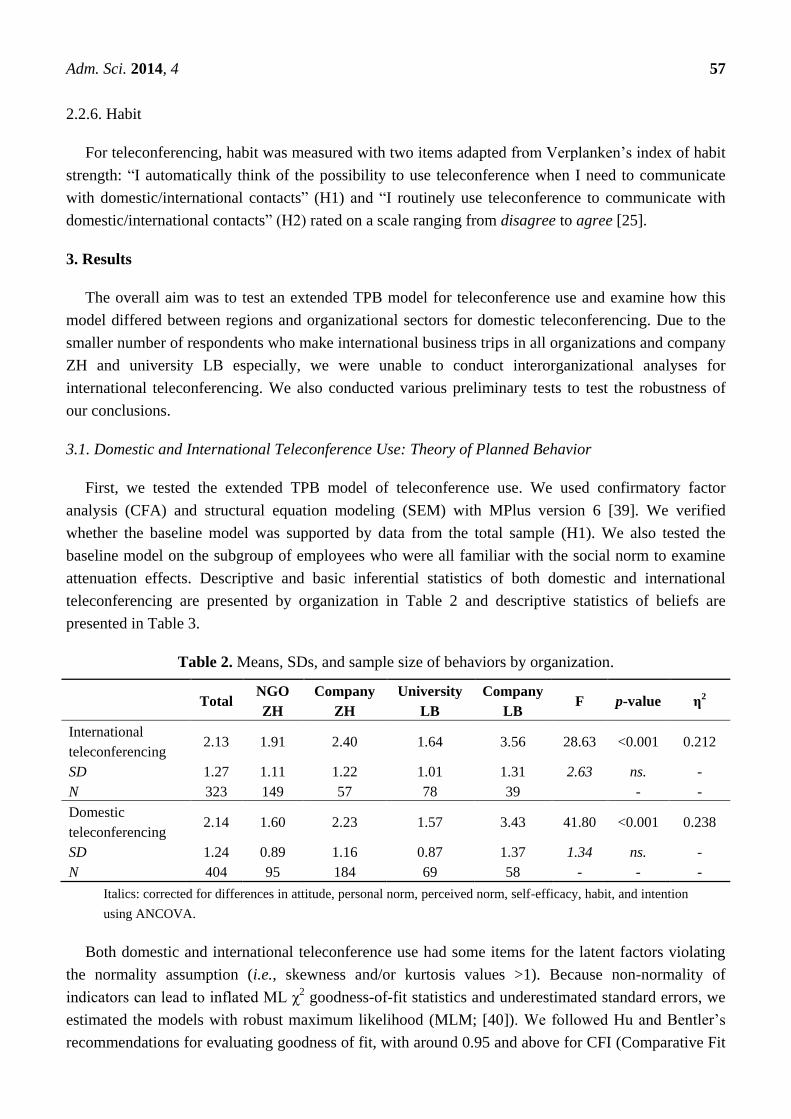
attenuation effects. Descriptive and basic inferential statistics of both domestic and international
teleconferencing are presented by organization in Table 2 and descriptive statistics of beliefs are
presented in Table 3.
Table 2. Means, SDs, and sample size of behaviors by organization.
Total NGO
ZH
Company
ZH
University
LB
Company
LB F p-value η
2
International
teleconferencing 2.13 1.91 2.40 1.64 3.56 28.63 <0.001 0.212
SD 1.27 1.11 1.22 1.01 1.31 2.63 ns. -
N 323 149 57 78 39 - -
Domestic
teleconferencing 2.14 1.60 2.23 1.57 3.43 41.80 <0.001 0.238
SD 1.24 0.89 1.16 0.87 1.37 1.34 ns. -
N 404 95 184 69 58 - - -
Italics: corrected for differences in attitude, personal norm, perceived norm, self-efficacy, habit, and intention
using ANCOVA.
Both domestic and international teleconference use had some items for the latent factors violating
the normality assumption (i.e., skewness and/or kurtosis values >1). Because non-normality of
indicators can lead to inflated ML χ2 goodness-of-fit statistics and underestimated standard errors, we
estimated the models with robust maximum likelihood (MLM; [40]). We followed Hu and Bentler’s
recommendations for evaluating goodness of fit, with around 0.95 and above for CFI (Comparative Fit
Adm. Sci. 2014, 4 58
Index) and TLI (Tucker-Lewis Index), and around 0.08 and below for RMSEA (Root Mean Square
Error of Approximation) and SRMR (Standardized Root Mean Square ResidualB) as indicators of
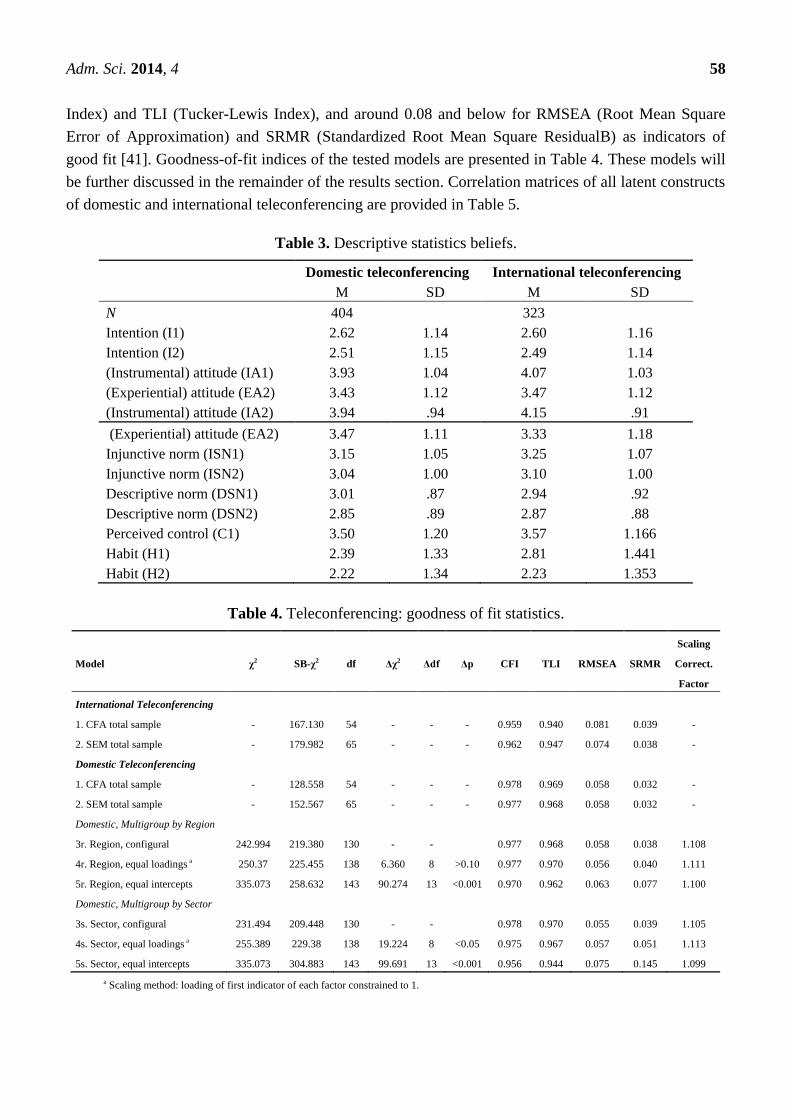
good fit [41]. Goodness-of-fit indices of the tested models are presented in Table 4. These models will
be further discussed in the remainder of the results section. Correlation matrices of all latent constructs
of domestic and international teleconferencing are provided in Table 5.
Table 3. Descriptive statistics beliefs.
Domestic teleconferencing International teleconferencing
M SD M SD
N 404 323
Intention (I1) 2.62 1.14 2.60 1.16
Intention (I2) 2.51 1.15 2.49 1.14
(Instrumental) attitude (IA1) 3.93 1.04 4.07 1.03
(Experiential) attitude (EA2) 3.43 1.12 3.47 1.12
(Instrumental) attitude (IA2) 3.94 .94 4.15 .91
(Experiential) attitude (EA2) 3.47 1.11 3.33 1.18
Injunctive norm (ISN1) 3.15 1.05 3.25 1.07
Injunctive norm (ISN2) 3.04 1.00 3.10 1.00
Descriptive norm (DSN1) 3.01 .87 2.94 .92
Descriptive norm (DSN2) 2.85 .89 2.87 .88
Perceived control (C1) 3.50 1.20 3.57 1.166
Habit (H1) 2.39 1.33 2.81 1.441
Habit (H2) 2.22 1.34 2.23 1.353
Table 4. Teleconferencing: goodness of fit statistics.
Model χ2 SB-χ2 df Δχ2 Δdf Δp CFI TLI RMSEA SRMR
Scaling
Correct.
Factor
International Teleconferencing
1. CFA total sample - 167.130 54 - - - 0.959 0.940 0.081 0.039 -
2. SEM total sample - 179.982 65 - - - 0.962 0.947 0.074 0.038 -
Domestic Teleconferencing
1. CFA total sample - 128.558 54 - - - 0.978 0.969 0.058 0.032 -
2. SEM total sample - 152.567 65 - - - 0.977 0.968 0.058 0.032 -
Domestic, Multigroup by Region
3r. Region, configural 242.994 219.380 130 - - 0.977 0.968 0.058 0.038 1.108
4r. Region, equal loadings a 250.37 225.455 138 6.360 8 >0.10 0.977 0.970 0.056 0.040 1.111
5r. Region, equal intercepts 335.073 258.632 143 90.274 13 <0.001 0.970 0.962 0.063 0.077 1.100
Domestic, Multigroup by Sector
3s. Sector, configural 231.494 209.448 130 - - 0.978 0.970 0.055 0.039 1.105
4s. Sector, equal loadings a 255.389 229.38 138 19.224 8 <0.05 0.975 0.967 0.057 0.051 1.113
5s. Sector, equal intercepts 335.073 304.883 143 99.691 13 <0.001 0.956 0.944 0.075 0.145 1.099
a Scaling method: loading of first indicator of each factor constrained to 1.
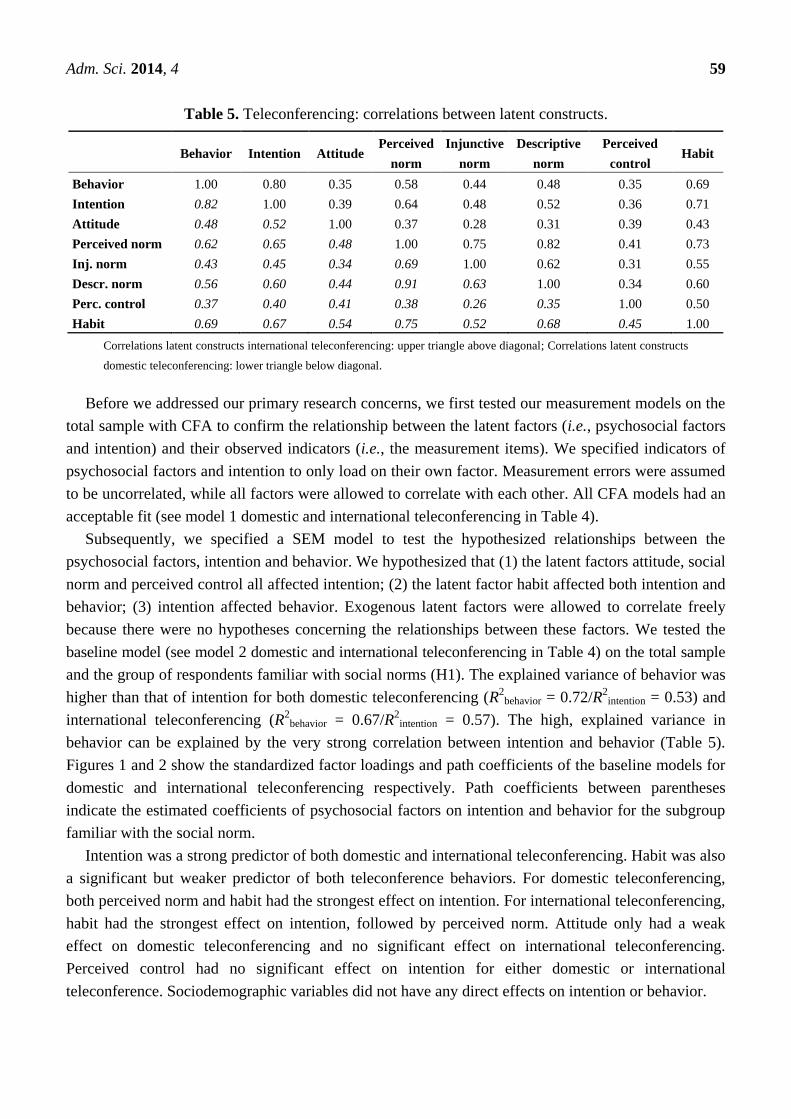
Adm. Sci. 2014, 4 59
Table 5. Teleconferencing: correlations between latent constructs.
Behavior Intention Attitude Perceived
norm
Injunctive
norm
Descriptive
norm
Perceived
control Habit
Behavior 1.00 0.80 0.35 0.58 0.44 0.48 0.35 0.69
Intention 0.82 1.00 0.39 0.64 0.48 0.52 0.36 0.71
Attitude 0.48 0.52 1.00 0.37 0.28 0.31 0.39 0.43
Perceived norm 0.62 0.65 0.48 1.00 0.75 0.82 0.41 0.73
Inj. norm 0.43 0.45 0.34 0.69 1.00 0.62 0.31 0.55
Descr. norm 0.56 0.60 0.44 0.91 0.63 1.00 0.34 0.60
Perc. control 0.37 0.40 0.41 0.38 0.26 0.35 1.00 0.50
Habit 0.69 0.67 0.54 0.75 0.52 0.68 0.45 1.00
Correlations latent constructs international teleconferencing: upper triangle above diagonal; Correlations latent constructs
domestic teleconferencing: lower triangle below diagonal.
Before we addressed our primary research concerns, we first tested our measurement models on the
total sample with CFA to confirm the relationship between the latent factors (i.e., psychosocial factors
and intention) and their observed indicators (i.e., the measurement items). We specified indicators of
psychosocial factors and intention to only load on their own factor. Measurement errors were assumed
to be uncorrelated, while all factors were allowed to correlate with each other. All CFA models had an
acceptable fit (see model 1 domestic and international teleconferencing in Table 4).
Subsequently, we specified a SEM model to test the hypothesized relationships between the
psychosocial factors, intention and behavior. We hypothesized that (1) the latent factors attitude, social
norm and perceived control all affected intention; (2) the latent factor habit affected both intention and
behavior; (3) intention affected behavior. Exogenous latent factors were allowed to correlate freely
because there were no hypotheses concerning the relationships between these factors. We tested the
baseline model (see model 2 domestic and international teleconferencing in Table 4) on the total sample
and the group of respondents familiar with social norms (H1). The explained variance of behavior was
higher than that of intention for both domestic teleconferencing (R2
behavior = 0.72/R2
intention = 0.53) and
international teleconferencing (R2
behavior = 0.67/R2
intention = 0.57). The high, explained variance in
behavior can be explained by the very strong correlation between intention and behavior (Table 5).
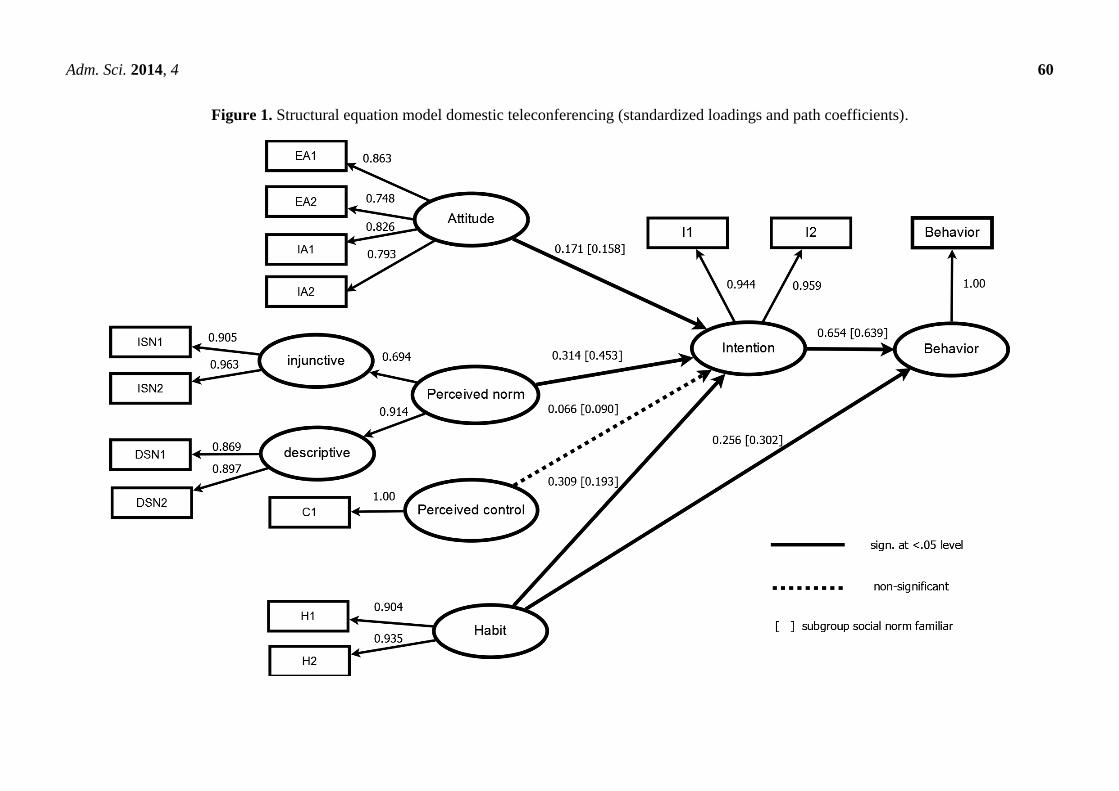
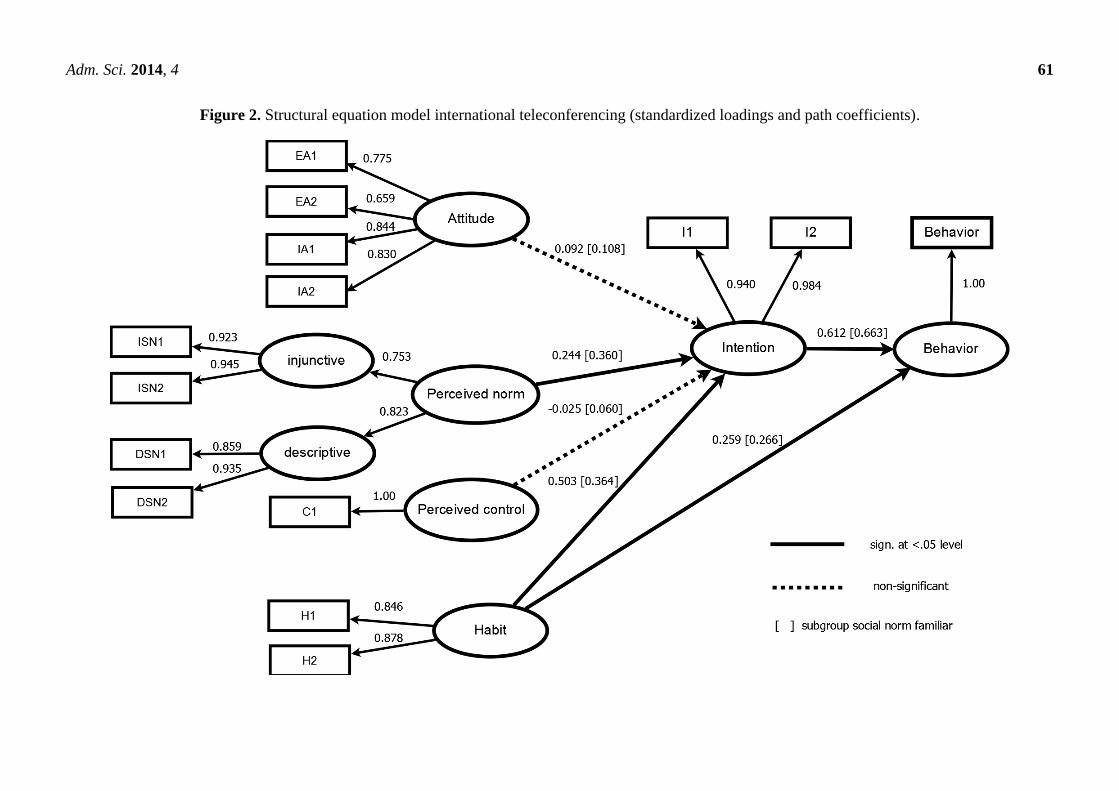
Figures 1 and 2 show the standardized factor loadings and path coefficients of the baseline models for
domestic and international teleconferencing respectively. Path coefficients between parentheses
indicate the estimated coefficients of psychosocial factors on intention and behavior for the subgroup
familiar with the social norm.
Intention was a strong predictor of both domestic and international teleconferencing. Habit was also
a significant but weaker predictor of both teleconference behaviors. For domestic teleconferencing,
both perceived norm and habit had the strongest effect on intention. For international teleconferencing,
habit had the strongest effect on intention, followed by perceived norm. Attitude only had a weak
effect on domestic teleconferencing and no significant effect on international teleconferencing.
Perceived control had no significant effect on intention for either domestic or international
teleconference. Sociodemographic variables did not have any direct effects on intention or behavior.
Adm. Sci. 2014, 4 60
Figure 1. Structural equation model domestic teleconferencing (standardized loadings and path coefficients).
Adm. Sci. 2014, 4 61
Figure 2. Structural equation model international teleconferencing (standardized loadings and path coefficients).
Adm. Sci. 2014, 4 62
As shown in Figures 1 and 2, standardized regression coefficients for the subgroup familiar with
social norms and the total sample differed considerably for the effects of perceived norms and habit on
teleconference behaviors (i.e., difference > 0.10). For domestic teleconferencing, the effect of
perceived norm on intention became substantially larger than that of habit, for which the effect on
intention reduced. For international teleconferencing, the coefficient of perceived norm became of a
magnitude comparable to that of habit. In brief, the extended TPB model was supported by the data,
although not all psychosocial factors examined were significantly related to intention and behavior.
The role of perceived norm and habit varied substantially between the total sample and respondents
who were all familiar with the norms.
3.2. Domestic Teleconference Use: Organizational Context
First, we tested for organizational-level differences in teleconference use (H3a; see Table 2). We
conducted one-way ANOVA (Analysis of Variance) tests and confirmed that there were significant
mean differences in behaviors between the organizations. We further tested with ANCOVA whether
the observed interorganizational differences in teleconference use could be explained by differences in
attitude, perceived norm, perceived control, habit and intention item scores (H3b) which was
confirmed for both domestic and international teleconferencing.
Following this, we conducted multigroup SEM analyses to test for sector (public vs. private)
differences (H2) and regional (Zuid-Holland vs. Limburg) differences (H3c) in the extended TPB
model of domestic teleconferencing.
3.2.1. Configural Model
For a model to be compared between groups (i.e., regions and organizational sectors), a necessary
condition is configural invariance. We tested for configural invariance in a multigroup SEM, which
tests an adequate fit of the baseline model for each group (see models 3r-3s in Table 4). The models
show acceptable goodness-of-fit indices suggesting that items are associated with the same common
factors in all groups. The configural invariance model functioned as the reference model for all further
multigroup analyses.
3.2.2. Factor Loadings
Having established acceptable configural invariance, we tested for equality of factor loadings in a
multigroup SEM by constraining these loadings to be equal across groups (H2; see models 4r-4s in
Table 4). A scaled SBχ2 difference test showed that equality of factor loadings across regions held for
domestic teleconferencing (ΔSBχ2 = 6.36, df = 8, ns.; [42]). The relevance of measured beliefs to
domestic teleconferencing is therefore equal across regions. Metric invariance across sectors, however,
was rejected for domestic teleconferencing (ΔSBχ2 = 19.22, df = 8, p < 0.05).
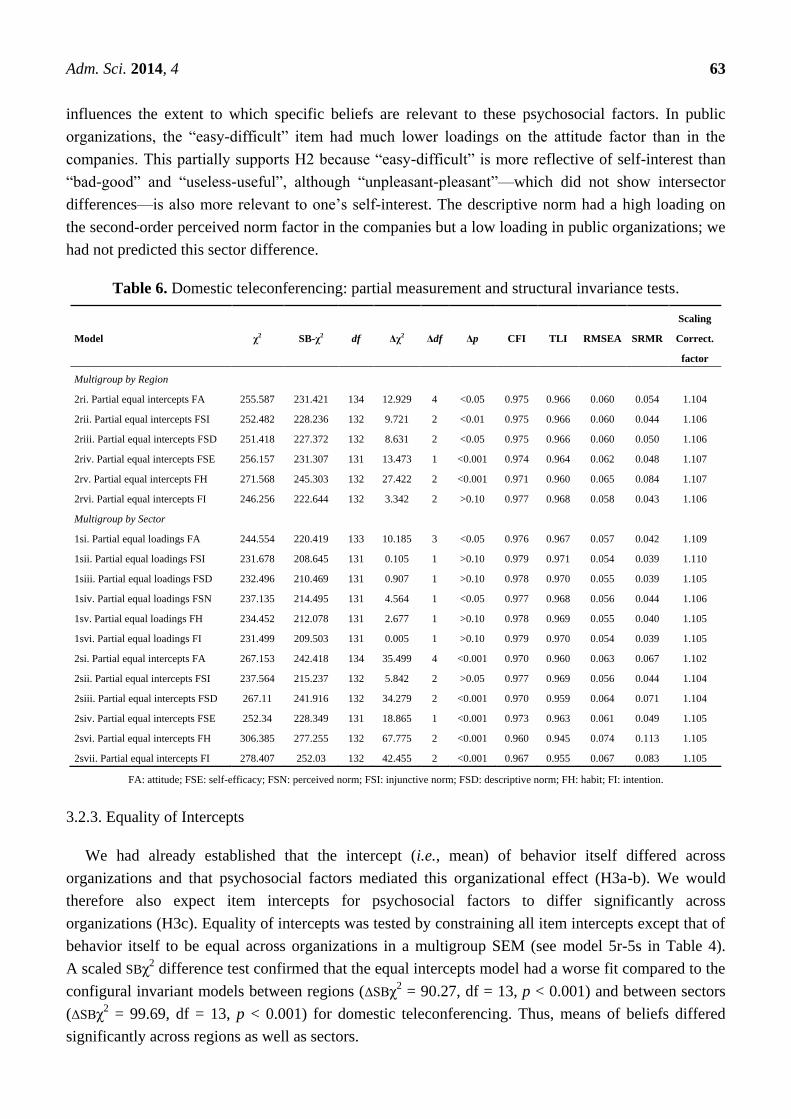
To identify which factor loadings of domestic teleconferencing differed significantly across sectors,
we conducted partial invariance tests by constraining the factor loadings of a single latent factor one at
a time (see models 1si-1svi in Table 6; more details in Appendix). Equality of factor loadings was
violated in the attitude and perceived norm factors, suggesting that the organizational context
Adm. Sci. 2014, 4 63
influences the extent to which specific beliefs are relevant to these psychosocial factors. In public
organizations, the ―easy-difficult‖ item had much lower loadings on the attitude factor than in the
companies. This partially supports H2 because ―easy-difficult‖ is more reflective of self-interest than
―bad-good‖ and ―useless-useful‖, although ―unpleasant-pleasant‖—which did not show intersector
differences—is also more relevant to one’s self-interest. The descriptive norm had a high loading on
the second-order perceived norm factor in the companies but a low loading in public organizations; we
had not predicted this sector difference.
Table 6. Domestic teleconferencing: partial measurement and structural invariance tests.
Model χ2 SB-χ2 df Δχ2 Δdf Δp CFI TLI RMSEA SRMR
Scaling
Correct.
factor
Multigroup by Region
2ri. Partial equal intercepts FA 255.587 231.421 134 12.929 4 <0.05 0.975 0.966 0.060 0.054 1.104
2rii. Partial equal intercepts FSI 252.482 228.236 132 9.721 2 <0.01 0.975 0.966 0.060 0.044 1.106
2riii. Partial equal intercepts FSD 251.418 227.372 132 8.631 2 <0.05 0.975 0.966 0.060 0.050 1.106
2riv. Partial equal intercepts FSE 256.157 231.307 131 13.473 1 <0.001 0.974 0.964 0.062 0.048 1.107
2rv. Partial equal intercepts FH 271.568 245.303 132 27.422 2 <0.001 0.971 0.960 0.065 0.084 1.107
2rvi. Partial equal intercepts FI 246.256 222.644 132 3.342 2 >0.10 0.977 0.968 0.058 0.043 1.106
Multigroup by Sector
1si. Partial equal loadings FA 244.554 220.419 133 10.185 3 <0.05 0.976 0.967 0.057 0.042 1.109
1sii. Partial equal loadings FSI 231.678 208.645 131 0.105 1 >0.10 0.979 0.971 0.054 0.039 1.110
1siii. Partial equal loadings FSD 232.496 210.469 131 0.907 1 >0.10 0.978 0.970 0.055 0.039 1.105
1siv. Partial equal loadings FSN 237.135 214.495 131 4.564 1 <0.05 0.977 0.968 0.056 0.044 1.106
1sv. Partial equal loadings FH 234.452 212.078 131 2.677 1 >0.10 0.978 0.969 0.055 0.040 1.105
1svi. Partial equal loadings FI 231.499 209.503 131 0.005 1 >0.10 0.979 0.970 0.054 0.039 1.105
2si. Partial equal intercepts FA 267.153 242.418 134 35.499 4 <0.001 0.970 0.960 0.063 0.067 1.102
2sii. Partial equal intercepts FSI 237.564 215.237 132 5.842 2 >0.05 0.977 0.969 0.056 0.044 1.104
2siii. Partial equal intercepts FSD 267.11 241.916 132 34.279 2 <0.001 0.970 0.959 0.064 0.071 1.104
2siv. Partial equal intercepts FSE 252.34 228.349 131 18.865 1 <0.001 0.973 0.963 0.061 0.049 1.105
2svi. Partial equal intercepts FH 306.385 277.255 132 67.775 2 <0.001 0.960 0.945 0.074 0.113 1.105
2svii. Partial equal intercepts FI 278.407 252.03 132 42.455 2 <0.001 0.967 0.955 0.067 0.083 1.105
FA: attitude; FSE: self-efficacy; FSN: perceived norm; FSI: injunctive norm; FSD: descriptive norm; FH: habit; FI: intention.
3.2.3. Equality of Intercepts
We had already established that the intercept (i.e., mean) of behavior itself differed across
organizations and that psychosocial factors mediated this organizational effect (H3a-b). We would
therefore also expect item intercepts for psychosocial factors to differ significantly across
organizations (H3c). Equality of intercepts was tested by constraining all item intercepts except that of
behavior itself to be equal across organizations in a multigroup SEM (see model 5r-5s in Table 4).
A scaled SBχ2 difference test confirmed that the equal intercepts model had a worse fit compared to the
configural invariant models between regions (ΔSBχ2 = 90.27, df = 13, p < 0.001) and between sectors
(ΔSBχ2 = 99.69, df = 13, p < 0.001) for domestic teleconferencing. Thus, means of beliefs differed
significantly across regions as well as sectors.
Adm. Sci. 2014, 4 64
Partial invariance tests were conducted to examine which item means differed between regions and
sectors (see models 2ri-2rvii and 2si-2svii in Table 6; more details in Appendix). Item means showed
that Limburg and company employees consistently had more favorable beliefs towards
teleconferencing than Zuid-Holland and public sector employees, respectively, thus, supporting H3c
and revealing a sector difference we had not hypothesized.
4. Discussion
This study tested an extended Theory of Planned Behavior model for domestic and international
teleconference use and analyzed how the model for domestic teleconference use differed across
regions and organizational sectors.
The hypothesized extended TPB model was supported by the data, although not all psychosocial
factors were significant predictors of intention and behavior. This does not contradict TPB,
which states that the role each psychosocial factor plays may vary, and should be established
empirically [17]. Intention was a strong, direct predictor of both domestic and international
teleconference use, as postulated by the TPB. Habit was an additional significant but weaker direct
predictor of domestic and international teleconference use. Habit was also the strongest overall
predictor of international teleconference intentions, whereas perceived norm and habit were both
strong predictors of domestic teleconference intentions. However, in the subgroup familiar with the
relevant social norm, the effect of perceived norm on intentions became larger, while the effect of
habit became smaller. Attitude was a significant, though weak predictor for domestic teleconference
intentions but failed to predict international teleconference intentions. In brief, unlike usage of many
other information technologies [29,43,44], perceived norm was a much stronger predictor of
teleconference use than attitude.
Organizational-level differences in employee teleconference use were mediated through
psychosocial factors incorporated in the extended TPB model. Differences in domestic teleconference
use were explored in multigroup analyses by region and by organizational sector. Most regional and
sector differences were found in the strength of beliefs (i.e., item intercepts) relevant to domestic
teleconference use. The general pattern was that Limburg (i.e., the less densely-populated and distant
region) and company employees had consistently more favorable beliefs towards teleconference use
than employees from Zuid-Holland and the public sector respectively. This supports our hypothesis
that a remote location and inferior transport links are associated with pro-teleconference beliefs.
However, we had not hypothesized a sector difference in beliefs. One possible explanation is the
geographical dispersion of the companies within the Netherlands, whereas the public sector
organizations were both located in one city only. This is also in line with previous findings
that organizational size (and the geographical dispersion that tends to be associated with it) is
linked to higher business travel frequency, which in turn, is associated with more potential for
teleconference use [5,7].
We also found sector differences in the relevance of specific beliefs (i.e., in factor loadings) to
psychosocial factors in domestic teleconference use. In companies the easy-difficult item was a more
important indicator of attitude than in public organizations. This is in line with the notion of
self-interest being more relevant to company employees than public sector employees, a hypothesis
Adm. Sci. 2014, 4 65
supported by previous research on sector differences [33]. The relevance of injunctive versus
descriptive norms to the overall perceived norm between sectors also differed, although we had not
hypothesized this. However, considering the range of possible environmental, ethical, and other
motivations for using teleconference facilities, there is no clear rationale why we should expect
descriptive norms of teleconference use to be relevant to company employees but not public sector
employees. Future research should explore possible explanations.
4.1. Study Limitations and Future Research
The main limitation of this study was the reliance on self-reported, cross-sectional data collected
through the voluntary participation in an online survey. Having said that, the aim was not to rigorously
test the validity of the theory, but to take advantage of a well-established social psychological theory to
shed light on teleconference use. There is ample evidence from previous TPB studies to show that
psychosocial factors are good predictors of (future) behavior, provided measurements are compatible
and no relevant contextual changes occur [17]. Therefore, the current findings should be seen as
a stepping-stone for future longitudinal research that can avoid potential pitfalls commonly associated
with self-report and cross-sectional data. In particular, longitudinal research can address the question
whether a change in relevant behavioral and normative beliefs leads to a change in subsequent
teleconference use and frequency of physical travel. Similarly, we could not closely match the
objective features of the teleconference facilities available to each respondent with their survey
responses. Previous studies have focused on how objective features of teleconference facilities could
influence its use, while this study focused on perceptions of teleconference use. Future research should
examine the interaction between facility features and users’ beliefs in (quasi-)experimental studies.
Another shortcoming is the measurement of perceived control with a single item. Although recent
research suggests that the reliability and validity of a single-item measure can be good [45–47],
conclusions drawn about perceived control are solely based on the relevance of this item rather than a
comprehensive multi-item measure of the perceived behavioral control concept.
Finally, the small number of organizations in our sample prevented us from examining the role of
organizational factors in more detail. Several conceptually distinguishable organizational factors could
not be examined independently. For instance, the companies were more geographically dispersed than
the public sector organizations in our sample. Perhaps a more fundamental issue is the lack of a
conceptual understanding of organizational factors relevant to teleconference use, which also forced us
to adopt a more explorative approach to examining organizational influences. Future research should
examine the role of organizational policies, facilities, and culture in more depth.
4.2. Implications for Practice
Several conclusions for organizational practice can be drawn. Assuming a causal relationship
between psychosocial factors and behavior, interventions should focus on habits and perceived norms
relevant to teleconference use. Surprisingly, attitude and perceived control—often seen as the most
important social-cognitive factors for technology use—seemed to play a minor or no role at all. The
results also underscore the importance of identifying relevant beliefs before intervening in any
organization, especially considering sector differences in the relevance of attitudinal and normative
Adm. Sci. 2014, 4 66
beliefs to employees’ overall attitude and perceived norm. The results also showed substantial
differences in the role of perceived norm between subgroups within organizations implying that when
norms are made more salient—for instance, through a change management process—their relative
influence on teleconference use could further increase. The potentially large impact of perceived norm
suggests that a social marketing approach could play a valuable role in any behavior change
interventions [48].
5. Conclusions
This study examined the psychosocial factors influencing teleconference use in various
organizations. Similar to previous findings from the wider literature on organizational and travel
behaviors, an extended Theory of Planned Behavior framework proved useful in explaining
teleconference use. Organizational differences were mainly associated with the strength of
teleconference-related beliefs. Employees in the remote region and those in companies held more
favorable beliefs towards teleconference use than those in the central region and the public sector
respectively. The relevance of attitudinal and normative beliefs as indicators of attitude towards and
perceived norm of teleconference use also differed between public and private sector organizations.
Author Contributions
Siu Hing Lo, Gjalt-Jorn Y. Peters, Gerjo Kok conceived of and designed the study. Siu Hing Lo and
Gerard J.P. van Breukelen collected the data. Siu Hing Lo and Gerard J.P. van Breukelen analyzed and
interpreted the data. Siu Hing Lo wrote the first draft of the paper. All the authors contributed to
subsequent versions of the manuscript.
Conflicts of Interest
The authors declare no conflict of interest.
References
1. Beaverstock, J.V.; Derudder, B.; Faulconbridge, J.R.; Witlox, F. International business travel:
Some explorations. Geogra. Ann. Ser. B Hum. Geogr. 2009, 91B, 193–202.
2. Elliot, S. Transdisciplinary perspectives on environmental sustainability: A resource base and
framework for IT-enabled business transformation. MIS Q. 2011, 35,197–236.
3. Rhoads, M. Face-to-face and computer-mediated communication: What does theory tell us and
what have we learned so far? J. Plan. Lit. 2010, 25, 111–122.
4. Arnfalk, P.; Kogg, B. Service transformation—Managing a shift from business travel to virtual
meetings. J. Clean. Prod. 2003, 11, 859–872.
5. Lu, J.L.; Peeta, S. Analysis of the factors that influence the relationship between business air
travel and videoconferencing. Transp. Res. Part A:Policy Pract. 2009, 43, 709–721.
6. Simon, A.F. Computer-mediated communication: Task performance and satisfaction. J. Soc. Psychol.
2006, 146, 349–379.
Adm. Sci. 2014, 4 67
7. Aguilera, A. Business travel and mobile workers. Transp. Res. Part a-Policy Pract. 2008, 42,
1109–1116.
8. Davies, Z.G.; Armsworth, P.R. Making an impact: The influence of policies to reduce emissions
from aviation on the business travel patterns of individual corporations. Energy Policy 2010, 38,
7634–7638.
9. Ajzen, I. The theory of planned behaviour: Reactions and reflections. Psychol. Health 2011, 26,
1113–1127.
10. Toffel, M.W.; Horvath, A. Environmental implications of wireless technologies: News delivery
and business meetings. Environ. Sci. Technol. 2004, 38, 2961–2970.
11. De Groot, G.M.; Morgenstern, P.P. Energieverbruik en Besparingspotentieel Bedrijven en
Instellingen (Energy Use and Saving Potential Companies and Institutions); RIVM (National
Institute for Public Health and the Environment): Bilthoven, The Netherlands, 2009.
12. Anderson, J.; Ashraf, N.; Douther, C.; Jack, M.A. Presence and usability in shared space virtual
conferencing: A participatory design study. Cyberpsychol. Behav. 2001, 4, 287–305.
13. Anderson, A.H.; McEwan, R.; Bal, J.; Carletta, J. Virtual team meetings: An analysis of
communication and context. Comput. Hum. Behav. 2007, 23, 2558–2580.
14. Kok, G.; Lo, S.H.; Peters, G.J.Y.; Ruiter, R.A.C. Changing energy-related behavior: An
Intervention Mapping approach. Energy Policy 2011, 39, 5280–5286.
15. Okereke, C.; Wittneben, B.; Bowen, F. Climate change: Challenging business, transforming
politics. Bus. Soc. 2012, 51, 7–30.
16. Armitage, C.J.; Conner, M. Efficacy of the theory of planned behaviour: A meta-analytic review.
Br. J. Soc. Psychol. 2001, 40, 471–499.
17. Fishbein, M.; Ajzen, I. Predicting and Changing Behavior: The Reasoned Action Approach;
Taylor & Francis Group: New York, NY, USA, 2010.
18. Gardner, B.; Abraham, C. Psychological correlates of car use: A meta-analysis. Transp. Res.
Part F:Traffic Psychol. Behav. 2008, 11, 300–311.
19. Bamberg, S.; Hunecke, M.; Blobaum, A. Social context, personal norms and the use of public
transportation: Two field studies. J. Environ. Psychol. 2007, 27, 190–203.
20. Chen, C.F.; Lai, W.T. The effects of rational and habitual factors on mode choice behaviors in a
motorcycle-dependent region: Evidence from Taiwan. Transp. Policy 2011, 18, 711–718.
21. Schultz, P.W.; Nolan, J.M.; Cialdini, R.B.; Goldstein, N.J.; Griskevicius, V. The constructive,
destructive and reconstructive power of social norms. Psychol. Sci. 2007, 18, 429–434.
22. Siero, S.; Boon, M.E.; Kok, G.J.; Siero, F.W.; Veen, P. Implementatie van energiebesparend
gedrag in een grote organisatie. M&O, Tijdschrift voor Organisatiekunde en Sociaal Beleid 1984,
38, 323–338.
23. Bandura, A. Self-Efficacy: The Exercise of Control; Worth Publishers: New York, NY, USA, 1997.
24. Ajzen, I. The theory of planned behavior. Organ. Behav. Hum. Decis. Processes 1991, 50, 179–211.
25. Verplanken, B.; Orbell, S. Reflections on past behavior: A self-report index of habit strength.
J. Appl. Soc. Psychol. 2003, 33, 1313–1330.
26. Wood, W.; Tam, L.; Guerrero Witt, M. Changing circumstances, disrupting habits. J. Pers.
Soc. Psychol. 2005, 88, 918–933.
Adm. Sci. 2014, 4 68
27. Bamberg, S.; Ajzen, I.; Schmidt, P. Choice of travel mode in the theory of planned behavior: The
roles of past behavior, habit, and reasoned action. Basic Appl. Soc. Psychol. 2003, 25, 175–187.
28. Davis, F.D. Perceived usefulness, perceived ease of use, and user acceptance of information
technologies. MIS Q. 1989, 13, 319–340.
29. Legris, P.; Ingham, J.; Collerette, P. Why do people use information technology? A critical review
of the technology acceptance model. Inf. Manag. 2003, 40, 191–204.
30. Taylor, S.; Todd, P.A. Understanding information technology usage: A test of competing models.
Inf. Syst. Res. 1995, 6, 144–176.
31. Mathieson, K. Predicting user intentions: Comparing the technology acceptance model with the
theory of planned behavior. Inf. Syst. Res. 1991, 2, 173–191.
32. Gallo, P.J.; Christensen, L.J. Firm size matters: An empirical investigation of organizational size
and ownership on sustainability-related behaviors. Bus. Soc. 2011, 50, 315–349.
33. Nilsson, A.; von Borgstede, C.; Biel, A. Willingness to accept climate change strategies: The
effect of values and norms. J. Environ. Psychol. 2004, 24, 267–277.
34. CBS, PBL, UR W. Bevolkingsomvang en aantal huishoudens, 1980–2010. Secondary
Bevolkingsomvang en aantal huishoudens, 1980–2010. Available online: http://www.compendium
voordeleefomgeving.nl/indicatoren/nl0001-Bevolkingsomvang-en-huishoudens.html?i=15–12
(accessed on 3 January 2012).
35. Chen, C.F.; Chao, W.H. Habitual or reasoned? Using the theory of planned behavior, technology
acceptance model, and habit to examine switching intentions toward public transit. Transp. Res.
Part F: Traffic Psychol. Behav. 2011, 14, 128–137.
36. Lo, S.H.; van Breukelen, G.J.P.; Peters, G.J.Y.; Kok, G. Proenvironmental travel behaviors
among office workers: A qualitative study of individual and organizational determinants.
Transp. Res. Part A: Policy Pract. 2011, 56, 11–22.
37. Wright, C.; Nyberg, D.; Grant, D. ―Hippies on the third floor‖: Climate change, narrative identity
and the micro-politics of corporate environmentalism. Organ. Stud. 2012, 33, 1451–1475.
38. Sturgis, P.; Roberts, C.; Smith, P. Middle alternatives revisited: How the neither/nor response acts
as a way of saying ―I Don’t Know‖? Sociol. Methods Res. 2012, doi:10.1177/0049124112452527.
39. Muthén, L.K.; Muthén, B.O. Mplus User’s Guide, 6th ed.; Muthén & Muthén: Los Angeles, CA,
USA, 1998–2010.
40. Satorra, A.; Bentler, P.M. Corrections to Test Statistics and Standard Enors in Covariance Structure
Analysis. In Latent Variables Analysis: Applications for Developmental Research; von Eye, A.,
Clogg, C.C., Eds.; Sage: Thousand Oaks, CA, USA, 1994; pp. 399–419.
41. Hu, L.T.; Bentler, P.M. Cutoff criteria for fit indexes in covariance structure analysis:
Conventional criteria versus new alternatives. Struct. Equ. Model. 1999, 6, 1–55.
42. Satorra, A.; Bentler, P.M. A scaled difference chi-square test statistic for moment structure
analysis. Psychometrika 2001, 66, 507–514.
43. Venkatesh, V.; Davis, F.D. A theoretical extension of the Technology Acceptance Model: Four
longitudinal field studies. Manag. Sci. 2000, 46, 186–204.
44. Yang, C.; Hsu, Y.C.; Tan, S.Y.T. Predicting the determinants of user’ intentions for using YouTube
to share video: Moderating gender effects. Cyberpsychol. Behav. Soc. Netw. 2010, 13, 141–152.
Adm. Sci. 2014, 4 69
45. Bergkvist, L.; Rossiter, J.R. The predictive validity of multiple-item versus single-item measures
of the same constructs. J. Mark. Res. 2007, 44, 175–184.
46. Christophersen, T.; Konradt, U. Reliability, validity, and sensitivity of a single-item measure of
online store usability. Int. J. Hum.-Comput. Stud. 2011, 69, 269–280.
47. Hoeppner, B.B.; Kelly, J.F.; Urbanoski, K.A.; Slaymaker, V. Comparative utility of a single-item
versus multiple-item measure of self-efficacy in predicting relapse among young adults. J. Subst.
Abuse Treat. 2011, 41, 305–312.
48. McKenzie-Mohr, D. Fostering sustainable behavior through community-based social marketing.
Am. Psychol. 2000, 55, 531–537.
Appendix
A1. Partial Measurement Invariance of Factor Loadings
We hypothesized that beliefs more reflective of self-interest would be better indicators of attitude in
the private sector (H3). To identify which factor loadings of domestic teleconferencing differed
significantly across sectors, we conducted partial invariance tests by constraining the factor loadings of
a single latent factor one at a time. For factors with significantly different factor loadings, we
calculated the ratio between the lowest and the highest standardized factor loading (taken from the
reference model) per indicator to gauge the magnitude of the violations. The lowest ratio of each factor
and a qualitative interpretation of the sector differences are reported.
Equality of factor loadings was violated for the attitude factor (ΔSBχ2 = 10.41, df = 3, p < 0.05,
diff. ratio = 0.74) and the second-order perceived norm factor (ΔSBχ2 = 4.22, df = 1, p < 0.05,
diff. ratio = 0.54). Thus, the relative importance of attitudinal measures and the descriptive versus the
injunctive norm to the respective latent factors differ across sectors. Inspection of the factor loadings in
the configural invariant model revealed that, in public organizations, the ―easy-difficult‖ item had
much lower loadings on the attitude factor than in the companies. Thus, ―easy-difficult‖ does not seem
to be indicative of public employees’ attitude, although it is for company employees. This partially
supports H4 because ―easy-difficult‖ is an experiential attitude item that is more exclusively relevant
to self-interest than the instrumental attitude items, ―bad-good‖ and ―useless-useful‖, although the fourth
item ―unpleasant-pleasant‖—that showed no sector differences—is also more relevant to self-interest.
The results also show that the descriptive norm had a very high loading on the second-order perceived
norm factor in the companies but a very low loading in public organizations. This suggests that what
others do themselves is very indicative of the perceived norm in companies but much less so in public
sector organizations. We did not predict this sector difference in perceived norm.
A2. Partial Measurement Invariance of Item Intercepts
We hypothesized that intercepts would be higher in the Limburg region (H2c). Partial invariance
tests were conducted to check in which parts of the model the assumption of intercept equality was
violated. Many violations were found for domestic teleconferencing. For factors with significantly
different intercepts, we calculated the largest difference per factor between groups to examine the
magnitude of the violations (note that the maximum mean difference is 4 for a 1–5 scale).
Adm. Sci. 2014, 4 70
Significant regional differences were found for all individual factors of domestic teleconferencing,
except for intention. The largest differences were found for habit (mean diff. = 0.80) with Limburg
showing higher intercepts. Although other intercepts showed regional differences of less than 0.50,
there was a consistent pattern: employees from Limburg held more favorable beliefs towards
teleconferencing than employees from Zuid-Holland.
Sector differences were found for all individual factors, except the injunctive norm factor. Beliefs
were more pro-teleconference in companies than in public organizations, all showing mean differences
approaching or exceeding 0.50. The largest differences were found for habit (mean diff. = 1.05).
© 2014 by the authors; licensee MDPI, Basel, Switzerland. This article is an open access article
distributed under the terms and conditions of the Creative Commons Attribution license
(http://creativecommons.org/licenses/by/3.0/).