Technology Improves Learning in Large Principles of Economics Classes: Using Our WITS
16
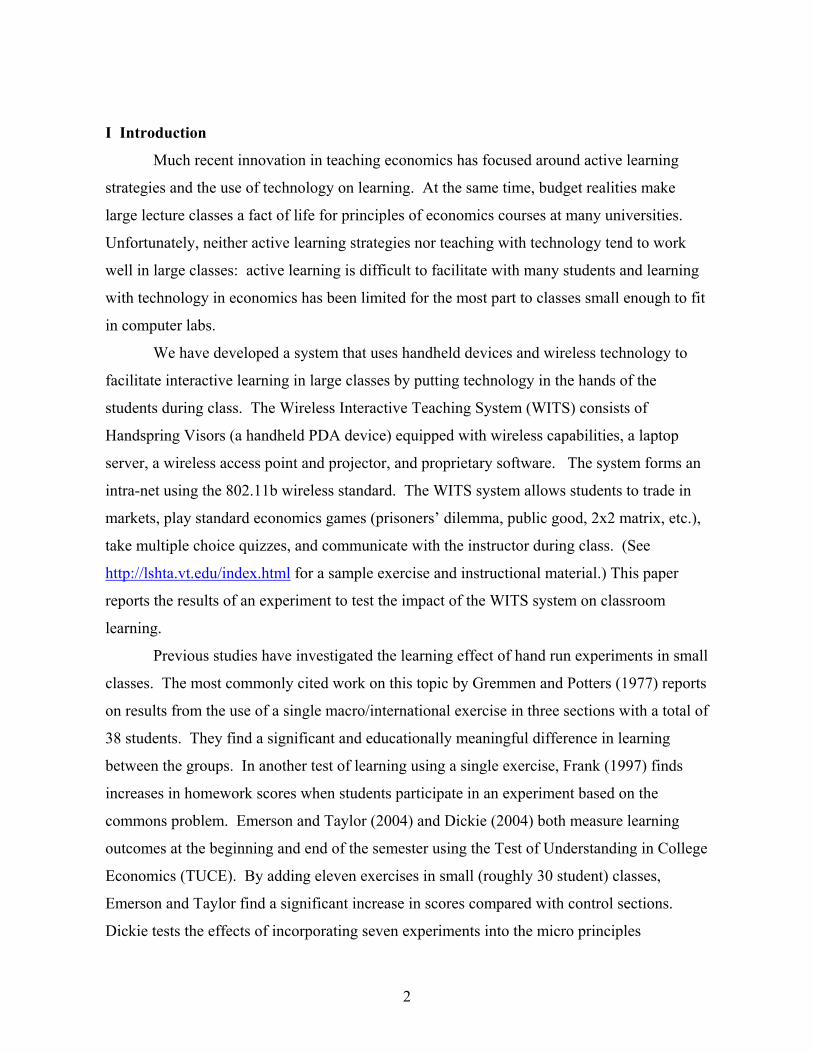
11/28/2005 Technology Improves Learning in Large Principles of Economics Classes: Using Our WITS * Sheryl B. Ball Dept. of Economics Virginia Tech Blacksburg, VA 24061 [email protected] Catherine C. Eckel School of Social Sciences University of Texas at Dallas Mail Station GR31 Richardson, TX 75080 [email protected] Christian Rojas Dept. of Economics Virginia Tech Blacksburg, VA 24061 [email protected] Abstract: Much recent innovation in teaching economics has focused around active learning strategies, which are often difficult or impossible to implement in large classes. We have developed a system that uses handheld devices and wireless technology to facilitate interactive learning in large classes by putting technology in the hands of the students during class. The Wireless Interactive Teaching System (WITS) consists of handheld wireless devices, a laptop server, and proprietary software. Students use the WITS system to trade in markets, play standard economics games, take multiple choice quizzes, and communicate with the instructor during class. This paper reports results of a controlled experiment to test the effectiveness of the WITS system using two 80-person principles of economics classes. Student who used the WITS system earned final grades that averaged 7 points higher than the control class, adjusting for other important influences on grades such as demographics, ability and experience. The impact on learning is highest for freshmen and women students, groups who often struggle with introductory economics, and lowest for male seniors, who, in our sample, tend to be engineering majors. Teaching evaluations are also significantly higher in the experimental class. JEL codes: A22, C9 * Funding was provided by the National Science Foundation, the Andrew Mellon Foundation, and the Center for Innovation in Learning at Virginia Tech. For their contributions to developing the WITS system, we thank Scott Midkiff, Kevin Oliver, James Nurmi, Eric Harding, Ross Ivins, Adam Ferguson and Sara Rangos. For research assistance we thank Constantinos Charalambous, Matt Parrett, Evan Moore, Narine Badasyan. Thanks to David Salemi for his comments and feedback and to Charlie Holt and Paul Romer for encouragement and support. 1
-
Upload
independent -
Category
Documents
-
view
2 -
download
0
Transcript of Technology Improves Learning in Large Principles of Economics Classes: Using Our WITS
11/28/2005
Technology Improves Learning in Large Principles of Economics Classes: Using Our WITS*
Sheryl B. Ball Dept. of Economics Virginia Tech Blacksburg, VA 24061 [email protected] Catherine C. Eckel School of Social Sciences University of Texas at Dallas Mail Station GR31 Richardson, TX 75080 [email protected] Christian Rojas Dept. of Economics Virginia Tech Blacksburg, VA 24061 [email protected]
Abstract: Much recent innovation in teaching economics has focused around active learning strategies, which are often difficult or impossible to implement in large classes. We have developed a system that uses handheld devices and wireless technology to facilitate interactive learning in large classes by putting technology in the hands of the students during class. The Wireless Interactive Teaching System (WITS) consists of handheld wireless devices, a laptop server, and proprietary software. Students use the WITS system to trade in markets, play standard economics games, take multiple choice quizzes, and communicate with the instructor during class. This paper reports results of a controlled experiment to test the effectiveness of the WITS system using two 80-person principles of economics classes. Student who used the WITS system earned final grades that averaged 7 points higher than the control class, adjusting for other important influences on grades such as demographics, ability and experience. The impact on learning is highest for freshmen and women students, groups who often struggle with introductory economics, and lowest for male seniors, who, in our sample, tend to be engineering majors. Teaching evaluations are also significantly higher in the experimental class. JEL codes: A22, C9 * Funding was provided by the National Science Foundation, the Andrew Mellon Foundation, and the Center for Innovation in Learning at Virginia Tech. For their contributions to developing the WITS system, we thank Scott Midkiff, Kevin Oliver, James Nurmi, Eric Harding, Ross Ivins, Adam Ferguson and Sara Rangos. For research assistance we thank Constantinos Charalambous, Matt Parrett, Evan Moore, Narine Badasyan. Thanks to David Salemi for his comments and feedback and to Charlie Holt and Paul Romer for encouragement and support.
1
I Introduction
Much recent innovation in teaching economics has focused around active learning
strategies and the use of technology on learning. At the same time, budget realities make
large lecture classes a fact of life for principles of economics courses at many universities.
Unfortunately, neither active learning strategies nor teaching with technology tend to work
well in large classes: active learning is difficult to facilitate with many students and learning
with technology in economics has been limited for the most part to classes small enough to fit
in computer labs.
We have developed a system that uses handheld devices and wireless technology to
facilitate interactive learning in large classes by putting technology in the hands of the
students during class. The Wireless Interactive Teaching System (WITS) consists of
Handspring Visors (a handheld PDA device) equipped with wireless capabilities, a laptop
server, a wireless access point and projector, and proprietary software. The system forms an
intra-net using the 802.11b wireless standard. The WITS system allows students to trade in
markets, play standard economics games (prisoners’ dilemma, public good, 2x2 matrix, etc.),
take multiple choice quizzes, and communicate with the instructor during class. (See
http://lshta.vt.edu/index.html for a sample exercise and instructional material.) This paper
reports the results of an experiment to test the impact of the WITS system on classroom
learning.
Previous studies have investigated the learning effect of hand run experiments in small
classes. The most commonly cited work on this topic by Gremmen and Potters (1977) reports
on results from the use of a single macro/international exercise in three sections with a total of
38 students. They find a significant and educationally meaningful difference in learning
between the groups. In another test of learning using a single exercise, Frank (1997) finds
increases in homework scores when students participate in an experiment based on the
commons problem. Emerson and Taylor (2004) and Dickie (2004) both measure learning
outcomes at the beginning and end of the semester using the Test of Understanding in College
Economics (TUCE). By adding eleven exercises in small (roughly 30 student) classes,
Emerson and Taylor find a significant increase in scores compared with control sections.
Dickie tests the effects of incorporating seven experiments into the micro principles
2

curriculum using three sections of about 50 students each, one of which was a control. He
finds a significantly larger improvement in scores on the TUCE by the experimental group.
Cardell et al. (1996), however, find that adding four classroom experiments does not yield
statistically significant improvements in student outcomes.
In fall 2003, we conducted a controlled experiment to test the effectiveness of the
WITS system using two 80-person principles of economics classes at Virginia Tech. Our
study differs from previous work in three important ways: First, use of the WITS system
allows us to implement experiments in larger classes. Second, we measure learning using
data on exams scores, rather than the TUCE. Improved results are, therefore, understandable
in terms of students’ grades, the metric that students and universities use to evaluate class
performance. Finally, on the days when our experimental class participated in an exercise, the
control class discussed research results from the same experiment, including reading the
experimental instructions. This way we are able to isolate whether the improvements in
learning are from substituting experiment-based material for standard lectures, or whether
gains are a result or active or passive learning.
Students who used the WITS system earned final grades that averaged approximately
7 points higher than the control class, adjusting for other important influences on grades such
as demographics, ability and experience. The impact on learning is highest for freshmen and
women students, groups who often struggle with introductory economics, and lowest for male
seniors, who, our sample, tend to be engineering majors satisfying a general education
requirement. Teaching evaluations are also significantly higher in the experimental class.
II. Experimental Design
Our test of the effectiveness of classroom experiments involved two matched
Principles of Economics classes taught in Fall, 2003. Both classes had 80 students enrolled at
the beginning of the term. They were taught in the same classroom, back-to-back, with 50
minute class periods beginning at 10:10 and 11:15 am on Monday, Wednesday and Friday.
Syllabi for the courses were identical including assignments, grading weights and dates on
which course topics were covered. We did not indicate until after the deadline to register for
classes that these classes were part of an experiment to improve teaching to avoid any
selection bias. During the semester we did not indicate which section was the experimental
3

and which the treatment class. The students in our sample constitute about 10 percent of the
total number of students in micro principles that semester. Only two of eight sections of
micro principles offered in Fall 2003 were part of the study because of limited data collection
resources.
We designed the curriculum for the two classes to cover standard topics in
microeconomic principles, except for the inclusion of the exercises. To assess the impact of
using experimental exercises in the classroom, we kept the class material constant across the
two sections. The experimental class incorporated seven classroom exercises: a posted offer
auction, an auction with buyer and seller-side taxes, a public goods game, a commons
problem, a monopoly exercise, a set of 2 x 2 matrix games, and ultimatum and dictator
games. We did not use the quiz or communication features of WITS, even in the
experimental class, to improve experimental control. The curriculum for the control class
included seven “research days” where we discussed the material covered by the exercises.
The parallel lecture in the control class consisted of reading through the instructions, and a
presentation of research and classroom results from those games. Both classes were told they
were test classes for curricular innovation: one for the interactive exercises, and the other for
the research days. Students were not informed that a comparison was being made between
different approaches in the two classes, and seemed unaware of any differences.
On days where experiments were conducted, devices were distributed to students in
the experimental class during class and collected at the end. Students logged into the system
with an ID number that allowed us to keep track of their decisions and scores. They then
interacted with the system via a series of user-friendly, touch-sensitive screens. For example,
in the auction, each student saw a screen displaying his cost information, and made a choice
of what price to charge by touching the screen. Each student received individual information
about cost, and entered individual decisions about selling price; at the end of the exercise,
each student received individual feedback on sales and profit. The server collected and
aggregated information (including the price distribution of the units sold), and displayed it to
the class.
Each of the seven modules for the experimental class contained five elements.
1. Instruction. This element involved instructions read by the students before class,
as well as in-class instruction. The materials read by the students focused on the
4
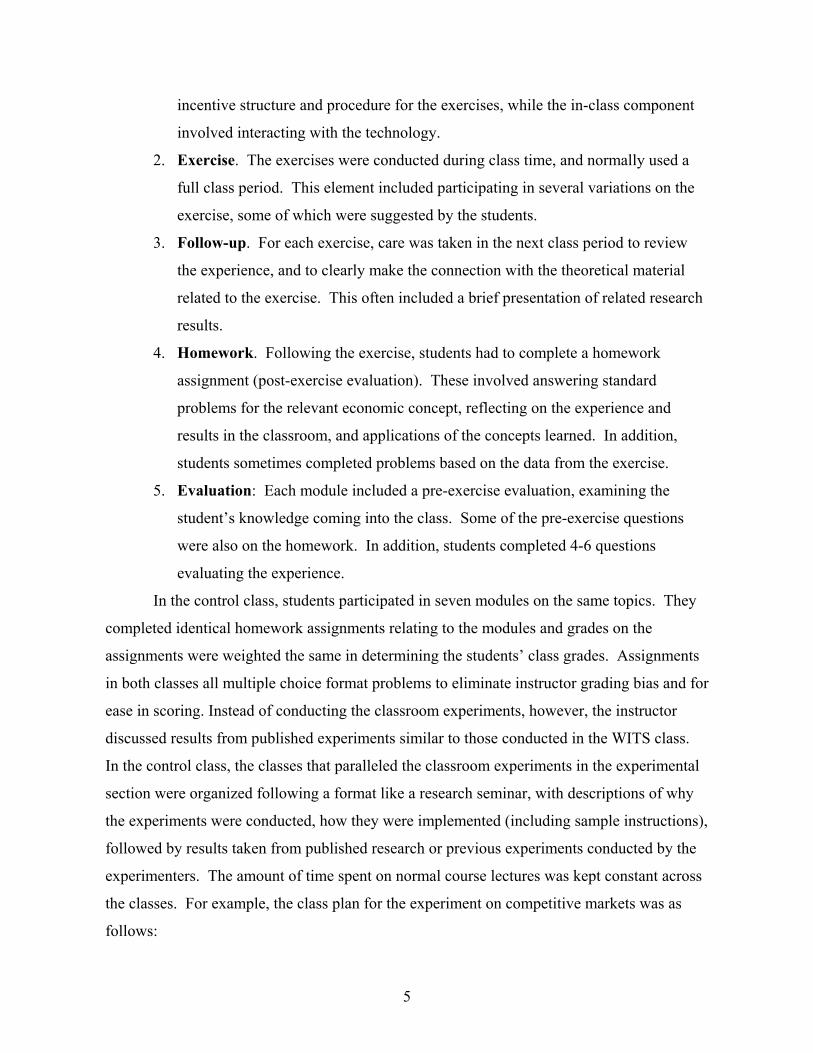
incentive structure and procedure for the exercises, while the in-class component
involved interacting with the technology.
2. Exercise. The exercises were conducted during class time, and normally used a
full class period. This element included participating in several variations on the
exercise, some of which were suggested by the students.
3. Follow-up. For each exercise, care was taken in the next class period to review
the experience, and to clearly make the connection with the theoretical material
related to the exercise. This often included a brief presentation of related research
results.
4. Homework. Following the exercise, students had to complete a homework
assignment (post-exercise evaluation). These involved answering standard
problems for the relevant economic concept, reflecting on the experience and
results in the classroom, and applications of the concepts learned. In addition,
students sometimes completed problems based on the data from the exercise.
5. Evaluation: Each module included a pre-exercise evaluation, examining the
student’s knowledge coming into the class. Some of the pre-exercise questions
were also on the homework. In addition, students completed 4-6 questions
evaluating the experience.
In the control class, students participated in seven modules on the same topics. They
completed identical homework assignments relating to the modules and grades on the
assignments were weighted the same in determining the students’ class grades. Assignments
in both classes all multiple choice format problems to eliminate instructor grading bias and for
ease in scoring. Instead of conducting the classroom experiments, however, the instructor
discussed results from published experiments similar to those conducted in the WITS class.
In the control class, the classes that paralleled the classroom experiments in the experimental
section were organized following a format like a research seminar, with descriptions of why
the experiments were conducted, how they were implemented (including sample instructions),
followed by results taken from published research or previous experiments conducted by the
experimenters. The amount of time spent on normal course lectures was kept constant across
the classes. For example, the class plan for the experiment on competitive markets was as
follows:
5

Element Control Class Experimental Class
Instructions on how to trade in an auction market
Read Instructions before class
Read Instructions before class
Pre-test Short in class quiz about supply and demand
Short in class quiz about supply and demand
Exercise View data from a market experiment with data before and a demand shift (50 minutes).
Use WITS to trade in a market both before and after a demand shift. Observe data from experiment (50 minutes).
Follow Up Review the exercise and connect it to lecture material on supply and demand.
Review the exercise and connect it to lecture material on supply and demand.
Homework Answer standard questions on supply and demand.
Answer standard questions on supply and demand. (same questions as control class.)
To assess the effectiveness of the technology-enabled exercises, we use pre- and post-
exercise evaluations (post-exercise evaluation scores counted for students’ homework grades
in both sections) for each of the seven modules and parallel final exams. We used multiple
choice exams to evaluate student achievement because they are the standard evaluation tool in
principles courses at Virginia Tech because of large class sizes and have the advantage of
avoiding instructor grading bias. At the beginning of the semester, data on demographics
(age, class, gender and major), experience (whether a student took economics in high school)
and ability (GPA, High School rank and math SAT score) were collected.1 At the end of the
semester, standard teaching evaluation forms were supplemented with a more extensive
evaluation form, which included questions on students’ perceptions prior to the class, their
experience with economics, their perception about the usefulness of experiments, and
students’ assessment of the class compared to others.
III. Sample Characteristics
After dropping incomplete observations, the data include 64 students in the control class
and 62 in the experimental class.2 As is typical of the principles course at Virginia Tech,
1 We also collected verbal SAT scores, however, math SAT scores had higher predictive power and both scores could not be included in our analysis due to strong correlation. 2 6 students in the experimental class and 8 students in the control class dropped the course; because this number is similar across treatments, we have some confidence that there was an endogenous response to either treatment.
6
students cover a broad range of majors, and include undergraduate students at all levels.
Twenty percent of students come from business majors, while 50% of students are from
engineering, science, or math. The rest of the enrolment is from a diverse collection of
majors.
Table 1 shows the characteristics of the two classes. The variance of all variables
(measured by their standard deviation) is approximately the same for the two classes. The
results of tests for differences in means across the two samples are presented in the last
column of the table (with p-values in brackets). The two groups are demographically similar.
Average age is between 18 and 19; approximately 75% of students in both classes (combined)
are 19 or younger. The experimental group is slightly older on average, though there is no
difference in the distribution of class attainment (freshmen, sophomore, junior, senior).
Approximately 30% percent of students in both groups are female. A larger percentage of
students in the experimental group had economics in high school (% Econ in HS).3 Although
average high school rank is significantly higher in the experimental class, the difference in
mean math SAT scores is not significant.
III. Results
A. Aggregate measures
Our analysis focuses primarily on the final exam grade, which is the most objective
measure of overall learning in the two classes. Both classes were given very similar final
exams written in multiple choice format. Care was taken that each question was matched
with a counterpart on the other exam. A core set of identical questions was included that
focused on the learning objectives of the experimental exercises. On average, students in the
experimental class scored 3.2 points higher (77.45) on the final exam than did those in the
control class (74.25). This difference is statistically significant at the 10% significance level.
5 students in the experimental class and 3 students in the control class did not take the final exam. 3 observations in the control class and 7 observations in the experimental class were dropped because no SAT score was available. Two outliers in the control class were ignored. One corresponded to a student that marked option ‘A’ as the answer for all the questions in the final exam (his score was 24 out of 100 points). The other outlier was a student that scored 42 out of 100 in the final exam; it was dropped because it significantly affected our normality and heteroskedasticity diagnostic tests. The rest dropped the class, failed to fill out the initial assessment/survey, or failed to take the final exam. 3 The use of categories instead of actual values for the age and high school rank variables is due to the way the initial survey was constructed. While attempts were made to recover more precise values, there was a large number of missing observations.
7

Figure 1 shows the distribution of the final exam grades in the two classes. The
distribution of grades for the experimental class is clearly shifted to the right with respect to
the distribution of the control class indicating higher grades using the WITS system.
Table 1: Demographic Summary Statistics (Standard deviation)
Variable Control
n=64 Experimental
n=62 Min Max Two tail t-
test [p-value]
Age (category) 2.031 2.313 1 4 2.97 1=17 years or younger, 2=18-19, 3=20-21, 4=22 or older
(0.50) (0.59) [0.00]
Class 1.625 1.758 1 6 0.75 1=Freshman, 2=Sophomore, 3=Junior, 4=Senior, 5= Graduate, 6=Other
(1.06) (0.94) [0.46]
% Female 26.6 30.6 0 1 0.50 0=Male, 1=Female [0.62] % who took economics in high school 3.13 16.13 0 1 2.53 0=No Econ, 1=Econ in HS [0.013] High school rank* 3.54 3.98 1 5 2.00 1=below 50%, 2=21-50%, 3=11-20%, 4=6-10%, 5=2-5%, 6=top 1%
(1.19) (1.20) [0.05]
SAT (math) 616 628 450 800 0.88 (80) (76) [0.38]
* For High School Rank, the number of available observations is 59 for both classes.
Figure 1: Distribution of Final Exam Grades
0.00
0.05
0.10
0.15
0.20
0.25
0.30
51-55 56-60 61-65 66-70 71-75 76-80 81-85 86-90 91-95 96-100
Score (0-100)
Control
Experimental
8

B. Regression Results
Given the differences between the two class populations, it is important to conduct
multivariate analysis to control for individual student characteristics. The baseline for the
econometric results is an OLS regression that has the final grade (in percentage format) as the
dependent variable and an experimental dummy together with demographics, experience and
ability measures as the explanatory variables. In addition, several interactions of explanatory
variables with the experimental dummy were created with the objective to test whether
experiments have a different effect on the performance of distinct demographic groups. These
results are shown in Table 2, which contains the estimates for three different specifications.
The explanatory variables include a dummy for whether a student was in the
experimental class (EXP), demographic measures (age, class, gender and major), experience
(whether a student took economics in high school) and ability (high school rank and math
SAT score).4 In addition to these variables, several indicator variables for different majors
and groups of majors (for example a dichotomous variable for business and non-business
majors) were created and it was found that none of these carried significant coefficients or
substantially affected the remaining relationships in the specifications we tested.5
The first specification contains only the experimental dummy (EXP) and is displayed
for comparison purposes with the other two. It shows that there is a statistically-significant
difference in the final exam grade between the two classes of 3.20 points. The second
specification includes demographics (but not interaction terms) and it can be seen that a
similar difference in grades (close to 4 points) remains after controlling for all demographic,
experience and ability variables.
The third specification includes the interaction terms that were found to be significant.
This specification also omits Age since the significance is very low and its inclusion increases
the standard errors of the remaining coefficients. The negative coefficient on the interaction of
the experimental variable and Class (EXP*Class) indicates that students that have just begun
their university studies (freshmen) benefit more (where the benefit is measured by their final
grade) from the use of experiments than do students that have been in school for some time. 4 Because a large number of our subjects were first semester freshmen, we were not able to collect consistent college GPA information, so this ability measure was not useable. 5 The available choices for major in the actual survey were: a) Economics (Business), b) Economics (Arts and Sciences), c) Other Business, d) Engineering/Science/Math, e) Social Sciences, f) Humanities/Arts, g) Education, h) Architecture, and i) Other.
9

The coefficient on the interaction of the experimental variable with Female (EXP*Female)
provides evidence that females benefit more from experiments than do males. Some
diagnostic tests on the residuals were performed for specification III; the corresponding p-
values are presented at the bottom of the table. Test results revealed no departures from
standard normality or heteroskedasticity assumptions.6
Table 2: OLS Results Dependent Variable: Grade on Final Exam
(t-statistics) Specification Explanatory Variables
I II III EXP 3.202 2.212 7.366
(1.81) * (1.35) (2.35) ** EXP*Class -3.832
(-2.48) ** EXP*Female 5.537
(1.58) Class 0.669 2.090
(0.82) (2.07)** Female 0.833 -1.518
(0.46) (-0.60) Econ in HS -1.906 -1.616
(-0.71) (-0.62) HS Rank 1.176 1.098
(1.78)* (1.70)* SAT (math) 0.066 0.063
(6.26)*** (6.05)*** Constant 74.250 28.063 28.593
(59.74)*** (7.33)*** (3.94)*** # Observations 126 118 118 R-squared 0.026 0.318 0.362 Adjusted R-squared 0.018 0.282 0.315 Residual Diagnostic Tests for Specification 3 (p-values): Null hypothesis of Normality: Shapiro-Wilk (0.12), Skewness-Kurtosis (0.34); Null hypothesis Heteroskedasticity: White (0.47), Breusch-Pagan (0.61) *** Significant at 1%, ** at 5%, * at 10%
6 A fourth specification (not shown) added a variable “SAT LOW”, which is a dummy variable equal to 1 for students with math SAT scores in the lower 10% of the sample and its interaction with the experimental treatment. While the coefficient on the interaction is statistically significant, its sign is consistent with previous studies that suggest very low ability students may not benefit from including experiments (Dickie, 2004).
10

In order to better visualize the varying magnitude of the effect of experiments on the
performance of different demographic groups, scores were simulated for 8 distinct Class-
Gender pairs (class: freshman, sophomore, junior, senior; gender: male, female).7 For each
pair, two scores were simulated, one assuming that the student did participate in the
experiment while the other assuming the student did not. Hence, there are 16 simulated
scores. Table 3 shows the simulated scores for each Class-Gender pair with a 95% confidence
interval in parenthesis.8
Table 3: Simulated Final Exam Scores by Demographic groups
Male Female Class / Gender
Control Experimental Control Experimental
Freshman 75.27 80.21 69.93 83.64
(72.52-78.02) (77.29-83.12) (65.46-74.39) (78.74-88.53)
Sophomore 71.93 72.53 73.60 76.63
(69.11-74.75) (69.64-75.44) (69.26-77.93) (72.52-80.74)
Junior 71.99 73.44 73.37 78.23
(68.04-75.93) (68.99-77.89) (68.25-78.49) (73.74-82.72)
Senior 81.50 68.28 N/A* 75.70
(76.09-86.91) (62.06-74.50) N/A (69.71-81.69) Note: These simulated values are computed using the estimates from specification III shown in table 2. For each Class-Gender pair in the table, the mean of the remaining variables (SAT, HS Rank and Econ in HS) over the individuals in each cell is used to calculate the predicted final exam score. 95% confidence intervals in parenthesis. * No students in the sample match the criteria of this cell.
The table shows that as students have more years of school, the impact of teaching
with experiments decreases. The benefit of the use of experiments for freshmen males is
approximately 5 percentage points; however, this benefit almost disappears for sophomore
and junior males and for senior males it appears that the use of experiments may have a
negative effect. The impact of using experiments on the female students is stronger. Freshmen
7 125 out of the 126 students involved in the study fall into these categories. 8 This interval is calculated as: cxxcsbx 1)'('ˆ −± , where x is the matrix of covariates, b is the vector of the estimated coefficients, is the square root of the sum of squared errors (divided by the degrees of freedom) and
is the vector containing the values of the covariates for which we are simulating the score.
ˆs
c
11
females benefit the most from experiments by improving their scores by approximately 14
percentage points. This impact decreases as female students accumulate more years of
experience in college.9
C. Impact on Teaching Evaluations
The impact of the WITS system was also measured using standardized teaching
evaluation given at the end of the semester. The experimental students provided higher scores
for almost all questions. However, there is a significant difference in means for only three
questions. On a four-point scale (1= poor, 2=fair, 3=good, 4=excellent), students in the
experimental class assessed the instructor as more successful in communicating the subject
matter (3.16 vs. 2.83, p=.056) and found the class more stimulating (3.18 vs. 2.78, p=.008)
than did students in the control class. In addition, the overall rating of the professor by the
experimental class was higher than that by the control class (3.32 vs. 3.07, p=.095). Students
in the two classes rated remaining elements of the class as the same, including knowledge of
subject matter, concern or respect for students, fairness in grading, administration of the class,
educational value, and effort required. We infer from this that students did not perceive that
the students in the two classes were treated differently by the instructor. Nevertheless, using
experiments significantly affected overall evaluations in a positive way.
IV. Conclusion
This paper focuses on the impact of using our WITS – a system of wireless-equipped
handheld devices – to facilitate interactive exercises in teaching micro principles of
economics in large classes. Overall, the impact on learning is strongly positive, with larger
impacts on freshmen students and on women, two groups who often struggle with
introductory economics. In addition, students’ evaluations on key questions were higher for
the experimental class, showing that students found the classes more stimulating than the
control class.
A critical question that remains largely unanswered is why students learn more when
interactive exercises are used in class. Those of us who have been teaching with experiments
for years believe we have an intuitive answer: both we and the students enjoy the classes
more and so engage with the material more fully. The fact that students enjoy their classroom
9 The comparisons and inference for juniors and seniors (for both males and females) is less reliable because only few students in the sample are in these two categories.
12
experience more also may make them think more about the subject matter, or spend more
time discussing it with their friends. In Ball, Eckel and Rojas (2005) we explore this question
further, and provide some evidence that students learn to ask different, more advanced or
application-oriented questions after participating in an experiment. One reason for this is the
flexibility built into the WITS system that allows instructors to test student-generated
hypotheses. If a student asks questions such as, “What would happen if there was only one
seller?” or “What would happen if the returns to cooperation were higher?” our approach is to
help the student develop the question into a testable hypothesis. The system is design so that
instructors can easily change the parameters of the game and “test” the student’s hypothesis.
Our system differs from the Personal Response Systems (PRS) currently marketing in
conjunction with several economics texts. Since many faculty members are now familiar
with this system, we are frequently asked to compare it to WITS. First, PRS devices have a
small number of buttons which limits input into the PRS. Second, the flexibility of the system
is limited. Since they do not have display screens, students cannot bid in markets, or
participate in games, such as the public goods game, that require random matching into small
groups. Because they have no “memory”, the PRS cannot store data for students to retrieve
later on. Third, communication is one way. Students cannot receive individualized data, such
as costs or values for market trading, or receive feedback on their performance in the exercise.
Despite their limitations, we like to think of the PRS as a primitive version of WITS.
Assessment of its value in teaching should provide useful information for refining the
development of WITS.
We believe in the importance of continuing assessment efforts in economics in an
attempt to better understand why teaching innovations succeed or fail, especially where
technology is concerned. Walstad (2001) discussed general issues involved in assessment of
economic education, and notes the wide variety of assessment techniques beyond the
standardized test. However, to us, the assessment of teaching technology carries special
challenges because instructors often adopt technology without thought to its impact on
learning. An example would be the widespread move to Powerpoint lectures, which has gone
largely unassessed. Failures of teaching technology are documented in Oppenheimer (2003)
who bemoans the tendency of technology adoption to diminish rather than enhance creativity.
13

It is very important to continue to assess changes in teaching practice in order to evaluate their
impact on learning, using a broad variety of assessment techniques.
At the same time that assessment evidence mounts that interactive exercises improve
teaching effectiveness in economics, it also has become easier for instructors to adopt this
approach. While the WITS system is still under development, other avenues are available for
using experiments in small and large classes. Bergstrom and Miller (1999) collect a number
of classroom experiments that can be conducted by hand in a standard Principles of
Economics class, though the exercises are for the most part oriented toward smaller sections.
Charles Holt provides a bibliography of published experimental exercises as well as pdf files
of his own (http://www.people.virginia.edu/~cah2k/teaching.html). These publications
contain exercises designed to teach particular points in economics, not only at the principles
level (e.g., competitive markets, public goods, how banks create money) but also in more
advance classes (collusion, coordination, information cascades, strategic voting). The papers
explain how to conduct the experiment, and how to integrate the exercises into the standard
curricula and may also contain suggestions for problems and homework assignments.
For classes with access to computer labs, several options are available. Holt has
developed Veconlab, an online site for conducting experiments via the internet
(http://www.people.virginia.edu/~cah2k/programs.html). His site includes a wide variety of
exercises with flexible parameters. Econport, a digital library of economics materials housed
at the University of Arizona, also maintains a site for conducting online experiments
(www.econport.org). Both sides are somewhat short on teaching materials, making them
more appropriate for experienced users. For instructors who want to try experiments for the
first time, Aplia is a great place to start. Founded by Paul Romer, Aplia provides support for
teaching that includes several internet-based experimental exercises designed to be conducted
outside of class. Teaching materials, homeworks, etc., are integrated into the user-friendly
Aplia system. Instruction on using interactive exercises in teaching is provided under the
American Economic Association’s Teaching Innovations Program (TIP). For the past few
years, Holt and his colleagues also have conducted NSF-sponsored workshops in using
experiments to teach, which emphasize the use of technology to facilitate classroom
experiments.
14

When things get dull in a chemistry class, the instructor can start a fire or blow
something up. In economics, we have no interesting chemical reactions to fall back on.
Interactive experiments give us a way to capture the attention and imagination of our students,
improving the learning experience and enhancing learning. Technology can help us extend
interactive learning to larger classes. Our work suggests the importance of building flexibility
into the design of such technology.
15

16
References
Ball, Sheryl, Catherine Eckel and Christian Rojas (2005), “Understanding the Role of
Experiments on Student Performance in Economic Principles”, Unpublished Manuscript, Virginia Tech.
Bergstrom, Theodore, and John Miller. (1999). Experiments with Economic Principles:
Microeconomics, 2nd Edition. McGraw-Hill/Irwin. Breusch, T. & Pagan, A. (1979), “A Simple Test of Heteroskedasticity and Random
Coefficient Variation”, Econometrica 47, 1287–1294. Cardell, N. Scott, Rodney Fort, Wayne Joerding, Fred Inaba, David Lamoreaux, Robert
Rosenman, Ernst Stromsdorfer, and Robin Barlett (1996). “Laboratory-BasedExperimental and Demonstration Initiatives in Teaching Undergraduate Economics,”American Economic Review Papers and Proceedings 86(2): 454-459 (May)
Dickie, Mark (2004). “Experimenting on Classroom Experiments: Do they increase learning
in introductory Microeconomics? Unpublished Manuscript, University of Central Florida.
Emerson, Tisha L.N. and Beck A. Taylor (2004). “Comparing Student Achievement across
Experimental and Lecture-Oriented Sections of a Principles of Microeconomics Course,” Southern Economic Journal 70(3): 672-93 (January).
Frank B., (1997). “The impact of classroom experiments on the learning of economics: an
empirical investigation” Economic Inquiry Oct 1997 v35 n4 p763(7) p 1. Gremmen, H., & Potters, J.(1997). Assessing the efficacy of gaming in economic education.
Journal of Economic Education, Fall. 291-303. Oppenheimer, Todd. (2003). The Flickering Mind: The False Promise of Technology in the
Classroom and How Learning Can Be Saved. New York: Random House. Shapiro, S. S. and M. B. Wilk, (1965). “An analysis of variance test for normality”
Biometrika, 52, 591-611 Walstad, William B. (2001). “Improving Assessment in University Economics.” Journal of
Economic Education v32, n3 (Summer 2001): 281-94 White, H. (1980), “A Heteroskedasticity Consistent Covariance Matrix Estimator and a Direct
Test for Heteroskedasticity”, Econometrica 48, 817–838.