
Technologies for the Electronic Distribution of Information Services - A Value Proposition Analysis
17
GENERAL RESEARCH Technologies for the Electronic Distribution of Information Services - A Value Proposition Analysis Jochen Wulf & Ruediger Zarnekow Received: 9 June 2009 / Accepted: 21 December 2009 / Published online: 2 February 2010 # Institute of Information Management, University of St. Gallen 2010 Abstract Since the original design and deployment of the Internet architecture, the economical and technological requirements regarding the distribution quality of web-based information services have changed drastically. Business models have evolved that particularly address quality and cost aspects of information service distribution, e.g. content delivery networks and peer-to-peer distribution. In addition, network operators apply differentiated routing technologies in dedicated infrastructures to guarantee a superior quality of service (QoS). This article compares the value propositions of technologies for information service distribution. 103 infor- mation services were analyzed by means of discriminant analyses in order to identify the main aspects influencing delivery quality and costs. The results indicate that the value propositions differ with regard to the type of services they support rather than with regard to direct QoS criteria, such as latency and packet loss. The insights derived from this work support information service vendors in their choice of a distribution provider. Keywords Electronic distribution . Content delivery . Quality of service JEL classification L86—Information and internet services . Computer software Introduction The electronic distribution of information services has been subject to a discourse in research since the immense growth of the Internet in the late-1990s. In e-business research, a rich variety of issues concerning the application of web- based information services to support business processes have been addressed (Amit and Zott 2001; Timmers 1998). Physical distribution is defined as the collective term for the range of activities involved in the movement of goods from the point of production to the final point of sale, such as warehousing and transportation (McKinnon 1988, 33). The objective of distribution is to meet customer desires with regard to the amount of delivered goods and the time and place of delivery. Distribution providers must thereby optimize the balance between quality and costs of delivery (Bowersox et al. 1986, pg. 19). Even though the economics of information services are fundamentally different (Demirkan et al. 2008; Shapiro and Varian 1999), the objectives for the distribution of tangible goods also hold for the distribution of information services over communication networks (electronic distribu- tion). Despite the richness of e-business research, the economic aspects associated with technologies for electronic distribution have scarcely been addressed. Several authors (Faratin 2007; Leighton 2009; Saroiu et al. 2002) differentiate between three major distribution methods in the Internet: centralized hosting, content delivery networks, and peer-to-peer file sharing systems. They describe technical implementations and find signifi- cant differences in traffic characteristics, but do not compare attributes related to distribution performance. In this paper, a fourth distribution method, called direct homing, is taken into account which is commonly used in practice and is based on proprietary IP networks or a modification of the public Internet architecture (Huston Responsible editor: Axel Hochstein J. Wulf (*) : R. Zarnekow Fachgebiet Informations- und Kommunikationsmanagement, Technische Universität Berlin, Sekr. H 93, Strasse des 17. Juni 135, 10623 Berlin, Germany e-mail: [email protected] R. Zarnekow e-mail: [email protected] Electron Markets (2010) 20:3–19 DOI 10.1007/s12525-010-0027-x
Transcript of Technologies for the Electronic Distribution of Information Services - A Value Proposition Analysis
GENERAL RESEARCH
Technologies for the Electronic Distribution of InformationServices - A Value Proposition Analysis
Jochen Wulf & Ruediger Zarnekow
Received: 9 June 2009 /Accepted: 21 December 2009 /Published online: 2 February 2010# Institute of Information Management, University of St. Gallen 2010
Abstract Since the original design and deployment of theInternet architecture, the economical and technologicalrequirements regarding the distribution quality of web-basedinformation services have changed drastically. Businessmodels have evolved that particularly address quality andcost aspects of information service distribution, e.g. contentdelivery networks and peer-to-peer distribution. In addition,network operators apply differentiated routing technologies indedicated infrastructures to guarantee a superior quality ofservice (QoS). This article compares the value propositions oftechnologies for information service distribution. 103 infor-mation services were analyzed by means of discriminantanalyses in order to identify the main aspects influencingdelivery quality and costs. The results indicate that the valuepropositions differ with regard to the type of services theysupport rather than with regard to direct QoS criteria, such aslatency and packet loss. The insights derived from this worksupport information service vendors in their choice of adistribution provider.
Keywords Electronic distribution . Content delivery .
Quality of service
JEL classification L86—Informationand internet services .
Computer software
Introduction
The electronic distribution of information services has beensubject to a discourse in research since the immense growthof the Internet in the late-1990s. In e-business research, arich variety of issues concerning the application of web-based information services to support business processeshave been addressed (Amit and Zott 2001; Timmers 1998).
Physical distribution is defined as the collective term for therange of activities involved in the movement of goods from thepoint of production to the final point of sale, such aswarehousing and transportation (McKinnon 1988, 33). Theobjective of distribution is to meet customer desires withregard to the amount of delivered goods and the time and placeof delivery. Distribution providers must thereby optimize thebalance between quality and costs of delivery (Bowersox et al.1986, pg. 19). Even though the economics of informationservices are fundamentally different (Demirkan et al. 2008;Shapiro and Varian 1999), the objectives for the distributionof tangible goods also hold for the distribution of informationservices over communication networks (electronic distribu-tion). Despite the richness of e-business research, theeconomic aspects associated with technologies for electronicdistribution have scarcely been addressed.
Several authors (Faratin 2007; Leighton 2009; Saroiu etal. 2002) differentiate between three major distributionmethods in the Internet: centralized hosting, contentdelivery networks, and peer-to-peer file sharing systems.They describe technical implementations and find signifi-cant differences in traffic characteristics, but do notcompare attributes related to distribution performance. Inthis paper, a fourth distribution method, called directhoming, is taken into account which is commonly used inpractice and is based on proprietary IP networks or amodification of the public Internet architecture (Huston
Responsible editor: Axel Hochstein
J. Wulf (*) :R. ZarnekowFachgebiet Informations- und Kommunikationsmanagement,Technische Universität Berlin,Sekr. H 93, Strasse des 17. Juni 135,10623 Berlin, Germanye-mail: [email protected]
R. Zarnekowe-mail: [email protected]
Electron Markets (2010) 20:3–19DOI 10.1007/s12525-010-0027-x

2000, pp 399–406, ISO 1989, Xiao and Ni 1999): in directhoming scenarios, network operators reserve dedicatedinfrastructure or perform traffic differentiation in order tomeet high performance requirements of specific services,such as IP TV.
Electronic distribution has evolved into a large commer-cial market. According to an industry report (FROST &SULLIVAN 2008), the content delivery network (CDN)market earned over $700 million in 2007, and is predicted toincrease earnings by up to 400% by 2013. A highly ratedtarget segment for CDN providers is the delivery of Video onDemand content, i.e. the streaming of multimedia contentfrom distributed servers. Other companies promise the samevalue proposition as CDN providers, i.e. high speed, reliabilityand efficiency, based on the peer-to-peer (P2P) distributiontechnology (Androutsellis-Theotokis and Spinellis 2004). P2Ptechnology is, for example, used to distribute IP TV contentin quasi real-time to global audiences.
From the perspective of an information service provider,the specific differences between the value propositions of thefour mentioned distribution methods remain largely unclear.The CDN provider Akamai and the P2P distributor BitTorrent,for example, both target download and streaming delivery(BitTorrent 2009; Akamai 2009). An exemplary service levelagreement of Akamai’s CDN service does not quantifyperformance improvement guarantees (Onecle 2009). Neitheracademic nor non-academic literature provides appropriatedecision support for the choice of a distribution method andstates which service requirements are met by whichdistribution method.
The objective of this paper is to compare the differenttechnologies for IP based distribution, and to outline theirdistinct characteristics and their abilities to provide value inspecific application contexts (value propositions). 103information services were analyzed in order to deduce thedistinctive value propositions of their associated distributionmethods. We argue that information services reveal inherentcharacteristics of the underlying distribution methods.
This article is structured as follows: in Chapter 2, therelationship between information service quality and ser-vice distribution is described. In Chapter 3, four distinct IPbased distribution methods, i.e. Centralized Hosting, Direct
Homing, Content Delivery Networks and P2P Distributionare explained. In Chapter 4, a set of information servicecharacteristics, which potentially bear a relationship todistribution performance, are identified. These relationshipsare verified by performing discriminate analyses in Chapter5. The article concludes with a summary in Chapter 6.
Information service quality and distribution
Service science researchers have identified a set of constitu-tive characteristics of services (Demirkan et al. 2008, amongothers). These characteristics lead to specific requirements onservice distribution and explain its importance (Fig. 1).
Firstly, the simultaneity of service production and con-sumption inhibits the preproduction and storage of servicesand imposes high quality requirements, e.g. concerning real-time service delivery. Secondly, the wide range of potentialservices results in heterogeneous requirements for servicedistribution. This makes it difficult to find a standard solutionfor the distribution of a service. Thirdly, the overall evaluationof the service quality as experienced by a consumer is, to alarge extent, subjective. For this reason, requirements for asatisfactory service delivery can not entirely be generalized. Inaddition, service delivery requires a direct customer involve-ment. As a consequence, the distribution quality, to a certaindegree, depends on a customer’s involvement (e.g. on theaccess capacity the customer allocates). Due to the intan-gibility of services the overall distribution quality can onlybe measured at the customer end, because this is thelocation at which a service is consumed. Intermediatemeasurements only allow predictions of overall servicequality. Lastly, services are perishable. That is why technicalparameters of distribution quality can only be measured atthe exact time of service provisioning.
The general concept of service quality has been subjectto extensive research in business sciences. It can beassessed by comparing a user’s expectations and percep-tions of the performance level for a range of serviceattributes (Parasuraman et al. 1985). Accordingly, theInternational Organization for Standardization states: Thequality of something can be determined by comparing a set
Service Characteristics
• Intangibility
• Perishability
• Customer contacts
• Simultaneity
• Heterogeneity
• Demand fluctuation over time
• Customization
• Complexity
Consequences for Service Distribution
• High requirements on service distribution quality (e.g. concerning real-time capabilities)
• Heterogeneity of distribution requirements and exchanged data
• Subjectivity of distribution quality experience
• Distribution quality depends on customer involvement
• Overall distribution quality can only be measured end-to-end
• Technical distribution quality parameters can only be measured during service provisioning
Fig. 1 Service characteristicsand consequences for servicedistribution
4 J. Wulf, R. Zarnekow

of inherent characteristics with a set of requirements [...] Aquality characteristic is tied to a requirement and is aninherent feature or property of a product, process, orsystem (ISO 2005). A requirement is understood as anexpectation or a need of a user. Various authors discuss thetypes of requirements which are to be taken into account inan information service quality assessment (Liao andCheung 2008; Liu and Arnett 2000; Zeithaml et al. 2000;Zeithaml et al. 2002). Zeithaml et al. (2002), for example,define the following attributes: information availability andcontent, usability, privacy/security, graphic style, andfulfilment. Such attributes represent the factors relevant toa user’s perception of service quality.
In telecommunications research, the term quality ofservice (QoS) is used heterogeneously to describevarious concepts of service quality. As discussed byGozdecki et al. (2003), the term QoS is used, on the onehand, to describe the customer’s service quality assess-ment (business oriented view) and, on the other hand, todefine technical parameters of service and networkperformance (technology oriented view). Figure 2 depictsboth views. Externally, i.e. in the relationship betweenservice provider and user, service quality describes thegeneral comparison of inherent service characteristics asexpected and perceived by users. Internally, i.e. among theparties involved in service production, service perfor-mance comprises all performance related parameters of aservice described in technical terms, such as speed,accuracy, availability and reliability. These parametersare affected by the inter-working of server, distributionand client systems.
The quality of service distribution represents onecomponent of service performance, as depicted in Fig. 2.It is determined by all systems involved in the delivery ofcontent from the originating servers to the end userterminals, such as routing, forwarding and caching systems(Tanenbaum 2003, pp. 343 et sqq.). Similar to the networkperformance concept (Xiao and Ni 1999; Zhao et al. 2000),it can be characterized by four quality parameters: band-width, delay, packet loss and jitter. Bandwidth defines theeffective volume of data per time unit being transmittedbetween communication end points. Delay comprises thelength of time that a data package takes from the sender tothe recipient. Packet loss defines the number of datapackets that are lost in the transmission from the sender tothe receiver. Jitter describes the fluctuation in the delay.Since it is a function of delay, it is not separately taken intoaccount in the following analyses. Several authors defineperformance levels for classes of services (CoS, Marchese2007, pp. 5–8, Gozdecki et al. 2003). CoS concepts definebounds for the QoS parameters to precisely describe what isconsidered an appropriate quality for specific serviceclasses, such as real-time conversational or near real-timeinteractive services.
Technologies for information service distribution
Different technological approaches have evolved since thedevelopment of the Internet architecture to supportinformation service distribution. These technologies aregenerally classified into four categories, summarized in
Fig. 2 Quality of service distribution and service quality
Technologies for the Electronic Distribution of Information Services 5

Tab
le1
Inform
ationservicedistribu
tiontechno
logies
andcase
exam
ples
Distribution
metho
dDefinition
Key
characteristics
References
Businessmod
elcase
exam
ples
Centralized
Internet
Hostin
gCentralized
internet
hostingrefers
tothe
useof
“one
orasm
allnu
mberof
collo
catio
nsitesto
hostcontent”
(Leigh
ton20
09).
-central
server,multip
leclients
-Leigh
ton(200
9)-bluehost(W
ebHostin
g)
-Internetbased
-Tanenbaum
(200
3,pg
.4)
-GoDaddy
(Web
Site
Hostin
g)
-Und
erwoo
d(200
1)-H
ostGator.com
(Dom
ainHostin
g)
-1&1(W
ebHostin
g)
DirectHom
ing
Directho
mingisthedistribu
tionof
services
vianetworks,which
are
able
toprov
idehigh
QoS
throug
htechno
logies
such
asresource
reservationor
trafficprioritization
(XiaoandNi19
99).
-proprietary
(mostly
sing
le)network
-Huston(200
0,pp
399–
406)
-AT&T(U
-Verse)
-con
figu
redaccess
lines
-XiaoandNi(199
9)-Swisscom
(Bluew
in)
-QoS
throug
hcapacity
reservation
orpacket
differentiatio
n-Zhaoet
al.(200
0)-BT(BTVision)
-T-H
ome(T-Entertain)
CDN
baseddistribu
tion
“CDNsactas
trustedov
erlaynetworks
that
offerhigh
-perform
ance
deliv
ery
ofcommon
Web
objects,static
data,
andrich
multim
edia
contentby
distribu
tingcontentload
amon
gserversthat
arecloseto
theclients.”
(VakaliandPallis
2003
)
-multip
leservers,multip
leclients
-Dilley
etal.(200
2)-A
kamai
(App
lication
Perform
ance
Solutions)
-Internetbased
-Pallis
andVakali(200
6)-A
mazon
(Cloud
fron
t)
-PathanandBuy
ya(200
8)-Lim
elight
(Lim
elightDELIV
ER)
-VakaliandPallis
(200
3)-Edg
ecast(Con
tent
Delivery)
Peer-to-Peerdistribu
tion
“Peer-to-peersystem
saredistribu
ted
system
sconsistin
gof
intercon
nected
nodesable
toself-organizeinto
network
topo
logies
with
thepu
rposeof
sharing
resourcessuch
ascontent,[...]
with
out
requ
iringtheinterm
ediatio
nor
supp
ort
ofaglob
alcentralized
server
orauthority.”
(And
routsellis-Theotok
isandSpinellis20
04)
-client
toclient
commun
ication
-And
routsellis-Theotok
isandSpinellis(200
4)-BitT
orrent
(DNA)
-Internetbased
-DeBoever(200
7)-Sharm
anNetworks
(KaZ
aA)
-Kwok
etal.(200
2)-Joo
stN.V.(joo
st)
-Kon
tiki(EnterpriseVideo
Delivery)
6 J. Wulf, R. Zarnekow
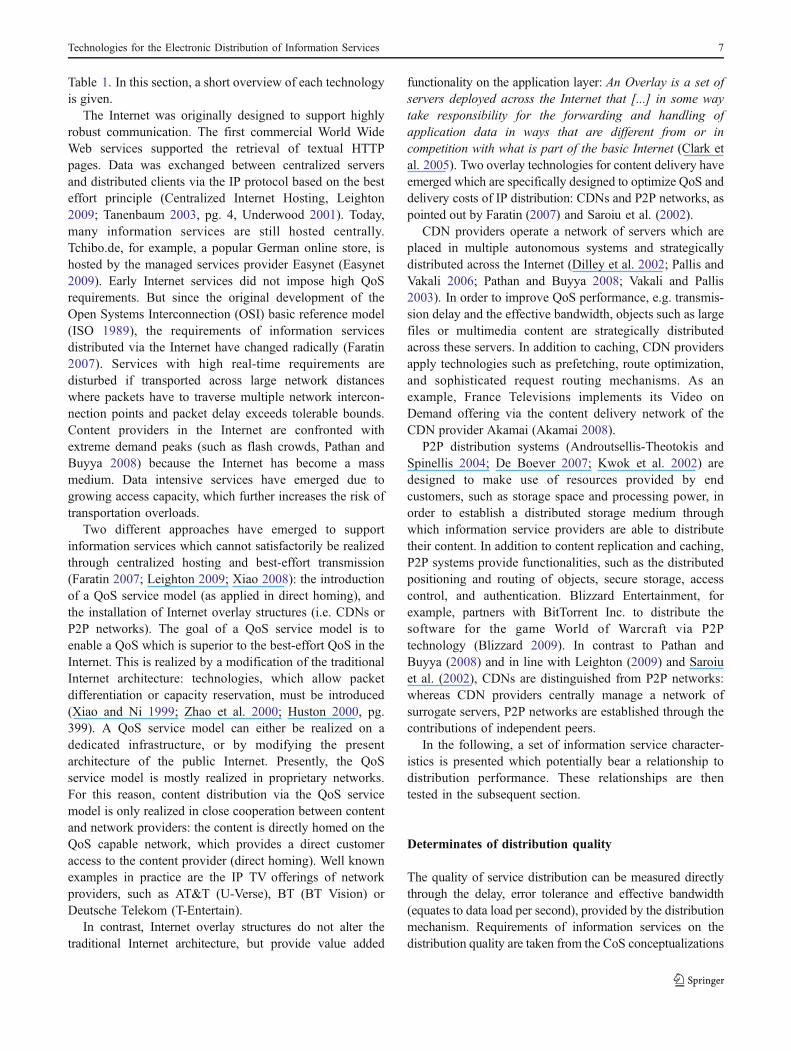
Table 1. In this section, a short overview of each technologyis given.
The Internet was originally designed to support highlyrobust communication. The first commercial World WideWeb services supported the retrieval of textual HTTPpages. Data was exchanged between centralized serversand distributed clients via the IP protocol based on the besteffort principle (Centralized Internet Hosting, Leighton2009; Tanenbaum 2003, pg. 4, Underwood 2001). Today,many information services are still hosted centrally.Tchibo.de, for example, a popular German online store, ishosted by the managed services provider Easynet (Easynet2009). Early Internet services did not impose high QoSrequirements. But since the original development of theOpen Systems Interconnection (OSI) basic reference model(ISO 1989), the requirements of information servicesdistributed via the Internet have changed radically (Faratin2007). Services with high real-time requirements aredisturbed if transported across large network distanceswhere packets have to traverse multiple network intercon-nection points and packet delay exceeds tolerable bounds.Content providers in the Internet are confronted withextreme demand peaks (such as flash crowds, Pathan andBuyya 2008) because the Internet has become a massmedium. Data intensive services have emerged due togrowing access capacity, which further increases the risk oftransportation overloads.
Two different approaches have emerged to supportinformation services which cannot satisfactorily be realizedthrough centralized hosting and best-effort transmission(Faratin 2007; Leighton 2009; Xiao 2008): the introductionof a QoS service model (as applied in direct homing), andthe installation of Internet overlay structures (i.e. CDNs orP2P networks). The goal of a QoS service model is toenable a QoS which is superior to the best-effort QoS in theInternet. This is realized by a modification of the traditionalInternet architecture: technologies, which allow packetdifferentiation or capacity reservation, must be introduced(Xiao and Ni 1999; Zhao et al. 2000; Huston 2000, pg.399). A QoS service model can either be realized on adedicated infrastructure, or by modifying the presentarchitecture of the public Internet. Presently, the QoSservice model is mostly realized in proprietary networks.For this reason, content distribution via the QoS servicemodel is only realized in close cooperation between contentand network providers: the content is directly homed on theQoS capable network, which provides a direct customeraccess to the content provider (direct homing). Well knownexamples in practice are the IP TV offerings of networkproviders, such as AT&T (U-Verse), BT (BT Vision) orDeutsche Telekom (T-Entertain).
In contrast, Internet overlay structures do not alter thetraditional Internet architecture, but provide value added
functionality on the application layer: An Overlay is a set ofservers deployed across the Internet that [...] in some waytake responsibility for the forwarding and handling ofapplication data in ways that are different from or incompetition with what is part of the basic Internet (Clark etal. 2005). Two overlay technologies for content delivery haveemerged which are specifically designed to optimize QoS anddelivery costs of IP distribution: CDNs and P2P networks, aspointed out by Faratin (2007) and Saroiu et al. (2002).
CDN providers operate a network of servers which areplaced in multiple autonomous systems and strategicallydistributed across the Internet (Dilley et al. 2002; Pallis andVakali 2006; Pathan and Buyya 2008; Vakali and Pallis2003). In order to improve QoS performance, e.g. transmis-sion delay and the effective bandwidth, objects such as largefiles or multimedia content are strategically distributedacross these servers. In addition to caching, CDN providersapply technologies such as prefetching, route optimization,and sophisticated request routing mechanisms. As anexample, France Televisions implements its Video onDemand offering via the content delivery network of theCDN provider Akamai (Akamai 2008).
P2P distribution systems (Androutsellis-Theotokis andSpinellis 2004; De Boever 2007; Kwok et al. 2002) aredesigned to make use of resources provided by endcustomers, such as storage space and processing power, inorder to establish a distributed storage medium throughwhich information service providers are able to distributetheir content. In addition to content replication and caching,P2P systems provide functionalities, such as the distributedpositioning and routing of objects, secure storage, accesscontrol, and authentication. Blizzard Entertainment, forexample, partners with BitTorrent Inc. to distribute thesoftware for the game World of Warcraft via P2Ptechnology (Blizzard 2009). In contrast to Pathan andBuyya (2008) and in line with Leighton (2009) and Saroiuet al. (2002), CDNs are distinguished from P2P networks:whereas CDN providers centrally manage a network ofsurrogate servers, P2P networks are established through thecontributions of independent peers.
In the following, a set of information service character-istics is presented which potentially bear a relationship todistribution performance. These relationships are thentested in the subsequent section.
Determinates of distribution quality
The quality of service distribution can be measured directlythrough the delay, error tolerance and effective bandwidth(equates to data load per second), provided by the distributionmechanism. Requirements of information services on thedistribution quality are taken from the CoS conceptualizations
Technologies for the Electronic Distribution of Information Services 7

(Marchese 2007, pp. 5–8). Information service providers are,nevertheless, unable to estimate the potential quality of adistribution technology prior to implementation. Moreover,the end-to-end measurement of distribution quality for arepresentative set of customers is a very complex task due tothe constitutive service characteristics, as explained above.
Information services expose heterogeneous require-ments, not only on the quality of service distribution, butalso on its implementation. The way information servicesare created and consumed potentially has a direct impact onthe performance of a specific distribution technology. Thenovel approach of the following analysis is the identifica-tion of dependencies of the quality provided by a servicedistribution technology based on the characteristics ofservice production and consumption (cf. Fig. 3, Table 2).These potential characteristics were identified in expertinterviews and through an analysis of the literature ondistribution technologies as presented above.
Relevant characteristics of service production are thedata load per service execution, the centrality of informa-tion origination, the interactivity of communication, thesimultaneity of provisioning and demand, and the servicerevenues. Data load per service execution describes howmuch traffic load a single service execution generates.Traffic load, being a main cost factor, is an important aspectin content distribution and influences technological deci-sions such as content caching strategies and serverlocalization. Centrality of information origination describeshow data originates and is fed into the network. Centralinformation origination implies that content originates at acentral location and, as such, can be distributed from acentral server. In contrast, distributed information origina-tion implies that content is produced at distributedlocations, e.g. the end customers’ clients. Content distribu-tion must, in this case, be carried out from distributedlocations, which leads to different prerequisites, e.g.concerning the application of route optimization strategies.Interactivity of communication characterizes the traffic flowbetween communication end points: in non-interactive
communication, a request by a client is typically followedby a large downstream traffic flow from a server. In interactivecommunication, traffic flows between end points have similarcharacteristics. Interactivity of communication plays animportant role in content distribution, e.g. regarding theimportance of route optimization technologies and theefficiency of content prefetching. Real-time services arecharacterized by a simultaneity of the provisioning anddemand for this content. As there exists no time for caching,such services rely mostly on route optimization strategies. Incontrast, elastic services are characterized by a time gapbetween information provisioning and demand, and for thisreason allow the application of buffering and cachingtechnologies. Service revenues, i.e. the revenues a serviceprovider generates per service execution, potentially provideinformation about the willingness of a service provider toinvest in high distribution quality. Distribution technologiesvary strongly with regard to the capital and operationalexpenses they induce. Low revenues do not allow highinvestments in service distribution and signal an endcustomer’s tolerance for low distribution quality. In contrast,high revenues provide information service providers withmore flexibility to invest in high distribution quality.
The relevant characteristics of service consumption arethe customer segment, demand locality, level of demand,consumer mobility, consumption frequency, and securitylevel. The customer segment, e.g. business or privatecustomers, potentially has an impact on the servicedistribution: business-to-business services in general im-pose stricter requirements on distribution quality, e.g.regarding service availability and reliability, than business-to-consumer services. The locality of demand also has asignificant impact: in order to meet a global servicedemand, comprehensive distribution technology implemen-tations need to be applied, which often require higherinvestments than meeting a demand that is restricted to asmall, well defined geographical area. The level of demanddescribes whether a service is considered a niche or a massservice. A niche service imposes different requirements for
Fig. 3 Characteristics of information services influencing the quality of service distribution
8 J. Wulf, R. Zarnekow

Tab
le2
Criteriacatego
ries
Criterion
Class
(Num
berof
Observatio
ns)
Mean
value
Stand
ard
deviation
12
34
5
Centrality
ofInform
ation
Originatio
ndecentral(37)
central(66)
//
/1.64
0.48
Con
sumer
Mob
ility
static
(21)
distribu
tedstationary
access
(59)
onthemov
e(23)
//
2.02
0.66
Customer
Segment
pure
B2C
(71)
nospecific
focus(20)
pure
B2B
(12)
//
1.43
0.69
DataLoadperSecon
d<64
kbitp
s(0)
[64kb
itps—
384kb
itps)
(17)
[384
kbitp
s—1Mbp
s)(44)
[1Mbp
s—4Mbp
s)(35)
>=4Mbp
s(7)
3.31
0.83
DataLoadperService
Executio
n<1
MB(0)
>=1
MB(21)
>=15
MB
(55)
>=50
0MB(20)
>=5
GB
(7)
3.13
0.81
Delay
Tolerance
<=10
0ms(24)
(100
ms—
1s]
(11)
(1s–4
s](36)
(4s–6
s](9)
>6
s(23)
2.96
1.43
Dem
andLocality
region
al(4)
coun
try(36)
continent(16)
glob
al(47)
/3.03
0.98
Error
Tolerance
0%(68)
<=0,3%
(0)
<=1%
(19)
>1%
(16)
/1.83
1.21
Frequ
ency
ofCon
sumption
>=1peryear
(15)
>=1permon
th(21)
>=1perweek(14)
>=1perday(36)
>=1perho
ur(17)
3.18
1.33
Interactivity
ofCom
mun
ication
one-way
commun
ication(65)
two-way
commun
ication
(con
trol
andcontentdata
flow
s)(13)
two-way
commun
ication
(hom
ogeneous
data
flow
s)(25)
//
1.61
0.85
Level
ofDem
and
nicheservice(19)
regu
larservice(37)
massservice(47)
//
2.27
0.76
Security
Level
noncritical
data
(41)
data
allowingendcustom
erprivacyintrusion(34)
strategicbu
siness
data
(20)
data
criticalwith
regard
tolegalandregu
latory
issues
(8)
/1.95
0.95
Service
Revenues(inUS$)
none
(2)
(0–1
0)(48)
[10–10
0)(35)
[100
–100
0)(10)
>=10
00(8)
2.75
0.95
Sim
ultaneity
ofProvision
ing
andDem
and
asyn
chrono
us(60)
quasisynchron
ous
(delay
tolerant)(8)
real-tim
e(35)
//
1.76
0.93
Technologies for the Electronic Distribution of Information Services 9

content delivery than a mass customer service. This affects theefficiency of technologies such as caching and capacityreservation. Consumer mobility also influences servicedelivery: In the case where a service is solely consumedfrom a single access line, such an access line can beexplicitly configured prior to service distribution. In contrast,mobile services do not allow a pre-configuration of accesslines, because such services must be available on multipleaccess lines, which cannot be determined in advance. Therealso exists a relationship between the frequency of serviceconsumption and the efficiency of content distributiontechnologies: the more regularly a service is consumed,the more efficient is application of refined distributiontechnologies, such as the installation of local caches. Thesecurity level of an information service describes therequirements of a service customer regarding the securityof data exchange. Sensitive customer data needs to beprotected more strictly than information, which is open to thepublic and does not carry any security risks. This affects, forexample, the employment of public infrastructure.
Value proposition analysis
103 IP based services were analyzed in order to identifydifferences in the value propositions of the four distributiontechnologies presented above. The services reveal insightsinto the value propositions of the distribution technologiesthey rely on.
Research methodology
The analysis was carried out according to the directives forcontent analysis research (Kassarjian 1977; Kolbe andBurnett 1991).1 Adequate sampling was ensured by pre-analyzing reference customer lists and use cases ofdistribution providers before making representative sampleselections. The distribution methods of the samples wereverified by employing various network tools such astraceroute and WHOIS.
The selected services were classified with respect to thedirect distribution quality criteria and the characteristics ofservice production and consumption presented in theprevious section. Table 2 contains a listing of the categoriesfor each criteria.
In order to guarantee data validity, the classificationwas carried out independently by five IT service experts,who were carefully chosen with respect to three selectioncriteria: education, work experience in the IT servicesfield, and expertise in IT service application, development,
and management. These selection criteria ensured that thejudges were familiar with the analyzed informationservices and their underlying technologies, and ultimatelyguaranteed the judges’ capability to produce accurateclassifications.2
Prior to coding, the judges were familiarized with thecriteria and category definitions. Judges were asked to carryout the following process steps during categorization:service and business model research, service testing, andresearch on service usage. Service and business modelresearch comprised the retrieval of information about theservice type, service technologies, target customers andunderlying business models from the service provider. Thisprocess step supplied valuable information for criteria suchas the customer segment, service revenues and securitylevel. The definition of a service type, based on CoSconceptualizations, supported the determination of delaytolerance, error tolerance, and data load per second for aspecific service. In a second step, judges used and tested theservices where possible. In order to track technical serviceparameters, such as data loads, judges were providedwith network and communication monitoring tools. Incombination with their personal usage experience withservices of similar types, testing gave valuable insightsfor criteria, such as the simultaneity of provisioning anddemand, centrality of information origination and con-sumer mobility. In a third step, judges were asked to gatherinformation on the usage and diffusion of a service frominformation technology research companies and web trafficmonitoring providers. This information was required for thecategorization of criteria such as the level of demand anddemand locality. After having followed these process steps,judges were asked to categorize an information service forall predefined criteria, and to leave blanks where a clearcategory distinction could not be detected. After collectingthe results from all judges, abnormal value discrepancieswere jointly analyzed and, in case of obvious misclassifi-cations, eliminated in a post valuation round. The fiveclassifications were merged in a final step by calculatingmean values.
Discriminant analyses (Klecka 1980) were carried out onthis data. The results indicate the relative importance of acriterion for the choice of a distribution method. For eachdistribution method, the group of services supported by thisspecific method was distinguished from the rest andinsights were gained into the discriminatory effect ofservice criteria. In each case, a univariate ANOVA and astepwise discriminant analysis were performed (Tables 3, 4,5 and 6). In the following section, all service criteria whichwere considered significant in both tests are discussed.
1 Refer to Table 8 in the Appendix for a summary of the directives andconformance justifications.
2 For an overview of the judges’ qualifications, readers are referred toTable 9 in the Appendix.
10 J. Wulf, R. Zarnekow

Table 3 Discriminatory service criteria for centralized hosting
Univariate analysis Stepwise discriminant analysisa,b,c
Group mean ‘centralizedhosting’ (n=27)
Group mean‘others’ (n=76)
F for group meanequality test
F toremove
F toenter
Wilks-Lambda (removal& entry criterion)
Discriminantloadingsd
DemandLocality 2.259 3.303 28.365*** 31.580*** .793 .651
DataLoadperExec 2.630 3.303 15.623*** 12.237*** .676 .483
ErrorTolerance 1.148 2.079 13.314*** 11.106*** .669 .446
ConsumerMobility 2.1111 1.9868 .712 3.312 .582 .169
CentralityOfInfoOrg 1.5556 1.6711 1.145 3.197 .582 −.128SimultanProvDem 1.3704 1.8947 6.630** 3.155 .583 .051
ServiceRevenues 2.3333 2.8947 7.447*** 2.540 .586 .088
LevelOfDemand 2.0370 2.3553 3.613* 2.537 .586 −.016DelayTolerance 2.8889 2.9868 .093 1.720 .591 −.119SecurityLevel 2.2222 1.8553 3.008* 1.335 .593 −.033DataLoadPerSec 3.0741 3.3947 3.042* 1.071 .595 .105
FrequencyOfCons 3.1111 3.2105 .110 .434 .599 .131
CustomerSegment 1.2593 1.4868 2.163 .176 .600 .245
InteractivityOfCom 1.4074 1.6842 2.114 .029 .601 .153
***p<0.01, **p<0.05, *p<0.10aMinimal partial F-statistic for acceptance: 3.84, Maximal partial F-statistic for exclusion: 2.71bWilks Lambda of Discriminant Function: 0.601, Number of Steps: 3c Class mean values of discriminant function: Centralized Hosting=-1.35, others=0.48d Correlation between discriminating variables and the canonical discriminant function
Table 4 Discriminatory service criteria for direct homing
Univariate analysis Stepwise discriminant analysisa,b,c
Group mean ‘directhoming’ (n=20)
Group mean‘others’ (n=83)
F for group meanequality test
F toremove
F toenter
Wilks-Lambda (removal& entry criterion)
Discriminantloadingsd
ConsumerMobility 1.000 2.265 143.381*** 400.532*** .385 −.336ErrorTolerance 2.900 1.578 23.688*** 104.456*** .155 .137
DataLoadPerSec 3.250 3.325 .132 33.869*** .100 −.010InteractivityOfCom 2.600 1.373 48.757*** 9.182*** .081 .196
ServiceRevenues 3.850 2.482 49.721*** 7.588*** .080 .198
FrequencyOfCons 4.500 2.867 31.314*** 4.915** .078 .157
DelayTolerance 1.150 3.398 65.040*** 4.061** .077 −.227SimultanProvDem 2.800 1.506 43.997*** 1.875 .072 .266
CustomerSegment 2.100 1.265 29.887*** .095 .074 .179
CentralityOfInfoOrg 1.200 1.747 25.786*** .898 .073 −.083DataLoadperExec 3.800 2.964 20.289*** .026 .074 .116
SecurityLevel 2.700 1.771 17.813*** .360 .074 .164
LevelOfDemand 1.900 2.361 6.307** .371 .074 −.020DemandLocality 2.700 3.108 2.822* 1.585 .073 .066
***p<0.01, **p<0.05, *p<0.10aMinimal partial F-statistic for acceptance: 3.84, Maximal partial F-statistic for exclusion: 2.71bWilks Lambda of Discriminant Function: 0.074, Number of Steps: 7c Class mean values of discriminant function: DH=7.14, others=−1.72d Correlation between discriminating variables and the canonical discriminant function
Technologies for the Electronic Distribution of Information Services 11

Table 5 Discriminatory service criteria for CDNs
Univariate analysis Stepwise discriminant analysisa,b,c
Group mean‘CDN’ (n=30)
Group mean‘others’ (n=73)
F for group meanequality test
F toremove
F toenter
Wilks-Lambda (removal& entry criterion)
Discriminantloadingsd
ConsumerMobility 2.400 1.861 16.264*** 24.990*** 0.796 0.530
ServiceRevenues 2.900 2.694 0.994 23.533*** 0.787 0.131
CentralityOfInfoOrg 1.900 1.528 14.212*** 12.356*** 0.714 0.495
LevelOfDemand 2.467 2.181 3.089* 5.241** 0.667 0.231
DataLoadperExec 3.133 3.139 0.001 3.211 0.613 0.257
DataLoadPerSec 3.467 3.250 1.441 2.712 0.616 0.382
InteractivityOfCom 1.267 1.764 7.604*** 1.517 0.623 −0.255ErrorTolerance 1.733 1.889 0.349 1.146 0.626 0.077
DelayTolerance 3.500 2.722 6.605** 1.050 0.626 0.209
DemandLocality 3.367 2.875 5.514** 0.949 0.627 0.149
FrequencyOfCons 2.800 3.347 3.621* 0.491 0.630 −0.154SimultanProvDem 1.633 1.819 0.837 0.338 0.631 −0.177CustomerSegment 1.300 1.486 1.519 0.254 0.631 −0.103SecurityLevel 1.833 2.014 0.757 0.017 0.633 −0.097
***p<0.01, **p<0.05, *p<0.10aMinimal partial F-statistic for acceptance: 3.84, Maximal partial F-statistic for exclusion: 2.71bWilks Lambda of Discriminant Function: 0.633, Number of Steps: 4c Class mean values of discriminant function: CDN=1.17, others=−0.49d Correlation between discriminating variables and the canonical discriminant function
Table 6 Discriminatory service criteria for P2P distribution
Univariate analysis Stepwise discriminant analysisa,b,c
Group mean‘P2P’ (n=26)
Group mean‘others’ (n=77)
F for group meanequality test
F toremove
F toenter
Wilks-Lambda (removal& entry criterion)
Discriminantloadingsd
DemandLocality 3.692 2.805 18.476*** 20.026*** 0.782 −0.584ServiceRevenues 2.154 2.948 15.639*** 8.677*** 0.708 0.537
SecurityLevel 1.231 2.195 24.426*** 4.224** 0.678 0.671
InteractivityOfCom 1.462 1.662 1.074 2.401 0.635 0.366
SimultanProvDem 1.500 1.844 2.684 1.557 0.640 0.400
DataLoadperExec 3.115 3.130 0.006 1.255 0.642 0.190
CustomerSegment 1.231 1.494 2.831* 1.081 0.643 0.350
ConsumerMobility 2.269 1.935 5.246** 1.053 0.644 −0.462DelayTolerance 3.808 2.675 13.761*** 0.609 0.647 −0.381DataLoadPerSec 3.423 3.273 0.637 0.596 0.647 0.019
ErrorTolerance 1.846 1.831 0.003 0.071 0.650 −0.052CentralityOfInfoOrg 1.769 1.597 2.505 0.028 0.650 −0.187FrequencyOfCons 2.692 3.351 4.916** 0.006 0.651 0.289
LevelOfDemand 2.577 2.169 5.928** 0.004 0.651 −0.322
***p<0.01, **p<0.05, *p<0.10aMinimal partial F-statistic for acceptance: 3.84, Maximal partial F-statistic for exclusion: 2.71bWilks Lambda of Discriminant Function: 0.651, Number of Steps: 3c Class mean values of discriminant function: P2P=−1.25, others=0.42d Correlation between discriminating variables and the canonical discriminant function
12 J. Wulf, R. Zarnekow

Centralized hosting
Centralized hosting technology represents the traditionaldistribution method within IP networks. Content is hostedon a single server which is connected to the network.Packets are routed through interconnected networks to therequesting client. QoS in pure centralized hosting distribu-tion varies highly, depending on the end customer’slocation and the specific route: thus QoS will most likelybe perfectly acceptable if the end customer is connected tothe same network service provider as the hosting provideror if traffic does not have to traverse large distances. QoSmay exceed acceptance thresholds if traffic is exchangedover large distances through various interconnected net-works. Both tests (Table 3) show that demand locality is themost significant criterion with respect to the choice forcentralized hosting distribution: the more demand is limitedto a specific region, the more effective centralized hostingbecomes as a distribution mechanism. This is well in linewith the argument above that interconnections and geo-graphical distance have a significant negative impact onQoS. The tests also reveal that centralized hosting isparticularly suitable for services with a low data load perservice execution. Hosting providers charge per stored andaccessed data volume; network service providers charge foraccess capacity. Moreover, data transport becomes moreexpensive if more interconnections are involved. Contentproviders, therefore, only choose centralized hosting forservices with low data volume. In addition, low errortolerance is well supported by centralized hosting. Thisresult suggests that highly error tolerant services, such asvideo conferencing, telephony, and multimedia streaming,are generally not provided through centralized hosting.
Direct homing
Within direct homing, IP traffic is not routed as part of thebest effort Internet class, but instead as a privileged class orthrough reserved capacities. Consumer mobility is thedominant selection criterion for direct homing (Table 4).This is caused by the fact that direct homing only supportsservice consumption with guaranteed end-to-end QoS frompre-configured access lines. Thus, end customers can notmake use of reserved capacities from arbitrary accesspoints, but only from dedicated access points. Hence, thistechnology is not adequate for mobile end customerservices. IP TV with guaranteed QoS, for example, isinstalled with a configured router on a single access line. Ahighly reliable and configurable QoS with low latency isaspired through the privileged treatment of direct homingtraffic. This is especially valuable for services with a highdegree of interactivity, such as Voice over IP (VoIP). Thetests affirm that directly homed services are indeed
characterized by a high level of interactivity and errortolerance. As data transport is carried out on predeterminedroutes, interactive services can be supported more effectivelythan by other distribution technologies. The high errortolerance of directly homed services suggests that directhoming is often used for error tolerant services such as voiceand streaming services. Traffic differentiation or routingthrough dedicated networks does not necessarily imply theneed to install separate hardware, but requires at leastadditional investments in the installation and operation ofrouting systems. As direct homing is often more cost intensivethan other distribution methods, direct homing is onlyadequate for services with a high frequency of consumptionand for services which generate high revenues. Otherwise, thehigh investments are not justifiable. In contrast to intuition,direct homing does not primarily address a B2B servicecontext. Direct homing represents the only distributiontechnology, where delay tolerance is a significant criterion.In contrast to the other distribution methods, where the directdiscriminatory effect of delay tolerance is insignificant, thisaspect is directly taken into account for direct homing.
Content delivery networks
CDN providers operate a complex network of edge servers.Content is distributed from and cached on these serversbased on strategies which take into account the location ofend customers, as well as network and server character-istics. CDNs, in contrast to direct homing, support a highcustomer mobility during service consumption (Table 5).CDN service coverage is not limited to configured accesslines and networks. CDNs support mobile services and arewell suited to deliver services such as video streaming,which are consumed en-route. CDN technology relies on asingle central origin server, that contains core serviceinformation and that directs content or requests to the edgeservers. On the other hand, CDN is not well suited forservices without a central origination of information, such ascommunication services in which each end customer feedsdata into the network. For such services, content caching onthe edge servers can not be carried out efficiently. Contentcaching becomes more efficient with higher cache hit ratios,i.e. the ratio of cached versus total documents requested. Forthis reason, CDNs particularly address services with a masscustomer focus. For niche services, cache hit ratios tend tobe low, which decreases the efficiency of cache networks.As the content needs to be transported to the edge serversprior to its distribution to end customers, this distributionmethod does not seem adequate for services where theorigination of information coincides with the demand forthis information. However, this hypothesis can not beconfirmed. CDN providers constantly improve their capa-bilities to support real-time services, e.g. through the
Technologies for the Electronic Distribution of Information Services 13

development of route optimization technologies. For quasireal-time services such as live streaming, CDN technologyis widely applied (Pathan and Buyya 2008).
P2P distribution
P2P distribution does not require large capital expenses.The main resource is P2P software running on endcustomers’ clients with established network connections.Content providers do not need to constantly feed contentinto the network from central servers and therefore savetransit costs. As overall distribution costs increase with theglobal nature of demand, P2P especially addresses serviceswith a global demand (Table 6). This is the most importantcriterion for choosing P2P distribution. In the case of astrictly local service demand, services could be distributedvia centralized hosting without significant distributioncosts. In case of a global demand, content distribution viaP2P incurs significantly less transit costs. As contentproviders do not have to feed content into the network foreach customer request, this distribution method is particu-larly attractive for services which generate low revenuesand do not justify investments in a costly distributiontechnology with high QoS guarantees. Hence, cost savingsin distribution are a dominant decision factor. More than inother distribution methods, content is exposed to the risk ofmanipulation. Since content is cached by third party clientsprior to its distribution, the risk of unauthorized serviceaccess or service modification is high compared to otherdistribution methods. For services with high securityrequirements (e.g. file storage and exchange services forbusinesses), this risk is generally not tolerable.
Summary
In this article, the quality provided by different technologiesfor information service distribution is discussed. Ananalysis of 103 information services was carried out inorder to identify the main characteristics influencing aninformation service providers choice of a specific distribu-
tion method. An underlying assumption of this approach isthat the information services analyzed are best supported bytheir associated distribution methods and, as such, allowdeductions on the value proposition of the distributiontechnologies. This assumption is justified by the rationalethat firms seek an optimal distribution choice. The results ofour analysis reveal that distribution technologies varystrongly with respect to the information services theysupport. A set of characteristics concerning service produc-tion and consumption was identified which have a stronginfluence on the quality provided by distribution technolo-gies. Distribution technologies and their significant servicecharacteristics are summarized in Table 7.
From the set of hypotheses, i.e. the set of characteristicswhich were taken into account, several were provenirrelevant: most notably, criteria directly describing thequality of service distribution, namely packet delay anddata load per second, have an insignificant influence on thechoice of a distribution technology. This means that there isno distribution technology which generally provides asuperior distribution quality. Instead, information serviceproviders need to match their individual service character-istics to the technological capabilities of distributionmethods for an optimal choice. Moreover, the simultaneityof provisioning and demand and the customer segment areirrelevant service criteria. From this it follows that theanalyzed distribution technologies all have real-time capa-bilities and that none is specifically tailored for a businessor an end consumer service scenario.
This work represents an initial analysis comparing thecapabilities of service distribution technologies. Theresults provide information service providers with prac-tical guidance in their choice of a distribution provider.They allow the selection of a distribution method basedon a matching of service characteristics and capabilitiesof distribution technologies.
Distribution technologies are constantly being enhanced.CDN and P2P technologies, for example, are most recentlybeing applied jointly to reach a more efficient servicedistribution. Blizzard Entertainment uses AKAMAI’s CDNand BitTorrent’s P2P technology to distribute its World of
Table 7 Distribution technologies and their significant service characteristics
Distributiontechnology
Significant service characteristics
Centralized Hosting Local demand, low data load per service execution, low error tolerance
Direct Homing Low consumer mobility, high error tolerance, high interactivity of communication,high service revenues, high frequency of consumption, low delay tolerance
Content Delivery Networks High consumer mobility, high centrality of information origination, high level of demand
P2P Distribution Global demand, low service revenues, low security level
14 J. Wulf, R. Zarnekow

Warcraft Software (Blizzard 2009). The future evolution ofinformation service distribution is dependent on deeperinsights into the quality of information services and theinfluence of distribution performance. Zeithaml et al. (2000)state that a negative perception of information service qualityresult from several gaps, two of which are critical for servicedistribution: the information gap represents differencesbetween customer requirements and a service provider’sbeliefs about requirements. The design gap describesdiscrepancies between the identified requirements and theimplemented service. By filling the information gap, serviceproviders gain a more profound understanding of the
constitutive characteristics of service quality. This knowledgeis a prerequisite for service implementation. The design gapis closed by correctly matching requirements with servicespecifications and by achieving these specifications duringservice operation. In this phase, the required quality ofservice distribution for specific information services isidentified. This work represents an approach to close thesegaps by establishing a relationship between service require-ments and distribution methods which are currently inoperation. A clear understanding of both gaps is aprerequisite for the further development and effectiveapplication of distribution technologies.
Appendix
Table 8 Conformance with content-analysis research directives (based on Kolbe and Burnett 1991)
Objectivity Definition of rules and procedures Reporting of categories and definitions
Judge training Presentation of category definition prior to coding
Unit measure pretesting Pretesting conducted by authors
Judge independence Engagement of four non-authoring judgesMultiple judges
Systematization Prohibition of bias between categoryselection and thesis
Avoidance of result predetermination by definitionof categories in cooperation with independent expertsand based on literature
Hypothesis testing Hypothesis formulation and foundation
Sampling Methods Generalizability of sample Selection of representative published use cases
Manageability of sample size Sample size of 103 applications
Reliability Categorical reliability Clear definition of categories
Interjudge reliability Introduction of feedback cycle to avoidinterjudge disagreements
Table 9 Information on judge qualifications
Judge Education Work experience inthe IT services field
Expertise in IT service application, development,and management
1 Information Engineering and Management (MSc) 6 years Application Programming, Software Engineering,Network Technologies, IT Service Management
2 Industrial Engineering and Management (MSc) 3 years Web Design, IT Service Quality Management,Internet Technologies
3 Information Systems Management (MSc) 8 years Application Programming, Software Engineering,IT Service Management
4 Industrial Engineering and Management (BSc) 1 ½ years Web Design, IT Service Management,Internet Technologies
5 Computer Sciences (BSc) 3 years Application Programming, Network Technologies,Server Configuration
Technologies for the Electronic Distribution of Information Services 15

Tab
le10
Listof
analyzed
inform
ationservices
Nam
eof
inform
ationservice
Inform
ationserviceprov
ider
Typ
edescription
Distributiontechno
logy
Distributionprov
ider
ICQ
/AOLInstantMesseng
erAOL
InstantMesseng
er,Internet
Telepho
nyP2P
AOL
20th
Century
Fox
Film
s20
thCentury
Fox
Video
Streaming
P2P
Vuze
301Records
Music
Album
301Records
Music
Dow
nload
P2P
Kazaa
ABS-CBN
TV
ABS-CBN
Global
TV
Streaming
CDN
Edg
eStream
Aeria
Gam
ePatches
Aeria
Gam
esGam
eDistribution
P2P
BitT
orent
Altn
etMusical
Dow
nloadService
Altn
etMusic
Dow
nload
P2P
Kazaa
amazon
.deWeb
Sho
pAmazon
OnlineSho
pIP
Transit
Level3
AMD
Drivers
AMD
DriverDow
nload
CDN
Akamai
Aud
iWebsite
Aud
iAG
BusinessInternet
Representation
CDN
Akamai
B2B
-trade.net
B2B
-Trade
Ltd.&
Co.
KG
B2B
Marketplace
IPTransit
Hosteurop
e
morgenp
ost.d
eBerlin
erMorgenp
ost
New
sPortal
IPTransit
Arcor
bild.de
BILD
digitalGmbH
&Co.
KG
New
sPortal
IPTransit
ColtTelecom
mun
ications
billiger.d
ebilliger.d
eInform
ationAgg
regator
IPTransit
IPExchang
eGmbH
Bluew
inTV
Swisscom
TV,Video
Streaming
DirectHom
ing
Swisscom
Bollywoo
dMov
ies
IndiaFM.com
Mov
ieDow
nload
P2P
Kazaa
Music
Video
Streaming
Son
yBMG
TV,Video
Streaming
DirectHom
ing
BT
BusinessCon
nect
Professional
Swisscom
VoIP
DirectHom
ing
Swisscom
BusinessVideo
1000
MXP
T-Systems
Video
Con
ferencing
DirectHom
ing
T-Systems
CathayPacific
AirwaysWebsite
CathayPacific
Airways
Website
CDN
Akamai
CNBCHom
epage
CNBC
New
sPortal
CDN
Akamai
Com
edyCentral
Series
Com
edyCentral
Video
Streaming
P2P
BitT
orent
tagesspiegel.de
Der
Tagesspiegel
New
sPortal
IPTransit
IPExchang
eGmbH
DirecTV
VoD
DirecTV
TV
Streaming
CDN
Techn
icolor
EDS
Dream
Works
Video
Clip
sDream
Works
Clip
Stream
CDN
Lim
elight
Networks
Ebay.de
Transactio
nPlatform
eBay
OnlineAuctio
nHou
seIP
Transit
Level3
ElectronicArtsGam
esSoftware
ElectronicArts
SoftwareDow
nload
CDN
Lim
elight
Networks
End
Customer
VoIP
Private
End
Customers
VoIP
DirectHom
ing
Telefon
icaDeutschland
GmBH
End
Customer
VoIP
Private
End
Customers
VoIP
DirectHom
ing
o2
End
Customer
VoIP
Private
End
Customers
VoIP
DirectHom
ing
Arcor
End
Customer
VoIP
Private
End
Customers
VoIP
DirectHom
ing
HanseNet
End
Customer
VoIP
Private
End
Customers
VoIP
DirectHom
ing
1&1
Equ
antManaged
IP-V
PN
Equ
ant
IPVPN
DirectHom
ing
Equ
ant
ESA
Portal
ESA
Clip
Stream
CDN
Akamai
FAZ.net
F.A.Z.ElectronicMedia
GmbH
New
sPortal
IPTransit
Versatel
ftd.de
Financial
Tim
esDeutschland
New
sPortal
IPTransit
Gruner+
Jahr
AG
&Co
16 J. Wulf, R. Zarnekow

Tab
le10
(con
tinued)
Nam
eof
inform
ationservice
Inform
ationserviceprov
ider
Type
description
Distributiontechno
logy
Distributionprov
ider
FranceTelevisions
VoD
FranceTelevisions
Video
onDem
and
CDN
Akamai
Gam
eShado
wSoftwareDow
nload
Gam
eShado
wSoftwareDow
nload
CDN
Lim
elight
Networks
Geizkragen.de
Geizkragen
Inform
ationAgg
regator
IPTransit
DTSSysteme
Goo
gleApp
sGoo
gleInc.
SaaS
IPTransit
Goo
gle
Goo
gleTalk
Goo
gle
Instantmesseng
er,Internet
Telepho
nyP2P
Goo
gle
guenstiger.de
guenstiger.de
Inform
ationAgg
regator
IPTransit
Inet
PeopleHostm
aster
hand
elsblatt.com
Handelsblatt
New
sPortal
IPTransit
circ
ITGMbH
HostelWebsite
HostelDavid
HostelWeb
Representation
IPTransit
StratoAG
IAHGam
ePatches
Infocomm
AsiaHolding
sPte
Ltd
(IAHGam
es)
SoftwareDow
nload
P2P
BitT
orent
IntelDriverDow
nload
Intel
SoftwareDow
nload
CDN
Akamai
InterCon
tinentalWebsite
InterCon
tinentalHotel
Group
Website
CDN
Akamai
IntraSelectVPN
T-Systems
IPVPN
DirectHom
ing
T-Systems
L’Equ
ipeHom
epage
L’Equ
ipe
New
sPortal
CDN
Akamai
Lionsgate
Film
sLionsgate
Video
Dow
nload
P2P
BitT
orent
MachinimaFilm
sMachinima
Mov
ieandClip
Dow
nload
P2P
Vuze
Managed
IP-V
PN
GlobalCrossing
IPVPN
DirectHom
ing
GlobalCrossing
Managed
IP-V
PN
TFM
Networks
IPVPN
DirectHom
ing
TFM
Networks
Managed
Voice
over
IPNetworks
T-Systems
VoIP
DirectHom
ing
T-Systems
Maxdo
meVoD
ProSiebenS
at.1
Media
&UnitedInternet
Video
onDem
and
CDN
Akamai
Ministryof
Sou
ndTV
Ministryof
Sou
ndMusic
P2P
Vuze
MSNBC
Webcast
MSNBC
Clip
Stream
CDN
Lim
elight
Networks
Music
Album
“The
Morning
Benders”
+1Records
Music
Dow
nload
P2P
Lim
eWire
Myd
eoEnterpriseMedia
Delivery
Myd
eoClip
Stream
CDN
Lim
elight
Networks
MyS
pace
Website
MyS
pace
SocialNetwork
CDN
Lim
elight
Networks
neu.de
Website
Neu.deGmbH
Partnerbö
rse
IPTransit
ColtTelecom
mun
ications
NXTbo
okMedia
OnlineBrochures
NXTbo
okMedia
printmaterialsforweb
use
CDN
MirrorIm
age
NY
PostHom
epage
NY
Post
New
sCDN
Akamai
OrvisWeb
Sho
pOrvis
OnlineStore
CDN
MirrorIm
age
PanTerra
On-Dem
andPlatform
SaaS
SUTHERLAND
NETWORKS
SaaS
DirectHom
ing
PanterraNetworks
Param
ount
PicturesVoD
Param
ount
Video
Dow
nload
P2P
BitT
orent
PetStore
Web
Sho
pPetStore
OnlineStore
CDN
MirrorIm
age
RajshriMedia
VoD
RajshriMedia
Video
onDem
and
CDN
Lim
elight
Networks
SageClubWebsite
SageClub
ClubHom
epage
IPTransit
NeueMedienMuenn
ichGmbH
SAPformedium
sizedbu
sinesses
AlliedPanelsEntwicklun
gs-und
Produ
ktions
GmbH
SaaS
DirectHom
ing
Freud
enberg
IT
SchuelerV
ZWebsite
Verlagsgrup
peGeorg
von
Holtzbrinck
GmbH
SocialNetwork
CDN
Panther
Exp
ress
Secon
dLife
LindenLabs
SoftwareDow
nload
IPTransit
Amazon
Technologies for the Electronic Distribution of Information Services 17
Tab
le10
(con
tinued)
Nam
eof
inform
ationservice
Inform
ationserviceprov
ider
Typ
edescription
Distributiontechno
logy
Distributionprov
ider
SegaSoftware
Sega
Gam
eDistribution
P2P
BitT
orent
shop
wahl.d
eWebsite
LeG
uide.com
Group
Sho
ppingDirectory
IPTransit
ColtTelecom
mun
ications
Sho
wtim
eFilm
sSho
wtim
eMov
ie,Series
P2P
Vuze
SiemensA&D
Software
SiemensA&D
SoftwareDow
nload
CDN
Akamai
Sipgate
Internet
Teleph
ony
Sipgate
Internet
Telepho
nyP2P
Sipgate
Sky
peInternet
Telepho
nyeB
ayInstantmesseng
er,Internet
Telepho
ny,Filesharing
P2P
eBay
Son
yEricssonSoftware
Son
yEricsson
SoftwareDow
nload
CDN
Akamai
Son
yPicturesFilm
sSon
yPictures
Mov
ieP2P
Vuze
Spacenatio
nsOnlineGam
eSpacenatio
nsBrowsergam
eIP
Transit
IPX
ServerGmbH
SPD
Website
SPD
Website
IPTransit
PIRONETNDH
AG
Sup
erbo
wlCom
mercial
Clip
sIFILM
Video,TV,Gam
esCDN
Lim
elight
Networks
StudiVZWebsite
Verlagsgrup
peGeorg
von
Holtzbrinck
GmbH
SocialNetwork
CDN
Panther
Exp
ress
tchibo
.deWebsite
Tchibo
OnlineSho
pIP
Transit
Easyn
etGmbH
Ten
Mile
TideMusic
Album
Ten
Mile
Tide
Music
P2P
Kazaa
TheCrownOnlineGam
eTheCrown
Browsergam
eIP
Transit
manitu
hosting
T-ho
meEntertainmentVoD
DeutscheTelekom
TV,Video
Streaming
DirectHom
ing
DTA
G
Trium
phVoIP
Trium
phVoIP
DirectHom
ing
DTA
G
U-Verse
VoD
AT&T
TV,Video
Streaming
DirectHom
ing
AT&T
Videoload
VoD
DeutscheTelekom
Video
Streaming
IPTransit
DTA
G
WarnerBros.Film
sWarnerBros.
Video
Dow
nload
P2P
BitT
orent
welt.d
eWebsite
Die
Welt
New
sPortal
IPTransit
Arcor
Windo
wsLiveMesseng
erMicrosoft
Instantmesseng
er,Internet
Telepho
nyP2P
Microsoft
World
ofWarcraftSoftware
Blizzard
SoftwareDow
nload
CDN
Lim
elight
Networks
World
ofWarcraftSoftware
Blizzard
SoftwareDow
nload
P2P
BitT
orent
www.blog.de
Website
Mok
onoGmbH
BlogSite
IPTransit
IPExchang
eGmbH
Yahoo
Messeng
erYahoo
Instantmesseng
er,Internet
Telepho
ny,Filesharing
P2P
Yahoo
ZattooIP
TV
Zattoo
P2P
TV
P2P
Zattoo
ZDFMediathek
VoD
ZDF
Video
OnDem
and
CDN
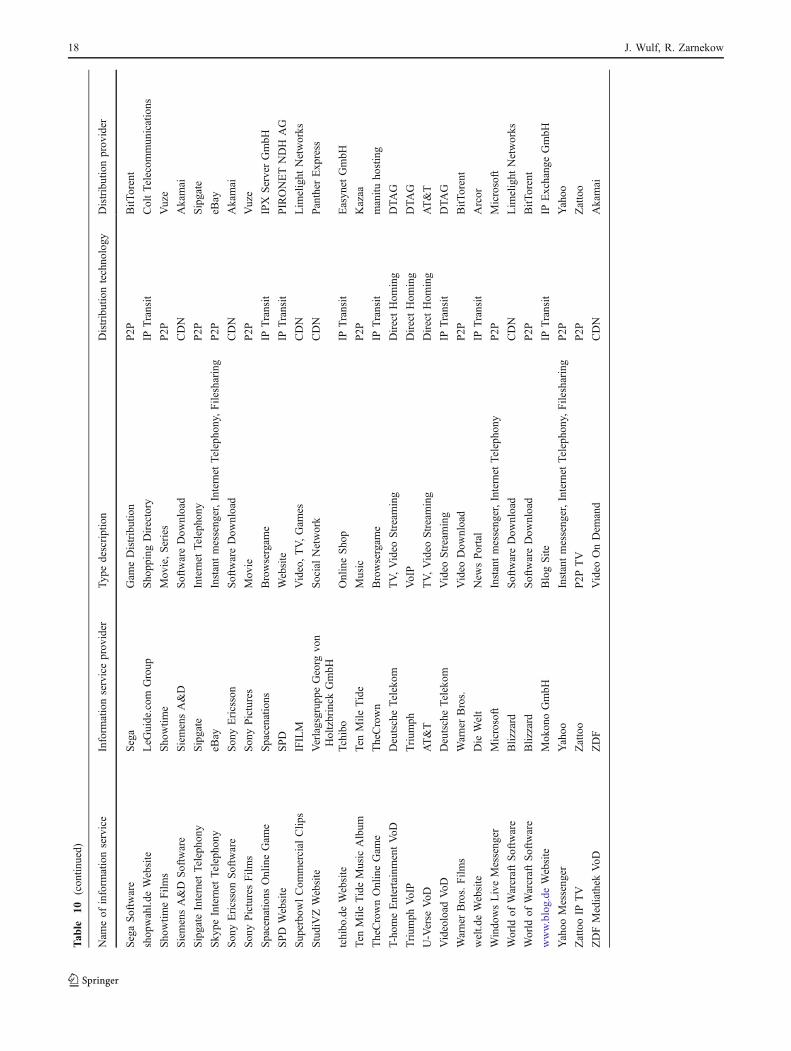
Akamai
18 J. Wulf, R. Zarnekow
References
Akamai (2008). Case study—france television interactive. AkamaiTechnologies, Inc.Website. http://www.akamai.com/html/customers/case_study_francetv.html. Accessed 4 June 2009.
Akamai (2009). Akamai: The leader in web application acceleration andperformance management. Streaming media, Akamai Technologies,Inc. Website. http://www.akamai.com. Accessed 19 May 2009.
Amit, R., & Zott, C. (2001). Value creation in e-business. StrategicManagement Journal, 22, 493–520.
Androutsellis-Theotokis, S., & Spinellis, D. (2004). A survey of peer-to-peer content distribution technologies. ACM ComputingSurveys, 36(4), 335–371.
BitTorrent (2009). Reduce content delivery bills. BitTorrent, Inc.Website. http://www.bittorrent.com/dna?csrc=splash. Accessed 5June 2009.
Blizzard (2009). Blizzard Downloader F. A. Q. Blizzard Entertain-ment, Inc. Website. http://www.worldofwarcraft.com/info/faq/blizzarddownloader.html. Accessed 4 June 2009.
Bowersox, D. J., Closs, D. J., & Helferich, O. K. (1986). Logisticalmanagement: A systems integration of physical distribution,manufacturing support, and materials procurement. New York:Macmillan.
Clark, D. D., Lehr, W., Bauer, S., Faratin, P., Sami, R., Wroclawski, J.(2005). The growth of internet overlay networks: Implications forarchitecture, industry structure and policy. In The Proceedings of the34th Telecommunications Policy Research Conference (TPRC 05).Arlington, VA, USA.
De Boever, J. (2007). Peer-to-peer networks as a distribution andpublishing model. In Proceedings of the 11th International Confer-ence on Electronic Publishing (pp. 175–188). Vienna, Austria.
Demirkan, H., Kauffman, R., Vayghan, J., Fill, H., Karagiannis, D., &Maglio, P. (2008). Service-oriented technology and manage-ment: perspectives on research and practice for the coming de-cade. Electronic Commerce Research & Applications, 7(4), 356–376.
Dilley, J., Maggs, B., Parikh, J., Prokop, H., Sitaraman, R., & Weihl,B. (2002). Globally distributed content delivery. Internet Com-puting, IEEE, 6(5), 50–58.
Easynet (2009). Easynet—facts and figures. Easynet Group Inc.Website. http://www.easynet.com/gb/en/about/fastFacts.aspx?SecondaryNavID=52. Accessed 4 June 2009.
Faratin, P. (2007). Economics of overlay networks: An industrialorganization perspective on network economics. In Proceedingsof the Joint Workshop on The Economics of Networked Systemsand Incentive-Based Computing (NetEcon+IBC), in conjunctionwith ACM Conference on Electronic Commerce (end custom-er’07). San Diego, California, USA.
Frost & Sullivan (2008). World video content delivery networksmarket. Frost & Sullivan Market Engineering Report #N425-70.
Gozdecki, J., Jajszezyk, A., & Stankiewiez, R. (2003). Quality ofservice terminology in IP networks. IEEE CommunicationsMagazine, 41(3), 153–159.
Huston, G. (2000). Internet performance survival guide: QoSstrategies for multiservice networks. Inc: John Wiley & Sons.
ISO (1989). Open systems interconnection—Basic reference model.International Organization for Standardization. Ref. Nr. 7498.Geneva, Switzerland.
ISO (2005). Quality management systems—Fundamentals and vocab-ulary. Third edition. International Organization for Standardiza-tion. Ref. Nr. 9000:2005(E). Geneva, Switzerland.
Kassarjian, H. H. (1977). Content analysis in consumer research.Journal of Consumer Research, 4(6), 8–18.
Klecka, W. R. (1980). Discriminant analysis. Quantitative applica-tions in the social sciences series. Thousand Oaks: Sage.
Kolbe, R. H., & Burnett, M. S. (1991). Content-analysis research: anexamination of applications with directives for improving researchreliability and objectivity. Journal of Consumer Research, 18(2),243–250.
Kwok, S. H., Lang, K. R., & Tam, K. Y. (2002). Peer-to-peertechnology business and service models: risks and opportunities.Electronic Markets, 12(3), 175–183.
Leighton, T. (2009). Improving performance on the internet. Commun,ACM, 52(2), 44–51.
Liao, Z., & Cheung, M. T. (2008). Measuring consumer satisfaction ininternet banking: a core framework. Communications of theACM, 51(4), 47–51.
Liu, C., & Arnett, K. P. (2000). Exploring the factors associated withWeb site success in the context of electronic commerce.Information & Management, 38(1), 23.
Marchese, M. (2007). QoS over heterogeneous networks. Hoboken:John Wiley & Sons Inc.
McKinnon, A. (1988). Physical distribution. In J. N. Marshall (Ed.),Services and uneven development (pp. 133–159). Oxford: OxfordUniversity Press.
Onecle (2009). Sample contracts—master services agreement—AkamaiTechnologies Inc. Onecle Inc. Website. http://contracts.onecle.com/akamai/msa.shtml. Accessed 25 April 2009.
Pallis, G., & Vakali, A. (2006). Insight and perspectives for contentdelivery networks. Communications of the ACM, 49(1), 101–106.
Parasuraman, A., Zeithaml, V. A., & Berry, L. L. (1985). A conceptualmodel of service quality and its implications for future research.Journal of Marketing, 49(4), 41–50.
Pathan, M., & Buyya, R. (2008). A taxonomy of CDNs. In R. Buyya, M.Pathan, & A. Vakali (Eds.), Content delivery networks (pp. 33–77).Germany: Springer-Verlag.
Saroiu, S., Gummadi, K. P., Dunn, R. J., Gribble, S. D., Levy, H. M.(2002). An analysis of internet content delivery systems. InProceedings of the 5th Symposium on Operating Systems Designand Implementation, San Francisco, USA.
Shapiro, C., & Varian, H. R. (1999). Information rules: a strategicguide to the network economy. Harvard Business School Press,Boston, Mass.
Tanenbaum, A. S. (2003). Computer networks (4th ed.). Upper SaddleRiver: Prentice-Hall.
Timmers, P. (1998). Business models for electronic markets. Elec-tronic Markets, 8(2), 3–8.
Underwood, K. (2001). Web hosting: An overview. Gartner TechnicalReport.
Vakali, A., & Pallis, G. (2003). Content delivery networks: Status andtrends. IEEE Internet Computing, IEEE Computer Society,November–December, 68–74.
Xiao, X., & Ni, L. M. (1999). Internet QoS: A big picture. IEEENetwork, March–April, 8–18.
Xiao, X. P. (2008). Technical, commercial and regulatory challenges ofQoS. An Internet service model perspective. Amsterdam: MorganKaufmann.
Zeithaml, V. A., Parasuraman, A., & Malhotra, A. (2000). Aconceptual framework for understanding e-service quality:Implications for future research and managerial practice. Work-ing paper, Cambridge, MA: Marketing Science Institute.
Zeithaml, V. A., Parasuraman, A., & Malhotra, A. (2002). Servicequality delivery through web sites: a critical review of extantknowledge. Journal of the Academy of Marketing Science, 30(4),362–375.
Zhao, W., Olshefski, D., & Schulzrinne, H. (2000). Internet qualityof service: An overview. Working Paper, Columbia University,New York.
Technologies for the Electronic Distribution of Information Services 19