Technical report of the Phos4You partnership on processes to ...
326
The Phos4You partnership September 2021 Technical report of the Phos4You partnership on processes to recover phosphorus from wastewater www.nweurope.eu/phos4you
-
Upload
khangminh22 -
Category
Documents
-
view
1 -
download
0
Transcript of Technical report of the Phos4You partnership on processes to ...
The Phos4You partnership September 2021
Technical report
of the Phos4You partnership
on processes to recover phosphorus from wastewater
www.nweurope.eu/phos4you
Technical report of the Phos4You partnership on processes to recover P from wastewater Page n°2
Technical report of the Phos4You partnership on processes to
recover phosphorus from wastewater
MOBIL ISE DEMONSTRATE IMPLEMENT
Phosphorus Recovery Processes
from wastewater in real environment for large & small WWTPs
edited by
LIPPEVERBAND
Ploteau, Marie-Edith; Althoff, Anke; Nafo, Issa; Teichgräber, Burkhard
Technical report of the Phos4You partnership on processes to recover P from wastewater Page n°3
Impressum
This report was prepared by the partners of the Phos4You project, funded through
INTERREG VB North-West Europe programme (2014-2020) under the grant NWE292.
DOI number: https://doi.org/10.17185/duepublico/74788
The report is available for download at: www.nweurope.eu/phos4you
Please cite this report and its contributions as follows:
Ploteau Marie-Edith, Althoff Anke, Nafo Issa, Teichgräber Burkhard, “Technical report
of the Phos4You partnership on processes to recover phosphorus from wastewater”,
September 2021, edited by LIPPEVERBAND, DOI n° 10.17185/duepublico/74788
and
Individual chapters are to be cited by naming the authors listed in each case.
Editor: LIPPEVERBAND
Kronprinzenstrasse 24
45128 Essen
Tel: +49 201 1040
www.eglv.de
First edition
This work may be used under a Creative Commons Attribution 4.0
License (CC BY 4.0) https://creativecommons.org/licenses/by/4.0/
September 2021
Essen (Germany)
Technical report of the Phos4You partnership on processes to recover P from wastewater Page n°4
Technical report of the Phos4You partnership on processes to
recover phosphorus from wastewater
List of contributors
Ploteau, Marie-Edith 1
Althoff Anke 1
Blöhse, Dennis 1
Nafo, Issa1
Léonard, Angélique 2
Pfennig, Andreas 2
Shariff, Zaheer 2
Leleu, David 2
Groslambert, Sylvie 2
Chantrain, Gaspard 2
Daumer, Marie-Line 3
Bareha, Younes 3
Harrington, Joe 4
Barnett, Denise 4
Power, Niahm 4
Siddiqui, Asif 4
O´Donnell, Ciaran4
Nättorp, Anders 5
Escudero, Ania 6
Reichelt, Lena-Dorothea 6
Pahl, Ole 6
Bremner, Barbara 7
Papp, Szabolcs 7
Taggart, Mark 7
Vedrenne, Fabien 8
Cunha, Marisa 8
Mébarki, Cédric 8
Schmelz, Karl-Georg 9
Klein, Daniel 9
Pamuk, Levent 9
Teichgräber, Burkhard 9
Zepke, Frank 10
1 Lippeverband, 2 Université de Liège, 3 Institut national de recherche pour l’agriculture,
l’alimentation et l’environnement, 4 Munster Technological University, 5 Fachhochschule Nordwest Schweiz, 6 Glasgow Caledonian University, 7 Environmental
Research Institute, The North Highland College, University of the Highlands and Islands, 8 Veolia Environnement, 9 Emschergenossenschaft, 10EuPhoRe GmbH
September 2021
Picture credit on first page: Till Möller † /LIPPEVERBAND
Technical report of the Phos4You partnership on processes to recover P from wastewater Page n°5
Abstract in four languages (EN, DE, FR, NL)
[EN] To address the growing European requirements in regard with phosphorus (P),
essential nutrient but finite resource, a main purpose of the Phos4You project was to
make the proof of technologies to recover P from wastewater. For this, new or existing
demonstrators were used to upscale innovative processes and/or validate emerging
technologies in live, operational-scale environments. This was applied to recover P from
large wastewater treatment plants (WWTP) or related sewage sludge incineration plant,
as well as from small WWTPs. In all cases, the recovery of valuable phosphorus materials
and by-products was aimed at. The Life Cycle Assessment (LCA) was carried out for
some of the most advanced processes. Three different wet-chemical processes
(TetraPhos®, Phos4Life™, PARFORCE) for leaching the P contained in sewage sludge ash
(SSA), with the aim of producing a marketable phosphoric acid and reusable by-products
from SSA with low P content, were successfully tested. A thermochemical process
(EuPhoRe®) producing SSA directly usable in fertilising products was validated. Two
processes starting with a biological or a chemical leaching (Struvia™ with bio-
acidification step, PULSE) successfully produced phosphate salts. Three processes
removing P at small-scale WWTPs were successfully demonstrated (microalgae
photobioreactor, Filtraflo™-P using adsorbent prepared out of crab-carapace, Struvia™
applied for WWTP-effluent). The LCA of the processes adopted the “system extension”
and the “avoided burden” approaches, both leading to similar conclusions.
Environmental advantage in terms of the mineral resource depletion were confirmed for
all P-recovery processes studied whereas the beneficial effects on other categories such
as climate change and fossil fuel depletion were variable between the different systems.
All results of the demonstrations were the base to prepare the deployment of P-
recycling in urban and rural regions.
[DE] Um den wachsenden europäischen Anforderungen in Bezug auf Phosphor (P) -
essentieller Nährstoff, aber endliche Ressource - gerecht zu werden, war das Hauptziel
des Phos4You-Projekts, den Nachweis zur technischen Rückgewinnung von P aus
Abwasser zu erbringen. Zu diesem Zweck wurden neue oder bestehende
Demonstratoren betrieben, um innovative Prozesse hochzuskalieren und/oder sich
entwickelnde Technologien im Betriebsmaßstab unter realen Bedingungen zu
validieren. Dies wurde sowohl für die Rückgewinnung von P aus großen Kläranlagen (KA)
oder zugehörigen Klärschlammverbrennungsanlagen als auch aus kleinen KA
angewandt. In allen Fällen wurde die Rückgewinnung von verwertbaren
phosphorhaltigen Materialien und Nebenprodukten angestrebt. Die Ökobilanzierung
(LCA) wurde für einige der am weitesten fortgeschrittenen Verfahren durchgeführt. Drei
Technical report of the Phos4You partnership on processes to recover P from wastewater Page n°6
verschiedene nasschemische Verfahren (TetraPhos®, Phos4Life™, PARFORCE) zur
Auslaugung des in Klärschlammasche (KSA) enthaltenen P wurden erfolgreich getestet
mit dem Ziel, eine marktfähige Phosphorsäure und wiederverwertbare Nebenprodukte
aus KSA mit geringem P-Gehalt herzustellen. Ein thermochemisches Verfahren
(EuPhoRe®) zur Herstellung von KSA, die direkt in Düngemitteln verwendet werden
können, wurde validiert. Zwei Prozesse, die mit einer biologischen oder chemischen
Auslaugung beginnen (Struvia™ mit Bio-Versäuerung, PULSE), produzierten erfolgreich
Phosphatsalze. Drei Prozesse zur Entfernung von P in kleinen Kläranlagen wurden
erfolgreich demonstriert (Mikroalgenphotobioreaktor, Filtraflo™-P mit Adsorptionsmittel
aus Krabbenpanzern, Struvia™ für Kläranlagenabwässer). Bei der Ökobilanz der
Verfahren wurden die Ansätze "Systemerweiterung" und "vermiedene Belastung"
angewandt, die beide zu ähnlichen Schlussfolgerungen führten. Für alle untersuchten P-
Rückgewinnungsverfahren wurden Umweltvorteile in Bezug auf die Erschöpfung
mineralischer Ressourcen bestätigt, während die positiven Auswirkungen auf andere
Kategorien wie den Klimawandel und die Erschöpfung fossiler Brennstoffe bei den
verschiedenen Systemen unterschiedlich ausfielen. Alle Ergebnisse der
Demonstrationen waren die Grundlage für die Vorbereitung des Einsatzes von P-
Recycling in städtischen und ländlichen Regionen.
[FR] Pour répondre aux enjeux croissants de l'Europe en matière de phosphore (P),
nutriment essentiel mais ressource limitée, un des principaux objectifs du projet
Phos4You était de faire la preuve des technologies de récupération du P dans les eaux
usées. Pour ce faire, des démonstrateurs nouveaux ou pré-existants ont été utilisés
pour améliorer des procédés innovants et/ou valider des technologies émergentes dans
des environnements réels, à l'échelle opérationnelle. Cette démarche a été appliquée
pour la récupération du phosphore depuis de grandes stations d'épuration des eaux
usées (STEP) ou des installations d'incinération des boues d'épuration correspondantes,
ainsi que depuis de petites STEP. Dans tous les cas, l'objectif était de récupérer des
matières phosphatées et des co-produits valorisables. L'analyse du cycle de vie (ACV) a
été réalisée pour certains des procédés les plus avancés. Trois différents procédés
chimiques acides (TetraPhos®, Phos4Life™, PARFORCE) ont été testés avec succès pour
la lixiviation du P contenu dans des cendres de boues d'épuration ayant une faible
teneur en P, dans le but de produire un acide phosphorique commercialisable et des co-
produits réutilisables. Un procédé thermochimique (EuPhoRe®) produisant des centres
de boues directement utilisables dans les produits fertilisants a été validé. Deux
procédés commençant par une lixiviation, biologique ou chimique (Struvia™ avec étape
de bio-acidification, PULSE), ont produit avec succès des sels phosphatés. Trois procédés
d'élimination du P dans des STEP de petite dimension ont été démontrés avec succès
Technical report of the Phos4You partnership on processes to recover P from wastewater Page n°7
(photobioréacteur à microalgues, Filtraflo™-P utilisant un adsorbant préparé à partir de
carapace de crabe, Struvia™ appliqué aux effluents de STEP). L'ACV des procédés a
adopté les approches "extension du système" et "produits évités", qui ont toutes deux
abouti à des conclusions similaires. Les avantages environnementaux en termes
d'épuisement des ressources minérales ont été confirmés pour tous les procédés de
récupération du P étudiés, tandis que les effets bénéfiques sur d'autres catégories telles
que le changement climatique et l'épuisement des combustibles fossiles étaient
variables entre les différents systèmes étudiés. Tous les résultats des démonstrations
ont servi de base pour préparer le déploiement du recyclage du P dans les régions
urbaines et rurales.
[NL] Om tegemoet te komen aan de groeiende Europese vraag naar fosfor (P), een
essentiële voedingsstof maar eindige hulpbron, was een van de hoofddoelen van het
Phos4You-project het testen van technologieën om P uit afvalwater terug te winnen.
Daartoe werden nieuwe of bestaande demonstratiemodellen gebruikt om innovatieve
processen op te schalen en/of opkomende technologieën te valideren in een omgeving
op operationele schaal. Dit werd toegepast om P terug te winnen uit grote
afvalwaterzuiveringsinstallaties (RWZI's) of daarmee verbonden
zuiveringsslibverbrandingsinstallaties, alsook uit kleine RWZI's. In alle gevallen werd
gestreefd naar de terugwinning van waardevolle fosforstoffen en bijproducten. De
levenscyclusanalyse (LCA) werd uitgevoerd voor sommigen van de meeste geavanceerde
processen. Drie verschillende nat-chemische processen (TetraPhos®, Phos4Life™,
PARFORCE) voor het uitlogen van de P in zuiveringsslibas (SSA), met het oog op de
productie van een verhandelbaar fosforzuur en herbruikbare bijproducten uit SSA met
een laag P-gehalte, werden met succes getest. Een thermochemisch proces (EuPhoRe®)
voor de productie van SSA dat rechtstreeks bruikbaar is in meststoffen, werd
gevalideerd. Twee processen die starten met een biologische of een chemische uitloging
(Struvia™ met bio-verzuringsstap, PULSE) produceerden met succes fosfaatzouten. Drie
processen voor de verwijdering van P in kleinschalige RWZI's werden met succes
gedemonstreerd (microalgenreactor, Filtraflo™-P met gebruikmaking van
adsorptiemiddel bereid uit carapaces van kreeftachtigen, Struvia™ toegepast op RWZI-
effluent). Voor de LCA van de processen werden de "systeemuitbreiding" en de
"vermeden belasting" benadering gebruikt, die beide tot soortgelijke conclusies leidden.
De milieuvoordelen met betrekking tot de uitputting van de minerale hulpbronnen
werden bevestigd voor alle bestudeerde processen voor de terugwinning van P, terwijl
de gunstige effecten op andere categorieën zoals klimaatverandering en de uitputting
van fossiele brandstoffen varieerden tussen de verschillende systemen. Alle resultaten

Technical report of the Phos4You partnership on processes to recover P from wastewater Page n°8
van de demonstraties vormden de basis voor de voorbereiding van de invoering van P-
recycling in stedelijke en rurale omgevingen.
Technical report of the Phos4You partnership on processes to recover P from wastewater Page n°9
Executive summary
Background
The challenges caused by the nutrient phosphorus are tackled in various ways in the
European Union, but always with the converging aim of avoiding potential damages
caused by phosphorus excess in waterways while avoiding the losses of this finite
resource, essential for all living organisms. The legal and regulatory framework in the EU
and in some Member States, as well as further entrepreneurial initiatives are supporting
the necessary technological developments to achieve a circularity in the management of
phosphorus flowing through the wastewater.
Addressed issue
A number of phosphorus recovery technologies have been developed in the lab scale in
the past decades. The variety of the technologies proposed answers the variety of
situation where they can be applied. In Phos4You, the selection of the technologies
aimed at reflecting the diversity of situations in which the recovery of phosphorus can
occur.
Basically, in North-West Europe it can be distinguished between regions of urban nature
and regions of rural nature. In a simplified view, the urban regions are equipped with
large wastewater treatment plant that retains the phosphorus in a tertiary treatment.
This phosphorus ends in sewage sludge and its nutrient value is lost when the sewage
sludge gets incinerated, or if its availability for plants is compromised by the treatment
of the sewage sludge or, even if plant available, when the sludge is not spread on soils.
For this case, Phos4You scaled up technical solutions to recover the phosphorus from
the sewage sludge ashes or from the sewage sludge out of large wastewater treatment
plants.
In rural regions, there is up to now generally no recovery of phosphorus but increasingly
this is recognised as a limiting factor for further developments especially in case of
catchments sensitive for eutrophication. For this case, Phos4You looked at technical
solutions to remove the phosphorus from the wastewater or from the wastewater
effluent of small wastewater treatment plants. In the context of avoiding nutrient losses,
the technical developments should ensure that the removed materials could be used as
fertilising products.
By the scaling up of the technologies in real environment, the project aimed at making
the proof of concept of processes and at giving solid information on which the further
deployment of phosphorus recycling in different regions can be prepared.
Technical report of the Phos4You partnership on processes to recover P from wastewater Page n°10
Main findings
During the project lifetime (2016-2021), four P-recovery processes for large wastewater
treatment schemes and three P-removal processes for small wastewater treatment
schemes were demonstrated. The demonstrations occurred either with the setting up
and operation of new pilot plants, or with pre-industrial testings carried out at existing
pilot plants. Partners cooperated all alongside the implementation to support joint
implementation and exchange on results and experiences.
Technically, all solutions were successful in achieving the production of phosphorus
materials and by-products that can be recycled in the existing value chains. The
achieved recovery rates were compliant with the legal requirements where such
requirements do exist (e.g. in Germany).
For the recovery of phosphorus from sewage sludge ashes, the two technologies fully
tested (TetraPhos® and PARFORCE) were successful in achieving the production of
phosphoric acid from sewage sludge ashes having a low P- content (the Phos4Life™
process was also successfully tested, but only for the first steps). A recovery rate over
80 % was achieved. Both technologies also managed to cope with SSA with a high
percentage of industrial sewage sludge, but for this, process adjustments and/or
additional technical steps were required. The main technical differences between those
processes - in terms of elution agent or process steps to remove impurities - led to the
production of difference by-products and residues. The quality of those by-products
(Gypsum, Fe-/Al-chloride, Fe-/Al-salt solution, brine or road salt, metal concentrate,
FeCl3) were roughly assessed to be recyclable in existing value chains.
For the recovery of phosphorus from sewage sludge, the three technologies
implemented into demonstrators (EuPhoRe®, Struvia™ optimised with a bio-acidification
reactor and PULSE) were successful in achieving the production of sewage sludge ashes
or phosphate salts usable as components of fertilising products. To achieve the heavy
metals reduction within the thermochemical treatment of sewage sludge, just a low
amount of additives was necessary while the pyrolysis enabled the phosphorus to stay
bioavailable for the crops despite of the post-combustion. The leaching of the
phosphorus in the sewage sludge phase (either biologically for Struvia™ or chemically
for PULSE) before the precipitation of phosphorus proofed in both cases to be a
necessary step to achieve a recovery rate of the overall process of at least 50 % (as
required e.g. by German legislation). The metal reduction was successfully achieved in
both cases. For the chemical leaching, a dried sludge presented advantages in terms of
handling and solid-liquid separation. For the biological leaching, the use of a low-cost co-
substrate is essential to achieve an economic balance. The phosphates in the form of
Technical report of the Phos4You partnership on processes to recover P from wastewater Page n°11
HAP (hydroxyapatite) or other calcium phosphate salts usable in fertilising products
after proper incorporation.
For the recovery of phosphorus at small-scale wastewater treatment plants, three
technologies were demonstrated (microalgae photobioreactor; P-adsorption with
Filtraflo™-P using CCM adsorbent; Struvia™). All were successful in reducing effluent P
values to below 1.7 to 0.5 mg/L (compliant with EU discharge requirements for WWTPs
discharging into sensitive areas potentially subject to eutrophication, currently only valid
for WWTP>10,000 p.e). In all three processes, the recovered materials (microalgae
biomass, P-rich biomass, calcium phosphate) showed fertilising properties. Using the
Chlamydomonas acidophila microalgae, the process covered at once a secondary and a
tertiary treatment and proved to be very robust, as well as working at very low light
intensity. In the case of the Filtraflo™-P (using an activated adsorbent from crab-
carapace) and Struvia™, effective tertiary treatment was shown. The conditions to create
an optimised CCM (Chitosan-Calcite Material) adsorbent from seafood waste were also
determined. With the downscaled Struvia™ process, the removal and recovery of
phosphorus led to simultaneous reductions in total nitrogen and COD in effluent.
In addition to the technical study of the demonstrators, an environmental evaluation
was conducted. By quantifying the impacts on the environment of the demonstrators
and comparing them to the impacts of the reference system in which the recovery
technologies were implemented, the study helped to highlight the most impactful steps
from an environmental point of view and then to formulate eco-design advice. Two
methodological approaches in the life cycle assessment were used: the system
expansion and the avoided burden methodology. Sensitivity analyses were also
performed on two parameters during the assessment, respectively the location of the
recovery plant and the P2O5 content of the sewage sludge. For all P-recovery processes
studied, an environmental advantage in terms of the mineral resource depletion
category was assessed and confirmed to be significant. Beneficial effects on other LCA-
categories such as global warming over the conventional chemical route to produce P
fertiliser were showed for some of the P-recovery systems.
Recommendations
The further upscale of the demonstrated technologies can be recommended as the
processes showed to be viable. Some upscales are already in preparation; some other
were hampered through the Covid pandemic. Further use of the results are presented in
the quality assessment report (Bogdan et al. 2021) and in the final report of Phos4You
(Ploteau et al. 2021).

Technical report of the Phos4You partnership on processes to recover P from wastewater Page n°12
Acknowledgments
This work has been possible thanks to the support of many colleagues from the
partners organizations involved in, associated to and external of the project Phos4You.
The authors express their gratitude to the INTERREG VB North-West Europe Programme
(2014-2020) for having trusted the partnership with the achievement of the project and
co-funded the financial effort out of the European Regional Development Fund.
Technical report of the Phos4You partnership on processes to recover P from wastewater Page n°13
Acronyms and Abbreviations
ACP Amorphous calcium phosphate
ADM Anaerobic Digestion Model
AIDE Association Intercommunale pour le Démergement et l'Epuration des
communes de la province de Liège
AQ2 SEAL AQ2 Discrete Analyser (Seal Analytical, UK)
BBD Box-Behnken design
BET Brunauer–Emmett–Teller
BMP Biomethanogen potential
BPD Biological Phosphorus Dissolution
BPDP Biological Phosphorus Dissolution Potential
C. Chlamydomonas
CaP Calcium phosphate
CCM Chitosan-Calcite Material
CIT Cork Institute of Technology (merged into MTU)
COD Chemical Oxygen Demand
CPD Chemical Phosphorus Dissolution
CRM Certified Reference Materials
DS Dry Substance
DM Dry Matter
DOC Dissolved Organic Carbon
DPP Deutsche Phosphor Platform (German phosphorus platform)
EDX X-ray pulse processor
EG EMSCHERGENOSSENSCHAFT
EBPR Enhanced biological phosphorus removal
EoL End of Life
ERI Environmental Research Institute, The North Highland College, University
of the Highlands and Islands
ESPP European Sustainable Phosphorus Platform
EU European Union
FHNW Fachhochschule Nordwestschweiz
FM Fresh matter
FTIR Fourier-transform infrared spectroscopy
FU Functional Unit
GCU Glasgow Caledonian University
GWP Global Warming Potential
HAP Hydroxyapatite
Technical report of the Phos4You partnership on processes to recover P from wastewater Page n°14
HRT Hydraulic Retention Time
HVC N.V. HVC Groep
ICP-OES Inductively coupled plasma optical emission spectroscopy
INRAE Institut national de recherche pour l’agriculture, l’alimentation et
l’environnement.
IR Impregnation Ratio
IUPAC International Union of Pure and Applied Chemistry
L/D light/dark
LCA Life Cycle Assessment
LCC Life Cycle Costing
LCV Lower Calorific Value
LV LIPPEVERBAND
Monetite Dicalcium phosphate
MS Mineral Solid
NPDES National Pollution Discharge Elimination System
NWE North-West Europe
OCP Octacalcium phosphate
OD Optical density
OWTS Onsite wastewater treatment systems
O/A Organic/aquaeous
P Phosphorus
P4Y Phos4You
PAM Polyacrylamide
PAO Polyphosphate Accumulating Organisms
PE Population Equivalent
PBR Photobioreactor
PFO Pseudo-First Order
PLC Programmable Logic Controller
PPE Personal Protective Equipment
PSO Pseudo-Second Order
QA/QC Quality Assurance/ Quality Control
RAS Return Activated Sludge
rpm Revolutions per minute
RSD Response Surface Design
RRI Remote, Rural and Island
S/L Solid/liquid
SEM Scanning Electron Microscope
SNB N.V. Slibverwerking Noord-Brabant
Technical report of the Phos4You partnership on processes to recover P from wastewater Page n°15
SSA Sewage sludge ashes
SSIP Sewage Sludge Incineration Plant
STDV Standard Deviation
SVA Schlammverbrennungsanlage
SW Scottish Water
TFF Tangential Flow Filter
TKN Total Kjeldahl Nitrogen
TON Total Oxidable Nitrogen
TN Total Nitrogen
TS Total Solid
TSP Triple Super Phosphate
TSS Total Suspended Solids
UGent Universität Gent
ULiège Université de Liège
USGS United States Geological Survey
VFA Volatile fatty acid
VS Volatile Solids
XRD X-ray diffraction
XRPD X-Ray Powder Diffraction
WFA Wirbelschichtfeuerungsanlage
WFD Water Framework Directive
WP Work Package
MTU Munster Technological University
WWTP Wastewater treatment plant
Technical report of the Phos4You partnership on processes to recover P from wastewater Page n°16
Contents
List of contributors ........................................................................................................................................... 4
Abstract in four languages (EN, DE, FR, NL) ...................................................................................................... 5
Executive summary .......................................................................................................................................... 9
Acknowledgments .......................................................................................................................................... 12
Acronyms and Abbreviations ......................................................................................................................... 13
1 Introduction ........................................................................................................................................... 33
1.1 Background of technical phosphorus recovery in North-West Europe ............................................... 33
1.2 Objectives of a network of demonstrators .......................................................................................... 34
1.3 Scope of document .............................................................................................................................. 35
2 Overall set up of the network of demonstrators .................................................................................... 36
2.1 Overview of the work package dedicated to P-recovery technologies ............................................... 36
2.2 Selection of the demonstrated technologies ...................................................................................... 37
2.3 Selected LCA-LCC approach ................................................................................................................. 39
3 Demonstration of phosphorus recovery solutions ................................................................................. 42
3.1 Demonstrator I2: Acid extraction of P from SSA (REMONDIS TetraPhos®, PARFORCE, Phos4Life™) .. 42
3.1.1 Preparation of I2 ............................................................................................................................. 44
3.1.2 Execution of I2 ................................................................................................................................. 49
3.1.3 Analyses of results of I2 operations ................................................................................................. 51
3.1.4 Discussion of results for I2 operation .............................................................................................. 77
3.1.5 Conclusion for I2 .............................................................................................................................. 78
3.2 Demonstrator I1: Thermochemical solution to recover P from sewage sludge (EuPhoRe®) ............... 80
3.2.1 Preparation of I1 ............................................................................................................................. 81
3.2.2 Execution of I1 ................................................................................................................................. 82
3.2.3 Analyses of results of I1 operation .................................................................................................. 90
3.2.4 Discussion of results for I1 operation .............................................................................................. 96
3.2.5 Conclusion for I1 .............................................................................................................................. 97
3.3 Demonstrator I6.1: Bio-acidification before P precipitation from sludge (optimised Struvia™) ......... 98
3.3.1 Preparation of I6.1 .......................................................................................................................... 98
3.3.2 Execution of I6.1 ............................................................................................................................ 110
3.3.3 Analyses of results of I6.1 operation ............................................................................................. 113
3.3.4 Discussion of results for I6.1 operation ......................................................................................... 118
Technical report of the Phos4You partnership on processes to recover P from wastewater Page n°17
3.3.5 Conclusion for I6.1 ......................................................................................................................... 119
3.4 Demonstrator I3: Acid leaching of P from partially/fully dried sewage sludge (PULSE) .................... 122
3.4.1 Preparation of I3 ........................................................................................................................... 122
3.4.2 Execution of I3 ............................................................................................................................... 146
3.4.3 Analyses of results of I3 operation ................................................................................................ 154
3.4.4 Discussion of results for I3 operation ............................................................................................ 158
3.4.5 Conclusion for I3 ............................................................................................................................ 159
4 Demonstration of solutions combining phosphorus removal and recovery ......................................... 161
4.1 Demonstrator I4: Microalgae to recover P from small-scale WWTPs ............................................... 161
4.1.1 Preparation of I4 ........................................................................................................................... 163
4.1.2 Execution of I4 ............................................................................................................................... 173
4.1.3 Analyses of results of I4 operation ................................................................................................ 174
4.1.4 Discussion of results for I4 operation ............................................................................................ 183
4.1.5 Conclusion for I4 ............................................................................................................................ 185
4.2 Demonstrator I5: P adsorption for small scale use (FILTRAFLO™-P with CCM adsorbent) ............... 186
4.2.1 Preparation of I5 ........................................................................................................................... 187
4.2.2 Execution of I5 ............................................................................................................................... 198
4.2.3 Analyses of results of I5 operation ................................................................................................ 205
4.2.4 Discussion of results for I5 operation ............................................................................................ 208
4.2.5 Conclusion for I5 ............................................................................................................................ 210
4.3 Demonstrator I6.2: P precipitation at small-scale WWTPs (downscaled Struvia™) .......................... 211
4.3.1 Preparation of I6.2 ........................................................................................................................ 211
4.3.2 Execution of I6.2 ............................................................................................................................ 218
4.3.3 Analyses of results of I6.2 operation ............................................................................................. 229
4.3.4 Discussion of results for I6.2 operation ......................................................................................... 241
4.3.5 Conclusion for I6.2 ......................................................................................................................... 242
5 Life Cycle Assessment – Life Cycle Costs works .................................................................................... 245
5.1 System expansion methodology ........................................................................................................ 247
5.1.1 Methodological choices ................................................................................................................. 247
5.1.2 Results for four recovery processes ............................................................................................... 254
5.1.3 Discussion of results for LCA with system expansion approach .................................................... 276
5.2 Avoided burden methodology ........................................................................................................... 278
5.2.1 Methodological choices ................................................................................................................. 278
Technical report of the Phos4You partnership on processes to recover P from wastewater Page n°18
5.2.2 Results for four recovery processes ............................................................................................... 279
5.2.3 Discussion of results for LCA with avoided burden approach ........................................................ 306
5.3 LCC analysis ....................................................................................................................................... 307
5.3.1 LCC analyses of EuPhoRe® process ................................................................................................. 308
5.4 Conclusion of LCA-LCC works ............................................................................................................ 310
6 Outlook ................................................................................................................................................ 311
References ................................................................................................................................................... 314
Technical report of the Phos4You partnership on processes to recover P from wastewater Page n°19
Figures
Figure 2.1.1: Overview of demonstrators and activities included in work package T1 ..................... 36
Figure 3.1.1: General scheme of “wet-chemical” P-recovery processes .............................................. 43
Figure 3.1.2: Removal of the sewage sludge from the chamber filter press at the WWTP of the
Emschergenossenschaft in Bottrop ................................................................................................. 45
Figure 3.1.3: Filling of the SSA samples into special silos at the WWTP of the
Emschergenossenschaft in Bottrop ................................................................................................. 45
Figure 3.1.4: Incineration plant of Innovatherm GmbH in Lünen ........................................................ 46
Figure 3.1.5: Process scheme of REMONDIS TetraPhos® process ....................................................... 51
Figure 3.1.6: REMONDIS TetraPhos® pilot plant in Werdohl-Elverlingsen .......................................... 54
Figure 3.1.7: Leaching rates for phosphorus obtained during the trials phases with the REMONDIS
TetraPhos® process ............................................................................................................................ 55
Figure 3.1.8: Phosphorus balance obtained with the TetraPhos® process applied to SSA of Bottrop
WWTP without coal conditioning ..................................................................................................... 56
Figure 3.1.9: Synthetic gypsum produced by TetraPhos® process (crystallisation/separation step)
.............................................................................................................................................................. 57
Figure 3.1.10: Exemplary pictures taken during the experiment (here after contact time in the
settling phase of the sludge) ............................................................................................................. 58
Figure 3.1.11: SSA residues produced by TetraPhos® process ............................................................. 59
Figure 3.1.12: Process scheme of Phos4Life™ ........................................................................................ 61
Figure 3.1.13: Experimental set up for leaching stage for the Phos4Life™ process .......................... 61
Figure 3.1.14: Experimental set up for Solvent extraction stage (Fe-extraction) ............................... 62
Figure 3.1.15: Experimental set up for Solvent extraction stage (H3PO4-extraction) ........................ 62
Figure 3.1.16: Process scheme of PARFORCE technology used in the lab-tests ................................ 65
Figure 3.1.17: Phosphorus balance obtained with the PARFORCE process applied to SSA of
Bottrop WWTP without coal conditioning as well as blends with high and low industrial
influence (see chapter above)........................................................................................................... 66
Figure 3.1.18: Phosphoric acid samples after evaporation (SSA#3 to #5 from left to right) ............ 67
Figure 3.1.19: Road salt samples after drying (SSA/Sample#1 to #3 from left to right) ................... 69
Figure 3.1.20: Process scheme of the PARFORCE technology during pilot demonstration.............. 71
Figure 3.1.21: Phosphorus balance obtained in the pilot-tests with the PARFORCE process applied
to sample SSA#5 ................................................................................................................................. 72
Technical report of the Phos4You partnership on processes to recover P from wastewater Page n°20
Figure 3.1.22: Phosphoric acid samples after evaporation (left: without Al-separation, right: after
Al-separation) ...................................................................................................................................... 73
Figure 3.1.23: Road salt samples after drying (left) and brine (right) .................................................. 76
Figure 3.1.24: Outlook on technology implementation of the “wet-chemical” P-recovery processes
considered in Phos4You .................................................................................................................... 79
Figure 3.2.1: Schematic overview of the EuPhoRe® process................................................................. 81
Figure 3.2.2 a and b: Sludge storage ........................................................................................................ 83
Figure 3.2.3 a and b: Sludge hopper and screws.................................................................................... 83
Figure 3.2.4 a and b: Drag chain conveyor .............................................................................................. 84
Figure 3.2.5 a and b: Conveyor belt and rotating cutter ...................................................................... 84
Figure 3.2.6 a and b: Dosing of additives and air lock ........................................................................... 85
Figure 3.2.7 a and b: Inside views of the rotary kiln .............................................................................. 86
Figure 3.2.8: External isolation .................................................................................................................. 86
Figure 3.2.9: SSA discharge at the EuPhoRe®-plant ............................................................................... 87
Figure 3.2.10 a and b: Gas split (flue/exhaust gas) and one of the two incineration chambers ...... 88
Figure 3.2.11 a and b: Inside view of the filter and view of the whole gas treatment system ......... 89
Figure 3.2.12 a and b: EuPhoRe®-SSA quality ......................................................................................... 92
Figure 3.2.13: Dry matter development for 5 harvests of perennial ryegrass, comparing EGLV 3%
and 6% as compared to TSP and zero control. .............................................................................. 94
Figure 3.2.14: Dry matter development for 5 harvests of perennial alfalfa, comparing EGLV 3%
and 6% as compared to TSP and zero control. .............................................................................. 95
Figure 3.2.15: Pellets of EuPhoRe®-SSA and 2 different types of salt-solution .................................. 96
Figure 3.3.1: pH evolution and P dissolution in non-digested sludge (CPD: chemical P dissolution,
BPD: biological P dissolution) ........................................................................................................ 103
Figure 3.3.2: pH evolution and P dissolution in digested sludge (CPD: chemical P dissolution, BPD:
biological P dissolution) .................................................................................................................. 103
Figure 3.3.3: pH evolution and P dissolution in MS2 with different co-substrate (Cos1: modified
starch, Cos2: Erythrol) ..................................................................................................................... 105
Figure 3.3.4: pH evolution and P dissolution in MS3 with different co-substrate (Cos1 : modified
starch, Cos2: Erythrol) ..................................................................................................................... 106
Figure 3.3.5: Biochemical methanogenic potential of acidified sludge compared to initial sludge
(FM: fresh matter). ........................................................................................................................... 109
Technical report of the Phos4You partnership on processes to recover P from wastewater Page n°21
Figure 3.3.6: Perimeter of implementation of the demonstrator in the Marquette-Lez-Lille WWTP
........................................................................................................................................................... 110
Figure 3.3.7: Scheme of demonstrator in Lille (left) and Tergnier (right); ........................................ 111
Figure 3.3.8: Both sides of the demonstrator in each location, Lille and Tergnier ......................... 111
Figure 3.3.9: Phosphorus concentration (total and dissolved) on Lille demonstrator ................... 113
Figure 3.3.10: Percentage of solubilisation of phosphorus (left axis) and final pH (right axis) on
Lille demonstrator. .......................................................................................................................... 114
Figure 3.3.11: Mineral and metals to phosphorus ratios (molar). .................................................... 114
Figure 3.3.12: Phosphorus concentration (total and dissolved) on Tergnier demonstrator after
bio-acidification. .............................................................................................................................. 115
Figure 3.3.13: Dissolved minerals and cations on Tergnier demonstrator after bio-acidification.
........................................................................................................................................................... 116
Figure 3.3.14: P-product crystals after washing .................................................................................. 117
Figure 3.3.15: Comparison between dark fermentation and bio-acidification on P dissolution and
VFA production ................................................................................................................................ 120
Figure 3.3.16: Comparison between experimental and simulated data during semi-continuous
bio-acidification/dark fermentation experiments on Tergnier sludge ..................................... 121
Figure 3.4.1: PULSE-process scheme. ................................................................................................... 122
Figure 3.4.2: Cascaded option tree for sludge-input options ............................................................ 123
Figure 3.4.3: Speciation using the SLLE tool. Initial concentrations in [mol/L]: Fe3+: 0.0703, Al3+:
0.0203, HCl: varying, PO4-3: 0.348, Ca2+: 0.2, Fe2+ - 0.03. The dashed curves show the
precipitation equilibrium ................................................................................................................ 125
Figure 3.4.4: Texture of undigested dewatered sludge from Oupeye WWTP (A): 20 to 22 %DM &
dried sludge (B): >97 %DM ............................................................................................................. 127
Figure 3.4.5: P-leaching efficiency from DS. Sludge: Oupeye WWTP, S/L ratio: 0.25, leaching
duration: 60 min, DM: >97 %, room temperature ...................................................................... 128
Figure 3.4.6: Effect of leaching time and S/L (solid-to-liquid) ratio on P leaching efficiency. Sludge:
Oupeye WWTP, DM: >97 %............................................................................................................. 129
Figure 3.4.7: Effect of drying mechanism on leaching of sludge. Sludge: Oupeye WWTP, DM:
>97 %, S1 –- rapid convective air drying for 4 h, S2 – slow drying without air circulation for 72
h at 80 to100 °C, S3 – drying without air circulation for 24 h at 100 °C ................................... 130
Figure 3.4.8: Cascaded option-tree evaluation of the acid to be used for sludge leaching .......... 131
Figure 3.4.9: Nutrients and metals leached from sludge with H2SO4 and HCl. Sludge: Oupeye
WWTP, DM: >97 %, S/L: 0.25, leaching duration: 1 h .................................................................. 132
Technical report of the Phos4You partnership on processes to recover P from wastewater Page n°22
Figure 3.4.10: Extraction efficiency of metal from HCl at1 mol/L based leach liquor, diluent: Ketrul-
D80, modifier for Alamine336: Exxal10, solvent concentration indicated in vol %, O/A phase
ratio: 2 ............................................................................................................................................... 133
Figure 3.4.11: Cascaded option tree for the selection of extractants .............................................. 134
Figure 3.4.12: Fitting of extraction constant log Kext and stochiometric coefficient for extraction of
Fe from HCl based leach liquor. Solvent: 10 vol-% Alamine 336 + 10 vol-% TBP + 3 vol-% Exxal
10 + 77 vol-% Ketrul D80 -, O/A phase ratio: 1 ............................................................................ 135
Figure 3.4.13: Degree of re-extraction of metals from spent extractant. Spent extractant; 10 vol-%
Alamine 336 + 10 vol-% TBP + 3 vol-% Exxal 10 + 77 vol-% Ketrul D80, O/A phase ratio: 1 .. 136
Figure 3.4.14: Degree of stripping of metals from the spent solvent at different concentrations of
Na2CO3. Spent extractant; 10 vol-% Alamine 336 + 10 vol-% TBP + 3 vol-% Exxal 10 + 77 vol-%
Ketrul D80, O/A phase ratio: 1 ....................................................................................................... 137
Figure 3.4.15: Evaluation of phase separation and drop diameter for separation of organic and
aqueous phase. Extractant; 10 vol-% Alamine 336 + 10 vol-% TBP + 3 vol-% Exxal 10 + 77 vol-
% Ketrul D80, leach liquor: 1 mol/L HCl, O/A phase ratio: 2 ...................................................... 137
Figure 3.4.16: Estimation of settler length ........................................................................................... 138
Figure 3.4.17: Precipitation of different components from extracted sludge leach liquor as a
function of pH with 5 mol/L NaOH ................................................................................................ 140
Figure 3.4.18: Simulation of Ca and P precipitation using SLLE tool ................................................ 140
Figure 3.4.19: Precipitation of different components from extracted sludge leach liquor as a
function of pH with 25% Ca(OH)2 slurry in PULSE process ........................................................ 141
Figure 3.4.20: PULSE demonstrator construction at ULiège .............................................................. 143
Figure 3.4.21: PULSE demonstrator: drying, crushing, leaching, precipitation, and filtration
modules installed inside container ............................................................................................... 143
Figure 3.4.22: Mixer-settler equipment for solvent extraction. Installed inside the Chemical
Engineering Hall of ULiège ............................................................................................................. 144
Figure 3.4.23: 5 stage mixer-settler equipment for solvent extraction tests in PULSE demonstrator
........................................................................................................................................................... 144
Figure 3.4.24 Tanks used for leaching and precipitation in I3 demonstrator ................................. 145
Figure 3.4.25: Pressurized bag filtration module and filter bag of 25 µm ....................................... 146
Figure 3.4.26: Comparison of P leaching efficiencies between SLLE tool, lab experiments and
demonstrator tests using HCl acid ................................................................................................ 148
Figure 3.4.27: SLLE tool v/s demonstrator average degree of extraction of metals from German
sludge liquor from a 2-stage counter-current operation at different O/A phase ratios ....... 149
Figure 3.4.28: I3 PULSE demonstrator at Oupeye WWTP ................................................................... 150
Technical report of the Phos4You partnership on processes to recover P from wastewater Page n°23
Figure 3.4.29: Comparison of P leaching efficiencies between SLLE tool, lab experiments and
demonstrator tests using HCl acid ................................................................................................ 151
Figure 3.4.30: SLLE tool v/s pilot trial average degree of extraction of metals from Oupeye sludge
liquor from a 2-stage counter-current operation ....................................................................... 151
Figure 3.4.31: Filter bag containing the filter cake (Picture: ULiege/Z.Shariff) ................................ 152
Figure 3.4.32: PULSE demonstrator trial at waste-water Development Centre of Scottish Water in
Bo'ness .............................................................................................................................................. 152
Figure 3.4.33: Comparison of P leaching efficiencies between SLLE tool, lab experiments and
demonstrator tests using HCl acid ................................................................................................ 153
Figure 3.4.34: SLLE tool v/s pilot trial avg. degree of extraction of metals from Scottish sludge
liquor from a 2-stage counter-current operation ....................................................................... 154
Figure 3.4.35: PULSE product during demonstrator trial with German sludge .............................. 154
Figure 3.4.36: Granulation tests by Prayon S.A. on the PULSE product obtained from German
sludge. A - during granulation; B - granulated product wet; C- granulated product dry ....... 159
Figure 4.1.1: Loads of P to EU regional seas, by source (tonnes/year in 2014) ............................... 161
Figure 4.1.2: Set-up of the process control parameters tests ........................................................... 163
Figure 4.1.3: Changes in the cell concentration in the medium during incubation. Each point
represents mean value from three replicate determinations with standard deviation ........ 165
Figure 4.1.4: Removals of PO4 in the medium during incubation, expressed as the ratio between
the PO4 concentrations in the media (Cx) and the initial PO4 concentration (C0). Each point
represents mean value from three replicate determinations with standard deviation ........ 166
Figure 4.1.5: Removals of PO4 in the medium during incubation at different light intensities and
different temperatures, expressed as the ratio between the PO4 concentrations in the media
(Cx) and the initial PO4 concentration (C0) .................................................................................... 168
Figure 4.1.6: Changes in the cell concentration in the medium during incubation at different light
intensities and different temperatures ........................................................................................ 169
Figure 4.1.7: Changes in NH4 and PO4 concentrations in the influent and effluent during the
experiment. Each point represents mean value from three replicate determinations with
standard deviation .......................................................................................................................... 171
Figure 4.1.8: Changes in NO3, NH4 and PO4 concentrations in the influent and effluent during the
experiment. Each point represents mean value from three replicate determinations with
standard deviation .......................................................................................................................... 172
Figure 4.1.9: Greenskill Environmental Technology Ltd. 75L and 500L PBRs installed at the
Wastewater Development Centre in Bo’ness .............................................................................. 174
Technical report of the Phos4You partnership on processes to recover P from wastewater Page n°24
Figure 4.1.10: Greenskill Environmental Technology Ltd. 75L PBR implemented at the Wastewater
Development Centre in Bo’ness .................................................................................................... 175
Figure 4.1.11: Treatment process configuration with 75L PBR ......................................................... 175
Figure 4.1.12: Changes in the optical density in 75L PBR from the 19th till the 25th of June 2019 177
Figure 4.1.13: PO4 and NH4 concentrations in the influent, tank and effluent during the trial in
Bo’ness (75L PBR) ............................................................................................................................ 178
Figure 4.1.14: COD concentrations in the influent and effluent (75L PBR) ...................................... 179
Figure 4.1.15: Greenskill Environmental Technology Ltd. 500L PBR implemented at the
Wastewater Development Centre in Bo’ness .............................................................................. 179
Figure 4.1.16: On the left, microalgae biomass concentration in the PBR. On the right, microalgae
biomass sedimentation after 5 min without (1) and after the addition of 0.5g L-1 of NaOH (2)
........................................................................................................................................................... 181
Figure 4.1.17: PO4 and NH4 concentrations in the influent, tank and effluent during the trial in
Bo’ness (500L PBR) .......................................................................................................................... 182
Figure 4.1.18: COD concentrations in the influent and effluent (500L PBR) .................................... 183
Figure 4.2.1: Contour and three-dimensional response surface plots regarding the effect of IR and
activation temperature (a-b), IR and activation time (c-d) and activation temperature and
activation time (e-f) on phosphorus adsorption ......................................................................... 189
Figure 4.2.2: SEM micrographs of pristine crab carapace (bar lengths 10 μm and 3.33 μm;
magnification × 1000 and × 3000) (a–b); optimised CCM adsorbent (bar lengths 14.3 μm and
10 μm; magnification × 700 and × 1000) (c–d); SEM micrographs with EDX spectra for pristine
crab carapace (e–f); the optimised CCM adsorbent (note the additional potassium-K signal)
(g–h) ................................................................................................................................................... 190
Figure 4.2.3: Nitrogen adsorption/desorption isotherms and BET data of raw crab carapace and
the CCM adsorbent after optimisation (a), XRPD patterns of raw crab carapace and the
optimised CCM adsorbent (Note: * reflections associated with calcite) (b) and FTIR spectra of
raw crab carapace and the optimised CCM adsorbent (c) (experimental conditions:
impregnation ratio for KOH:carapace (g/g) 1:1; activation temperature 105 °C; activation time
150 min) ............................................................................................................................................ 192
Figure 4.2.4: Batch adsorption experimental results: adsorption equilibrium data (a), adsorption
reaction kinetics (b) and P desorption in water, using 0.5 M HCl and 2 % citric acid as eluents
(c) (initial concentration: 1–50 mg P/L; no pH adjustment; contact time: 1-300 min; dose of
adsorbent: 1 g/L; rotation speed: 150 rpm - Note: the data (n = 3) are represented as mean ±
standard error) ................................................................................................................................ 195
Figure 4.2.5: Fixed-bed column adsorption experiments: effect of bed height (a), initial phosphate
concentration (b) and flow rate (c) (initial concentration: 5-20 mg P/L; no pH adjustment; flow
rate: 3.5-10.5 mL/min; bed height: 3-10 cm) ............................................................................... 197
Technical report of the Phos4You partnership on processes to recover P from wastewater Page n°25
Figure 4.2.6: Scottish Water Horizons Development Centre at Bo’ness .......................................... 199
Figure 4.2.7: FILTRAFLOTM-P pilot reactor designed by Veolia (a), the CCM adsorbent developed by
ERI (b) and the airlift supported self-backwashing system visible at the bottom and right side
of the unit (c) .................................................................................................................................... 200
Figure 4.2.8: FILTRAFLOTM-P pilot reactor valve system (a) and with the IBC tanks (b) .................. 201
Figure 4.2.9: Wastewater circulation within the FILTRAFLOTM-P pilot reactor ................................. 201
Figure 4.2.10: Schematic of the pilot test process run with FILTRAFLO™-P unit and CCM adsorbent
........................................................................................................................................................... 202
Figure 4.2.11: P theoretical breakthrough curves (Bohart-Adams with solid line; Clark with dash
line) for the field trials. Low P concentration influents (a) and high concentration influents (b)
(0.5 mg P/L being the EU Water Framework Directive (WFD) and US National Pollution
Discharge Elimination System (NPDES) regulation limit for sensitive water bodies and the
2 mg P/L point the common effluent limit EU member states need to meet depending on
population equivalence and the presence of sensitive areas) .................................................. 205
Figure 4.2.12: The ratio between effluent and influent levels (Ce/Ci) for pH (a), conductivity (b) and
turbidity (c) during the trials .......................................................................................................... 206
Figure 4.2.13: Organic compound and nutrient removal efficiency during the trials (a-d) ........... 207
Figure 4.2.14: Macro- and micro-element removal efficiency during the trials (a-d) ..................... 208
Figure 4.3.1: Macroom Wastewater Treatment Plant Schematic Diagram ...................................... 213
Figure 4.3.2: Struvia™ process crystallisation reactor with TurboMix™, and lamella settlers ....... 214
Figure 4.3.3: Jar test apparatus .............................................................................................................. 215
Figure 4.3.4: Phosphorus precipitation in a jar test glass beaker ..................................................... 216
Figure 4.3.5: Struvia™ pilot plant container ......................................................................................... 219
Figure 4.3.6: Internal view of the Struvia™ pilot plant container ...................................................... 219
Figure 4.3.7: Struvia™ pilot plant service hatch ................................................................................... 220
Figure 4.3.8: Struvia™ pilot plant layout ............................................................................................... 221
Figure 4.3.9: Simplified Struvia™ pilot plant schematic ...................................................................... 222
Figure 4.3.10: Computerised control station with automatic shut off system ................................ 223
Figure 4.3.11: Process flowsheet for the Struvia™ pilot plant at the WWTP .................................... 224
Figure 4.3.12: Components inside the Struvia™ pilot plant ............................................................... 225
Figure 4.3.13: Recovered P product from the pilot plant at the WWTP ........................................... 227
Figure 4.3.14: Establishment of the fluidized bed in the reactor ...................................................... 231
Technical report of the Phos4You partnership on processes to recover P from wastewater Page n°26
Figure 4.3.15: Change in phosphorus concentration during operation of the Struvia™ pilot plant
starting the 19th of February 2020 ................................................................................................ 232
Figure 4.3.16: Change in total nitrogen concentration during operation of the Struvia™ pilot plant
starting the 19th of February 2020 ................................................................................................ 233
Figure 4.3.17: Change in COD during operation of the Struvia™ pilot plant starting the 19th of
February 2020 .................................................................................................................................. 234
Figure 4.3.18: Change in alkalinity during operation of the Struvia™ pilot plant starting the 19th of
February 2020 .................................................................................................................................. 235
Figure 4.3.19: PO43- removal at pH 10.6, 10.4 and 10.0 testing started 26th of November 2020 .. 236
Figure 4.3.20: Lime usage verse sludge production starting the 19th of February 2020 ............... 237
Figure 4.3.21: Water usage measurement started on the 24th of November 2020 ........................ 239
Figure 4.3.22: P removal using recycled calcium products with additional pH adjustment .......... 240
Figure 4.3.23: Incremental gypsum inclusion at 0.199 g/jar, with initial PO43- concentration of
4.5 mg/L ............................................................................................................................................ 241
Figure 4.3.1: System expansion vs. avoided burden........................................................................... 246
Figure 5.1.1: Flowsheet of the Oupeye WWTP ..................................................................................... 248
Figure 5.1.2: Results of the normalisation of the reference system impacts of the expansion
system method: ReCiPe 2016 Midpoint (H) V1.04 / World (2010) H / Normalisation / Excluding
long-term emissions ....................................................................................................................... 253
Figure 5.1.3: Boundaries for the reference system: 100 m³ of wastewater treated in the WWTP
and 0.80 kg of P2O5 by chemical route ......................................................................................... 255
Figure 5.1.4: Environmental impacts of the multifunctional system including 100 m³ of treated
water in the WWTP, and 0,80 kg of chemical P2O5 – Characterisation ReCiPe 2016 H/World H
........................................................................................................................................................... 256
Figure 5.1.5: System boundaries for the EuPhoRe® process in the multifunctional system ......... 258
Figure 5.1.6: Environmental impacts of the multifunctional system including 100 m³ of treated
water in the WWTP, the P recovery from the sewage sludge in EuPhoRe® process and the
additional production of chemical P to obtain 0,80 kg of P2O5 – Characterisation ReCiPe 2016
H/World H ......................................................................................................................................... 259
Figure 5.1.7: Environmental impacts of the production of 1 kg of P2O5 by EuPhoRe® process –
Characterisation ReCiPe 2016 H/World H .................................................................................... 260
Figure 5.1.8: Comparison of the EuPhoRe® system and the reference system in terms of
environmental performance– Characterisation ReCiPe 2016 H/World H ............................... 261
Figure 5.1.9: Tergnier pilot plant of the Struvia™ process – the OPALIX part is not installed ....... 263
Technical report of the Phos4You partnership on processes to recover P from wastewater Page n°27
Figure 5.1.10: System boundaries for the Struvia™ process in the multifunctional system ......... 264
Figure 5.1.11: Environmental impacts of the multifunctional system including 100 m³ of treated
water in the WWTP, the P recovery from the sewage sludge in Struvia™ process and the
additional production of chemical P to obtain 0.80 kg of P2O5– Characterisation ReCiPe 2016
H/World H ......................................................................................................................................... 265
Figure 5.1.12: Environmental impacts of the production of 1 kg of P2O5 by Struvia™ process–
Characterisation ReCiPe 2016 H/World H .................................................................................... 266
Figure 5.1.13: Comparison of the environmental impacts of the Struvia™ system and the
reference system– Characterisation ReCiPe 2016 H/World H .................................................. 267
Figure 5.1.14: System boundaries for the PARFORCE process in the multifunctional system ..... 268
Figure 5.1.15: Environmental impacts of the multifunctional system including 100 m³ of treated
water in the WWTP, the P recovery from the sewage sludge in PARFORCE process and the
additional production of chemical P to obtain 0.80 kg of P2O5– Characterisation ReCiPe 2016
H/World H ......................................................................................................................................... 269
Figure 5.1.16: Environmental impacts of the production of 1 kg of H3PO4 by PARFORCE process–
Characterisation ReCiPe 2016 H/World H .................................................................................... 270
Figure 5.1.17: Comparison of the environmental impacts of producing 1 kg of H3PO4 by
conventional production and by the PARFORCE process– Characterisation ReCiPe 2016
H/World H ......................................................................................................................................... 271
Figure 5.1.18: Comparison of the environmental impacts of the PARFORCE system and the
reference system– Characterisation ReCiPe 2016 H/World H .................................................. 272
Figure 5.1.19: System boundaries for the PULSE process in the multifunctional system ............. 273
Figure 5.1.20: Environmental impacts of the multifunctional system including 100 m³ of treated
water in the WWTP, the P recovery from the sewage sludge in PULSE process and the
additional production of chemical P to obtain 0.80 kg of P2O5– Characterisation ReCiPe 2016
H/World H ......................................................................................................................................... 274
Figure 5.1.21: Environmental impacts of the production of 1 kg of P2O5 by PULSE process–
Characterisation ReCiPe 2016 H/World H .................................................................................... 275
Figure 5.1.22: Comparison of the environmental impacts of the PULSE system and the reference
system– Characterisation ReCiPe 2016 H/World H .................................................................... 276
Figure 5.2.1: System boundaries for the reference case with the avoided burden approach...... 280
Figure 5.2.2: Environmental impacts of the reference case with the avoided burden approach–
Characterisation ReCiPe 2016 H/World H .................................................................................... 281
Figure 5.2.3: System boundaries for the EuPhoRe® system with the avoided burden approach 282
Technical report of the Phos4You partnership on processes to recover P from wastewater Page n°28
Figure 5.2.4: Environmental impacts of the EuPhoRe® system with the avoided burden approach–
Characterisation ReCiPe 2016 H/World H .................................................................................... 283
Figure 5.2.5: Comparison of the environmental impacts of the EuPhoRe® system and the
reference system with the avoided burden method – Characterisation ReCiPe 2016 H/World
H ......................................................................................................................................................... 284
Figure 5.2.6: Comparison of the environmental impacts of the EuPhoRe® system for the three
electricity mixes studied (German, Belgian and French) – Characterisation ReCiPe 2016
H/World H ......................................................................................................................................... 285
Figure 5.2.7: Comparison of the environmental impacts of the EuPhoRe® system for the three
levels of P2O5 content of the SSA studied (16 %: reference, 11.2 %: down and 20.8 %: up)–
Characterisation ReCiPe 2016 H/World H .................................................................................... 287
Figure 5.2.8: System boundaries for the PARFORCE system with the avoided burden approach 288
Figure 5.2.9: Environmental impacts of the PARFORCE system with the avoided burden approach–
Characterisation ReCiPe 2016 H/World H .................................................................................... 289
Figure 5.2.10: Comparison of the environmental impacts of the PARFORCE system and the
reference system with the avoided burden method – Characterisation ReCiPe 2016 H/World
H ......................................................................................................................................................... 290
Figure 5.2.11: Comparison of the environmental impacts of the PARFORCE system for the three
electricity mixes studied (German, Belgian and French) – Characterisation ReCiPe 2016
H/World H ......................................................................................................................................... 292
Figure 5.2.12: Comparison of the environmental impacts of the PARFORCE system for the two
levels of P2O5 content in the digested sludge studied – Characterisation ReCiPe 2016 H/World
H ......................................................................................................................................................... 293
Figure 5.2.13: System boundaries for the Struvia system with the avoided burden approach ... 295
Figure 5.2.14: Environmental impacts of the Struvia™ system with the avoided burden approach –
Characterisation ReCiPe 2016 H/World H .................................................................................... 296
Figure 5.2.15: Comparison of the environmental impacts of the Struvia™ system and the
reference system with the avoided burden method – Characterisation ReCiPe 2016 H/World
H ......................................................................................................................................................... 297
Figure 5.2.16: Comparison of the environmental impacts of the Struvia system for the three
electricity mixes studied (German, Belgian and French)– Characterisation ReCiPe 2016
H/World H ......................................................................................................................................... 298
Figure 5.2.17: Comparison of the environmental impacts of the Struvia™ system for the three
levels of P2O5 content studied in the sludge – Characterisation ReCiPe 2016 H/World H .... 299
Figure 5.2.18: System boundaries for the Pulse system with the avoided burden approach ...... 301
Technical report of the Phos4You partnership on processes to recover P from wastewater Page n°29
Figure 5.2.19: Environmental impacts of the PULSE system with the avoided burden approach –
Characterisation ReCiPe 2016 H/World H .................................................................................... 302
Figure 5.2.20: Comparison of the environmental impacts of the PULSE system and the reference
system with the avoided burden method – Characterisation ReCiPe 2016 H/World H ........ 303
Figure 5.2.21: Comparison of the environmental impacts of the PULSE system for the three
electricity mixes studied (German, Belgian and French) – Characterisation ReCiPe 2016
H/World H ......................................................................................................................................... 304
Figure 5.2.22: Comparison of the environmental impacts of the PULSE system for the three levels
of P2O5 content studied in the sludge – Characterisation ReCiPe 2016 H/World H ............... 305
Figure 5.3.1: Illustration of the principle of life cycle costing as applied to P-recovery technologies
........................................................................................................................................................... 307
Figure 5.3.2: Repartition of costs for EuPhoRe® process ................................................................... 309
Technical report of the Phos4You partnership on processes to recover P from wastewater Page n°30
Tables
Table 2.2.1: Key data of the Phos4You demonstrators ......................................................................... 38
Table 3.1.1: Overview of the investigated “wet-chemical” P-recovery processes investigated ........ 43
Table 3.1.2: Overview of the generated SSA samples............................................................................ 46
Table 3.1.3: SSIPs and mixing ratio of the different SSA samples ........................................................ 47
Table 3.1.4: Composition of the investigated SSA samples compared with usual values of purely
municipal SSA from German SSIPs .................................................................................................. 48
Table 3.1.5: Overview of SSA samples used in the Lab- and Pilot-tests with different technologies
.............................................................................................................................................................. 50
Table 3.1.6: Quality of REPACID® (converted to 75 % H3PO4) produced compared to product
specifications ...................................................................................................................................... 56
Table 3.1.7: Leaching rates for main compounds of different samples, achieved with the
PARFORCE process ............................................................................................................................. 65
Table 3.1.8: Overview of the ingredients of the produced phosphoric acid samples converted to
75 % H3PO4 .......................................................................................................................................... 68
Table 3.1.9: Overview of the ingredients of the produced metal salt ................................................. 69
Table 3.1.10: Overview of the ingredients of the produced road salt in comparison with the limit
values on DIN EN 16811-2 ................................................................................................................. 70
Table 3.1.11: Leaching rates for main compounds of used samples SSA#5 compared to the
results from the lab-tests, achieved with the PARFORCE process ............................................... 72
Table 3.1.12: Overview of the ingredients of the produced phosphoric acid samples of used SSA
samples#5 compared to the results from the lab-tests converted to 75 wt % H3PO4 ............. 74
Table 3.1.13: Overview of the ingredients of the produced metal salt solutions .............................. 75
Table 3.1.14: Overview of the ingredients of the produced road salt compared to the results from
the lab-tests and the limit values on DIN EN 16811-2 ................................................................... 76
Table 3.2.1: Phosphate solubility of lab-scale trials ............................................................................... 82
Table 3.2.2: Average composition of sewage sludge of DO-Deusen (main elements) ..................... 91
Table 3.2.3: Average composition of sewage sludge of DO-Deusen (heavy metals) ........................ 91
Table 3.2.4: Overview on selected results of the SSA analyses (focussing on heavy metals) .......... 92
Table 3.2.5: Overview on selected results of the SSA analyses (focussing on nutrients) ................. 93
Table 3.3.1: Sludge characteristics within the BPDP test (TS: total solid, MS: mineral solid) ........... 99
Table 3.3.2: Characteristics of the mixture used for the acidification test ......................................... 99
Technical report of the Phos4You partnership on processes to recover P from wastewater Page n°31
Table 3.3.3: Concentrations after acidification (concentrations of total and dissolved phosphorus
are in mg.l-1) ..................................................................................................................................... 100
Table 3.3.4: Recovery of each element in the liquid phase (%). (C= control) ................................... 101
Table 3.3.5: Final concentration in liquid fraction after bio-acidification (in mM) .......................... 101
Table 3.3.6: Characteristics of sludge used for the second bio-acidification experiment (raw
matter basis) .................................................................................................................................... 102
Table 3.3.7: Amount of acidification agent required to reach pH = 4±0,5 ....................................... 102
Table 3.3.8: Fraction of total Iron in liquid after biological (BPDP) or chemical (CPD) acidification at
different pH level. Data expressed in %. ...................................................................................... 104
Table 3.3.9: Characteristics of the sludge used for the bio-acidification (raw matter basis)......... 105
Table 3.3.10: Characteristics of the sludge used for the bio-acidification with Cos3 (raw matter
basis) ................................................................................................................................................. 106
Table 3.3.11: Characteristics of the resins tested................................................................................ 107
Table 3.3.12: Cations removal by the resins ( % of the initial concentration) ................................. 107
Table 3.3.13: Sequence of tests carried out in Lille. ............................................................................ 112
Table 3.3.14: IN/OUT balance of the STRUVIA™ process. ................................................................... 116
Table 3.3.15: Economic balance. ............................................................................................................ 118
Table 3.4.1: Concentration of components in sludge leach liquor from Oupeye sludge before and
after extraction. Leaching acid conc. 2 mol/L HCl; extraction with 10 vol% Alamine 336 + 10
vol% TBP + 3vol% Exxal 10 in Ketrul D80; extraction stages: 2; O/A phase ratio: 1 ............... 139
Table 3.4.2: Composition of different intermediate streams of the I3 demonstrator during
operation with German sludge...................................................................................................... 155
Table 3.4.3: Composition of different intermediate streams of the I3 demonstrator during
operation with Scottish sludge ...................................................................................................... 156
Table 3.4.4: Composition of different intermediate streams of the I3 demonstrator during
operation with Scottish sludge ...................................................................................................... 157
Table 4.1.1: Characteristics of small scale WWTP’s wastewaters used to evaluate the behaviour of
the microalgae ................................................................................................................................. 170
Table 4.2.1: Varying operation conditions (bed height, flow and initial P concentration) and the
results obtained for the fixed bed column experiments ........................................................... 198
Table 4.2.2: Typical composition of the secondary wastewater effluent used to test the
FILTRAFLO™-P unit with CCM adsorbent ..................................................................................... 204
Table 4.3.1: Results of the jar test experiment using synthetic waste. ............................................ 215
Table 4.3.2: Results of the jar test experiment using treated effluent from the WWTP ................ 217
Technical report of the Phos4You partnership on processes to recover P from wastewater Page n°32
Table 4.3.3: Container specifications with the Struvia™ unit ............................................................. 218
Table 4.3.4: Influent and effluent samples analysis for the pilot plant in stage 1 .......................... 230
Table 4.3.5: Summary of results at pH 10.8 ......................................................................................... 243
Table 5.1.1: Scenarios for the multifunctional systems ...................................................................... 251
Table 5.2.1: Sensitivity analysis of the environmental impacts of the EuPhoRe® system for the
three electricity mixes studied (German, Belgian and French) ................................................. 285
Table 5.2.2: Sensitivity analysis of the environmental impacts of the EuPhoRe® system for the
three levels of P2O5 content studied (16%: reference, 11.2%: down and 20.8%: up) ............. 287
Table 5.2.3: Sensitivity analysis of the environmental impacts of the PARFORCE system for the
three electricity mixes studied (German, Belgian and French) ................................................. 292
Table 5.2.4: Sensitivity analysis of the environmental impacts of the PARFORCE system for a +30%
variation P2O5 content in sludge ................................................................................................... 294
Table 5.2.5: Sensitivity analysis of the environmental impacts of the Struvia™ system for the three
electricity mixes studied (German, Belgian and French) ............................................................ 298
Table 5.2.6: Sensitivity analysis of the environmental impacts of the Struvia™ system for the three
levels of phosphorus content studied .......................................................................................... 300
Table 5.2.7: Sensitivity analysis of the environmental impacts of the PULSE system for the three
electricity mixes studied (German, Belgian and French) ............................................................ 304
Table 5.2.8: Sensitivity analysis of the environmental impacts of the PULSE system for the three
levels of P2O5 content studied in the sludge................................................................................ 306
Table 5.3.1: Financial data for the EuPhoRe® process ........................................................................ 308
Technical report of the Phos4You partnership on processes to recover P from wastewater Page n°33
1 Introduction
The addition of phosphate rock to the list of critical raw materials for the European
Union in 2014 renewed in 2017 and 2020 (European Commission 2014, 2017a, 2020a)
underlines the need to increase the recycling rates of phosphorus materials in the EU.
Given the non-substitutability of phosphorus in parallel to its essentiality for all living
organisms, plus the lack of resources in the EU, a reliable access to phosphorus is a
concern for European citizens. Fostering the uptake of innovations to recover
phosphorus from different waste streams can alleviate Europe´s reliance on P-imports.
Municipal wastewater is one of the waste streams where phosphorus (P) can be
recovered from. Empowering the stakeholders of the wastewater sector to gather
experiences with P-recovery processes and to interact with European industries and
stakeholders using P in their value chains would dramatically improve the likelihood of
implementing the recycling of phosphorus from wastewater.
In support of the deployment of P-recycling, the Phos4You partnership conducted works
to understand the drivers of the implementation of phosphorus recovery processes
under real-life conditions. Twelve partners from seven countries cooperated to
demonstrate and test innovative P-recovery technologies in the North-West Europe
area.
1.1 Background of technical phosphorus recovery in North-West Europe
Wastewater treatment plants operators in North-West Europe will face new compliance
requirements in the field of phosphorus removal and recovery in the near future.
Countries such as Switzerland or Germany have introduced in their legislations
(Abfallverordnung, Schweizerischer Bundesrat 4/12/2015; AbfKlärV, Deutscher
Bundestag 2017) a mandatory recovery of phosphorus from wastewater respectively
from 2026 and 2029/2032 on (the deadline for implementation is depending on the size
of the wastewater treatment plants (WWTP)). At the EU level, with the adoption of the
Circular Economy Action Plan on March 2020 (European Commission 2020b), the
Commission is committed to consider the revision of the Sewage Sludge Directive
86/278/EEC. The direct use of sludge in agriculture (as it is rich in nutrients such as
nitrogen and phosphorus and it is a source of organic matter) is evaluated with regard
of its contaminants level and its potential risk of pollution of soil, water and/or air
(European Commission 2020d). In this context, one of the challenges that the project
investigated is to understand the drivers for the implementation and the deployment of
Technical report of the Phos4You partnership on processes to recover P from wastewater Page n°34
sustainable technical P-recovery facilities within existing infrastructures for wastewater
treatment and sludge disposal.
In other countries, such as in Scotland, mitigation measures to reduce the P discharges
from onsite wastewater treatment systems (OWTS) are required where there is a great
potential to degrade ecological water quality (O´Keeffe et al. n.d. [2015]). At the overall
EU level, small agglomerations, non-connected dwellings, individual or other appropriate
systems were identified as remaining sources of loads having a significant pressure on
the EU´s surface water bodies within the evaluation of the Urban Wastewater
Treatment Directive (European Commission 2019). Design solutions integrating the
recyclability of the removed phosphorus at small-scale WWTPs is a further challenge
that the project investigated.
To support stakeholders of the wastewater sector selecting a P-recovery technology and
developing a P-recovery strategy, Phos4You tackled the need for more demonstrations
in real environment (EU COM - DG Research and Innovation 2015). The partnership
made use of promising P-recovery processes, so far developed at lab or pilot scale, to
upscale and/or test them in larger demonstrators operated under real-life conditions.
The Phos4You project brought together an interdisciplinary team including operators of
WWTPs and sewage sludge incineration plants, process-holders, universities and
research institutions to cooperate in the field of P-recycling. Fertilisers’ manufacturers as
well as national authorities and phosphorus or nutrients platforms were associated to
the project, to permanently ensure that the recovery efforts fit with the numerous
requirements of the users in different national contexts.
1.2 Objectives of a network of demonstrators
The objective of setting up a network of demonstrators was to demonstrate that the
recovery of phosphorus is technically feasible, at different stages of the wastewater
treatment and for different sizes of WWTPs throughout North-West Europe (NWE). One
of the challenges of P-recovery at the beginning of the project is the lack of experiences
in real environment with P-recovery processes as well as a high disparity between the
NWE countries in regard with the handling of phosphorus discharged to WWTPs.
Successful experiences made with the demonstrators will enable WWTP operators to
prepare their business plans towards an improved sustainable management of the
phosphorus resource. It will also contribute to bring P-recovery related innovations
closer to the market. To enable the full-scale implementation of P-recovery, it is
necessary to gain experiences in real environment with existing innovative technologies
Technical report of the Phos4You partnership on processes to recover P from wastewater Page n°35
and to further develop them. Furthermore, to facilitate the uptake of P-recovery
technologies in the different territories in NWE, the network of demonstrators relies on
the transfer of technology, knowledge and expertise between stakeholders.
The operation of the P-recovery demonstrators is used to:
• test the suitability of different input materials for each process;
• optimise existing processes;
• generate recovered P-materials of which quality will be assessed and of which
integration in value chains will be evaluated or tested;
• support the development of models to enable the prediction of recovery
efficiency with new inputs;
• provide reliable data to prepare business plans for P-recycling in urban or rural
areas.
Successful implementation of the demonstrators has also further advanced the
capability of wastewater treatment works operators, research institutes and universities
to act in the field of P-recovery.
1.3 Scope of document
This report documents the works achieved within the project lifetime of Phos4You to
make the proof of concept of seven solutions to recover phosphorus from wastewater.
It also gives focus on the realised Life Cycle Assessment (LCA) and Life Cycle Costing
(LCC) works.
Specifically, the following aspects of the project are discussed for each technical
demonstration:
• Preparation of the demonstration, focusing on the preparatory works and results
realised at labs (tests, experimentation);
• Execution of the demonstration, including the timeframe and locations of the
operation, as well as the experimental set up;
• Analyses of the results of the operation of the demonstrators, including a
dedicated part for the LCA and LCC aspects in chapter 5;
• Discussion of the results;
• Conclusion for the demonstrator.
The term of “product” has been used to described the materials coming out of the
processes. It doesn’t necessarily match with the definition of “product” in legal texts.
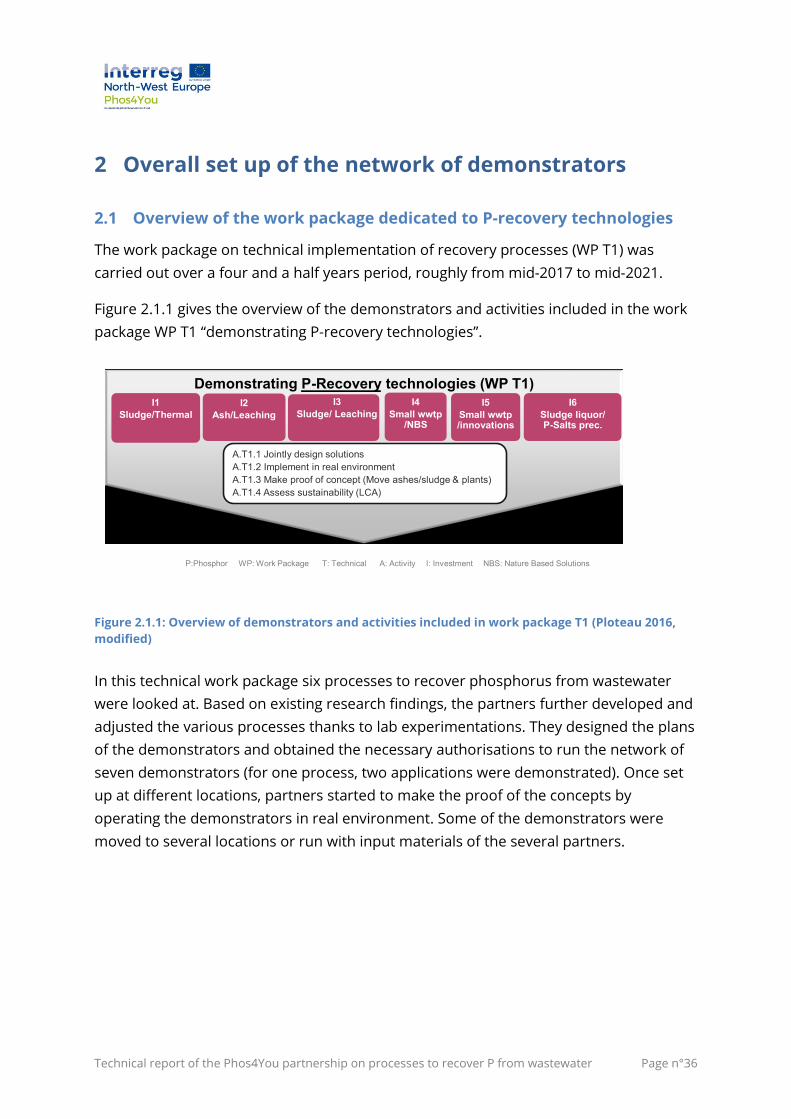
Technical report of the Phos4You partnership on processes to recover P from wastewater Page n°36
2 Overall set up of the network of demonstrators
2.1 Overview of the work package dedicated to P-recovery technologies
The work package on technical implementation of recovery processes (WP T1) was
carried out over a four and a half years period, roughly from mid-2017 to mid-2021.
Figure 2.1.1 gives the overview of the demonstrators and activities included in the work
package WP T1 “demonstrating P-recovery technologies”.
P:Phosphor WP: Work Package T: Technical A: Activity I: Investment NBS: Nature Based Solutions
• INVESTENT
?
Demonstrating P-Recovery technologies (WP T1)
A.T1.1 Jointly design solutions
A.T1.2 Implement in real environment
A.T1.3 Make proof of concept (Move ashes/sludge & plants)
A.T1.4 Assess sustainability (LCA)
I1
Sludge/Thermal
I2
Ash/Leaching
I3
Sludge/ Leaching
I4
Small wwtp/NBS
I5
Small wwtp/innovations
I6
Sludge liquor/P-Salts prec.
Figure 2.1.1: Overview of demonstrators and activities included in work package T1 (Ploteau 2016,
modified)
In this technical work package six processes to recover phosphorus from wastewater
were looked at. Based on existing research findings, the partners further developed and
adjusted the various processes thanks to lab experimentations. They designed the plans
of the demonstrators and obtained the necessary authorisations to run the network of
seven demonstrators (for one process, two applications were demonstrated). Once set
up at different locations, partners started to make the proof of the concepts by
operating the demonstrators in real environment. Some of the demonstrators were
moved to several locations or run with input materials of the several partners.
Technical report of the Phos4You partnership on processes to recover P from wastewater Page n°37
2.2 Selection of the demonstrated technologies
The selection of the processes has looked to ensure on one hand the demonstration of
a wide range of input sources for the recovery of phosphorus (sewage sludge ashes,
sewage sludge, sewage sludge liquor, wastewater effluent). On the other hand, the
synergies that can arise between phosphorus removal and recovery for small scale
wastewater treatment plants have been in focus.
Phos4You has demonstrated how phosphorus can be recovered (Figure 2.1.1):
• from sewage sludge with a thermochemical treatment (I1 – EuPhoRe® process);
• from sewage sludge with precipitation after a chemical leaching (I3 – PULSE
process);
• from sewage sludge or liquor with crystallisation after a biological acidification
(I6.1 – STRUVIA™ optimised with bio-acidification);
• from sewage sludge ashes with a leaching process (I2 – TetraPhos® process).
In addition, Phos4You has demonstrated how complementarity between phosphorus
removal and phosphorus recovery can be achieved:
• from wastewater at small scale wastewater treatment works with nature based
solutions (I4 – Microalgae Chlamydomonas acidophila);
• from wastewater effluent of smallest scale wastewater treatment works with
adsorption filter using innovative adsorbents (I5 – Filtraflo™-P with chitosan-
calcite adsorbent from seafood waste)
• from wastewater effluent of small scale wastewater treatment works with
crystallisation process (I6.2 – STRUVIA™ downscaled)
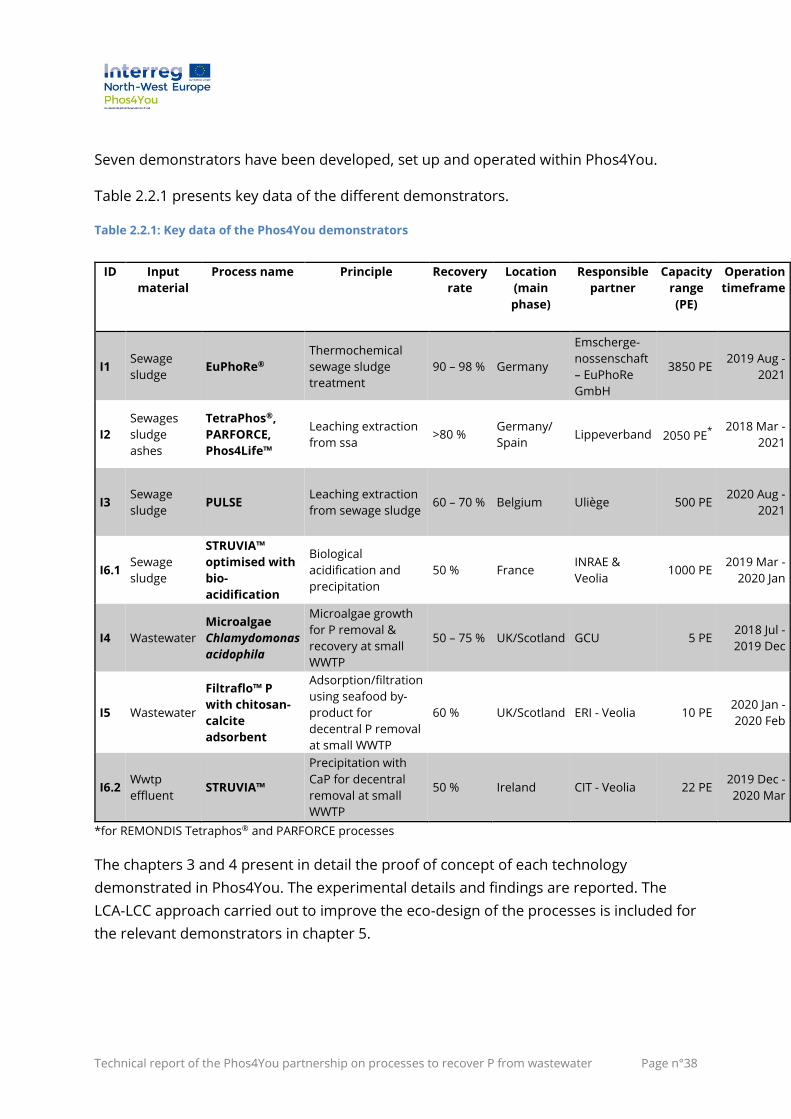
Technical report of the Phos4You partnership on processes to recover P from wastewater Page n°38
Seven demonstrators have been developed, set up and operated within Phos4You.
Table 2.2.1 presents key data of the different demonstrators.
Table 2.2.1: Key data of the Phos4You demonstrators
ID Input
material
Process name Principle Recovery
rate
Location
(main
phase)
Responsible
partner
Capacity
range
(PE)
Operation
timeframe
I1 Sewage
sludge EuPhoRe®
Thermochemical
sewage sludge
treatment
90 – 98 % Germany
Emscherge-
nossenschaft
– EuPhoRe
GmbH
3850 PE 2019 Aug -
2021
I2
Sewages
sludge
ashes
TetraPhos®,
PARFORCE,
Phos4Life™
Leaching extraction
from ssa >80 %
Germany/
Spain Lippeverband 2050 PE
*
2018 Mar -
2021
I3 Sewage
sludge PULSE
Leaching extraction
from sewage sludge 60 – 70 % Belgium Uliège 500 PE
2020 Aug -
2021
I6.1 Sewage
sludge
STRUVIA™
optimised with
bio-
acidification
Biological
acidification and
precipitation
50 % France INRAE &
Veolia 1000 PE
2019 Mar -
2020 Jan
I4 Wastewater
Microalgae
Chlamydomonas
acidophila
Microalgae growth
for P removal &
recovery at small
WWTP
50 – 75 % UK/Scotland GCU 5 PE 2018 Jul -
2019 Dec
I5 Wastewater
Filtraflo™ P
with chitosan-
calcite
adsorbent
Adsorption/filtration
using seafood by-
product for
decentral P removal
at small WWTP
60 % UK/Scotland ERI - Veolia 10 PE 2020 Jan -
2020 Feb
I6.2 Wwtp
effluent STRUVIA™
Precipitation with
CaP for decentral
removal at small
WWTP
50 % Ireland CIT - Veolia 22 PE 2019 Dec -
2020 Mar
*for REMONDIS Tetraphos® and PARFORCE processes
The chapters 3 and 4 present in detail the proof of concept of each technology
demonstrated in Phos4You. The experimental details and findings are reported. The
LCA-LCC approach carried out to improve the eco-design of the processes is included for
the relevant demonstrators in chapter 5.
Technical report of the Phos4You partnership on processes to recover P from wastewater Page n°39
2.3 Selected LCA-LCC approach
Authors: Gaspard Chantrain, Sylvie Groslambert, Angélique Léonard (ULiège);
Anders Nättorp (FHNW)
In addition to the technical analysis of the phosphorus recovery demonstrators, an
assessment of their environmental performance is included in the project. This
environmental analysis is done using the life cycle analysis method. The Life Cycle
assessment conducted for each process aimed at improving the eco-design of the
technology and to quantify its environmental impacts.
Life Cycle Assessment is ruled by the ISO 14040:2006 and ISO 14044:2006 standards.
The four mandatory steps of this analysis are: goal and scope definition, inventory
analysis, impact assessment, and interpretation.
The goal and scope have been defined in order to be the same for all the
demonstrators. The goal is the assessment of the environmental impact of the
phosphorus recovery as defined in the frame of the Phos4You project.
Regarding inventories of demonstrators, it is important to bear in mind that most of the
demonstrators are at lab or small pilot scale. Even if some scale-up rules exist and can
help to extrapolate the data, it is very difficult to rely on lab scale data to assess the
potential environmental impact of a process. All energy data are usually over-estimated
since an industrial process usually benefits of energy optimisation. Moreover, yields that
can be obtained at lab scale are rarely achieved when the industrial process is
concerned.
Since no reliable inventory can be established from lab scale demonstrators, only the
environmental analyses of the EuPhoRe®, PARFORCE, PULSE and Struvia™ processes
were carried out. For this purpose, specific data from demonstrators were used to
model the environmental impacts of the demonstrators.
All environmental impacts are assessed with the ReCiPe 2016 method (Huijbregts et al.
2017) by selecting the most relevant impact categories and using the Simapro software.
Papers reviews show that sewage sludge is mainly considered as “waste-to-product”
sludge. The “zero burden assumption” is frequently applied and sludge is seldom
charged with an environmental burden associated with its production (cut-off
approach). This is not questionable when sewage sludge is considered as “waste” or
“waste-to-product” sludge with energy recovery. However, this is becoming more
debatable when sludge is considered as “product” sludge or as “waste-to-product”
Technical report of the Phos4You partnership on processes to recover P from wastewater Page n°40
sludge with nutrient or material recovery. In such cases, the “zero burden assumption” is
a no longer valid hypothesis as the sludge life cycle needs to be fully considered. This
can only be done if the sludge carries an upstream environmental burden (Pradel et al.
2016). This leads to the problem of allocating the environmental costs of the treatment
plant between its two functions, the primary one which is wastewater treatment and the
secondary one which is sewage sludge production. This difficulty can be tackled by
several methodological approaches, a number of which have been studied in the
framework of the project.
Initially, the system expansion approach has been applied to evaluate environmental
impacts of the Euphore®, PARFORCE, PULSE and Struvia™ demonstrators, and to a
reference scenario for comparison. This methodological approach considers the
environmental impacts of sludge production by including the whole wastewater
treatment plant in the system boundaries studied. The boundaries then include the
wastewater treatment plant and the production of phosphorus fertiliser which implies
that the whole system is multifunctional (wastewater treatment function coupled with
phosphorus fertiliser production function). The functional unit of such a system include
the treatment of the wastewater (100 m³) and the production of 0.80 kg of P2O5 fertiliser
(from P recovery in Phos4You demonstrators and/or chemical route). The wastewater
treatment was modelled by a large size Belgian WWTP (Liège-Oupeye). The treatment of
100 m³ of wastewater generates a certain amount of sludge, and its valorisation to
recover P was realised using the Phos4You demonstrators. The valorisation of sewage
sludge by the demonstrators produces a quantity of material rich in phosphorus lower
than 0.80 kg of P2O5 and the complement to obtain the reference amount of 0.80 kg of
P2O5 came from the "BAU" P fertiliser production route (chemical). The reference system
consists in the co-incineration of the sewage sludge together with the chemical
production of the totality of the P fertiliser.
In a second part of the project, the methodological approach has been reviewed and the
“avoided burden” approach has been added. At this time, it was also decided to include
sludge biodigestion as well as cogeneration with electricity and heat recovery in the
studied scenarios, as this is state-of-the art e.g. in Germany. The reference scenario for
sludge treatment is also changed to mono-incineration of digested sludge with energy
recovery (heat and electricity).
The environmental performance of each demonstrator has been therefore studied with
the two methodological approaches and compared with the performance of the
reference system. A detailed environmental assessment of each process also has
allowed to highlight the most impacting steps for each process and to formulate eco-
Technical report of the Phos4You partnership on processes to recover P from wastewater Page n°41
design advices. Two sensitivity analyses have also been performed. The first one aimed
at evaluating the influence of the location of the demonstrator (Germany, France or
Belgium). The second sensitivity analysis has been performed to investigate the impact
of phosphorus variation in the sewage sludge used on the environmental performance
of the process.
Finally, a life cycle cost analysis of the fertilisers delivered by the demonstrators of the
project has also been carried out to estimate the economic feasibility of these P-
materials. The principle of this type of analysis applied to a demonstrator is to account
for all monetary flows out of and into the system. This analysis could make it possible to
estimate two useful values. The first is the production cost of phosphorus-rich materials
(in €/kg P2O5) and the second is the cost of processing one tonne of sewage sludge
through the demonstrator (in €/tonne of sewage sludge treated). These two parameters
illustrate the two functions of the demonstrators; the first one being the production of
P-materials and the second one the treatment of the sewage sludge.
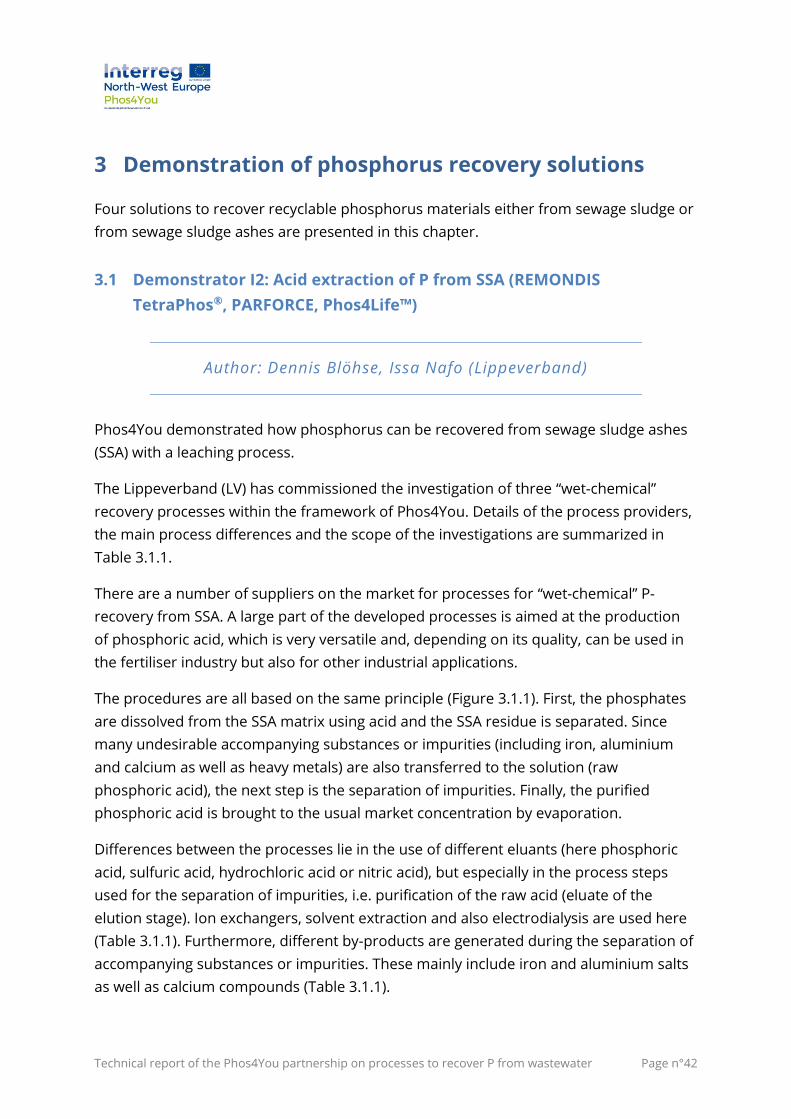
Technical report of the Phos4You partnership on processes to recover P from wastewater Page n°42
3 Demonstration of phosphorus recovery solutions
Four solutions to recover recyclable phosphorus materials either from sewage sludge or
from sewage sludge ashes are presented in this chapter.
3.1 Demonstrator I2: Acid extraction of P from SSA (REMONDIS
TetraPhos®, PARFORCE, Phos4Life™)
Author: Dennis Blöhse, Issa Nafo (Lippeverband)
Phos4You demonstrated how phosphorus can be recovered from sewage sludge ashes
(SSA) with a leaching process.
The Lippeverband (LV) has commissioned the investigation of three “wet-chemical”
recovery processes within the framework of Phos4You. Details of the process providers,
the main process differences and the scope of the investigations are summarized in
Table 3.1.1.
There are a number of suppliers on the market for processes for “wet-chemical” P-
recovery from SSA. A large part of the developed processes is aimed at the production
of phosphoric acid, which is very versatile and, depending on its quality, can be used in
the fertiliser industry but also for other industrial applications.
The procedures are all based on the same principle (Figure 3.1.1). First, the phosphates
are dissolved from the SSA matrix using acid and the SSA residue is separated. Since
many undesirable accompanying substances or impurities (including iron, aluminium
and calcium as well as heavy metals) are also transferred to the solution (raw
phosphoric acid), the next step is the separation of impurities. Finally, the purified
phosphoric acid is brought to the usual market concentration by evaporation.
Differences between the processes lie in the use of different eluants (here phosphoric
acid, sulfuric acid, hydrochloric acid or nitric acid), but especially in the process steps
used for the separation of impurities, i.e. purification of the raw acid (eluate of the
elution stage). Ion exchangers, solvent extraction and also electrodialysis are used here
(Table 3.1.1). Furthermore, different by-products are generated during the separation of
accompanying substances or impurities. These mainly include iron and aluminium salts
as well as calcium compounds (Table 3.1.1).
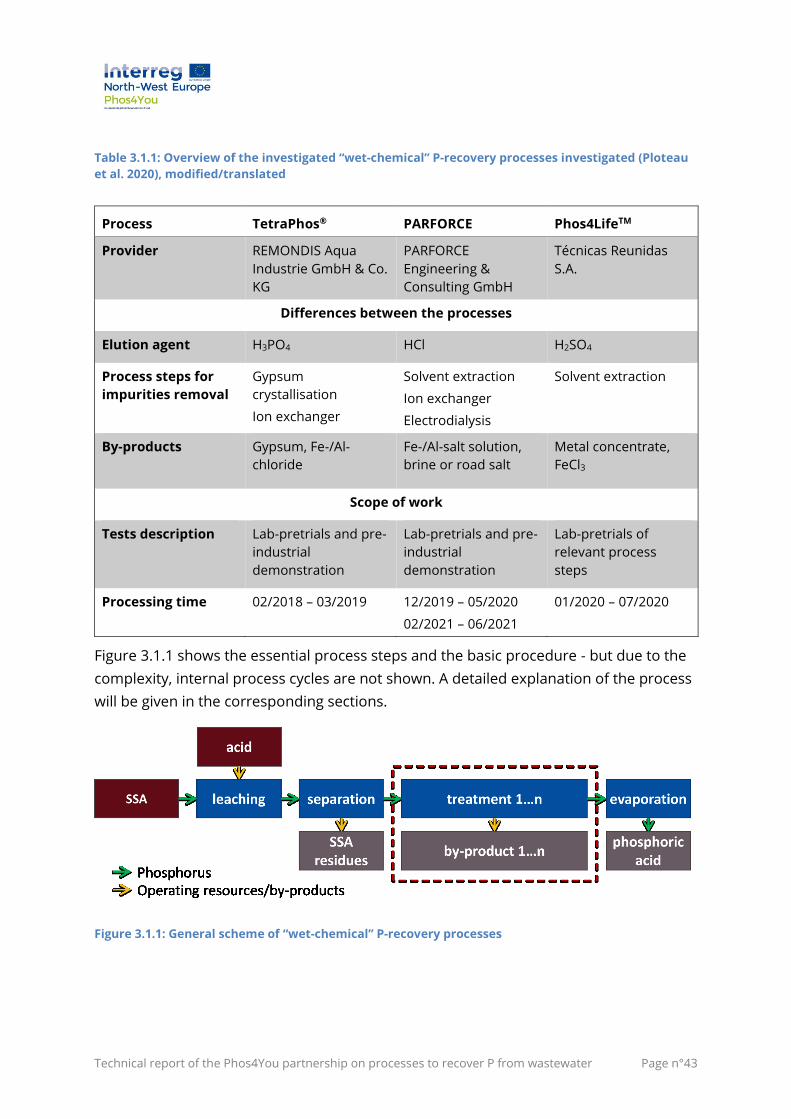
Technical report of the Phos4You partnership on processes to recover P from wastewater Page n°43
Table 3.1.1: Overview of the investigated “wet-chemical” P-recovery processes investigated (Ploteau
et al. 2020), modified/translated
Process TetraPhos® PARFORCE Phos4LifeTM
Provider REMONDIS Aqua
Industrie GmbH & Co.
KG
PARFORCE
Engineering &
Consulting GmbH
Técnicas Reunidas
S.A.
Differences between the processes
Elution agent H3PO4 HCl H2SO4
Process steps for
impurities removal
Gypsum
crystallisation
Ion exchanger
Solvent extraction
Ion exchanger
Electrodialysis
Solvent extraction
By-products Gypsum, Fe-/Al-
chloride
Fe-/Al-salt solution,
brine or road salt
Metal concentrate,
FeCl3
Scope of work
Tests description Lab-pretrials and pre-
industrial
demonstration
Lab-pretrials and pre-
industrial
demonstration
Lab-pretrials of
relevant process
steps
Processing time 02/2018 – 03/2019 12/2019 – 05/2020
02/2021 – 06/2021
01/2020 – 07/2020
Figure 3.1.1 shows the essential process steps and the basic procedure - but due to the
complexity, internal process cycles are not shown. A detailed explanation of the process
will be given in the corresponding sections.
Figure 3.1.1: General scheme of “wet-chemical” P-recovery processes
Technical report of the Phos4You partnership on processes to recover P from wastewater Page n°44
Different SSA samples were tested during the investigations. The sample batches came
from the incineration plant of Emschergenossenschaft (EG) in Bottrop and the
Innovatherm GmbH in Lünen. In addition, samples from other incineration plants of the
Wupperverband/SVA Buchenhofen (Wuppertal) and the WFA Elverlingsen GmbH
(Werdohl) were used.
The focus of the investigations is not necessarily on a final process comparison, but
rather on the combination of different experiences with external processes. Of
particular interest here are the range of results with regard to chemical consumption,
energy requirements (electricity, heat, steam), wastewater generation and the value-
added chains in the recycling of the various by-products. Furthermore, the possible
investment costs and space requirements can be estimated much better in case of
industrial implementation.
3.1.1 Preparation of I2
Several tonnes of SSA were required for the investigations. The focus of the
demonstration was the investigation of different SSA qualities. It was also of great
interest to illustrate future changes in the SSA composition.
3.1.1.1 Sampling of SSA from Bottrop/Lünen
The Emschergenossenschaft operates a sewage sludge incineration plant (SSIP) in
Bottrop, which is still being operated with coal-conditioned sewage sludge at the time of
the trials. The conditioning with coal is on the one hand historically justified and on the
other hand necessary in order to optimally adjust the dewatering properties and the
calorific value of the sewage sludge.
In the future, the use of coal conditioning will be abandoned and instead the calorific
value will be adjusted by solar-thermal drying of the sewage sludge. In addition to
positive effects on the consumption of fossil resources, this also makes it necessary for
the study to depict this considerable change in SSA composition.
Therefore, it was necessary to operate the SSIP in Bottrop in a special campaign with
dewatered sewage sludge without coal conditioning. The biggest challenge for the
operating staff was to dewater the sludge by means of the chamber filter presses.
Because no coal was used, the sludge was very sticky and had to be removed manually
from each individual chamber of the press (Figure 3.1.2).
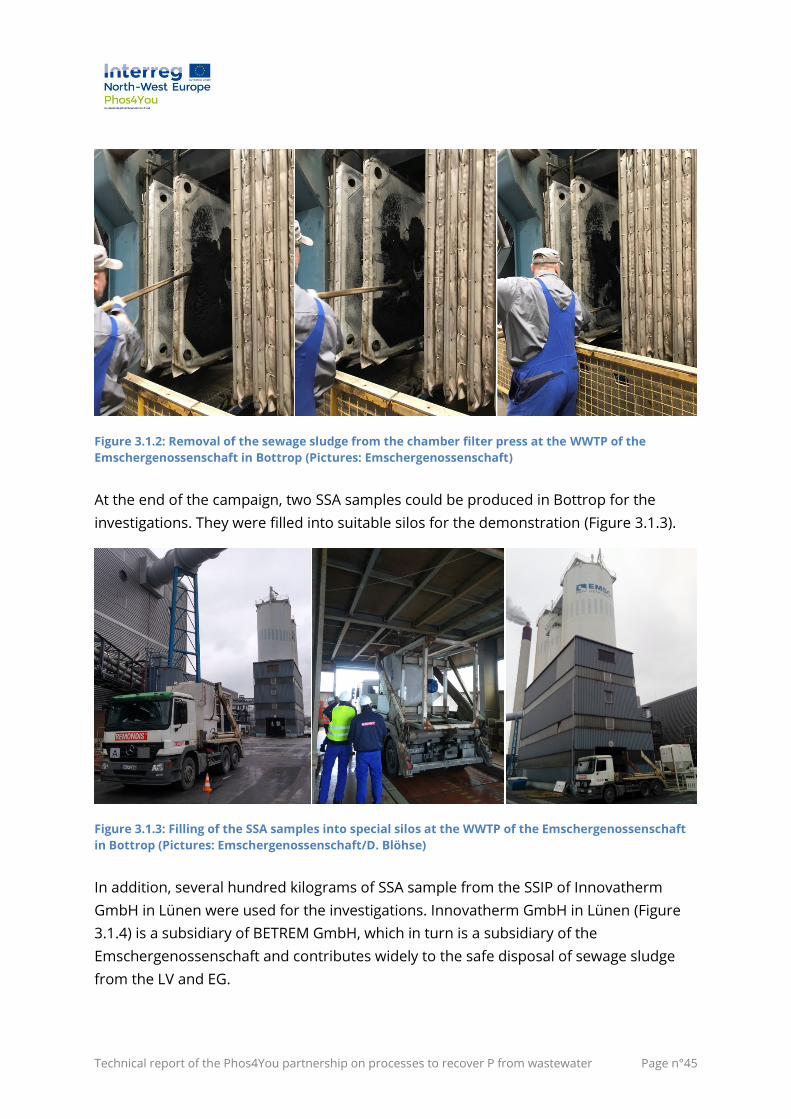
Technical report of the Phos4You partnership on processes to recover P from wastewater Page n°45
Figure 3.1.2: Removal of the sewage sludge from the chamber filter press at the WWTP of the
Emschergenossenschaft in Bottrop (Pictures: Emschergenossenschaft)
At the end of the campaign, two SSA samples could be produced in Bottrop for the
investigations. They were filled into suitable silos for the demonstration (Figure 3.1.3).
Figure 3.1.3: Filling of the SSA samples into special silos at the WWTP of the Emschergenossenschaft
in Bottrop (Pictures: Emschergenossenschaft/D. Blöhse)
In addition, several hundred kilograms of SSA sample from the SSIP of Innovatherm
GmbH in Lünen were used for the investigations. Innovatherm GmbH in Lünen (Figure
3.1.4) is a subsidiary of BETREM GmbH, which in turn is a subsidiary of the
Emschergenossenschaft and contributes widely to the safe disposal of sewage sludge
from the LV and EG.
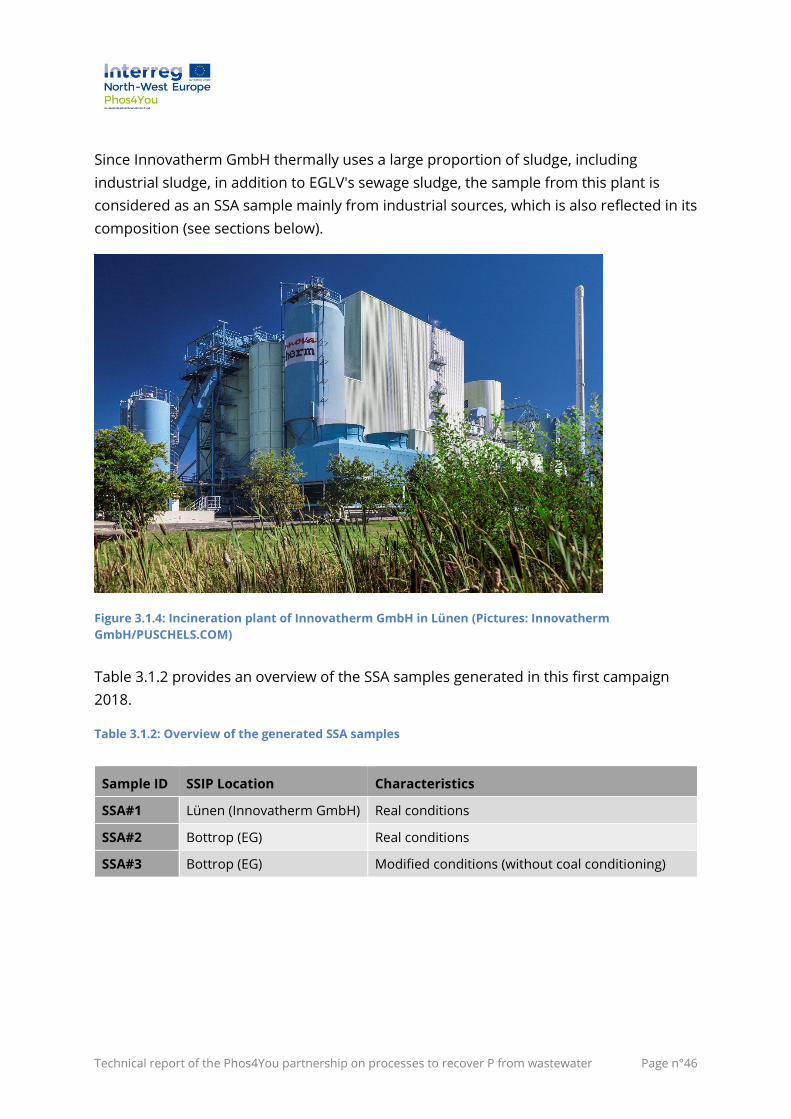
Technical report of the Phos4You partnership on processes to recover P from wastewater Page n°46
Since Innovatherm GmbH thermally uses a large proportion of sludge, including
industrial sludge, in addition to EGLV's sewage sludge, the sample from this plant is
considered as an SSA sample mainly from industrial sources, which is also reflected in its
composition (see sections below).
Figure 3.1.4: Incineration plant of Innovatherm GmbH in Lünen (Pictures: Innovatherm
GmbH/PUSCHELS.COM)
Table 3.1.2 provides an overview of the SSA samples generated in this first campaign
2018.
Table 3.1.2: Overview of the generated SSA samples
Sample ID SSIP Location Characteristics
SSA#1 Lünen (Innovatherm GmbH) Real conditions
SSA#2 Bottrop (EG) Real conditions
SSA#3 Bottrop (EG) Modified conditions (without coal conditioning)
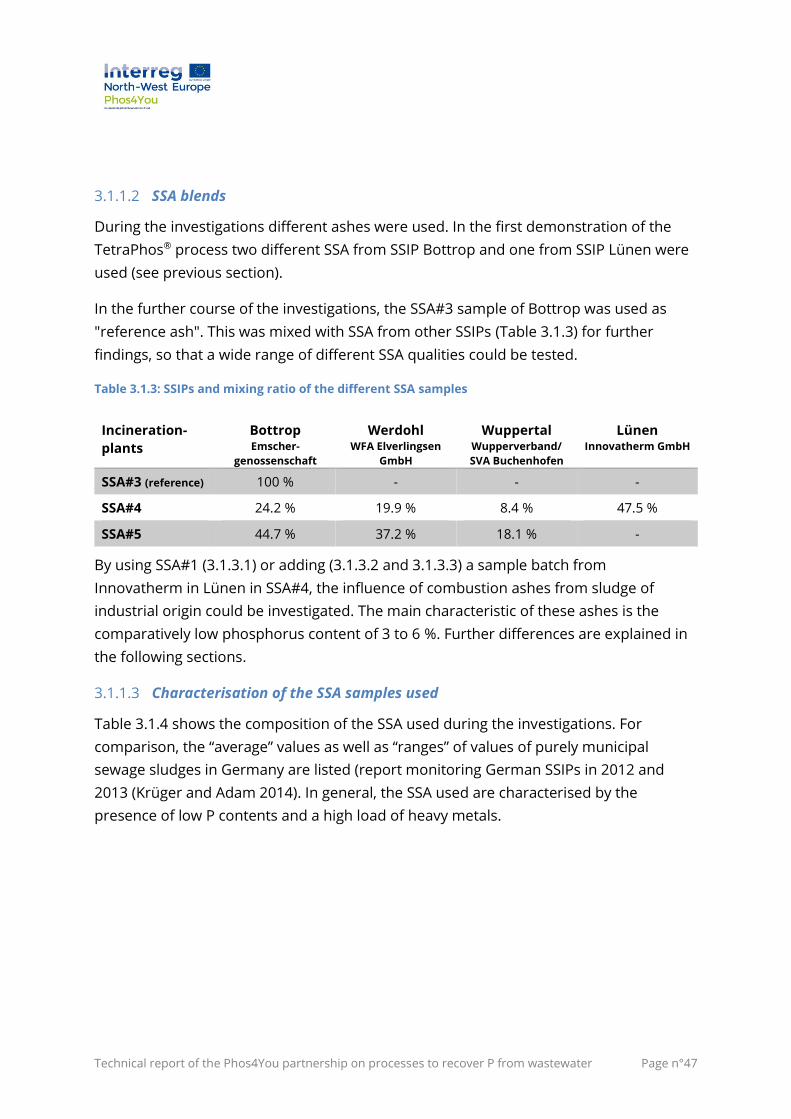
Technical report of the Phos4You partnership on processes to recover P from wastewater Page n°47
3.1.1.2 SSA blends
During the investigations different ashes were used. In the first demonstration of the
TetraPhos® process two different SSA from SSIP Bottrop and one from SSIP Lünen were
used (see previous section).
In the further course of the investigations, the SSA#3 sample of Bottrop was used as
"reference ash". This was mixed with SSA from other SSIPs (Table 3.1.3) for further
findings, so that a wide range of different SSA qualities could be tested.
Table 3.1.3: SSIPs and mixing ratio of the different SSA samples
Incineration-
plants
Bottrop Emscher-
genossenschaft
Werdohl WFA Elverlingsen
GmbH
Wuppertal Wupperverband/
SVA Buchenhofen
Lünen Innovatherm GmbH
SSA#3 (reference) 100 % - - -
SSA#4 24.2 % 19.9 % 8.4 % 47.5 %
SSA#5 44.7 % 37.2 % 18.1 % -
By using SSA#1 (3.1.3.1) or adding (3.1.3.2 and 3.1.3.3) a sample batch from
Innovatherm in Lünen in SSA#4, the influence of combustion ashes from sludge of
industrial origin could be investigated. The main characteristic of these ashes is the
comparatively low phosphorus content of 3 to 6 %. Further differences are explained in
the following sections.
3.1.1.3 Characterisation of the SSA samples used
Table 3.1.4 shows the composition of the SSA used during the investigations. For
comparison, the “average” values as well as “ranges” of values of purely municipal
sewage sludges in Germany are listed (report monitoring German SSIPs in 2012 and
2013 (Krüger and Adam 2014). In general, the SSA used are characterised by the
presence of low P contents and a high load of heavy metals.
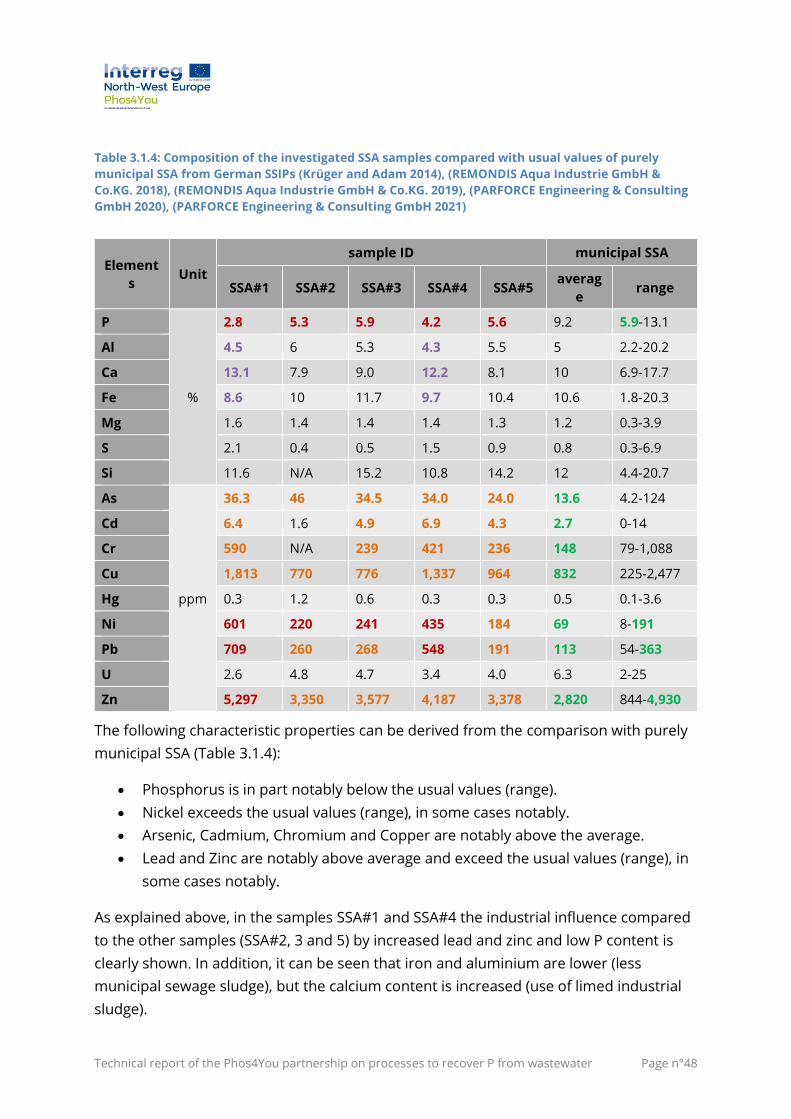
Technical report of the Phos4You partnership on processes to recover P from wastewater Page n°48
Table 3.1.4: Composition of the investigated SSA samples compared with usual values of purely
municipal SSA from German SSIPs (Krüger and Adam 2014), (REMONDIS Aqua Industrie GmbH &
Co.KG. 2018), (REMONDIS Aqua Industrie GmbH & Co.KG. 2019), (PARFORCE Engineering & Consulting
GmbH 2020), (PARFORCE Engineering & Consulting GmbH 2021)
Element
s Unit
sample ID municipal SSA
SSA#1 SSA#2 SSA#3 SSA#4 SSA#5 averag
e range
P
%
2.8 5.3 5.9 4.2 5.6 9.2 5.9-13.1
Al 4.5 6 5.3 4.3 5.5 5 2.2-20.2
Ca 13.1 7.9 9.0 12.2 8.1 10 6.9-17.7
Fe 8.6 10 11.7 9.7 10.4 10.6 1.8-20.3
Mg 1.6 1.4 1.4 1.4 1.3 1.2 0.3-3.9
S 2.1 0.4 0.5 1.5 0.9 0.8 0.3-6.9
Si 11.6 N/A 15.2 10.8 14.2 12 4.4-20.7
As
ppm
36.3 46 34.5 34.0 24.0 13.6 4.2-124
Cd 6.4 1.6 4.9 6.9 4.3 2.7 0-14
Cr 590 N/A 239 421 236 148 79-1,088
Cu 1,813 770 776 1,337 964 832 225-2,477
Hg 0.3 1.2 0.6 0.3 0.3 0.5 0.1-3.6
Ni 601 220 241 435 184 69 8-191
Pb 709 260 268 548 191 113 54-363
U 2.6 4.8 4.7 3.4 4.0 6.3 2-25
Zn 5,297 3,350 3,577 4,187 3,378 2,820 844-4,930
The following characteristic properties can be derived from the comparison with purely
municipal SSA (Table 3.1.4):
• Phosphorus is in part notably below the usual values (range).
• Nickel exceeds the usual values (range), in some cases notably.
• Arsenic, Cadmium, Chromium and Copper are notably above the average.
• Lead and Zinc are notably above average and exceed the usual values (range), in
some cases notably.
As explained above, in the samples SSA#1 and SSA#4 the industrial influence compared
to the other samples (SSA#2, 3 and 5) by increased lead and zinc and low P content is
clearly shown. In addition, it can be seen that iron and aluminium are lower (less
municipal sewage sludge), but the calcium content is increased (use of limed industrial
sludge).
Technical report of the Phos4You partnership on processes to recover P from wastewater Page n°49
3.1.2 Execution of I2
In order to test the suitability of the SSAs of the Emscher-Lippe region to have its
phosphorus recovered, three different leaching technologies were selected and applied
to the SSA:
• The REMONDIS TetraPhos® technology,
• The Phos4Life™ technology,
• The PARFORCE technology.
The focus was primarily on processes that also promote the production of high-quality
phosphoric acid as a product. The results should provide in-depth process knowledge
and demonstrate the understanding of different approaches, especially for the
purification of raw phosphoric acid, as well as the production and possible uses of
various by-products. This offers the possibility for approaches for process optimisation
as well as for the development of different business cases. A further reason for
additional investigations existed particularly against the background of the scenarios to
be considered "inter-communal cooperation", whereby it is of special interest to include
SSA samples of neighbouring water management associations (here Ruhrverband and
Wupperverband) in the investigations. This was not yet taken into account in the
previous investigations using the REMONDIS TetraPhos® process.
The main differences between the processes or process steps used lie in the use of
different eluants (here phosphoric acid, sulfuric acid, hydrochloric acid or nitric acid), but
especially in the separation of impurities, i.e. the purification of the raw acid (eluate of
the elution stage). In the TetraPhos® process tested in the first step, ion exchangers are
used for the separation of impurities.
On the basis of market exploration, the PARFORCE and Phos4Life™ processes meet the
desired technical limits compared to the REMONDIS TetraPhos® process with the aim of
producing phosphoric acid. As process engineering variants, the purification is carried
out by means of 1.) solvent extraction and 2.) electrodialysis. These possibilities are
considered as process variants within the scope of the investigations.
Preliminary tests with all processes were carried out in the laboratory, depending on the
possibility of mapping the processes on a laboratory scale in slightly different ways.
Essentially, the work included the following tasks: characterisation of the samples and
preliminary leaching tests. In addition - depending on the possibility of mapping the
process chain on a laboratory scale - preliminary tests were also carried out in part to
Technical report of the Phos4You partnership on processes to recover P from wastewater Page n°50
remove impurities and in one case by-products and phosphoric acid were also
produced.
The technologies were demonstrated on a pre-industrial scale using REMONDIS
TetraPhos® and the PARFORCE process. Both technology providers have a
corresponding pilot plant which guarantees further investigations.
Based on the knowledge gained from these laboratory tests, the investigations were
continued on a pre-industrial scale. This made it possible to generate relevant data on
the processes and to produce recovered materials and by-products in order to
incorporate their quality and ability to be integrated into value chains into further
investigations.
Basically, batch tests/continuous tests with several tonnes SSA were performed. Table
3.1.5 gives an overview of the SSA samples used in the different investigation orders.
Table 3.1.5: Overview of SSA samples used in the Lab- and Pilot-tests with different technologies
Technologie Lab-tests Pilot-tests
TetraPhos® SSA#1, 2, 3 SSA#3, (1*)
Phos4LifeTM SSA#3, 4, 5 -
PARFORCE SSA#3, 4, 5 SSA#5
*just elution and separation step
The following test results as well as assessments of quality or usability and marketability
are based on information provided by the technology suppliers (REMONDIS Aqua
Industrie GmbH & Co.KG. 2018), (REMONDIS Aqua Industrie GmbH & Co.KG. 2019),
(Técnicas Reunidas 2020), (PARFORCE Engineering & Consulting GmbH 2020, 2021) as
well as investigations (Westfälisches Umwelt Zentrum 2020) and statements by third
parties.
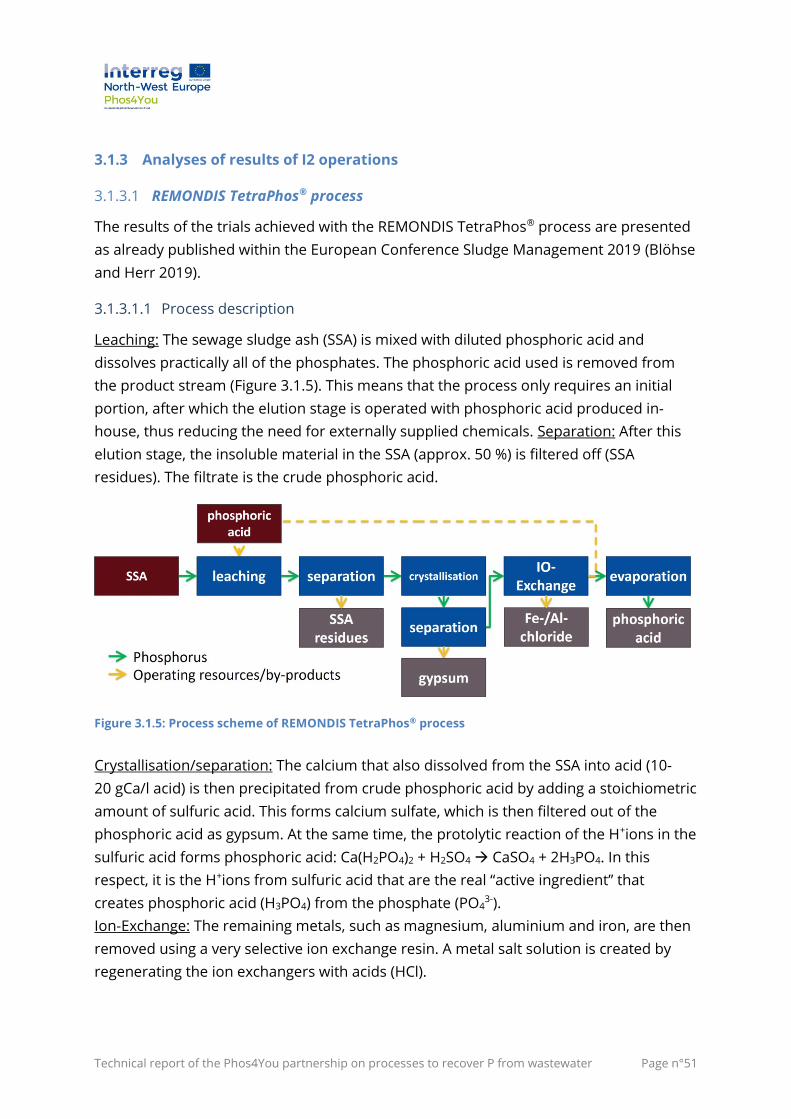
Technical report of the Phos4You partnership on processes to recover P from wastewater Page n°51
3.1.3 Analyses of results of I2 operations
3.1.3.1 REMONDIS TetraPhos® process
The results of the trials achieved with the REMONDIS TetraPhos® process are presented
as already published within the European Conference Sludge Management 2019 (Blöhse
and Herr 2019).
3.1.3.1.1 Process description
Leaching: The sewage sludge ash (SSA) is mixed with diluted phosphoric acid and
dissolves practically all of the phosphates. The phosphoric acid used is removed from
the product stream (Figure 3.1.5). This means that the process only requires an initial
portion, after which the elution stage is operated with phosphoric acid produced in-
house, thus reducing the need for externally supplied chemicals. Separation: After this
elution stage, the insoluble material in the SSA (approx. 50 %) is filtered off (SSA
residues). The filtrate is the crude phosphoric acid.
Figure 3.1.5: Process scheme of REMONDIS TetraPhos® process
Crystallisation/separation: The calcium that also dissolved from the SSA into acid (10-
20 gCa/l acid) is then precipitated from crude phosphoric acid by adding a stoichiometric
amount of sulfuric acid. This forms calcium sulfate, which is then filtered out of the
phosphoric acid as gypsum. At the same time, the protolytic reaction of the H+ions in the
sulfuric acid forms phosphoric acid: Ca(H2PO4)2 + H2SO4 → CaSO4 + 2H3PO4. In this
respect, it is the H+ions from sulfuric acid that are the real “active ingredient” that
creates phosphoric acid (H3PO4) from the phosphate (PO43-).
Ion-Exchange: The remaining metals, such as magnesium, aluminium and iron, are then
removed using a very selective ion exchange resin. A metal salt solution is created by
regenerating the ion exchangers with acids (HCl).
Technical report of the Phos4You partnership on processes to recover P from wastewater Page n°52
Evaporation: During the final phase, the phosphoric acid (now with low metal content) is
concentrated to 75 %, in a vacuum evaporator.
The TetraPhos® process described generates an industrial quality phosphoric acid
(trademark: REPACID®), which is suitable for use in industrial applications.
3.1.3.1.2 Pre-trials
Preliminary lab scale tests were conducted using SSAs with different phosphorus
content (3-6 % P) to assess phosphorus extraction behaviour. In the pre-trials, three SSA
(#1, 2, 3, Table 3.1.5) of varying quality were tested (Table 3.1.4).
The following objectives were pursued in the laboratory-scale preliminary tests:
• Selection of SSA quality for the subsequent demonstration tests from the three
SSA samples provided;
• Identification of process parameters and operating settings for the selected SSA
quality as a basis for the subsequent demonstration test;
• Characterisation of the various SSA samples in comparison with historical data
(report monitoring german SSIPs in 2012 and 2013 (Krüger and Adam 2014) to
determine if the available samples are representative for the SSIP;
• Investigation of effects due to coal-based sewage sludge conditioning practiced in
Bottrop on the properties of the resulting SSA.
After characterising SSA samples as well as coal mixture used for sewage sludge
conditioning in Bottrop, the process stage of elution in the TetraPhos® process was
simulated with the SSAs on a laboratory scale. In addition to determining the
phosphorus release (target: >80 % of phosphorus) the release of selected metals was
considered as an important partial aspect. In addition, the filtration properties of the
suspension of acid and SSA were of central importance. During the elution tests, the
elution parameters were varied individually in order to determine the optimum
parameter set for the respective sample.
Conclusions on the pre-trials
In order to check the filtration properties in advance, a particle size separation was also
carried out. Here, no significant difference between the studied SSAs and no negative
effect on the filtration process from particle size were identified.
In order to gain preliminary knowledge on the influence of coal conditioning, the
incineration residue of black and brown coal was investigated. The following things were
learned:
Technical report of the Phos4You partnership on processes to recover P from wastewater Page n°53
• The P content of coal SSA was below the detection limit;
• The coal conditioned SSA (SSA#2) carried a higher aluminium, sulfur, and
magnesium content than the unconditioned SSA (SSA#3).
With all three SSAs, a successful elution investigation was conducted by varying different
elution parameters. After optimising the specific parameter sets, the following results
(REMONDIS Aqua Industrie GmbH & Co.KG. 2018) were obtained:
EGLV SSAs have a low phosphorus content compared to German municipal SSA. The
influence of the higher portion of industrial wastewater of external industrial sludges
especially in the sample from Lünen (SSA#1) is clearly recognisable. Typical mineral
phases like whitlockite, quartz, hematite, and aluminium phosphate were identified.
Calcium sulfate-anhydride was found in the SSA#1 sample.
• For all three SSAs, the future legal requirement of >80 % recovery of phosphorus
will be met, and in some cases significantly exceeded.
• From a technical point of view, the coal conditioning is not a problem for the
recovery of the resulting residue with the TetraPhos® process.
• From an economic point of view, the coal conditioning must be removed in order
to prevent a reduction of P-content.
• The high industrial influence, especially in the SSA#1 from Lünen (lower P-
content and higher Ca-content through external industrial sludges), is technically
manageable but should be kept to a minimum to improve the profitability of the
process.
Considering future changes to the EGLV sewage sludge strategy, it was decided to carry
out a pre-industrial scale demonstration with the SSA from Bottrop without coal
conditioning (SSA#3).
3.1.3.1.3 Pre-industrial demonstration
Following the lab scale tests, the TetraPhos® pilot plant (Figure 3.1.6) located in Werdohl-
Elverlingsen (capacity 50-100 kg SSA/h) (Blöhse and Herr 2018) was operated for several
months processing one EGLV SSA type. Operation of the demonstrator proved stability
of the process with high and constant quality of the produced acid.
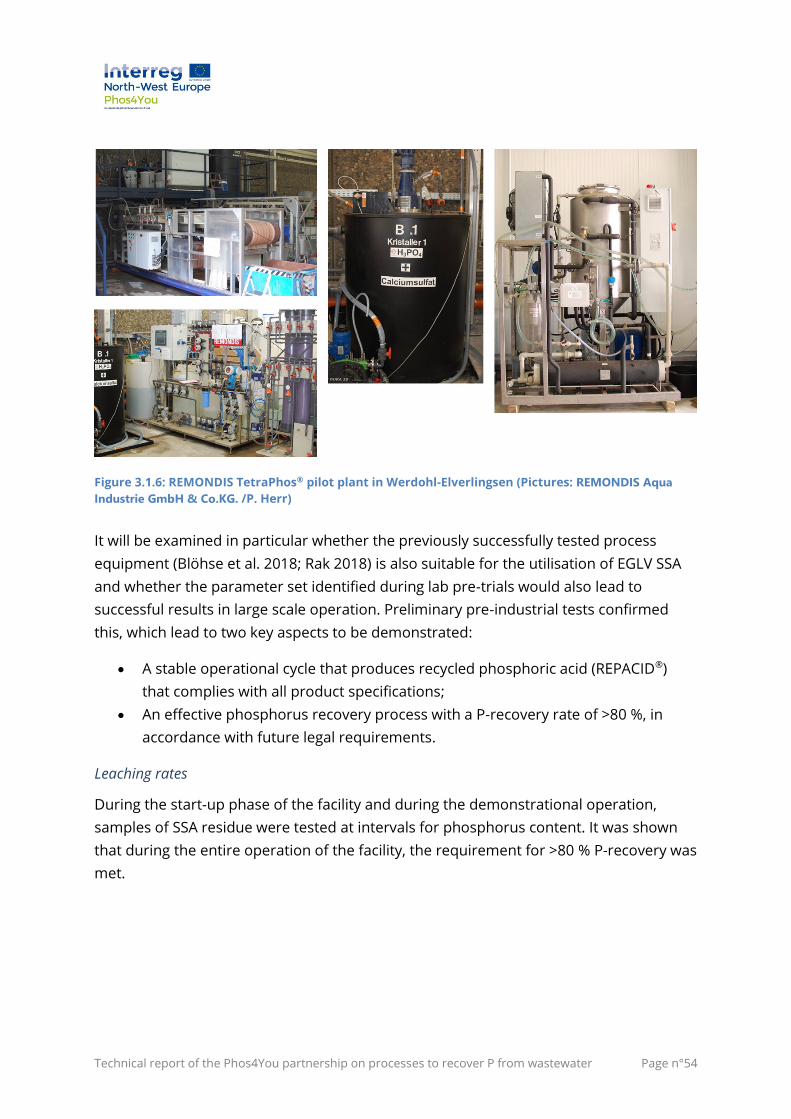
Technical report of the Phos4You partnership on processes to recover P from wastewater Page n°54
Figure 3.1.6: REMONDIS TetraPhos® pilot plant in Werdohl-Elverlingsen (Pictures: REMONDIS Aqua
Industrie GmbH & Co.KG. /P. Herr)
It will be examined in particular whether the previously successfully tested process
equipment (Blöhse et al. 2018; Rak 2018) is also suitable for the utilisation of EGLV SSA
and whether the parameter set identified during lab pre-trials would also lead to
successful results in large scale operation. Preliminary pre-industrial tests confirmed
this, which lead to two key aspects to be demonstrated:
• A stable operational cycle that produces recycled phosphoric acid (REPACID®)
that complies with all product specifications;
• An effective phosphorus recovery process with a P-recovery rate of >80 %, in
accordance with future legal requirements.
Leaching rates
During the start-up phase of the facility and during the demonstrational operation,
samples of SSA residue were tested at intervals for phosphorus content. It was shown
that during the entire operation of the facility, the requirement for >80 % P-recovery was
met.
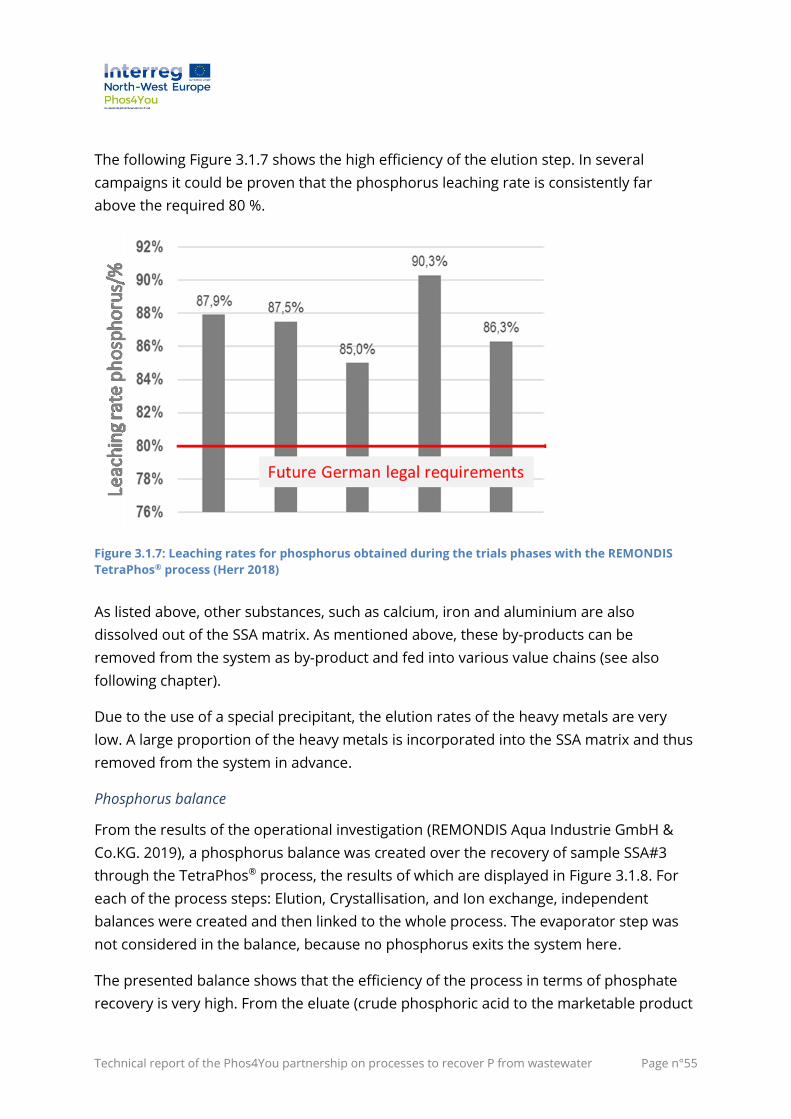
Technical report of the Phos4You partnership on processes to recover P from wastewater Page n°55
The following Figure 3.1.7 shows the high efficiency of the elution step. In several
campaigns it could be proven that the phosphorus leaching rate is consistently far
above the required 80 %.
Figure 3.1.7: Leaching rates for phosphorus obtained during the trials phases with the REMONDIS
TetraPhos® process (Herr 2018)
As listed above, other substances, such as calcium, iron and aluminium are also
dissolved out of the SSA matrix. As mentioned above, these by-products can be
removed from the system as by-product and fed into various value chains (see also
following chapter).
Due to the use of a special precipitant, the elution rates of the heavy metals are very
low. A large proportion of the heavy metals is incorporated into the SSA matrix and thus
removed from the system in advance.
Phosphorus balance
From the results of the operational investigation (REMONDIS Aqua Industrie GmbH &
Co.KG. 2019), a phosphorus balance was created over the recovery of sample SSA#3
through the TetraPhos® process, the results of which are displayed in Figure 3.1.8. For
each of the process steps: Elution, Crystallisation, and Ion exchange, independent
balances were created and then linked to the whole process. The evaporator step was
not considered in the balance, because no phosphorus exits the system here.
The presented balance shows that the efficiency of the process in terms of phosphate
recovery is very high. From the eluate (crude phosphoric acid to the marketable product
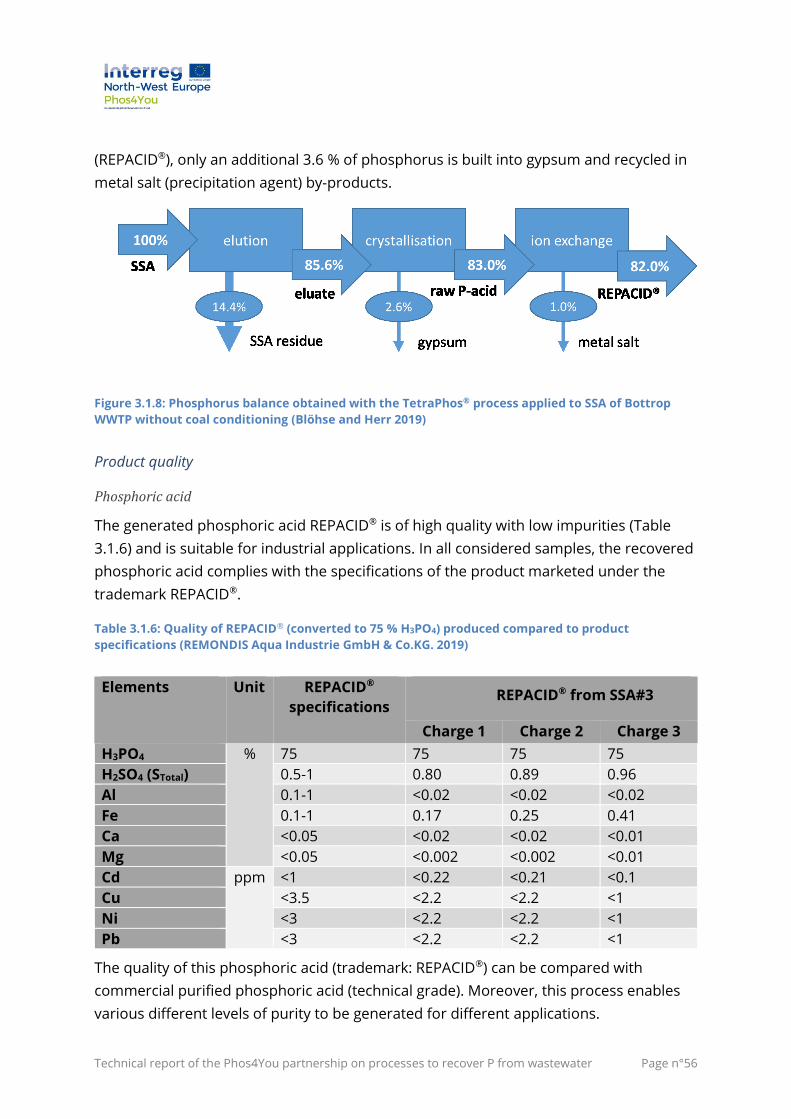
Technical report of the Phos4You partnership on processes to recover P from wastewater Page n°56
(REPACID®), only an additional 3.6 % of phosphorus is built into gypsum and recycled in
metal salt (precipitation agent) by-products.
Figure 3.1.8: Phosphorus balance obtained with the TetraPhos® process applied to SSA of Bottrop
WWTP without coal conditioning (Blöhse and Herr 2019)
Product quality
Phosphoric acid
The generated phosphoric acid REPACID® is of high quality with low impurities (Table
3.1.6) and is suitable for industrial applications. In all considered samples, the recovered
phosphoric acid complies with the specifications of the product marketed under the
trademark REPACID®.
Table 3.1.6: Quality of REPACID® (converted to 75 % H3PO4) produced compared to product
specifications (REMONDIS Aqua Industrie GmbH & Co.KG. 2019)
Elements Unit REPACID®
specifications REPACID® from SSA#3
Charge 1 Charge 2 Charge 3
H3PO4 % 75 75 75 75
H2SO4 (STotal) 0.5-1 0.80 0.89 0.96
Al 0.1-1 <0.02 <0.02 <0.02
Fe 0.1-1 0.17 0.25 0.41
Ca <0.05 <0.02 <0.02 <0.01
Mg <0.05 <0.002 <0.002 <0.01
Cd ppm <1 <0.22 <0.21 <0.1
Cu <3.5 <2.2 <2.2 <1
Ni <3 <2.2 <2.2 <1
Pb <3 <2.2 <2.2 <1
The quality of this phosphoric acid (trademark: REPACID®) can be compared with
commercial purified phosphoric acid (technical grade). Moreover, this process enables
various different levels of purity to be generated for different applications.
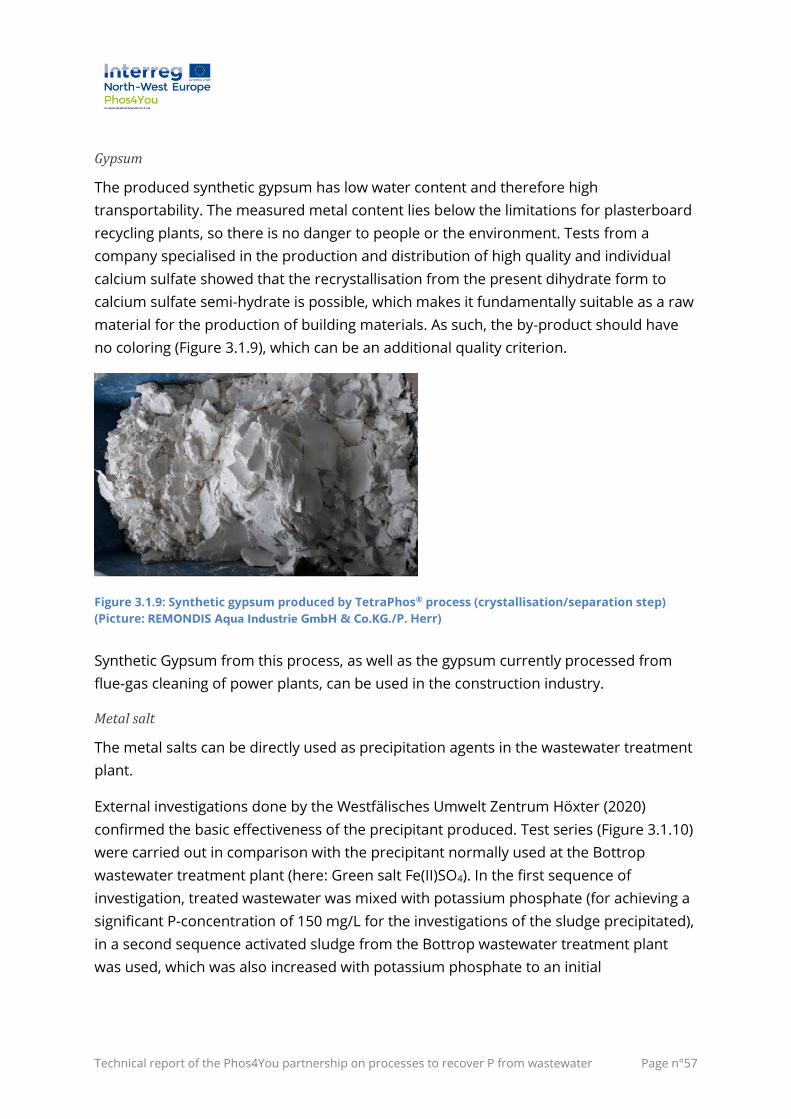
Technical report of the Phos4You partnership on processes to recover P from wastewater Page n°57
Gypsum
The produced synthetic gypsum has low water content and therefore high
transportability. The measured metal content lies below the limitations for plasterboard
recycling plants, so there is no danger to people or the environment. Tests from a
company specialised in the production and distribution of high quality and individual
calcium sulfate showed that the recrystallisation from the present dihydrate form to
calcium sulfate semi-hydrate is possible, which makes it fundamentally suitable as a raw
material for the production of building materials. As such, the by-product should have
no coloring (Figure 3.1.9), which can be an additional quality criterion.
Figure 3.1.9: Synthetic gypsum produced by TetraPhos® process (crystallisation/separation step)
(Picture: REMONDIS Aqua Industrie GmbH & Co.KG./P. Herr)
Synthetic Gypsum from this process, as well as the gypsum currently processed from
flue-gas cleaning of power plants, can be used in the construction industry.
Metal salt
The metal salts can be directly used as precipitation agents in the wastewater treatment
plant.
External investigations done by the Westfälisches Umwelt Zentrum Höxter (2020)
confirmed the basic effectiveness of the precipitant produced. Test series (Figure 3.1.10)
were carried out in comparison with the precipitant normally used at the Bottrop
wastewater treatment plant (here: Green salt Fe(II)SO4). In the first sequence of
investigation, treated wastewater was mixed with potassium phosphate (for achieving a
significant P-concentration of 150 mg/L for the investigations of the sludge precipitated),
in a second sequence activated sludge from the Bottrop wastewater treatment plant
was used, which was also increased with potassium phosphate to an initial
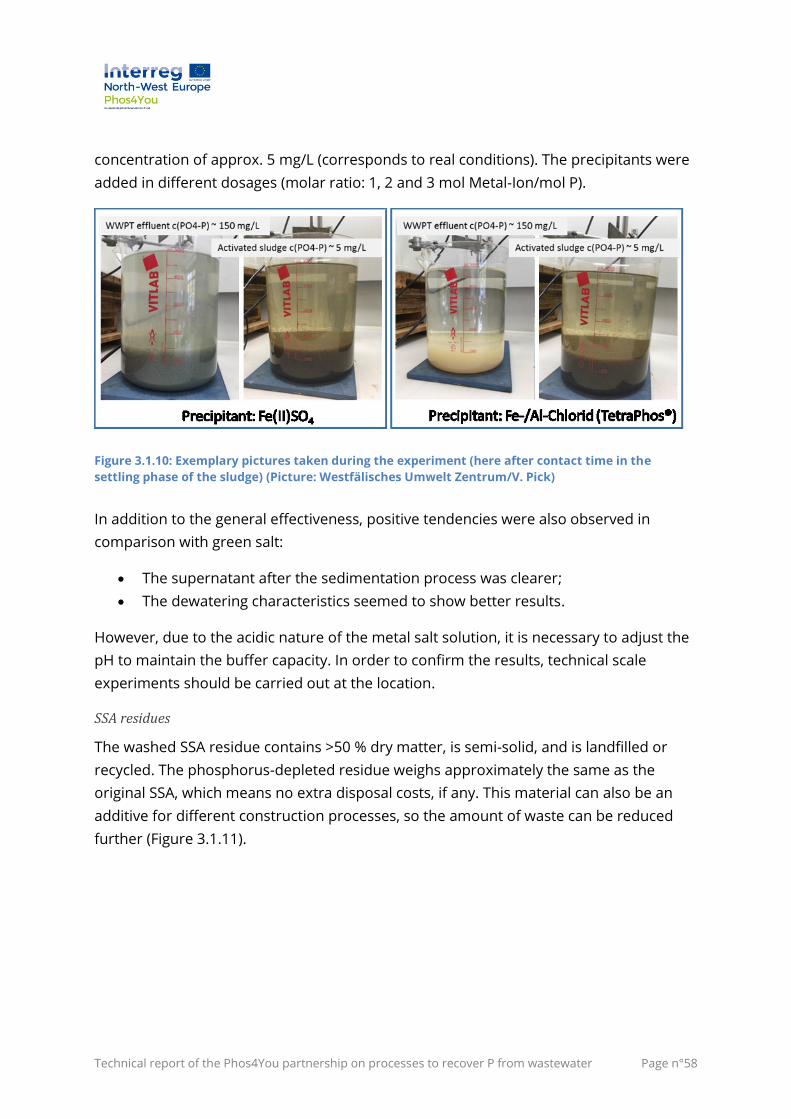
Technical report of the Phos4You partnership on processes to recover P from wastewater Page n°58
concentration of approx. 5 mg/L (corresponds to real conditions). The precipitants were
added in different dosages (molar ratio: 1, 2 and 3 mol Metal-Ion/mol P).
Figure 3.1.10: Exemplary pictures taken during the experiment (here after contact time in the
settling phase of the sludge) (Picture: Westfälisches Umwelt Zentrum/V. Pick)
In addition to the general effectiveness, positive tendencies were also observed in
comparison with green salt:
• The supernatant after the sedimentation process was clearer;
• The dewatering characteristics seemed to show better results.
However, due to the acidic nature of the metal salt solution, it is necessary to adjust the
pH to maintain the buffer capacity. In order to confirm the results, technical scale
experiments should be carried out at the location.
SSA residues
The washed SSA residue contains >50 % dry matter, is semi-solid, and is landfilled or
recycled. The phosphorus-depleted residue weighs approximately the same as the
original SSA, which means no extra disposal costs, if any. This material can also be an
additive for different construction processes, so the amount of waste can be reduced
further (Figure 3.1.11).
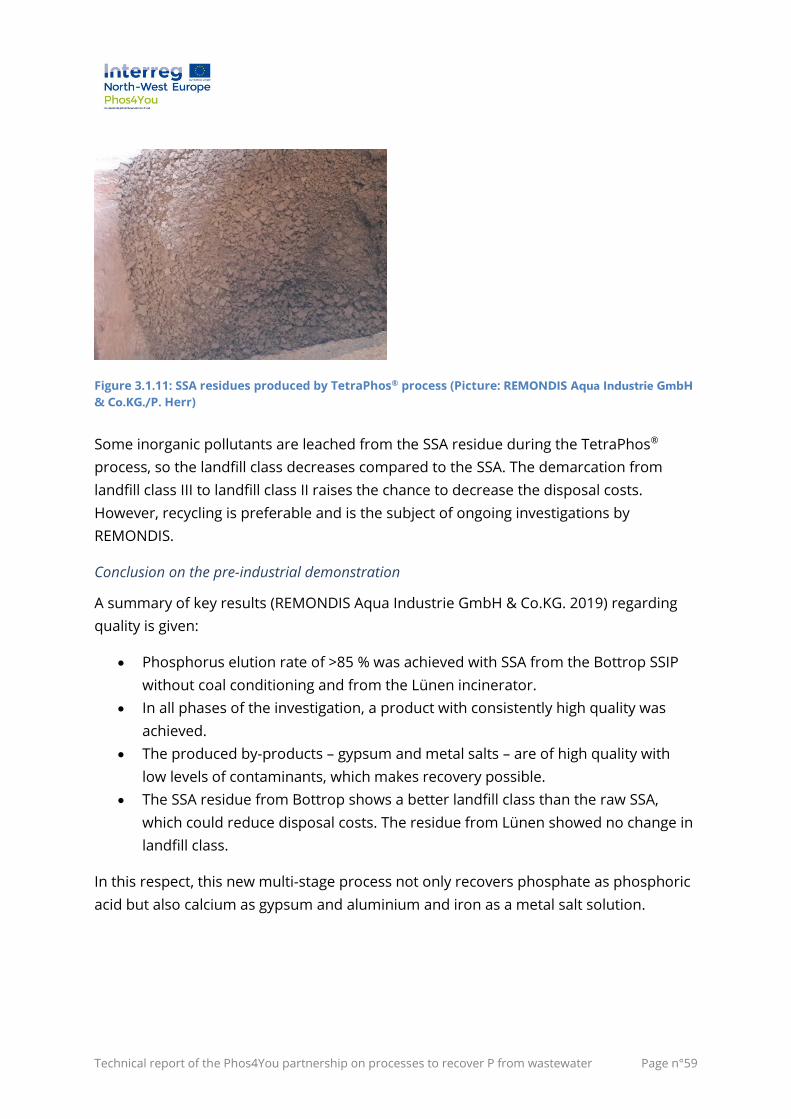
Technical report of the Phos4You partnership on processes to recover P from wastewater Page n°59
Figure 3.1.11: SSA residues produced by TetraPhos® process (Picture: REMONDIS Aqua Industrie GmbH
& Co.KG./P. Herr)
Some inorganic pollutants are leached from the SSA residue during the TetraPhos®
process, so the landfill class decreases compared to the SSA. The demarcation from
landfill class III to landfill class II raises the chance to decrease the disposal costs.
However, recycling is preferable and is the subject of ongoing investigations by
REMONDIS.
Conclusion on the pre-industrial demonstration
A summary of key results (REMONDIS Aqua Industrie GmbH & Co.KG. 2019) regarding
quality is given:
• Phosphorus elution rate of >85 % was achieved with SSA from the Bottrop SSIP
without coal conditioning and from the Lünen incinerator.
• In all phases of the investigation, a product with consistently high quality was
achieved.
• The produced by-products – gypsum and metal salts – are of high quality with
low levels of contaminants, which makes recovery possible.
• The SSA residue from Bottrop shows a better landfill class than the raw SSA,
which could reduce disposal costs. The residue from Lünen showed no change in
landfill class.
In this respect, this new multi-stage process not only recovers phosphate as phosphoric
acid but also calcium as gypsum and aluminium and iron as a metal salt solution.
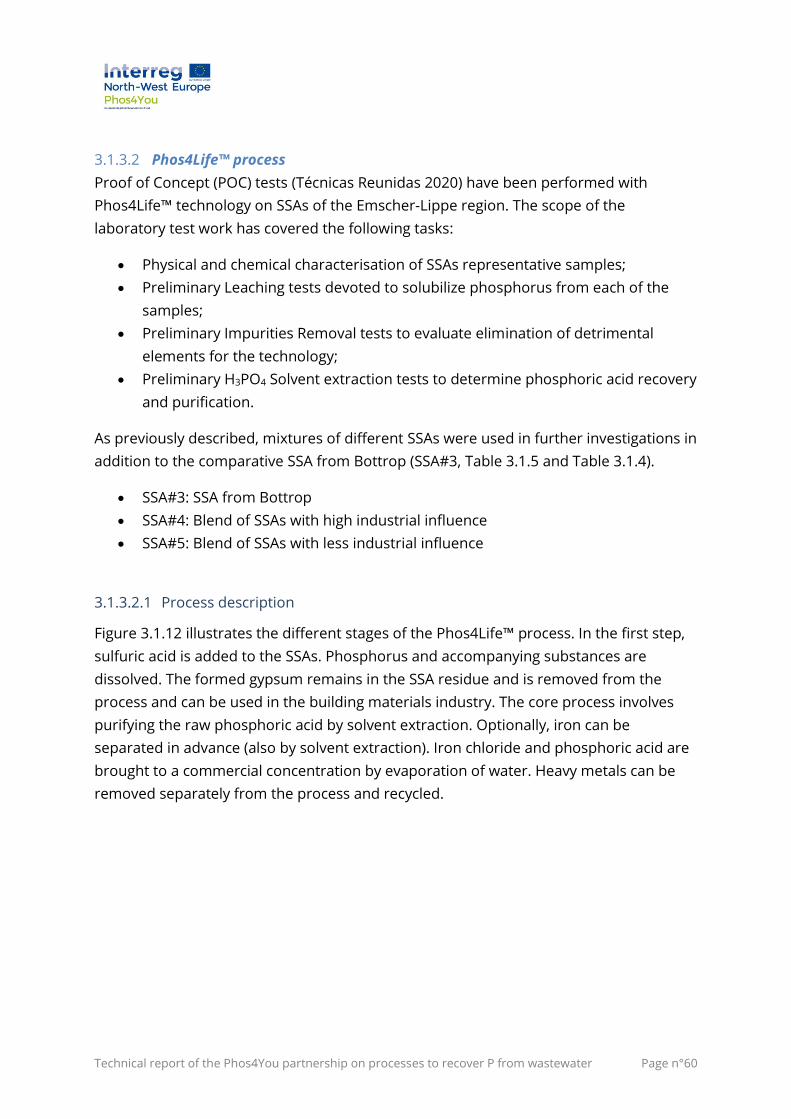
Technical report of the Phos4You partnership on processes to recover P from wastewater Page n°60
3.1.3.2 Phos4Life™ process
Proof of Concept (POC) tests (Técnicas Reunidas 2020) have been performed with
Phos4Life™ technology on SSAs of the Emscher-Lippe region. The scope of the
laboratory test work has covered the following tasks:
• Physical and chemical characterisation of SSAs representative samples;
• Preliminary Leaching tests devoted to solubilize phosphorus from each of the
samples;
• Preliminary Impurities Removal tests to evaluate elimination of detrimental
elements for the technology;
• Preliminary H3PO4 Solvent extraction tests to determine phosphoric acid recovery
and purification.
As previously described, mixtures of different SSAs were used in further investigations in
addition to the comparative SSA from Bottrop (SSA#3, Table 3.1.5 and Table 3.1.4).
• SSA#3: SSA from Bottrop
• SSA#4: Blend of SSAs with high industrial influence
• SSA#5: Blend of SSAs with less industrial influence
3.1.3.2.1 Process description
Figure 3.1.12 illustrates the different stages of the Phos4Life™ process. In the first step,
sulfuric acid is added to the SSAs. Phosphorus and accompanying substances are
dissolved. The formed gypsum remains in the SSA residue and is removed from the
process and can be used in the building materials industry. The core process involves
purifying the raw phosphoric acid by solvent extraction. Optionally, iron can be
separated in advance (also by solvent extraction). Iron chloride and phosphoric acid are
brought to a commercial concentration by evaporation of water. Heavy metals can be
removed separately from the process and recycled.
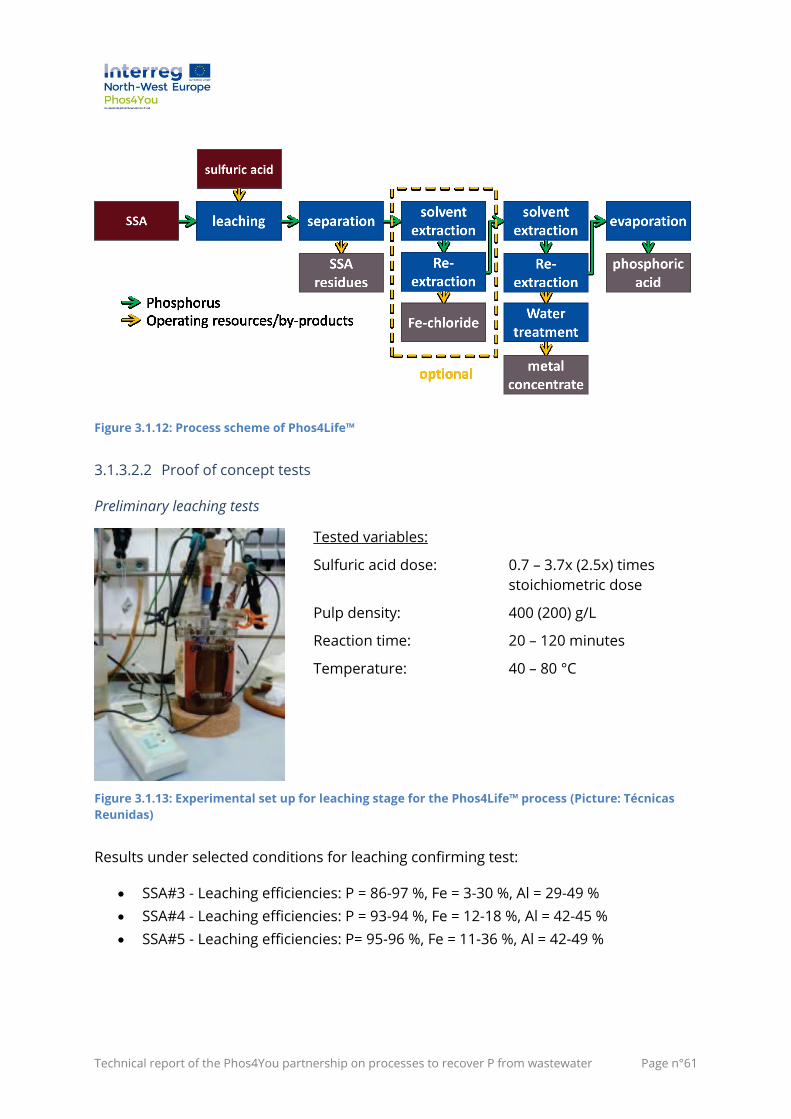
Technical report of the Phos4You partnership on processes to recover P from wastewater Page n°61
Figure 3.1.12: Process scheme of Phos4Life™
3.1.3.2.2 Proof of concept tests
Preliminary leaching tests
Tested variables:
Sulfuric acid dose: 0.7 – 3.7x (2.5x) times
stoichiometric dose
Pulp density: 400 (200) g/L
Reaction time: 20 – 120 minutes
Temperature: 40 – 80 °C
Figure 3.1.13: Experimental set up for leaching stage for the Phos4Life™ process (Picture: Técnicas
Reunidas)
Results under selected conditions for leaching confirming test:
• SSA#3 - Leaching efficiencies: P = 86-97 %, Fe = 3-30 %, Al = 29-49 %
• SSA#4 - Leaching efficiencies: P = 93-94 %, Fe = 12-18 %, Al = 42-45 %
• SSA#5 - Leaching efficiencies: P= 95-96 %, Fe = 11-36 %, Al = 42-49 %
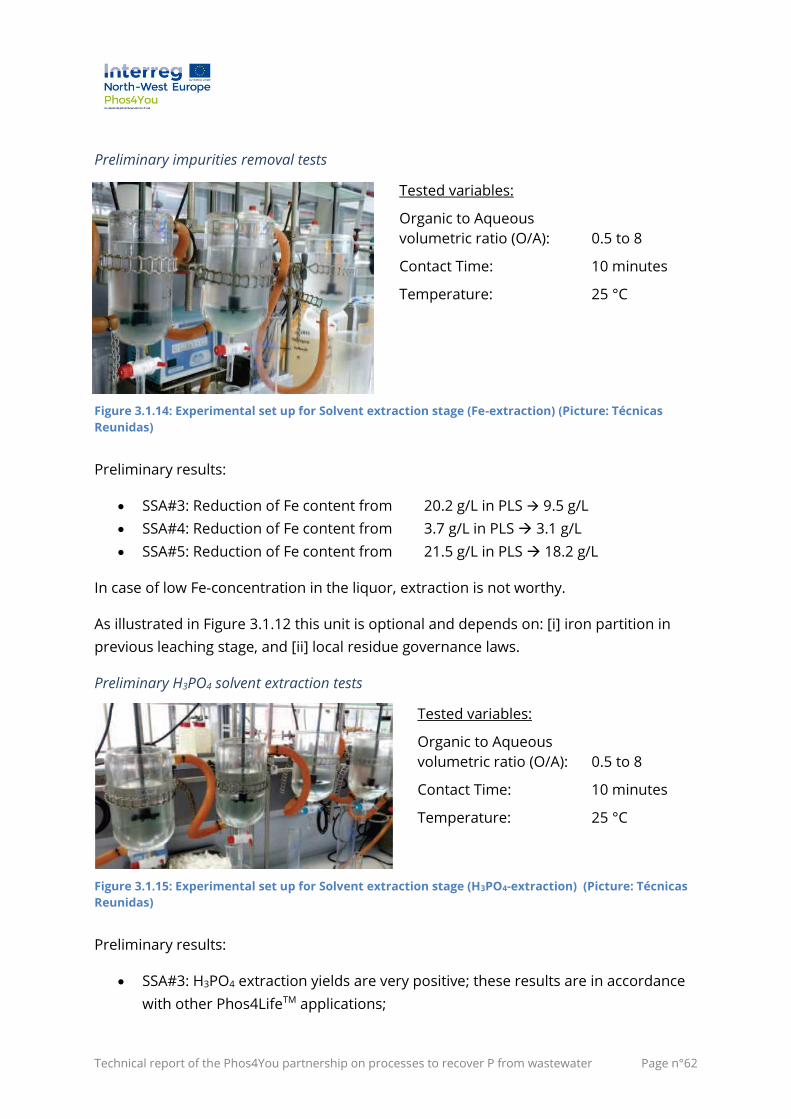
Technical report of the Phos4You partnership on processes to recover P from wastewater Page n°62
Preliminary impurities removal tests
Tested variables:
Organic to Aqueous
volumetric ratio (O/A):
0.5 to 8
Contact Time: 10 minutes
Temperature: 25 °C
Figure 3.1.14: Experimental set up for Solvent extraction stage (Fe-extraction) (Picture: Técnicas
Reunidas)
Preliminary results:
• SSA#3: Reduction of Fe content from 20.2 g/L in PLS → 9.5 g/L
• SSA#4: Reduction of Fe content from 3.7 g/L in PLS → 3.1 g/L
• SSA#5: Reduction of Fe content from 21.5 g/L in PLS → 18.2 g/L
In case of low Fe-concentration in the liquor, extraction is not worthy.
As illustrated in Figure 3.1.12 this unit is optional and depends on: [i] iron partition in
previous leaching stage, and [ii] local residue governance laws.
Preliminary H3PO4 solvent extraction tests
Tested variables:
Organic to Aqueous
volumetric ratio (O/A):
0.5 to 8
Contact Time: 10 minutes
Temperature: 25 °C
Figure 3.1.15: Experimental set up for Solvent extraction stage (H3PO4-extraction) (Picture: Técnicas
Reunidas)
Preliminary results:
• SSA#3: H3PO4 extraction yields are very positive; these results are in accordance
with other Phos4LifeTM applications;
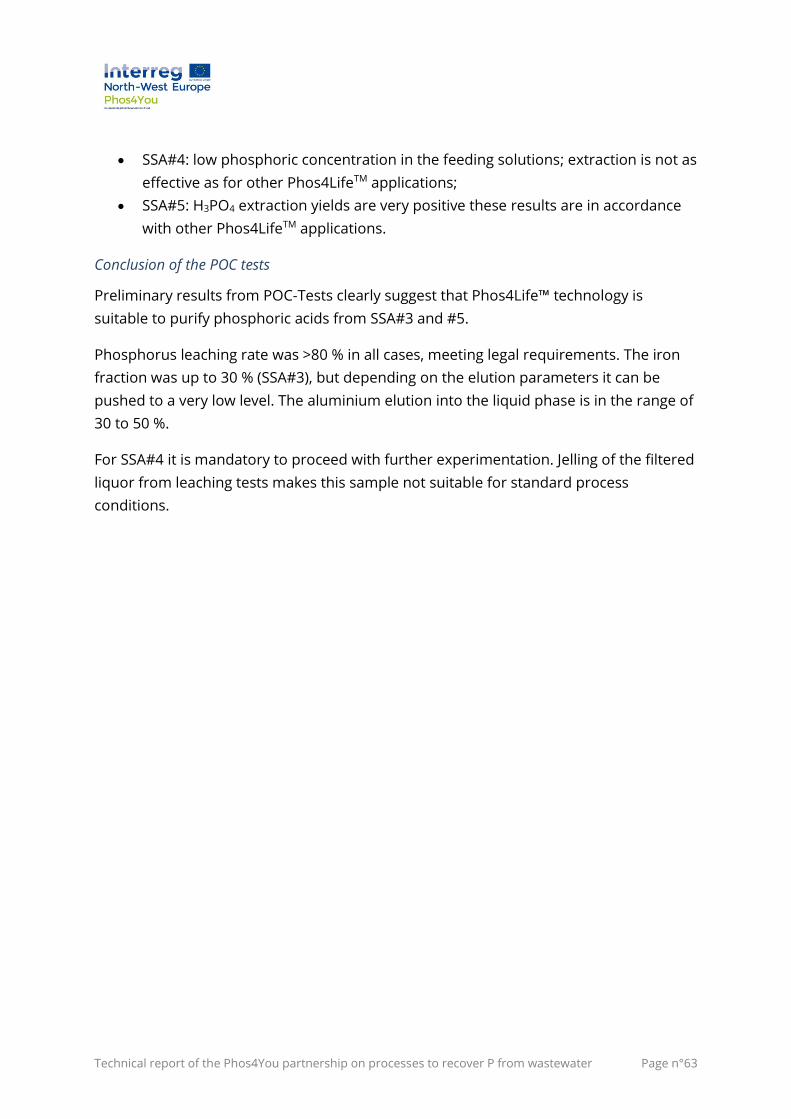
Technical report of the Phos4You partnership on processes to recover P from wastewater Page n°63
• SSA#4: low phosphoric concentration in the feeding solutions; extraction is not as
effective as for other Phos4LifeTM applications;
• SSA#5: H3PO4 extraction yields are very positive these results are in accordance
with other Phos4LifeTM applications.
Conclusion of the POC tests
Preliminary results from POC-Tests clearly suggest that Phos4Life™ technology is
suitable to purify phosphoric acids from SSA#3 and #5.
Phosphorus leaching rate was >80 % in all cases, meeting legal requirements. The iron
fraction was up to 30 % (SSA#3), but depending on the elution parameters it can be
pushed to a very low level. The aluminium elution into the liquid phase is in the range of
30 to 50 %.
For SSA#4 it is mandatory to proceed with further experimentation. Jelling of the filtered
liquor from leaching tests makes this sample not suitable for standard process
conditions.
Technical report of the Phos4You partnership on processes to recover P from wastewater Page n°64
3.1.3.3 PARFORCE process
In the lab-tests and in the pilot demonstration, all the main process steps shown in the
process diagrams below (Figure 3.1.16 and Figure 3.1.20) were tested. The project also
includes the determination of material flows, of chemical and energy consumption as
well as the qualified estimation of investment and operating costs for the recovery of
phosphoric acid with the PARFORCE process from three SSA samples provided by the
Lippeverband.
Analogous to the "Phos4Life™" POC tests (3.1.3.2), three different samples, SSA#3 (SSA
Bottrop without coal conditioning), SSA#4 (SSA blend with high industrial influence) and
SSA#5 (SSA blend with low industrial influence), were used (Table 3.1.5 and Table 3.1.4).
3.1.3.3.1 Lab-tests
Process description for lab-tests
Figure 3.1.16 illustrates the different stages of the PARFORCE process during the lab-
tests. In the first step, diluted hydrochloric acid is added to the SSA to elute the
phosphorus (approx. 15 % HCl). Analogous to the other processes described, the SSA
residue is then separated and the eluate (crude phosphoric acid) is further processed.
Following the wet solid separation, the iron fraction is first separated from the eluate by
solvent extraction. In this process, portions of the dissolved phosphorus are also
transferred to the extractant. To minimize P losses, the co-extracted P fraction is
selectively separated in a first re-extraction step and returned to the process. In the
second re-extraction step, the iron fraction is selectively separated and discharged as
iron sulfate (by-product).
This is followed by further purification of the crude phosphoric acid by electrodialysis. In
this process, one and two valent ions such as calcium and magnesium as well as most
toxic heavy metal ions are selectively separated from the crude phosphoric acid. The
separated concentrate stream is neutralized and precipitated by-products, including
phosphorus, are returned to the process. After neutralization, a Ca-/Na-chloride solution
is produced, which can be used directly as a brine or, after evaporation as a road salt, or
as a de-icing agent in winter.
The diluate stream (phosphoric acid) is brought to marketable concentrations by
evaporation. The resulting phosphoric acid basically meets the quality requirements of
the fertiliser industry. Further processing steps can be integrated to produce a higher-
grade (technical grade acid) product.
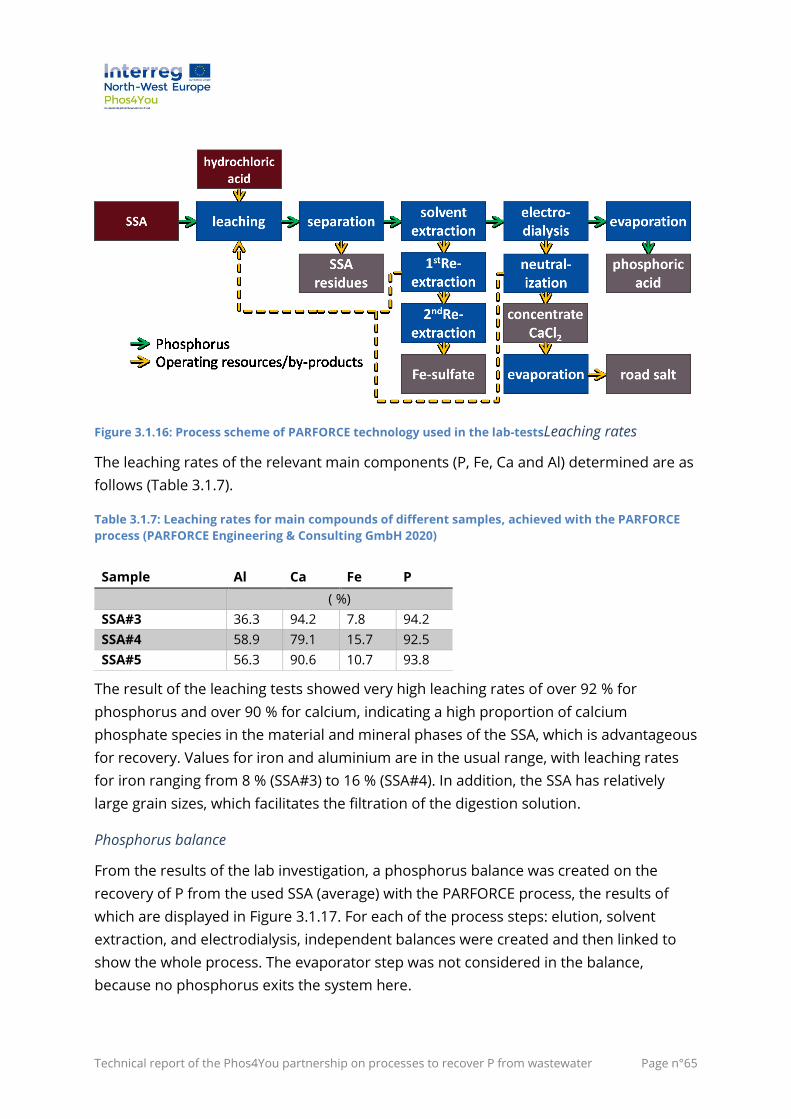
Technical report of the Phos4You partnership on processes to recover P from wastewater Page n°65
Figure 3.1.16: Process scheme of PARFORCE technology used in the lab-testsLeaching rates
The leaching rates of the relevant main components (P, Fe, Ca and Al) determined are as
follows (Table 3.1.7).
Table 3.1.7: Leaching rates for main compounds of different samples, achieved with the PARFORCE
process (PARFORCE Engineering & Consulting GmbH 2020)
Sample Al Ca Fe P
( %)
SSA#3 36.3 94.2 7.8 94.2
SSA#4 58.9 79.1 15.7 92.5
SSA#5 56.3 90.6 10.7 93.8
The result of the leaching tests showed very high leaching rates of over 92 % for
phosphorus and over 90 % for calcium, indicating a high proportion of calcium
phosphate species in the material and mineral phases of the SSA, which is advantageous
for recovery. Values for iron and aluminium are in the usual range, with leaching rates
for iron ranging from 8 % (SSA#3) to 16 % (SSA#4). In addition, the SSA has relatively
large grain sizes, which facilitates the filtration of the digestion solution.
Phosphorus balance
From the results of the lab investigation, a phosphorus balance was created on the
recovery of P from the used SSA (average) with the PARFORCE process, the results of
which are displayed in Figure 3.1.17. For each of the process steps: elution, solvent
extraction, and electrodialysis, independent balances were created and then linked to
show the whole process. The evaporator step was not considered in the balance,
because no phosphorus exits the system here.
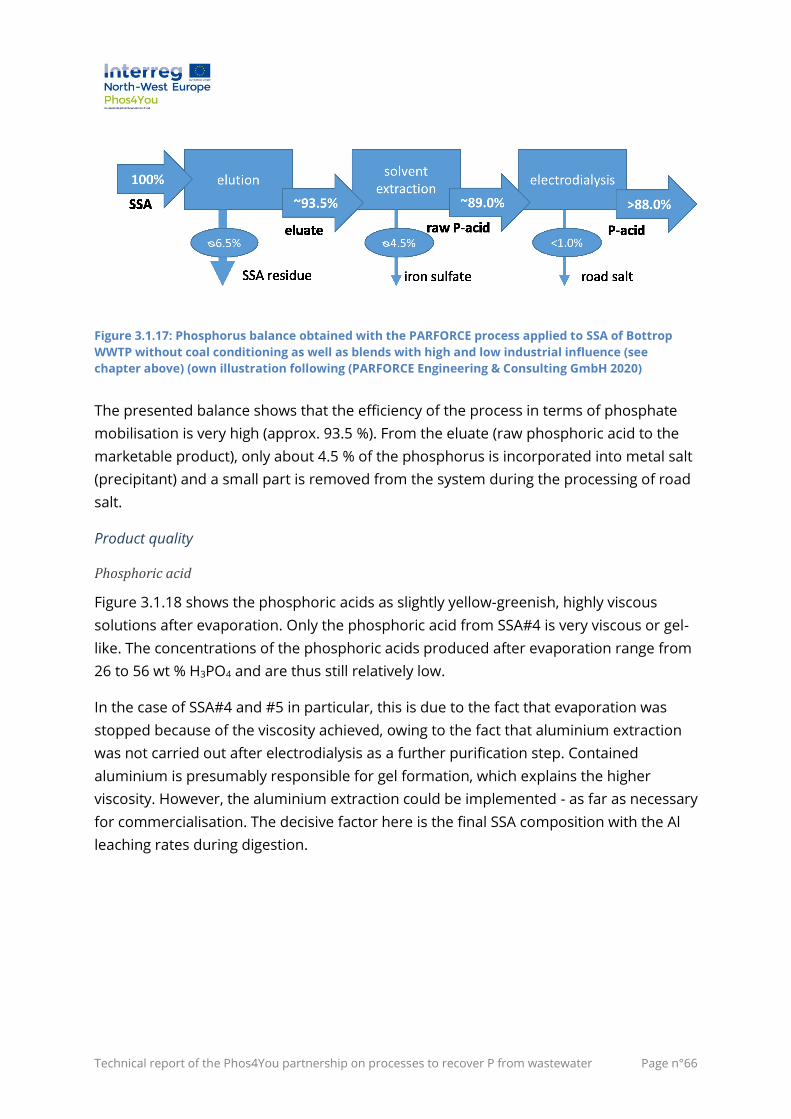
Technical report of the Phos4You partnership on processes to recover P from wastewater Page n°66
Figure 3.1.17: Phosphorus balance obtained with the PARFORCE process applied to SSA of Bottrop
WWTP without coal conditioning as well as blends with high and low industrial influence (see
chapter above) (own illustration following (PARFORCE Engineering & Consulting GmbH 2020)
The presented balance shows that the efficiency of the process in terms of phosphate
mobilisation is very high (approx. 93.5 %). From the eluate (raw phosphoric acid to the
marketable product), only about 4.5 % of the phosphorus is incorporated into metal salt
(precipitant) and a small part is removed from the system during the processing of road
salt.
Product quality
Phosphoric acid
Figure 3.1.18 shows the phosphoric acids as slightly yellow-greenish, highly viscous
solutions after evaporation. Only the phosphoric acid from SSA#4 is very viscous or gel-
like. The concentrations of the phosphoric acids produced after evaporation range from
26 to 56 wt % H3PO4 and are thus still relatively low.
In the case of SSA#4 and #5 in particular, this is due to the fact that evaporation was
stopped because of the viscosity achieved, owing to the fact that aluminium extraction
was not carried out after electrodialysis as a further purification step. Contained
aluminium is presumably responsible for gel formation, which explains the higher
viscosity. However, the aluminium extraction could be implemented - as far as necessary
for commercialisation. The decisive factor here is the final SSA composition with the Al
leaching rates during digestion.
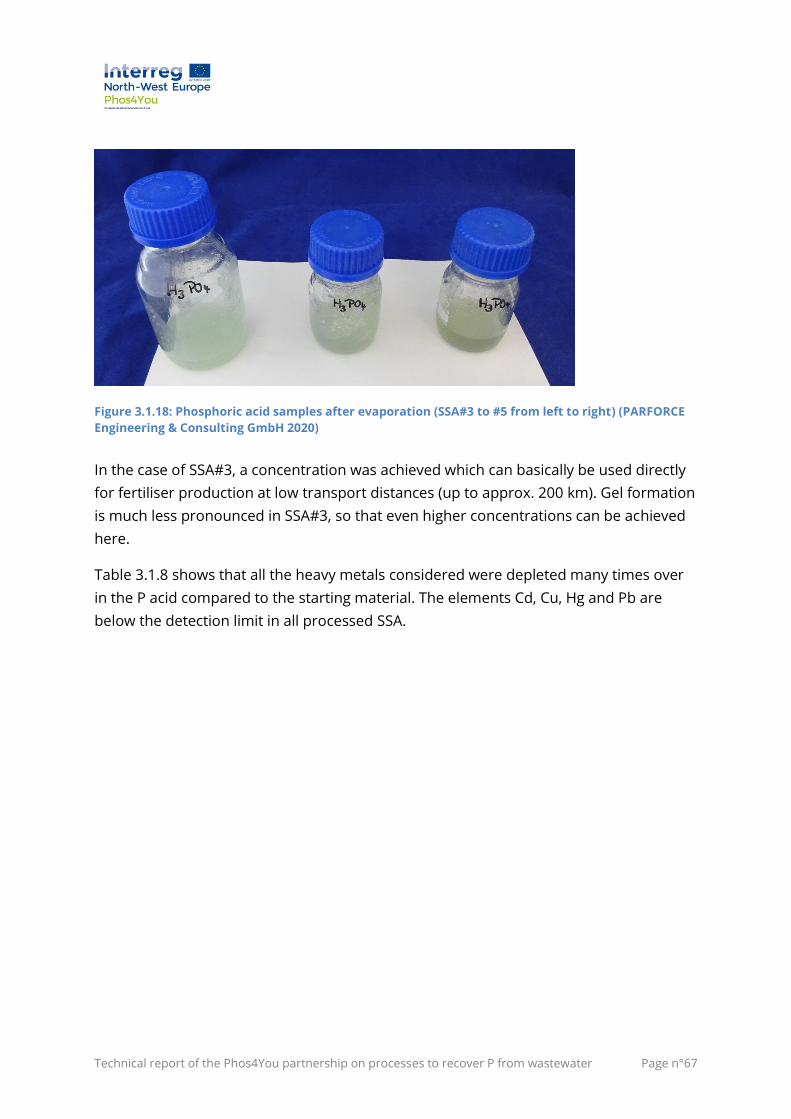
Technical report of the Phos4You partnership on processes to recover P from wastewater Page n°67
Figure 3.1.18: Phosphoric acid samples after evaporation (SSA#3 to #5 from left to right) (PARFORCE
Engineering & Consulting GmbH 2020)
In the case of SSA#3, a concentration was achieved which can basically be used directly
for fertiliser production at low transport distances (up to approx. 200 km). Gel formation
is much less pronounced in SSA#3, so that even higher concentrations can be achieved
here.
Table 3.1.8 shows that all the heavy metals considered were depleted many times over
in the P acid compared to the starting material. The elements Cd, Cu, Hg and Pb are
below the detection limit in all processed SSA.
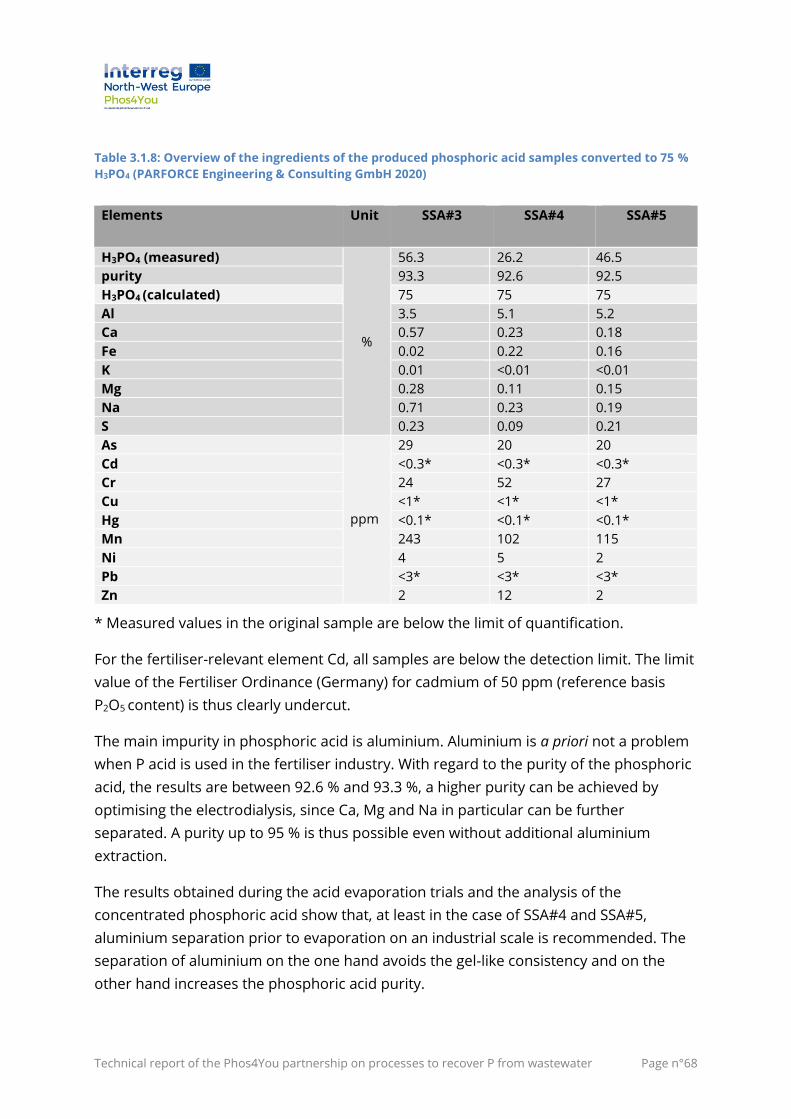
Technical report of the Phos4You partnership on processes to recover P from wastewater Page n°68
Table 3.1.8: Overview of the ingredients of the produced phosphoric acid samples converted to 75 %
H3PO4 (PARFORCE Engineering & Consulting GmbH 2020)
Elements Unit SSA#3 SSA#4 SSA#5
H3PO4 (measured)
%
56.3 26.2 46.5
purity 93.3 92.6 92.5
H3PO4 (calculated) 75 75 75
Al 3.5 5.1 5.2
Ca 0.57 0.23 0.18
Fe 0.02 0.22 0.16
K 0.01 <0.01 <0.01
Mg 0.28 0.11 0.15
Na 0.71 0.23 0.19
S 0.23 0.09 0.21
As
ppm
29 20 20
Cd <0.3* <0.3* <0.3*
Cr 24 52 27
Cu <1* <1* <1*
Hg <0.1* <0.1* <0.1*
Mn 243 102 115
Ni 4 5 2
Pb <3* <3* <3*
Zn 2 12 2
* Measured values in the original sample are below the limit of quantification.
For the fertiliser-relevant element Cd, all samples are below the detection limit. The limit
value of the Fertiliser Ordinance (Germany) for cadmium of 50 ppm (reference basis
P2O5 content) is thus clearly undercut.
The main impurity in phosphoric acid is aluminium. Aluminium is a priori not a problem
when P acid is used in the fertiliser industry. With regard to the purity of the phosphoric
acid, the results are between 92.6 % and 93.3 %, a higher purity can be achieved by
optimising the electrodialysis, since Ca, Mg and Na in particular can be further
separated. A purity up to 95 % is thus possible even without additional aluminium
extraction.
The results obtained during the acid evaporation trials and the analysis of the
concentrated phosphoric acid show that, at least in the case of SSA#4 and SSA#5,
aluminium separation prior to evaporation on an industrial scale is recommended. The
separation of aluminium on the one hand avoids the gel-like consistency and on the
other hand increases the phosphoric acid purity.
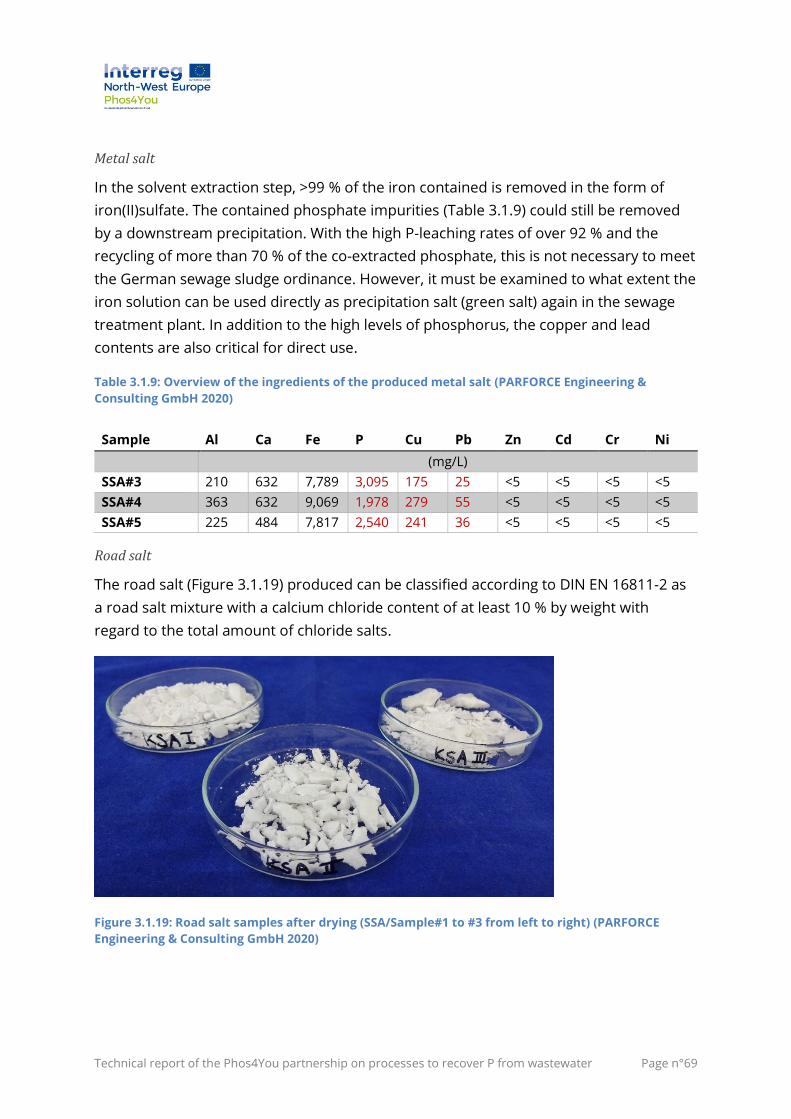
Technical report of the Phos4You partnership on processes to recover P from wastewater Page n°69
Metal salt
In the solvent extraction step, >99 % of the iron contained is removed in the form of
iron(II)sulfate. The contained phosphate impurities (Table 3.1.9) could still be removed
by a downstream precipitation. With the high P-leaching rates of over 92 % and the
recycling of more than 70 % of the co-extracted phosphate, this is not necessary to meet
the German sewage sludge ordinance. However, it must be examined to what extent the
iron solution can be used directly as precipitation salt (green salt) again in the sewage
treatment plant. In addition to the high levels of phosphorus, the copper and lead
contents are also critical for direct use.
Table 3.1.9: Overview of the ingredients of the produced metal salt (PARFORCE Engineering &
Consulting GmbH 2020)
Sample Al Ca Fe P Cu Pb Zn Cd Cr Ni
(mg/L)
SSA#3 210 632 7,789 3,095 175 25 <5 <5 <5 <5
SSA#4 363 632 9,069 1,978 279 55 <5 <5 <5 <5
SSA#5 225 484 7,817 2,540 241 36 <5 <5 <5 <5
Road salt
The road salt (Figure 3.1.19) produced can be classified according to DIN EN 16811-2 as
a road salt mixture with a calcium chloride content of at least 10 % by weight with
regard to the total amount of chloride salts.
Figure 3.1.19: Road salt samples after drying (SSA/Sample#1 to #3 from left to right) (PARFORCE
Engineering & Consulting GmbH 2020)
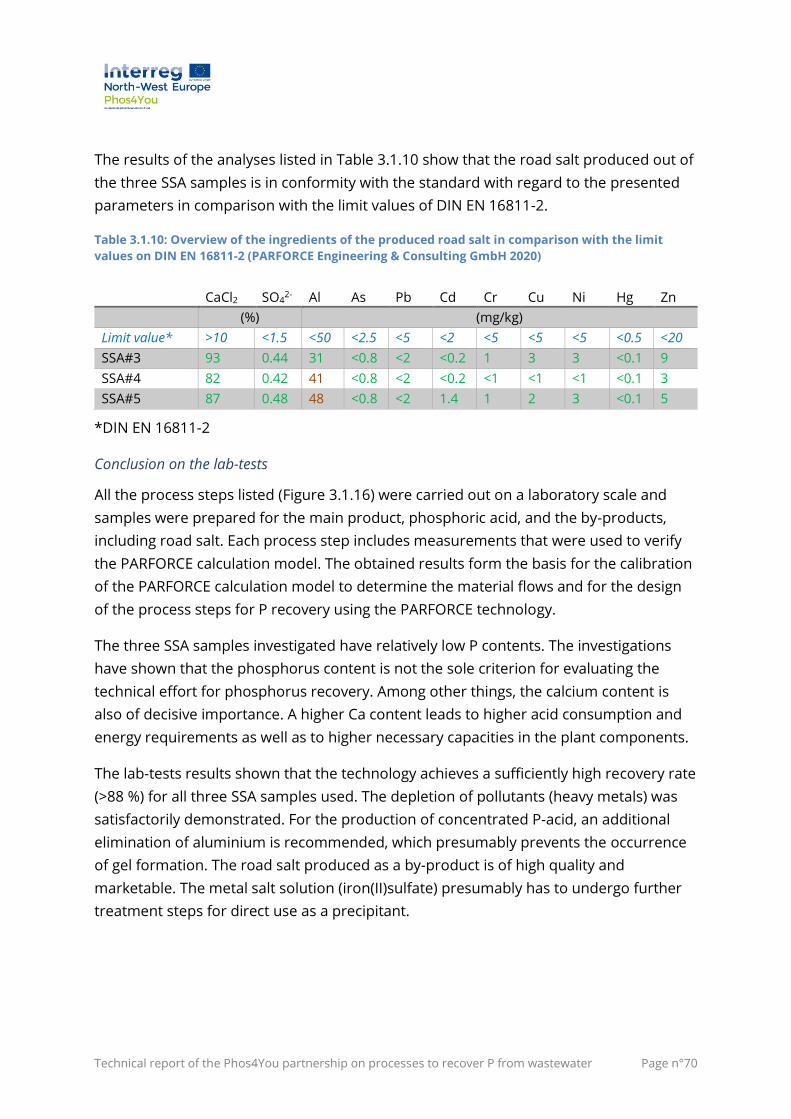
Technical report of the Phos4You partnership on processes to recover P from wastewater Page n°70
The results of the analyses listed in Table 3.1.10 show that the road salt produced out of
the three SSA samples is in conformity with the standard with regard to the presented
parameters in comparison with the limit values of DIN EN 16811-2.
Table 3.1.10: Overview of the ingredients of the produced road salt in comparison with the limit
values on DIN EN 16811-2 (PARFORCE Engineering & Consulting GmbH 2020)
CaCl2 SO4
2- Al As Pb Cd Cr Cu Ni Hg Zn (%) (mg/kg)
Limit value* >10 <1.5 <50 <2.5 <5 <2 <5 <5 <5 <0.5 <20
SSA#3 93 0.44 31 <0.8 <2 <0.2 1 3 3 <0.1 9
SSA#4 82 0.42 41 <0.8 <2 <0.2 <1 <1 <1 <0.1 3
SSA#5 87 0.48 48 <0.8 <2 1.4 1 2 3 <0.1 5
*DIN EN 16811-2
Conclusion on the lab-tests
All the process steps listed (Figure 3.1.16) were carried out on a laboratory scale and
samples were prepared for the main product, phosphoric acid, and the by-products,
including road salt. Each process step includes measurements that were used to verify
the PARFORCE calculation model. The obtained results form the basis for the calibration
of the PARFORCE calculation model to determine the material flows and for the design
of the process steps for P recovery using the PARFORCE technology.
The three SSA samples investigated have relatively low P contents. The investigations
have shown that the phosphorus content is not the sole criterion for evaluating the
technical effort for phosphorus recovery. Among other things, the calcium content is
also of decisive importance. A higher Ca content leads to higher acid consumption and
energy requirements as well as to higher necessary capacities in the plant components.
The lab-tests results shown that the technology achieves a sufficiently high recovery rate
(>88 %) for all three SSA samples used. The depletion of pollutants (heavy metals) was
satisfactorily demonstrated. For the production of concentrated P-acid, an additional
elimination of aluminium is recommended, which presumably prevents the occurrence
of gel formation. The road salt produced as a by-product is of high quality and
marketable. The metal salt solution (iron(II)sulfate) presumably has to undergo further
treatment steps for direct use as a precipitant.
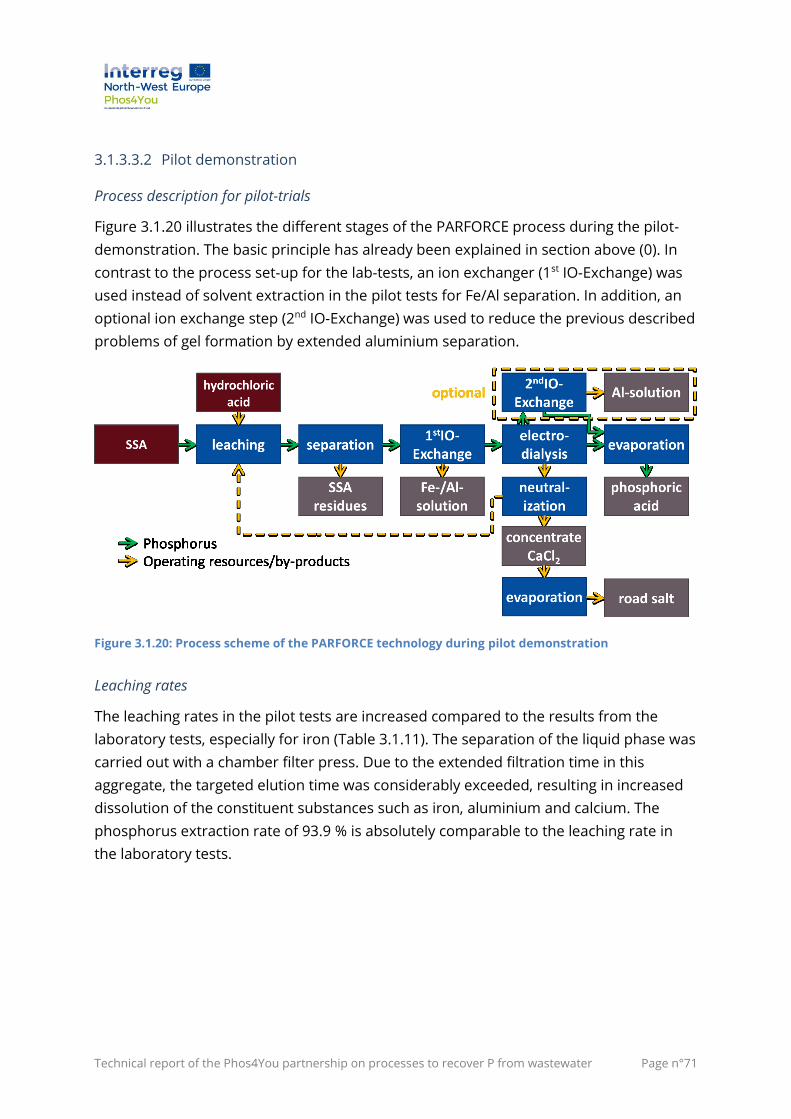
Technical report of the Phos4You partnership on processes to recover P from wastewater Page n°71
3.1.3.3.2 Pilot demonstration
Process description for pilot-trials
Figure 3.1.20 illustrates the different stages of the PARFORCE process during the pilot-
demonstration. The basic principle has already been explained in section above (0). In
contrast to the process set-up for the lab-tests, an ion exchanger (1st IO-Exchange) was
used instead of solvent extraction in the pilot tests for Fe/Al separation. In addition, an
optional ion exchange step (2nd IO-Exchange) was used to reduce the previous described
problems of gel formation by extended aluminium separation.
Figure 3.1.20: Process scheme of the PARFORCE technology during pilot demonstration
Leaching rates
The leaching rates in the pilot tests are increased compared to the results from the
laboratory tests, especially for iron (Table 3.1.11). The separation of the liquid phase was
carried out with a chamber filter press. Due to the extended filtration time in this
aggregate, the targeted elution time was considerably exceeded, resulting in increased
dissolution of the constituent substances such as iron, aluminium and calcium. The
phosphorus extraction rate of 93.9 % is absolutely comparable to the leaching rate in
the laboratory tests.
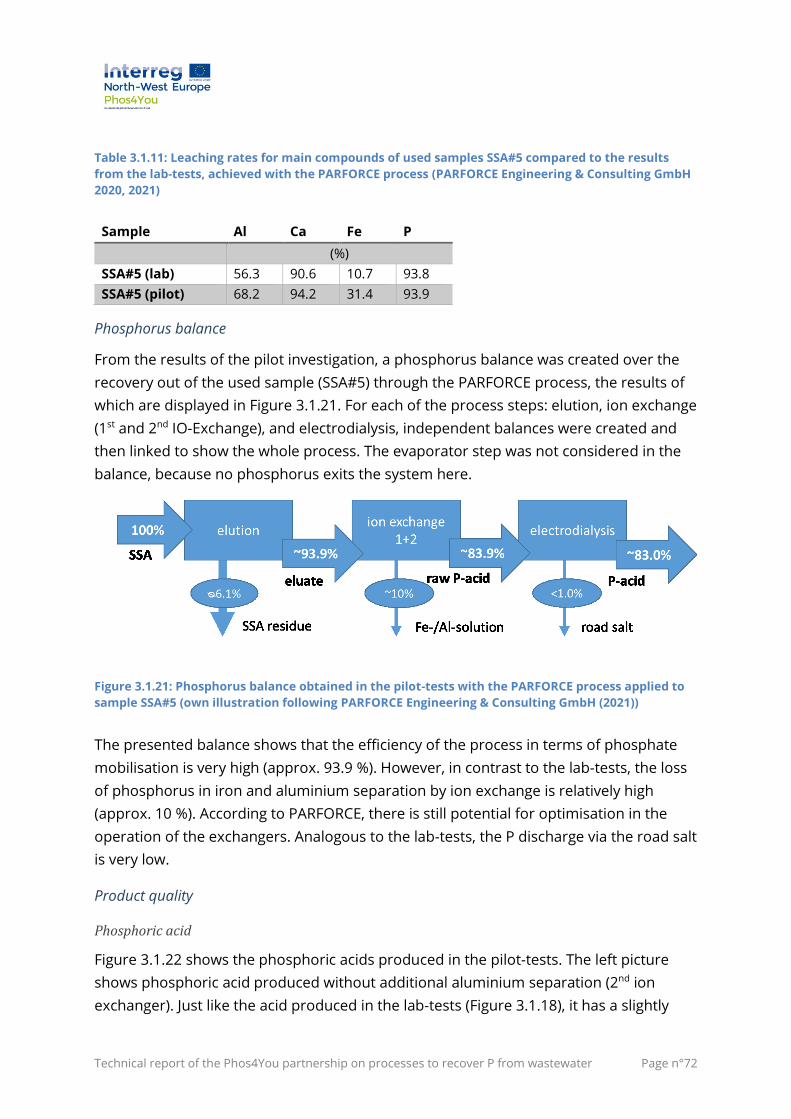
Technical report of the Phos4You partnership on processes to recover P from wastewater Page n°72
Table 3.1.11: Leaching rates for main compounds of used samples SSA#5 compared to the results
from the lab-tests, achieved with the PARFORCE process (PARFORCE Engineering & Consulting GmbH
2020, 2021)
Sample Al Ca Fe P
(%)
SSA#5 (lab) 56.3 90.6 10.7 93.8
SSA#5 (pilot) 68.2 94.2 31.4 93.9
Phosphorus balance
From the results of the pilot investigation, a phosphorus balance was created over the
recovery out of the used sample (SSA#5) through the PARFORCE process, the results of
which are displayed in Figure 3.1.21. For each of the process steps: elution, ion exchange
(1st and 2nd IO-Exchange), and electrodialysis, independent balances were created and
then linked to show the whole process. The evaporator step was not considered in the
balance, because no phosphorus exits the system here.
Figure 3.1.21: Phosphorus balance obtained in the pilot-tests with the PARFORCE process applied to
sample SSA#5 (own illustration following PARFORCE Engineering & Consulting GmbH (2021))
The presented balance shows that the efficiency of the process in terms of phosphate
mobilisation is very high (approx. 93.9 %). However, in contrast to the lab-tests, the loss
of phosphorus in iron and aluminium separation by ion exchange is relatively high
(approx. 10 %). According to PARFORCE, there is still potential for optimisation in the
operation of the exchangers. Analogous to the lab-tests, the P discharge via the road salt
is very low.
Product quality
Phosphoric acid
Figure 3.1.22 shows the phosphoric acids produced in the pilot-tests. The left picture
shows phosphoric acid produced without additional aluminium separation (2nd ion
exchanger). Just like the acid produced in the lab-tests (Figure 3.1.18), it has a slightly
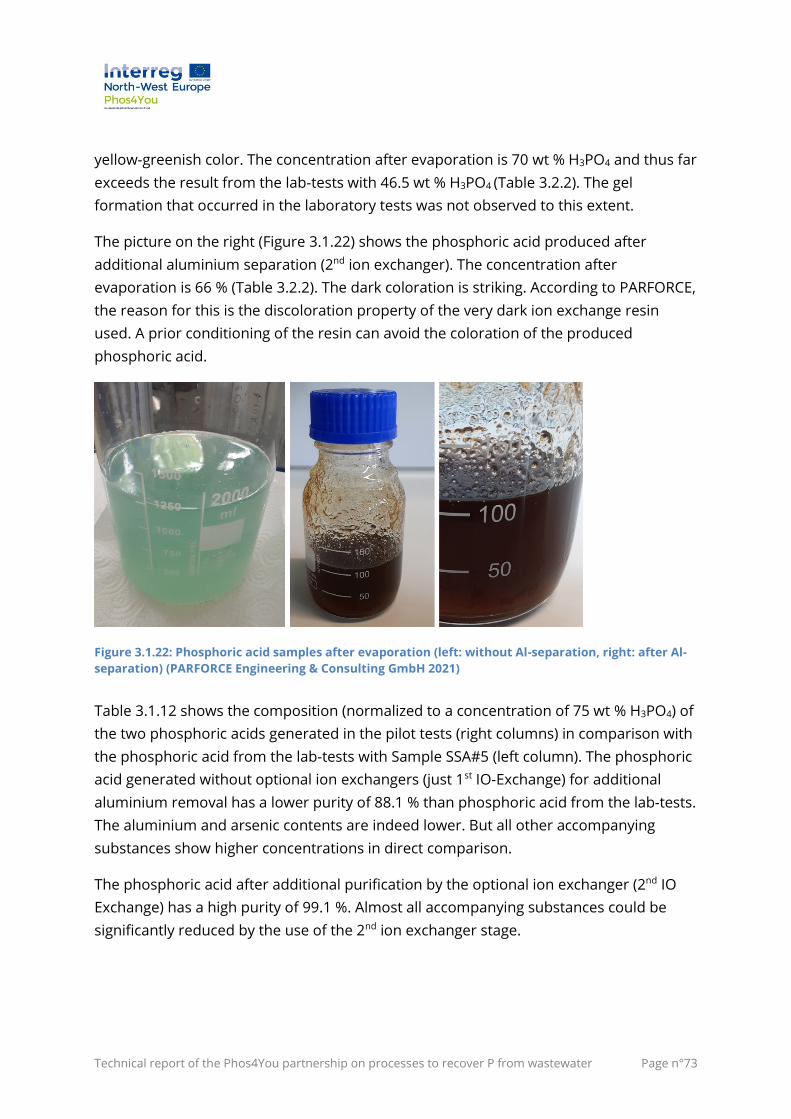
Technical report of the Phos4You partnership on processes to recover P from wastewater Page n°73
yellow-greenish color. The concentration after evaporation is 70 wt % H3PO4 and thus far
exceeds the result from the lab-tests with 46.5 wt % H3PO4 (Table 3.2.2). The gel
formation that occurred in the laboratory tests was not observed to this extent.
The picture on the right (Figure 3.1.22) shows the phosphoric acid produced after
additional aluminium separation (2nd ion exchanger). The concentration after
evaporation is 66 % (Table 3.2.2). The dark coloration is striking. According to PARFORCE,
the reason for this is the discoloration property of the very dark ion exchange resin
used. A prior conditioning of the resin can avoid the coloration of the produced
phosphoric acid.
Figure 3.1.22: Phosphoric acid samples after evaporation (left: without Al-separation, right: after Al-
separation) (PARFORCE Engineering & Consulting GmbH 2021)
Table 3.1.12 shows the composition (normalized to a concentration of 75 wt % H3PO4) of
the two phosphoric acids generated in the pilot tests (right columns) in comparison with
the phosphoric acid from the lab-tests with Sample SSA#5 (left column). The phosphoric
acid generated without optional ion exchangers (just 1st IO-Exchange) for additional
aluminium removal has a lower purity of 88.1 % than phosphoric acid from the lab-tests.
The aluminium and arsenic contents are indeed lower. But all other accompanying
substances show higher concentrations in direct comparison.
The phosphoric acid after additional purification by the optional ion exchanger (2nd IO
Exchange) has a high purity of 99.1 %. Almost all accompanying substances could be
significantly reduced by the use of the 2nd ion exchanger stage.
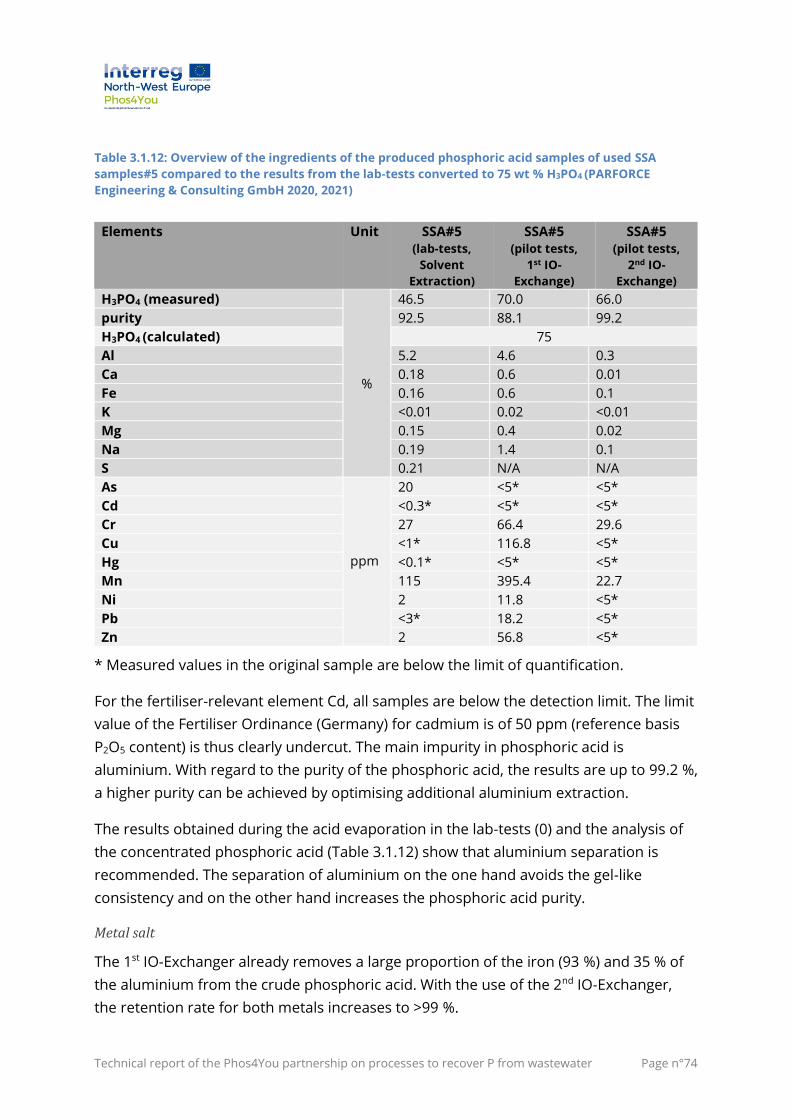
Technical report of the Phos4You partnership on processes to recover P from wastewater Page n°74
Table 3.1.12: Overview of the ingredients of the produced phosphoric acid samples of used SSA
samples#5 compared to the results from the lab-tests converted to 75 wt % H3PO4 (PARFORCE
Engineering & Consulting GmbH 2020, 2021)
Elements Unit SSA#5
(lab-tests,
Solvent
Extraction)
SSA#5
(pilot tests,
1st IO-
Exchange)
SSA#5
(pilot tests,
2nd IO-
Exchange)
H3PO4 (measured)
%
46.5 70.0 66.0
purity 92.5 88.1 99.2
H3PO4 (calculated) 75
Al 5.2 4.6 0.3
Ca 0.18 0.6 0.01
Fe 0.16 0.6 0.1
K <0.01 0.02 <0.01
Mg 0.15 0.4 0.02
Na 0.19 1.4 0.1
S 0.21 N/A N/A
As
ppm
20 <5* <5*
Cd <0.3* <5* <5*
Cr 27 66.4 29.6
Cu <1* 116.8 <5*
Hg <0.1* <5* <5*
Mn 115 395.4 22.7
Ni 2 11.8 <5*
Pb <3* 18.2 <5*
Zn 2 56.8 <5*
* Measured values in the original sample are below the limit of quantification.
For the fertiliser-relevant element Cd, all samples are below the detection limit. The limit
value of the Fertiliser Ordinance (Germany) for cadmium is of 50 ppm (reference basis
P2O5 content) is thus clearly undercut. The main impurity in phosphoric acid is
aluminium. With regard to the purity of the phosphoric acid, the results are up to 99.2 %,
a higher purity can be achieved by optimising additional aluminium extraction.
The results obtained during the acid evaporation in the lab-tests (0) and the analysis of
the concentrated phosphoric acid (Table 3.1.12) show that aluminium separation is
recommended. The separation of aluminium on the one hand avoids the gel-like
consistency and on the other hand increases the phosphoric acid purity.
Metal salt
The 1st IO-Exchanger already removes a large proportion of the iron (93 %) and 35 % of
the aluminium from the crude phosphoric acid. With the use of the 2nd IO-Exchanger,
the retention rate for both metals increases to >99 %.
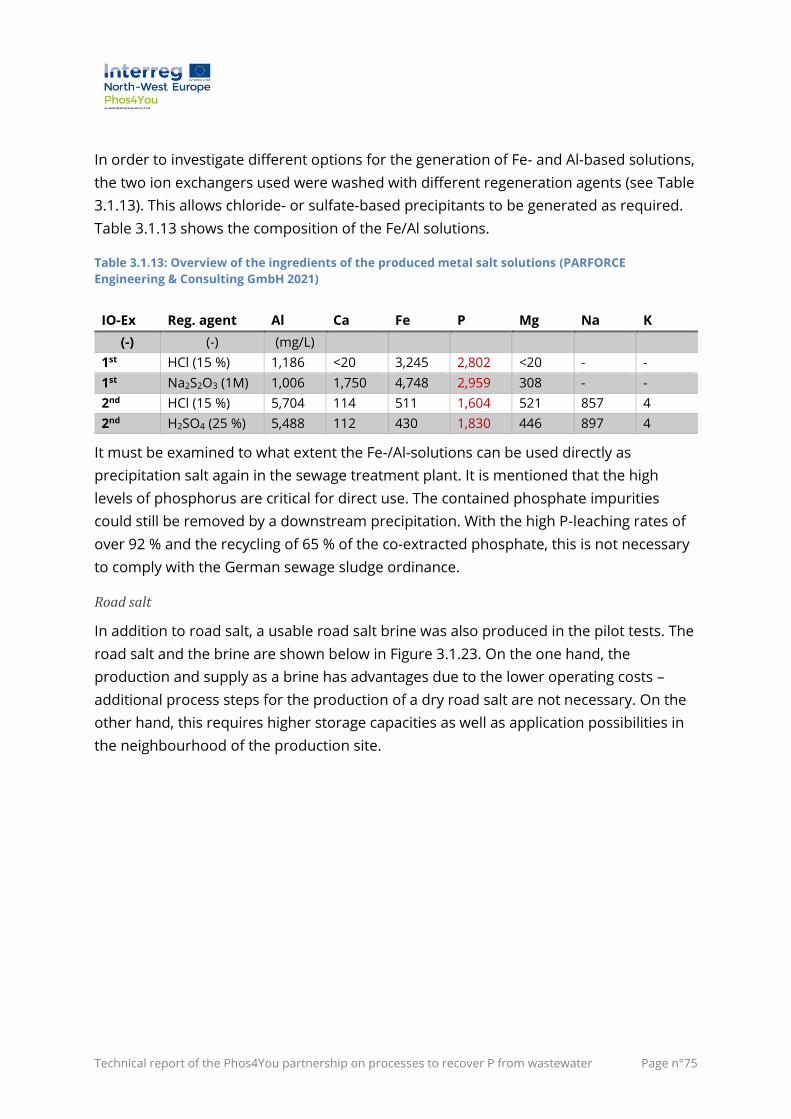
Technical report of the Phos4You partnership on processes to recover P from wastewater Page n°75
In order to investigate different options for the generation of Fe- and Al-based solutions,
the two ion exchangers used were washed with different regeneration agents (see Table
3.1.13). This allows chloride- or sulfate-based precipitants to be generated as required.
Table 3.1.13 shows the composition of the Fe/Al solutions.
Table 3.1.13: Overview of the ingredients of the produced metal salt solutions (PARFORCE
Engineering & Consulting GmbH 2021)
IO-Ex Reg. agent Al Ca Fe P Mg Na K
(-) (-) (mg/L)
1st HCl (15 %) 1,186 <20 3,245 2,802 <20 - -
1st Na2S2O3 (1M) 1,006 1,750 4,748 2,959 308 - -
2nd HCl (15 %) 5,704 114 511 1,604 521 857 4
2nd H2SO4 (25 %) 5,488 112 430 1,830 446 897 4
It must be examined to what extent the Fe-/Al-solutions can be used directly as
precipitation salt again in the sewage treatment plant. It is mentioned that the high
levels of phosphorus are critical for direct use. The contained phosphate impurities
could still be removed by a downstream precipitation. With the high P-leaching rates of
over 92 % and the recycling of 65 % of the co-extracted phosphate, this is not necessary
to comply with the German sewage sludge ordinance.
Road salt
In addition to road salt, a usable road salt brine was also produced in the pilot tests. The
road salt and the brine are shown below in Figure 3.1.23. On the one hand, the
production and supply as a brine has advantages due to the lower operating costs –
additional process steps for the production of a dry road salt are not necessary. On the
other hand, this requires higher storage capacities as well as application possibilities in
the neighbourhood of the production site.
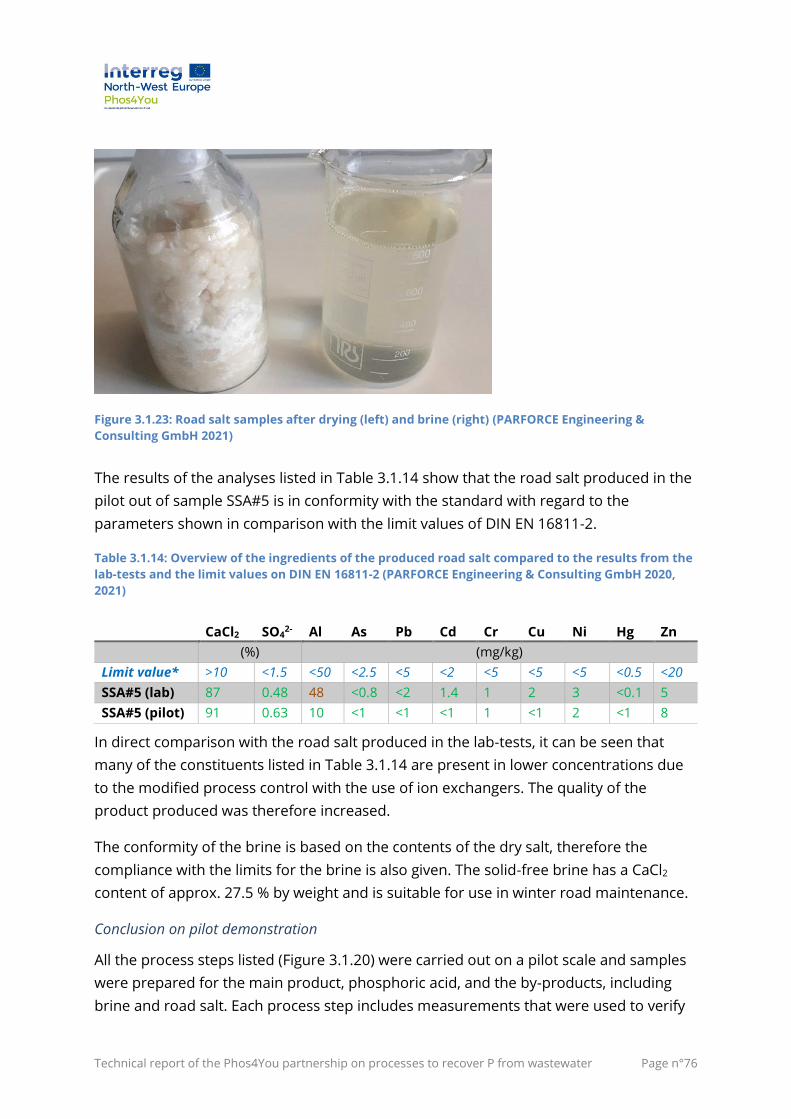
Technical report of the Phos4You partnership on processes to recover P from wastewater Page n°76
Figure 3.1.23: Road salt samples after drying (left) and brine (right) (PARFORCE Engineering &
Consulting GmbH 2021)
The results of the analyses listed in Table 3.1.14 show that the road salt produced in the
pilot out of sample SSA#5 is in conformity with the standard with regard to the
parameters shown in comparison with the limit values of DIN EN 16811-2.
Table 3.1.14: Overview of the ingredients of the produced road salt compared to the results from the
lab-tests and the limit values on DIN EN 16811-2 (PARFORCE Engineering & Consulting GmbH 2020,
2021)
CaCl2 SO4
2- Al As Pb Cd Cr Cu Ni Hg Zn (%) (mg/kg)
Limit value* >10 <1.5 <50 <2.5 <5 <2 <5 <5 <5 <0.5 <20
SSA#5 (lab) 87 0.48 48 <0.8 <2 1.4 1 2 3 <0.1 5
SSA#5 (pilot) 91 0.63 10 <1 <1 <1 1 <1 2 <1 8
In direct comparison with the road salt produced in the lab-tests, it can be seen that
many of the constituents listed in Table 3.1.14 are present in lower concentrations due
to the modified process control with the use of ion exchangers. The quality of the
product produced was therefore increased.
The conformity of the brine is based on the contents of the dry salt, therefore the
compliance with the limits for the brine is also given. The solid-free brine has a CaCl2
content of approx. 27.5 % by weight and is suitable for use in winter road maintenance.
Conclusion on pilot demonstration
All the process steps listed (Figure 3.1.20) were carried out on a pilot scale and samples
were prepared for the main product, phosphoric acid, and the by-products, including
brine and road salt. Each process step includes measurements that were used to verify
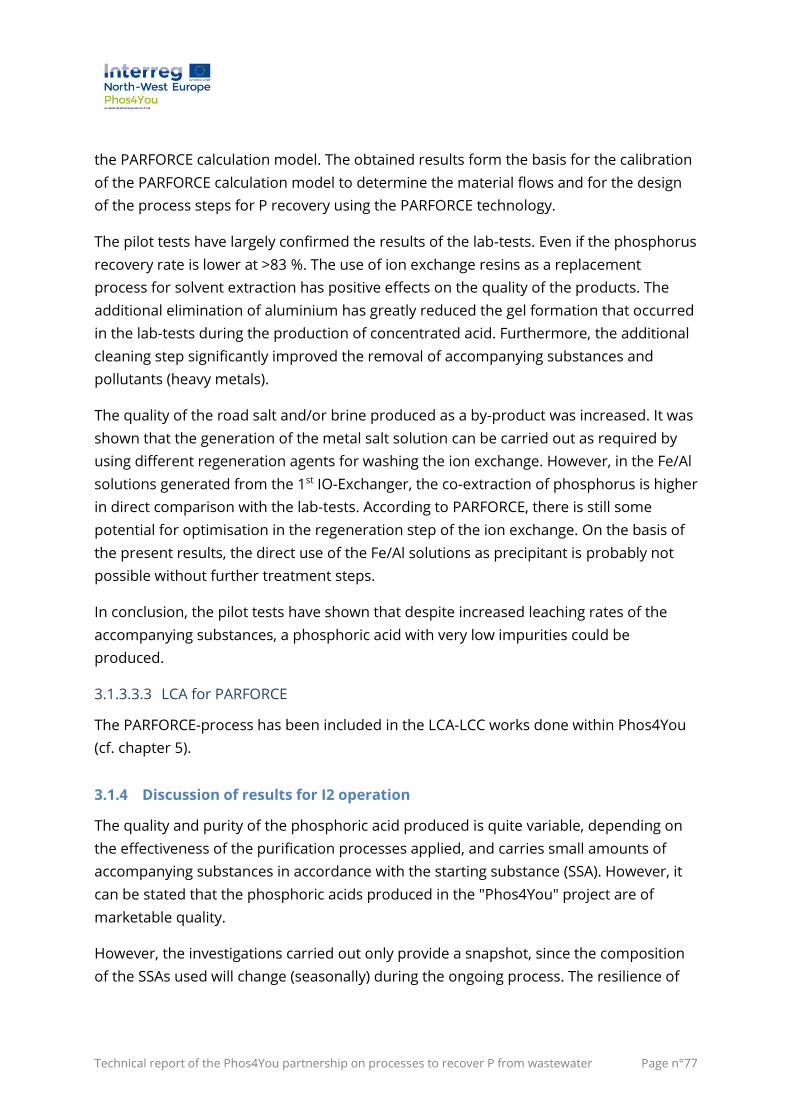
Technical report of the Phos4You partnership on processes to recover P from wastewater Page n°77
the PARFORCE calculation model. The obtained results form the basis for the calibration
of the PARFORCE calculation model to determine the material flows and for the design
of the process steps for P recovery using the PARFORCE technology.
The pilot tests have largely confirmed the results of the lab-tests. Even if the phosphorus
recovery rate is lower at >83 %. The use of ion exchange resins as a replacement
process for solvent extraction has positive effects on the quality of the products. The
additional elimination of aluminium has greatly reduced the gel formation that occurred
in the lab-tests during the production of concentrated acid. Furthermore, the additional
cleaning step significantly improved the removal of accompanying substances and
pollutants (heavy metals).
The quality of the road salt and/or brine produced as a by-product was increased. It was
shown that the generation of the metal salt solution can be carried out as required by
using different regeneration agents for washing the ion exchange. However, in the Fe/Al
solutions generated from the 1st IO-Exchanger, the co-extraction of phosphorus is higher
in direct comparison with the lab-tests. According to PARFORCE, there is still some
potential for optimisation in the regeneration step of the ion exchange. On the basis of
the present results, the direct use of the Fe/Al solutions as precipitant is probably not
possible without further treatment steps.
In conclusion, the pilot tests have shown that despite increased leaching rates of the
accompanying substances, a phosphoric acid with very low impurities could be
produced.
3.1.3.3.3 LCA for PARFORCE
The PARFORCE-process has been included in the LCA-LCC works done within Phos4You
(cf. chapter 5).
3.1.4 Discussion of results for I2 operation
The quality and purity of the phosphoric acid produced is quite variable, depending on
the effectiveness of the purification processes applied, and carries small amounts of
accompanying substances in accordance with the starting substance (SSA). However, it
can be stated that the phosphoric acids produced in the "Phos4You" project are of
marketable quality.
However, the investigations carried out only provide a snapshot, since the composition
of the SSAs used will change (seasonally) during the ongoing process. The resilience of
Technical report of the Phos4You partnership on processes to recover P from wastewater Page n°78
the processes/procedures in continuous operation will only become apparent when
they are implemented industrially over a longer period of time.
Particularly with regard to the quality and possible uses of the by-products and residual
materials generated with wet-chemical P-recovery processes, there are still some
uncertainties. Open questions about disposal routes or stable sales markets or recycling
possibilities exist, but still need to be validated.
In the context of advancing technological implementation, the following points will play
an essential role in the efficient design of phosphorus recovery from SSAs by “wet-
chemical” processes:
• Process optimisation/adaptations also in terms of operating chemical (including
mineral acid - eluate) and energy requirement
• Process design in terms of by-product generation and quality
3.1.5 Conclusion for I2
In conclusion, it can be stated that the technological solution of “wet-chemical”
phosphorus recovery from SSAs is generally applicable and that the legal requirements,
such as those of the German Sewage Sludge Ordinance (target: recovery rate > 80 %),
can be met.
Further technological implementation will demonstrate feasibility and answer any
remaining questions. The processes considered in Phos4You will be implemented on an
industrial scale in further projects (Figure 3.1.24). (EUWID 2020; Schneider 2021;
Ruhrverband 2021; Schlumberger 2021; AWEL 2018)
• TetraPhos® → Germany, Hamburg 2021
• PARFORCE → Germany, Bottrop 2023
• Phos4LifeTM → Switzerland, Zuchwil 2027/2028
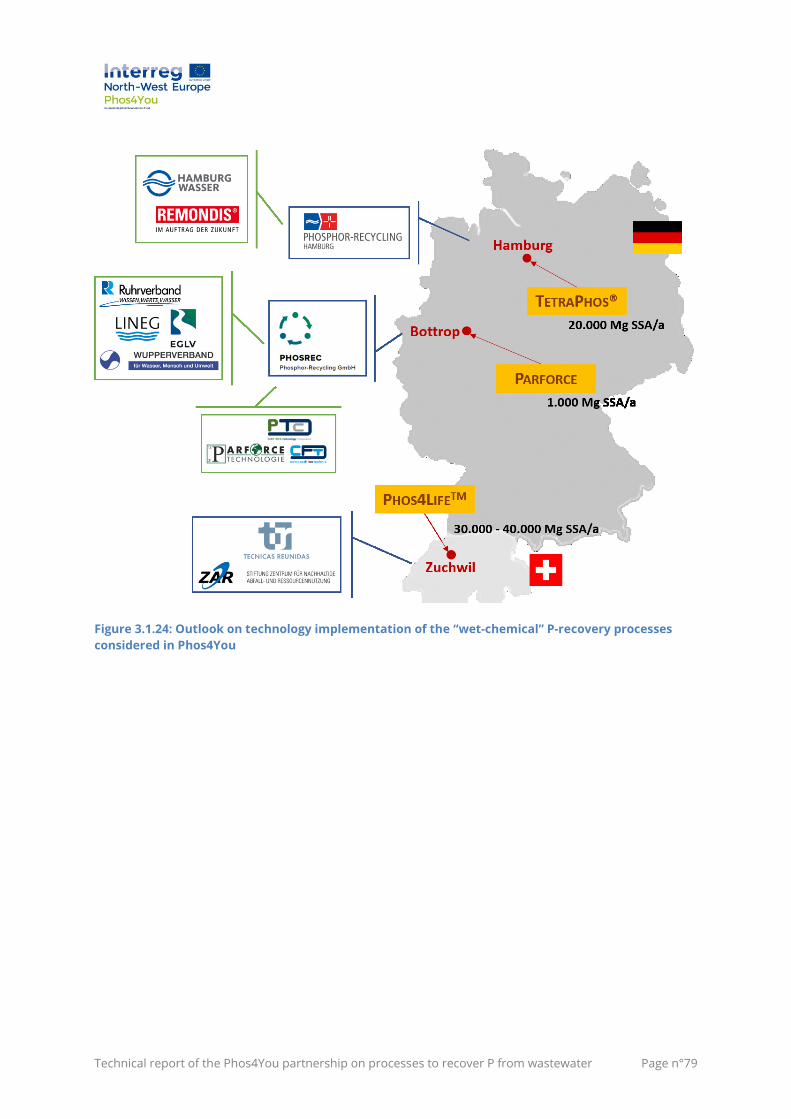
Technical report of the Phos4You partnership on processes to recover P from wastewater Page n°79
Figure 3.1.24: Outlook on technology implementation of the “wet-chemical” P-recovery processes
considered in Phos4You
Technical report of the Phos4You partnership on processes to recover P from wastewater Page n°80
3.2 Demonstrator I1: Thermochemical solution to recover P from sewage
sludge (EuPhoRe®)
Authors: Daniel Klein, Karl-Georg Schmelz, Levent Pamuk,
Burkhard Teichgräber (Emschergenossenschaft); Frank Zepke
(EuPhoRe GmbH)
Phos4You demonstrated how phosphorus can be recovered from sewage sludge thanks
to a thermochemical incineration process. The EuPhoRe® plant built by the
Emschergenossenschaft in Dinslaken is the first stand-alone plant of the technology
(Klein et al. 2019), i.e. the plant is not combined with e.g. an (existing) power plant.
The EuPhoRe®-process is a 2-stage thermochemical incineration process and consists of
a rotary kiln where dewatered sewage sludge is successively dried, reduced and
oxidized. In the reduction step (650-750°C), a major part of the volatile matter is already
transferred to the gas phase. Besides, the reactivity of the solid phase is increased
(Hedvall-Effect), yet leading to a notable transfer of heavy metals to the gas phase. The
remainder of the pollutants is subsequently removed during the oxidation step (up to
1.000°C). Additives such as MgCl2 are added to the sludge in order to improve the heavy
metals removal through the gas phase. The additives also have a notable influence on
the plant availability of the remaining sewage sludge ashes. Given this process, the
sewage sludge ash (SSA) of the EuPhoRe®-process is – compared to the SSAs of e.g. a
fluidised bed incineration – plant available and has a notably lower heavy metal content
(Klose 2018). Figure 3.2.1 illustrates the process.
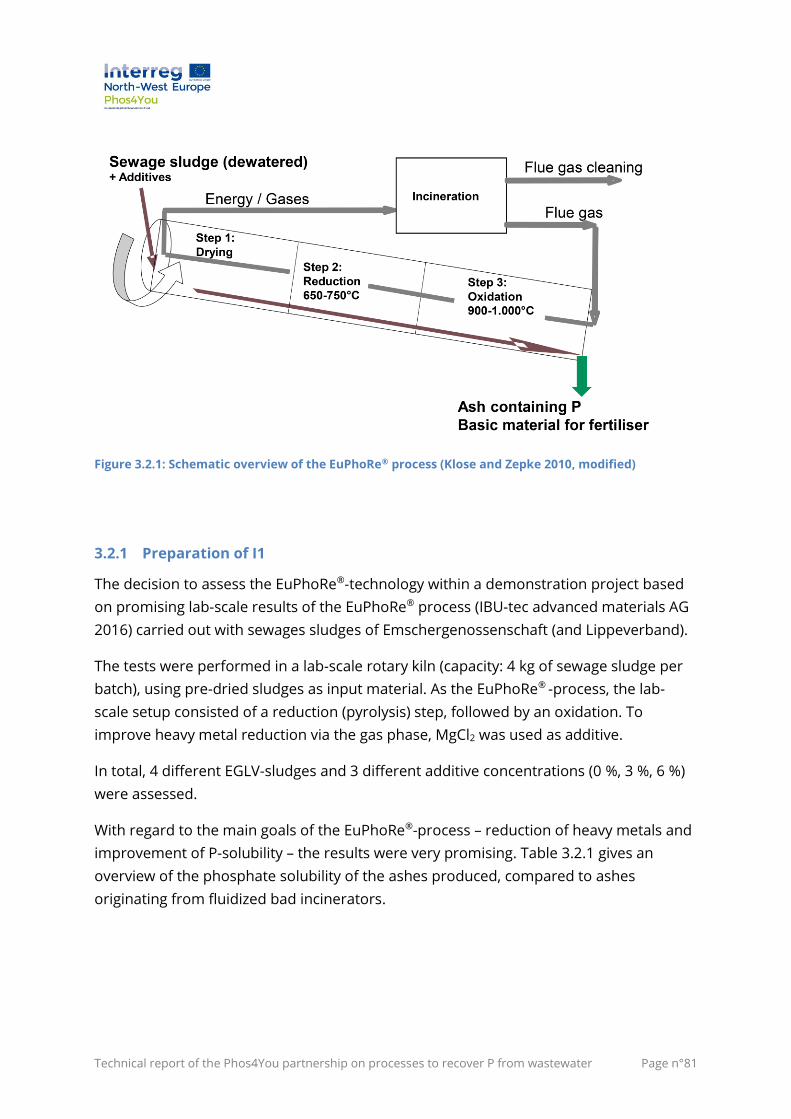
Technical report of the Phos4You partnership on processes to recover P from wastewater Page n°81
Figure 3.2.1: Schematic overview of the EuPhoRe® process (Klose and Zepke 2010, modified)
3.2.1 Preparation of I1
The decision to assess the EuPhoRe®-technology within a demonstration project based
on promising lab-scale results of the EuPhoRe® process (IBU-tec advanced materials AG
2016) carried out with sewages sludges of Emschergenossenschaft (and Lippeverband).
The tests were performed in a lab-scale rotary kiln (capacity: 4 kg of sewage sludge per
batch), using pre-dried sludges as input material. As the EuPhoRe® -process, the lab-
scale setup consisted of a reduction (pyrolysis) step, followed by an oxidation. To
improve heavy metal reduction via the gas phase, MgCl2 was used as additive.
In total, 4 different EGLV-sludges and 3 different additive concentrations (0 %, 3 %, 6 %)
were assessed.
With regard to the main goals of the EuPhoRe®-process – reduction of heavy metals and
improvement of P-solubility – the results were very promising. Table 3.2.1 gives an
overview of the phosphate solubility of the ashes produced, compared to ashes
originating from fluidized bad incinerators.
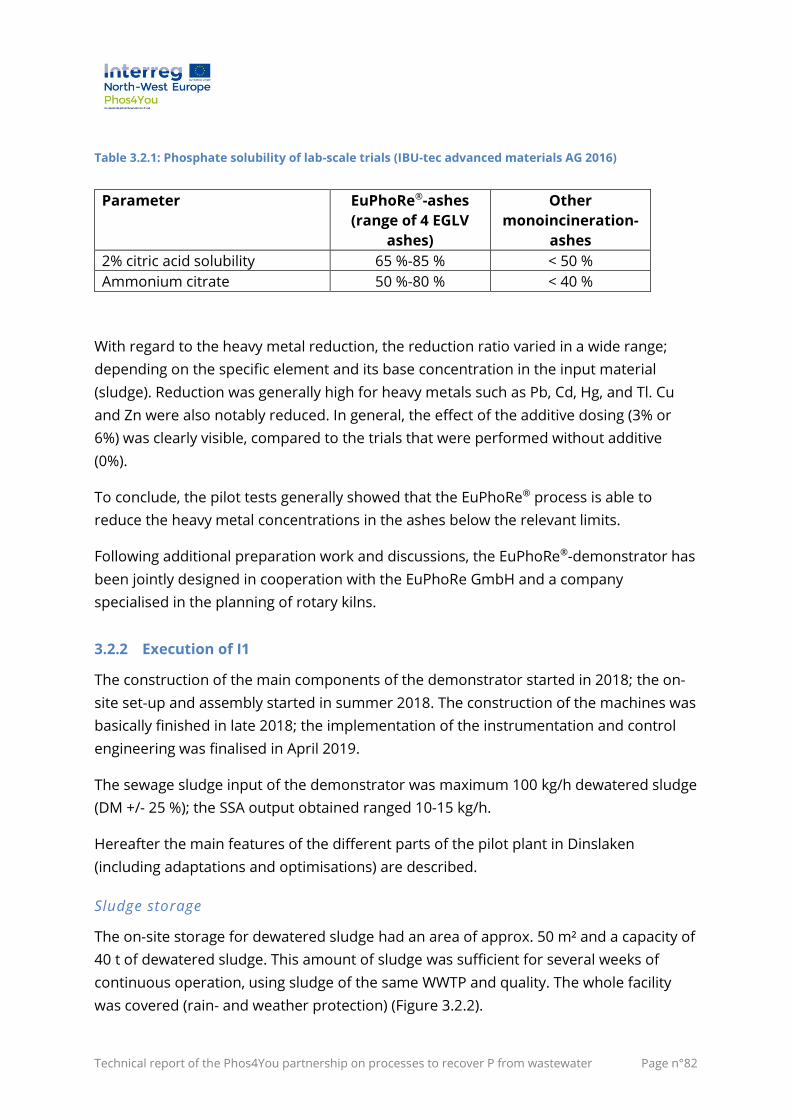
Technical report of the Phos4You partnership on processes to recover P from wastewater Page n°82
Table 3.2.1: Phosphate solubility of lab-scale trials (IBU-tec advanced materials AG 2016)
Parameter EuPhoRe®-ashes
(range of 4 EGLV
ashes)
Other
monoincineration-
ashes
2% citric acid solubility 65 %-85 % < 50 %
Ammonium citrate 50 %-80 % < 40 %
With regard to the heavy metal reduction, the reduction ratio varied in a wide range;
depending on the specific element and its base concentration in the input material
(sludge). Reduction was generally high for heavy metals such as Pb, Cd, Hg, and Tl. Cu
and Zn were also notably reduced. In general, the effect of the additive dosing (3% or
6%) was clearly visible, compared to the trials that were performed without additive
(0%).
To conclude, the pilot tests generally showed that the EuPhoRe® process is able to
reduce the heavy metal concentrations in the ashes below the relevant limits.
Following additional preparation work and discussions, the EuPhoRe®-demonstrator has
been jointly designed in cooperation with the EuPhoRe GmbH and a company
specialised in the planning of rotary kilns.
3.2.2 Execution of I1
The construction of the main components of the demonstrator started in 2018; the on-
site set-up and assembly started in summer 2018. The construction of the machines was
basically finished in late 2018; the implementation of the instrumentation and control
engineering was finalised in April 2019.
The sewage sludge input of the demonstrator was maximum 100 kg/h dewatered sludge
(DM +/- 25 %); the SSA output obtained ranged 10-15 kg/h.
Hereafter the main features of the different parts of the pilot plant in Dinslaken
(including adaptations and optimisations) are described.
Sludge storage
The on-site storage for dewatered sludge had an area of approx. 50 m² and a capacity of
40 t of dewatered sludge. This amount of sludge was sufficient for several weeks of
continuous operation, using sludge of the same WWTP and quality. The whole facility
was covered (rain- and weather protection) (Figure 3.2.2).
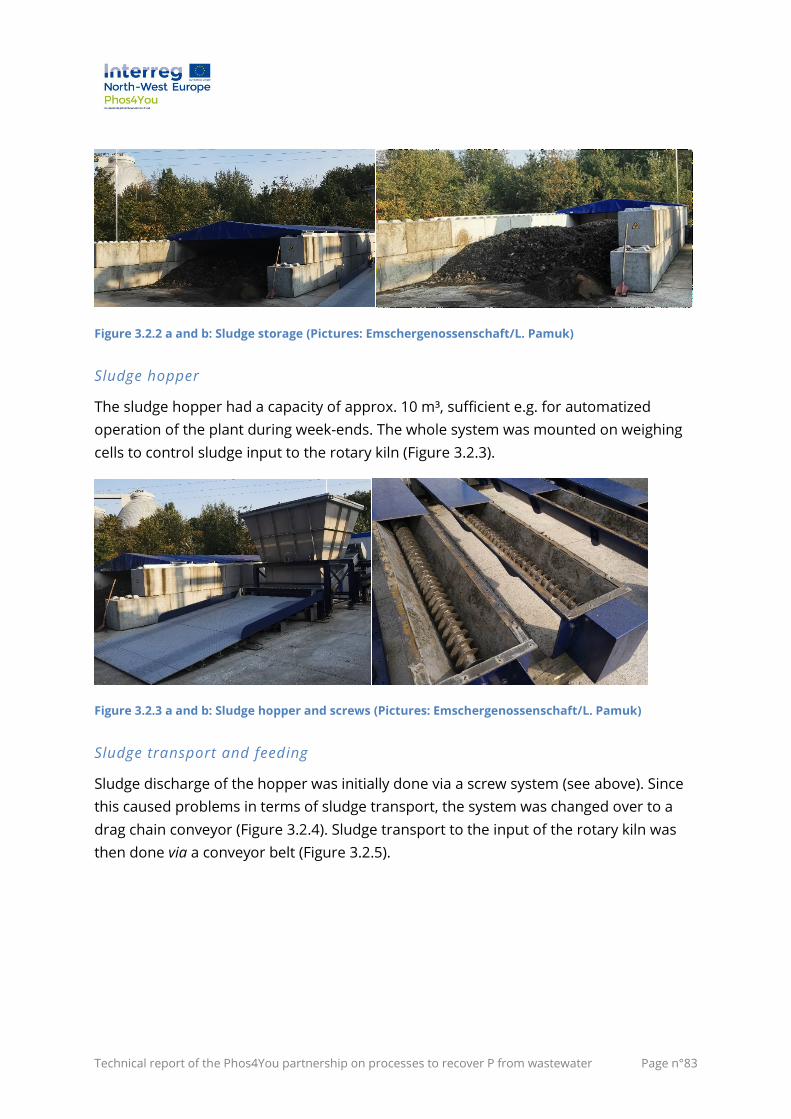
Technical report of the Phos4You partnership on processes to recover P from wastewater Page n°83
Figure 3.2.2 a and b: Sludge storage (Pictures: Emschergenossenschaft/L. Pamuk)
Sludge hopper
The sludge hopper had a capacity of approx. 10 m³, sufficient e.g. for automatized
operation of the plant during week-ends. The whole system was mounted on weighing
cells to control sludge input to the rotary kiln (Figure 3.2.3).
Figure 3.2.3 a and b: Sludge hopper and screws (Pictures: Emschergenossenschaft/L. Pamuk)
Sludge transport and feeding
Sludge discharge of the hopper was initially done via a screw system (see above). Since
this caused problems in terms of sludge transport, the system was changed over to a
drag chain conveyor (Figure 3.2.4). Sludge transport to the input of the rotary kiln was
then done via a conveyor belt (Figure 3.2.5).
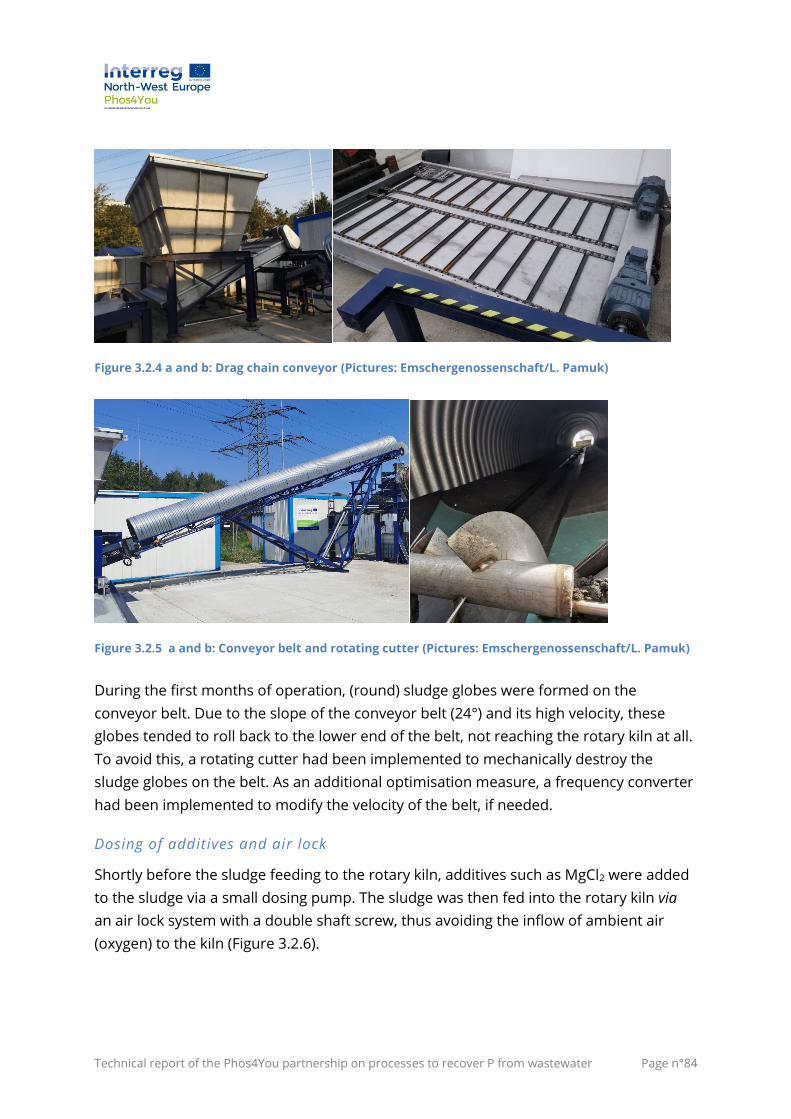
Technical report of the Phos4You partnership on processes to recover P from wastewater Page n°84
Figure 3.2.4 a and b: Drag chain conveyor (Pictures: Emschergenossenschaft/L. Pamuk)
Figure 3.2.5 a and b: Conveyor belt and rotating cutter (Pictures: Emschergenossenschaft/L. Pamuk)
During the first months of operation, (round) sludge globes were formed on the
conveyor belt. Due to the slope of the conveyor belt (24°) and its high velocity, these
globes tended to roll back to the lower end of the belt, not reaching the rotary kiln at all.
To avoid this, a rotating cutter had been implemented to mechanically destroy the
sludge globes on the belt. As an additional optimisation measure, a frequency converter
had been implemented to modify the velocity of the belt, if needed.
Dosing of additives and air lock
Shortly before the sludge feeding to the rotary kiln, additives such as MgCl2 were added
to the sludge via a small dosing pump. The sludge was then fed into the rotary kiln via
an air lock system with a double shaft screw, thus avoiding the inflow of ambient air
(oxygen) to the kiln (Figure 3.2.6).
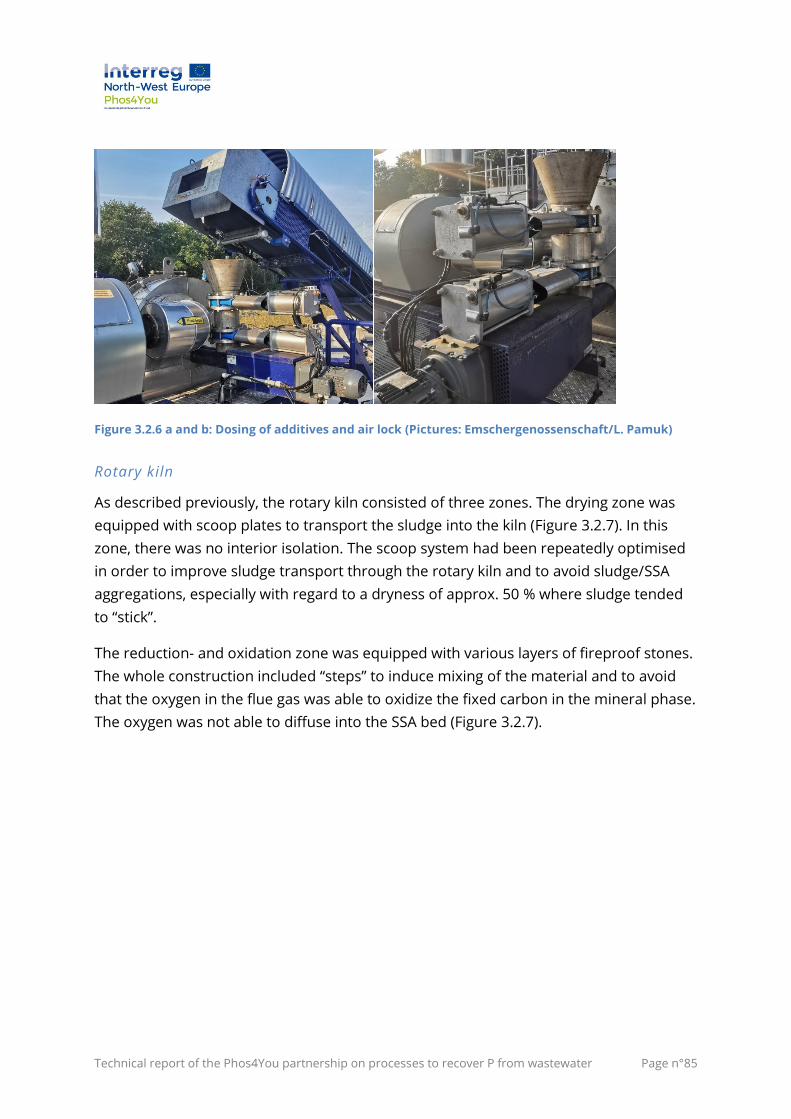
Technical report of the Phos4You partnership on processes to recover P from wastewater Page n°85
Figure 3.2.6 a and b: Dosing of additives and air lock (Pictures: Emschergenossenschaft/L. Pamuk)
Rotary kiln
As described previously, the rotary kiln consisted of three zones. The drying zone was
equipped with scoop plates to transport the sludge into the kiln (Figure 3.2.7). In this
zone, there was no interior isolation. The scoop system had been repeatedly optimised
in order to improve sludge transport through the rotary kiln and to avoid sludge/SSA
aggregations, especially with regard to a dryness of approx. 50 % where sludge tended
to “stick”.
The reduction- and oxidation zone was equipped with various layers of fireproof stones.
The whole construction included “steps” to induce mixing of the material and to avoid
that the oxygen in the flue gas was able to oxidize the fixed carbon in the mineral phase.
The oxygen was not able to diffuse into the SSA bed (Figure 3.2.7).
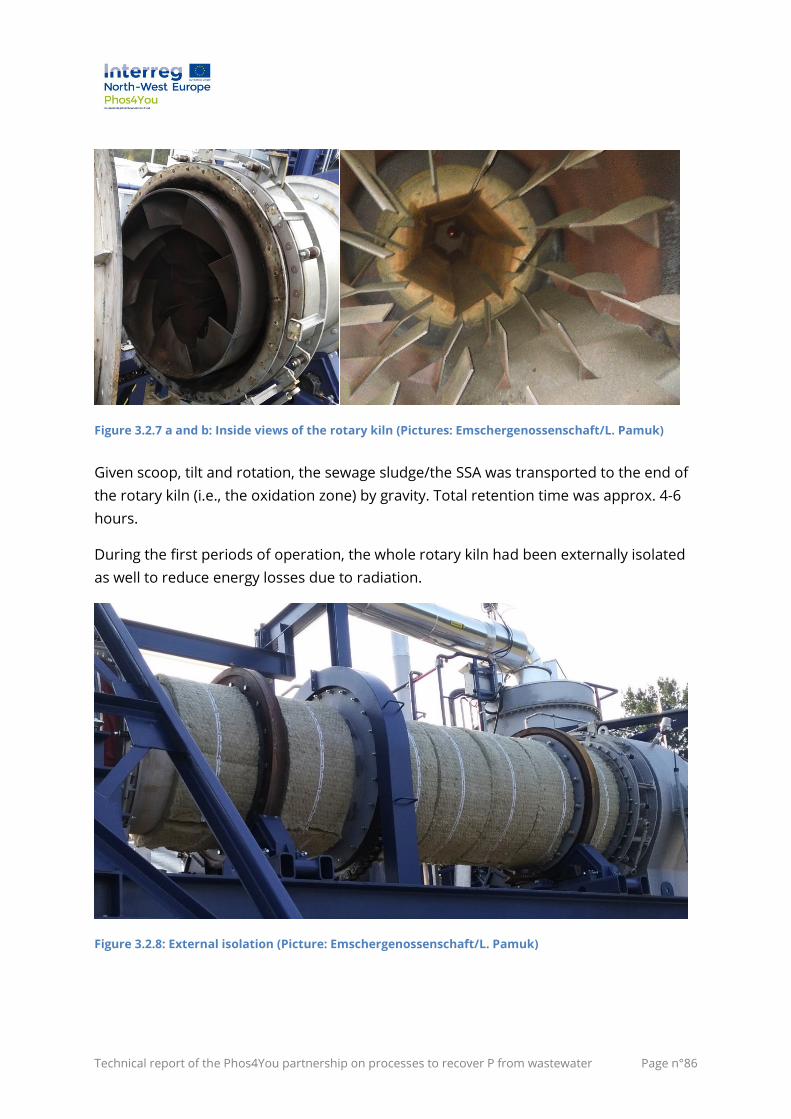
Technical report of the Phos4You partnership on processes to recover P from wastewater Page n°86
Figure 3.2.7 a and b: Inside views of the rotary kiln (Pictures: Emschergenossenschaft/L. Pamuk)
Given scoop, tilt and rotation, the sewage sludge/the SSA was transported to the end of
the rotary kiln (i.e., the oxidation zone) by gravity. Total retention time was approx. 4-6
hours.
During the first periods of operation, the whole rotary kiln had been externally isolated
as well to reduce energy losses due to radiation.
Figure 3.2.8: External isolation (Picture: Emschergenossenschaft/L. Pamuk)
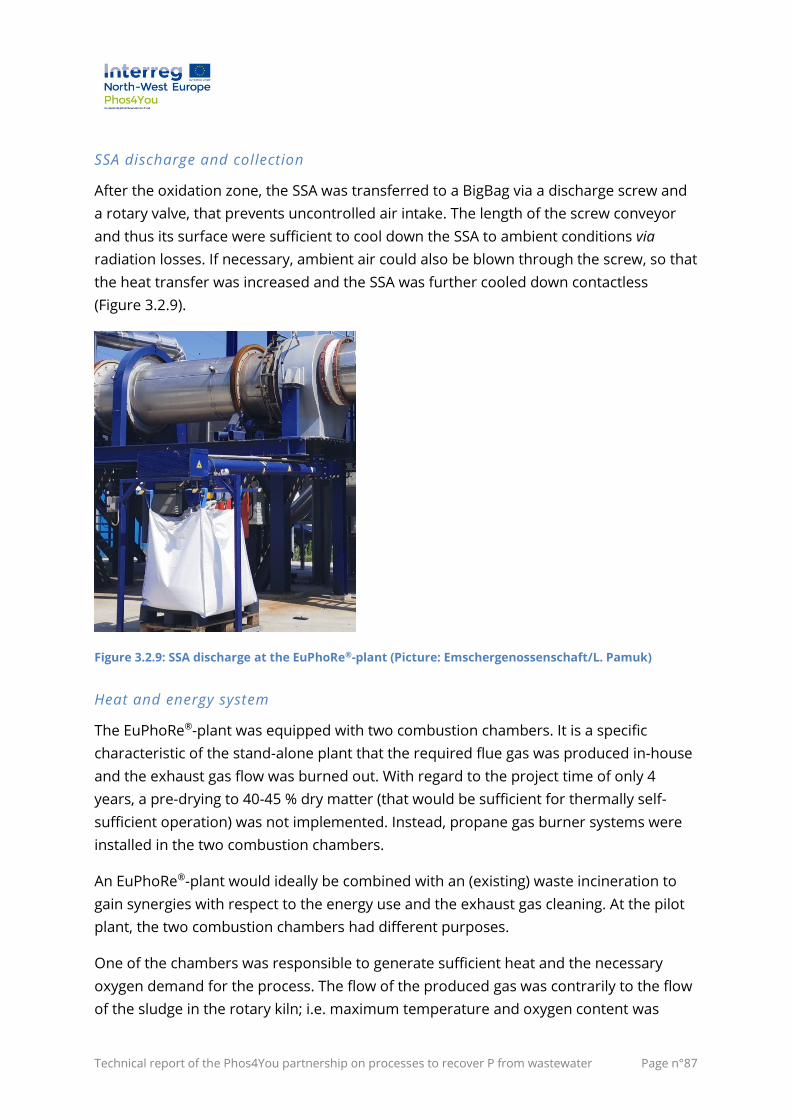
Technical report of the Phos4You partnership on processes to recover P from wastewater Page n°87
SSA discharge and collection
After the oxidation zone, the SSA was transferred to a BigBag via a discharge screw and
a rotary valve, that prevents uncontrolled air intake. The length of the screw conveyor
and thus its surface were sufficient to cool down the SSA to ambient conditions via
radiation losses. If necessary, ambient air could also be blown through the screw, so that
the heat transfer was increased and the SSA was further cooled down contactless
(Figure 3.2.9).
Figure 3.2.9: SSA discharge at the EuPhoRe®-plant (Picture: Emschergenossenschaft/L. Pamuk)
Heat and energy system
The EuPhoRe®-plant was equipped with two combustion chambers. It is a specific
characteristic of the stand-alone plant that the required flue gas was produced in-house
and the exhaust gas flow was burned out. With regard to the project time of only 4
years, a pre-drying to 40-45 % dry matter (that would be sufficient for thermally self-
sufficient operation) was not implemented. Instead, propane gas burner systems were
installed in the two combustion chambers.
An EuPhoRe®-plant would ideally be combined with an (existing) waste incineration to
gain synergies with respect to the energy use and the exhaust gas cleaning. At the pilot
plant, the two combustion chambers had different purposes.
One of the chambers was responsible to generate sufficient heat and the necessary
oxygen demand for the process. The flow of the produced gas was contrarily to the flow
of the sludge in the rotary kiln; i.e. maximum temperature and oxygen content was
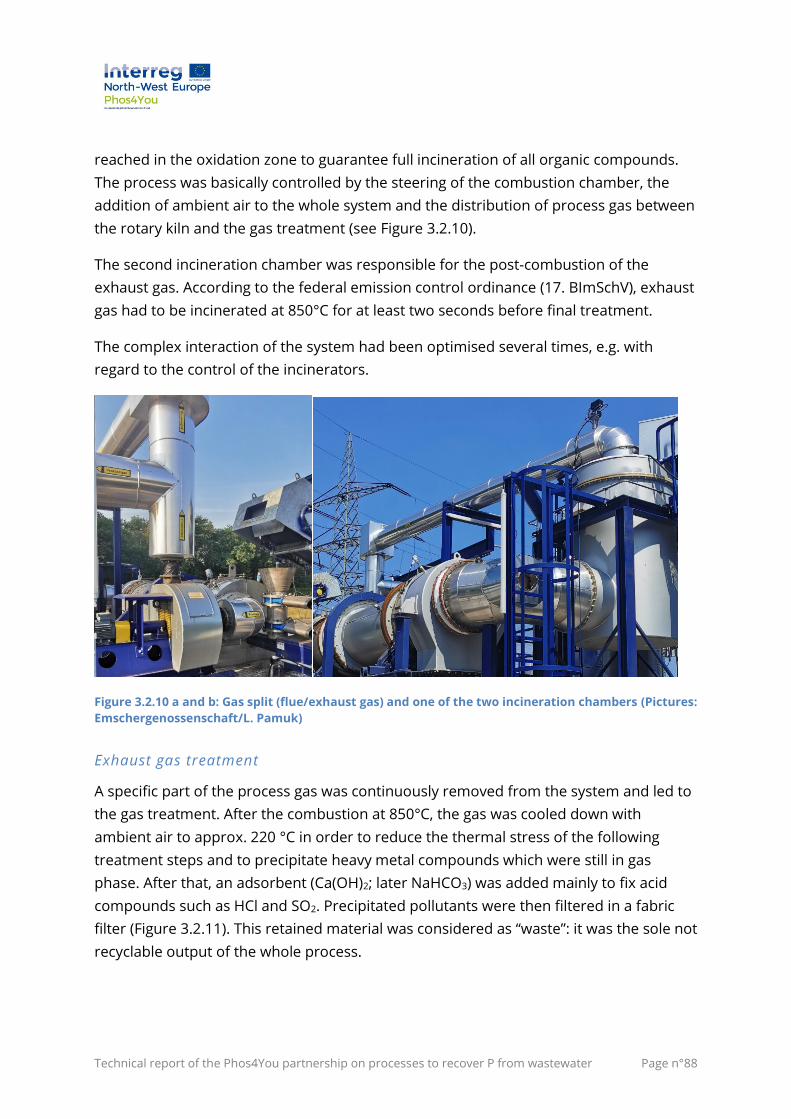
Technical report of the Phos4You partnership on processes to recover P from wastewater Page n°88
reached in the oxidation zone to guarantee full incineration of all organic compounds.
The process was basically controlled by the steering of the combustion chamber, the
addition of ambient air to the whole system and the distribution of process gas between
the rotary kiln and the gas treatment (see Figure 3.2.10).
The second incineration chamber was responsible for the post-combustion of the
exhaust gas. According to the federal emission control ordinance (17. BImSchV), exhaust
gas had to be incinerated at 850°C for at least two seconds before final treatment.
The complex interaction of the system had been optimised several times, e.g. with
regard to the control of the incinerators.
Figure 3.2.10 a and b: Gas split (flue/exhaust gas) and one of the two incineration chambers (Pictures:
Emschergenossenschaft/L. Pamuk)
Exhaust gas treatment
A specific part of the process gas was continuously removed from the system and led to
the gas treatment. After the combustion at 850°C, the gas was cooled down with
ambient air to approx. 220 °C in order to reduce the thermal stress of the following
treatment steps and to precipitate heavy metal compounds which were still in gas
phase. After that, an adsorbent (Ca(OH)2; later NaHCO3) was added mainly to fix acid
compounds such as HCl and SO2. Precipitated pollutants were then filtered in a fabric
filter (Figure 3.2.11). This retained material was considered as “waste”: it was the sole not
recyclable output of the whole process.
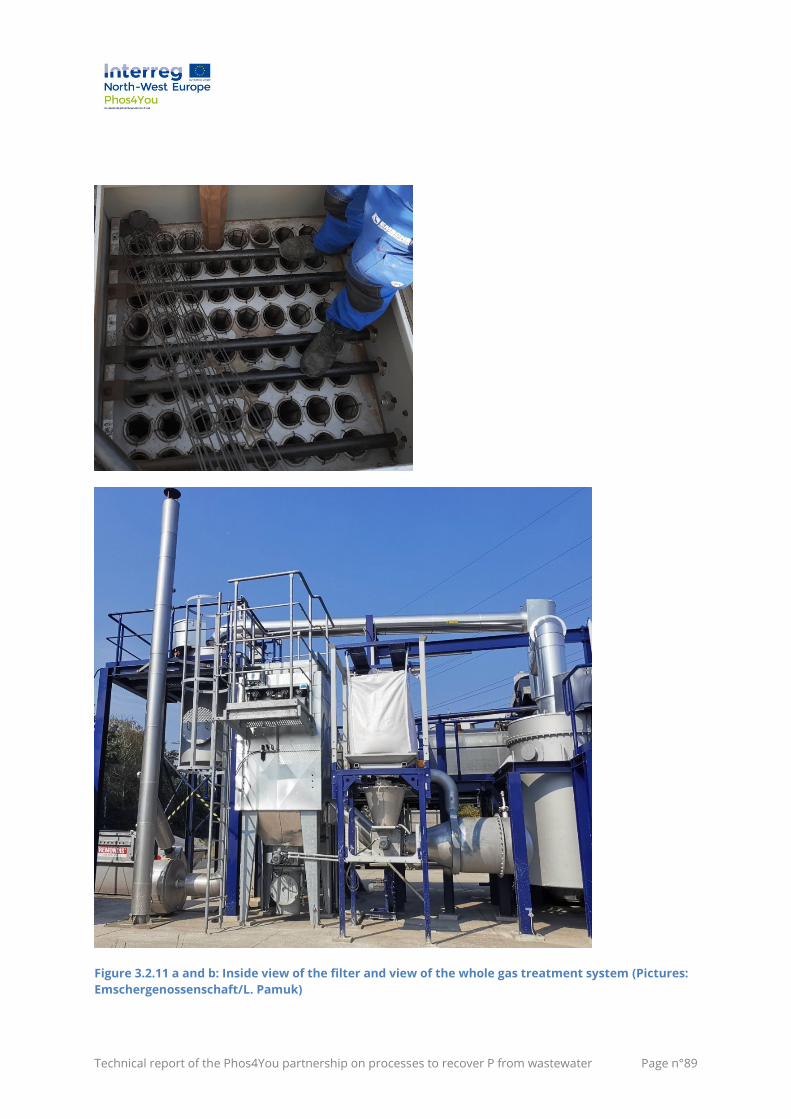
Technical report of the Phos4You partnership on processes to recover P from wastewater Page n°89
Figure 3.2.11 a and b: Inside view of the filter and view of the whole gas treatment system (Pictures:
Emschergenossenschaft/L. Pamuk)
Technical report of the Phos4You partnership on processes to recover P from wastewater Page n°90
After initial setup, the flue gas chimney was equipped with sockets to enable flue gas
analyses in conformity with the 17. BImSchV (federal emission control ordinance).
Since the results of the first analyses showed that especially the reduction of the acid
components of the flue gas was not sufficient, the control of the filter cleaning process
was modified. In addition, the feeding of the adsorbent was optimised. Finally, the type
of the adsorbent was changed from Ca(OH)2 to NaHCO3.
3.2.3 Analyses of results of I1 operation
After the setup was completed in April 2019, the plant was operated manually at the
beginning due to delays in programming and automatisation. During this period, several
optimisation potentials have already been identified and implemented. These aspects
have already been described above.
At the beginning of 2020, the operation of the plant was more and more stable. Various
continuous trials for some subsequent days and nights have been performed, focusing
on (the optimisation of) specific parameters such as the dosing of additives.
Exhaust gas analyses
Exhaust gas has been repeatedly analysed. It turned out that especially the content of
acid compound such as HCl or SO2 was too high with regard to the limits agreed upon
with the authority. Using these compounds as an easy-to-measure proxy, the gas
treatment was optimised with regard to type and dispersion of the adsorbent and the
function of the cloth filter.
It has to be mentioned that the problems related to the gas treatment were related to
the uniqueness of the plant, its small size and its features. In full-scale, no comparable
problems are expected.
Analyses of input material
In a first stage, the sludge of the WWTP Dortmund-Deusen was used as input material.
The sludge was chosen due to its relatively “standard” composition for German sludges
with regard to nutrients and pollutants. It is basically a municipal sludge with common
industrial influences (Table 3.2.2, Table 3.2.3).
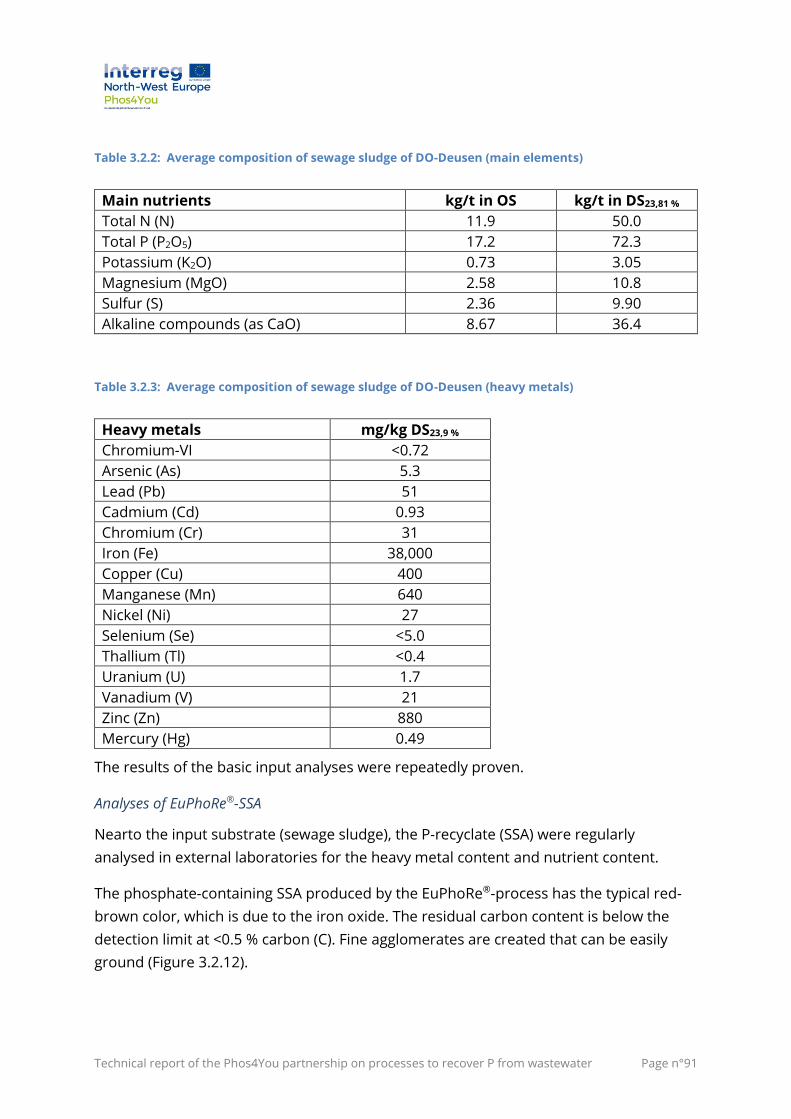
Technical report of the Phos4You partnership on processes to recover P from wastewater Page n°91
Table 3.2.2: Average composition of sewage sludge of DO-Deusen (main elements)
Main nutrients kg/t in OS kg/t in DS23,81 %
Total N (N) 11.9 50.0
Total P (P2O5) 17.2 72.3
Potassium (K2O) 0.73 3.05
Magnesium (MgO) 2.58 10.8
Sulfur (S) 2.36 9.90
Alkaline compounds (as CaO) 8.67 36.4
Table 3.2.3: Average composition of sewage sludge of DO-Deusen (heavy metals)
Heavy metals mg/kg DS23,9 %
Chromium-VI <0.72
Arsenic (As) 5.3
Lead (Pb) 51
Cadmium (Cd) 0.93
Chromium (Cr) 31
Iron (Fe) 38,000
Copper (Cu) 400
Manganese (Mn) 640
Nickel (Ni) 27
Selenium (Se) <5.0
Thallium (Tl) <0.4
Uranium (U) 1.7
Vanadium (V) 21
Zinc (Zn) 880
Mercury (Hg) 0.49
The results of the basic input analyses were repeatedly proven.
Analyses of EuPhoRe®-SSA
Nearto the input substrate (sewage sludge), the P-recyclate (SSA) were regularly
analysed in external laboratories for the heavy metal content and nutrient content.
The phosphate-containing SSA produced by the EuPhoRe®-process has the typical red-
brown color, which is due to the iron oxide. The residual carbon content is below the
detection limit at <0.5 % carbon (C). Fine agglomerates are created that can be easily
ground (Figure 3.2.12).
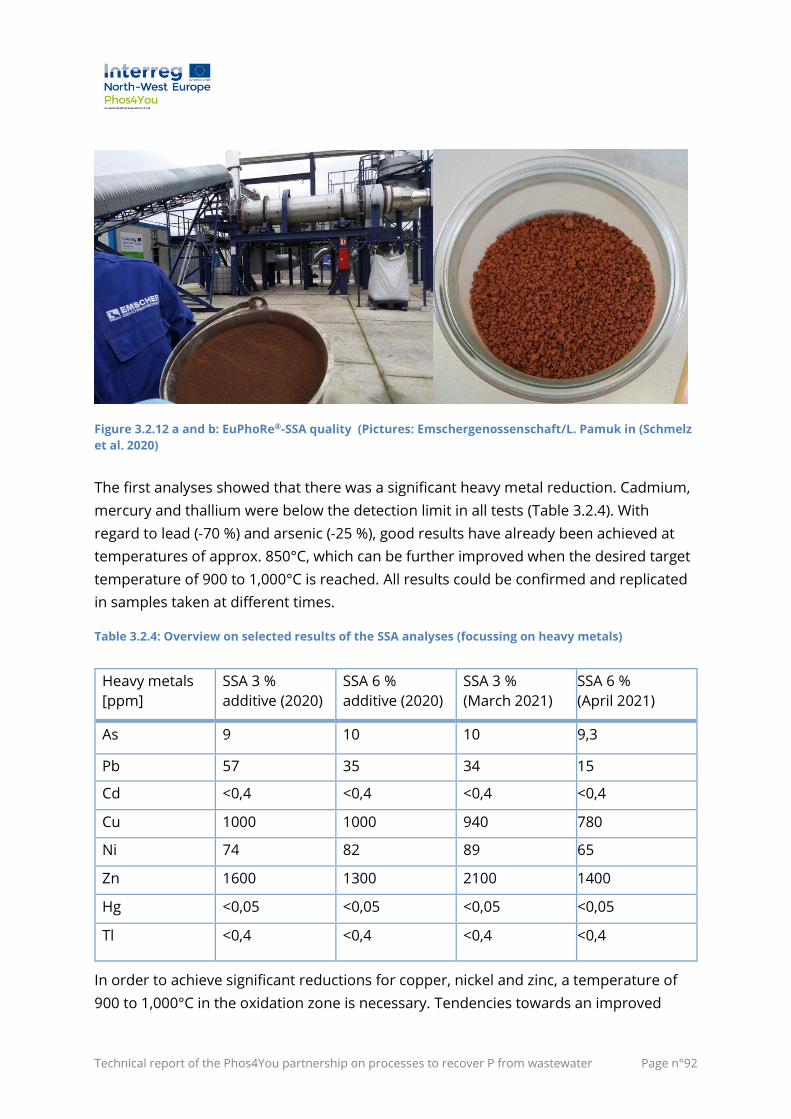
Technical report of the Phos4You partnership on processes to recover P from wastewater Page n°92
Figure 3.2.12 a and b: EuPhoRe®-SSA quality (Pictures: Emschergenossenschaft/L. Pamuk in (Schmelz
et al. 2020)
The first analyses showed that there was a significant heavy metal reduction. Cadmium,
mercury and thallium were below the detection limit in all tests (Table 3.2.4). With
regard to lead (-70 %) and arsenic (-25 %), good results have already been achieved at
temperatures of approx. 850°C, which can be further improved when the desired target
temperature of 900 to 1,000°C is reached. All results could be confirmed and replicated
in samples taken at different times.
Table 3.2.4: Overview on selected results of the SSA analyses (focussing on heavy metals)
Heavy metals
[ppm]
SSA 3 %
additive (2020)
SSA 6 %
additive (2020)
SSA 3 %
(March 2021)
SSA 6 %
(April 2021)
As 9 10 10 9,3
Pb 57 35 34 15
Cd <0,4 <0,4 <0,4 <0,4
Cu 1000 1000 940 780
Ni 74 82 89 65
Zn 1600 1300 2100 1400
Hg <0,05 <0,05 <0,05 <0,05
Tl <0,4 <0,4 <0,4 <0,4
In order to achieve significant reductions for copper, nickel and zinc, a temperature of
900 to 1,000°C in the oxidation zone is necessary. Tendencies towards an improved
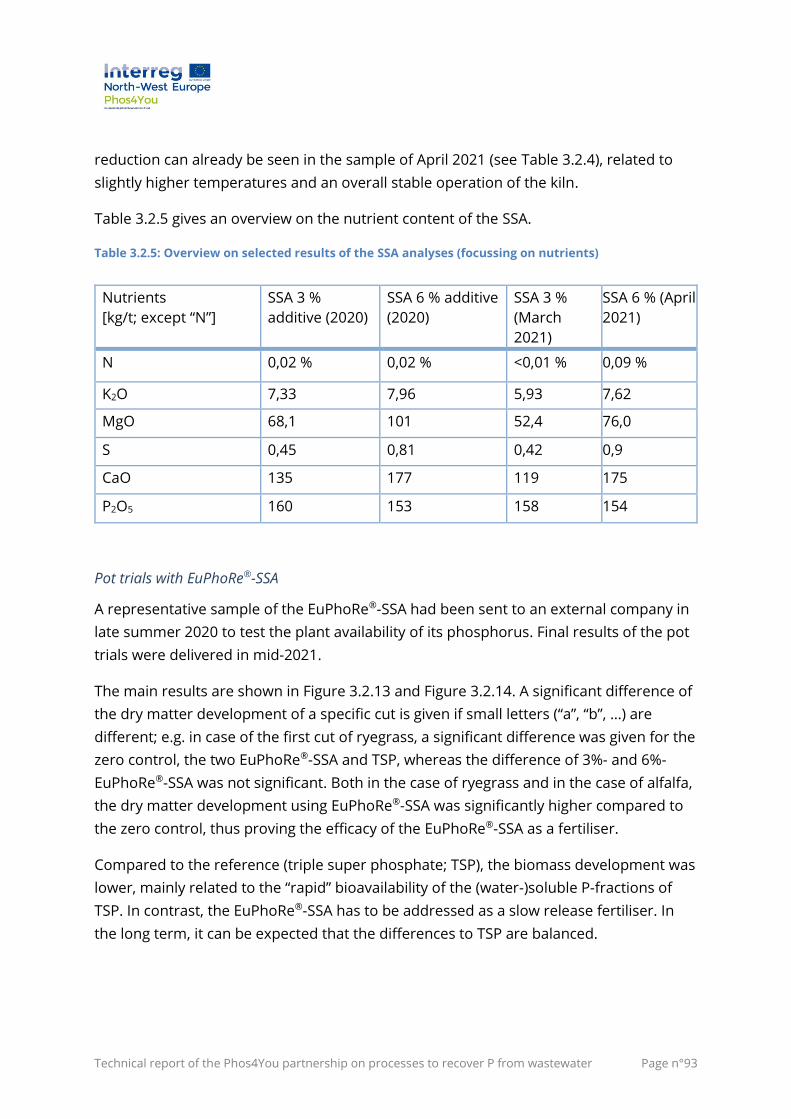
Technical report of the Phos4You partnership on processes to recover P from wastewater Page n°93
reduction can already be seen in the sample of April 2021 (see Table 3.2.4), related to
slightly higher temperatures and an overall stable operation of the kiln.
Table 3.2.5 gives an overview on the nutrient content of the SSA.
Table 3.2.5: Overview on selected results of the SSA analyses (focussing on nutrients)
Nutrients
[kg/t; except “N”]
SSA 3 %
additive (2020)
SSA 6 % additive
(2020)
SSA 3 %
(March
2021)
SSA 6 % (April
2021)
N 0,02 % 0,02 % <0,01 % 0,09 %
K2O 7,33 7,96 5,93 7,62
MgO 68,1 101 52,4 76,0
S 0,45 0,81 0,42 0,9
CaO 135 177 119 175
P2O5 160 153 158 154
Pot trials with EuPhoRe®-SSA
A representative sample of the EuPhoRe®-SSA had been sent to an external company in
late summer 2020 to test the plant availability of its phosphorus. Final results of the pot
trials were delivered in mid-2021.
The main results are shown in Figure 3.2.13 and Figure 3.2.14. A significant difference of
the dry matter development of a specific cut is given if small letters (“a”, “b”, …) are
different; e.g. in case of the first cut of ryegrass, a significant difference was given for the
zero control, the two EuPhoRe®-SSA and TSP, whereas the difference of 3%- and 6%-
EuPhoRe®-SSA was not significant. Both in the case of ryegrass and in the case of alfalfa,
the dry matter development using EuPhoRe®-SSA was significantly higher compared to
the zero control, thus proving the efficacy of the EuPhoRe®-SSA as a fertiliser.
Compared to the reference (triple super phosphate; TSP), the biomass development was
lower, mainly related to the “rapid” bioavailability of the (water-)soluble P-fractions of
TSP. In contrast, the EuPhoRe®-SSA has to be addressed as a slow release fertiliser. In
the long term, it can be expected that the differences to TSP are balanced.
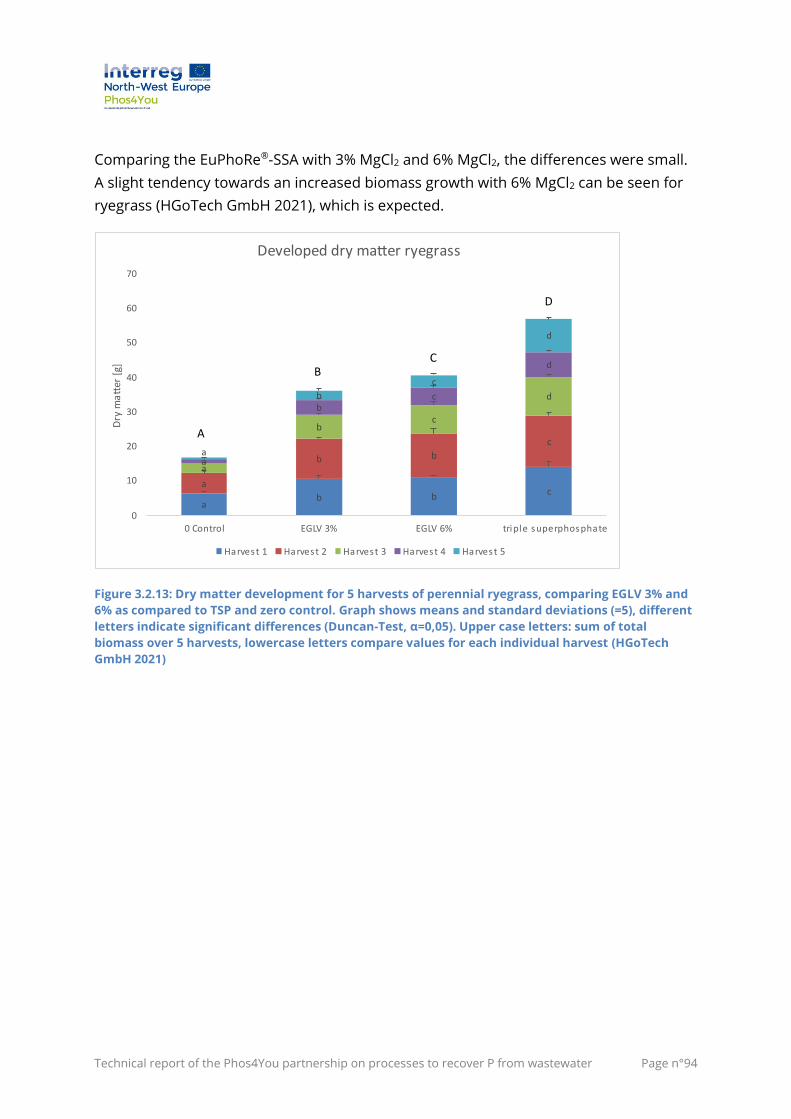
Technical report of the Phos4You partnership on processes to recover P from wastewater Page n°94
Comparing the EuPhoRe®-SSA with 3% MgCl2 and 6% MgCl2, the differences were small.
A slight tendency towards an increased biomass growth with 6% MgCl2 can be seen for
ryegrass (HGoTech GmbH 2021), which is expected.
Figure 3.2.13: Dry matter development for 5 harvests of perennial ryegrass, comparing EGLV 3% and
6% as compared to TSP and zero control. Graph shows means and standard deviations (=5), different
letters indicate significant differences (Duncan-Test, α=0,05). Upper case letters: sum of total
biomass over 5 harvests, lowercase letters compare values for each individual harvest (HGoTech
GmbH 2021)
ab b c
a
b b
c
a
bc
d
a
bc
d
a
b
c
d
4
5
Control E L E L triple superphosphate
Dr ma er g
Developed dr ma er r egrass
arvest arvest arvest arvest 4 arvest 5
A
D
C
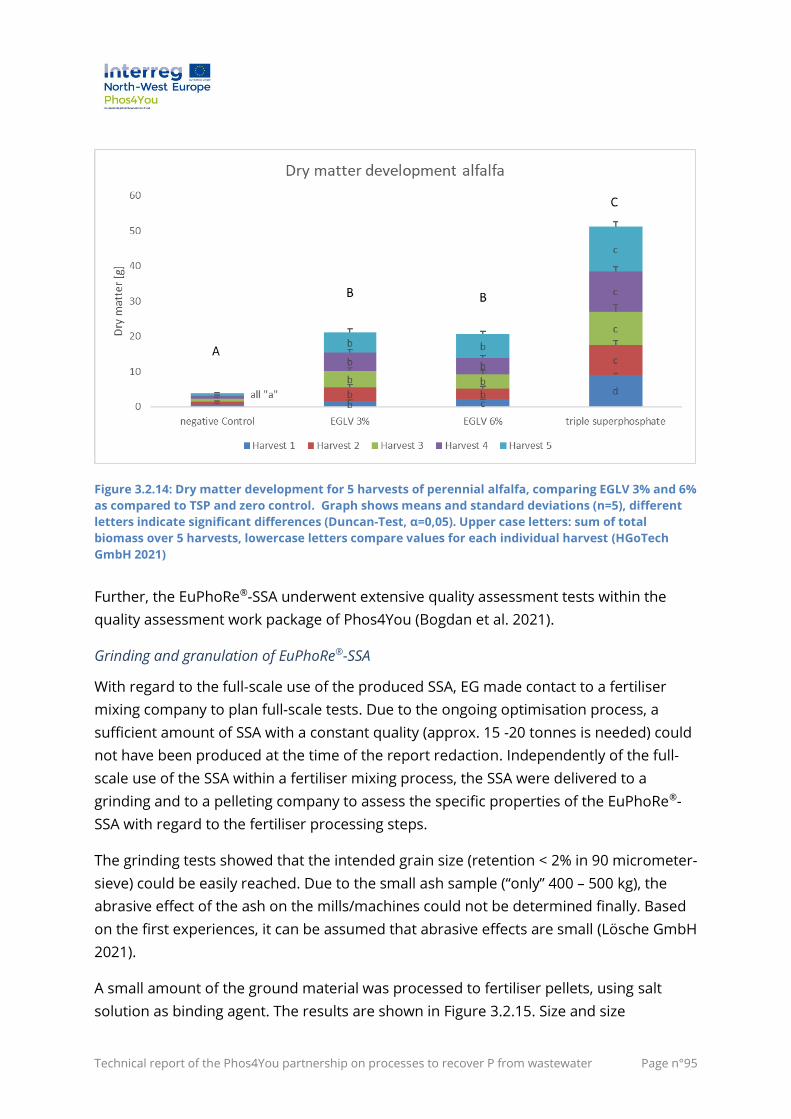
Technical report of the Phos4You partnership on processes to recover P from wastewater Page n°95
Figure 3.2.14: Dry matter development for 5 harvests of perennial alfalfa, comparing EGLV 3% and 6%
as compared to TSP and zero control. Graph shows means and standard deviations (n=5), different
letters indicate significant differences (Duncan-Test, α=0,05). Upper case letters: sum of total
biomass over 5 harvests, lowercase letters compare values for each individual harvest (HGoTech
GmbH 2021)
Further, the EuPhoRe®-SSA underwent extensive quality assessment tests within the
quality assessment work package of Phos4You (Bogdan et al. 2021).
Grinding and granulation of EuPhoRe®-SSA
With regard to the full-scale use of the produced SSA, EG made contact to a fertiliser
mixing company to plan full-scale tests. Due to the ongoing optimisation process, a
sufficient amount of SSA with a constant quality (approx. 15 -20 tonnes is needed) could
not have been produced at the time of the report redaction. Independently of the full-
scale use of the SSA within a fertiliser mixing process, the SSA were delivered to a
grinding and to a pelleting company to assess the specific properties of the EuPhoRe®-
SSA with regard to the fertiliser processing steps.
The grinding tests showed that the intended grain size (retention < 2% in 90 micrometer-
sieve) could be easily reached. Due to the small ash sample (“only” 400 – 500 kg), the
abrasive effect of the ash on the mills/machines could not be determined finally. Based
on the first experiences, it can be assumed that abrasive effects are small (Lösche GmbH
2021).
A small amount of the ground material was processed to fertiliser pellets, using salt
solution as binding agent. The results are shown in Figure 3.2.15. Size and size
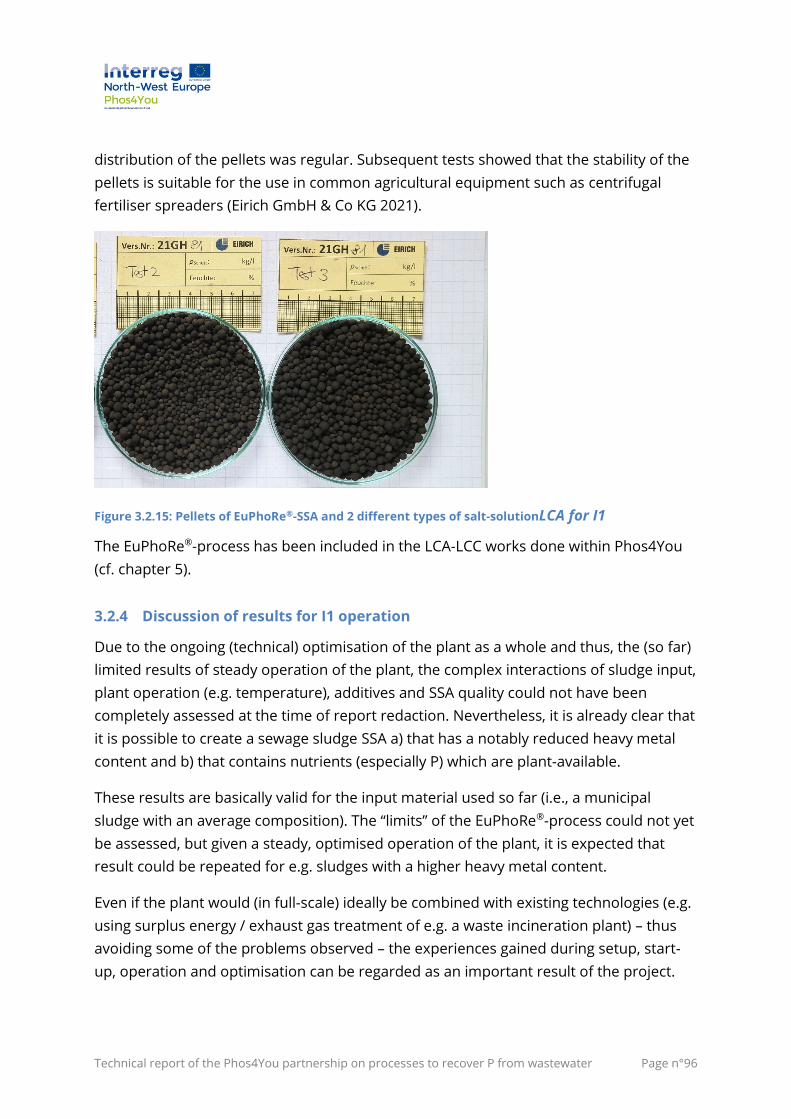
Technical report of the Phos4You partnership on processes to recover P from wastewater Page n°96
distribution of the pellets was regular. Subsequent tests showed that the stability of the
pellets is suitable for the use in common agricultural equipment such as centrifugal
fertiliser spreaders (Eirich GmbH & Co KG 2021).
Figure 3.2.15: Pellets of EuPhoRe®-SSA and 2 different types of salt-solutionLCA for I1
The EuPhoRe®-process has been included in the LCA-LCC works done within Phos4You
(cf. chapter 5).
3.2.4 Discussion of results for I1 operation
Due to the ongoing (technical) optimisation of the plant as a whole and thus, the (so far)
limited results of steady operation of the plant, the complex interactions of sludge input,
plant operation (e.g. temperature), additives and SSA quality could not have been
completely assessed at the time of report redaction. Nevertheless, it is already clear that
it is possible to create a sewage sludge SSA a) that has a notably reduced heavy metal
content and b) that contains nutrients (especially P) which are plant-available.
These results are basically valid for the input material used so far (i.e., a municipal
sludge with an average composition). The “limits” of the EuPhoRe®-process could not yet
be assessed, but given a steady, optimised operation of the plant, it is expected that
result could be repeated for e.g. sludges with a higher heavy metal content.
Even if the plant would (in full-scale) ideally be combined with existing technologies (e.g.
using surplus energy / exhaust gas treatment of e.g. a waste incineration plant) – thus
avoiding some of the problems observed – the experiences gained during setup, start-
up, operation and optimisation can be regarded as an important result of the project.
Technical report of the Phos4You partnership on processes to recover P from wastewater Page n°97
The stand-alone concept of the pilot plant is generally transferrable to other (larger)
WWTP. In this case, an upscaling would be needed. During this process, the exhaust gas
treatment would certainly be revised and optimised, using standard components of the
exhaust gas treatment technology, because this down scaled part of the system turned
out to be prone to failures.
During upscaling for the installation of a permanently operated sewage sludge
treatment plant, the high temperature of the flue gas would not be cooled down with
ambient (as it is the case at the pilot plant). Instead, standardized energy recovery
systems would be used. The recovered energy would then be used for pre-drying so that
thermally self-sufficient operation is guaranteed.
3.2.5 Conclusion for I1
It could be shown that the EuPhoRe®-process is suitable for a two-stage thermochemical
treatment of sewage sludges. Produced SSAs after appropriated granulation or dust
binding generally meet the requirements for phosphate fertilisers, notably in regard to
the heavy metal content.
Specific aspects regarding the evolving legislation are detailed within the final report of
Phos4You (Ploteau et al. 2021). Problems observed were related to the size of the plant
(“demonstrator”) and will likely not occur in full-scale.
The EuPhoRe®--processes considered in Phos4You will be implemented on an industrial
scale in Mannheim, Germany (Franke 11/22/2017) in 2021(sludge input capacity 135,000
tonnes/a). Other full-scale realisations are under discussion (Klose 8/3/2021).
Technical report of the Phos4You partnership on processes to recover P from wastewater Page n°98
3.3 Demonstrator I6.1: Bio-acidification before P precipitation from sludge
(optimised Struvia™)
Authors: Marie-Line Daumer, Younes Bareha (INRAE); Fabien
Vedrenne, Marisa Cunha, Cédric Mébarki (Veolia)
The aim of the I6 demonstrator was to demonstrate the STRUVIA™ technology of Veolia
in different new applications, enabling implementation and testing solutions to recover
P from sewage liquor. The STRUVIA™ technology had been developed by Veolia during
the P-REX European project and validated for P-recovery as Struvite on sludge liquor
after digestion, which is leading to 20 % recovery of the total P entering in a municipal
WWTP. The objective was to make the demonstration of a bio-acidification stage on
liquid sludge (developed by INRAE) combined with a STRUVIA™ unit to crystallise the P-
PO4 released into a P by-product. This combination was proven in labs to significantly
increase the P-recovery rate.
3.3.1 Preparation of I6.1
The results presented in this chapter are those necessary to design and run the
demonstrator. More detailed results have been already presented in conferences and
discussed in three scientific papers. The first one has been published in Environmental
technology (Bareha et al. 2020), the further are under revision or preparation. They will
help to understand better the mechanisms involved at the different steps and will be
useful to optimise the operation of the process.
3.3.1.1 Feasibility of P dissolving when Al-salts were used for P removal
The first site to test was Marquette-lez-Lille. It’s a large scale WWTP combining biological
and chemical P removal (EBPR + Aluminium salts). It was chosen because of the
pressure on the land to spread the sludge.
In order to decide where the demonstrator should be implemented five sludge were
sampled at different stages of the WWTP and tested for their Biological Phosphorus
Dissolution Potential (BPDP) with bio-acidification test as previously described by Braak
et al. 2016.
The characteristics of the sludge are presented in Table 3.3.1.
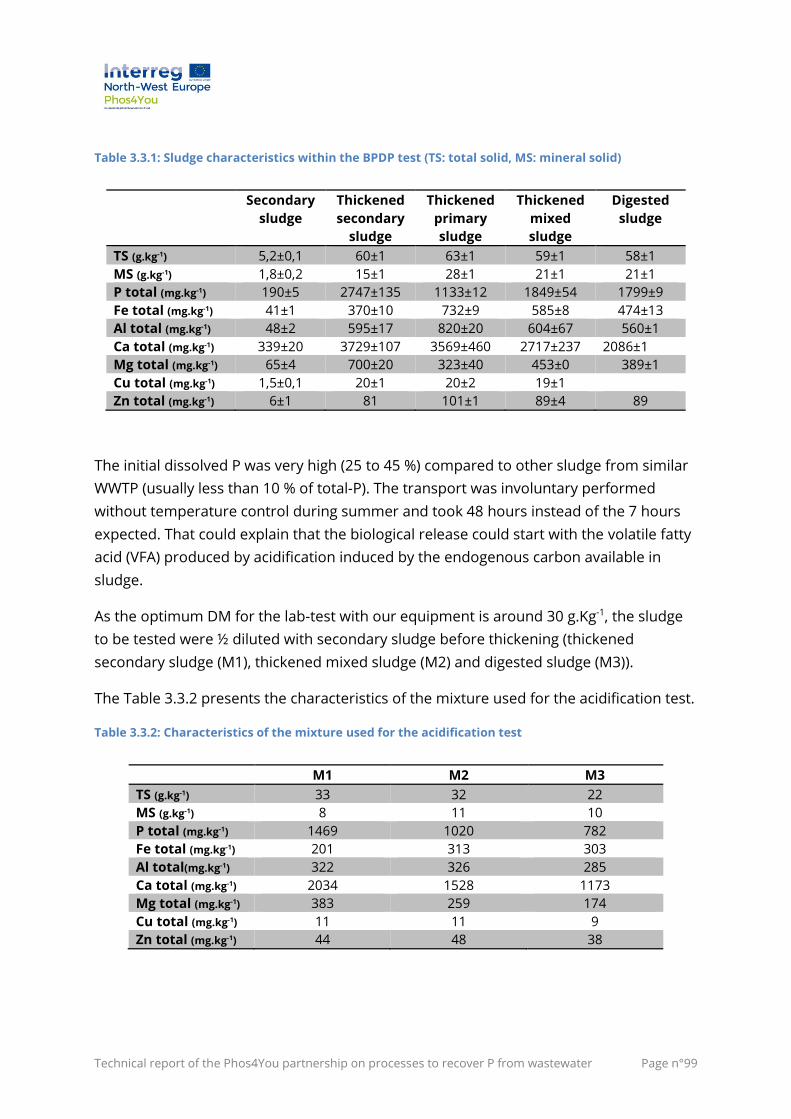
Technical report of the Phos4You partnership on processes to recover P from wastewater Page n°99
Table 3.3.1: Sludge characteristics within the BPDP test (TS: total solid, MS: mineral solid)
Secondary
sludge
Thickened
secondary
sludge
Thickened
primary
sludge
Thickened
mixed
sludge
Digested
sludge
TS (g.kg-1) 5,2±0,1 60±1 63±1 59±1 58±1
MS (g.kg-1) 1,8±0,2 15±1 28±1 21±1 21±1
P total (mg.kg-1) 190±5 2747±135 1133±12 1849±54 1799±9
Fe total (mg.kg-1) 41±1 370±10 732±9 585±8 474±13
Al total (mg.kg-1) 48±2 595±17 820±20 604±67 560±1
Ca total (mg.kg-1) 339±20 3729±107 3569±460 2717±237 2086±1
Mg total (mg.kg-1) 65±4 700±20 323±40 453±0 389±1
Cu total (mg.kg-1) 1,5±0,1 20±1 20±2 19±1
Zn total (mg.kg-1) 6±1 81 101±1 89±4 89
The initial dissolved P was very high (25 to 45 %) compared to other sludge from similar
WWTP (usually less than 10 % of total-P). The transport was involuntary performed
without temperature control during summer and took 48 hours instead of the 7 hours
expected. That could explain that the biological release could start with the volatile fatty
acid (VFA) produced by acidification induced by the endogenous carbon available in
sludge.
As the optimum DM for the lab-test with our equipment is around 30 g.Kg-1, the sludge
to be tested were ½ diluted with secondary sludge before thickening (thickened
secondary sludge (M1), thickened mixed sludge (M2) and digested sludge (M3)).
The Table 3.3.2 presents the characteristics of the mixture used for the acidification test.
Table 3.3.2: Characteristics of the mixture used for the acidification test
M1 M2 M3
TS (g.kg-1) 33 32 22
MS (g.kg-1) 8 11 10
P total (mg.kg-1) 1469 1020 782
Fe total (mg.kg-1) 201 313 303
Al total(mg.kg-1) 322 326 285
Ca total (mg.kg-1) 2034 1528 1173
Mg total (mg.kg-1) 383 259 174
Cu total (mg.kg-1) 11 11 9
Zn total (mg.kg-1) 44 48 38
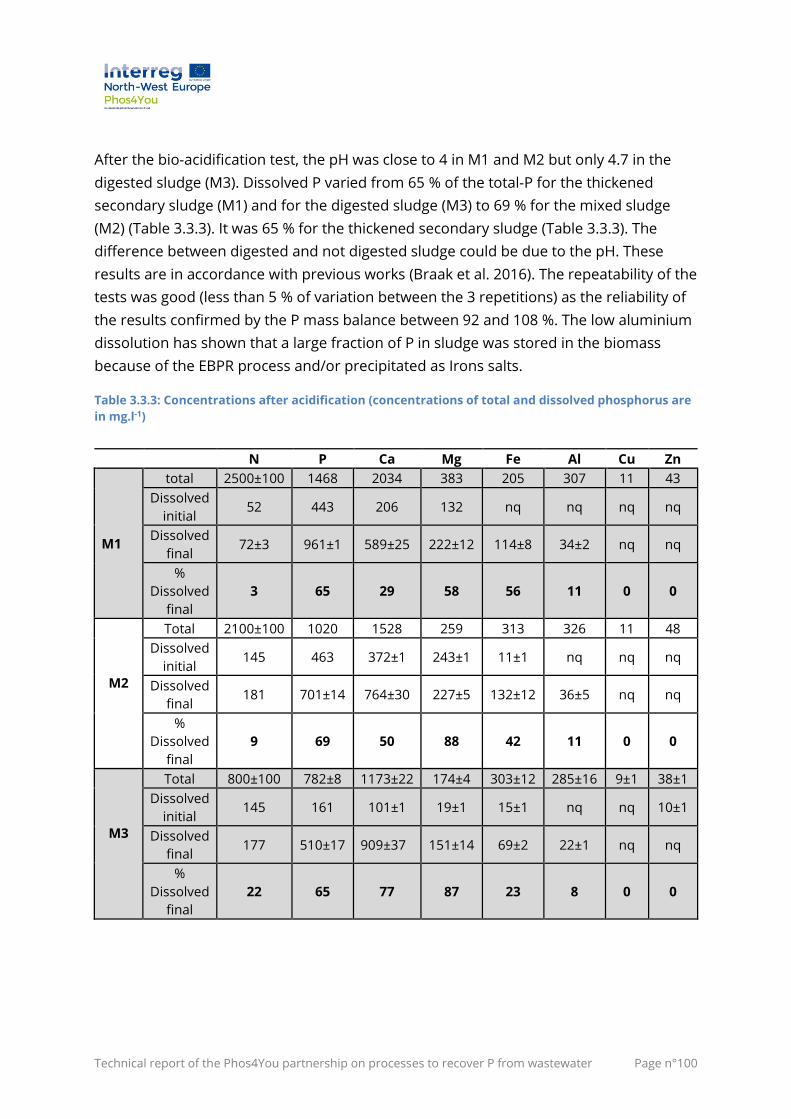
Technical report of the Phos4You partnership on processes to recover P from wastewater Page n°100
After the bio-acidification test, the pH was close to 4 in M1 and M2 but only 4.7 in the
digested sludge (M3). Dissolved P varied from 65 % of the total-P for the thickened
secondary sludge (M1) and for the digested sludge (M3) to 69 % for the mixed sludge
(M2) (Table 3.3.3). It was 65 % for the thickened secondary sludge (Table 3.3.3). The
difference between digested and not digested sludge could be due to the pH. These
results are in accordance with previous works (Braak et al. 2016). The repeatability of the
tests was good (less than 5 % of variation between the 3 repetitions) as the reliability of
the results confirmed by the P mass balance between 92 and 108 %. The low aluminium
dissolution has shown that a large fraction of P in sludge was stored in the biomass
because of the EBPR process and/or precipitated as Irons salts.
Table 3.3.3: Concentrations after acidification (concentrations of total and dissolved phosphorus are
in mg.l-1)
N P Ca Mg Fe Al Cu Zn
M1
total 2500±100 1468 2034 383 205 307 11 43
Dissolved
initial 52 443 206 132 nq nq nq nq
Dissolved
final 72±3 961±1 589±25 222±12 114±8 34±2 nq nq
%
Dissolved
final
3 65 29 58 56 11 0 0
M2
Total 2100±100 1020 1528 259 313 326 11 48
Dissolved
initial 145 463 372±1 243±1 11±1 nq nq nq
Dissolved
final 181 701±14 764±30 227±5 132±12 36±5 nq nq
%
Dissolved
final
9 69 50 88 42 11 0 0
M3
Total 800±100 782±8 1173±22 174±4 303±12 285±16 9±1 38±1
Dissolved
initial 145 161 101±1 19±1 15±1 nq nq 10±1
Dissolved
final 177 510±17 909±37 151±14 69±2 22±1 nq nq
%
Dissolved
final
22 65 77 87 23 8 0 0
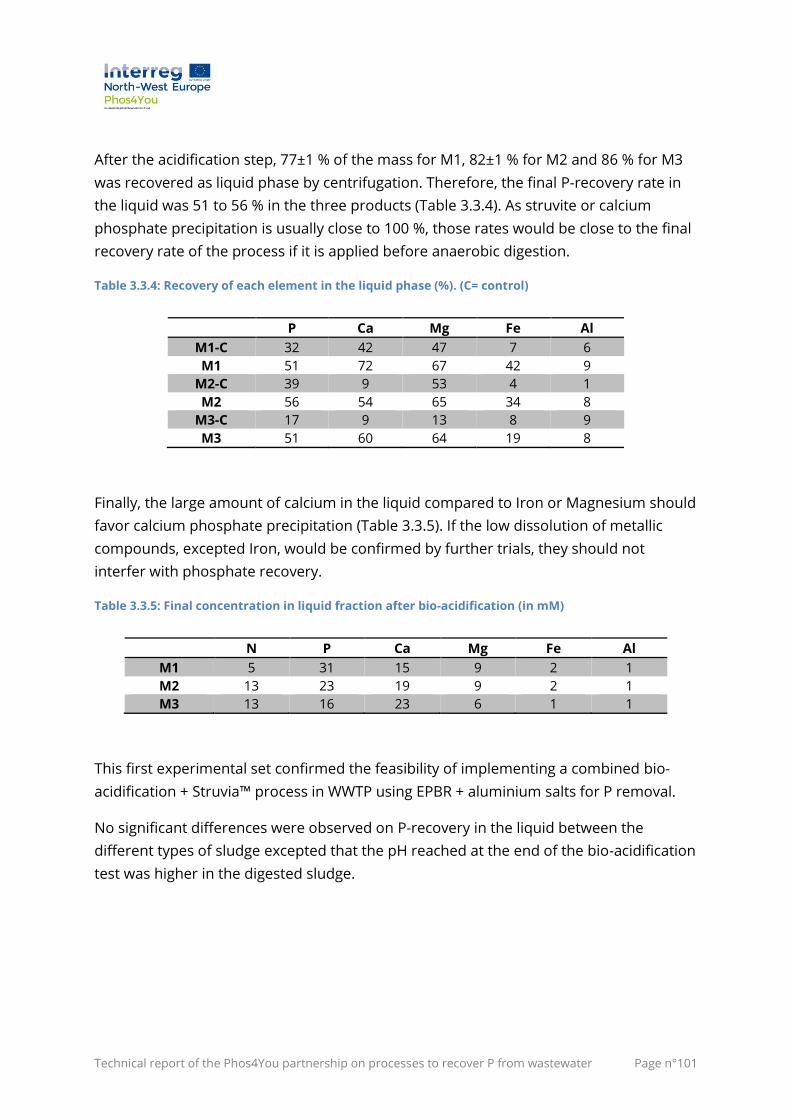
Technical report of the Phos4You partnership on processes to recover P from wastewater Page n°101
After the acidification step, 77±1 % of the mass for M1, 82±1 % for M2 and 86 % for M3
was recovered as liquid phase by centrifugation. Therefore, the final P-recovery rate in
the liquid was 51 to 56 % in the three products (Table 3.3.4). As struvite or calcium
phosphate precipitation is usually close to 100 %, those rates would be close to the final
recovery rate of the process if it is applied before anaerobic digestion.
Table 3.3.4: Recovery of each element in the liquid phase (%). (C= control)
P Ca Mg Fe Al
M1-C 32 42 47 7 6
M1 51 72 67 42 9
M2-C 39 9 53 4 1
M2 56 54 65 34 8
M3-C 17 9 13 8 9
M3 51 60 64 19 8
Finally, the large amount of calcium in the liquid compared to Iron or Magnesium should
favor calcium phosphate precipitation (Table 3.3.5). If the low dissolution of metallic
compounds, excepted Iron, would be confirmed by further trials, they should not
interfer with phosphate recovery.
Table 3.3.5: Final concentration in liquid fraction after bio-acidification (in mM)
N P Ca Mg Fe Al
M1 5 31 15 9 2 1
M2 13 23 19 9 2 1
M3 13 16 23 6 1 1
This first experimental set confirmed the feasibility of implementing a combined bio-
acidification + Struvia™ process in WWTP using EPBR + aluminium salts for P removal.
No significant differences were observed on P-recovery in the liquid between the
different types of sludge excepted that the pH reached at the end of the bio-acidification
test was higher in the digested sludge.
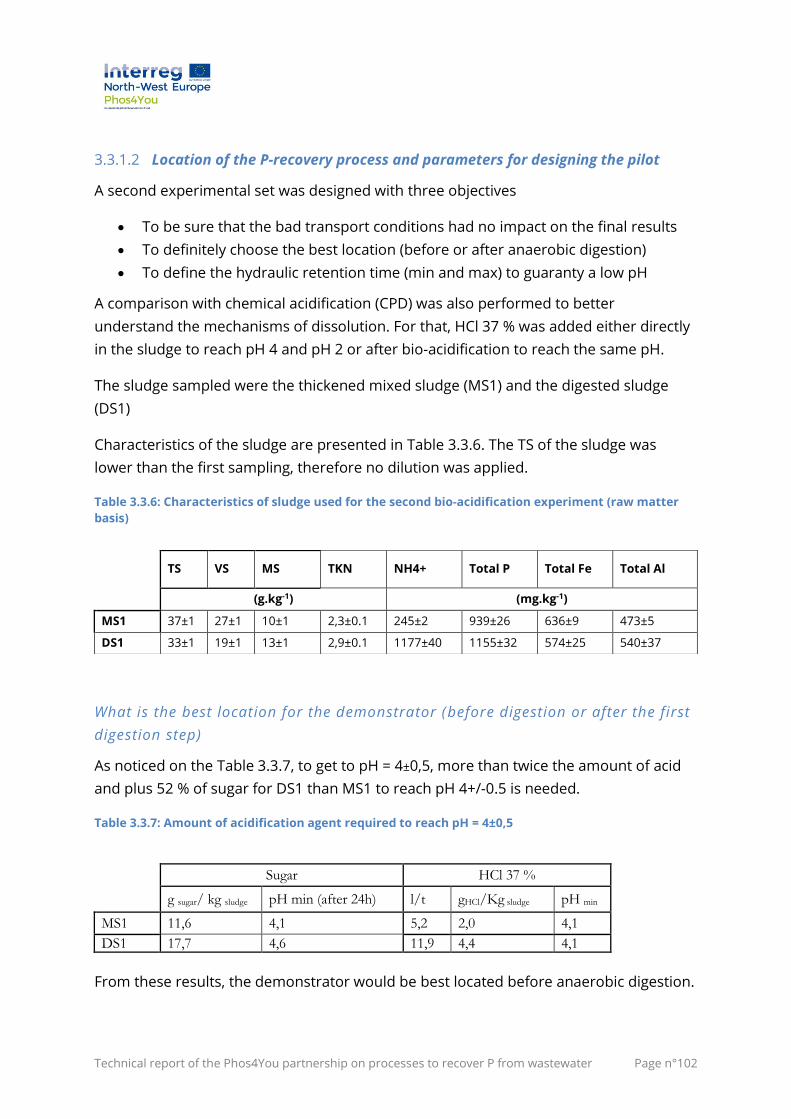
Technical report of the Phos4You partnership on processes to recover P from wastewater Page n°102
3.3.1.2 Location of the P-recovery process and parameters for designing the pilot
A second experimental set was designed with three objectives
• To be sure that the bad transport conditions had no impact on the final results
• To definitely choose the best location (before or after anaerobic digestion)
• To define the hydraulic retention time (min and max) to guaranty a low pH
A comparison with chemical acidification (CPD) was also performed to better
understand the mechanisms of dissolution. For that, HCl 37 % was added either directly
in the sludge to reach pH 4 and pH 2 or after bio-acidification to reach the same pH.
The sludge sampled were the thickened mixed sludge (MS1) and the digested sludge
(DS1)
Characteristics of the sludge are presented in Table 3.3.6. The TS of the sludge was
lower than the first sampling, therefore no dilution was applied.
Table 3.3.6: Characteristics of sludge used for the second bio-acidification experiment (raw matter
basis)
What is the best location for the demonstrator (before digestion or after the first
digestion step)
As noticed on the Table 3.3.7, to get to pH = 4±0,5, more than twice the amount of acid
and plus 52 % of sugar for DS1 than MS1 to reach pH 4+/-0.5 is needed.
Table 3.3.7: Amount of acidification agent required to reach pH = 4±0,5
From these results, the demonstrator would be best located before anaerobic digestion.
TS VS MS TKN NH4+ Total P Total Fe Total Al
(g.kg-1) (mg.kg-1)
MS1 37±1 27±1 10±1 2,3±0.1 245±2 939±26 636±9 473±5
DS1 33±1 19±1 13±1 2,9±0.1 1177±40 1155±32 574±25 540±37
Sugar HCl 37 %
g sugar/ kg sludge pH min (after 24h) l/t gHCl/Kg sludge pH min
MS1 11,6 4,1 5,2 2,0 4,1
DS1 17,7 4,6 11,9 4,4 4,1
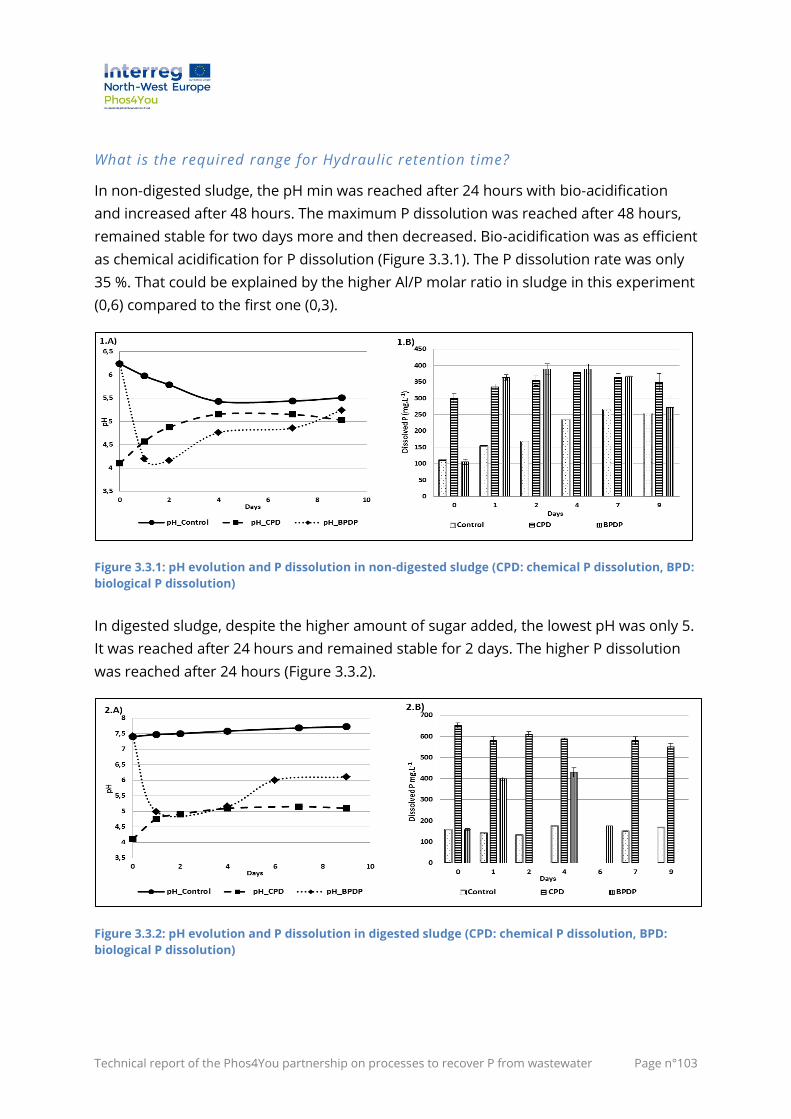
Technical report of the Phos4You partnership on processes to recover P from wastewater Page n°103
What is the required range for Hydraulic retention time?
In non-digested sludge, the pH min was reached after 24 hours with bio-acidification
and increased after 48 hours. The maximum P dissolution was reached after 48 hours,
remained stable for two days more and then decreased. Bio-acidification was as efficient
as chemical acidification for P dissolution (Figure 3.3.1). The P dissolution rate was only
35 %. That could be explained by the higher Al/P molar ratio in sludge in this experiment
(0,6) compared to the first one (0,3).
Figure 3.3.1: pH evolution and P dissolution in non-digested sludge (CPD: chemical P dissolution, BPD:
biological P dissolution)
In digested sludge, despite the higher amount of sugar added, the lowest pH was only 5.
It was reached after 24 hours and remained stable for 2 days. The higher P dissolution
was reached after 24 hours (Figure 3.3.2).
Figure 3.3.2: pH evolution and P dissolution in digested sludge (CPD: chemical P dissolution, BPD:
biological P dissolution)
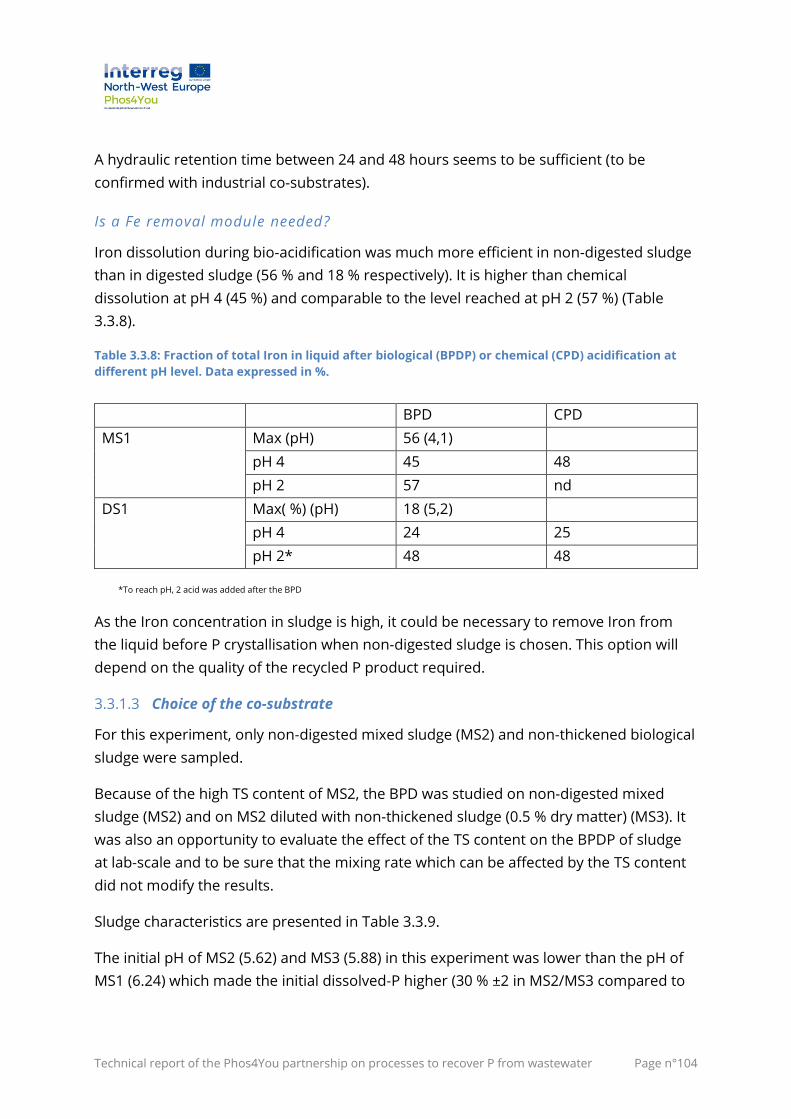
Technical report of the Phos4You partnership on processes to recover P from wastewater Page n°104
A hydraulic retention time between 24 and 48 hours seems to be sufficient (to be
confirmed with industrial co-substrates).
Is a Fe removal module needed?
Iron dissolution during bio-acidification was much more efficient in non-digested sludge
than in digested sludge (56 % and 18 % respectively). It is higher than chemical
dissolution at pH 4 (45 %) and comparable to the level reached at pH 2 (57 %) (Table
3.3.8).
Table 3.3.8: Fraction of total Iron in liquid after biological (BPDP) or chemical (CPD) acidification at
different pH level. Data expressed in %.
BPD CPD
MS1 Max (pH) 56 (4,1)
pH 4 45 48
pH 2 57 nd
DS1 Max( %) (pH) 18 (5,2)
pH 4 24 25
pH 2* 48 48
*To reach pH, 2 acid was added after the BPD
As the Iron concentration in sludge is high, it could be necessary to remove Iron from
the liquid before P crystallisation when non-digested sludge is chosen. This option will
depend on the quality of the recycled P product required.
3.3.1.3 Choice of the co-substrate
For this experiment, only non-digested mixed sludge (MS2) and non-thickened biological
sludge were sampled.
Because of the high TS content of MS2, the BPD was studied on non-digested mixed
sludge (MS2) and on MS2 diluted with non-thickened sludge (0.5 % dry matter) (MS3). It
was also an opportunity to evaluate the effect of the TS content on the BPDP of sludge
at lab-scale and to be sure that the mixing rate which can be affected by the TS content
did not modify the results.
Sludge characteristics are presented in Table 3.3.9.
The initial pH of MS2 (5.62) and MS3 (5.88) in this experiment was lower than the pH of
MS1 (6.24) which made the initial dissolved-P higher (30 % ±2 in MS2/MS3 compared to
Technical report of the Phos4You partnership on processes to recover P from wastewater Page n°105
11 % in MS1). There was no significant change in pH and dissolved P percentage after
dilution.
Table 3.3.9: Characteristics of the sludge used for the bio-acidification (raw matter basis)
The first co-substrate used in this experiment is a modified industrial starch sold for a
denitrification purpose (Cos1) and the second one is a by-product of food additive
(Erythrol) manufacture (Cos2) that can be found in abundance and at low cost, near the
WWTP. To be able to compare the results to the previous one, the BPDP using sugar was
also performed. In every case the co-substrate was added at 0.5 g COD.g VS-1. A control
sample of the sludge without any addition was also studied to investigate the natural P
release by PAOs.
MS2 and MS3 have similar pH and dissolved P evolution, especially after 20h of
incubation. The pH decreased to pH 4.3 when using sugar, and to pH 4.7 and pH 4.1
when adding Cos1 for MS2 and MS3 respectively. When using Cos2, the pH of MS2 and
MS3 dropped only to pH 5.2 and pH 5.3 respectively. The pH remained stable in the
control sample. The P dissolution rate was 43 % to 45 % of total P with sugar, 36 % to
38 % with Cos1 and 37 % to 40 % with CoS2. The pH in MS2 and MS3 continued to
decrease to pH 4.3 and pH 3.8 after 40 h respectively when Cos1 was used, remains
stable or re-increased slightly with Cos2 (Figure 3.3.3 and Figure 3.3.4).
Figure 3.3.3: pH evolution and P dissolution in MS2 with different co-substrate (Cos1: modified starch,
Cos2: Erythrol)
TS VS MS TKN NH4+ Total P Total Fe Total Al
(g.kg-1) (mg.kg-1)
MS2 55±1 39±1 15±1 2.8±0.1 351±13 1237±26 527±7 641±1
MS3 30±1 22±1 8±1 1.7±0.2 181±2 715±37 281±11 352±5

Technical report of the Phos4You partnership on processes to recover P from wastewater Page n°106
Figure 3.3.4: pH evolution and P dissolution in MS3 with different co-substrate (Cos1 : modified
starch, Cos2: Erythrol)
The TS content of the sludge did not affect significantly the bio-acidification step.
To see if a higher amount of Cos2 could decrease the pH down to 4 and therefore
increase the P dissolution, a new trial was performed with MS2 sludge stored for about
one month, at 4°C in a concealed container. During this storage, the pH slightly
increased from 5.6 to 5.9 decreasing the dissolved P by only 2 %. The BPDP with two
concentrations of Cos2 (0.75 and 1 g COD.g VS-1) were compared with Cos1
(0.5 g COD.g VS-1). The pH decreased to 5 and 4.9, with Cos2 at 0.75 g COD.g VS-1
(35 g Cos2.kg MS2-1) and 1 g COD.g VS-1 (47 g Cos2.kg MS2-1) respectively, when it
decreased to pH 4.16 when Cos1 was used at 0.5 g COD.g VS-1 (24 g Cos2.kg MS2-1).
However, as for the first trial with those co-substrates even if the pH was higher there
was no difference between P dissolution rate (48 %) with CoS2 and CoS1.
Finally, a last test was performed with a new co-substrate (CoS3: fruit industry waste)
and compared to Cos1. Mixed thickened sludge was sampled in the WWTP (MS4). Sludge
characteristics are shown in the Table 3.3.10. The initial pH was the same as for
MS2 (5.6) but the initial dissolved P rate was higher (42 %) probably because of the low
Al/P ratio (0,3).
Table 3.3.10: Characteristics of the sludge used for the bio-acidification with Cos3 (raw matter basis)
TS VS MS TKN NH4+ Total P Total Fe Total Al
(g.kg-1) (mg.kg-1)
MS4 37±1 26±1 11±1 2.8±0.1 351±13 783±26 433±12 205±3
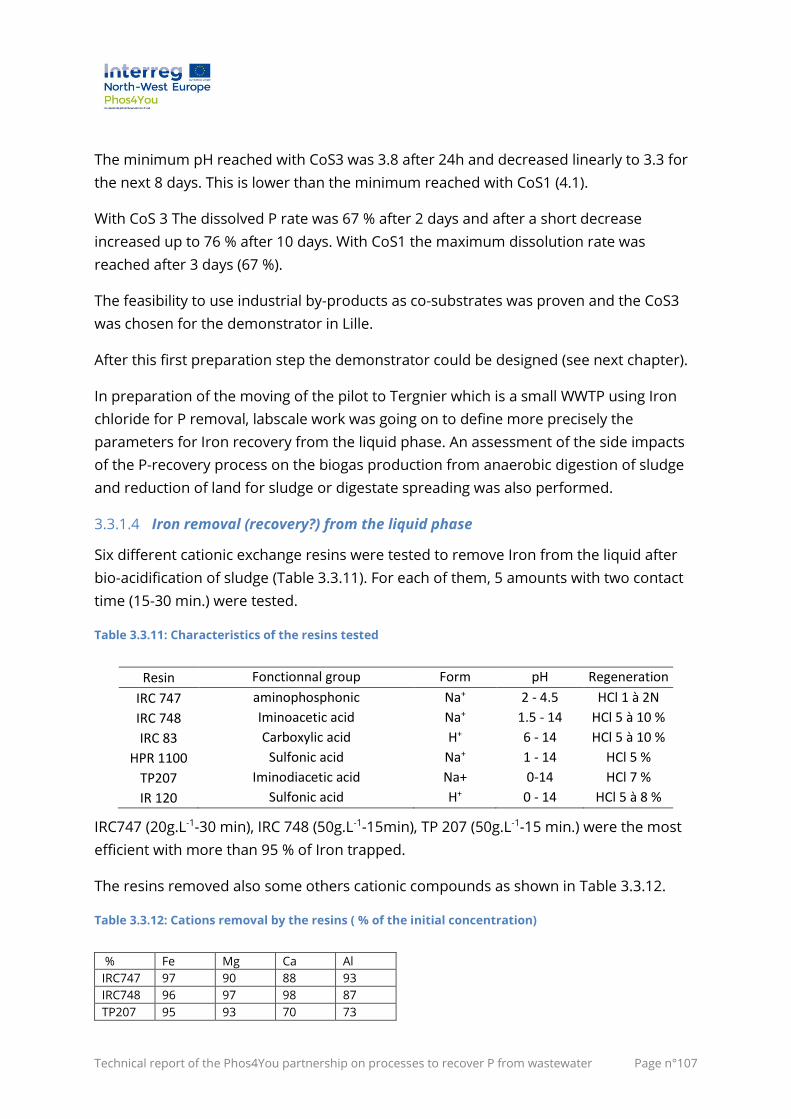
Technical report of the Phos4You partnership on processes to recover P from wastewater Page n°107
The minimum pH reached with CoS3 was 3.8 after 24h and decreased linearly to 3.3 for
the next 8 days. This is lower than the minimum reached with CoS1 (4.1).
With CoS 3 The dissolved P rate was 67 % after 2 days and after a short decrease
increased up to 76 % after 10 days. With CoS1 the maximum dissolution rate was
reached after 3 days (67 %).
The feasibility to use industrial by-products as co-substrates was proven and the CoS3
was chosen for the demonstrator in Lille.
After this first preparation step the demonstrator could be designed (see next chapter).
In preparation of the moving of the pilot to Tergnier which is a small WWTP using Iron
chloride for P removal, labscale work was going on to define more precisely the
parameters for Iron recovery from the liquid phase. An assessment of the side impacts
of the P-recovery process on the biogas production from anaerobic digestion of sludge
and reduction of land for sludge or digestate spreading was also performed.
3.3.1.4 Iron removal (recovery?) from the liquid phase
Six different cationic exchange resins were tested to remove Iron from the liquid after
bio-acidification of sludge (Table 3.3.11). For each of them, 5 amounts with two contact
time (15-30 min.) were tested.
Table 3.3.11: Characteristics of the resins tested
Resin Fonctionnal group Form pH Regeneration
IRC 747 aminophosphonic Na+ 2 - 4.5 HCl 1 à 2N
IRC 748 Iminoacetic acid Na+ 1.5 - 14 HCl 5 à 10 %
IRC 83 Carboxylic acid H+ 6 - 14 HCl 5 à 10 %
HPR 1100 Sulfonic acid Na+ 1 - 14 HCl 5 %
TP207 Iminodiacetic acid Na+ 0-14 HCl 7 %
IR 120 Sulfonic acid H+ 0 - 14 HCl 5 à 8 %
IRC747 (20g.L-1-30 min), IRC 748 (50g.L-1-15min), TP 207 (50g.L-1-15 min.) were the most
efficient with more than 95 % of Iron trapped.
The resins removed also some others cationic compounds as shown in Table 3.3.12.
Table 3.3.12: Cations removal by the resins ( % of the initial concentration)
% Fe Mg Ca Al
IRC747 97 90 88 93
IRC748 96 97 98 87
TP207 95 93 70 73
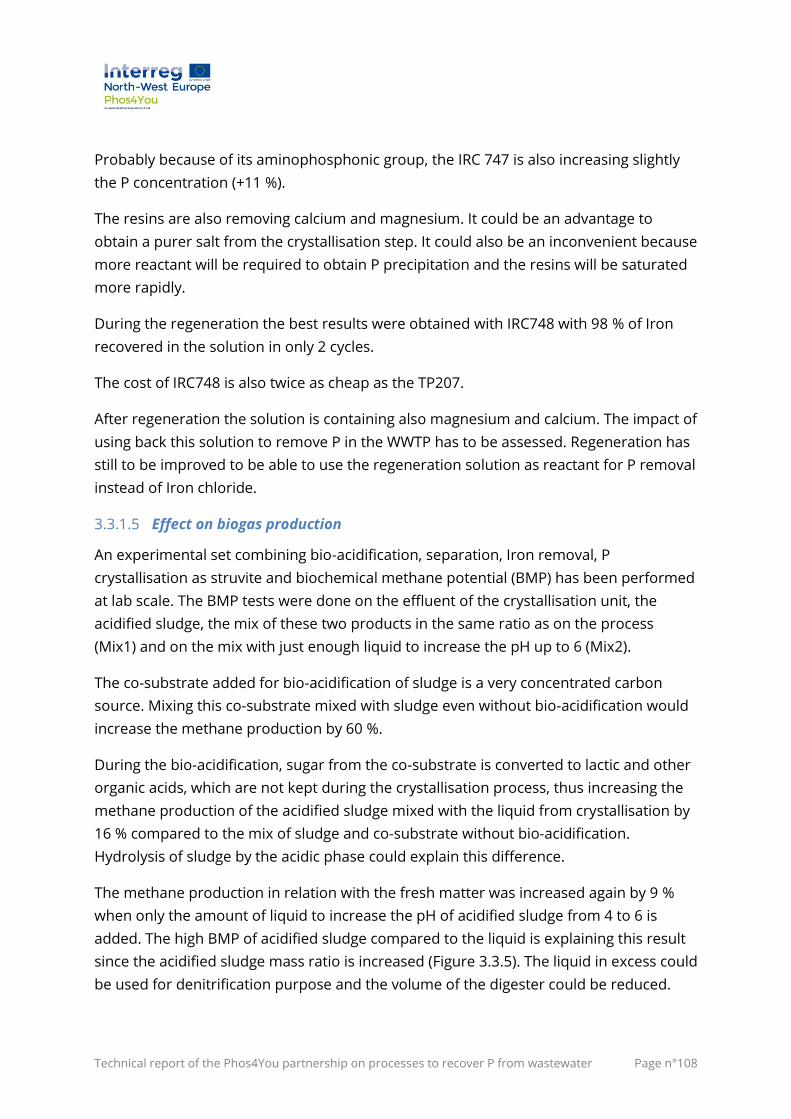
Technical report of the Phos4You partnership on processes to recover P from wastewater Page n°108
Probably because of its aminophosphonic group, the IRC 747 is also increasing slightly
the P concentration (+11 %).
The resins are also removing calcium and magnesium. It could be an advantage to
obtain a purer salt from the crystallisation step. It could also be an inconvenient because
more reactant will be required to obtain P precipitation and the resins will be saturated
more rapidly.
During the regeneration the best results were obtained with IRC748 with 98 % of Iron
recovered in the solution in only 2 cycles.
The cost of IRC748 is also twice as cheap as the TP207.
After regeneration the solution is containing also magnesium and calcium. The impact of
using back this solution to remove P in the WWTP has to be assessed. Regeneration has
still to be improved to be able to use the regeneration solution as reactant for P removal
instead of Iron chloride.
3.3.1.5 Effect on biogas production
An experimental set combining bio-acidification, separation, Iron removal, P
crystallisation as struvite and biochemical methane potential (BMP) has been performed
at lab scale. The BMP tests were done on the effluent of the crystallisation unit, the
acidified sludge, the mix of these two products in the same ratio as on the process
(Mix1) and on the mix with just enough liquid to increase the pH up to 6 (Mix2).
The co-substrate added for bio-acidification of sludge is a very concentrated carbon
source. Mixing this co-substrate mixed with sludge even without bio-acidification would
increase the methane production by 60 %.
During the bio-acidification, sugar from the co-substrate is converted to lactic and other
organic acids, which are not kept during the crystallisation process, thus increasing the
methane production of the acidified sludge mixed with the liquid from crystallisation by
16 % compared to the mix of sludge and co-substrate without bio-acidification.
Hydrolysis of sludge by the acidic phase could explain this difference.
The methane production in relation with the fresh matter was increased again by 9 %
when only the amount of liquid to increase the pH of acidified sludge from 4 to 6 is
added. The high BMP of acidified sludge compared to the liquid is explaining this result
since the acidified sludge mass ratio is increased (Figure 3.3.5). The liquid in excess could
be used for denitrification purpose and the volume of the digester could be reduced.
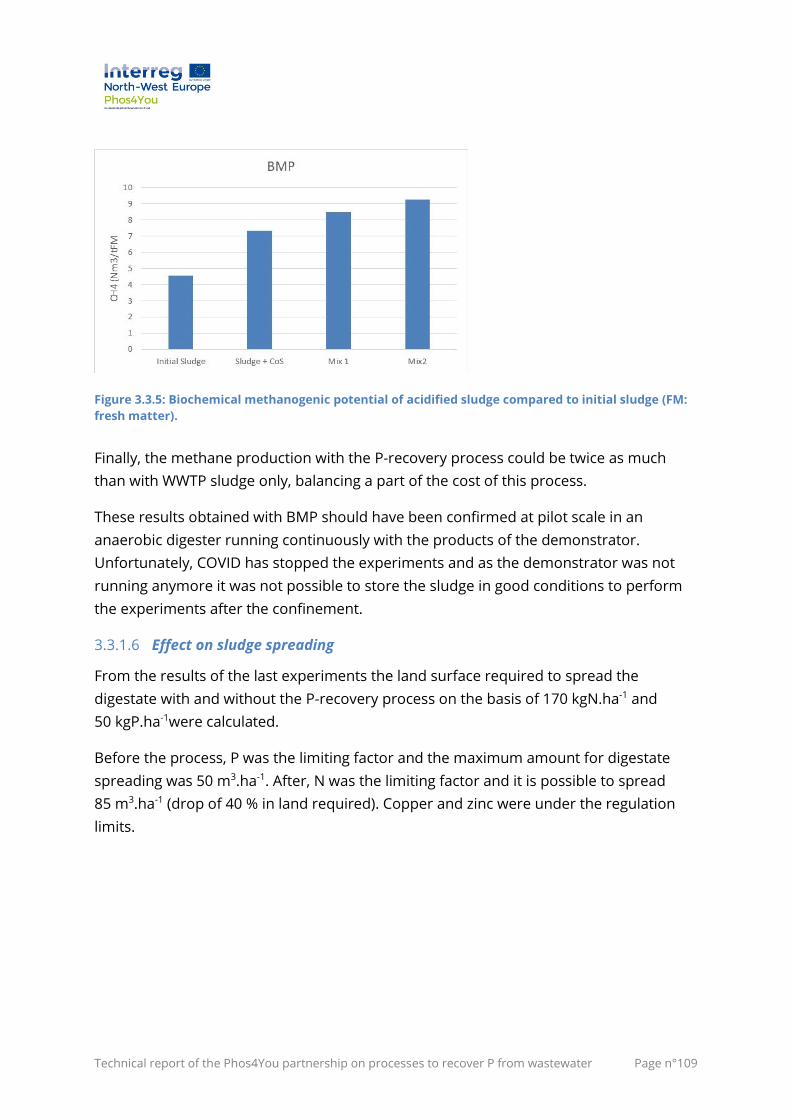
Technical report of the Phos4You partnership on processes to recover P from wastewater Page n°109
Figure 3.3.5: Biochemical methanogenic potential of acidified sludge compared to initial sludge (FM:
fresh matter).
Finally, the methane production with the P-recovery process could be twice as much
than with WWTP sludge only, balancing a part of the cost of this process.
These results obtained with BMP should have been confirmed at pilot scale in an
anaerobic digester running continuously with the products of the demonstrator.
Unfortunately, COVID has stopped the experiments and as the demonstrator was not
running anymore it was not possible to store the sludge in good conditions to perform
the experiments after the confinement.
3.3.1.6 Effect on sludge spreading
From the results of the last experiments the land surface required to spread the
digestate with and without the P-recovery process on the basis of 170 kgN.ha-1 and
50 kgP.ha-1were calculated.
Before the process, P was the limiting factor and the maximum amount for digestate
spreading was 50 m3.ha-1. After, N was the limiting factor and it is possible to spread
85 m3.ha-1 (drop of 40 % in land required). Copper and zinc were under the regulation
limits.
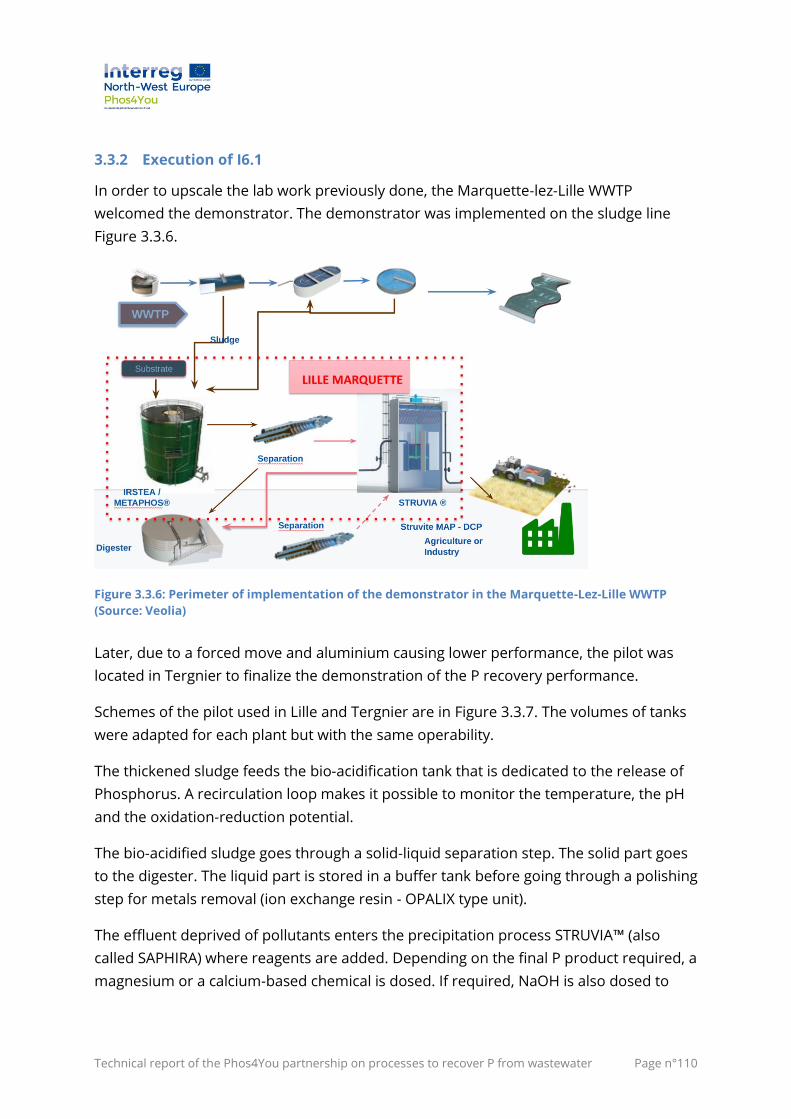
Technical report of the Phos4You partnership on processes to recover P from wastewater Page n°110
3.3.2 Execution of I6.1
In order to upscale the lab work previously done, the Marquette-lez-Lille WWTP
welcomed the demonstrator. The demonstrator was implemented on the sludge line
Figure 3.3.6.
Figure 3.3.6: Perimeter of implementation of the demonstrator in the Marquette-Lez-Lille WWTP
(Source: Veolia)
Later, due to a forced move and aluminium causing lower performance, the pilot was
located in Tergnier to finalize the demonstration of the P recovery performance.
Schemes of the pilot used in Lille and Tergnier are in Figure 3.3.7. The volumes of tanks
were adapted for each plant but with the same operability.
The thickened sludge feeds the bio-acidification tank that is dedicated to the release of
Phosphorus. A recirculation loop makes it possible to monitor the temperature, the pH
and the oxidation-reduction potential.
The bio-acidified sludge goes through a solid-liquid separation step. The solid part goes
to the digester. The liquid part is stored in a buffer tank before going through a polishing
step for metals removal (ion exchange resin - OPALIX type unit).
The effluent deprived of pollutants enters the precipitation process STRUVIA™ (also
called SAPHIRA) where reagents are added. Depending on the final P product required, a
magnesium or a calcium-based chemical is dosed. If required, NaOH is also dosed to
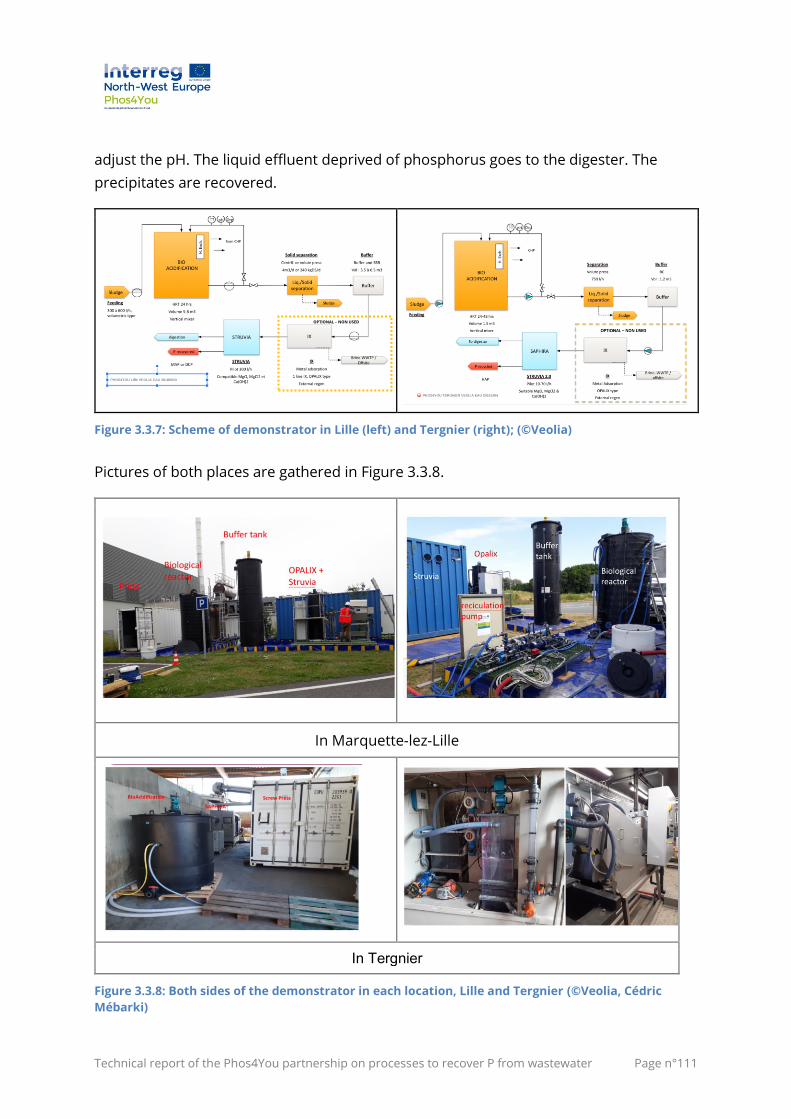
Technical report of the Phos4You partnership on processes to recover P from wastewater Page n°111
adjust the pH. The liquid effluent deprived of phosphorus goes to the digester. The
precipitates are recovered.
Figure 3.3.7: Scheme of demonstrator in Lille (left) and Tergnier (right); (©Veolia)
Pictures of both places are gathered in Figure 3.3.8.
In Marquette-lez-Lille
In Tergnier
Figure 3.3.8: Both sides of the demonstrator in each location, Lille and Tergnier (©Veolia, Cédric
Mébarki)
OPTIONAL – NON USED
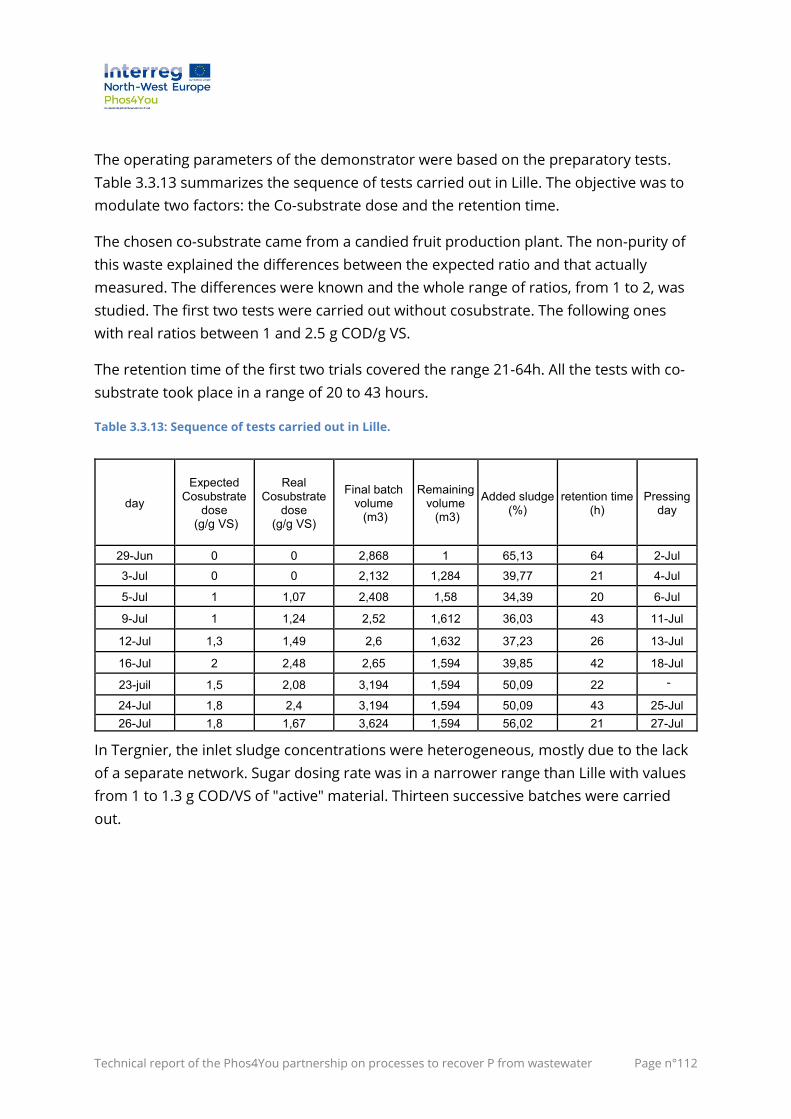
Technical report of the Phos4You partnership on processes to recover P from wastewater Page n°112
The operating parameters of the demonstrator were based on the preparatory tests.
Table 3.3.13 summarizes the sequence of tests carried out in Lille. The objective was to
modulate two factors: the Co-substrate dose and the retention time.
The chosen co-substrate came from a candied fruit production plant. The non-purity of
this waste explained the differences between the expected ratio and that actually
measured. The differences were known and the whole range of ratios, from 1 to 2, was
studied. The first two tests were carried out without cosubstrate. The following ones
with real ratios between 1 and 2.5 g COD/g VS.
The retention time of the first two trials covered the range 21-64h. All the tests with co-
substrate took place in a range of 20 to 43 hours.
Table 3.3.13: Sequence of tests carried out in Lille.
day
Expected Cosubstrate
dose (g/g VS)
Real Cosubstrate
dose (g/g VS)
Final batch volume (m3)
Remaining volume (m3)
Added sludge (%)
retention time (h)
Pressing day
29-Jun 0 0 2,868 1 65,13 64 2-Jul
3-Jul 0 0 2,132 1,284 39,77 21 4-Jul
5-Jul 1 1,07 2,408 1,58 34,39 20 6-Jul
9-Jul 1 1,24 2,52 1,612 36,03 43 11-Jul
12-Jul 1,3 1,49 2,6 1,632 37,23 26 13-Jul
16-Jul 2 2,48 2,65 1,594 39,85 42 18-Jul
23-juil 1,5 2,08 3,194 1,594 50,09 22 -
24-Jul 1,8 2,4 3,194 1,594 50,09 43 25-Jul 26-Jul 1,8 1,67 3,624 1,594 56,02 21 27-Jul
In Tergnier, the inlet sludge concentrations were heterogeneous, mostly due to the lack
of a separate network. Sugar dosing rate was in a narrower range than Lille with values
from 1 to 1.3 g COD/VS of "active" material. Thirteen successive batches were carried
out.
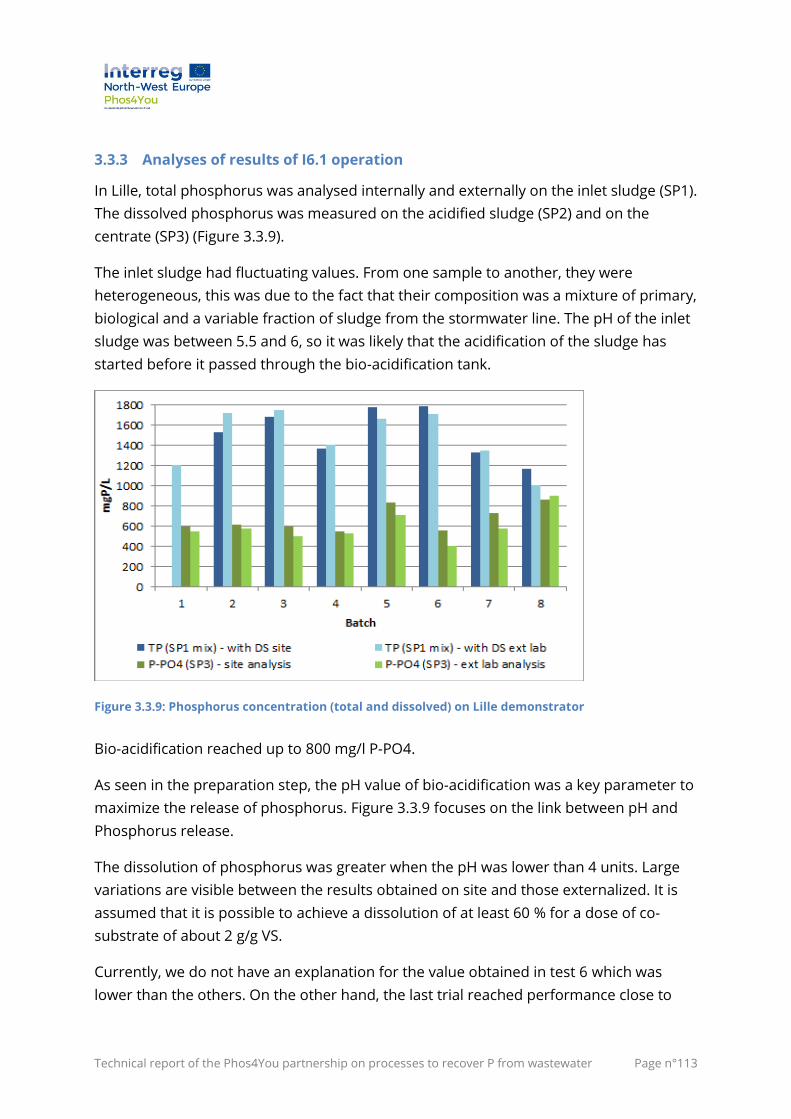
Technical report of the Phos4You partnership on processes to recover P from wastewater Page n°113
3.3.3 Analyses of results of I6.1 operation
In Lille, total phosphorus was analysed internally and externally on the inlet sludge (SP1).
The dissolved phosphorus was measured on the acidified sludge (SP2) and on the
centrate (SP3) (Figure 3.3.9).
The inlet sludge had fluctuating values. From one sample to another, they were
heterogeneous, this was due to the fact that their composition was a mixture of primary,
biological and a variable fraction of sludge from the stormwater line. The pH of the inlet
sludge was between 5.5 and 6, so it was likely that the acidification of the sludge has
started before it passed through the bio-acidification tank.
Figure 3.3.9: Phosphorus concentration (total and dissolved) on Lille demonstrator
Bio-acidification reached up to 800 mg/l P-PO4.
As seen in the preparation step, the pH value of bio-acidification was a key parameter to
maximize the release of phosphorus. Figure 3.3.9 focuses on the link between pH and
Phosphorus release.
The dissolution of phosphorus was greater when the pH was lower than 4 units. Large
variations are visible between the results obtained on site and those externalized. It is
assumed that it is possible to achieve a dissolution of at least 60 % for a dose of co-
substrate of about 2 g/g VS.
Currently, we do not have an explanation for the value obtained in test 6 which was
lower than the others. On the other hand, the last trial reached performance close to
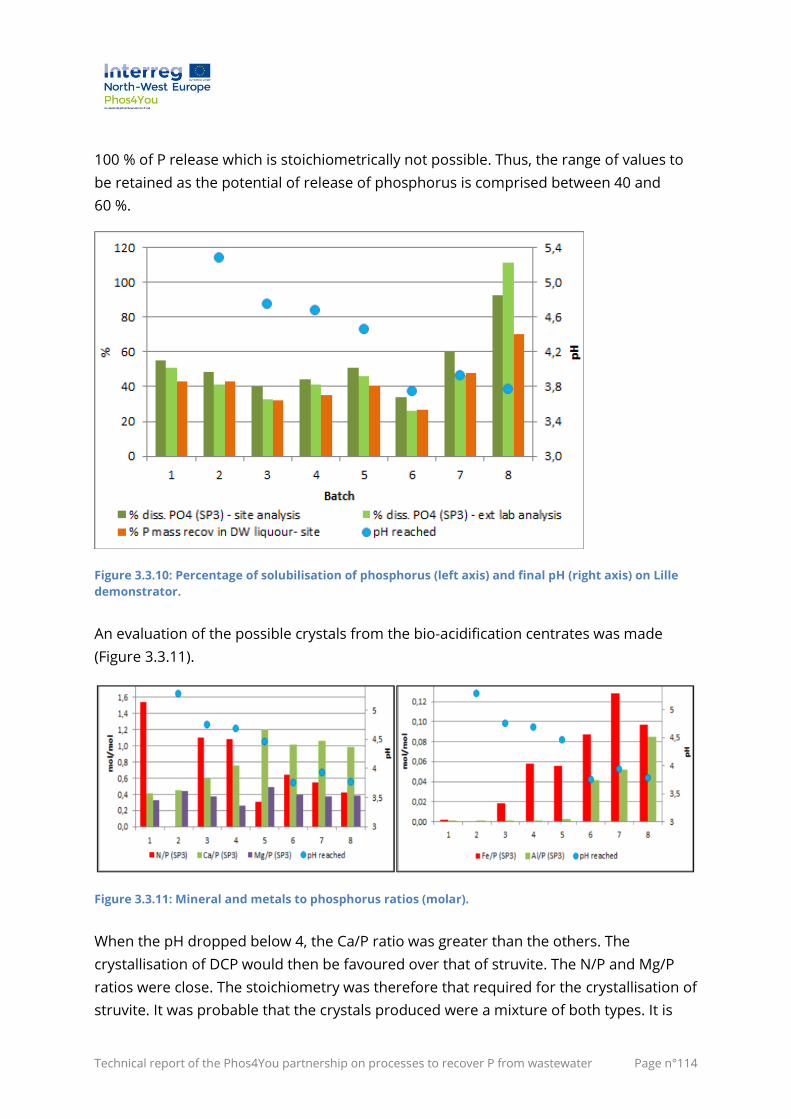
Technical report of the Phos4You partnership on processes to recover P from wastewater Page n°114
100 % of P release which is stoichiometrically not possible. Thus, the range of values to
be retained as the potential of release of phosphorus is comprised between 40 and
60 %.
Figure 3.3.10: Percentage of solubilisation of phosphorus (left axis) and final pH (right axis) on Lille
demonstrator.
An evaluation of the possible crystals from the bio-acidification centrates was made
(Figure 3.3.11).
Figure 3.3.11: Mineral and metals to phosphorus ratios (molar).
When the pH dropped below 4, the Ca/P ratio was greater than the others. The
crystallisation of DCP would then be favoured over that of struvite. The N/P and Mg/P
ratios were close. The stoichiometry was therefore that required for the crystallisation of
struvite. It was probable that the crystals produced were a mixture of both types. It is
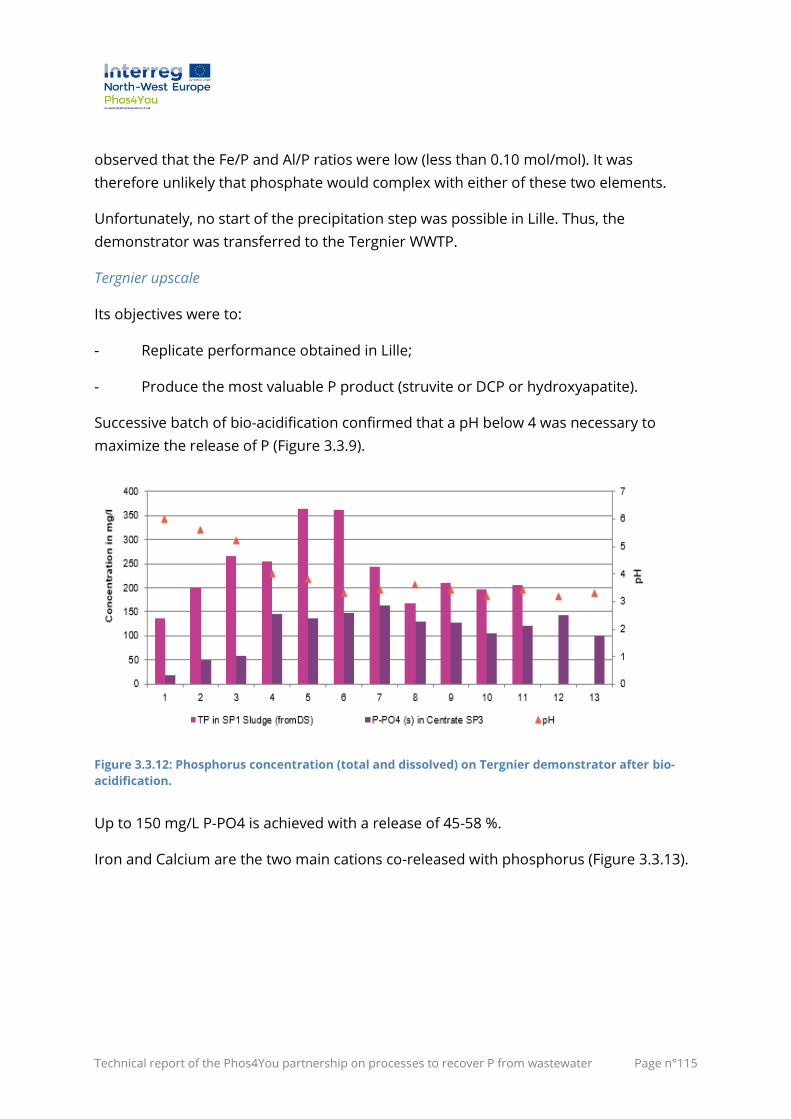
Technical report of the Phos4You partnership on processes to recover P from wastewater Page n°115
observed that the Fe/P and Al/P ratios were low (less than 0.10 mol/mol). It was
therefore unlikely that phosphate would complex with either of these two elements.
Unfortunately, no start of the precipitation step was possible in Lille. Thus, the
demonstrator was transferred to the Tergnier WWTP.
Tergnier upscale
Its objectives were to:
- Replicate performance obtained in Lille;
- Produce the most valuable P product (struvite or DCP or hydroxyapatite).
Successive batch of bio-acidification confirmed that a pH below 4 was necessary to
maximize the release of P (Figure 3.3.9).
Figure 3.3.12: Phosphorus concentration (total and dissolved) on Tergnier demonstrator after bio-
acidification.
Up to 150 mg/L P-PO4 is achieved with a release of 45-58 %.
Iron and Calcium are the two main cations co-released with phosphorus (Figure 3.3.13).
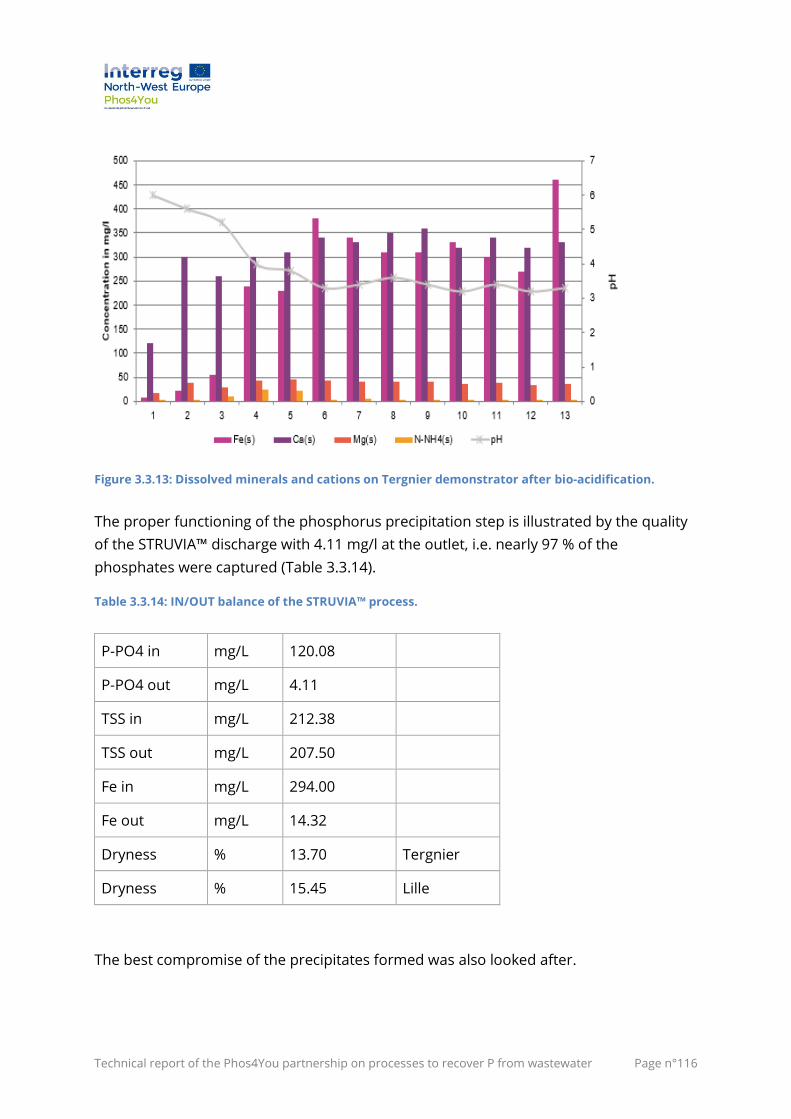
Technical report of the Phos4You partnership on processes to recover P from wastewater Page n°116
Figure 3.3.13: Dissolved minerals and cations on Tergnier demonstrator after bio-acidification.
The proper functioning of the phosphorus precipitation step is illustrated by the quality
of the STRUVIA™ discharge with 4.11 mg/l at the outlet, i.e. nearly 97 % of the
phosphates were captured (Table 3.3.14).
Table 3.3.14: IN/OUT balance of the STRUVIA™ process.
P-PO4 in mg/L 120.08
P-PO4 out mg/L 4.11
TSS in mg/L 212.38
TSS out mg/L 207.50
Fe in mg/L 294.00
Fe out mg/L 14.32
Dryness % 13.70 Tergnier
Dryness % 15.45 Lille
The best compromise of the precipitates formed was also looked after.
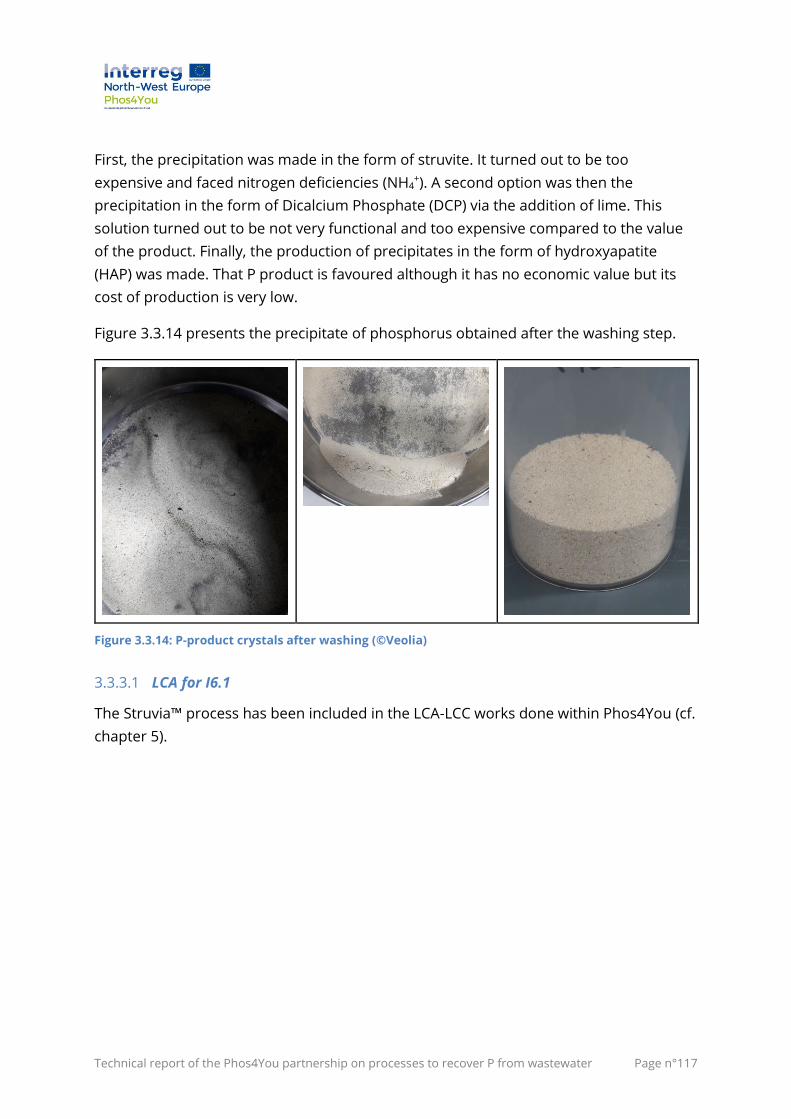
Technical report of the Phos4You partnership on processes to recover P from wastewater Page n°117
First, the precipitation was made in the form of struvite. It turned out to be too
expensive and faced nitrogen deficiencies (NH4+). A second option was then the
precipitation in the form of Dicalcium Phosphate (DCP) via the addition of lime. This
solution turned out to be not very functional and too expensive compared to the value
of the product. Finally, the production of precipitates in the form of hydroxyapatite
(HAP) was made. That P product is favoured although it has no economic value but its
cost of production is very low.
Figure 3.3.14 presents the precipitate of phosphorus obtained after the washing step.
Figure 3.3.14: P-product crystals after washing (©Veolia)
3.3.3.1 LCA for I6.1
The Struvia™ process has been included in the LCA-LCC works done within Phos4You (cf.
chapter 5).
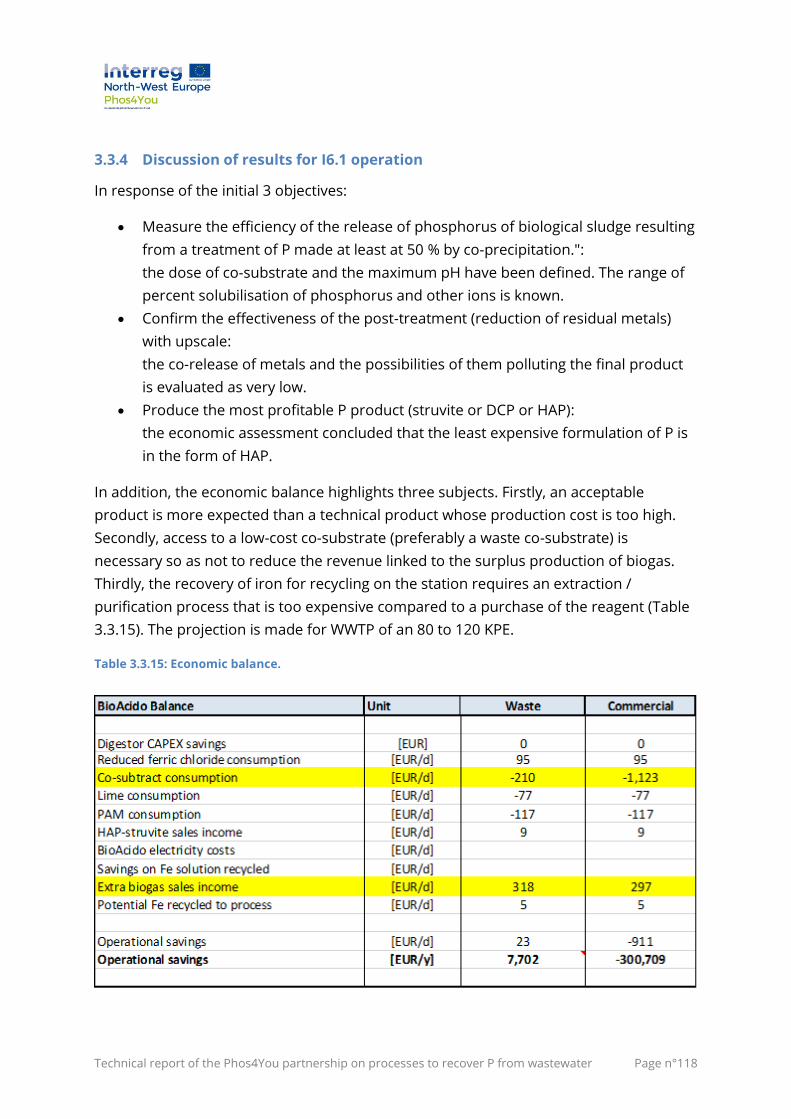
Technical report of the Phos4You partnership on processes to recover P from wastewater Page n°118
3.3.4 Discussion of results for I6.1 operation
In response of the initial 3 objectives:
• Measure the efficiency of the release of phosphorus of biological sludge resulting
from a treatment of P made at least at 50 % by co-precipitation.":
the dose of co-substrate and the maximum pH have been defined. The range of
percent solubilisation of phosphorus and other ions is known.
• Confirm the effectiveness of the post-treatment (reduction of residual metals)
with upscale:
the co-release of metals and the possibilities of them polluting the final product
is evaluated as very low.
• Produce the most profitable P product (struvite or DCP or HAP):
the economic assessment concluded that the least expensive formulation of P is
in the form of HAP.
In addition, the economic balance highlights three subjects. Firstly, an acceptable
product is more expected than a technical product whose production cost is too high.
Secondly, access to a low-cost co-substrate (preferably a waste co-substrate) is
necessary so as not to reduce the revenue linked to the surplus production of biogas.
Thirdly, the recovery of iron for recycling on the station requires an extraction /
purification process that is too expensive compared to a purchase of the reagent (Table
3.3.15). The projection is made for WWTP of an 80 to 120 KPE.
Table 3.3.15: Economic balance.
Technical report of the Phos4You partnership on processes to recover P from wastewater Page n°119
3.3.5 Conclusion for I6.1
The implementation of bio-acidification, followed by a step of precipitation of
phosphorus on a larger scale was carried out. The performances of the bio-acidification
step were of the same order of magnitude as those obtained at the laboratory scale by
INRAE. pH and residence time conditions were confirmed. The use of agribusiness waste
as a co-substrate required a slight increase in the doses to be added. The use of a low
cost co-substrate (preferably a waste co-substrate) is essential so as not to reduce the
income linked to the surplus production of biogas. The Struvia™ technology has proven
its complementarity after the bio-acidification step with P capture yields of 97 %. The
combination of both processes achieves 50 % phosphorus recovery. The modularity of
Struvia™ makes it possible to produce different P products. The most valuable
precipitate at this stage is HAP in terms of invest (benefit vs. chemical investment).
3.3.5.1 Perspectives
The conditions for the bio-acidification are close to dark fermentation. Dark
fermentation is developed to produce either hydrogen or specific VFA with a high
economical added value. To see if a synergy could be found between P recovery and
those promising valorisation ways for sewage sludge, new experiments were performed
at labscale. The main differences between bio-acidification and dark fermentation is the
pH, around 4 and 5, respectively. Two semi-continuous pilots were used to tests the two
processes on two different sludge, one coming from Tergnier and the other one from a
large city using EBPR and Iron P removal. P dissolution was lower with dark fermentation
but depending on the context and on the recycling goals, it could be interesting to think
about combination of P recovery and dark fermentation. The results of these
experiments have been published in 2020 in Environmental Technology (Bareha et al.
2020). Experiments and main results are summarized in Figure 3.3.15.
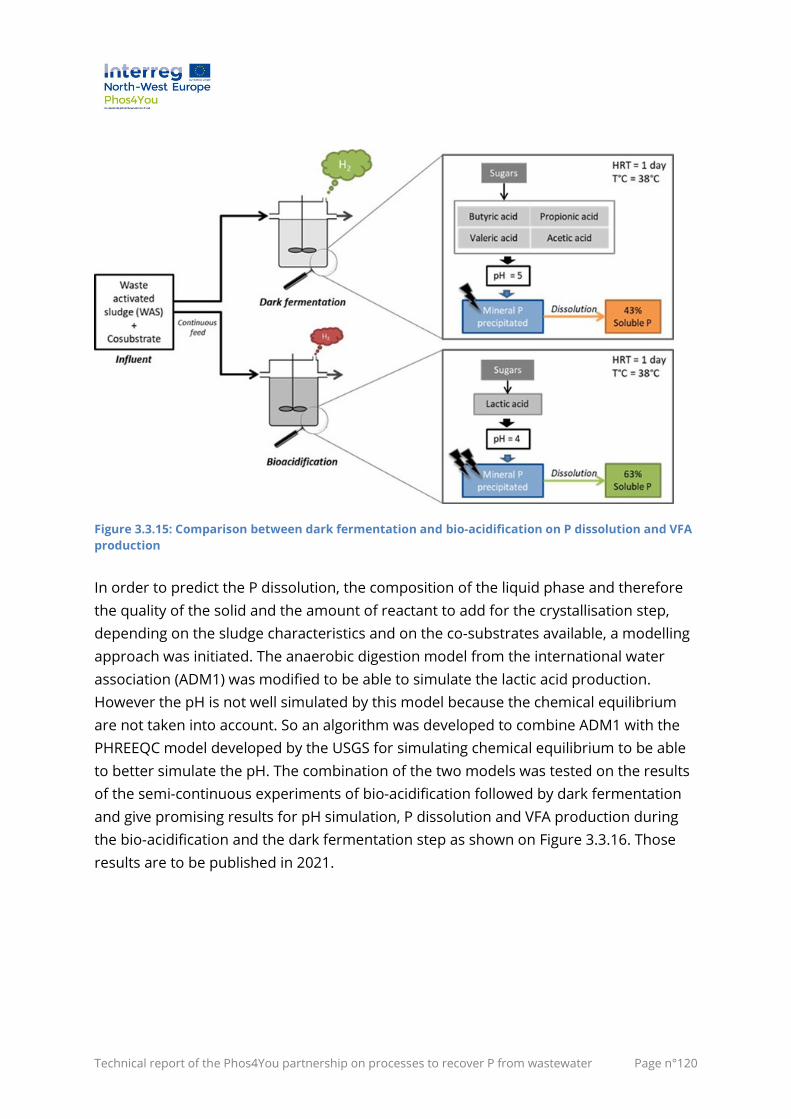
Technical report of the Phos4You partnership on processes to recover P from wastewater Page n°120
Figure 3.3.15: Comparison between dark fermentation and bio-acidification on P dissolution and VFA
production
In order to predict the P dissolution, the composition of the liquid phase and therefore
the quality of the solid and the amount of reactant to add for the crystallisation step,
depending on the sludge characteristics and on the co-substrates available, a modelling
approach was initiated. The anaerobic digestion model from the international water
association (ADM1) was modified to be able to simulate the lactic acid production.
However the pH is not well simulated by this model because the chemical equilibrium
are not taken into account. So an algorithm was developed to combine ADM1 with the
PHREEQC model developed by the USGS for simulating chemical equilibrium to be able
to better simulate the pH. The combination of the two models was tested on the results
of the semi-continuous experiments of bio-acidification followed by dark fermentation
and give promising results for pH simulation, P dissolution and VFA production during
the bio-acidification and the dark fermentation step as shown on Figure 3.3.16. Those
results are to be published in 2021.
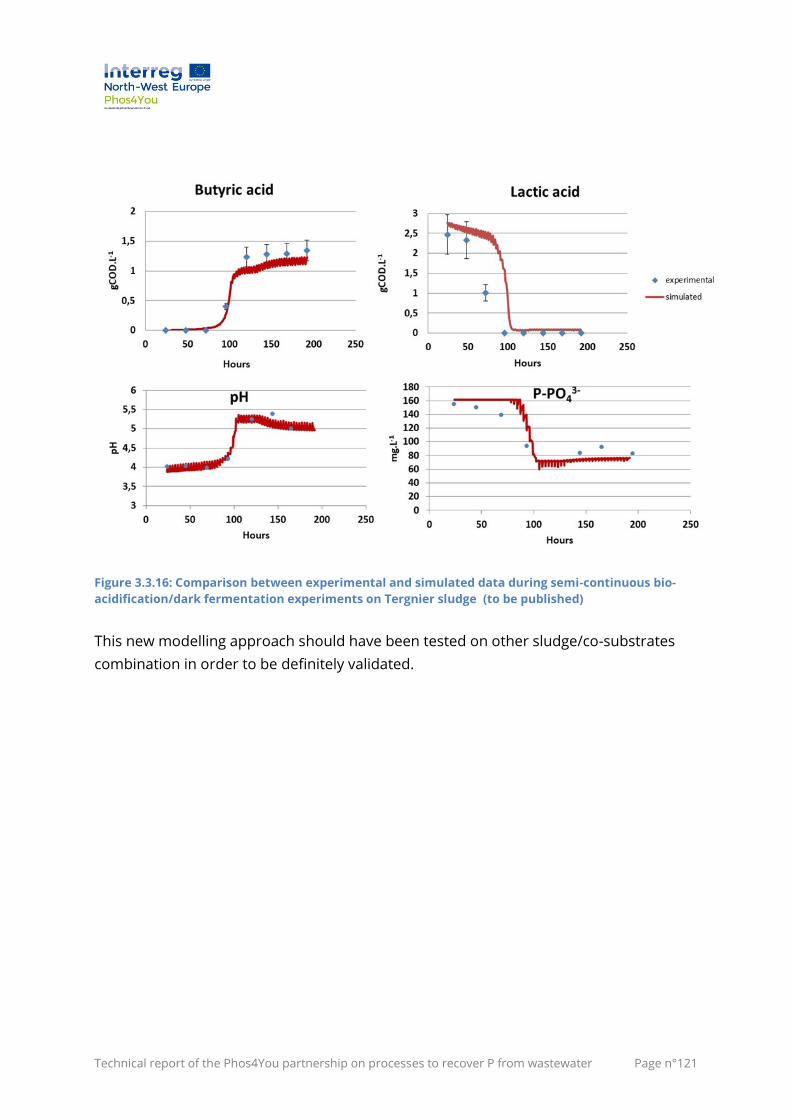
Technical report of the Phos4You partnership on processes to recover P from wastewater Page n°121
Figure 3.3.16: Comparison between experimental and simulated data during semi-continuous bio-
acidification/dark fermentation experiments on Tergnier sludge (to be published)
This new modelling approach should have been tested on other sludge/co-substrates
combination in order to be definitely validated.
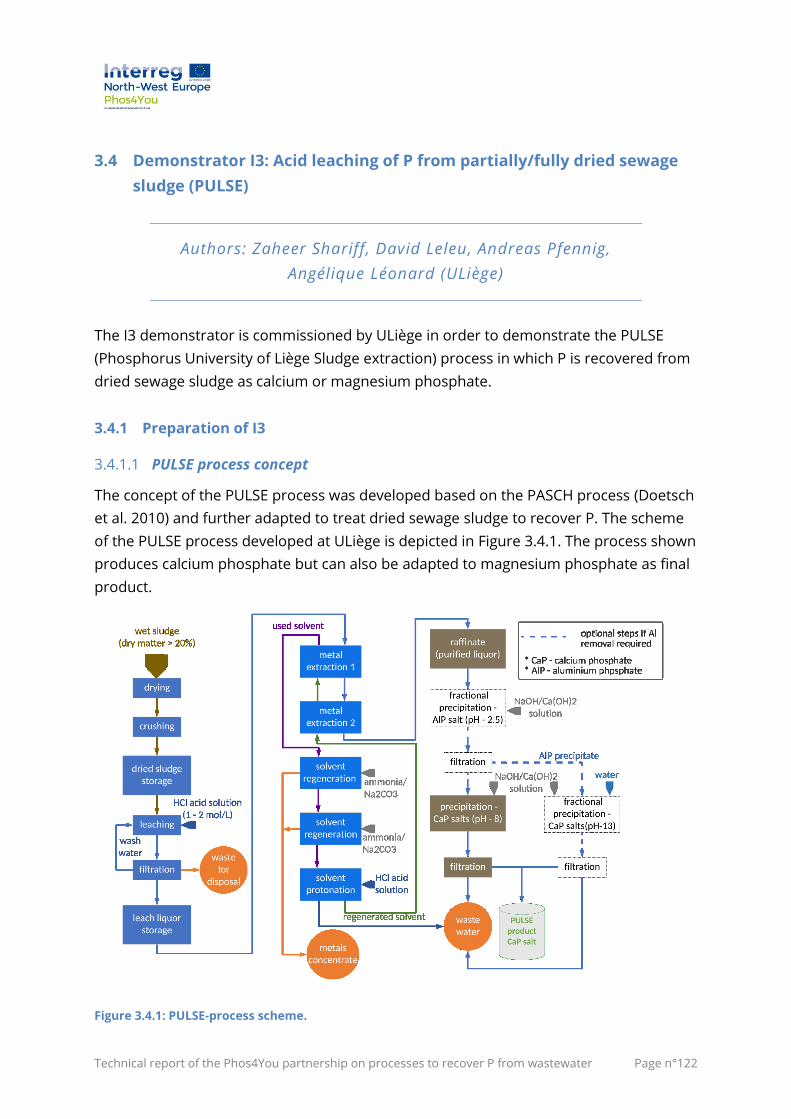
Technical report of the Phos4You partnership on processes to recover P from wastewater Page n°122
3.4 Demonstrator I3: Acid leaching of P from partially/fully dried sewage
sludge (PULSE)
Authors: Zaheer Shariff, David Leleu, Andreas Pfennig,
Angélique Léonard (ULiège)
The I3 demonstrator is commissioned by ULiège in order to demonstrate the PULSE
(Phosphorus University of Liège Sludge extraction) process in which P is recovered from
dried sewage sludge as calcium or magnesium phosphate.
3.4.1 Preparation of I3
3.4.1.1 PULSE process concept
The concept of the PULSE process was developed based on the PASCH process (Doetsch
et al. 2010) and further adapted to treat dried sewage sludge to recover P. The scheme
of the PULSE process developed at ULiège is depicted in Figure 3.4.1. The process shown
produces calcium phosphate but can also be adapted to magnesium phosphate as final
product.
Figure 3.4.1: PULSE-process scheme.
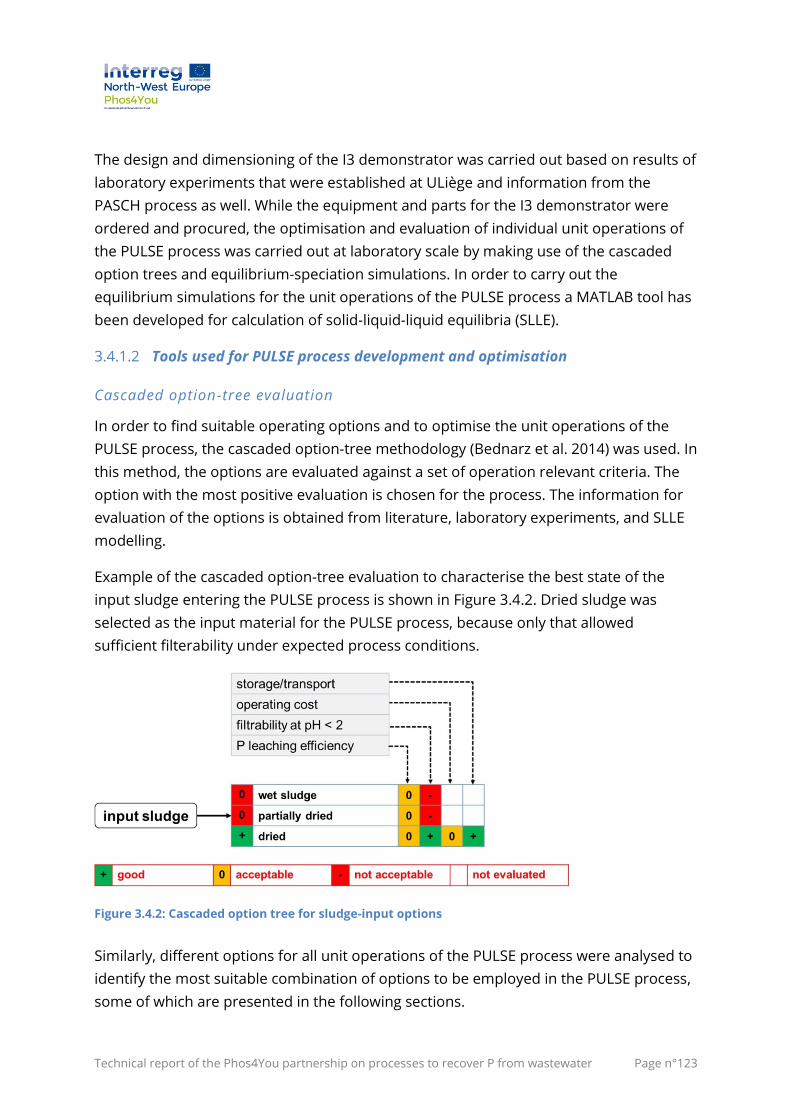
Technical report of the Phos4You partnership on processes to recover P from wastewater Page n°123
The design and dimensioning of the I3 demonstrator was carried out based on results of
laboratory experiments that were established at ULiège and information from the
PASCH process as well. While the equipment and parts for the I3 demonstrator were
ordered and procured, the optimisation and evaluation of individual unit operations of
the PULSE process was carried out at laboratory scale by making use of the cascaded
option trees and equilibrium-speciation simulations. In order to carry out the
equilibrium simulations for the unit operations of the PULSE process a MATLAB tool has
been developed for calculation of solid-liquid-liquid equilibria (SLLE).
3.4.1.2 Tools used for PULSE process development and optimisation
Cascaded option-tree evaluation
In order to find suitable operating options and to optimise the unit operations of the
PULSE process, the cascaded option-tree methodology (Bednarz et al. 2014) was used. In
this method, the options are evaluated against a set of operation relevant criteria. The
option with the most positive evaluation is chosen for the process. The information for
evaluation of the options is obtained from literature, laboratory experiments, and SLLE
modelling.
Example of the cascaded option-tree evaluation to characterise the best state of the
input sludge entering the PULSE process is shown in Figure 3.4.2. Dried sludge was
selected as the input material for the PULSE process, because only that allowed
sufficient filterability under expected process conditions.
Figure 3.4.2: Cascaded option tree for sludge-input options
Similarly, different options for all unit operations of the PULSE process were analysed to
identify the most suitable combination of options to be employed in the PULSE process,
some of which are presented in the following sections.
Technical report of the Phos4You partnership on processes to recover P from wastewater Page n°124
Solid Liquid Liquid equilibrium modelling tool
The chemical unit operations of the PULSE process, i.e. leaching, solvent extraction of
metals and subsequent stripping of metals from the spent solvent for regeneration, and
the precipitation of P salts are inter-dependent and sensitive to the pH of the respective
operation among other operating parameters. As the characteristics of sludge can vary
from day to day, it is imperative to understand the chemistry and reactions occurring as
a function of pH in each of these operations. Therefore, a MATLAB tool for simulating
SLLE was developed, which can be used to describe the chemical unit operations. With
the help of this tool, it is possible to optimise the process for sludge with different
characteristics minimizing experimental work.
The SLLE tool solves a set of nonlinear equations consisting of charge neutrality, mass
balance and law of mass action constraints which describe the system (Shariff et al.
2020), including appropriate quantification of thermodynamic non-idealities. The
solution of the non-linear system of equations leads to the concentrations of all
chemical species that exist in the aqueous phase and/or in the organic phase as well as
the solids that can precipitate at equilibrium as shown in Figure 3.4.3. In that example,
representing undigested dewatered sludge used for performing experiments to develop
the PULSE process contained calcium, iron and aluminium as the pre-dominant metals
besides phosphorus. Analysis of Ferric and ferrous iron leached from the dried sludge
revealed that about 70 % of the iron were present as Ferric, Fe3+. Depending on the
molar concentration of iron, a major fraction of inorganic phosphorus in sludge can be
present as ferric phosphate (FePO4). It can be seen from Figure 3.4.3, FePO4 can remain
undissolved if the pH is greater than 0.3.

Technical report of the Phos4You partnership on processes to recover P from wastewater Page n°125
Figure 3.4.3: Speciation using the SLLE tool. Initial concentrations in [mol/L]: Fe3+: 0.0703, Al3+:
0.0203, HCl: varying, PO4-3: 0.348, Ca2+: 0.2, Fe2+ - 0.03. The dashed curves show the precipitation
equilibrium
The SLLE tool allows simulations both by fixing the input amounts for the components
to obtain the equilibrium concentrations and pH, or alternatively to calculate the
amount of pre-defined component needed to reach a desired pH. It is also possible to
calculate the equilibrium concentration of different species when two solutions
containing different components are mixed.
The input data to the SLLE tool includes the total input amount or concentration of the
different components, the chemical equilibrium constants and the reaction
stoichiometry. With this input information, the SLLE tool determines the output
concentrations of the aqueous species and the amount of solids that precipitate
depending on the equilibrium conditions for each step of the PULSE process.
Although extensive thermodynamic data are available for aqueous phase reactions and
precipitation, it is not the case for solvent extraction or organic phase reactions. Since
the description of these equilibria is required to optimise the PULSE process, the
chemical equilibrium constants and reaction stoichiometry are determined in this case
by performing equilibrium experiments and fitting the parameters to experimental data
using the tool.
-1 0 1 2 3 4 5 6 7 8 91E-6
1E-5
1E-4
1E-3
0.01
0.1
1
aqueous species
precipitating solid
CaHPO4
FeCl4-
FeHPOFe2+
PO4
3-
CaHPO4(S)
AlPO4(S)
FePO4(S)
CaH2PO
4+
FeH2PO
4
2+
H3PO
4
H2PO
4-
HPO4
2-
FeH2PO
4+
Ca2+
Cl-
Al3+
Fe3+
concentr
ation m
ol/l
pH
Technical report of the Phos4You partnership on processes to recover P from wastewater Page n°126
3.4.1.3 PULSE-process development and optimisation with lab experiments
Lab-scale experiments for each unit operation of the PULSE process were established in
order to obtain the necessary information for the design of the I3 demonstrator and to
develop and optimise the overall process. The general outcomes of the process
development and optimisation for the individual unit operations of the PULSE process
are discussed below. All the laboratory experiments were carried out using undigested
dewatered sludge from Oupeye wastewater treatment plant (WWTP) in Liège, Belgium.
Sludge drying
The P-leaching efficiency of dried sludge (DS) and dewatered sludge (DWS) was
compared after leaching with hydrochloric acid (HCl) in order to select the optimal input
material to the process. A batch convective air dryer was used for drying the sludge. The
drier also allows for the continuous monitoring of the weight of sample. The sludge was
dried at 110 - 120°C until no further change in the weight of the sludge sample was
observed. After drying, the sludge was crushed to a particle size of <5 mm and stored.
The dry matter content was measured just before leaching and it was found to be
98.2 %. The dried sludge was leached using a solid-liquid ratio by weight of 0.25 i.e.
250 g of dried sludge was mixed with 1 litre of HCl solution. In case of dewatered sludge,
which has a paste-like appearance as shown in Figure 3.4.4, the liquid fraction is already
about 0.75. Therefore, in the latter case, excess of acid solution is required to solubilize
the pasty sludge and to overcome the dilution effect due to the water content of the
sludge itself. Laboratory tests indicated that at least twice the amount of water or acid
solution must be added to the dewatered sludge to convert it to fluid form. The
equilibrium pH of the liquor after leaching and separation of solids was 0.4 and 0.5 for
dried sludge and dewatered sludge, and the leaching efficiency was found to be 69.1 %
and 72.6 %, respectively. This indicated that drying of sludge had negligible influence on
the P-leaching efficiency but reduced the amount of acid required to reach the desired
pH.
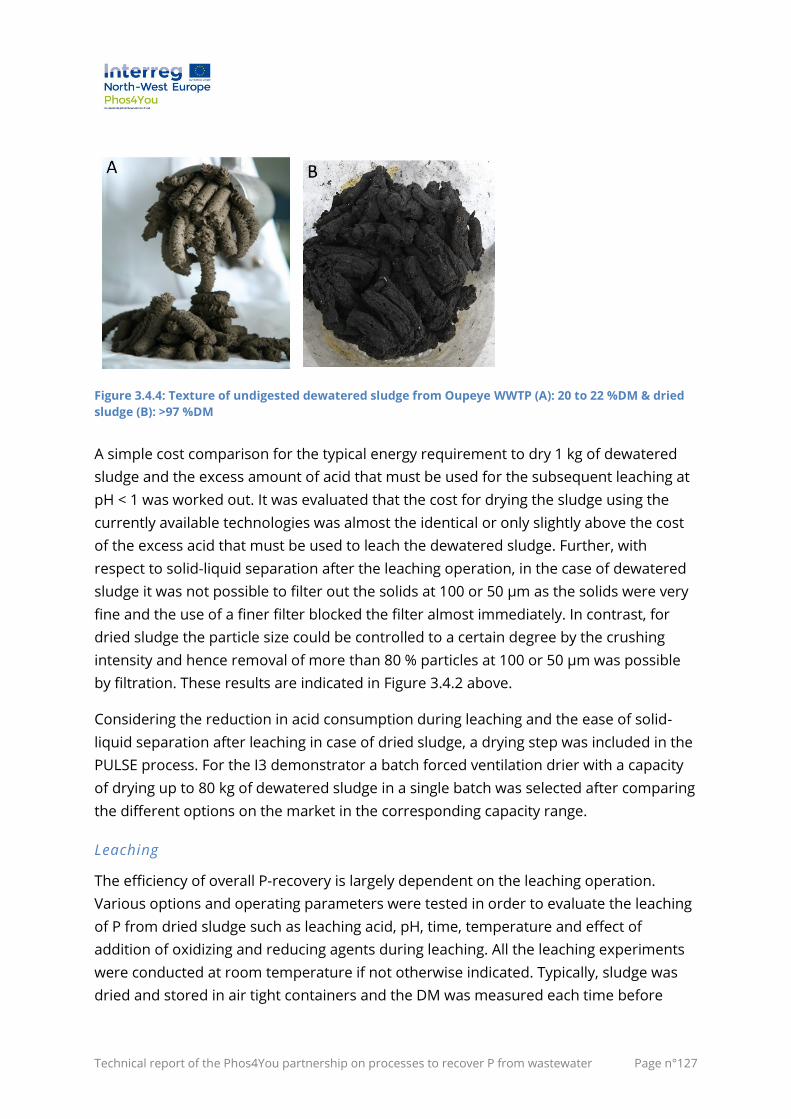
Technical report of the Phos4You partnership on processes to recover P from wastewater Page n°127
Figure 3.4.4: Texture of undigested dewatered sludge from Oupeye WWTP (A): 20 to 22 %DM & dried
sludge (B): >97 %DM
A simple cost comparison for the typical energy requirement to dry 1 kg of dewatered
sludge and the excess amount of acid that must be used for the subsequent leaching at
pH < 1 was worked out. It was evaluated that the cost for drying the sludge using the
currently available technologies was almost the identical or only slightly above the cost
of the excess acid that must be used to leach the dewatered sludge. Further, with
respect to solid-liquid separation after the leaching operation, in the case of dewatered
sludge it was not possible to filter out the solids at 100 or 50 µm as the solids were very
fine and the use of a finer filter blocked the filter almost immediately. In contrast, for
dried sludge the particle size could be controlled to a certain degree by the crushing
intensity and hence removal of more than 80 % particles at 100 or 50 µm was possible
by filtration. These results are indicated in Figure 3.4.2 above.
Considering the reduction in acid consumption during leaching and the ease of solid-
liquid separation after leaching in case of dried sludge, a drying step was included in the
PULSE process. For the I3 demonstrator a batch forced ventilation drier with a capacity
of drying up to 80 kg of dewatered sludge in a single batch was selected after comparing
the different options on the market in the corresponding capacity range.
Leaching
The efficiency of overall P-recovery is largely dependent on the leaching operation.
Various options and operating parameters were tested in order to evaluate the leaching
of P from dried sludge such as leaching acid, pH, time, temperature and effect of
addition of oxidizing and reducing agents during leaching. All the leaching experiments
were conducted at room temperature if not otherwise indicated. Typically, sludge was
dried and stored in air tight containers and the DM was measured each time before
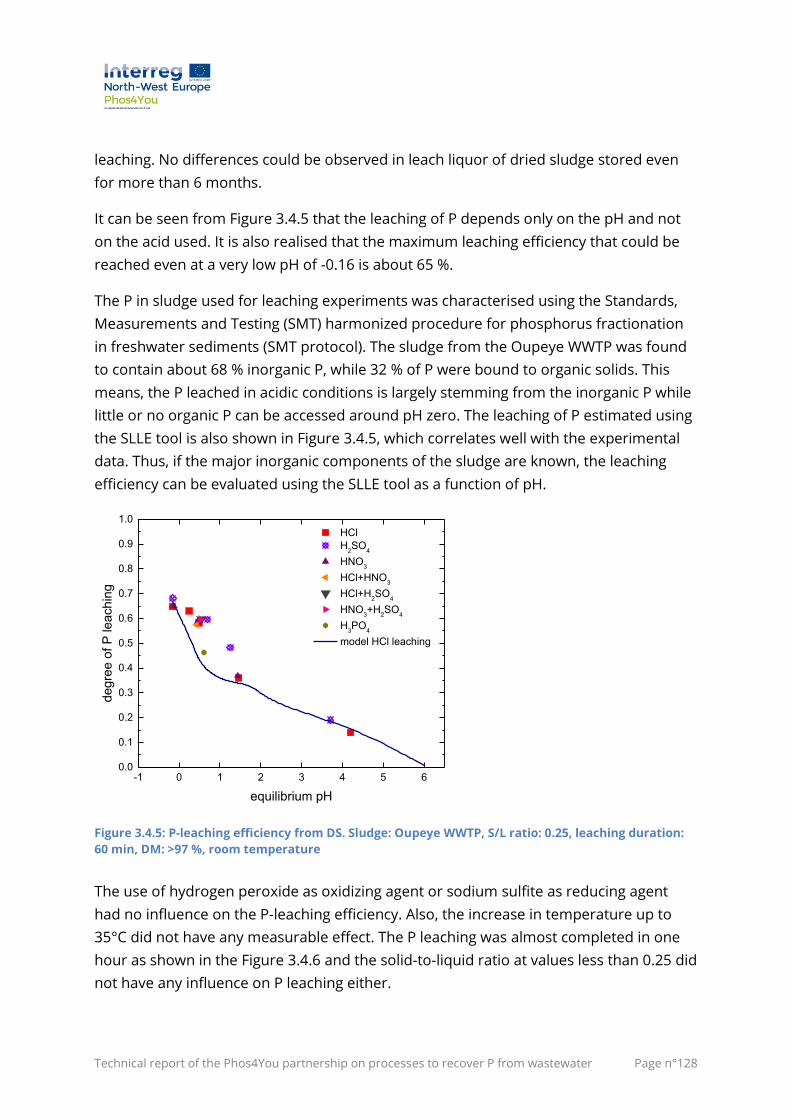
Technical report of the Phos4You partnership on processes to recover P from wastewater Page n°128
leaching. No differences could be observed in leach liquor of dried sludge stored even
for more than 6 months.
It can be seen from Figure 3.4.5 that the leaching of P depends only on the pH and not
on the acid used. It is also realised that the maximum leaching efficiency that could be
reached even at a very low pH of -0.16 is about 65 %.
The P in sludge used for leaching experiments was characterised using the Standards,
Measurements and Testing (SMT) harmonized procedure for phosphorus fractionation
in freshwater sediments (SMT protocol). The sludge from the Oupeye WWTP was found
to contain about 68 % inorganic P, while 32 % of P were bound to organic solids. This
means, the P leached in acidic conditions is largely stemming from the inorganic P while
little or no organic P can be accessed around pH zero. The leaching of P estimated using
the SLLE tool is also shown in Figure 3.4.5, which correlates well with the experimental
data. Thus, if the major inorganic components of the sludge are known, the leaching
efficiency can be evaluated using the SLLE tool as a function of pH.
Figure 3.4.5: P-leaching efficiency from DS. Sludge: Oupeye WWTP, S/L ratio: 0.25, leaching duration:
60 min, DM: >97 %, room temperature
The use of hydrogen peroxide as oxidizing agent or sodium sulfite as reducing agent
had no influence on the P-leaching efficiency. Also, the increase in temperature up to
35°C did not have any measurable effect. The P leaching was almost completed in one
hour as shown in the Figure 3.4.6 and the solid-to-liquid ratio at values less than 0.25 did
not have any influence on P leaching either.
-1 0 1 2 3 4 5 60.0
0.1
0.2
0.3
0.4
0.5
0.6
0.7
0.8
0.9
1.0
degre
e o
f P
leachin
g
equilibrium pH
HCl
H2SO
4
HNO3
HCl+HNO3
HCl+H2SO
4
HNO3+H
2SO
4
H3PO
4
model HCl leaching
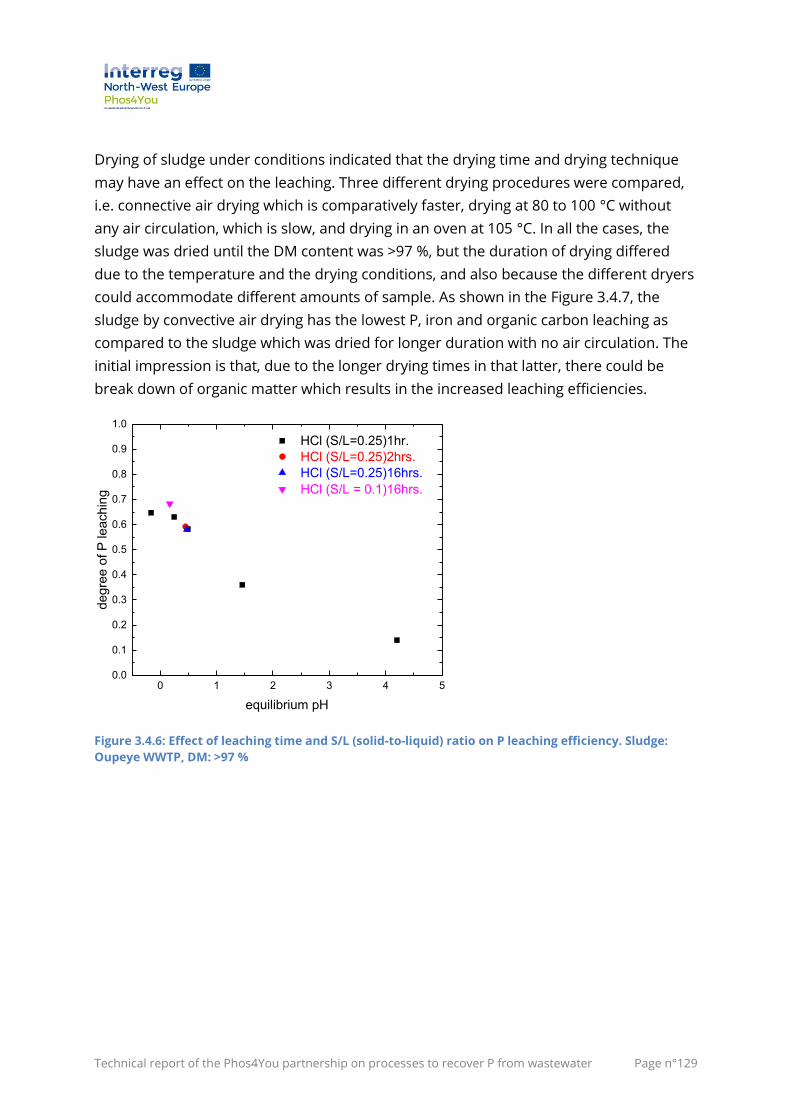
Technical report of the Phos4You partnership on processes to recover P from wastewater Page n°129
Drying of sludge under conditions indicated that the drying time and drying technique
may have an effect on the leaching. Three different drying procedures were compared,
i.e. connective air drying which is comparatively faster, drying at 80 to 100 °C without
any air circulation, which is slow, and drying in an oven at 105 °C. In all the cases, the
sludge was dried until the DM content was >97 %, but the duration of drying differed
due to the temperature and the drying conditions, and also because the different dryers
could accommodate different amounts of sample. As shown in the Figure 3.4.7, the
sludge by convective air drying has the lowest P, iron and organic carbon leaching as
compared to the sludge which was dried for longer duration with no air circulation. The
initial impression is that, due to the longer drying times in that latter, there could be
break down of organic matter which results in the increased leaching efficiencies.
Figure 3.4.6: Effect of leaching time and S/L (solid-to-liquid) ratio on P leaching efficiency. Sludge:
Oupeye WWTP, DM: >97 %
0 1 2 3 4 50.0
0.1
0.2
0.3
0.4
0.5
0.6
0.7
0.8
0.9
1.0
deg
ree o
f P
le
ach
ing
equilibrium pH
HCl (S/L=0.25)1hr.
HCl (S/L=0.25)2hrs.
HCl (S/L=0.25)16hrs.
HCl (S/L = 0.1)16hrs.
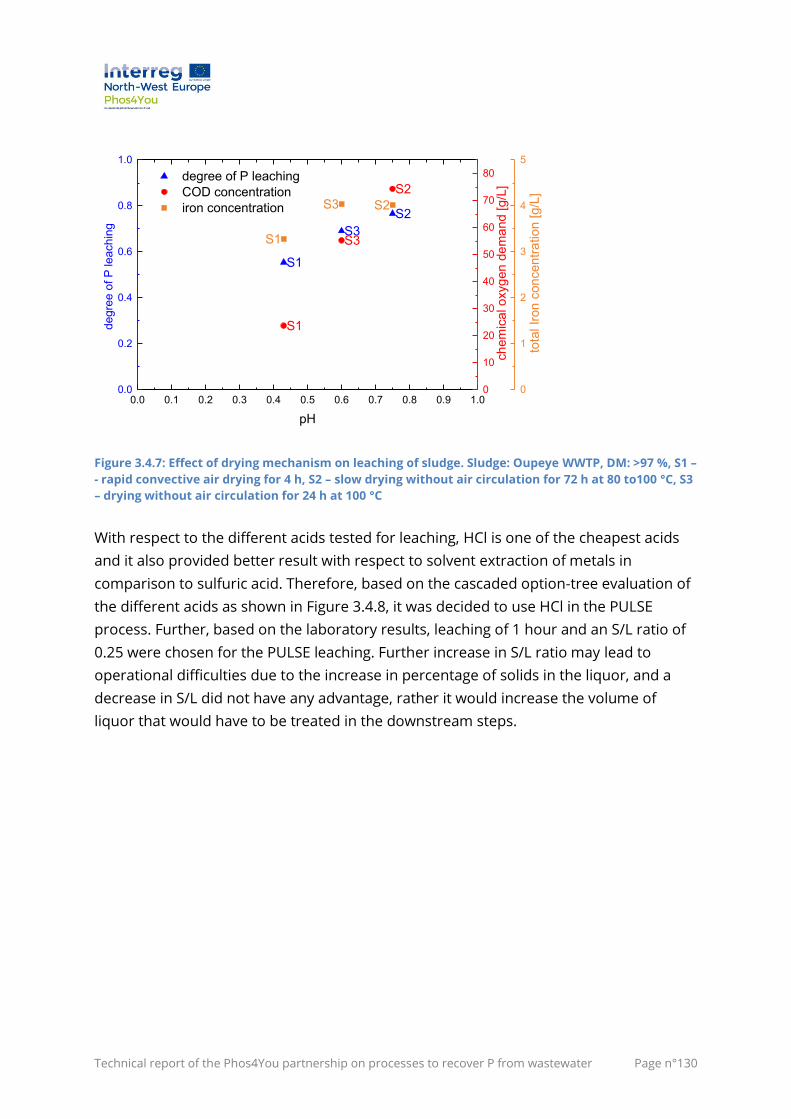
Technical report of the Phos4You partnership on processes to recover P from wastewater Page n°130
Figure 3.4.7: Effect of drying mechanism on leaching of sludge. Sludge: Oupeye WWTP, DM: >97 %, S1 –
- rapid convective air drying for 4 h, S2 – slow drying without air circulation for 72 h at 80 to100 °C, S3
– drying without air circulation for 24 h at 100 °C
With respect to the different acids tested for leaching, HCl is one of the cheapest acids
and it also provided better result with respect to solvent extraction of metals in
comparison to sulfuric acid. Therefore, based on the cascaded option-tree evaluation of
the different acids as shown in Figure 3.4.8, it was decided to use HCl in the PULSE
process. Further, based on the laboratory results, leaching of 1 hour and an S/L ratio of
0.25 were chosen for the PULSE leaching. Further increase in S/L ratio may lead to
operational difficulties due to the increase in percentage of solids in the liquor, and a
decrease in S/L did not have any advantage, rather it would increase the volume of
liquor that would have to be treated in the downstream steps.
S1
S2
S3
S1
S2
S3S1
S2S3
0.0 0.1 0.2 0.3 0.4 0.5 0.6 0.7 0.8 0.9 1.00.0
0.2
0.4
0.6
0.8
1.0
degree of P leaching
COD concentration
iron concentration
degre
e o
f P
leachin
g
pH
0
10
20
30
40
50
60
70
80
chem
ical oxygen d
em
and [g/L
]
0
1
2
3
4
5
tota
l Ir
on c
oncentr
ation [g/L
]
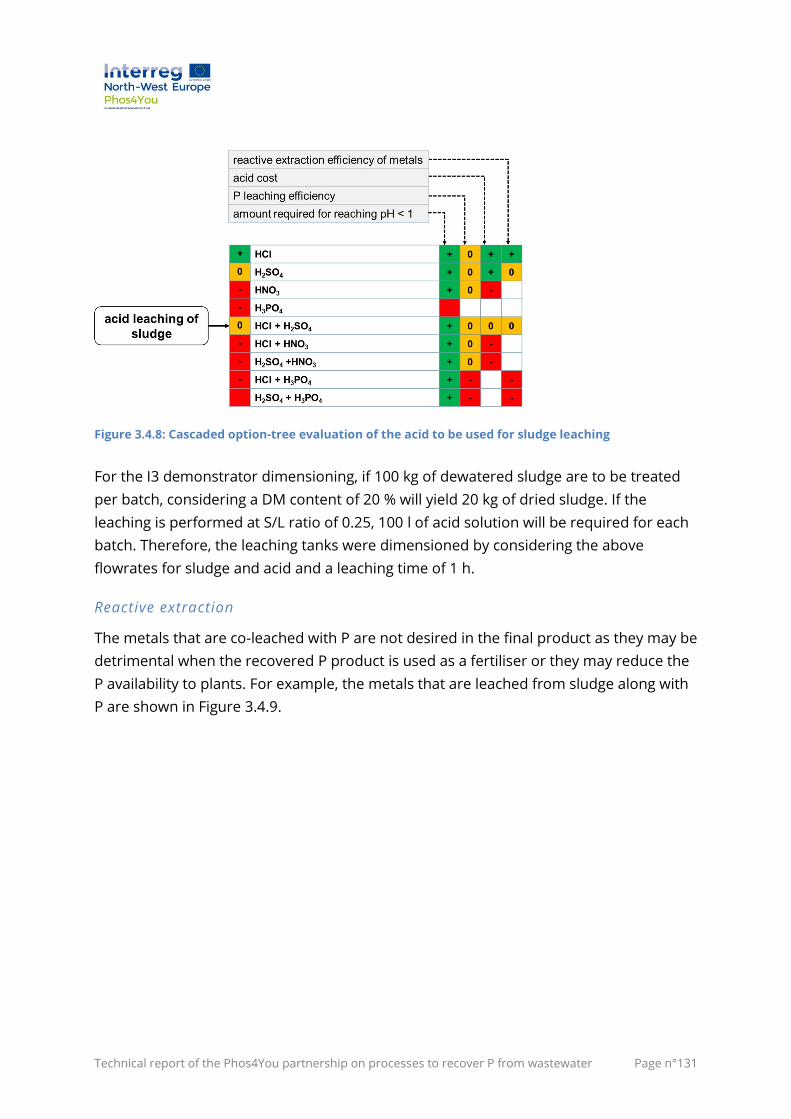
Technical report of the Phos4You partnership on processes to recover P from wastewater Page n°131
Figure 3.4.8: Cascaded option-tree evaluation of the acid to be used for sludge leaching
For the I3 demonstrator dimensioning, if 100 kg of dewatered sludge are to be treated
per batch, considering a DM content of 20 % will yield 20 kg of dried sludge. If the
leaching is performed at S/L ratio of 0.25, 100 l of acid solution will be required for each
batch. Therefore, the leaching tanks were dimensioned by considering the above
flowrates for sludge and acid and a leaching time of 1 h.
Reactive extraction
The metals that are co-leached with P are not desired in the final product as they may be
detrimental when the recovered P product is used as a fertiliser or they may reduce the
P availability to plants. For example, the metals that are leached from sludge along with
P are shown in Figure 3.4.9.
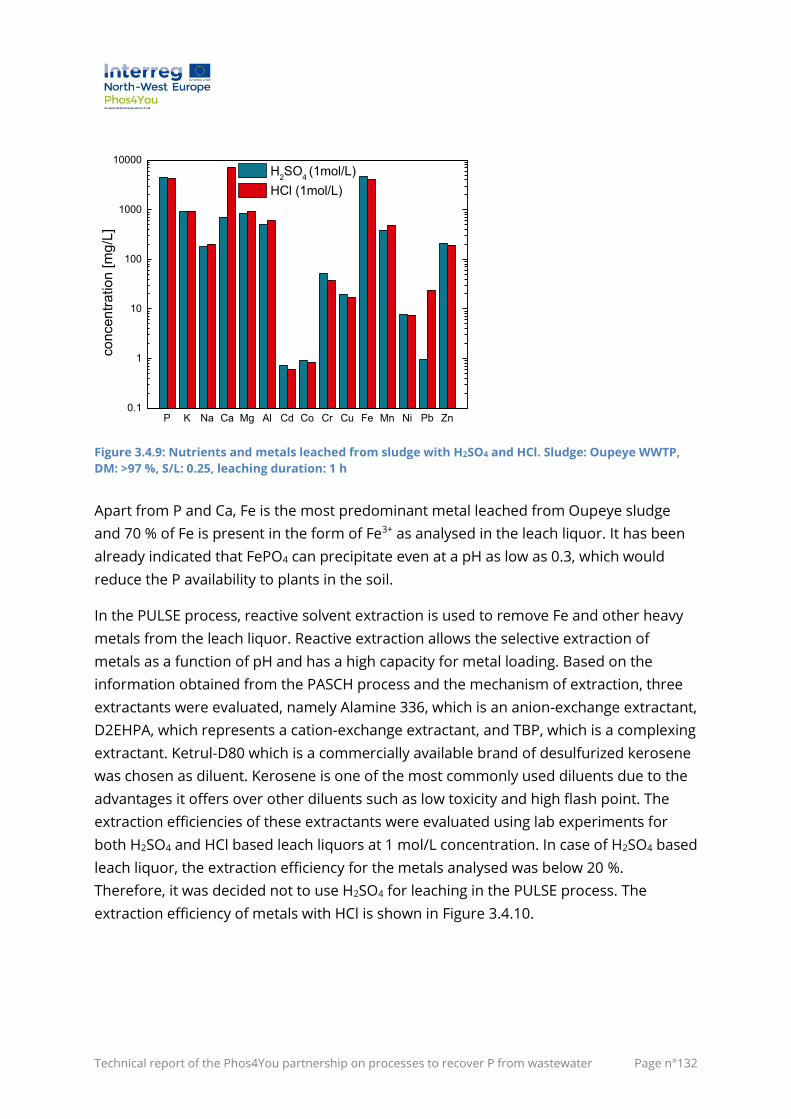
Technical report of the Phos4You partnership on processes to recover P from wastewater Page n°132
Figure 3.4.9: Nutrients and metals leached from sludge with H2SO4 and HCl. Sludge: Oupeye WWTP,
DM: >97 %, S/L: 0.25, leaching duration: 1 h
Apart from P and Ca, Fe is the most predominant metal leached from Oupeye sludge
and 70 % of Fe is present in the form of Fe3+ as analysed in the leach liquor. It has been
already indicated that FePO4 can precipitate even at a pH as low as 0.3, which would
reduce the P availability to plants in the soil.
In the PULSE process, reactive solvent extraction is used to remove Fe and other heavy
metals from the leach liquor. Reactive extraction allows the selective extraction of
metals as a function of pH and has a high capacity for metal loading. Based on the
information obtained from the PASCH process and the mechanism of extraction, three
extractants were evaluated, namely Alamine 336, which is an anion-exchange extractant,
D2EHPA, which represents a cation-exchange extractant, and TBP, which is a complexing
extractant. Ketrul-D80 which is a commercially available brand of desulfurized kerosene
was chosen as diluent. Kerosene is one of the most commonly used diluents due to the
advantages it offers over other diluents such as low toxicity and high flash point. The
extraction efficiencies of these extractants were evaluated using lab experiments for
both H2SO4 and HCl based leach liquors at 1 mol/L concentration. In case of H2SO4 based
leach liquor, the extraction efficiency for the metals analysed was below 20 %.
Therefore, it was decided not to use H2SO4 for leaching in the PULSE process. The
extraction efficiency of metals with HCl is shown in Figure 3.4.10.
P K Na Ca Mg Al Cd Co Cr Cu Fe Mn Ni Pb Zn0.1
1
10
100
1000
10000
co
ncen
tra
tion
[m
g/L
]
H2SO
4 (1mol/L)
HCl (1mol/L)
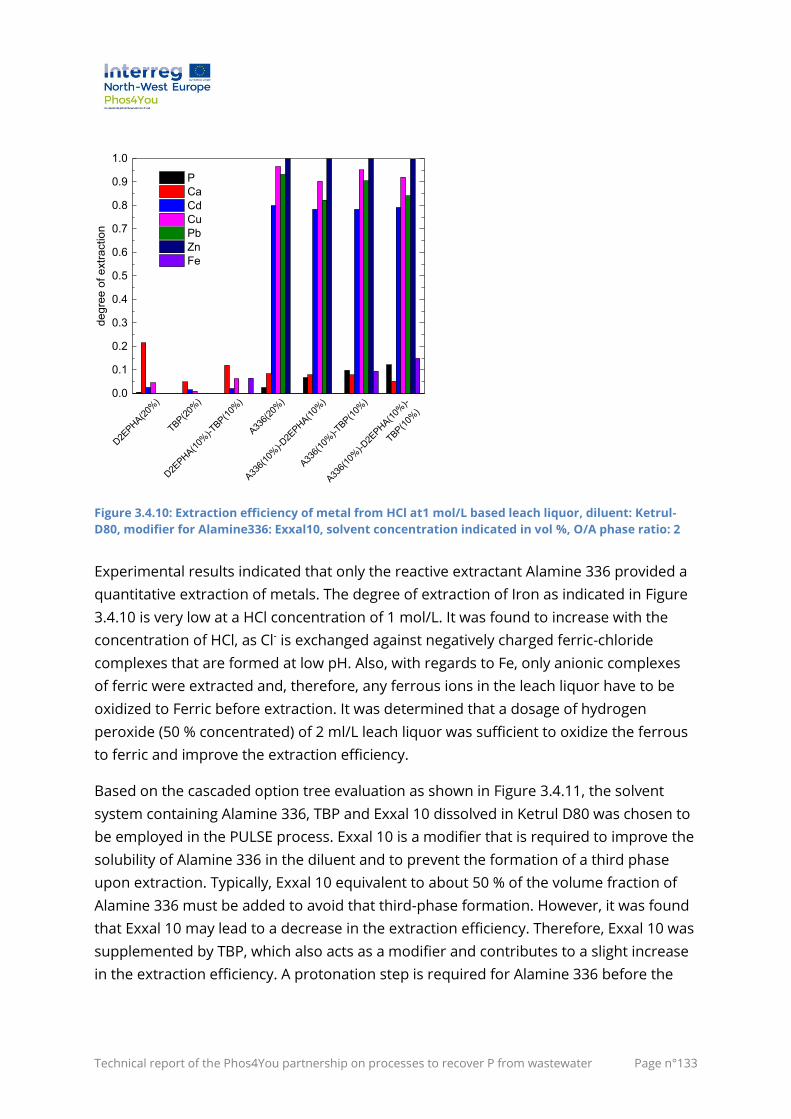
Technical report of the Phos4You partnership on processes to recover P from wastewater Page n°133
Figure 3.4.10: Extraction efficiency of metal from HCl at1 mol/L based leach liquor, diluent: Ketrul-
D80, modifier for Alamine336: Exxal10, solvent concentration indicated in vol %, O/A phase ratio: 2
Experimental results indicated that only the reactive extractant Alamine 336 provided a
quantitative extraction of metals. The degree of extraction of Iron as indicated in Figure
3.4.10 is very low at a HCl concentration of 1 mol/L. It was found to increase with the
concentration of HCl, as Cl- is exchanged against negatively charged ferric-chloride
complexes that are formed at low pH. Also, with regards to Fe, only anionic complexes
of ferric were extracted and, therefore, any ferrous ions in the leach liquor have to be
oxidized to Ferric before extraction. It was determined that a dosage of hydrogen
peroxide (50 % concentrated) of 2 ml/L leach liquor was sufficient to oxidize the ferrous
to ferric and improve the extraction efficiency.
Based on the cascaded option tree evaluation as shown in Figure 3.4.11, the solvent
system containing Alamine 336, TBP and Exxal 10 dissolved in Ketrul D80 was chosen to
be employed in the PULSE process. Exxal 10 is a modifier that is required to improve the
solubility of Alamine 336 in the diluent and to prevent the formation of a third phase
upon extraction. Typically, Exxal 10 equivalent to about 50 % of the volume fraction of
Alamine 336 must be added to avoid that third-phase formation. However, it was found
that Exxal 10 may lead to a decrease in the extraction efficiency. Therefore, Exxal 10 was
supplemented by TBP, which also acts as a modifier and contributes to a slight increase
in the extraction efficiency. A protonation step is required for Alamine 336 before the
D2E
PHA(2
0%)
TBP(2
0%)
D2E
PHA(1
0%)-TB
P(1
0%)
A33
6(20
%)
A33
6(10
%)-D2E
PHA(1
0%)
A33
6(10
%)-TB
P(1
0%)
A33
6(10
%)-D2E
PHA(1
0%)-
TBP(1
0%)
0.0
0.1
0.2
0.3
0.4
0.5
0.6
0.7
0.8
0.9
1.0
de
gre
e o
f e
xtr
actio
n
P
Ca
Cd
Cu
Pb
Zn
Fe
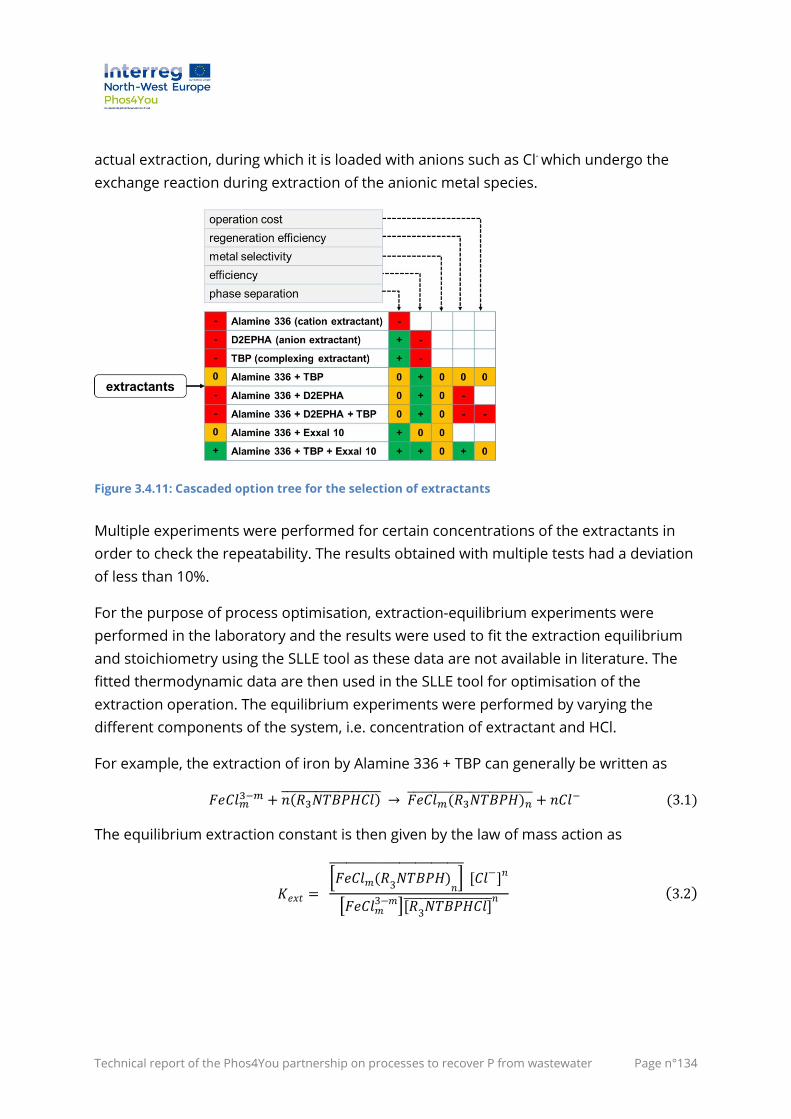
Technical report of the Phos4You partnership on processes to recover P from wastewater Page n°134
actual extraction, during which it is loaded with anions such as Cl- which undergo the
exchange reaction during extraction of the anionic metal species.
Figure 3.4.11: Cascaded option tree for the selection of extractants
Multiple experiments were performed for certain concentrations of the extractants in
order to check the repeatability. The results obtained with multiple tests had a deviation
of less than 10%.
For the purpose of process optimisation, extraction-equilibrium experiments were
performed in the laboratory and the results were used to fit the extraction equilibrium
and stoichiometry using the SLLE tool as these data are not available in literature. The
fitted thermodynamic data are then used in the SLLE tool for optimisation of the
extraction operation. The equilibrium experiments were performed by varying the
different components of the system, i.e. concentration of extractant and HCl.
For example, the extraction of iron by Alamine 336 + TBP can generally be written as
𝐹𝑒𝐶𝑙𝑚3−𝑚 + 𝑛(𝑅3𝑁𝑇𝐵𝑃𝐻𝐶𝑙) → 𝐹𝑒𝐶𝑙𝑚(𝑅3𝑁𝑇𝐵𝑃𝐻)𝑛
+ 𝑛𝐶𝑙− (3.1)
The equilibrium extraction constant is then given by the law of mass action as
𝐾𝑒𝑥𝑡 = [𝐹𝑒𝐶𝑙𝑚(𝑅
3𝑁𝑇𝐵𝑃𝐻)
𝑛]
[𝐶𝑙−]𝑛
[𝐹𝑒𝐶𝑙𝑚3−𝑚][𝑅
3𝑁𝑇𝐵𝑃𝐻𝐶𝑙] 𝑛 (3.2)
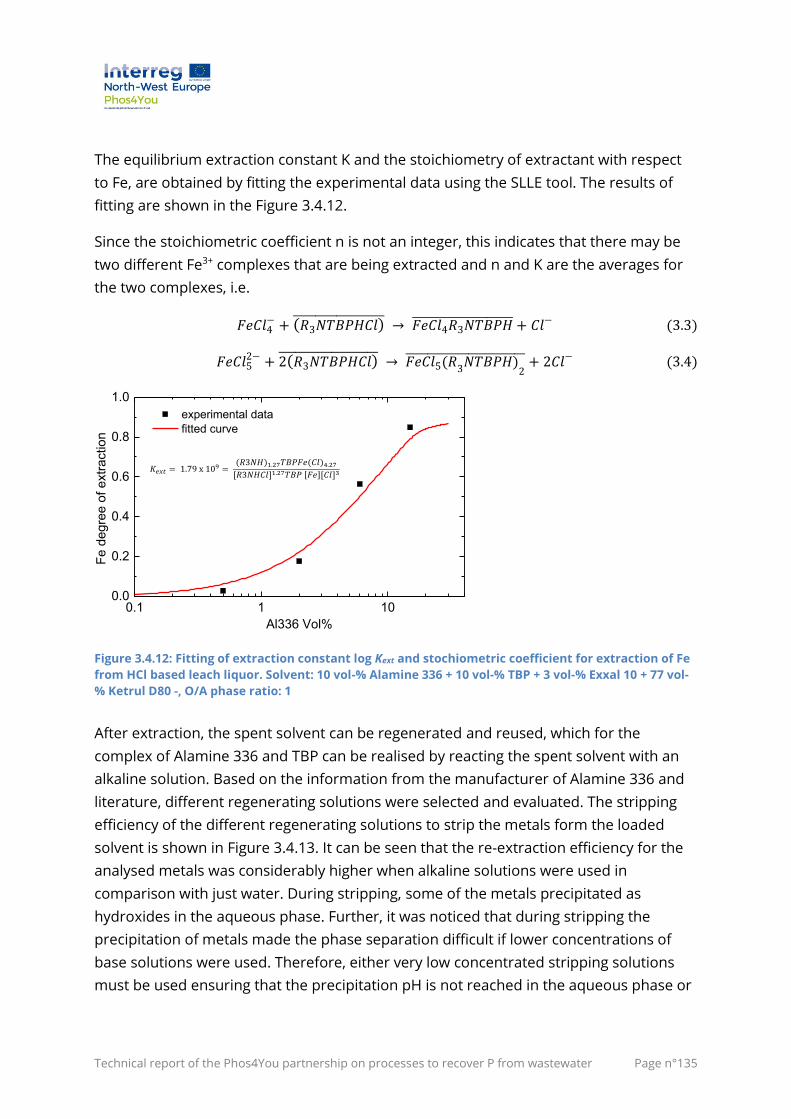
Technical report of the Phos4You partnership on processes to recover P from wastewater Page n°135
The equilibrium extraction constant K and the stoichiometry of extractant with respect
to Fe, are obtained by fitting the experimental data using the SLLE tool. The results of
fitting are shown in the Figure 3.4.12.
Since the stoichiometric coefficient n is not an integer, this indicates that there may be
two different Fe3+ complexes that are being extracted and n and K are the averages for
the two complexes, i.e.
𝐹𝑒𝐶𝑙4− + (𝑅3𝑁𝑇𝐵𝑃𝐻𝐶𝑙) → 𝐹𝑒𝐶𝑙4𝑅3𝑁𝑇𝐵𝑃𝐻 + 𝐶𝑙− (3.3)
𝐹𝑒𝐶𝑙52− + 2(𝑅3𝑁𝑇𝐵𝑃𝐻𝐶𝑙) → 𝐹𝑒𝐶𝑙5(𝑅
3𝑁𝑇𝐵𝑃𝐻)
2 + 2𝐶𝑙− (3.4)
Figure 3.4.12: Fitting of extraction constant log Kext and stochiometric coefficient for extraction of Fe
from HCl based leach liquor. Solvent: 10 vol-% Alamine 336 + 10 vol-% TBP + 3 vol-% Exxal 10 + 77 vol-
% Ketrul D80 -, O/A phase ratio: 1
After extraction, the spent solvent can be regenerated and reused, which for the
complex of Alamine 336 and TBP can be realised by reacting the spent solvent with an
alkaline solution. Based on the information from the manufacturer of Alamine 336 and
literature, different regenerating solutions were selected and evaluated. The stripping
efficiency of the different regenerating solutions to strip the metals form the loaded
solvent is shown in Figure 3.4.13. It can be seen that the re-extraction efficiency for the
analysed metals was considerably higher when alkaline solutions were used in
comparison with just water. During stripping, some of the metals precipitated as
hydroxides in the aqueous phase. Further, it was noticed that during stripping the
precipitation of metals made the phase separation difficult if lower concentrations of
base solutions were used. Therefore, either very low concentrated stripping solutions
must be used ensuring that the precipitation pH is not reached in the aqueous phase or
0.1 1 100.0
0.2
0.4
0.6
0.8
1.0
experimental data
fitted curve
Fe d
egre
e o
f extr
action
Al336 Vol%
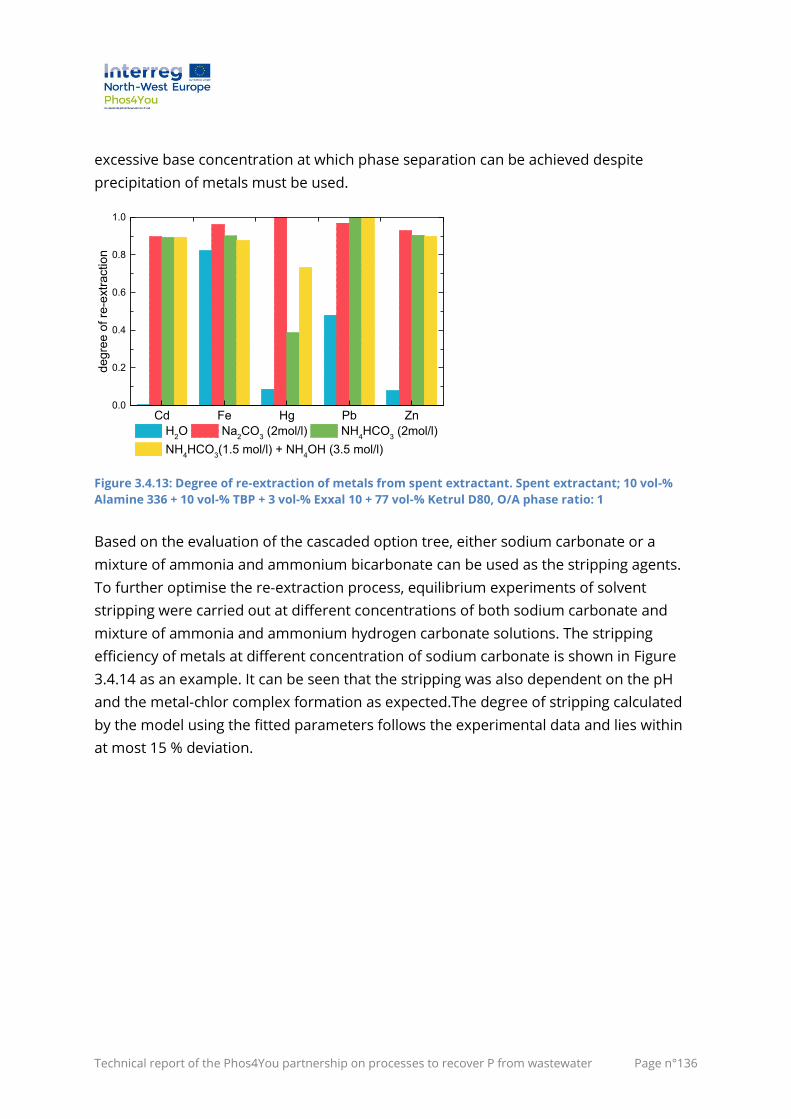
Technical report of the Phos4You partnership on processes to recover P from wastewater Page n°136
excessive base concentration at which phase separation can be achieved despite
precipitation of metals must be used.
Figure 3.4.13: Degree of re-extraction of metals from spent extractant. Spent extractant; 10 vol-%
Alamine 336 + 10 vol-% TBP + 3 vol-% Exxal 10 + 77 vol-% Ketrul D80, O/A phase ratio: 1
Based on the evaluation of the cascaded option tree, either sodium carbonate or a
mixture of ammonia and ammonium bicarbonate can be used as the stripping agents.
To further optimise the re-extraction process, equilibrium experiments of solvent
stripping were carried out at different concentrations of both sodium carbonate and
mixture of ammonia and ammonium hydrogen carbonate solutions. The stripping
efficiency of metals at different concentration of sodium carbonate is shown in Figure
3.4.14 as an example. It can be seen that the stripping was also dependent on the pH
and the metal-chlor complex formation as expected.The degree of stripping calculated
by the model using the fitted parameters follows the experimental data and lies within
at most 15 % deviation.
Cd Fe Hg Pb Zn0.0
0.2
0.4
0.6
0.8
1.0
deg
ree o
f re
-extr
actio
n
H2O Na
2CO
3 (2mol/l) NH
4HCO
3 (2mol/l)
NH4HCO
3(1.5 mol/l) + NH
4OH (3.5 mol/l)
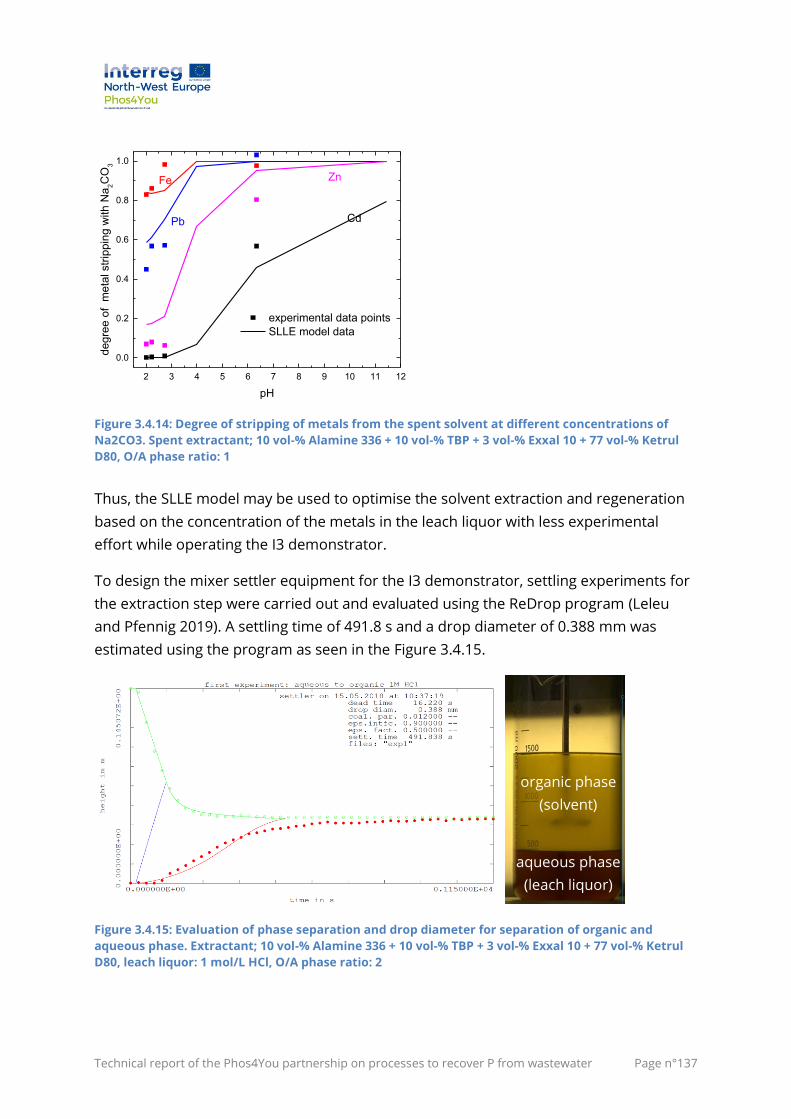
Technical report of the Phos4You partnership on processes to recover P from wastewater Page n°137
Figure 3.4.14: Degree of stripping of metals from the spent solvent at different concentrations of
Na2CO3. Spent extractant; 10 vol-% Alamine 336 + 10 vol-% TBP + 3 vol-% Exxal 10 + 77 vol-% Ketrul
D80, O/A phase ratio: 1
Thus, the SLLE model may be used to optimise the solvent extraction and regeneration
based on the concentration of the metals in the leach liquor with less experimental
effort while operating the I3 demonstrator.
To design the mixer settler equipment for the I3 demonstrator, settling experiments for
the extraction step were carried out and evaluated using the ReDrop program (Leleu
and Pfennig 2019). A settling time of 491.8 s and a drop diameter of 0.388 mm was
estimated using the program as seen in the Figure 3.4.15.
Figure 3.4.15: Evaluation of phase separation and drop diameter for separation of organic and
aqueous phase. Extractant; 10 vol-% Alamine 336 + 10 vol-% TBP + 3 vol-% Exxal 10 + 77 vol-% Ketrul
D80, leach liquor: 1 mol/L HCl, O/A phase ratio: 2
2 3 4 5 6 7 8 9 10 11 12
0.0
0.2
0.4
0.6
0.8
1.0
experimental data points
SLLE model data
Fe
Pb
Zn
Cd
deg
ree o
f m
eta
l str
ipp
ing w
ith
Na
2C
O3
pH
organic phase
(solvent)
aqueous phase
(leach liquor)
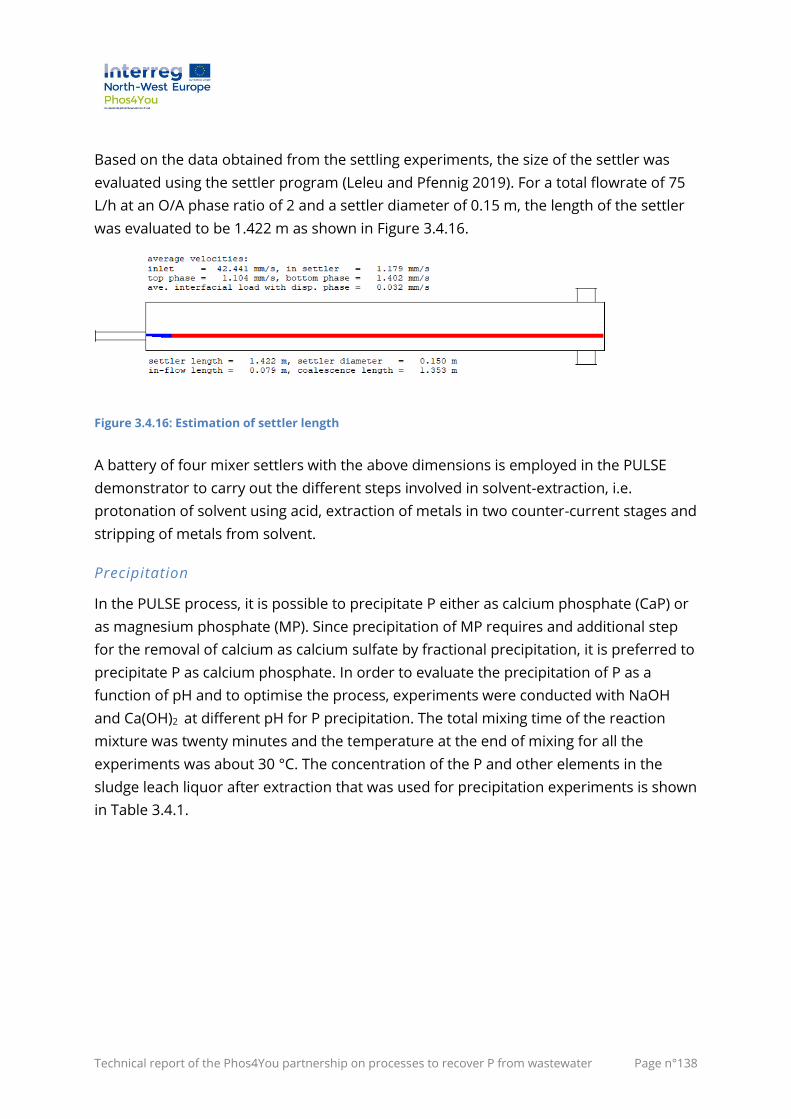
Technical report of the Phos4You partnership on processes to recover P from wastewater Page n°138
Based on the data obtained from the settling experiments, the size of the settler was
evaluated using the settler program (Leleu and Pfennig 2019). For a total flowrate of 75
L/h at an O/A phase ratio of 2 and a settler diameter of 0.15 m, the length of the settler
was evaluated to be 1.422 m as shown in Figure 3.4.16.
Figure 3.4.16: Estimation of settler length
A battery of four mixer settlers with the above dimensions is employed in the PULSE
demonstrator to carry out the different steps involved in solvent-extraction, i.e.
protonation of solvent using acid, extraction of metals in two counter-current stages and
stripping of metals from solvent.
Precipitation
In the PULSE process, it is possible to precipitate P either as calcium phosphate (CaP) or
as magnesium phosphate (MP). Since precipitation of MP requires and additional step
for the removal of calcium as calcium sulfate by fractional precipitation, it is preferred to
precipitate P as calcium phosphate. In order to evaluate the precipitation of P as a
function of pH and to optimise the process, experiments were conducted with NaOH
and Ca(OH)2 at different pH for P precipitation. The total mixing time of the reaction
mixture was twenty minutes and the temperature at the end of mixing for all the
experiments was about 30 °C. The concentration of the P and other elements in the
sludge leach liquor after extraction that was used for precipitation experiments is shown
in Table 3.4.1.
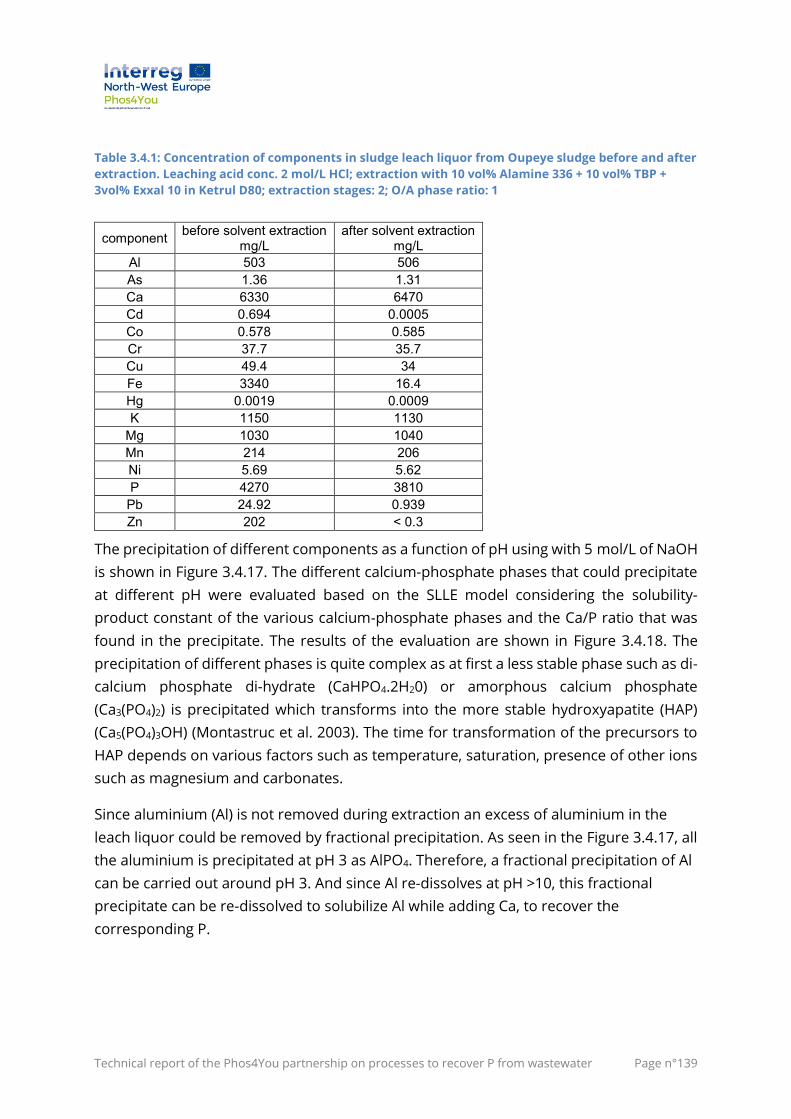
Technical report of the Phos4You partnership on processes to recover P from wastewater Page n°139
Table 3.4.1: Concentration of components in sludge leach liquor from Oupeye sludge before and after
extraction. Leaching acid conc. 2 mol/L HCl; extraction with 10 vol% Alamine 336 + 10 vol% TBP +
3vol% Exxal 10 in Ketrul D80; extraction stages: 2; O/A phase ratio: 1
component before solvent extraction
mg/L after solvent extraction
mg/L
Al 503 506
As 1.36 1.31
Ca 6330 6470
Cd 0.694 0.0005
Co 0.578 0.585
Cr 37.7 35.7
Cu 49.4 34
Fe 3340 16.4
Hg 0.0019 0.0009
K 1150 1130
Mg 1030 1040
Mn 214 206
Ni 5.69 5.62
P 4270 3810
Pb 24.92 0.939
Zn 202 < 0.3
The precipitation of different components as a function of pH using with 5 mol/L of NaOH
is shown in Figure 3.4.17. The different calcium-phosphate phases that could precipitate
at different pH were evaluated based on the SLLE model considering the solubility-
product constant of the various calcium-phosphate phases and the Ca/P ratio that was
found in the precipitate. The results of the evaluation are shown in Figure 3.4.18. The
precipitation of different phases is quite complex as at first a less stable phase such as di-
calcium phosphate di-hydrate (CaHPO4.2H20) or amorphous calcium phosphate
(Ca3(PO4)2) is precipitated which transforms into the more stable hydroxyapatite (HAP)
(Ca5(PO4)3OH) (Montastruc et al. 2003). The time for transformation of the precursors to
HAP depends on various factors such as temperature, saturation, presence of other ions
such as magnesium and carbonates.
Since aluminium (Al) is not removed during extraction an excess of aluminium in the
leach liquor could be removed by fractional precipitation. As seen in the Figure 3.4.17, all
the aluminium is precipitated at pH 3 as AlPO4. Therefore, a fractional precipitation of Al
can be carried out around pH 3. And since Al re-dissolves at pH >10, this fractional
precipitate can be re-dissolved to solubilize Al while adding Ca, to recover the
corresponding P.
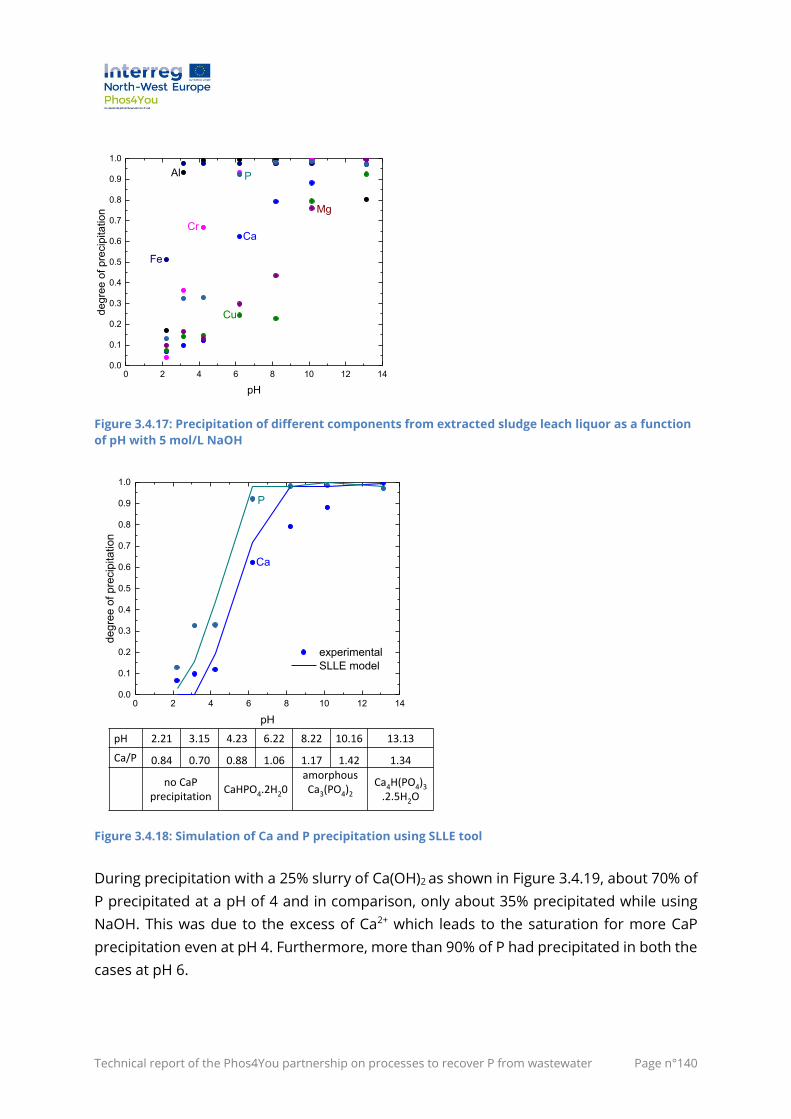
Technical report of the Phos4You partnership on processes to recover P from wastewater Page n°140
Figure 3.4.17: Precipitation of different components from extracted sludge leach liquor as a function
of pH with 5 mol/L NaOH
Figure 3.4.18: Simulation of Ca and P precipitation using SLLE tool
During precipitation with a 25% slurry of Ca(OH)2 as shown in Figure 3.4.19, about 70% of
P precipitated at a pH of 4 and in comparison, only about 35% precipitated while using
NaOH. This was due to the excess of Ca2+ which leads to the saturation for more CaP
precipitation even at pH 4. Furthermore, more than 90% of P had precipitated in both the
cases at pH 6.
0 2 4 6 8 10 12 140.0
0.1
0.2
0.3
0.4
0.5
0.6
0.7
0.8
0.9
1.0
P
Mg
Cu
CaCr
Fe
Al
deg
ree o
f p
recip
ita
tion
pH
pH 2.21 3.15 4.23 6.22 8.22 10.16 13.13
Ca/P 0.84 0.70 0.88 1.06 1.17 1.42 1.34
no CaPprecipitation
CaHPO4.2H20amorphousCa3(PO4)2
Ca4H(PO4)3
.2.5H2O
0 2 4 6 8 10 12 140.0
0.1
0.2
0.3
0.4
0.5
0.6
0.7
0.8
0.9
1.0
experimental
SLLE model
P
Ca
deg
ree o
f p
recip
ita
tion
pH
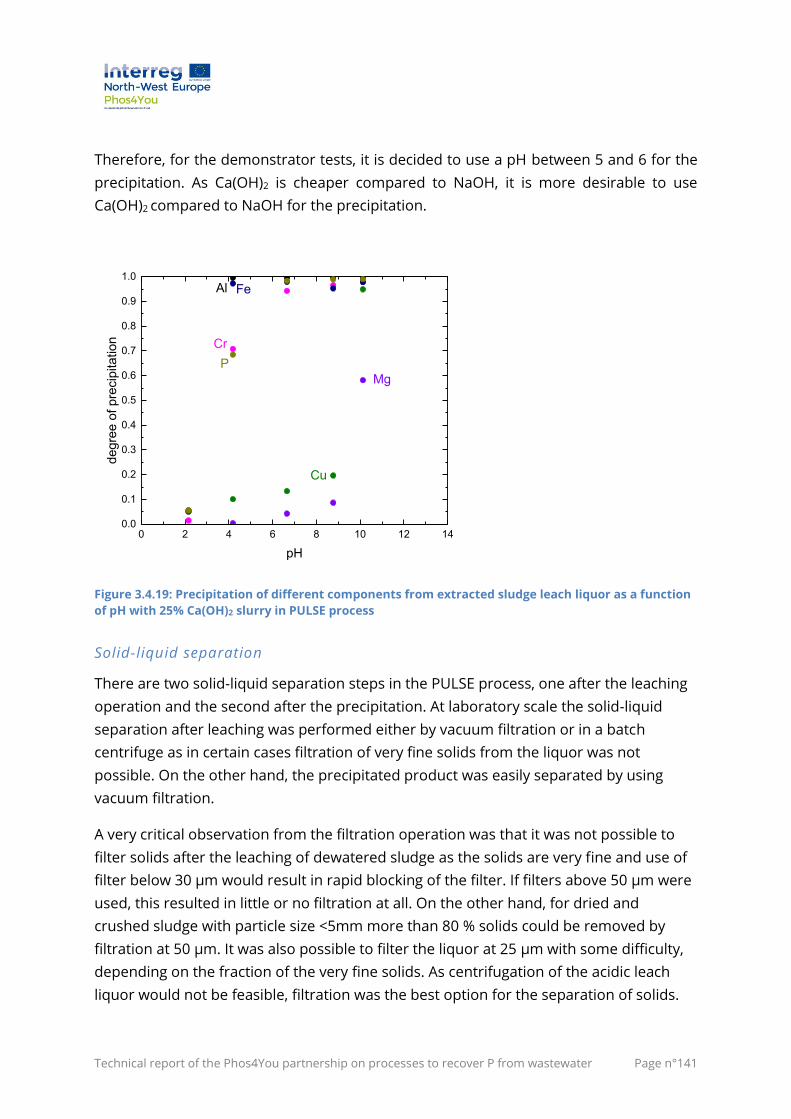
Technical report of the Phos4You partnership on processes to recover P from wastewater Page n°141
Therefore, for the demonstrator tests, it is decided to use a pH between 5 and 6 for the
precipitation. As Ca(OH)2 is cheaper compared to NaOH, it is more desirable to use
Ca(OH)2 compared to NaOH for the precipitation.
Figure 3.4.19: Precipitation of different components from extracted sludge leach liquor as a function
of pH with 25% Ca(OH)2 slurry in PULSE process
Solid-liquid separation
There are two solid-liquid separation steps in the PULSE process, one after the leaching
operation and the second after the precipitation. At laboratory scale the solid-liquid
separation after leaching was performed either by vacuum filtration or in a batch
centrifuge as in certain cases filtration of very fine solids from the liquor was not
possible. On the other hand, the precipitated product was easily separated by using
vacuum filtration.
A very critical observation from the filtration operation was that it was not possible to
filter solids after the leaching of dewatered sludge as the solids are very fine and use of
filter below 30 µm would result in rapid blocking of the filter. If filters above 50 µm were
used, this resulted in little or no filtration at all. On the other hand, for dried and
crushed sludge with particle size <5mm more than 80 % solids could be removed by
filtration at 50 µm. It was also possible to filter the liquor at 25 µm with some difficulty,
depending on the fraction of the very fine solids. As centrifugation of the acidic leach
liquor would not be feasible, filtration was the best option for the separation of solids.
0 2 4 6 8 10 12 140.0
0.1
0.2
0.3
0.4
0.5
0.6
0.7
0.8
0.9
1.0
P
Mg
Fe
Cu
Cr
Al
deg
ree o
f p
recip
itation
pH
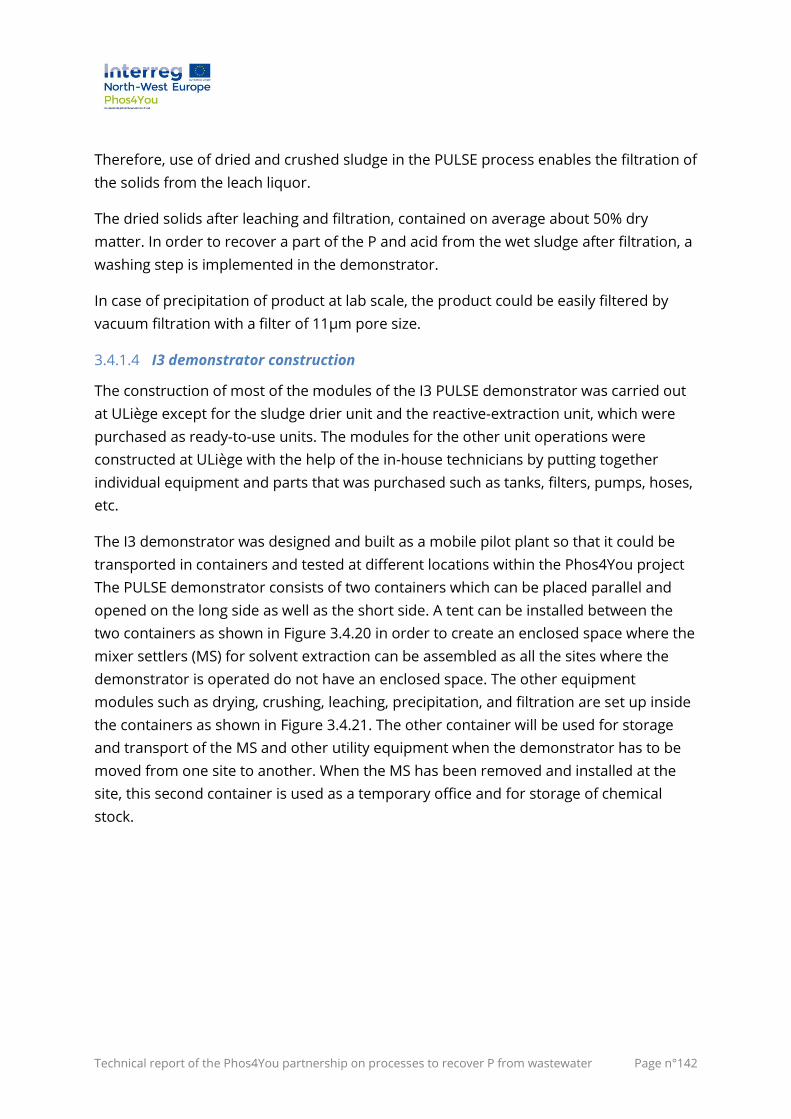
Technical report of the Phos4You partnership on processes to recover P from wastewater Page n°142
Therefore, use of dried and crushed sludge in the PULSE process enables the filtration of
the solids from the leach liquor.
The dried solids after leaching and filtration, contained on average about 50% dry
matter. In order to recover a part of the P and acid from the wet sludge after filtration, a
washing step is implemented in the demonstrator.
In case of precipitation of product at lab scale, the product could be easily filtered by
vacuum filtration with a filter of 11µm pore size.
3.4.1.4 I3 demonstrator construction
The construction of most of the modules of the I3 PULSE demonstrator was carried out
at ULiège except for the sludge drier unit and the reactive-extraction unit, which were
purchased as ready-to-use units. The modules for the other unit operations were
constructed at ULiège with the help of the in-house technicians by putting together
individual equipment and parts that was purchased such as tanks, filters, pumps, hoses,
etc.
The I3 demonstrator was designed and built as a mobile pilot plant so that it could be
transported in containers and tested at different locations within the Phos4You project
The PULSE demonstrator consists of two containers which can be placed parallel and
opened on the long side as well as the short side. A tent can be installed between the
two containers as shown in Figure 3.4.20 in order to create an enclosed space where the
mixer settlers (MS) for solvent extraction can be assembled as all the sites where the
demonstrator is operated do not have an enclosed space. The other equipment
modules such as drying, crushing, leaching, precipitation, and filtration are set up inside
the containers as shown in Figure 3.4.21. The other container will be used for storage
and transport of the MS and other utility equipment when the demonstrator has to be
moved from one site to another. When the MS has been removed and installed at the
site, this second container is used as a temporary office and for storage of chemical
stock.
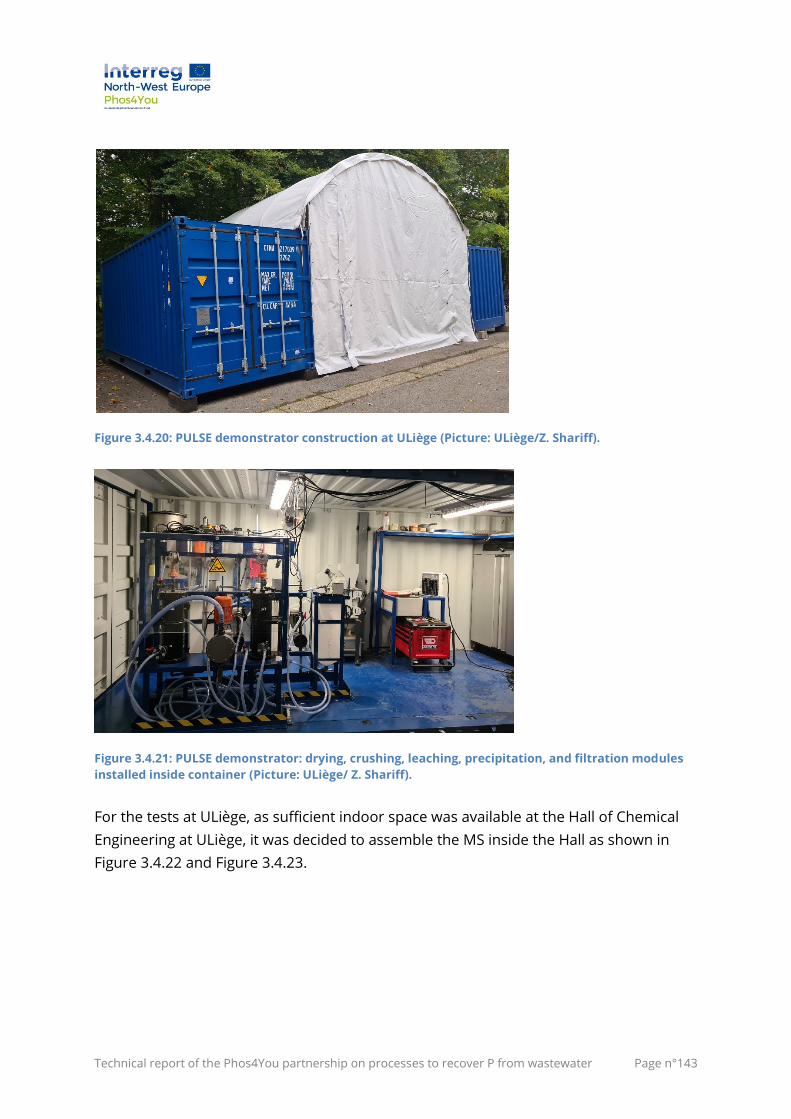
Technical report of the Phos4You partnership on processes to recover P from wastewater Page n°143
Figure 3.4.20: PULSE demonstrator construction at ULiège (Picture: ULiège/Z. Shariff).
Figure 3.4.21: PULSE demonstrator: drying, crushing, leaching, precipitation, and filtration modules
installed inside container (Picture: ULiège/ Z. Shariff).
For the tests at ULiège, as sufficient indoor space was available at the Hall of Chemical
Engineering at ULiège, it was decided to assemble the MS inside the Hall as shown in
Figure 3.4.22 and Figure 3.4.23.
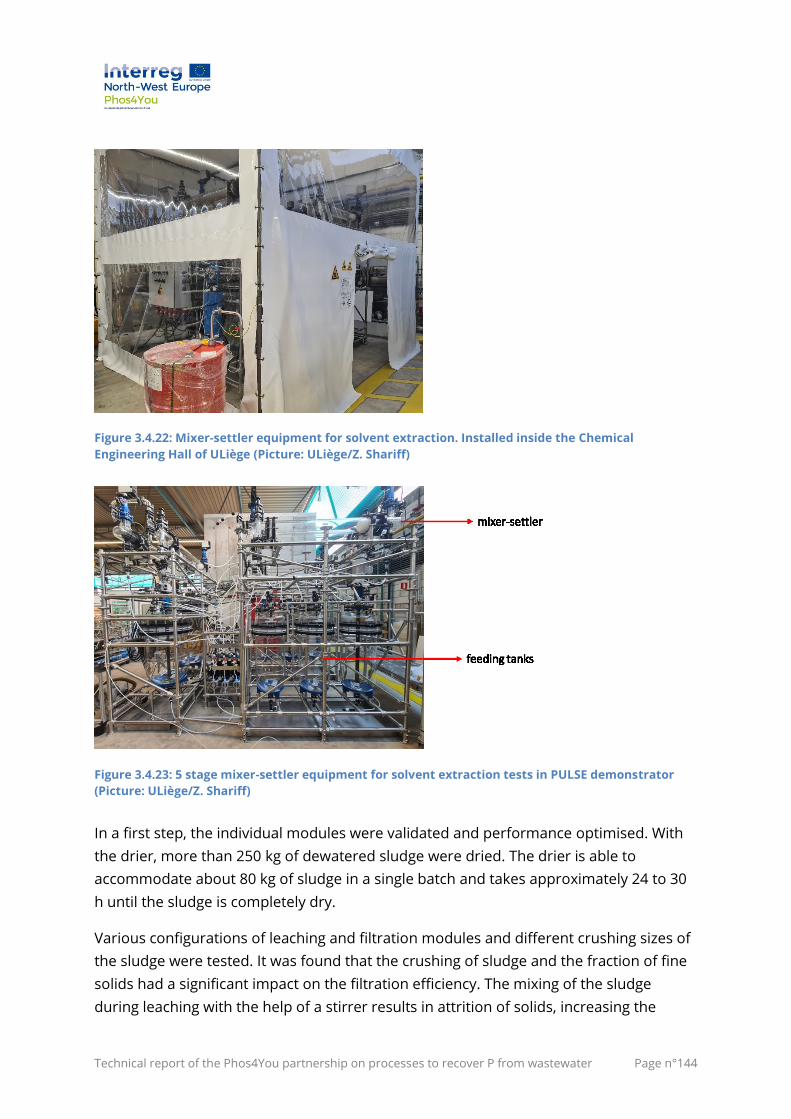
Technical report of the Phos4You partnership on processes to recover P from wastewater Page n°144
Figure 3.4.22: Mixer-settler equipment for solvent extraction. Installed inside the Chemical
Engineering Hall of ULiège (Picture: ULiège/Z. Shariff)
Figure 3.4.23: 5 stage mixer-settler equipment for solvent extraction tests in PULSE demonstrator
(Picture: ULiège/Z. Shariff)
In a first step, the individual modules were validated and performance optimised. With
the drier, more than 250 kg of dewatered sludge were dried. The drier is able to
accommodate about 80 kg of sludge in a single batch and takes approximately 24 to 30
h until the sludge is completely dry.
Various configurations of leaching and filtration modules and different crushing sizes of
the sludge were tested. It was found that the crushing of sludge and the fraction of fine
solids had a significant impact on the filtration efficiency. The mixing of the sludge
during leaching with the help of a stirrer results in attrition of solids, increasing the
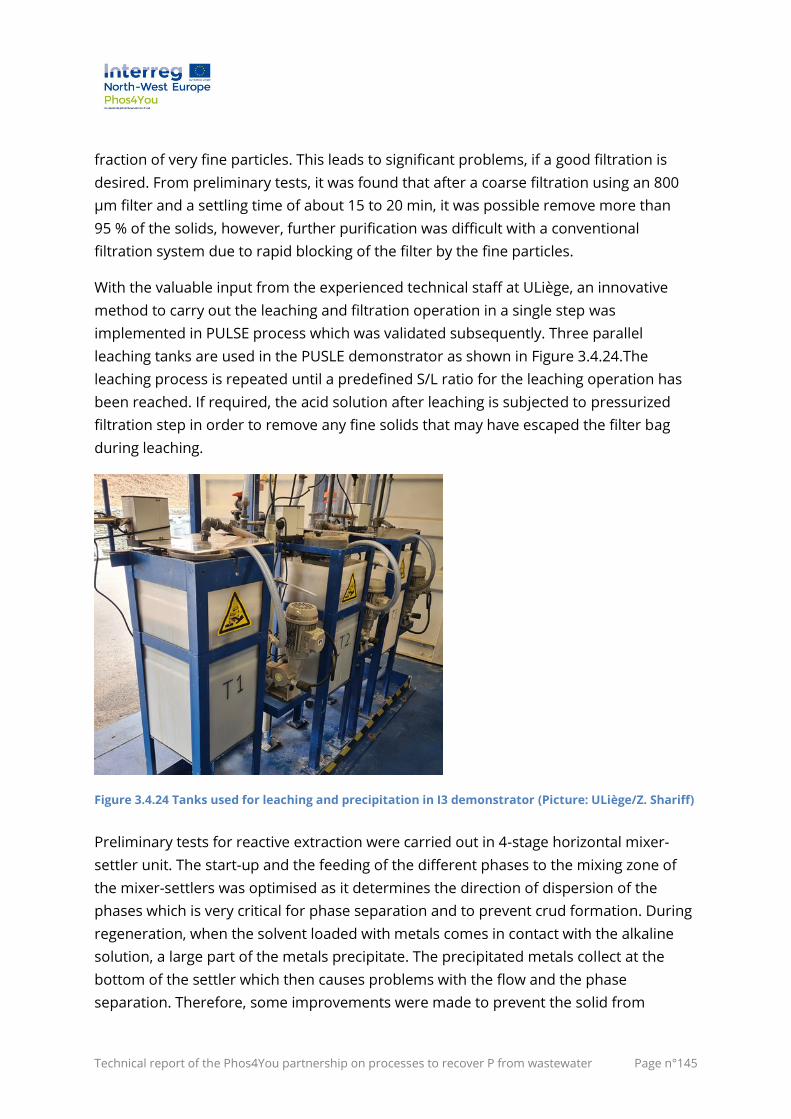
Technical report of the Phos4You partnership on processes to recover P from wastewater Page n°145
fraction of very fine particles. This leads to significant problems, if a good filtration is
desired. From preliminary tests, it was found that after a coarse filtration using an 800
µm filter and a settling time of about 15 to 20 min, it was possible remove more than
95 % of the solids, however, further purification was difficult with a conventional
filtration system due to rapid blocking of the filter by the fine particles.
With the valuable input from the experienced technical staff at ULiège, an innovative
method to carry out the leaching and filtration operation in a single step was
implemented in PULSE process which was validated subsequently. Three parallel
leaching tanks are used in the PUSLE demonstrator as shown in Figure 3.4.24.The
leaching process is repeated until a predefined S/L ratio for the leaching operation has
been reached. If required, the acid solution after leaching is subjected to pressurized
filtration step in order to remove any fine solids that may have escaped the filter bag
during leaching.
Figure 3.4.24 Tanks used for leaching and precipitation in I3 demonstrator (Picture: ULiège/Z. Shariff)
Preliminary tests for reactive extraction were carried out in 4-stage horizontal mixer-
settler unit. The start-up and the feeding of the different phases to the mixing zone of
the mixer-settlers was optimised as it determines the direction of dispersion of the
phases which is very critical for phase separation and to prevent crud formation. During
regeneration, when the solvent loaded with metals comes in contact with the alkaline
solution, a large part of the metals precipitate. The precipitated metals collect at the
bottom of the settler which then causes problems with the flow and the phase
separation. Therefore, some improvements were made to prevent the solid from
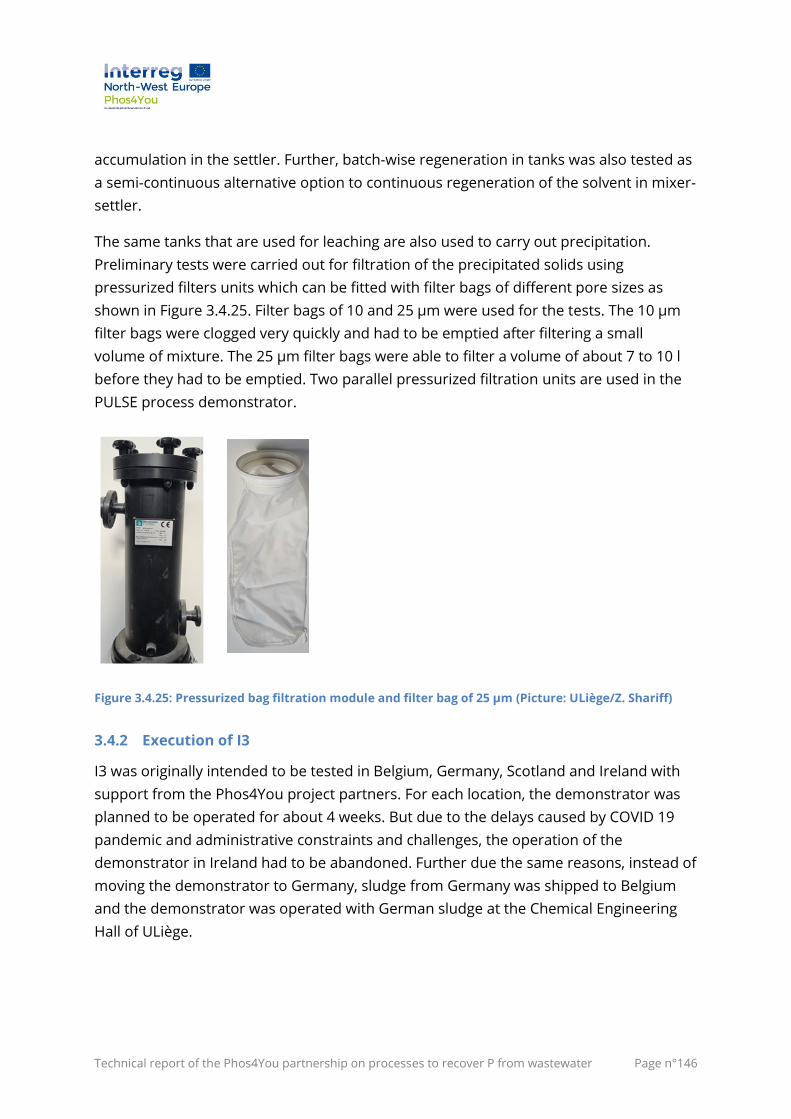
Technical report of the Phos4You partnership on processes to recover P from wastewater Page n°146
accumulation in the settler. Further, batch-wise regeneration in tanks was also tested as
a semi-continuous alternative option to continuous regeneration of the solvent in mixer-
settler.
The same tanks that are used for leaching are also used to carry out precipitation.
Preliminary tests were carried out for filtration of the precipitated solids using
pressurized filters units which can be fitted with filter bags of different pore sizes as
shown in Figure 3.4.25. Filter bags of 10 and 25 µm were used for the tests. The 10 µm
filter bags were clogged very quickly and had to be emptied after filtering a small
volume of mixture. The 25 µm filter bags were able to filter a volume of about 7 to 10 l
before they had to be emptied. Two parallel pressurized filtration units are used in the
PULSE process demonstrator.
Figure 3.4.25: Pressurized bag filtration module and filter bag of 25 µm (Picture: ULiège/Z. Shariff)
3.4.2 Execution of I3
I3 was originally intended to be tested in Belgium, Germany, Scotland and Ireland with
support from the Phos4You project partners. For each location, the demonstrator was
planned to be operated for about 4 weeks. But due to the delays caused by COVID 19
pandemic and administrative constraints and challenges, the operation of the
demonstrator in Ireland had to be abandoned. Further due the same reasons, instead of
moving the demonstrator to Germany, sludge from Germany was shipped to Belgium
and the demonstrator was operated with German sludge at the Chemical Engineering
Hall of ULiège.
Technical report of the Phos4You partnership on processes to recover P from wastewater Page n°147
3.4.2.1 I3 operation with German sludge
Sludge from Dortmund-Deusen WWTP (700,000 PE capacity) was used for demonstrator
tests. Approximately 340 kg of anaerobically stabilized and dewatered sludge was
received from the German partners in 2 batches in December 2020 and in January 2021.
Before the demonstrator operation, laboratory experiments were conducted and
simulations with the SLLE tool were performed in order to find optimal operating
parameters for the operation of the demonstrator. The dewatered German sludge had
DM content of 23 % (±0.2 %) and total P content of 3.47 %. The sludge was dried to
obtain 78.2 kg of dry solids with a DM content of 98.32 % and crushed to a 2 mm particle
size.
The dried and crushed sludge was leached using 2 mol/L hydrochloric acid and S/L ratio
of 0.25. For operation, the filter cartridge was filled with 3.3 kg of dry sludge and
immersed in tank containing 40 l of HCl solution. After the desired leaching time, the
used sludge was replaced with new batch of sludge until the S/L corresponded to 0.25 or
10 kg of sludge for 40 l of acid solution. Each cartridge of used sludge is subjected to
washing with tap water and about 20 l of water is used to wash the 10 kg of solids. From
312 l of HCl solution about 264 l of pregnant liquor which includes the washing water
was produced. The leached and washed solids have a DM matter content of about 50 %.
Figure 3.4.26 shows the comparison of P leaching efficiency between the SLLE tool, lab
experiments and the demonstrator test. With the demonstrator, a maximum P leaching
efficiency of about 75 % was achieved. During the leaching operation it was noticed that
the wetting of the sludge inside the cartridge by the acid was not uniform, which
resulted in lower leaching efficiencies initially. Therefore, modifications were made to
improve the wetting of the sludge and the leaching efficiency.
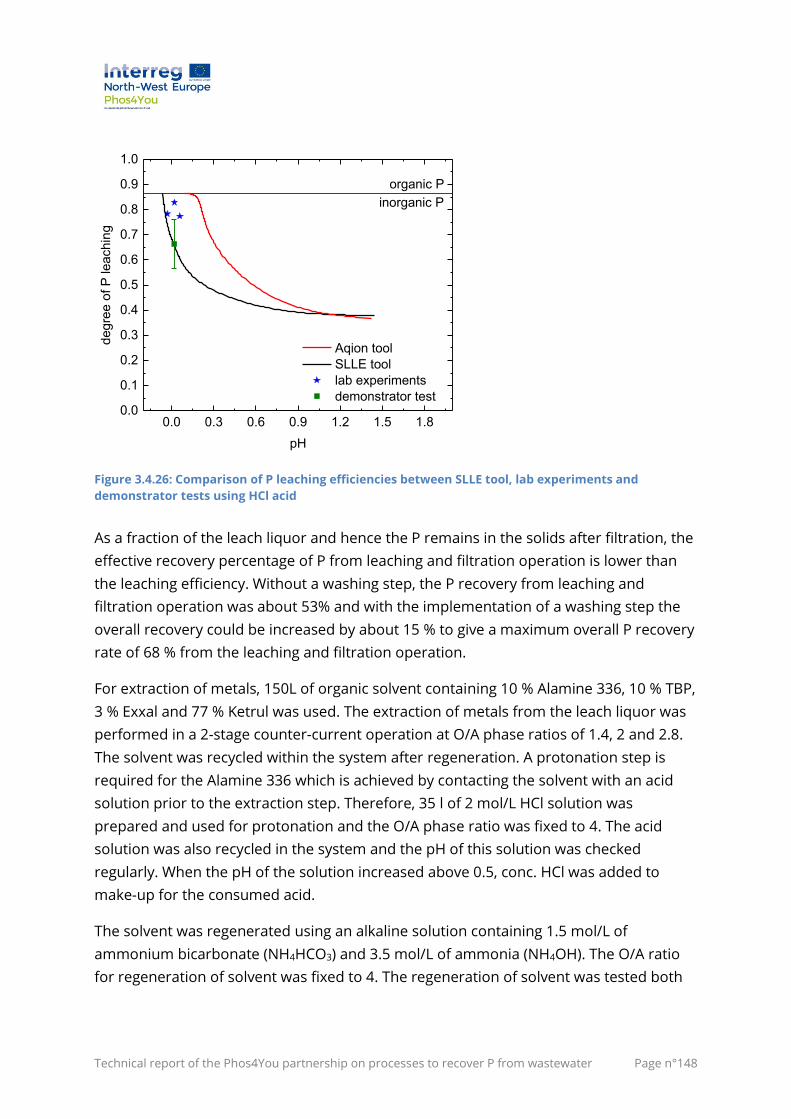
Technical report of the Phos4You partnership on processes to recover P from wastewater Page n°148
Figure 3.4.26: Comparison of P leaching efficiencies between SLLE tool, lab experiments and
demonstrator tests using HCl acid
As a fraction of the leach liquor and hence the P remains in the solids after filtration, the
effective recovery percentage of P from leaching and filtration operation is lower than
the leaching efficiency. Without a washing step, the P recovery from leaching and
filtration operation was about 53% and with the implementation of a washing step the
overall recovery could be increased by about 15 % to give a maximum overall P recovery
rate of 68 % from the leaching and filtration operation.
For extraction of metals, 150L of organic solvent containing 10 % Alamine 336, 10 % TBP,
3 % Exxal and 77 % Ketrul was used. The extraction of metals from the leach liquor was
performed in a 2-stage counter-current operation at O/A phase ratios of 1.4, 2 and 2.8.
The solvent was recycled within the system after regeneration. A protonation step is
required for the Alamine 336 which is achieved by contacting the solvent with an acid
solution prior to the extraction step. Therefore, 35 l of 2 mol/L HCl solution was
prepared and used for protonation and the O/A phase ratio was fixed to 4. The acid
solution was also recycled in the system and the pH of this solution was checked
regularly. When the pH of the solution increased above 0.5, conc. HCl was added to
make-up for the consumed acid.
The solvent was regenerated using an alkaline solution containing 1.5 mol/L of
ammonium bicarbonate (NH4HCO3) and 3.5 mol/L of ammonia (NH4OH). The O/A ratio
for regeneration of solvent was fixed to 4. The regeneration of solvent was tested both
0.0 0.3 0.6 0.9 1.2 1.5 1.80.0
0.1
0.2
0.3
0.4
0.5
0.6
0.7
0.8
0.9
1.0
organic P
inorganic P
degre
e o
f P
leach
ing
pH
Aqion tool
SLLE tool
lab experiments
demonstrator test
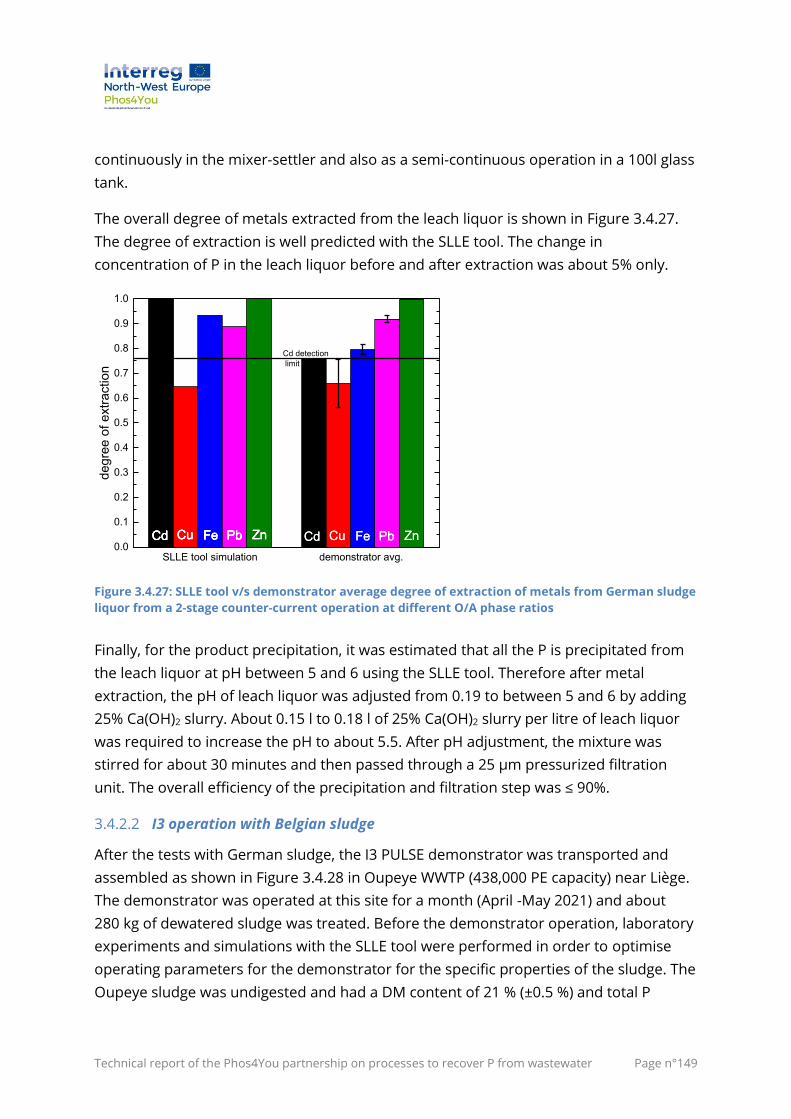
Technical report of the Phos4You partnership on processes to recover P from wastewater Page n°149
continuously in the mixer-settler and also as a semi-continuous operation in a 100l glass
tank.
The overall degree of metals extracted from the leach liquor is shown in Figure 3.4.27.
The degree of extraction is well predicted with the SLLE tool. The change in
concentration of P in the leach liquor before and after extraction was about 5% only.
Figure 3.4.27: SLLE tool v/s demonstrator average degree of extraction of metals from German sludge
liquor from a 2-stage counter-current operation at different O/A phase ratios
Finally, for the product precipitation, it was estimated that all the P is precipitated from
the leach liquor at pH between 5 and 6 using the SLLE tool. Therefore after metal
extraction, the pH of leach liquor was adjusted from 0.19 to between 5 and 6 by adding
25% Ca(OH)2 slurry. About 0.15 l to 0.18 l of 25% Ca(OH)2 slurry per litre of leach liquor
was required to increase the pH to about 5.5. After pH adjustment, the mixture was
stirred for about 30 minutes and then passed through a 25 µm pressurized filtration
unit. The overall efficiency of the precipitation and filtration step was ≤ 90%.
3.4.2.2 I3 operation with Belgian sludge
After the tests with German sludge, the I3 PULSE demonstrator was transported and
assembled as shown in Figure 3.4.28 in Oupeye WWTP (438,000 PE capacity) near Liège.
The demonstrator was operated at this site for a month (April -May 2021) and about
280 kg of dewatered sludge was treated. Before the demonstrator operation, laboratory
experiments and simulations with the SLLE tool were performed in order to optimise
operating parameters for the demonstrator for the specific properties of the sludge. The
Oupeye sludge was undigested and had a DM content of 21 % (±0.5 %) and total P
SLLE tool simulation demonstrator avg. 0.0
0.1
0.2
0.3
0.4
0.5
0.6
0.7
0.8
0.9
1.0
ZnPbFeCuCd
deg
ree o
f e
xtr
actio
n
Cd detection
limit
ZnPbFeCuCd ZnPbFeCuCd ZnPbFeCuCd ZnPbFeCuCd ZnPbFeCuCd
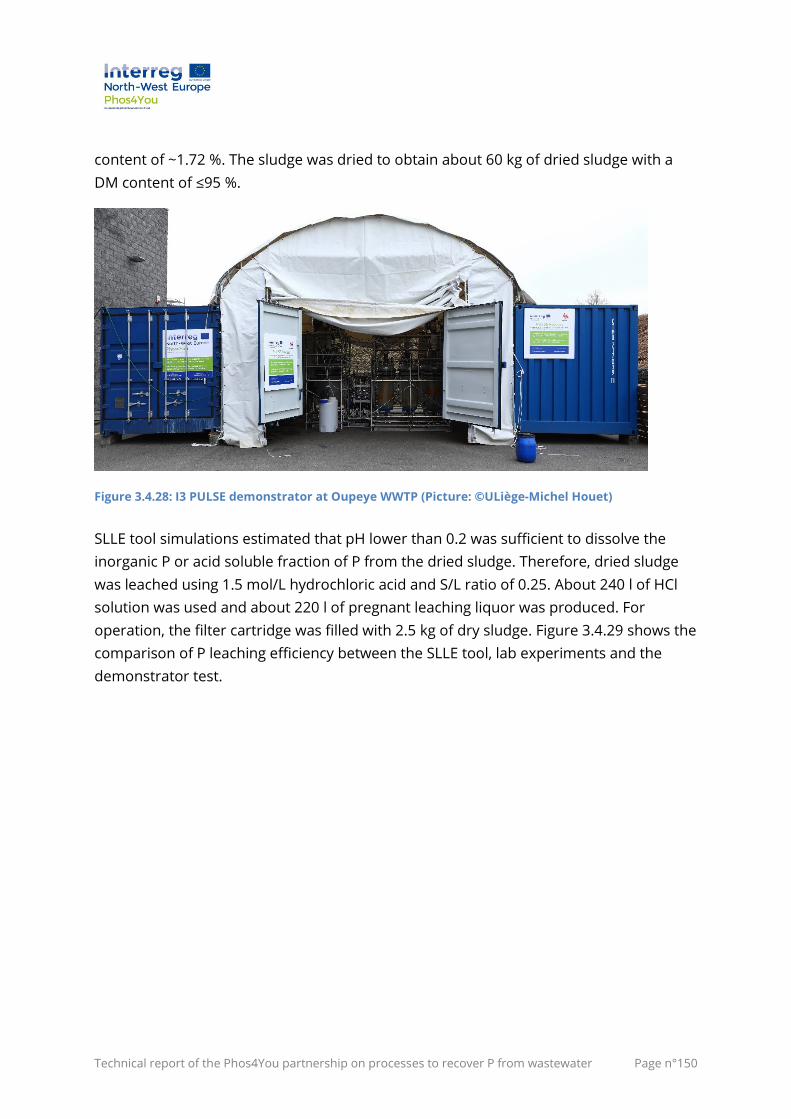
Technical report of the Phos4You partnership on processes to recover P from wastewater Page n°150
content of ~1.72 %. The sludge was dried to obtain about 60 kg of dried sludge with a
DM content of ≤95 %.
Figure 3.4.28: I3 PULSE demonstrator at Oupeye WWTP (Picture: ©ULiège-Michel Houet)
SLLE tool simulations estimated that pH lower than 0.2 was sufficient to dissolve the
inorganic P or acid soluble fraction of P from the dried sludge. Therefore, dried sludge
was leached using 1.5 mol/L hydrochloric acid and S/L ratio of 0.25. About 240 l of HCl
solution was used and about 220 l of pregnant leaching liquor was produced. For
operation, the filter cartridge was filled with 2.5 kg of dry sludge. Figure 3.4.29 shows the
comparison of P leaching efficiency between the SLLE tool, lab experiments and the
demonstrator test.
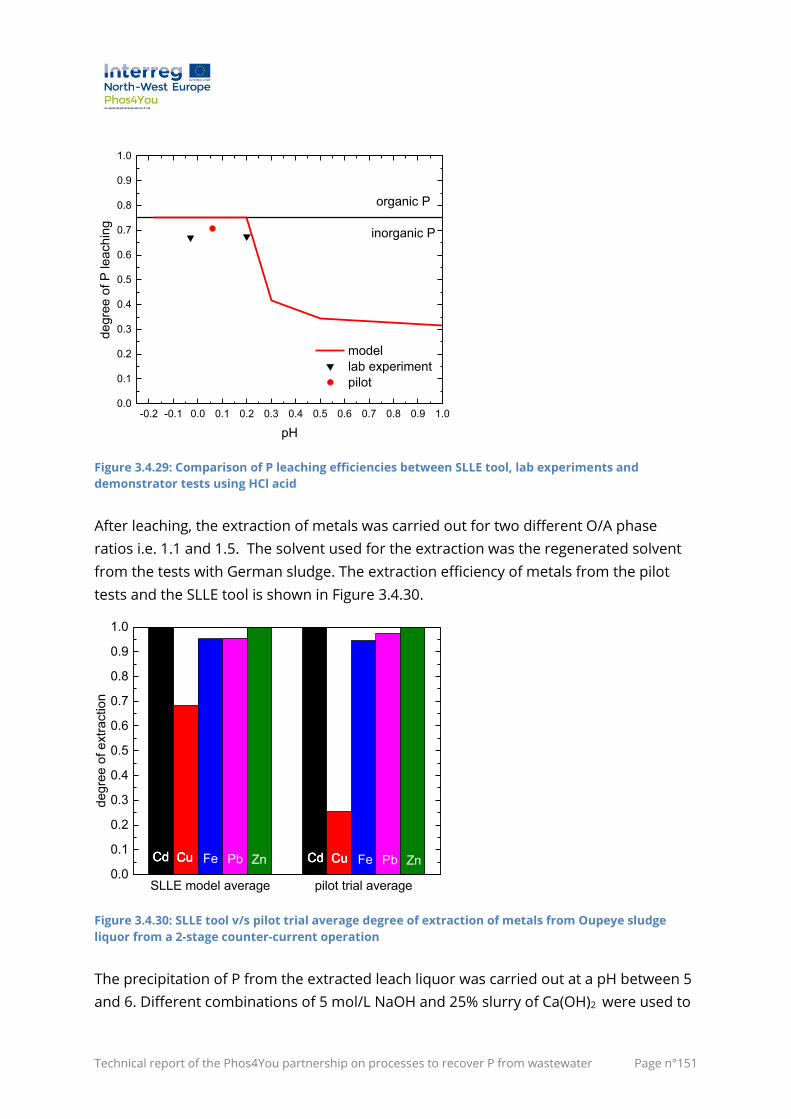
Technical report of the Phos4You partnership on processes to recover P from wastewater Page n°151
Figure 3.4.29: Comparison of P leaching efficiencies between SLLE tool, lab experiments and
demonstrator tests using HCl acid
After leaching, the extraction of metals was carried out for two different O/A phase
ratios i.e. 1.1 and 1.5. The solvent used for the extraction was the regenerated solvent
from the tests with German sludge. The extraction efficiency of metals from the pilot
tests and the SLLE tool is shown in Figure 3.4.30.
Figure 3.4.30: SLLE tool v/s pilot trial average degree of extraction of metals from Oupeye sludge
liquor from a 2-stage counter-current operation
The precipitation of P from the extracted leach liquor was carried out at a pH between 5
and 6. Different combinations of 5 mol/L NaOH and 25% slurry of Ca(OH)2 were used to
-0.2 -0.1 0.0 0.1 0.2 0.3 0.4 0.5 0.6 0.7 0.8 0.9 1.00.0
0.1
0.2
0.3
0.4
0.5
0.6
0.7
0.8
0.9
1.0
organic P
inorganic P
model
lab experiment
pilot
deg
ree o
f P
le
ach
ing
pH
SLLE model average pilot trial average0.0
0.1
0.2
0.3
0.4
0.5
0.6
0.7
0.8
0.9
1.0
CuCd
degre
e o
f extr
action
CuCd ZnPbFeCuCd CuCd CuCd ZnPbFeCuCd
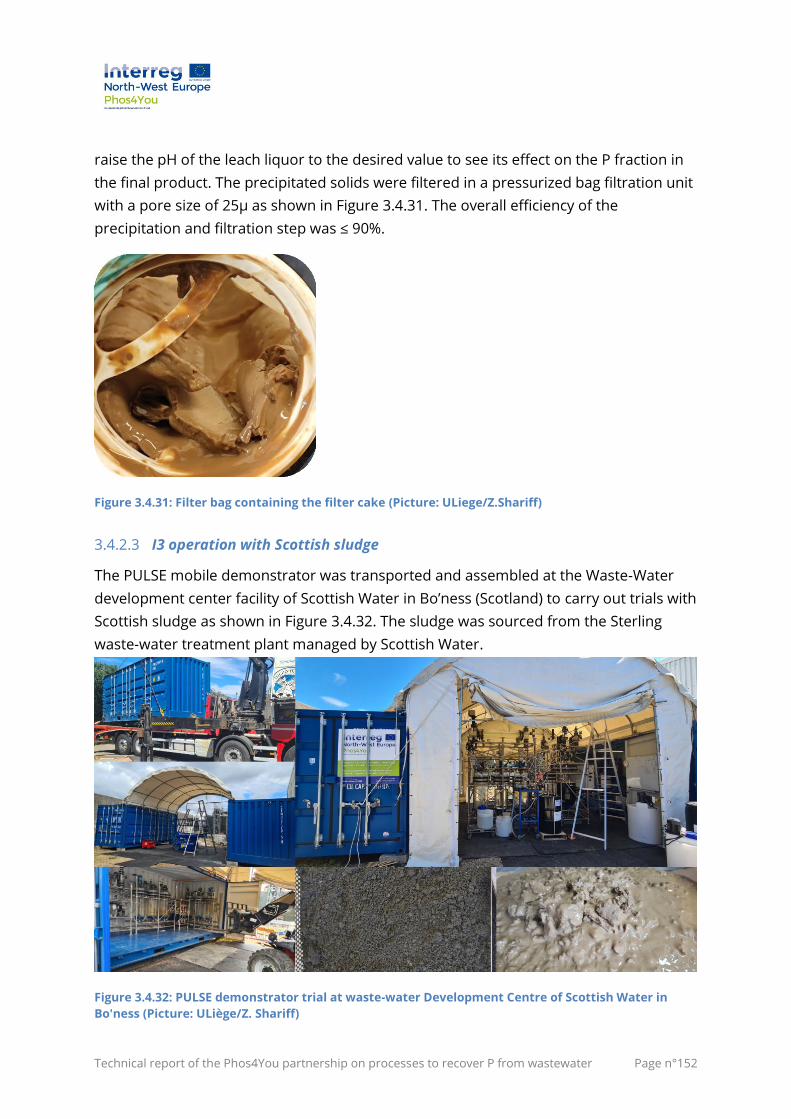
Technical report of the Phos4You partnership on processes to recover P from wastewater Page n°152
raise the pH of the leach liquor to the desired value to see its effect on the P fraction in
the final product. The precipitated solids were filtered in a pressurized bag filtration unit
with a pore size of 25µ as shown in Figure 3.4.31. The overall efficiency of the
precipitation and filtration step was ≤ 90%.
Figure 3.4.31: Filter bag containing the filter cake (Picture: ULiege/Z.Shariff)
3.4.2.3 I3 operation with Scottish sludge
The PULSE mobile demonstrator was transported and assembled at the Waste-Water
development center facility of Scottish Water in Bo’ness (Scotland) to carry out trials with
Scottish sludge as shown in Figure 3.4.32. The sludge was sourced from the Sterling
waste-water treatment plant managed by Scottish Water.
Figure 3.4.32: PULSE demonstrator trial at waste-water Development Centre of Scottish Water in
Bo'ness (Picture: ULiège/Z. Shariff)
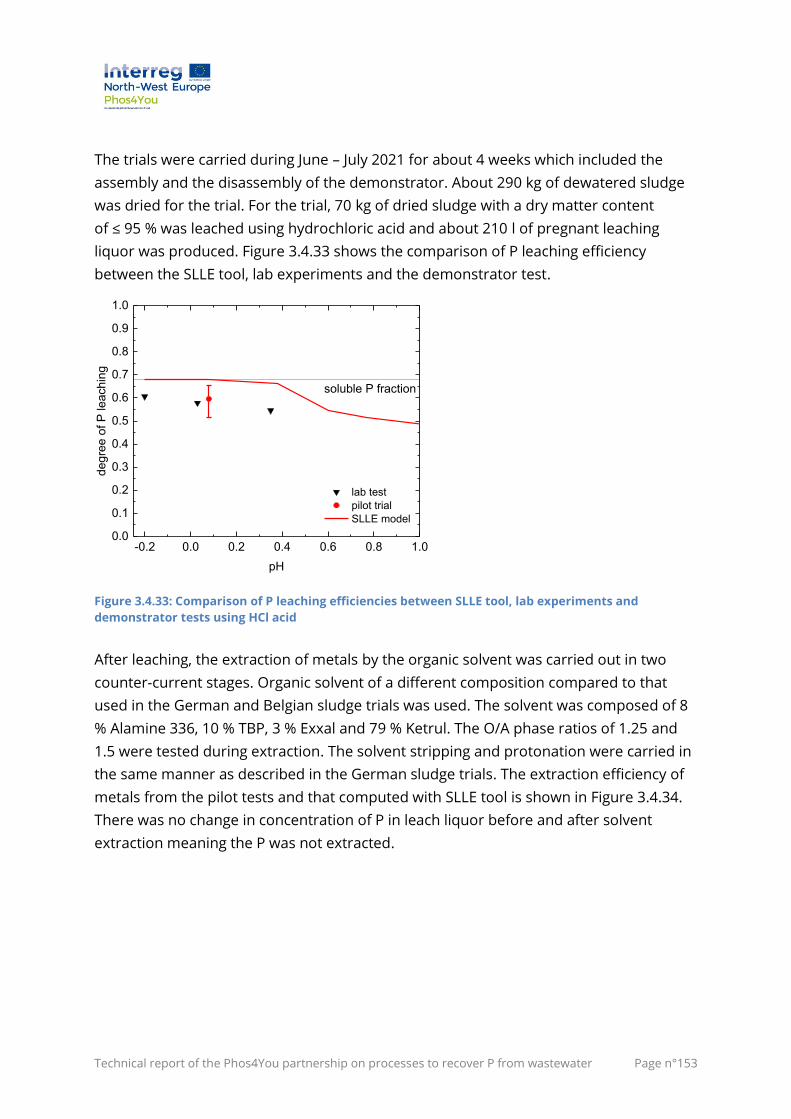
Technical report of the Phos4You partnership on processes to recover P from wastewater Page n°153
The trials were carried during June – July 2021 for about 4 weeks which included the
assembly and the disassembly of the demonstrator. About 290 kg of dewatered sludge
was dried for the trial. For the trial, 70 kg of dried sludge with a dry matter content
of ≤ 95 % was leached using hydrochloric acid and about 210 l of pregnant leaching
liquor was produced. Figure 3.4.33 shows the comparison of P leaching efficiency
between the SLLE tool, lab experiments and the demonstrator test.
Figure 3.4.33: Comparison of P leaching efficiencies between SLLE tool, lab experiments and
demonstrator tests using HCl acid
After leaching, the extraction of metals by the organic solvent was carried out in two
counter-current stages. Organic solvent of a different composition compared to that
used in the German and Belgian sludge trials was used. The solvent was composed of 8
% Alamine 336, 10 % TBP, 3 % Exxal and 79 % Ketrul. The O/A phase ratios of 1.25 and
1.5 were tested during extraction. The solvent stripping and protonation were carried in
the same manner as described in the German sludge trials. The extraction efficiency of
metals from the pilot tests and that computed with SLLE tool is shown in Figure 3.4.34.
There was no change in concentration of P in leach liquor before and after solvent
extraction meaning the P was not extracted.
-0.2 0.0 0.2 0.4 0.6 0.8 1.00.0
0.1
0.2
0.3
0.4
0.5
0.6
0.7
0.8
0.9
1.0
lab test
pilot trial
SLLE model
deg
ree o
f P
le
ach
ing
pH
soluble P fraction
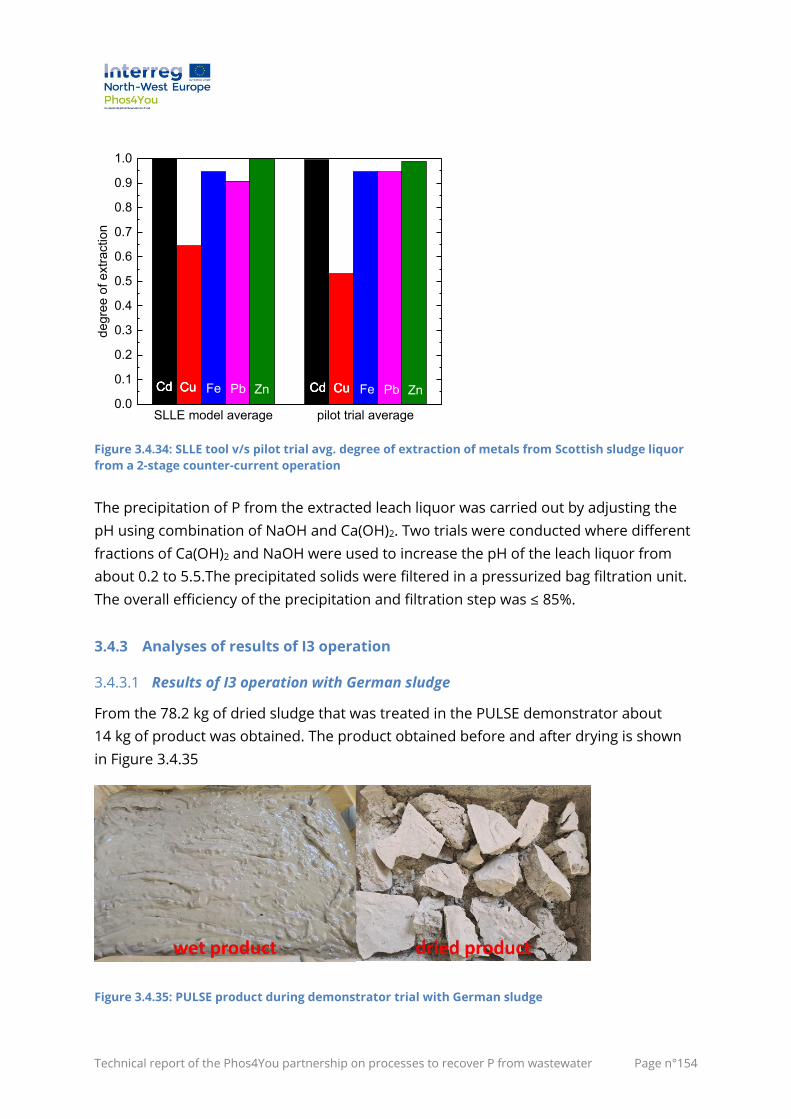
Technical report of the Phos4You partnership on processes to recover P from wastewater Page n°154
Figure 3.4.34: SLLE tool v/s pilot trial avg. degree of extraction of metals from Scottish sludge liquor
from a 2-stage counter-current operation
The precipitation of P from the extracted leach liquor was carried out by adjusting the
pH using combination of NaOH and Ca(OH)2. Two trials were conducted where different
fractions of Ca(OH)2 and NaOH were used to increase the pH of the leach liquor from
about 0.2 to 5.5.The precipitated solids were filtered in a pressurized bag filtration unit.
The overall efficiency of the precipitation and filtration step was ≤ 85%.
3.4.3 Analyses of results of I3 operation
3.4.3.1 Results of I3 operation with German sludge
From the 78.2 kg of dried sludge that was treated in the PULSE demonstrator about
14 kg of product was obtained. The product obtained before and after drying is shown
in Figure 3.4.35
Figure 3.4.35: PULSE product during demonstrator trial with German sludge
SLLE model average pilot trial average0.0
0.1
0.2
0.3
0.4
0.5
0.6
0.7
0.8
0.9
1.0
CuCd
degre
e o
f extr
action
CuCd ZnPbFeCuCd CuCd CuCd ZnPbFeCuCd
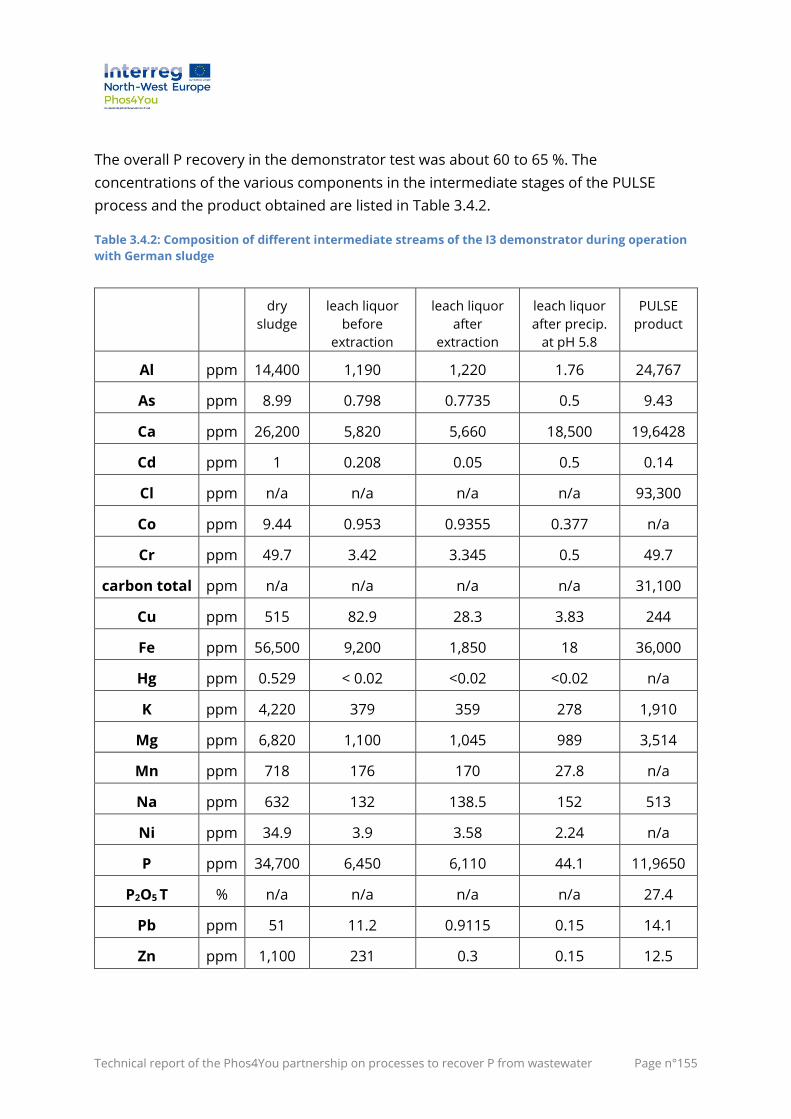
Technical report of the Phos4You partnership on processes to recover P from wastewater Page n°155
The overall P recovery in the demonstrator test was about 60 to 65 %. The
concentrations of the various components in the intermediate stages of the PULSE
process and the product obtained are listed in Table 3.4.2.
Table 3.4.2: Composition of different intermediate streams of the I3 demonstrator during operation
with German sludge
dry
sludge
leach liquor
before
extraction
leach liquor
after
extraction
leach liquor
after precip.
at pH 5.8
PULSE
product
Al ppm 14,400 1,190 1,220 1.76 24,767
As ppm 8.99 0.798 0.7735 0.5 9.43
Ca ppm 26,200 5,820 5,660 18,500 19,6428
Cd ppm 1 0.208 0.05 0.5 0.14
Cl ppm n/a n/a n/a n/a 93,300
Co ppm 9.44 0.953 0.9355 0.377 n/a
Cr ppm 49.7 3.42 3.345 0.5 49.7
carbon total ppm n/a n/a n/a n/a 31,100
Cu ppm 515 82.9 28.3 3.83 244
Fe ppm 56,500 9,200 1,850 18 36,000
Hg ppm 0.529 < 0.02 <0.02 <0.02 n/a
K ppm 4,220 379 359 278 1,910
Mg ppm 6,820 1,100 1,045 989 3,514
Mn ppm 718 176 170 27.8 n/a
Na ppm 632 132 138.5 152 513
Ni ppm 34.9 3.9 3.58 2.24 n/a
P ppm 34,700 6,450 6,110 44.1 11,9650
P2O5 T % n/a n/a n/a n/a 27.4
Pb ppm 51 11.2 0.9115 0.15 14.1
Zn ppm 1,100 231 0.3 0.15 12.5
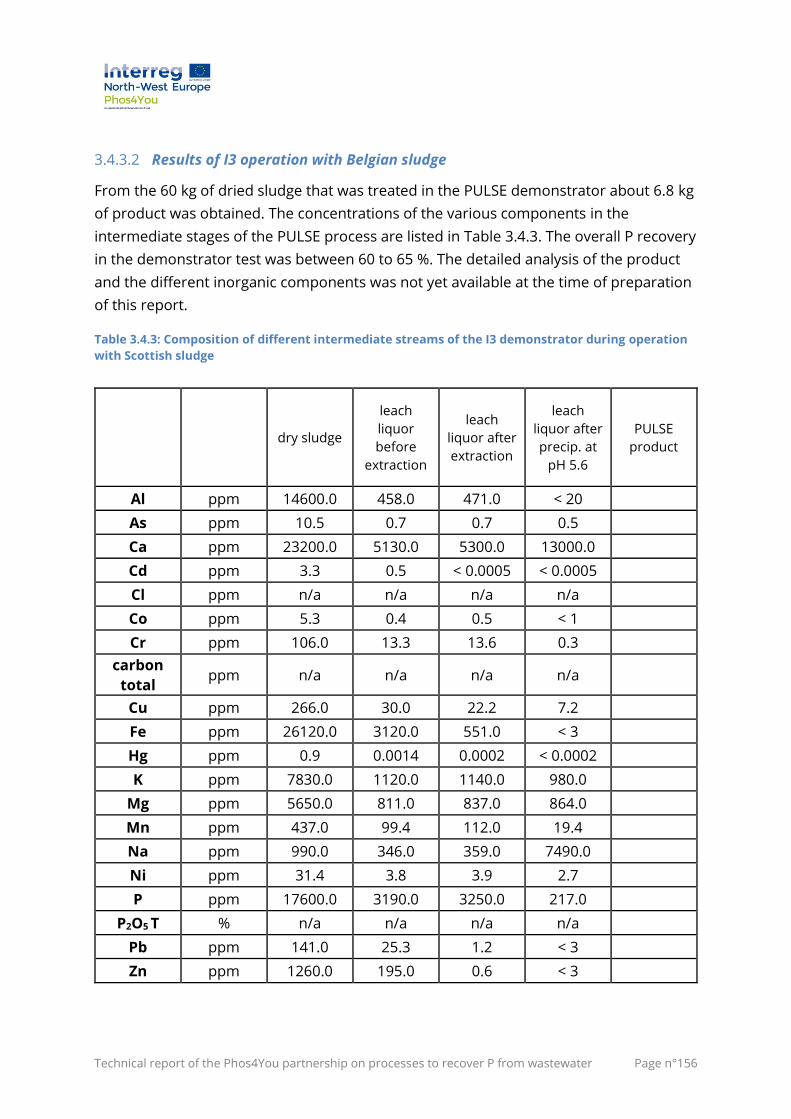
Technical report of the Phos4You partnership on processes to recover P from wastewater Page n°156
3.4.3.2 Results of I3 operation with Belgian sludge
From the 60 kg of dried sludge that was treated in the PULSE demonstrator about 6.8 kg
of product was obtained. The concentrations of the various components in the
intermediate stages of the PULSE process are listed in Table 3.4.3. The overall P recovery
in the demonstrator test was between 60 to 65 %. The detailed analysis of the product
and the different inorganic components was not yet available at the time of preparation
of this report.
Table 3.4.3: Composition of different intermediate streams of the I3 demonstrator during operation
with Scottish sludge
dry sludge
leach
liquor
before
extraction
leach
liquor after
extraction
leach
liquor after
precip. at
pH 5.6
PULSE
product
Al ppm 14600.0 458.0 471.0 < 20
As ppm 10.5 0.7 0.7 0.5
Ca ppm 23200.0 5130.0 5300.0 13000.0
Cd ppm 3.3 0.5 < 0.0005 < 0.0005
Cl ppm n/a n/a n/a n/a
Co ppm 5.3 0.4 0.5 < 1
Cr ppm 106.0 13.3 13.6 0.3
carbon
total ppm n/a n/a n/a n/a
Cu ppm 266.0 30.0 22.2 7.2
Fe ppm 26120.0 3120.0 551.0 < 3
Hg ppm 0.9 0.0014 0.0002 < 0.0002
K ppm 7830.0 1120.0 1140.0 980.0
Mg ppm 5650.0 811.0 837.0 864.0
Mn ppm 437.0 99.4 112.0 19.4
Na ppm 990.0 346.0 359.0 7490.0
Ni ppm 31.4 3.8 3.9 2.7
P ppm 17600.0 3190.0 3250.0 217.0
P2O5 T % n/a n/a n/a n/a
Pb ppm 141.0 25.3 1.2 < 3
Zn ppm 1260.0 195.0 0.6 < 3
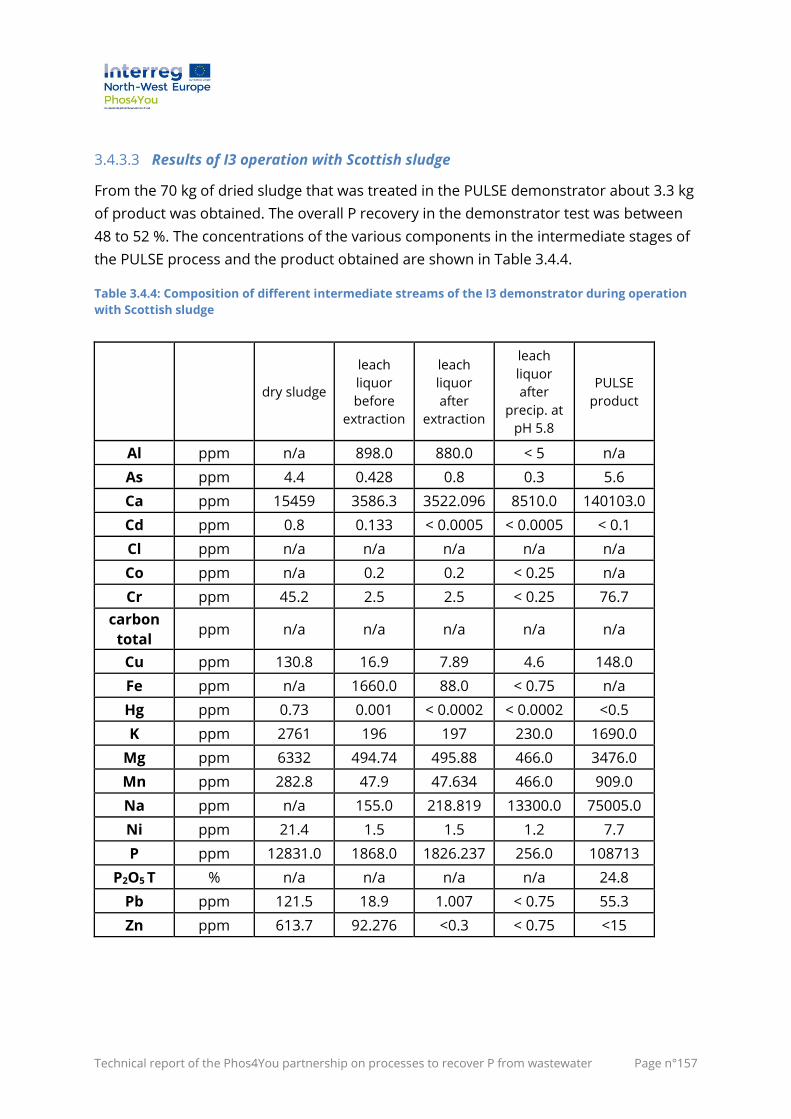
Technical report of the Phos4You partnership on processes to recover P from wastewater Page n°157
3.4.3.3 Results of I3 operation with Scottish sludge
From the 70 kg of dried sludge that was treated in the PULSE demonstrator about 3.3 kg
of product was obtained. The overall P recovery in the demonstrator test was between
48 to 52 %. The concentrations of the various components in the intermediate stages of
the PULSE process and the product obtained are shown in Table 3.4.4.
Table 3.4.4: Composition of different intermediate streams of the I3 demonstrator during operation
with Scottish sludge
dry sludge
leach
liquor
before
extraction
leach
liquor
after
extraction
leach
liquor
after
precip. at
pH 5.8
PULSE
product
Al ppm n/a 898.0 880.0 < 5 n/a
As ppm 4.4 0.428 0.8 0.3 5.6
Ca ppm 15459 3586.3 3522.096 8510.0 140103.0
Cd ppm 0.8 0.133 < 0.0005 < 0.0005 < 0.1
Cl ppm n/a n/a n/a n/a n/a
Co ppm n/a 0.2 0.2 < 0.25 n/a
Cr ppm 45.2 2.5 2.5 < 0.25 76.7
carbon
total ppm n/a n/a n/a n/a n/a
Cu ppm 130.8 16.9 7.89 4.6 148.0
Fe ppm n/a 1660.0 88.0 < 0.75 n/a
Hg ppm 0.73 0.001 < 0.0002 < 0.0002 <0.5
K ppm 2761 196 197 230.0 1690.0
Mg ppm 6332 494.74 495.88 466.0 3476.0
Mn ppm 282.8 47.9 47.634 466.0 909.0
Na ppm n/a 155.0 218.819 13300.0 75005.0
Ni ppm 21.4 1.5 1.5 1.2 7.7
P ppm 12831.0 1868.0 1826.237 256.0 108713
P2O5 T % n/a n/a n/a n/a 24.8
Pb ppm 121.5 18.9 1.007 < 0.75 55.3
Zn ppm 613.7 92.276 <0.3 < 0.75 <15
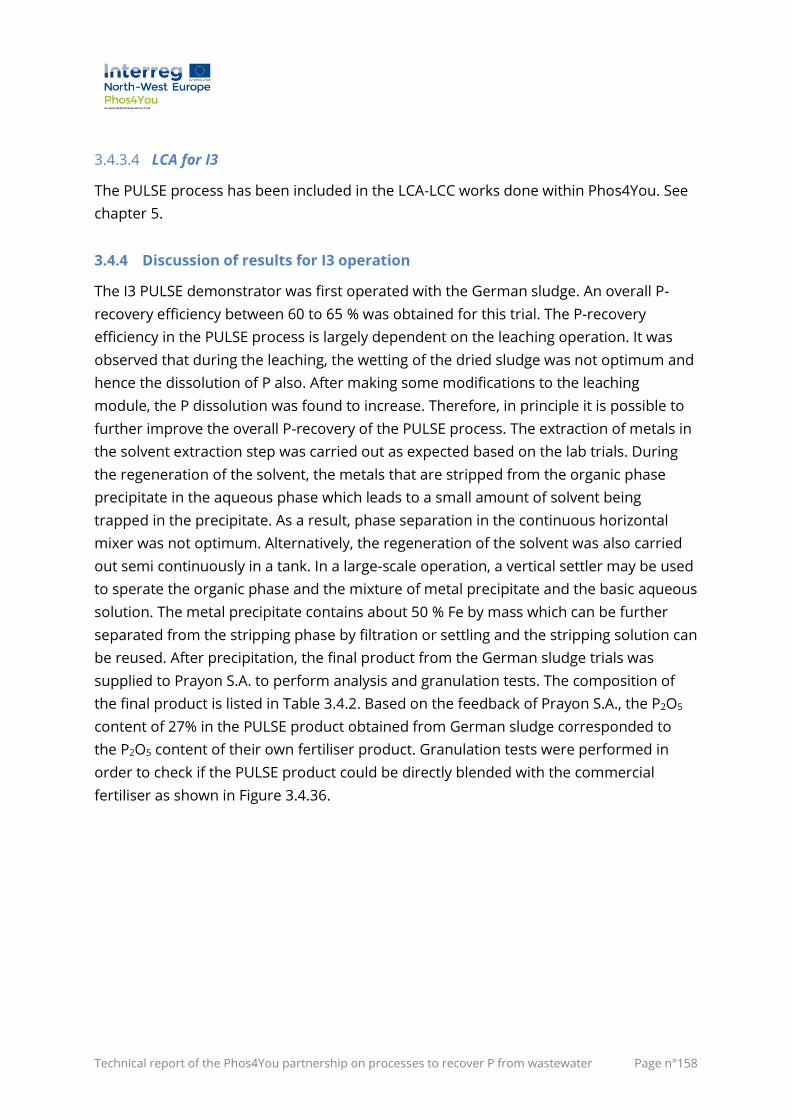
Technical report of the Phos4You partnership on processes to recover P from wastewater Page n°158
3.4.3.4 LCA for I3
The PULSE process has been included in the LCA-LCC works done within Phos4You. See
chapter 5.
3.4.4 Discussion of results for I3 operation
The I3 PULSE demonstrator was first operated with the German sludge. An overall P-
recovery efficiency between 60 to 65 % was obtained for this trial. The P-recovery
efficiency in the PULSE process is largely dependent on the leaching operation. It was
observed that during the leaching, the wetting of the dried sludge was not optimum and
hence the dissolution of P also. After making some modifications to the leaching
module, the P dissolution was found to increase. Therefore, in principle it is possible to
further improve the overall P-recovery of the PULSE process. The extraction of metals in
the solvent extraction step was carried out as expected based on the lab trials. During
the regeneration of the solvent, the metals that are stripped from the organic phase
precipitate in the aqueous phase which leads to a small amount of solvent being
trapped in the precipitate. As a result, phase separation in the continuous horizontal
mixer was not optimum. Alternatively, the regeneration of the solvent was also carried
out semi continuously in a tank. In a large-scale operation, a vertical settler may be used
to sperate the organic phase and the mixture of metal precipitate and the basic aqueous
solution. The metal precipitate contains about 50 % Fe by mass which can be further
separated from the stripping phase by filtration or settling and the stripping solution can
be reused. After precipitation, the final product from the German sludge trials was
supplied to Prayon S.A. to perform analysis and granulation tests. The composition of
the final product is listed in Table 3.4.2. Based on the feedback of Prayon S.A., the P2O5
content of 27% in the PULSE product obtained from German sludge corresponded to
the P2O5 content of their own fertiliser product. Granulation tests were performed in
order to check if the PULSE product could be directly blended with the commercial
fertiliser as shown in Figure 3.4.36.
Technical report of the Phos4You partnership on processes to recover P from wastewater Page n°159
Figure 3.4.36: Granulation tests by Prayon S.A. on the PULSE product obtained from German sludge. A
- during granulation; B - granulated product wet; C- granulated product dry (Picture: Prayon S.A.)
The granulation tests for PULSE product were satisfactory meaning the dried PULSE
product can be milled, blended with the commercial fertiliser, and then granulated. The
total carbon content of the product is only harmful in case of traces of organic solvents
or toxic organic compounds. An organic analysis carried out by the quality assessment
team of the Phos4You project on a previously produced PULSE product sample at semi-
pilot scale from Oupeye sludge did not detect any harmful organic compounds (Bogdan
et al. 2021).
The total P concentration of sludge from Oupeye wwtp in Belgium and Sterling wwtp in
Scotland were much lower compared to that of the German sludge. The acid-soluble P
fraction of the two sludges was also lower and therefore correspondingly lesser
amounts of product was produced during the trials.
3.4.5 Conclusion for I3
Based on the results of leaching wet and dried sludge, it can be concluded that there
was no significant difference in the leaching efficiency of P. In principal, acidic leaching
dissolves mostly the inorganic fraction of P from the sludge and this dissolution is
dependent on the pH. Dried sludge is easier to handle and also the solids liquid
separation after leaching is more efficient compared to wet sludge. Drying the sludge,
also reduces the consumption of acid and the volumes that must be treated in the later
steps.
It was observed that the inorganic or acid-soluble fraction of P was higher in the German
sludge which was anaerobically stabilized sludge and therefore the leaching efficiency is
also higher.
Technical report of the Phos4You partnership on processes to recover P from wastewater Page n°160
During solvent extraction, the metals Fe, Cd, Hg, Pb and Zn were very well extracted and
Cu was extracted moderately while the change in P concentration of the leach liquor is
negligible. The solvent regeneration was very efficient, except for the issue of phase
separation when the metals precipitate during regeneration with basic solution which
can be optimised by quasi-continuous operation in tanks or use of vertical settlers.
The final product of the PULSE process containing calcium phosphate salts has very low
concentrations of Fe, Cd, Cu, Hg, Pb and Zn. The P2O5 concentration of the final product
depends on the base used i.e. NaOH or Ca(OH)2 and also on the other precipitable
components in the liquor. The overall efficiency of the P recovery from sludge in the
PULSE process is between 60 to 70 %.
The P2O5 content of the product obtained by PULSE process is high, so that the PULSE
product can be used directly as a fertiliser after milling and granulation.
After the completion of the demonstrator trials in Scotland within the Phos4You project,
the demonstrator will be located at the ULiège-Sart-Tilman campus. The equipment of
the demonstrator will be used to carry out scale-up studies for some of the unit
operations. The ULiège team will actively explore opportunities and co-operations in
order to further carry out demonstrations of the PULSE process.
Acknowledgements
We are thankful to BTC Europe GmbH for samples of Alamine336, TOTAL Belgium for
samples of Ketrul D80, and Exxon Mobil for samples of Exxal 10.
We are thankful to Emschergenossenschaft / Lippeverband and Scottish Water for
supplying the sludge and for supporting the PULSE demonstrator trials.
We are thankful to Faculty of Bioscience Engineering – UGhent for ICP analysis of
samples and Prayon S.A. for analysis and granulation tests of the PULSE product.
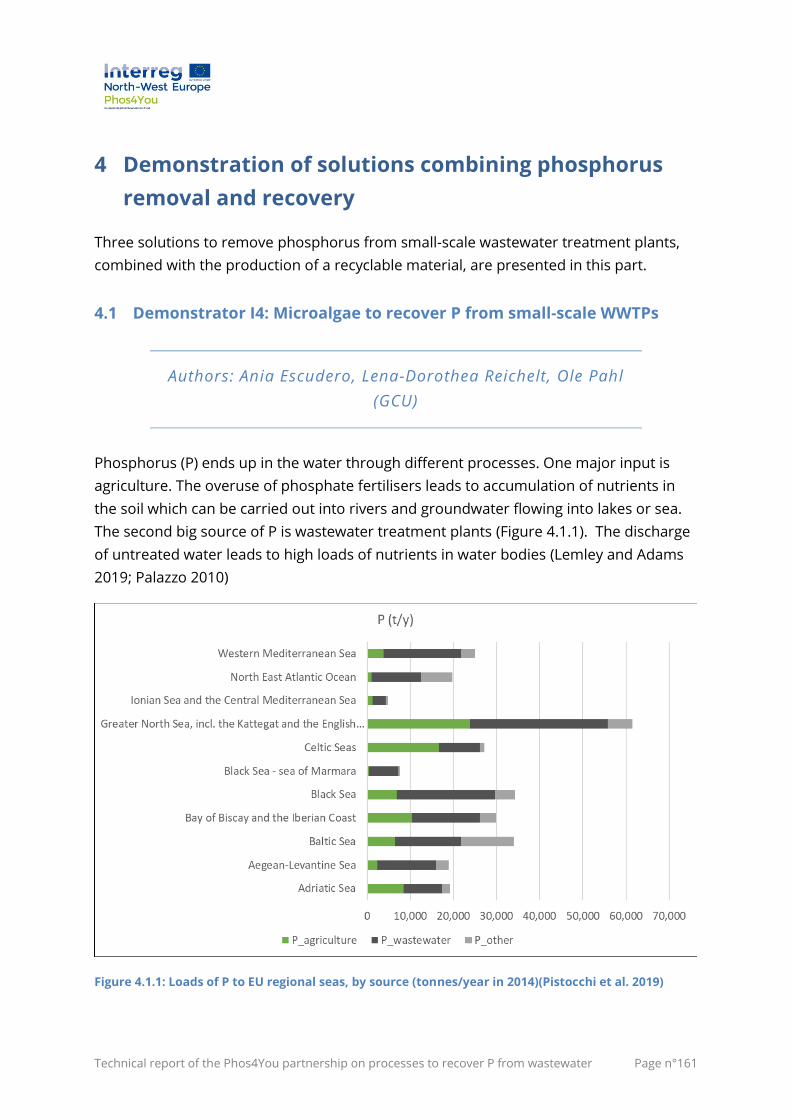
Technical report of the Phos4You partnership on processes to recover P from wastewater Page n°161
4 Demonstration of solutions combining phosphorus
removal and recovery
Three solutions to remove phosphorus from small-scale wastewater treatment plants,
combined with the production of a recyclable material, are presented in this part.
4.1 Demonstrator I4: Microalgae to recover P from small-scale WWTPs
Authors: Ania Escudero, Lena-Dorothea Reichelt, Ole Pahl
(GCU)
Phosphorus (P) ends up in the water through different processes. One major input is
agriculture. The overuse of phosphate fertilisers leads to accumulation of nutrients in
the soil which can be carried out into rivers and groundwater flowing into lakes or sea.
The second big source of P is wastewater treatment plants (Figure 4.1.1). The discharge
of untreated water leads to high loads of nutrients in water bodies (Lemley and Adams
2019; Palazzo 2010)
Figure 4.1.1: Loads of P to EU regional seas, by source (tonnes/year in 2014)(Pistocchi et al. 2019)
Technical report of the Phos4You partnership on processes to recover P from wastewater Page n°162
Scotland is considered as 97 % rural with around 1600 WWTP of a capacity lower than
500PE, most of them concentrated in the northern part of the country. A large part of
eutrophication is caused by the insufficient treatment of wastewater in septic tanks and
small wastewater treatment plants (Bunce et al. 2018, pp. 1–15; Scottish Environment
Protection Agency (SEPA) 2017).
There is no clear single legislation dealing with the problem of eutrophication in the UK.
The European Community’s urban wastewater treatment directive aims to reduce
eutrophication where discharges bring in high loads of nutrients. In the UK, to 62 rivers
and canals, 13 lakes and reservoirs and 5 estuaries have been identified to be eutrophic
areas (European Commission 2017b).
Phosphorus removal technologies find their origin in Switzerland in the 1950ies with
phosphorus precipitation to solve the widespread problem of eutrophication (Rich
2005). This simple chemical process is now widely spread around the globe as one of the
most common methods to remove P from different wastewaters. However, as the urge
of recovering P from wastewater instead of removing it is getting more attention due to
new regulation and legislation in place, new technologies are being developed to meet
the low required concentrations. Each treatment has its own advantages and
disadvantages.
In Scotland, recovering P from small, and possibly remote, sites presents several
challenges as suitable systems require robustness and low maintenance plus the
variability of P in wastewater is often high. The extremophilic microalgae
Chlamydomonas acidophila, which grows at a pH of 2-3, appears to have potential for P-
recovery at these sites, as it is able to recover P and N in different wastewaters at a rate
of around 7 mg L-1d-1 and 9 mg L-1d-1, respectively (Escudero et al. 2014). Furthermore,
this species is mixotrophic so the presence of organic carbon in the effluent improves
nutrient recovery efficiency.
One of the limiting factors in microalgae technology is light availability and C. acidophila
have shown to require a very low light intensity to grow (40-113 µmol photons m-2s-1).
Additionally, the presence of micropollutants such as pharmaceuticals in urban
wastewater could inhibit biological treatment processes. Here C. acidophila is shown to
be a resistant species as it is able to grow and consume nutrients in the presence of
pharmaceuticals 1000 times higher concentrations than the ones reported in these
effluents (Escudero et al. 2020a).
Different experiments were carried out in order to optimise the scaling-up of this
process: On the one hand the microalgae process control parameters were studied to
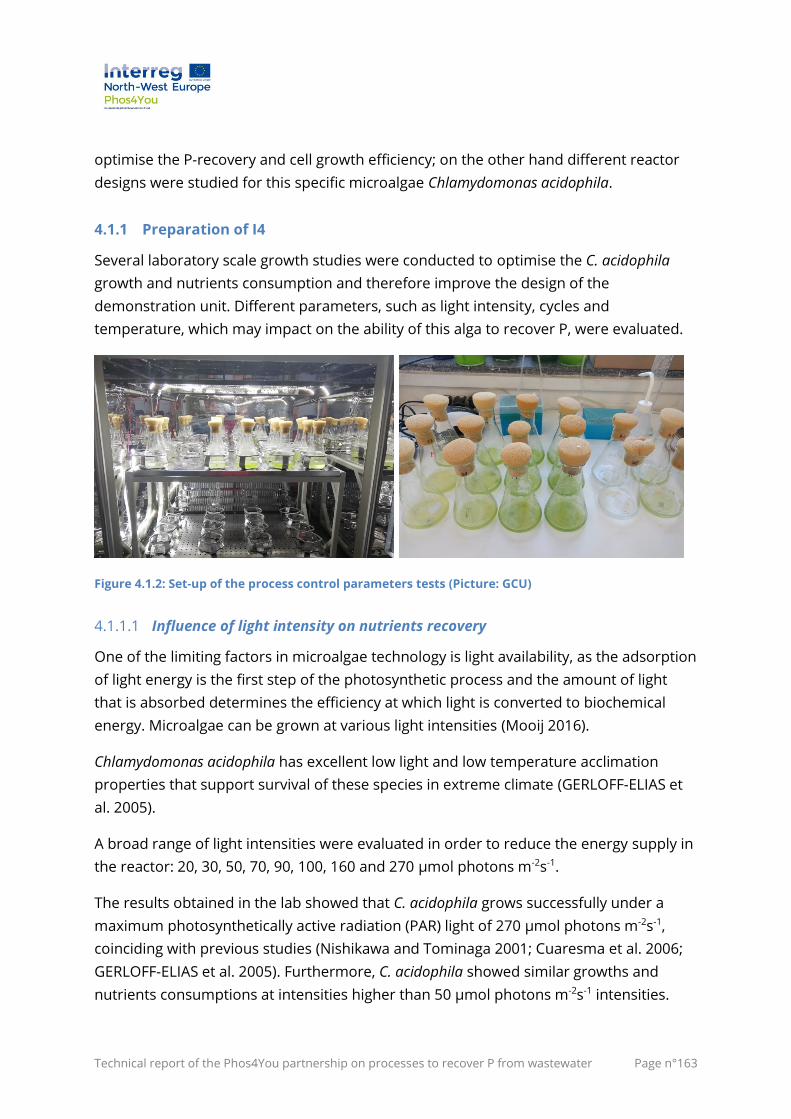
Technical report of the Phos4You partnership on processes to recover P from wastewater Page n°163
optimise the P-recovery and cell growth efficiency; on the other hand different reactor
designs were studied for this specific microalgae Chlamydomonas acidophila.
4.1.1 Preparation of I4
Several laboratory scale growth studies were conducted to optimise the C. acidophila
growth and nutrients consumption and therefore improve the design of the
demonstration unit. Different parameters, such as light intensity, cycles and
temperature, which may impact on the ability of this alga to recover P, were evaluated.
Figure 4.1.2: Set-up of the process control parameters tests (Picture: GCU)
4.1.1.1 Influence of light intensity on nutrients recovery
One of the limiting factors in microalgae technology is light availability, as the adsorption
of light energy is the first step of the photosynthetic process and the amount of light
that is absorbed determines the efficiency at which light is converted to biochemical
energy. Microalgae can be grown at various light intensities (Mooij 2016).
Chlamydomonas acidophila has excellent low light and low temperature acclimation
properties that support survival of these species in extreme climate (GERLOFF-ELIAS et
al. 2005).
A broad range of light intensities were evaluated in order to reduce the energy supply in
the reactor: 20, 30, 50, 70, 90, 100, 160 and 270 μmol photons m-2s-1.
The results obtained in the lab showed that C. acidophila grows successfully under a
maximum photosynthetically active radiation (PAR) light of 270 μmol photons m-2s-1,
coinciding with previous studies (Nishikawa and Tominaga 2001; Cuaresma et al. 2006;
GERLOFF-ELIAS et al. 2005). Furthermore, C. acidophila showed similar growths and
nutrients consumptions at intensities higher than 50 μmol photons m-2s-1 intensities.
Technical report of the Phos4You partnership on processes to recover P from wastewater Page n°164
Usually, at low light intensities, microalgae are capable of utilising light energy at a very
high efficiency. At increasing light intensities, the light use efficiency drops as the
photosynthetic machinery slowly becomes oversaturated, which leads to a waste of light
energy. Therefore, it seems that at intensities higher than 50-70 μmol photons m-2s-1 the
photosynthesis rate is saturated, and the extra light is dissipated as heat. Thus, it seems
that Chlamydomonas acidophila consumes nutrient more effectively at low light
intensities as the highest removals were achieved at 50 µmol photons m-2 s-1 while other
species perform their best at higher light intensities.
At lower intensities such as 20 and 30 μmol photons m-2s-1, the microalgae grew and
consumed nutrients slightly slower than at higher intensities, which means that they are
able to utilise more light energy at higher efficiencies.
Based on the obtained results, it can be concluded that C. acidophila requires much
lower light intensities to grow and consume nutrients than other microalgae used for
wastewater treatment, which leads to a lower energy consumption by the
demonstration unit.
4.1.1.2 Influence of light cycles on nutrients recovery and biomass growth
It is acknowledged that light availability is one of the greatest challenges for microalgae
cultivation and a high photosynthetic efficiency is essential to decrease the costs of
microalgal biomass production. Furthermore, some researchers have found that the
light/dark (L/D) cycle, in which the microalgae alternated between the light and dark, can
promote the microalgae growth better than continuous light (Liao et al. 2014; Deng et al.
2019). Therefore, understanding the L/D cycle characteristics has important implications
for designing effective large-scale microalgae culture systems. Although many authors
have studied this parameter in different microalgae, there are no reports about the
effect on C. acidophila. The aim of this study was to evaluate the effect of different light
cycles on the growth of C. acidophila and phosphorus recovery rates from urban
wastewater under very low light intensities.
Batch laboratory scale growth studies were conducted to evaluate the effect of different
L/D cycles on the nutrient removal by C. acidophila from urban wastewater. Five
different L/D regimes were studied: 24/0, 18/6, 12/12, 6/6 and 2/2 h. Assays were carried
out using effluent taken after primary sedimentation from an urban WWTP in Paisley,
Scotland. The Chemical Oxygen Demand (COD), NH4 and PO4 concentrations in this
effluent were around 100, 17 and 7 mg L-1 respectively. The pH was adjusted to 3 by
addition of 5N H2SO4 and 50 mL effluent in 250 mL glass Erlenmeyer flasks were
inoculated with C. acidophila adjusted to approximately 1.106cells mL-1. Flasks were place
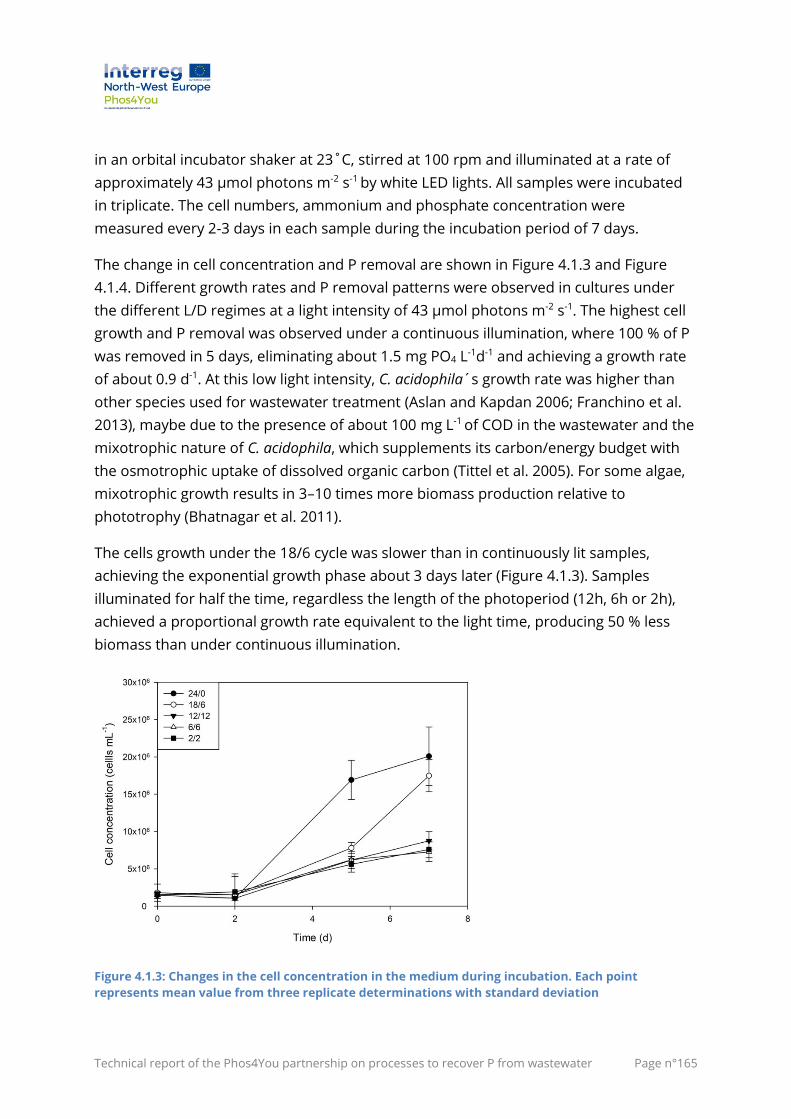
Technical report of the Phos4You partnership on processes to recover P from wastewater Page n°165
in an orbital incubator shaker at 23˚C, stirred at 100 rpm and illuminated at a rate of
approximately 43 µmol photons m-2 s-1 by white LED lights. All samples were incubated
in triplicate. The cell numbers, ammonium and phosphate concentration were
measured every 2-3 days in each sample during the incubation period of 7 days.
The change in cell concentration and P removal are shown in Figure 4.1.3 and Figure
4.1.4. Different growth rates and P removal patterns were observed in cultures under
the different L/D regimes at a light intensity of 43 µmol photons m-2 s-1. The highest cell
growth and P removal was observed under a continuous illumination, where 100 % of P
was removed in 5 days, eliminating about 1.5 mg PO4 L-1d-1 and achieving a growth rate
of about 0.9 d-1. At this low light intensity, C. acidophila´s growth rate was higher than
other species used for wastewater treatment (Aslan and Kapdan 2006; Franchino et al.
2013), maybe due to the presence of about 100 mg L-1 of COD in the wastewater and the
mixotrophic nature of C. acidophila, which supplements its carbon/energy budget with
the osmotrophic uptake of dissolved organic carbon (Tittel et al. 2005). For some algae,
mixotrophic growth results in 3–10 times more biomass production relative to
phototrophy (Bhatnagar et al. 2011).
The cells growth under the 18/6 cycle was slower than in continuously lit samples,
achieving the exponential growth phase about 3 days later (Figure 4.1.3). Samples
illuminated for half the time, regardless the length of the photoperiod (12h, 6h or 2h),
achieved a proportional growth rate equivalent to the light time, producing 50 % less
biomass than under continuous illumination.
Figure 4.1.3: Changes in the cell concentration in the medium during incubation. Each point
represents mean value from three replicate determinations with standard deviation
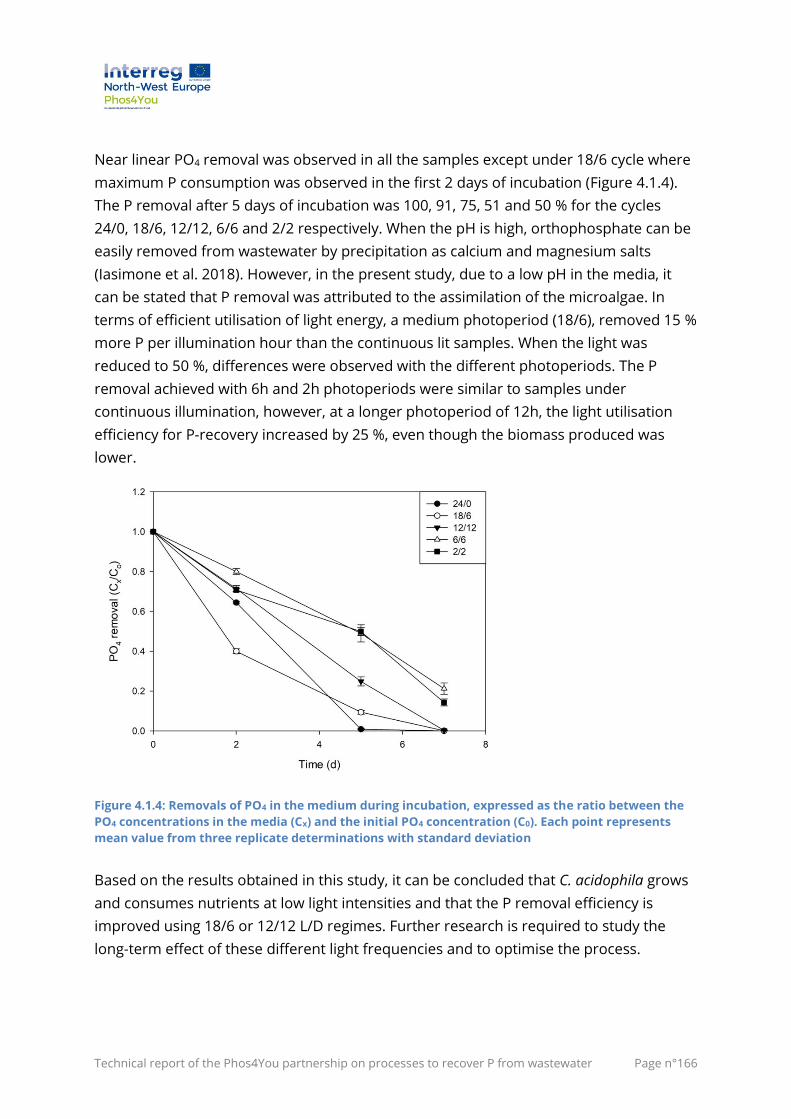
Technical report of the Phos4You partnership on processes to recover P from wastewater Page n°166
Near linear PO4 removal was observed in all the samples except under 18/6 cycle where
maximum P consumption was observed in the first 2 days of incubation (Figure 4.1.4).
The P removal after 5 days of incubation was 100, 91, 75, 51 and 50 % for the cycles
24/0, 18/6, 12/12, 6/6 and 2/2 respectively. When the pH is high, orthophosphate can be
easily removed from wastewater by precipitation as calcium and magnesium salts
(Iasimone et al. 2018). However, in the present study, due to a low pH in the media, it
can be stated that P removal was attributed to the assimilation of the microalgae. In
terms of efficient utilisation of light energy, a medium photoperiod (18/6), removed 15 %
more P per illumination hour than the continuous lit samples. When the light was
reduced to 50 %, differences were observed with the different photoperiods. The P
removal achieved with 6h and 2h photoperiods were similar to samples under
continuous illumination, however, at a longer photoperiod of 12h, the light utilisation
efficiency for P-recovery increased by 25 %, even though the biomass produced was
lower.
Figure 4.1.4: Removals of PO4 in the medium during incubation, expressed as the ratio between the
PO4 concentrations in the media (Cx) and the initial PO4 concentration (C0). Each point represents
mean value from three replicate determinations with standard deviation
Based on the results obtained in this study, it can be concluded that C. acidophila grows
and consumes nutrients at low light intensities and that the P removal efficiency is
improved using 18/6 or 12/12 L/D regimes. Further research is required to study the
long-term effect of these different light frequencies and to optimise the process.
Technical report of the Phos4You partnership on processes to recover P from wastewater Page n°167
4.1.1.3 Influence of temperature and light intensity combination on nutrients
recovery and cells growth
The growth rate of microalgae and their efficiency in wastewater remediation is highly
influenced by light and temperature conditions. Light is the main energy source in
photochemical reactions and temperature influences macromolecular structures,
energy absorption and consumption, as well as the functioning of photosynthetic and
metabolic enzymes (Ferro et al. 2018). Photo-inhibition is a function of temperature and
shows a coupled response with photorespiratory carbon metabolism (Kim and Lee
2001) and therefore, the effect of the combination of different light intensities at
different temperatures on the growth and nutrient consumption by Chlamydomonas
acidophila in urban wastewater should been studied in order to evaluate the most cost
effective and efficient values of these two parameters in combination.
Four batch experiments were carried out at different temperatures (16, 20, 25 and
30 °C) and light intensities (15, 40 and 172 μmol photons m-2s-1) and the results are
shown in Figure 4.1.5 and Figure 4.1.6.
Chlamydomonas acidophila is an extremophilic species known for requiring low light
intensities to grow and consume nutrients. Based on the results obtained in these
experiments, it seems that the microalgae recover more PO4 under a lower light
intensity of 40 μmol photons m-2s-1 than 172 μmol photons m-2s-1 irrespective of the
incubation temperature. Usually, at low light intensities, microalgae are capable of
utilising light energy at a very high efficiency. At increasing light intensities, the light use
efficiency drops as the photosynthetic machinery slowly becomes oversaturated, which
leads to a waste of light energy. Therefore, the microalgae grew and consumed
nutrients slightly slower than at higher intensities, which means that they are able to
utilise more light energy at higher efficiencies.
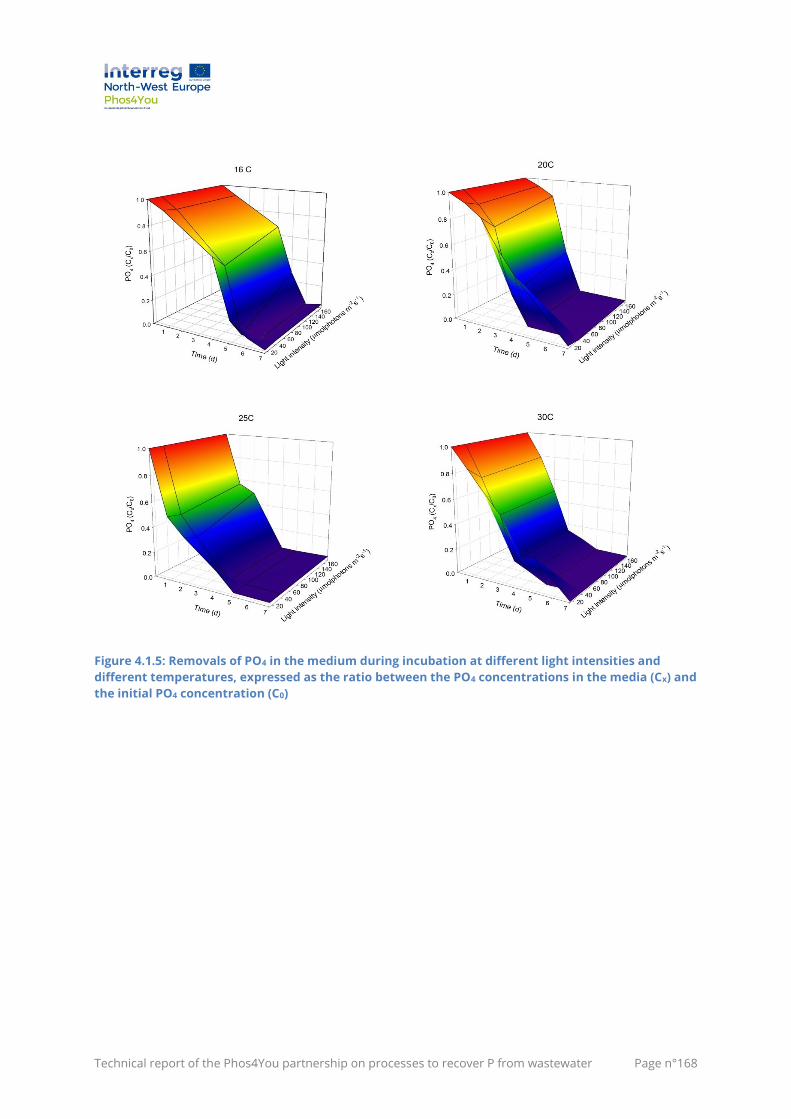
Technical report of the Phos4You partnership on processes to recover P from wastewater Page n°168
Figure 4.1.5: Removals of PO4 in the medium during incubation at different light intensities and
different temperatures, expressed as the ratio between the PO4 concentrations in the media (Cx) and
the initial PO4 concentration (C0)
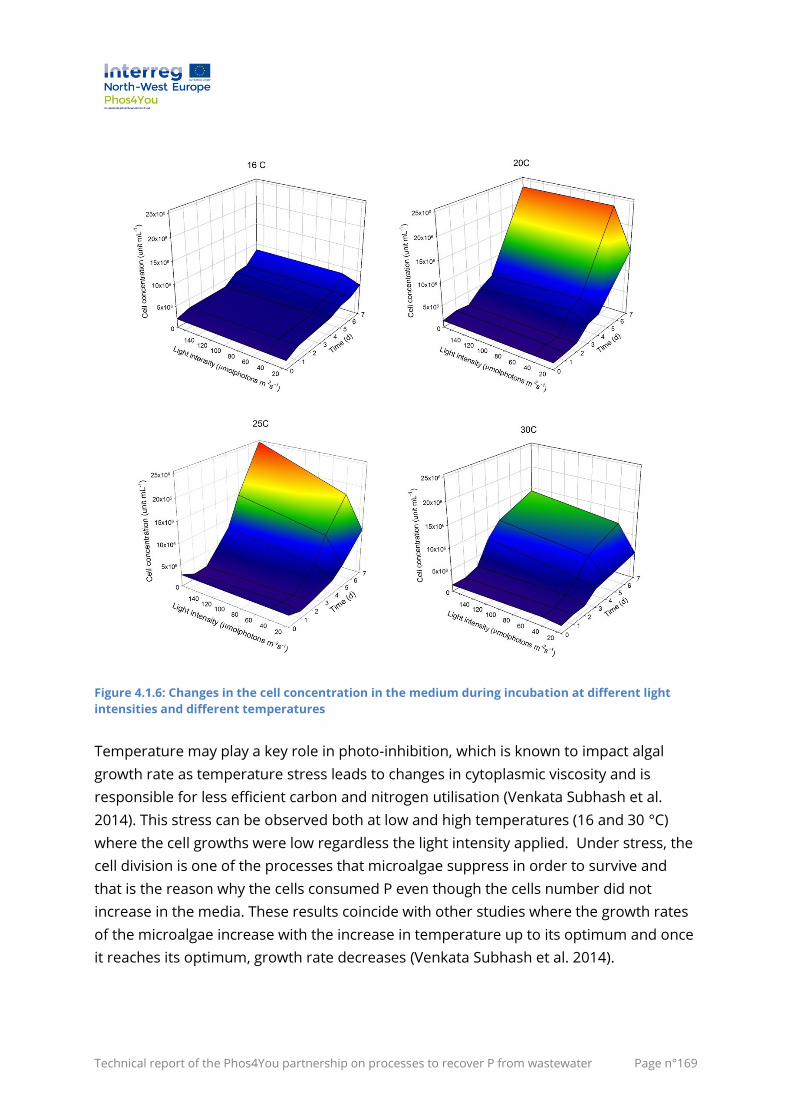
Technical report of the Phos4You partnership on processes to recover P from wastewater Page n°169
Figure 4.1.6: Changes in the cell concentration in the medium during incubation at different light
intensities and different temperatures
Temperature may play a key role in photo-inhibition, which is known to impact algal
growth rate as temperature stress leads to changes in cytoplasmic viscosity and is
responsible for less efficient carbon and nitrogen utilisation (Venkata Subhash et al.
2014). This stress can be observed both at low and high temperatures (16 and 30 °C)
where the cell growths were low regardless the light intensity applied. Under stress, the
cell division is one of the processes that microalgae suppress in order to survive and
that is the reason why the cells consumed P even though the cells number did not
increase in the media. These results coincide with other studies where the growth rates
of the microalgae increase with the increase in temperature up to its optimum and once
it reaches its optimum, growth rate decreases (Venkata Subhash et al. 2014).
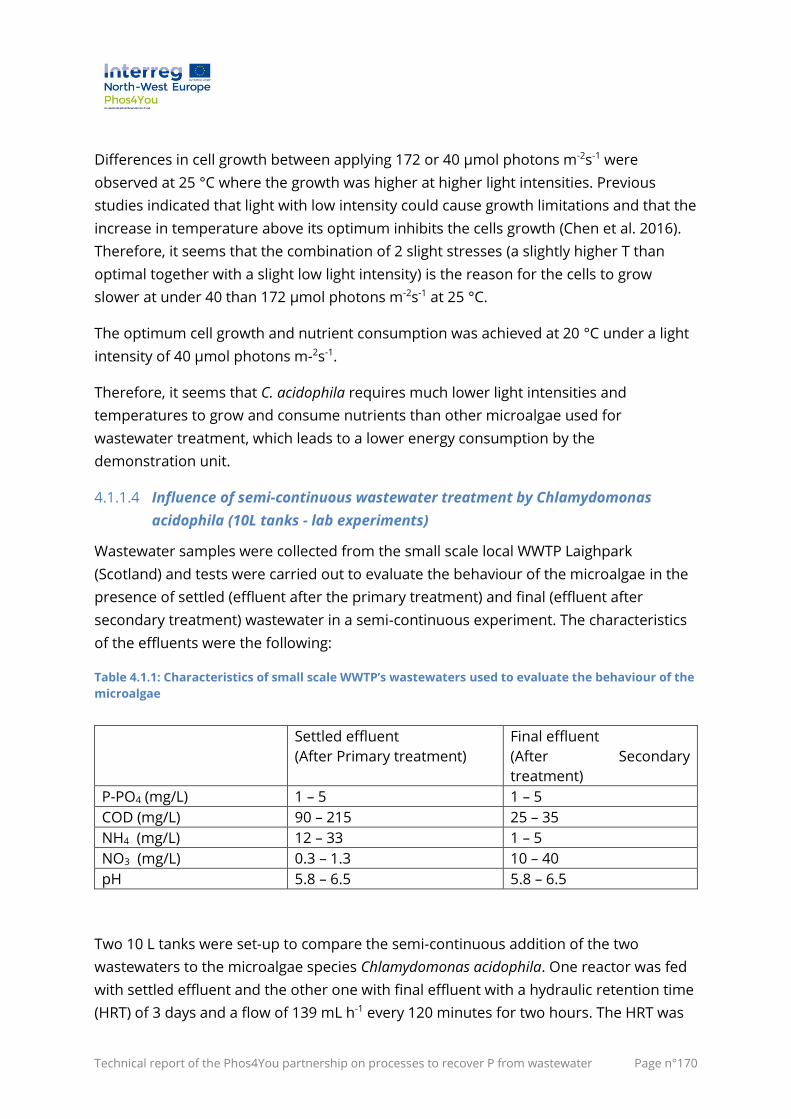
Technical report of the Phos4You partnership on processes to recover P from wastewater Page n°170
Differences in cell growth between applying 172 or 40 μmol photons m-2s-1 were
observed at 25 °C where the growth was higher at higher light intensities. Previous
studies indicated that light with low intensity could cause growth limitations and that the
increase in temperature above its optimum inhibits the cells growth (Chen et al. 2016).
Therefore, it seems that the combination of 2 slight stresses (a slightly higher T than
optimal together with a slight low light intensity) is the reason for the cells to grow
slower at under 40 than 172 μmol photons m-2s-1 at 25 °C.
The optimum cell growth and nutrient consumption was achieved at 20 °C under a light
intensity of 40 μmol photons m-2s-1.
Therefore, it seems that C. acidophila requires much lower light intensities and
temperatures to grow and consume nutrients than other microalgae used for
wastewater treatment, which leads to a lower energy consumption by the
demonstration unit.
4.1.1.4 Influence of semi-continuous wastewater treatment by Chlamydomonas
acidophila (10L tanks - lab experiments)
Wastewater samples were collected from the small scale local WWTP Laighpark
(Scotland) and tests were carried out to evaluate the behaviour of the microalgae in the
presence of settled (effluent after the primary treatment) and final (effluent after
secondary treatment) wastewater in a semi-continuous experiment. The characteristics
of the effluents were the following:
Table 4.1.1: Characteristics of small scale WWTP’s wastewaters used to evaluate the behaviour of the
microalgae
Settled effluent
(After Primary treatment)
Final effluent
(After Secondary
treatment)
P-PO4 (mg/L) 1 – 5 1 – 5
COD (mg/L) 90 – 215 25 – 35
NH4 (mg/L) 12 – 33 1 – 5
NO3 (mg/L) 0.3 – 1.3 10 – 40
pH 5.8 – 6.5 5.8 – 6.5
Two 10 L tanks were set-up to compare the semi-continuous addition of the two
wastewaters to the microalgae species Chlamydomonas acidophila. One reactor was fed
with settled effluent and the other one with final effluent with a hydraulic retention time
(HRT) of 3 days and a flow of 139 mL h-1 every 120 minutes for two hours. The HRT was
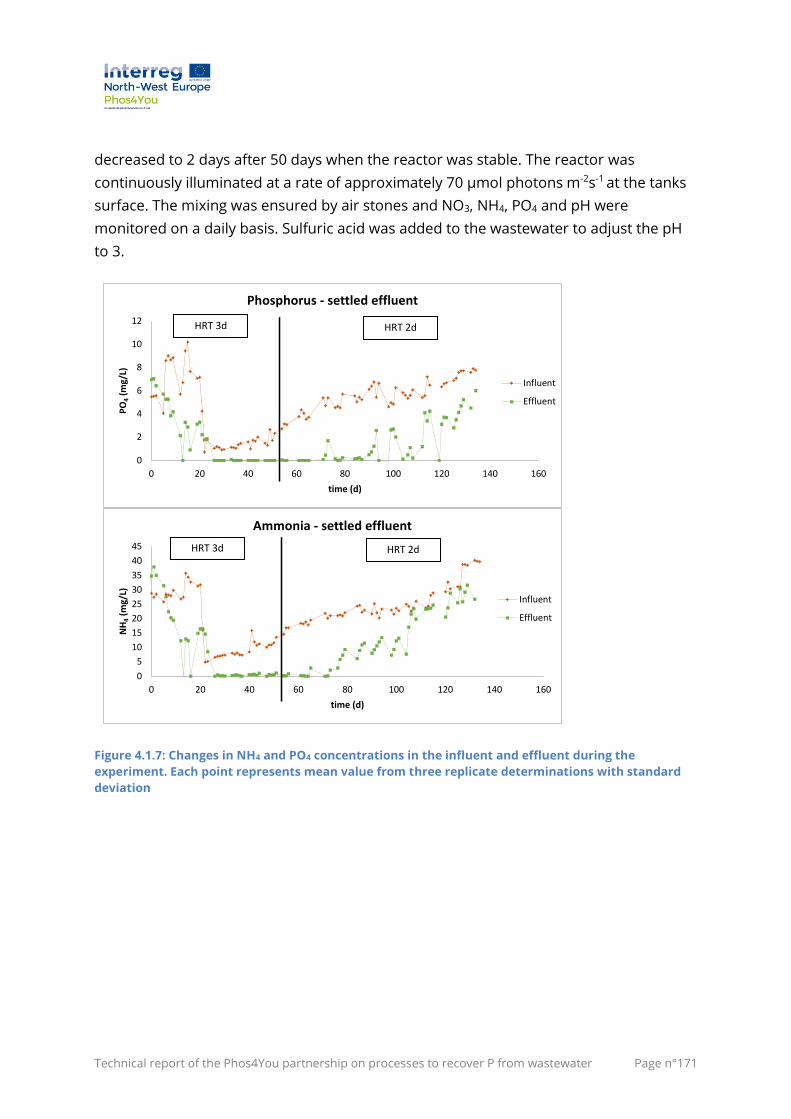
Technical report of the Phos4You partnership on processes to recover P from wastewater Page n°171
decreased to 2 days after 50 days when the reactor was stable. The reactor was
continuously illuminated at a rate of approximately 70 µmol photons m-2s-1 at the tanks
surface. The mixing was ensured by air stones and NO3, NH4, PO4 and pH were
monitored on a daily basis. Sulfuric acid was added to the wastewater to adjust the pH
to 3.
Figure 4.1.7: Changes in NH4 and PO4 concentrations in the influent and effluent during the
experiment. Each point represents mean value from three replicate determinations with standard
deviation
0
2
4
6
8
10
12
0 20 40 60 80 100 120 140 160
PO
4(m
g/L)
time (d)
Phosphorus - settled effluent
Influent
Effluent
HRT 2dHRT 3d
0
5
10
15
20
25
30
35
40
45
0 20 40 60 80 100 120 140 160
NH
4(m
g/L)
time (d)
Ammonia - settled effluent
Influent
Effluent
HRT 3d HRT 2d
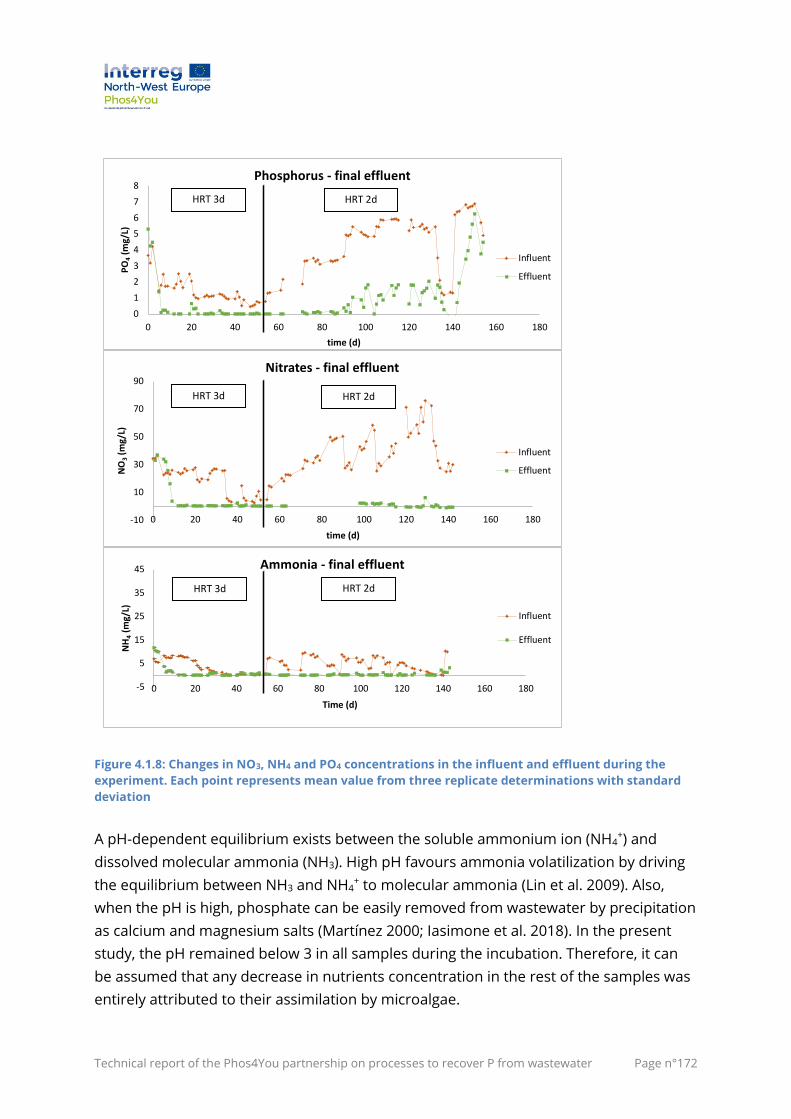
Technical report of the Phos4You partnership on processes to recover P from wastewater Page n°172
Figure 4.1.8: Changes in NO3, NH4 and PO4 concentrations in the influent and effluent during the
experiment. Each point represents mean value from three replicate determinations with standard
deviation
A pH-dependent equilibrium exists between the soluble ammonium ion (NH4+) and
dissolved molecular ammonia (NH3). High pH favours ammonia volatilization by driving
the equilibrium between NH3 and NH4+ to molecular ammonia (Lin et al. 2009). Also,
when the pH is high, phosphate can be easily removed from wastewater by precipitation
as calcium and magnesium salts (Martínez 2000; Iasimone et al. 2018). In the present
study, the pH remained below 3 in all samples during the incubation. Therefore, it can
be assumed that any decrease in nutrients concentration in the rest of the samples was
entirely attributed to their assimilation by microalgae.
0
1
2
3
4
5
6
7
8
0 20 40 60 80 100 120 140 160 180
PO
4(m
g/L)
time (d)
Phosphorus - final effluent
Influent
Effluent
HRT 3d HRT 2d
-10
10
30
50
70
90
0 20 40 60 80 100 120 140 160 180
NO
3(m
g/L)
time (d)
Nitrates - final effluent
Influent
Effluent
HRT 3d HRT 2d
-5
5
15
25
35
45
0 20 40 60 80 100 120 140 160 180
NH
4(m
g/L)
Time (d)
Ammonia - final effluent
Influent
Effluent
HRT 3d HRT 2d
Technical report of the Phos4You partnership on processes to recover P from wastewater Page n°173
Both tanks seem to recover N and P adequately, removing 100 % of these compounds
during 50 days of experiment. The microalgae needed around 6 day to acclimatize and
start consuming nutrients. After this start-up period, recovery values of around 10 mg
NH4 L-1d-1 and 2.5 mg PO4 L-1d-1 and 20 mg NO3 L-1d-1 and 1.5 mg PO4 L-1d-1 were achieved
in the tank fed with settled effluent and final effluent. The ammonium removal
efficiencies using C. acidophila are higher than those reported in studies with other
microalga and in which the pH was maintained below 7, and therefore ammonia
volatization and phosphate precipitation was controlled (Aslan and Kapdan 2006;
Franchino et al. 2013).
A reduction of HRT to 2d and an increase in the nutrient concentration in wastewater
derived in a non-complete nutrient removal from wastewater. However, the recovery
rates were higher due to a higher concentration of nutrients in influent wastewaters.
In summary, C. acidophila appears to be a promising agent for long-term treatment of
wastewater effluents and therefore for pilot-scale trials.
4.1.2 Execution of I4
In order to test the suitability of an existing photobioreactor (PBR) to grow
Chlamydomonas acidophila to investigate scale-up for wastewater treatment, two
suspended cells reactor designs were selected to compare the performance on
recovering P of the two technologies:
- 500 L self-cleaning photobioreactor which does not require aeration and
incorporates a high surface area LED lighting and external heat exchanger
(Designed and manufactured by Greenskill Environmental Technology Ltd.).
- 700 L air lift photobioreactor operated via a controller that allows adjusting the
temperature, the pH and the light intensity (Designed and manufactured by
Xanthella Ltd.).
A preliminary three-month trial was carried out, where the growth of Chlamydomonas
acidophila in these two PBRs was tested and several control parameters (pH, cell growth
and nutrients concentrations) were monitored.
Based on the results obtained from those trials, the photobioreactor designed by
Greenskill was selected to be implemented at the Wastewater Development Centre of
Scottish Water in Bo’ness, Scotland (Figure 4.1.9), as it appeared to be the most suitable
for the growth of Chlamydomonas acidophila.
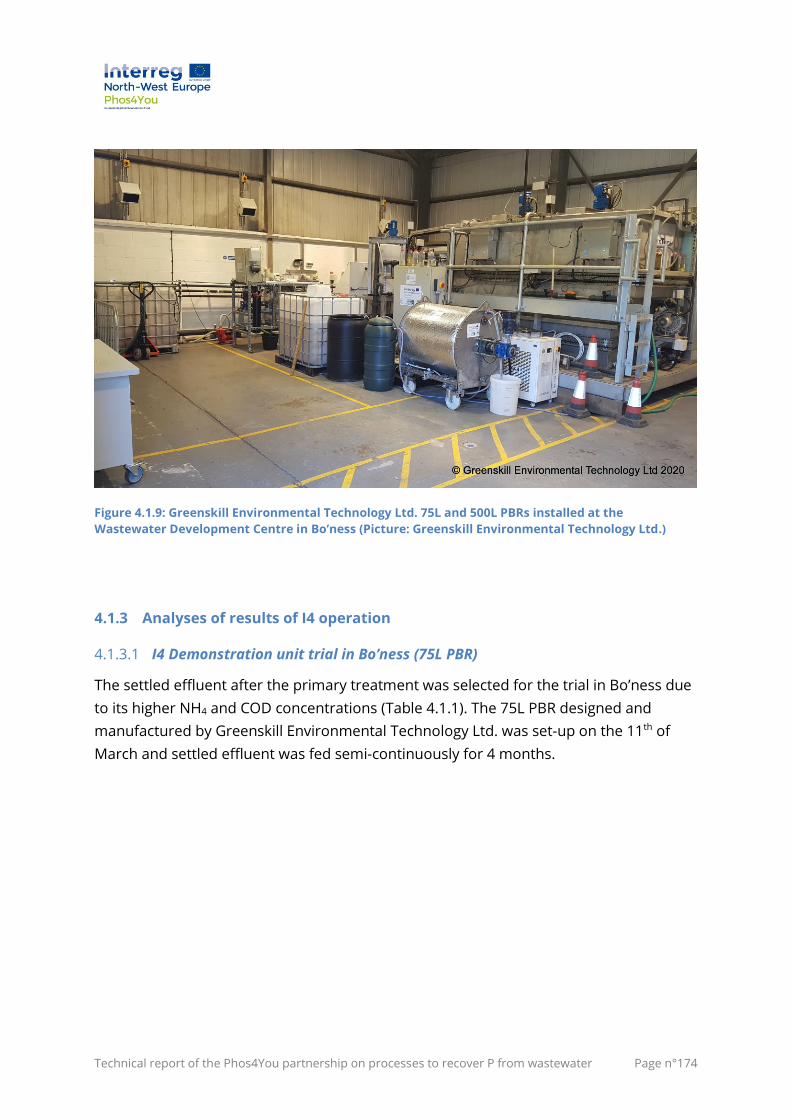
Technical report of the Phos4You partnership on processes to recover P from wastewater Page n°174
Figure 4.1.9: Greenskill Environmental Technology Ltd. 75L and 500L PBRs installed at the
Wastewater Development Centre in Bo’ness (Picture: Greenskill Environmental Technology Ltd.)
4.1.3 Analyses of results of I4 operation
4.1.3.1 I4 Demonstration unit trial in Bo’ness (75L PBR)
The settled effluent after the primary treatment was selected for the trial in Bo’ness due
to its higher NH4 and COD concentrations (Table 4.1.1). The 75L PBR designed and
manufactured by Greenskill Environmental Technology Ltd. was set-up on the 11th of
March and settled effluent was fed semi-continuously for 4 months.
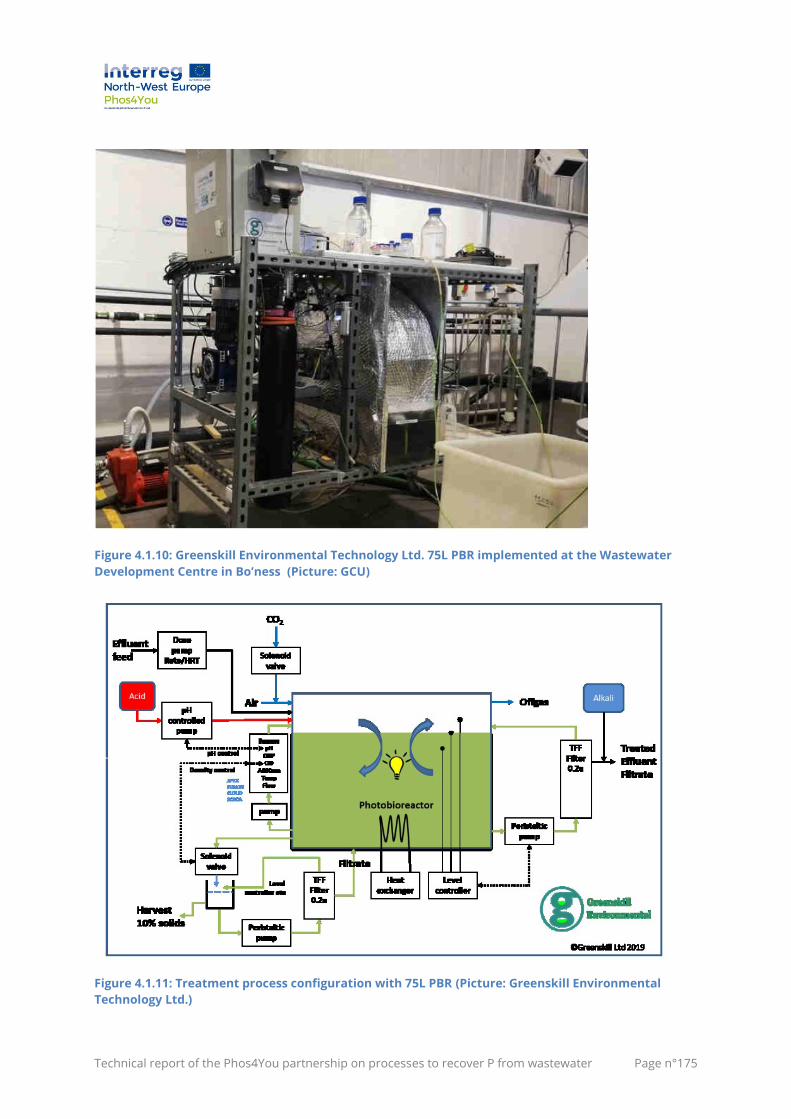
Technical report of the Phos4You partnership on processes to recover P from wastewater Page n°175
Figure 4.1.10: Greenskill Environmental Technology Ltd. 75L PBR implemented at the Wastewater
Development Centre in Bo’ness (Picture: GCU)
Figure 4.1.11: Treatment process configuration with 75L PBR (Picture: Greenskill Environmental
Technology Ltd.)
Technical report of the Phos4You partnership on processes to recover P from wastewater Page n°176
The central unit was a 75L tank fed with settled effluent with an HRT of 3.75 days. The
tank was continuously illuminated at a low rate of 0.4 Amp. The light is usually the
limiting factor in microalgae technology, as it contributes to the higher energy
consumption. However, Chlamydomonas acidophila have shown to require low light
intensities and therefore, a low rate of 0.4 Amp was enough to achieve successful
nutrients recoveries.
The temperature was kept between 22 to 24 °C using an external refrigerating cooler
and submersible heater. CO2 was supplied at the beginning of the trial to accelerate the
start-up phase in the reactor, however, once the microalgae started growing, CO2 supply
was not required.
The microalgae biomass was retained in the PBR by a tangential flow filter, type-
Microgon, MiniKros Tangential flow separation module with hollow fibre membrane
(TFF) P/N: M22M-600-01N, Media: Methyl ester, Pore side: 0.2μm, Surface area: 6500cm2.
It was backwashed twice per day for 5 min. During the 4 month trial, it did not foam or
exhibit biofilm formation neither in the Greenskill PBR nor in the filter, even though we
were treating settled wastewater which contains more suspended solids than the final
effluent. Therefore, it seems that tangential flow filter is a suitable option for retaining
the cells in the reactor without getting blocked.
The biomass concentration started increasing in the PBR reaching values up to 2g L-1. On
the 21st of June (day 90 of trial), 75 % of the volume in the reactor was removed and
inoculated into the 500L reactor. An increase of Optical density (OD) was observed due
to the dilution of the culture (Figure 4.1.12), however, the microalgae cells grew
exponentially in the following days, reaching a biomass concentration of 2g L-1 in just 4
days.
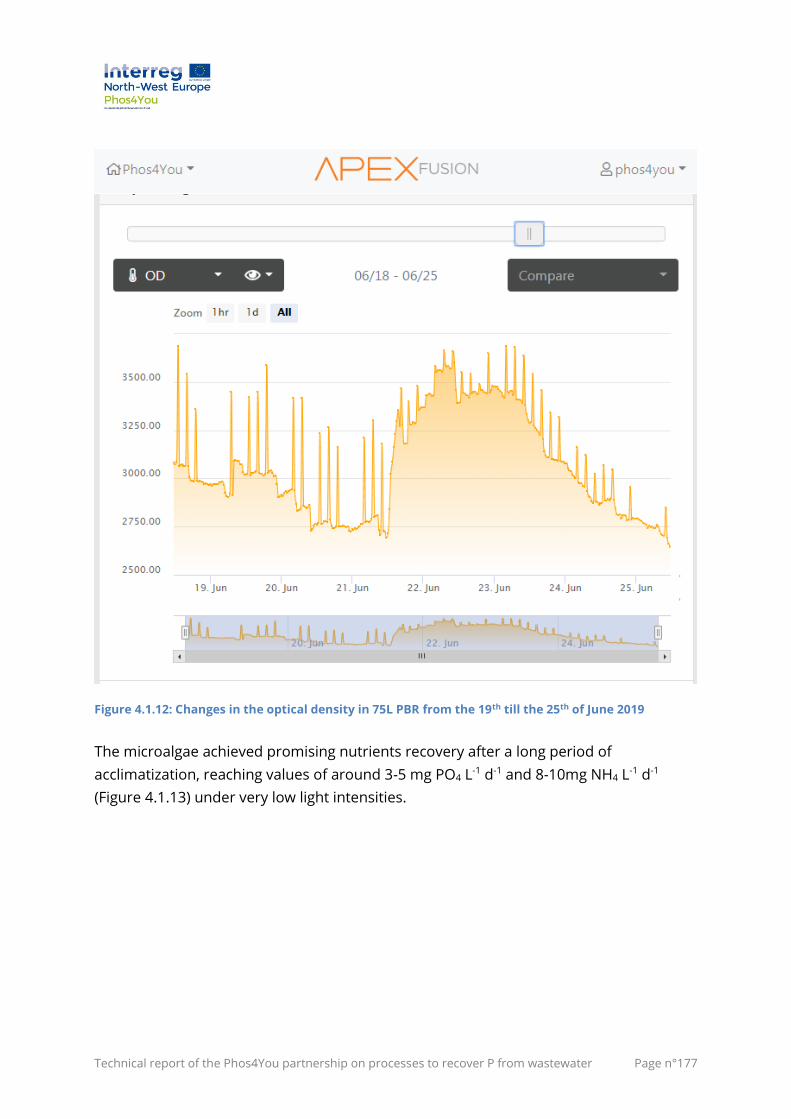
Technical report of the Phos4You partnership on processes to recover P from wastewater Page n°177
Figure 4.1.12: Changes in the optical density in 75L PBR from the 19th till the 25th of June 2019
The microalgae achieved promising nutrients recovery after a long period of
acclimatization, reaching values of around 3-5 mg PO4 L-1 d-1 and 8-10mg NH4 L-1 d-1
(Figure 4.1.13) under very low light intensities.
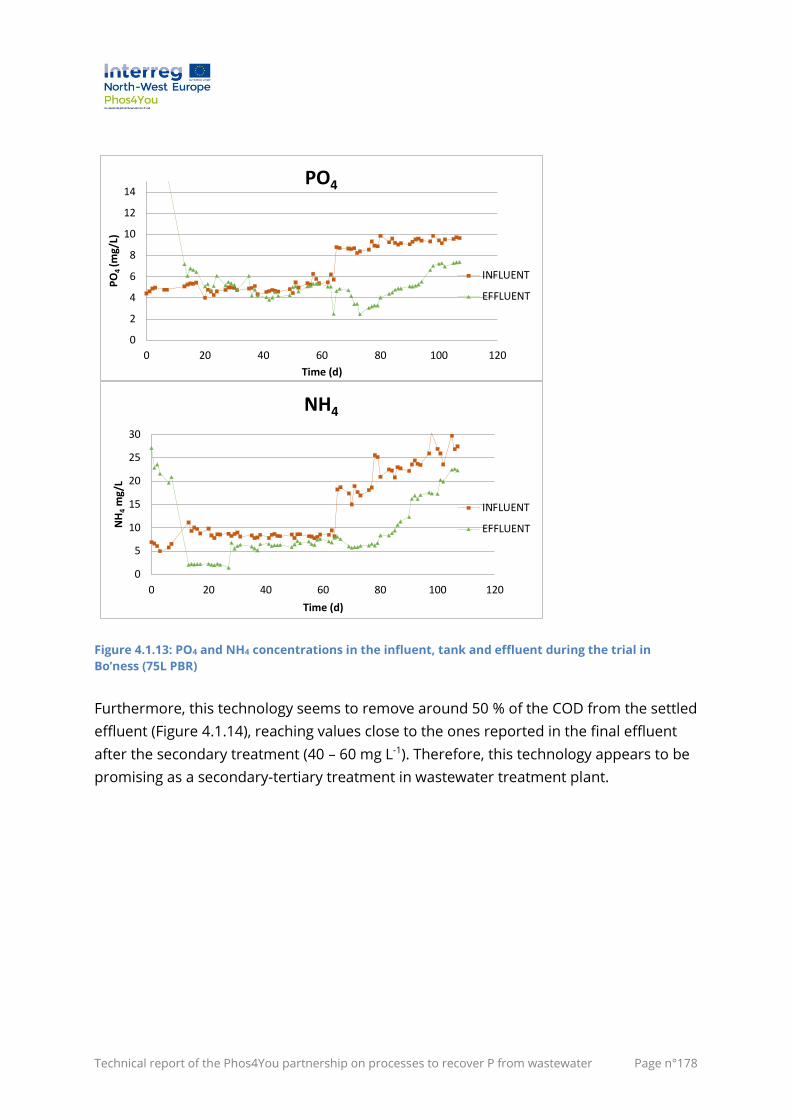
Technical report of the Phos4You partnership on processes to recover P from wastewater Page n°178
Figure 4.1.13: PO4 and NH4 concentrations in the influent, tank and effluent during the trial in
Bo’ness (75L PBR)
Furthermore, this technology seems to remove around 50 % of the COD from the settled
effluent (Figure 4.1.14), reaching values close to the ones reported in the final effluent
after the secondary treatment (40 – 60 mg L-1). Therefore, this technology appears to be
promising as a secondary-tertiary treatment in wastewater treatment plant.
0
2
4
6
8
10
12
14
0 20 40 60 80 100 120
PO
4 (m
g/L)
Time (d)
PO4
INFLUENT
EFFLUENT
0
5
10
15
20
25
30
0 20 40 60 80 100 120
NH
4m
g/L
Time (d)
NH4
INFLUENT
EFFLUENT
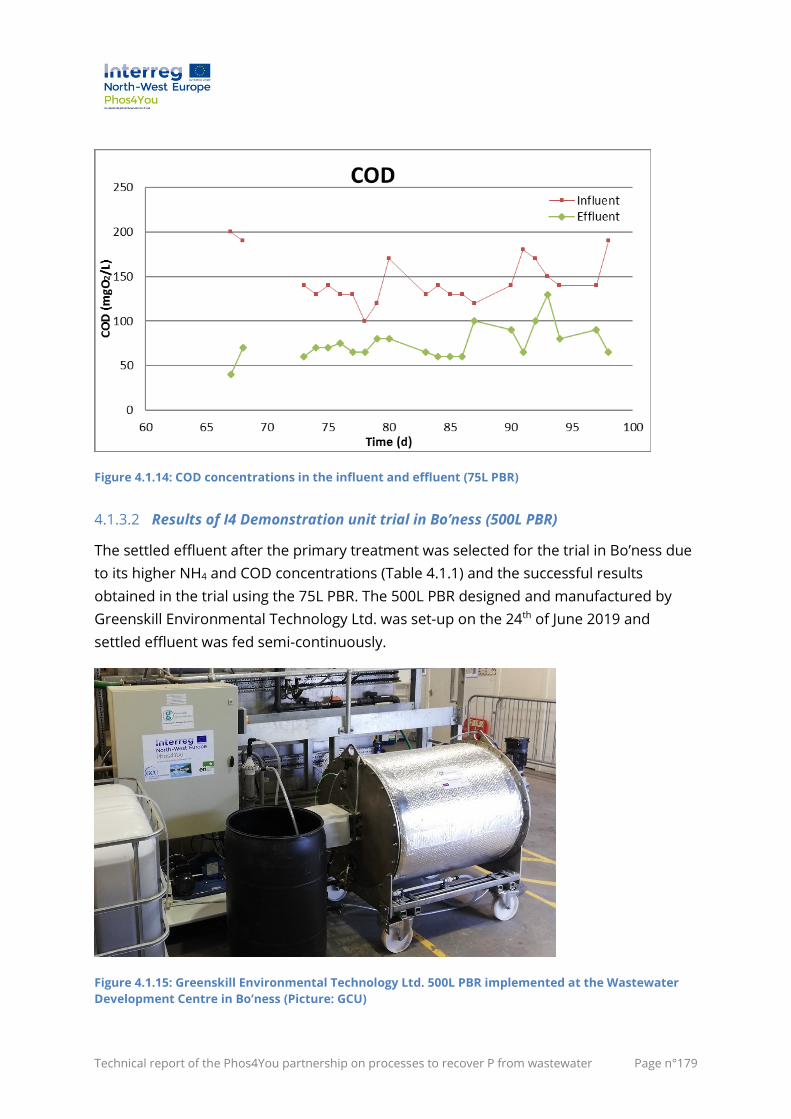
Technical report of the Phos4You partnership on processes to recover P from wastewater Page n°179
Figure 4.1.14: COD concentrations in the influent and effluent (75L PBR)
4.1.3.2 Results of I4 Demonstration unit trial in Bo’ness (500L PBR)
The settled effluent after the primary treatment was selected for the trial in Bo’ness due
to its higher NH4 and COD concentrations (Table 4.1.1) and the successful results
obtained in the trial using the 75L PBR. The 500L PBR designed and manufactured by
Greenskill Environmental Technology Ltd. was set-up on the 24th of June 2019 and
settled effluent was fed semi-continuously.
Figure 4.1.15: Greenskill Environmental Technology Ltd. 500L PBR implemented at the Wastewater
Development Centre in Bo’ness (Picture: GCU)
Technical report of the Phos4You partnership on processes to recover P from wastewater Page n°180
The central unit was a 500L tank fed with settled effluent with a HRT of 2 - 3.75 days. The
tank was continuously illuminated at a low rate of 0.4 Amp. The light is usually the
limiting factor in microalgae technology, as it contributes to the higher energy
consumption. However, Chlamydomonas acidophila have shown to require low light
intensities and therefore, a low rate of 0.4 Amp was enough to achieve successful
nutrients recoveries.
The temperature was kept between 22 – 24 °C using an external refrigerating cooler and
submersible heater. CO2 was supplied after the 17th of September 2019 in order to
improve the nutrients consumption.
The microalgae biomass was retained in the PBR by a tangential flow filter, type-
Microgon, MiniKros Tangential flow separation module with hollow fibre membrane
(TFF) P/N: M22M-600-01N, Media: Methyl ester, Pore side: 0.2μm, Surface area: 6500cm2.
It was backwashed twice per day for 5 min. During the trial, it did not foam or exhibit
biofilm formation neither in the Greenskill PBR nor in the filter, even though we were
treating settled wastewater which contains more suspended solids than the final
effluent.
Therefore, it seems that tangential flow filter is a suitable option for retaining the cells in
the reactor without getting blocked.
The biomass concentration started increasing in the PBR reaching values up to 4 g L-1
(Figure 4.1.16) and therefore, on the 24th of October 2019, 10 % of the reactor’s biomass
was harvested on a weekly basis. The microalgae biomass was settled by the addition of
0.5 g NaOH L-1, in which the mixture reached a pH of 10 and therefore the microalgae
formed flocs that were easily settling in around 5 minutes (Figure 4.1.16). This recycled P
product was dried and stored for further quality assessment as part of WP T2 (around
1 kg of biomass was achieved by the end of December 2019).
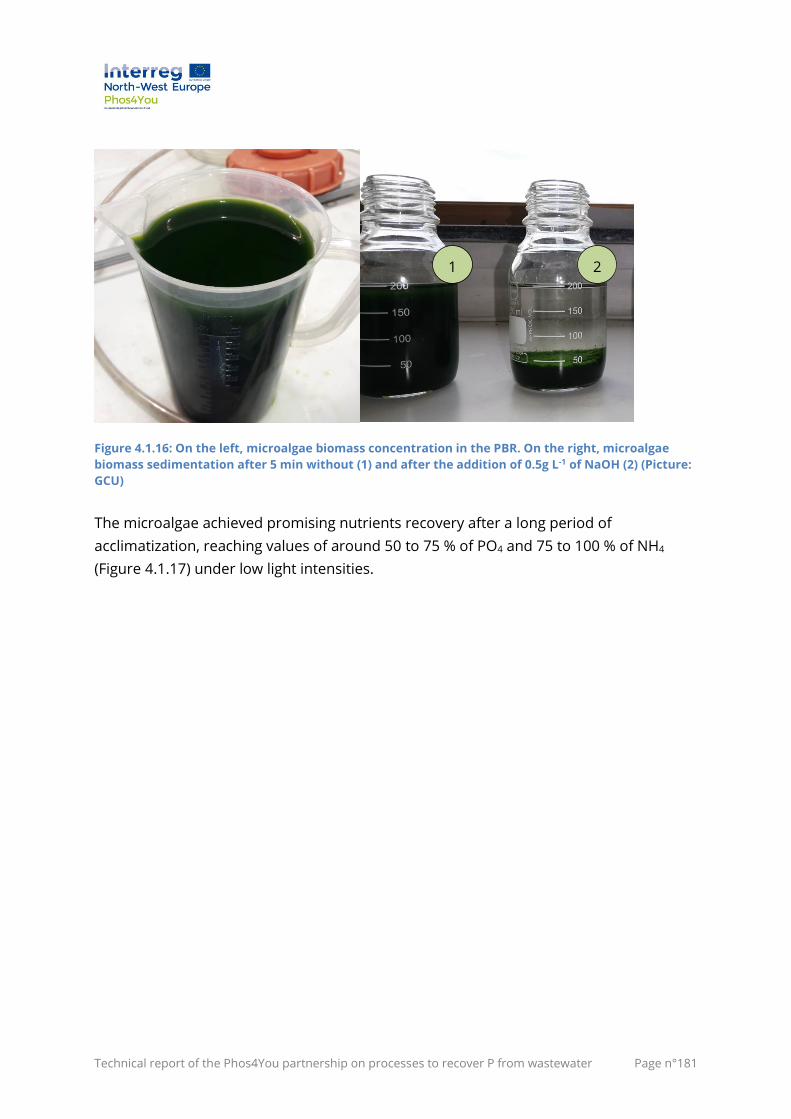
Technical report of the Phos4You partnership on processes to recover P from wastewater Page n°181
Figure 4.1.16: On the left, microalgae biomass concentration in the PBR. On the right, microalgae
biomass sedimentation after 5 min without (1) and after the addition of 0.5g L-1 of NaOH (2) (Picture:
GCU)
The microalgae achieved promising nutrients recovery after a long period of
acclimatization, reaching values of around 50 to 75 % of PO4 and 75 to 100 % of NH4
(Figure 4.1.17) under low light intensities.
1 2
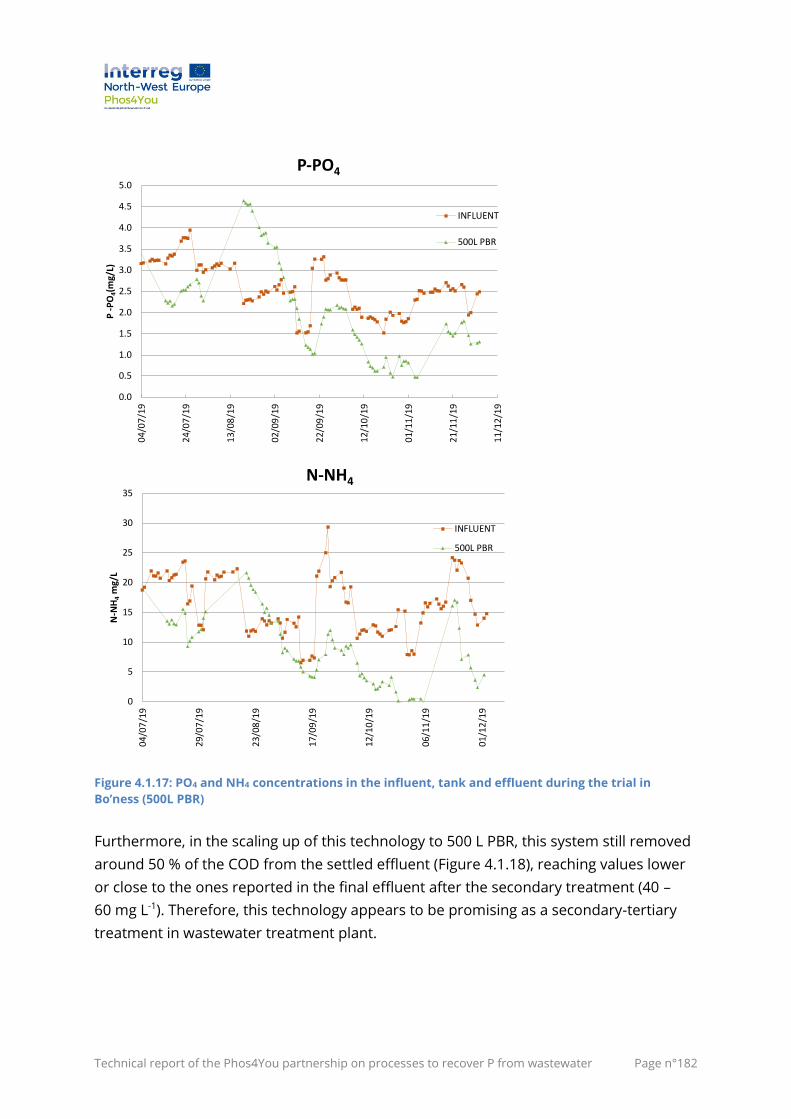
Technical report of the Phos4You partnership on processes to recover P from wastewater Page n°182
Figure 4.1.17: PO4 and NH4 concentrations in the influent, tank and effluent during the trial in
Bo’ness (500L PBR)
Furthermore, in the scaling up of this technology to 500 L PBR, this system still removed
around 50 % of the COD from the settled effluent (Figure 4.1.18), reaching values lower
or close to the ones reported in the final effluent after the secondary treatment (40 –
60 mg L-1). Therefore, this technology appears to be promising as a secondary-tertiary
treatment in wastewater treatment plant.
0.0
0.5
1.0
1.5
2.0
2.5
3.0
3.5
4.0
4.5
5.0
04
/07
/19
24
/07
/19
13
/08
/19
02
/09
/19
22
/09
/19
12
/10
/19
01
/11
/19
21
/11
/19
11
/12
/19
P -
PO
4(m
g/L)
P-PO4
INFLUENT
500L PBR
0
5
10
15
20
25
30
35
04/
07/1
9
29/
07/1
9
23/
08/1
9
17/
09/1
9
12/
10/1
9
06/
11/1
9
01/
12/1
9
N-N
H4
mg/
L
N-NH4
INFLUENT
500L PBR
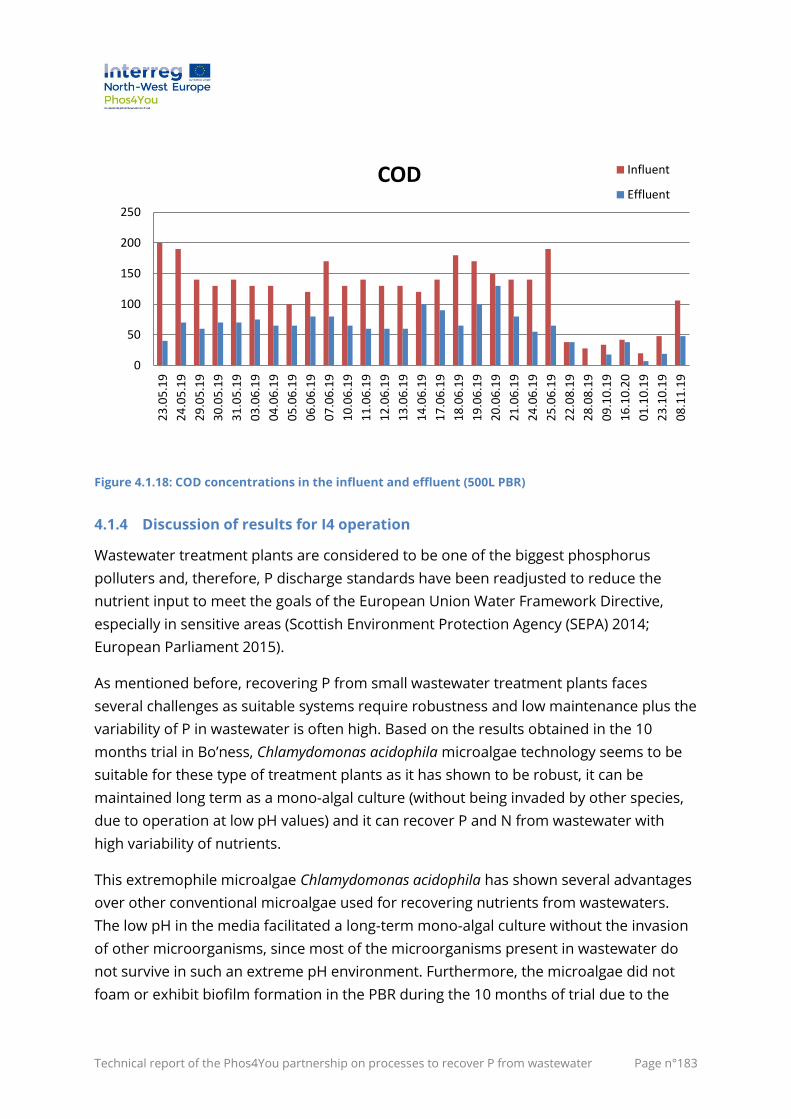
Technical report of the Phos4You partnership on processes to recover P from wastewater Page n°183
Figure 4.1.18: COD concentrations in the influent and effluent (500L PBR)
4.1.4 Discussion of results for I4 operation
Wastewater treatment plants are considered to be one of the biggest phosphorus
polluters and, therefore, P discharge standards have been readjusted to reduce the
nutrient input to meet the goals of the European Union Water Framework Directive,
especially in sensitive areas (Scottish Environment Protection Agency (SEPA) 2014;
European Parliament 2015).
As mentioned before, recovering P from small wastewater treatment plants faces
several challenges as suitable systems require robustness and low maintenance plus the
variability of P in wastewater is often high. Based on the results obtained in the 10
months trial in Bo’ness, Chlamydomonas acidophila microalgae technology seems to be
suitable for these type of treatment plants as it has shown to be robust, it can be
maintained long term as a mono-algal culture (without being invaded by other species,
due to operation at low pH values) and it can recover P and N from wastewater with
high variability of nutrients.
This extremophile microalgae Chlamydomonas acidophila has shown several advantages
over other conventional microalgae used for recovering nutrients from wastewaters.
The low pH in the media facilitated a long-term mono-algal culture without the invasion
of other microorganisms, since most of the microorganisms present in wastewater do
not survive in such an extreme pH environment. Furthermore, the microalgae did not
foam or exhibit biofilm formation in the PBR during the 10 months of trial due to the
0
50
100
150
200
250
23
.05
.19
24
.05
.19
29
.05
.19
30
.05
.19
31
.05
.19
03
.06
.19
04
.06
.19
05
.06
.19
06
.06
.19
07
.06
.19
10
.06
.19
11
.06
.19
12
.06
.19
13
.06
.19
14
.06
.19
17
.06
.19
18
.06
.19
19
.06
.19
20
.06
.19
21
.06
.19
24
.06
.19
25
.06
.19
22
.08
.19
28
.08
.19
09
.10
.19
16
.10
.20
01
.10
.19
23
.10
.19
08
.11
.19
COD Influent
Effluent
Technical report of the Phos4You partnership on processes to recover P from wastewater Page n°184
continuously low pH, which is normally used in the cleaning of membrane filters. It was
thus easy to separate biomass using tangential flow filtration, which is usually one of the
limiting factors in microalgae technology.
Moreover, C. acidophila requires much lower light intensities and temperatures to grow
and consume nutrients than other microalgae used for wastewater treatment, which
leads to a lower energy consumption by the demonstration unit.
The onset of the Water Framework Directive across Europe required a reduction in P
discharge levels below the current value of 1.2 mg L-1, specified within the Urban
Wastewater Treatment Directive to 0.5 mg L-1 (European Parliament 2015). C. acidophila
has shown successful nutrient removal reaching values in the effluent of below 1-0.5 mg
L-1, indicating potential for the use in wastewater treatment.
Many studies use final effluent for the microalgae growth to avoid inhibition derived
from high concentrations of NH4 and COD in primary effluents and the competition with
other organism present in the wastewater such as bacteria and fungi (Luo et al. 2017).
However, C. acidophila have shown to be able to grow and consume nutrients in primary
effluent and thus in the presence of high NH4 concentrations and even reduce this
compound’s concentration by 80- 100 %. Moreover, since this microalga is mixotrophic,
it removed around 50 % of the COD from the primary effluent, reaching values close to
those reported for final effluent after conventional secondary treatment (40 – 60 mg L-1).
Therefore, this technology appears to be promising as a secondary-tertiary treatment in
wastewater treatment plant.
The bioreactors used in these trials, like most of the current algal bioreactors, rely on
suspended cultures. These culture systems often require a large amount of energy to
harvest algal cells and eliminate water downstream – estimated to be up to 30 % of the
costs (Gross et al. 2013; Molina Grima et al. 2003; Uduman et al. 2010). However, after
addition of 0.5g L-1 of NaOH, C. acidophila forms flocs that settle in under 5 minutes,
enabling easy harvesting and separation from the liquid phase.
The recovered microalgae biomass potential ranges from 1.3 to 2.6 Mg/y/plant, based
on WWTP capacities of 100 PE – 200 PE, with an average P-content in the dry microalgae
biomass of around 1.4 % (41-82 kg P2O5/y/plant), N-content of 7 %, and further main
components such as plant hormones, vitamins, fatty acids and antioxidants. This
biomass could be distributed locally in remote, rural and island locations. Low seasonal
variability in quantity and quality can be expected, due to the low light intensity supplied
and required by C. acidophila (Escudero et al. 2020b).
Technical report of the Phos4You partnership on processes to recover P from wastewater Page n°185
Recycling this microalgae biomass as a biofertiliser has the reported potential of
enhancing soil fertility, plant growth, nutrients dynamic, fruit quality and nutritional
characteristics and grain yield. Also, C. acidophila accumulates carotenoids, valuable
antioxidants able to improve plant growth. In addition, the non-harmfulness of potential
residual elements of the wastewater where C. acidophila grew are to be assessed. Such
potential benefits and risks are further investigated in a work package of the Phos4You
project, dealing with the quality assessment of recovered P materials.
4.1.5 Conclusion for I4
Most advanced wastewater treatment technologies are typically not feasible in rural
WWTPs, since these small sites require simple, robust and affordable systems. Based on
the results obtained in the 10 months’ trials in Bo’ness, this microalgae technology
seems to be suitable as a secondary/tertiary treatment of wastewater for these small
sites. Since Chlamydomonas acidophila has shown to be robust (resistant to NH4, COD
and several pollutants’ concentrations), it can be maintained long term as a mono-algal
culture (due to its dominant nature under low pH values) and it can remove P, N and
COD from wastewater under very low light intensities.
It is acknowledged that light availability is one of the greatest challenges for microalgae
cultivation and therefore, C. acidophila’s high photosynthetic efficiency is essential to
decrease the costs of microalgal biomass production. Furthermore, it did not foam or
exhibit biofilm formation in the PBR and it is easy to separate using tangential flow
filtration, which is usually another key challenge in microalgae systems.
Technical report of the Phos4You partnership on processes to recover P from wastewater Page n°186
4.2 Demonstrator I5: P adsorption for small scale use (FILTRAFLO™-P with
CCM adsorbent)
Authors: Szabolcs Papp, Mark Taggart, Barbara Bremner
(ERI); Cédric Mébarki (Veolia)
Phosphorus (P) recovery (and potentially re-use) through adsorption has been identified
as a promising technology as this involves low energy consumption, may provide various
economic benefits, is simple technology to apply, and it may be highly effective even at
low P concentrations. Recovery of P from wastewater through adsorption onto natural
solid waste material may also provide a low-cost P-rich product that could be re-
purposed (i.e., as a soil improver), provided the final material is also low in other co-
adsorbed contaminants. If a P-saturated adsorbent can also be re-purposed in this way
(i.e., used as a P-rich soil enhancer in agriculture), this would be highly consistent with
the principles of a ‘circular economy’, whereby re-use or recycling of waste materials is
optimised to extract maximum value (Zheng et al. 2019).
Crab carapace is composed mainly of calcium carbonate (calcite) and chitin, and is a
common waste by-product from the seafood industry in Scotland and worldwide; with
millions of tonnes created/wasted annually, most of which is disposed of in landfill (Lu et
al. 2007). Re-purposing such waste into a value-added product, i.e., as a P-adsorbent and
then potential soil enhancer, may provide multiple agricultural benefits including
increasing soil organic matter content; improving soil physical properties (texture);
provision of essential plant nutrients; and buffering (through CaCO3 content) against soil
acidification caused by nitrogen application. In addition, chitin/chitosan has antibacterial
properties – which may in turn support rhizobial multiplication by biologically controlling
root pathogenic organisms (Pap et al. 2020c).
As part of the Phos4You project, the Environmental Research Institute (ERI) has been
developing a new adsorbent material from crab carapace and, together with Veolia, has
been using the FILTRAFLOTM-P Unit to recover P from wastewater treatment plant
(WWTP) final effluent through a filtration/adsorption process. This small unit employs
enhanced gravitational filtration through an adsorption media with continuous self-
backwashing. Trials have been designed to assess how the FILTRAFLOTM-P would
operate under ‘real’ conditions, and to ascertain the effectiveness of the crab carapace-
based chitosan-calcite material/adsorbent (CCM) to recover P from final effluent. Based
Technical report of the Phos4You partnership on processes to recover P from wastewater Page n°187
on extensive lab-scale experiments, a six- week trial of this technology was carried out at
the Scottish Water Horizons Development Centre at Bo’ness in January-February 2020.
4.2.1 Preparation of I5
4.2.1.1 Adsorbent synthesis optimisation and characterisation
Materials and methods
During the first stage of development, different seafood waste materials (oyster and
mussel shells and crab carapace), were examined for their P adsorption capacity and
characteristics. All raw materials were collected (as food waste) from a seafood
restaurant in Scrabster, Scotland. In experiments, crab carapace showed the highest
potential, based on its P adsorption capacity and physico-chemical structure. However,
low P bonding potential indicated that further improvement of the crab carapace
material was needed. Hence, a thermochemical activation process using potassium
hydroxide (KOH) was utilised to produce a more effective P adsorbent (CCM). For
adsorbent preparation, a response surface design (RSD) in conjunction with Box-
Behnken design (BBD) process was used to optimise the synthesis technique. RSD and
BBD determine the best connection between various effects/interactions and a group of
variable parameters, leading to a better understanding of the minimum number of
experimental runs needed to estimate the effect of those parameters, and identify
optimal processing conditions.
During CCM optimisation, raw crab carapace was first mixed at different mass ratios
with KOH, then placed into crucibles. These mixtures were placed into a muffle furnace
and heated from room temperature up to different final temperatures, which were then
held for varying times (see conditions below). After cooling, the resultant adsorbent
samples were rinsed with Milli-Q water to eliminate any by-product residues, then dried
at 105 °C for 2 h and stored in glass bottles. The final optimised adsorbent is referred to
here as ‘CCM’. The following preparation parameters were studied: (X1) impregnation
ratio — IR (at 0.10 – 1.00 g of KOH per gram of material), (X2) activation time (30 – 180
min) and (X3) activation temperature (80 – 500 °C). These three parameters, together
with their respective ranges, were chosen based on a literature review, ideal cost
requirements and the outcomes of preliminary experiments. The optimised adsorbent
was sieved to <250 μm (for batch experiments) and 0.5 – 2 mm (for column studies).
The percentage of P removal, R (%), and the equilibrium adsorption capacity, qe (mg P/g),
were determined using:
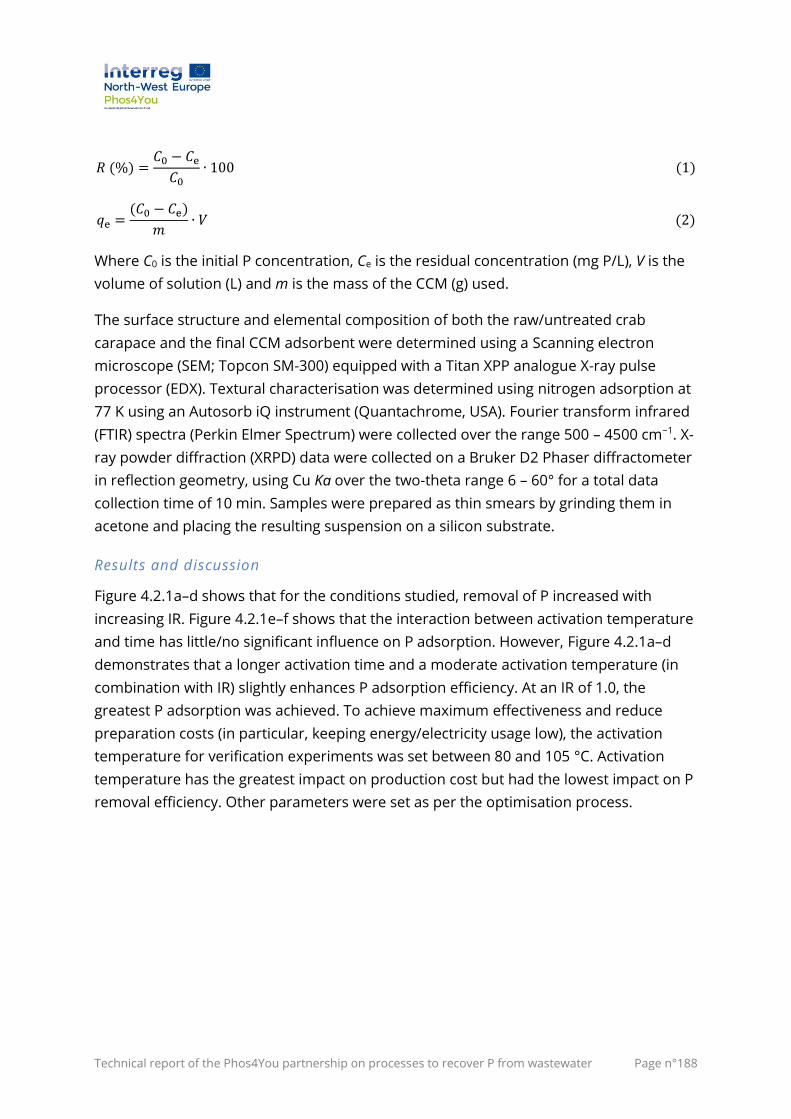
Technical report of the Phos4You partnership on processes to recover P from wastewater Page n°188
𝑅 (%) =𝐶0 − 𝐶e
𝐶0∙ 100 (1)
𝑞e =(𝐶0 − 𝐶e)
𝑚∙ 𝑉 (2)
Where C0 is the initial P concentration, Ce is the residual concentration (mg P/L), V is the
volume of solution (L) and m is the mass of the CCM (g) used.
The surface structure and elemental composition of both the raw/untreated crab
carapace and the final CCM adsorbent were determined using a Scanning electron
microscope (SEM; Topcon SM-300) equipped with a Titan XPP analogue X-ray pulse
processor (EDX). Textural characterisation was determined using nitrogen adsorption at
77 K using an Autosorb iQ instrument (Quantachrome, USA). Fourier transform infrared
(FTIR) spectra (Perkin Elmer Spectrum) were collected over the range 500 – 4500 cm−1. X-
ray powder diffraction (XRPD) data were collected on a Bruker D2 Phaser diffractometer
in reflection geometry, using Cu Kɑ over the two-theta range 6 – 60° for a total data
collection time of 10 min. Samples were prepared as thin smears by grinding them in
acetone and placing the resulting suspension on a silicon substrate.
Results and discussion
Figure 4.2.1a–d shows that for the conditions studied, removal of P increased with
increasing IR. Figure 4.2.1e–f shows that the interaction between activation temperature
and time has little/no significant influence on P adsorption. However, Figure 4.2.1a–d
demonstrates that a longer activation time and a moderate activation temperature (in
combination with IR) slightly enhances P adsorption efficiency. At an IR of 1.0, the
greatest P adsorption was achieved. To achieve maximum effectiveness and reduce
preparation costs (in particular, keeping energy/electricity usage low), the activation
temperature for verification experiments was set between 80 and 105 °C. Activation
temperature has the greatest impact on production cost but had the lowest impact on P
removal efficiency. Other parameters were set as per the optimisation process.
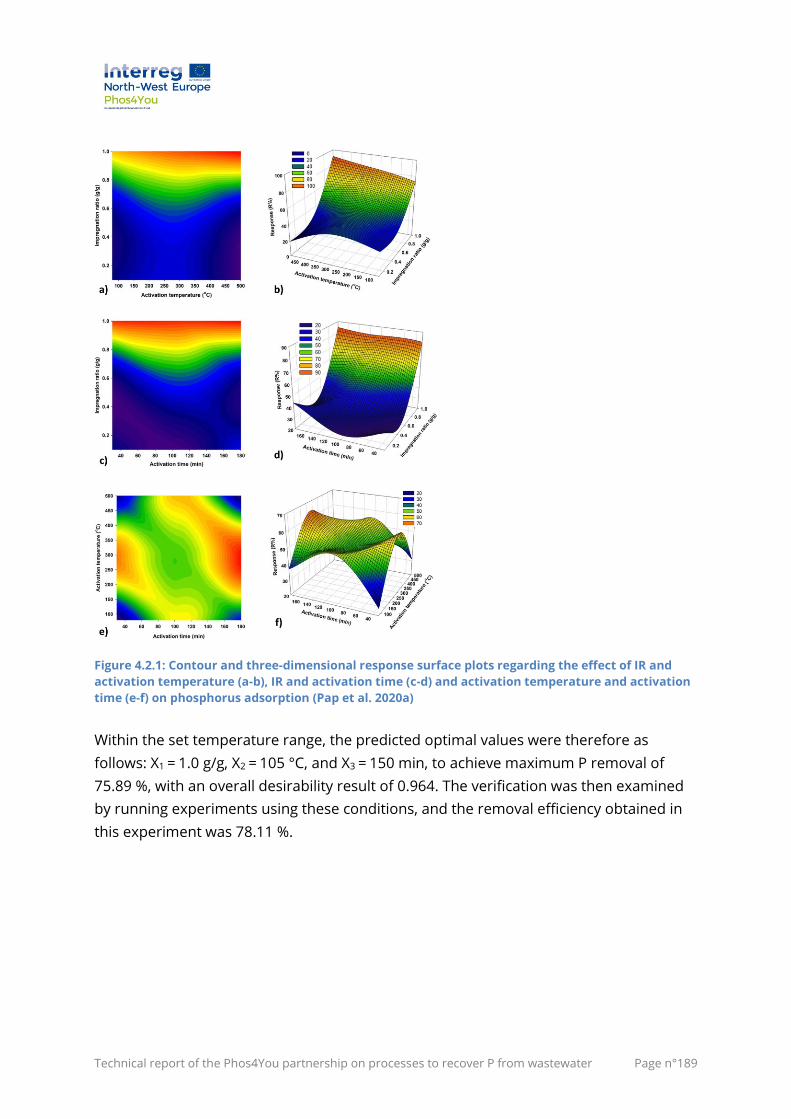
Technical report of the Phos4You partnership on processes to recover P from wastewater Page n°189
Figure 4.2.1: Contour and three-dimensional response surface plots regarding the effect of IR and
activation temperature (a-b), IR and activation time (c-d) and activation temperature and activation
time (e-f) on phosphorus adsorption (Pap et al. 2020a)
Within the set temperature range, the predicted optimal values were therefore as
follows: X1 = 1.0 g/g, X2 = 105 °C, and X3 = 150 min, to achieve maximum P removal of
75.89 %, with an overall desirability result of 0.964. The verification was then examined
by running experiments using these conditions, and the removal efficiency obtained in
this experiment was 78.11 %.
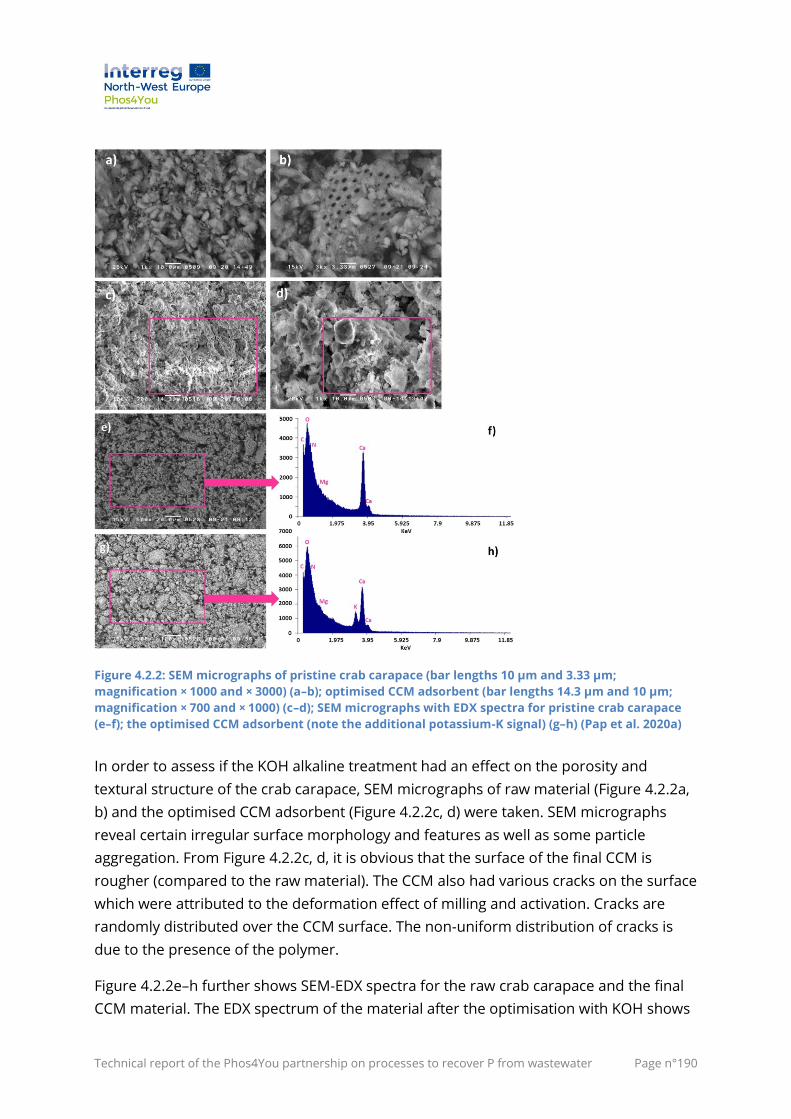
Technical report of the Phos4You partnership on processes to recover P from wastewater Page n°190
Figure 4.2.2: SEM micrographs of pristine crab carapace (bar lengths 10 μm and 3.33 μm;
magnification × 1000 and × 3000) (a–b); optimised CCM adsorbent (bar lengths 14.3 μm and 10 μm;
magnification × 700 and × 1000) (c–d); SEM micrographs with EDX spectra for pristine crab carapace
(e–f); the optimised CCM adsorbent (note the additional potassium-K signal) (g–h) (Pap et al. 2020a)
In order to assess if the KOH alkaline treatment had an effect on the porosity and
textural structure of the crab carapace, SEM micrographs of raw material (Figure 4.2.2a,
b) and the optimised CCM adsorbent (Figure 4.2.2c, d) were taken. SEM micrographs
reveal certain irregular surface morphology and features as well as some particle
aggregation. From Figure 4.2.2c, d, it is obvious that the surface of the final CCM is
rougher (compared to the raw material). The CCM also had various cracks on the surface
which were attributed to the deformation effect of milling and activation. Cracks are
randomly distributed over the CCM surface. The non-uniform distribution of cracks is
due to the presence of the polymer.
Figure 4.2.2e–h further shows SEM-EDX spectra for the raw crab carapace and the final
CCM material. The EDX spectrum of the material after the optimisation with KOH shows
Technical report of the Phos4You partnership on processes to recover P from wastewater Page n°191
the characteristic peak for K, which confirms the presence of K alongside other elements
(such as C, O, N, Mg and Ca), and shows KOH has impacted the process. The presence of
all mono- and divalent ions on the CCM surface will assist in the formation of new Ca-P,
Mg-P and K-P crystals. This surface precipitation phenomena is also generally favoured
at alkaline pH.
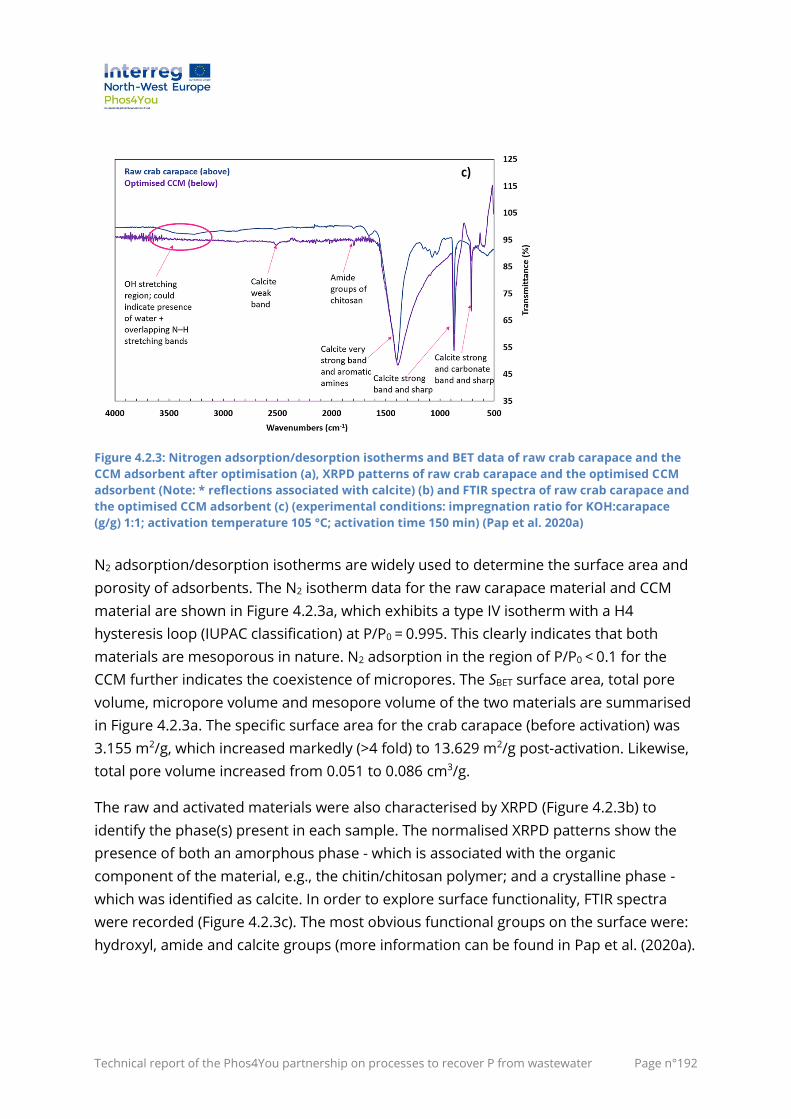
Technical report of the Phos4You partnership on processes to recover P from wastewater Page n°192
Figure 4.2.3: Nitrogen adsorption/desorption isotherms and BET data of raw crab carapace and the
CCM adsorbent after optimisation (a), XRPD patterns of raw crab carapace and the optimised CCM
adsorbent (Note: * reflections associated with calcite) (b) and FTIR spectra of raw crab carapace and
the optimised CCM adsorbent (c) (experimental conditions: impregnation ratio for KOH:carapace
(g/g) 1:1; activation temperature 105 °C; activation time 150 min) (Pap et al. 2020a)
N2 adsorption/desorption isotherms are widely used to determine the surface area and
porosity of adsorbents. The N2 isotherm data for the raw carapace material and CCM
material are shown in Figure 4.2.3a, which exhibits a type IV isotherm with a H4
hysteresis loop (IUPAC classification) at P/P0 = 0.995. This clearly indicates that both
materials are mesoporous in nature. N2 adsorption in the region of P/P0 < 0.1 for the
CCM further indicates the coexistence of micropores. The SBET surface area, total pore
volume, micropore volume and mesopore volume of the two materials are summarised
in Figure 4.2.3a. The specific surface area for the crab carapace (before activation) was
3.155 m2/g, which increased markedly (>4 fold) to 13.629 m2/g post-activation. Likewise,
total pore volume increased from 0.051 to 0.086 cm3/g.
The raw and activated materials were also characterised by XRPD (Figure 4.2.3b) to
identify the phase(s) present in each sample. The normalised XRPD patterns show the
presence of both an amorphous phase - which is associated with the organic
component of the material, e.g., the chitin/chitosan polymer; and a crystalline phase -
which was identified as calcite. In order to explore surface functionality, FTIR spectra
were recorded (Figure 4.2.3c). The most obvious functional groups on the surface were:
hydroxyl, amide and calcite groups (more information can be found in Pap et al. (2020a).
Technical report of the Phos4You partnership on processes to recover P from wastewater Page n°193
4.2.1.2 Bench-scale Phosphorus (P) adsorption optimisation on the Chitosan-Calcium
Adsorbent (CCM)
Materials and methods
Batch and dynamic lab trials using different experimental conditions were undertaken
to optimise P removal efficiency by the CCM and determine the governing removal
mechanisms. To assess the effect of pH on P adsorption, 200 mg of CCM was added to
50 mL of P solution (at 20 mg/L P) in Erlenmeyer flasks. The pH of solutions was adjusted
within the range of 2.0 – 12.0 with 0.1 M HCl or NaOH. Flasks were then placed on an
orbital shaker (IKA KS 260) at 150 rpm for 120 min at room temperature (22 °C).
Adsorption kinetics (influence of contact time) were investigated using 500 mg of CCM in
500 mL of P solution (20 mg P/L) at two different temperatures (22 and 42 °C). Solution
pH was not adjusted (but had a starting pH of ~7), and the Erlenmeyer flasks were
shaken at 150 rpm. Samples were taken over a 300 min contact period, at
predetermined time intervals (1, 5, 15, 30, 45, 60, 90, 120, 180, 240 and 300 min).
Adsorption isotherms (influence of equilibrium concentration) were created at three
different temperatures (22, 32 and 42 °C) using 100 mL solutions containing different
initial P concentrations (within the range of 1–50 mg P/L), with a CCM dose of 100 mg.
P desorption experiments were conducted by first adding 100 mg of CCM into 50 mL of
50 mg/L P solution, then shaking for 2 h. The resultant P-loaded CCM was then
separated from the suspension by centrifugation at 4000 rpm for 10 min. The P-loaded
CCM was then desorbed using 3 different solutions separately (a) 2 % citric acid, (b) 0.5M
HCl, and (c) Milli-Q water – using a liquid/solid ratio of 500 mL/g (i.e., 0.1 g in 50 mL of
eluent) at 22 °C. After a 2 h contact time, eluent supernatants were removed and
measured for P concentration. At the same time, blank experiments were carried out to
quantify the ‘background’ P dissolved from the primary (unloaded) CCM adsorbent.
Dynamic column studies were conducted at room temperature using glass columns (20
cm length, 2 cm internal diameter). Glass wool was placed at the bottom and top of the
column to prevent adsorbent washout. P working solutions were continuously fed in an
up-flow mode into the column by peristaltic pump (Masterflex, Cole-Parmer Instrument
Co., USA). The influent contained different P concentrations (5, 10, and 20 mg P/L) and
passed through varying column bed-heights (3, 6 and 10 cm) using three flow rates (3.5,
7.0, and 10.5 mL/min). Samples were collected at regular time intervals (using an ISCO
Foxy Junior fraction collector) to obtain breakthrough curves. The breakthrough time (tb)
was taken when the outlet P concentration attained 10 % of the inlet concentration,
Technical report of the Phos4You partnership on processes to recover P from wastewater Page n°194
whilst the exhaustion time (te) was determined when the effluent P level reached 90 % of
the inlet concentration. The maximum column capacity, qtotal (mg) for a given set of
conditions was calculated from the area under the plot for the adsorbed P
concentration, Cad (mg P/L), versus time, as given by:
𝑞𝑡𝑜𝑡𝑎𝑙 =𝑄𝐴
1000=
𝑄
1000∫ 𝐶𝑎𝑑𝑑𝑡
𝑡=𝑡𝑡𝑜𝑡𝑎𝑙
𝑡=0
(3)
Where Cad = Ci-Ce (mg/L), ttotal is the total flow time (min), Q is the flow rate (mL/min) and A
is the area under the breakthrough curve (cm2).
The equilibrium uptake (qeq), i.e., the amount of P adsorbed (mg) per unit dry weight of
adsorbent (mg P/g) in the column, was given by the equation:
𝑞eq =𝑞total
𝑊 (4)
Where W is the total amount of adsorbent (g) in the column.
Results and discussion
The influence of initial P concentration on P adsorption onto the CCM was investigated
within a concentration range from 1.0 to 50 mg P/L, at three different temperatures. As
shown in Figure 4.2.4a, P adsorption capacity gradually increased as the initial P
concentration and temperature increased. Maximum adsorption capacities were 21.56,
23.88 and 24.85 mg P/g at 22, 32 and 42 °C, respectively. Further, P adsorption
behaviour was explored using two isotherm models (Langmuir and Freundlich) and the
curves at different operating temperatures are provided in Figure 4.2.4a. The good
Langmuir isotherm fit, implies that the adsorption of P onto the CCM relates to
monolayer adsorption. This may be because modification of the CCM (with KOH)
increased surface homogeneity, creating a finite number of binding sites for P
adsorption.
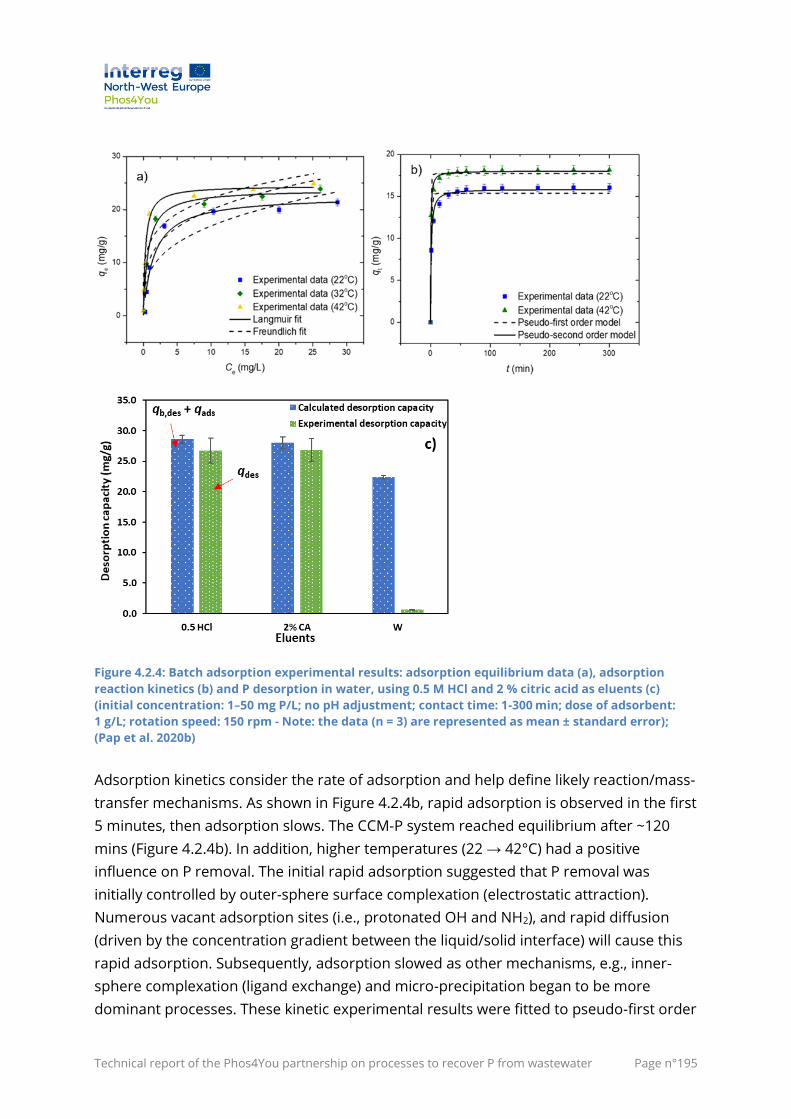
Technical report of the Phos4You partnership on processes to recover P from wastewater Page n°195
Figure 4.2.4: Batch adsorption experimental results: adsorption equilibrium data (a), adsorption
reaction kinetics (b) and P desorption in water, using 0.5 M HCl and 2 % citric acid as eluents (c)
(initial concentration: 1–50 mg P/L; no pH adjustment; contact time: 1-300 min; dose of adsorbent:
1 g/L; rotation speed: 150 rpm - Note: the data (n = 3) are represented as mean ± standard error);
(Pap et al. 2020b)
Adsorption kinetics consider the rate of adsorption and help define likely reaction/mass-
transfer mechanisms. As shown in Figure 4.2.4b, rapid adsorption is observed in the first
5 minutes, then adsorption slows. The CCM-P system reached equilibrium after ~120
mins (Figure 4.2.4b). In addition, higher temperatures (22 → 42°C) had a positive
influence on P removal. The initial rapid adsorption suggested that P removal was
initially controlled by outer-sphere surface complexation (electrostatic attraction).
Numerous vacant adsorption sites (i.e., protonated OH and NH2), and rapid diffusion
(driven by the concentration gradient between the liquid/solid interface) will cause this
rapid adsorption. Subsequently, adsorption slowed as other mechanisms, e.g., inner-
sphere complexation (ligand exchange) and micro-precipitation began to be more
dominant processes. These kinetic experimental results were fitted to pseudo-first order
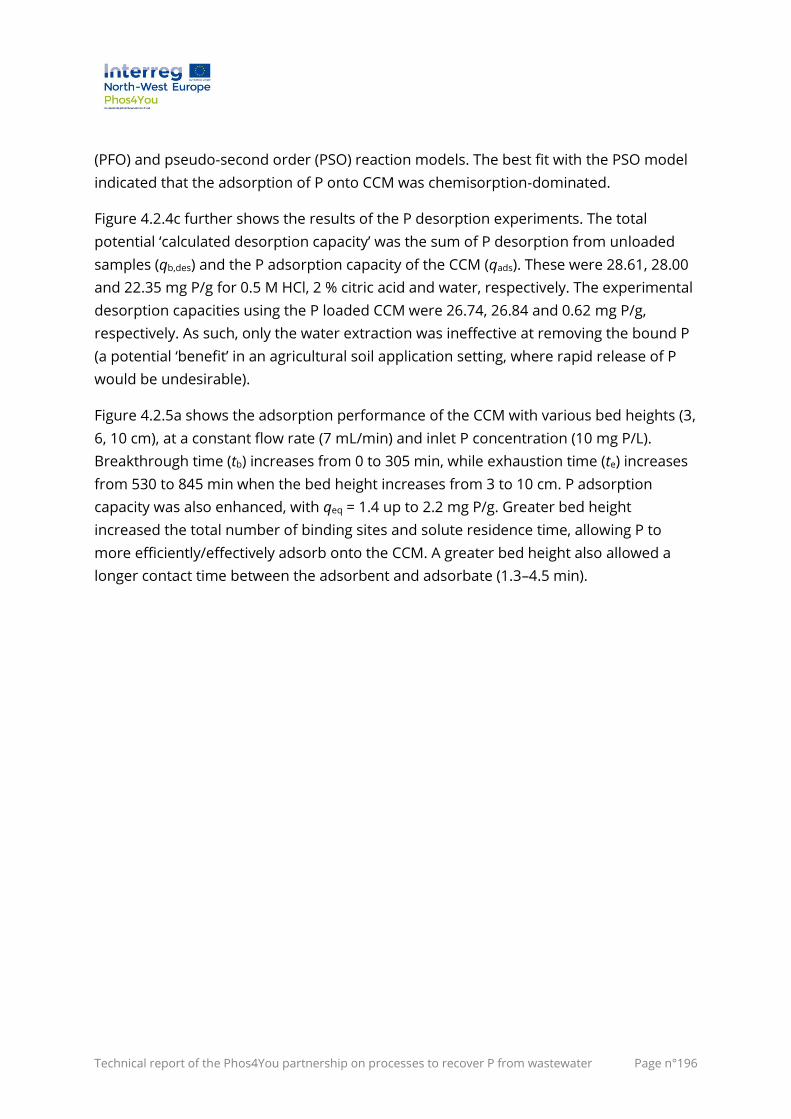
Technical report of the Phos4You partnership on processes to recover P from wastewater Page n°196
(PFO) and pseudo-second order (PSO) reaction models. The best fit with the PSO model
indicated that the adsorption of P onto CCM was chemisorption-dominated.
Figure 4.2.4c further shows the results of the P desorption experiments. The total
potential ‘calculated desorption capacity’ was the sum of P desorption from unloaded
samples (qb,des) and the P adsorption capacity of the CCM (qads). These were 28.61, 28.00
and 22.35 mg P/g for 0.5 M HCl, 2 % citric acid and water, respectively. The experimental
desorption capacities using the P loaded CCM were 26.74, 26.84 and 0.62 mg P/g,
respectively. As such, only the water extraction was ineffective at removing the bound P
(a potential ‘benefit’ in an agricultural soil application setting, where rapid release of P
would be undesirable).
Figure 4.2.5a shows the adsorption performance of the CCM with various bed heights (3,
6, 10 cm), at a constant flow rate (7 mL/min) and inlet P concentration (10 mg P/L).
Breakthrough time (tb) increases from 0 to 305 min, while exhaustion time (te) increases
from 530 to 845 min when the bed height increases from 3 to 10 cm. P adsorption
capacity was also enhanced, with qeq = 1.4 up to 2.2 mg P/g. Greater bed height
increased the total number of binding sites and solute residence time, allowing P to
more efficiently/effectively adsorb onto the CCM. A greater bed height also allowed a
longer contact time between the adsorbent and adsorbate (1.3–4.5 min).
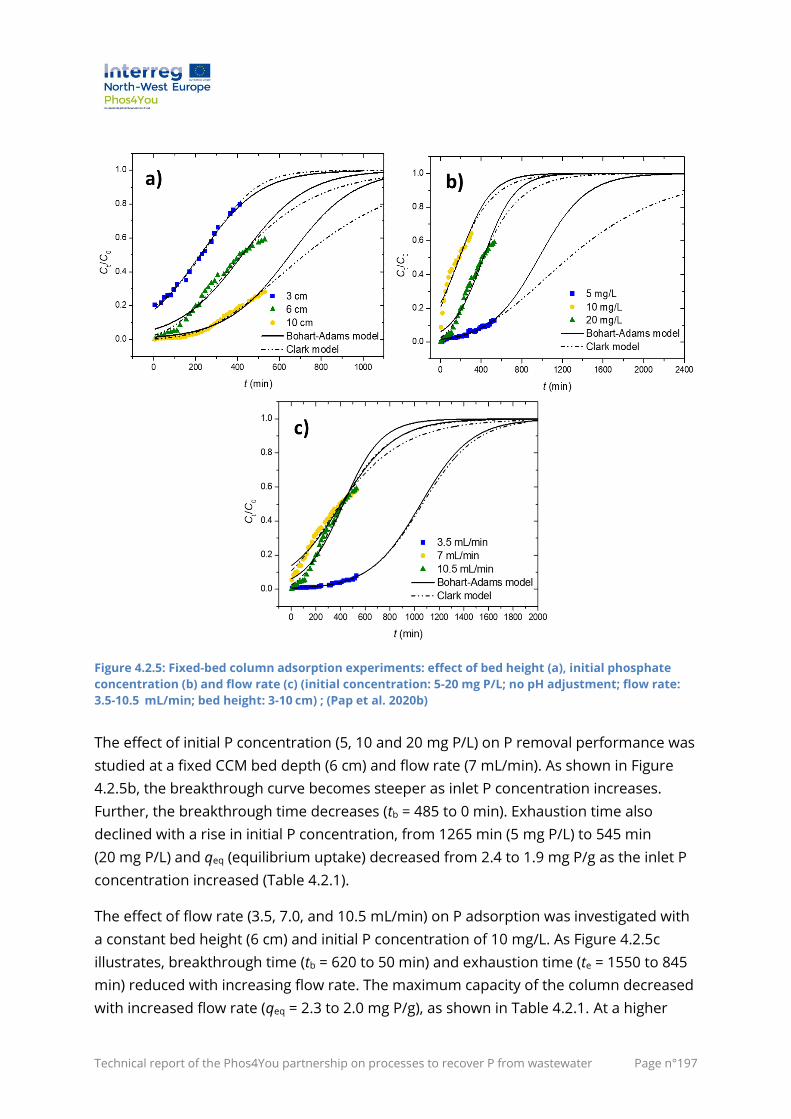
Technical report of the Phos4You partnership on processes to recover P from wastewater Page n°197
Figure 4.2.5: Fixed-bed column adsorption experiments: effect of bed height (a), initial phosphate
concentration (b) and flow rate (c) (initial concentration: 5-20 mg P/L; no pH adjustment; flow rate:
3.5-10.5 mL/min; bed height: 3-10 cm) ; (Pap et al. 2020b)
The effect of initial P concentration (5, 10 and 20 mg P/L) on P removal performance was
studied at a fixed CCM bed depth (6 cm) and flow rate (7 mL/min). As shown in Figure
4.2.5b, the breakthrough curve becomes steeper as inlet P concentration increases.
Further, the breakthrough time decreases (tb = 485 to 0 min). Exhaustion time also
declined with a rise in initial P concentration, from 1265 min (5 mg P/L) to 545 min
(20 mg P/L) and qeq (equilibrium uptake) decreased from 2.4 to 1.9 mg P/g as the inlet P
concentration increased (Table 4.2.1).
The effect of flow rate (3.5, 7.0, and 10.5 mL/min) on P adsorption was investigated with
a constant bed height (6 cm) and initial P concentration of 10 mg/L. As Figure 4.2.5c
illustrates, breakthrough time (tb = 620 to 50 min) and exhaustion time (te = 1550 to 845
min) reduced with increasing flow rate. The maximum capacity of the column decreased
with increased flow rate (qeq = 2.3 to 2.0 mg P/g), as shown in Table 4.2.1. At a higher
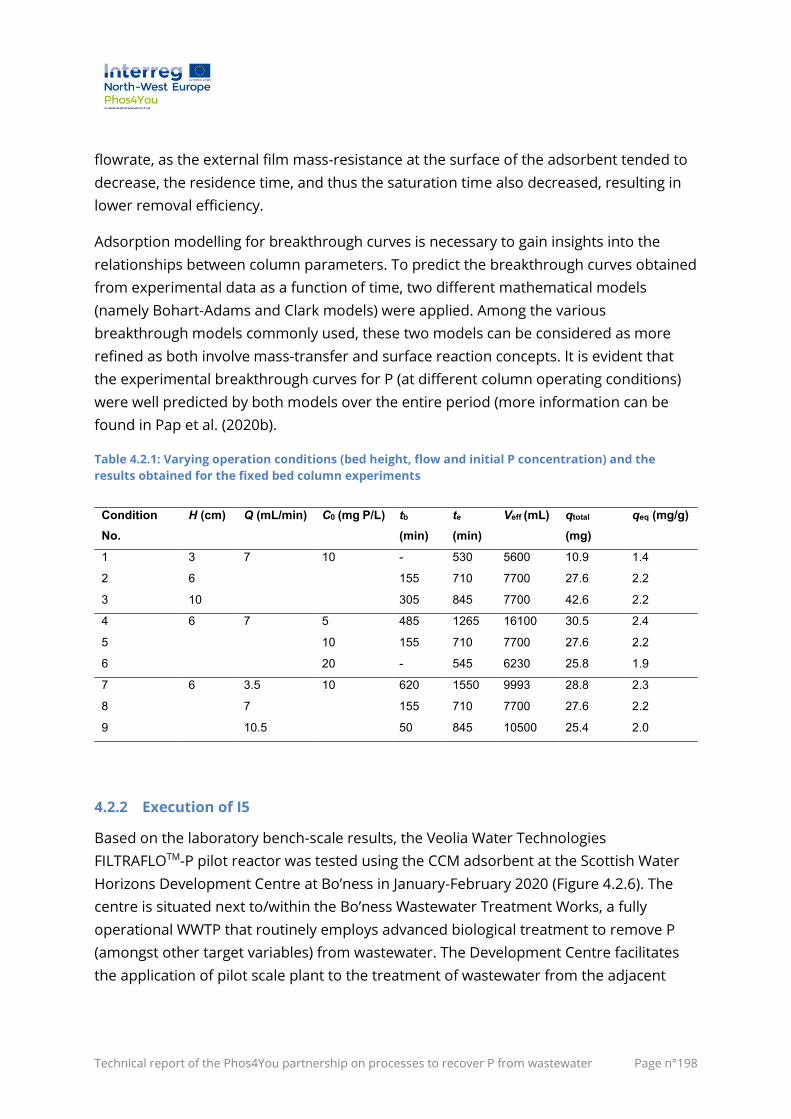
Technical report of the Phos4You partnership on processes to recover P from wastewater Page n°198
flowrate, as the external film mass-resistance at the surface of the adsorbent tended to
decrease, the residence time, and thus the saturation time also decreased, resulting in
lower removal efficiency.
Adsorption modelling for breakthrough curves is necessary to gain insights into the
relationships between column parameters. To predict the breakthrough curves obtained
from experimental data as a function of time, two different mathematical models
(namely Bohart-Adams and Clark models) were applied. Among the various
breakthrough models commonly used, these two models can be considered as more
refined as both involve mass-transfer and surface reaction concepts. It is evident that
the experimental breakthrough curves for P (at different column operating conditions)
were well predicted by both models over the entire period (more information can be
found in Pap et al. (2020b).
Table 4.2.1: Varying operation conditions (bed height, flow and initial P concentration) and the
results obtained for the fixed bed column experiments
Condition
No.
H (cm) Q (mL/min) C0 (mg P/L) tb
(min)
te
(min)
Veff (mL) qtotal
(mg)
qeq (mg/g)
1 3 7 10 - 530 5600 10.9 1.4
2 6 155 710 7700 27.6 2.2
3 10 305 845 7700 42.6 2.2
4 6 7 5 485 1265 16100 30.5 2.4
5 10 155 710 7700 27.6 2.2
6 20 - 545 6230 25.8 1.9
7 6 3.5 10 620 1550 9993 28.8 2.3
8 7 155 710 7700 27.6 2.2
9 10.5 50 845 10500 25.4 2.0
4.2.2 Execution of I5
Based on the laboratory bench-scale results, the Veolia Water Technologies
FILTRAFLOTM-P pilot reactor was tested using the CCM adsorbent at the Scottish Water
Horizons Development Centre at Bo’ness in January-February 2020 (Figure 4.2.6). The
centre is situated next to/within the Bo’ness Wastewater Treatment Works, a fully
operational WWTP that routinely employs advanced biological treatment to remove P
(amongst other target variables) from wastewater. The Development Centre facilitates
the application of pilot scale plant to the treatment of wastewater from the adjacent
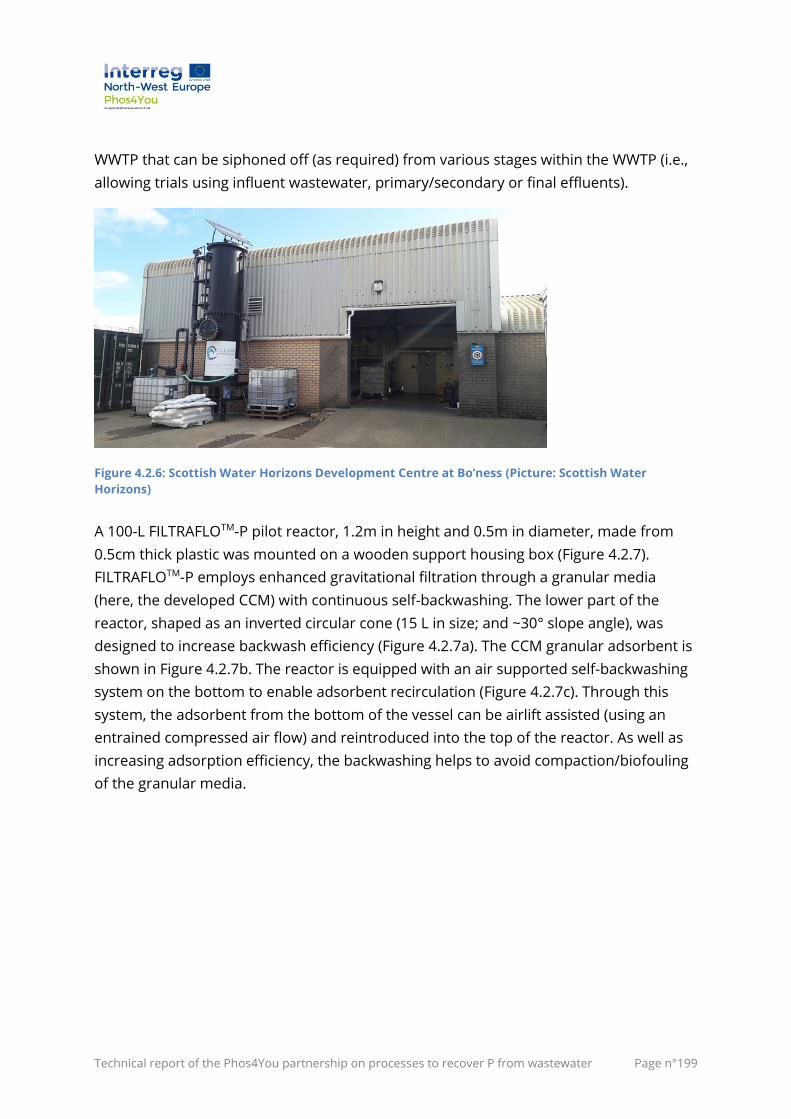
Technical report of the Phos4You partnership on processes to recover P from wastewater Page n°199
WWTP that can be siphoned off (as required) from various stages within the WWTP (i.e.,
allowing trials using influent wastewater, primary/secondary or final effluents).
Figure 4.2.6: Scottish Water Horizons Development Centre at Bo’ness (Picture: Scottish Water
Horizons)
A 100-L FILTRAFLOTM-P pilot reactor, 1.2m in height and 0.5m in diameter, made from
0.5cm thick plastic was mounted on a wooden support housing box (Figure 4.2.7).
FILTRAFLOTM-P employs enhanced gravitational filtration through a granular media
(here, the developed CCM) with continuous self-backwashing. The lower part of the
reactor, shaped as an inverted circular cone (15 L in size; and ~30° slope angle), was
designed to increase backwash efficiency (Figure 4.2.7a). The CCM granular adsorbent is
shown in Figure 4.2.7b. The reactor is equipped with an air supported self-backwashing
system on the bottom to enable adsorbent recirculation (Figure 4.2.7c). Through this
system, the adsorbent from the bottom of the vessel can be airlift assisted (using an
entrained compressed air flow) and reintroduced into the top of the reactor. As well as
increasing adsorption efficiency, the backwashing helps to avoid compaction/biofouling
of the granular media.
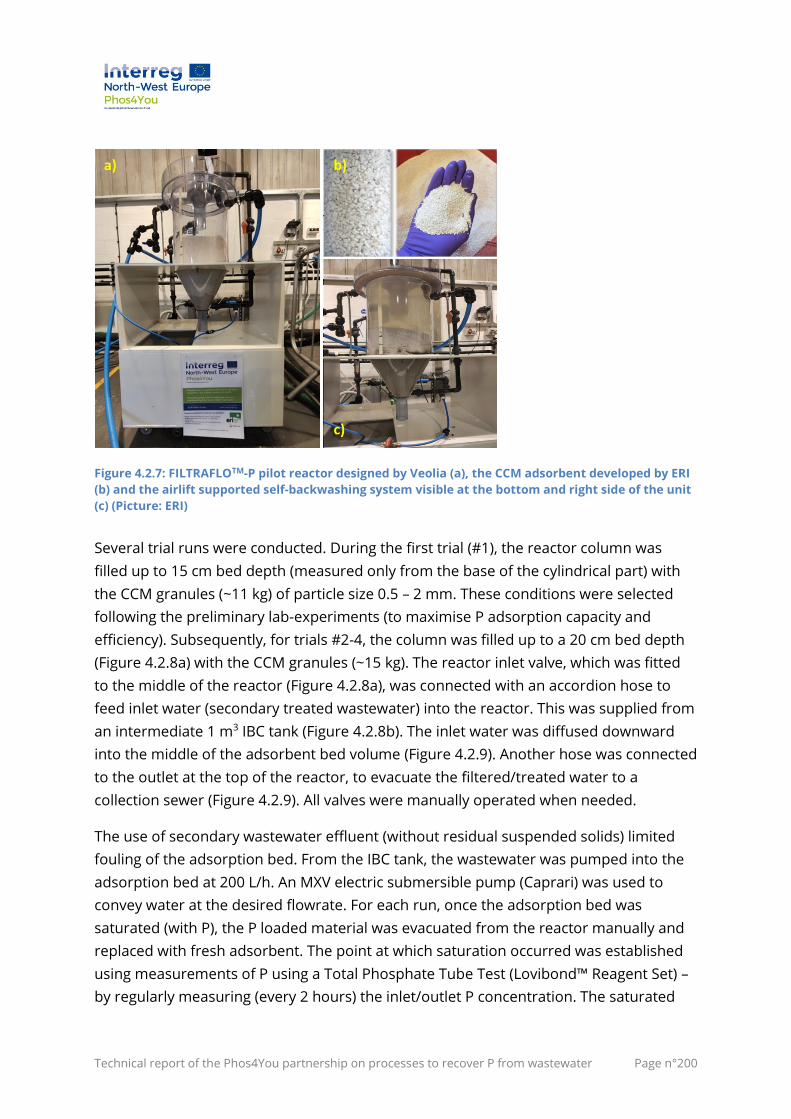
Technical report of the Phos4You partnership on processes to recover P from wastewater Page n°200
Figure 4.2.7: FILTRAFLOTM-P pilot reactor designed by Veolia (a), the CCM adsorbent developed by ERI
(b) and the airlift supported self-backwashing system visible at the bottom and right side of the unit
(c) (Picture: ERI)
Several trial runs were conducted. During the first trial (#1), the reactor column was
filled up to 15 cm bed depth (measured only from the base of the cylindrical part) with
the CCM granules (~11 kg) of particle size 0.5 – 2 mm. These conditions were selected
following the preliminary lab-experiments (to maximise P adsorption capacity and
efficiency). Subsequently, for trials #2-4, the column was filled up to a 20 cm bed depth
(Figure 4.2.8a) with the CCM granules (~15 kg). The reactor inlet valve, which was fitted
to the middle of the reactor (Figure 4.2.8a), was connected with an accordion hose to
feed inlet water (secondary treated wastewater) into the reactor. This was supplied from
an intermediate 1 m3 IBC tank (Figure 4.2.8b). The inlet water was diffused downward
into the middle of the adsorbent bed volume (Figure 4.2.9). Another hose was connected
to the outlet at the top of the reactor, to evacuate the filtered/treated water to a
collection sewer (Figure 4.2.9). All valves were manually operated when needed.
The use of secondary wastewater effluent (without residual suspended solids) limited
fouling of the adsorption bed. From the IBC tank, the wastewater was pumped into the
adsorption bed at 200 L/h. An MXV electric submersible pump (Caprari) was used to
convey water at the desired flowrate. For each run, once the adsorption bed was
saturated (with P), the P loaded material was evacuated from the reactor manually and
replaced with fresh adsorbent. The point at which saturation occurred was established
using measurements of P using a Total Phosphate Tube Test (Lovibond™ Reagent Set) –
by regularly measuring (every 2 hours) the inlet/outlet P concentration. The saturated
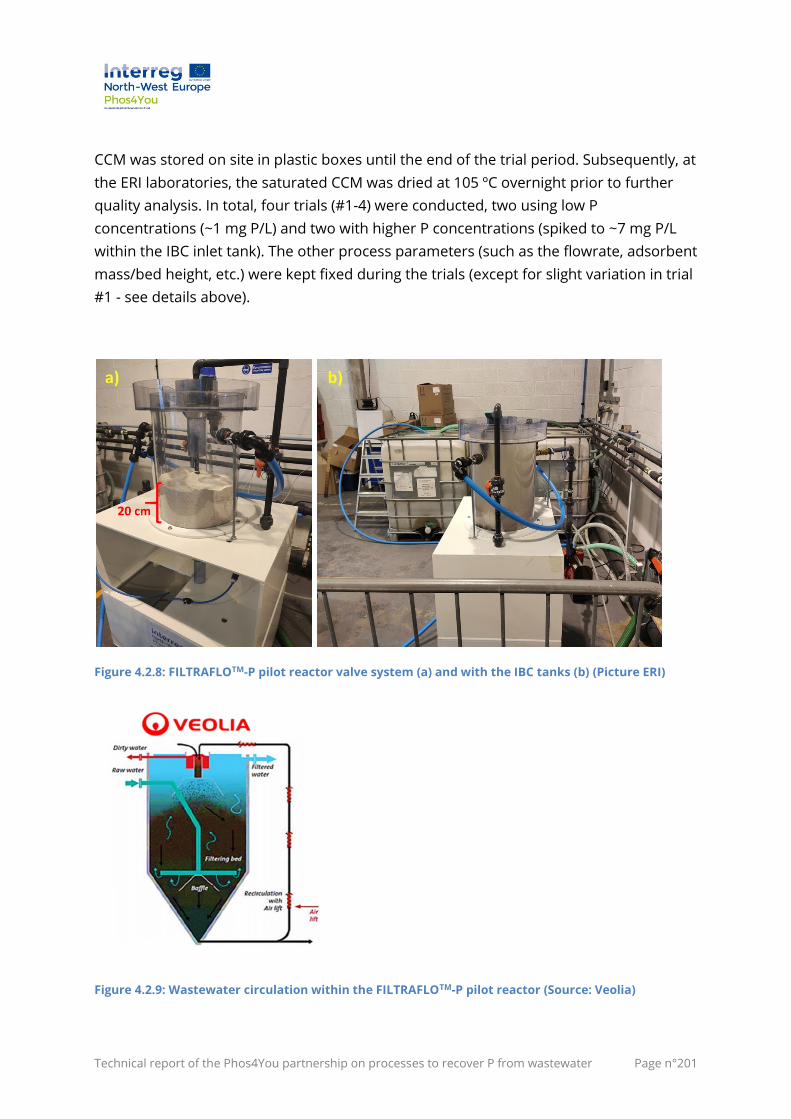
Technical report of the Phos4You partnership on processes to recover P from wastewater Page n°201
CCM was stored on site in plastic boxes until the end of the trial period. Subsequently, at
the ERI laboratories, the saturated CCM was dried at 105 ºC overnight prior to further
quality analysis. In total, four trials (#1-4) were conducted, two using low P
concentrations (~1 mg P/L) and two with higher P concentrations (spiked to ~7 mg P/L
within the IBC inlet tank). The other process parameters (such as the flowrate, adsorbent
mass/bed height, etc.) were kept fixed during the trials (except for slight variation in trial
#1 - see details above).
Figure 4.2.8: FILTRAFLOTM-P pilot reactor valve system (a) and with the IBC tanks (b) (Picture ERI)
Figure 4.2.9: Wastewater circulation within the FILTRAFLOTM-P pilot reactor (Source: Veolia)
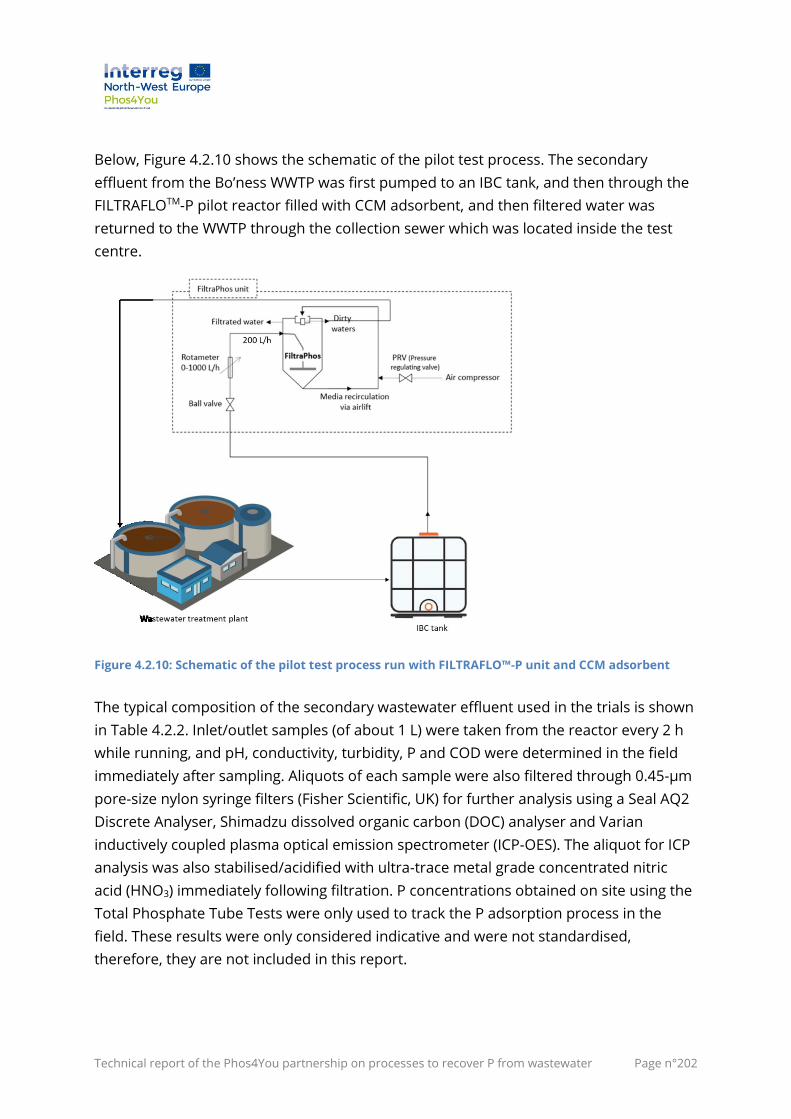
Technical report of the Phos4You partnership on processes to recover P from wastewater Page n°202
Below, Figure 4.2.10 shows the schematic of the pilot test process. The secondary
effluent from the Bo’ness WWTP was first pumped to an IBC tank, and then through the
FILTRAFLOTM-P pilot reactor filled with CCM adsorbent, and then filtered water was
returned to the WWTP through the collection sewer which was located inside the test
centre.
Figure 4.2.10: Schematic of the pilot test process run with FILTRAFLO™-P unit and CCM adsorbent
The typical composition of the secondary wastewater effluent used in the trials is shown
in Table 4.2.2. Inlet/outlet samples (of about 1 L) were taken from the reactor every 2 h
while running, and pH, conductivity, turbidity, P and COD were determined in the field
immediately after sampling. Aliquots of each sample were also filtered through 0.45-µm
pore-size nylon syringe filters (Fisher Scientific, UK) for further analysis using a Seal AQ2
Discrete Analyser, Shimadzu dissolved organic carbon (DOC) analyser and Varian
inductively coupled plasma optical emission spectrometer (ICP-OES). The aliquot for ICP
analysis was also stabilised/acidified with ultra-trace metal grade concentrated nitric
acid (HNO3) immediately following filtration. P concentrations obtained on site using the
Total Phosphate Tube Tests were only used to track the P adsorption process in the
field. These results were only considered indicative and were not standardised,
therefore, they are not included in this report.
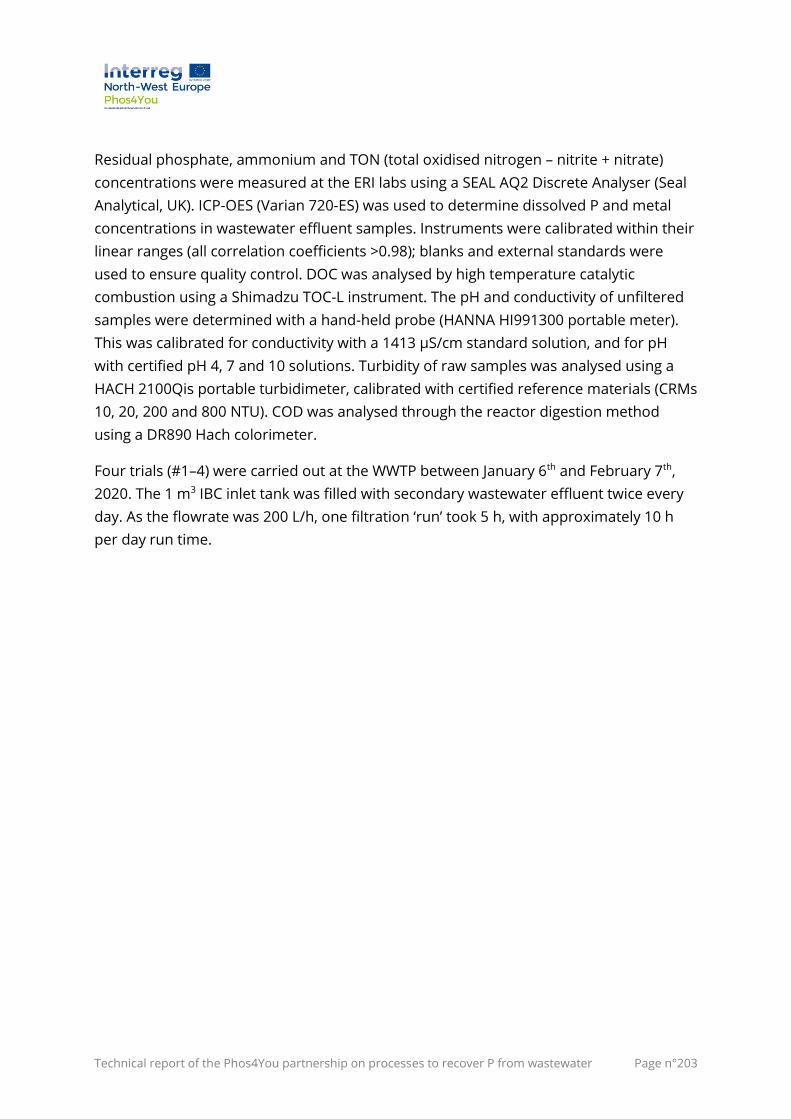
Technical report of the Phos4You partnership on processes to recover P from wastewater Page n°203
Residual phosphate, ammonium and TON (total oxidised nitrogen – nitrite + nitrate)
concentrations were measured at the ERI labs using a SEAL AQ2 Discrete Analyser (Seal
Analytical, UK). ICP-OES (Varian 720-ES) was used to determine dissolved P and metal
concentrations in wastewater effluent samples. Instruments were calibrated within their
linear ranges (all correlation coefficients >0.98); blanks and external standards were
used to ensure quality control. DOC was analysed by high temperature catalytic
combustion using a Shimadzu TOC-L instrument. The pH and conductivity of unfiltered
samples were determined with a hand-held probe (HANNA HI991300 portable meter).
This was calibrated for conductivity with a 1413 µS/cm standard solution, and for pH
with certified pH 4, 7 and 10 solutions. Turbidity of raw samples was analysed using a
HACH 2100Qis portable turbidimeter, calibrated with certified reference materials (CRMs
10, 20, 200 and 800 NTU). COD was analysed through the reactor digestion method
using a DR890 Hach colorimeter.
Four trials (#1–4) were carried out at the WWTP between January 6th and February 7th,
2020. The 1 m3 IBC inlet tank was filled with secondary wastewater effluent twice every
day. As the flowrate was 200 L/h, one filtration ‘run’ took 5 h, with approximately 10 h
per day run time.
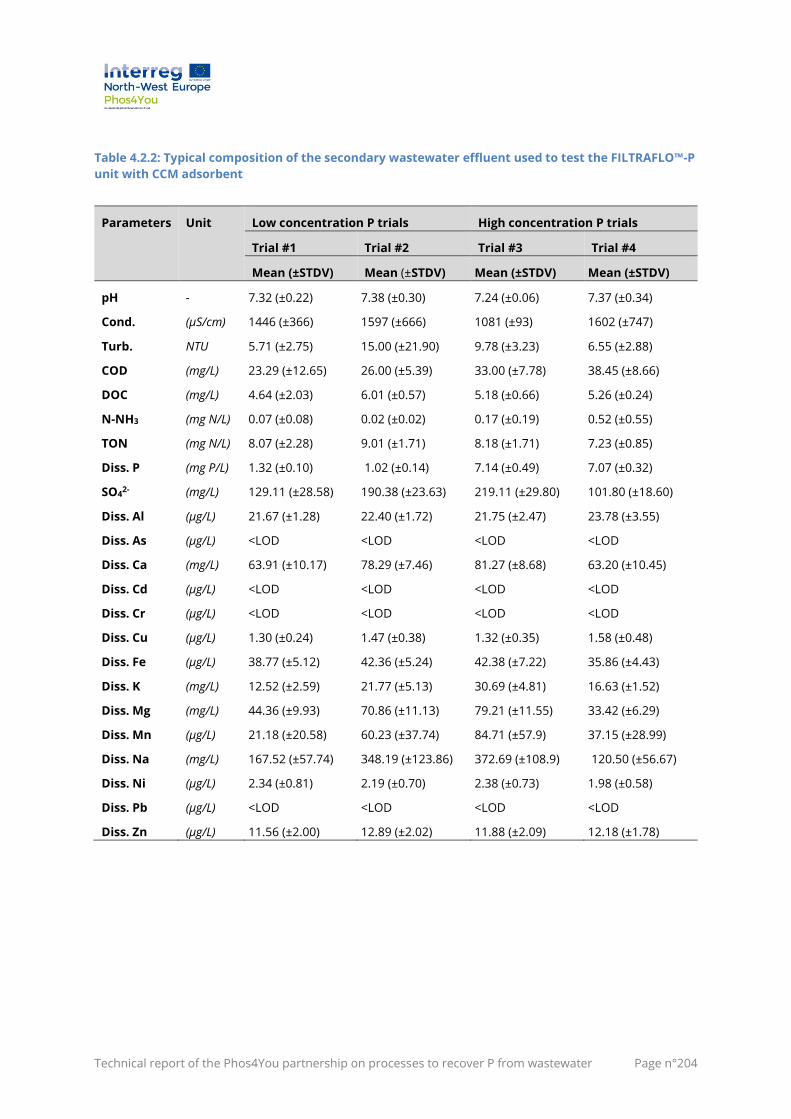
Technical report of the Phos4You partnership on processes to recover P from wastewater Page n°204
Table 4.2.2: Typical composition of the secondary wastewater effluent used to test the FILTRAFLO™-P
unit with CCM adsorbent
Parameters Unit Low concentration P trials High concentration P trials
Trial #1 Trial #2 Trial #3 Trial #4
Mean (±STDV) Mean (±STDV) Mean (±STDV) Mean (±STDV)
pH - 7.32 (±0.22) 7.38 (±0.30) 7.24 (±0.06) 7.37 (±0.34)
Cond. (µS/cm) 1446 (±366) 1597 (±666) 1081 (±93) 1602 (±747)
Turb. NTU 5.71 (±2.75) 15.00 (±21.90) 9.78 (±3.23) 6.55 (±2.88)
COD (mg/L) 23.29 (±12.65) 26.00 (±5.39) 33.00 (±7.78) 38.45 (±8.66)
DOC (mg/L) 4.64 (±2.03) 6.01 (±0.57) 5.18 (±0.66) 5.26 (±0.24)
N-NH3 (mg N/L) 0.07 (±0.08) 0.02 (±0.02) 0.17 (±0.19) 0.52 (±0.55)
TON (mg N/L) 8.07 (±2.28) 9.01 (±1.71) 8.18 (±1.71) 7.23 (±0.85)
Diss. P (mg P/L) 1.32 (±0.10) 1.02 (±0.14) 7.14 (±0.49) 7.07 (±0.32)
SO42- (mg/L) 129.11 (±28.58) 190.38 (±23.63) 219.11 (±29.80) 101.80 (±18.60)
Diss. Al (µg/L) 21.67 (±1.28) 22.40 (±1.72) 21.75 (±2.47) 23.78 (±3.55)
Diss. As (µg/L) <LOD <LOD <LOD <LOD
Diss. Ca (mg/L) 63.91 (±10.17) 78.29 (±7.46) 81.27 (±8.68) 63.20 (±10.45)
Diss. Cd (µg/L) <LOD <LOD <LOD <LOD
Diss. Cr (µg/L) <LOD <LOD <LOD <LOD
Diss. Cu (µg/L) 1.30 (±0.24) 1.47 (±0.38) 1.32 (±0.35) 1.58 (±0.48)
Diss. Fe (µg/L) 38.77 (±5.12) 42.36 (±5.24) 42.38 (±7.22) 35.86 (±4.43)
Diss. K (mg/L) 12.52 (±2.59) 21.77 (±5.13) 30.69 (±4.81) 16.63 (±1.52)
Diss. Mg (mg/L) 44.36 (±9.93) 70.86 (±11.13) 79.21 (±11.55) 33.42 (±6.29)
Diss. Mn (µg/L) 21.18 (±20.58) 60.23 (±37.74) 84.71 (±57.9) 37.15 (±28.99)
Diss. Na (mg/L) 167.52 (±57.74) 348.19 (±123.86) 372.69 (±108.9) 120.50 (±56.67)
Diss. Ni (µg/L) 2.34 (±0.81) 2.19 (±0.70) 2.38 (±0.73) 1.98 (±0.58)
Diss. Pb (µg/L) <LOD <LOD <LOD <LOD
Diss. Zn (µg/L) 11.56 (±2.00) 12.89 (±2.02) 11.88 (±2.09) 12.18 (±1.78)
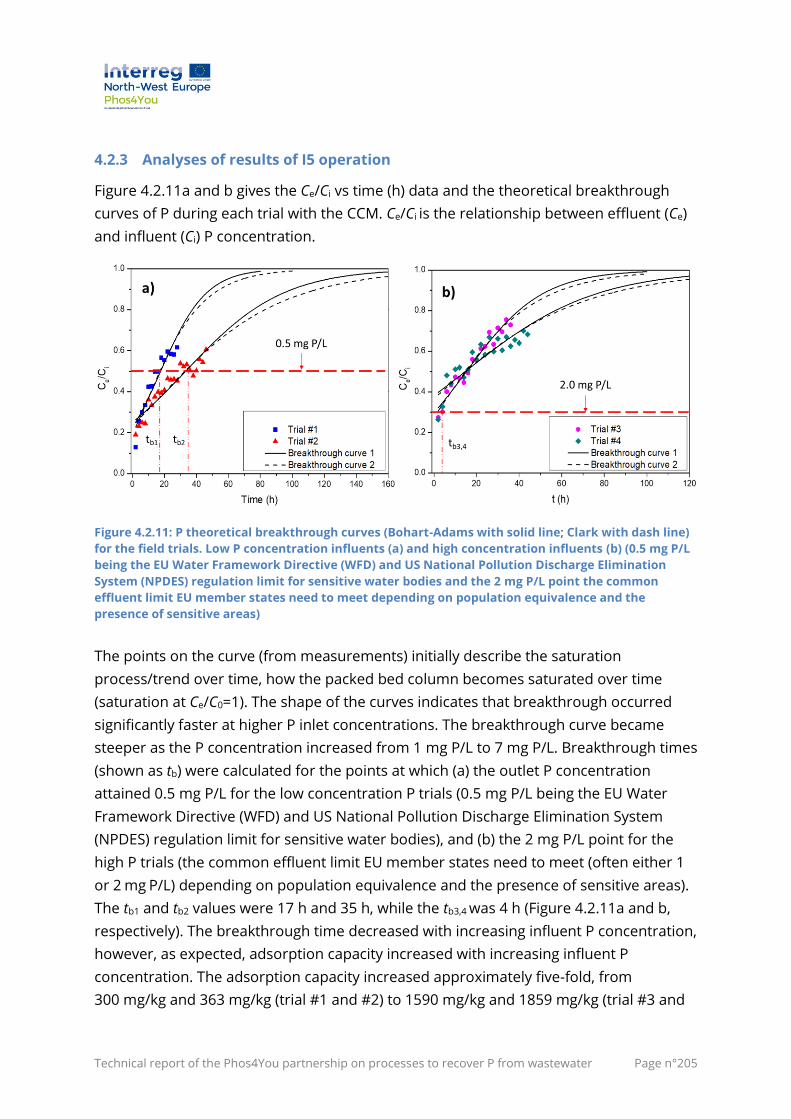
Technical report of the Phos4You partnership on processes to recover P from wastewater Page n°205
4.2.3 Analyses of results of I5 operation
Figure 4.2.11a and b gives the Ce/Ci vs time (h) data and the theoretical breakthrough
curves of P during each trial with the CCM. Ce/Ci is the relationship between effluent (Ce)
and influent (Ci) P concentration.
Figure 4.2.11: P theoretical breakthrough curves (Bohart-Adams with solid line; Clark with dash line)
for the field trials. Low P concentration influents (a) and high concentration influents (b) (0.5 mg P/L
being the EU Water Framework Directive (WFD) and US National Pollution Discharge Elimination
System (NPDES) regulation limit for sensitive water bodies and the 2 mg P/L point the common
effluent limit EU member states need to meet depending on population equivalence and the
presence of sensitive areas)
The points on the curve (from measurements) initially describe the saturation
process/trend over time, how the packed bed column becomes saturated over time
(saturation at Ce/C0=1). The shape of the curves indicates that breakthrough occurred
significantly faster at higher P inlet concentrations. The breakthrough curve became
steeper as the P concentration increased from 1 mg P/L to 7 mg P/L. Breakthrough times
(shown as tb) were calculated for the points at which (a) the outlet P concentration
attained 0.5 mg P/L for the low concentration P trials (0.5 mg P/L being the EU Water
Framework Directive (WFD) and US National Pollution Discharge Elimination System
(NPDES) regulation limit for sensitive water bodies), and (b) the 2 mg P/L point for the
high P trials (the common effluent limit EU member states need to meet (often either 1
or 2 mg P/L) depending on population equivalence and the presence of sensitive areas).
The tb1 and tb2 values were 17 h and 35 h, while the tb3,4 was 4 h (Figure 4.2.11a and b,
respectively). The breakthrough time decreased with increasing influent P concentration,
however, as expected, adsorption capacity increased with increasing influent P
concentration. The adsorption capacity increased approximately five-fold, from
300 mg/kg and 363 mg/kg (trial #1 and #2) to 1590 mg/kg and 1859 mg/kg (trial #3 and
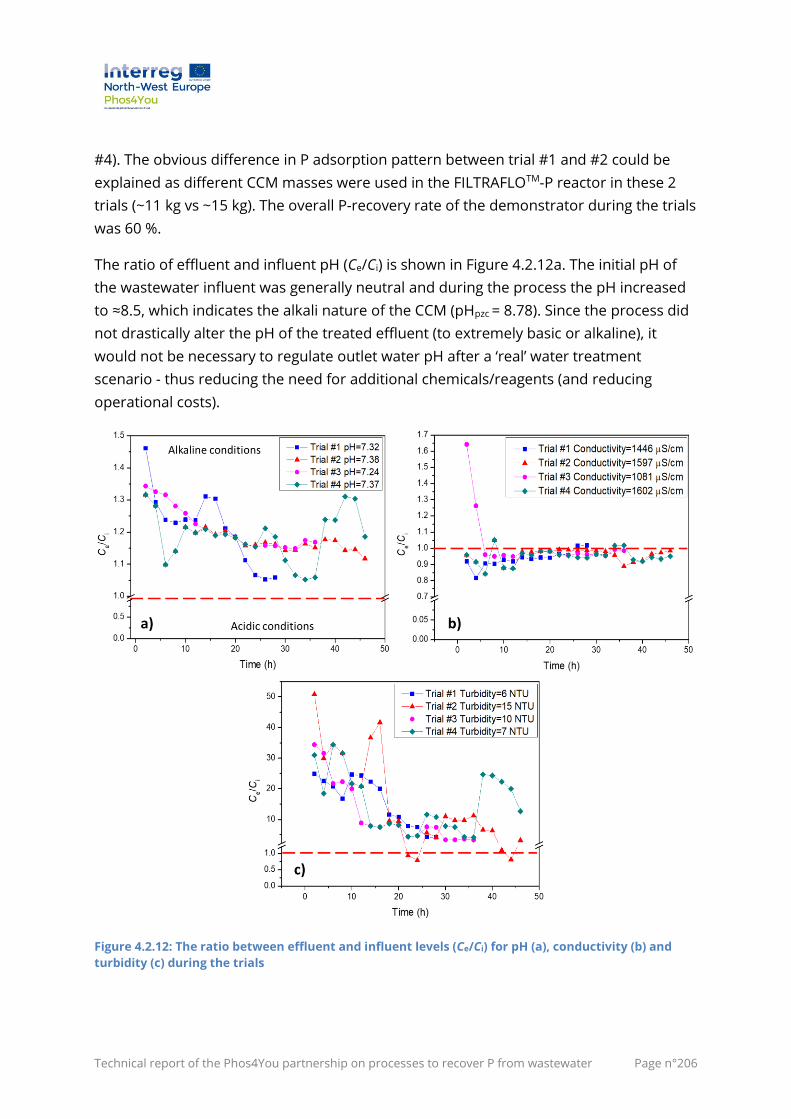
Technical report of the Phos4You partnership on processes to recover P from wastewater Page n°206
#4). The obvious difference in P adsorption pattern between trial #1 and #2 could be
explained as different CCM masses were used in the FILTRAFLOTM-P reactor in these 2
trials (~11 kg vs ~15 kg). The overall P-recovery rate of the demonstrator during the trials
was 60 %.
The ratio of effluent and influent pH (Ce/Ci) is shown in Figure 4.2.12a. The initial pH of
the wastewater influent was generally neutral and during the process the pH increased
to ≈8.5, which indicates the alkali nature of the CCM (pHpzc = 8.78). Since the process did
not drastically alter the pH of the treated effluent (to extremely basic or alkaline), it
would not be necessary to regulate outlet water pH after a ‘real’ water treatment
scenario - thus reducing the need for additional chemicals/reagents (and reducing
operational costs).
Figure 4.2.12: The ratio between effluent and influent levels (Ce/Ci) for pH (a), conductivity (b) and
turbidity (c) during the trials
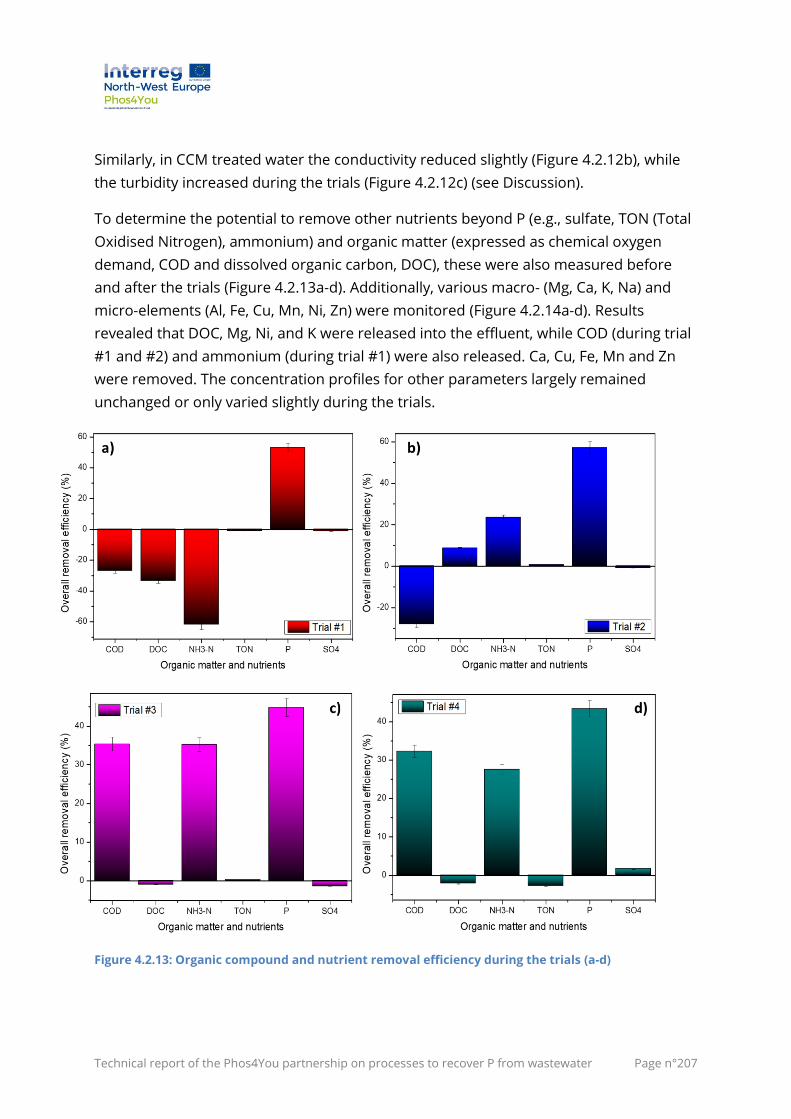
Technical report of the Phos4You partnership on processes to recover P from wastewater Page n°207
Similarly, in CCM treated water the conductivity reduced slightly (Figure 4.2.12b), while
the turbidity increased during the trials (Figure 4.2.12c) (see Discussion).
To determine the potential to remove other nutrients beyond P (e.g., sulfate, TON (Total
Oxidised Nitrogen), ammonium) and organic matter (expressed as chemical oxygen
demand, COD and dissolved organic carbon, DOC), these were also measured before
and after the trials (Figure 4.2.13a-d). Additionally, various macro- (Mg, Ca, K, Na) and
micro-elements (Al, Fe, Cu, Mn, Ni, Zn) were monitored (Figure 4.2.14a-d). Results
revealed that DOC, Mg, Ni, and K were released into the effluent, while COD (during trial
#1 and #2) and ammonium (during trial #1) were also released. Ca, Cu, Fe, Mn and Zn
were removed. The concentration profiles for other parameters largely remained
unchanged or only varied slightly during the trials.
Figure 4.2.13: Organic compound and nutrient removal efficiency during the trials (a-d)
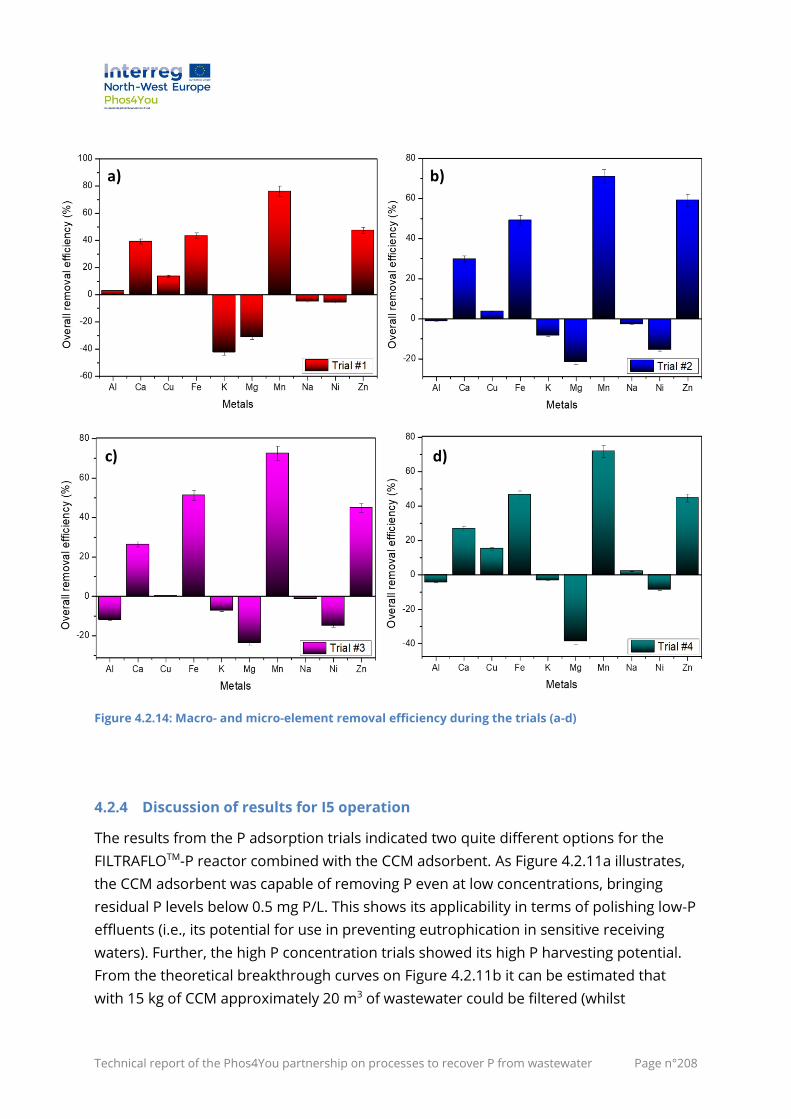
Technical report of the Phos4You partnership on processes to recover P from wastewater Page n°208
Figure 4.2.14: Macro- and micro-element removal efficiency during the trials (a-d)
4.2.4 Discussion of results for I5 operation
The results from the P adsorption trials indicated two quite different options for the
FILTRAFLOTM-P reactor combined with the CCM adsorbent. As Figure 4.2.11a illustrates,
the CCM adsorbent was capable of removing P even at low concentrations, bringing
residual P levels below 0.5 mg P/L. This shows its applicability in terms of polishing low-P
effluents (i.e., its potential for use in preventing eutrophication in sensitive receiving
waters). Further, the high P concentration trials showed its high P harvesting potential.
From the theoretical breakthrough curves on Figure 4.2.11b it can be estimated that
with 15 kg of CCM approximately 20 m3 of wastewater could be filtered (whilst
Technical report of the Phos4You partnership on processes to recover P from wastewater Page n°209
harvesting P). Further process optimisation should be considered, related to the bed
height in the reactor, flow rate of the influent and granulation of the CCM adsorbent.
At alkaline pH values, OH− ions may interfere directly with P adsorption; but this may be
(partially) counteracted by favoured hydroxyapatite (Ca5(PO4)3(OH)) precipitation on the
CCM surface at pH 8–9 (a microprecipitation mechanism). Another important removal
mechanism under these conditions was ligand exchange whereby H2PO4− and HPO4
2−
anions replaced CO32− on the CCM surface and formed inner-sphere surface complexes
(via Lewis acid-base interactions between P and ≡Ca–CO3 groups). P anions behave like
Lewis bases, and can act as electron donors, donating electron pairs by binding to Ca
atoms. At the same time, carbonate ions may be displaced into solution, driving pH
increases (Figure 4.2.12a).
The sharp increase in turbidity at the beginning of each trial could be due to
smaller/lighter adsorbent particles being washed out (flowrates were ~200 L/h). After
this initial stage, the turbidity levels started to decrease again and stabilised at ~10 times
the influent values (~50-60 NTU). This could be connected with the main CCM P removal
mechanism, namely, the replacement of carbonate (CO32−) ions. These may then form
salts with available Mg, Na and K in the treated wastewater and thus increase turbidity.
This points to the necessity to integrate/combine the FILTRAFLOTM-P unit with further
filtration (e.g., slow sand filtration). Slow sand filtration is a cost-effective and low energy
technology. It easily integrates with physico-chemical (FILTRAFLOTM-P) and biological
processes for turbidity removal from wastewater (Verma et al. 2017).
CCM COD (indicative of organic compounds) and ammonium removal may have
additional benefits, if this were to increase the organic carbon and nitrogen content of
the loaded CCM material, assuming these organics are not undesirable harmful
contaminants (which will be assessed/detailed in the Quality Examination report). Mg
and K release could be explained by the material composition, since the CCM adsorbent
contains high levels of Mg (originating from the crab carapace itself) and K (from the
activation with potassium hydroxide).
Additional confirmation of the governing removal mechanisms at play for P, could be
seen in the removal trends for metals such Ca, Cu, Fe, Mn and Zn. It is well known that
alkaline earth and transition metals can strongly adsorb to phosphate between pH 6 and
9. They can thus bond to phosphate ions at the adsorbent surface through inner sphere
complexation (e.g., ligand exchange with carbonates in this case).
Technical report of the Phos4You partnership on processes to recover P from wastewater Page n°210
4.2.5 Conclusion for I5
On the basis of above, the main conclusions here are:
• The optimum conditions found for the CCM adsorbent production process were
a 1:1 ratio of potassium hydroxide: crab carapace (g/g), with an activation
temperature of 105 °C and an activation time of 150 min.
• The produced CCM possessed higher crystallisation, richer surface chemistry, a
larger surface area and higher porosity when compared to raw crab carapace.
• Lab-scale studies confirmed P to be effectively adsorbed onto the CCM under
slightly alkaline conditions (pH > 7) through mixed mechanisms, which included
mainly inner-sphere complexation (ligand exchange) and microprecipitation (as
hydroxyapatite).
• The P-loaded CCM was also amenable to efficient desorption (using 0.5 M HCl or
2 % citric acid), indicating its potential to serve as P rich soil amendment material
(wherein the P would not be excessively soluble, i.e., in water alone).
• High P removal/recovery potential was achieved in pilot scale WWTP trials even at
low P concentrations, bringing the residual P level below 1 mg/L (the EU limit for
sensitive water bodies).
• Surface microprecipitation and inner-sphere complexation were postulated as
key P adsorption mechanisms in real wastewater effluent trials due to reduced
concentrations of Fe, Ca, Cu, Mn and Ca. Also, the high inorganic carbon
(carbonate) concentration in treated effluent indicated ligand-exchange through
these metals (mainly Ca).
• The slightly increased turbidity noted in treated water (e.g., likely due to
magnesium and potassium carbonates) may require integration/combination of
the FILTRAFLO™-P unit with slow sand filtration.
• The results showed that the FILTRAFLO™-P unit with CCM could serve as a water
polishing unit (with low P concentration effluents) and/or as a P harvesting unit
(where P concentrations were high).
• Future work will involve pot and field-based plant growth trials to consider P
uptake/availability in different soils/crops using the P-loaded CCM (using material
obtained from the Bo’ness trials or from other trials in the future on different P
rich waste streams).
Technical report of the Phos4You partnership on processes to recover P from wastewater Page n°211
4.3 Demonstrator I6.2: P precipitation at small-scale WWTPs (downscaled
Struvia™)
Authors: Joe Harrington, Denise Barnett, Niamh Power, Asif
Siddiqui, Ciaran O´Donnell (MTU); Cédric Mébarki (Veolia)
The demonstrator I6.2 aims to investigate the process of phosphorus removal and its
recovery from municipal wastewater using lime for chemical precipitation; this is one of
a range of P-recovery technologies from wastewater that has been applied (Bunce et al.
2018; Cornel and Schaum 2009; Macintosh et al. 2019; Ryan et al. 2016).
4.3.1 Preparation of I6.2
Background
A vital element of the investigation is the operation of a pilot plant at an Irish municipal
wastewater treatment plant. A trial agreement to operate a pilot plant at the Macroom
Wastewater Treatment Plant (WWTP) was developed and formally signed on 26th
September 2019 between Munster Technological University (MTU) and Irish Water. This
was preceded by a comprehensive study of potentially suitable wastewater treatment
facilities in the Cork Region before the Macroom Plant was selected for the pilot study.
In compliance with the agreement, all relevant MTU staff members have completed the
necessary training (Safe Pass and Manual Handling) and have undertaken the necessary
course of vaccinations to meet the Irish Water requirements to work at the WWTP.
Following the Covid-19 pandemic (March 2020) additional health and safety
documentation and actions were required to protect the public, MTU and Irish Water
staff and for general operations at the Macroom WWTP. A comprehensive Covid19
health and safety risk assessment and plan was prepared in line with public health
guidance. The items implemented for the health and safety plan included procedures
for travel to and from site, and onsite procedures for PPE, social distancing and
sanitization.
The pilot plant is based on the Struvia™ technology (developed by Veolia Water, France -
Veolia Water Technologies 2016) and is located at the Macroom Wastewater Treatment
Plant. The Macroom wastewater treatment plant (WWTP) was selected as a suitable site
for the Struvia™ P-Recovery pilot plant after an extensive search commencing in
September 2017. The WWTP is located approximately 35 km west of Cork city. It
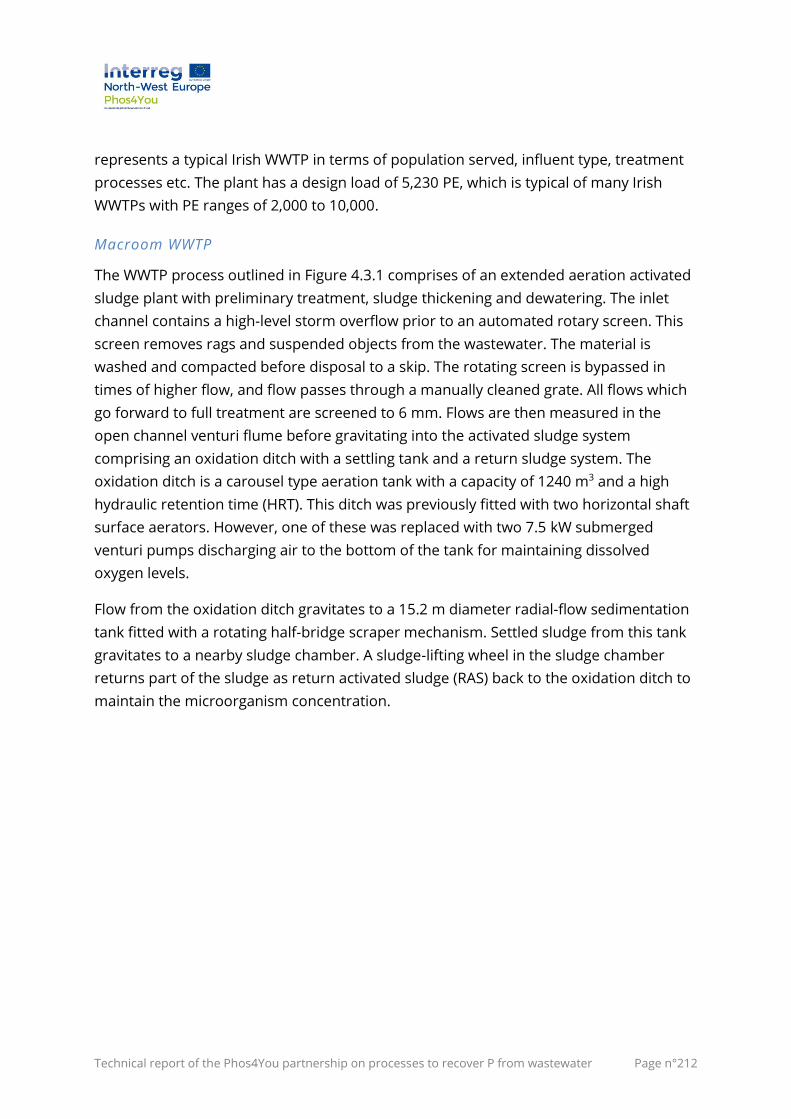
Technical report of the Phos4You partnership on processes to recover P from wastewater Page n°212
represents a typical Irish WWTP in terms of population served, influent type, treatment
processes etc. The plant has a design load of 5,230 PE, which is typical of many Irish
WWTPs with PE ranges of 2,000 to 10,000.
Macroom WWTP
The WWTP process outlined in Figure 4.3.1 comprises of an extended aeration activated
sludge plant with preliminary treatment, sludge thickening and dewatering. The inlet
channel contains a high-level storm overflow prior to an automated rotary screen. This
screen removes rags and suspended objects from the wastewater. The material is
washed and compacted before disposal to a skip. The rotating screen is bypassed in
times of higher flow, and flow passes through a manually cleaned grate. All flows which
go forward to full treatment are screened to 6 mm. Flows are then measured in the
open channel venturi flume before gravitating into the activated sludge system
comprising an oxidation ditch with a settling tank and a return sludge system. The
oxidation ditch is a carousel type aeration tank with a capacity of 1240 m3 and a high
hydraulic retention time (HRT). This ditch was previously fitted with two horizontal shaft
surface aerators. However, one of these was replaced with two 7.5 kW submerged
venturi pumps discharging air to the bottom of the tank for maintaining dissolved
oxygen levels.
Flow from the oxidation ditch gravitates to a 15.2 m diameter radial-flow sedimentation
tank fitted with a rotating half-bridge scraper mechanism. Settled sludge from this tank
gravitates to a nearby sludge chamber. A sludge-lifting wheel in the sludge chamber
returns part of the sludge as return activated sludge (RAS) back to the oxidation ditch to
maintain the microorganism concentration.
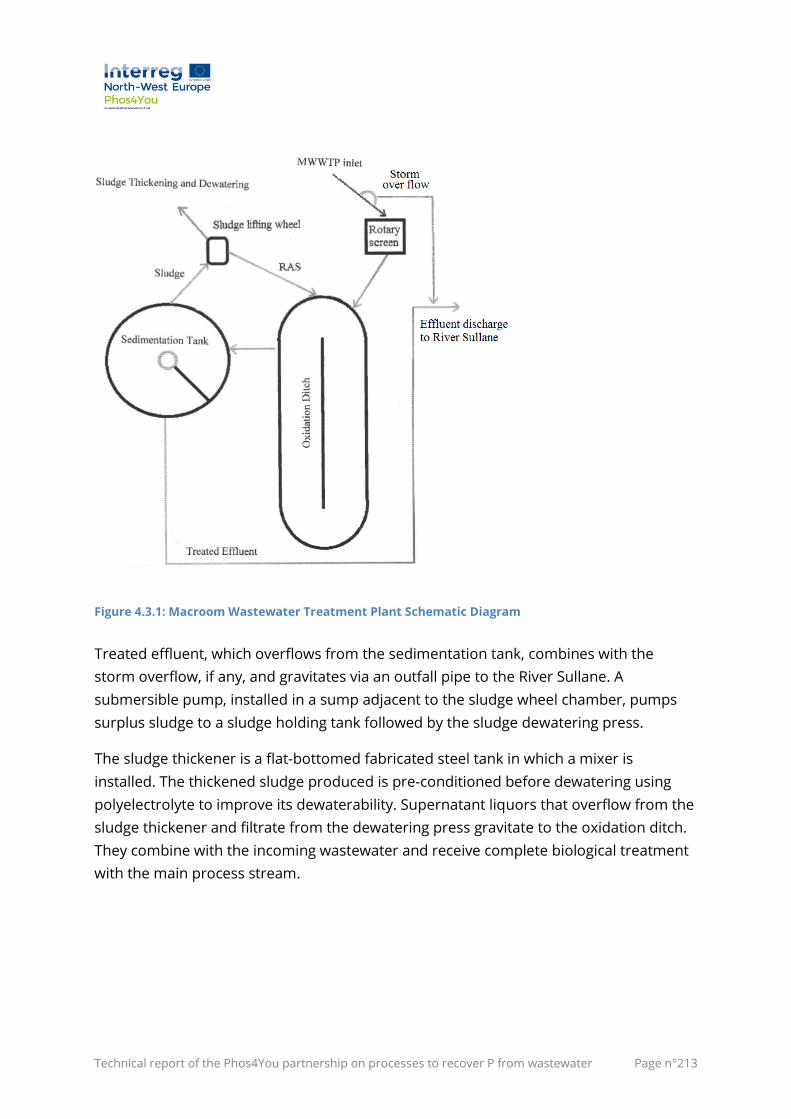
Technical report of the Phos4You partnership on processes to recover P from wastewater Page n°213
Figure 4.3.1: Macroom Wastewater Treatment Plant Schematic Diagram
Treated effluent, which overflows from the sedimentation tank, combines with the
storm overflow, if any, and gravitates via an outfall pipe to the River Sullane. A
submersible pump, installed in a sump adjacent to the sludge wheel chamber, pumps
surplus sludge to a sludge holding tank followed by the sludge dewatering press.
The sludge thickener is a flat-bottomed fabricated steel tank in which a mixer is
installed. The thickened sludge produced is pre-conditioned before dewatering using
polyelectrolyte to improve its dewaterability. Supernatant liquors that overflow from the
sludge thickener and filtrate from the dewatering press gravitate to the oxidation ditch.
They combine with the incoming wastewater and receive complete biological treatment
with the main process stream.
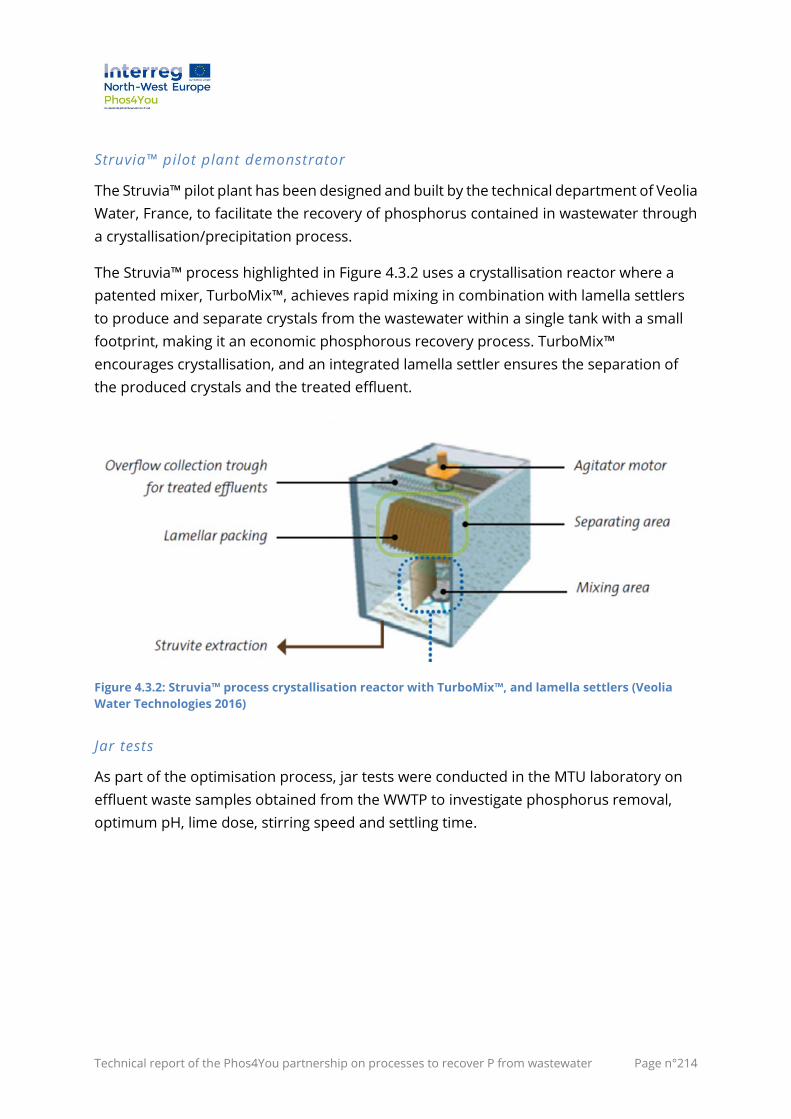
Technical report of the Phos4You partnership on processes to recover P from wastewater Page n°214
Struvia™ pilot plant demonstrator
The Struvia™ pilot plant has been designed and built by the technical department of Veolia
Water, France, to facilitate the recovery of phosphorus contained in wastewater through
a crystallisation/precipitation process.
The Struvia™ process highlighted in Figure 4.3.2 uses a crystallisation reactor where a
patented mixer, TurboMix™, achieves rapid mixing in combination with lamella settlers
to produce and separate crystals from the wastewater within a single tank with a small
footprint, making it an economic phosphorous recovery process. TurboMix™
encourages crystallisation, and an integrated lamella settler ensures the separation of
the produced crystals and the treated effluent.
Figure 4.3.2: Struvia™ process crystallisation reactor with TurboMix™, and lamella settlers (Veolia
Water Technologies 2016)
Jar tests
As part of the optimisation process, jar tests were conducted in the MTU laboratory on
effluent waste samples obtained from the WWTP to investigate phosphorus removal,
optimum pH, lime dose, stirring speed and settling time.
Technical report of the Phos4You partnership on processes to recover P from wastewater Page n°215
Figure 4.3.3: Jar test apparatus (Pictures: MTU)
Jar tests were conducted in batch experiments using lime addition on both a synthetic
wastewater solution and the actual wastewater effluent from the WWTP.
Synthetic wastewater: A synthetic solution containing 20 mg/L phosphorus was
prepared by dissolving reagent grade KH2PO4 in deionised water. This wastewater was
poured into six glass jars to a volume of 500 ml. Increasing quantities of hydrated lime
(commercial lime powder containing 95 % Ca(OH)2) were added to each jar. Immediately
after lime addition, synthetic wastewater solution was mixed with a stirrer at 200 rpm
for 1 minute, followed by slow mixing at 60 rpm for 20 minutes to encourage
flocculation of the precipitates in a jar test assembly shown in Figure 4.3.3. After mixing,
precipitates were allowed to settle for 30 minutes, and then the supernatant in each jar
was analysed for phosphorus concentration. The results of the jar test experiment using
synthetic wastewater are presented in Table 4.3.1. The concentration of phosphorus
was determined with the Hach DR 2800 spectrophotometer.
Table 4.3.1: Results of the jar test experiment using synthetic waste.
Beaker (500 mL) Lime Dose (mg/L) pH PO4-P
concentration
(mg/L)
1 100 9.68 3.1
2 200 10.03 2.4
3 300 10.28 1.5
4 400 10.47 1.1
5 500 10.78 0.9
6 600 10.93 0.5
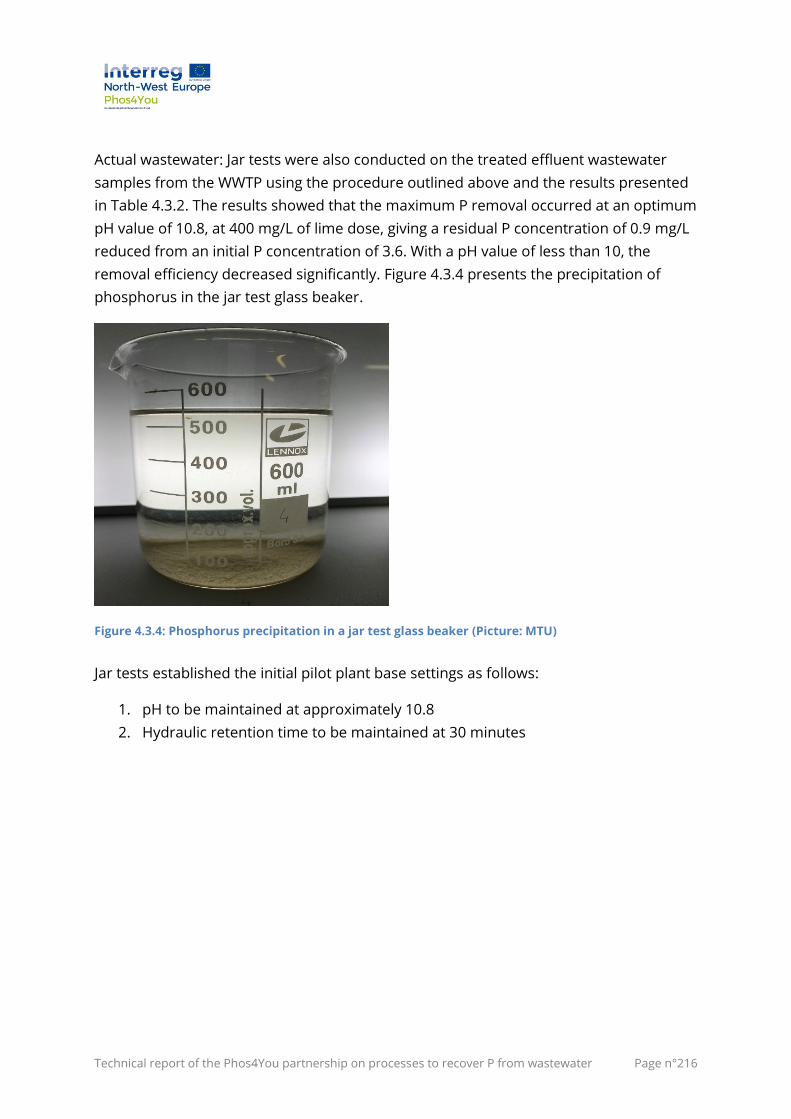
Technical report of the Phos4You partnership on processes to recover P from wastewater Page n°216
Actual wastewater: Jar tests were also conducted on the treated effluent wastewater
samples from the WWTP using the procedure outlined above and the results presented
in Table 4.3.2. The results showed that the maximum P removal occurred at an optimum
pH value of 10.8, at 400 mg/L of lime dose, giving a residual P concentration of 0.9 mg/L
reduced from an initial P concentration of 3.6. With a pH value of less than 10, the
removal efficiency decreased significantly. Figure 4.3.4 presents the precipitation of
phosphorus in the jar test glass beaker.
Figure 4.3.4: Phosphorus precipitation in a jar test glass beaker (Picture: MTU)
Jar tests established the initial pilot plant base settings as follows:
1. pH to be maintained at approximately 10.8
2. Hydraulic retention time to be maintained at 30 minutes

Technical report of the Phos4You partnership on processes to recover P from wastewater Page n°217
Table 4.3.2: Results of the jar test experiment using treated effluent from the WWTP
Sample 1: Initial PO4-P concentration = 3.6 mg/L
Beaker (500 mL) Lime Dose (mg/L) pH PO4-P concentration
(mg/L)
1 80 8.61 3.1
2 160 9.73 2.9
3 240 10.19 2.5
4 320 10.56 1.3
5 400 10.80 0.9
6 480 10.95 0.9
Sample 2: Initial PO4-P concentration = 4.3 mg/L
Beaker (500 mL) Lime Dose (mg/L) pH PO4-P concentration
(mg/L)
1 80 9.21 3.2
2 160 10.17 2.8
3 240 10.38 2.1
4 320 10.57 1.7
5 400 10.82 1.1
6 480 11.04 1.0
Sample 3: Initial PO4-P concentration = 3.1 mg/L
Beaker (500 mL) Lime Dose (mg/L) pH PO4-P concentration
(mg/L)
1 80 8.93 2.6
2 160 9.77 2.1
3 240 10.14 1.5
4 320 10.38 1.2
5 400 10.85 0.9
6 480 11.10 0.8
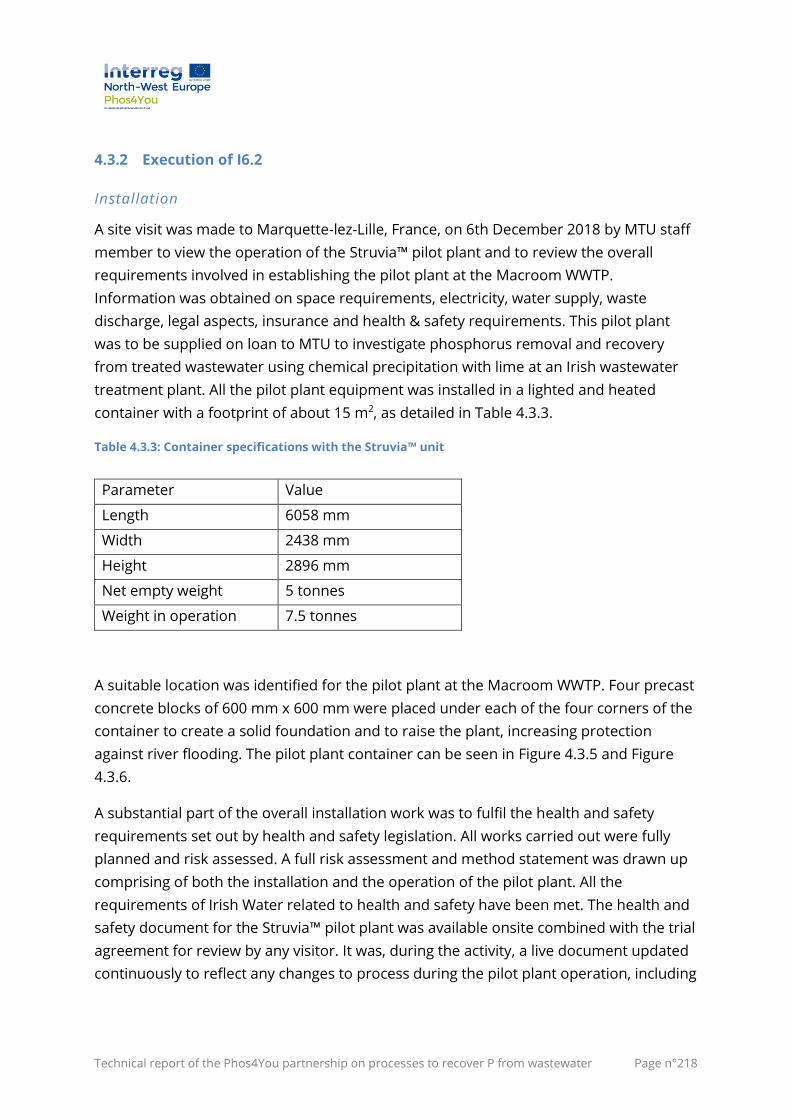
Technical report of the Phos4You partnership on processes to recover P from wastewater Page n°218
4.3.2 Execution of I6.2
Installation
A site visit was made to Marquette-lez-Lille, France, on 6th December 2018 by MTU staff
member to view the operation of the Struvia™ pilot plant and to review the overall
requirements involved in establishing the pilot plant at the Macroom WWTP.
Information was obtained on space requirements, electricity, water supply, waste
discharge, legal aspects, insurance and health & safety requirements. This pilot plant
was to be supplied on loan to MTU to investigate phosphorus removal and recovery
from treated wastewater using chemical precipitation with lime at an Irish wastewater
treatment plant. All the pilot plant equipment was installed in a lighted and heated
container with a footprint of about 15 m2, as detailed in Table 4.3.3.
Table 4.3.3: Container specifications with the Struvia™ unit
Parameter Value
Length 6058 mm
Width 2438 mm
Height 2896 mm
Net empty weight 5 tonnes
Weight in operation 7.5 tonnes
A suitable location was identified for the pilot plant at the Macroom WWTP. Four precast
concrete blocks of 600 mm x 600 mm were placed under each of the four corners of the
container to create a solid foundation and to raise the plant, increasing protection
against river flooding. The pilot plant container can be seen in Figure 4.3.5 and Figure
4.3.6.
A substantial part of the overall installation work was to fulfil the health and safety
requirements set out by health and safety legislation. All works carried out were fully
planned and risk assessed. A full risk assessment and method statement was drawn up
comprising of both the installation and the operation of the pilot plant. All the
requirements of Irish Water related to health and safety have been met. The health and
safety document for the Struvia™ pilot plant was available onsite combined with the trial
agreement for review by any visitor. It was, during the activity, a live document updated
continuously to reflect any changes to process during the pilot plant operation, including
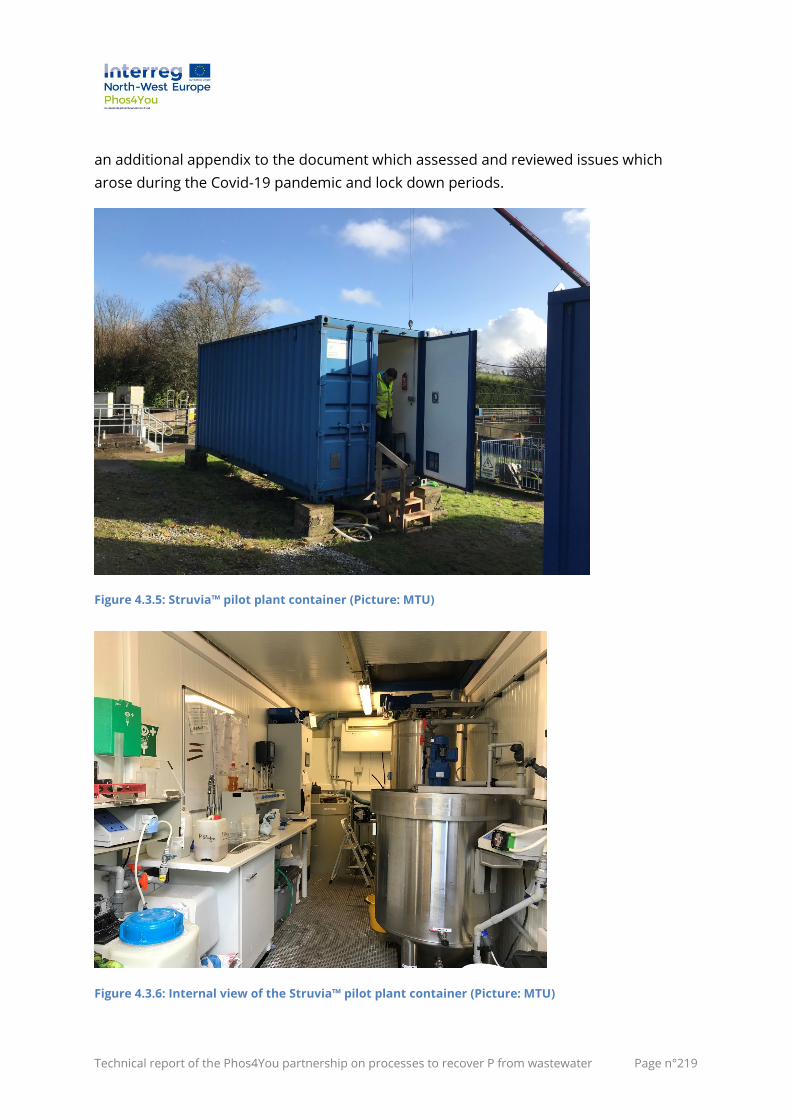
Technical report of the Phos4You partnership on processes to recover P from wastewater Page n°219
an additional appendix to the document which assessed and reviewed issues which
arose during the Covid-19 pandemic and lock down periods.
Figure 4.3.5: Struvia™ pilot plant container (Picture: MTU)
Figure 4.3.6: Internal view of the Struvia™ pilot plant container (Picture: MTU)
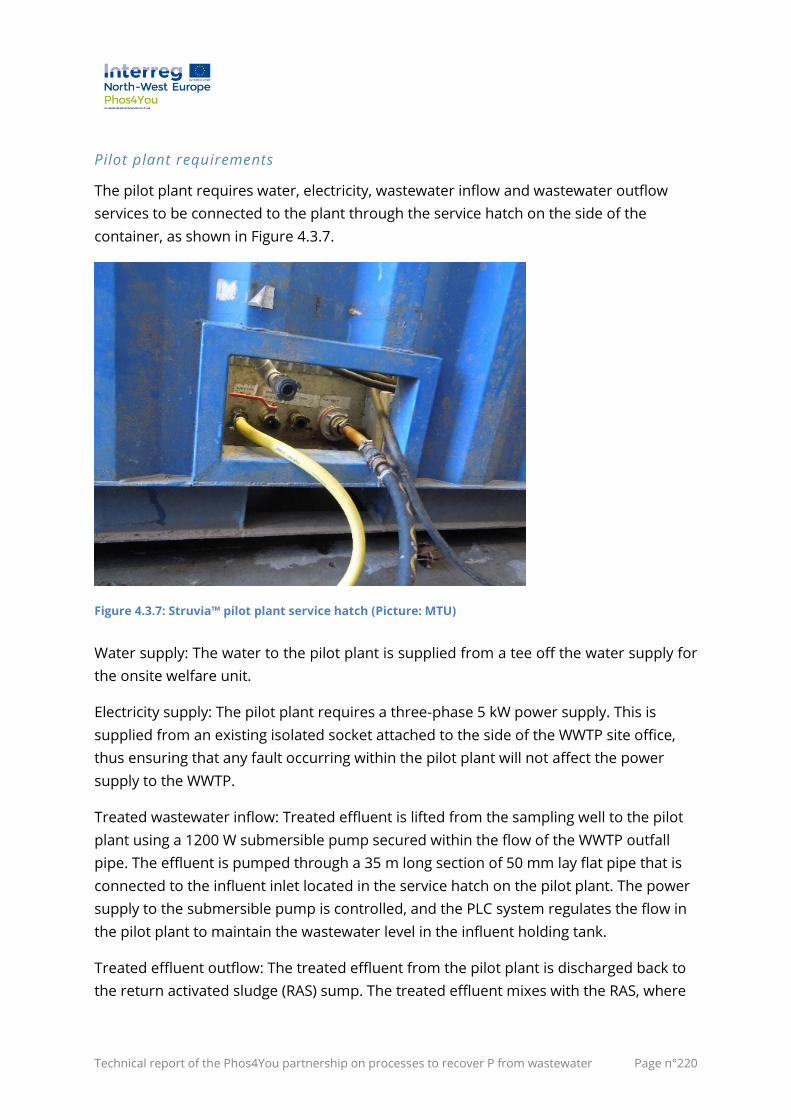
Technical report of the Phos4You partnership on processes to recover P from wastewater Page n°220
Pilot plant requirements
The pilot plant requires water, electricity, wastewater inflow and wastewater outflow
services to be connected to the plant through the service hatch on the side of the
container, as shown in Figure 4.3.7.
Figure 4.3.7: Struvia™ pilot plant service hatch (Picture: MTU)
Water supply: The water to the pilot plant is supplied from a tee off the water supply for
the onsite welfare unit.
Electricity supply: The pilot plant requires a three-phase 5 kW power supply. This is
supplied from an existing isolated socket attached to the side of the WWTP site office,
thus ensuring that any fault occurring within the pilot plant will not affect the power
supply to the WWTP.
Treated wastewater inflow: Treated effluent is lifted from the sampling well to the pilot
plant using a 1200 W submersible pump secured within the flow of the WWTP outfall
pipe. The effluent is pumped through a 35 m long section of 50 mm lay flat pipe that is
connected to the influent inlet located in the service hatch on the pilot plant. The power
supply to the submersible pump is controlled, and the PLC system regulates the flow in
the pilot plant to maintain the wastewater level in the influent holding tank.
Treated effluent outflow: The treated effluent from the pilot plant is discharged back to
the return activated sludge (RAS) sump. The treated effluent mixes with the RAS, where
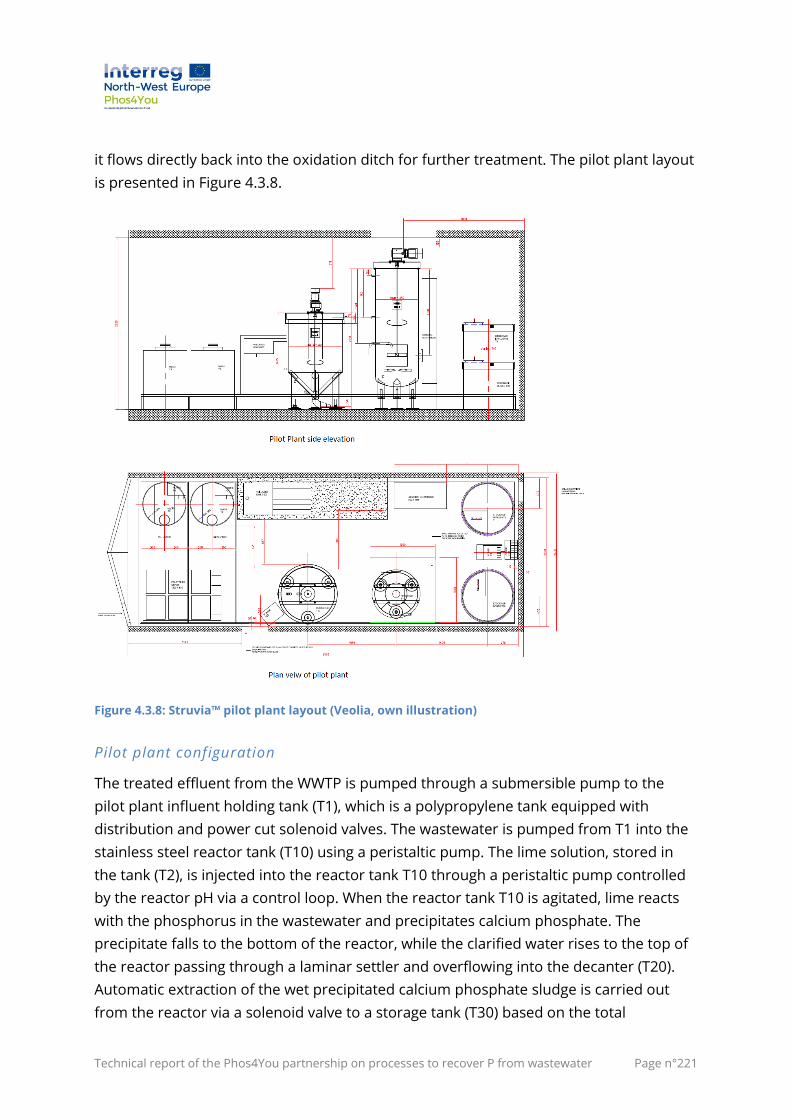
Technical report of the Phos4You partnership on processes to recover P from wastewater Page n°221
it flows directly back into the oxidation ditch for further treatment. The pilot plant layout
is presented in Figure 4.3.8.
Figure 4.3.8: Struvia™ pilot plant layout (Veolia, own illustration)
Pilot plant configuration
The treated effluent from the WWTP is pumped through a submersible pump to the
pilot plant influent holding tank (T1), which is a polypropylene tank equipped with
distribution and power cut solenoid valves. The wastewater is pumped from T1 into the
stainless steel reactor tank (T10) using a peristaltic pump. The lime solution, stored in
the tank (T2), is injected into the reactor tank T10 through a peristaltic pump controlled
by the reactor pH via a control loop. When the reactor tank T10 is agitated, lime reacts
with the phosphorus in the wastewater and precipitates calcium phosphate. The
precipitate falls to the bottom of the reactor, while the clarified water rises to the top of
the reactor passing through a laminar settler and overflowing into the decanter (T20).
Automatic extraction of the wet precipitated calcium phosphate sludge is carried out
from the reactor via a solenoid valve to a storage tank (T30) based on the total
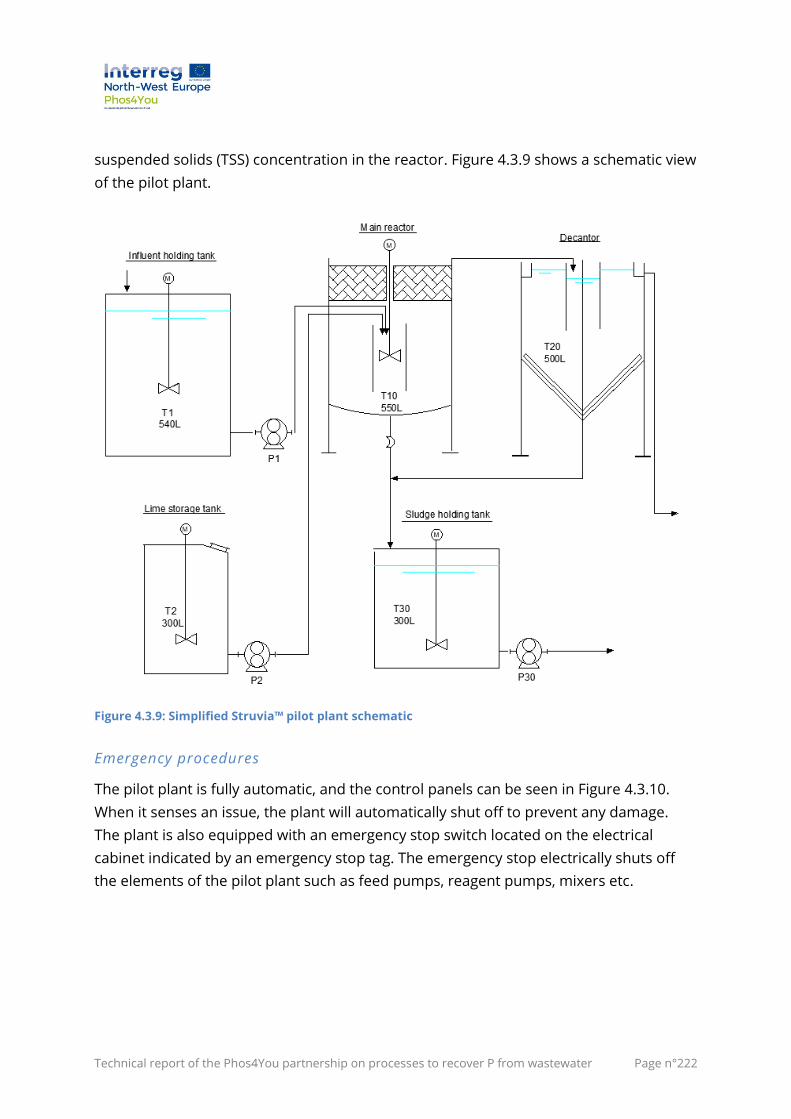
Technical report of the Phos4You partnership on processes to recover P from wastewater Page n°222
suspended solids (TSS) concentration in the reactor. Figure 4.3.9 shows a schematic view
of the pilot plant.
Figure 4.3.9: Simplified Struvia™ pilot plant schematic
Emergency procedures
The pilot plant is fully automatic, and the control panels can be seen in Figure 4.3.10.
When it senses an issue, the plant will automatically shut off to prevent any damage.
The plant is also equipped with an emergency stop switch located on the electrical
cabinet indicated by an emergency stop tag. The emergency stop electrically shuts off
the elements of the pilot plant such as feed pumps, reagent pumps, mixers etc.
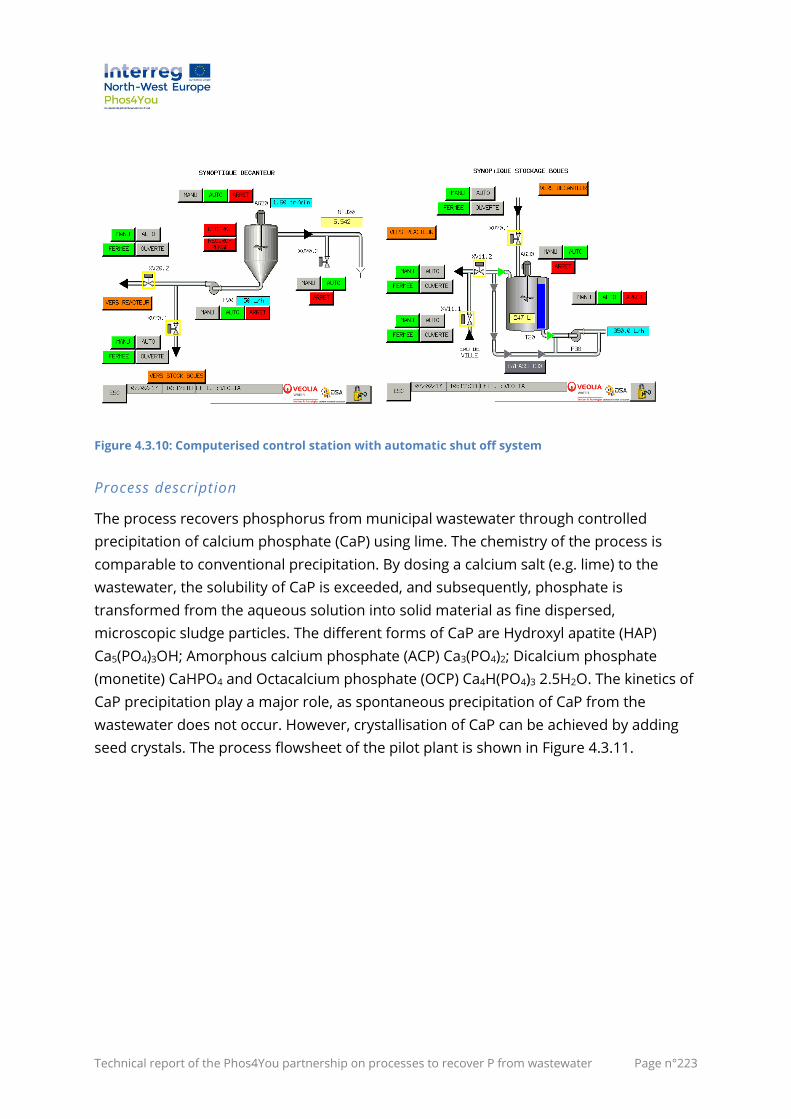
Technical report of the Phos4You partnership on processes to recover P from wastewater Page n°223
Figure 4.3.10: Computerised control station with automatic shut off system
Process description
The process recovers phosphorus from municipal wastewater through controlled
precipitation of calcium phosphate (CaP) using lime. The chemistry of the process is
comparable to conventional precipitation. By dosing a calcium salt (e.g. lime) to the
wastewater, the solubility of CaP is exceeded, and subsequently, phosphate is
transformed from the aqueous solution into solid material as fine dispersed,
microscopic sludge particles. The different forms of CaP are Hydroxyl apatite (HAP)
Ca5(PO4)3OH; Amorphous calcium phosphate (ACP) Ca3(PO4)2; Dicalcium phosphate
(monetite) CaHPO4 and Octacalcium phosphate (OCP) Ca4H(PO4)3 2.5H2O. The kinetics of
CaP precipitation play a major role, as spontaneous precipitation of CaP from the
wastewater does not occur. However, crystallisation of CaP can be achieved by adding
seed crystals. The process flowsheet of the pilot plant is shown in Figure 4.3.11.
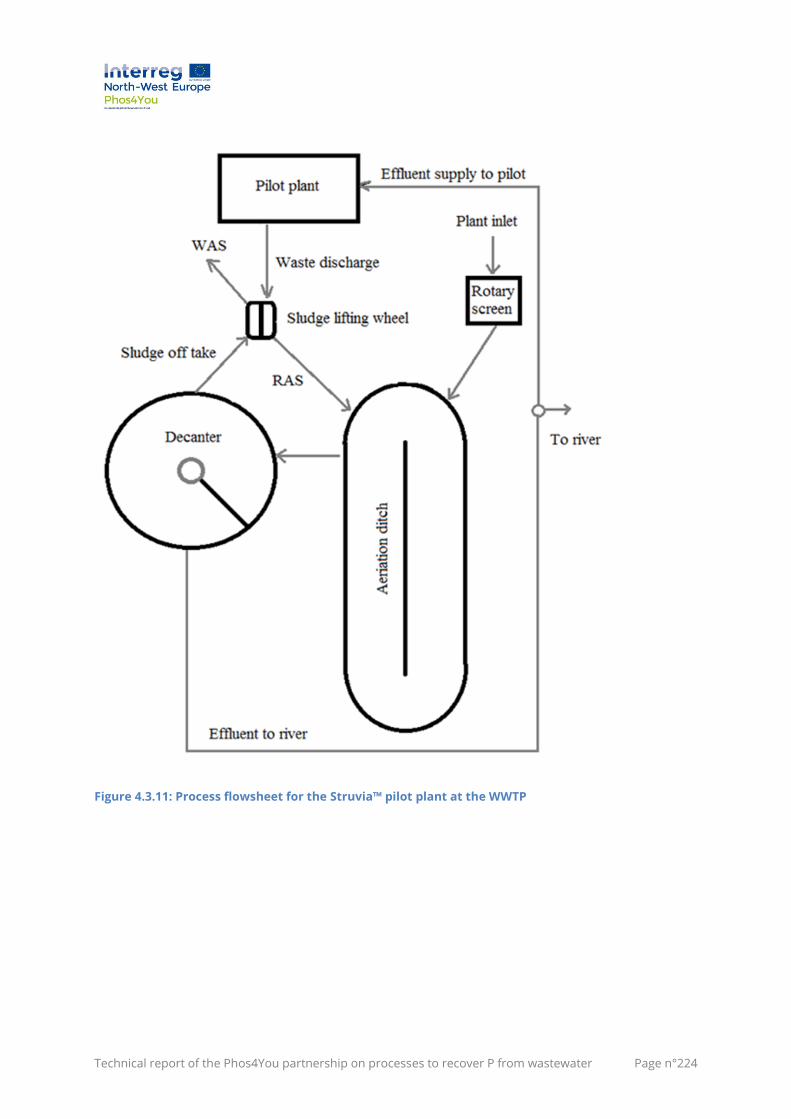
Technical report of the Phos4You partnership on processes to recover P from wastewater Page n°224
Figure 4.3.11: Process flowsheet for the Struvia™ pilot plant at the WWTP
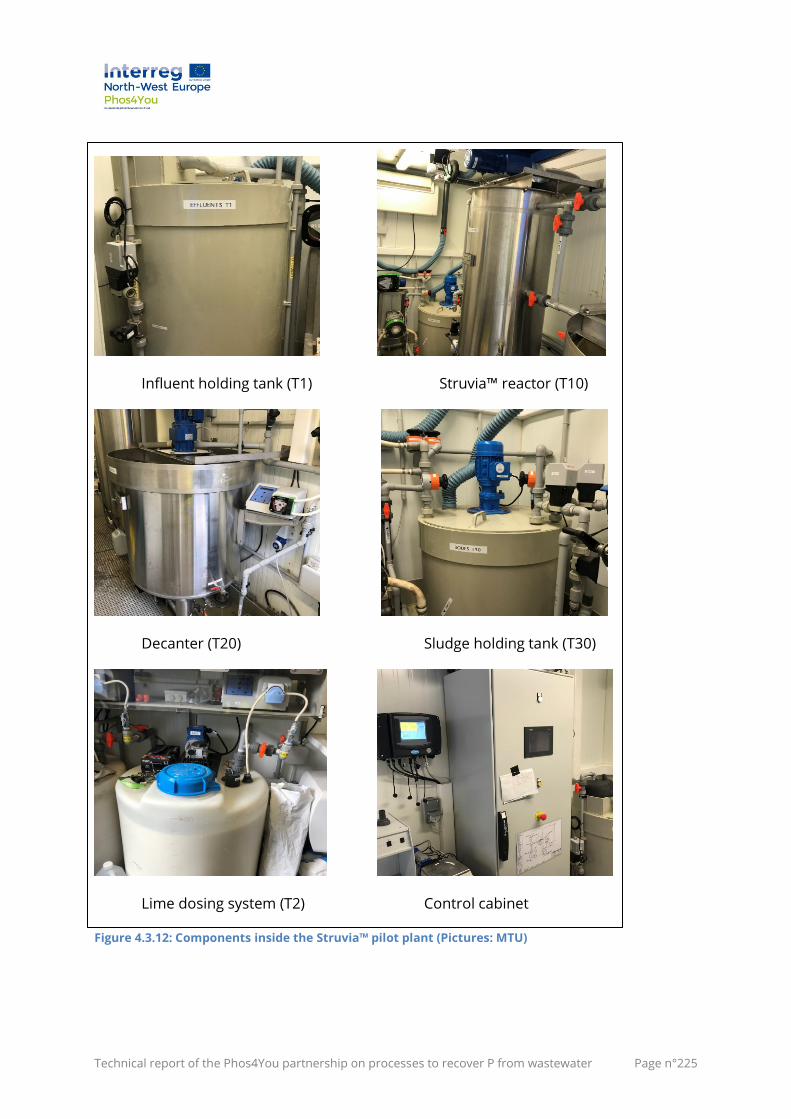
Technical report of the Phos4You partnership on processes to recover P from wastewater Page n°225
Influent holding tank (T1) Struvia™ reactor (T10)
Decanter (T20) Sludge holding tank (T30)
Lime dosing system (T2) Control cabinet
Figure 4.3.12: Components inside the Struvia™ pilot plant (Pictures: MTU)
Technical report of the Phos4You partnership on processes to recover P from wastewater Page n°226
In the Struvia™ reactor, the two-step precipitation and solid/liquid separation occur in
the same device. The mixing zone is equipped with a vertical mixer/stirrer, a draft tube
and several baffles to optimise the mixing and the chemical injection. Above the mixing
zone is an integrated lamella settler to ensure the separation of the treated effluent and
the precipitates. On-line probes for pH, turbidity and TSS are used to control the
process. Figure 4.3.12 shows photographs of the different components of the pilot
plant.
Pilot plant operation
The effluent from WWTP is pumped from the sampling well to the pilot plant, and the
flow is regulated by the PLC system in the pilot plant. The waste is then pumped at 500
L/h in an upward direction through the cylindrical reactor into the mixing and reaction
zone where 3 % lime solution is also injected and pH is controlled in the range 10.7 to
10.9 using a pH probe. The CaP precipitates are formed and grow in the reactor
maintained at an HRT value of 30 minutes with a mixing speed of 100 rpm. Growing
precipitates in the reactor are held in suspension and at the start, 3 kg of crushed
limestone fines (100 – 200 µm size) was injected as seed material in the bottom of the
reactor to initiate the establishment of a fluidised bed.
The fluidised bed enables CaP precipitates to grow and allows the bigger particles to
settle in the conic bottom of the reactor. In contrast, the smaller particles are kept in the
loop until they become large enough to settle. These precipitates subsequently settle
and form sludge, which is discharged in a small quantity from the bottom of the reactor
at regular intervals. A TSS probe records the average concentration of precipitates in the
reactor. When a target concentration of TSS in the reactor is reached, the precipitates
are drained and collected. In consultation with Veolia the solids extraction point was
then set at 60 g/L and the suspended solids above this concentration are drained and
collected out of the reactor.
These precipitates are dried to obtain a recovered P product, as shown in Figure 4.3.13.
Lamella packing retains most precipitates in the mixing zone and the treated effluent
from the top of the reactor flows into the decanter equipped with a scraper. Some
precipitates settle at the bottom of the decanter and are pumped back to the reactor to
promote precipitate growth. The supernatant of the decanter is checked for turbidity
with a turbidity probe and discharged to the RAS sump to return to the oxidation ditch
for further treatment.
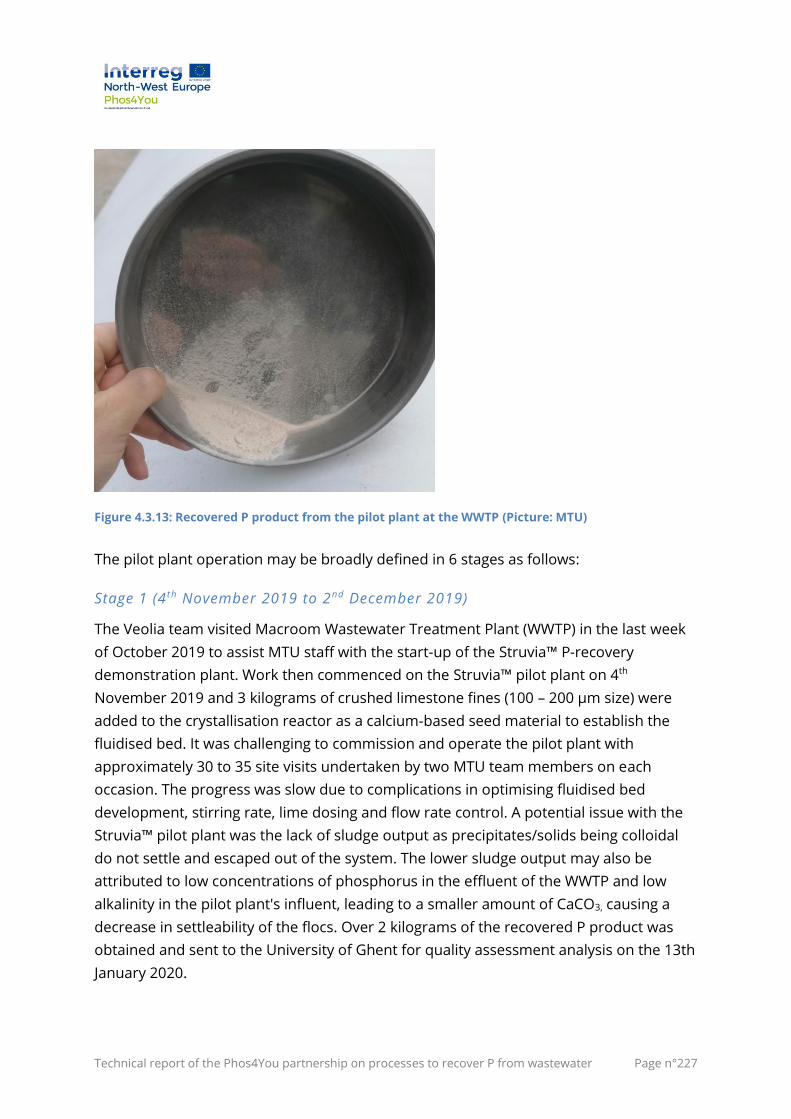
Technical report of the Phos4You partnership on processes to recover P from wastewater Page n°227
Figure 4.3.13: Recovered P product from the pilot plant at the WWTP (Picture: MTU)
The pilot plant operation may be broadly defined in 6 stages as follows:
Stage 1 (4 th November 2019 to 2nd December 2019)
The Veolia team visited Macroom Wastewater Treatment Plant (WWTP) in the last week
of October 2019 to assist MTU staff with the start-up of the Struvia™ P-recovery
demonstration plant. Work then commenced on the Struvia™ pilot plant on 4th
November 2019 and 3 kilograms of crushed limestone fines (100 – 200 µm size) were
added to the crystallisation reactor as a calcium-based seed material to establish the
fluidised bed. It was challenging to commission and operate the pilot plant with
approximately 30 to 35 site visits undertaken by two MTU team members on each
occasion. The progress was slow due to complications in optimising fluidised bed
development, stirring rate, lime dosing and flow rate control. A potential issue with the
Struvia™ pilot plant was the lack of sludge output as precipitates/solids being colloidal
do not settle and escaped out of the system. The lower sludge output may also be
attributed to low concentrations of phosphorus in the effluent of the WWTP and low
alkalinity in the pilot plant's influent, leading to a smaller amount of CaCO3, causing a
decrease in settleability of the flocs. Over 2 kilograms of the recovered P product was
obtained and sent to the University of Ghent for quality assessment analysis on the 13th
January 2020.
Technical report of the Phos4You partnership on processes to recover P from wastewater Page n°228
The fluidised bed could not be stabilised and a high amount of solids escaped with the
effluent from the system leading to the temporary shutdown of the pilot plant on the
2nd December 2019. Total suspended solids (TSS) in the incoming treated effluent from
the WWTP were in the range 10-20 mg/L, whereas the TSS going out with the effluent
from the pilot plant was in the range 30-60 mg/L.
Stage 2 (27 th January 2020 to 19 th February 2020)
The Veolia Water team from France visited again in the 3rd week of January 2020 to assist
MTU with the plant's restart and optimisation of the process. A new system for poly
dosing was set up to inject cationic polymer at a dose of 0.4 mg/L in the influent to the
main reactor to facilitate the floc formation and settling of fine precipitates. Several
issues were encountered before achieving the entire operation of the process, including
blockages to the lime dosing pipe, and improper functioning of valves, sensors and the
submersible pump.
Work recommenced on the Struvia™ P-recovery demonstration plant on 27th January
2020 to ensure the optimisation and continued operation of the demonstrator unit. The
bed was gradually established and stabilised until 19th February 2020. The restart
process, commissioning and optimisation process was very challenging, but the pilot
plant became fully operational to establish the fluidised bed with promising outcomes.
The Struvia™ pilot plant was initially ran during the daytime before being subsequently
operated continuously for periods up to one week.
Stage 3 (20 th February 2020 to 27 th November 2020 – including pre and post-
Covid lockdown periods)
The Struvia™ P-recovery demonstration plant operated continuously and was working
satisfactorily at a steady-state before it was closed down on 12th March 2020 due to
Covid-19 restrictions under a directive from Irish Water, the owner of WWTP. 40 to 45
site visits to the WWTP took place over the period from 27th January 2020 to 12th March
2020. The waste stream contains low concentrations of P, making direct recovery of
phosphorus technically challenging. The lower sludge output may also be attributed to
the low alkalinity in the pilot plant's influent, leading to a smaller amount of CaCO3,
causing a decrease in settleability of the flocs. The waste samples were collected and
analysed in the MTU laboratory for pH, alkalinity, total suspended solids, COD,
phosphorus and total nitrogen content. The TSS concentration in the effluent from the
pilot plant was maintained in the range of 15-25 mg/L. The average pH of the pilot plant
effluent was 10.37. The recovered P product was harvested daily, and approximately 15
kilograms was obtained, of which approximately 5-6 kilogram has been used at MTU in
Technical report of the Phos4You partnership on processes to recover P from wastewater Page n°229
field and pot trials for quality assessment. Following a lengthy health and safety
assessment process, permission was granted to restart operations at Macroom WWTP.
Testing recommenced on 18th November 2020. The plant was recommissioned over two
days before being operated at pH 10.80 for an additional six days.
Stage 4 (26 th November 2020 to 22nd December 2020)
This involved operating the pilot plant at incrementally lowered pH levels, in a bid to
reduce pilot plant inputs. The work focused on reducing the quantity of hydrated lime
being used within the system, as hydrated lime has a high carbon footprint. Previous jar
test experiments have highlighted that varying levels of P removal occur at or above a
pH of 10.0. To review the effects of P removal and recovery at varying pH levels, a
research plan was devised to incrementally lower the pH levels of the plant to 10.6, 10.4
and 10.0. At each incremental pH level, it was intended to operate the plant for at least
one week.
Stage 5 (11 th January 2021 to 20 th January 2021 – Testing of recycled products)
Stage 5 consisted of replacing hydrated lime with recycled calcium products to reduce
the overall carbon footprint of the recovery process. Preliminary jar tests indicated that
recycled plasterboard (gypsum) could remove sufficient quantities of P when combined
with equal amounts of hydrated lime. Testing commenced on the inclusion of recycled
calcium products in the pilot plant from 11th January 2021 and concluded on 20th January
2021.
Stage 6 (11 th February 2021)
Comprised of the pilot plant shutdown and decommissioning process. It was conducted
over four days commencing on 11th February 2021.
4.3.3 Analyses of results of I6.2 operation
The phosphorus concentration in the WWTP is reduced by conventional sewage
treatment from 10 - 12 mg/L in the raw sewage to 3-4 mg/L in the treated effluent. The
pH values and phosphorus concentrations of the influent and effluent wastewater
samples of the pilot plant were analysed in stage 1 operation and the results are shown
in Table 4.3.4.
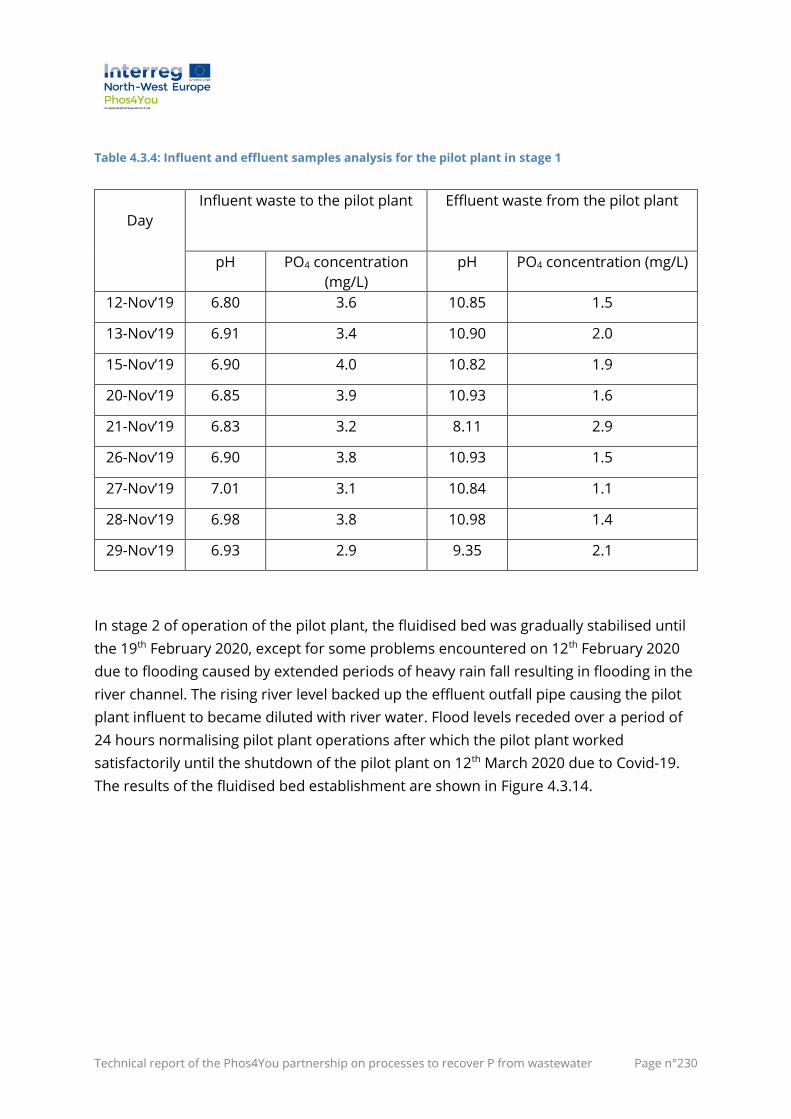
Technical report of the Phos4You partnership on processes to recover P from wastewater Page n°230
Table 4.3.4: Influent and effluent samples analysis for the pilot plant in stage 1
Day
Influent waste to the pilot plant Effluent waste from the pilot plant
pH PO4 concentration
(mg/L)
pH PO4 concentration (mg/L)
12-Nov’19 6.80 3.6 10.85 1.5
13-Nov’19 6.91 3.4 10.90 2.0
15-Nov’19 6.90 4.0 10.82 1.9
20-Nov’19 6.85 3.9 10.93 1.6
21-Nov’19 6.83 3.2 8.11 2.9
26-Nov’19 6.90 3.8 10.93 1.5
27-Nov’19 7.01 3.1 10.84 1.1
28-Nov’19 6.98 3.8 10.98 1.4
29-Nov’19 6.93 2.9 9.35 2.1
In stage 2 of operation of the pilot plant, the fluidised bed was gradually stabilised until
the 19th February 2020, except for some problems encountered on 12th February 2020
due to flooding caused by extended periods of heavy rain fall resulting in flooding in the
river channel. The rising river level backed up the effluent outfall pipe causing the pilot
plant influent to became diluted with river water. Flood levels receded over a period of
24 hours normalising pilot plant operations after which the pilot plant worked
satisfactorily until the shutdown of the pilot plant on 12th March 2020 due to Covid-19.
The results of the fluidised bed establishment are shown in Figure 4.3.14.
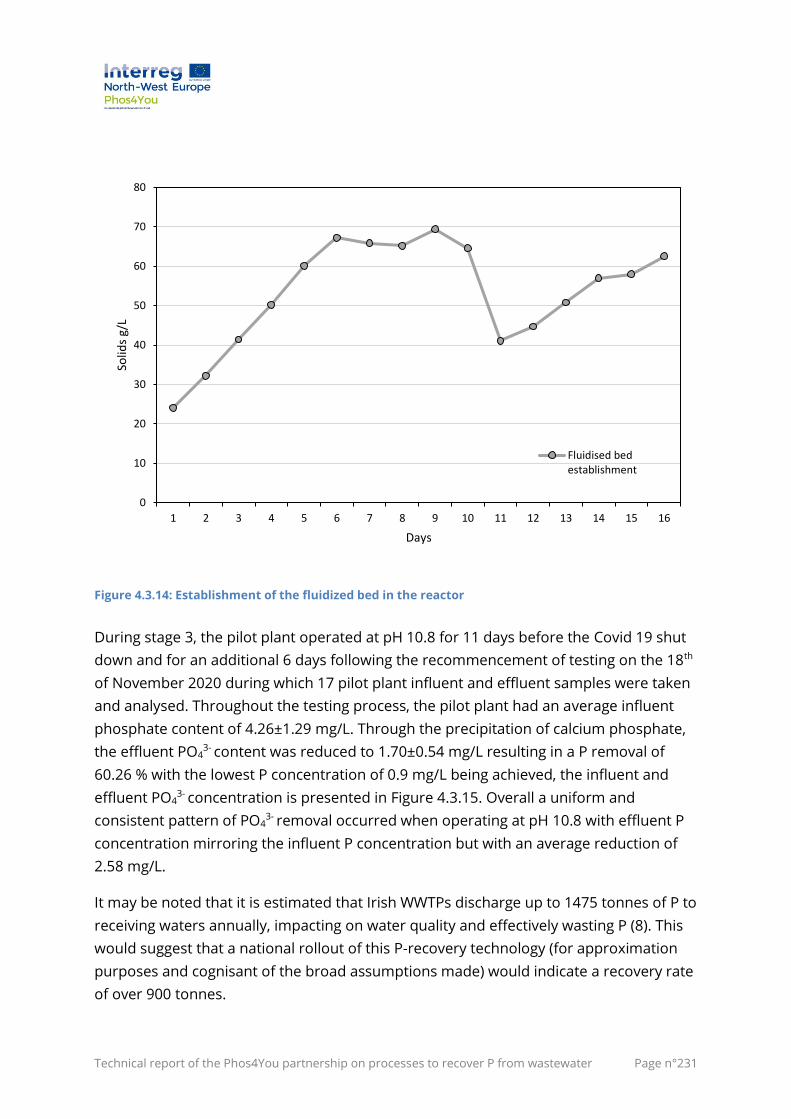
Technical report of the Phos4You partnership on processes to recover P from wastewater Page n°231
Figure 4.3.14: Establishment of the fluidized bed in the reactor
During stage 3, the pilot plant operated at pH 10.8 for 11 days before the Covid 19 shut
down and for an additional 6 days following the recommencement of testing on the 18th
of November 2020 during which 17 pilot plant influent and effluent samples were taken
and analysed. Throughout the testing process, the pilot plant had an average influent
phosphate content of 4.26±1.29 mg/L. Through the precipitation of calcium phosphate,
the effluent PO43- content was reduced to 1.70±0.54 mg/L resulting in a P removal of
60.26 % with the lowest P concentration of 0.9 mg/L being achieved, the influent and
effluent PO43- concentration is presented in Figure 4.3.15. Overall a uniform and
consistent pattern of PO43- removal occurred when operating at pH 10.8 with effluent P
concentration mirroring the influent P concentration but with an average reduction of
2.58 mg/L.
It may be noted that it is estimated that Irish WWTPs discharge up to 1475 tonnes of P to
receiving waters annually, impacting on water quality and effectively wasting P (8). This
would suggest that a national rollout of this P-recovery technology (for approximation
purposes and cognisant of the broad assumptions made) would indicate a recovery rate
of over 900 tonnes.
0
10
20
30
40
50
60
70
80
1 2 3 4 5 6 7 8 9 10 11 12 13 14 15 16
Solid
s g/
L
Days
Fluidised bedestablishment
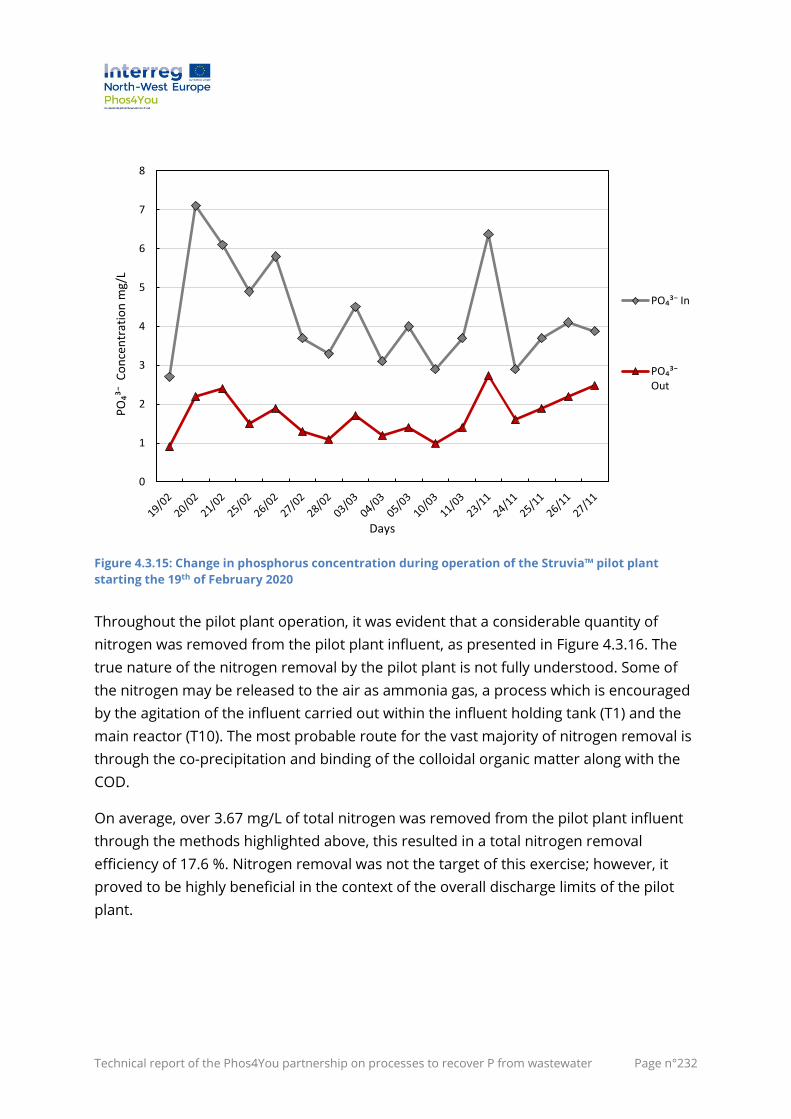
Technical report of the Phos4You partnership on processes to recover P from wastewater Page n°232
Figure 4.3.15: Change in phosphorus concentration during operation of the Struvia™ pilot plant
starting the 19th of February 2020
Throughout the pilot plant operation, it was evident that a considerable quantity of
nitrogen was removed from the pilot plant influent, as presented in Figure 4.3.16. The
true nature of the nitrogen removal by the pilot plant is not fully understood. Some of
the nitrogen may be released to the air as ammonia gas, a process which is encouraged
by the agitation of the influent carried out within the influent holding tank (T1) and the
main reactor (T10). The most probable route for the vast majority of nitrogen removal is
through the co-precipitation and binding of the colloidal organic matter along with the
COD.
On average, over 3.67 mg/L of total nitrogen was removed from the pilot plant influent
through the methods highlighted above, this resulted in a total nitrogen removal
efficiency of 17.6 %. Nitrogen removal was not the target of this exercise; however, it
proved to be highly beneficial in the context of the overall discharge limits of the pilot
plant.
0
1
2
3
4
5
6
7
8
PO₄³⁻
Co
nce
ntr
atio
n m
g/L
Days
PO₄³⁻ In
PO₄³⁻ Out
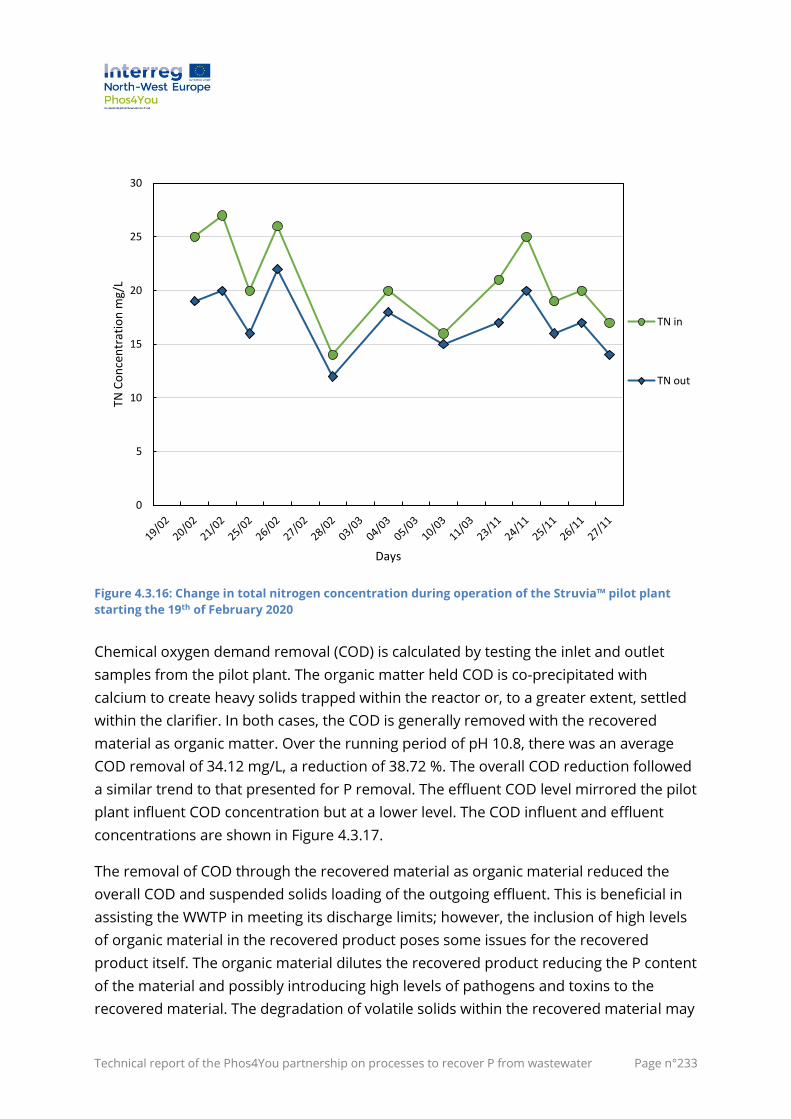
Technical report of the Phos4You partnership on processes to recover P from wastewater Page n°233
Figure 4.3.16: Change in total nitrogen concentration during operation of the Struvia™ pilot plant
starting the 19th of February 2020
Chemical oxygen demand removal (COD) is calculated by testing the inlet and outlet
samples from the pilot plant. The organic matter held COD is co-precipitated with
calcium to create heavy solids trapped within the reactor or, to a greater extent, settled
within the clarifier. In both cases, the COD is generally removed with the recovered
material as organic matter. Over the running period of pH 10.8, there was an average
COD removal of 34.12 mg/L, a reduction of 38.72 %. The overall COD reduction followed
a similar trend to that presented for P removal. The effluent COD level mirrored the pilot
plant influent COD concentration but at a lower level. The COD influent and effluent
concentrations are shown in Figure 4.3.17.
The removal of COD through the recovered material as organic material reduced the
overall COD and suspended solids loading of the outgoing effluent. This is beneficial in
assisting the WWTP in meeting its discharge limits; however, the inclusion of high levels
of organic material in the recovered product poses some issues for the recovered
product itself. The organic material dilutes the recovered product reducing the P content
of the material and possibly introducing high levels of pathogens and toxins to the
recovered material. The degradation of volatile solids within the recovered material may
0
5
10
15
20
25
30
TN C
on
cen
trat
ion
mg/
L
Days
TN in
TN out
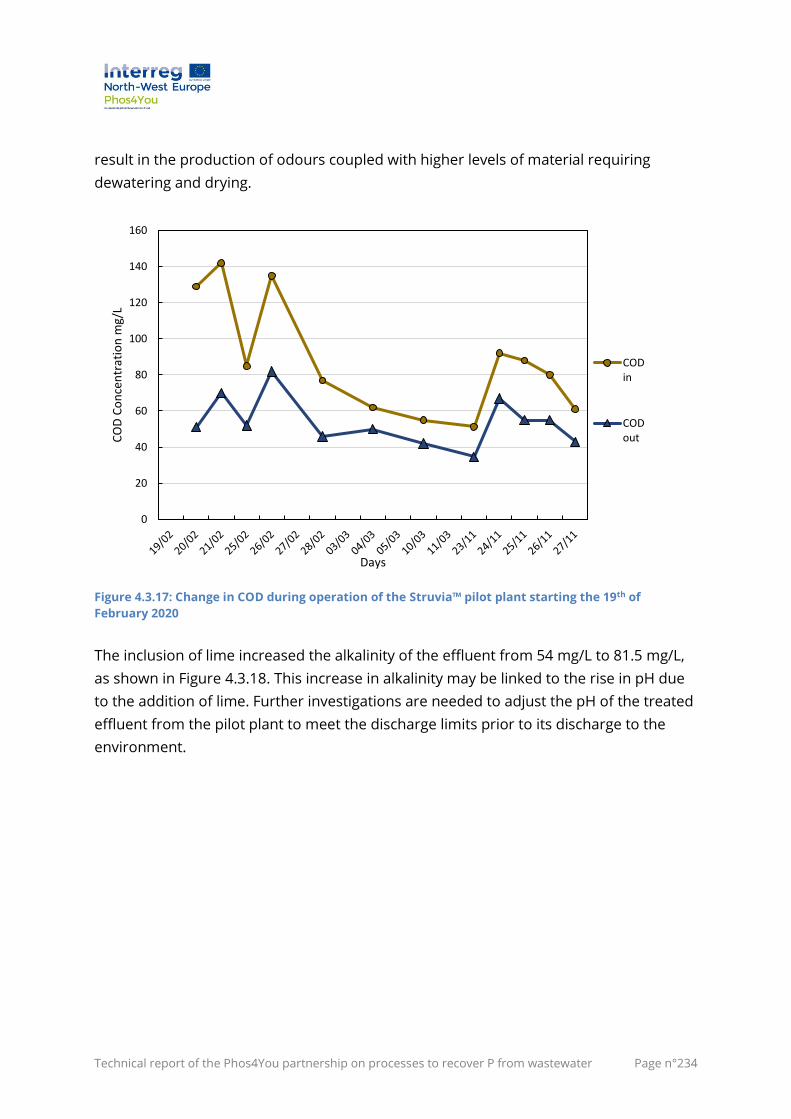
Technical report of the Phos4You partnership on processes to recover P from wastewater Page n°234
result in the production of odours coupled with higher levels of material requiring
dewatering and drying.
Figure 4.3.17: Change in COD during operation of the Struvia™ pilot plant starting the 19th of
February 2020
The inclusion of lime increased the alkalinity of the effluent from 54 mg/L to 81.5 mg/L,
as shown in Figure 4.3.18. This increase in alkalinity may be linked to the rise in pH due
to the addition of lime. Further investigations are needed to adjust the pH of the treated
effluent from the pilot plant to meet the discharge limits prior to its discharge to the
environment.
0
20
40
60
80
100
120
140
160
CO
D C
on
cen
trat
ion
mg/
L
Days
CODin
CODout
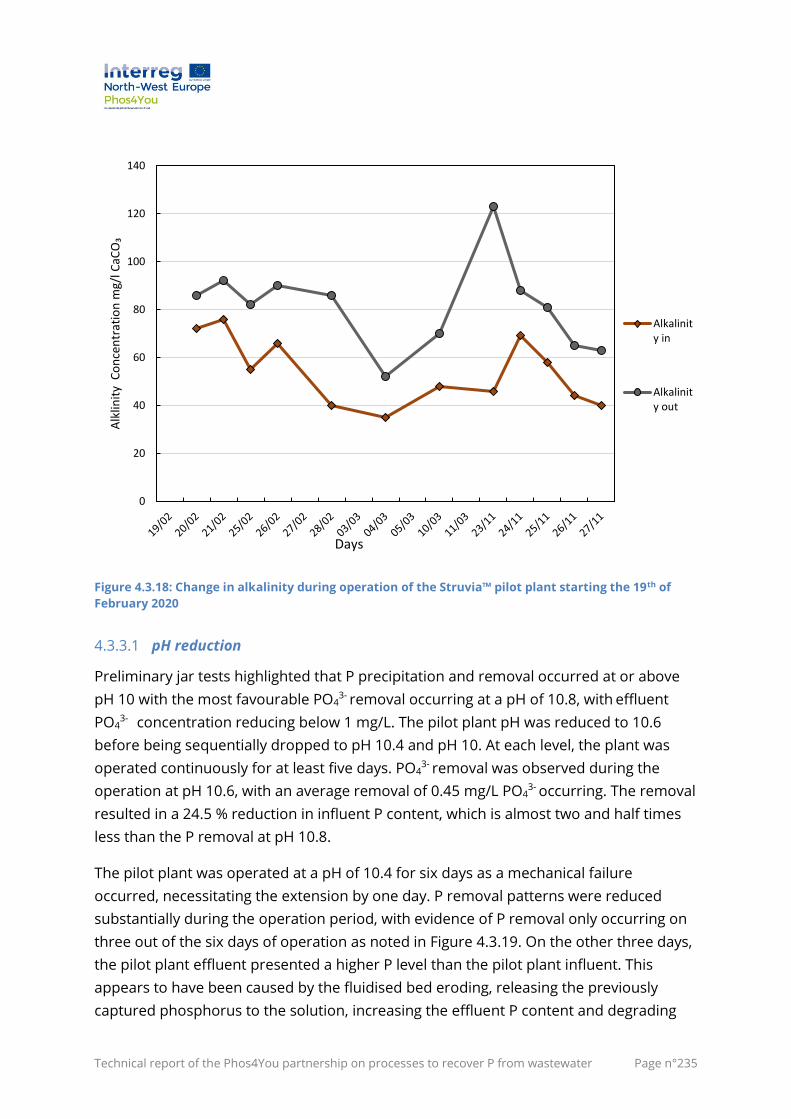
Technical report of the Phos4You partnership on processes to recover P from wastewater Page n°235
Figure 4.3.18: Change in alkalinity during operation of the Struvia™ pilot plant starting the 19th of
February 2020
4.3.3.1 pH reduction
Preliminary jar tests highlighted that P precipitation and removal occurred at or above
pH 10 with the most favourable PO43- removal occurring at a pH of 10.8, with effluent
PO43- concentration reducing below 1 mg/L. The pilot plant pH was reduced to 10.6
before being sequentially dropped to pH 10.4 and pH 10. At each level, the plant was
operated continuously for at least five days. PO43- removal was observed during the
operation at pH 10.6, with an average removal of 0.45 mg/L PO43- occurring. The removal
resulted in a 24.5 % reduction in influent P content, which is almost two and half times
less than the P removal at pH 10.8.
The pilot plant was operated at a pH of 10.4 for six days as a mechanical failure
occurred, necessitating the extension by one day. P removal patterns were reduced
substantially during the operation period, with evidence of P removal only occurring on
three out of the six days of operation as noted in Figure 4.3.19. On the other three days,
the pilot plant effluent presented a higher P level than the pilot plant influent. This
appears to have been caused by the fluidised bed eroding, releasing the previously
captured phosphorus to the solution, increasing the effluent P content and degrading
0
20
40
60
80
100
120
140
Alk
linit
y C
on
cen
trat
ion
mg/
l CaC
O₃
Alkalinity in
Alkalinity out
Days
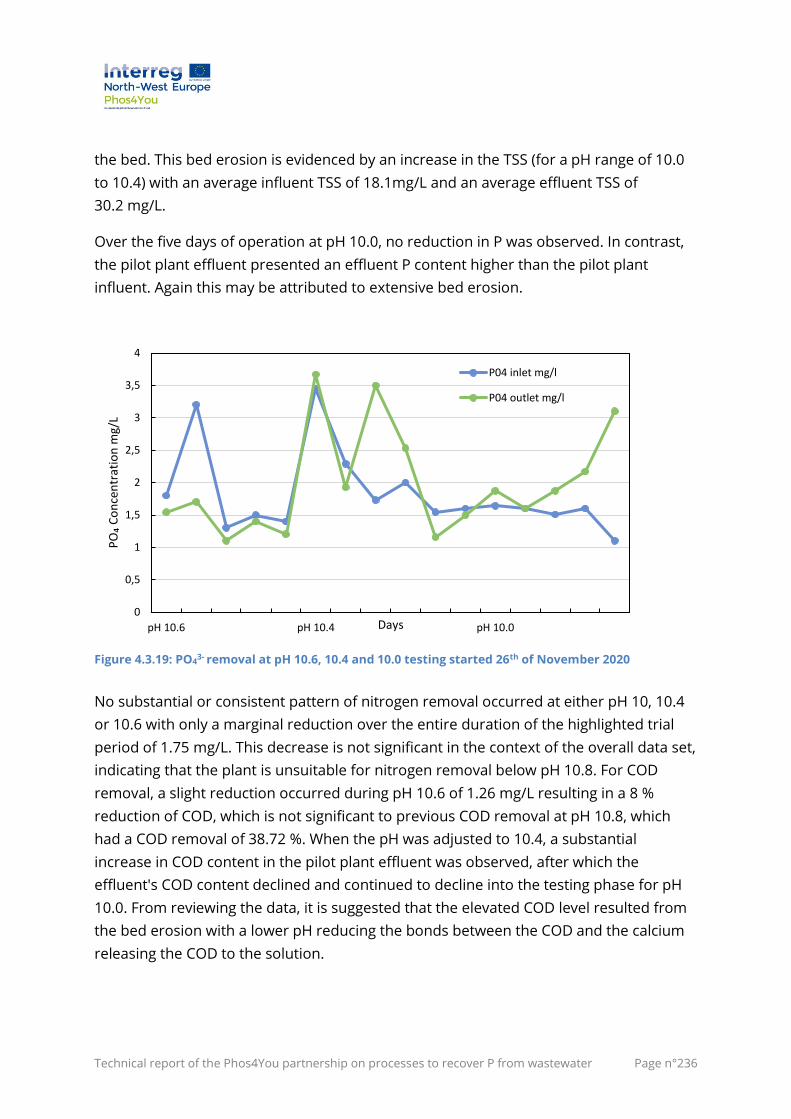
Technical report of the Phos4You partnership on processes to recover P from wastewater Page n°236
the bed. This bed erosion is evidenced by an increase in the TSS (for a pH range of 10.0
to 10.4) with an average influent TSS of 18.1mg/L and an average effluent TSS of
30.2 mg/L.
Over the five days of operation at pH 10.0, no reduction in P was observed. In contrast,
the pilot plant effluent presented an effluent P content higher than the pilot plant
influent. Again this may be attributed to extensive bed erosion.
Figure 4.3.19: PO43- removal at pH 10.6, 10.4 and 10.0 testing started 26th of November 2020
No substantial or consistent pattern of nitrogen removal occurred at either pH 10, 10.4
or 10.6 with only a marginal reduction over the entire duration of the highlighted trial
period of 1.75 mg/L. This decrease is not significant in the context of the overall data set,
indicating that the plant is unsuitable for nitrogen removal below pH 10.8. For COD
removal, a slight reduction occurred during pH 10.6 of 1.26 mg/L resulting in a 8 %
reduction of COD, which is not significant to previous COD removal at pH 10.8, which
had a COD removal of 38.72 %. When the pH was adjusted to 10.4, a substantial
increase in COD content in the pilot plant effluent was observed, after which the
effluent's COD content declined and continued to decline into the testing phase for pH
10.0. From reviewing the data, it is suggested that the elevated COD level resulted from
the bed erosion with a lower pH reducing the bonds between the COD and the calcium
releasing the COD to the solution.
0
0,5
1
1,5
2
2,5
3
3,5
4
pH 10.6 pH 10.4 pH 10.0
PO₄
Co
nce
ntr
atio
n m
g/L
Days
P04 inlet mg/l
P04 outlet mg/l
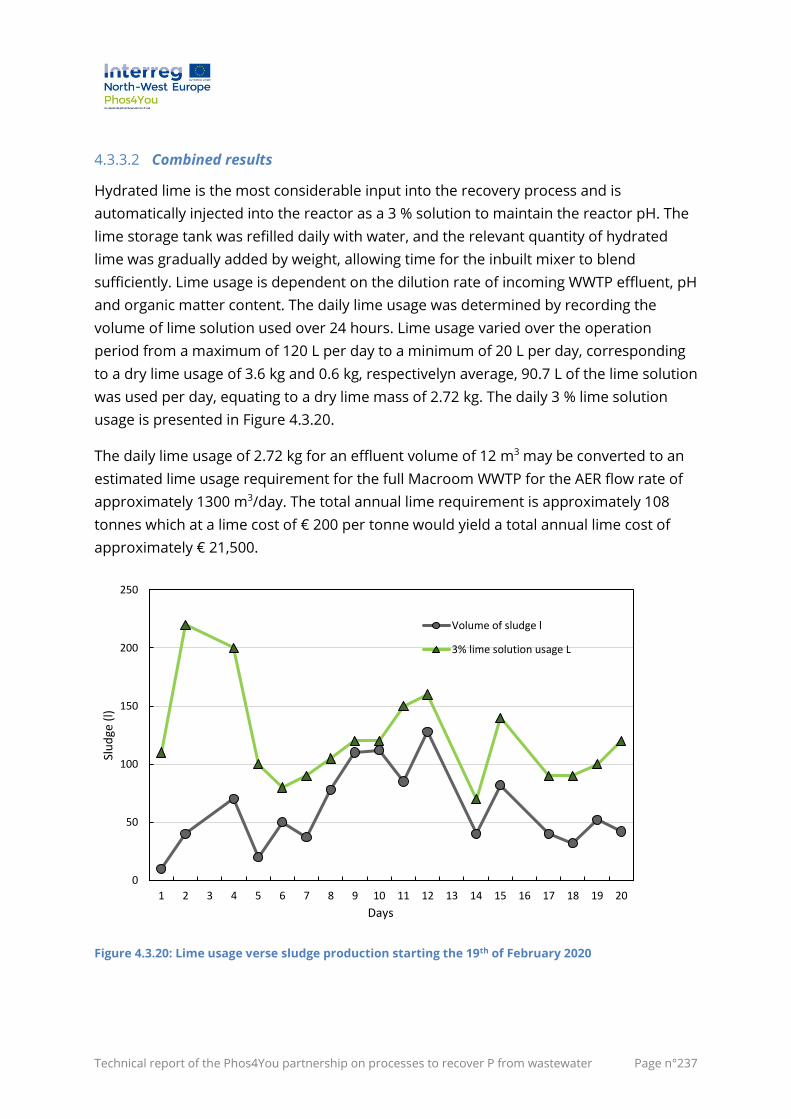
Technical report of the Phos4You partnership on processes to recover P from wastewater Page n°237
4.3.3.2 Combined results
Hydrated lime is the most considerable input into the recovery process and is
automatically injected into the reactor as a 3 % solution to maintain the reactor pH. The
lime storage tank was refilled daily with water, and the relevant quantity of hydrated
lime was gradually added by weight, allowing time for the inbuilt mixer to blend
sufficiently. Lime usage is dependent on the dilution rate of incoming WWTP effluent, pH
and organic matter content. The daily lime usage was determined by recording the
volume of lime solution used over 24 hours. Lime usage varied over the operation
period from a maximum of 120 L per day to a minimum of 20 L per day, corresponding
to a dry lime usage of 3.6 kg and 0.6 kg, respectivelyn average, 90.7 L of the lime solution
was used per day, equating to a dry lime mass of 2.72 kg. The daily 3 % lime solution
usage is presented in Figure 4.3.20.
The daily lime usage of 2.72 kg for an effluent volume of 12 m3 may be converted to an
estimated lime usage requirement for the full Macroom WWTP for the AER flow rate of
approximately 1300 m3/day. The total annual lime requirement is approximately 108
tonnes which at a lime cost of € 200 per tonne would yield a total annual lime cost of
approximately € 21,500.
Figure 4.3.20: Lime usage verse sludge production starting the 19th of February 2020
0
50
100
150
200
250
1 2 3 4 5 6 7 8 9 10 11 12 13 14 15 16 17 18 19 20
Slu
dge
(l)
Days
Volume of sludge l
3% lime solution usage L
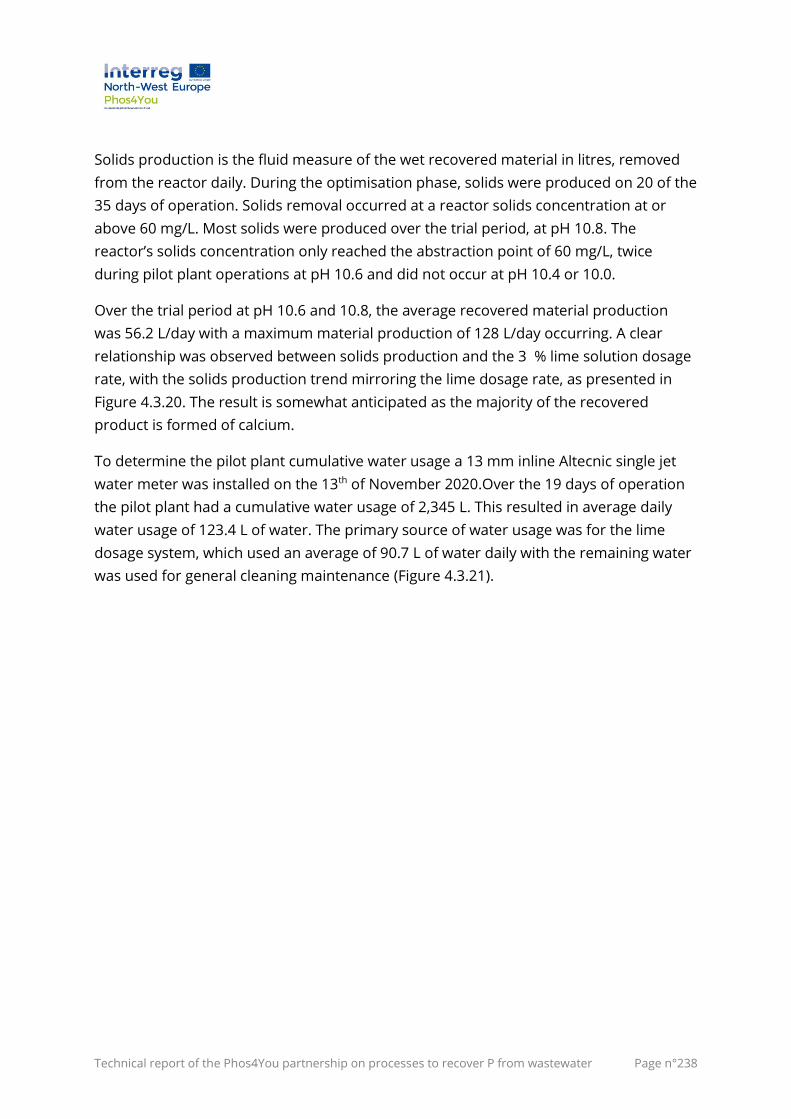
Technical report of the Phos4You partnership on processes to recover P from wastewater Page n°238
Solids production is the fluid measure of the wet recovered material in litres, removed
from the reactor daily. During the optimisation phase, solids were produced on 20 of the
35 days of operation. Solids removal occurred at a reactor solids concentration at or
above 60 mg/L. Most solids were produced over the trial period, at pH 10.8. The
reactor’s solids concentration only reached the abstraction point of 60 mg/L, twice
during pilot plant operations at pH 10.6 and did not occur at pH 10.4 or 10.0.
Over the trial period at pH 10.6 and 10.8, the average recovered material production
was 56.2 L/day with a maximum material production of 128 L/day occurring. A clear
relationship was observed between solids production and the 3 % lime solution dosage
rate, with the solids production trend mirroring the lime dosage rate, as presented in
Figure 4.3.20. The result is somewhat anticipated as the majority of the recovered
product is formed of calcium.
To determine the pilot plant cumulative water usage a 13 mm inline Altecnic single jet
water meter was installed on the 13th of November 2020.Over the 19 days of operation
the pilot plant had a cumulative water usage of 2,345 L. This resulted in average daily
water usage of 123.4 L of water. The primary source of water usage was for the lime
dosage system, which used an average of 90.7 L of water daily with the remaining water
was used for general cleaning maintenance (Figure 4.3.21).
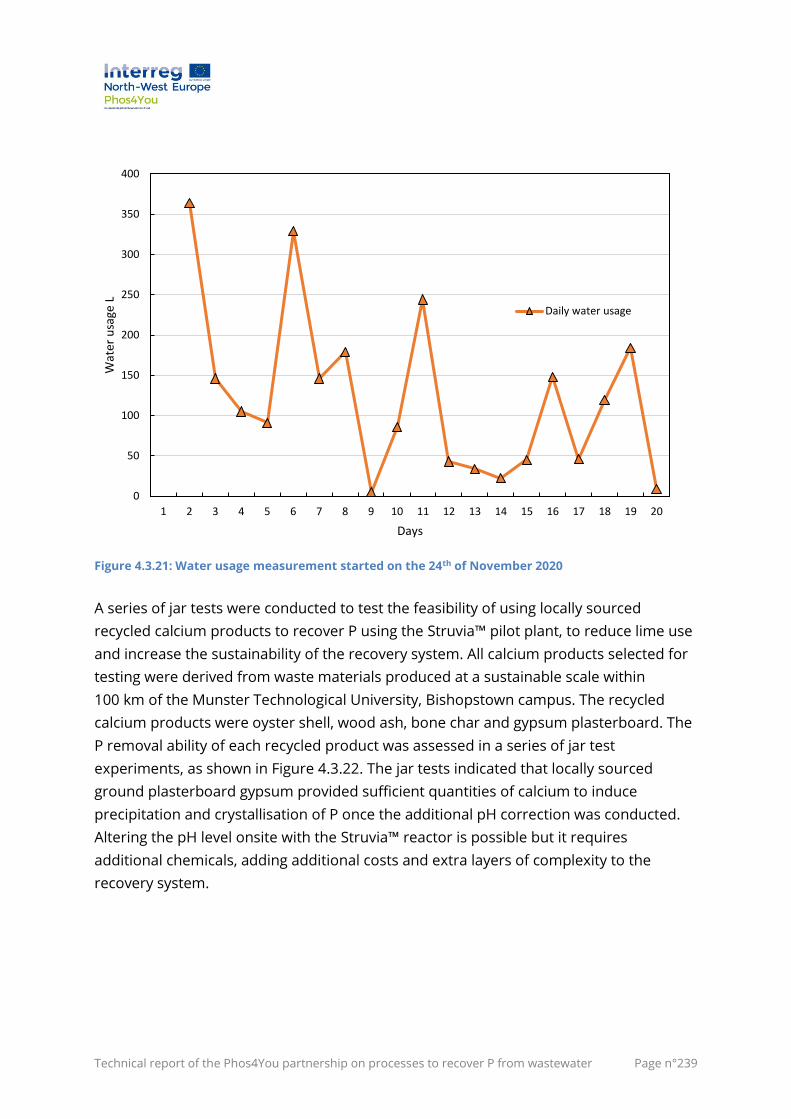
Technical report of the Phos4You partnership on processes to recover P from wastewater Page n°239
Figure 4.3.21: Water usage measurement started on the 24th of November 2020
A series of jar tests were conducted to test the feasibility of using locally sourced
recycled calcium products to recover P using the Struvia™ pilot plant, to reduce lime use
and increase the sustainability of the recovery system. All calcium products selected for
testing were derived from waste materials produced at a sustainable scale within
100 km of the Munster Technological University, Bishopstown campus. The recycled
calcium products were oyster shell, wood ash, bone char and gypsum plasterboard. The
P removal ability of each recycled product was assessed in a series of jar test
experiments, as shown in Figure 4.3.22. The jar tests indicated that locally sourced
ground plasterboard gypsum provided sufficient quantities of calcium to induce
precipitation and crystallisation of P once the additional pH correction was conducted.
Altering the pH level onsite with the Struvia™ reactor is possible but it requires
additional chemicals, adding additional costs and extra layers of complexity to the
recovery system.
0
50
100
150
200
250
300
350
400
1 2 3 4 5 6 7 8 9 10 11 12 13 14 15 16 17 18 19 20
Wat
er u
sage
L
Days
Daily water usage
Technical report of the Phos4You partnership on processes to recover P from wastewater Page n°240
Figure 4.3.22: P removal using recycled calcium products with additional pH adjustment
Investigations revealed that an equal blend of recycled gypsum and hydrated lime could
raise the pilot plant’s influent pH level sufficiently to stimulate P removal. Initial jar tests
indicated that a PO43- of below 1 mg/L could be obtained using this method, as shown in
Figure 4.3.23. Full-scale pilot plant tests were conducted to include recycled gypsum in
the pilot plants lime injection system. Over two weeks, many unsuccessful attempts
were made to modify the existing pilot plant mixing and injection system to dose the
gypsum and lime solution successfully. The gypsum powder has a high specific gravity,
leading to excessive sedimentation of the gypsum powder within the lime storage tank.
Numerous processes were trialled to keep the gypsum powder in suspension, including
increasing the mixing speed and inclusion of compressed air. None of the trialled
techniques could successfully maintain the gypsum in suspension, allowing it to be
injected into the pilot plant reactor. It may be concluded that, with the constraints of the
automated pilot plant process, it is unsuitable for injecting gypsum or other dense
materials into the pilot plant reactor.
0
1
2
3
4
5
6
7
0,01 0,073 0,136 0,199 0,262 0,325
PO
4 C
on
cen
trat
ion
mg/
l
Dose g/ Jar
Effluent PO4-Pconcentration(mg/l)
Hydrated lime
Wood ash
Gypsum
Bone char
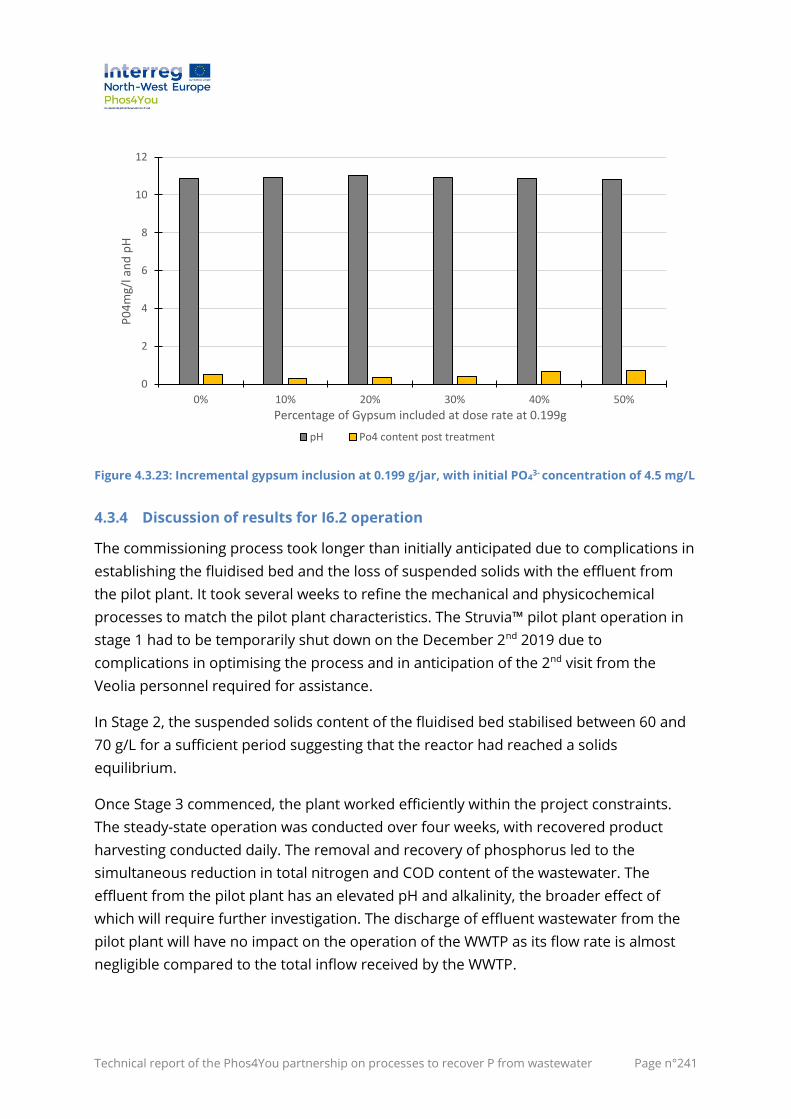
Technical report of the Phos4You partnership on processes to recover P from wastewater Page n°241
Figure 4.3.23: Incremental gypsum inclusion at 0.199 g/jar, with initial PO43- concentration of 4.5 mg/L
4.3.4 Discussion of results for I6.2 operation
The commissioning process took longer than initially anticipated due to complications in
establishing the fluidised bed and the loss of suspended solids with the effluent from
the pilot plant. It took several weeks to refine the mechanical and physicochemical
processes to match the pilot plant characteristics. The Struvia™ pilot plant operation in
stage 1 had to be temporarily shut down on the December 2nd 2019 due to
complications in optimising the process and in anticipation of the 2nd visit from the
Veolia personnel required for assistance.
In Stage 2, the suspended solids content of the fluidised bed stabilised between 60 and
70 g/L for a sufficient period suggesting that the reactor had reached a solids
equilibrium.
Once Stage 3 commenced, the plant worked efficiently within the project constraints.
The steady-state operation was conducted over four weeks, with recovered product
harvesting conducted daily. The removal and recovery of phosphorus led to the
simultaneous reduction in total nitrogen and COD content of the wastewater. The
effluent from the pilot plant has an elevated pH and alkalinity, the broader effect of
which will require further investigation. The discharge of effluent wastewater from the
pilot plant will have no impact on the operation of the WWTP as its flow rate is almost
negligible compared to the total inflow received by the WWTP.
0
2
4
6
8
10
12
0% 10% 20% 30% 40% 50%
P0
4m
g/l a
nd
pH
Percentage of Gypsum included at dose rate at 0.199g
pH Po4 content post treatment
Technical report of the Phos4You partnership on processes to recover P from wastewater Page n°242
The recovered P product has an approximate 4.6±0.2 % P2O5 content. Further analyses
are being conducted to determine the plant bioavailability and contaminant
concentrations to evaluate its potential as a fertiliser.
Some P removal was observed during stage 4 operations. However, the research
highlighted that the most suitable operating pH is 10.8. Recycled calcium products like
gypsum plasterboard have the possibility to remove and recover P from municipal
wastewater streams. The Struvia™ pilot plant is not configured correctly to allow for
efficient and consistent injection of a Gypsum solution.
4.3.5 Conclusion for I6.2
The following are the primary conclusions based on the Demonstrator I6.2 which was
undertaken to investigate the process of phosphorous removal and its recovery from
municipal wastewater based on the Struvia™ Technology at the Macroom Wastewater
Treatment Plant using lime for chemical precipitation.
1. Overall, this demonstration has provided significant insight into the effectiveness
and limitations of the Struvia™ process through installation at the Macroom
WWTP.
2. The primary benefits of the Struvia™ process are its simplicity and flexibility of
application; lower demand for chemicals, production of recovered P from
wastewater, reduction in P emissions and overall improvement to the
environment.
3. The pilot plant operated most efficiently at a pH of 10.8 and less so in the range
from 10 to 10.4.
4. The pilot plant has operated successfully at Macroom WWTP, reducing the
wastewater PO43- content from 4.28 mg/L to 1.70 mg/L, resulting in a removal
efficiency of 60.26 %, as shown in Table 4.3.5.
5. The removal and recovery of phosphorus led to a simultaneous reduction in total
nitrogen and COD content of the effluent. The effluent from the pilot plant has an
elevated pH and alkalinity, the broader effect of which will require further
investigation.
6. The Struvia™ operation at the Macroom WWTP produced approximately 60 kg of
dry recovered calcium phosphate.
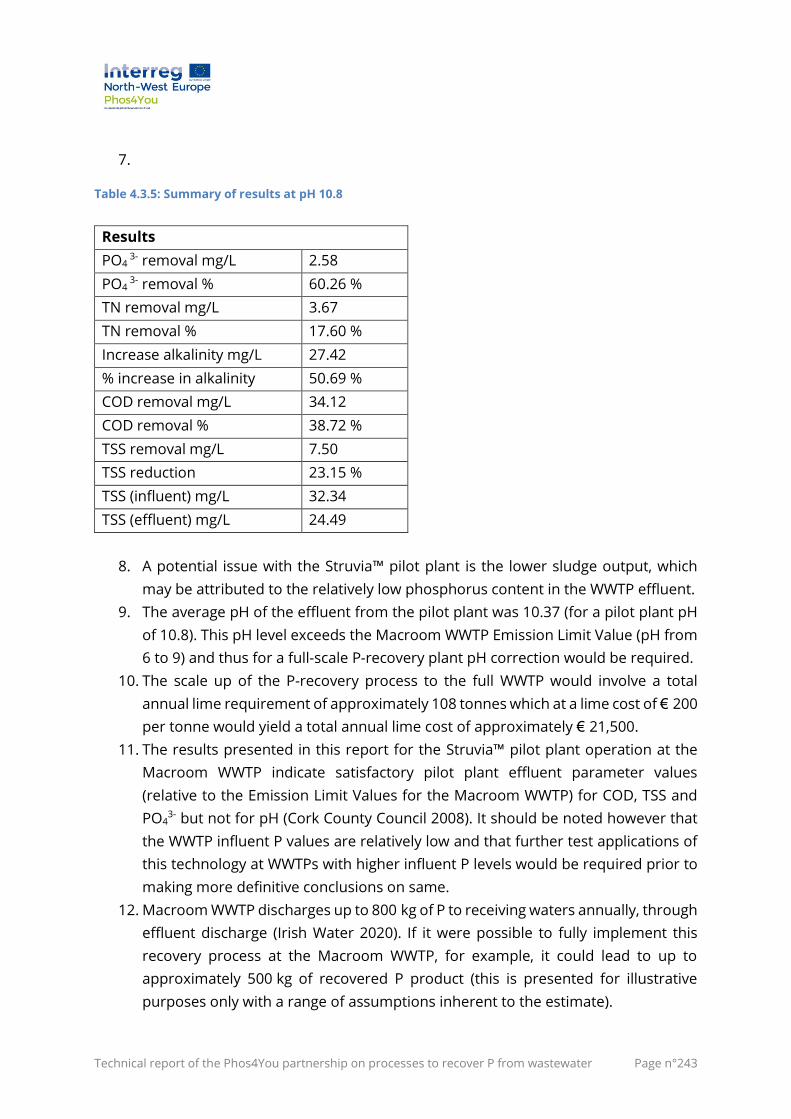
Technical report of the Phos4You partnership on processes to recover P from wastewater Page n°243
7.
Table 4.3.5: Summary of results at pH 10.8
Results
PO4 3- removal mg/L 2.58
PO4 3- removal % 60.26 %
TN removal mg/L 3.67
TN removal % 17.60 %
Increase alkalinity mg/L 27.42
% increase in alkalinity 50.69 %
COD removal mg/L 34.12
COD removal % 38.72 %
TSS removal mg/L 7.50
TSS reduction 23.15 %
TSS (influent) mg/L 32.34
TSS (effluent) mg/L 24.49
8. A potential issue with the Struvia™ pilot plant is the lower sludge output, which
may be attributed to the relatively low phosphorus content in the WWTP effluent.
9. The average pH of the effluent from the pilot plant was 10.37 (for a pilot plant pH
of 10.8). This pH level exceeds the Macroom WWTP Emission Limit Value (pH from
6 to 9) and thus for a full-scale P-recovery plant pH correction would be required.
10. The scale up of the P-recovery process to the full WWTP would involve a total
annual lime requirement of approximately 108 tonnes which at a lime cost of € 200
per tonne would yield a total annual lime cost of approximately € 21,500.
11. The results presented in this report for the Struvia™ pilot plant operation at the
Macroom WWTP indicate satisfactory pilot plant effluent parameter values
(relative to the Emission Limit Values for the Macroom WWTP) for COD, TSS and
PO43- but not for pH (Cork County Council 2008). It should be noted however that
the WWTP influent P values are relatively low and that further test applications of
this technology at WWTPs with higher influent P levels would be required prior to
making more definitive conclusions on same.
12. Macroom WWTP discharges up to 800 kg of P to receiving waters annually, through
effluent discharge (Irish Water 2020). If it were possible to fully implement this
recovery process at the Macroom WWTP, for example, it could lead to up to
approximately 500 kg of recovered P product (this is presented for illustrative
purposes only with a range of assumptions inherent to the estimate).
Technical report of the Phos4You partnership on processes to recover P from wastewater Page n°244
13. At a national level it is estimated that approximately 1,475 tonnes of P is discharged
annually from Irish municipal WWTPs (O'Donnell et al. 2021), the application of this
technology, for example, at a national level would indicate the potential for P-
recovery of over 900 tonnes of P (this is presented for illustrative purposes only
and acknowledging that there are a wide range of assumptions inherent to the
estimate).
Technical report of the Phos4You partnership on processes to recover P from wastewater Page n°245
5 Life Cycle Assessment – Life Cycle Costs works
Authors: Gaspard Chantrain Sylvie Groslambert, , Angélique
Léonard (ULiège); Anders Nättorp (FHNW)
An environmental analysis was performed on some of the recovery process
demonstrators that were larger in scale than the laboratory. The laboratory scale
processes were not included in the study to ensure that the data provided was as
representative as possible of the industrial scale application. The processes studied
therefore include the EuPhoRe®, Struvia™, PARFORCE and PULSE demonstrators. The
environmental assessment was done using the life cycle assessment methodology and
aim to quantify their environmental impacts. The environmental analysis also allowed to
highlight the most impacting steps of each process, this can be used for eco-design
purposes. Finally, the environmental performance of each demonstrator was compared
with a reference system.
Although very important, legal aspects were not taken into account in the LCA. It was
assumed that all products from the project demonstrators were legally usable. In
addition, the environmental performance of the demonstrators were compared to the
reference system and not to each other. This choice reflects the fact that demonstrators
adapt to the needs of particular situations and the legal frameworks of that situation.
The demonstrators should therefore be chosen to be most suitable for the situation
according to their technical specificity and will therefore not compete in the same
situation.
The use of the products from the demonstrators and its consequences were not taken
into account in the environmental analysis of this project. The LCA was carried out on
the production phases of the P-materials and was therefore called "cradle to gate" LCA.
In the environmental assessment of the demonstrators of the Phos4You project, the
first difficulty was to take into account the environmental impacts attributed to the
production of the sludge used by the demonstrators. Different approaches are possible
to estimate the environmental burden of complex systems. The mains approaches are
known as "system expansion" and "avoided burden". They are illustrated in Figure 4.3.1 .
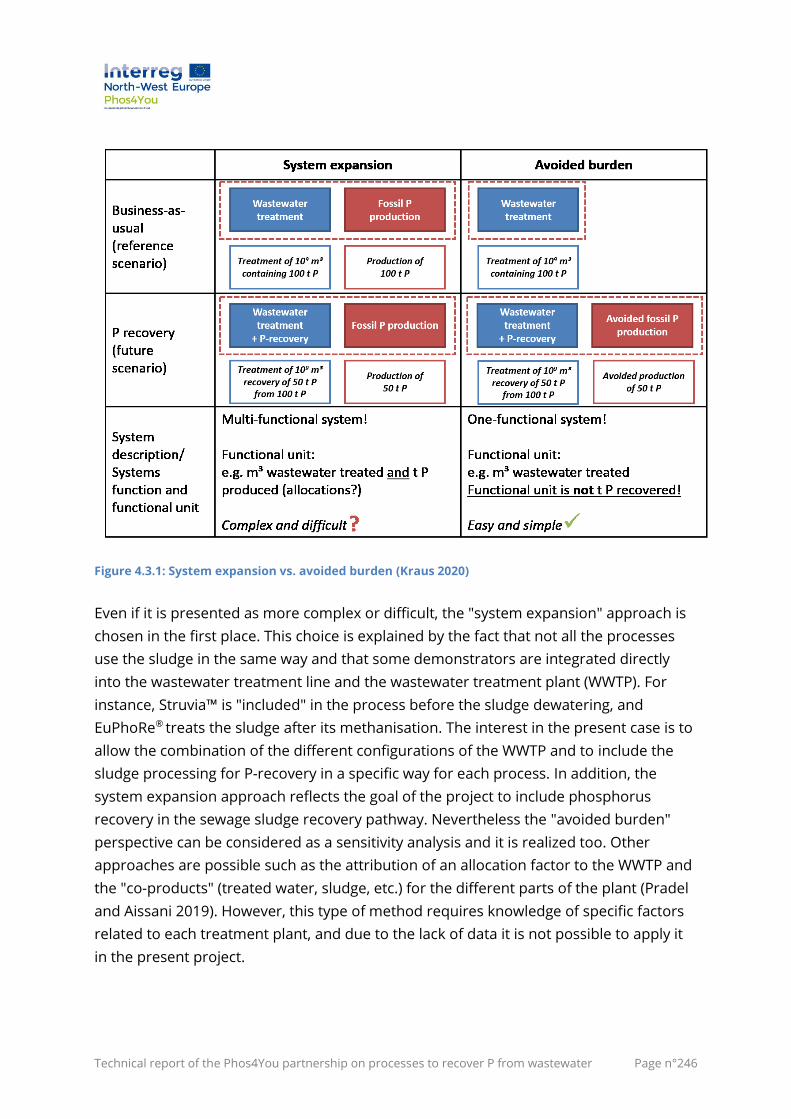
Technical report of the Phos4You partnership on processes to recover P from wastewater Page n°246
Figure 4.3.1: System expansion vs. avoided burden (Kraus 2020)
Even if it is presented as more complex or difficult, the "system expansion" approach is
chosen in the first place. This choice is explained by the fact that not all the processes
use the sludge in the same way and that some demonstrators are integrated directly
into the wastewater treatment line and the wastewater treatment plant (WWTP). For
instance, Struvia™ is "included" in the process before the sludge dewatering, and
EuPhoRe® treats the sludge after its methanisation. The interest in the present case is to
allow the combination of the different configurations of the WWTP and to include the
sludge processing for P-recovery in a specific way for each process. In addition, the
system expansion approach reflects the goal of the project to include phosphorus
recovery in the sewage sludge recovery pathway. Nevertheless the "avoided burden"
perspective can be considered as a sensitivity analysis and it is realized too. Other
approaches are possible such as the attribution of an allocation factor to the WWTP and
the "co-products" (treated water, sludge, etc.) for the different parts of the plant (Pradel
and Aissani 2019). However, this type of method requires knowledge of specific factors
related to each treatment plant, and due to the lack of data it is not possible to apply it
in the present project.
Technical report of the Phos4You partnership on processes to recover P from wastewater Page n°247
5.1 System expansion methodology
Firstly, the system extension approach has been chosen. This consists of studying the
environmental performance of a system with two functions. The first is the treatment of
wastewater and the treatment of sludge produced during wastewater treatment. In the
case of the demonstrators, there will be a recovery of phosphorus from the sewage
sludge treatment unlike in the reference system. The second function of the system is
the production of phosphorus fertiliser.
5.1.1 Methodological choices
5.1.1.1 Functional unit
The functional unit (FU) is defined as 100 m³ of treated wastewater (in the WWTP)
(including sludge elimination or valorisation) + 0.80 kg of P2O5 fertiliser. We consider
only two main functions in the model (wastewater treatment and P-fertiliser
production). The amount of P2O5 produced and included in the functional unit was
calculated in relation to the P2O5 concentration typically found in German sewage
treatment plants. This concentration is between 6.5 and 7 % of P2O5 in the dry matter of
the sludge. The quantity of 0.80 kg of P2O5 produced as a functional unit was also
chosen to reflect the maximum quantity of P2O5 recovered out of 100 m³ wastewater
with a P-recovery technology (a recovery rate between 95 and 100% of the P2O5 present
in the sludge is feasible with i.e. the EuPhoRe® process)1.
In the case of the Phos4You demonstrators, the amount of P is calculated based on the
quantity of sludge produced by the treatment of 100 m ³ of water, and the specific
yield for P recovery of each process.
Depending of the scenario, the "0,80 kg of P2O5 " is produced:
• by conventional "chemical" P routes. The reference is the triple super phosphate
(TSP) in the reference scenario. This choice is justified by the fact that P-materials
are compared to TSP in the quality assessment of the project.
• by the recovery process of Phos4You under study.
1 0,80 kg of P2O5 = 0.82 kg of P2O5 x 98.5%. The amount of sludge obtained by the treatment of
100 m³ and after the reduction due to biodigestion is estimated at 60.57 kg DM 20 %. Taking an
average of 6.5 to 7 % P2O5 in the dry matter of the digested sludge, it is estimated that 0.82 kg
P2O5 are in the 60.57 kg DM 20 %. Taking into account a recovery rate between 95 and 100 %
(maximum achieved for the EuPhoRe® process), the quantity corresponding to the functional unit
of 0.80 kg of P2O5 is obtained.
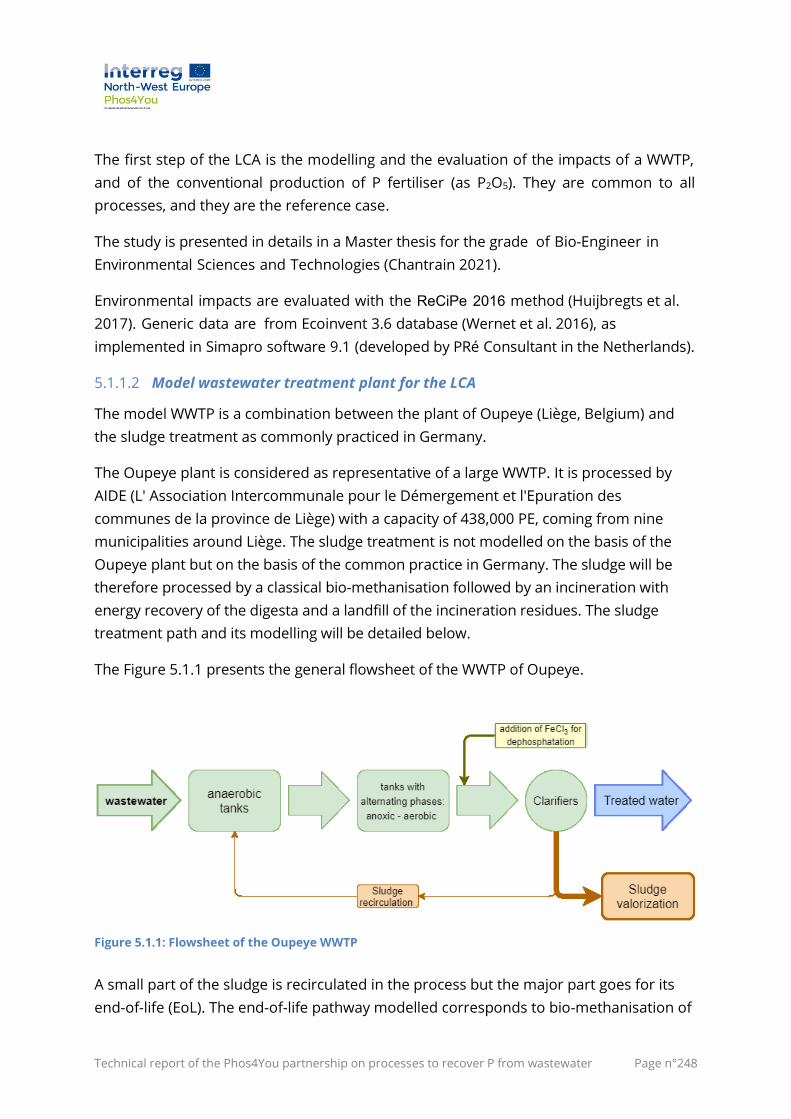
Technical report of the Phos4You partnership on processes to recover P from wastewater Page n°248
The first step of the LCA is the modelling and the evaluation of the impacts of a WWTP,
and of the conventional production of P fertiliser (as P2O5). They are common to all
processes, and they are the reference case.
The study is presented in details in a Master thesis for the grade of Bio-Engineer in
Environmental Sciences and Technologies (Chantrain 2021).
Environmental impacts are evaluated with the ReCiPe 2016 method (Huijbregts et al.
2017). Generic data are from Ecoinvent 3.6 database (Wernet et al. 2016), as
implemented in Simapro software 9.1 (developed by PRé Consultant in the Netherlands).
5.1.1.2 Model wastewater treatment plant for the LCA
The model WWTP is a combination between the plant of Oupeye (Liège, Belgium) and
the sludge treatment as commonly practiced in Germany.
The Oupeye plant is considered as representative of a large WWTP. It is processed by
AIDE (L' Association Intercommunale pour le Démergement et l'Epuration des
communes de la province de Liège) with a capacity of 438,000 PE, coming from nine
municipalities around Liège. The sludge treatment is not modelled on the basis of the
Oupeye plant but on the basis of the common practice in Germany. The sludge will be
therefore processed by a classical bio-methanisation followed by an incineration with
energy recovery of the digesta and a landfill of the incineration residues. The sludge
treatment path and its modelling will be detailed below.
The Figure 5.1.1 presents the general flowsheet of the WWTP of Oupeye.
Figure 5.1.1: Flowsheet of the Oupeye WWTP
A small part of the sludge is recirculated in the process but the major part goes for its
end-of-life (EoL). The end-of-life pathway modelled corresponds to bio-methanisation of
Technical report of the Phos4You partnership on processes to recover P from wastewater Page n°249
the sludge followed by co-generation (with electricity and heat production) and finally
incineration (also with energy recovery). The reference system will be described in more
detail further on.
Data for modelling the wastewater treatment plant (chemicals, energy and sludge
production) are primary data from AIDE. The waste from grid refusal is incinerated,
while the sand from the desanding process is used as fill material. Direct emissions and
sludge valorisation impacts are from scientific papers and generic database.
The direct agricultural application of sludge on fields has not been considered in this
study, despite the fact that it allows an integral and direct return of phosphorus from
the sewage sludge to the fields. This choice is motivated by the fact that the standards in
terms of trace pollutants for agricultural spreading exclude a large number of sludges
produced. In addition, the legislation for this practice is becoming more and more
restrictive. It is already forbidden in several European countries such as Germany, the
Netherlands or in Switzerland. The hypothesis made here is that agricultural spreading
is not possible for legislative reasons and that phosphorus recovery processes are used
to ensure the return of phosphorus from sludge to the fields.
5.1.1.3 Conventional route for P-fertiliser production
Conventional phosphorus fertiliser production is modelled by the production of triple
super phosphate (TSP). This choice is motivated by the fact that the properties of the
phosphorus fertilisers from the demonstrators were compared with those of TSP in the
quality assessments works achieved within the Phos4You project.
It was shown in the quality assessments of the P-materials from the demonstrators that
the phosphorus they contained was at least as available for plants as that in the TSP
after a number of cuts (usually 4) in pot trials (Bogdan et al. 2021). A unit equivalence
factor was therefore chosen between the amount of P2O5 contained in the P-materials
and that contained in the TSP. In view of the good results on the bioavailability of
phosphorus in the P-materials of the demonstrators, this unit equivalence factor
appears to be prudent. In addition, some forms of phosphorus allow a slow release of P
into the soil, which is known to reduce eutrophication and allow better utilisation of P by
plants (Shaviv and Mikkelsen 1993). These advantages will not be taken into account in
the environmental analysis of P-materials.

Technical report of the Phos4You partnership on processes to recover P from wastewater Page n°250
The environmental impacts of TSP production were modelled using the corresponding
entry in the generic Ecoinvent database. This entry includes all the stages of TSP
production, starting from the extraction of phosphate rock.
5.1.1.4 Multifunctional systems – scenario description
The different scenarios for the multifunctional systems are briefly presented in Table
5.1.1. The boundaries of each system and the calculations involved will be explained in
more details in each of the chapters dedicated to them.
As specified in 5.1.1.1, the functional unit (FU) is the treatment of 100 m³ of wastewater
and the production of 0,80 kg of P2O5.
The treatment of 100 m³ of wastewater produces a certain amount of sludge, depending
of the configuration of the WWTP. From this sludge, some P2O5 is recovered, with a yield
depending of the process. Therefore, the "0,80 kg P2O5" of the FU is distributed between
the P2O5 recovered with the Phos4You demonstrator and the necessary
complement of conventional chemical production (noted as "chemical P") to reach
the desired quantity (0,80 kg). As a reminder, the amount of 0.80 kg P2O5 was calculated
based on the typical concentration of German sewage sludge and the highest recovery
rate among the studied demonstrators. Table 5.1.1 summarizes the system expansion
approach applied to each demonstrator as well as the estimated recovery percentage
with the calculation assumptions explained earlier.
For the reference scenario, the EoL of the sludge considered starts with a bio-
methanisation of the sludge (with cogeneration of the biogas produced). The digested
sludge is then incinerated with energy recovery and the incineration residues are
landfilled.
The electricity used in all the systems studied was modelled using the 2016 German
electricity mix. The influence of this modelling choice will be investigated later by means
of a sensitivity analysis of the origin of the electricity used.
It is also important to note that only phosphorus is taken into account in the LCA of the
P-materials from demonstrators and that the calculations to determine the equivalence
between the different forms of phosphorus found in the P-materials are based on
stoichiometry. Finally, it must also be considered that the environmental analysis here
focuses on the phosphorus content of the P-materials and that other nutrients may be
present in the products from the demonstrators.
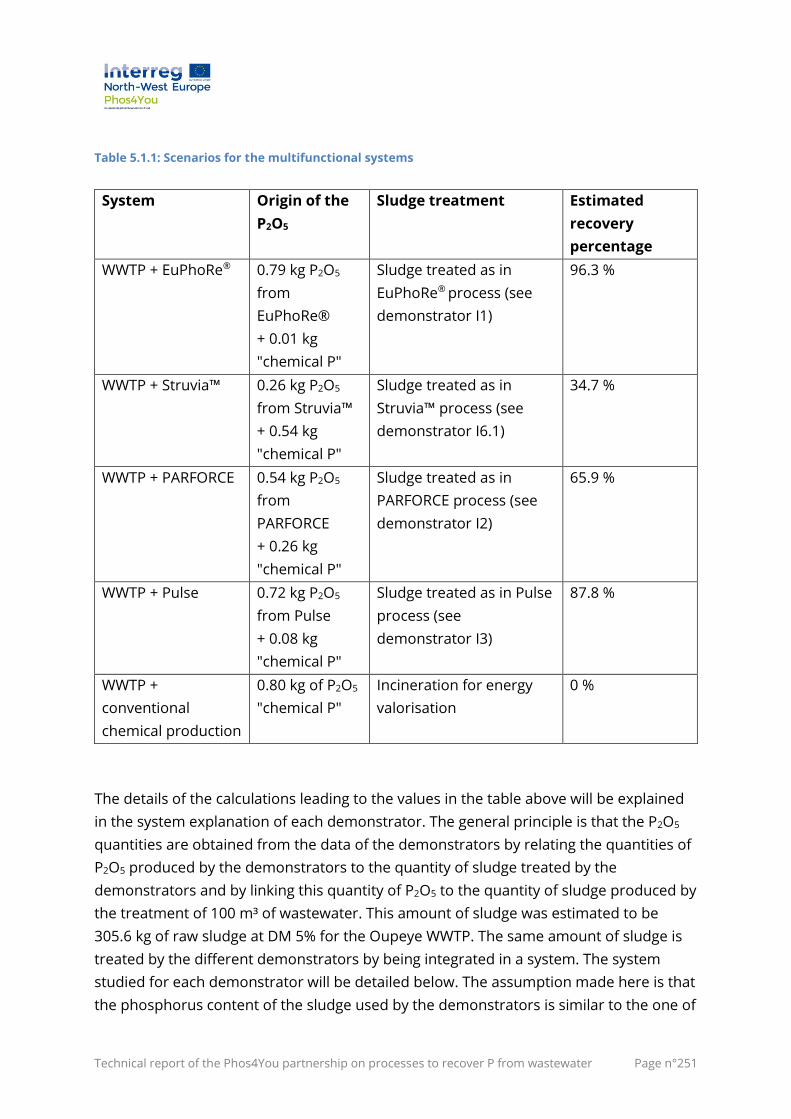
Technical report of the Phos4You partnership on processes to recover P from wastewater Page n°251
Table 5.1.1: Scenarios for the multifunctional systems
System Origin of the
P2O5
Sludge treatment Estimated
recovery
percentage
WWTP + EuPhoRe® 0.79 kg P2O5
from
EuPhoRe®
+ 0.01 kg
"chemical P"
Sludge treated as in
EuPhoRe® process (see
demonstrator I1)
96.3 %
WWTP + Struvia™ 0.26 kg P2O5
from Struvia™
+ 0.54 kg
"chemical P"
Sludge treated as in
Struvia™ process (see
demonstrator I6.1)
34.7 %
WWTP + PARFORCE 0.54 kg P2O5
from
PARFORCE
+ 0.26 kg
"chemical P"
Sludge treated as in
PARFORCE process (see
demonstrator I2)
65.9 %
WWTP + Pulse 0.72 kg P2O5
from Pulse
+ 0.08 kg
"chemical P"
Sludge treated as in Pulse
process (see
demonstrator I3)
87.8 %
WWTP +
conventional
chemical production
0.80 kg of P2O5
"chemical P"
Incineration for energy
valorisation
0 %
The details of the calculations leading to the values in the table above will be explained
in the system explanation of each demonstrator. The general principle is that the P2O5
quantities are obtained from the data of the demonstrators by relating the quantities of
P2O5 produced by the demonstrators to the quantity of sludge treated by the
demonstrators and by linking this quantity of P2O5 to the quantity of sludge produced by
the treatment of 100 m³ of wastewater. This amount of sludge was estimated to be
305.6 kg of raw sludge at DM 5% for the Oupeye WWTP. The same amount of sludge is
treated by the different demonstrators by being integrated in a system. The system
studied for each demonstrator will be detailed below. The assumption made here is that
the phosphorus content of the sludge used by the demonstrators is similar to the one of
Technical report of the Phos4You partnership on processes to recover P from wastewater Page n°252
the standard German sludges (between 6.5 and 7 % P2O5 in the dry matter of the
digested sludge). This assumption was verified by data provided by the operators of the
EuPhoRe®, PARFORCE and PULSE demonstrators. For the Struvia™ process, the P-
content was estimated by taking into account the fact that the sludge used was not
digested, which lowered the P2O5 content to 4.9 % of dry matter. The sludge volume
reduction by biodigestion was calculated by taking into account an organic matter rate
of 50 % of the sludge dry matter and a degradation rate of 45 % of the sludge organic
matter.
Discrepancies between the recovery rates calculated on the basis of the assumptions
used in the LCA and the actual recovery rates of the demonstrators can be explained by
the fact that the sludge used in the data collection may have had a different phosphorus
content or by the fact that the recovery technologies were not yet at a sufficiently
advanced stage of development to achieve the final recovery rate.
5.1.1.5 Selection of impact categories studied
As said above (5.1.1.1), the environmental assessment of the project uses the ReCiPe
2016 method (Huijbregts et al. 2017) and the generic data are taken from the Ecoinvent
3.6 database (Wernet et al. 2016). The entire project is implemented in Simapro 9.1
software (developed by PRé Consultant in The Netherlands).
The 2016 ReCiPe methodology proposes a set of 18 impact categories. These categories
are: global warming, stratospheric ozone depletion, ionizing radiation, ozone formation
(human health), fine particulate matter formation, ozone formation (terrestrial
ecosystems), terrestrial acidification, freshwater eutrophication, terrestrial ecotoxicity,
freshwater ecotoxicity, marine ecotoxicity, human carcinogenic toxicity, human non-
carcinogenic toxicity, marine eutrophication, land use, mineral resource scarcity, water
consumption.
In order to synthesise the results, certain impact categories were selected in the rest of
the project. This selection was done in three steps and based on the results of the
reference system for the system expansion method (developed below). The first step
was the exclusion of the toxicity categories due to the large uncertainty associated with
these categories and their lack of relevance to the nature of the project. The selection of
categories was then based on the results of the normalisations. Normalisation allows
the impacts on the different categories to be ranked by dividing the impacts by a
common reference value. In the case of the ReCiPe 2016 method, this common value is
the average pollution generated per person worldwide in 2010.
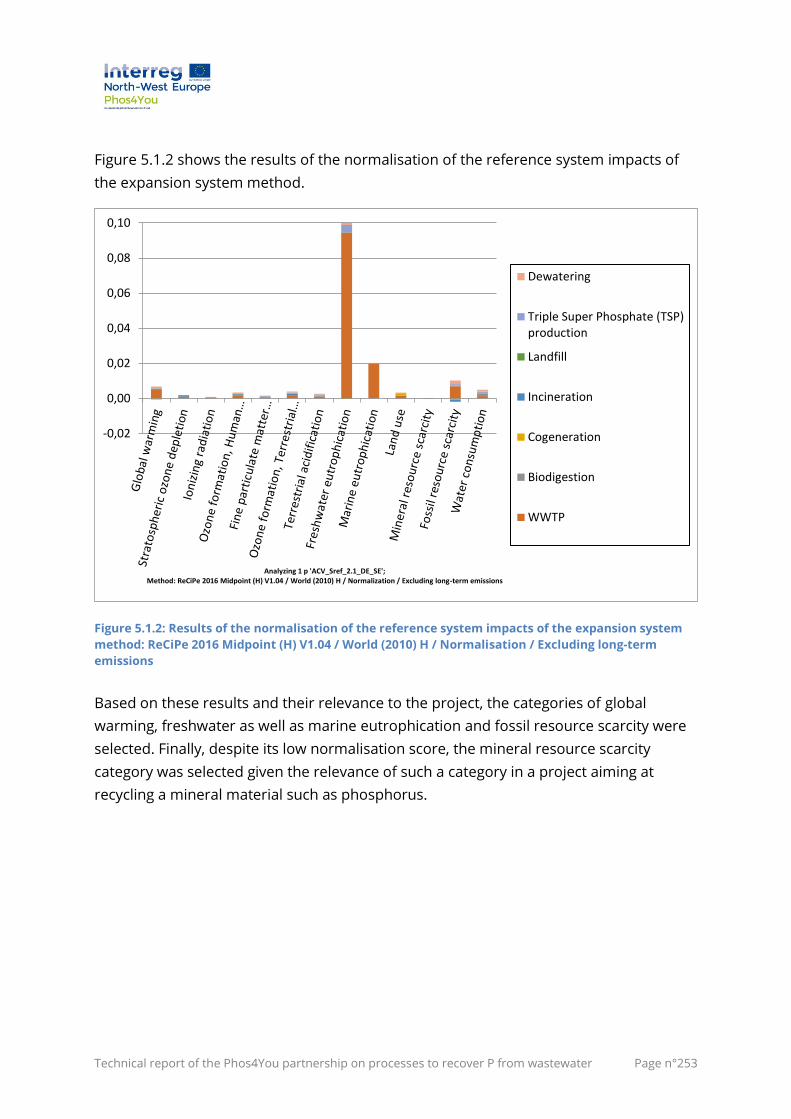
Technical report of the Phos4You partnership on processes to recover P from wastewater Page n°253
Figure 5.1.2 shows the results of the normalisation of the reference system impacts of
the expansion system method.
Figure 5.1.2: Results of the normalisation of the reference system impacts of the expansion system
method: ReCiPe 2016 Midpoint (H) V1.04 / World (2010) H / Normalisation / Excluding long-term
emissions
Based on these results and their relevance to the project, the categories of global
warming, freshwater as well as marine eutrophication and fossil resource scarcity were
selected. Finally, despite its low normalisation score, the mineral resource scarcity
category was selected given the relevance of such a category in a project aiming at
recycling a mineral material such as phosphorus.
-0,02
0,00
0,02
0,04
0,06
0,08
0,10
Analyzing 1 p 'ACV_Sref_2.1_DE_SE';Method: ReCiPe 2016 Midpoint (H) V1.04 / World (2010) H / Normalization / Excluding long-term emissions
Dewatering
Triple Super Phosphate (TSP)production
Landfill
Incineration
Cogeneration
Biodigestion
WWTP
Technical report of the Phos4You partnership on processes to recover P from wastewater Page n°254
5.1.2 Results for four recovery processes
In the subsequent part, the systems studied will first be described and then the main
results of the environmental analysis will be presented for each system, according to the
selected impact categories.
5.1.2.1 LCA of the reference system
The reference case includes the wastewater treatment plant with the energy
consumption (electricity and fuel), the chemicals consumption and the emissions (mainly
to air) of the WWTP. The treatment of plant waste (grid refusals and sand removal) is
also taken into account.
The WWTP produces undigested sludge. In this scenario it is sent directly to a
biodigestion unit. The consumption of this digestion (electricity and heat) and the
emissions (leakages) are also considered. During this biodigestion, the organic matter
content decreases, which significantly reduces the amount of sludge. A degradation of
45 % of the organic matter is taken into account to produce biogas which will be used in
a co-generation unit to produce heat and electricity. Also here, the emissions as well as
the energy (heat, electricity) and reagent consumption have been taken into account.
The heat and electricity produced in the cogeneration process are included as avoided
products. The cogeneration efficiencies taken into account are 37 % for electricity
production and 52 % for heat recovery (Jungbluth et al. 2007).
The dewatering of digested sludge is then planned according to an average of available
techniques (including electricity and reagent consumption). The last two stages of sludge
treatment are the incineration with recovery of heat (and electricity) and extraction of fly
ash and landfilling of incineration residues. All these steps were taken into account using
data from the Ecoinvent database. The recovery efficiencies adopted for the incineration
phase are those from the Ecoinvent database and are 52 % for heat recovery and only
1.6 % for net electricity production (Jungbluth et al. 2007).
Phosphorus fertilizer production has been taken into account through the Ecoinvent
entry for TSP production. This entry contains all the production stages with their
consumption and emissions. The amount of P2O5 produced in this system is 0.8 kg
which is equivalent to 1.66 kg of TSP at 48 % de P2O5.
The Figure 5.1.3 shows the boundaries of the reference system.
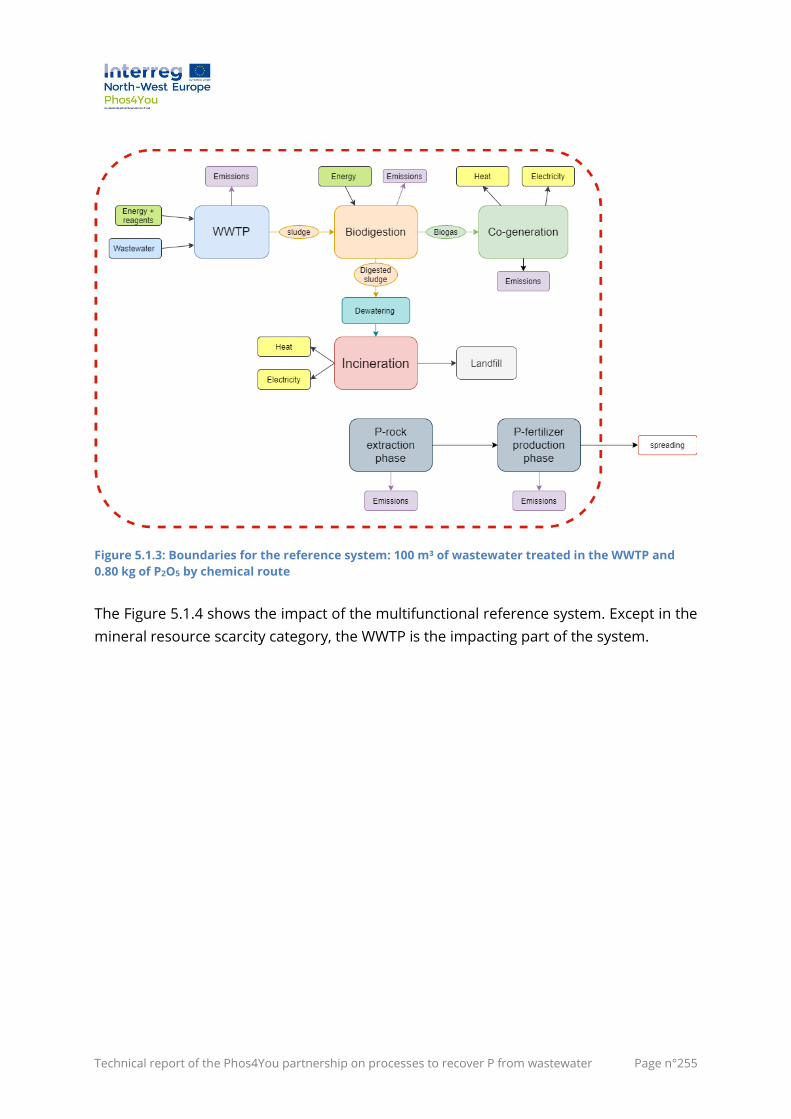
Technical report of the Phos4You partnership on processes to recover P from wastewater Page n°255
Figure 5.1.3: Boundaries for the reference system: 100 m³ of wastewater treated in the WWTP and
0.80 kg of P2O5 by chemical route
The Figure 5.1.4 shows the impact of the multifunctional reference system. Except in the
mineral resource scarcity category, the WWTP is the impacting part of the system.
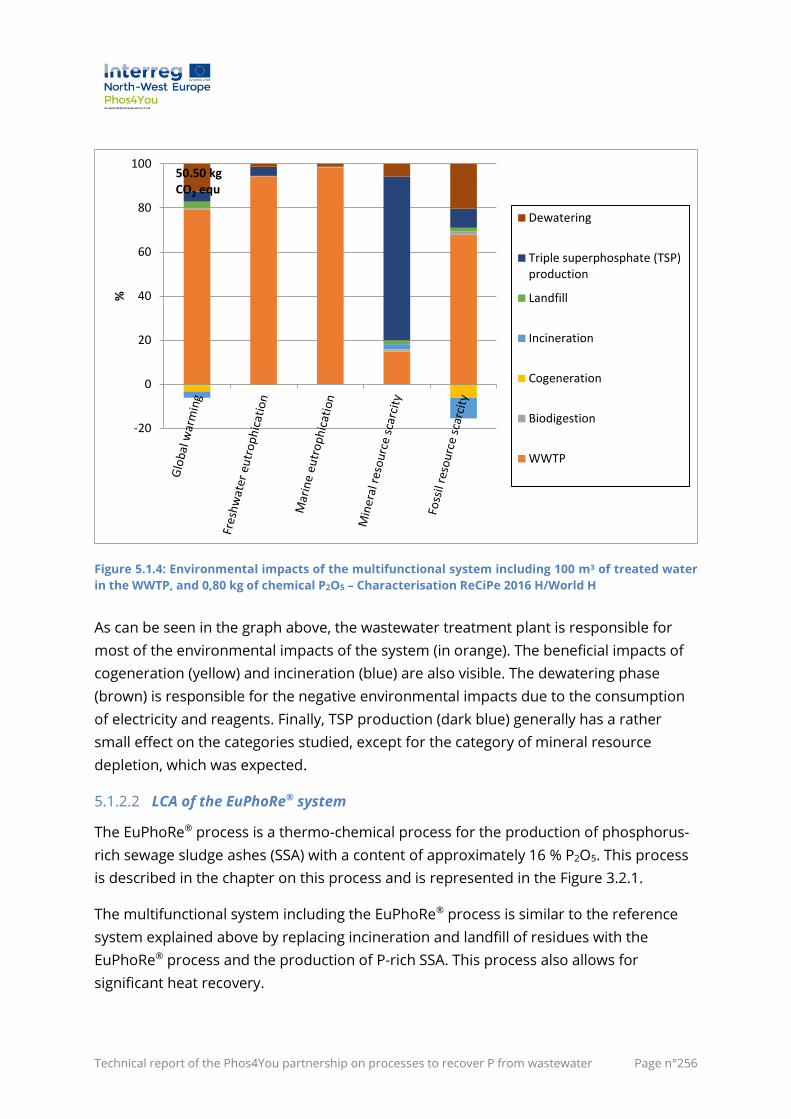
Technical report of the Phos4You partnership on processes to recover P from wastewater Page n°256
Figure 5.1.4: Environmental impacts of the multifunctional system including 100 m³ of treated water
in the WWTP, and 0,80 kg of chemical P2O5 – Characterisation ReCiPe 2016 H/World H
As can be seen in the graph above, the wastewater treatment plant is responsible for
most of the environmental impacts of the system (in orange). The beneficial impacts of
cogeneration (yellow) and incineration (blue) are also visible. The dewatering phase
(brown) is responsible for the negative environmental impacts due to the consumption
of electricity and reagents. Finally, TSP production (dark blue) generally has a rather
small effect on the categories studied, except for the category of mineral resource
depletion, which was expected.
5.1.2.2 LCA of the EuPhoRe® system
The EuPhoRe® process is a thermo-chemical process for the production of phosphorus-
rich sewage sludge ashes (SSA) with a content of approximately 16 % P2O5. This process
is described in the chapter on this process and is represented in the Figure 3.2.1.
The multifunctional system including the EuPhoRe® process is similar to the reference
system explained above by replacing incineration and landfill of residues with the
EuPhoRe® process and the production of P-rich SSA. This process also allows for
significant heat recovery.
-20
0
20
40
60
80
100
%
Dewatering
Triple superphosphate (TSP)production
Landfill
Incineration
Cogeneration
Biodigestion
WWTP
50.50 kg CO2 equ
Technical report of the Phos4You partnership on processes to recover P from wastewater Page n°257
In this system as for the reference system, the treatment of 100 m³ of water produces
305.6 kg DM 5 % of non-digested sludge which corresponds after digestion and
dewatering to 60.57 kg of DM 20 % sludge. The reduction of dry matter following
biodigestion is calculated on the basis of an organic matter rate of 40 % of the dry
matter and a degradation of 45 % of the total organic matter. The 60.57 kg DM 20%
sludge is then dried in a solar greenhouse to reach a dry matter content of more than
75 %. Using the annual P-rich SSA production data and annual sludge consumption, it
was calculated that 0.79 kg of P2O5 was produced from the 60.57 kg of sludge at
DM 20 %. The main data can be summarised by knowing that the process treats
5,200 tonnes of sludge per year, which allows the production of 1,590 tonnes of P-rich
SSA, which contains 254.4 tonnes of P2O5. The sludge is pre-treated by a solar dryer
before entering the process and the amount of heat recovered is 9,100 MWh per year.
The implicit assumption here is that the composition of the sludge used by the
EuPhoRe® process is similar to the sludge produced by the studied WWTP after
biodigestion.
For the multifunctional system, the sludge resulting of the 100 m³ of wastewater treated
in the WWTP can deliver 0.79 kg of P2O5 equivalent in the P-rich SSA material; 0.01 kg of
P2O5 fertiliser have to be produced by conventional chemical route to reach the "0.80 kg
P2O5 " objective of the FU. This 0.01 kg of chemically produced P2O5 corresponds to the
production of 0.0208 kg of TSP at 48 % P2O5.
The system boundaries for the EuPhoRe® process are presented in Figure 5.1.5.
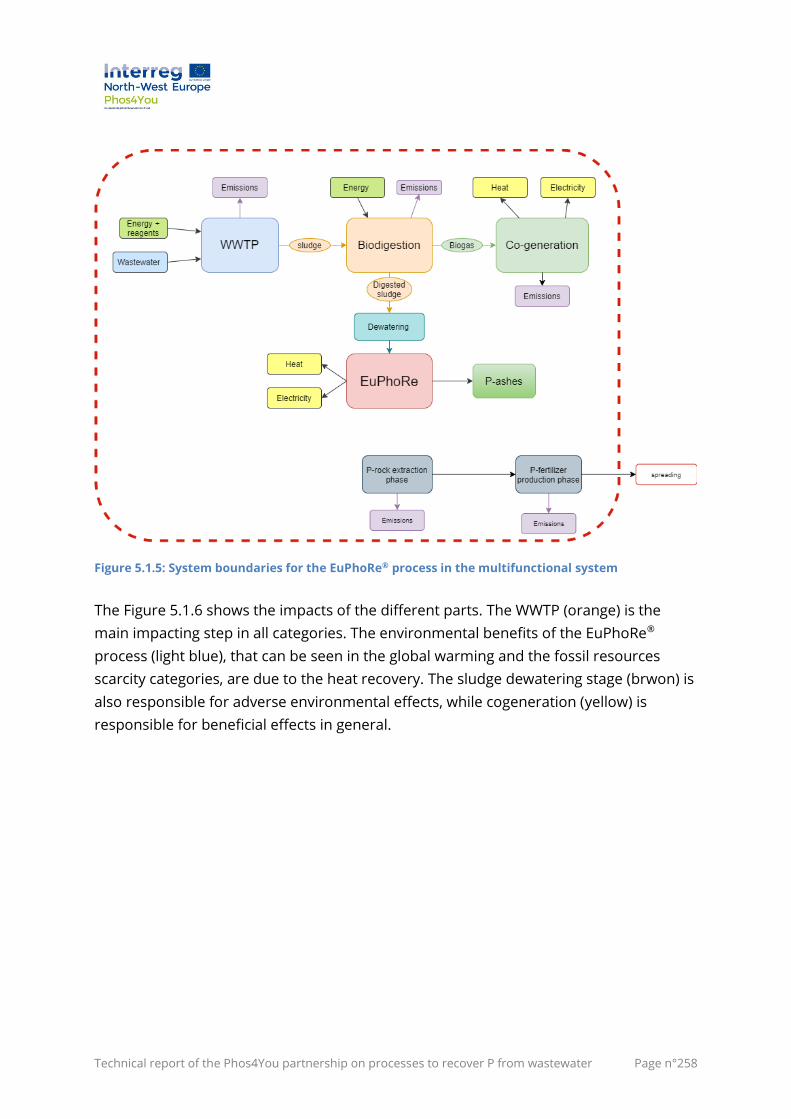
Technical report of the Phos4You partnership on processes to recover P from wastewater Page n°258
Figure 5.1.5: System boundaries for the EuPhoRe® process in the multifunctional system
The Figure 5.1.6 shows the impacts of the different parts. The WWTP (orange) is the
main impacting step in all categories. The environmental benefits of the EuPhoRe®
process (light blue), that can be seen in the global warming and the fossil resources
scarcity categories, are due to the heat recovery. The sludge dewatering stage (brwon) is
also responsible for adverse environmental effects, while cogeneration (yellow) is
responsible for beneficial effects in general.
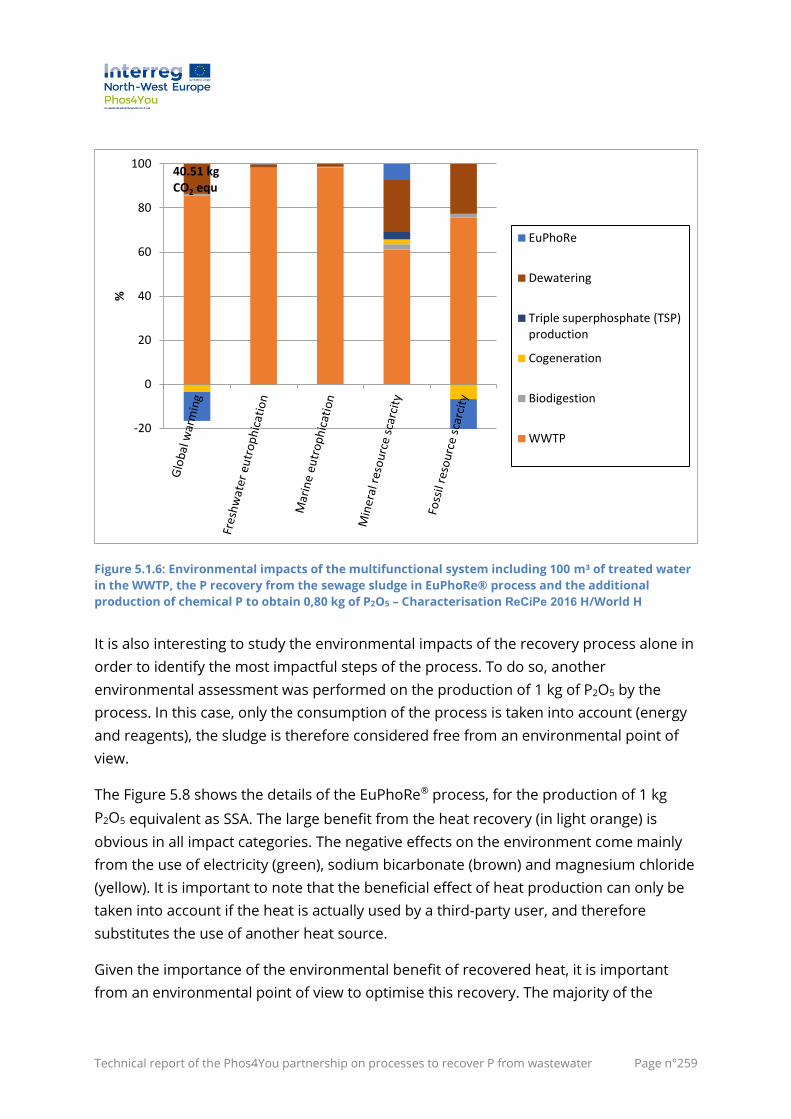
Technical report of the Phos4You partnership on processes to recover P from wastewater Page n°259
Figure 5.1.6: Environmental impacts of the multifunctional system including 100 m³ of treated water
in the WWTP, the P recovery from the sewage sludge in EuPhoRe® process and the additional
production of chemical P to obtain 0,80 kg of P2O5 – Characterisation ReCiPe 2016 H/World H
It is also interesting to study the environmental impacts of the recovery process alone in
order to identify the most impactful steps of the process. To do so, another
environmental assessment was performed on the production of 1 kg of P2O5 by the
process. In this case, only the consumption of the process is taken into account (energy
and reagents), the sludge is therefore considered free from an environmental point of
view.
The Figure 5.8 shows the details of the EuPhoRe® process, for the production of 1 kg
P2O5 equivalent as SSA. The large benefit from the heat recovery (in light orange) is
obvious in all impact categories. The negative effects on the environment come mainly
from the use of electricity (green), sodium bicarbonate (brown) and magnesium chloride
(yellow). It is important to note that the beneficial effect of heat production can only be
taken into account if the heat is actually used by a third-party user, and therefore
substitutes the use of another heat source.
Given the importance of the environmental benefit of recovered heat, it is important
from an environmental point of view to optimise this recovery. The majority of the
-20
0
20
40
60
80
100
%
EuPhoRe
Dewatering
Triple superphosphate (TSP)production
Cogeneration
Biodigestion
WWTP
40.51 kg CO2 equ
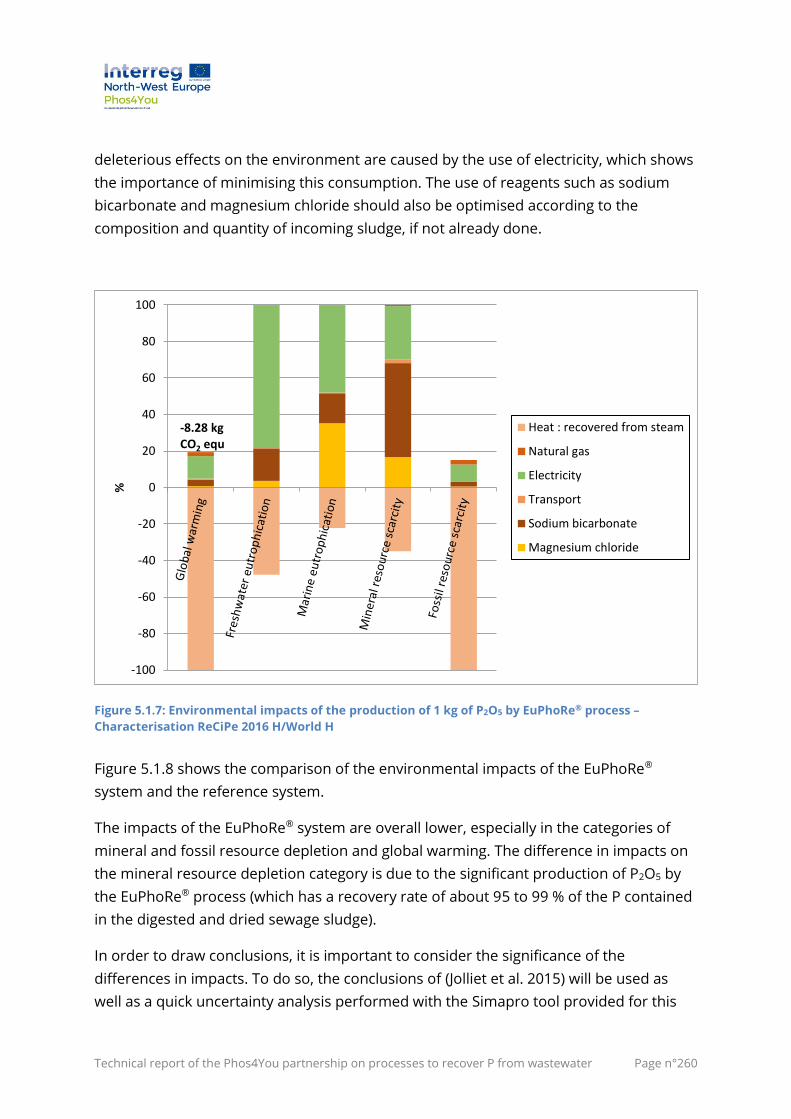
Technical report of the Phos4You partnership on processes to recover P from wastewater Page n°260
deleterious effects on the environment are caused by the use of electricity, which shows
the importance of minimising this consumption. The use of reagents such as sodium
bicarbonate and magnesium chloride should also be optimised according to the
composition and quantity of incoming sludge, if not already done.
Figure 5.1.7: Environmental impacts of the production of 1 kg of P2O5 by EuPhoRe® process –
Characterisation ReCiPe 2016 H/World H
Figure 5.1.8 shows the comparison of the environmental impacts of the EuPhoRe®
system and the reference system.
The impacts of the EuPhoRe® system are overall lower, especially in the categories of
mineral and fossil resource depletion and global warming. The difference in impacts on
the mineral resource depletion category is due to the significant production of P2O5 by
the EuPhoRe® process (which has a recovery rate of about 95 to 99 % of the P contained
in the digested and dried sewage sludge).
In order to draw conclusions, it is important to consider the significance of the
differences in impacts. To do so, the conclusions of (Jolliet et al. 2015) will be used as
well as a quick uncertainty analysis performed with the Simapro tool provided for this
-100
-80
-60
-40
-20
0
20
40
60
80
100
%
Heat : recovered from steam
Natural gas
Electricity
Transport
Sodium bicarbonate
Magnesium chloride
-8.28 kg CO2 equ
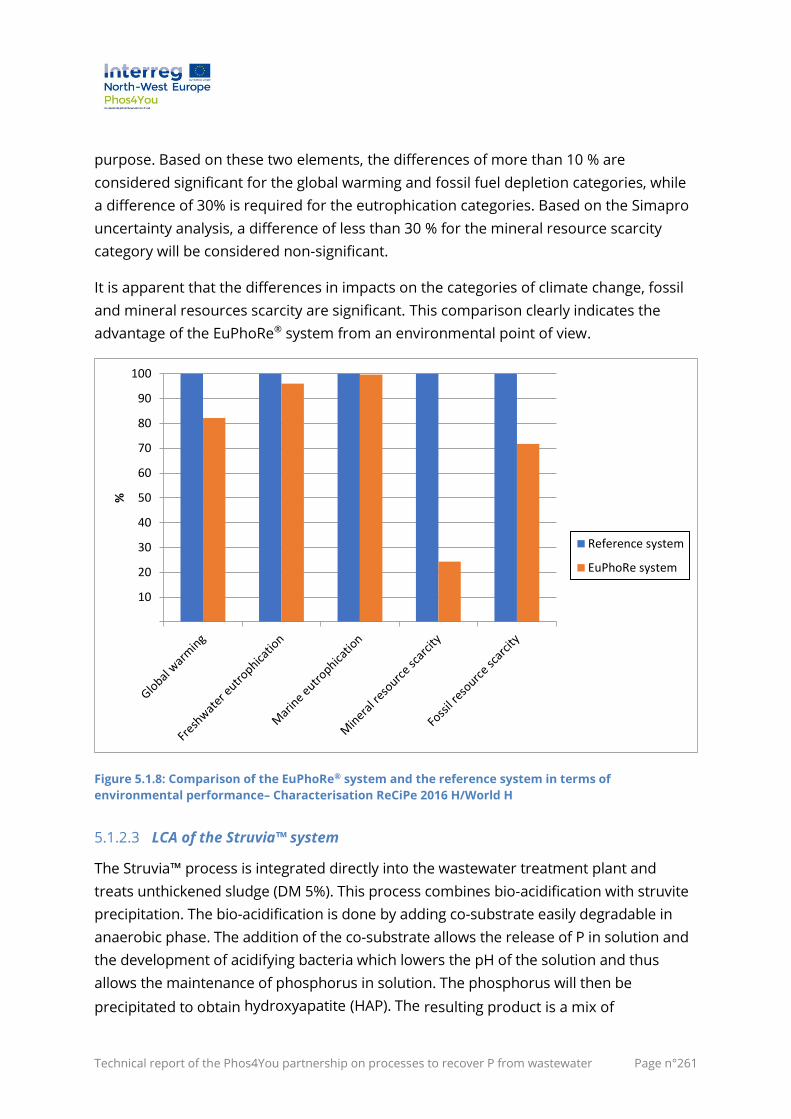
Technical report of the Phos4You partnership on processes to recover P from wastewater Page n°261
purpose. Based on these two elements, the differences of more than 10 % are
considered significant for the global warming and fossil fuel depletion categories, while
a difference of 30% is required for the eutrophication categories. Based on the Simapro
uncertainty analysis, a difference of less than 30 % for the mineral resource scarcity
category will be considered non-significant.
It is apparent that the differences in impacts on the categories of climate change, fossil
and mineral resources scarcity are significant. This comparison clearly indicates the
advantage of the EuPhoRe® system from an environmental point of view.
Figure 5.1.8: Comparison of the EuPhoRe® system and the reference system in terms of
environmental performance– Characterisation ReCiPe 2016 H/World H
5.1.2.3 LCA of the Struvia™ system
The Struvia™ process is integrated directly into the wastewater treatment plant and
treats unthickened sludge (DM 5%). This process combines bio-acidification with struvite
precipitation. The bio-acidification is done by adding co-substrate easily degradable in
anaerobic phase. The addition of the co-substrate allows the release of P in solution and
the development of acidifying bacteria which lowers the pH of the solution and thus
allows the maintenance of phosphorus in solution. The phosphorus will then be
precipitated to obtain hydroxyapatite (HAP). The resulting product is a mix of
10
20
30
40
50
60
70
80
90
100
%
Reference system
EuPhoRe system
Technical report of the Phos4You partnership on processes to recover P from wastewater Page n°262
hydroxyapatite (HAP) Ca5(PO4)3.OH, CaCO3 and iron (Fe) in trace. The phosphorus level of
the final product is 6 and 8 % of P for the dry product, corresponding to 14- 18 % of
P2O5. This value can vary depending on the sludge that is fed in the process. The final
product will be exported as a dewatered form with 35-50 % dry matter. Here, the average
values of 16 % P2O5 and 43 % DM were used for the calculations. A metal extraction
system, OPALIX, is available depending on the composition of the treated water but is not
installed on the pilot studied here.
This process has been implemented in two pilots with different capacities, the first one
has a capacity of 103 m³ of DM 5% sludge per day and the second of 4 m³ per day. Data
are based on the pilot operating with a flow rate of 103 m³ of sludge per day. It is located
in Tergnier. The pilot of 103 m³ sludge/day can produce around 1.3 tonne/day of HAP
product (43 % DM).
The data from the two pilots are similar in terms of reagent consumption, but the
electrical consumption of the small-scale pilot is significantly higher (10 kWh/m³ instead
of 3 kWh/m³). Electricity consumption is modelled by the German low voltage electricity
mix of 2016.
The co-substrate used for the bio acidification is a waste, produced locally (50 km). It is a
residue of sugar from candied fruit or molasses production. It is a "real waste" that has to
be disposed from production sites. Therefore, it is "free" of burden on an environmental
point of view.
The polymer powder used is an anionic flocculant and is modelled using the
corresponding Ecoinvent entry (polyacrylamide).
The Figure 5.1.9 shows the Struvia™ process.
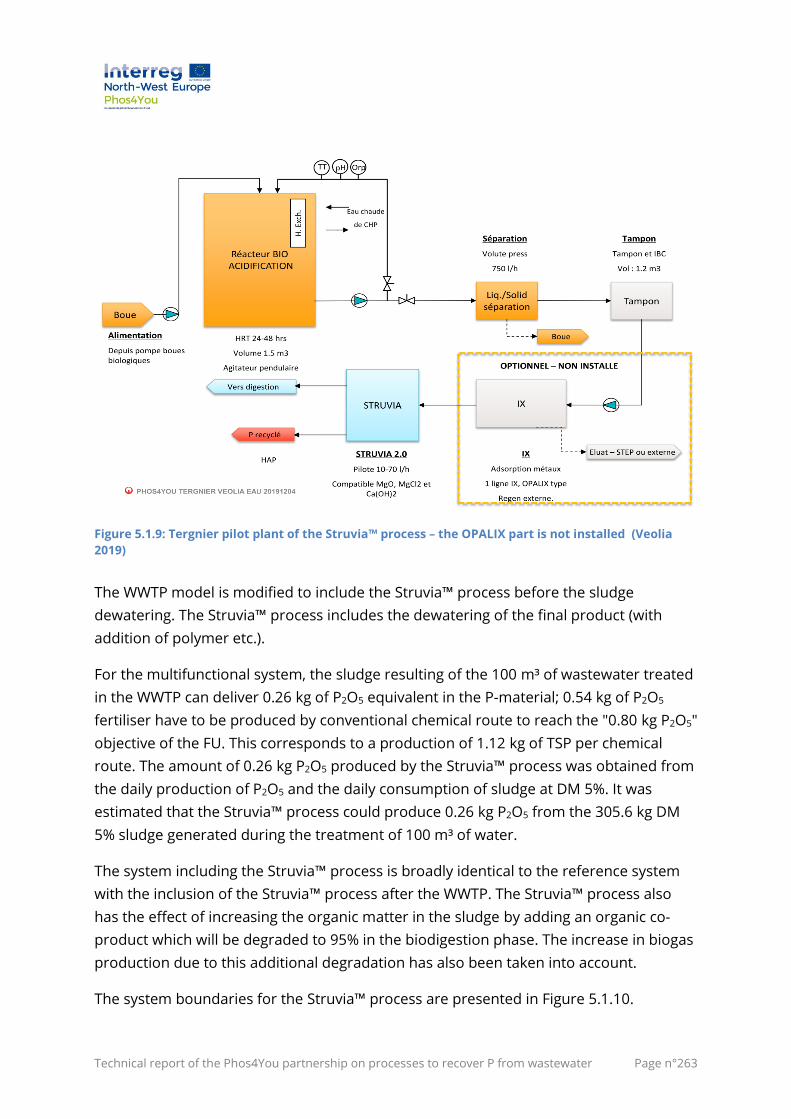
Technical report of the Phos4You partnership on processes to recover P from wastewater Page n°263
Figure 5.1.9: Tergnier pilot plant of the Struvia™ process – the OPALIX part is not installed (Veolia
2019)
The WWTP model is modified to include the Struvia™ process before the sludge
dewatering. The Struvia™ process includes the dewatering of the final product (with
addition of polymer etc.).
For the multifunctional system, the sludge resulting of the 100 m³ of wastewater treated
in the WWTP can deliver 0.26 kg of P2O5 equivalent in the P-material; 0.54 kg of P2O5
fertiliser have to be produced by conventional chemical route to reach the "0.80 kg P2O5"
objective of the FU. This corresponds to a production of 1.12 kg of TSP per chemical
route. The amount of 0.26 kg P2O5 produced by the Struvia™ process was obtained from
the daily production of P2O5 and the daily consumption of sludge at DM 5%. It was
estimated that the Struvia™ process could produce 0.26 kg P2O5 from the 305.6 kg DM
5% sludge generated during the treatment of 100 m³ of water.
The system including the Struvia™ process is broadly identical to the reference system
with the inclusion of the Struvia™ process after the WWTP. The Struvia™ process also
has the effect of increasing the organic matter in the sludge by adding an organic co-
product which will be degraded to 95% in the biodigestion phase. The increase in biogas
production due to this additional degradation has also been taken into account.
The system boundaries for the Struvia™ process are presented in Figure 5.1.10.
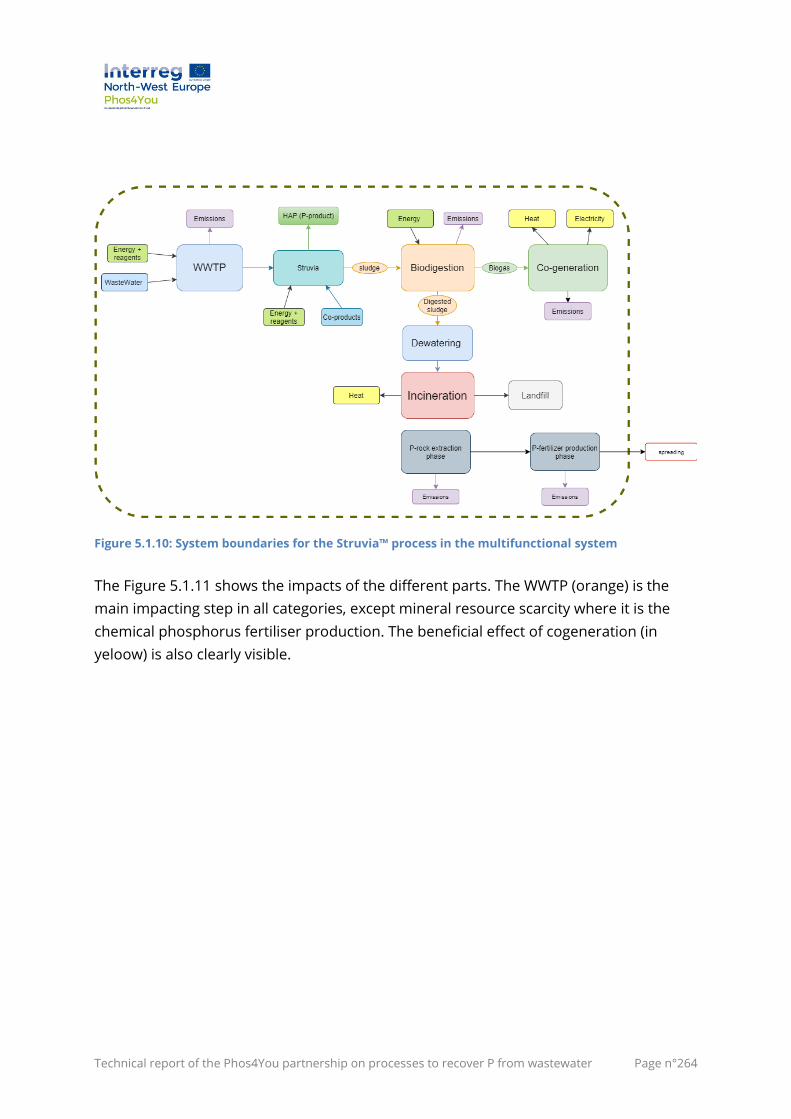
Technical report of the Phos4You partnership on processes to recover P from wastewater Page n°264
Figure 5.1.10: System boundaries for the Struvia™ process in the multifunctional system
The Figure 5.1.11 shows the impacts of the different parts. The WWTP (orange) is the
main impacting step in all categories, except mineral resource scarcity where it is the
chemical phosphorus fertiliser production. The beneficial effect of cogeneration (in
yeloow) is also clearly visible.
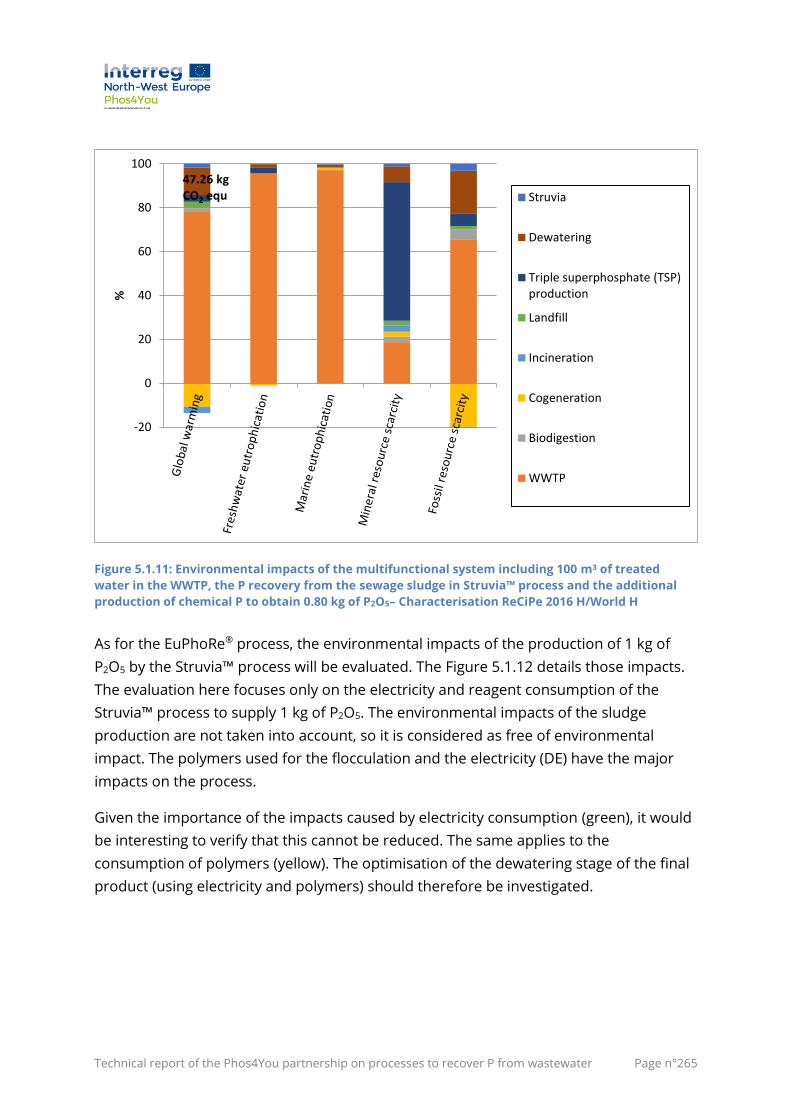
Technical report of the Phos4You partnership on processes to recover P from wastewater Page n°265
Figure 5.1.11: Environmental impacts of the multifunctional system including 100 m³ of treated
water in the WWTP, the P recovery from the sewage sludge in Struvia™ process and the additional
production of chemical P to obtain 0.80 kg of P2O5– Characterisation ReCiPe 2016 H/World H
As for the EuPhoRe® process, the environmental impacts of the production of 1 kg of
P2O5 by the Struvia™ process will be evaluated. The Figure 5.1.12 details those impacts.
The evaluation here focuses only on the electricity and reagent consumption of the
Struvia™ process to supply 1 kg of P2O5. The environmental impacts of the sludge
production are not taken into account, so it is considered as free of environmental
impact. The polymers used for the flocculation and the electricity (DE) have the major
impacts on the process.
Given the importance of the impacts caused by electricity consumption (green), it would
be interesting to verify that this cannot be reduced. The same applies to the
consumption of polymers (yellow). The optimisation of the dewatering stage of the final
product (using electricity and polymers) should therefore be investigated.
-20
0
20
40
60
80
100
%
Struvia
Dewatering
Triple superphosphate (TSP)production
Landfill
Incineration
Cogeneration
Biodigestion
WWTP
47.26 kg CO2 equ
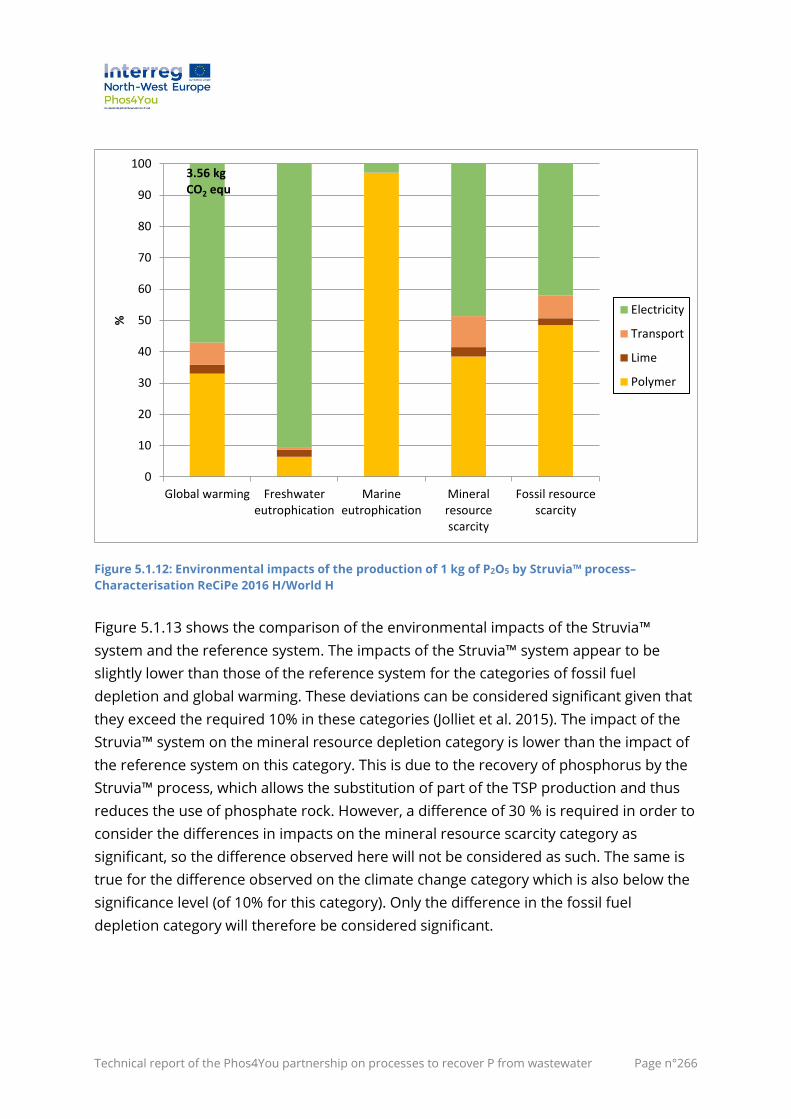
Technical report of the Phos4You partnership on processes to recover P from wastewater Page n°266
Figure 5.1.12: Environmental impacts of the production of 1 kg of P2O5 by Struvia™ process–
Characterisation ReCiPe 2016 H/World H
Figure 5.1.13 shows the comparison of the environmental impacts of the Struvia™
system and the reference system. The impacts of the Struvia™ system appear to be
slightly lower than those of the reference system for the categories of fossil fuel
depletion and global warming. These deviations can be considered significant given that
they exceed the required 10% in these categories (Jolliet et al. 2015). The impact of the
Struvia™ system on the mineral resource depletion category is lower than the impact of
the reference system on this category. This is due to the recovery of phosphorus by the
Struvia™ process, which allows the substitution of part of the TSP production and thus
reduces the use of phosphate rock. However, a difference of 30 % is required in order to
consider the differences in impacts on the mineral resource scarcity category as
significant, so the difference observed here will not be considered as such. The same is
true for the difference observed on the climate change category which is also below the
significance level (of 10% for this category). Only the difference in the fossil fuel
depletion category will therefore be considered significant.
0
10
20
30
40
50
60
70
80
90
100
Global warming Freshwatereutrophication
Marineeutrophication
Mineralresourcescarcity
Fossil resourcescarcity
%
Electricity
Transport
Lime
Polymer
3.56 kgCO2 equ
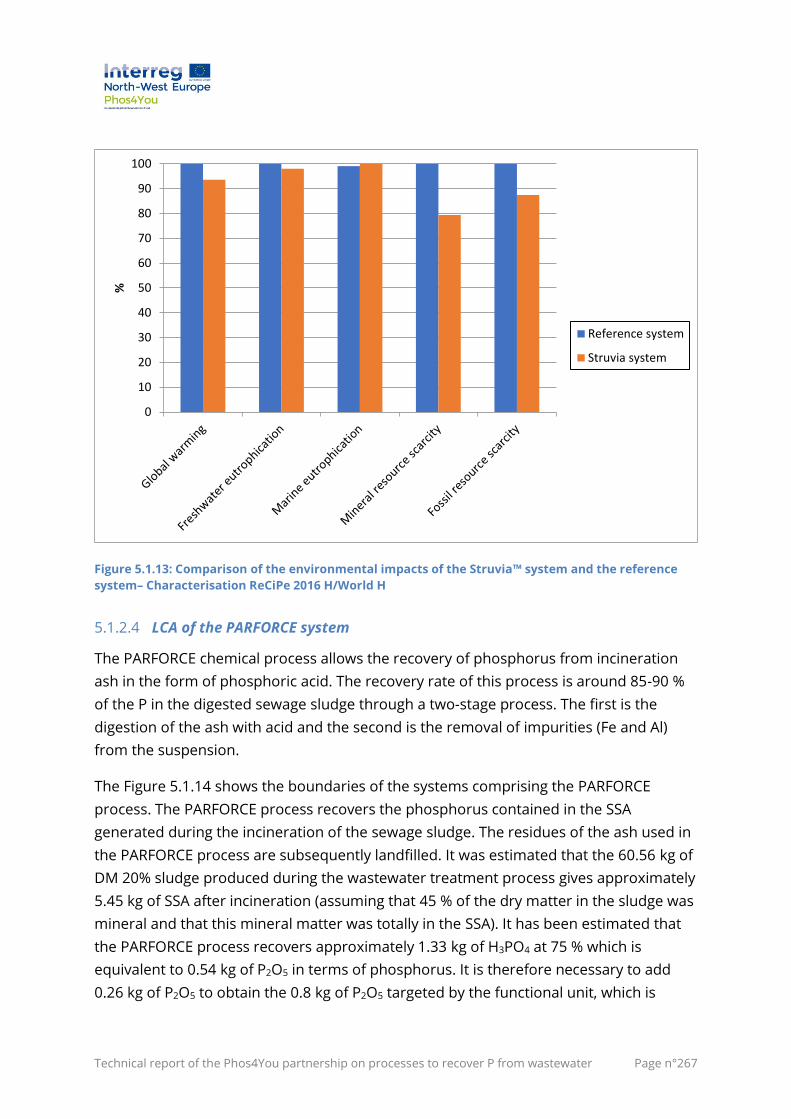
Technical report of the Phos4You partnership on processes to recover P from wastewater Page n°267
Figure 5.1.13: Comparison of the environmental impacts of the Struvia™ system and the reference
system– Characterisation ReCiPe 2016 H/World H
5.1.2.4 LCA of the PARFORCE system
The PARFORCE chemical process allows the recovery of phosphorus from incineration
ash in the form of phosphoric acid. The recovery rate of this process is around 85-90 %
of the P in the digested sewage sludge through a two-stage process. The first is the
digestion of the ash with acid and the second is the removal of impurities (Fe and Al)
from the suspension.
The Figure 5.1.14 shows the boundaries of the systems comprising the PARFORCE
process. The PARFORCE process recovers the phosphorus contained in the SSA
generated during the incineration of the sewage sludge. The residues of the ash used in
the PARFORCE process are subsequently landfilled. It was estimated that the 60.56 kg of
DM 20% sludge produced during the wastewater treatment process gives approximately
5.45 kg of SSA after incineration (assuming that 45 % of the dry matter in the sludge was
mineral and that this mineral matter was totally in the SSA). It has been estimated that
the PARFORCE process recovers approximately 1.33 kg of H3PO4 at 75 % which is
equivalent to 0.54 kg of P2O5 in terms of phosphorus. It is therefore necessary to add
0.26 kg of P2O5 to obtain the 0.8 kg of P2O5 targeted by the functional unit, which is
0
10
20
30
40
50
60
70
80
90
100
%
Reference system
Struvia system
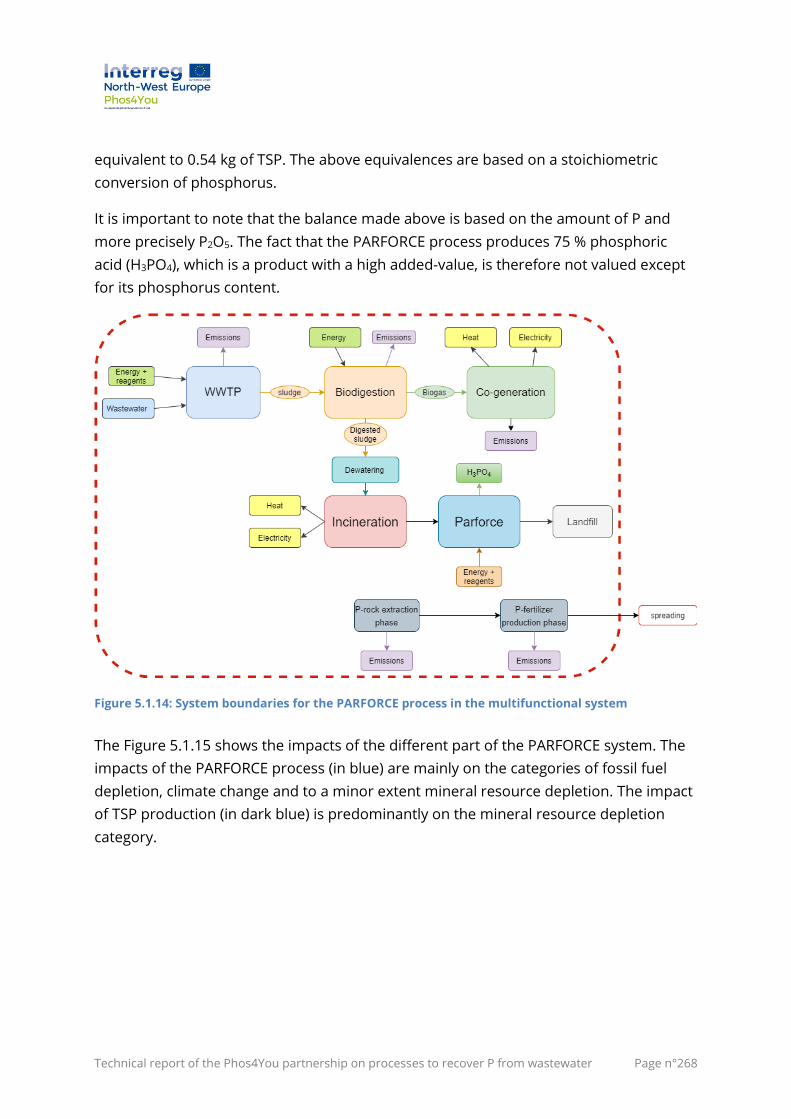
Technical report of the Phos4You partnership on processes to recover P from wastewater Page n°268
equivalent to 0.54 kg of TSP. The above equivalences are based on a stoichiometric
conversion of phosphorus.
It is important to note that the balance made above is based on the amount of P and
more precisely P2O5. The fact that the PARFORCE process produces 75 % phosphoric
acid (H3PO4), which is a product with a high added-value, is therefore not valued except
for its phosphorus content.
Figure 5.1.14: System boundaries for the PARFORCE process in the multifunctional system
The Figure 5.1.15 shows the impacts of the different part of the PARFORCE system. The
impacts of the PARFORCE process (in blue) are mainly on the categories of fossil fuel
depletion, climate change and to a minor extent mineral resource depletion. The impact
of TSP production (in dark blue) is predominantly on the mineral resource depletion
category.
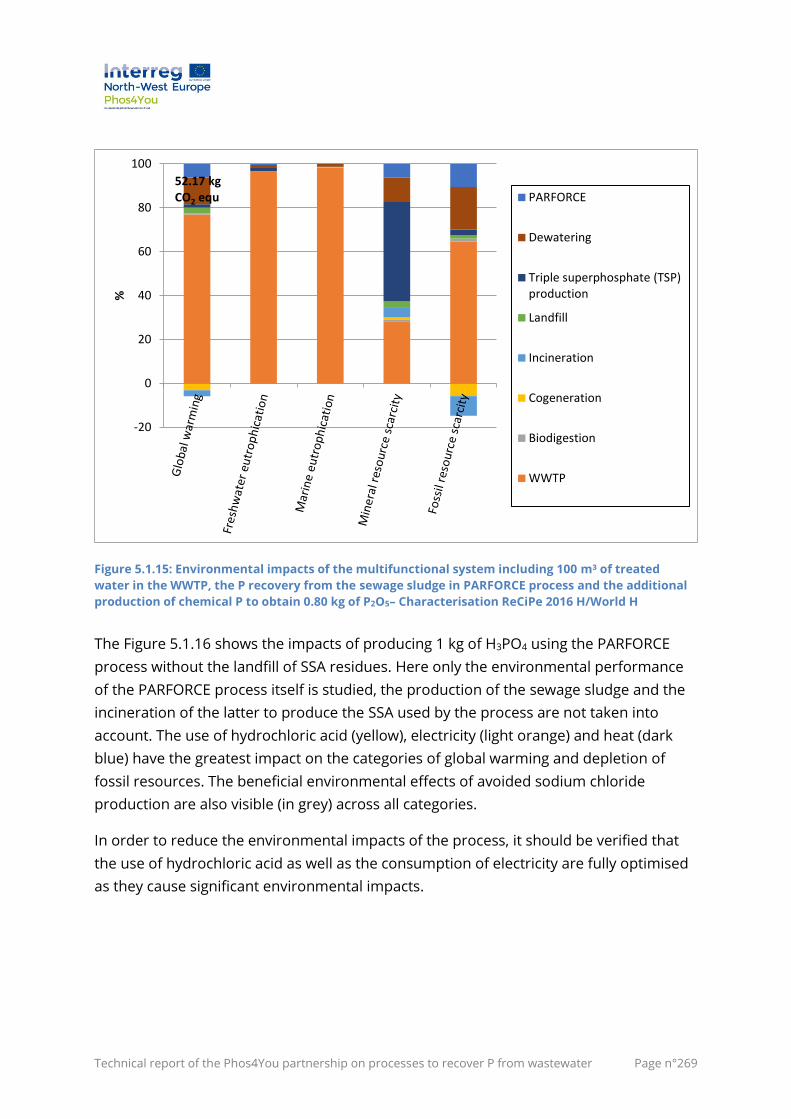
Technical report of the Phos4You partnership on processes to recover P from wastewater Page n°269
Figure 5.1.15: Environmental impacts of the multifunctional system including 100 m³ of treated
water in the WWTP, the P recovery from the sewage sludge in PARFORCE process and the additional
production of chemical P to obtain 0.80 kg of P2O5– Characterisation ReCiPe 2016 H/World H
The Figure 5.1.16 shows the impacts of producing 1 kg of H3PO4 using the PARFORCE
process without the landfill of SSA residues. Here only the environmental performance
of the PARFORCE process itself is studied, the production of the sewage sludge and the
incineration of the latter to produce the SSA used by the process are not taken into
account. The use of hydrochloric acid (yellow), electricity (light orange) and heat (dark
blue) have the greatest impact on the categories of global warming and depletion of
fossil resources. The beneficial environmental effects of avoided sodium chloride
production are also visible (in grey) across all categories.
In order to reduce the environmental impacts of the process, it should be verified that
the use of hydrochloric acid as well as the consumption of electricity are fully optimised
as they cause significant environmental impacts.
-20
0
20
40
60
80
100
%
PARFORCE
Dewatering
Triple superphosphate (TSP)production
Landfill
Incineration
Cogeneration
Biodigestion
WWTP
52.17 kg CO2 equ
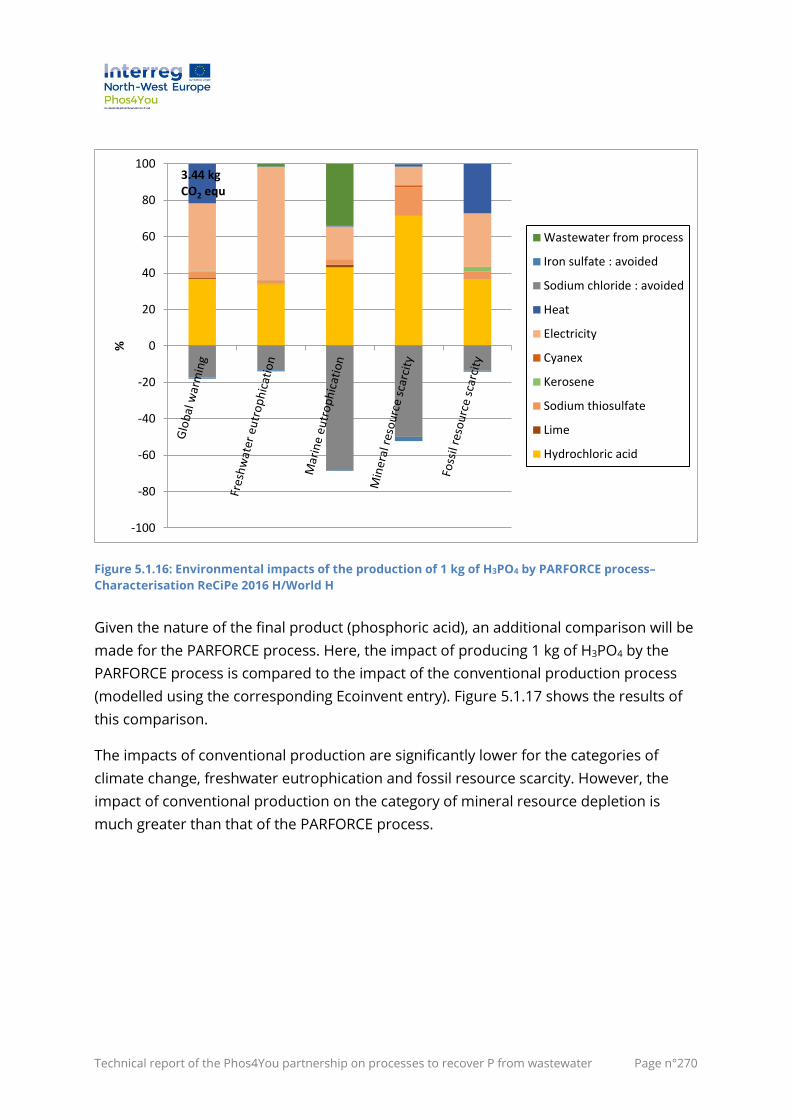
Technical report of the Phos4You partnership on processes to recover P from wastewater Page n°270
Figure 5.1.16: Environmental impacts of the production of 1 kg of H3PO4 by PARFORCE process–
Characterisation ReCiPe 2016 H/World H
Given the nature of the final product (phosphoric acid), an additional comparison will be
made for the PARFORCE process. Here, the impact of producing 1 kg of H3PO4 by the
PARFORCE process is compared to the impact of the conventional production process
(modelled using the corresponding Ecoinvent entry). Figure 5.1.17 shows the results of
this comparison.
The impacts of conventional production are significantly lower for the categories of
climate change, freshwater eutrophication and fossil resource scarcity. However, the
impact of conventional production on the category of mineral resource depletion is
much greater than that of the PARFORCE process.
-100
-80
-60
-40
-20
0
20
40
60
80
100
%
Wastewater from process
Iron sulfate : avoided
Sodium chloride : avoided
Heat
Electricity
Cyanex
Kerosene
Sodium thiosulfate
Lime
Hydrochloric acid
3.44 kg CO2 equ
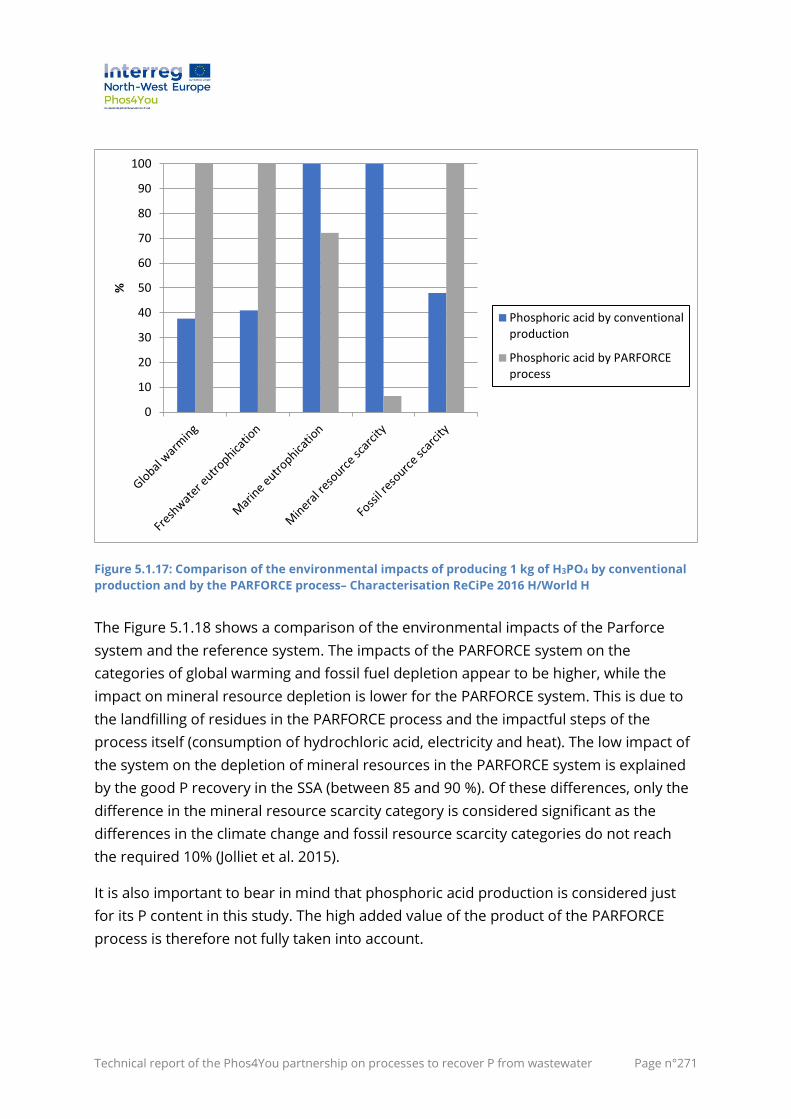
Technical report of the Phos4You partnership on processes to recover P from wastewater Page n°271
Figure 5.1.17: Comparison of the environmental impacts of producing 1 kg of H3PO4 by conventional
production and by the PARFORCE process– Characterisation ReCiPe 2016 H/World H
The Figure 5.1.18 shows a comparison of the environmental impacts of the Parforce
system and the reference system. The impacts of the PARFORCE system on the
categories of global warming and fossil fuel depletion appear to be higher, while the
impact on mineral resource depletion is lower for the PARFORCE system. This is due to
the landfilling of residues in the PARFORCE process and the impactful steps of the
process itself (consumption of hydrochloric acid, electricity and heat). The low impact of
the system on the depletion of mineral resources in the PARFORCE system is explained
by the good P recovery in the SSA (between 85 and 90 %). Of these differences, only the
difference in the mineral resource scarcity category is considered significant as the
differences in the climate change and fossil resource scarcity categories do not reach
the required 10% (Jolliet et al. 2015).
It is also important to bear in mind that phosphoric acid production is considered just
for its P content in this study. The high added value of the product of the PARFORCE
process is therefore not fully taken into account.
0
10
20
30
40
50
60
70
80
90
100
%
Phosphoric acid by conventionalproduction
Phosphoric acid by PARFORCEprocess
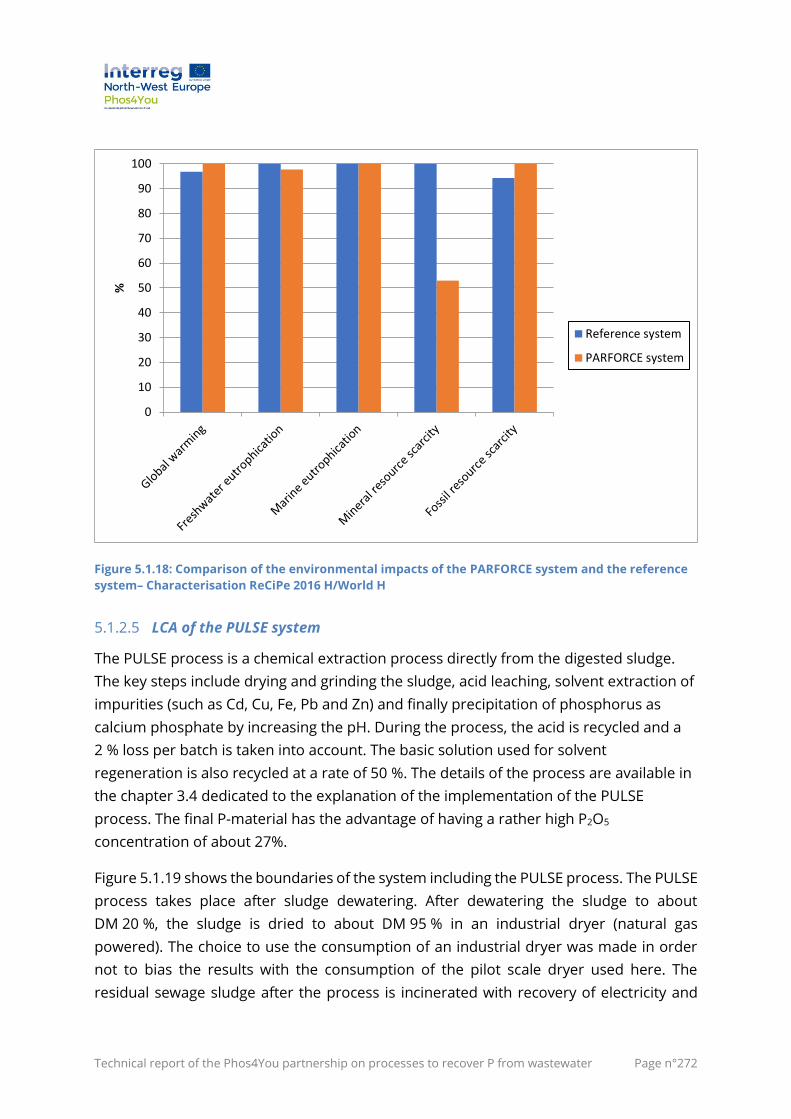
Technical report of the Phos4You partnership on processes to recover P from wastewater Page n°272
Figure 5.1.18: Comparison of the environmental impacts of the PARFORCE system and the reference
system– Characterisation ReCiPe 2016 H/World H
5.1.2.5 LCA of the PULSE system
The PULSE process is a chemical extraction process directly from the digested sludge.
The key steps include drying and grinding the sludge, acid leaching, solvent extraction of
impurities (such as Cd, Cu, Fe, Pb and Zn) and finally precipitation of phosphorus as
calcium phosphate by increasing the pH. During the process, the acid is recycled and a
2 % loss per batch is taken into account. The basic solution used for solvent
regeneration is also recycled at a rate of 50 %. The details of the process are available in
the chapter 3.4 dedicated to the explanation of the implementation of the PULSE
process. The final P-material has the advantage of having a rather high P2O5
concentration of about 27%.
Figure 5.1.19 shows the boundaries of the system including the PULSE process. The PULSE
process takes place after sludge dewatering. After dewatering the sludge to about
DM 20 %, the sludge is dried to about DM 95 % in an industrial dryer (natural gas
powered). The choice to use the consumption of an industrial dryer was made in order
not to bias the results with the consumption of the pilot scale dryer used here. The
residual sewage sludge after the process is incinerated with recovery of electricity and
0
10
20
30
40
50
60
70
80
90
100
%
Reference system
PARFORCE system
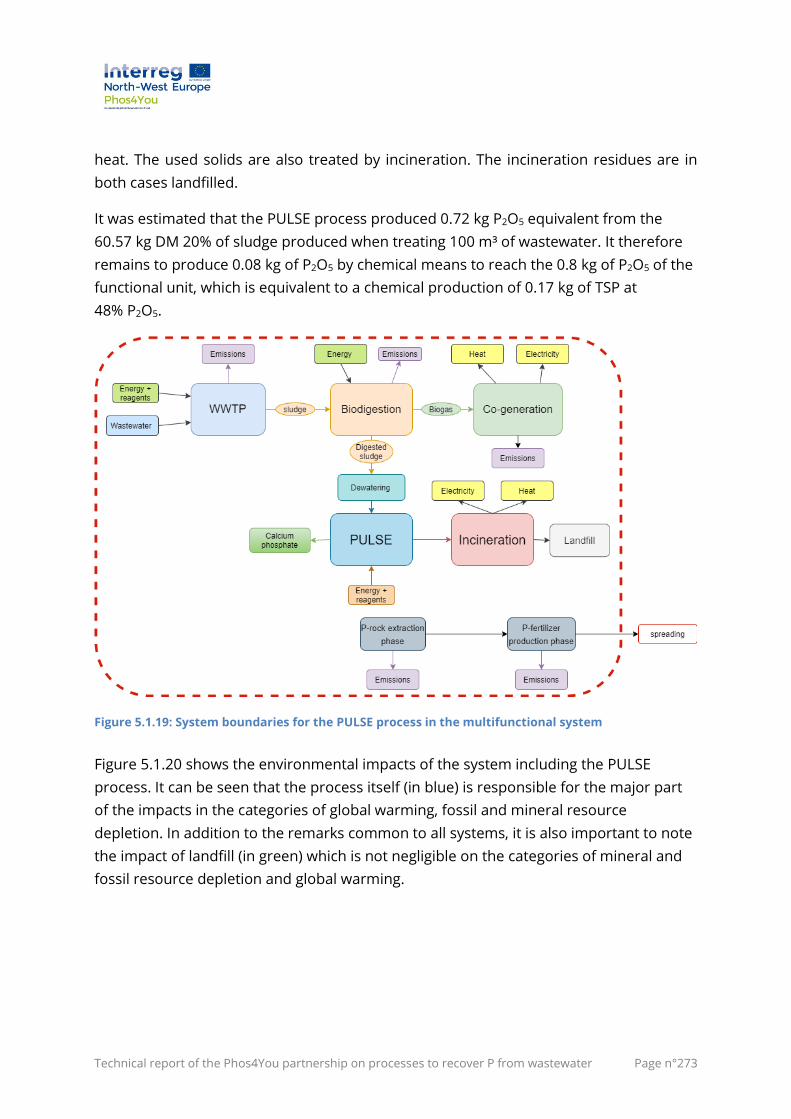
Technical report of the Phos4You partnership on processes to recover P from wastewater Page n°273
heat. The used solids are also treated by incineration. The incineration residues are in
both cases landfilled.
It was estimated that the PULSE process produced 0.72 kg P2O5 equivalent from the
60.57 kg DM 20% of sludge produced when treating 100 m³ of wastewater. It therefore
remains to produce 0.08 kg of P2O5 by chemical means to reach the 0.8 kg of P2O5 of the
functional unit, which is equivalent to a chemical production of 0.17 kg of TSP at
48% P2O5.
Figure 5.1.19: System boundaries for the PULSE process in the multifunctional system
Figure 5.1.20 shows the environmental impacts of the system including the PULSE
process. It can be seen that the process itself (in blue) is responsible for the major part
of the impacts in the categories of global warming, fossil and mineral resource
depletion. In addition to the remarks common to all systems, it is also important to note
the impact of landfill (in green) which is not negligible on the categories of mineral and
fossil resource depletion and global warming.
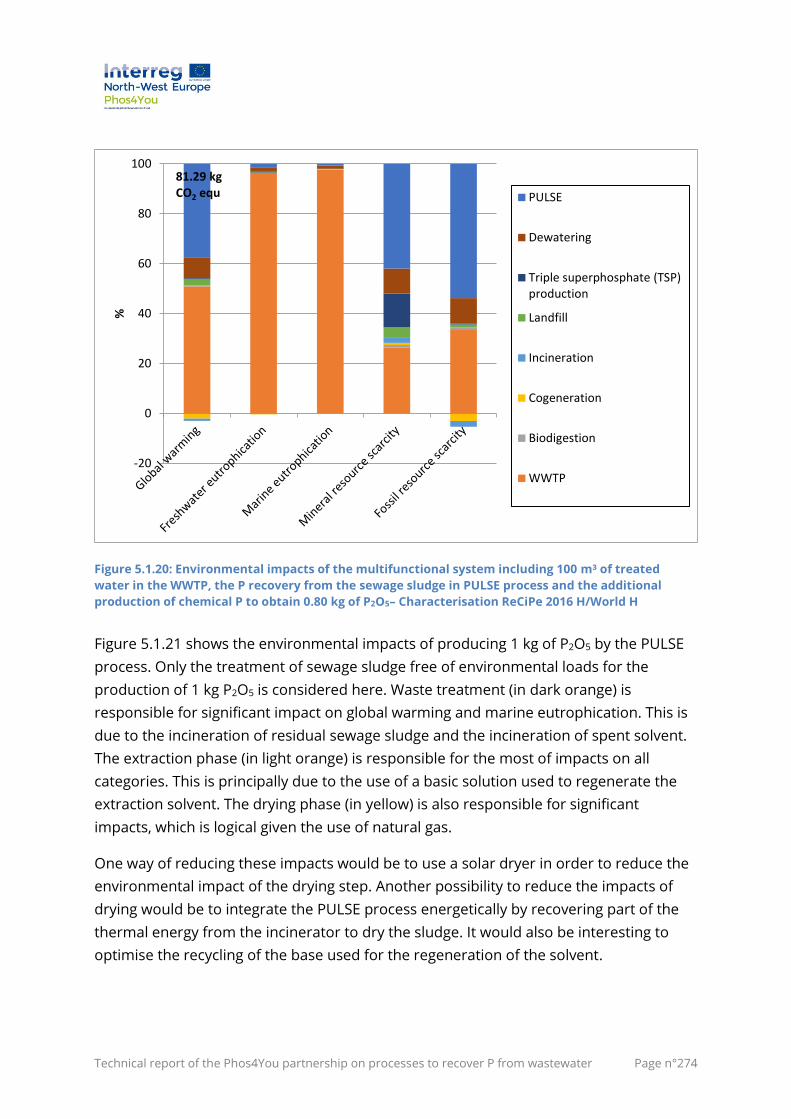
Technical report of the Phos4You partnership on processes to recover P from wastewater Page n°274
Figure 5.1.20: Environmental impacts of the multifunctional system including 100 m³ of treated
water in the WWTP, the P recovery from the sewage sludge in PULSE process and the additional
production of chemical P to obtain 0.80 kg of P2O5– Characterisation ReCiPe 2016 H/World H
Figure 5.1.21 shows the environmental impacts of producing 1 kg of P2O5 by the PULSE
process. Only the treatment of sewage sludge free of environmental loads for the
production of 1 kg P2O5 is considered here. Waste treatment (in dark orange) is
responsible for significant impact on global warming and marine eutrophication. This is
due to the incineration of residual sewage sludge and the incineration of spent solvent.
The extraction phase (in light orange) is responsible for the most of impacts on all
categories. This is principally due to the use of a basic solution used to regenerate the
extraction solvent. The drying phase (in yellow) is also responsible for significant
impacts, which is logical given the use of natural gas.
One way of reducing these impacts would be to use a solar dryer in order to reduce the
environmental impact of the drying step. Another possibility to reduce the impacts of
drying would be to integrate the PULSE process energetically by recovering part of the
thermal energy from the incinerator to dry the sludge. It would also be interesting to
optimise the recycling of the base used for the regeneration of the solvent.
-20
0
20
40
60
80
100
%
PULSE
Dewatering
Triple superphosphate (TSP)production
Landfill
Incineration
Cogeneration
Biodigestion
WWTP
81.29 kg CO2 equ
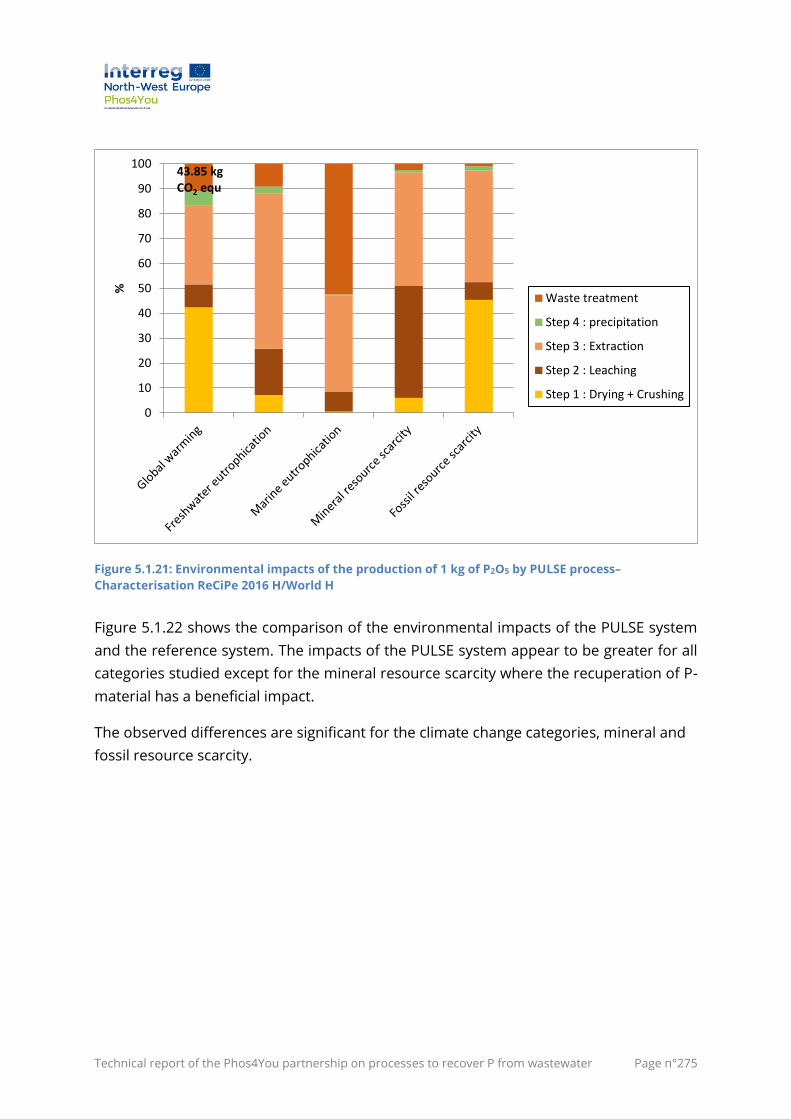
Technical report of the Phos4You partnership on processes to recover P from wastewater Page n°275
Figure 5.1.21: Environmental impacts of the production of 1 kg of P2O5 by PULSE process–
Characterisation ReCiPe 2016 H/World H
Figure 5.1.22 shows the comparison of the environmental impacts of the PULSE system
and the reference system. The impacts of the PULSE system appear to be greater for all
categories studied except for the mineral resource scarcity where the recuperation of P-
material has a beneficial impact.
The observed differences are significant for the climate change categories, mineral and
fossil resource scarcity.
0
10
20
30
40
50
60
70
80
90
100
%
Waste treatment
Step 4 : precipitation
Step 3 : Extraction
Step 2 : Leaching
Step 1 : Drying + Crushing
43.85 kg CO2 equ
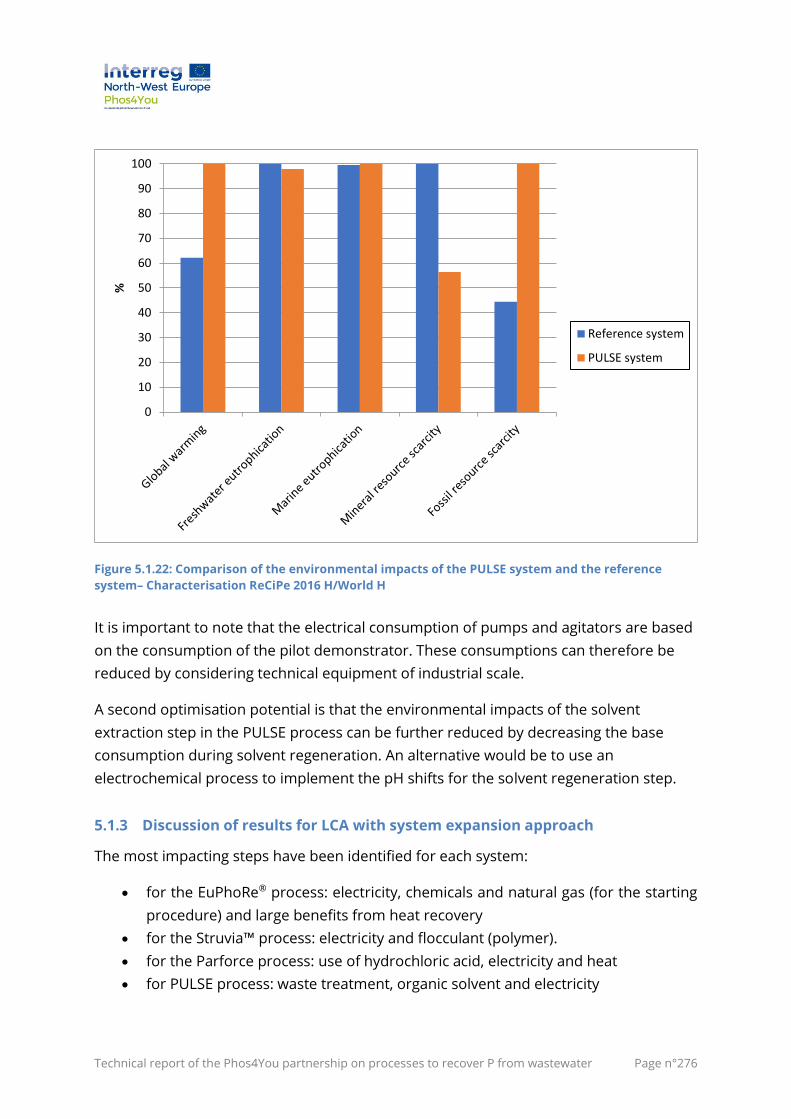
Technical report of the Phos4You partnership on processes to recover P from wastewater Page n°276
Figure 5.1.22: Comparison of the environmental impacts of the PULSE system and the reference
system– Characterisation ReCiPe 2016 H/World H
It is important to note that the electrical consumption of pumps and agitators are based
on the consumption of the pilot demonstrator. These consumptions can therefore be
reduced by considering technical equipment of industrial scale.
A second optimisation potential is that the environmental impacts of the solvent
extraction step in the PULSE process can be further reduced by decreasing the base
consumption during solvent regeneration. An alternative would be to use an
electrochemical process to implement the pH shifts for the solvent regeneration step.
5.1.3 Discussion of results for LCA with system expansion approach
The most impacting steps have been identified for each system:
• for the EuPhoRe® process: electricity, chemicals and natural gas (for the starting
procedure) and large benefits from heat recovery
• for the Struvia™ process: electricity and flocculant (polymer).
• for the Parforce process: use of hydrochloric acid, electricity and heat
• for PULSE process: waste treatment, organic solvent and electricity
0
10
20
30
40
50
60
70
80
90
100
%
Reference system
PULSE system
Technical report of the Phos4You partnership on processes to recover P from wastewater Page n°277
In conclusion, the environmental performance study with the perspective of system
expansion showed that P recovery as realised in the EuPhoRe® and Struvia™
demonstrators presents environmental advantages over the conventional chemical
route to produce P fertiliser.
The PULSE and PARFORCE processes appear to have higher environmental impacts than
the reference system. However, it is important to note that these processes produce P-
material that can have a high added value (70% phosphoric acid and 27% calcium
phosphate P2O5). The major advantage of all the processes studied is that they allow the
relocation of phosphorus fertiliser and to more independence for the EU regarding P
importation from other continents.
This conclusion is different of the one from(Pradel and Aissani 2019)(Pradel and Aissani
2019)(Pradel and Aissani 2019)(Pradel and Aissani 2019)(Pradel and Aissani 2019) Pradel
and Aissani 2019). Indeed, they concluded that phosphorus recovery processes from
sewage sludge were less environmentally friendly than conventional production by
basing their LCA on the calculation of an allocation factor distributing the environmental
impacts of the sewage treatment plant between the wastewater treatment and sludge
production functions. This allocation factor was based on physical parameters of the
wastewater treatment line. These differing conclusions are therefore not surprising
given that the means of accounting for the wastewater treatment plant is drastically
different from one study to another. Furthermore, these differences highlight the
importance of taking into account several methodological approaches in order to
confirm the conclusions in the environmental assessment of sewage sludge-based
nutrient recovery processes.
In order to confirm the results and make the conclusions more robust, another LCA
approach was considered. The avoided burden method will now be developed for
application to the systems studied.
Technical report of the Phos4You partnership on processes to recover P from wastewater Page n°278
5.2 Avoided burden methodology
5.2.1 Methodological choices
The avoided burden method is an LCA methodology that allows the co-products of a
system to be taken into account without extending the boundaries of the system (as the
system expansion method does) and without the use of allocation factors (which are
difficult to implement and often disputed).
This method consists of taking into account the co-product by subtracting the
environmental impacts of the production that this co-product replaces from those of the
system as a whole. The avoided burden approach applied to this project consists of
studying the environmental impacts of a system including the treatment of a quantity of
wastewater and the treatment of the sewage sludge through the introduction of a
phosphorus recovery process. The environmental impacts of the phosphorus fertiliser
production are also studied in order to subtract the environmental impacts of the
avoided mineral fertiliser production through the recovery process from the total
impacts of the system studied. Following this approach, the functional unit of the
systems studied is the treatment of 100 m³ of wastewater and the corresponding
treatment of sewage sludge. The phosphorus-rich products of the different recovery
processes are taken into account as avoided mineral fertilisers. In the modelling of these
mineral fertilisers, it is the production of triple super phosphate (TSP) that is considered.
The data used for the environmental assessment of the WWTP correspond to the WWTP
of Liège-Oupeye (438,000 PE, Wallonia, Belgium) and are provided by the AIDE. This
plant is chosen because it is representative of large and relatively modern (2007) Belgian
WWTP. A biodigestion unit is added to be closer to what is done in most of the European
WWTP (especially German or French). The electricity consumptions were modelled with
the German mix of 2016 using the corresponding Ecoinvent entry. A sensitivity analysis
was performed by comparing the impacts of the modelled systems with the German
(2016), French (2016) and Belgian (2016) mix, this analysis will be detailed below.
The data for direct emissions are calculated on the basis of the relevant scientific literature
and the inputs and outputs of the WWTP are modelled using generic data from the
Ecoinvent database.
The Ecoinvent database was also used to model biodigestion of sludge, cogeneration of
biogas, dewatering and incineration of digested sludge with energy recovery and landfill
operations.
Technical report of the Phos4You partnership on processes to recover P from wastewater Page n°279
The data for the recovery processes was received directly from the partners and the
modelling of the inputs and outputs was generally done using the Ecoinvent database.
Finally, a sensitivity analysis was also carried out on the phosphorus content of the
sewage sludge used with the avoided burden method. Indeed, it is common for the P
content of sewage sludge to vary according to regional and climatic factors and the
origin of the treated wastewater. To study the reaction of each phosphorus recovery
process to these variations, a sensitivity analysis was carried out on this factor. The
influence of these variations was discussed with the owners of the technologies in order
to best model these changes in an appropriated way for each demonstrator.
5.2.2 Results for four recovery processes
5.2.2.1 LCA of the reference system
Introduction
The reference case for the avoided burden method is very similar to that of the
expansion system method with the difference that the fertiliser production by the
demonstrators is taken into account as avoided TSP production. The impacts of this
avoided chemical production are therefore subtracted from the impacts of the studied
system.
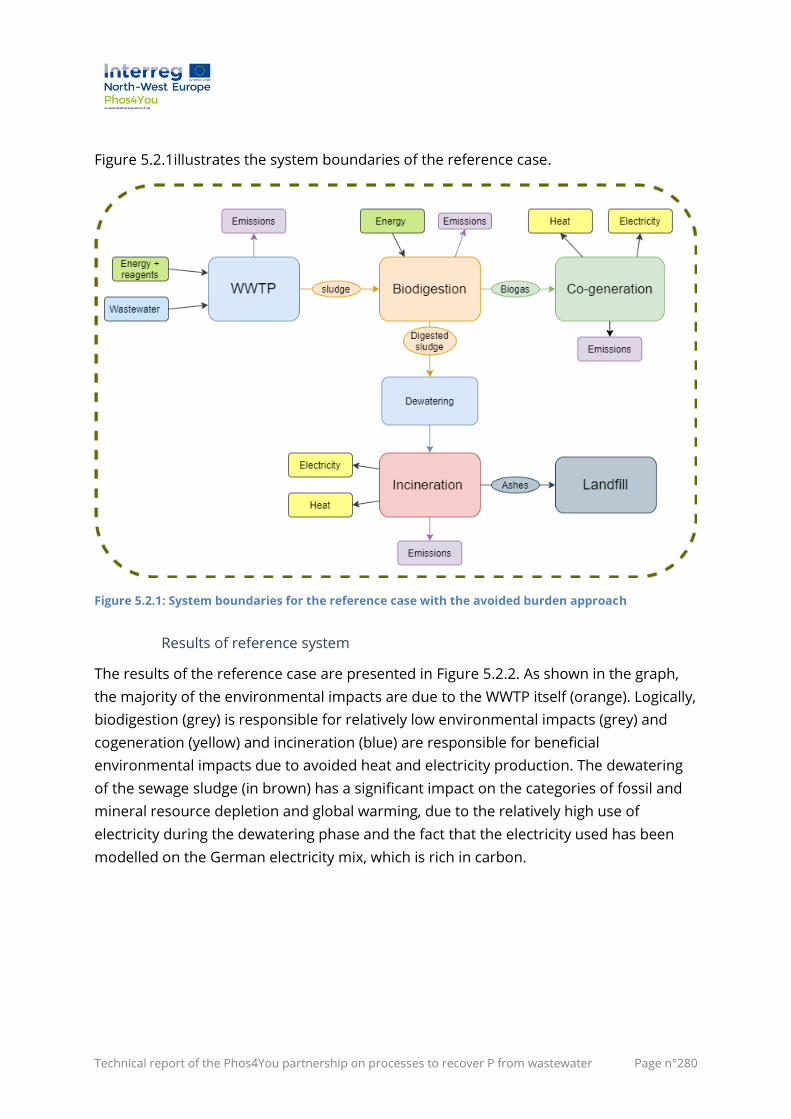
Technical report of the Phos4You partnership on processes to recover P from wastewater Page n°280
Figure 5.2.1illustrates the system boundaries of the reference case.
Figure 5.2.1: System boundaries for the reference case with the avoided burden approach
Results of reference system
The results of the reference case are presented in Figure 5.2.2. As shown in the graph,
the majority of the environmental impacts are due to the WWTP itself (orange). Logically,
biodigestion (grey) is responsible for relatively low environmental impacts (grey) and
cogeneration (yellow) and incineration (blue) are responsible for beneficial
environmental impacts due to avoided heat and electricity production. The dewatering
of the sewage sludge (in brown) has a significant impact on the categories of fossil and
mineral resource depletion and global warming, due to the relatively high use of
electricity during the dewatering phase and the fact that the electricity used has been
modelled on the German electricity mix, which is rich in carbon.
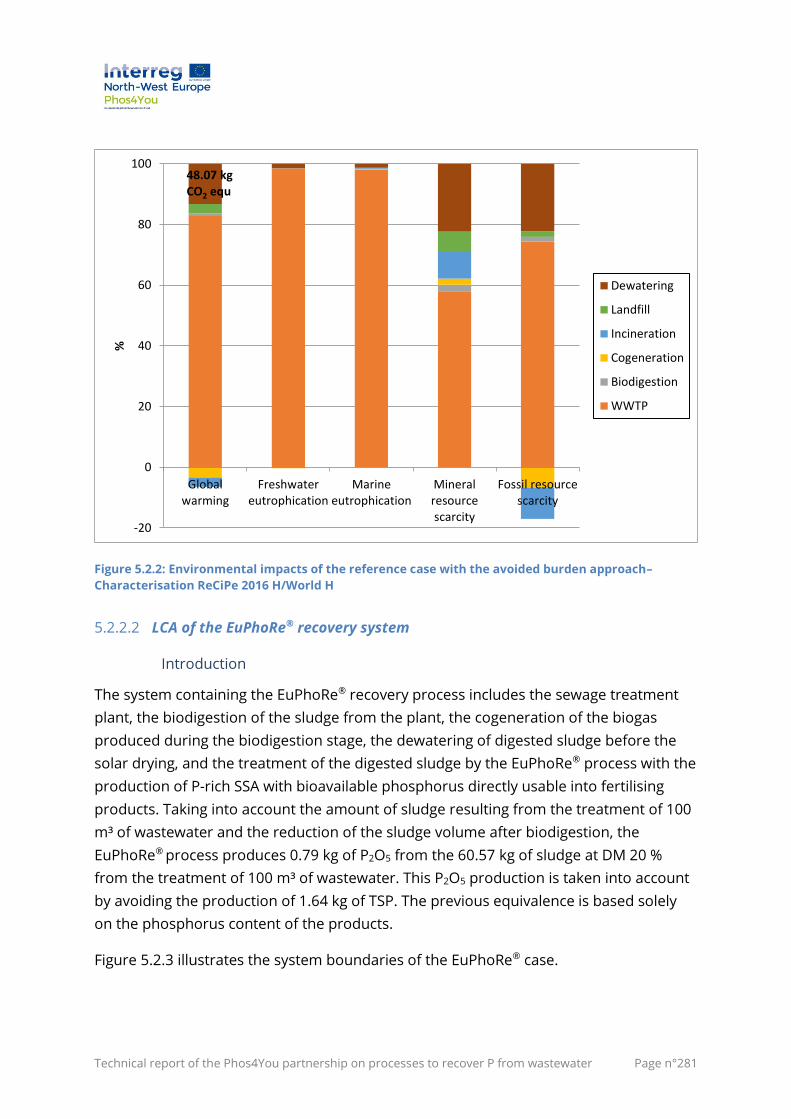
Technical report of the Phos4You partnership on processes to recover P from wastewater Page n°281
Figure 5.2.2: Environmental impacts of the reference case with the avoided burden approach–
Characterisation ReCiPe 2016 H/World H
5.2.2.2 LCA of the EuPhoRe® recovery system
Introduction
The system containing the EuPhoRe® recovery process includes the sewage treatment
plant, the biodigestion of the sludge from the plant, the cogeneration of the biogas
produced during the biodigestion stage, the dewatering of digested sludge before the
solar drying, and the treatment of the digested sludge by the EuPhoRe® process with the
production of P-rich SSA with bioavailable phosphorus directly usable into fertilising
products. Taking into account the amount of sludge resulting from the treatment of 100
m³ of wastewater and the reduction of the sludge volume after biodigestion, the
EuPhoRe® process produces 0.79 kg of P2O5 from the 60.57 kg of sludge at DM 20 %
from the treatment of 100 m³ of wastewater. This P2O5 production is taken into account
by avoiding the production of 1.64 kg of TSP. The previous equivalence is based solely
on the phosphorus content of the products.
Figure 5.2.3 illustrates the system boundaries of the EuPhoRe® case.
-20
0
20
40
60
80
100
Globalwarming
Freshwatereutrophication
Marineeutrophication
Mineralresourcescarcity
Fossil resourcescarcity
%
Dewatering
Landfill
Incineration
Cogeneration
Biodigestion
WWTP
48.07 kg CO2 equ
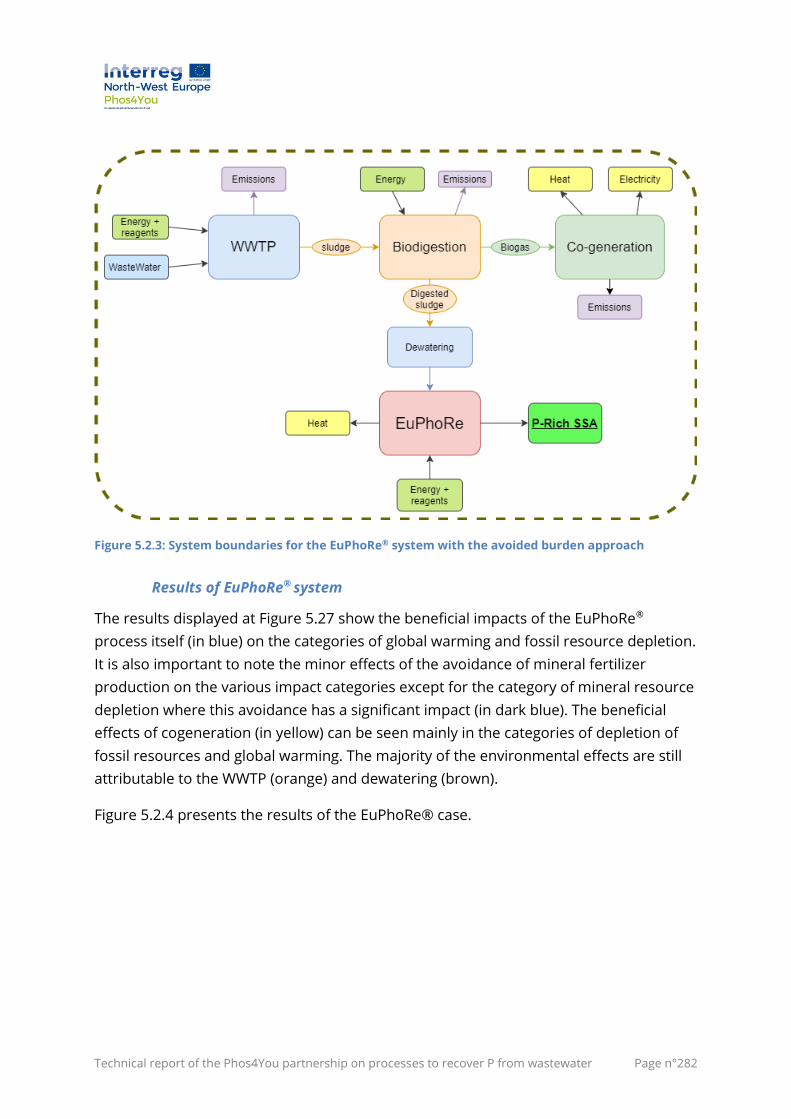
Technical report of the Phos4You partnership on processes to recover P from wastewater Page n°282
Figure 5.2.3: System boundaries for the EuPhoRe® system with the avoided burden approach
Results of EuPhoRe® system
The results displayed at Figure 5.27 show the beneficial impacts of the EuPhoRe®
process itself (in blue) on the categories of global warming and fossil resource depletion.
It is also important to note the minor effects of the avoidance of mineral fertilizer
production on the various impact categories except for the category of mineral resource
depletion where this avoidance has a significant impact (in dark blue). The beneficial
effects of cogeneration (in yellow) can be seen mainly in the categories of depletion of
fossil resources and global warming. The majority of the environmental effects are still
attributable to the WWTP (orange) and dewatering (brown).
Figure 5.2.4 presents the results of the EuPhoRe® case.
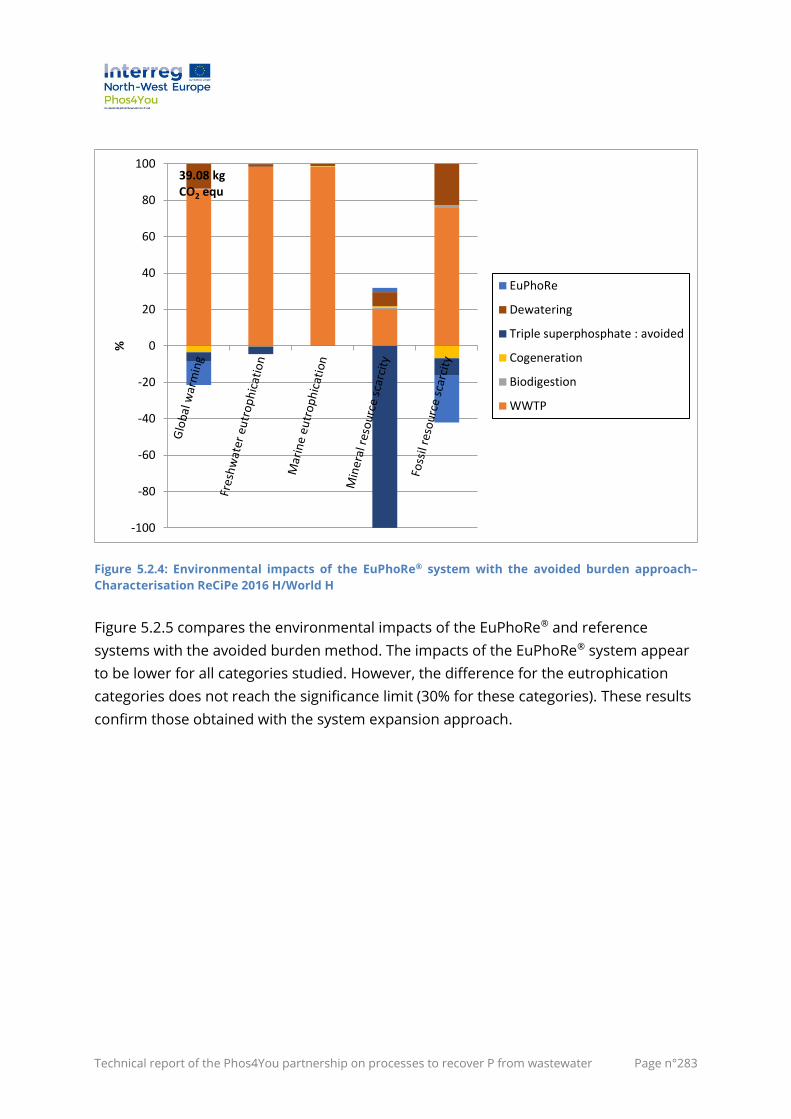
Technical report of the Phos4You partnership on processes to recover P from wastewater Page n°283
Figure 5.2.4: Environmental impacts of the EuPhoRe® system with the avoided burden approach–
Characterisation ReCiPe 2016 H/World H
Figure 5.2.5 compares the environmental impacts of the EuPhoRe® and reference
systems with the avoided burden method. The impacts of the EuPhoRe® system appear
to be lower for all categories studied. However, the difference for the eutrophication
categories does not reach the significance limit (30% for these categories). These results
confirm those obtained with the system expansion approach.
-100
-80
-60
-40
-20
0
20
40
60
80
100
%
EuPhoRe
Dewatering
Triple superphosphate : avoided
Cogeneration
Biodigestion
WWTP
39.08 kg CO2 equ
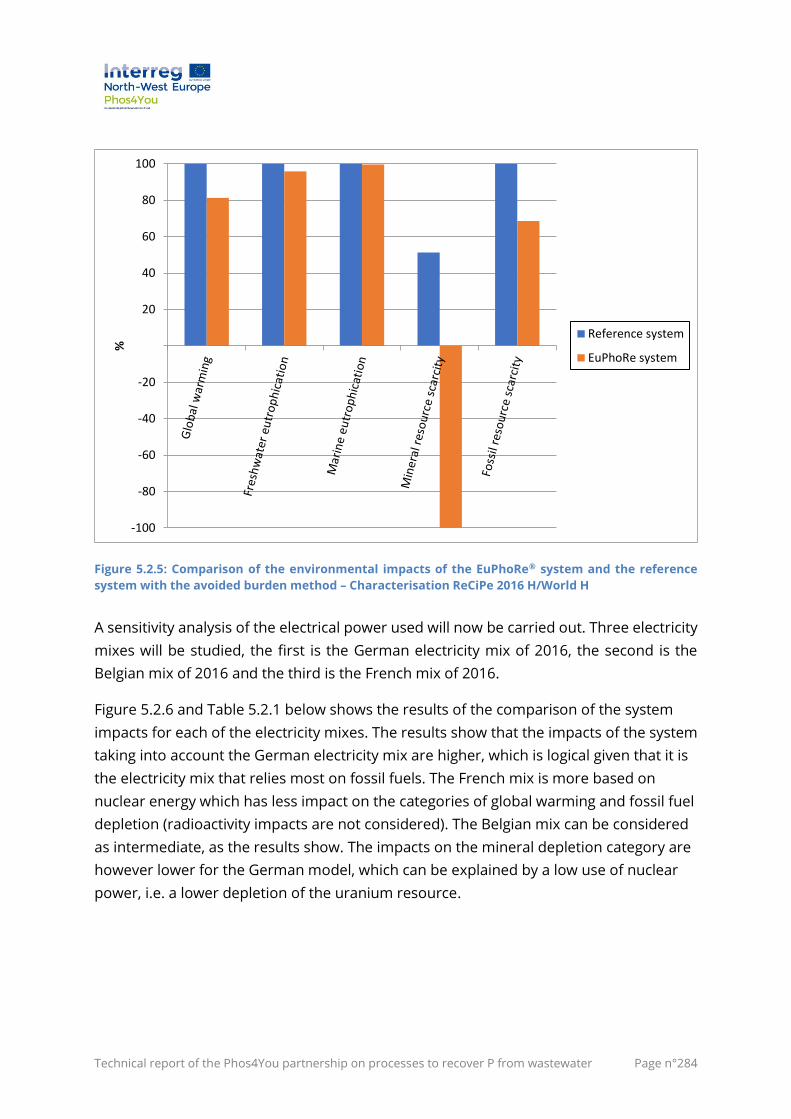
Technical report of the Phos4You partnership on processes to recover P from wastewater Page n°284
Figure 5.2.5: Comparison of the environmental impacts of the EuPhoRe® system and the reference
system with the avoided burden method – Characterisation ReCiPe 2016 H/World H
A sensitivity analysis of the electrical power used will now be carried out. Three electricity
mixes will be studied, the first is the German electricity mix of 2016, the second is the
Belgian mix of 2016 and the third is the French mix of 2016.
Figure 5.2.6 and Table 5.2.1 below shows the results of the comparison of the system
impacts for each of the electricity mixes. The results show that the impacts of the system
taking into account the German electricity mix are higher, which is logical given that it is
the electricity mix that relies most on fossil fuels. The French mix is more based on
nuclear energy which has less impact on the categories of global warming and fossil fuel
depletion (radioactivity impacts are not considered). The Belgian mix can be considered
as intermediate, as the results show. The impacts on the mineral depletion category are
however lower for the German model, which can be explained by a low use of nuclear
power, i.e. a lower depletion of the uranium resource.
-100
-80
-60
-40
-20
20
40
60
80
100
%
Reference system
EuPhoRe system
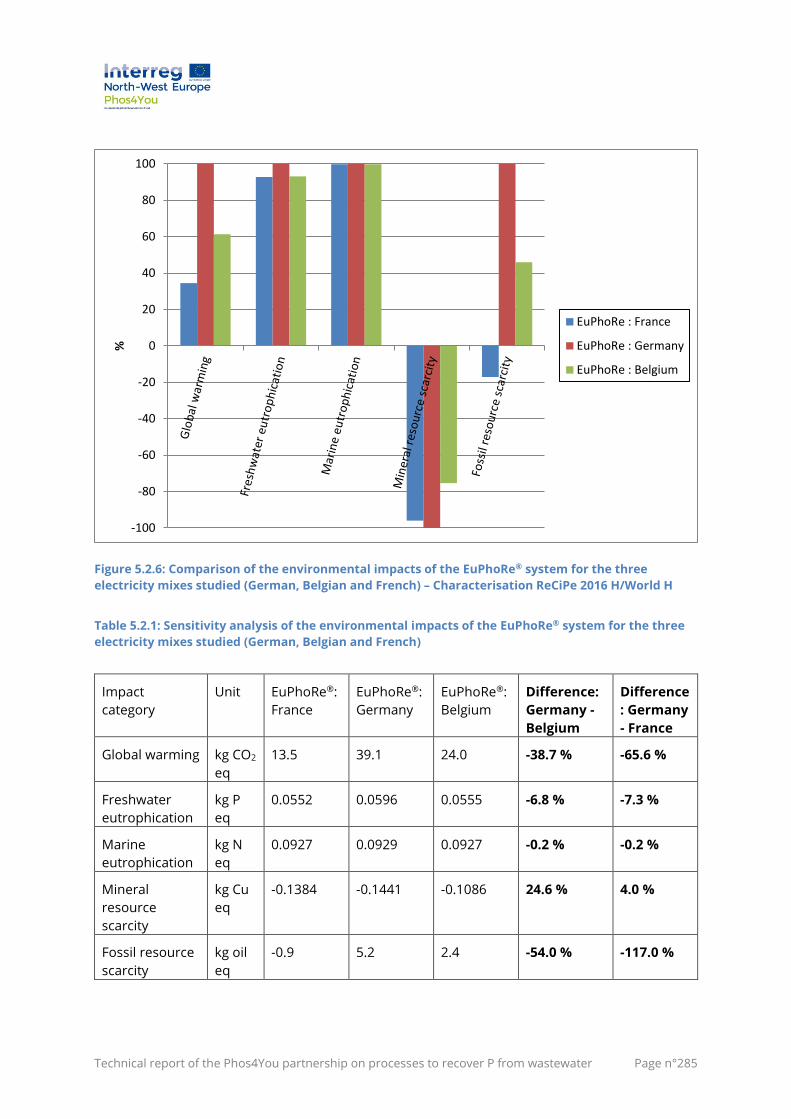
Technical report of the Phos4You partnership on processes to recover P from wastewater Page n°285
Figure 5.2.6: Comparison of the environmental impacts of the EuPhoRe® system for the three
electricity mixes studied (German, Belgian and French) – Characterisation ReCiPe 2016 H/World H
Table 5.2.1: Sensitivity analysis of the environmental impacts of the EuPhoRe® system for the three
electricity mixes studied (German, Belgian and French)
Impact
category
Unit EuPhoRe®:
France
EuPhoRe®:
Germany
EuPhoRe®:
Belgium
Difference:
Germany -
Belgium
Difference
: Germany
- France
Global warming kg CO2
eq
13.5 39.1 24.0 -38.7 % -65.6 %
Freshwater
eutrophication
kg P
eq
0.0552 0.0596 0.0555 -6.8 % -7.3 %
Marine
eutrophication
kg N
eq
0.0927 0.0929 0.0927 -0.2 % -0.2 %
Mineral
resource
scarcity
kg Cu
eq
-0.1384 -0.1441 -0.1086 24.6 % 4.0 %
Fossil resource
scarcity
kg oil
eq
-0.9 5.2 2.4 -54.0 % -117.0 %
-100
-80
-60
-40
-20
0
20
40
60
80
100
%
EuPhoRe : France
EuPhoRe : Germany
EuPhoRe : Belgium
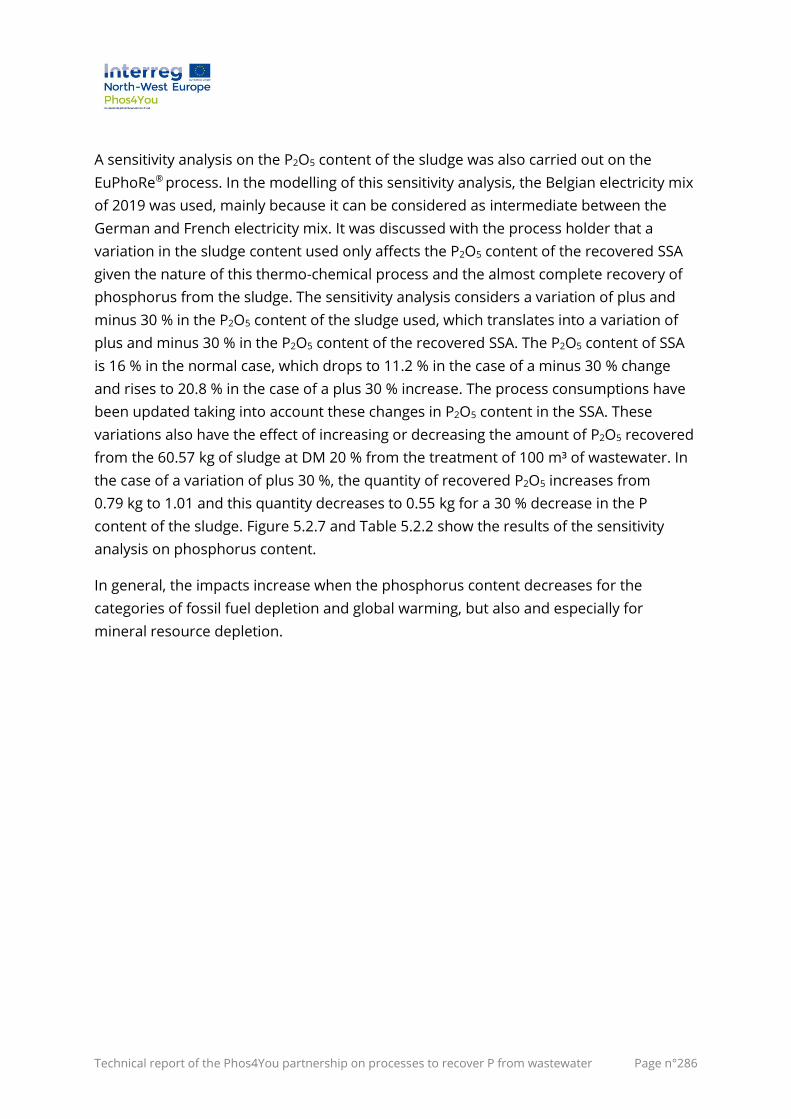
Technical report of the Phos4You partnership on processes to recover P from wastewater Page n°286
A sensitivity analysis on the P2O5 content of the sludge was also carried out on the
EuPhoRe® process. In the modelling of this sensitivity analysis, the Belgian electricity mix
of 2019 was used, mainly because it can be considered as intermediate between the
German and French electricity mix. It was discussed with the process holder that a
variation in the sludge content used only affects the P2O5 content of the recovered SSA
given the nature of this thermo-chemical process and the almost complete recovery of
phosphorus from the sludge. The sensitivity analysis considers a variation of plus and
minus 30 % in the P2O5 content of the sludge used, which translates into a variation of
plus and minus 30 % in the P2O5 content of the recovered SSA. The P2O5 content of SSA
is 16 % in the normal case, which drops to 11.2 % in the case of a minus 30 % change
and rises to 20.8 % in the case of a plus 30 % increase. The process consumptions have
been updated taking into account these changes in P2O5 content in the SSA. These
variations also have the effect of increasing or decreasing the amount of P2O5 recovered
from the 60.57 kg of sludge at DM 20 % from the treatment of 100 m³ of wastewater. In
the case of a variation of plus 30 %, the quantity of recovered P2O5 increases from
0.79 kg to 1.01 and this quantity decreases to 0.55 kg for a 30 % decrease in the P
content of the sludge. Figure 5.2.7 and Table 5.2.2 show the results of the sensitivity
analysis on phosphorus content.
In general, the impacts increase when the phosphorus content decreases for the
categories of fossil fuel depletion and global warming, but also and especially for
mineral resource depletion.
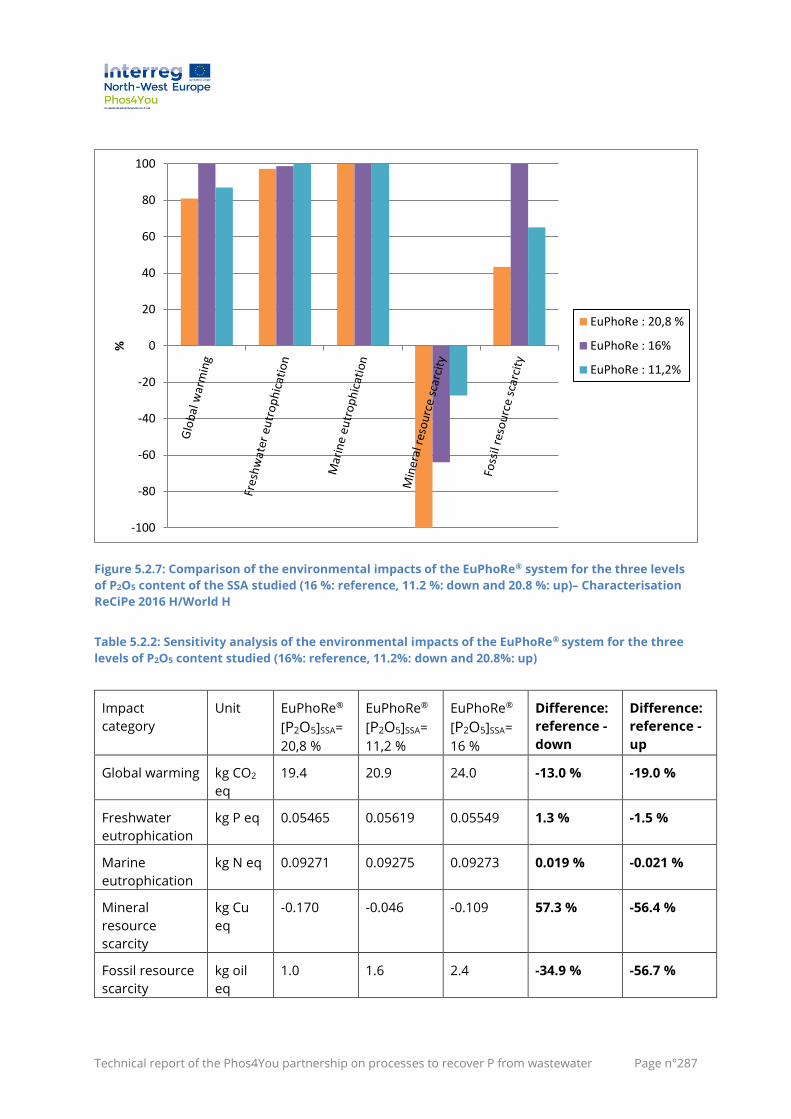
Technical report of the Phos4You partnership on processes to recover P from wastewater Page n°287
Figure 5.2.7: Comparison of the environmental impacts of the EuPhoRe® system for the three levels
of P2O5 content of the SSA studied (16 %: reference, 11.2 %: down and 20.8 %: up)– Characterisation
ReCiPe 2016 H/World H
Table 5.2.2: Sensitivity analysis of the environmental impacts of the EuPhoRe® system for the three
levels of P2O5 content studied (16%: reference, 11.2%: down and 20.8%: up)
Impact
category
Unit EuPhoRe®
[P2O5]SSA=
20,8 %
EuPhoRe®
[P2O5]SSA=
11,2 %
EuPhoRe®
[P2O5]SSA=
16 %
Difference:
reference -
down
Difference:
reference -
up
Global warming kg CO2
eq
19.4 20.9 24.0 -13.0 % -19.0 %
Freshwater
eutrophication
kg P eq 0.05465 0.05619 0.05549 1.3 % -1.5 %
Marine
eutrophication
kg N eq 0.09271 0.09275 0.09273 0.019 % -0.021 %
Mineral
resource
scarcity
kg Cu
eq
-0.170 -0.046 -0.109 57.3 % -56.4 %
Fossil resource
scarcity
kg oil
eq
1.0 1.6 2.4 -34.9 % -56.7 %
-100
-80
-60
-40
-20
0
20
40
60
80
100
%
EuPhoRe : 20,8 %
EuPhoRe : 16%
EuPhoRe : 11,2%
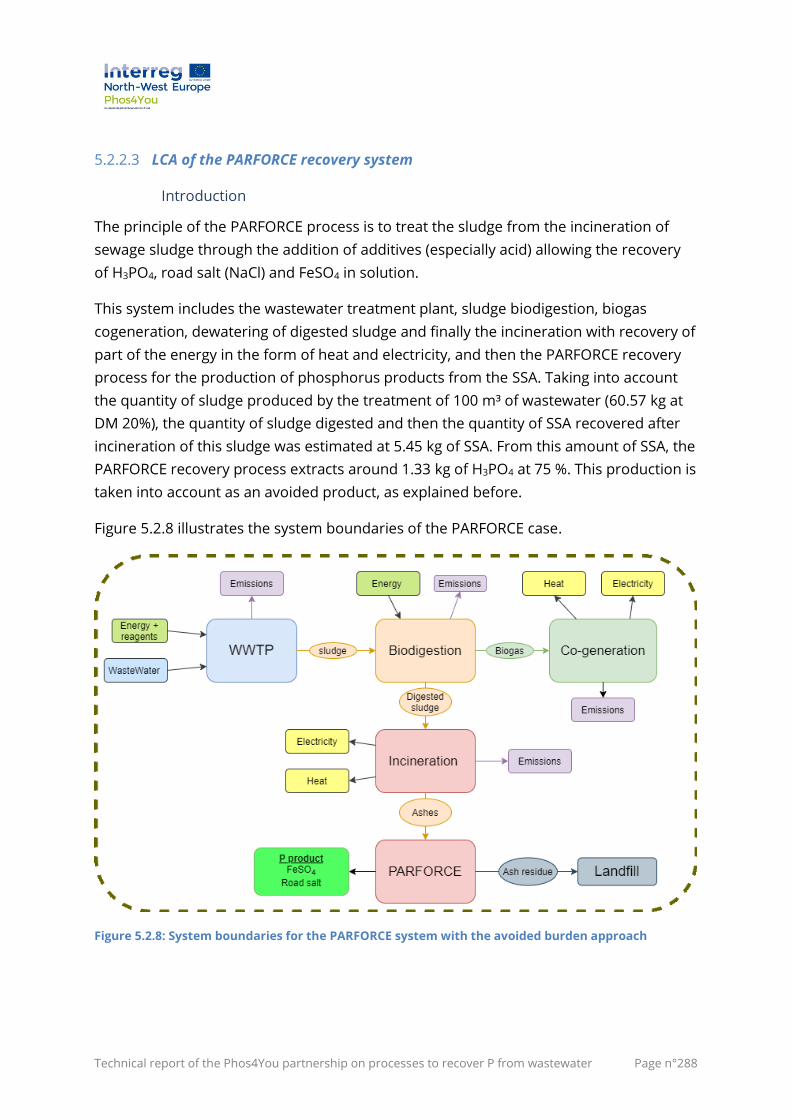
Technical report of the Phos4You partnership on processes to recover P from wastewater Page n°288
5.2.2.3 LCA of the PARFORCE recovery system
Introduction
The principle of the PARFORCE process is to treat the sludge from the incineration of
sewage sludge through the addition of additives (especially acid) allowing the recovery
of H3PO4, road salt (NaCl) and FeSO4 in solution.
This system includes the wastewater treatment plant, sludge biodigestion, biogas
cogeneration, dewatering of digested sludge and finally the incineration with recovery of
part of the energy in the form of heat and electricity, and then the PARFORCE recovery
process for the production of phosphorus products from the SSA. Taking into account
the quantity of sludge produced by the treatment of 100 m³ of wastewater (60.57 kg at
DM 20%), the quantity of sludge digested and then the quantity of SSA recovered after
incineration of this sludge was estimated at 5.45 kg of SSA. From this amount of SSA, the
PARFORCE recovery process extracts around 1.33 kg of H3PO4 at 75 %. This production is
taken into account as an avoided product, as explained before.
Figure 5.2.8 illustrates the system boundaries of the PARFORCE case.
Figure 5.2.8: System boundaries for the PARFORCE system with the avoided burden approach
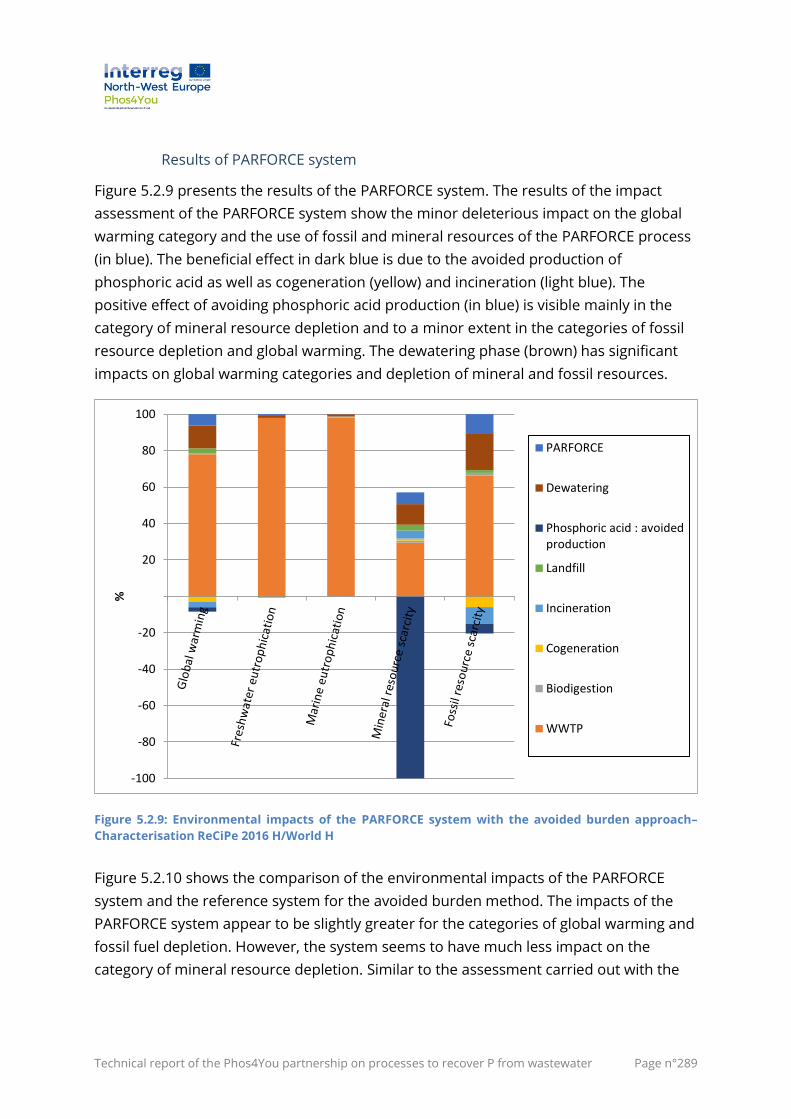
Technical report of the Phos4You partnership on processes to recover P from wastewater Page n°289
Results of PARFORCE system
Figure 5.2.9 presents the results of the PARFORCE system. The results of the impact
assessment of the PARFORCE system show the minor deleterious impact on the global
warming category and the use of fossil and mineral resources of the PARFORCE process
(in blue). The beneficial effect in dark blue is due to the avoided production of
phosphoric acid as well as cogeneration (yellow) and incineration (light blue). The
positive effect of avoiding phosphoric acid production (in blue) is visible mainly in the
category of mineral resource depletion and to a minor extent in the categories of fossil
resource depletion and global warming. The dewatering phase (brown) has significant
impacts on global warming categories and depletion of mineral and fossil resources.
Figure 5.2.9: Environmental impacts of the PARFORCE system with the avoided burden approach–
Characterisation ReCiPe 2016 H/World H
Figure 5.2.10 shows the comparison of the environmental impacts of the PARFORCE
system and the reference system for the avoided burden method. The impacts of the
PARFORCE system appear to be slightly greater for the categories of global warming and
fossil fuel depletion. However, the system seems to have much less impact on the
category of mineral resource depletion. Similar to the assessment carried out with the
-100
-80
-60
-40
-20
20
40
60
80
100
%
PARFORCE
Dewatering
Phosphoric acid : avoidedproduction
Landfill
Incineration
Cogeneration
Biodigestion
WWTP
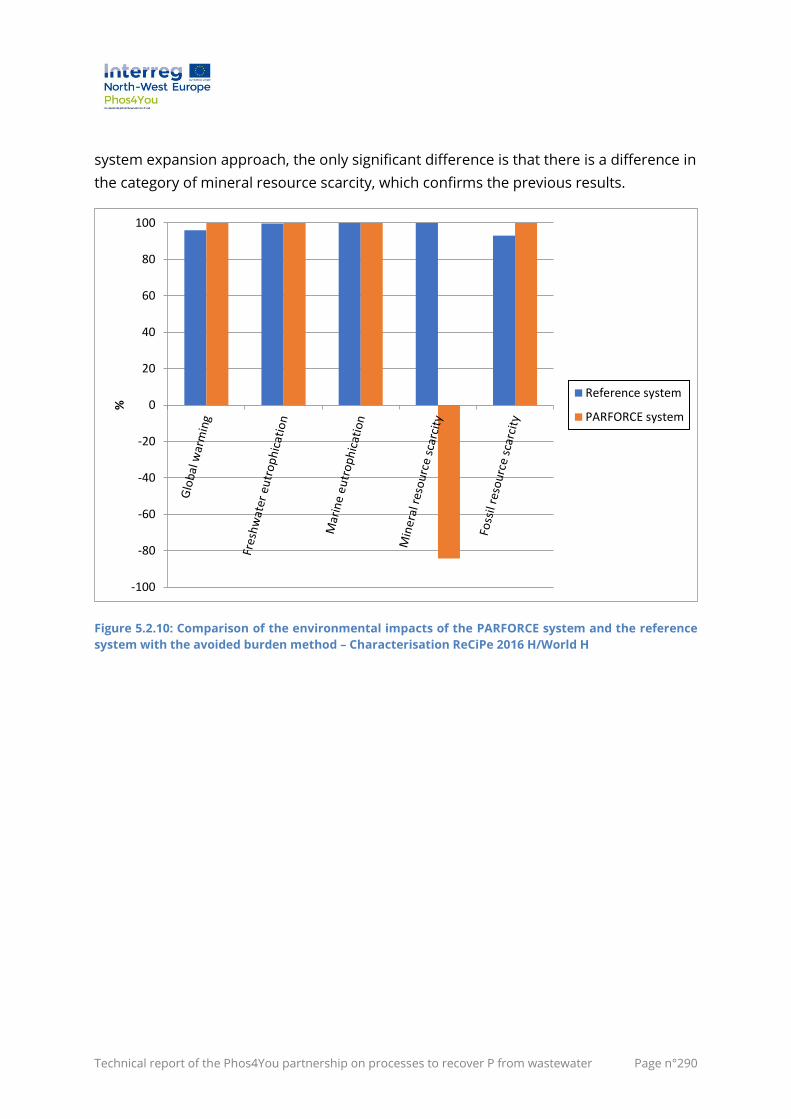
Technical report of the Phos4You partnership on processes to recover P from wastewater Page n°290
system expansion approach, the only significant difference is that there is a difference in
the category of mineral resource scarcity, which confirms the previous results.
Figure 5.2.10: Comparison of the environmental impacts of the PARFORCE system and the reference
system with the avoided burden method – Characterisation ReCiPe 2016 H/World H
-100
-80
-60
-40
-20
0
20
40
60
80
100
%
Reference system
PARFORCE system
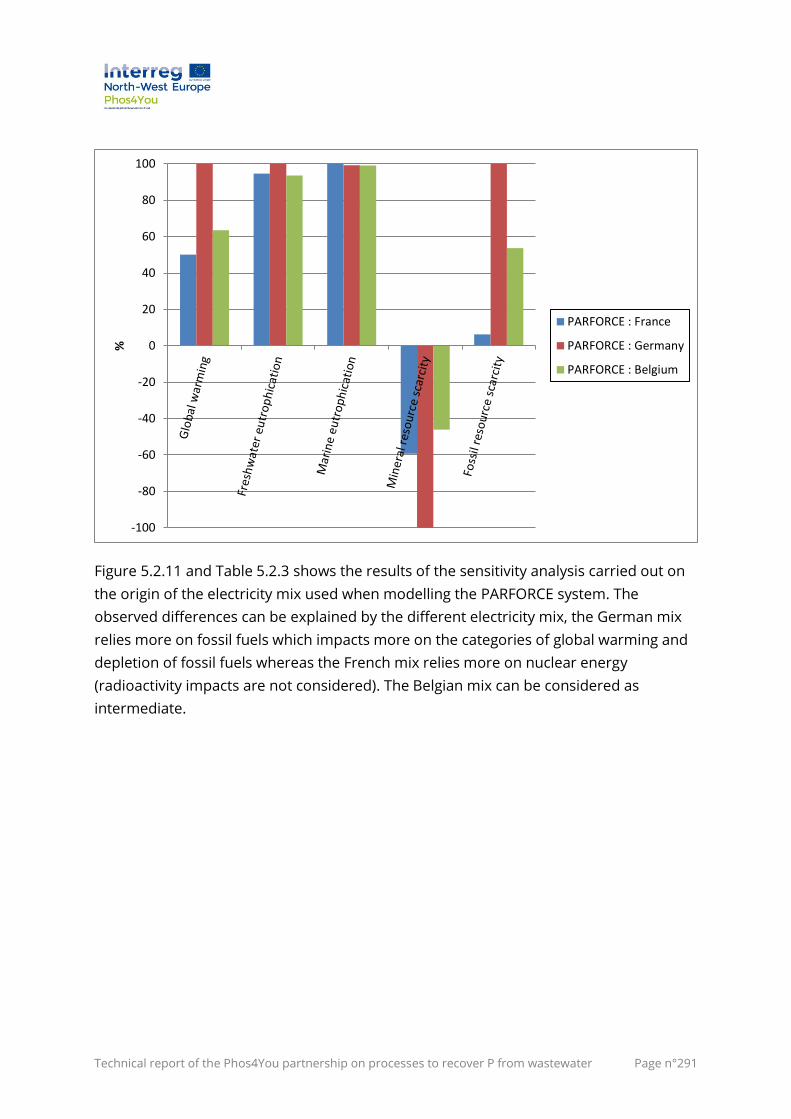
Technical report of the Phos4You partnership on processes to recover P from wastewater Page n°291
Figure 5.2.11 and Table 5.2.3 shows the results of the sensitivity analysis carried out on
the origin of the electricity mix used when modelling the PARFORCE system. The
observed differences can be explained by the different electricity mix, the German mix
relies more on fossil fuels which impacts more on the categories of global warming and
depletion of fossil fuels whereas the French mix relies more on nuclear energy
(radioactivity impacts are not considered). The Belgian mix can be considered as
intermediate.
-100
-80
-60
-40
-20
0
20
40
60
80
100
%
PARFORCE : France
PARFORCE : Germany
PARFORCE : Belgium
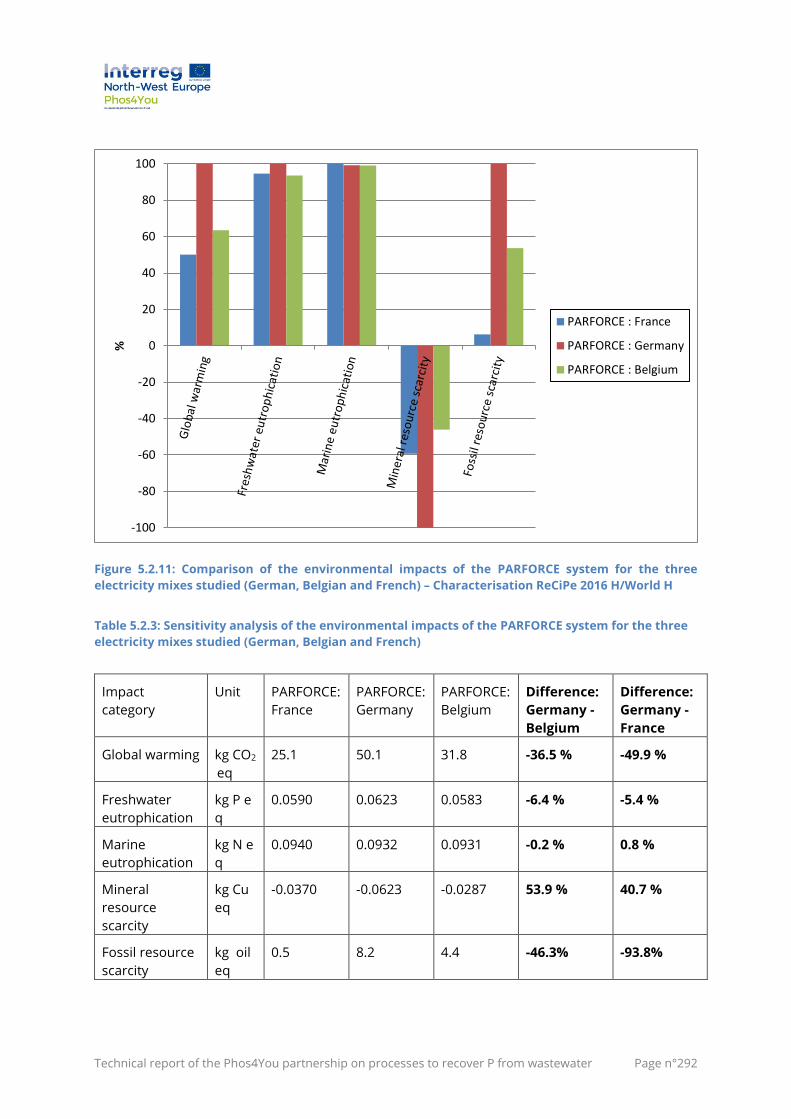
Technical report of the Phos4You partnership on processes to recover P from wastewater Page n°292
Figure 5.2.11: Comparison of the environmental impacts of the PARFORCE system for the three
electricity mixes studied (German, Belgian and French) – Characterisation ReCiPe 2016 H/World H
Table 5.2.3: Sensitivity analysis of the environmental impacts of the PARFORCE system for the three
electricity mixes studied (German, Belgian and French)
Impact
category
Unit PARFORCE:
France
PARFORCE:
Germany
PARFORCE:
Belgium
Difference:
Germany -
Belgium
Difference:
Germany -
France
Global warming kg CO2
eq
25.1 50.1 31.8 -36.5 % -49.9 %
Freshwater
eutrophication
kg P e
q
0.0590 0.0623 0.0583 -6.4 % -5.4 %
Marine
eutrophication
kg N e
q
0.0940 0.0932 0.0931 -0.2 % 0.8 %
Mineral
resource
scarcity
kg Cu
eq
-0.0370 -0.0623 -0.0287 53.9 % 40.7 %
Fossil resource
scarcity
kg oil
eq
0.5 8.2 4.4 -46.3% -93.8%
-100
-80
-60
-40
-20
0
20
40
60
80
100
%
PARFORCE : France
PARFORCE : Germany
PARFORCE : Belgium
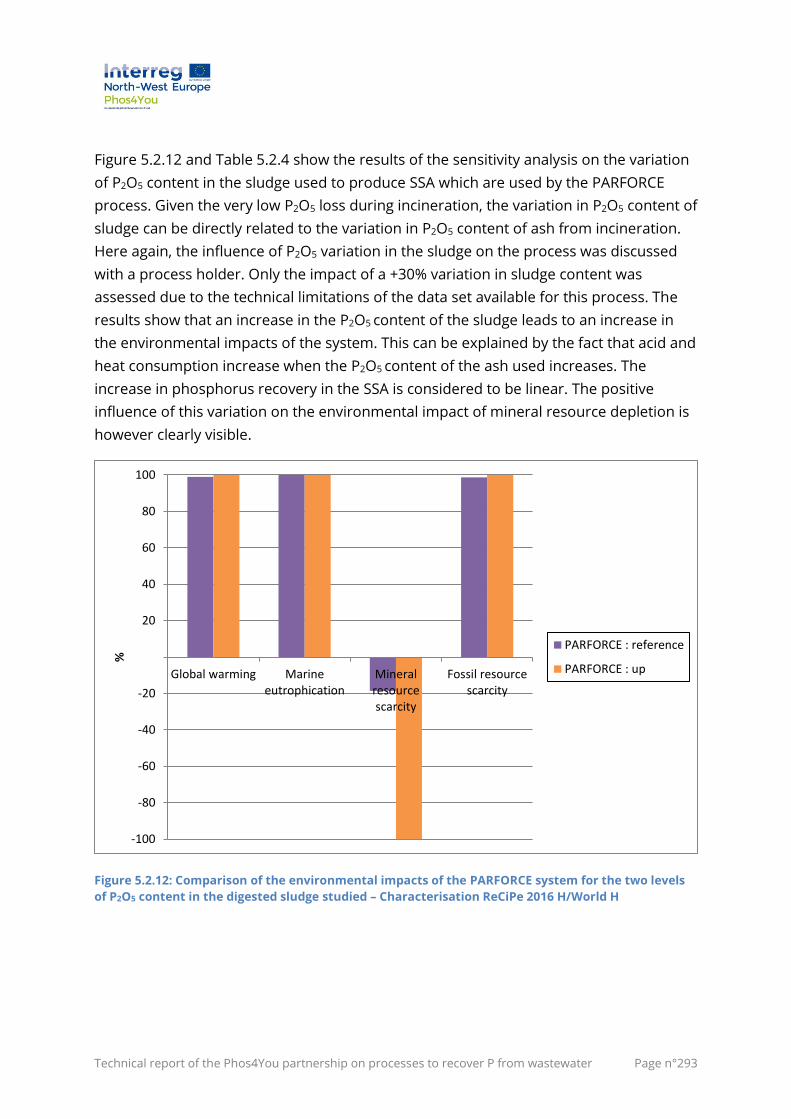
Technical report of the Phos4You partnership on processes to recover P from wastewater Page n°293
Figure 5.2.12 and Table 5.2.4 show the results of the sensitivity analysis on the variation
of P2O5 content in the sludge used to produce SSA which are used by the PARFORCE
process. Given the very low P2O5 loss during incineration, the variation in P2O5 content of
sludge can be directly related to the variation in P2O5 content of ash from incineration.
Here again, the influence of P2O5 variation in the sludge on the process was discussed
with a process holder. Only the impact of a +30% variation in sludge content was
assessed due to the technical limitations of the data set available for this process. The
results show that an increase in the P2O5 content of the sludge leads to an increase in
the environmental impacts of the system. This can be explained by the fact that acid and
heat consumption increase when the P2O5 content of the ash used increases. The
increase in phosphorus recovery in the SSA is considered to be linear. The positive
influence of this variation on the environmental impact of mineral resource depletion is
however clearly visible.
Figure 5.2.12: Comparison of the environmental impacts of the PARFORCE system for the two levels
of P2O5 content in the digested sludge studied – Characterisation ReCiPe 2016 H/World H
-100
-80
-60
-40
-20
20
40
60
80
100
Global warming Marineeutrophication
Mineralresourcescarcity
Fossil resourcescarcity
%
PARFORCE : reference
PARFORCE : up
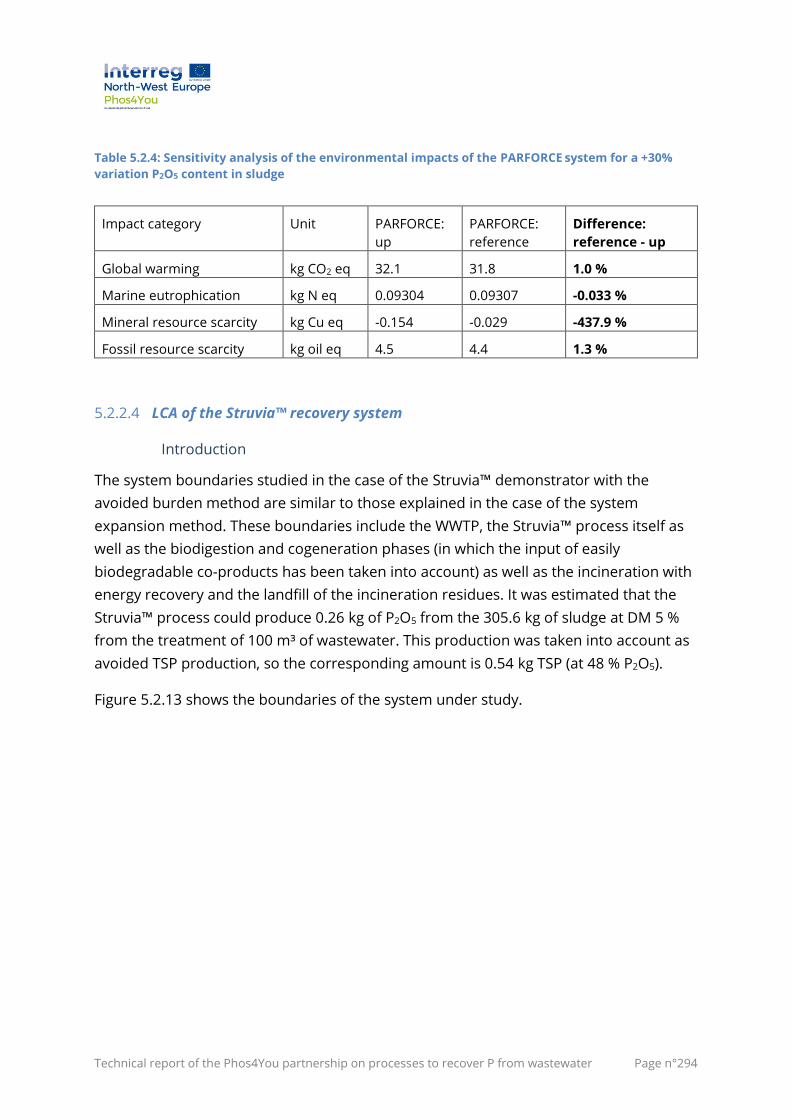
Technical report of the Phos4You partnership on processes to recover P from wastewater Page n°294
Table 5.2.4: Sensitivity analysis of the environmental impacts of the PARFORCE system for a +30%
variation P2O5 content in sludge
Impact category Unit PARFORCE:
up
PARFORCE:
reference
Difference:
reference - up
Global warming kg CO2 eq 32.1 31.8 1.0 %
Marine eutrophication kg N eq 0.09304 0.09307 -0.033 %
Mineral resource scarcity kg Cu eq -0.154 -0.029 -437.9 %
Fossil resource scarcity kg oil eq 4.5 4.4 1.3 %
5.2.2.4 LCA of the Struvia™ recovery system
Introduction
The system boundaries studied in the case of the Struvia™ demonstrator with the
avoided burden method are similar to those explained in the case of the system
expansion method. These boundaries include the WWTP, the Struvia™ process itself as
well as the biodigestion and cogeneration phases (in which the input of easily
biodegradable co-products has been taken into account) as well as the incineration with
energy recovery and the landfill of the incineration residues. It was estimated that the
Struvia™ process could produce 0.26 kg of P2O5 from the 305.6 kg of sludge at DM 5 %
from the treatment of 100 m³ of wastewater. This production was taken into account as
avoided TSP production, so the corresponding amount is 0.54 kg TSP (at 48 % P2O5).
Figure 5.2.13 shows the boundaries of the system under study.
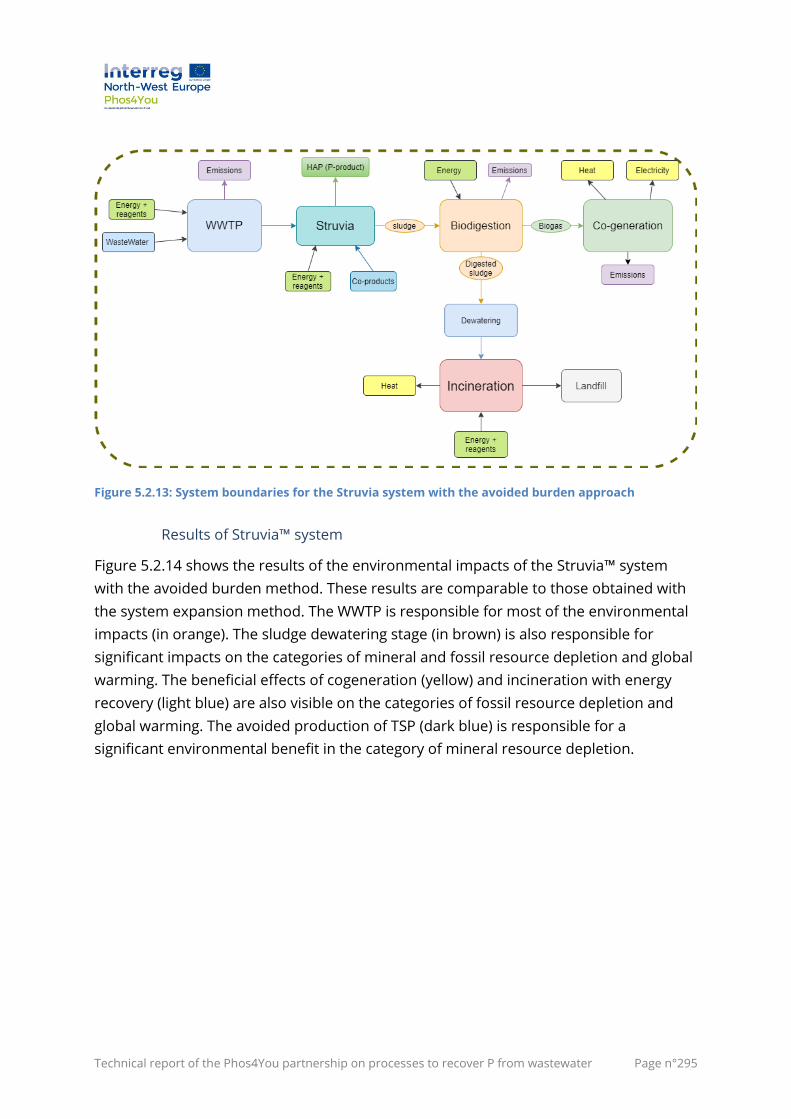
Technical report of the Phos4You partnership on processes to recover P from wastewater Page n°295
Figure 5.2.13: System boundaries for the Struvia system with the avoided burden approach
Results of Struvia™ system
Figure 5.2.14 shows the results of the environmental impacts of the Struvia™ system
with the avoided burden method. These results are comparable to those obtained with
the system expansion method. The WWTP is responsible for most of the environmental
impacts (in orange). The sludge dewatering stage (in brown) is also responsible for
significant impacts on the categories of mineral and fossil resource depletion and global
warming. The beneficial effects of cogeneration (yellow) and incineration with energy
recovery (light blue) are also visible on the categories of fossil resource depletion and
global warming. The avoided production of TSP (dark blue) is responsible for a
significant environmental benefit in the category of mineral resource depletion.
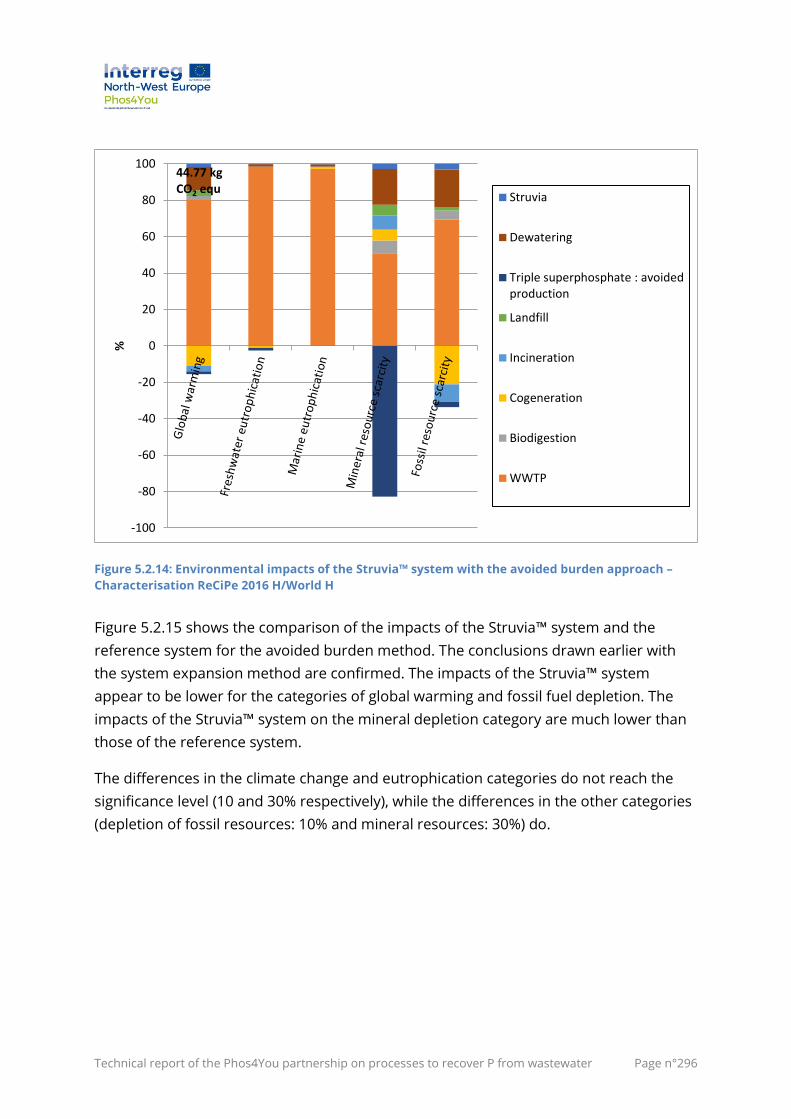
Technical report of the Phos4You partnership on processes to recover P from wastewater Page n°296
Figure 5.2.14: Environmental impacts of the Struvia™ system with the avoided burden approach –
Characterisation ReCiPe 2016 H/World H
Figure 5.2.15 shows the comparison of the impacts of the Struvia™ system and the
reference system for the avoided burden method. The conclusions drawn earlier with
the system expansion method are confirmed. The impacts of the Struvia™ system
appear to be lower for the categories of global warming and fossil fuel depletion. The
impacts of the Struvia™ system on the mineral depletion category are much lower than
those of the reference system.
The differences in the climate change and eutrophication categories do not reach the
significance level (10 and 30% respectively), while the differences in the other categories
(depletion of fossil resources: 10% and mineral resources: 30%) do.
-100
-80
-60
-40
-20
0
20
40
60
80
100
%
Struvia
Dewatering
Triple superphosphate : avoidedproduction
Landfill
Incineration
Cogeneration
Biodigestion
WWTP
44.77 kg CO2 equ
Technical report of the Phos4You partnership on processes to recover P from wastewater Page n°297
Figure 5.2.15: Comparison of the environmental impacts of the Struvia™ system and the reference
system with the avoided burden method – Characterisation ReCiPe 2016 H/World H
Figure 5.2.16 and Table 5.2.5 present the results of the sensitivity analysis on the origin
of the electricity mix used in the modelling. As for the other systems, the impacts of the
system using German electricity are more important than the one using French
electricity. The impacts of the system using Belgian electricity are at intermediate levels
between the two previous ones.
10
20
30
40
50
60
70
80
90
100
%
Reference system
Struvia system
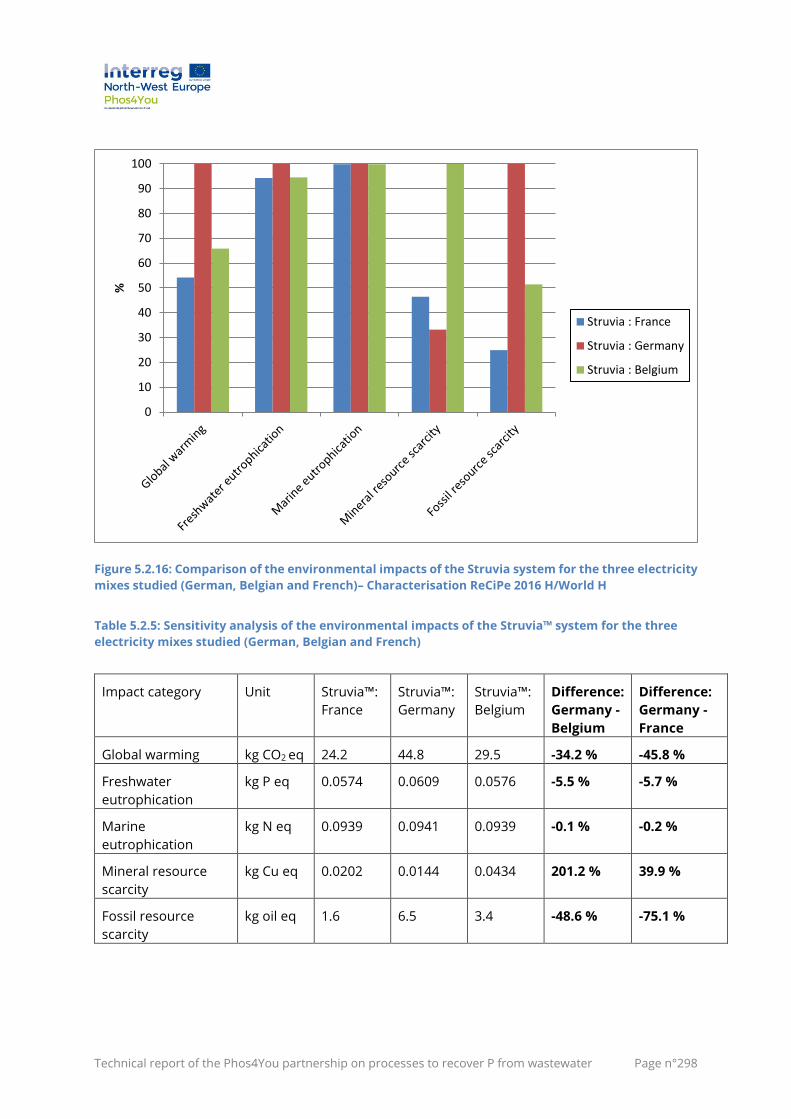
Technical report of the Phos4You partnership on processes to recover P from wastewater Page n°298
Figure 5.2.16: Comparison of the environmental impacts of the Struvia system for the three electricity
mixes studied (German, Belgian and French)– Characterisation ReCiPe 2016 H/World H
Table 5.2.5: Sensitivity analysis of the environmental impacts of the Struvia™ system for the three
electricity mixes studied (German, Belgian and French)
Impact category Unit Struvia™:
France
Struvia™:
Germany
Struvia™:
Belgium
Difference:
Germany -
Belgium
Difference:
Germany -
France
Global warming kg CO2 eq 24.2 44.8 29.5 -34.2 % -45.8 %
Freshwater
eutrophication
kg P eq 0.0574 0.0609 0.0576 -5.5 % -5.7 %
Marine
eutrophication
kg N eq 0.0939 0.0941 0.0939 -0.1 % -0.2 %
Mineral resource
scarcity
kg Cu eq 0.0202 0.0144 0.0434 201.2 % 39.9 %
Fossil resource
scarcity
kg oil eq 1.6 6.5 3.4 -48.6 % -75.1 %
0
10
20
30
40
50
60
70
80
90
100
%
Struvia : France
Struvia : Germany
Struvia : Belgium
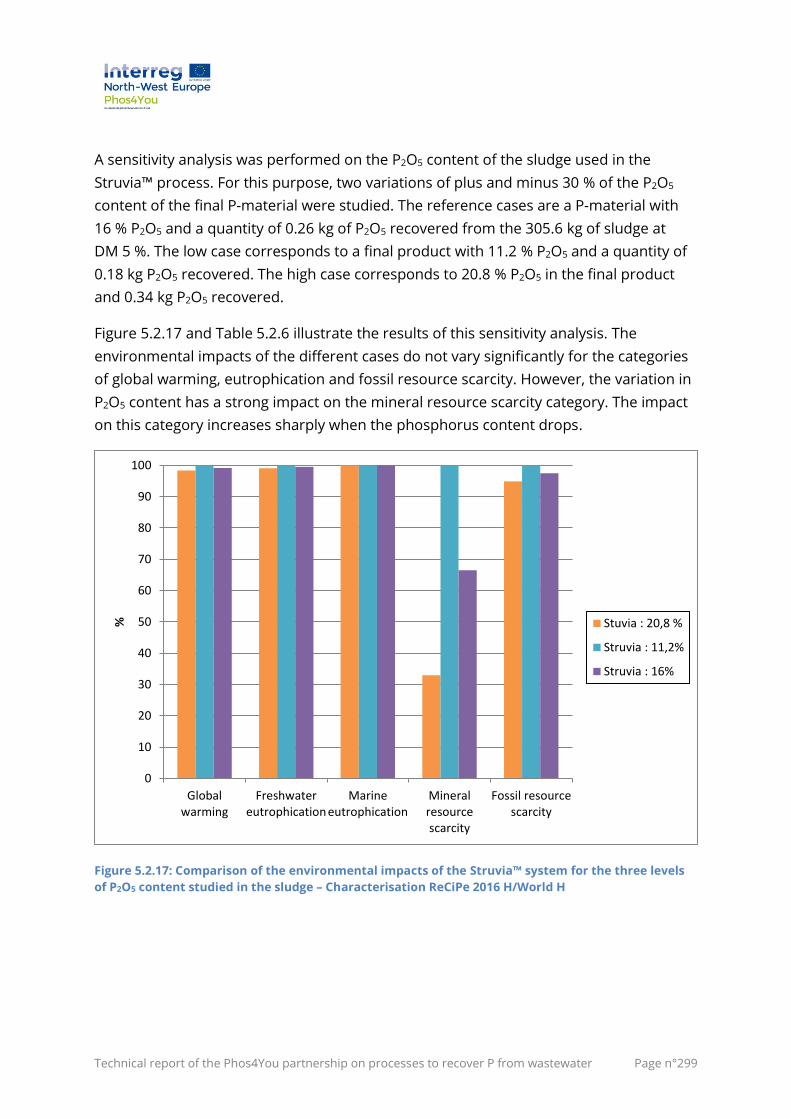
Technical report of the Phos4You partnership on processes to recover P from wastewater Page n°299
A sensitivity analysis was performed on the P2O5 content of the sludge used in the
Struvia™ process. For this purpose, two variations of plus and minus 30 % of the P2O5
content of the final P-material were studied. The reference cases are a P-material with
16 % P2O5 and a quantity of 0.26 kg of P2O5 recovered from the 305.6 kg of sludge at
DM 5 %. The low case corresponds to a final product with 11.2 % P2O5 and a quantity of
0.18 kg P2O5 recovered. The high case corresponds to 20.8 % P2O5 in the final product
and 0.34 kg P2O5 recovered.
Figure 5.2.17 and Table 5.2.6 illustrate the results of this sensitivity analysis. The
environmental impacts of the different cases do not vary significantly for the categories
of global warming, eutrophication and fossil resource scarcity. However, the variation in
P2O5 content has a strong impact on the mineral resource scarcity category. The impact
on this category increases sharply when the phosphorus content drops.
Figure 5.2.17: Comparison of the environmental impacts of the Struvia™ system for the three levels
of P2O5 content studied in the sludge – Characterisation ReCiPe 2016 H/World H
0
10
20
30
40
50
60
70
80
90
100
Globalwarming
Freshwatereutrophication
Marineeutrophication
Mineralresourcescarcity
Fossil resourcescarcity
% Stuvia : 20,8 %
Struvia : 11,2%
Struvia : 16%
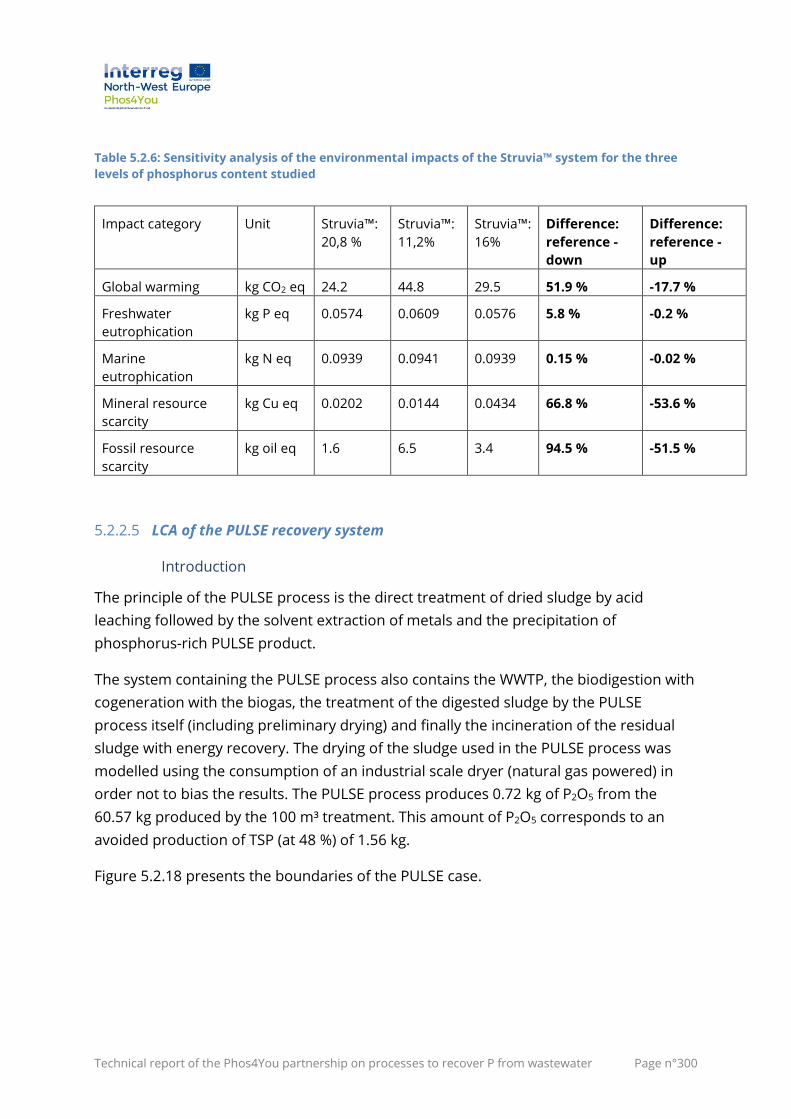
Technical report of the Phos4You partnership on processes to recover P from wastewater Page n°300
Table 5.2.6: Sensitivity analysis of the environmental impacts of the Struvia™ system for the three
levels of phosphorus content studied
Impact category Unit Struvia™:
20,8 %
Struvia™:
11,2%
Struvia™:
16%
Difference:
reference -
down
Difference:
reference -
up
Global warming kg CO2 eq 24.2 44.8 29.5 51.9 % -17.7 %
Freshwater
eutrophication
kg P eq 0.0574 0.0609 0.0576 5.8 % -0.2 %
Marine
eutrophication
kg N eq 0.0939 0.0941 0.0939 0.15 % -0.02 %
Mineral resource
scarcity
kg Cu eq 0.0202 0.0144 0.0434 66.8 % -53.6 %
Fossil resource
scarcity
kg oil eq 1.6 6.5 3.4 94.5 % -51.5 %
5.2.2.5 LCA of the PULSE recovery system
Introduction
The principle of the PULSE process is the direct treatment of dried sludge by acid
leaching followed by the solvent extraction of metals and the precipitation of
phosphorus-rich PULSE product.
The system containing the PULSE process also contains the WWTP, the biodigestion with
cogeneration with the biogas, the treatment of the digested sludge by the PULSE
process itself (including preliminary drying) and finally the incineration of the residual
sludge with energy recovery. The drying of the sludge used in the PULSE process was
modelled using the consumption of an industrial scale dryer (natural gas powered) in
order not to bias the results. The PULSE process produces 0.72 kg of P2O5 from the
60.57 kg produced by the 100 m³ treatment. This amount of P2O5 corresponds to an
avoided production of TSP (at 48 %) of 1.56 kg.
Figure 5.2.18 presents the boundaries of the PULSE case.
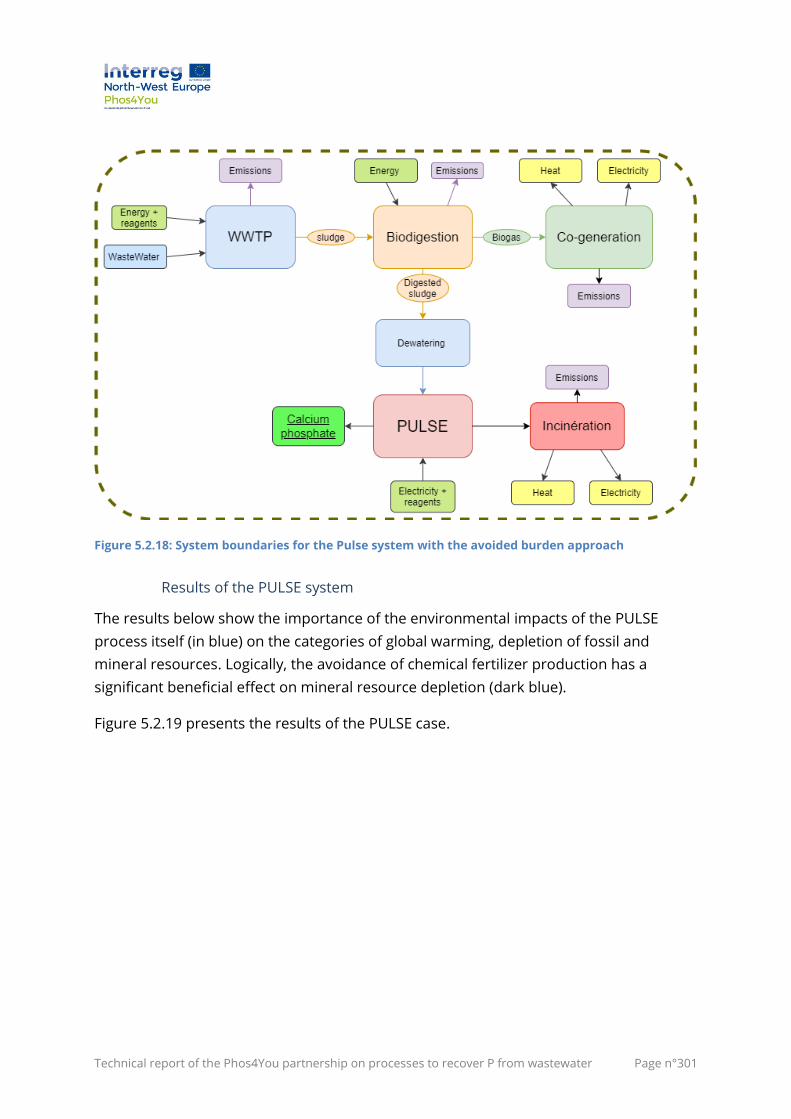
Technical report of the Phos4You partnership on processes to recover P from wastewater Page n°301
Figure 5.2.18: System boundaries for the Pulse system with the avoided burden approach
Results of the PULSE system
The results below show the importance of the environmental impacts of the PULSE
process itself (in blue) on the categories of global warming, depletion of fossil and
mineral resources. Logically, the avoidance of chemical fertilizer production has a
significant beneficial effect on mineral resource depletion (dark blue).
Figure 5.2.19 presents the results of the PULSE case.
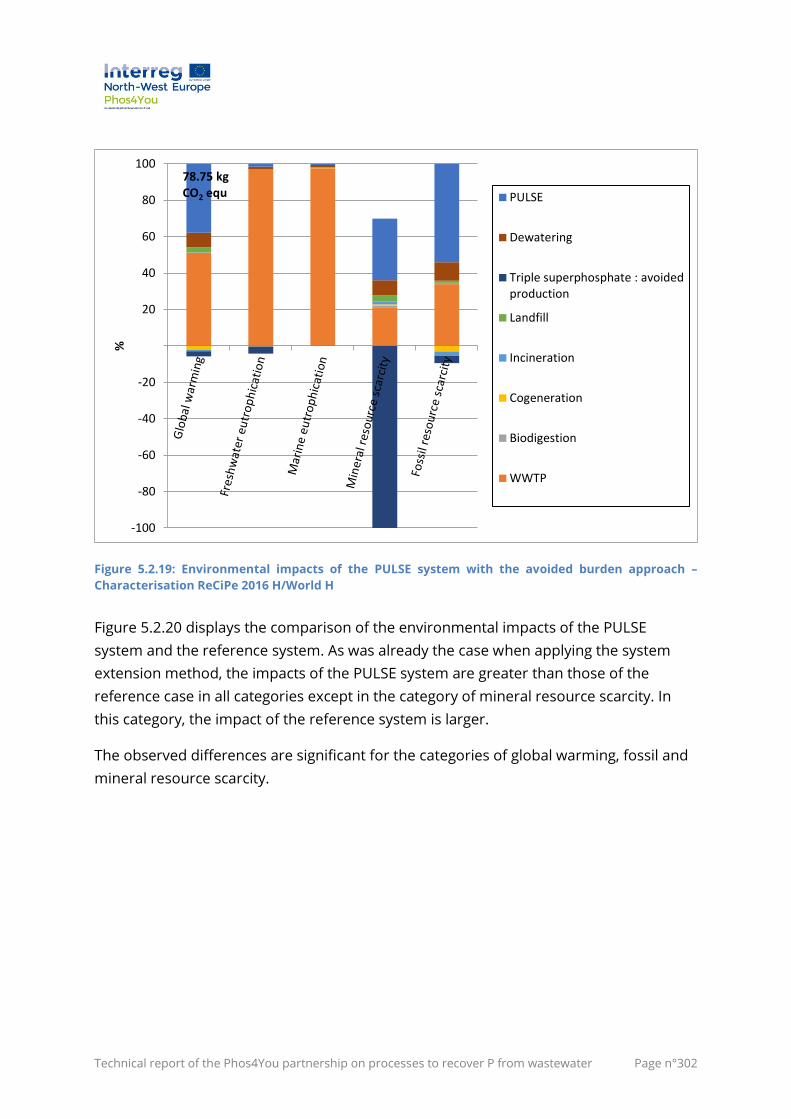
Technical report of the Phos4You partnership on processes to recover P from wastewater Page n°302
Figure 5.2.19: Environmental impacts of the PULSE system with the avoided burden approach –
Characterisation ReCiPe 2016 H/World H
Figure 5.2.20 displays the comparison of the environmental impacts of the PULSE
system and the reference system. As was already the case when applying the system
extension method, the impacts of the PULSE system are greater than those of the
reference case in all categories except in the category of mineral resource scarcity. In
this category, the impact of the reference system is larger.
The observed differences are significant for the categories of global warming, fossil and
mineral resource scarcity.
-100
-80
-60
-40
-20
20
40
60
80
100
%
PULSE
Dewatering
Triple superphosphate : avoidedproduction
Landfill
Incineration
Cogeneration
Biodigestion
WWTP
78.75 kgCO2 equ
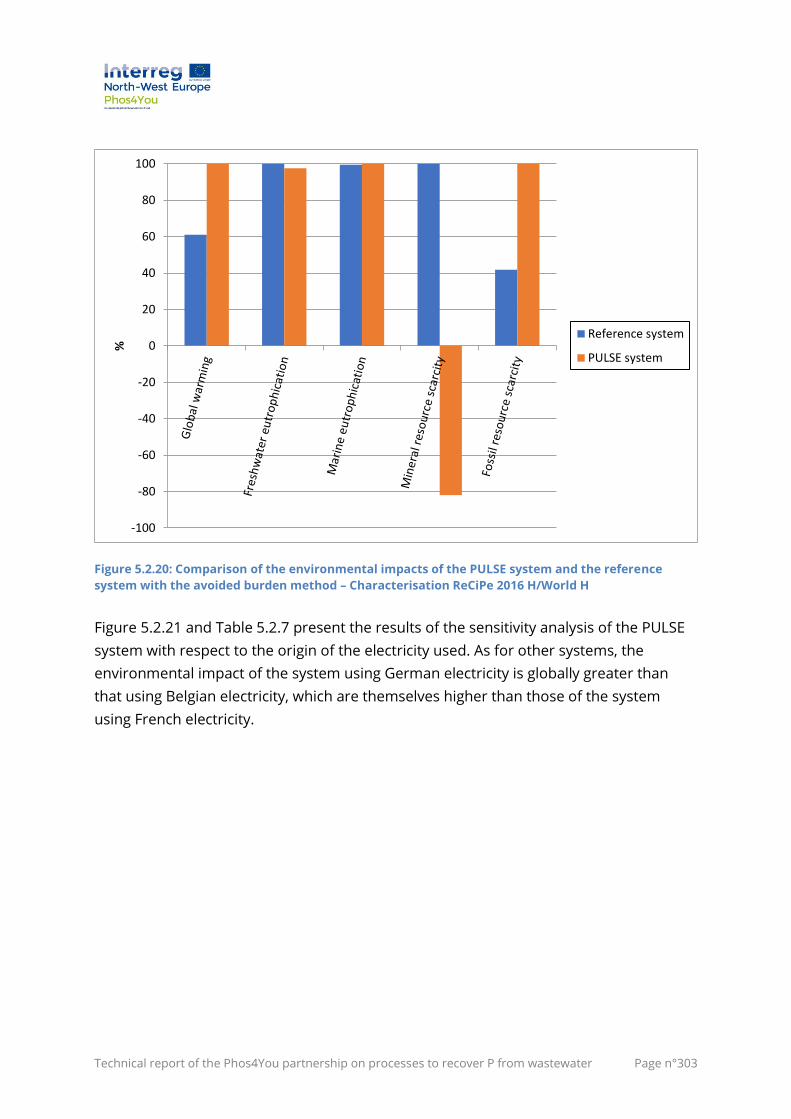
Technical report of the Phos4You partnership on processes to recover P from wastewater Page n°303
Figure 5.2.20: Comparison of the environmental impacts of the PULSE system and the reference
system with the avoided burden method – Characterisation ReCiPe 2016 H/World H
Figure 5.2.21 and Table 5.2.7 present the results of the sensitivity analysis of the PULSE
system with respect to the origin of the electricity used. As for other systems, the
environmental impact of the system using German electricity is globally greater than
that using Belgian electricity, which are themselves higher than those of the system
using French electricity.
-100
-80
-60
-40
-20
0
20
40
60
80
100
%
Reference system
PULSE system
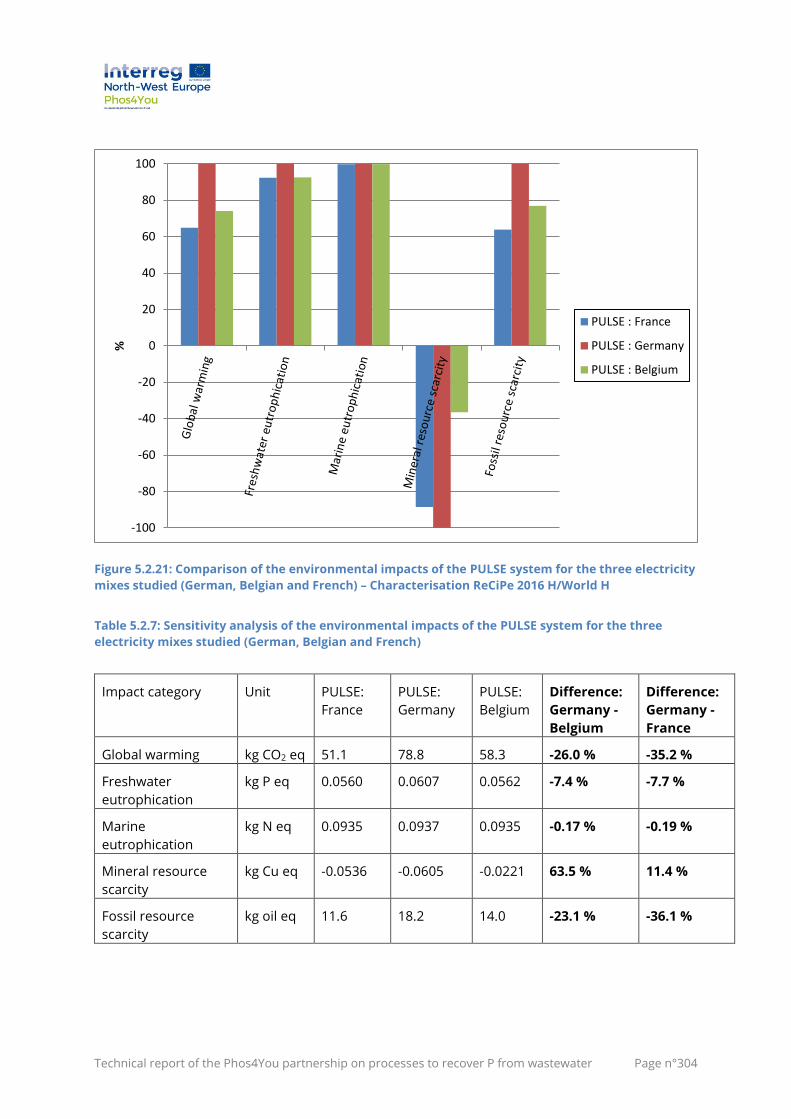
Technical report of the Phos4You partnership on processes to recover P from wastewater Page n°304
Figure 5.2.21: Comparison of the environmental impacts of the PULSE system for the three electricity
mixes studied (German, Belgian and French) – Characterisation ReCiPe 2016 H/World H
Table 5.2.7: Sensitivity analysis of the environmental impacts of the PULSE system for the three
electricity mixes studied (German, Belgian and French)
Impact category Unit PULSE:
France
PULSE:
Germany
PULSE:
Belgium
Difference:
Germany -
Belgium
Difference:
Germany -
France
Global warming kg CO2 eq 51.1 78.8 58.3 -26.0 % -35.2 %
Freshwater
eutrophication
kg P eq 0.0560 0.0607 0.0562 -7.4 % -7.7 %
Marine
eutrophication
kg N eq 0.0935 0.0937 0.0935 -0.17 % -0.19 %
Mineral resource
scarcity
kg Cu eq -0.0536 -0.0605 -0.0221 63.5 % 11.4 %
Fossil resource
scarcity
kg oil eq 11.6 18.2 14.0 -23.1 % -36.1 %
-100
-80
-60
-40
-20
0
20
40
60
80
100
%
PULSE : France
PULSE : Germany
PULSE : Belgium
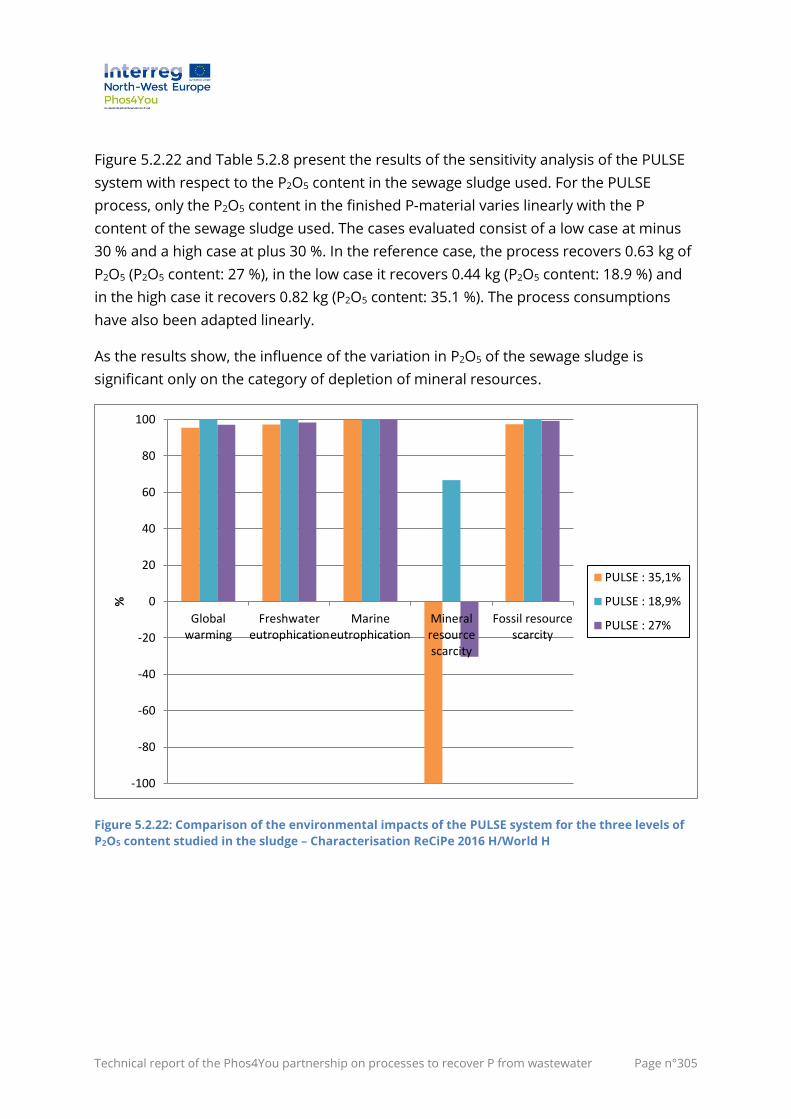
Technical report of the Phos4You partnership on processes to recover P from wastewater Page n°305
Figure 5.2.22 and Table 5.2.8 present the results of the sensitivity analysis of the PULSE
system with respect to the P2O5 content in the sewage sludge used. For the PULSE
process, only the P2O5 content in the finished P-material varies linearly with the P
content of the sewage sludge used. The cases evaluated consist of a low case at minus
30 % and a high case at plus 30 %. In the reference case, the process recovers 0.63 kg of
P2O5 (P2O5 content: 27 %), in the low case it recovers 0.44 kg (P2O5 content: 18.9 %) and
in the high case it recovers 0.82 kg (P2O5 content: 35.1 %). The process consumptions
have also been adapted linearly.
As the results show, the influence of the variation in P2O5 of the sewage sludge is
significant only on the category of depletion of mineral resources.
Figure 5.2.22: Comparison of the environmental impacts of the PULSE system for the three levels of
P2O5 content studied in the sludge – Characterisation ReCiPe 2016 H/World H
-100
-80
-60
-40
-20
0
20
40
60
80
100
Globalwarming
Freshwatereutrophication
Marineeutrophication
Mineralresourcescarcity
Fossil resourcescarcity
%
PULSE : 35,1%
PULSE : 18,9%
PULSE : 27%
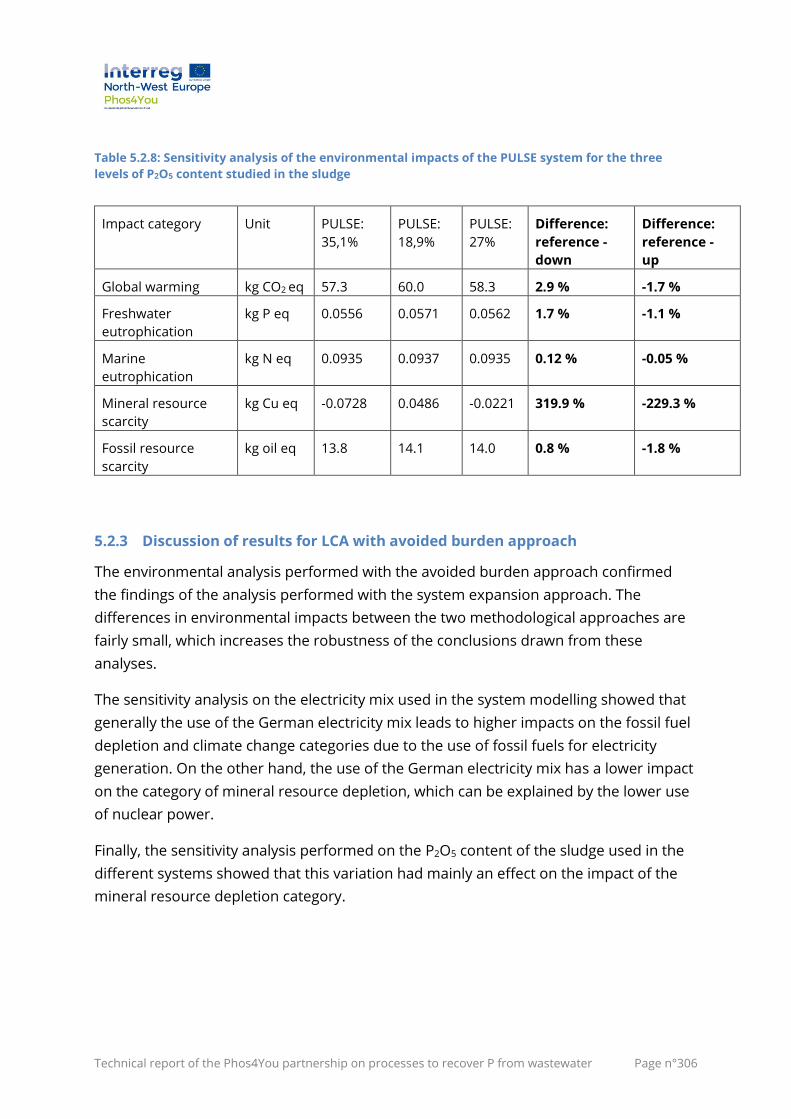
Technical report of the Phos4You partnership on processes to recover P from wastewater Page n°306
Table 5.2.8: Sensitivity analysis of the environmental impacts of the PULSE system for the three
levels of P2O5 content studied in the sludge
Impact category Unit PULSE:
35,1%
PULSE:
18,9%
PULSE:
27%
Difference:
reference -
down
Difference:
reference -
up
Global warming kg CO2 eq 57.3 60.0 58.3 2.9 % -1.7 %
Freshwater
eutrophication
kg P eq 0.0556 0.0571 0.0562 1.7 % -1.1 %
Marine
eutrophication
kg N eq 0.0935 0.0937 0.0935 0.12 % -0.05 %
Mineral resource
scarcity
kg Cu eq -0.0728 0.0486 -0.0221 319.9 % -229.3 %
Fossil resource
scarcity
kg oil eq 13.8 14.1 14.0 0.8 % -1.8 %
5.2.3 Discussion of results for LCA with avoided burden approach
The environmental analysis performed with the avoided burden approach confirmed
the findings of the analysis performed with the system expansion approach. The
differences in environmental impacts between the two methodological approaches are
fairly small, which increases the robustness of the conclusions drawn from these
analyses.
The sensitivity analysis on the electricity mix used in the system modelling showed that
generally the use of the German electricity mix leads to higher impacts on the fossil fuel
depletion and climate change categories due to the use of fossil fuels for electricity
generation. On the other hand, the use of the German electricity mix has a lower impact
on the category of mineral resource depletion, which can be explained by the lower use
of nuclear power.
Finally, the sensitivity analysis performed on the P2O5 content of the sludge used in the
different systems showed that this variation had mainly an effect on the impact of the
mineral resource depletion category.
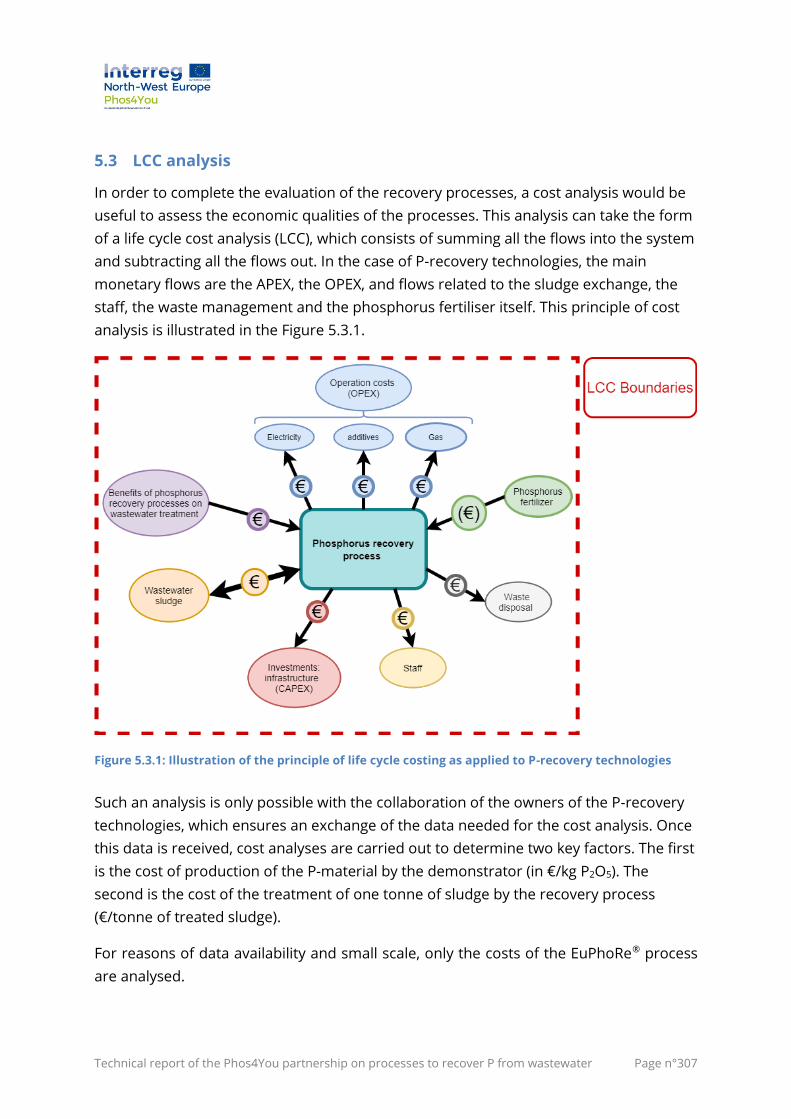
Technical report of the Phos4You partnership on processes to recover P from wastewater Page n°307
5.3 LCC analysis
In order to complete the evaluation of the recovery processes, a cost analysis would be
useful to assess the economic qualities of the processes. This analysis can take the form
of a life cycle cost analysis (LCC), which consists of summing all the flows into the system
and subtracting all the flows out. In the case of P-recovery technologies, the main
monetary flows are the APEX, the OPEX, and flows related to the sludge exchange, the
staff, the waste management and the phosphorus fertiliser itself. This principle of cost
analysis is illustrated in the Figure 5.3.1.
Figure 5.3.1: Illustration of the principle of life cycle costing as applied to P-recovery technologies
Such an analysis is only possible with the collaboration of the owners of the P-recovery
technologies, which ensures an exchange of the data needed for the cost analysis. Once
this data is received, cost analyses are carried out to determine two key factors. The first
is the cost of production of the P-material by the demonstrator (in €/kg P2O5). The
second is the cost of the treatment of one tonne of sludge by the recovery process
(€/tonne of treated sludge).
For reasons of data availability and small scale, only the costs of the EuPhoRe® process
are analysed.
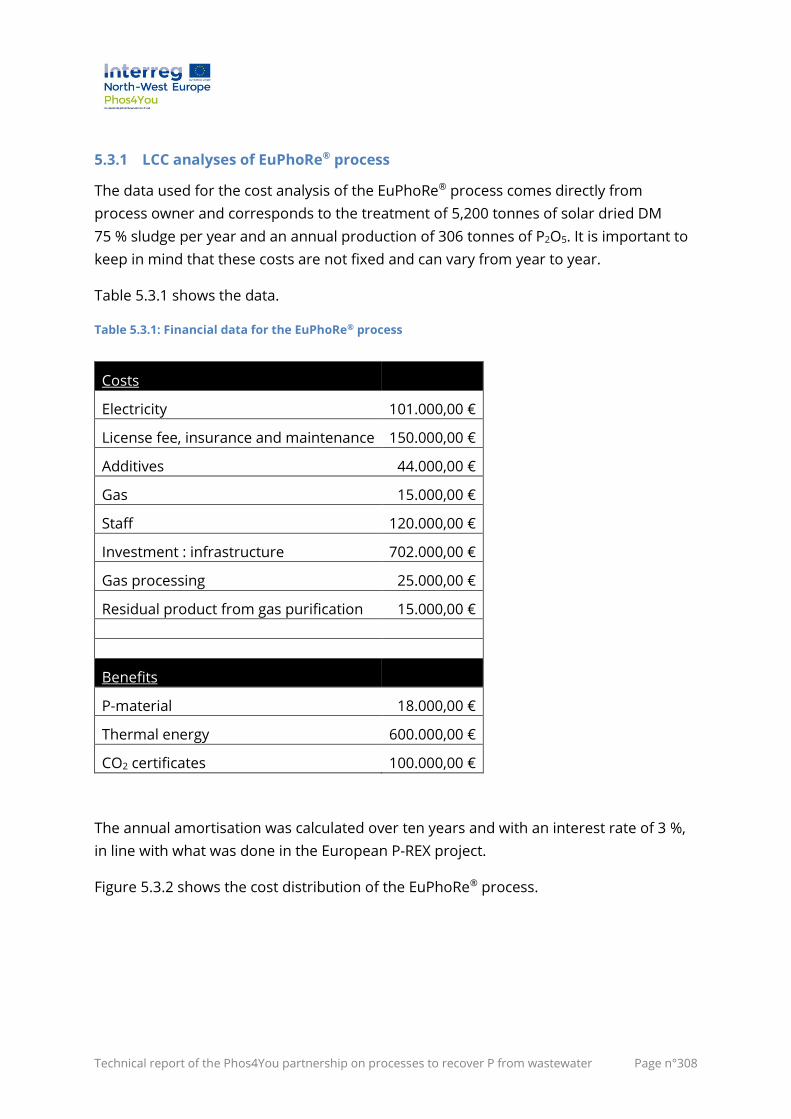
Technical report of the Phos4You partnership on processes to recover P from wastewater Page n°308
5.3.1 LCC analyses of EuPhoRe® process
The data used for the cost analysis of the EuPhoRe® process comes directly from
process owner and corresponds to the treatment of 5,200 tonnes of solar dried DM
75 % sludge per year and an annual production of 306 tonnes of P2O5. It is important to
keep in mind that these costs are not fixed and can vary from year to year.
Table 5.3.1 shows the data.
Table 5.3.1: Financial data for the EuPhoRe® process
Costs
Electricity 101.000,00 €
License fee, insurance and maintenance 150.000,00 €
Additives 44.000,00 €
Gas 15.000,00 €
Staff 120.000,00 €
Investment : infrastructure 702.000,00 €
Gas processing 25.000,00 €
Residual product from gas purification 15.000,00 €
Benefits
P-material 18.000,00 €
Thermal energy 600.000,00 €
CO2 certificates 100.000,00 €
The annual amortisation was calculated over ten years and with an interest rate of 3 %,
in line with what was done in the European P-REX project.
Figure 5.3.2 shows the cost distribution of the EuPhoRe® process.
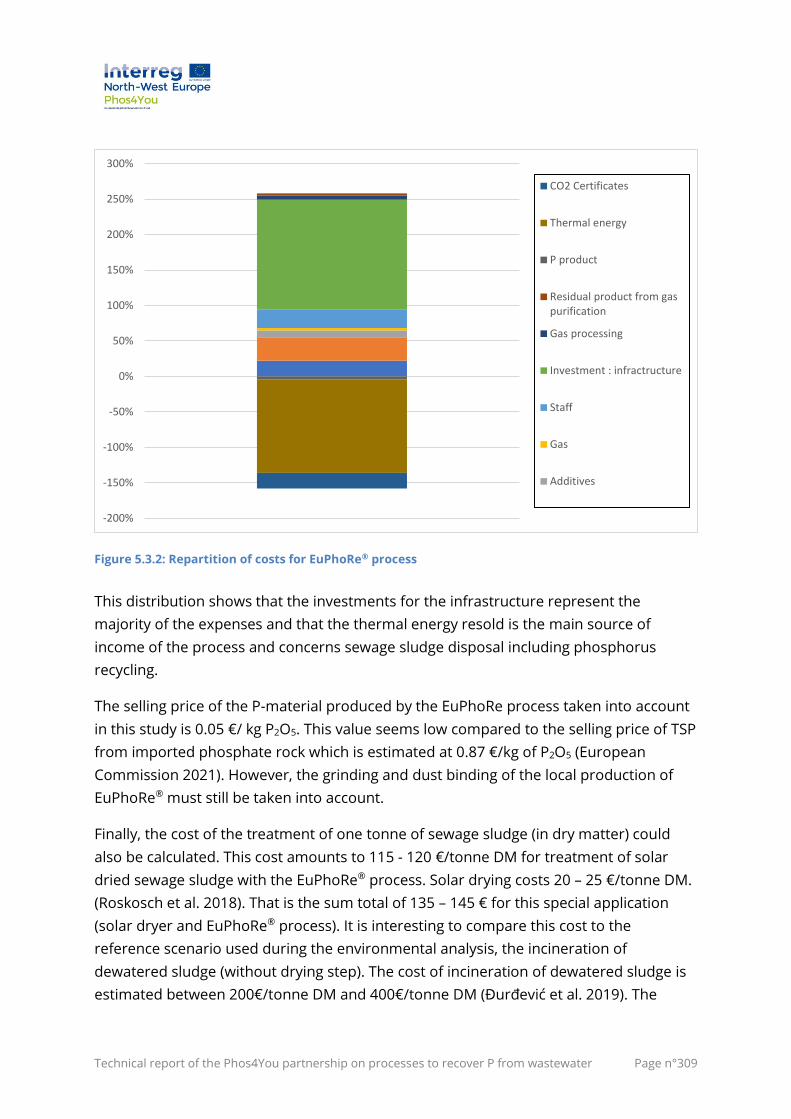
Technical report of the Phos4You partnership on processes to recover P from wastewater Page n°309
Figure 5.3.2: Repartition of costs for EuPhoRe® process
This distribution shows that the investments for the infrastructure represent the
majority of the expenses and that the thermal energy resold is the main source of
income of the process and concerns sewage sludge disposal including phosphorus
recycling.
The selling price of the P-material produced by the EuPhoRe process taken into account
in this study is 0.05 €/ kg P2O5. This value seems low compared to the selling price of TSP
from imported phosphate rock which is estimated at 0.87 €/kg of P2O5 (European
Commission 2021). However, the grinding and dust binding of the local production of
EuPhoRe® must still be taken into account.
Finally, the cost of the treatment of one tonne of sewage sludge (in dry matter) could
also be calculated. This cost amounts to 115 - 120 €/tonne DM for treatment of solar
dried sewage sludge with the EuPhoRe® process. Solar drying costs 20 – 25 €/tonne DM.
(Roskosch et al. 2018). That is the sum total of 135 – 145 € for this special application
(solar dryer and EuPhoRe® process). It is interesting to compare this cost to the
reference scenario used during the environmental analysis, the incineration of
dewatered sludge (without drying step). The cost of incineration of dewatered sludge is
estimated between 200€/tonne DM and 400€/tonne DM (Đurđević et al. 2019). The
-200%
-150%
-100%
-50%
0%
50%
100%
150%
200%
250%
300%
CO2 Certificates
Thermal energy
P product
Residual product from gaspurification
Gas processing
Investment : infractructure
Staff
Gas
Additives
Technical report of the Phos4You partnership on processes to recover P from wastewater Page n°310
EuPhoRe® system studied here seems therefore to show an economic advantage as a
way to valorise sewage sludge, in addition to the obvious advantage of local production
of P-material through the recycling of the phosphorus found in the treated sludge.
5.4 Conclusion of LCA-LCC works
The results of the analysis of the environmental performance of the systems including
the recovery processes showed that all processes had an environmental advantage in
terms of the mineral resource depletion category. This advantage reflects the possibility
of saving the world's mineral resources and more specifically phosphorus. A major
advantage of these demonstrators is that they prove that the made in Europe
production of phosphorus is feasible and well within reach. This production will reduce
Europe's dependence on phosphorus importing countries. The European food
production system will then be less sensitive to possible geopolitical conflicts with these
importing countries.
Some demonstrators such as EuPhoRe® and Struvia™ have also shown their potential
beneficial effects on other studied categories such as climate change and fossil fuel
depletion.
Two methodological approaches were studied in the environmental analysis of the
demonstrators, the system extension approach and the avoided burden approach. Both
approaches showed similar results and led to similar conclusions.
Finally, it is important to remember some key assumptions of the environmental
analysis of the project demonstrators. Firstly, the P-materials from the demonstrators
were considered legally usable. These products were therefore put on an equal footing
even though they may differ in terms of purity and concentration (and bioavailability).
Possible traces of pollutants, such as heavy metals, were not taken into account, nor
were other nutrients possibly present in the P-materials.
The cost analysis (LCC) of the EuPhoRe® process showed that the production of one
kilogram of P2O5 by the process was more expensive than the purchase price of P2O5
from phosphate rock (70 % price increase). However, this price difference should be
seen in the light of the advantages of local, sustainable and independent production at
European level. It has also been shown that the price of sludge disposal via the
EuPhoRe® process can be lower than that of conventional incineration. Therefore, the
process has an economic advantage as a means of sludge valorisation.
Technical report of the Phos4You partnership on processes to recover P from wastewater Page n°311
6 Outlook
Seven processes to recover phosphorus from municipal wastewater were demonstrated
in real environment within the Phos4You project. All demonstrators were technically
successful in producing phosphorus materials from wastewater, WWTP effluents,
sewage sludge or sewage sludge ashes.
Except the phosphoric acid being a common chemical substance, the generated samples
of materials were made available to research institutions and universities for the
assessment of their fertilising quality. Those works are reported in a dedicated report
(Bogdan et al. 2021) The samples of those recovered materials were also made available
to industrial partners, in order to test their suitability to be integrated in their production
processes.
The results of the technical proofs of concept delivered baseline information for the
development of scenarios and case studies to implement the phosphorus recycling in
urban and rural regions. The details of those works are presented in the final report of
the Phos4You partnership (Ploteau et al. 2021).
As a whole, the project confirmed that the diversity of P-recovery solutions proposed
allow to cover a wide range of configuration: from very small wastewater systems to
highly complex treatment including incineration of sewage sludge). Nevertheless, by the
development of scenarios based on the Phos4You demonstrations, it was showed that
the choice of an appropriated P-recovery solution needs to undergo a complex decision-
making process.
On the one hand, the selected technology needs to fit with the current situation. The
development of wastewater treatment in Europe has resulted in a successive addition of
treatment steps (preliminary treatment, primary treatment, secondary or biological
treatment and tertiary or advanced treatment) in order to face the new emerging
problems. The P-recovery creates an additional step. By selecting a technology, the cycle
of investment of the different parts of the treatment system need to be considered,
rendering in some case difficult to implement a more holistic approach which would
require a global system change (e.g. in case of algae solutions or new way to incinerate
sludge).
On the other hand, the selected technology needs to meet the requirements of the
future situation and its related objective. The EU set up a “zero pollution” vision at
horizon 2050 “to respect the boundaries our planet can cope with” (European
Commission 2020c). This is fully in line with the key-findings of the Intergovernmental
Technical report of the Phos4You partnership on processes to recover P from wastewater Page n°312
Panel on Climate Change calling in its report 2021 for “deep reductions in CO2 and GHG
emissions” (IPCC 2021). This opens discussion on future adapted valorisation and
treatment of sewage sludge, rendering thereby difficult the selection of a long-term P-
recovery solution.
The level of transnational cooperation is a further criterion by the selection of a P-
recovery solution. Through the cross-border activities between Phos4You partners and
stakeholders of the fertiliser sector, it became evident that the transnational
cooperation in the field of P-recovery is slow-down by the complex rules of the EU
related to the transport of waste materials. The notification procedure applying for very
small quantities of material renders some simple testing disproportionally labour- and
cost-intensive (e.g. in case of transport of sewage sludge ashes). This is not encouraging
cooperation for full-scale P-recycling.
The evaluation of the Phos4You demonstrations showcased how the implementation of
P-recovery technologies enlarges the field of activities waterboards are dealing with.
Consequently, new staff competences will be required for the operation and
management of P-recovery plants. Where large streams of materials such as chemicals,
products, by-products and input materials will flow, the logistical aspects of the P-
recycling will gain in strategical importance.
Overall, the benefits of development centres at wastewater treatment plants for
emerging technologies has been stated. Those facilities enabled for easier set up and
operation of Phos4You demonstrators (e.g. Bo´Ness (Scotland), Technikum/Dinslaken
(Germany)) in comparison with the Phos4You demonstrators installed at standard
wastewater plants. This was particularly true in term of authorisation procedure,
technical installation and access under pandemic condition.
The environmental assessment of the recovery technologies highlighted the most
damaging parts of each process and demonstrated case by case their environmental
impacts. This assessment also enabled the comparison of two methodological
approaches to solve the thorny problem of taking into account the WWTP in the LCA of
recovery technologies (system expansion method and avoided burden method). Both
approaches provided comparable results, which reinforces their robustness for the
application to the process of phosphorus recovery from sewage sludge. Considering this
robustness, international standardisation norms such as the ILCD Handbook and the
EPD could require the application of one of these methodological approaches in the
environmental assessment of wastewater sludge-based fertilisers. This requirement
would allow a homogenisation of methodological approaches in LCA studies of sludge-

Technical report of the Phos4You partnership on processes to recover P from wastewater Page n°313
sourced fertilisers. This would facilitate the comparison of results to clearly highlight the
individual environmental advantages of each recovery technology on a scientific basis.
The different P-recovery processes demonstrated in Phos4You will continue to be
upscaled and implemented.
Technical report of the Phos4You partnership on processes to recover P from wastewater Page n°314
References
Aslan, Sebnem; Kapdan, Ilgi Karapinar (2006): Batch kinetics of nitrogen and phosphorus
removal from synthetic wastewater by algae. In Ecological Engineering 28 (1), pp. 64–70.
DOI: 10.1016/j.ecoleng.2006.04.003.
AWEL, Baudirektion des Kantons Zürich - Amt für Abfall, Wasser, Energie und Luft (2018)
(Projektblatt, 6). Available online at https://zar-
ch.ch/fileadmin/user_upload/Contentdokumente/Phosphor/projektblatt_phosphor_klae
rschlammasche_nr_6.pdf, checked on 6/25/2021.
Bareha, Y.; Saoudi, M.; Santellani, A. C.; Le Bihan, A.; Picard, S.; Mebarki, C. et al. (2020):
Use of fermentation processes for improving the dissolution of phosphorus and its
recovery from waste activated sludge. In Environmental technology, pp. 1–11. DOI:
10.1080/09593330.2020.1827301.
Bednarz, Andreas; Rüngeler, Bettina; Pfennig, Andreas (2014): Use of Cascaded Option
Trees in Chemical-Engineering Process Development. In Chemie Ingenieur Technik 86 (5),
pp. 611–620. DOI: 10.1002/cite.201300115.
Bhatnagar, Ashish; Chinnasamy, Senthil; Singh, Manjinder; Das, K. C. (2011): Renewable
biomass production by mixotrophic algae in the presence of various carbon sources and
wastewaters. In Applied Energy 88 (10), pp. 3425–3431. DOI:
10.1016/j.apenergy.2010.12.064.
Blöhse, Dennis; Herr, Patrick (2018): Acid extraction of phosphorus from sewage sludge
incineration ash: REMONDIS TetraPhos® (Phos4You Information sheet). Available online
at https://www.nweurope.eu/media/5064/2_phos4you-tetraphos.pdf.
Blöhse, Dennis; Herr, Patrick (2019): Results of Pilot Scale Tests for P-Recovery from
Emschergenossenschaft-Lippeverband Sewage Sludge Ashes with REMONDIS
TetraPhos® Process. In Université de Liège (Ed.): Proceedings. 5th European Conference
on Sludge Management Liège. Liège, 6-8 October.
Blöhse, Dennis; Ploteau, Marie-Edith; Schmelz, Karl-Georg; Nafo, Issa (2018): Konzepte
eines großen Klärschlammerzeugers aus NRW zur Phosphorrückgewinnung: Erste
Erkenntnisse aus dem INTERREG Verbundprojekt Phos4You. In Olaf Holm, Elisabeth
Thomé-Kozmiensky, Peter Quicker, Stefan Kopp-Assenmacher (Eds.): Verwertung von
Klärschlamm. Neuruppin: Thomé-Kozmiensky Verlag GmbH.
Technical report of the Phos4You partnership on processes to recover P from wastewater Page n°315
Bogdan, Aleksandra; Robles-Aguilar, Ana Alejandra; Szabolcs, Papp; Taggart, Mark;
Coquery, Marina; Le Guédard, Marina et al. (2021): Quality assessment of recovered
phosphorus materials carried out within the Phos4You project. Edited by Evi Michels,
Erik Meers. UGhent. Ghent.
Braak, Etienne; Auby, Sarah; Piveteau, Simon; Guilayn, Felipe; Daumer, Marie-Line
(2016): Phosphorus recycling potential assessment by a biological test applied to
wastewater sludge. In Environmental technology 37 (11), pp. 1398–1407. DOI:
10.1080/09593330.2015.1116612.
Bunce, Joshua T.; Ndam, Edmond; Ofiteru, Irina D.; Moore, Andrew; Graham, David W.
(2018): A Review of Phosphorus Removal Technologies and Their Applicability to Small-
Scale Domestic Wastewater Treatment Systems. In Front. Environ. Sci. 6, p. 235. DOI:
10.3389/fenvs.2018.00008.
Chantrain, Gaspard (2021): Étude des impacts environnementaux de nouvelles
technologies de récupération du phosphore dans les boues de station d'épuration.
Master thesis for the grade of bio-engineer in environmental sciences and technologies.
Université de Liège - Gembloux Agro-Biotech, Liège.
Chen, Zhijie; Zhang, Xinru; Jiang, Zeyi; Chen, Xuehui; He, Hongzhou; Zhang, Xinxin (2016):
Light/dark cycle of microalgae cells in raceway ponds: Effects of paddlewheel rotational
speeds and baffles installation. In Bioresource Technology 219, pp. 387–391. DOI:
10.1016/j.biortech.2016.07.108.
Cork County Council (2008): Wastewater Discharge Licence Application under S.I 684 of
2007 Regulations - Scheme/Agglomeration: Macroom - Submission Date: 22nd
September 2008.
Cornel, P.; Schaum, C. (2009): Phosphorus recovery from wastewater: needs,
technologies and costs. In Water science and technology : a journal of the International
Association on Water Pollution Research 59 (6), pp. 1069–1076. DOI: 10.2166/wst.2009.045.
Cuaresma, María; Garbayo, Inés; Vega, José M.; Vílchez, Carlos (2006): Growth and
photosynthetic utilization of inorganic carbon of the microalga Chlamydomonas
acidophila isolated from Tinto river. In Enzyme and Microbial Technology 40 (1), pp. 158–
162. DOI: 10.1016/j.enzmictec.2005.10.049.
Deng, Xiangyuan; Chen, Biao; Xue, Chunye; Li, Da; Hu, Xiaoli; Gao, Kun (2019): Biomass
production and biochemical profiles of a freshwater microalga Chlorella kessleri in
Technical report of the Phos4You partnership on processes to recover P from wastewater Page n°316
mixotrophic culture: Effects of light intensity and photoperiodicity. In Bioresource
Technology 273, pp. 358–367. DOI: 10.1016/j.biortech.2018.11.032.
Deutscher Bundestag (2017): Verordnung zur Neuordnung der Klärschlammverwertung.
(Klärschlammverordnung - AbfKlärV). Source: Bundesgesetzblatt Jahrgang 2017 Teil I
(65), pp. 3465–3512. Available online at http://www.gesetze-im-
internet.de/abfkl_rv_2017/index.html.
Doetsch, Peter; Pinnekamp, Johannes; Rath, Walter; Grömping, Markus (2010):
Rückgewinnung von Pflanzennährstoffen, insbesondere Phosphor aus der Asche von
Klärschlamm. Abschlussbericht PASCH. With assistance of David Montag. Edited by
Umwelt-Forum der RWTH Aachen. Institut für Siedlungswasserwirtschaft der RWTH
Aachen.
Đurđević, Dinko; Blecich, Paolo; Jurić, Željko (2019): Energy Recovery from Sewage
Sludge: The Case Study of Croatia. In Energies 12 (10), p. 1927. DOI: 10.3390/en12101927.
Eirich GmbH & Co KG (2021): Versuchsbericht - Versuche vom Granulieren von
Klärschlammasche (not published). Hardheim.
Escudero, Ania; Blanco, Fernando; Lacalle, Arrate; Pinto, Miriam (2014): Ammonium
removal from anaerobically treated effluent by Chlamydomonas acidophila. In
Bioresource Technology 153, pp. 62–68. DOI: 10.1016/j.biortech.2013.11.076.
Escudero, Ania; Hunter, Colin; Roberts, Joanne; Helwig, Karin; Pahl, Ole (2020a):
Pharmaceuticals removal and nutrient recovery from wastewaters by Chlamydomonas
acidophila. In Biochemical Engineering Journal 156, p. 107517. DOI:
10.1016/j.bej.2020.107517.
Escudero, Ania; Klose, Siegfried; Ploteau, Marie-Edith (2020b): Microalgae biomass
(Phos4You Information sheet). Available online at
https://www.nweurope.eu/media/12160/phos4you_microalgae_biomass_en_nov2020.pd
f.
EU COM - DG Research and Innovation (2015): Circular approaches to phosphorus. From
research to deployment. Luxembourg: Publications Office.
European Commission (2014): COM(2014) 297 final - On the review of the list of critical
raw materials for the EU and the implementation of the Raw Materials Initiative.
European Commission (2017a): COM(2017) 490 final - On the 2017 list of Critical Raw
Materials for the EU.
Technical report of the Phos4You partnership on processes to recover P from wastewater Page n°317
European Commission (2017b): Ninth Report on the implementation status and the
programmes for implementation (as required by Article 17) of Council Directive
91/271/EEC concerning urban waste water treatment. COM/2017/0749 final.
European Commission (2019): SWD(2019) 700 final - Evaluation of the Council Directive
91/271/EEC of 21 May 1991, concerning urban waste-water treatment.
European Commission (2020a): COM(2020) 474 final - Critical Raw Materials Resilience:
Charting a Path towards greater Security and Sustainability.
European Commission (2020b): COM(2020) 98 final - A new Circular Economy Action
Plan For a cleaner and more competitive Europe.
European Commission (2020c): COM(2020) 98 final A new Circular Economy Action Plan
For a cleaner and more competitive Europe.
European Commission (2020d): Public consultation (Feedback period 20 Nov. 2020 - 5
March 2021) for the evaluation of sewage sludge use in farming. Available online at
https://ec.europa.eu/info/law/better-regulation/have-your-say/initiatives/12328-
Evaluation-of-the-Sewage-Sludge-Directive-86-278-EEC-/public-consultation, checked on
6/30/2021.
European Commission (2021): PRICE DASHBOARD No 106 – March 2021 edition.
European Parliament (2015): Directive (EU) 2015/1535 of the European Parliament and
of the Council of 9 September 2015 laying down a procedure for the provision of
information in the field of technical regulations and of rules on Information Society
services (codification). In : Official Journal of the European Union.
EUWID (2020): Remondis und Hamburg Wasser recyceln ab Januar Phosphor. In EUWID
Recycling und Entsorgung, 12/18/2020. Available online at, https://www.euwid-
recycling.de/news/wirtschaft/einzelansicht/Artikel/remondis-und-hamburg-wasser-
recyceln-ab-januar-phosphor.html, checked on 6/25/2021.
Ferro, Lorenza; Gorzsás, András; Gentili, Francesco G.; Funk, Christiane (2018): Subarctic
microalgal strains treat wastewater and produce biomass at low temperature and short
photoperiod. In Algal Research 35, pp. 160–167. DOI: 10.1016/j.algal.2018.08.031.
Franchino, Marta; Comino, Elena; Bona, Francesca; Riggio, Vincenzo A. (2013): Growth of
three microalgae strains and nutrient removal from an agro-zootechnical digestate. In
Chemosphere 92 (6), pp. 738–744. DOI: 10.1016/j.chemosphere.2013.04.023.
Technical report of the Phos4You partnership on processes to recover P from wastewater Page n°318
Franke, Holge (2017): Klärschlammbehandlung mit Phosphor-Rückgewinnung am HKW
Mannheim. 3. Kongress Phosphor-Rückgewinnung. Stuttgart - Bad Cannstatt,
11/22/2017. Available online at https://prueck-
bw.de/cms/content/media/1.3.3.0_11.Dipl.-Ing.Holger_Franke-
Klaerschlamm_mit_Phosphor-Rueckgewinnung.pdf, checked on 8/16/2021.
GERLOFF-ELIAS, ANTJE; SPIJKERMAN, ELLY; SCHUBERT, HENDRIK (2005): Light acclimation
of Chlamydomonas acidophila accumulating in the hypolimnion of an acidic lake (pH
2.6). In Freshwater Biol 50 (8), pp. 1301–1314. DOI: 10.1111/j.1365-2427.2005.01400.x.
Gross, Martin; Henry, Wesley; Michael, Clayton; Wen, Zhiyou (2013): Development of a
rotating algal biofilm growth system for attached microalgae growth with in situ biomass
harvest. In Bioresource Technology 150, pp. 195–201. DOI: 10.1016/j.biortech.2013.10.016.
Herr, Patrick (2018): Industrial development of Tetraphos®-process, first results with
Emscher-Lippe-like SSA (unpublished). 4th working group meeting of the INTERREG VB
Nord-West Europe project Phos4You. Rotterdam, 2018.
HGoTech GmbH (2021): Report: P-Supply by EuPhoRe Recycled Phosphate - Winter Term
2020/21. Bonn.
Huijbregts, Mark A. J.; Steinmann, Zoran J. N.; Elshout, Pieter M. F.; Stam, Gea; Verones,
Francesca; Vieira, Marisa et al. (2017): ReCiPe2016: a harmonised life cycle impact
assessment method at midpoint and endpoint level. In Int J Life Cycle Assess 22 (2),
pp. 138–147. DOI: 10.1007/s11367-016-1246-y.
Iasimone, F.; Panico, A.; Felice, V. de; Fantasma, F.; Iorizzi, M.; Pirozzi, F. (2018): Effect of
light intensity and nutrients supply on microalgae cultivated in urban wastewater:
Biomass production, lipids accumulation and settleability characteristics. In Journal of
environmental management 223, pp. 1078–1085. DOI: 10.1016/j.jenvman.2018.07.024.
IBU-tec advanced materials AG (2016): Entwicklungsversuche zur batchweisen
thermischen Behandlung von getrockneten Klärschlämmen im technischen Maßstab im
direkt beheizten Drehrohrofen BDO (not published). Bericht. Weimar.
IPCC (2021): Summary for policymakers. In IPCC (Ed.): Climate Change 2021: The Physical
Science Basis. Contribution of Working Group I to the Sixth Assessment Report of the
Intergovernmental Panel on Climate Change. With assistance of V. Masson-Delmotte, P.
Zhai, A. Pirani, S.L. Connors, C. Péan, S. Berger et al. in Press: Cambridge University
Press.
Technical report of the Phos4You partnership on processes to recover P from wastewater Page n°319
Irish Water (2020): Annual Environmental Report 2019. Macroom D0126-01. With
assistance of Katherine Walshe. Available online at
https://www.water.ie/docs/aers/2019/D0126-01_2019_AER.pdf.
Jolliet, Olivier; Saadé-Sbeih, Myriam; Shaked, Shanna; Jolliet, Alexandre; Crettaz, Pierre
(2015): Environmental life cycle assessment. Boca Raton: CRC Press. Available online at
http://search.ebscohost.com/login.aspx?direct=true&scope=site&db=nlebk&AN=109909
7.
Jungbluth, N.; Chudacoff, M.; Dauriat, A.; Dinkel, F.; Doka, G.; Faist Emmenegger, M. et al.
(2007): Life Cycle Inventories of Bioenergy. ecoinvent report No. 17. Edited by Swiss
Centre for Life Cycle Inventories. Dübendorf, CH.
Kim, Nag-Jong; Lee, Choul-Gyun (2001): A theoretical consideration on oxygen
production rate in microalgal cultures. In Biotechnol. Bioprocess Eng. 6 (5), pp. 352–358.
DOI: 10.1007/BF02933005.
Klein, Daniel; Schmelz, Karl-Georg; Pamuk, Levent; Ploteau, Marie-Edith; Zepke, Frank;
Klose, Siegfried (2019): First results of the EuPhoRe pilot plant. In Université de Liège
(Ed.): Proceedings. 5th European Conference on Sludge Management Liège. Liège, 6-8
October.
Klose, Ingeborg; Zepke, Frank (2010): Verfahren zur Eliminierung von Schadstoffen aus
Klärschlamm und Verfahren zur Herstellung von Phosphaten und phosphathaltigen
Verbindungen. Patent no. DE 10 2009 014 884 A1.
Klose, Siegfried (2018): Thermo-chemische Klärschlammbehandlung nach dem
EuPhoRe®-Verfahren. In Olaf Holm, Elisabeth Thomé-Kozmiensky, Peter Quicker, Stefan
Kopp-Assenmacher (Eds.): Verwertung von Klärschlamm. Neuruppin: Thomé-
Kozmiensky Verlag GmbH.
Klose, Siegfried (2021): EuPhoRe-anlage in der Entwicklung to Daniel Klein, 8/3/2021.
Kraus, Fabian (2020): Methodological considerations regarding LCA of P-Recovery
processes. 9th working group meeting of the INTERREG VB Nord-West Europe project
Phos4You. Kompetenzzentrum Wasser Berlin GmbH. online, 2020.
Krüger, Oliver; Adam, Christian (2014): Monitoring von
Klärschlammmonoverbrennungsaschen hinsichtlich ihrer Zusammensetzung zur
Ermittlung ihrer Rohstoffrückgewinnungspotentiale und zur Erstellung von
Referenzmaterial für die Überwachungsanalytik (TEXTE 49/2014). Available online at
Technical report of the Phos4You partnership on processes to recover P from wastewater Page n°320
https://www.umweltbundesamt.de/en/publikationen/monitoring-von-
klaerschlammmonoverbrennungsaschen.
Leleu, David; Pfennig, Andreas (2019): Coalescence Modeling for Design of Technical
Equipment. In Chem. Eng. Technol. 42 (7), pp. 1404–1413. DOI: 10.1002/ceat.201900037.
Lemley, Daniel A.; Adams, Janine B. (2019): Eutrophication. In : Encyclopedia of Ecology,
vol. 25: Elsevier, pp. 86–90.
Liao, Qiang; Li, Lin; Chen, Rong; Zhu, Xun (2014): A novel photobioreactor generating the
light/dark cycle to improve microalgae cultivation. In Bioresource Technology 161,
pp. 186–191. DOI: 10.1016/j.biortech.2014.02.119.
Lin, Li; Yuan, Songhu; Chen, Jing; Xu, Zuqun; Lu, Xiaohua (2009): Removal of ammonia
nitrogen in wastewater by microwave radiation. In Journal of hazardous materials 161 (2-
3), pp. 1063–1068. DOI: 10.1016/j.jhazmat.2008.04.053.
Lösche GmbH (2021): Kurzbericht Mahlversuch_10458 (unpublished). Emscher
Klärschlammasche Mahlversuch. Düsseldorf.
Lu, Shuguang; Gibb, Stuart W.; Cochrane, Emma (2007): Effective removal of zinc ions
from aqueous solutions using crab carapace biosorbent. In Journal of hazardous
materials 149 (1), pp. 208–217. DOI: 10.1016/j.jhazmat.2007.03.070.
Luo, Yunlong; Le-Clech, Pierre; Henderson, Rita K. (2017): Simultaneous microalgae
cultivation and wastewater treatment in submerged membrane photobioreactors: A
review. In Algal Research 24 (Part A), pp. 425–437. DOI: 10.1016/j.algal.2016.10.026.
Macintosh, Katrina A.; Chin, Jason; McHugh, Daren; Connolly, Jasmine; O’Flaherty,
Vincent; McGrath, John W. et al. (2019): Phosphorus from wastewater: Novel
technologies for advanced treatment and re-use (EPA Research Report, 289).
Martínez, M. (2000): Nitrogen and phosphorus removal from urban wastewater by the
microalga Scenedesmus obliquus. In Bioresource Technology 73 (3), pp. 263–272. DOI:
10.1016/S0960-8524(99)00121-2.
Molina Grima, E.; Belarbi, E.-H; Acién Fernández, F.G; Robles Medina, A.; Chisti, Yusuf
(2003): Recovery of microalgal biomass and metabolites: process options and
economics. In Biotechnology Advances 20 (7-8), pp. 491–515. DOI: 10.1016/S0734-
9750(02)00050-2.
Technical report of the Phos4You partnership on processes to recover P from wastewater Page n°321
Montastruc, L.; Azzaro-Pantel, C.; Biscans, B.; Cabassud, M.; Domenech, S. (2003): A
thermochemical approach for calcium phosphate precipitation modeling in a pellet
reactor. In Chemical Engineering Journal 94 (1), pp. 41–50. DOI: 10.1016/S1385-
8947(03)00044-5.
Mooij, T. de (2016): Antenna size reduction in microalgae mass culture. Doctor degree.
Nishikawa, K.; Tominaga, N. (2001): Isolation, growth, ultrastructure, and metal tolerance
of the green alga, Chlamydomonas acidophila (Chlorophyta). In Bioscience, biotechnology,
and biochemistry 65 (12), pp. 2650–2656. DOI: 10.1271/bbb.65.2650.
O´Keeffe, J.; Akunna, J.; Olszewska, J.; Bruce, A.; May, L.; Allan, R. (n.d. [2015]): Practical
measures for reducing phosphorus and faecal microbial loads from onsite wastewater
treatment system discharges to the environment - A review. Edited by CREW Scotland´s
centre of expertise for waters. Aberdeen.
O'Donnell, Ciarán; Egan, Aoife; Harrington, Joe; Barnett, Denise; Forrestal, Patrick; Power,
Niamh (2021): An overview on deficit and requirements of the Irish national soil
phosphorus balance. In The Science of the total environment 785, p. 147251. DOI:
10.1016/j.scitotenv.2021.147251.
Palazzo (2010): What is eutrophication? Causes, effects and control, pp. 1–6.
Pap, Szabolcs; Kirk, Caroline; Bremner, Barbara; Turk Sekulic, Maja; Gibb, Stuart W.;
Maletic, Snezana; Taggart, Mark A. (2020a): Synthesis optimisation and characterisation
of chitosan-calcite adsorbent from fishery-food waste for phosphorus removal. In
Environ Sci Pollut Res 27 (9), pp. 9790–9802. DOI: 10.1007/s11356-019-07570-0.
Pap, Szabolcs; Kirk, Caroline; Bremner, Barbara; Turk Sekulic, Maja; Shearer, Lisa; Gibb,
Stuart W.; Taggart, Mark A. (2020b): Low-cost chitosan-calcite adsorbent development
for potential phosphate removal and recovery from wastewater effluent. In Water
Research 173, p. 115573. DOI: 10.1016/j.watres.2020.115573.
Pap, Szabolcs; Taggart, Mark A.; Bremner, Barbara; Ploteau, Marie-Edith (2020c): P-rich
biomass (Phos4You Information sheet). Available online at
https://www.nweurope.eu/media/12161/phos4you_p-rich_biomass_en_nov2020.pdf.
PARFORCE Engineering & Consulting GmbH (2020): Laborversuche,
Stoffstrombilanzierung sowie Investitions- und Betriebskostenabschätzung der
Phosphorrückgewinnung aus Klärschlammaschen mit der PARFORCE-Technologie im
Rahmen des INTERREG VB Projekt Phos4You (unpublished).
Technical report of the Phos4You partnership on processes to recover P from wastewater Page n°322
PARFORCE Engineering & Consulting GmbH (2021): Vorindustrieller
Demonstrationsversuch in der PARFORCE-Pilotanlage inkl. Überarbeitung und
Verfeinerung der Stoffstrombilanzierung sowie der wirtschaftlichen Kenngrößen im
Rahmen des INTERREG VB NW Phos4You Projektes (unpublished).
Pistocchi, A.; Dorati, C.; Grizzetti, B.; Udias, A.; Vigiak, O.; Zanni, M. (2019): Water quality
in Europe. Effects of the urban wastewater treatment directive : a retrospective and
scenario analysis of Dir. 91/271/EEC. Luxembourg: Publications Office of the European
Union (EUR, 30003).
Ploteau, Marie-Edith (2016): Work plan overview of Pho4You. Project outline of the
INTERREG VB NWE application form of Phos4You. Essen.
Ploteau, Marie-Edith; Althoff, Anke; Nafo, Issa; Teichgräber, Burkhard (Eds.) (2021): Final
report of the Phos4You partnership: deploying phosphorus recycling from wastewater in
North-West Europe. Lippeverband. Essen.
Ploteau, Marie-Edith; Blöhse, Dennis; Bogaczyk, Dirk; Pamuk, Levent; Klein, Daniel;
Schmelz, Karl-Georg; Nafo, Issa (2020): Erkenntnisse aus dem EU-Projekt Phos4You zur
Phosphorrückgewinnung. In Korrespondenz Abwasser, Abfall 67, pp. 502–510. DOI:
10.3242/kae2020.07.001.
Pradel, Marilys; Aissani, Lynda (2019): Environmental impacts of phosphorus recovery
from a “product” Life Cycle Assessment perspective: Allocating burdens of wastewater
treatment in the production of sludge-based phosphate fertilizers. In Science of The Total
Environment 656, pp. 55–69. DOI: 10.1016/j.scitotenv.2018.11.356.
Pradel, Marilys; Aissani, Lynda; Villot, Jonathan; Baudez, Jean-Christophe; Laforest,
Valérie (2016): From waste to added value product: towards a paradigm shift in life cycle
assessment applied to wastewater sludge – a review. In Journal of Cleaner Production
131, pp. 60–75. DOI: 10.1016/j.jclepro.2016.05.076.
Rak, A. (2018): Das REMONDIS TetraPhos®-Verfahren. In Olaf Holm, Elisabeth Thomé-
Kozmiensky, Peter Quicker, Stefan Kopp-Assenmacher (Eds.): Verwertung von
Klärschlamm. Neuruppin: Thomé-Kozmiensky Verlag GmbH, pp. 491–494.
REMONDIS Aqua Industrie GmbH & Co.KG. (2018): Bericht zu Laborversuchen zur
Rückgewinnung von Phosphor aus Klärschlammaschen des Verbandsgebietes von
Emschergenossenschaft und Lippeverband mit dem REMONDIS TetraPhos®-Verfahren
(unpublished).
Technical report of the Phos4You partnership on processes to recover P from wastewater Page n°323
REMONDIS Aqua Industrie GmbH & Co.KG. (2019): Pilotversuche zur Rückgewinnung von
Phosphor aus Klärschlammaschen des Verbandsgebietes von Emschergenossenschaft
und Lippeverband mit dem REMONDIS TetraPhos®-Verfahren (unpublished).
Rich, David (2005): The Removal of Total Phosphorus from Natural Waters by
Precipitation. A Dissertation Submitted to Northwestern International University in
partial fulfillment of the requirements for the degree of Doctor of Philosophy in
Environmental Science.
Roskosch, Andrea; Heidecke, Patric; Bannick, Claus-Gerhard; Brandt, Simone; Bernicke,
Maja; Dienemann, Claudia et al. (2018): Klärschlammentsorgung in der Bundesrepublik
Deutschland. Edited by Umweltbundesamt. Available online at
https://www.umweltbundesamt.de/publikationen/klaerschlammentsorgung-in-der-
bundesrepublik.
Ruhrverband (2021): Forschungsprojekt AMPHORE zum Phosphorrecycling startet in die
Planungsphase. Press release on 23.03. Available online at
https://www.ruhrverband.de/presse/pressemitteilungen/detailansicht/news///forschung
sprojekt-amphore-zum-phosphorrecycling-startet-in-die-planungsphase/, checked on
6/25/2021.
Ryan, Michael P.; Boyce, Angela; Walsh, Gary (2016): Identification and evaluation of
phosphorus recovery technologies in an Irish context. Ireland: Environmental Protection
Agency (EPA Research Report, 189).
Schlumberger, Stefan Dr. (2021): Phos4YLife implementation. Phone 15/06/2021 to
Dennis Blöhse, 2021.
Schmelz, Karl-Georg; Klein, Daniel; Zepke, Frank (2020): Aufbau, Betrieb und erste
Ergebnisse der EuPhoRe-Pilotanlage in Dinslaken. In wasserwirtschaft wassertechnik 69.
Jahrgang (Nr. 10/2020), pp. 8–12. Available online at
https://www.umweltwirtschaft.com/epaper/umw/99/epaper/epaper.pdf.
Schneider, Yvonne (2021): Demonstrationsprojekt AMPHORE. Regionale
Strategieentwicklung und Verfahrensauswahl für das Phosphorrecycling aus
Klärschlammasche. WebForum Phosphorrückgewinnung, 4. Februar, 2021.
Schweizerischer Bundesrat (4/12/2015): Verordnung über die Vermeidung und die
Entsorgung von Abfällen. Abfallverordnung, VVEA. Source: Amtliche Sammlung (AS
2015), pp. 5699–5751. Available online at https://www.admin.ch/opc/de/official-
compilation/2015/5699.pdf.
Technical report of the Phos4You partnership on processes to recover P from wastewater Page n°324
Scottish Environment Protection Agency (SEPA) (2014): Regulatory Method (WAT-RM-37):
Regulation of Phosphorous discharges into freshwater lochs, p. 18.
Scottish Environment Protection Agency (SEPA) (2017): Land Use Planning System SEPA
Guidance Note 19 (Addendum). Planning advice on waste water drainage.
Shariff, Zaheer; Fraikin, Laurent; Léonard, Angélique; Pfennig, Andreas (2020):
Development of solid-liquid-liquid equilibrium speciation and data fitting tool and its
application to phosphorus recovery process from sludge. In DECHEMA e.V. (Ed.).
Jahrestreffen der ProcessNet-Fachgruppen Fluidverfahrenstechnik, Adsorption und
Extraktion. AlpenCongress Berchtesgaden, 26. - 28. Februar. Available online at
http://hdl.handle.net/2268/247818.
Shaviv, A.; Mikkelsen, R. L. (1993): Controlled-release fertilizers to increase efficiency of
nutrient use and minimize environmental degradation - A review. In Fertilizer Research 35
(1-2), pp. 1–12. DOI: 10.1007/BF00750215.
Técnicas Reunidas (2020): PHOS4LIFE™ Technology for Technical Grade Phosphoric Acid
Production from Sewage Sludge Ashes (SSA). Proof of Concept Tests (POC)
(unpublished).
Tittel, Jörg; Bissinger, Vera; Gaedke, Ursula; Kamjunke, Norbert (2005): Inorganic carbon
limitation and mixotrophic growth in Chlamydomonas from an acidic mining lake. In
Protist 156 (1), pp. 63–75. DOI: 10.1016/j.protis.2004.09.001.
Uduman, Nyomi; Qi, Ying; Danquah, Michael K.; Forde, Gareth M.; Hoadley, Andrew
(2010): Dewatering of microalgal cultures: A major bottleneck to algae-based fuels. In
Water science and technology : a journal of the International Association on Water Pollution
Research 2 (1), p. 12701. DOI: 10.1063/1.3294480.
Venkata Subhash, G.; Rohit, M. V.; Devi, M. Prathima; Swamy, Y. V.; Venkata Mohan, S.
(2014): Temperature induced stress influence on biodiesel productivity during
mixotrophic microalgae cultivation with wastewater. In Bioresource Technology 169,
pp. 789–793. DOI: 10.1016/j.biortech.2014.07.019.
Veolia Water Technologies (2016): STRUVIATM – sustainable recycling of phosphorus from
wastewater. France, 2016. Available online at
https://www.veoliawatertechnologies.com/sites/g/files/dvc2476/files/document/2019/02
/3351%2C150354_Mkt_Mun_Brochure_STRUVIA_EN_.pdf, checked on 6/29/2021.
Technical report of the Phos4You partnership on processes to recover P from wastewater Page n°325
Verma, Srishti; Daverey, Achlesh; Sharma, Archana (2017): Slow sand filtration for water
and wastewater treatment – a review. In Environmental Technology Reviews 6 (1), pp. 47–
58. DOI: 10.1080/21622515.2016.1278278.
Wernet, Gregor; Bauer, Christian; Steubing, Bernhard; Reinhard, Jürgen; Moreno-Ruiz,
Emilia; Weidema, Bo (2016): The ecoinvent database version 3 (part I): overview and
methodology. In Int J Life Cycle Assess 21 (9), pp. 1218–1230. DOI: 10.1007/s11367-016-
1087-8.
Westfälisches Umwelt Zentrum (2020): Versuche zur Ausfällung von gelösten
Phosphorverbindungen aus kommunalem Abwasser unter Einsatz von zwei
verschiedenen Fälmitteln (unpublished). With assistance of Volker Pick.
Zheng, Yulin; Wang, Bing; Wester, Anne Elise; Chen, Jianjun; He, Feng; Chen, Hao; Gao,
Bin (2019): Reclaiming phosphorus from secondary treated municipal wastewater with
engineered biochar. In Chemical Engineering Journal 362, pp. 460–468. DOI:
10.1016/j.cej.2019.01.036.

The project Phos4You is co-funded from the European Regional Development Fund
within the INTERREG North-West Europe VB Programm.
www.nweurope.eu/phos4you
This text is made available via DuEPublico, the institutional repository of the University ofDuisburg-Essen. This version may eventually differ from another version distributed by acommercial publisher.
DOI:URN:
10.17185/duepublico/74788urn:nbn:de:hbz:464-20210920-094346-4
This work may be used under a Creative Commons Attribution 4.0License (CC BY 4.0).