Technical Report: Fish remains from the Drogheda Boat, Ireland
32
1 Reports from the Centre for Human Palaeoecology, University of York Report 2009/02 Technical Report: Fish remains from the Drogheda Boat, Ireland By Jennifer Harland Fishlab, Centre for Human Palaeoecology, Department of Archaeology, University of York, The King‟s Manor, York YO1 7EP 8 June 2009
Transcript of Technical Report: Fish remains from the Drogheda Boat, Ireland
1
Reports from the Centre for Human
Palaeoecology, University of York
Report 2009/02
Technical Report: Fish remains from the Drogheda Boat, Ireland
By
Jennifer Harland
Fishlab, Centre for Human Palaeoecology, Department of Archaeology, University of
York, The King‟s Manor, York YO1 7EP
8 June 2009
2
Technical Report: Fish remains from the Drogheda Boat, Ireland
Jennifer Harland
Summary
The fish remains recovered from a 16th century Irish shipwreck were analysed and found to
consist entirely of Atlantic herring, Clupea harengus. All material was sieved to 300μ. A
minimum of 513 herring were present in the samples studied, making it likely many thousands
of herring had been the original cargo. Element patterning indicated the herring were
butchered to remove elements from the appendicular region, most likely along with some of
the guts; the herring were therefore probably picked in salt and barrelled for long-term
preservation. The herring found were mostly between 20 and 30cm total length, probably
reflecting exploitation of autumn-spawning populations around the Isle of Man and the east
coast of Ireland. Historical sources indicate that substantial trade in preserved herring was
undertaken between the eastern Irish ports and English ports, including Bristol. The herring
were recovered from a total of 14 barrels, and thus might have comprised one ‘last’, a
commonly traded commercial unit of about 10,000 to 14,000 herring.
KEYWORDS: HERRING, PRESERVED FISH TRADE, SHIPWRECK, ZOOARCHAEOLOGY, 16
TH
CENTURY
The Centre for Human Palaeoecology brings together archaeological
scientists within the University of York whose research interests include
past human activity, economy and environment. Disclaimer: this report is one of a series produced by staff and colleagues of the Centre for
Human Palaeoecology, based in the Department of Archaeology, University of York. It
contains material that may eventually be intended for publication and, as such, may represent
only an interim statement. When quoting this report, please refer to it in this way:
Harland, JF (2009). Technical Report: Fish remains from the Drogheda Boat, Ireland.
Reports from the Centre for Human Palaeoecology, University of York 2009/02, 32pp.
Please address all non-academic enquiries concerning these reports to the Centre for Human
Palaeoecology, Department of Archaeology, University of York, The King‟s Manor, York
YO1 7EP (e-mail: [email protected]).
3
Fish remains from the Drogheda Boat, Ireland
Introduction
This report details the analysis of 15,152 identified fish remains from the Drogheda
Boat shipwreck, from the port of Drogheda on the east coast of Ireland. All were
derived from sieved samples and all were identified as the Atlantic herring, Clupea
harengus. Over 19,000 other fish remains were examined but were not identified to
element, although all were likely also from herring. The Drogheda Boat was a small
clinker-built vessel of about 9m in length and 3m in width, and it contained a cargo of
14 barrels when it sunk. It was discovered in the River Boyne about 2km east of
Drogheda, and based on preliminary dendrochronology, it was built c. 1520AD
(Anon. 2008). It was probably ferrying cargos between the port itself and ships that
were too large to anchor directly in Drogheda. The lower portions of the barrels were
well preserved, as were the contents, which were retrieved as a dark, waterlogged,
organic sludge with many visible fish remains. These were comprehensively
sampled, as were nearby contexts from outside the barrels for comparison.
The Drogheda Boat remains are exceptionally unusual in that they are securely dated,
well preserved, and they represent the remains of preserved herrings probably being
exported for trade. Most contemporary fish remains are found in domestic contexts,
representing the remains of many meals over a long time span, and could represent
both fresh and preserved fish. The Drogheda Boat herring provide a unique
opportunity to study preservation methods from the first half of the 16th
century, set
within the early historical references to European herring preservation as well as the
export market from Drogheda.
Fish remains from 15 separate samples were fully examined. Eleven were from inside
the barrels (including barrels 2, 4, 5, 6, 8, 12, 13) and these contained the vast
majority of the herring remains. The remainder were from contexts near the barrels.
One sample, number 55, context/feature E8, was examined but not a single fish bone
or scale was observed. Although not every sample could be included in the analysis,
at least one sample per barrel was included, and barrels 4, 8, 12, 13 were all
represented by two or more samples. Samples that were excluded from analysis
tended to contain much smaller quantities of bone than those that were selected for
identification, and in particular, they contained far fewer of the readily identifiable
remains from the >4mm sieved fraction. Only three large samples were excluded
from analysis on the basis that they were from barrels 4, 12 and 13, which were
already represented by two or more identified samples.
The herring trade
Herring are naturally an oily fish which decay very quickly unless some attempt at
preservation is made shortly after capture. The seasonal abundance of herring stocks,
and their ease of capture, have made them an important resource to fishing
communities for millennia. Short-term preservation methods have probably been
used for just as long to allow this important food to be consumed over weeks and
months, rather than immediately after capture, but it was only with new preservation
4
techniques in the medieval period that long-term preservation became possible – and
with it, the long-distance herring trade.
Archaeological evidence from some developing English urban areas indicate that
herring were first being eaten in large quantities in the 8th
, 9th
and 10th
centuries, but
these were most likely locally-caught and, if preserved, this was probably only with a
light cure (Serjeantson and Woolgar 2006). However, following the „fish event
horizon‟, the shift towards large-scale exploitation of marine species like cod and
herring that occurred c. 1000AD, herring quickly became ubiquitous in most western
European sites wherever fish remains were found (Barrett et al. 2004b; Barrett et al.
2004a).
Early curing methods for herring probably involved salting, either in salt crystals or in
brine, air drying in extreme northern regions like Iceland, or smoking, and sometimes
these procedures were associated with limited butchery to remove non-food parts of
the fish (Cutting 1955; Robinson 2000). Large scale herring fisheries are known
historically from a variety of Northern European countries, including most that border
on the North Sea and the Baltic. By the early decades of the second millennium AD,
the large-scale herring trade can be recognised archaeologically by the increasing
occurrence of herring remains in domestic deposits. These herring were most likely
lightly preserved using salting, probably processed in heaps on the ground, rather than
in barrels, and without any butchery (Cutting 1955; Hoffmann 2005). The resulting
product would keep for a few months, but no more, which would allow them to be
transported relatively long distances from the fishing grounds. Archaeological
remains of herring from these early centuries are characterised by the presence of
cranial, appendicular and vertebral elements being present in relatively equal, natural
frequencies (e.g. Harland and Jones In prep.). Butchery marks are not normally
observed in these assemblages, suggesting that if any butchery had occurred, it
removed only soft parts of the flesh, and not bone. Of course, herring preserved with
these simple methods are virtually impossible to distinguish from herring consumed
fresh, but it is possible to take into account the distance between the archaeological
site and the possible fishing grounds when speculating about early herring
preservation.
Historical sources are only available from the 12th
century onwards, but these confirm
the importance of this early herring trade (Barrett et al. 2004a). The Hanse, or
Hanseatic League, became the major group of merchants involved in this early trade –
one of their many endeavours – and much of their power originated from the wealth
derived from herring. They ensured the quality and supply of herring throughout
much of Europe, maintained by strict rules, regulations and monopolies regarding
curing practice and product supply. The cured herring by either smoking them („red
herring‟) or by pickling in salt brine („white herring‟). The latter were first gutted,
washed in salt water, and packed into barrels with salt. The process of gutting the
herring has not apparently left any archaeological trace, implying that no bones were
removed.
Improved methods of curing occurred at some point in the 14th
century. Historical
sources mention the Dutch were responsible for innovations in butchery, salting and
barrelling, producing a product called „kaken‟ (Cutting 1955). Herring were now
processed immediately after being caught, even while still onboard ship, allowing new

5
fishing grounds to be exploited for the first time (Childs 2000; Hoffmann 2005). The
gills and some of the guts were removed by one simple cut to the throat and
underbelly region, leaving part of the intestines as the digestive enzymes remaining in
the fish played a role in preservation. The butchered fish were then immediately
salted and packed head to tail in layers in barrels. Each layer was finished with
additional salt and the subsequent layer was placed at a different angle. The contents
were allowed to settle, and were topped up before the barrel was sealed with fish from
a similar state of preservation, creating an airtight atmosphere and thus allowing long-
term storage (Cutting 1955; Hoffmann 2005). Historically at least, the Dutch took
responsibility for this new method and its success played a role in the rise of Dutch
power and wealth in the 15th
and later centuries (Cutting 1955; Hoffmann 2005).
From the early 15th
century, fishing vessels increased in size to allow longer journeys
and greater cargo capacity for the newly cured herring.
Herring were commonly exported in units called „lasts‟ during this period, a term used
throughout the ensuing centuries for herring and other fish products. Each last of
herring comprised between 10 and 14 barrels, each of which contained about 1000
herring, making one last contain anything between 10,000 and 14,000 herring
(Cutting 1955). Historical references to fisheries weights and measures are often
imprecise and vary by place and time, making it difficult to fully appreciate what is
meant in any one historical document. Bristol customs accounts from the mid 16th
century list barrels and lasts of white (pickled) herring from Ireland, and as one last is
worth on average £3, and one barrel is worth on average 5s, the average last must
have contained about 12 barrels at this time (Flavin and Jones 2008). A slightly later
Irish source is consistent with this description, as it describes a last of herring as
comprising about 12 barrels, with estimates of 10,000-13,000 fish per last for smoked
herring and pilchards, but with more variable quantities for salted herring (Longfield
1929). The Drogheda Boat contained 14 barrels, at least 7 of which were found to
contain herring remains – so it is possible that the cargo could have represented one
last of herring.
An exceptional archaeological deposit of herring remains from the Danish site of
Selsø-Vestby provides the earliest evidence for the „kaken‟ method of herring
preservation. The 12th
and 13th
century date of this material questions the supposed
Dutch invention of this method of preservation, although there is no doubting that the
Dutch later used the method to their advantage. At Selsø-Vestby, unique deposits
consisting solely of herring remains were found, and furthermore, the vast majority of
identified elements were from the hyoid, gill and shoulder regions, including the
cleithra, supracleithra, ceratohyals, epihyals, urohyals and scapulas (Enghoff 1996;
Enghoff 1999; see Figure 3 for an anatomical diagram of the fish skeleton). These
were interpreted as the discarded remains of a butchery strategy very similar to that
described above – the removal of the gill region and part of the gut to aid
preservation. This butchery strategy has been termed the „Skanian‟ method in the
zooarchaeological literature, and it probably would have prolonged the storage
potential of the herring from a few days or weeks to up to a year (Childs 2000; Locker
2000; Woolgar 2000). The Skanian method was probably introduced to Britain‟s
Yorkshire coast herring fishery in the very late 14th
century, while a date of about
1400 applies to its historical introduction to the continental North Sea herring fishery
(Childs 2000). However, contemporary archaeological deposits have yet to reveal the
Skanian element proportions (e.g. the extensive herring deposits from 14th
to 16th

6
century sites in York show that all elements were present (Harland and Jones In
prep.)), suggesting that they were probably consumed in conjunction with fresh and
lightly cured herring.
Red herrings were salted and smoked, a process probably improved in Yarmouth in
the 14th
century, although more lightly smoked herring was probably produced in a
variety of places prior to this date (Cutting 1955). They were probably lightly salted
onboard ship, then upon landing, they were washed, placed in salt for a few weeks,
and then speared on sticks through the gills and mouth, and smoked for a few weeks
(Cutting 1955). No gutting or gill removal was used and therefore their consumption
would be difficult to identify in the archaeological record. Red herrings were often
seen as inferior to salted herrings, both in taste and in the duration of preservation; it
is only in recent centuries, post-dating the Drogheda Boat, that smoked herring –
kippers – have become so common (Cutting 1955). That said, red herring production
is known historically in Ireland from at least the 17th
century (Went 1977), but with no
documented gutting or butchery to the product, they would not have been visible in
the archaeological record.
By the late 15th
century, Dutch supremacy over the herring trade was vast: they
supplied most of northern Europe‟s preserved herring, including most of the imports
to English markets (Hoffmann 2005). However, herring stocks have always been
notoriously fickle, responding to subtle environmental changes as well as to fishing
pressures, and several stocks were known to collapse or dramatically shift to new
geographical regions in the medieval period. For example, the herring stocks in the
southern North Sea region collapsed about 1360, as did those in the Skanian region of
southern Sweden in the early decades of the 15th
century. These were possibly linked
general cooling patterns of Europe‟s “Little Ice Age”, which would have adversely
affected herring stocks from the late 14th
century until the 1520s (Hoffmann 2005) –
and which might have led to Ireland‟s herring industry becoming more important
about this time.
Archaeological examples of definitively preserved herring are rare. The Selsø-Vestby
example is unique in that it represents the processing waste from preserving herring
using the „kaken‟ or „Skanian‟ method. A 16th
century Dutch shipwreck provides the
most obvious comparison to the Drogheda Boat: 17 barrels were found and some of
the residues were sieved to 2mm (Lauwerier and Laarman 2008). Over 29,000 fish
remains were then identified, most of which were herring. At least 700 fish were
represented They ranged in size from 17 to 30cm total length, with an average of
about 25cm, and the authors thought it likely that no grading by size was performed
prior to preservation. Although most elements were present, the cleithra, urohyals,
scapulae and supracleithra were either absent or represented by only a few specimens,
while the ceratohyals were found in smaller than expected quantities. The few
cleithra fragments present tended to be from the dorsal region and some may have
been butchered. This Dutch example provides an archaeological signature for the
„kaken‟ or „Skanian‟ method of herring preservation, and matches well to the Selsø-
Vestby butchery waste. Other medieval or later examples of preserved herring are
known but sample sizes tend to be much smaller (e.g. 15-16th
century Dutch examples
cited in Lauwerier and Laarman 2008). Herring remains from a 17th
century whaling
station in Spitsbergen were interpreted as herring preserved using this method
7
(Seeman 1986), but with less than 400 herring bones found, the results cannot be
conclusive.
Historical evidence for the Irish herring trade
Historical sources relating specifically to the Irish herring trade are rare. Drogheda
itself is almost never mentioned explicitly in the historical accounts, although the port
was known to trade with Chester in the 14th
or 15th
centuries (Childs and O'Neill
1993). A 13th
century reference mentions Irish fishing boats from communities on the
east coast taking part in the herring fishery around the Isle of Man, and by the end of
the 14th
century, quantities of Irish fish were being exported to Bristol (Down 1993).
However, the Irish markets were still too small at this time to interest the larger
European traders like the Hanse (Childs and O'Neill 1993). Herring and other fish
were “undoubtedly the most important product of sixteenth century Ireland”
(Longfield 1929), but they were not necessarily fished by the Irish: historical accounts
document conflicts between Spanish, French and local fishers (Longfield 1929; Down
1993). Irish fish were also caught by Irish fishers, then bought and exported by
foreigners, including English merchants; however, some English boats and fishers
directly exploited Irish stocks without landing any fish actually in Ireland. A fleet of
600 English boats were known to prosecute the fishery around Carlingford Lough in
1535, only about 35km north-northeast of Drogheda (Childs and O'Neill 1993). By
the early 16th
century, fish exported were deemed too large, and pleas were made to
retain a larger portion for Irish consumption (Childs and O'Neill 1993). Drogheda
was one of a number of ports exporting Irish produce, among them fish products,
including herring, salmon, and the cod family, as well as wool, hides, tallow, and
timber, and in return, importing salt, “all sortes of corrupt wines” and, presumably,
some of better quality, as well as iron cloth, metal and luxury goods (Longfield 1929,
45; Went 1977; Moody et al. 1991; Childs and O'Neill 1993; Down 1993).
Irish herring were exported primarily to England, but with some quantities ultimately
destined for the continent (Longfield 1929). Anglo-Irish customs reports for the 16th
century provide some historical details of this trade. Herring were the staple export,
along with the more valuable salmon, and various grades of fish were exported. Full,
white herring were the most desired product, as they had yet to spawn and thus were
full of roe; these were worth two or three times the price of white „shotten‟ herring
that had already spawned. Records of Cornish imports from Dungarvan, an Irish port
in the southeast, indicate that in 1562 full white herring were worth £9 per last and
white shotten herring about £3 (Longfield 1929). Bristol was the primary destination
for much of this fish in the 15th
century (Childs and O'Neill 1993), and detailed
customs accounts from the 16th
century provide further information on seasonality and
the extent of imports from Ireland.
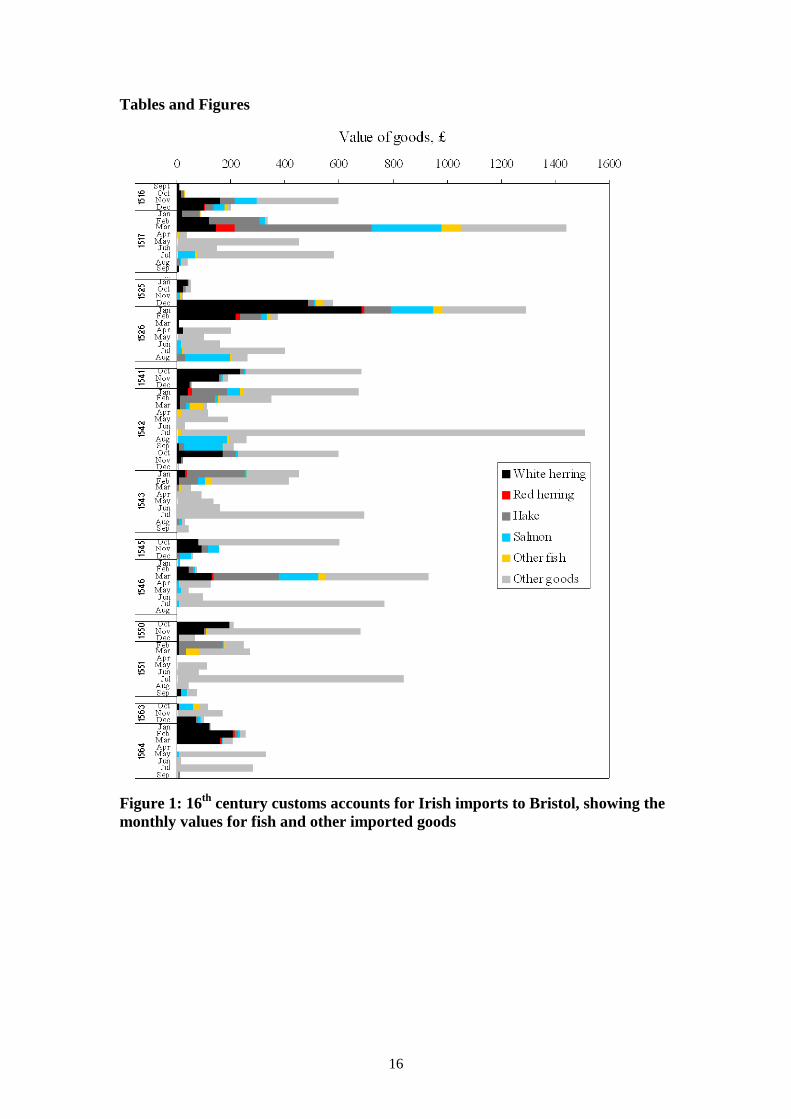
Detailed monthly customs accounts for 16th
century Bristol are available online
(Flavin and Jones 2008), and it was possible to extract values for all goods originating
in Ireland and arriving in Bristol. Although it was not possible to isolate ships from
Drogheda, these data are extremely useful in providing an indication of the value and
seasonality of goods leaving Ireland. These data are displayed by month in Figure 1,
showing the values for white (pickled) herring, red (smoked) herring, hake, salmon,
other fish and other goods. The sequence through the century contains many gaps,
but because the data are displayed month by month, seasonal trends are visible.
White herring are the predominant export (by value) for the late autumn, winter and

8
spring for several years. They dominated exports for December, January and
February in 1525/26, while in 1541/42 they were more common slightly earlier in
October and November, and secondarily in December and January. In 1542/43,
1545/46 and 1550/51, very few imports from Ireland were recorded over the winter
months. During these years, herring were exported predominantly in October and
November, and secondarily in January, February and March. By 1563/64, December
to March was once again the predominant export season. Red herrings were exploited
but in very small values, and at the same time of year as white herring. The actual
quantity of fish represented in Figure 1 is more difficult to ascertain, because a variety
of different units were recorded in the customs accounts. A total of 499 ¾ lasts of
white herring were included in this figure, as were 8908 separately recorded barrels;
assuming 12 barrels per last, this figure therefore includes just under 15,000 barrels of
white herring. Very small values of white herring were also recorded under units of
„hoghead‟, „hogshead‟, „kilderkin‟, „mease‟ and „virkin‟.
These customs accounts are based on several Irish herring fisheries, which have
altered in importance and production throughout the 16th
century. These records are
not complete either, but they are still useful – they indicate both the overwhelming
importance of herring to Ireland‟s export trade, and the late autumn to spring nature of
the fisheries.
In the late 16th
century the Anglo-Irish fish trade declined, probably because of the
wider availability of Newfoundland fish stocks, as well as a general decline in trading
(Longfield 1929). Additionally, herring stocks appear to have shifted from the Irish
Sea in the early 17th
century, affecting both location and international trade (Moody et
al. 1991); this might have been in response to over-exploitation or to natural climactic
fluctuations. A mid 19th
century account of Drogheda describes Scottish herrings
being sold in Drogheda‟s markets, implying no locally-produced herring were
available by this time (D‟Alton 1863).
Irish Sea herring biology
Irish Sea herring are known to shoal and spawn in late September for 3 to 4 weeks,
predominantly now around the southern and eastern coasts of the Isle of Man, some
100km east of Drogheda (Dickey-Collas et al. 2001; Brophy and Danilowicz 2002).
Traditional spawning grounds were also known historically in the Kilkeel region
(called the Mourne spawning), about 40km north-northeast of Drogheda, and further
afield in the Clyde estuary on the west coast of Scotland, about 250km to the north
(Brophy and Danilowicz 2002). The Clyde herring fishery historically took place in
March and April (Brophy and Danilowicz 2002).
The fish that could have been caught from Drogheda were therefore likely a mixture
of autumn-spawning herring from the Isle of Man and Mourne and spring-spawning
herring from the Clyde. However, even within the Irish Sea spawning grounds were
known to shift historically and in the modern era, linked to environmental factors and
fishing pressure (Dickey-Collas et al. 2001). Herring are also known to spawn in the
spring in the western area of the Celtic Sea and St. George‟s Channel, near Dunmore
and Cork (Brophy and Danilowicz 2002). Herring spawned in each of these areas are
known to grow at different rates, dependent on temperature and ecosystem structure,
and all are likely to have mixed in the Irish Sea area. The degree of mixing is now
dependent on numerous environmental factors, as would have been the case in the
9
past (Brophy and Danilowicz 2002). Modern studies of otoliths can distinguish
between the various populations (Burke et al. 2008), but no otoliths were found in the
Drogheda Boat material, and in any case, archaeological otoliths are often not
adequately preserved for modern fisheries techniques.
Methods
This assemblage was recorded using the York System, an Access database utility
designed for recording zooarchaeological assemblages, as well as the extensive
reference material available in the Department of Archaeology, University of York.
The recording protocol is fully detailed in Harland et al. (2003). Briefly, this entails
the detailed recording of the 18 most commonly occurring and easily identified
elements, termed quantification code (QC) 1. For each of these, the element, species,
approximate size, side, fragmentation, texture, weight and any modifications are
usually recorded in detail. Fish vertebrae (QC2) are recorded in more limited fashion,
with counts, element and species recorded. Some elements are unusual and/or are
particularly diagnostic, like otoliths or otic bullae, and are fully recorded (QC4). The
final category of material (QC0), includes elements not routinely identified as well as
unidentifiable material. Data analysis involved structured database queries, as well as
manipulation using Excel.
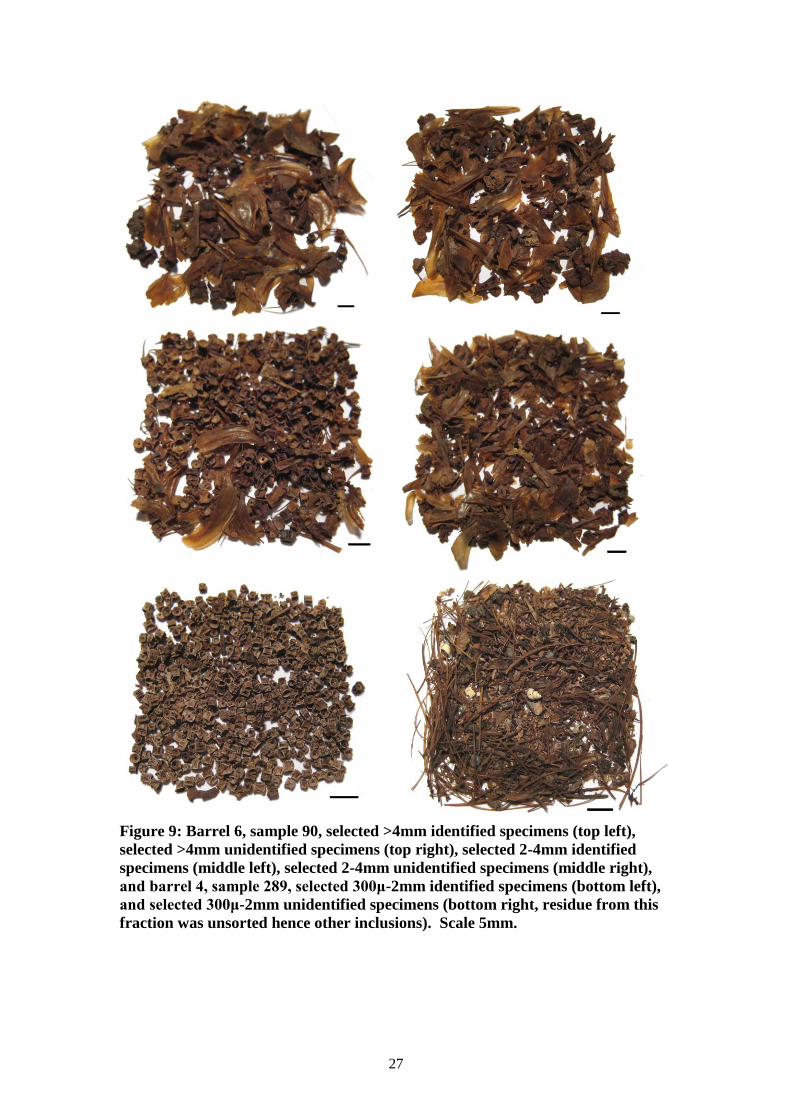
Samples arrived sieved into >4mm and 300μ to 4mm fractions, and wet from
processing. These samples were slowly air-dried by the author at room temperature.
The fractions were then re-sieved into >4mm, 2-4mm and 300μ-2mm. All material
>2mm was fully identified, and a count was taken of the fragments that were QC0
(unidentified or unidentifiable). The material from the smallest fraction was scanned
for identifiable elements, which were then fully recorded, but no attempt was made to
count the QC0 elements from this fraction. The small quantity of identifiable
fragments from this small fraction made it unnecessary to spend an undue amount of
time on analysis, but every attempt was made to retrieve all identifiable QC1, QC2
and QC4 elements. Examples of identified and unidentified elements from each
fraction are illustrated in Figure 9.
It became apparent during the initial assessment of the Drogheda Boat samples that
this assemblage was exceptional and that routine recording would have to be
modified. Historical and archaeological studies of preserved herring have indicated
certain elements are particularly important for understanding the preservation process
(Enghoff 1999; Lauwerier and Laarman 2008), making it necessary to add the epihyal
and urohyal to the list of QC1 elements; as these are only of importance during the
study of preserved herring, they are not routinely identified in normal assemblages.
Some studies of preserved herring have included the coracoid, but as this is a small
and fragile element not routinely noted even in assemblages of complete herring, it
was thought unnecessary to add to the list of routinely identified elements. A
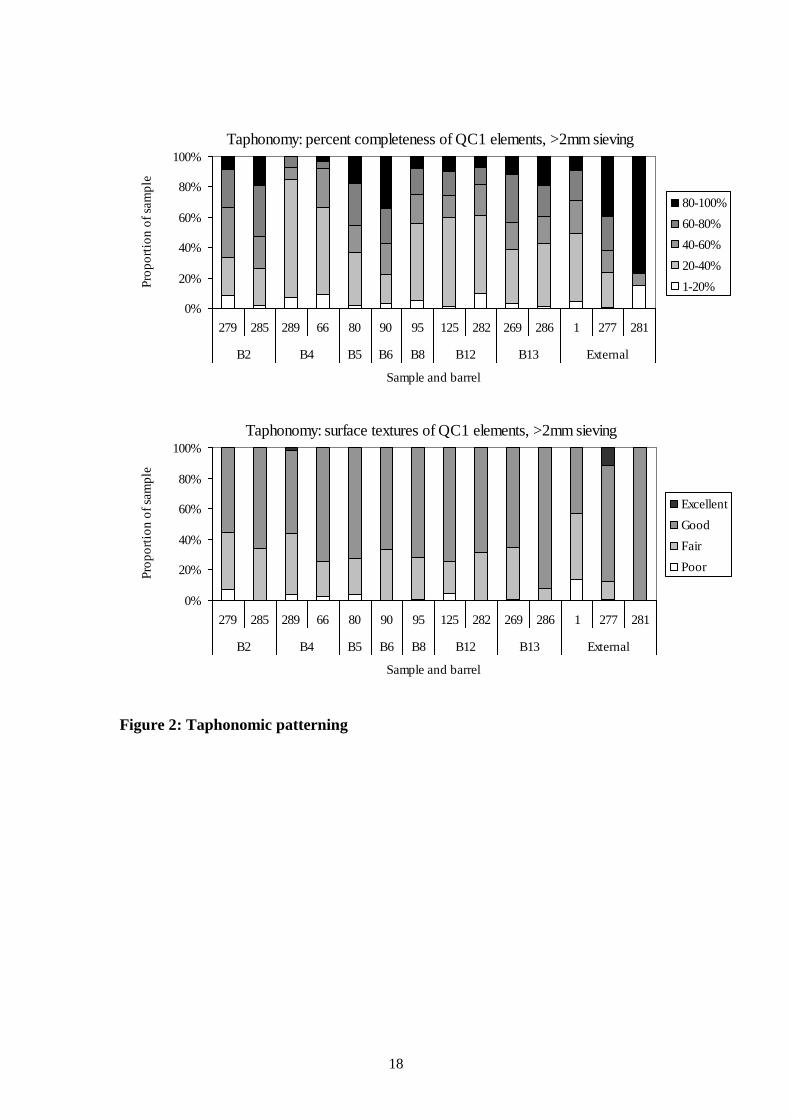
simplified fish skeleton diagram is provided in Figure 3, showing approximate
locations of all identified elements. Although this is based on a perch skeleton, the
basic morphology is similar to that of the herring and thus the positioning of elements
is comparable.
Weights and maximum linear dimension of the herring remains were not recorded, as
the former is only of use when comparing between species and classes of material,
10
while the latter is useful for understanding fragmentation patterning in normal,
domestic assemblages with a variety of species. Recording of both attributes would
add considerably to the analytical time but with, in this case, little return.
Because fish remains are so small, there is little point studying remains from contexts
that are hand collected, and even coarse sieving will only provide certain species
(Wheeler and Jones 1989). Usually, a mesh size of 2mm is preferred, as this will
provide most of the identifiable elements. The material from Drogheda, sieved to
300μ, is exceptional and provides a very unusual opportunity to study the small 300μ-
2mm fraction, in addition to the routinely studied 2-4mm and >4mm fractions.
However, in order for the results to be comparable with other published fish
assemblages, the fractions will sometimes be discussed separately, or, where relevant,
in grouped form. This is made explicit throughout the text.
The complete archive has been submitted to the excavators as both an Access file and
as simple text files containing the same data. These are also kept on file in the Fishlab
at the University of York.
Preservation
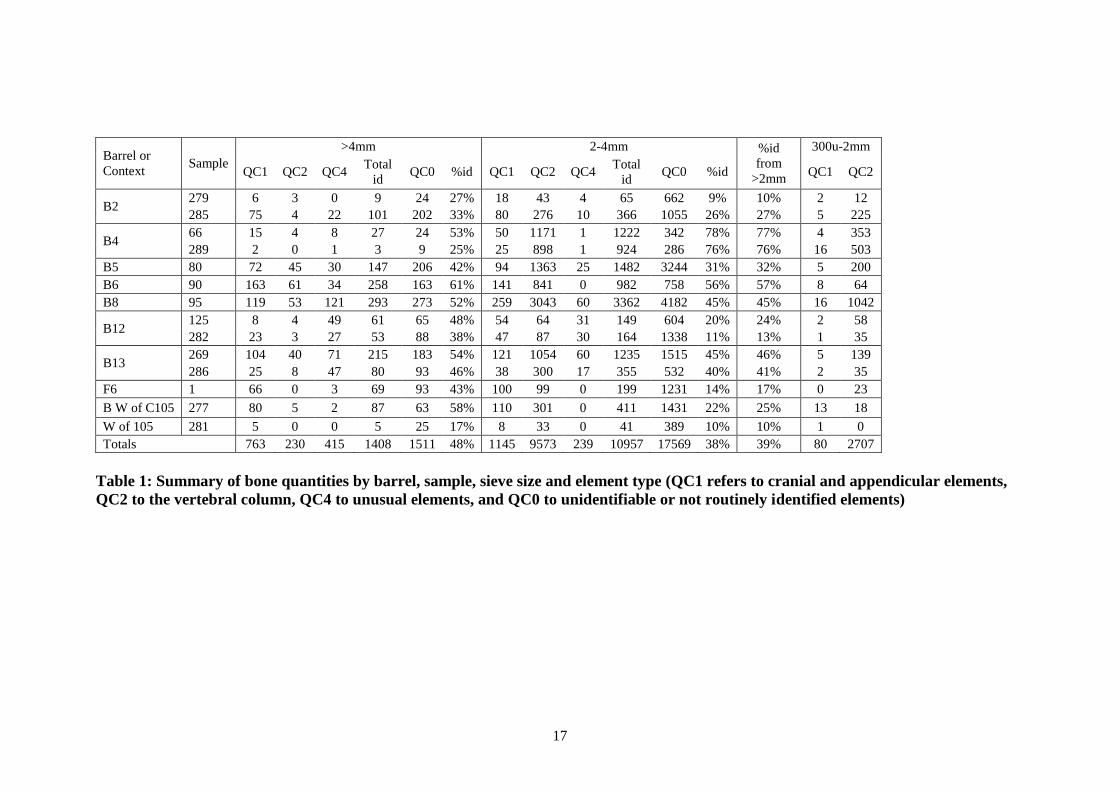
Bone preservation was recorded using surface textures and element percent
completeness, recorded for all QC1 elements. Preservation was overall very good
compared to other herring remains found on more typical archaeological sites,
especially when considering the small size and fragility of herring remains. Overall
rates of identification were exceptionally high for sieved samples. Almost 40% of the
>4mm and 2-4mm fractions combined could be identified. Bone textures were
generally recorded as „good‟ or „fair‟ throughout most samples (Figure 2). Percent
completeness was more variable, with some samples recording very high
completeness scores, and others being more fragmentary (Figure 2). Within each of
the four barrels with multiple samples there was a general consistency in taphonomic
patterning and the percentage of bone that could be identified (Table 1), suggesting
the internal barrel environment played a factor in the long-term survival of the bone.
The three external samples showed the greatest degree of variation in both bone
texture and percent completeness, and had some of the lowest rates of identification.
Bone modifications were extremely rare. Only three elements were noted as crushed,
including one abdominal vertebra from barrel 6, sample 90, one caudal vertebra from
barrel 4, sample 66, and one ceratohyal from barrel 13, sample 269. Ordinarily,
herring have a high rate of crushing, as many found on typical archaeological sites
have been chewed by humans or animals, but these from the Drogheda Boat were
obviously not consumed. No burning was noted, again in keeping with the type of
assemblage. A total of 127 bone fragments were found concreted with other material,
including vegetation and shell fragments. A variety of elements and unidentifiable
fragments were represented by these concretions. Most were from barrel 8 (50
fragments) and barrel 5 (49 fragments), with the remainder from barrels 4, 6, 12 and
13.
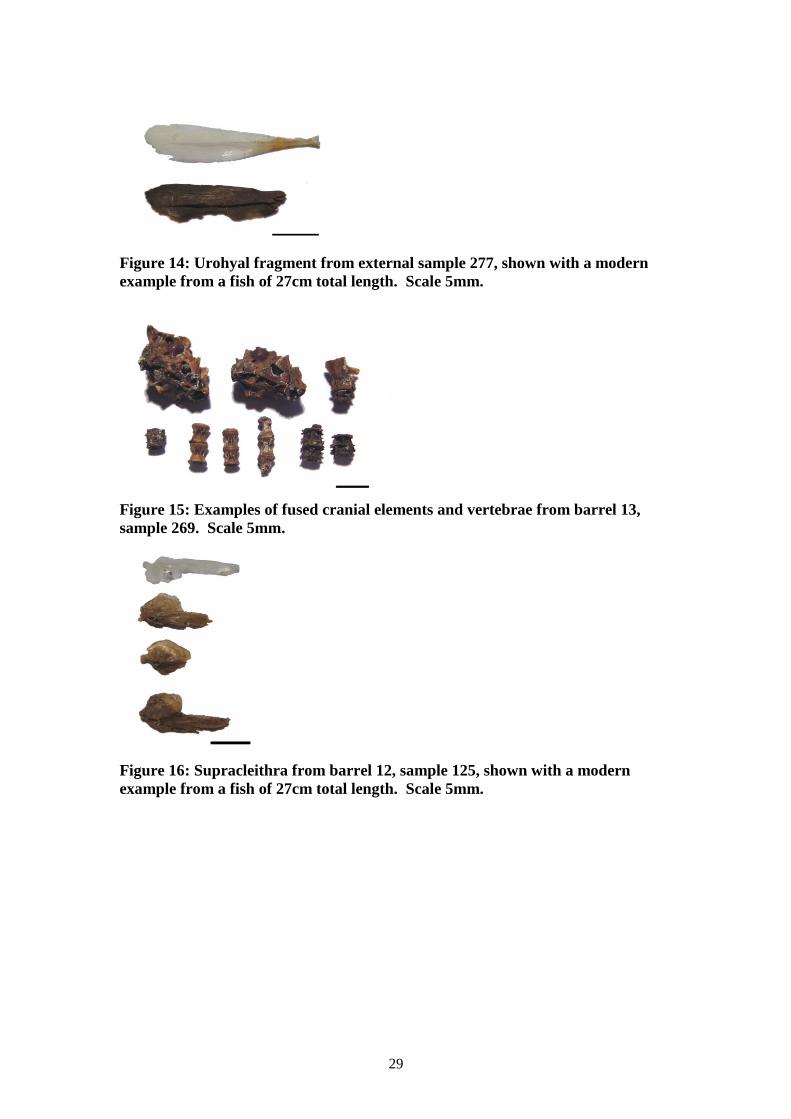
The assemblage contained a high number of fused bones, comprising at least 244
separate elements, many of which were either sequences of vertebrae, or bones from
the cranium including the basioccipital and the otic bullae. Most were found in barrel
11
13 (210 fragments, some illustrated in Figure 15), with some others found in barrels 4,
6, 8 and 12. Their predominance in one barrel suggests they are the result of
taphonomic patterning and the particular burial environment found within the barrels,
rather than pathological changes to the bone.
Results
Element patterning
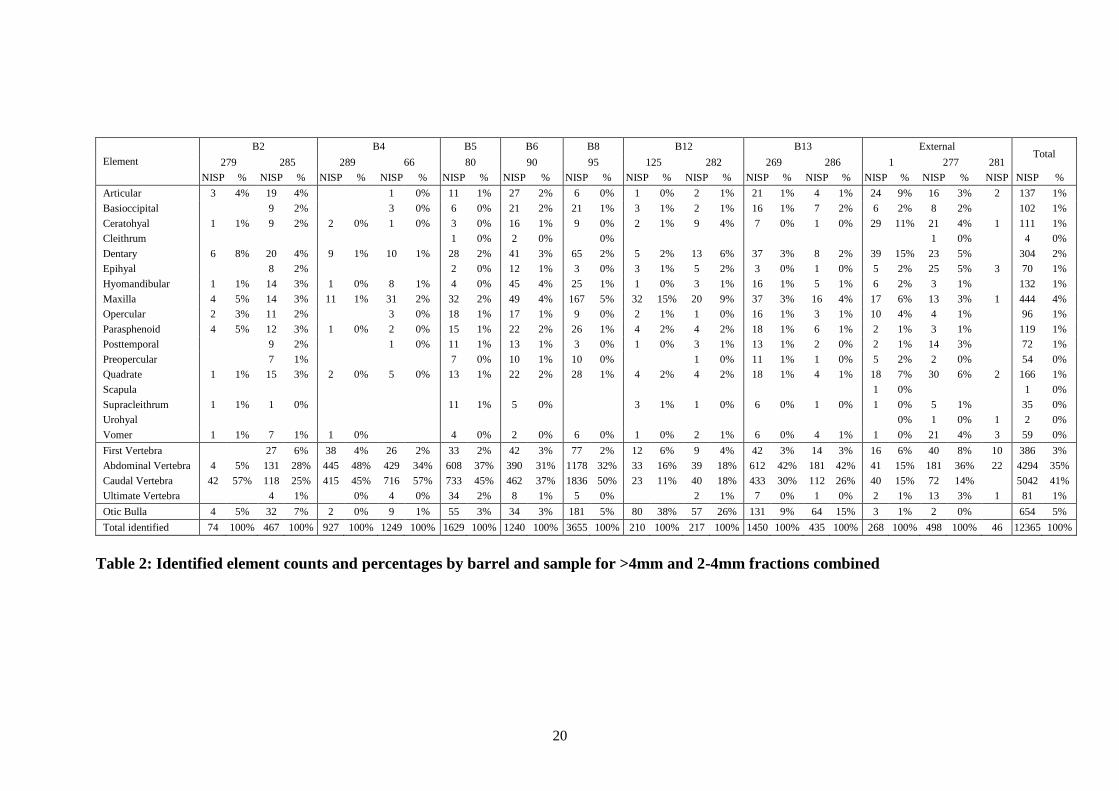
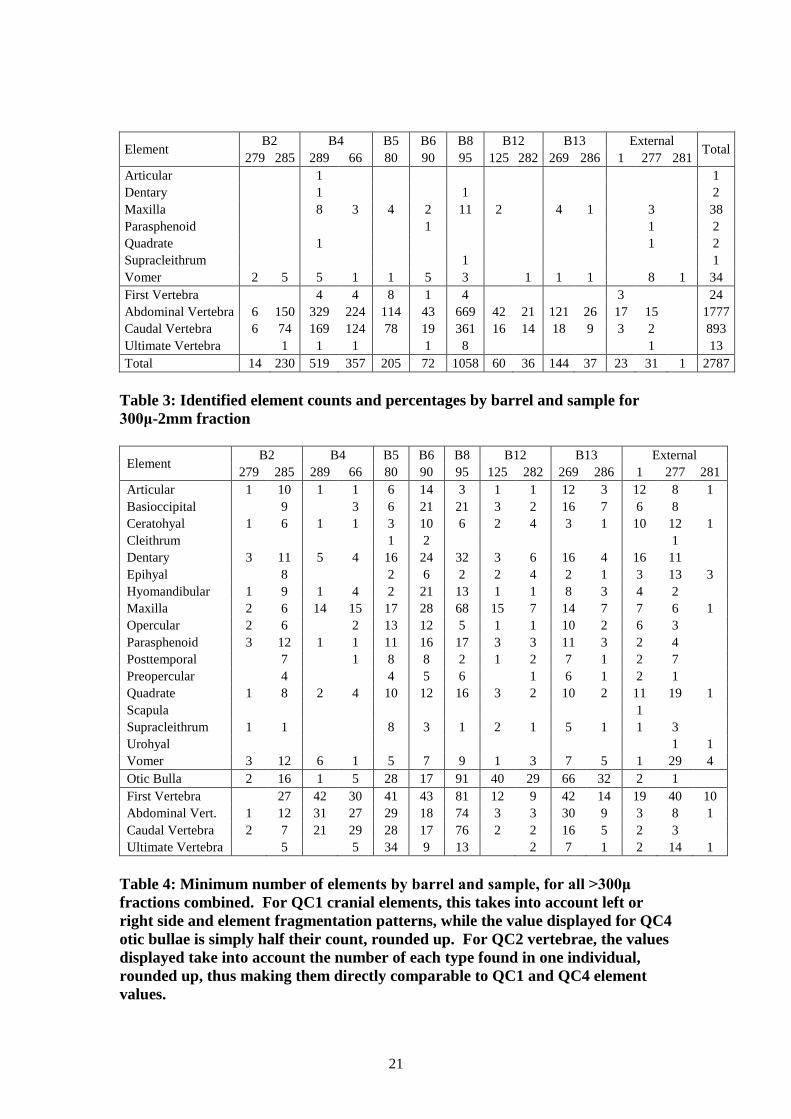
Elements counts and percentages are provided in Table 2 for all >2mm fractions, and
in Table 3 for the smaller 300μ-2mm fraction (for reference, Figure 3 shows the basic
location of each of these elements within the fish skeleton). These tables provide a
basic quantification of all elements found by sample and barrel. For most samples
with sufficient quantities, most parts of the skeleton are well represented: the
vertebrae account for between half and three quarters of all identified bone, while the
cranial elements, particularly those from around the mouth and front of the head,
account for much of the remainder. However, the appendicular elements are
conspicuous by their absence: the cleithra, scapula and urohyal are all represented by
only a few specimens.
Element fragmentation and the number of occurrences in the body account for some
of the variation in the raw counts and percentages, thus obscuring real patterning.
Table 4 displays the minimum number of elements per sample, taking into account the
number of times an element appears in an individual body, as well as fragmentation.
When recording cranial and appendicular elements, a series of diagnostic zones is
recorded which provides an indication of fragmentation, and the quantity of each
recorded zone is taken into account when calculating the minimum number of
elements (see Harland et al. 2003 for details). For vertebrae, the quantity of recorded
elements is divided by the number of bones that occur in the body, thus making the
minimum number of elements statistic directly comparable to cranial element
statistics. The results are shown graphically in Figure 4.
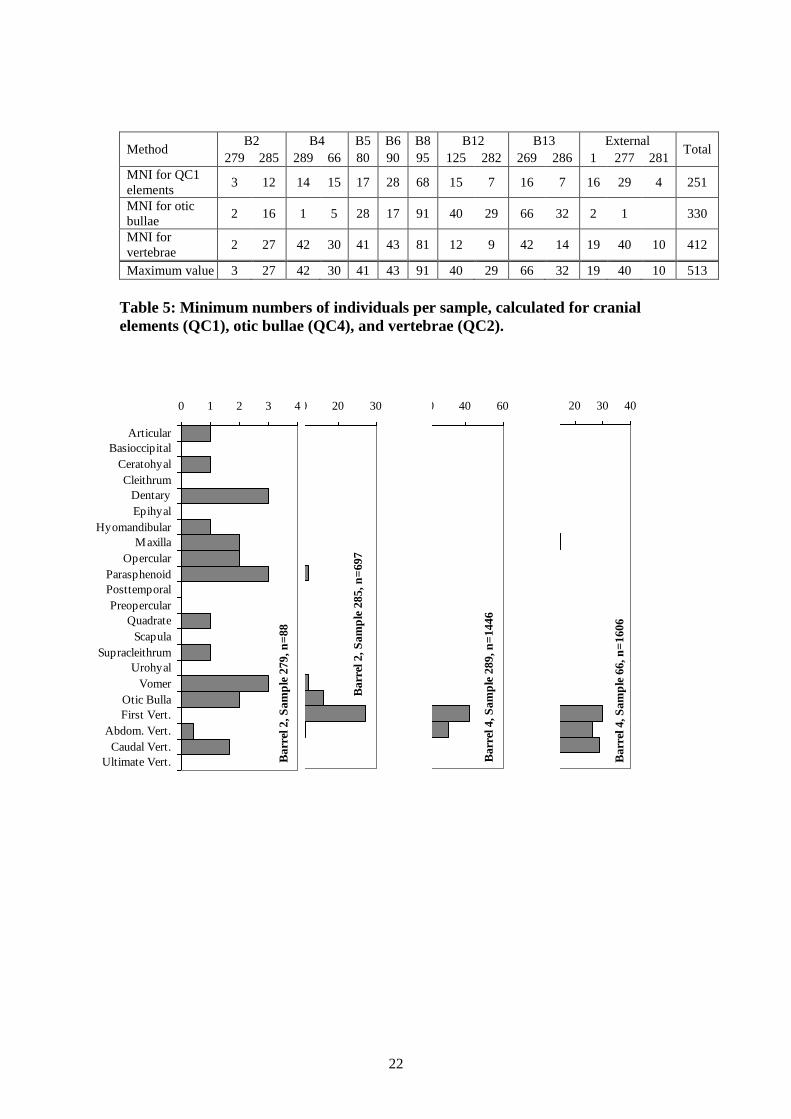
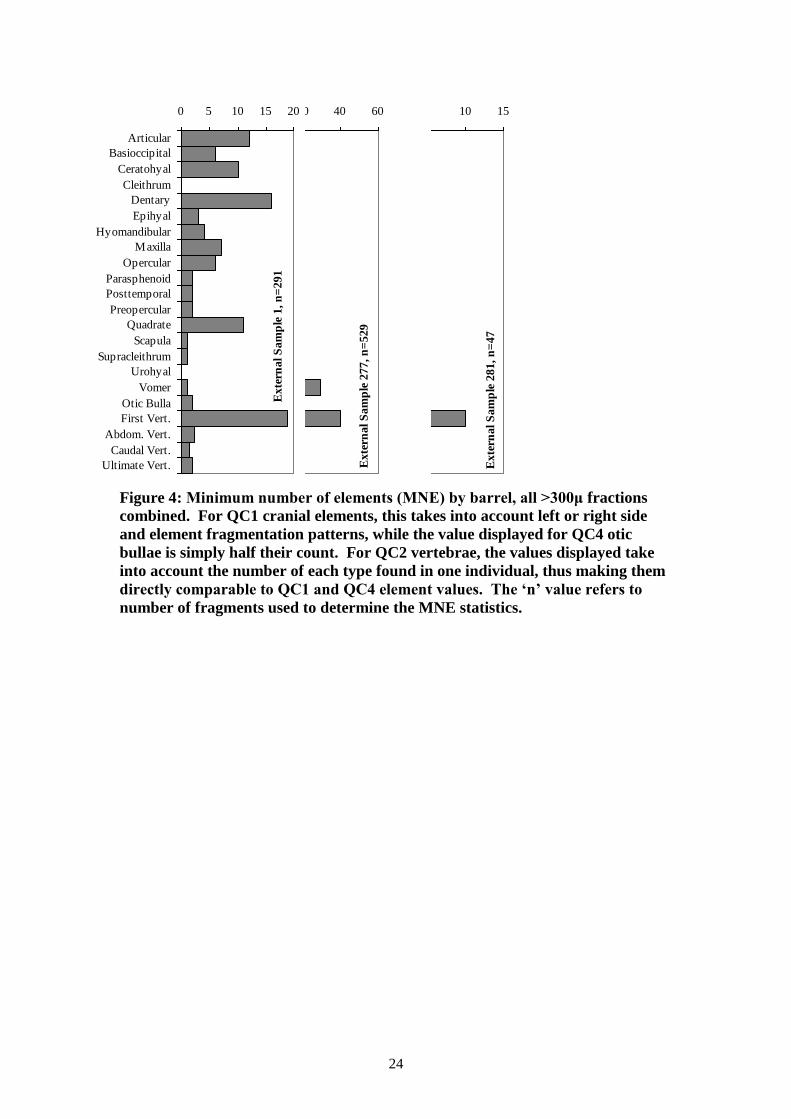
The first vertebrae is the most commonly occurring element in eight of the samples.
This is a small and extremely robust element, which probably accounts for its
excellent survival rates. It is also readily identifiable, being large and distinctive, and
it less likely to fragment than other vertebrae, which could account for the high
quantities observed here. It is the most common element in all three of the external
samples, which accords well with its robust survival given the variable taphonomy of
these samples.
The otic bulla (the eyeball) is the most commonly occurring element in five of the
samples. This is a large, robust and readily identifiable element that rarely fragments.
It is particularly common in barrels 12 and 13, suggesting something in the
environment of these two barrels favoured its survival. In the three external samples,
it is much less frequently found, but the small sample sizes and variable taphonomy of
these samples make them more difficult to interpret. Otic bullae are less common in
both barrel 4 samples, but overall, cranial and appendicular elements are not very
common in this barrel compared to vertebrae.
Other elements are more variable. In the two barrel 4 samples, the vertebrae greatly
outnumber other elements. This could result from the slightly poorer percent
12
completeness scores for these two samples, but texture was no different. An
alternative explanation is that the fish represented a single layer from the bottom of
the barrel, and this layer had been packed head-to-tail – which we know from
historical sources was probably the case – and that the heads were more subject to
taphonomic attrition than the bodies.
Cranial elements that are robust and easily recognisable are naturally recorded in
greater numbers, as would be expected. This accounts for the high quantities of
dentaries and maxillae. The frequencies of most other cranial elements are a natural
result of taphonomic patterning. However, as already suggested above, the
appendicular elements are unusually absent. The scapulae, urohyals and cleithra are
the three least frequently occurring elements overall, while the supracleithra were
found in larger quantities but were still the fourth least frequently occurring element
overall. The scapula is a tiny and extraordinarily fragile element and thus would not
be expected to be found in any quantity, but the cleithra, supracleithra urohyals are all
moderately robust and readily recognisable. Their absence is therefore related to
butchery and preservation strategies, discussed further below. There is some
suggestion that, historically at least, the ceratohyal and epihyal are associated with
this butchery strategy. Both are readily recognisable elements, but they are only
moderately robust. At Drogheda, both were found in relatively low to average
quantities. Some may therefore have been removed during butchery, but many
remained with the preserved product.
Minimum numbers of herring
The samples examined originally contained at least 513 herring, and most likely
many, many more were originally present. Three methods were used to determine
this statistic, using the raw minimum numbers of elements detailed in Table 4 for
cranial and appendicular elements (QC1), for otic bullae (QC4) and for vertebrae
(QC2). The results are displayed by element type and sample in Table 5. The
minimum numbers of herring recorded varied from only at least 3 in sample 279,
barrel 2, to at least 91 in sample 95, barrel 8, and these results are approximately
linked to sample sizes, as would be expected. If it were possible to determine
estimated barrel volumes, it might be possible to compare sample volumes with the
estimated minimum numbers of herring and therefore derive an approximation of the
original numbers per barrel. It would not be unreasonable to suggest that the barrels
may have comprised one „last‟ of herring, or between 10,000 and 14,000 herring in
total.
Size ranges
Sizes were recorded using two methods. Firstly, the broad size category was recorded
for all cranial and appendicular QC1 elements. For every specimen from Drogheda, a
size range of 15 to 30cm total length was recorded, which is not surprising given that
most herring from domestic medieval and later European assemblages fall within this
size range. Detailed measurements were recorded for all dentaries, quadrates and
basioccipital (as defined in Harland et al. 2003). These could be compared to
measurements taken from the twelve modern skeletal herring of known length held in
the Fishlab‟s reference collection. Dentaries and quadrates provided the majority of
the measurable elements, and thus are most useful for comparative analysis.
Although there were insufficient modern herring to derive a regression equation for
13
each measurement, it was possible to perform a detailed visual comparison between
measurements of fish of known length and the archaeological material.
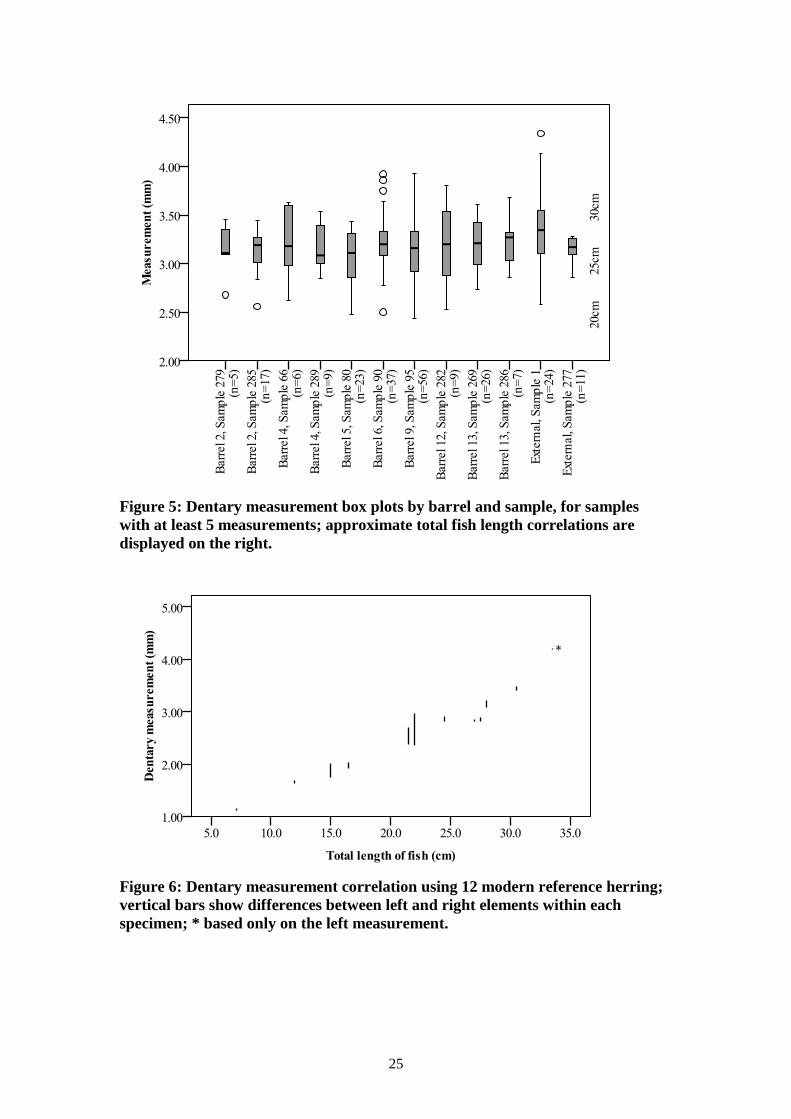
Box plots are illustrated for all samples with at least five measurements, showing the
minimum, maximum, mean, outliers and inter-quartile ranges for raw dentary
measurements (Figure 5) and for raw quadrate measurements (Figure 7). These
figures also indicate the approximate total fish lengths represented by these data,
determined using the twelve modern reference skeletons, as illustrated in Figure 6 and
Figure 8.
Both the dentary and quadrate measurements indicate a considerable range of fish
sizes were present, ranging from about 20cm total length to over 30cm. Most,
however, were within 23 to 28cm total length. Sample 95 from barrel 9 contained the
smallest mean value, yet had two of the largest outliers when the quadrates were
considered, but dentary measurements were average. Overall, there was very little
patterning or consistency between samples from the same barrels, suggesting the
contents of each barrel were not graded by size, and that a relatively wide size range
was available at any one time.
Butchery and curing methods
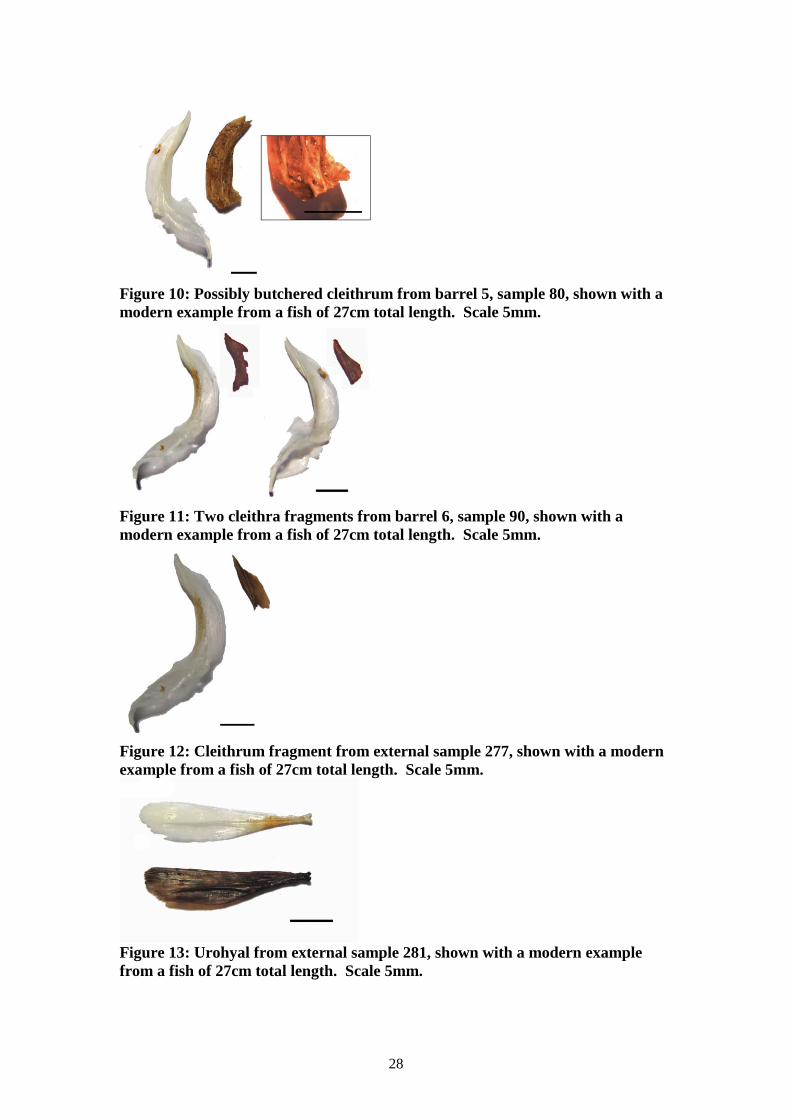
Element patterning has clearly indicated that cleithra and urohyals are absent from the
assemblage, barring a few unusual specimens, and scapulas are similarly rare. Four
cleithra fragments were identified, two from sample 90, barrel 6 (Figure 11), one from
external sample 277 (Figure 12), and one from sample 80, barrel 5 (Figure 10). All
fragments were only represented by the dorsal zone, and both left and right specimens
were recorded. Two explanations are possible: the ventral portions may have been
naturally broken off, or they may have been deliberately removed. The specimen
from sample 80 was probably butchered in the frontal plane to remove the lower,
ventral half of the cleithrum, making it likely that the butchery process usually
removed the entirety of the cleithra, but in some cases, a fragment from the dorsal
region remained in the preserved fish.
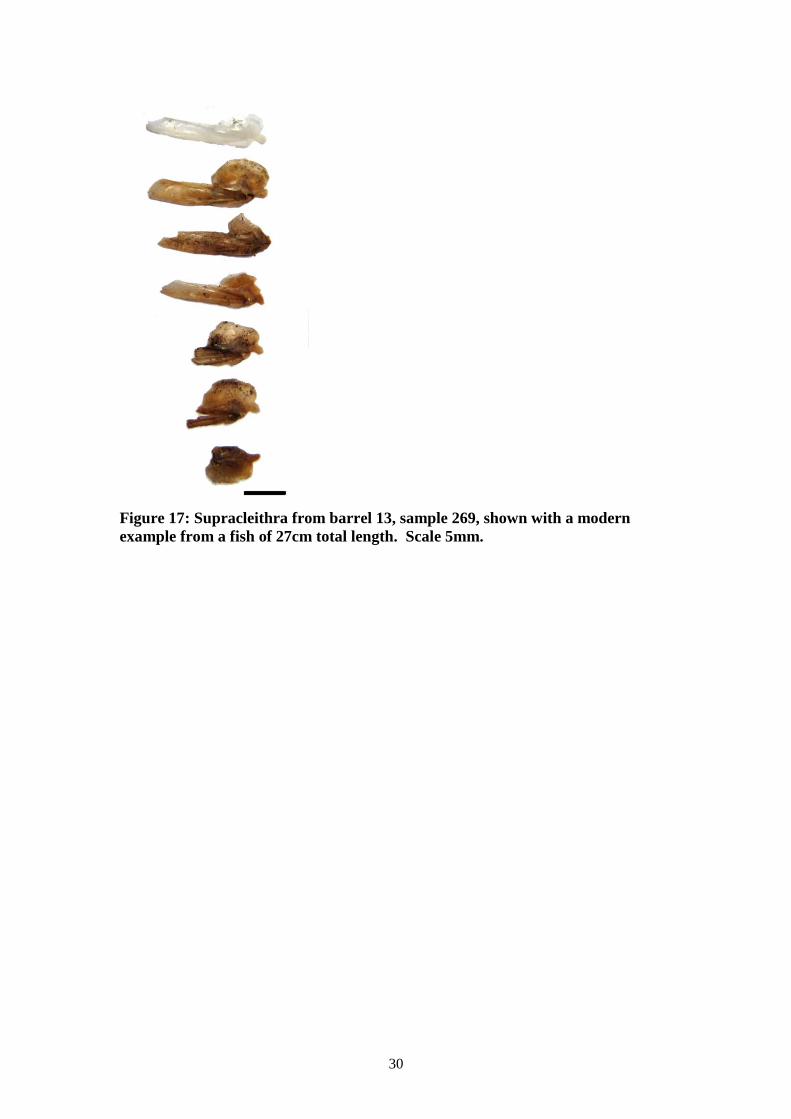
A total of 35 supracleithra were recorded from a variety of samples, some of which
are illustrated in Figure 16 and Figure 17. Both partial and complete specimens were
found, as were both left and right examples. The supracleithra is a fragile element,
but can be readily recognised even when fragmented. It is therefore difficult to assess
whether its absence is natural taphonomic patterning or indicative of a real absence.
As the supracleithrum is located adjacent to the dorsal, anterior edge of the cleithrum
(Wheeler and Jones 1989), the evidence is equivocal: it may have occasionally been
removed during butchery. Two urohyals were recorded, a complete element from
external sample 281 (Figure 13), and a fragment from external sample 277 (Figure
14). No butchery marks were noted. As the urohyal is a midline appendicular
element located in the region of the cleithra and scapulae, it was probably removed
during the same butchery process. The virtually complete absence of scapulae is
unsurprising, given that they articulate with the lower ventral portion of the cleithra –
none of which were recorded.
14
Discussion and conclusions
The 15 Drogheda samples studied represent the remains of at least several hundred
herring, packed into 7 barrels, with a further 7 barrels recovered from the wreck.
These herring were preserved using a distinctive butchery technique known
historically, but which has hitherto been very rare archaeologically. The fish were
butchered to remove the gills and part of the guts, which also removed most of the
cleithra, scapulae, urohyals and supracleithra. The few surviving cleithra fragments
indicate that the butchery technique usually encompassed all of the cleithra, but
occasionally the dorsal (upper) tip was left in the preserved product. The fish were
then most likely packed with salt and/or brine in layers in the barrels. The resulting
product would have been sealed and would remain preserved for many months,
probably up to a year.
The low proportion of cranial elements and the predominance of vertebrae from both
barrel 4 samples suggest that the heads may have been lost due to attrition. The fish
were probably arranged in layers in the barrels, with all fish in each layer lying
parallel. If only the bottom layer was preserved, and if one side was exposed to the
elements, then this could account for the poor survival of heads.
The wide size range of the herring found in the Drogheda Boat, from about 23 to
28cm total length, indicates no particular grading by size was performed prior to
gutting and packing. The herring could have come from a number of sources in the
Irish Sea, including the prolific Isle of Man fishery, or the smaller Mourne spawning
grounds just north of Drogheda. Both of these were autumn spawning and both
fishing grounds would have been within easy reach of the port. If both were exploited
at the same time, this could account for the wide size variation found in the remains.
Later in the season, the spring spawning grounds of the Clyde would also have been
available to the Drogheda fishers, while further south, spring spawning in the Celtic
Sea and St. George‟s Channel could have provided additional stocks for exploitation.
Both of these would have required considerable travel from Drogheda, but again, if a
mixture of spring spawning grounds were being exploited, this could explain the size
ranges found in the Drogheda Boat herring.
Given that a total of 14 barrels were found in the wreck, this cargo could have been
one „last‟ of herring. This was a unit used for customs and trade accounts during this
period, and it consisted of about 10 to 14 barrels, each with about 1000 preserved
herring inside, comprising a total of between 10,000 and 14,000 herring.
Archaeological comparisons are rare. Butchery waste from a 12th
and 13th
century
Danish site was comprised almost entirely of the elements missing from the Drogheda
samples, indicating this preservation method had been in use for a few centuries
before being applied to the Irish material. A 16th
century Dutch shipwreck contained
barrels of herring with very similar element and butchery patterning to Drogheda,
suggesting the same preservation strategy had been applied.
Fish bones benefit from finely detailed sieving, as has long been known (Wheeler and
Jones 1989). The Drogheda Boat material was sieved to 300μ, which is more detailed
than most fish assemblages, but this has proved beneficial. The small 300μ-2mm
fraction, which would normally not be examined, was found to contain numerous

15
vomers and maxillae fragments which would otherwise have been lost; the vomer in
particular would have been under-represented by the larger fractions (contrast to the
16th
century Dutch barrels of herring, only analysed at >2mm (Lauwerier and
Laarman 2008)). The numerous small vertebrae found in the smallest fraction have
also contributed to the estimation of the minimum number of herring found at
Drogheda.
16
Tables and Figures
Figure 1: 16
th century customs accounts for Irish imports to Bristol, showing the
monthly values for fish and other imported goods
17
Barrel or
Context Sample
>4mm 2-4mm %id
from
>2mm
300u-2mm
QC1 QC2 QC4 Total
id QC0 %id QC1 QC2 QC4
Total
id QC0 %id QC1 QC2
B2 279 6 3 0 9 24 27% 18 43 4 65 662 9% 10% 2 12
285 75 4 22 101 202 33% 80 276 10 366 1055 26% 27% 5 225
B4 66 15 4 8 27 24 53% 50 1171 1 1222 342 78% 77% 4 353
289 2 0 1 3 9 25% 25 898 1 924 286 76% 76% 16 503
B5 80 72 45 30 147 206 42% 94 1363 25 1482 3244 31% 32% 5 200
B6 90 163 61 34 258 163 61% 141 841 0 982 758 56% 57% 8 64
B8 95 119 53 121 293 273 52% 259 3043 60 3362 4182 45% 45% 16 1042
B12 125 8 4 49 61 65 48% 54 64 31 149 604 20% 24% 2 58
282 23 3 27 53 88 38% 47 87 30 164 1338 11% 13% 1 35
B13 269 104 40 71 215 183 54% 121 1054 60 1235 1515 45% 46% 5 139
286 25 8 47 80 93 46% 38 300 17 355 532 40% 41% 2 35
F6 1 66 0 3 69 93 43% 100 99 0 199 1231 14% 17% 0 23
B W of C105 277 80 5 2 87 63 58% 110 301 0 411 1431 22% 25% 13 18
W of 105 281 5 0 0 5 25 17% 8 33 0 41 389 10% 10% 1 0
Totals 763 230 415 1408 1511 48% 1145 9573 239 10957 17569 38% 39% 80 2707
Table 1: Summary of bone quantities by barrel, sample, sieve size and element type (QC1 refers to cranial and appendicular elements,
QC2 to the vertebral column, QC4 to unusual elements, and QC0 to unidentifiable or not routinely identified elements)
18
Taphonomy: percent completeness of QC1 elements, >2mm sieving
0%
20%
40%
60%
80%
100%
279 285 289 66 80 90 95 125 282 269 286 1 277 281
B2 B4 B5 B6 B8 B12 B13 External
Sample and barrel
Pro
po
rtio
n o
f sa
mp
le
80-100%
60-80%
40-60%
20-40%
1-20%
Taphonomy: surface textures of QC1 elements, >2mm sieving
0%
20%
40%
60%
80%
100%
279 285 289 66 80 90 95 125 282 269 286 1 277 281
B2 B4 B5 B6 B8 B12 B13 External
Sample and barrel
Pro
po
rtio
n o
f sa
mp
le
Excellent
Good
Fair
Poor
Figure 2: Taphonomic patterning
19
Figure 3: Diagram of a fish skeleton with approximate locations of major
elements: 1 – articular; 2 – basioccipital; 3 – ceratohyal; 4 – cleithrum; 5 –
dentary; 6 – epihyal; 7 – hyomandibular; 8 – maxilla; 9 – opercular; 10 –
parasphenoid; 11 – posttemporal; 12 – preopercular; 13 – quadrate; 14 –
scapula; 15 – supracleithrum; 16 – urohyal; 17 – vomer; ob – otic bulla; fv – first
vertebra; av – abdominal vertebrae; cv – caudal vertebrae; uv – ultimate
vertebra
20
Element
B2 B4 B5 B6 B8 B12 B13 External Total
279 285 289 66 80 90 95 125 282 269 286 1 277 281
NISP % NISP % NISP % NISP % NISP % NISP % NISP % NISP % NISP % NISP % NISP % NISP % NISP % NISP NISP %
Articular 3 4% 19 4% 1 0% 11 1% 27 2% 6 0% 1 0% 2 1% 21 1% 4 1% 24 9% 16 3% 2 137 1%
Basioccipital 9 2% 3 0% 6 0% 21 2% 21 1% 3 1% 2 1% 16 1% 7 2% 6 2% 8 2% 102 1%
Ceratohyal 1 1% 9 2% 2 0% 1 0% 3 0% 16 1% 9 0% 2 1% 9 4% 7 0% 1 0% 29 11% 21 4% 1 111 1%
Cleithrum 1 0% 2 0% 0% 1 0% 4 0%
Dentary 6 8% 20 4% 9 1% 10 1% 28 2% 41 3% 65 2% 5 2% 13 6% 37 3% 8 2% 39 15% 23 5% 304 2%
Epihyal 8 2% 2 0% 12 1% 3 0% 3 1% 5 2% 3 0% 1 0% 5 2% 25 5% 3 70 1%
Hyomandibular 1 1% 14 3% 1 0% 8 1% 4 0% 45 4% 25 1% 1 0% 3 1% 16 1% 5 1% 6 2% 3 1% 132 1%
Maxilla 4 5% 14 3% 11 1% 31 2% 32 2% 49 4% 167 5% 32 15% 20 9% 37 3% 16 4% 17 6% 13 3% 1 444 4%
Opercular 2 3% 11 2% 3 0% 18 1% 17 1% 9 0% 2 1% 1 0% 16 1% 3 1% 10 4% 4 1% 96 1%
Parasphenoid 4 5% 12 3% 1 0% 2 0% 15 1% 22 2% 26 1% 4 2% 4 2% 18 1% 6 1% 2 1% 3 1% 119 1%
Posttemporal 9 2% 1 0% 11 1% 13 1% 3 0% 1 0% 3 1% 13 1% 2 0% 2 1% 14 3% 72 1%
Preopercular 7 1% 7 0% 10 1% 10 0% 1 0% 11 1% 1 0% 5 2% 2 0% 54 0%
Quadrate 1 1% 15 3% 2 0% 5 0% 13 1% 22 2% 28 1% 4 2% 4 2% 18 1% 4 1% 18 7% 30 6% 2 166 1%
Scapula 1 0% 1 0%
Supracleithrum 1 1% 1 0% 11 1% 5 0% 3 1% 1 0% 6 0% 1 0% 1 0% 5 1% 35 0%
Urohyal 0% 1 0% 1 2 0%
Vomer 1 1% 7 1% 1 0% 4 0% 2 0% 6 0% 1 0% 2 1% 6 0% 4 1% 1 0% 21 4% 3 59 0%
First Vertebra 27 6% 38 4% 26 2% 33 2% 42 3% 77 2% 12 6% 9 4% 42 3% 14 3% 16 6% 40 8% 10 386 3%
Abdominal Vertebra 4 5% 131 28% 445 48% 429 34% 608 37% 390 31% 1178 32% 33 16% 39 18% 612 42% 181 42% 41 15% 181 36% 22 4294 35%
Caudal Vertebra 42 57% 118 25% 415 45% 716 57% 733 45% 462 37% 1836 50% 23 11% 40 18% 433 30% 112 26% 40 15% 72 14% 5042 41%
Ultimate Vertebra 4 1% 0% 4 0% 34 2% 8 1% 5 0% 2 1% 7 0% 1 0% 2 1% 13 3% 1 81 1%
Otic Bulla 4 5% 32 7% 2 0% 9 1% 55 3% 34 3% 181 5% 80 38% 57 26% 131 9% 64 15% 3 1% 2 0% 654 5%
Total identified 74 100% 467 100% 927 100% 1249 100% 1629 100% 1240 100% 3655 100% 210 100% 217 100% 1450 100% 435 100% 268 100% 498 100% 46 12365 100%
Table 2: Identified element counts and percentages by barrel and sample for >4mm and 2-4mm fractions combined
21
Element B2 B4 B5 B6 B8 B12 B13 External
Total 279 285 289 66 80 90 95 125 282 269 286 1 277 281
Articular 1 1
Dentary 1 1 2
Maxilla 8 3 4 2 11 2 4 1 3 38
Parasphenoid 1 1 2
Quadrate 1 1 2
Supracleithrum 1 1
Vomer 2 5 5 1 1 5 3 1 1 1 8 1 34
First Vertebra 4 4 8 1 4 3 24
Abdominal Vertebra 6 150 329 224 114 43 669 42 21 121 26 17 15 1777
Caudal Vertebra 6 74 169 124 78 19 361 16 14 18 9 3 2 893
Ultimate Vertebra 1 1 1 1 8 1 13
Total 14 230 519 357 205 72 1058 60 36 144 37 23 31 1 2787
Table 3: Identified element counts and percentages by barrel and sample for
300μ-2mm fraction
Element B2 B4 B5 B6 B8 B12 B13 External
279 285 289 66 80 90 95 125 282 269 286 1 277 281
Articular 1 10 1 1 6 14 3 1 1 12 3 12 8 1
Basioccipital 9 3 6 21 21 3 2 16 7 6 8
Ceratohyal 1 6 1 1 3 10 6 2 4 3 1 10 12 1
Cleithrum 1 2 1
Dentary 3 11 5 4 16 24 32 3 6 16 4 16 11
Epihyal 8 2 6 2 2 4 2 1 3 13 3
Hyomandibular 1 9 1 4 2 21 13 1 1 8 3 4 2
Maxilla 2 6 14 15 17 28 68 15 7 14 7 7 6 1
Opercular 2 6 2 13 12 5 1 1 10 2 6 3
Parasphenoid 3 12 1 1 11 16 17 3 3 11 3 2 4
Posttemporal 7 1 8 8 2 1 2 7 1 2 7
Preopercular 4 4 5 6 1 6 1 2 1
Quadrate 1 8 2 4 10 12 16 3 2 10 2 11 19 1
Scapula 1
Supracleithrum 1 1 8 3 1 2 1 5 1 1 3
Urohyal 1 1
Vomer 3 12 6 1 5 7 9 1 3 7 5 1 29 4
Otic Bulla 2 16 1 5 28 17 91 40 29 66 32 2 1
First Vertebra 27 42 30 41 43 81 12 9 42 14 19 40 10
Abdominal Vert. 1 12 31 27 29 18 74 3 3 30 9 3 8 1
Caudal Vertebra 2 7 21 29 28 17 76 2 2 16 5 2 3
Ultimate Vertebra 5 5 34 9 13 2 7 1 2 14 1
Table 4: Minimum number of elements by barrel and sample, for all >300μ
fractions combined. For QC1 cranial elements, this takes into account left or
right side and element fragmentation patterns, while the value displayed for QC4
otic bullae is simply half their count, rounded up. For QC2 vertebrae, the values
displayed take into account the number of each type found in one individual,
rounded up, thus making them directly comparable to QC1 and QC4 element
values.
22
Method B2 B4 B5 B6 B8 B12 B13 External
Total 279 285 289 66 80 90 95 125 282 269 286 1 277 281
MNI for QC1
elements 3 12 14 15 17 28 68 15 7 16 7 16 29 4 251
MNI for otic
bullae 2 16 1 5 28 17 91 40 29 66 32 2 1 330
MNI for
vertebrae 2 27 42 30 41 43 81 12 9 42 14 19 40 10 412
Maximum value 3 27 42 30 41 43 91 40 29 66 32 19 40 10 513
Table 5: Minimum numbers of individuals per sample, calculated for cranial
elements (QC1), otic bullae (QC4), and vertebrae (QC2).
Barr
el 2
, S
am
ple
279
, n
=88
0 1 2 3 4
Articular
Basioccipital
Ceratohyal
Cleithrum
Dentary
Epihyal
Hyomandibular
Maxilla
Opercular
Parasphenoid
Posttemporal
Preopercular
Quadrate
Scapula
Supracleithrum
Urohyal
Vomer
Otic Bulla
First Vert.
Abdom. Vert.
Caudal Vert.
Ultimate Vert.
Barr
el 2
, S
am
ple
285
, n
=697
0 10 20 30
Articular
Basioccipital
Ceratohyal
Cleithrum
Dentary
Epihyal
Hyomandibular
Maxilla
Opercular
Parasphenoid
Posttemporal
Preopercular
Quadrate
Scapula
Supracleithrum
Urohyal
Vomer
Otic Bulla
First Vert.
Abdom. Vert.
Caudal Vert.
Ultimate Vert.
Barr
el 4
, S
am
ple
289
, n
=144
6
0 20 40 60
Articular
Basioccipital
Ceratohyal
Cleithrum
Dentary
Epihyal
Hyomandibular
Maxilla
Opercular
Parasphenoid
Posttemporal
Preopercular
Quadrate
Scapula
Supracleithrum
Urohyal
Vomer
Otic Bulla
First Vert.
Abdom. Vert.
Caudal Vert.
Ultimate Vert.
Barr
el 4
, S
am
ple
66, n
=160
6
0 10 20 30 40
Articular
Basioccipital
Ceratohyal
Cleithrum
Dentary
Epihyal
Hyomandibular
Maxilla
Opercular
Parasphenoid
Posttemporal
Preopercular
Quadrate
Scapula
Supracleithrum
Urohyal
Vomer
Otic Bulla
First Vert.
Abdom. Vert.
Caudal Vert.
Ultimate Vert.

23
Barr
el 5
, S
am
ple
80, n
=183
4
0 20 40 60
Articular
Basioccipital
Ceratohyal
Cleithrum
Dentary
Epihyal
Hyomandibular
Maxilla
Opercular
Parasphenoid
Posttemporal
Preopercular
Quadrate
Scapula
Supracleithrum
Urohyal
Vomer
Otic Bulla
First Vert.
Abdom. Vert.
Caudal Vert.
Ultimate Vert.
Barr
el 6
, S
am
ple
90, n
=131
2
0 20 40 60
Articular
Basioccipital
Ceratohyal
Cleithrum
Dentary
Epihyal
Hyomandibular
Maxilla
Opercular
Parasphenoid
Posttemporal
Preopercular
Quadrate
Scapula
Supracleithrum
Urohyal
Vomer
Otic Bulla
First Vert.
Abdom. Vert.
Caudal Vert.
Ultimate Vert.
B
arr
el 8
, S
am
ple
95, n
=471
3
0 50 100
Articular
Basioccipital
Ceratohyal
Cleithrum
Dentary
Epihyal
Hyomandibular
Maxilla
Opercular
Parasphenoid
Posttemporal
Preopercular
Quadrate
Scapula
Supracleithrum
Urohyal
Vomer
Otic Bulla
First Vert.
Abdom. Vert.
Caudal Vert.
Ultimate Vert.
Barr
el 1
2, S
am
ple
125
, n
=354
0 20 40 60
Articular
Basioccipital
Ceratohyal
Cleithrum
Dentary
Epihyal
Hyomandibular
Maxilla
Opercular
Parasphenoid
Posttemporal
Preopercular
Quadrate
Scapula
Supracleithrum
Urohyal
Vomer
Otic Bulla
First Vert.
Abdom. Vert.
Caudal Vert.
Ultimate Vert.
Barr
el 1
2, S
am
ple
282
, n
=253
0 10 20 30 40
Articular
Basioccipital
Ceratohyal
Cleithrum
Dentary
Epihyal
Hyomandibular
Maxilla
Opercular
Parasphenoid
Posttemporal
Preopercular
Quadrate
Scapula
Supracleithrum
Urohyal
Vomer
Otic Bulla
First Vert.
Abdom. Vert.
Caudal Vert.
Ultimate Vert.
Barr
el 1
3, S
am
ple
269
, n
=159
4
0 20 40 60 80
Articular
Basioccipital
Ceratohyal
Cleithrum
Dentary
Epihyal
Hyomandibular
Maxilla
Opercular
Parasphenoid
Posttemporal
Preopercular
Quadrate
Scapula
Supracleithrum
Urohyal
Vomer
Otic Bulla
First Vert.
Abdom. Vert.
Caudal Vert.
Ultimate Vert.
Barr
el 1
3, S
am
ple
286
, n
=472
0 10 20 30 40
Articular
Basioccipital
Ceratohyal
Cleithrum
Dentary
Epihyal
Hyomandibular
Maxilla
Opercular
Parasphenoid
Posttemporal
Preopercular
Quadrate
Scapula
Supracleithrum
Urohyal
Vomer
Otic Bulla
First Vert.
Abdom. Vert.
Caudal Vert.
Ultimate Vert.
24
Exte
rnal
Sam
ple
1, n
=291
0 5 10 15 20
Articular
Basioccipital
Ceratohyal
Cleithrum
Dentary
Epihyal
Hyomandibular
Maxilla
Opercular
Parasphenoid
Posttemporal
Preopercular
Quadrate
Scapula
Supracleithrum
Urohyal
Vomer
Otic Bulla
First Vert.
Abdom. Vert.
Caudal Vert.
Ultimate Vert.
Exte
rnal
Sam
ple
277
, n
=529
0 20 40 60
Articular
Basioccipital
Ceratohyal
Cleithrum
Dentary
Epihyal
Hyomandibular
Maxilla
Opercular
Parasphenoid
Posttemporal
Preopercular
Quadrate
Scapula
Supracleithrum
Urohyal
Vomer
Otic Bulla
First Vert.
Abdom. Vert.
Caudal Vert.
Ultimate Vert.
E
xte
rnal
Sam
ple
281
, n
=47
0 5 10 15
Articular
Basioccipital
Ceratohyal
Cleithrum
Dentary
Epihyal
Hyomandibular
Maxilla
Opercular
Parasphenoid
Posttemporal
Preopercular
Quadrate
Scapula
Supracleithrum
Urohyal
Vomer
Otic Bulla
First Vert.
Abdom. Vert.
Caudal Vert.
Ultimate Vert.
Figure 4: Minimum number of elements (MNE) by barrel, all >300μ fractions
combined. For QC1 cranial elements, this takes into account left or right side
and element fragmentation patterns, while the value displayed for QC4 otic
bullae is simply half their count. For QC2 vertebrae, the values displayed take
into account the number of each type found in one individual, thus making them
directly comparable to QC1 and QC4 element values. The ‘n’ value refers to
number of fragments used to determine the MNE statistics.
25
Figure 5: Dentary measurement box plots by barrel and sample, for samples
with at least 5 measurements; approximate total fish length correlations are
displayed on the right.
Figure 6: Dentary measurement correlation using 12 modern reference herring;
vertical bars show differences between left and right elements within each
specimen; * based only on the left measurement.

26
Figure 7: Quadrate measurement box plots by barrel and sample, for samples
with at least 5 measurements; approximate total fish length correlations are
displayed on the right.
Figure 8: Quadrate measurement correlation using 12 modern reference
herring; vertical bars show differences between left and right elements within
each specimen; * based only on the left measurement
27
Figure 9: Barrel 6, sample 90, selected >4mm identified specimens (top left),
selected >4mm unidentified specimens (top right), selected 2-4mm identified
specimens (middle left), selected 2-4mm unidentified specimens (middle right),
and barrel 4, sample 289, selected 300μ-2mm identified specimens (bottom left),
and selected 300μ-2mm unidentified specimens (bottom right, residue from this
fraction was unsorted hence other inclusions). Scale 5mm.
28
Figure 10: Possibly butchered cleithrum from barrel 5, sample 80, shown with a
modern example from a fish of 27cm total length. Scale 5mm.
Figure 11: Two cleithra fragments from barrel 6, sample 90, shown with a
modern example from a fish of 27cm total length. Scale 5mm.
Figure 12: Cleithrum fragment from external sample 277, shown with a modern
example from a fish of 27cm total length. Scale 5mm.
Figure 13: Urohyal from external sample 281, shown with a modern example
from a fish of 27cm total length. Scale 5mm.
29
Figure 14: Urohyal fragment from external sample 277, shown with a modern
example from a fish of 27cm total length. Scale 5mm.
Figure 15: Examples of fused cranial elements and vertebrae from barrel 13,
sample 269. Scale 5mm.
Figure 16: Supracleithra from barrel 12, sample 125, shown with a modern
example from a fish of 27cm total length. Scale 5mm.
30
Figure 17: Supracleithra from barrel 13, sample 269, shown with a modern
example from a fish of 27cm total length. Scale 5mm.
31
Bibliography
Anon. (2008) „Request for Tenders for Environmental Analysis for the Drogheda Boat Post-
Excavation Project‟, Unpublished report, National Monuments Service, Department of the
Environment, Heritage and Local Government.
Barrett, J H, A M Locker and C M Roberts (2004a). „„Dark Age Economics‟ revisited: the
English fish bone evidence AD 600-1600‟, Antiquity 78 (301), 618–636.
Barrett, J H, A M Locker and C M Roberts (2004b). „The origins of intensive marine fishing
in medieval Europe: The English evidence‟, Proceedings of the Royal Society of London B
271, 2417-2421.
Brophy, D and B S Danilowicz (2002). „Tracing populations of Atlantic herring (Clupea
harengus L.) in the Irish and Celtic Seas using otolith microstructure‟, ICES Journal of
Marine Science 59, 1305-1313.
Burke, N, D Brophy and P A King (2008). „Otolith shape analysis: its application for
discriminating between stocks of Irish Sea and Celtic Sea herring (Clupea harengus) in the
Irish Sea‟, ICES Journal of Marine Science 65, 1670-1675.
Carus-Wilson, E M (1933). „The Overseas Trade of Bristol‟ in E. Power and M. M. Postan
(eds), Studies in English Trade in the Fifteenth Century, 183-246. London
Childs, W (2000). „Fishing and Fisheries in the Middle Ages: The Eastern Fisheries‟ in D.
Starkey, C. Reid and N. Ashcroft (eds), England’s Sea Fisheries: The Commercial Sea
Fisheries of England and Wales since 1300, 19-23. London: Chatham Publishing.
Childs, W and T O‟Neill (1993). „Overseas Trade‟ in A. Cosgrove (ed) A New History of
Ireland, Vol. II: Medieval Ireland 1169-1534, 492-524. Oxford: Clarendon Press.
Cutting, C L (1955). Fish Saving: a History of Fish Processing from Ancient to Modern
Times. London: Leonard Hill.
D‟Alton, J (1863). The History of Drogheda, with its Environs; and an Introductory Memoir
of the Dublin and Drogheda Railway, Vol. 2. Dublin: McGlashan and Gill.
Dickey-Collas, M, R D M Nash and J Brown (2001). „The location of spawning of Irish Sea
herring (Clupea harengus)‟, Journal of the Marine Biological Association of the United
Kingdom 81, 713-714.
Down, K (1993). „Colonial Society and Economy‟ in A. Cosgrove (ed) New History of
Ireland, Vol. II: Medieval Ireland 1169-1534, 439-491. Oxford: Clarendon Press.
Enghoff, I B (1996). „A medieval herring industry in Denmark and the importance of herring
in eastern Denmark‟, Archaeofauna 5, 43-47.
Enghoff, I B (1999). „Fishing in the Baltic region from the 5th century BC to the 16th century
AD: Evidence from fish bones‟, Archaeofauna 8, 41-85.
Flavin, S and E T Jones (2008) „Ireland-Bristol Trade in the Sixteenth Century‟,
http://www.bris.ac.uk/Depts/History/Ireland/datasets.htm. Page consulted December 2008.
Harland, J F, J Barrett, J Carrott, K Dobney and D Jaques (2003). „The York System: An
integrated zooarchaeological database for research and teaching‟, Internet Archaeology 13.

32
Harland, J F and A K G Jones (In prep.) „Fish remains from York: patterns of consumption,
trade and ecological change from the late 7th century AD to the 1700s‟.
Hoffmann, R C (2005). „A brief history of aquatic resource use in medieval Europe‟,
Helgoland Marine Research 59, 22-30.
Lauwerier, R C G M and F J Laarman (2008). „Relics of 16th-century gutted herring from a
Dutch vessel‟, Environmental Archaeology 13, 135-142.
Locker, A M (2000) „The role of stored fish in England 900-1750AD; the evidence from
historical and archaeological data‟, Unpublished PhD, University of Southampton.
Longfield, A K (1929). Anglo-Irish Trade in the Sixteenth Century. London: George
Routledge and Sons, Ltd.
Moody, T W, F X Martin and F J Byrne (1991). A New History of Ireland: Volume III: Early
Modern Ireland 1534-1691. Oxford: Oxford University Press.
Robinson, R (2000). „The Common North Atlantic Pool‟ in D. Starkey, C. Reid and N.
Ashcroft (eds), England’s Sea Fisheries: The Commercial Sea Fisheries of England and
Wales since 1300, 9-17. London: Chatham Publishing.
Seeman, M (1986). „Fish remains from Smeerenburg, a 17th century Dutch whaling station on
the westcoast of Spitsbergen‟ in D. C. Brinkhuizen and A. T. Clason (eds), Fish and
Archaeology. Studies in Osteometry, Taphonomy, Seasonality and Fishing Methods (BAR
International Series 294), 129-39. Oxford: British Archaeological Reports.
Serjeantson, D and C Woolgar (2006). „Fish consumption in Medieval England‟ in C.
Woolgar, D. Serjeantson and T. Waldron (eds), Food in Medieval England: Diet and
Nutrition, 102-130. Oxford: Oxford University Press.
Went, A E J (1977). „Red herrings in Ireland‟, Journal of the Royal Society of Antiquaries of
Ireland 107, 108-110.
Wheeler, A and A K G Jones (1989). Fishes. Cambridge: Cambridge University Press.
Woolgar, C (2000). „„Take this penance now, and afterwards the fare will improve‟: Seafood
and Late Medieval diet‟ in D. Starkey, C. Reid and N. Ashcroft (eds), England’s Sea
Fisheries: The Commercial Sea Fisheries of England and Wales since 1300, 36-44. London:
Chatham Publishing.