The Professional Bachelor: How to Exploit Her Inner Psycho ...

Tech Mining: Multiple Ways to Exploit Science, Technology & Information Resources
Alan L. Porter, M. Simone M. Alencar, Adelaide M.S. Antunes, Marcelo F. M. Persegona, Roberto de Camargo Penteado Filho, Luc Quoniam, Eric Boutin, Leandro I. L. Faria, and José A. R. Gregolin*
1. Introduction We truly are in an “Information Age.” This is especially the case for decision-makers (professionals, managers, and policy-makers) dealing with parts of the Science, Technology and Innovation (“S,T&I”) system. Literally, hundreds of electronic databases filter and compile pertinent information on R&D, intellectual property, and related issues. Many of those contain tens of millions of distinct records. Proprietary databases and the worldwide web add tremendous amounts of text, numeric, and graphical data. These electronic information resources present a treasure trove of potential competitive technical intelligence (“CTI”). However, traditional means of gaining CTI are time-consuming and expensive. One company worked six months to catalog half of 13,000 potentially relevant patents (Teichert and Mittermayer, 2002). Fortunately, analytical tools (software) are rapidly coming available. These enable one to process sets of 13,000 patent abstracts (or other pertinent S,T&I text records) far more effectively and efficiently. In essence, one treats text as data, and applies text mining with other tools to derive and represent valuable knowledge. Simply put, those S,T&I decision-makers who ignore this technical intelligence are operating at a huge disadvantage. Too often managers don't use empirical intelligence for a variety of reasons (Porter et al., 2004). We believe the fault lies on both sides. On one side, decision-makers overly rely on intuitive judgments. On the other, analysts get carried away with playing with the data and generating esoteric reports. We feel that resolution lies in close collaboration among the decision-makers, analysts, and information specialists to constitute a functioning ST&I intelligence system. This begins with commitment to understand what those decision-makers need, when, to make better judgments. This paper briefly highlights our “Tech Mining” framework (Porter and Cunningham, 2005), then illustrates a range of applications that exploit S,T&I data to help manage technology, primarily in Brazilian contexts. We hope these * Order reflects the sequential section contributions. Alan Porter is Director, R&D, Search Technology, Inc., and Co-Director, Technology Policy and Assessment Center, Georgia Tech [where he is Professor Emeritus of Industrial & Systems Engineering, and of Public Policy] – [email protected]. Marcelo Persegona is pursuing a doctorate in Environmental Policy and Management at the Sustainable Development Center of the University of Brasilia [CDS/UnB] -- [email protected] M. Simone M. Alencar is a doctoral candidate in the School of Chemistry, Federal University of Rio de Janeiro [email protected] / [email protected] Adelaide M.S. Antunes, Titular Professor of the School of Chemistry (EQ), Federal University of Rio de Janeiro (UFRJ), Brazil -- [email protected] Roberto Penteado is senior staff, Empresa Brasileira de Pesquisa Agropecuária - Embrapa, Assessoria de Comunicação Social (ACS) and doctoral candidate at Université du Sud Toulon Var, France -- [email protected] Luc Quoniam is Professor at Université du Sud Toulon Var -- [email protected] Eric Boutin is Maître de Conférences at Université du Sud Toulon Var -- [email protected] Leandro Innocentini Lopes de Faria is professor of Departamento de Ciência da Informação da Universidade Federal de São Carlos and Director of NIT/Materiais - Núcleo de Informação Tecnológica em Materiais -- [email protected] José Angelo Rodrigues Gregolin is professor of Departamento de Engenharia de Materiais da Universidade Federal de São Carlos and Director of NIT/Materiais - Núcleo de Informação Tecnológica em Materiais -- [email protected]

Tech Mining – Alan L. Porter
2
convey the rich possibilities for dramatic gains in effective intelligence that are possible through well-focused application of text mining to S&T information resources.
2. The Approach: Purposeful analyses to address explicit management needs The Tech Mining Framework begins by identifying S,T&I decision issues that are widely addressed (Table 1). A common thread among these is that they can benefit from well-focused empirical technical intelligence. To further this aim, we set out recurring S,T&I questions. We began with 39 such questions and had these enriched in brainstorming with the National Research Council of Canada. These questions tend to relate to multiple issues (and each issue spawns multiple questions) (Porter and Cunningham, 2005). The particular questions most amenable to being answered through analyses of database search results on given topics relate to the four general themes:
• What? • Who? • When? • Where?
Most informative are combinations of these – for instance, what topics are being emphasized, recently, by the leading research centers on the S,T&I topic confronting us? To answer such questions, we suggest a combination of 1) straightforward measures (e.g., lists of the organizations with the most patents on topic T in the past 5 years), and 2) “innovation indicators” – more subtle treatments of the data that get at underlying factors affecting “I” (innovation prospects). We distinguish three families of innovation indicators, respectively addressing:
• Technological maturation (how far along the life cycle is the emerging technology under scrutiny?) • Contextual forces (is the infrastructure in place conducive to deployment of this technology?) • Market prospects (what is the likelihood that target users will adopt embodiments of this technology in
processes, services, or products?)
Table 1. Prominent Science, Technology & Innovation Issues
A. R&D Portfolio Selection B. R&D Project Initiation C. Engineering Project Initiation D. New Product Development E. New Market Development F. Mergers G. Acquisitions of Intellectual Property ("IP")
H. Exploiting One's Intellectual Assets I. Collaborative Technology Development J. Assessing Competing Organizations K. Forecasting Opportunities & Threats L. Strategic Technology Planning M. Technology Roadmapping
Tech Mining – Alan L. Porter
3
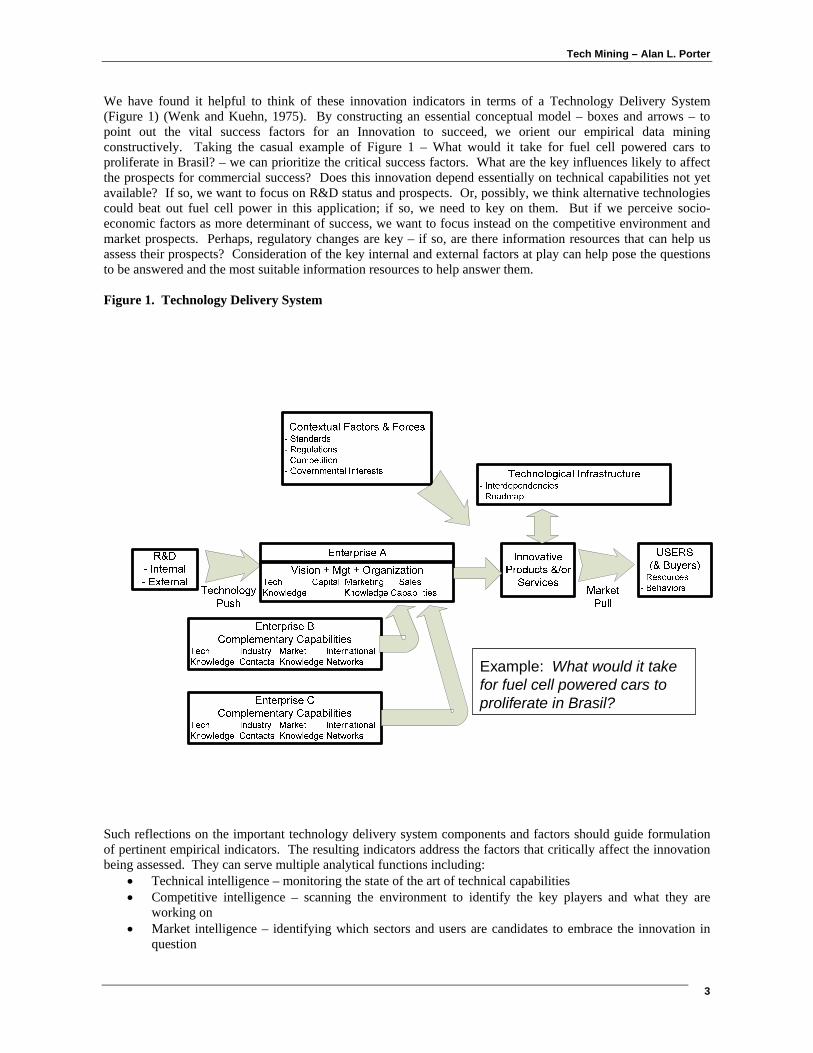
We have found it helpful to think of these innovation indicators in terms of a Technology Delivery System (Figure 1) (Wenk and Kuehn, 1975). By constructing an essential conceptual model – boxes and arrows – to point out the vital success factors for an Innovation to succeed, we orient our empirical data mining constructively. Taking the casual example of Figure 1 – What would it take for fuel cell powered cars to proliferate in Brasil? – we can prioritize the critical success factors. What are the key influences likely to affect the prospects for commercial success? Does this innovation depend essentially on technical capabilities not yet available? If so, we want to focus on R&D status and prospects. Or, possibly, we think alternative technologies could beat out fuel cell power in this application; if so, we need to key on them. But if we perceive socio-economic factors as more determinant of success, we want to focus instead on the competitive environment and market prospects. Perhaps, regulatory changes are key – if so, are there information resources that can help us assess their prospects? Consideration of the key internal and external factors at play can help pose the questions to be answered and the most suitable information resources to help answer them. Figure 1. Technology Delivery System
Example: What would it takefor fuel cell powered cars to proliferate in Brasil?
Such reflections on the important technology delivery system components and factors should guide formulation of pertinent empirical indicators. The resulting indicators address the factors that critically affect the innovation being assessed. They can serve multiple analytical functions including:
• Technical intelligence – monitoring the state of the art of technical capabilities • Competitive intelligence – scanning the environment to identify the key players and what they are
working on • Market intelligence – identifying which sectors and users are candidates to embrace the innovation in
question
Tech Mining – Alan L. Porter
4
• Technology roadmapping – providing essential information to help piece together the likely progression of technical capabilities (e.g., in a given fuel cell type) and of products (e.g., automotive applications)
• Technology forecasting – showing trends and enabling growth modeling • Technology assessment – helping to identify potential secondary effects of implementing this
technology • Technology foresight – providing base information on which alternative futures can be conceived and
evaluated by interested stakeholders Our message is thus balanced. On the one hand, we start with a shopping list of fairly general issues, questions, and candidate empirical indicators. On the other, we make sure that the intelligence to be generated is what the target users seek. The following applications illustrate the wide range of possible tech mining information content and forms. 3. Applications This section presents cases. These illustrate the range of tech mining possibilities across data types, analytical emphases, and alternative representations. They address a spectrum of S,T&I issues, questions, and potential indicators. And they touch on a number of the Technology Delivery System factors that affect innovation.
A) Innovation Indicators -- Ceramic coating of automotive engine components B) Life cycle positioning analysis: Nanotechnology patent patterns C) Webmapping: Extracting multiple data forms for visual representations D) Text mining to audit media coverage of an R&D organization -- Embrapa E) Composing empirical S,T&I indicators F) Combining multiple empirical sources with expert opinion to assess plastic molding technologies
A. An Innovation Indicator to help assess an emerging technology This study was led by Bob Watts of the U.S. Army with Alan Porter collaborating (Watts and Porter 1997). Analytical approaches, including the use of “Keyword Richness” to flag a significant step change in ceramics technology maturation, were reported (Figure 1). As the story unfolds, the Army, along with most other interested parties, had become disillusioned with the prospects of ceramics R&D leading to useful product innovations. In the mid-1980’s, expectations had been overheated. This led to a flurry of research activity (note the spike in engineering research publications in 1987-88 shown in the back row of the Figure), followed by a dramatic drop-off. The middle row shows the number of players following a similar pattern – huge rise in 1987-88, followed by a sharp drop, with only a modest increase in 1993-95. But note our “innovation indicator” – keyword richness. Whereas this had only risen modestly in the boom years (1987-88), it takes off dramatically in 1993-95. This flags the possibility that there has been a vital change in the R&D taking place. Note that it does not guarantee that this is the case, nor indicate the exact nature of the change. We took these results to ceramic experts who verified that this technology had reached a new and much more promising stage of development. Indeed, further analyses helped depict what was happening. Categorization of the keywords enabled one to track the progression of each aspect over time. For instance, the topics emphasized in the mid-1980’s tended to be generic (e.g., ceramic materials have potential for use as sensors). By the mid-1990’s, the research themes were far more specific (e.g., aluminum titanate material; thermal insulating properties). The 1993-95 research mentioned far more specific applications and got into issues such as verification of material characteristics. In sum, this technology was maturing toward bonafide applications.

Tech Mining – Alan L. Porter
5
Figure 1. Keyword Richness as an Innovation Indicator
To update the story, after being convinced of the heightened potential, the Army Tank-Automotive Research, Development & Engineering Center (TARDEC) sought expertise in thin-film ceramics. “Tech Mining” played a second essential role by identifying “who” were the key players. Such research was taking place in a quite different ceramics venue – namely, semiconductor (integrated circuit) R&D. This led to identification of two key R&D groups – neither of which had been considering engine applications. Army funding of development projects with Sandia National Lab and a private company pursued such applications. The focus was to adapt vapor deposition of ceramics to coat automotive engine components. And this had a successful result -- in 2004 the Rouge River plant began to coat Abrams tank turbine blades with ceramics. The coating offered improved performance, enhanced product life, and yielded environmental benefits as well. B. Life cycle positioning analysis: Nanotechnology patent patterns Many bibliometric profiles of nanotechnology have been prepared (c.f., Hullman and Martin, 2003; Manley and Welsh, 2005; Schummer, 2004). Alencar et al. (under submission) present a novel approach to compare national nanotechnology development efforts based on patenting emphases, 1994-2005. They use a nanotechnology production chain proposed by Lux Research (2004) that distinguishes three developmental nano stages – raw materials, intermediates, and products. This section draws on that study. This study analyzed 18, 952 “nano” patents drawn from the Derwent Innovation Index database for 1994-2005. “Nano” presents particular challenges in formulating a “just right” search algorithm – here 44 search queries were applied and results consolidated using VantagePoint. Considering results by region, Asia leads (45%), followed by North America (35%) and the European Union (14%); these account for all but 6% of the nano patent set. We picked the leading country contributing to each of these regions for these comparisons – Japan, USA, and Germany. This discussion keys on distinguishing their value chain emphases [other analytical targets are treated in the full paper – Alencar et al. (under submission)]. International Patent Classification (IPC) 8th edition codes were analyzed. Subclasses present in more than 5% of the selected patents were studied (e.g., at the level of H01L – semiconductor devices). In addition the “patent use” abstract field was parsed using VantagePoint. This content analysis of nanopatent uses was cross-referenced
Tech Mining – Alan L. Porter
6
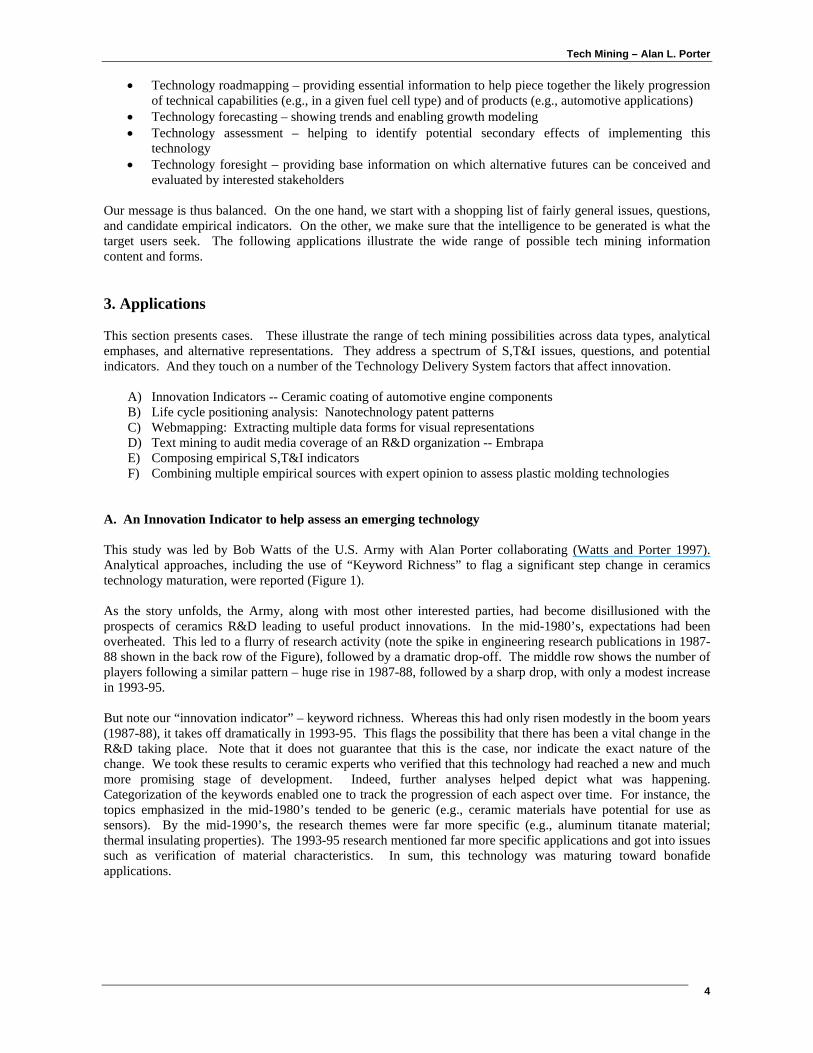
against the IPC subclasses. [Note that tech mining here combines two different ways to gain perspective on R&D emphases.] The described use of the patents can be interpreted to indicate position along the nano value chain. This, in turn, provides a vital indicator of market orientation. Nano raw materials are any raw material whose nanometric scale confers properties specific to this dimension. Nanointermediates are situated in the middle of the chain; that is, they incorporate nano raw materials, but are not yet aimed at the final user. Nanoproducts are products available in the market. Table 2 presents selected indicated uses within the leading patent classes with our location of that use along the nano value chain. Table 2. IPC subclasses, main uses, and position along the nano value chain
Main IPC [# patents] Main uses description in the nanopatents
Position along the Nano Value Chain
H01L-Semiconductor Devices; Electric Solid State Devices Not Otherwise Provided [2870]
• Electron device • Semiconductor device • Solar cell
• Nanointermediate • Nanointermediate • Nano-products
C01B-Non-Metallic Elements; Compounds Thereof [2716]
• carbon nanotube • fuel cell • catalyst
• Nano-raw material • Nano-products • Nanointermediate
A61K-Preparations For Medical, Dental, Or Toilet Purposes [1863]
• Cancer (treatment, medication) • Cosmetics • drugs
• Nano-products • Nano-products • Nano-products
B82B-Nano-Structures; Manufacture Or Treatment Thereof Chemistry [1615]
• Carbon nanotube • Electron device • catalyst
• Nano-raw material • Nanointermediate • Nanointermediate
B01J-Chemical Or Physical Processes, E.G. Catalysis, Colloid Chemistry; Their Relevant Apparatus [1520]
• Catalyst • Fuel cell • Carbon nanotube
• Nanointermediate • Nano-products • Nano-raw material
G01N-Investigating Or Analyzing Materials By Determining Their Chemical Or Physical Properties [1362]
• Protein • Nucleic acid • antibody
• Nano-raw material • Nano-raw material • Nano-raw material
C08K-Use Of Inorganic Or Non-Macromolecular Organic Substances As Compounding Ingredients [1351]
• Film • Coat • adhesive
• Nanointermediate • Nanointermediate • Nanointermediate
C08L-Compositions Of Macromolecular Compounds [1134]
• Film • Coat • fiber
• Nanointermediate • Nanointermediate • Nanointermediate
H01J-Electric Discharge Tubes Or Discharge Lamps [1128]
• Carbon nanotube • Field emission display • Display device
• Nano-raw material • Nanointermediate • Nanointermediate
B32B-Layered Products, I.E. Products Built-Up Of Strata Of Flat Or Non-Flat, E.G. Cellular Or Honeycomb, Form Printing [1043]
• Substrate • Coat • film
• Nanointermediate • Nanointermediate • Nanointermediate
An “orientation map” of US patent assignees (Figure 2) was created based on prevalence of IPC subclasses of the main patent assignees. This yields clusters relating to target applications by combining two distinct information sources. The top IPC subclasses indicate the main application sectors. Text mining of the terms in the “use” subfield can be related to the most significant objects of patenting. Combining these two data forms yields clusters that reflect positioning along the nano value chain.

Tech Mining – Alan L. Porter
7
Figure 2. Orientation Map of leading US patent assignees
Cluster 1, shown in more detail in Figure 3, involves three important companies: EASTMAN KODAK, mainly positioned in nanoproducts (industrial radiography, image, optic systems); DUPONT DE NEMOURS, patenting most strongly in nanointermediates (biosensors, photovoltaic devices, and memory storage devices); and GENERAL ELECTRIC, active in nanoproducts (applications in computers, film and automobiles). Figure 3. Cluster 1 – USA
Cluster 2 consists of three large companies and two research institutions, shown in Figure 4. MIT and INTEL have registered patents with the greatest intensity in the nano raw material and nanointermediate segments of the

Tech Mining – Alan L. Porter
8
value chain. MIT’s main applications are in proteins, sensors, and tissue engineering, while INTEL has patents in nucleic acid, proteins, and semiconductor devices -- all placed in the first two segments of the chain. The other three institutions are placed primarily in the nanointermediate segment: the University of California has amongst its main applications -- sensors, catalysis, and nucleic acid; IBM focuses on electron devices, integrated circuits, and thin films; HP keys on sensors, memory, and electron devices. Figure 4. Cluster 2 – USA
Similar maps were developed for Japan and Germany, the leading countries, respectively, in Asia and Europe. The analyses show up notable differences in value chain niches being emphasized by Japanese, American (US) and European (German) development efforts. The country which leads in the number of nanopatents, the USA, spreads its inventiveness thinly among many organizations, and across the three segments of the proposed nano value chain. Japan stands out as the country whose institutions are making the most important contribution to the world of nanopatents – most of the leading organizations are Japanese. Japanese organizations appear to emphasize the beginning and middle of the chain – nano raw materials and nanointermediates. Germany, although presenting a lower volume of patent documents, leads among the European nations. Of the three countries profiled, it presents the greatest added value along the nano value chain, tending to emphasize nanoproducts. German organizations appear to be concentrating their R&D more than either US or Japanese counterparts. We suggest that this analysis of patent emphases in terms of position along the market value chain can lend important insights. Our illustrations suggest that important differences can be detected at the organization level; this could help identify potential partners with complementary strengths. It also appears to distinguish national differences. Countries may want to consider focusing their nano R&D in terms of perceived greatest value chain opportunities, exerting some coordination to take best advantage of their institutional capabilities. Analogous value chain categorization could be fruitful in analyzing other technologies as well. C. Webmapping: Extracting text and other data forms for visual representations This work has the goal of bringing together data from several primary sources, including: Banco do Brasil (BB), Caixa Econômica Federal (Caixa), Instituto Brasileiro de Geografia e Estatística (IBGE) and Empresa de Correios e Telégrafos (ECT). An illustrative analysis concerns how many branches of Banco do Brasil, Caixa, and ECT are established in each microregion of Brazil. This composite value is represented by an indicator called Indicator of Accessibility to Credit (IndAC). As the necessary data come from different primary sources, they had no coincident registration keys. For example, Banco do Brasil refers to its branches through a branch code, whereas ECT and Caixa do it through a Federation Unit acronym (UF) and the name of the municipality. The IBGE possesses a numerical code made up of six and seven digits. Therefore, the initial challenge was to relate these data to a common coding system. We adopt the numerical code of the microregion used by the IBGE because the Webmapping data system also makes use of this pattern. This facilitates data export to the latter and afterwards the creation of thematic maps.

Tech Mining – Alan L. Porter
9
The original data also represent different levels of aggregation than the level desired for final presentation. The information includes some at the municipality level, whereas the desirable representation is at the level of the microregion†. For the creation of the list of the microregions, the IBGE site is consulted, or, more precisely, the Automatic Recovery IBGE System -- SIDRA. The list of the microregions is drawn from this system and exported to MS Excel. After creation of the list of the microregions and the lists of the Banco do Brasil, Caixa and ETC branches, these lists are imported into VantagePoint to group the data at the desired level of detail. This task creates another list which is then exported to MS Excel to calculate the desired Indicator of Accessibility to Credit for each microregion. We also need to create specific programs to load the data into the Webmapping system. The Webmapping system makes use of the DBF databank format, which is related to the shape format files to be read for the creation of the thematic maps. The DBF data provide Webmapping with the textual pieces of information that are needed for the development of criteria for the color system, generation of information labels, and textual content for the active layer. The scheme presented in Figure 5 synthesizes the methodological steps adopted for the formation of the thematic maps. This illustrates combination of multiple forms of data to generate effective intelligence, enhanced through geo-mapping, as executed by CDS/UnB. Figure 5. Processing Multiple Data Forms to Generate Geo-maps
The Webmapping system allows visualization of the data at several levels, such as the world, continents, country, regions, states, middle regions, microregions, municipalities, city, district, etc. Furthermore, it is possible to visualize more than one layer simultaneously. The system also allows visualizing data in the shape format using satellite images. Another possible illustration of using the Webmapping system would be a presentation of the
† Brazil has several forms of subdivisions, among which are 5 regions, 27 states, 138 middle regions, 588 microregions, and 5,561 municipalities. There are also other kinds of divisions not addressed herein.

Tech Mining – Alan L. Porter
10
municipalities of Brazil possessing nanotechnology research institutes. Another would be to depict the countries that actively cooperate scientifically with Brazil (recall that such information is one interest of the Sao Paulo S&T Indicators analyses). The possibilities of using the Webmapping system for the geo representation of data are infinite. By working with multiple software programs, text and numeric data can be combined and represented in suitable thematic maps. Such combination of analysis and visualization makes it possible to understand better the behavior of cities, regions, and/or countries. This can facilitate strategic planning, monitoring, and control. Related tools have shown to be extremely useful in spatial evaluation of phenomena in several fields. Users can grasp geo-referenced information via digitized maps, aerial or satellite images and overlays, digitized cartographic bases, linear-formatted data, and various shape depictions. Integration of VantagePoint, MS Excel, and the Webmapping system allows handling of any kind of information. Resulting visualizations can help S,T&I decision makers assimilate complex intelligence. D. Text mining to audit media coverage of an R&D organization -- Embrapa Agricultural research conducted by Embrapa is vital to Brazil. For instance, grain production could go from 120 million tons to 350 million tons using 90 million hectares of land not yet cultivated in its cerrados (savannas) region. Until 30 years ago, this area was only suitable for cattle breeding (c.f., Flores, 1991). Gasques et al. (2003, p. 42) wrote that technology plays a decisive role in agribusiness success and the Brazilian Agricultural Research Corporation (Embrapa) leads in the generation and diffusion of innovations to this sector. Grunig and Repper (1992) define Public Relations, or Managerial Communication, as a tool to unite organizations and their strategic publics. Its function is to build and to maintain a hospitable environment for the organization. It provides a means for organizations and interest groups to administer conflicts, to the benefit of all (Grunig, 1992). Communication research helps track public interests, develops a mutual understanding between the organization and the public, and contributes so that society has well-founded debates on critical subjects. The “clipping function” is widespread internationally. It is the most common way to track what is being communicated. Bueno (2002) affirms that:
clipping, whether it is incomplete or not, imprecise or not, mistaken or not, is fundamental .... a raw material for the auditing job, to be accomplished a posteriori, and when well-oriented, can send a signal for publicity opportunities, diagnose personalities and styles of vehicles and editors and, above all, allow the companies or organs to refine relations with the media.
Paper clipping has serious size and cost limitations. Distributing clippings to more than a dozen people is a true challenge. Hundreds of papers are edited per month, which makes file maintenance difficult and tedious. Thus, only the management or the top ranks of an organization have the opportunity to be informed on what is happening in its macro environment. The employees, managers, and supervisors do not have access to the crucial information that will assist them in managing day-to-day projects and initiatives. Realizing these limitations, Embrapa created its system of electronic clipping in 1997. It introduced innovative concepts at the time, using technologies such as the Internet and Adobe Acrobat to digitize everything that was previously done on paper. It offered new products via an internal network, Embrapa's Intranet, to all its widely distributed research centers. This constituted an important instrument for the democratization of information in the organization. In 2002, a database was added with the objective of allowing for text mining analysis of the electronic clippings.
Tech Mining – Alan L. Porter
11
The Clipping database includes 16.999 news articles from 2003 and 2004. A sample record indicates the content available for analyses:
TIT (Title): Na ponta dos dedos VEI (Vehicle): Panorama Rural UF (State of the Vehicle): SP DTP (Date): 01/2003 ANO (Year): 2003 PAG (Number of pages): 4 ou + paginas GEN (Journalistic genre of each news article; news, editorial, reportage, interviews, article, op-ed, informative notes, reader's letter, chronicle): Noticia FON (Source of the news article): Pesquisador PRE (Presence of the organization in the news article; cover/ first page, page headline, title, lead, text citation, footnote/observations): Destaque no texto CGR (Graphic treatment; one element, two elements, three elements, four elements (text, photo, illustration, box), five or more elements): 2 elementos (texto + foto/ilustracao) TEM (Theme): Fatores e Insumos, Maquinas e Implementos PCH (Key words): agricultura UD (Embrapa's centers): Milho e Sorgo, Instrumentacao Agropecuária.
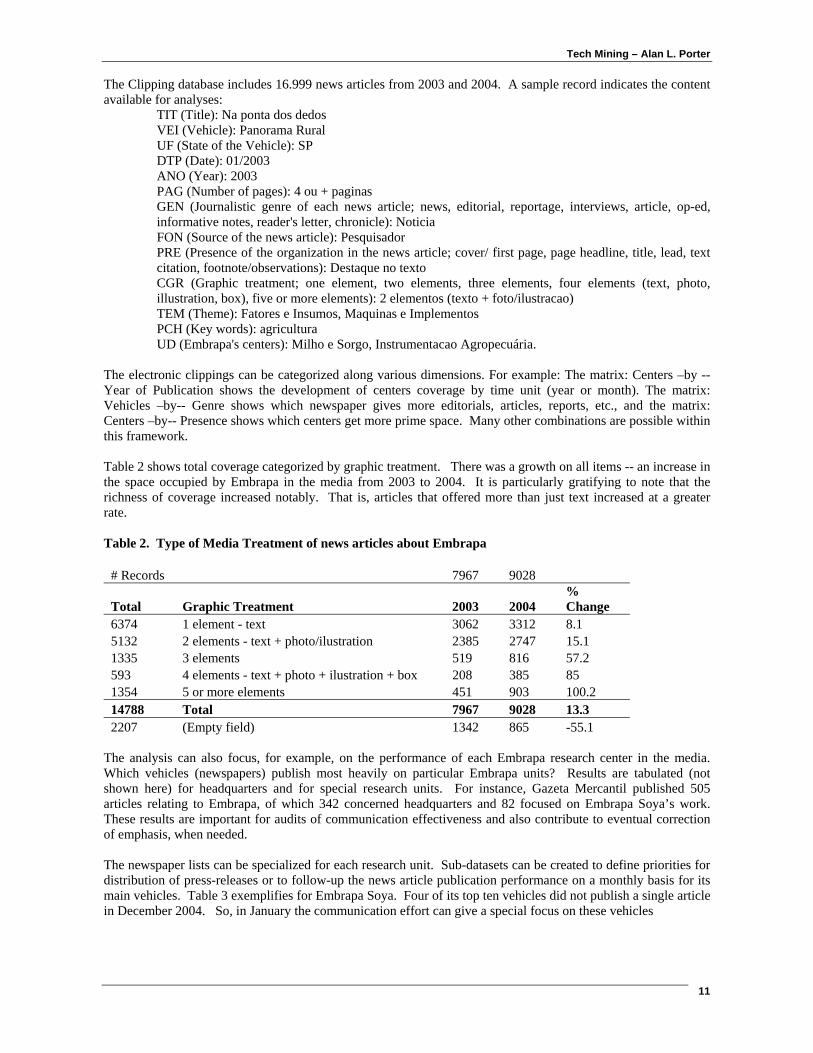
The electronic clippings can be categorized along various dimensions. For example: The matrix: Centers –by --Year of Publication shows the development of centers coverage by time unit (year or month). The matrix: Vehicles –by-- Genre shows which newspaper gives more editorials, articles, reports, etc., and the matrix: Centers –by-- Presence shows which centers get more prime space. Many other combinations are possible within this framework. Table 2 shows total coverage categorized by graphic treatment. There was a growth on all items -- an increase in the space occupied by Embrapa in the media from 2003 to 2004. It is particularly gratifying to note that the richness of coverage increased notably. That is, articles that offered more than just text increased at a greater rate. Table 2. Type of Media Treatment of news articles about Embrapa
# Records 7967 9028
Total Graphic Treatment 2003 2004 % Change
6374 1 element - text 3062 3312 8.1 5132 2 elements - text + photo/ilustration 2385 2747 15.1 1335 3 elements 519 816 57.2 593 4 elements - text + photo + ilustration + box 208 385 85 1354 5 or more elements 451 903 100.2 14788 Total 7967 9028 13.3 2207 (Empty field) 1342 865 -55.1
The analysis can also focus, for example, on the performance of each Embrapa research center in the media. Which vehicles (newspapers) publish most heavily on particular Embrapa units? Results are tabulated (not shown here) for headquarters and for special research units. For instance, Gazeta Mercantil published 505 articles relating to Embrapa, of which 342 concerned headquarters and 82 focused on Embrapa Soya’s work. These results are important for audits of communication effectiveness and also contribute to eventual correction of emphasis, when needed. The newspaper lists can be specialized for each research unit. Sub-datasets can be created to define priorities for distribution of press-releases or to follow-up the news article publication performance on a monthly basis for its main vehicles. Table 3 exemplifies for Embrapa Soya. Four of its top ten vehicles did not publish a single article in December 2004. So, in January the communication effort can give a special focus on these vehicles
Tech Mining – Alan L. Porter
12
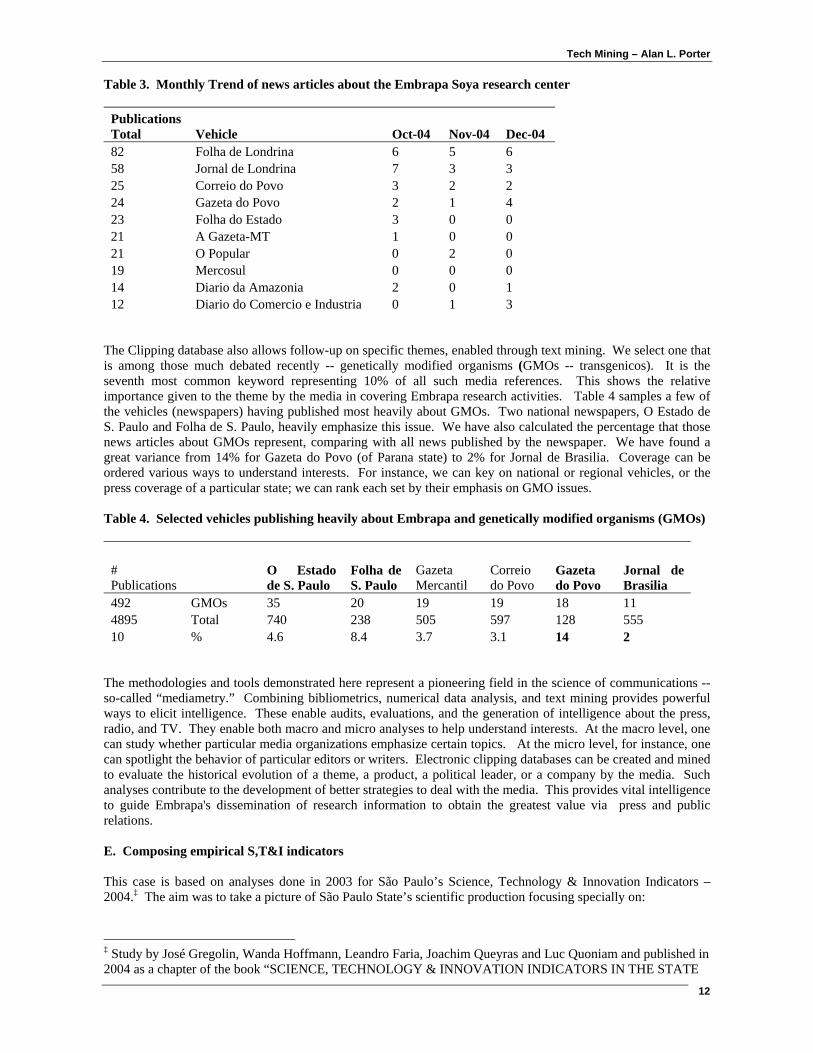
Table 3. Monthly Trend of news articles about the Embrapa Soya research center
Publications Total Vehicle Oct-04 Nov-04 Dec-04 82 Folha de Londrina 6 5 6 58 Jornal de Londrina 7 3 3 25 Correio do Povo 3 2 2 24 Gazeta do Povo 2 1 4 23 Folha do Estado 3 0 0 21 A Gazeta-MT 1 0 0 21 O Popular 0 2 0 19 Mercosul 0 0 0 14 Diario da Amazonia 2 0 1 12 Diario do Comercio e Industria 0 1 3
The Clipping database also allows follow-up on specific themes, enabled through text mining. We select one that is among those much debated recently -- genetically modified organisms (GMOs -- transgenicos). It is the seventh most common keyword representing 10% of all such media references. This shows the relative importance given to the theme by the media in covering Embrapa research activities. Table 4 samples a few of the vehicles (newspapers) having published most heavily about GMOs. Two national newspapers, O Estado de S. Paulo and Folha de S. Paulo, heavily emphasize this issue. We have also calculated the percentage that those news articles about GMOs represent, comparing with all news published by the newspaper. We have found a great variance from 14% for Gazeta do Povo (of Parana state) to 2% for Jornal de Brasilia. Coverage can be ordered various ways to understand interests. For instance, we can key on national or regional vehicles, or the press coverage of a particular state; we can rank each set by their emphasis on GMO issues. Table 4. Selected vehicles publishing heavily about Embrapa and genetically modified organisms (GMOs)
# Publications
O Estado de S. Paulo
Folha de S. Paulo
Gazeta Mercantil
Correio do Povo
Gazeta do Povo
Jornal de Brasilia
492 GMOs 35 20 19 19 18 11 4895 Total 740 238 505 597 128 555 10 % 4.6 8.4 3.7 3.1 14 2
The methodologies and tools demonstrated here represent a pioneering field in the science of communications -- so-called “mediametry.” Combining bibliometrics, numerical data analysis, and text mining provides powerful ways to elicit intelligence. These enable audits, evaluations, and the generation of intelligence about the press, radio, and TV. They enable both macro and micro analyses to help understand interests. At the macro level, one can study whether particular media organizations emphasize certain topics. At the micro level, for instance, one can spotlight the behavior of particular editors or writers. Electronic clipping databases can be created and mined to evaluate the historical evolution of a theme, a product, a political leader, or a company by the media. Such analyses contribute to the development of better strategies to deal with the media. This provides vital intelligence to guide Embrapa's dissemination of research information to obtain the greatest value via press and public relations. E. Composing empirical S,T&I indicators This case is based on analyses done in 2003 for São Paulo’s Science, Technology & Innovation Indicators – 2004.‡ The aim was to take a picture of São Paulo State’s scientific production focusing specially on:
‡ Study by José Gregolin, Wanda Hoffmann, Leandro Faria, Joachim Queyras and Luc Quoniam and published in 2004 as a chapter of the book “SCIENCE, TECHNOLOGY & INNOVATION INDICATORS IN THE STATE

Tech Mining – Alan L. Porter
13
• Comparing trends with other states of Brazil and with the world • Mapping the distribution by knowledge area, institution and geographic level • Identifying scientific collaboration patterns
Figure 6 presents a simple schematic of the data mining procedures. The data (64.475 records) were collected from Science Citation Index Expanded / Web of Science Interface (“SCIE”). The records were prepared by using infotrans software to create new fields, automatically classify the publications by “knowledge area,” as a first step in standardization of institution and city names. This was followed by aggregation of the publications by ”geographical levels” (cities, states, regions, countries). Vantagepoint software was used to create lists, with rankings. Then, co-occurrence matrixes (combining pairs of lists) were generated using the fields: publication year, knowledge area, country, region, state, city, institution, and others. The lists and matrixes were transported to MS Excel to generate tables and graphics, such as those illustrated in the next figures. The tables and graphics were analyzed, interpreted, and checked with bibliographic data and expert opinion. Figure 6. Steps in the S,T&I Data Mining
Aspectos metodolAspectos metodolóógicos: gicos: MMéétodo analtodo analíítico e uso da SCIEtico e uso da SCIE
Base SCIE
Preparação básica dos dados1. Limpeza de dados
Aprimoramentos no artigo2. Mudanças em campos3. Inserção da Classificação do ISI4. Padronização de nomes5. Agregação de dados por área geográfica
Criação da base de dados operacional6. Codificação para software7. Importação para o software
Preparação dos dados
Texto de armazenamentoTI _____________________________SO _____________________________NN _____________________________/A _____________________________OUTROS CAMPOS___________________
Gráficos e Tabelas
AnáliseInterpretaçãoImplicações
Recomendações
Software de Text Mining
• Uso de Text Mining (bibliometria)• Confiabilidade dos dados• Possibilidade de cruzamentos
• Artigo científicos indexados na SCIE• Web of Science, 64.475 artigos, 1998-2002• Seleção de revistas• Cobertura não–uniforme das áreas• Mais usada internacionalmente
Figure 7 shows how the scientific production of 15 selected countries has changed in the period 1998 to 2002. Figure 7a shows the 5 countries that account individually for more than 5% of the world scientific publication activity (based on Web of Science). There are two points to be noted: the leading position of the United States, accounting for 32% of the total and the stability of these 5 countries’ activity levels over the period. A key factor in concentration in these countries is the large number of scientists and engineers engaged in research and development activities (R&D), added to the significant amount invested in the sector (UNESCO, 2004a & b). OF SÃO PAULO/BRAZIL – 2004”, sponsored by Fapesp – Fundação de Amparo à Pesquisa do Estado de São Paulo. It can be downloaded in portuguese or english version from http://www.fapesp.br/indicadores.

Tech Mining – Alan L. Porter
14
Figure 7: National Benchmarking: Brazilian Contribution to World Science -- Small but Growing
NATIONAL BENCHMARKING: Classifying CountriesNATIONAL BENCHMARKING: Classifying CountriesProduProduççãoão cientcientííficafica brasileirabrasileira: : ContribuiContribuiççãoão p/ total p/ total mundialmundial pequenapequena, , masmas crescendo crescendo rapidamenterapidamente
Brasil 1998 e 2002• de 10.279 a 15.846 publicações• contribuição de 1,1% a 1,5%
Crescimentos no período: • Brasil - 54%• Mundo - 9%• EUA – 1,7%• China – 103,5 %
Evolução do número de publicações indexadas na base SCIE – Países selecionados, 1998-2002
The five selected countries that accounted for between 2% and 5% of world scientific output are shown in Figure 7b. China stands out as displaying the fastest growth in the period: about 103%. Its performance apparently reflects large and expanding numbers of scientists and technicians dedicated to R&D activities in recent years, in the same order of magnitude as for Japan (UNESCO, 2004b). The other countries in the group – Canada, Spain, Australia and India – displayed more moderate growth in the period. The results of this study also show Brazil maintaining its position as the Latin American leader in the period. According to the SCIE database, Brazil’s scientific output increased from 1.1% of the world total in 1998 to 1.5% in 2002. Figure 7.2c shows similarly strong growth in the scientific output of other Latin American countries for the period 1998-2002. They include Argentina, Chile, and Mexico, selected here for the sake of comparison. In none of the three was growth as fast as in Brazil. Figure 3 breaks out scientific activity by region for Brazil. The Southeast maintained its lead over other regions over the period, 1998-2002, accounting for 77% of Brazilian publications indexed by SCIE. Next came the South with 15%, the Northeast with 9%, the Centrer-West with 4%, and the North with 2%. This mainly reflected the Southeast region’s lead in terms of numbers of highly skilled researchers and technicians as well as significantly higher public and private investment in R&D (FAPESP, 2002). As shown in Figure 8 (by the “whiskers” on each column), scientific output in the Southeast grew 54% in the period, lagging behind both the South (71%) and the Northeast (65%). Theoretically at least, faster growth of scientific output in the South and Northeast than in the Southeast may reflect policy measures aimed at decentralizing scientific and technological activities implemented by the Federal Government. Examples included programs created by the National Council for Scientific & Technological Development (CNPq) to promote regional deconcentration of its investment in R&D, and by Coordination for the Improvement of Higher Education Personnel (CAPES) to promote the creation of new post-

Tech Mining – Alan L. Porter
15
graduate courses in regions with a low density of such courses and partner with state governments on regional projects in strategic areas. Figure 8. Regional Brazilian Comparisons: Scientific Production: Geographically Concentrated but with “Deconcentration Indications”
REGIONAL COMPARISON: Showing both Activity & Rate of ChangeREGIONAL COMPARISON: Showing both Activity & Rate of ChangeProduProduççãoão cientcientííficafica brasileirabrasileira: : concentradaconcentrada geograficamentegeograficamente, com , com sinaissinais de de desconcentradesconcentraççãoão
• Produção concentrada no Sudeste: 77,1% em 2002• Sinais de desconcentração: Sul (71%) e Nordeste (65%) crescem mais que Sudeste (54%)• Possível explicação:
• Políticas públicas federais buscando desconcentração• Consolidação de programas de pós-graduação fora do Sudeste
Participação porcentual das regiões no total de publicações brasileiras indexadas na base SCIE e taxa de crescimento – 1998-2002 (acumulado)
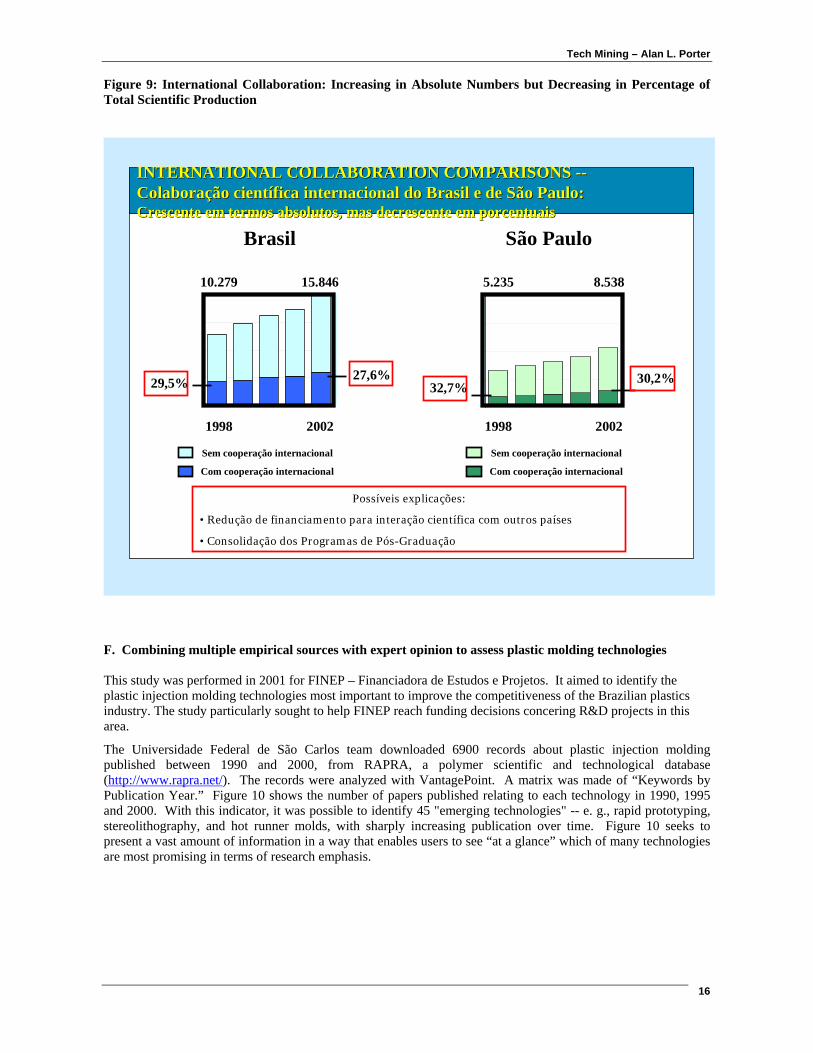
Brazil’s international scientific collaboration -- in terms of the number of SCIE-indexed Brazilian publications involving authors in other countries -- rose 43% between 1998 and 2002 (Figure 9). However, Figure 9a shows that as a proportion of total national output it fell moderately, from 32.7% of Brazilian publications in 1998 to 30.2% in 2002. This downtrend was detected previously in other studies (FAPESP, 2002; Viotti & Macedo, 2003). Some analysts see it as probably associated with the growing maturity of post-graduate programs in Brazil, leading to an increase in national scientific output as a proportion of the total and an overall reduction in the number of grants to fund research abroad. São Paulo state scientific production, shown in Figure 9b, has the same downtrend in international collaboration, but keeping a level of international collaboration greater than the nation overall.
Tech Mining – Alan L. Porter
16
Figure 9: International Collaboration: Increasing in Absolute Numbers but Decreasing in Percentage of Total Scientific Production
INTERNATIONAL COLLABORATION COMPARISONS INTERNATIONAL COLLABORATION COMPARISONS ----ColaboraColaboraççãoão cientcientííficafica internacionalinternacional do do BrasilBrasil e de São Paulo:e de São Paulo:CrescenteCrescente em em termostermos absolutosabsolutos, , masmas decrescentedecrescente em em porcentuaisporcentuais
Brasil
27,6%29,5%
20021998
15.84610.279
Sem cooperação internacional
Com cooperação internacional
São Paulo
32,7%30,2%
20021998
8.5385.235
Sem cooperação internacional
Com cooperação internacional
Possíveis explicações:
• Redução de financiamento para interação científica com outros países
• Consolidação dos Programas de Pós-Graduação
F. Combining multiple empirical sources with expert opinion to assess plastic molding technologies This study was performed in 2001 for FINEP – Financiadora de Estudos e Projetos. It aimed to identify the plastic injection molding technologies most important to improve the competitiveness of the Brazilian plastics industry. The study particularly sought to help FINEP reach funding decisions concering R&D projects in this area.
The Universidade Federal de São Carlos team downloaded 6900 records about plastic injection molding published between 1990 and 2000, from RAPRA, a polymer scientific and technological database (http://www.rapra.net/). The records were analyzed with VantagePoint. A matrix was made of “Keywords by Publication Year.” Figure 10 shows the number of papers published relating to each technology in 1990, 1995 and 2000. With this indicator, it was possible to identify 45 "emerging technologies" -- e. g., rapid prototyping, stereolithography, and hot runner molds, with sharply increasing publication over time. Figure 10 seeks to present a vast amount of information in a way that enables users to see “at a glance” which of many technologies are most promising in terms of research emphasis.

Tech Mining – Alan L. Porter
17
Figure 10. Plastic Molding Technologies; Change in Research Activity over a Decade

Tech Mining – Alan L. Porter
18
This study is interesting in that it involved combining tech mining with other future-oriented technology analyses. Figure 11 spotlights results of the expert opinion component. Some 600 experts were invited to answer questions about the 45 emerging technologies using a Delphi methodology (150 experts participated). The emerging technologies were classified in 5 groups: computational technologies, special project technologies, manufacturing technologies, materials technologies and management technologies. The expert opinion statistics were composed with Statistica software (www.statsoft.com). Figure 11 shows expert opinion about the impact these technologies could have in improving the competitiveness of the Brazilian plastics industry. Expert opinion about Brazilian development on these technologies is compared with other countries (national benchmarking). In this figure we again condense a tremendous amount of information, trying to concisely convey the key comparisons. Six graphics -- one for each technology category (computational tech – brown; special project tech – green; manufacturing tech – rose; materials tech – light blue and management tech – dark blue) and one for all technologies together. Each numbered point represents one technology. Manufacturing technologies combine perceived high impact on competitiveness and low Brazilian development, and thus warrant higher priority. Materials technologies combine medium impact on competitiveness and medium to high Brazilian development, and should possibly be lower priority. Other figures presented other expert opinion profiles. Figure 11.
These analyses led to a number of recommendations to FINEP concerning priorities. For example:
• General Recommendations -- Consider creating: a national molding technology center, a new technical assistance network, a new molding engineering course for undergraduates, and a molding project course for professionals.
• Specific Recommendations – Suggested foci as priority technologies for development

Tech Mining – Alan L. Porter
19
o Manufacturing technologies: 3-D machining, high speed machining, laser welding, rapid modeling, and adhesives for molds
o Computational technologies: virtual simulation, virtual modeling, national polymers database o Special molding technologies: rapid prototyping
4. Discussion We have sought to illustrate the range of possible applications of tech mining – i.e., of ways to analyze S,T&I information resources to gain vital intelligence to inform decision making. The tech mining framework arrays frequently recurring S,T&I managerial issues and questions. As the tools advance and applications are tried out, we look toward the emergence of certain widely used innovation indicators. This article hints at the diverse possibilities. The Technology Delivery System notion provides an easy-to-apply framework to help identify what factors are most salient to the S,T&I issue at hand. Completing a simple sketch of these factors and their interrelationships can help focus tech mining data search and analyses. It can also suggest critical issues to help focus the representations of results so that decision makers get right to the most vital intelligence. Information summarization and visualization are key. These deserve serious attention and assessment to determine what form of presentation and degree of detail work best. We are experimenting with “one-pagers” that consolidate the key information to help decide on issues at hand briskly (Porter and Cunningham, 2006). By agreeing upon “standard” indicators within an organization, these can be produced more efficiently and effectively. More efficiently can come about by preparing scripts that automatically step through analytical actions by multiple software programs. More effectively can result because decision makers become familiar with the chosen empirical indicators and know how to interpret them well. Our illustrations obviously cannot cover all the possibilities. However they do open several vistas worth pursuing:
• Inputs: Be alert to multiple types of data – S,T&I advances are captured in numerical, text, and visual forms. Software can manipulate and coordinate these to good advantage.
• Analytics: Again, think to combine multiple information resources. We can treat text – content – quantitatively, as well as qualitatively. Blending empirical and expert information resources is particularly advisable (e.g., gather multiple expert perspective inputs; get experts to review empirical analyses and information representations). Comparisons can be especially effective; try to benchmark results where decision makers will find that convincing.
• Visual and Other Outputs: Think in terms of multiple types of information representation – analytical results can be conveyed through combinations of numerical (charts), text, and visualizations. Note the combination of multiple messages in one figure (c.f., scientific activity and rate of change of this in Figure 8). Composite “one-pagers” can be very effective at communicating the essential messages.
• Systems: Conceptualize the S,T&I issues as a Technology Delivery System – this can assure that tech mining efforts focus on the more determinant factors, not those the analysts are most comfortable addressing.
• Zoom (focus): Text mining and related tools enable both “big picture” treatment of entire bodies of R&D, and capability to zoom in to address “micro elements” (e.g., to key on what a leading competitor is pursuing).
• “Zoom” (analytical speed): By standardizing on desirable innovation indicators that address frequently recurring questions, S,T&I analyses can be speeded up from months to days (c.f., Porter and Cunningham, 2006).
REFERENCES ABRAIC. (2005), Associação Brasileira dos Analistas de Inteligência Competitiva. Disponível em: http://www.abraic.org.br/site/faqs.asp#ic Alencar, M.S.M., Porter, A.L., and Antunes, A.M.S., National Nanopatenting Patterns, under submission

Tech Mining – Alan L. Porter
20
Batista, Fábio F. (2005), O governo que aprende: implementando a gestão do conhecimento no Executivo Federal. In Gestão da Informação e Inteligência Competitiva. Editora Saraiva. São Paulo. p. 185-194. Carvalho, Carlos Alberto. (2004), Desenvolvimento de Aplicações WebGIS em MapServer. EMBRAPA, Campinas. Flores, M. X. (1991), EMBRAPA project: Agricultural research going into the twentieth century. Brazil, Brasilia, DF: EMBRAPA-SEA, No. 4. FUNDAÇÃO DE AMPARO À PESQUISA DO ESTADO DE SÃO PAULO – FAPESP (2002). Indicadores de ciência, tecnologia e inovação em São Paulo: 2001. Organização de Francisco Romeu Landi. São Paulo: FAPESP, p.488. Gasques, José G. (Coor.); Rezende, Gervásio. C. de; Verde, Carlos M. V.; Conceição, Junia C. P. R. da; Carvalho, João C. de S.; Salerno, Mario. S. (2003), Desempenho e Crescimento do Agronegócio no Brasil. IPEA. Instituto de Pesquisa Econômica Aplicada, Brazil, Brasília - DF, (October). Grunig, J. E. (1992), Communication, public relations, and effective organizations. An overview of the book. In J. E. Grunig (Ed.), Excellence in Public Relations and Communication Management (pp.1-31). Hillsdale, NJ: Lawrence Erlbaum Associates. Grunig, J. E., & Repper, F. (1992), Strategic management, publics, and issues. In J. E. Grunig (Ed.), Excellence in Public Relations and Communication Management (pp.117-158). Hillsdale, NJ: Lawrence Erlbaum Associates. Hullman, A., and Meyer, M. (2003), Publications and Patents in Nanotechnology: An Overview of Previous Studies and the State of the Art, Scientometrics 58, 507-527. Lux Research (2005) -- ??reference SIMONE Manley, C.G., and Welsh, T.S. (2005), Publishing Patterns and Core Journals of the “Nano” Research Front, Special Library Association Annual Conference, Toronto. Persegona, Marcelo F. M. e ALVES, Isabel T. G. (2004), Sistema de Apoio à Decisão com Informações Georreferenciadas. I Simpósio de Tecnologia da Informação da Marinha, Rio de Janeiro, 1-6.
Pinheiro, Lena V. R. (2005). Inteligência Competitiva como disciplina da Ciência da Informação e sua trajetória e evolução no Brasil. In Gestão da Informação e Inteligência Competitiva. Editora Saraiva. São Paulo, 17-32. Porter, A.L., and Cunningham, S.W. (2005), Tech Mining: Exploiting New Technologies for Competitive Advantage, Wiley, New York. Porter, A.L., and Cunningham, S.W. (2006), Just-In-Time Technology Analysis Support, International Journal of Technology Management, Vol. 34, Nos. 3/4, 319-339. Porter, A.L., Yglesias, E., Kongthon, A., Courseault, C., and Newman, N.C. (2004), Get What You Need from Technology Information Products, Research-Technology Management, Vol. 47 (No. 6), 16-19. Schummer, J. (2004), Multidisciplinarity, Interdisciplinarity, and Patterns of Research Collaboration in Nanoscience and Nanotechnology, Scientometrics 59, 425-465.
Siames, Marta. (2005), Compartilhar ou proteger conhecimento? Grande desafio no comportamento informacional das organizações. In Gestão da Informação e Inteligência Competitiva. Editora Saraiva. São Paulo, 255-270. Teichert, T., and Mittermayer, M-A. (2002), Text Mining for Technology Monitoring, IEEE IEMC 2002, 596-601.

Tech Mining – Alan L. Porter
21
UNITED NATIONS EDUCATIONAL SCIENTIFIC AND CULTURAL ORGANIZATION-UNESCO (2004a). Selected research and development indicators. Available at <http://www.unesco.org>. Accessed March, 2004. UNITED NATIONS EDUCATIONAL SCIENTIFIC AND CULTURAL ORGANIZATION-UNESCO (2004b). Research and development (R&D) personnel by occupation. Available at <http://www.unesco.org>. Accessed March, 2004. VIOTTI, E.B.; MACEDO, M.M., (Org.) Indicadores de ciência, tecnologia e inovação no Brasil. Campinas: Editora da Unicamp, 2003. p. 614. Watts, R. J. and A. L. Porter (1997). "Innovation forecasting." Technological Forecasting and Social Change 56(1): 25-47. Wenk, E. Jr. & Kuehn, T. J. (1977). "Interinstitutional Networks in Technological Delivery Systems," in: J. Haberer (Ed.), Science and Technology Policy, Lexington Books, Lexington, MA, p. 153-175. MAPSERVER. (2004). MapServer Documentation Project. http://mapserver.cttmar.univali.br
Copyright © 2022 FDOKUMEN