Teaching Complex Content in Healthcare - CORE
332
e University of San Francisco USF Scholarship: a digital repository @ Gleeson Library | Geschke Center Doctoral Dissertations eses, Dissertations, Capstones and Projects Spring 2018 Teaching Complex Content in Healthcare: A Comparison of the Effect of ree Types of Multimedia Pretraining on Schematic Knowledge and Near Transfer Melisa Patrice Kaye University of San Francisco, [email protected] Follow this and additional works at: hps://repository.usfca.edu/diss Part of the Educational Psychology Commons is Dissertation is brought to you for free and open access by the eses, Dissertations, Capstones and Projects at USF Scholarship: a digital repository @ Gleeson Library | Geschke Center. It has been accepted for inclusion in Doctoral Dissertations by an authorized administrator of USF Scholarship: a digital repository @ Gleeson Library | Geschke Center. For more information, please contact [email protected]. Recommended Citation Kaye, Melisa Patrice, "Teaching Complex Content in Healthcare: A Comparison of the Effect of ree Types of Multimedia Pretraining on Schematic Knowledge and Near Transfer" (2018). Doctoral Dissertations. 417. hps://repository.usfca.edu/diss/417
-
Upload
khangminh22 -
Category
Documents
-
view
1 -
download
0
Transcript of Teaching Complex Content in Healthcare - CORE

The University of San FranciscoUSF Scholarship: a digital repository @ Gleeson Library |Geschke Center
Doctoral Dissertations Theses, Dissertations, Capstones and Projects
Spring 2018
Teaching Complex Content in Healthcare: AComparison of the Effect of Three Types ofMultimedia Pretraining on Schematic Knowledgeand Near TransferMelisa Patrice KayeUniversity of San Francisco, [email protected]
Follow this and additional works at: https://repository.usfca.edu/diss
Part of the Educational Psychology Commons
This Dissertation is brought to you for free and open access by the Theses, Dissertations, Capstones and Projects at USF Scholarship: a digitalrepository @ Gleeson Library | Geschke Center. It has been accepted for inclusion in Doctoral Dissertations by an authorized administrator of USFScholarship: a digital repository @ Gleeson Library | Geschke Center. For more information, please contact [email protected].
Recommended CitationKaye, Melisa Patrice, "Teaching Complex Content in Healthcare: A Comparison of the Effect of Three Types of MultimediaPretraining on Schematic Knowledge and Near Transfer" (2018). Doctoral Dissertations. 417.https://repository.usfca.edu/diss/417
The University of San Francisco
TEACHING COMPLEX CONTENT IN HEALTHCARE: A COMPARISON OF THE EFFECT OF THREE TYPES OF MULTIMEDIA PRETRAINING ON SCHEMATIC KNOWLEDGE AND NEAR TRANSFER
A Dissertation Presented to
The Faculty of the School of Education Department of Learning and Instruction
In Partial Fulfillment of the Requirements for the Degree
Doctor of Education
by Melisa Kaye
San Francisco April 2018
ii
THE UNIVERSITY OF SAN FRANCISCO
Dissertation Abstract
Teaching Complex Content in Healthcare: A Comparison of the Effect of Three Types of
Multimedia Pretraining on Schematic Knowledge and Near Transfer
Challenged to teach complex content to students, university educators in
healthcare disciplines face a practical need for effective pedagogical approaches. The
preponderance of multimedia and digital resources in and beyond college classrooms
suggests that solutions to teaching complex content should leverage educational
technology and multimedia resources. The multimedia principle of pretraining is one
effective way to augment complex content learning. The pretraining principle specifies
that learning is more effective when the names and characteristics of main terms and
concepts are introduced before more nuanced and complex content is presented.
The purpose of this study was to investigate three approaches to pretraining—
traditional pretraining, pretraining with a static concept map, and pretraining with an
animated concept map—to examine the effect that the method of pretraining had on
schematic knowledge and near transfer achievement. Pretraining has been found
especially effective with learners who have low prior knowledge, with difficult and
conceptual content, and with fast-paced instruction. The study also explored whether
student perceptions about the usefulness of concept maps as a learning resource was
reflected in achievement.
Using a quasi-experimental pretest-posttest design, 145 occupational therapy
students were assigned to one of the three treatment conditions. Following a pretest to
obtain a baseline of prior knowledge, the 12-minute pretraining treatment on the topic of
iii
sensory integration theory was administered via a video module, and then participants
were exposed to a 60-minute multimedia lecture. An immediate posttest was completed,
followed two weeks later by a delayed posttest. A questionnaire to measure participant
perceptions about concept maps was also administered at the posttest.
Data analysis was completed using repeated measures ANOVA to examine gain
scores from pretest to posttest to delayed posttest. On the measures of schematic
knowledge and near transfer, the static concept map group demonstrated statistically
significant gains and stronger scores than the other two groups. The findings suggest that
the most effective of these three strategies for learning complex content is pretraining
with a static concept map. Traditional pretraining is another viable option but pretraining
with an animated concept map is not an efficient approach.

iv
This dissertation, written under the direction of the candidate’s dissertation committee
and approved by the members of the committee, has been presented to and accepted by
the Faculty of the School of Education in partial fulfillment of the requirements for the
degree of Doctor of Education. The content and research methodologies presented in this
work represent the work of the candidate alone.
Melisa Kaye___________________________________ April 26, 2018 Candidate Date Dissertation Committee
Mathew Mitchell, PhD April 26, 2018 Chairperson
Kevin Oh, PhD April 26, 2018
Susan Prion, EdD April 26, 2018

v
Acknowledgements
I have an enormous amount of gratitude to my loved ones who, over the past five years, helped me persist in my studies and taught me about the freedom of seeking perfect imperfection. To the 145 Bay Area occupational therapy students who generously participated in this research study. And to my former students for spurring me to answer the hard questions about how to best teach and learn. To my beloved Aunt Sooz for believing in me, supporting me, laughing with me, and rarely tiring of hearing about the minutia of my coursework, research, writing, and life. To my Aunt Rita for being my role model, for cheering me on every step of the way, and for encouraging my analytical writing, critical thinking, grit, and wonder about it all. To those with me in spirit: My mother, Dr. Nancy Kaye, who championed my lust for learning and my questioning spirit. My Uncle Bill, whose enduring support reassured me that someone always had my back. To my incredible school sisters, Dr. Elizabeth Schroeder and Dr. Collette Roche, who have supported me through this whole crazy process. And to my school wife, Dr. Diana Neebe, who shared her home, her family, her heart, and her brilliant intellect with me. To my dissertation committee, Dr. Susan Prion and Dr. Kevin Oh, for challenging me to build my academic skill and tenacity. And to my chairperson, Dr. Mathew Mitchell, who for the past five years has encouraged my curiosity, creativity, and scholarship. To my dear friends Jeany, Melissa, and Ann, who have been my champions and practically walked this puppy to the finish line themselves. And to Ricki Boden for her wise words and quiet affirmations over these many years. To all the children, families, and OTs at Firefly Center for being my best teachers and holding down the fort while I completed this journey. And to Jean Ayres, Kay Schwartz and my OT colleagues for igniting my passion for sensory integration and encouraging my professional growth. To Borderlands Cafe and Bookstore staff for all the tea and conversation, and the folks at the Wednesday Shut Up and Write group, who witnessed the birth of this dissertation. To the community with whom I trudge that happy road—for modeling strength, courage, resilience, compassion, kindness, tolerance, and patience—one day at a time. And to my Kauai ohana who have cheered me on from afar—mahalo nui loa. To Miz Hannah the poodle, who has dragged me out for walks, remained fiercely devoted, and been by my side throughout this whole damn thing. Finally, I dedicate this dissertation to my wife, Lisa, who has supported me and believed in me always, who knows almost as much as I do about sensory integration and pretraining, and who I love with all my heart.
vi
TABLE OF CONTENTS
ABSTRACT ........................................................................................................................ ii
SIGNATURE PAGE ......................................................................................................... iv
ACKNOWLEDGEMENTS .................................................................................................v
LIST OF TABLES ...............................................................................................................x
LIST OF FIGURES .......................................................................................................... xii
CHAPTER I: STATEMENT OF THE PROBLEM ............................................................1
Purpose of the Study ................................................................................................6
Significance of the Study .........................................................................................8
Theoretical Framework ..........................................................................................10 Assimilation theory of retention ................................................................10 Cognitive load theory .................................................................................14 Cognitive theory of multimedia learning ...................................................21
Background and Need ............................................................................................27 Teaching complex content .........................................................................27 Managing essential processing ..................................................................29 Pretraining ..................................................................................................30 Pretraining using concept maps .................................................................34 The need for the study ................................................................................39
Research Questions ................................................................................................42
Definition of Terms ................................................................................................43
CHAPTER II: REVIEW OF THE LITERATURE ...........................................................47
Advance Organizers to Facilitate Meaningful Learning ........................................47 Early research .............................................................................................48 Criticism of advance organizers .................................................................50 Support for advance organizers .................................................................51 Current perspectives ...................................................................................53 Summary of the advance organizer ............................................................54
Instructional Visual Displays for Understanding Complex Content .....................55 Graphic organizers .....................................................................................57 Concept maps .............................................................................................59
vii
Effectiveness of concept maps ...................................................................60 Concept map structural considerations ......................................................66 Hierarchical and network concept maps ....................................................67 Signaling with concept maps .....................................................................68 Comparing static and animated concept maps ...........................................69 Potential limitations of concept maps ........................................................72 Summary of instructional visual models for learning complex content ....73
The Principle of Pretraining ...................................................................................74 Two-phase, isolated-interacting elements pretraining ...............................75 Effectiveness of traditional pretraining ......................................................76
Pretraining Using Concept Maps ...........................................................................83
Summary of the Literature .....................................................................................86
CHAPTER III: METHODOLOGY ...................................................................................87
Research Questions ................................................................................................89
Research Design .....................................................................................................93
Sample ....................................................................................................................93
Protection of Human Subjects ...............................................................................98
Instrumentation ....................................................................................................100 Measurement of pretraining .....................................................................100 Testing instruments ..................................................................................101 Instructional materials ..............................................................................104 Pretraining module information ...............................................................109
Procedures ............................................................................................................111 Prior to the intervention ...........................................................................112 Week one of the study ..............................................................................113 Week two of the study .............................................................................113 Week four of the study .............................................................................114
Pilot Procedures ...................................................................................................114
Data Analyses ......................................................................................................116
CHAPTER IV: RESULTS ...............................................................................................116
Research Questions 1 and 2: Schematic Knowledge Results ..............................120 Primary analysis: Schematic knowledge .................................................121
viii
Ancillary analysis: Schematic knowledge ...............................................126
Research Questions 3 and 4: Near Transfer Results ............................................132 Primary analysis: Near transfer ................................................................132 Ancillary analysis: Near transfer .............................................................137
Research Question 5: Concept Map Perceptions and Achievement ....................142
Summary of Results .............................................................................................144
CHAPTER V: DISCUSSION OF RESULTS .................................................................147
Summary of the Study .........................................................................................147
Summary of Results .............................................................................................152
Limitations of the Study .......................................................................................154 Sample ......................................................................................................155 Classroom setting .....................................................................................156 Study design .............................................................................................157
Discussion of Findings .........................................................................................160 Using pretraining to teach complex content ............................................161 Pretraining best practice: Which strategy to use? ....................................163
Conclusions ..........................................................................................................191
Implications for Research ....................................................................................192
Methodological Implications ...............................................................................197 Measuring schematic knowledge .............................................................198 Measuring near transfer ...........................................................................199 Measurement considerations in the continuum between schema and transfer ......................................................................199
Implications for Practice ......................................................................................203 Pretraining techniques for the classroom .................................................204 Integrating Pretraining into the College Curriculum ...............................209
REFERENCES ................................................................................................................212
APPENDIX A: Glossary of Terms ..................................................................................250
APPENDIX B: Informed Consent ...................................................................................259

ix
APPENDIX C: Word Association Test ...........................................................................262
APPENDIX D: Near Transfer Test ..................................................................................264
APPENDIX E: Concept Map Questionnaire ...................................................................268
APPENDIX F: Multimedia Learning Principles .............................................................269
APPENDIX G: Pretraining Content with References .....................................................270
APPENDIX H: Master Pretraining Script for Three Pretraining Conditions ..................272
APPENDIX I: Color and Black and White Concept Map for Pretraining .....................281
APPENDIX J: Sample of Animated Concept Map Images .............................................282
APPENDIX K: Sensory Integration Lecture Slides and Presenter Notes .......................284
x
LIST OF TABLES
Table 1 Occupational Therapy Student Sample Details by School of Attendance .......95 Table 2 Sensory Integration (SI) Pretraining Terms and Concepts ...........................105 Table 3 Design Principles for Creating Concept Maps ..............................................108 Table 4 Weekly Sequence of Events of Pretraining Study ........................................... 112 Table 5 Earned Scores for Schematic Knowledge and Near Transfer at Three Testing
Intervals .........................................................................................................118 Table 6 Schematic Knowledge Results: Descriptive Statistics at Three Testing
Intervals .........................................................................................................121 Table 7 Schematic Knowledge Gain Score Results: Descriptive Statistics, Repeated
Measures ANOVA, and Effect Size at Three Testing Intervals ......................124 Table 8 Pairwise Comparison of Schematic Knowledge Gain Scores: Mean Difference
and Effect Size ................................................................................................125 Table 9 Demographic Information for Matched Trio Low Prior Knowledge Research
Subsample for Ancillary Analysis ..................................................................127 Table 10 Schematic Knowledge Results for Low Prior Matched Trios: Descriptive
Statistics at Three Testing Intervals ...............................................................128 Table 11 Schematic Knowledge Gain Score Results for Low Prior Matched Trios:
Descriptive Statistics, Repeated Measures ANOVA, and Effect Size at Three Testing Intervals .............................................................................................130
Table 12 Pairwise Comparison of Schematic Knowledge Gain Scores in Low Prior
Matched Trios: Mean Difference and Effect Size ..........................................131 Table 13 Near Transfer Results: Descriptive Statistics at Three Testing Intervals ......133 Table 14 Near Transfer Gain Score Results: Descriptive Statistics, Repeated Measures
ANOVA, and Effect Size at Three Testing Intervals ......................................135 Table 15 Pairwise Comparison of Near Transfer Gain Scores: Mean Difference and
Effect Size .......................................................................................................136
xi
Table 16 Near Transfer Results for Low Prior Matched Trios: Descriptive Statistics at Three Testing Intervals ..................................................................................138
Table 17 Near Transfer Gain Score Results for Low Prior Matched Trios: Descriptive
Statistics, Repeated Measures ANOVA, and Effect Size at Three Testing Intervals .........................................................................................................140
Table 18 Pairwise Comparison of Near Transfer Gain Scores in Low Prior Matched
Trios: Mean Difference and Effect Size .........................................................141 Table 19 Descriptive Statistics for Concept Map Questionnaire, Schematic Knowledge
Correlates, and Near Transfer Correlates ....................................................142 Table 20 Summary of Inter-Correlations Between Concept Map Questionnaire Results
and Scores on Measures of Schematic Knowledge and Near Transfer .........143 Table 21 Design and Methodological Considerations for Creating Standard, Enhanced, Static Concept Map, and Animated Concept Map Pretraining
Presentations ..................................................................................................166
xii
LIST OF FIGURES
Figure 1. Continuum of meaningful learning. .................................................................12 Figure 2. Working memory and cognitive load. .............................................................19 Figure 3. Mayer’s cognitive theory of multimedia learning. ..........................................22 Figure 4. Paivio’s dual-coding theory. ............................................................................56 Figure 5. Example of a graphic organizer. ......................................................................57 Figure 6. Example of a concept map about concept maps. .............................................60 Figure 7. Example of hierarchical and network concept map structures. .......................67 Figure 8. Pretraining research study timeline and tasks. .................................................92 Figure 9. One-minute word association example. .........................................................103 Figure 10. Sensory integration concept map for pretraining. ..........................................110 Figure 11. Schematic knowledge scores at three time intervals for traditional pretraining
(TP), pretraining with a static concept map (SCM), and pretraining with an animated concept map (ACM) treatment groups. ..........................................122
Figure 12. Low prior knowledge matched trios subsample: schematic knowledge scores
at three time intervals for traditional pretraining (TP), pretraining with a static concept map (SCM), and pretraining with an animated concept map (ACM) treatment groups. ............................................................................................129
Figure 13. Near transfer scores at pretest, posttest, and delayed posttest for traditional
pretraining (TP), pretraining with a static concept map (SCM), and pretraining with an animated concept map (ACM) treatment groups. .............................134
Figure 14. Low prior knowledge matched trios subsample: near transfer scores at pretest,
posttest, and delayed posttest for traditional pretraining (TP), pretraining with a static concept map (SCM), and pretraining with an animated concept map (ACM) treatment groups. ...............................................................................139
Figure 15. Sample slide illustrating the multimedia principle. .......................................169 Figure 16. Sample slide illustrating the signaling principle using text-emphasizing
technique. ......................................................................................................171
xiii
Figure 17. Sample slide illustrating the signaling principle using a text-labeling technique. .......................................................................................................172
Figure 18. Fostering social agency. .................................................................................174 Figure 19. Example of the gestalt principle of similarity. ...............................................179 Figure 20. Static concept map of sensory integration terms. ..........................................180 Figure 21. Examples of the gestalt principle of proximity. .............................................181 Figure 22. Example of the gestalt principle of symmetry or order. .................................182
1
CHAPTER I
STATEMENT OF THE PROBLEM
Preparing healthcare students for professional practice is challenging for many
reasons, and the difficulty level of the content is a fundamental factor (Josephsen, 2015;
Michael, 2007; Sözbilir, 2004). With an ultimate goal of becoming competent clinicians,
students in the healthcare fields of medicine and nursing, as well as allied health
professions such as occupational, speech and language, and physical therapy, must tackle
numerous complex topics (Mayer, 2010). Topic difficulty, also referred to as content
complexity, is determined by three factors: (a) the number of elements of information to
be processed, (b) the proportion of elements that must be understood simultaneously and
in relationship to one another, and (c) the learner’s prior experience with the topic
(Sweller, Ayres, & Kalyuga, 2011). The greater the number of interacting elements and
the more limited the learner’s prior knowledge, the more challenging the content.
In addition to the content challenges, students must be able to integrate large
amounts of information, engage in critical appraisal of content, and then transfer
academic knowledge to clinical contexts (Josephsen, 2015; Leppink & van den Heuvel,
2015; van Merriënboer & Sweller, 2010). Content complexity, therefore, is representative
of the larger goal of transferring knowledge to practical application (Mayer & Wittrock,
1996; Mayer, 2002). This research study focused on the ability of first year occupational
therapy students to negotiate complex content in the study of sensory integration, a
commonly used framework for the evaluation and treatment of adults and children with
sensory, motor, and self-regulation challenges (Lane, Roley, & Champagne, 2014).
2
Occupational therapy is an allied health profession that assists people of all ages in
participating in meaningful everyday activities, also known as occupations.
“Occupational therapy services are provided for habilitation, rehabilitation, and the
promotion of health and wellness to those who have or are at risk for developing an
illness, injury, disease, disorder, condition, impairment, disability, activity limitation, or
participation restriction” (American Occupational Therapy Association [AOTA], 2014a
p. 1). A detailed description of the discipline can be found in Appendix A: Glossary of
Terms.
Healthcare educators including occupational therapy instructors recognize the
challenge of teaching complex content and are examining pedagogical methods to
address the issues (Kaylor, 2014; Naismith, Cheung, Ringsted, & Cavalcanti, 2015;
Pociask, Morrison, & Reid, 2013). One approach is to guide teaching with the use of
psychological learning theories such as cognitive load theory. Developed in the late
1980s to address how human cognition relates to instructional design, cognitive load
theory delineates three types of stressors, or load, imposed on the learner during
instruction (Sweller, van Merriënboer, & Paas, 1998). The first is (1) extraneous load,
composed of any distracting or unnecessary design or instructional factors that impede
learning. The second is (2) intrinsic load, the effort required to understand difficult
content. Finally, (3) germane load refers to the effort expended on learning, after the
learner has contended with design issues and content difficulty.
While cognitive load theory describes the types of mental load experienced during
learning sessions, a related theory, the cognitive theory of multimedia learning, offers a
set of principles for solving the challenges presented by the three types of cognitive load
3
(Mayer, 2014a). Within the cognitive theory of multimedia learning framework, there are
ways to reduce extraneous load, maximize germane load, and manage intrinsic load.
Managing intrinsic load, called essential processing in the cognitive theory of multimedia
learning, focuses on strategies for easing the difficulty of learning complex content by
creatively devoting maximal cognitive resources to the topic at hand. There are three
prime strategies to manage essential processing and one of these approaches, pretraining,
is the focus of this study. The pretraining principle specifies that learning is more
effective when the names and characteristics of main terms and concepts are introduced
before more nuanced and complex content is presented (Mayer & Pilegard, 2014).
This study was designed to examine the use of pretraining to teach complex
healthcare-related content to occupational therapy students. The intervention introduced
information with low element interactivity in advance of more complex information with
a goal of increasing learning as evidenced by test scores in the areas of schematic
knowledge and near transfer. Content that is low in element interactivity easily can be
understood in isolation from related information and understanding is not predicated on
understanding a conceptual whole. Schematic knowledge is a term used to describe
cognitive organization of information within a particular topic (Kalyuga, 2010). Transfer
measures a learner’s ability to apply what has been learned to related problems or
questions (Brooks & Dansereau, 1987; Mayer, 1999, 2002).
Evidence suggests that pretraining is an effective way to augment complex
content learning and that pretraining can be especially useful for learners who have low
prior knowledge (Mayer, 2009). Pretraining has been studied primarily in laboratory
environments using pools of college psychology students (Eitel, Scheiter, & Schüler,
4
2013; Kester, Kirschner, & van Merriënboer, 2004a; Mayer, Mathias, & Wetzell, 2002;
Mayer, Mautone, & Prothero, 2002). Research on pretraining has focused on cause and
effect—mechanical processes such as car braking systems, pumps, and pulleys (Eitel et
al., 2013; Kester, Kirschner, & van Merriënboer, 2004b; Kester, Kirschner, & van
Merriënboer, 2006; Mayer, Mathias, et al., 2002; Pollock, Chandler, & Sweller, 2002).
Traditional pretraining—the two-phase, isolated-interacting elements approach—has
been studied almost exclusively. Traditional pretraining introduces a learner to the names
and characteristics of main concepts in phase one, and then teaches the more complex,
interacting elements in phase two. Traditional pretraining is effective, although
researchers caution that the method requires learners to suspend their initial
understanding of a topic during the pretraining phase, which may hinder ultimate
understanding (Pollock et al., 2002; Van Merrienboer, Kirschner, & Kester, 2003).
Despite a modest, yet solid body of literature supporting the use of pretraining,
more research is needed. Laboratory environments are well suited for isolating the effect
of the intervention, but the context of pretraining needs to be expanded to include
authentic educational and clinical environments. Studies situated in classroom
environments are vital to determining the functional effect of pretraining for managing
essential processing in higher education. Evaluation of content understanding is key,
along with transfer to novel situations and problems. Research in the more naturalistic
settings in which occupational therapy learning occurs will also enable educators to better
generalize the use of pretraining to their own student populations.
The scope of subject matter used with pretraining should also be broadened to
include more robust topics that draw from a range of related fields of study and require
5
the learner to integrate information across those topic areas, such as those found in the
healthcare disciplines. For example, the treatment of a particular disease will depend on
simultaneously synthesizing a range of associated knowledge including but not limited to
anatomy, physiology, chemistry, pathology, and neurology. To date, research on the use of
pretraining for healthcare related topics is scant and focuses primarily on basic biological
sciences (McDonnell, O’Connor, & Rawe, 2012; Seery & Donnelly, 2012) and medicine
(Cutrer, Castro, Roy, & Turner, 2011; Zheng, Gupta, & Dewald, 2012). Only one study
on the use of essential processing strategies exists in the area of occupational therapy
(Pociask, DiZazzo-Miller, & Samuel, 2013). In that study, an “isolated-to-interacting-
elements sequencing approach” (p. 92) is used to address cognitive load. Pretraining is
combined with the practice of dividing and presenting content over several learning
sessions, so although the study addresses essential processing, the research is not focused
solely on pretraining.
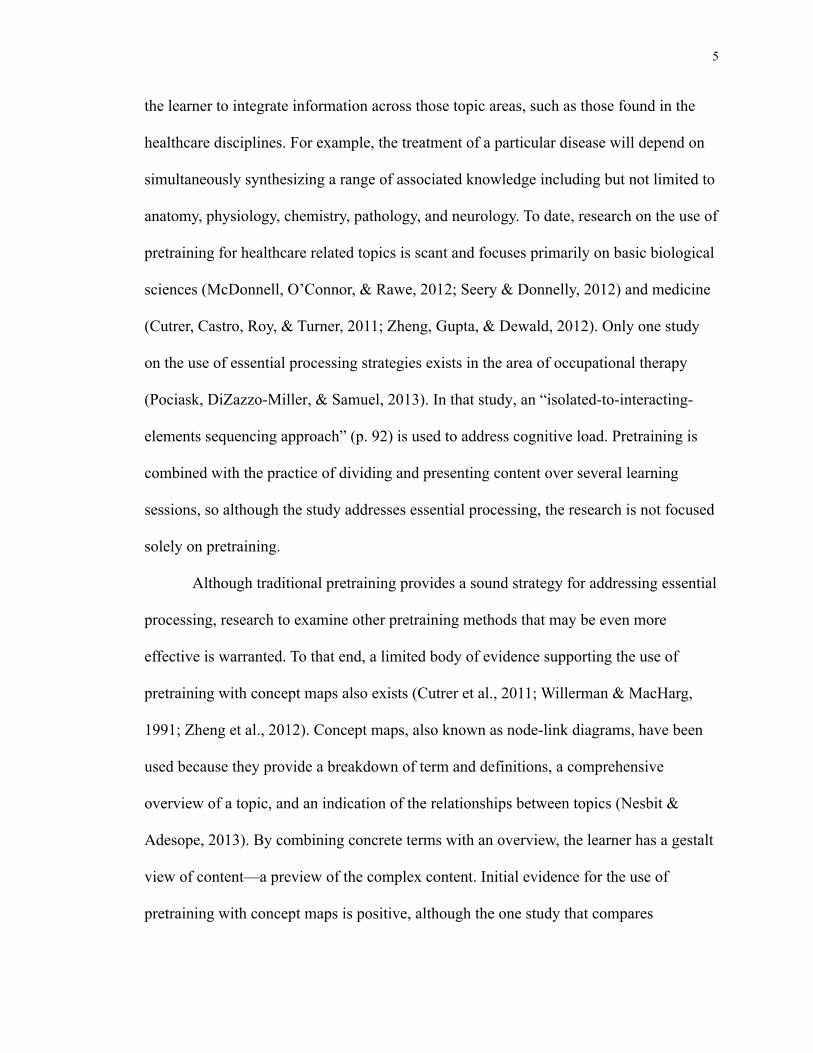
Although traditional pretraining provides a sound strategy for addressing essential
processing, research to examine other pretraining methods that may be even more
effective is warranted. To that end, a limited body of evidence supporting the use of
pretraining with concept maps also exists (Cutrer et al., 2011; Willerman & MacHarg,
1991; Zheng et al., 2012). Concept maps, also known as node-link diagrams, have been
used because they provide a breakdown of term and definitions, a comprehensive
overview of a topic, and an indication of the relationships between topics (Nesbit &
Adesope, 2013). By combining concrete terms with an overview, the learner has a gestalt
view of content—a preview of the complex content. Initial evidence for the use of
pretraining with concept maps is positive, although the one study that compares
6
pretraining using concept maps with traditional pretraining found both methods to be
equally effective; no advantage was gained by using a visual model (Zheng et al., 2012).
However, that study did not provide a clear accounting of procedures or results, so it
should be interpreted with caution.
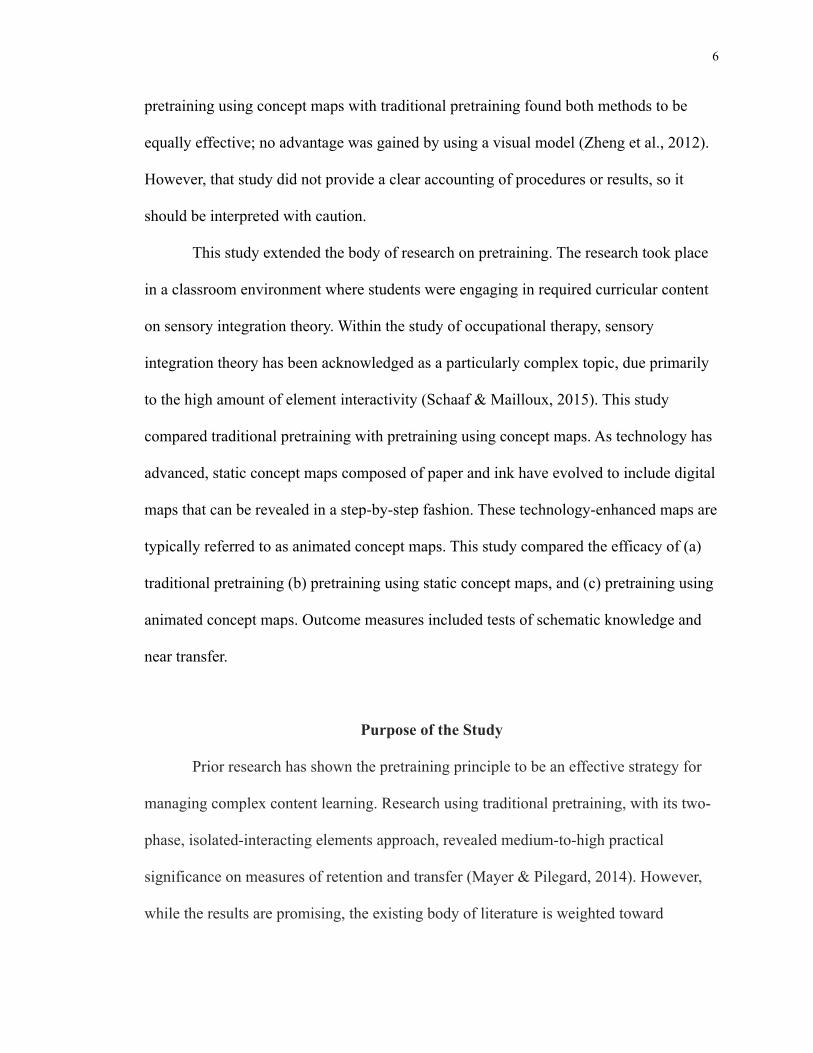
This study extended the body of research on pretraining. The research took place
in a classroom environment where students were engaging in required curricular content
on sensory integration theory. Within the study of occupational therapy, sensory
integration theory has been acknowledged as a particularly complex topic, due primarily
to the high amount of element interactivity (Schaaf & Mailloux, 2015). This study
compared traditional pretraining with pretraining using concept maps. As technology has
advanced, static concept maps composed of paper and ink have evolved to include digital
maps that can be revealed in a step-by-step fashion. These technology-enhanced maps are
typically referred to as animated concept maps. This study compared the efficacy of (a)
traditional pretraining (b) pretraining using static concept maps, and (c) pretraining using
animated concept maps. Outcome measures included tests of schematic knowledge and
near transfer.
Purpose of the Study
Prior research has shown the pretraining principle to be an effective strategy for
managing complex content learning. Research using traditional pretraining, with its two-
phase, isolated-interacting elements approach, revealed medium-to-high practical
significance on measures of retention and transfer (Mayer & Pilegard, 2014). However,
while the results are promising, the existing body of literature is weighted toward
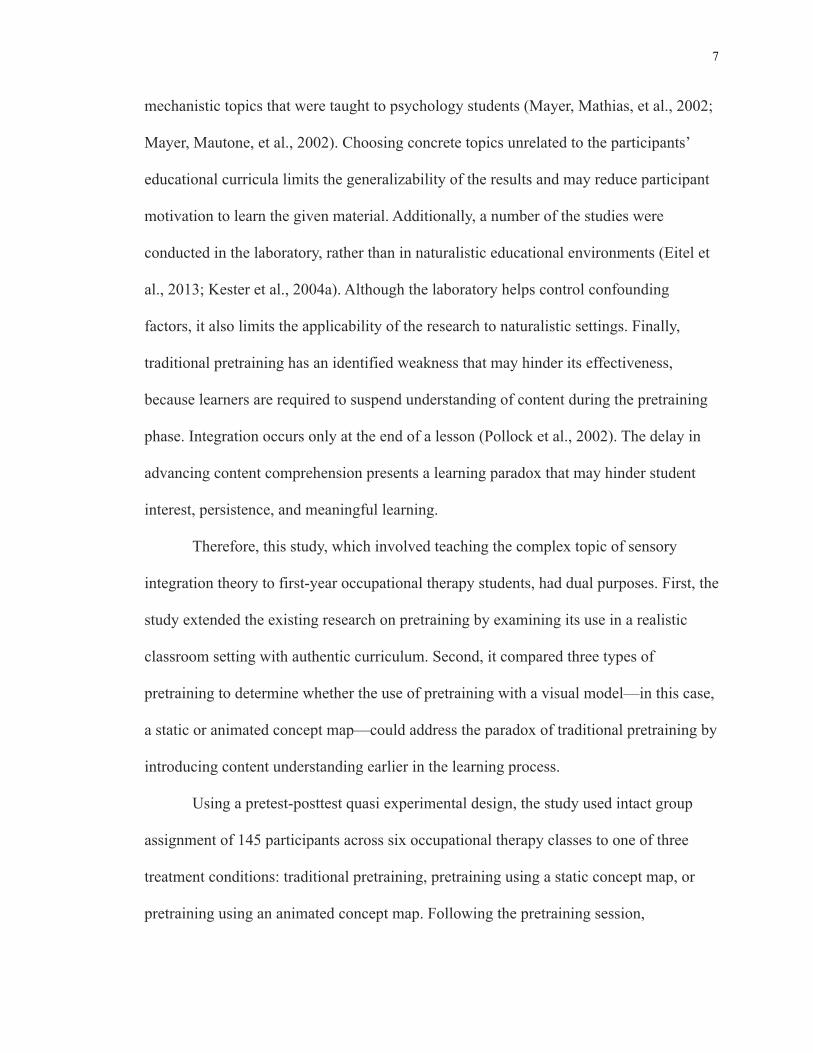
7
mechanistic topics that were taught to psychology students (Mayer, Mathias, et al., 2002;
Mayer, Mautone, et al., 2002). Choosing concrete topics unrelated to the participants’
educational curricula limits the generalizability of the results and may reduce participant
motivation to learn the given material. Additionally, a number of the studies were
conducted in the laboratory, rather than in naturalistic educational environments (Eitel et
al., 2013; Kester et al., 2004a). Although the laboratory helps control confounding
factors, it also limits the applicability of the research to naturalistic settings. Finally,
traditional pretraining has an identified weakness that may hinder its effectiveness,
because learners are required to suspend understanding of content during the pretraining
phase. Integration occurs only at the end of a lesson (Pollock et al., 2002). The delay in
advancing content comprehension presents a learning paradox that may hinder student
interest, persistence, and meaningful learning.
Therefore, this study, which involved teaching the complex topic of sensory
integration theory to first-year occupational therapy students, had dual purposes. First, the
study extended the existing research on pretraining by examining its use in a realistic
classroom setting with authentic curriculum. Second, it compared three types of
pretraining to determine whether the use of pretraining with a visual model—in this case,
a static or animated concept map—could address the paradox of traditional pretraining by
introducing content understanding earlier in the learning process.
Using a pretest-posttest quasi experimental design, the study used intact group
assignment of 145 participants across six occupational therapy classes to one of three
treatment conditions: traditional pretraining, pretraining using a static concept map, or
pretraining using an animated concept map. Following the pretraining session,
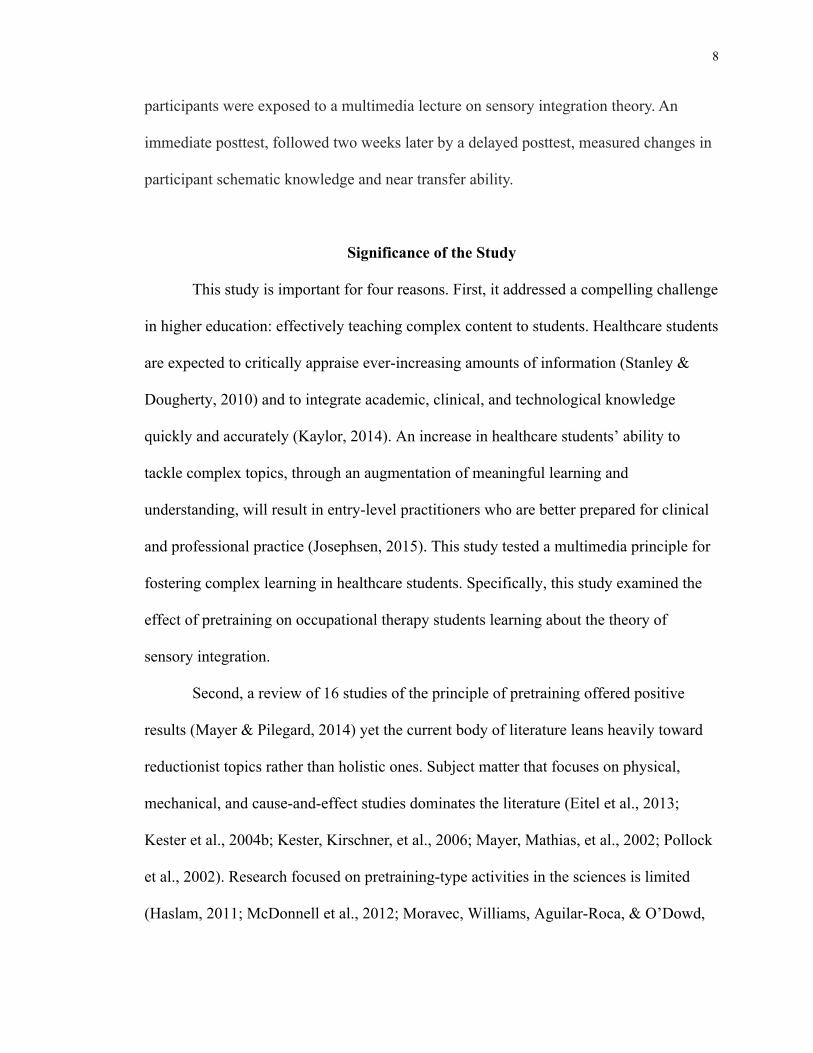
8
participants were exposed to a multimedia lecture on sensory integration theory. An
immediate posttest, followed two weeks later by a delayed posttest, measured changes in
participant schematic knowledge and near transfer ability.
Significance of the Study
This study is important for four reasons. First, it addressed a compelling challenge
in higher education: effectively teaching complex content to students. Healthcare students
are expected to critically appraise ever-increasing amounts of information (Stanley &
Dougherty, 2010) and to integrate academic, clinical, and technological knowledge
quickly and accurately (Kaylor, 2014). An increase in healthcare students’ ability to
tackle complex topics, through an augmentation of meaningful learning and
understanding, will result in entry-level practitioners who are better prepared for clinical
and professional practice (Josephsen, 2015). This study tested a multimedia principle for
fostering complex learning in healthcare students. Specifically, this study examined the
effect of pretraining on occupational therapy students learning about the theory of
sensory integration.
Second, a review of 16 studies of the principle of pretraining offered positive
results (Mayer & Pilegard, 2014) yet the current body of literature leans heavily toward
reductionist topics rather than holistic ones. Subject matter that focuses on physical,
mechanical, and cause-and-effect studies dominates the literature (Eitel et al., 2013;
Kester et al., 2004b; Kester, Kirschner, et al., 2006; Mayer, Mathias, et al., 2002; Pollock
et al., 2002). Research focused on pretraining-type activities in the sciences is limited
(Haslam, 2011; McDonnell et al., 2012; Moravec, Williams, Aguilar-Roca, & O’Dowd,

9
2010), and even less literature addresses pretraining in healthcare education (Cutrer et al.,
2011). Mayer and Pilegard (2014) recommend research to “extend the principle beyond
cause-and-effect systems” to determine “whether similar benefits of pre-training occur
for different kinds of lessons, such as an explanation of how to solve a mathematics
problem or an analysis of a historical controversy” (p. 339). Research on pretraining with
subject matter such as healthcare and other applied sciences can help confirm its
usefulness as a wide-reaching teaching and learning strategy. This study extending
evidence of the effectiveness of pretraining into an applied healthcare discipline.
Third, the study provided application of laboratory-based research to a realistic
classroom setting. Mayer and Pilegard (2014) suggest future research is needed “in which
the principles are tested within more ecologically valid environments, such as with
students in their classrooms” (p. 338). Extending the use of pretraining from a controlled
laboratory setting (Eitel et al., 2013; Kester et al., 2004a; Mayer, Mathias, et al., 2002;
Mayer, Mautone, et al., 2002) into an authentic classroom will help build a template for
realistic classroom use of the strategy. In addition, this study’s use of pretraining within a
designated course curriculum revealed important insights regarding how best to promote
learning when students are challenged with complex topics.
Finally, although the principle of pretraining has proven effective, learners must
suspend initial understanding during use of the strategy (Pollock et al., 2002). The current
study explored alternative approaches to traditional pretraining, to see if a general
understanding of the topic—in this case, sensory integration theory—can be introduced
and encouraged during pretraining, rather than afterward. The study compared traditional
pretraining with pretraining using a visual display to provide isolated element
10
information and an overview of the topic of sensory integration. By augmenting
pretraining with the use of a visual display—in this case, a static or animated concept
map—learners used their visual and verbal systems (Nesbit & Adesope, 2013) as they
constructed schematic knowledge and prior knowledge concurrently during pretraining.
Theoretical Framework
Grounding this study are three cognitive learning theories: the assimilation theory
of retention, cognitive load theory, and the cognitive theory of multimedia learning. The
assimilation theory of retention emphasizes meaningful learning, a vital component and
goal in the process of mastering complex content (Ausubel, 1960, 1962, 1968; Ausubel,
Novak, & Hanesian, 1978; Mayer, 1979). Cognitive load theory examines how human
cognition functions during learning, and it delineates three cognitive forces that impact
the learning process (Moreno & Park, 2010; Sweller et al., 2011). Building on cognitive
load theory, the cognitive theory of multimedia learning is based on a set of evidence-
based principles to guide the development of instructional presentations (Mayer, 2014a).
Assimilation Theory of Retention
Developed in the early 1960s, the assimilation theory of retention was an
alternative to behaviorism, the longstanding and predominant learning theory of the time
(Aliakbari, Parvin, Heidari, & Haghani, 2015). Behaviorists believed learning was an
external process that was based on objective observation of the environment and that led
to behavioral responses to those observations (Cooper, 1993). Behaviorism emphasized
learning as a reinforced process of producing appropriate responses to specific stimuli;
11
practically, this translated into memorization and repetition of educational content
(Behaviorism, 2017).
Conversely, assimilation theory of retention founder David Ausubel viewed
learning as an internal cognitive process. He emphasized understanding, integration, and
organization of incoming information (Ausubel, 1962, 1968). Ausubel asserted that the
assimilation (sometimes referred to as subsumption) of new information into an existing
knowledge base would yield increasingly sophisticated cognitive organizational
structures that were supportive of enduring and transferrable learning (Ausubel et al.,
1978).
Meaningful learning. The cornerstone of the assimilation theory of retention is
meaningful learning, the process of actively integrating new information into a well-
organized, existing structure of knowledge (Novak, 2013). Meaningful learning
emphasizes understanding content, rather than simply memorizing it. Understanding can
be defined as the capacity to explain, interpret, apply, shift perspective, empathize, and
self-assess during the learning process (Wiggins & McTighe, 2005). One’s ability to use
information to solve novel problems is a prime means of measuring whether meaningful
learning has occurred (Brooks & Dansereau, 1987). This skill is often referred to as
transfer (Cormier & Hagman, 1987).
Novak (2002) proposed that meaningful learning and rote learning form a
continuum, as detailed in Figure 1. Rote learning is defined as the memorization and
rehearsal of information (Fata-Hartley, 2011). At one end of the continuum, the student’s
goal is to memorize information so that it can be recalled on demand, typically for an
exam. When information is memorized, but not integrated with prior knowledge or
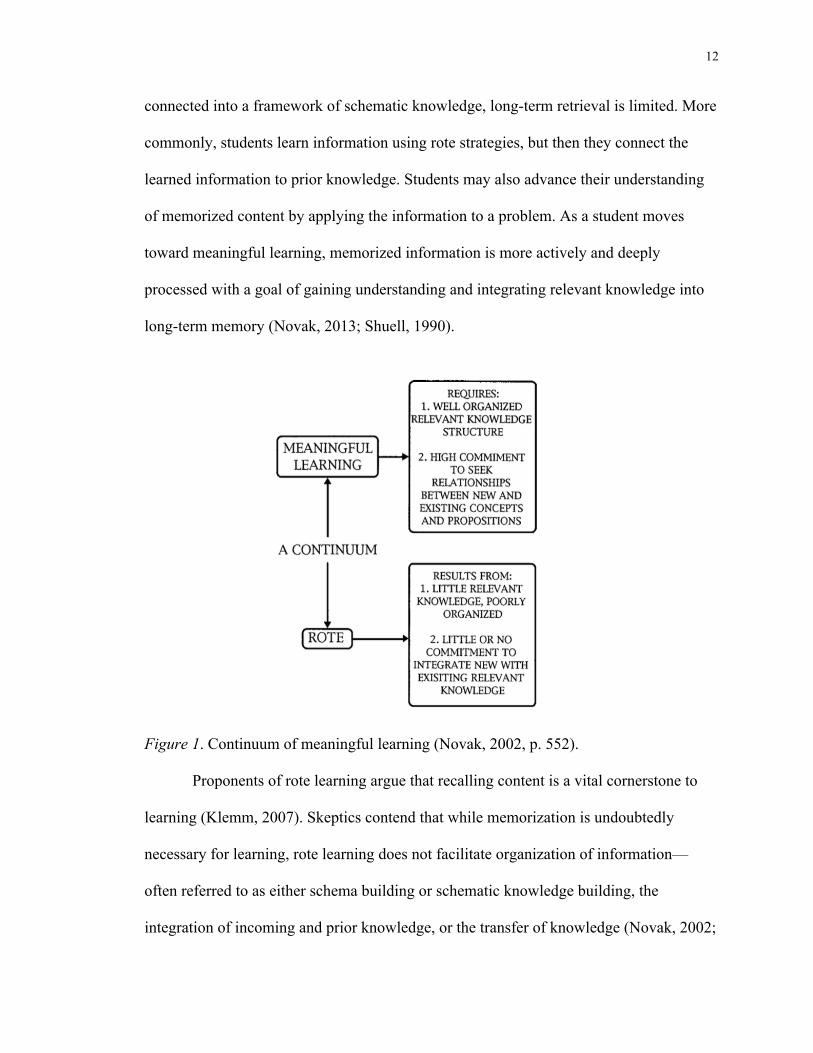
12
connected into a framework of schematic knowledge, long-term retrieval is limited. More
commonly, students learn information using rote strategies, but then they connect the
learned information to prior knowledge. Students may also advance their understanding
of memorized content by applying the information to a problem. As a student moves
toward meaningful learning, memorized information is more actively and deeply
processed with a goal of gaining understanding and integrating relevant knowledge into
long-term memory (Novak, 2013; Shuell, 1990).
Figure 1. Continuum of meaningful learning (Novak, 2002, p. 552).
Proponents of rote learning argue that recalling content is a vital cornerstone to
learning (Klemm, 2007). Skeptics contend that while memorization is undoubtedly
necessary for learning, rote learning does not facilitate organization of information—
often referred to as either schema building or schematic knowledge building, the
integration of incoming and prior knowledge, or the transfer of knowledge (Novak, 2002;
13
Mayer, 2002). Emphasizing this point, Etches (2016) argues that the value of rote
learning can be determined by how much transfer to authentic situations and tasks can be
gained from recall.
Practically, rote learning may not be a terminal learning strategy, because
remembering without understanding often results in relatively rapid forgetting (Putnam,
Sungkhasettee, & Roediger, 2016). Cramming for an exam is an example of this
phenomenon. Learners use rehearsed information to succeed on a test, but prolonged
retention and later retrieval for use is limited (Mayer, 2002). However, rote learning does
provide a foundational step in a comprehensive learning process. For example, to
complete math equations, learners must first memorize multiplication tables and store
that information as prior knowledge. Only after basic information is memorized can
learners attend to content with higher levels of complexity.
The advance organizer. To facilitate meaningful learning, Ausubel developed
the advance organizer, a learning strategy to prepare the learner for later and more
complex content (Ausubel, 1962). During a lesson, advance organizers act as a scaffold
to provide concrete, factual material in advance of subsequent conceptual or abstract
material (Ausubel, 1968). In describing advance organizers, Ausubel et al. (1978) says,
“These more general, more inclusive learning materials serve as a kind of ‘cognitive
bridge’ to facilitate linkage of new learning material to available, relevant elements in the
learner’s cognitive structure” (p. 172).
According to Ausubel (1968), advance organizers serve three purposes. First, they
facilitate meaningful learning by introducing relevant, anchoring ideas into the learner’s
cognitive structure, which then serve as the starting point for schematic knowledge
14
acquisition. Second, they provide a general and accessible introduction to content,
thereby increasing the learner’s prior knowledge base. And third, advance organizers
offer a preview of relevant content, which then enables the learner to begin forming a
cognitive organizational structure. Ausubel (1968) says, “The principle function of the
organizer is to bridge the gap between what the learner already knows and what he needs
to know before he can meaningfully learn the task at hand” (p. 148, italics original).
Mayer and Pilegard (2014) suggest that advance organizers are closely related to
pretraining in both structure and function.
The assimilation theory of retention and advance organizers provide a historical
perspective on learning, and they highlight factors Ausubel believed to be vital to the
learning process. The concept of meaningful learning is key, since complex content must
be processed in an active and concentrated way. To simply memorize and regurgitate
information does not promote meaningful learning. Neither does it further the acquisition
of schematic knowledge networks, which act to organize and integrate new information
with prior knowledge, necessary processes for mastering complex topics in the healthcare
realm.
In the next section, the assimilation theory of retention framework will be
extended to address strategies for fostering meaningful learning. Factors that hinder
meaningful learning and means to avert them will also be explored. The foundation of
meaningful learning will be extended to encompass more current knowledge of human
cognition and learning through an examination of cognitive load theory.
15
Cognitive Load Theory
Cognitive load theory describes the intersections between human cognitive
architecture, instructional design, and learner characteristics as they affect the learning
process (Moreno & Park, 2010). Cognitive architecture refers to the processes, functions,
and capacities of human neurological systems (Sweller et al., 1998). As educational
psychologist John Sweller explains, “The primary purpose of [cognitive load theory] has
been to indicate how to present novel information ... to reduce unnecessary working
memory load, and to facilitate change in long-term memory” (Sweller, 2010, p. 40). The
framework for cognitive load theory was built around assumptions concerning working
memory, long-term memory, schema acquisition, and the classification mental effort used
during the learning process.
Working memory. Working memory is a multi-component system that provides
a temporary storage site for incoming information. The system is composed of the
phonological loop, the visuospatial sketch pad, the episodic buffer, and the central
executive (Baddeley, 2015). With its limited capacity, working memory can hold only
seven, plus or minus two, items of novel information at a time (Miller, 1956). Learners
can likely process only four of those seven items simultaneously, further shrinking the
capacity of working memory (Cowan, 2001). The duration of working memory is
likewise limited, with retention of information lasting approximately 20 to 30 seconds
unless the contents of working memory are refreshed (Peterson & Peterson, 1959;
Shiffrin & Nosofsky, 1994). Limitations in size and duration create vulnerability during
the learning process, since working memory can be easily and quickly overloaded. The
limited capacity of working memory has significant implications for instructional
16
practice, especially when students are attempting to learn complex content in which
multiple elements of information must be processed simultaneously. Educators and
instructional designers are thus challenged to strategically present content in a way that
maximizes working memory without overloading it (Schüler, Scheiter, & van Genuchten,
2011).
Long-term memory. When information is slated for permanent storage, it is
transported from working memory to long-term memory. With its theoretically limitless
capacity, long-term memory provides a storage site for complex networks of information
(Moreno & Park, 2010). According to the classification proposed by Squire (1992), long-
term memory is composed of a number of components including explicit (declarative)
memory and implicit (non-declarative) memory. As information moves into long-term
memory, it is organized, integrated with relevant prior knowledge, and coded to assist
with later retrieval (Cowan, 2008).
In the 1960s and ‘70s, advances in the study of cognition refined our
understanding of the role of long-term memory. Not only does long-term memory hold
factual and procedural information, but it is also a “central component for problem
solving and thought” (Sweller 2010, p. 32). What was once viewed as ability or
intelligence, a relatively fixed construct, could now be attributed to the organizational
network of information held in long-term memory. An example illustrating this concept
is found in the study of master chess players (Chase & Simon, 1973; De Groot, 1966).
Researchers found that the main difference between novice and expert chess players was
not the IQ of the player, but rather the number of board configurations and problem-
solving strategies the masters held in their long-term memory (Sweller, 2010). Master
17
chess players were able to chunk information to remember as many as 100,000 board
configurations (Simon & Gilmartin, 1973). Grandmasters recalled 90% of board
configurations, whereas novice players could recall only 50% of the patterns (De Groot,
1966). From an educational perspective, this finding indicates that instruction should
focus on optimizing working memory function, as well as helping learners strategically
integrate new information with prior knowledge in long-term memory. Moving processed
information from working memory to long-term memory, and integrating new and
existing content within long-term memory, requires the learner to develop cognitive
frameworks to organize and store all of this knowledge. These organizational systems are
often referred to as schemas.
Schemas. A schema is a cognitive construct used to organize information in long-
term memory and to aid with retrieval. Schemas classify multiple elements of
information into a single element, called a chunk, based on how that information will be
used (Kalyuga, 2010; Sweller et al., 2011). Chunking information maximizes learning
potential, because a packet of information, which includes a number of items, is
processed in working memory as one element, rather than as the original multiple items
of information. The outcome of schema acquisition is possession of schematic
knowledge, a term describing the organized web of information provided within a
schema. Often hierarchically organized, schemas incorporate information of more and
more complexity as one’s body of knowledge increases (Sweller, 2010).
Once a schema is acquired, schematic knowledge can become automated,
typically from extensive practice or use (Sweller et al., 1998), which allows for rapid and
accurate access of information with limited cognitive effort. Automated schemas can be
18
seen as a set of rules that guide the learner to problem solving quickly and with little
effort (Kotovsky, Hayes, & Simon, 1985). When a schema is automated, processing
largely bypasses working memory, which frees up memory resources for relevant aspects
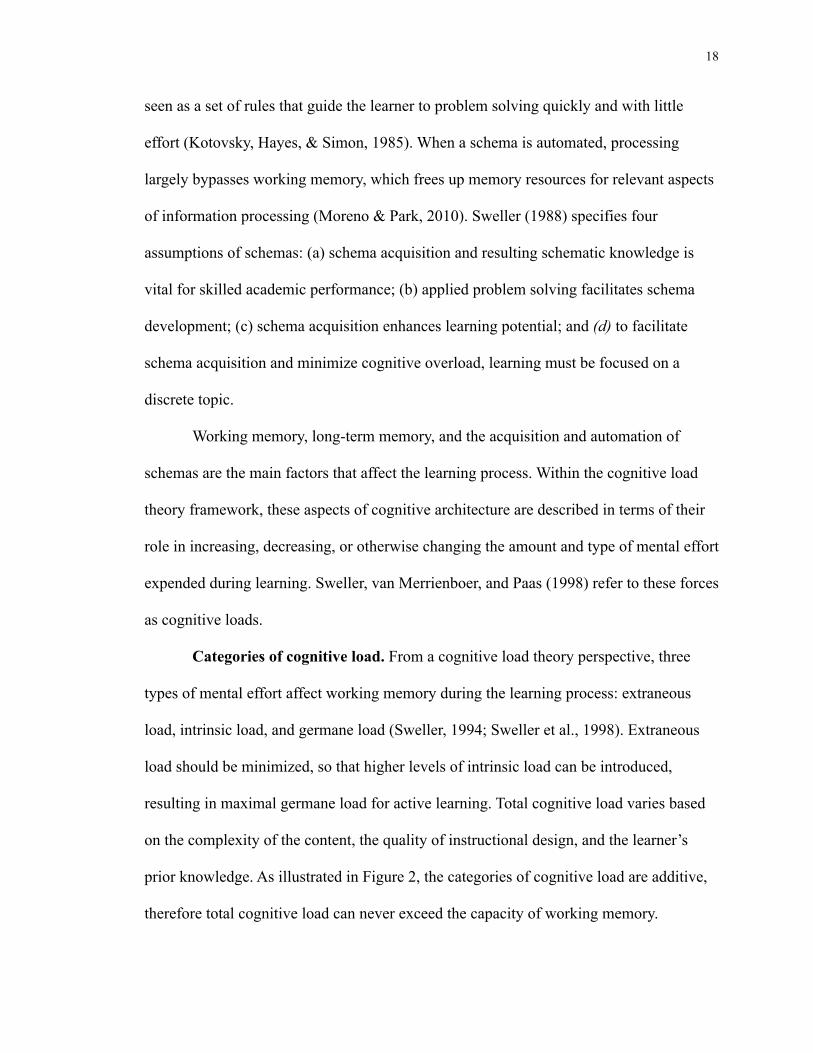
of information processing (Moreno & Park, 2010). Sweller (1988) specifies four
assumptions of schemas: (a) schema acquisition and resulting schematic knowledge is
vital for skilled academic performance; (b) applied problem solving facilitates schema
development; (c) schema acquisition enhances learning potential; and (d) to facilitate
schema acquisition and minimize cognitive overload, learning must be focused on a
discrete topic.
Working memory, long-term memory, and the acquisition and automation of
schemas are the main factors that affect the learning process. Within the cognitive load
theory framework, these aspects of cognitive architecture are described in terms of their
role in increasing, decreasing, or otherwise changing the amount and type of mental effort
expended during learning. Sweller, van Merrienboer, and Paas (1998) refer to these forces
as cognitive loads.
Categories of cognitive load. From a cognitive load theory perspective, three
types of mental effort affect working memory during the learning process: extraneous
load, intrinsic load, and germane load (Sweller, 1994; Sweller et al., 1998). Extraneous
load should be minimized, so that higher levels of intrinsic load can be introduced,
resulting in maximal germane load for active learning. Total cognitive load varies based
on the complexity of the content, the quality of instructional design, and the learner’s
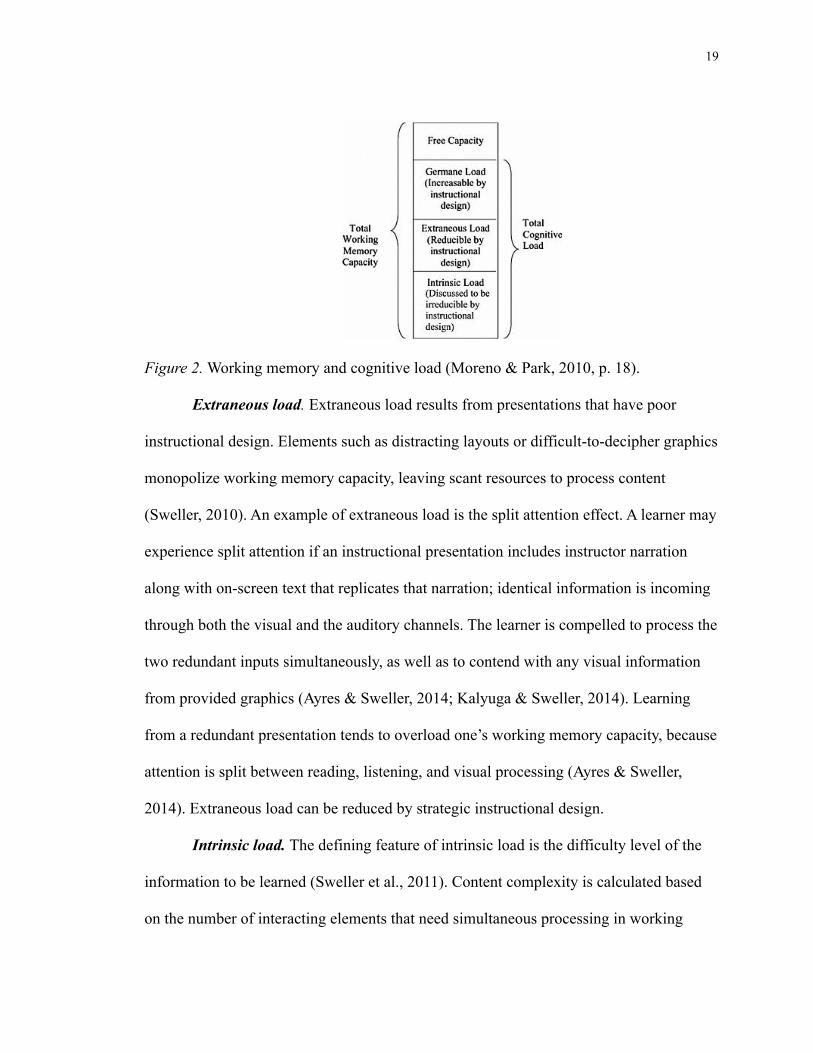
prior knowledge. As illustrated in Figure 2, the categories of cognitive load are additive,
therefore total cognitive load can never exceed the capacity of working memory.
19
Figure 2. Working memory and cognitive load (Moreno & Park, 2010, p. 18).
Extraneous load. Extraneous load results from presentations that have poor
instructional design. Elements such as distracting layouts or difficult-to-decipher graphics
monopolize working memory capacity, leaving scant resources to process content
(Sweller, 2010). An example of extraneous load is the split attention effect. A learner may
experience split attention if an instructional presentation includes instructor narration
along with on-screen text that replicates that narration; identical information is incoming
through both the visual and the auditory channels. The learner is compelled to process the
two redundant inputs simultaneously, as well as to contend with any visual information
from provided graphics (Ayres & Sweller, 2014; Kalyuga & Sweller, 2014). Learning
from a redundant presentation tends to overload one’s working memory capacity, because
attention is split between reading, listening, and visual processing (Ayres & Sweller,
2014). Extraneous load can be reduced by strategic instructional design.
Intrinsic load. The defining feature of intrinsic load is the difficulty level of the
information to be learned (Sweller et al., 2011). Content complexity is calculated based
on the number of interacting elements that need simultaneous processing in working
20
memory. High intrinsic load results from greater numbers of interacting elements and
greater stress on working memory. Low intrinsic load occurs when elements can be
learned serially, rather than simultaneously. For example, when learning a new language,
studying vocabulary is low in element interactivity because words can be learned one at a
time, and knowing one word does not influence one’s learning of another word.
Conversely, learning grammar presents a high intrinsic load, because each word must be
arranged and understood in relation to other words (Sweller et al., 1998). The only certain
way to lower intrinsic load is to increase a learner’s prior knowledge, allowing the learner
to expend less working memory on understanding content (Sweller, 2010).
Cognitive load theory researchers debate whether intrinsic load actually can be
reduced, or whether it can merely be managed (Mayer, 2014a). Attempts to reduce
intrinsic load rather than manage intrinsic load can decrease the complexity of the
content, but results in an inevitable change in the quality and quantity of knowledge
presented and processed. When content is altered, however, the learning task is
fundamentally changed, rather than simply reduced in difficulty (Paas, Renkl, & Sweller,
2003). Managing intrinsic load effectively requires using instructional strategies to
maximize working memory capacity without changing the complexity of the content.
Techniques used to manage intrinsic load typically either provide complementary visual
and auditory input (modality principle), dividing information into bite-sized pieces
(segmenting principle), or temporarily reduce element interactivity (pretraining principle)
(Mayer, Mautone, et al., 2002; Van Merriënboer & Sweller, 2005).
Germane load. The type of cognitive load that is directly related to effective
learning is germane load (Moreno & Park, 2010). According to Sweller (2010),
21
“Instruction should be designed to ensure that the bulk of working memory resources is
germane to the goal of schema acquisition and automation” (p. 43). When extraneous
load is sufficiently low and intrinsic load does not exceed the learner’s capabilities,
available cognitive resources are directed to germane load. To enhance germane load, and
thus enhance meaningful learning, instructional design efforts must be focused on
reducing extraneous load, thus allowing working memory to be directed toward
processing intrinsic load.
Cognitive load theory provides insights into aspects of cognitive architecture that
affect learning—and especially learning of complex content. The theory also offers a
classification system of the types of loads that impact learning, allowing the issues
around complex learning to be disentangled for more thorough examination. Further,
cognitive load theory delineates the instructional design factors contributing to the
various loads and describes strategies that help address difficulties when they arise, thus
helping to meet the challenge of creating presentations for complex content. Research on
complex learning is predicated on understanding the central emphases of cognitive load
theory: how the brain takes in, processes, and stores information, and what can be done to
facilitate those cognitive activities. Cognitive load theory is also the foundation that
informs the cognitive theory of multimedia learning, which is focused on tailoring
instructional presentations to the capacities of human cognitive architecture.
Cognitive Theory of Multimedia Learning
The cognitive theory of multimedia learning is an instructional design theory,
based on the principles of cognitive load theory, that is focused on fostering meaningful
learning (Paas & Sweller, 2014). The essential message of the cognitive theory of
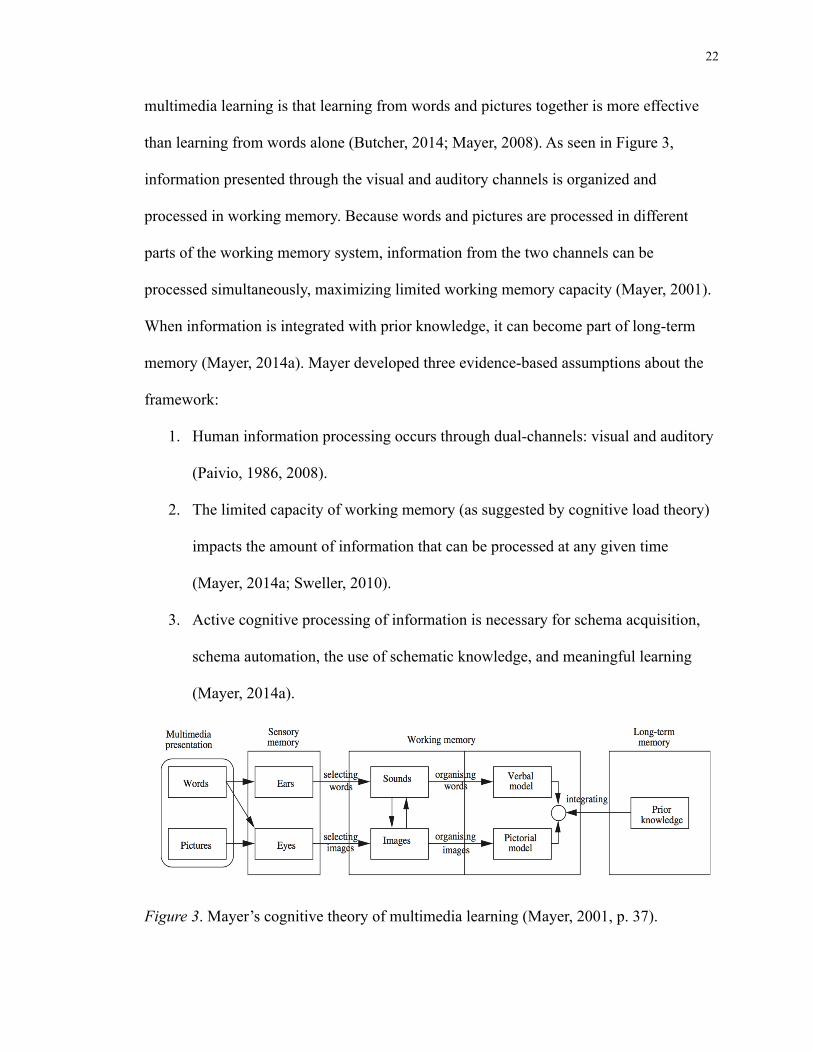
22
multimedia learning is that learning from words and pictures together is more effective
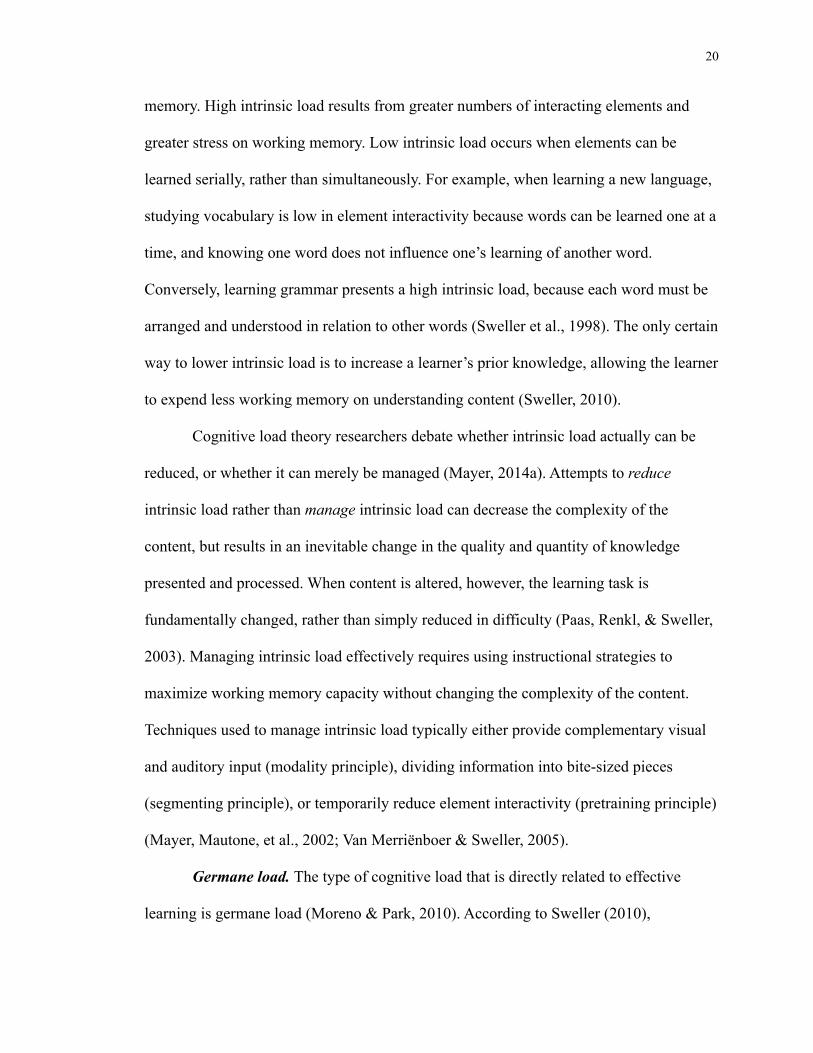
than learning from words alone (Butcher, 2014; Mayer, 2008). As seen in Figure 3,
information presented through the visual and auditory channels is organized and
processed in working memory. Because words and pictures are processed in different
parts of the working memory system, information from the two channels can be
processed simultaneously, maximizing limited working memory capacity (Mayer, 2001).
When information is integrated with prior knowledge, it can become part of long-term
memory (Mayer, 2014a). Mayer developed three evidence-based assumptions about the
framework:
1. Human information processing occurs through dual-channels: visual and auditory
(Paivio, 1986, 2008).
2. The limited capacity of working memory (as suggested by cognitive load theory)
impacts the amount of information that can be processed at any given time
(Mayer, 2014a; Sweller, 2010).
3. Active cognitive processing of information is necessary for schema acquisition,
schema automation, the use of schematic knowledge, and meaningful learning
(Mayer, 2014a).
Figure 3. Mayer’s cognitive theory of multimedia learning (Mayer, 2001, p. 37).
23
Categories of cognitive processing. The three assumptions about the cognitive
theory of multimedia learning introduced above are used as stepping stones for
delineating the aspects of cognitive processing inherent in multimedia learning. Similar to
the three types of cognitive load in cognitive load theory, there are three categories of
cognitive processing in the cognitive theory of multimedia learning. However, the
cognitive theory of multimedia learning nomenclature is more than a set of synonyms for
cognitive load. The labels form a taxonomy for identifying the principles of the cognitive
theory of multimedia learning, which in turn provides concrete tools for addressing the
effects of the cognitive loads (Mayer, 2009). Thus, cognitive load theory classifies the
types of mental effort arising during the learning process, while the cognitive theory of
multimedia learning provides processing strategies for dealing with those stressors.
The first multimedia learning category is extraneous processing, which is
associated with extraneous load in cognitive load theory. The extraneous processing
principles suggest strategies for designing presentations that encourage optimal learning
(Mayer & Fiorella, 2014). Examples include highlighting key words and graphics,
deleting extraneous or redundant words or graphics, and placing essential words and
graphics next to each other (Mayer, 2009).
The second category is generative processing, associated with germane load in
cognitive load theory. The generative processing principles suggest methods to increase
engagement and active learning (Mayer, 2009). Examples include using both words and
pictures to capture learner attention and interest (Mayer, 2009), encouraging learners to
explain what they have learned (Chi, de Leeuw, Chiu, & LaVancher, 1994; Wylie & Chi,
2014), and using a variety of social cues to motivate learners (Mayer, 2014b).
24
The third and final category is essential processing, which mirrors intrinsic load in
cognitive load theory. Essential processing principles are associated with managing
complex content, and they are designed to assist with learning information that places a
heavy load on working memory. Essential processing is of particular interest to this study,
as it addresses the challenge of learning about topics that are high in element interactivity.
The cognitive theory of multimedia learning advocates for managing essential
processing via three principles: modality, segmenting, and pretraining. The modality
principle suggests that presentations combine graphics with narration and limit on-screen
text to maximize the capacity of working memory (Low & Sweller, 2014). The
segmenting principle proposes that content be divided into small chunks, and that content
delivery be spaced out so that working memory is not overloaded with too much
information all at once (Mayer & Moreno, 2003). The pretraining principle, which is the
focus of this study, indicates that “people learn more deeply from a multimedia message
when they know the names and characteristics of the main concepts” (Mayer & Pilegard,
2014, p. 316).
Pretraining to manage essential processing. In learning complex content, two
courses of action must occur: learning about the parts of a topic (e.g., the names and
definitions of novel terms) and learning how all of the parts interact conceptually (van
Merriënboer, Kester, & Paas, 2006). When learners attempt to understand terms and
definitions at the same time they are trying to learn concepts and relationships, cognitive
capacity can be overwhelmed. This state is called essential overload, and it results in an
inability to take in any new information (Mayer & Moreno, 2003).
25
To avoid essential overload, dividing a lesson into two parts by introducing
pretraining can temporarily and artificially lower the essential processing demands. The
components of a topic are learned before the interaction between components is
introduced. For example, in two studies completed by Mayer, Mathias, and Wetzell
(2002), participants learned about a hydraulic braking system for automobiles. Learning
was divided into two stages: (1) building a component model for each major part of the
system, and then (2) building a causal model of the entire system. Using narrated
animations, pretraining was used to teach participants the names and behaviors of central
parts of the system (e.g., brake pedal, pistons, master cylinder, fluid, brake shoes, and
brake drums). Participants then learned about the cause-and-effect relationships between
the components, as well as the overall chain of events that comprise the process of
braking a car (e.g., pushing the brake pedal causes the pistons in the master cylinder to
move, which causes the fluid to be compressed). As Mayer (2009) explains, “Pretraining
provides prior knowledge that reduces the amount of processing needed to understand
[the presentation]” (p. 193). Pretraining works especially well when learners have low
prior knowledge, when learners are dealing with complex content, and when content is
being delivered at a fast pace (Mayer, 2009; Mayer & Pilegard, 2014). Pretraining
enables learners to build prior knowledge and acquire schematic knowledge without
overloading available cognitive resources.
In its entirety, the cognitive theory of multimedia learning is a design plan for
addressing complex content learning. The assumptions of the framework explain the
capacities of human cognition and form a link to the cognitive load theory premises. The
schematic of how information is processed through the dual visual and auditory channels
26
builds a convincing argument for the use of multimedia presentations (Figure 3), which is
especially relevant when considering the challenge of complex topics in healthcare.
Finally, the cognitive theory of multimedia learning provides a set of strategies to ease
the working memory stresses during learning of complex content. After reducing
extraneous processing, the essential processing strategies of segmenting, modality, and
pretraining each offer a complementary approach to manage the difficulty of learning
content high in element interactivity. Pretraining, the topic of this research, is one tool in
a set of resources provided by the cognitive theory of multimedia learning.
Placing pretraining in context. The theoretical underpinnings of the assimilation
theory of retention, cognitive load theory, and the cognitive theory of multimedia
learning provided substantive links to this pretraining study. When considering how to
best teach complex content, the assimilation theory of retention and the construct of
meaningful learning propose a framework for understanding content at a deep level.
Within the assimilation theory of retention, the use of advance organizers provides a
historical blueprint for the contemporary pretraining principle. Cognitive load theory
defines and delineates the connections between human cognitive architecture,
instructional design, and learning. Additionally, cognitive load theory classifies the types
of cognitive load that are inherent during the learning process and examines the
mechanisms of intrinsic load as it relates to complex content learning. Finally, the
cognitive theory of multimedia learning provides principles for enhancing processing and
meaningful learning in multimedia-based environments. Specifically, the cognitive theory
of multimedia learning proposes evidence-based strategies for managing essential
processing and details how pretraining can work to facilitate learning complex content.
27
Background and Need
Teaching Complex Content
Facilitating student learning is an ongoing challenge for educators, as instructors
must attend to pedagogical issues and student characteristics in addition to content
demands (Michael, 2007). In higher education, a particular area of challenge is teaching
complex content to students. Understanding complex content requires a learner to
understand multiple subtopics that comprise a topic and to integrate information from
multiple sources. Processing complex content places high demands on working memory,
causing learning to become difficult (Van Merriënboer & Sweller, 2005).
When teaching complex content, instructors often focus on the promotion of
meaningful learning, a process in which new and substantive information is related to
what one already knows (Ausubel, 1968). By linking new knowledge to prior knowledge,
the student can move beyond information retention and recall, to application, analysis,
and evaluation of information (Mayer, 2002). The student can also focus on transferring
information to authentic contexts and issues (Van Merriënboer et al., 2006).
Transfer is defined as the ability to apply existing knowledge, skills, or content in
new ways and in situations different from where they were originally acquired (Gick &
Holyoak, 1987). The phenomenon of transfer is complex and involves a number of
cognitive processes. Schunk (2012) specifies two general types of transfer, near and far.
When a context is similar to that of the original learning, it is referred to as near transfer.
For example, near transfer occurs when a student learns fractions in math and that student
is then tested on the content by completing similar problems. In contrast, far transfer
28
occurs when the transfer context is different from the context of the original learning.
Using the fraction example, far transfer would occur if a student was asked to use her
ability to add fractions by finding the total volume of two types of liquid in a cooking
recipe (Schunk, 2012).
Although many areas of university study are abundant in complex content, prime
examples include the healthcare fields and science, technology, engineering, and math.
The nature of courses in these disciplines is such that an understanding of a topic is
predicated on existing knowledge from many sources (Çimer 2012; Michael, 2007). For
example, to understand the condition of autism, students must apply knowledge of
neurology (including anatomy, physiology, biology, and chemistry), child development
(including physical, cognitive, communication, adaptive, and social domains),
psychology, and learning theory. New information then must be processed, integrated
with existing knowledge, and transferred to long-term memory using a process known as
schema acquisition (Kalyuga, 2010). To demonstrate mastery of a topic, the learner must
be able to engage in successful transfer. Using the example of understanding autism, a
student must be able to apply learned information to solving novel problems using a case
study, simulation, or clinical experience.
Addressing teaching challenges related to content difficulty has a long and varied
history (Shulman, 1986, 1987). Core to the issue is determining how to moderate the
learning intensity without oversimplifying the content or losing sophisticated levels of
understanding (Paas et al., 2003). To manage complex content, contemporary educational
theorists recommend the use of authentic learning tasks based on real-life challenges.
Examples include problem-based learning, case studies, simulations, and whole-task
29
approaches that focus on supporting conceptual understanding (Kester et al., 2004a,
2004b; Van Merriënboer, & Kester, 2008; Van Merriënboer & Sweller, 2010). Although
these approaches have shown promising results, their efficacy can be limited when
students have low prior knowledge of a topic (Van Merriënboer et al., 2003). Other
approaches to manage the difficulty level of content include augmenting learning with
visual displays (Schraw, McCrudden, & Robinson, 2013), strategic timing and
sequencing of instruction (Kester, Kirschner, et al., 2006), and scaffolding, which is a
specific type of performance support (Rosenshine & Meister, 1992). Each of these
methods is based on a growing understanding of the relationships between human
cognition and information processing (Sweller et al., 1998).
Managing Essential Processing
Regardless of pedagogical framework, the crux of teaching complex content rests
on the management of essential processing. Mayer and Pilegard (2014) specify three
principles for managing essential processing during learning: modality, segmenting, and
pretraining. The principles are designed to reduce working memory load, maximize prior
knowledge development, and facilitate schema acquisition and schematic knowledge use.
Mayer (2014a) focuses on multimedia instructional resources, but the principles can
apply to any teaching strategies. The modality principle specifies that learning is
maximized when words that accompany images (especially complex ones) are spoken
rather than printed (Low & Sweller, 2014). The segmenting principle suggests that
learning is enhanced by dividing information into smaller chunks and pacing student
study (Mayer, 2009). The pretraining principle proposes that learners be provided with a
list of names and definition of terms within a topic before the presentation of the whole
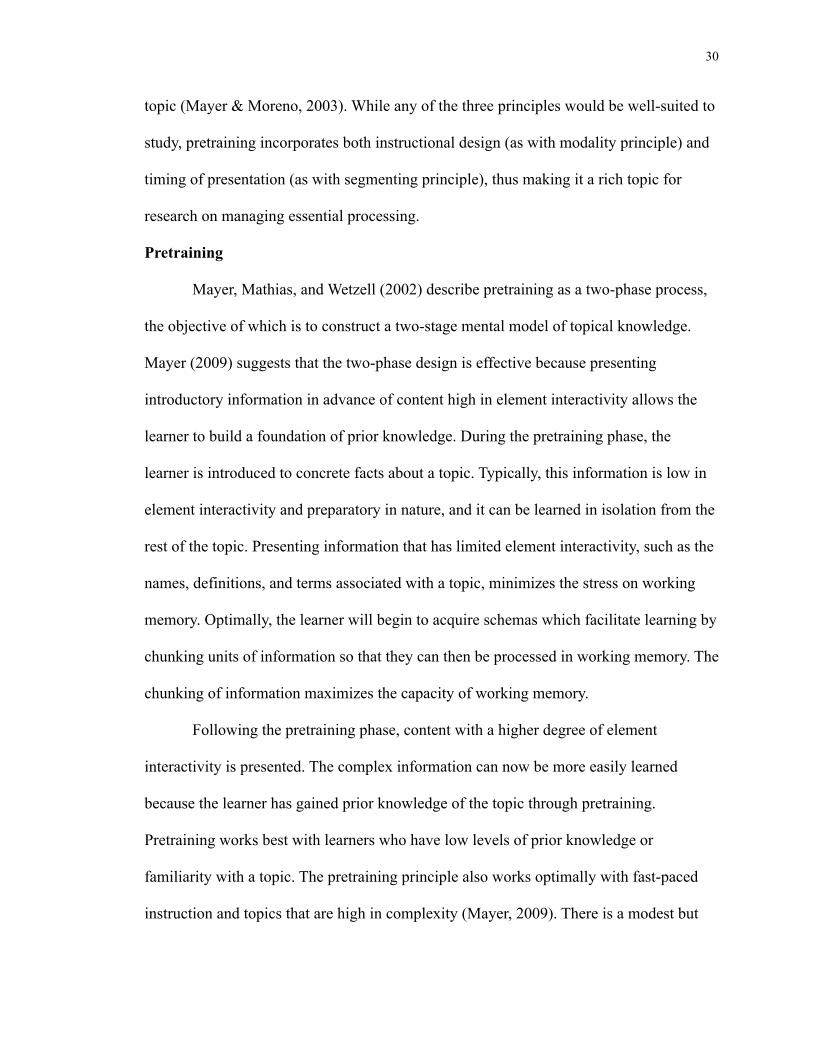
30
topic (Mayer & Moreno, 2003). While any of the three principles would be well-suited to
study, pretraining incorporates both instructional design (as with modality principle) and
timing of presentation (as with segmenting principle), thus making it a rich topic for
research on managing essential processing.
Pretraining
Mayer, Mathias, and Wetzell (2002) describe pretraining as a two-phase process,
the objective of which is to construct a two-stage mental model of topical knowledge.
Mayer (2009) suggests that the two-phase design is effective because presenting
introductory information in advance of content high in element interactivity allows the
learner to build a foundation of prior knowledge. During the pretraining phase, the
learner is introduced to concrete facts about a topic. Typically, this information is low in
element interactivity and preparatory in nature, and it can be learned in isolation from the
rest of the topic. Presenting information that has limited element interactivity, such as the
names, definitions, and terms associated with a topic, minimizes the stress on working
memory. Optimally, the learner will begin to acquire schemas which facilitate learning by
chunking units of information so that they can then be processed in working memory. The
chunking of information maximizes the capacity of working memory.
Following the pretraining phase, content with a higher degree of element
interactivity is presented. The complex information can now be more easily learned
because the learner has gained prior knowledge of the topic through pretraining.
Pretraining works best with learners who have low levels of prior knowledge or
familiarity with a topic. The pretraining principle also works optimally with fast-paced
instruction and topics that are high in complexity (Mayer, 2009). There is a modest but
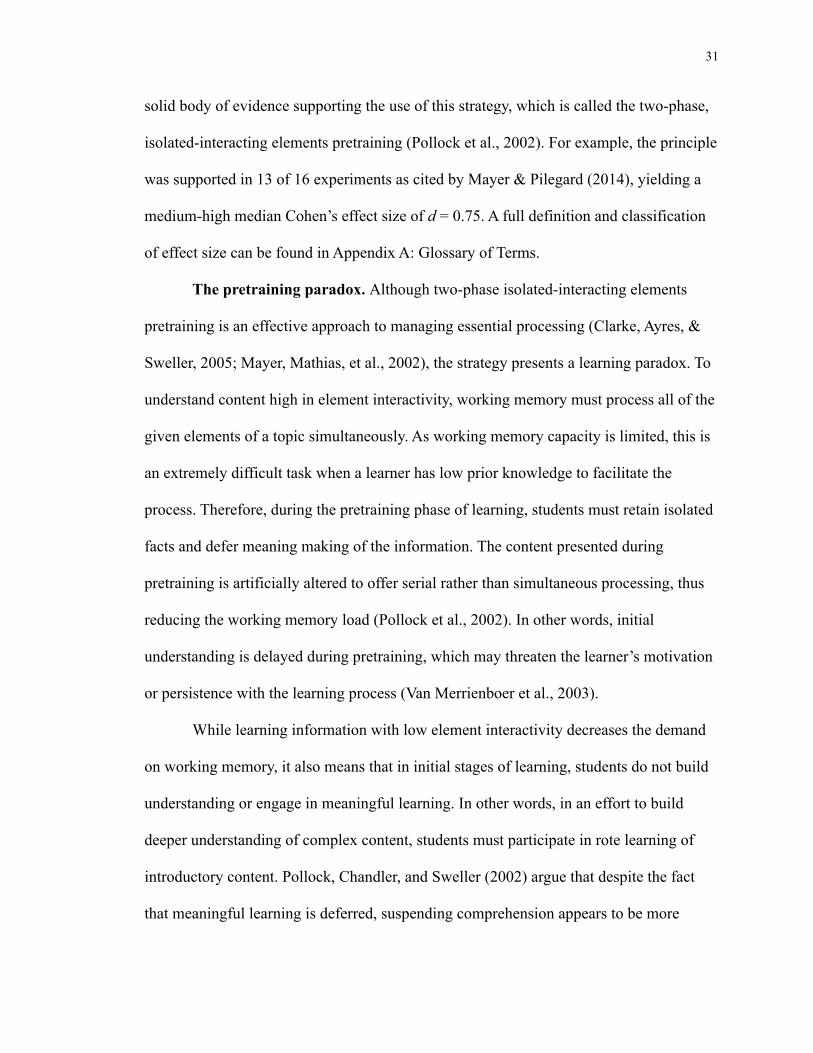
31
solid body of evidence supporting the use of this strategy, which is called the two-phase,
isolated-interacting elements pretraining (Pollock et al., 2002). For example, the principle
was supported in 13 of 16 experiments as cited by Mayer & Pilegard (2014), yielding a
medium-high median Cohen’s effect size of d = 0.75. A full definition and classification
of effect size can be found in Appendix A: Glossary of Terms.
The pretraining paradox. Although two-phase isolated-interacting elements
pretraining is an effective approach to managing essential processing (Clarke, Ayres, &
Sweller, 2005; Mayer, Mathias, et al., 2002), the strategy presents a learning paradox. To
understand content high in element interactivity, working memory must process all of the
given elements of a topic simultaneously. As working memory capacity is limited, this is
an extremely difficult task when a learner has low prior knowledge to facilitate the
process. Therefore, during the pretraining phase of learning, students must retain isolated
facts and defer meaning making of the information. The content presented during
pretraining is artificially altered to offer serial rather than simultaneous processing, thus
reducing the working memory load (Pollock et al., 2002). In other words, initial
understanding is delayed during pretraining, which may threaten the learner’s motivation
or persistence with the learning process (Van Merrienboer et al., 2003).
While learning information with low element interactivity decreases the demand
on working memory, it also means that in initial stages of learning, students do not build
understanding or engage in meaningful learning. In other words, in an effort to build
deeper understanding of complex content, students must participate in rote learning of
introductory content. Pollock, Chandler, and Sweller (2002) argue that despite the fact
that meaningful learning is deferred, suspending comprehension appears to be more
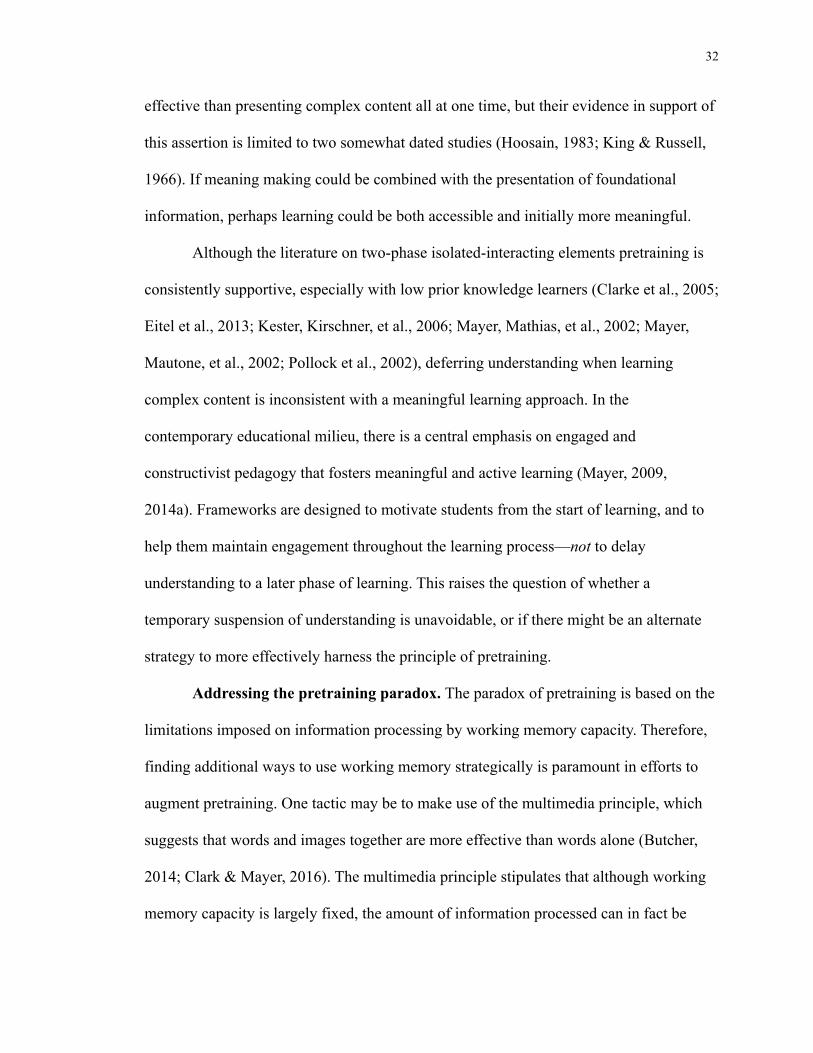
32
effective than presenting complex content all at one time, but their evidence in support of
this assertion is limited to two somewhat dated studies (Hoosain, 1983; King & Russell,
1966). If meaning making could be combined with the presentation of foundational
information, perhaps learning could be both accessible and initially more meaningful.
Although the literature on two-phase isolated-interacting elements pretraining is
consistently supportive, especially with low prior knowledge learners (Clarke et al., 2005;
Eitel et al., 2013; Kester, Kirschner, et al., 2006; Mayer, Mathias, et al., 2002; Mayer,
Mautone, et al., 2002; Pollock et al., 2002), deferring understanding when learning
complex content is inconsistent with a meaningful learning approach. In the
contemporary educational milieu, there is a central emphasis on engaged and
constructivist pedagogy that fosters meaningful and active learning (Mayer, 2009,
2014a). Frameworks are designed to motivate students from the start of learning, and to
help them maintain engagement throughout the learning process—not to delay
understanding to a later phase of learning. This raises the question of whether a
temporary suspension of understanding is unavoidable, or if there might be an alternate
strategy to more effectively harness the principle of pretraining.
Addressing the pretraining paradox. The paradox of pretraining is based on the
limitations imposed on information processing by working memory capacity. Therefore,
finding additional ways to use working memory strategically is paramount in efforts to
augment pretraining. One tactic may be to make use of the multimedia principle, which
suggests that words and images together are more effective than words alone (Butcher,
2014; Clark & Mayer, 2016). The multimedia principle stipulates that although working
memory capacity is largely fixed, the amount of information processed can in fact be
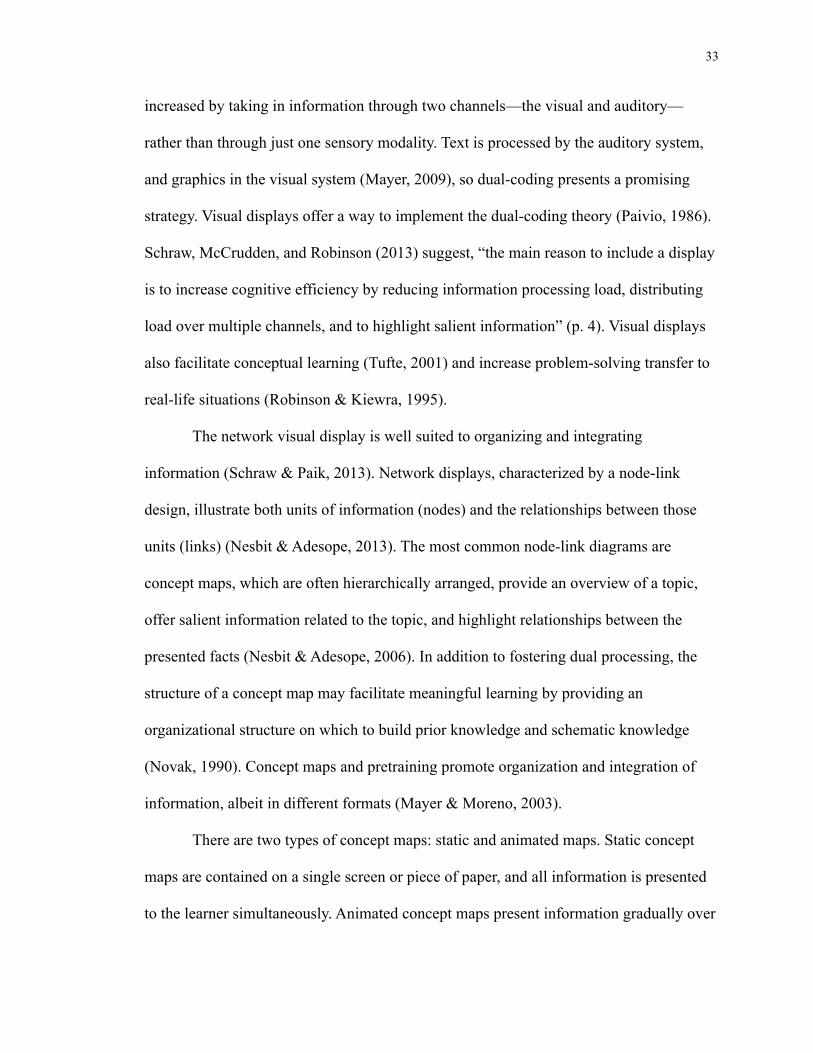
33
increased by taking in information through two channels—the visual and auditory—
rather than through just one sensory modality. Text is processed by the auditory system,
and graphics in the visual system (Mayer, 2009), so dual-coding presents a promising
strategy. Visual displays offer a way to implement the dual-coding theory (Paivio, 1986).
Schraw, McCrudden, and Robinson (2013) suggest, “the main reason to include a display
is to increase cognitive efficiency by reducing information processing load, distributing
load over multiple channels, and to highlight salient information” (p. 4). Visual displays
also facilitate conceptual learning (Tufte, 2001) and increase problem-solving transfer to
real-life situations (Robinson & Kiewra, 1995).
The network visual display is well suited to organizing and integrating
information (Schraw & Paik, 2013). Network displays, characterized by a node-link
design, illustrate both units of information (nodes) and the relationships between those
units (links) (Nesbit & Adesope, 2013). The most common node-link diagrams are
concept maps, which are often hierarchically arranged, provide an overview of a topic,
offer salient information related to the topic, and highlight relationships between the
presented facts (Nesbit & Adesope, 2006). In addition to fostering dual processing, the
structure of a concept map may facilitate meaningful learning by providing an
organizational structure on which to build prior knowledge and schematic knowledge
(Novak, 1990). Concept maps and pretraining promote organization and integration of
information, albeit in different formats (Mayer & Moreno, 2003).
There are two types of concept maps: static and animated maps. Static concept
maps are contained on a single screen or piece of paper, and all information is presented
to the learner simultaneously. Animated concept maps present information gradually over
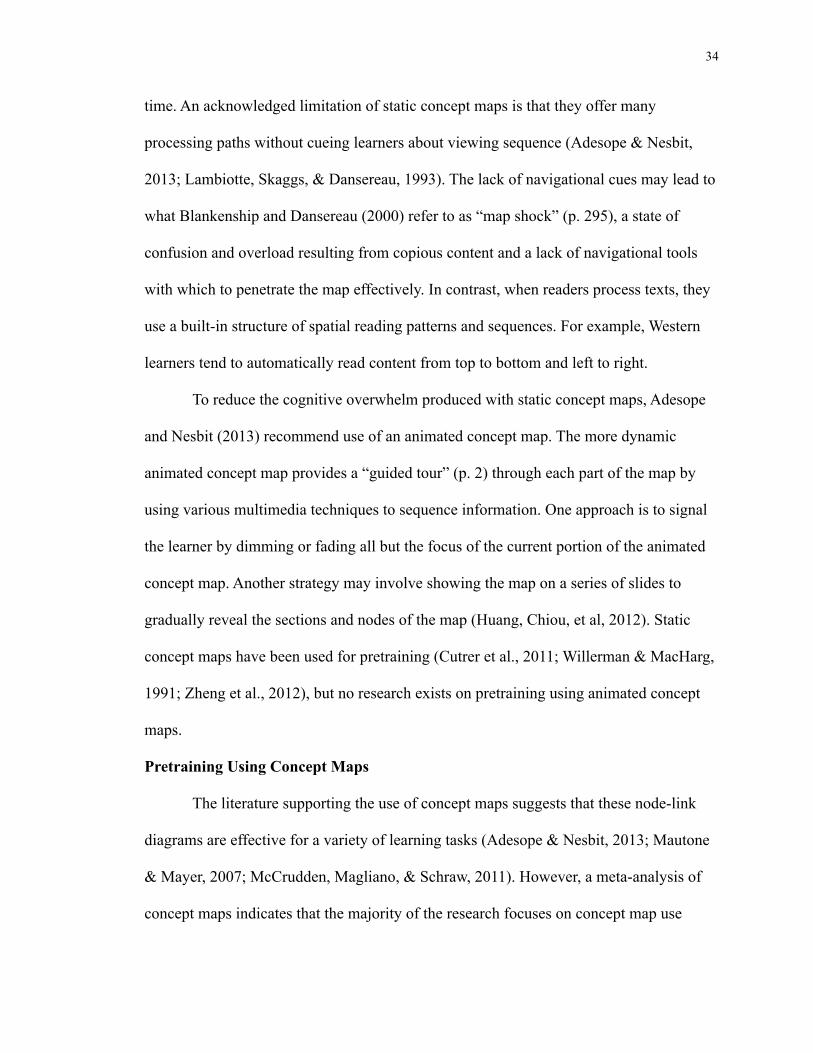
34
time. An acknowledged limitation of static concept maps is that they offer many
processing paths without cueing learners about viewing sequence (Adesope & Nesbit,
2013; Lambiotte, Skaggs, & Dansereau, 1993). The lack of navigational cues may lead to
what Blankenship and Dansereau (2000) refer to as “map shock” (p. 295), a state of
confusion and overload resulting from copious content and a lack of navigational tools
with which to penetrate the map effectively. In contrast, when readers process texts, they
use a built-in structure of spatial reading patterns and sequences. For example, Western
learners tend to automatically read content from top to bottom and left to right.
To reduce the cognitive overwhelm produced with static concept maps, Adesope
and Nesbit (2013) recommend use of an animated concept map. The more dynamic
animated concept map provides a “guided tour” (p. 2) through each part of the map by
using various multimedia techniques to sequence information. One approach is to signal
the learner by dimming or fading all but the focus of the current portion of the animated
concept map. Another strategy may involve showing the map on a series of slides to
gradually reveal the sections and nodes of the map (Huang, Chiou, et al, 2012). Static
concept maps have been used for pretraining (Cutrer et al., 2011; Willerman & MacHarg,
1991; Zheng et al., 2012), but no research exists on pretraining using animated concept
maps.
Pretraining Using Concept Maps
The literature supporting the use of concept maps suggests that these node-link
diagrams are effective for a variety of learning tasks (Adesope & Nesbit, 2013; Mautone
& Mayer, 2007; McCrudden, Magliano, & Schraw, 2011). However, a meta-analysis of
concept maps indicates that the majority of the research focuses on concept map use
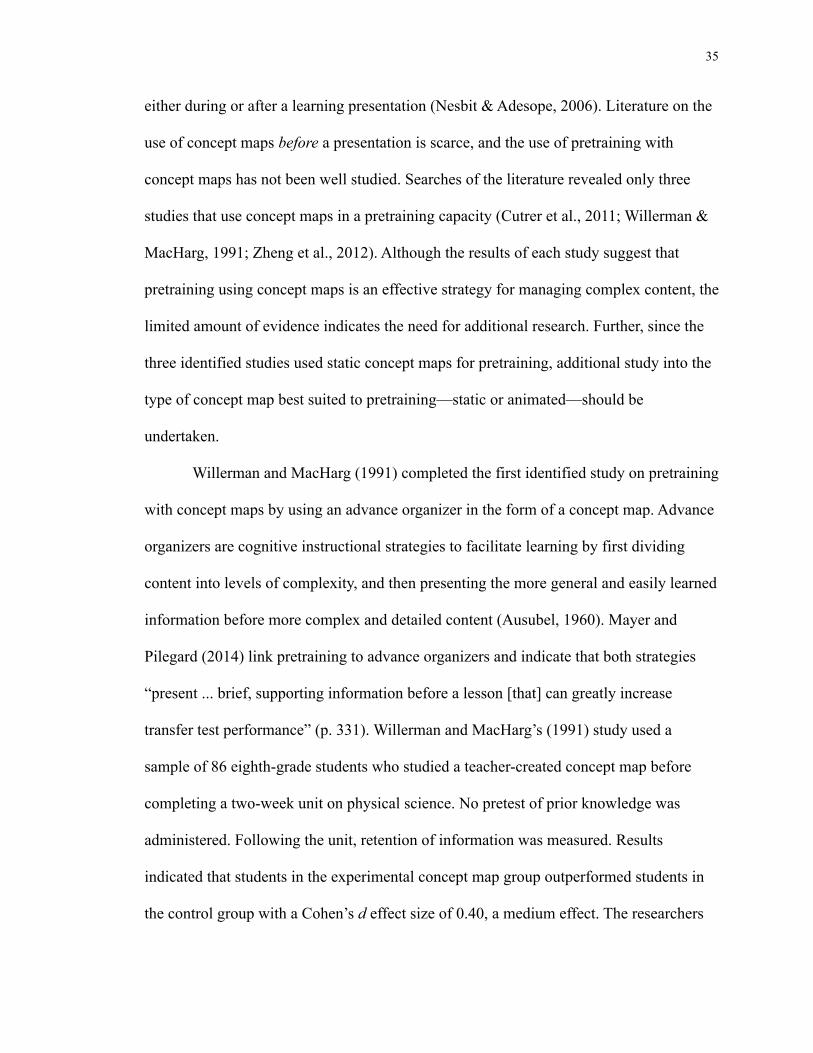
35
either during or after a learning presentation (Nesbit & Adesope, 2006). Literature on the
use of concept maps before a presentation is scarce, and the use of pretraining with
concept maps has not been well studied. Searches of the literature revealed only three
studies that use concept maps in a pretraining capacity (Cutrer et al., 2011; Willerman &
MacHarg, 1991; Zheng et al., 2012). Although the results of each study suggest that
pretraining using concept maps is an effective strategy for managing complex content, the
limited amount of evidence indicates the need for additional research. Further, since the
three identified studies used static concept maps for pretraining, additional study into the
type of concept map best suited to pretraining—static or animated—should be
undertaken.
Willerman and MacHarg (1991) completed the first identified study on pretraining
with concept maps by using an advance organizer in the form of a concept map. Advance
organizers are cognitive instructional strategies to facilitate learning by first dividing
content into levels of complexity, and then presenting the more general and easily learned
information before more complex and detailed content (Ausubel, 1960). Mayer and
Pilegard (2014) link pretraining to advance organizers and indicate that both strategies
“present ... brief, supporting information before a lesson [that] can greatly increase
transfer test performance” (p. 331). Willerman and MacHarg’s (1991) study used a
sample of 86 eighth-grade students who studied a teacher-created concept map before
completing a two-week unit on physical science. No pretest of prior knowledge was
administered. Following the unit, retention of information was measured. Results
indicated that students in the experimental concept map group outperformed students in
the control group with a Cohen’s d effect size of 0.40, a medium effect. The researchers
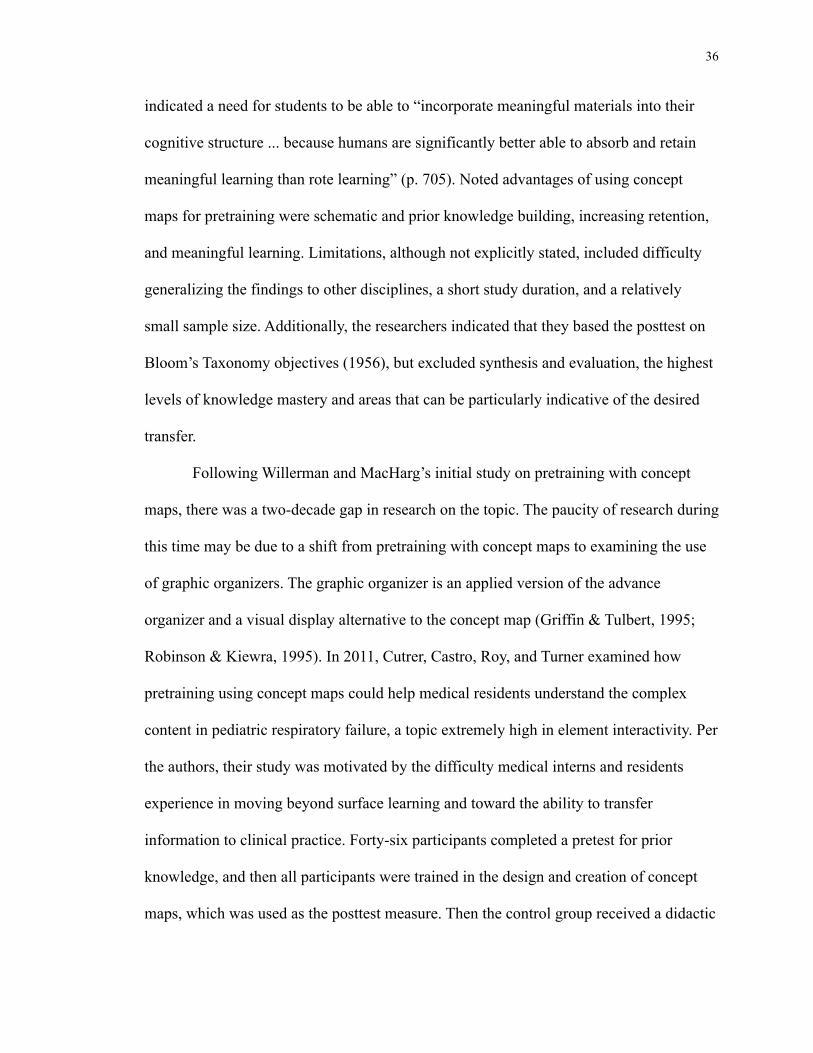
36
indicated a need for students to be able to “incorporate meaningful materials into their
cognitive structure ... because humans are significantly better able to absorb and retain
meaningful learning than rote learning” (p. 705). Noted advantages of using concept
maps for pretraining were schematic and prior knowledge building, increasing retention,
and meaningful learning. Limitations, although not explicitly stated, included difficulty
generalizing the findings to other disciplines, a short study duration, and a relatively
small sample size. Additionally, the researchers indicated that they based the posttest on
Bloom’s Taxonomy objectives (1956), but excluded synthesis and evaluation, the highest
levels of knowledge mastery and areas that can be particularly indicative of the desired
transfer.
Following Willerman and MacHarg’s initial study on pretraining with concept
maps, there was a two-decade gap in research on the topic. The paucity of research during
this time may be due to a shift from pretraining with concept maps to examining the use
of graphic organizers. The graphic organizer is an applied version of the advance
organizer and a visual display alternative to the concept map (Griffin & Tulbert, 1995;
Robinson & Kiewra, 1995). In 2011, Cutrer, Castro, Roy, and Turner examined how
pretraining using concept maps could help medical residents understand the complex
content in pediatric respiratory failure, a topic extremely high in element interactivity. Per
the authors, their study was motivated by the difficulty medical interns and residents
experience in moving beyond surface learning and toward the ability to transfer
information to clinical practice. Forty-six participants completed a pretest for prior
knowledge, and then all participants were trained in the design and creation of concept
maps, which was used as the posttest measure. Then the control group received a didactic

37
PowerPoint lecture. The experimental group received pretraining with a simplified
concept map and subsequently participated in an instructor-facilitated discussion, during
which the same concept map—in its entirety—was used to guide the discussion.
During pretraining, the simplified concept map, which contained basic
information about the topic, was studied by the learners for 5 minutes. Per the
researchers, “To create a simplified advance organizer version of the expert respiratory
failure concept map, a majority of the details were removed from the full expert map
leaving a scaffold of important overarching concepts” (Cutrer et al., 2011, p. 1020). Both
an immediate posttest and a one-week delayed posttest were administered to measure
retention. All posttests consisted of completing a concept map. The mean scores of the
experimental pretraining group were statistically significantly higher than those of the
PowerPoint control group on both the posttest and the delayed posttest. Posttest effect
sizes were very large, with a Cohen’s d = 4.61. Delayed posttest effect sizes were also
large, with a Cohen’s d = 2.97. However, the researchers caution that the discussion
session completed by the experimental group may have skewed the results, since the
pretraining group received more exposure to the material than the control group. In fact,
the experimental group used the complete concept map (on which the simplified
pretraining concept map was based) as a learning resource for the 45-minute instructor-
facilitated discussion. Other limitations of the study included the lack of a transfer
measure, the absence of a secondary outcome measure, and having only a one-week
delay before the final posttest.
In a final identified study, Zheng, Gupta, and Dewald (2012) studied pretraining
effectiveness with undergraduate psychology students. Their study compared the
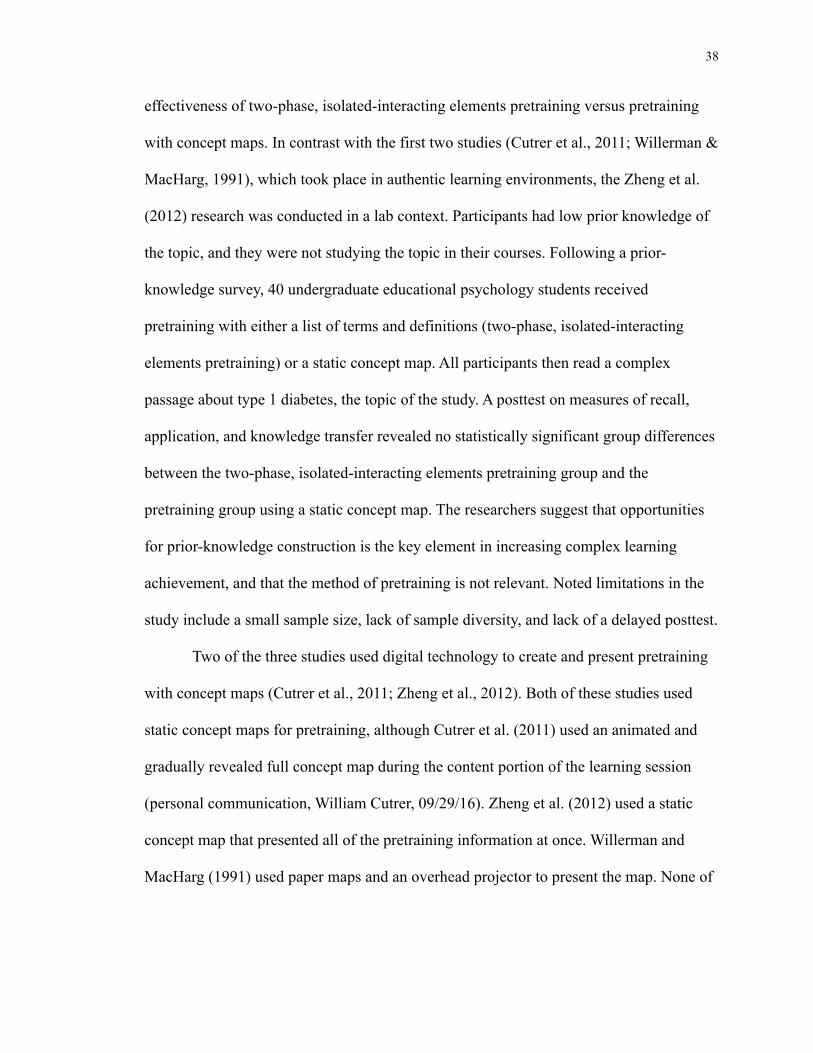
38
effectiveness of two-phase, isolated-interacting elements pretraining versus pretraining
with concept maps. In contrast with the first two studies (Cutrer et al., 2011; Willerman &
MacHarg, 1991), which took place in authentic learning environments, the Zheng et al.
(2012) research was conducted in a lab context. Participants had low prior knowledge of
the topic, and they were not studying the topic in their courses. Following a prior-
knowledge survey, 40 undergraduate educational psychology students received
pretraining with either a list of terms and definitions (two-phase, isolated-interacting
elements pretraining) or a static concept map. All participants then read a complex
passage about type 1 diabetes, the topic of the study. A posttest on measures of recall,
application, and knowledge transfer revealed no statistically significant group differences
between the two-phase, isolated-interacting elements pretraining group and the
pretraining group using a static concept map. The researchers suggest that opportunities
for prior-knowledge construction is the key element in increasing complex learning
achievement, and that the method of pretraining is not relevant. Noted limitations in the
study include a small sample size, lack of sample diversity, and lack of a delayed posttest.
Two of the three studies used digital technology to create and present pretraining
with concept maps (Cutrer et al., 2011; Zheng et al., 2012). Both of these studies used
static concept maps for pretraining, although Cutrer et al. (2011) used an animated and
gradually revealed full concept map during the content portion of the learning session
(personal communication, William Cutrer, 09/29/16). Zheng et al. (2012) used a static
concept map that presented all of the pretraining information at once. Willerman and
MacHarg (1991) used paper maps and an overhead projector to present the map. None of
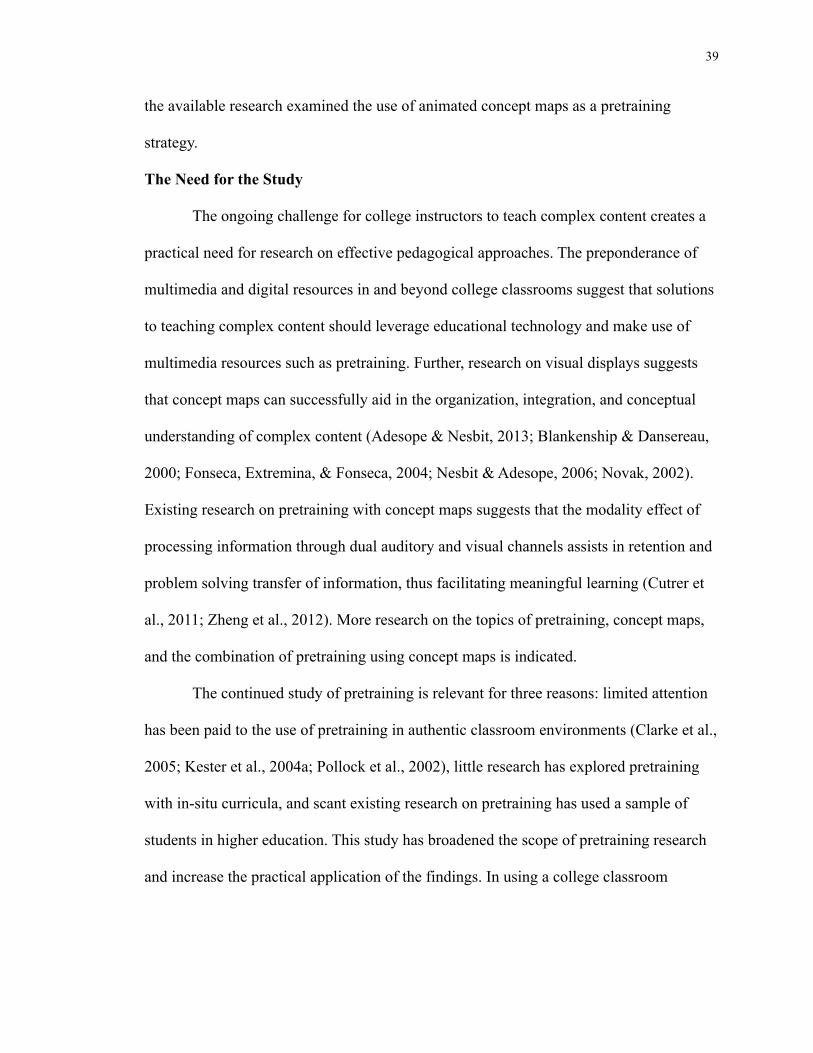
39
the available research examined the use of animated concept maps as a pretraining
strategy.
The Need for the Study
The ongoing challenge for college instructors to teach complex content creates a
practical need for research on effective pedagogical approaches. The preponderance of
multimedia and digital resources in and beyond college classrooms suggest that solutions
to teaching complex content should leverage educational technology and make use of
multimedia resources such as pretraining. Further, research on visual displays suggests
that concept maps can successfully aid in the organization, integration, and conceptual
understanding of complex content (Adesope & Nesbit, 2013; Blankenship & Dansereau,
2000; Fonseca, Extremina, & Fonseca, 2004; Nesbit & Adesope, 2006; Novak, 2002).
Existing research on pretraining with concept maps suggests that the modality effect of
processing information through dual auditory and visual channels assists in retention and
problem solving transfer of information, thus facilitating meaningful learning (Cutrer et
al., 2011; Zheng et al., 2012). More research on the topics of pretraining, concept maps,
and the combination of pretraining using concept maps is indicated.
The continued study of pretraining is relevant for three reasons: limited attention
has been paid to the use of pretraining in authentic classroom environments (Clarke et al.,
2005; Kester et al., 2004a; Pollock et al., 2002), little research has explored pretraining
with in-situ curricula, and scant existing research on pretraining has used a sample of
students in higher education. This study has broadened the scope of pretraining research
and increase the practical application of the findings. In using a college classroom
40
environment, internal validity was addressed and controlled through the research design,
and the classroom leant itself to external generalization (Krathwohl, 2009).
The research also extended the scope of the study of concept maps by using them
as an instructional resource prior to complex content presentations. Concept maps are a
well-studied instructional resource, but most literature examines concept maps either
during or after informational lessons (Nesbit & Adesope, 2006). Examining the use of
concept maps in advance of a presentation is a way to broaden the evidence base on the
use of visual models for teaching complex topics.
Finally, this study has added to the limited literature on the topic of pretraining
with concept maps. Enhancements included the use of a larger sample, more probing
outcome measures, and evaluation of delayed retention of information. First, a greater
number of participants provided a larger pool of resulting data and thus more statistically
stable and reliable results. Two of the three identified studies on pretraining with concept
maps noted small sample size as a limitation to the research (Cutrer et al., 2011; Zheng et
al., 2012). This study included a sample of 145 participants.
Additionally, outcome measures ventured beyond retention to include both
schematic knowledge and near transfer. In the identified literature on pretraining with
concept maps, retention of information was a focus (Cutrer et al., 2011; Willerman &
MacHarg, 1991). Only one of the studies examined transfer as well as retention (Zheng et
al., 2012). Transfer, however, is a measure of applied and meaningful learning (Mayer,
2002), as well as being a desired outcome of learning complex content (Van Merriënboer
& Sweller, 2005). This study built on the measure of retention by assessing schematic

41
knowledge, and it included a near transfer measure to capture the effect of the
intervention.
Finally, the little researched topic of delayed recall of information was addressed
in this study. Longer-term retention in the identified areas of schematic knowledge and
near transfer is indicative of knowledge being more permanently learned (Baddeley &
Hitch, 1974; 1994). Of the identified existing research, only the Cutrer et al. (2011) study
included a delayed posttest. Furthermore, that follow-up posttest was delayed only one
week from the immediate posttest and measured only retention of information. The
delayed posttest in this study was completed two weeks following the intervention, and it
included measures of both schematic knowledge and transfer. Extending the gap between
immediate and delayed posttests better simulated a typical pace of classroom instruction,
application of knowledge, and assessment.
Evidence supporting the use of two-phase, element-interactive pretraining is clear
and reveals a medium-to-large median effect size of Cohen’s d = 0.75 over 16
experiments (Mayer & Pilegard, 2014). Research supporting the use of concept maps is
similarly unambiguous; a meta-analysis of 55 articles on the topic reveals an effect size
for recall of central ideas to be Cohen’s d = 0.60, a medium effect size (Nesbit &
Adesope, 2006). Additional evidence on the use of animated concept maps suggests the
efficacy of using a multimedia approach to augment learner recall, transfer, and
understanding (Blankenship & Dansereau, 2000; Chou, 2013; Marée, van Bruggen, &
Jochems, 2013). Therefore, this study assumed effectiveness of the following constructs:
pretraining and concept map use. The focus of the study was on the efficacy of
pretraining with concept maps as an educational strategy for learning complex content.
42
More specifically, the study met two objectives. First, it increased the limited
body of research on pretraining using static concept maps. Second, it extended the
research on pretraining with concept maps by investigating the use of pretraining with
animated concept maps—an area not yet studied. Ultimately, the study added to the body
of evidence on which of these three approaches may provide educators with the most
powerful instructional strategy: two-phase, element-interactive element pretraining,
pretraining with static concept maps, or pretraining with animated concept maps. Finally,
the study explored the intersections between participant perspectives on the use of
concept maps and the effectiveness of concept maps in fostering achievement.
Research Questions
1. How does the type of pretraining affect schematic knowledge when measured
immediately after a lesson?
2. How does the type of pretraining affect schematic knowledge when measured two
weeks after a lesson?
3. How does the type of pretraining affect near transfer when measured immediately
after a lesson?
4. How does the type of pretraining affect near transfer when measured two weeks
after a lesson?
5. What is the relationship between students’ perceptions of the usefulness of concept
maps and scores on measures of schematic knowledge and near transfer?
43
Definition of Terms
The definition of terms provided in this section is limited to vocabulary and
concepts that are critical to understanding the research. Definitions are focused toward
delineating the independent and dependent variables in the study. For more information, a
comprehensive set of terms and definitions relevant to the research is provided in
Appendix A: Glossary of Terms.
Animated concept map: A computer-generated concept map that changes over time and
allows variability in the pace and sequence of the map display (Adesope &
Nesbit, 2013). For the purposes of this study, an animated concept map is
operationally defined as a complete concept map that is revealed to the learner
segment by segment over time, with a goal of aiding in the navigation of the map
and thus reducing map shock.
Complex content: Academic topics that have high levels of element interactivity.
Increased element interactivity makes complex content more difficult to learn,
due to increased stress on working memory (Sweller et al., 2011).
Concept map: A visual diagram composed of nodes and links. Nodes are geometric
shapes containing text that provides topical information. Links are lines that
connect the nodes and indicate relationships between them. (Eppler, 2006; Novak
& Cañas, 2008). Most concept maps are arranged hierarchically and provide an
overarching view of a topic by showcasing and highlighting the main concepts, as
well as providing the most relevant details (Amadieu, Van Gog, Paas, Tricot, &
Mariné, 2009). For the purposes of this study, concept map is operationally
defined as a hierarchically structured visual display that includes the use of color
44
coding and proximity of nodes to signal the viewer about relevant aspects of the
map and reading sequence (Mayer, 2009; Van Gog, 2014). Links are labeled as
necessary.
Element interactivity: The number of items of information that must be processed
simultaneously in working memory. Topics that are high in element interactivity
are typically complex and place a high burden on working memory capacity,
which translates into high intrinsic load (Sweller, 2010). For the purposes of this
study, element interactivity is operationally defined as a prime determinant of the
complexity level of an academic topic. The number of items needed for a state of
high element interactivity is dependent on the topic and the difficulty level of
each of the items. Therefore, there is no standardized formula available (Sweller
& Chandler, 1994).
Near transfer: A concept that describes assessment of ability when the testing scenario is
very similar to that provided in the original lesson (Schunk, 2012). For the
purposes of this study, near transfer is measured with a case study similar to that
presented in the treatment lesson.
Pretraining: A principle in the cognitive theory of multimedia learning that suggests that
people learn more deeply from a multimedia message when they know the names,
definitions, and/or characteristics of the main concepts (Mayer & Pilegard, 2014).
Pretraining allows learners to develop specific prior knowledge before key
materials are presented, thereby increasing prior knowledge and schema
acquisition (Sweller et al., 2011). For the purposes of this study, any learning
activity presented in advance of the main lesson, and that provides students with
45
foundational information that is low in element interactivity and fosters schematic
knowledge, is operationally defined as a type of pretraining. In particular, advance
organizers that are operationally defined as indicated above are included in the
classification of pretraining approaches.
Prior knowledge: The pre-existing information, schematic knowledge, cognitive
strategies, and skills a learner possesses, which influence how new information is
perceived, organized, and integrated. Prior knowledge is a determinant of the
amount and complexity of content that can be processed before working memory
capacity becomes overloaded (Van Merriënboer & Kester, 2014).
Schema: Conceptual cognitive frameworks for organizing information into topical
chunks (Sweller et al., 1998). Schemas are composed of many interacting
elements (Sweller & Chandler, 1994). When schemas are introduced into working
memory, they can be treated as a single element rather than as multiple pieces of
information, which reduces the demands on working memory (Kalyuga, 2010).
Schemas produce schematic knowledge that can be used for fostering learning.
Schematic knowledge: A term used to describe cognitive organization of information.
Schematic knowledge can be visualized as a web of units of interrelated
information that are linked to relevant prior knowledge and that form building
blocks for meaningful learning (Kalyuga, 2010). Schematic knowledge is the
outcome of schema acquisition.
Static concept map: A node and link diagram presented in its entirety on a single screen
or piece of paper. For the purposes of this study, static concept map is
46
operationally defined as a hierarchically structured concept map presented on a
single screen.
Two-phase, isolated-interacting elements pretraining: A strategy, also known as
traditional pretraining, for dividing complex learning into two consecutive phases.
First, an isolated elements phase to present elements that can be more easily held
in working memory, but that cannot be understood in their current form and
without added context. Second, the interactive elements phase to present the
connections between the isolated elements and foster greater understanding
(Mayer & Pilegard, 2014). For the purposes of this study, traditional pretraining is
operationally defined as a list of terms or concepts and their definitions, either
printed or provided via narration, as well as relevant graphics that assist the
learner in understanding the term or concept.
Transfer: The “ability to use what was learned to solve new problems, answer new
questions, or facilitate learning new subject matter” (Mayer, 2002).
47
CHAPTER II
REVIEW OF THE LITERATURE
The purpose of this study was to determine the differences in gains of schematic
knowledge and near transfer when first year occupational therapy students studying the
complex topic of sensory integration were provided with one of three types of
pretraining. The types of pretraining include traditional pretraining, pretraining with a
static concept map, and pretraining with an animated concept map. Relevant to the
research are four areas of the literature reviewed here: (a) advance organizers to facilitate
meaningful learning, (b) instructional visual displays for understanding complex content,
(c) the cognitive theory of multimedia learning principle of pretraining, and (d)
pretraining with concept maps.
Advance Organizers to Facilitate Meaningful Learning
A cornerstone of the assimilation theory of retention, the advance organizer is a
predecessor to pretraining and provides a historical context for the contemporary use of
pretraining. By providing a brief prose passage at the start of a lesson, the advance
organizer promotes prior knowledge acquisition by increasing cognitive organization,
retention, and understanding of subsequent content (Ausubel, 1968; Langan-Fox,
Waycott, & Albert, 2000). Ausubel (1968) defined advance organizers as “appropriately
relevant and inclusive introductory materials ... introduced in advance of learning ... and
presented at a higher level of abstraction, generality, and inclusiveness” (p. 148). The
advance organizer was developed to augment a learner’s prior knowledge of complex or
48
unfamiliar content (Williams & Butterfield, 1992) and to promote meaningful learning
(Ausubel, 1962).
Early Research
In the early 1960s, Ausubel and colleagues began developing a body of research
on the advance organizer, which was then a novel educational strategy. In a pioneering
study, 120 undergraduate psychology students learned about the metallurgical properties
of carbon steel, a topic likely to be both unfamiliar and of some basic interest to the
participants (Ausubel, 1960). The goal of the study was to determine whether advance
organizers could facilitate retention of information in learners with low prior knowledge.
The experimental group was exposed to an advance organizer for five minutes, and the
control group read a passage that provided historical but not conceptual information.
Both groups then read a 2,500-word passage on the topic. Posttests three days after the
treatment showed a statistically significant difference in favor of the advance organizer
group over the control group on measures of meaningful verbal learning and retention.
Although the research found promising outcomes for use of the advance
organizer, the study suffered from a number of sampling and procedural design flaws,
which decreased the validity of the results. For example, the matched pairs in the study
were based on unfamiliarity with the material, but the pretest material had nothing to do
with metallurgy. Additionally, when gender and field of study were found to be linked to
posttest scores, the experimental and control groups were re-matched after the data was
collected, a questionable procedure. The initial two groups of sixty participants each
became two groups of only forty participants each, and the assumption of unfamiliarity
with the content was not satisfied (McEneaney, 1990). As was to become a pattern in the
49
early research on advance organizers, no clear description or operational definition of
advance organizer was provided. Finally, even though Ausubel’s study did not achieve
statistical significance, he argued that “the difference between the means of the
experimental and control groups was almost significant at the .01 level for a one-tailed
test” (p. 269, italics added), and then proceeded as if the results were, in fact, statistically
significant.
In another seminal study, a group of college psychology students (n = 155) were
taught about the unfamiliar topic of Buddhism (Ausubel & Fitzgerald, 1961). Using a
three-group experimental design, the comparative group was exposed to an advance
organizer designed to link prior knowledge of Christianity to the study of Buddhism. The
expository group received an advance organizer content not connected to prior
knowledge of religion, and the control group received general historical information. A
posttest administered three days after the treatment showed that the comparative group
retained significantly more information than the expository or control groups. Ten days
after the study, posttest scores of both the comparative group and the expository group
were superior to that of the control group. The results suggested that clear and stable prior
knowledge is key to supporting schema development with new but related topics, and that
advance organizers can facilitate schematic knowledge development and use.
Through the mid-1960s, Ausubel and colleagues completed a number of other
studies examining advance organizers for increasing learning retention and building
cognitive schema (Ausubel & Fitzgerald, 1962; Ausubel & Youssef, 1963; Fitzgerald &
Ausubel, 1963). Each of the studies demonstrated modest but positive results in support
of advance organizers, but they all suffered from methodological flaws. A new cadre of
50
researchers began to study advance organizers in the late 1960s through the 1980s
(Doyle, 1986; Gillies, 1984; Mayer, 1983), and the field expanded to include visual
advance organizers in addition to text-based advance organizers (Weisberg, 1970).
Results from the second wave of research were inconsistent, with some studies showing
support for the method (Grotelueschen & Sjogren, 1968; Kuhn & Novak, 1971) while
others found advance organizers to be ineffective (Barnes & Clawson, 1975; Bertou,
Clasen, & Lambert, 1972; Graber, Means, & Johnston, 1972).
Criticism of Advance Organizers
The equivocal effectiveness of advance organizers was called to task when Barnes
and Clawson (1975) completed their meta-analysis of advance organizers. In 12 of 32
studies, results provided statistical significance in support of advance organizers, but in
the other 20 studies, advance organizers were found to be ineffective as learning
resources. The authors concluded that advance organizers, “as presently constructed,
generally do not facilitate learning” (p. 651). A year later, Hartley and Davies (1976)
continued the attack on advance organizers and cited a significant flaw in the research:
there was no clear operational definition for advance organizers. The researchers argued
that if advance organizers could not be explicitly quantified, then all attempts to measure
the strategy would be unsuccessful in showing their efficacy.
In an American Educational Research Association commentary, Ausubel (1978)
vociferously refuted the criticisms of Barnes and Clawson (1975) and Hartley and Davies
(1976). Unfortunately, doubt had taken hold regarding not only the use of advance
organizers, but also the assimilation theory of retention as an educational framework. The
criticism was revived in 1990 with yet another critical review of advance organizers
51
(McEneaney, 1990), this time focusing on studies completed by Ausubel and his
colleagues (Ausubel, 1960; Ausubel & Fitzgerald, 1961; Ausubel & Fitzgerald, 1962;
Ausubel & Youssef, 1963). The author determined that the body of original research
offered little solid support for use of the method. The larger question that arose was
whether presenting foundational information in advance of more detailed content actually
supported meaningful learning.
Support for Advance Organizers
In 1980, yet another meta-analysis of advance organizers was published (Luiten,
Ames, & Ackerson, 1980). After reviewing 135 studies, the authors concluded that
advance organizers were, in fact, effective at facilitating learning and retention in
students. Inaccuracies in the methods used by Barnes and Clawson (1975) were cited, and
the researchers proposed the use of effect size to judge advance organizers studies (Glass,
1978). A mean effect size of d = 0.21 was found for the research in the analysis,
indicating a small but significant level of practical importance.
Two other meta-analyses completed around the same period (Kozlow, 1978;
Stone, 1983) confirmed Luiten, Ames, and Ackerson’s (1980) findings. The reviews
indicated that comparative advance organizers may be more effective than expository
ones. Comparative organizers build on the learner’s prior knowledge to identify
similarities and differences between new information and existing knowledge, whereas
expository organizers are used when a learner has little prior knowledge of a topic
(Ausubel & Fitzgerald, 1961). The Stone analysis indicated an overall small to medium
effect size of d = 0.48 for all the 112 studies reviewed, and comparative studies showed a
medium effect size of d = 0.68. Kozlow recommended additional meta-analyses with
52
calculated foci on the assessment tools used, an operationalized definition of “advance
organizer,” and increased methodological rigor.
In a meta-analysis of 44 studies on the well-defined topics of science and math,
Mayer (1979) advanced the conclusions about advance organizer effectiveness and
clarified relevant issues in the ongoing debate. Rather than asking whether advance
organizers are effective, Mayer considered the desired learning goal and the
circumstances whereby the method should be used. Results suggested that advance
organizers are facilitative for learning when a learner is encoding rather than retrieving
information, when material is poorly organized or integrated, when learners are
inexperienced with the given topic, and when the goal of learning is transfer rather than
retention of facts. Sound and viable recommendations for future research were presented.
Perhaps most importantly, Mayer also developed a vital operational definition of
an advance organizer:
An advance organizer generally has each of the following characteristics: (1)
Short set of verbal or visual information, (2) Presented prior to learning a larger
body of to-be-learned information, (3) Containing no specific content from the to-
be-learned information, (4) Providing a means of generating the logical
relationships among the elements in the to-be-learned information, (5) Influencing
the learner’s encoding process. (p. 382)
The manner in which an organizer influences encoding may serve either of two functions:
to provide a new general organization as an assimilative context that would not have
normally been present, or to activate a general organization from the learner’s existing
knowledge that would not have normally been used to assimilate the new material. The

53
definition served to ground future research, while also providing a foundation for the
development of the cognitive theory of multimedia learning pretraining principle, a
concept Mayer later examined in detail (Mayer, 2009; Mayer & Pilegard, 2014).
Current Perspectives
Despite historical disputes over the efficacy of advance organizers, studies of
advance organizers abounded between 1990 and 2017. A literature search (ERIC,
PsychInfo, CINAHL, and PubMed/Medline) yielded over 6,500 studies that reference the
strategy. Studies include participants of all ages (Chuang & Liu, 2014; High & VanHorn,
2012; Thompson, 1998). Topics were widespread and included a range of disciplines:
language learning (Ambard & Ambard, 2012; Jafari & Hashim, 2012; Mohammadi,
Moenikia, & Zahed-Babelan, 2010), literacy (Ambard & Ambard, 2012; Bayat, 2007;
Langford, Rizzo, & Roth, 2003), online education (Chen, Hirumi, & Zhang, 2007; Jia,
2007; Urakami & Krems, 2012), multimedia studies (Apitz, 2008; Li, 2012; Lin & Chen,
2007), and special education (Daniel & Polloway, 2005; Kirkland, Byrom, MacDougall,
& Corcoran, 1995). Additional topics known for high levels of complex content were
also identified and included:
• healthcare (Cutrer et al., 2011; Duphorne & Gunawardena, 2005);
• the sciences (Barbosa, Marques, & Torres, 2005; Bency & Raja, 2010; Korur,
Toker, & Eryilmaz, 2016; Koscianski, Ribeiro, & Da Silva, 2012; Shihusa &
Keraro, 2009);
• mathematics (Donaldson, 2005; Groth, Butler, & Nelson, 2016);
• and digital technology (Billings & Mathison, 2012; Langan-Fox, Platania-Phung,
& Waycott, 2006).
54
The literature also expanded to include pure research on the theory and uses of advance
organizers (Gurlitt, Dummel, Schuster, & Nückles, 2012; Kiewra et al., 1996; Schwartz,
Ellsworth, Graham, & Knight, 1998). The basic research studies are valuable, as they
examine the theoretical underpinnings of advance organizers and add depth to the
evidence base.
Summary of the Advance Organizer
The advance organizer is still being investigated, and it continues to be a
commonly used practitioner tool (Dell’Olio & Donk, 2007; Walberg & Paik, 2000). The
effectiveness of the advance organizer is dependent on a number of factors, including the
form and construction of the organizer, the fit between the advance organizer and the
content to be learned, the measure of learning outcomes, and the learner’s degree of prior
knowledge. Current studies have shown increased methodological rigor, as well as
attention to operational definitions of the advance organizer (Kiewra et al., 1996). Recent
studies have extended the study of advance organizers from the education milieu to the
world of industry (Langan-Fox et al., 2006; Langan-Fox et al., 2000). Educational
researchers are also examining the use of technology enhanced advance organizers
(Billings & Mathison, 2012; Korur et al., 2016).
Questions about how advance organizers have evolved and been refined for
increased usefulness remain. Ausubel and his colleagues focused on the text-based
advance organizer, but the graphic organizer, an offshoot of the original advance
organizer, popped up in the 1970s. Still in use today, the graphic organizer is another
mechanism for introducing foundational content to learners in advance of a lesson. The
55
focus of the next section, on instructional visual displays, will examine graphic
organizers, as well as their successor, the concept map.
Instructional Visual Displays
for Understanding Complex Content
An instructional visual display is “a visual representation used to convey a set of
relationships” (Schraw & Paik, 2013, p. 98). The purpose of instructional visual displays
is threefold: (1) to increase cognitive efficiency by limiting the amount of information
presented, (2) to distribute the cognitive load by pairing text and graphics, and (3) to
highlight essential information (Schraw et al., 2013). Instructional visual displays
organize and summarize information so that the learner can grasp the gestalt, while still
attending to the most relevant aspects of the content (Blankenship & Dansereau, 2000).
One important way instructional visual displays assist learners with understanding
complex content is by dual-coding content through the auditory and visual systems
(Höchpochler et al., 2013; Mayer, 2009). Dual-coding theory suggests that verbal and
nonverbal input are processed in separate centers of the brain (Paivio, 1986). More
specifically, text information is processed in the verbal centers of the brain during
learning, and graphical information is processed in separate visual centers. The relevant
outcome of this process is that images augment text during learning, without swamping
the limited capacity of working memory. In effect, dual-coding maximizes working
memory capacity by offering two channels, rather than one, for information processing.
Figure 4 illustrates Paivio’s theory. By dual-coding information, learners can increase

56
understanding while also improving retention and retrieval of information, two important
factors for complex learning.
Figure 4. Paivio’s dual-coding theory (1986).
One of the early forms of instructional visual display was the graphic organizer, a
resource that combined the theory of the advance organizer with a visual approach to
support dual-coding during learning. The graphic organizer, a historical successor to the
advance organizer, was developed as a means of operationalizing and applying the
advance organizer to teaching practice (Griffen & Tulbert, 1995). Graphic organizer
research will be examined to provide the context for the use of visual displays for
complex content learning. Then a particular type of graphic organizer will be examined:
the concept map (Novak & Gowin, 1984). Both static and animated concept maps will be
considered.
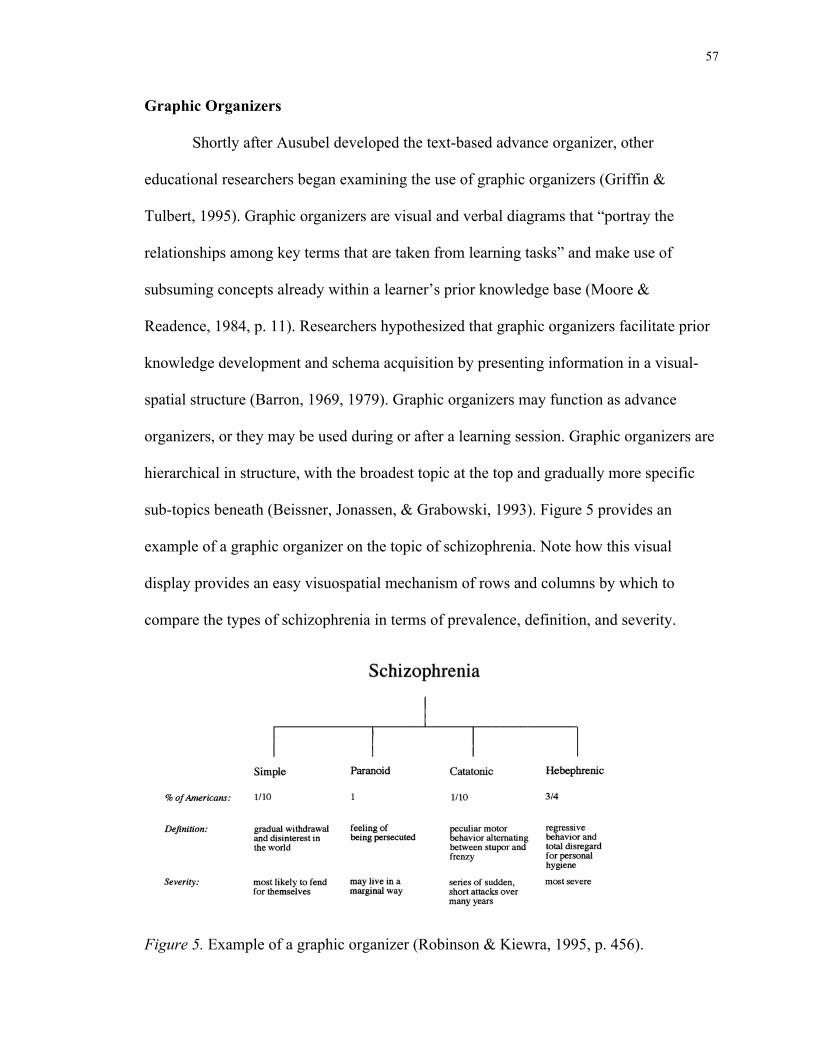
57
Graphic Organizers
Shortly after Ausubel developed the text-based advance organizer, other
educational researchers began examining the use of graphic organizers (Griffin &
Tulbert, 1995). Graphic organizers are visual and verbal diagrams that “portray the
relationships among key terms that are taken from learning tasks” and make use of
subsuming concepts already within a learner’s prior knowledge base (Moore &
Readence, 1984, p. 11). Researchers hypothesized that graphic organizers facilitate prior
knowledge development and schema acquisition by presenting information in a visual-
spatial structure (Barron, 1969, 1979). Graphic organizers may function as advance
organizers, or they may be used during or after a learning session. Graphic organizers are
hierarchical in structure, with the broadest topic at the top and gradually more specific
sub-topics beneath (Beissner, Jonassen, & Grabowski, 1993). Figure 5 provides an
example of a graphic organizer on the topic of schizophrenia. Note how this visual
display provides an easy visuospatial mechanism of rows and columns by which to
compare the types of schizophrenia in terms of prevalence, definition, and severity.
Figure 5. Example of a graphic organizer (Robinson & Kiewra, 1995, p. 456).
58
Graphic organizers followed a research trajectory similar to that of advance
organizers; they were widely used in practice, but conclusive supportive research was
scarce. The paucity of unequivocal findings may have been due to difficulty measuring
the effectiveness of the graphic organizer, since it was used in many different contexts,
with heterogeneous groups of learners, and at various times during the learning process.
A meta-analysis of 23 graphic organizer studies completed by Moore and Readence
(1984) indicated a small but positive effect for use of the graphic organizers (d = 0.22).
More than a decade later, a particularly insightful study of graphic organizers was
completed by Robinson and Keiwra (1995). Rather than asking whether students learned
from graphic organizers, the authors inquired about what type of student learning was
facilitated by the use of graphic organizers. In a set of two experiments, the researchers
compared the use of graphic organizers with the use of outlines to support learning.
Undergraduate educational psychology students (experiment one: n = 111, experiment
two: n = 42) were randomly assigned to a graphic organizer group, an outline group, or a
control group (text-only information) to learn about the topic of abnormal psychology.
The experiments were completed in a naturalistic classroom environment and focused on
whether a spatial format would provide learners with more information about key
concepts than an outline. Posttests included immediate and delayed testing after two days,
and measured facts, relations, and application. Results indicated that graphic organizers
were more effective than outlines or text in learning about hierarchical relations,
coordinate relations, and transfer of learning, and more effective for integrating
knowledge in an essay composition. Factual learning was no more effective with a
graphic organizer than with an outline. Participants indicated a preference for graphic
59
organizers over outlines. The researchers recommended graphic organizers to support
learning of well-organized, longer, chapter-length text passages. They concluded that the
structure, rather than the content, of graphic organizers is the main reason for their
effectiveness. The findings are supported by subsequent research studies (Dexter &
Hughes, 2011; Robinson, Robinson, & Katayama, 1999; Roman, Jones, Basaraba, &
Hironaka, 2016).
While there are conflicting conclusions regarding the effectiveness of graphic
organizers, they continue to be used frequently in educational practice, where they are
viewed as a useful instructional visual display (Crooks & Cheon, 2013; Dexter &
Hughes, 2013; Roman et al., 2016). The graphic organizer has expanded to include a
number of different forms that are classified according to structure and purpose (Schraw
& Paik, 2013). The categorization of graphic organizers has increased researcher ability
to study the resource more precisely. Referred to more generically as spatial diagrams,
graphic organizers can be divided into three types: matrices (as seen in Figure 5),
hierarchies (flow charts, tree diagrams, argument maps), and networks (concept, mind,
knowledge, and spider maps) (Novick, 2006; Schraw & Paik, 2013). The concept map
has become a particularly popular resource for visual learning via dual-coding
(Blankenship & Dansereau, 2000) and for delineating complex content (Novak and
Cañas, 2008).
Concept Maps
A concept map, sometimes referred to as a node-link diagram, is an instructional
display designed to visually denote concepts and connections among those concepts
(Adesope & Nesbit, 2013). Geometric shapes holding the concept information are the
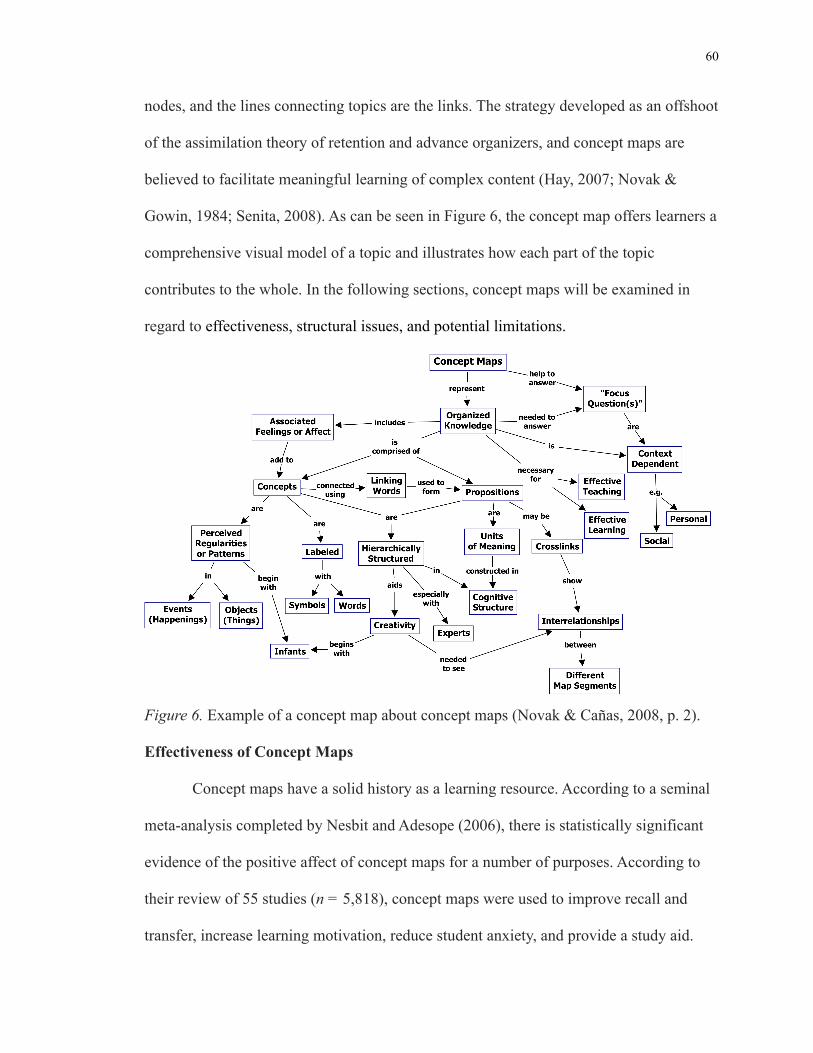
60
nodes, and the lines connecting topics are the links. The strategy developed as an offshoot
of the assimilation theory of retention and advance organizers, and concept maps are
believed to facilitate meaningful learning of complex content (Hay, 2007; Novak &
Gowin, 1984; Senita, 2008). As can be seen in Figure 6, the concept map offers learners a
comprehensive visual model of a topic and illustrates how each part of the topic
contributes to the whole. In the following sections, concept maps will be examined in
regard to effectiveness, structural issues, and potential limitations.
Figure 6. Example of a concept map about concept maps (Novak & Cañas, 2008, p. 2). Effectiveness of Concept Maps
Concept maps have a solid history as a learning resource. According to a seminal
meta-analysis completed by Nesbit and Adesope (2006), there is statistically significant
evidence of the positive affect of concept maps for a number of purposes. According to
their review of 55 studies (n = 5,818), concept maps were used to improve recall and
transfer, increase learning motivation, reduce student anxiety, and provide a study aid.
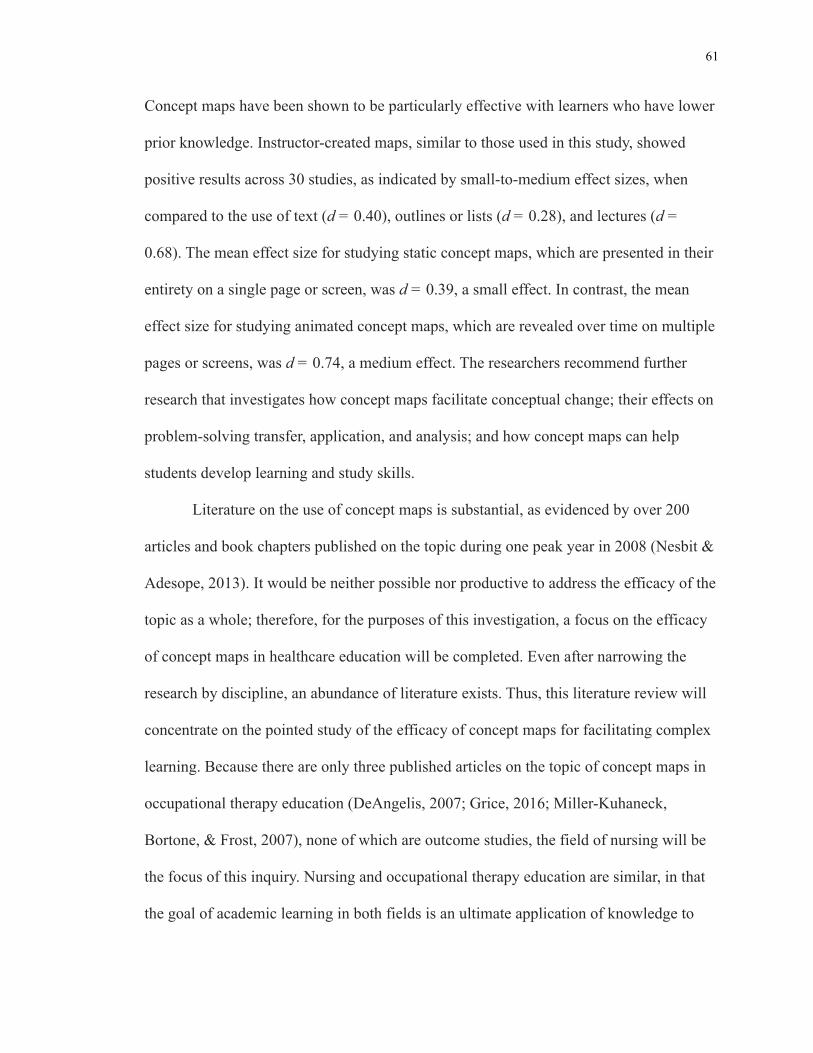
61
Concept maps have been shown to be particularly effective with learners who have lower
prior knowledge. Instructor-created maps, similar to those used in this study, showed
positive results across 30 studies, as indicated by small-to-medium effect sizes, when
compared to the use of text (d = 0.40), outlines or lists (d = 0.28), and lectures (d =
0.68). The mean effect size for studying static concept maps, which are presented in their
entirety on a single page or screen, was d = 0.39, a small effect. In contrast, the mean
effect size for studying animated concept maps, which are revealed over time on multiple
pages or screens, was d = 0.74, a medium effect. The researchers recommend further
research that investigates how concept maps facilitate conceptual change; their effects on
problem-solving transfer, application, and analysis; and how concept maps can help
students develop learning and study skills.
Literature on the use of concept maps is substantial, as evidenced by over 200
articles and book chapters published on the topic during one peak year in 2008 (Nesbit &
Adesope, 2013). It would be neither possible nor productive to address the efficacy of the
topic as a whole; therefore, for the purposes of this investigation, a focus on the efficacy
of concept maps in healthcare education will be completed. Even after narrowing the
research by discipline, an abundance of literature exists. Thus, this literature review will
concentrate on the pointed study of the efficacy of concept maps for facilitating complex
learning. Because there are only three published articles on the topic of concept maps in
occupational therapy education (DeAngelis, 2007; Grice, 2016; Miller-Kuhaneck,
Bortone, & Frost, 2007), none of which are outcome studies, the field of nursing will be
the focus of this inquiry. Nursing and occupational therapy education are similar, in that
the goal of academic learning in both fields is an ultimate application of knowledge to
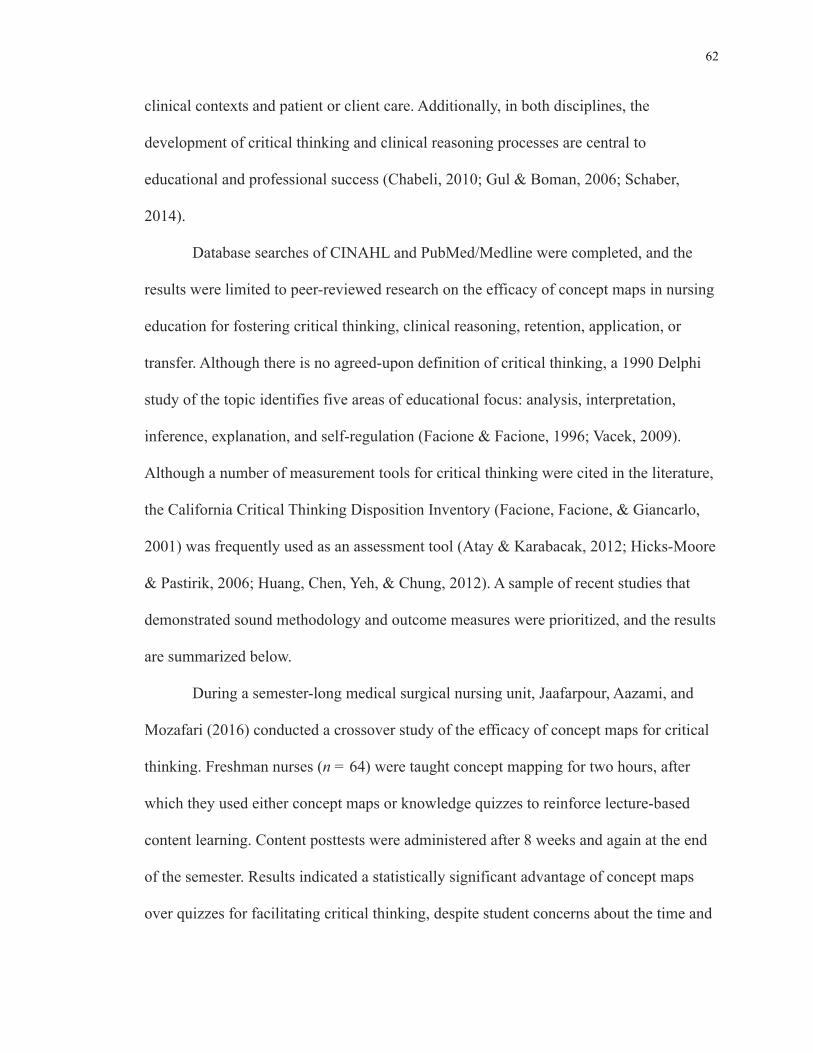
62
clinical contexts and patient or client care. Additionally, in both disciplines, the
development of critical thinking and clinical reasoning processes are central to
educational and professional success (Chabeli, 2010; Gul & Boman, 2006; Schaber,
2014).
Database searches of CINAHL and PubMed/Medline were completed, and the
results were limited to peer-reviewed research on the efficacy of concept maps in nursing
education for fostering critical thinking, clinical reasoning, retention, application, or
transfer. Although there is no agreed-upon definition of critical thinking, a 1990 Delphi
study of the topic identifies five areas of educational focus: analysis, interpretation,
inference, explanation, and self-regulation (Facione & Facione, 1996; Vacek, 2009).
Although a number of measurement tools for critical thinking were cited in the literature,
the California Critical Thinking Disposition Inventory (Facione, Facione, & Giancarlo,
2001) was frequently used as an assessment tool (Atay & Karabacak, 2012; Hicks-Moore
& Pastirik, 2006; Huang, Chen, Yeh, & Chung, 2012). A sample of recent studies that
demonstrated sound methodology and outcome measures were prioritized, and the results
are summarized below.
During a semester-long medical surgical nursing unit, Jaafarpour, Aazami, and
Mozafari (2016) conducted a crossover study of the efficacy of concept maps for critical
thinking. Freshman nurses (n = 64) were taught concept mapping for two hours, after
which they used either concept maps or knowledge quizzes to reinforce lecture-based
content learning. Content posttests were administered after 8 weeks and again at the end
of the semester. Results indicated a statistically significant advantage of concept maps
over quizzes for facilitating critical thinking, despite student concerns about the time and
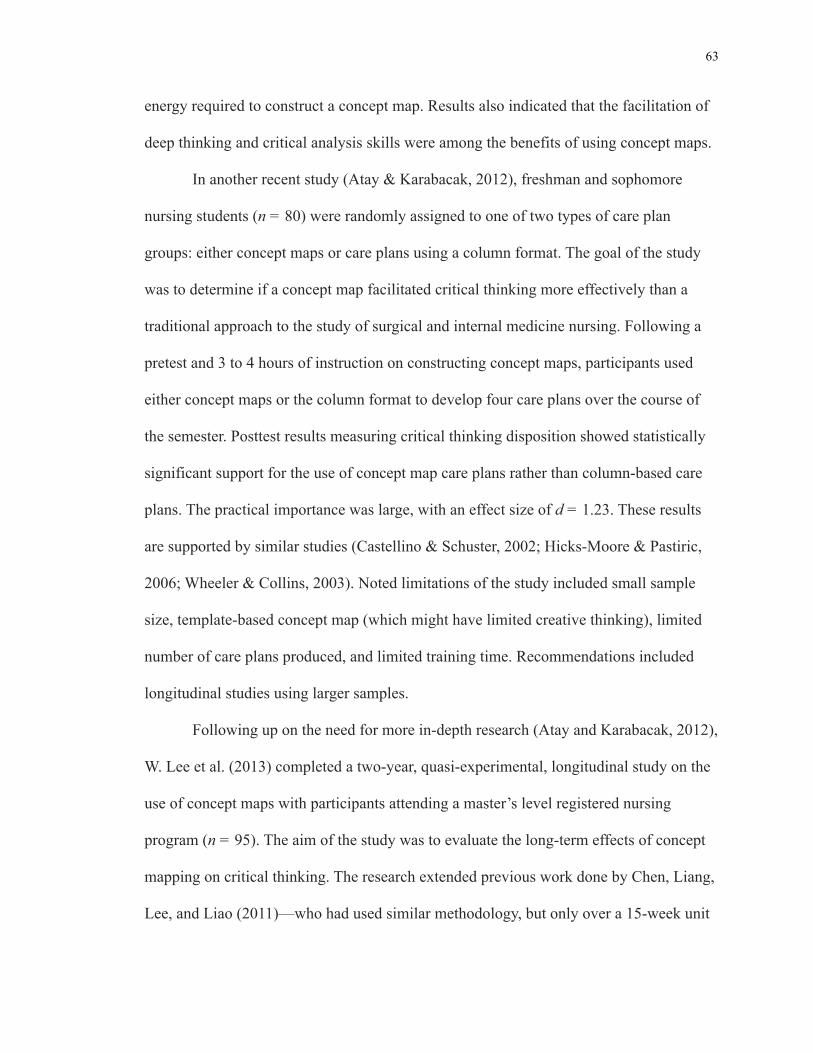
63
energy required to construct a concept map. Results also indicated that the facilitation of
deep thinking and critical analysis skills were among the benefits of using concept maps.
In another recent study (Atay & Karabacak, 2012), freshman and sophomore
nursing students (n = 80) were randomly assigned to one of two types of care plan
groups: either concept maps or care plans using a column format. The goal of the study
was to determine if a concept map facilitated critical thinking more effectively than a
traditional approach to the study of surgical and internal medicine nursing. Following a
pretest and 3 to 4 hours of instruction on constructing concept maps, participants used
either concept maps or the column format to develop four care plans over the course of
the semester. Posttest results measuring critical thinking disposition showed statistically
significant support for the use of concept map care plans rather than column-based care
plans. The practical importance was large, with an effect size of d = 1.23. These results
are supported by similar studies (Castellino & Schuster, 2002; Hicks-Moore & Pastiric,
2006; Wheeler & Collins, 2003). Noted limitations of the study included small sample
size, template-based concept map (which might have limited creative thinking), limited
number of care plans produced, and limited training time. Recommendations included
longitudinal studies using larger samples.
Following up on the need for more in-depth research (Atay and Karabacak, 2012),
W. Lee et al. (2013) completed a two-year, quasi-experimental, longitudinal study on the
use of concept maps with participants attending a master’s level registered nursing
program (n = 95). The aim of the study was to evaluate the long-term effects of concept
mapping on critical thinking. The research extended previous work done by Chen, Liang,
Lee, and Liao (2011)—who had used similar methodology, but only over a 15-week unit

64
on medical-surgical nursing—and found a positive effect for the use of concept maps on
measures of critical thinking, especially in the area of inference. In the Lee study, the
experimental group received instruction in constructing hierarchical concept maps and
then used the concept maps as a study and assignment aid. Additionally, instructors used
concept maps at the end of lectures to summarize content. The control group received
lectures and completed studies using traditional nursing processes. Data was collected at
four points over the two-year period. Results indicated that the concept map group had
statistically higher scores on inference and deduction than the control group. Limitations
of the study included possible sample bias, a limited number of data collection times, and
statistical regression toward the mean during the final data collection period. These
results are supported by some other longitudinal studies (McMullen & McMullen, 2009;
Tseng et al., 2011), although not by all (Daly, 2001; D’Antoni, Zipp, Olson, & Cahill,
2010). The disparate conclusions from the body of research may be attributable to a
vague operational definition of critical thinking used in some of the studies (Lee et al.,
2013).
Although there is a predominance of supportive research for the use of concept
maps to foster critical reasoning skills in nursing, not all results have been positive. In a
study of associate nursing students from two community colleges (experiment one:
n = 96, experiment two: n = 56), the effectiveness of concept maps for developing care
plans was contrasted with the generation of traditional care plans (Maneval, Filburn,
Deringer, & Lum, 2011). The posttest included measures of critical thinking and mastery
of skills across 17 topics. Analysis of test scores indicated that the traditional care plan
group scored significantly better than the concept map group in seven areas on the
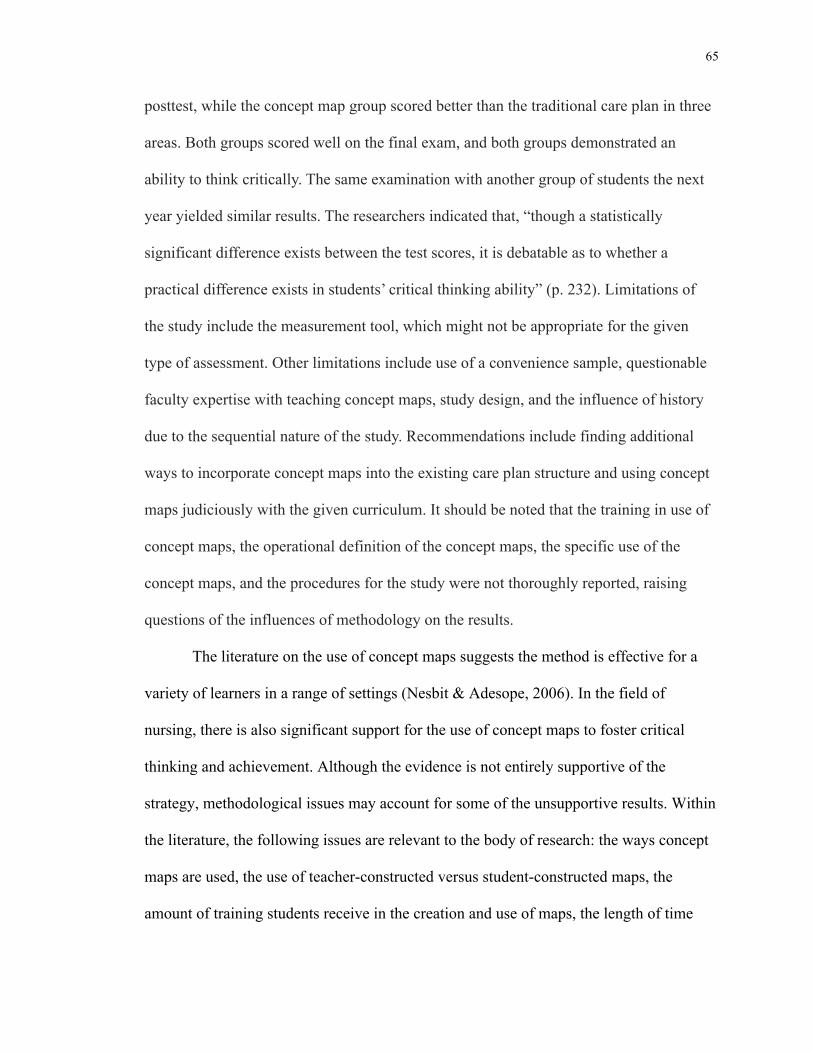
65
posttest, while the concept map group scored better than the traditional care plan in three
areas. Both groups scored well on the final exam, and both groups demonstrated an
ability to think critically. The same examination with another group of students the next
year yielded similar results. The researchers indicated that, “though a statistically
significant difference exists between the test scores, it is debatable as to whether a
practical difference exists in students’ critical thinking ability” (p. 232). Limitations of
the study include the measurement tool, which might not be appropriate for the given
type of assessment. Other limitations include use of a convenience sample, questionable
faculty expertise with teaching concept maps, study design, and the influence of history
due to the sequential nature of the study. Recommendations include finding additional
ways to incorporate concept maps into the existing care plan structure and using concept
maps judiciously with the given curriculum. It should be noted that the training in use of
concept maps, the operational definition of the concept maps, the specific use of the
concept maps, and the procedures for the study were not thoroughly reported, raising
questions of the influences of methodology on the results.
The literature on the use of concept maps suggests the method is effective for a
variety of learners in a range of settings (Nesbit & Adesope, 2006). In the field of
nursing, there is also significant support for the use of concept maps to foster critical
thinking and achievement. Although the evidence is not entirely supportive of the
strategy, methodological issues may account for some of the unsupportive results. Within
the literature, the following issues are relevant to the body of research: the ways concept
maps are used, the use of teacher-constructed versus student-constructed maps, the
amount of training students receive in the creation and use of maps, the length of time
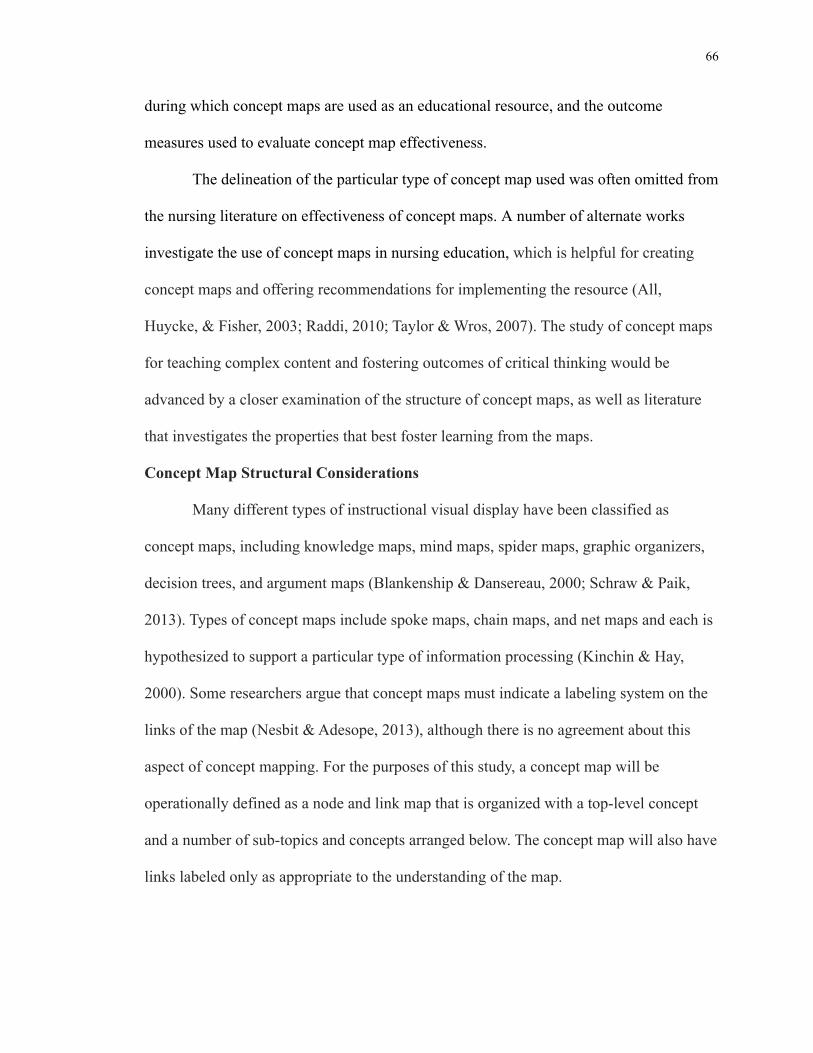
66
during which concept maps are used as an educational resource, and the outcome
measures used to evaluate concept map effectiveness.
The delineation of the particular type of concept map used was often omitted from
the nursing literature on effectiveness of concept maps. A number of alternate works
investigate the use of concept maps in nursing education, which is helpful for creating
concept maps and offering recommendations for implementing the resource (All,
Huycke, & Fisher, 2003; Raddi, 2010; Taylor & Wros, 2007). The study of concept maps
for teaching complex content and fostering outcomes of critical thinking would be
advanced by a closer examination of the structure of concept maps, as well as literature
that investigates the properties that best foster learning from the maps.
Concept Map Structural Considerations
Many different types of instructional visual display have been classified as
concept maps, including knowledge maps, mind maps, spider maps, graphic organizers,
decision trees, and argument maps (Blankenship & Dansereau, 2000; Schraw & Paik,
2013). Types of concept maps include spoke maps, chain maps, and net maps and each is
hypothesized to support a particular type of information processing (Kinchin & Hay,
2000). Some researchers argue that concept maps must indicate a labeling system on the
links of the map (Nesbit & Adesope, 2013), although there is no agreement about this
aspect of concept mapping. For the purposes of this study, a concept map will be
operationally defined as a node and link map that is organized with a top-level concept
and a number of sub-topics and concepts arranged below. The concept map will also have
links labeled only as appropriate to the understanding of the map.
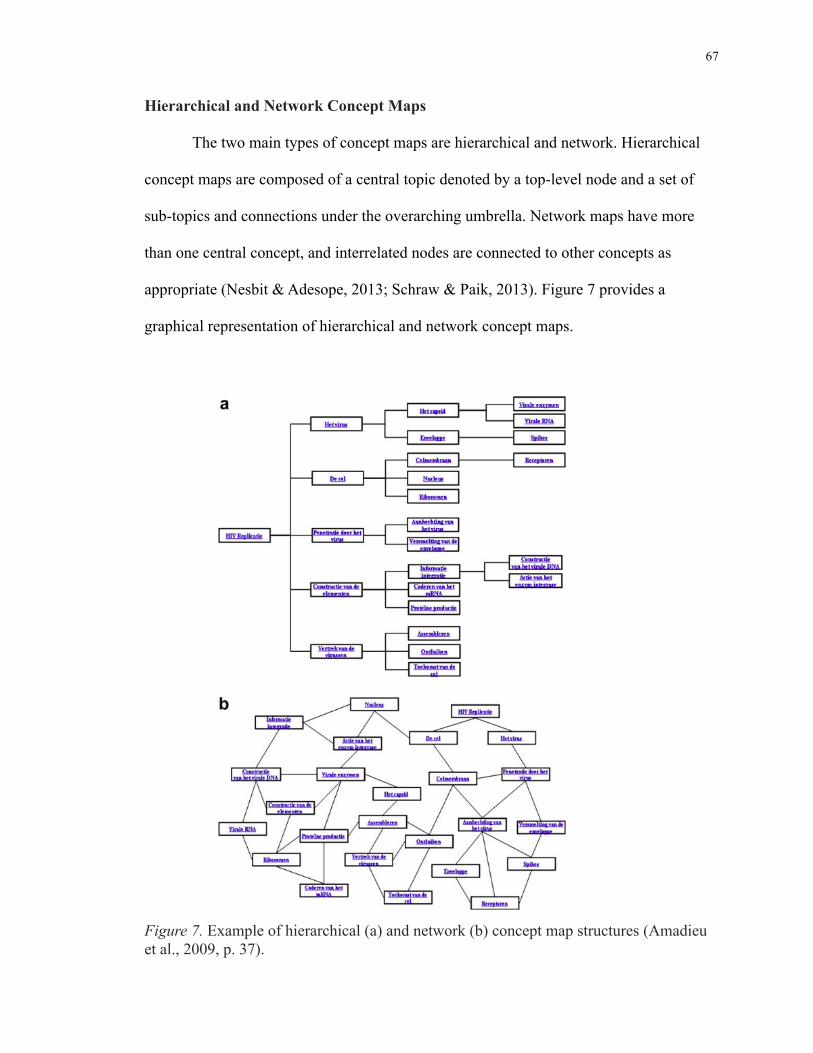
67
Hierarchical and Network Concept Maps
The two main types of concept maps are hierarchical and network. Hierarchical
concept maps are composed of a central topic denoted by a top-level node and a set of
sub-topics and connections under the overarching umbrella. Network maps have more
than one central concept, and interrelated nodes are connected to other concepts as
appropriate (Nesbit & Adesope, 2013; Schraw & Paik, 2013). Figure 7 provides a
graphical representation of hierarchical and network concept maps.
Figure 7. Example of hierarchical (a) and network (b) concept map structures (Amadieu et al., 2009, p. 37).
68
The type of map used largely depends on the purpose of the map and other learner
factors (Nesbit & Adesope, 2006). A study by Amadieu, Van Gog, Paas, Tricot, and
Mariné (2009) compared the use of hierarchical and network concept maps for learners
with low prior knowledge and high prior knowledge. Results suggested that low prior
knowledge learners gained equal factual knowledge from both types of concept map, but
gained more conceptual knowledge from the hierarchical concept map. High prior
knowledge learners gained more factual knowledge from the hierarchical concept map
and experienced no difference in conceptual learning from the two types of concept map.
Both groups of learners rated the hierarchical concept map as requiring less mental effort
to process than the network concept map.
Signaling with Concept Maps
Another aspect of concept map design is how the map signals or cues the learner
to relevant map concepts. Signaling is defined as any type of emphasis added to a visual
display that assists the learner in deciphering the meaning of the graphic (Mayer, 2013;
Van Gog, 2014). Examples of visual signaling include adding arrows, distinctive colors,
animated flashing, onscreen pointing, or graying out non-emphasized concepts (Mayer,
2009). The spatial arrangement of nodes that have similar topics in close proximity can
help to cue the learner and guide the sequence of learning (O’Donnell, Dansereau, &
Hall, 2002). Additionally, adding color to a concept map can increase its effectiveness by
visually signaling the learner to clusters of related concepts (Wallace, West, Ware, and
Dansereau, 1998).
69
Comparing Static and Animated Concept Maps
Another structural feature of concept maps concerns whether they are static or
animated. A static concept map is presented in its entirety on a single page or screen. An
animated concept map is a computer-generated concept map that changes over time,
allowing the viewer a sequenced view of the full map display (Adesope & Nesbit, 2013).
Typically, an animated concept map will show the complete concept map initially, but
then—using screencasting or other video technology—continue the presentation by
revealing one map branch at a time until the whole map has been discussed and viewed.
Animated concept maps direct attentional focus to the most relevant aspects of the map in
a logical and discrete manner, increasing the viewer’s macro perspective of the map over
time (Blankenship & Dansereau, 2000).
Animated concept maps were developed, in part, to alleviate a phenomenon called
map shock (Dansereau, Dees, & Simpson, 1994). Map shock is a type of cognitive
overload, a “feeling of being overwhelmed by the scale and complexity of the map
display” (Blankenship & Dansereau, 2000, p. 295). The literature on the use of animated
concept maps is modest; in fact, Nesbit and Adesope (2013) indicate that it is a topic
rarely studied. Two relevant studies elucidating the topic are reviewed below.
In an early study, Blankenship and Dansereau (2000) tested the attentional effects
of using animated concept maps versus static concept maps. In a four-group, posttest-
only study, undergraduate psychology students (n = 133) were randomly assigned to one
of four groups (animated concept map, static concept map, animated text, or static text) to
learn about human immune system function. Results of the free recall test indicated a
statistically significant increase in main idea information recall for the participants in the
70
animated concept map group, over the scores of participants in the animated text group,
with a medium effect size of d = 0.71. Increase in scores were seen in the animated
concept map group, as compared to the static concept map group, and in the static text
group, but results were not statistically significant. Results of the quiz revealed similar
findings, but there was also a statistically significant result seen for animated concept
maps over static concept maps in recall of macrostructural information. Limitations in the
study were primarily due to the presentation mode in the static concept map. A high level
of complexity to the information was presented, and the static concept map was described
as lacking in “gestalt organization” (p. 303), meaning that it had poor structure and
symmetry as well as a non-hierarchical and crowded distribution of nodes. The
disorganized presentation of the static map decreased its effectiveness in providing an
organized processing route, offering chunking opportunities, or visually cuing the learner
to the underlying complexity of the topic. All of these factors may have hindered the
effectiveness of the static concept map and created a situation in which it was not an
effective comparison for the animated concept map.
In a 2013 study by Adesope and Nesbit, the effectiveness of animated concept
maps with spoken narration was assessed on measures of retention and transfer. One
hundred and forty college students were paid a nominal fee to participate in the study.
The concept maps focused on the topic of human nervous system function. Following the
treatment, posttests to measure recall, understanding, and application were administered.
Results showed that concept map groups outperformed the text groups on measures of
free recall and transfer with a small effect size of d = 0.20 and on the knowledge test with
an infinitesimal effect size of d = 0.05. The researchers did not find a statistically
71
significant difference between the performance of the animated concept map and the
static concept map, indicating that animated concept maps were not superior to static
concept maps. The authors hypothesized that the lack of difference between the animated
concept map and the static concept map might have resulted from the concept map’s lack
of complexity. They also postulated that the narration and animation may have provided a
similar effect in helping the participants navigate the map. Therefore, the benefits of
providing an animated concept map were masked. They suggested that removing
narration from all conditions may have induced a more valid result from the animated
concept map versus the static concept map. Recommendations for future studies included
extending the content areas and types of learners, as well as using more complex concept
maps and further examining the effect of animated concept maps. Using eye tracking as
an outcome measure to assess focus and attention was also recommended.
Blankenship and Dansereau (2000) and Adesope and Nesbit (2013) showed
inconclusive results of animated concept map over the static concept map. In the former
study, results were promising and practically important, but not all were significant at the
p = 0.05 level. In the latter study, the results may have been confounded, per the
researchers, by the addition of recorded spoken narration to the presentations, thereby
negating any advantage of the animated concept map over the static concept map.
Additional research is necessary to explore the most relevant uses of animated and static
concept maps.
Although limited research exists on the topic of animated concept map efficacy,
there is a larger body of literature on the use of animated graphics. In a 2007 meta-
analysis of 26 studies and 76 pair-wise comparisons, Höffler and Leutner compared
72
instructional animations with static pictures, and found a mean weighted effect size of d
= 0.37 in favor of the animated presentations for learning. When the animation was
video-based, the effect size increased to d = 0.76. Representational animations were more
effective than decorational animations, and animations were better for building
procedural knowledge than declarative or problem-solving knowledge. The authors
concluded that a sound grounding in educational theory and a pointed use of animation
for specific purposes was key to leverage the effectiveness of animated graphics.
Additional studies supported these findings (Kühl, Scheiter, Gerjets, & Edelmann, 2011;
Lai & Newby, 2012). Other studies show mixed results and recommendations included
weighing the benefits of the strategy against the potential costs on learning (Lowe &
Schnotz, 2014; Tversky, Morrison, & Betancourt, 2002; Zhu & Grabowski, 2006). In
their work on multimedia learning using animation techniques, Lowe and Schnotz (2014)
cautioned that the design of animation must be aligned with human cognitive abilities and
that animation must be used pragmatically to minimize the potential for cognitive
overload.
Potential Limitations of Concept Maps
Concept maps are used before, during, and after instruction for a range of
purposes, and also as both an assessment tool and a study aid. Concept maps may be
developed by the learner or the instructor, and multiple disciplines incorporate concept
maps into their curriculum. Concept map research includes participants from elementary
school through postsecondary levels (Nesbit & Adesope, 2006). Evidence suggests that
students with low verbal ability benefit more than high verbal ability learners (Patterson,
Dansereau, & Weismann, 1993; Stensvold & Wilson, 1990), and students with low prior
73
knowledge may benefit more from concept maps than students with high prior knowledge
(Lambiotte et al., 1993; O’Donnell et al., 2002). With all of these variables in play, it is
unsurprising that there are a number of limitations and boundary conditions for use of the
strategy. Some drawbacks pertain to the particular uses and structure of concept maps,
while other potential disadvantages have been more universally identified.
Nesbit and Adesope (2006, 2013) site four main potential disadvantages of
concept maps. First and foremost, the level of complexity of even a mid-size concept map
can be daunting for viewers. It can be difficult to determine where to start reading the
map, and the sheer number of elements can be intimidating to the learner, which may
result in incomplete processing of the map or even a lack of motivation to use the
resource at all (Blankenship & Dansereau, 2000). Additionally, concept maps often
require more space for viewing than the same amount of text. The spatial requirement can
be addressed by using an animated concept map, but the unique format and size can be an
issue. Another potential disadvantage is that concept maps used as a learner-generated
activity can be onerous to construct and edit, especially if the map is hand drawn. Finally,
effective use of concept maps created by learners requires training, which takes time and
energy to complete. Along the same lines, training educators to construct and effectively
use concept maps in the classroom takes time and effort.
Summary of Instructional Visual Models for Learning Complex Content
The text-based advance organizer morphed into the graphic organizer in order to
operationally define the advance organizer and facilitate its use in teaching practice.
Additionally, visual organizers, as opposed to text-based organizers, can make use of the
power of dual-coding to maximize working memory capacity, and thus to facilitate
74
learning of complex content. Over time, various types of graphic organizer were
developed—among them, the concept map. Network displays, such as the concept map,
have a solid body of literature supporting their use, and the strategy has been used with
many different types of learners, in a variety of settings, and to meet various learning
objectives. For the purposes of the study, the concept map was used, in advance of the
main lesson, as a form of advance organizer. A more current name for the advance
organizer is pretraining. The concept maps were developed using multimedia presentation
guidelines, including the principle of pretraining.
The Principle of Pretraining
Within the cognitive theory of multimedia learning, the principle of pretraining
suggests that individuals learn more effectively from presentations when they already
know the names and characteristics of the main concepts included in a given topic
(Mayer & Pilegard, 2014). Pretraining allows learners to increase schematic knowledge
stores in long-term memory (Sweller et al., 2011). In a more general sense, pretraining is
a concept that applies to any devices or strategies, when used to simplify a student’s first
exposure to content, that offer ways for learners to build prior knowledge before
addressing the full complexity of a lesson or presentation that follows. Depending on how
they are structured and used, advance organizers and graphic organizers may fulfill the
goals of pretraining. Differentiated from curriculum design, pretraining applies
specifically to sequencing of information presentation within a particular learning task,
rather than over the full scope of a class. Pretraining is also often associated with
75
multimedia presentations, although it does not necessarily need to be paired with digital
educational technology.
The ultimate goal of pretraining is the management of high levels of intrinsic
cognitive load. Mayer (2014a) stipulates that intrinsic load cannot be reduced, but only
altered by changing the nature of the task or increasing prior knowledge levels.
Pretraining works by altering the learning task from a one-step procedure to a two-step
process. In the first stage, pretraining is introduced to present information that is low in
element interactivity—typically the names, definitions, or characteristics of a topic. In the
second stage, and armed with an increased store of prior knowledge, the more
challenging, highly element-interactive aspects of a topic are presented. The desired
result of pretraining is more effective and meaningful knowledge acquisition, so that
learning can be transferred to authentic contexts.
Two-Phase, Isolated-Interacting Elements Pretraining
The most common type of pretraining is the two-phase, isolated-interacting
elements approach (Pollock et al., 2002), also referred to as the part-task approach
(Sweller et al., 2011) or the two-stage mental model construction (Mayer, Mathias, et al.,
2002). For purposes of this study, it will also be called “traditional pretraining.” With
traditional pretraining, the components, definitions, or other concrete facts related to a
topic are introduced. Then a comprehensive model of the information is built, focusing on
component interactions and causal relationships between various parts of the information.
By learning low element-interactive content initially, students develop prior knowledge
and build schemas to support subsequent learning. Then more complex learning is
accessible.
76
Effectiveness of Traditional Pretraining
In their comprehensive review of the pretraining research, Mayer and Pilegard
(2014) examined 16 pretraining experiments and found pretraining to be an effective
strategy for fostering both retention and transfer of learning. The researchers sited a
median Cohen’s effect size of d = 0.75. The studies highlight the positive effects of
pretraining with learners who have low prior knowledge. In fact, learners with high prior
knowledge either showed no benefit at all from pretraining or their learning was actually
hindered by pretraining (Clarke et al., 2005; Pollock et al., 2002). The following sections
review a number of seminal studies on the use of pretraining to facilitate the learning of
complex material.
In an early pretraining study, Pollock et al. (2002) completed four experiments,
each examining electrical engineering topics. The goal of the studies was to determine the
effectiveness of pretraining, as well as to differentiate the usefulness of pretraining with
low and high prior knowledge learners. Two of the four experiments focused on
procedural information in electrical engineering, and the other two covered conceptual
aspects of electrical tests and principles. Using random group assignments and a two-
group, two-phase, quasi-experimental design, vocational students and apprentices (n = 18
to 25, depending on the experiment) received either (1) the pretraining treatment and an
interactive presentation or (2) two sessions of interactive training (control). Two of the
experiments included participants with low prior knowledge, and the other two included
participants with high prior knowledge. Posttests included a written, practical exam
consisting of both low and high element-interactive questions and a subjective test of
perceived effort.
77
Results from repeated measures of analyses of variance showed statistically
significant positive results for learners with low prior knowledge and large measures of
practical importance, as indicated by d = 1.22 (experiment one) and d = 1.15 (experiment
three). Conversely, for learners who had high prior knowledge of the content, effect sizes
were negligible or negative, indicating that pretraining was not an effective adjunct to
learning with these participants. The authors also highlight a paradox of the traditional
method of pretraining, which is that meaningful understanding of content must be
temporarily suspended during the pretraining phase of learning. The danger of deferring
comprehension is that learners will lose interest in or persistence with the topic or task, or
fail to engage in active learning. Although delayed understanding is an unavoidable
aspect of traditional pretraining, it also means that there is “an initial decrease in the
student’s capacity for understanding” (p. 82). The authors argue that the payoff is greater
ultimate understanding and learning, and thus that a lack of initial understanding is
acceptable.
The rationale is not universally accepted, as Sweller, Ayres, and Kalyuga (2011)
assert: “For complex motor tasks and many professional real-life tasks, it is essential that
the learner understand and learn the relevant interactions and coordinations between the
various subtasks. By learning the subtasks in isolation, these interactions may be missed”
(p. 212). Cutrer et al. (2011) echo this stance, indicating that there is vital value in
helping learners understand concepts, rather than just facts, in the initial phases of
learning. Limitations of the study included small sample size, which may hinder external
validity.
78
In the same year, Mayer, Mathias, and Wetzell (2002) completed a three-
experiment study examining the effect of pretraining on retention and transfer in college
psychology students. In two of the experiments, participants learned about a car braking
system, and in the third they learned how a bicycle pump works. Participants (experiment
one: n = 65, experiment two: n = 33, and experiment three: n = 45) were randomly
assigned to either a pretraining or a no-pretraining group. Experiments one and two
differed only in that experiment one used a paper pretraining diagram, while experiment
two used computerized pretraining materials. Experiment three made use of a 3-D plastic
model during treatment. Based on a limitation discovered in the first two studies, a post-
training group was added to experiment three, to equalize exposure time to content
amongst the groups. Pretraining was followed by a multimedia presentation. Posttests
included retention and problem-solving transfer measures.
In experiments one and two, results from independent t-tests indicated statistically
significant benefits for pretraining over the control condition on measures of both
retention and transfer. In experiment one, effect size was medium for retention (d = 0.63)
and large for transfer (d = 0.91). In experiment two, effect size was medium for retention
(d = 0.64) and large for transfer (d = 1.54). These medium-to-large effects sizes suggest
that both paper-based and computer-based pretraining materials facilitate meaningful
learning. In experiment three, statistically significant gains in transfer for the pretraining
group, over the no-pretraining and post-training groups, showed a large effect of d =
2.16. Scores of the post-training group did not differ significantly from control group
scores. In comparing the pretraining and post-training groups, medium effect size of
d = 0.49 for retention and large effect size of d = 2.16 for transfer were reported. In
79
addition to adding to the literature based on the effectiveness of pretraining, the findings
of experiment three suggest that the timing of foundational learning, rather than the total
exposure time to content, is key for learning complex information.
In yet another set of studies, Mayer, Mautone, and Prothero (2002) examined
pretraining for use with a geology simulation game. The pretraining groups were exposed
to illustrations to learn about major geological features (e.g., ridges and trenches).
Experiment one revealed methodological flaws that were addressed in the second and
third studies. Participants in experiment two (n = 105) were psychology students who
had low prior knowledge of geology. They received pretraining in the form of pictorial
scaffolding or strategy modeling, both aids, or no aids (control). Results indicated that
participants who received the pretraining in the form of pictorial scaffolding solved
significantly more problems in the simulation game than participants in any of the other
groups, with a medium effect size of d = 0.45. In experiment three, participants (n = 73)
participated in identical groups to experiment two, but a 5-item transfer test and 3 spatial
tests were added to the assessments. Results again indicated that the pictorial aid was
superior in regard to number of problems solved with a medium to large effect (d = 0.75).
Additionally, results showed that both low and high spatial ability learners benefitted
from a pictorial scaffold for pretraining, and that pictorial pretraining increases transfer
ability for both high and low spatial ability participants. The effect size was large (d =
0.85).
Building on the early research on pretraining, Clarke, Ayres, and Sweller (2005)
examined whether sequential or concurrent instruction in the interrelated content areas of
math and spreadsheet knowledge would yield more effective learning. The goal of the
80
study was to determine whether pretraining could assist high school students who were
learning about graphical representations of linear math functions using a spreadsheet
application. A secondary objective was the comparison of low and high prior knowledge
learners. The 2 x 2, between subjects, factorial design consisted of ninth-grade students (n
= 21) randomly assigned to matched pairs based on math skill and self-assessment of
spreadsheet ability. Learning gains were measured by posttests of spreadsheet and math
knowledge, as well as subjective cognitive load measurement. Results indicated that
participants with low prior knowledge benefitted more from pretraining that did high
prior knowledge participants. Effect sizes were large for low priors (d = 1.84) and
negative (d = -0.38) for high prior knowledge learners. Researchers hypothesized that
outcomes for high prior knowledge participants may have been due to the expertise
reversal effect, which refers to the lowered effectiveness of pretraining when learners
have high prior knowledge of a topic. In this case, the additional foundational training
was unnecessary and either had no effect or a negative effect on learning (Kalyuga,
Ayres, Chandler, & Sweller, 2003; Lee, Plass, & Homer, 2006). Limitations of the study
included the small sample size, which significantly limited generalization of the findings.
The researchers concluded that the technical aspects of instructional technology resources
are best learned in advance of subject area content.
A series of studies by Kester and colleagues extended the research on pretraining
by examining the timing of treatment and the type of information provided during
pretraining (Kester, Kirschner, & van Merriënboer, 2004a, 2004b, 2006; Kester,
Kirschner, van Merriënboer, & Baumer, 2001; Kester, Lehnen, van Gerven, and
Kirschner, 2006). This approach to a pretraining-like strategy segmented content, just as
81
pretraining does, but did not necessarily present simpler and less element-interactive
information before more complex content. Known as just-in-time information
presentation (Kester et al., 2001), the content necessary for carrying out a task is
presented at precisely the time it is needed. Supportive information is presented before
practicing tasks, while procedural information is presented during practice on learning
tasks. Results from the studies show mixed results, with pretraining showing a positive
effect when used in a 2006 study of solving electrical circuit problems (Kester,
Kirschner, et al., 2006), but not proving effective when used with statistics problems
(Kester et al., 2004a), electrical circuits (Kester et al., 2004b), or neural networks (Kester,
Lehnen, et al., 2006). Further investigation into why these particular studies failed to
produce positive results is indicated.
In a recent study completed by Seery and Donnelly (2012), pretraining was used
to assist first-year chemistry students in navigating complex course content. The purpose
of the study was to examine how to reduce cognitive overload observed in novice
chemistry students. The study differed from earlier studies in that it took place in a
naturalistic classroom setting, and the pretraining treatment was being used to increase
student outcomes in their major classes. In the study, pretraining was referred to as pre-
lecture resources—functionally speaking, a pretraining activity. The research was
composed of a series of case studies (n = 49). Each student was provided a 5-minute,
multimedia pre-lecture presentation designed to provide foundational information prior to
the lecture. Ten pre-lectures were prepared, with one for each lecture presentation. A quiz
to test understanding and clarify misconceptions accompanied each pretraining module.
The effectiveness of the pretraining was measured by comparing exam scores for students
82
who had no prior knowledge of chemistry before coming to college with the scores of
students who had completed high school chemistry and scored at a competent level in
their final high school exams. At midterm exams, results indicated that there was no
statistically significant difference between students with and without prior knowledge.
Scores for students with high prior averaged 61%, while those without prior knowledge
scored 55% on average. This finding was in contrast to the previous year, when there had
been no pretraining and students had showed a gap of 19% between low and high priors
at midterms. Findings from the end of the semester exam showed no significant
differences at all between the low and high priors. The researchers suggest that
pretraining in the form of pre-lecture resources manages cognitive load and levels the
field between students with low and high prior knowledge.
In a final study on traditional pretraining, college students (n = 114) participated
in a pretest-posttest experiment on the structure and function of a pulley system (Eitel et
al., 2013). Randomly assigned to one of six conditions, participants used digital
technology to view either pictures, text, or both for varying lengths of time. The pictorial
and text presentations were used as pretraining activities. Outcome measures included
spatial ability, verbal and pictorial recall, and comprehension posttests. Results indicated
that when a self-paced diagram was used for pretraining before exposure to
accompanying text, comprehension was increased, and a large effect, d = 1.37 was noted.
Structural comprehension was more improved than procedural comprehension.
83
Pretraining Using Concept Maps
Despite a compelling evidence base supporting the principle of pretraining, little
literature exists on pretraining using non-traditional approaches. Database searches
(ERIC, PsychINFO, CINAHL, PubMed/Medline, and Academic Complete) for
pretraining using concept maps revealed only three studies. In two of the studies,
pretraining is referred to as an advance organizer (Cutrer et al., 2011; Willerman &
MacHarg, 1991). In evaluating the studies, the operational definition of the advance
organizer is synonymous with the strategy of pretraining. Each of the studies reported
statistically significant positive results, and the research is synthesized below.
Willerman and MacHarg (1991) completed the first study on concept maps for
pretraining. The goal of their research was to investigate the use of teacher-created
concept maps to improve physical science achievement in 8th-grade students. Using a
test-retest design, the authors assigned four classes of physical science students (n = 82)
to a control or experimental group for a two-week unit on chemical properties of
elements and compounds. Students in the experimental group were provided with blank
concept maps that they filled in from a teacher model, and the teacher then reviewed and
revised them for accuracy. The control group received unit objectives and “interesting
questions designed to instill motivation” (p. 708). At the end of the two-week unit, a 50-
item, teacher-constructed knowledge test was administered. Results of a one-tailed t-test
showed a statistically significant outcome for the experimental group over the control,
with a medium effect size of d = 0.40. The results suggest that using a concept map as a
pretraining method is a successful way to foster academic achievement. The authors
postulated that providing a visual representation of concepts and connections between
84
aspects of a topic that is hierarchical and conceptual by nature was an effective means for
promoting learning.
In a later study by Cutrer et al. (2011), the researchers explored medical residents’
understanding of the process of respiratory failure. The goal of the study was to facilitate
critical understanding of complex content and to examine how the use of expert concept
maps can promote deeper and more meaningful learning and retention in medical
residents. Using a pretest-posttest design, instructor-created concept maps were compared
with didactic lecture. All participants (n = 46) were taught to create concept maps, as that
was the method to be used to measure knowledge retention. The control group received a
45-minute PowerPoint lecture, and the experimental group received a 45-minute concept
map session using a simplified overview of the topic as an pretraining strategy:
The experimental session began with participants spending 5 minutes examining
the structure of the advance organizer version of the expert concept map, allowing
learners to visualize important concepts without being overwhelmed by the details
and completeness of the full expert concept map. (p. 1020)
The posttest involved completion of a concept map. Knowledge retention was assessed
immediately after instruction, and again after one week. An anonymous questionnaire
was also completed to assess participant experiences with use of concept maps.
The experimental group scored higher on recall immediately after the session with
a large effect size (d = 4.61) and at the one-week follow-up assessment, again with a
large effect size (d = 2.97). The experimental group improved more than the control
group, with senior interns exhibiting more improvement than incoming interns. Results
indicated that concept maps used as a pretraining strategy, as compared to didactic
85
lectures, result in greater gains in knowledge organization and integration. Limitations of
the study included no secondary outcome measure and no applied evaluation.
Additionally, exposure to concept maps may have inflated the experimental group’s
ability with the maps, as compared to the control group’s exposure on the posttest. Peer
interaction was not well controlled, which may have skewed the results. Finally, a one-
week follow-up may not have been long enough to accurately measure retention.
Measurement of meaningful learning is best seen at least 6 weeks after the learning
encounter (Novak & Gowin, 1984).
In the final identified study, Zheng et al. (2012) examined whether a two-phase,
isolated-interacting elements pretraining or pretraining resulted in more effective learning
than pretraining with a concept map. The main goal of the study was to investigate the
effects of different types of pretraining on learners’ prior knowledge construction and
subsequent achievement. Participants were undergraduate educational psychology
students (n = 40), who were randomly assigned to either a concept map pretraining group
(concept map group) or an isolated-interacting elements learning group (two-phase
group). Pretraining on the topic of type 1 diabetes was administered online to each of the
treatment groups, followed by a presentation of complex material on type 1 diabetes for
both groups. Immediate posttest assessment measured recall, application, and knowledge
transfer. The results indicated that pretraining is effective for learning complex material,
but an analysis of variance showed no statistically significant difference in group scores
between the concept map group and the two-phase group. Both groups had strong scores
on recall (80%), application (61%), and knowledge transfer (63%) tests. The authors
recommend future studies with larger and more diverse samples.
86
Summary of the Literature
Exposing students to introductory materials in advance of a lesson is not a new
concept. Advance organizers, advance graphic organizers, and pretraining have been used
successfully with learners for decades. The strategy works especially well for complex
content, that is, topics that are high in element interactivity. By dividing learning into two
stages, educators can help students build prior knowledge and schema to ease the
difficulty level of the main content. Additionally, when introductory learning materials
include both visuospatial and text-based content, dual-coding of information allows the
learner to maximize the limited capacity of working memory, which leads to increased
knowledge acquisition and integration. The principle of pretraining and its historical
predecessors have been shown to work particularly well with learners who have low prior
knowledge of a topic. An identified paradox of traditional pretraining is that the learner
must suspend understanding in the early stages of learning in service of greater
comprehension later. A limited number of studies combining pretraining with the visual
display of the concept map have begun to address the challenge, although more research
is indicated.
The combined literature around advance organizers for meaningful learning,
instructional visual displays—including concept maps—for learning complex content,
and pretraining defined a trajectory for the study. Pretraining using concept maps offer a
visual display-based option to traditional pretraining. As they encounter visual and spatial
representations of information in pretraining materials, learners have the potential to learn
complex content even more effectively than with traditional pretraining.
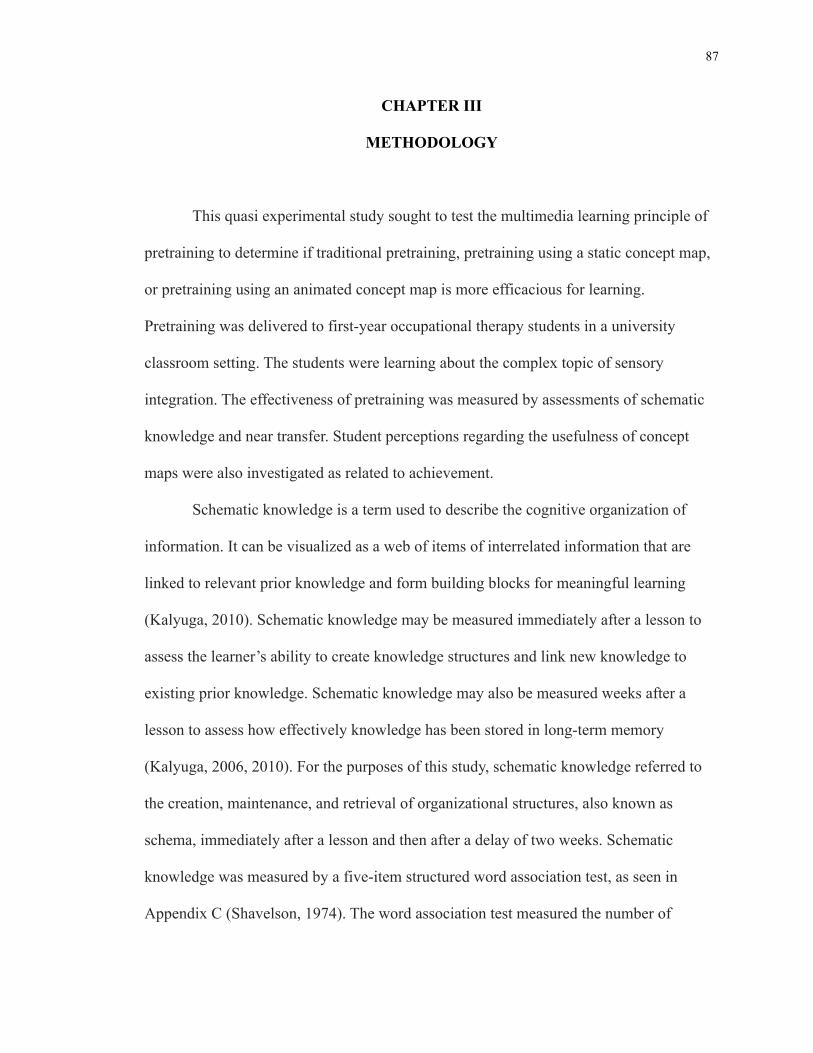
87
CHAPTER III
METHODOLOGY
This quasi experimental study sought to test the multimedia learning principle of
pretraining to determine if traditional pretraining, pretraining using a static concept map,
or pretraining using an animated concept map is more efficacious for learning.
Pretraining was delivered to first-year occupational therapy students in a university
classroom setting. The students were learning about the complex topic of sensory
integration. The effectiveness of pretraining was measured by assessments of schematic
knowledge and near transfer. Student perceptions regarding the usefulness of concept
maps were also investigated as related to achievement.
Schematic knowledge is a term used to describe the cognitive organization of
information. It can be visualized as a web of items of interrelated information that are
linked to relevant prior knowledge and form building blocks for meaningful learning
(Kalyuga, 2010). Schematic knowledge may be measured immediately after a lesson to
assess the learner’s ability to create knowledge structures and link new knowledge to
existing prior knowledge. Schematic knowledge may also be measured weeks after a
lesson to assess how effectively knowledge has been stored in long-term memory
(Kalyuga, 2006, 2010). For the purposes of this study, schematic knowledge referred to
the creation, maintenance, and retrieval of organizational structures, also known as
schema, immediately after a lesson and then after a delay of two weeks. Schematic
knowledge was measured by a five-item structured word association test, as seen in
Appendix C (Shavelson, 1974). The word association test measured the number of
88
correct responses to each prompt and had no ceiling score (most scores were between
zero and 10 per word association item).
Transfer is a term used to describe a change in ability resulting from increased
knowledge. Transfer is measured by applying what has been learned to a novel situation
or task (Gick & Holyoak, 1987). Near transfer can be contrasted with far transfer, a type
of content application in which there is little overlap between the original context and the
transfer context (Schunk, 2012). This study focused on near transfer, a concept that
describes assessment of ability when the testing scenario is very similar to that provided
in the original lesson (Schunk, 2012). Because the participants in this study had only
limited prior knowledge of the topic, their ability to apply learning likely extended only
to scenarios analogous to those from the lesson. Near transfer was measured by replying
to eight multiple choice and fill-in-the-blank questions about a case study worth a
possible total of twelve points. The case study in the test was comparable in content and
structure to one presented in the lesson.
The relationship between students’ views of concept maps and achievement was
measured in the areas of schematic knowledge and near transfer. Perceptions about the
usefulness of concept maps was quantified using Likert-like questionnaire composed of
seven items and scored using a six-point scale ranging from strongly agree to strongly
disagree. The scale was completed at the end of the posttest and was designed to
highlight aspects of the concept map that may have been interpreted as being useful to the
learning process.
89
Research Questions
The study sought to answer five research questions about college students who
were learning complex, healthcare-based content in an occupational therapy program:
1. How does the type of pretraining affect schematic knowledge when measured
immediately after a lesson?
2. How does the type of pretraining affect schematic knowledge when measured two
weeks after a lesson?
3. How does the type of pretraining affect near transfer when measured immediately
after a lesson?
4. How does the type of pretraining affect near transfer when measured two weeks after
a lesson?
5. What is the relationship between students’ perceptions of the usefulness of concept
maps and scores on measures of schematic knowledge and near transfer?
A three-group, pretest-posttest quasi-experimental design was implemented with
six classes of first-year occupational therapy students at three local universities. This
setting was selected for its applicability to the researcher’s teaching discipline, field of
practice, and professional knowledge of the challenges that occupational therapy students
experience while learning complex content. The content topic presented was sensory
integration, a theoretical framework frequently used in occupational therapy practice
(Lane et al., 2014). First year students were recruited because they were most likely to
have low prior knowledge as they had not yet been exposed to the sensory integration
90
topic. All treatments, presentations, and testing took place during regularly scheduled
class periods or workshop sessions.
Sensory integration is a required topic within the occupational therapy
curriculum, so all students received a comprehensive lesson that included a pretest,
pretraining activity, lecture presentation, posttest, and delayed posttest. The researcher, an
expert in sensory integration, conducted the sensory integration lesson. Because the
content was germane to training and eventual licensure, students almost assuredly put
forth maximal effort in learning the information. Course instructors had access to all
study materials and resources for use in their classes. After data collection, students were
provided with all study materials and a set of resources for further learning. Students who
were willing to have their data analyzed completed a written consent form.
The independent variable in this study was the type of pretraining received: (a)
traditional pretraining, which uses two-phase, isolated-interacting elements; (b)
pretraining using a static concept map; or (c) pretraining using an animated concept map.
Pretraining, which lasted 15 minutes (a 12-minute video plus 3 minutes for setup), was
used to introduce a 60-minute lecture on sensory integration theory and principles, and
included the opportunity to ask questions and clarify concepts. The dependent variables
were scores on two posttests that lasted 15-minutes total and measured schematic
knowledge and near transfer. A five-item instrument covered schematic knowledge, and a
companion eight item test addressed near transfer. Two weeks after the lesson, additional
data on schematic knowledge and near transfer was gathered from scores on parallel form
delayed posttests that lasted a total of 15 minutes. Yet another parallel form of the
instruments was used as a 15-minute pretest to assess prior knowledge.
91
The study consisted of three visits to each of five regularly scheduled
occupational therapy class over a four-week period. The occupational therapy class
sessions lasted one hour and 40 minutes to two hours and 45 minutes, and classes met
once per week. The sixth group was seen twice during workshop sessions. The first
workshop session lasted two hours and included the pretest, intervention, and posttest.
The second workshop session lasted for 15 minutes and included the delayed posttest.
During the first week, a 10-minute informational presentation and a question-and-
answer session about the study was completed. Students who were willing to have their
data analyzed for the study completed a written consent form and a demographic
questionnaire, and created a personal identification number to help protect their
anonymity. Following the consent process, all students completed a fifteen-minute
pretest.
During the second week of the study, students participated in one of three 12-
minute pretraining protocols: (a) traditional pretraining, (b) pretraining with a static
concept map, or (c) pretraining with an animated concept map. After pretraining, all
students in the class received a 60-minute live lecture consisting of a slide deck
presentation with narration by the researcher. Questions were permitted. To ensure
consistency and equivalence of presentations in the various classes, a detailed outline of
the presentation and scripted presenter notes were used during each session (see
Appendix H). After completion of the pretraining and presentation, students completed
the schematic knowledge and near transfer tests, which lasted 15 minutes in total.
Schematic knowledge was measured with a 5-item, word-association subtest (see
Appendix C). Near transfer was measured with an 8-item, multiple choice and fill-in-the-
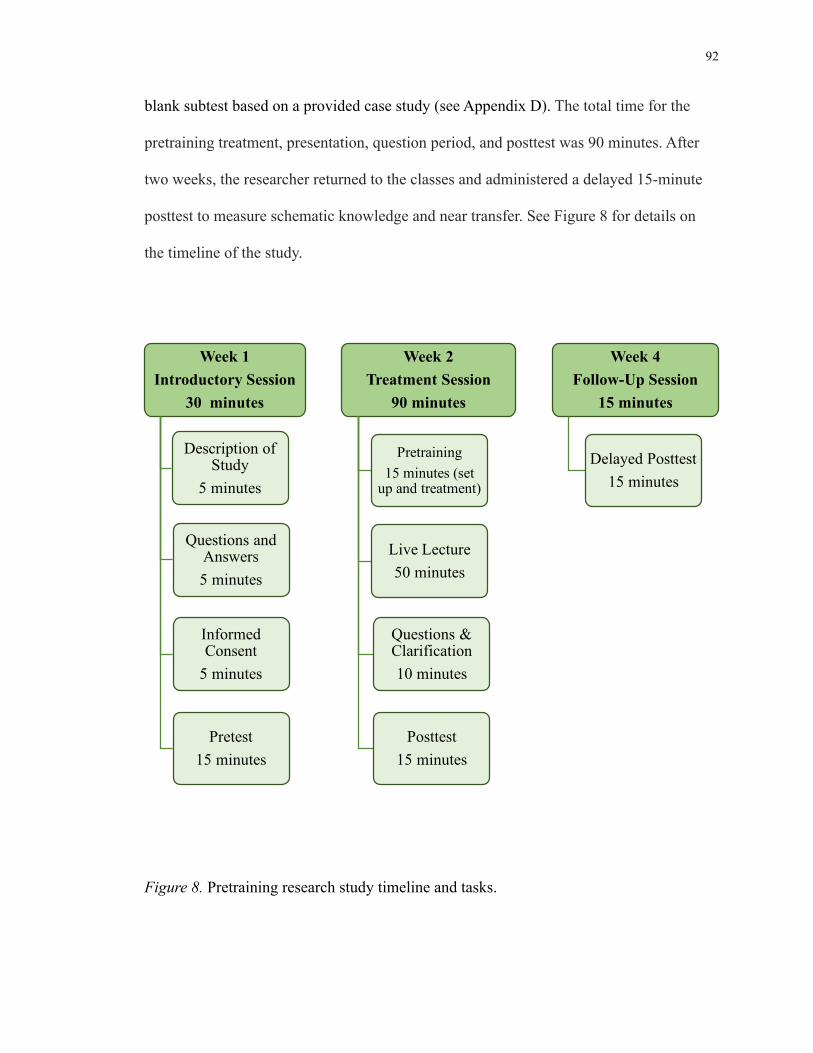
92
blank subtest based on a provided case study (see Appendix D). The total time for the
pretraining treatment, presentation, question period, and posttest was 90 minutes. After
two weeks, the researcher returned to the classes and administered a delayed 15-minute
posttest to measure schematic knowledge and near transfer. See Figure 8 for details on
the timeline of the study.
Figure 8. Pretraining research study timeline and tasks.
Week 1Introductory Session
30 minutes
Description of Study
5 minutes
Questions and Answers5 minutes
Informed Consent
5 minutes
Pretest15 minutes
Week 2Treatment Session
90 minutes
Pretraining 15 minutes (set
up and treatment)
Live Lecture50 minutes
Questions & Clarification10 minutes
Posttest 15 minutes
Week 4Follow-Up Session
15 minutes
Delayed Posttest15 minutes
93
Research Design
This study used a three-group, quasi-experimental, pretest-posttest design. The
study was implemented with six classes of first-year occupational therapy graduate
students from three West Coast universities. The independent variable for this study was
the method of pretraining: two-phase, isolated-interacting elements pretraining
(traditional pretraining), pretraining using a static concept map, or pretraining using an
animated concept map. The two dependent variables for this study were (a) schematic
knowledge and (b) near transfer. The intervention was completed during occupational
therapy class or workshop sessions and lasted 90 minutes per class of participants. The
study had a duration of four weeks per class, with the pretest on week one, the pretraining
treatment and posttest on week two, and the delayed posttest being completed two weeks
later on week four.
Sample
The participants were recruited from three West-Coast universities that offer
master’s or clinical doctoral degree programs in occupational therapy. University A is a
public, urban institution with an enrollment of approximately 32,700 undergraduate and
graduate students. University A offers a two-year, entry level master’s program in
occupational therapy and enrolled students will have completed a bachelor’s degree in a
related field prior to admittance. University B is a private, suburban school with an
enrollment of approximately 1,900 undergraduate and graduate students. University B
has two occupational therapy programs: a bachelor’s to master’s program that takes five
years to complete, and an entry level master’s program that can be completed in three
years. University C is a private urban school with an enrollment of approximately 1,400
94
students in the healthcare fields. University C offered an entry level master’s program in
occupational therapy, but in 2016 admitted their first doctor of occupational therapy
cohort and will be discontinuing the master’s level training. The participants in this study
were all entry level doctoral students. The sample included the majority of the first-year
occupational therapy students at the three schools (n = 145). University A has 79
occupational therapy students and the study was conducted across in two courses. The
pretests and delayed posttests were completed in the Historical and Theoretical
Foundations of Occupational Therapy class sections. The intervention and posttests were
administered in the Occupation Through the Lifespan class sections. University B has
approximately 47 occupational therapy students and the study was conducted in two
Occupational Therapy Foundations class sections. University C had 42 students and the
study was initiated in one Introduction to Pediatrics class. After administering the pretest
and communicating directly with the instructors, it was discovered that this class takes
place in students’ second rather than first year of study. Pretest scores reflected the higher
level of prior knowledge and all 42 students were excluded from participation in the
study. A volunteer group of 19 first year students at University C were then recruited and
these participants completed the study in a series of two workshop sessions facilitated by
the researcher and assisted by an occupational therapy faculty member. The group of
volunteer participants represent approximately half of the first-year class cohort. Table 1
provides details on the sample by university of attendance.
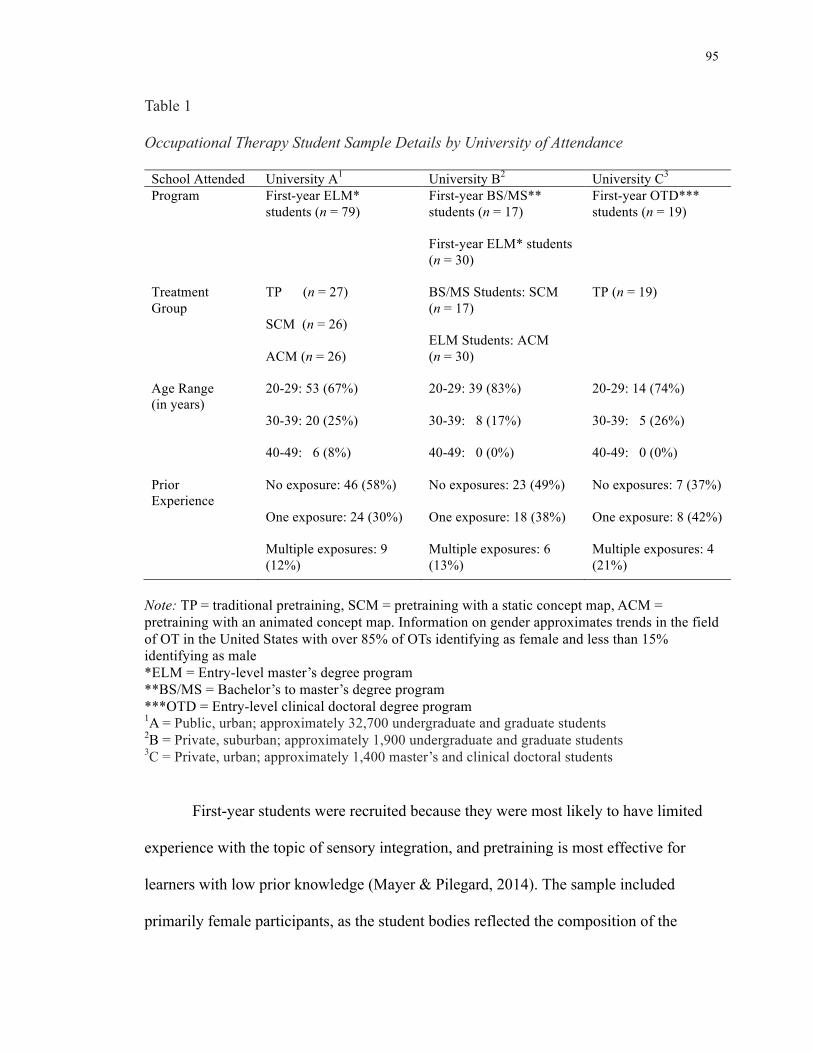
95
Table 1 Occupational Therapy Student Sample Details by University of Attendance
School Attended University A1 University B2 University C3
Program First-year ELM* students (n = 79)
First-year BS/MS** students (n = 17) First-year ELM* students (n = 30)
First-year OTD*** students (n = 19)
Treatment Group
TP (n = 27) SCM (n = 26) ACM (n = 26)
BS/MS Students: SCM (n = 17) ELM Students: ACM (n = 30)
TP (n = 19)
Age Range (in years)
20-29: 53 (67%) 30-39: 20 (25%) 40-49: 6 (8%)
20-29: 39 (83%) 30-39: 8 (17%) 40-49: 0 (0%)
20-29: 14 (74%) 30-39: 5 (26%) 40-49: 0 (0%)
Prior Experience
No exposure: 46 (58%) One exposure: 24 (30%) Multiple exposures: 9 (12%)
No exposures: 23 (49%) One exposure: 18 (38%) Multiple exposures: 6 (13%)
No exposures: 7 (37%) One exposure: 8 (42%) Multiple exposures: 4 (21%)
Note: TP = traditional pretraining, SCM = pretraining with a static concept map, ACM = pretraining with an animated concept map. Information on gender approximates trends in the field of OT in the United States with over 85% of OTs identifying as female and less than 15% identifying as male *ELM = Entry-level master’s degree program **BS/MS = Bachelor’s to master’s degree program ***OTD = Entry-level clinical doctoral degree program 1A = Public, urban; approximately 32,700 undergraduate and graduate students 2B = Private, suburban; approximately 1,900 undergraduate and graduate students 3C = Private, urban; approximately 1,400 master’s and clinical doctoral students
First-year students were recruited because they were most likely to have limited
experience with the topic of sensory integration, and pretraining is most effective for
learners with low prior knowledge (Mayer & Pilegard, 2014). The sample included
primarily female participants, as the student bodies reflected the composition of the
96
occupational therapy profession, which in 2016 was approximately 88% female (United
States Bureau of Labor Statistics, 2016). Because the proportion of males in the sample
was so low, analyzing gender in this study would decrease the participants’ anonymity
and thus this demographic statistic was not reported.
Participants were randomly assigned by intact class section to one of the three
treatment groups: (a) traditional pretraining, (b) pretraining using a static concept map, or
(c) pretraining using an animated concept map. Of the six class sections, two class
sections received each of the three treatment protocols. At school A, one class was
assigned to each of the three types of treatment. At school B, the class of bachelor’s to
master’s students was assigned to the pretraining using a static concept map condition
and the entry level master’s students class was assigned to the pretraining with an
animated concept map condition. At school C, the single class section received the
traditional pretraining treatment. Intact class sections were used so that the treatment
could be administered to all participants in a timely manner and to ensure that all
participants successfully experienced the treatment in the limited time frame available.
Scores on the pretest were analyzed to examine group equivalence.
Results from the schematic knowledge and near transfer pretests were recorded
and analyzed to examine group equivalence before treatment. The means and standard
deviations (SD) on schematic knowledge were as follows: traditional pretraining group
(M = 13.41, SD = 5.42), pretraining with a static concept map group (M = 6.65, SD =
4.23), and pretraining with an animated concept map group (M = 12.02, SD = 5.37). An
analysis of variance (ANOVA) was conducted to investigate these scores and results
indicated that the scores were statistically significantly different [F(2, 142) = 22.06, p <
97
.05]. Post hoc analysis revealed that the static concept map group had statistically
significantly lower pretest scores than either the traditional pretraining group and the
pretraining with an animated concept map group. Further examination of the two classes
that composed the pretraining with a static concept map treatment group indicated that
the participants in the bachelor’s to master’s program from school B had lower scores
(M = 3.76, SD = 3.33) than did the entry level master’s students from school A
(M = 8.54, SD = 3.68). No statistically significant differences were found at pretest
between the traditional pretraining group and the pretraining with an animated concept
map group.
Group equivalence was then examined for the near transfer pretest. The means
and standard deviations for scores on the near transfer pretest were as following:
traditional pretraining group (M = 6.35, SD = 1.79), static concept map group (M = 4.42,
SD = 1.83), and animated concept map group (M = 4.95, SD = 1.58). An ANOVA was
conducted to investigate these differences and results confirmed the scores were
statistically significant different [F(2, 142) = 15.18, p < .05]. Post hoc analysis showed
that the pretraining with a static concept map group had statistically significantly lower
scores than either the traditional pretraining group or the animated concept map group.
Further examination of the two classes that composed the pretraining with a static
concept map treatment group indicated that the participants in the bachelor’s to master’s
program from school B had lower scores (M = 3.76, SD = 3.33) than did the entry level
master’s students from school A (M = 4.81, SD = 1.88). No statistically significant
differences were found at pretest between the traditional pretraining group and the
animated concept map group. During data analysis, pre-existing differences between
98
treatment groups on schematic knowledge and near transfer pretest scores were addressed
via repeated measures ANOVA and post hoc statistical measures, yet the non-
equivalence of the treatment groups at baseline may have skewed the analysis. Therefore,
in addition to using statistical tests to address the non-equivalence of the groups, a
subsample with equivalent pretest scores was created and ancillary analysis of the
subsample was completed. Results of both analyses are detailed in Chapter 4.
Protection of Human Subjects
Research plans were reviewed by the University of San Francisco Institutional
Review Board for the Protection of Human Subjects (USFIRBPHS) for adherence to
ethical practices. The study was approved by this review board as exempt research,
because it involved minimal risk to subjects according to 45CFR46.101(b). This research
adhered to the ethical standards of the USFIRBPHS. All site requirements at the three
universities where the research was conducted was addressed and Institutional Review
Board approval was obtained from each of the three schools. Informed consent was
obtained from the participants by asking them to read and agree to an introductory
statement of purpose. Risk of harm to participants was minimal, and no physical, mental,
or emotional risks were anticipated. Participant pretest, posttest, and delayed posttest data
was kept confidential, and results were reported only in aggregated groups.
The pretraining learning activities, lecture on sensory integration, and assessments
were required curricular elements of the course. Data from those students who consented
to participate in the study was analyzed. The following steps were taken to address
ethical considerations:
99
1. Consent forms and Research Participant Bill of Rights were uploaded to all course
websites and students were asked to review the materials prior to the first week of the
study.
2. An introduction to the research was presented in each class section and to each
potential participant before consent was requested. All participants were provided
with an opportunity to ask questions about the research study. Potential participants
were informed that the learning materials, class attendance, and participation in the
learning activities were a mandatory part of their coursework, but that participation or
non-participation in the study would have no effect on their course grades or their
good standing in the department or at their university.
3. A signed letter of consent was obtained from each participant. The form described the
purpose of the study and the data collection methods (see Appendix B).
4. All participants were assured that data used for the research would be anonymously
reported. Only the researcher would have the participants’ identifying information
and their data. The researcher used identifying information only for the purpose of
verifying consent. The researcher deleted all code numbers from students who did not
provide consent. Data was stored in a secure location. Consent forms were kept in a
secure location separate from the data.
5. The measures of schematic knowledge and near transfer were used by the researcher
for the purpose of data analyses. Course instructors did not have access to the data nor
the results of the study. Course instructors were provided with the lecture notes and a
resource packet for the purposes of refining curricula and future teaching.
100
6. At the conclusion of the study, participants received access to research materials and
resources used during the study, in case they wished to use them as a study guide or
retain them for reference.
7. Participants have access to results of the study if they wish to review them.
Instrumentation
This study made use of the following instrumentation: three testing instruments,
three pretraining protocols, and one lecture presentation. Pretraining protocols and the
presentation were presented by the researcher and were made available to participants at
the conclusion of the study. Assessment instruments were presented as paper hard copy.
Participants completed the pretest prior to receiving the pretraining treatment or lecture
presentation. All materials including the testing instruments, the pretraining protocols and
the lecture were reviewed by a team of content experts, critiqued by two multimedia
experts, pilot tested prior to the start of the study and revised as indicated.
Measurement of Pretraining
Two measures were used to gauge the effectiveness of pretraining: schematic
knowledge and near transfer. These concepts are defined earlier in this section. Schematic
knowledge and near transfer were measured immediately after the lesson and again two
weeks later.
Testing Instruments
No standardized assessment measures of sensory integration principles could be
identified, so all testing instruments were developed by the researcher. Items of varying
difficulty were included to avoid ceiling or floor effects. Content validity of all items
101
included on the pretest, posttest, and delayed posttest was established by review of the
instruments by twelve occupational therapy experts who have specializations in sensory
integration. Five of the twelve hold doctorate degrees, six hold master’s degrees, and one
has a bachelor’s degree. Half of the group have advanced certification in sensory
integration, and number of the experts teach sensory integration. All are experts in the
curriculum as well as being practitioners of sensory integration theory, evaluation, and
intervention.
To maximize the likelihood of developing a relevant and comprehensive test of
the topic, Lawshe’s content validity index was implemented. The content validity index
provides a statistical means for a panel of content experts to validate an assessment
instrument through item review (Gilbert & Prion, 2016). A content validity ratio for each
prospective item on the assessment was calculated using item ratings from the twelve
content experts. Then an index score was determined by obtaining the mean score for all
items. A content validity index of at least 0.70—preferably exceeding 0.80—is
recommended (Gilbert & Prion, 2016). The calculated overall content validity index for
the combined posttest was 0.77, an acceptable score.
To further investigate the internal consistency of the testing instruments,
Cronbach’s alpha statistics were also calculated. Scores over .90 are considered excellent,
.80-.90 are good, .70-.80 are acceptable, .60-.70 are questionable, and .50-.60 are low
(Popham, 2000) The Cronbach’s alpha for the 17 items in the schematic knowledge and
near transfer tests combined was a = .70, an acceptable score. The 5-item schematic
knowledge items achieved Cronbach’s a = .77, also an acceptable score. The eight-item,
12 response near transfer test received a Cronback’s a = .51, a low value, despite
102
revisions being made after the content experts had reviewed the instrument. Increasing
the number of test items may have helped to raise the reliability of the near transfer test
(Popham, 2000).
Pretests. Prior knowledge of sensory integration theory was measured with a
five-item word association test to gauge schematic knowledge and an eight-item
instrument used with a short case study to gauge near transfer. Additional demographic
questions on the pretest included school of attendance, program of attendance (BS/MS,
entry level master’s, or entry level doctoral program), age range of the participant (using
10-year age bands), and prior experience with sensory integration (e.g., whether a
participant was exposed to sensory integration while completing volunteer hours before
being admitted to an occupational therapy program).
Posttests. An instrument to measure schematic knowledge and near transfer was
administered immediately after the intervention and lecture presentation. Schematic
knowledge was measured through a structured word association subtest consisting of five
items (Gunstone, 1981; Shavelson, 1974). The subtest was designed to measure
organization of knowledge and relationships between units of knowledge acquired by the
learner during the pretraining and lecture presentation. Students were allowed one minute
per item for each of the five items. Figure 9 shows a sample of the word association
structure. (See Appendix C for the subtest structure.) Near transfer was measured by
providing answers on an 8-question subtest based on a brief case study, which was
structured to include information similar to that presented in the lecture (see Appendix
D). The near transfer test is worth a maximum of twelve points and included multiple
103
choice and fill-in-the-blank questions. The word association posttest intentionally was
administered before the transfer posttest to reactivate existing knowledge.
The posttest included seven additional items about concept map preferences and
use, which were presented as a six-option, Likert scale. Response options included
strongly agree, agree, slightly agree, slightly disagree, disagree, and strongly disagree.
These last seven items, which did not pertain schematic knowledge or transfer were
included because they provided additional information regarding participant perspectives
on the use of concept maps. These questions were used to analyze any associations
between participant perspectives on concept maps as a learning resource with assessment
scores. The items are listed below and the instrument is provided in Appendix E.
i) The concept map was useful for my learning about sensory integration.
ii) The color coding of the concept map was helpful.
iii) I would have found it easier to understand the content without the concept
map.
iv) The spatial structure of the concept map helped my understanding of
sensory integration.
v) The concept map was a useful resource for learning about a challenging
topic.
vi) I did not need the concept map to understand sensory integration.
vii) The concept map made it easier to understand sensory integration.
Delayed posttests. The 8-item delayed posttest was administered two weeks
following the intervention and lecture presentation. In a parallel format to the posttest, it
contained equivalent content and was worth twelve points. The delayed posttest measured

104
schematic knowledge and near transfer, and it included two follow-up questions to
ascertain how much time, if any, students spent accessing or reviewing sensory
integration content or materials between the posttest and the delayed posttest.
Suppose I ask you to write down as many words related to the word apple as you can. You might write down the following:
Apple: fruit
Apple: red
Apple: round
Apple: grows on a tree
Apple: good for pie
Apple: seeds
Apple: like a pear
Apple: one a day keeps the doctor away
Apple: ____________
Apple: ____________
You will notice that there are many associations with the word apple. Some are one-word answers, and others are a phrase. All the words and phrases are related to the key word. Not all the blanks are filled, which is okay.
Figure 9. One-minute word association example. Instructional Materials
Instructional materials for the study included a Traditional Pretraining Module, a
Pretraining with a Static Concept Map Module, a Pretraining with an Animated Concept
Map Module, and a lecture presentation slide deck with accompanying detailed outline
and presenter notes. Each of the three 15-minute pretraining modules included identical
content and was presented as a 12-minute narrated screencast and accessed classwide via
a laptop, projector, and screen. Three additional minutes were allotted for set up. Table 2
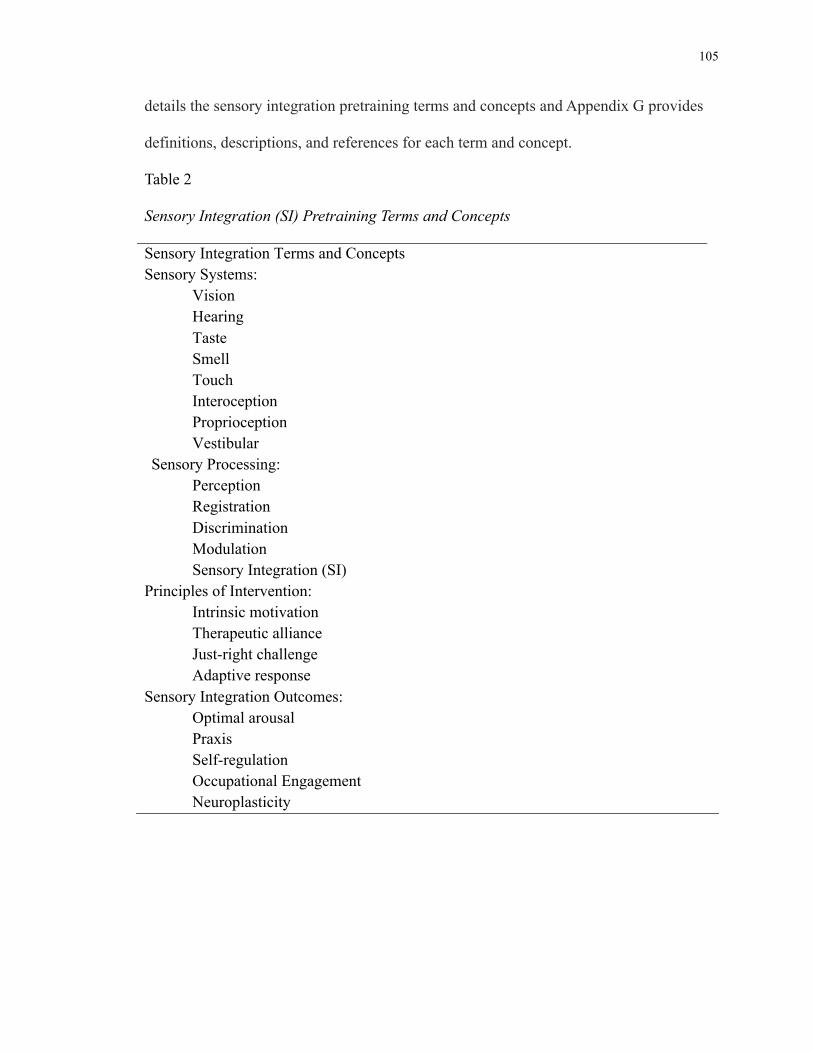
105
details the sensory integration pretraining terms and concepts and Appendix G provides
definitions, descriptions, and references for each term and concept.
Table 2 Sensory Integration (SI) Pretraining Terms and Concepts Sensory Integration Terms and Concepts Sensory Systems:
Vision Hearing Taste Smell Touch Interoception Proprioception Vestibular
Sensory Processing: Perception Registration Discrimination Modulation Sensory Integration (SI)
Principles of Intervention: Intrinsic motivation Therapeutic alliance Just-right challenge Adaptive response
Sensory Integration Outcomes: Optimal arousal Praxis Self-regulation Occupational Engagement Neuroplasticity
106
All pretraining modules adhered to general cognitive theory of multimedia
learning principles (Mayer, 2014a). For example, one focus was on minimizing
extraneous design elements such as redundant text and narration (redundancy principle,
split attention principle), decorative images (coherence principle), or spatial and temporal
disconnects between information (contiguity principles). Another focus was on
maximizing the strategic use of words and images together (modality principle) and using
human voice speaking in a conversational style for the narration (voice and
personalization principles). Appendix F shows details of the cognitive theory of
multimedia learning principle use.
The pretraining modules that use a concept map were designed in accordance with
best practices for creating concept maps (Adesope & Nesbit, 2013). The principles
presented address both the defining features of concept maps and features that increase
the understandability of concept map diagrams. Table 3 delineates recommendations for
creating effective concept maps. The static concept map can be reviewed in Figure 10 and
in Appendix I, and a sample of still images from the animated concept map can be seen in
Appendix J. Videos showing the three pretraining modules can be viewed at
https://tinyurl.com/ybzrk362.
The lecture presentation was delivered live in each class after the pretraining
module. The 60-minute presentation was provided by the researcher using a slide deck
and a detailed presenter notes. The full slide deck and presenter notes for the sensory
integration lecture can be found in Appendix K (it is best viewed on a computing device
to see the color signaling).
107
All three pretraining interventions and the lecture presentation were narrated by
the researcher. This decision served two purposes. First, it limited confounding factors
that may have been introduced by having different voices presenting aspects of the
lesson. Second, the design choice acted to extend the social agency, or the idea that social
cues in multimedia presentations can prime a social response in learners which may in
turn lead to increased learning outcomes (Mayer, 2014b). By using a familiar voice
connected to a live instructor students may have increased their social connection to the
lesson and therefore their ability to learning the material more deeply and effectively.
To ensure content quality and validity of the instructional materials, the
information presented in each of the modules was reviewed by twelve content experts in
the fields of occupational therapy and sensory integration. Follow up interviews were
completed with five of the content experts after they had reviewed the pretraining module
content and the lecture outline. Questions focused on the accurateness of the content, the
sequence of presentation, and the clarity of the materials. Revisions to the pretraining
terms and definitions, and to the lecture structure were made accordingly. Then, to ensure
best practices using cognitive load theory and the principles of cognitive theory of
multimedia learning, and to minimize extraneous load as much as possible, two education
professors skilled in curriculum development and multimedia instructional material
design reviewed the style and structure of the materials and provided feedback. Revisions
were included in the final versions of the pretraining modules and the lecture.
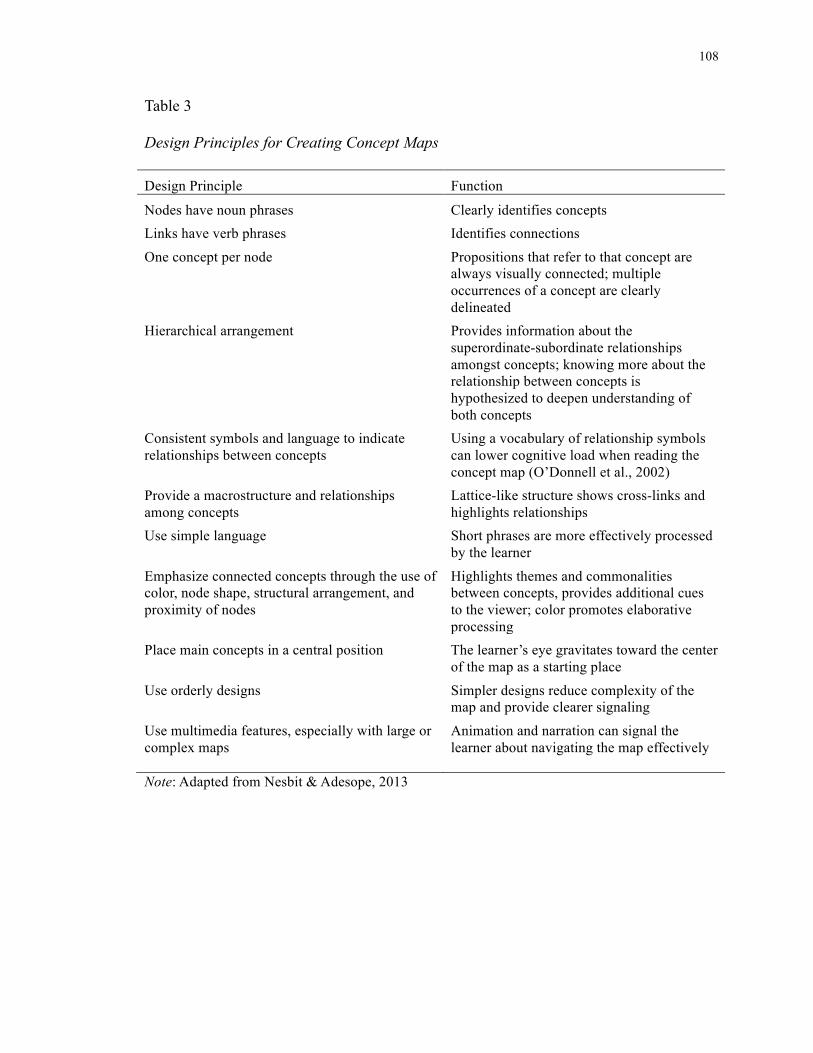
108
Table 3 Design Principles for Creating Concept Maps Design Principle Function
Nodes have noun phrases Clearly identifies concepts Links have verb phrases Identifies connections
One concept per node Propositions that refer to that concept are always visually connected; multiple occurrences of a concept are clearly delineated
Hierarchical arrangement Provides information about the superordinate-subordinate relationships amongst concepts; knowing more about the relationship between concepts is hypothesized to deepen understanding of both concepts
Consistent symbols and language to indicate relationships between concepts
Using a vocabulary of relationship symbols can lower cognitive load when reading the concept map (O’Donnell et al., 2002)
Provide a macrostructure and relationships among concepts
Lattice-like structure shows cross-links and highlights relationships
Use simple language Short phrases are more effectively processed by the learner
Emphasize connected concepts through the use of color, node shape, structural arrangement, and proximity of nodes
Highlights themes and commonalities between concepts, provides additional cues to the viewer; color promotes elaborative processing
Place main concepts in a central position The learner’s eye gravitates toward the center of the map as a starting place
Use orderly designs Simpler designs reduce complexity of the map and provide clearer signaling
Use multimedia features, especially with large or complex maps
Animation and narration can signal the learner about navigating the map effectively
Note: Adapted from Nesbit & Adesope, 2013

109
Pretraining Module Information
Traditional pretraining module. Using the two-phase, isolated-interacting
elements pretraining approach suggested in the literature (Pollock et al., 2002; Zheng et
al., 2012), pretraining instructional materials consisted of a narrated list of key terms and
definitions central to sensory integration theory. Text was augmented by relevant images.
The Traditional Pretraining Module was created using screencasting software and
narrated for equivalence with the pretraining modules that used a concept map.
Adherence to cognitive theory of multimedia learning principles (Mayer, 2009; Mayer &
Moreno, 2003) and cognitive load theory guidelines (Mayer & Moreno, 2010a, 2010b)
was maintained. Each participant in the traditional pretraining groups viewed the
projected pretraining module as a group in their class. The video can be accessed at
https://youtu.be/dt3cB-ZGbwQ.
Pretraining using a static concept map module. A one-screen static concept
map was created using guidelines for creating concept maps (Adesope & Nesbit, 2013;
Novak, 2010; Novak & Cañas, 2008 and adhering to multimedia principles for creating
instructional resources (Mayer, 2009; Mayer, 2014a; Mayer & Moreno, 2003). The static
concept map was color-coded to help signal the viewer to the various topics and
subtopics. The pretraining using a static concept map module created with visual
modeling software and contained information identical to that in the Traditional
Pretraining Module. The concept map was then transferred to a screen casting
application, where prerecorded narration was added. The narration included prompts to
help viewers reference the relevant aspects of the map (e.g., “On the left side of your
screen in blue, you will see the terms related to sensory processing”). These additional
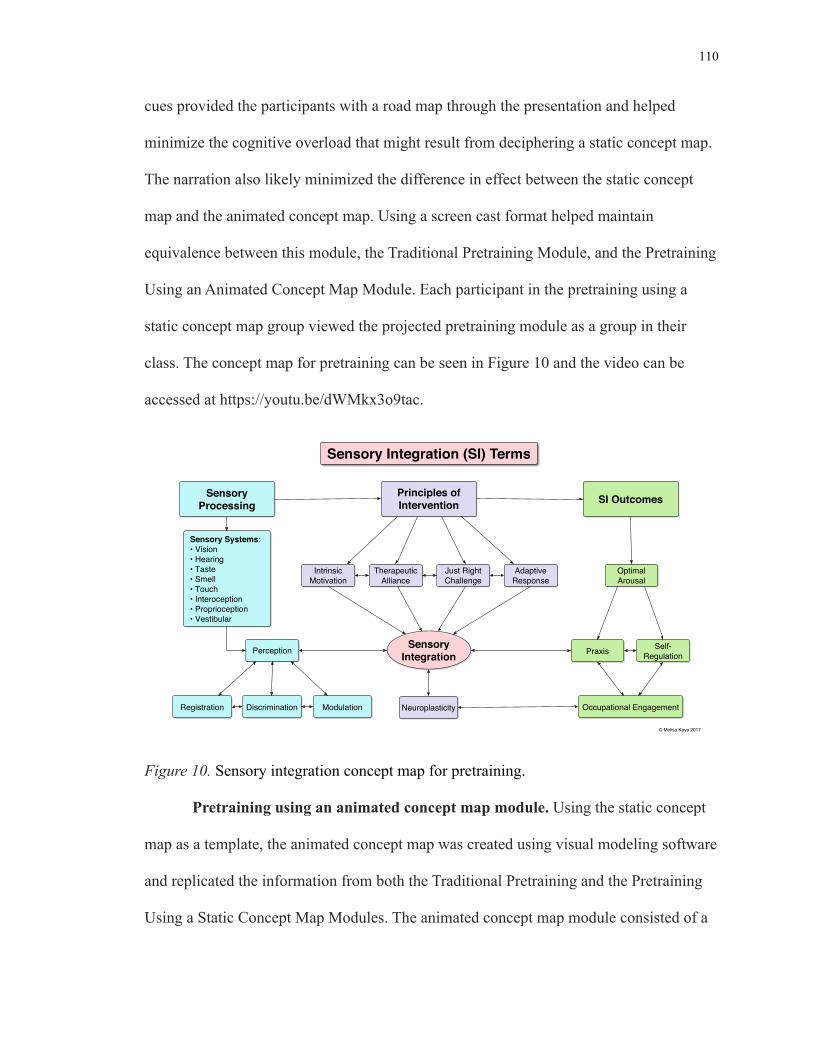
110
cues provided the participants with a road map through the presentation and helped
minimize the cognitive overload that might result from deciphering a static concept map.
The narration also likely minimized the difference in effect between the static concept
map and the animated concept map. Using a screen cast format helped maintain
equivalence between this module, the Traditional Pretraining Module, and the Pretraining
Using an Animated Concept Map Module. Each participant in the pretraining using a
static concept map group viewed the projected pretraining module as a group in their
class. The concept map for pretraining can be seen in Figure 10 and the video can be
accessed at https://youtu.be/dWMkx3o9tac.
Figure 10. Sensory integration concept map for pretraining.
Pretraining using an animated concept map module. Using the static concept
map as a template, the animated concept map was created using visual modeling software
and replicated the information from both the Traditional Pretraining and the Pretraining
Using a Static Concept Map Modules. The animated concept map module consisted of a
Sensory Integration
Sensory Processing
Principles of Intervention
Intrinsic Motivation
Therapeutic Alliance
Just Right Challenge
Adaptive Response
SI Outcomes
Praxis Self-Regulation
Optimal Arousal
Registration ModulationDiscrimination Occupational Engagement
Sensory Integration (SI) Terms
© Melisa Kaye 2017
Perception
Neuroplasticity
Sensory Systems:• Vision• Hearing• Taste• Smell• Touch• Interoception• Proprioception• Vestibular
111
number of slides, each one depicting one branch or sub-branch of the concept map.
Color-coding was used to help signal the viewer to the various topics and subtopics. Over
the course of the pretraining, the concept map was gradually revealed until it was shown
in its entirety. The final slide in the pretraining using an animated concept map module
reviewed the complete concept map. The animated concept map was presented using a
screencast to help maintain equivalence with the Traditional Pretraining Module and the
Pretraining Using a Static Concept Map Module. Each participant in the pretraining using
an animated concept map group viewed the projected pretraining module as a group in
their class. A sample of the animated concept map stills can be seen in Appendix J, and
the video can be accessed at https://youtu.be/TomQ3lDpWwE.
Live lecture presentation. A presentation on sensory integration principles was
created using slide deck software. The presentation adhered to the guidelines of cognitive
load theory (Sweller, 1994; Sweller et al., 1998; Van Merriënboer & Sweller, 2010),
cognitive theory of multimedia learning principles (Mayer, 2009; Mayer, 2014b; Mayer
& Moreno, 2003), and Reynolds’ design principles (2013). The presentation was
delivered live by the researcher, a content expert in sensory integration theory and
principles. The live lecture was used because it most authentically replicates the format of
a typical occupational therapy class experience. Appendix K contains all lecture slides
and presenter notes.
Procedures
The following procedures were used to conduct the study and collect the data.
Table 4 shows the week-by-week schedule for the research, including all tasks that were
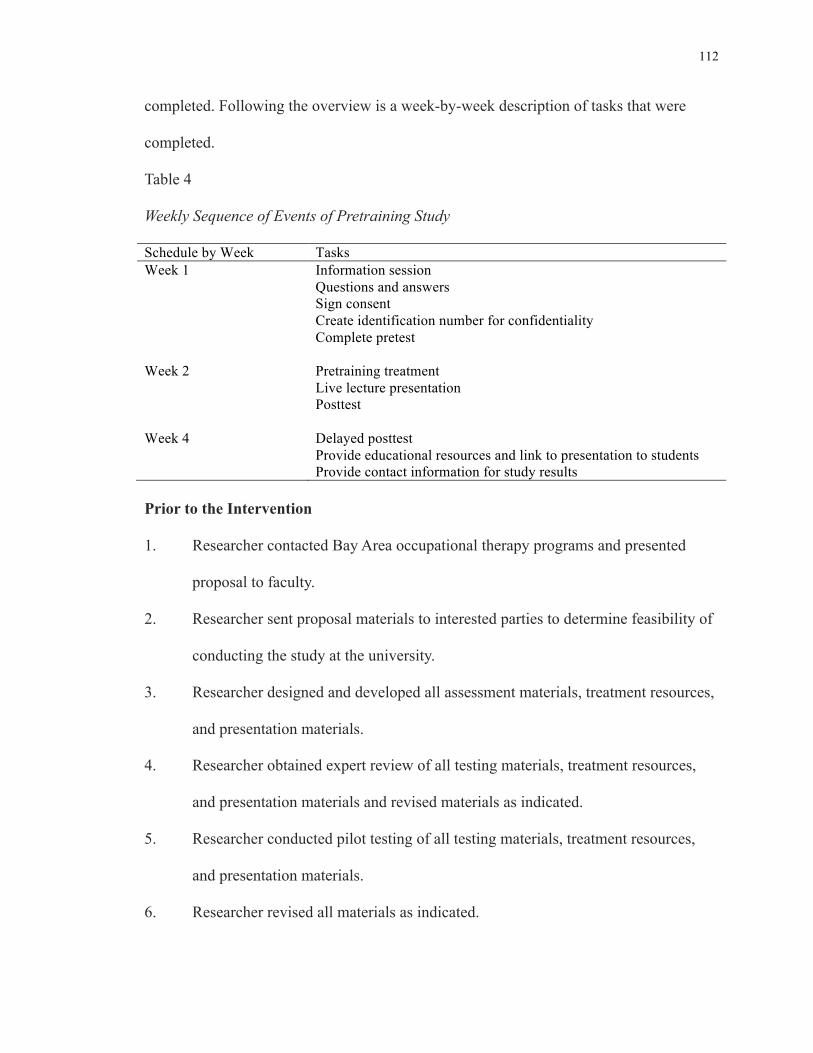
112
completed. Following the overview is a week-by-week description of tasks that were
completed.
Table 4 Weekly Sequence of Events of Pretraining Study Schedule by Week Tasks Week 1 Information session
Questions and answers Sign consent Create identification number for confidentiality Complete pretest
Week 2
Pretraining treatment Live lecture presentation Posttest
Week 4
Delayed posttest Provide educational resources and link to presentation to students Provide contact information for study results
Prior to the Intervention
1. Researcher contacted Bay Area occupational therapy programs and presented
proposal to faculty.
2. Researcher sent proposal materials to interested parties to determine feasibility of
conducting the study at the university.
3. Researcher designed and developed all assessment materials, treatment resources,
and presentation materials.
4. Researcher obtained expert review of all testing materials, treatment resources,
and presentation materials and revised materials as indicated.
5. Researcher conducted pilot testing of all testing materials, treatment resources,
and presentation materials.
6. Researcher revised all materials as indicated.

113
Week One of the Study
1. All prospective participants attended an informational session. The presentation
included a brief description of the study, protection of human subjects and
confidentiality information, and notice that participation or non-participation
would not be connected with course grade. Then prospective participants were
invited to participate in a question-and-answer period.
2. Participants who were willing to have their testing data analyzed for the study
completed written consent paperwork.
3. Participants in the study created an identification code consisting of the initials of
their first and last name and the month and day of their birth. Birth month and day
each consisted of a two-digit number. For example, for with the initials of ZF and
a birthday of July 25, the code would be ZF0725.
4. All students were required to attend the class session to receive a lecture
presentation on sensory integration theory and participate in related learning
activities, regardless of their decision to have their data collected and analyzed.
5. Participants completed the schematic knowledge and near transfer pretests for 15
minutes and identified themselves on the test instrument by their identification
code.
Week Two of the Study
1. As a class section, students were presented with one of three narrated, screencast
pretraining modules and completed the 15-minute treatment (12-minute video
plus 3 minutes to set up and begin the treatment).
114
2. Students completed the 60-minute lecture and the 15-minute posttests of
schematic knowledge and near transfer.
3. The posttests of schematic knowledge and near transfer, and items pertaining to
the use of concept maps for learning were administered to all students via paper
and pen testing.
4. Participants were instructed to refrain from discussing the learning activities or
the assessment until all class sections completed the treatment and posttests.
5. Data from participants have signed a consent form, as indicated by identification
code provided on the posttest, had their test scores recorded for analysis.
Week Four of the Study
The researcher returned to each class section two weeks later to administer the
delayed posttests of schematic knowledge and near transfer. Participants received a paper
and pen delayed posttest to complete. Participants received access to the presentation and
lecture and a packet of resource materials for future use. Participants were reminded that
they could access the results of the completed study and were provided with relevant
contact information. Any follow-up questions about the topic of sensory integration or the
study were addressed.
Pilot Procedures
Prior to the data collection, a pilot study was completed to test the directions, time
estimates, clarity of the procedures, and data collection aspects of the study. The pilot
study also allowed the researcher to test the technology-based aspects of the study
(screencasts, video, testing materials, and presentation) to be sure all was in good
115
working order. A sample of 16 individuals known to the researcher provided the pilot test
sample. Two additional pilots using one individual participant each from the researcher’s
educational institution and healthcare practice were also completed. Following the pilot
testing sessions, cognitive interviews with the participants were completed. Interview
questions focused on investigating the flow and conciseness of the pretraining video
modules and the lecture. Additional questions revolved around the usefulness of the
images and any instances when the participant was either a) bored or inattentive or b)
confused. Revisions to the pretraining video modules and the lecture slide deck and
content were made accordingly.
Data Analyses
For research questions 1-4, descriptive statistics including means and standard
deviations were reported for the pretest, posttest, and delayed posttest scores, for the
sample as a whole and for each of the three pretraining groups. Means and standard
deviations were reported for change scores from the pretest to posttest to the pretest to
delayed posttest on both measures of schematic knowledge and near transfer for each of
the three pretraining groups and for the sample as a whole.
As indicated in an earlier section of this chapter under Sample, pretest scores
varied significantly between groups. The groups were found to be statistically
significantly unequivalent. These identified differences were addressed statistically using
post hoc measures. Details regarding the data analysis can be found in Chapter IV:
Results.
116
Repeated measures one-way analyses of variance (ANOVA) were completed to
compare scores between the three treatment groups and for both schematic knowledge
and near transfer achievement. Repeated measures ANOVAs were completed at three
time periods: after the pretest and before pretraining, for posttest scores immediately after
the pretraining and lecture, and for delayed posttest scores two weeks later. Post hoc
planned comparisons (e.g., Bonferroni tests) were used to identify the nature of the
differences between each of the groups’ scores and gain scores from posttest to delayed
posttest. Pairwise comparisons and effect size differences between groups were
calculated to measure the practical importance of any group differences that were found.
For research question five on participant perspectives of concept map use as they
may relate to achievement scores, the concept map questionnaire was first scored. The
total possible score was 42 for seven items scored on a six-point continuum. Then, the
total point score was divided by the number of items to present a more easily
understandable range of 1-6 points, with six representing total support for the use of
concept maps. Following the presentation of descriptive statistics, a Pearson’s product-
moment correlation was used to analyze potential associations between participant
perceptions of concept maps and assessment scores. Specifically, a correlation matrix was
created to examine the links between participants’ use of concept maps, preferences for
concept maps, and posttest and delayed posttest scores on measures of schematic
knowledge and near transfer. The composite score for all seven questions was used in the
correlation procedure because correlating individual items on a rating scale may produce
inexact results due to the potentially unequal scale rating intervals.
117
CHAPTER IV
RESULTS
The purpose of this study was to investigate three pretraining approaches to
determine what effect the method of pretraining had on schematic knowledge and near
transfer achievement. Learning was measured immediately after the treatment and again
two weeks later. Additionally, the study extended the existing research by examining the
effect of pretraining in an authentic university classroom setting working with first-year
occupational therapy students. The student participants, who were learning about the
complex topic of sensory integration, had low prior knowledge of the content. Finally, the
study explored whether student perceptions about the usefulness of concept maps as a
learning resource was reflected in schematic knowledge and near transfer achievement.
Using a quasi-experimental pretest-posttest design, students were assigned in
intact class groups to one of the three treatment conditions: traditional pretraining,
pretraining with a static concept map, or pretraining with an animated concept map. The
independent variable was the method of pretraining. The dependent variables were
schematic knowledge, as measured by a five-item structured word association test, and
near transfer, as measured by an eight-question multiple choice and fill-in-the-blank test.
To provide context for results presented, Table 5 shows the minimum and
maximum possible scores for the two tests, as well as the mean minimum, maximum, and
range of scores earned by participants in each of the treatment groups. Prior to the
treatment, which consisted of 12 minutes of pretraining and a 60-minute multimedia
lecture lesson, both tests were administered to establish a baseline of prior knowledge.
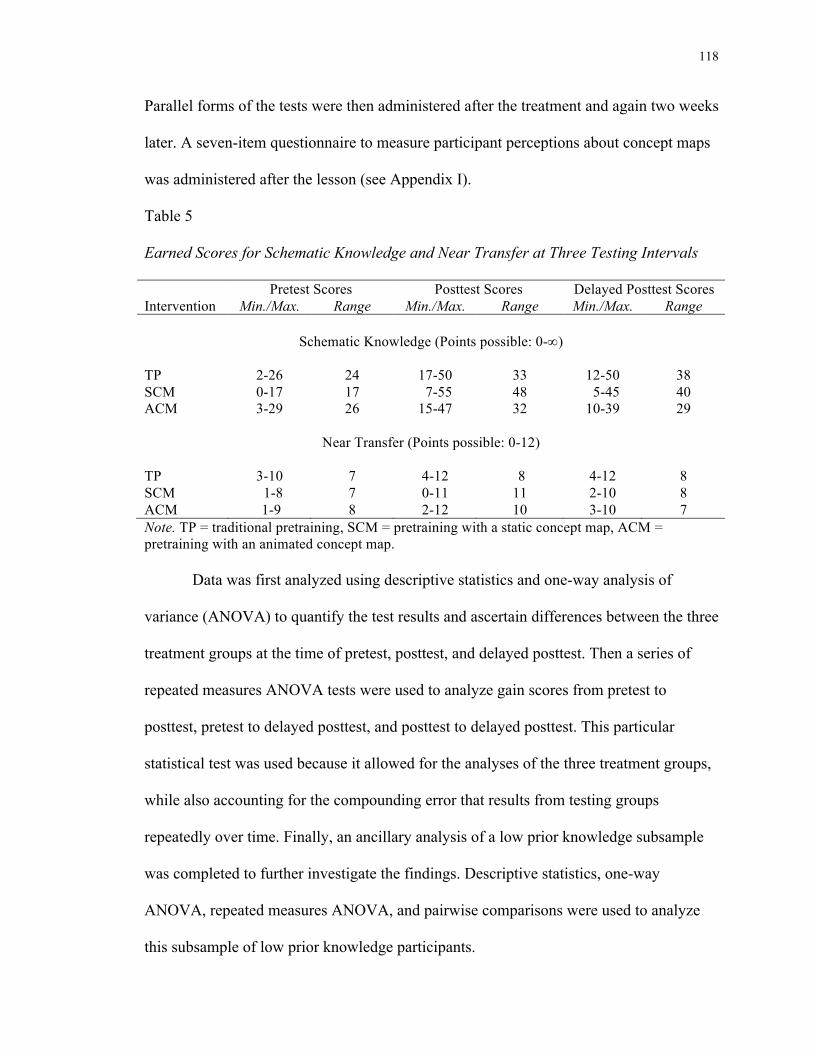
118
Parallel forms of the tests were then administered after the treatment and again two weeks
later. A seven-item questionnaire to measure participant perceptions about concept maps
was administered after the lesson (see Appendix I).
Table 5 Earned Scores for Schematic Knowledge and Near Transfer at Three Testing Intervals
Pretest Scores Posttest Scores Delayed Posttest Scores Intervention Min./Max. Range Min./Max. Range Min./Max. Range
Schematic Knowledge (Points possible: 0-¥)
TP 2-26 24 17-50 33 12-50 38 SCM 0-17 17 7-55 48 5-45 40 ACM 3-29 26 15-47 32 10-39 29
Near Transfer (Points possible: 0-12)
TP 3-10 7 4-12 8 4-12 8 SCM 1-8 7 0-11 11 2-10 8 ACM 1-9 8 2-12 10 3-10 7 Note. TP = traditional pretraining, SCM = pretraining with a static concept map, ACM = pretraining with an animated concept map.
Data was first analyzed using descriptive statistics and one-way analysis of
variance (ANOVA) to quantify the test results and ascertain differences between the three
treatment groups at the time of pretest, posttest, and delayed posttest. Then a series of
repeated measures ANOVA tests were used to analyze gain scores from pretest to
posttest, pretest to delayed posttest, and posttest to delayed posttest. This particular
statistical test was used because it allowed for the analyses of the three treatment groups,
while also accounting for the compounding error that results from testing groups
repeatedly over time. Finally, an ancillary analysis of a low prior knowledge subsample
was completed to further investigate the findings. Descriptive statistics, one-way
ANOVA, repeated measures ANOVA, and pairwise comparisons were used to analyze
this subsample of low prior knowledge participants.
119
Two measures of effect were used to quantify the practical importance of the
results: partial eta squared effect size and Cohen’s d effect size. Partial eta squared was
used to represent effect sizes for three group analyses while Cohen’s d was used when
analyzing two groups. In interpreting partial eta squared effect size, 0.01 is considered a
small effect, a medium effect is 0.06, and a large effect is 0.14 (Cohen, 1988). In
interpreting Cohen’s d effect sizes, a small effect size is 0.20, a medium effect is 0.50,
and a large effect is 0.80 (Cohen, 1988). Partial eta squared and Cohen’s d effect size are
reported regardless of a finding of statistical significance, since these measures of
practical importance may be used to better delineate the findings of this study and to
inform future research inquiries.
This chapter first addresses research questions one and two, which focus on the
effect the method of pretraining may have on schematic knowledge gains. Next, the
chapter examines research questions three and four, which focus on the effect the method
of pretraining may have on near transfer gains. Ancillary results, which are included at
the end of each of these first two sections, examine the results of pretraining with a
portion of the sample that has low prior knowledge. The schematic knowledge ancillary
results include information about sample selection and composition. Then question five,
concerning the possible relationship between student perceptions of the value of concept
maps and scores on tests of achievement, is investigated. A summary of findings
concludes the chapter.
120
Research Questions 1 and 2: Schematic Knowledge Results
1. How does the type of pretraining affect schematic knowledge when measured
immediately after a lesson?
2. How does the type of pretraining affect schematic knowledge when measured two
weeks after a lesson?
Primary Analysis: Schematic Knowledge
The first two research questions investigated the participants’ mean score gains in
the area of schematic knowledge—that is, given the pretraining treatment, the extent to
which participants in each of the treatment groups built a cognitive web of information
and retained that network of knowledge over time. Question one addressed gains in
schematic knowledge immediately after treatment, and question two focused on gain two
weeks after the intervention.
To address these questions, descriptive statistics were used to quantify scores at
the three testing intervals and a one-way analysis of variance (ANOVA) was conducted
to measure the statistical significance of the scores at each testing interval. Post hoc tests
were used to more specifically define statistically significant results. Then repeated
measures ANOVA tests were used to analyze mean gain scores at three time intervals—
pretest to posttest, pretest to delayed posttest, and posttest to delayed posttest—to
measure growth over time. Finally, a pairwise analysis was completed to investigate the
practical importance of the results for each treatment group.
Table 6 presents the means and standard deviations for the three treatment groups
at the three testing intervals. At pretest, the traditional pretraining group presented with
higher scores than the other two groups. An especially marked gap was revealed between
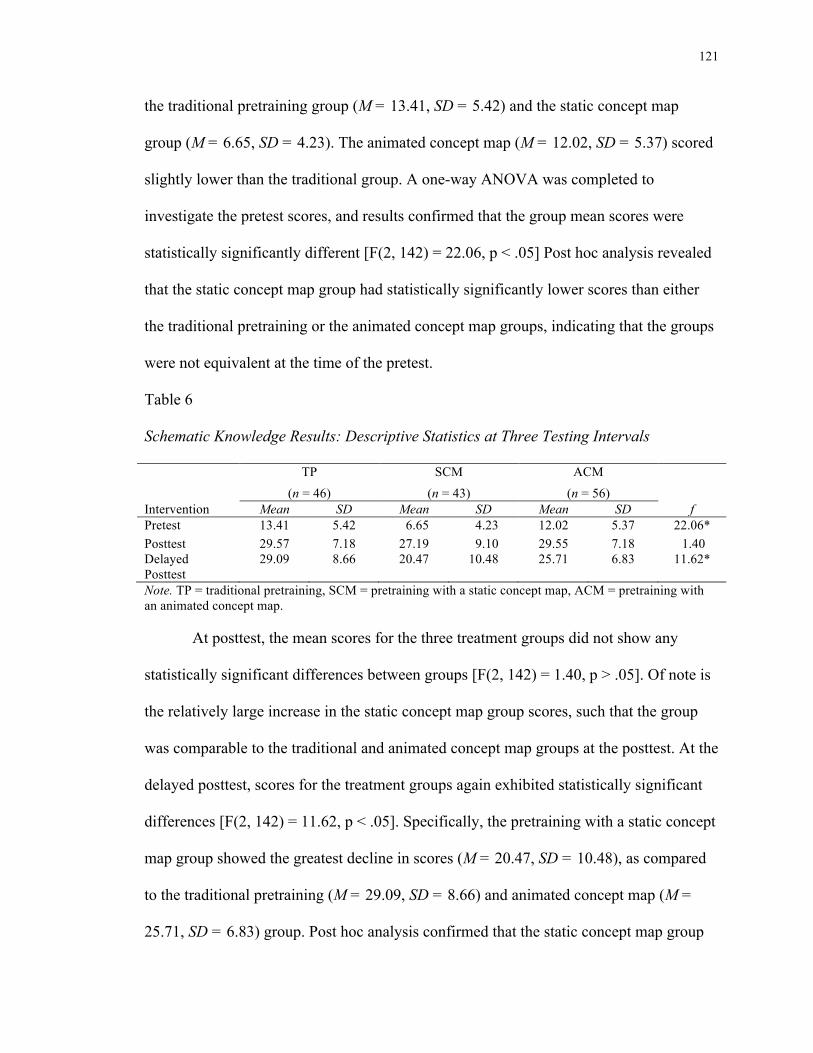
121
the traditional pretraining group (M = 13.41, SD = 5.42) and the static concept map
group (M = 6.65, SD = 4.23). The animated concept map (M = 12.02, SD = 5.37) scored
slightly lower than the traditional group. A one-way ANOVA was completed to
investigate the pretest scores, and results confirmed that the group mean scores were
statistically significantly different [F(2, 142) = 22.06, p < .05] Post hoc analysis revealed
that the static concept map group had statistically significantly lower scores than either
the traditional pretraining or the animated concept map groups, indicating that the groups
were not equivalent at the time of the pretest.
Table 6 Schematic Knowledge Results: Descriptive Statistics at Three Testing Intervals TP SCM ACM (n = 46) (n = 43) (n = 56) Intervention Mean SD Mean SD Mean SD f Pretest 13.41 5.42 6.65 4.23 12.02 5.37 22.06* Posttest 29.57 7.18 27.19 9.10 29.55 7.18 1.40 Delayed Posttest
29.09 8.66 20.47 10.48 25.71 6.83 11.62*
Note. TP = traditional pretraining, SCM = pretraining with a static concept map, ACM = pretraining with an animated concept map.
At posttest, the mean scores for the three treatment groups did not show any
statistically significant differences between groups [F(2, 142) = 1.40, p > .05]. Of note is
the relatively large increase in the static concept map group scores, such that the group
was comparable to the traditional and animated concept map groups at the posttest. At the
delayed posttest, scores for the treatment groups again exhibited statistically significant
differences [F(2, 142) = 11.62, p < .05]. Specifically, the pretraining with a static concept
map group showed the greatest decline in scores (M = 20.47, SD = 10.48), as compared
to the traditional pretraining (M = 29.09, SD = 8.66) and animated concept map (M =
25.71, SD = 6.83) group. Post hoc analysis confirmed that the static concept map group
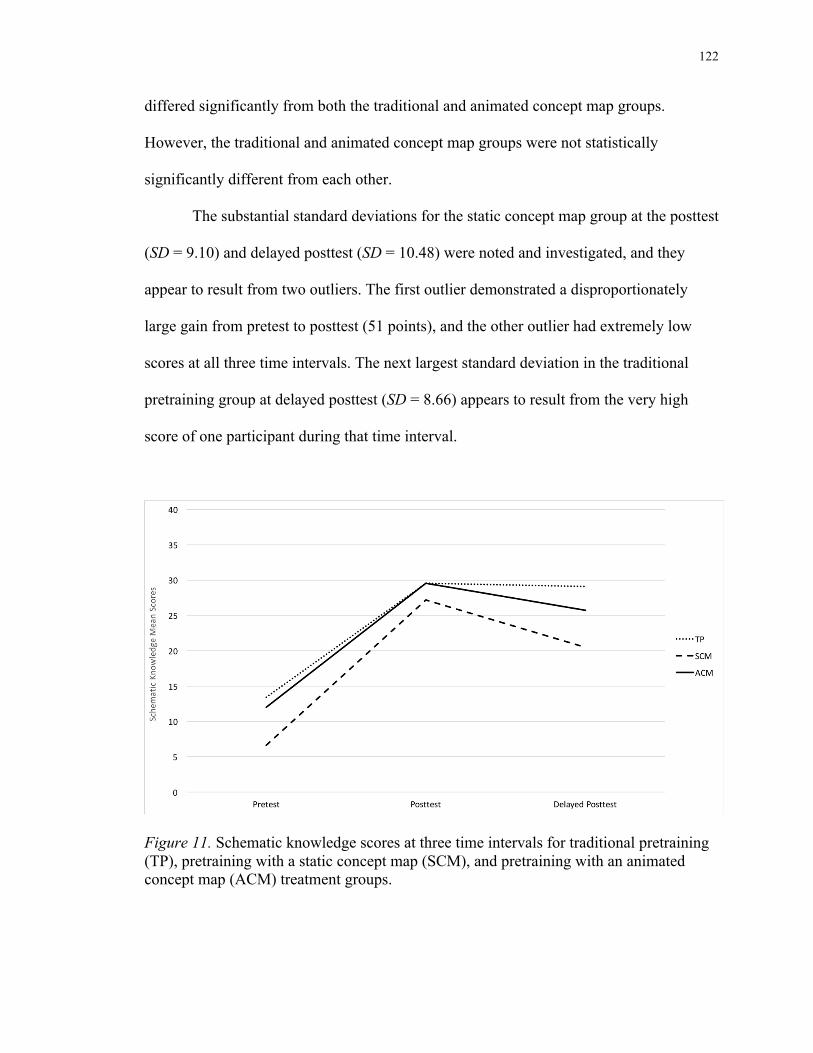
122
differed significantly from both the traditional and animated concept map groups.
However, the traditional and animated concept map groups were not statistically
significantly different from each other.
The substantial standard deviations for the static concept map group at the posttest
(SD = 9.10) and delayed posttest (SD = 10.48) were noted and investigated, and they
appear to result from two outliers. The first outlier demonstrated a disproportionately
large gain from pretest to posttest (51 points), and the other outlier had extremely low
scores at all three time intervals. The next largest standard deviation in the traditional
pretraining group at delayed posttest (SD = 8.66) appears to result from the very high
score of one participant during that time interval.
Figure 11. Schematic knowledge scores at three time intervals for traditional pretraining (TP), pretraining with a static concept map (SCM), and pretraining with an animated concept map (ACM) treatment groups.
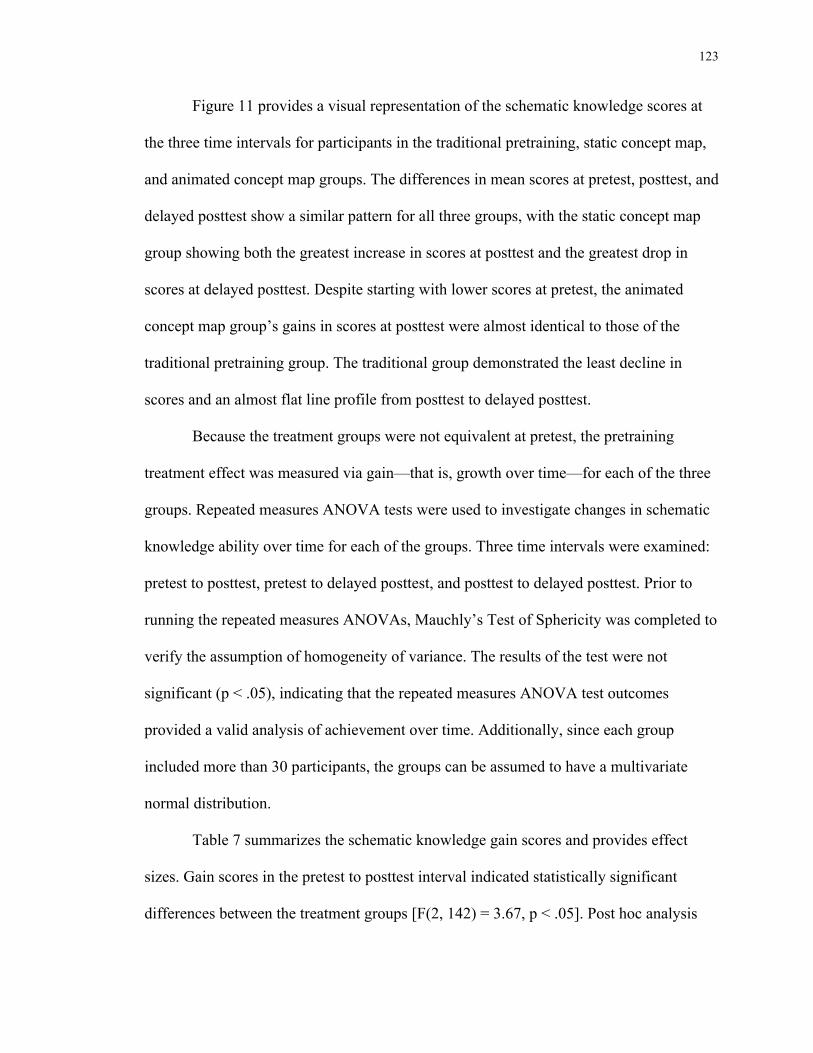
123
Figure 11 provides a visual representation of the schematic knowledge scores at
the three time intervals for participants in the traditional pretraining, static concept map,
and animated concept map groups. The differences in mean scores at pretest, posttest, and
delayed posttest show a similar pattern for all three groups, with the static concept map
group showing both the greatest increase in scores at posttest and the greatest drop in
scores at delayed posttest. Despite starting with lower scores at pretest, the animated
concept map group’s gains in scores at posttest were almost identical to those of the
traditional pretraining group. The traditional group demonstrated the least decline in
scores and an almost flat line profile from posttest to delayed posttest.
Because the treatment groups were not equivalent at pretest, the pretraining
treatment effect was measured via gain—that is, growth over time—for each of the three
groups. Repeated measures ANOVA tests were used to investigate changes in schematic
knowledge ability over time for each of the groups. Three time intervals were examined:
pretest to posttest, pretest to delayed posttest, and posttest to delayed posttest. Prior to
running the repeated measures ANOVAs, Mauchly’s Test of Sphericity was completed to
verify the assumption of homogeneity of variance. The results of the test were not
significant (p < .05), indicating that the repeated measures ANOVA test outcomes
provided a valid analysis of achievement over time. Additionally, since each group
included more than 30 participants, the groups can be assumed to have a multivariate
normal distribution.
Table 7 summarizes the schematic knowledge gain scores and provides effect
sizes. Gain scores in the pretest to posttest interval indicated statistically significant
differences between the treatment groups [F(2, 142) = 3.67, p < .05]. Post hoc analysis
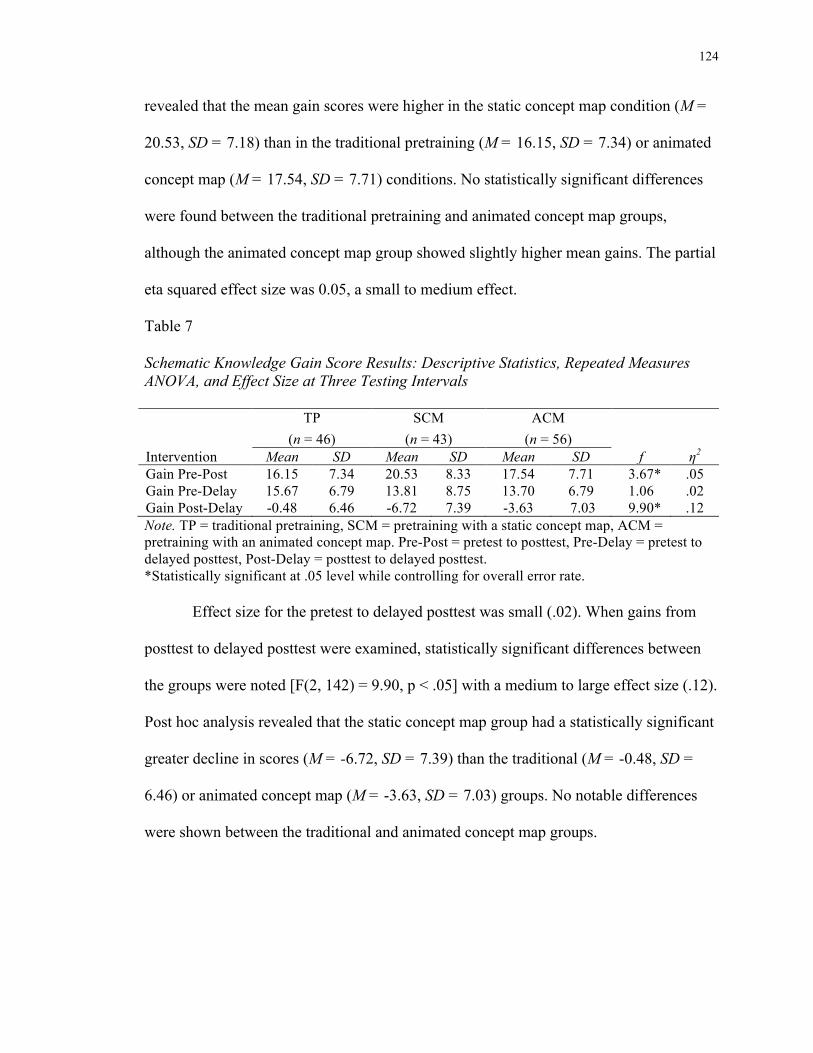
124
revealed that the mean gain scores were higher in the static concept map condition (M =
20.53, SD = 7.18) than in the traditional pretraining (M = 16.15, SD = 7.34) or animated
concept map (M = 17.54, SD = 7.71) conditions. No statistically significant differences
were found between the traditional pretraining and animated concept map groups,
although the animated concept map group showed slightly higher mean gains. The partial
eta squared effect size was 0.05, a small to medium effect.
Table 7 Schematic Knowledge Gain Score Results: Descriptive Statistics, Repeated Measures ANOVA, and Effect Size at Three Testing Intervals TP SCM ACM (n = 46) (n = 43) (n = 56) Intervention Mean SD Mean SD Mean SD f η2
Gain Pre-Post 16.15 7.34 20.53 8.33 17.54 7.71 3.67* .05 Gain Pre-Delay 15.67 6.79 13.81 8.75 13.70 6.79 1.06 .02 Gain Post-Delay -0.48 6.46 -6.72 7.39 -3.63 7.03 9.90* .12 Note. TP = traditional pretraining, SCM = pretraining with a static concept map, ACM = pretraining with an animated concept map. Pre-Post = pretest to posttest, Pre-Delay = pretest to delayed posttest, Post-Delay = posttest to delayed posttest. *Statistically significant at .05 level while controlling for overall error rate.
Effect size for the pretest to delayed posttest was small (.02). When gains from
posttest to delayed posttest were examined, statistically significant differences between
the groups were noted [F(2, 142) = 9.90, p < .05] with a medium to large effect size (.12).
Post hoc analysis revealed that the static concept map group had a statistically significant
greater decline in scores (M = -6.72, SD = 7.39) than the traditional (M = -0.48, SD =
6.46) or animated concept map (M = -3.63, SD = 7.03) groups. No notable differences
were shown between the traditional and animated concept map groups.
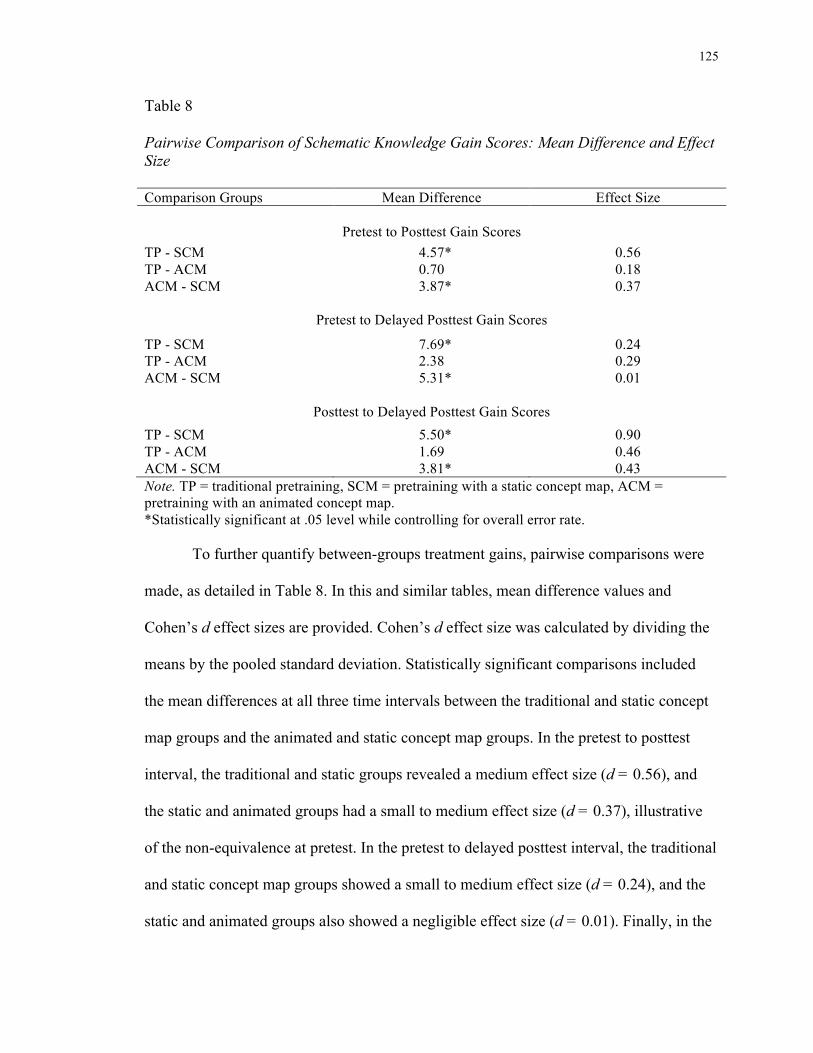
125
Table 8 Pairwise Comparison of Schematic Knowledge Gain Scores: Mean Difference and Effect Size Comparison Groups Mean Difference Effect Size
Pretest to Posttest Gain Scores
TP - SCM 4.57* 0.56 TP - ACM 0.70 0.18 ACM - SCM 3.87* 0.37
Pretest to Delayed Posttest Gain Scores
TP - SCM 7.69* 0.24 TP - ACM 2.38 0.29 ACM - SCM 5.31* 0.01
Posttest to Delayed Posttest Gain Scores
TP - SCM 5.50* 0.90 TP - ACM 1.69 0.46 ACM - SCM 3.81* 0.43 Note. TP = traditional pretraining, SCM = pretraining with a static concept map, ACM = pretraining with an animated concept map. *Statistically significant at .05 level while controlling for overall error rate.
To further quantify between-groups treatment gains, pairwise comparisons were
made, as detailed in Table 8. In this and similar tables, mean difference values and
Cohen’s d effect sizes are provided. Cohen’s d effect size was calculated by dividing the
means by the pooled standard deviation. Statistically significant comparisons included
the mean differences at all three time intervals between the traditional and static concept
map groups and the animated and static concept map groups. In the pretest to posttest
interval, the traditional and static groups revealed a medium effect size (d = 0.56), and
the static and animated groups had a small to medium effect size (d = 0.37), illustrative
of the non-equivalence at pretest. In the pretest to delayed posttest interval, the traditional
and static concept map groups showed a small to medium effect size (d = 0.24), and the
static and animated groups also showed a negligible effect size (d = 0.01). Finally, in the
126
posttest to delayed posttest interval, the traditional and static groups revealed a large
effect size (d = 0.90), while the static and animated groups showed a small to medium
effect size (d = 0.43). The larger effect sizes in the posttest to delayed posttest interval is
reflective of the greater decline in scores for the static group than for the traditional or
animated groups.
Ancillary Analysis: Schematic Knowledge
The validity of any statistical analysis rests in part on a baseline equivalence
between treatment groups. In this study, the participants in the three treatment groups had
statistically significant disparities in scores at the pretest, indicating non-equivalence.
Specifically, the static concept map group scored much lower on the pretest than the
other two groups. A vital boundary condition for pretraining effectiveness is that learners
with low prior knowledge benefit the most substantially from the strategy (Mayer &
Pilegard, 2014). Therefore, an ancillary analysis of a portion of the total sample was
completed. Table 9 quantifies the composition of the subsample, followed by a discussion
of criteria for developing the subsample, and the ancillary findings follow.
In conducting the ancillary analysis, the first step was to choose the most
appropriate procedures for establishing a subsample of low prior knowledge learners.
After multiple attempts at determining subsample inclusion criteria, the schematic
knowledge measure was chosen because it had acceptable scores on a Cronbach’s alpha
review (a = .77) and high content validity scores on the Lawshe’s content validity index
(.90). Additionally, the structure of the instrument most effectively reflected participants’
prior knowledge rather than, as with the multiple-choice transfer test, their test taking
ability. As a reminder, the score range on the schematic knowledge pretest was between
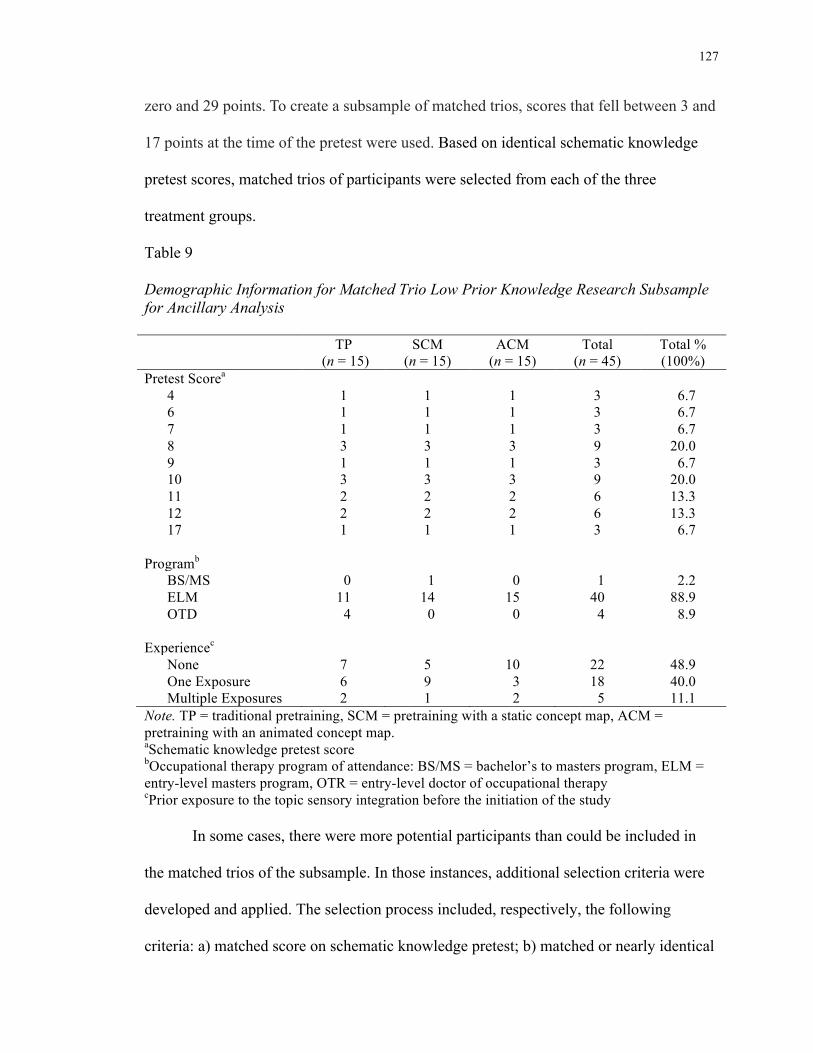
127
zero and 29 points. To create a subsample of matched trios, scores that fell between 3 and
17 points at the time of the pretest were used. Based on identical schematic knowledge
pretest scores, matched trios of participants were selected from each of the three
treatment groups.
Table 9 Demographic Information for Matched Trio Low Prior Knowledge Research Subsample for Ancillary Analysis
TP (n = 15)
SCM (n = 15)
ACM (n = 15)
Total (n = 45)
Total % (100%)
Pretest Scorea 4 1 1 1 3 6.7 6 1 1 1 3 6.7 7 1 1 1 3 6.7 8 3 3 3 9 20.0 9 1 1 1 3 6.7 10 3 3 3 9 20.0 11 2 2 2 6 13.3 12 2 2 2 6 13.3 17 1 1 1 3 6.7
Programb
BS/MS 0 1 0 1 2.2 ELM 11 14 15 40 88.9 OTD 4 0 0 4 8.9
Experiencec
None 7 5 10 22 48.9 One Exposure 6 9 3 18 40.0 Multiple Exposures 2 1 2 5 11.1
Note. TP = traditional pretraining, SCM = pretraining with a static concept map, ACM = pretraining with an animated concept map. aSchematic knowledge pretest score bOccupational therapy program of attendance: BS/MS = bachelor’s to masters program, ELM = entry-level masters program, OTR = entry-level doctor of occupational therapy cPrior exposure to the topic sensory integration before the initiation of the study
In some cases, there were more potential participants than could be included in
the matched trios of the subsample. In those instances, additional selection criteria were
developed and applied. The selection process included, respectively, the following
criteria: a) matched score on schematic knowledge pretest; b) matched or nearly identical
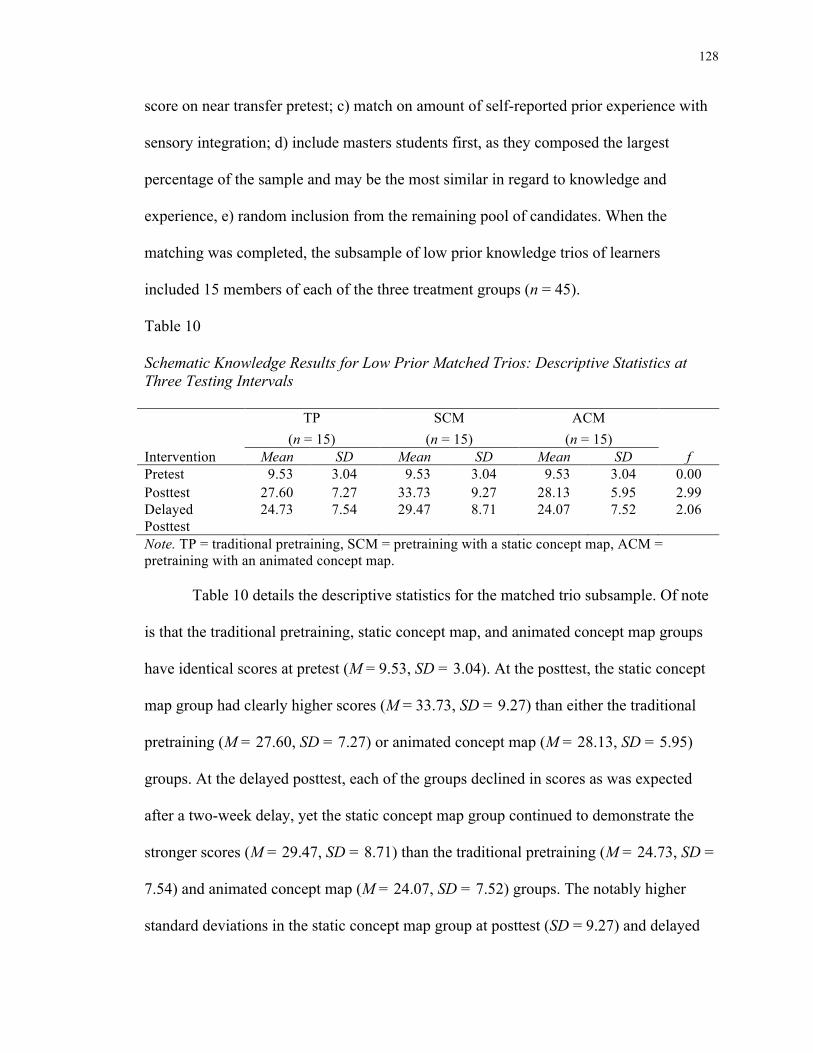
128
score on near transfer pretest; c) match on amount of self-reported prior experience with
sensory integration; d) include masters students first, as they composed the largest
percentage of the sample and may be the most similar in regard to knowledge and
experience, e) random inclusion from the remaining pool of candidates. When the
matching was completed, the subsample of low prior knowledge trios of learners
included 15 members of each of the three treatment groups (n = 45).
Table 10 Schematic Knowledge Results for Low Prior Matched Trios: Descriptive Statistics at Three Testing Intervals TP SCM ACM (n = 15) (n = 15) (n = 15) Intervention Mean SD Mean SD Mean SD f Pretest 9.53 3.04 9.53 3.04 9.53 3.04 0.00 Posttest 27.60 7.27 33.73 9.27 28.13 5.95 2.99 Delayed Posttest
24.73 7.54 29.47 8.71 24.07 7.52 2.06
Note. TP = traditional pretraining, SCM = pretraining with a static concept map, ACM = pretraining with an animated concept map.
Table 10 details the descriptive statistics for the matched trio subsample. Of note
is that the traditional pretraining, static concept map, and animated concept map groups
have identical scores at pretest (M = 9.53, SD = 3.04). At the posttest, the static concept
map group had clearly higher scores (M = 33.73, SD = 9.27) than either the traditional
pretraining (M = 27.60, SD = 7.27) or animated concept map (M = 28.13, SD = 5.95)
groups. At the delayed posttest, each of the groups declined in scores as was expected
after a two-week delay, yet the static concept map group continued to demonstrate the
stronger scores (M = 29.47, SD = 8.71) than the traditional pretraining (M = 24.73, SD =
7.54) and animated concept map (M = 24.07, SD = 7.52) groups. The notably higher
standard deviations in the static concept map group at posttest (SD = 9.27) and delayed
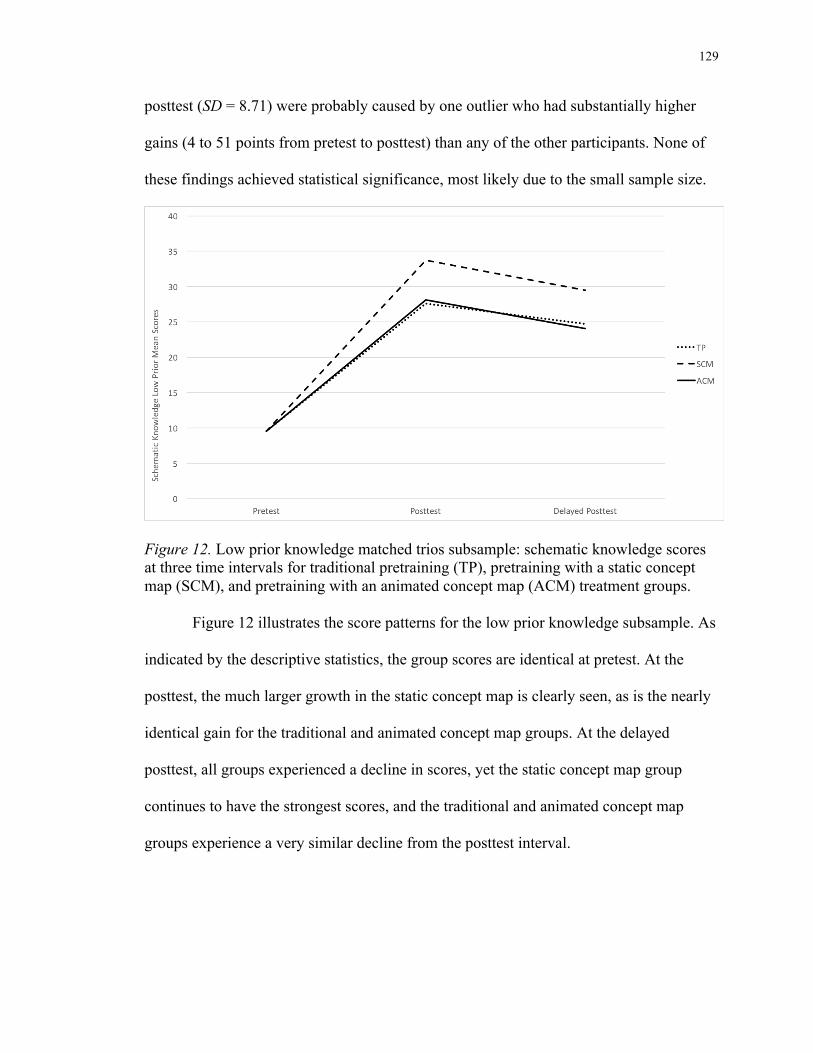
129
posttest (SD = 8.71) were probably caused by one outlier who had substantially higher
gains (4 to 51 points from pretest to posttest) than any of the other participants. None of
these findings achieved statistical significance, most likely due to the small sample size.
Figure 12. Low prior knowledge matched trios subsample: schematic knowledge scores at three time intervals for traditional pretraining (TP), pretraining with a static concept map (SCM), and pretraining with an animated concept map (ACM) treatment groups.
Figure 12 illustrates the score patterns for the low prior knowledge subsample. As
indicated by the descriptive statistics, the group scores are identical at pretest. At the
posttest, the much larger growth in the static concept map is clearly seen, as is the nearly
identical gain for the traditional and animated concept map groups. At the delayed
posttest, all groups experienced a decline in scores, yet the static concept map group
continues to have the strongest scores, and the traditional and animated concept map
groups experience a very similar decline from the posttest interval.
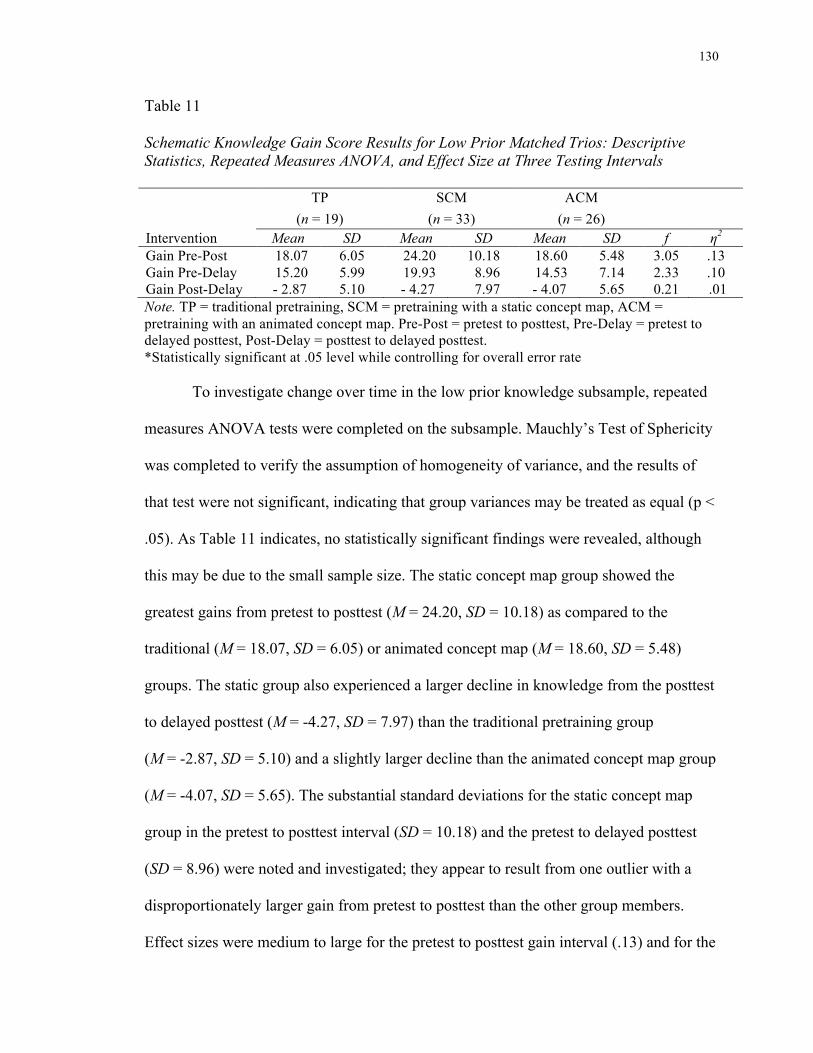
130
Table 11 Schematic Knowledge Gain Score Results for Low Prior Matched Trios: Descriptive Statistics, Repeated Measures ANOVA, and Effect Size at Three Testing Intervals TP SCM ACM (n = 19) (n = 33) (n = 26) Intervention Mean SD Mean SD Mean SD f η2
Gain Pre-Post 18.07 6.05 24.20 10.18 18.60 5.48 3.05 .13 Gain Pre-Delay 15.20 5.99 19.93 8.96 14.53 7.14 2.33 .10 Gain Post-Delay - 2.87 5.10 - 4.27 7.97 - 4.07 5.65 0.21 .01 Note. TP = traditional pretraining, SCM = pretraining with a static concept map, ACM = pretraining with an animated concept map. Pre-Post = pretest to posttest, Pre-Delay = pretest to delayed posttest, Post-Delay = posttest to delayed posttest. *Statistically significant at .05 level while controlling for overall error rate
To investigate change over time in the low prior knowledge subsample, repeated
measures ANOVA tests were completed on the subsample. Mauchly’s Test of Sphericity
was completed to verify the assumption of homogeneity of variance, and the results of
that test were not significant, indicating that group variances may be treated as equal (p <
.05). As Table 11 indicates, no statistically significant findings were revealed, although
this may be due to the small sample size. The static concept map group showed the
greatest gains from pretest to posttest (M = 24.20, SD = 10.18) as compared to the
traditional (M = 18.07, SD = 6.05) or animated concept map (M = 18.60, SD = 5.48)
groups. The static group also experienced a larger decline in knowledge from the posttest
to delayed posttest (M = -4.27, SD = 7.97) than the traditional pretraining group
(M = -2.87, SD = 5.10) and a slightly larger decline than the animated concept map group
(M = -4.07, SD = 5.65). The substantial standard deviations for the static concept map
group in the pretest to posttest interval (SD = 10.18) and the pretest to delayed posttest
(SD = 8.96) were noted and investigated; they appear to result from one outlier with a
disproportionately larger gain from pretest to posttest than the other group members.
Effect sizes were medium to large for the pretest to posttest gain interval (.13) and for the
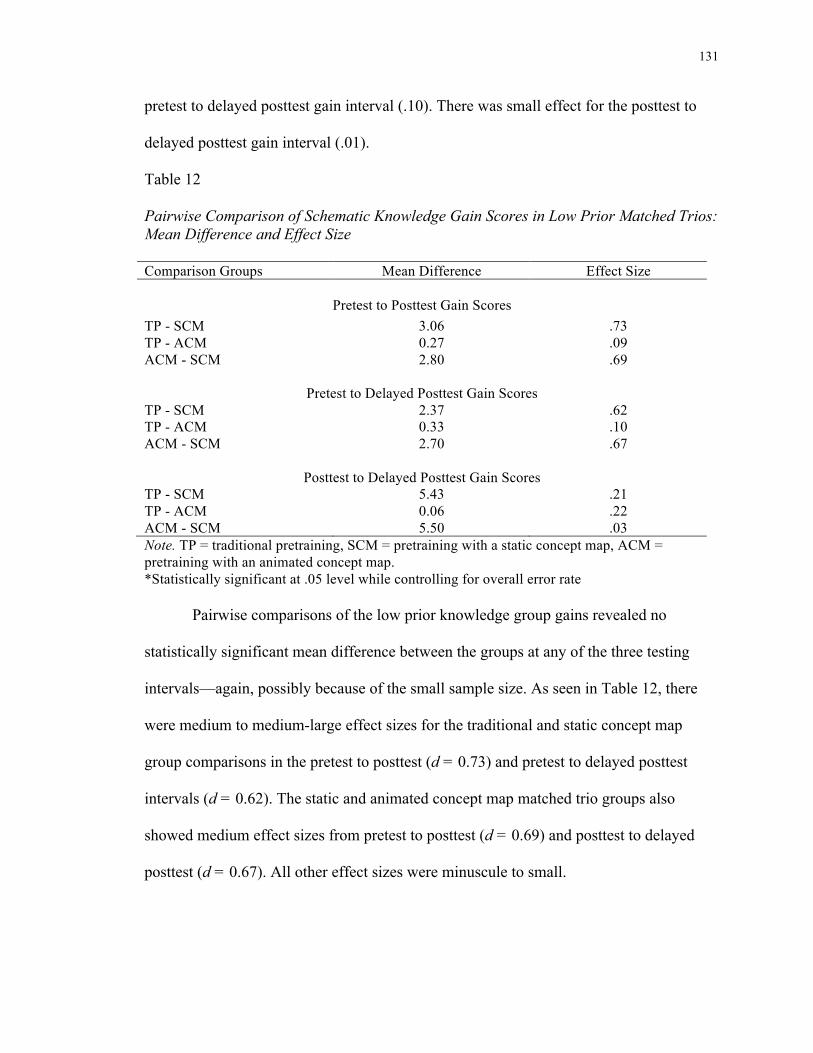
131
pretest to delayed posttest gain interval (.10). There was small effect for the posttest to
delayed posttest gain interval (.01).
Table 12 Pairwise Comparison of Schematic Knowledge Gain Scores in Low Prior Matched Trios: Mean Difference and Effect Size Comparison Groups Mean Difference Effect Size
Pretest to Posttest Gain Scores
TP - SCM 3.06 .73 TP - ACM 0.27 .09 ACM - SCM 2.80 .69
Pretest to Delayed Posttest Gain Scores
TP - SCM 2.37 .62 TP - ACM 0.33 .10 ACM - SCM 2.70 .67
Posttest to Delayed Posttest Gain Scores
TP - SCM 5.43 .21 TP - ACM 0.06 .22 ACM - SCM 5.50 .03 Note. TP = traditional pretraining, SCM = pretraining with a static concept map, ACM = pretraining with an animated concept map. *Statistically significant at .05 level while controlling for overall error rate
Pairwise comparisons of the low prior knowledge group gains revealed no
statistically significant mean difference between the groups at any of the three testing
intervals—again, possibly because of the small sample size. As seen in Table 12, there
were medium to medium-large effect sizes for the traditional and static concept map
group comparisons in the pretest to posttest (d = 0.73) and pretest to delayed posttest
intervals (d = 0.62). The static and animated concept map matched trio groups also
showed medium effect sizes from pretest to posttest (d = 0.69) and posttest to delayed
posttest (d = 0.67). All other effect sizes were minuscule to small.
132
Research Questions 3 and 4: Near Transfer Results
3. How does the type of pretraining affect near transfer when measured immediately
after a lesson?
4. How does the type of pretraining affect near transfer when measured two weeks
after a lesson?
Primary Analysis: Near Transfer
The third and fourth research questions investigated the participants’ mean score
gains in the area of near transfer—that is, given the pretraining treatment, how well
participants in each of the groups used their learned knowledge in a novel context that
was similar to lecture content examples that had been presented. Question three
addressed gains in near transfer immediately after treatment, and question four focused
on gain two weeks after the intervention. To address these questions, descriptive statistics
were used to quantify scores at the three testing intervals and one-way analysis of
variance (ANOVA) was conducted to measure the statistical significance of the scores.
Then, using repeated measures ANOVA, mean gain scores were analyzed at pretest to
posttest, pretest to delayed posttest, and posttest to delayed posttest to measure growth
over time, and post hoc analysis was used to clarify results. Finally, a pairwise analysis
was completed to investigate the practical importance of the results for each group.
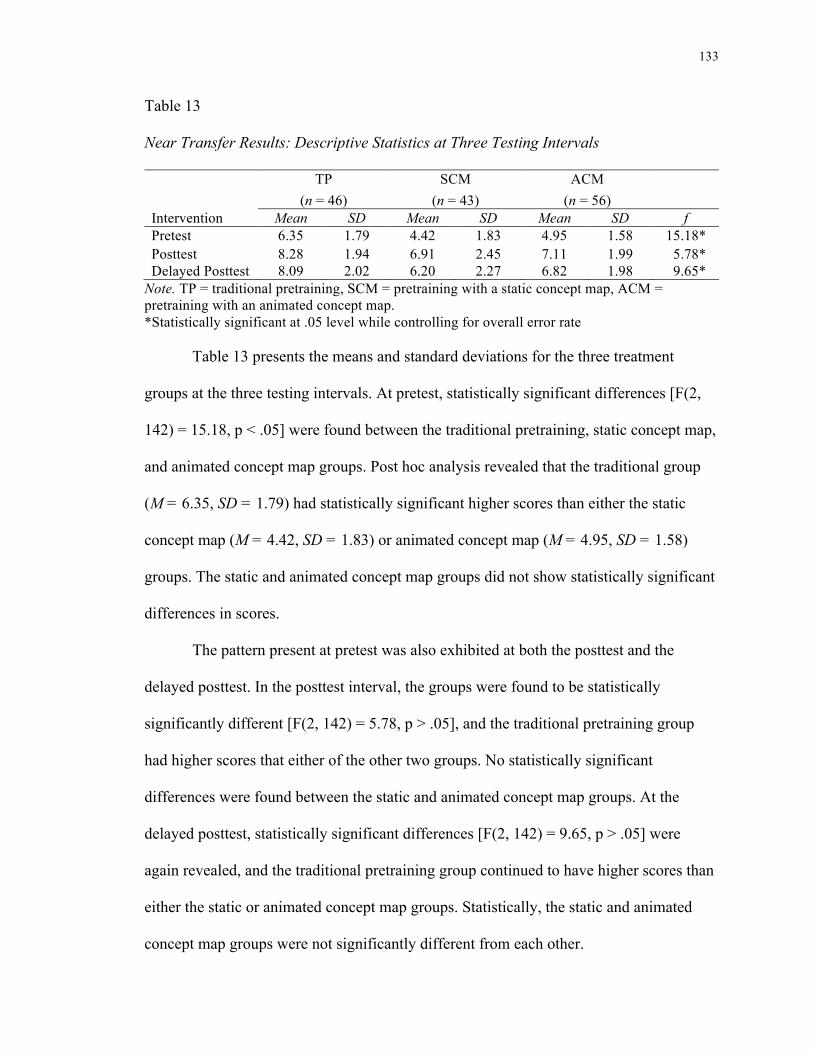
133
Table 13 Near Transfer Results: Descriptive Statistics at Three Testing Intervals TP SCM ACM (n = 46) (n = 43) (n = 56) Intervention Mean SD Mean SD Mean SD f Pretest 6.35 1.79 4.42 1.83 4.95 1.58 15.18* Posttest 8.28 1.94 6.91 2.45 7.11 1.99 5.78* Delayed Posttest 8.09 2.02 6.20 2.27 6.82 1.98 9.65*
Note. TP = traditional pretraining, SCM = pretraining with a static concept map, ACM = pretraining with an animated concept map. *Statistically significant at .05 level while controlling for overall error rate
Table 13 presents the means and standard deviations for the three treatment
groups at the three testing intervals. At pretest, statistically significant differences [F(2,
142) = 15.18, p < .05] were found between the traditional pretraining, static concept map,
and animated concept map groups. Post hoc analysis revealed that the traditional group
(M = 6.35, SD = 1.79) had statistically significant higher scores than either the static
concept map (M = 4.42, SD = 1.83) or animated concept map (M = 4.95, SD = 1.58)
groups. The static and animated concept map groups did not show statistically significant
differences in scores.
The pattern present at pretest was also exhibited at both the posttest and the
delayed posttest. In the posttest interval, the groups were found to be statistically
significantly different [F(2, 142) = 5.78, p > .05], and the traditional pretraining group
had higher scores that either of the other two groups. No statistically significant
differences were found between the static and animated concept map groups. At the
delayed posttest, statistically significant differences [F(2, 142) = 9.65, p > .05] were
again revealed, and the traditional pretraining group continued to have higher scores than
either the static or animated concept map groups. Statistically, the static and animated
concept map groups were not significantly different from each other.
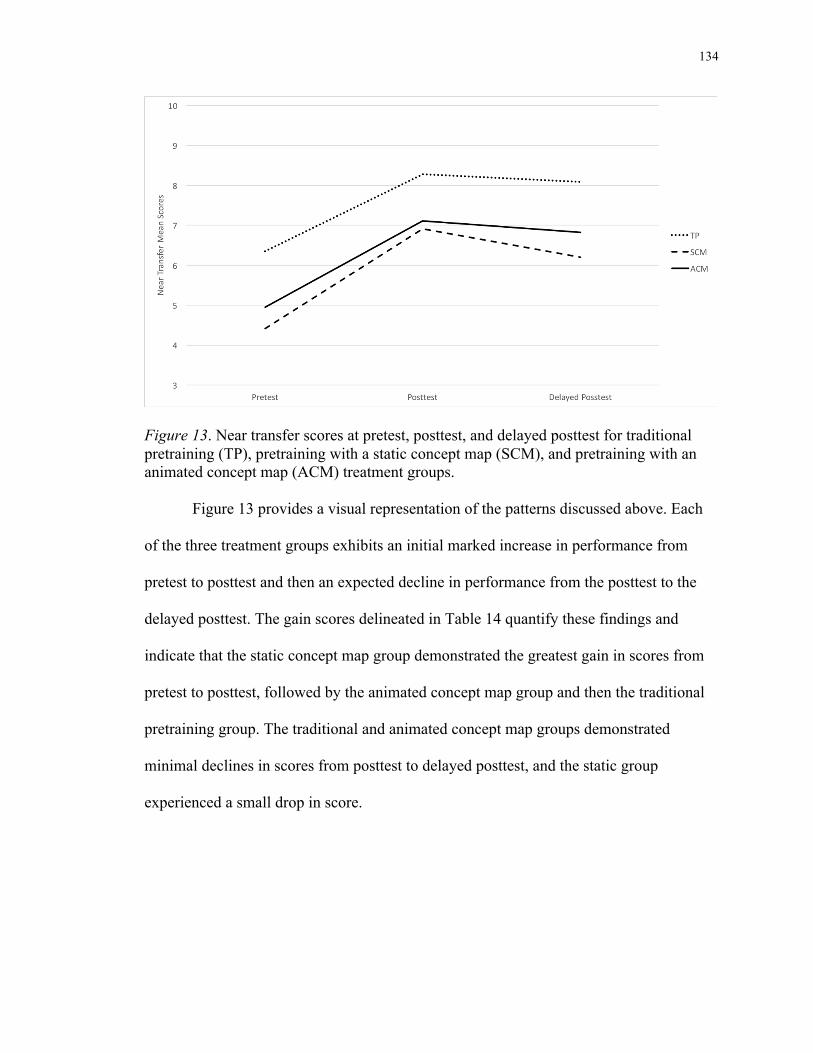
134
Figure 13. Near transfer scores at pretest, posttest, and delayed posttest for traditional pretraining (TP), pretraining with a static concept map (SCM), and pretraining with an animated concept map (ACM) treatment groups.
Figure 13 provides a visual representation of the patterns discussed above. Each
of the three treatment groups exhibits an initial marked increase in performance from
pretest to posttest and then an expected decline in performance from the posttest to the
delayed posttest. The gain scores delineated in Table 14 quantify these findings and
indicate that the static concept map group demonstrated the greatest gain in scores from
pretest to posttest, followed by the animated concept map group and then the traditional
pretraining group. The traditional and animated concept map groups demonstrated
minimal declines in scores from posttest to delayed posttest, and the static group
experienced a small drop in score.
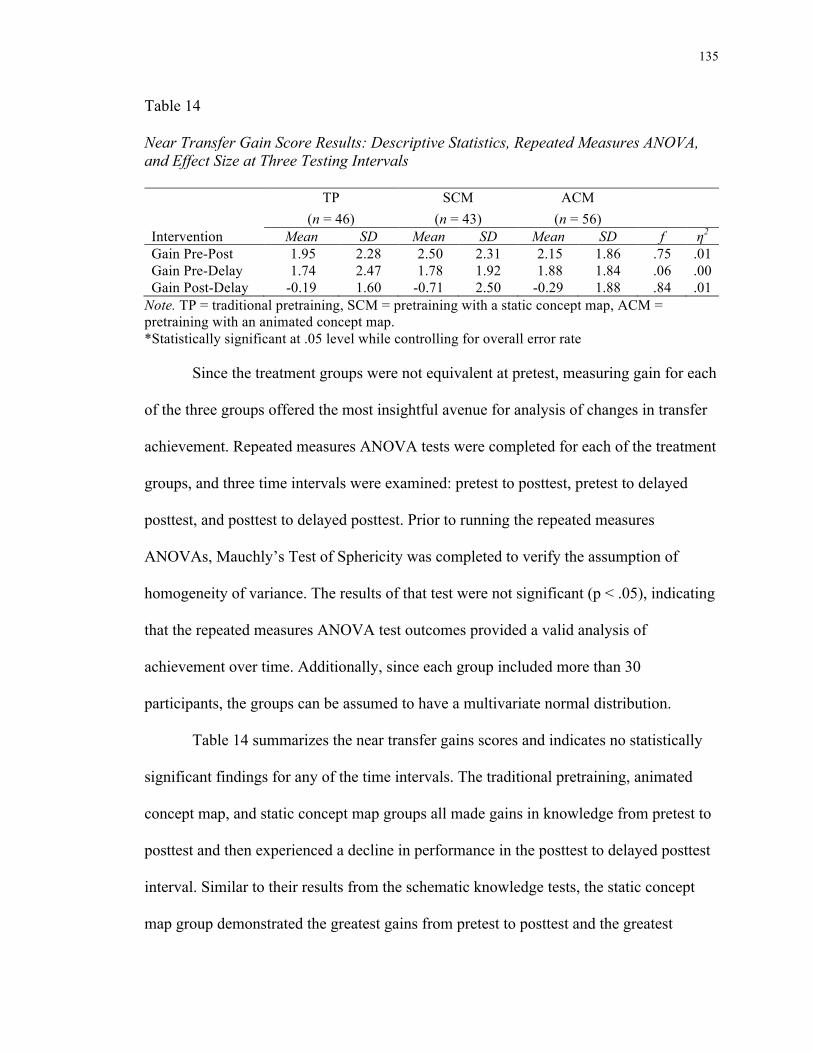
135
Table 14 Near Transfer Gain Score Results: Descriptive Statistics, Repeated Measures ANOVA, and Effect Size at Three Testing Intervals TP SCM ACM (n = 46) (n = 43) (n = 56) Intervention Mean SD Mean SD Mean SD f η2
Gain Pre-Post 1.95 2.28 2.50 2.31 2.15 1.86 .75 .01 Gain Pre-Delay 1.74 2.47 1.78 1.92 1.88 1.84 .06 .00 Gain Post-Delay -0.19 1.60 -0.71 2.50 -0.29 1.88 .84 .01
Note. TP = traditional pretraining, SCM = pretraining with a static concept map, ACM = pretraining with an animated concept map. *Statistically significant at .05 level while controlling for overall error rate
Since the treatment groups were not equivalent at pretest, measuring gain for each
of the three groups offered the most insightful avenue for analysis of changes in transfer
achievement. Repeated measures ANOVA tests were completed for each of the treatment
groups, and three time intervals were examined: pretest to posttest, pretest to delayed
posttest, and posttest to delayed posttest. Prior to running the repeated measures
ANOVAs, Mauchly’s Test of Sphericity was completed to verify the assumption of
homogeneity of variance. The results of that test were not significant (p < .05), indicating
that the repeated measures ANOVA test outcomes provided a valid analysis of
achievement over time. Additionally, since each group included more than 30
participants, the groups can be assumed to have a multivariate normal distribution.
Table 14 summarizes the near transfer gains scores and indicates no statistically
significant findings for any of the time intervals. The traditional pretraining, animated
concept map, and static concept map groups all made gains in knowledge from pretest to
posttest and then experienced a decline in performance in the posttest to delayed posttest
interval. Similar to their results from the schematic knowledge tests, the static concept
map group demonstrated the greatest gains from pretest to posttest and the greatest
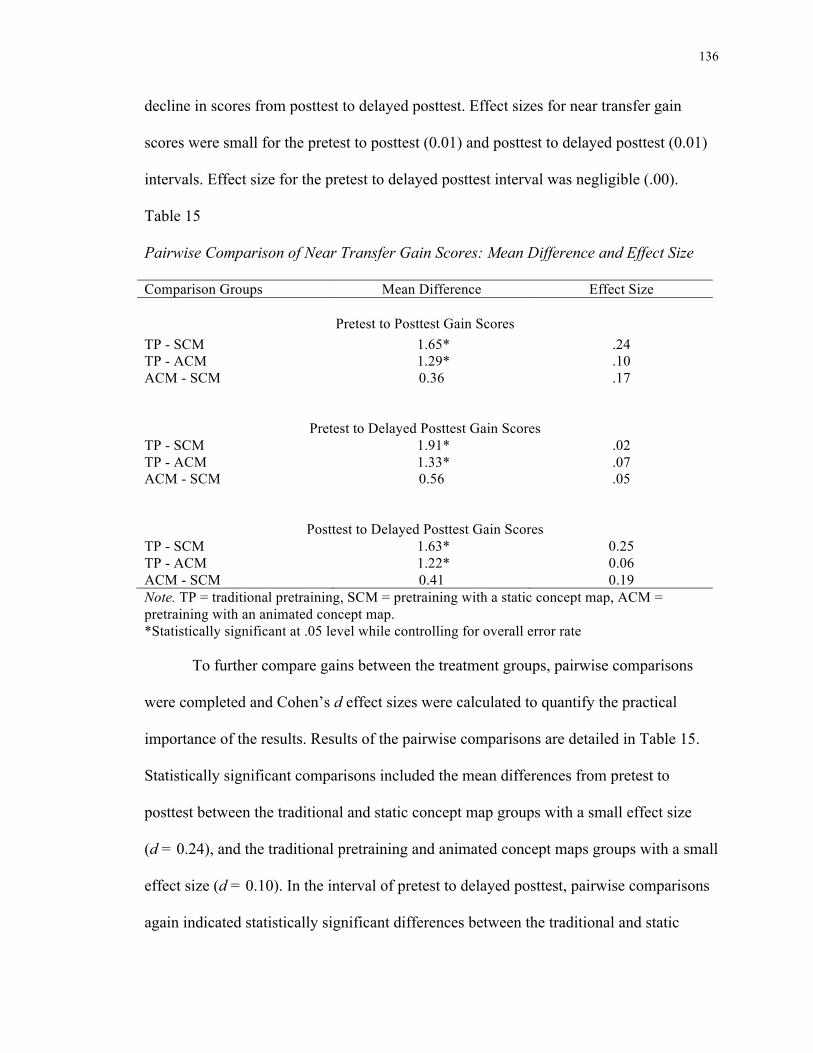
136
decline in scores from posttest to delayed posttest. Effect sizes for near transfer gain
scores were small for the pretest to posttest (0.01) and posttest to delayed posttest (0.01)
intervals. Effect size for the pretest to delayed posttest interval was negligible (.00).
Table 15 Pairwise Comparison of Near Transfer Gain Scores: Mean Difference and Effect Size Comparison Groups Mean Difference Effect Size
Pretest to Posttest Gain Scores
TP - SCM 1.65* .24 TP - ACM 1.29* .10 ACM - SCM 0.36 .17
Pretest to Delayed Posttest Gain Scores TP - SCM 1.91* .02 TP - ACM 1.33* .07 ACM - SCM 0.56 .05
Posttest to Delayed Posttest Gain Scores TP - SCM 1.63* 0.25 TP - ACM 1.22* 0.06 ACM - SCM 0.41 0.19 Note. TP = traditional pretraining, SCM = pretraining with a static concept map, ACM = pretraining with an animated concept map. *Statistically significant at .05 level while controlling for overall error rate
To further compare gains between the treatment groups, pairwise comparisons
were completed and Cohen’s d effect sizes were calculated to quantify the practical
importance of the results. Results of the pairwise comparisons are detailed in Table 15.
Statistically significant comparisons included the mean differences from pretest to
posttest between the traditional and static concept map groups with a small effect size
(d = 0.24), and the traditional pretraining and animated concept maps groups with a small
effect size (d = 0.10). In the interval of pretest to delayed posttest, pairwise comparisons
again indicated statistically significant differences between the traditional and static
137
concept map groups and the traditional and animated concept map groups with minuscule
effect sizes (d = 0.02– 0.07). Finally, in the interval between posttest and delayed
posttest, there were statistically significant differences between the traditional and static
concept map groups, with a small effect size (d = 0.25), and the traditional and animated
concept maps groups, with a negligible effect size (d = 0.06). Overall, these effect sizes
seem to reflect that the overall scores for the traditional pretraining group were stronger
than those of the static and animated concept map groups.
Ancillary Analysis: Near Transfer
Because of the non-equivalent baselines of prior knowledge, a subsample of low
prior knowledge participants was created and analyzed, as discussed in the introduction
and the ancillary analysis of schematic knowledge sections of this chapter. Since
pretraining has been found to be maximally effective when used with learners with low
prior knowledge (Mayer & Pilegard, 2014), the subsample was developed from matched
trios from the three groups and based on scores from the schematic knowledge pretest. A
second criterion was matched or near matched scores on the near transfer pretest. The
Ancillary Analysis: Schematic Knowledge subsection earlier in this chapter details the
sample demographics, selection criteria, and rationale used.
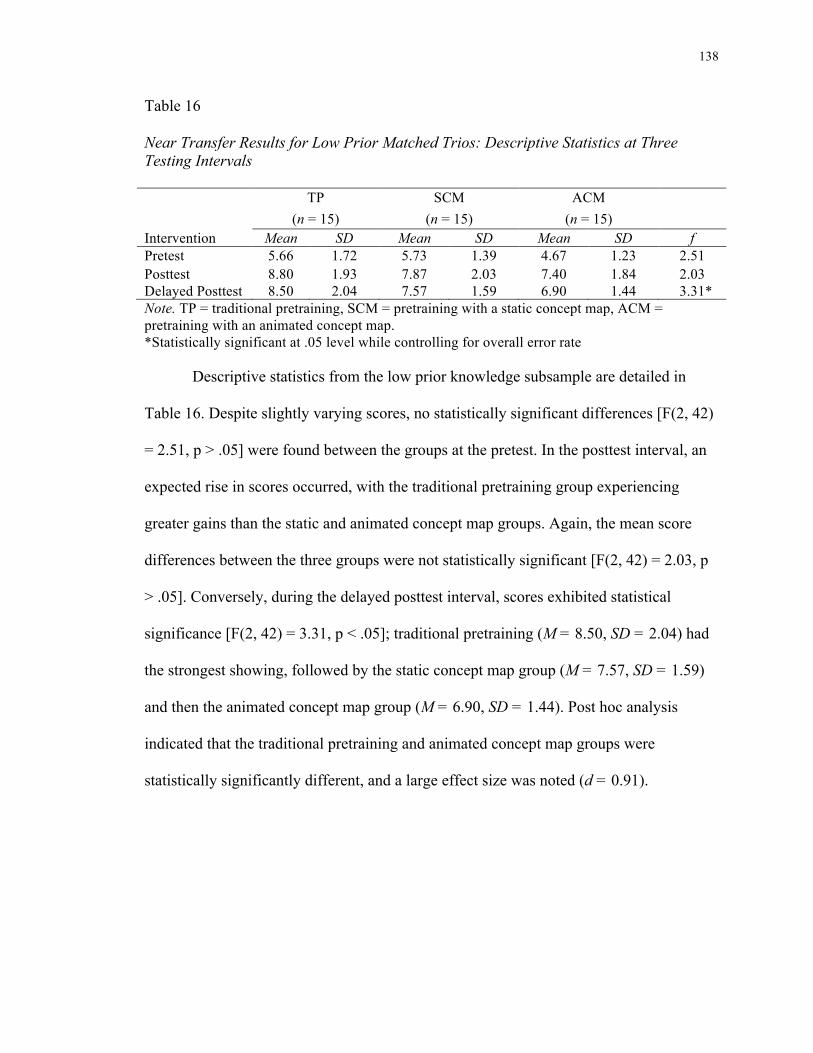
138
Table 16 Near Transfer Results for Low Prior Matched Trios: Descriptive Statistics at Three Testing Intervals TP SCM ACM (n = 15) (n = 15) (n = 15) Intervention Mean SD Mean SD Mean SD f Pretest 5.66 1.72 5.73 1.39 4.67 1.23 2.51 Posttest 8.80 1.93 7.87 2.03 7.40 1.84 2.03 Delayed Posttest 8.50 2.04 7.57 1.59 6.90 1.44 3.31* Note. TP = traditional pretraining, SCM = pretraining with a static concept map, ACM = pretraining with an animated concept map. *Statistically significant at .05 level while controlling for overall error rate
Descriptive statistics from the low prior knowledge subsample are detailed in
Table 16. Despite slightly varying scores, no statistically significant differences [F(2, 42)
= 2.51, p > .05] were found between the groups at the pretest. In the posttest interval, an
expected rise in scores occurred, with the traditional pretraining group experiencing
greater gains than the static and animated concept map groups. Again, the mean score
differences between the three groups were not statistically significant [F(2, 42) = 2.03, p
> .05]. Conversely, during the delayed posttest interval, scores exhibited statistical
significance [F(2, 42) = 3.31, p < .05]; traditional pretraining (M = 8.50, SD = 2.04) had
the strongest showing, followed by the static concept map group (M = 7.57, SD = 1.59)
and then the animated concept map group (M = 6.90, SD = 1.44). Post hoc analysis
indicated that the traditional pretraining and animated concept map groups were
statistically significantly different, and a large effect size was noted (d = 0.91).
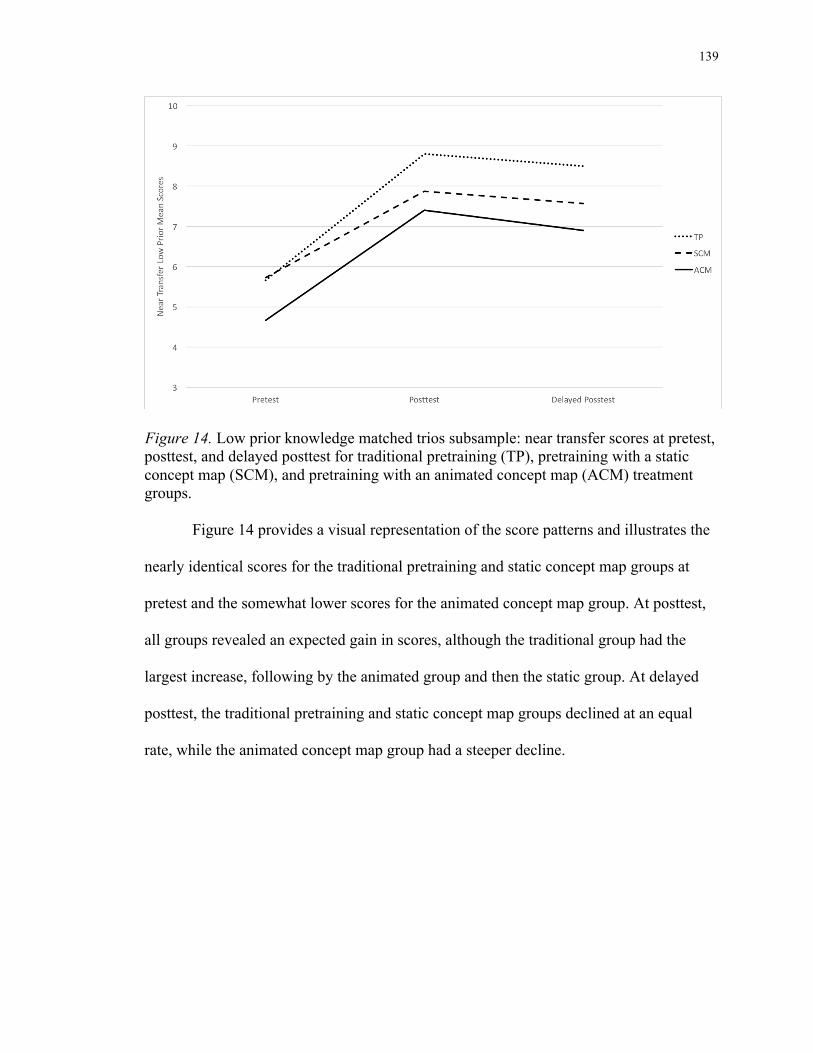
139
Figure 14. Low prior knowledge matched trios subsample: near transfer scores at pretest, posttest, and delayed posttest for traditional pretraining (TP), pretraining with a static concept map (SCM), and pretraining with an animated concept map (ACM) treatment groups.
Figure 14 provides a visual representation of the score patterns and illustrates the
nearly identical scores for the traditional pretraining and static concept map groups at
pretest and the somewhat lower scores for the animated concept map group. At posttest,
all groups revealed an expected gain in scores, although the traditional group had the
largest increase, following by the animated group and then the static group. At delayed
posttest, the traditional pretraining and static concept map groups declined at an equal
rate, while the animated concept map group had a steeper decline.

140
Table 17 Near Transfer Gain Score Results for Low Prior Matched Trios: Descriptive Statistics, Repeated Measures ANOVA, and Effect Size at Three Testing Intervals TP SCM ACM (n = 15) (n = 15) (n = 15) Intervention Mean SD Mean SD Mean SD f η2
Gain Pre-Post 3.13 2.13 2.17 2.36 2.73 2.02 0.46 .04 Gain Pre-Delay 2.83 2.53 1.83 1.53 2.23 1.80 0.95 .04 Gain Post-Delay -0.30 1.56 -0.30 2.30 -0.50 1.72 0.06 .00
Note. TP = traditional pretraining, SCM = pretraining with a static concept map, ACM = pretraining with an animated concept map. Pre-Post = pretest to posttest, Pre-Delay = pretest to delayed posttest, Post-Delay = posttest to delayed posttest. *Statistically significant at .05 level while controlling for overall error rate
Table 17 shows gain for the low prior knowledge matched trio subsample. Prior to
completing the repeated measures ANOVA, Mauchly’s Test of Sphericity was completed
to verify the assumption of homogeneity of variance. The results of that test were not
significant, indicating that group variances may be treated as equal (p < .05). No
statistically significant results were found in any of the gain intervals for any of the three
groups. Effect sizes were small for the pretest to posttest gain interval (.04), small for the
pretest to delayed posttest gain interval (.04), and negligible for the posttest to delayed
posttest gain interval (.00). That lack of statistical significance may be due to the small
subsample size.
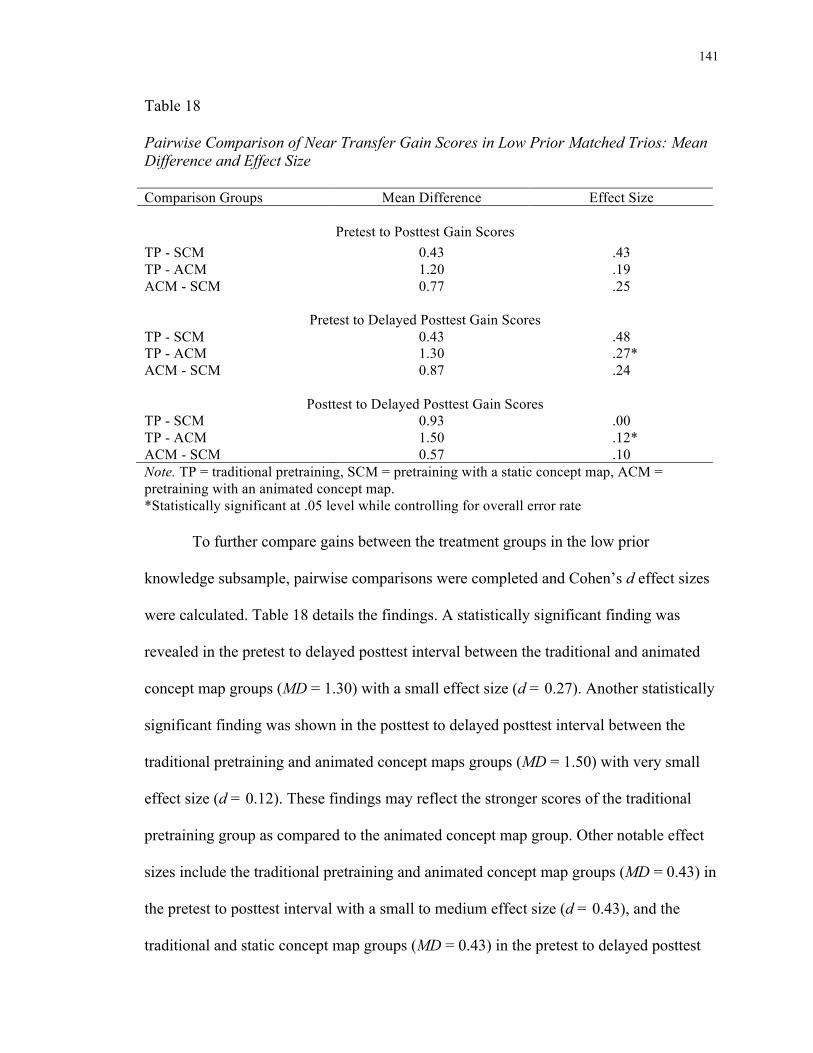
141
Table 18 Pairwise Comparison of Near Transfer Gain Scores in Low Prior Matched Trios: Mean Difference and Effect Size Comparison Groups Mean Difference Effect Size
Pretest to Posttest Gain Scores
TP - SCM 0.43 .43 TP - ACM 1.20 .19 ACM - SCM 0.77 .25
Pretest to Delayed Posttest Gain Scores
TP - SCM 0.43 .48 TP - ACM 1.30 .27* ACM - SCM 0.87 .24
Posttest to Delayed Posttest Gain Scores
TP - SCM 0.93 .00 TP - ACM 1.50 .12* ACM - SCM 0.57 .10 Note. TP = traditional pretraining, SCM = pretraining with a static concept map, ACM = pretraining with an animated concept map. *Statistically significant at .05 level while controlling for overall error rate
To further compare gains between the treatment groups in the low prior
knowledge subsample, pairwise comparisons were completed and Cohen’s d effect sizes
were calculated. Table 18 details the findings. A statistically significant finding was
revealed in the pretest to delayed posttest interval between the traditional and animated
concept map groups (MD = 1.30) with a small effect size (d = 0.27). Another statistically
significant finding was shown in the posttest to delayed posttest interval between the
traditional pretraining and animated concept maps groups (MD = 1.50) with very small
effect size (d = 0.12). These findings may reflect the stronger scores of the traditional
pretraining group as compared to the animated concept map group. Other notable effect
sizes include the traditional pretraining and animated concept map groups (MD = 0.43) in
the pretest to posttest interval with a small to medium effect size (d = 0.43), and the
traditional and static concept map groups (MD = 0.43) in the pretest to delayed posttest
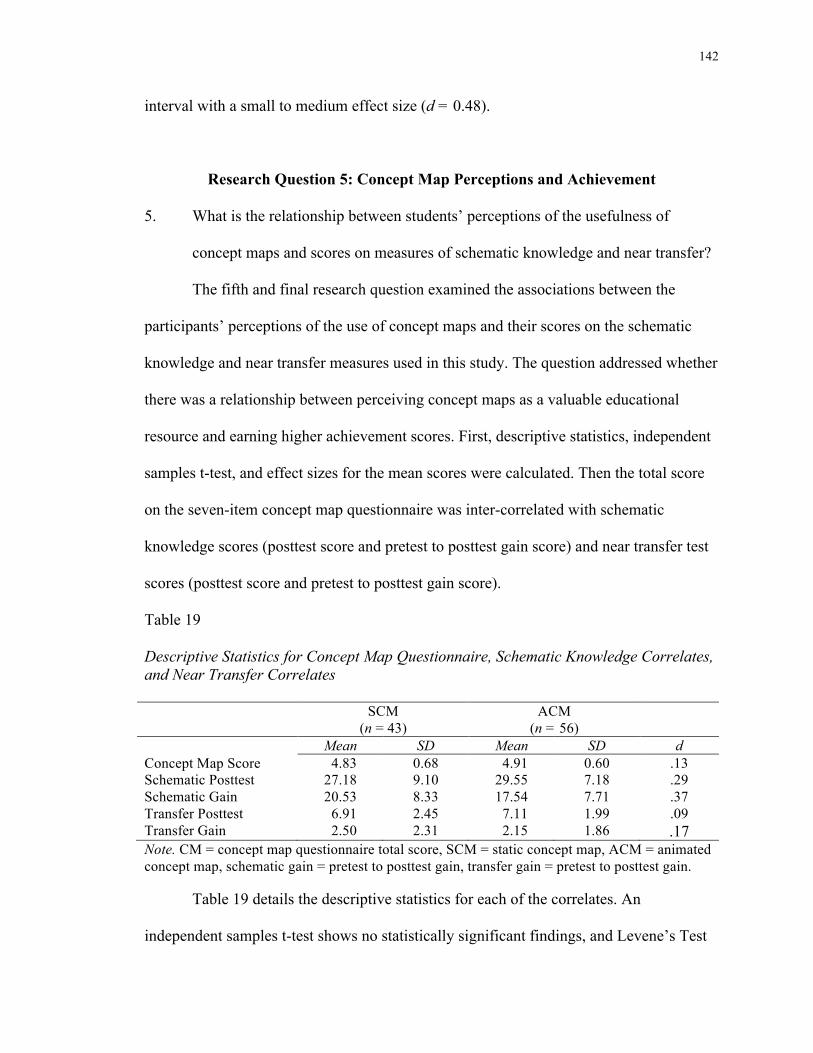
142
interval with a small to medium effect size (d = 0.48).
Research Question 5: Concept Map Perceptions and Achievement
5. What is the relationship between students’ perceptions of the usefulness of
concept maps and scores on measures of schematic knowledge and near transfer?
The fifth and final research question examined the associations between the
participants’ perceptions of the use of concept maps and their scores on the schematic
knowledge and near transfer measures used in this study. The question addressed whether
there was a relationship between perceiving concept maps as a valuable educational
resource and earning higher achievement scores. First, descriptive statistics, independent
samples t-test, and effect sizes for the mean scores were calculated. Then the total score
on the seven-item concept map questionnaire was inter-correlated with schematic
knowledge scores (posttest score and pretest to posttest gain score) and near transfer test
scores (posttest score and pretest to posttest gain score).
Table 19 Descriptive Statistics for Concept Map Questionnaire, Schematic Knowledge Correlates, and Near Transfer Correlates SCM
(n = 43) ACM
(n = 56)
Mean SD Mean SD d Concept Map Score 4.83 0.68 4.91 0.60 .13 Schematic Posttest 27.18 9.10 29.55 7.18 .29 Schematic Gain 20.53 8.33 17.54 7.71 .37 Transfer Posttest 6.91 2.45 7.11 1.99 .09 Transfer Gain 2.50 2.31 2.15 1.86 .17 Note. CM = concept map questionnaire total score, SCM = static concept map, ACM = animated concept map, schematic gain = pretest to posttest gain, transfer gain = pretest to posttest gain.
Table 19 details the descriptive statistics for each of the correlates. An
independent samples t-test shows no statistically significant findings, and Levene’s Test
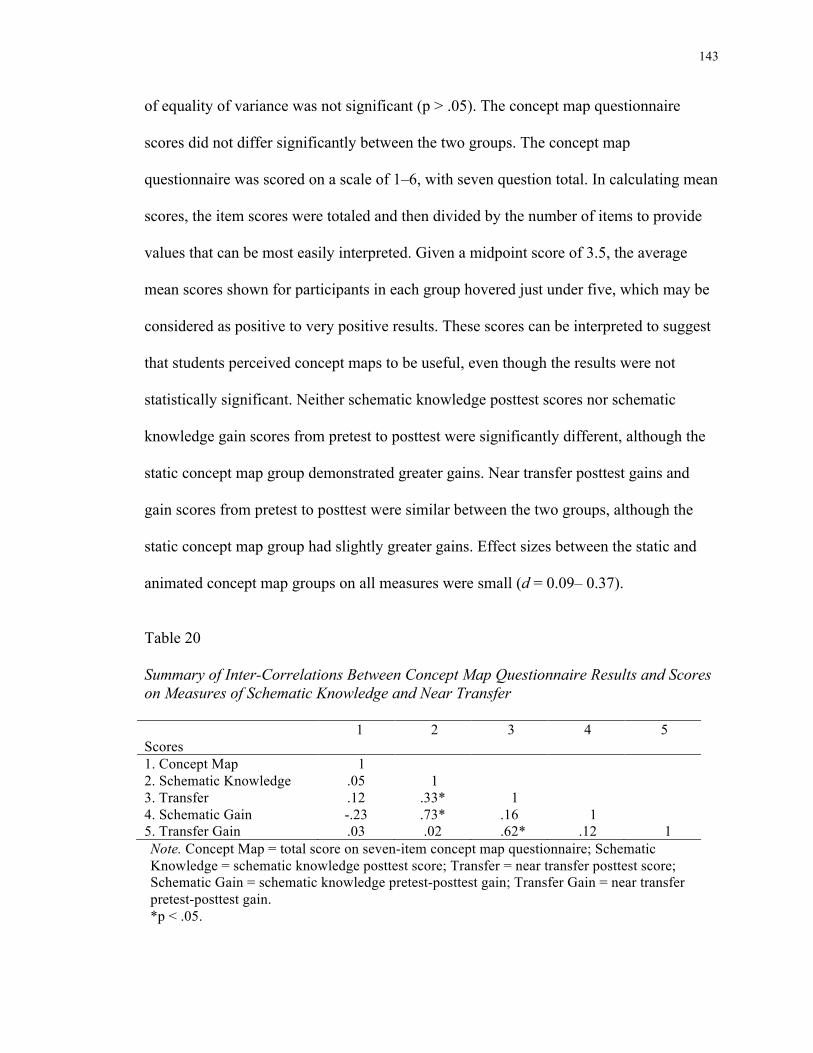
143
of equality of variance was not significant (p > .05). The concept map questionnaire
scores did not differ significantly between the two groups. The concept map
questionnaire was scored on a scale of 1–6, with seven question total. In calculating mean
scores, the item scores were totaled and then divided by the number of items to provide
values that can be most easily interpreted. Given a midpoint score of 3.5, the average
mean scores shown for participants in each group hovered just under five, which may be
considered as positive to very positive results. These scores can be interpreted to suggest
that students perceived concept maps to be useful, even though the results were not
statistically significant. Neither schematic knowledge posttest scores nor schematic
knowledge gain scores from pretest to posttest were significantly different, although the
static concept map group demonstrated greater gains. Near transfer posttest gains and
gain scores from pretest to posttest were similar between the two groups, although the
static concept map group had slightly greater gains. Effect sizes between the static and
animated concept map groups on all measures were small (d = 0.09– 0.37).
Table 20 Summary of Inter-Correlations Between Concept Map Questionnaire Results and Scores on Measures of Schematic Knowledge and Near Transfer Scores
1 2 3 4 5
1. Concept Map 1 2. Schematic Knowledge .05 1 3. Transfer .12 .33* 1 4. Schematic Gain -.23 .73* .16 1 5. Transfer Gain .03 .02 .62* .12 1 Note. Concept Map = total score on seven-item concept map questionnaire; Schematic Knowledge = schematic knowledge posttest score; Transfer = near transfer posttest score; Schematic Gain = schematic knowledge pretest-posttest gain; Transfer Gain = near transfer pretest-posttest gain. *p < .05.
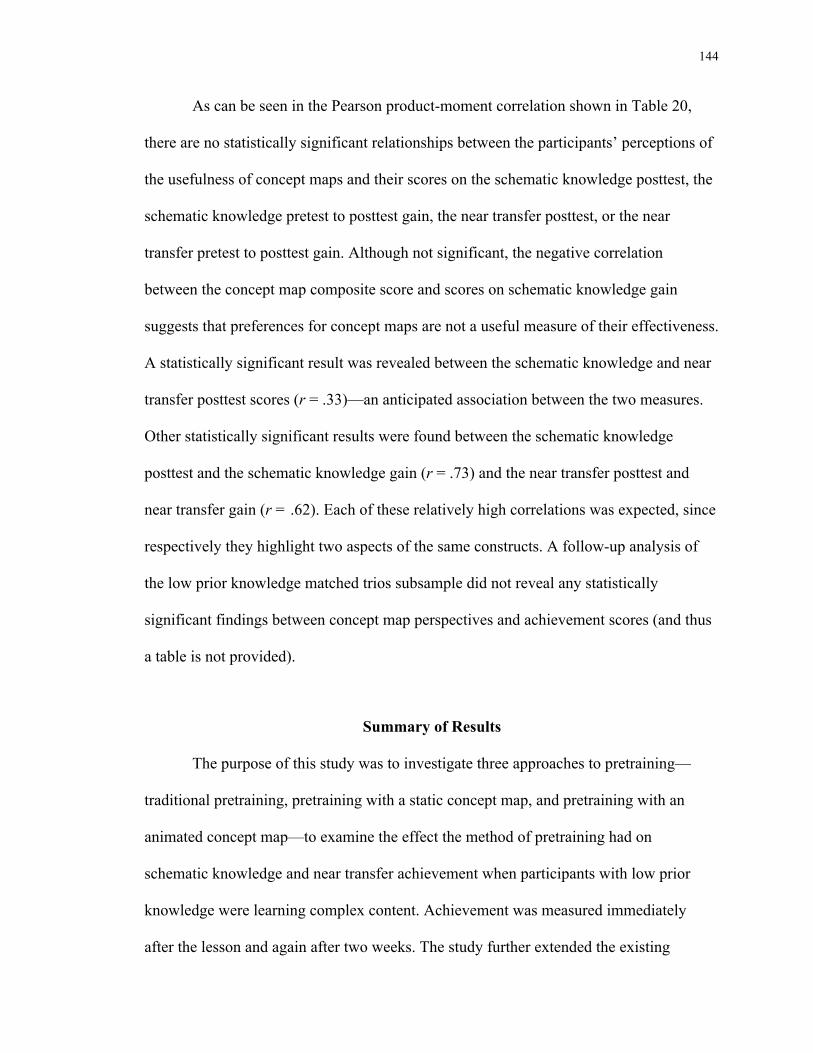
144
As can be seen in the Pearson product-moment correlation shown in Table 20,
there are no statistically significant relationships between the participants’ perceptions of
the usefulness of concept maps and their scores on the schematic knowledge posttest, the
schematic knowledge pretest to posttest gain, the near transfer posttest, or the near
transfer pretest to posttest gain. Although not significant, the negative correlation
between the concept map composite score and scores on schematic knowledge gain
suggests that preferences for concept maps are not a useful measure of their effectiveness.
A statistically significant result was revealed between the schematic knowledge and near
transfer posttest scores (r = .33)—an anticipated association between the two measures.
Other statistically significant results were found between the schematic knowledge
posttest and the schematic knowledge gain (r = .73) and the near transfer posttest and
near transfer gain (r = .62). Each of these relatively high correlations was expected, since
respectively they highlight two aspects of the same constructs. A follow-up analysis of
the low prior knowledge matched trios subsample did not reveal any statistically
significant findings between concept map perspectives and achievement scores (and thus
a table is not provided).
Summary of Results
The purpose of this study was to investigate three approaches to pretraining—
traditional pretraining, pretraining with a static concept map, and pretraining with an
animated concept map—to examine the effect the method of pretraining had on
schematic knowledge and near transfer achievement when participants with low prior
knowledge were learning complex content. Achievement was measured immediately
after the lesson and again after two weeks. The study further extended the existing
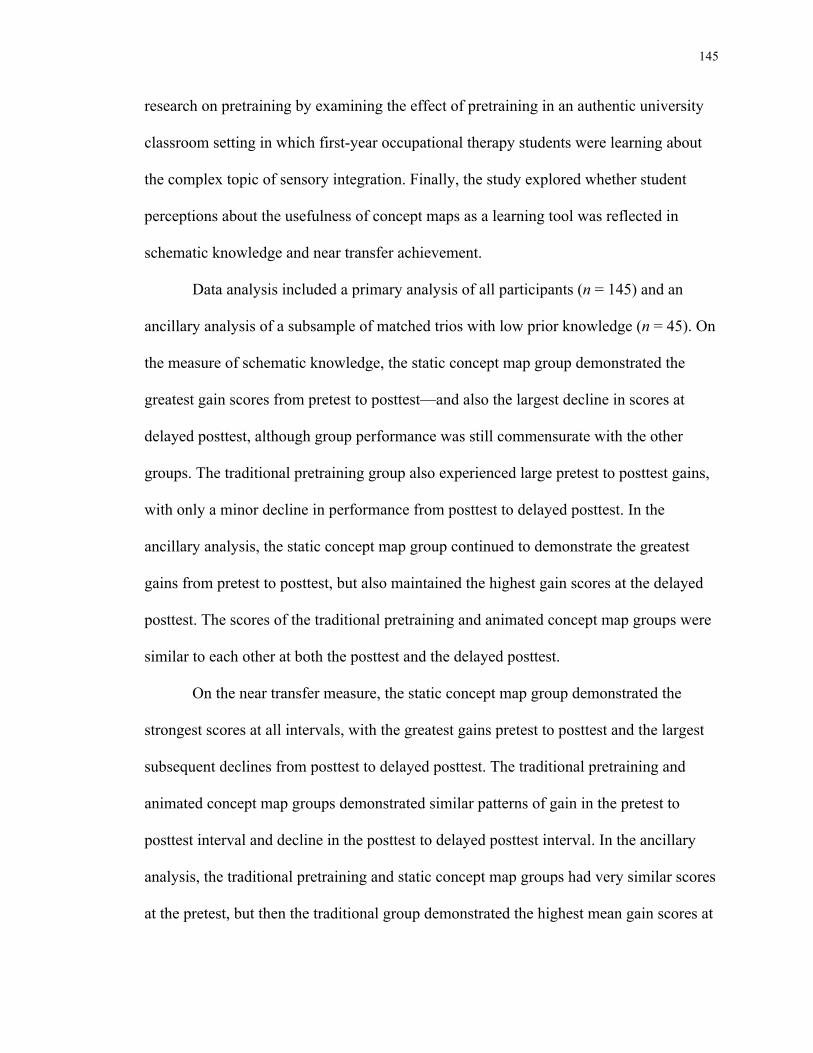
145
research on pretraining by examining the effect of pretraining in an authentic university
classroom setting in which first-year occupational therapy students were learning about
the complex topic of sensory integration. Finally, the study explored whether student
perceptions about the usefulness of concept maps as a learning tool was reflected in
schematic knowledge and near transfer achievement.
Data analysis included a primary analysis of all participants (n = 145) and an
ancillary analysis of a subsample of matched trios with low prior knowledge (n = 45). On
the measure of schematic knowledge, the static concept map group demonstrated the
greatest gain scores from pretest to posttest—and also the largest decline in scores at
delayed posttest, although group performance was still commensurate with the other
groups. The traditional pretraining group also experienced large pretest to posttest gains,
with only a minor decline in performance from posttest to delayed posttest. In the
ancillary analysis, the static concept map group continued to demonstrate the greatest
gains from pretest to posttest, but also maintained the highest gain scores at the delayed
posttest. The scores of the traditional pretraining and animated concept map groups were
similar to each other at both the posttest and the delayed posttest.
On the near transfer measure, the static concept map group demonstrated the
strongest scores at all intervals, with the greatest gains pretest to posttest and the largest
subsequent declines from posttest to delayed posttest. The traditional pretraining and
animated concept map groups demonstrated similar patterns of gain in the pretest to
posttest interval and decline in the posttest to delayed posttest interval. In the ancillary
analysis, the traditional pretraining and static concept map groups had very similar scores
at the pretest, but then the traditional group demonstrated the highest mean gain scores at

146
posttest and delayed posttest. The animated concept map group had the lowest scores at
all time intervals. There were no notable relationships between positive perceptions of the
usefulness of concept maps and either schematic knowledge or near transfer achievement.
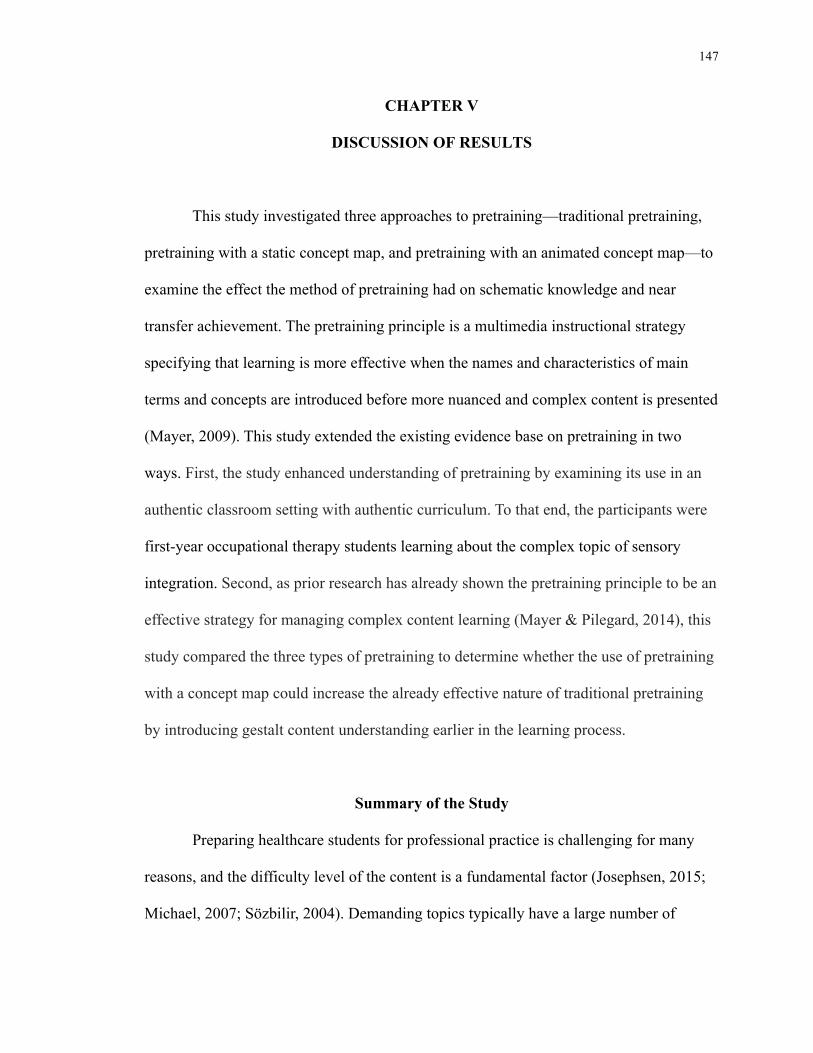
147
CHAPTER V
DISCUSSION OF RESULTS
This study investigated three approaches to pretraining—traditional pretraining,
pretraining with a static concept map, and pretraining with an animated concept map—to
examine the effect the method of pretraining had on schematic knowledge and near
transfer achievement. The pretraining principle is a multimedia instructional strategy
specifying that learning is more effective when the names and characteristics of main
terms and concepts are introduced before more nuanced and complex content is presented
(Mayer, 2009). This study extended the existing evidence base on pretraining in two
ways. First, the study enhanced understanding of pretraining by examining its use in an
authentic classroom setting with authentic curriculum. To that end, the participants were
first-year occupational therapy students learning about the complex topic of sensory
integration. Second, as prior research has already shown the pretraining principle to be an
effective strategy for managing complex content learning (Mayer & Pilegard, 2014), this
study compared the three types of pretraining to determine whether the use of pretraining
with a concept map could increase the already effective nature of traditional pretraining
by introducing gestalt content understanding earlier in the learning process.
Summary of the Study
Preparing healthcare students for professional practice is challenging for many
reasons, and the difficulty level of the content is a fundamental factor (Josephsen, 2015;
Michael, 2007; Sözbilir, 2004). Demanding topics typically have a large number of
148
elements to be learned, and understanding is predicated on cognitively processing all of
these elements in relation to one another (Sweller et al., 2011). Learners tackling complex
content often start with low prior knowledge, which further increases the difficulty. With
an ultimate goal of becoming competent clinicians, students in the healthcare fields of
medicine and nursing, as well as occupational therapy, must tackle numerous complex
topics (Mayer, 2010). In addition to the content challenges, students must be able to
integrate large amounts of information, engage in critical appraisal of content, and then
transfer academic knowledge to clinical contexts (Josephsen, 2015; Leppink & van den
Heuvel, 2015; van Merriënboer & Sweller, 2010).
College instructors in healthcare disciplines are challenged to teach complex
content, and this reality creates a practical need for research on effective pedagogical
approaches (Kaylor, 2014; Naismith et al., 2015; Pociask, Morrison, & Reid, 2013). The
preponderance of multimedia and digital resources in and beyond college classrooms
suggests that solutions to teaching complex content should leverage educational
technology and make use of multimedia resources. Within cognitive theory, the
management of content complexity provides a key to instructional success. In combining
the contributions from these two learning theories, evidence suggests a number of
strategies for tackling complex content. The multimedia principle of pretraining is one
effective way to augment complex content learning, and it can be especially useful for
learners who have low prior knowledge of a topic (Mayer, 2009).
Pretraining is also referred to as a two-phase, isolated-interacting elements
approach. A list of terms and definitions, along with relevant diagrams, is provided to a
learner for review (the isolated elements phase), and then details and more in-depth
149
information is delivered (the interacting elements phase). To date, pretraining has been
studied primarily in laboratory environments using pools of college psychology students
(Eitel et al., 2013; Kester et al., 2004a; Mayer, Mathias, et al., 2002; Mayer, Mautone, et
al., 2002). Studies have focused mainly on cause and effect processes, such as car braking
systems, pumps, and pulleys (Eitel et al., 2013; Kester et al., 2004b; Kester, Kirschner, et
al., 2006; Mayer, Mathias, et al., 2002). Extending the study of pretraining to natural
environments, such as classrooms, and to non-mechanistic topics, like those found in the
healthcare disciplines, is indicated.
While traditional pretraining has proven to be a sound strategy for managing
complex learning (Mayer & Pilegard, 2014), one identified drawback of the method is
that meaningful understanding of a topic must be delayed until the pretraining is
complete (Pollock et al., 2002). Investigating alternative methods of pretraining that
address this paradox is indicated, and one alternative approach to pretraining is the use of
concept maps (Cutrer et al., 2011; Willerman & MacHarg, 1991; Zheng et al., 2012).
Research on visual displays suggests that concept maps can successfully aid in the
organization, integration, and conceptual understanding of complex content (Adesope &
Nesbit, 2013; Blankenship & Dansereau, 2000; Fonseca et al., 2004; Nesbit & Adesope,
2006; Novak, 2002). Additionally, concept maps can benefit learners who have low prior
knowledge (Nesbit & Adesope, 2013; Weinstein & Mayer, 1986). By augmenting
pretraining with a concept map, more effective and meaningful processing of new terms
and definitions may be possible, since the concept map adds visual signals to aid the
learner and the map structure provides a comprehensive overview of the topic. Although
the results of the studies on pretraining with a concept map suggest that it can be an
150
effective strategy for managing complex content (Cutrer et al., 2011; Willerman &
MacHarg, 1991; Zheng et al., 2012), the scant body of evidence indicates the need for
additional research.
The theoretical framework for this study is developed from three cognitive
learning theories: the assimilation theory of retention, cognitive load theory, and the
cognitive theory of multimedia learning. When considering how to best teach complex
content, the assimilation theory of retention and its emphasis on meaningful learning
propose a framework for understanding content at a deep level (Ausubel, 1960, 1962,
1968; Ausubel et al., 1978; Mayer, 1979). Within the assimilation theory of retention, the
use of advance organizers provides a historical blueprint for the contemporary pretraining
principle (Ausubel, 1968; Ausubel et al., 1978). Cognitive load theory defines and
delineates the connections between human cognitive architecture, instructional design,
and learning—especially in relation to complex learning. Further, cognitive load theory
delineates the instructional design factors contributing to the various loads and describes
strategies that help address difficulties when they arise (Moreno & Park, 2010; Sweller et
al., 2011). Building on cognitive load theory, the cognitive theory of multimedia learning
provides principles for enhancing processing and meaningful learning in multimedia-
based environments. Specifically, the cognitive theory of multimedia learning proposes
evidence-based strategies for managing essential processing and details how pretraining
can work to facilitate the learning of complex content (Mayer, 2014a). Within the
cognitive theory of multimedia learning, the pretraining principle offers one approach to
tackling complex learning successfully (Mayer & Pilegard, 2014, p. 316).
151
Using a pretest-posttest quasi-experimental design, this study included 145
participants in six first-year occupational therapy classes. Intact class sections were
assigned to one of three treatment groups: traditional pretraining, pretraining using a
static concept map, or pretraining using an animated concept map. Following a pretest to
obtain a baseline of prior knowledge, the 12-minute pretraining treatment was
administered via a video module (with three minutes added for setup), and then
participants were exposed to a 60-minute multimedia lecture on sensory integration
theory. To measure changes in participant schematic knowledge and near transfer ability,
an immediate posttest was completed, followed two weeks later by a delayed posttest. A
questionnaire to measure participant perceptions about concept maps was also
administered at the posttest. The study considered five research questions:
1. How does the type of pretraining affect schematic knowledge when measured
immediately after a lesson?
2. How does the type of pretraining affect schematic knowledge when measured two
weeks after a lesson?
3. How does the type of pretraining affect near transfer when measured immediately
after a lesson?
4. How does the type of pretraining affect near transfer when measured two weeks
after a lesson?
5. What is the relationship between students’ perceptions of the usefulness of
concept maps and scores on measures of schematic knowledge and near transfer?
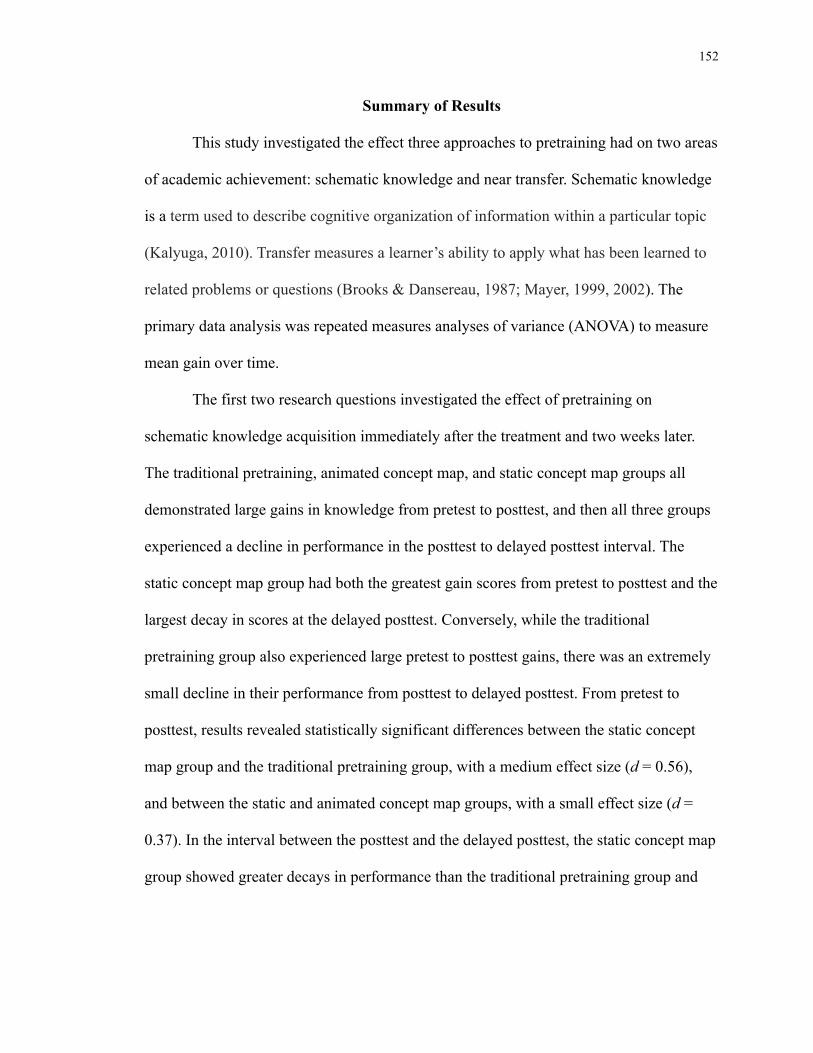
152
Summary of Results
This study investigated the effect three approaches to pretraining had on two areas
of academic achievement: schematic knowledge and near transfer. Schematic knowledge
is a term used to describe cognitive organization of information within a particular topic
(Kalyuga, 2010). Transfer measures a learner’s ability to apply what has been learned to
related problems or questions (Brooks & Dansereau, 1987; Mayer, 1999, 2002). The
primary data analysis was repeated measures analyses of variance (ANOVA) to measure
mean gain over time.
The first two research questions investigated the effect of pretraining on
schematic knowledge acquisition immediately after the treatment and two weeks later.
The traditional pretraining, animated concept map, and static concept map groups all
demonstrated large gains in knowledge from pretest to posttest, and then all three groups
experienced a decline in performance in the posttest to delayed posttest interval. The
static concept map group had both the greatest gain scores from pretest to posttest and the
largest decay in scores at the delayed posttest. Conversely, while the traditional
pretraining group also experienced large pretest to posttest gains, there was an extremely
small decline in their performance from posttest to delayed posttest. From pretest to
posttest, results revealed statistically significant differences between the static concept
map group and the traditional pretraining group, with a medium effect size (d = 0.56),
and between the static and animated concept map groups, with a small effect size (d =
0.37). In the interval between the posttest and the delayed posttest, the static concept map
group showed greater decays in performance than the traditional pretraining group and
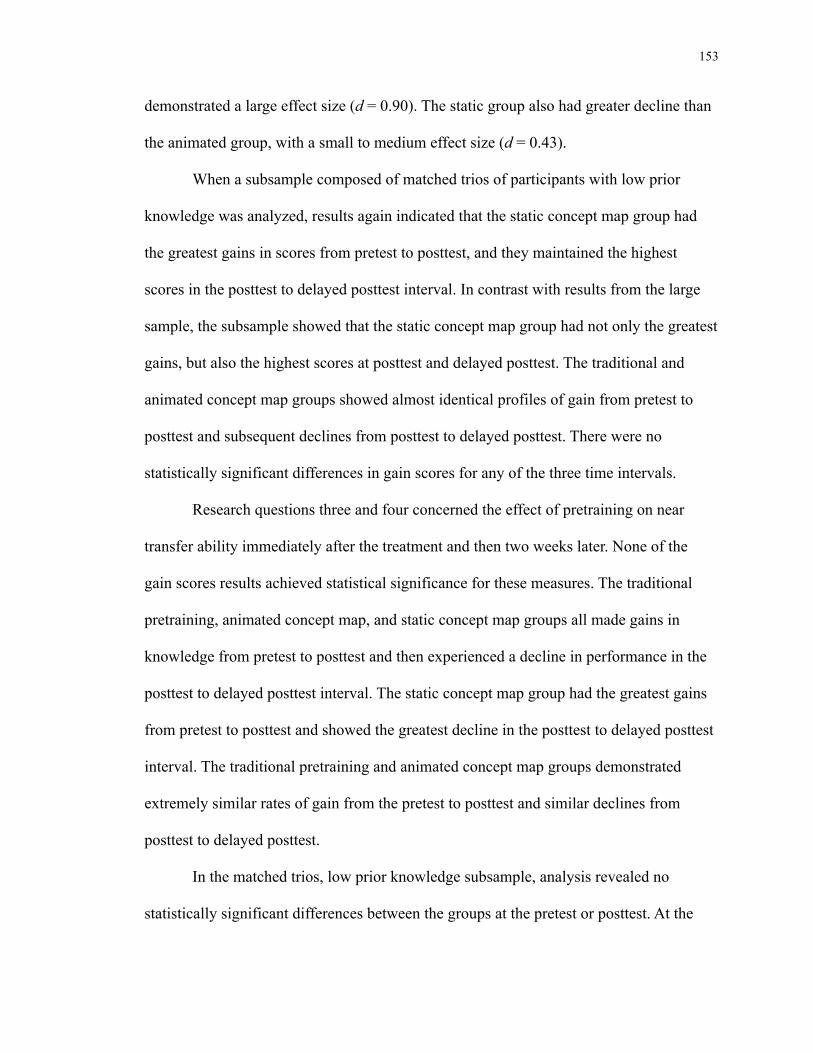
153
demonstrated a large effect size (d = 0.90). The static group also had greater decline than
the animated group, with a small to medium effect size (d = 0.43).
When a subsample composed of matched trios of participants with low prior
knowledge was analyzed, results again indicated that the static concept map group had
the greatest gains in scores from pretest to posttest, and they maintained the highest
scores in the posttest to delayed posttest interval. In contrast with results from the large
sample, the subsample showed that the static concept map group had not only the greatest
gains, but also the highest scores at posttest and delayed posttest. The traditional and
animated concept map groups showed almost identical profiles of gain from pretest to
posttest and subsequent declines from posttest to delayed posttest. There were no
statistically significant differences in gain scores for any of the three time intervals.
Research questions three and four concerned the effect of pretraining on near
transfer ability immediately after the treatment and then two weeks later. None of the
gain scores results achieved statistical significance for these measures. The traditional
pretraining, animated concept map, and static concept map groups all made gains in
knowledge from pretest to posttest and then experienced a decline in performance in the
posttest to delayed posttest interval. The static concept map group had the greatest gains
from pretest to posttest and showed the greatest decline in the posttest to delayed posttest
interval. The traditional pretraining and animated concept map groups demonstrated
extremely similar rates of gain from the pretest to posttest and similar declines from
posttest to delayed posttest.
In the matched trios, low prior knowledge subsample, analysis revealed no
statistically significant differences between the groups at the pretest or posttest. At the
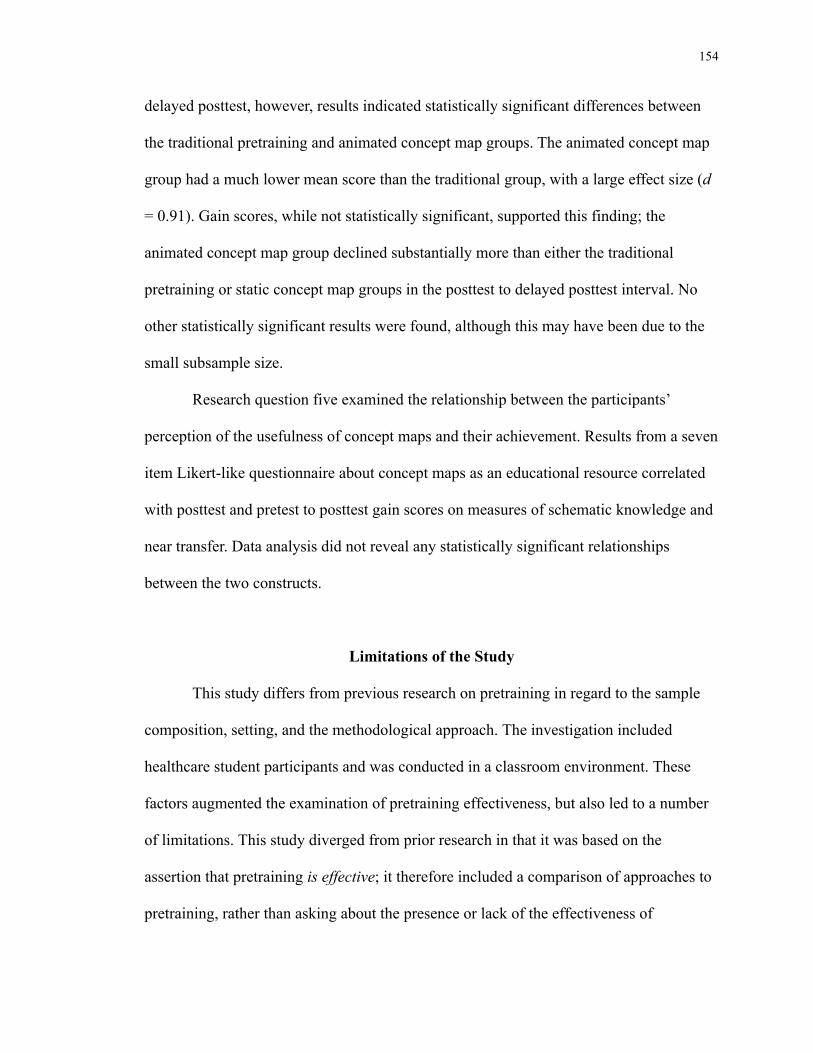
154
delayed posttest, however, results indicated statistically significant differences between
the traditional pretraining and animated concept map groups. The animated concept map
group had a much lower mean score than the traditional group, with a large effect size (d
= 0.91). Gain scores, while not statistically significant, supported this finding; the
animated concept map group declined substantially more than either the traditional
pretraining or static concept map groups in the posttest to delayed posttest interval. No
other statistically significant results were found, although this may have been due to the
small subsample size.
Research question five examined the relationship between the participants’
perception of the usefulness of concept maps and their achievement. Results from a seven
item Likert-like questionnaire about concept maps as an educational resource correlated
with posttest and pretest to posttest gain scores on measures of schematic knowledge and
near transfer. Data analysis did not reveal any statistically significant relationships
between the two constructs.
Limitations of the Study
This study differs from previous research on pretraining in regard to the sample
composition, setting, and the methodological approach. The investigation included
healthcare student participants and was conducted in a classroom environment. These
factors augmented the examination of pretraining effectiveness, but also led to a number
of limitations. This study diverged from prior research in that it was based on the
assertion that pretraining is effective; it therefore included a comparison of approaches to
pretraining, rather than asking about the presence or lack of the effectiveness of
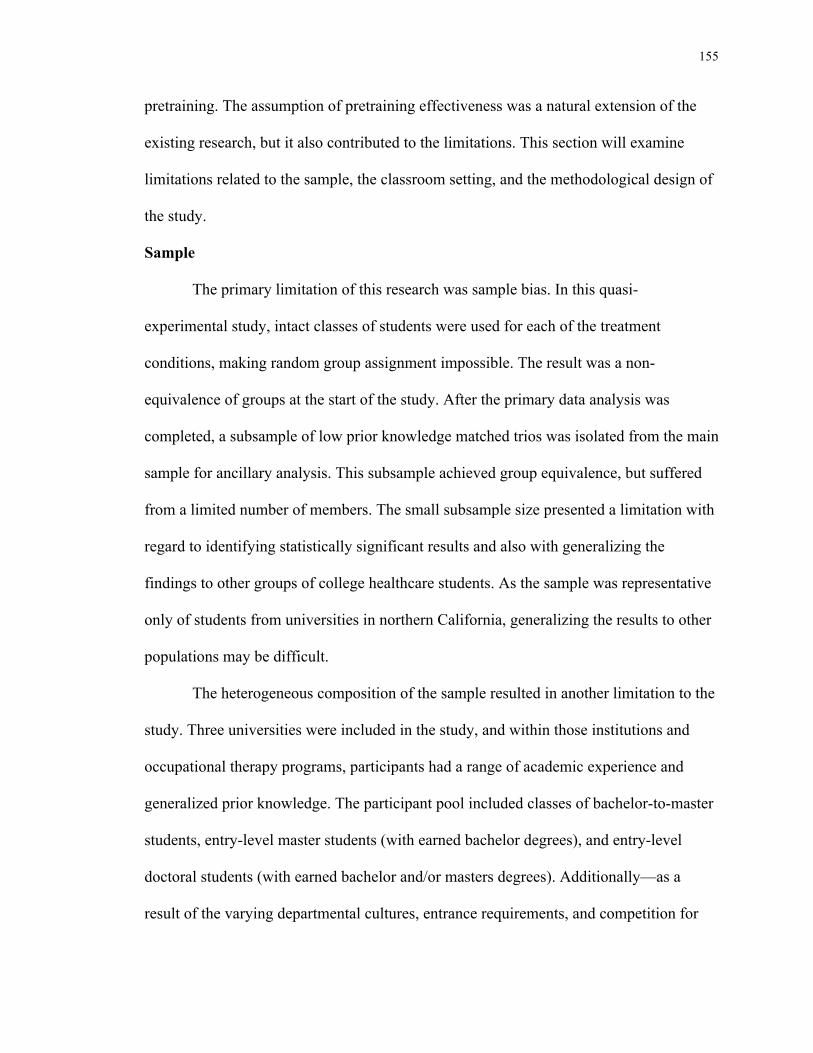
155
pretraining. The assumption of pretraining effectiveness was a natural extension of the
existing research, but it also contributed to the limitations. This section will examine
limitations related to the sample, the classroom setting, and the methodological design of
the study.
Sample
The primary limitation of this research was sample bias. In this quasi-
experimental study, intact classes of students were used for each of the treatment
conditions, making random group assignment impossible. The result was a non-
equivalence of groups at the start of the study. After the primary data analysis was
completed, a subsample of low prior knowledge matched trios was isolated from the main
sample for ancillary analysis. This subsample achieved group equivalence, but suffered
from a limited number of members. The small subsample size presented a limitation with
regard to identifying statistically significant results and also with generalizing the
findings to other groups of college healthcare students. As the sample was representative
only of students from universities in northern California, generalizing the results to other
populations may be difficult.
The heterogeneous composition of the sample resulted in another limitation to the
study. Three universities were included in the study, and within those institutions and
occupational therapy programs, participants had a range of academic experience and
generalized prior knowledge. The participant pool included classes of bachelor-to-master
students, entry-level master students (with earned bachelor degrees), and entry-level
doctoral students (with earned bachelor and/or masters degrees). Additionally—as a
result of the varying departmental cultures, entrance requirements, and competition for
156
entry to each of the three schools—participants had a variety of demographic, personal,
and professional differences. In particular, the bachelor-to-master students demonstrated
lower levels of prior knowledge and subsequent achievement, which may have been due
to their relatively younger ages and lower work and life experience levels as compared
with their counterparts.
Classroom Setting
Situated in an authentic classroom environment, this study extended the research
on pretraining but also presented several potential limitations. The first set of challenges
focused on ensuring that students were attending, maximally engaged, and evincing their
best effort on the assessments. Steps to address the situation included asking all
participants to stow laptops, tablets, and phones during the treatment session. An
introductory statement about the study emphasized that the content was relevant to
occupational therapy education and the given class curriculum, and that the topic would
be present on the national board examination needed for licensure. This information was
designed to encourage students to attend and perform at their highest ability. The lesson
was not started until all students were present, and students were provided with frequent
restroom breaks. They were also asked to remain present during the entire lesson if at all
possible. Other factors affecting the results of the study included the time of day of the
presentations (which may have affected the energy and attention of the participants), the
participants’ inherent interest or disinterest in the topic, and their fatigue and stress levels.
The advantages of conducting research in a classroom environment outweighed the
potential drawbacks raised by a lack of control over the participants’ effort. Although the
laboratory would have provided a more highly controlled environment and potentially
157
more uniform student effort, understanding of the use of pretraining is most needed in
natural situations and contexts.
The classroom setting itself presented another set of possible limitations to the
results. One such limitation was the technology available, which varied by classroom. For
example, in one classroom the speakers were non-functional, necessitating the use of an
external speaker, and in other classrooms the built-in projector did not effectively resolve
the colors in the concept maps or slide deck. The researcher navigated numerous other
factors in scheduling the introductory and pretest session, the treatment and lesson, and
the delayed posttest and debrief. Practically, this resulted in three of the classes of
participants having the pretest and delayed posttest in one course but the treatment and
lesson in a different course. The change of environment, teacher, and time of day may
have affected their performance. Another issue was that one class was actually composed
of second-year students who had significantly higher levels of prior knowledge than the
first-year students in all of the other classes of participants. The solution to this issue was
to quickly recruit a volunteer group of first-year student participants. However, the self-
selection of volunteers may have resulted in a group that had greater motivation, interest,
and/or knowledge than the rest of the sample. Finally, the physical environment—room
temperature, lighting, seating, available space, environmental distractions, etc.—may
have impacted the participants and thus skewed the results of the study.
Study Design
Despite the insightful results garnered from this study, a decided limitation was
the lack of a control group. The study was designed to compare three types of pretraining
to see which was the most effective for fostering schematic knowledge and near transfer
158
ability. While not absolutely necessary, a control group that did not receive pretraining
would have provided a baseline against which to measure achievement, thus allowing
further quantification and comparison of the results. Unfortunately, the inclusion of a
control group would have required reducing the treatment group size to fewer than 30
participants in some instances, thus violating the central limit theorem. This statistical
guideline specifies that groups in excess of 30 members can be considered to be normally
distributed and thus reflective of the population.
Additionally, the composition of the concept map, and in particular the color
choices used for the map may have negatively affected participants who are color blind.
Participants who have other visual limitations which prevent them from differentiating
colored hues or diseases which alter their vision may also have been impacted. Using
universal design for learning principles regarding color choice is indicated in future
studies.
Another methodological limitation was the use of narration for all three treatment
conditions. In an effort to engage in best pedagogical practice, narration was added to all
modules to elucidate the pretraining content. Unfortunately, the use of narration on both
the static and animated concept map conditions nullified—or at least reduced—the
amount of difference between the two treatments. As discussed later in this chapter, the
narration provided additional cueing for both of the map groups, thus potentially reducing
the signaling inherent in the structure of the animated concept map. Map shock was also
minimized because the narration provided a road map for processing the static concept
map.
159
A final notable limitation was the choice of assessment types and scoring of
outcome measures. With regard to the schematic knowledge test, the choice of measure
was based on prior research (Shavelson, 1974) and Cronbach’s alpha was acceptable (a =
.77). However, the scoring was based on a content validity review and then included the
widest array of acceptable replies possible. The inclusion of broadly acceptable responses
was not of issue, but the lack of a score ranking protocol meant that no differentiation
between more and less sophisticated replies evidencing schema development was
possible. In contrast to the schematic knowledge test, the near transfer test assessment
had a relatively low Cronbach’s score (a = .51) and may not have reflected transfer
achievement as reliably as was desired. Additionally, although the near transfer test made
use of fill-in-the-blank questions, in addition to multiple choice questions, the use of
narrative replies may have better quantified the participants’ transfer achievement. Again,
due to the nature of the study and the resources of one researcher available to score the
435 assessments (145 participants with 3 tests each), a decision was made to balance the
study design between nuance and feasibility. With regard to the concept map
questionnaire, results may have been more relevant if participants had been queried about
their prior experience with concept maps during intake and this factor then had been
considered during data analysis.
In summary, the opportunity to work with most of the first-year occupational
therapy students in the San Francisco Bay area in their natural classroom settings was a
unique and valuable one. Nonetheless, it also contributed to the limitations of this study.
Although measures were taken to limit the impact of the environment and study design
on the research, these factors inevitably had some effect. Likewise, the sample bias and
160
resultantly low subsample size were problematic in the data analysis and ability to
generalize the findings. Issues related to instrumentation and methodology, while
carefully considered and problem solved, also contributed to the limitations. Finally, the
scope of the present study, which was set in a particular locale and with a specific subset
of healthcare students, is necessarily limited in how widely it might be generalized to the
population.
Discussion of Findings
When the findings of this study are distilled to the most basic message, it is that
pretraining using a static concept map can provide an excellent educational strategy for
delivering complex healthcare-related content to students who possess low prior
knowledge. In fact, according to the results of both the primary and ancillary analyses in
the areas of schematic knowledge and near transfer, the static concept map provides the
best option for pretraining in a college healthcare setting. Traditional pretraining, as it
was presented in this study, also offers a solid foundation-building strategy for complex
learning. Pretraining with animated concept maps is likewise effective, but due to the
substantial amounts of time and technical knowledge needed to create animated concept
maps, as well as the lack of superior learning outcomes, it is a less desirable option.
The following discussion examines the intersections between the literature on
pretraining, the evidence base for static and animated concept maps, and the results of
this study. First the results from the study will be situated within a broader perspective on
factors that affect the teaching of complex content to students in higher education. Then

161
the affordances and drawbacks of the three types of pretraining will be revisited and
investigated in light of the research results.
Using Pretraining to Teach Complex Content
In his work on the cognitive theory of multimedia, Mayer (2009) emphasizes that
educational strategies to enhance learning must be considered in light of boundary
conditions for use. With regard to pretraining, the technique is most effective with low
prior knowledge learners, the presentation of complex instructional content, and fast-
paced content delivery. This research study emphasized the vital impact that the level of
prior knowledge has on cognitive load during the learning process. Although the
participants were all first-year students with little prior knowledge of the field of
occupational therapy or the complex topic of sensory integration, they possessed a
multitude of existing levels of prior knowledge. The non-equivalence of treatment groups
at the start of the study highlighted this factor and clouded the primary analysis, although
the lower prior knowledge learners demonstrated the greatest gains in achievement.
When students with the least prior knowledge were isolated into a matched trio sample
and results were analyzed, a more authentic picture of how low prior knowledge affects
pretraining emerged, despite the smaller sample size. Thus the boundary claim that
pretraining works the best for low prior knowledge learners was wholeheartedly
supported (Mayer & Pilegard, 2014).
With regard to the need for complex content in best showcasing the power of
pretraining, healthcare topics are notoriously challenging and ripe for the use of
pretraining. In fact, in two of the three citations on pretraining with a concept map, the
identified topic was an aspect of healthcare. One study focused on medical students
162
learning about respiratory failure (Cutrer et al., 2011) and the other on Type 1 diabetes
(Zheng et al., 2012). The third study, while not healthcare related, used a related topic of
physical science (Willerman & MacHarg, 1991). Additionally, in a recent meta-analysis
of concept maps, one area of focus was the use of concept maps to improve teaching and
learning in the STEM (science, technology, engineering, and math) fields, which are
intricately related to the healthcare disciplines (Schroeder, Nesbit, Anguiano, & Adesope,
2017). The topic of sensory integration theory proved to be a sound choice for this study,
as evidenced by the questions posed by the participants during the lesson and the fact that
no one left the pretraining lesson having an entirely comprehensive schema developed or
a perfect score on the transfer test.
Regarding the third boundary condition—that pretraining is best used with fast-
paced instruction—an authentic classroom setting, the curricula to be covered, and the
restrictions imposed by class schedules created an undeniably brisk pace. Again, the
healthcare setting of occupational therapy provided a context ripe for research efforts due
to the considerable content to be covered in a short period of time. This factor is alluded
to in most literature on pretraining, as the lessons built on complicated concepts and the
studies were limited in duration, but prior research often did not specify the speed of the
content delivery. For example, a number of studies used self-paced modules that lasted
from one to two hours (Clark et al., 2005; Kester, Kirchner, et al., 2004a, 2004b, 2006;
Kester, Lehnen, et al., 2006; Mayer, Mathias, et al., 2002; Pollock et al., 2002).
The natural outgrowth of a fast-paced lesson and additional area of investigation
for this discussion was the duration of pretraining. In this study, the amount of content to
be delivered and the speed needed to cover it in a class session meant that pretraining
163
needed to be brief. Pretraining was allotted 15 minutes, and the videos lasted
approximately 12 minutes each. No consistent agreement about length of pretraining
exists, and studies have reported durations ranging from milliseconds to view an image
(Eitel et al., 2013), to five minutes for pretraining concept map review (Cutrer et al.,
2011), to the use of a self-paced, computerized learning module with pretraining
embedded into the lesson (Clark et al., 2005; Kester, Kirschner, et al., 2004a, 2004b,
2006; Kester, Lehnen, et al., 2006; Mayer, Mathias, et al., 2002; Pollock et al., 2002).
The length of the pretraining varies depending on the structure of the lesson and the
content to be covered during the presentation of foundational material. Prior research also
made good use of precious class time by implementing pretraining as part of a flipped
classroom experience. The pretraining was presented on a learning management system
(LMS) before class, leaving the class period itself for more complex conceptual
instruction (McDonnell et al., 2012; Seery & Donnelly, 2012).
Pretraining Best Practice: Which Strategy to Use?
Now that the conditions for the use of pretraining have been reviewed in light of
the present study, the discussion turns to the factors that optimize the development and
effectiveness of pretraining resources. Although the topics explored here may be most
closely associated with one of the three approaches to pretraining, the principles and
practices often are applicable to any of the pretraining methods. Areas addressed include
general presentation, multimedia principles, social agency, gestalt principles, and type of
learning.
As this discussion was being developed, it became clear that the term “traditional
pretraining”—which referenced a replication of the two-phase, isolating-, interacting-
164
elements approach to pretraining (Pollock et al., 2002; Mayer, Mathias, et al., 2002)—is a
misnomer. The two-phase pretraining used in the present study was augmented in a
number of ways that differentiated it from standard pretraining as investigated in the
literature. For this reason, the non-concept map based pretraining used in this research
(and until now referred to as “traditional” pretraining) will be referred to as “enhanced”
pretraining throughout the remainder of chapter 5. Alternately, the two-phase pretraining
in existing identified studies will be characterized as “standard” pretraining.
No template for standard pretraining exists, and presentations vary according to
the information to be presented and the conceptual knowledge that will follow. Standard
pretraining is often composed of a basic black and white image and accompanying text
that is presented as hard copy (Clark et al., 2005; Lee, 2010; Mayer, Mathias, et al., 2002;
Pollock et al., 2002). Another frequent approach is to use pretraining to begin a self-
paced module within a computerized educational program that uses text or captions with
images or diagrams (Kester, Kirchner, et al., 2004a, 2004b, 2006; Kester, Lehnen, et al.,
2006). Duration of standard pretraining varies, and there are no specified time frames for
pretraining presentations, although relative brevity as compared to the lesson or lecture is
common. The ambiguity of pretraining duration makes it challenging to compare this
study with the existing research on the topic.
Although the body of literature about standard pretraining precipitated an
examination of general presentation factors, as noted above, the identified research did
little to delineate the specific factors that went into the development and creation of
pretraining presentations. Because limited information was available on the theory and
principles behind the construction of the standard presentations, further investigation was

165
not warranted. It should be noted that the available literature on standard pretraining does
not classify the presentations according to design or theoretical approach. Emphasis is
solely on the effectiveness of standard pretraining, which has solid support and is well
documented (Mayer & Pilegard, 2014).
In this section, the three types of pretraining used in this study will be revisited
with an emphasis on the connections between the results of this study and the existing
literature on pretraining and the use of concept maps. The goal of this examination is a
critical reflection on aspects of design and delivery that either augmented or hindered
pretraining within the context of each of the three approaches. The context for this
discussion will be limited to factors affecting pretraining use in a university healthcare
classroom, although generalization to other settings and topics may be appropriate. The
section on implications for practice, later in this chapter, will focus more directly on the
use of the various approaches to pretraining in the higher education occupational therapy
milieu. The theoretical and practical techniques used in developing the pretraining
modules are specified in Table 21, which also indicates whether the technique was
present and, if so, with what frequency in each of the four specific approaches to
pretraining. Factors affecting enhanced pretraining and animated concept map pretraining
are based solely on the findings from this study, as no other research has explored these
methods. Conversely, factors affecting standard pretraining and static concept map
pretraining are based on both the results from this study and the existing identified
literature.
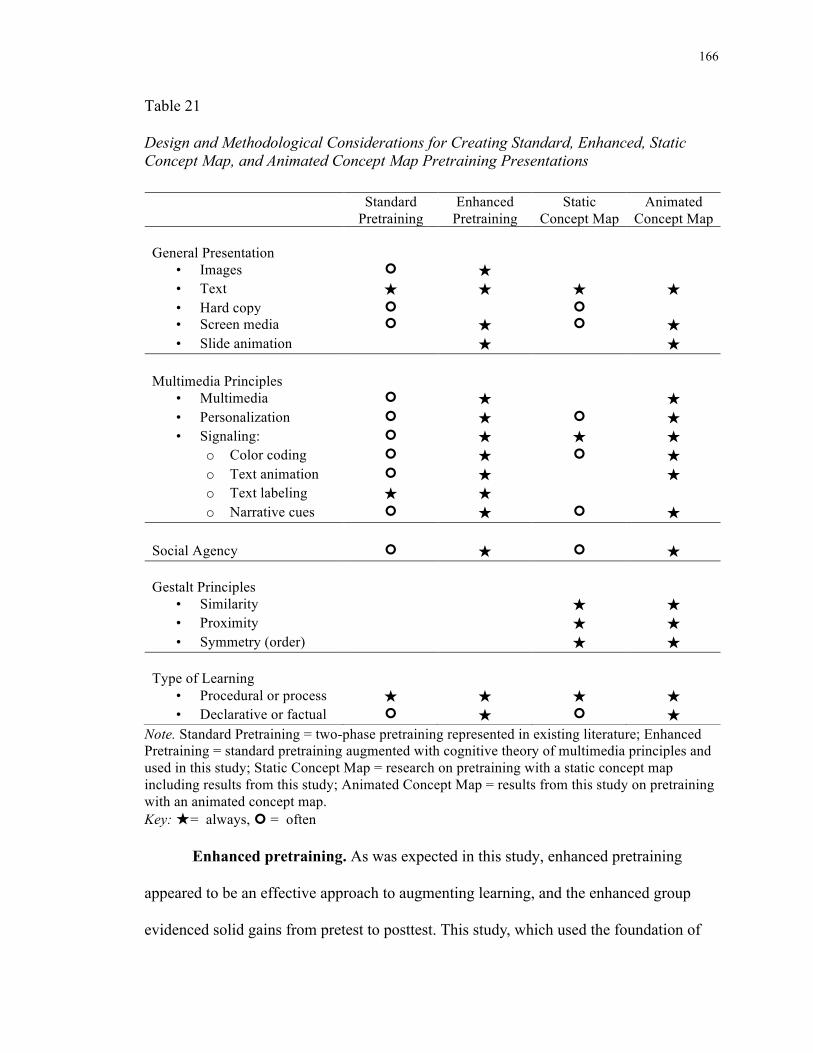
166
Table 21 Design and Methodological Considerations for Creating Standard, Enhanced, Static Concept Map, and Animated Concept Map Pretraining Presentations
Note. Standard Pretraining = two-phase pretraining represented in existing literature; Enhanced Pretraining = standard pretraining augmented with cognitive theory of multimedia principles and used in this study; Static Concept Map = research on pretraining with a static concept map including results from this study; Animated Concept Map = results from this study on pretraining with an animated concept map. Key: ★= always, ¢ = often
Enhanced pretraining. As was expected in this study, enhanced pretraining
appeared to be an effective approach to augmenting learning, and the enhanced group
evidenced solid gains from pretest to posttest. This study, which used the foundation of
Standard Pretraining
Enhanced Pretraining
Static Concept Map
Animated Concept Map
General Presentation
• Images ¢ ★ • Text ★ ★ ★ ★ • Hard copy ¢ ¢ • Screen media ¢ ★ ¢ ★ • Slide animation ★ ★
Multimedia Principles
• Multimedia ¢ ★ ★ • Personalization ¢ ★ ¢ ★ • Signaling: ¢ ★ ★ ★
o Color coding ¢ ★ ¢ ★ o Text animation ¢ ★ ★ o Text labeling ★ ★ o Narrative cues ¢ ★ ¢ ★
Social Agency ¢ ★ ¢ ★ Gestalt Principles
• Similarity ★ ★ • Proximity ★ ★ • Symmetry (order) ★ ★
Type of Learning
• Procedural or process ★ ★ ★ ★ • Declarative or factual ¢ ★ ¢ ★
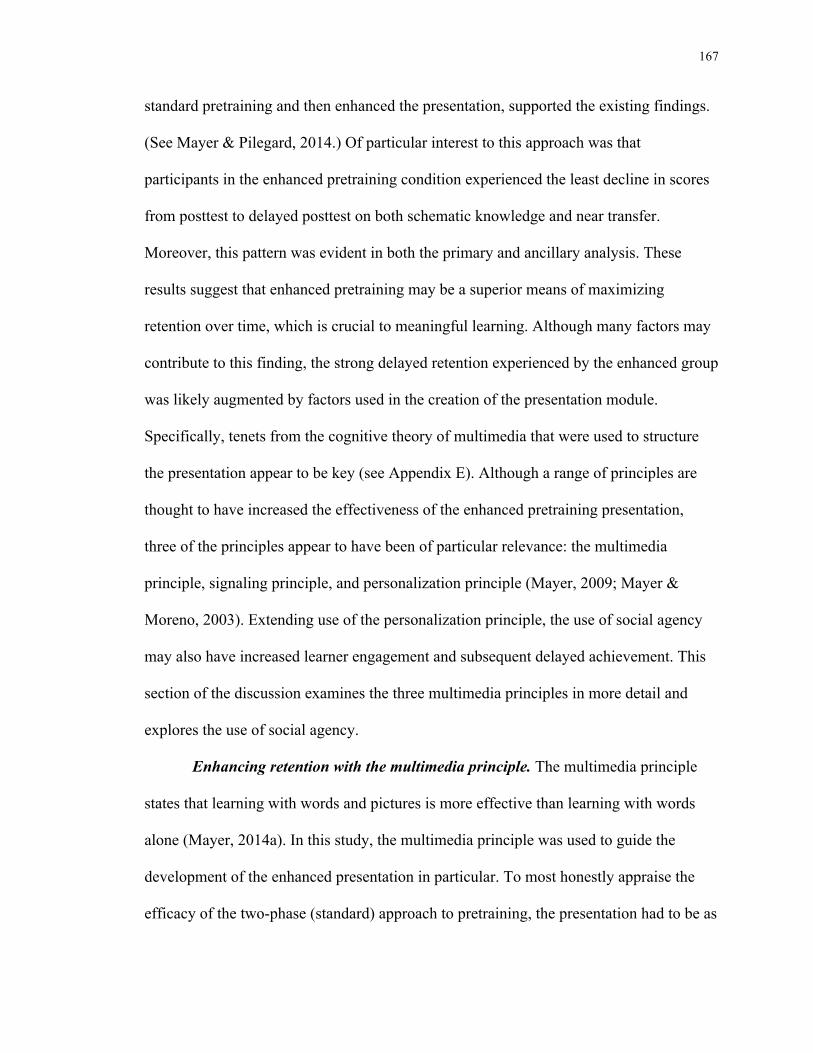
167
standard pretraining and then enhanced the presentation, supported the existing findings.
(See Mayer & Pilegard, 2014.) Of particular interest to this approach was that
participants in the enhanced pretraining condition experienced the least decline in scores
from posttest to delayed posttest on both schematic knowledge and near transfer.
Moreover, this pattern was evident in both the primary and ancillary analysis. These
results suggest that enhanced pretraining may be a superior means of maximizing
retention over time, which is crucial to meaningful learning. Although many factors may
contribute to this finding, the strong delayed retention experienced by the enhanced group
was likely augmented by factors used in the creation of the presentation module.
Specifically, tenets from the cognitive theory of multimedia that were used to structure
the presentation appear to be key (see Appendix E). Although a range of principles are
thought to have increased the effectiveness of the enhanced pretraining presentation,
three of the principles appear to have been of particular relevance: the multimedia
principle, signaling principle, and personalization principle (Mayer, 2009; Mayer &
Moreno, 2003). Extending use of the personalization principle, the use of social agency
may also have increased learner engagement and subsequent delayed achievement. This
section of the discussion examines the three multimedia principles in more detail and
explores the use of social agency.
Enhancing retention with the multimedia principle. The multimedia principle
states that learning with words and pictures is more effective than learning with words
alone (Mayer, 2014a). In this study, the multimedia principle was used to guide the
development of the enhanced presentation in particular. To most honestly appraise the
efficacy of the two-phase (standard) approach to pretraining, the presentation had to be as
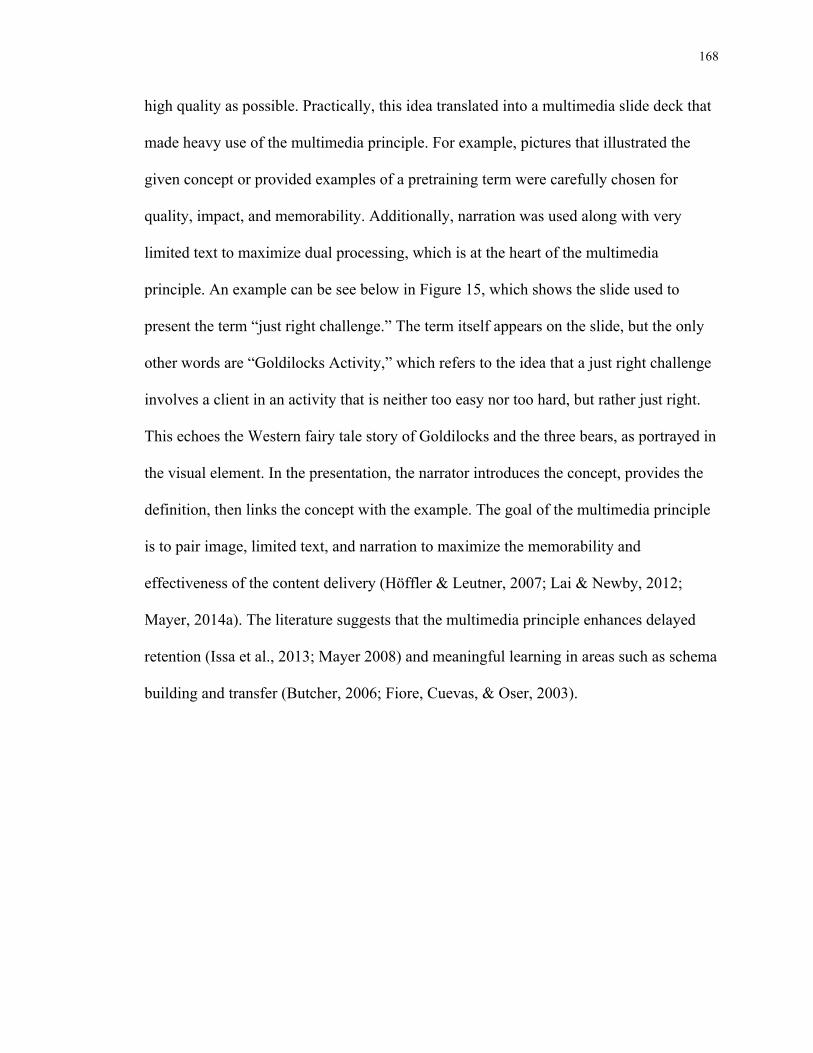
168
high quality as possible. Practically, this idea translated into a multimedia slide deck that
made heavy use of the multimedia principle. For example, pictures that illustrated the
given concept or provided examples of a pretraining term were carefully chosen for
quality, impact, and memorability. Additionally, narration was used along with very
limited text to maximize dual processing, which is at the heart of the multimedia
principle. An example can be see below in Figure 15, which shows the slide used to
present the term “just right challenge.” The term itself appears on the slide, but the only
other words are “Goldilocks Activity,” which refers to the idea that a just right challenge
involves a client in an activity that is neither too easy nor too hard, but rather just right.
This echoes the Western fairy tale story of Goldilocks and the three bears, as portrayed in
the visual element. In the presentation, the narrator introduces the concept, provides the
definition, then links the concept with the example. The goal of the multimedia principle
is to pair image, limited text, and narration to maximize the memorability and
effectiveness of the content delivery (Höffler & Leutner, 2007; Lai & Newby, 2012;
Mayer, 2014a). The literature suggests that the multimedia principle enhances delayed
retention (Issa et al., 2013; Mayer 2008) and meaningful learning in areas such as schema
building and transfer (Butcher, 2006; Fiore, Cuevas, & Oser, 2003).
169
Figure 15. Sample slide illustrating the multimedia principle.
Emphasizing relevant information with the signaling principle. In addition to
the use of the multimedia principle, the signaling principle—also referred to as the cueing
principle—was emphasized in the enhanced pretraining condition. Signaling was also
used in both concept map conditions, as will be illustrated later in this discussion. The
signaling principle specifies that learning is more effective when the learner’s attention is
guided to the most salient features of the material and the organization of the material is
emphasized. When provided with visual, text, and auditory signals or cues, the learner
experiences increased understanding (Van Gog, 2014). Signaling is believed to help
learners select, organize, and integrate information by using as efficient a cognitive
process as possible and minimizing attention to extraneous features of the presentation.
The principle is especially relevant to learners with low prior knowledge, a population
that otherwise may tend to focus on the most novel or visually engaging aspects of the
material rather than attending to the most salient features (Lowe, 2003). When low priors
process less relevant information, it induces extraneous cognitive load that can hinder
learning (Sweller et al., 2011). To combat these pitfalls and augment effective learning,
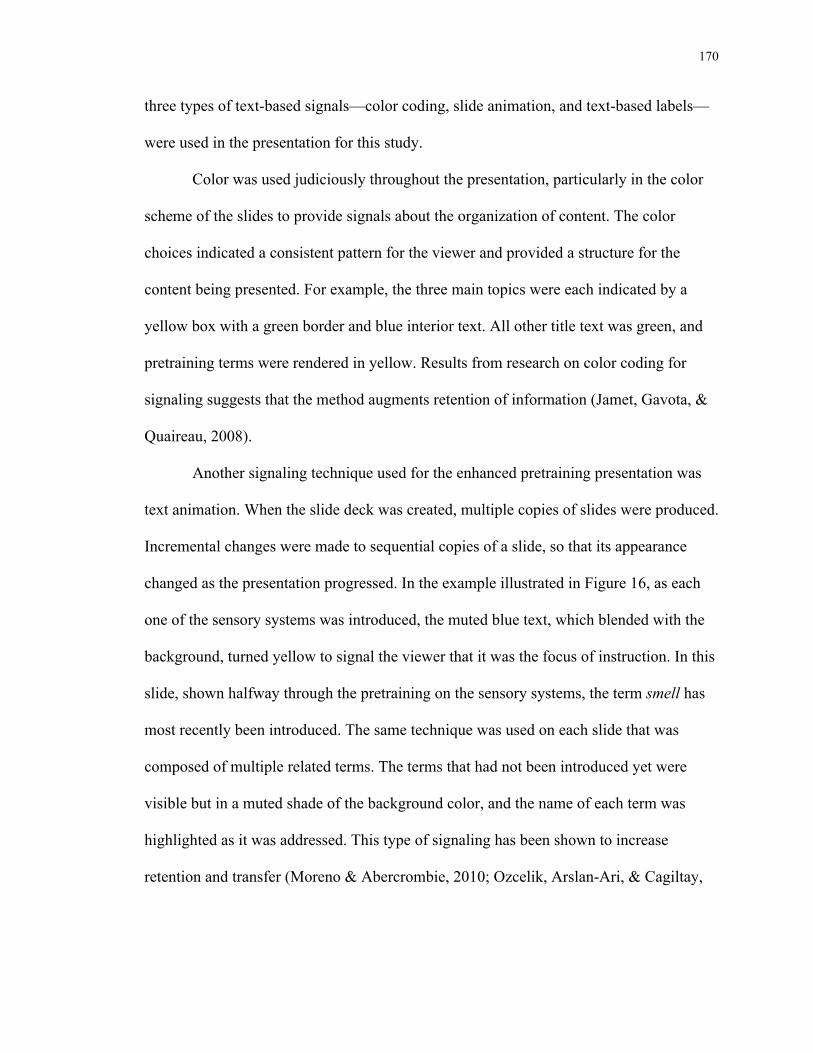
170
three types of text-based signals—color coding, slide animation, and text-based labels—
were used in the presentation for this study.
Color was used judiciously throughout the presentation, particularly in the color
scheme of the slides to provide signals about the organization of content. The color
choices indicated a consistent pattern for the viewer and provided a structure for the
content being presented. For example, the three main topics were each indicated by a
yellow box with a green border and blue interior text. All other title text was green, and
pretraining terms were rendered in yellow. Results from research on color coding for
signaling suggests that the method augments retention of information (Jamet, Gavota, &
Quaireau, 2008).
Another signaling technique used for the enhanced pretraining presentation was
text animation. When the slide deck was created, multiple copies of slides were produced.
Incremental changes were made to sequential copies of a slide, so that its appearance
changed as the presentation progressed. In the example illustrated in Figure 16, as each
one of the sensory systems was introduced, the muted blue text, which blended with the
background, turned yellow to signal the viewer that it was the focus of instruction. In this
slide, shown halfway through the pretraining on the sensory systems, the term smell has
most recently been introduced. The same technique was used on each slide that was
composed of multiple related terms. The terms that had not been introduced yet were
visible but in a muted shade of the background color, and the name of each term was
highlighted as it was addressed. This type of signaling has been shown to increase
retention and transfer (Moreno & Abercrombie, 2010; Ozcelik, Arslan-Ari, & Cagiltay,
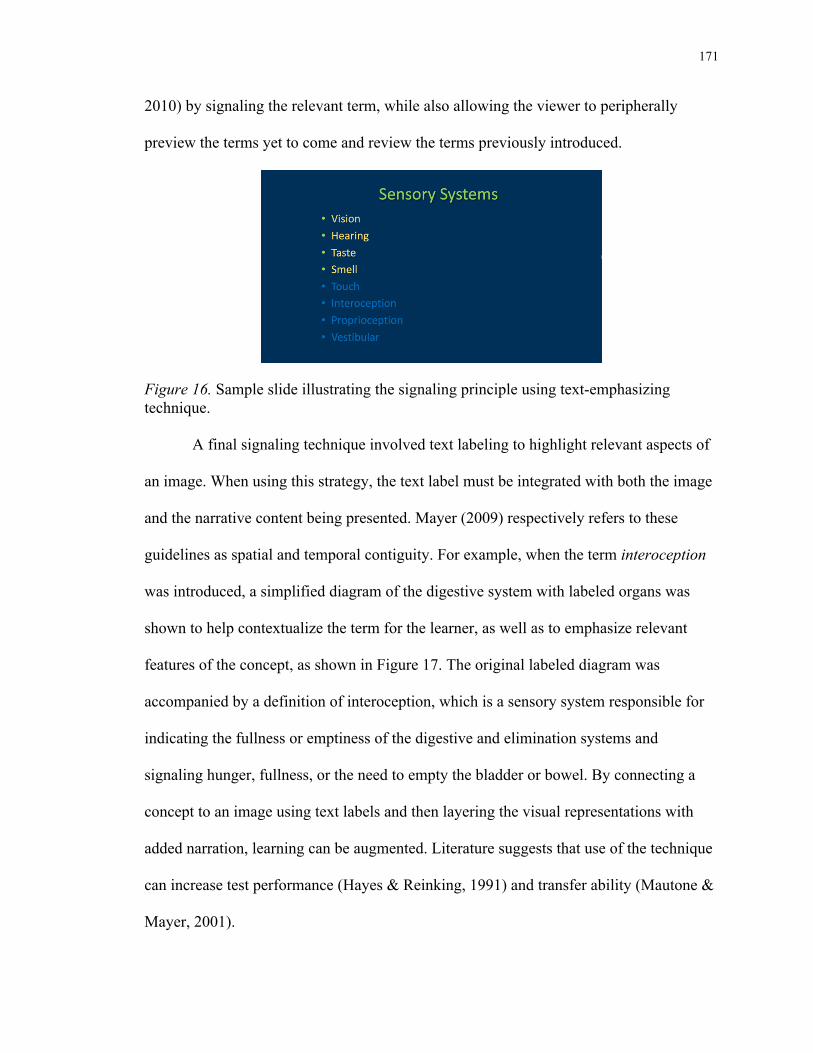
171
2010) by signaling the relevant term, while also allowing the viewer to peripherally
preview the terms yet to come and review the terms previously introduced.
Figure 16. Sample slide illustrating the signaling principle using text-emphasizing technique.
A final signaling technique involved text labeling to highlight relevant aspects of
an image. When using this strategy, the text label must be integrated with both the image
and the narrative content being presented. Mayer (2009) respectively refers to these
guidelines as spatial and temporal contiguity. For example, when the term interoception
was introduced, a simplified diagram of the digestive system with labeled organs was
shown to help contextualize the term for the learner, as well as to emphasize relevant
features of the concept, as shown in Figure 17. The original labeled diagram was
accompanied by a definition of interoception, which is a sensory system responsible for
indicating the fullness or emptiness of the digestive and elimination systems and
signaling hunger, fullness, or the need to empty the bladder or bowel. By connecting a
concept to an image using text labels and then layering the visual representations with
added narration, learning can be augmented. Literature suggests that use of the technique
can increase test performance (Hayes & Reinking, 1991) and transfer ability (Mautone &
Mayer, 2001).
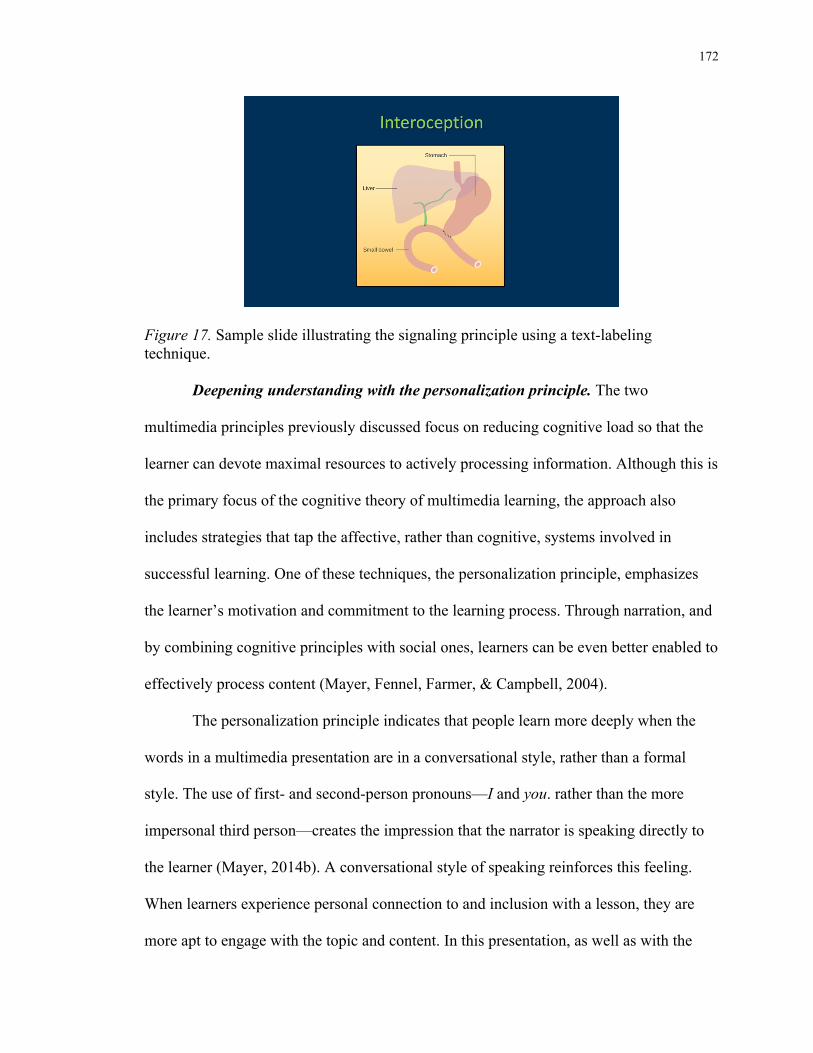
172
Figure 17. Sample slide illustrating the signaling principle using a text-labeling technique.
Deepening understanding with the personalization principle. The two
multimedia principles previously discussed focus on reducing cognitive load so that the
learner can devote maximal resources to actively processing information. Although this is
the primary focus of the cognitive theory of multimedia learning, the approach also
includes strategies that tap the affective, rather than cognitive, systems involved in
successful learning. One of these techniques, the personalization principle, emphasizes
the learner’s motivation and commitment to the learning process. Through narration, and
by combining cognitive principles with social ones, learners can be even better enabled to
effectively process content (Mayer, Fennel, Farmer, & Campbell, 2004).
The personalization principle indicates that people learn more deeply when the
words in a multimedia presentation are in a conversational style, rather than a formal
style. The use of first- and second-person pronouns—I and you. rather than the more
impersonal third person—creates the impression that the narrator is speaking directly to
the learner (Mayer, 2014b). A conversational style of speaking reinforces this feeling.
When learners experience personal connection to and inclusion with a lesson, they are
more apt to engage with the topic and content. In this presentation, as well as with the
173
two concept map presentations, the use of familiar rather than formal language was
emphasized, both to lessen the daunting amount of pretraining content being introduced
and to socially partner with the participants. It should be noted that the goal in
personalizing the narration is to enhance the conversational style without altering the
content. The personalization principle using informal language suggests strong support
for the technique (Kartal, 2010; Moreno & Mayer, 2004; Mayer et al., 2004; McLaren,
DeLeeuw, & Mayer, 2011a, 2011b).
The personalization principle is reported to work best with students who have low
prior knowledge or lack expertise in a subject area, and in shorter lessons of 35 minutes
or less (McLaren et al., 2011a, 2011b; Ginns, Martin & Marsh, 2013). By using learners
with low prior knowledge and limiting presentations to 15 minutes, this study supported
and extended the use of the personalization principle. The strategy of social engagement
combined with active cognitive processing likely contributed to the strong delayed
retention results evidenced in this study, and in other studies the use of personalization
has improved delayed retention (Wang & Crooks, 2015).
Extending the personalization principle with social agency. While the
multimedia and signaling principles were used to structure the presentation and make it
as effective as possible, and the personalization principle encouraged learner ease,
engaging and motivating the learner was further augmented through social agency. This
concept refers to “the idea that social cues in multimedia instructional messages can
prime a social response in learners … that lead to deeper cognitive processing and better
learning outcomes” (Mayer, 2014b, p. 348). Researchers theorize that attending to
emotional and social context when designing multimedia learning presentations leads to
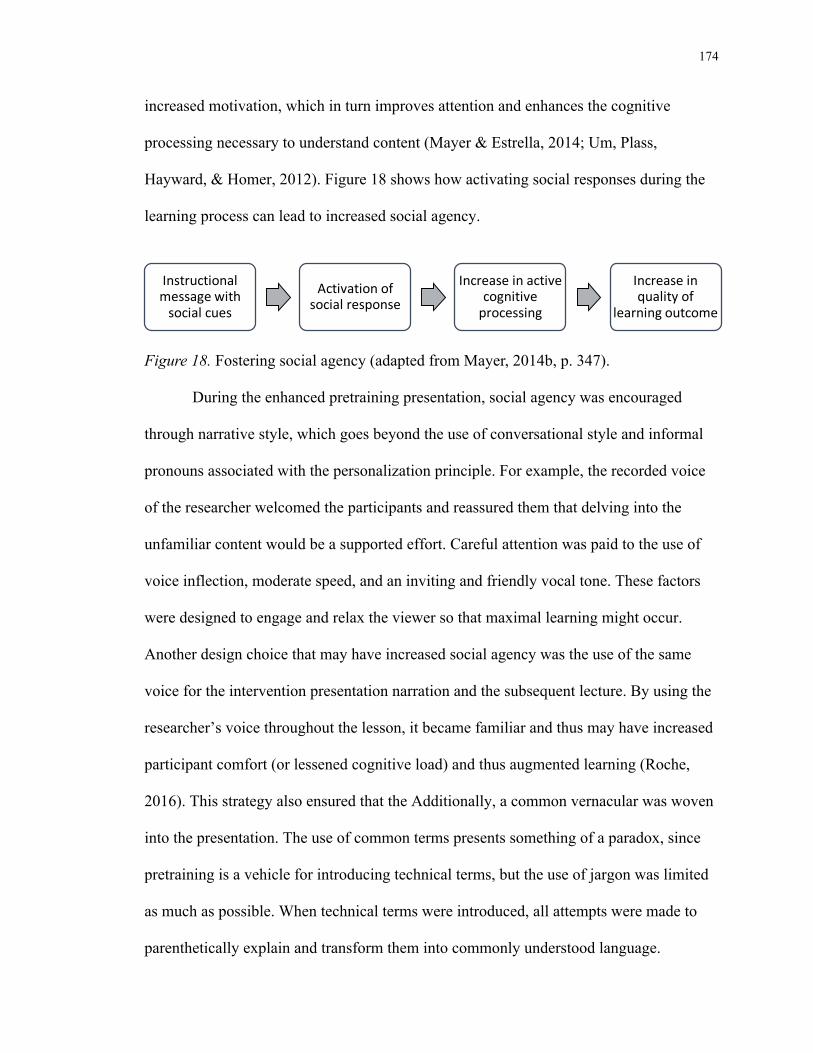
174
increased motivation, which in turn improves attention and enhances the cognitive
processing necessary to understand content (Mayer & Estrella, 2014; Um, Plass,
Hayward, & Homer, 2012). Figure 18 shows how activating social responses during the
learning process can lead to increased social agency.
Figure 18. Fostering social agency (adapted from Mayer, 2014b, p. 347).
During the enhanced pretraining presentation, social agency was encouraged
through narrative style, which goes beyond the use of conversational style and informal
pronouns associated with the personalization principle. For example, the recorded voice
of the researcher welcomed the participants and reassured them that delving into the
unfamiliar content would be a supported effort. Careful attention was paid to the use of
voice inflection, moderate speed, and an inviting and friendly vocal tone. These factors
were designed to engage and relax the viewer so that maximal learning might occur.
Another design choice that may have increased social agency was the use of the same
voice for the intervention presentation narration and the subsequent lecture. By using the
researcher’s voice throughout the lesson, it became familiar and thus may have increased
participant comfort (or lessened cognitive load) and thus augmented learning (Roche,
2016). This strategy also ensured that the Additionally, a common vernacular was woven
into the presentation. The use of common terms presents something of a paradox, since
pretraining is a vehicle for introducing technical terms, but the use of jargon was limited
as much as possible. When technical terms were introduced, all attempts were made to
parenthetically explain and transform them into commonly understood language.
Instructional message with social cues
Activation of social response
Increase in active cognitive processing
Increase in quality of
learning outcome
175
Engaged scenarios were provided as well. For example, when the term self-regulation
was introduced, it was accompanied by an anecdote of having a bug crawl across your
foot at a picnic, which illustrated the concept and provided social cues attached to shared
human sensory experiences. To create equivalent presentations, the same techniques were
replicated in the two concept map pretraining conditions. By using the personalization
principle and attending to social agency, this study expands the body of research on
pretraining into new arenas.
It should be noted that few of the existing studies on pretraining made use of
narration during the presentation. Most studies used text and diagrams (Kester, Kirschner,
& Van Merriënboer, 2004a, 2004b; Mayer, Mathias, et al., 2002; Pollock et al., 2002)
without audio or narration. Only one of the identified existing studies used narration
along with the visuals—to scaffold pictorial pretraining in learning about geological
features (Mayer, Mautone, et al., 2002). The authors of that study did not note the details
of creating the narration, and results from research indicated that the use of images, rather
than the narrative modeling, provided the most assistance. The present study differs from
the Mayer, Mautone, et al. study in two respects: (1) the learning task was not spatial in
nature, and (2) the pretraining was used for a declarative purpose (vocabulary building)
rather than a procedural one (playing a geology simulation game). While not the purpose
of the present study, the inclusion of social cues and strategies may have increased
participant engagement and thus learning outcomes in the enhanced pretraining group.
Summary of enhanced pretraining. The enhanced pretraining approach worked
well for participants, and gains were particularly strong in the period from posttest to
delayed posttest. An investigation into the factors that contributed to the delayed
176
retention results suggest that use of multimedia principles, including signaling and
personalization, can augment meaningful learning and thus retention. Also, the use of
social agency may deepen the effect of the multimedia principles by enticing the learner
into engaging with the presentation, which promotes attention and increases motivation to
learn. Enhanced pretraining is a sound pretraining strategy, especially when the
presentation adheres to the cognitive theory of multimedia learning principles and
accounts for the potential power of social agency.
Pretraining with static concept maps. The participants exposed to pretraining
with a static concept map had the strongest gains in the study. In both the primary data
analysis and the ancillary analysis of the data for the subsample of low prior matched
trios, the static concept map group outperformed the other two groups and demonstrated
the greatest gains in schematic knowledge. Even taking into account that this group
showed the greatest decline from posttest to delayed posttest, it maintained achievement
levels commensurate with the other two treatment groups. Additionally, the static concept
map group had a strong showing in the area of near transfer, and gains were on par with
the other two groups. These findings were surprising since they contrasted with the
literature available at the time of the data collection. Research into the use of static and
animated concept maps largely supported the use of animated concept maps (Blankenship
& Dansereau, 2000), and two meta-analyses on the use of visual models and concept
maps upheld this view (Höffler & Leutner, 2007; Nesbit & Adesope, 2006). These meta-
analyses included only two studies on animated concept maps, indicating that the
findings should be interpreted with caution. Interestingly, and in keeping with the
findings of this study, a meta-analysis on the use of concept maps published in 2017
177
differed from earlier research and found that animated concept maps had no advantage
over static concept maps (Schroeder et al., 2017). Twenty-four animated concept map
studies were included in this later study.
The primary drawback of static concept maps is a phenomenon known as map
shock, characterized by a feeling of being overwhelmed by the scale and complexity of a
map display (Blankenship & Dansereau, 2000; Dansereau et al., 1994; Nesbit &
Adesope, 2006). Map shock occurs in part because there is no pre-determined order for
viewing and processing the concept map. Depending on the structure of the map and the
number of nodes and links, this can mean a huge number of alternative processing routes
(Lambiotte et al., 1993; Nesbit & Adesope, 2013). In other words, static concept maps
lack the road map for processing that viewers have with text or animated concept maps.
According to Blankenship and Dansereau, this lack of direction can “produce an affective
reaction that results in a lack of motivation to process the map” (p. 295). The cognitive
perplexity, when paired with the emotional response of map shock, leads to suboptimal
cognitive processing of the map elements and their relationships to each other—and thus
hinders learning.
Despite the identified disadvantage of map shock, the pretraining with a static
concept map group out-performed the other groups. Investigation suggested that a
primary reason might be the painstaking design of the map, which gave consideration to
concept map construction guidelines (Table 3) and multimedia principles (see Appendix
E). Additional examination revealed research suggesting that the effectiveness of static
concept maps is increased when gestalt principles are used in the map design
(Blankenship & Dansereau, 2000; Nesbit & Adesope, 2011; Wallace et al., 1998). These
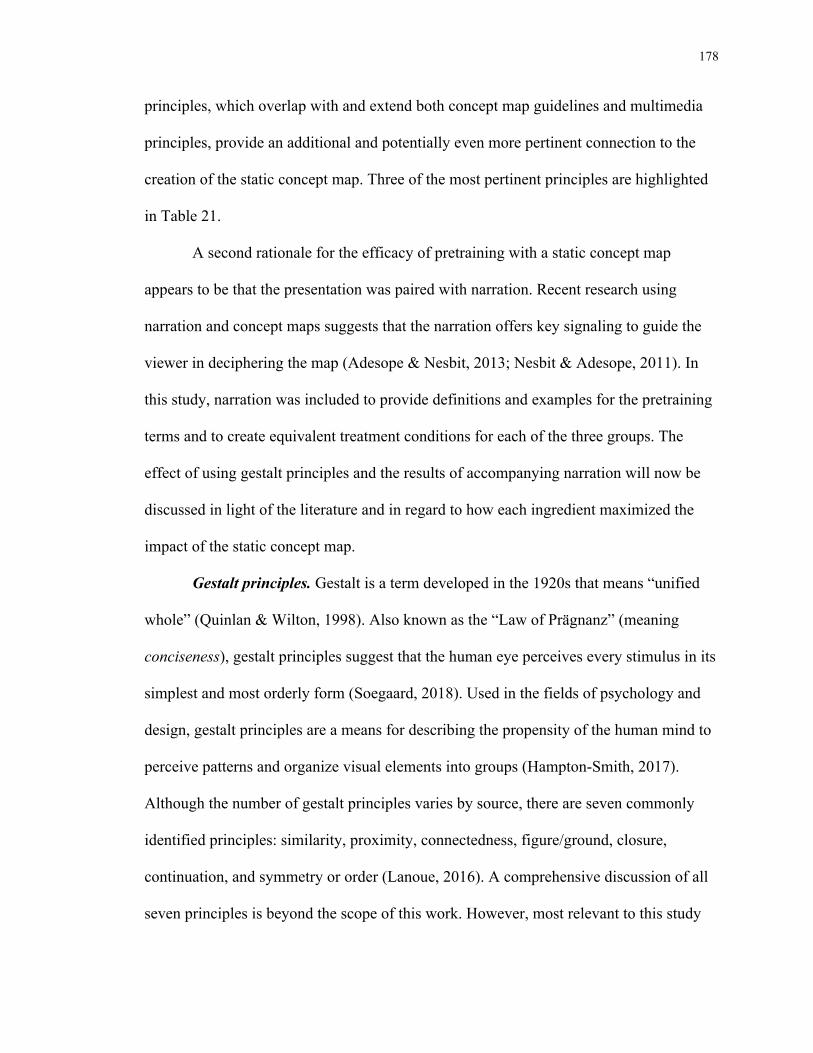
178
principles, which overlap with and extend both concept map guidelines and multimedia
principles, provide an additional and potentially even more pertinent connection to the
creation of the static concept map. Three of the most pertinent principles are highlighted
in Table 21.
A second rationale for the efficacy of pretraining with a static concept map
appears to be that the presentation was paired with narration. Recent research using
narration and concept maps suggests that the narration offers key signaling to guide the
viewer in deciphering the map (Adesope & Nesbit, 2013; Nesbit & Adesope, 2011). In
this study, narration was included to provide definitions and examples for the pretraining
terms and to create equivalent treatment conditions for each of the three groups. The
effect of using gestalt principles and the results of accompanying narration will now be
discussed in light of the literature and in regard to how each ingredient maximized the
impact of the static concept map.
Gestalt principles. Gestalt is a term developed in the 1920s that means “unified
whole” (Quinlan & Wilton, 1998). Also known as the “Law of Prägnanz” (meaning
conciseness), gestalt principles suggest that the human eye perceives every stimulus in its
simplest and most orderly form (Soegaard, 2018). Used in the fields of psychology and
design, gestalt principles are a means for describing the propensity of the human mind to
perceive patterns and organize visual elements into groups (Hampton-Smith, 2017).
Although the number of gestalt principles varies by source, there are seven commonly
identified principles: similarity, proximity, connectedness, figure/ground, closure,
continuation, and symmetry or order (Lanoue, 2016). A comprehensive discussion of all
seven principles is beyond the scope of this work. However, most relevant to this study
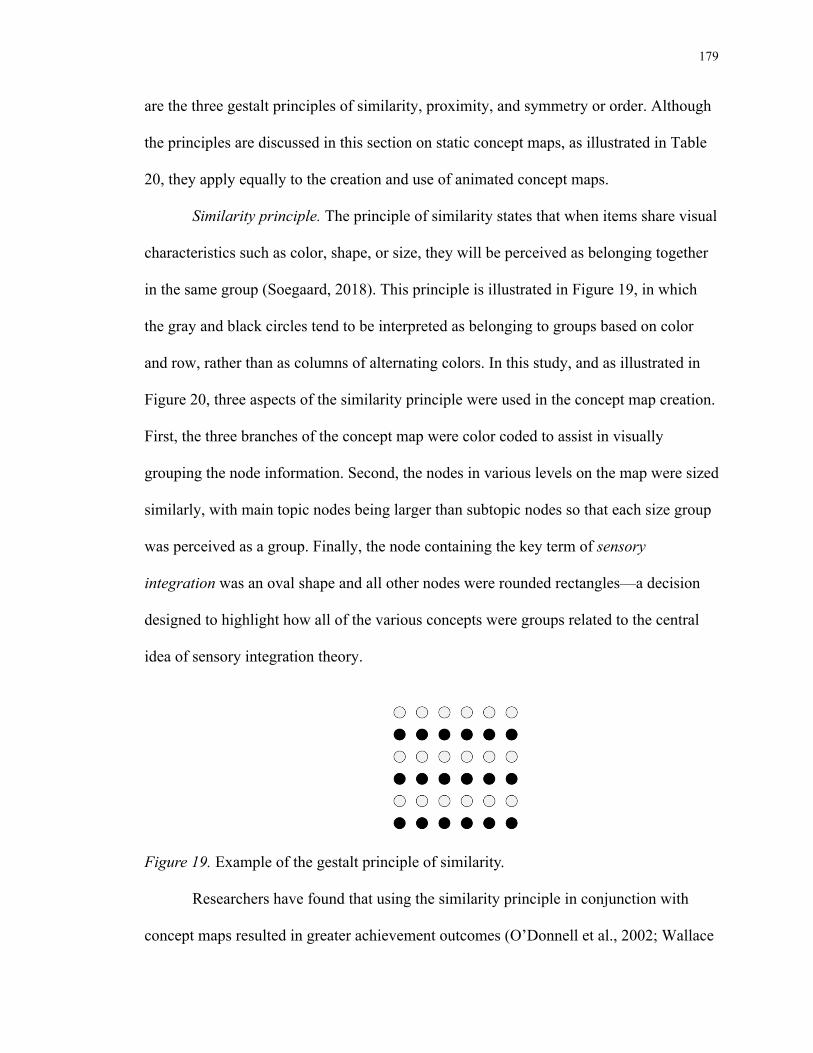
179
are the three gestalt principles of similarity, proximity, and symmetry or order. Although
the principles are discussed in this section on static concept maps, as illustrated in Table
20, they apply equally to the creation and use of animated concept maps.
Similarity principle. The principle of similarity states that when items share visual
characteristics such as color, shape, or size, they will be perceived as belonging together
in the same group (Soegaard, 2018). This principle is illustrated in Figure 19, in which
the gray and black circles tend to be interpreted as belonging to groups based on color
and row, rather than as columns of alternating colors. In this study, and as illustrated in
Figure 20, three aspects of the similarity principle were used in the concept map creation.
First, the three branches of the concept map were color coded to assist in visually
grouping the node information. Second, the nodes in various levels on the map were sized
similarly, with main topic nodes being larger than subtopic nodes so that each size group
was perceived as a group. Finally, the node containing the key term of sensory
integration was an oval shape and all other nodes were rounded rectangles—a decision
designed to highlight how all of the various concepts were groups related to the central
idea of sensory integration theory.
Figure 19. Example of the gestalt principle of similarity.
Researchers have found that using the similarity principle in conjunction with
concept maps resulted in greater achievement outcomes (O’Donnell et al., 2002; Wallace
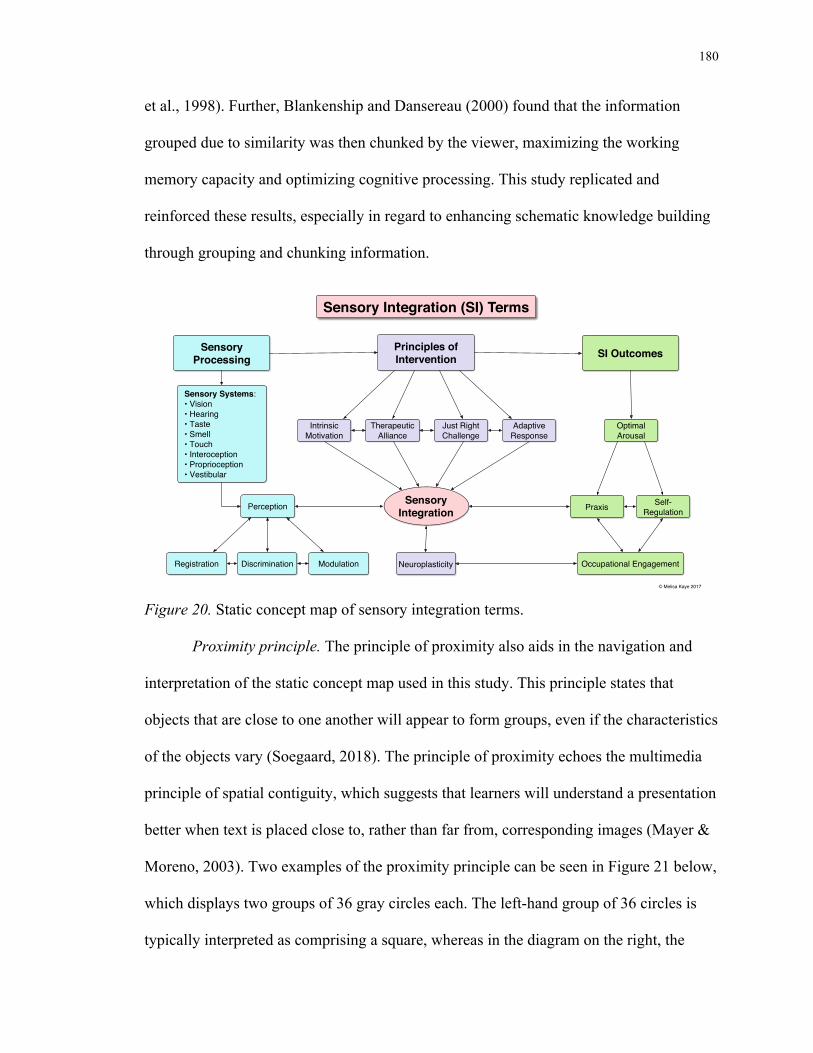
180
et al., 1998). Further, Blankenship and Dansereau (2000) found that the information
grouped due to similarity was then chunked by the viewer, maximizing the working
memory capacity and optimizing cognitive processing. This study replicated and
reinforced these results, especially in regard to enhancing schematic knowledge building
through grouping and chunking information.
Figure 20. Static concept map of sensory integration terms.
Proximity principle. The principle of proximity also aids in the navigation and
interpretation of the static concept map used in this study. This principle states that
objects that are close to one another will appear to form groups, even if the characteristics
of the objects vary (Soegaard, 2018). The principle of proximity echoes the multimedia
principle of spatial contiguity, which suggests that learners will understand a presentation
better when text is placed close to, rather than far from, corresponding images (Mayer &
Moreno, 2003). Two examples of the proximity principle can be seen in Figure 21 below,
which displays two groups of 36 gray circles each. The left-hand group of 36 circles is
typically interpreted as comprising a square, whereas in the diagram on the right, the
Sensory Integration
Sensory Processing
Principles of Intervention
Intrinsic Motivation
Therapeutic Alliance
Just Right Challenge
Adaptive Response
SI Outcomes
Praxis Self-Regulation
Optimal Arousal
Registration ModulationDiscrimination Occupational Engagement
Sensory Integration (SI) Terms
© Melisa Kaye 2017
Perception
Neuroplasticity
Sensory Systems:• Vision• Hearing• Taste• Smell• Touch• Interoception• Proprioception• Vestibular
181
spatial proximity of the circles leads the viewer to see three vertical rectangles made up
of twelve circles each. The concept map used in this study made use of the proximity
principle by locating related concepts close together, so that they would be interpreted as
belonging to a single group. In the case of hierarchically related items, spatial proximity
was achieved by situating the nodes in vertical alignment with each other. Finally, the
eight senses were to be seen as aspects of a category called “sensory systems,” so these
terms were housed in a single node to reinforce the importance of their proximity and the
need to understand them as parts of a whole.
Figure 21. Examples of the gestalt principle of proximity.
Wallace, West, Ware, and Dansereau (1998) studied the usefulness of concept
maps by investigating the effect of the two gestalt principles of similarity and proximity
in conjunction with each other. These researchers found that when they manipulated the
spatial arrangement, node shape, and color scheme of a concept map, participants
retained more information from the gestalt-enhanced concept maps than from concept
maps that were not enhanced. Likewise, the group in the gestalt-enhanced map condition
in the Wallace et al. (1998) study continued, after a two-week delay, to show superior
recall to the unenhanced map condition and the text-only condition. The researchers
credited their use of the similarity and proximity principles with helping learners interpret
the maps, chunk information for better schema acquisition, and lower the cognitive
demands placed on working memory.
182
Symmetry principle. The gestalt principle of symmetry or order indicates that an
object or image will be more effectively attended to when the viewer has an impression
of visual balance (Soegaard, 2018). In some instances, balance is achieved through a
symmetrical presentation, and in other cases, an organized and structured pattern
provides a sense of balance (Busche, 2018). Figure 22 illustrates in a general way how
the symmetry of shapes that comprise a circle impress a sense of balance on the viewer.
Figure 22. Example of the gestalt principle of symmetry or order.
In this study, design decisions were made to favor a balanced map that was
symmetrically arranged around the title term and the central concept of sensory
integration. Additionally, the map was ordered in a hierarchical fashion with the
overarching and most global topics at the top and more detailed subtopics subsumed
beneath these main topics. Concept map researchers (Blankenship & Dansereau, 2000;
Wiegmann, Dansereau, McCagg, Rewey, & Pitre, 1992) indicate that symmetry and
coherence of design are key factors in the level of effectiveness of concept maps. The
hierarchical structure of this study’s concept map is illustrated in Figure 16; although the
map is not entirely symmetrical, it is balanced and orderly. These factors have been found
to be a superior method for organizing complex content in a concept map (Novak &
Canas, 2008).
183
When incorporated into concept maps, the three gestalt principles of similarity,
proximity, and symmetry or order cue the viewer to the relevant facets of the map and
thereby reduce map shock. The literature supports these observations and suggests that
the similarity principle, in particular, can stimulate the visual working memory system so
that its limited capacity is maximized (Peterson & Berryhill, 2013). Other researchers
have found that combining the principles of similarity and proximity results in even
greater benefit for learner achievement (Kubovy & van den Berg, 2008). With regard to
the principle of symmetry, existing studies confirm that visual processing is more
efficient when it involves symmetrical images (Baylis & Driver, 2001). The use of gestalt
principles, combined with the aforementioned concept map guidelines and multimedia
principles, offers an effective structure for the design and creation of static concept maps
that significantly reduce the impact of map shock.
Narration for signaling. In addition to the use of gestalt principles, narrating the
static concept map pretraining presentation assuredly added to the effectiveness of the
resource, and the same holds true for the animated concept map condition. The study
design included creating a video for each of the three conditions. In an effort to provide
presentations that were equivalent in quality and composition, each video included
images and narration. The audio was used to define terms and expand on the limited text
included in the presentations. In the static map condition, narration also provided a verbal
roadmap through the concepts, including navigational phrases such as, “If you look to the
top left corner in blue, you will see the information related to sensory processing.” The
restriction of text and inclusion of audio narration was in keeping with the multimedia
modality principle, which suggests that transfer of learning is better when words are
184
presented as narration rather than as text (Mayer & Moreno, 2003). The design decision
to include narration also made use of dual coding theory to maximize the capacity of
working memory through simultaneous visual and auditory processing (Paivio, 1986,
2008). Narrative scripts of the presentations, which can be reviewed in Appendix J, were
as similar to one another as possible.
Narration very likely neutralized any map shock that would have resulted from a
participant navigating the map without assistance. Additionally, since the narration was
used with both the static and animated maps, it minimized any differences that may have
been found between the two techniques. The narrative factor present in this study is also
evidenced in existing literature, and other researchers have found similar results in regard
to adding narration to static and animated concept maps. Recommendations for future
research include finding ways to isolate the animated and static map approaches from the
addition of narration without sacrificing learning (Adesope & Nesbit, 2013; Nesbit &
Adesope, 2011).
Summary of static concept maps. In all three existing studies on pretraining with
concept maps, static maps were found to be effective (Cutrer et al., 2011; Zheng et al.,
2012; Willerman & MacHarg, 1991), and this study replicated those findings. The use of
gestalt principles and narration are two key factors hypothesized to maximize the
effectiveness of static concept maps by reducing map shock. Because of their structure,
concept maps are powerful tools for fostering both retention and delayed retention
(Chmeilewski, Moreland, & Dansereau, 1997). Concept maps have also been found to
have particular benefit for learners with low prior knowledge, because the structural
presentation—the most salient features of a topic, the relationships between topics, and
185
the hierarchy of topics—allows learners to minimize extraneous processing (Amadieu et
al., 2009; O’Donnell et al., 2002; Schroeder et al., 2017). In combination, all of these
factors likely contributed to the effectiveness of the static concept map in encouraging
strong achievement outcomes.
Pretraining with animated concept maps. Now that pretraining with a static
concept map and enhanced pretraining have been explored, this discussion turns to the
use of animated concept maps for pretraining. At the outset of the study, the animated
concept map group was predicted to outperform the other two groups, but that did not
prove to be the case. From pretest to posttest, the animated concept map group
experienced solid gains, but so did the other two pretraining groups. In primary and
ancillary analyses, the animated concept map group demonstrated gains on measures of
schematic knowledge similar to those of the enhanced group—but their subsequent
decline was greater. In the area of transfer, the enhanced and animated groups were quite
similar in the primary analysis, but the animated group had weaker scores and more
decline than the enhanced group in the ancillary analysis. In this section, factors affecting
pretraining with animated concept maps are considered.
As noted earlier in this discussion, support for the use of animated concept maps
over static concept maps is mixed (Blankenship & Dansereau, 2000; Lewalter, 2003). An
older and seminal meta-analysis indicates that animated maps are superior to static maps
(Nesbit & Adesope, 2006), yet a newer meta-analysis asserts that there is no difference in
findings between the two types of map (Schroeder et al., 2017). Early research on
concept maps included only two animated (vs. 32 static) concept map studies, whereas
the newer study included 24 animated (vs. 105 static) map studies, suggesting that the
186
newer study provides a more reliable set of findings. In finding that the animated concept
map group was not superior to the other two groups, this study supported Schroeder et
al.’s (2017) results.
Practically speaking, there is no particular motivation for using this strategy.
Creating an animated concept map requires considerable time and energy, which may not
be a wise use of educator resources. In this study, creating an animated concept map for
pretraining was a lengthy, difficult, and painstaking process. The map went through
multiple iterations and the animation slides needed to be re-created and re-indexed
several times; every time the content changed even slightly, the process had to start anew
so that the progression of map images was consistent. Then the slide deck had to be
screencast and converted to video. All in all, the process might have been worthwhile if it
had resulted in a clearly superior resource. Given the unremarkable results, however, it
was not worth the effort.
Three factors may have influenced the effectiveness of the pretraining with an
animated concept map. First, the visual and narrative signaling present in the static
concept map condition may have neutralized the impact of the animated map. Second,
animation may be more effective with procedural information rather than declarative
content. Finally, the extra cognitive processing associated with reading static concept
maps might manifest in a different way in animated presentations, but the toll on the
learner remains.
The use of signaling. Similar to the signaling used with the enhanced pretraining
group and the pretraining with a static concept map group (contextualized by the gestalt
principles), the animated concept map design also focused heavily on cueing the viewer
187
to relevant aspects of the presentation. In fact, the animated concept map presentation
combined use of all strategies from the static concept map condition. In addition,
however, the animation provided a way to present and emphasize each branch, section,
and concept of the map in a sequential manner. Using a set of over 40 slides, the map was
revealed over the course of the pretraining video. The structure of the presentation was
such that as the narrator introduced each new term, that topical node was highlighted on
the map. Terms not yet introduced were indicated by a muted outline similar to the
background slide color and had no text. Terms that had been covered but were no longer
being discussed had text in them, but both the text and the node outline were muted. In
this way, and accompanied by narration, the map signaled the viewer to each new term
over time. Appendix I shows a sample of stills from the animated concept map
presentation.
This method of presenting animated concept maps has been found to significantly
increase what can be learned from narration or lecture alone (Adesope & Nesbit, 2013;
Nesbit & Adesope, 2013). As animated maps are designed to lead the viewer through the
map, they also provide a solid strategy for avoiding map shock (Nesbit & Adesope, 2011;
Schroeder et al., 2017). The techniques used in this study are supported by the literature
on animated concept map construction and use (Nesbit & Adesope, 2006, 2013). It stands
to reason, therefore, that the signaling strategies used in this study optimized narrative
content and minimized map shock as much as possible, given the positive results. This
finding supports the existing literature on the use of animated concept maps, yet does not
account for their suboptimal performance as compared to the enhanced and static concept
map pretraining groups.
188
Types of information that are best suited to animation. Given that signaling
through visual and narrative cues clearly augmented pretraining with an animated
concept map, the discussion now turns to more specific uses for which animated concept
maps are best suited. The goal of this investigation to ascertain whether animated concept
maps are best suited for a particular type of learning. A study by Robinson and Keiwra
(1995) on the use of graphic organizers found that the basic structure of the concept map
(animated or static) is best suited to learning about hierarchical relations, coordinate
relations, transfer of learning, and integrating knowledge. Factual learning was no more
effective with a graphic organizer than with an outline. These researchers and others
concluded that the structure, rather than the content, of graphic organizers is the main
reason for their effectiveness (Dexter & Hughes, 2011; Robinson et al., 1999; Roman et
al., 2016). Investigating animated concept maps in particular, evidence suggests that they
are best used with procedural rather than declarative content. In a meta-analysis on the
use of instructional animations versus static pictures, the authors found that although
animations were overall more effective (d = 0.37), the results were contingent on those
studies using animations to learn procedural knowledge. Animations are not as effective
for learning problem solving, which requires that a task be broken down into discrete
steps that can be studied, or for declarative knowledge (Hoffler & Leutner, 2007). Other
findings argue that topics involving motion and processes are best for animation, since
they are supported by the movement provided by the animation (Höffler, Schmeck, &
Opfermann, 2013). These results support research findings that animated concept maps
are not the best choice for pretraining, as the strategy is focused on learning declarative,
189
factual knowledge rather than on learning about processes that are revealed in a
sequential manner.
The paradoxical effect of animated concept maps on cognitive load. Animated
concept maps were developed in part to reduce map shock and minimize cognitive load.
Blankenship and Dansereau (2000) suggest that animated maps offered more support for
the learner “by directing the viewers’ attention along a coherent processing route, by
illustrating relevant information clusters (chunks), and by slowly revealing complexity”
(p. 305). The power of animated concept maps also rests on the impact of an evolving
gestalt visual that builds over time (Adesope & Nesbit, 2013). Working memory may be
less stressed with animated concept maps as the inherent chunking of information
provides efficient bite-sized packets of information. When used with learners who have
low prior knowledge, the best approach is to have highly structured, system-controlled
(as opposed to user-controlled) animations to limit overwhelm and extraneous load from
focusing on non-relevant aspects of an animated lesson (Höffler, Schmeck, &
Opfermann, 2013). This study abided by that structure and supports that assertion.
Learners with higher levels of prior knowledge may also benefit from animated maps,
even more than from static diagrams, because their existing knowledge allows for
processing of more complex animated aspects of the diagram.
Given these compelling arguments in favor of the use of animated concept maps,
one might logically imagine that as a pretraining resource, they would be superior to
enhanced or static concept maps. However, a closer look at the theory behind the use of
animations provides a fuller picture and speaks to the potential disadvantages of using
animated concept maps. Core to the issue is that rather than reducing cognitive
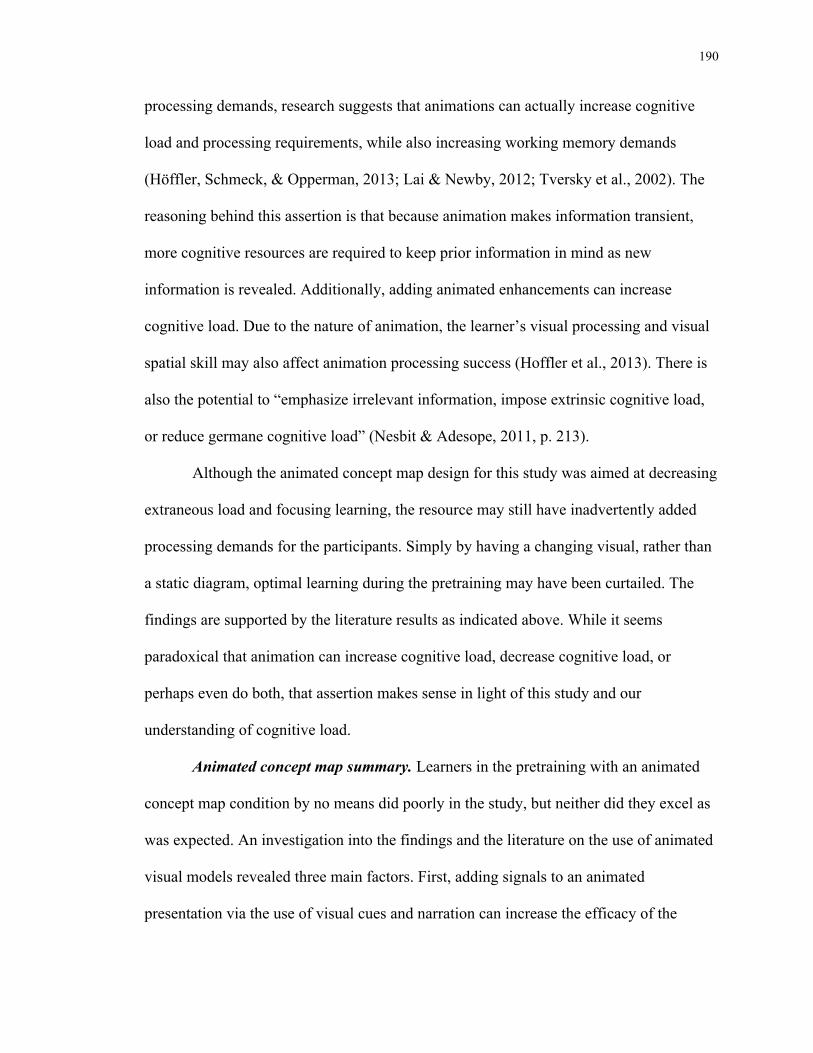
190
processing demands, research suggests that animations can actually increase cognitive
load and processing requirements, while also increasing working memory demands
(Höffler, Schmeck, & Opperman, 2013; Lai & Newby, 2012; Tversky et al., 2002). The
reasoning behind this assertion is that because animation makes information transient,
more cognitive resources are required to keep prior information in mind as new
information is revealed. Additionally, adding animated enhancements can increase
cognitive load. Due to the nature of animation, the learner’s visual processing and visual
spatial skill may also affect animation processing success (Hoffler et al., 2013). There is
also the potential to “emphasize irrelevant information, impose extrinsic cognitive load,
or reduce germane cognitive load” (Nesbit & Adesope, 2011, p. 213).
Although the animated concept map design for this study was aimed at decreasing
extraneous load and focusing learning, the resource may still have inadvertently added
processing demands for the participants. Simply by having a changing visual, rather than
a static diagram, optimal learning during the pretraining may have been curtailed. The
findings are supported by the literature results as indicated above. While it seems
paradoxical that animation can increase cognitive load, decrease cognitive load, or
perhaps even do both, that assertion makes sense in light of this study and our
understanding of cognitive load.
Animated concept map summary. Learners in the pretraining with an animated
concept map condition by no means did poorly in the study, but neither did they excel as
was expected. An investigation into the findings and the literature on the use of animated
visual models revealed three main factors. First, adding signals to an animated
presentation via the use of visual cues and narration can increase the efficacy of the
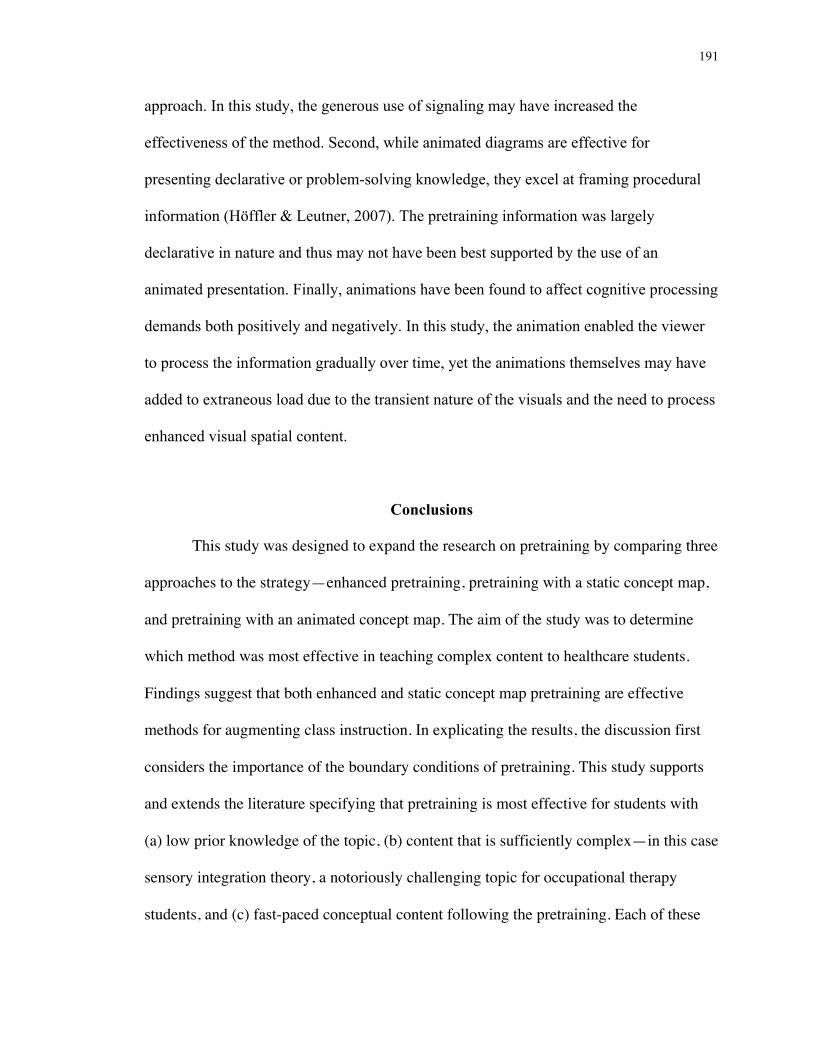
191
approach. In this study, the generous use of signaling may have increased the
effectiveness of the method. Second, while animated diagrams are effective for
presenting declarative or problem-solving knowledge, they excel at framing procedural
information (Höffler & Leutner, 2007). The pretraining information was largely
declarative in nature and thus may not have been best supported by the use of an
animated presentation. Finally, animations have been found to affect cognitive processing
demands both positively and negatively. In this study, the animation enabled the viewer
to process the information gradually over time, yet the animations themselves may have
added to extraneous load due to the transient nature of the visuals and the need to process
enhanced visual spatial content.
Conclusions
This study was designed to expand the research on pretraining by comparing three
approaches to the strategy—enhanced pretraining, pretraining with a static concept map,
and pretraining with an animated concept map. The aim of the study was to determine
which method was most effective in teaching complex content to healthcare students.
Findings suggest that both enhanced and static concept map pretraining are effective
methods for augmenting class instruction. In explicating the results, the discussion first
considers the importance of the boundary conditions of pretraining. This study supports
and extends the literature specifying that pretraining is most effective for students with
(a) low prior knowledge of the topic, (b) content that is sufficiently complex—in this case
sensory integration theory, a notoriously challenging topic for occupational therapy
students, and (c) fast-paced conceptual content following the pretraining. Each of these
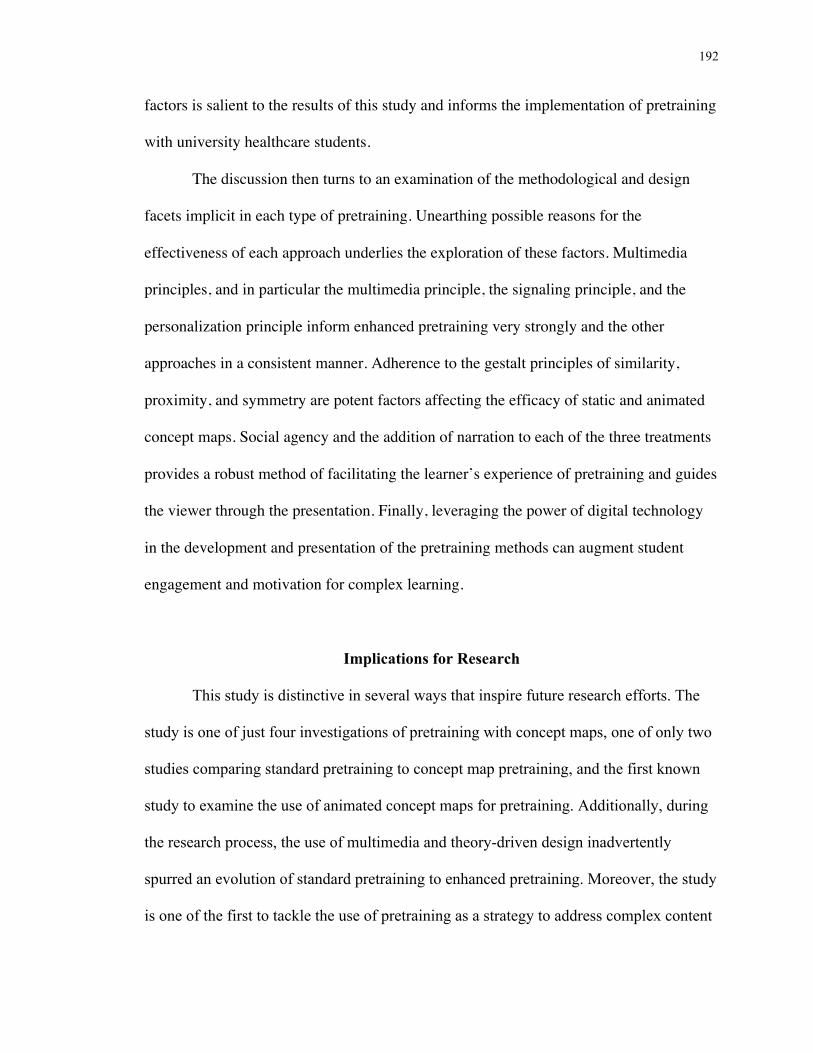
192
factors is salient to the results of this study and informs the implementation of pretraining
with university healthcare students.
The discussion then turns to an examination of the methodological and design
facets implicit in each type of pretraining. Unearthing possible reasons for the
effectiveness of each approach underlies the exploration of these factors. Multimedia
principles, and in particular the multimedia principle, the signaling principle, and the
personalization principle inform enhanced pretraining very strongly and the other
approaches in a consistent manner. Adherence to the gestalt principles of similarity,
proximity, and symmetry are potent factors affecting the efficacy of static and animated
concept maps. Social agency and the addition of narration to each of the three treatments
provides a robust method of facilitating the learner’s experience of pretraining and guides
the viewer through the presentation. Finally, leveraging the power of digital technology
in the development and presentation of the pretraining methods can augment student
engagement and motivation for complex learning.
Implications for Research
This study is distinctive in several ways that inspire future research efforts. The
study is one of just four investigations of pretraining with concept maps, one of only two
studies comparing standard pretraining to concept map pretraining, and the first known
study to examine the use of animated concept maps for pretraining. Additionally, during
the research process, the use of multimedia and theory-driven design inadvertently
spurred an evolution of standard pretraining to enhanced pretraining. Moreover, the study
is one of the first to tackle the use of pretraining as a strategy to address complex content
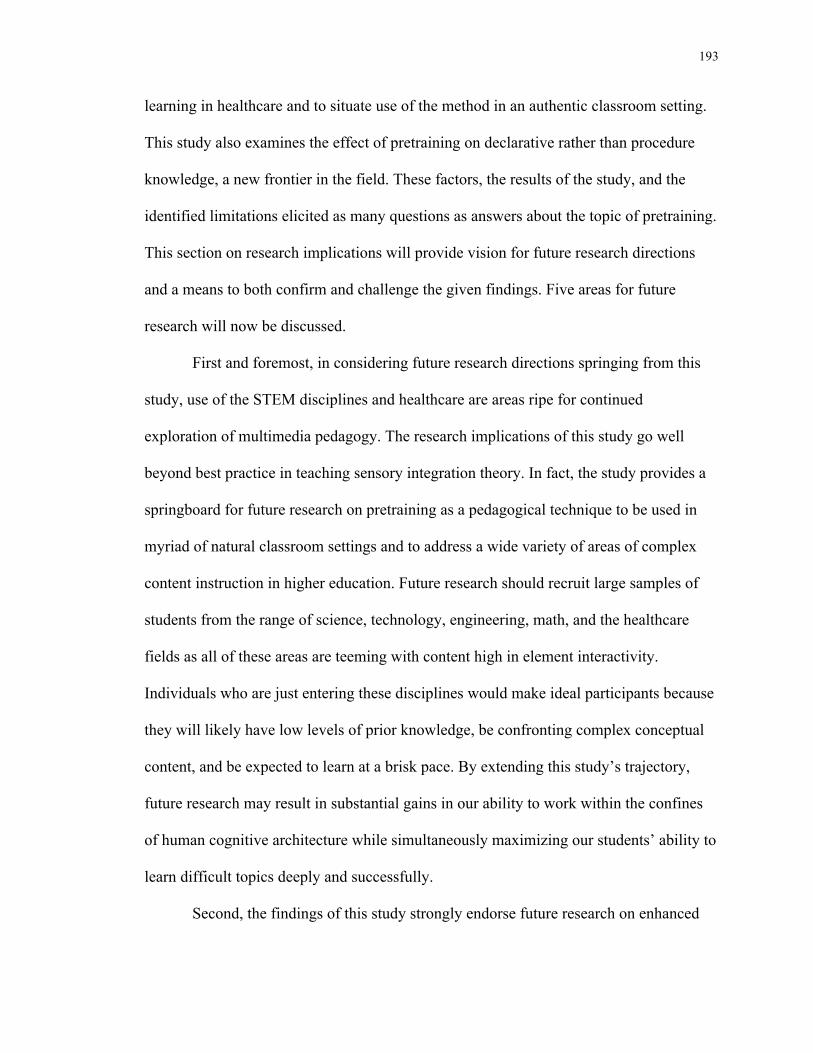
193
learning in healthcare and to situate use of the method in an authentic classroom setting.
This study also examines the effect of pretraining on declarative rather than procedure
knowledge, a new frontier in the field. These factors, the results of the study, and the
identified limitations elicited as many questions as answers about the topic of pretraining.
This section on research implications will provide vision for future research directions
and a means to both confirm and challenge the given findings. Five areas for future
research will now be discussed.
First and foremost, in considering future research directions springing from this
study, use of the STEM disciplines and healthcare are areas ripe for continued
exploration of multimedia pedagogy. The research implications of this study go well
beyond best practice in teaching sensory integration theory. In fact, the study provides a
springboard for future research on pretraining as a pedagogical technique to be used in
myriad of natural classroom settings and to address a wide variety of areas of complex
content instruction in higher education. Future research should recruit large samples of
students from the range of science, technology, engineering, math, and the healthcare
fields as all of these areas are teeming with content high in element interactivity.
Individuals who are just entering these disciplines would make ideal participants because
they will likely have low levels of prior knowledge, be confronting complex conceptual
content, and be expected to learn at a brisk pace. By extending this study’s trajectory,
future research may result in substantial gains in our ability to work within the confines
of human cognitive architecture while simultaneously maximizing our students’ ability to
learn difficult topics deeply and successfully.
Second, the findings of this study strongly endorse future research on enhanced
194
pretraining and pretraining with static concept maps. This study suggests that both
methods work well, but little is known about their effectiveness in comparison with
standard pretraining. Contrasting enhanced and static concept map pretraining with a
control group that does not receive pretraining treatment will be of value as a measure of
the magnitude of effect of pretraining in general and of a preferred method of pretraining
in particular. Completing studies that use random group assignment to large samples of
students who have low prior knowledge are also recommended—both for group
equivalence and to delve more deeply into the potentially significant future findings.
Future studies should also reflect a goal of this study, which was to shift pretraining from
the lab into a natural classroom environment and to expand the scope of pretraining use
from mechanistic, cause-and-effect topics to less clear-cut areas of complex content
learning. Extending the current body of research to include declarative rather than mainly
procedural or process-oriented learning is strongly recommended. As university students
are inextricably bound to the use of technology with a seemingly endless flow of content
available to them at all times, addressing the need to effectively learn complex
declarative content is more important now than ever before.
Third, the findings of this study highlight the power that narration has in
pretraining presentations of all types and in signaling the navigation of concept maps.
Future investigations into narration and no-narration conditions during pretraining with
concept maps would be helpful in ascertaining the ways a vocal guide can assist the
student during learning with a concept map. Studies that add narration to enhanced
pretraining presentations would also be valuable. Within these investigations, closely
examining the use of the personalization principle and the implementation of social
195
agency strategies is indicated. As we move further into online and digital learning
platforms and environs, finding ways to personalize instruction, motivate and engage
students, and offer a milieu of virtual support will become ever more crucial to students’
school success.
Fourth, finding the most effective and accurate way to measure pretraining
outcomes is important to the evolution of the evidence base. To date, the measurement of
pretraining in the existing literature is largely focused on retention and transfer. (See
Mayer & Pilegard, 2014.) Extending achievement assessment to include schematic
knowledge and applied problem solving may reveal a more nuanced view of the power of
pretraining.
With regard to schematic knowledge, fine tuning word association tests to provide
more nuanced results is indicated. This may be accomplished by requiring students to
create a hierarchical list or outline, rather than simply generating terms related to the key
term. If word association responses were more detailed, then they may more accurately
reflect the schemas that participants had acquired. In addition to word association tests,
Shavelson (1974) recommends the use of structured graphs and diagrams to measure
schema acquisition. Additionally, as the structure of a concept map can be analogous to a
cognitive schematic framework, the use of concept mapping for quantifying schema
acquisition would be a fruitful undertaking. With regard to transfer, honing in on the
learning edge where students make maximal use of pretraining without being
overwhelmed will provide valuable insights.
A final direction for measurement research involves the challenge of quantifying
how cognitive processing of visual information occurs during pretraining. Investigating
196
visual and visual perceptual processing shines a focused light on facets of pretraining
presentations including the various types of signaling, the use of gestalt principles to
inform design decisions, and multimedia strategies for optimizing learners’ cognitive
processing. Studies that use eye tracking to measure student learning with concept maps
provide a guide for starting these efforts (Amadieu et al., 2015; Amadieu et al., 2009;
Dogusoy-Taylan & Cagiltay, 2014; Liu, 2014; Molinari, 2017)
Fifth, although uses for concept maps abound, the literature typically focuses on
the use of this technique either during or after instruction (Nesbit & Adesope, 2006,
2013; Schroeder et al., 2017). This research, and the few other identified studies of
pretraining with a concept map, have unlocked the potential for timing the use of concept
maps prior to instruction. Therefore, additional research on pretraining with concept
maps is indicated. Efforts also may be extended to include investigations into student-
constructed or -completed concept maps to front load learning and encourage prior
knowledge acquisition. Finally, although animated concept maps seemingly fall short,
both as a pretraining vehicle and as an improved alternative to static concept maps,
examining more closely the advantages and restrictions of animated concept maps is
indicated. This route could be expanded to include interactive maps with learner
interfaces that allow additional functionality, beyond progressing through the map, and
may provide a more global learning opportunity and structure (Schroeder et al., 2017).
Regardless of the timing or presentation method used with concept maps, integrating
universal design for learning principles into construction of the visual models and into the
presentations themselves will augment their efficacy. In our increasingly digitized and
technology enhanced educational systems, investigating ways to effectively use animated
197
and interactive visual models in pretraining and education is likely quite beneficial.
Methodological Implications
Research outcomes on the effectiveness of pretraining are only as insightful as the
aspects of achievement they measure. Existing research on standard pretraining typically
focuses on retention and transfer outcomes. (See Mayer & Pilegard, 2014.) Schematic
knowledge is rarely referred to, and transfer is not often clearly described in the given
studies, despite the complexity of the topic. Among the other outcomes, analysis of this
study spurred thought about the methodology of measuring pretraining in future research
designs. Although this study was constrained by design, factors relating to the available
sample, the time and environment available for the study, and the researcher resources, a
robust harvest of potential future methodological changes were exposed. While the
previous section on research implications delineates directions for future studies, this
section explores these design and research methodology factors in more detail.
When quantifying complex content learning, moving beyond basic retention to
deeper learning outcomes is crucial (Butcher, 2006; Fiore et al., 2003). This study
worked to extend and augment the existing literature on standard pretraining, as well as
to focus on deeper learning measures such as schema acquisition, which in this study is
referred to as schematic knowledge. This study also narrowed the concept of transfer to
measure near transfer, the assessment of ability in solving applied problems that are close
to—but not replications of—presented scenarios. Of the pretraining with a concept map
studies identified, similar to this research, Willerman and MacHarg (1991) measured only
retention outcomes. Cutrer et al. (2011) upped the ante and required participants to
198
construct a concept map, which demonstrated recall and added an aspect of schema
acquisition. Only Zheng et al. (2012) assessed transfer. The researchers used a structured
short answer test that required participants to problem solve solutions to scenarios that
presented complications of diabetes (the given topic). These researchers also measured
recall and application of knowledge via multiple choice questions. No identified existing
studies have tackled both schema acquisition and transfer, as did the present study.
Measuring Schematic Knowledge
When analyzing the results of this study in light of existing research, it is almost
certain that measuring schematic knowledge is germane as a pretraining outcome. Just as
in the Cutrer et al. study (2011), schematic knowledge gains were substantial in this
study. In contrast with Cutrer et al., however, this study measured schema acquisition
through word association, unlike other authors who have assessed the construct via
concept map construction. Despite the differences in measurement technique, assessing
schema acquisition is reflective of increases in prior knowledge—the central goal of
pretraining. This assertion is supported by other researchers who draw a comparison
between concept map structure and schematic knowledge structures (Novak & Canas,
2008; Shavelson, Ruiz-Primo, & Wiley, 2005). Therefore, measuring the growth of a
learner’s web of knowledge as an outcome of studying a concept map is strongly
indicated. It should be noted that using concept map construction as an outcome measure
was beyond the scope of this study. That would have required participants first to be
trained in concept map construction, but time was not available for this process.
Measuring Near Transfer
In investigating the assessment of transfer, it quickly became clear that the
199
construct is complex and requires a graded view when considering how best to measure
the outcome. For example, there are a variety of types of transfer, including near and far,
construct, literal and figurative, low road and high road, and forward reaching and
backward reaching (Schunk, 2012). Informed researchers will consciously decide which
aspects of transfer are most relevant to a study. In this study, analysis of the near transfer
findings also indicated solid gains, yet the scores did not demonstrate as consistent or
clear a picture of achievement as compared to the schematic knowledge scores. This
finding may result from the fact that transfer is not directly related to pretraining, but
rather to the knowledge gained from the lecture, which was based on the foundation of
pretraining. Additionally, transfer—even near transfer—requires a much more complex
and robust set of learner abilities, including but not limited to schema acquisition, schema
automation, and problem solving. The transfer results spurred an examination of the
constructs of schematic knowledge and transfer, and by extension, an exploration of the
most insightful and illuminating tools to use when measuring pretraining.
Measurement Considerations in the Continuum Between Schema and Transfer
In considering the relationships between schematic knowledge and near transfer,
exploring the continuum of skills and abilities is necessary. Kalyuga (2010) discusses
schema in relation to cognitive load and identifies two phases of schematic knowledge:
schema acquisition and schema automation. During schema acquisition, a web of
knowledge is created, incoming knowledge is organized into logical chunks (which will
ease the demands on working memory), and schemas move to long-term memory storage.
During this part of the process, prior knowledge is typically low, and the learner will
likely process “unfamiliar information in working memory element by element by using
200
unorganized, random-search approaches that are cognitively inefficient” (p. 56). Care
must be taken at this point to avoid misconceptions about content. Two instructional
strategies that can help during this initial stage of learning are clear direct instructional
explanations and worked examples.
Then, after schemas have been formed, schema automation must occur. During
this phase, knowledge becomes readily accessible from long-term memory and—because
it has already been organized and chunked during schema acquisition—requires limited
cognitive processing to access. Retrieved knowledge can be integrated with new
incoming knowledge. Schema automation provides a jumping off point for the learner to
focus on “higher, more creative levels of cognition that enable the transfer of learning”
(Kalyuga, 2010, p. 50). When schematic knowledge structures are automated, they can
help guide complex cognitive processing and inform executive function.
Once schemas have been formed and automated, a third step in the process is
necessary. At this point, the learner must engage in problem solving (Brooks and
Dansereau, 1987). Schemas must be retrieved from long-term memory and knowledge
applied to functional tasks. Problem solving is an extensive process that involves step-by-
step changes in the learner’s skill level. Problem solving is a vital interim step in the
process because it forces the learner to translate the task from “a linguistic representation
to a mental representation” (Schunk, 2012, p. 340). This translation requires solid
organization and classification of knowledge in long-term memory and effective
strategies for accessing and using the knowledge and skills for solving problems
(Kalyuga & Hanham, 2011). Each time the learner solves a new problem and applies
their schematic knowledge, a more solid foundation for transfer is being built.
201
Finally, the learner is ready to engage in transfer, or the application of knowledge
to a problem that is different to any that have been directly learned (Schunk, 2012). In
mastering transfer, executive processing is vital. Instructional goals must be set close
enough together so that instructional complexity (intrinsic load) does not overwhelm the
learner and cause cognitive overload. In the transfer stage of learning, the learner can be
assisted by using worked examples and being exposed to incrementally more complex
instructional goals, as well as by self-regulated learning and attending to the meta-
learning that is occurring (Brooks & Dansereau, 1987; Gick & Holyoak, 1987; Schunk,
2012). When transfer ability is well-developed, the learner can engage in transfer of both
knowledge and skills learned, generalizing both skills and knowledge to novel
environments (Schunk, 2012).
The exploration into the steps that extend from schema acquisition to transfer
indicate that when using pretraining, a number of areas of knowledge may be measured.
Certainly, schematic knowledge acquisition is the cornerstone of meaningful learning.
Attending to problem solving is also indicated, and transfer ability is yet another valid
measure of learning. That said, in the present study, application to problem solving rather
than transfer may have been a more appropriate direction, given the limited time frame
provided for learning and the difficulty of the content.
In the literature, transfer often involved the participants describing processes (e.g.,
a braking system) and indicating how to improve a given example (Mayer, Mathias, et
al., 2002) or demonstrating practical protocols as with troubleshooting electrical circuits
(Kester et al., 2004a; Pollock et al., 2002). Another approach was to ask the participants
when a particular type of approach to problem solving was indicated, as with a study
202
involving statistical tests (Kester et al., 2004b). In each of these examples, the transfer
test involved a process or procedural information. Conversely the present study measured
transfer from two case studies presented during the lecture portion of the lesson to a
posttest. The structure of the transfer test involved multiple choice and fill-in-the-blank
questions when given a case study very similar to those presented during the lesson. In
contrast with the literature, in this study the type of transfer was primarily declarative
rather than procedural, suggesting that the construct being measured was qualitatively
disparate. Procedural information may be more easily transferred than declarative
content, because the structure and flow of a procedure lends itself to chunking and
provides more cues than does declarative knowledge (Glisky, 1992; Gray & Orasanu,
1987).
Methodology in future studies can benefit from a careful consideration of whether
the desired outcomes are schema acquisition, problem solving application, or transfer of
one or more types. Decisions would be well made with an eye to the duration of the study
and the lesson, the type of information to be taught, the prior knowledge and general
experience level of the participants, and the complexity of the content. Certainly,
measuring recall is a foundational aspect of measuring pretraining, but as the technique is
designed to help foster meaningful complex content learning, the outcomes must reflect
the objectives.
Implications for Practice
This research study originated with a practical question of how best to enhance
203
teaching effectiveness when presenting complex content to occupational therapy students.
Now the work concludes with a practitioner call to action followed by reflections on the
use of pretraining in the classroom. The study has offered a model for using a multimedia
pedagogical strategy in a naturalistic higher education setting. Now as instructors, we
must critically appraise our own practice and subsequently motivate and mobilize to meld
content delivery with sound and intentional pedagogy. We would also be well served by
increasing our skills in designing and implementing curriculum aided by pretraining and
other multimedia strategies.
Indisputably, effective instructors possess a wealth of content expertise to share
with their learners. To be truly beneficial to our students however, educators must also
commit to engaging in evidence-based pedagogy and to thoughtfully integrating digital
technology into our classrooms. Fortunately, we have ample knowledge explicating
human learning processes and offering approaches and strategies for optimizing
instructional efforts. To help our students learn more effectively and efficiently, we must
actively draw on these available theories and techniques including cognitive load theory,
the cognitive theory of multimedia learning, and frameworks like TPACK which
encourage a synthesis and balance between technology, pedagogy and content knowledge
(Mishra & Koehler, 2006; Neebe, 2017). In service to pedagogy, we must also study and
leverage the boundless resources and strategies offered by digital technology. In any
twenty-first century higher education milieu, it is unacceptable to view pedagogy or
technology as optional areas of focus. Rather, educators must marry their content
expertise to a well-honed and evolving teaching practice. Pretraining, the range of
multimedia techniques available, and our knowledge of cognition and learning forms a
204
solid starting point for this journey.
With regard to pretraining in particular, the findings from this study may be used
to provide greater clarity on how best to augment student learning. Further, the lessons
learned from conducting this study lead to indications for the use of pretraining in a
typical occupational therapy or healthcare classroom. The implications for practice are
divided into two subtopics: first, a micro-level set of nuts-and-bolts and how-to
pretraining recommendations, and then a macro-level vision for the use of pretraining in
college courses.
Although a definitive decision must always be based on an instructor’s personal
expertise and pedagogical need, findings suggested that pretraining with the use of a
static concept map and enhanced pretraining both offered promise. The static concept
map in particular is an excellent method for building prior knowledge and introducing a
comprehensive overview of a complex topic. Provided that it incorporates multimedia
principles and works to minimize extraneous cognitive load, enhanced pretraining is also
a solid option. When either method integrates social agency, the outcomes are likely to be
even more positive. For busy classroom educators, animated concept maps are likely not
worth the substantial investment of time and resources required to create them.
Pretraining Techniques for the Classroom
When developing pretraining resources for classroom use, committing to the
exploration of evidence-based pedagogical strategies is the first consideration, followed
closely by deciding to whether to use a static concept map or enhanced pretraining.
Results from this study suggested that both are strong approaches. In some cases, like
those involving declarative information or vocabulary terms that need not be
205
conceptually linked, enhanced pretraining will nicely fit the bill. With the judicious use
of relevant images to reinforce retention of the information, and narration that offers a
rich tableau of examples, enhanced pretraining is a strong choice. One central
consideration is the inclusion of multimedia principles into the presentation. Instructors
will need to familiarize themselves with the cognitive theory of multimedia principles in
general, as well as a number of specific principles crucial to the structure of the
presentation. Practically speaking, this means extra time and care with the construction of
the enhanced pretraining presentation, so that it is coherent and provides strong signaling
throughout. Additionally, the spatial structure of the slides must reflect use of spatial and
temporal contiguity, as well as considering the gestalt principles of similarity and
proximity. On-screen text must be kept to a minimum, and narration needs to do the bulk
of the heavy lifting of content delivery. Creating slides with a minimalist approach to text
may run counter to an instructor’s experience or training, but it is vitally important in
limiting cognitive overload during the initial stages of learning. Further, the narration that
is provided must integrate cleanly with the slide concepts and rely as much as possible on
lay terms. Narration must also be geared to the use of conversational language, including
social cues that create a sense of connectedness between the learner and the narrator.
These considerations, while not difficult to implement, do require additional time and
attention to execute effectively.
When the pretraining content would benefit from being organized into a
conceptual overview, is best learned as a series of sub-categories, or includes procedural
or process information, a static concept map structure offers an excellent approach.
Concept maps can also be used confidently for terminology or declarative content, since
206
the structure of the map offers cues to linking the learning topics. Regardless of the type
of content, considerations in using a concept map include the structure of the information
in the map, the integration of narration and social agency, and attention to the
overarching implications and possibilities afforded by use in the classroom.
Static concept map development considerations. Transforming information
from a list or narrative into a concept map can be challenging, but it is ultimately very
doable. For some, training in concept map construction provides a good introduction to
the process. In creating concept maps, there are currently many digital applications that
can ease the process and provide templates to get the instructor started. The process of
creating a concept map may enable the educator to think about the content in a new way,
which can result in greater mental flexibility when considering the topic. For example,
concept map construction requires that each node contain brief and pointed text that
describes the concept without overwhelming the viewer. Prioritizing the description and
detail of the content to include only the most relevant words is an excellent way to
identify the most vital kernels of content. Often, writing less is infinitely more
challenging that writing more. Fortunately, content presentation is not disposed of, but
rather shifted from the visual model to the narration. Additionally, determining where the
links between nodes are to be placed requires thoughtful consideration. The links provide
the vital first steps in facilitating the learner’s schema acquisition and must be dealt with
accordingly.
Turning to the next level of concept map development, information included in
the map must be carefully organized so that sets of nodes in each branch and sub-branch
of the map are logically and ideationally connected. This requires the educator to deeply
207
understand the overall topic so that sub-topics effectively can be linked, both
conceptually and spatially. If a hierarchical map structure is used, each level of nodes
must also accurately correspond to the tiered structure of knowledge offered by the whole
map, and nodes on each level must be related and of the same level of specificity and
detail. The structure compels the map creator to consider which terms and ideas are
subsumed by higher order and more general concepts, and which ones drill down into
greater specificity. Whatever the ultimate structure, the completed map must present a
meaningful and understandable cascade or set of classified ideas.
A still more overarching aspect of concept map development is the spatial
arrangement of the map as a whole. At this point in the map development, gestalt and
multimedia principles must be considered. In particular, and using the proximity
principle, massaging the spatial arrangement of the map so that like ideas are clearly and
intuitively clustered near one another is key. Additionally, and using the similarity and
signaling principles, color coding nodes and creating a pattern of node shapes and sizes is
important for reinforcing the viewer’s ability to associate specific sets of terms or ideas
with one another. Finally, attending to symmetry and order can help provide a cohesive
resource for the viewer. The concept map need not, and often cannot, be entirely
symmetrical, but attending to a sense of balance and proportionality is important to the
readability and interpretability of the map.
Integrating a static concept map into a class curriculum. This study has
focused on use of the concept map as a pretraining vehicle, but actually concept maps are
more popularly used in many other capacities. When including pretraining with a concept
map into a course, it may be advantageous to extend use of the map to additional
208
purposes and thereby make the tool even more powerful. Concept maps for pretraining
involve studying an expert-created map, but concept maps can be also used as study aids,
with either expert- or student-created maps. Maps that are partially completed can be
used to aid student study and review, as they find and fill in information. Concept maps
can also be used as a method for assessment. If students are taught concept mapping, they
can then create a concept map as a means for measuring knowledge on a topic. The
benefit of a concept map test is that in addition to showing knowledge recall, it can also
show schematic knowledge ability as evidenced by the structure and complexity of the
map and the links between nodes. In any event, teaching concept mapping to students and
then integrating the technique into classroom activities, study, and assessment can
exponentially increase the usefulness of the static concept map for learning.
Integration of narration with static concept map and enhanced pretraining.
The findings of this study support the literature by indicating that the difficulty
with navigating a static concept map, which sometimes leads to map shock, can be
alleviated by providing adequate signaling during the map review. In particular, adding
narration to the map to guide the viewer through the content is effective. Therefore,
considerations for narrating the static concept map are provided here. First, the narration
must signal the viewer as to the spatial arrangement of the map and the branch that is
currently being addressed. In this study, phrases such as “If you turn your attention to the
top left corner of the map in blue …” were used to guide the viewer. Other narration
factors, which apply also to enhanced pretraining, include the use of the personalization
principle and social agency to increase the accessibility of the information through social
cueing. Pretraining is best used with learners who have low prior knowledge of a topic,
209
so the importance of limiting cognitive overload through emotionally sensitive design
and using affect to subtly motivate the learner and increase attention cannot be
overstated. Finally, taking the time to create a quality product using an effective sound
recording system and sound editing software can make the difference between a mediocre
resource and a superb one that will endure into future semesters and courses.
Integrating Pretraining into the College Curriculum
Whether using enhanced pretraining or pretraining with a static concept map,
determining how to weave the strategy into the classroom setting is important.
Considerations should include the brief nature of pretraining; in this study, the treatment
lasted 12 minutes. With a goal of building prior knowledge, we want as little stress as
possible on working memory, so shorter presentations are best. As with the majority of
college classes and curricula, seat time is precious, so limiting the foundational
preparation of pretraining is wise. In fact, if pretraining could be offered in advance of a
lesson and provided on the learning management system or other access route, all the
better. The gap between the pretraining and the lesson should be as brief as possible. To
ensure that students have accessed and made the most of the pretraining resource, a low
stakes or formative online quiz may be used. Use of a brief assessment would also help
reinforce the content by providing an additional exposure to it.
Another consideration is how to maximize the use of pretraining information.
Providing an online document or handout for use with the audio or video pretraining, and
then additional use with the lecture and as a review tool, can help underscore the
effectiveness of the pretraining. Additionally, creating a video of pretraining rather than
presenting live can be helpful because the video can be viewed and reviewed. Finally,
210
although this study used one pretraining module to correspond with one subsequent
lecture, multiple pretraining presentations may be developed and used to support prior
knowledge acquisition throughout a unit or an entire course.
Finally, use of pretraining will vary among the heterogeneous groups of learners
found in today’s educational milieu. Students with low prior knowledge will likely reap
the most benefit from the technique, while students with higher levels of prior knowledge
may not need the resource as much. With high prior knowledge learners, pretraining can
be used as a review. The caution of providing pretraining to high prior knowledge
learners is the expertise reversal effect; instructional strategies that are effective with
novices may not be effective with more experienced learners, and strategies that do not
work for low priors become more effective for high priors (Sweller, 2010). Because
pretraining is brief and foundational, the expertise reversal effect is unlikely to occur or
to be particularly detrimental to learning if it does occur. Ultimately, the use of
pretraining, either enhanced or with a static concept map, is a powerful resource for
augmenting student learning of complex content in healthcare.
Healthcare students navigating the academic challenges inherent in becoming
skilled professionals can expect to encounter complex content, fast-paced instruction, and
rigorous assessments. These undertakings can lead to meaningful learning, but without
guidance, the demands are difficult to tackle. University instructors can enhance student
learning with the use of strategic pedagogical approaches and curricular design. Further,
occupational therapy educators are poised to enhance our effectiveness by expanding our
content-rich and hands-on kinesthetic legacy of instruction to encompass pedagogical and
technological resources in our educational programs.
211
As reliance on technology becomes ever more prevalent, shrewd educators will
want to include digital approaches to aiding students in the classroom and in online
environments. For educational technology to be most effective, however, digital
strategies must be coupled with a keen knowledge of the processes involved in learning
challenging content. Only when an understanding of the capacities and limitations of
human cognition is paired with digital resources can presentation creation maximize
student knowledge acquisition.
Educators willing to take up the charge of optimizing learning processes will find
that multimedia techniques provide practical and accessible instructional roadmaps.
Pretraining and related techniques offer potent tools to assist students in accessing and
understanding complex content. Instructors committed to using cognitive multimedia
approaches can provide streamlined lessons geared to prioritizing relevant content,
minimizing extraneous elements, and managing difficult learning. This enables students
to focus their efforts beyond fact retention for examinations and on powerful measures of
achievement including schema acquisition and automation, problem solving application,
and transfer ability. Developing these robust abilities will fortify healthcare students with
the skills necessary to adeptly transition from academic training to competent
professional practice.
212
REFERENCES
Adesope, O. O., & Nesbit, J. C. (2013). Animated and static concept maps enhance
learning from spoken narration. Learning and Instruction, 27, 1–10.
doi.org/10.1016/j.learninstruc.2013.02.002
Aliakbari, F., Parvin, N., Heidari, M., & Haghani, F. (2015). Learning theories
application in nursing education. Journal of Education and Health Promotion, 4,
2. doi.org/10.4103/2277-9531.151867
All, A. C., Huycke, L. I., & Fisher, M. J. (2003). Instructional tools for nursing
education: Concept maps. Nursing Education Perspectives, 24(6), 311–317.
Amadieu, F., Salmerón, L., Cegarra, J., Paubel, P.-V., Lemarié, J., & Chevalier, A.
(2015). Learning from concept mapping and hypertext: An eye tracking study.
Educational Technology & Society, 18(4), 100–112.
Amadieu, F., Van Gog, T., Paas, F., Tricot, A., & Mariné, C. (2009). Effects of prior
knowledge and concept-map structure on disorientation, cognitive load, and
learning. Learning and Instruction, 19(5), 376–386.
doi.org/10.1016/j.learninstruc.2009.02.005
Ambard, P. D., & Ambard, L. K. (2012). Effects of narrative script advance organizer
strategies used to introduce video in the foreign language classroom. Foreign
Language Annals, 45(2), 203–228.
American Academy of Pediatrics. (2012). Policy statement: Sensory integration therapies
for children with developmental and behavioral disorders. Section on
Complementary and Integrative Medicine and Council on Children with
Disabilities. Pediatrics, 129, 1186-1189. doi.org/10.1542/peds.2012-0876
213
American Occupational Therapy Association (AOTA). (2014a). Occupational therapy
education research agenda. American Journal of Occupational Therapy, 68, S83–
6 1p. doi.org/10.5014/ajot.2014.685S06
American Occupational Therapy Association (AOTA). (2014b). Occupational therapy
practice framework: Domain and process. American Journal of Occupational
Therapy, 68(Suppl. 1), S1–S48. doi:10.5014/ajot.2014.682006
American Occupational Therapy Association (AOTA). (2017). About occupational
therapy. AOTA, Inc. Retrieved from http://www.aota.org/About-Occupational-
Therapy.aspx.
Apitz, A. (2008). The effects of multimedia advance organizers on comprehending
authentic German video (Unpublished doctoral dissertation). The University of
Iowa, Iowa City, IA.
Atay, S., & Karabacak, Ü. (2012). Care plans using concept maps and their effects on the
critical thinking dispositions of nursing students: Care plans using concept maps
and effects. International Journal of Nursing Practice, 18(3), 233–239.
doi.org/10.1111/j.1440-172X.2012.02034.x
Ausubel, D. P. (1960). The use of advance organizers in the learning and retention of
meaningful verbal material. Journal of Educational Psychology, 51(5), 267.
Ausubel, D. P. (1962). A subsumption theory of meaningful verbal learning and retention.
Journal of General Psychology, 66(2), 213–224.
Ausubel, D. P. (1968). Educational psychology: A cognitive view. NY: Holt, Rinehart and
Winston.
Ausubel, D. P. (1978). In defense of advance organizers: A reply to the critics. Review of
214
Educational Research, 48(2), 251. doi.org/10.2307/1170083
Ausubel, D. P., & Fitzgerald, D. (1961). The role of discriminability in meaningful verbal
learning and retention. Journal of Educational Psychology, 53(5), 266–274.
Ausubel, D. P., & Fitzgerald, D. (1962). Organizer, general background, and antecedent
learning variables in sequential verbal learning. Journal of Educational
Psychology, 53(6), 243.
Ausubel, D. P., Novak, J. D., & Hanesian, H. (1978). Educational psychology: A
cognitive view (2nd ed.). New York, NY: Holt, Rinehart and Winston.
Ausubel, D. P., & Youssef, M. (1963). Role of discriminability in meaningful paralleled
learning. Journal of Educational Psychology, 54(6), 331.
Ayres, A. J. (1972). Sensory integration and learning disorders. Los Angeles, CA: WPS.
Ayres, A. J. (1979). Sensory integration and the child. Los Angeles, CA: WPS.
Ayres, P., & Sweller, J. (2014). The split-attention principle in multimedia learning. In R.
E. Mayer (Ed.), The Cambridge handbook of multimedia learning (2nd ed., pp.
206–226). New York, NY: Cambridge University Press.
Baddeley, A. (2015). Working memory. In A. Baddeley, M. W. Eysenck, & M. C.
Anderson (Eds.), Memory (2nd ed., pp. 66–105). New York, NY: Psychology
Press.
Baddeley, A. D., & Hitch, G.J. (1974). Working memory. In G. H. Bower (Ed.), The
psychology of learning and motivation: Advances in research and theory (pp. 47–
89). New York: Academic Press.
Baddeley, A. D., & Hitch, G.J. (1994). Developments in the concept of working memory.
Neuropsychology, 8(4), 485–493.
215
Barbosa, H. R., Marques, M. V., & Torres, B. B. (2005). An advance organizer for
teaching bacterial metabolism. Biochemistry and Molecular Biology Education,
33(4), 265–268.
Barnes, B. R., & Clawson, E. U. (1975). Do advance organizers facilitate learning?
Recommendations for further research based on an analysis of 32 studies. Review
of Educational Research, 45(4), 637. doi.org/10.2307/1170068
Barron, R. F. (1969). The use of vocabulary as an advance organizer. In H. L. Herbert &
P. L. Sanders (Eds.), Research on reading in the content area: First-year report
(pp. 29–39). Syracuse, NY: Syracuse University Press.
Barron, R. F. (1979). The effect of graphic organizers on learning of social studies
content and attitude towards reading. In H. L. Herbert & P. L. Sanders (Eds.),
Research on reading in the content area: The fourth report (pp. 42–51). Syracuse,
NY: Syracuse University Press.
Bayat, N. (2007). The effectiveness of advance organizers on the signification of poetic
images. Educational Sciences: Theory & Practice, 7(3), 1147–1154.
Baylis, G. C., & Driver, J. (2001). Perception of symmetry and repetition within and
across visual shapes: Part-descriptions and object-based attention. Visual Cognition,
8(2), 163–196. doi.org/10.1080/13506280042000126
Behaviorism. (2017). Berkeley, CA: Graduate Student Instructor Teaching and Resource
Center, Berkeley Graduate Division, University of California. Access date
January 13, 2017. Retrieved from http://gsi.berkeley.edu/gsi-guide-
contents/learning-theory-research/behaviorism/
216
Beissner, K. L., Jonassen, D. H., & Grabowski, B. L. (1993). Using and selecting graphic
techniques to acquire structural knowledge. Proceedings of Selected Research and
Development Presentations at the Convention of the Association for Educational
Communications and Technology, New Orleans, Louisiana, January 13–17, 1993.
Bency, P. B., & Raja, B. W. D. (2010). Performance in physical science education by dint
of advance organiser model of teaching. I-Manager’s Journal on School
Educational Technology, 6(1), 70.
Bertou, D. P., Clasen, R. E., & Lambert, P. (1972). An analysis of the relative efficacy of
advanced organizers, post organizers, interspersed questions and combinations
thereof in facilitating learning and retention from a televised lecture. Journal of
Educational Research, 65(7), 329–333
Billings, E. S., & Mathison, C. (2012). I get to use an iPod in school? Using technology-
based advance organizers to support the academic success of English learners.
Journal of Science Education and Technology, 21(4), 494–503.
doi.org/10.1007/s10956-011-9341-0
Blankenship, J., & Dansereau, D. F. (2000). The effect of animated node-link displays on
information recall. Journal of Experimental Education, 68(4), 293–308.
Bloom, B. S. (1956). Taxonomy of educational objectives, handbook I: The cognitive
domain. New York: David McKay.
Brooks, L. W., & Dansereau, D. F. (1987). Transfer of information: An instructional
perspective. In S. M. Cormier & J. D. Hagman (Eds.), Transfer of learning:
Contemporary research and applications (pp. 121–150). San Diego, CA:
Academic Press.
217
Busche, L. (2018). Simplicity, symmetry and more: Gestalt theory and the design
principles it gave birth to. Canva. Retrieved from
https://www.canva.com/learn/gestalt-theory/
Butcher, K. R. (2006). Learning from text with diagrams: Promoting mental model
development and inference generation. Journal of Educational Psychology, 98(1),
182–197.
Butcher, K. R. (2014). The multimedia principle. In R. E. Mayer (Ed.), The Cambridge
handbook of multimedia learning (2nd ed., pp. 174–205). NY: Cambridge
University Press.
Castellino, A. R., & Schuster, P. (2002). Evaluation of outcomes in nursing students
using clinical concept map care plans. Nurse Educator, 27, 149–150.
Chabeli, M. (2010). Concept-mapping as a teaching method to facilitate critical thinking
in nursing education: A review of the literature. Health SA Gesondheid, 15(1).
doi.org/10.4102/hsag.v15i1.432
Chase, W. G., & Simon, H. A. (1973). Perception in chess. Cognitive Psychology, 4, 55–
81.
Chen, B., Hirumi, A., & Zhang, N. J. (2007). Investigating the use of advance organizers
as an instructional strategy for web-based distance education. The Quarterly
Review of Distance Education, 8(3), 2007, 223–231.
Chen, S.-L., Liang, T., Lee, M. L., & Liao, I. C. (2011). Effects of concept map teaching
on students’ critical thinking and approach to learning and studying. Journal of
Nursing Education, 50(8), 466–469. doi.org/10.3928/01484834-20110415-06
Chi, M. T. H., de Leeuw, N., Chiu, M.-H., & LaVancher, C. (1994). Eliciting self-
218
explanations improves understanding. Cognitive Science, 18, 439–477.
Chmielewski, T. L., Moreland, J. L., & Dansereau, D. F. (1997, August). Integrating new
information into prior knowledge. Paper presented at the 105th annual convention
of the American Psychological Association, Chicago, IL.
Chou, P. N. (2013). Effect of instructor-provided concept maps and self-directed learning
ability on students’ online hypermedia learning performance. Journal of College
Teaching & Learning (Online), 10(4), 223.
Chuang, H.-H., & Liu, H.-C. (2014). Investigating the effect of different verbal formats
of advance organizers on third graders’ understanding of heat transfer concept.
International Journal of Education in Mathematics, Science and Technology,
2(1). Retrieved from http://www.ijemst.net/article/view/5000036017
Çimer, A. (2012). What makes biology learning difficult and effective: Students’ views.
Educational Research and Reviews, 7(3), 61.
Clark, R. C., & Mayer, R. E. (2016). E-Learning and the science of instruction: Proven
guidelines for consumers and designers of multimedia learning (4th ed.). San
Francisco, CA: Pfeiffer.
Clarke, T., Ayres, P., & Sweller, J. (2005). The impact of sequencing and prior
knowledge on learning mathematics through spreadsheet applications.
Educational Technology Research & Development, 53(3), 15–24.
Cohen, J. (1988). Statistical power analysis for the behavioral sciences (2nd ed.).
Hillsdale, NJ: Erlbaum.
Cooper, P. A. (1993). Paradigm shifts in designed instruction: From behaviorism to
cognitivism to constructivism. Educational Technology, 33(5), 12–19.

219
Cormier, S. M., & Hagman, J. D. (1987). Introduction. In S. M. Cormier & J. D. Hagman
(Eds.), Transfer of learning: Contemporary research and applications (pp. 1–8).
San Diego, CA: Academic Press.
Cowan, N. (2001). The magical number 4 in short-term memory: A reconsideration of
mental storage capacity. Behavioral and Brain Sciences, 24, 87–114.
Cowan, N. (2008). What are the differences between long-term, short-term, and working
memory? Progress in Brain Research, 169, 323–338.
Crooks, M. M., & Cheon, J. (2013). Strategies for note taking on computer-based graphic
organizers. In G. Schraw, M. T. McCrudden, & D. Robinson (Eds.), Learning
through visual displays (pp. 187–222). Charlotte, NC: Information Age.
Cutrer, W. B., Castro, D., Roy, K. M., & Turner, T. L. (2011). Use of an expert concept
map as an advance organizer to improve understanding of respiratory failure.
Medical Teacher, 33(12), 1018–1026. doi.org/10.3109/0142159X.2010.531159
Daly, W. M. (2001). The development of an alternative method in the assessment of
critical thinking as an outcome of nursing education. Journal of Advanced
Nursing, 36, 120–130.
Daniel, K. J., & Polloway, S. (2005). Advance organizers: Activating and building
schema for more successful learning in students with disabilities. Lynchburg
College Journal Special Education, 201(4), 1–22.
Dansereau, D. F., Dees, S. M., & Simpson D. D. (1994). Using schematic organizers to
help college students organize personal concepts and behavior related to alcohol
and cocaine use. Addictive Behaviors, 18, 645–657.
D’Antoni, A. V., Zipp, G. P., Olson, V., & Cahill, T. F. (2010). Does the mind map
220
learning strategy facilitate information retrieval and critical thinking in medical
students? BMC Medical Education, 10, 61–71.
De Groot, A. (1966). Perception and memory versus thought: Some old ideas and recent
findings. In B. Kleinmuntz (Ed.), Problem solving: Research, method, and theory
(pp. 19–50). New York, NY: Wiley.
DeAngelis, T. (2007). Concept mapping: Is a picture worth a thousand words? American
Occupational Therapy Association, 17(3), 1–4.
Dell’Olio, J. M., & Donk, T. (2007). Models of teaching: Connecting student learning
with standards. Thousand Oaks, CA: Sage.
Dexter, D. D., & Hughes, C. A. (2011). Graphic organizers and students with learning
disabilities: A meta-analysis. Learning Disability Quarterly, 34(1), 51–72.
Dexter, D. D., & Hughes, C. A. (2013). Graphic organizers as aids for students with
learning disabilities. In G. Schraw, M. T. McCrudden, & D. Robinson (Eds.),
Learning through visual displays (pp. 281–302). Charlotte, NC: Information Age.
Dogusoy-Taylan, B., & Cagiltay, K. (2014). Cognitive analysis of experts’ and novices’
concept mapping processes: An eye tracking study. Computers in Human
Behavior, 36, 82–93.
Donaldson, H. (2005). An investigation of the effectiveness of using advance organizers
and literacy strategies to promote student learning in mathematics: a research
report. Retrieved from http://ir.canterbury.ac.nz/handle/10092/3014
Doyle, W. H. (1986). Using an advance organizer to establish a subsuming function
concept for facilitating achievement in remedial college mathematics. American
Educational Research Journal, 23(3), 507–516.
221
Duphorne, P. L., & Gunawardena, C. N. (2005). The effect of three computer
conferencing designs on critical thinking skills of nursing students. American
Journal of Distance Education, 19(1), 37–50.
doi.org/10.1207/s15389286ajde1901_4
Eitel, A., Scheiter, K., & Schüler, A. (2013). How inspecting a picture affects processing
of text in multimedia learning. Applied Cognitive Psychology, 27(4), 451–461.
doi.org/10.1002/acp.2922
Eppler, M. J. (2006). A comparison between concept maps, mind maps, conceptual
diagrams, and visual metaphors as complementary tools for knowledge
construction and sharing. Information Visualization, 5(3), 202–210.
doi.org/10.1057/palgrave.ivs.9500131
Etches, P. (2016, March 19). Brain training: Should you believe the hype? The Guardian.
Retrieved from https://www.theguardian.com/education/2016/mar/19/brain-
training-should-you-believe-the-hype
Facione, N. C., & Facione, P. A. (1996). Assessment design issues for evaluating critical
thinking in nursing. Holistic Nursing Practice, 10(3), 41–53.
Facione, P. A., Facione, N. C., & Giancarlo, C. A. (2001). The California critical thinking
disposition inventory: CCTDI [Assessment instrument]. Millbrae, CA: California
Academic Press.
Fata-Hartley, C. (2011). Resisting rote: The importance of active learning for all course
learning objectives. Journal of College Science Teaching, 40(3). Retrieved from
http://search.ebscohost.com/login.aspx?direct=true&profile=ehost&scope=site&a
uthtype=crawler&jrnl=0047231X&AN=57271190&h=CbvZCKDvMkl188ImL7
222
HL5f%2FkGx6cOSabBUDlQZdFZOKxsFthVEIDViNczp94BVr2UcBFd2s0hu3
YGXIGk32Ziw%3D%3D&crl=c
Fiore, S. M., Cuevas, H. M., & Oser, R. L. (2003). A picture is worth a thousand
connections: The facilitative effects of diagrams on mental model development and
task performance. Computers in Human Behavior, 19(2), 185–199.
Fitzgerald, D., & Ausubel, D. P. (1963). Cognitive versus affective factors in the learning
and retention of controversial material. Journal of Educational Psychology, 54(2),
73–84.
Fonseca, A. P., Extremina, C. I., & de Fonseca, A. F. (2004). Concept mapping: A strategy
for meaningful learning in medical biology. Concept maps: Theory, methodology,
technology. Proceedings of the First International Conference on Concept
Mapping, Pamplona, Spain. Retrieved from
http://citeseerx.ist.psu.edu/viewdoc/download?doi=10.1.1.412.3942&rep=rep1&t
ype=pdf
Gick, M. L., & Holyoak, K. J. (1987). The cognitive basis of knowledge transfer. In
Cormier, S. M. & Hagman, J. D. (Eds.), Transfer of learning: Contemporary
research and application (9–47). San Diego, CA: Academic Press.
Gilbert, G. E., & Prion, S. (2016). Making sense of methods and measurements:
Lawshe’s content validity index. Clinical Simulation in Nursing, 12(12), 530–
531.
Gillies, D. A. (1984). Effect of advance organizers on learning medical surgical nursing
content by baccalaureate nursing students. Research in Nursing & Health, 7(3),
173–180.
223
Ginns, P., Martin, A. J., & Marsh, H. W. (2013). Designing instructional text in a
conversational style: A meta-analysis. Educational Psychology Review, 25(4),
445–472. doi.org/10.1007/s10648-013-9228-0
Glass, G. V. (1978). Integrating findings: The meta-analysis in research. In L. S.
Schulman (Ed.), Review of Researcher in Education (Vol. 5). Itasca, MN:
Peacock.
Glisky, E. L. (1992). Acquisition and transfer of declarative and procedural knowledge by
memory-impaired patients: A computer data-entry task. Neuropsychologia, 30(10),
899–910.
Graber, R. A., Means, R. S., & Johnston, T. D. (1972). The effects of subsuming
concepts on student achievement on unfamiliar science learning material. Journal
of Research Science Teaching, 9, 277–279.
Gray, W. D., & Orasanu, J. M. (1987). Transfer of cognitive skills. In S. M. Cormier & J.
D. Hagman (Eds.), Transfer of learning: Contemporary research and applications
(pp. 183–215). San Diego, CA: Academic Press.
Grice, K. (2016). Concept mapping as a learning tool in occupational therapy education.
Occupational Therapy in Health Care, 30(3), 310–319.
Griffin, C. C., & Tulbert, B. L. (1995). The effect of graphic organizers on students’
comprehension and recall of expository text: A review of the research and
implications for practice. Reading & Writing Quarterly: Overcoming Learning
Difficulties, 11, 73–89.
Grotelueschen, A. D., & Sjogren, D. O. (1968). Effects of differential structural
introductory materials and learning tasks on learning transfer. American

224
Educational Research Journal, 5, 191–202.
Groth, R. E., Butler, J., & Nelson, D. (2016). Overcoming challenges in learning
probability vocabulary. Teaching Statistics, 38(3), 102–107.
Gul, R. B., & Boman, J. A. (2006). Concept mapping: A strategy for teaching and
evaluation in nursing education. Nurse Education in Practice, 6(4), 199–206.
doi.org/10.1016/j.nepr.2006.01.001
Gunstone, R. F. (1981). Cognitive structure and performance after physics instruction.
Retrieved from http://eric.ed.gov/?ed=ED202703
Gurlitt, J., Dummel, S., Schuster, S., & Nückles, M. (2012). Differently structured
advance organizers lead to different initial schemata and learning outcomes.
Instructional Science, 40(2), 351–369. doi.org/10.1007/s11251-011-9180-7
Hampton-Smith, S. (2017). The designer’s guide to Gestalt Theory. Creative Bloq: Art
and Design Inspiration. Retrieved from https://www.creativebloq.com/graphic-
design/gestalt-theory-10134960
Hartley, J., & Davies, I. K. (1976). Pre-instructional strategies: The role of pretests,
behavioral objectives, overviews and advance organizers. Review of Educational
Research, 46(2), 239. doi.org/10.2307/1170040
Haslam, C. Y. (2011). Pre-training: To help science students learn complex information.
In
http://www.education.auckland.ac.nz/webdav/site/education/shared/about/schools
/smtedu/docs/SERS-Edited-Proceedings.pdf. The Authors. Retrieved from
https://researchspace.auckland.ac.nz/handle/2292/17084
Hay, D. B. (2007). Using concept maps to measure deep, surface and non-‐learning
225
outcomes. Studies in Higher Education, 32(1), 39–57.
doi.org/10.1080/03075070601099432
Hayes, D. A., & Reinking, D. (1991). Good and poor readers’ use of graphic aids cued in
texts and in adjunct study materials. Contemporary Educational Psychology, 16,
391–398.
Hicks-Moore, S. L., & Pastirik, P. J. (2006). Evaluating critical thinking in clinical
concept maps: A pilot study. International Journal of Nursing Education
Scholarship, 3(1), 1314.
High, V., & VanHorn, L. (2012). Soil science in the digital age. Science and Children,
50(3), 36–40.
Hochpöchler, U., Schnotz, W., Rasch, T., Ullrich, M., Horz, H., McElvany, N., &
Baumert, J. (2013). Dynamics of mental model construction from text and
graphics. European Journal of Psychology of Education, 28(4), 1105–1126.
doi.org/10.1007/s10212-012-0156-z
Höffler, T. N., & Leutner, D. (2007). Instructional animation versus static pictures: A
meta-analysis. Learning and Instruction, 17(6), 722–738.
doi.org/10.1016/j.learninstruc.2007.09.013
Höffler, T. N., Schmeck, A., & Opfermann, M. (2013). Static and dynamic visual
representations: Individual differences in processing. In G. Schraw, M. T.
McCrudden, & D. Robinson (Eds.), Learning through visual displays (pp. 133–
164). Charlotte, NC: Information Age.
Hoosain, R. (1983). Memorization of classical Chinese. Psychologia: An International
Journal of Psychology in the Orient, 26(3), 193–197.
226
Huang, H. S., Chiou, C. C., Chiang, H. K., Lai, S. H., Huang, C. Y., & Chou, Y. Y.
(2012). Effects of multidimensional concept maps on fourth graders’ learning in
web-based computer course. Computers & Education, 58(3), 863–873.
doi.org/10.1016/j.compedu.2011.10.016
Huang, Y. C., Chen, H. H., Yeh, M. L., & Chung, Y. C. (2012). Case studies combined
with or without concept maps improve critical thinking in hospital-based nurses: A
randomized-controlled trial. International Journal of Nursing Studies, 49(6), 747–
754. doi.org/10.1016/j.ijnurstu.2012.01.008
Issa, N., Mayer, R. E., Schuller, M., Wang, E., Shapiro, M. B., & DaRosa, D. A. (2013).
Teaching for understanding in medical classrooms using multimedia design
principles: Evidence-based lecture design in medical education. Medical Education,
47(4), 388–396. doi.org/10.1111/medu.12127
Jaafarpour, M., Aazami, S., & Mozafari, M. (2016). Does concept mapping enhance
learning outcome of nursing students? Nurse Education Today, 36, 129–132.
doi.org/10.1016/j.nedt.2015.08.029
Jafari, K., & Hashim, F. (2012). The effects of using advance organizers on improving
EFL learners’ listening comprehension: A mixed method study. System, 40(2),
270–281. doi.org/10.1016/j.system.2012.04.009
Jamet, E., Gavota, M., & Quaireua, C. (2008). Attention guiding in multimedia learning.
Learning and Instruction, 18, 135–145.
Jia, J. (2007). The effects of concept mapping as advance organizers in instructional
designs for distance learning programs (Unpublished doctoral dissertation).
Wayne State University, Detroit, MI.
227
Josephsen, J. (2015). Cognitive load theory and nursing simulation: An integrative
review. Clinical Simulation in Nursing, 11(5), 259–267.
doi.org/10.1016/j.ecns.2015.02.004
Kalyuga, S. (2006). Rapid cognitive assessment of learners’ knowledge structures.
Learning and Instruction, 16(1), 1–11. doi.org/10.1016/j.learninstruc.2005.12.002
Kalyuga, S. (2010). Schema acquisition and sources of cognitive load. In J. L. Plass, R.
Moreno, & R. Brünken (Eds.), Cognitive load theory (pp. 48–64). New York, NY:
Cambridge University Press.
Kalyuga, S., Ayres, P., Chandler, P., & Sweller, J. (2003). The expertise reversal effect.
Educational Psychologist, 38, 23–31.
Kalyuga, S., & Hanham, J. (2011). Instructing in generalized knowledge structures to
develop flexible problem solving skills. Computers in Human Behavior, 27(1),
63–68. doi.org/10.1016/j.chb.2010.05.024
Kalyuga, S., & Sweller, J. (2014). The redundancy principle in multimedia learning. In R.
E. Mayer (Ed.), The Cambridge handbook of multimedia learning (2nd ed., pp.
247–262). New York, NY: Cambridge University Press.
Kartal, G. (2010). Does language matter in multimedia learning? Personalization
principle revisited. Journal of Educational Psychology, 102(3), 615–624.
doi.org/10.1037/a0019345
Kaylor, S. K. (2014). Preventing information overload: Cognitive load theory as an
instructional framework for teaching pharmacology. Journal of Nursing
Education. doi.org/10.3928/01484834-20140122-03
Kester, L., Kirschner, P. A., van Merriënboer, J. J. G., & Baumer, A. (2001). Just-in-time

228
information presentation and the acquisition of complex cognitive skills.
Computers in Human Behavior, 17(4), 373–391. doi.org/10.1016/S0747-
5632(01)00011-5
Kester, L., Kirschner, P. A., & van Merriënboer, J. J. G. (2004a). Information presentation
and troubleshooting in electrical circuits. International Journal of Science
Education, 26(2), 239–256. doi.org/10.1080/69032000072809
Kester, L., Kirschner, P. A., & van Merriënboer, J. J. G. (2004b). Timing of information
presentation in learning statistics. Instructional Science, 32(3), 233–252.
doi.org/10.1023/B:TRUC.0000024191.27560.e3
Kester, L., Kirschner, P. A., & van Merriënboer, J. J. G. (2006). Just-in-time information
presentation: Improving learning a troubleshooting skill. Contemporary
Educational Psychology, 31(2), 167–185.
doi.org/10.1016/j.cedpsych.2005.04.002
Kester, L., Lehnen, C., Van Gerven, P. W. M., & Kirschner, P. A. (2006). Just-in-time,
schematic supportive information presentation during cognitive skill acquisition.
Computers in Human Behavior, 22(1), 93–112. doi.org/10.1016/j.chb.2005.01.008
Kiewra, K. A., Mayer, R. E., Dubois, N. F., Christensen, M., Kim, S. I., & Risch, N.
(1996). Effects of advance organizers and repeated presentations on students’
learning. The Journal of Experimental Education, 65(2), 147–159.
doi.org/10.1080/00220973.1997.9943789
Kinchin, I. M., & Hay, D. B. (2000). How a qualitative approach to concept map analysis
can be used to aid learning by illustrating patterns of conceptual development?
Educational Research, 42(1), 43–57. doi:10.1080/001318800363908
229
King, D. J., & Russell, G. W. (1966). A comparison of rote and meaningful learning of
connected meaningful material. Journal of Verbal Learning and Verbal Behavior,
5, 478–483.
Kirkland, C. E., Byrom, E. M., MacDougall, M. A., & Corcoran, M. D. (1995, April).
Using advance organizers with learning disabled students. Paper presented at the
meeting of the American Educational Research Association, San Francisco, CA.
Klemm, W. R. (2007). What good is learning if you don’t remember it? Journal of
Effective Teaching, 7(1), 61–73.
Korur, F., Toker, S., & Eryilmaz, A. (2016). Effects of the integrated online advance
organizer teaching materials on students’ science achievement and attitude.
Journal of Science Education and Technology, 25(4), 628–640.
doi.org/10.1007/s10956-016-9618-4
Koscianski, A., Ribeiro, R. J., & Da Silva, S. C. R. (2012). Short animation movies as
advance organizers in physics teaching: a preliminary study. Research in Science
& Technological Education, 30(3), 255–269.
doi.org/10.1080/02635143.2012.732057
Kotovsky, K., Hayes, J. R., & Simon, H. A. (1985). Why are some problems hard?
Evidence from Tower of Hanoi. Cognitive Psychology, 17(2), 248–294.
Kozlow, M. J. (1978). A meta-analysis of selected advance organizer research reports
from 1960–1977. (Unpublished doctoral dissertation). Ohio State University.
Krathwohl, D. R. (2009). Methods of educational and social science research (3rd ed.).
Long Grove, IL: Waveland Press.
230
Kubovy, M., & van den Berg, M. (2008). The whole is equal to the sum of its parts: A
probabilistic model of grouping by proximity and similarity in regular patterns.
Psychological Review, 115(1), 131–154. doi.org/10.1037/0033-295X.115.1.131
Kühl, T., Scheiter, K., Gerjets, P., & Edelmann, J. (2011). The influence of text modality
on learning with static and dynamic visualizations. Computers in Human
Behavior, 27(1), 29–35. doi.org/10.1016/j.chb.2010.05.008
Kuhn, D. J., & Novak, J. D. (1971). A study of cognitive subsumption in the life
sciences. Science Education, 55(3), 309–320. doi:10.1002/sce.3730550310
Lai, F.-Q., & Newby, T. J. (2012). Impact of static graphics, animated graphics and
mental imagery on a complex learning task. Australasian Journal of Educational
Technology, 28(1), 91–104.
Lambiotte, J. G., Skaggs, L. P., & Dansereau, D. F. (1993). Learning from lectures:
Effects of knowledge maps and cooperative review strategies. Applied Cognitive
Psychology, 7(6), 483–497.
Lane, S. J., Roley, S. S., & Champagne, T. (2014). Sensory integration and processing:
Theories and applications to occupational performance. In B. A. Schell, G. Gillen,
M. Scaffa, & E. S. Cohn (Eds.), Willard and Spackman’s occupational therapy
(12th ed., pp. 816–868). Baltimore, MD: Lippincott Williams & Wilkins.
Langan-Fox, J., Platania-Phung, C., & Waycott, J. (2006). Effects of advance organizers,
mental models and abilities on task and recall performance using a mobile phone
network. Applied Cognitive Psychology, 20(9), 1143–1165.
doi.org/10.1002/acp.1258
231
Langan-Fox, J., Waycott, J. L., & Albert, K. (2000). Linear and graphic advance
organizers: Properties and processing. International Journal of Cognitive
Ergonomics, 4(1), 19–34.
Langford, P. A., Rizzo, S. K., & Roth, J. M. (2003). Improving student comprehension in
content areas through the use of reading strategies. Retrieved from
http://eric.ed.gov/?id=ED478769
Lanoue, S. (2016). Cognitive psychology for UX: 7 Gestalt principles of visual
perception. Retrieved from https://www.usertesting.com/blog/2016/02/24/gestalt-
principles/
Lee, H., Plass, J. L., & Homer, B. D. (2006). Optimizing cognitive load for learning from
computer-based science simulations. Journal of Educational Psychology, 98(4),
902–913. doi.org/10.1037/0022-0663.98.4.902
Lee, W., Chiang, C. H., Liao, I. C., Lee, M. L., Chen, S. L., & Liang, T. (2013). The
longitudinal effect of concept map teaching on critical thinking of nursing
students. Nurse Education Today, 33(10), 1219–1223.
doi.org/10.1016/j.nedt.2012.06.010
Lee, Y. J. (2010). Effects of instructional preparation strategies on problem solving in a
web-based learning environment. Journal of Educational Computing Research,
42(4), 385–406.
Leppink, J., & van den Heuvel, A. (2015). The evolution of cognitive load theory and its
application to medical education. Perspectives on Medical Education, 4(3), 119–
127. doi.org/10.1007/s40037-015-0192-x
232
Lewalter, D. (2003). Cognitive strategies for learning from static and dynamic visuals.
Learning and Instruction, 13(2), 177–189. doi.org/10.1016/S0959-
4752(02)00019-1
Li, C. H. (2012). Are they listening better? Supporting EFL college students’ DVD video
comprehension with advance organizers in a multimedia English course. Journal
of College Teaching & Learning (Online), 9(4), 277.
Lin, H., & Chen, T. (2007). Reading authentic EFL text using visualization and advance
organizers in a multimedia learning environment. Language Learning &
Technology, 11(3), 83–106.
Liu, P. L. (2014). Using eye tracking to understand learners’ reading process through the
concept-mapping learning strategy. Computers & Education, 78, 237–249.
Low, R., & Sweller, J. (2014). The modality principle in multimedia learning. In R. E.
Mayer (Ed.), The Cambridge handbook of multimedia learning (2nd ed., pp. 227–
246). New York, NY: Cambridge University Press.
Lowe, R. K. (2003). Animation and learning: Selective processing of information in
dynamic graphics. Learning and Instruction, 13, 157–176.
Lowe, R. K., & Schnotz, W. (2014). Animation principles in multimedia learning. In R.
E. Mayer (Ed.), The Cambridge handbook of multimedia learning (2nd ed., pp.
513–546). New York, NY: Cambridge University Press.
Luiten, J., Ames, W., & Ackerson, G. (1980). A meta-analysis of the effects of advance
organizers on learning and retention. American Educational Research Journal,
17(2), 211–218.
233
Maneval, R. E., Filburn, M. J., Deringer, S. O., & Lum, G. D. (2011). Concept mapping:
does it improve critical thinking ability in practical nursing students? Nursing
Education Perspectives, 32(4), 229–233.
Marée, T. J., van Bruggen, J. M., & Jochems, W. M. G. (2013). Effective self-regulated
science learning through multimedia-enriched skeleton concept maps. Research in
Science & Technological Education, 31(1), 16–30.
doi.org/10.1080/02635143.2013.782283
Mautone, P. D., & Mayer, R. E. (2001). Signaling as a cognitive guide in multimedia
learning. Journal of Educational Psychology, 93(2), 377-389.
Mautone, P. D., & Mayer, R. E. (2007). Cognitive aids for guiding graph comprehension.
Journal of Educational Psychology, 99(3), 640–652. doi.org/10.1037/0022-
0663.99.3.640
Mayer, R. E. (1979). Can advance organizers influence meaningful learning? Review of
Educational Research, 49(2), 371. doi.org/10.2307/1169964
Mayer, R. E. (1983). Can you repeat that? Qualitative effects of repetition and advance
organizers on learning from science prose. Journal of Educational Psychology,
75(1), 40.
Mayer, R. E. (1999). Multimedia aids to problem-solving transfer. International Journal
of Educational Research, 31(7), 611–623.
Mayer, R. E. (2001). Multimedia learning. New York: Cambridge University Press.
Mayer, R. E. (2002). Rote versus meaningful learning. Theory into Practice, 41(4), 15–
21.
Mayer, R. E. (2008). Applying the science of learning: Evidence-based principles for the
234
design of multimedia instruction. American Psychologist, 63(8), 760.
Mayer, R. E. (2009). Multimedia learning (2nd ed.). New York, NY: Cambridge
University Press.
Mayer, R. E. (2010). Applying the science of learning to medical education: Applying the
science of learning. Medical Education, 44(6), 543–549. doi.org/10.1111/j.1365-
2923.2010.03624.x
Mayer, R. E. (2013). Fostering learning with visual displays. In G. Schraw, M. T.
McCrudden, & D. Robinson (Eds.), Learning through visual displays (pp. 47–74).
Charlotte, NC: Information Age.
Mayer, R. E. (2014a). Cognitive theory of multimedia learning. In R. E. Mayer (Ed.), The
Cambridge handbook of multimedia learning (2nd ed., pp. 43–71). New York,
NY: Cambridge University Press.
Mayer, R. E. (2014b). Principles based on social cues in multimedia learning:
Personalization, voice, image, and embodiment principles. In R. E. Mayer (Ed.),
The Cambridge handbook of multimedia learning (2nd ed., pp. 345–370). New
York, NY: Cambridge University Press.
Mayer, R. E., & Estrella, G. (2014). Benefits of emotional design in multimedia
instruction. Learning and Instructions, 33, 12–18.
Mayer, R. E., Fennel, S., Farmer, L., & Campbell, J. (2004). A personalization effect in
multimedia learning: Students learn better when words are in conversational style
rather than formal style. Journal of Educational Psychology, 95, 419–425.
Mayer, R. E., & Fiorella, L. (2014). Principles for reducing extraneous processing. In R.
E. Mayer (Ed.), The Cambridge handbook of multimedia learning (2nd ed., pp.
235
279–315). New York, NY: Cambridge University Press.
Mayer, R. E., Mathias, A., & Wetzell, K. (2002). Fostering understanding of multimedia
messages through pre-training: Evidence for a two-stage theory of mental model
construction. Journal of Experimental Psychology: Applied, 8(3), 147–154.
doi.org/10.1037/1076-898X.8.3.147
Mayer, R. E., Mautone, P., & Prothero, W. (2002). Pictorial aids for learning by doing in
a multimedia geology simulation game. Journal of Educational Psychology,
94(1), 171–185. doi.org/10.1037/0022-0663.94.1.171
Mayer, R. E., & Moreno, R. (2003). Nine ways to reduce cognitive load in multimedia
learning. Educational Psychologist, 38(1), 43–52.
doi.org/10.1207/S15326985EP3801_6
Mayer, R. E., & Moreno, R. (2010a). Techniques that reduce extraneous cognitive load
and manage intrinsic cognitive load during multimedia learning. In J. L. Plass, R.
Moreno, & R. Brünken (Eds.), Cognitive load theory (pp. 131–152). New York,
NY: Cambridge University Press.
Mayer, R. E., & Moreno, R. (2010b). Techniques that increase generative processing in
multimedia learning: Open questions for cognitive load research. In J. L. Plass, R.
Moreno, & R. Brünken (Eds.), Cognitive load theory (pp. 153–180). New York,
NY: Cambridge University Press.
Mayer, R. E., & Pilegard, C. (2014). Principles for managing essential processing in
multimedia learning: Segmenting, pretraining, and modality principles. In R. E.
Mayer (Ed.), The Cambridge handbook of multimedia learning (2nd ed., pp. 316–
344). New York, NY: Cambridge University Press.
236
Mayer, R. E., & Wittrock, M. C. (1996). Problem-solving transfer. In D. Berliner & R.
Calfee (Eds.), Handbook of educational psychology (pp. 47–62). New York, NY:
Routledge.
McCrudden, M. T., Magliano, J. P., & Schraw, G. (2011). The effect of diagrams on
online reading processes and memory. Discourse Processes, 48(2), 69–92.
doi.org/10.1080/01638531003694561
McDonnell, C., O’Connor, C., & Rawe, S. (2012). Scaffolding for cognitive overload
using pre-lecture e-resources (SCOPE) for first year chemistry undergraduates.
Teaching Fellowships. Paper 26. Retrieved from http://arrow.dit.ie/fellow/26/
McEneaney, J. E. (1990). Do advance organizers facilitate learning? A review of
subsumption theory. Journal of Research and Development in Education, 23(2),
89–96.
McLaren, B. M., DeLeeuw. K. E., & Mayer, R. E. (2011a). Polite web-based intelligent
tutors: Can they improve learning in classrooms? Computers in Education, 56,
574–584.
McLaren, B. M., DeLeeuw. K. E., & Mayer, R. E. (2011b). A politeness effect in learning
with web-based intelligent tutors. International Journal of Human-Computer
Studies, 69, 70–79.
McMullen, M. A., & McMullen, W. F. (2009). Examining patterns of change in the
critical thinking skills of graduate nursing students. Journal of Nursing Education,
48(6), 310–318.
Michael, J. (2007). What makes physiology hard for students to learn? Results of a
faculty survey. AJP: Advances in Physiology Education, 31(1), 34–40.
237
doi.org/10.1152/advan.00057.2006
Miller, G. A. (1956). The magical number seven, plus or minus two: Some limits on our
capacity for processing information. Psychological Review, 63(2), 81–97.
Miller-Kuhaneck, H., Bortone, J. M., & Frost, L. (2007). Concept mapping 101.
American Occupational Therapy Association’s Education Special Interest Section
Quarterly, 17(2), 1–4. Retrieved from
https://works.bepress.com/heather_kuhaneck/9/
Mishra, P., & Koehler, M. J. (2006). Technological pedagogical content knowledge: A
framework for teacher knowledge. Teachers College Record, 108(6), 1017–1054.
Mitchell, M. (2015). Effect size tutorial. Retrieved from
http://mathewmitchell.net/tutorials/effectsize
Mohammadi, M., Moenikia, M., & Zahed-Babelan, A. (2010). The role of advance
organizer on English language learning as a second language. Procedia—Social
and Behavioral Sciences, 2(2), 4667–4671. doi.org/10.1016/j.sbspro.2010.03.747
Molinari, G. (2017). From learners’ concept maps of their similar or complementary prior
knowledge to collaborative concept map: Dual eye-tracking and concept map
analyses. Psychologie Française, 62(3), 293–311.
Moore, D. W., & Readence, J. E. (1984). A quantitative and qualitative review of graphic
organizer research. Journal of Educational Research, 78(1), 11–17.
Moravec, M., Williams, A., Aguilar-Roca, N., & O’Dowd, D. K. (2010). Learn before
lecture: A strategy that improves learning outcomes in a large introductory
biology class. CBE Life Sciences Education, 9(4), 473–481.
doi.org/10.1187/cbe.10-04-0063
238
Moreno, R., & Abercrombie, S. (2010). Promoting awareness of learner diversity in
prospective teachers: Signaling individual and group differences within virtual
classroom cases. Journal of Technology and Teacher Education, 18(1), 111–130.
Moreno, R., & Mayer, R. E. (2004). Personalized messages that promote science learning
in virtual environments. Journal of Educational Psychology, 96(1), 165–173.
doi.org/10.1037/0022-0663.96.1.165
Moreno, R., & Park, B. (2010). Cognitive load theory: Historical development and
relation to other theories. In J. L. Plass, R. Moreno, & R. Brünken (Eds.),
Cognitive load theory (pp. 9–28). New York, NY: Cambridge University Press.
Naismith, L. M., Cheung, J. J. H., Ringsted, C., & Cavalcanti, R. B. (2015). Limitations
of subjective cognitive load measures in simulation-based procedural training.
Medical Education, 49(8), 805–814. doi.org/10.1111/medu.12732
Neebe, D. (2017). Differentiating literacy instruction for digital learners: The effect of
multimedia think-aloud worked examples on adolescent analytical reading
comprehension (Unpublished doctoral dissertation). The University of San
Francisco, San Francisco, CA.
Nesbit, J. C., & Adesope, O. O. (2011). Learning from animated concept maps with
concurrent audio narration. The Journal of Experimental Education, 79, 209–230.
Nesbit, J. C., & Adesope, O. O. (2006). Learning with concept and knowledge maps: A
meta-analysis. Review of Educational Research, 76(3), 413–448.
doi.org/10.3102/00346543076003413
Nesbit, J. C., & Adesope, O. O. (2013). Concept maps for learning: Theory, research, and
design. In G. Schraw, M. T. McCrudden, & D. Robinson (Eds.), Learning
239
through visual displays (pp. 303–328). Charlotte, NC: Information Age.
Novak, J., & Gowin, D. B. (1984). Learning how to learn. Cambridge, UK: Cambridge
University Press.
Novak, J. D. (1990). Concept maps and vee diagrams: Two metacognitive tools to
facilitate meaningful learning. Instructional Science, 19, 29–52.
Novak, J. D. (2002). Meaningful learning: The essential factor for conceptual change in
limited or inappropriate propositional hierarchies leading to empowerment of
learners. Science Education, 86(4), 548–571. doi.org/10.1002/sce.10032
Novak, J. D. (2010). Learning, creating, and using knowledge: Concept maps as
facilitative tools in schools and corporation (invited paper). Journal of e-Learning
and Knowledge Society, 6(3), 21–30.
Novak, J. D. (2013). Meaningful learning is the foundation for creativity. Qurriculum:
Revista de Teoría, Investigación Y Práctica Educativa, 26, 27–38.
Novak, J. D., & Cañas, A. J. (2008). The theory underlying concept maps and how to
construct them. Florida Institute for Human and Machine Cognition, 1. Retrieved
from
http://cmap.ihmc.us/Publications/researchPapers/theorycmaps/TheoryUnderlying
ConceptMaps.bck-11-01-06.htm
Novick, L. R. (2006). Understanding spatial diagram structure: An analysis of
hierarchies, matrices, and networks. Quarterly Journal of Experimental
Psychology, 59(10), 1826–1856. doi.org/10.1080/17470210500298997
O’Donnell, A. M., Dansereau, D. F., & Hall, R. H. (2002). Knowledge maps as scaffolds
for cognitive processing. Educational Psychology Review, 14, 71–86.
240
Ozcelik, E., Arslan-Ari, I., & Cagiltay, K. (2010). Why does signaling enhance
multimedia learning? Evidence from eye movements. Computers in Human
Behavior, 26, 110–117.
Paas, F., Renkl, A., & Sweller, J. (2003). Cognitive load theory and instructional design:
Recent developments. Educational Psychologist, 38(1), 1–4.
Paas, F., & Sweller, J. (2014). Implications of cognitive load theory for multimedia
learning. In R. E. Mayer (Ed.), The Cambridge handbook of multimedia learning
(2nd ed., pp. 27–42). New York, NY: Cambridge University Press.
Paivio, A. (1986). Mental representations: A dual coding approach. Oxford, UK: Oxford
University Press.
Paivio, A. (2008). The dual coding theory. In S. B. Neuman (Ed.), Educating the other
America: Top experts tackle poverty, literacy, and achievement in our schools
(pp.227–242). Baltimore, MD: Bookes.
Parham, L. D., & Mailloux, Z. (2015). Sensory integration. In J. Case-Smith & J. C.
O’Brien (Eds.), Occupational therapy for children and adolescents (7th ed., pp.
258–303). St. Louis, MO: Elsevier Health Sciences.
Parham, L. D., Roley, S. S., May-Benson, T. A., Koomar, J., Brett-Green, B., Burke, J. P.,
Cohn, E. S., Mailloux, Z., Miller, L. J., & Schaaf, R. C. (2011). Development of a
fidelity measure for research on the effectiveness of the Ayres Sensory
Integration® intervention. American Journal of Occupational Therapy, 65(2),
133–142.
Patterson, M. E., Dansereau, D. F., & Wiesmann, D. A. (1993). Receiving information
during a cooperative episode: Effects of communication aids and verbal ability.
241
Learning and Individual Differences, 5, 1–11.
Peterson, D. J., & Berryhill, M. E. (2013). The Gestalt principle of similarity benefits
visual working memory. Psychonomic Bulletin & Review, 20(6), 1282–1289.
doi.org/10.3758/s13423-013-0460-x
Peterson, L., & Peterson, M. (1959). Short-term retention of individual verbal items.
Journal of Experimental Psychology, 58, 193–198.
Pociask, F. D., DiZazzo-Miller, R., & Samuel, P. S. (2013). Reducing cognitive load
while teaching complex instruction to occupational therapy students. American
Journal of Occupational Therapy, 67(5), e92–e99.
Pociask, F. D., Morrison, G. R., & Reid, K. R. (2013). Managing cognitive load while
teaching human gait to novice health care science students. Journal of Physical
Therapy Education, 27(1), 58.
Pollock, E., Chandler, P., & Sweller, J. (2002). Assimilating complex information.
Learning and Instruction, 12(1), 61–86. doi.org/10.1016/S0959-4752(01)00016-0
Popham, W.J. (2000). Modern educational measurement: Practical guidelines for
educational leaders (3rd ed.). New York, NY: Pearson.
Putnam, A. L., Sungkhasettee, V. W., & Roediger, H. L. (2016). Optimizing learning in
college tips from cognitive psychology. Perspectives on Psychological Science,
11(5), 652–660.
Quinlan, P. T. and Wilton, R. N. (1998). Grouping by proximity or similarity?
Competition between the gestalt principles in vision. Perception, 27(4), 417–430.
Raddi, S. A. (2010). Concept mapping in nursing education. International Journal of
Nursing Education, 2(1), 55-58.

242
Reynolds, G. (2013). Presentation Zen design: Simple design principles and techniques
to enhance your presentations (2nd ed.). Berkeley, CA: New Riders.
Robinson, D. H., & Kiewra, K. A. (1995). Visual argument: Graphic organizers are
superior to outlines in improving learning from text. Journal of Educational
Psychology, 87(3), 455–467. doi.org/10.1037/0022-0663.87.3.455
Robinson, D. H., Robinson, S. L., & Katayama, A. D. (1999). When words are
represented in memory like pictures: Evidence for spatial encoding of study
materials. Contemporary Educational Psychology, 24, 38–54.
Roche, C. (2016). The effect of more and less relevant details and teacher voice on
student retention and problem-solving transfer in teacher-created multimedia
(Unpublished doctoral dissertation). The University of San Francisco, San
Francisco, CA.
Roman, D., Jones, F., Basaraba, D., & Hironaka, S. (2016). Helping students bridge
inferences in science texts using graphic organizers. Journal of Adolescent &
Adult Literacy, 60(2), 121–130. doi.org/10.1002/jaal.555
Rosenshine, B. V., & Meister, C. (1992). The use of scaffolds for teaching less structured
cognitive tasks. Educational Leadership, 49(7), 26–33.
Schaaf, R. C., & Mailloux, Z. (2015). Clinician’s guide for implementing Ayres Sensory
Integration: Promoting participation for children with autism. Bethesda, MD:
AOTA.
Schaaf, R. C., Schoen, S. A., Roley, S. S., Lane, S. J., Koomar, J., & May Benson, T. A.
(2010). A frame of reference for sensory integration. In P. Kramer & J. Hinojosa
(Eds.), Frames of reference for pediatric occupational therapy (3rd ed., pp. 99–

243
186). Baltimore, MD: Lippincott Williams & Wilkins.
Schaber, P. (2014). Conference Proceedings—Keynote address: Searching for and
identifying signature pedagogies in occupational therapy education. American
Journal of Occupational Therapy, 68, S40–S44. doi.org/10.5014/
ajot.2014.685S08
Schraw, G., McCrudden, M. T., & Robinson, D. (Eds.). (2013). Learning through visual
displays. Charlotte, NC: Information Age.
Schraw, G., & Paik, E. (2013). Toward a typology of instructional visual displays. In G.
Schraw, M. T. McCrudden, & D. Robinson (Eds.), Learning through visual
displays (pp. 97–132). Charlotte, NC: Information Age.
Schroeder, N. L., Nesbit, J. C., Anguiano, C. J., & Adesope, O. O. (2017). Studying and
constructing concept maps: A meta-analysis. Educational Psychology Review.
doi.org/10.1007/s10648-017-9403-9
Schüler, A., Scheiter, K., & van Genuchten, E. (2011). The role of working memory in
multimedia instruction: Is working memory working during learning from text
and pictures? Educational Psychology Review, 23(3), 389–411.
doi.org/10.1007/s10648-011-9168-5
Schunk, D. H. (2012). Learning theories: An educational perspective (6th ed.). Boston,
MA: Pearson.
Schwartz, N. H., Ellsworth, L. S., Graham, L., & Knight, B. (1998). Accessing prior
knowledge to remember text: A comparison of advance organizers and maps.
Contemporary Educational Psychology, 23, 65–89.
Seery, M. K., & Donnelly, R. (2012). The implementation of pre-lecture resources to
244
reduce in-class cognitive load: A case study for higher education chemistry: Pre-
lecture resources to reduce cognitive load. British Journal of Educational
Technology, 43(4), 667–677. doi.org/10.1111/j.1467-8535.2011.01237.x
Senita, J. (2008). The use of concept maps to evaluate critical thinking in the clinical
setting. Teaching and Learning in Nursing, 3(1), 6–10.
doi.org/10.1016/j.teln.2007.08.002
Shavelson, R. J. (1974). Some methods for examining content structure and cognitive
structure in instruction. Educational Psychologist, 11(2), 110–122.
doi.org/10.1080/00461527409529132
Shavelson, R. J., Ruiz-Primo, M. A., & Wiley, E. W. (2005). Windows into the mind.
Higher Education, 49(4), 413–430. doi.org/10.1007/s10734-004-9448-9
Shiffrin, R. M., & Nosofsky, R. M. (1994). Seven, plus or minus two: A commentary on
capacity limitations. Psychological Review, 101(2), 343–352.
Shihusa, H., & Keraro, F. N. (2009). Using advance organizers to enhance students’
motivation in learning biology. Eurasia Journal of Mathematics, Science &
Technology Education, 5(4), 413–420.
Shuell, T. J. (1990). Phases of meaningful learning. Review of Educational Research,
60(4), 531. doi.org/10.2307/1170505
Shulman, L. S. (1986). Those who understand: Knowledge growth in teaching.
Educational Researcher, 15(2), 4–14.
Shulman, L. S. (1987). Knowledge and teaching: Foundations of the new reform.
Harvard Educational Review, 57(1), 1–21.
Simon, H., & Gilmartin, K. (1973). A simulation of memory for chess positions.
245
Cognitive Psychology, 5, 29–46.
Soegaard, M. (2018). Gestalt principles (1, 2, 3). Interaction Design Foundation.
Retrieved from https://www.interaction-design.org/literature/article/the-law-of-
similarity-gestalt-principles-1
Sözbilir, M. (2004). What makes physical chemistry difficult? Perceptions of Turkish
chemistry undergraduates and lecturers. Journal of Chemical Education, 81(4),
573.
Squire, L. R. (1992). Declarative and non-declarative memory: Multiple brain systems
supporting learning and memory. Journal of Cognitive Neuroscience, 4, 232–243.
Stanley, M. J., & Dougherty, J. P. (2010). A paradigm shift in nursing education: A new
model. Nursing Education Perspectives, 31, 378–380.
Stensvold, M. S., & Wilson, J. T. (1990). The interaction of verbal ability with concept
mapping in learning from a chemistry laboratory activity. Science Education, 74,
473–480.
Stone, C. L. (1983). A meta-analysis of advance organizer studies. Journal of
Experimental Education, 51(4), 194–199.
Sweller, J. (1988). Cognitive load during problem solving: Effects of problem solving.
Cognitive Science, 12, 257–285.
Sweller, J. (1994). Cognitive load theory, learning difficulty, and instructional design.
Learning and Instruction, 4(4), 295–312. doi.org/10.1016/0959-4752(94)90003-5
Sweller, J. (2010). Cognitive load theory: Recent theoretical advances. In J. L. Plass, R.
Moreno, & R. Brünken (Eds.), Cognitive load theory (pp. 29–47). New York, NY:
Cambridge University Press.
246
Sweller, J., Ayres, P., & Kalyuga, S. (2011). Cognitive load theory: Explorations in the
learning sciences, instructional systems and performance technologies. New
York, NY: Springer.
Sweller, J. & Chandler, P. (1994). Why some material is difficult to learn. Cognition and
Instruction, 12(3), 185–233.
Sweller, J., van Merrienboer, J. J. G., & Paas, F. G. W. C. (1998). Cognitive architecture
and instructional design. Educational Psychology Review, 10(3), 251–296.
doi.org/10.1023/A:1022193728205
Taylor, J. & Wros, P. (2007). Concept mapping: A nursing model for care planning.
Journal of Nursing Education, 46(5), 211–216.
Thompson, D. N. (1998). Using advance organizers to facilitate reading comprehension
among older adults. Educational Gerontology, 24(7), 625–638.
Tseng, H. C., Chou, F. H., Wang, H. H., Ko, H.-K., Jian, S. Y., & Weng, W. C. (2011).
The effectiveness of problem-based learning and concept mapping among
Taiwanese registered nursing students. Nurse Education Today, 31(8), e41–e46.
Tufte, E. R. (2001). The visual display of quantitative information (2nd ed.). Cheshire,
CT: Graphics Press.
Tversky, B., Morrison, J. B., & Betancourt, M. (2002). Animation: Can it facilitate?
International Journal of Human-Computer Studies, 57, 247–262.
Um, E. “Rachel,” Plass, J. L., Hayward, E. O., & Homer, B. D. (2012). Emotional design
in multimedia learning. Journal of Educational Psychology, 104(2), 485–498.
doi.org/10.1037/a0026609
United States Bureau of Labor Statistics. (2016). Labor force statistics from the current

247
population survey. Downloaded from http://www.bls.gov/cps/cpsaat11.htm
Urakami, J., & Krems, J. F. (2012). How hypertext reading sequences affect
understanding of causal and temporal relations in story comprehension.
Instructional Science, 40(2), 277–295. doi.org/10.1007/s11251-011-9178-1
Vacek, J. E. (2009). Using a conceptual approach with concept mapping to promote
critical thinking. Journal of Nursing Education, 48(1), 45–48.
Van Gog, T. (2014). The signaling or cueing principle in multimedia learning. In R. E.
Mayer (Ed.), The Cambridge handbook of multimedia learning (2nd ed., pp. 263–
278). New York, NY: Cambridge University Press.
Van Merriënboer, J. J. G., Kester, L., & Paas, F. (2006). Teaching complex rather than
simple tasks: Balancing intrinsic and germane load to enhance transfer of
learning. Applied Cognitive Psychology, 20(3), 343–352.
Van Merriënboer, J. J. G., & Kester, L. (2008). Whole-task models in education. In J. M.
Spector, M. D. Merrill, J. J. G. van Merriënboer, & M. P. Driscoll (Eds.),
Handbook of research on educational communications and technology (3rd ed.,
pp. 441–456). New York: Lawrence Erlbaum.
Van Merriënboer, J. J. G., & Kester, L. (2014). The four-component instructional design
model: Multimedia design principles in environments for complex learning. In R.
E. Mayer (Ed.), The Cambridge handbook of multimedia learning (2nd ed., pp.
104–150). New York, NY: Cambridge University Press.
Van Merrienboer, J. J. G., Kirschner, P. A., & Kester, L. (2003). Taking the load off a
learner’s mind: Instructional design for complex learning. Educational
Psychologist, 38(1), 5–13. doi.org/10.1207/S15326985EP3801_2
248
Van Merriënboer, J. J. G., & Sweller, J. (2005). Cognitive load theory and complex
learning: Recent developments and future directions. Educational Psychology
Review, 17(2), 147–177. doi.org/10.1007/s10648-005-3951-0
Van Merriënboer, J. J. G., & Sweller, J. (2010). Cognitive load theory in health
professional education: Design principles and strategies. Medical Education,
44(1), 85–93. doi.org/10.1111/j.1365-2923.2009.03498.x
Walberg, H. J., & Paik, S. J. (2000). Effective educational practices. Educational
Practices Series–3. Retrieved from http://eric.ed.gov/?id=ED443788
Wallace, D. S., West, S. W. C., Ware, A., & Dansereau, D. F. (1998). The effect of
knowledge maps that incorporate gestalt principles on learning. Journal of
Experimental Education, 67, 5–16.
Wang, Y., & Crooks, S. M. (2015). Does combining the embodiment and personalization
principles of multimedia learning affect learning the culture of a foreign language?
Journal of Educational Multimedia and Hypermedia, 24(2), 161–177.
Weinstein, C. E., & Mayer, R. (1986). The teaching of learning strategies. In M. C.
Wittrock (Ed.), Handbook of research on teaching (pp. 315–327). New York:
Macmillan.
Weisberg, J. S. (1970, March). The use of visual advance organizers for learning earth
science concepts. Paper presented at the 43rd annual meeting of the National
Association for Research in Science Teaching, Minneapolis, MN.
Wheeler, L. A., & Collins, S. K. (2003). The influence of concept mapping on critical
thinking in baccalaureate nursing students. Journal of Professional Nursing,
19(6), 339–346. doi.org/10.1016/S8755-7223(03)00134-0
249
Wiegmann, D. A., Dansereau, D. F., McCagg, E. C., Rewey, K. L., & Pitre, U. (1992).
Effects of knowledge map characteristics on information processing. Contemporary
Educational Psychology, 17(2), 136–155.
Wiggins, G., & McTighe, J. (2005). Understanding by design (2nd ed.). Upper Saddle
River, NY: Pearson Education.
Willerman, M., & MacHarg, R. A. (1991). The concept map as an advance organizer.
Journal of Research in Science Teaching, 28(8), 705–711.
Williams, T. R., & Butterfield, E. C. (1992). Advance organizers: a review of the
research—Part I. Journal of Technical Writing and Communication, 22(3), 259–
272.
Williamson, G. G., & Anzalone, M. E. (2001). Sensory integration and self-regulation in
infants and toddlers: Helping very young children interact with their environment.
Washington DC: Zero to Three.
Wylie, R., & Chi, M. T. H. (2014). The self-explanation principle in multimedia learning.
In R. E. Mayer (Ed.), The Cambridge handbook of multimedia learning (2nd ed.,
pp. 413–432). New York, NY: Cambridge University Press.
Zheng, R. Z., Gupta, U., & Dewald, A. (2012). Does the format of pretraining matter? A
study on the effects of different pretraining approaches on prior knowledge
construction in an online learning environment. International Journal of Cyber
Behavior, Psychology and Learning, 2(2), 35–47.
Zhu, L., & Grabowski, B. (2006). Web-based animation or static graphics: Is the extra
cost of animation worth it? Journal of Educational Multimedia and Hypermedia,
15, 329–347.

250
Appendix A
Glossary of Terms
Advance organizer: Relevant introductory materials presented in advance of text,
graphics, or hypermedia. The focus of an advance organizer is to relate prior
knowledge to new content to be learned with a goal of increasing retention.
Advance organizers should be at a higher level of abstraction, generality, and
inclusiveness than the core content to be presented (Ausubel, 1968).
Animated concept map: A computer-generated concept map that changes over time and
allows variability in the pace and sequence of the map display (Adesope &
Nesbit, 2013). For the purposes of this study, an animated concept map is
operationally defined as a complete concept map that is revealed to the learner
segment by segment over time, with a goal of aiding in the navigation of the map
and thus reducing map shock.
Cognitive load theory: An instructional design theory based on knowledge of human
cognitive architecture that specifically addresses the limitations of working
memory (Paas & Sweller, 2014). Cognitive load theory has three classifications of
mental effort during learning: germane load, extraneous load, and intrinsic load
(Sweller, 1994).
Cognitive theory of multimedia learning: An instructional design theory that asserts that
learning from words and pictures together is more effective than learning from
words alone (Mayer, 2009). The cognitive theory of multimedia learning relies
upon three assumptions: limited capacity of working memory (Mayer, 2014a),
251
dual-channel processing (Paivio, 1986), and active information processing
(Mayer, 2014a).
Complex content: Academic topics that have high levels of element interactivity.
Increased element interactivity makes complex content more difficult to learn,
due to increased stress on working memory (Sweller et al., 2011).
Concept map: A visual diagram composed of nodes and links. Nodes are geometric
shapes containing text that provides topical information. Links are lines that
connect the nodes and indicate relationships between them. (Eppler, 2006; Novak
& Cañas, 2008). Most concept maps are arranged hierarchically and provide an
overarching view of a topic by showcasing and highlighting the main concepts, as
well as providing the most relevant details (Amadieu et al., 2009). For the
purposes of this study, a concept map is operationally defined as a hierarchically
structured visual display that includes the use of color coding and proximity of
nodes to signal the viewer about relevant aspects of the map and reading sequence
(Mayer, 2009; Van Gog, 2014). Links are labeled as necessary.
Dual-coding: A theory suggesting that the human neurological system processes verbal
and visuospatial information in separate cognitive centers of the brain. Dual
processing is hypothesized to augment information retention and retrieval (Paivio,
1986).
Effect size: A statistical measure of significance that describes “how big the difference is
between group means, or how impressive the relationship is between variables,”
and thus provides a sense of the practical importance of a given phenomenon
(Mitchell, 2015). Effect size is most commonly measured using Cohen’s d

252
(Cohen, 1988) and is calculated by subtracting the mean score of the control
group from the mean score of the experimental group, and dividing by the pooled
standard deviation. The effect size indicates, in standard deviation units, how
much improvement in performance was obtained from the treatment (Mayer,
2009). An effect size of d > .80 is considered a large effect, d > .50 is considered
a medium effect, d > .20 is considered a small effect, and d < .20 is considered as
having no effect.
Element interactivity: The number of items of information that must be processed
simultaneously in working memory. Topics that are high in element interactivity
are typically complex and place a high burden on working memory capacity,
which translates into high intrinsic load (Sweller, 2010). For the purposes of this
study, element interactivity is operationally defined as a prime determinant of the
complexity level of an academic topic. The number of items needed for a state of
high element interactivity is dependent on the topic and the difficulty level of
each of the items. Therefore no quantitative formula can be provided.
Essential processing: In the cognitive theory of multimedia learning, the learning
processes that relate to complexity of content. Synonymous with intrinsic
cognitive load (Mayer, 2014a).
Extraneous load: In cognitive load theory, the unnecessary demands placed on working
memory by sub-optimal design of instructional materials. Synonymous with
extraneous processing (Paas & Sweller, 2014).
253
Extraneous processing: In the cognitive theory of multimedia learning, the non-essential
and confounding processes present during learning that unnecessarily stress
working memory. Synonymous with extraneous load (Mayer, 2014a).
Far transfer: A type of content application in which there is little overlap between the
original context and the transfer context (Schunk, 2012).
Generative processing: In the cognitive theory of multimedia learning, the cognitive
processing needed to make sense of essential learning material and augmented by
the learner’s motivation and effort. Synonymous with germane load (Mayer,
2014b).
Germane load: In cognitive load theory, the mental effort that can be devoted to the
acquisition and automation of schemas and schematic knowledge use, after the
working memory used by extraneous and intrinsic loads have been assessed.
Synonymous with generative processing (Paas & Sweller, 2014).
Graphic organizer: A type of visual display that presents facts or concepts spatially, with
a goal of promoting meaningful learning. Relationships between concepts are
evident due to their spatial organization (Dexter & Hughes, 2013). Concept maps
are a type of graphic organizer.
Intrinsic load: In cognitive load theory, the innate difficulty of the material created by
essential interacting elements that must be simultaneously processed in working
memory. Synonymous with essential processing (Paas & Sweller, 2014).
Map shock: The cognitive overload and feeling of overwhelm caused by the scale and
complexity of a concept map display (Blankenship & Dansereau, 2000). Map
shock leads to incomplete processing of the map display.

254
Meaningful learning: Knowledge acquisition characterized by a well-organized, relevant
structure and student motivation to seek out new relationships between known
ideas and new concepts (Novak, 2013). Meaningful learning fosters retention and
transfer of knowledge (Ausubel, 1968).
Near transfer: A concept that describes assessment of ability when the testing scenario is
very similar to that provided in the original lesson (Schunk, 2012). For the
purposes of this study, near transfer is measured with a case study similar to that
presented in the treatment lesson.
Occupational therapy: A profession that assists people of all ages in participating in
meaningful everyday activities, also known as occupations. “Common
occupational therapy interventions include helping children with disabilities to
participate fully in school and social situations, helping people recovering from
injury to regain skills, and providing supports for older adults experiencing
physical and cognitive changes” (AOTA, 2017). The scope of occupational
therapy includes key areas of function including activities of daily living (e.g.,
grooming, bathing, dressing, toileting, eating, etc.); instrumental activities of daily
living (e.g., home and money management, meal preparation, driving, and phone
use); work- and school-related activities; social-, play-, and leisure-related
activities; and sleep and rest (AOTA, 2014b). The “use of occupations, including
everyday life activities with individuals, groups, populations, or organizations to
support participation, performance, and function in roles and situations in home,
school, workplace, community, and other settings. Occupational therapy services
are provided for habilitation, rehabilitation, and the promotion of health and
255
wellness to those who have or are at risk for developing an illness, injury, disease,
disorder, condition, impairment, disability, activity limitation, or participation
restriction. Occupational therapy addresses the physical, cognitive, psychosocial,
sensory-perceptual, and other aspects of performance in a variety of contexts and
environments to support engagement in occupations that affect physical and
mental health, well-being, and quality of life” (AOTA, 2014a, p. 1). Occupational
therapy students must train to the master’s degree level, complete internship
training, and successfully pass a national board examination. In 2027, training
requirements will change and occupational therapists will need an entry-level
clinical doctorate for licensure and practice. Research doctoral degrees in
occupational therapy are also available.
Pretraining: A principle in the cognitive theory of multimedia learning that suggests that
people learn more deeply from a multimedia message when they know the names,
definitions, and/or characteristics of the main concepts (Mayer & Pilegard, 2014).
Pretraining allows learners to develop specific prior knowledge before key
materials are presented, thereby increasing prior knowledge and schema
acquisition (Sweller et al., 2011). For the purposes of this study, any learning
activity that is presented in advance of the main lesson, and that provides students
with foundational information that is low in element interactivity and fosters
schematic knowledge is operationally defined as a type of pretraining. In
particular, advance organizers that are operationally defined as indicated above
are included in the classification of pretraining approaches.
256
Prior knowledge: The pre-existing information, schematic knowledge, cognitive
strategies, and skills a learner possesses, which influence how new information is
perceived, organized, and integrated. Prior knowledge is a determinant of the
amount and complexity of content that can be processed before working memory
capacity becomes overloaded (Van Merriënboer & Kester, 2014).
Retention: The ability to remember information learned at a later time and in the same
way it was presented during previous instruction (Mayer, 2002).
Rote learning: The memorization of content without regard to situating information in
context or meaning making. Rote learning results from presentation of content
that is neither well organized nor relevant (Novak, 2002).
Scaffolding: Any of a variety of instructional techniques used to temporarily support and
assist the student in the learning process. Scaffolds are designed to provide initial
support in greater amounts, and then to be gradually removed as the learner
becomes more familiar and skilled with a topic.
Schema: Conceptual cognitive frameworks for organizing information into topical
chunks (Sweller et al., 1998). Schemas are composed of many interacting
elements (Sweller & Chandler, 1994). When schemas are introduced into working
memory, they can be treated as a single element rather than as multiple pieces of
information, which reduces the demands on working memory (Kalyuga, 2010).
Schemas produce schematic knowledge that can be used for fostering learning.
Schematic knowledge: A term used to describe cognitive organization of information.
Schematic knowledge can be visualized as a web of units of interrelated
information that are linked to relevant prior knowledge and that form building
257
blocks for meaningful learning (Kalyuga, 2010). Schematic knowledge is the
outcome of schema acquisition.
Sensory integration: “A framework first described by occupational therapist A. Jean
Ayres, PhD, in the 1970s. It refers to the body’s way of handling and processing
sensory inputs from the environment. Ayres felt that the sensory system develops
over time, much like other aspects of development (language, motor, etc.), and
that deficits can occur in the process of developing a well-organized sensory
system. A well-organized sensory system can integrate input from multiple
sources (visual, auditory, proprioceptive, or vestibular). Ayres postulated that
sensory integration dysfunction occurs when sensory neurons are not signaling or
functioning efficiently, leading to deficits in development, learning, and/or
emotional regulation” (American Academy of Pediatrics, 2012, p. 1186).
Static concept map: A node and link diagram presented in its entirety on a single screen
or piece of paper. For the purposes of this study, static concept map is
operationally defined as a hierarchically structured concept map presented on a
single screen.
Two-phase, isolated-interacting elements pretraining: A strategy, also known as
traditional pretraining, for dividing complex learning into two consecutive phases.
First, an isolated elements phase to present elements that can be more easily held
in working memory, but that cannot be understood in their current form and
without added context. Second, the interactive elements phase to present the
connections between the isolated elements and foster greater understanding
(Mayer & Pilegard, 2014). For the purposes of this study, traditional pretraining is
258
operationally defined as a list of terms or concepts and their definitions, either
printed or provided via narration, as well as relevant graphics that assist the
learner in understanding the term or concept.
Transfer: The “ability to use what was learned to solve new problems, answer new
questions, or facilitate learning new subject matter” (Mayer, 2002).
Working memory: The aspect of short-term memory that is responsible for immediate
conscious cognitive and perceptual processing. Working memory capacity is
limited to between 5 and 9 items at any given time, thus making it vulnerable to
overload (Baddeley & Hitch, 1994).

259
Appendix B
Informed Consent
CONSENT TO BE A RESEARCH PARTICIPANT
Purpose and Background: Melisa Kaye, a doctoral student in the School of Education at the University of San Francisco, is completing a study of the multimedia principle of pretraining to determine which of three types might be more effective in facilitating learning in college students: traditional pretraining, pretraining with a static concept map, or pretraining with an animated concept map. Pretraining is one of several cognitive theory of multimedia learning (CTML) strategies used to help students master challenging academic content. Concept maps are a type of visual display that provides increased organizational and visuospatial context during the learning process. In this study, pretraining will be used to help students access content about sensory integration, a framework frequently used with children and adults who have sensory or motor challenges. Sensory integration is a topic included in occupational therapy curricula. I am being asked to participate because I am a college student who is currently attending an occupational therapy (OT) program.
Procedures: If I agree to be a participant in this study, the following will happen:
Week 1 (today): a. I will complete a short questionnaire and provide basic information about
myself, including my name, the OT program I am attending, and my prior experience with sensory integration.
b. I will complete a 15-minute pretest to determine my level of prior knowledge about sensory integration. No prior knowledge about sensory integration is expected of participants, and no prior knowledge of sensory integration is required for participation in the study.
Week 2:
260
a. Using my headphones with my laptop computer, tablet, or other computing device, I will watch a 15-minute pretraining presentation on the topic of sensory integration.
b. I will receive a 45-minute live lecture on the topic of sensory integration from the researcher, who is a pediatric OT, educator, and expert on sensory integration.
c. I will complete a 15-minute posttest about sensory integration to measure how much knowledge I gained from the learning activities. My scores will be coded and kept confidential, and they will not affect my course standing or grade.
Week 4: a. I will complete a 15-minute delayed posttest to measure how much knowledge
about sensory integration I have retained from the lesson. My scores will be coded and kept confidential, and they will not affect my course standing or grade.
b. I will receive information about how to obtain results of the study after it is completed, as well as how to receive additional information about sensory integration.
Risks and/or Discomforts:
1. It is possible that some of the questions on the pretest, posttest, or delayed posttest may be challenging, and I may feel uncomfortable if I cannot answer the questions confidently.
2. Participation in research may mean a loss of confidentiality. Study records will be kept as confidential as is possible. No individual identities will be used in any reports or publications resulting from the study. Study information will be coded and kept in locked files at all times. Only study personnel will have access to the files.
3. Because the time required for my participation may be up to 75 minutes on the day of the intervention, I may become tired or bored.
Benefits:
1. One anticipated benefit of participation in this study is my increased understanding of how to conduct research in the field of occupational therapy. A related benefit is my contribution to the evidence base of research in occupational therapy education.
2. An additional benefit of participation in this study is the provision of two tools to assist in learning and study efforts while in my educational program: pretraining and concept maps.

261
Costs and Financial Considerations: I will incur no financial costs as a result of taking part in this study. Payment or Reimbursement: There is no financial payment or reimbursement for my participation in this study. Questions: I have talked with Melisa Kaye about this study and I have had my questions answered. If I have further questions about the study, I may call her at (415) 533-0324, email her at [email protected], or email Dr. Mathew Mitchell at [email protected]. If I have any questions or comments about participation in this study, I should first talk with the researchers. If I do not wish to do this for any reason, I may contact the IRBPHS, which is concerned with protection of volunteers in research projects. I may reach the IRBPHS office by e-mailing [email protected]. Consent: I have been given a copy of the “Research Participant’s Bill of Rights” and I have been given a copy of this consent form to keep. PARTICIPATION IN RESEARCH IS VOLUNTARY. I am free to decline to be in this study or to withdraw from it at any point. My decision as to whether or not to participate in this study will have no influence on my standing or grade in my class or at my school of attendance. My signature below indicates that I agree to participate in this study.
_____________________________________________ __________________
Signature of Participant Date of Signature
_____________________________________________ __________________
Signature of Person Obtaining Consent Date of Signature
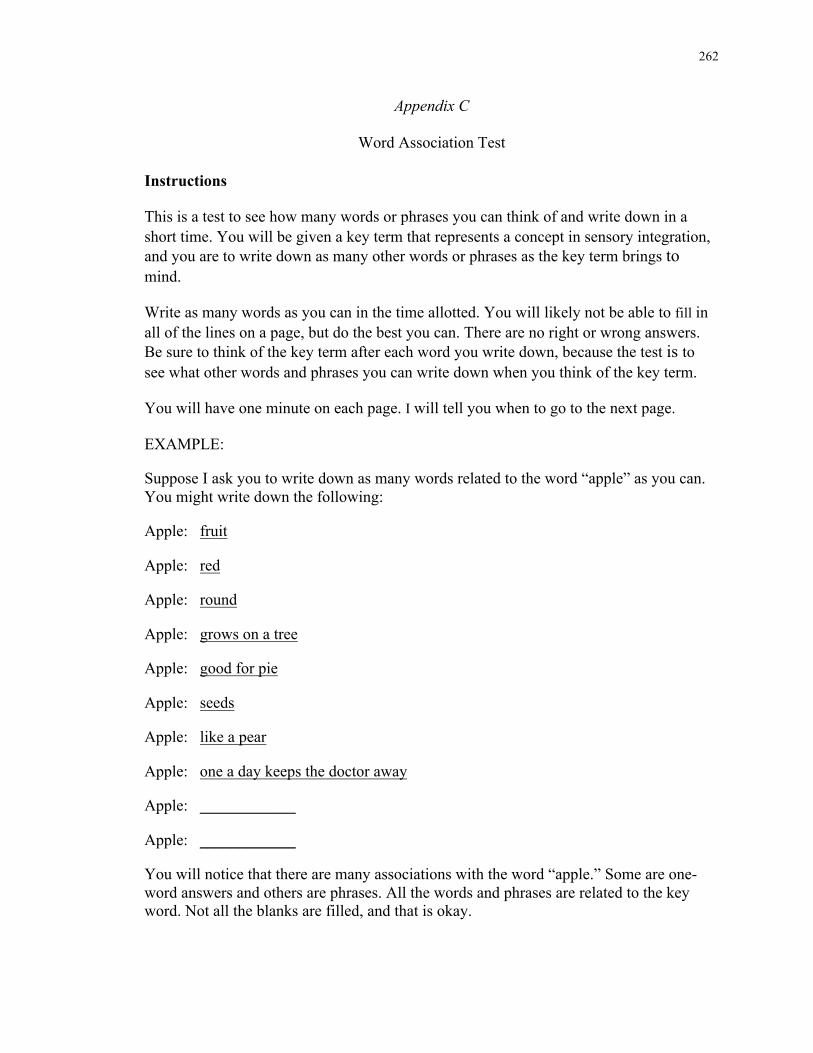
262
Appendix C
Word Association Test
Instructions
This is a test to see how many words or phrases you can think of and write down in a short time. You will be given a key term that represents a concept in sensory integration, and you are to write down as many other words or phrases as the key term brings to mind.
Write as many words as you can in the time allotted. You will likely not be able to fill in all of the lines on a page, but do the best you can. There are no right or wrong answers. Be sure to think of the key term after each word you write down, because the test is to see what other words and phrases you can write down when you think of the key term.
You will have one minute on each page. I will tell you when to go to the next page.
EXAMPLE:
Suppose I ask you to write down as many words related to the word “apple” as you can. You might write down the following:
Apple: fruit
Apple: red
Apple: round
Apple: grows on a tree
Apple: good for pie
Apple: seeds
Apple: like a pear
Apple: one a day keeps the doctor away
Apple: ____________
Apple: ____________
You will notice that there are many associations with the word “apple.” Some are one-word answers and others are phrases. All the words and phrases are related to the key word. Not all the blanks are filled, and that is okay.
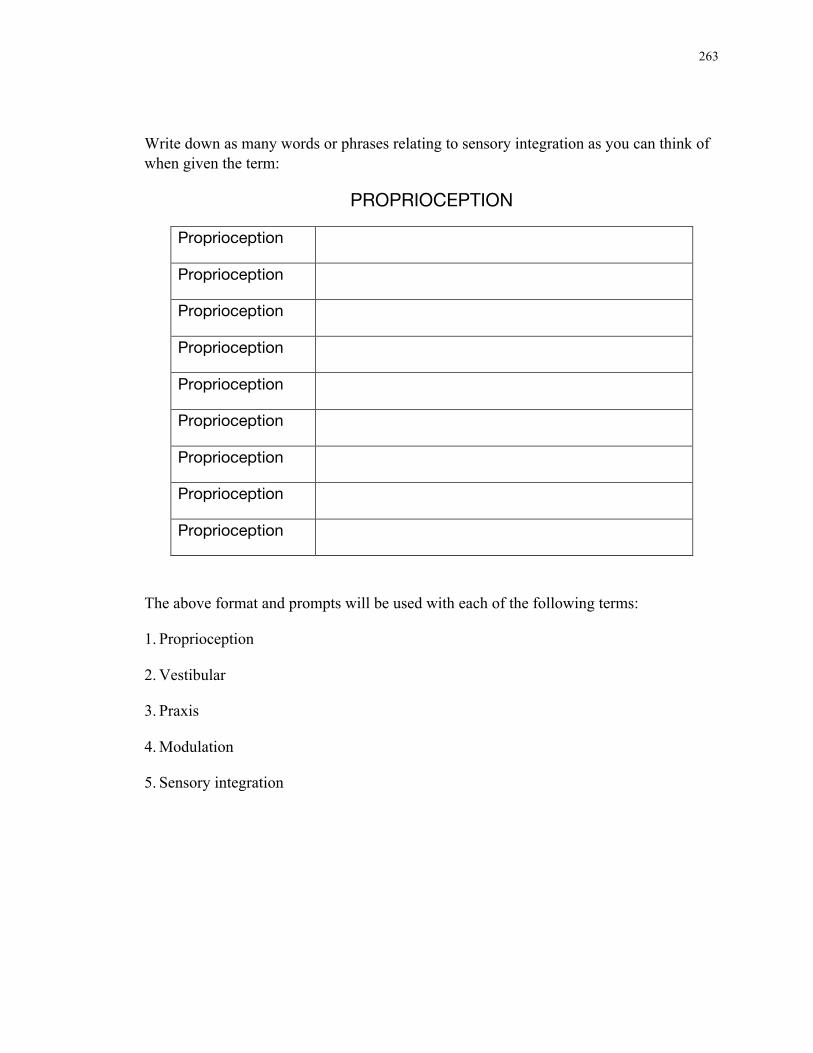
263
Write down as many words or phrases relating to sensory integration as you can think of when given the term:
PROPRIOCEPTION
Proprioception
Proprioception
Proprioception
Proprioception
Proprioception
Proprioception
Proprioception
Proprioception
Proprioception
The above format and prompts will be used with each of the following terms:
1. Proprioception
2. Vestibular
3. Praxis
4. Modulation
5. Sensory integration

264
Appendix D
Near Transfer Test
Carefully read the Case Study below and then answer the questions that follow.
Case Study: Zoe is 5 years old and is attending kindergarten at her local elementary school. Despite her solid connections to her teacher and classmates, she is having difficulty at school. Her teacher has observed some puzzling and concerning behaviors and has referred Zoe for an evaluation. Her teacher notes the following:
• Zoe is reluctant to go out to the playground for recess. In particular, she avoids the climbing structure, the swings, and the slide. If her teacher suggests Zoe join her friends on the tire swing, Zoe looks terrified and tries to run away.
• When her class goes to physical education (“PE”), Zoe hides behind her teacher or makes an excuse to use the restroom and returns just as class is ending. She is especially fearful of doing somersaults, rolling on a mat, or playing circle games like Ring Around the Rosy.
• Lunch is another difficult time for Zoe. She avoids entering the cafeteria because being in the same room with cooked food odors causes her to gag. She has been known to hide or run away from class right before lunch. Her nose seems more sensitive than most, and her teacher notes Zoe will comment on the smell of paint and glue.
• Zoe receives hot school lunches, but will rarely eat any of the provided items. She complains that the food feels “funny and icky” in her mouth, although the taste is “OK”. Zoe is repulsed by any foods that are slippery—like veggies and fruits. She also avoids foods that have chunks in them-- like stews or soups. Zoe’s teacher is worried about Zoe getting adequate nutrition. Zoe’s mom reports that Zoe has a very limited diet at home, and primarily eats crackers and other crunchy, dry foods.
• In school, Zoe frequently responds with fear and avoidance of activities. Her teacher says that she helps Zoe calm down by giving her a big hug, or letting Zoe crawl under the pile of heavy pillows in the reading corner. Being “teacher’s

265
helper” and carrying a basket of books to the library or sweeping with the push broom also seems to calm Zoe.
• Zoe is a bright and curious student. She is an excellent artist who draws well, can easily write her first and last name, and is a beginning reader. She is a skilled observer and is able to construct puzzles and build Lego models. When she is relaxed, she has a great sense of humor, and creates rich and imaginative stories and pretend play adventures.
Using the Case Study information and the information from the lesson answer the following questions. Circle your answers. When a question asks you to fill-in-the-blank, please print legibly.
1. What seems to be Zoe’s primary challenge?
A. She has praxis problems
B. She has registration problems
C. She has modulation problems
D. She has discrimination problems
E. She has low intrinsic motivation
2. Some of Zoe’s senses are causing difficulties for her. In the blanks below, and using the information in the case study, write the names of the three sensory systems that are most problematic for Zoe.
A. _____________________________________________________
B. _____________________________________________________
C. _____________________________________________________
3. A couple of Zoe’s senses are helping her to cope in school. In the blanks below, name two senses that seem to be working to help Zoe cope with her challenges.
A. _____________________________________________________
B. _____________________________________________________

266
4. Zoe is frequently afraid and stressed out. With a goal of increasing her comfort and trust in treatment, which of the following activities may be the best example of tapping her intrinsic motivation?
A. Climb on top of the monkey bars and chat with her best friend.
B. Have a pretend tea party with a variety of foods and drinks to try.
C. Create a pretend story about a brave princess who must fight a dragon.
D. Sing songs and play musical instruments.
E. Build a stronger teacher-student bond.
5. If you were to choose a class activity for Zoe to comfortably and actively participate in, which of the following activities do you think would provide a just right challenge (aka “Goldilocks Activity”)?
A. Scribbling with markers on large paper along with her classmates.
B. Completing an obstacle course with crawling and tug of war.
C. Jumping on a trampoline with a classmate.
D. Doing water play with real seaweed with her classmates during science.
E. Dancing to hip hop music with her whole class during circle time.
6. At the start of SI therapy, what might be a very basic adaptive response one might expect to see from Zoe?
A. Zoe would go out on the playground and push another child on the swings.
B. Zoe would participate in all vigorous physical education activities except spinning.
C. Zoe would eat 3/4 of her lunch every day.
D. Zoe would climb at least one piece of playground equipment each day.
E. Zoe would complete a puzzle without help.

267
7. Occupational engagement is an ultimate outcome for Zoe, especially in the area of schooling and education. Which of the following activities would best mark her progress in this arena? (Remember, occupational engagement is a high-level goal).
A. Using the bathroom without help and washing her hands when done.
B. Voluntarily attending all school activities, even if she does not always participate.
C. Making friends and playing imaginary strategy games.
D. Eating 100% of her food at lunch, and all of her meals at home.
E. Not getting as dizzy or nauseous when swinging on the tire swing.
8. Below, list two activities that would beneficially stimulate Zoe’s proprioceptive system without overstimulating her vestibular system.
A. _____________________________________________________________
B. _____________________________________________________________
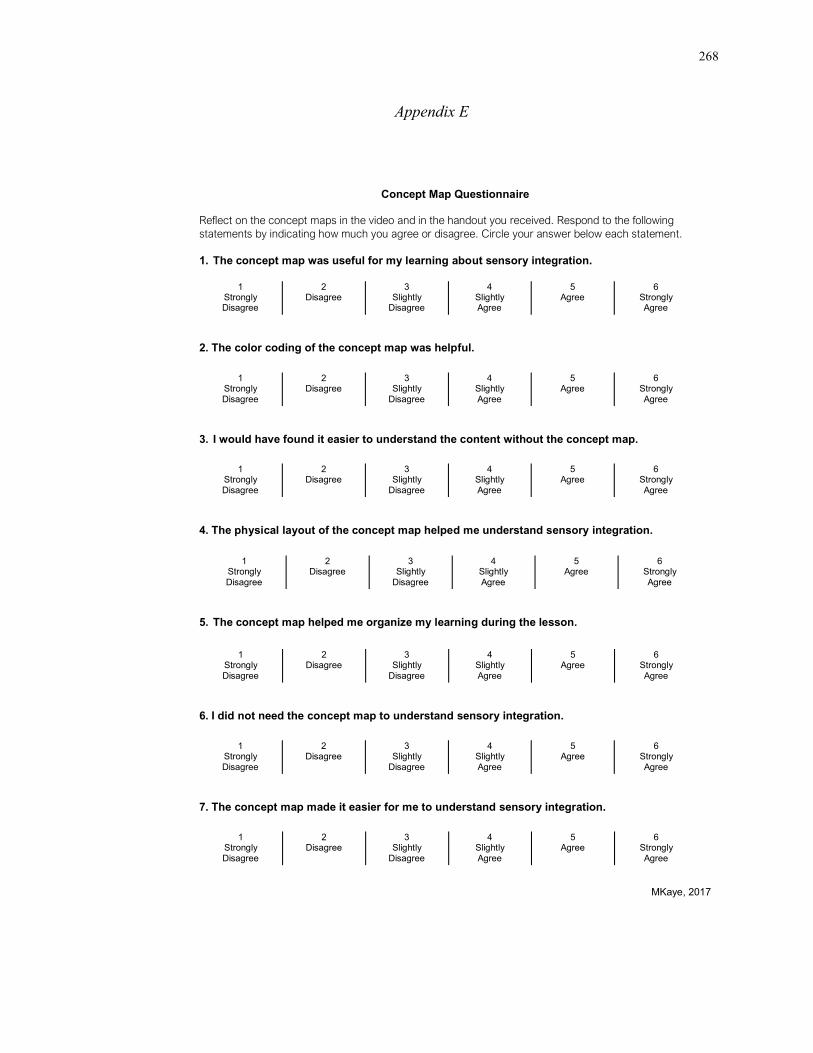
268
Appendix E
MKaye, 2017
Concept Map Questionnaire
Reflect on the concept maps in the video and in the handout you received. Respond to the following statements by indicating how much you agree or disagree. Circle your answer below each statement. 1. The concept map was useful for my learning about sensory integration.
2. The color coding of the concept map was helpful.
3. I would have found it easier to understand the content without the concept map.
4. The physical layout of the concept map helped me understand sensory integration.
5. The concept map helped me organize my learning during the lesson.
6. I did not need the concept map to understand sensory integration.
7. The concept map made it easier for me to understand sensory integration.
1 Strongly Disagree
2 Disagree
3 Slightly
Disagree
4 Slightly Agree
5 Agree
6 Strongly Agree
1 Strongly Disagree
2 Disagree
3 Slightly
Disagree
4 Slightly Agree
5 Agree
6 Strongly Agree
1 Strongly Disagree
2 Disagree
3 Slightly
Disagree
4 Slightly Agree
5 Agree
6 Strongly Agree
1 Strongly Disagree
2 Disagree
3 Slightly
Disagree
4 Slightly Agree
5 Agree
6 Strongly Agree
1 Strongly Disagree
2 Disagree
3 Slightly
Disagree
4 Slightly Agree
5 Agree
6 Strongly Agree
1 Strongly Disagree
2 Disagree
3 Slightly
Disagree
4 Slightly Agree
5 Agree
6 Strongly Agree
1 Strongly Disagree
2 Disagree
3 Slightly
Disagree
4 Slightly Agree
5 Agree
6 Strongly Agree
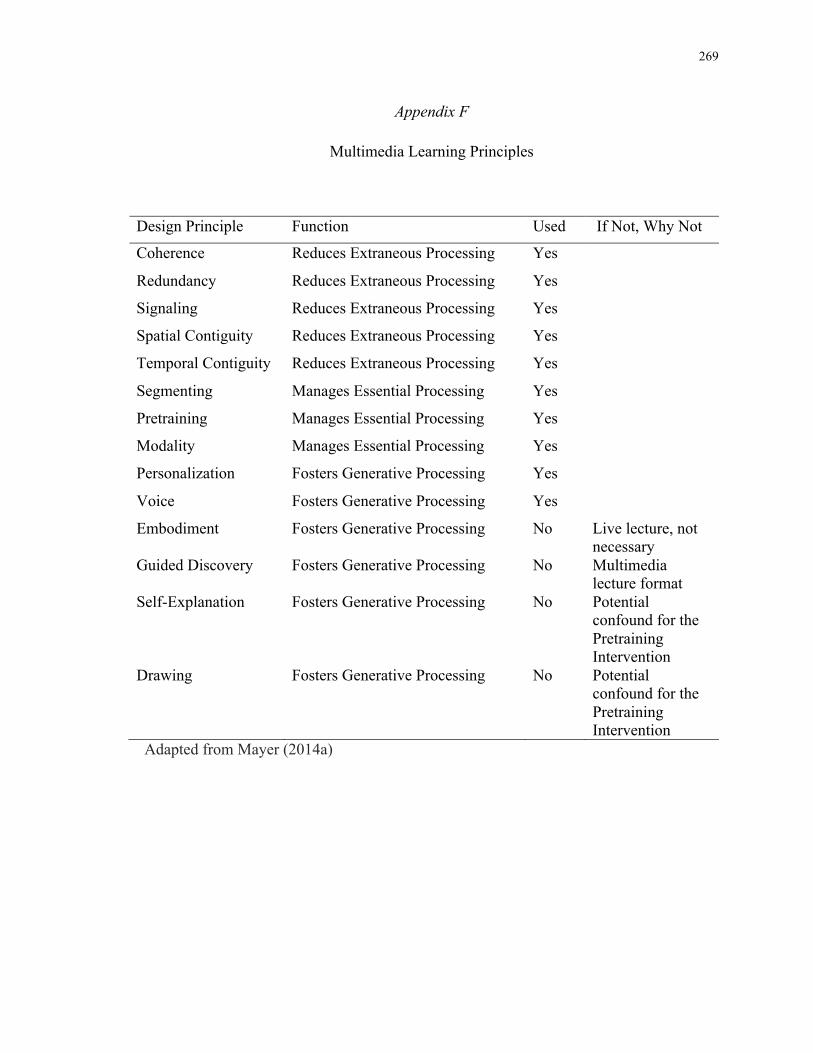
269
Appendix F
Multimedia Learning Principles
Design Principle Function Used If Not, Why Not
Coherence Reduces Extraneous Processing Yes
Redundancy Reduces Extraneous Processing Yes
Signaling Reduces Extraneous Processing Yes
Spatial Contiguity Reduces Extraneous Processing Yes
Temporal Contiguity Reduces Extraneous Processing Yes
Segmenting Manages Essential Processing Yes
Pretraining Manages Essential Processing Yes
Modality Manages Essential Processing Yes
Personalization Fosters Generative Processing Yes
Voice Fosters Generative Processing Yes
Embodiment Fosters Generative Processing No Live lecture, not necessary
Guided Discovery Fosters Generative Processing No Multimedia lecture format
Self-Explanation Fosters Generative Processing No Potential confound for the Pretraining Intervention
Drawing Fosters Generative Processing No Potential confound for the Pretraining Intervention
Adapted from Mayer (2014a)
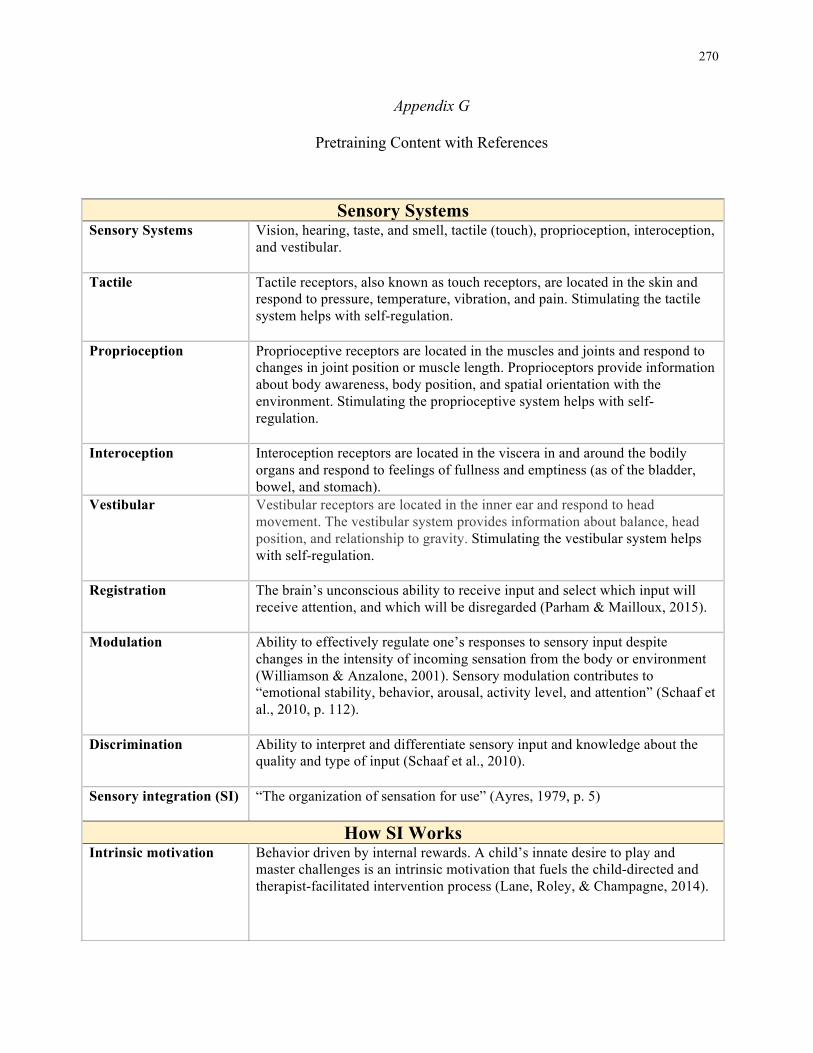
270
Appendix G
Pretraining Content with References
Sensory Systems Sensory Systems Vision, hearing, taste, and smell, tactile (touch), proprioception, interoception,
and vestibular.
Tactile Tactile receptors, also known as touch receptors, are located in the skin and respond to pressure, temperature, vibration, and pain. Stimulating the tactile system helps with self-regulation.
Proprioception Proprioceptive receptors are located in the muscles and joints and respond to changes in joint position or muscle length. Proprioceptors provide information about body awareness, body position, and spatial orientation with the environment. Stimulating the proprioceptive system helps with self-regulation.
Interoception Interoception receptors are located in the viscera in and around the bodily organs and respond to feelings of fullness and emptiness (as of the bladder, bowel, and stomach).
Vestibular Vestibular receptors are located in the inner ear and respond to head movement. The vestibular system provides information about balance, head position, and relationship to gravity. Stimulating the vestibular system helps with self-regulation.
Registration The brain’s unconscious ability to receive input and select which input will receive attention, and which will be disregarded (Parham & Mailloux, 2015).
Modulation Ability to effectively regulate one’s responses to sensory input despite changes in the intensity of incoming sensation from the body or environment (Williamson & Anzalone, 2001). Sensory modulation contributes to “emotional stability, behavior, arousal, activity level, and attention” (Schaaf et al., 2010, p. 112).
Discrimination Ability to interpret and differentiate sensory input and knowledge about the quality and type of input (Schaaf et al., 2010).
Sensory integration (SI) “The organization of sensation for use” (Ayres, 1979, p. 5)
How SI Works Intrinsic motivation Behavior driven by internal rewards. A child’s innate desire to play and
master challenges is an intrinsic motivation that fuels the child-directed and therapist-facilitated intervention process (Lane, Roley, & Champagne, 2014).
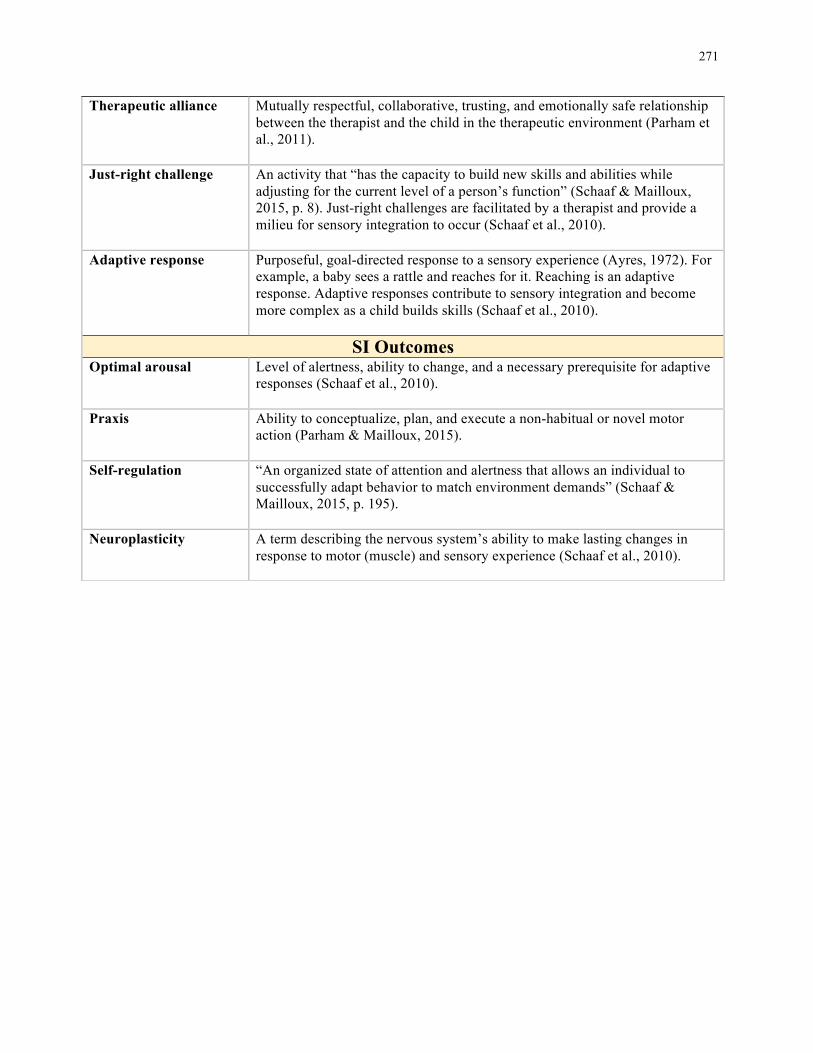
271
Therapeutic alliance Mutually respectful, collaborative, trusting, and emotionally safe relationship between the therapist and the child in the therapeutic environment (Parham et al., 2011).
Just-right challenge An activity that “has the capacity to build new skills and abilities while adjusting for the current level of a person’s function” (Schaaf & Mailloux, 2015, p. 8). Just-right challenges are facilitated by a therapist and provide a milieu for sensory integration to occur (Schaaf et al., 2010).
Adaptive response Purposeful, goal-directed response to a sensory experience (Ayres, 1972). For example, a baby sees a rattle and reaches for it. Reaching is an adaptive response. Adaptive responses contribute to sensory integration and become more complex as a child builds skills (Schaaf et al., 2010).
SI Outcomes Optimal arousal Level of alertness, ability to change, and a necessary prerequisite for adaptive
responses (Schaaf et al., 2010).
Praxis Ability to conceptualize, plan, and execute a non-habitual or novel motor action (Parham & Mailloux, 2015).
Self-regulation “An organized state of attention and alertness that allows an individual to successfully adapt behavior to match environment demands” (Schaaf & Mailloux, 2015, p. 195).
Neuroplasticity A term describing the nervous system’s ability to make lasting changes in response to motor (muscle) and sensory experience (Schaaf et al., 2010).
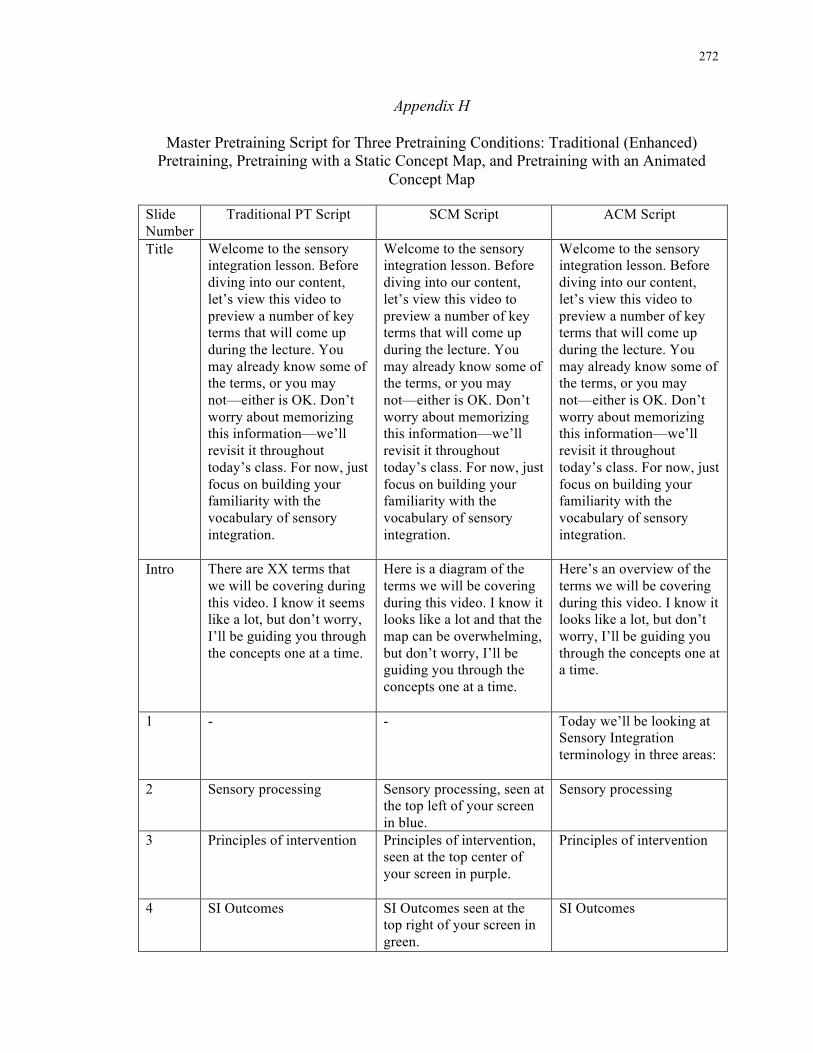
272
Appendix H
Master Pretraining Script for Three Pretraining Conditions: Traditional (Enhanced) Pretraining, Pretraining with a Static Concept Map, and Pretraining with an Animated
Concept Map Slide Number
Traditional PT Script SCM Script ACM Script
Title Welcome to the sensory integration lesson. Before diving into our content, let’s view this video to preview a number of key terms that will come up during the lecture. You may already know some of the terms, or you may not—either is OK. Don’t worry about memorizing this information—we’ll revisit it throughout today’s class. For now, just focus on building your familiarity with the vocabulary of sensory integration.
Welcome to the sensory integration lesson. Before diving into our content, let’s view this video to preview a number of key terms that will come up during the lecture. You may already know some of the terms, or you may not—either is OK. Don’t worry about memorizing this information—we’ll revisit it throughout today’s class. For now, just focus on building your familiarity with the vocabulary of sensory integration.
Welcome to the sensory integration lesson. Before diving into our content, let’s view this video to preview a number of key terms that will come up during the lecture. You may already know some of the terms, or you may not—either is OK. Don’t worry about memorizing this information—we’ll revisit it throughout today’s class. For now, just focus on building your familiarity with the vocabulary of sensory integration.
Intro There are XX terms that we will be covering during this video. I know it seems like a lot, but don’t worry, I’ll be guiding you through the concepts one at a time.
Here is a diagram of the terms we will be covering during this video. I know it looks like a lot and that the map can be overwhelming, but don’t worry, I’ll be guiding you through the concepts one at a time.
Here’s an overview of the terms we will be covering during this video. I know it looks like a lot, but don’t worry, I’ll be guiding you through the concepts one at a time.
1 - - Today we’ll be looking at Sensory Integration terminology in three areas:
2 Sensory processing Sensory processing, seen at the top left of your screen in blue.
Sensory processing
3 Principles of intervention
Principles of intervention, seen at the top center of your screen in purple.
Principles of intervention
4 SI Outcomes SI Outcomes seen at the top right of your screen in green.
SI Outcomes
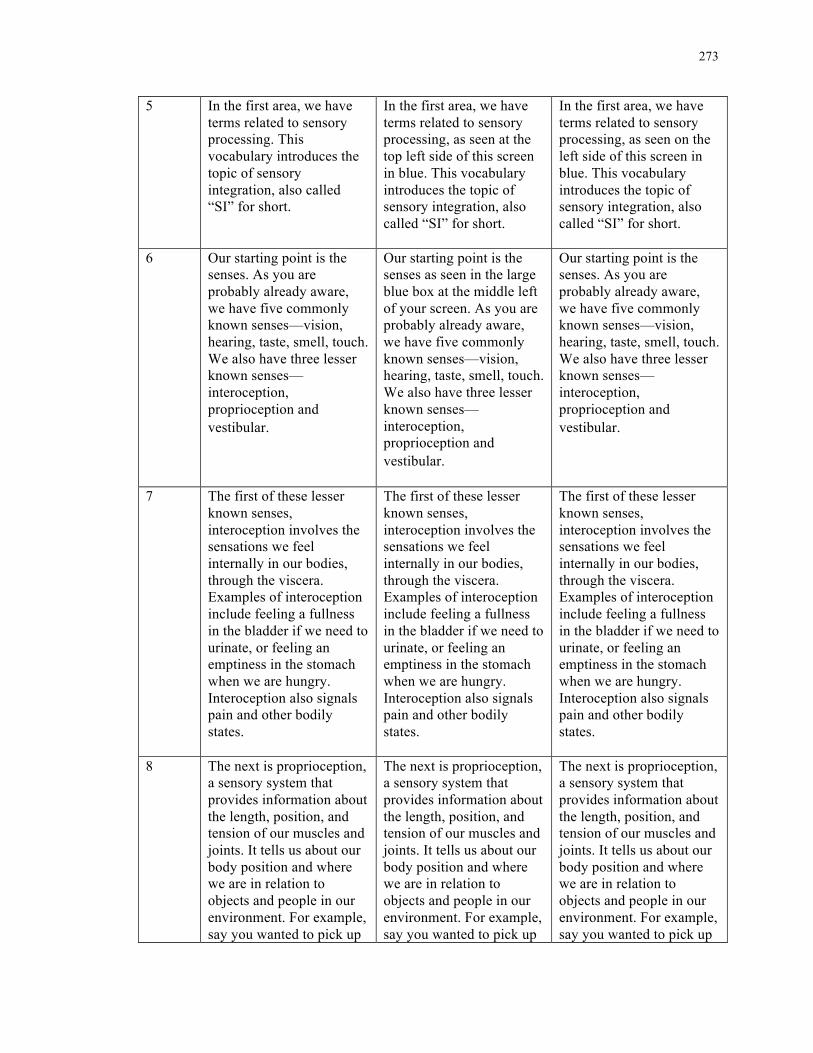
273
5 In the first area, we have terms related to sensory processing. This vocabulary introduces the topic of sensory integration, also called “SI” for short.
In the first area, we have terms related to sensory processing, as seen at the top left side of this screen in blue. This vocabulary introduces the topic of sensory integration, also called “SI” for short.
In the first area, we have terms related to sensory processing, as seen on the left side of this screen in blue. This vocabulary introduces the topic of sensory integration, also called “SI” for short.
6 Our starting point is the senses. As you are probably already aware, we have five commonly known senses—vision, hearing, taste, smell, touch. We also have three lesser known senses—interoception, proprioception and vestibular.
Our starting point is the senses as seen in the large blue box at the middle left of your screen. As you are probably already aware, we have five commonly known senses—vision, hearing, taste, smell, touch. We also have three lesser known senses—interoception, proprioception and vestibular.
Our starting point is the senses. As you are probably already aware, we have five commonly known senses—vision, hearing, taste, smell, touch. We also have three lesser known senses—interoception, proprioception and vestibular.
7 The first of these lesser known senses, interoception involves the sensations we feel internally in our bodies, through the viscera. Examples of interoception include feeling a fullness in the bladder if we need to urinate, or feeling an emptiness in the stomach when we are hungry. Interoception also signals pain and other bodily states.
The first of these lesser known senses, interoception involves the sensations we feel internally in our bodies, through the viscera. Examples of interoception include feeling a fullness in the bladder if we need to urinate, or feeling an emptiness in the stomach when we are hungry. Interoception also signals pain and other bodily states.
The first of these lesser known senses, interoception involves the sensations we feel internally in our bodies, through the viscera. Examples of interoception include feeling a fullness in the bladder if we need to urinate, or feeling an emptiness in the stomach when we are hungry. Interoception also signals pain and other bodily states.
8 The next is proprioception, a sensory system that provides information about the length, position, and tension of our muscles and joints. It tells us about our body position and where we are in relation to objects and people in our environment. For example, say you wanted to pick up
The next is proprioception, a sensory system that provides information about the length, position, and tension of our muscles and joints. It tells us about our body position and where we are in relation to objects and people in our environment. For example, say you wanted to pick up
The next is proprioception, a sensory system that provides information about the length, position, and tension of our muscles and joints. It tells us about our body position and where we are in relation to objects and people in our environment. For example, say you wanted to pick up
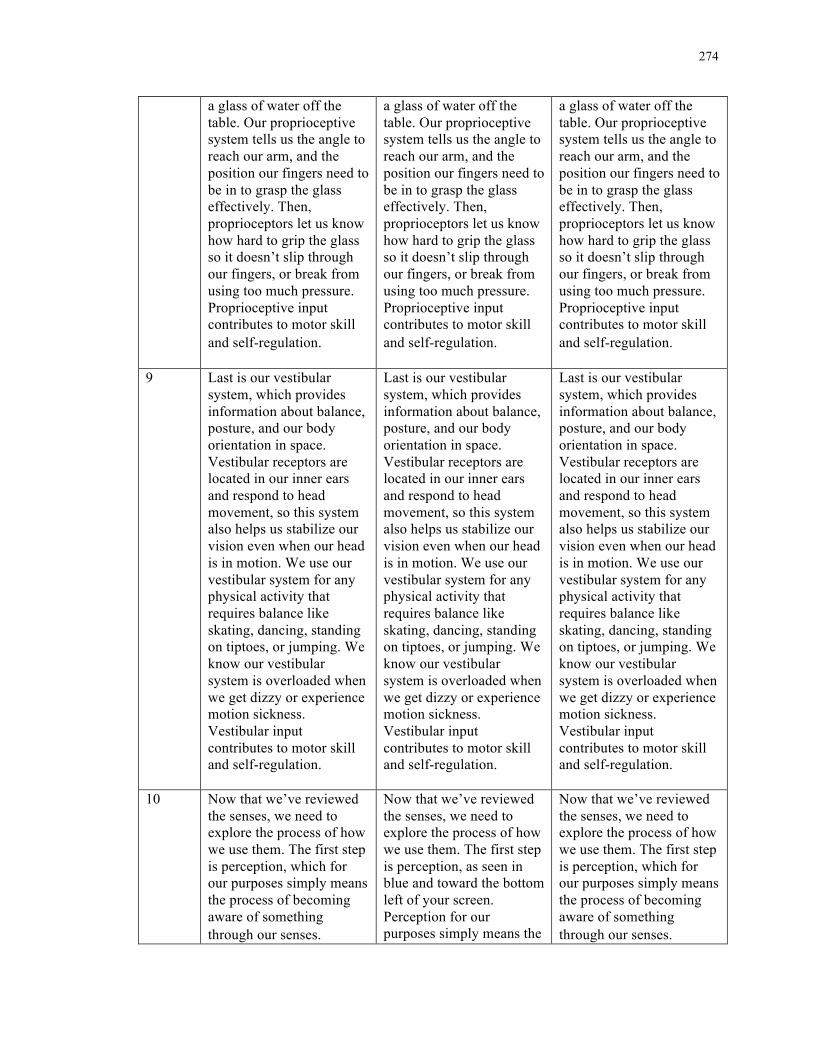
274
a glass of water off the table. Our proprioceptive system tells us the angle to reach our arm, and the position our fingers need to be in to grasp the glass effectively. Then, proprioceptors let us know how hard to grip the glass so it doesn’t slip through our fingers, or break from using too much pressure. Proprioceptive input contributes to motor skill and self-regulation.
a glass of water off the table. Our proprioceptive system tells us the angle to reach our arm, and the position our fingers need to be in to grasp the glass effectively. Then, proprioceptors let us know how hard to grip the glass so it doesn’t slip through our fingers, or break from using too much pressure. Proprioceptive input contributes to motor skill and self-regulation.
a glass of water off the table. Our proprioceptive system tells us the angle to reach our arm, and the position our fingers need to be in to grasp the glass effectively. Then, proprioceptors let us know how hard to grip the glass so it doesn’t slip through our fingers, or break from using too much pressure. Proprioceptive input contributes to motor skill and self-regulation.
9 Last is our vestibular system, which provides information about balance, posture, and our body orientation in space. Vestibular receptors are located in our inner ears and respond to head movement, so this system also helps us stabilize our vision even when our head is in motion. We use our vestibular system for any physical activity that requires balance like skating, dancing, standing on tiptoes, or jumping. We know our vestibular system is overloaded when we get dizzy or experience motion sickness. Vestibular input contributes to motor skill and self-regulation.
Last is our vestibular system, which provides information about balance, posture, and our body orientation in space. Vestibular receptors are located in our inner ears and respond to head movement, so this system also helps us stabilize our vision even when our head is in motion. We use our vestibular system for any physical activity that requires balance like skating, dancing, standing on tiptoes, or jumping. We know our vestibular system is overloaded when we get dizzy or experience motion sickness. Vestibular input contributes to motor skill and self-regulation.
Last is our vestibular system, which provides information about balance, posture, and our body orientation in space. Vestibular receptors are located in our inner ears and respond to head movement, so this system also helps us stabilize our vision even when our head is in motion. We use our vestibular system for any physical activity that requires balance like skating, dancing, standing on tiptoes, or jumping. We know our vestibular system is overloaded when we get dizzy or experience motion sickness. Vestibular input contributes to motor skill and self-regulation.
10 Now that we’ve reviewed the senses, we need to explore the process of how we use them. The first step is perception, which for our purposes simply means the process of becoming aware of something through our senses.
Now that we’ve reviewed the senses, we need to explore the process of how we use them. The first step is perception, as seen in blue and toward the bottom left of your screen. Perception for our purposes simply means the
Now that we’ve reviewed the senses, we need to explore the process of how we use them. The first step is perception, which for our purposes simply means the process of becoming aware of something through our senses.
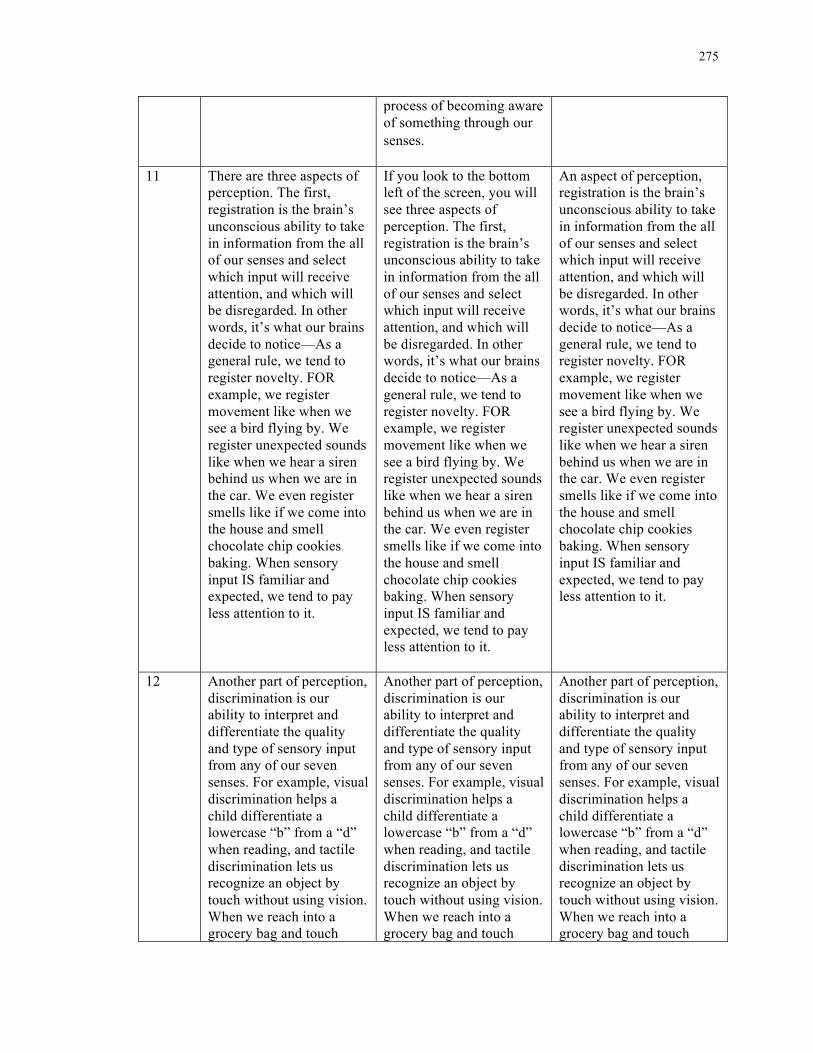
275
process of becoming aware of something through our senses.
11 There are three aspects of perception. The first, registration is the brain’s unconscious ability to take in information from the all of our senses and select which input will receive attention, and which will be disregarded. In other words, it’s what our brains decide to notice—As a general rule, we tend to register novelty. FOR example, we register movement like when we see a bird flying by. We register unexpected sounds like when we hear a siren behind us when we are in the car. We even register smells like if we come into the house and smell chocolate chip cookies baking. When sensory input IS familiar and expected, we tend to pay less attention to it.
If you look to the bottom left of the screen, you will see three aspects of perception. The first, registration is the brain’s unconscious ability to take in information from the all of our senses and select which input will receive attention, and which will be disregarded. In other words, it’s what our brains decide to notice—As a general rule, we tend to register novelty. FOR example, we register movement like when we see a bird flying by. We register unexpected sounds like when we hear a siren behind us when we are in the car. We even register smells like if we come into the house and smell chocolate chip cookies baking. When sensory input IS familiar and expected, we tend to pay less attention to it.
An aspect of perception, registration is the brain’s unconscious ability to take in information from the all of our senses and select which input will receive attention, and which will be disregarded. In other words, it’s what our brains decide to notice—As a general rule, we tend to register novelty. FOR example, we register movement like when we see a bird flying by. We register unexpected sounds like when we hear a siren behind us when we are in the car. We even register smells like if we come into the house and smell chocolate chip cookies baking. When sensory input IS familiar and expected, we tend to pay less attention to it.
12 Another part of perception, discrimination is our ability to interpret and differentiate the quality and type of sensory input from any of our seven senses. For example, visual discrimination helps a child differentiate a lowercase “b” from a “d” when reading, and tactile discrimination lets us recognize an object by touch without using vision. When we reach into a grocery bag and touch
Another part of perception, discrimination is our ability to interpret and differentiate the quality and type of sensory input from any of our seven senses. For example, visual discrimination helps a child differentiate a lowercase “b” from a “d” when reading, and tactile discrimination lets us recognize an object by touch without using vision. When we reach into a grocery bag and touch
Another part of perception, discrimination is our ability to interpret and differentiate the quality and type of sensory input from any of our seven senses. For example, visual discrimination helps a child differentiate a lowercase “b” from a “d” when reading, and tactile discrimination lets us recognize an object by touch without using vision. When we reach into a grocery bag and touch
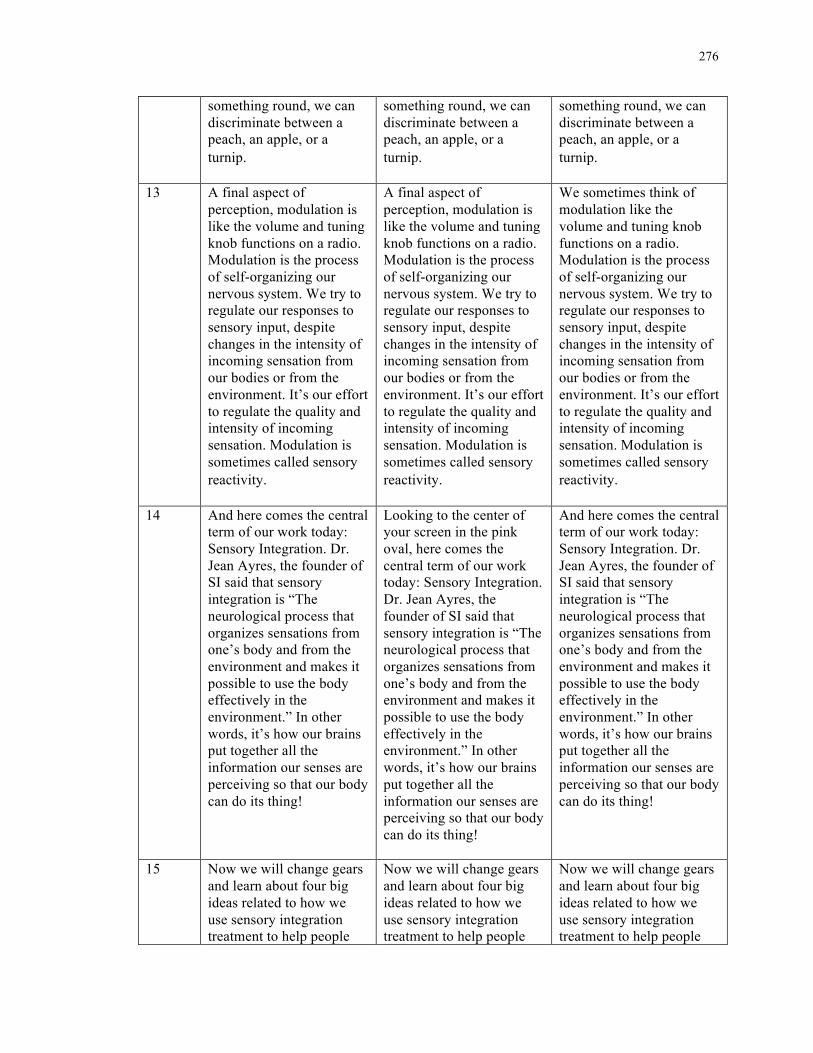
276
something round, we can discriminate between a peach, an apple, or a turnip.
something round, we can discriminate between a peach, an apple, or a turnip.
something round, we can discriminate between a peach, an apple, or a turnip.
13 A final aspect of perception, modulation is like the volume and tuning knob functions on a radio. Modulation is the process of self-organizing our nervous system. We try to regulate our responses to sensory input, despite changes in the intensity of incoming sensation from our bodies or from the environment. It’s our effort to regulate the quality and intensity of incoming sensation. Modulation is sometimes called sensory reactivity.
A final aspect of perception, modulation is like the volume and tuning knob functions on a radio. Modulation is the process of self-organizing our nervous system. We try to regulate our responses to sensory input, despite changes in the intensity of incoming sensation from our bodies or from the environment. It’s our effort to regulate the quality and intensity of incoming sensation. Modulation is sometimes called sensory reactivity.
We sometimes think of modulation like the volume and tuning knob functions on a radio. Modulation is the process of self-organizing our nervous system. We try to regulate our responses to sensory input, despite changes in the intensity of incoming sensation from our bodies or from the environment. It’s our effort to regulate the quality and intensity of incoming sensation. Modulation is sometimes called sensory reactivity.
14 And here comes the central term of our work today: Sensory Integration. Dr. Jean Ayres, the founder of SI said that sensory integration is “The neurological process that organizes sensations from one’s body and from the environment and makes it possible to use the body effectively in the environment.” In other words, it’s how our brains put together all the information our senses are perceiving so that our body can do its thing!
Looking to the center of your screen in the pink oval, here comes the central term of our work today: Sensory Integration. Dr. Jean Ayres, the founder of SI said that sensory integration is “The neurological process that organizes sensations from one’s body and from the environment and makes it possible to use the body effectively in the environment.” In other words, it’s how our brains put together all the information our senses are perceiving so that our body can do its thing!
And here comes the central term of our work today: Sensory Integration. Dr. Jean Ayres, the founder of SI said that sensory integration is “The neurological process that organizes sensations from one’s body and from the environment and makes it possible to use the body effectively in the environment.” In other words, it’s how our brains put together all the information our senses are perceiving so that our body can do its thing!
15 Now we will change gears and learn about four big ideas related to how we use sensory integration treatment to help people
Now we will change gears and learn about four big ideas related to how we use sensory integration treatment to help people
Now we will change gears and learn about four big ideas related to how we use sensory integration treatment to help people
277
with SI difficulties. Collectively, we’ll call these the Principles of Intervention.
with SI difficulties. Collectively, we’ll call these the Principles of Intervention, as you can see in the purple box in the middle of the screen.
with SI difficulties. Collectively, we’ll call these the Principles of Intervention, as you can see in the purple box in the middle of the screen.
16 First, intrinsic motivation is when someone is driven by internal, rather than external rewards. For example, a child’s innate desire to play and master engaging challenges is an intrinsic motivation. Intrinsic motivation is necessary for SI interventions to work.
First, intrinsic motivation is when someone is driven by internal, rather than external rewards. For example, a child’s innate desire to play and master engaging challenges is an intrinsic motivation. Intrinsic motivation is necessary for SI interventions to work.
First, intrinsic motivation is when someone is driven by internal, rather than external rewards. For example, a child’s innate desire to play and master engaging challenges is an intrinsic motivation. Intrinsic motivation is necessary for SI interventions to work.
17 Second, therapeutic alliance happens between therapist and a client in the intervention setting. It is a relationship characterized by mutual respect, collaboration, trust, and emotional safety—factors vital for the therapeutic process.
Second, therapeutic alliance happens between therapist and a client in the intervention setting. It is a relationship characterized by mutual respect, collaboration, trust, and emotional safety—factors vital for the therapeutic process.
Second, therapeutic alliance happens between therapist and a client in the intervention setting. It is a relationship characterized by mutual respect, collaboration, trust, and emotional safety—factors vital for the therapeutic process.
18 Third, a just right challenge is an activity that can help us to build new skills and abilities while simultaneously being responsive and adjustable to our current level of functioning. We might think of this as a “Goldilocks activity”—not too hard, not too easy, but just right. The SI therapist helps create the just right challenge, and thus facilitates sensory integration.
Third, a just right challenge is an activity that can help us to build new skills and abilities while simultaneously being responsive and adjustable to our current level of functioning. We might think of this as a “Goldilocks activity”—not too hard, not too easy, but just right. The SI therapist helps create the just right challenge, and thus facilitates sensory integration.
Third, a just right challenge is an activity that can help us to build new skills and abilities while simultaneously being responsive and adjustable to our current level of functioning. We might think of this as a “Goldilocks activity”—not too hard, not too easy, but just right. The SI therapist helps create the just right challenge, and thus facilitates sensory integration.
19 Finally, an adaptive response is any purposeful, goal-directed counter action to a sensory
Finally, an adaptive response is any purposeful, goal-directed counter action to a sensory
Finally, an adaptive response is any purposeful, goal-directed counter action to a sensory

278
experience. For example, a baby sees a rattle and reaches for it. Reaching is a basic adaptive response. Adaptive responses become more complex as a client builds skills, and they signal that sensory integration is increasing.
experience. For example, a baby sees a rattle and reaches for it. Reaching is a basic adaptive response. Adaptive responses become more complex as a client builds skills, and they signal that sensory integration is increasing.
experience. For example, a baby sees a rattle and reaches for it. Reaching is a basic adaptive response. Adaptive responses become more complex as a client builds skills, and they signal that sensory integration is increasing.
20 All four of these principles of intervention are connected to Sensory Integration
Notice how all of these principles are connected to Sensory Integration as indicated by the links from the four purple boxes to the concept of sensory integration in the oval.
Notice how all of these principles are connected to Sensory Integration
21 Now let’s shift gears one more time, and look at terms that reflect some of the desired outcomes of sensory integration.
Now let’s shift gears one more time, and look at terms that reflect some of the desired outcomes of sensory integration. This information is shown in green on the right side of the screen.
Now let’s shift gears one more time, and look at terms that reflect some of the desired outcomes of sensory integration. This information is in green on the right side of the screen.
22 The first and most basic outcome of SI is called optimal arousal. This type of arousal is about one’s level of alertness. Optimal arousal is your ability to achieve and change levels of alertness to meet the demands of a situation. Having optimal arousal, or at least aiming toward optimal arousal is a necessary ingredient for adaptive responses.
The first and most basic outcome of SI is called optimal arousal. This type of arousal is about one’s level of alertness. Optimal arousal is your ability to achieve and change levels of alertness to meet the demands of a situation. Having optimal arousal, or at least aiming toward optimal arousal is a necessary ingredient for adaptive responses.
The first and most basic outcome of SI is called optimal arousal. This type of arousal is about one’s level of alertness. Optimal arousal is your ability to achieve and change levels of alertness to meet the demands of a situation. Having optimal arousal, or at least aiming toward optimal arousal is a necessary ingredient for adaptive responses.
23 Next, praxis is a motor, or muscle based outcome of SI. Praxis is the ability to conceptualize, plan, and execute skilled physical tasks supported through the sensory processing and integration. In other words,
Below optimal arousal is the concept of praxis. Praxis is a motor, or muscle based outcome of SI. Praxis is the ability to conceptualize, plan, and execute skilled physical tasks supported through
Next, praxis is a motor, or muscle based outcome of SI. Praxis is the ability to conceptualize, plan, and execute skilled physical tasks supported through the sensory processing and integration. In other words,
279
praxis is key for performing all physical activity in an effective way.
the sensory processing and integration. In other words, praxis is key for performing all physical activity in an effective way.
praxis is key for performing all physical activity in an effective way.
24 A counterpoint to praxis, self-regulation is a behavioral outcome of SI. It is an organized state of attention and arousal that allows us to adapt our behavior to match the demands of the environment. For example, say we are sitting at a park, and a bug runs across our bare foot. Our tactile system goes into emergency mode to determine if we are in danger. Then, even though our foot feels all creepy crawly, our vision kicks in and we see that it’s a little insect. We self-regulate to calm our system so that we can go back to enjoying our picnic at the park.
Next to, and constituting a counterpoint to praxis, self-regulation is a behavioral outcome of SI. It is an organized state of attention and arousal that allows us to adapt our behavior to match the demands of the environment. For example, say we are sitting at a park, and a bug runs across our bare foot. Our tactile system goes into emergency mode to determine if we are in danger. Then, even though our foot feels all creepy crawly, our vision kicks in and we see that it’s a little insect. We self-regulate to calm our system so that we can go back to enjoying our picnic at the park.
A counterpoint to praxis, self-regulation is a behavioral outcome of SI. It is an organized state of attention and arousal that allows us to adapt our behavior to match the demands of the environment. For example, say we are sitting at a park, and a bug runs across our bare foot. Our tactile system goes into emergency mode to determine if we are in danger. Then, even though our foot feels all creepy crawly, our vision kicks in and we see that it’s a little insect. We self-regulate to calm our system so that we can go back to enjoying our picnic at the park.
25 Optimal arousal, praxis, and self-regulation are all outcomes of sensory integration.
Optimal arousal, praxis, and self-regulation are all outcomes that are connected to sensory integration.
Optimal arousal, praxis, and self-regulation are all outcomes of sensory integration.
26 Subsequently, a bigger outcome of SI is to make lasting and beneficial changes to our nervous system. When we change our nervous system in response to our experiences, this is called neuroplasticity. A common example of neuroplasticity is when a person undergoes rehab and regains brain function and
Looking to the bottom center of your screen in purple, a bigger outcome of SI is to make lasting and beneficial changes to our nervous system. When we change our nervous system in response to our experiences, this is called neuroplasticity. A common example of neuroplasticity is when a person undergoes rehab and
Subsequently, a bigger outcome of SI is to make lasting and beneficial changes to our nervous system. When we change our nervous system in response to our experiences, this is called neuroplasticity. A common example of neuroplasticity is when a person undergoes rehab and regains brain function and
280
movement after having had a stroke. SI activities promote neuroplasticity.
regains brain function and movement after having had a stroke. SI activities promote neuroplasticity.
movement after having had a stroke. SI activities promote neuroplasticity.
27 A final SI outcome is occupational engagement. This goal is more global. It reflects how SI can facilitate our ability to participate in meaningful every-day pursuits including activities of daily living, work and education, play and leisure, and rest and sleep. Participating in these activities supports and builds our sense of self-esteem and self-worth. Occupational engagement as assisted by sensory integration and neuroplasticity is critical for our health and wellbeing.
A final SI outcome is occupational engagement as shown in the lower right corner of your screen in green. This goal is more global. It reflects how SI can facilitate our ability to participate in meaningful every-day pursuits including activities of daily living, work and education, play and leisure, and rest and sleep. Participating in these activities supports and builds our sense of self-esteem and self-worth. Occupational engagement as assisted by sensory integration and neuroplasticity is critical for our health and wellbeing.
A final SI outcome is occupational engagement. This goal is more global. It reflects how SI can facilitate our ability to participate in meaningful every-day pursuits including activities of daily living, work and education, play and leisure, and rest and sleep. Participating in these activities supports and builds our sense of self-esteem and self-worth. Occupational engagement as assisted by sensory integration and neuroplasticity is critical for our health and wellbeing.
28 Sensory Processing, Principles of intervention, and SI outcomes are all aspects of the larger topic of sensory integration theory, and these concepts all contribute to sensory integration.
Moving from left to right, Sensory Processing, Principles of intervention, and SI outcomes are all aspects of the larger topic of sensory integration theory, and these concepts all contribute to sensory integration.
As you can see, Sensory Processing (a), Principles of intervention (b)…
29 Now that you’ve gotten a sneak peek at the basic terms surrounding sensory integration, let’s dive into the details and consider how SI affects real people in real situations.
Now that you’ve gotten a sneak peek at the basic terms surrounding sensory integration, let’s dive into the details and consider how SI affects real people in real situations.
….and SI outcomes are aspects of the larger topic of sensory integration theory, and these concepts all contribute to sensory integration. Now that you’ve gotten a sneak peek at the basic terms surrounding sensory integration, let’s dive into the details and consider how SI affects real people in real situations.
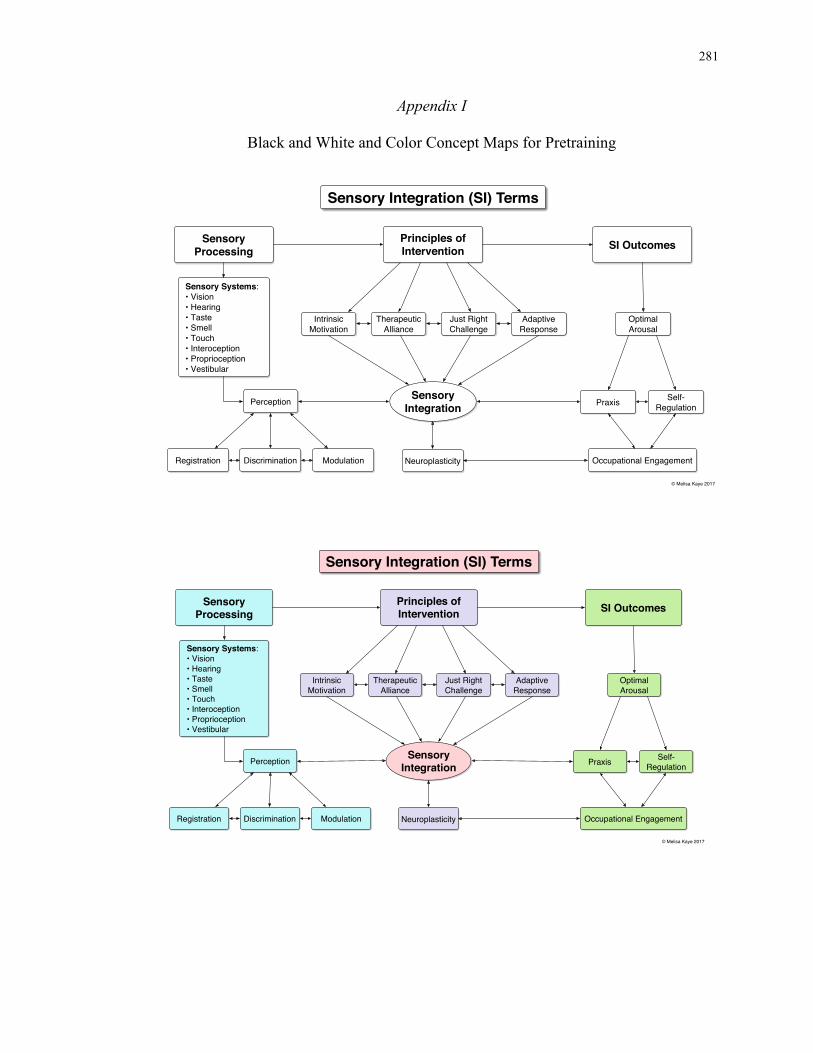
281
Appendix I
Black and White and Color Concept Maps for Pretraining
Sensory Integration
Sensory Processing
Principles of Intervention
Intrinsic Motivation
Therapeutic Alliance
Just Right Challenge
Adaptive Response
SI Outcomes
Praxis Self-Regulation
Optimal Arousal
Registration ModulationDiscrimination Occupational Engagement
Sensory Integration (SI) Terms
© Melisa Kaye 2017
Perception
Neuroplasticity
Sensory Systems:• Vision• Hearing• Taste• Smell• Touch• Interoception• Proprioception• Vestibular
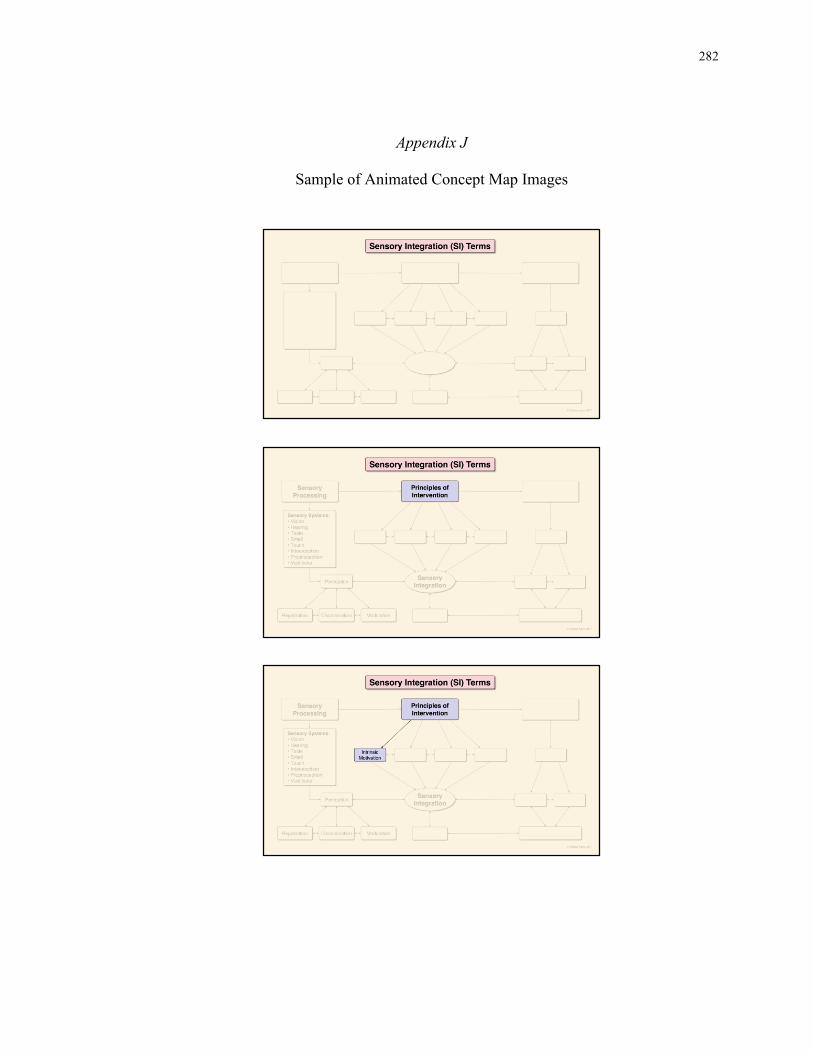
282
Appendix J
Sample of Animated Concept Map Images
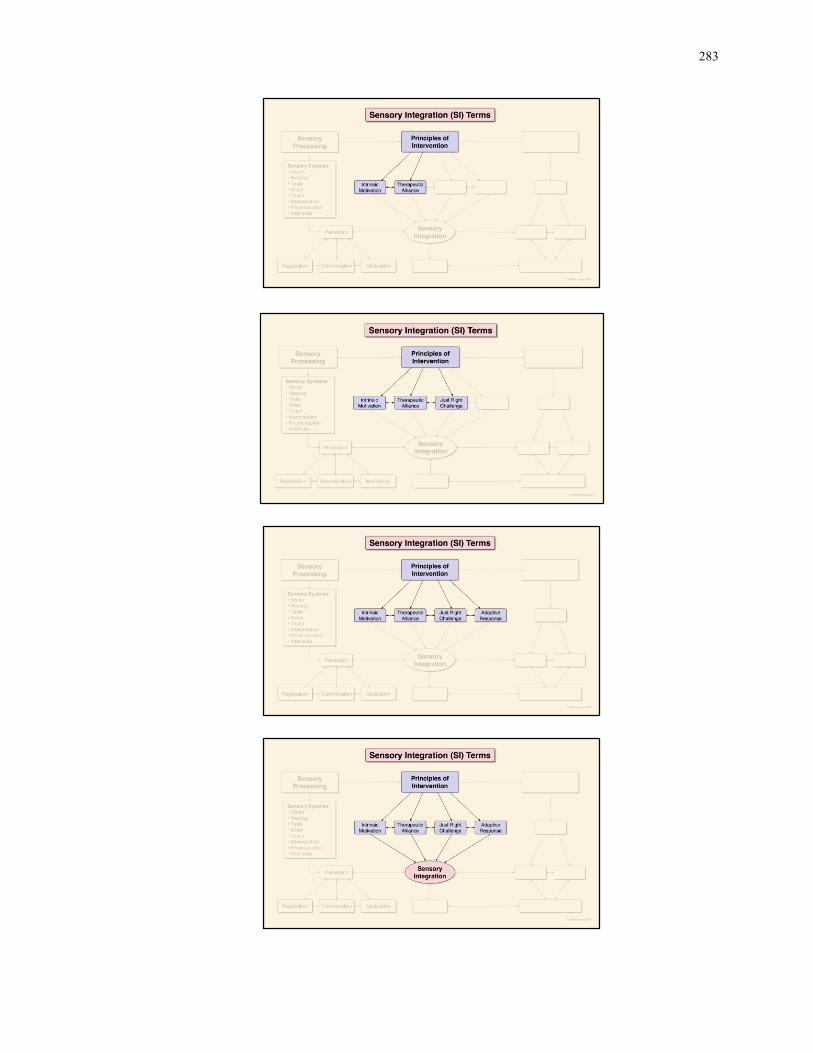
283
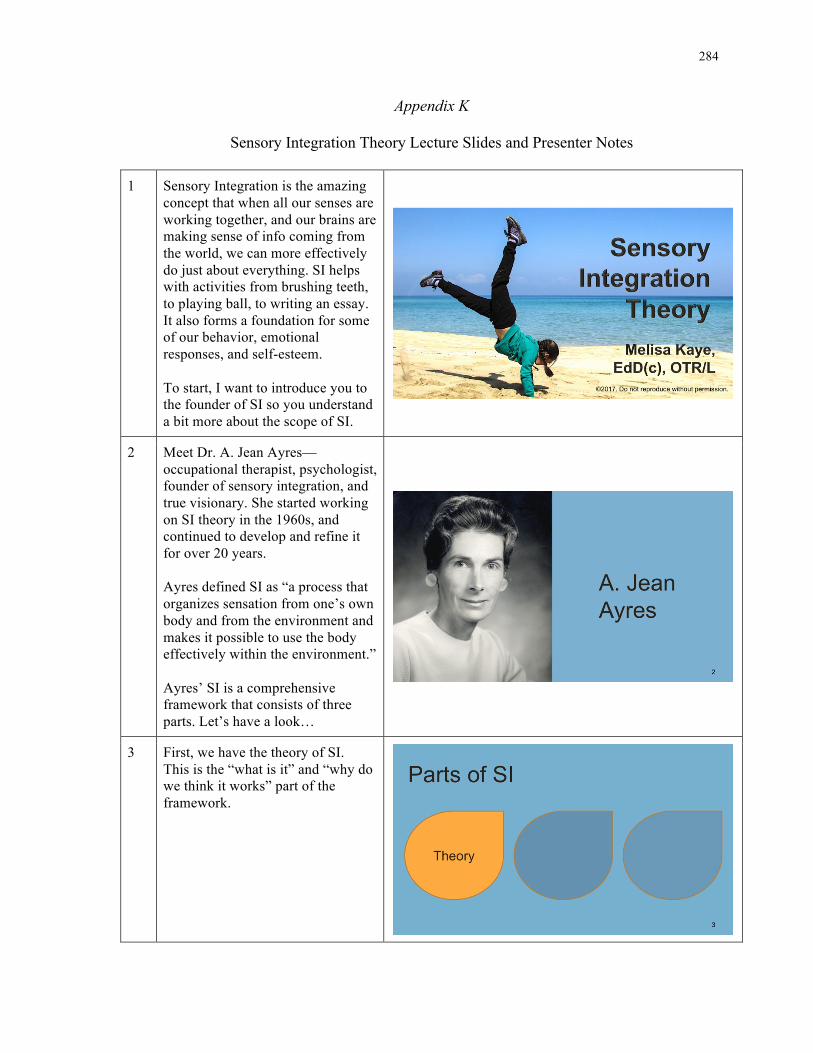
284
Appendix K
Sensory Integration Theory Lecture Slides and Presenter Notes
1 Sensory Integration is the amazing concept that when all our senses are working together, and our brains are making sense of info coming from the world, we can more effectively do just about everything. SI helps with activities from brushing teeth, to playing ball, to writing an essay. It also forms a foundation for some of our behavior, emotional responses, and self-esteem. To start, I want to introduce you to the founder of SI so you understand a bit more about the scope of SI.
2 Meet Dr. A. Jean Ayres—occupational therapist, psychologist, founder of sensory integration, and true visionary. She started working on SI theory in the 1960s, and continued to develop and refine it for over 20 years. Ayres defined SI as “a process that organizes sensation from one’s own body and from the environment and makes it possible to use the body effectively within the environment.” Ayres’ SI is a comprehensive framework that consists of three parts. Let’s have a look…
3 First, we have the theory of SI. This is the “what is it” and “why do we think it works” part of the framework.
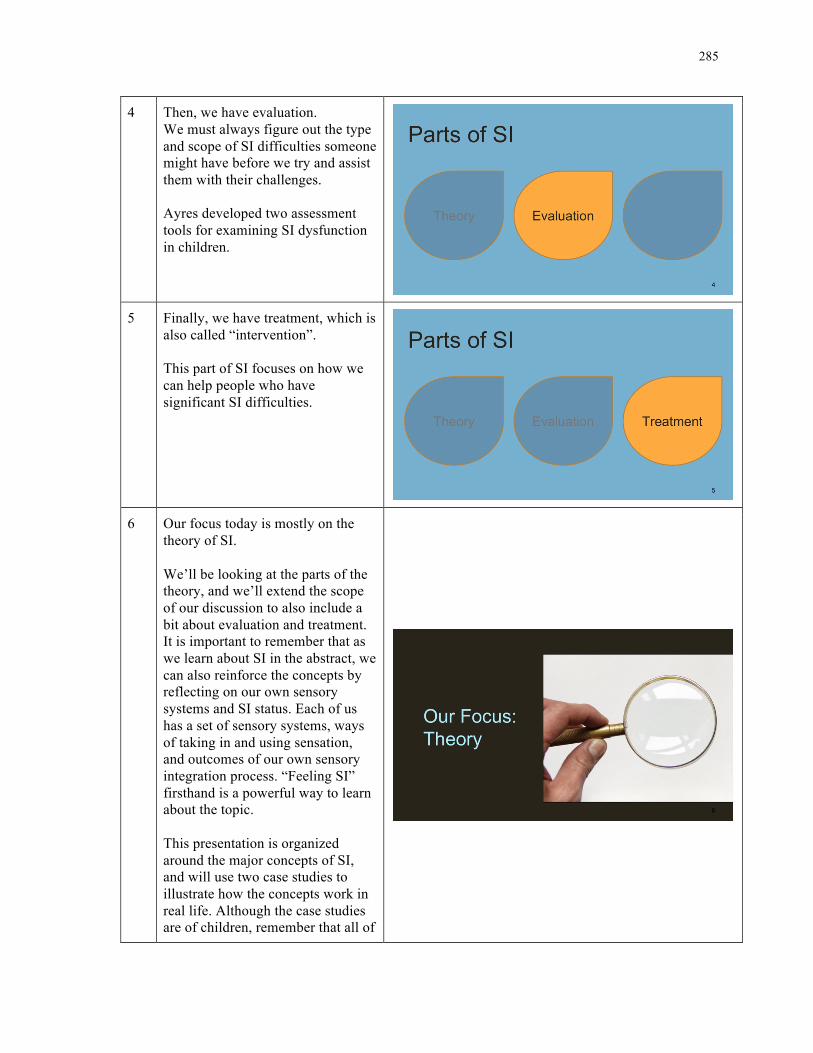
285
4 Then, we have evaluation. We must always figure out the type and scope of SI difficulties someone might have before we try and assist them with their challenges. Ayres developed two assessment tools for examining SI dysfunction in children.
5 Finally, we have treatment, which is also called “intervention”. This part of SI focuses on how we can help people who have significant SI difficulties.
6 Our focus today is mostly on the theory of SI. We’ll be looking at the parts of the theory, and we’ll extend the scope of our discussion to also include a bit about evaluation and treatment. It is important to remember that as we learn about SI in the abstract, we can also reinforce the concepts by reflecting on our own sensory systems and SI status. Each of us has a set of sensory systems, ways of taking in and using sensation, and outcomes of our own sensory integration process. “Feeling SI” firsthand is a powerful way to learn about the topic. This presentation is organized around the major concepts of SI, and will use two case studies to illustrate how the concepts work in real life. Although the case studies are of children, remember that all of
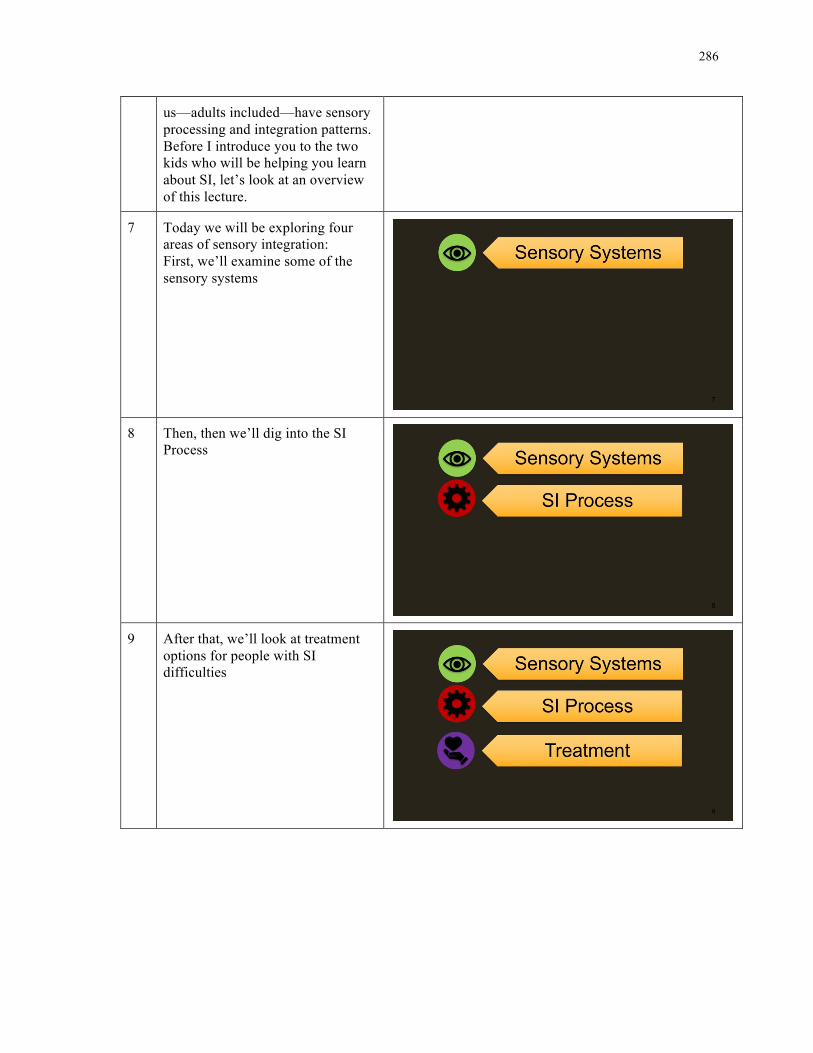
286
us—adults included—have sensory processing and integration patterns. Before I introduce you to the two kids who will be helping you learn about SI, let’s look at an overview of this lecture.
7 Today we will be exploring four areas of sensory integration: First, we’ll examine some of the sensory systems
8 Then, then we’ll dig into the SI Process
9 After that, we’ll look at treatment options for people with SI difficulties
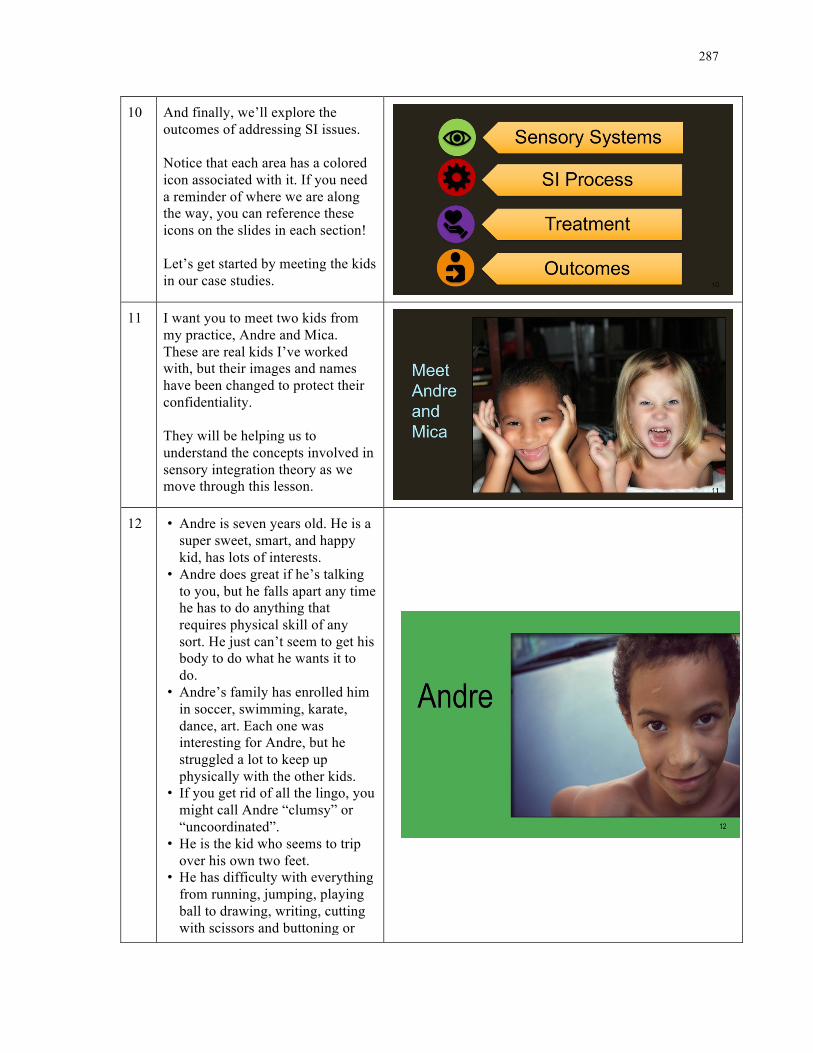
287
10 And finally, we’ll explore the outcomes of addressing SI issues. Notice that each area has a colored icon associated with it. If you need a reminder of where we are along the way, you can reference these icons on the slides in each section! Let’s get started by meeting the kids in our case studies.
11 I want you to meet two kids from my practice, Andre and Mica. These are real kids I’ve worked with, but their images and names have been changed to protect their confidentiality. They will be helping us to understand the concepts involved in sensory integration theory as we move through this lesson.
12 • Andre is seven years old. He is a super sweet, smart, and happy kid, has lots of interests.
• Andre does great if he’s talking to you, but he falls apart any time he has to do anything that requires physical skill of any sort. He just can’t seem to get his body to do what he wants it to do.
• Andre’s family has enrolled him in soccer, swimming, karate, dance, art. Each one was interesting for Andre, but he struggled a lot to keep up physically with the other kids.
• If you get rid of all the lingo, you might call Andre “clumsy” or “uncoordinated”.
• He is the kid who seems to trip over his own two feet.
• He has difficulty with everything from running, jumping, playing ball to drawing, writing, cutting with scissors and buttoning or

288
zipping his clothes. • When he was younger, this didn’t
seem to bother Andre, but his Mom says that he has recently been saying that he’s “stupid” and acts like a “little kid”. He is reluctant to hang out with kids his own age, because he just can’t do the activities they want to do. He family is worried that he is becoming depressed.
13 Andre has praxis problems. This is often called “dyspraxia” meaning poor praxis. To review: praxis is connected with our motor or muscle systems. Praxis is the ability to think up (or imagine), to plan, and to execute (or carry out) physical activities of all types.
14 • Mica is almost 6, and while he resembles an angel in this photo, most people who meet him remember him as a holy terror.
• Mica has a few things that he likes, and a whole lot of things that he really hates. When his family or teacher try to get him to do any of the things he hates, he throws a tantrum, tries to run away, or cries inconsolably.
• His mom says that Mica likes his dog, swinging in his backyard, going to the climbing gym, and playing video games.
• The stuff that bothers Mica the most includes:
• Anything to do with self-care like bathing, brushing his teeth or getting dressed
• Wearing anything that is not old and very soft. He wants to wear the same pair of sweats and the same t-shirt every day. He cannot stand socks and if he’s forced to wear them he takes his shoes off
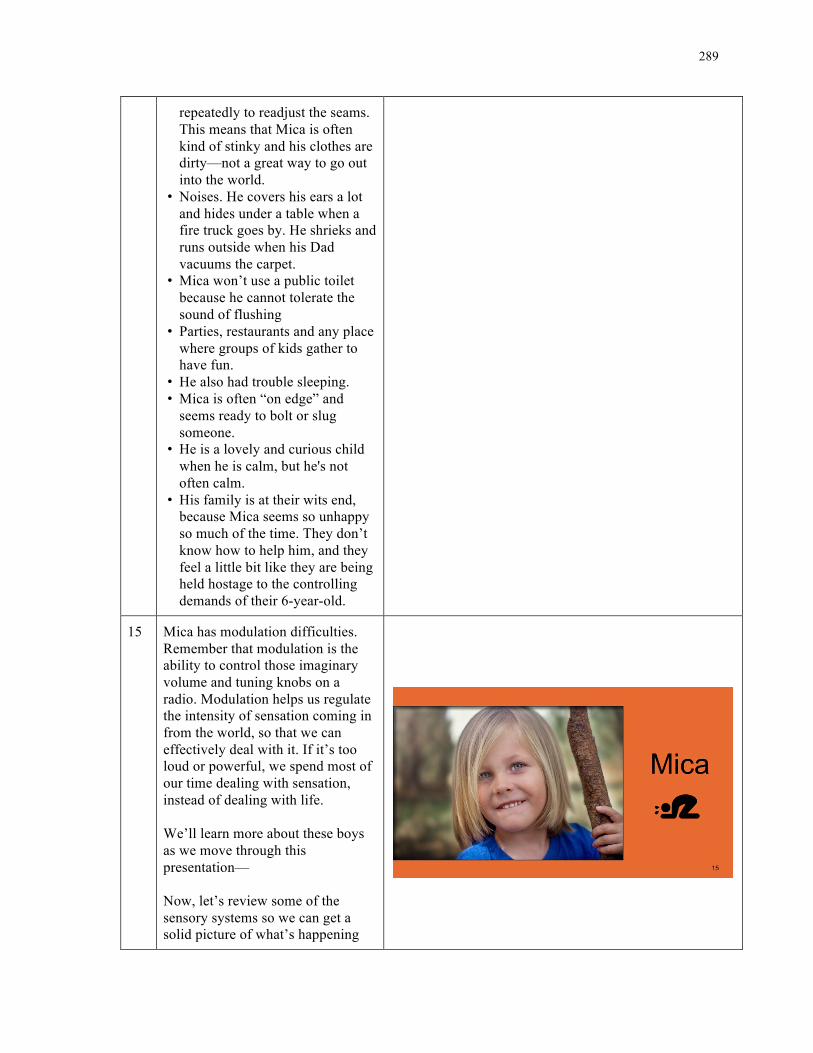
289
repeatedly to readjust the seams. This means that Mica is often kind of stinky and his clothes are dirty—not a great way to go out into the world.
• Noises. He covers his ears a lot and hides under a table when a fire truck goes by. He shrieks and runs outside when his Dad vacuums the carpet.
• Mica won’t use a public toilet because he cannot tolerate the sound of flushing
• Parties, restaurants and any place where groups of kids gather to have fun.
• He also had trouble sleeping. • Mica is often “on edge” and
seems ready to bolt or slug someone.
• He is a lovely and curious child when he is calm, but he's not often calm.
• His family is at their wits end, because Mica seems so unhappy so much of the time. They don’t know how to help him, and they feel a little bit like they are being held hostage to the controlling demands of their 6-year-old.
15 Mica has modulation difficulties. Remember that modulation is the ability to control those imaginary volume and tuning knobs on a radio. Modulation helps us regulate the intensity of sensation coming in from the world, so that we can effectively deal with it. If it’s too loud or powerful, we spend most of our time dealing with sensation, instead of dealing with life. We’ll learn more about these boys as we move through this presentation— Now, let’s review some of the sensory systems so we can get a solid picture of what’s happening
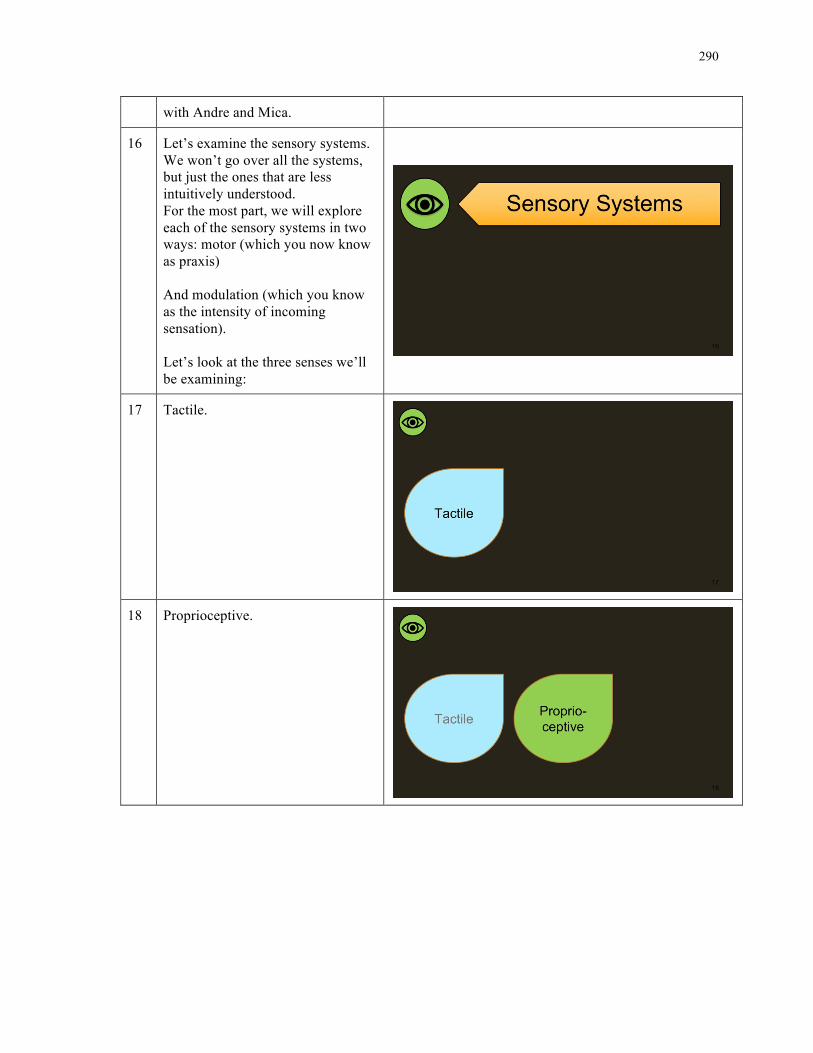
290
with Andre and Mica.
16 Let’s examine the sensory systems. We won’t go over all the systems, but just the ones that are less intuitively understood. For the most part, we will explore each of the sensory systems in two ways: motor (which you now know as praxis) And modulation (which you know as the intensity of incoming sensation). Let’s look at the three senses we’ll be examining:
17 Tactile.
18 Proprioceptive.
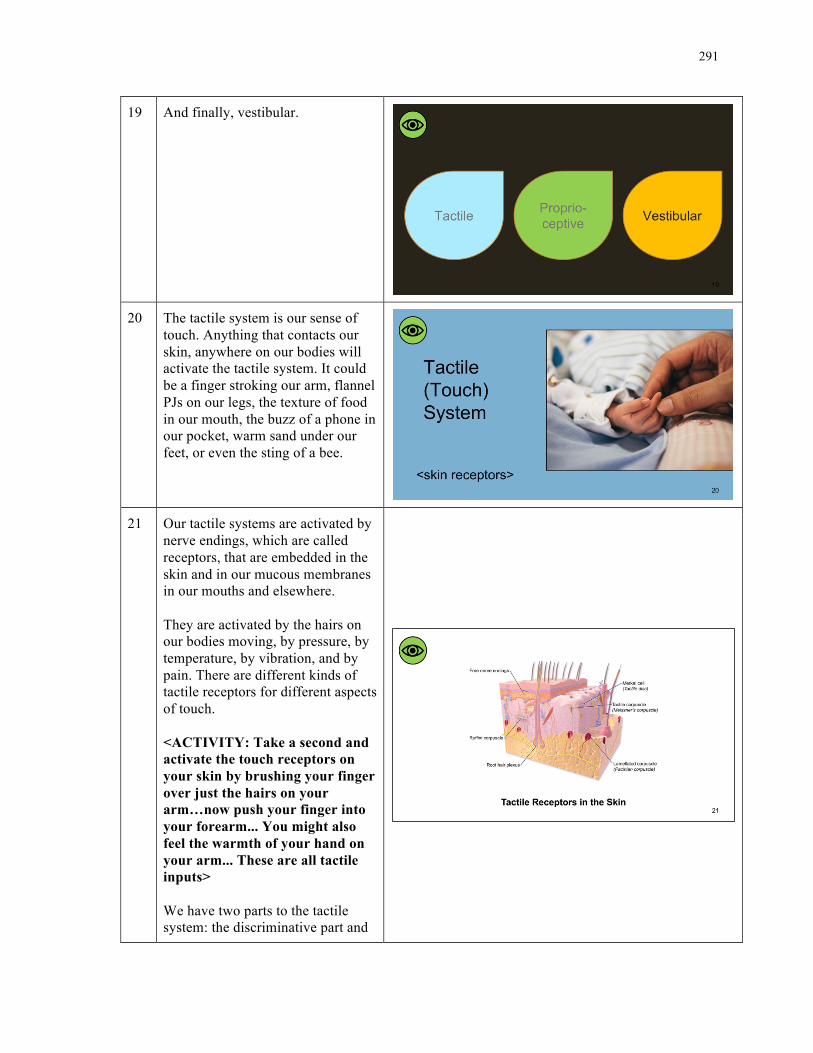
291
19 And finally, vestibular.
20 The tactile system is our sense of touch. Anything that contacts our skin, anywhere on our bodies will activate the tactile system. It could be a finger stroking our arm, flannel PJs on our legs, the texture of food in our mouth, the buzz of a phone in our pocket, warm sand under our feet, or even the sting of a bee.
21 Our tactile systems are activated by nerve endings, which are called receptors, that are embedded in the skin and in our mucous membranes in our mouths and elsewhere. They are activated by the hairs on our bodies moving, by pressure, by temperature, by vibration, and by pain. There are different kinds of tactile receptors for different aspects of touch. <ACTIVITY: Take a second and activate the touch receptors on your skin by brushing your finger over just the hairs on your arm…now push your finger into your forearm... You might also feel the warmth of your hand on your arm... These are all tactile inputs> We have two parts to the tactile system: the discriminative part and
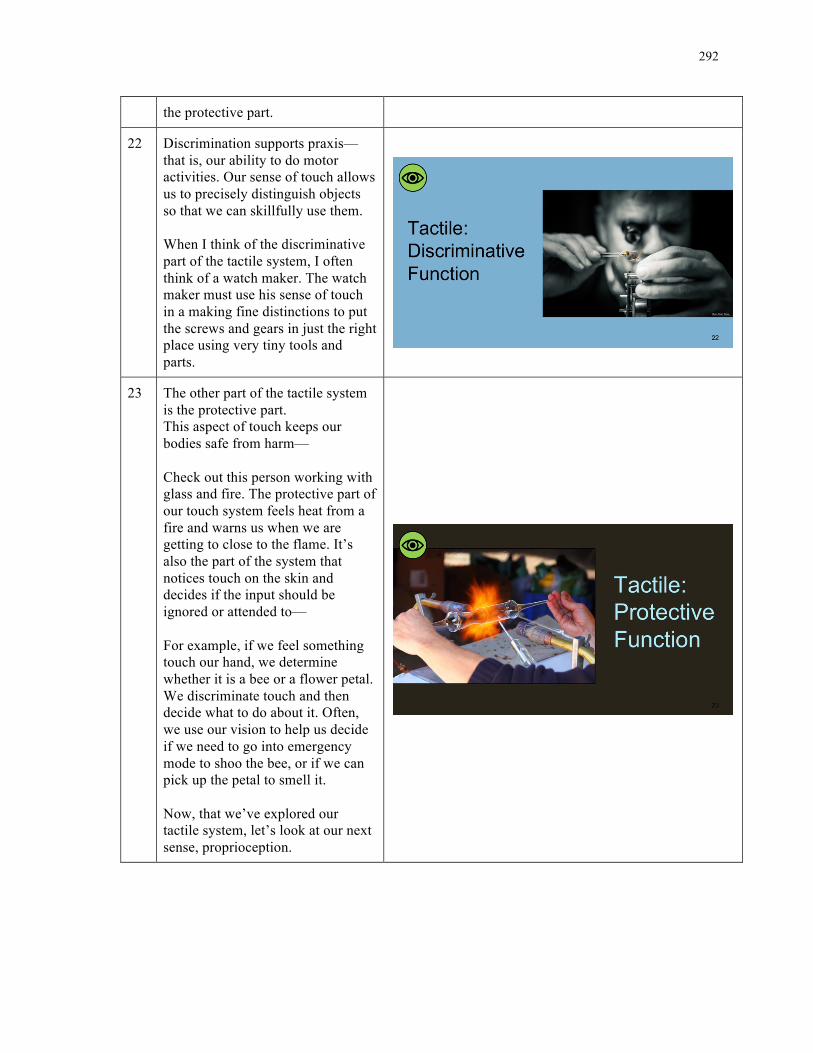
292
the protective part.
22 Discrimination supports praxis—that is, our ability to do motor activities. Our sense of touch allows us to precisely distinguish objects so that we can skillfully use them. When I think of the discriminative part of the tactile system, I often think of a watch maker. The watch maker must use his sense of touch in a making fine distinctions to put the screws and gears in just the right place using very tiny tools and parts.
23 The other part of the tactile system is the protective part. This aspect of touch keeps our bodies safe from harm— Check out this person working with glass and fire. The protective part of our touch system feels heat from a fire and warns us when we are getting to close to the flame. It’s also the part of the system that notices touch on the skin and decides if the input should be ignored or attended to— For example, if we feel something touch our hand, we determine whether it is a bee or a flower petal. We discriminate touch and then decide what to do about it. Often, we use our vision to help us decide if we need to go into emergency mode to shoo the bee, or if we can pick up the petal to smell it. Now, that we’ve explored our tactile system, let’s look at our next sense, proprioception.
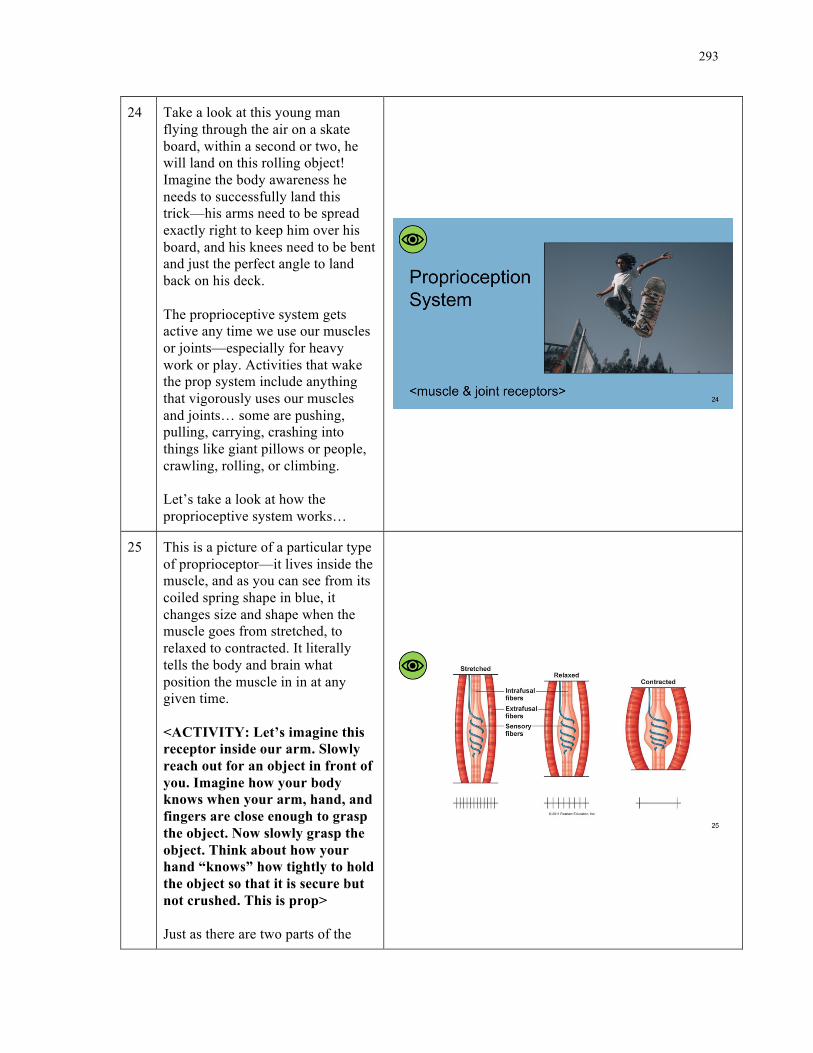
293
24 Take a look at this young man flying through the air on a skate board, within a second or two, he will land on this rolling object! Imagine the body awareness he needs to successfully land this trick—his arms need to be spread exactly right to keep him over his board, and his knees need to be bent and just the perfect angle to land back on his deck. The proprioceptive system gets active any time we use our muscles or joints—especially for heavy work or play. Activities that wake the prop system include anything that vigorously uses our muscles and joints… some are pushing, pulling, carrying, crashing into things like giant pillows or people, crawling, rolling, or climbing. Let’s take a look at how the proprioceptive system works…
25 This is a picture of a particular type of proprioceptor—it lives inside the muscle, and as you can see from its coiled spring shape in blue, it changes size and shape when the muscle goes from stretched, to relaxed to contracted. It literally tells the body and brain what position the muscle in in at any given time. <ACTIVITY: Let’s imagine this receptor inside our arm. Slowly reach out for an object in front of you. Imagine how your body knows when your arm, hand, and fingers are close enough to grasp the object. Now slowly grasp the object. Think about how your hand “knows” how tightly to hold the object so that it is secure but not crushed. This is prop> Just as there are two parts of the
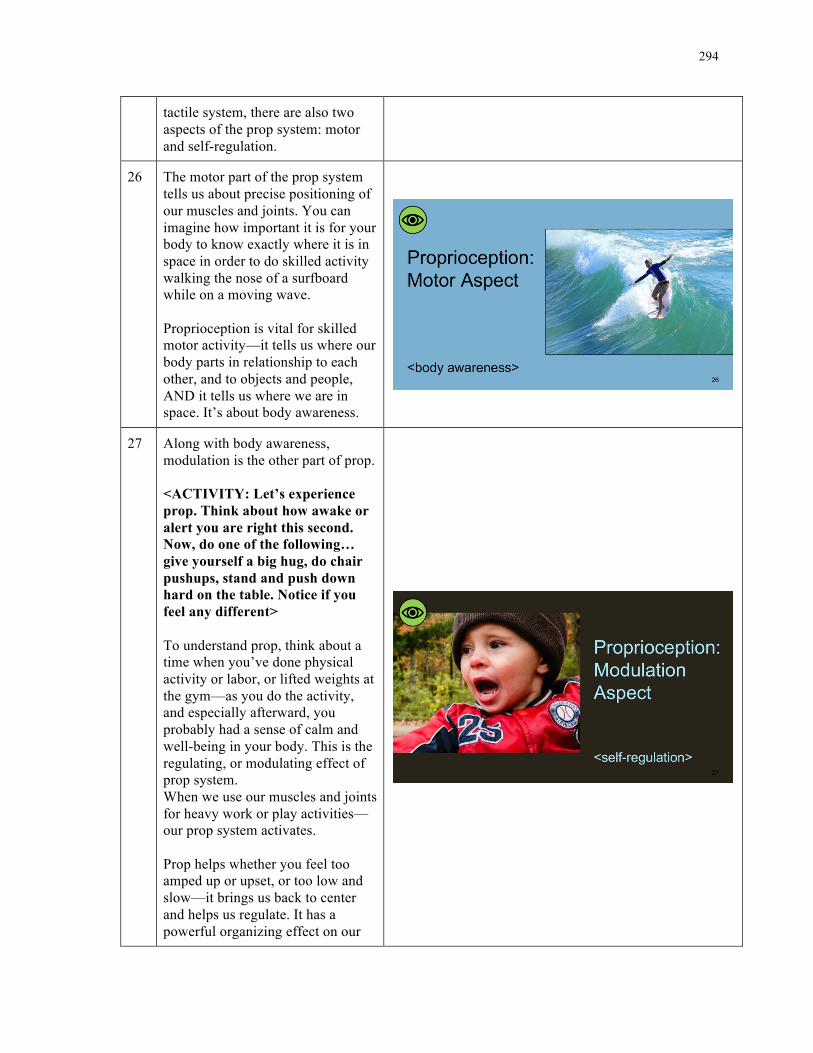
294
tactile system, there are also two aspects of the prop system: motor and self-regulation.
26 The motor part of the prop system tells us about precise positioning of our muscles and joints. You can imagine how important it is for your body to know exactly where it is in space in order to do skilled activity walking the nose of a surfboard while on a moving wave. Proprioception is vital for skilled motor activity—it tells us where our body parts in relationship to each other, and to objects and people, AND it tells us where we are in space. It’s about body awareness.
27 Along with body awareness, modulation is the other part of prop. <ACTIVITY: Let’s experience prop. Think about how awake or alert you are right this second. Now, do one of the following… give yourself a big hug, do chair pushups, stand and push down hard on the table. Notice if you feel any different> To understand prop, think about a time when you’ve done physical activity or labor, or lifted weights at the gym—as you do the activity, and especially afterward, you probably had a sense of calm and well-being in your body. This is the regulating, or modulating effect of prop system. When we use our muscles and joints for heavy work or play activities—our prop system activates. Prop helps whether you feel too amped up or upset, or too low and slow—it brings us back to center and helps us regulate. It has a powerful organizing effect on our
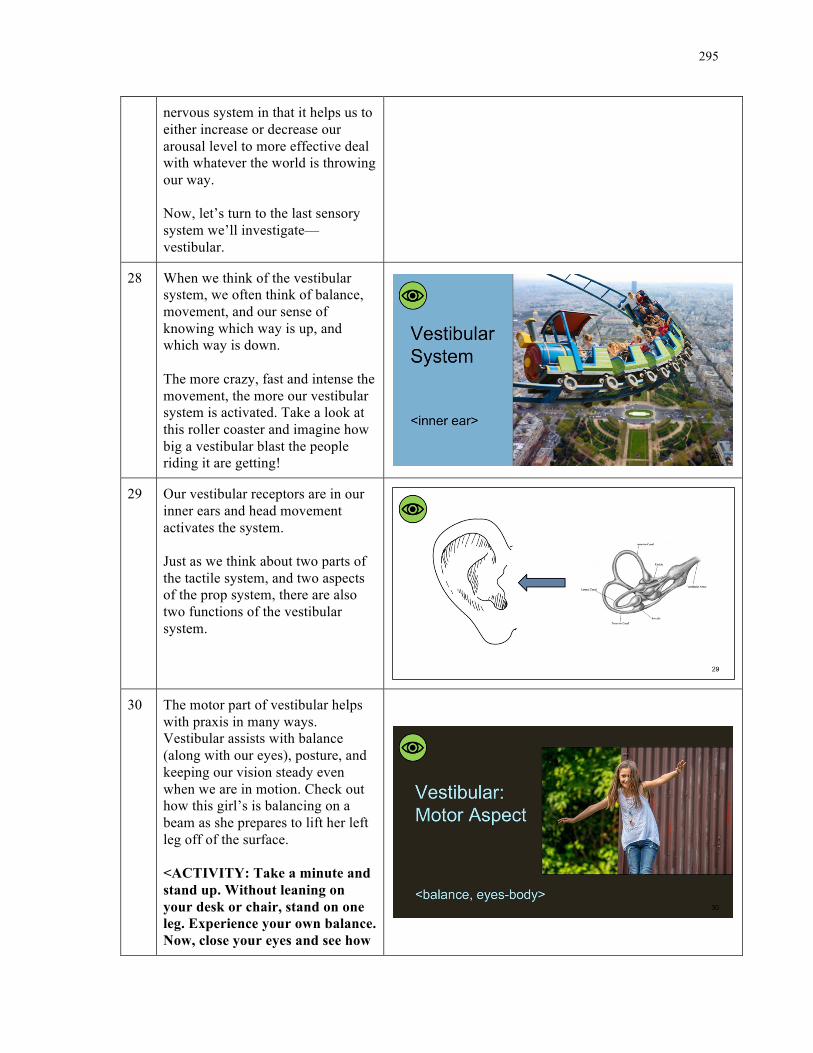
295
nervous system in that it helps us to either increase or decrease our arousal level to more effective deal with whatever the world is throwing our way. Now, let’s turn to the last sensory system we’ll investigate—vestibular.
28 When we think of the vestibular system, we often think of balance, movement, and our sense of knowing which way is up, and which way is down. The more crazy, fast and intense the movement, the more our vestibular system is activated. Take a look at this roller coaster and imagine how big a vestibular blast the people riding it are getting!
29 Our vestibular receptors are in our inner ears and head movement activates the system. Just as we think about two parts of the tactile system, and two aspects of the prop system, there are also two functions of the vestibular system.
30 The motor part of vestibular helps with praxis in many ways. Vestibular assists with balance (along with our eyes), posture, and keeping our vision steady even when we are in motion. Check out how this girl’s is balancing on a beam as she prepares to lift her left leg off of the surface. <ACTIVITY: Take a minute and stand up. Without leaning on your desk or chair, stand on one leg. Experience your own balance. Now, close your eyes and see how
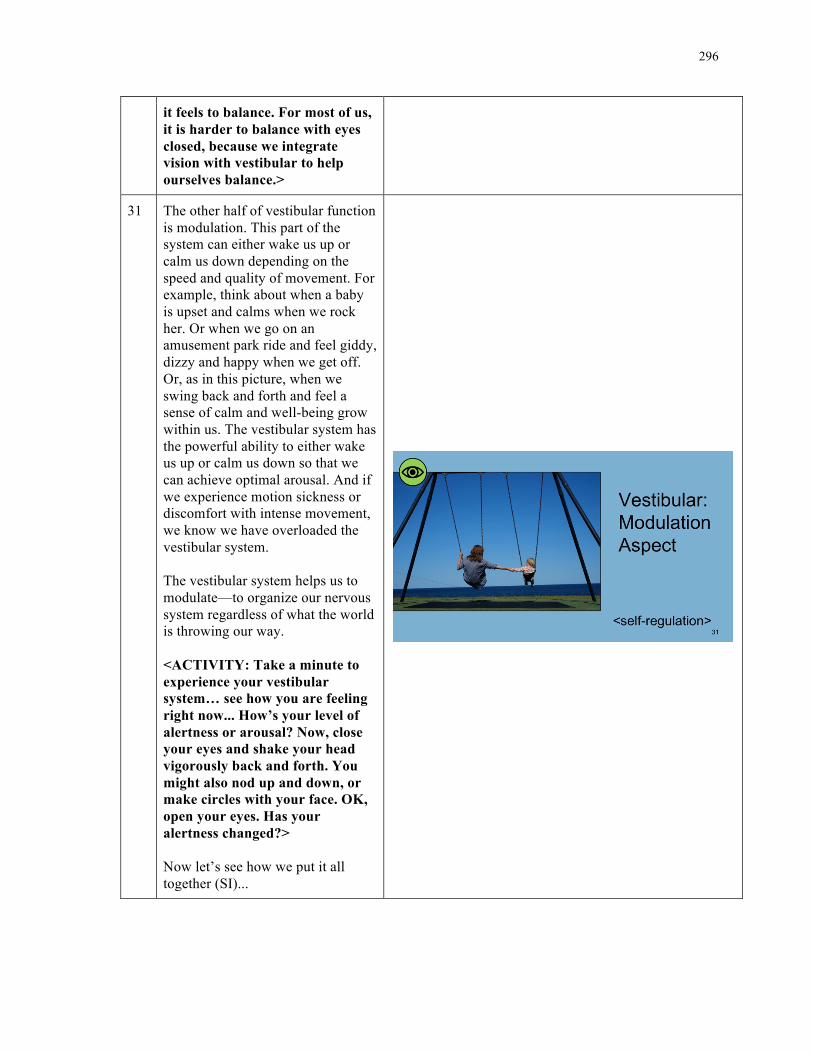
296
it feels to balance. For most of us, it is harder to balance with eyes closed, because we integrate vision with vestibular to help ourselves balance.>
31 The other half of vestibular function is modulation. This part of the system can either wake us up or calm us down depending on the speed and quality of movement. For example, think about when a baby is upset and calms when we rock her. Or when we go on an amusement park ride and feel giddy, dizzy and happy when we get off. Or, as in this picture, when we swing back and forth and feel a sense of calm and well-being grow within us. The vestibular system has the powerful ability to either wake us up or calm us down so that we can achieve optimal arousal. And if we experience motion sickness or discomfort with intense movement, we know we have overloaded the vestibular system. The vestibular system helps us to modulate—to organize our nervous system regardless of what the world is throwing our way. <ACTIVITY: Take a minute to experience your vestibular system… see how you are feeling right now... How’s your level of alertness or arousal? Now, close your eyes and shake your head vigorously back and forth. You might also nod up and down, or make circles with your face. OK, open your eyes. Has your alertness changed?> Now let’s see how we put it all together (SI)...
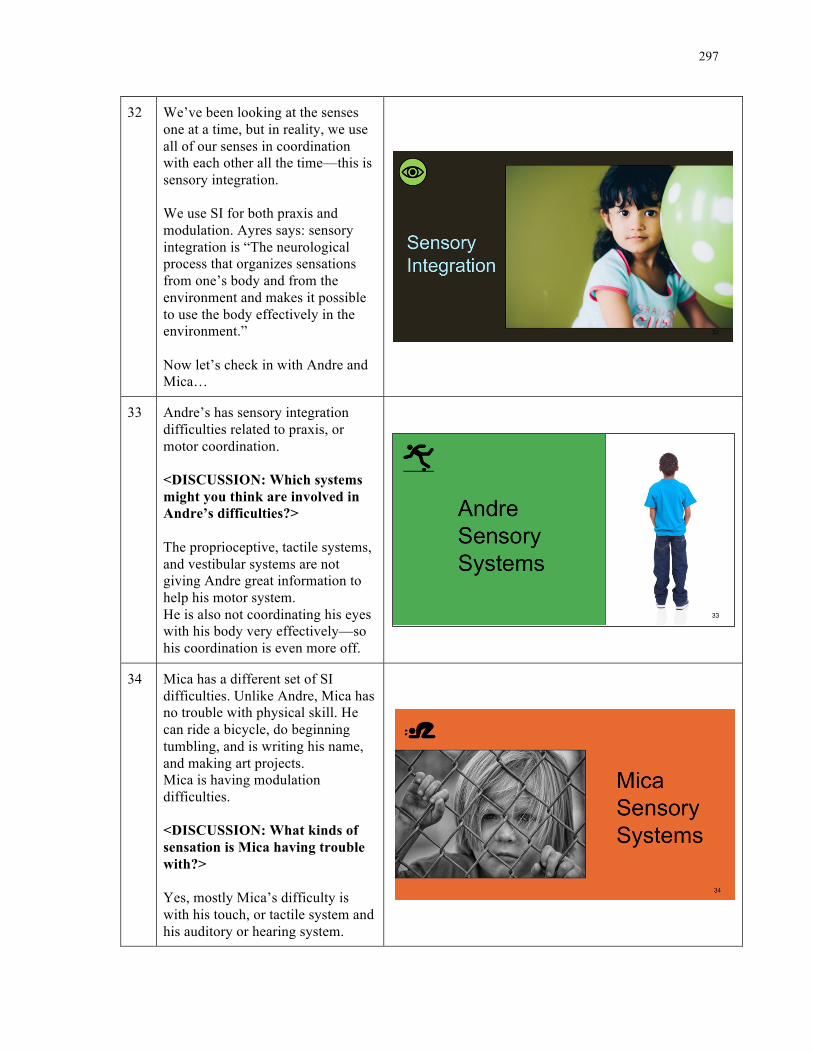
297
32 We’ve been looking at the senses one at a time, but in reality, we use all of our senses in coordination with each other all the time—this is sensory integration. We use SI for both praxis and modulation. Ayres says: sensory integration is “The neurological process that organizes sensations from one’s body and from the environment and makes it possible to use the body effectively in the environment.” Now let’s check in with Andre and Mica…
33 Andre’s has sensory integration difficulties related to praxis, or motor coordination. <DISCUSSION: Which systems might you think are involved in Andre’s difficulties?> The proprioceptive, tactile systems, and vestibular systems are not giving Andre great information to help his motor system. He is also not coordinating his eyes with his body very effectively—so his coordination is even more off.
34 Mica has a different set of SI difficulties. Unlike Andre, Mica has no trouble with physical skill. He can ride a bicycle, do beginning tumbling, and is writing his name, and making art projects. Mica is having modulation difficulties. <DISCUSSION: What kinds of sensation is Mica having trouble with?> Yes, mostly Mica’s difficulty is with his touch, or tactile system and his auditory or hearing system.
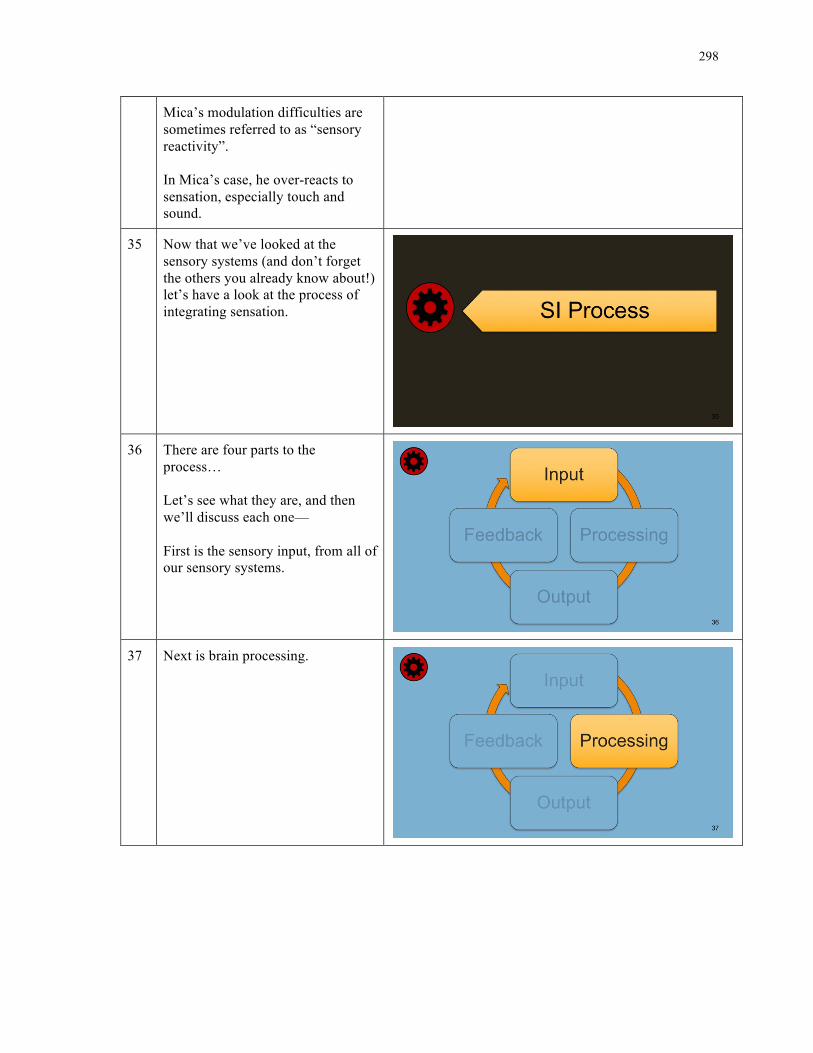
298
Mica’s modulation difficulties are sometimes referred to as “sensory reactivity”. In Mica’s case, he over-reacts to sensation, especially touch and sound.
35 Now that we’ve looked at the sensory systems (and don’t forget the others you already know about!) let’s have a look at the process of integrating sensation.
36 There are four parts to the process… Let’s see what they are, and then we’ll discuss each one— First is the sensory input, from all of our sensory systems.
37 Next is brain processing.
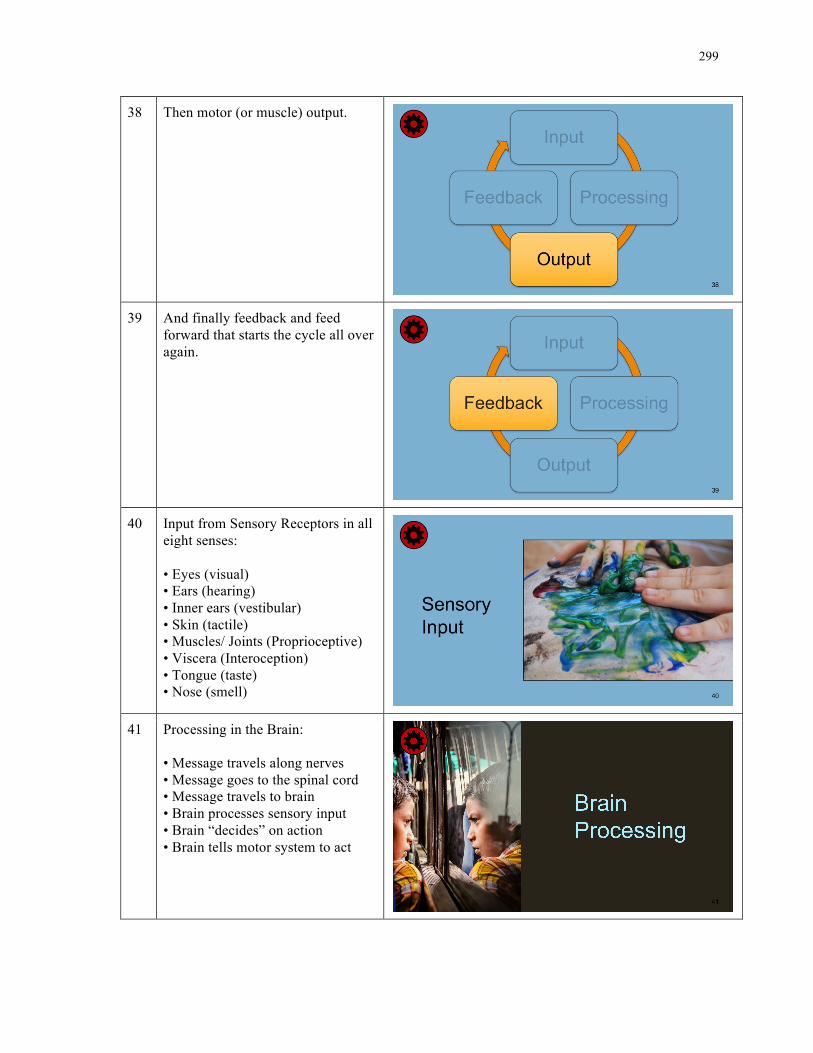
299
38 Then motor (or muscle) output.
39 And finally feedback and feed forward that starts the cycle all over again.
40 Input from Sensory Receptors in all eight senses: • Eyes (visual) • Ears (hearing) • Inner ears (vestibular) • Skin (tactile) • Muscles/ Joints (Proprioceptive) • Viscera (Interoception) • Tongue (taste) • Nose (smell)
41 Processing in the Brain: • Message travels along nerves • Message goes to the spinal cord • Message travels to brain • Brain processes sensory input • Brain “decides” on action • Brain tells motor system to act
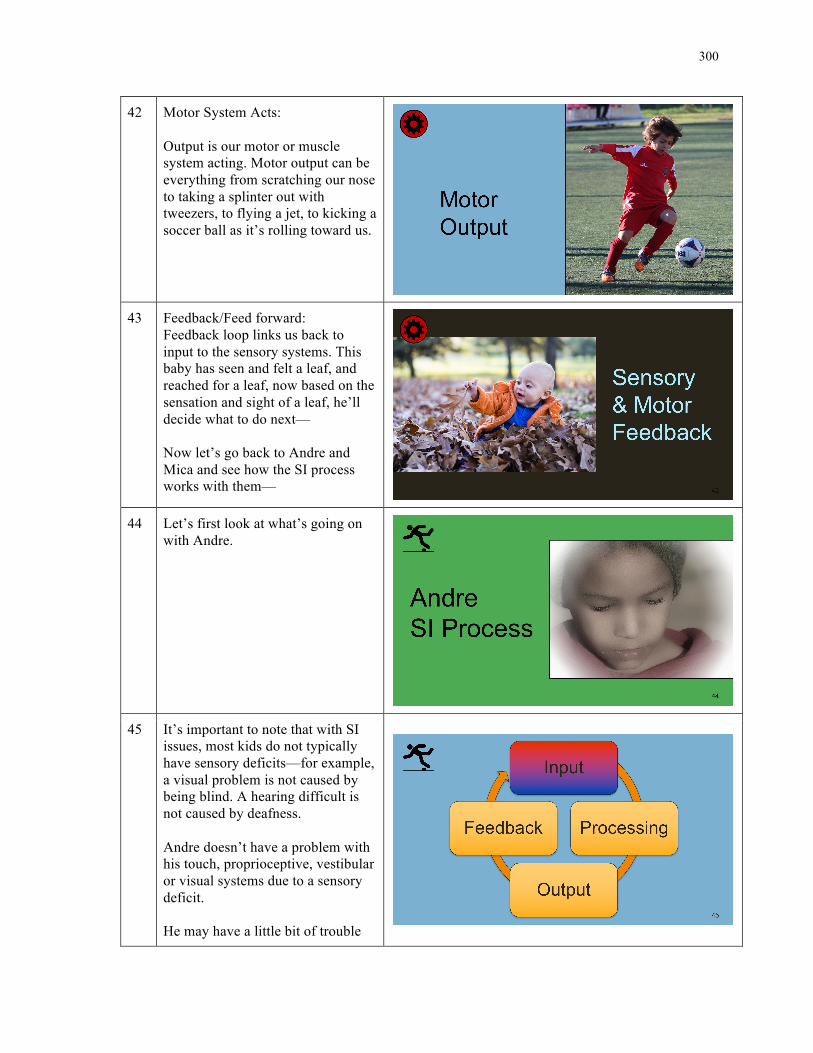
300
42 Motor System Acts: Output is our motor or muscle system acting. Motor output can be everything from scratching our nose to taking a splinter out with tweezers, to flying a jet, to kicking a soccer ball as it’s rolling toward us.
43 Feedback/Feed forward: Feedback loop links us back to input to the sensory systems. This baby has seen and felt a leaf, and reached for a leaf, now based on the sensation and sight of a leaf, he’ll decide what to do next— Now let’s go back to Andre and Mica and see how the SI process works with them—
44 Let’s first look at what’s going on with Andre.
45 It’s important to note that with SI issues, most kids do not typically have sensory deficits—for example, a visual problem is not caused by being blind. A hearing difficult is not caused by deafness. Andre doesn’t have a problem with his touch, proprioceptive, vestibular or visual systems due to a sensory deficit. He may have a little bit of trouble
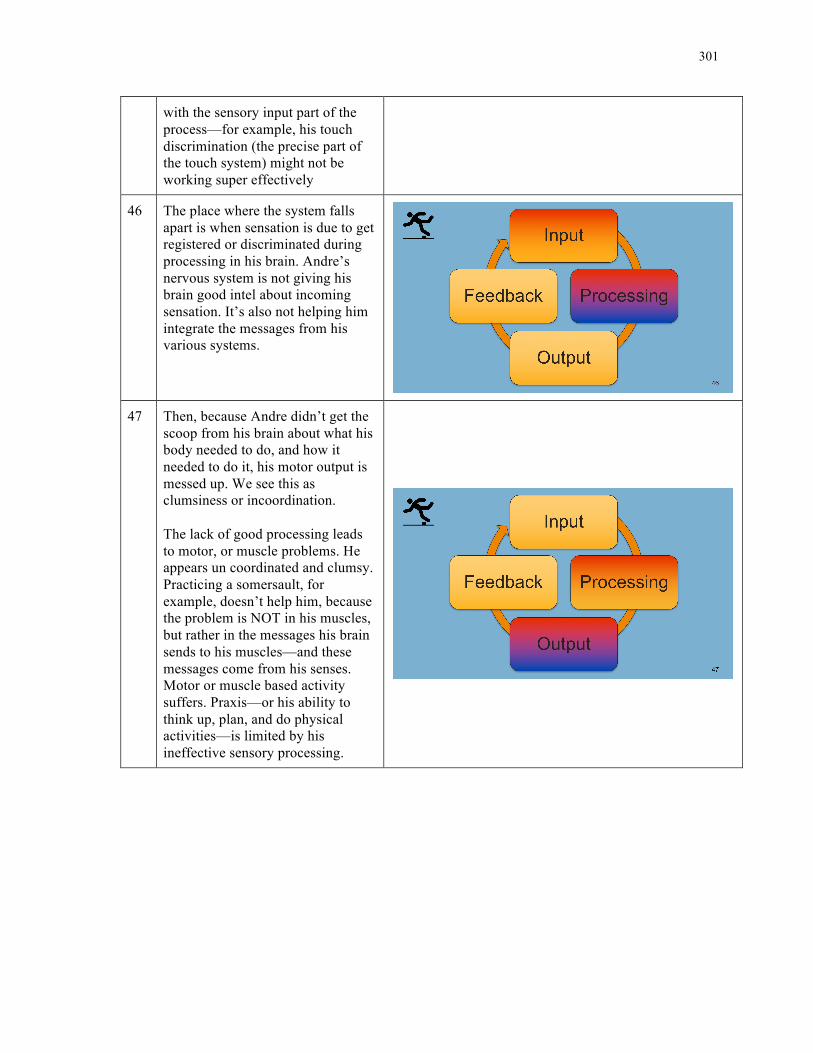
301
with the sensory input part of the process—for example, his touch discrimination (the precise part of the touch system) might not be working super effectively
46 The place where the system falls apart is when sensation is due to get registered or discriminated during processing in his brain. Andre’s nervous system is not giving his brain good intel about incoming sensation. It’s also not helping him integrate the messages from his various systems.
47 Then, because Andre didn’t get the scoop from his brain about what his body needed to do, and how it needed to do it, his motor output is messed up. We see this as clumsiness or incoordination. The lack of good processing leads to motor, or muscle problems. He appears un coordinated and clumsy. Practicing a somersault, for example, doesn’t help him, because the problem is NOT in his muscles, but rather in the messages his brain sends to his muscles—and these messages come from his senses. Motor or muscle based activity suffers. Praxis—or his ability to think up, plan, and do physical activities—is limited by his ineffective sensory processing.
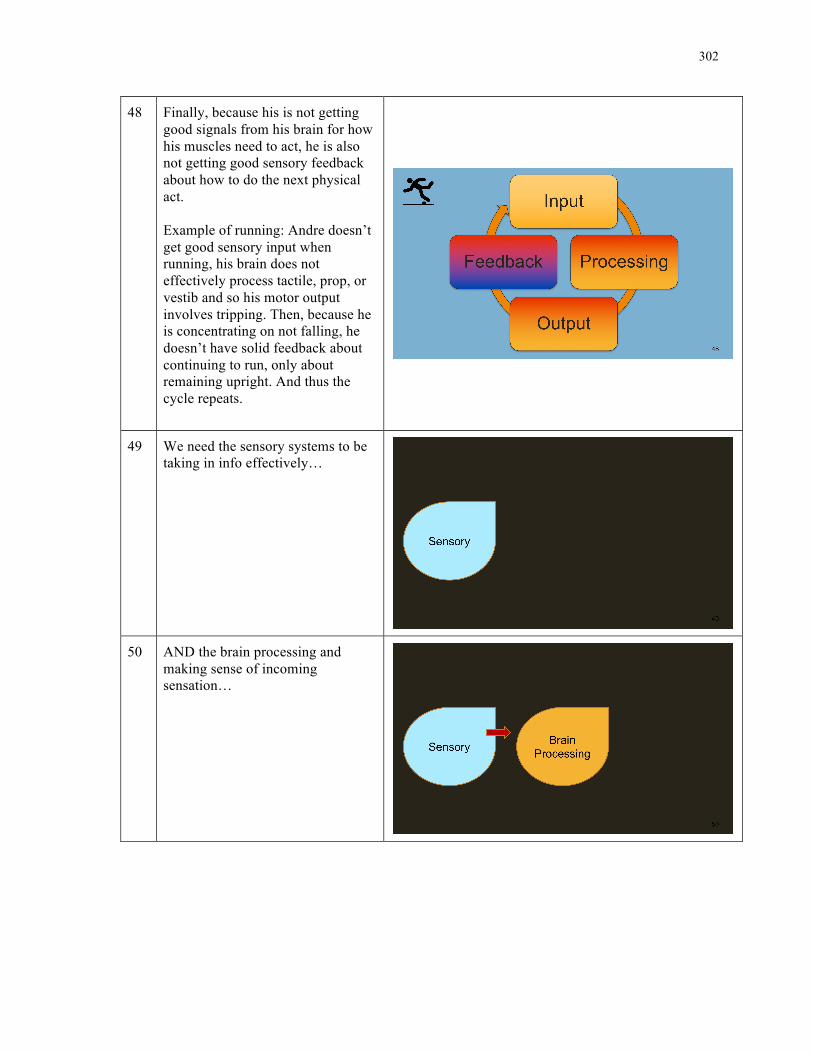
302
48 Finally, because his is not getting good signals from his brain for how his muscles need to act, he is also not getting good sensory feedback about how to do the next physical act. Example of running: Andre doesn’t get good sensory input when running, his brain does not effectively process tactile, prop, or vestib and so his motor output involves tripping. Then, because he is concentrating on not falling, he doesn’t have solid feedback about continuing to run, only about remaining upright. And thus the cycle repeats.
49 We need the sensory systems to be taking in info effectively…
50 AND the brain processing and making sense of incoming sensation…
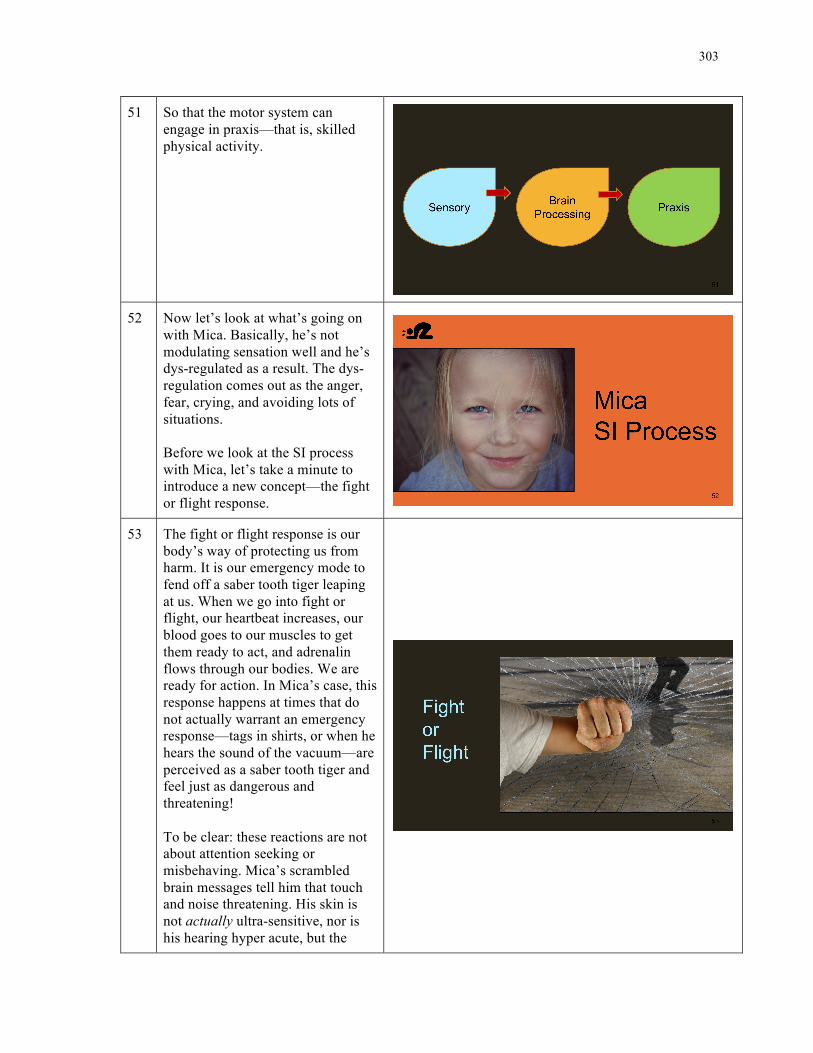
303
51 So that the motor system can engage in praxis—that is, skilled physical activity.
52 Now let’s look at what’s going on with Mica. Basically, he’s not modulating sensation well and he’s dys-regulated as a result. The dys-regulation comes out as the anger, fear, crying, and avoiding lots of situations. Before we look at the SI process with Mica, let’s take a minute to introduce a new concept—the fight or flight response.
53 The fight or flight response is our body’s way of protecting us from harm. It is our emergency mode to fend off a saber tooth tiger leaping at us. When we go into fight or flight, our heartbeat increases, our blood goes to our muscles to get them ready to act, and adrenalin flows through our bodies. We are ready for action. In Mica’s case, this response happens at times that do not actually warrant an emergency response—tags in shirts, or when he hears the sound of the vacuum—are perceived as a saber tooth tiger and feel just as dangerous and threatening! To be clear: these reactions are not about attention seeking or misbehaving. Mica’s scrambled brain messages tell him that touch and noise threatening. His skin is not actually ultra-sensitive, nor is his hearing hyper acute, but the
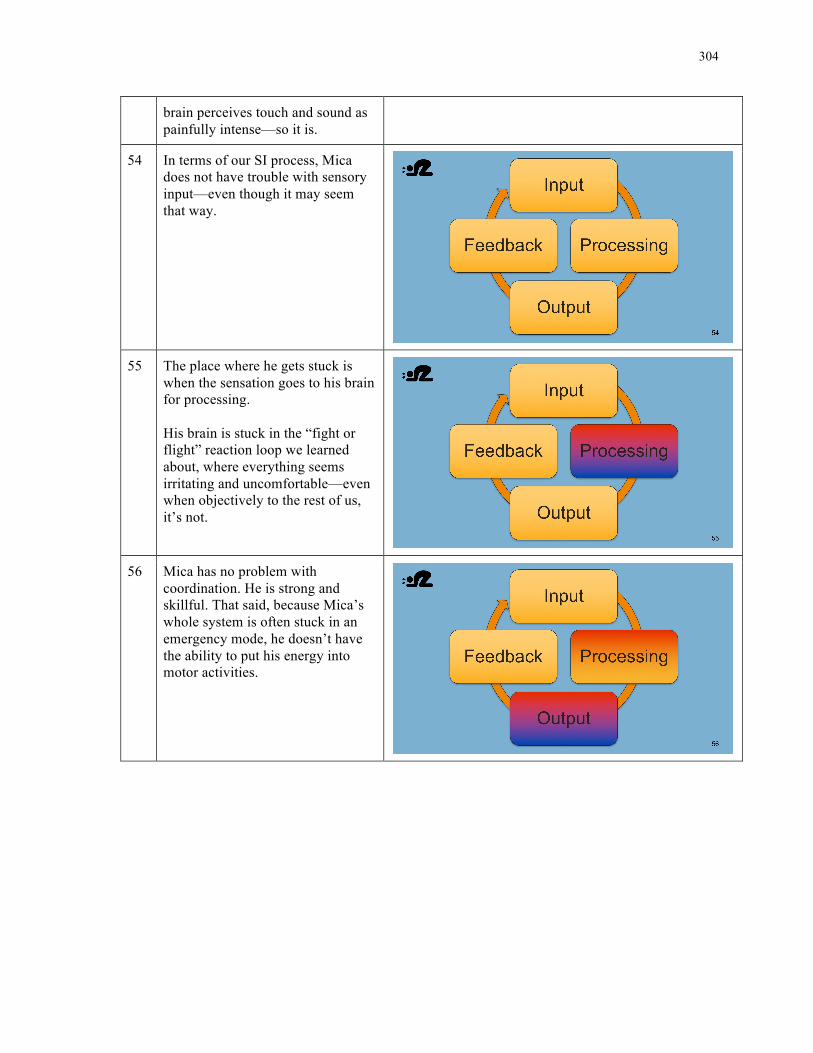
304
brain perceives touch and sound as painfully intense—so it is.
54 In terms of our SI process, Mica does not have trouble with sensory input—even though it may seem that way.
55 The place where he gets stuck is when the sensation goes to his brain for processing. His brain is stuck in the “fight or flight” reaction loop we learned about, where everything seems irritating and uncomfortable—even when objectively to the rest of us, it’s not.
56 Mica has no problem with coordination. He is strong and skillful. That said, because Mica’s whole system is often stuck in an emergency mode, he doesn’t have the ability to put his energy into motor activities.
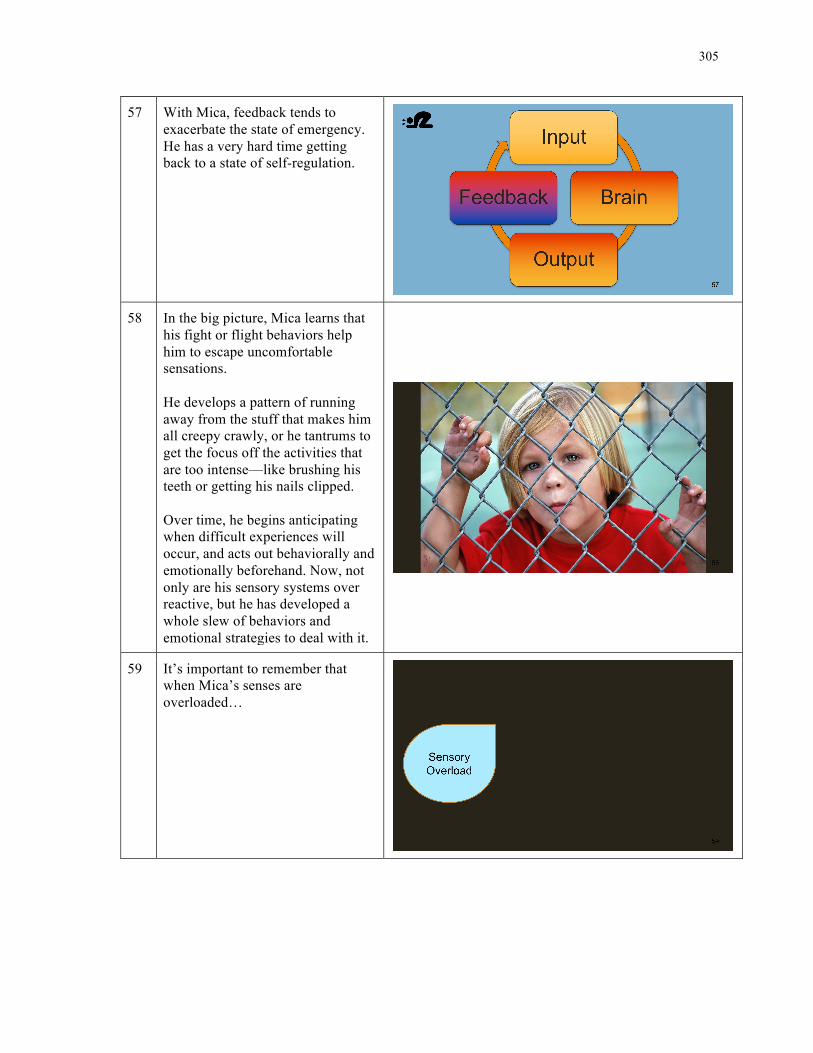
305
57 With Mica, feedback tends to exacerbate the state of emergency. He has a very hard time getting back to a state of self-regulation.
58 In the big picture, Mica learns that his fight or flight behaviors help him to escape uncomfortable sensations. He develops a pattern of running away from the stuff that makes him all creepy crawly, or he tantrums to get the focus off the activities that are too intense—like brushing his teeth or getting his nails clipped. Over time, he begins anticipating when difficult experiences will occur, and acts out behaviorally and emotionally beforehand. Now, not only are his sensory systems over reactive, but he has developed a whole slew of behaviors and emotional strategies to deal with it.
59 It’s important to remember that when Mica’s senses are overloaded…
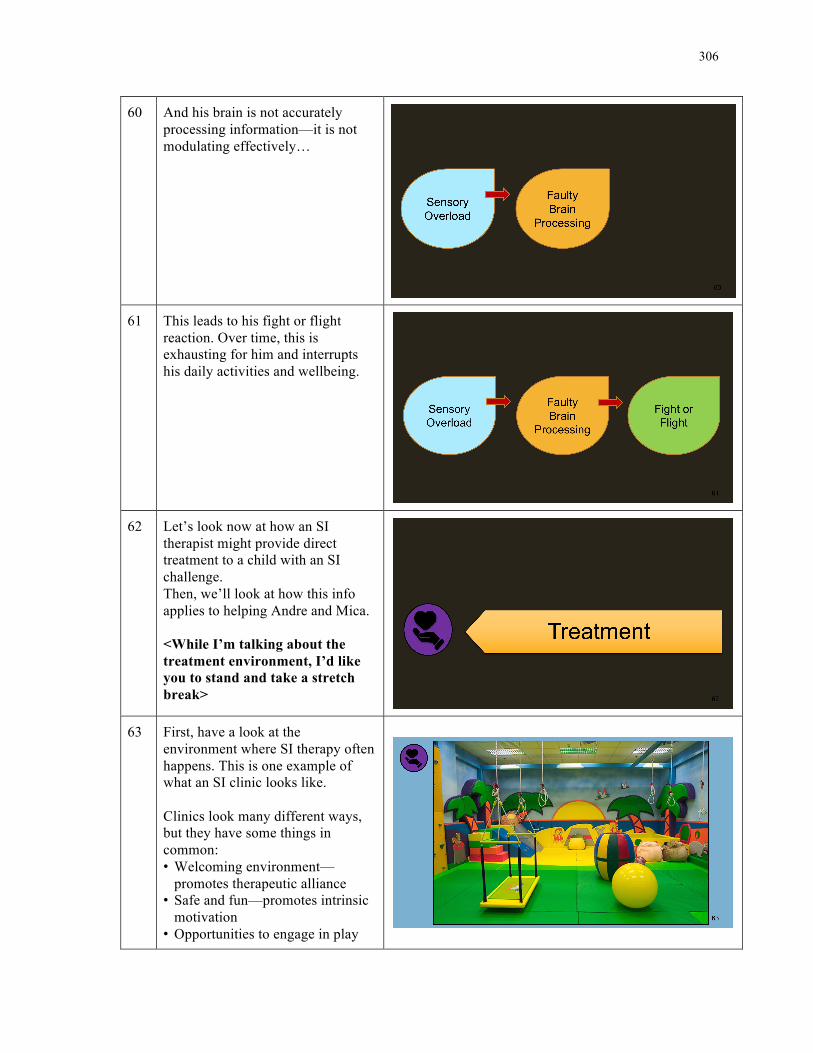
306
60 And his brain is not accurately processing information—it is not modulating effectively…
61 This leads to his fight or flight reaction. Over time, this is exhausting for him and interrupts his daily activities and wellbeing.
62 Let’s look now at how an SI therapist might provide direct treatment to a child with an SI challenge. Then, we’ll look at how this info applies to helping Andre and Mica. <While I’m talking about the treatment environment, I’d like you to stand and take a stretch break>
63 First, have a look at the environment where SI therapy often happens. This is one example of what an SI clinic looks like. Clinics look many different ways, but they have some things in common: • Welcoming environment—
promotes therapeutic alliance • Safe and fun—promotes intrinsic
motivation • Opportunities to engage in play
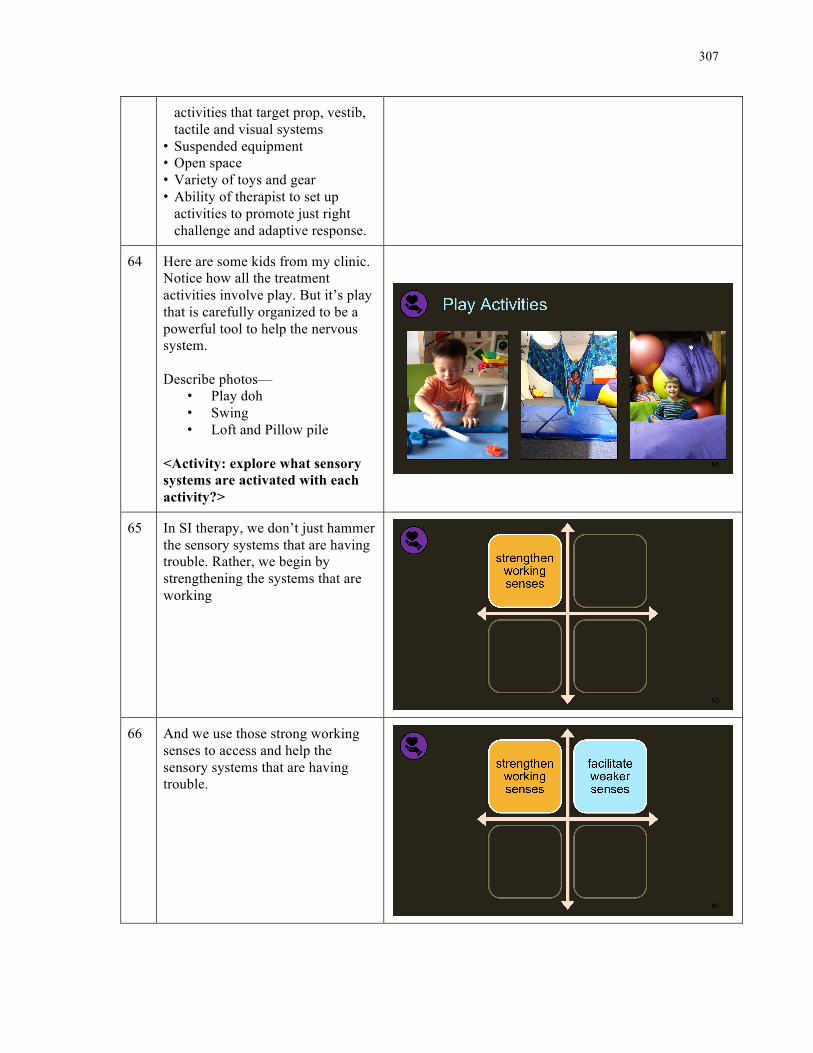
307
activities that target prop, vestib, tactile and visual systems
• Suspended equipment • Open space • Variety of toys and gear • Ability of therapist to set up
activities to promote just right challenge and adaptive response.
64 Here are some kids from my clinic. Notice how all the treatment activities involve play. But it’s play that is carefully organized to be a powerful tool to help the nervous system. Describe photos—
• Play doh • Swing • Loft and Pillow pile
<Activity: explore what sensory systems are activated with each activity?>
65 In SI therapy, we don’t just hammer the sensory systems that are having trouble. Rather, we begin by strengthening the systems that are working
66 And we use those strong working senses to access and help the sensory systems that are having trouble.

308
67 As much as possible, we focus on preventing poor SI from impacting a kid, rather than on reacting after the fact—which is a lot less helpful.
68 Sometimes, we can change the nervous system itself, and other times we need to help the child compensate and adapt to the challenges that are slow or resistant to change. Here’s an example: say a kid has a fear of movement. Vestibular processing is not working well. We won’t throw the kid on a swing, but rather we will use activities that engage and strengthen the working systems, while also gently supporting the vestibular system. One good option might be to use lots of heavy play proprioceptive activities to help with modulation and body awareness before introducing any movement activities. Another option is to use the visual system to help support the vestibular system—much like your vision helped you stand on one leg more easily. Then, slowly and in collaboration with the kid, we would approach movement activities that were motivating and a just right challenge—perhaps just sitting on a swing and playing a game, while we used on the calming heavy work of prop and then orienting work of vision. Now, let’s look more at how
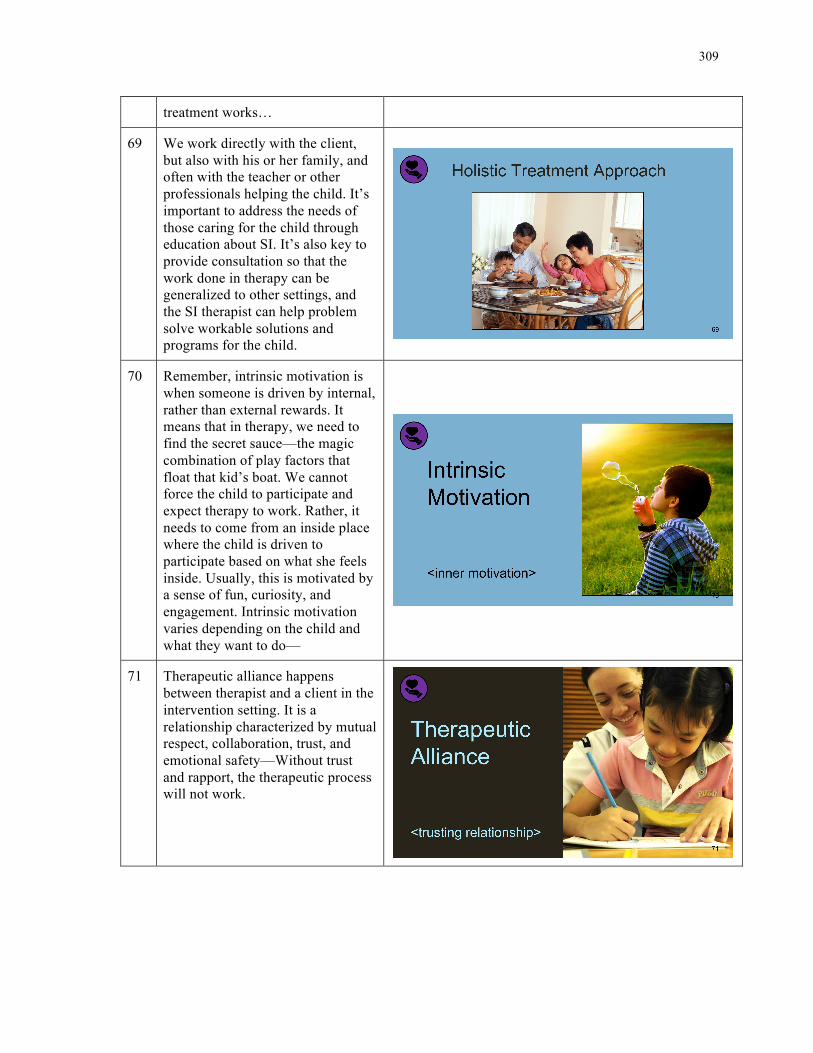
309
treatment works…
69 We work directly with the client, but also with his or her family, and often with the teacher or other professionals helping the child. It’s important to address the needs of those caring for the child through education about SI. It’s also key to provide consultation so that the work done in therapy can be generalized to other settings, and the SI therapist can help problem solve workable solutions and programs for the child.
70 Remember, intrinsic motivation is when someone is driven by internal, rather than external rewards. It means that in therapy, we need to find the secret sauce—the magic combination of play factors that float that kid’s boat. We cannot force the child to participate and expect therapy to work. Rather, it needs to come from an inside place where the child is driven to participate based on what she feels inside. Usually, this is motivated by a sense of fun, curiosity, and engagement. Intrinsic motivation varies depending on the child and what they want to do—
71 Therapeutic alliance happens between therapist and a client in the intervention setting. It is a relationship characterized by mutual respect, collaboration, trust, and emotional safety—Without trust and rapport, the therapeutic process will not work.
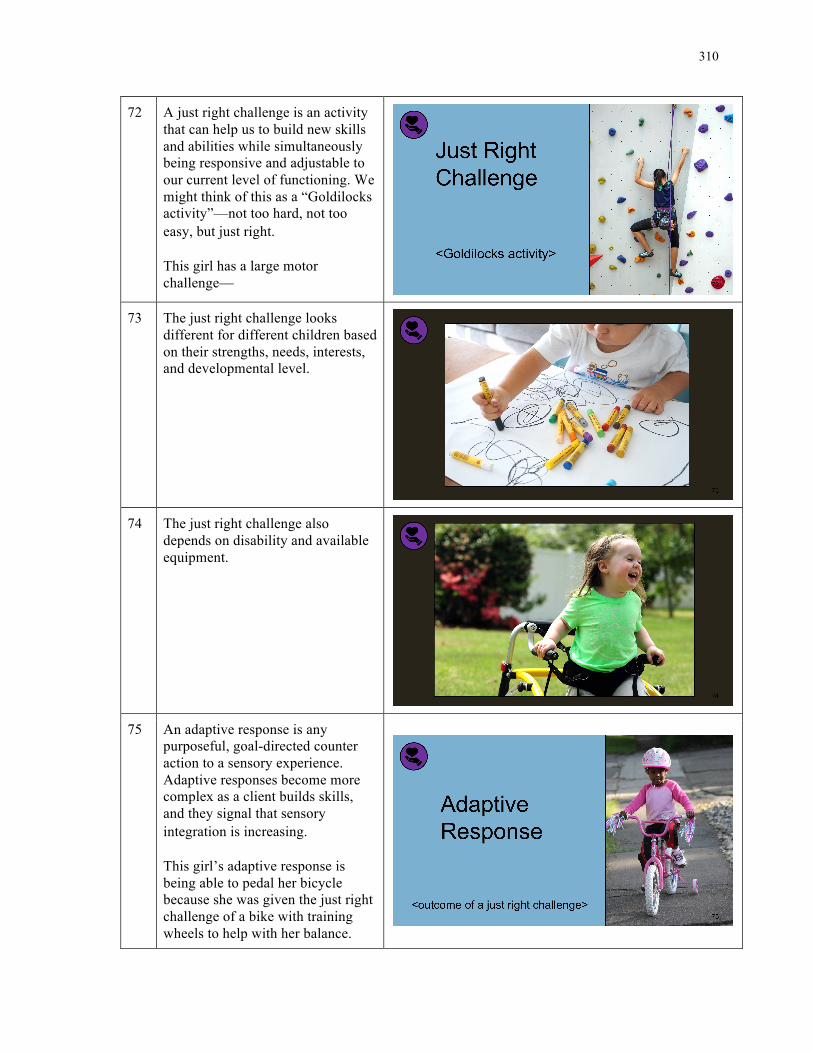
310
72 A just right challenge is an activity that can help us to build new skills and abilities while simultaneously being responsive and adjustable to our current level of functioning. We might think of this as a “Goldilocks activity”—not too hard, not too easy, but just right. This girl has a large motor challenge—
73 The just right challenge looks different for different children based on their strengths, needs, interests, and developmental level.
74 The just right challenge also depends on disability and available equipment.
75 An adaptive response is any purposeful, goal-directed counter action to a sensory experience. Adaptive responses become more complex as a client builds skills, and they signal that sensory integration is increasing. This girl’s adaptive response is being able to pedal her bicycle because she was given the just right challenge of a bike with training wheels to help with her balance.
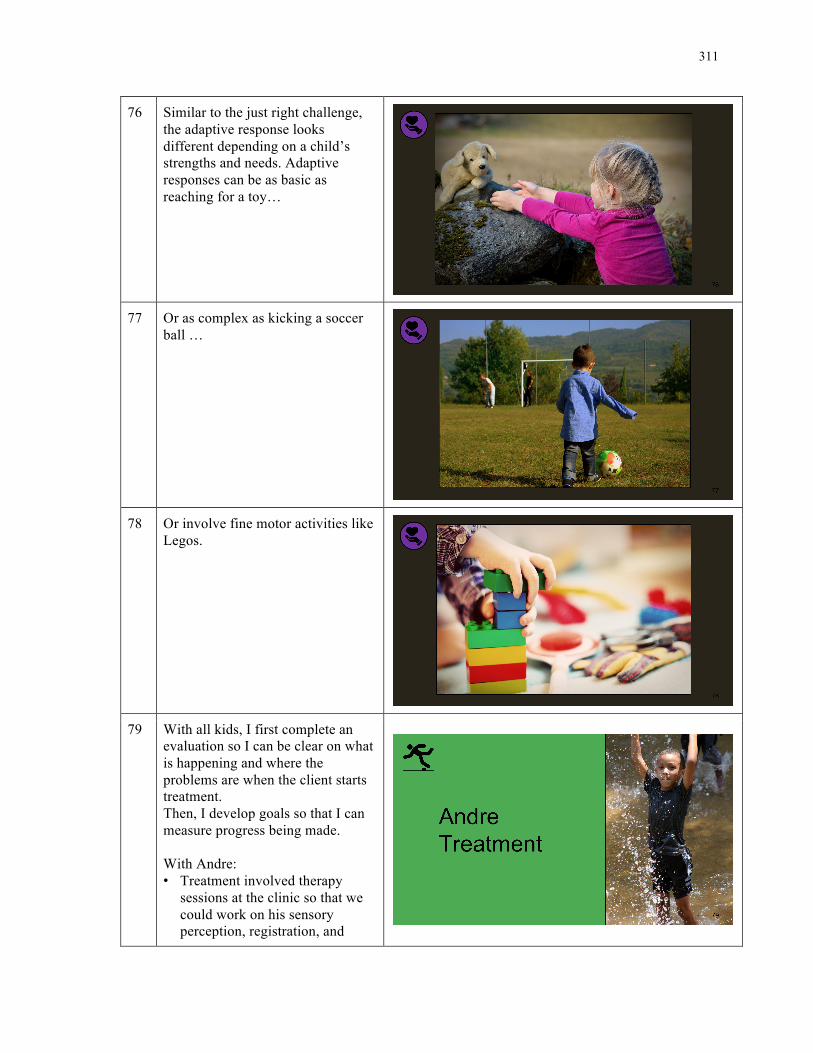
311
76 Similar to the just right challenge, the adaptive response looks different depending on a child’s strengths and needs. Adaptive responses can be as basic as reaching for a toy…
77 Or as complex as kicking a soccer ball …
78 Or involve fine motor activities like Legos.
79 With all kids, I first complete an evaluation so I can be clear on what is happening and where the problems are when the client starts treatment. Then, I develop goals so that I can measure progress being made. With Andre: • Treatment involved therapy
sessions at the clinic so that we could work on his sensory perception, registration, and
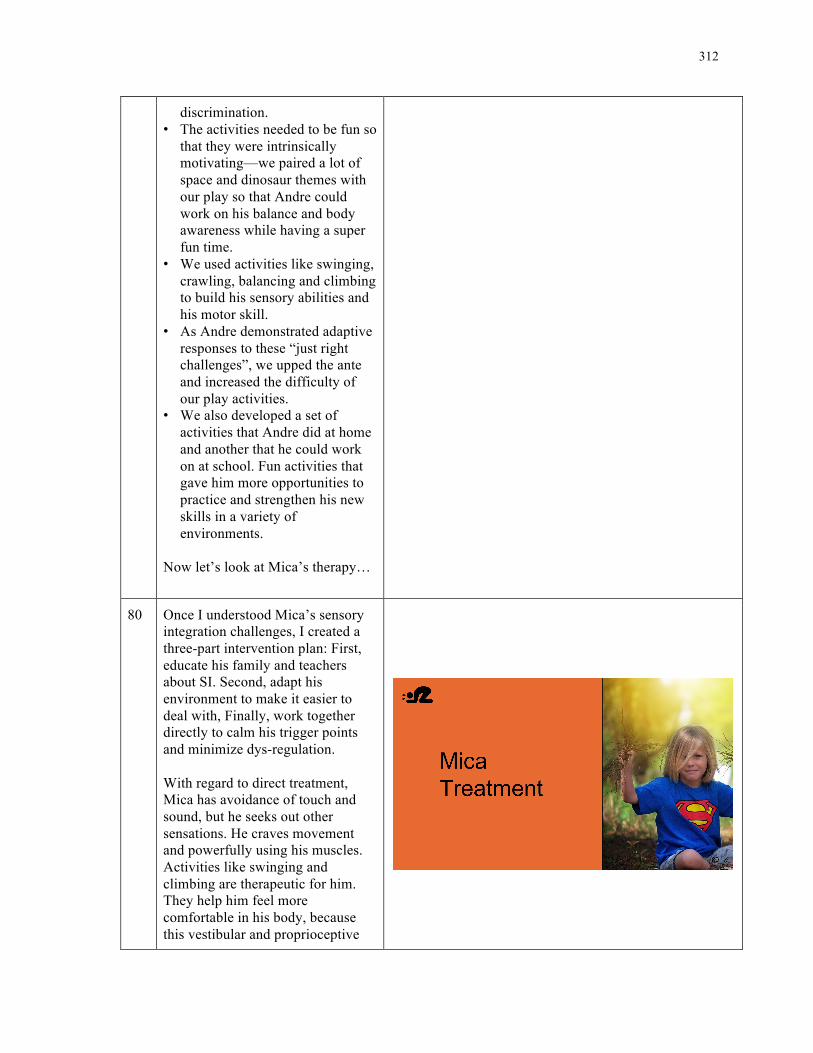
312
discrimination. • The activities needed to be fun so
that they were intrinsically motivating—we paired a lot of space and dinosaur themes with our play so that Andre could work on his balance and body awareness while having a super fun time.
• We used activities like swinging, crawling, balancing and climbing to build his sensory abilities and his motor skill.
• As Andre demonstrated adaptive responses to these “just right challenges”, we upped the ante and increased the difficulty of our play activities.
• We also developed a set of activities that Andre did at home and another that he could work on at school. Fun activities that gave him more opportunities to practice and strengthen his new skills in a variety of environments.
Now let’s look at Mica’s therapy…
80 Once I understood Mica’s sensory integration challenges, I created a three-part intervention plan: First, educate his family and teachers about SI. Second, adapt his environment to make it easier to deal with, Finally, work together directly to calm his trigger points and minimize dys-regulation. With regard to direct treatment, Mica has avoidance of touch and sound, but he seeks out other sensations. He craves movement and powerfully using his muscles. Activities like swinging and climbing are therapeutic for him. They help him feel more comfortable in his body, because this vestibular and proprioceptive
313
input helps regulate and center the nervous system. We used these activities proactively and preventatively to help make touch and sound more bearable. Mica’s adaptive responses were not necessarily observed as an increase in tolerating touch and sound. Rather, we looked at his ability to consciously and appropriately take care of himself when the incoming sensations were just too much for him. For example, he might stay on the periphery of his class during circle time to minimize unexpected light touch from his classmates. In this way, he could participate a bit more fully without stressing his nervous system quite as much. In addition to working together in the clinic, we made a home and school plan to put these activities into play throughout the day, every day, to preventatively counteract all the triggers Mica experienced.
81 Now, let’s explore our final area of the outcomes of addressing SI issues.
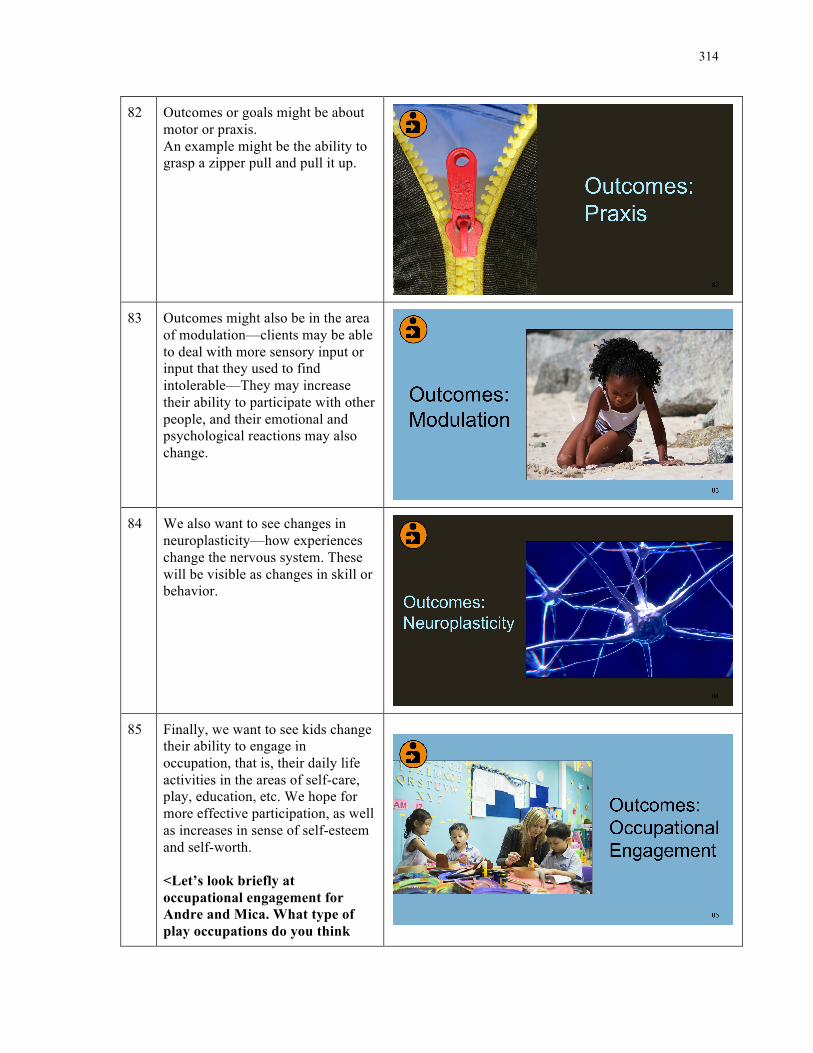
314
82 Outcomes or goals might be about motor or praxis. An example might be the ability to grasp a zipper pull and pull it up.
83 Outcomes might also be in the area of modulation—clients may be able to deal with more sensory input or input that they used to find intolerable—They may increase their ability to participate with other people, and their emotional and psychological reactions may also change.
84 We also want to see changes in neuroplasticity—how experiences change the nervous system. These will be visible as changes in skill or behavior.
85 Finally, we want to see kids change their ability to engage in occupation, that is, their daily life activities in the areas of self-care, play, education, etc. We hope for more effective participation, as well as increases in sense of self-esteem and self-worth. <Let’s look briefly at occupational engagement for Andre and Mica. What type of play occupations do you think
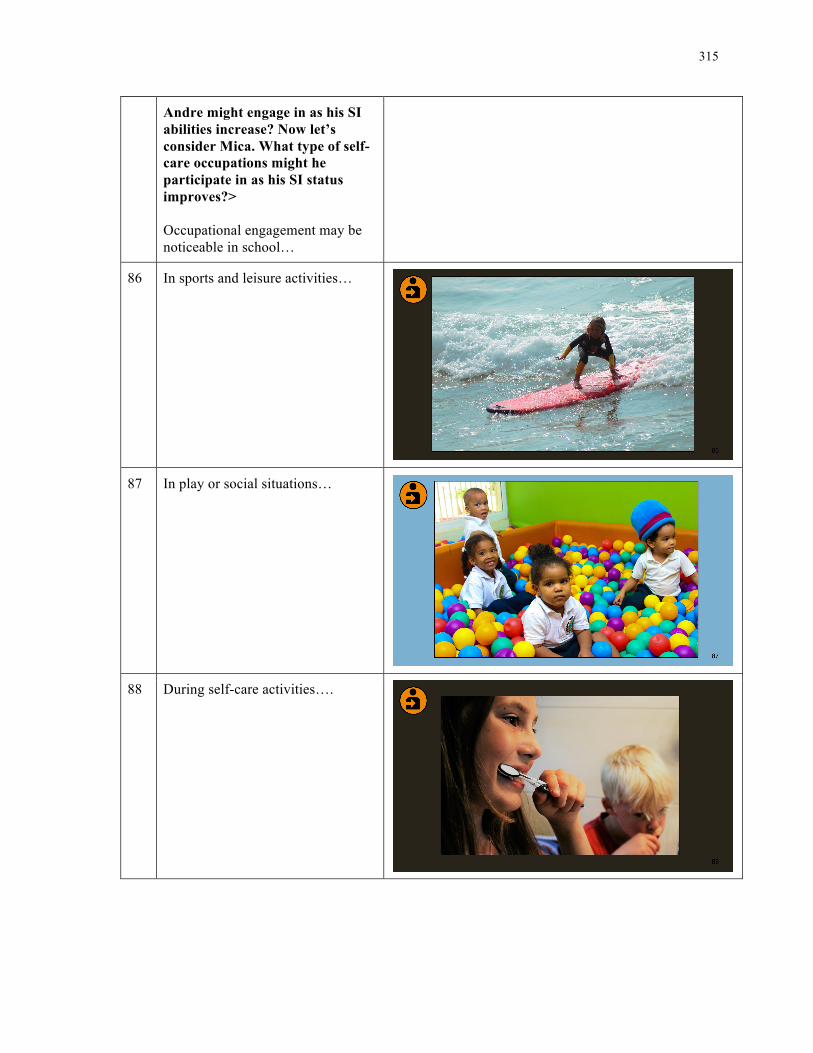
315
Andre might engage in as his SI abilities increase? Now let’s consider Mica. What type of self-care occupations might he participate in as his SI status improves?> Occupational engagement may be noticeable in school…
86 In sports and leisure activities…
87 In play or social situations…
88 During self-care activities….
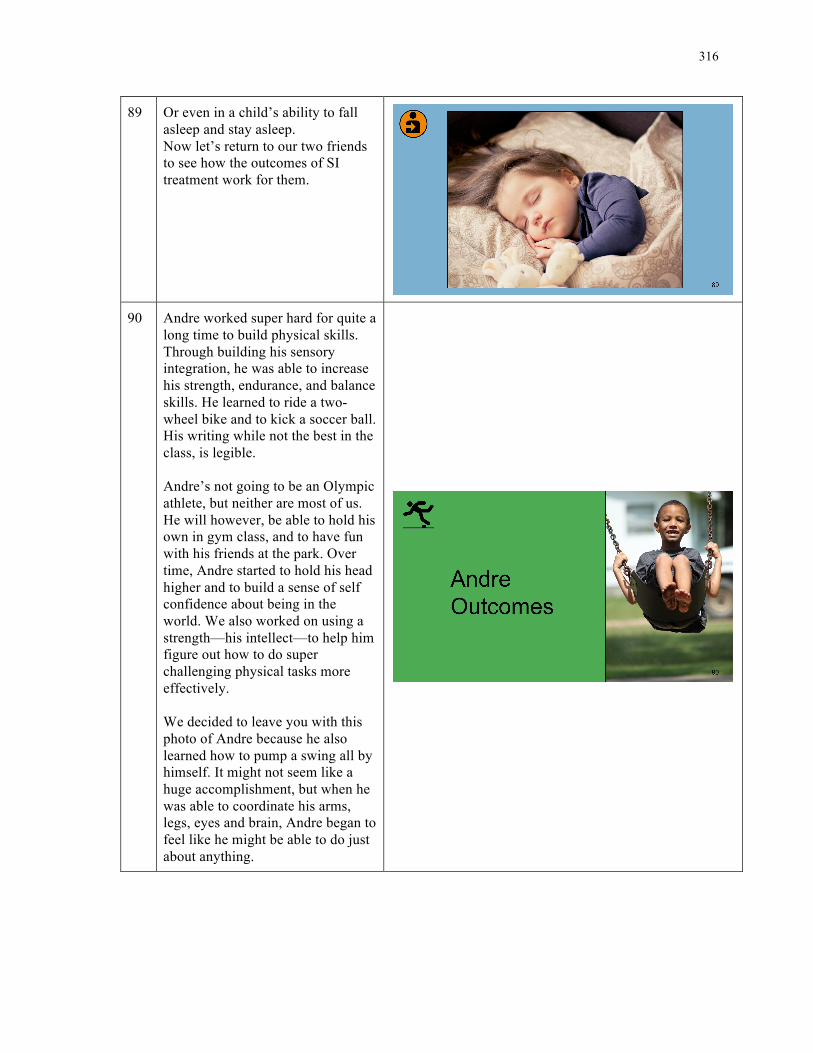
316
89 Or even in a child’s ability to fall asleep and stay asleep. Now let’s return to our two friends to see how the outcomes of SI treatment work for them.
90 Andre worked super hard for quite a long time to build physical skills. Through building his sensory integration, he was able to increase his strength, endurance, and balance skills. He learned to ride a two-wheel bike and to kick a soccer ball. His writing while not the best in the class, is legible. Andre’s not going to be an Olympic athlete, but neither are most of us. He will however, be able to hold his own in gym class, and to have fun with his friends at the park. Over time, Andre started to hold his head higher and to build a sense of self confidence about being in the world. We also worked on using a strength—his intellect—to help him figure out how to do super challenging physical tasks more effectively. We decided to leave you with this photo of Andre because he also learned how to pump a swing all by himself. It might not seem like a huge accomplishment, but when he was able to coordinate his arms, legs, eyes and brain, Andre began to feel like he might be able to do just about anything.
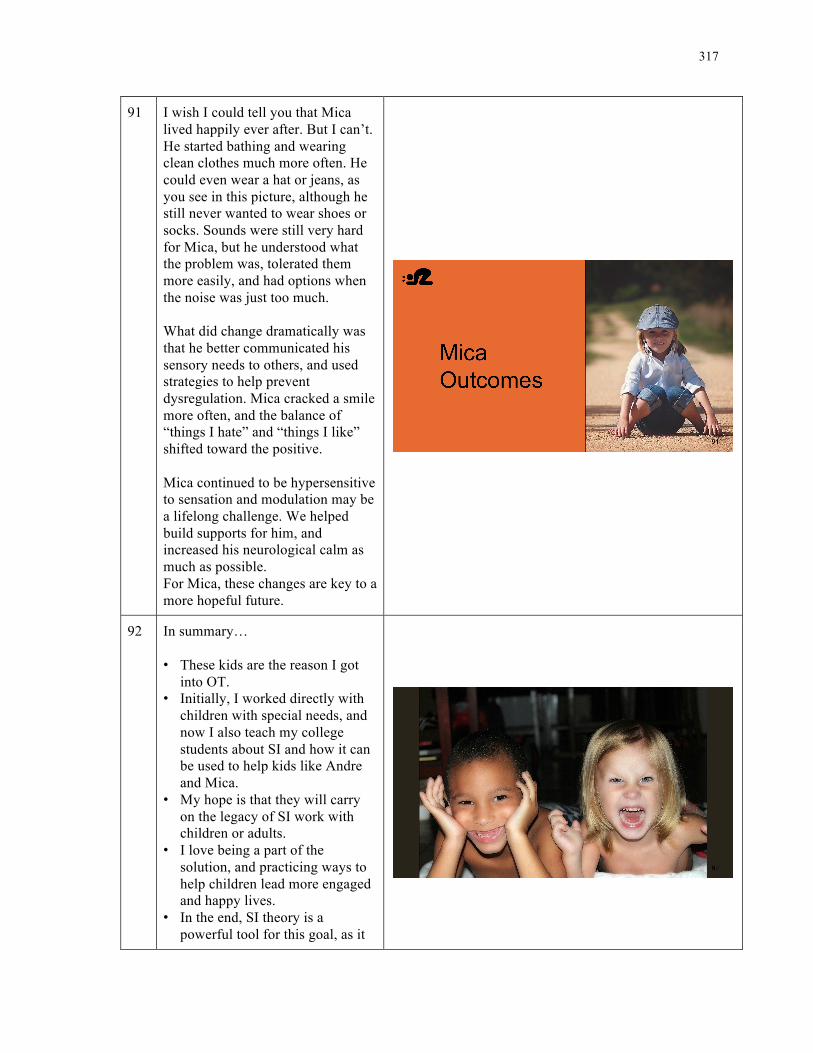
317
91 I wish I could tell you that Mica lived happily ever after. But I can’t. He started bathing and wearing clean clothes much more often. He could even wear a hat or jeans, as you see in this picture, although he still never wanted to wear shoes or socks. Sounds were still very hard for Mica, but he understood what the problem was, tolerated them more easily, and had options when the noise was just too much. What did change dramatically was that he better communicated his sensory needs to others, and used strategies to help prevent dysregulation. Mica cracked a smile more often, and the balance of “things I hate” and “things I like” shifted toward the positive. Mica continued to be hypersensitive to sensation and modulation may be a lifelong challenge. We helped build supports for him, and increased his neurological calm as much as possible. For Mica, these changes are key to a more hopeful future.
92 In summary… • These kids are the reason I got
into OT. • Initially, I worked directly with
children with special needs, and now I also teach my college students about SI and how it can be used to help kids like Andre and Mica.
• My hope is that they will carry on the legacy of SI work with children or adults.
• I love being a part of the solution, and practicing ways to help children lead more engaged and happy lives.
• In the end, SI theory is a powerful tool for this goal, as it
318
supports the dynamic treatment of human beings so that they can go out into the world and be engaged, motivated, and happy.
Thank you.
93 All permissions secured before images were used. Photo attributions available on request.