Task-related coherence and task-related spectral power changes during sequential finger movements
13
Task-related coherence and task-related spectral power changes during sequential finger movements P. Manganotti, C. Gerloff, C. Toro, H. Katsuta, N. Sadato, P. Zhuang, L. Leocani, M. Hallett* Human Motor Control Section, Medical Neurology Branch, National Institute of Neurological Disorders and Stroke, Building 10, Room 5N226, National Institutes of Health, 10 Center Drive, MSC-1428, Bethesda, MD 20892–1428, USA Accepted for publication: 30 September 1997 Abstract In order to investigate the activity of cortical regions in the control of complex movements, we studied task-related coherence (TRCoh) and task-related spectral power (TRPow) changes in 8 right-handed subjects during the execution of 4 different finger movement sequences of increasing complexity. All sequences were performed with the right hand and were paced by a metronome at 2 Hz. EEG power spectra and coherence values were computed within alpha (8–12 Hz) and beta (13–20 Hz) frequency bands for 29 scalp EEG positions during the execution of the sequences and were compared with values obtained during a rest (control) condition. Movement sequences were associated with TRPow decreases in the alpha and beta frequency bands over bilateral sensorimotor and parietal areas, with a preponderance over the contralateral hemisphere. Increases of TRCoh occurred over bilateral frontocentral regions. TRCoh decreases were present over the temporal and occipital areas. The spatial extent and the magnitude of TRPow decreases and TRCoh increases in both frequency bands were greater for sequential movements of higher complexity than for simpler ones. These results are consistent with previous findings of bilateral activation of sensorimotor areas during sequential finger movements. Moreover, the present results indicate an active intercom- munication between bilateral and mesial central and prefrontal regions which becomes more intense with more complex sequential movements. 1998 Elsevier Science Ireland Ltd. Keywords: EEG; Coherence; Motor control 1. Introduction Cortical activation related to movement preparation and execution desynchronizes the mu rhythm (Gastaut et al., 1952; Chatrian et al., 1959) and is known as event-related desynchronization (ERD) (Pfurtscheller and Aranibar, 1978). ERD corresponds to power decreases in the alpha frequency band, and is, in hand movement, most prominent over the contralateral sensorimotor cortex (Pfurtscheller and Berghold, 1989; Pfurtscheller and Klimesch, 1989; Pfurtscheller et al., 1994a,b; Toro et al., 1994a,b; Salmelin and Hari, 1994; Stancak and Pfurtscheller, 1996; Leocani et al., 1997). The opposite phenomenon, event-related syn- chronization (ERS; increase in spectral power), occurs over cortical regions not involved in a task or, immediately after movement execution, over the same areas that had previously displayed ERD. It is assumed that ERD is an indicator of oscillatory aspects of cortical activation and that ERS reflects a cortical idling state (Pfurtscheller, 1992). Coherence analysis is an indicator of functional connec- tivity between different cortical areas (Sklar et al., 1972; Busk and Galbraith, 1975; Shaw et al., 1978; Thatcher et al., 1986; Rappelsberger and Petsche, 1988; Rappelsberger et al., 1994; Thatcher, 1995; Andrew and Pfurtscheller, 1996; Gerloff et al., 1996). Mathematically, coherence between two EEG signals is defined as their cross power spectrum (normalized for the absolute power values of both signals). Coherence values are therefore statistical values between 0 and 1. Recently, the relationship between coher- ence and event-related changes in spectral power has been investigated in externally paced (Rappelsberger et al., 1994) and self-paced simple finger movements (Leocani et al., Electroencephalography and clinical Neurophysiology 109 (1998) 50–62 0924-980X/98/$19.00 1998 Elsevier Science Ireland Ltd. All rights reserved PII S0924-980X(97)00074-X EEM 97033 * Corresponding author. Tel.: +1 301 4961561; fax: +1 301 4021007; e-mail: [email protected]
Transcript of Task-related coherence and task-related spectral power changes during sequential finger movements
Task-related coherence and task-related spectral power changes duringsequential finger movements
P. Manganotti, C. Gerloff, C. Toro, H. Katsuta, N. Sadato, P. Zhuang, L. Leocani, M. Hallett*
Human Motor Control Section, Medical Neurology Branch, National Institute of Neurological Disorders and Stroke, Building 10,Room 5N226, National Institutes of Health, 10 Center Drive, MSC-1428, Bethesda, MD 20892–1428, USA
Accepted for publication: 30 September 1997
Abstract
In order to investigate the activity of cortical regions in the control of complex movements, we studied task-related coherence (TRCoh)and task-related spectral power (TRPow) changes in 8 right-handed subjects during the execution of 4 different finger movement sequencesof increasing complexity. All sequences were performed with the right hand and were paced by a metronome at 2 Hz. EEG power spectraand coherence values were computed within alpha (8–12 Hz) and beta (13–20 Hz) frequency bands for 29 scalp EEG positions during theexecution of the sequences and were compared with values obtained during a rest (control) condition. Movement sequences were associatedwith TRPow decreases in the alpha and beta frequency bands over bilateral sensorimotor and parietal areas, with a preponderance over thecontralateral hemisphere. Increases of TRCoh occurred over bilateral frontocentral regions. TRCoh decreases were present over thetemporal and occipital areas. The spatial extent and the magnitude of TRPow decreases and TRCoh increases in both frequency bandswere greater for sequential movements of higher complexity than for simpler ones. These results are consistent with previous findings ofbilateral activation of sensorimotor areas during sequential finger movements. Moreover, the present results indicate an active intercom-munication between bilateral and mesial central and prefrontal regions which becomes more intense with more complex sequentialmovements. 1998 Elsevier Science Ireland Ltd.
Keywords:EEG; Coherence; Motor control
1. Introduction
Cortical activation related to movement preparation andexecution desynchronizes the mu rhythm (Gastaut et al.,1952; Chatrian et al., 1959) and is known as event-relateddesynchronization (ERD) (Pfurtscheller and Aranibar,1978). ERD corresponds to power decreases in the alphafrequency band, and is, in hand movement, most prominentover the contralateral sensorimotor cortex (Pfurtscheller andBerghold, 1989; Pfurtscheller and Klimesch, 1989;Pfurtscheller et al., 1994a,b; Toro et al., 1994a,b; Salmelinand Hari, 1994; Stancak and Pfurtscheller, 1996; Leocani etal., 1997). The opposite phenomenon, event-related syn-chronization (ERS; increase in spectral power), occurs
over cortical regions not involved in a task or, immediatelyafter movement execution, over the same areas that hadpreviously displayed ERD. It is assumed that ERD is anindicator of oscillatory aspects of cortical activation andthat ERS reflects a cortical idling state (Pfurtscheller, 1992).
Coherence analysis is an indicator of functional connec-tivity between different cortical areas (Sklar et al., 1972;Busk and Galbraith, 1975; Shaw et al., 1978; Thatcher etal., 1986; Rappelsberger and Petsche, 1988; Rappelsbergeret al., 1994; Thatcher, 1995; Andrew and Pfurtscheller,1996; Gerloff et al., 1996). Mathematically, coherencebetween two EEG signals is defined as their cross powerspectrum (normalized for the absolute power values of bothsignals). Coherence values are therefore statistical valuesbetween 0 and 1. Recently, the relationship between coher-ence and event-related changes in spectral power has beeninvestigated in externally paced (Rappelsberger et al., 1994)and self-paced simple finger movements (Leocani et al.,
Electroencephalography and clinical Neurophysiology 109 (1998) 50–62
0924-980X/98/$19.00 1998 Elsevier Science Ireland Ltd. All rights reservedPII S0924-980X(97)00074-X EEM 97033
* Corresponding author. Tel.: +1 301 4961561; fax: +1 301 4021007;e-mail: [email protected]
1997). These studies reported an increase in coherencebetween central and frontal regions during the period ofmarked power decreases (10 Hz) before movement and agreater increase in coherence between the bilateral sensor-imotor areas after movement.
The majority of previous experiments have studied theevent-related power changes in simple, brisk finger move-ments. Data on the oscillatory activity in the human brainassociated with sequential finger movements are scarce(Zhuang et al., 1997).
Performance of complex sequential motor tasks requiresexecution of central motor programs with specific temporaland spatial patterns. According to neuroimaging studies(Roland et al., 1980; Grafton et al., 1992; Rao et al.,1993; Shibasaki et al., 1993; Sadato et al., 1996a), principalcortical areas involved in the processing of sequential move-ments are bilateral primary sensorimotor cortex (SM1), lat-eral premotor areas (PMA), and supplementary motor areas(SMA). Using finger movement sequences of different com-plexity in a PET study, Sadato et al. (1996a) found a linearincrease of regional cerebral blood flow (rCBF) in the ipsi-lateral PMA and parietal areas as a function of sequencecomplexity. Activation of the bilateral SM1 and SMAremained at a steady level across the sequences.
In the present study, we extend the previous data byinvestigating oscillatory aspects of regional brain activationand, particularly, inter-regional connectivity during execu-tion of the same 4 sequential finger movements as used inour previous PET study (Sadato et al., 1996a). Spectralpower data are referred to as task-related power (TRPow)and coherence data as task-related coherence (TRCoh)because we investigated steady-state changes associatedwith continuous ‘tasks’ (i.e., ongoing sequential movementsas in the PET study of Sadato et al., 1996a) rather than
phasic changes associated with a single discrete ‘event’,as previously done for ERD.
2. Methods
We studied 12 normal volunteers (7 men, 5 women), allof whom are right-handed according to the Oldfield (1971)handedness inventory. The data analysis included only 8subjects (5 men, 3 women), whose mean age was 33.3(±10.2) years. Data from 4 subjects were excluded becauseless than 20 artifact-free trials could be obtained as a con-sequence of muscle and eye movement artifacts (two sub-jects) or drowsiness during the rest condition (two subjects).
The protocol was approved by the Institutional ReviewBoard, and the subjects gave their written informed consentfor the study.
2.1. Motor paradigm
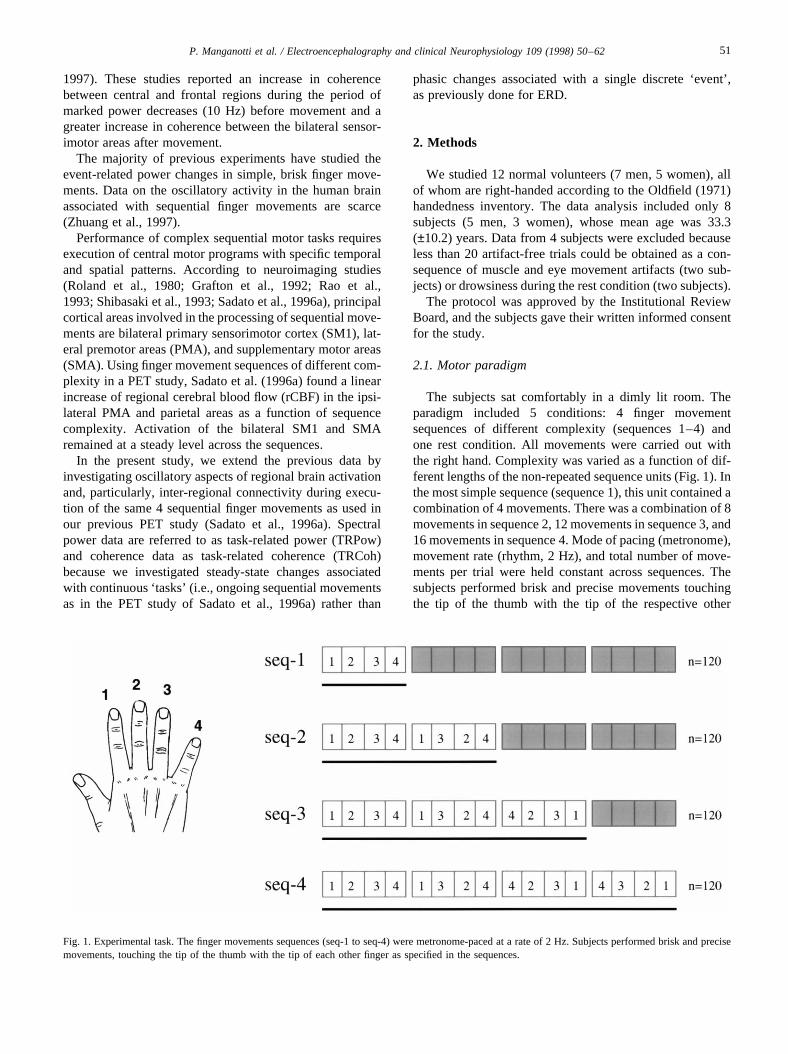
The subjects sat comfortably in a dimly lit room. Theparadigm included 5 conditions: 4 finger movementsequences of different complexity (sequences 1–4) andone rest condition. All movements were carried out withthe right hand. Complexity was varied as a function of dif-ferent lengths of the non-repeated sequence units (Fig. 1). Inthe most simple sequence (sequence 1), this unit contained acombination of 4 movements. There was a combination of 8movements in sequence 2, 12 movements in sequence 3, and16 movements in sequence 4. Mode of pacing (metronome),movement rate (rhythm, 2 Hz), and total number of move-ments per trial were held constant across sequences. Thesubjects performed brisk and precise movements touchingthe tip of the thumb with the tip of the respective other
Fig. 1. Experimental task. The finger movements sequences (seq-1 to seq-4) were metronome-paced at a rate of 2 Hz. Subjects performed brisk and precisemovements, touching the tip of the thumb with the tip of each other finger as specified in the sequences.
51P. Manganotti et al. / Electroencephalography and clinical Neurophysiology 109 (1998) 50–62
finger. During each trial, subjects were looking at a targetpoint approximately 1 m in front of the subject in order tominimize eye-movement artifacts. The moving hand waskept out of the subject’s visual field. The subjects wore asoft glove fitted with metal contacts at the finger tips. Thefinger contacts generated digital signals that were used tomonitor and measure task performance and movement tim-ing. The level of task performance was calculated for eachsubject as percentage of correct finger taps out of all tapsperformed during the experiment [(correct taps/totaltaps)× 100]. The recording for each movement sequencewas separated into a first and a second part to allow for testingintra-session variability of motor performance. The subjectswere also visually monitored during the recording for perfor-mance, presence of ‘mirror’ movements, or evidence of prox-imal arm muscle co-activation. During the rest condition,subjects listened to the metronome beat, looked at the targetpoint, and kept their muscles at rest. The order of thesequences was randomized across subjects. All subjects prac-ticed the movement sequences before the experiment to avoidlearning effect during the recording session.
2.2. EEG recording
The EEG signal was amplified using DC Synamp ampli-fiers (Neuroscan Inc., Herndon, VA) with a bandpass of DCto 50 Hz. The data were digitized with 16 bit resolution at asampling rate of 250 Hz for off-line analysis. Twenty-nineEEG channels were recorded from scalp electrodes mountedin an elastic cap (Electrocap International, Eaton, OH)according to the 10–20 international system of electrodeplacement, with additional electrodes placed along the long-itudinal axis and additional fronto-temporal (FT7, FT8) andparieto-temporal (TP7, TP8) electrodes. Impedance was keptbelow 5.0 kQ. Linked earlobe electrodes served as reference.Referential EEG recordings for coherence mapping havebeen recommended previously based on simulation data(Rappelsberger, 1989). Bipolar EMG was recorded from sur-face electrodes placed over the right abductor pollicis brevismuscle for additional monitoring of the finger movementsand over the right flexor carpi radialis muscle to check forfailure to relax more proximally. Bipolar EOG was regis-tered to facilitate detection of eye movement artifacts.
2.3. Spectral power analysis
The continuous EEG was segmented into successiveartifact-free epochs of 2048 ms duration, separately foreach movement sequence, and for the rest period. Thepower spectrum from 1 to 50 Hz was calculated for eachsingle epoch and then averaged across epochs. A mini-mum of 20 epochs was required for each condition (range,20–35), and the number of epochs was matched acrossthe different conditions for each subject. In order toaccount for inter-subject variability, TRPow was expressedas the percentage of spectral power during activation
(PowActivation) compared to the spectral power during therest condition (PowRest). This normalization was computedaccording to the equation:
TRPow= (PowActivation −PowRest)=PowRest� � × 100 (1)
Further analysis of the power spectra concentrated on thealpha (8–12 Hz) and beta (13–20 Hz) bands because theyshowed the most prominent task-related spectral changeson visual inspection of the raw spectra. In addition, a ‘bifid’alpha peak consisting of a low (8–10 Hz) and high (10–12Hz) component was observed in all subjects. This config-uration has been described similarly by Pfurtscheller andBerghold (1989), with the high alpha component beingmore anterior and lateralized contralaterally to the move-ment and the low component (8–10 Hz) being more poster-ior and bilaterally diffuse. Pfurtscheller (1992) suggestedthat the high alpha component may represent cortical activ-ity over the sensorimotor areas in a particularly specificway. Therefore, we analyzed this component in additionto the entire alpha band.
2.4. Coherence analysis
Inter-electrode coherence values were computed for thealpha (8–12 Hz) and beta (13–20 Hz) bands. Coherencewas computed for all possible pairs of the 29 EEG electro-des (406 pairs), employing the method implemented in theEDIT module of the SCAN software (Neuroscan Inc., Hern-don, VA). The coherence values were calculated for eachfrequency bin (fj), according to the equation:
Coh(fj)xy =
>>>>>>>>>>∑n
i =1(Xi − X)(Yi − Y)� �
p
����������������������������������������������������������������������������������∑n
i =1(Xi − X)(Xi − X)� �
p ∑n
i =1(Yi − Y)(Yi − Y)� �
p
r>>>>>>>>>>
2
(2)
which is the extension of the Pearson’s correlation coeffi-cient to complex number pairs. In this equation,Xi andYi
are complex values of frequency spectra at a given fre-quencyfj for two signals from electrodesx andy, calculatedfor n single epochsi. The numerator contains the value ofthe cross-spectrum for electrodesxi andyi for a given fre-quency bin (fj), the denominator the respective values of theautospectra forxi andyi. The denominator is always a realnumber. The coherence value (Cohxy) is obtained by squar-ing the magnitude of the complex correlation coefficient,and is a real number between 0 and 1. To obtain broad bandcoherence valuesCohxy(f ), Cohxy(fj) was summed over fre-quency binsj = fmin to fmax (with fmin andfmax correspondingto the lowest and highest frequency bins in the chosenfrequency band), and divided by the number of frequencybins. In order to reduce the effect of inter-subject and inter-electrode-pair variability of absolute coherence values,TRCoh was obtained by subtracting the coherence valuesduring rest (CohRest) from coherence values during the cor-
52 P. Manganotti et al. / Electroencephalography and clinical Neurophysiology 109 (1998) 50–62
responding activation conditions (CohActivation) according tothe equation:
TRCoh=CohActivation −CohRest (3)
Therefore, coherence magnitude increments wereexpressed as positive values while coherence decrementswere expressed as negative values. This differentialapproach also eliminates coherences that are equally pre-sent during both activation and rest condition and are there-fore not task-related (e.g., coherences introduced byvolume conduction or by the reference) (Rappelsberger,1989). Coherence increments or decrements between base-line and movement conditions for each pairs of electrodeswere displayed as color-coded ‘links’ plots which permittedthe inspection of the magnitude and the spatial patterns oftask-related coherence changes.
Group grand averages of percentage power changes andcoherence differences were then calculated.
2.5. Statistical analyses
For the percentage of correct taps,t tests were used toevaluate differences in performance between movementsequences.
For the TRPow data, Wilcoxon’s signed ranks tests wereused to assess the significance of differences between restcondition and activation conditions (sequences 1–4), as wellas between the activation conditions directly. This was donefor single electrodes or groups of electrodes.
Standard methods for determining significant differencesin dynamic coherence changes have not been developed.We used a factorial ANOVA design to determine the sig-nificance of TRCoh differences between the 4 sequences(main effect ‘sequence’). Alpha (8–12 Hz) and beta (13–20 Hz) bands were analyzed separately. We defined elec-trode ‘pairs of interest’ (POI), which is similar to the‘region-of-interest’ (ROI) approach used in positron emis-sion tomography (PET) or magnetic resonance spectro-scopy. We chose the POI on the basis of prior anatomicaland physiological knowledge, including electrodes knownto overlie approximately the premotor and primary sensor-imotor cortex of the left and right hemispheres (left, FC3,C3, CP3; right, FC4, C4, CP4) and the mesial frontal cortexincluding the SMA (Fz, FCz, Cz). The total number of inter-regional links between these POI was 27. Links within theregions (e.g., FC3-C3, FCz-Cz, C4-CP4) were not inte-grated in the analysis, because the focus of the study wasinter-regional coherence. To test whether the effectsobserved in the POI were topographically restricted (asopposed to global in all electrode pairs), we applied the
same statistical procedure to 27 randomly chosen pairs ofelectrode (RAN): P4-F8, FP1-TP7, FP1-F4, T3-TP7, CP3-O2, O2-T6, O1-F7, FT7-Cz, Pz-TP8, F3-F7, F4-T4, O1-O2,T3-CP3, FPz-F8, O1-FC3, F3-T3, FC3-T6, FC3-O2, FP1-Fz, TP7-CP4, F7-FCz, T4-T6, FPz-CP4, P4-T6, F8-T4,FP1-FC3, and F8-CP4. In addition, to test whether the 27POI were significantly different from each possible combi-nation of any 27 randomly chosen electrode pairs, and notonly for the representative one (RAN), we calculated theZscores of the POI within the distribution of any 27 randomlychosen pairs from the pool of 406 possible pairs, separatelyfor each sequence, according to the formula:
Z = (meanPOI −meanTOTAL)=SEM27 (4)
whereSEM27 is the standard error of the mean for samplesof 27. For a one-sided significance level ofP , 0.05(hypothesis:TRCohPOI . TRCohRAN), the POI Z scoreshave to be.1.65 in this case. We calculated theZ scoresfor the 27 RAN accordingly, in order to characterize theirposition in the population distribution (i.e., to assess thequestion of whether or not they constituted a representativecontrol sample).
3. Results
3.1. Performance of sequential finger movements
The percentage of correct taps exceeded 90% in all move-ment sequences (Table 1). No statistically significant differ-ence in performance was found between part 1 and part 2 ofeach recording, indicating appropriate learning of thesequences during the practice sessions. Inspection of thetemporal relations between EMG signals, finger contactsand metronome tones indicated that at the pacing frequencyof 2 Hz, the tones were used to set the general speed andrhythm of the entire task rather than to cue each individualmovement. EMG burst onset and movements often pre-ceded the occurrence of the tones. In general, a lower per-
Table 1
Performance of sequential finger movements
Sequence Trial 1 (n = 8) Trial 2 (n = 8)
1 98.1± 1.5 98.0± 1.12 95.9± 1.1 96.6± 23 93.8± 3 94.6± 3.54 96.6± 1.3 97.1± 2.4
Values are given as means± SD for percentage of correct taps (%=correct taps/total taps× 100).
Fig. 2. Topographic maps of spectral power changes in the alpha band (8–12 Hz; average of 8 subjects) during performance of sequences 1–4 (seq-1 to seq-4).Red color coding indicates maximal TRPow decreases.
Fig. 3. Topographic maps of spectral power changes in the beta band (13–20 Hz; average of 8 subjects) during performance of sequences 1–4 (seq-1 to seq-4).Red color coding indicates maximal TRPow decreases.
53P. Manganotti et al. / Electroencephalography and clinical Neurophysiology 109 (1998) 50–62

54 P. Manganotti et al. / Electroencephalography and clinical Neurophysiology 109 (1998) 50–62

centage of errors accompanied sequences with shorter unitlength, however the differences in the percentage of correcttaps were not significant between sequences.
3.2. TRPow during sequential finger movements
TRPow decreases in the alpha (8–12 Hz) and beta (13–20Hz) frequency bands were prominent over central and par-ietal areas contralateral to the movement (Figs. 2 and 3;Tables 2, 3 and 4). TRPow decreases were also present,but less prominent, over similar regions in the ipsilateralhemisphere and over frontal regions. No considerableTRPow decreases were seen over temporal, prefrontal,and occipital regions.
Execution of the task exerted a different effect on thetopographic features of the low (8–10 Hz) and high (10–12 Hz) alpha bands (Fig. 2). TRPow decreases in the lowalpha bands were seen mainly in bilateral centro-parietalregions (electrodes P3, CP3, P4, CP4). TRPow decreasesin the high alpha bands were topographically more restrictedto the contralateral centro-parietal regions (C3, CP3, P3).Ipsilateral TRPow decreases in the high alpha bands, ratherthan occurring over areas homologous to the contralateralchanges, had a more focal and anterior distribution (FC4,C4, CP4). TRPow decreases in the entire alpha band (8–12Hz) over the contralateral electrodes across differentsequences reached values as high as 40% of the powervalues during the rest condition, resulting in the highest
significance levels (P , 0.001; activation condition versusrest) for F3, FC3, C3, CP3 and P3 (Table 2). Alpha bandTRPow decreases in electrodes ipsilateral to the movinghand reached values up to 36%, with the highest signifi-cance levels (P , 0.001) for F4, FC4, C4, CP4 and P4(Table 2). Beta band TRPow decreases (Table 3) had amore focal and anterior distribution with values as high as25% over the contralateral central region (FC3, C3, CP3),and 15% over the ipsilateral fronto-centro-parietal cortex(electrodes F4, FC4, C4 and P4) (bothP , 0.001) (Fig. 3).
3.3. Differences in TRPow between finger movementsequences of different complexity
In the broad alpha-band (8–12 Hz), TRPow decreaseswere increasingly large from the control condition tosequences 1, 2, 3 and 4 in electrode C3. However, whenconsidering all conditions and all contralateral central elec-trodes, significant differences were only observed for thecomparison between sequence 1 and each of the othersequences (P , 0.001), not for comparisons between thesequences 2, 3 and 4 (Table 2), indicating that the majorincrease in sequence difficulty occurred between sequence 1and sequences 2–4, respectively. The results were similarfor the ipsilateral electrodes (Table 2).
Also in the high alpha band (10–12 Hz) (Table 4),TRPow decreases were of higher amplitude in the contral-ateral centro-parietal electrodes (FC3, C3, CP3, P3) for the
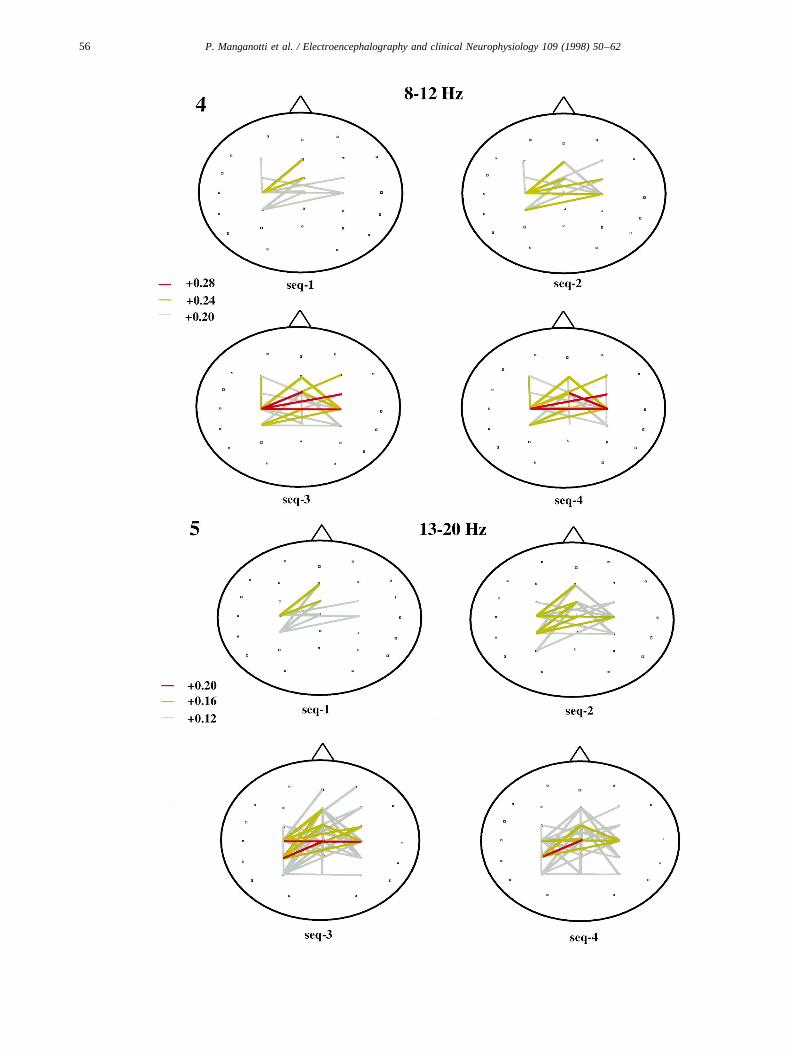
Fig. 4. Topographic coherence maps, alpha band (8–12 Hz; average of 8 subjects), during performance of sequences 1–4 (seq-1 to seq-4). Red and yellowlines indicate high TRCoh.
Fig. 5. Topographic coherence maps, beta band (13–20 Hz; average of 8 subjects), during performance of sequences 1–4 (seq-1 to seq-4). Red and yellowlines indicate high TRCoh. Note the increased number of links during performance of the more complex sequences.
Table 2
Grand average values of power decreases (%) for the alpha band (8–12 Hz)
Electrode Seq-1 Seq-2 Seq-3 Seq-4
ContralateralF3 −10.6 −15.3 −18.5 −18.6FC3 −19.3 −22.3 −25.2 −21.2C3 −30.2 −36.5 −38.0 −38.6CP3 −33.8 −40.0 −40.0 −39.6P3 −23.5 −36.4 −40.0 −38.6
IpsilateralF4 −10.0 −19.9 −19.4 −18.8FC4 −13.9 −19.8 −22.3 −19.0C4 −24.1 −29.0 −31.2 −29.9CP4 −20.8 −28.7 −31.1 −31.4P4 −23.3 −31.1 −34.8 −36.4
Data recorded in 8 subjects over the contralateral and ipsilateral sensor-imotor scalp electrodes during right-finger movement sequences of in-creasing complexity. For contralateral and ipsilateral electrodes, thedifference between sequence 1 and the other sequences was significant(P , 0.001). No significant differences were found between sequences2, 3 and 4.
Table 3
Grand average values of power decreases (%) for the beta band (13–20 Hz)
Electrode Seq-1 Seq-2 Seq-3 Seq-4
ContralateralF3 −5.13 −7.11 −9.68 −5.37FC3 −14.69 −14.22 −15.24 −13.99C3 −20.74 −22.89 −23.88 −22.20CP3 −21.16 −22.20 −25.23 −22.12P3 −14.69 −12.17 −16.57 −13.83
IpsilateralF4 −5.10 −5.13 −8.12 −5.00FC4 −10.00 −13.00 −15.25 −12.89C4 −5.74 −9.89 −11.88 −10.20CP4 −5.15 −8.21 −9.10 −8.11P4 −5.68 −8.18 −9.57 −11.73
Data recorded in 8 subjects over the contralateral and ipsilateral sensor-imotor scalp electrodes during right-finger movement sequences of in-creasing complexity. For contralateral and ipsilateral electrodes, thedifference between sequence 1 and the other sequences was significant(P , 0.001). No significant differences were found between sequences2, 3 and 4.
55P. Manganotti et al. / Electroencephalography and clinical Neurophysiology 109 (1998) 50–62
56 P. Manganotti et al. / Electroencephalography and clinical Neurophysiology 109 (1998) 50–62
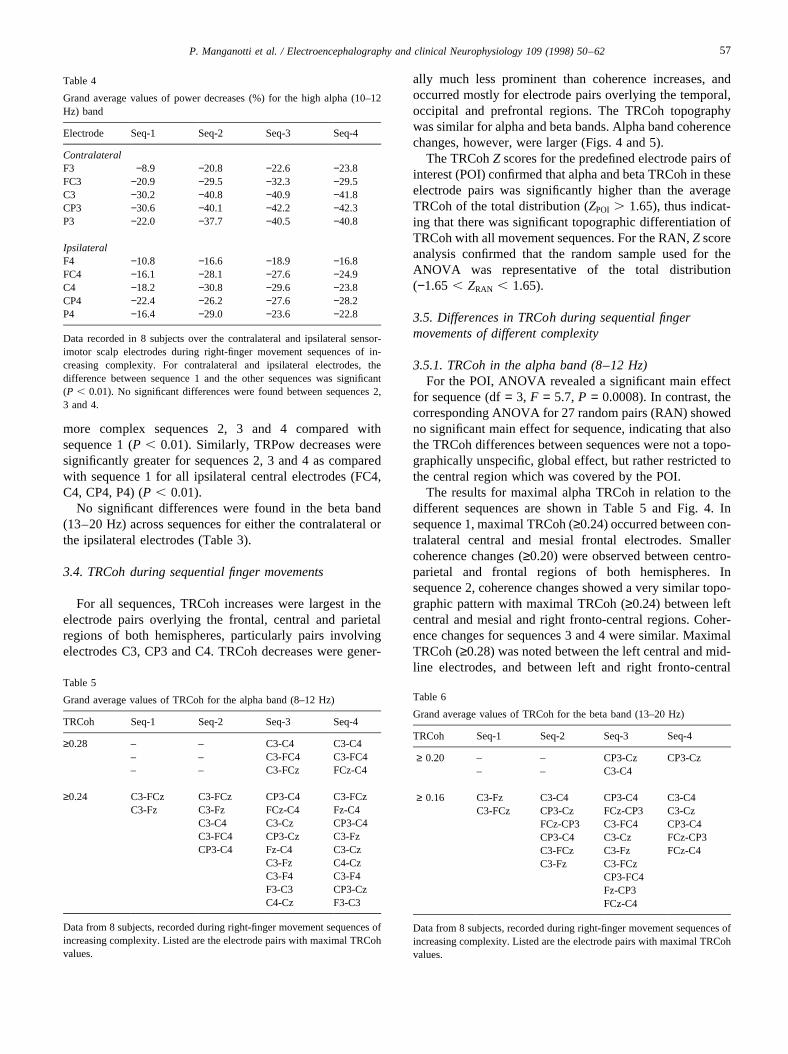
more complex sequences 2, 3 and 4 compared withsequence 1 (P , 0.01). Similarly, TRPow decreases weresignificantly greater for sequences 2, 3 and 4 as comparedwith sequence 1 for all ipsilateral central electrodes (FC4,C4, CP4, P4) (P , 0.01).
No significant differences were found in the beta band(13–20 Hz) across sequences for either the contralateral orthe ipsilateral electrodes (Table 3).
3.4. TRCoh during sequential finger movements
For all sequences, TRCoh increases were largest in theelectrode pairs overlying the frontal, central and parietalregions of both hemispheres, particularly pairs involvingelectrodes C3, CP3 and C4. TRCoh decreases were gener-
ally much less prominent than coherence increases, andoccurred mostly for electrode pairs overlying the temporal,occipital and prefrontal regions. The TRCoh topographywas similar for alpha and beta bands. Alpha band coherencechanges, however, were larger (Figs. 4 and 5).
The TRCohZ scores for the predefined electrode pairs ofinterest (POI) confirmed that alpha and beta TRCoh in theseelectrode pairs was significantly higher than the averageTRCoh of the total distribution (ZPOI . 1.65), thus indicat-ing that there was significant topographic differentiation ofTRCoh with all movement sequences. For the RAN,Z scoreanalysis confirmed that the random sample used for theANOVA was representative of the total distribution(−1.65 , ZRAN , 1.65).
3.5. Differences in TRCoh during sequential fingermovements of different complexity
3.5.1. TRCoh in the alpha band (8–12 Hz)For the POI, ANOVA revealed a significant main effect
for sequence (df= 3, F = 5.7,P = 0.0008). In contrast, thecorresponding ANOVA for 27 random pairs (RAN) showedno significant main effect for sequence, indicating that alsothe TRCoh differences between sequences were not a topo-graphically unspecific, global effect, but rather restricted tothe central region which was covered by the POI.
The results for maximal alpha TRCoh in relation to thedifferent sequences are shown in Table 5 and Fig. 4. Insequence 1, maximal TRCoh (≥0.24) occurred between con-tralateral central and mesial frontal electrodes. Smallercoherence changes (≥0.20) were observed between centro-parietal and frontal regions of both hemispheres. Insequence 2, coherence changes showed a very similar topo-graphic pattern with maximal TRCoh (≥0.24) between leftcentral and mesial and right fronto-central regions. Coher-ence changes for sequences 3 and 4 were similar. MaximalTRCoh (≥0.28) was noted between the left central and mid-line electrodes, and between left and right fronto-central
Table 4
Grand average values of power decreases (%) for the high alpha (10–12Hz) band
Electrode Seq-1 Seq-2 Seq-3 Seq-4
ContralateralF3 −8.9 −20.8 −22.6 −23.8FC3 −20.9 −29.5 −32.3 −29.5C3 −30.2 −40.8 −40.9 −41.8CP3 −30.6 −40.1 −42.2 −42.3P3 −22.0 −37.7 −40.5 −40.8
IpsilateralF4 −10.8 −16.6 −18.9 −16.8FC4 −16.1 −28.1 −27.6 −24.9C4 −18.2 −30.8 −29.6 −23.8CP4 −22.4 −26.2 −27.6 −28.2P4 −16.4 −29.0 −23.6 −22.8
Data recorded in 8 subjects over the contralateral and ipsilateral sensor-imotor scalp electrodes during right-finger movement sequences of in-creasing complexity. For contralateral and ipsilateral electrodes, thedifference between sequence 1 and the other sequences was significant(P , 0.01). No significant differences were found between sequences 2,3 and 4.
Table 5
Grand average values of TRCoh for the alpha band (8–12 Hz)
TRCoh Seq-1 Seq-2 Seq-3 Seq-4
≥0.28 – – C3-C4 C3-C4– – C3-FC4 C3-FC4– – C3-FCz FCz-C4
≥0.24 C3-FCz C3-FCz CP3-C4 C3-FCzC3-Fz C3-Fz FCz-C4 Fz-C4
C3-C4 C3-Cz CP3-C4C3-FC4 CP3-Cz C3-FzCP3-C4 Fz-C4 C3-Cz
C3-Fz C4-CzC3-F4 C3-F4F3-C3 CP3-CzC4-Cz F3-C3
Data from 8 subjects, recorded during right-finger movement sequences ofincreasing complexity. Listed are the electrode pairs with maximal TRCohvalues.
Table 6
Grand average values of TRCoh for the beta band (13–20 Hz)
TRCoh Seq-1 Seq-2 Seq-3 Seq-4
≥ 0.20 – – CP3-Cz CP3-Cz– – C3-C4
≥ 0.16 C3-Fz C3-C4 CP3-C4 C3-C4C3-FCz CP3-Cz FCz-CP3 C3-Cz
FCz-CP3 C3-FC4 CP3-C4CP3-C4 C3-Cz FCz-CP3C3-FCz C3-Fz FCz-C4C3-Fz C3-FCz
CP3-FC4Fz-CP3FCz-C4
Data from 8 subjects, recorded during right-finger movement sequences ofincreasing complexity. Listed are the electrode pairs with maximal TRCohvalues.
57P. Manganotti et al. / Electroencephalography and clinical Neurophysiology 109 (1998) 50–62
electrodes. With sequences 2, 3 and 4, TRCoh of lowermagnitude (≥0.20) occurred in a greater number of electrodepairs over the central and frontal regions of both hemi-spheres.
3.5.2. TRCoh in the beta band (13–20 Hz)For the POI, ANOVA revealed a significant main effect
for sequence (df= 3, F = 6.3, P = 0.0003). The corre-sponding ANOVA for 27 seven randomly selected pairs(RAN) showed no significant main effect for sequence.
The results for maximal beta TRCoh in relation to thedifferent sequences are shown in Table 6 and Fig. 5. Thecoherence changes during movement for the beta band weresmaller but similar in topographic distribution comparedwith the alpha band TRCoh. For sequence 1, maximalTRCoh (≥0.16) occurred between left central and mesialfronto-central electrodes. For sequence 2, maximal TRCoh(≥0.16) occurred in the same regions, with more involve-ment of electrode pairs between bilateral centro-parietal andfronto-central regions. Numerous additional TRCoh links oflower magnitude (≥0.12) were observed between bilateralcentro-parietal and fronto-central regions, and some linksbetween left parietal and mesial and right fronto-centralregions. For sequences 3 and 4, maximal TRCoh (≥0.20)was present in electrode pairs CP3-Cz and C3-C4. Addi-tional TRCoh links of lower magnitude (≥0.16) werenoted between left centro-parietal and right fronto-centralelectrodes. More involvement of posterior parietal electro-des (P3) with the right central and frontal regions was alsoobserved in sequences 3 and 4.
4. Discussion
The purpose of this study was to evaluate the patterns oftask-related oscillatory brain activity during performance ofmotor sequences of different complexity. We used here thesame 4 movement sequences as used in our previous PETstudy (Sadato et al., 1996a) in order to compare the resultsobtained with the two different neuroimaging techniques.While the PET study gave us accurate ‘spatial’ informationof cortical activation patterns, the present study focused onadditional ‘functional’ aspects that cannot be assessed usingPET, especially functional coupling between corticalregions by means of EEG coherence analysis.
4.1. Behavioral aspects
Movement complexity can be determined by a variety offactors, for example, speed and accuracy (Martin andGhez, 1993), type of movement preparation and selection(Georgopoulos, 1994; Kawashima et al., 1994; Deiber etal., 1996), and more or less difficult combinations ofmovements into motor sequences (Lang et al., 1988; Shi-basaki et al., 1993; Sadato et al., 1996a). The term com-plexity in the present experiment was predominantly
related to the length of the basic unit of each finger move-ment sequence (4, 8, 12 or 16 movements; Fig. 1). Inaddition, the order of the movements in the longersequences was probably somewhat more difficult, sincenot only adjacent fingers had to be moved subsequently(e.g., 1–2–3–4), but transitions over two fingers wererequired (e.g., 1–3 or 4–2). Frequency, number of move-ments, and presumably the force were held constant. Insupport of the idea that longer sequences are more complexand difficult to perform, we observed a lower percentage ofcorrect taps for the sequences 2, 3 and 4 than for sequence1. After the practice sessions, however, these differenceswere not significant, thus indicating comparable perfor-mance during each of the sequences.
4.2. TRPow findings
Increase of movement sequence complexity was asso-ciated with more pronounced decreases in TRPow overthe bilateral sensorimotor areas. This trend was observedin all subjects for contralateral and ipsilateral centro-parietalelectrodes, mainly in the alpha band.
For all movement sequences, the alpha TRPow decreasesshowed a consistent topographic distribution over centraland parietal electrodes, with larger amplitudes over the con-tralateral hemisphere. The high alpha band (10–12 Hz)showed more prominent hemispheric asymmetry than thelow alpha band (8–10 Hz). This result is in line with pre-vious studies (Toro et al., 1994a; Leocani et al., 1997;Zhuang et al., 1997) that showed a similar topographic dis-tribution of spectral power decreases associated with simplefinger movements.
The presence of alpha TRPow decreases over the ipsilat-eral hemisphere during unimanual finger movements is inagreement with previous EEG and MEG data (Salmelin andHari, 1994; Leocani et al., 1997). During movement pre-paration, decreases of spectral power are predominant overthe contralateral centro-parietal regions, and they becomebilateral symmetrical once the movement has started (Rap-pelsberger et al., 1994; Salmelin and Hari, 1994; Leocani etal., 1997). In our study, we observed larger TRPowdecreases in the alpha band over the ipsilateral hemispherewith more complex unimanual finger movements, indicat-ing that bilateral processing in the motor system may bemore important when movement complexity increases.
The TRPow decreases in the beta band showed generallythe same pattern as in the alpha band, but the changes wereless prominent, which is in agreement with previous resultsof frequency domain analysis of subdural EEG data (Arroyoet al., 1993). A very focal distribution of the power decreaseover the contralateral centro-parietal regions, however, wasobserved for some frequencies (16–19 Hz). The differentbehavior of alpha and beta bands, as well as different move-ment-related changes within the beta band have beendescribed previously in EEG (Nashmi et al., 1994;Pfurtscheller et al., 1994b; Toro et al., 1994a; Leocani et
58 P. Manganotti et al. / Electroencephalography and clinical Neurophysiology 109 (1998) 50–62

al., 1997) and MEG (Thiihonen et al., 1989) studies. Thesedifferences may be related to different underlying sourcesfor oscillations in different frequency ranges.
4.3. TRCoh findings
Coherence changes between contralateral and ipsilateralcentral electrodes and between contralateral central electro-des and bilateral frontal electrodes became more numerousand symmetrical during the performance of more complexsequential movements for both alpha and beta bands. Com-plexity-related TRCoh differences were most prominentbetween sequence 1 and the more complex sequences. Com-pared with the patterns of the TRPow decreases, the coher-ence changes showed a more anterior distribution. For boththe alpha and beta bands, the centro-parietal regions showeda greater power decrease than the frontal regions, but coher-ence changes were distributed more anteriorly, over thecentral and frontal regions. An increasing number of linksto contralateral parietal electrodes, however, was observedfor the more complex sequences in both frequency bands.
No increase in coherence was observed between centraland temporal or occipital regions, but there was occasion-ally a TRCoh decrease between these regions. The oppositeTRCoh pattern between central and neighboring temporalelectrodes is evidence against possible effects due to themontage with linked-ears reference or due to volume con-duction (Fein et al., 1988; Rappelsberger, 1989). For exam-ple, false-positive interhemispheric coherences due to thelinked-ears reference would be expected to be present inall interhemispheric electrode pairings. In the present data,high interhemispheric TRCoh occurred only in electrodepairs overlying the central region (e.g., C3-C4), not in elec-trode pairs over other regions (e.g., T5-T6, F7-F8, Fp1-Fp2).A bias of the TRCoh results due to the use of a referentialrecording is therefore unlikely. More likely, increases anddecreases of TRCoh in neighboring electrode pairs indicatethe differential functional coupling between a given targetarea (e.g., contralateral sensorimotor cortex) and others(e.g., ipsilateral sensorimotor versus contralateral temporal)in relation to the required task performance.
What are the potential mechanisms underlying coherencechanges? Inter-regional TRCoh could be driven by a com-mon subcortical input to these regions, for example, by acommon thalamic pacemaker. The thalamus is anatomicallywell connected to sensory cortical areas. Thalamic contribu-tion to the generation and modulation of cortical oscillationshas been described for the occipital alpha rhythm (forreview see Llinas, 1988; Steriade and Llinas, 1988; Steriadeet al., 1990). In return, synchronous oscillations (7–14 Hzspindles) in the thalamus are under cortical influence (Con-treras et al., 1996). A correlate of movement-reactive soma-tosensory rhythms at 12–16 Hz has been found in the VPLnucleus of the thalamus in the cat (Howe and Sterman,1972). Similarly, multilevel synchronous oscillatory activ-ity has been reported in rat somatosensory cortex and VPL
thalamus at 7–12 Hz and 19–21 Hz (Nicoleleis et al., 1995),and parietal beta oscillations (35–45 Hz) have been found tobe coherent with oscillations in the medial part of the poster-ior group of the thalamus and were abolished by lesions inthis thalamic zone (Bouyer et al., 1987). The hypothesis of acommon thalamic input that drives the TRCoh increasesbetween sensorimotor areas as movement sequencesbecome more complex, would also be consistent with theobservation of increased thalamic activation in complexcompared with simple sequences in our PET study (Sadatoet al., 1996a). Alternatively, synchronization of regionaloscillatory activity in distant sites of the brain could alsobe mediated through the abundant lateral cortico-corticalinterconnections that link the sensorimotor cortex to numer-ous frontal and parietal regions. This principle has beensuggested previously for the visual system (Echorn et al.,1988; Singer, 1993, 1995), and the sensorimotor cortex(Murthy and Fetz, 1992). On the basis of our data, we cannotdifferentiate between these mechanisms. However, it is con-ceivable that during complex tasks both cortical and sub-cortical influences contribute to the large-scale coherencechanges that we observed.
It is important to stress that regional activation asreflected by the patterns of the TRPow decreases and func-tional coupling as reflected by TRCoh were to some extentindependent from each other. Most strikingly, TRCoh andTRPow topography was not identical, with a more anteriordistribution of the coherence changes. The different beha-vior of TRCoh and TRPow indicates that the activity of acortical network can be modulated at least in two partiallyindependent ways, namely, by increasing and decreasingfocal activity at any ‘node’ of the network, or by enhancingor suppressing the functional coupling between any of thenodes.
What is the biological meaning of TRCoh? An increase ofcoherence most likely reflects greater cooperation betweenneuronal assemblies. However, the effect of this coopera-tion does not need to be excitatory. Particularly duringunimanual motor performance, increased coherencebetween bilateral sensorimotor areas could as well be acorrelate of inhibiting the homologous areas that controlthe non-target hand. The presence of fast synchronous oscil-lations in networks of inhibitory neurons that are connectedby synapses using GABA in the neocortex provide groundsfor this interpretation (Whittington et al., 1995). Transcal-losal projections of GABAergic neurons to homologousareas (Jones, 1993) could be the structural substrate of inter-hemispheric ‘inhibitory’ coherence, particularly in order tosuppress mirror movements. Alternatively, increased inter-hemispheric coherence could reflect coordination of excita-tory activity in contralateral and ipsilateral sensorimotorareas. The ipsilateral sensorimotor cortex could participatein movement processing via small, uncrossed corticospinalpathways, which have been estimated to account forapproximately 8–10% of the pyramidal tract fibers(Nyberg-Hansen and Rinvik, 1963; Yakolev and Rakic,
59P. Manganotti et al. / Electroencephalography and clinical Neurophysiology 109 (1998) 50–62
1966). Further evidence for ipsilateral cortical control ofdistal movement comes from single unit recordings (Tanjiet al., 1988; Aizawa et al., 1990). Taken together, it seemslikely that both inhibitory and excitatory mechanisms con-tribute to the large-scale coherence changes that can bedocumented in scalp-recorded EEG. TRCoh would thenreflect the fact that two regions communicate, indepen-dently of the goal of this communication with respect toinhibition or excitation.
If coherence increases are interpreted as signs of greaterinter-regional communication and cooperation, then coher-ence decreases should indicate a state of relative functional‘disconnection’ (Bullock, 1992; Singer, 1995). During allmovement sequences, we found coherence decreasesbetween central and temporal electrodes and between cen-tral and occipital electrodes, indicating that temporal andoccipital regions were uncoupled from the sensorimotorregion and did not contribute to task performance. It istempting to speculate that coherence decreases could, more-over, imply some kind of active suppression of potentially‘distracting’ interactions between cortical regions that aretemporarily not needed. Direct evidence for this hypothesisis lacking.
4.4. Comparison with corresponding PET results andbiological relevance
Our PET findings (Sadato et al., 1996a) and other neuroi-maging studies (Kim et al., 1993; Rao et al., 1993; Shibasakiet al., 1993) have documented that performance of unim-anual sequential finger movements is associated with anincrease of rCBF not only in the SM1 contralateral to themovement but also in the ipsilateral hemisphere. Other prin-cipal regions involved are the SMA (Roland et al., 1980;Colebatch et al., 1991; Grafton et al., 1992), and the lateralPMA and parietal cortex bilaterally (Sadato et al., 1996a). Iffocal decreases of EEG spectral power reflect regional brainactivation (e.g., Pfurtscheller, 1992; Toro et al., 1994a,b)and if similar aspects of brain activation are reflected byincreases of regional cerebral blood flow (rCBF) in PET,then the areas of decreased TRPow should correspond tocortical areas activated in our corresponding PET study(Sadato et al., 1996a).
The spatial resolution of surface EEG recordings from 29electrodes covering the entire head is in the range of severalcentimeters (the inter-electrode distances in anterior-to-pos-terior direction are ~3 cm, in medial-to-lateral direction ~6cm). Therefore, the correlative interpretation of the presentEEG results with the previous, spatially more accurate PETdata (Sadato et al., 1996a) is of particular importance. Theregions involved in task performance across sequences weregenerally comparable between EEG and PET, includingbilateral SM1 and PMA, parietal cortex, and SMA. Withrespect to complexity-related activity increases in particu-lar, the EEG and PET data corresponded well in the rightPMA and parietal areas (Brodmann areas 6 and 7), but were
different in the ipsilateral and contralateral SM1. EEG wasclearly suggestive of increasing activation in ipsilateral andcontralateral SM1 as sequence complexity increased, whilePET did not. The EEG coherence data corresponded wellwith the PET results in that they demonstrated higher gradesof coupling between areas that were in fact activated inPET, particularly coupling between the contralateral (left)SM1 and right PMA and centro-parietal areas. In addition,the TRCoh data suggest complexity-related increases infunctional coupling between areas that were equally activeacross the different sequences, in both PET and TRPowanalyses. This was particularly remarkable for coherencelinks between contralateral and ipsilateral SM1 and betweencontralateral SM1 and mesial frontal cortex including theregion of the SMA. The bilaterality of the scalp-recordedEEG findings is consistent with data on movement-relatedcortical activity as recorded from subdural electrodes(Neshige et al., 1988; Ikeda et al., 1992). This makes itvery unlikely that the high grade of bilaterality seen in thepresent study is an artifact due to volume conduction or theuse of a particular EEG montage. In PET, a complexity-related rCBF increase occurred also in the left thalamus.With respect to the question of potential mechanisms under-lying coherence, this could be consistent with an increasedthalamocortical drive generating the complexity-relatedchanges in TRCoh.
Discrepancies between EEG and rCBF-PET data mayhave a variety of reasons. A major problem of comparingdata from different studies using different techniques isusually variations in the experimental conditions. The para-digms in the present EEG and our previous PET study(Sadato et al., 1996a) were identical, and behavioral issuesare therefore unlikely to account for differences in the cor-tical activation patterns. It is likely, however, that EEGfrequency domain analysis and rCBF methods have differ-ent sensitivities to changes in cortical activity or that, forexample, ceiling effects may conceal further increases ofactivation, if these occur in addition to any level of pre-activation. This kind of ceiling effect has recently beendemonstrated in PET using a paradigm with increasingrates of finger movements (Sadato et al., 1996b). Accordingto these data, at a movement rate of more than 2 Hz, thereare no more significant rCBF increases due to saturation. Inthe previous PET study on complexity (Sadato et al.,1996a), the movement rate was 2 Hz, so the rCBF in theSM1 was probably already at ceiling even in the simplestsequence. This would be a plausible explanation of whyonly TRPow, but not PET, documented complexity-relatedactivity increases in the bilateral sensorimotor cortex whenthe sequences became more complex. A ceiling effect mayalso occur in the EEG which differentiated the sequencesclearly between the first difficulty level and the others, butshowed only minor differences between the higher difficultylevels (sequences 2, 3 and 4). More work manipulating thelevel of difficulty is required to understand the limits offunctional sensitivity, with both rCBF and EEG measures.
60 P. Manganotti et al. / Electroencephalography and clinical Neurophysiology 109 (1998) 50–62
Of even greater physiological interest might be the differ-ences between complexity-related PET (and to some extentTRPow) activation changes and coherence changes. TheTRCoh versus PET/TRPow findings may point to a veryimportant aspect of information processing in the humancortex, namely, modulation of network-like activity due tomodulation of interaction, without modulation of the netactivation of participating regions (or network nodes).Therefore, the integration of coherence analysis into func-tional imaging of the human brain can provide new andunique information.
Acknowledgements
The authors wish to thank Ms. B.J. Hessie for skillfulediting and Ms. N. Dang for expert technical assistance.Dr. C. Gerloff was supported by the Deutsche Forschungs-gemeinschaft (grant Ge 844/1–1).
References
Aizawa, H., Mushiake, H. and Tanji, I. An output zone of the monkeyprimary cortex specialized for bilateral hand movements. Exp. BrainRes., 1990, 82: 219–221.
Andrew, C. and Pfurtscheller, G. Event-related coherence as a tool forstudying dynamic interaction of brain regions. Electroenceph. clin.Neurophysiol., 1996, 98: 144–148.
Arroyo, S., Lesser, R.P., Gordon, B., Uematsu, S., Jackson, D. andWebber, R. Functional significance of the mu rhythms of human cortex:an electrophysiologic study with subdural electrodes. Electroenceph.clin. Neurophysiol., 1993, 87: 76–87.
Bullock, T.H. Introduction to induced rhythms: a widespread heteroge-neous class of oscillations. In: E. Basar and T.H. Bullock (Eds.),Induced Rhythm of the Brain. Birkhauser, Boston, 1992, pp. 1–26.
Bouyer, J.J., Montaron, M.F., Vahnee, J.M., Vahnee, J.M., Albert, M.P.and Rougeul, A. Anatomical localization of cortical beta rhythms incats. Neuroscience, 1987, 22: 863–869.
Busk, J. and Galbraith, G.C. EEG correlates of visual motor practice inman. Electroenceph. clin. Neurophysiol., 1975, 38: 415–422.
Chatrian, G.E., Petersen, M.C. and Lazarete, J.A. The blocking of therolandic wicket rhythm and some central changes related tomovement. Electroenceph. clin. Neurophysiol., 1959, 11: 497–510.
Colebatch, G.J., Deiber, M.P., Passingham, K., Friston, J.K. andFrackowiack, R.S.J. Regional cerebral blood flow during voluntaryarm movements in human subjects. J. Neurophysiol., 1991, 65: 1392–1401.
Contreras, D., Destexhe, A., Terrence, J.S. and Steriade, M. Control ofspatiotemporal coherence of a thalamic oscillation by corticothalamicfeedback. Science, 1996, 274: 771–774.
Deiber, M.-P., Iban˜ez, V., Sadato, N. and Hallett, M. Cerebral structuresparticipating in motor preparation in humans: a positron emission tomo-graphy study. J. Neurophysiol., 1996, 75: 233–247.
Echorn, R., Bauer, R., Jordan, W., Brosch, M., Kruse, W., Munk, M. andReitbock, H.J. Coherent oscillations: a mechanism for feature linking inthe visual cortex? Biol. Cybern., 1988, 60: 121–130.
Fein, G., Raz, J., Brown, F. and Merrin, E. Common reference coherencedata are confounded by power and phase effects. Electroenceph. clin.Neurophysiol., 1988, 69: 581–584.
Gastaut, H., Terzian, H. and Gastaut, Y. Etude d’une activite arceau elec-troencephalografique meconnue: le rythme rolandique en arceau. Mar-seille Med., 1952, 89: 296–310.
Georgopoulos, A.P. New concepts in generation of movement. Neuron,1994, 13: 257–268.
Gerloff, C., Hadley, J., DeLeo, J.M., Classen, J., Toro, C. and Hallett, M.Coherent bilateral activity of the human premotor and sensorimotorcortex during internally- and externally-cued finger movements. Soc.Neurosci. Abst., 1996, 22: 1451.
Grafton, S.T., Mazziotta, J.C., Woods, R.P. and Phelps, M.E. Humanfunctional anatomy of visually guided finger movements. Brain, 1992,115: 565–587.
Howe, R.C. and Sterman, M.B. Cortico-subcortical EEG correlates ofsuppressed motor behavior during sleep and walking in the cat. Electro-enceph. clin. Neurophysiol., 1972, 32: 681–695.
Ikeda, A., Luders, H.O., Burgess, R.C. and Shibasaki, H. Movementrelated potentials recorded from supplementary motor area and primarymotor area. Role of supplementary motor area in voluntary movements.Brain, 1992, 95: 323–334.
Jones, E.G. GABAergic neurons and their role in cortical plasticity inprimates. Cereb. Cortex, 1993, 3: 361–372.
Kawashima, R., Roland, P.E. and O’Sullivan, B.T. Fields in human motorareas involved in preparation for reaching, actual reaching, and visuo-motor learning: a positron emission tomography study. J Neurosci.,1994, 14: 3462–3474.
Kim, S.G., Ashe, J., Hendrich, K., Hellermann, J., Merkle, H., Ugurbil, K.and Georgopoulos, A.P. Functional magnetic resonance imaging ofmotor cortex: hemispheric asymmetry and handedness. Science, 1993,261: 615–617.
Lang, W., Lang, M., Koska, C., Kornhuber, A. and Deecke, L. Negativecortical DC shifts preceding and accompanying simultaneous andsequential finger movements. Exp. Brain Res., 1988, 71: 579–587.
Leocani, L., Toro, C., Manganotti, P., Zhuang, P. and Hallett, M. Event-related coherence and event-related desynchronization in the 10 Hz and20 Hz EEG during self-paced movements. Electroenceph. clin. Neuro-physiol., 1997, 104: 199–206.
Llinas, R.R. The intrinsic electrophysiological properties of mammalianneurons: insights into central nervous system function. Science, 1988,242: 1654–1664.
Martin, M. and Ghez, C. Differential impairments in reaching and graspingproduced by local inactivation within the forelimb representation of themotor cortex in the cat. Exp. Brain Res., 1993, 94: 429–443.
Murthy, V. and Fetz, E.E. Coherent 25 to 35 Hz oscillations in the sensor-imotor cortex of awake behaving monkeys. Proc. Natl. Acad. Sci. USA,1992, 89: 5670–5674.
Nashmi, R., Mendoca, A.J. and Mackay, W.A. EEG rhythms of the sen-sorimotor region during hand movements. Electroenceph. clin.Neurophysiol., 1994, 91: 457–467.
Neshige, R., Lu¨ders, H., Friedman, L. and Shibasaki, H. Recording ofmovement-related potentials from the human cortex. Ann. Neurol.,1988, 24: 439–445.
Nicoleleis, M.A.L., Baccala, L.A., Lin, R.C.S. and Chapin, J.K. Sensor-imotor encoding by synchronous neural ensemble activity at multiplelevels of somatosensory system. Science, 1995, 268: 1353–1358.
Nyberg-Hansen, R. and Rinvik, E. Some comments on the pyramidal tract,with special reference to its individual variations in man. Acta Neurol.Scand., 1963, 39: 1–30.
Oldfield, R.C. The assessment and analysis of handedness: the Edinburghinventory. Neuropsychologia, 1971, 9: 97–113.
Pfurtscheller, G. Event related synchronization (ERS): an electrophysiolo-gical correlate of cortical areas at rest. Electroenceph. clin.Neurophysiol., 1992, 83: 62–69.
Pfurtscheller, G. and Aranibar, A. Occipital rhythmic activity within thealpha band during conditioned externally paced movement. Electroen-ceph. clin. Neurophysiol., 1978, 45: 226–235.
Pfurtscheller, G. and Berghold, A. Pattern of cortical activation duringplanning of voluntary movement. Electroenceph. clin. Neurophysiol.,1989, 72: 250–285.
Pfurtscheller, G. and Klimesch, W. Cortical activation pattern during read-ing and recognition of words studied with dynamic event-related desyn-
61P. Manganotti et al. / Electroencephalography and clinical Neurophysiology 109 (1998) 50–62
chronization mapping. In: K. Maurer (Ed.), Topograhic Mapping ofEEG and Evoked Potentials. Springer-Verlag, Berlin, 1989, pp. 303–313.
Pfurtscheller, G., Flotzinger, D. and Neuper, C. Differentiation betweenfinger, toe and tongue movement in man based on 40 Hz EEG. Electro-enceph. clin. Neurophysiol., 1994a, 90: 456–460.
Pfurtscheller, G., Pragenzer, M. and Neuper, C. Visualization of sensor-imotor areas involved in preparation for hand movement based on clas-sification of mu and central beta rhythm in single EEG trials in man.Neurosci. Lett., 1994b, 181: 43–46.
Rao, S.M., Binder, J.R., Bandettini, P.A., Hammeke, T.A., Yeltkin, F.Z.,Jesmanovicz, A., Lisk, L.M., Morris, G.L., Mueller, W.M., Estkowski,L.D., Wong, E.C., Haughton, V.M. and Hyde, J.S. Functional magneticresonance imaging of complex human movements. Neurology, 1993,43: 2311–2318.
Rappelsberger, P. The reference problem and mapping of coherence: astimulation study. Brain Topogr., 1989, 2: 63–72.
Rappelsberger, P. and Petsche, H. Probability mapping: power and coher-ence analysis of cognitive process. Brain Topogr., 1988, 1: 46–54.
Rappelsberger, P., Pfurtscheller, G. and Filz, O. Calculation of eventrelated coherence. A new method to study short lasting couplingbetween brain areas. Brain Topogr., 1994, 7: 121–127.
Roland, P.E., Larsen, B., Lassen, N.A. and Skinhoj, E. Supplementarymotor area and other cortical areas in organization of voluntary move-ments in man. J. Neurophysiol., 1980, 43: 118–136.
Sadato, N., Campbell, G., Ibanez, V., Deiber, M.P. and Hallett, M. Com-plexity affects regional cerebral blood flow change during sequentialfinger movements. J. Neurosci., 1996a, 16: 2693–2700.
Sadato, N., Ibanez, V., Deiber, M.P., Campbell, G., Leonardo, M. andHallett, M. Frequency-dependent changes of regional cerebral bloodflow during finger movements. J. Cereb. Blood Flow Metab., 1996b,16: 23–33.
Salmelin, R. and Hari, R. Spatiotemporal characteristic of sensorimotorneuromagnetic rhythms related to thumb movement. Neuroscience,1994, 6: 537–550.
Shaw, J.C., O’Conor, K.P. and Ongley, O.C. EEG coherence as a measureof cerebral functional organization. In: M.A.B. Brazier and H. Petsche(Eds.), Architectonics of Cerebral Cortex. Raven Press, New York,1978, pp. 245–256.
Shibasaki, H., Sadato, N., Lyshkow, H., Yonekura, Y., Honda, M.,Nagamine, T., Suwazono, S., Agata, Y., Ikeda, A., Miyazaki, M.,Hidenao, F., Renin, A. and Junji, K. Both primary and supplementarymotor areas play an important role in complex finger movement. Brain,1993, 116: 1387–1398.
Singer, W. Neuronal representations, assemblies and temporal coherence.Prog. Brain Res., 1993, 95: 461–474.
Singer, W. Development and plasticity of cortical processing architectures.Science, 1995, 270: 758–763.
Sklar, R.L., Hanley, J. and Simmons, W.W. An EEG experiment aimedtoward identifying dyslexic children. Nature (London), 1972, 240: 414–416.
Stancak, A. and Pfurtscheller, G. The effects of handiness and type ofmovement on the contralateral preponderance ofm-rhythmdesynchronization. Electroenceph. clin. Neurophysiol., 1996, 99: 174–182.
Steriade, M. and Llinas, R.R. The functional states of the thalamus andassociated neuronal interplay. Physiol. Rev., 1988, 68: 649–742.
Steriade, M., Gloor, P., Llinas, R.R., Lopes da Silva, F.H. and Mesulam,M.M. Basic mechanisms of cerebral rhythmic activities. Electroenceph.clin. Neurophysiol., 1990, 76: 481–508.
Tanji, J., Okano, K. and Sato, K. Neuronal activity in cortical motor areasrelated to ipsilateral, contralateral, and bilateral digit movements ofmonkey. J. Neurophysiol., 1988, 60: 325–343.
Thatcher, R.W. Tomographic electroencephalography/magnetoencephalo-graphy. Dynamics of human neural network switching. J. Neuroima-ging, 1995, 5: 35–45.
Thatcher, R.W., Krause, P.J. and Hrybyk, M. Cortico-cortical associationsand EEG coherence a two compartmental model. Electroenceph. clin.Neurophysiol., 1986, 64: 123–143.
Thiihonen, J., Kajola, M. and Hari, R. Magnetic mu rhythm in man.Neuroscience, 1989, 32: 793–800.
Toro, C., Deuschl, G., Thatcher, R., Sato, S., Kufta, C. and Hallett, M.Event related desynchronization and movement-related cortical poten-tials on ECoG and EEG. Electroenceph. clin. Neurophysiol., 1994a, 93:380–389.
Toro, C., Cox, C., Friehs, G., Ojekangas, C., Maxwell, R., Gates, R.J.,Gumnit, R.J. and Ebner, T. 8–12 Hz rhythmic oscillations in humanmotor cortex during two dimensional arm movements: evidence forrepresentations of kinematic parameters. Electroenceph. clin. Neuro-physiol., 1994b, 93: 390–403.
Whittington, M.A., Traub, R.D. and Jeferys, J.G.R. Synchronized oscilla-tions in interneuron networks driven by metabotropic glutamate receptoractivation. Nature, 1995, 373: 612–615.
Yakolev, P.I. and Rakic, P. Patterns of decussation of bulbar pyramids anddistribution of pyramidal tracts on two sides of the spinal cord. Trans.Am. Neurol. Assoc., 1966, 91: 366–367.
Zhuang, P., Toro, C., Grafman, J., Manganotti, P., Leocani, L. and Hallett,M. Event related desynchronization (ERD) in alpha frequency duringdevelopment of implicit and explicit learning. Electroenceph. clin. Neu-rophysiol., 1997, 102: 374–381.
62 P. Manganotti et al. / Electroencephalography and clinical Neurophysiology 109 (1998) 50–62