Tales from a thousand and one ways to integrate marine ecosystem components when assessing the...
20
REVIEW ARTICLE published: 05 December 2014 doi: 10.3389/fmars.2014.00072 Tales from a thousand and one ways to integrate marine ecosystem components when assessing the environmenta status l Angel Borja 1 *, Theo C. Prins 2 , Nomiki Simboura 3 , Jesper H. Andersen 4 , Torsten Berg 5 , Joao-Carlos Marques 6 , Joao M. Neto 6 , Nadia Papadopoulou 7 , Johnny Reker 8 , Heliana Teixeira 9 and Laura Uusitalo 10 1 AZTI-Tecnalia, Marine Research Division, Pasaia, Spain 2 Deltares, Delft, Netherlands 3 Hellenic Centre for Marine Research, Institute of Oceanography, Anavissos, Greece 4 NIVA Denmark Water Research, Copenhagen, Denmark 5 MariLim Aquatic Research GmbH, Schönkirchen, Germany 6 MARE - Marine and Environmental Sciences Centre, Faculty of Sciences and Technology, University of Coimbra, Coimbra, Portugal 7 Hellenic Centre for Marine Research, Institute of Marine Biological Resources and Inland Waters, Crete, Greece 8 European Environment Agency, Copenhagen, Denmark 9 European Commission, Joint Research Centre, Institute for Environment and Sustainability, Ispra, Italy 10 Finnish Environment Institute (SYKE), Helsinki, Finland Edited by: Stelios Katsanevakis, University of the Aegean, Greece Reviewed by: Angel Pérez-Ruzafa, Universidad de Murcia, Spain Henn Ojaveer, University of Tartu, Estonia Sabine Cochrane, Akvaplan-niva, Norway *Correspondence: Angel Borja, AZTI-Tecnalia, Marine Research Division, Herrera Kaia, Portualdea S/N, 20110 Pasaia, Spain e-mail: [email protected] Assessing the environmental status of marine ecosystems is useful when communicating key messages to policymakers or the society, reducing the complex information of the multiple ecosystem and biodiversity components and their important spatial and temporal variability into manageable units. Taking into account the ecosystem components to be addressed (e.g., biological, chemical, physical), the numerous biodiversity elements to be assessed (e.g., from microbes to sea mammals), the different indicators needed to be studied (e.g., in Europe, 56 indicators of status have been selected), and the different assessment scales to be undertaken (e.g., from local to regional sea scale), some criteria to define spatial scales and some guidance on aggregating and integrating information is needed. We have reviewed, from ecological and management perspectives, the approaches for aggregating and integrating currently available for marine status assessment in Europe and other regions of the world. Advantages and shortcomings of the different alternatives are highlighted. We provide some guidance on the steps toward defining rules for aggregation and integration of information at multiple levels of ecosystem organization, providing recommendations on when using specific rules in the assessment. A main conclusion is that any integration principle used should be ecologically-relevant, transparent and well documented, in order to make it comparable across different geographic regions. Keywords: ecosystems, marine, indicators, Marine Strategy Framework Directive, descriptors, criteria, assessment, integration INTRODUCTION The requirement to assess the environmental status of marine waters is growing across continents (Borja et al., 2008). It is also one of the challenging tasks to be accomplished in Europe, within the Marine Strategy Framework Directive (MSFD) (European Commission, 2008). The different legislative mandates to asses status coming from the MSFD, Water Framework Directive (WFD) (2000/60/EC) and Habitats Directive (92/43/EEC) and other international initiatives have produced numerous method- ologies that can be applied to different ecosystem components, such as various taxonomic or functional groups, habitats, traits, physical features, or to the whole ecosystem (Birk et al., 2012; Halpern et al., 2012). Despite this wealth of methods, determin- ing environmental status and assessing marine ecosystems health in an integrative way is still one of the grand challenges in marine ecosystems ecology research and management (Borja, 2014). Different attempts to understand, define and assess ecosystem health have been made in recent years (Costanza and Mageau, 1999; Ulanowicz, 2000; Mee et al., 2008; Ojaveer and Eero, 2011; Borja et al., 2013; Tett et al., 2013). The concept of “good envi- ronmental status” (GEnS) integrates physical, chemical and bio- logical aspects, together with the services provided by ecosystems, including a sustainable use of the marine resources by society (Borja, 2014). However, synthesizing these aspects into a single value will never appropriately reflect all aspects considered to derive the value (Purvis and Hector, 2000; Derous et al., 2007). Still, this step is useful when communicating key messages to pol- icymakers or the society, reducing the complex information of the www.frontiersin.org December 2014 | Volume 1 | Article 72 | 1 MARINE SCIENCE
Transcript of Tales from a thousand and one ways to integrate marine ecosystem components when assessing the...
REVIEW ARTICLEpublished: 05 December 2014
doi: 10.3389/fmars.2014.00072
Tales from a thousand and one ways to integrate marineecosystem components when assessing the environmentastatus
l
Angel Borja1*, Theo C. Prins2, Nomiki Simboura3, Jesper H. Andersen4, Torsten Berg5,Joao-Carlos Marques6, Joao M. Neto6, Nadia Papadopoulou7, Johnny Reker8, Heliana Teixeira9 andLaura Uusitalo10
1 AZTI-Tecnalia, Marine Research Division, Pasaia, Spain2 Deltares, Delft, Netherlands3 Hellenic Centre for Marine Research, Institute of Oceanography, Anavissos, Greece4 NIVA Denmark Water Research, Copenhagen, Denmark5 MariLim Aquatic Research GmbH, Schönkirchen, Germany6 MARE - Marine and Environmental Sciences Centre, Faculty of Sciences and Technology, University of Coimbra, Coimbra, Portugal7 Hellenic Centre for Marine Research, Institute of Marine Biological Resources and Inland Waters, Crete, Greece8 European Environment Agency, Copenhagen, Denmark9 European Commission, Joint Research Centre, Institute for Environment and Sustainability, Ispra, Italy10 Finnish Environment Institute (SYKE), Helsinki, Finland
Edited by:Stelios Katsanevakis, University ofthe Aegean, Greece
Reviewed by:Angel Pérez-Ruzafa, Universidad deMurcia, SpainHenn Ojaveer, University of Tartu,EstoniaSabine Cochrane, Akvaplan-niva,Norway
*Correspondence:Angel Borja, AZTI-Tecnalia, MarineResearch Division, Herrera Kaia,Portualdea S/N, 20110 Pasaia, Spaine-mail: [email protected]
Assessing the environmental status of marine ecosystems is useful when communicatingkey messages to policymakers or the society, reducing the complex information of themultiple ecosystem and biodiversity components and their important spatial and temporalvariability into manageable units. Taking into account the ecosystem components to beaddressed (e.g., biological, chemical, physical), the numerous biodiversity elements tobe assessed (e.g., from microbes to sea mammals), the different indicators neededto be studied (e.g., in Europe, 56 indicators of status have been selected), and thedifferent assessment scales to be undertaken (e.g., from local to regional sea scale),some criteria to define spatial scales and some guidance on aggregating and integratinginformation is needed. We have reviewed, from ecological and management perspectives,the approaches for aggregating and integrating currently available for marine statusassessment in Europe and other regions of the world. Advantages and shortcomingsof the different alternatives are highlighted. We provide some guidance on the stepstoward defining rules for aggregation and integration of information at multiple levelsof ecosystem organization, providing recommendations on when using specific rulesin the assessment. A main conclusion is that any integration principle used should beecologically-relevant, transparent and well documented, in order to make it comparableacross different geographic regions.
Keywords: ecosystems, marine, indicators, Marine Strategy Framework Directive, descriptors, criteria, assessment,integration
INTRODUCTIONThe requirement to assess the environmental status of marinewaters is growing across continents (Borja et al., 2008). It is alsoone of the challenging tasks to be accomplished in Europe, withinthe Marine Strategy Framework Directive (MSFD) (EuropeanCommission, 2008). The different legislative mandates to assesstatus coming from the MSFD, Water Framework Directive(WFD) (2000/60/EC) and Habitats Directive (92/43/EEC) andother international initiatives have produced numerous method-ologies that can be applied to different ecosystem components,such as various taxonomic or functional groups, habitats, traits,physical features, or to the whole ecosystem (Birk et al., 2012;Halpern et al., 2012). Despite this wealth of methods, determin-ing environmental status and assessing marine ecosystems health
in an integrative way is still one of the grand challenges in marineecosystems ecology research and management (Borja, 2014).
Different attempts to understand, define and assess ecosystemhealth have been made in recent years (Costanza and Mageau,1999; Ulanowicz, 2000; Mee et al., 2008; Ojaveer and Eero, 2011;Borja et al., 2013; Tett et al., 2013). The concept of “good envi-ronmental status” (GEnS) integrates physical, chemical and bio-logical aspects, together with the services provided by ecosystems,including a sustainable use of the marine resources by society(Borja, 2014). However, synthesizing these aspects into a singlevalue will never appropriately reflect all aspects considered toderive the value (Purvis and Hector, 2000; Derous et al., 2007).Still, this step is useful when communicating key messages to pol-icymakers or the society, reducing the complex information of the
www.frontiersin.org December 2014 | Volume 1 | Article 72 | 1
MARINE SCIENCE
Borja et al. Integrating ecosystem elements for assessment
multiple ecosystem components and their important spatial andtemporal variability into manageable units, which can be usedin ecosystem management. Following the recommendation fromMee et al. (2008), we use the GEnS acronym because the mean-ing of “environmental,” within the MSFD, and “ecological” (goodecological status), within the WFD, is different (see Borja et al.,2010, for differences between both concepts), implying a differentemphasis between these two major pieces of legislation.
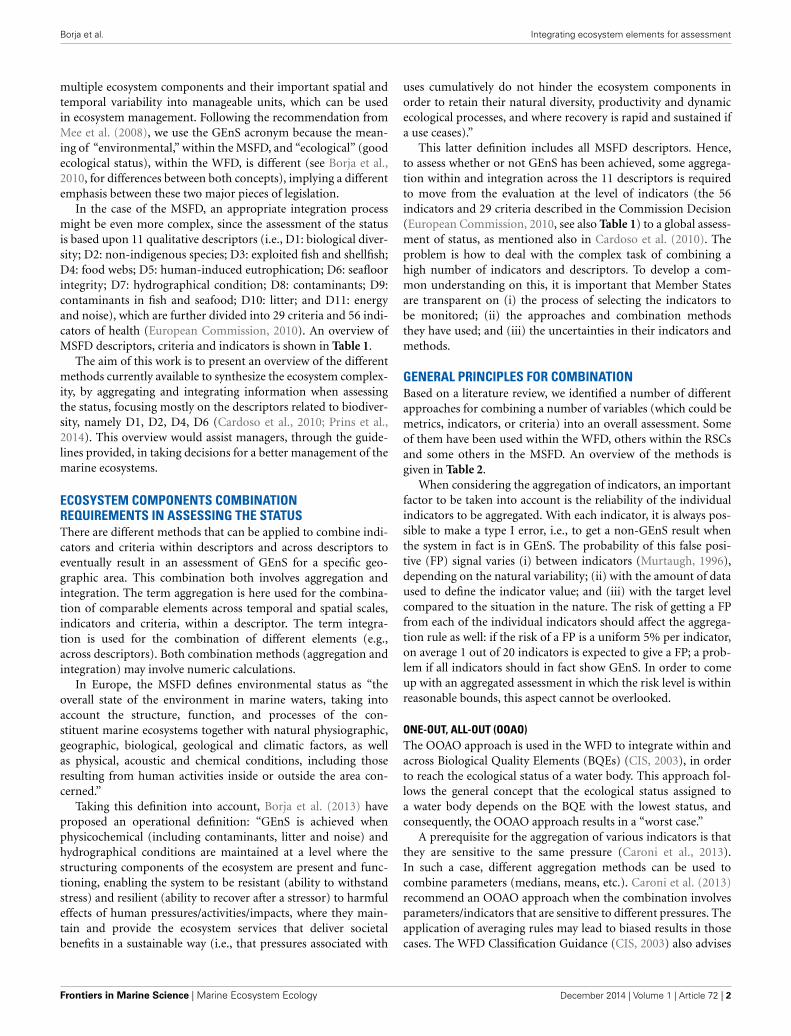
In the case of the MSFD, an appropriate integration processmight be even more complex, since the assessment of the statusis based upon 11 qualitative descriptors (i.e., D1: biological diver-sity; D2: non-indigenous species; D3: exploited fish and shellfish;D4: food webs; D5: human-induced eutrophication; D6: seafloorintegrity; D7: hydrographical condition; D8: contaminants; D9:contaminants in fish and seafood; D10: litter; and D11: energyand noise), which are further divided into 29 criteria and 56 indi-cators of health (European Commission, 2010). An overview ofMSFD descriptors, criteria and indicators is shown in Table 1.
The aim of this work is to present an overview of the differentmethods currently available to synthesize the ecosystem complex-ity, by aggregating and integrating information when assessingthe status, focusing mostly on the descriptors related to biodiver-sity, namely D1, D2, D4, D6 (Cardoso et al., 2010; Prins et al.,2014). This overview would assist managers, through the guide-lines provided, in taking decisions for a better management of themarine ecosystems.
ECOSYSTEM COMPONENTS COMBINATIONREQUIREMENTS IN ASSESSING THE STATUSThere are different methods that can be applied to combine indi-cators and criteria within descriptors and across descriptors toeventually result in an assessment of GEnS for a specific geo-graphic area. This combination both involves aggregation andintegration. The term aggregation is here used for the combina-tion of comparable elements across temporal and spatial scales,indicators and criteria, within a descriptor. The term integra-tion is used for the combination of different elements (e.g.,across descriptors). Both combination methods (aggregation andintegration) may involve numeric calculations.
In Europe, the MSFD defines environmental status as “theoverall state of the environment in marine waters, taking intoaccount the structure, function, and processes of the con-stituent marine ecosystems together with natural physiographic,geographic, biological, geological and climatic factors, as wellas physical, acoustic and chemical conditions, including thoseresulting from human activities inside or outside the area con-cerned.”
Taking this definition into account, Borja et al. (2013) haveproposed an operational definition: “GEnS is achieved whenphysicochemical (including contaminants, litter and noise) andhydrographical conditions are maintained at a level where thestructuring components of the ecosystem are present and func-tioning, enabling the system to be resistant (ability to withstandstress) and resilient (ability to recover after a stressor) to harmfuleffects of human pressures/activities/impacts, where they main-tain and provide the ecosystem services that deliver societalbenefits in a sustainable way (i.e., that pressures associated with
uses cumulatively do not hinder the ecosystem components inorder to retain their natural diversity, productivity and dynamicecological processes, and where recovery is rapid and sustained ifa use ceases).”
This latter definition includes all MSFD descriptors. Hence,to assess whether or not GEnS has been achieved, some aggrega-tion within and integration across the 11 descriptors is requiredto move from the evaluation at the level of indicators (the 56indicators and 29 criteria described in the Commission Decision(European Commission, 2010, see also Table 1) to a global assess-ment of status, as mentioned also in Cardoso et al. (2010). Theproblem is how to deal with the complex task of combining ahigh number of indicators and descriptors. To develop a com-mon understanding on this, it is important that Member Statesare transparent on (i) the process of selecting the indicators tobe monitored; (ii) the approaches and combination methodsthey have used; and (iii) the uncertainties in their indicators andmethods.
GENERAL PRINCIPLES FOR COMBINATIONBased on a literature review, we identified a number of differentapproaches for combining a number of variables (which could bemetrics, indicators, or criteria) into an overall assessment. Someof them have been used within the WFD, others within the RSCsand some others in the MSFD. An overview of the methods isgiven in Table 2.
When considering the aggregation of indicators, an importantfactor to be taken into account is the reliability of the individualindicators to be aggregated. With each indicator, it is always pos-sible to make a type I error, i.e., to get a non-GEnS result whenthe system in fact is in GEnS. The probability of this false posi-tive (FP) signal varies (i) between indicators (Murtaugh, 1996),depending on the natural variability; (ii) with the amount of dataused to define the indicator value; and (iii) with the target levelcompared to the situation in the nature. The risk of getting a FPfrom each of the individual indicators should affect the aggrega-tion rule as well: if the risk of a FP is a uniform 5% per indicator,on average 1 out of 20 indicators is expected to give a FP; a prob-lem if all indicators should in fact show GEnS. In order to comeup with an aggregated assessment in which the risk level is withinreasonable bounds, this aspect cannot be overlooked.
ONE-OUT, ALL-OUT (OOAO)The OOAO approach is used in the WFD to integrate within andacross Biological Quality Elements (BQEs) (CIS, 2003), in orderto reach the ecological status of a water body. This approach fol-lows the general concept that the ecological status assigned toa water body depends on the BQE with the lowest status, andconsequently, the OOAO approach results in a “worst case.”
A prerequisite for the aggregation of various indicators is thatthey are sensitive to the same pressure (Caroni et al., 2013).In such a case, different aggregation methods can be used tocombine parameters (medians, means, etc.). Caroni et al. (2013)recommend an OOAO approach when the combination involvesparameters/indicators that are sensitive to different pressures. Theapplication of averaging rules may lead to biased results in thosecases. The WFD Classification Guidance (CIS, 2003) also advises
Frontiers in Marine Science | Marine Ecosystem Ecology December 2014 | Volume 1 | Article 72 | 2
Borja et al. Integrating ecosystem elements for assessment
Table 1 | Descriptors, criteria and indicators selected by the European Commission (2010), for ecosystem-based assessment and managementof European seas, within the Marine Strategy Framework Directive.
Descriptors Criteria Indicators
1. Biological diversity is maintained. Thequality and occurrence of habitats and thedistribution and abundance of species arein line with prevailing physiographic,geographic and climatic conditions.
1.1. Species distribution 1.1.1. Distributional range1.1.2. Distributional pattern within the latter, whereappropriate1.1.3. Area covered by the species (for sessile/benthicspecies)
1.2. Population size 1.2.1. Population abundance and/or biomass, asappropriate
1.3. Population condition 1.3.1. Population demographic characteristics (e.g.,body size or age class structure, sex ratio, fecundityrates, survival/ mortality rates)1.3.2. Population genetic structure, where appropriate
1.4. Habitat distribution 1.4.1. Distributional range1.4.2. Distributional pattern
1.5. Habitat extent 1.5.1. Habitat area1.5.2. Habitat volume, where relevant
1.6. Habitat condition 1.6.1. Condition of the typical species and communities1.6.2. Relative abundance and/or biomass, asappropriate1.6.3. Physical, hydrological and chemical conditions
1.7. Ecosystem structure 1.7.1. Composition and relative proportions ofecosystem components (habitats and species)
2. Non-indigenous species introduced byhuman activities are at levels that do notadversely alter the ecosystems.
2.1. Abundance and statecharacterization of non-indigenousspecies, in particular invasive species
2.1.1. Trends in abundance, temporal occurrence andspatial distribution in the wild of non-indigenousspecies, particularly invasive non-indigenous species,notably in risk areas, in relation to the main vectors andpathways of spreading of such species
2.2. Environmental impact of invasivenon-indigenous species
2.2.1 Ratio between invasive non-indigenous speciesand native species in some well-studied taxonomicgroups (e.g., fish, macroalgae, molluscs) that mayprovide a measure of change in species composition(e.g., further to the displacement of native species)2.2.2. Impacts of non-indigenous invasive species atthe level of species, habitats and ecosystem, wherefeasible
3. Populations of all commerciallyexploited fish and shellfish are withinsafe biological limits, exhibiting apopulation age and size distribution that isindicative of a healthy stock.
3.1. Level of pressure of the fishingactivity
3.1.1. Fishing mortality (F)3.1.2. Ratio between catch and biomass index(hereinafter “catch/biomass ratio”) (if analyticalassessments yielding values for F are not available)
3.2. Reproductive capacity of thestock
3.2.1. Spawning Stock Biomass (SSB)3.2.2. Biomass indices (if analytical assessmentsyielding values for SSB are not available)
3.3. Population age and sizedistribution
3.3.1. Proportion of fish larger than the mean size offirst sexual maturation3.3.2. Mean maximum length across all species foundin research vessel surveys3.3.3. 95 % percentile of the fish length distributionobserved in research vessel surveys3.3.4. Size at first sexual maturation, which may reflectthe extent of undesirable genetic effects of exploitation(secondary indicator)
(Continued)
www.frontiersin.org December 2014 | Volume 1 | Article 72 | 3
Borja et al. Integrating ecosystem elements for assessment
Table 1 | Continued
Descriptors Criteria Indicators
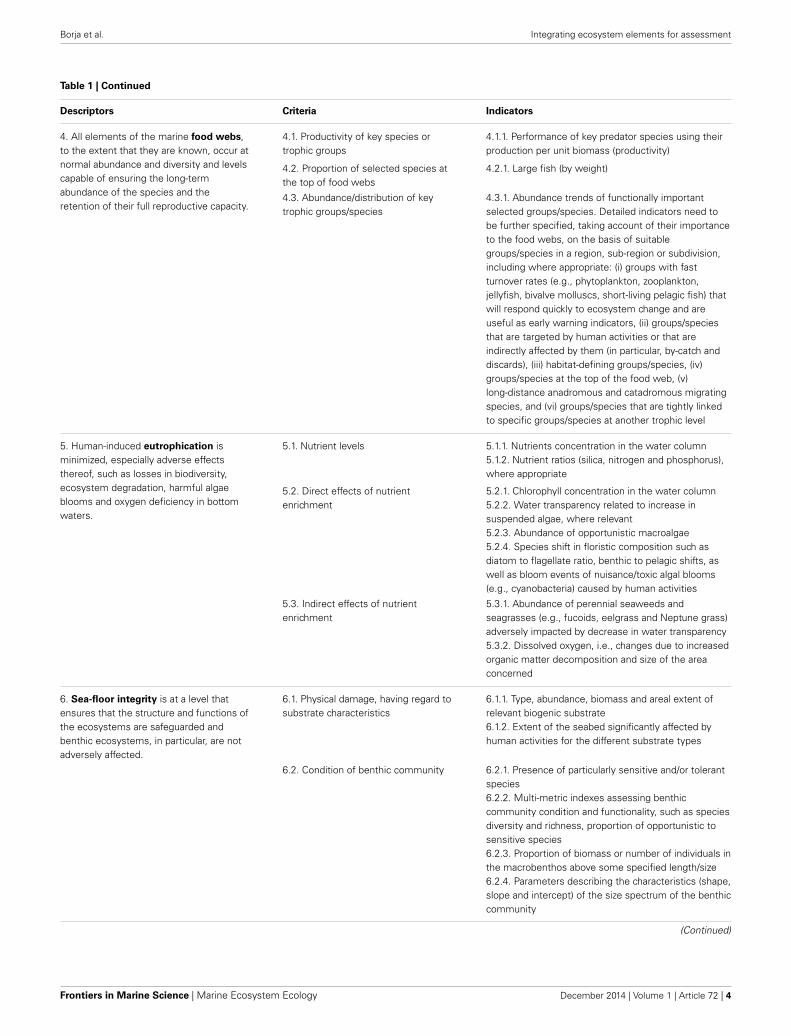
4. All elements of the marine food webs,to the extent that they are known, occur atnormal abundance and diversity and levelscapable of ensuring the long-termabundance of the species and theretention of their full reproductive capacity.
4.1. Productivity of key species ortrophic groups
4.1.1. Performance of key predator species using theirproduction per unit biomass (productivity)
4.2. Proportion of selected species atthe top of food webs
4.2.1. Large fish (by weight)
4.3. Abundance/distribution of keytrophic groups/species
4.3.1. Abundance trends of functionally importantselected groups/species. Detailed indicators need tobe further specified, taking account of their importanceto the food webs, on the basis of suitablegroups/species in a region, sub-region or subdivision,including where appropriate: (i) groups with fastturnover rates (e.g., phytoplankton, zooplankton,jellyfish, bivalve molluscs, short-living pelagic fish) thatwill respond quickly to ecosystem change and areuseful as early warning indicators, (ii) groups/speciesthat are targeted by human activities or that areindirectly affected by them (in particular, by-catch anddiscards), (iii) habitat-defining groups/species, (iv)groups/species at the top of the food web, (v)long-distance anadromous and catadromous migratingspecies, and (vi) groups/species that are tightly linkedto specific groups/species at another trophic level
5. Human-induced eutrophication isminimized, especially adverse effectsthereof, such as losses in biodiversity,ecosystem degradation, harmful algaeblooms and oxygen deficiency in bottomwaters.
5.1. Nutrient levels 5.1.1. Nutrients concentration in the water column5.1.2. Nutrient ratios (silica, nitrogen and phosphorus),where appropriate
5.2. Direct effects of nutrientenrichment
5.2.1. Chlorophyll concentration in the water column5.2.2. Water transparency related to increase insuspended algae, where relevant5.2.3. Abundance of opportunistic macroalgae5.2.4. Species shift in floristic composition such asdiatom to flagellate ratio, benthic to pelagic shifts, aswell as bloom events of nuisance/toxic algal blooms(e.g., cyanobacteria) caused by human activities
5.3. Indirect effects of nutrientenrichment
5.3.1. Abundance of perennial seaweeds andseagrasses (e.g., fucoids, eelgrass and Neptune grass)adversely impacted by decrease in water transparency5.3.2. Dissolved oxygen, i.e., changes due to increasedorganic matter decomposition and size of the areaconcerned
6. Sea-floor integrity is at a level thatensures that the structure and functions ofthe ecosystems are safeguarded andbenthic ecosystems, in particular, are notadversely affected.
6.1. Physical damage, having regard tosubstrate characteristics
6.1.1. Type, abundance, biomass and areal extent ofrelevant biogenic substrate6.1.2. Extent of the seabed significantly affected byhuman activities for the different substrate types
6.2. Condition of benthic community 6.2.1. Presence of particularly sensitive and/or tolerantspecies6.2.2. Multi-metric indexes assessing benthiccommunity condition and functionality, such as speciesdiversity and richness, proportion of opportunistic tosensitive species6.2.3. Proportion of biomass or number of individuals inthe macrobenthos above some specified length/size6.2.4. Parameters describing the characteristics (shape,slope and intercept) of the size spectrum of the benthiccommunity
(Continued)
Frontiers in Marine Science | Marine Ecosystem Ecology December 2014 | Volume 1 | Article 72 | 4
Borja et al. Integrating ecosystem elements for assessment
Table 1 | Continued
Descriptors Criteria Indicators
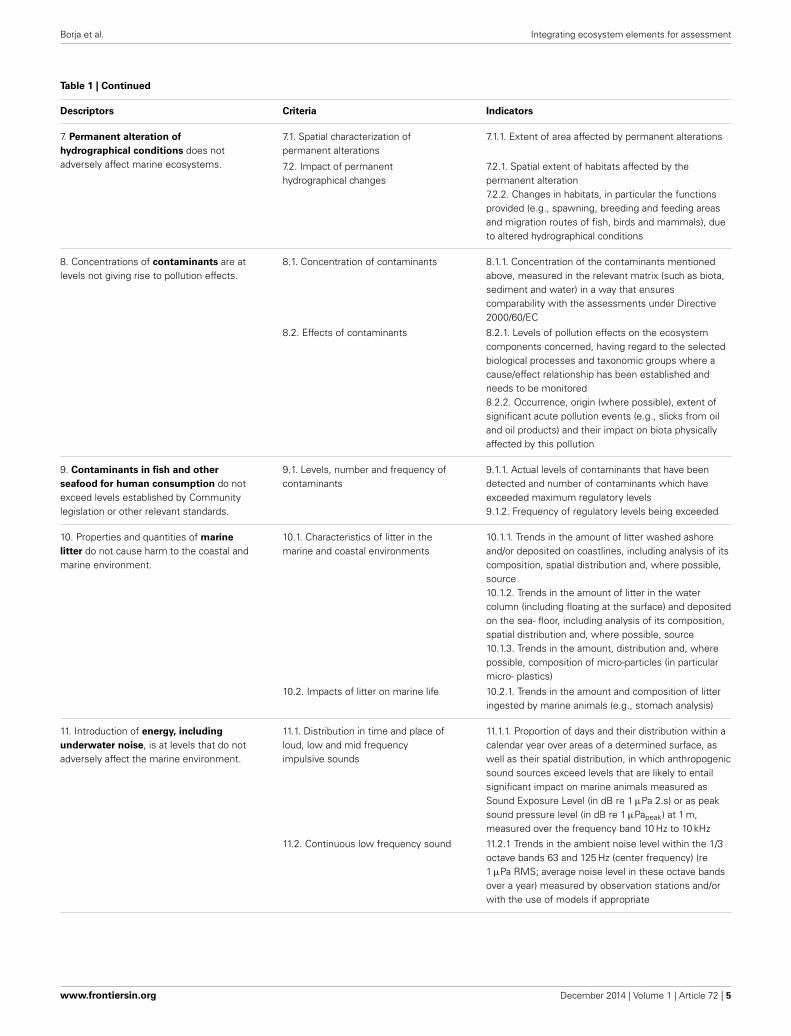
7. Permanent alteration ofhydrographical conditions does notadversely affect marine ecosystems.
7.1. Spatial characterization ofpermanent alterations
7.1.1. Extent of area affected by permanent alterations
7.2. Impact of permanenthydrographical changes
7.2.1. Spatial extent of habitats affected by thepermanent alteration7.2.2. Changes in habitats, in particular the functionsprovided (e.g., spawning, breeding and feeding areasand migration routes of fish, birds and mammals), dueto altered hydrographical conditions
8. Concentrations of contaminants are atlevels not giving rise to pollution effects.
8.1. Concentration of contaminants 8.1.1. Concentration of the contaminants mentionedabove, measured in the relevant matrix (such as biota,sediment and water) in a way that ensurescomparability with the assessments under Directive2000/60/EC
8.2. Effects of contaminants 8.2.1. Levels of pollution effects on the ecosystemcomponents concerned, having regard to the selectedbiological processes and taxonomic groups where acause/effect relationship has been established andneeds to be monitored8.2.2. Occurrence, origin (where possible), extent ofsignificant acute pollution events (e.g., slicks from oiland oil products) and their impact on biota physicallyaffected by this pollution
9. Contaminants in fish and otherseafood for human consumption do notexceed levels established by Communitylegislation or other relevant standards.
9.1. Levels, number and frequency ofcontaminants
9.1.1. Actual levels of contaminants that have beendetected and number of contaminants which haveexceeded maximum regulatory levels9.1.2. Frequency of regulatory levels being exceeded
10. Properties and quantities of marinelitter do not cause harm to the coastal andmarine environment.
10.1. Characteristics of litter in themarine and coastal environments
10.1.1. Trends in the amount of litter washed ashoreand/or deposited on coastlines, including analysis of itscomposition, spatial distribution and, where possible,source10.1.2. Trends in the amount of litter in the watercolumn (including floating at the surface) and depositedon the sea- floor, including analysis of its composition,spatial distribution and, where possible, source10.1.3. Trends in the amount, distribution and, wherepossible, composition of micro-particles (in particularmicro- plastics)
10.2. Impacts of litter on marine life 10.2.1. Trends in the amount and composition of litteringested by marine animals (e.g., stomach analysis)
11. Introduction of energy, includingunderwater noise, is at levels that do notadversely affect the marine environment.
11.1. Distribution in time and place ofloud, low and mid frequencyimpulsive sounds
11.1.1. Proportion of days and their distribution within acalendar year over areas of a determined surface, aswell as their spatial distribution, in which anthropogenicsound sources exceed levels that are likely to entailsignificant impact on marine animals measured asSound Exposure Level (in dB re 1 µPa 2.s) or as peaksound pressure level (in dB re 1 µPapeak) at 1 m,measured over the frequency band 10 Hz to 10 kHz
11.2. Continuous low frequency sound 11.2.1 Trends in the ambient noise level within the 1/3octave bands 63 and 125 Hz (center frequency) (re1 µPa RMS; average noise level in these octave bandsover a year) measured by observation stations and/orwith the use of models if appropriate
www.frontiersin.org December 2014 | Volume 1 | Article 72 | 5
Borja et al. Integrating ecosystem elements for assessment
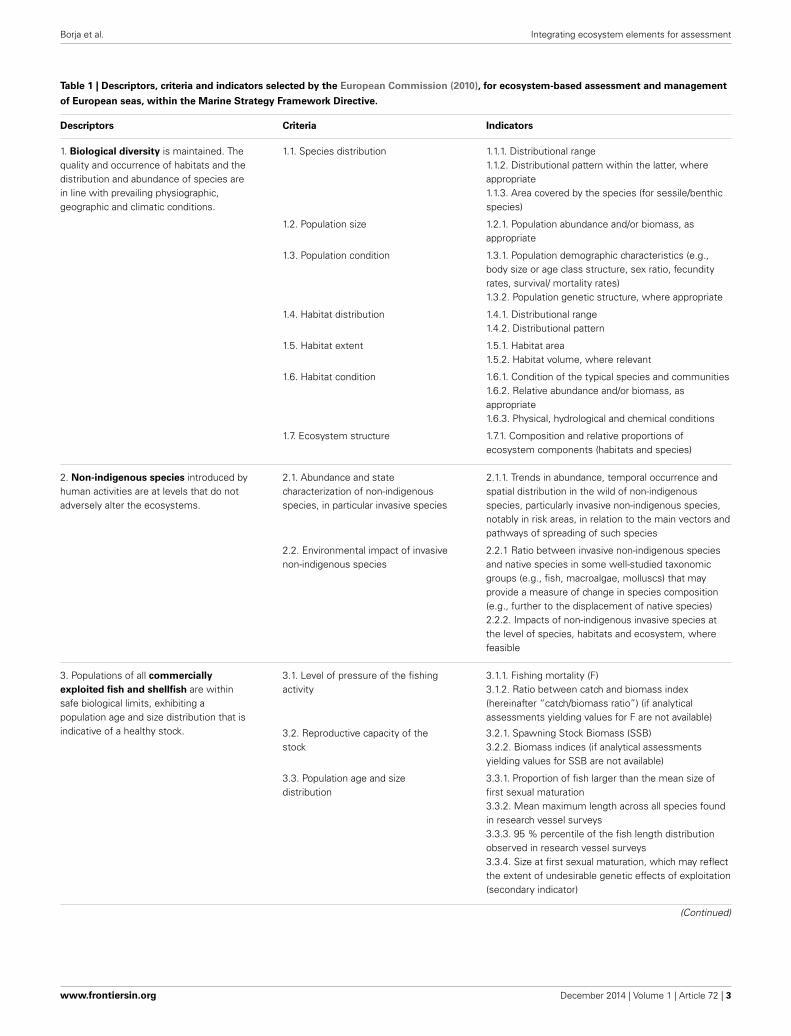
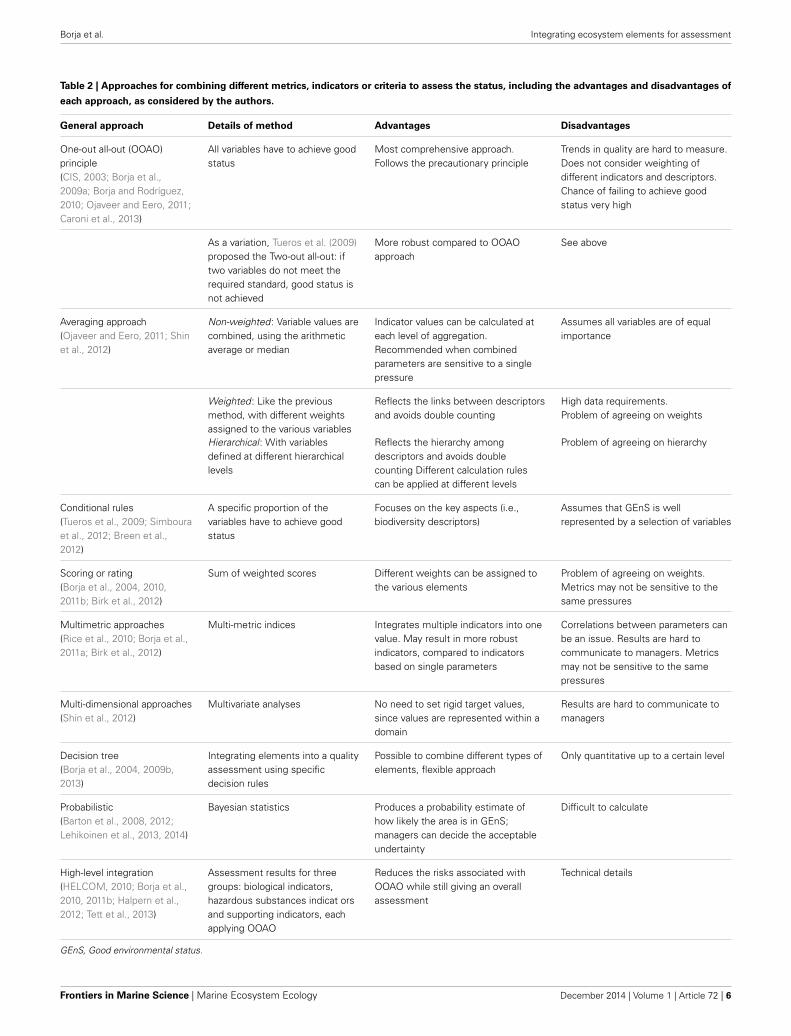
Table 2 | Approaches for combining different metrics, indicators or criteria to assess the status, including the advantages and disadvantages ofeach approach, as considered by the authors.
General approach Details of method Advantages Disadvantages
One-out all-out (OOAO)principle(CIS, 2003; Borja et al.,2009a; Borja and Rodríguez,2010; Ojaveer and Eero, 2011;Caroni et al., 2013)
All variables have to achieve goodstatus
Most comprehensive approach.Follows the precautionary principle
Trends in quality are hard to measure.Does not consider weighting ofdifferent indicators and descriptors.Chance of failing to achieve goodstatus very high
As a variation, Tueros et al. (2009)proposed the Two-out all-out: iftwo variables do not meet therequired standard, good status isnot achieved
More robust compared to OOAOapproach
See above
Averaging approach(Ojaveer and Eero, 2011; Shinet al., 2012)
Non-weighted: Variable values arecombined, using the arithmeticaverage or median
Indicator values can be calculated ateach level of aggregation.Recommended when combinedparameters are sensitive to a singlepressure
Assumes all variables are of equalimportance
Weighted: Like the previousmethod, with different weightsassigned to the various variables
Reflects the links between descriptorsand avoids double counting
High data requirements.Problem of agreeing on weights
Hierarchical: With variablesdefined at different hierarchicallevels
Reflects the hierarchy amongdescriptors and avoids doublecounting Different calculation rulescan be applied at different levels
Problem of agreeing on hierarchy
Conditional rules(Tueros et al., 2009; Simbouraet al., 2012; Breen et al.,2012)
A specific proportion of thevariables have to achieve goodstatus
Focuses on the key aspects (i.e.,biodiversity descriptors)
Assumes that GEnS is wellrepresented by a selection of variables
Scoring or rating(Borja et al., 2004, 2010,2011b; Birk et al., 2012)
Sum of weighted scores Different weights can be assigned tothe various elements
Problem of agreeing on weights.Metrics may not be sensitive to thesame pressures
Multimetric approaches(Rice et al., 2010; Borja et al.,2011a; Birk et al., 2012)
Multi-metric indices Integrates multiple indicators into onevalue. May result in more robustindicators, compared to indicatorsbased on single parameters
Correlations between parameters canbe an issue. Results are hard tocommunicate to managers. Metricsmay not be sensitive to the samepressures
Multi-dimensional approaches(Shin et al., 2012)
Multivariate analyses No need to set rigid target values,since values are represented within adomain
Results are hard to communicate tomanagers
Decision tree(Borja et al., 2004, 2009b,2013)
Integrating elements into a qualityassessment using specificdecision rules
Possible to combine different types ofelements, flexible approach
Only quantitative up to a certain level
Probabilistic(Barton et al., 2008, 2012;Lehikoinen et al., 2013, 2014)
Bayesian statistics Produces a probability estimate ofhow likely the area is in GEnS;managers can decide the acceptableundertainty
Difficult to calculate
High-level integration(HELCOM, 2010; Borja et al.,2010, 2011b; Halpern et al.,2012; Tett et al., 2013)
Assessment results for threegroups: biological indicators,hazardous substances indicat orsand supporting indicators, eachapplying OOAO
Reduces the risks associated withOOAO while still giving an overallassessment
Technical details
GEnS, Good environmental status.
Frontiers in Marine Science | Marine Ecosystem Ecology December 2014 | Volume 1 | Article 72 | 6
Borja et al. Integrating ecosystem elements for assessment
to use OOAO when combining parameters/indicators that aresensitive to different pressures.
Borja et al. (2009a) discussed the challenge of assessingecological integrity in marine waters, and suggest that simpleapproaches, such as the “OOAO” principle of the WFD, may be auseful starting point, but eventually should be avoided. The eco-logical integrity of an aquatic system should be evaluated usingall information available, including as many biological ecosystemelements as is reasonable, and using an ecosystem-based assess-ment approach. The OOAO rule can be considered a rigorousapproach to the precautionary rule, in an ideal world where thestatus based on each BQE can be measured without error. Itresults in very conservative assessments (Ojaveer and Eero, 2011).In practice, the inevitable uncertainty associated with monitor-ing and assessment for each metric and BQE leads to problems ofprobable underestimation of the true overall status. The OOAOprinciple has therefore been criticized as it increases the probabil-ity of committing a false positive error, leading to an erroneousdowngrading of the status of a water body as it has been observedespecially within the WFD (Borja and Rodríguez, 2010; Ojaveerand Eero, 2011; Borja et al., 2013; Caroni et al., 2013). In the caseof the MSFD, with such large number of descriptors, criteria andindicators, the probability of not achieving good status becomesvery high and, probably, unmanageable in practical terms (Borjaet al., 2013).
Alternative methods for integrating multiple BQEs in the WFDare currently being considered (Caroni et al., 2013).
AVERAGING APPROACHThe averaging approach is the most commonly used method toaggregate indicators (Shin et al., 2012) and consists of simple cal-culations, using methods such as arithmetic average, hierarchicalaverage, weighted average, median, sum, product or combina-tions of those rules, to come up with an overall assessmentvalue.
Ojaveer and Eero (2011) showed that in cases where a largenumber of indicators is available, the choice of e.g., either medi-ans or averages in aggregating indicators did not substantiallyinfluence the assessment results. However, this might not nec-essarily be the case when only a few indicators are available. Insuch a situation, the result will depend to a larger degree on thedistribution of the values involved. A skewed distribution reflect-ing some major factors and a few ones with very different valueswill result in very different assessment results for the mediancompared to assessments based on means. Apart from the math-ematical applicability of either method based on the underlyingdata (e.g., homoscedasticity), the choice of the actual averagingmethod may be driven by policy decisions focusing on either cen-tral trends without much attention to extreme values (median) orfocusing on weighting the individual values by their magnitude(arithmetic mean).
The way the indicators are hierarchically arranged influencesthe assessment results as well, but Ojaveer and Eero (2011) foundthat these effects were considerably less important than the effectsof applying different aggregation rules.
Differential weighting applied to the various indicators can beused when calculating means or medians. An adequate basis for
assigning weights is not always available and in such cases an equalweight is recommended by Ojaveer and Eero (2011). Assigningweights often involves expert judgment, and Aubry and Elliott(2006) point out that in some cases, expert opinions on weightscan show important divergence.
CONDITIONAL RULESConditional rules (a specific proportion of the variables have toachieve good status) are an approach where indicators can becombined in different ways for an overall assessment, depend-ing on certain criteria. This provides an opportunity to use expertjudgment when combining indicators, in a transparent way. Anexample of this approach is the application of a conditional ruleof at least two out of three indicators (one biotic index and twostructural or diversity indices) should pass the threshold in orderto achieve GEnS for benthic community condition under D6in Hellenic waters (Simboura et al., 2012). Tueros et al. (2009)present another example of the conditional rule in which whenintegrating water and sediment variables into an overall assess-ment of the chemical status and only one sediment or watervariable does not meet the objective, while the rest of the vari-ables meet, the final chemical status achieves the objective. Thiswork was also mentioned under the “two out, all out” approachconsidering the case when two variables do not meet the objectiveand the final status fails.
Breen et al. (2012) used several risk criteria rules and worst-case or integrated approaches when combining evidence before afinal assessment. Following Cardoso et al. (2010) the integratedapproach was applied to Biodiversity, Non-indigenous species,Eutrophication and Seafloor Integrity descriptors, while all otherdescriptors used a worst case approach following the OOAOprinciple whereby if one set of evidence suggested that the riskwas “high” then “high” was automatically assessed for the entiredescriptor.
SCORING OR RATINGIn this method different scores are assigned to a status level (forexample, ranging from 1 to 5), for a number of different elements.The scores are summed up to derive a total score which is thenrated according to the number of elements taken into account.Different weights can be assigned to the various elements. Thismethod was proposed by Borja et al. (2004) to calculate an inte-grative index of quality and is the basis of many multimetricindices used within the WFD and the MSFD combining differ-ent parameters or metrics using the weighted scoring or ratingrule into one integrative multimetric index (Birk et al., 2012).It must be recognized here that this approach implies the scorevalues being on a cardinal scale and acting as weighting factors.Otherwise, using an ordinal scale for the scores, summing up theindividual elements is mathematically not defined.
Another example is the method developed by Borja et al.(2010, 2011b) for a cross-descriptor integration, combining the11 descriptors of MSFD based on the WFD, HELCOM (2009a,b,2010) and OSPAR (2010, 2012) experiences. An EcologicalQuality Ratio (EQR) was calculated for each indicator of the var-ious MSFD descriptors, with the EQR for the whole descriptorbeing the average value of the EQR of the indicators. Then, by
www.frontiersin.org December 2014 | Volume 1 | Article 72 | 7
Borja et al. Integrating ecosystem elements for assessment
multiplying the EQR with the percent weight assigned to eachdescriptor (and summing up to 100), an overall environmentalstatus value was derived.
MULTIMETRIC INDICES TO COMBINE INDICATORSWithin the WFD there are many examples of multimetric indicesdeveloped for different biological elements, driven by the need tofulfill the detailed requirements of the WFD (see Birk et al., 2012for a complete synthesis).
In addition, within the MSFD, the European Commissionestablished a number of Task Groups consisting of technicalexperts to help inform the discussions on how to reach a com-mon understanding of the 11 descriptors. Hence, Task Group 6report on seafloor integrity (Rice et al., 2010) recommends theuse of multimetric indices or multivariate techniques for integrat-ing indicators of species composition attributes of this descriptor,such as diversity, distinctness, complementarity/(dis)similarity,or species-area relationships.
There are various other examples of multi-metric indicesused to assess the status of the macrobenthos (see Borja et al.,2011a for an overview). Multimetric methods to combine mul-tiple parameters in one assessment may result in more robustindicators, compared to indicators based on single parame-ters. However, scaling of a multimetric index may be lessstraightforward, and ideally the various parameters should notbe inter-correlated (e.g., the discussion on the TRIX index inPrimpas and Karydis, 2011).
MULTIDIMENSIONAL APPROACHESMultivariate methods, such as Discriminant Analysis or FactorAnalysis combine parameters in a multi-dimensional space. Forassessment purposes, areas need to be classified into groups ofGEnS and non-GEnS.
Multivariate methods have the advantage of being more robustand less sensitive to correlation between indicators. However,interpretation is less intuitive than other methods, as informa-tion on individual indicators in each ecosystem is lost (Shin et al.,2012) and links to management options are less obvious.
DECISION TREEDecision trees provide the opportunity to apply different, specific,rules to combine individual assessments into an overall assess-ment. A decision tree allows implementing individual rules ateach of its nodes and thus incorporates arbitrary decisions at eachstep within the decision tree. The decision rules can be quanti-tative or qualitative as well as based on expert judgment. Thisgives room for a high degree of flexibility in reaching the finalassessment and can thus be used where the other principles failto represent the intricate interactions, feedback loops and depen-dencies involved in ecosystem functioning between the ecosystemcomponents.
A simple version of a decision tree involves only having afew conditional rules where a specific proportion or certainindividually specified indicators have to achieve good status inorder to achieve GEnS. Borja et al. (2013) implicitly proposeusing this kind of decision tree when they take the view that forbiodiversity (D1) to be in good status, all other descriptors must
be in good status and if one of the pressure descriptors fails, thenD1 also fails.
Borja et al. (2004, 2009b) describe a methodology that inte-grates several biological elements (phytoplankton, benthos, algae,phanerogams, and fishes), together with physicochemical ele-ments (including pollutants) into a quality assessment. The pro-posed methodologies accommodate both WFD and the MSFD.They suggest that the decision tree should give more weight toindividual elements taking into account the spatial and tem-poral variability and the availability of accurate methodologiesfor some of them (i.e., benthos) and to individual assessmentmethods which have been used broadly by authors other thanthe proposers of the method, tested for several different humanpressures, and/or intercalibrated with other methods.
PROBABILISTIC APPROACHEach of the indicator results are uncertain, due to several fac-tors e.g., natural variation in the sampling sites, random variationin the samples, insufficient scientific understanding about whatshould be the reference value for good status, etc. Some indica-tors are bound to include more uncertainty that others, due todifferences in the amount of data used, the extent of scientificunderstanding regarding the issue, and the amplitude of naturalvariation. If these uncertainties can be approximated, this givesrise to the possibility of taking this information into accountwhen integrating the indicators. The more uncertain indicatorswill get less weight in the integrated assessment, while the morecertain ones will be more reliable and hence get more weight. Thecalculus of the integrated assessment can be based on Bayesianstatistics, giving transparent and coherent rules by which the finalscore is calculated.
This approach can be combined to one or several of the above-mentioned approaches: for example, conditional rules can beset in addition to the probabilistic integration rule to includeexpert judgment; and the principles outlined in the decision treeapproach can be applied as well.
Barton et al. (2012) demonstrate how to use the probabilisticapproach in the DPSIR framework in the case of eutrophica-tion management. There are several other examples in the recentliterature about how to evaluate various management measuresunder uncertainty to optimize one target, such as eutrophication(Barton et al., 2008; Lehikoinen et al., 2014) and oil spill sever-ity (Lehikoinen et al., 2013). This approach could be expanded toinclude several descriptors or indicators.
Probabilistic combination of uncertain indicators would natu-rally lead to a probability estimate of how likely it is that a marinearea is in GEnS; we would, for example, end up with an estimatethat the sea area is in GEnS with 70% probability. The managerswould then have to decide how much uncertainty they are willingto tolerate; i.e., are they happy if the probability of GEnS is above50%, or whether they want a higher certainty?
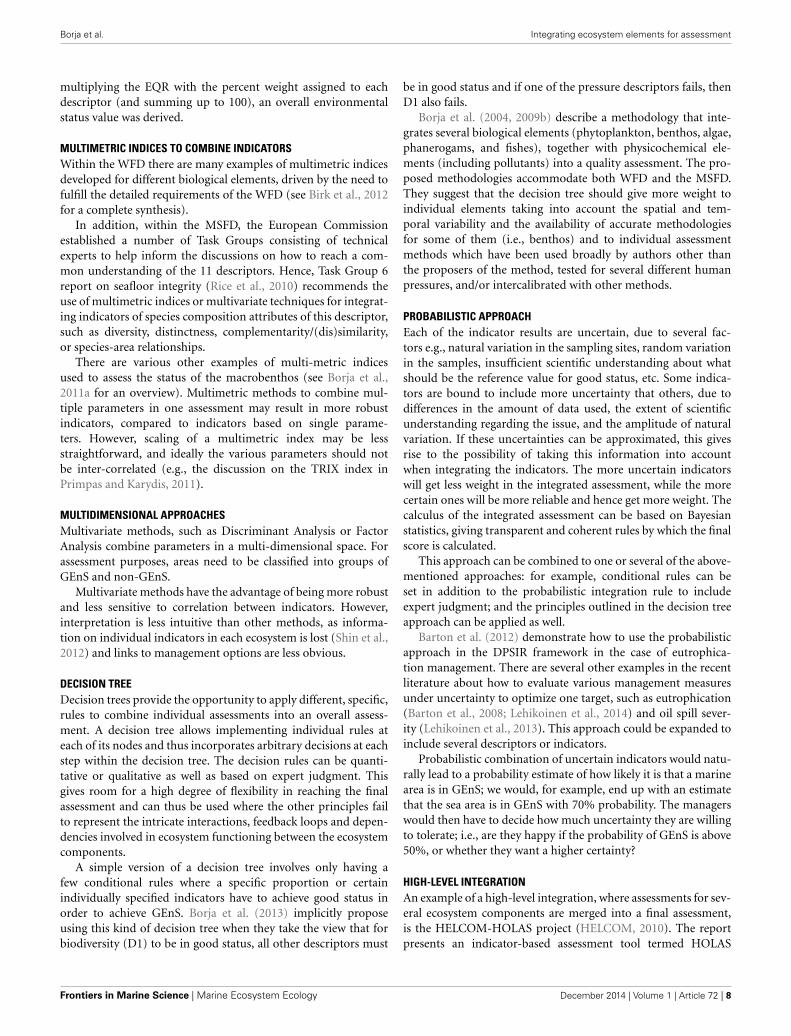
HIGH-LEVEL INTEGRATIONAn example of a high-level integration, where assessments for sev-eral ecosystem components are merged into a final assessment,is the HELCOM-HOLAS project (HELCOM, 2010). The reportpresents an indicator-based assessment tool termed HOLAS
Frontiers in Marine Science | Marine Ecosystem Ecology December 2014 | Volume 1 | Article 72 | 8
Borja et al. Integrating ecosystem elements for assessment
(“Holistic Assessment of Ecosystem Health Status”). The indica-tors used in the thematic assessments for eutrophication (HEAT),hazardous substances (CHASE) and biodiversity (BEAT) wereintegrated into a Holistic Assessment of “ecosystem health.” TheHOLAS tool presented assessment results for three groups: bio-logical indicators, hazardous substances indicators and support-ing indicators, and then applied the OOAO principle on theassessment results of those three groups for the final assessment(Figure 1).
This approach, which includes the selection of an agreedreduced set of indicators and agreed weighting rules, could beconsidered a pragmatic compromise, reducing the risks associatedwith OOAO while still giving an overall assessment.
An example of such a high level aggregation is the integra-tive method of Borja et al. (2010, 2011b), which includes aweighted scoring or rating method proposed for the MSFD in the
southern Bay of Biscay. After aggregating the indicators withineach descriptor, each descriptor was weighted according to thehuman pressure supported by the area. Then the value of eachdescriptor (i.e., an EQR) was multiplied by the weighting andadded to obtain a final value between 0 and 1, being 0 the worstenvironmental status and 1 the best. This high-level integrationwas done at spatial and temporal scale. Although these authorscombine values across descriptors, leading to a single value ofenvironmental status, it could also be reported as “x out of 11descriptors” having reached GEnS. In both cases, this allows totake management measures on those human activities impactingmore in some of the descriptors or indicators not achieving goodstatus, as shown in Borja et al. (2011b).
Halpern et al. (2012) developed another method, based moreupon human activities and pressures, which presents a high-levelintegration at country level, using internationally available
FIGURE 1 | (A) Example of an integrated assessment of ecosystem health in the Baltic Sea 2003–2007 based on the HOLAS tool. (B) Screenshot to illustratehow the HOLAS classification tool for the Gulf of Finland works. See HELCOM (2010) for details. Courtesy by Helsinki Commission.
www.frontiersin.org December 2014 | Volume 1 | Article 72 | 9
Borja et al. Integrating ecosystem elements for assessment
datasets (Ocean Health Index http://www.oceanhealthindex.org).Similarly, Micheli et al. (2013) looked at cumulative impacts tothe marine ecosystems of the Mediterranean and the Black Seaas a whole, while producing impact scores and maps for sevenecoregions and the territorial waters of EU Member states.
A Baltic Sea Health Index (BSHI) will be developed based on:(i) the existing HELCOM toolbox (HEAT, BEAT, CHASE andHOLAS), the MSFD (European Commission, 2008, 2010), and(ii) the Ocean Health Index (Halpern et al., 2012).
Finally, there is a recent high-level integration example inTett et al. (2013), for the North Sea, which includes five stepsin the calculation: (i) identify (spatial extent) of ecosystem; (ii)identify spatial granularity and extent of repetitive temporal vari-ability, and decide how to average or integrate over these; (iii)select state variables; (iv) plot trajectory in state space and cal-culate Euclidian (scalar) distance from (arbitrary) reference con-dition; and (v) calculate medium-term variability about trendin state space, and use this variability as proxy for (inverse)resilience.
CONSIDERATIONS AND RECOMMENDATIONS WHEN USINGSPECIFIC RULESAs shown in the previous section, the considerations to be used incombining values and assessing the environmental status are noteasily defined. From the lessons learned above, some guidance canbe offered:
(1) OOAO is appropriate when:
• Legal criteria are involved, (e.g., contaminants exceedinglegal quality standards, species or habitats failing favor-able conservation status under Birds or Habitat Directives,commercial fish stocks failing Maximum Sustainable Yieldtargets under Common Fisheries Policy).
• Different pressures are addressed (but in that case othermethods can be also used).
• There is an impact or risk on a future impact.• The precautionary principle is applied (e.g., in the case
when little information from only a few indicators isavailable).
(2) OOAO cannot be used:
• In cases where indicators show a high level of uncertainty,when various indicators are sensitive to the same pressure,etc. In practice, the uncertainty associated with monitor-ing and assessment for each indicator/descriptor leads toproblems of probable underestimation of the true overallclass. Hence, if the error associated to the method used toassess the status of each indicator/descriptor is too high theOOAO approach is not advisable.
• Note: Often, not all indicators are in the same state ofdevelopment, or are scientifically sound and fully tested.In some cases P-S-I (Pressure-State-Impact) relations areuncertain. Also, sometimes multiple indicators are usedto describe state. While not all of those indicators maybe equally important or even comparable, this is done toinclude indicators that are used as supportive indicators,
where P-S-I relations are uncertain. In those cases anaggregation rule such as OOAO should not be applied.
(3) A “two out, all out” approach can be considered in caseswhere several methods are combined in one assessment; e.g.,when several matrices are used in pollutants to give a broaderview of the status (e.g., pollutants in water for an instant pic-ture, pollutants in sediments or biota for a time-integratedresult, Tueros et al., 2009).
(4) Averaging is appropriate when combined variables or indi-cators are of equal importance or sensitive to the samepressure.
(5) Scoring or decision tree approaches are appropriate when:
• The methods to assess the status of the different indica-tors/descriptors are in different levels of development. Inthis case, consider giving more weight to those indica-tor/assessment methods which have been: (i) used broadlyby authors other than the proposers of the method; (ii)tested for several different human pressures; and/or (iii)intercalibrated with other methods.
• It is important to be able to track the different stepsinvolved in the assessment, making the path to the finalassessment result transparent.
• Note: Consider different weights for individual indica-tors/descriptors taking into account the relationship withthe pressures within the assessment (sub)region. E.g., ifthe area is under high fishing pressure the most affecteddescriptors will be D1, D3, D4, D6 and D11; in turn, D2,D5, D7, D8, D9 and D10 will be less affected.
(6) Probabilistic approach:
• Consider carefully the uncertainties related to all of thevarious parts of the problem; be sure not to overesti-mate the well-known uncertainties (e.g., natural varianceand sampling bias) and underestimate the poorly knownuncertainties (e.g., insufficient knowledge or competinghypotheses about ecological interactions; combined effectsof various pressures that may be strengthen or weaken eachother, etc.).
• Consider using expert knowledge in evaluating the variousuncertainties.
• If using expert judgment to weigh the different indicatorsin addition to the uncertainty estimate, make sure that theweighing is based on the relative importance of the indica-tors, not on the perceived uncertainty; otherwise you willend up double counting the effect of uncertainty in thefinal evaluation.
(7) Multimetric and multivariate methods are appropriate when:
• Integrating several indicators of species composition orseveral indicators of eutrophication or seafloor integrity(e.g., in D1, D5, D6).
• It is advisable to verify that stakeholders and managers canunderstand the interpretation of the results, and resultsmust be presented in a clear way.
(8) For any of the described methods take into account that:
Frontiers in Marine Science | Marine Ecosystem Ecology December 2014 | Volume 1 | Article 72 | 10
Borja et al. Integrating ecosystem elements for assessment
• Using as many ecosystem components/indicators/criteriaas reasonable and available will make the analysis morerobust.
• Integrate across state descriptors (D1, D3, D4, D6) differ-ently than across pressure descriptors (D2, D5, D7, D8, D9,D10, D11), giving higher weight to state-based descriptors.
APPLICATION OF COMBINATION RULES IN ASSESSMENTSAs shown above, the WFD focuses on the structure of the ecosys-tem using a limited number of biodiversity components (theBQEs), that are combined through the precautionary OOAOapproach (Borja et al., 2010). In contrast, the MSFD can be con-sidered to follow a “holistic functional approach,” as it takes intoaccount not only structure (biodiversity components, habitats),but also function (e.g., food webs, seafloor integrity) and pro-cesses (e.g., biogeochemical cycles) of the marine ecosystems. TheMSFD also uses descriptors that not only relate to biological andphysicochemical state indicators but also to pressure indicators(Borja et al., 2010, 2013). The MSFD requires the determinationof GEnS on the basis of the qualitative descriptors in Annex I,but does not specifically require one single GEnS assessment, incontrast to the WFD.
There are many methodological challenges and uncertaintiesinvolved in establishing a holistic ecosystem assessment, when itis based on the large number of descriptors, associated criteriaand indicators defined under the MSFD. The choice of indicatoraggregation rules is essential, as the final outcome of the assess-ment may be very sensitive to those indicator aggregation rules(Ojaveer and Eero, 2011; Borja et al., 2013; Caroni et al., 2013).As shown in the previous section, different methodologies can beapplied for aggregating indicators, which vary, amongst others, inthe way the outliers influence the aggregate value.
When aggregating indicators most researchers agree that mul-tiple accounting should be avoided. For example, phytoplanktonindicators under D1 should be indicative of biodiversity state
while under D5 it should be an estimator of the level of eutroph-ication. Similarly, macroinvertebrates under D1 should representbiodiversity state and under D6 also the state change from pres-sures on the seafloor. In these cases, although the datasets usedcould be the same, the main characteristics of the indicators to beused within each descriptor should be different, e.g., the value ofmacroinvertebrates indicators under D1 (rarity of species, endan-gered species, engineer species presence, etc.) and the conditionof benthic community under D6 (ratio of opportunistic/sensitive,multimetric methods to assess the status, etc.). Of course, foraggregating indicators within the same criterion it is impor-tant that all indicators have the same level of maturity and thatsufficient data are available.
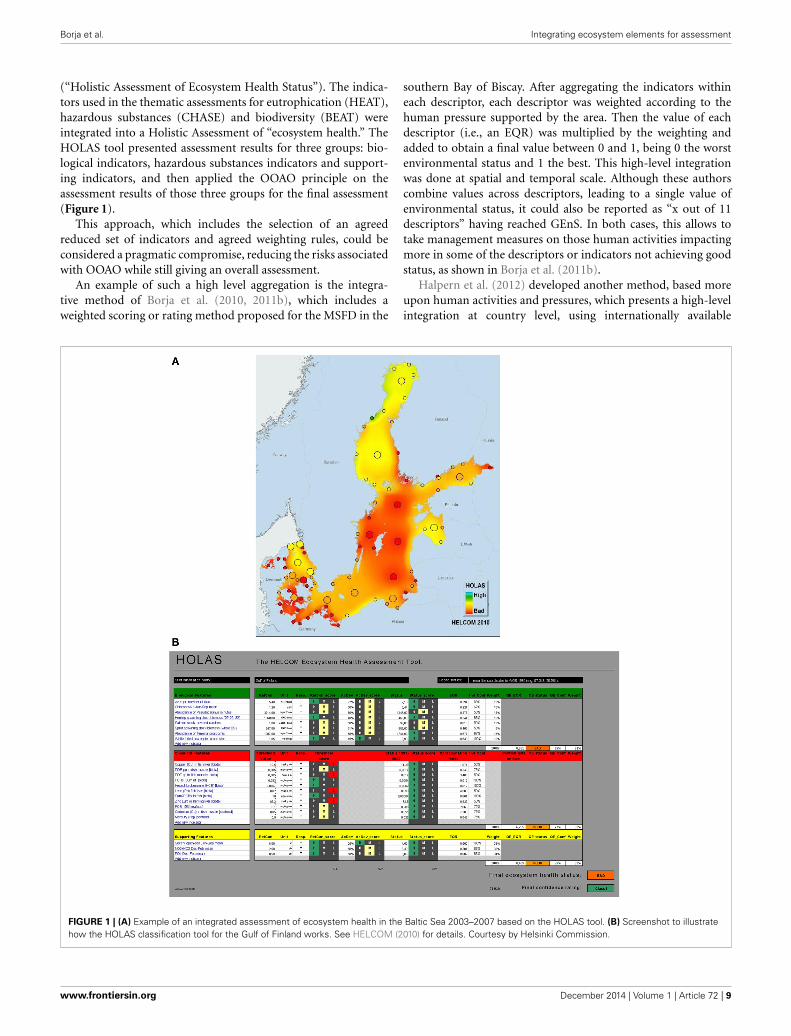
There are at least four levels of combination required to movefrom evaluation of the individual metrics or indicators identifiedby the Task Groups to an assessment of GEnS (Cardoso et al.,2010). As an example, using D6 (Seafloor integrity), Figure 2shows: (i) aggregation of metrics/indices within indicators (seenames of indicators in Table 1); (ii) aggregation of indicatorswithin the criteria of a descriptor (for complex descriptors), e.g.,criteria 6.1 (physical damage) and 6.2 (condition of benthic com-munity); (iii) status across all the criteria of a descriptor; and (iv)integration of status across all descriptors.
As one moves up the scale from metric/indicator level to over-all GEnS, the diversity of features that have to be combinedincreases rapidly (Figure 2). This poses several challenges aris-ing from the diversity of metrics, scales, performance features(sensitivity, specificity, etc.) and inherent nature (state indicators,pressure indicators, impact indicators) of the metrics that mustbe integrated.
AGGREGATION OF INDICATORS AND CRITERIA (COMBINATIONWITHIN A DESCRIPTOR)Cardoso et al. (2010) summarize the methods for an integrationwithin a MSFD descriptor, categorizing them into two wider
FIGURE 2 | Diagram of a possible approach for aggregation of indicators and criteria and integration of descriptors (D), using D6 as an example. Forindicators and criteria description, see Table 1.
www.frontiersin.org December 2014 | Volume 1 | Article 72 | 11
Borja et al. Integrating ecosystem elements for assessment
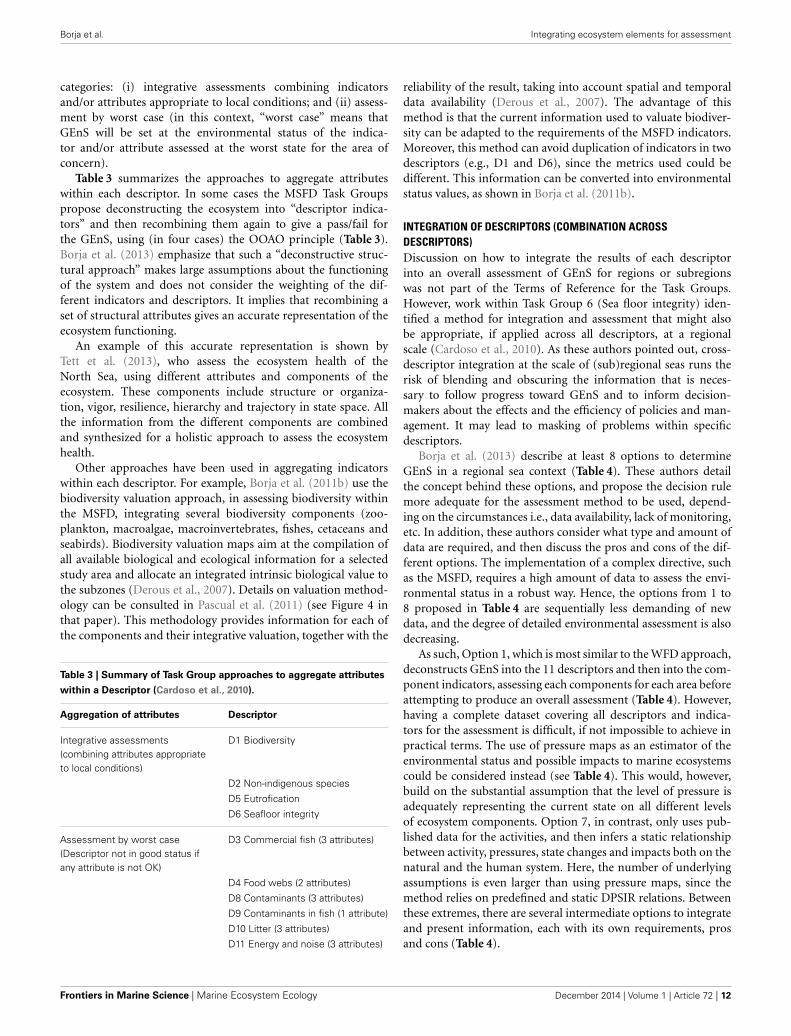
categories: (i) integrative assessments combining indicatorsand/or attributes appropriate to local conditions; and (ii) assess-ment by worst case (in this context, “worst case” means thatGEnS will be set at the environmental status of the indica-tor and/or attribute assessed at the worst state for the area ofconcern).
Table 3 summarizes the approaches to aggregate attributeswithin each descriptor. In some cases the MSFD Task Groupspropose deconstructing the ecosystem into “descriptor indica-tors” and then recombining them again to give a pass/fail forthe GEnS, using (in four cases) the OOAO principle (Table 3).Borja et al. (2013) emphasize that such a “deconstructive struc-tural approach” makes large assumptions about the functioningof the system and does not consider the weighting of the dif-ferent indicators and descriptors. It implies that recombining aset of structural attributes gives an accurate representation of theecosystem functioning.
An example of this accurate representation is shown byTett et al. (2013), who assess the ecosystem health of theNorth Sea, using different attributes and components of theecosystem. These components include structure or organiza-tion, vigor, resilience, hierarchy and trajectory in state space. Allthe information from the different components are combinedand synthesized for a holistic approach to assess the ecosystemhealth.
Other approaches have been used in aggregating indicatorswithin each descriptor. For example, Borja et al. (2011b) use thebiodiversity valuation approach, in assessing biodiversity withinthe MSFD, integrating several biodiversity components (zoo-plankton, macroalgae, macroinvertebrates, fishes, cetaceans andseabirds). Biodiversity valuation maps aim at the compilation ofall available biological and ecological information for a selectedstudy area and allocate an integrated intrinsic biological value tothe subzones (Derous et al., 2007). Details on valuation method-ology can be consulted in Pascual et al. (2011) (see Figure 4 inthat paper). This methodology provides information for each ofthe components and their integrative valuation, together with the
Table 3 | Summary of Task Group approaches to aggregate attributeswithin a Descriptor (Cardoso et al., 2010).
Aggregation of attributes Descriptor
Integrative assessments(combining attributes appropriateto local conditions)
D1 Biodiversity
D2 Non-indigenous speciesD5 EutroficationD6 Seafloor integrity
Assessment by worst case(Descriptor not in good status ifany attribute is not OK)
D3 Commercial fish (3 attributes)
D4 Food webs (2 attributes)D8 Contaminants (3 attributes)D9 Contaminants in fish (1 attribute)D10 Litter (3 attributes)D11 Energy and noise (3 attributes)
reliability of the result, taking into account spatial and temporaldata availability (Derous et al., 2007). The advantage of thismethod is that the current information used to valuate biodiver-sity can be adapted to the requirements of the MSFD indicators.Moreover, this method can avoid duplication of indicators in twodescriptors (e.g., D1 and D6), since the metrics used could bedifferent. This information can be converted into environmentalstatus values, as shown in Borja et al. (2011b).
INTEGRATION OF DESCRIPTORS (COMBINATION ACROSSDESCRIPTORS)Discussion on how to integrate the results of each descriptorinto an overall assessment of GEnS for regions or subregionswas not part of the Terms of Reference for the Task Groups.However, work within Task Group 6 (Sea floor integrity) iden-tified a method for integration and assessment that might alsobe appropriate, if applied across all descriptors, at a regionalscale (Cardoso et al., 2010). As these authors pointed out, cross-descriptor integration at the scale of (sub)regional seas runs therisk of blending and obscuring the information that is neces-sary to follow progress toward GEnS and to inform decision-makers about the effects and the efficiency of policies and man-agement. It may lead to masking of problems within specificdescriptors.
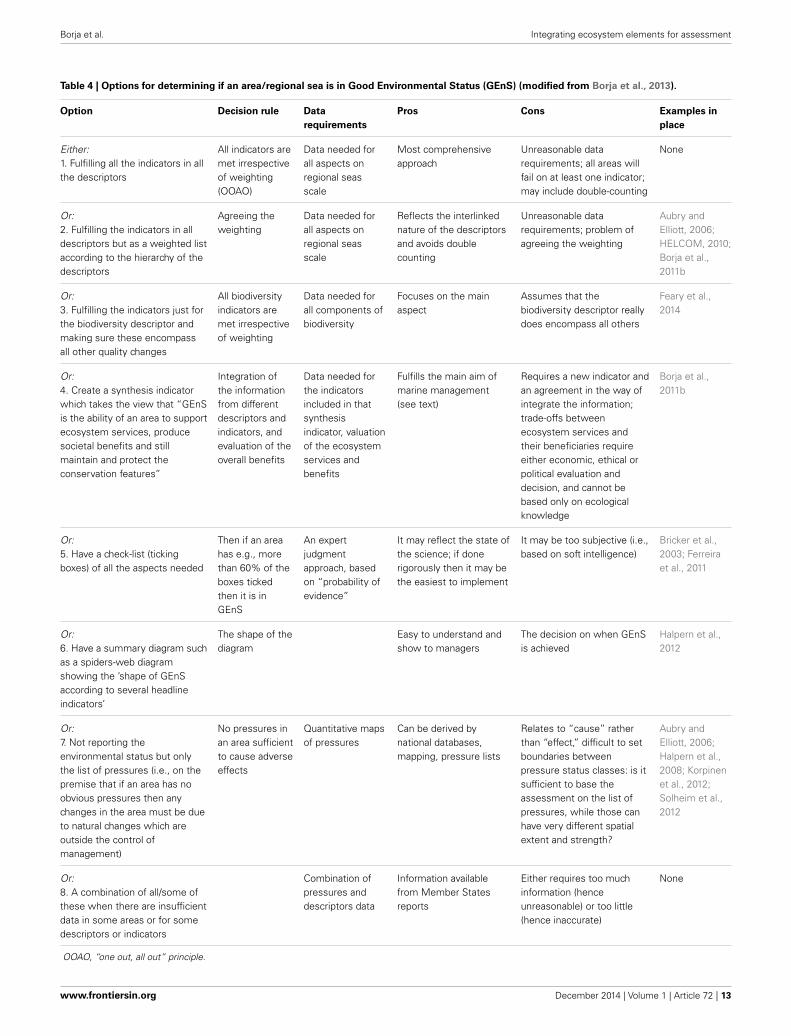
Borja et al. (2013) describe at least 8 options to determineGEnS in a regional sea context (Table 4). These authors detailthe concept behind these options, and propose the decision rulemore adequate for the assessment method to be used, depend-ing on the circumstances i.e., data availability, lack of monitoring,etc. In addition, these authors consider what type and amount ofdata are required, and then discuss the pros and cons of the dif-ferent options. The implementation of a complex directive, suchas the MSFD, requires a high amount of data to assess the envi-ronmental status in a robust way. Hence, the options from 1 to8 proposed in Table 4 are sequentially less demanding of newdata, and the degree of detailed environmental assessment is alsodecreasing.
As such, Option 1, which is most similar to the WFD approach,deconstructs GEnS into the 11 descriptors and then into the com-ponent indicators, assessing each components for each area beforeattempting to produce an overall assessment (Table 4). However,having a complete dataset covering all descriptors and indica-tors for the assessment is difficult, if not impossible to achieve inpractical terms. The use of pressure maps as an estimator of theenvironmental status and possible impacts to marine ecosystemscould be considered instead (see Table 4). This would, however,build on the substantial assumption that the level of pressure isadequately representing the current state on all different levelsof ecosystem components. Option 7, in contrast, only uses pub-lished data for the activities, and then infers a static relationshipbetween activity, pressures, state changes and impacts both on thenatural and the human system. Here, the number of underlyingassumptions is even larger than using pressure maps, since themethod relies on predefined and static DPSIR relations. Betweenthese extremes, there are several intermediate options to integrateand present information, each with its own requirements, prosand cons (Table 4).
Frontiers in Marine Science | Marine Ecosystem Ecology December 2014 | Volume 1 | Article 72 | 12
Borja et al. Integrating ecosystem elements for assessment
Table 4 | Options for determining if an area/regional sea is in Good Environmental Status (GEnS) (modified from Borja et al., 2013).
Option Decision rule Datarequirements
Pros Cons Examples inplace
Either:1. Fulfilling all the indicators in allthe descriptors
All indicators aremet irrespectiveof weighting(OOAO)
Data needed forall aspects onregional seasscale
Most comprehensiveapproach
Unreasonable datarequirements; all areas willfail on at least one indicator;may include double-counting
None
Or:2. Fulfilling the indicators in alldescriptors but as a weighted listaccording to the hierarchy of thedescriptors
Agreeing theweighting
Data needed forall aspects onregional seasscale
Reflects the interlinkednature of the descriptorsand avoids doublecounting
Unreasonable datarequirements; problem ofagreeing the weighting
Aubry andElliott, 2006;HELCOM, 2010;Borja et al.,2011b
Or:3. Fulfilling the indicators just forthe biodiversity descriptor andmaking sure these encompassall other quality changes
All biodiversityindicators aremet irrespectiveof weighting
Data needed forall components ofbiodiversity
Focuses on the mainaspect
Assumes that thebiodiversity descriptor reallydoes encompass all others
Feary et al.,2014
Or:4. Create a synthesis indicatorwhich takes the view that “GEnSis the ability of an area to supportecosystem services, producesocietal benefits and stillmaintain and protect theconservation features”
Integration ofthe informationfrom differentdescriptors andindicators, andevaluation of theoverall benefits
Data needed forthe indicatorsincluded in thatsynthesisindicator, valuationof the ecosystemservices andbenefits
Fulfills the main aim ofmarine management(see text)
Requires a new indicator andan agreement in the way ofintegrate the information;trade-offs betweenecosystem services andtheir beneficiaries requireeither economic, ethical orpolitical evaluation anddecision, and cannot bebased only on ecologicalknowledge
Borja et al.,2011b
Or:5. Have a check-list (tickingboxes) of all the aspects needed
Then if an areahas e.g., morethan 60% of theboxes tickedthen it is inGEnS
An expertjudgmentapproach, basedon “probability ofevidence”
It may reflect the state ofthe science; if donerigorously then it may bethe easiest to implement
It may be too subjective (i.e.,based on soft intelligence)
Bricker et al.,2003; Ferreiraet al., 2011
Or:6. Have a summary diagram suchas a spiders-web diagramshowing the ’shape of GEnSaccording to several headlineindicators’
The shape of thediagram
Easy to understand andshow to managers
The decision on when GEnSis achieved
Halpern et al.,2012
Or:7. Not reporting theenvironmental status but onlythe list of pressures (i.e., on thepremise that if an area has noobvious pressures then anychanges in the area must be dueto natural changes which areoutside the control ofmanagement)
No pressures inan area sufficientto cause adverseeffects
Quantitative mapsof pressures
Can be derived bynational databases,mapping, pressure lists
Relates to “cause” ratherthan “effect,” difficult to setboundaries betweenpressure status classes: is itsufficient to base theassessment on the list ofpressures, while those canhave very different spatialextent and strength?
Aubry andElliott, 2006;Halpern et al.,2008; Korpinenet al., 2012;Solheim et al.,2012
Or:8. A combination of all/some ofthese when there are insufficientdata in some areas or for somedescriptors or indicators
Combination ofpressures anddescriptors data
Information availablefrom Member Statesreports
Either requires too muchinformation (henceunreasonable) or too little(hence inaccurate)
None
OOAO, “one out, all out” principle.
www.frontiersin.org December 2014 | Volume 1 | Article 72 | 13
Borja et al. Integrating ecosystem elements for assessment
One-out, all-out (OOAO)Although the MSFD describes the GEnS individually for each ofthe 11 descriptors, this does not necessarily imply the ability tohave GEnS at the level of all the descriptors, nor does it meanthat each descriptor should necessarily be graded individually ina binary way (i.e., good or not good environmental status) (Borjaet al., 2013).
It could be argued that the 11 descriptors together summa-rize the way in which the ecosystem functions in terms of theMSFD view. As Member States have to consider each of thedescriptors to determine good environmental status, this couldbe interpreted as a requirement to achieve GEnS for each of thesedescriptors. In that case, applying OOAO is the only integra-tion method that can be applied to arrive at an overall assess-ment of GEnS, leading to a high probability of not achievingGEnS.
This assumes that the 11 descriptors, and the associated indi-cators, can be considered a coherent and consistent frameworkthat adequately reflects the environmental status. In that situa-tion, state descriptors not achieving GEnS would be accompaniedby pressure descriptors not achieving GEnS, if the reaction ofthe ecosystem components is immediate, acting on the sametime scale as the pressures. If this is not the case, for exam-ple if a pressure descriptor (e.g., D5 or D8) indicates that thelevel of the pressure is too high to achieve GEnS, while statedescriptors (e.g., D1 or D4) do not reflect this, there is clearlyan inconsistency in the assumed MSFD assessment framework,indicating that it does not capture delayed responses of stateindicators to changing pressure indicators. That could be inter-preted as a need for further research on the nature of P-S-Irelations and the consistency in environmental targets for thedescriptors involved, since our current state of knowledge onquantitative causal relations between pressures, state changes andimpacts is limited. In addition, nearly all ecosystem componentsare subject to the true cumulative effects of many simultane-ous pressures related to a range of human activities (Crainet al., 2008; Stelzenmüller et al., 2010; Knights et al., 2013). Thismeans that, for some descriptors at least, there is a large scien-tific uncertainty associated with the definition of environmentaltargets and GEnS. Uncertainties in target setting, in the perfor-mance of an action (e.g., ecosystem state post-management) orin the contribution of individual driver(s) causing state changecan undermine decision making when implementing environ-mental policy and can limit our ability to identify what shouldbe managed, and what the impact of management might be(Knights et al., 2014). Consequently, developing a consistentassessment framework for all descriptors and indicators is anextremely challenging task, and using the OOAO approach is notappropriate.
Alternative approachesThe usefulness of integrating descriptors to one single value(overall GEnS assessment based on combination of the 11descriptors) is under discussion by the Member States and theEuropean Commission groups for the implementation of theMSFD. An argument against integration across descriptors isthat it may not be informative any more since it results in loss
of information at a crucial level where different elements arecombined that cannot be integrated without major concessions.
The abovementioned groups have suggested that an inte-gration across the biodiversity-related descriptors (D1, D2, D4,D6) might be an option, splitting those descriptors into vari-ous groups (e.g., functional or species groups). If a species orspecies group is assessed under more than one descriptor differ-ent aspects should be considered (e.g., chlorophyll a under D5and phytoplankton species composition under D1).
However, if an integration across all descriptors is decided,Borja et al. (2010) suggest that the 11 descriptors are hierarchi-cal and do not have an equal weighting when assessing the overallGEnS. Hence, Borja et al. (2013) suggest that for biodiversity (D1)to be fulfilled requires all others to be met and similarly if oneof the stressor or pressure-related descriptors (e.g., D11, energyincluding noise) fails then by definition the biodiversity will beadversely affected at some point. This approach addresses theconceptual drawback of the OOAO principle and allows to havedelayed responses to changing pressure regimes without drawingfalse conclusions and still being precautionary.
In addition to the problem of combining indicators (seen inthe previous section) and descriptors the MSFD requires MemberStates to integrate and geographically scale-up the assessmentsat the level of a region or subregion (Borja et al., 2010). Thisdiffers strongly from the approach under the WFD, which isrestricted to quality assessments at the scale of a water body(Hering et al., 2010). This means that the GEnS assessments ofthe different Member States within a regional sea need to be com-parable and should avoid anomalies at the borders of MemberStates in order to enable synthesizing of the assessments into aregion-wide assessment (Borja et al., 2013). This requires bothcomparable methods and associated combination rules to ensureminimum standards for GEnS reporting across Member States.As such, we advocate a set of common principles (expanded fromClaussen et al., 2011, as shown in Borja et al., 2013):
– The combination across levels of different complexity shouldaccommodate different alternatives, i.e., aggregation belowdescriptor level (across indicators within criteria, and criteriawithin descriptors, as shown in the previous section) and cancertainly differ from descriptor level integration.
– Integration across state descriptors (D1, D3, D4, D6) should bedone differently than across pressure descriptors (D2, D5, D7,D8, D9, D10, D11), but avoiding double counting of indicatorsin different descriptors (e.g., phytoplankton under D1 and D5,macroinvertebrates under D1 and D6).
– Consideration of a different contribution of the two typesof descriptors for the overall GEnS evaluation—giving statedescriptors a higher weight, as receptors of the impacts causedby pressures. The rationale for this, as recognized by Claussenet al. (2011), is that “in principle, where GEnS for state-baseddescriptors (D1, 3, 4, 6) is achieved it follows that GEnS forpressure-based descriptors should also be met.” This princi-ple makes the assumption that the state eventually will reflectceasing pressures. When the state descriptors finally reach a sat-isfactory level then the pressures must be having a limited (ormitigated) impact.
Frontiers in Marine Science | Marine Ecosystem Ecology December 2014 | Volume 1 | Article 72 | 14
Borja et al. Integrating ecosystem elements for assessment
Visualizing and communicating the statusThe outlined alternative approach also shows that concerns onintegration across descriptors do not necessarily have to be aproblem. There are some methods which have demonstratedthat integrating the information into single values (Borja et al.,2011b), maps (HELCOM, 2010) or radar schemes (Halpern et al.,2012) is still helpful and informative for ecosystem management,despite the involved loss of information that is inherent to a sin-gle number. Information can be retained when always presentingthat single number together with the main underlying data, ide-ally visualizing the different levels of aggregation, allowing thelookup of the status at any level and relating the status with theactual pressures that lead to the synthesized value.
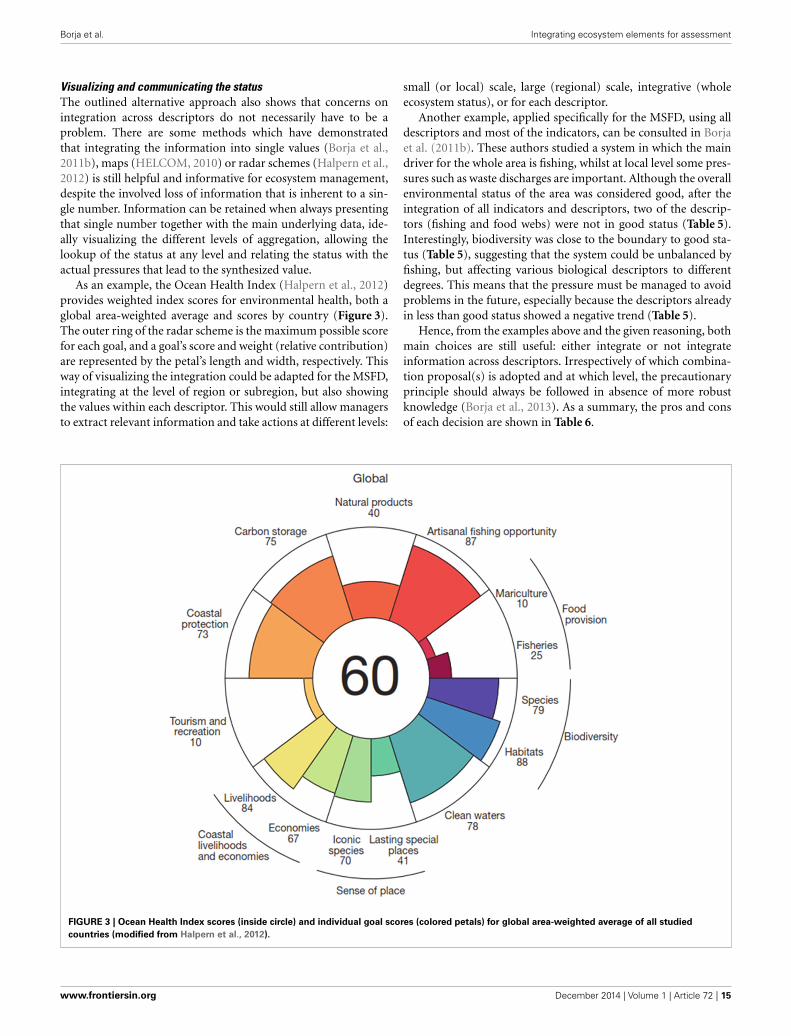
As an example, the Ocean Health Index (Halpern et al., 2012)provides weighted index scores for environmental health, both aglobal area-weighted average and scores by country (Figure 3).The outer ring of the radar scheme is the maximum possible scorefor each goal, and a goal’s score and weight (relative contribution)are represented by the petal’s length and width, respectively. Thisway of visualizing the integration could be adapted for the MSFD,integrating at the level of region or subregion, but also showingthe values within each descriptor. This would still allow managersto extract relevant information and take actions at different levels:
small (or local) scale, large (regional) scale, integrative (wholeecosystem status), or for each descriptor.
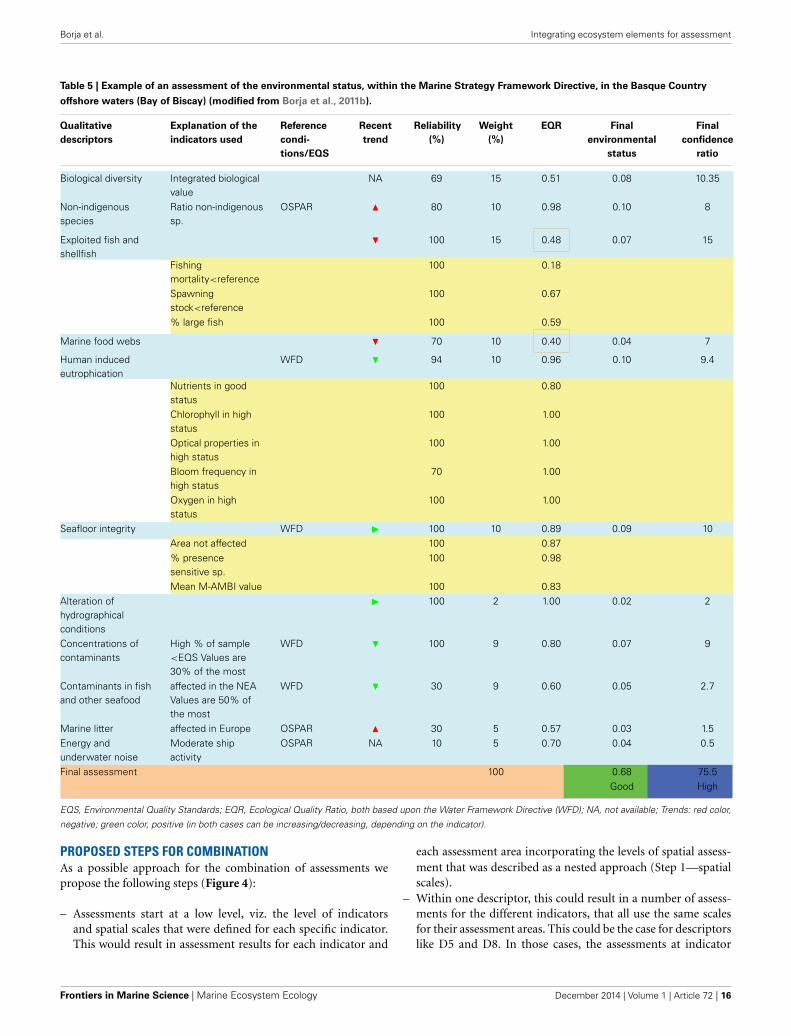
Another example, applied specifically for the MSFD, using alldescriptors and most of the indicators, can be consulted in Borjaet al. (2011b). These authors studied a system in which the maindriver for the whole area is fishing, whilst at local level some pres-sures such as waste discharges are important. Although the overallenvironmental status of the area was considered good, after theintegration of all indicators and descriptors, two of the descrip-tors (fishing and food webs) were not in good status (Table 5).Interestingly, biodiversity was close to the boundary to good sta-tus (Table 5), suggesting that the system could be unbalanced byfishing, but affecting various biological descriptors to differentdegrees. This means that the pressure must be managed to avoidproblems in the future, especially because the descriptors alreadyin less than good status showed a negative trend (Table 5).
Hence, from the examples above and the given reasoning, bothmain choices are still useful: either integrate or not integrateinformation across descriptors. Irrespectively of which combina-tion proposal(s) is adopted and at which level, the precautionaryprinciple should always be followed in absence of more robustknowledge (Borja et al., 2013). As a summary, the pros and consof each decision are shown in Table 6.
FIGURE 3 | Ocean Health Index scores (inside circle) and individual goal scores (colored petals) for global area-weighted average of all studiedcountries (modified from Halpern et al., 2012).
www.frontiersin.org December 2014 | Volume 1 | Article 72 | 15
Borja et al. Integrating ecosystem elements for assessment
Table 5 | Example of an assessment of the environmental status, within the Marine Strategy Framework Directive, in the Basque Countryoffshore waters (Bay of Biscay) (modified from Borja et al., 2011b).
Qualitativedescriptors
Explanation of theindicators used
Referencecondi-tions/EQS
Recenttrend
Reliability(%)
Weight(%)
EQR Finalenvironmental
status
Finalconfidence
ratio
Biological diversity Integrated biologicalvalue
NA 69 15 0.51 0.08 10.35
Non-indigenousspecies
Ratio non-indigenoussp.
OSPAR ! 80 10 0.98 0.10 8
Exploited fish andshellfish
" 100 15 0.48 0.07 15
Fishingmortality<reference
100 0.18
Spawningstock<reference
100 0.67
% large fish 100 0.59
Marine food webs " 70 10 0.40 0.04 7
Human inducedeutrophication
WFD " 94 10 0.96 0.10 9.4
Nutrients in goodstatus
100 0.80
Chlorophyll in highstatus
100 1.00
Optical properties inhigh status
100 1.00
Bloom frequency inhigh status
70 1.00
Oxygen in highstatus
100 1.00
Seafloor integrity WFD # 100 10 0.89 0.09 10Area not affected 100 0.87% presencesensitive sp.
100 0.98
Mean M-AMBI value 100 0.83Alteration ofhydrographicalconditions
# 100 2 1.00 0.02 2
Concentrations ofcontaminants
High % of sample<EQS Values are30% of the most
WFD " 100 9 0.80 0.07 9
Contaminants in fishand other seafood
affected in the NEAValues are 50% ofthe most
WFD " 30 9 0.60 0.05 2.7
Marine litter affected in Europe OSPAR ! 30 5 0.57 0.03 1.5Energy andunderwater noise
Moderate shipactivity
OSPAR NA 10 5 0.70 0.04 0.5
Final assessment 100 0.68 75.5Good High
EQS, Environmental Quality Standards; EQR, Ecological Quality Ratio, both based upon the Water Framework Directive (WFD); NA, not available; Trends: red color,negative; green color, positive (in both cases can be increasing/decreasing, depending on the indicator).
PROPOSED STEPS FOR COMBINATIONAs a possible approach for the combination of assessments wepropose the following steps (Figure 4):
– Assessments start at a low level, viz. the level of indicatorsand spatial scales that were defined for each specific indicator.This would result in assessment results for each indicator and
each assessment area incorporating the levels of spatial assess-ment that was described as a nested approach (Step 1—spatialscales).
– Within one descriptor, this could result in a number of assess-ments for the different indicators, that all use the same scalesfor their assessment areas. This could be the case for descriptorslike D5 and D8. In those cases, the assessments at indicator
Frontiers in Marine Science | Marine Ecosystem Ecology December 2014 | Volume 1 | Article 72 | 16
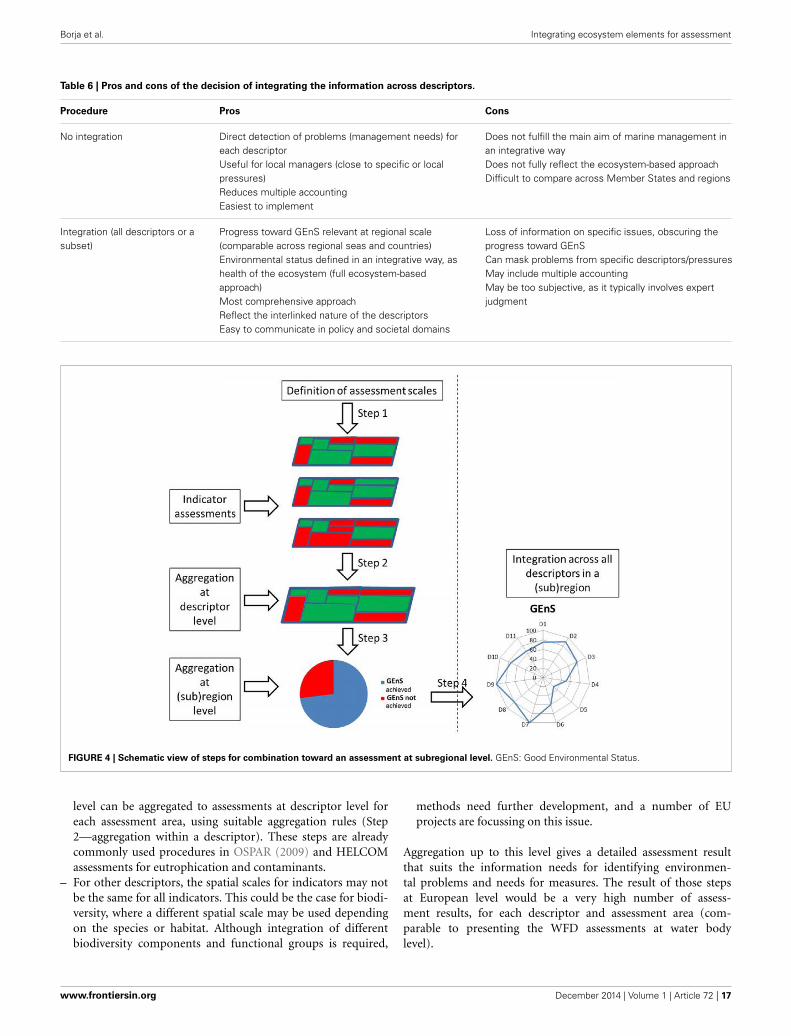
Borja et al. Integrating ecosystem elements for assessment
Table 6 | Pros and cons of the decision of integrating the information across descriptors.
Procedure Pros Cons
No integration Direct detection of problems (management needs) foreach descriptorUseful for local managers (close to specific or localpressures)Reduces multiple accountingEasiest to implement
Does not fulfill the main aim of marine management inan integrative wayDoes not fully reflect the ecosystem-based approachDifficult to compare across Member States and regions
Integration (all descriptors or asubset)
Progress toward GEnS relevant at regional scale(comparable across regional seas and countries)Environmental status defined in an integrative way, ashealth of the ecosystem (full ecosystem-basedapproach)Most comprehensive approachReflect the interlinked nature of the descriptorsEasy to communicate in policy and societal domains
Loss of information on specific issues, obscuring theprogress toward GEnSCan mask problems from specific descriptors/pressuresMay include multiple accountingMay be too subjective, as it typically involves expertjudgment
FIGURE 4 | Schematic view of steps for combination toward an assessment at subregional level. GEnS: Good Environmental Status.
level can be aggregated to assessments at descriptor level foreach assessment area, using suitable aggregation rules (Step2—aggregation within a descriptor). These steps are alreadycommonly used procedures in OSPAR (2009) and HELCOMassessments for eutrophication and contaminants.
– For other descriptors, the spatial scales for indicators may notbe the same for all indicators. This could be the case for biodi-versity, where a different spatial scale may be used dependingon the species or habitat. Although integration of differentbiodiversity components and functional groups is required,
methods need further development, and a number of EUprojects are focussing on this issue.
Aggregation up to this level gives a detailed assessment resultthat suits the information needs for identifying environmen-tal problems and needs for measures. The result of those stepsat European level would be a very high number of assess-ment results, for each descriptor and assessment area (com-parable to presenting the WFD assessments at water bodylevel).
www.frontiersin.org December 2014 | Volume 1 | Article 72 | 17
Borja et al. Integrating ecosystem elements for assessment
The following steps could provide information at a higher levelof integration presenting the required overview of the currentstatus of the overall environmental state and the progress towardGEnS:
– Within a descriptor, the assessment results of all assessmentareas within a subregion can be presented in a more integratedway (Step 3—spatial aggregation).
• Generally, use of OOAO (if one assessment area fails GEnS,the whole subregion fails) is not useful, as it gives a very con-servative result and is not informative. Also, if the pressureis highly localized this approach is not adequate, since thewhole subregion could fail GEnS due to a single location(which, of course, will need specific management measures).
• In some cases, for example if a pressure is more or lesshomogeneous across a whole subregion (fishing, shipping),it could be useful to apply OOAO.
– Percentage of surface area achieving GEnS: This could be amore useful approach, if the extent and intensity of a pressurecan be quantified. For example, if the pressure is present in45% of the surface area of a subregion, but the surface areanot achieving GEnS is only 2%, it could be concluded thatthe subregion does not achieve GEnS in 2% of its area, wheremanagement measures are needed.
– Other metrics.
For some descriptors, surface area may be a good measureto express status at a subregional level: for example, D5, D8,and D10. For other descriptors, surface area is not suitablebut other metrics should be considered, e.g., D1: numbers ofspecies/habitats failing to achieve favorable conservation status;D3: number of stocks failing to meet “Maximum SustainableYield.”
The end result of Step 3 could present the level at which GEnSis achieved at subregional scale as a pie chart. The aggregationresults of Step 3 could be integrated across descriptors in a finalpresentation per subregion, using methods such as radar plots, ormethods similar to the Ocean Health Index (Step 4—aggregationacross descriptors). In this step, weighted approaches as suggestedin previous sections would be considered.
CONCLUDING REMARKSFrom the information provided in this overview, some conclu-sions can be highlighted:
– Some kind of integration across indicators, criteria anddescriptors is required to arrive at assessment of GEnS or“ecosystem health.”
– Integration principles should be ecologically-relevant, trans-parent and documented.
– Integrated assessment should not only present a classifica-tion result (primary assessment) but also address uncertaintiesand assess confidence of the classification result (as a sec-ondary assessment). When carrying out an assessment at aspecific scale, the decisions made in regard to integration
principles/rules should be available as a sort of third assessmentor backlog.
– Assessments should be planned around the question(s) to beaddressed and the tool(s) to be used. Monitoring should sub-sequently be designed to meet the requirements of the plannedassessments.
– This study provides information on combining methods tointegrate ecosystem components to assess status and guidelinesfor scientists and managers on the steps to be followed, whendeciding on assessment scales and combination approaches.Integration of taxonomic, functional and key or keystone bio-diversity components into an overall biodiversity assessmentable to link to GEnS and to ecosystem service provision andthe sustainable management of detrimental human activities isthe next challenge.
ACKNOWLEDGMENTSThe opinions expressed in this document are the sole responsi-bility of the authors and do not represent the official positionof the European Commission. This work has been done underFramework contract No ENV.D2/FRA/2012/0019 (Coherent geo-graphic scales and aggregation rules in assessment and moni-toring of Good Environmental Status—analysis and conceptualphase), of the European Directorate General of Environment; andDEVOTES project (DEVelopment Of innovative Tools for under-standing marine biodiversity and assessing good EnvironmentalStatus) funded by the European Union under the 7th FrameworkProgram “The Ocean of Tomorrow” Theme (grant agreementno. 308392) (www.devotes-project.eu). JHA was supported bythe WATERS project (Waterbody Assessment Tools for EcologicalReference conditions and status in Sweden). María C. Uyarra(AZTI-Tecnalia) and Mike Elliott (University of Hull) providedconstructive comments to the first version of the manuscript. Thisis contribution number 674 from the Marine Research Division(AZTI-Tecnalia).
REFERENCESAubry, A., and Elliott, M. (2006). The use of environmental integra-
tive indicators to assess seabed disturbance in estuaries and coasts:Application to the Humber Estuary, UK. Mar. Pollut. Bull. 53, 175–185. doi:10.1016/j.marpolbul.2005.09.021
Barton, D. N., Saloranta, T., Moe, S. J., Eggestad, H. O., and Kuikka, S. (2008).Bayesian belief networks as a meta-modelling tool in integrated river basinmanagement - Pros and cons in evaluating nutrient abatement decisionsunder uncertainty in a Norwegian river basin. Ecol. Econ. 66, 91–104. doi:10.1016/j.ecolecon.2008.02.012
Barton, D. N., Kuikka, S., Varis, O., Uusitalo, L., Henriksen, H. J., Borsuk, M., et al.(2012). Bayesian networks in environmental and resource management. Integr.Environ. Assess. Manage. 8, 418–429. doi: 10.1002/ieam.1327
Birk, S., Bonne, W., Borja, A., Brucet, S., Courrat, A., Poikane, S., et al. (2012).Three hundred ways to assess Europe’s surface waters: an almost completeoverview of biological methods to implement the Water Framework Directive.Ecol. Indic. 18, 31–41. doi: 10.1016/j.ecolind.2011.10.009
Borja, A. (2014). Grand challenges in marine ecosystems ecology. Front. Mar. Sci.1:1. doi: 10.3389/fmars.2014.00001
Borja, A., and Rodríguez, J. G. (2010). Problems associated with the ‘one-out,all-out’ principle, when using multiple ecosystem components in assessingthe ecological status of marine waters. Mar. Pollut. Bull. 60, 1143–1146. doi:10.1016/j.marpolbul.2010.06.026
Borja, A., Valencia, V., Franco, J., Muxika, I., Bald, J., Belzunce, M. J., et al. (2004).The water framework directive: water alone, or in association with sediment
Frontiers in Marine Science | Marine Ecosystem Ecology December 2014 | Volume 1 | Article 72 | 18
Borja et al. Integrating ecosystem elements for assessment
and biota, in determining quality standards? Mar. Pollut. Bull. 49, 8–11. doi:10.1016/j.marpolbul.2004.04.008
Borja, A., Bricker, S. B., Dauer, D. M., Demetriades, N. T., Ferreira, J. G., Forbes,A. T., et al. (2008). Overview of integrative tools and methods in assessingecological integrity in estuarine and coastal systems worldwide. Mar. Pollut.Bull. 56, 1519–1537. doi: 10.1016/j.marpolbul.2008.07.005
Borja, A., Ranasinghe, A., and Weisberg, S. B. (2009a). Assessing ecological integrityin marine waters, using multiple indices and ecosystem components: challengesfor the future. Mar. Pollut. Bull. 59, 1–4. doi: 10.1016/j.marpolbul.2008.11.006
Borja, A., Bald, J., Franco, J., Larreta, J., Muxika, I., Revilla, M., et al. (2009b).Using multiple ecosystem components, in assessing ecological status in Spanish(Basque Country) Atlantic marine waters. Mar. Pollut. Bull. 59, 54–64. doi:10.1016/j.marpolbul.2008.11.010
Borja, A., Elliott, M., Carstensen, J., Heiskanen, A. S., and van de Bund, W. (2010).Marine management–towards an integrated implementation of the EuropeanMarine Strategy Framework and the Water Framework Directives. Mar. Pollut.Bull. 60, 2175–2186. doi: 10.1016/j.marpolbul.2010.09.026
Borja, A., Barbone, E., Basset, A., Borgersen, G., Brkljacic, M., Elliott,M., et al. (2011a). Response of single benthic metrics and multi-metricmethods to anthropogenic pressure gradients, in five distinct Europeancoastal and transitional ecosystems. Mar. Pollut. Bull. 62, 499–513. doi:10.1016/j.marpolbul.2010.12.009
Borja, A., Galparsoro, I., Irigoien, X., Iriondo, A., Menchaca, I., Muxika, I.,et al. (2011b). Implementation of the European Marine Strategy FrameworkDirective: a methodological approach for the assessment of environmental sta-tus, from the Basque Country (Bay of Biscay). Mar. Pollut. Bull. 62, 889–904.doi: 10.1016/j.marpolbul.2011.03.031
Borja, A., Elliott, M., Andersen, J. H., Cardoso, A. C., Carstensen, J., Ferreira, J. G.,et al. (2013). Good Environmental Status of marine ecosystems: What is it andhow do we know when we have attained it? Mar. Pollut. Bull. 76, 16–27. doi:10.1016/j.marpolbul.2013.08.042
Breen, P., Robinson, L. A., Rogers, S. I., Knights, A. M., Piet, G., Churilova, T., et al.(2012). An environmental assessment of risk in achieving good environmentalstatus to support regional prioritisation of management in Europe. Mar. Policy36, 1033–1043. doi: 10.1016/j.marpol.2012.02.003
Bricker, S. B., Ferreira, J. G., and Simas, T. (2003). An integrated methodol-ogy for assessment of estuarine trophic status. Ecol. Modell. 169, 39–60. doi:10.1016/S0304-3800(03)00199-6
Cardoso, A. C., Cochrane, S., Doemer, H., Ferreira, J. G., Galgani, F., Hagebro,C., et al. (2010). Scientific support to the European Commission on theMarine Strategy Framework Directive. Management Group Report. EUR 24336EN, (Luxembourg: Joint Research Centre) Office for Official Publications of theEuropean Communities: 57.
Caroni, R., Bund, W., Clarke, R. T., and Johnson, R. K. (2013). Combinationof multiple biological quality elements into waterbody assessment of surfacewaters. Hydrobiologia 704, 437–451. doi: 10.1007/s10750-012-1274-y
CIS (2003). “Overall Approach to the Classification of Ecological Status andEcological Potential,” in Water Framework Directive Common ImplementationStrategy Working Group 2 A Ecological Status (ECOSTAT), Rome, 53.
Claussen, U., Connor, D., de Vrees, L., Leppänen, J. M., Percelay, J., Kapari, M., et al.(2011). Common Understanding of (Initial) Assessment, Determination of GoodEnvironmental Status (GES) and Establishment of Environmental Targets (Articles8, 9 and 10 MSFD). European Commission, 73.
Costanza, R., and Mageau, M. (1999). What is a healthy ecosystem? Aquat. Ecol. 33,105–115. doi: 10.1023/A:1009930313242
Crain, C. M., Kroeker, K., and Halpern, B. S. (2008). Interactive and cumulativeeffects of multiple human stressors in marine systems. Ecol. Lett. 11, 1304–1315.doi: 10.1111/j.1461-0248.2008.01253.x
Derous, S., Agardy, T., Hillewaert, H., Hostens, K., Jamieson, G., Lieberknecht, L.,et al. (2007). A concept for biological valuation in the marine environment.Oceanologia 49, 99–128.
European Commission. (2008). Directive 2008/56/EC of the European Parliamentand of the Council establishing a framework for community action in thefield of marine environmental policy (Marine Strategy Framework Directive).Official J. Eur. Union L164, 19–40.
European Commission. (2010). Commission Decision of 1 September 2010 on cri-teria and methodological standards on good environmental status of marinewaters (notified under document C(2010) 5956)(2010/477/EU). Official J. Eur.Union L232, 12–24.
Feary, D. A., Fowler, A. M., and Ward, T. J. (2014). Developing a rapid method forundertaking the World Ocean Assessment in data-poor regions – A case studyusing the South China Sea Large Marine Ecosystem. Ocean Coast. Manage. 95,129–137. doi: 10.1016/j.ocecoaman.2014.04.006
Ferreira, J. G., Andersen, J. H., Borja, A., Bricker, S. B., Camp, J. M., et al. (2011).Overview of eutrophication indicators to assess environmental status withinthe European Marine Strategy Framework Directive. Est. Coast. Shelf Sci. 93,117–131. doi: 10.1016/j.ecss.2011.03.014
Halpern, B. S., Walbridge, S., Selkoe, K. A., Kappel, C. V., Micheli, F., D’Agrosa, C.,et al. (2008). A global map of human impact on marine ecosystems. Science 319,948–952. doi: 10.1126/science.1149345
Halpern, B. S., Longo, C., Hardy, D., McLeod, K. L., Samhouri, J. F., Katona, S.K., et al. (2012). An index to assess the health and benefits of the global ocean.Nature 488, 615–620. doi: 10.1038/nature11397
HELCOM. (2009a). Eutrophication in the Baltic Sea – An integrated thematicassessment of the effects of nutrient enrichment and eutrophication in the BalticSea region. Balt. Sea Environ. Proc. 115B, 152.
HELCOM. (2009b). Biodiversity in the Baltic Sea – An integrated thematic assess-ment on biodiversity and nature conservation in the Baltic Sea. Balt. SeaEnviron. Proc. 116B, 192.
HELCOM. (2010). Ecosystem Health of the Baltic Sea 2003–2007: HELCOM InitialHolistic Assessment. Balt. Sea Environ. Proc. 122, 68.
Hering, D., Borja, A., Carstensen, J., Carvalho, L., Elliott, M., Feld, C. K., et al.(2010). The European Water Framework Directive at the age of 10: a criticalreview of the achievements with recommendations for the future. Sci. TotalEnviron. 408, 4007–4019. doi: 10.1016/j.scitotenv.2010.05.031
Knights, A. M., Koss, R. S., and Robinson, L. A. (2013). Identifying commonpressure pathways from a complex network of human activities to sup-port ecosystem-based management. Ecol. Appl. 23, 755–765. doi: 10.1890/12-1137.1
Knights, A. M., Culhane, F., Hussain, S. S., Papadopoulou, K. N., Piet, G. J., Raakær,J., et al. (2014). A step-wise process of decision-making under uncertaintywhen implementing environmental policy. Environ. Sci. Policy 39, 56–64. doi:10.1016/j.envsci.2014.02.010
Korpinen, S., Meski, L., Andersen, J. H., and Laamanen, M. (2012). Human pres-sures and their potential impact on the Baltic Sea ecosystem. Ecol. Indic. 15,105–114. doi: 10.1016/j.ecolind.2011.09.023
Lehikoinen, A., Helle, I., Klemola, E., Mäntyniemi, S., Kuikka, S., and Pitkänen,H. (2014). Evaluating the impact of nutrient abatement measures on the eco-logical status of coastal waters: a Bayesian network for decision analysis. Int. J.Multicriteria Decis. Mak. 4, 114–134. doi: 10.1504/IJMCDM.2014.060426
Lehikoinen, A., Luoma, E., Mantyniemi, S., and Kuikka, S. (2013). Optimizingthe recovery efficiency of Finnish oil combating vessels in the Gulf ofFinland using Bayesian Networks. Environ. Sci. Technol. 47, 1792–1799. doi:10.1021/es303634f
Mee, L. D., Jefferson, R. L., d’A Laffoley, D., and Elliott, M. (2008). Howgood is good? Human values and Europe’s proposed Marine StrategyDirective. Mar. Pollut. Bull. 56, 187–204. doi: 10.1016/j.marpolbul.2007.09.038
Micheli, F., Halpern, B. S., Walbridge, S., Ciriaco, S., Ferretti, F., Fraschetti, S., et al.(2013). Cumulative human impacts on mediterranean and black sea marineecosystems: assessing current pressures and opportunities. PLoS ONE 8:e79889.doi: 10.1371/journal.pone.0079889
Murtaugh, P. A. (1996). The statistical evaluation of ecological indicators. Ecol.Appl. 6, 132–139. doi: 10.2307/2269559
Ojaveer, H., and Eero, M. (2011). Methodological challenges in assessing the envi-ronmental status of a marine ecosystem: case study of the Baltic Sea. PLoS ONE6:e19231. doi: 10.1371/journal.pone.0019231
OSPAR (2009). Eutrophication Status of the OSPAR Maritime Area. SecondOSPAR Integrated Report. Eutrophication Series. OSPAR Commission,London, 107. Available online at: http://qsr2010.ospar.org/media/assessments/p00372_Second_integrated_report.pdf
OSPAR (2010). OSPAR Quality Status Report 2010. London: OSPAR Commission.OSPAR (2012). MSFD Advice Manual and Background Document on Biodiversity.
London, Publication Number: 581/2012, 141.Pascual, M., Borja, A., Eede, S. V., Deneudt, K., Vincx, M., Galparsoro, I., et al.
(2011). Marine biological valuation mapping of the Basque continental shelf(Bay of Biscay), within the context of marine spatial planning. Est. Coast. ShelfSci. 95, 186–198. doi: 10.1016/j.ecss.2011.08.031
www.frontiersin.org December 2014 | Volume 1 | Article 72 | 19
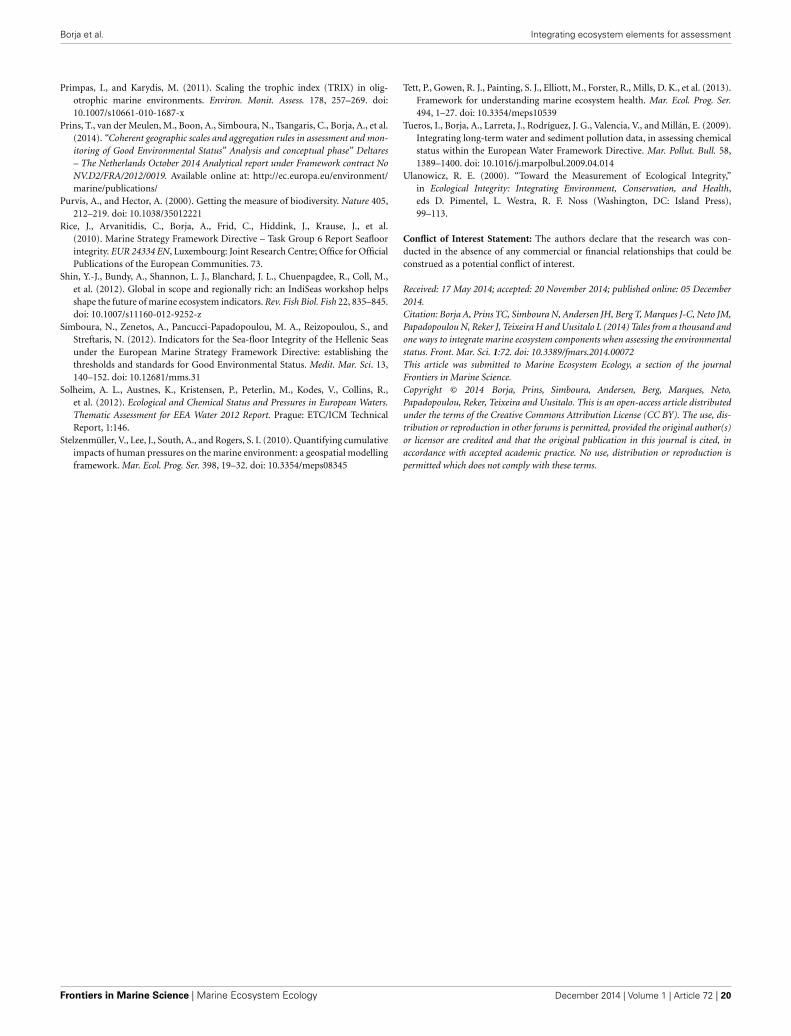
Borja et al. Integrating ecosystem elements for assessment
Primpas, I., and Karydis, M. (2011). Scaling the trophic index (TRIX) in olig-otrophic marine environments. Environ. Monit. Assess. 178, 257–269. doi:10.1007/s10661-010-1687-x
Prins, T., van der Meulen, M., Boon, A., Simboura, N., Tsangaris, C., Borja, A., et al.(2014). “Coherent geographic scales and aggregation rules in assessment and mon-itoring of Good Environmental Status” Analysis and conceptual phase” Deltares– The Netherlands October 2014 Analytical report under Framework contract NoNV.D2/FRA/2012/0019. Available online at: http://ec.europa.eu/environment/marine/publications/
Purvis, A., and Hector, A. (2000). Getting the measure of biodiversity. Nature 405,212–219. doi: 10.1038/35012221
Rice, J., Arvanitidis, C., Borja, A., Frid, C., Hiddink, J., Krause, J., et al.(2010). Marine Strategy Framework Directive – Task Group 6 Report Seafloorintegrity. EUR 24334 EN, Luxembourg: Joint Research Centre; Office for OfficialPublications of the European Communities. 73.
Shin, Y.-J., Bundy, A., Shannon, L. J., Blanchard, J. L., Chuenpagdee, R., Coll, M.,et al. (2012). Global in scope and regionally rich: an IndiSeas workshop helpsshape the future of marine ecosystem indicators. Rev. Fish Biol. Fish 22, 835–845.doi: 10.1007/s11160-012-9252-z
Simboura, N., Zenetos, A., Pancucci-Papadopoulou, M. A., Reizopoulou, S., andStreftaris, N. (2012). Indicators for the Sea-floor Integrity of the Hellenic Seasunder the European Marine Strategy Framework Directive: establishing thethresholds and standards for Good Environmental Status. Medit. Mar. Sci. 13,140–152. doi: 10.12681/mms.31
Solheim, A. L., Austnes, K., Kristensen, P., Peterlin, M., Kodes, V., Collins, R.,et al. (2012). Ecological and Chemical Status and Pressures in European Waters.Thematic Assessment for EEA Water 2012 Report. Prague: ETC/ICM TechnicalReport, 1:146.
Stelzenmüller, V., Lee, J., South, A., and Rogers, S. I. (2010). Quantifying cumulativeimpacts of human pressures on the marine environment: a geospatial modellingframework. Mar. Ecol. Prog. Ser. 398, 19–32. doi: 10.3354/meps08345
Tett, P., Gowen, R. J., Painting, S. J., Elliott, M., Forster, R., Mills, D. K., et al. (2013).Framework for understanding marine ecosystem health. Mar. Ecol. Prog. Ser.494, 1–27. doi: 10.3354/meps10539
Tueros, I., Borja, A., Larreta, J., Rodríguez, J. G., Valencia, V., and Millán, E. (2009).Integrating long-term water and sediment pollution data, in assessing chemicalstatus within the European Water Framework Directive. Mar. Pollut. Bull. 58,1389–1400. doi: 10.1016/j.marpolbul.2009.04.014
Ulanowicz, R. E. (2000). “Toward the Measurement of Ecological Integrity,”in Ecological Integrity: Integrating Environment, Conservation, and Health,eds D. Pimentel, L. Westra, R. F. Noss (Washington, DC: Island Press),99–113.
Conflict of Interest Statement: The authors declare that the research was con-ducted in the absence of any commercial or financial relationships that could beconstrued as a potential conflict of interest.
Received: 17 May 2014; accepted: 20 November 2014; published online: 05 December2014.Citation: Borja A, Prins TC, Simboura N, Andersen JH, Berg T, Marques J-C, Neto JM,Papadopoulou N, Reker J, Teixeira H and Uusitalo L (2014) Tales from a thousand andone ways to integrate marine ecosystem components when assessing the environmentalstatus. Front. Mar. Sci. 1:72. doi: 10.3389/fmars.2014.00072This article was submitted to Marine Ecosystem Ecology, a section of the journalFrontiers in Marine Science.Copyright © 2014 Borja, Prins, Simboura, Andersen, Berg, Marques, Neto,Papadopoulou, Reker, Teixeira and Uusitalo. This is an open-access article distributedunder the terms of the Creative Commons Attribution License (CC BY). The use, dis-tribution or reproduction in other forums is permitted, provided the original author(s)or licensor are credited and that the original publication in this journal is cited, inaccordance with accepted academic practice. No use, distribution or reproduction ispermitted which does not comply with these terms.
Frontiers in Marine Science | Marine Ecosystem Ecology December 2014 | Volume 1 | Article 72 | 20