
Taking Multiple Infections of Cells and Recombination into Account Leads to Small Within-Host...
12
Taking Multiple Infections of Cells and Recombination into Account Leads to Small Within-Host Effective- Population-Size Estimates of HIV-1 Rajesh Balagam 1 , Vasantika Singh 1 , Aparna Raju Sagi 1 , Narendra M. Dixit 1,2 * 1 Department of Chemical Engineering, Indian Institute of Science, Bangalore, India, 2 Bioinformatics Centre, Indian Institute of Science, Bangalore, India Abstract Whether HIV-1 evolution in infected individuals is dominated by deterministic or stochastic effects remains unclear because current estimates of the effective population size of HIV-1 in vivo, N e , are widely varying. Models assuming HIV-1 evolution to be neutral estimate N e ,10 2 –10 4 , smaller than the inverse mutation rate of HIV-1 (,10 5 ), implying the predominance of stochastic forces. In contrast, a model that includes selection estimates N e .10 5 , suggesting that deterministic forces would hold sway. The consequent uncertainty in the nature of HIV-1 evolution compromises our ability to describe disease progression and outcomes of therapy. We perform detailed bit-string simulations of viral evolution that consider large genome lengths and incorporate the key evolutionary processes underlying the genomic diversification of HIV-1 in infected individuals, namely, mutation, multiple infections of cells, recombination, selection, and epistatic interactions between multiple loci. Our simulations describe quantitatively the evolution of HIV-1 diversity and divergence in patients. From comparisons of our simulations with patient data, we estimate N e ,10 3 –10 4 , implying predominantly stochastic evolution. Interestingly, we find that N e and the viral generation time are correlated with the disease progression time, presenting a route to a priori prediction of disease progression in patients. Further, we show that the previous estimate of N e .10 5 reduces as the frequencies of multiple infections of cells and recombination assumed increase. Our simulations with N e ,10 3 –10 4 may be employed to estimate markers of disease progression and outcomes of therapy that depend on the evolution of viral diversity and divergence. Citation: Balagam R, Singh V, Sagi AR, Dixit NM (2011) Taking Multiple Infections of Cells and Recombination into Account Leads to Small Within-Host Effective- Population-Size Estimates of HIV-1. PLoS ONE 6(1): e14531. doi:10.1371/journal.pone.0014531 Editor: Art F. Y. Poon, BC Centre for Excellence in HIV/AIDS, Canada Received November 20, 2009; Accepted December 14, 2010; Published January 13, 2011 Copyright: ß 2011 Balagam et al. This is an open-access article distributed under the terms of the Creative Commons Attribution License, which permits unrestricted use, distribution, and reproduction in any medium, provided the original author and source are credited. Funding: This work was supported by the National Institutes of Health Grant AI065334. ARS acknowledges the Jawaharlal Nehru Centre for Advanced Scientific Research for a fellowship under JNCASR-SRFP-2008. The funders had no role in study design, data collection and analysis, decision to publish, or preparation of the manuscript. Competing Interests: The authors have declared that no competing interests exist. * E-mail: [email protected] Introduction The within-host genomic evolution of HIV-1 is driven by both deterministic forces such as selection and stochastic forces such as random genetic drift. The large census population of HIV-1 infected cells, ,10 7 –10 8 in a typical patient [1], suggests the predominance of deterministic forces underlying HIV-1 evolution. Yet, inter-patient variations in the duration of the asymptomatic phase of infection, in the set point viral load, and in the rates and patterns of the emergence of drug resistant and immune escape mutants are large [2]. For instance, genotypic resistance to the protease inhibitor ritonavir arose at widely different times and through distinct combinations of mutations in different patients [3]. One reason for these inter-patient variations may be variations in host-genetic factors [2,4]. Recently, variation in the copy number of the CCL3L1 gene, a potent suppressor of HIV-1, was shown to be associated with the variation in the susceptibility of individuals to HIV-1 [5]. Inter-patient variations may also arise if stochastic forces underlying HIV-1 evolution dominate determin- istic forces. The relative influence of stochastic forces is determined by the within-host effective population size, N e : despite the large census population, stochastic forces may dominate if N e is small [6]. Current estimates of N e are widely varying, ranging from a few hundred to .10 5 cells, which leaves unclear the nature of HIV-1 evolution in vivo and limits our ability to describe disease progression and outcomes of therapy [7]. N e is defined as the size of an idealized population that has the same population genetic properties as that of the natural population [7,8]. To estimate N e , a calibration quantity that is measurable in the natural population, such as genomic diversity, is predicted using a model of the evolution of an idealized population, such as the Wright-Fisher model. The calibration quantity is a function of the population size, C, in the idealized model. N e is then identified as that value of C at which the predicted value of the calibration quantity matches the value measured in the natural population. Accurate estimation of N e relies on an idealized model that closely mimics the evolution of the calibration quantity in the natural population [7]. The idealized model with C = N e may then be employed to predict other quantities that describe the behaviour of the natural population but are difficult to measure so long as the evolutionary forces that govern the latter quantities are the same as those underlying the calibration quantity and incorporated in the idealized model [7]. To estimate N e for HIV-1 in vivo, several studies have employed idealized models that assume HIV-1 evolution to be neutral [3,9– PLoS ONE | www.plosone.org 1 January 2011 | Volume 6 | Issue 1 | e14531
-
Upload
independent -
Category
Documents
-
view
2 -
download
0
Transcript of Taking Multiple Infections of Cells and Recombination into Account Leads to Small Within-Host...
Taking Multiple Infections of Cells and Recombinationinto Account Leads to Small Within-Host Effective-Population-Size Estimates of HIV-1Rajesh Balagam1, Vasantika Singh1, Aparna Raju Sagi1, Narendra M. Dixit1,2*
1 Department of Chemical Engineering, Indian Institute of Science, Bangalore, India, 2 Bioinformatics Centre, Indian Institute of Science, Bangalore, India
Abstract
Whether HIV-1 evolution in infected individuals is dominated by deterministic or stochastic effects remains unclear becausecurrent estimates of the effective population size of HIV-1 in vivo, Ne, are widely varying. Models assuming HIV-1 evolutionto be neutral estimate Ne,102–104, smaller than the inverse mutation rate of HIV-1 (,105), implying the predominance ofstochastic forces. In contrast, a model that includes selection estimates Ne.105, suggesting that deterministic forces wouldhold sway. The consequent uncertainty in the nature of HIV-1 evolution compromises our ability to describe diseaseprogression and outcomes of therapy. We perform detailed bit-string simulations of viral evolution that consider largegenome lengths and incorporate the key evolutionary processes underlying the genomic diversification of HIV-1 in infectedindividuals, namely, mutation, multiple infections of cells, recombination, selection, and epistatic interactions betweenmultiple loci. Our simulations describe quantitatively the evolution of HIV-1 diversity and divergence in patients. Fromcomparisons of our simulations with patient data, we estimate Ne,103–104, implying predominantly stochastic evolution.Interestingly, we find that Ne and the viral generation time are correlated with the disease progression time, presenting aroute to a priori prediction of disease progression in patients. Further, we show that the previous estimate of Ne.105
reduces as the frequencies of multiple infections of cells and recombination assumed increase. Our simulations withNe,103–104 may be employed to estimate markers of disease progression and outcomes of therapy that depend on theevolution of viral diversity and divergence.
Citation: Balagam R, Singh V, Sagi AR, Dixit NM (2011) Taking Multiple Infections of Cells and Recombination into Account Leads to Small Within-Host Effective-Population-Size Estimates of HIV-1. PLoS ONE 6(1): e14531. doi:10.1371/journal.pone.0014531
Editor: Art F. Y. Poon, BC Centre for Excellence in HIV/AIDS, Canada
Received November 20, 2009; Accepted December 14, 2010; Published January 13, 2011
Copyright: � 2011 Balagam et al. This is an open-access article distributed under the terms of the Creative Commons Attribution License, which permitsunrestricted use, distribution, and reproduction in any medium, provided the original author and source are credited.
Funding: This work was supported by the National Institutes of Health Grant AI065334. ARS acknowledges the Jawaharlal Nehru Centre for Advanced ScientificResearch for a fellowship under JNCASR-SRFP-2008. The funders had no role in study design, data collection and analysis, decision to publish, or preparation ofthe manuscript.
Competing Interests: The authors have declared that no competing interests exist.
* E-mail: [email protected]
Introduction
The within-host genomic evolution of HIV-1 is driven by both
deterministic forces such as selection and stochastic forces such as
random genetic drift. The large census population of HIV-1
infected cells, ,107–108 in a typical patient [1], suggests the
predominance of deterministic forces underlying HIV-1 evolution.
Yet, inter-patient variations in the duration of the asymptomatic
phase of infection, in the set point viral load, and in the rates and
patterns of the emergence of drug resistant and immune escape
mutants are large [2]. For instance, genotypic resistance to the
protease inhibitor ritonavir arose at widely different times and
through distinct combinations of mutations in different patients
[3]. One reason for these inter-patient variations may be variations
in host-genetic factors [2,4]. Recently, variation in the copy
number of the CCL3L1 gene, a potent suppressor of HIV-1, was
shown to be associated with the variation in the susceptibility of
individuals to HIV-1 [5]. Inter-patient variations may also arise if
stochastic forces underlying HIV-1 evolution dominate determin-
istic forces. The relative influence of stochastic forces is determined
by the within-host effective population size, Ne: despite the large
census population, stochastic forces may dominate if Ne is small
[6]. Current estimates of Ne are widely varying, ranging from a few
hundred to .105 cells, which leaves unclear the nature of HIV-1
evolution in vivo and limits our ability to describe disease
progression and outcomes of therapy [7].
Ne is defined as the size of an idealized population that has the
same population genetic properties as that of the natural
population [7,8]. To estimate Ne, a calibration quantity that is
measurable in the natural population, such as genomic diversity, is
predicted using a model of the evolution of an idealized
population, such as the Wright-Fisher model. The calibration
quantity is a function of the population size, C, in the idealized
model. Ne is then identified as that value of C at which the
predicted value of the calibration quantity matches the value
measured in the natural population. Accurate estimation of Ne
relies on an idealized model that closely mimics the evolution of
the calibration quantity in the natural population [7]. The
idealized model with C = Ne may then be employed to predict
other quantities that describe the behaviour of the natural
population but are difficult to measure so long as the evolutionary
forces that govern the latter quantities are the same as those
underlying the calibration quantity and incorporated in the
idealized model [7].
To estimate Ne for HIV-1 in vivo, several studies have employed
idealized models that assume HIV-1 evolution to be neutral [3,9–
PLoS ONE | www.plosone.org 1 January 2011 | Volume 6 | Issue 1 | e14531
13]; i.e., that genomic variations do not lead to variation in fitness
and therefore selective forces are inconsequential. By comparisons
of model predictions with data on polymorphisms in the env or the
gag-pol region of HIV-1, the latter studies obtained Ne,102–104.
These latter studies employed several tests to ascertain the
predominant neutrality of HIV-1 evolution. More recent evidence,
however, points to significant selective pressures on both the env
and the gag-pol regions [7,12,14], rendering uncertain the estimates
of Ne obtained by neutral models. Rouzine and Coffin considered
HIV-1 evolution with selection and predicted the frequency of the
least abundant haplotype in a two-locus/two-allele model [15]. By
comparison with data from env and pro regions, the latter model
yielded Ne.105. The latter model, however, did not include
recombination. Growing evidence [16,17], including the observa-
tion of circulating recombinant forms of HIV-1 as well as
recombinant forms unique to individuals [18], points to the
significance of recombination in the evolution of HIV-1.
Recombination alters the association of mutations and influences
the prevalence of haplotypes [19-22], which in turn may affect the
estimate of Ne obtained by Rouzine and Coffin. It is of importance
therefore to estimate Ne using a model of HIV-1 evolution that
incorporates both selection and recombination.
Substantial efforts are ongoing to describe HIV-1 evolution in
the presence of recombination [23-35]. Recent advances in
mathematical modelling and stochastic simulations have provided
valuable insights into the role of recombination in the genomic
diversification of HIV-1 in vivo, particularly in the context of the
development of resistance to antiretroviral therapy (reviewed in
[22]). Specifically, the influence of recombination is predicted to
depend sensitively on Ne and on the nature of fitness interactions
between loci, characterized by epistasis: When Ne is small,
recombination tends to lower viral genomic diversity independent
of epistasis, whereas when Ne is large, recombination lowers
(enhances) diversity if epistasis is positive (negative). Further,
recombination is also predicted to lower the waiting time for the
emergence of viral genomes carrying new, potentially favourable
combinations of mutations.
Our aim is to employ a model of HIV-1 evolution that
accurately mimics viral genomic diversification in infected
individuals as a function of the population size and estimate Ne
from comparisons of model predictions with patient data.
Analytical models of HIV-1 evolution with recombination allow
description of viral evolution not only at the extremes of very small
and very large Ne, where drift and selection, respectively,
dominate, but also at intermediate values of Ne where both
selection and drift remain important simultaneously [24,27,28,
31,33-35]. The models, however, are restricted to a small number
of loci and/or to simple (multiplicative) fitness landscapes.
Experimental data on viral diversification, in contrast, is available
over genomic regions that are up to several hundred nucleotides
long (e.g., see [36]). Besides, the best available description of the
HIV-1 fitness landscape [37] points to significant deviations from a
simple multiplicative fitness profile. To overcome these limitations
of analytical models, we have recently developed bit-string
simulations of the within-host genomic diversification of HIV-1
[32]. Our simulations consider large genome lengths and
incorporate mutation, infection of cells by multiple virions,
recombination, fitness selection, and epistatic interactions between
multiple loci, thereby presenting a detailed description of the
evolution of viral diversity and divergence in infected individuals
[32]. In particular, our simulations elucidate the role of
recombination in HIV-1 diversification as a function of Ne and
with the experimentally determined fitness landscape. Here, we
apply the simulations to describe patient data and obtain estimates
of Ne. We examine the dependence of our estimates of Ne on the
frequency of multiple infections of cells and on the nature of the
fitness landscape, which remain to be established in vivo. Finally,
we revisit the large estimate of Ne obtained by Rouzine and Coffin
[15] by incorporating multiple infections of cells and recombina-
tion in their two-locus/two-allele model.
Results
Simulations of the within-host genomic diversification ofHIV-1
We perform simulations to predict the evolution of viral
diversity, dG, and divergence, dS, in an HIV-1 infected individual
(Methods). Diversity is a measure of the genomic variation in the
viral population at any given time, whereas divergence is a
measure of the deviation of the viral genomes from the founder
strain. Simulations begin with the synchronous infection of a fixed
population, C, of cells by identical homozygous virions. Following
infection, viral RNA are reverse transcribed to proviral DNA,
during which process mutation and recombination introduce
genomic variation. Proviral DNA are then transcribed into viral
RNA, which are randomly assorted into pairs and released as new
virions. New virions are chosen according to their fitness to infect
the next generation of uninfected cells, and the cycle is repeated.
We employ parameter values representative of HIV-1 infection
in vivo. We consider a viral genome length of L = 100 nucleotides,
which spans the experimental fitness landscape [37] (Methods) and
captures expected epistatic interactions between multiple loci and
is also similar to the genome lengths examined in the experiments
we consider [36] (see below). We assume that mutations occur
independently at each of the L sites at the rate m = 361025
substitutions per site per replication [38]. Because a majority of
HIV mutations are transitions [38], we ignore transversions,
insertions and deletions. Following recent estimates, we choose the
recombination rate r = 8.361024 crossovers per site per replica-
tion [17,31]. The relative fitness of the founder strain, determined
by j (Methods), remains unknown. Recent studies show that the
founder strain evolves under selective forces and is distinct from
the strain(s) dominant in the chronic infection phase [39–41]. In a
previous study, we found that j,0.05–0.1 provides best fits to the
evolution of divergence and diversity in the two patients examined
[32]. This is in accordance with the maximum divergence of ,0.1
in the patient data we consider [36]. Here, we therefore set j= 0.1.
We let selection follow the fitness landscape determined experi-
mentally [37] (Methods). We also examine the effects of alternative
(multiplicative) fitness landscapes on our estimates of Ne. The
frequency of multiple infections of cells in vivo remains uncertain.
Infections of individual cells by multiple virions allow the
formation of heterozygous progeny virions and set the stage for
recombination to introduce genomic variation [42]. Jung et al.
[16] found that infected splenocytes in the two patients they
examined harbored between 1 and 8 proviruses with a mean of 3–
4 proviruses per cell. In contrast, Josefsson et al. [43] recently
observed that a vast majority of the peripheral blood mononuclear
cells in four patients harbored single proviruses. Here, we
therefore perform simulations with both these patterns of multiple
infections of cells: We first follow Jung et al. [16] and let each cell
be infected by M = 3 virions. We then repeat our simulations with
M drawn from a distribution that follows from a model of viral
dynamics (Methods) and that mimics the observations of Josefsson
et al. [43]. Although the viral burst size is large, ,102–104
[1,44,45] only a few (2–3 per cell [46]) of the virions produced may
be infectious [46–48]. More recent estimates of the basic
reproductive ratio of HIV-1 in vivo suggest the production of 6–8
Within-Host Effective Population Size of HIV-1
PLoS ONE | www.plosone.org 2 January 2011 | Volume 6 | Issue 1 | e14531
infectious virions per cell [49]. Here, we let each cell produce P = 5
infectious progeny virions [32]. We let simulations proceed to
4000 generations (,10–12 years).
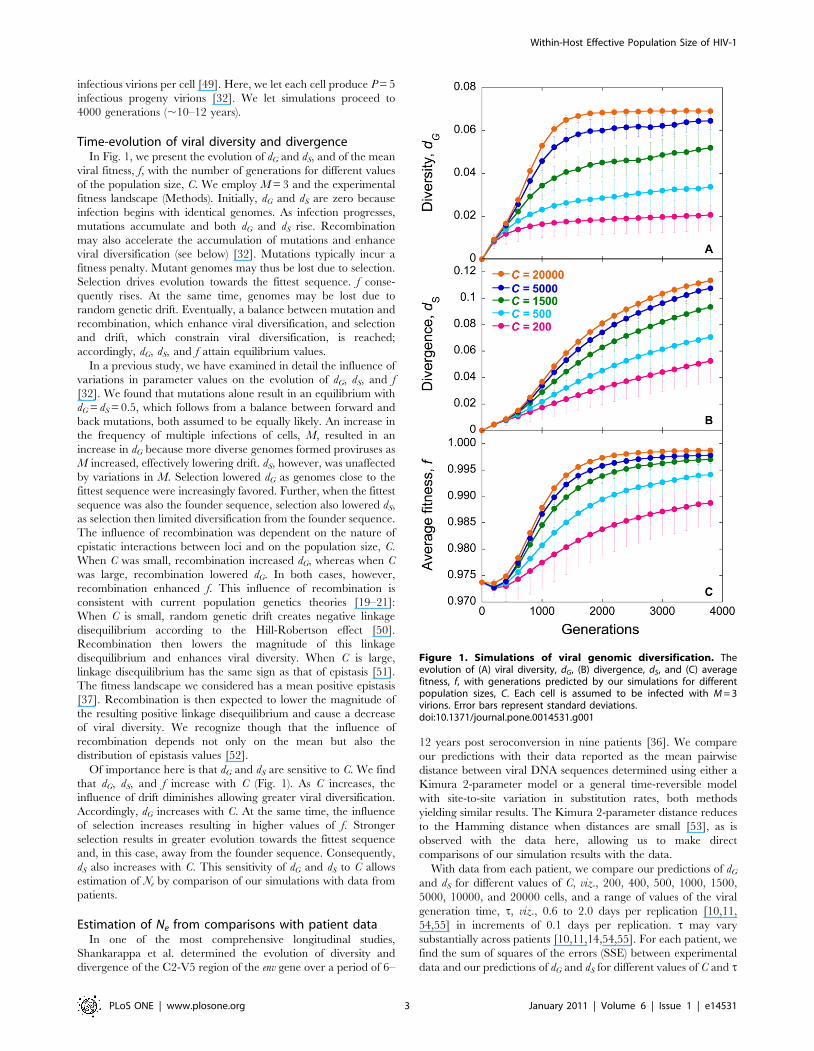
Time-evolution of viral diversity and divergenceIn Fig. 1, we present the evolution of dG and dS, and of the mean
viral fitness, f, with the number of generations for different values
of the population size, C. We employ M = 3 and the experimental
fitness landscape (Methods). Initially, dG and dS are zero because
infection begins with identical genomes. As infection progresses,
mutations accumulate and both dG and dS rise. Recombination
may also accelerate the accumulation of mutations and enhance
viral diversification (see below) [32]. Mutations typically incur a
fitness penalty. Mutant genomes may thus be lost due to selection.
Selection drives evolution towards the fittest sequence. f conse-
quently rises. At the same time, genomes may be lost due to
random genetic drift. Eventually, a balance between mutation and
recombination, which enhance viral diversification, and selection
and drift, which constrain viral diversification, is reached;
accordingly, dG, dS, and f attain equilibrium values.
In a previous study, we have examined in detail the influence of
variations in parameter values on the evolution of dG, dS, and f
[32]. We found that mutations alone result in an equilibrium with
dG = dS = 0.5, which follows from a balance between forward and
back mutations, both assumed to be equally likely. An increase in
the frequency of multiple infections of cells, M, resulted in an
increase in dG because more diverse genomes formed proviruses as
M increased, effectively lowering drift. dS, however, was unaffected
by variations in M. Selection lowered dG as genomes close to the
fittest sequence were increasingly favored. Further, when the fittest
sequence was also the founder sequence, selection also lowered dS,
as selection then limited diversification from the founder sequence.
The influence of recombination was dependent on the nature of
epistatic interactions between loci and on the population size, C.
When C was small, recombination increased dG, whereas when C
was large, recombination lowered dG. In both cases, however,
recombination enhanced f. This influence of recombination is
consistent with current population genetics theories [19–21]:
When C is small, random genetic drift creates negative linkage
disequilibrium according to the Hill-Robertson effect [50].
Recombination then lowers the magnitude of this linkage
disequilibrium and enhances viral diversity. When C is large,
linkage disequilibrium has the same sign as that of epistasis [51].
The fitness landscape we considered has a mean positive epistasis
[37]. Recombination is then expected to lower the magnitude of
the resulting positive linkage disequilibrium and cause a decrease
of viral diversity. We recognize though that the influence of
recombination depends not only on the mean but also the
distribution of epistasis values [52].
Of importance here is that dG and dS are sensitive to C. We find
that dG, dS, and f increase with C (Fig. 1). As C increases, the
influence of drift diminishes allowing greater viral diversification.
Accordingly, dG increases with C. At the same time, the influence
of selection increases resulting in higher values of f. Stronger
selection results in greater evolution towards the fittest sequence
and, in this case, away from the founder sequence. Consequently,
dS also increases with C. This sensitivity of dG and dS to C allows
estimation of Ne by comparison of our simulations with data from
patients.
Estimation of Ne from comparisons with patient dataIn one of the most comprehensive longitudinal studies,
Shankarappa et al. determined the evolution of diversity and
divergence of the C2-V5 region of the env gene over a period of 6–
12 years post seroconversion in nine patients [36]. We compare
our predictions with their data reported as the mean pairwise
distance between viral DNA sequences determined using either a
Kimura 2-parameter model or a general time-reversible model
with site-to-site variation in substitution rates, both methods
yielding similar results. The Kimura 2-parameter distance reduces
to the Hamming distance when distances are small [53], as is
observed with the data here, allowing us to make direct
comparisons of our simulation results with the data.
With data from each patient, we compare our predictions of dG
and dS for different values of C, viz., 200, 400, 500, 1000, 1500,
5000, 10000, and 20000 cells, and a range of values of the viral
generation time, t, viz., 0.6 to 2.0 days per replication [10,11,
54,55] in increments of 0.1 days per replication. t may vary
substantially across patients [10,11,14,54,55]. For each patient, we
find the sum of squares of the errors (SSE) between experimental
data and our predictions of dG and dS for different values of C and t
Figure 1. Simulations of viral genomic diversification. Theevolution of (A) viral diversity, dG, (B) divergence, dS, and (C) averagefitness, f, with generations predicted by our simulations for differentpopulation sizes, C. Each cell is assumed to be infected with M = 3virions. Error bars represent standard deviations.doi:10.1371/journal.pone.0014531.g001
Within-Host Effective Population Size of HIV-1
PLoS ONE | www.plosone.org 3 January 2011 | Volume 6 | Issue 1 | e14531
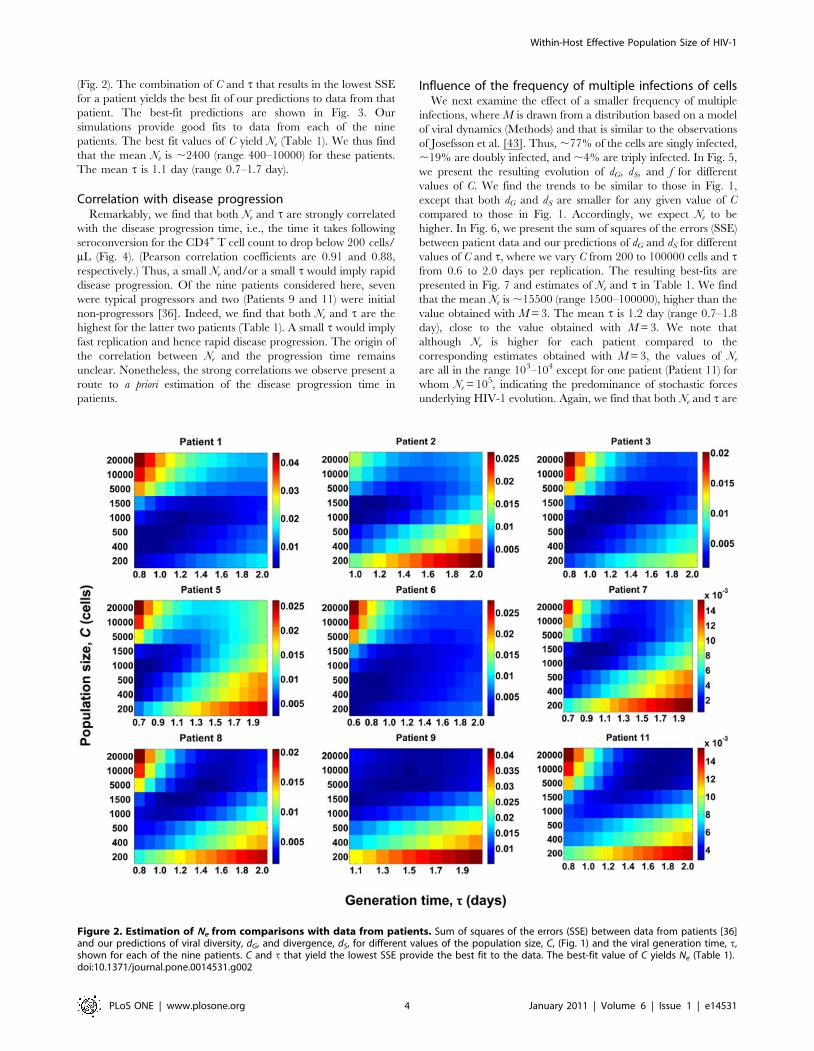
(Fig. 2). The combination of C and t that results in the lowest SSE
for a patient yields the best fit of our predictions to data from that
patient. The best-fit predictions are shown in Fig. 3. Our
simulations provide good fits to data from each of the nine
patients. The best fit values of C yield Ne (Table 1). We thus find
that the mean Ne is ,2400 (range 400–10000) for these patients.
The mean t is 1.1 day (range 0.7–1.7 day).
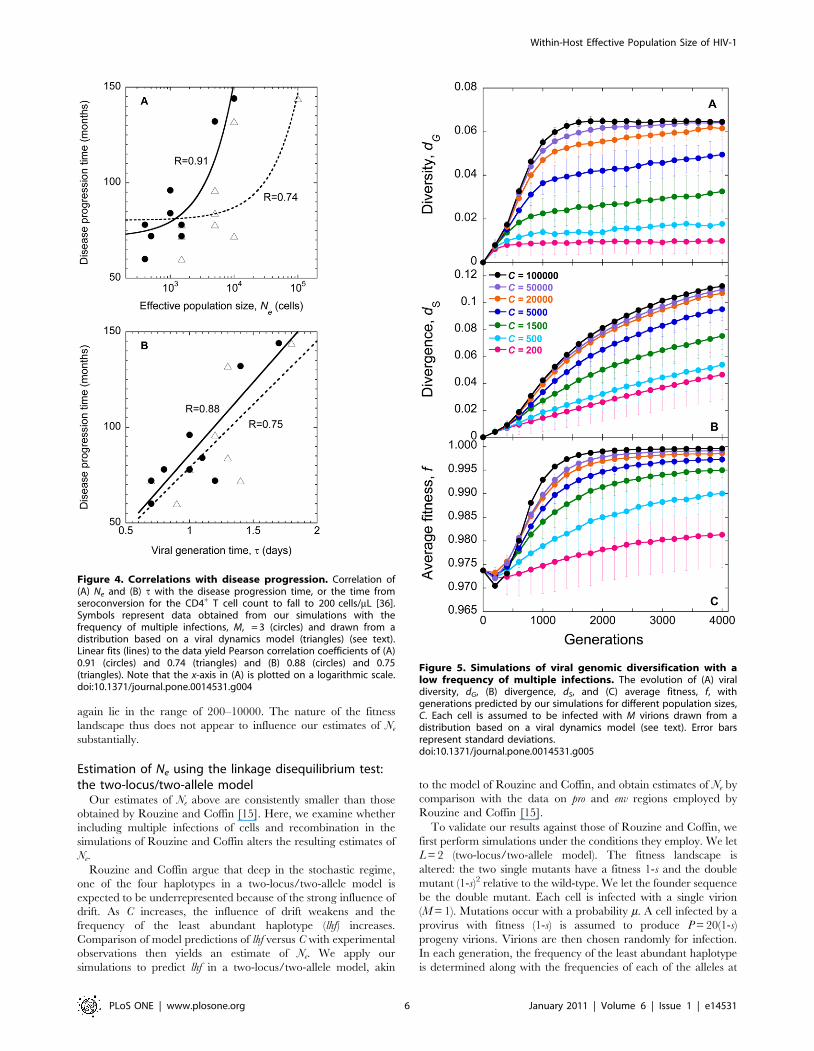
Correlation with disease progressionRemarkably, we find that both Ne and t are strongly correlated
with the disease progression time, i.e., the time it takes following
seroconversion for the CD4+ T cell count to drop below 200 cells/
mL (Fig. 4). (Pearson correlation coefficients are 0.91 and 0.88,
respectively.) Thus, a small Ne and/or a small t would imply rapid
disease progression. Of the nine patients considered here, seven
were typical progressors and two (Patients 9 and 11) were initial
non-progressors [36]. Indeed, we find that both Ne and t are the
highest for the latter two patients (Table 1). A small t would imply
fast replication and hence rapid disease progression. The origin of
the correlation between Ne and the progression time remains
unclear. Nonetheless, the strong correlations we observe present a
route to a priori estimation of the disease progression time in
patients.
Influence of the frequency of multiple infections of cellsWe next examine the effect of a smaller frequency of multiple
infections, where M is drawn from a distribution based on a model
of viral dynamics (Methods) and that is similar to the observations
of Josefsson et al. [43]. Thus, ,77% of the cells are singly infected,
,19% are doubly infected, and ,4% are triply infected. In Fig. 5,
we present the resulting evolution of dG, dS, and f for different
values of C. We find the trends to be similar to those in Fig. 1,
except that both dG and dS are smaller for any given value of C
compared to those in Fig. 1. Accordingly, we expect Ne to be
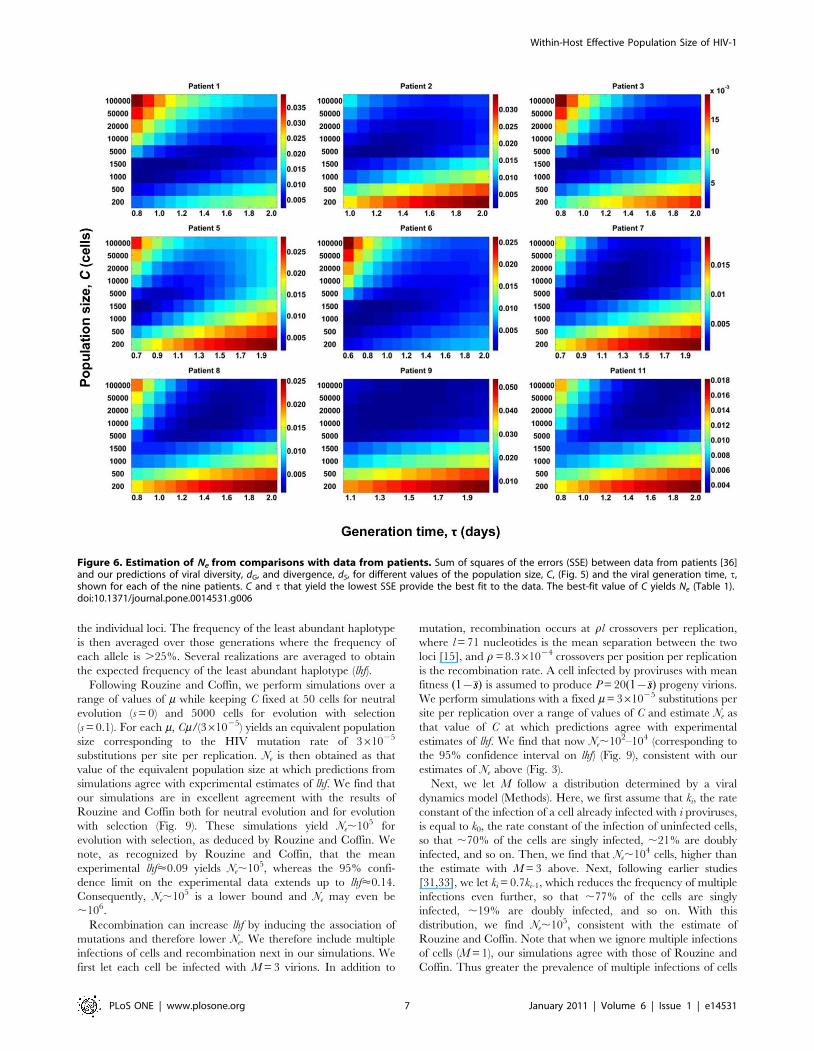
higher. In Fig. 6, we present the sum of squares of the errors (SSE)
between patient data and our predictions of dG and dS for different
values of C and t, where we vary C from 200 to 100000 cells and tfrom 0.6 to 2.0 days per replication. The resulting best-fits are
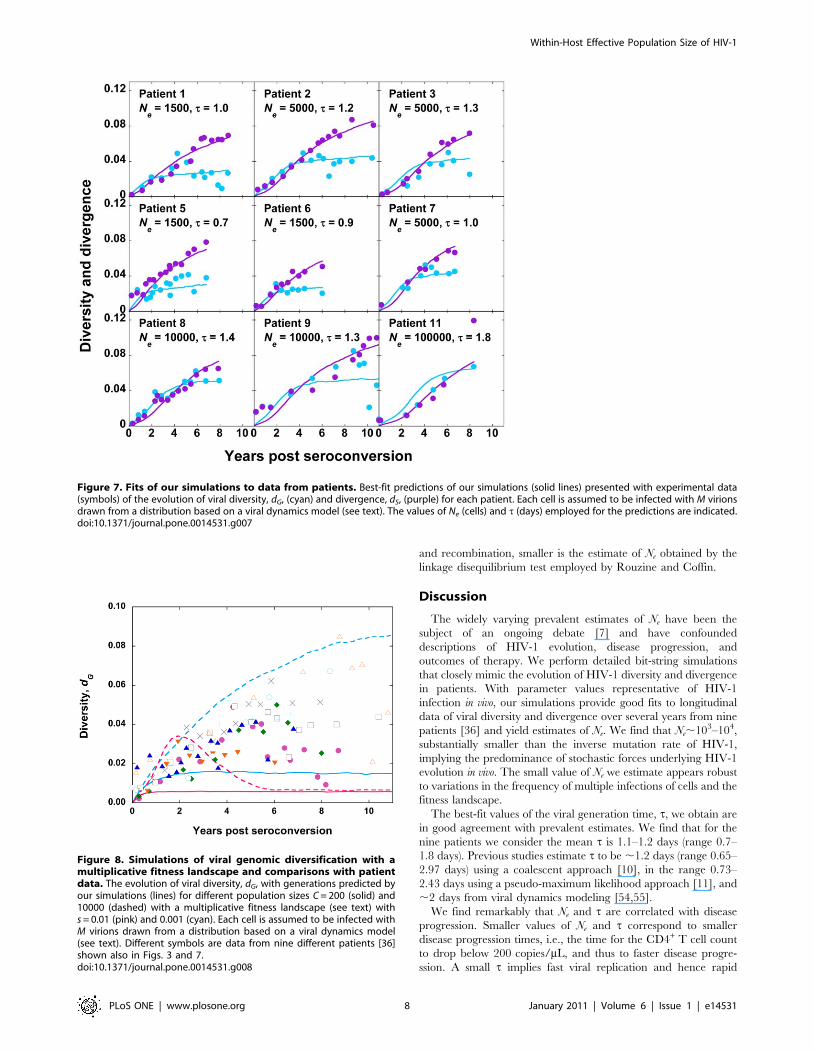
presented in Fig. 7 and estimates of Ne and t in Table 1. We find
that the mean Ne is ,15500 (range 1500–100000), higher than the
value obtained with M = 3. The mean t is 1.2 day (range 0.7–1.8
day), close to the value obtained with M = 3. We note that
although Ne is higher for each patient compared to the
corresponding estimates obtained with M = 3, the values of Ne
are all in the range 103–104 except for one patient (Patient 11) for
whom Ne = 105, indicating the predominance of stochastic forces
underlying HIV-1 evolution. Again, we find that both Ne and t are
Figure 2. Estimation of Ne from comparisons with data from patients. Sum of squares of the errors (SSE) between data from patients [36]and our predictions of viral diversity, dG, and divergence, dS, for different values of the population size, C, (Fig. 1) and the viral generation time, t,shown for each of the nine patients. C and t that yield the lowest SSE provide the best fit to the data. The best-fit value of C yields Ne (Table 1).doi:10.1371/journal.pone.0014531.g002
Within-Host Effective Population Size of HIV-1
PLoS ONE | www.plosone.org 4 January 2011 | Volume 6 | Issue 1 | e14531

correlated with the disease progression time, although the
correlations are weaker than with M = 3 (Fig. 4).
Influence of the fitness landscapeWe examine next whether the nature of the fitness landscape
has any influence on our estimates of Ne. In the absence of
information on the fitness landscape in vivo, a multiplicative fitness
landscape, which assumes that fi = exp(-sdiFL), has been employed
in recent studies [28,30,35], where diF is the normalized Hamming
distance of sequence i from the fittest sequence and s is the fitness
penalty per mutation. Here, we perform calculations with the
latter landscape for two values of s, viz., 0.01 and 0.001 (see [35]).
M is drawn from a distribution based on a model of viral dynamics
mentioned above. We find that with s = 0.01, both dG and dS
assume equilibrium values of ,0.01 over a wide range of values of
C, which is inconsistent with patient data (Fig. 8). With s = 0.001,
the evolution of dG and dS is consistent with patient data over the
range C = 200–10000 (Fig. 8). Thus, the resulting values of Ne
Figure 3. Fits of our simulations to data from patients. Best-fit predictions of our simulations (solid lines) presented with experimental data(symbols) of the evolution of viral diversity, dG, (cyan) and divergence, dS, (purple) for each patient. Each cell is assumed to be infected with M = 3virions in our simulations. The values of Ne (cells) and t (days) employed for the predictions are indicated.doi:10.1371/journal.pone.0014531.g003
Table 1. Best-fit parameter estimates and the disease progression time.
PatientEffective populationsize, Ne (cells) (Fig. 3)
Viral generationtime, t (days) (Fig. 3)
Effective populationsize, Ne (cells) (Fig. 7)
Viral generationtime, t (days) (Fig. 7)
Disease progressiontime (months) [36]
1 400 0.8 1500 1.0 78
2 1000 1.0 5000 1.2 96
3 1000 1.1 5000 1.3 84
5 500 0.7 1500 0.7 72
6 400 0.7 1500 0.9 60
7 1500 1.0 5000 1.0 78
8 1500 1.2 10000 1.4 72
9 5000 1.4 10000 1.3 132
11 10000 1.7 100000 1.8 144
Mean 2367 1.1 15500 1.2 91
Best-fit estimates of Ne and t obtained by comparison of our simulations with data of viral diversity and divergence from different patients [36] (Figs. 3 and 7). Also listedare the disease progression times determined experimentally [36].doi:10.1371/journal.pone.0014531.t001
Within-Host Effective Population Size of HIV-1
PLoS ONE | www.plosone.org 5 January 2011 | Volume 6 | Issue 1 | e14531
again lie in the range of 200–10000. The nature of the fitness
landscape thus does not appear to influence our estimates of Ne
substantially.
Estimation of Ne using the linkage disequilibrium test:the two-locus/two-allele model
Our estimates of Ne above are consistently smaller than those
obtained by Rouzine and Coffin [15]. Here, we examine whether
including multiple infections of cells and recombination in the
simulations of Rouzine and Coffin alters the resulting estimates of
Ne.
Rouzine and Coffin argue that deep in the stochastic regime,
one of the four haplotypes in a two-locus/two-allele model is
expected to be underrepresented because of the strong influence of
drift. As C increases, the influence of drift weakens and the
frequency of the least abundant haplotype (lhf) increases.
Comparison of model predictions of lhf versus C with experimental
observations then yields an estimate of Ne. We apply our
simulations to predict lhf in a two-locus/two-allele model, akin
to the model of Rouzine and Coffin, and obtain estimates of Ne by
comparison with the data on pro and env regions employed by
Rouzine and Coffin [15].
To validate our results against those of Rouzine and Coffin, we
first perform simulations under the conditions they employ. We let
L = 2 (two-locus/two-allele model). The fitness landscape is
altered: the two single mutants have a fitness 1-s and the double
mutant (1-s)2 relative to the wild-type. We let the founder sequence
be the double mutant. Each cell is infected with a single virion
(M = 1). Mutations occur with a probability m. A cell infected by a
provirus with fitness (1-s) is assumed to produce P = 20(1-s)
progeny virions. Virions are then chosen randomly for infection.
In each generation, the frequency of the least abundant haplotype
is determined along with the frequencies of each of the alleles at
Figure 4. Correlations with disease progression. Correlation of(A) Ne and (B) t with the disease progression time, or the time fromseroconversion for the CD4+ T cell count to fall to 200 cells/mL [36].Symbols represent data obtained from our simulations with thefrequency of multiple infections, M, = 3 (circles) and drawn from adistribution based on a viral dynamics model (triangles) (see text).Linear fits (lines) to the data yield Pearson correlation coefficients of (A)0.91 (circles) and 0.74 (triangles) and (B) 0.88 (circles) and 0.75(triangles). Note that the x-axis in (A) is plotted on a logarithmic scale.doi:10.1371/journal.pone.0014531.g004
Figure 5. Simulations of viral genomic diversification with alow frequency of multiple infections. The evolution of (A) viraldiversity, dG, (B) divergence, dS, and (C) average fitness, f, withgenerations predicted by our simulations for different population sizes,C. Each cell is assumed to be infected with M virions drawn from adistribution based on a viral dynamics model (see text). Error barsrepresent standard deviations.doi:10.1371/journal.pone.0014531.g005
Within-Host Effective Population Size of HIV-1
PLoS ONE | www.plosone.org 6 January 2011 | Volume 6 | Issue 1 | e14531
the individual loci. The frequency of the least abundant haplotype
is then averaged over those generations where the frequency of
each allele is .25%. Several realizations are averaged to obtain
the expected frequency of the least abundant haplotype (lhf).
Following Rouzine and Coffin, we perform simulations over a
range of values of m while keeping C fixed at 50 cells for neutral
evolution (s = 0) and 5000 cells for evolution with selection
(s = 0.1). For each m, Cm/(361025) yields an equivalent population
size corresponding to the HIV mutation rate of 361025
substitutions per site per replication. Ne is then obtained as that
value of the equivalent population size at which predictions from
simulations agree with experimental estimates of lhf. We find that
our simulations are in excellent agreement with the results of
Rouzine and Coffin both for neutral evolution and for evolution
with selection (Fig. 9). These simulations yield Ne,105 for
evolution with selection, as deduced by Rouzine and Coffin. We
note, as recognized by Rouzine and Coffin, that the mean
experimental lhf<0.09 yields Ne,105, whereas the 95% confi-
dence limit on the experimental data extends up to lhf<0.14.
Consequently, Ne,105 is a lower bound and Ne may even be
,106.
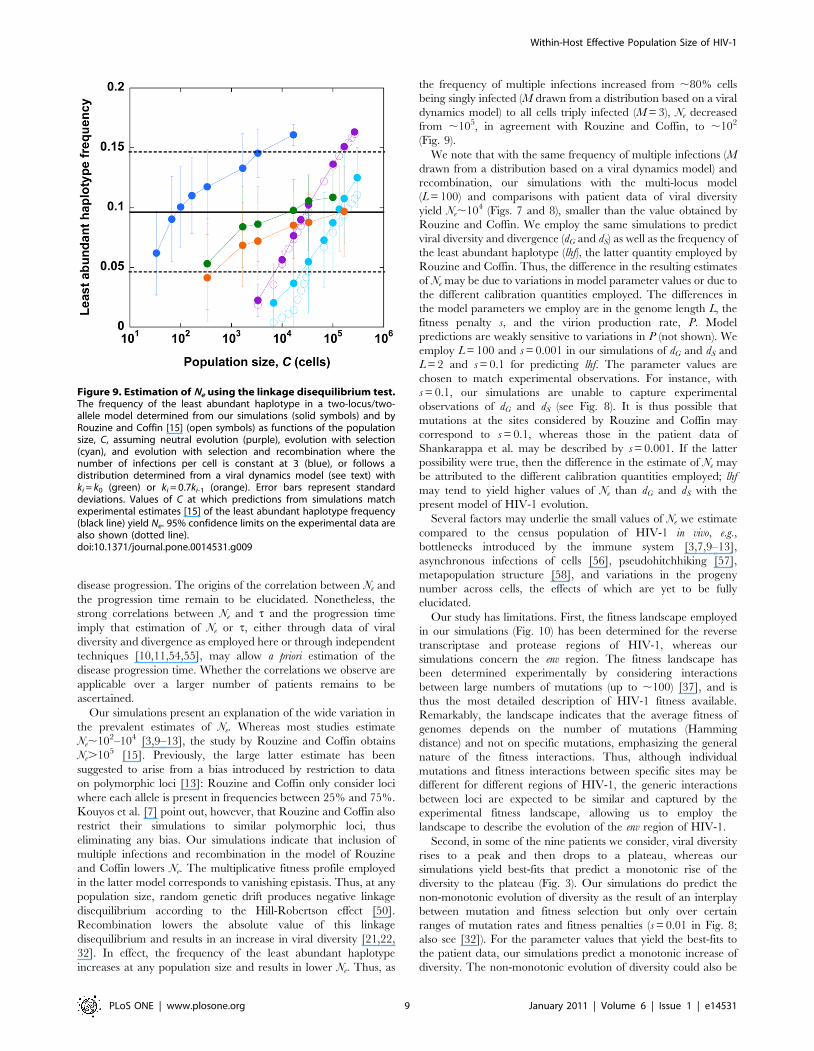
Recombination can increase lhf by inducing the association of
mutations and therefore lower Ne. We therefore include multiple
infections of cells and recombination next in our simulations. We
first let each cell be infected with M = 3 virions. In addition to
mutation, recombination occurs at rl crossovers per replication,
where l = 71 nucleotides is the mean separation between the two
loci [15], and r = 8.361024 crossovers per position per replication
is the recombination rate. A cell infected by proviruses with mean
fitness (1{�ss) is assumed to produce P = 20(1{�ss) progeny virions.
We perform simulations with a fixed m = 361025 substitutions per
site per replication over a range of values of C and estimate Ne as
that value of C at which predictions agree with experimental
estimates of lhf. We find that now Ne,102–104 (corresponding to
the 95% confidence interval on lhf) (Fig. 9), consistent with our
estimates of Ne above (Fig. 3).
Next, we let M follow a distribution determined by a viral
dynamics model (Methods). Here, we first assume that ki, the rate
constant of the infection of a cell already infected with i proviruses,
is equal to k0, the rate constant of the infection of uninfected cells,
so that ,70% of the cells are singly infected, ,21% are doubly
infected, and so on. Then, we find that Ne,104 cells, higher than
the estimate with M = 3 above. Next, following earlier studies
[31,33], we let ki = 0.7ki-1, which reduces the frequency of multiple
infections even further, so that ,77% of the cells are singly
infected, ,19% are doubly infected, and so on. With this
distribution, we find Ne,105, consistent with the estimate of
Rouzine and Coffin. Note that when we ignore multiple infections
of cells (M = 1), our simulations agree with those of Rouzine and
Coffin. Thus greater the prevalence of multiple infections of cells
Figure 6. Estimation of Ne from comparisons with data from patients. Sum of squares of the errors (SSE) between data from patients [36]and our predictions of viral diversity, dG, and divergence, dS, for different values of the population size, C, (Fig. 5) and the viral generation time, t,shown for each of the nine patients. C and t that yield the lowest SSE provide the best fit to the data. The best-fit value of C yields Ne (Table 1).doi:10.1371/journal.pone.0014531.g006
Within-Host Effective Population Size of HIV-1
PLoS ONE | www.plosone.org 7 January 2011 | Volume 6 | Issue 1 | e14531
and recombination, smaller is the estimate of Ne obtained by the
linkage disequilibrium test employed by Rouzine and Coffin.
Discussion
The widely varying prevalent estimates of Ne have been the
subject of an ongoing debate [7] and have confounded
descriptions of HIV-1 evolution, disease progression, and
outcomes of therapy. We perform detailed bit-string simulations
that closely mimic the evolution of HIV-1 diversity and divergence
in patients. With parameter values representative of HIV-1
infection in vivo, our simulations provide good fits to longitudinal
data of viral diversity and divergence over several years from nine
patients [36] and yield estimates of Ne. We find that Ne,103–104,
substantially smaller than the inverse mutation rate of HIV-1,
implying the predominance of stochastic forces underlying HIV-1
evolution in vivo. The small value of Ne we estimate appears robust
to variations in the frequency of multiple infections of cells and the
fitness landscape.
The best-fit values of the viral generation time, t, we obtain are
in good agreement with prevalent estimates. We find that for the
nine patients we consider the mean t is 1.1–1.2 days (range 0.7–
1.8 days). Previous studies estimate t to be ,1.2 days (range 0.65–
2.97 days) using a coalescent approach [10], in the range 0.73–
2.43 days using a pseudo-maximum likelihood approach [11], and
,2 days from viral dynamics modeling [54,55].
We find remarkably that Ne and t are correlated with disease
progression. Smaller values of Ne and t correspond to smaller
disease progression times, i.e., the time for the CD4+ T cell count
to drop below 200 copies/mL, and thus to faster disease progre-
ssion. A small t implies fast viral replication and hence rapid
Figure 7. Fits of our simulations to data from patients. Best-fit predictions of our simulations (solid lines) presented with experimental data(symbols) of the evolution of viral diversity, dG, (cyan) and divergence, dS, (purple) for each patient. Each cell is assumed to be infected with M virionsdrawn from a distribution based on a viral dynamics model (see text). The values of Ne (cells) and t (days) employed for the predictions are indicated.doi:10.1371/journal.pone.0014531.g007
Figure 8. Simulations of viral genomic diversification with amultiplicative fitness landscape and comparisons with patientdata. The evolution of viral diversity, dG, with generations predicted byour simulations (lines) for different population sizes C = 200 (solid) and10000 (dashed) with a multiplicative fitness landscape (see text) withs = 0.01 (pink) and 0.001 (cyan). Each cell is assumed to be infected withM virions drawn from a distribution based on a viral dynamics model(see text). Different symbols are data from nine different patients [36]shown also in Figs. 3 and 7.doi:10.1371/journal.pone.0014531.g008
Within-Host Effective Population Size of HIV-1
PLoS ONE | www.plosone.org 8 January 2011 | Volume 6 | Issue 1 | e14531
disease progression. The origins of the correlation between Ne and
the progression time remain to be elucidated. Nonetheless, the
strong correlations between Ne and t and the progression time
imply that estimation of Ne or t, either through data of viral
diversity and divergence as employed here or through independent
techniques [10,11,54,55], may allow a priori estimation of the
disease progression time. Whether the correlations we observe are
applicable over a larger number of patients remains to be
ascertained.
Our simulations present an explanation of the wide variation in
the prevalent estimates of Ne. Whereas most studies estimate
Ne,102–104 [3,9–13], the study by Rouzine and Coffin obtains
Ne.105 [15]. Previously, the large latter estimate has been
suggested to arise from a bias introduced by restriction to data
on polymorphic loci [13]: Rouzine and Coffin only consider loci
where each allele is present in frequencies between 25% and 75%.
Kouyos et al. [7] point out, however, that Rouzine and Coffin also
restrict their simulations to similar polymorphic loci, thus
eliminating any bias. Our simulations indicate that inclusion of
multiple infections and recombination in the model of Rouzine
and Coffin lowers Ne. The multiplicative fitness profile employed
in the latter model corresponds to vanishing epistasis. Thus, at any
population size, random genetic drift produces negative linkage
disequilibrium according to the Hill-Robertson effect [50].
Recombination lowers the absolute value of this linkage
disequilibrium and results in an increase in viral diversity [21,22,
32]. In effect, the frequency of the least abundant haplotype
increases at any population size and results in lower Ne. Thus, as
the frequency of multiple infections increased from ,80% cells
being singly infected (M drawn from a distribution based on a viral
dynamics model) to all cells triply infected (M = 3), Ne decreased
from ,105, in agreement with Rouzine and Coffin, to ,102
(Fig. 9).
We note that with the same frequency of multiple infections (M
drawn from a distribution based on a viral dynamics model) and
recombination, our simulations with the multi-locus model
(L = 100) and comparisons with patient data of viral diversity
yield Ne,104 (Figs. 7 and 8), smaller than the value obtained by
Rouzine and Coffin. We employ the same simulations to predict
viral diversity and divergence (dG and dS) as well as the frequency of
the least abundant haplotype (lhf), the latter quantity employed by
Rouzine and Coffin. Thus, the difference in the resulting estimates
of Ne may be due to variations in model parameter values or due to
the different calibration quantities employed. The differences in
the model parameters we employ are in the genome length L, the
fitness penalty s, and the virion production rate, P. Model
predictions are weakly sensitive to variations in P (not shown). We
employ L = 100 and s = 0.001 in our simulations of dG and dS and
L = 2 and s = 0.1 for predicting lhf. The parameter values are
chosen to match experimental observations. For instance, with
s = 0.1, our simulations are unable to capture experimental
observations of dG and dS (see Fig. 8). It is thus possible that
mutations at the sites considered by Rouzine and Coffin may
correspond to s = 0.1, whereas those in the patient data of
Shankarappa et al. may be described by s = 0.001. If the latter
possibility were true, then the difference in the estimate of Ne may
be attributed to the different calibration quantities employed; lhf
may tend to yield higher values of Ne than dG and dS with the
present model of HIV-1 evolution.
Several factors may underlie the small values of Ne we estimate
compared to the census population of HIV-1 in vivo, e.g.,
bottlenecks introduced by the immune system [3,7,9–13],
asynchronous infections of cells [56], pseudohitchhiking [57],
metapopulation structure [58], and variations in the progeny
number across cells, the effects of which are yet to be fully
elucidated.
Our study has limitations. First, the fitness landscape employed
in our simulations (Fig. 10) has been determined for the reverse
transcriptase and protease regions of HIV-1, whereas our
simulations concern the env region. The fitness landscape has
been determined experimentally by considering interactions
between large numbers of mutations (up to ,100) [37], and is
thus the most detailed description of HIV-1 fitness available.
Remarkably, the landscape indicates that the average fitness of
genomes depends on the number of mutations (Hamming
distance) and not on specific mutations, emphasizing the general
nature of the fitness interactions. Thus, although individual
mutations and fitness interactions between specific sites may be
different for different regions of HIV-1, the generic interactions
between loci are expected to be similar and captured by the
experimental fitness landscape, allowing us to employ the
landscape to describe the evolution of the env region of HIV-1.
Second, in some of the nine patients we consider, viral diversity
rises to a peak and then drops to a plateau, whereas our
simulations yield best-fits that predict a monotonic rise of the
diversity to the plateau (Fig. 3). Our simulations do predict the
non-monotonic evolution of diversity as the result of an interplay
between mutation and fitness selection but only over certain
ranges of mutation rates and fitness penalties (s = 0.01 in Fig. 8;
also see [32]). For the parameter values that yield the best-fits to
the patient data, our simulations predict a monotonic increase of
diversity. The non-monotonic evolution of diversity could also be
Figure 9. Estimation of Ne using the linkage disequilibrium test.The frequency of the least abundant haplotype in a two-locus/two-allele model determined from our simulations (solid symbols) and byRouzine and Coffin [15] (open symbols) as functions of the populationsize, C, assuming neutral evolution (purple), evolution with selection(cyan), and evolution with selection and recombination where thenumber of infections per cell is constant at 3 (blue), or follows adistribution determined from a viral dynamics model (see text) withki = k0 (green) or ki = 0.7ki-1 (orange). Error bars represent standarddeviations. Values of C at which predictions from simulations matchexperimental estimates [15] of the least abundant haplotype frequency(black line) yield Ne. 95% confidence limits on the experimental data arealso shown (dotted line).doi:10.1371/journal.pone.0014531.g009
Within-Host Effective Population Size of HIV-1
PLoS ONE | www.plosone.org 9 January 2011 | Volume 6 | Issue 1 | e14531
the result of HIV mediated collapse of the immune system, i.e.,
immune relaxation [59], which our simulations ignore.
Nonetheless, our simulations incorporate the key evolutionary
forces that govern HIV-1 diversification in vivo and describe
quantitatively experimental observations of the time-evolution of
viral diversity and divergence in patients over extended durations.
Our simulations may thus be applied to predict determinants of
disease progression and outcomes of therapy that are functions of
viral diversity and divergence, such as the prevalence of drug-
resistant strains prior to the onset of therapy, the role of
recombination on the development of drug resistance, and the
time of emergence and growth of drug-resistant and immune
escape mutants [7,22,25,33,34,60], which have remained difficult
to determine experimentally.
The predominance of stochastic forces predicted by our estimates
of Ne has further implications for describing the within-host
evolution of HIV-1 [7]. For instance, variations in disease
progression may arise not only from host-genetic factors [4,5,61]
but also from stochastic effects. A recent study attributed 15% of the
inter-patient variation in the viral load in the chronic asymptomatic
phase of infection to polymorphisms in a few host genes [61]. It
would be of interest to identify the origins of the remaining 85% of
the variation. Stochastic viral evolution implies that not all of the
inter-patient variations may be attributable to variations in host-
genetic factors. For instance, two individuals with identical genetic
makeup may have distinct set point viral loads because viral
genomes with different fitness may get fixed in the two patients by
sheer chance. Accounting for stochastic variations in markers of
disease state, for which our simulations present a framework, would
lead to more robust associations between host-genetic factors and
disease progression and facilitate more accurate identification of
central players in HIV-1 pathogenesis.
Methods
Simulations of the within-host genomic diversification ofHIV
We consider a fixed population, C, of uninfected cells exposed to
a pool of V virions. Each virion consists of two RNA genomes
represented by bit-strings of length L each. Infection begins with a
pool of identical homozygous virions. We generate a sequence F of
L nucleotides chosen randomly from A, G, C, and U. We let F be
the fittest sequence and assign it the relative fitness of 1. We next
generate the founder sequence, H, by mutating F in a fraction j of
positions, chosen randomly. The founder sequence constitutes all
the viral genomes in the initial viral pool [39].
We let infections occur in discrete generations. In any
generation, each cell is infected by M virions drawn from the
viral pool. A virion is chosen for infection with a probability equal
to its relative fitness. Following infection, reverse transcription
converts the viral RNA in each virion to proviral DNA of length L.
Here, mutation and recombination introduce genomic variations.
Mutations occur at m substitutions per site per replication and
recombination occurs at r crossovers per site per replication. The
proviral DNA are then transcribed into viral RNA, which are
assorted randomly into pairs and released as new virions. Each cell
produces P progeny virions. The progeny virions form the viral
pool for infection of the next generation of uninfected cells.
In each generation, we compute the average diversity,
dG~2(PQ{1
i~1
PQj~iz1
dij)
,Q(Q{1), of the Q proviruses present in
that generation and their average divergence from the founder
sequence, dS~PQi~1
diH
�Q, where dij is the Hamming distance per
position between genomes i and j, and H represents the founder
sequence. The Hamming distance between two genomes is the
number of positions at which the two genomes differ. We also
compute the average fitness of the V virions in each generation,
f ~PV
k~1
f (k)
�V . The fitness f(k) of virion k containing genomes i
and j is assumed to be the average (fi+fj)/2, where fi is the fitness of
genome i (see below).
Several realizations of the infection process are averaged to
obtain the expected evolution of dG, dS and f. The simulations are
implemented using a computer program written in C++.
Fitness landscapeFor selection, we employ the recently determined experimental
fitness landscape for HIV-1, which quantifies the fitness of a
genome, fi, as a function of the Hamming distance between the
amino acid sequence of that genome and that of the fittest
genome, F [37]. The average ratio of non-synonymous to
synonymous substitution rates in the env gene for the patient data
of our interest is estimated to be ,2.16 (Table 2) [14].
Consequently, we assume that a Hamming distance of 2.16
between amino acid sequences corresponds on average to a
Hamming distance of 3.16 between nucleotide sequences. The
resulting experimental fitness landscape in terms of the Hamm-
ing distance per position between nucleotide sequences is
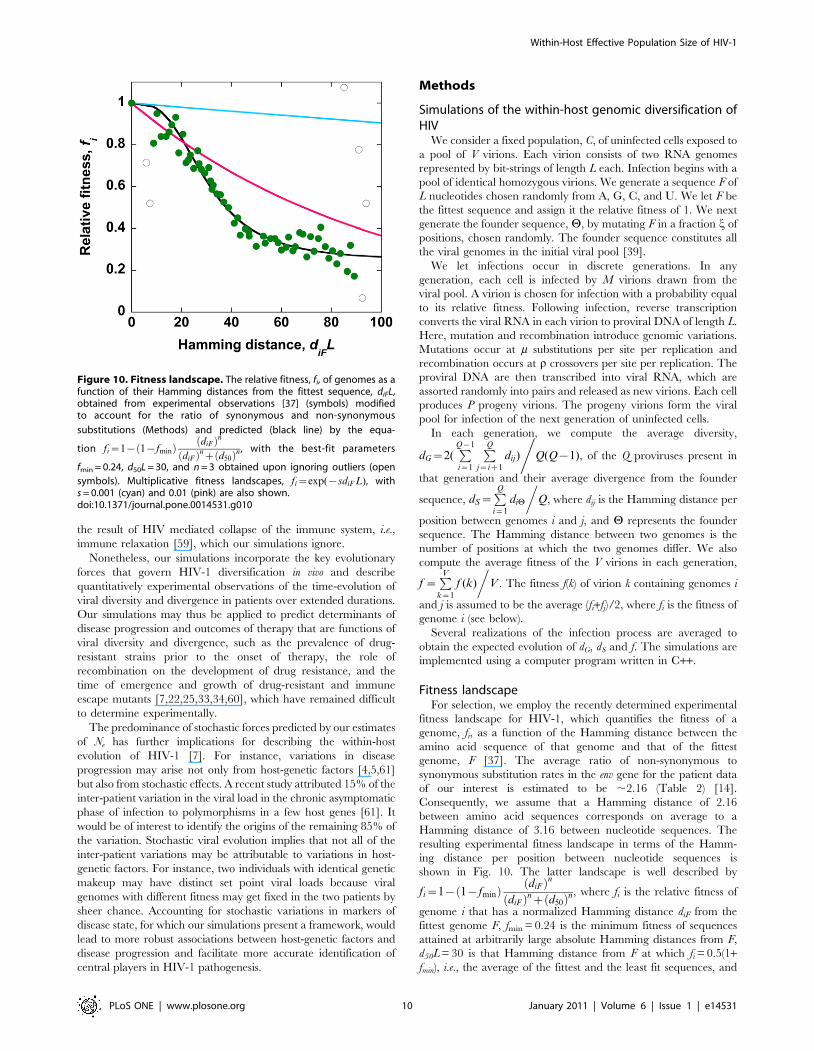
shown in Fig. 10. The latter landscape is well described by
fi~1{ 1{fminð Þ diFð Þn
diFð Þnz d50ð Þn, where fi is the relative fitness of
genome i that has a normalized Hamming distance diF from the
fittest genome F, fmin = 0.24 is the minimum fitness of sequences
attained at arbitrarily large absolute Hamming distances from F,
d50L = 30 is that Hamming distance from F at which fi = 0.5(1+fmin), i.e., the average of the fittest and the least fit sequences, and
Figure 10. Fitness landscape. The relative fitness, fi, of genomes as afunction of their Hamming distances from the fittest sequence, diFL,obtained from experimental observations [37] (symbols) modifiedto account for the ratio of synonymous and non-synonymous
substitutions (Methods) and predicted (black line) by the equa-
tion fi~1{ 1{fminð Þ diFð Þn
diFð Þnz d50ð Þn , with the best-fit parameters
fmin = 0.24, d50L = 30, and n = 3 obtained upon ignoring outliers (open
symbols). Multiplicative fitness landscapes, fi~exp({sdiF L), withs = 0.001 (cyan) and 0.01 (pink) are also shown.doi:10.1371/journal.pone.0014531.g010
Within-Host Effective Population Size of HIV-1
PLoS ONE | www.plosone.org 10 January 2011 | Volume 6 | Issue 1 | e14531
n = 3 is analogous to the Hill coefficient (Fig. 10). We also perform
simulations with a multiplicative fitness landscape, where
fi~exp({sdiF L) with s the fitness penalty per mutation.
Frequency of multiple infections of cells from viraldynamics
To estimate the frequency of multiple infections of cells from
viral dynamics, we consider the following model:
dT
dt~l{dT T{k0TV
dT1
dt~k0TV{k1T1V{dT1
dTi
dt~ki{1Ti{1V{kiTiV{dTi; i~2,:::,5
dT6
dt~k5T5V{dT6
dV
dt~Nd
X6
i~1
Ti{cV
Here, uninfected CD4+ cells, T, are produced from the thymus
at the rate l, die with first order rate constant dT, and are lost due
to infection by free virions with the second order rate constant k0.
The latter infections produce singly infected cells, T1, which in
turn are lost by further infections with the second order rate
constant k1, or by death at the rate d. Similarly, cells with two,
three, etc. infections (Ti, i = 2,3,…), are produced by successive
infections. We restrict our model to a maximum of 6 infections per
cell. (Including more infections does not alter our results
significantly.) All infected cells produce virions at the rate Nd,
where N is the viral burst size. Virions are cleared at the rate c.
We solve these equations using parameter values representative
of HIV-1 infection in vivo [55,62]. We let l = 105 cells/ml/day,
dT = 0.1/day, k0 = 2.461028 ml/day d= 1/day, N = 103 virions/
cell, and c = 23/day. The rates of infection of infected cells, ki, are
not known. Virus-induced CD4 down-modulation [63,64] would
lower ki with increasing i. We have developed models previously
that account for the continuous decrease of the susceptibility of
cells owing to CD4 down-modulation following viral infection
[31,65]. A simplification of the latter models allowing up to two
infections per cell found that k1 = 0.7k0 captured in vitro
observations of the frequencies of coinfection quantitatively [31].
The cells employed in the latter in vitro experiments were not
highly susceptible to infection. Other experiments found that
coinfections occur more frequently than expected from random,
independent infection events [66,67], implying that k1.k0. Cell-to-
cell transmission could also result in a high frequency of multiply
infected cells [66,68,69]. Here, we therefore employ either ki = k0
or ki = 0.7ki-1 for all i. (Note that M = 3 corresponds to k1.k0.)
At long-times following the onset of infection, the above
equations predict that infection reaches a steady state. The steady
state populations of Ti yield a distribution of the frequency of
multiple infections of cells. We find at that steady state that ,70%
of the infected cells are singly infected, ,21% are doubly infected,
,6% are triply infected, ,2% are quadruply infected, ,0.5% are
quintuply infected, and ,0.2% are hextuply infected when ki = k0.
Whereas, when ki = 0.7ki-1, at steady state ,77% of the infected
cells are singly infected, ,19% are doubly infected, ,3.4% are
triply infected, ,0.5% are quadruply infected, ,0.04% are
quintuply infected, and ,0.002% are hextuply infected.
Author Contributions
Conceived and designed the experiments: NMD. Performed the
experiments: RB VS ARS. Analyzed the data: RB NMD. Contributed
reagents/materials/analysis tools: RB VS ARS NMD. Wrote the paper:
NMD.
References
1. Haase AT, Henry K, Zupancic M, Sedgewick G, Faust RA, et al. (1996)
Quantitative image analysis of HIV-1 infection in lymphoid tissue. Science 274:
985–989.
2. Telenti A, Goldstein DB (2006) Genomics meets HIV-1. Nat Rev Microbiol 4:
865–873.
3. Nijhuis M, Boucher CAB, Schipper P, Leitner T, Schuurman R, et al. (1998)
Stochastic processes strongly influence HIV-1 evolution during suboptimal
protease-inhibitor therapy. Proc Natl Acad Sci U S A 95: 14441–14446.
4. Telenti A, Carrington M (2008) Host factors associated with outcome from
primary human immunodeficiency virus-1 infection. Curr Opin HIV AIDS 3:
28–35.
5. Gonzalez E, Kulkarni H, Bolivar H, Mangano A, Sanchez R, et al. (2005) The
influence of CCL3L1 gene-containing segmental duplications on HIV-1/AIDS
susceptibility. Science 307: 1434–1440.
6. Charlesworth B (2009) Effective population size and patterns of molecular
evolution and variation. Nat Rev Genet 10: 195–205.
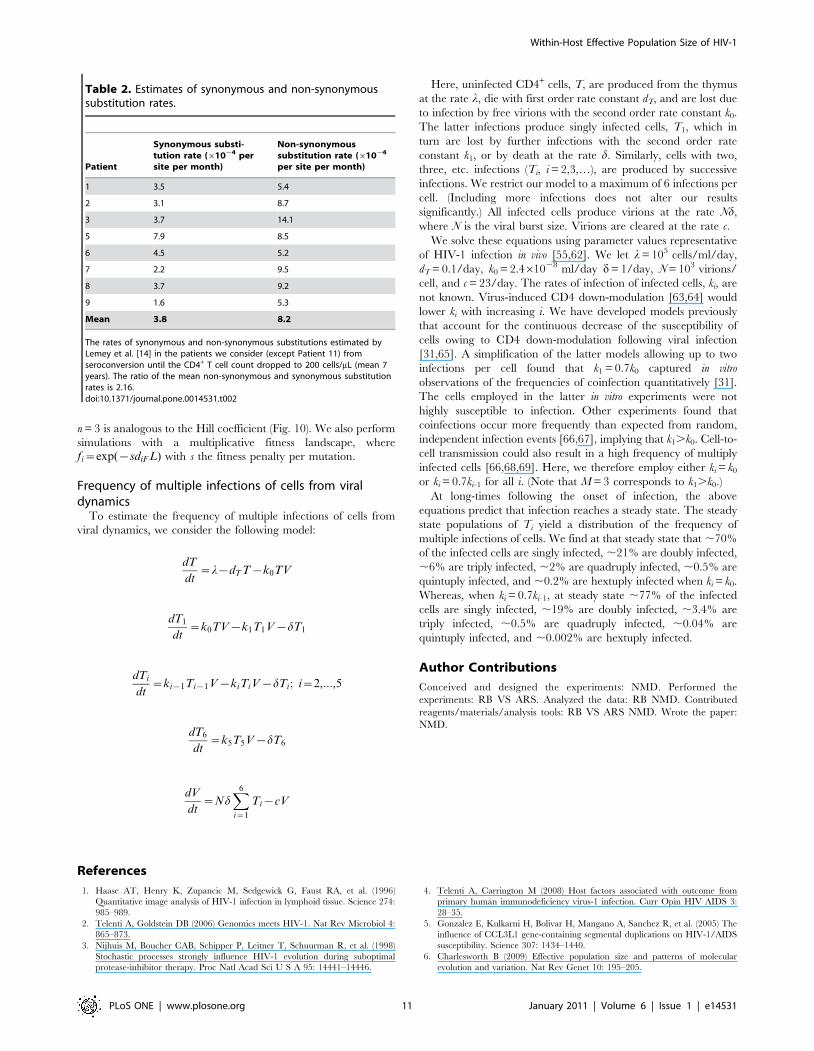
Table 2. Estimates of synonymous and non-synonymoussubstitution rates.
Patient
Synonymous substi-tution rate (61024 persite per month)
Non-synonymoussubstitution rate (61024
per site per month)
1 3.5 5.4
2 3.1 8.7
3 3.7 14.1
5 7.9 8.5
6 4.5 5.2
7 2.2 9.5
8 3.7 9.2
9 1.6 5.3
Mean 3.8 8.2
The rates of synonymous and non-synonymous substitutions estimated byLemey et al. [14] in the patients we consider (except Patient 11) fromseroconversion until the CD4+ T cell count dropped to 200 cells/mL (mean 7years). The ratio of the mean non-synonymous and synonymous substitutionrates is 2.16.doi:10.1371/journal.pone.0014531.t002
Within-Host Effective Population Size of HIV-1
PLoS ONE | www.plosone.org 11 January 2011 | Volume 6 | Issue 1 | e14531
7. Kouyos RD, Althaus CL, Bonhoeffer S (2006) Stochastic or deterministic: what
is the effective population size of HIV-1? Trends Microbiol 14: 507–511.8. Wright S (1931) Evolution in Mendelian populations. Genetics 16: 97–159.
9. Brown AL (1997) Analysis of HIV-1 env gene sequences reveals evidence for a
low effective number in the viral population. Proc Natl Acad Sci U S A 94:1862–1865.
10. Rodrigo AG, Shpaer EG, Delwart EL, Iversen AKN, Gallo MV, et al. (1999)Coalescent estimates of HIV-1 generation time in vivo. Proc Natl Acad Sci U S A
96: 2187–2191.
11. Seo TK, Thorne JL, Hasegawa M, Kishino H (2002) Estimation of effectivepopulation size of HIV-1 within a host: A pseudomaximum-likelihood approach.
Genetics 160: 1283–1293.12. Achaz G, Palmer S, Kearney M, Maldarelli F, Mellors JW, et al. (2004) A robust
measure of HIV-1 population turnover within chronically infected individuals.Mol Biol Evol 21: 1902–1912.
13. Shriner D, Shankarappa R, Jensen MA, Nickle DC, Mittler JE, et al. (2004)
Influence of random genetic drift on human immunodeficiency virus type I envevolution during chronic infection. Genetics 166: 1155–1164.
14. Lemey P, Kosakovsky Pond SL, Drummond AJ, Pybus OG, Shapiro B, et al.(2007) Synonymous substitution rates predict HIV disease progression as a result
of underlying replication dynamics. PLoS Comput Biol 3: e29.
15. Rouzine IM, Coffin JM (1999) Linkage disequilibrium test implies a largeeffective population number for HIV in vivo. Proc Natl Acad Sci U S A 96:
10758–10763.16. Jung A, Maier R, Vartanian JP, Bocharov G, Jung V, et al. (2002) Multiply
infected spleen cells in HIV patients. Nature 418: 144–144.17. Levy DN, Aldrovandi GM, Kutsch O, Shaw GM (2004) Dynamics of HIV-1
recombination in its natural target cells. Proc Natl Acad Sci U S A 101:
4204–4209.18. McCutchan FE (2006) Global epidemiology of HIV. J Med Virol 78: S7–S12.
19. Otto SP, Lenormand T (2002) Resolving the paradox of sex and recombination.Nat Rev Genet 3: 252–261.
20. Hartl DL, Clark AG (2007) Principles of Population Genetics. Sunderland:
Sinauer Associates, Inc.21. Kouyos RD, Silander OK, Bonhoeffer S (2007) Epistasis between deleterious
mutations and the evolution of recombination. Trends Ecol Evol 22: 308–315.22. Dixit NM (2008) Modelling HIV infection dynamics: The role of recombination
in the development of drug resistance. Future HIV Ther 2: 375–388.23. Boerlijst MC, Bonhoeffer S, Nowak MA (1996) Viral quasi-species and
recombination. P R Soc Lond B Bio 263: 1577–1584.
24. Bretscher MT, Althaus CL, Muller V, Bonhoeffer S (2004) Recombination inHIV and the evolution of drug resistance: for better or for worse? Bioessays 26:
180–188.25. Althaus CL, Bonhoeffer S (2005) Stochastic interplay between mutation and
recombination during the acquisition of drug resistance mutations in human
immunodeficiency virus type 1. J Virol 79: 13572–13578.26. Bocharov G, Ford NJ, Edwards J, Breinig T, Wain-Hobson S, et al. (2005) A
genetic-algorithm approach to simulating human immunodeficiency virusevolution reveals the strong impact of multiply infected cells and recombination.
J Gen Virol 86: 3109–3118.27. Fraser C (2005) HIV recombination: what is the impact on antiretroviral
therapy? J R Soc Interface 2: 489–503.
28. Rouzine IM, Coffin JM (2005) Evolution of human immunodeficiency virusunder selection and weak recombination. Genetics 170: 7–18.
29. Carvajal-Rodriguez A, Crandall KA, Posada D (2007) Recombination favors theevolution of drug resistance in HIV-1 during antiretroviral therapy. Infect Genet
Evol 7: 476–483.
30. Gheorghiu-Svirschevski S, Rouzine IM, Coffin JM (2007) Increasing sequencecorrelation limits the efficiency of recombination in a multisite evolution model.
Mol Biol Evol 24: 574–586.31. Suryavanshi GW, Dixit NM (2007) Emergence of recombinant forms of HIV:
Dynamics and scaling. PLoS Comput Biol 3: e205.
32. Vijay NV, Vasantika, Ajmani R, Perelson AS, Dixit NM (2008) Recombinationincreases human immunodeficiency virus fitness, but not necessarily diversity.
J Gen Virol 89: 1467–1477.33. Arora P, Dixit NM (2009) Timing the emergence of resistance to anti-HIV drugs
with large genetic barriers. PLoS Comput Biol 5: e1000305.34. Gadhamsetty S, Dixit NM (2010) Estimating frequencies of minority nevirapine-
resistant strains in chronically HIV-1-infected individuals naive to nevirapine by
using stochastic simulations and a mathematical model. J Virol 84: 10230–10240.35. Rouzine IM, Coffin JM (2010) Multi-site adaptation in the presence of
infrequent recombination. Theor Popul Biol 77: 189–204.36. Shankarappa R, Margolick JB, Gange SJ, Rodrigo AG, Upchurch D, et al.
(1999) Consistent viral evolutionary changes associated with the progression of
human immunodeficiency virus type 1 infection. J Virol 73: 10489–10502.37. Bonhoeffer S, Chappey C, Parkin NT, Whitcomb JM, Petropoulos CJ (2004)
Evidence for positive epistasis in HIV-1. Science 306: 1547–1550.38. Mansky LM, Temin HM (1995) Lower in-vivo mutation-rate of human-
immunodeficiency-virus type-1 than that predicted from the fidelity of purifiedreverse-transcriptase. J Virol 69: 5087–5094.
39. Keele BF, Giorgi EE, Salazar-Gonzalez JF, Decker JM, Pham KT, et al. (2008)
Identification and characterisation of transmitted and early founder virusenvelopes in primary HIV-1 infection. Proc Natl Acad Sci U S A 105:
7552–7557.
40. Goonetilleke N, Liu MKP, Salazar-Gonzalez JF, Ferrari G, Giorgi E, et al.
(2009) The first T cell response to transmitted/founder virus contributes to thecontrol of acute viremia in HIV-1 infection. J Exp Med 206: 1253–1272.
41. Salazar-Gonzalez JF, Salazar MG, Keele BF, Learn GH, Giorgi EE, et al. (2009)
Genetic identity, biological phenotype, and evolutionary pathways of transmit-ted/founder viruses in acute and early HIV-1 infection. J Exp Med 206:
1273–1289.42. Rhodes T, Wargo H, Hu W-S (2003) High rates of human immunodeficiency
virus type 1 recombination: near-random segregation of markers one kilobase
apart in one round of viral replication. J Virol 77: 11193–11200.43. Josefsson L, Brannstrom J, Makilato B, Maldarelli F, Kearney M, et al. (2010)
Analysis of HIV DNA molecules in single infected cells from recently andchronically infected patients, Abstract #289. San Francisco: 17th Conference on
Retroviruses and Opportunistic Infections.44. Hockett RD, Michael Kilby J, Derdeyn CA, Saag MS, Sillers M, et al. (1999)
Constant mean viral copy number per infected cell in tissues regardless of high,
low, or undetectable plasma HIV RNA. J Exp Med 189: 1545–1554.45. Chen HY, Di Mascio M, Perelson AS, Ho DD, Zhang L (2007) Determination
of virus burst size in vivo using a single-cycle SIV in rhesus macaques. Proc NatlAcad Sci U S A 104: 19079–19084.
46. Dimitrov DS, Martin MA (1995) CD4+ cell turnover. Nature 375: 194–195.
47. Dimitrov DS, Willey RL, Sato H, Chang LJ, Blumenthal R, et al. (1993)Quantitation of human-immunodeficiency-virus type-1 infection kinetics. J Virol
67: 2182–2190.48. Piatak M, Saag MS, Yang LC, Clark SJ, Kappes JC, et al. (1993) High-levels of
HIV-1 in plasma during all stages of infection determined by competitive PCR.Science 259: 1749–1754.
49. Ribeiro RM, Qin L, Chavez LL, Li D, Self SG, et al. (2010) Estimation of the
initial viral growth rate and basic reproductive number during acute HIV-1infection. J Virol 84: 6096–6102.
50. Hill WG, Robertson A (1966) Effect of linkage on limits to artificial selection.Genet Res 8: 269–294.
51. Eshel I, Feldman MW (1970) On the evolutionary effect of recombination.
Theor Popul Biol 1: 88–100.52. Kouyos RD, Otto SP, Bonhoeffer S (2006) Effect of varying epistasis on the
evolution of recombination. Genetics 173: 589–597.53. Kimura M (1980) A simple method for estimating evolutionary rates of base
substitutions through comparative studies of nucleotide sequences. J Mol Evol16: 111–120.
54. Perelson AS, Neumann AU, Markowitz M, Leonard JM, Ho DD (1996) HIV-1
dynamics in vivo: Virion clearance rate, infected cell life-span, and viralgeneration time. Science 271: 1582–1586.
55. Dixit NM, Markowitz M, Ho DD, Perelson AS (2004) Estimates of intracellulardelay and average drug efficacy from viral load data of HIV-infected individuals
under antiretroviral therapy. Antivir Ther 9: 237–246.
56. Voronin Y, Holte S, Overbaugh J, Emerman M (2009) Genetic drift of HIVpopulations in culture. PloS Genet 5: e1000431.
57. Gillespie JH (2000) Genetic drift in an infinite population: The pseudohitchhik-ing model. Genetics 155: 909–919.
58. Frost SDW, Dumaurier MJ, Wain-Hobson S, Brown AJL (2001) Genetic driftand within-host metapopulation dynamics of HIV-1 infection. Proc Natl Acad
Sci U S A 98: 6975–6980.
59. Williamson S, Perry SM, Bustamante CD, Orive ME, Stearns MN, et al. (2005)A statistical characterization of consistent patterns of human immunodeficiency
virus evolution within infected patients. Mol Biol Evol 22: 456–468.60. Liu Y, Mullins JI, Mittler JE (2006) Waiting times for the appearance of
cytotoxic T-lymphocyte escape mutants in chronic HIV-1 infection. Virology
347: 140–146.61. Fellay J, Shianna KV, Ge DL, Colombo S, Ledergerber B, et al. (2007) A whole-
genome association study of major determinants for host control of HIV-1.Science 317: 944–947.
62. Perelson AS (2002) Modelling viral and immune system dynamics. Nat Rev
Immunol 2: 28–36.63. Chen BK, Gandhi RT, Baltimore D (1996) CD4 down-modulation during
infection of human T cells with human immunodeficiency virus type 1 involvesindependent activities of vpu, env, and nef. J Virol 70: 6044–6053.
64. Piguet V, Gu F, Foti M, Demaurex N, Gruenberg J, et al. (1999) Nef-inducedCD4 degradation: A diacidic-based motif in Nef functions as a lysosomal
targeting signal through the binding of beta-COP in endosomes. Cell 97: 63–73.
65. Dixit NM, Perelson AS (2005) HIV dynamics with multiple infections of targetcells. Proc Natl Acad Sci U S A 102: 8198–8203.
66. Dang Q, Chen JB, Unutmaz D, Coffin JM, Pathak VK, et al. (2004)Nonrandom HIV-1 infection and double infection via direct and cell-mediated
pathways. Proc Natl Acad Sci U S A 101: 632–637.
67. Chen J, Dang Q, Unutmaz D, Pathak VK, Maldarelli F, et al. (2005)Mechanisms of nonrandom human immunodeficiency virus type 1 infection and
double infection: preference in virus entry is important but is not the sole factor.J Virol 79: 4140–4149.
68. Chen P, Hubner W, Spinelli MA, Chen BK (2007) Predominant Mode ofhuman immunodeficiency virus transfer between T cells is mediated by
sustained Env-dependent neutralization-resistant virological synapses. J Virol
81: 12582–12595.69. Dixit NM, Perelson AS (2004) Multiplicity of human immunodeficiency virus
infections in lymphoid tissue. J Virol 78: 8942–8945.
Within-Host Effective Population Size of HIV-1
PLoS ONE | www.plosone.org 12 January 2011 | Volume 6 | Issue 1 | e14531