
Tackling Shrinkage in the Fast Moving Consumer Goods Supply Chain: Developing a Methodology
24
Paper Title: Tackling Shrinkage in the Fast Moving Consumer Goods Supply Chain: Developing a Methodology Publication details: Security Journal V16 N2 pp61-75. Authors: Adrian Beck Reader in Criminology Department of Criminology University of Leicester 154 Upper New Walk Leicester LE1 7QA UK Telephone: +44 [0]116 252 5702 Email: [email protected] Charlotte Bilby Lecturer in Criminology Department of Criminology University of Leicester The Friars, 154 Upper New Walk Leicester. LE1 7QA United Kingdom. Tel: 0116 252 5708 Email: [email protected] Paul Chapman Senior Research Fellow Cranfield School of Management, Cranfield University. Bedfordshire. MK43 0AL United Kingdom. Telephone +44 1234 751122 Email: [email protected]
-
Upload
northumbria -
Category
Documents
-
view
5 -
download
0
Transcript of Tackling Shrinkage in the Fast Moving Consumer Goods Supply Chain: Developing a Methodology
Paper Title: Tackling Shrinkage in the Fast Moving Consumer Goods Supply Chain: Developing a Methodology
Publication details: Security Journal
V16 N2 pp61-75. Authors: Adrian Beck
Reader in Criminology Department of Criminology University of Leicester 154 Upper New Walk Leicester LE1 7QA UK Telephone: +44 [0]116 252 5702 Email: [email protected] Charlotte Bilby Lecturer in Criminology Department of Criminology University of Leicester The Friars, 154 Upper New Walk Leicester. LE1 7QA United Kingdom. Tel: 0116 252 5708 Email: [email protected] Paul Chapman Senior Research Fellow Cranfield School of Management, Cranfield University. Bedfordshire. MK43 0AL United Kingdom. Telephone +44 1234 751122 Email: [email protected]
c6837
Text Box
Security Journal, Volume 16, Issue 2 (April 2003)

Tackling Shrinkage in the Fast Moving Consumer Goods Supply Chain
2
Tackling Shrinkage in the Fast Moving Consumer Goods Supply Chain: Developing a Methodology
by
Adrian Beck, Charlotte Bilby and Paul Chapman1
Abstract
Shrinkage for retailers and suppliers of Fast Moving Consumer Goods (FMCG) continues to
be a significant problem, one that seems resilient to ameliorative actions. In an effort to
respond to the apparent failure of existing approaches to loss prevention, this chapter
introduces a ‘process-orientated’ approach to tackling shrinkage. The approach consists of a
prescriptive series of seven steps that form a stock loss reduction ‘road map’, together with
associated techniques and tools for undertaking each step.
Introduction
Recent research has once again demonstrated the extent of the problem of shrinkage for
retailers and suppliers of Fast Moving Consumer Goods, FMCG2. Losses in this €824.4
billion3 industry were found to equate to 2.31 per cent of turnover, 1.75 per cent for retailers
and 0.56 per cent for manufacturers, resulting in annual bill for shrinkage of €18 billion.
In some respects, there is nothing new about attempting to quantify the cost of stock loss4.
However it is increasingly clear that not only is the problem enormous, it is the fact that this
issue seems resilient to ameliorative actions. This failure draws into question the
effectiveness of the world-wide market for security ‘solutions’, for example closed circuit
television (CCTV), electronic article surveillance (EAS), guarding and store detectives, and
the effectiveness of the multi-billion Euro global industry. It could be argued that this
expenditure, ‘keeps a lid’ on losses and contains them to relatively acceptable levels.

Tackling Shrinkage in the Fast Moving Consumer Goods Supply Chain
3
However this approach seems only to be an argument of convenience although proving this to
be the case is currently beyond most established methodologies.
Recent research has shown that between only 20-40 per cent of loss is accounted for by
external theft5. Hence, many of the technology-led solutions such as electronic article
surveillance (EAS) are only capable of impacting on a minority of modes of stock loss. They
make little or no impact on delivery and warehouse staff theft or losses through product going
out of date due to poor company ordering procedures. Accordingly, this article seeks to
provide a new methodology that can be used by shrinkage practitioners to enable them to
begin to adopt a more studied approach to dealing with the problem. It is based upon original
research carried out throughout the FMCG sector in Europe by academics specialising in
supply chain management and security management.
This approach, termed here as a ‘road map’, charts the various steps that need to be taken in
order for a more holistic and systematic approach to be taken. This roadmap aims to
supersede existing approaches that are characteristically partial, piecemeal and for the most
part poorly conceived practices. In doing so, the intention is to lead organisations to face up
to their large and growing bill for shrinkage whilst also presenting them with a rich
opportunity to dramatically improve their profitability.
Methodology
This study used a methodology based upon two approaches: a review of the existing
literature; and investigative fieldwork exploring 12 FMCG supply chains. The analysis of
these supply chains required an investigation of 17 companies, including manufacturers,
distributors and retailers, on 41 sites in 10 European countries. Following the flow of
products through FMCG supply chains in a structured manner required both a systematic and
systemic approach. Being systematic, this research was methodically arranged and
undertaken according to plan. The systemic nature of this work referred to the focus on each
Tackling Shrinkage in the Fast Moving Consumer Goods Supply Chain
4
supply chain as a single process by integrating research undertaken at the separate sites along
each supply chain.
Each site visit, whether at a manufacturing company, distributor or a retailer, consisted of
structured interviews with members of the senior management team and managers responsible
for security, logistics and stock loss. In addition to the interviews, goods were physically
followed through sites in order to document the supply chain process and to identify the
practices and procedures used to facilitate this process and to control losses. The
investigation made use of Failure Modes and Effect Analysis (FMEA) to examine the various
ways that a process may fail and to determine the effect of the different failure modes.
Through focussing attention upon stock loss, and by using the FMEA technique, it was
possible understand the:
• Ways in which the supply chain process can fail and allow stock to be lost
• Severity of the loss should a failure happen
• Likelihood of a failure occurring
• Ability to detect that a failure has occurred
The data collated from the process analysis and interviews allowed a composite model of the
supply chains to be constructed. This provided the basis from which the performance of the
supply chains was analysed and the conclusions drawn.
The ‘Road Map’
In theory, the concept of stock loss reduction is simple. It can be described in terms of the
three following steps:
• Make stock highly visible so that loss is immediately noticed
• Quickly identify the cause of the loss

Tackling Shrinkage in the Fast Moving Consumer Goods Supply Chain
5
• Implement preventative solutions to resolve the cause of the loss and thus prevent
reoccurrence of the problem
Difficulties in implementation arise for a wide number of reasons. Not least is the complexity
of the sector, the absence of reliable data on the extent and nature of the problem and a lack of
co-operation both within companies and between companies in the supply chain to develop
shared solutions. Underpinning these issues is the difficulties associated with managing
change, particularly the lack of a clear method for undertaking stock loss reduction projects.
Stock Loss Reduction Principles
In order to overcome the inhibitors to stock loss reduction, the stock loss reduction roadmap is
constructed around the application of three key principles:
• Holistic
• Systematic
• Collaborative
These three principles underpin the structure of the roadmap and also the method for applying
it. The roles of these three principles are described below.
Holistic
Resolving stock loss requires businesses to take a holistic approach to identifying and
analysing stock loss problems from a supply chain perspective. Supply chains consist of
processes made up of diverse, interlinked tasks and hence analysing the processes opens up
the ‘black box’ of the supply chain. Taking this process-orientated approach to the
investigation of both individual activities and whole organisations allows both the trees and
the forest to be analysed. It also ensures the realities of work practices are considered in
parallel with the supply chain’s overall function.
Tackling Shrinkage in the Fast Moving Consumer Goods Supply Chain
6
Systematic
The complexity inherent in supply chains requires their investigation to be undertaking in a
systematic manner. Being systematic requires planning the investigation methodically and
undertaken this work according to the plan. For example where a site visit is required,
whether at a manufacturing company, distributor or a retailer, this visit needs to consist of
structured data gathering through interviews to collate the following information and data:
• Stock loss statistics
• Company methods to identify stock loss
• Extent of staff and external theft
• Company methods to reduce stock loss
• Justification for the methods of reducing stock loss
• Impact of loss prevention methods on sales
In addition, the structure of material handling and information exchange processes is
understood through physically following goods through the material handling processes. This
is undertaken in order to document the activities and associated practices and procedures used
to facilitate this process and control loss.
Collaborative
Collaboration within a company provides the means to resolve problems beyond the scope of
individual functions to solve. Likewise, collaboration between companies resolves communal
problems beyond the scope of the separate companies to solve. The results of this work will
be to:
• Design loss prevention solutions into the fabric of processes and facilities
• Ensure that these solutions effectively contribute to total supply chain efficiency,
instead of solving a problem at one end of the chain only
• Implement simpler and cheaper controls to minimise loss

Tackling Shrinkage in the Fast Moving Consumer Goods Supply Chain
7
Stock Loss Reduction Roadmap Structure
The stock loss reduction ‘roadmap’ seeks to overcome the inhibitors to successful loss
prevention by employing a method for reducing stock loss consisting of:
• A general approach to stock loss reduction
• Specific tools and techniques for dealing with specific problems
The roadmap is intended as a manual or guide, describing the overall activities that need to be
undertaken in order to reduce stock loss. This guide consists of a general approach made up
of the steps a company needs to follow, together with techniques and tools to help undertake
each phase and to deal with problems that may be encountered. The general approach that
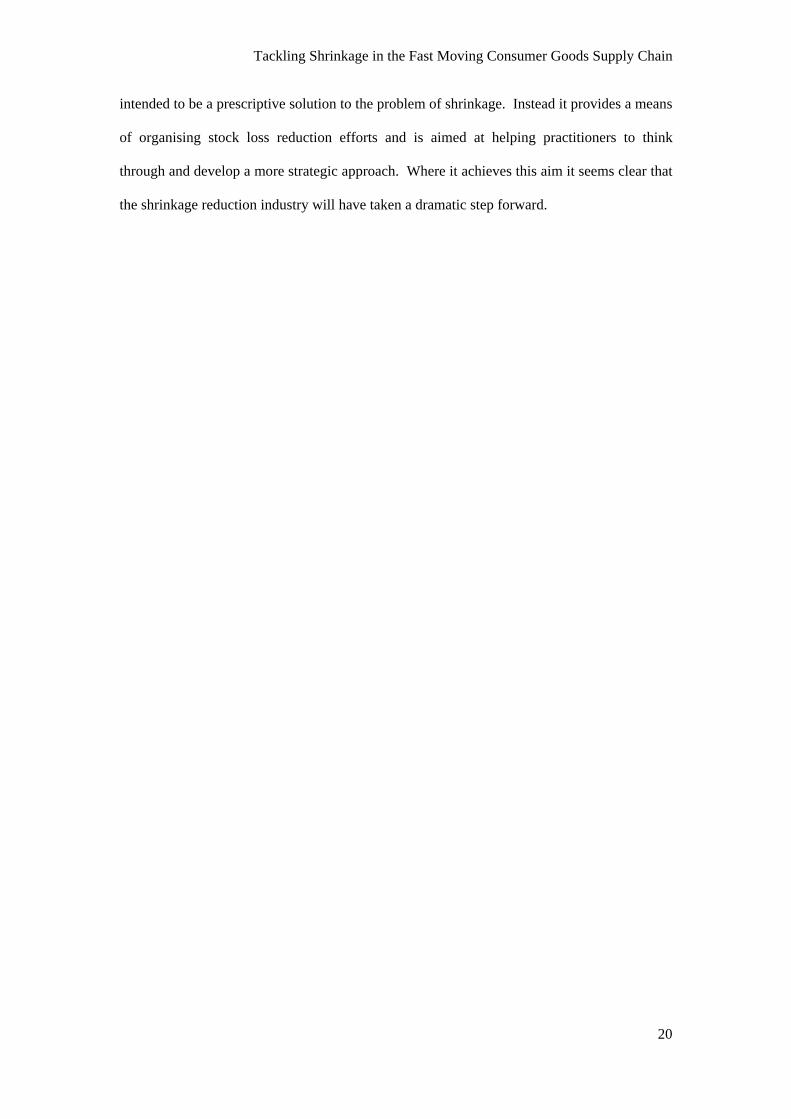
forms the heart of the guide is shown in Figure 1. This structure is systematic and provides
the means for planning and undertaking stock loss reduction projects while guiding users
towards continuous improvement through the cycle.
Insert figure 1 about here
The roadmap is designed to enable both problem diagnosis and solution implementation. The
structure consists of a sequence of steps where through well-planned investigation, pressing
business needs are identified. These needs are responded to by undertaking small-scale
experiments that explore the stock loss problem, identify likely causes and develop
appropriate solutions. The solutions are tested in trials where their effectiveness is assessed.
Where a solution is found to be successful it is then implemented widely and the business’s
practices standardised around it.
This approach to stock loss reduction recognises that given the uniqueness of each business
environment where stock loss occurs, the prescription of a single, ‘right’ strategy for reducing
stock loss is inappropriate. Instead, whilst a basic structure is provided, the approach is
intended to be tailored to match prevailing circumstances in order for it to be effective.
Tackling Shrinkage in the Fast Moving Consumer Goods Supply Chain
8
The approach described in this chapter provides a means for involving all company
employees in stock loss reduction. Widespread participation provides knowledge of current
practices, such as stock control, and helps build commitment that allow changes to be
implemented.
To help undertake the steps of the general approach, a number of techniques and tools are
recommended. These have been chosen to aid communication and understanding. This list is
not comprehensive and prospective users should introduce their own tools where they find
them to have a better fit given the prevailing local circumstances.
Figure 1 shows the roadmap as consisting of six sequential steps, that join to form a circle of
diagnosis and implementation. These steps are described below in more detail, along with a
number of techniques and tools that can be used to help accomplish the objectives of each
step and overcome problems that may be encountered.
Step 0: Recognise that Stock Loss Shrinks Profit and Sales
As related research has shown, the FMCG sector in Europe suffers significant losses each
year through shrinkage (€18 billion)6. These losses occur all along the supply chain: from
point of manufacture, throughout the distribution process, to the point of sale. While €10
billion of this loss cannot be accounted for, the effects of shrinkage are clear: the shopper
suffers through added cost and poorer service. The outlook for retailers, manufacturers and
consumers concerning shrinkage is bleak unless action is taken quickly.
Whilst current levels of stock loss are significant, future levels are likely to increase. Food
retailers continue to expand the number of non-food items they carry, such as CDs, clothes
and electrical items, which are products perceived by them to be at greatest risk of theft. In
general, current attempts to address shrinkage are characterised by a heavy reliance upon
reactive strategies that are only triggered when a particular problem become intolerable. Such
knee jerk and insular reactions not only fail to resolve the causes of loss, but they can also
Tackling Shrinkage in the Fast Moving Consumer Goods Supply Chain
9
have a detrimental effect upon the profitability of a company. For instance, adopting
‘defensive merchandising’ can cause problems with replenishment and availability. Hence,
the first step in the road map is twofold:
• Wake up to the magnitude of the stock loss problem
• Recognise that current approaches to stock loss reduction generally do not work.
Step 1: Develop a Strategic Plan
Current efforts to contain stock loss are at best piece-meal, with few companies operating an
organisation-wide approach to resolving the problem. Companies need to recognise that
traditional approaches, that is only tasking security, audit or health and safety departments
with the challenge, are not effectual in tackling the structural deficiencies in business
operations that are the root cause of stock loss. Instead, companies need to change their
approach to resolving stock loss and make use of a wider range of skills and resources. In
changing their approach, companies need to choose one that is systematic, holistic and
collaborative.
Applying the Principle of Being ‘Holistic’
Effective stock loss reduction requires companies to be holistic by identifying, for the supply
chain as a whole, where problems occur and can best be resolved. Such work requires
collaboration along supply chains between suppliers, distributors and retailers as well as
across the FMCG sector as a whole. Only when internal and external problems are
considered together can comprehensive analysis be undertaken to deliver early, tangible
results. Currently, companies are simply not taking advantage of the opportunities to share
expertise with either their competitors or suppliers, or indeed internally7. For example, only
one-half of all retailers and manufacturers are working together to tackle stock loss. This

Tackling Shrinkage in the Fast Moving Consumer Goods Supply Chain
10
clearly demonstrates that problems affecting the whole of the supply chain are not being
addressed in a holistic manner.
Applying the Principle of Being ‘Systematic’
In general, stock loss is not currently approached in a systematic manner. In order to break
away from the culture of half-truths and anecdotes, a systematic approach provides the way
for a company to quantify and prioritise its problems, to analyse the causes of these problems
and to direct its available resources to the most cost effective solutions. Finally, the true
effectiveness of these solutions needs to be determined after their implementation and this
information then used to guide future investment. Hence the first step in the systematic
approach to stock loss reduction is planning and the last step is the evaluation of the
effectiveness of actions.
Planning is based upon clear, realistic, attainable objectives with criteria for knowing when
these objectives are met. This requires the project team responsible for delivering loss
reductions to have answers to the following questions:
• What is the supply chain process to be improved?
• When does the supply process to be improved start and finish?
• What are the goals of the stock loss reduction activity?
• When is the date by which some benefits must be felt?
• What are the attributes of the ideal supply process?
• What are the constraints to improvement?
• What are the stock loss threats faced by the company?
The answers to these questions guide the project team’s activities towards achieving their
goals. Starting the project in this way is especially important in cross-functional/inter-
Tackling Shrinkage in the Fast Moving Consumer Goods Supply Chain
11
company projects where the effectiveness and efficiency with which project resources are
used dramatically improves with up-front investment in planning.
Step 2: Map Key Processes and Measure Problem
Reducing stock loss begins with a rigorous diagnosis of the problem. This diagnosis starts by
understanding the nature of the losses and then identifying their causes. Understanding the
current operational system and processes is also the first step in gaining widespread
recognition of the problem and establishing the need to change within an organisation. The
act of creating a business process model that identifies the source of stock loss can develop
the critical momentum required to change existing behaviour.
A process-led approach to reducing stock loss applies process analysis to the stock loss
problem and emphasises prevention. This provides the means to identify and prevent system
and procedural losses, which also reduces loss from theft by removing the opportunity to
abuse deficient systems.
The starting point for taking a process orientated approach to diagnosing stock loss is to
undertake process mapping and measurement. These two techniques are described below.
Process Mapping
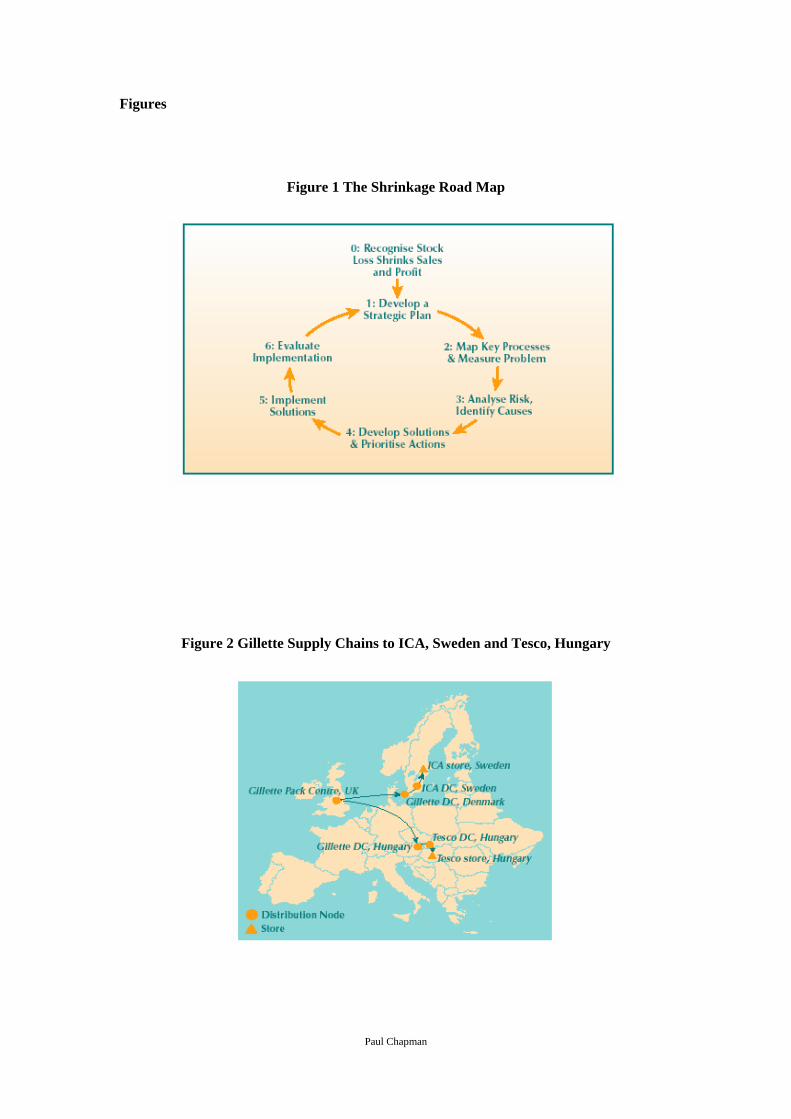
Process mapping is a technique used to detail business processes that focuses on the important
elements that influence behaviour, allowing the business to be viewed at a glance8. Mapping
and measuring a process establishes the performance base line that enables the effectiveness
of solutions to be measured. An example of a top-level supply chain is depicted in Figure 2.
This diagram shows two supply chains from Gillette in the UK to two of their customers, ICA
in Sweden and Tesco in Hungary.
Tackling Shrinkage in the Fast Moving Consumer Goods Supply Chain
12
Insert figure 2 about here
Whilst this gives an understanding of the total supply chain, it provides few details. In order
to show more in-depth information, a more rigorous process map is required. Simple flow
charting techniques are often the most appropriate technique to use when process mapping for
the first time.
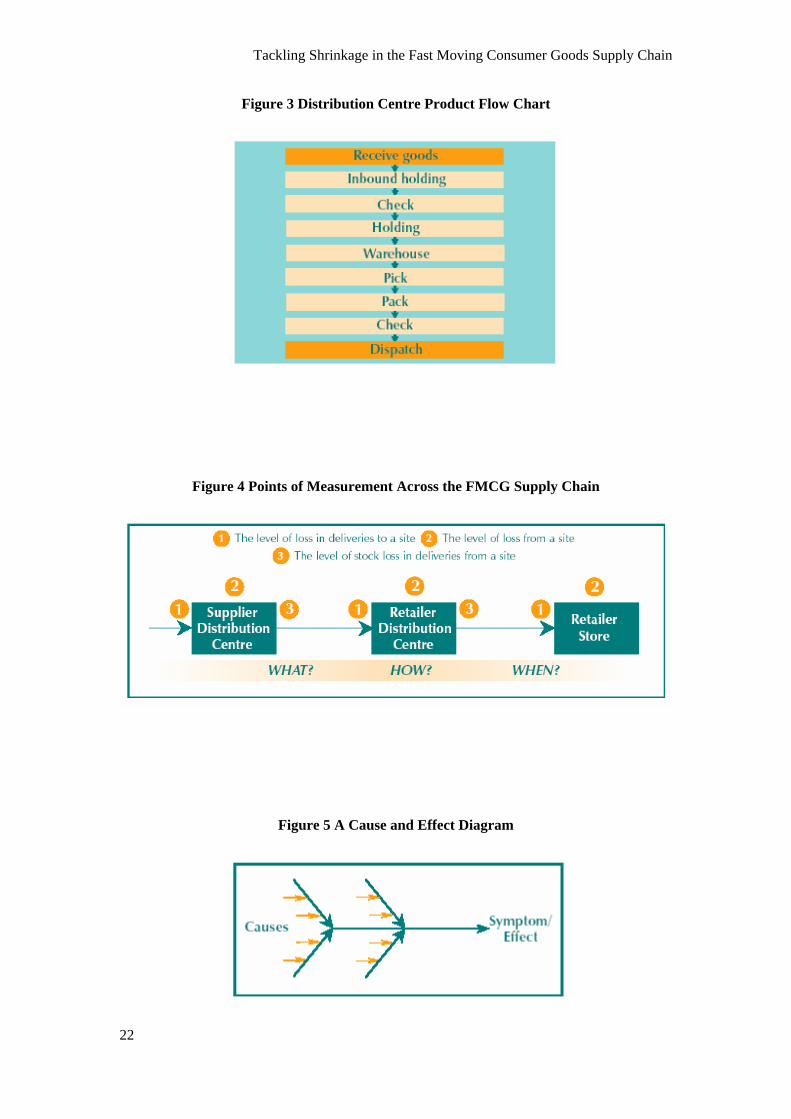
The data for creating a process maps is best collated by physically following products as they
pass along the supply chain. This involves visiting each site that the products pass through
and documenting the steps involved in receiving, storing and dispatching them. Figure 3 is an
example of a process map showing the flow of products through a distribution centre.
Insert figure 3 about here
This presents the steps involved in receiving, storing and dispatching goods in a simple
graphical format. Even when the flow chart does not provide a complete or totally accurate
model of a process it will significantly add to understanding by promoting and
communicating a process-orientated approach to improvements9.
Hot Products
Processes and systems usually contain a large number of separate products. Rather than map
all the various routes taken by all the different items it is appropriate in the initial cycle of
analysis to focus on ‘hot products’10. These products illustrate general features of the supply
chain and expose major problems inherent within it. ‘Hot products’ is a concept that many
retailers and manufacturers are familiar with, and generally refers to those products most
attractive to thieves. If retailers and manufacturers were to gain a better idea of what makes a
product ‘hot’, then this could, by reducing the levels of the theft element within stock loss,
help dramatically reduce levels of shrinkage within the whole supply chain.
Current approaches to categorising hot products are usually based upon perceptions of the
security department, as methods are not always in place to analyse the true nature of stock
Tackling Shrinkage in the Fast Moving Consumer Goods Supply Chain
13
loss. As the recent ECR Europe data shows, retailers can only identify 41 per cent of their
losses and manufacturers are aware of 59 per cent of the losses they suffer11. However, the
study also found that non-food products are perceived to be most at risk of theft, particularly;
tobacco goods, videos, CDs, DVDs, beers, wines and spirits, health and beauty products and
electrical goods. These items increasingly feature within grocery stores, so the need to
control their loss may be the trigger for retailers and their suppliers to work collaboratively to
deal with this problem. While the concept of hot products refers mainly to items that are
stolen, lessons learnt from closely monitoring their progress throughout the entire supply
chain may have more generalised benefits for improving the processes used to move these,
and all other products.
Measuring the Problem
The ECR Europe shrinkage study also found that currently within the FMCG sector, most
retailers keep records of supplier fraud and process failures but few kept computerised records
of internal and external theft, either at a company or store level. Manufacturers were found to
keep computerised records of process failures but few recorded any form of theft on a
computerised system. The majority kept either no record whatsoever or only paper files12.
It is only through the use of computerised databases that trends can be identified and a more
information-led, systematic approach can be adopted to deal with all the elements that account
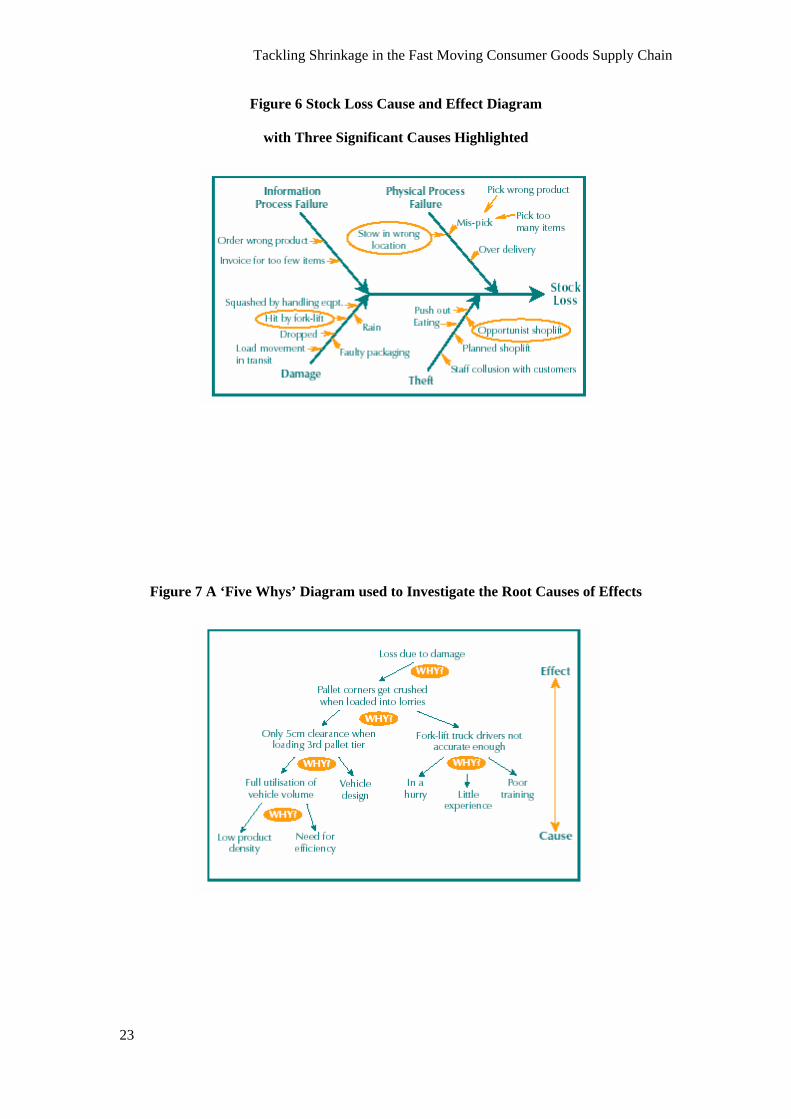
for shrinkage. There are a number of fundamental measures of stock loss that are required in
order to determine the What? How? and When? for each stock loss incident. From a supply
chain perspective, the following basic measures need to be collected:
• The level of loss in deliveries to a site
• The level of loss from a site
• The level of stock loss in deliveries from a site

Tackling Shrinkage in the Fast Moving Consumer Goods Supply Chain
14
These measures allow a ‘top-level’ assessment of the extent and location of stock loss across a
supply chain. In addition, it is necessary to collect data on the following factors:
• The type of incident
• How the incident occurred
• When it happened
This data allows the nature of the type of stock losses suffered to be better understood. The
points in the supply chain where these measures should be taken are shown in Figure 4.
Insert figure 4 about here
In addition to where the loss has taken place, companies need to develop systems that track
how and when particular incidents occur and they need to do this for all types of stock loss.
Companies need to develop an approach that is systematic and part of an on-going process for
collecting and collating timely and useful information that describes patterns, trends and
information on stock loss throughout the supply chain – from first delivery to final check out.
Step 3: Analyse Risk, Identify Causes and Prioritise Actions
Having mapped and measured the current operation, this data should be analysed to
understand and describe exactly what is wrong. Failure Modes and Effect Analysis (FMEA)
is a tool for assessing the various ways that a process may fail and to determine the effect of
the different failure modes13. Through focussing attention upon stock loss, and by using the
FMEA technique, it was possible understand the:
• Ways in which a process can fail and allow stock to be lost
• Severity of the loss should a failure happen
• Likelihood of a failure occurring
• Ability to detect that a failure has occurred
Tackling Shrinkage in the Fast Moving Consumer Goods Supply Chain
15
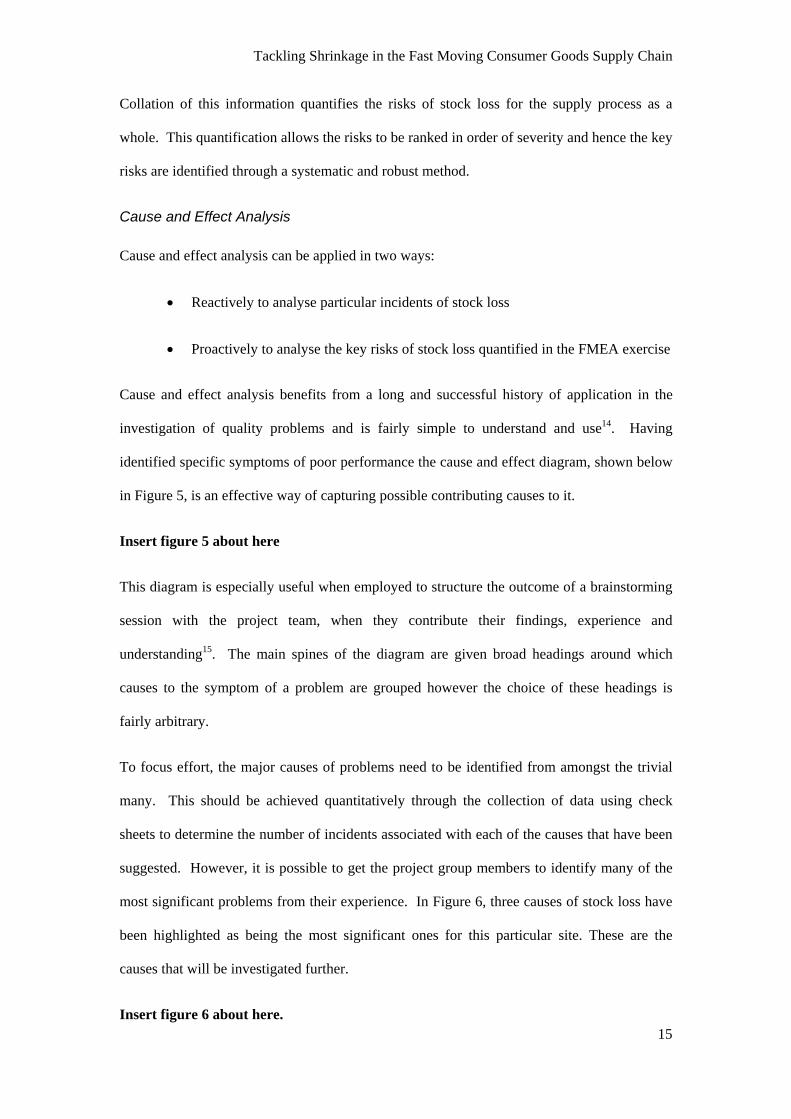
Collation of this information quantifies the risks of stock loss for the supply process as a
whole. This quantification allows the risks to be ranked in order of severity and hence the key
risks are identified through a systematic and robust method.
Cause and Effect Analysis
Cause and effect analysis can be applied in two ways:
• Reactively to analyse particular incidents of stock loss
• Proactively to analyse the key risks of stock loss quantified in the FMEA exercise
Cause and effect analysis benefits from a long and successful history of application in the
investigation of quality problems and is fairly simple to understand and use14. Having
identified specific symptoms of poor performance the cause and effect diagram, shown below
in Figure 5, is an effective way of capturing possible contributing causes to it.
Insert figure 5 about here
This diagram is especially useful when employed to structure the outcome of a brainstorming
session with the project team, when they contribute their findings, experience and
understanding15. The main spines of the diagram are given broad headings around which
causes to the symptom of a problem are grouped however the choice of these headings is
fairly arbitrary.
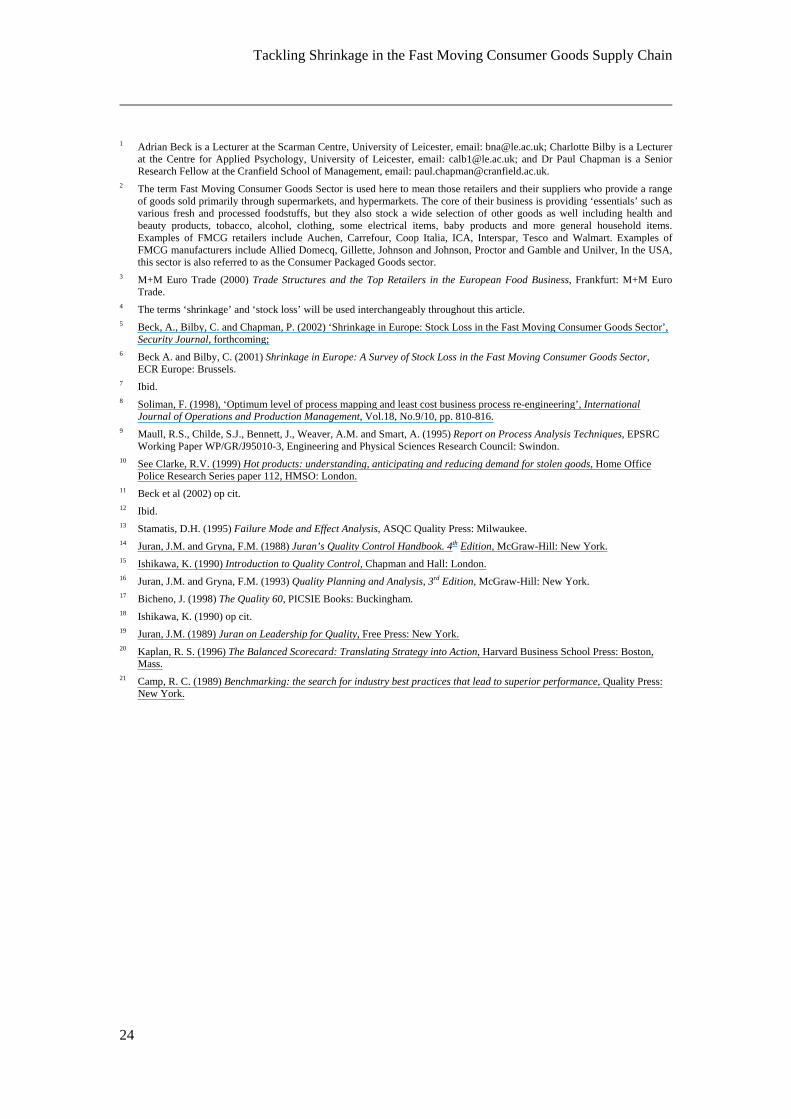
To focus effort, the major causes of problems need to be identified from amongst the trivial
many. This should be achieved quantitatively through the collection of data using check
sheets to determine the number of incidents associated with each of the causes that have been
suggested. However, it is possible to get the project group members to identify many of the
most significant problems from their experience. In Figure 6, three causes of stock loss have
been highlighted as being the most significant ones for this particular site. These are the
causes that will be investigated further.
Insert figure 6 about here.
Tackling Shrinkage in the Fast Moving Consumer Goods Supply Chain
16
This approach follows the Pareto Principle that the ‘vital few’ causes are responsible for the
bulk of problems16.
Five Whys
Initial ideas about the causes of problems are unlikely to identify underlying root causes.
Having tidied the initial ideas and focused upon the significant ones, deeper cause and effect
structures need to be identified. A technique to explore underlying causes of problems, not
those that are first perceived, is the ‘5 whys’ technique17. This technique explores the
underlying causes of losses as fully as possible by repeating the question, ‘why?’18 This
technique is illustrated in Figure 7, below.
Insert figure 7 about here
The 5-whys technique also illustrates that the causes of loss are likely to be many and varied.
In order to focus effort onto the key underlying causes, the Pareto Principle should be once
more applied and the vital few causes of loss highlighted from amongst the trivial many.
Identification and understanding of root causes concludes the diagnosis of the causes of stock
loss and starts the ‘remedial journey’, where solutions to these problems are sought19.
Step 4: Develop Solutions and Prioritise Actions
Organisations traditionally start their stock loss reduction efforts at this, the solution stage. It
is not uncommon to find a great solution and then search for a problem to apply it to. The
systematic process of investigation described in Steps 0 – 3 of the roadmap, requires stock
loss problems to be firstly investigated and their causes identified before the development of
solutions that resolve these causes and hence reduce loss. These solutions are usually
extremely context-specific and it is therefore not possible to simply prescribe solutions
without considering the findings from the investigation work. However, it is important to
note that having identified a set of appropriate solutions, these can be implemented through
one of two general approaches: clean sheet or the renovating of existing operations.

Tackling Shrinkage in the Fast Moving Consumer Goods Supply Chain
17
The clean sheet approach sets existing systems to one side and starts afresh. This recognises
that current practices are beyond salvage and have no further use. Renovating existing
processes builds upon the capabilities that have underpinned the historical success of the
organisation. This approach requires these capabilities to have retained some value, which
may not be the case.
New processes and systems should be accompanied by newly designed performance
measurement systems. In the same way that processes are redesigned to deliver their
objectives, so the performance measurement systems also need to be redesigned to monitor
and control the new processes. Such a system requires a suite of measures. These must
reflect the range of factors important to the organisation that the improvement project needs to
enhance. Considering them in harmony, for instance by using a ‘Balanced Scorecard’20,
promotes improvements across a broad front or at least ensures performance is maintained for
the basket of measures whilst driving progress in a key one. Where performance levels
essential to future success have been identified, but the process design that delivers them is
not understood, benchmarking can be a useful technique to help over come this21. A
benchmarking exercise helps identify the processes used in other organisations that enable
them to achieve superior performance, for example by benchmarking against other hot
products or items from other product categories.
Step 5: Implement Solutions
In a similar manner to the approach used to plan the project investigation, the implementation
of the solution that will reduce stock loss requires project planning. Successful projects
require a sponsor to be responsible for delivering the benefits of the project. To achieve
success the sponsor, usually a senior manager, needs to ensure that the project team constructs
a clear and robust business case. This business case defines what is to be delivered, the
benefits this will bring and the resources required.

Tackling Shrinkage in the Fast Moving Consumer Goods Supply Chain
18
The creation of a project plan is necessary to target resources to achieve the desired objectives
within time and cost limitations. At a top level, a project plan consists of a sequence of steps
that need to be undertaken. A typical set of steps is described below:
• Identify the overview tasks needed to complete the project
• Show the interrelationships between tasks and the sequence in which they can be undertaken on a network diagram
• Estimate the types and amount of effort needed to complete these tasks
• Calculate the resource profile over time to complete the project
• Identify potential risks to successful project delivery
• Mitigate risks or plan contingency
• Iterate the plan to match it against resource availability
• Secure resource
• Put in place procedures for evaluation
Evaluating the effectiveness of the stock loss reduction effort provides information that guides
the direction of the next cycle of loss reduction. Stock loss reduction needs to be ongoing to
ensure loss reduction efforts are compatible with developments across the supply chain and to
counter the resourcefulness of criminals.
Step 6: Evaluate Implementation
The stock loss reduction project ends with an effective solution in place. However, this is not
the end of stock loss reduction as a whole. From the organisation’s perspective, evaluation of
one project is important in order to determine the success of the solution and guide future
projects. The review is therefore the last step of one project and the first step of the next.
The ability to sustain significant improvements in stock loss over long periods of time rests on
the capability to learn from experience and to ensure that companies access the wide range of
developing tools at their disposal. Therefore this review of the implementation must be
objective. All too often reviews are undertaken with the aim of justifying the work that has
been done and fail to provide an honest appraisal of what solution worked and why.

Tackling Shrinkage in the Fast Moving Consumer Goods Supply Chain
19
Accordingly, the evaluation should be rigorous, robust and led by somebody who can provide
an objective review, independent of equipment providers and those who may have
commissioned the project in the first instance. They need a clear mandate to assess the
performance of the implemented solution and compare this against the level of performance
originally planned. This assessment should consider how the implementation of solutions
was justified, for example by the use of a cost/benefit analysis. This information provides the
feedback that allows the stock loss reduction team to objectively consider the effectiveness of
the approach the project team took to reducing stock loss and the specific solutions they
implemented.
In addition, the aim of this feedback phase is to identify whether any further action is required
before the current project can be signed off and to gain a better appreciation of successful
approaches and solutions that might be applied during future projects. It should be noted,
however, that the evaluation process may need to be ongoing as the performance of an
initiative can change as its ‘environment’ alters. For instance criminals may gradually find
ways of defeating the newly adopted approach or changes in product range or levels of
staffing might reduce its effectiveness. Therefore, periodic reviews of newly adopted
measures may need to be carried out in order to gauge their effectiveness over time and to
evaluate whether any corrective measures need to be taken.
Conclusion
The data from a plethora of studies has shown that the problem of shrinkage is massive and
growing, accounting for a significant percentage of the annual turnover of companies
throughout the FMCG industry. It also shows that to date most efforts to deal with the
problem have been piecemeal and partial, relying upon hearsay and guesswork.
The stock loss reduction ‘roadmap’ is an attempt to begin to impose a greater degree of rigour
upon the stock loss process through a more holistic and systematic methodology. It not
Tackling Shrinkage in the Fast Moving Consumer Goods Supply Chain
20
intended to be a prescriptive solution to the problem of shrinkage. Instead it provides a means
of organising stock loss reduction efforts and is aimed at helping practitioners to think
through and develop a more strategic approach. Where it achieves this aim it seems clear that
the shrinkage reduction industry will have taken a dramatic step forward.
Paul Chapman
Figures
Figure 1 The Shrinkage Road Map
Figure 2 Gillette Supply Chains to ICA, Sweden and Tesco, Hungary
Tackling Shrinkage in the Fast Moving Consumer Goods Supply Chain
22
Figure 3 Distribution Centre Product Flow Chart
Figure 4 Points of Measurement Across the FMCG Supply Chain
Figure 5 A Cause and Effect Diagram
Tackling Shrinkage in the Fast Moving Consumer Goods Supply Chain
23
Figure 6 Stock Loss Cause and Effect Diagram
with Three Significant Causes Highlighted
Figure 7 A ‘Five Whys’ Diagram used to Investigate the Root Causes of Effects
Tackling Shrinkage in the Fast Moving Consumer Goods Supply Chain
24
1 Adrian Beck is a Lecturer at the Scarman Centre, University of Leicester, email: [email protected]; Charlotte Bilby is a Lecturer at the Centre for Applied Psychology, University of Leicester, email: [email protected]; and Dr Paul Chapman is a Senior Research Fellow at the Cranfield School of Management, email: [email protected].
2 The term Fast Moving Consumer Goods Sector is used here to mean those retailers and their suppliers who provide a range of goods sold primarily through supermarkets, and hypermarkets. The core of their business is providing ‘essentials’ such as various fresh and processed foodstuffs, but they also stock a wide selection of other goods as well including health and beauty products, tobacco, alcohol, clothing, some electrical items, baby products and more general household items. Examples of FMCG retailers include Auchen, Carrefour, Coop Italia, ICA, Interspar, Tesco and Walmart. Examples of FMCG manufacturers include Allied Domecq, Gillette, Johnson and Johnson, Proctor and Gamble and Unilver, In the USA, this sector is also referred to as the Consumer Packaged Goods sector.
3 M+M Euro Trade (2000) Trade Structures and the Top Retailers in the European Food Business, Frankfurt: M+M Euro Trade.
4 The terms ‘shrinkage’ and ‘stock loss’ will be used interchangeably throughout this article. 5 Beck, A., Bilby, C. and Chapman, P. (2002) ‘Shrinkage in Europe: Stock Loss in the Fast Moving Consumer Goods Sector’,
Security Journal, forthcoming; 6 Beck A. and Bilby, C. (2001) Shrinkage in Europe: A Survey of Stock Loss in the Fast Moving Consumer Goods Sector,
ECR Europe: Brussels. 7 Ibid. 8 Soliman, F. (1998), ‘Optimum level of process mapping and least cost business process re-engineering’, International
Journal of Operations and Production Management, Vol.18, No.9/10, pp. 810-816. 9 Maull, R.S., Childe, S.J., Bennett, J., Weaver, A.M. and Smart, A. (1995) Report on Process Analysis Techniques, EPSRC
Working Paper WP/GR/J95010-3, Engineering and Physical Sciences Research Council: Swindon. 10 See Clarke, R.V. (1999) Hot products: understanding, anticipating and reducing demand for stolen goods, Home Office
Police Research Series paper 112, HMSO: London. 11 Beck et al (2002) op cit. 12 Ibid. 13 Stamatis, D.H. (1995) Failure Mode and Effect Analysis, ASQC Quality Press: Milwaukee. 14 Juran, J.M. and Gryna, F.M. (1988) Juran’s Quality Control Handbook. 4th Edition, McGraw-Hill: New York. 15 Ishikawa, K. (1990) Introduction to Quality Control, Chapman and Hall: London. 16 Juran, J.M. and Gryna, F.M. (1993) Quality Planning and Analysis, 3rd Edition, McGraw-Hill: New York. 17 Bicheno, J. (1998) The Quality 60, PICSIE Books: Buckingham. 18 Ishikawa, K. (1990) op cit. 19 Juran, J.M. (1989) Juran on Leadership for Quality, Free Press: New York. 20 Kaplan, R. S. (1996) The Balanced Scorecard: Translating Strategy into Action, Harvard Business School Press: Boston,
Mass. 21 Camp, R. C. (1989) Benchmarking: the search for industry best practices that lead to superior performance, Quality Press:
New York.