table of contents - Central Bank of Kenya
70
1 Statistical Bulletin, June 2019 TABLE OF CONTENTS Page INTRODUCTORY NOTES................................................................................................ 4 1. SUMMARISED ACCOUNTS OF THE BANKING SYSTEM 1.1 CENTRAL BANK OF KENYA 1.1.1 Assets ............................................................................................. 10 1.1.2 Liabilities ....................................................................................... 11 1.2 OFFICIAL RESERVES 1.2.1 Foreign Assets ................................................................................ 12 1.3 MONETARY AUTHORITY 1.3.1 Assets ............................................................................................ 13 1.3.2 Liabilities ...................................................................................... 14 1.4 COMMERCIAL BANKS 1.4.1 Assets ........................................................................................... 15 1.4.2 Liabilities ..................................................................................... 16 1.5 DEPOSITORY CORPORATIONS SURVEY 1.5.1 Sources of Money ....................................................................... 17 1.5.2 Money Supply ............................................................................. 18 1.6 SECTORAL DISTRIBUTION OF CREDIT FACILITIES 1.6.1 Sectoral Distribution of Credit Facilities ....................................19 2. DETAILED ACCOUNTS OF THE BANKING SYSTEM 2.1 CENTRAL BANK 2.1.1 Assets ........................................................................................... 21 2.1.2 Liabilities ..................................................................................... 22 2.1.3 Notes in Circulation .................................................................... 23 2.1.4 Coins in Circulation .................................................................... 24 2.2 COMMERCIAL BANKS 2.2.1 Analysis of Deposits ................................................................ 25 2.2.2 Liquid Assets ............................................................................ 26 2.2.3 Advances/Deposits and Cash Ratios ........................................ 27 2.2.4 Bankers’ Clearing House ......................................................... 28 2.2.5 Outstanding Credit to Agriculture by Enterprises..................... 29 2.2.6 Outstanding Credit to Agriculture by Period of Credit ............. 30 2.3 KENYA POST OFFICE SAVINGS BANK 2.3.1 Assets and Liabilities.................................................................. 31 2.3.2 Analysis of Deposits and Withdrawals ....................................... 32 2.4 PRINCIPAL INTEREST RATES 2.4.1 Deposit Interest Rates ............................................................... 33 2.4.2 Lending Interest Rates ............................................................... 34
-
Upload
khangminh22 -
Category
Documents
-
view
3 -
download
0
Transcript of table of contents - Central Bank of Kenya
1Statistical Bulletin, June 2019
TABLE OF CONTENTS Page
INTRODUCTORY NOTES................................................................................................ 4
1. SUMMARISED ACCOUNTS OF THE BANKING SYSTEM
1.1 CENTRAL BANK OF KENYA 1.1.1 Assets ............................................................................................. 10 1.1.2 Liabilities ....................................................................................... 11 1.2 OFFICIAL RESERVES 1.2.1 Foreign Assets ................................................................................ 12 1.3 MONETARY AUTHORITY 1.3.1 Assets ............................................................................................ 13 1.3.2 Liabilities ...................................................................................... 14 1.4 COMMERCIAL BANKS 1.4.1 Assets ........................................................................................... 15 1.4.2 Liabilities ..................................................................................... 16 1.5 DEPOSITORY CORPORATIONS SURVEY 1.5.1 Sources of Money ....................................................................... 17 1.5.2 Money Supply ............................................................................. 18 1.6 SECTORAL DISTRIBUTION OF CREDIT FACILITIES 1.6.1 Sectoral Distribution of Credit Facilities ....................................19 2. DETAILED ACCOUNTS OF THE BANKING SYSTEM
2.1 CENTRAL BANK 2.1.1 Assets ........................................................................................... 21 2.1.2 Liabilities ..................................................................................... 22 2.1.3 Notes in Circulation .................................................................... 23 2.1.4 Coins in Circulation .................................................................... 24 2.2 COMMERCIAL BANKS 2.2.1 Analysis of Deposits ................................................................ 25 2.2.2 Liquid Assets ............................................................................ 26 2.2.3 Advances/Deposits and Cash Ratios ........................................ 27 2.2.4 Bankers’ Clearing House ......................................................... 28 2.2.5 Outstanding Credit to Agriculture by Enterprises ..................... 29 2.2.6 Outstanding Credit to Agriculture by Period of Credit ............. 30 2.3 KENYA POST OFFICE SAVINGS BANK 2.3.1 Assets and Liabilities .................................................................. 31 2.3.2 Analysis of Deposits and Withdrawals ....................................... 32 2.4 PRINCIPAL INTEREST RATES 2.4.1 Deposit Interest Rates ............................................................... 33 2.4.2 Lending Interest Rates ............................................................... 34
2Statistical Bulletin, June 2019
2.5 BANKING INSTITUTIONS UNDER LIQUIDATION 2.5.1 Assets ............................................................................................ 35 2.5.2 Liabilities ........................................................................................ 36
2.6 MOBILE BANKING TRANSACTIONS 2.6.1 Mobile Banking Transactions ........................................................ 37
3. INTERNATIONAL TRADE AND FINANCE 3.1 SHILLING EXCHANGE RATES 3.1.1 Selected End of Period Mean Exchange Rates .............................. 38 3.1.2 Selected Monthly and Annual Average Exchange Rates ............... 39
3.2 INTERNATIONAL TRADE 3.2.1 Balance of Payment in BPM 6 Format ....................................... .40 3.2.2 Foreign Trade Summary ............................................................. .41 3.2.3 Principal Exports: Volume, Value and Unit Prices ....................... 42 3.2.4 Domestic Exports: Selected Commodities ................................... 43 3.2.5 Exports: Major Countries of Destination ..................................... 44 3.2.6 Exports: Major Countries of Destination (Africa) ....................... 45 3.2.7 Direct Imports: S.I.T.C Section ................................................... 46
3.2.8 Direct Imports: Major Countries of Origin .................................. 47 3.2.9 Imports: Major African Countries of Origin ................................. 48
4. CENTRAL GOVERNMENT
4.1 GOVERNMENT FINANCE4.1.1 Revenue, Grants and Expenditure ................................................. 494.1.2(a) Composition of Government Revenue ....................................... 504.1.2(b) Composition of Government Expenditure .................................... 514.1.3 Deficit Financing and Public Debt ................................................. 524.1.4 Financing and Stock of Government Debt .................................... 534.1.5(a) Issue of Government Securities - Treasury Bills ........................... 544.1.5(b) Issue of Government Securities - Treasury Bonds ........................ 55
4.2 HOLDERS OF GOVERNMENT SECURITIES 4.2.1 The Banking System ....................................................................... 56 4.2.2 Parastatals ....................................................................................... 57 4.2.3 Others Holders ................................................................................. 58 4.3 INTEREST RATES 4.3.1 Government Securities and Central Bank Advances to Government .59
3Statistical Bulletin, June 2019
5. NATIONAL ACCOUNTS INDICATORS
5.1 GROSS DOMESTIC PRODUCT 5.1.1 Gross Domestic Product at Current Prices ..................................... 60 5.1.2 Gross Domestic Product at Constant (2009) Prices ........................ 61 5.1.3 Quarterly GDP at Current Prices ................................................... 62 5.1.4 Quarterly GDP at Constant 2009 Prices ........................................ 63
6. GENERAL ECONOMIC INDICATORS
6.1 CONSUMER PRICE INDICES 6.1.1 Nairobi Lower Income Group ......................................................... 64 6.1.2 Nairobi Middle Income Group ........................................................ 65 6.1.3 Nairobi Upper Income Group ......................................................... 66 6.1.4 Nairobi Overall Price Index ........................................................... 67 6.1.5 Rest of Urban Towns Consumer Price Index .................................. 68 6.1.6 Kenya Consumer Price Index ........................................................ 69
6.2 ECONOMIC INDICATORS 6.2.1 Selected Economic Indicators ......................................................... 70
4Statistical Bulletin, June 2019
NOTES
1: SUMMARISED ACCOUNTS OF THE BANKING SYSTEM
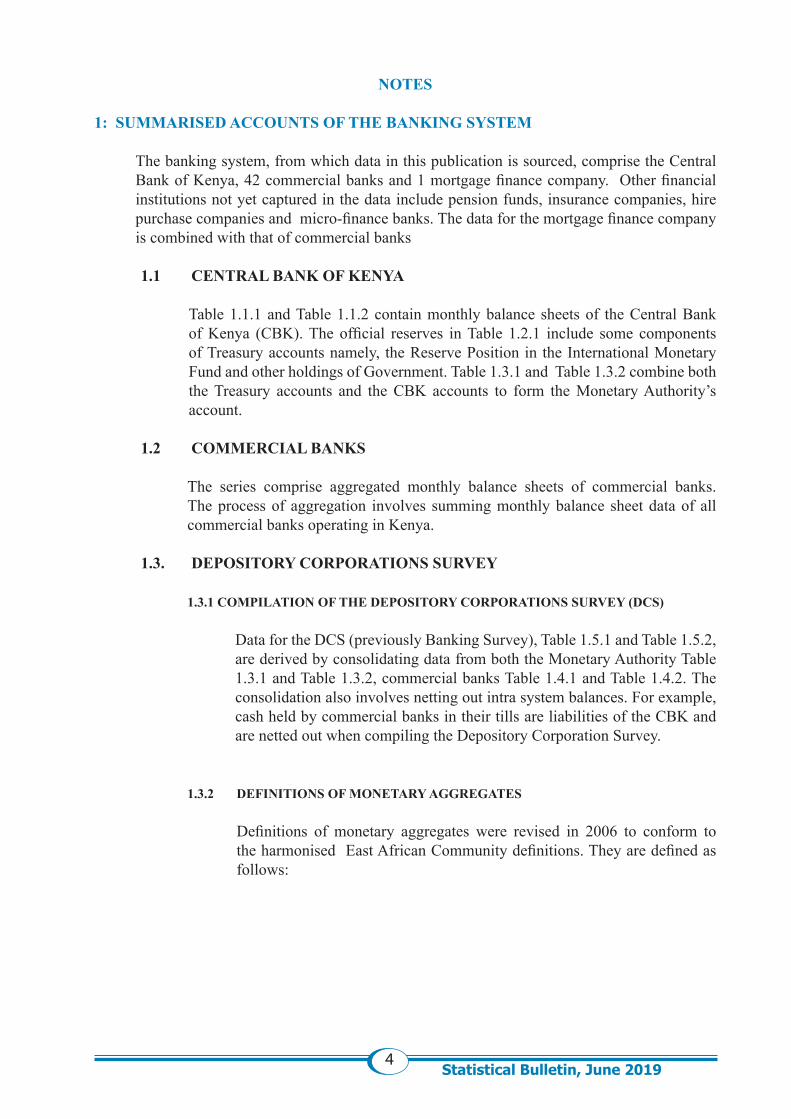
The banking system, from which data in this publication is sourced, comprise the Central Bank of Kenya, 42 commercial banks and 1 mortgage finance company. Other financial institutions not yet captured in the data include pension funds, insurance companies, hire purchase companies and micro-finance banks. The data for the mortgage finance company is combined with that of commercial banks
1.1 CENTRAL BANK OF KENYA
Table 1.1.1 and Table 1.1.2 contain monthly balance sheets of the Central Bank of Kenya (CBK). The official reserves in Table 1.2.1 include some components of Treasury accounts namely, the Reserve Position in the International Monetary Fund and other holdings of Government. Table 1.3.1 and Table 1.3.2 combine both the Treasury accounts and the CBK accounts to form the Monetary Authority’s account.
1.2 COMMERCIAL BANKS
The series comprise aggregated monthly balance sheets of commercial banks. The process of aggregation involves summing monthly balance sheet data of all commercial banks operating in Kenya.
1.3. DEPOSITORY CORPORATIONS SURVEY
1.3.1 COMPILATION OF THE DEPOSITORY CORPORATIONS SURVEY (DCS)
Data for the DCS (previously Banking Survey), Table 1.5.1 and Table 1.5.2, are derived by consolidating data from both the Monetary Authority Table 1.3.1 and Table 1.3.2, commercial banks Table 1.4.1 and Table 1.4.2. The consolidation also involves netting out intra system balances. For example, cash held by commercial banks in their tills are liabilities of the CBK and are netted out when compiling the Depository Corporation Survey.
1.3.2 DEFINITIONS OF MONETARY AGGREGATES
Definitions of monetary aggregates were revised in 2006 to conform to the harmonised East African Community definitions. They are defined as follows:
5Statistical Bulletin, June 2019
Narrow Money M0 : Currency outside the banking system excluding commemorative coins. M1 : M0 + demand deposits of banks (or depository corporations) plus other deposits at CBK.
Broad Money M2 : M1 + quasi (long term) money deposits i.e. time and savings deposits of banks. This was previously M3. The previous M2 was this aggregate less both quasi-money deposits in non-bank financial institutions and their holding of cash in till and any deposits they hold in other banks.
Extended Broad Money M3 : M2 + resident foreign currency deposits. This was previously M3X.
Overall Liquidity L : M3 + non-bank holdings of Government Paper. This, however, is not a monetary aggregate.
2: DETAILED ACCOUNTS OF THE BANKING SYSTEM
These tables provide detailed information on the basis of which consolidated reports such as the Depository Corporations Survey are derived, and also facilitate cross checks for the summary reports. Additional data include series on liquid assets (Table 2.2.2), commercial bank loans to the agricultural sector (Table 2.2.5 and Table 2.2.6) and interest rates (Table 2.4.1 and Table 2.4.2).
Liquid assets of commercial banks are made up of their cash holdings, balances held at the CBK, investments in Treasury bills and bonds and balances held with banks abroad. The ratio of liquid assets to total deposits is the liquidity ratio and the statutory minimum ratio required currently stands at 20 percent. It is reported on a daily basis.
Commercial bank loans by type of enterprise for small scale enterprises, large scale enterprises, co-operative societies and agricultural boards are shown in Table 2.2.5. The same loans are structured according to maturities in Table 2.2.6.
Interest rates include commercial banks’ weighted average lending and deposit rates. For example, the weighted average rate for various deposit accounts in a bank is computed as follows:
where:
∑ is summation over all the deposit accounts in a bank
ri is the rate of interest earned by the ith deposit account
Qi is the deposit amount for the ith account.
D is total deposit amount for all the accounts, which is the sum of all Qi.
6Statistical Bulletin, June 2019
A representative rate for all the banks for a given type of deposit account is then obtained in a similar manner. In that case:
∑ is the summation over all the banks.
ri is the average rate of interest offered by the ith bank.
Qi is the deposit amount for the ith bank.
D is the total deposit for all the banks, which is the sum of all Qi.
Weighted average lending rates are computed in a similar manner using the respective lending rates and loan amounts.
3: INTERNATIONAL TRADE AND FINANCE
3.1. MEAN AND END PERIOD EXCHANGE RATES
End period exchange rate refers to the closing mean exchange rate for the last trading day of each month. The mean exchange rate is computed as the simple average of the mean buying and selling exchange rates on any trading day. The mean buying and selling exchange rates are computed by calculating simple averages for the buying and selling exchange rates for major commercial bank players in the foreign exchange market.
Uganda, Tanzania, Rwanda and Burundi currency units are quoted as currency units per Kenya shilling while all other currencies are quoted as Kenya shillings per currency unit. The Japanese yen is quoted as Kenya shillings per 100 Japanese yen.
3.2 BALANCE OF PAYMENTS
The balance of payments statement (Table 3.2.1 ) is obtained from the Economic Survey published by the Kenya National Bureau of Statistics (KNBS). No alterations are made to the figures but cross checks have been done. The statement conforms to the sixth edition of IMF’s Balance of Payments Manual (BPM6). The reserve assets section reports changes that have taken place in reserve assets within the reference period.
3.3 FOREIGN TRADE SUMMARY
The foreign trade summary gives monthly total imports (cif), total exports (fob), re-exports (fob), and trade balance. Monthly totals may not add up to annual totals due to revisions made to monthly data in the course of the year. Therefore, annual totals reported by the CBK may differ slightly from annual totals reported by the KNBS in its annual publication.
7Statistical Bulletin, June 2019
4: GOVERNMENT FINANCE STATISTICS
4.1 CENTRAL GOVERNMENT FINANCE
4.1.1 Government Revenue and Grants
Government revenue is classified as tax or non-tax. Tax revenue comprises import duty, excise duty, income tax (including PAYE) and value added tax (VAT). Non-tax revenue comprises investment income, appropriations in aid (AIA) and other levies relating to traffic, land, airport, wildlife and tourism, licenses, fines and forfeitures. Grants are gift funds received by the Government from other governments or international organisations.
4.1.2 Government Expenditure and Net Lending (Commitment Basis)
Government expenditure is classified into two, namely, recurrent expenditure and development expenditure. Recurrent expenditure refers to expenditures incurred persistently (e.g. monthly). It consists of domestic interest and foreign payments, wages and salaries, pensions and payments for maintenance and operations. Development expenditure refers to the expenditures incurred on projects including relevant salaries and wages. Net lending is the difference between Central Government advances to parastatals and repayments by parastatals to the Central Government. It also includes Government guaranteed lending to public entities.
4.1.3 Budget Deficit and Surplus (Cash Basis)
A budget deficit results when expenditure exceeds revenue and grants. Conversely, when revenue exceeds expenditure, there is a surplus. The deficit on a commitment basis is the deficit derived using the expenditure the Government is under obligation (committed) to finance. The deficit on a cash basis is derived using the actual expenditure the Government has financed. It is the deficit on commitment basis adjusted for unsettled claims on the Government. The deficit on a cash basis takes into account stocks of funds paid in advance, expenditure arrears and cash in the main Government account, which is the Paymaster General (PMG).
4.1.4 Deficit Financing
The budget deficit is financed through external borrowing, domestic borrowing and sale of Government shares in parastatals (privatisation). External borrowing consists of credit from multilateral organisations including the World Bank, other countries (bilateral) and external commercial banks. Domestic borrowing is from the domestic money and capital markets through Treasury bills and bonds, and also loans and advances from banking institutions including any overdraft at CBK.
8Statistical Bulletin, June 2019
4.2 GOVERNMENT DEBT
Government debt comprises external and domestic debt. Domestic debt is reported on a gross basis and excludes Government deposits in commercial banks and CBK, also excluded are Treasury advances to parastatals. It consists of Government securities and government guaranteed loans and advances from commercial banks. External debt consists of public and publicly guaranteed debt from outside the country contracted in foreign currency.
In Table 4.2 the maturity of the security at the time of issue is shown, not the years to redemption of the various issues of the same tenor.
4.3 INTEREST RATES
4.3.1 Treasury Bill Interest Rate
Interest rates on Treasury bills are compiled from the weighted average weekly accepted tender rate for the 91-day, 182-day and 364-day Treasury bills. The average interest rate for the month is derived by computing a simple average of the weighted average weekly tender rates within the month. The Treasury bill rate does not include rates on the Repo Treasury bills which are issued for monetary policy purposes.
4.3.2 Treasury Bond Interest Rate
Treasury bonds are issued periodically and have maturities of between one and thirty years. The types of Treasury bonds which have been issued in Kenya are floating rate, special floating, fixed rate, discounted fixed rate, infrastructure and zero coupons. Interest rates paid on each bond tenor in a particular month is derived by computing the weighted average rate for bonds of the same tenor for which interest payments are due. But it should be noted that infrastructure bonds are tax free hence, their rates are not comparable with other bonds.
4.3.3 Interest on Government Overdraft at CBK
The Government is allowed to overdraw its accounts at the CBK up to a limit of 5 percent of the ordinary revenue in its latest audited accounts. Interest is charged on the overdraft amount at the Central Bank Rate (CBR) .
9Statistical Bulletin, June 2019
5: NATIONAL ACCOUNTS
5.1. GROSS DOMESTIC PRODUCT (GDP) – CURRENT AND CONSTANT (2009) PRICES
National accounts data are compiled by the KNBS. Annual GDP data are extracted from the Economic Survey and Statistical Abstract published by KNBS annually. The Economic Survey is released in April or May each year. Quarterly real GDP figures are released with a lag of three months.
6: GENERAL ECONOMIC INDICATORS
6.1 CONSUMER PRICES
Data on consumer price indices (CPIs) are collected by the KNBS from retail outlets in 25 urban centers in Kenya in the second and third week of every month. In accordance with the findings of the Kenya Integrated Household Budget Survey (KIHBS) conducted in 2005/06, the CPI basket was, in February 2009, split into 12 categories of goods and services (previously 10) classified in conformity with the Classification of Individual Consumption According to Purpose (COICOP), and re-weighted to reflect the change in consumption patterns. This CPI reflects the classification and weights.
The Geometric Mean computation method was adopted beginning October 2009, replacing the Arithmetic Mean method which had hitherto been applied. Under the new method, the CPI is computed using the standard Laspeyres Index together with geometric averaging at the elementary level and arithmetic averaging at the higher level. The series dating back to October 2005 was recomputed using the new method but applying the old weights (not presented in the current issue).
The detailed methodology for computing CPI at the elementary and higher levels is contained in the KNBS - The 2008 Consumer Price Index (CPI) – publication.
6.2 ECONOMIC INDICATORS
The series are derived from the annual Economic Survey and the monthly Leading Economic Indicators publications, both produced by the KNBS, and data from the Nairobi Securities Exchange.
6.3 REVISION POLICY
Provisional numbers are revised in subsequent editions of the Statistical bulletin.
10Statistical Bulletin, June 2019
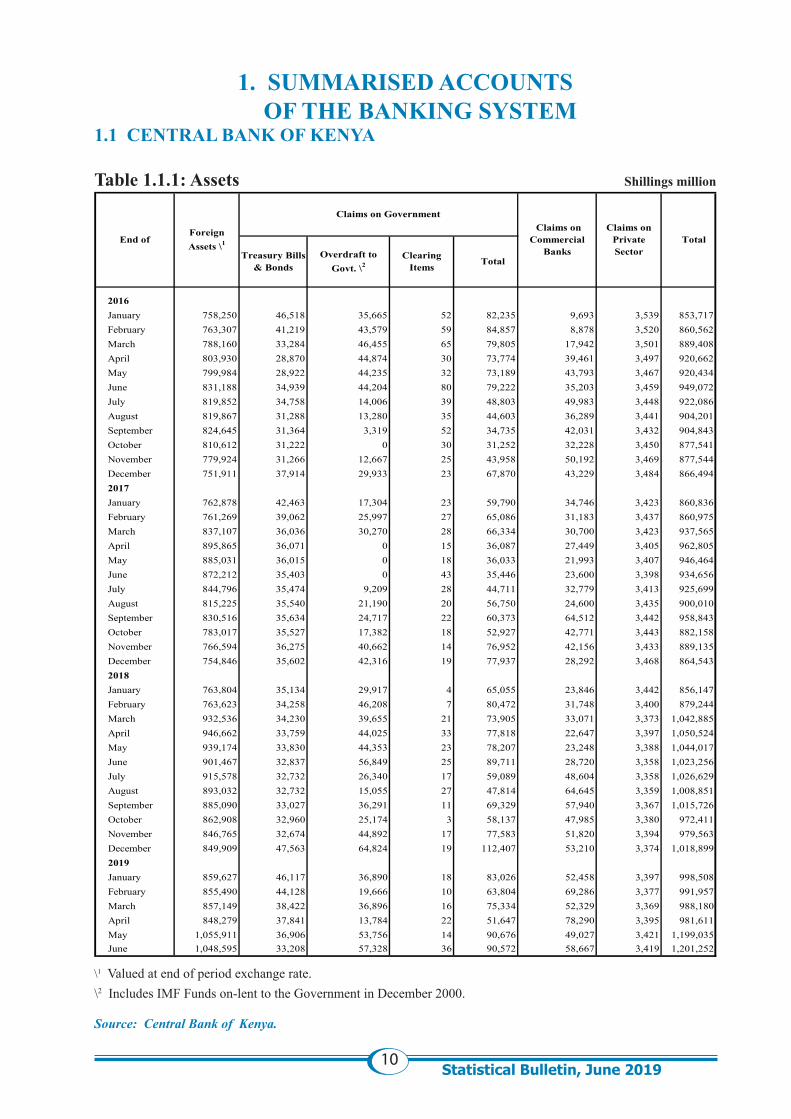
1. SUMMARISED ACCOUNTS OF THE BANKING SYSTEM
1.1 CENTRAL BANK OF KENYA Table 1.1.1: Assets Shillings million
\1 Valued at end of period exchange rate. \2 Includes IMF Funds on-lent to the Government in December 2000.
Source: Central Bank of Kenya.
2016January 758,250 46,518 35,665 52 82,235 9,693 3,539 853,717February 763,307 41,219 43,579 59 84,857 8,878 3,520 860,562March 788,160 33,284 46,455 65 79,805 17,942 3,501 889,408April 803,930 28,870 44,874 30 73,774 39,461 3,497 920,662May 799,984 28,922 44,235 32 73,189 43,793 3,467 920,434June 831,188 34,939 44,204 80 79,222 35,203 3,459 949,072July 819,852 34,758 14,006 39 48,803 49,983 3,448 922,086August 819,867 31,288 13,280 35 44,603 36,289 3,441 904,201September 824,645 31,364 3,319 52 34,735 42,031 3,432 904,843October 810,612 31,222 0 30 31,252 32,228 3,450 877,541November 779,924 31,266 12,667 25 43,958 50,192 3,469 877,544December 751,911 37,914 29,933 23 67,870 43,229 3,484 866,4942017January 762,878 42,463 17,304 23 59,790 34,746 3,423 860,836February 761,269 39,062 25,997 27 65,086 31,183 3,437 860,975March 837,107 36,036 30,270 28 66,334 30,700 3,423 937,565April 895,865 36,071 0 15 36,087 27,449 3,405 962,805May 885,031 36,015 0 18 36,033 21,993 3,407 946,464June 872,212 35,403 0 43 35,446 23,600 3,398 934,656July 844,796 35,474 9,209 28 44,711 32,779 3,413 925,699August 815,225 35,540 21,190 20 56,750 24,600 3,435 900,010September 830,516 35,634 24,717 22 60,373 64,512 3,442 958,843October 783,017 35,527 17,382 18 52,927 42,771 3,443 882,158November 766,594 36,275 40,662 14 76,952 42,156 3,433 889,135December 754,846 35,602 42,316 19 77,937 28,292 3,468 864,5432018January 763,804 35,134 29,917 4 65,055 23,846 3,442 856,147February 763,623 34,258 46,208 7 80,472 31,748 3,400 879,244March 932,536 34,230 39,655 21 73,905 33,071 3,373 1,042,885April 946,662 33,759 44,025 33 77,818 22,647 3,397 1,050,524May 939,174 33,830 44,353 23 78,207 23,248 3,388 1,044,017June 901,467 32,837 56,849 25 89,711 28,720 3,358 1,023,256July 915,578 32,732 26,340 17 59,089 48,604 3,358 1,026,629August 893,032 32,732 15,055 27 47,814 64,645 3,359 1,008,851September 885,090 33,027 36,291 11 69,329 57,940 3,367 1,015,726October 862,908 32,960 25,174 3 58,137 47,985 3,380 972,411November 846,765 32,674 44,892 17 77,583 51,820 3,394 979,563December 849,909 47,563 64,824 19 112,407 53,210 3,374 1,018,8992019January 859,627 46,117 36,890 18 83,026 52,458 3,397 998,508February 855,490 44,128 19,666 10 63,804 69,286 3,377 991,957March 857,149 38,422 36,896 16 75,334 52,329 3,369 988,180April 848,279 37,841 13,784 22 51,647 78,290 3,395 981,611May 1,055,911 36,906 53,756 14 90,676 49,027 3,421 1,199,035June 1,048,595 33,208 57,328 36 90,572 58,667 3,419 1,201,252
Total
Treasury Bills & Bonds
Overdraft to Govt. \2
Clearing Items Total
End ofForeign Assets \1
Claims on Government Claims on
Commercial Banks
Claims on Private Sector
11Statistical Bulletin, June 2019
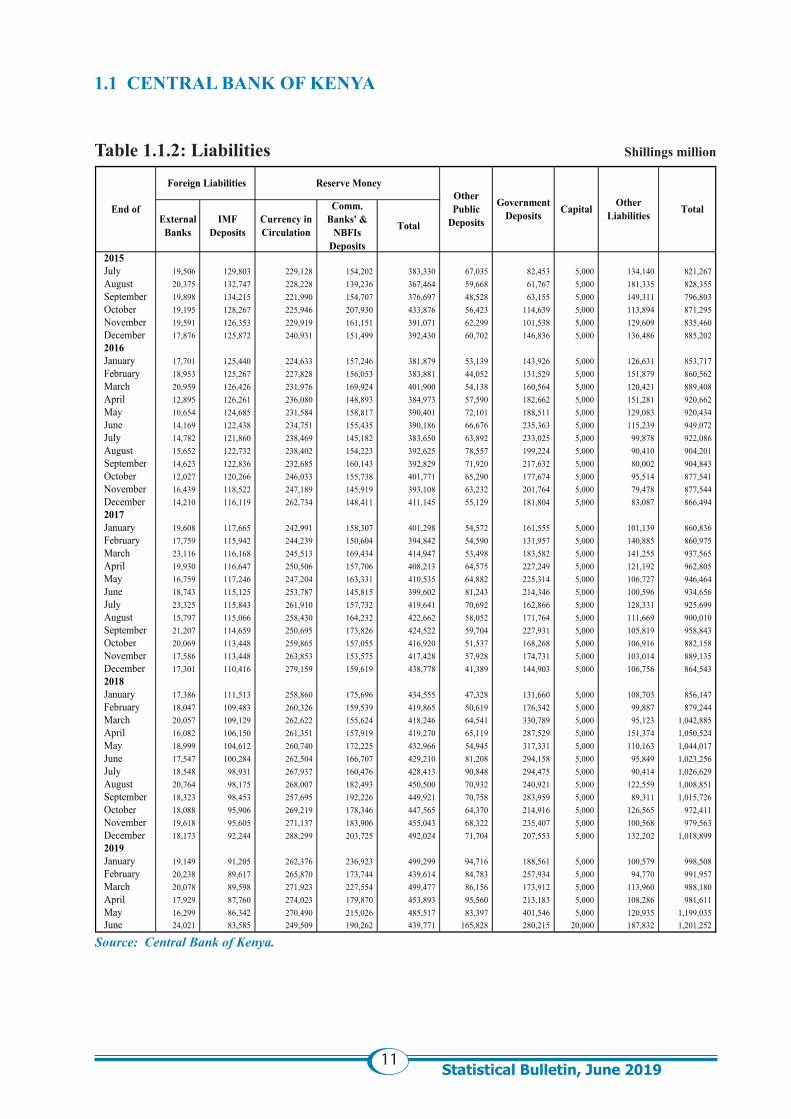
1.1 CENTRAL BANK OF KENYA
Table 1.1.2: Liabilities Shillings million
Source: Central Bank of Kenya.
2015July 19,506 129,803 229,128 154,202 383,330 67,035 82,453 5,000 134,140 821,267 August 20,375 132,747 228,228 139,236 367,464 59,668 61,767 5,000 181,335 828,355 September 19,898 134,215 221,990 154,707 376,697 48,528 63,155 5,000 149,311 796,803 October 19,195 128,267 225,946 207,930 433,876 56,423 114,639 5,000 113,894 871,295 November 19,591 126,353 229,919 161,151 391,071 62,299 101,538 5,000 129,609 835,460 December 17,876 125,872 240,931 151,499 392,430 60,702 146,836 5,000 136,486 885,202 2016January 17,701 125,440 224,633 157,246 381,879 53,139 143,926 5,000 126,631 853,717 February 18,953 125,267 227,828 156,053 383,881 44,052 131,529 5,000 151,879 860,562 March 20,959 126,426 231,976 169,924 401,900 54,138 160,564 5,000 120,421 889,408 April 12,895 126,261 236,080 148,893 384,973 57,590 182,662 5,000 151,281 920,662 May 10,654 124,685 231,584 158,817 390,401 72,101 188,511 5,000 129,083 920,434 June 14,169 122,438 234,751 155,435 390,186 66,676 235,363 5,000 115,239 949,072 July 14,782 121,860 238,469 145,182 383,650 63,892 233,025 5,000 99,878 922,086 August 15,652 122,732 238,402 154,223 392,625 78,557 199,224 5,000 90,410 904,201 September 14,623 122,836 232,685 160,143 392,829 71,920 217,632 5,000 80,002 904,843 October 12,027 120,266 246,033 155,738 401,771 65,290 177,674 5,000 95,514 877,541 November 16,439 118,522 247,189 145,919 393,108 63,232 201,764 5,000 79,478 877,544 December 14,210 116,119 262,734 148,411 411,145 55,129 181,804 5,000 83,087 866,494 2017January 19,608 117,665 242,991 158,307 401,298 54,572 161,555 5,000 101,139 860,836 February 17,759 115,942 244,239 150,604 394,842 54,590 131,957 5,000 140,885 860,975 March 23,116 116,168 245,513 169,434 414,947 53,498 183,582 5,000 141,255 937,565 April 19,930 116,647 250,506 157,706 408,213 64,575 227,249 5,000 121,192 962,805 May 16,759 117,246 247,204 163,331 410,535 64,882 225,314 5,000 106,727 946,464 June 18,743 115,125 253,787 145,815 399,602 81,243 214,346 5,000 100,596 934,656 July 23,325 115,843 261,910 157,732 419,641 70,692 162,866 5,000 128,331 925,699 August 15,797 115,066 258,430 164,232 422,662 58,052 171,764 5,000 111,669 900,010 September 21,207 114,659 250,695 173,826 424,522 59,704 227,931 5,000 105,819 958,843 October 20,069 113,448 259,865 157,055 416,920 51,537 168,268 5,000 106,916 882,158 November 17,586 113,448 263,853 153,575 417,428 57,928 174,731 5,000 103,014 889,135 December 17,301 110,416 279,159 159,619 438,778 41,389 144,903 5,000 106,756 864,543 2018January 17,386 111,513 258,860 175,696 434,555 47,328 131,660 5,000 108,703 856,147 February 18,047 109,483 260,326 159,539 419,865 50,619 176,342 5,000 99,887 879,244 March 20,057 109,129 262,622 155,624 418,246 64,541 330,789 5,000 95,123 1,042,885 April 16,082 106,150 261,351 157,919 419,270 65,119 287,529 5,000 151,374 1,050,524 May 18,999 104,612 260,740 172,225 432,966 54,945 317,331 5,000 110,163 1,044,017 June 17,547 100,284 262,504 166,707 429,210 81,208 294,158 5,000 95,849 1,023,256 July 18,548 98,931 267,937 160,476 428,413 90,848 294,475 5,000 90,414 1,026,629 August 20,764 98,175 268,007 182,493 450,500 70,932 240,921 5,000 122,559 1,008,851 September 18,323 98,453 257,695 192,226 449,921 70,758 283,959 5,000 89,311 1,015,726 October 18,088 95,906 269,219 178,346 447,565 64,370 214,916 5,000 126,565 972,411 November 19,618 95,605 271,137 183,906 455,043 68,322 235,407 5,000 100,568 979,563 December 18,173 92,244 288,299 203,725 492,024 71,704 207,553 5,000 132,202 1,018,899 2019January 19,149 91,205 262,376 236,923 499,299 94,716 188,561 5,000 100,579 998,508 February 20,238 89,617 265,870 173,744 439,614 84,783 257,934 5,000 94,770 991,957 March 20,078 89,598 271,923 227,554 499,477 86,156 173,912 5,000 113,960 988,180 April 17,929 87,760 274,023 179,870 453,893 95,560 213,183 5,000 108,286 981,611 May 16,299 86,342 270,490 215,026 485,517 83,397 401,546 5,000 120,935 1,199,035 June 24,021 83,585 249,509 190,262 439,771 165,828 280,215 20,000 187,832 1,201,252
End of
Foreign Liabilities Reserve Money Other Public
Deposits
Government Deposits
Other Liabilities Total
External Banks
IMF Deposits
Currency in Circulation
Comm. Banks' &
NBFIs Deposits
TotalCapital
12Statistical Bulletin, June 2019
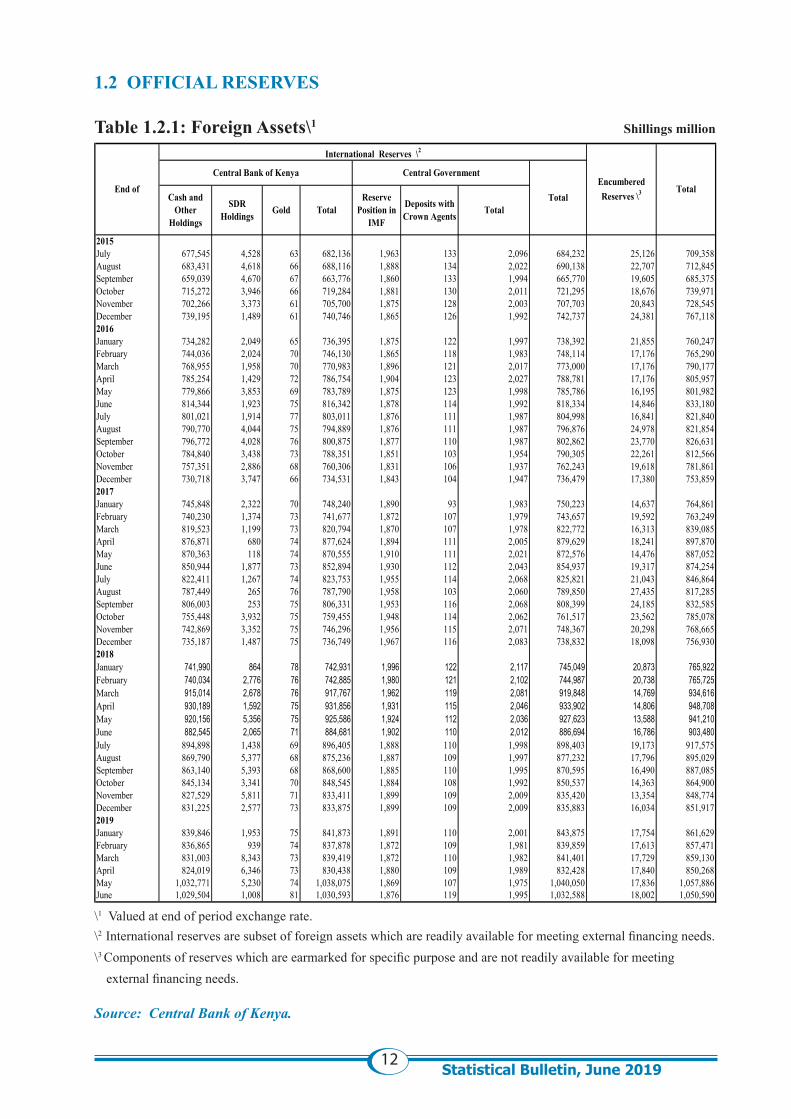
1.2 OFFICIAL RESERVES Table 1.2.1: Foreign Assets\1 Shillings million
\1 Valued at end of period exchange rate.\2 International reserves are subset of foreign assets which are readily available for meeting external financing needs. \3 Components of reserves which are earmarked for specific purpose and are not readily available for meeting
external financing needs.
Source: Central Bank of Kenya.
2015July 677,545 4,528 63 682,136 1,963 133 2,096 684,232 25,126 709,358August 683,431 4,618 66 688,116 1,888 134 2,022 690,138 22,707 712,845September 659,039 4,670 67 663,776 1,860 133 1,994 665,770 19,605 685,375October 715,272 3,946 66 719,284 1,881 130 2,011 721,295 18,676 739,971November 702,266 3,373 61 705,700 1,875 128 2,003 707,703 20,843 728,545December 739,195 1,489 61 740,746 1,865 126 1,992 742,737 24,381 767,1182016January 734,282 2,049 65 736,395 1,875 122 1,997 738,392 21,855 760,247February 744,036 2,024 70 746,130 1,865 118 1,983 748,114 17,176 765,290March 768,955 1,958 70 770,983 1,896 121 2,017 773,000 17,176 790,177April 785,254 1,429 72 786,754 1,904 123 2,027 788,781 17,176 805,957May 779,866 3,853 69 783,789 1,875 123 1,998 785,786 16,195 801,982June 814,344 1,923 75 816,342 1,878 114 1,992 818,334 14,846 833,180July 801,021 1,914 77 803,011 1,876 111 1,987 804,998 16,841 821,840August 790,770 4,044 75 794,889 1,876 111 1,987 796,876 24,978 821,854September 796,772 4,028 76 800,875 1,877 110 1,987 802,862 23,770 826,631October 784,840 3,438 73 788,351 1,851 103 1,954 790,305 22,261 812,566November 757,351 2,886 68 760,306 1,831 106 1,937 762,243 19,618 781,861December 730,718 3,747 66 734,531 1,843 104 1,947 736,479 17,380 753,8592017January 745,848 2,322 70 748,240 1,890 93 1,983 750,223 14,637 764,861February 740,230 1,374 73 741,677 1,872 107 1,979 743,657 19,592 763,249March 819,523 1,199 73 820,794 1,870 107 1,978 822,772 16,313 839,085April 876,871 680 74 877,624 1,894 111 2,005 879,629 18,241 897,870May 870,363 118 74 870,555 1,910 111 2,021 872,576 14,476 887,052June 850,944 1,877 73 852,894 1,930 112 2,043 854,937 19,317 874,254July 822,411 1,267 74 823,753 1,955 114 2,068 825,821 21,043 846,864August 787,449 265 76 787,790 1,958 103 2,060 789,850 27,435 817,285September 806,003 253 75 806,331 1,953 116 2,068 808,399 24,185 832,585October 755,448 3,932 75 759,455 1,948 114 2,062 761,517 23,562 785,078November 742,869 3,352 75 746,296 1,956 115 2,071 748,367 20,298 768,665December 735,187 1,487 75 736,749 1,967 116 2,083 738,832 18,098 756,9302018January 741,990 864 78 742,931 1,996 122 2,117 745,049 20,873 765,922February 740,034 2,776 76 742,885 1,980 121 2,102 744,987 20,738 765,725March 915,014 2,678 76 917,767 1,962 119 2,081 919,848 14,769 934,616April 930,189 1,592 75 931,856 1,931 115 2,046 933,902 14,806 948,708May 920,156 5,356 75 925,586 1,924 112 2,036 927,623 13,588 941,210June 882,545 2,065 71 884,681 1,902 110 2,012 886,694 16,786 903,480July 894,898 1,438 69 896,405 1,888 110 1,998 898,403 19,173 917,575August 869,790 5,377 68 875,236 1,887 109 1,997 877,232 17,796 895,029September 863,140 5,393 68 868,600 1,885 110 1,995 870,595 16,490 887,085October 845,134 3,341 70 848,545 1,884 108 1,992 850,537 14,363 864,900November 827,529 5,811 71 833,411 1,899 109 2,009 835,420 13,354 848,774December 831,225 2,577 73 833,875 1,899 109 2,009 835,883 16,034 851,9172019January 839,846 1,953 75 841,873 1,891 110 2,001 843,875 17,754 861,629February 836,865 939 74 837,878 1,872 109 1,981 839,859 17,613 857,471March 831,003 8,343 73 839,419 1,872 110 1,982 841,401 17,729 859,130April 824,019 6,346 73 830,438 1,880 109 1,989 832,428 17,840 850,268May 1,032,771 5,230 74 1,038,075 1,869 107 1,975 1,040,050 17,836 1,057,886June 1,029,504 1,008 81 1,030,593 1,876 119 1,995 1,032,588 18,002 1,050,590
End of
International Reserves \2
Encumbered Reserves \3 Total
Central Bank of Kenya Central Government
TotalCash and Other
Holdings
SDR Holdings Gold Total
Reserve Position in
IMF
Deposits with Crown Agents Total
13Statistical Bulletin, June 2019
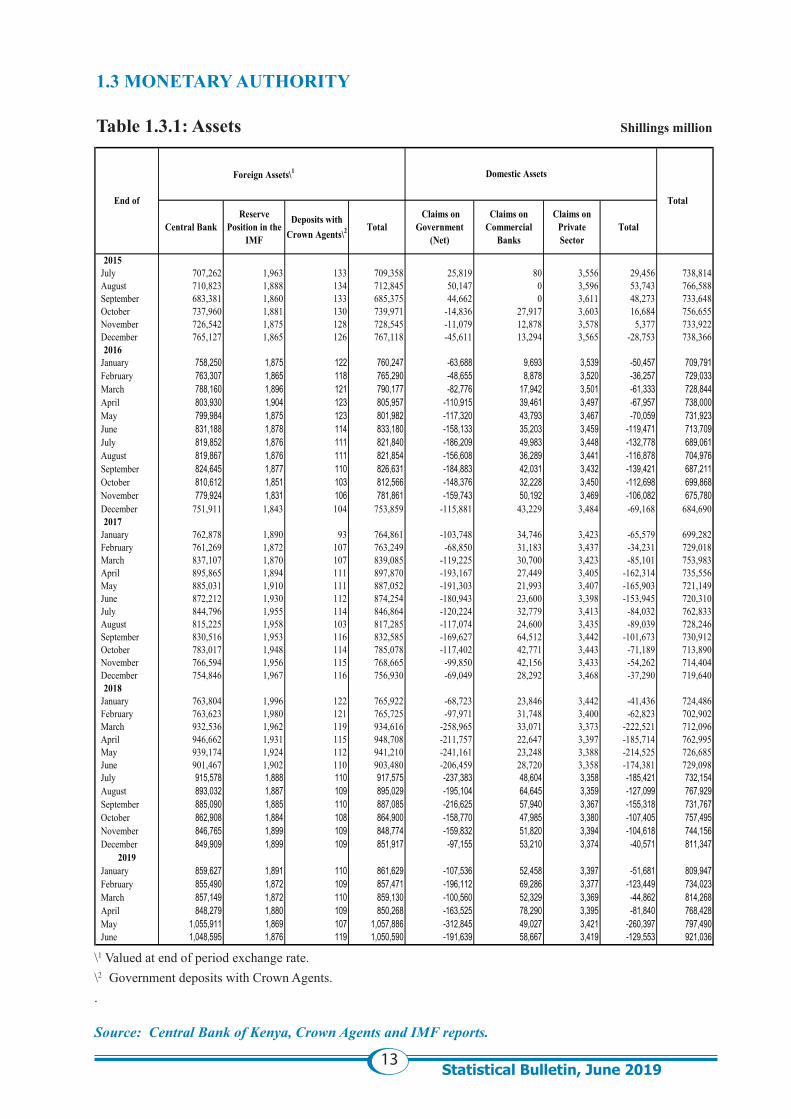
1.3 MONETARY AUTHORITY Table 1.3.1: Assets Shillings million
\1 Valued at end of period exchange rate.\2 Government deposits with Crown Agents..
Source: Central Bank of Kenya, Crown Agents and IMF reports.
2015 July 707,262 1,963 133 709,358 25,819 80 3,556 29,456 738,814 August 710,823 1,888 134 712,845 50,147 0 3,596 53,743 766,588 September 683,381 1,860 133 685,375 44,662 0 3,611 48,273 733,648 October 737,960 1,881 130 739,971 -14,836 27,917 3,603 16,684 756,655 November 726,542 1,875 128 728,545 -11,079 12,878 3,578 5,377 733,922 December 765,127 1,865 126 767,118 -45,611 13,294 3,565 -28,753 738,366
2016 January 758,250 1,875 122 760,247 -63,688 9,693 3,539 -50,457 709,791 February 763,307 1,865 118 765,290 -48,655 8,878 3,520 -36,257 729,033 March 788,160 1,896 121 790,177 -82,776 17,942 3,501 -61,333 728,844 April 803,930 1,904 123 805,957 -110,915 39,461 3,497 -67,957 738,000 May 799,984 1,875 123 801,982 -117,320 43,793 3,467 -70,059 731,923 June 831,188 1,878 114 833,180 -158,133 35,203 3,459 -119,471 713,709 July 819,852 1,876 111 821,840 -186,209 49,983 3,448 -132,778 689,061 August 819,867 1,876 111 821,854 -156,608 36,289 3,441 -116,878 704,976 September 824,645 1,877 110 826,631 -184,883 42,031 3,432 -139,421 687,211 October 810,612 1,851 103 812,566 -148,376 32,228 3,450 -112,698 699,868 November 779,924 1,831 106 781,861 -159,743 50,192 3,469 -106,082 675,780 December 751,911 1,843 104 753,859 -115,881 43,229 3,484 -69,168 684,690
2017 January 762,878 1,890 93 764,861 -103,748 34,746 3,423 -65,579 699,282 February 761,269 1,872 107 763,249 -68,850 31,183 3,437 -34,231 729,018 March 837,107 1,870 107 839,085 -119,225 30,700 3,423 -85,101 753,983 April 895,865 1,894 111 897,870 -193,167 27,449 3,405 -162,314 735,556 May 885,031 1,910 111 887,052 -191,303 21,993 3,407 -165,903 721,149 June 872,212 1,930 112 874,254 -180,943 23,600 3,398 -153,945 720,310 July 844,796 1,955 114 846,864 -120,224 32,779 3,413 -84,032 762,833 August 815,225 1,958 103 817,285 -117,074 24,600 3,435 -89,039 728,246 September 830,516 1,953 116 832,585 -169,627 64,512 3,442 -101,673 730,912 October 783,017 1,948 114 785,078 -117,402 42,771 3,443 -71,189 713,890 November 766,594 1,956 115 768,665 -99,850 42,156 3,433 -54,262 714,404 December 754,846 1,967 116 756,930 -69,049 28,292 3,468 -37,290 719,640
2018 January 763,804 1,996 122 765,922 -68,723 23,846 3,442 -41,436 724,486 February 763,623 1,980 121 765,725 -97,971 31,748 3,400 -62,823 702,902 March 932,536 1,962 119 934,616 -258,965 33,071 3,373 -222,521 712,096 April 946,662 1,931 115 948,708 -211,757 22,647 3,397 -185,714 762,995 May 939,174 1,924 112 941,210 -241,161 23,248 3,388 -214,525 726,685 June 901,467 1,902 110 903,480 -206,459 28,720 3,358 -174,381 729,098 July 915,578 1,888 110 917,575 -237,383 48,604 3,358 -185,421 732,154 August 893,032 1,887 109 895,029 -195,104 64,645 3,359 -127,099 767,929 September 885,090 1,885 110 887,085 -216,625 57,940 3,367 -155,318 731,767 October 862,908 1,884 108 864,900 -158,770 47,985 3,380 -107,405 757,495 November 846,765 1,899 109 848,774 -159,832 51,820 3,394 -104,618 744,156 December 849,909 1,899 109 851,917 -97,155 53,210 3,374 -40,571 811,347
2019 January 859,627 1,891 110 861,629 -107,536 52,458 3,397 -51,681 809,947 February 855,490 1,872 109 857,471 -196,112 69,286 3,377 -123,449 734,023 March 857,149 1,872 110 859,130 -100,560 52,329 3,369 -44,862 814,268 April 848,279 1,880 109 850,268 -163,525 78,290 3,395 -81,840 768,428 May 1,055,911 1,869 107 1,057,886 -312,845 49,027 3,421 -260,397 797,490 June 1,048,595 1,876 119 1,050,590 -191,639 58,667 3,419 -129,553 921,036
End of
Foreign Assets\1 Domestic Assets
Total
Central BankReserve
Position in the IMF
Deposits with Crown Agents\2 Total
Claims on Government
(Net)
Claims on Commercial
Banks
Claims on Private Sector
Total
14Statistical Bulletin, June 2019
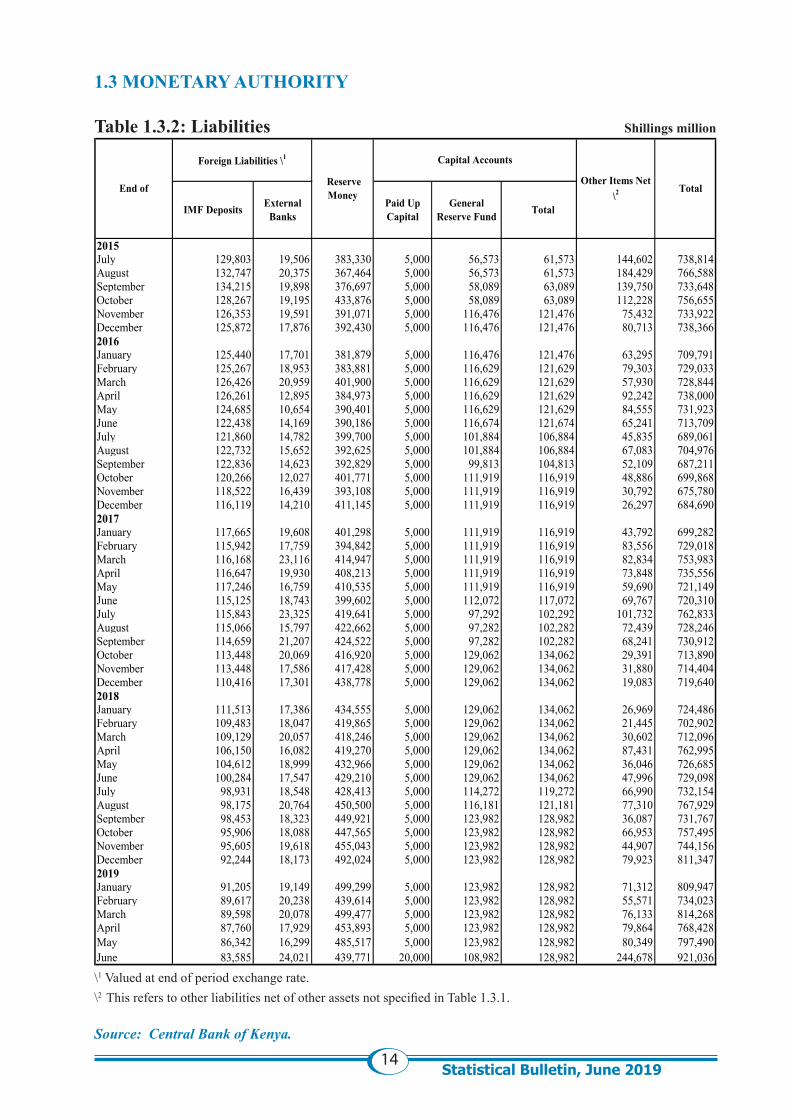
\1 Valued at end of period exchange rate.\2 This refers to other liabilities net of other assets not specified in Table 1.3.1.
Source: Central Bank of Kenya.
1.3 MONETARY AUTHORITY Table 1.3.2: Liabilities Shillings million
2015July 129,803 19,506 383,330 5,000 56,573 61,573 144,602 738,814August 132,747 20,375 367,464 5,000 56,573 61,573 184,429 766,588September 134,215 19,898 376,697 5,000 58,089 63,089 139,750 733,648October 128,267 19,195 433,876 5,000 58,089 63,089 112,228 756,655November 126,353 19,591 391,071 5,000 116,476 121,476 75,432 733,922December 125,872 17,876 392,430 5,000 116,476 121,476 80,713 738,3662016January 125,440 17,701 381,879 5,000 116,476 121,476 63,295 709,791February 125,267 18,953 383,881 5,000 116,629 121,629 79,303 729,033March 126,426 20,959 401,900 5,000 116,629 121,629 57,930 728,844April 126,261 12,895 384,973 5,000 116,629 121,629 92,242 738,000May 124,685 10,654 390,401 5,000 116,629 121,629 84,555 731,923June 122,438 14,169 390,186 5,000 116,674 121,674 65,241 713,709July 121,860 14,782 399,700 5,000 101,884 106,884 45,835 689,061August 122,732 15,652 392,625 5,000 101,884 106,884 67,083 704,976September 122,836 14,623 392,829 5,000 99,813 104,813 52,109 687,211October 120,266 12,027 401,771 5,000 111,919 116,919 48,886 699,868November 118,522 16,439 393,108 5,000 111,919 116,919 30,792 675,780December 116,119 14,210 411,145 5,000 111,919 116,919 26,297 684,6902017January 117,665 19,608 401,298 5,000 111,919 116,919 43,792 699,282February 115,942 17,759 394,842 5,000 111,919 116,919 83,556 729,018March 116,168 23,116 414,947 5,000 111,919 116,919 82,834 753,983April 116,647 19,930 408,213 5,000 111,919 116,919 73,848 735,556May 117,246 16,759 410,535 5,000 111,919 116,919 59,690 721,149June 115,125 18,743 399,602 5,000 112,072 117,072 69,767 720,310July 115,843 23,325 419,641 5,000 97,292 102,292 101,732 762,833August 115,066 15,797 422,662 5,000 97,282 102,282 72,439 728,246September 114,659 21,207 424,522 5,000 97,282 102,282 68,241 730,912October 113,448 20,069 416,920 5,000 129,062 134,062 29,391 713,890November 113,448 17,586 417,428 5,000 129,062 134,062 31,880 714,404December 110,416 17,301 438,778 5,000 129,062 134,062 19,083 719,6402018January 111,513 17,386 434,555 5,000 129,062 134,062 26,969 724,486February 109,483 18,047 419,865 5,000 129,062 134,062 21,445 702,902March 109,129 20,057 418,246 5,000 129,062 134,062 30,602 712,096April 106,150 16,082 419,270 5,000 129,062 134,062 87,431 762,995May 104,612 18,999 432,966 5,000 129,062 134,062 36,046 726,685June 100,284 17,547 429,210 5,000 129,062 134,062 47,996 729,098July 98,931 18,548 428,413 5,000 114,272 119,272 66,990 732,154August 98,175 20,764 450,500 5,000 116,181 121,181 77,310 767,929September 98,453 18,323 449,921 5,000 123,982 128,982 36,087 731,767October 95,906 18,088 447,565 5,000 123,982 128,982 66,953 757,495November 95,605 19,618 455,043 5,000 123,982 128,982 44,907 744,156December 92,244 18,173 492,024 5,000 123,982 128,982 79,923 811,3472019January 91,205 19,149 499,299 5,000 123,982 128,982 71,312 809,947February 89,617 20,238 439,614 5,000 123,982 128,982 55,571 734,023March 89,598 20,078 499,477 5,000 123,982 128,982 76,133 814,268April 87,760 17,929 453,893 5,000 123,982 128,982 79,864 768,428May 86,342 16,299 485,517 5,000 123,982 128,982 80,349 797,490June 83,585 24,021 439,771 20,000 108,982 128,982 244,678 921,036
Total
IMF Deposits External Banks
Paid Up Capital
General Reserve Fund Total
End of
Foreign Liabilities \1
Reserve Money
Capital Accounts
Other Items Net \2
15Statistical Bulletin, June 2019
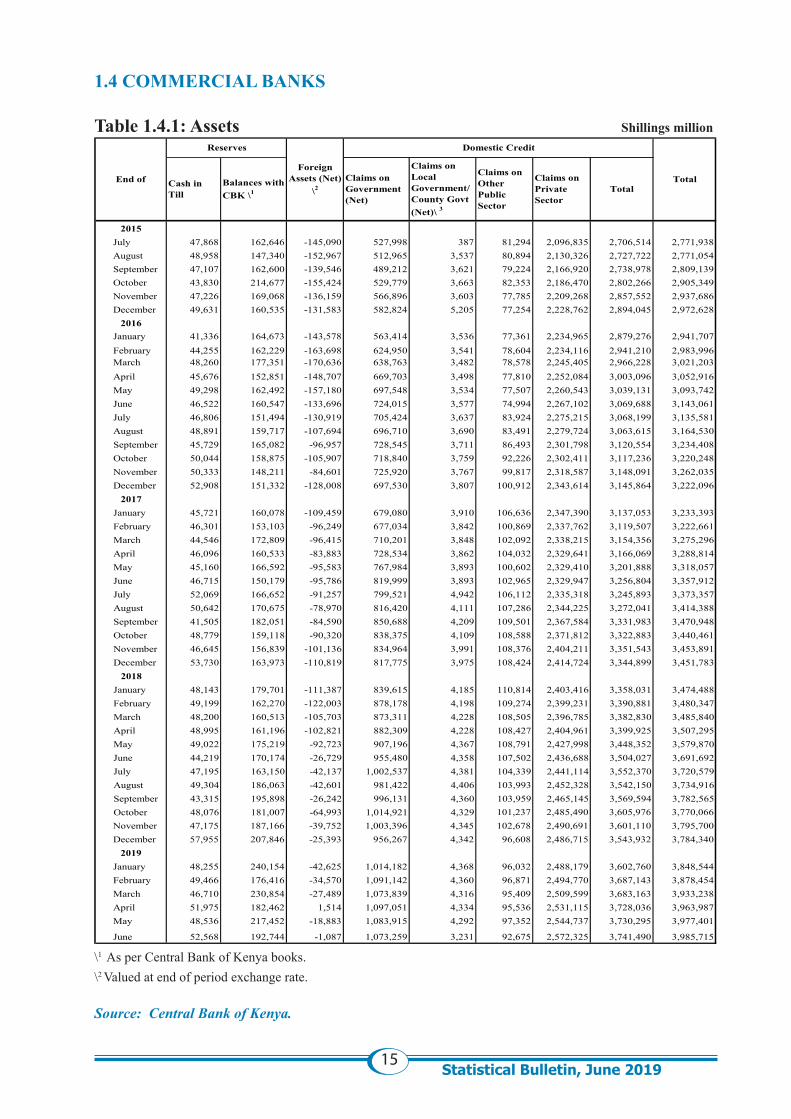
1.4 COMMERCIAL BANKS Table 1.4.1: Assets Shillings million
\1 As per Central Bank of Kenya books.\2 Valued at end of period exchange rate.
Source: Central Bank of Kenya.
2015 July 47,868 162,646 -145,090 527,998 387 81,294 2,096,835 2,706,514 2,771,938 August 48,958 147,340 -152,967 512,965 3,537 80,894 2,130,326 2,727,722 2,771,054 September 47,107 162,600 -139,546 489,212 3,621 79,224 2,166,920 2,738,978 2,809,139 October 43,830 214,677 -155,424 529,779 3,663 82,353 2,186,470 2,802,266 2,905,349 November 47,226 169,068 -136,159 566,896 3,603 77,785 2,209,268 2,857,552 2,937,686 December 49,631 160,535 -131,583 582,824 5,205 77,254 2,228,762 2,894,045 2,972,628
2016 January 41,336 164,673 -143,578 563,414 3,536 77,361 2,234,965 2,879,276 2,941,707 February 44,255 162,229 -163,698 624,950 3,541 78,604 2,234,116 2,941,210 2,983,996 March 48,260 177,351 -170,636 638,763 3,482 78,578 2,245,405 2,966,228 3,021,203 April 45,676 152,851 -148,707 669,703 3,498 77,810 2,252,084 3,003,096 3,052,916 May 49,298 162,492 -157,180 697,548 3,534 77,507 2,260,543 3,039,131 3,093,742 June 46,522 160,547 -133,696 724,015 3,577 74,994 2,267,102 3,069,688 3,143,061 July 46,806 151,494 -130,919 705,424 3,637 83,924 2,275,215 3,068,199 3,135,581 August 48,891 159,717 -107,694 696,710 3,690 83,491 2,279,724 3,063,615 3,164,530 September 45,729 165,082 -96,957 728,545 3,711 86,493 2,301,798 3,120,554 3,234,408 October 50,044 158,875 -105,907 718,840 3,759 92,226 2,302,411 3,117,236 3,220,248 November 50,333 148,211 -84,601 725,920 3,767 99,817 2,318,587 3,148,091 3,262,035 December 52,908 151,332 -128,008 697,530 3,807 100,912 2,343,614 3,145,864 3,222,096
2017 January 45,721 160,078 -109,459 679,080 3,910 106,636 2,347,390 3,137,053 3,233,393 February 46,301 153,103 -96,249 677,034 3,842 100,869 2,337,762 3,119,507 3,222,661 March 44,546 172,809 -96,415 710,201 3,848 102,092 2,338,215 3,154,356 3,275,296 April 46,096 160,533 -83,883 728,534 3,862 104,032 2,329,641 3,166,069 3,288,814 May 45,160 166,592 -95,583 767,984 3,893 100,602 2,329,410 3,201,888 3,318,057 June 46,715 150,179 -95,786 819,999 3,893 102,965 2,329,947 3,256,804 3,357,912 July 52,069 166,652 -91,257 799,521 4,942 106,112 2,335,318 3,245,893 3,373,357 August 50,642 170,675 -78,970 816,420 4,111 107,286 2,344,225 3,272,041 3,414,388 September 41,505 182,051 -84,590 850,688 4,209 109,501 2,367,584 3,331,983 3,470,948 October 48,779 159,118 -90,320 838,375 4,109 108,588 2,371,812 3,322,883 3,440,461 November 46,645 156,839 -101,136 834,964 3,991 108,376 2,404,211 3,351,543 3,453,891 December 53,730 163,973 -110,819 817,775 3,975 108,424 2,414,724 3,344,899 3,451,783
2018 January 48,143 179,701 -111,387 839,615 4,185 110,814 2,403,416 3,358,031 3,474,488 February 49,199 162,270 -122,003 878,178 4,198 109,274 2,399,231 3,390,881 3,480,347 March 48,200 160,513 -105,703 873,311 4,228 108,505 2,396,785 3,382,830 3,485,840 April 48,995 161,196 -102,821 882,309 4,228 108,427 2,404,961 3,399,925 3,507,295 May 49,022 175,219 -92,723 907,196 4,367 108,791 2,427,998 3,448,352 3,579,870 June 44,219 170,174 -26,729 955,480 4,358 107,502 2,436,688 3,504,027 3,691,692 July 47,195 163,150 -42,137 1,002,537 4,381 104,339 2,441,114 3,552,370 3,720,579 August 49,304 186,063 -42,601 981,422 4,406 103,993 2,452,328 3,542,150 3,734,916 September 43,315 195,898 -26,242 996,131 4,360 103,959 2,465,145 3,569,594 3,782,565 October 48,076 181,007 -64,993 1,014,921 4,329 101,237 2,485,490 3,605,976 3,770,066 November 47,175 187,166 -39,752 1,003,396 4,345 102,678 2,490,691 3,601,110 3,795,700 December 57,955 207,846 -25,393 956,267 4,342 96,608 2,486,715 3,543,932 3,784,340
2019 January 48,255 240,154 -42,625 1,014,182 4,368 96,032 2,488,179 3,602,760 3,848,544 February 49,466 176,416 -34,570 1,091,142 4,360 96,871 2,494,770 3,687,143 3,878,454 March 46,710 230,854 -27,489 1,073,839 4,316 95,409 2,509,599 3,683,163 3,933,238 April 51,975 182,462 1,514 1,097,051 4,334 95,536 2,531,115 3,728,036 3,963,987 May 48,536 217,452 -18,883 1,083,915 4,292 97,352 2,544,737 3,730,295 3,977,401
June 52,568 192,744 -1,087 1,073,259 3,231 92,675 2,572,325 3,741,490 3,985,715
End of
Reserves
Foreign Assets (Net)
\2
Domestic Credit
TotalCash in Till
Balances with CBK \1
Claims on Government (Net)
Claims on Local Government/County Govt (Net)\ 3
Claims on Other Public Sector
TotalClaims on Private Sector
16Statistical Bulletin, June 2019
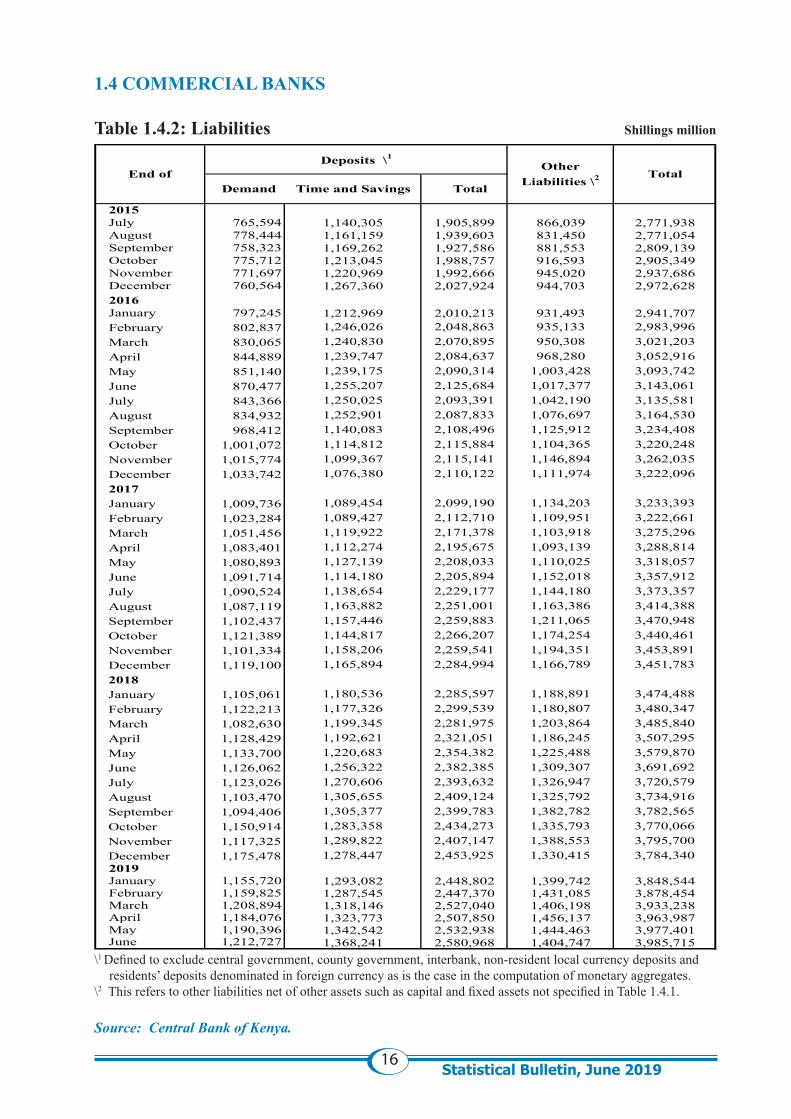
1.4 COMMERCIAL BANKS Table 1.4.2: Liabilities Shillings million
\1 Defined to exclude central government, county government, interbank, non-resident local currency deposits and residents’ deposits denominated in foreign currency as is the case in the computation of monetary aggregates.
\2 This refers to other liabilities net of other assets such as capital and fixed assets not specified in Table 1.4.1. Source: Central Bank of Kenya.
2015 July 765,594 1,140,305 1,905,899 866,039 2,771,938 August 778,444 1,161,159 1,939,603 831,450 2,771,054 September 758,323 1,169,262 1,927,586 881,553 2,809,139 October 775,712 1,213,045 1,988,757 916,593 2,905,349 November 771,697 1,220,969 1,992,666 945,020 2,937,686 December 760,564 1,267,360 2,027,924 944,703 2,972,628
2016 January 797,245 1,212,969 2,010,213 931,493 2,941,707 February 802,837 1,246,026 2,048,863 935,133 2,983,996 March 830,065 1,240,830 2,070,895 950,308 3,021,203 April 844,889 1,239,747 2,084,637 968,280 3,052,916 May 851,140 1,239,175 2,090,314 1,003,428 3,093,742 June 870,477 1,255,207 2,125,684 1,017,377 3,143,061 July 843,366 1,250,025 2,093,391 1,042,190 3,135,581 August 834,932 1,252,901 2,087,833 1,076,697 3,164,530 September 968,412 1,140,083 2,108,496 1,125,912 3,234,408 October 1,001,072 1,114,812 2,115,884 1,104,365 3,220,248 November 1,015,774 1,099,367 2,115,141 1,146,894 3,262,035 December 1,033,742 1,076,380 2,110,122 1,111,974 3,222,096
2017 January 1,009,736 1,089,454 2,099,190 1,134,203 3,233,393 February 1,023,284 1,089,427 2,112,710 1,109,951 3,222,661 March 1,051,456 1,119,922 2,171,378 1,103,918 3,275,296 April 1,083,401 1,112,274 2,195,675 1,093,139 3,288,814 May 1,080,893 1,127,139 2,208,033 1,110,025 3,318,057 June 1,091,714 1,114,180 2,205,894 1,152,018 3,357,912 July 1,090,524 1,138,654 2,229,177 1,144,180 3,373,357 August 1,087,119 1,163,882 2,251,001 1,163,386 3,414,388 September 1,102,437 1,157,446 2,259,883 1,211,065 3,470,948 October 1,121,389 1,144,817 2,266,207 1,174,254 3,440,461 November 1,101,334 1,158,206 2,259,541 1,194,351 3,453,891 December 1,119,100 1,165,894 2,284,994 1,166,789 3,451,783
2018 January 1,105,061 1,180,536 2,285,597 1,188,891 3,474,488 February 1,122,213 1,177,326 2,299,539 1,180,807 3,480,347 March 1,082,630 1,199,345 2,281,975 1,203,864 3,485,840 April 1,128,429 1,192,621 2,321,051 1,186,245 3,507,295 May 1,133,700 1,220,683 2,354,382 1,225,488 3,579,870 June 1,126,062 1,256,322 2,382,385 1,309,307 3,691,692 July 1,123,026 1,270,606 2,393,632 1,326,947 3,720,579 August 1,103,470 1,305,655 2,409,124 1,325,792 3,734,916 September 1,094,406 1,305,377 2,399,783 1,382,782 3,782,565 October 1,150,914 1,283,358 2,434,273 1,335,793 3,770,066 November 1,117,325 1,289,822 2,407,147 1,388,553 3,795,700 December 1,175,478 1,278,447 2,453,925 1,330,415 3,784,340
2019 January 1,155,720 1,293,082 2,448,802 1,399,742 3,848,544 February 1,159,825 1,287,545 2,447,370 1,431,085 3,878,454 March 1,208,894 1,318,146 2,527,040 1,406,198 3,933,238 April 1,184,076 1,323,773 2,507,850 1,456,137 3,963,987 May 1,190,396 1,342,542 2,532,938 1,444,463 3,977,401 June 1,212,727 1,368,241 2,580,968 1,404,747 3,985,715
End ofDeposits \1
Other Liabilities \2 Total
Demand Time and Savings Total
17Statistical Bulletin, June 2019
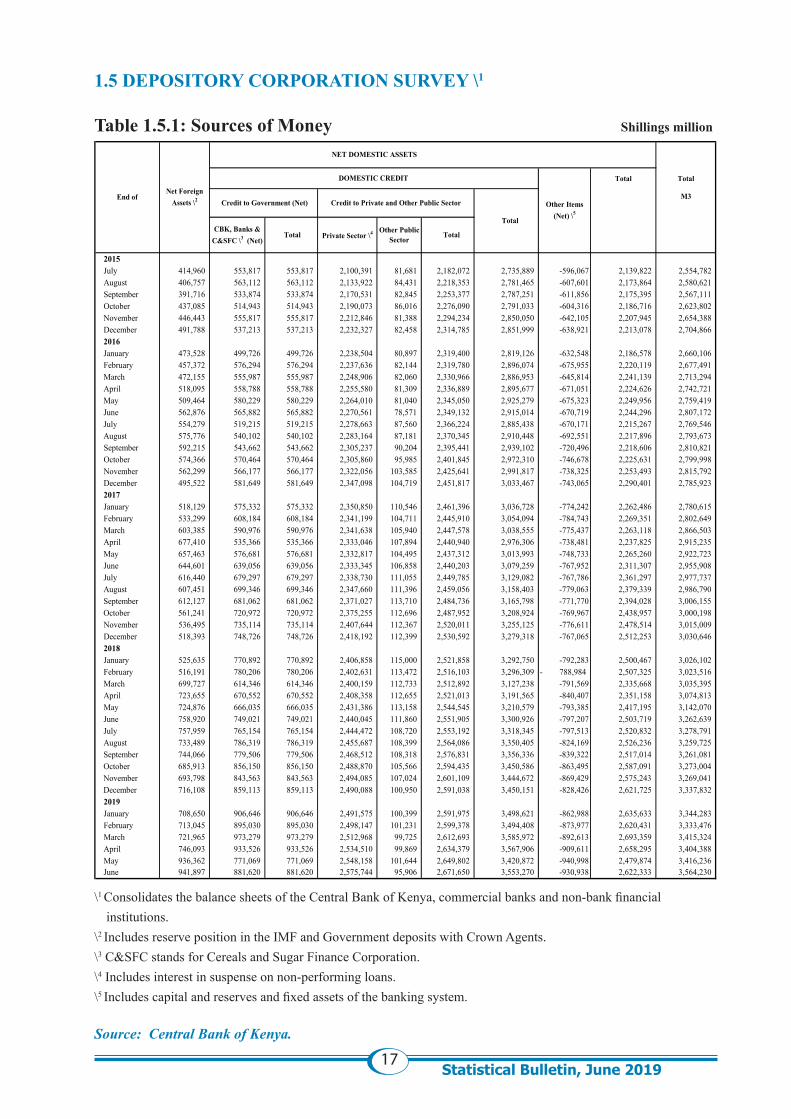
1.5 DEPOSITORY CORPORATION SURVEY \1 Table 1.5.1: Sources of Money Shillings million
\1 Consolidates the balance sheets of the Central Bank of Kenya, commercial banks and non-bank financial institutions.
\2 Includes reserve position in the IMF and Government deposits with Crown Agents. \3 C&SFC stands for Cereals and Sugar Finance Corporation.\4 Includes interest in suspense on non-performing loans. \5 Includes capital and reserves and fixed assets of the banking system. Source: Central Bank of Kenya.
Total Total
M3
2015July 414,960 553,817 553,817 2,100,391 81,681 2,182,072 2,735,889 -596,067 2,139,822 2,554,782 August 406,757 563,112 563,112 2,133,922 84,431 2,218,353 2,781,465 -607,601 2,173,864 2,580,621 September 391,716 533,874 533,874 2,170,531 82,845 2,253,377 2,787,251 -611,856 2,175,395 2,567,111 October 437,085 514,943 514,943 2,190,073 86,016 2,276,090 2,791,033 -604,316 2,186,716 2,623,802 November 446,443 555,817 555,817 2,212,846 81,388 2,294,234 2,850,050 -642,105 2,207,945 2,654,388 December 491,788 537,213 537,213 2,232,327 82,458 2,314,785 2,851,999 -638,921 2,213,078 2,704,866 2016January 473,528 499,726 499,726 2,238,504 80,897 2,319,400 2,819,126 -632,548 2,186,578 2,660,106 February 457,372 576,294 576,294 2,237,636 82,144 2,319,780 2,896,074 -675,955 2,220,119 2,677,491 March 472,155 555,987 555,987 2,248,906 82,060 2,330,966 2,886,953 -645,814 2,241,139 2,713,294 April 518,095 558,788 558,788 2,255,580 81,309 2,336,889 2,895,677 -671,051 2,224,626 2,742,721 May 509,464 580,229 580,229 2,264,010 81,040 2,345,050 2,925,279 -675,323 2,249,956 2,759,419 June 562,876 565,882 565,882 2,270,561 78,571 2,349,132 2,915,014 -670,719 2,244,296 2,807,172 July 554,279 519,215 519,215 2,278,663 87,560 2,366,224 2,885,438 -670,171 2,215,267 2,769,546 August 575,776 540,102 540,102 2,283,164 87,181 2,370,345 2,910,448 -692,551 2,217,896 2,793,673 September 592,215 543,662 543,662 2,305,237 90,204 2,395,441 2,939,102 -720,496 2,218,606 2,810,821 October 574,366 570,464 570,464 2,305,860 95,985 2,401,845 2,972,310 -746,678 2,225,631 2,799,998 November 562,299 566,177 566,177 2,322,056 103,585 2,425,641 2,991,817 -738,325 2,253,493 2,815,792 December 495,522 581,649 581,649 2,347,098 104,719 2,451,817 3,033,467 -743,065 2,290,401 2,785,923 2017January 518,129 575,332 575,332 2,350,850 110,546 2,461,396 3,036,728 -774,242 2,262,486 2,780,615 February 533,299 608,184 608,184 2,341,199 104,711 2,445,910 3,054,094 -784,743 2,269,351 2,802,649 March 603,385 590,976 590,976 2,341,638 105,940 2,447,578 3,038,555 -775,437 2,263,118 2,866,503 April 677,410 535,366 535,366 2,333,046 107,894 2,440,940 2,976,306 -738,481 2,237,825 2,915,235 May 657,463 576,681 576,681 2,332,817 104,495 2,437,312 3,013,993 -748,733 2,265,260 2,922,723 June 644,601 639,056 639,056 2,333,345 106,858 2,440,203 3,079,259 -767,952 2,311,307 2,955,908 July 616,440 679,297 679,297 2,338,730 111,055 2,449,785 3,129,082 -767,786 2,361,297 2,977,737 August 607,451 699,346 699,346 2,347,660 111,396 2,459,056 3,158,403 -779,063 2,379,339 2,986,790 September 612,127 681,062 681,062 2,371,027 113,710 2,484,736 3,165,798 -771,770 2,394,028 3,006,155 October 561,241 720,972 720,972 2,375,255 112,696 2,487,952 3,208,924 -769,967 2,438,957 3,000,198 November 536,495 735,114 735,114 2,407,644 112,367 2,520,011 3,255,125 -776,611 2,478,514 3,015,009 December 518,393 748,726 748,726 2,418,192 112,399 2,530,592 3,279,318 -767,065 2,512,253 3,030,646 2018January 525,635 770,892 770,892 2,406,858 115,000 2,521,858 3,292,750 -792,283 2,500,467 3,026,102 February 516,191 780,206 780,206 2,402,631 113,472 2,516,103 3,296,309 788,984- 2,507,325 3,023,516 March 699,727 614,346 614,346 2,400,159 112,733 2,512,892 3,127,238 -791,569 2,335,668 3,035,395 April 723,655 670,552 670,552 2,408,358 112,655 2,521,013 3,191,565 -840,407 2,351,158 3,074,813 May 724,876 666,035 666,035 2,431,386 113,158 2,544,545 3,210,579 -793,385 2,417,195 3,142,070 June 758,920 749,021 749,021 2,440,045 111,860 2,551,905 3,300,926 -797,207 2,503,719 3,262,639 July 757,959 765,154 765,154 2,444,472 108,720 2,553,192 3,318,345 -797,513 2,520,832 3,278,791 August 733,489 786,319 786,319 2,455,687 108,399 2,564,086 3,350,405 -824,169 2,526,236 3,259,725 September 744,066 779,506 779,506 2,468,512 108,318 2,576,831 3,356,336 -839,322 2,517,014 3,261,081 October 685,913 856,150 856,150 2,488,870 105,566 2,594,435 3,450,586 -863,495 2,587,091 3,273,004 November 693,798 843,563 843,563 2,494,085 107,024 2,601,109 3,444,672 -869,429 2,575,243 3,269,041 December 716,108 859,113 859,113 2,490,088 100,950 2,591,038 3,450,151 -828,426 2,621,725 3,337,832 2019January 708,650 906,646 906,646 2,491,575 100,399 2,591,975 3,498,621 -862,988 2,635,633 3,344,283 February 713,045 895,030 895,030 2,498,147 101,231 2,599,378 3,494,408 -873,977 2,620,431 3,333,476 March 721,965 973,279 973,279 2,512,968 99,725 2,612,693 3,585,972 -892,613 2,693,359 3,415,324 April 746,093 933,526 933,526 2,534,510 99,869 2,634,379 3,567,906 -909,611 2,658,295 3,404,388 May 936,362 771,069 771,069 2,548,158 101,644 2,649,802 3,420,872 -940,998 2,479,874 3,416,236 June 941,897 881,620 881,620 2,575,744 95,906 2,671,650 3,553,270 -930,938 2,622,333 3,564,230
Other Items (Net) \5
Private Sector \4 Other Public Sector Total
End ofNet Foreign
Assets \2
NET DOMESTIC ASSETS
DOMESTIC CREDIT
Credit to Government (Net) Credit to Private and Other Public Sector
TotalCBK, Banks &
C&SFC \3 (Net) Total
18Statistical Bulletin, June 2019
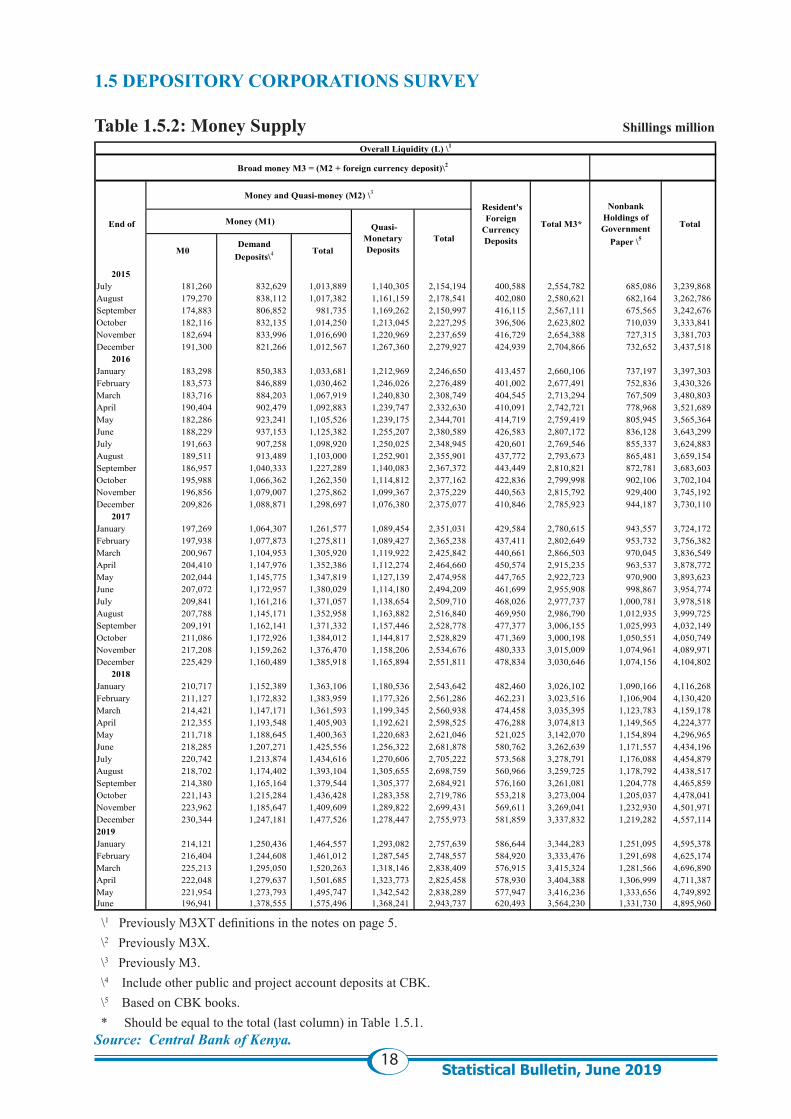
1.5 DEPOSITORY CORPORATIONS SURVEY Table 1.5.2: Money Supply Shillings million
\1 Previously M3XT definitions in the notes on page 5. \2 Previously M3X. \3 Previously M3. \4 Include other public and project account deposits at CBK. \5 Based on CBK books. * Should be equal to the total (last column) in Table 1.5.1.Source: Central Bank of Kenya.
2015July 181,260 832,629 1,013,889 1,140,305 2,154,194 400,588 2,554,782 685,086 3,239,868 August 179,270 838,112 1,017,382 1,161,159 2,178,541 402,080 2,580,621 682,164 3,262,786 September 174,883 806,852 981,735 1,169,262 2,150,997 416,115 2,567,111 675,565 3,242,676 October 182,116 832,135 1,014,250 1,213,045 2,227,295 396,506 2,623,802 710,039 3,333,841 November 182,694 833,996 1,016,690 1,220,969 2,237,659 416,729 2,654,388 727,315 3,381,703 December 191,300 821,266 1,012,567 1,267,360 2,279,927 424,939 2,704,866 732,652 3,437,518
2016January 183,298 850,383 1,033,681 1,212,969 2,246,650 413,457 2,660,106 737,197 3,397,303 February 183,573 846,889 1,030,462 1,246,026 2,276,489 401,002 2,677,491 752,836 3,430,326 March 183,716 884,203 1,067,919 1,240,830 2,308,749 404,545 2,713,294 767,509 3,480,803 April 190,404 902,479 1,092,883 1,239,747 2,332,630 410,091 2,742,721 778,968 3,521,689 May 182,286 923,241 1,105,526 1,239,175 2,344,701 414,719 2,759,419 805,945 3,565,364 June 188,229 937,153 1,125,382 1,255,207 2,380,589 426,583 2,807,172 836,128 3,643,299 July 191,663 907,258 1,098,920 1,250,025 2,348,945 420,601 2,769,546 855,337 3,624,883 August 189,511 913,489 1,103,000 1,252,901 2,355,901 437,772 2,793,673 865,481 3,659,154 September 186,957 1,040,333 1,227,289 1,140,083 2,367,372 443,449 2,810,821 872,781 3,683,603 October 195,988 1,066,362 1,262,350 1,114,812 2,377,162 422,836 2,799,998 902,106 3,702,104 November 196,856 1,079,007 1,275,862 1,099,367 2,375,229 440,563 2,815,792 929,400 3,745,192 December 209,826 1,088,871 1,298,697 1,076,380 2,375,077 410,846 2,785,923 944,187 3,730,110
2017January 197,269 1,064,307 1,261,577 1,089,454 2,351,031 429,584 2,780,615 943,557 3,724,172 February 197,938 1,077,873 1,275,811 1,089,427 2,365,238 437,411 2,802,649 953,732 3,756,382 March 200,967 1,104,953 1,305,920 1,119,922 2,425,842 440,661 2,866,503 970,045 3,836,549 April 204,410 1,147,976 1,352,386 1,112,274 2,464,660 450,574 2,915,235 963,537 3,878,772 May 202,044 1,145,775 1,347,819 1,127,139 2,474,958 447,765 2,922,723 970,900 3,893,623 June 207,072 1,172,957 1,380,029 1,114,180 2,494,209 461,699 2,955,908 998,867 3,954,774 July 209,841 1,161,216 1,371,057 1,138,654 2,509,710 468,026 2,977,737 1,000,781 3,978,518 August 207,788 1,145,171 1,352,958 1,163,882 2,516,840 469,950 2,986,790 1,012,935 3,999,725 September 209,191 1,162,141 1,371,332 1,157,446 2,528,778 477,377 3,006,155 1,025,993 4,032,149 October 211,086 1,172,926 1,384,012 1,144,817 2,528,829 471,369 3,000,198 1,050,551 4,050,749 November 217,208 1,159,262 1,376,470 1,158,206 2,534,676 480,333 3,015,009 1,074,961 4,089,971 December 225,429 1,160,489 1,385,918 1,165,894 2,551,811 478,834 3,030,646 1,074,156 4,104,802
2018January 210,717 1,152,389 1,363,106 1,180,536 2,543,642 482,460 3,026,102 1,090,166 4,116,268 February 211,127 1,172,832 1,383,959 1,177,326 2,561,286 462,231 3,023,516 1,106,904 4,130,420 March 214,421 1,147,171 1,361,593 1,199,345 2,560,938 474,458 3,035,395 1,123,783 4,159,178 April 212,355 1,193,548 1,405,903 1,192,621 2,598,525 476,288 3,074,813 1,149,565 4,224,377 May 211,718 1,188,645 1,400,363 1,220,683 2,621,046 521,025 3,142,070 1,154,894 4,296,965 June 218,285 1,207,271 1,425,556 1,256,322 2,681,878 580,762 3,262,639 1,171,557 4,434,196 July 220,742 1,213,874 1,434,616 1,270,606 2,705,222 573,568 3,278,791 1,176,088 4,454,879 August 218,702 1,174,402 1,393,104 1,305,655 2,698,759 560,966 3,259,725 1,178,792 4,438,517 September 214,380 1,165,164 1,379,544 1,305,377 2,684,921 576,160 3,261,081 1,204,778 4,465,859 October 221,143 1,215,284 1,436,428 1,283,358 2,719,786 553,218 3,273,004 1,205,037 4,478,041 November 223,962 1,185,647 1,409,609 1,289,822 2,699,431 569,611 3,269,041 1,232,930 4,501,971 December 230,344 1,247,181 1,477,526 1,278,447 2,755,973 581,859 3,337,832 1,219,282 4,557,114 2019January 214,121 1,250,436 1,464,557 1,293,082 2,757,639 586,644 3,344,283 1,251,095 4,595,378 February 216,404 1,244,608 1,461,012 1,287,545 2,748,557 584,920 3,333,476 1,291,698 4,625,174 March 225,213 1,295,050 1,520,263 1,318,146 2,838,409 576,915 3,415,324 1,281,566 4,696,890 April 222,048 1,279,637 1,501,685 1,323,773 2,825,458 578,930 3,404,388 1,306,999 4,711,387 May 221,954 1,273,793 1,495,747 1,342,542 2,838,289 577,947 3,416,236 1,333,656 4,749,892 June 196,941 1,378,555 1,575,496 1,368,241 2,943,737 620,493 3,564,230 1,331,730 4,895,960
Overall Liquidity (L) \1
Broad money M3 = (M2 + foreign currency deposit)\2
End of
Money and Quasi-money (M2) \3
Resident's Foreign
Currency Deposits
Total M3*
Nonbank Holdings of Government
Paper \5
Total Money (M1) Quasi-Monetary Deposits
Total M0
Demand Deposits\4 Total
19Statistical Bulletin, June 2019
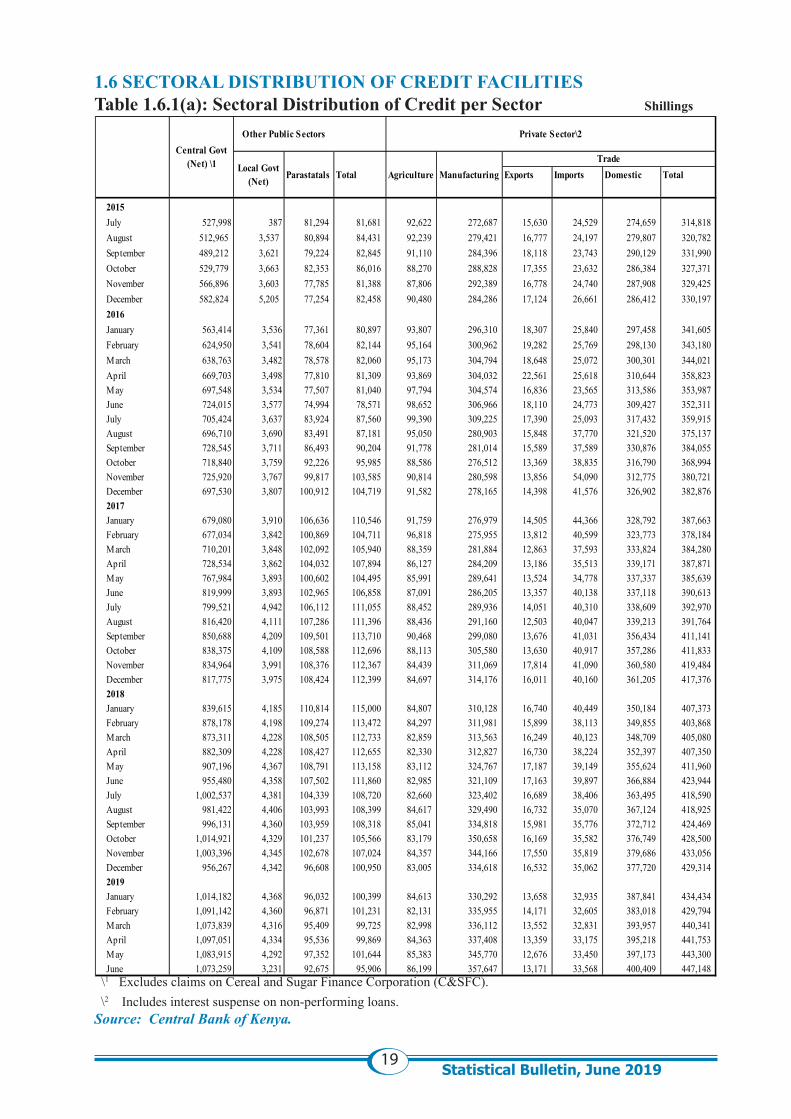
1.6 SECTORAL DISTRIBUTION OF CREDIT FACILITIESTable 1.6.1(a): Sectoral Distribution of Credit per Sector Shillings
\1 Excludes claims on Cereal and Sugar Finance Corporation (C&SFC). \2 Includes interest suspense on non-performing loans.Source: Central Bank of Kenya.
Exports Imports Domestic Total
2015July 527,998 387 81,294 81,681 92,622 272,687 15,630 24,529 274,659 314,818 August 512,965 3,537 80,894 84,431 92,239 279,421 16,777 24,197 279,807 320,782 September 489,212 3,621 79,224 82,845 91,110 284,396 18,118 23,743 290,129 331,990 October 529,779 3,663 82,353 86,016 88,270 288,828 17,355 23,632 286,384 327,371 November 566,896 3,603 77,785 81,388 87,806 292,389 16,778 24,740 287,908 329,425 December 582,824 5,205 77,254 82,458 90,480 284,286 17,124 26,661 286,412 330,197 2016January 563,414 3,536 77,361 80,897 93,807 296,310 18,307 25,840 297,458 341,605 February 624,950 3,541 78,604 82,144 95,164 300,962 19,282 25,769 298,130 343,180 March 638,763 3,482 78,578 82,060 95,173 304,794 18,648 25,072 300,301 344,021 April 669,703 3,498 77,810 81,309 93,869 304,032 22,561 25,618 310,644 358,823 May 697,548 3,534 77,507 81,040 97,794 304,574 16,836 23,565 313,586 353,987 June 724,015 3,577 74,994 78,571 98,652 306,966 18,110 24,773 309,427 352,311 July 705,424 3,637 83,924 87,560 99,390 309,225 17,390 25,093 317,432 359,915 August 696,710 3,690 83,491 87,181 95,050 280,903 15,848 37,770 321,520 375,137 September 728,545 3,711 86,493 90,204 91,778 281,014 15,589 37,589 330,876 384,055 October 718,840 3,759 92,226 95,985 88,586 276,512 13,369 38,835 316,790 368,994 November 725,920 3,767 99,817 103,585 90,814 280,598 13,856 54,090 312,775 380,721 December 697,530 3,807 100,912 104,719 91,582 278,165 14,398 41,576 326,902 382,876 2017January 679,080 3,910 106,636 110,546 91,759 276,979 14,505 44,366 328,792 387,663 February 677,034 3,842 100,869 104,711 96,818 275,955 13,812 40,599 323,773 378,184 March 710,201 3,848 102,092 105,940 88,359 281,884 12,863 37,593 333,824 384,280 April 728,534 3,862 104,032 107,894 86,127 284,209 13,186 35,513 339,171 387,871 May 767,984 3,893 100,602 104,495 85,991 289,641 13,524 34,778 337,337 385,639 June 819,999 3,893 102,965 106,858 87,091 286,205 13,357 40,138 337,118 390,613 July 799,521 4,942 106,112 111,055 88,452 289,936 14,051 40,310 338,609 392,970 August 816,420 4,111 107,286 111,396 88,436 291,160 12,503 40,047 339,213 391,764 September 850,688 4,209 109,501 113,710 90,468 299,080 13,676 41,031 356,434 411,141 October 838,375 4,109 108,588 112,696 88,113 305,580 13,630 40,917 357,286 411,833 November 834,964 3,991 108,376 112,367 84,439 311,069 17,814 41,090 360,580 419,484 December 817,775 3,975 108,424 112,399 84,697 314,176 16,011 40,160 361,205 417,376 2018January 839,615 4,185 110,814 115,000 84,807 310,128 16,740 40,449 350,184 407,373 February 878,178 4,198 109,274 113,472 84,297 311,981 15,899 38,113 349,855 403,868 March 873,311 4,228 108,505 112,733 82,859 313,563 16,249 40,123 348,709 405,080 April 882,309 4,228 108,427 112,655 82,330 312,827 16,730 38,224 352,397 407,350 May 907,196 4,367 108,791 113,158 83,112 324,767 17,187 39,149 355,624 411,960 June 955,480 4,358 107,502 111,860 82,985 321,109 17,163 39,897 366,884 423,944 July 1,002,537 4,381 104,339 108,720 82,660 323,402 16,689 38,406 363,495 418,590 August 981,422 4,406 103,993 108,399 84,617 329,490 16,732 35,070 367,124 418,925 September 996,131 4,360 103,959 108,318 85,041 334,818 15,981 35,776 372,712 424,469 October 1,014,921 4,329 101,237 105,566 83,179 350,658 16,169 35,582 376,749 428,500 November 1,003,396 4,345 102,678 107,024 84,357 344,166 17,550 35,819 379,686 433,056 December 956,267 4,342 96,608 100,950 83,005 334,618 16,532 35,062 377,720 429,314 2019January 1,014,182 4,368 96,032 100,399 84,613 330,292 13,658 32,935 387,841 434,434 February 1,091,142 4,360 96,871 101,231 82,131 335,955 14,171 32,605 383,018 429,794 March 1,073,839 4,316 95,409 99,725 82,998 336,112 13,552 32,831 393,957 440,341 April 1,097,051 4,334 95,536 99,869 84,363 337,408 13,359 33,175 395,218 441,753 May 1,083,915 4,292 97,352 101,644 85,383 345,770 12,676 33,450 397,173 443,300 June 1,073,259 3,231 92,675 95,906 86,199 357,647 13,171 33,568 400,409 447,148
Private Sector\2Central Govt
(Net) \1
Other Public Sectors
Local Govt (Net)
Parastatals Total Agriculture ManufacturingTrade
20Statistical Bulletin, June 2019
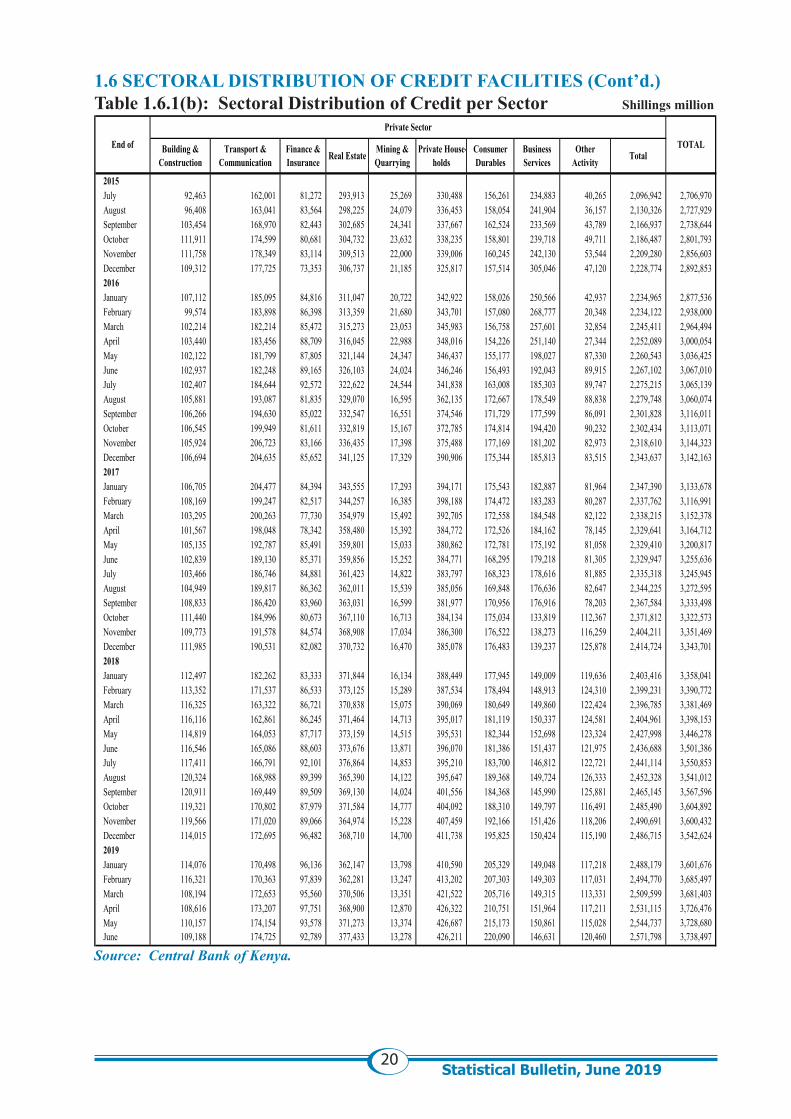
1.6 SECTORAL DISTRIBUTION OF CREDIT FACILITIES (Cont’d.)Table 1.6.1(b): Sectoral Distribution of Credit per Sector Shillings million
Source: Central Bank of Kenya.
2015July 92,463 162,001 81,272 293,913 25,269 330,488 156,261 234,883 40,265 2,096,942 2,706,970 August 96,408 163,041 83,564 298,225 24,079 336,453 158,054 241,904 36,157 2,130,326 2,727,929 September 103,454 168,970 82,443 302,685 24,341 337,667 162,524 233,569 43,789 2,166,937 2,738,644 October 111,911 174,599 80,681 304,732 23,632 338,235 158,801 239,718 49,711 2,186,487 2,801,793 November 111,758 178,349 83,114 309,513 22,000 339,006 160,245 242,130 53,544 2,209,280 2,856,603 December 109,312 177,725 73,353 306,737 21,185 325,817 157,514 305,046 47,120 2,228,774 2,892,853 2016January 107,112 185,095 84,816 311,047 20,722 342,922 158,026 250,566 42,937 2,234,965 2,877,536 February 99,574 183,898 86,398 313,359 21,680 343,701 157,080 268,777 20,348 2,234,122 2,938,000 March 102,214 182,214 85,472 315,273 23,053 345,983 156,758 257,601 32,854 2,245,411 2,964,494 April 103,440 183,456 88,709 316,045 22,988 348,016 154,226 251,140 27,344 2,252,089 3,000,054 May 102,122 181,799 87,805 321,144 24,347 346,437 155,177 198,027 87,330 2,260,543 3,036,425 June 102,937 182,248 89,165 326,103 24,024 346,246 156,493 192,043 89,915 2,267,102 3,067,010 July 102,407 184,644 92,572 322,622 24,544 341,838 163,008 185,303 89,747 2,275,215 3,065,139 August 105,881 193,087 81,835 329,070 16,595 362,135 172,667 178,549 88,838 2,279,748 3,060,074 September 106,266 194,630 85,022 332,547 16,551 374,546 171,729 177,599 86,091 2,301,828 3,116,011 October 106,545 199,949 81,611 332,819 15,167 372,785 174,814 194,420 90,232 2,302,434 3,113,071 November 105,924 206,723 83,166 336,435 17,398 375,488 177,169 181,202 82,973 2,318,610 3,144,323 December 106,694 204,635 85,652 341,125 17,329 390,906 175,344 185,813 83,515 2,343,637 3,142,163 2017January 106,705 204,477 84,394 343,555 17,293 394,171 175,543 182,887 81,964 2,347,390 3,133,678 February 108,169 199,247 82,517 344,257 16,385 398,188 174,472 183,283 80,287 2,337,762 3,116,991 March 103,295 200,263 77,730 354,979 15,492 392,705 172,558 184,548 82,122 2,338,215 3,152,378 April 101,567 198,048 78,342 358,480 15,392 384,772 172,526 184,162 78,145 2,329,641 3,164,712 May 105,135 192,787 85,491 359,801 15,033 380,862 172,781 175,192 81,058 2,329,410 3,200,817 June 102,839 189,130 85,371 359,856 15,252 384,771 168,295 179,218 81,305 2,329,947 3,255,636 July 103,466 186,746 84,881 361,423 14,822 383,797 168,323 178,616 81,885 2,335,318 3,245,945 August 104,949 189,817 86,362 362,011 15,539 385,056 169,848 176,636 82,647 2,344,225 3,272,595 September 108,833 186,420 83,960 363,031 16,599 381,977 170,956 176,916 78,203 2,367,584 3,333,498 October 111,440 184,996 80,673 367,110 16,713 384,134 175,034 133,819 112,367 2,371,812 3,322,573 November 109,773 191,578 84,574 368,908 17,034 386,300 176,522 138,273 116,259 2,404,211 3,351,469 December 111,985 190,531 82,082 370,732 16,470 385,078 176,483 139,237 125,878 2,414,724 3,343,701 2018January 112,497 182,262 83,333 371,844 16,134 388,449 177,945 149,009 119,636 2,403,416 3,358,041 February 113,352 171,537 86,533 373,125 15,289 387,534 178,494 148,913 124,310 2,399,231 3,390,772 March 116,325 163,322 86,721 370,838 15,075 390,069 180,649 149,860 122,424 2,396,785 3,381,469 April 116,116 162,861 86,245 371,464 14,713 395,017 181,119 150,337 124,581 2,404,961 3,398,153 May 114,819 164,053 87,717 373,159 14,515 395,531 182,344 152,698 123,324 2,427,998 3,446,278 June 116,546 165,086 88,603 373,676 13,871 396,070 181,386 151,437 121,975 2,436,688 3,501,386 July 117,411 166,791 92,101 376,864 14,853 395,210 183,700 146,812 122,721 2,441,114 3,550,853 August 120,324 168,988 89,399 365,390 14,122 395,647 189,368 149,724 126,333 2,452,328 3,541,012 September 120,911 169,449 89,509 369,130 14,024 401,556 184,368 145,990 125,881 2,465,145 3,567,596 October 119,321 170,802 87,979 371,584 14,777 404,092 188,310 149,797 116,491 2,485,490 3,604,892 November 119,566 171,020 89,066 364,974 15,228 407,459 192,166 151,426 118,206 2,490,691 3,600,432 December 114,015 172,695 96,482 368,710 14,700 411,738 195,825 150,424 115,190 2,486,715 3,542,624 2019January 114,076 170,498 96,136 362,147 13,798 410,590 205,329 149,048 117,218 2,488,179 3,601,676 February 116,321 170,363 97,839 362,281 13,247 413,202 207,303 149,303 117,031 2,494,770 3,685,497 March 108,194 172,653 95,560 370,506 13,351 421,522 205,716 149,315 113,331 2,509,599 3,681,403 April 108,616 173,207 97,751 368,900 12,870 426,322 210,751 151,964 117,211 2,531,115 3,726,476 May 110,157 174,154 93,578 371,273 13,374 426,687 215,173 150,861 115,028 2,544,737 3,728,680 June 109,188 174,725 92,789 377,433 13,278 426,211 220,090 146,631 120,460 2,571,798 3,738,497
End of Private Sector
TOTALBuilding & Construction
Transport & Communication
Finance & Insurance Real Estate Mining &
QuarryingPrivate House-
holdsConsumer Durables
Business Services
Other Activity Total
21Statistical Bulletin, June 2019
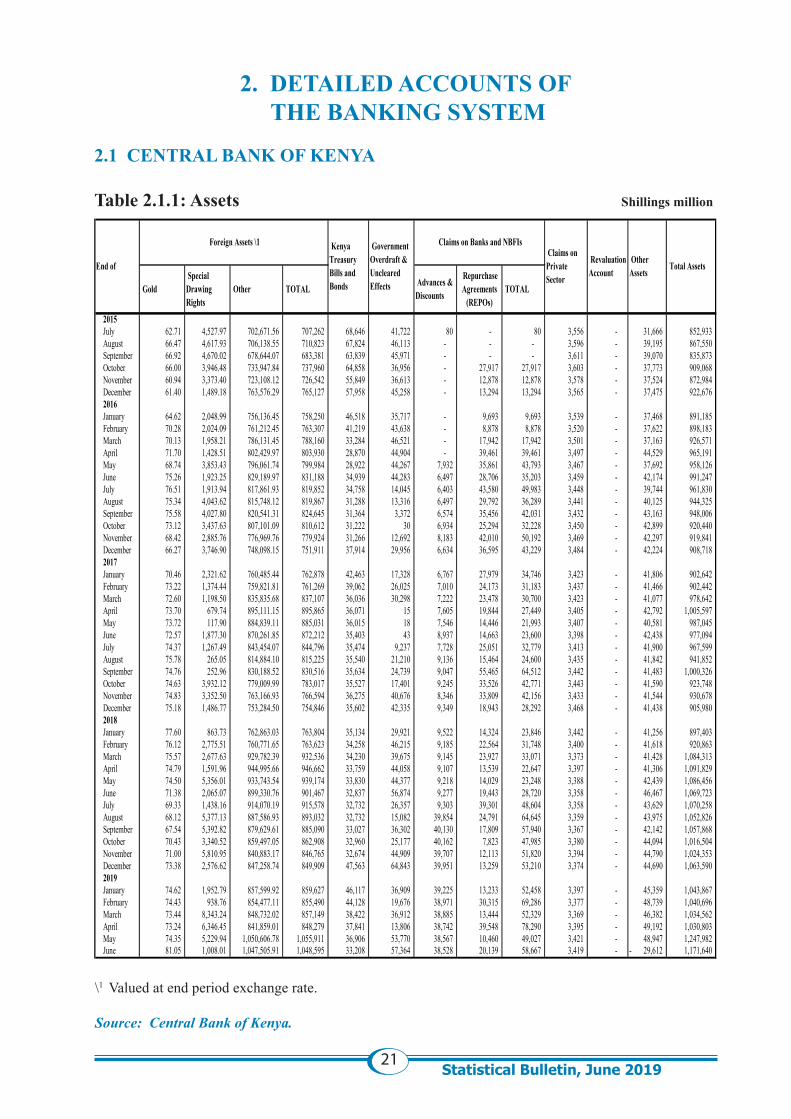
2. DETAILED ACCOUNTS OF THE BANKING SYSTEM
2.1 CENTRAL BANK OF KENYA Table 2.1.1: Assets Shillings million
\1 Valued at end period exchange rate.
Source: Central Bank of Kenya.
2015July 62.71 4,527.97 702,671.56 707,262 68,646 41,722 80 - 80 3,556 - 31,666 852,933 August 66.47 4,617.93 706,138.55 710,823 67,824 46,113 - - - 3,596 - 39,195 867,550 September 66.92 4,670.02 678,644.07 683,381 63,839 45,971 - - - 3,611 - 39,070 835,873 October 66.00 3,946.48 733,947.84 737,960 64,858 36,956 - 27,917 27,917 3,603 - 37,773 909,068 November 60.94 3,373.40 723,108.12 726,542 55,849 36,613 - 12,878 12,878 3,578 - 37,524 872,984 December 61.40 1,489.18 763,576.29 765,127 57,958 45,258 - 13,294 13,294 3,565 - 37,475 922,676 2016January 64.62 2,048.99 756,136.45 758,250 46,518 35,717 - 9,693 9,693 3,539 - 37,468 891,185 February 70.28 2,024.09 761,212.45 763,307 41,219 43,638 - 8,878 8,878 3,520 - 37,622 898,183 March 70.13 1,958.21 786,131.45 788,160 33,284 46,521 - 17,942 17,942 3,501 - 37,163 926,571 April 71.70 1,428.51 802,429.97 803,930 28,870 44,904 - 39,461 39,461 3,497 - 44,529 965,191 May 68.74 3,853.43 796,061.74 799,984 28,922 44,267 7,932 35,861 43,793 3,467 - 37,692 958,126 June 75.26 1,923.25 829,189.97 831,188 34,939 44,283 6,497 28,706 35,203 3,459 - 42,174 991,247 July 76.51 1,913.94 817,861.93 819,852 34,758 14,045 6,403 43,580 49,983 3,448 - 39,744 961,830 August 75.34 4,043.62 815,748.12 819,867 31,288 13,316 6,497 29,792 36,289 3,441 - 40,125 944,325 September 75.58 4,027.80 820,541.31 824,645 31,364 3,372 6,574 35,456 42,031 3,432 - 43,163 948,006 October 73.12 3,437.63 807,101.09 810,612 31,222 30 6,934 25,294 32,228 3,450 - 42,899 920,440 November 68.42 2,885.76 776,969.76 779,924 31,266 12,692 8,183 42,010 50,192 3,469 - 42,297 919,841 December 66.27 3,746.90 748,098.15 751,911 37,914 29,956 6,634 36,595 43,229 3,484 - 42,224 908,718 2017January 70.46 2,321.62 760,485.44 762,878 42,463 17,328 6,767 27,979 34,746 3,423 - 41,806 902,642 February 73.22 1,374.44 759,821.81 761,269 39,062 26,025 7,010 24,173 31,183 3,437 - 41,466 902,442 March 72.60 1,198.50 835,835.68 837,107 36,036 30,298 7,222 23,478 30,700 3,423 - 41,077 978,642 April 73.70 679.74 895,111.15 895,865 36,071 15 7,605 19,844 27,449 3,405 - 42,792 1,005,597 May 73.72 117.90 884,839.11 885,031 36,015 18 7,546 14,446 21,993 3,407 - 40,581 987,045 June 72.57 1,877.30 870,261.85 872,212 35,403 43 8,937 14,663 23,600 3,398 - 42,438 977,094 July 74.37 1,267.49 843,454.07 844,796 35,474 9,237 7,728 25,051 32,779 3,413 - 41,900 967,599 August 75.78 265.05 814,884.10 815,225 35,540 21,210 9,136 15,464 24,600 3,435 - 41,842 941,852 September 74.76 252.96 830,188.52 830,516 35,634 24,739 9,047 55,465 64,512 3,442 - 41,483 1,000,326 October 74.63 3,932.12 779,009.99 783,017 35,527 17,401 9,245 33,526 42,771 3,443 - 41,590 923,748 November 74.83 3,352.50 763,166.93 766,594 36,275 40,676 8,346 33,809 42,156 3,433 - 41,544 930,678 December 75.18 1,486.77 753,284.50 754,846 35,602 42,335 9,349 18,943 28,292 3,468 - 41,438 905,980 2018January 77.60 863.73 762,863.03 763,804 35,134 29,921 9,522 14,324 23,846 3,442 - 41,256 897,403 February 76.12 2,775.51 760,771.65 763,623 34,258 46,215 9,185 22,564 31,748 3,400 - 41,618 920,863 March 75.57 2,677.63 929,782.39 932,536 34,230 39,675 9,145 23,927 33,071 3,373 - 41,428 1,084,313 April 74.79 1,591.96 944,995.66 946,662 33,759 44,058 9,107 13,539 22,647 3,397 - 41,306 1,091,829 May 74.50 5,356.01 933,743.54 939,174 33,830 44,377 9,218 14,029 23,248 3,388 - 42,439 1,086,456 June 71.38 2,065.07 899,330.76 901,467 32,837 56,874 9,277 19,443 28,720 3,358 - 46,467 1,069,723 July 69.33 1,438.16 914,070.19 915,578 32,732 26,357 9,303 39,301 48,604 3,358 - 43,629 1,070,258 August 68.12 5,377.13 887,586.93 893,032 32,732 15,082 39,854 24,791 64,645 3,359 - 43,975 1,052,826 September 67.54 5,392.82 879,629.61 885,090 33,027 36,302 40,130 17,809 57,940 3,367 - 42,142 1,057,868 October 70.43 3,340.52 859,497.05 862,908 32,960 25,177 40,162 7,823 47,985 3,380 - 44,094 1,016,504 November 71.00 5,810.95 840,883.17 846,765 32,674 44,909 39,707 12,113 51,820 3,394 - 44,790 1,024,353 December 73.38 2,576.62 847,258.74 849,909 47,563 64,843 39,951 13,259 53,210 3,374 - 44,690 1,063,590 2019January 74.62 1,952.79 857,599.92 859,627 46,117 36,909 39,225 13,233 52,458 3,397 - 45,359 1,043,867 February 74.43 938.76 854,477.11 855,490 44,128 19,676 38,971 30,315 69,286 3,377 - 48,739 1,040,696 March 73.44 8,343.24 848,732.02 857,149 38,422 36,912 38,885 13,444 52,329 3,369 - 46,382 1,034,562 April 73.24 6,346.45 841,859.01 848,279 37,841 13,806 38,742 39,548 78,290 3,395 - 49,192 1,030,803 May 74.35 5,229.94 1,050,606.78 1,055,911 36,906 53,770 38,567 10,460 49,027 3,421 - 48,947 1,247,982 June 81.05 1,008.01 1,047,505.91 1,048,595 33,208 57,364 38,528 20,139 58,667 3,419 - 29,612- 1,171,640
TOTAL
Total Assets End of
Foreign Assets \1 Kenya Treasury Bills and Bonds
Government Overdraft & Uncleared Effects
Claims on Banks and NBFIs Claims on Private Sector
Revaluation Account
Other Assets
Gold Special Drawing Rights
Other TOTAL Advances & Discounts
Repurchase Agreements
(REPOs)
22Statistical Bulletin, June 2019
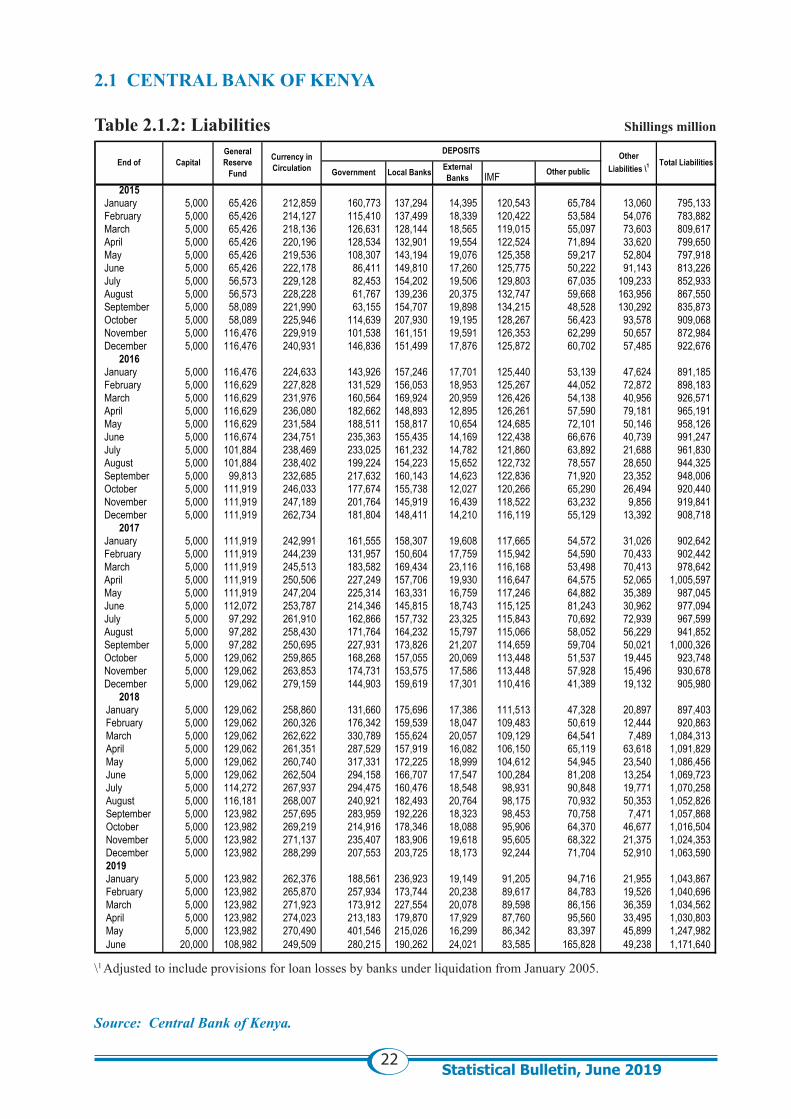
2.1 CENTRAL BANK OF KENYA Table 2.1.2: Liabilities Shillings million
\1 Adjusted to include provisions for loan losses by banks under liquidation from January 2005.
Source: Central Bank of Kenya.
2015 January 5,000 65,426 212,859 160,773 137,294 14,395 120,543 65,784 13,060 795,133 February 5,000 65,426 214,127 115,410 137,499 18,339 120,422 53,584 54,076 783,882 March 5,000 65,426 218,136 126,631 128,144 18,565 119,015 55,097 73,603 809,617 April 5,000 65,426 220,196 128,534 132,901 19,554 122,524 71,894 33,620 799,650 May 5,000 65,426 219,536 108,307 143,194 19,076 125,358 59,217 52,804 797,918 June 5,000 65,426 222,178 86,411 149,810 17,260 125,775 50,222 91,143 813,226 July 5,000 56,573 229,128 82,453 154,202 19,506 129,803 67,035 109,233 852,933 August 5,000 56,573 228,228 61,767 139,236 20,375 132,747 59,668 163,956 867,550 September 5,000 58,089 221,990 63,155 154,707 19,898 134,215 48,528 130,292 835,873 October 5,000 58,089 225,946 114,639 207,930 19,195 128,267 56,423 93,578 909,068 November 5,000 116,476 229,919 101,538 161,151 19,591 126,353 62,299 50,657 872,984 December 5,000 116,476 240,931 146,836 151,499 17,876 125,872 60,702 57,485 922,676
2016 January 5,000 116,476 224,633 143,926 157,246 17,701 125,440 53,139 47,624 891,185 February 5,000 116,629 227,828 131,529 156,053 18,953 125,267 44,052 72,872 898,183 March 5,000 116,629 231,976 160,564 169,924 20,959 126,426 54,138 40,956 926,571 April 5,000 116,629 236,080 182,662 148,893 12,895 126,261 57,590 79,181 965,191 May 5,000 116,629 231,584 188,511 158,817 10,654 124,685 72,101 50,146 958,126 June 5,000 116,674 234,751 235,363 155,435 14,169 122,438 66,676 40,739 991,247 July 5,000 101,884 238,469 233,025 161,232 14,782 121,860 63,892 21,688 961,830 August 5,000 101,884 238,402 199,224 154,223 15,652 122,732 78,557 28,650 944,325 September 5,000 99,813 232,685 217,632 160,143 14,623 122,836 71,920 23,352 948,006 October 5,000 111,919 246,033 177,674 155,738 12,027 120,266 65,290 26,494 920,440 November 5,000 111,919 247,189 201,764 145,919 16,439 118,522 63,232 9,856 919,841 December 5,000 111,919 262,734 181,804 148,411 14,210 116,119 55,129 13,392 908,718
2017 January 5,000 111,919 242,991 161,555 158,307 19,608 117,665 54,572 31,026 902,642 February 5,000 111,919 244,239 131,957 150,604 17,759 115,942 54,590 70,433 902,442 March 5,000 111,919 245,513 183,582 169,434 23,116 116,168 53,498 70,413 978,642 April 5,000 111,919 250,506 227,249 157,706 19,930 116,647 64,575 52,065 1,005,597 May 5,000 111,919 247,204 225,314 163,331 16,759 117,246 64,882 35,389 987,045 June 5,000 112,072 253,787 214,346 145,815 18,743 115,125 81,243 30,962 977,094 July 5,000 97,292 261,910 162,866 157,732 23,325 115,843 70,692 72,939 967,599 August 5,000 97,282 258,430 171,764 164,232 15,797 115,066 58,052 56,229 941,852 September 5,000 97,282 250,695 227,931 173,826 21,207 114,659 59,704 50,021 1,000,326 October 5,000 129,062 259,865 168,268 157,055 20,069 113,448 51,537 19,445 923,748 November 5,000 129,062 263,853 174,731 153,575 17,586 113,448 57,928 15,496 930,678 December 5,000 129,062 279,159 144,903 159,619 17,301 110,416 41,389 19,132 905,980
2018January 5,000 129,062 258,860 131,660 175,696 17,386 111,513 47,328 20,897 897,403 February 5,000 129,062 260,326 176,342 159,539 18,047 109,483 50,619 12,444 920,863 March 5,000 129,062 262,622 330,789 155,624 20,057 109,129 64,541 7,489 1,084,313 April 5,000 129,062 261,351 287,529 157,919 16,082 106,150 65,119 63,618 1,091,829 May 5,000 129,062 260,740 317,331 172,225 18,999 104,612 54,945 23,540 1,086,456 June 5,000 129,062 262,504 294,158 166,707 17,547 100,284 81,208 13,254 1,069,723 July 5,000 114,272 267,937 294,475 160,476 18,548 98,931 90,848 19,771 1,070,258 August 5,000 116,181 268,007 240,921 182,493 20,764 98,175 70,932 50,353 1,052,826 September 5,000 123,982 257,695 283,959 192,226 18,323 98,453 70,758 7,471 1,057,868 October 5,000 123,982 269,219 214,916 178,346 18,088 95,906 64,370 46,677 1,016,504 November 5,000 123,982 271,137 235,407 183,906 19,618 95,605 68,322 21,375 1,024,353 December 5,000 123,982 288,299 207,553 203,725 18,173 92,244 71,704 52,910 1,063,590 2019January 5,000 123,982 262,376 188,561 236,923 19,149 91,205 94,716 21,955 1,043,867 February 5,000 123,982 265,870 257,934 173,744 20,238 89,617 84,783 19,526 1,040,696 March 5,000 123,982 271,923 173,912 227,554 20,078 89,598 86,156 36,359 1,034,562 April 5,000 123,982 274,023 213,183 179,870 17,929 87,760 95,560 33,495 1,030,803 May 5,000 123,982 270,490 401,546 215,026 16,299 86,342 83,397 45,899 1,247,982 June 20,000 108,982 249,509 280,215 190,262 24,021 83,585 165,828 49,238 1,171,640
End of CapitalGeneral Reserve
Fund
Currency in Circulation
DEPOSITSTotal Liabilities
Government Local Banks External Banks IMF Other public
Other Liabilities \1
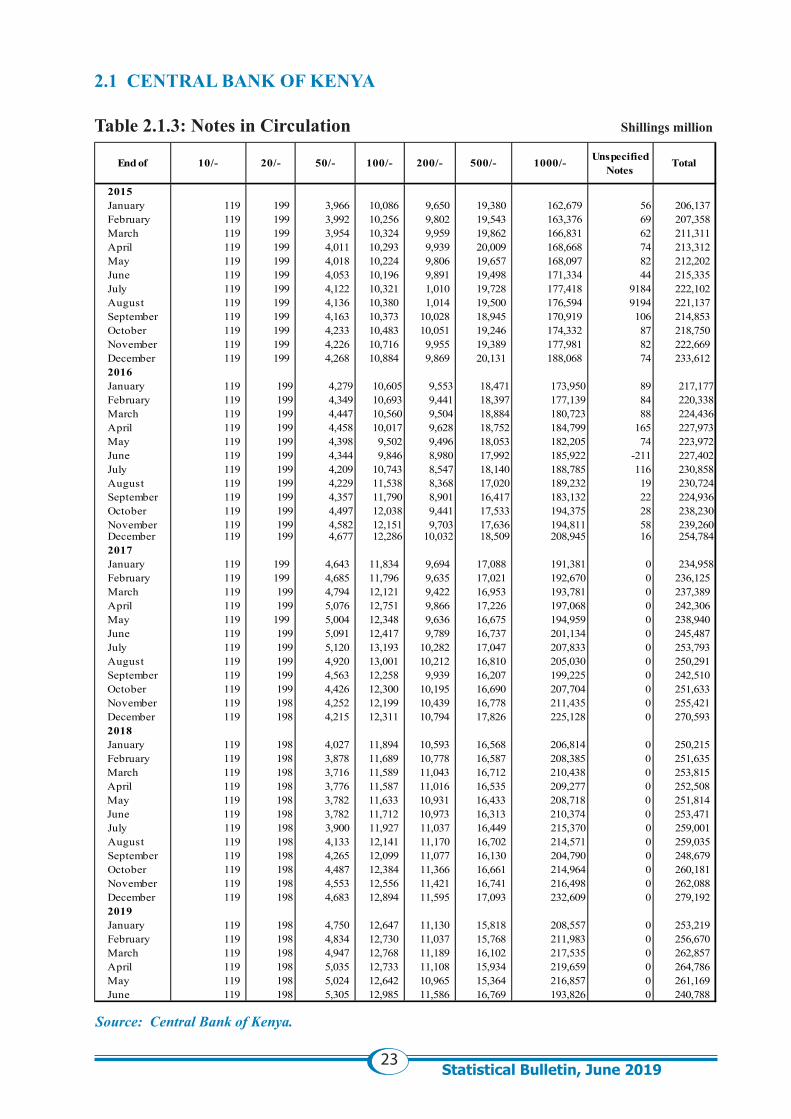
23Statistical Bulletin, June 2019
2.1 CENTRAL BANK OF KENYA Table 2.1.3: Notes in Circulation Shillings million
Source: Central Bank of Kenya.
2015January 119 199 3,966 10,086 9,650 19,380 162,679 56 206,137 February 119 199 3,992 10,256 9,802 19,543 163,376 69 207,358 March 119 199 3,954 10,324 9,959 19,862 166,831 62 211,311 April 119 199 4,011 10,293 9,939 20,009 168,668 74 213,312 May 119 199 4,018 10,224 9,806 19,657 168,097 82 212,202 June 119 199 4,053 10,196 9,891 19,498 171,334 44 215,335 July 119 199 4,122 10,321 1,010 19,728 177,418 9184 222,102 August 119 199 4,136 10,380 1,014 19,500 176,594 9194 221,137 September 119 199 4,163 10,373 10,028 18,945 170,919 106 214,853 October 119 199 4,233 10,483 10,051 19,246 174,332 87 218,750 November 119 199 4,226 10,716 9,955 19,389 177,981 82 222,669 December 119 199 4,268 10,884 9,869 20,131 188,068 74 233,612 2016January 119 199 4,279 10,605 9,553 18,471 173,950 89 217,177February 119 199 4,349 10,693 9,441 18,397 177,139 84 220,338March 119 199 4,447 10,560 9,504 18,884 180,723 88 224,436April 119 199 4,458 10,017 9,628 18,752 184,799 165 227,973May 119 199 4,398 9,502 9,496 18,053 182,205 74 223,972June 119 199 4,344 9,846 8,980 17,992 185,922 -211 227,402July 119 199 4,209 10,743 8,547 18,140 188,785 116 230,858August 119 199 4,229 11,538 8,368 17,020 189,232 19 230,724September 119 199 4,357 11,790 8,901 16,417 183,132 22 224,936October 119 199 4,497 12,038 9,441 17,533 194,375 28 238,230November 119 199 4,582 12,151 9,703 17,636 194,811 58 239,260December 119 199 4,677 12,286 10,032 18,509 208,945 16 254,7842017January 119 199 4,643 11,834 9,694 17,088 191,381 0 234,958February 119 199 4,685 11,796 9,635 17,021 192,670 0 236,125 March 119 199 4,794 12,121 9,422 16,953 193,781 0 237,389 April 119 199 5,076 12,751 9,866 17,226 197,068 0 242,306 May 119 199 5,004 12,348 9,636 16,675 194,959 0 238,940 June 119 199 5,091 12,417 9,789 16,737 201,134 0 245,487 July 119 199 5,120 13,193 10,282 17,047 207,833 0 253,793 August 119 199 4,920 13,001 10,212 16,810 205,030 0 250,291 September 119 199 4,563 12,258 9,939 16,207 199,225 0 242,510 October 119 199 4,426 12,300 10,195 16,690 207,704 0 251,633 November 119 198 4,252 12,199 10,439 16,778 211,435 0 255,421 December 119 198 4,215 12,311 10,794 17,826 225,128 0 270,593 2018January 119 198 4,027 11,894 10,593 16,568 206,814 0 250,215 February 119 198 3,878 11,689 10,778 16,587 208,385 0 251,635 March 119 198 3,716 11,589 11,043 16,712 210,438 0 253,815 April 119 198 3,776 11,587 11,016 16,535 209,277 0 252,508 May 119 198 3,782 11,633 10,931 16,433 208,718 0 251,814 June 119 198 3,782 11,712 10,973 16,313 210,374 0 253,471 July 119 198 3,900 11,927 11,037 16,449 215,370 0 259,001 August 119 198 4,133 12,141 11,170 16,702 214,571 0 259,035 September 119 198 4,265 12,099 11,077 16,130 204,790 0 248,679 October 119 198 4,487 12,384 11,366 16,661 214,964 0 260,181 November 119 198 4,553 12,556 11,421 16,741 216,498 0 262,088 December 119 198 4,683 12,894 11,595 17,093 232,609 0 279,192 2019January 119 198 4,750 12,647 11,130 15,818 208,557 0 253,219 February 119 198 4,834 12,730 11,037 15,768 211,983 0 256,670 March 119 198 4,947 12,768 11,189 16,102 217,535 0 262,857 April 119 198 5,035 12,733 11,108 15,934 219,659 0 264,786 May 119 198 5,024 12,642 10,965 15,364 216,857 0 261,169 June 119 198 5,305 12,985 11,586 16,769 193,826 0 240,788
End of 10/- 20/- Total50/- 100/- 200/- 500/- Unspecified Notes
1000/-
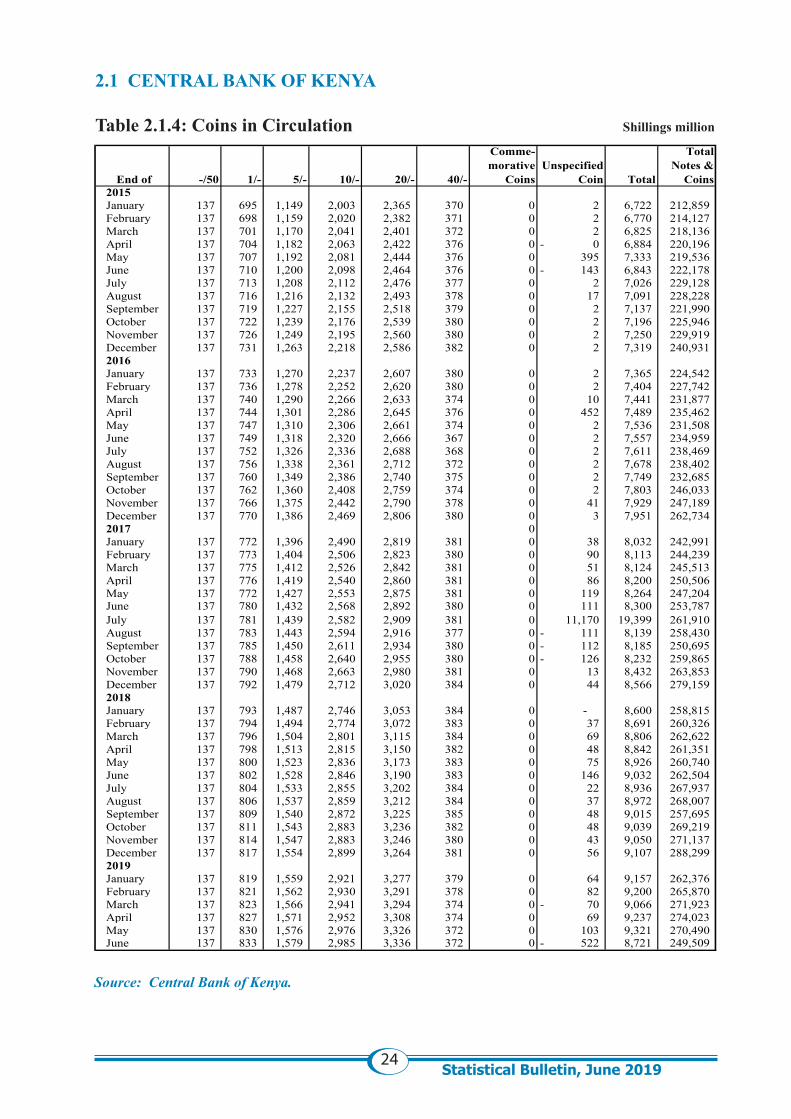
24Statistical Bulletin, June 2019
2.1 CENTRAL BANK OF KENYA Table 2.1.4: Coins in Circulation Shillings million
Source: Central Bank of Kenya.
2015January 137 695 1,149 2,003 2,365 370 0 2 6,722 212,859 February 137 698 1,159 2,020 2,382 371 0 2 6,770 214,127 March 137 701 1,170 2,041 2,401 372 0 2 6,825 218,136 April 137 704 1,182 2,063 2,422 376 0 0- 6,884 220,196 May 137 707 1,192 2,081 2,444 376 0 395 7,333 219,536 June 137 710 1,200 2,098 2,464 376 0 143- 6,843 222,178 July 137 713 1,208 2,112 2,476 377 0 2 7,026 229,128 August 137 716 1,216 2,132 2,493 378 0 17 7,091 228,228 September 137 719 1,227 2,155 2,518 379 0 2 7,137 221,990 October 137 722 1,239 2,176 2,539 380 0 2 7,196 225,946 November 137 726 1,249 2,195 2,560 380 0 2 7,250 229,919 December 137 731 1,263 2,218 2,586 382 0 2 7,319 240,931 2016January 137 733 1,270 2,237 2,607 380 0 2 7,365 224,542 February 137 736 1,278 2,252 2,620 380 0 2 7,404 227,742 March 137 740 1,290 2,266 2,633 374 0 10 7,441 231,877 April 137 744 1,301 2,286 2,645 376 0 452 7,489 235,462 May 137 747 1,310 2,306 2,661 374 0 2 7,536 231,508 June 137 749 1,318 2,320 2,666 367 0 2 7,557 234,959 July 137 752 1,326 2,336 2,688 368 0 2 7,611 238,469 August 137 756 1,338 2,361 2,712 372 0 2 7,678 238,402 September 137 760 1,349 2,386 2,740 375 0 2 7,749 232,685 October 137 762 1,360 2,408 2,759 374 0 2 7,803 246,033 November 137 766 1,375 2,442 2,790 378 0 41 7,929 247,189 December 137 770 1,386 2,469 2,806 380 0 3 7,951 262,734 2017 0January 137 772 1,396 2,490 2,819 381 0 38 8,032 242,991 February 137 773 1,404 2,506 2,823 380 0 90 8,113 244,239 March 137 775 1,412 2,526 2,842 381 0 51 8,124 245,513 April 137 776 1,419 2,540 2,860 381 0 86 8,200 250,506 May 137 772 1,427 2,553 2,875 381 0 119 8,264 247,204 June 137 780 1,432 2,568 2,892 380 0 111 8,300 253,787 July 137 781 1,439 2,582 2,909 381 0 11,170 19,399 261,910 August 137 783 1,443 2,594 2,916 377 0 111- 8,139 258,430 September 137 785 1,450 2,611 2,934 380 0 112- 8,185 250,695 October 137 788 1,458 2,640 2,955 380 0 126- 8,232 259,865 November 137 790 1,468 2,663 2,980 381 0 13 8,432 263,853 December 137 792 1,479 2,712 3,020 384 0 44 8,566 279,159 2018January 137 793 1,487 2,746 3,053 384 0 - 8,600 258,815 February 137 794 1,494 2,774 3,072 383 0 37 8,691 260,326 March 137 796 1,504 2,801 3,115 384 0 69 8,806 262,622 April 137 798 1,513 2,815 3,150 382 0 48 8,842 261,351 May 137 800 1,523 2,836 3,173 383 0 75 8,926 260,740 June 137 802 1,528 2,846 3,190 383 0 146 9,032 262,504 July 137 804 1,533 2,855 3,202 384 0 22 8,936 267,937 August 137 806 1,537 2,859 3,212 384 0 37 8,972 268,007 September 137 809 1,540 2,872 3,225 385 0 48 9,015 257,695 October 137 811 1,543 2,883 3,236 382 0 48 9,039 269,219 November 137 814 1,547 2,883 3,246 380 0 43 9,050 271,137 December 137 817 1,554 2,899 3,264 381 0 56 9,107 288,299 2019January 137 819 1,559 2,921 3,277 379 0 64 9,157 262,376 February 137 821 1,562 2,930 3,291 378 0 82 9,200 265,870 March 137 823 1,566 2,941 3,294 374 0 70- 9,066 271,923 April 137 827 1,571 2,952 3,308 374 0 69 9,237 274,023 May 137 830 1,576 2,976 3,326 372 0 103 9,321 270,490 June 137 833 1,579 2,985 3,336 372 0 522- 8,721 249,509
1/- End of -/50 5/- Total
Total Notes &
Coins10/- 20/-
Comme-morative
CoinsUnspecified
Coin40/-
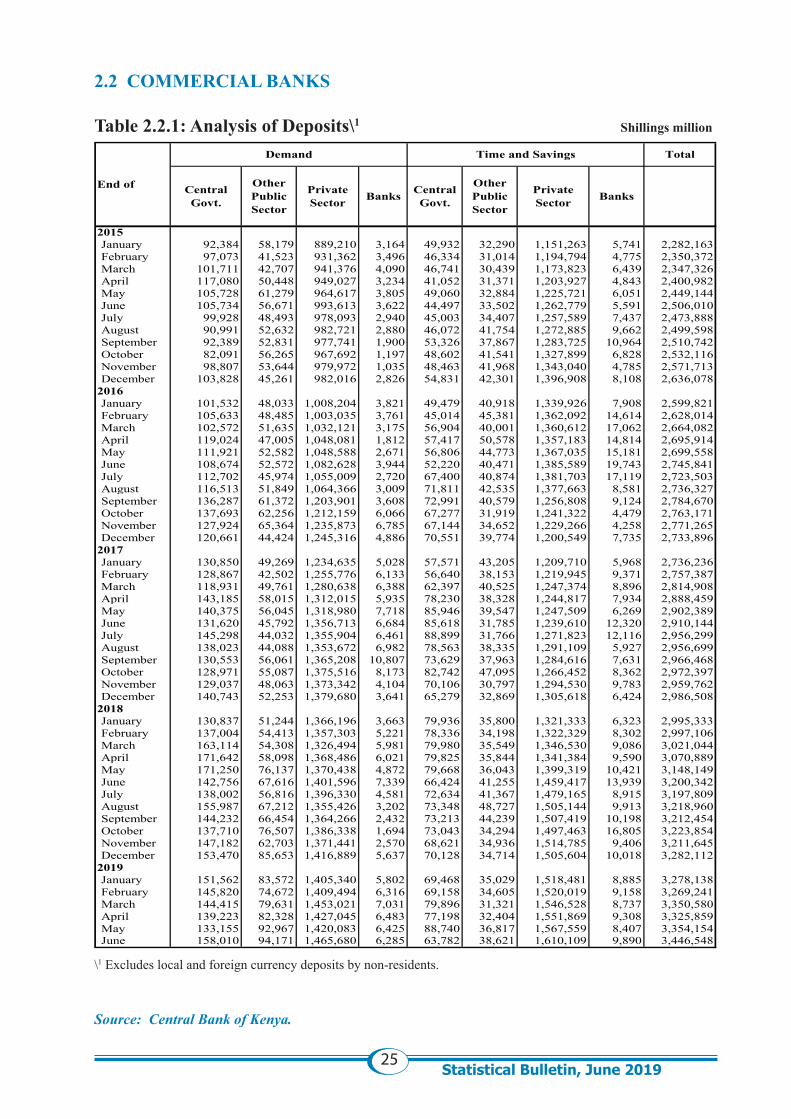
25Statistical Bulletin, June 2019
2.2 COMMERCIAL BANKS Table 2.2.1: Analysis of Deposits\1 Shillings million
\1 Excludes local and foreign currency deposits by non-residents.
Source: Central Bank of Kenya.
2015January 92,384 58,179 889,210 3,164 49,932 32,290 1,151,263 5,741 2,282,163February 97,073 41,523 931,362 3,496 46,334 31,014 1,194,794 4,775 2,350,372March 101,711 42,707 941,376 4,090 46,741 30,439 1,173,823 6,439 2,347,326April 117,080 50,448 949,027 3,234 41,052 31,371 1,203,927 4,843 2,400,982May 105,728 61,279 964,617 3,805 49,060 32,884 1,225,721 6,051 2,449,144June 105,734 56,671 993,613 3,622 44,497 33,502 1,262,779 5,591 2,506,010July 99,928 48,493 978,093 2,940 45,003 34,407 1,257,589 7,437 2,473,888August 90,991 52,632 982,721 2,880 46,072 41,754 1,272,885 9,662 2,499,598September 92,389 52,831 977,741 1,900 53,326 37,867 1,283,725 10,964 2,510,742October 82,091 56,265 967,692 1,197 48,602 41,541 1,327,899 6,828 2,532,116November 98,807 53,644 979,972 1,035 48,463 41,968 1,343,040 4,785 2,571,713December 103,828 45,261 982,016 2,826 54,831 42,301 1,396,908 8,108 2,636,078
2016January 101,532 48,033 1,008,204 3,821 49,479 40,918 1,339,926 7,908 2,599,821February 105,633 48,485 1,003,035 3,761 45,014 45,381 1,362,092 14,614 2,628,014March 102,572 51,635 1,032,121 3,175 56,904 40,001 1,360,612 17,062 2,664,082April 119,024 47,005 1,048,081 1,812 57,417 50,578 1,357,183 14,814 2,695,914May 111,921 52,582 1,048,588 2,671 56,806 44,773 1,367,035 15,181 2,699,558June 108,674 52,572 1,082,628 3,944 52,220 40,471 1,385,589 19,743 2,745,841July 112,702 45,974 1,055,009 2,720 67,400 40,874 1,381,703 17,119 2,723,503August 116,513 51,849 1,064,366 3,009 71,811 42,535 1,377,663 8,581 2,736,327September 136,287 61,372 1,203,901 3,608 72,991 40,579 1,256,808 9,124 2,784,670October 137,693 62,256 1,212,159 6,066 67,277 31,919 1,241,322 4,479 2,763,171November 127,924 65,364 1,235,873 6,785 67,144 34,652 1,229,266 4,258 2,771,265December 120,661 44,424 1,245,316 4,886 70,551 39,774 1,200,549 7,735 2,733,896
2017January 130,850 49,269 1,234,635 5,028 57,571 43,205 1,209,710 5,968 2,736,236February 128,867 42,502 1,255,776 6,133 56,640 38,153 1,219,945 9,371 2,757,387March 118,931 49,761 1,280,638 6,388 62,397 40,525 1,247,374 8,896 2,814,908April 143,185 58,015 1,312,015 5,935 78,230 38,328 1,244,817 7,934 2,888,459May 140,375 56,045 1,318,980 7,718 85,946 39,547 1,247,509 6,269 2,902,389June 131,620 45,792 1,356,713 6,684 85,618 31,785 1,239,610 12,320 2,910,144July 145,298 44,032 1,355,904 6,461 88,899 31,766 1,271,823 12,116 2,956,299August 138,023 44,088 1,353,672 6,982 78,563 38,335 1,291,109 5,927 2,956,699September 130,553 56,061 1,365,208 10,807 73,629 37,963 1,284,616 7,631 2,966,468October 128,971 55,087 1,375,516 8,173 82,742 47,095 1,266,452 8,362 2,972,397November 129,037 48,063 1,373,342 4,104 70,106 30,797 1,294,530 9,783 2,959,762December 140,743 52,253 1,379,680 3,641 65,279 32,869 1,305,618 6,424 2,986,508
2018January 130,837 51,244 1,366,196 3,663 79,936 35,800 1,321,333 6,323 2,995,333February 137,004 54,413 1,357,303 5,221 78,336 34,198 1,322,329 8,302 2,997,106March 163,114 54,308 1,326,494 5,981 79,980 35,549 1,346,530 9,086 3,021,044April 171,642 58,098 1,368,486 6,021 79,825 35,844 1,341,384 9,590 3,070,889May 171,250 76,137 1,370,438 4,872 79,668 36,043 1,399,319 10,421 3,148,149June 142,756 67,616 1,401,596 7,339 66,424 41,255 1,459,417 13,939 3,200,342July 138,002 56,816 1,396,330 4,581 72,634 41,367 1,479,165 8,915 3,197,809August 155,987 67,212 1,355,426 3,202 73,348 48,727 1,505,144 9,913 3,218,960September 144,232 66,454 1,364,266 2,432 73,213 44,239 1,507,419 10,198 3,212,454October 137,710 76,507 1,386,338 1,694 73,043 34,294 1,497,463 16,805 3,223,854November 147,182 62,703 1,371,441 2,570 68,621 34,936 1,514,785 9,406 3,211,645December 153,470 85,653 1,416,889 5,637 70,128 34,714 1,505,604 10,018 3,282,112
2019January 151,562 83,572 1,405,340 5,802 69,468 35,029 1,518,481 8,885 3,278,138February 145,820 74,672 1,409,494 6,316 69,158 34,605 1,520,019 9,158 3,269,241March 144,415 79,631 1,453,021 7,031 79,896 31,321 1,546,528 8,737 3,350,580April 139,223 82,328 1,427,045 6,483 77,198 32,404 1,551,869 9,308 3,325,859May 133,155 92,967 1,420,083 6,425 88,740 36,817 1,567,559 8,407 3,354,154June 158,010 94,171 1,465,680 6,285 63,782 38,621 1,610,109 9,890 3,446,548
Banks BanksEnd of Central
Govt.
Other Public Sector
Demand
Private Sector
TotalTime and Savings
Central Govt.
Other Public Sector
Private Sector
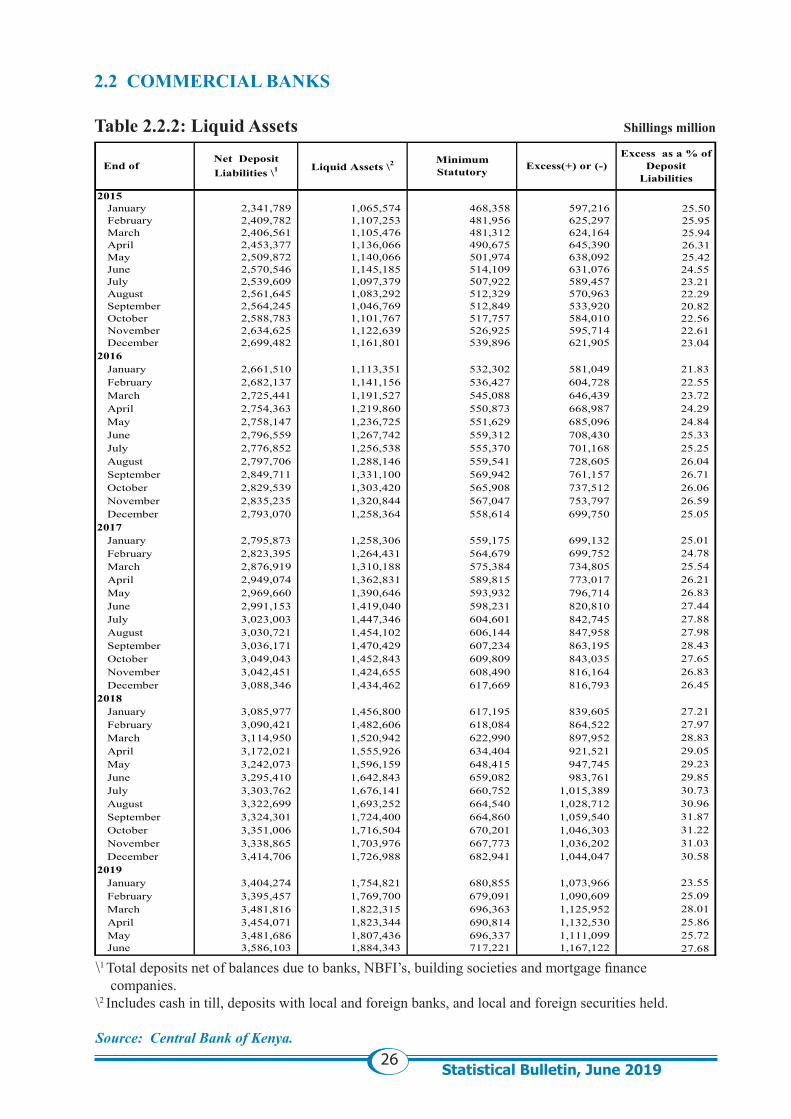
26Statistical Bulletin, June 2019
2.2 COMMERCIAL BANKS Table 2.2.2: Liquid Assets Shillings million
\1 Total deposits net of balances due to banks, NBFI’s, building societies and mortgage finance companies.
\2 Includes cash in till, deposits with local and foreign banks, and local and foreign securities held.
Source: Central Bank of Kenya.
2015 January 2,341,789 1,065,574 468,358 597,216 25.50 February 2,409,782 1,107,253 481,956 625,297 25.95 March 2,406,561 1,105,476 481,312 624,164 25.94 April 2,453,377 1,136,066 490,675 645,390 26.31 May 2,509,872 1,140,066 501,974 638,092 25.42 June 2,570,546 1,145,185 514,109 631,076 24.55 July 2,539,609 1,097,379 507,922 589,457 23.21 August 2,561,645 1,083,292 512,329 570,963 22.29 September 2,564,245 1,046,769 512,849 533,920 20.82 October 2,588,783 1,101,767 517,757 584,010 22.56 November 2,634,625 1,122,639 526,925 595,714 22.61 December 2,699,482 1,161,801 539,896 621,905 23.04
2016 January 2,661,510 1,113,351 532,302 581,049 21.83 February 2,682,137 1,141,156 536,427 604,728 22.55 March 2,725,441 1,191,527 545,088 646,439 23.72 April 2,754,363 1,219,860 550,873 668,987 24.29 May 2,758,147 1,236,725 551,629 685,096 24.84 June 2,796,559 1,267,742 559,312 708,430 25.33 July 2,776,852 1,256,538 555,370 701,168 25.25 August 2,797,706 1,288,146 559,541 728,605 26.04 September 2,849,711 1,331,100 569,942 761,157 26.71 October 2,829,539 1,303,420 565,908 737,512 26.06 November 2,835,235 1,320,844 567,047 753,797 26.59 December 2,793,070 1,258,364 558,614 699,750 25.05
2017 January 2,795,873 1,258,306 559,175 699,132 25.01 February 2,823,395 1,264,431 564,679 699,752 24.78 March 2,876,919 1,310,188 575,384 734,805 25.54 April 2,949,074 1,362,831 589,815 773,017 26.21 May 2,969,660 1,390,646 593,932 796,714 26.83 June 2,991,153 1,419,040 598,231 820,810 27.44 July 3,023,003 1,447,346 604,601 842,745 27.88 August 3,030,721 1,454,102 606,144 847,958 27.98 September 3,036,171 1,470,429 607,234 863,195 28.43 October 3,049,043 1,452,843 609,809 843,035 27.65 November 3,042,451 1,424,655 608,490 816,164 26.83 December 3,088,346 1,434,462 617,669 816,793 26.45
2018January 3,085,977 1,456,800 617,195 839,605 27.21 February 3,090,421 1,482,606 618,084 864,522 27.97 March 3,114,950 1,520,942 622,990 897,952 28.83 April 3,172,021 1,555,926 634,404 921,521 29.05 May 3,242,073 1,596,159 648,415 947,745 29.23 June 3,295,410 1,642,843 659,082 983,761 29.85 July 3,303,762 1,676,141 660,752 1,015,389 30.73 August 3,322,699 1,693,252 664,540 1,028,712 30.96 September 3,324,301 1,724,400 664,860 1,059,540 31.87 October 3,351,006 1,716,504 670,201 1,046,303 31.22 November 3,338,865 1,703,976 667,773 1,036,202 31.03 December 3,414,706 1,726,988 682,941 1,044,047 30.58
2019January 3,404,274 1,754,821 680,855 1,073,966 23.55 February 3,395,457 1,769,700 679,091 1,090,609 25.09 March 3,481,816 1,822,315 696,363 1,125,952 28.01 April 3,454,071 1,823,344 690,814 1,132,530 25.86 May 3,481,686 1,807,436 696,337 1,111,099 25.72 June 3,586,103 1,884,343 717,221 1,167,122 27.68
Excess(+) or (-)Excess as a % of
Deposit Liabilities
End ofNet Deposit Liabilities \1 Liquid Assets \2 Minimum
Statutory
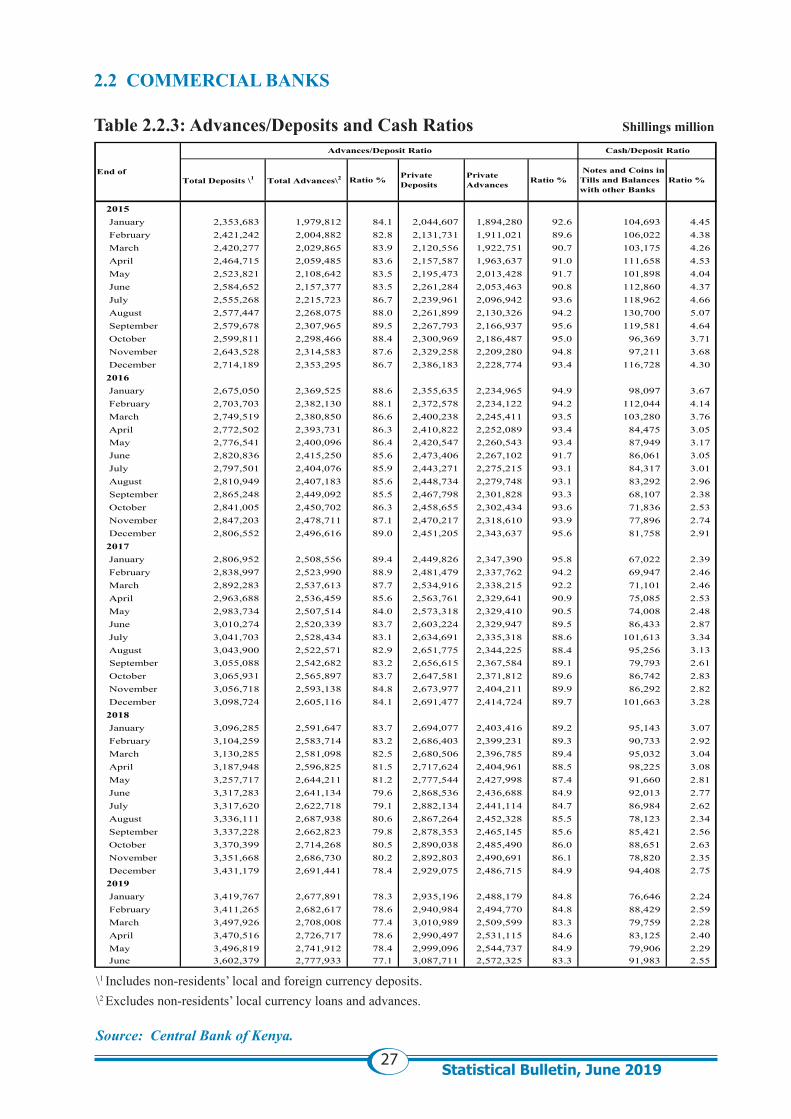
27Statistical Bulletin, June 2019
2.2 COMMERCIAL BANKS Table 2.2.3: Advances/Deposits and Cash Ratios Shillings million
\1 Includes non-residents’ local and foreign currency deposits.\2 Excludes non-residents’ local currency loans and advances.
Source: Central Bank of Kenya.
2015 January 2,353,683 1,979,812 84.1 2,044,607 1,894,280 92.6 104,693 4.45 February 2,421,242 2,004,882 82.8 2,131,731 1,911,021 89.6 106,022 4.38 March 2,420,277 2,029,865 83.9 2,120,556 1,922,751 90.7 103,175 4.26 April 2,464,715 2,059,485 83.6 2,157,587 1,963,637 91.0 111,658 4.53 May 2,523,821 2,108,642 83.5 2,195,473 2,013,428 91.7 101,898 4.04 June 2,584,652 2,157,377 83.5 2,261,284 2,053,463 90.8 112,860 4.37 July 2,555,268 2,215,723 86.7 2,239,961 2,096,942 93.6 118,962 4.66 August 2,577,447 2,268,075 88.0 2,261,899 2,130,326 94.2 130,700 5.07 September 2,579,678 2,307,965 89.5 2,267,793 2,166,937 95.6 119,581 4.64 October 2,599,811 2,298,466 88.4 2,300,969 2,186,487 95.0 96,369 3.71 November 2,643,528 2,314,583 87.6 2,329,258 2,209,280 94.8 97,211 3.68 December 2,714,189 2,353,295 86.7 2,386,183 2,228,774 93.4 116,728 4.30 2016 January 2,675,050 2,369,525 88.6 2,355,635 2,234,965 94.9 98,097 3.67 February 2,703,703 2,382,130 88.1 2,372,578 2,234,122 94.2 112,044 4.14 March 2,749,519 2,380,850 86.6 2,400,238 2,245,411 93.5 103,280 3.76 April 2,772,502 2,393,731 86.3 2,410,822 2,252,089 93.4 84,475 3.05 May 2,776,541 2,400,096 86.4 2,420,547 2,260,543 93.4 87,949 3.17 June 2,820,836 2,415,250 85.6 2,473,406 2,267,102 91.7 86,061 3.05 July 2,797,501 2,404,076 85.9 2,443,271 2,275,215 93.1 84,317 3.01 August 2,810,949 2,407,183 85.6 2,448,734 2,279,748 93.1 83,292 2.96 September 2,865,248 2,449,092 85.5 2,467,798 2,301,828 93.3 68,107 2.38 October 2,841,005 2,450,702 86.3 2,458,655 2,302,434 93.6 71,836 2.53 November 2,847,203 2,478,711 87.1 2,470,217 2,318,610 93.9 77,896 2.74 December 2,806,552 2,496,616 89.0 2,451,205 2,343,637 95.6 81,758 2.91 2017 January 2,806,952 2,508,556 89.4 2,449,826 2,347,390 95.8 67,022 2.39 February 2,838,997 2,523,990 88.9 2,481,479 2,337,762 94.2 69,947 2.46 March 2,892,283 2,537,613 87.7 2,534,916 2,338,215 92.2 71,101 2.46 April 2,963,688 2,536,459 85.6 2,563,761 2,329,641 90.9 75,085 2.53 May 2,983,734 2,507,514 84.0 2,573,318 2,329,410 90.5 74,008 2.48 June 3,010,274 2,520,339 83.7 2,603,224 2,329,947 89.5 86,433 2.87 July 3,041,703 2,528,434 83.1 2,634,691 2,335,318 88.6 101,613 3.34 August 3,043,900 2,522,571 82.9 2,651,775 2,344,225 88.4 95,256 3.13 September 3,055,088 2,542,682 83.2 2,656,615 2,367,584 89.1 79,793 2.61 October 3,065,931 2,565,897 83.7 2,647,581 2,371,812 89.6 86,742 2.83 November 3,056,718 2,593,138 84.8 2,673,977 2,404,211 89.9 86,292 2.82 December 3,098,724 2,605,116 84.1 2,691,477 2,414,724 89.7 101,663 3.28 2018 January 3,096,285 2,591,647 83.7 2,694,077 2,403,416 89.2 95,143 3.07 February 3,104,259 2,583,714 83.2 2,686,403 2,399,231 89.3 90,733 2.92 March 3,130,285 2,581,098 82.5 2,680,506 2,396,785 89.4 95,032 3.04 April 3,187,948 2,596,825 81.5 2,717,624 2,404,961 88.5 98,225 3.08 May 3,257,717 2,644,211 81.2 2,777,544 2,427,998 87.4 91,660 2.81 June 3,317,283 2,641,134 79.6 2,868,536 2,436,688 84.9 92,013 2.77 July 3,317,620 2,622,718 79.1 2,882,134 2,441,114 84.7 86,984 2.62 August 3,336,111 2,687,938 80.6 2,867,264 2,452,328 85.5 78,123 2.34 September 3,337,228 2,662,823 79.8 2,878,353 2,465,145 85.6 85,421 2.56 October 3,370,399 2,714,268 80.5 2,890,038 2,485,490 86.0 88,651 2.63 November 3,351,668 2,686,730 80.2 2,892,803 2,490,691 86.1 78,820 2.35 December 3,431,179 2,691,441 78.4 2,929,075 2,486,715 84.9 94,408 2.75 2019 January 3,419,767 2,677,891 78.3 2,935,196 2,488,179 84.8 76,646 2.24 February 3,411,265 2,682,617 78.6 2,940,984 2,494,770 84.8 88,429 2.59 March 3,497,926 2,708,008 77.4 3,010,989 2,509,599 83.3 79,759 2.28 April 3,470,516 2,726,717 78.6 2,990,497 2,531,115 84.6 83,125 2.40 May 3,496,819 2,741,912 78.4 2,999,096 2,544,737 84.9 79,906 2.29 June 3,602,379 2,777,933 77.1 3,087,711 2,572,325 83.3 91,983 2.55
End ofTotal Deposits \1 Total Advances\2 Ratio % Ratio %
Cash/Deposit RatioAdvances/Deposit Ratio
Private Deposits
Private Advances Ratio %
Notes and Coins in Tills and Balances with other Banks
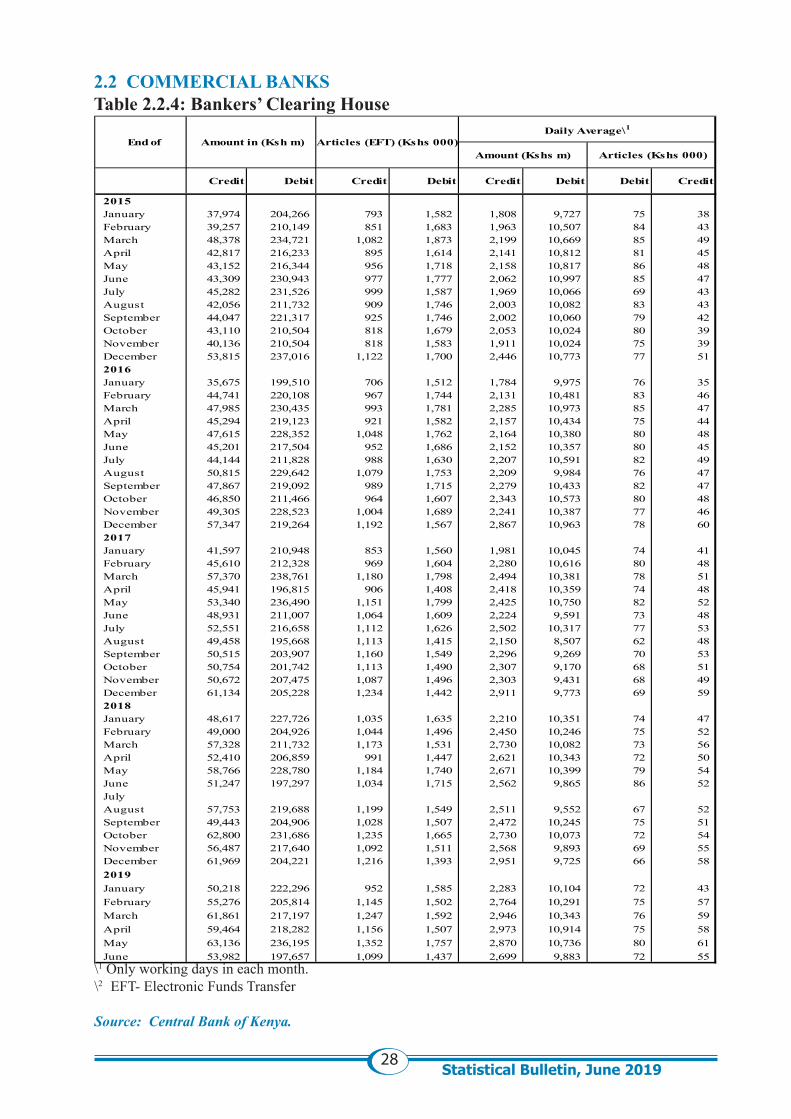
28Statistical Bulletin, June 2019
2.2 COMMERCIAL BANKSTable 2.2.4: Bankers’ Clearing House
\1 Only working days in each month.\2 EFT- Electronic Funds Transfer
Source: Central Bank of Kenya.
2015 January 37,974 204,266 793 1,582 1,808 9,727 75 38 February 39,257 210,149 851 1,683 1,963 10,507 84 43 March 48,378 234,721 1,082 1,873 2,199 10,669 85 49 April 42,817 216,233 895 1,614 2,141 10,812 81 45 May 43,152 216,344 956 1,718 2,158 10,817 86 48 June 43,309 230,943 977 1,777 2,062 10,997 85 47 July 45,282 231,526 999 1,587 1,969 10,066 69 43 August 42,056 211,732 909 1,746 2,003 10,082 83 43 September 44,047 221,317 925 1,746 2,002 10,060 79 42 October 43,110 210,504 818 1,679 2,053 10,024 80 39 November 40,136 210,504 818 1,583 1,911 10,024 75 39 December 53,815 237,016 1,122 1,700 2,446 10,773 77 51 2016 January 35,675 199,510 706 1,512 1,784 9,975 76 35 February 44,741 220,108 967 1,744 2,131 10,481 83 46 March 47,985 230,435 993 1,781 2,285 10,973 85 47 April 45,294 219,123 921 1,582 2,157 10,434 75 44 May 47,615 228,352 1,048 1,762 2,164 10,380 80 48 June 45,201 217,504 952 1,686 2,152 10,357 80 45 July 44,144 211,828 988 1,630 2,207 10,591 82 49 August 50,815 229,642 1,079 1,753 2,209 9,984 76 47 September 47,867 219,092 989 1,715 2,279 10,433 82 47 October 46,850 211,466 964 1,607 2,343 10,573 80 48 November 49,305 228,523 1,004 1,689 2,241 10,387 77 46 December 57,347 219,264 1,192 1,567 2,867 10,963 78 60 2017 January 41,597 210,948 853 1,560 1,981 10,045 74 41 February 45,610 212,328 969 1,604 2,280 10,616 80 48 March 57,370 238,761 1,180 1,798 2,494 10,381 78 51 April 45,941 196,815 906 1,408 2,418 10,359 74 48 May 53,340 236,490 1,151 1,799 2,425 10,750 82 52 June 48,931 211,007 1,064 1,609 2,224 9,591 73 48 July 52,551 216,658 1,112 1,626 2,502 10,317 77 53 August 49,458 195,668 1,113 1,415 2,150 8,507 62 48 September 50,515 203,907 1,160 1,549 2,296 9,269 70 53 October 50,754 201,742 1,113 1,490 2,307 9,170 68 51 November 50,672 207,475 1,087 1,496 2,303 9,431 68 49 December 61,134 205,228 1,234 1,442 2,911 9,773 69 59 2018 January 48,617 227,726 1,035 1,635 2,210 10,351 74 47 February 49,000 204,926 1,044 1,496 2,450 10,246 75 52 March 57,328 211,732 1,173 1,531 2,730 10,082 73 56 April 52,410 206,859 991 1,447 2,621 10,343 72 50 May 58,766 228,780 1,184 1,740 2,671 10,399 79 54 June 51,247 197,297 1,034 1,715 2,562 9,865 86 52 July August 57,753 219,688 1,199 1,549 2,511 9,552 67 52 September 49,443 204,906 1,028 1,507 2,472 10,245 75 51 October 62,800 231,686 1,235 1,665 2,730 10,073 72 54 November 56,487 217,640 1,092 1,511 2,568 9,893 69 55 December 61,969 204,221 1,216 1,393 2,951 9,725 66 58 2019 January 50,218 222,296 952 1,585 2,283 10,104 72 43 February 55,276 205,814 1,145 1,502 2,764 10,291 75 57 March 61,861 217,197 1,247 1,592 2,946 10,343 76 59 April 59,464 218,282 1,156 1,507 2,973 10,914 75 58 May 63,136 236,195 1,352 1,757 2,870 10,736 80 61 June 53,982 197,657 1,099 1,437 2,699 9,883 72 55
Daily Average\1
Amount (Kshs m) Articles (Kshs 000)
Credit Debit Debit Credit
Articles (EFT) (Kshs 000)
Credit Debit
End of Amount in (Ksh m)
Credit Debit
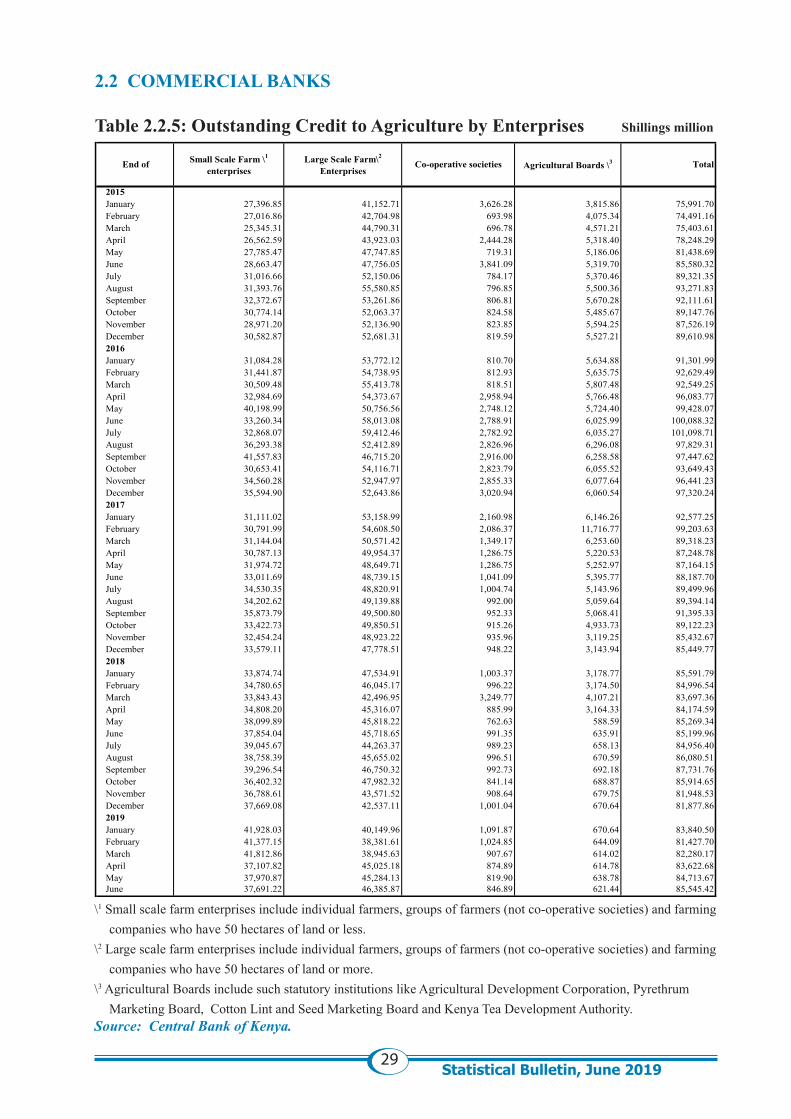
29Statistical Bulletin, June 2019
2.2 COMMERCIAL BANKS
Table 2.2.5: Outstanding Credit to Agriculture by Enterprises Shillings million
\1 Small scale farm enterprises include individual farmers, groups of farmers (not co-operative societies) and farming companies who have 50 hectares of land or less.
\2 Large scale farm enterprises include individual farmers, groups of farmers (not co-operative societies) and farming companies who have 50 hectares of land or more.
\3 Agricultural Boards include such statutory institutions like Agricultural Development Corporation, Pyrethrum Marketing Board, Cotton Lint and Seed Marketing Board and Kenya Tea Development Authority.
Source: Central Bank of Kenya.
2015January 27,396.85 41,152.71 3,626.28 3,815.86 75,991.70February 27,016.86 42,704.98 693.98 4,075.34 74,491.16March 25,345.31 44,790.31 696.78 4,571.21 75,403.61April 26,562.59 43,923.03 2,444.28 5,318.40 78,248.29May 27,785.47 47,747.85 719.31 5,186.06 81,438.69June 28,663.47 47,756.05 3,841.09 5,319.70 85,580.32July 31,016.66 52,150.06 784.17 5,370.46 89,321.35August 31,393.76 55,580.85 796.85 5,500.36 93,271.83September 32,372.67 53,261.86 806.81 5,670.28 92,111.61October 30,774.14 52,063.37 824.58 5,485.67 89,147.76November 28,971.20 52,136.90 823.85 5,594.25 87,526.19December 30,582.87 52,681.31 819.59 5,527.21 89,610.982016January 31,084.28 53,772.12 810.70 5,634.88 91,301.99February 31,441.87 54,738.95 812.93 5,635.75 92,629.49March 30,509.48 55,413.78 818.51 5,807.48 92,549.25April 32,984.69 54,373.67 2,958.94 5,766.48 96,083.77May 40,198.99 50,756.56 2,748.12 5,724.40 99,428.07June 33,260.34 58,013.08 2,788.91 6,025.99 100,088.32July 32,868.07 59,412.46 2,782.92 6,035.27 101,098.71August 36,293.38 52,412.89 2,826.96 6,296.08 97,829.31September 41,557.83 46,715.20 2,916.00 6,258.58 97,447.62October 30,653.41 54,116.71 2,823.79 6,055.52 93,649.43November 34,560.28 52,947.97 2,855.33 6,077.64 96,441.23December 35,594.90 52,643.86 3,020.94 6,060.54 97,320.242017January 31,111.02 53,158.99 2,160.98 6,146.26 92,577.25February 30,791.99 54,608.50 2,086.37 11,716.77 99,203.63March 31,144.04 50,571.42 1,349.17 6,253.60 89,318.23April 30,787.13 49,954.37 1,286.75 5,220.53 87,248.78May 31,974.72 48,649.71 1,286.75 5,252.97 87,164.15June 33,011.69 48,739.15 1,041.09 5,395.77 88,187.70July 34,530.35 48,820.91 1,004.74 5,143.96 89,499.96August 34,202.62 49,139.88 992.00 5,059.64 89,394.14September 35,873.79 49,500.80 952.33 5,068.41 91,395.33October 33,422.73 49,850.51 915.26 4,933.73 89,122.23November 32,454.24 48,923.22 935.96 3,119.25 85,432.67December 33,579.11 47,778.51 948.22 3,143.94 85,449.772018January 33,874.74 47,534.91 1,003.37 3,178.77 85,591.79February 34,780.65 46,045.17 996.22 3,174.50 84,996.54March 33,843.43 42,496.95 3,249.77 4,107.21 83,697.36April 34,808.20 45,316.07 885.99 3,164.33 84,174.59May 38,099.89 45,818.22 762.63 588.59 85,269.34June 37,854.04 45,718.65 991.35 635.91 85,199.96July 39,045.67 44,263.37 989.23 658.13 84,956.40August 38,758.39 45,655.02 996.51 670.59 86,080.51September 39,296.54 46,750.32 992.73 692.18 87,731.76October 36,402.32 47,982.32 841.14 688.87 85,914.65November 36,788.61 43,571.52 908.64 679.75 81,948.53December 37,669.08 42,537.11 1,001.04 670.64 81,877.862019January 41,928.03 40,149.96 1,091.87 670.64 83,840.50February 41,377.15 38,381.61 1,024.85 644.09 81,427.70March 41,812.86 38,945.63 907.67 614.02 82,280.17April 37,107.82 45,025.18 874.89 614.78 83,622.68May 37,970.87 45,284.13 819.90 638.78 84,713.67June 37,691.22 46,385.87 846.89 621.44 85,545.42
End of Small Scale Farm \1
enterprisesLarge Scale Farm\2
EnterprisesCo-operative societies Agricultural Boards \3 Total
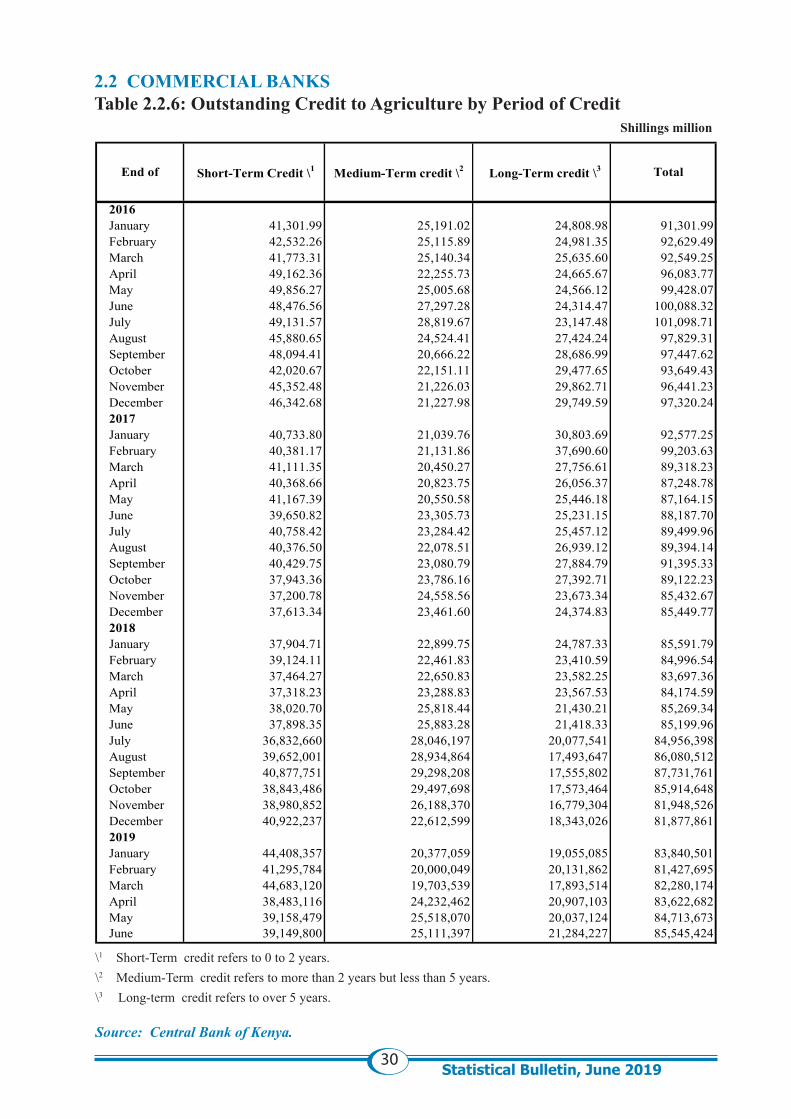
30Statistical Bulletin, June 2019
2.2 COMMERCIAL BANKSTable 2.2.6: Outstanding Credit to Agriculture by Period of Credit Shillings million
\1 Short-Term credit refers to 0 to 2 years.\2 Medium-Term credit refers to more than 2 years but less than 5 years. \3 Long-term credit refers to over 5 years.
Source: Central Bank of Kenya.
2016January 41,301.99 25,191.02 24,808.98 91,301.99February 42,532.26 25,115.89 24,981.35 92,629.49March 41,773.31 25,140.34 25,635.60 92,549.25April 49,162.36 22,255.73 24,665.67 96,083.77May 49,856.27 25,005.68 24,566.12 99,428.07June 48,476.56 27,297.28 24,314.47 100,088.32July 49,131.57 28,819.67 23,147.48 101,098.71August 45,880.65 24,524.41 27,424.24 97,829.31September 48,094.41 20,666.22 28,686.99 97,447.62October 42,020.67 22,151.11 29,477.65 93,649.43November 45,352.48 21,226.03 29,862.71 96,441.23December 46,342.68 21,227.98 29,749.59 97,320.242017January 40,733.80 21,039.76 30,803.69 92,577.25February 40,381.17 21,131.86 37,690.60 99,203.63March 41,111.35 20,450.27 27,756.61 89,318.23April 40,368.66 20,823.75 26,056.37 87,248.78May 41,167.39 20,550.58 25,446.18 87,164.15June 39,650.82 23,305.73 25,231.15 88,187.70July 40,758.42 23,284.42 25,457.12 89,499.96August 40,376.50 22,078.51 26,939.12 89,394.14September 40,429.75 23,080.79 27,884.79 91,395.33October 37,943.36 23,786.16 27,392.71 89,122.23November 37,200.78 24,558.56 23,673.34 85,432.67December 37,613.34 23,461.60 24,374.83 85,449.772018January 37,904.71 22,899.75 24,787.33 85,591.79February 39,124.11 22,461.83 23,410.59 84,996.54March 37,464.27 22,650.83 23,582.25 83,697.36April 37,318.23 23,288.83 23,567.53 84,174.59May 38,020.70 25,818.44 21,430.21 85,269.34June 37,898.35 25,883.28 21,418.33 85,199.96July 36,832,660 28,046,197 20,077,541 84,956,398August 39,652,001 28,934,864 17,493,647 86,080,512September 40,877,751 29,298,208 17,555,802 87,731,761October 38,843,486 29,497,698 17,573,464 85,914,648November 38,980,852 26,188,370 16,779,304 81,948,526December 40,922,237 22,612,599 18,343,026 81,877,8612019January 44,408,357 20,377,059 19,055,085 83,840,501February 41,295,784 20,000,049 20,131,862 81,427,695March 44,683,120 19,703,539 17,893,514 82,280,174April 38,483,116 24,232,462 20,907,103 83,622,682May 39,158,479 25,518,070 20,037,124 84,713,673June 39,149,800 25,111,397 21,284,227 85,545,424
End of Short-Term Credit \1 Medium-Term credit \2 Long-Term credit \3 Total
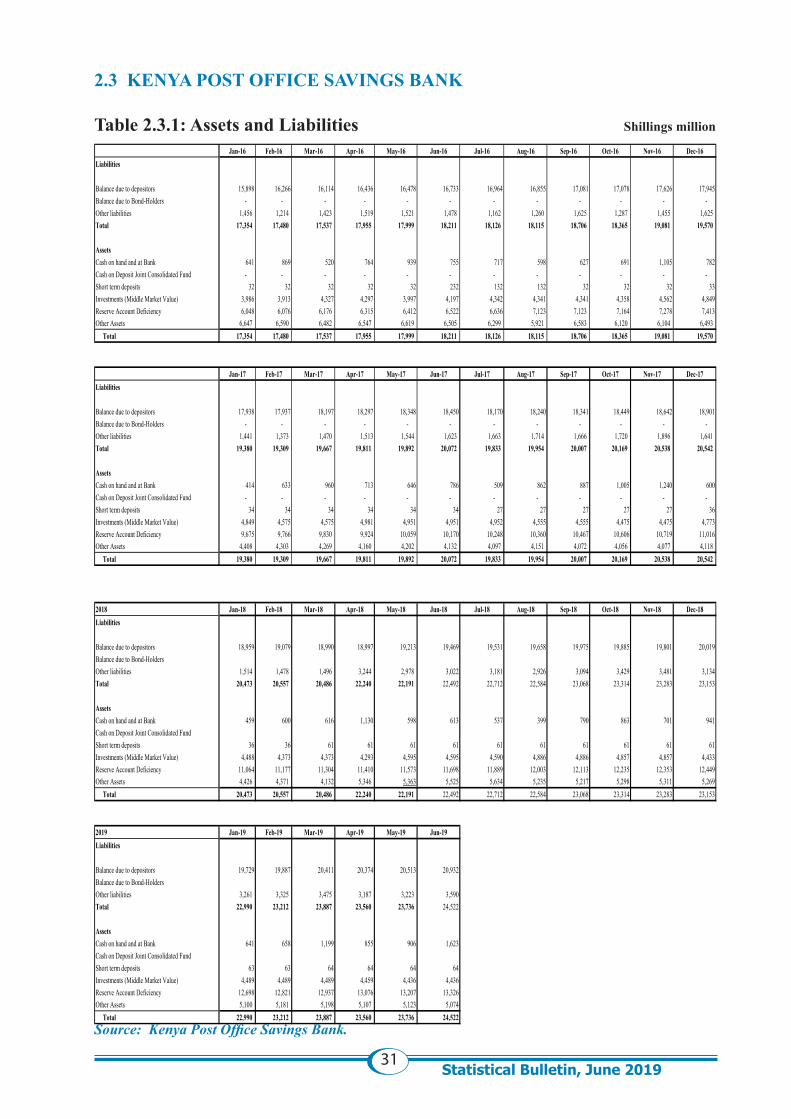
31Statistical Bulletin, June 2019
2.3 KENYA POST OFFICE SAVINGS BANK Table 2.3.1: Assets and Liabilities Shillings million
Source: Kenya Post Office Savings Bank.
Jan-16 Feb-16 Mar-16 Apr-16 May-16 Jun-16 Jul-16 Aug-16 Sep-16 Oct-16 Nov-16 Dec-16Liabilities
Balance due to depositors 15,898 16,266 16,114 16,436 16,478 16,733 16,964 16,855 17,081 17,078 17,626 17,945Balance due to Bond-Holders - - - - - - - - - - - - Other liabilities 1,456 1,214 1,423 1,519 1,521 1,478 1,162 1,260 1,625 1,287 1,455 1,625 Total 17,354 17,480 17,537 17,955 17,999 18,211 18,126 18,115 18,706 18,365 19,081 19,570
AssetsCash on hand and at Bank 641 869 520 764 939 755 717 598 627 691 1,105 782Cash on Deposit Joint Consolidated Fund - - - - - - - - - - - - Short term deposits 32 32 32 32 32 232 132 132 32 32 32 33Investments (Middle Market Value) 3,986 3,913 4,327 4,297 3,997 4,197 4,342 4,341 4,341 4,358 4,562 4,849Reserve Account Deficiency 6,048 6,076 6,176 6,315 6,412 6,522 6,636 7,123 7,123 7,164 7,278 7,413Other Assets 6,647 6,590 6,482 6,547 6,619 6,505 6,299 5,921 6,583 6,120 6,104 6,493 Total 17,354 17,480 17,537 17,955 17,999 18,211 18,126 18,115 18,706 18,365 19,081 19,570
Jan-17 Feb-17 Mar-17 Apr-17 May-17 Jun-17 Jul-17 Aug-17 Sep-17 Oct-17 Nov-17 Dec-17Liabilities
Balance due to depositors 17,938 17,937 18,197 18,297 18,348 18,450 18,170 18,240 18,341 18,449 18,642 18,901Balance due to Bond-Holders - - - - - - - - - - - - Other liabilities 1,441 1,373 1,470 1,513 1,544 1,623 1,663 1,714 1,666 1,720 1,896 1,641 Total 19,380 19,309 19,667 19,811 19,892 20,072 19,833 19,954 20,007 20,169 20,538 20,542
AssetsCash on hand and at Bank 414 633 960 713 646 786 509 862 887 1,005 1,240 600Cash on Deposit Joint Consolidated Fund - - - - - - - - - - - - Short term deposits 34 34 34 34 34 34 27 27 27 27 27 36Investments (Middle Market Value) 4,849 4,575 4,575 4,981 4,951 4,951 4,952 4,555 4,555 4,475 4,475 4,773Reserve Account Deficiency 9,675 9,766 9,830 9,924 10,059 10,170 10,248 10,360 10,467 10,606 10,719 11,016Other Assets 4,408 4,303 4,269 4,160 4,202 4,132 4,097 4,151 4,072 4,056 4,077 4,118 Total 19,380 19,309 19,667 19,811 19,892 20,072 19,833 19,954 20,007 20,169 20,538 20,542
2018 Jan-18 Feb-18 Mar-18 Apr-18 May-18 Jun-18 Jul-18 Aug-18 Sep-18 Oct-18 Nov-18 Dec-18Liabilities
Balance due to depositors 18,959 19,079 18,990 18,997 19,213 19,469 19,531 19,658 19,975 19,885 19,801 20,019Balance due to Bond-HoldersOther liabilities 1,514 1,478 1,496 3,244 2,978 3,022 3,181 2,926 3,094 3,429 3,481 3,134Total 20,473 20,557 20,486 22,240 22,191 22,492 22,712 22,584 23,068 23,314 23,283 23,153
AssetsCash on hand and at Bank 459 600 616 1,130 598 613 537 399 790 863 701 941Cash on Deposit Joint Consolidated FundShort term deposits 36 36 61 61 61 61 61 61 61 61 61 61Investments (Middle Market Value) 4,488 4,373 4,373 4,293 4,595 4,595 4,590 4,886 4,886 4,857 4,857 4,433Reserve Account Deficiency 11,064 11,177 11,304 11,410 11,573 11,698 11,889 12,003 12,113 12,235 12,353 12,449Other Assets 4,426 4,371 4,132 5,346 5,363 5,525 5,634 5,235 5,217 5,298 5,311 5,269 Total 20,473 20,557 20,486 22,240 22,191 22,492 22,712 22,584 23,068 23,314 23,283 23,153
2019 Jan-19 Feb-19 Mar-19 Apr-19 May-19 Jun-19Liabilities
Balance due to depositors 19,729 19,887 20,411 20,374 20,513 20,932Balance due to Bond-HoldersOther liabilities 3,261 3,325 3,475 3,187 3,223 3,590Total 22,990 23,212 23,887 23,560 23,736 24,522
AssetsCash on hand and at Bank 641 658 1,199 855 906 1,623Cash on Deposit Joint Consolidated FundShort term deposits 63 63 64 64 64 64Investments (Middle Market Value) 4,489 4,489 4,489 4,459 4,436 4,436Reserve Account Deficiency 12,698 12,821 12,937 13,076 13,207 13,326Other Assets 5,100 5,181 5,198 5,107 5,123 5,074 Total 22,990 23,212 23,887 23,560 23,736 24,522
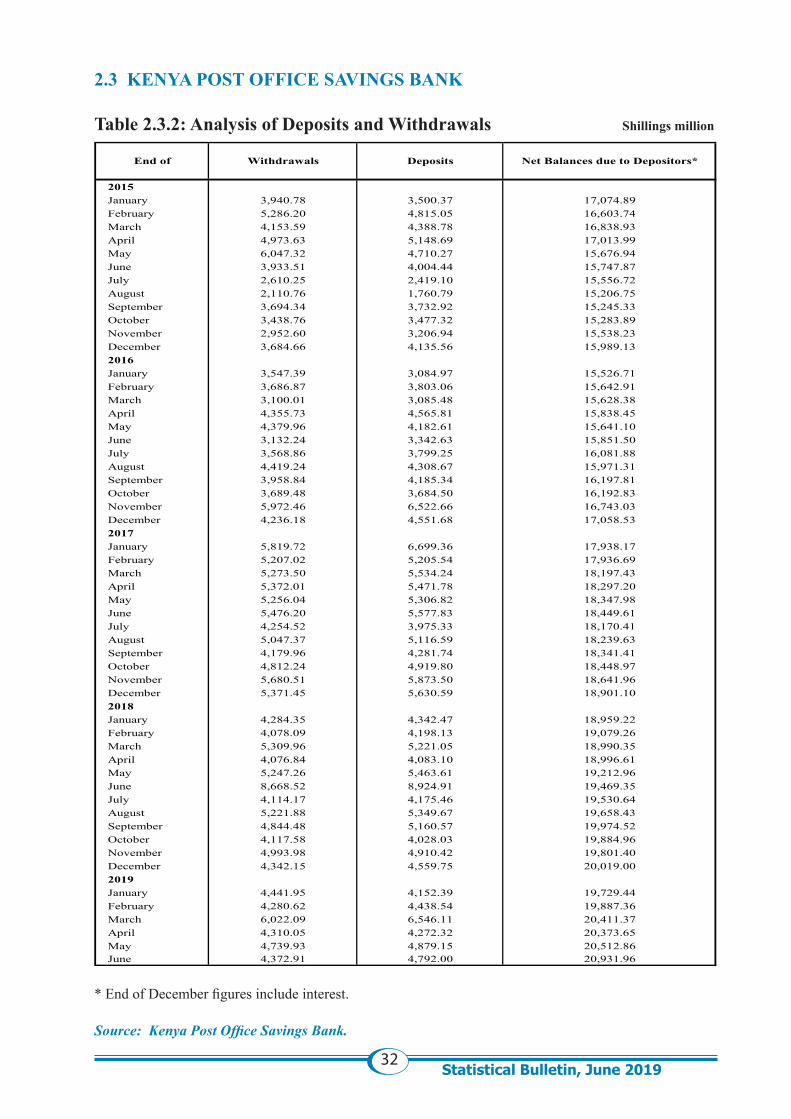
32Statistical Bulletin, June 2019
2.3 KENYA POST OFFICE SAVINGS BANK Table 2.3.2: Analysis of Deposits and Withdrawals Shillings million
* End of December figures include interest.
Source: Kenya Post Office Savings Bank.
2015January 3,940.78 3,500.37 17,074.89February 5,286.20 4,815.05 16,603.74March 4,153.59 4,388.78 16,838.93April 4,973.63 5,148.69 17,013.99May 6,047.32 4,710.27 15,676.94June 3,933.51 4,004.44 15,747.87July 2,610.25 2,419.10 15,556.72August 2,110.76 1,760.79 15,206.75September 3,694.34 3,732.92 15,245.33October 3,438.76 3,477.32 15,283.89November 2,952.60 3,206.94 15,538.23December 3,684.66 4,135.56 15,989.132016January 3,547.39 3,084.97 15,526.71February 3,686.87 3,803.06 15,642.91March 3,100.01 3,085.48 15,628.38April 4,355.73 4,565.81 15,838.45May 4,379.96 4,182.61 15,641.10June 3,132.24 3,342.63 15,851.50July 3,568.86 3,799.25 16,081.88August 4,419.24 4,308.67 15,971.31September 3,958.84 4,185.34 16,197.81October 3,689.48 3,684.50 16,192.83November 5,972.46 6,522.66 16,743.03December 4,236.18 4,551.68 17,058.532017January 5,819.72 6,699.36 17,938.17February 5,207.02 5,205.54 17,936.69March 5,273.50 5,534.24 18,197.43April 5,372.01 5,471.78 18,297.20May 5,256.04 5,306.82 18,347.98June 5,476.20 5,577.83 18,449.61July 4,254.52 3,975.33 18,170.41August 5,047.37 5,116.59 18,239.63September 4,179.96 4,281.74 18,341.41October 4,812.24 4,919.80 18,448.97November 5,680.51 5,873.50 18,641.96December 5,371.45 5,630.59 18,901.102018January 4,284.35 4,342.47 18,959.22February 4,078.09 4,198.13 19,079.26March 5,309.96 5,221.05 18,990.35April 4,076.84 4,083.10 18,996.61May 5,247.26 5,463.61 19,212.96June 8,668.52 8,924.91 19,469.35July 4,114.17 4,175.46 19,530.64August 5,221.88 5,349.67 19,658.43September 4,844.48 5,160.57 19,974.52October 4,117.58 4,028.03 19,884.96November 4,993.98 4,910.42 19,801.40December 4,342.15 4,559.75 20,019.002019January 4,441.95 4,152.39 19,729.44February 4,280.62 4,438.54 19,887.36March 6,022.09 6,546.11 20,411.37April 4,310.05 4,272.32 20,373.65May 4,739.93 4,879.15 20,512.86June 4,372.91 4,792.00 20,931.96
End of Withdrawals Deposits Net Balances due to Depositors*
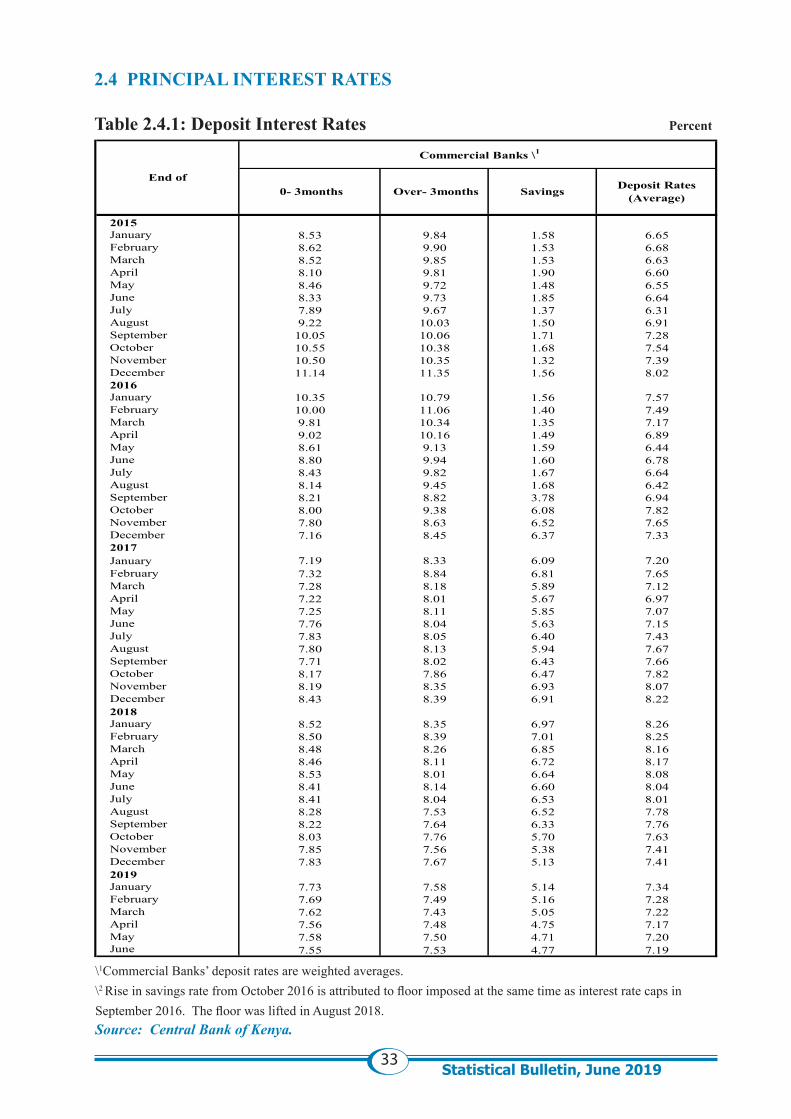
33Statistical Bulletin, June 2019
2.4 PRINCIPAL INTEREST RATES
Table 2.4.1: Deposit Interest Rates Percent
\1Commercial Banks’ deposit rates are weighted averages.\2 Rise in savings rate from October 2016 is attributed to floor imposed at the same time as interest rate caps in September 2016. The floor was lifted in August 2018.Source: Central Bank of Kenya.
December 8.54 8.14 0.96 7.792015January 8.53 9.84 1.58 6.65February 8.62 9.90 1.53 6.68March 8.52 9.85 1.53 6.63April 8.10 9.81 1.90 6.60May 8.46 9.72 1.48 6.55June 8.33 9.73 1.85 6.64July 7.89 9.67 1.37 6.31August 9.22 10.03 1.50 6.91September 10.05 10.06 1.71 7.28October 10.55 10.38 1.68 7.54November 10.50 10.35 1.32 7.39December 11.14 11.35 1.56 8.022016January 10.35 10.79 1.56 7.57February 10.00 11.06 1.40 7.49March 9.81 10.34 1.35 7.17April 9.02 10.16 1.49 6.89May 8.61 9.13 1.59 6.44June 8.80 9.94 1.60 6.78July 8.43 9.82 1.67 6.64August 8.14 9.45 1.68 6.42September 8.21 8.82 3.78 6.94October 8.00 9.38 6.08 7.82November 7.80 8.63 6.52 7.65December 7.16 8.45 6.37 7.332017January 7.19 8.33 6.09 7.20February 7.32 8.84 6.81 7.65March 7.28 8.18 5.89 7.12April 7.22 8.01 5.67 6.97May 7.25 8.11 5.85 7.07June 7.76 8.04 5.63 7.15July 7.83 8.05 6.40 7.43August 7.80 8.13 5.94 7.67September 7.71 8.02 6.43 7.66October 8.17 7.86 6.47 7.82November 8.19 8.35 6.93 8.07December 8.43 8.39 6.91 8.222018January 8.52 8.35 6.97 8.26February 8.50 8.39 7.01 8.25March 8.48 8.26 6.85 8.16April 8.46 8.11 6.72 8.17May 8.53 8.01 6.64 8.08June 8.41 8.14 6.60 8.04July 8.41 8.04 6.53 8.01August 8.28 7.53 6.52 7.78September 8.22 7.64 6.33 7.76October 8.03 7.76 5.70 7.63November 7.85 7.56 5.38 7.41December 7.83 7.67 5.13 7.412019January 7.73 7.58 5.14 7.34February 7.69 7.49 5.16 7.28March 7.62 7.43 5.05 7.22April 7.56 7.48 4.75 7.17May 7.58 7.50 4.71 7.20June 7.55 7.53 4.77 7.19
Deposit Rates (Average)
End of 0- 3months Over- 3months Savings
Commercial Banks \1
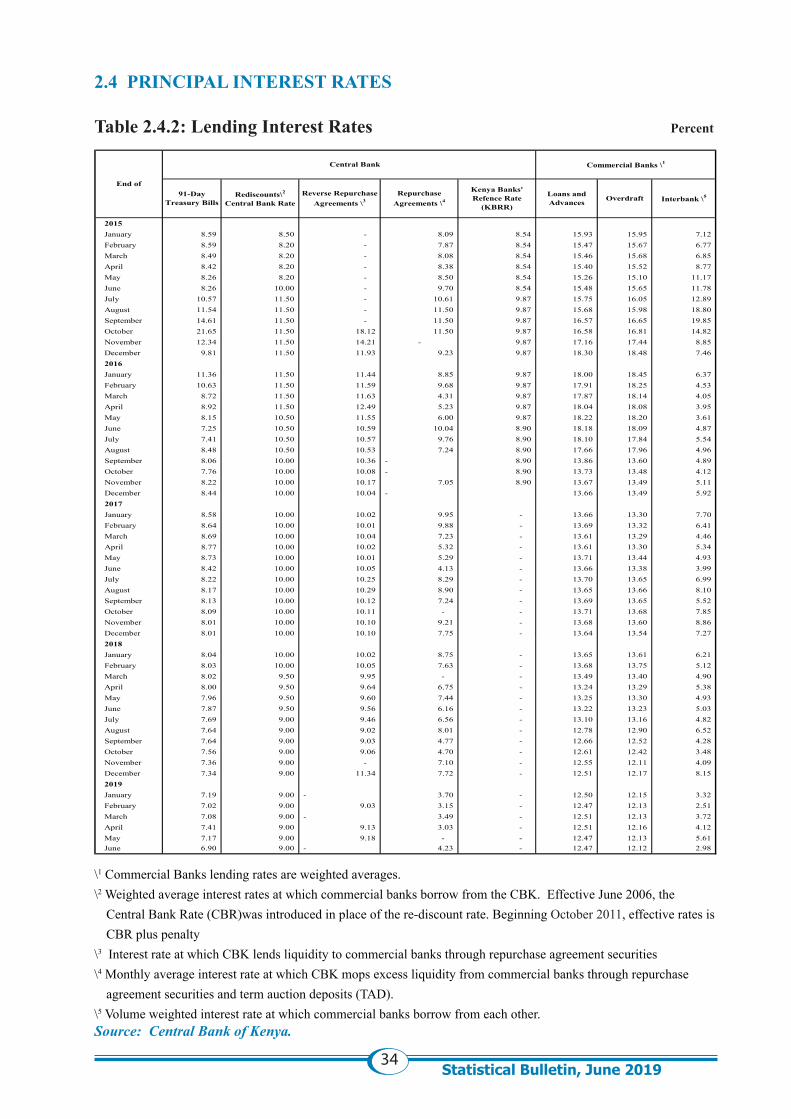
34Statistical Bulletin, June 2019
2.4 PRINCIPAL INTEREST RATES Table 2.4.2: Lending Interest Rates Percent
\1 Commercial Banks lending rates are weighted averages. \2 Weighted average interest rates at which commercial banks borrow from the CBK. Effective June 2006, the
Central Bank Rate (CBR)was introduced in place of the re-discount rate. Beginning October 2011, effective rates is CBR plus penalty
\3 Interest rate at which CBK lends liquidity to commercial banks through repurchase agreement securities\4 Monthly average interest rate at which CBK mops excess liquidity from commercial banks through repurchase
agreement securities and term auction deposits (TAD).\5 Volume weighted interest rate at which commercial banks borrow from each other. Source: Central Bank of Kenya.
2015January 8.59 8.50 - 8.09 8.54 15.93 15.95 7.12February 8.59 8.20 - 7.87 8.54 15.47 15.67 6.77March 8.49 8.20 - 8.08 8.54 15.46 15.68 6.85April 8.42 8.20 - 8.38 8.54 15.40 15.52 8.77May 8.26 8.20 - 8.50 8.54 15.26 15.10 11.17June 8.26 10.00 - 9.70 8.54 15.48 15.65 11.78July 10.57 11.50 - 10.61 9.87 15.75 16.05 12.89August 11.54 11.50 - 11.50 9.87 15.68 15.98 18.80September 14.61 11.50 - 11.50 9.87 16.57 16.65 19.85October 21.65 11.50 18.12 11.50 9.87 16.58 16.81 14.82November 12.34 11.50 14.21 - 9.87 17.16 17.44 8.85December 9.81 11.50 11.93 9.23 9.87 18.30 18.48 7.462016January 11.36 11.50 11.44 8.85 9.87 18.00 18.45 6.37February 10.63 11.50 11.59 9.68 9.87 17.91 18.25 4.53March 8.72 11.50 11.63 4.31 9.87 17.87 18.14 4.05April 8.92 11.50 12.49 5.23 9.87 18.04 18.08 3.95May 8.15 10.50 11.55 6.00 9.87 18.22 18.20 3.61June 7.25 10.50 10.59 10.04 8.90 18.18 18.09 4.87July 7.41 10.50 10.57 9.76 8.90 18.10 17.84 5.54August 8.48 10.50 10.53 7.24 8.90 17.66 17.96 4.96September 8.06 10.00 10.36 - 8.90 13.86 13.60 4.89October 7.76 10.00 10.08 - 8.90 13.73 13.48 4.12November 8.22 10.00 10.17 7.05 8.90 13.67 13.49 5.11December 8.44 10.00 10.04 - 13.66 13.49 5.922017January 8.58 10.00 10.02 9.95 - 13.66 13.30 7.70February 8.64 10.00 10.01 9.88 - 13.69 13.32 6.41March 8.69 10.00 10.04 7.23 - 13.61 13.29 4.46April 8.77 10.00 10.02 5.32 - 13.61 13.30 5.34May 8.73 10.00 10.01 5.29 - 13.71 13.44 4.93June 8.42 10.00 10.05 4.13 - 13.66 13.38 3.99July 8.22 10.00 10.25 8.29 - 13.70 13.65 6.99August 8.17 10.00 10.29 8.90 - 13.65 13.66 8.10September 8.13 10.00 10.12 7.24 - 13.69 13.65 5.52October 8.09 10.00 10.11 - - 13.71 13.68 7.85November 8.01 10.00 10.10 9.21 - 13.68 13.60 8.86December 8.01 10.00 10.10 7.75 - 13.64 13.54 7.272018January 8.04 10.00 10.02 8.75 - 13.65 13.61 6.21February 8.03 10.00 10.05 7.63 - 13.68 13.75 5.12March 8.02 9.50 9.95 - - 13.49 13.40 4.90April 8.00 9.50 9.64 6.75 - 13.24 13.29 5.38May 7.96 9.50 9.60 7.44 - 13.25 13.30 4.93June 7.87 9.50 9.56 6.16 - 13.22 13.23 5.03July 7.69 9.00 9.46 6.56 - 13.10 13.16 4.82August 7.64 9.00 9.02 8.01 - 12.78 12.90 6.52September 7.64 9.00 9.03 4.77 - 12.66 12.52 4.28October 7.56 9.00 9.06 4.70 - 12.61 12.42 3.48November 7.36 9.00 - 7.10 - 12.55 12.11 4.09December 7.34 9.00 11.34 7.72 - 12.51 12.17 8.152019January 7.19 9.00 - 3.70 - 12.50 12.15 3.32February 7.02 9.00 9.03 3.15 - 12.47 12.13 2.51March 7.08 9.00 - 3.49 - 12.51 12.13 3.72April 7.41 9.00 9.13 3.03 - 12.51 12.16 4.12May 7.17 9.00 9.18 - - 12.47 12.13 5.61June 6.90 9.00 - 4.23 - 12.47 12.12 2.98
End of
Commercial Banks \1
91-Day Treasury Bills
Rediscounts\2
Central Bank RateReverse Repurchase
Agreements \3Repurchase
Agreements \4Loans and Advances Interbank \5Overdraft
Kenya Banks' Refence Rate
(KBRR)
Central Bank
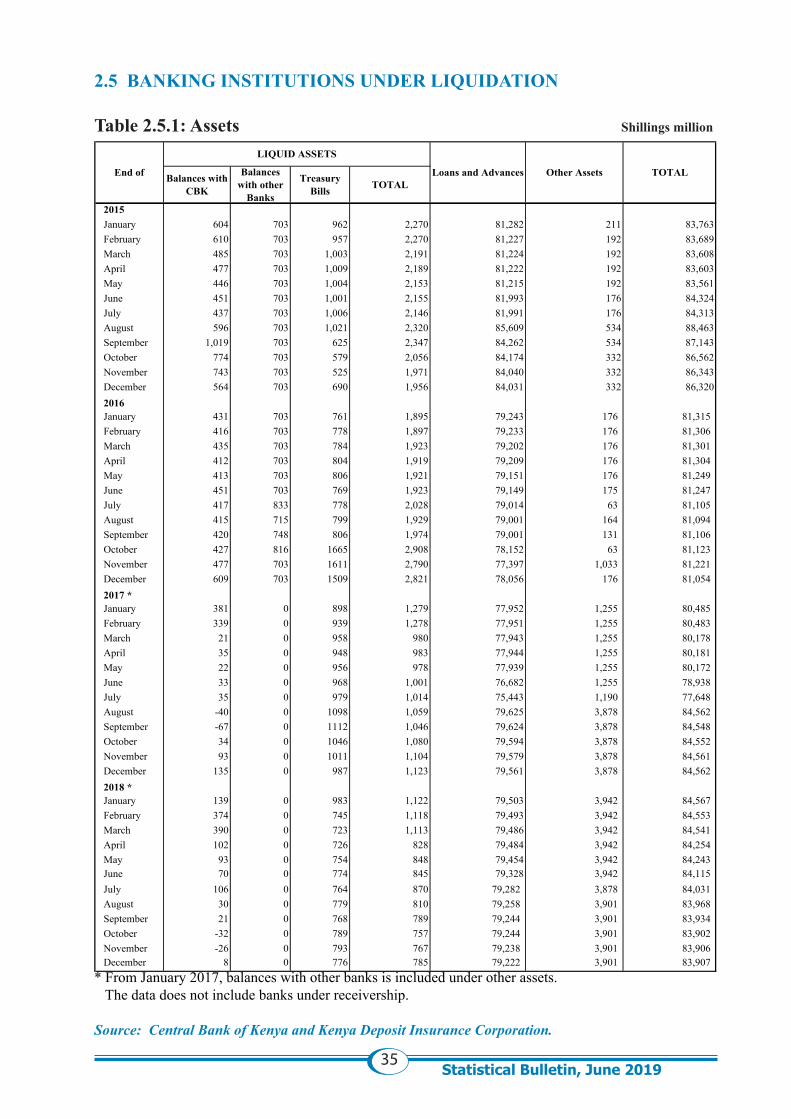
35Statistical Bulletin, June 2019
2.5 BANKING INSTITUTIONS UNDER LIQUIDATION Table 2.5.1: Assets Shillings million
* From January 2017, balances with other banks is included under other assets. The data does not include banks under receivership.
Source: Central Bank of Kenya and Kenya Deposit Insurance Corporation.
2015January 604 703 962 2,270 81,282 211 83,763February 610 703 957 2,270 81,227 192 83,689March 485 703 1,003 2,191 81,224 192 83,608April 477 703 1,009 2,189 81,222 192 83,603May 446 703 1,004 2,153 81,215 192 83,561June 451 703 1,001 2,155 81,993 176 84,324July 437 703 1,006 2,146 81,991 176 84,313August 596 703 1,021 2,320 85,609 534 88,463September 1,019 703 625 2,347 84,262 534 87,143October 774 703 579 2,056 84,174 332 86,562November 743 703 525 1,971 84,040 332 86,343December 564 703 690 1,956 84,031 332 86,3202016January 431 703 761 1,895 79,243 176 81,315 February 416 703 778 1,897 79,233 176 81,306 March 435 703 784 1,923 79,202 176 81,301 April 412 703 804 1,919 79,209 176 81,304 May 413 703 806 1,921 79,151 176 81,249 June 451 703 769 1,923 79,149 175 81,247 July 417 833 778 2,028 79,014 63 81,105 August 415 715 799 1,929 79,001 164 81,094 September 420 748 806 1,974 79,001 131 81,106 October 427 816 1665 2,908 78,152 63 81,123 November 477 703 1611 2,790 77,397 1,033 81,221 December 609 703 1509 2,821 78,056 176 81,054 2017 *January 381 0 898 1,279 77,952 1,255 80,485 February 339 0 939 1,278 77,951 1,255 80,483 March 21 0 958 980 77,943 1,255 80,178 April 35 0 948 983 77,944 1,255 80,181 May 22 0 956 978 77,939 1,255 80,172 June 33 0 968 1,001 76,682 1,255 78,938 July 35 0 979 1,014 75,443 1,190 77,648 August -40 0 1098 1,059 79,625 3,878 84,562 September -67 0 1112 1,046 79,624 3,878 84,548 October 34 0 1046 1,080 79,594 3,878 84,552 November 93 0 1011 1,104 79,579 3,878 84,561 December 135 0 987 1,123 79,561 3,878 84,562 2018 *January 139 0 983 1,122 79,503 3,942 84,567 February 374 0 745 1,118 79,493 3,942 84,553 March 390 0 723 1,113 79,486 3,942 84,541 April 102 0 726 828 79,484 3,942 84,254 May 93 0 754 848 79,454 3,942 84,243 June 70 0 774 845 79,328 3,942 84,115 July 106 0 764 870 79,282 3,878 84,031 August 30 0 779 810 79,258 3,901 83,968 September 21 0 768 789 79,244 3,901 83,934 October -32 0 789 757 79,244 3,901 83,902 November -26 0 793 767 79,238 3,901 83,906 December 8 0 776 785 79,222 3,901 83,907
Loans and Advances Other Assets TOTALEnd of
LIQUID ASSETS
Balances with CBK
Balances with other
Banks
Treasury Bills TOTAL
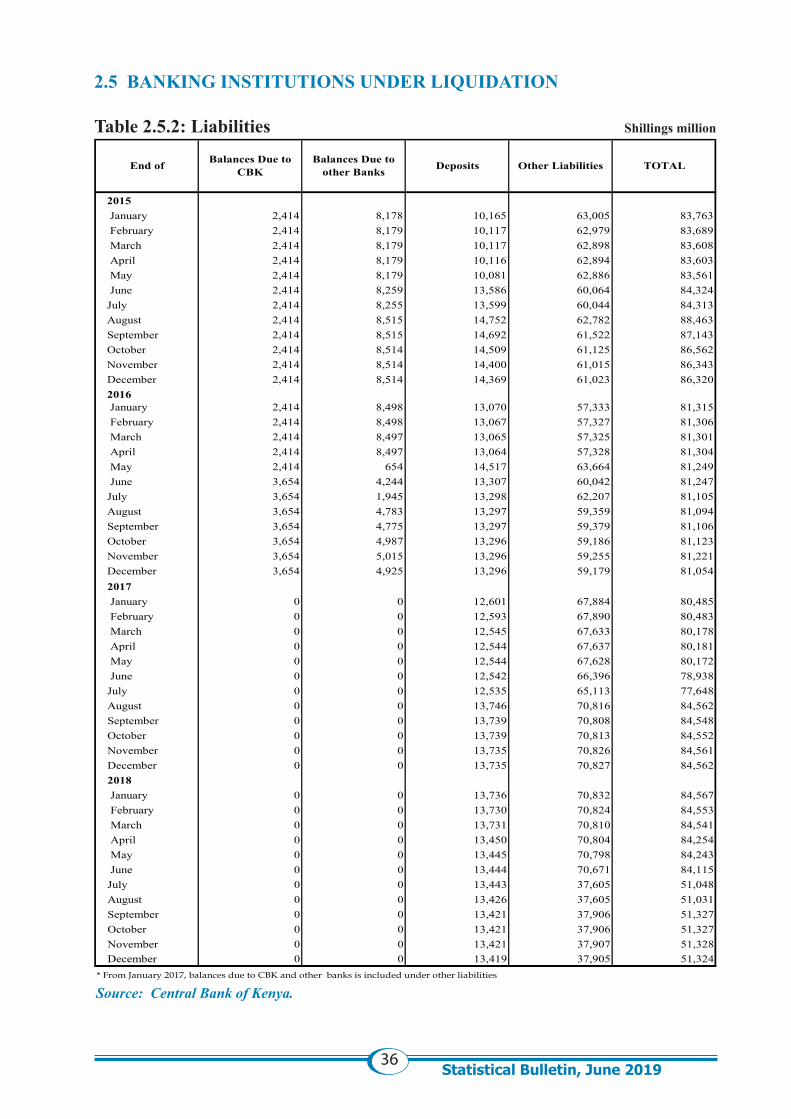
36Statistical Bulletin, June 2019
2.5 BANKING INSTITUTIONS UNDER LIQUIDATION Table 2.5.2: Liabilities Shillings million
Source: Central Bank of Kenya.
2015 January 2,414 8,178 10,165 63,005 83,763 February 2,414 8,179 10,117 62,979 83,689 March 2,414 8,179 10,117 62,898 83,608 April 2,414 8,179 10,116 62,894 83,603 May 2,414 8,179 10,081 62,886 83,561 June 2,414 8,259 13,586 60,064 84,324July 2,414 8,255 13,599 60,044 84,313August 2,414 8,515 14,752 62,782 88,463September 2,414 8,515 14,692 61,522 87,143October 2,414 8,514 14,509 61,125 86,562November 2,414 8,514 14,400 61,015 86,343December 2,414 8,514 14,369 61,023 86,3202016 January 2,414 8,498 13,070 57,333 81,315 February 2,414 8,498 13,067 57,327 81,306 March 2,414 8,497 13,065 57,325 81,301 April 2,414 8,497 13,064 57,328 81,304 May 2,414 654 14,517 63,664 81,249 June 3,654 4,244 13,307 60,042 81,247July 3,654 1,945 13,298 62,207 81,105August 3,654 4,783 13,297 59,359 81,094September 3,654 4,775 13,297 59,379 81,106October 3,654 4,987 13,296 59,186 81,123November 3,654 5,015 13,296 59,255 81,221December 3,654 4,925 13,296 59,179 81,0542017 January 0 0 12,601 67,884 80,485 February 0 0 12,593 67,890 80,483 March 0 0 12,545 67,633 80,178 April 0 0 12,544 67,637 80,181 May 0 0 12,544 67,628 80,172 June 0 0 12,542 66,396 78,938July 0 0 12,535 65,113 77,648August 0 0 13,746 70,816 84,562September 0 0 13,739 70,808 84,548October 0 0 13,739 70,813 84,552November 0 0 13,735 70,826 84,561December 0 0 13,735 70,827 84,5622018 January 0 0 13,736 70,832 84,567 February 0 0 13,730 70,824 84,553 March 0 0 13,731 70,810 84,541 April 0 0 13,450 70,804 84,254 May 0 0 13,445 70,798 84,243 June 0 0 13,444 70,671 84,115July 0 0 13,443 37,605 51,048August 0 0 13,426 37,605 51,031September 0 0 13,421 37,906 51,327October 0 0 13,421 37,906 51,327November 0 0 13,421 37,907 51,328December 0 0 13,419 37,905 51,324
* From January 2017, balances due to CBK and other banks is included under other liabilities
Other Liabilities TOTALEnd of Balances Due to CBK
Balances Due to other Banks Deposits
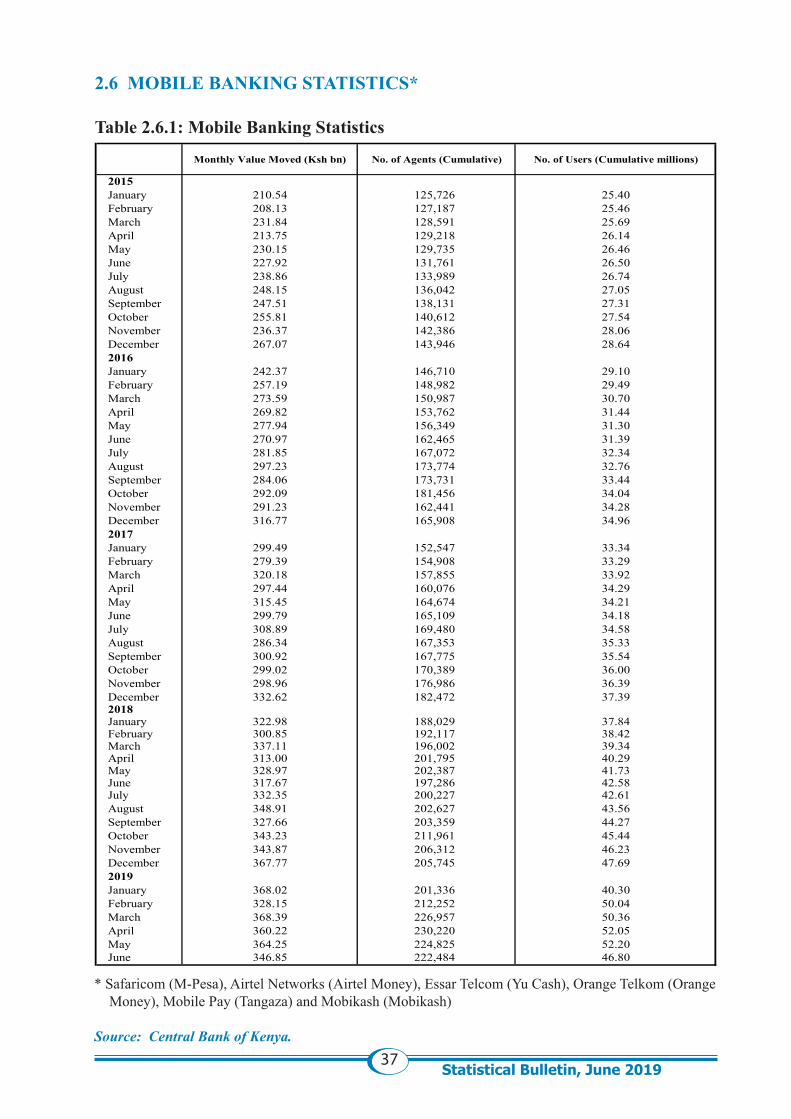
37Statistical Bulletin, June 2019
2.6 MOBILE BANKING STATISTICS*
Table 2.6.1: Mobile Banking Statistics
* Safaricom (M-Pesa), Airtel Networks (Airtel Money), Essar Telcom (Yu Cash), Orange Telkom (Orange Money), Mobile Pay (Tangaza) and Mobikash (Mobikash)
Source: Central Bank of Kenya.
Monthly Value Moved (Ksh bn) No. of Agents (Cumulative) No. of Users (Cumulative millions)
2015January 210.54 125,726 25.40February 208.13 127,187 25.46March 231.84 128,591 25.69April 213.75 129,218 26.14May 230.15 129,735 26.46June 227.92 131,761 26.50July 238.86 133,989 26.74August 248.15 136,042 27.05September 247.51 138,131 27.31October 255.81 140,612 27.54November 236.37 142,386 28.06December 267.07 143,946 28.642016January 242.37 146,710 29.10February 257.19 148,982 29.49March 273.59 150,987 30.70April 269.82 153,762 31.44May 277.94 156,349 31.30June 270.97 162,465 31.39July 281.85 167,072 32.34August 297.23 173,774 32.76September 284.06 173,731 33.44October 292.09 181,456 34.04November 291.23 162,441 34.28December 316.77 165,908 34.962017January 299.49 152,547 33.34February 279.39 154,908 33.29March 320.18 157,855 33.92April 297.44 160,076 34.29May 315.45 164,674 34.21June 299.79 165,109 34.18July 308.89 169,480 34.58August 286.34 167,353 35.33September 300.92 167,775 35.54October 299.02 170,389 36.00November 298.96 176,986 36.39December 332.62 182,472 37.392018January 322.98 188,029 37.84February 300.85 192,117 38.42March 337.11 196,002 39.34April 313.00 201,795 40.29May 328.97 202,387 41.73June 317.67 197,286 42.58July 332.35 200,227 42.61August 348.91 202,627 43.56September 327.66 203,359 44.27October 343.23 211,961 45.44November 343.87 206,312 46.23December 367.77 205,745 47.692019January 368.02 201,336 40.30February 328.15 212,252 50.04March 368.39 226,957 50.36April 360.22 230,220 52.05May 364.25 224,825 52.20June 346.85 222,484 46.80
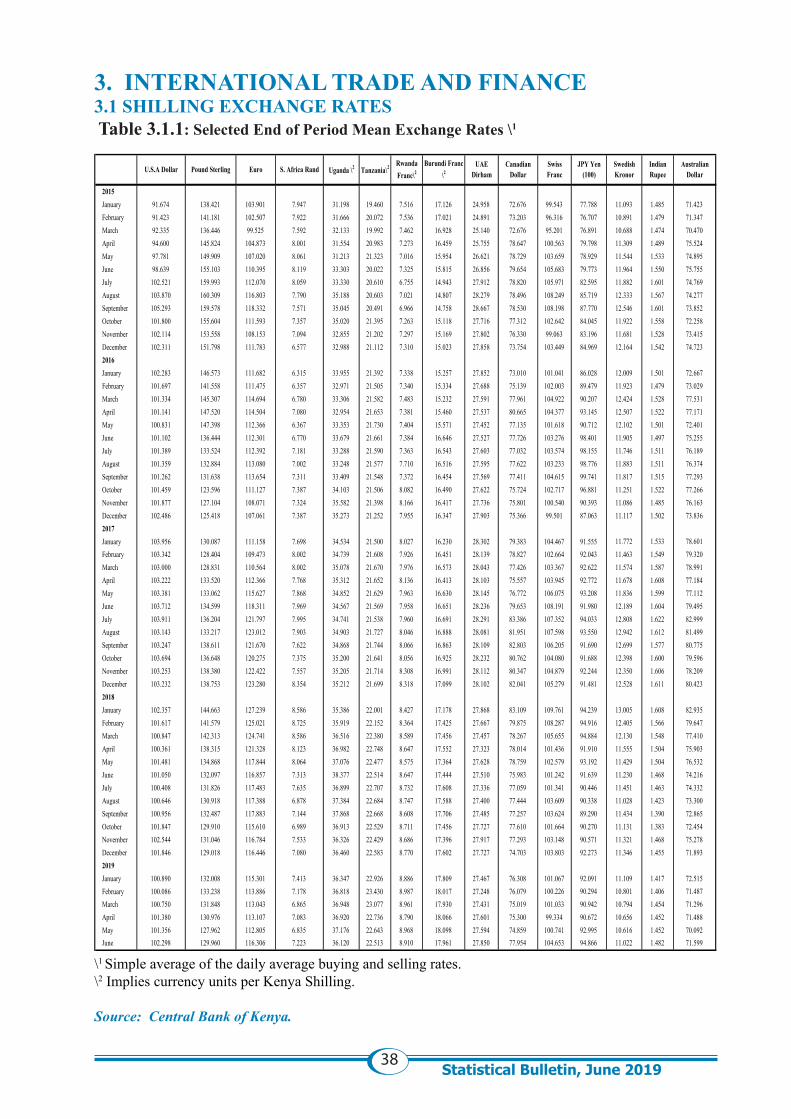
38Statistical Bulletin, June 2019
3. INTERNATIONAL TRADE AND FINANCE3.1 SHILLING EXCHANGE RATES Table 3.1.1: Selected End of Period Mean Exchange Rates \1
\1 Simple average of the daily average buying and selling rates. \2 Implies currency units per Kenya Shilling.
Source: Central Bank of Kenya.
2015January 91.674 138.421 103.901 7.947 31.198 19.460 7.516 17.126 24.958 72.676 99.543 77.788 11.093 1.485 71.423February 91.423 141.181 102.507 7.922 31.666 20.072 7.536 17.021 24.891 73.203 96.316 76.707 10.891 1.479 71.347March 92.335 136.446 99.525 7.592 32.133 19.992 7.462 16.928 25.140 72.676 95.201 76.891 10.688 1.474 70.470April 94.600 145.824 104.873 8.001 31.554 20.983 7.273 16.459 25.755 78.647 100.563 79.798 11.309 1.489 75.524May 97.781 149.909 107.020 8.061 31.213 21.323 7.016 15.954 26.621 78.729 103.659 78.929 11.544 1.533 74.895June 98.639 155.103 110.395 8.119 33.303 20.022 7.325 15.815 26.856 79.654 105.683 79.773 11.964 1.550 75.755July 102.521 159.993 112.070 8.059 33.330 20.610 6.755 14.943 27.912 78.820 105.971 82.595 11.882 1.601 74.769August 103.870 160.309 116.803 7.790 35.188 20.603 7.021 14.807 28.279 78.496 108.249 85.719 12.333 1.567 74.277September 105.293 159.578 118.332 7.571 35.045 20.491 6.966 14.758 28.667 78.530 108.198 87.770 12.546 1.601 73.852October 101.800 155.604 111.593 7.357 35.020 21.395 7.263 15.118 27.716 77.312 102.642 84.045 11.922 1.558 72.258November 102.114 153.558 108.153 7.094 32.855 21.202 7.297 15.169 27.802 76.330 99.063 83.196 11.681 1.528 73.415December 102.311 151.798 111.783 6.577 32.988 21.112 7.310 15.023 27.858 73.754 103.449 84.969 12.164 1.542 74.7232016January 102.283 146.573 111.682 6.315 33.955 21.392 7.338 15.257 27.852 73.010 101.041 86.028 12.009 1.501 72.667February 101.697 141.558 111.475 6.357 32.971 21.505 7.340 15.334 27.688 75.139 102.003 89.479 11.923 1.479 73.029March 101.334 145.307 114.694 6.780 33.306 21.582 7.483 15.232 27.591 77.961 104.922 90.207 12.424 1.528 77.531April 101.141 147.520 114.504 7.080 32.954 21.653 7.381 15.460 27.537 80.665 104.377 93.145 12.507 1.522 77.171May 100.831 147.398 112.366 6.367 33.353 21.730 7.404 15.571 27.452 77.135 101.618 90.712 12.102 1.501 72.401June 101.102 136.444 112.301 6.770 33.679 21.661 7.384 16.646 27.527 77.726 103.276 98.401 11.905 1.497 75.255July 101.389 133.524 112.392 7.181 33.288 21.590 7.363 16.543 27.603 77.032 103.574 98.155 11.746 1.511 76.189August 101.359 132.884 113.080 7.002 33.248 21.577 7.710 16.516 27.595 77.622 103.233 98.776 11.883 1.511 76.374September 101.262 131.638 113.654 7.311 33.409 21.548 7.372 16.454 27.569 77.411 104.615 99.741 11.817 1.515 77.293October 101.459 123.596 111.127 7.387 34.103 21.506 8.082 16.490 27.622 75.724 102.717 96.881 11.251 1.522 77.266November 101.877 127.104 108.071 7.324 35.582 21.398 8.166 16.417 27.736 75.801 100.540 90.393 11.086 1.485 76.163December 102.486 125.418 107.061 7.387 35.273 21.252 7.955 16.347 27.903 75.366 99.501 87.063 11.117 1.502 73.8362017January 103.956 130.087 111.158 7.698 34.534 21.500 8.027 16.230 28.302 79.383 104.467 91.555 11.772 1.533 78.601February 103.342 128.404 109.473 8.002 34.739 21.608 7.926 16.451 28.139 78.827 102.664 92.043 11.463 1.549 79.320March 103.000 128.831 110.564 8.002 35.078 21.670 7.976 16.573 28.043 77.426 103.367 92.622 11.574 1.587 78.991April 103.222 133.520 112.366 7.768 35.312 21.652 8.136 16.413 28.103 75.557 103.945 92.772 11.678 1.608 77.184May 103.381 133.062 115.627 7.868 34.852 21.629 7.963 16.630 28.145 76.772 106.075 93.208 11.836 1.599 77.112June 103.712 134.599 118.311 7.969 34.567 21.569 7.958 16.651 28.236 79.653 108.191 91.980 12.189 1.604 79.495July 103.911 136.204 121.797 7.995 34.741 21.538 7.960 16.691 28.291 83.386 107.352 94.033 12.808 1.622 82.999August 103.143 133.217 123.012 7.903 34.903 21.727 8.046 16.888 28.081 81.951 107.598 93.550 12.942 1.612 81.499September 103.247 138.611 121.670 7.622 34.868 21.744 8.066 16.863 28.109 82.803 106.205 91.690 12.699 1.577 80.775October 103.694 136.648 120.275 7.375 35.200 21.641 8.056 16.925 28.232 80.762 104.080 91.688 12.398 1.600 79.596November 103.253 138.380 122.422 7.557 35.205 21.714 8.308 16.991 28.112 80.347 104.879 92.244 12.350 1.606 78.209December 103.232 138.753 123.280 8.354 35.212 21.699 8.318 17.099 28.102 82.041 105.279 91.481 12.528 1.611 80.4232018January 102.357 144.663 127.239 8.586 35.386 22.001 8.427 17.178 27.868 83.109 109.761 94.239 13.005 1.608 82.935February 101.617 141.579 125.021 8.725 35.919 22.152 8.364 17.425 27.667 79.875 108.287 94.916 12.405 1.566 79.647March 100.847 142.313 124.741 8.586 36.516 22.380 8.589 17.456 27.457 78.267 105.655 94.884 12.130 1.548 77.410April 100.361 138.315 121.328 8.123 36.982 22.748 8.647 17.552 27.323 78.014 101.436 91.910 11.555 1.504 75.903May 101.481 134.868 117.844 8.064 37.076 22.477 8.575 17.364 27.628 78.759 102.579 93.192 11.429 1.504 76.532June 101.050 132.097 116.857 7.313 38.377 22.514 8.647 17.444 27.510 75.983 101.242 91.639 11.230 1.468 74.216July 100.408 131.826 117.483 7.635 36.899 22.707 8.732 17.608 27.336 77.059 101.341 90.446 11.451 1.463 74.332August 100.646 130.918 117.388 6.878 37.384 22.684 8.747 17.588 27.400 77.444 103.609 90.338 11.028 1.423 73.300September 100.956 132.487 117.883 7.144 37.868 22.668 8.608 17.706 27.485 77.257 103.624 89.290 11.434 1.390 72.865October 101.847 129.910 115.610 6.989 36.913 22.529 8.711 17.456 27.727 77.610 101.664 90.270 11.131 1.383 72.454November 102.544 131.046 116.784 7.533 36.326 22.429 8.686 17.396 27.917 77.293 103.148 90.571 11.321 1.468 75.278December 101.846 129.018 116.446 7.080 36.460 22.583 8.770 17.602 27.727 74.703 103.803 92.273 11.346 1.455 71.8932019January 100.890 132.008 115.301 7.413 36.347 22.926 8.886 17.809 27.467 76.308 101.067 92.091 11.109 1.417 72.515February 100.086 133.238 113.886 7.178 36.818 23.430 8.987 18.017 27.248 76.079 100.226 90.294 10.801 1.406 71.487March 100.750 131.848 113.043 6.865 36.948 23.077 8.961 17.930 27.431 75.019 101.033 90.942 10.794 1.454 71.296April 101.380 130.976 113.107 7.083 36.920 22.736 8.790 18.066 27.601 75.300 99.334 90.672 10.656 1.452 71.488May 101.356 127.962 112.805 6.835 37.176 22.643 8.968 18.098 27.594 74.859 100.741 92.995 10.616 1.452 70.092June 102.298 129.960 116.306 7.223 36.120 22.513 8.910 17.961 27.850 77.954 104.653 94.866 11.022 1.482 71.599
U.S.A Dollar Pound Sterling Euro S. Africa Rand Uganda \2 Burundi Franc \2
UAE Dirham
Canadian Dollar
Swiss Franc
JPY Yen (100)
Swedish Kronor
Indian Rupee
Australian DollarTanzania\2 Rwanda
Franc\2
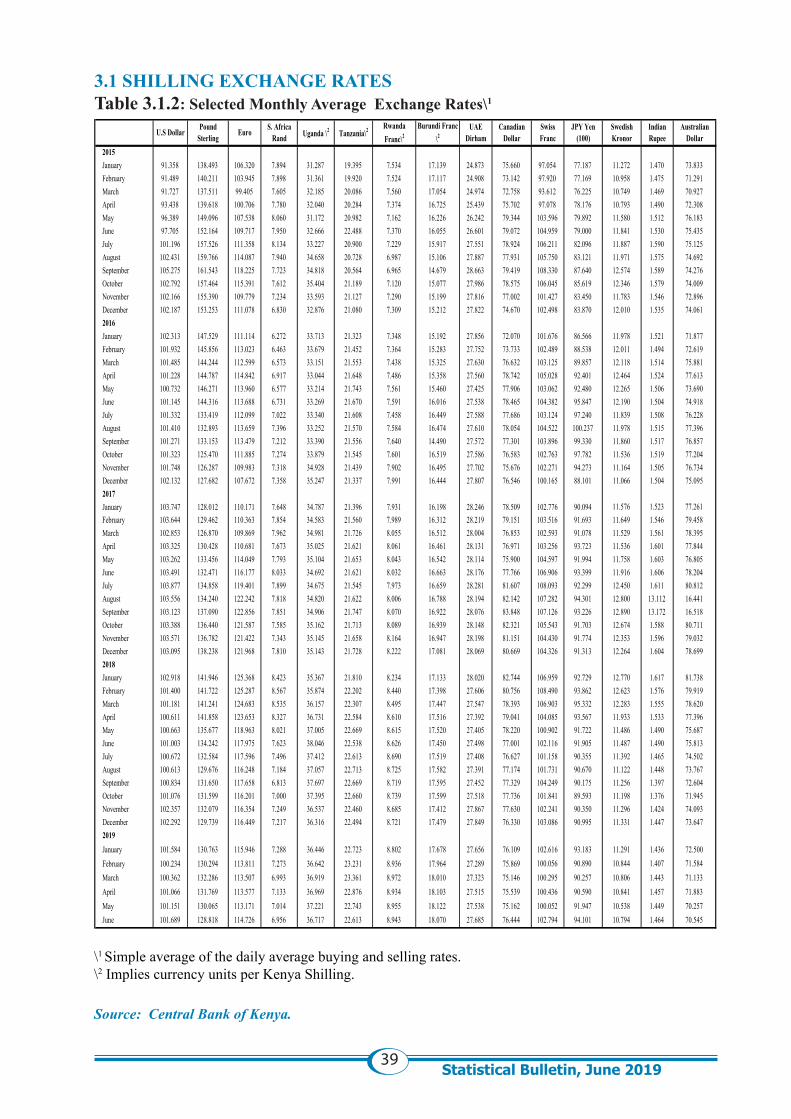
39Statistical Bulletin, June 2019
3.1 SHILLING EXCHANGE RATESTable 3.1.2: Selected Monthly Average Exchange Rates\1
\1 Simple average of the daily average buying and selling rates. \2 Implies currency units per Kenya Shilling.
Source: Central Bank of Kenya.
2015January 91.358 138.493 106.320 7.894 31.287 19.395 7.534 17.139 24.873 75.660 97.054 77.187 11.272 1.470 73.833February 91.489 140.211 103.945 7.898 31.361 19.920 7.524 17.117 24.908 73.142 97.920 77.169 10.958 1.475 71.291March 91.727 137.511 99.405 7.605 32.185 20.086 7.560 17.054 24.974 72.758 93.612 76.225 10.749 1.469 70.927April 93.438 139.618 100.706 7.780 32.040 20.284 7.374 16.725 25.439 75.702 97.078 78.176 10.793 1.490 72.308May 96.389 149.096 107.538 8.060 31.172 20.982 7.162 16.226 26.242 79.344 103.596 79.892 11.580 1.512 76.183June 97.705 152.164 109.717 7.950 32.666 22.488 7.370 16.055 26.601 79.072 104.959 79.000 11.841 1.530 75.435July 101.196 157.526 111.358 8.134 33.227 20.900 7.229 15.917 27.551 78.924 106.211 82.096 11.887 1.590 75.125August 102.431 159.766 114.087 7.940 34.658 20.728 6.987 15.106 27.887 77.931 105.750 83.121 11.971 1.575 74.692September 105.275 161.543 118.225 7.723 34.818 20.564 6.965 14.679 28.663 79.419 108.330 87.640 12.574 1.589 74.276October 102.792 157.464 115.391 7.612 35.404 21.189 7.120 15.077 27.986 78.575 106.045 85.619 12.346 1.579 74.009November 102.166 155.390 109.779 7.234 33.593 21.127 7.290 15.199 27.816 77.002 101.427 83.450 11.783 1.546 72.896December 102.187 153.253 111.078 6.830 32.876 21.080 7.309 15.212 27.822 74.670 102.498 83.870 12.010 1.535 74.0612016January 102.313 147.529 111.114 6.272 33.713 21.323 7.348 15.192 27.856 72.070 101.676 86.566 11.978 1.521 71.877February 101.932 145.856 113.023 6.463 33.679 21.452 7.364 15.283 27.752 73.733 102.489 88.538 12.011 1.494 72.619March 101.485 144.244 112.599 6.573 33.151 21.553 7.438 15.325 27.630 76.632 103.125 89.857 12.118 1.514 75.881April 101.228 144.787 114.842 6.917 33.044 21.648 7.486 15.358 27.560 78.742 105.028 92.401 12.464 1.524 77.613May 100.732 146.271 113.960 6.577 33.214 21.743 7.561 15.460 27.425 77.906 103.062 92.480 12.265 1.506 73.690June 101.145 144.316 113.688 6.731 33.269 21.670 7.591 16.016 27.538 78.465 104.382 95.847 12.190 1.504 74.918July 101.332 133.419 112.099 7.022 33.340 21.608 7.458 16.449 27.588 77.686 103.124 97.240 11.839 1.508 76.228August 101.410 132.893 113.659 7.396 33.252 21.570 7.584 16.474 27.610 78.054 104.522 100.237 11.978 1.515 77.396September 101.271 133.153 113.479 7.212 33.390 21.556 7.640 14.490 27.572 77.301 103.896 99.330 11.860 1.517 76.857October 101.323 125.470 111.885 7.274 33.879 21.545 7.601 16.519 27.586 76.583 102.763 97.782 11.536 1.519 77.204November 101.748 126.287 109.983 7.318 34.928 21.439 7.902 16.495 27.702 75.676 102.271 94.273 11.164 1.505 76.734December 102.132 127.682 107.672 7.358 35.247 21.337 7.991 16.444 27.807 76.546 100.165 88.101 11.066 1.504 75.0952017January 103.747 128.012 110.171 7.648 34.787 21.396 7.931 16.198 28.246 78.509 102.776 90.094 11.576 1.523 77.261February 103.644 129.462 110.363 7.854 34.583 21.560 7.989 16.312 28.219 79.151 103.516 91.693 11.649 1.546 79.458March 102.853 126.870 109.869 7.962 34.981 21.726 8.055 16.512 28.004 76.853 102.593 91.078 11.529 1.561 78.395April 103.325 130.428 110.681 7.673 35.025 21.621 8.061 16.461 28.131 76.971 103.256 93.723 11.536 1.601 77.844May 103.262 133.456 114.049 7.793 35.104 21.653 8.043 16.542 28.114 75.900 104.597 91.994 11.758 1.603 76.805June 103.491 132.471 116.177 8.033 34.692 21.621 8.032 16.663 28.176 77.766 106.906 93.399 11.916 1.606 78.204July 103.877 134.858 119.401 7.899 34.675 21.545 7.973 16.659 28.281 81.607 108.093 92.299 12.450 1.611 80.812August 103.556 134.240 122.242 7.818 34.820 21.622 8.006 16.788 28.194 82.142 107.282 94.301 12.800 13.112 16.441September 103.123 137.090 122.856 7.851 34.906 21.747 8.070 16.922 28.076 83.848 107.126 93.226 12.890 13.172 16.518October 103.388 136.440 121.587 7.585 35.162 21.713 8.089 16.939 28.148 82.321 105.543 91.703 12.674 1.588 80.711November 103.571 136.782 121.422 7.343 35.145 21.658 8.164 16.947 28.198 81.151 104.430 91.774 12.353 1.596 79.032December 103.095 138.238 121.968 7.810 35.143 21.728 8.222 17.081 28.069 80.669 104.326 91.313 12.264 1.604 78.6992018January 102.918 141.946 125.368 8.423 35.367 21.810 8.234 17.133 28.020 82.744 106.959 92.729 12.770 1.617 81.738February 101.400 141.722 125.287 8.567 35.874 22.202 8.440 17.398 27.606 80.756 108.490 93.862 12.623 1.576 79.919March 101.181 141.241 124.683 8.535 36.157 22.307 8.495 17.447 27.547 78.393 106.903 95.332 12.283 1.555 78.620April 100.611 141.858 123.653 8.327 36.731 22.584 8.610 17.516 27.392 79.041 104.085 93.567 11.933 1.533 77.396May 100.663 135.677 118.963 8.021 37.005 22.669 8.615 17.520 27.405 78.220 100.902 91.722 11.486 1.490 75.687June 101.003 134.242 117.975 7.623 38.046 22.538 8.626 17.450 27.498 77.001 102.116 91.905 11.487 1.490 75.813July 100.672 132.584 117.596 7.496 37.412 22.613 8.690 17.519 27.408 76.627 101.158 90.355 11.392 1.465 74.502August 100.613 129.676 116.248 7.184 37.057 22.713 8.725 17.582 27.391 77.174 101.731 90.670 11.122 1.448 73.767September 100.834 131.650 117.658 6.813 37.697 22.669 8.719 17.595 27.452 77.329 104.249 90.175 11.256 1.397 72.604October 101.076 131.599 116.201 7.000 37.395 22.660 8.739 17.599 27.518 77.736 101.841 89.593 11.198 1.376 71.945November 102.357 132.079 116.354 7.249 36.537 22.460 8.685 17.412 27.867 77.630 102.241 90.350 11.296 1.424 74.093December 102.292 129.739 116.449 7.217 36.316 22.494 8.721 17.479 27.849 76.330 103.086 90.995 11.331 1.447 73.6472019January 101.584 130.763 115.946 7.288 36.446 22.723 8.802 17.678 27.656 76.109 102.616 93.183 11.291 1.436 72.500February 100.234 130.294 113.811 7.273 36.642 23.231 8.936 17.964 27.289 75.869 100.056 90.890 10.844 1.407 71.584March 100.362 132.286 113.507 6.993 36.919 23.361 8.972 18.010 27.323 75.146 100.295 90.257 10.806 1.443 71.133April 101.066 131.769 113.577 7.133 36.969 22.876 8.934 18.103 27.515 75.539 100.436 90.590 10.841 1.457 71.883May 101.151 130.065 113.171 7.014 37.221 22.743 8.955 18.122 27.538 75.162 100.052 91.947 10.538 1.449 70.257June 101.689 128.818 114.726 6.956 36.717 22.613 8.943 18.070 27.685 76.444 102.794 94.101 10.794 1.464 70.545
U.S Dollar Pound Sterling Euro S. Africa
Rand Uganda \2 Tanzania\2 UAE Dirham
Canadian Dollar
Rwanda Franc\2
Burundi Franc \2
Swiss Franc
JPY Yen (100)
Swedish Kronor
Indian Rupee
Australian Dollar
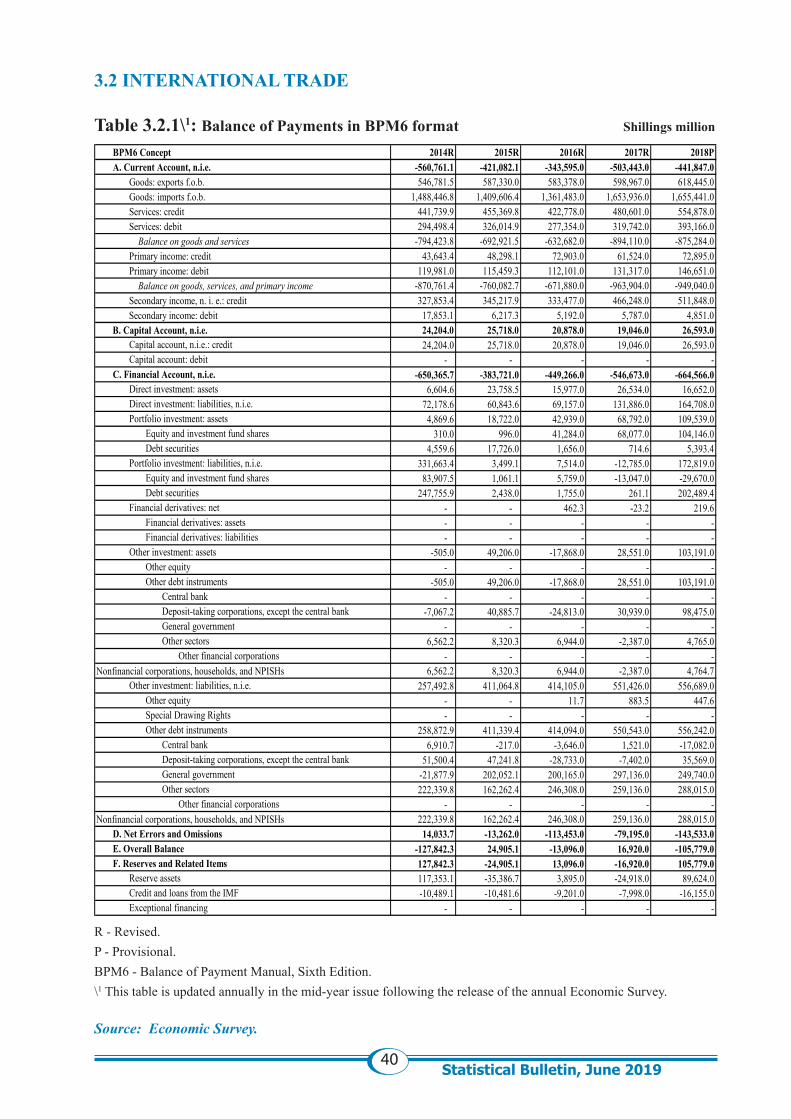
40Statistical Bulletin, June 2019
3.2 INTERNATIONAL TRADE Table 3.2.1\1: Balance of Payments in BPM6 format Shillings million
R - Revised.P - Provisional.BPM6 - Balance of Payment Manual, Sixth Edition.\1 This table is updated annually in the mid-year issue following the release of the annual Economic Survey.
Source: Economic Survey.
BPM6 Concept 2014R 2015R 2016R 2017R 2018PA. Current Account, n.i.e. -560,761.1 -421,082.1 -343,595.0 -503,443.0 -441,847.0
Goods: exports f.o.b. 546,781.5 587,330.0 583,378.0 598,967.0 618,445.0Goods: imports f.o.b. 1,488,446.8 1,409,606.4 1,361,483.0 1,653,936.0 1,655,441.0Services: credit 441,739.9 455,369.8 422,778.0 480,601.0 554,878.0Services: debit 294,498.4 326,014.9 277,354.0 319,742.0 393,166.0 Balance on goods and services -794,423.8 -692,921.5 -632,682.0 -894,110.0 -875,284.0Primary income: credit 43,643.4 48,298.1 72,903.0 61,524.0 72,895.0Primary income: debit 119,981.0 115,459.3 112,101.0 131,317.0 146,651.0 Balance on goods, services, and primary income -870,761.4 -760,082.7 -671,880.0 -963,904.0 -949,040.0Secondary income, n. i. e.: credit 327,853.4 345,217.9 333,477.0 466,248.0 511,848.0Secondary income: debit 17,853.1 6,217.3 5,192.0 5,787.0 4,851.0
B. Capital Account, n.i.e. 24,204.0 25,718.0 20,878.0 19,046.0 26,593.0Capital account, n.i.e.: credit 24,204.0 25,718.0 20,878.0 19,046.0 26,593.0Capital account: debit - - - - -
C. Financial Account, n.i.e. -650,365.7 -383,721.0 -449,266.0 -546,673.0 -664,566.0Direct investment: assets 6,604.6 23,758.5 15,977.0 26,534.0 16,652.0Direct investment: liabilities, n.i.e. 72,178.6 60,843.6 69,157.0 131,886.0 164,708.0Portfolio investment: assets 4,869.6 18,722.0 42,939.0 68,792.0 109,539.0
Equity and investment fund shares 310.0 996.0 41,284.0 68,077.0 104,146.0Debt securities 4,559.6 17,726.0 1,656.0 714.6 5,393.4
Portfolio investment: liabilities, n.i.e. 331,663.4 3,499.1 7,514.0 -12,785.0 172,819.0Equity and investment fund shares 83,907.5 1,061.1 5,759.0 -13,047.0 -29,670.0Debt securities 247,755.9 2,438.0 1,755.0 261.1 202,489.4
Financial derivatives: net - - 462.3 -23.2 219.6Financial derivatives: assets - - - - -Financial derivatives: liabilities - - - - -
Other investment: assets -505.0 49,206.0 -17,868.0 28,551.0 103,191.0Other equity - - - - -Other debt instruments -505.0 49,206.0 -17,868.0 28,551.0 103,191.0
Central bank - - - - -Deposit-taking corporations, except the central bank -7,067.2 40,885.7 -24,813.0 30,939.0 98,475.0General government - - - - -Other sectors 6,562.2 8,320.3 6,944.0 -2,387.0 4,765.0
Other financial corporations - - - - -Nonfinancial corporations, households, and NPISHs 6,562.2 8,320.3 6,944.0 -2,387.0 4,764.7
Other investment: liabilities, n.i.e. 257,492.8 411,064.8 414,105.0 551,426.0 556,689.0Other equity - - 11.7 883.5 447.6Special Drawing Rights - - - - -Other debt instruments 258,872.9 411,339.4 414,094.0 550,543.0 556,242.0
Central bank 6,910.7 -217.0 -3,646.0 1,521.0 -17,082.0Deposit-taking corporations, except the central bank 51,500.4 47,241.8 -28,733.0 -7,402.0 35,569.0General government -21,877.9 202,052.1 200,165.0 297,136.0 249,740.0Other sectors 222,339.8 162,262.4 246,308.0 259,136.0 288,015.0
Other financial corporations - - - - -Nonfinancial corporations, households, and NPISHs 222,339.8 162,262.4 246,308.0 259,136.0 288,015.0
D. Net Errors and Omissions 14,033.7 -13,262.0 -113,453.0 -79,195.0 -143,533.0E. Overall Balance -127,842.3 24,905.1 -13,096.0 16,920.0 -105,779.0F. Reserves and Related Items 127,842.3 -24,905.1 13,096.0 -16,920.0 105,779.0
Reserve assets 117,353.1 -35,386.7 3,895.0 -24,918.0 89,624.0Credit and loans from the IMF -10,489.1 -10,481.6 -9,201.0 -7,998.0 -16,155.0Exceptional financing - - - - -
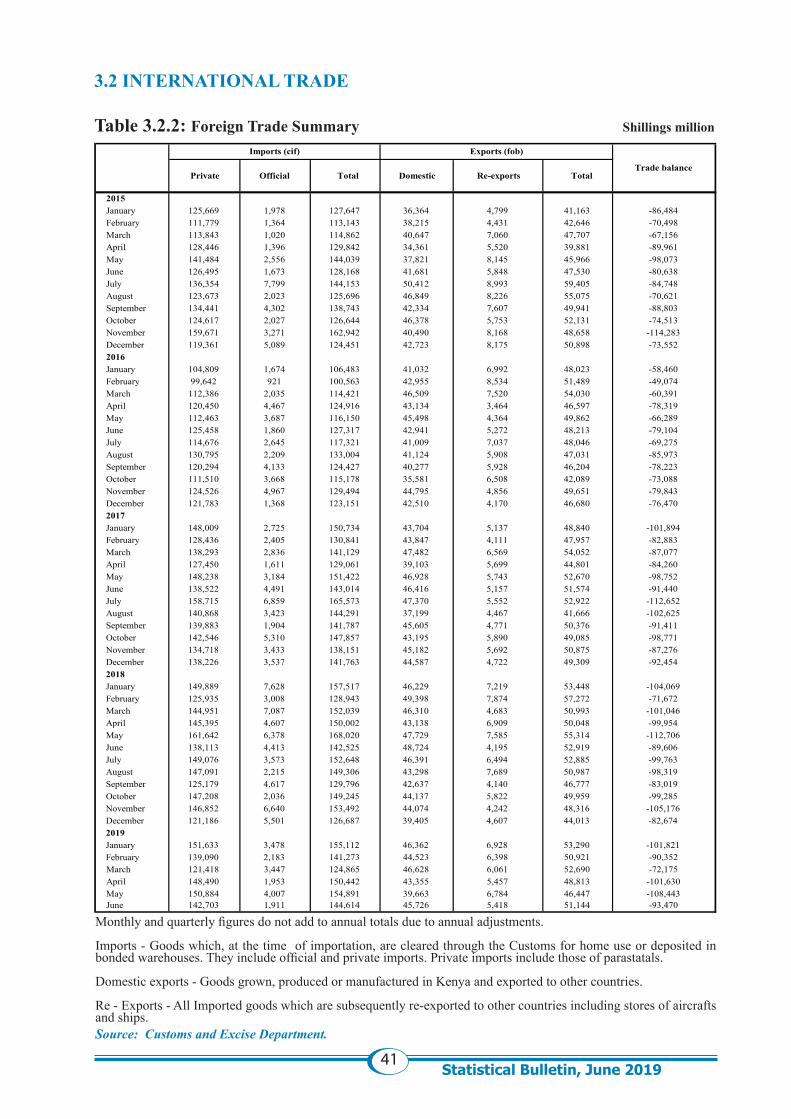
41Statistical Bulletin, June 2019
3.2 INTERNATIONAL TRADE
Table 3.2.2: Foreign Trade Summary Shillings million
Monthly and quarterly figures do not add to annual totals due to annual adjustments. Imports - Goods which, at the time of importation, are cleared through the Customs for home use or deposited in bonded warehouses. They include official and private imports. Private imports include those of parastatals. Domestic exports - Goods grown, produced or manufactured in Kenya and exported to other countries. Re - Exports - All Imported goods which are subsequently re-exported to other countries including stores of aircrafts and ships. Source: Customs and Excise Department.
2015January 125,669 1,978 127,647 36,364 4,799 41,163 -86,484 February 111,779 1,364 113,143 38,215 4,431 42,646 -70,498 March 113,843 1,020 114,862 40,647 7,060 47,707 -67,156 April 128,446 1,396 129,842 34,361 5,520 39,881 -89,961 May 141,484 2,556 144,039 37,821 8,145 45,966 -98,073 June 126,495 1,673 128,168 41,681 5,848 47,530 -80,638 July 136,354 7,799 144,153 50,412 8,993 59,405 -84,748 August 123,673 2,023 125,696 46,849 8,226 55,075 -70,621 September 134,441 4,302 138,743 42,334 7,607 49,941 -88,803 October 124,617 2,027 126,644 46,378 5,753 52,131 -74,513 November 159,671 3,271 162,942 40,490 8,168 48,658 -114,283 December 119,361 5,089 124,451 42,723 8,175 50,898 -73,552 2016January 104,809 1,674 106,483 41,032 6,992 48,023 -58,460 February 99,642 921 100,563 42,955 8,534 51,489 -49,074 March 112,386 2,035 114,421 46,509 7,520 54,030 -60,391 April 120,450 4,467 124,916 43,134 3,464 46,597 -78,319 May 112,463 3,687 116,150 45,498 4,364 49,862 -66,289 June 125,458 1,860 127,317 42,941 5,272 48,213 -79,104 July 114,676 2,645 117,321 41,009 7,037 48,046 -69,275 August 130,795 2,209 133,004 41,124 5,908 47,031 -85,973 September 120,294 4,133 124,427 40,277 5,928 46,204 -78,223 October 111,510 3,668 115,178 35,581 6,508 42,089 -73,088 November 124,526 4,967 129,494 44,795 4,856 49,651 -79,843 December 121,783 1,368 123,151 42,510 4,170 46,680 -76,470 2017January 148,009 2,725 150,734 43,704 5,137 48,840 -101,894 February 128,436 2,405 130,841 43,847 4,111 47,957 -82,883 March 138,293 2,836 141,129 47,482 6,569 54,052 -87,077 April 127,450 1,611 129,061 39,103 5,699 44,801 -84,260 May 148,238 3,184 151,422 46,928 5,743 52,670 -98,752 June 138,522 4,491 143,014 46,416 5,157 51,574 -91,440 July 158,715 6,859 165,573 47,370 5,552 52,922 -112,652 August 140,868 3,423 144,291 37,199 4,467 41,666 -102,625 September 139,883 1,904 141,787 45,605 4,771 50,376 -91,411 October 142,546 5,310 147,857 43,195 5,890 49,085 -98,771 November 134,718 3,433 138,151 45,182 5,692 50,875 -87,276 December 138,226 3,537 141,763 44,587 4,722 49,309 -92,454 2018January 149,889 7,628 157,517 46,229 7,219 53,448 -104,069 February 125,935 3,008 128,943 49,398 7,874 57,272 -71,672 March 144,951 7,087 152,039 46,310 4,683 50,993 -101,046 April 145,395 4,607 150,002 43,138 6,909 50,048 -99,954 May 161,642 6,378 168,020 47,729 7,585 55,314 -112,706 June 138,113 4,413 142,525 48,724 4,195 52,919 -89,606 July 149,076 3,573 152,648 46,391 6,494 52,885 -99,763 August 147,091 2,215 149,306 43,298 7,689 50,987 -98,319 September 125,179 4,617 129,796 42,637 4,140 46,777 -83,019 October 147,208 2,036 149,245 44,137 5,822 49,959 -99,285 November 146,852 6,640 153,492 44,074 4,242 48,316 -105,176 December 121,186 5,501 126,687 39,405 4,607 44,013 -82,674 2019January 151,633 3,478 155,112 46,362 6,928 53,290 -101,821 February 139,090 2,183 141,273 44,523 6,398 50,921 -90,352 March 121,418 3,447 124,865 46,628 6,061 52,690 -72,175 April 148,490 1,953 150,442 43,355 5,457 48,813 -101,630 May 150,884 4,007 154,891 39,663 6,784 46,447 -108,443 June 142,703 1,911 144,614 45,726 5,418 51,144 -93,470
Imports (cif) Exports (fob)
Trade balance Private TotalOfficial Total Domestic Re-exports

42Statistical Bulletin, June 2019
3.2 INTERNATIONAL TRADETable 3.2.3: Principal Exports: Volume, Value and Unit Prices
Monthly and quarterly figures do not add to annual totals due to annual adjustments.Notes:1. Coffee: Unroasted coffee (SITC Code: 0711).2. Tea: (SITC Code: 0741).3. Horticulture: (SITC Code 054+057+292711). Source: Customs and Excise Department..
2015January 2,844 1,307 459,421 40,970 8,485 207,096 28,419 6,024 211,967February 2,884 1,339 464,180 41,086 9,313 226,679 29,963 6,979 232,927March 4,289 2,025 472,101 35,700 8,796 246,392 35,084 7,235 206,224April 3,948 1,900 481,347 28,262 7,189 254,374 28,804 5,629 195,422May 4,383 2,236 510,118 27,016 7,506 277,821 30,507 6,608 216,607June 4,220 2,068 490,076 35,915 11,263 313,598 32,055 5,554 173,255July 3,938 1,943 493,354 30,623 10,146 331,332 46,365 9,174 197,865August 3,991 1,790 448,567 27,687 9,481 342,429 44,638 5,316 119,084September 3,405 1,617 475,026 33,528 11,413 340,397 35,756 7,493 209,562October 4,493 2,030 451,885 40,246 13,538 336,387 33,267 7,968 239,524November 2,840 1,256 442,393 36,714 12,126 330,280 25,492 5,889 231,020December 2,528 1,092 431,948 42,779 12,126 283,453 27,929 5,996 214,7002016January 2,529 1,201 474,678 36,575 11,013 301,112 39,160 7,788 198,872February 3,339 1,642 491,870 43,287 12,200 281,850 38,606 7,342 190,178March 4,221 2,212 524,106 37,571 9,887 263,147 49,778 9,493 190,713April 4,936 2,559 518,376 39,313 9,517 242,081 47,472 8,467 178,364May 4,888 2,177 445,322 44,901 10,658 237,358 35,615 7,899 221,787June 5,018 2,371 472,465 52,175 12,613 241,747 30,095 6,846 227,495July 4,067 1,820 447,488 42,751 10,679 249,802 34,902 7,319 209,696August 3,810 1,649 432,883 39,673 9,993 251,895 37,399 7,453 199,297September 3,312 1,414 426,989 33,528 8,454 252,136 36,407 7,563 207,744October 3,208 1,502 468,378 29,656 7,547 254,505 33,572 6,510 193,911November 4,063 1,715 422,243 41,138 11,123 270,393 39,327 9,040 229,862December 2,978 1,299 436,072 39,396 10,811 274,428 29,847 6,690 224,1382017January 3,273 1,565 478,022 46,434 14,072 303,053 32,281 6,876 213,001February 3,967 2,111 532,061 33,898 10,880 320,960 34,905 8,506 243,699March 5,588 3,238 579,454 33,662 10,693 317,661 36,204 7,956 219,762April 4,318 2,728 631,829 32,091 9,991 311,332 31,417 7,294 232,178May 5,565 3,168 569,286 39,329 12,354 314,123 38,063 8,951 235,157June 4,489 2,506 558,185 42,370 13,485 318,277 36,719 8,157 222,152July 3,675 1,987 540,592 41,437 13,442 324,403 37,981 8,477 223,190August 2,746 1,335 486,220 29,628 9,269 312,833 31,432 7,462 237,414September 3,271 1,557 475,953 43,469 13,570 312,172 32,776 7,076 215,882October 2,472 1,154 466,883 41,173 13,147 319,319 37,314 8,364 224,146November 3,341 1,611 482,102 39,128 12,713 324,906 33,701 7,824 232,157December 2,058 795 386,311 44,413 13,634 306,993 31,314 7,831 250,0792018January 2,589 1,293 499,286 48,447 14,964 308,884 33,540 8,092 241,259February 2,958 1,615 546,139 47,357 14,657 309,501 41,285 9,958 241,214March 4,095 2,258 551,517 34,488 10,471 303,614 42,201 10,017 237,359April 4,736 2,911 614,773 33,565 9,830 292,855 39,522 9,137 231,190May 5,698 3,231 567,027 42,533 11,703 275,152 34,965 9,316 266,441June 4,794 2,702 563,588 45,182 12,463 275,844 38,876 9,167 235,811July 5,016 2,525 503,403 45,242 12,226 270,236 48,833 10,004 204,854August 3,105 1,572 506,258 38,023 9,919 260,884 42,559 8,249 193,829September 2,676 1,174 438,758 40,802 10,479 256,818 36,268 9,027 248,901October 3,642 1,499 411,672 43,894 11,327 258,060 35,555 8,464 238,044November 4,843 1,775 366,545 44,108 11,015 249,720 22,511 7,042 312,826December 2,398 933 388,987 38,681 9,781 252,871 29,185 7,188 246,2982019January 3,539 1,531 432,632 48,623 11,831 243,328 38,407 9,576 249,317February 4,677 1,910 408,421 41,027 9,638 234,926 39,987 10,221 255,614March 4,517 2,298 508,794 42,457 9,910 233,421 42,127 10,847 257,494April 4,822 2,522 522,932 36,884 8,631 233,992 32,823 9,120 277,859May 5,576 2,752 493,456 36,994 9,293 251,200 25,672 6,814 265,419June 4,730 1,994 421,466 29,355 7,154 243,709 41,054 12,277 299,043
Coffee Tea
Price Shs Per Tonne
Volume in Tonnes
Volume in Tonnes Value Shs m
Horticulture
Value Shs m Price Shs Per Tonne
Volume in Tonnes Value Shs m Price Shs Per
Tonne
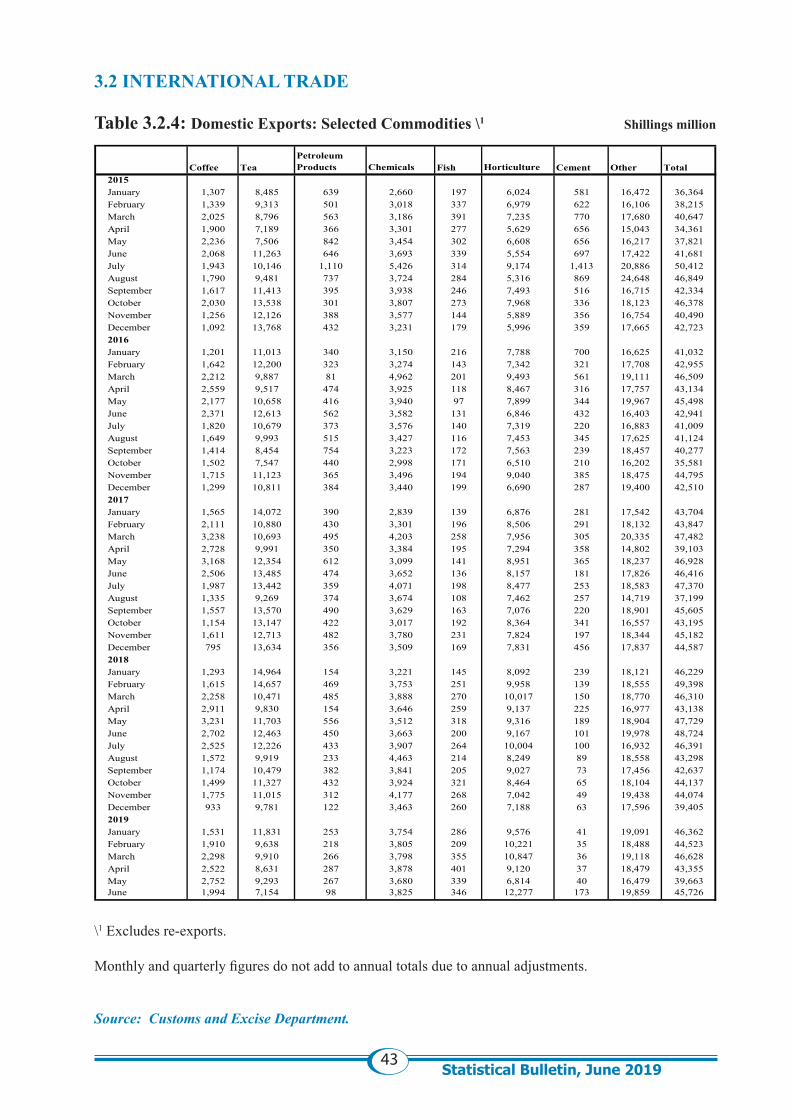
43Statistical Bulletin, June 2019
3.2 INTERNATIONAL TRADE
Table 3.2.4: Domestic Exports: Selected Commodities \1 Shillings million
\1 Excludes re-exports.
Monthly and quarterly figures do not add to annual totals due to annual adjustments.
Source: Customs and Excise Department.
2015January 1,307 8,485 639 2,660 197 6,024 581 16,472 36,364February 1,339 9,313 501 3,018 337 6,979 622 16,106 38,215March 2,025 8,796 563 3,186 391 7,235 770 17,680 40,647April 1,900 7,189 366 3,301 277 5,629 656 15,043 34,361May 2,236 7,506 842 3,454 302 6,608 656 16,217 37,821June 2,068 11,263 646 3,693 339 5,554 697 17,422 41,681July 1,943 10,146 1,110 5,426 314 9,174 1,413 20,886 50,412August 1,790 9,481 737 3,724 284 5,316 869 24,648 46,849September 1,617 11,413 395 3,938 246 7,493 516 16,715 42,334October 2,030 13,538 301 3,807 273 7,968 336 18,123 46,378November 1,256 12,126 388 3,577 144 5,889 356 16,754 40,490December 1,092 13,768 432 3,231 179 5,996 359 17,665 42,7232016January 1,201 11,013 340 3,150 216 7,788 700 16,625 41,032February 1,642 12,200 323 3,274 143 7,342 321 17,708 42,955March 2,212 9,887 81 4,962 201 9,493 561 19,111 46,509April 2,559 9,517 474 3,925 118 8,467 316 17,757 43,134May 2,177 10,658 416 3,940 97 7,899 344 19,967 45,498June 2,371 12,613 562 3,582 131 6,846 432 16,403 42,941July 1,820 10,679 373 3,576 140 7,319 220 16,883 41,009August 1,649 9,993 515 3,427 116 7,453 345 17,625 41,124September 1,414 8,454 754 3,223 172 7,563 239 18,457 40,277October 1,502 7,547 440 2,998 171 6,510 210 16,202 35,581November 1,715 11,123 365 3,496 194 9,040 385 18,475 44,795December 1,299 10,811 384 3,440 199 6,690 287 19,400 42,5102017January 1,565 14,072 390 2,839 139 6,876 281 17,542 43,704February 2,111 10,880 430 3,301 196 8,506 291 18,132 43,847March 3,238 10,693 495 4,203 258 7,956 305 20,335 47,482April 2,728 9,991 350 3,384 195 7,294 358 14,802 39,103May 3,168 12,354 612 3,099 141 8,951 365 18,237 46,928June 2,506 13,485 474 3,652 136 8,157 181 17,826 46,416July 1,987 13,442 359 4,071 198 8,477 253 18,583 47,370August 1,335 9,269 374 3,674 108 7,462 257 14,719 37,199September 1,557 13,570 490 3,629 163 7,076 220 18,901 45,605October 1,154 13,147 422 3,017 192 8,364 341 16,557 43,195November 1,611 12,713 482 3,780 231 7,824 197 18,344 45,182December 795 13,634 356 3,509 169 7,831 456 17,837 44,5872018January 1,293 14,964 154 3,221 145 8,092 239 18,121 46,229February 1,615 14,657 469 3,753 251 9,958 139 18,555 49,398March 2,258 10,471 485 3,888 270 10,017 150 18,770 46,310April 2,911 9,830 154 3,646 259 9,137 225 16,977 43,138May 3,231 11,703 556 3,512 318 9,316 189 18,904 47,729June 2,702 12,463 450 3,663 200 9,167 101 19,978 48,724July 2,525 12,226 433 3,907 264 10,004 100 16,932 46,391August 1,572 9,919 233 4,463 214 8,249 89 18,558 43,298September 1,174 10,479 382 3,841 205 9,027 73 17,456 42,637October 1,499 11,327 432 3,924 321 8,464 65 18,104 44,137November 1,775 11,015 312 4,177 268 7,042 49 19,438 44,074December 933 9,781 122 3,463 260 7,188 63 17,596 39,4052019January 1,531 11,831 253 3,754 286 9,576 41 19,091 46,362February 1,910 9,638 218 3,805 209 10,221 35 18,488 44,523March 2,298 9,910 266 3,798 355 10,847 36 19,118 46,628April 2,522 8,631 287 3,878 401 9,120 37 18,479 43,355May 2,752 9,293 267 3,680 339 6,814 40 16,479 39,663June 1,994 7,154 98 3,825 346 12,277 173 19,859 45,726
Coffee Tea TotalChemicals Fish Horticulture Cement OtherPetroleum Products
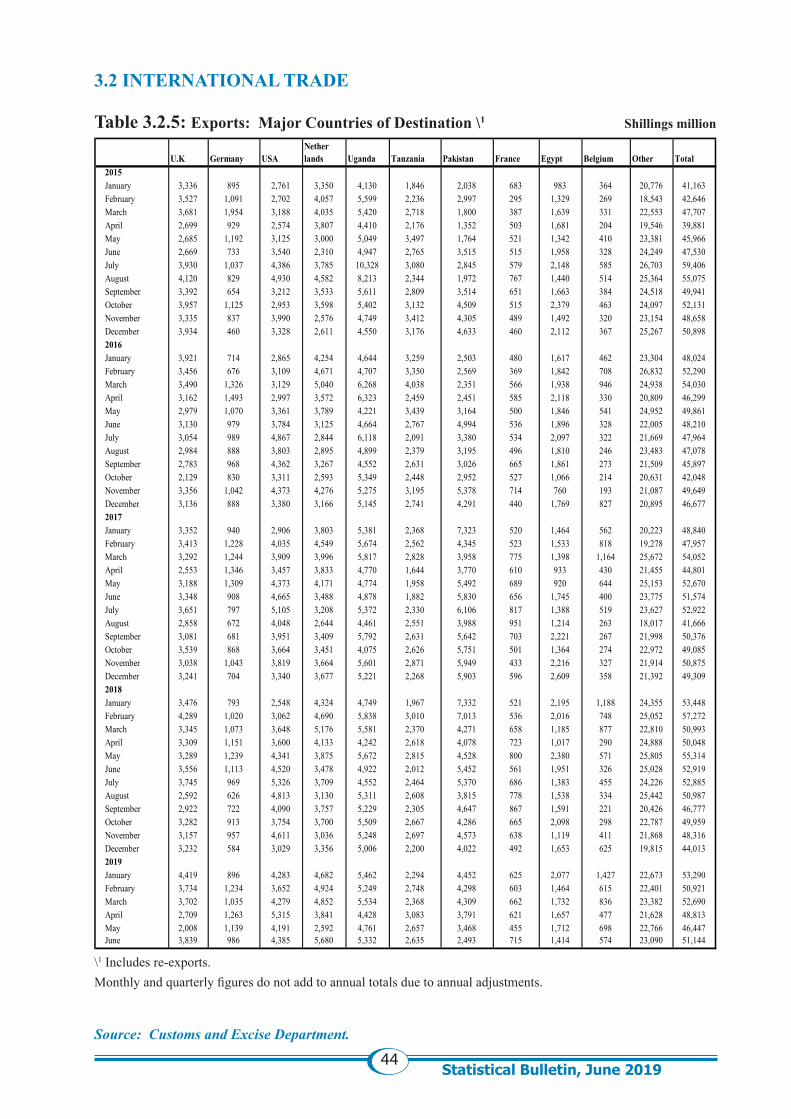
44Statistical Bulletin, June 2019
\1 Includes re-exports.Monthly and quarterly figures do not add to annual totals due to annual adjustments.
Source: Customs and Excise Department.
3.2 INTERNATIONAL TRADE Table 3.2.5: Exports: Major Countries of Destination \1 Shillings million
2015January 3,336 895 2,761 3,350 4,130 1,846 2,038 683 983 364 20,776 41,163February 3,527 1,091 2,702 4,057 5,599 2,236 2,997 295 1,329 269 18,543 42,646March 3,681 1,954 3,188 4,035 5,420 2,718 1,800 387 1,639 331 22,553 47,707April 2,699 929 2,574 3,807 4,410 2,176 1,352 503 1,681 204 19,546 39,881May 2,685 1,192 3,125 3,000 5,049 3,497 1,764 521 1,342 410 23,381 45,966June 2,669 733 3,540 2,310 4,947 2,765 3,515 515 1,958 328 24,249 47,530July 3,930 1,037 4,386 3,785 10,328 3,080 2,845 579 2,148 585 26,703 59,406August 4,120 829 4,930 4,582 8,213 2,344 1,972 767 1,440 514 25,364 55,075September 3,392 654 3,212 3,533 5,611 2,809 3,514 651 1,663 384 24,518 49,941October 3,957 1,125 2,953 3,598 5,402 3,132 4,509 515 2,379 463 24,097 52,131November 3,335 837 3,990 2,576 4,749 3,412 4,305 489 1,492 320 23,154 48,658December 3,934 460 3,328 2,611 4,550 3,176 4,633 460 2,112 367 25,267 50,8982016January 3,921 714 2,865 4,254 4,644 3,259 2,503 480 1,617 462 23,304 48,024February 3,456 676 3,109 4,671 4,707 3,350 2,569 369 1,842 708 26,832 52,290March 3,490 1,326 3,129 5,040 6,268 4,038 2,351 566 1,938 946 24,938 54,030April 3,162 1,493 2,997 3,572 6,323 2,459 2,451 585 2,118 330 20,809 46,299May 2,979 1,070 3,361 3,789 4,221 3,439 3,164 500 1,846 541 24,952 49,861June 3,130 979 3,784 3,125 4,664 2,767 4,994 536 1,896 328 22,005 48,210July 3,054 989 4,867 2,844 6,118 2,091 3,380 534 2,097 322 21,669 47,964August 2,984 888 3,803 2,895 4,899 2,379 3,195 496 1,810 246 23,483 47,078September 2,783 968 4,362 3,267 4,552 2,631 3,026 665 1,861 273 21,509 45,897October 2,129 830 3,311 2,593 5,349 2,448 2,952 527 1,066 214 20,631 42,048November 3,356 1,042 4,373 4,276 5,275 3,195 5,378 714 760 193 21,087 49,649December 3,136 888 3,380 3,166 5,145 2,741 4,291 440 1,769 827 20,895 46,6772017January 3,352 940 2,906 3,803 5,381 2,368 7,323 520 1,464 562 20,223 48,840February 3,413 1,228 4,035 4,549 5,674 2,562 4,345 523 1,533 818 19,278 47,957March 3,292 1,244 3,909 3,996 5,817 2,828 3,958 775 1,398 1,164 25,672 54,052April 2,553 1,346 3,457 3,833 4,770 1,644 3,770 610 933 430 21,455 44,801May 3,188 1,309 4,373 4,171 4,774 1,958 5,492 689 920 644 25,153 52,670June 3,348 908 4,665 3,488 4,878 1,882 5,830 656 1,745 400 23,775 51,574July 3,651 797 5,105 3,208 5,372 2,330 6,106 817 1,388 519 23,627 52,922August 2,858 672 4,048 2,644 4,461 2,551 3,988 951 1,214 263 18,017 41,666September 3,081 681 3,951 3,409 5,792 2,631 5,642 703 2,221 267 21,998 50,376October 3,539 868 3,664 3,451 4,075 2,626 5,751 501 1,364 274 22,972 49,085November 3,038 1,043 3,819 3,664 5,601 2,871 5,949 433 2,216 327 21,914 50,875December 3,241 704 3,340 3,677 5,221 2,268 5,903 596 2,609 358 21,392 49,3092018January 3,476 793 2,548 4,324 4,749 1,967 7,332 521 2,195 1,188 24,355 53,448February 4,289 1,020 3,062 4,690 5,838 3,010 7,013 536 2,016 748 25,052 57,272March 3,345 1,073 3,648 5,176 5,581 2,370 4,271 658 1,185 877 22,810 50,993April 3,309 1,151 3,600 4,133 4,242 2,618 4,078 723 1,017 290 24,888 50,048May 3,289 1,239 4,341 3,875 5,672 2,815 4,528 800 2,380 571 25,805 55,314June 3,556 1,113 4,520 3,478 4,922 2,012 5,452 561 1,951 326 25,028 52,919July 3,745 969 5,326 3,709 4,552 2,464 5,370 686 1,383 455 24,226 52,885August 2,592 626 4,813 3,130 5,311 2,608 3,815 778 1,538 334 25,442 50,987September 2,922 722 4,090 3,757 5,229 2,305 4,647 867 1,591 221 20,426 46,777October 3,282 913 3,754 3,700 5,509 2,667 4,286 665 2,098 298 22,787 49,959November 3,157 957 4,611 3,036 5,248 2,697 4,573 638 1,119 411 21,868 48,316December 3,232 584 3,029 3,356 5,006 2,200 4,022 492 1,653 625 19,815 44,0132019January 4,419 896 4,283 4,682 5,462 2,294 4,452 625 2,077 1,427 22,673 53,290February 3,734 1,234 3,652 4,924 5,249 2,748 4,298 603 1,464 615 22,401 50,921March 3,702 1,035 4,279 4,852 5,534 2,368 4,309 662 1,732 836 23,382 52,690April 2,709 1,263 5,315 3,841 4,428 3,083 3,791 621 1,657 477 21,628 48,813May 2,008 1,139 4,191 2,592 4,761 2,657 3,468 455 1,712 698 22,766 46,447June 3,839 986 4,385 5,680 5,332 2,635 2,493 715 1,414 574 23,090 51,144
France Egypt Belgium Other TotalU.K Germany USANether lands Uganda Tanzania Pakistan
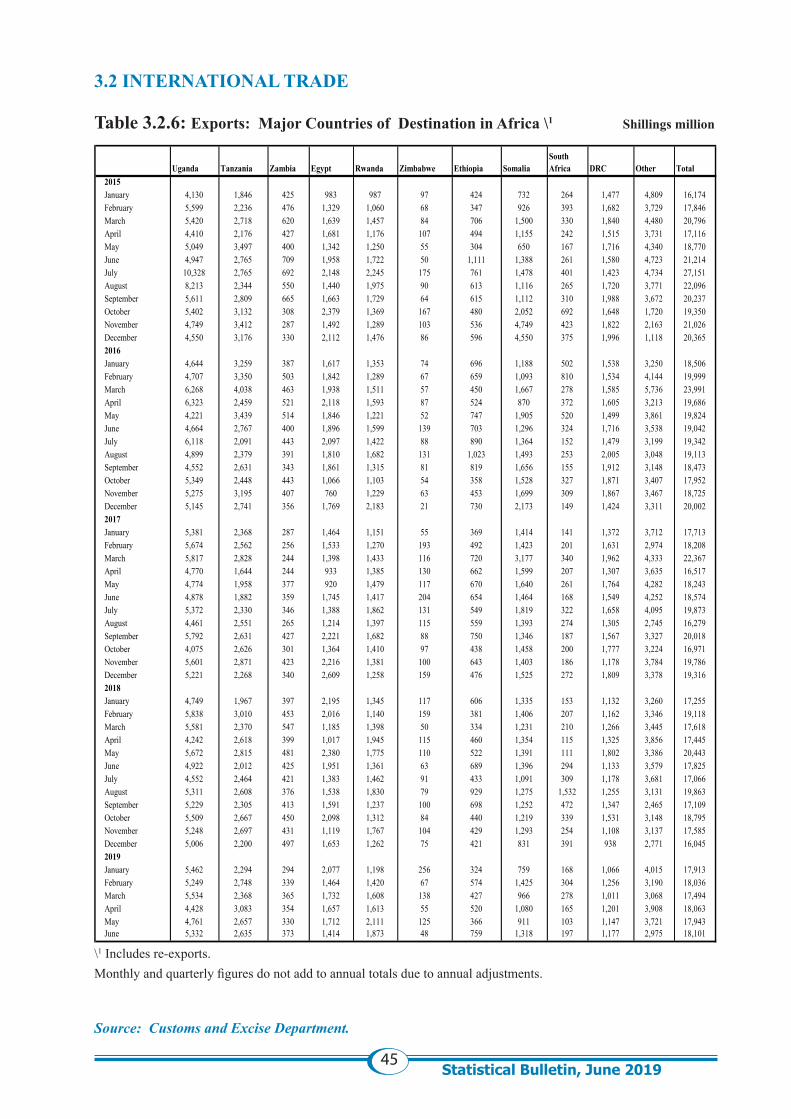
45Statistical Bulletin, June 2019
3.2 INTERNATIONAL TRADE
Table 3.2.6: Exports: Major Countries of Destination in Africa \1 Shillings million
\1 Includes re-exports.Monthly and quarterly figures do not add to annual totals due to annual adjustments.
Source: Customs and Excise Department.
2015January 4,130 1,846 425 983 987 97 424 732 264 1,477 4,809 16,174February 5,599 2,236 476 1,329 1,060 68 347 926 393 1,682 3,729 17,846March 5,420 2,718 620 1,639 1,457 84 706 1,500 330 1,840 4,480 20,796April 4,410 2,176 427 1,681 1,176 107 494 1,155 242 1,515 3,731 17,116May 5,049 3,497 400 1,342 1,250 55 304 650 167 1,716 4,340 18,770June 4,947 2,765 709 1,958 1,722 50 1,111 1,388 261 1,580 4,723 21,214July 10,328 2,765 692 2,148 2,245 175 761 1,478 401 1,423 4,734 27,151August 8,213 2,344 550 1,440 1,975 90 613 1,116 265 1,720 3,771 22,096September 5,611 2,809 665 1,663 1,729 64 615 1,112 310 1,988 3,672 20,237October 5,402 3,132 308 2,379 1,369 167 480 2,052 692 1,648 1,720 19,350November 4,749 3,412 287 1,492 1,289 103 536 4,749 423 1,822 2,163 21,026December 4,550 3,176 330 2,112 1,476 86 596 4,550 375 1,996 1,118 20,3652016January 4,644 3,259 387 1,617 1,353 74 696 1,188 502 1,538 3,250 18,506February 4,707 3,350 503 1,842 1,289 67 659 1,093 810 1,534 4,144 19,999March 6,268 4,038 463 1,938 1,511 57 450 1,667 278 1,585 5,736 23,991April 6,323 2,459 521 2,118 1,593 87 524 870 372 1,605 3,213 19,686May 4,221 3,439 514 1,846 1,221 52 747 1,905 520 1,499 3,861 19,824June 4,664 2,767 400 1,896 1,599 139 703 1,296 324 1,716 3,538 19,042July 6,118 2,091 443 2,097 1,422 88 890 1,364 152 1,479 3,199 19,342August 4,899 2,379 391 1,810 1,682 131 1,023 1,493 253 2,005 3,048 19,113September 4,552 2,631 343 1,861 1,315 81 819 1,656 155 1,912 3,148 18,473October 5,349 2,448 443 1,066 1,103 54 358 1,528 327 1,871 3,407 17,952November 5,275 3,195 407 760 1,229 63 453 1,699 309 1,867 3,467 18,725December 5,145 2,741 356 1,769 2,183 21 730 2,173 149 1,424 3,311 20,0022017January 5,381 2,368 287 1,464 1,151 55 369 1,414 141 1,372 3,712 17,713February 5,674 2,562 256 1,533 1,270 193 492 1,423 201 1,631 2,974 18,208March 5,817 2,828 244 1,398 1,433 116 720 3,177 340 1,962 4,333 22,367April 4,770 1,644 244 933 1,385 130 662 1,599 207 1,307 3,635 16,517May 4,774 1,958 377 920 1,479 117 670 1,640 261 1,764 4,282 18,243June 4,878 1,882 359 1,745 1,417 204 654 1,464 168 1,549 4,252 18,574July 5,372 2,330 346 1,388 1,862 131 549 1,819 322 1,658 4,095 19,873August 4,461 2,551 265 1,214 1,397 115 559 1,393 274 1,305 2,745 16,279September 5,792 2,631 427 2,221 1,682 88 750 1,346 187 1,567 3,327 20,018October 4,075 2,626 301 1,364 1,410 97 438 1,458 200 1,777 3,224 16,971November 5,601 2,871 423 2,216 1,381 100 643 1,403 186 1,178 3,784 19,786December 5,221 2,268 340 2,609 1,258 159 476 1,525 272 1,809 3,378 19,3162018January 4,749 1,967 397 2,195 1,345 117 606 1,335 153 1,132 3,260 17,255February 5,838 3,010 453 2,016 1,140 159 381 1,406 207 1,162 3,346 19,118March 5,581 2,370 547 1,185 1,398 50 334 1,231 210 1,266 3,445 17,618April 4,242 2,618 399 1,017 1,945 115 460 1,354 115 1,325 3,856 17,445May 5,672 2,815 481 2,380 1,775 110 522 1,391 111 1,802 3,386 20,443June 4,922 2,012 425 1,951 1,361 63 689 1,396 294 1,133 3,579 17,825July 4,552 2,464 421 1,383 1,462 91 433 1,091 309 1,178 3,681 17,066August 5,311 2,608 376 1,538 1,830 79 929 1,275 1,532 1,255 3,131 19,863September 5,229 2,305 413 1,591 1,237 100 698 1,252 472 1,347 2,465 17,109October 5,509 2,667 450 2,098 1,312 84 440 1,219 339 1,531 3,148 18,795November 5,248 2,697 431 1,119 1,767 104 429 1,293 254 1,108 3,137 17,585December 5,006 2,200 497 1,653 1,262 75 421 831 391 938 2,771 16,0452019January 5,462 2,294 294 2,077 1,198 256 324 759 168 1,066 4,015 17,913February 5,249 2,748 339 1,464 1,420 67 574 1,425 304 1,256 3,190 18,036March 5,534 2,368 365 1,732 1,608 138 427 966 278 1,011 3,068 17,494April 4,428 3,083 354 1,657 1,613 55 520 1,080 165 1,201 3,908 18,063May 4,761 2,657 330 1,712 2,111 125 366 911 103 1,147 3,721 17,943June 5,332 2,635 373 1,414 1,873 48 759 1,318 197 1,177 2,975 18,101
SomaliaSouth Africa DRC Other TotalUganda Tanzania Zambia Egypt Rwanda Zimbabwe Ethiopia
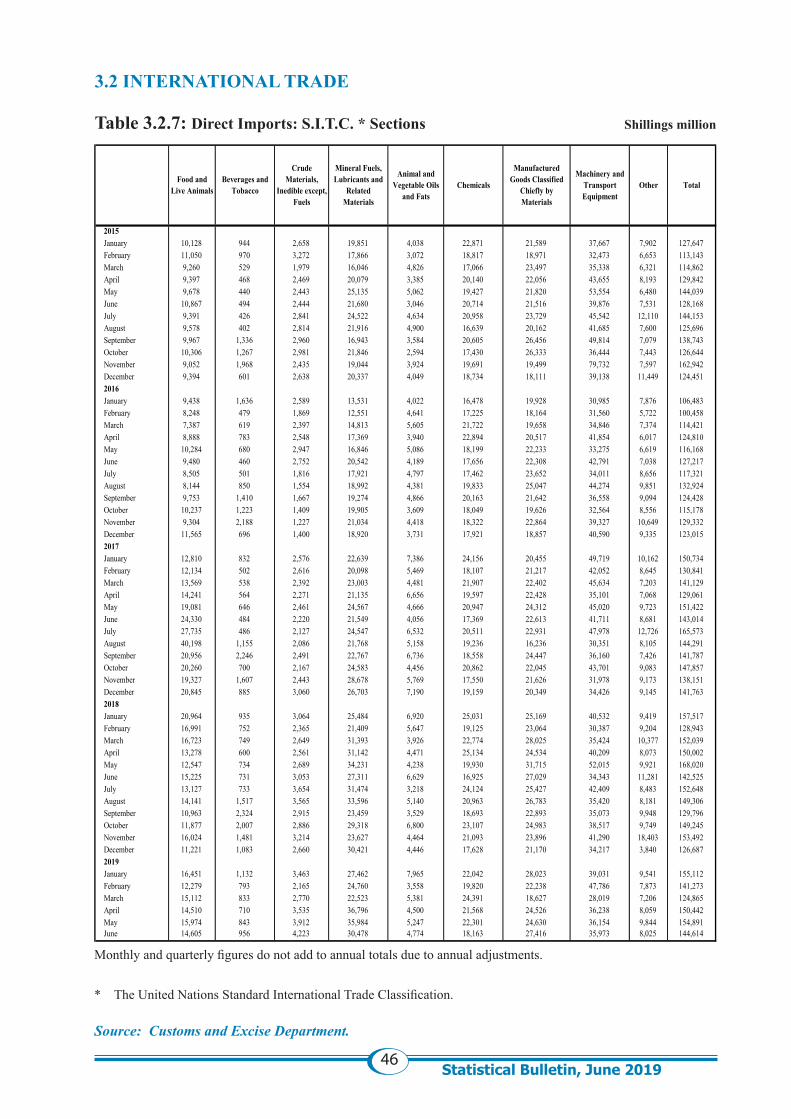
46Statistical Bulletin, June 2019
3.2 INTERNATIONAL TRADE
Table 3.2.7: Direct Imports: S.I.T.C. * Sections Shillings million
Monthly and quarterly figures do not add to annual totals due to annual adjustments. * The United Nations Standard International Trade Classification. Source: Customs and Excise Department.
2015January 10,128 944 2,658 19,851 4,038 22,871 21,589 37,667 7,902 127,647February 11,050 970 3,272 17,866 3,072 18,817 18,971 32,473 6,653 113,143March 9,260 529 1,979 16,046 4,826 17,066 23,497 35,338 6,321 114,862April 9,397 468 2,469 20,079 3,385 20,140 22,056 43,655 8,193 129,842May 9,678 440 2,443 25,135 5,062 19,427 21,820 53,554 6,480 144,039June 10,867 494 2,444 21,680 3,046 20,714 21,516 39,876 7,531 128,168July 9,391 426 2,841 24,522 4,634 20,958 23,729 45,542 12,110 144,153August 9,578 402 2,814 21,916 4,900 16,639 20,162 41,685 7,600 125,696September 9,967 1,336 2,960 16,943 3,584 20,605 26,456 49,814 7,079 138,743October 10,306 1,267 2,981 21,846 2,594 17,430 26,333 36,444 7,443 126,644November 9,052 1,968 2,435 19,044 3,924 19,691 19,499 79,732 7,597 162,942December 9,394 601 2,638 20,337 4,049 18,734 18,111 39,138 11,449 124,4512016January 9,438 1,636 2,589 13,531 4,022 16,478 19,928 30,985 7,876 106,483February 8,248 479 1,869 12,551 4,641 17,225 18,164 31,560 5,722 100,458March 7,387 619 2,397 14,813 5,605 21,722 19,658 34,846 7,374 114,421April 8,888 783 2,548 17,369 3,940 22,894 20,517 41,854 6,017 124,810May 10,284 680 2,947 16,846 5,086 18,199 22,233 33,275 6,619 116,168June 9,480 460 2,752 20,542 4,189 17,656 22,308 42,791 7,038 127,217July 8,505 501 1,816 17,921 4,797 17,462 23,652 34,011 8,656 117,321August 8,144 850 1,554 18,992 4,381 19,833 25,047 44,274 9,851 132,924September 9,753 1,410 1,667 19,274 4,866 20,163 21,642 36,558 9,094 124,428October 10,237 1,223 1,409 19,905 3,609 18,049 19,626 32,564 8,556 115,178November 9,304 2,188 1,227 21,034 4,418 18,322 22,864 39,327 10,649 129,332December 11,565 696 1,400 18,920 3,731 17,921 18,857 40,590 9,335 123,0152017January 12,810 832 2,576 22,639 7,386 24,156 20,455 49,719 10,162 150,734February 12,134 502 2,616 20,098 5,469 18,107 21,217 42,052 8,645 130,841March 13,569 538 2,392 23,003 4,481 21,907 22,402 45,634 7,203 141,129April 14,241 564 2,271 21,135 6,656 19,597 22,428 35,101 7,068 129,061May 19,081 646 2,461 24,567 4,666 20,947 24,312 45,020 9,723 151,422June 24,330 484 2,220 21,549 4,056 17,369 22,613 41,711 8,681 143,014July 27,735 486 2,127 24,547 6,532 20,511 22,931 47,978 12,726 165,573August 40,198 1,155 2,086 21,768 5,158 19,236 16,236 30,351 8,105 144,291September 20,956 2,246 2,491 22,767 6,736 18,558 24,447 36,160 7,426 141,787October 20,260 700 2,167 24,583 4,456 20,862 22,045 43,701 9,083 147,857November 19,327 1,607 2,443 28,678 5,769 17,550 21,626 31,978 9,173 138,151December 20,845 885 3,060 26,703 7,190 19,159 20,349 34,426 9,145 141,7632018January 20,964 935 3,064 25,484 6,920 25,031 25,169 40,532 9,419 157,517February 16,991 752 2,365 21,409 5,647 19,125 23,064 30,387 9,204 128,943March 16,723 749 2,649 31,393 3,926 22,774 28,025 35,424 10,377 152,039April 13,278 600 2,561 31,142 4,471 25,134 24,534 40,209 8,073 150,002May 12,547 734 2,689 34,231 4,238 19,930 31,715 52,015 9,921 168,020June 15,225 731 3,053 27,311 6,629 16,925 27,029 34,343 11,281 142,525July 13,127 733 3,654 31,474 3,218 24,124 25,427 42,409 8,483 152,648August 14,141 1,517 3,565 33,596 5,140 20,963 26,783 35,420 8,181 149,306September 10,963 2,324 2,915 23,459 3,529 18,693 22,893 35,073 9,948 129,796October 11,877 2,007 2,886 29,318 6,800 23,107 24,983 38,517 9,749 149,245November 16,024 1,481 3,214 23,627 4,464 21,093 23,896 41,290 18,403 153,492December 11,221 1,083 2,660 30,421 4,446 17,628 21,170 34,217 3,840 126,6872019January 16,451 1,132 3,463 27,462 7,965 22,042 28,023 39,031 9,541 155,112February 12,279 793 2,165 24,760 3,558 19,820 22,238 47,786 7,873 141,273March 15,112 833 2,770 22,523 5,381 24,391 18,627 28,019 7,206 124,865April 14,510 710 3,535 36,796 4,500 21,568 24,526 36,238 8,059 150,442May 15,974 843 3,912 35,984 5,247 22,301 24,630 36,154 9,844 154,891June 14,605 956 4,223 30,478 4,774 18,163 27,416 35,973 8,025 144,614
Machinery and Transport Equipment
Other Total
Crude Materials,
Inedible except, Fuels
Mineral Fuels, Lubricants and
Related Materials
Animal and Vegetable Oils
and FatsChemicals
Manufactured Goods Classified
Chiefly by Materials
Food and Live Animals
Beverages and Tobacco
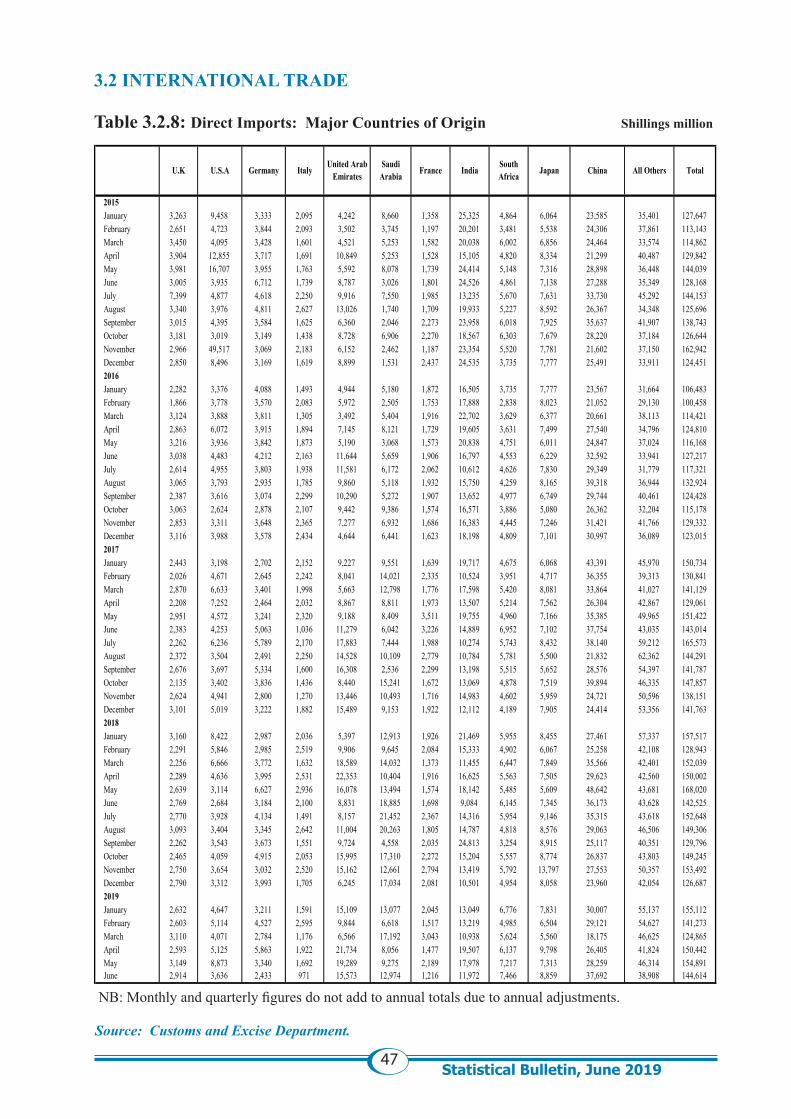
47Statistical Bulletin, June 2019
3.2 INTERNATIONAL TRADE
Table 3.2.8: Direct Imports: Major Countries of Origin Shillings million
NB: Monthly and quarterly figures do not add to annual totals due to annual adjustments. Source: Customs and Excise Department.
2015January 3,263 9,458 3,333 2,095 4,242 8,660 1,358 25,325 4,864 6,064 23,585 35,401 127,647February 2,651 4,723 3,844 2,093 3,502 3,745 1,197 20,201 3,481 5,538 24,306 37,861 113,143March 3,450 4,095 3,428 1,601 4,521 5,253 1,582 20,038 6,002 6,856 24,464 33,574 114,862April 3,904 12,855 3,717 1,691 10,849 5,253 1,528 15,105 4,820 8,334 21,299 40,487 129,842May 3,981 16,707 3,955 1,763 5,592 8,078 1,739 24,414 5,148 7,316 28,898 36,448 144,039June 3,005 3,935 6,712 1,739 8,787 3,026 1,801 24,526 4,861 7,138 27,288 35,349 128,168July 7,399 4,877 4,618 2,250 9,916 7,550 1,985 13,235 5,670 7,631 33,730 45,292 144,153August 3,340 3,976 4,811 2,627 13,026 1,740 1,709 19,933 5,227 8,592 26,367 34,348 125,696September 3,015 4,395 3,584 1,625 6,360 2,046 2,273 23,958 6,018 7,925 35,637 41,907 138,743October 3,181 3,019 3,149 1,438 8,728 6,906 2,270 18,567 6,303 7,679 28,220 37,184 126,644November 2,966 49,517 3,069 2,183 6,152 2,462 1,187 23,354 5,520 7,781 21,602 37,150 162,942December 2,850 8,496 3,169 1,619 8,899 1,531 2,437 24,535 3,735 7,777 25,491 33,911 124,4512016January 2,282 3,376 4,088 1,493 4,944 5,180 1,872 16,505 3,735 7,777 23,567 31,664 106,483February 1,866 3,778 3,570 2,083 5,972 2,505 1,753 17,888 2,838 8,023 21,052 29,130 100,458March 3,124 3,888 3,811 1,305 3,492 5,404 1,916 22,702 3,629 6,377 20,661 38,113 114,421April 2,863 6,072 3,915 1,894 7,145 8,121 1,729 19,605 3,631 7,499 27,540 34,796 124,810May 3,216 3,936 3,842 1,873 5,190 3,068 1,573 20,838 4,751 6,011 24,847 37,024 116,168June 3,038 4,483 4,212 2,163 11,644 5,659 1,906 16,797 4,553 6,229 32,592 33,941 127,217July 2,614 4,955 3,803 1,938 11,581 6,172 2,062 10,612 4,626 7,830 29,349 31,779 117,321August 3,065 3,793 2,935 1,785 9,860 5,118 1,932 15,750 4,259 8,165 39,318 36,944 132,924September 2,387 3,616 3,074 2,299 10,290 5,272 1,907 13,652 4,977 6,749 29,744 40,461 124,428October 3,063 2,624 2,878 2,107 9,442 9,386 1,574 16,571 3,886 5,080 26,362 32,204 115,178November 2,853 3,311 3,648 2,365 7,277 6,932 1,686 16,383 4,445 7,246 31,421 41,766 129,332December 3,116 3,988 3,578 2,434 4,644 6,441 1,623 18,198 4,809 7,101 30,997 36,089 123,0152017January 2,443 3,198 2,702 2,152 9,227 9,551 1,639 19,717 4,675 6,068 43,391 45,970 150,734February 2,026 4,671 2,645 2,242 8,041 14,021 2,335 10,524 3,951 4,717 36,355 39,313 130,841March 2,870 6,633 3,401 1,998 5,663 12,798 1,776 17,598 5,420 8,081 33,864 41,027 141,129April 2,208 7,252 2,464 2,032 8,867 8,811 1,973 13,507 5,214 7,562 26,304 42,867 129,061May 2,951 4,572 3,241 2,320 9,188 8,409 3,511 19,755 4,960 7,166 35,385 49,965 151,422June 2,383 4,253 5,063 1,036 11,279 6,042 3,226 14,889 6,952 7,102 37,754 43,035 143,014July 2,262 6,236 5,789 2,170 17,883 7,444 1,988 10,274 5,743 8,432 38,140 59,212 165,573August 2,372 3,504 2,491 2,250 14,528 10,109 2,779 10,784 5,781 5,500 21,832 62,362 144,291September 2,676 3,697 5,334 1,600 16,308 2,536 2,299 13,198 5,515 5,652 28,576 54,397 141,787October 2,135 3,402 3,836 1,436 8,440 15,241 1,672 13,069 4,878 7,519 39,894 46,335 147,857November 2,624 4,941 2,800 1,270 13,446 10,493 1,716 14,983 4,602 5,959 24,721 50,596 138,151December 3,101 5,019 3,222 1,882 15,489 9,153 1,922 12,112 4,189 7,905 24,414 53,356 141,7632018January 3,160 8,422 2,987 2,036 5,397 12,913 1,926 21,469 5,955 8,455 27,461 57,337 157,517February 2,291 5,846 2,985 2,519 9,906 9,645 2,084 15,333 4,902 6,067 25,258 42,108 128,943March 2,256 6,666 3,772 1,632 18,589 14,032 1,373 11,455 6,447 7,849 35,566 42,401 152,039April 2,289 4,636 3,995 2,531 22,353 10,404 1,916 16,625 5,563 7,505 29,623 42,560 150,002May 2,639 3,114 6,627 2,936 16,078 13,494 1,574 18,142 5,485 5,609 48,642 43,681 168,020June 2,769 2,684 3,184 2,100 8,831 18,885 1,698 9,084 6,145 7,345 36,173 43,628 142,525July 2,770 3,928 4,134 1,491 8,157 21,452 2,367 14,316 5,954 9,146 35,315 43,618 152,648August 3,093 3,404 3,345 2,642 11,004 20,263 1,805 14,787 4,818 8,576 29,063 46,506 149,306September 2,262 3,543 3,673 1,551 9,724 4,558 2,035 24,813 3,254 8,915 25,117 40,351 129,796October 2,465 4,059 4,915 2,053 15,995 17,310 2,272 15,204 5,557 8,774 26,837 43,803 149,245November 2,750 3,654 3,032 2,520 15,162 12,661 2,794 13,419 5,792 13,797 27,553 50,357 153,492December 2,790 3,312 3,993 1,705 6,245 17,034 2,081 10,501 4,954 8,058 23,960 42,054 126,6872019January 2,632 4,647 3,211 1,591 15,109 13,077 2,045 13,049 6,776 7,831 30,007 55,137 155,112February 2,603 5,114 4,527 2,595 9,844 6,618 1,517 13,219 4,985 6,504 29,121 54,627 141,273March 3,110 4,071 2,784 1,176 6,566 17,192 3,043 10,938 5,624 5,560 18,175 46,625 124,865April 2,593 5,125 5,863 1,922 21,734 8,056 1,477 19,507 6,137 9,798 26,405 41,824 150,442May 3,149 8,873 3,340 1,692 19,289 9,275 2,189 17,978 7,217 7,313 28,259 46,314 154,891June 2,914 3,636 2,433 971 15,573 12,974 1,216 11,972 7,466 8,859 37,692 38,908 144,614
U.K U.S.A Germany TotalUnited Arab Emirates
Saudi Arabia France India South
Africa Japan All OthersItaly China
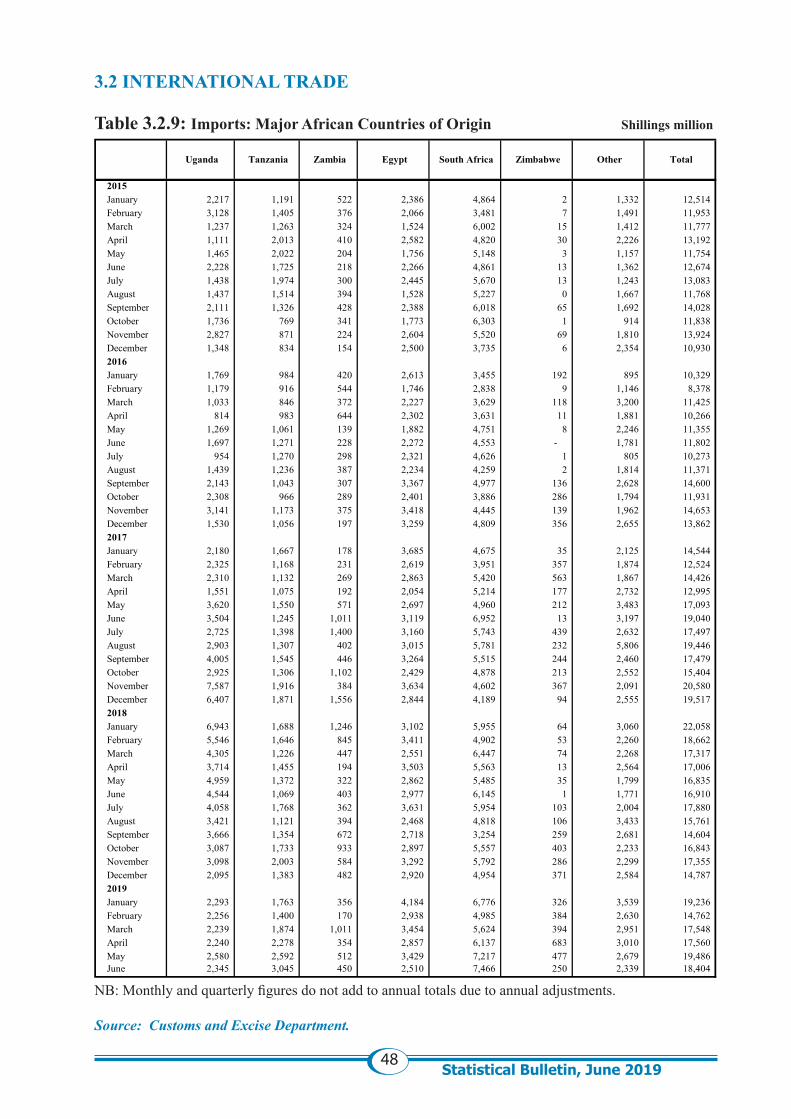
48Statistical Bulletin, June 2019
3.2 INTERNATIONAL TRADE
Table 3.2.9: Imports: Major African Countries of Origin Shillings million
NB: Monthly and quarterly figures do not add to annual totals due to annual adjustments.
Source: Customs and Excise Department.
2015January 2,217 1,191 522 2,386 4,864 2 1,332 12,514 February 3,128 1,405 376 2,066 3,481 7 1,491 11,953 March 1,237 1,263 324 1,524 6,002 15 1,412 11,777 April 1,111 2,013 410 2,582 4,820 30 2,226 13,192 May 1,465 2,022 204 1,756 5,148 3 1,157 11,754 June 2,228 1,725 218 2,266 4,861 13 1,362 12,674 July 1,438 1,974 300 2,445 5,670 13 1,243 13,083 August 1,437 1,514 394 1,528 5,227 0 1,667 11,768 September 2,111 1,326 428 2,388 6,018 65 1,692 14,028 October 1,736 769 341 1,773 6,303 1 914 11,838 November 2,827 871 224 2,604 5,520 69 1,810 13,924 December 1,348 834 154 2,500 3,735 6 2,354 10,930 2016January 1,769 984 420 2,613 3,455 192 895 10,329 February 1,179 916 544 1,746 2,838 9 1,146 8,378 March 1,033 846 372 2,227 3,629 118 3,200 11,425 April 814 983 644 2,302 3,631 11 1,881 10,266 May 1,269 1,061 139 1,882 4,751 8 2,246 11,355 June 1,697 1,271 228 2,272 4,553 - 1,781 11,802 July 954 1,270 298 2,321 4,626 1 805 10,273 August 1,439 1,236 387 2,234 4,259 2 1,814 11,371 September 2,143 1,043 307 3,367 4,977 136 2,628 14,600 October 2,308 966 289 2,401 3,886 286 1,794 11,931 November 3,141 1,173 375 3,418 4,445 139 1,962 14,653 December 1,530 1,056 197 3,259 4,809 356 2,655 13,862 2017January 2,180 1,667 178 3,685 4,675 35 2,125 14,544 February 2,325 1,168 231 2,619 3,951 357 1,874 12,524 March 2,310 1,132 269 2,863 5,420 563 1,867 14,426 April 1,551 1,075 192 2,054 5,214 177 2,732 12,995 May 3,620 1,550 571 2,697 4,960 212 3,483 17,093 June 3,504 1,245 1,011 3,119 6,952 13 3,197 19,040 July 2,725 1,398 1,400 3,160 5,743 439 2,632 17,497 August 2,903 1,307 402 3,015 5,781 232 5,806 19,446 September 4,005 1,545 446 3,264 5,515 244 2,460 17,479 October 2,925 1,306 1,102 2,429 4,878 213 2,552 15,404 November 7,587 1,916 384 3,634 4,602 367 2,091 20,580 December 6,407 1,871 1,556 2,844 4,189 94 2,555 19,517 2018January 6,943 1,688 1,246 3,102 5,955 64 3,060 22,058 February 5,546 1,646 845 3,411 4,902 53 2,260 18,662 March 4,305 1,226 447 2,551 6,447 74 2,268 17,317 April 3,714 1,455 194 3,503 5,563 13 2,564 17,006 May 4,959 1,372 322 2,862 5,485 35 1,799 16,835 June 4,544 1,069 403 2,977 6,145 1 1,771 16,910 July 4,058 1,768 362 3,631 5,954 103 2,004 17,880 August 3,421 1,121 394 2,468 4,818 106 3,433 15,761 September 3,666 1,354 672 2,718 3,254 259 2,681 14,604 October 3,087 1,733 933 2,897 5,557 403 2,233 16,843 November 3,098 2,003 584 3,292 5,792 286 2,299 17,355 December 2,095 1,383 482 2,920 4,954 371 2,584 14,787 2019January 2,293 1,763 356 4,184 6,776 326 3,539 19,236 February 2,256 1,400 170 2,938 4,985 384 2,630 14,762 March 2,239 1,874 1,011 3,454 5,624 394 2,951 17,548 April 2,240 2,278 354 2,857 6,137 683 3,010 17,560 May 2,580 2,592 512 3,429 7,217 477 2,679 19,486 June 2,345 3,045 450 2,510 7,466 250 2,339 18,404
Uganda Tanzania Other Total Zambia Egypt South Africa Zimbabwe
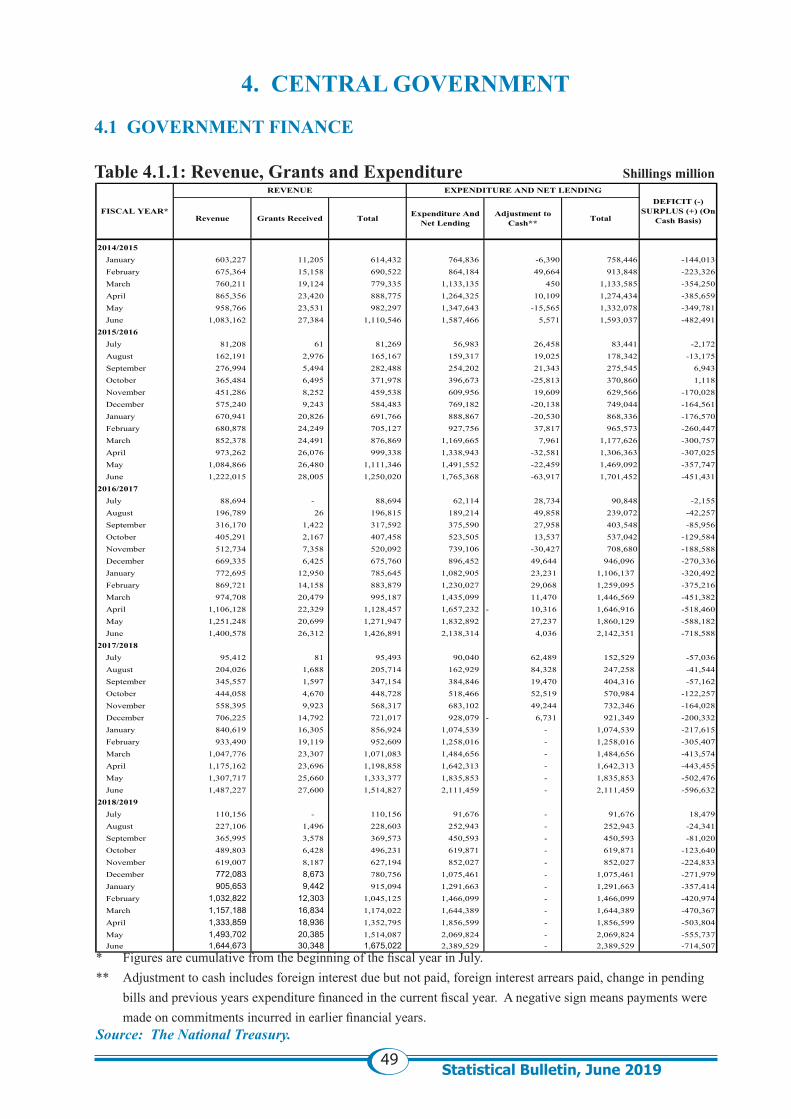
49Statistical Bulletin, June 2019
4. CENTRAL GOVERNMENT
4.1 GOVERNMENT FINANCE Table 4.1.1: Revenue, Grants and Expenditure Shillings million
* Figures are cumulative from the beginning of the fiscal year in July. ** Adjustment to cash includes foreign interest due but not paid, foreign interest arrears paid, change in pending
bills and previous years expenditure financed in the current fiscal year. A negative sign means payments were made on commitments incurred in earlier financial years.
Source: The National Treasury.
2014/2015January 603,227 11,205 614,432 764,836 -6,390 758,446 -144,013February 675,364 15,158 690,522 864,184 49,664 913,848 -223,326March 760,211 19,124 779,335 1,133,135 450 1,133,585 -354,250April 865,356 23,420 888,775 1,264,325 10,109 1,274,434 -385,659May 958,766 23,531 982,297 1,347,643 -15,565 1,332,078 -349,781June 1,083,162 27,384 1,110,546 1,587,466 5,571 1,593,037 -482,491
2015/2016July 81,208 61 81,269 56,983 26,458 83,441 -2,172August 162,191 2,976 165,167 159,317 19,025 178,342 -13,175September 276,994 5,494 282,488 254,202 21,343 275,545 6,943October 365,484 6,495 371,978 396,673 -25,813 370,860 1,118November 451,286 8,252 459,538 609,956 19,609 629,566 -170,028December 575,240 9,243 584,483 769,182 -20,138 749,044 -164,561January 670,941 20,826 691,766 888,867 -20,530 868,336 -176,570February 680,878 24,249 705,127 927,756 37,817 965,573 -260,447March 852,378 24,491 876,869 1,169,665 7,961 1,177,626 -300,757April 973,262 26,076 999,338 1,338,943 -32,581 1,306,363 -307,025May 1,084,866 26,480 1,111,346 1,491,552 -22,459 1,469,092 -357,747June 1,222,015 28,005 1,250,020 1,765,368 -63,917 1,701,452 -451,431
2016/2017July 88,694 - 88,694 62,114 28,734 90,848 -2,155August 196,789 26 196,815 189,214 49,858 239,072 -42,257September 316,170 1,422 317,592 375,590 27,958 403,548 -85,956October 405,291 2,167 407,458 523,505 13,537 537,042 -129,584November 512,734 7,358 520,092 739,106 -30,427 708,680 -188,588December 669,335 6,425 675,760 896,452 49,644 946,096 -270,336January 772,695 12,950 785,645 1,082,905 23,231 1,106,137 -320,492February 869,721 14,158 883,879 1,230,027 29,068 1,259,095 -375,216March 974,708 20,479 995,187 1,435,099 11,470 1,446,569 -451,382April 1,106,128 22,329 1,128,457 1,657,232 10,316- 1,646,916 -518,460May 1,251,248 20,699 1,271,947 1,832,892 27,237 1,860,129 -588,182June 1,400,578 26,312 1,426,891 2,138,314 4,036 2,142,351 -718,588
2017/2018July 95,412 81 95,493 90,040 62,489 152,529 -57,036August 204,026 1,688 205,714 162,929 84,328 247,258 -41,544September 345,557 1,597 347,154 384,846 19,470 404,316 -57,162October 444,058 4,670 448,728 518,466 52,519 570,984 -122,257November 558,395 9,923 568,317 683,102 49,244 732,346 -164,028December 706,225 14,792 721,017 928,079 6,731- 921,349 -200,332January 840,619 16,305 856,924 1,074,539 - 1,074,539 -217,615February 933,490 19,119 952,609 1,258,016 - 1,258,016 -305,407March 1,047,776 23,307 1,071,083 1,484,656 - 1,484,656 -413,574April 1,175,162 23,696 1,198,858 1,642,313 - 1,642,313 -443,455May 1,307,717 25,660 1,333,377 1,835,853 - 1,835,853 -502,476June 1,487,227 27,600 1,514,827 2,111,459 - 2,111,459 -596,632
2018/2019July 110,156 - 110,156 91,676 - 91,676 18,479August 227,106 1,496 228,603 252,943 - 252,943 -24,341September 365,995 3,578 369,573 450,593 - 450,593 -81,020October 489,803 6,428 496,231 619,871 - 619,871 -123,640November 619,007 8,187 627,194 852,027 - 852,027 -224,833December 772,083 8,673 780,756 1,075,461 - 1,075,461 -271,979January 905,653 9,442 915,094 1,291,663 - 1,291,663 -357,414February 1,032,822 12,303 1,045,125 1,466,099 - 1,466,099 -420,974March 1,157,188 16,834 1,174,022 1,644,389 - 1,644,389 -470,367April 1,333,859 18,936 1,352,795 1,856,599 - 1,856,599 -503,804May 1,493,702 20,385 1,514,087 2,069,824 - 2,069,824 -555,737June 1,644,673 30,348 1,675,022 2,389,529 - 2,389,529 -714,507
DEFICIT (-) SURPLUS (+) (On
Cash Basis)Grants ReceivedRevenueFISCAL YEAR*
Total TotalAdjustment to Cash**
Expenditure And Net Lending
REVENUE EXPENDITURE AND NET LENDING
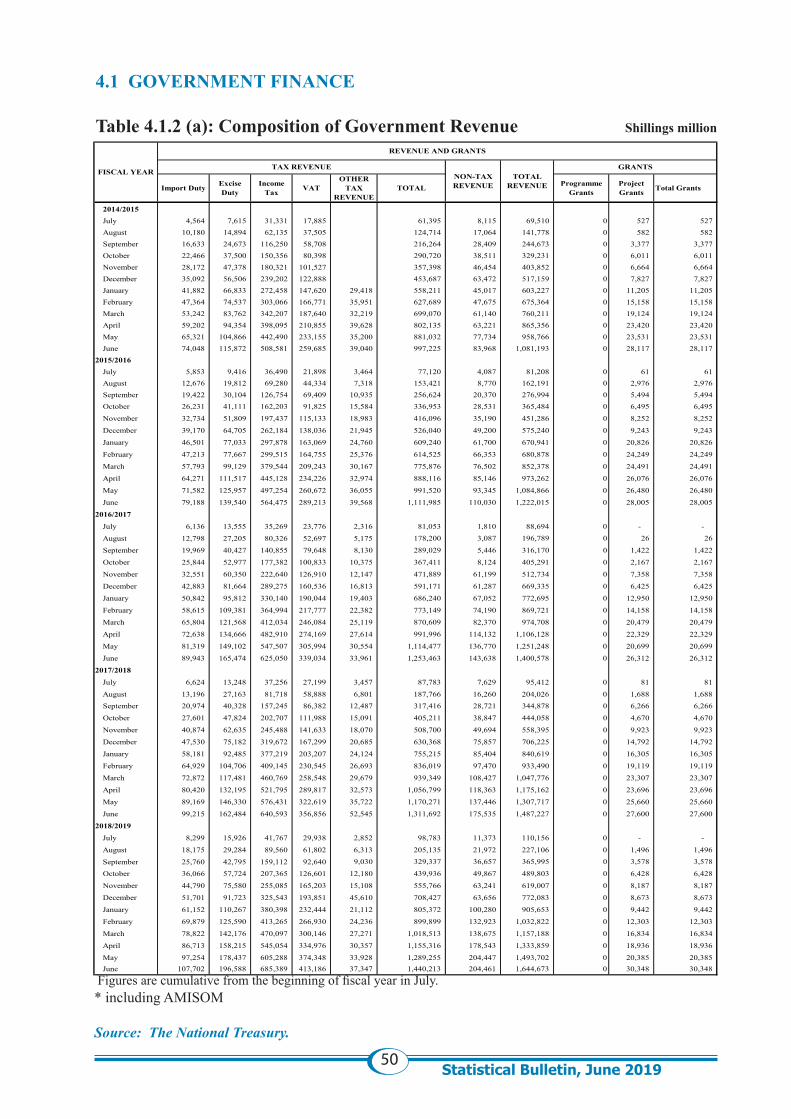
50Statistical Bulletin, June 2019
4.1 GOVERNMENT FINANCE
Table 4.1.2 (a): Composition of Government Revenue Shillings million
Figures are cumulative from the beginning of fiscal year in July.* including AMISOM
Source: The National Treasury.
2014/2015July 4,564 7,615 31,331 17,885 61,395 8,115 69,510 0 527 527 August 10,180 14,894 62,135 37,505 124,714 17,064 141,778 0 582 582 September 16,633 24,673 116,250 58,708 216,264 28,409 244,673 0 3,377 3,377 October 22,466 37,500 150,356 80,398 290,720 38,511 329,231 0 6,011 6,011 November 28,172 47,378 180,321 101,527 357,398 46,454 403,852 0 6,664 6,664 December 35,092 56,506 239,202 122,888 453,687 63,472 517,159 0 7,827 7,827 January 41,882 66,833 272,458 147,620 29,418 558,211 45,017 603,227 0 11,205 11,205 February 47,364 74,537 303,066 166,771 35,951 627,689 47,675 675,364 0 15,158 15,158 March 53,242 83,762 342,207 187,640 32,219 699,070 61,140 760,211 0 19,124 19,124 April 59,202 94,354 398,095 210,855 39,628 802,135 63,221 865,356 0 23,420 23,420 May 65,321 104,866 442,490 233,155 35,200 881,032 77,734 958,766 0 23,531 23,531 June 74,048 115,872 508,581 259,685 39,040 997,225 83,968 1,081,193 0 28,117 28,117
2015/2016July 5,853 9,416 36,490 21,898 3,464 77,120 4,087 81,208 0 61 61 August 12,676 19,812 69,280 44,334 7,318 153,421 8,770 162,191 0 2,976 2,976 September 19,422 30,104 126,754 69,409 10,935 256,624 20,370 276,994 0 5,494 5,494 October 26,231 41,111 162,203 91,825 15,584 336,953 28,531 365,484 0 6,495 6,495
November 32,734 51,809 197,437 115,133 18,983 416,096 35,190 451,286 0 8,252 8,252
December 39,170 64,705 262,184 138,036 21,945 526,040 49,200 575,240 0 9,243 9,243
January 46,501 77,033 297,878 163,069 24,760 609,240 61,700 670,941 0 20,826 20,826
February 47,213 77,667 299,515 164,755 25,376 614,525 66,353 680,878 0 24,249 24,249
March 57,793 99,129 379,544 209,243 30,167 775,876 76,502 852,378 0 24,491 24,491
April 64,271 111,517 445,128 234,226 32,974 888,116 85,146 973,262 0 26,076 26,076
May 71,582 125,957 497,254 260,672 36,055 991,520 93,345 1,084,866 0 26,480 26,480
June 79,188 139,540 564,475 289,213 39,568 1,111,985 110,030 1,222,015 0 28,005 28,005
2016/2017
July 6,136 13,555 35,269 23,776 2,316 81,053 1,810 88,694 0 - -
August 12,798 27,205 80,326 52,697 5,175 178,200 3,087 196,789 0 26 26
September 19,969 40,427 140,855 79,648 8,130 289,029 5,446 316,170 0 1,422 1,422
October 25,844 52,977 177,382 100,833 10,375 367,411 8,124 405,291 0 2,167 2,167
November 32,551 60,350 222,640 126,910 12,147 471,889 61,199 512,734 0 7,358 7,358
December 42,883 81,664 289,275 160,536 16,813 591,171 61,287 669,335 0 6,425 6,425
January 50,842 95,812 330,140 190,044 19,403 686,240 67,052 772,695 0 12,950 12,950
February 58,615 109,381 364,994 217,777 22,382 773,149 74,190 869,721 0 14,158 14,158
March 65,804 121,568 412,034 246,084 25,119 870,609 82,370 974,708 0 20,479 20,479
April 72,638 134,666 482,910 274,169 27,614 991,996 114,132 1,106,128 0 22,329 22,329
May 81,319 149,102 547,507 305,994 30,554 1,114,477 136,770 1,251,248 0 20,699 20,699
June 89,943 165,474 625,050 339,034 33,961 1,253,463 143,638 1,400,578 0 26,312 26,312
2017/2018
July 6,624 13,248 37,256 27,199 3,457 87,783 7,629 95,412 0 81 81
August 13,196 27,163 81,718 58,888 6,801 187,766 16,260 204,026 0 1,688 1,688
September 20,974 40,328 157,245 86,382 12,487 317,416 28,721 344,878 0 6,266 6,266
October 27,601 47,824 202,707 111,988 15,091 405,211 38,847 444,058 0 4,670 4,670
November 40,874 62,635 245,488 141,633 18,070 508,700 49,694 558,395 0 9,923 9,923
December 47,530 75,182 319,672 167,299 20,685 630,368 75,857 706,225 0 14,792 14,792
January 58,181 92,485 377,219 203,207 24,124 755,215 85,404 840,619 0 16,305 16,305
February 64,929 104,706 409,145 230,545 26,693 836,019 97,470 933,490 0 19,119 19,119
March 72,872 117,481 460,769 258,548 29,679 939,349 108,427 1,047,776 0 23,307 23,307
April 80,420 132,195 521,795 289,817 32,573 1,056,799 118,363 1,175,162 0 23,696 23,696
May 89,169 146,330 576,431 322,619 35,722 1,170,271 137,446 1,307,717 0 25,660 25,660
June 99,215 162,484 640,593 356,856 52,545 1,311,692 175,535 1,487,227 0 27,600 27,600
2018/2019
July 8,299 15,926 41,767 29,938 2,852 98,783 11,373 110,156 0 - -
August 18,175 29,284 89,560 61,802 6,313 205,135 21,972 227,106 0 1,496 1,496
September 25,760 42,795 159,112 92,640 9,030 329,337 36,657 365,995 0 3,578 3,578
October 36,066 57,724 207,365 126,601 12,180 439,936 49,867 489,803 0 6,428 6,428
November 44,790 75,580 255,085 165,203 15,108 555,766 63,241 619,007 0 8,187 8,187
December 51,701 91,723 325,543 193,851 45,610 708,427 63,656 772,083 0 8,673 8,673
January 61,152 110,267 380,398 232,444 21,112 805,372 100,280 905,653 0 9,442 9,442
February 69,879 125,590 413,265 266,930 24,236 899,899 132,923 1,032,822 0 12,303 12,303
March 78,822 142,176 470,097 300,146 27,271 1,018,513 138,675 1,157,188 0 16,834 16,834
April 86,713 158,215 545,054 334,976 30,357 1,155,316 178,543 1,333,859 0 18,936 18,936
May 97,254 178,437 605,288 374,348 33,928 1,289,255 204,447 1,493,702 0 20,385 20,385 June 107,702 196,588 685,389 413,186 37,347 1,440,213 204,461 1,644,673 0 30,348 30,348
TOTAL
TAX REVENUEFISCAL YEAR
Import Duty Excise Duty
Income Tax VAT
REVENUE AND GRANTS
GRANTSNON-TAX REVENUE
TOTAL REVENUE Project
Grants Total GrantsProgramme Grants
OTHER TAX
REVENUE
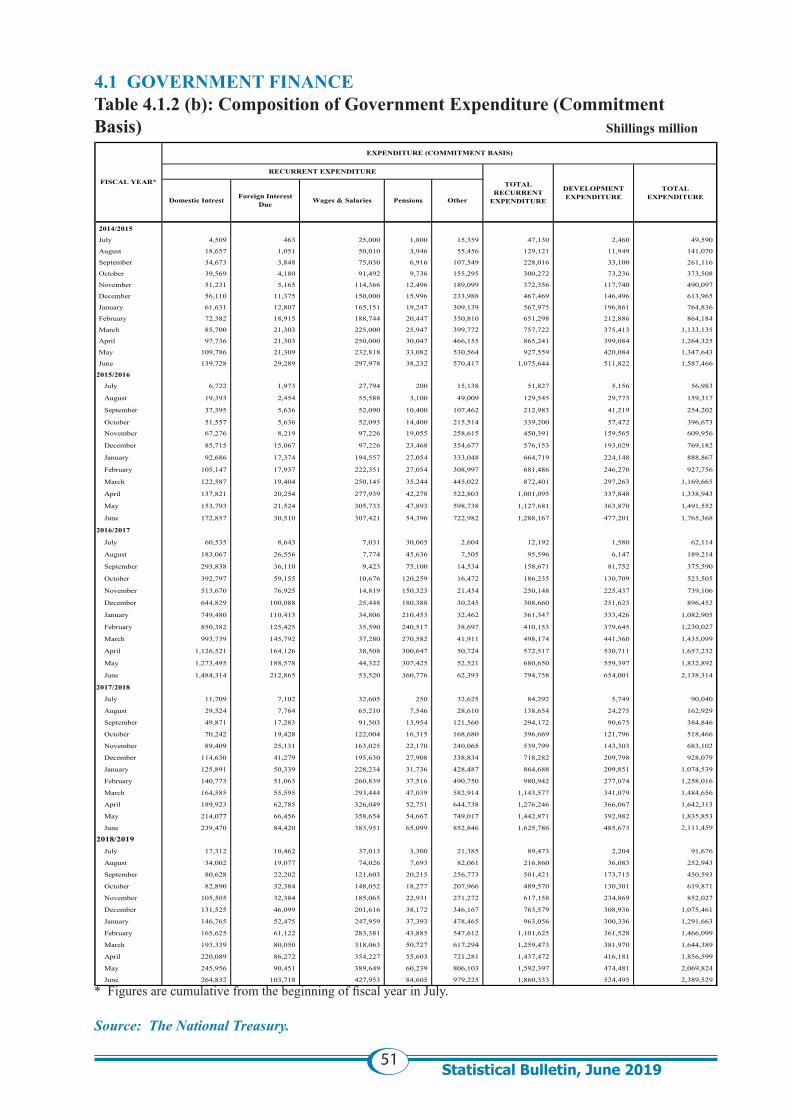
51Statistical Bulletin, June 2019
4.1 GOVERNMENT FINANCETable 4.1.2 (b): Composition of Government Expenditure (Commitment Basis) Shillings million
* Figures are cumulative from the beginning of fiscal year in July.
Source: The National Treasury.
2014/2015
July 4,509 463 25,000 1,800 15,359 47,130 2,460 49,590
August 18,657 1,051 50,010 3,946 55,456 129,121 11,949 141,070
September 34,673 3,848 75,030 6,916 107,549 228,016 33,100 261,116
October 39,569 4,180 91,492 9,736 155,295 300,272 73,236 373,508
November 51,231 5,165 114,366 12,496 189,099 372,356 117,740 490,097
December 56,110 11,375 150,000 15,996 233,988 467,469 146,496 613,965
January 61,631 12,807 165,151 19,247 309,139 567,975 196,861 764,836
February 72,382 18,915 188,744 20,447 350,810 651,298 212,886 864,184
March 85,700 21,303 225,000 25,947 399,772 757,722 375,413 1,133,135
April 97,736 21,303 250,000 30,047 466,155 865,241 399,084 1,264,325
May 109,786 21,309 232,818 33,082 530,564 927,559 420,084 1,347,643
June 139,728 29,289 297,978 38,232 570,417 1,075,644 511,822 1,587,466
2015/2016
July 6,722 1,973 27,794 200 15,138 51,827 5,156 56,983
August 19,393 2,454 55,588 3,100 49,009 129,545 29,773 159,317
September 37,395 5,636 52,090 10,400 107,462 212,983 41,219 254,202
October 51,557 5,636 52,093 14,400 215,514 339,200 57,472 396,673
November 67,276 8,219 97,226 19,055 258,615 450,391 159,565 609,956
December 85,715 15,067 97,226 23,468 354,677 576,153 193,029 769,182
January 92,686 17,374 194,557 27,054 333,048 664,719 224,148 888,867
February 105,147 17,937 222,351 27,054 308,997 681,486 246,270 927,756
March 122,587 19,404 250,145 35,244 445,022 872,401 297,263 1,169,665
April 137,821 20,254 277,939 42,278 522,803 1,001,095 337,848 1,338,943
May 153,793 21,524 305,733 47,893 598,738 1,127,681 363,870 1,491,552
June 172,857 30,510 307,421 54,396 722,982 1,288,167 477,201 1,765,368
2016/2017
July 60,535 8,643 7,031 30,065 2,604 12,192 1,580 62,114
August 183,067 26,556 7,774 45,636 7,505 95,596 6,147 189,214
September 293,838 36,110 9,423 75,100 14,534 158,671 81,752 375,590
October 392,797 59,155 10,676 120,259 16,472 186,235 130,709 523,505
November 513,670 76,925 14,819 150,323 21,454 250,148 225,437 739,106
December 644,829 100,088 25,448 180,388 30,245 308,660 251,623 896,452
January 749,480 110,413 34,806 210,453 32,462 361,347 333,426 1,082,905
February 850,382 125,425 35,590 240,517 38,697 410,153 379,645 1,230,027
March 993,739 145,792 37,280 270,582 41,911 498,174 441,360 1,435,099
April 1,126,521 164,126 38,508 300,647 50,724 572,517 530,711 1,657,232
May 1,273,495 188,578 44,322 307,425 52,521 680,650 559,397 1,832,892
June 1,484,314 212,865 53,520 360,776 62,393 794,758 654,001 2,138,314
2017/2018
July 11,709 7,102 32,605 250 32,625 84,292 5,749 90,040
August 29,524 7,764 65,210 7,546 28,610 138,654 24,275 162,929
September 49,871 17,283 91,503 13,954 121,560 294,172 90,675 384,846
October 70,242 19,428 122,004 16,315 168,680 396,669 121,796 518,466
November 89,409 25,131 163,025 22,170 240,065 539,799 143,303 683,102
December 114,630 41,279 195,630 27,908 338,834 718,282 209,798 928,079
January 125,891 50,339 228,234 31,736 428,487 864,688 209,851 1,074,539
February 140,773 51,063 260,839 37,516 490,750 980,942 277,074 1,258,016
March 164,585 55,595 293,444 47,039 582,914 1,143,577 341,079 1,484,656
April 189,923 62,785 326,049 52,751 644,738 1,276,246 366,067 1,642,313
May 214,077 66,456 358,654 54,667 749,017 1,442,871 392,982 1,835,853
June 239,470 84,420 383,951 65,099 852,846 1,625,786 485,673 2,111,459
2018/2019July 17,312 10,462 37,013 3,300 21,385 89,473 2,204 91,676
August 34,002 19,077 74,026 7,693 82,061 216,860 36,083 252,943
September 80,628 22,202 121,603 20,215 256,773 501,421 173,715 450,593
October 82,890 32,384 148,052 18,277 207,966 489,570 130,301 619,871
November 105,505 32,384 185,065 22,931 271,272 617,158 234,869 852,027
December 131,525 46,099 201,616 38,172 346,167 763,579 308,936 1,075,461
January 146,765 52,475 247,959 37,393 478,465 963,056 300,336 1,291,663
February 165,625 61,122 283,381 43,885 547,612 1,101,625 361,528 1,466,099
March 193,339 80,050 318,063 50,727 617,294 1,259,473 381,970 1,644,389
April 220,089 86,272 354,227 55,603 721,281 1,437,472 416,181 1,856,599
May 245,956 90,451 389,649 60,239 806,103 1,592,397 474,481 2,069,824
June 264,832 103,718 427,953 84,605 979,225 1,860,333 524,495 2,389,529
FISCAL YEAR*
EXPENDITURE (COMMITMENT BASIS)
RECURRENT EXPENDITURE
DEVELOPMENT EXPENDITURE
TOTAL EXPENDITURE
TOTAL RECURRENT
EXPENDITUREDomestic Intrest Foreign Interest Due Wages & Salaries Pensions Other
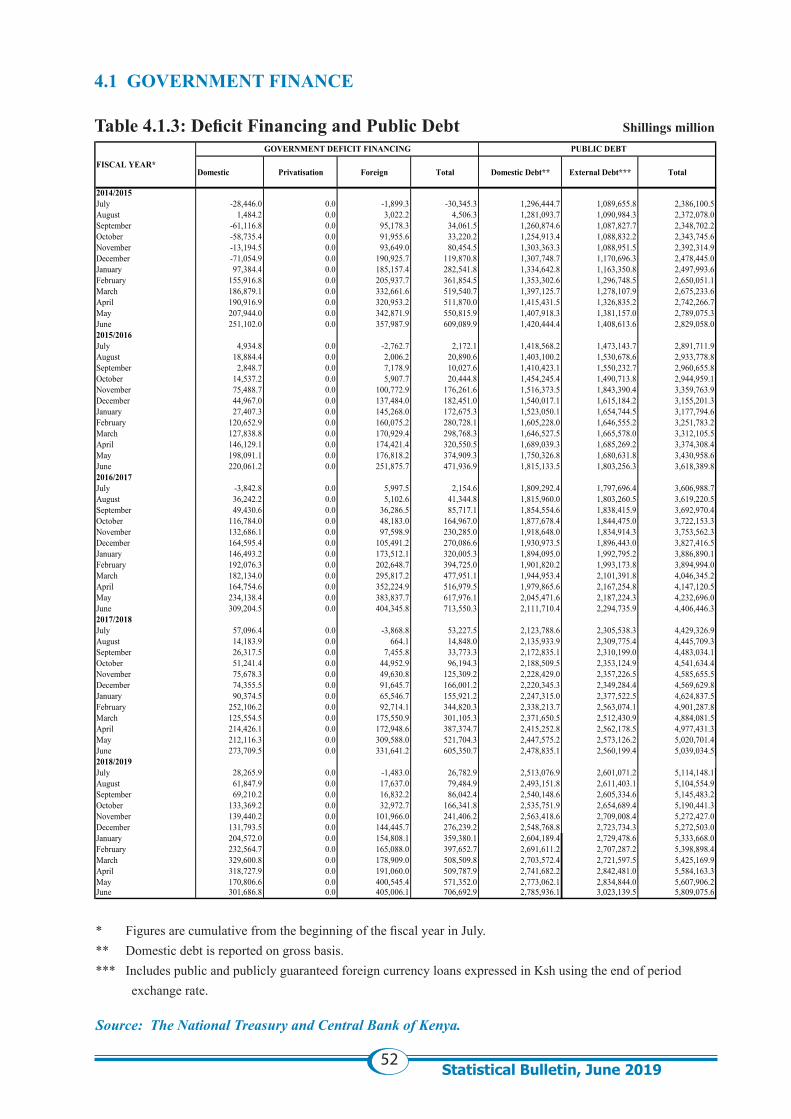
52Statistical Bulletin, June 2019
4.1 GOVERNMENT FINANCE
Table 4.1.3: Deficit Financing and Public Debt Shillings million
* Figures are cumulative from the beginning of the fiscal year in July. ** Domestic debt is reported on gross basis.*** Includes public and publicly guaranteed foreign currency loans expressed in Ksh using the end of period
exchange rate.
Source: The National Treasury and Central Bank of Kenya.
Domestic Privatisation Foreign Total Domestic Debt** External Debt*** Total
2014/2015July -28,446.0 0.0 -1,899.3 -30,345.3 1,296,444.7 1,089,655.8 2,386,100.5August 1,484.2 0.0 3,022.2 4,506.3 1,281,093.7 1,090,984.3 2,372,078.0September -61,116.8 0.0 95,178.3 34,061.5 1,260,874.6 1,087,827.7 2,348,702.2October -58,735.4 0.0 91,955.6 33,220.2 1,254,913.4 1,088,832.2 2,343,745.6November -13,194.5 0.0 93,649.0 80,454.5 1,303,363.3 1,088,951.5 2,392,314.9December -71,054.9 0.0 190,925.7 119,870.8 1,307,748.7 1,170,696.3 2,478,445.0January 97,384.4 0.0 185,157.4 282,541.8 1,334,642.8 1,163,350.8 2,497,993.6February 155,916.8 0.0 205,937.7 361,854.5 1,353,302.6 1,296,748.5 2,650,051.1March 186,879.1 0.0 332,661.6 519,540.7 1,397,125.7 1,278,107.9 2,675,233.6April 190,916.9 0.0 320,953.2 511,870.0 1,415,431.5 1,326,835.2 2,742,266.7May 207,944.0 0.0 342,871.9 550,815.9 1,407,918.3 1,381,157.0 2,789,075.3June 251,102.0 0.0 357,987.9 609,089.9 1,420,444.4 1,408,613.6 2,829,058.02015/2016July 4,934.8 0.0 -2,762.7 2,172.1 1,418,568.2 1,473,143.7 2,891,711.9August 18,884.4 0.0 2,006.2 20,890.6 1,403,100.2 1,530,678.6 2,933,778.8September 2,848.7 0.0 7,178.9 10,027.6 1,410,423.1 1,550,232.7 2,960,655.8October 14,537.2 0.0 5,907.7 20,444.8 1,454,245.4 1,490,713.8 2,944,959.1November 75,488.7 0.0 100,772.9 176,261.6 1,516,373.5 1,843,390.4 3,359,763.9December 44,967.0 0.0 137,484.0 182,451.0 1,540,017.1 1,615,184.2 3,155,201.3January 27,407.3 0.0 145,268.0 172,675.3 1,523,050.1 1,654,744.5 3,177,794.6February 120,652.9 0.0 160,075.2 280,728.1 1,605,228.0 1,646,555.2 3,251,783.2March 127,838.8 0.0 170,929.4 298,768.3 1,646,527.5 1,665,578.0 3,312,105.5April 146,129.1 0.0 174,421.4 320,550.5 1,689,039.3 1,685,269.2 3,374,308.4May 198,091.1 0.0 176,818.2 374,909.3 1,750,326.8 1,680,631.8 3,430,958.6June 220,061.2 0.0 251,875.7 471,936.9 1,815,133.5 1,803,256.3 3,618,389.82016/2017July -3,842.8 0.0 5,997.5 2,154.6 1,809,292.4 1,797,696.4 3,606,988.7August 36,242.2 0.0 5,102.6 41,344.8 1,815,960.0 1,803,260.5 3,619,220.5September 49,430.6 0.0 36,286.5 85,717.1 1,854,554.6 1,838,415.9 3,692,970.4October 116,784.0 0.0 48,183.0 164,967.0 1,877,678.4 1,844,475.0 3,722,153.3November 132,686.1 0.0 97,598.9 230,285.0 1,918,648.0 1,834,914.3 3,753,562.3December 164,595.4 0.0 105,491.2 270,086.6 1,930,973.5 1,896,443.0 3,827,416.5January 146,493.2 0.0 173,512.1 320,005.3 1,894,095.0 1,992,795.2 3,886,890.1February 192,076.3 0.0 202,648.7 394,725.0 1,901,820.2 1,993,173.8 3,894,994.0March 182,134.0 0.0 295,817.2 477,951.1 1,944,953.4 2,101,391.8 4,046,345.2April 164,754.6 0.0 352,224.9 516,979.5 1,979,865.6 2,167,254.8 4,147,120.5May 234,138.4 0.0 383,837.7 617,976.1 2,045,471.6 2,187,224.3 4,232,696.0June 309,204.5 0.0 404,345.8 713,550.3 2,111,710.4 2,294,735.9 4,406,446.32017/2018July 57,096.4 0.0 -3,868.8 53,227.5 2,123,788.6 2,305,538.3 4,429,326.9August 14,183.9 0.0 664.1 14,848.0 2,135,933.9 2,309,775.4 4,445,709.3September 26,317.5 0.0 7,455.8 33,773.3 2,172,835.1 2,310,199.0 4,483,034.1October 51,241.4 0.0 44,952.9 96,194.3 2,188,509.5 2,353,124.9 4,541,634.4November 75,678.3 0.0 49,630.8 125,309.2 2,228,429.0 2,357,226.5 4,585,655.5December 74,355.5 0.0 91,645.7 166,001.2 2,220,345.3 2,349,284.4 4,569,629.8January 90,374.5 0.0 65,546.7 155,921.2 2,247,315.0 2,377,522.5 4,624,837.5February 252,106.2 0.0 92,714.1 344,820.3 2,338,213.7 2,563,074.1 4,901,287.8March 125,554.5 0.0 175,550.9 301,105.3 2,371,650.5 2,512,430.9 4,884,081.5April 214,426.1 0.0 172,948.6 387,374.7 2,415,252.8 2,562,178.5 4,977,431.3May 212,116.3 0.0 309,588.0 521,704.3 2,447,575.2 2,573,126.2 5,020,701.4June 273,709.5 0.0 331,641.2 605,350.7 2,478,835.1 2,560,199.4 5,039,034.52018/2019July 28,265.9 0.0 -1,483.0 26,782.9 2,513,076.9 2,601,071.2 5,114,148.1August 61,847.9 0.0 17,637.0 79,484.9 2,493,151.8 2,611,403.1 5,104,554.9September 69,210.2 0.0 16,832.2 86,042.4 2,540,148.6 2,605,334.6 5,145,483.2October 133,369.2 0.0 32,972.7 166,341.8 2,535,751.9 2,654,689.4 5,190,441.3November 139,440.2 0.0 101,966.0 241,406.2 2,563,418.6 2,709,008.4 5,272,427.0December 131,793.5 0.0 144,445.7 276,239.2 2,548,768.8 2,723,734.3 5,272,503.0January 204,572.0 0.0 154,808.1 359,380.1 2,604,189.4 2,729,478.6 5,333,668.0February 232,564.7 0.0 165,088.0 397,652.7 2,691,611.2 2,707,287.2 5,398,898.4March 329,600.8 0.0 178,909.0 508,509.8 2,703,572.4 2,721,597.5 5,425,169.9April 318,727.9 0.0 191,060.0 509,787.9 2,741,682.2 2,842,481.0 5,584,163.3May 170,806.6 0.0 400,545.4 571,352.0 2,773,062.1 2,834,844.0 5,607,906.2June 301,686.8 0.0 405,006.1 706,692.9 2,785,936.1 3,023,139.5 5,809,075.6
GOVERNMENT DEFICIT FINANCING PUBLIC DEBT
FISCAL YEAR*
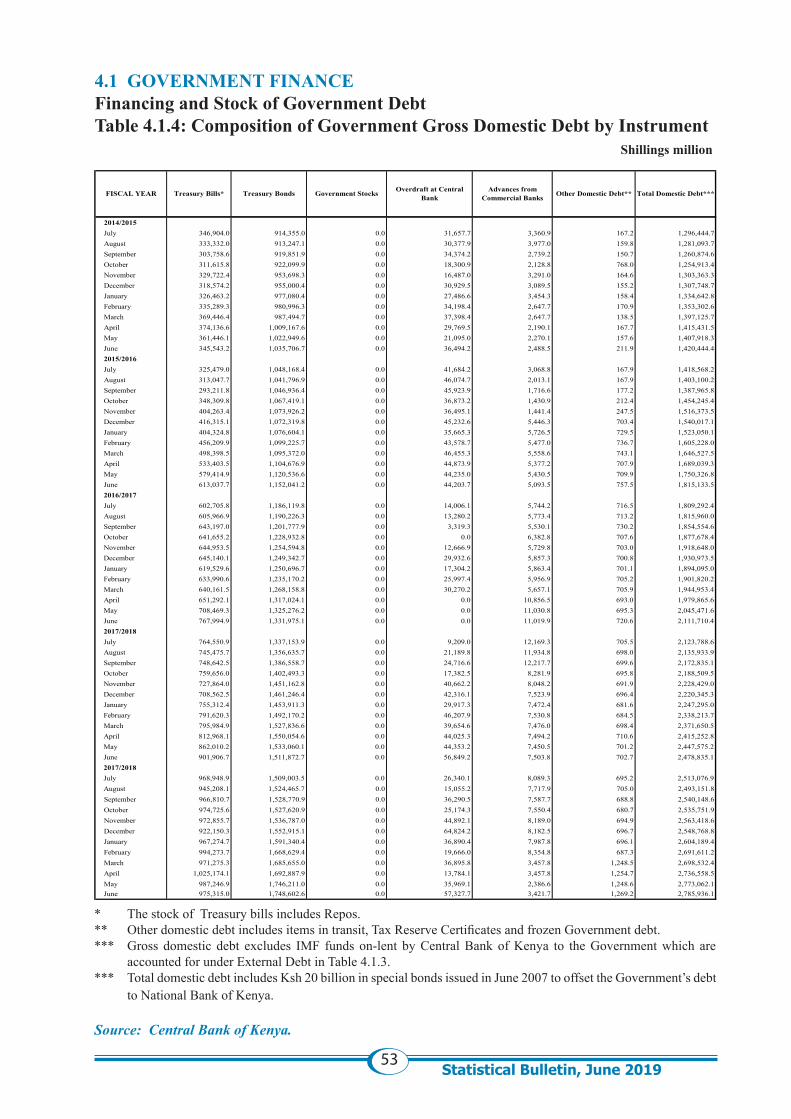
53Statistical Bulletin, June 2019
4.1 GOVERNMENT FINANCEFinancing and Stock of Government DebtTable 4.1.4: Composition of Government Gross Domestic Debt by Instrument Shillings million
* The stock of Treasury bills includes Repos. ** Other domestic debt includes items in transit, Tax Reserve Certificates and frozen Government debt.*** Gross domestic debt excludes IMF funds on-lent by Central Bank of Kenya to the Government which are
accounted for under External Debt in Table 4.1.3. *** Total domestic debt includes Ksh 20 billion in special bonds issued in June 2007 to offset the Government’s debt
to National Bank of Kenya.
Source: Central Bank of Kenya.
2014/2015July 346,904.0 914,355.0 0.0 31,657.7 3,360.9 167.2 1,296,444.7August 333,332.0 913,247.1 0.0 30,377.9 3,977.0 159.8 1,281,093.7September 303,758.6 919,851.9 0.0 34,374.2 2,739.2 150.7 1,260,874.6October 311,615.8 922,099.9 0.0 18,300.9 2,128.8 768.0 1,254,913.4November 329,722.4 953,698.3 0.0 16,487.0 3,291.0 164.6 1,303,363.3December 318,574.2 955,000.4 0.0 30,929.5 3,089.5 155.2 1,307,748.7January 326,463.2 977,080.4 0.0 27,486.6 3,454.3 158.4 1,334,642.8February 335,289.3 980,996.3 0.0 34,198.4 2,647.7 170.9 1,353,302.6March 369,446.4 987,494.7 0.0 37,398.4 2,647.7 138.5 1,397,125.7April 374,136.6 1,009,167.6 0.0 29,769.5 2,190.1 167.7 1,415,431.5May 361,446.1 1,022,949.6 0.0 21,095.0 2,270.1 157.6 1,407,918.3June 345,543.2 1,035,706.7 0.0 36,494.2 2,488.5 211.9 1,420,444.42015/2016July 325,479.0 1,048,168.4 0.0 41,684.2 3,068.8 167.9 1,418,568.2August 313,047.7 1,041,796.9 0.0 46,074.7 2,013.1 167.9 1,403,100.2September 293,211.8 1,046,936.4 0.0 45,923.9 1,716.6 177.2 1,387,965.8October 348,309.8 1,067,419.1 0.0 36,873.2 1,430.9 212.4 1,454,245.4November 404,263.4 1,073,926.2 0.0 36,495.1 1,441.4 247.5 1,516,373.5December 416,315.1 1,072,319.8 0.0 45,232.6 5,446.3 703.4 1,540,017.1January 404,324.8 1,076,604.1 0.0 35,665.3 5,726.5 729.5 1,523,050.1February 456,209.9 1,099,225.7 0.0 43,578.7 5,477.0 736.7 1,605,228.0March 498,398.5 1,095,372.0 0.0 46,455.3 5,558.6 743.1 1,646,527.5April 533,403.5 1,104,676.9 0.0 44,873.9 5,377.2 707.9 1,689,039.3May 579,414.9 1,120,536.6 0.0 44,235.0 5,430.5 709.9 1,750,326.8June 613,037.7 1,152,041.2 0.0 44,203.7 5,093.5 757.5 1,815,133.52016/2017July 602,705.8 1,186,119.8 0.0 14,006.1 5,744.2 716.5 1,809,292.4August 605,966.9 1,190,226.3 0.0 13,280.2 5,773.4 713.2 1,815,960.0September 643,197.0 1,201,777.9 0.0 3,319.3 5,530.1 730.2 1,854,554.6October 641,655.2 1,228,932.8 0.0 0.0 6,382.8 707.6 1,877,678.4November 644,953.5 1,254,594.8 0.0 12,666.9 5,729.8 703.0 1,918,648.0December 645,140.1 1,249,342.7 0.0 29,932.6 5,857.3 700.8 1,930,973.5January 619,529.6 1,250,696.7 0.0 17,304.2 5,863.4 701.1 1,894,095.0February 633,990.6 1,235,170.2 0.0 25,997.4 5,956.9 705.2 1,901,820.2March 640,161.5 1,268,158.8 0.0 30,270.2 5,657.1 705.9 1,944,953.4April 651,292.1 1,317,024.1 0.0 0.0 10,856.5 693.0 1,979,865.6May 708,469.3 1,325,276.2 0.0 0.0 11,030.8 695.3 2,045,471.6June 767,994.9 1,331,975.1 0.0 0.0 11,019.9 720.6 2,111,710.42017/2018July 764,550.9 1,337,153.9 0.0 9,209.0 12,169.3 705.5 2,123,788.6August 745,475.7 1,356,635.7 0.0 21,189.8 11,934.8 698.0 2,135,933.9September 748,642.5 1,386,558.7 0.0 24,716.6 12,217.7 699.6 2,172,835.1October 759,656.0 1,402,493.3 0.0 17,382.5 8,281.9 695.8 2,188,509.5November 727,864.0 1,451,162.8 0.0 40,662.2 8,048.2 691.9 2,228,429.0December 708,562.5 1,461,246.4 0.0 42,316.1 7,523.9 696.4 2,220,345.3January 755,312.4 1,453,911.3 0.0 29,917.3 7,472.4 681.6 2,247,295.0February 791,620.3 1,492,170.2 0.0 46,207.9 7,530.8 684.5 2,338,213.7March 795,984.9 1,527,836.6 0.0 39,654.6 7,476.0 698.4 2,371,650.5April 812,968.1 1,550,054.6 0.0 44,025.3 7,494.2 710.6 2,415,252.8May 862,010.2 1,533,060.1 0.0 44,353.2 7,450.5 701.2 2,447,575.2June 901,906.7 1,511,872.7 0.0 56,849.2 7,503.8 702.7 2,478,835.12017/2018July 968,948.9 1,509,003.5 0.0 26,340.1 8,089.3 695.2 2,513,076.9August 945,208.1 1,524,465.7 0.0 15,055.2 7,717.9 705.0 2,493,151.8September 966,810.7 1,528,770.9 0.0 36,290.5 7,587.7 688.8 2,540,148.6October 974,725.6 1,527,620.9 0.0 25,174.3 7,550.4 680.7 2,535,751.9November 972,855.7 1,536,787.0 0.0 44,892.1 8,189.0 694.9 2,563,418.6December 922,150.3 1,552,915.1 0.0 64,824.2 8,182.5 696.7 2,548,768.8January 967,274.7 1,591,340.4 0.0 36,890.4 7,987.8 696.1 2,604,189.4February 994,273.7 1,668,629.4 0.0 19,666.0 8,354.8 687.3 2,691,611.2March 971,275.3 1,685,655.0 0.0 36,895.8 3,457.8 1,248.5 2,698,532.4April 1,025,174.1 1,692,887.9 0.0 13,784.1 3,457.8 1,254.7 2,736,558.5May 987,246.9 1,746,211.0 0.0 35,969.1 2,386.6 1,248.6 2,773,062.1June 975,315.0 1,748,602.6 0.0 57,327.7 3,421.7 1,269.2 2,785,936.1
FISCAL YEAR Total Domestic Debt***Treasury Bills* Treasury Bonds Government Stocks Overdraft at Central Bank
Advances from Commercial Banks Other Domestic Debt**
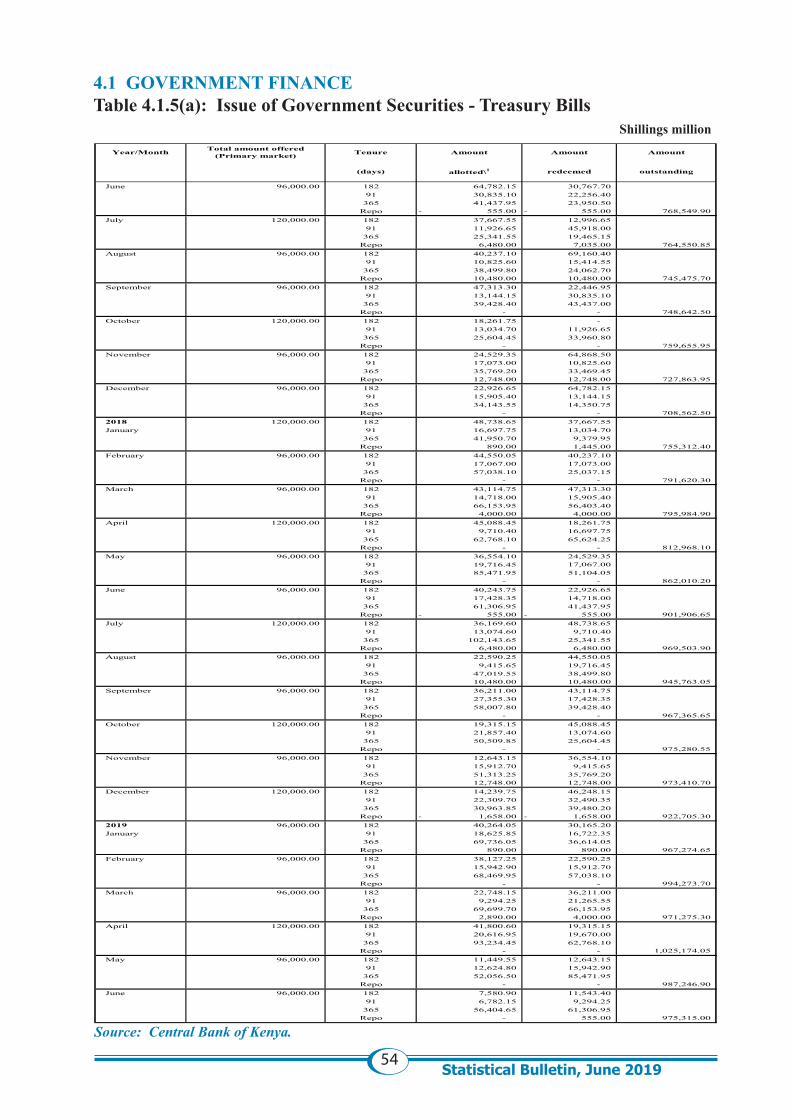
54Statistical Bulletin, June 2019
4.1 GOVERNMENT FINANCETable 4.1.5(a): Issue of Government Securities - Treasury Bills Shillings million
Source: Central Bank of Kenya.
Year/Month Total amount offered (Primary market) Tenure Amount Amount Amount
(days) allotted\1 redeemed outstanding
June 96,000.00 182 64,782.15 30,767.70 91 30,835.10 22,256.40
365 41,437.95 23,950.50 Repo 555.00- 555.00- 768,549.90
July 120,000.00 182 37,667.55 12,996.65 91 11,926.65 45,918.00
365 25,341.55 19,465.15 Repo 6,480.00 7,035.00 764,550.85
August 96,000.00 182 40,237.10 69,160.40 91 10,825.60 15,414.55
365 38,499.80 24,062.70 Repo 10,480.00 10,480.00 745,475.70
September 96,000.00 182 47,313.30 22,446.95 91 13,144.15 30,835.10
365 39,428.40 43,437.00 Repo - - 748,642.50
October 120,000.00 182 18,261.75 - 91 13,034.70 11,926.65
365 25,604.45 33,960.80 Repo - - 759,655.95
November 96,000.00 182 24,529.35 64,868.50 91 17,073.00 10,825.60
365 35,769.20 33,469.45 Repo 12,748.00 12,748.00 727,863.95
December 96,000.00 182 22,926.65 64,782.15 91 15,905.40 13,144.15
365 34,143.55 14,350.75 Repo - - 708,562.50
2018 120,000.00 182 48,738.65 37,667.55 January 91 16,697.75 13,034.70
365 41,950.70 9,379.95 Repo 890.00 1,445.00 755,312.40
February 96,000.00 182 44,550.05 40,237.10 91 17,067.00 17,073.00
365 57,038.10 25,037.15 Repo - - 791,620.30
March 96,000.00 182 43,114.75 47,313.30 91 14,718.00 15,905.40
365 66,153.95 56,403.40 Repo 4,000.00 4,000.00 795,984.90
April 120,000.00 182 45,088.45 18,261.75 91 9,710.40 16,697.75
365 62,768.10 65,624.25 Repo - - 812,968.10
May 96,000.00 182 36,554.10 24,529.35 91 19,716.45 17,067.00
365 85,471.95 51,104.05 Repo - - 862,010.20
June 96,000.00 182 40,243.75 22,926.65 91 17,428.35 14,718.00
365 61,306.95 41,437.95 Repo 555.00- 555.00- 901,906.65
July 120,000.00 182 36,169.60 48,738.65 91 13,074.60 9,710.40
365 102,143.65 25,341.55 Repo 6,480.00 6,480.00 969,503.90
August 96,000.00 182 22,590.25 44,550.05 91 9,415.65 19,716.45
365 47,019.55 38,499.80 Repo 10,480.00 10,480.00 945,763.05
September 96,000.00 182 36,211.00 43,114.75 91 27,355.30 17,428.35
365 58,007.80 39,428.40 Repo - - 967,365.65
October 120,000.00 182 19,315.15 45,088.45 91 21,857.40 13,074.60
365 50,509.85 25,604.45 Repo - - 975,280.55
November 96,000.00 182 12,643.15 36,554.10 91 15,912.70 9,415.65
365 51,313.25 35,769.20 Repo 12,748.00 12,748.00 973,410.70
December 120,000.00 182 14,239.75 46,248.15 91 22,309.70 32,490.35
365 30,963.85 39,480.20 Repo 1,658.00- 1,658.00- 922,705.30
2019 96,000.00 182 40,264.05 30,165.20 January 91 18,625.85 16,722.35
365 69,736.05 36,614.05 Repo 890.00 890.00 967,274.65
February 96,000.00 182 38,127.25 22,590.25 91 15,942.90 15,912.70
365 68,469.95 57,038.10 Repo - - 994,273.70
March 96,000.00 182 22,748.15 36,211.00 91 9,294.25 21,265.55
365 69,699.70 66,153.95 Repo 2,890.00 4,000.00 971,275.30
April 120,000.00 182 41,800.60 19,315.15 91 20,616.95 19,670.00
365 93,234.45 62,768.10 Repo - - 1,025,174.05
May 96,000.00 182 11,449.55 12,643.15 91 12,624.80 15,942.90
365 52,056.50 85,471.95 Repo - - 987,246.90
June 96,000.00 182 7,580.90 11,543.40 91 6,782.15 9,294.25
365 56,404.65 61,306.95 Repo - 555.00 975,315.00
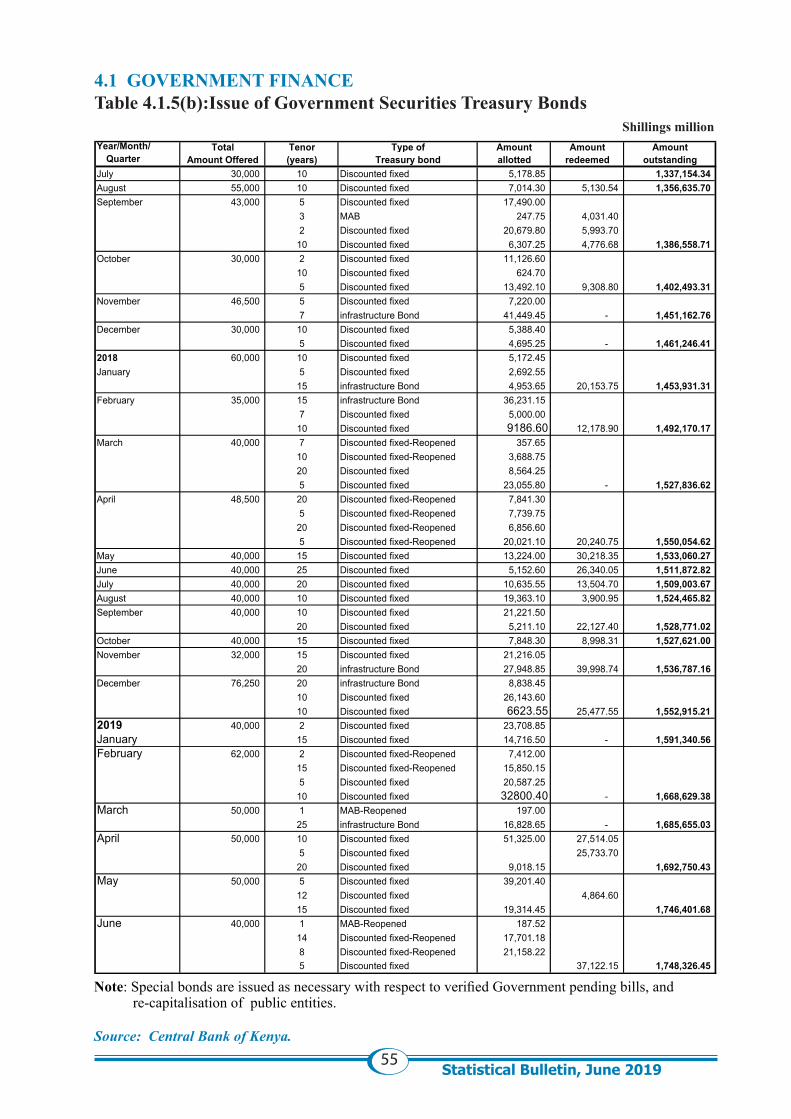
55Statistical Bulletin, June 2019
4.1 GOVERNMENT FINANCETable 4.1.5(b):Issue of Government Securities Treasury Bonds Shillings million
Note: Special bonds are issued as necessary with respect to verified Government pending bills, and re-capitalisation of public entities.
Source: Central Bank of Kenya.
Year/Month/ Total Tenor Type of Amount Amount AmountQuarter Amount Offered (years) Treasury bond allotted redeemed outstanding
July 30,000 10 Discounted fixed 5,178.85 1,337,154.34 August 55,000 10 Discounted fixed 7,014.30 5,130.54 1,356,635.70 September 43,000 5 Discounted fixed 17,490.00
3 MAB 247.75 4,031.40 2 Discounted fixed 20,679.80 5,993.70
10 Discounted fixed 6,307.25 4,776.68 1,386,558.71 October 30,000 2 Discounted fixed 11,126.60
10 Discounted fixed 624.70 5 Discounted fixed 13,492.10 9,308.80 1,402,493.31
November 46,500 5 Discounted fixed 7,220.00 7 infrastructure Bond 41,449.45 - 1,451,162.76
December 30,000 10 Discounted fixed 5,388.40 5 Discounted fixed 4,695.25 - 1,461,246.41
2018 60,000 10 Discounted fixed 5,172.45 January 5 Discounted fixed 2,692.55
15 infrastructure Bond 4,953.65 20,153.75 1,453,931.31 February 35,000 15 infrastructure Bond 36,231.15
7 Discounted fixed 5,000.00 10 Discounted fixed 9186.60 12,178.90 1,492,170.17
March 40,000 7 Discounted fixed-Reopened 357.65 10 Discounted fixed-Reopened 3,688.75 20 Discounted fixed 8,564.25 5 Discounted fixed 23,055.80 - 1,527,836.62
April 48,500 20 Discounted fixed-Reopened 7,841.30 5 Discounted fixed-Reopened 7,739.75
20 Discounted fixed-Reopened 6,856.60 5 Discounted fixed-Reopened 20,021.10 20,240.75 1,550,054.62
May 40,000 15 Discounted fixed 13,224.00 30,218.35 1,533,060.27 June 40,000 25 Discounted fixed 5,152.60 26,340.05 1,511,872.82 July 40,000 20 Discounted fixed 10,635.55 13,504.70 1,509,003.67 August 40,000 10 Discounted fixed 19,363.10 3,900.95 1,524,465.82 September 40,000 10 Discounted fixed 21,221.50
20 Discounted fixed 5,211.10 22,127.40 1,528,771.02 October 40,000 15 Discounted fixed 7,848.30 8,998.31 1,527,621.00 November 32,000 15 Discounted fixed 21,216.05
20 infrastructure Bond 27,948.85 39,998.74 1,536,787.16 December 76,250 20 infrastructure Bond 8,838.45
10 Discounted fixed 26,143.60 10 Discounted fixed 6623.55 25,477.55 1,552,915.21
2019 40,000 2 Discounted fixed 23,708.85 January 15 Discounted fixed 14,716.50 - 1,591,340.56 February 62,000 2 Discounted fixed-Reopened 7,412.00
15 Discounted fixed-Reopened 15,850.15 5 Discounted fixed 20,587.25
10 Discounted fixed 32800.40 - 1,668,629.38 March 50,000 1 MAB-Reopened 197.00
25 infrastructure Bond 16,828.65 - 1,685,655.03 April 50,000 10 Discounted fixed 51,325.00 27,514.05
5 Discounted fixed 25,733.70 20 Discounted fixed 9,018.15 1,692,750.43
May 50,000 5 Discounted fixed 39,201.40 12 Discounted fixed 4,864.60 15 Discounted fixed 19,314.45 1,746,401.68
June 40,000 1 MAB-Reopened 187.52 14 Discounted fixed-Reopened 17,701.18 8 Discounted fixed-Reopened 21,158.22 5 Discounted fixed 37,122.15 1,748,326.45
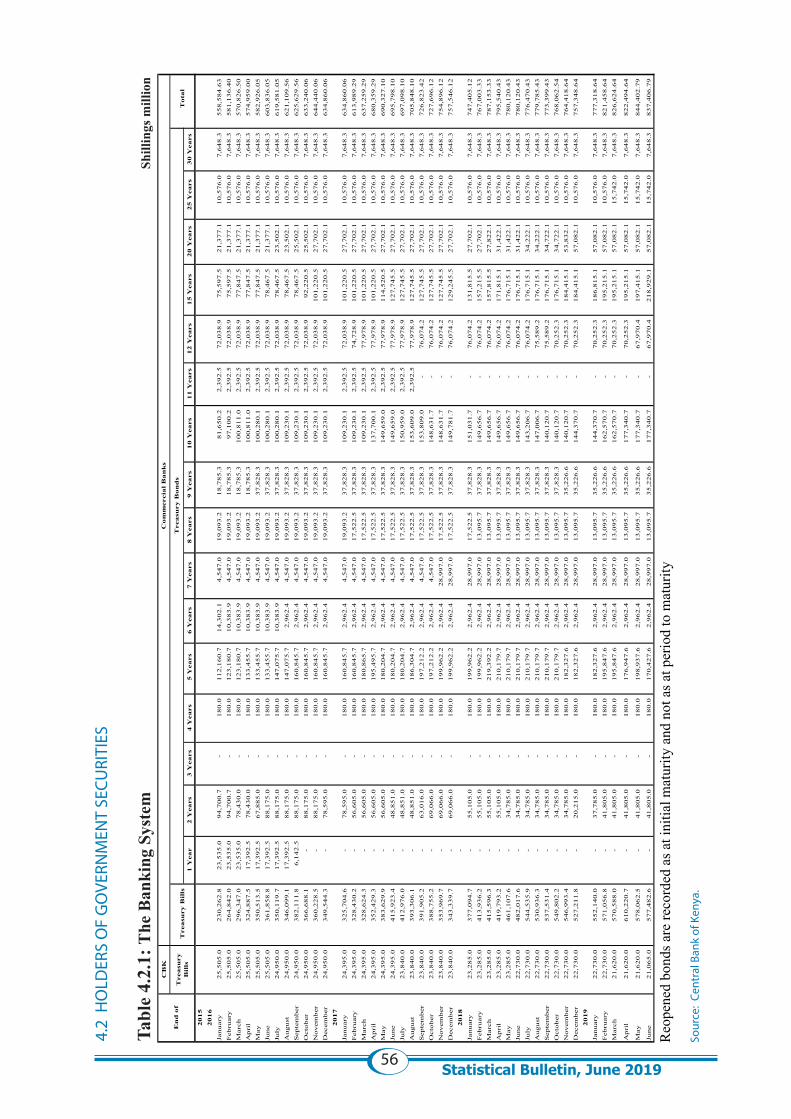
56Statistical Bulletin, June 2019
4.2
HO
LDER
S O
F G
OVE
RNM
ENT
SECU
RITI
ES
Tabl
e 4.
2.1:
The
Ban
king
Sys
tem
Shi
lling
s mill
ion
Reo
pene
d bo
nds a
re re
cord
ed a
s at i
nitia
l mat
urity
and
not
as a
t per
iod
to m
atur
ity
Sour
ce:
Cent
ral B
ank
of K
enya
.
CB
K
1 Y
ear
2 Y
ears
3 Y
ears
4 Y
ears
5 Y
ears
6 Y
ears
7 Y
ears
8 Y
ears
9 Y
ears
10
Yea
rs1
1 Y
ears
12
Yea
rs1
5 Y
ears
20
Yea
rs2
5 Y
ears
30
Yea
rs
20
15
20
16
Jan
uar
y2
5,5
05
.0
23
0,2
62
.8
23
,53
5.0
9
4,7
00
.7
-
18
0.0
11
2,1
60
.7
14
,30
2.1
4,5
47
.0
1
9,0
93
.2
1
8,7
85
.3
81
,65
0.2
2
,39
2.5
7
2,0
38
.9
75
,59
7.5
21
,37
7.1
10
,57
6.0
7
,64
8.3
5
58
,58
4.6
3
F
ebru
ary
25
,50
5.0
2
64
,84
2.0
2
3,5
35
.0
94
,70
0.7
-
1
80
.0
1
23
,18
0.7
1
0,3
83
.9
4
,54
7.0
19
,09
3.2
18
,78
5.3
9
7,1
00
.2
2,3
92
.5
72
,03
8.9
7
5,5
97
.5
2
1,3
77
.1
1
0,5
76
.0
7,6
48
.3
58
1,1
36
.40
Mar
ch2
5,5
05
.0
29
6,3
47
.0
23
,53
5.0
7
8,4
30
.0
-
18
0.0
12
3,1
80
.7
10
,38
3.9
4,5
47
.0
1
9,0
93
.2
1
8,7
85
.3
10
0,8
11
.0
2
,39
2.5
7
2,0
38
.9
77
,84
7.5
21
,37
7.1
10
,57
6.0
7
,64
8.3
5
70
,82
6.5
0
A
pri
l2
5,5
05
.0
32
4,8
87
.5
17
,39
2.5
7
8,4
30
.0
-
18
0.0
13
3,4
55
.7
10
,38
3.9
4,5
47
.0
1
9,0
93
.2
1
8,7
85
.3
10
0,8
11
.0
2
,39
2.5
7
2,0
38
.9
77
,84
7.5
21
,37
7.1
10
,57
6.0
7
,64
8.3
5
74
,95
9.0
0
M
ay2
5,5
05
.0
35
0,5
13
.5
17
,39
2.5
6
7,8
85
.0
-
18
0.0
13
3,4
55
.7
10
,38
3.9
4,5
47
.0
1
9,0
93
.2
3
7,8
28
.3
10
0,2
80
.1
2
,39
2.5
7
2,0
38
.9
77
,84
7.5
21
,37
7.1
10
,57
6.0
7
,64
8.3
5
82
,92
6.0
5
Ju
ne
25
,50
5.0
3
61
,85
8.8
1
7,3
92
.5
88
,17
5.0
-
1
80
.0
1
33
,45
5.7
1
0,3
83
.9
4
,54
7.0
19
,09
3.2
37
,82
8.3
1
00
,28
0.1
2,3
92
.5
72
,03
8.9
7
8,4
67
.5
2
1,3
77
.1
1
0,5
76
.0
7,6
48
.3
60
3,8
36
.05
July
24
,95
0.0
3
50
,11
9.7
1
7,3
92
.5
88
,17
5.0
-
1
80
.0
1
47
,07
5.7
1
0,3
83
.9
4
,54
7.0
19
,09
3.2
37
,82
8.3
1
00
,28
0.1
2,3
92
.5
72
,03
8.9
7
8,4
67
.5
2
3,5
02
.1
1
0,5
76
.0
7,6
48
.3
61
9,5
81
.05
Au
gu
st2
4,9
50
.0
34
6,0
99
.1
17
,39
2.5
8
8,1
75
.0
-
18
0.0
14
7,0
75
.7
2,9
62
.4
4,5
47
.0
1
9,0
93
.2
3
7,8
28
.3
10
9,2
30
.1
2
,39
2.5
7
2,0
38
.9
78
,46
7.5
23
,50
2.1
10
,57
6.0
7
,64
8.3
6
21
,10
9.5
6
S
epte
mb
er2
4,9
50
.0
38
2,1
11
.8
6,1
42
.5
8
8,1
75
.0
-
18
0.0
16
0,8
45
.7
2,9
62
.4
4,5
47
.0
1
9,0
93
.2
3
7,8
28
.3
10
9,2
30
.1
2
,39
2.5
7
2,0
38
.9
78
,46
7.5
25
,50
2.1
10
,57
6.0
7
,64
8.3
6
25
,62
9.5
6
O
ctob
er2
4,9
50
.0
36
6,6
88
.1
-
88
,17
5.0
-
1
80
.0
1
60
,84
5.7
2
,96
2.4
4
,54
7.0
19
,09
3.2
37
,82
8.3
1
09
,23
0.1
2,3
92
.5
72
,03
8.9
9
2,2
20
.5
2
5,5
02
.1
1
0,5
76
.0
7,6
48
.3
63
3,2
40
.06
Novem
ber
24
,95
0.0
3
60
,22
8.5
-
8
8,1
75
.0
-
18
0.0
16
0,8
45
.7
2,9
62
.4
4,5
47
.0
1
9,0
93
.2
3
7,8
28
.3
10
9,2
30
.1
2
,39
2.5
7
2,0
38
.9
10
1,2
20
.5
27
,70
2.1
10
,57
6.0
7
,64
8.3
6
44
,44
0.0
6
D
ecem
ber
24
,95
0.0
3
49
,54
4.3
-
7
8,5
95
.0
-
18
0.0
16
0,8
45
.7
2,9
62
.4
4,5
47
.0
1
9,0
93
.2
3
7,8
28
.3
10
9,2
30
.1
2
,39
2.5
7
2,0
38
.9
10
1,2
20
.5
27
,70
2.1
10
,57
6.0
7
,64
8.3
6
34
,86
0.0
6
2
01
7Ja
nu
ary
24
,39
5.0
3
25
,70
4.6
-
7
8,5
95
.0
-
18
0.0
16
0,8
45
.7
2,9
62
.4
4,5
47
.0
1
9,0
93
.2
3
7,8
28
.3
10
9,2
30
.1
2
,39
2.5
7
2,0
38
.9
10
1,2
20
.5
27
,70
2.1
10
,57
6.0
7
,64
8.3
6
34
,86
0.0
6
F
ebru
ary
24
,39
5.0
3
28
,43
0.2
-
5
6,6
05
.0
-
18
0.0
16
0,8
45
.7
2,9
62
.4
4,5
47
.0
1
7,5
22
.5
3
7,8
28
.3
10
9,2
30
.1
2
,39
2.5
7
4,7
28
.9
10
1,2
20
.5
27
,70
2.1
10
,57
6.0
7
,64
8.3
6
13
,98
9.2
9
M
arch
24
,39
5.0
3
28
,62
4.3
-
5
6,6
05
.0
-
18
0.0
18
0,8
65
.7
2,9
62
.4
4,5
47
.0
1
7,5
22
.5
3
7,8
28
.3
10
9,2
30
.1
2
,39
2.5
7
7,9
78
.9
10
1,2
20
.5
27
,70
2.1
10
,57
6.0
7
,64
8.3
6
37
,25
9.2
9
A
pri
l2
4,3
95
.0
35
2,4
29
.3
-
56
,60
5.0
-
1
80
.0
1
95
,49
5.7
2
,96
2.4
4
,54
7.0
17
,52
2.5
37
,82
8.3
1
37
,70
0.1
2,3
92
.5
77
,97
8.9
1
01
,22
0.5
2
7,7
02
.1
1
0,5
76
.0
7,6
48
.3
68
0,3
59
.29
May
24
,39
5.0
3
83
,62
9.9
-
5
6,6
05
.0
-
18
0.0
18
0,2
04
.7
2,9
62
.4
4,5
47
.0
1
7,5
22
.5
3
7,8
28
.3
14
9,6
59
.0
2
,39
2.5
7
7,9
78
.9
11
4,5
20
.5
27
,70
2.1
10
,57
6.0
7
,64
8.3
6
90
,32
7.1
0
Ju
ne
24
,39
5.0
4
15
,92
3.4
-
4
8,8
51
.0
-
18
0.0
18
0,2
04
.7
2,9
62
.4
4,5
47
.0
1
7,5
22
.5
3
7,8
28
.3
14
9,6
59
.0
2
,39
2.5
7
7,9
78
.9
12
7,7
45
.5
27
,70
2.1
10
,57
6.0
7
,64
8.3
6
95
,79
8.1
0
Ju
ly2
3,8
40
.0
41
2,9
76
.0
-
48
,85
1.0
-
1
80
.0
1
80
,20
4.7
2
,96
2.4
4
,54
7.0
17
,52
2.5
37
,82
8.3
1
50
,95
9.0
2,3
92
.5
77
,97
8.9
1
27
,74
5.5
2
7,7
02
.1
1
0,5
76
.0
7,6
48
.3
69
7,0
98
.10
Au
gu
st2
3,8
40
.0
39
3,3
06
.1
-
48
,85
1.0
-
1
80
.0
1
86
,30
4.7
2
,96
2.4
4
,54
7.0
17
,52
2.5
37
,82
8.3
1
53
,60
9.0
2,3
92
.5
77
,97
8.9
1
27
,74
5.5
2
7,7
02
.1
1
0,5
76
.0
7,6
48
.3
70
5,8
48
.10
Sep
tem
ber
23
,84
0.0
3
91
,90
5.2
-
6
3,0
16
.0
-
18
0.0
19
7,2
12
.2
2,9
62
.4
4,5
47
.0
1
7,5
22
.5
3
7,8
28
.3
15
3,8
09
.0
-
76
,07
4.2
1
27
,74
5.5
2
7,7
02
.1
1
0,5
76
.0
7,6
48
.3
72
6,8
23
.42
Oct
ob
er2
3,8
40
.0
38
8,7
55
.2
-
69
,06
6.0
-
1
80
.0
1
97
,21
2.2
2
,96
2.4
4
,54
7.0
17
,52
2.5
37
,82
8.3
1
48
,63
1.7
-
7
6,0
74
.2
12
7,7
45
.5
27
,70
2.1
10
,57
6.0
7
,64
8.3
7
27
,69
6.1
2
N
ovem
ber
23
,84
0.0
3
53
,96
9.7
-
6
9,0
66
.0
-
18
0.0
19
9,9
62
.2
2,9
62
.4
28
,99
7.0
1
7,5
22
.5
3
7,8
28
.3
14
8,6
31
.7
-
76
,07
4.2
1
27
,74
5.5
2
7,7
02
.1
1
0,5
76
.0
7,6
48
.3
75
4,8
96
.12
Dec
emb
er2
3,8
40
.0
34
3,3
39
.7
-
69
,06
6.0
-
1
80
.0
1
99
,96
2.2
2
,96
2.4
2
8,9
97
.0
17
,52
2.5
37
,82
8.3
1
49
,78
1.7
-
7
6,0
74
.2
12
9,2
45
.5
27
,70
2.1
10
,57
6.0
7
,64
8.3
7
57
,54
6.1
2
2
01
8-
Ja
nu
ary
23
,28
5.0
3
77
,09
4.7
-
5
5,1
05
.0
-
18
0.0
19
9,9
62
.2
2,9
62
.4
28
,99
7.0
1
7,5
22
.5
3
7,8
28
.3
15
1,0
31
.7
-
76
,07
4.2
1
31
,81
5.5
2
7,7
02
.1
1
0,5
76
.0
7,6
48
.3
74
7,4
05
.12
Feb
ruar
y2
3,2
85
.0
41
3,9
36
.2
-
55
,10
5.0
-
1
80
.0
1
99
,96
2.2
2
,96
2.4
2
8,9
97
.0
13
,09
5.7
37
,82
8.3
1
49
,65
6.7
-
7
6,0
74
.2
15
7,2
15
.5
27
,70
2.1
10
,57
6.0
7
,64
8.3
7
67
,00
3.3
3
M
arch
23
,28
5.0
4
15
,59
6.3
-
5
5,1
05
.0
-
18
0.0
21
9,3
92
.2
2,9
62
.4
28
,99
7.0
1
3,0
95
.7
3
7,8
28
.3
14
9,6
56
.7
-
76
,07
4.2
1
57
,81
5.5
2
7,8
22
.1
1
0,5
76
.0
7,6
48
.3
78
7,1
53
.33
Ap
ril
23
,28
5.0
4
19
,79
3.2
-
5
5,1
05
.0
-
18
0.0
21
0,1
79
.7
2,9
62
.4
28
,99
7.0
1
3,0
95
.7
3
7,8
28
.3
14
9,6
56
.7
-
76
,07
4.2
1
71
,81
5.1
3
1,4
22
.1
1
0,5
76
.0
7,6
48
.3
79
5,5
40
.43
May
23
,28
5.0
4
61
,10
7.6
-
3
4,7
85
.0
-
18
0.0
21
0,1
79
.7
2,9
62
.4
28
,99
7.0
1
3,0
95
.7
3
7,8
28
.3
14
9,6
56
.7
-
76
,07
4.2
1
76
,71
5.1
3
1,4
22
.1
1
0,5
76
.0
7,6
48
.3
78
0,1
20
.43
Jun
e2
2,7
30
.0
48
2,0
17
.6
-
34
,78
5.0
-
1
80
.0
2
10
,17
9.7
2
,96
2.4
2
8,9
97
.0
13
,09
5.7
37
,82
8.3
1
49
,65
6.7
-
7
6,0
74
.2
17
6,7
15
.1
31
,42
2.1
10
,57
6.0
7
,64
8.3
7
80
,12
0.4
3
Ju
ly2
2,7
30
.0
54
4,5
35
.9
-
34
,78
5.0
-
1
80
.0
2
10
,17
9.7
2
,96
2.4
2
8,9
97
.0
13
,09
5.7
37
,82
8.3
1
43
,20
6.7
-
7
6,0
74
.2
17
6,7
15
.1
34
,22
2.1
10
,57
6.0
7
,64
8.3
7
76
,47
0.4
3
A
ugu
st2
2,7
30
.0
53
0,9
36
.3
-
34
,78
5.0
-
1
80
.0
2
10
,17
9.7
2
,96
2.4
2
8,9
97
.0
13
,09
5.7
37
,82
8.3
1
47
,00
6.7
-
7
5,5
89
.2
17
6,7
15
.1
34
,22
2.1
10
,57
6.0
7
,64
8.3
7
79
,78
5.4
3
S
epte
mb
er2
2,7
30
.0
53
7,5
31
.4
-
34
,78
5.0
-
1
80
.0
2
10
,17
9.7
2
,96
2.4
2
8,9
97
.0
13
,09
5.7
37
,82
8.3
1
40
,12
0.7
-
7
5,5
89
.2
17
6,7
15
.1
34
,72
2.1
10
,57
6.0
7
,64
8.3
7
73
,39
9.4
3
O
ctob
er2
2,7
30
.0
54
9,8
02
.2
-
34
,78
5.0
-
1
80
.0
2
10
,17
9.7
2
,96
2.4
2
8,9
97
.0
13
,09
5.7
37
,82
8.3
1
40
,12
0.7
-
7
0,2
52
.3
17
6,7
15
.1
34
,72
2.1
10
,57
6.0
7
,64
8.3
7
68
,06
2.5
4
N
ovem
ber
22
,73
0.0
5
46
,99
3.4
-
3
4,7
85
.0
-
18
0.0
18
2,3
27
.6
2,9
62
.4
28
,99
7.0
1
3,0
95
.7
3
5,2
26
.6
14
0,1
20
.7
-
70
,25
2.3
1
84
,41
5.1
5
3,8
32
.1
1
0,5
76
.0
7,6
48
.3
76
4,4
18
.64
Dec
emb
er2
2,7
30
.0
52
7,2
11
.8
-
20
,21
5.0
-
1
80
.0
1
82
,32
7.6
2
,96
2.4
2
8,9
97
.0
13
,09
5.7
35
,22
6.6
1
44
,37
0.7
-
7
0,2
52
.3
18
4,4
15
.1
57
,08
2.1
10
,57
6.0
7
,64
8.3
7
57
,34
8.6
4
2
01
9Ja
nu
ary
22
,73
0.0
5
52
,14
0.0
-
3
7,7
85
.0
-
18
0.0
18
2,3
27
.6
2,9
62
.4
28
,99
7.0
1
3,0
95
.7
3
5,2
26
.6
14
4,3
70
.7
-
70
,25
2.3
1
86
,81
5.1
5
7,0
82
.1
1
0,5
76
.0
7,6
48
.3
77
7,3
18
.64
Feb
ruar
y2
2,7
30
.0
57
1,0
56
.8
-
41
,80
5.0
-
1
80
.0
1
95
,84
7.6
2
,96
2.4
2
8,9
97
.0
13
,09
5.7
35
,22
6.6
1
62
,57
0.7
-
7
0,2
52
.3
19
5,2
15
.1
57
,08
2.1
10
,57
6.0
7
,64
8.3
8
21
,45
8.6
4
M
arch
21
,62
0.0
5
70
,58
8.0
-
4
1,8
05
.0
-
18
0.0
19
5,8
47
.6
2,9
62
.4
28
,99
7.0
1
3,0
95
.7
3
5,2
26
.6
16
2,5
70
.7
-
70
,25
2.3
1
95
,21
5.1
5
7,0
82
.1
1
5,7
42
.0
7,6
48
.3
82
6,6
24
.64
Ap
ril
21
,62
0.0
6
10
,22
0.7
-
4
1,8
05
.0
-
18
0.0
17
6,9
47
.6
2,9
62
.4
28
,99
7.0
1
3,0
95
.7
3
5,2
26
.6
17
7,3
40
.7
-
70
,25
2.3
1
95
,21
5.1
5
7,0
82
.1
1
5,7
42
.0
7,6
48
.3
82
2,4
94
.64
May
21
,62
0.0
5
78
,06
2.5
-
4
1,8
05
.0
-
18
0.0
19
8,9
37
.6
2,9
62
.4
28
,99
7.0
1
3,0
95
.7
3
5,2
26
.6
17
7,3
40
.7
-
67
,97
0.4
1
97
,41
5.1
5
7,0
82
.1
1
5,7
42
.0
7,6
48
.3
84
4,4
02
.79
Jun
e2
1,0
65
.0
57
7,4
82
.6
-
41
,80
5.0
-
1
80
.0
1
70
,42
7.6
2
,96
2.4
2
8,9
97
.0
13
,09
5.7
35
,22
6.6
1
77
,34
0.7
-
6
7,9
70
.4
21
8,9
29
.1
57
,08
2.1
15
,74
2.0
7
,64
8.3
8
37
,40
6.7
9
Co
mm
erci
al
Ba
nk
s
Tre
asu
ry B
on
ds
En
d o
f
To
tal
Tre
asu
ry
Bil
ls T
rea
sury
Bil
ls
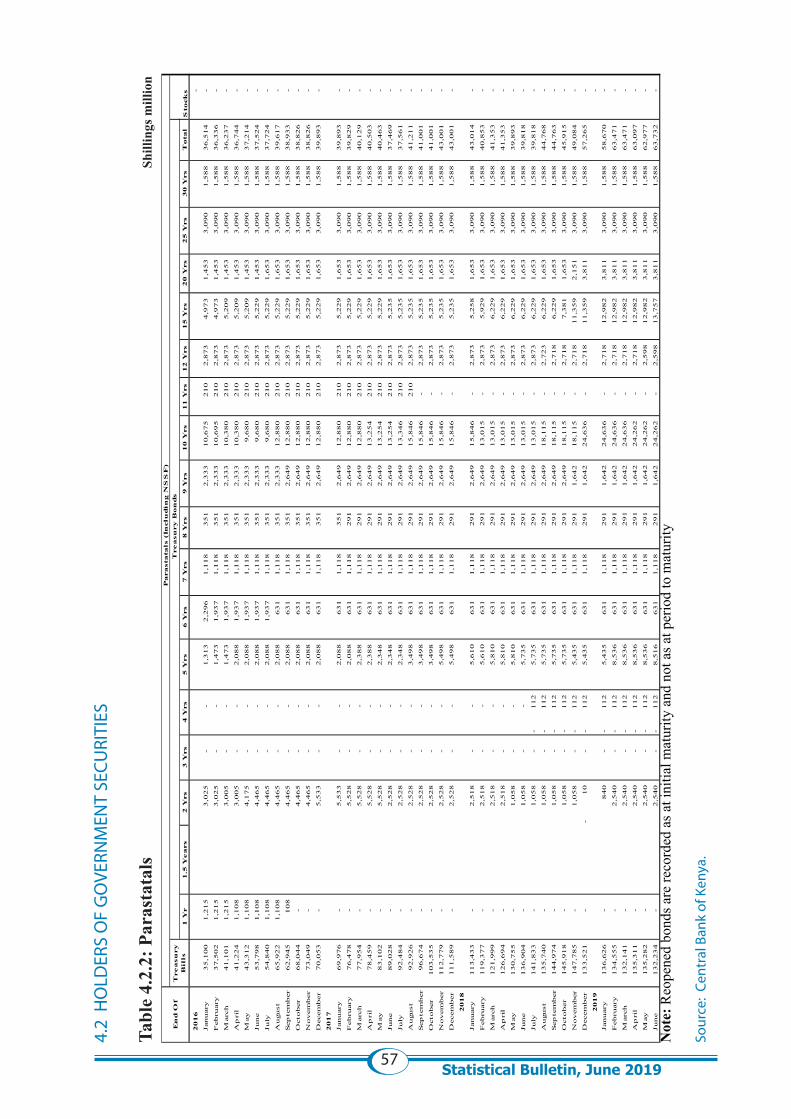
57Statistical Bulletin, June 2019
4.2
HO
LDER
S O
F G
OVE
RNM
ENT
SECU
RITI
ES
Tabl
e 4.
2.2:
Par
asta
tals
Sh
illin
gs m
illio
n
Not
e: R
eope
ned
bond
s are
reco
rded
as a
t ini
tial m
atur
ity a
nd n
ot a
s at p
erio
d to
mat
urity
Sour
ce:
Cent
ral B
ank
of K
enya
.
1 Y
r1.5
Years
2 Y
rs
3 Y
rs
4 Y
rs
5 Y
rs
6 Y
rs
7 Y
rs
8 Y
rs
9 Y
rs
10 Y
rs
11 Y
rs
12 Y
rs
15 Y
rs
20 Y
rs
25 Y
rs
30 Y
rs
Tota
l
2016
-
January
35,1
00
1,2
15
3,0
25
-
-
1,3
13
2,2
96
1,1
18
351
2,3
33
10,6
75
210
2,8
73
4,9
73
1,4
53
3,0
90
1,5
88
36,5
14
-
Febru
ary
37,5
02
1,2
15
3,0
25
-
-
1,4
73
1,9
37
1,1
18
351
2,3
33
10,6
95
210
2,8
73
4,9
73
1,4
53
3,0
90
1,5
88
36,3
36
-
Marc
h41,1
01
1,2
15
3,0
05
-
-
1,4
73
1,9
37
1,1
18
351
2,3
33
10,3
80
210
2,8
73
5,2
09
1,4
53
3,0
90
1,5
88
36,2
37
-
Ap
ril
41,2
24
1,1
08
3,0
05
-
-
2,0
88
1,9
37
1,1
18
351
2,3
33
10,3
80
210
2,8
73
5,2
09
1,4
53
3,0
90
1,5
88
36,7
44
-
May
43,3
12
1,1
08
4,1
75
-
-
2,0
88
1,9
37
1,1
18
351
2,3
33
9,6
80
210
2,8
73
5,2
09
1,4
53
3,0
90
1,5
88
37,2
14
-
June
53,7
98
1,1
08
4,4
65
-
-
2,0
88
1,9
37
1,1
18
351
2,3
33
9,6
80
210
2,8
73
5,2
29
1,4
53
3,0
90
1,5
88
37,5
24
-
July
54,8
40
1,1
08
4,4
65
-
-
2,0
88
1,9
37
1,1
18
351
2,3
33
9,6
80
210
2,8
73
5,2
29
1,6
53
3,0
90
1,5
88
37,7
24
-
August
65,9
22
1,1
08
4,4
65
-
-
2,0
88
631
1,1
18
351
2,3
33
12,8
80
210
2,8
73
5,2
29
1,6
53
3,0
90
1,5
88
39,6
17
-
Sep
tem
ber
62,9
45
108
4,4
65
-
-
2,0
88
631
1,1
18
351
2,6
49
12,8
80
210
2,8
73
5,2
29
1,6
53
3,0
90
1,5
88
38,9
33
-
Octo
ber
68,0
44
-
4,4
65
-
-
2,0
88
631
1,1
18
351
2,6
49
12,8
80
210
2,8
73
5,2
29
1,6
53
3,0
90
1,5
88
38,8
26
-
Novem
ber
73,0
49
-
4,4
65
-
-
2,0
88
631
1,1
18
351
2,6
49
12,8
80
210
2,8
73
5,2
29
1,6
53
3,0
90
1,5
88
38,8
26
-
Decem
ber
70,0
53
-
5,5
33
-
-
2,0
88
631
1,1
18
351
2,6
49
12,8
80
210
2,8
73
5,2
29
1,6
53
3,0
90
1,5
88
39,8
93
-
2017
January
69,9
76
-
5,5
33
-
-
2,0
88
631
1,1
18
351
2,6
49
12,8
80
210
2,8
73
5,2
29
1,6
53
3,0
90
1,5
88
39,8
93
-
Febru
ary
76,4
78
-
5,5
28
-
-
2,0
88
631
1,1
18
291
2,6
49
12,8
80
210
2,8
73
5,2
29
1,6
53
3,0
90
1,5
88
39,8
29
-
Marc
h77,9
54
-
5,5
28
-
-
2,3
88
631
1,1
18
291
2,6
49
12,8
80
210
2,8
73
5,2
29
1,6
53
3,0
90
1,5
88
40,1
29
-
Ap
ril
78,4
59
-
5,5
28
-
-
2,3
88
631
1,1
18
291
2,6
49
13,2
54
210
2,8
73
5,2
29
1,6
53
3,0
90
1,5
88
40,5
03
-
May
83,1
02
-
5,5
28
-
-
2,3
48
631
1,1
18
291
2,6
49
13,2
54
210
2,8
73
5,2
29
1,6
53
3,0
90
1,5
88
40,4
63
-
June
89,0
28
-
2,5
28
-
-
2,3
48
631
1,1
18
291
2,6
49
13,2
54
210
2,8
73
5,2
35
1,6
53
3,0
90
1,5
88
37,4
69
-
July
92,4
84
-
2,5
28
-
-
2,3
48
631
1,1
18
291
2,6
49
13,3
46
210
2,8
73
5,2
35
1,6
53
3,0
90
1,5
88
37,5
61
-
August
92,9
26
-
2,5
28
-
-
3,4
98
631
1,1
18
291
2,6
49
15,8
46
210
2,8
73
5,2
35
1,6
53
3,0
90
1,5
88
41,2
11
-
Sep
tem
ber
96,6
74
-
2,5
28
-
-
3,4
98
631
1,1
18
291
2,6
49
15,8
46
-
2,8
73
5,2
35
1,6
53
3,0
90
1,5
88
41,0
01
-
Octo
ber
103,5
35
-
2,5
28
-
-
3,4
98
631
1,1
18
291
2,6
49
15,8
46
-
2,8
73
5,2
35
1,6
53
3,0
90
1,5
88
41,0
01
-
Novem
ber
112,7
79
-
2,5
28
-
-
5,4
98
631
1,1
18
291
2,6
49
15,8
46
-
2,8
73
5,2
35
1,6
53
3,0
90
1,5
88
43,0
01
-
Decem
ber
111,5
89
-
2,5
28
-
-
5,4
98
631
1,1
18
291
2,6
49
15,8
46
-
2,8
73
5,2
35
1,6
53
3,0
90
1,5
88
43,0
01
-
2018
January
113,4
33
-
2,5
18
-
-
5,6
10
631
1,1
18
291
2,6
49
15,8
46
-
2,8
73
5,2
58
1,6
53
3,0
90
1,5
88
43,0
14
-
Febru
ary
119,3
77
-
2,5
18
-
-
5,6
10
631
1,1
18
291
2,6
49
13,0
15
-
2,8
73
5,9
29
1,6
53
3,0
90
1,5
88
40,8
53
-
Marc
h121,9
99
-
2,5
18
-
-
5,8
10
631
1,1
18
291
2,6
49
13,0
15
-
2,8
73
6,2
29
1,6
53
3,0
90
1,5
88
41,3
53
-
Ap
ril
126,6
94
-
2,5
18
-
-
5,8
10
631
1,1
18
291
2,6
49
13,0
15
-
2,8
73
6,2
29
1,6
53
3,0
90
1,5
88
41,3
53
-
May
130,7
55
-
1,0
58
-
-
5,8
10
631
1,1
18
291
2,6
49
13,0
15
-
2,8
73
6,2
29
1,6
53
3,0
90
1,5
88
39,8
93
-
June
136,9
04
-
1,0
58
-
-
5,7
35
631
1,1
18
291
2,6
49
13,0
15
-
2,8
73
6,2
29
1,6
53
3,0
90
1,5
88
39,8
18
-
July
141,8
33
-
1,0
58
-
112
-
5,7
35
631
1,1
18
291
2,6
49
13,0
15
-
2,8
73
6,2
29
1,6
53
3,0
90
1,5
88
39,8
18
-
August
135,7
40
-
1,0
58
-
112
-
5,7
35
631
1,1
18
291
2,6
49
18,1
15
-
2,7
23
6,2
29
1,6
53
3,0
90
1,5
88
44,7
68
-
Sep
tem
ber
144,9
74
-
1,0
58
-
112
-
5,7
35
631
1,1
18
291
2,6
49
18,1
15
-
2,7
18
6,2
29
1,6
53
3,0
90
1,5
88
44,7
63
-
Octo
ber
145,9
18
-
1,0
58
-
112
-
5,7
35
631
1,1
18
291
2,6
49
18,1
15
-
2,7
18
7,3
81
1,6
53
3,0
90
1,5
88
45,9
15
-
Novem
ber
147,7
85
-
1,0
58
-
112
-
5,4
35
631
1,1
18
291
1,6
42
18,1
15
-
2,7
18
11,3
59
2,1
51
3,0
90
1,5
88
49,0
84
-
Decem
ber
133,5
21
-
10
-
-
112
-
5,4
35
631
1,1
18
291
1,6
42
24,6
36
-
2,7
18
11,3
59
3,8
11
3,0
90
1,5
88
57,2
65
-
2019
-
January
136,6
26
-
840
-
112
-
5,4
35
631
1,1
18
291
1,6
42
24,6
36
-
2,7
18
12,9
82
3,8
11
3,0
90
1,5
88
58,6
70
-
Febru
ary
134,5
55
-
2,5
40
-
112
-
8,5
36
631
1,1
18
291
1,6
42
24,6
36
-
2,7
18
12,9
82
3,8
11
3,0
90
1,5
88
63,4
71
-
Marc
h132,1
41
-
2,5
40
-
112
-
8,5
36
631
1,1
18
291
1,6
42
24,6
36
-
2,7
18
12,9
82
3,8
11
3,0
90
1,5
88
63,4
71
-
Ap
ril
135,3
11
-
2,5
40
-
112
-
8,5
36
631
1,1
18
291
1,6
42
24,2
62
-
2,7
18
12,9
82
3,8
11
3,0
90
1,5
88
63,0
97
-
May
135,2
82
-
2,5
40
-
112
-
8,5
36
631
1,1
18
291
1,6
42
24,2
62
-
2,5
98
12,9
82
3,8
11
3,0
90
1,5
88
62,9
77
-
June
132,2
34
-
2,5
40
-
112
-
8,5
16
631
1,1
18
291
1,6
42
24,2
62
-
2,5
98
13,7
57
3,8
11
3,0
90
1,5
88
63,7
32
-
P
arasta
tals
(In
clu
din
g N
SS
F)
T
reasu
ry B
on
ds
En
d O
fT
reasu
ry
Bil
lsS
tock
s
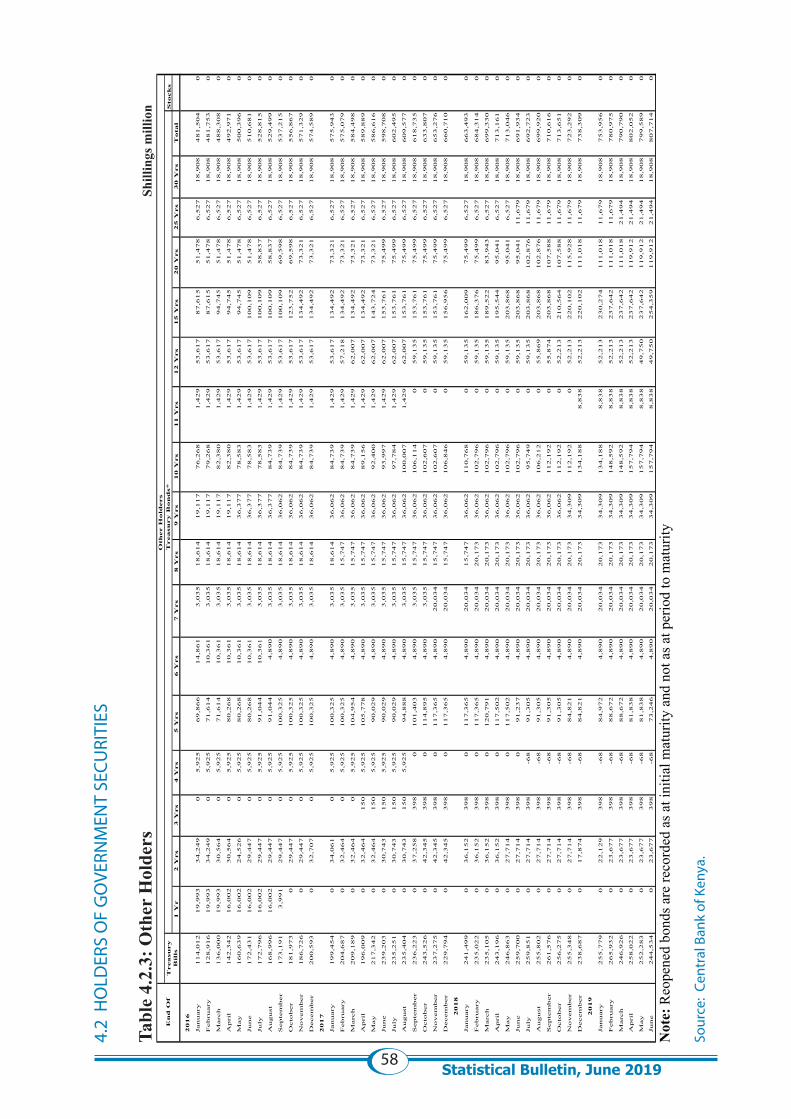
58Statistical Bulletin, June 2019
4.2
HO
LDER
S O
F G
OVE
RNM
ENT
SECU
RITI
ES
Tabl
e 4.
2.3:
Oth
er H
olde
rs
Shi
lling
s mill
ion
Not
e: R
eope
ned
bond
s are
reco
rded
as a
t ini
tial m
atur
ity a
nd n
ot a
s at p
erio
d to
mat
urity
Sour
ce:
Cent
ral B
ank
of K
enya
.
Sto
ck
s1
Yr
2 Y
rs
3 Y
rs
4 Y
rs
5 Y
rs
6 Y
rs
7 Y
rs
8 Y
rs
9 Y
rs
10
Yrs
11
Yrs
12
Yrs
15
Yrs
20
Yrs
25
Yrs
30
Yrs
Tota
l
20
16
Jan
uary
11
4,0
12
19
,99
33
4,2
49
05
,92
56
9,8
66
14
,86
13
,03
51
8,6
14
19
,11
77
6,2
68
1,4
29
53
,61
78
7,6
15
51
,47
86
,52
71
8,9
08
48
1,5
04
0
Feb
ruary
12
8,9
16
19
,99
33
4,2
49
05
,92
57
1,6
14
10
,36
13
,03
51
8,6
14
19
,11
77
9,2
68
1,4
29
53
,61
78
7,6
15
51
,47
86
,52
71
8,9
08
48
1,7
53
0
Marc
h1
36
,00
01
9,9
93
30
,56
40
5,9
25
71
,61
41
0,3
61
3,0
35
18
,61
41
9,1
17
82
,38
01
,42
95
3,6
17
94
,74
55
1,4
78
6,5
27
18
,90
84
88
,30
80
Ap
ril
14
2,3
42
16
,00
23
0,5
64
05
,92
58
0,2
68
10
,36
13
,03
51
8,6
14
19
,11
78
2,3
80
1,4
29
53
,61
79
4,7
45
51
,47
86
,52
71
8,9
08
49
2,9
71
0
May
16
0,6
39
16
,00
22
4,5
26
05
,92
58
0,2
68
10
,36
13
,03
51
8,6
14
36
,37
77
8,5
83
1,4
29
53
,61
79
4,7
45
51
,47
86
,52
71
8,9
08
50
0,3
96
0
Ju
ne
17
2,4
31
16
,00
22
9,4
47
05
,92
58
0,2
68
10
,36
13
,03
51
8,6
14
36
,37
77
8,5
83
1,4
29
53
,61
71
00
,10
95
1,4
78
6,5
27
18
,90
85
10
,68
10
Ju
ly1
72
,79
61
6,0
02
29
,44
70
5,9
25
91
,04
41
0,3
61
3,0
35
18
,61
43
6,3
77
78
,58
31
,42
95
3,6
17
10
0,1
09
58
,83
76
,52
71
8,9
08
52
8,8
15
0
Au
gu
st
16
8,9
96
16
,00
22
9,4
47
05
,92
59
1,0
44
4,8
90
3,0
35
18
,61
43
6,3
77
84
,73
91
,42
95
3,6
17
10
0,1
09
58
,83
76
,52
71
8,9
08
52
9,4
99
0
Sep
tem
ber
17
3,1
91
3,9
91
29
,44
70
5,9
25
10
0,3
25
4,8
90
3,0
35
18
,61
43
6,0
62
84
,73
91
,42
95
3,6
17
10
0,1
09
69
,59
86
,52
71
8,9
08
53
7,2
15
0
Octo
ber
18
1,9
73
02
9,4
47
05
,92
51
00
,32
54
,89
03
,03
51
8,6
14
36
,06
28
4,7
39
1,4
29
53
,61
71
23
,75
26
9,5
98
6,5
27
18
,90
85
56
,86
70
No
vem
ber
18
6,7
26
02
9,4
47
05
,92
51
00
,32
54
,89
03
,03
51
8,6
14
36
,06
28
4,7
39
1,4
29
53
,61
71
34
,49
27
3,3
21
6,5
27
18
,90
85
71
,32
90
Decem
ber
20
0,5
93
03
2,7
07
05
,92
51
00
,32
54
,89
03
,03
51
8,6
14
36
,06
28
4,7
39
1,4
29
53
,61
71
34
,49
27
3,3
21
6,5
27
18
,90
85
74
,58
90
20
17
Jan
uary
19
9,4
54
03
4,0
61
05
,92
51
00
,32
54
,89
03
,03
51
8,6
14
36
,06
28
4,7
39
1,4
29
53
,61
71
34
,49
27
3,3
21
6,5
27
18
,90
85
75
,94
30
Feb
ruary
20
4,6
87
03
2,4
64
05
,92
51
00
,32
54
,89
03
,03
51
5,7
47
36
,06
28
4,7
39
1,4
29
57
,21
81
34
,49
27
3,3
21
6,5
27
18
,90
85
75
,07
90
Marc
h2
09
,18
90
32
,46
40
5,9
25
10
4,9
54
4,8
90
3,0
35
15
,74
73
6,0
62
84
,73
91
,42
96
2,0
07
13
4,4
92
73
,32
16
,52
71
8,9
08
58
4,4
98
0
Ap
ril
19
6,0
09
03
2,4
64
15
05
,92
51
05
,77
84
,89
03
,03
51
5,7
47
36
,06
28
9,1
56
1,4
29
62
,00
71
34
,49
27
3,3
21
6,5
27
18
,90
85
89
,88
90
May
21
7,3
42
03
2,4
64
15
05
,92
59
0,0
29
4,8
90
3,0
35
15
,74
73
6,0
62
92
,40
01
,42
96
2,0
07
14
3,7
24
73
,32
16
,52
71
8,9
08
58
6,6
16
0
Ju
ne
23
9,2
03
03
0,7
43
15
05
,92
59
0,0
29
4,8
90
3,0
35
15
,74
73
6,0
62
93
,99
71
,42
96
2,0
07
15
3,7
61
75
,49
96
,52
71
8,9
08
59
8,7
08
0
Ju
ly2
35
,25
10
30
,74
31
50
5,9
25
90
,02
94
,89
03
,03
51
5,7
47
36
,06
29
7,7
84
1,4
29
62
,00
71
53
,76
17
5,4
99
6,5
27
18
,90
86
02
,49
50
Au
gu
st
23
5,4
04
03
0,7
43
15
05
,92
59
4,8
88
4,8
90
3,0
35
15
,74
73
6,0
62
10
0,0
07
1,4
29
62
,00
71
53
,76
17
5,4
99
6,5
27
18
,90
86
09
,57
70
Sep
tem
ber
23
6,2
23
03
7,2
58
39
80
10
1,4
03
4,8
90
3,0
35
15
,74
73
6,0
62
10
6,1
14
05
9,1
35
15
3,7
61
75
,49
96
,52
71
8,9
08
61
8,7
35
0
Octo
ber
24
3,5
26
04
2,3
45
39
80
11
4,8
95
4,8
90
3,0
35
15
,74
73
6,0
62
10
2,6
07
05
9,1
35
15
3,7
61
75
,49
96
,52
71
8,9
08
63
3,8
07
0
No
vem
ber
23
7,2
75
04
2,3
45
39
80
11
7,3
65
4,8
90
20
,03
41
5,7
47
36
,06
21
02
,60
70
59
,13
51
53
,76
17
5,4
99
6,5
27
18
,90
86
53
,27
60
Decem
ber
22
9,7
94
04
2,3
45
39
80
11
7,3
65
4,8
90
20
,03
41
5,7
47
36
,06
21
06
,84
60
59
,13
51
56
,95
67
5,4
99
6,5
27
18
,90
86
60
,71
00
20
18
Jan
uary
24
1,4
99
03
6,1
52
39
80
11
7,3
65
4,8
90
20
,03
41
5,7
47
36
,06
21
10
,76
80
59
,13
51
62
,00
97
5,4
99
6,5
27
18
,90
86
63
,49
30
Feb
ruary
23
5,0
22
03
6,1
52
39
80
11
7,3
65
4,8
90
20
,03
42
0,1
73
36
,06
21
02
,79
60
59
,13
51
86
,37
67
5,4
99
6,5
27
18
,90
86
84
,31
40
Marc
h2
35
,10
50
36
,15
23
98
01
20
,79
14
,89
02
0,0
34
20
,17
33
6,0
62
10
2,7
96
05
9,1
35
18
9,5
22
83
,94
36
,52
71
8,9
08
69
9,3
30
0
Ap
ril
24
3,1
96
03
6,1
52
39
80
11
7,5
02
4,8
90
20
,03
42
0,1
73
36
,06
21
02
,79
60
59
,13
51
95
,54
49
5,0
41
6,5
27
18
,90
87
13
,16
10
May
24
6,8
63
02
7,7
14
39
80
11
7,5
02
4,8
90
20
,03
42
0,1
73
36
,06
21
02
,79
60
59
,13
52
03
,86
89
5,0
41
6,5
27
18
,90
87
13
,04
60
Ju
ne
25
9,7
00
02
7,7
14
39
80
91
,23
74
,89
02
0,0
34
20
,17
33
6,0
62
10
2,7
96
05
9,1
35
20
3,8
68
95
,04
11
1,6
79
18
,90
86
91
,93
40
Ju
ly2
59
,85
10
27
,71
43
98
-68
91
,30
54
,89
02
0,0
34
20
,17
33
6,0
62
95
,74
90
59
,13
52
03
,86
81
02
,87
61
1,6
79
18
,90
86
92
,72
30
Au
gu
st
25
5,8
02
02
7,7
14
39
8-6
89
1,3
05
4,8
90
20
,03
42
0,1
73
36
,06
21
06
,21
20
55
,86
92
03
,86
81
02
,87
61
1,6
79
18
,90
86
99
,92
00
Sep
tem
ber
26
1,5
76
02
7,7
14
39
8-6
89
1,3
05
4,8
90
20
,03
42
0,1
73
36
,06
21
12
,19
20
55
,87
42
03
,86
81
07
,58
81
1,6
79
18
,90
87
10
,61
60
Octo
ber
25
6,2
75
02
7,7
14
39
8-6
89
1,3
05
4,8
90
20
,03
42
0,1
73
36
,06
21
12
,19
20
52
,21
32
10
,56
41
07
,58
81
1,6
79
18
,90
87
13
,65
10
No
vem
ber
25
5,3
48
02
7,7
14
39
8-6
88
4,8
21
4,8
90
20
,03
42
0,1
73
34
,30
91
12
,19
20
52
,21
32
20
,10
21
15
,92
81
1,6
79
18
,90
87
23
,29
20
Decem
ber
23
8,6
87
01
7,8
74
39
8-6
88
4,8
21
4,8
90
20
,03
42
0,1
73
34
,30
91
34
,18
88
,83
85
2,2
13
22
0,1
02
11
1,0
18
11
,67
91
8,9
08
73
8,3
09
0
20
19
Jan
uary
25
5,7
79
02
2,1
29
39
8-6
88
4,9
72
4,8
90
20
,03
42
0,1
73
34
,30
91
34
,18
88
,83
85
2,2
13
23
0,2
74
11
1,0
18
11
,67
91
8,9
08
75
3,9
56
0
Feb
ruary
26
5,9
32
02
3,6
77
39
8-6
88
8,6
72
4,8
90
20
,03
42
0,1
73
34
,30
91
48
,59
28
,83
85
2,2
13
23
7,6
42
11
1,0
18
11
,67
91
8,9
08
78
0,9
75
0
Marc
h2
46
,92
60
23
,67
73
98
-68
88
,67
24
,89
02
0,0
34
20
,17
33
4,3
09
14
8,5
92
8,8
38
52
,21
32
37
,64
21
11
,01
82
1,4
94
18
,90
87
90
,79
00
Ap
ril
25
8,0
22
02
3,6
77
39
8-6
88
1,8
38
4,8
90
20
,03
42
0,1
73
34
,30
91
57
,79
48
,83
85
2,2
13
23
7,6
42
11
9,9
12
21
,49
41
8,9
08
80
2,0
52
0
May
25
2,2
83
02
3,6
77
39
8-6
88
1,8
38
4,8
90
20
,03
42
0,1
73
34
,30
91
57
,79
48
,83
84
9,7
50
23
7,6
42
11
9,9
12
21
,49
41
8,9
08
79
9,5
89
0
Ju
ne
24
4,5
34
02
3,6
77
39
8-6
87
3,2
46
4,8
90
20
,03
42
0,1
73
34
,30
91
57
,79
48
,83
84
9,7
50
25
4,3
59
11
9,9
12
21
,49
41
8,9
08
80
7,7
14
0
Treasu
ry
Bon
ds*
Oth
er H
old
ers
En
d O
fT
reasu
ry
B
ills
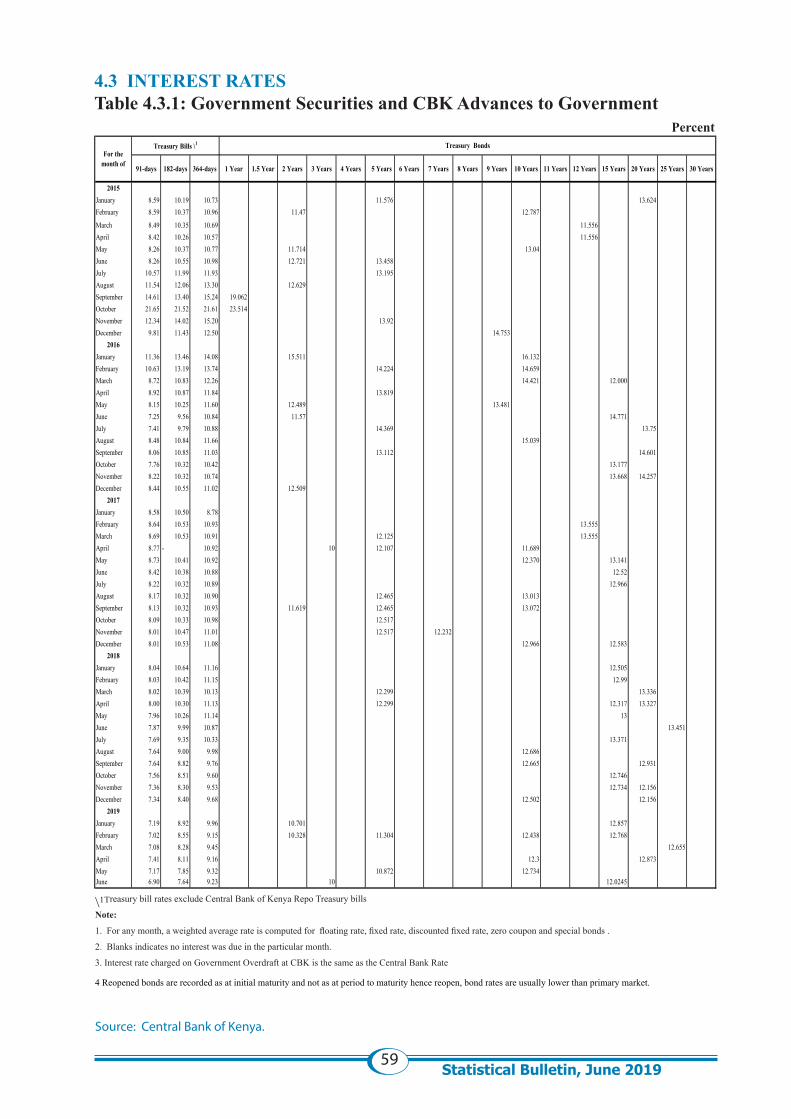
59Statistical Bulletin, June 2019
4.3 INTEREST RATESTable 4.3.1: Government Securities and CBK Advances to Government Percent
\1Treasury bill rates exclude Central Bank of Kenya Repo Treasury bills Note: 1. For any month, a weighted average rate is computed for floating rate, fixed rate, discounted fixed rate, zero coupon and special bonds . 2. Blanks indicates no interest was due in the particular month. 3. Interest rate charged on Government Overdraft at CBK is the same as the Central Bank Rate 4 Reopened bonds are recorded as at initial maturity and not as at period to maturity hence reopen, bond rates are usually lower than primary market.
Source: Central Bank of Kenya.
91-days 182-days 364-days 1 Year 1.5 Year 2 Years 3 Years 4 Years 5 Years 6 Years 7 Years 8 Years 9 Years 10 Years 11 Years 12 Years 15 Years 20 Years 25 Years 30 Years
2015January 8.59 10.19 10.73 11.576 13.624February 8.59 10.37 10.96 11.47 12.787
March 8.49 10.35 10.69 11.556April 8.42 10.26 10.57 11.556May 8.26 10.37 10.77 11.714 13.04June 8.26 10.55 10.98 12.721 13.458July 10.57 11.99 11.93 13.195August 11.54 12.06 13.30 12.629September 14.61 13.40 15.24 19.062October 21.65 21.52 21.61 23.514November 12.34 14.02 15.20 13.92December 9.81 11.43 12.50 14.753
2016January 11.36 13.46 14.08 15.511 16.132February 10.63 13.19 13.74 14.224 14.659March 8.72 10.83 12.26 14.421 12.000April 8.92 10.87 11.84 13.819May 8.15 10.25 11.60 12.489 13.481June 7.25 9.56 10.84 11.57 14.771July 7.41 9.79 10.88 14.369 13.75August 8.48 10.84 11.66 15.039September 8.06 10.85 11.03 13.112 14.601October 7.76 10.32 10.42 13.177November 8.22 10.32 10.74 13.668 14.257December 8.44 10.55 11.02 12.509
2017January 8.58 10.50 8.78February 8.64 10.53 10.93 13.555March 8.69 10.53 10.91 12.125 13.555April 8.77 - 10.92 10 12.107 11.689May 8.73 10.41 10.92 12.370 13.141June 8.42 10.38 10.88 12.52July 8.22 10.32 10.89 12.966August 8.17 10.32 10.90 12.465 13.013September 8.13 10.32 10.93 11.619 12.465 13.072October 8.09 10.33 10.98 12.517November 8.01 10.47 11.01 12.517 12.232December 8.01 10.53 11.08 12.966 12.583
2018January 8.04 10.64 11.16 12.505February 8.03 10.42 11.15 12.99March 8.02 10.39 10.13 12.299 13.336April 8.00 10.30 11.13 12.299 12.317 13.327May 7.96 10.26 11.14 13June 7.87 9.99 10.87 13.451July 7.69 9.35 10.33 13.371August 7.64 9.00 9.98 12.686September 7.64 8.82 9.76 12.665 12.931October 7.56 8.51 9.60 12.746November 7.36 8.30 9.53 12.734 12.156December 7.34 8.40 9.68 12.502 12.156
2019January 7.19 8.92 9.96 10.701 12.857February 7.02 8.55 9.15 10.328 11.304 12.438 12.768March 7.08 8.28 9.45 12.655April 7.41 8.11 9.16 12.3 12.873May 7.17 7.85 9.32 10.872 12.734June 6.90 7.64 9.23 10 12.0245
Treasury Bills \1 Treasury BondsFor the
month of
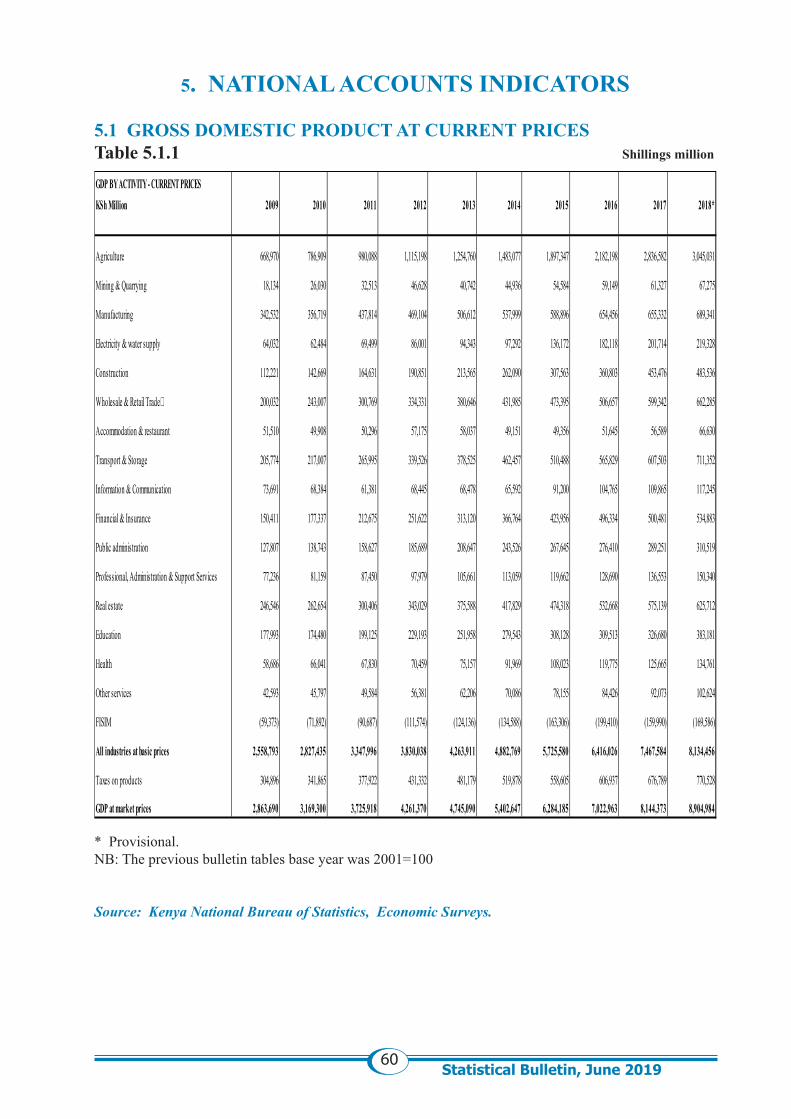
60Statistical Bulletin, June 2019
5. NATIONAL ACCOUNTS INDICATORS
5.1 GROSS DOMESTIC PRODUCT AT CURRENT PRICESTable 5.1.1 Shillings million
* Provisional.NB: The previous bulletin tables base year was 2001=100
Source: Kenya National Bureau of Statistics, Economic Surveys.
GDP BY ACTIVITY - CURRENT PRICESKSh Million 2009 2010 2011 2012 2013 2014 2015 2016 2017 2018*
Agriculture 668,970 786,909 980,088 1,115,198 1,254,760 1,483,077 1,897,347 2,182,198 2,836,582 3,045,031
Mining & Quarrying 18,134 26,030 32,513 46,628 40,742 44,936 54,584 59,149 61,327 67,275
Manufacturing 342,532 356,719 437,814 469,104 506,612 537,999 588,896 654,456 655,332 689,341
Electricity & water supply 64,032 62,484 69,499 86,001 94,343 97,292 136,172 182,118 201,714 219,328
Construction 112,221 142,669 164,631 190,851 213,565 262,090 307,563 360,803 453,476 483,536
Wholesale & Retail Trade 200,032 243,007 300,769 334,331 380,646 431,985 473,395 506,657 599,342 662,285
Accommodation & restaurant 51,510 49,908 50,296 57,175 58,037 49,151 49,356 51,645 56,589 66,630
Transport & Storage 205,774 217,007 265,995 339,526 378,525 462,457 510,488 565,829 607,503 711,352
Information & Communication 73,691 68,384 61,381 68,445 68,478 65,592 91,200 104,765 109,865 117,245
Financial & Insurance 150,411 177,337 212,675 251,622 313,120 366,764 423,956 496,334 500,481 534,883
Public administration 127,807 138,743 158,627 185,689 208,647 243,526 267,645 276,410 289,251 310,519
Professional, Administration & Support Services 77,236 81,159 87,450 97,979 105,661 113,059 119,662 128,690 136,553 150,340
Real estate 246,546 262,654 300,406 343,029 375,588 417,829 474,318 532,668 575,139 625,712
Education 177,993 174,480 199,125 229,193 251,958 279,543 308,128 309,513 326,680 383,181
Health 58,686 66,041 67,830 70,459 75,157 91,969 108,023 119,775 125,665 134,761
Other services 42,593 45,797 49,584 56,381 62,206 70,086 78,155 84,426 92,073 102,624
FISIM (59,373) (71,892) (90,687) (111,574) (124,136) (134,588) (163,306) (199,410) (159,990) (169,586)
All industries at basic prices 2,558,793 2,827,435 3,347,996 3,830,038 4,263,911 4,882,769 5,725,580 6,416,026 7,467,584 8,134,456
Taxes on products 304,896 341,865 377,922 431,332 481,179 519,878 558,605 606,937 676,789 770,528
GDP at market prices 2,863,690 3,169,300 3,725,918 4,261,370 4,745,090 5,402,647 6,284,185 7,022,963 8,144,373 8,904,984
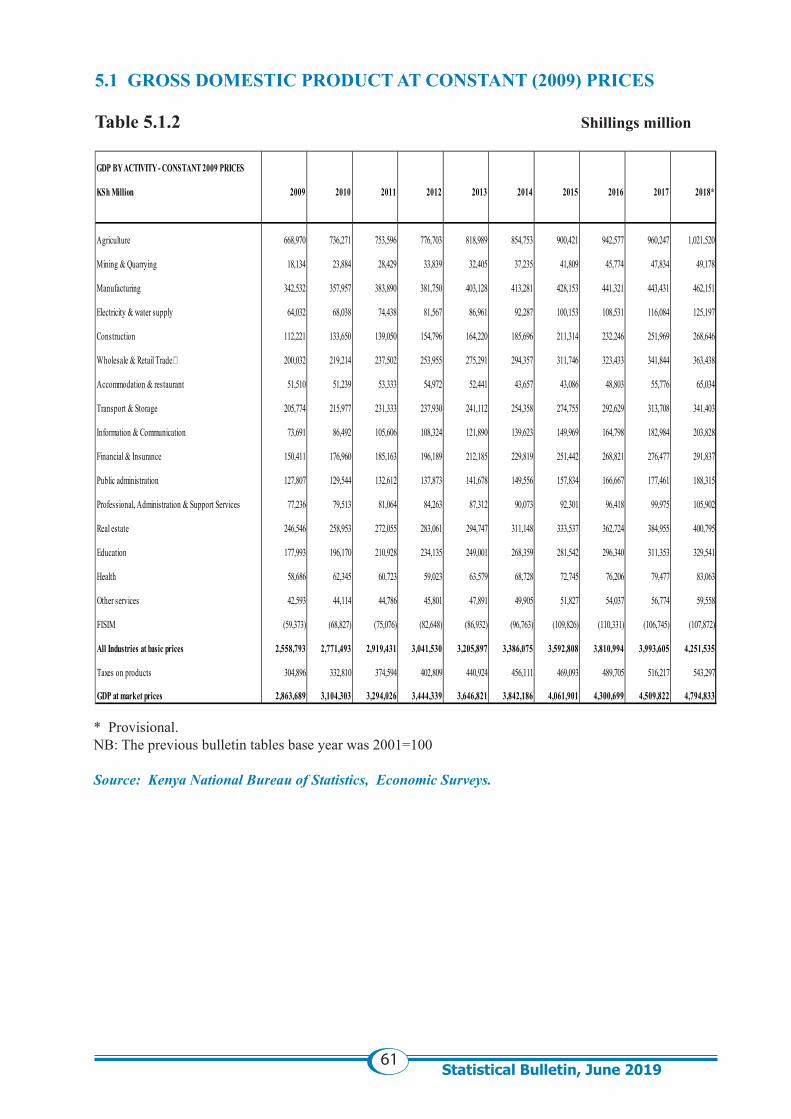
61Statistical Bulletin, June 2019
5.1 GROSS DOMESTIC PRODUCT AT CONSTANT (2009) PRICES
Table 5.1.2 Shillings million
* Provisional.NB: The previous bulletin tables base year was 2001=100
Source: Kenya National Bureau of Statistics, Economic Surveys.
GDP BY ACTIVITY - CONSTANT 2009 PRICES
KSh Million 2009 2010 2011 2012 2013 2014 2015 2016 2017 2018*
Agriculture 668,970 736,271 753,596 776,703 818,989 854,753 900,421 942,577 960,247 1,021,520
Mining & Quarrying 18,134 23,884 28,429 33,839 32,405 37,235 41,809 45,774 47,834 49,178
Manufacturing 342,532 357,957 383,890 381,750 403,128 413,281 428,153 441,321 443,431 462,151
Electricity & water supply 64,032 68,038 74,438 81,567 86,961 92,287 100,153 108,531 116,084 125,197
Construction 112,221 133,650 139,050 154,796 164,220 185,696 211,314 232,246 251,969 268,646
Wholesale & Retail Trade 200,032 219,214 237,502 253,955 275,291 294,357 311,746 323,433 341,844 363,438
Accommodation & restaurant 51,510 51,239 53,333 54,972 52,441 43,657 43,086 48,803 55,776 65,034
Transport & Storage 205,774 215,977 231,333 237,930 241,112 254,358 274,755 292,629 313,708 341,403
Information & Communication 73,691 86,492 105,606 108,324 121,890 139,623 149,969 164,798 182,984 203,828
Financial & Insurance 150,411 176,960 185,163 196,189 212,185 229,819 251,442 268,821 276,477 291,837
Public administration 127,807 129,544 132,612 137,873 141,678 149,556 157,834 166,667 177,461 188,315
Professional, Administration & Support Services 77,236 79,513 81,064 84,263 87,312 90,073 92,301 96,418 99,975 105,902
Real estate 246,546 258,953 272,055 283,061 294,747 311,148 333,537 362,724 384,955 400,795
Education 177,993 196,170 210,928 234,135 249,001 268,359 281,542 296,340 311,353 329,541
Health 58,686 62,345 60,723 59,023 63,579 68,728 72,745 76,206 79,477 83,063
Other services 42,593 44,114 44,786 45,801 47,891 49,905 51,827 54,037 56,774 59,558
FISIM (59,373) (68,827) (75,076) (82,648) (86,932) (96,763) (109,826) (110,331) (106,745) (107,872)
All Industries at basic prices 2,558,793 2,771,493 2,919,431 3,041,530 3,205,897 3,386,075 3,592,808 3,810,994 3,993,605 4,251,535
Taxes on products 304,896 332,810 374,594 402,809 440,924 456,111 469,093 489,705 516,217 543,297
GDP at market prices 2,863,689 3,104,303 3,294,026 3,444,339 3,646,821 3,842,186 4,061,901 4,300,699 4,509,822 4,794,833
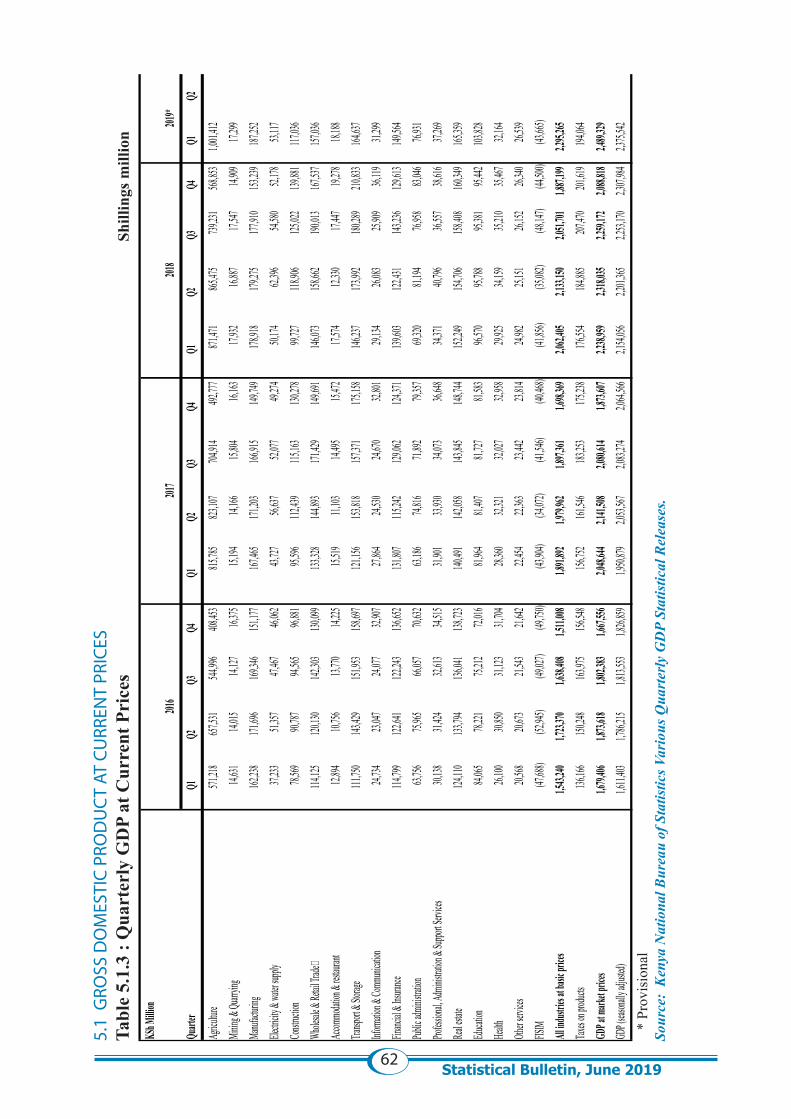
62Statistical Bulletin, June 2019
5.1
GRO
SS D
OM
ESTI
C PR
OD
UC
T AT
CU
RREN
T PR
ICES
Ta
ble
5.1.
3 : Q
uart
erly
GD
P at
Cur
rent
Pri
ces
Shi
lling
s mill
ion
*
Prov
isio
nal
Sour
ce:
Ken
ya N
atio
nal B
urea
u of
Sta
tistic
s Var
ious
Qua
rter
ly G
DP
Stat
istic
al R
elea
ses.
KSh M
illion
Quart
erQ1
Q2Q3
Q4Q1
Q2Q3
Q4Q1
Q2Q3
Q4Q1
Q2
Agricu
lture
571,21
8
657
,531
544
,996
408
,453
815
,785
823,10
7
704,91
4
492,77
7
871
,471
865
,475
739,23
1
568,85
3
1,0
01,412
Min
ing &
Quarry
ing14,
631
14,015
14,
127
16,
375
15,194
14,166
15,
804
16,
163
17,
932
16,
887
17,
547
14,
909
17,
299
Ma
nufactu
ring162
,238
171,69
6
169,34
6
151,17
7
167,46
5
171
,203
166
,915
149
,749
178,91
8
179,27
5
177
,910
153
,239
187,25
2
Ele
ctricity
& wat
er supp
ly37,
233
51,357
47,
467
46,
062
43,727
56,637
52,
077
49,
274
50,
174
62,
396
54,
580
52,
178
53,
117
Con
structio
n78,
569
90,787
94,
565
96,
881
95,596
112,43
9
115,16
3
130,27
8
99,
727
118
,906
125,02
2
139,88
1
117
,036
Whole
sale &
Retail
Trade
114,12
5
120
,130
142
,303
130
,099
133
,328
144,89
3
171,42
9
149,69
1
146
,073
158
,662
190,01
3
167,53
7
157
,036
Accom
modat
ion &
restaur
ant12,
894
10,756
13,
770
14,
225
15,519
11,103
14,
495
15,
472
17,
574
12,
330
17,
447
19,
278
18,
188
Tra
nsport
& Stora
ge111
,750
143,42
9
151,95
3
158,69
7
121,15
6
153
,818
157
,371
175
,158
146,23
7
173,99
2
180
,289
210
,833
164,63
7
Info
rmation
& Com
munic
ation
24,734
23,
047
24,077
32,907
27,
864
24,
530
24,670
32,801
29,134
26,083
25,909
36,119
31,299
Financ
ial & I
nsuran
ce114
,799
122,64
1
122,24
3
136,65
2
131,80
7
115
,242
129
,062
124
,371
139,60
3
122,43
1
143
,236
129
,613
149,56
4
Pub
lic adm
inistrat
ion63,
756
75,965
66,
057
70,
632
63,186
74,816
71,
892
79,
357
69,
320
81,
194
76,
958
83,
046
76,
931
Pro
fession
al, Ad
ministr
ation &
Suppo
rt Serv
ices30,
138
31,424
32,
613
34,
515
31,901
33,930
34,
073
36,
648
34,
371
40,
796
36,
557
38,
616
37,
269
Rea
l estate
124,11
0
133
,794
136
,041
138
,723
140
,491
142,05
8
143,84
5
148,74
4
152
,249
154
,706
158,40
8
160,34
9
165
,359
Educati
on84,
065
78,221
75,
212
72,
016
81,964
81,407
81,
727
81,
583
96,
570
95,
788
95,
381
95,
442
103
,828
Health
26,100
30,
850
31,123
31,704
28,
360
32,
321
32,027
32,958
29,925
34,159
35,210
35,467
32,164
Other s
ervices
20,568
20,
673
21,543
21,642
22,
454
22,
363
23,442
23,814
24,982
25,151
26,152
26,340
26,539
FISIM
(47,68
8)
(52,94
5)
(49,02
7)
(49,75
0)
(43,90
4)
(34
,072)
(41
,546)
(40
,468)
(41,85
6)
(35
,082)
(48,14
7)
(44
,500)
(43,66
5)
All
indust
ries at
basic p
rices
1,543,
240
1,7
23,370
1,638,
408
1,511,
008
1,8
91,892
1,9
79,962
1,897,
361
1,698,
369
2,062,
405
2,133,
150
2,051,
701
1,887,
199
2,295,
265
Taxes o
n prod
ucts
136,16
6
150
,248
163
,975
156
,548
156
,752
161,54
6
183,25
3
175,23
8
176
,554
184
,885
207,47
0
201,61
9
194
,064
GDP a
t mark
et price
s1,6
79,406
1,873,
618
1,8
02,383
1,6
67,556
2,048,
644
2,141,
508
2,0
80,614
1,8
73,607
2,2
38,959
2,3
18,035
2,2
59,172
2,0
88,818
2,4
89,329
GD
P (seas
onally
adjuste
d)1,6
11,403
1,786,
215
1,8
13,553
1,8
26,859
1,950,
879
2,053,
567
2,0
83,274
2,0
64,566
2,1
54,056
2,2
01,365
2,2
53,170
2,3
07,984
2,3
75,542
2019*
2016
2017
2018
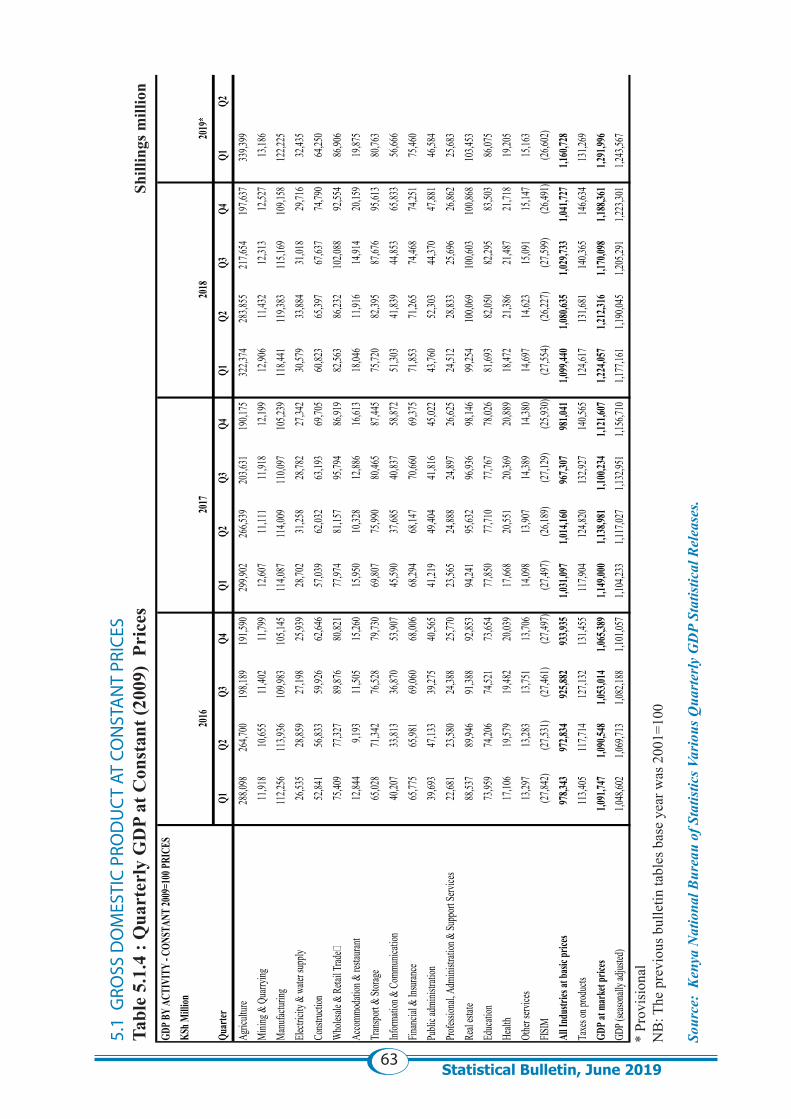
63Statistical Bulletin, June 2019
5.1
GRO
SS D
OM
ESTI
C PR
OD
UC
T AT
CO
NST
AN
T PR
ICES
Ta
ble
5.1.
4 : Q
uart
erly
GD
P at
Con
stan
t (20
09)
Pric
es
Shi
lling
s mill
ion
* Pr
ovis
iona
lN
B: T
he p
revi
ous b
ulle
tin ta
bles
bas
e ye
ar w
as 2
001=
100
Sour
ce:
Ken
ya N
atio
nal B
urea
u of
Sta
tistic
s Var
ious
Qua
rter
ly G
DP
Stat
istic
al R
elea
ses.
GDP B
Y AC
TIVI
TY - C
ONST
ANT
2009
=100
PRIC
ESKS
h Milli
on
Quar
terQ1
Q2Q3
Q4Q1
Q2Q3
Q4Q1
Q2Q3
Q4Q1
Q2
Agric
ulture
288,0
98
26
4,700
198,1
89
19
1,590
299,9
02
26
6,539
203,6
31
19
0,175
322,3
74
28
3,855
217,6
54
19
7,637
339,3
99
Mi
ning &
Qua
rrying
11,91
8
10,65
5
11,40
2
11,79
9
12,60
7
11,11
1
11,91
8
12,19
9
12,90
6
11,43
2
12,31
3
12,52
7
13,18
6
Manu
factur
ing11
2,256
113,9
36
10
9,983
105,1
45
11
4,087
114,0
09
11
0,097
105,2
39
11
8,441
119,3
83
11
5,169
109,1
58
12
2,225
Electr
icity
& wa
ter su
pply
26,53
5
28,85
9
27,19
8
25,93
9
28,70
2
31,25
8
28,78
2
27,34
2
30,57
9
33,88
4
31,01
8
29,71
6
32,43
5
Const
ructio
n52
,841
56
,833
59
,926
62
,646
57
,039
62
,032
63
,193
69
,705
60
,823
65
,397
67
,637
74
,790
64
,250
W
holes
ale &
Reta
il Trad
e75
,409
77
,327
89
,876
80
,821
77
,974
81
,157
95
,794
86
,919
82
,563
86
,232
10
2,088
92,55
4
86,90
6
Acco
mmod
ation
& re
staura
nt12
,844
9,1
93
11,50
5
15,26
0
15,95
0
10,32
8
12,88
6
16,61
3
18,04
6
11,91
6
14,91
4
20,15
9
19,87
5
Tran
sport &
Stora
ge65
,028
71
,342
76
,528
79
,730
69
,807
75
,990
80
,465
87
,445
75
,720
82
,395
87
,676
95
,613
80
,763
Inf
ormati
on &
Com
munic
ation
40,20
7
33,81
3
36,87
0
53,90
7
45,59
0
37,68
5
40,83
7
58,87
2
51,30
3
41,83
9
44,85
3
65,83
3
56,66
6
Finan
cial &
Insur
ance
65,77
5
65,98
1
69,06
0
68,00
6
68,29
4
68,14
7
70,66
0
69,37
5
71,85
3
71,26
5
74,46
8
74,25
1
75,46
0
Publi
c adm
inistr
ation
39,69
3
47,13
3
39,27
5
40,56
5
41,21
9
49,40
4
41,81
6
45,02
2
43,76
0
52,30
3
44,37
0
47,88
1
46,58
4
Profes
siona
l, Adm
inistr
ation
& Su
pport
Servi
ces22
,681
23
,580
24
,388
25
,770
23
,565
24
,888
24
,897
26
,625
24
,512
28
,833
25
,696
26
,862
25
,683
Re
al est
ate88
,537
89
,946
91
,388
92
,853
94
,241
95
,632
96
,936
98
,146
99
,254
10
0,069
100,6
03
10
0,868
103,4
53
Ed
ucati
on73
,959
74
,206
74
,521
73
,654
77
,850
77
,710
77
,767
78
,026
81
,693
82
,050
82
,295
83
,503
86
,075
He
alth
17,10
6
19,57
9
19,48
2
20,03
9
17,66
8
20,55
1
20,36
9
20,88
9
18,47
2
21,38
6
21,48
7
21,71
8
19,20
5
Othe
r serv
ices
13,29
7
13,28
3
13,75
1
13,70
6
14,09
8
13,90
7
14,38
9
14,38
0
14,69
7
14,62
3
15,09
1
15,14
7
15,16
3
FISIM
(27,84
2)
(27,53
1)
(27,46
1)
(27,49
7)
(27,49
7)
(26,18
9)
(27,12
9)
(25,93
0)
(27,55
4)
(26,22
7)
(27,59
9)
(26,49
1)
(26,60
2)
All I
ndus
tries
at ba
sic pr
ices
978,3
43
97
2,834
925,8
82
93
3,935
1,031
,097
1,014
,160
967,3
07
98
1,041
1,099
,440
1,080
,635
1,029
,733
1,041
,727
1,160
,728
Taxe
s on p
roduc
ts11
3,405
117,7
14
12
7,132
131,4
55
11
7,904
124,8
20
13
2,927
140,5
65
12
4,617
131,6
81
14
0,365
146,6
34
13
1,269
GDP a
t mar
ket p
rices
1,091
,747
1,090
,548
1,053
,014
1,065
,389
1,149
,000
1,138
,981
1,100
,234
1,121
,607
1,224
,057
1,212
,316
1,170
,098
1,188
,361
1,291
,996
GDP (
season
ally a
djuste
d)1,0
48,60
2
1,0
69,71
3
1,0
82,18
8
1,1
01,05
7
1,1
04,23
3
1,1
17,02
7
1,1
32,95
1
1,1
56,71
0
1,1
77,16
1
1,1
90,04
5
1,2
05,29
1
1,2
23,30
1
1,2
43,56
7
2019
*20
1620
1720
18
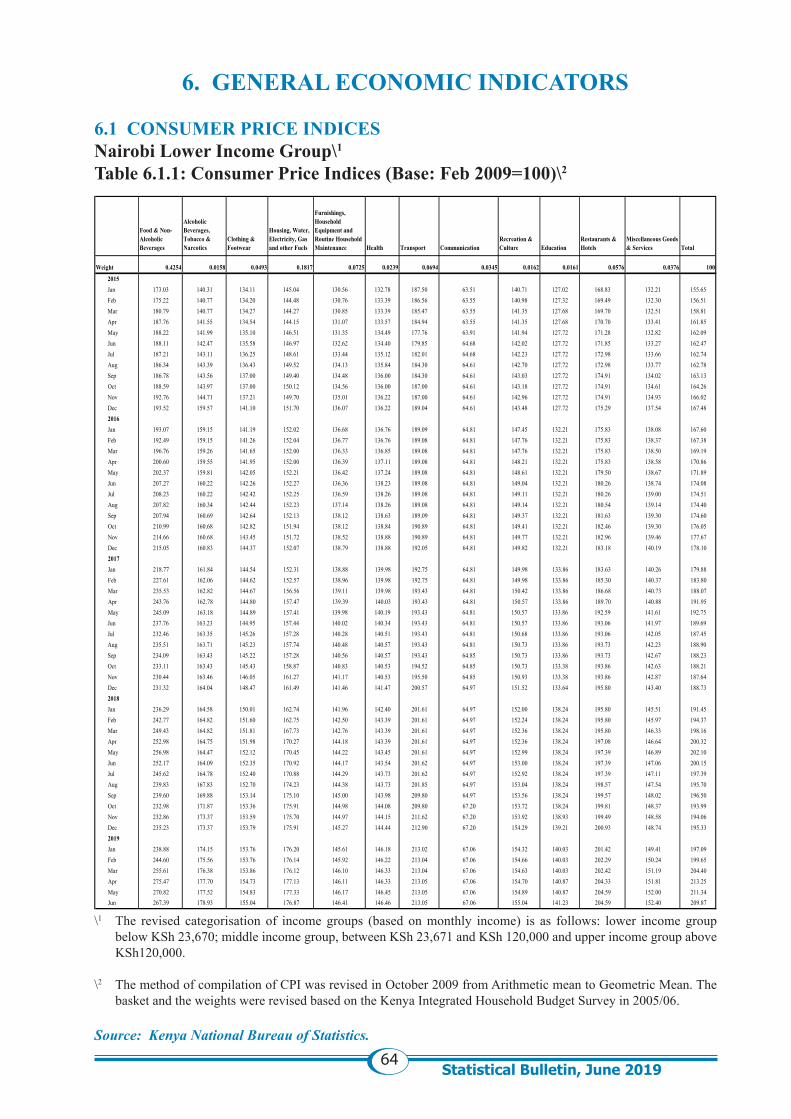
64Statistical Bulletin, June 2019
6. GENERAL ECONOMIC INDICATORS
6.1 CONSUMER PRICE INDICESNairobi Lower Income Group\1
Table 6.1.1: Consumer Price Indices (Base: Feb 2009=100)\2
\1 The revised categorisation of income groups (based on monthly income) is as follows: lower income group below KSh 23,670; middle income group, between KSh 23,671 and KSh 120,000 and upper income group above KSh120,000.
\2 The method of compilation of CPI was revised in October 2009 from Arithmetic mean to Geometric Mean. The basket and the weights were revised based on the Kenya Integrated Household Budget Survey in 2005/06.
Source: Kenya National Bureau of Statistics.
Food & Non-Alcoholic Beverages
Alcoholic Beverages, Tobacco & Narcotics
Clothing & Footwear
Housing, Water, Electricity, Gas and other Fuels
Furnishings, Household Equipment and Routine Household Maintenance Health Transport Communication
Recreation & Culture Education
Restaurants & Hotels
Miscellaneous Goods & Services Total
Weight 0.4254 0.0158 0.0493 0.1817 0.0725 0.0239 0.0694 0.0345 0.0162 0.0161 0.0576 0.0376 100
2015Jan 173.03 140.31 134.11 145.04 130.56 132.78 187.50 63.51 140.71 127.02 168.83 132.21 155.65Feb 175.22 140.77 134.20 144.48 130.76 133.39 186.56 63.55 140.98 127.32 169.49 132.30 156.51Mar 180.79 140.77 134.27 144.27 130.85 133.39 185.47 63.55 141.35 127.68 169.70 132.51 158.81Apr 187.76 141.55 134.54 144.15 131.07 133.57 184.94 63.55 141.35 127.68 170.70 133.41 161.85May 188.22 141.99 135.10 146.51 131.35 134.49 177.76 63.91 141.94 127.72 171.28 132.82 162.09Jun 188.11 142.47 135.58 146.97 132.62 134.40 179.85 64.68 142.02 127.72 171.85 133.27 162.47Jul 187.21 143.11 136.25 148.61 133.44 135.12 182.01 64.68 142.23 127.72 172.98 133.66 162.74Aug 186.34 143.39 136.43 149.52 134.13 135.84 184.30 64.61 142.70 127.72 172.98 133.77 162.78Sep 186.78 143.56 137.00 149.40 134.48 136.00 184.30 64.61 143.03 127.72 174.91 134.02 163.13Oct 188.59 143.97 137.00 150.12 134.56 136.00 187.00 64.61 143.18 127.72 174.91 134.61 164.26Nov 192.76 144.71 137.21 149.70 135.01 136.22 187.00 64.61 142.96 127.72 174.91 134.93 166.02Dec 193.52 159.57 141.10 151.70 136.07 136.22 189.04 64.61 143.48 127.72 175.29 137.54 167.482016Jan 193.07 159.15 141.19 152.02 136.68 136.76 189.09 64.81 147.45 132.21 175.83 138.08 167.60Feb 192.49 159.15 141.26 152.04 136.77 136.76 189.08 64.81 147.76 132.21 175.83 138.37 167.38Mar 196.76 159.26 141.65 152.00 136.33 136.85 189.08 64.81 147.76 132.21 175.83 138.50 169.19Apr 200.60 159.55 141.95 152.00 136.39 137.11 189.08 64.81 148.21 132.21 175.83 138.58 170.86May 202.37 159.81 142.05 152.21 136.42 137.24 189.08 64.81 148.61 132.21 179.50 138.67 171.89Jun 207.27 160.22 142.26 152.27 136.36 138.23 189.08 64.81 149.04 132.21 180.26 138.74 174.08Jul 208.23 160.22 142.42 152.25 136.59 138.26 189.08 64.81 149.11 132.21 180.26 139.00 174.51Aug 207.82 160.34 142.44 152.23 137.14 138.26 189.08 64.81 149.14 132.21 180.54 139.14 174.40Sep 207.94 160.69 142.64 152.13 138.12 138.63 189.09 64.81 149.37 132.21 181.63 139.30 174.60Oct 210.99 160.68 142.82 151.94 138.12 138.84 190.89 64.81 149.41 132.21 182.46 139.30 176.05Nov 214.66 160.68 143.45 151.72 138.52 138.88 190.89 64.81 149.77 132.21 182.96 139.46 177.67Dec 215.05 160.83 144.37 152.07 138.79 138.88 192.05 64.81 149.82 132.21 183.18 140.19 178.102017Jan 218.77 161.84 144.54 152.31 138.88 139.98 192.75 64.81 149.98 133.86 183.63 140.26 179.88Feb 227.61 162.06 144.62 152.57 138.96 139.98 192.75 64.81 149.98 133.86 185.30 140.37 183.80Mar 235.53 162.82 144.67 156.56 139.11 139.98 193.43 64.81 150.42 133.86 186.68 140.73 188.07Apr 243.76 162.78 144.80 157.47 139.39 140.03 193.43 64.81 150.57 133.86 189.70 140.88 191.95May 245.09 163.18 144.89 157.41 139.98 140.19 193.43 64.81 150.57 133.86 192.59 141.61 192.75Jun 237.76 163.23 144.95 157.44 140.02 140.34 193.43 64.81 150.57 133.86 193.06 141.97 189.69Jul 232.46 163.35 145.26 157.28 140.28 140.51 193.43 64.81 150.68 133.86 193.06 142.05 187.45Aug 235.51 163.71 145.23 157.74 140.48 140.57 193.43 64.81 150.73 133.86 193.73 142.23 188.90Sep 234.09 163.43 145.22 157.28 140.56 140.57 193.43 64.85 150.73 133.86 193.73 142.67 188.23Oct 233.11 163.43 145.43 158.87 140.83 140.53 194.52 64.85 150.73 133.38 193.86 142.63 188.21Nov 230.44 163.46 146.05 161.27 141.17 140.53 195.50 64.85 150.93 133.38 193.86 142.87 187.64Dec 231.32 164.04 148.47 161.49 141.46 141.47 200.57 64.97 151.52 133.64 195.80 143.40 188.732018Jan 236.29 164.58 150.01 162.74 141.96 142.40 201.61 64.97 152.00 138.24 195.80 145.51 191.45Feb 242.77 164.82 151.60 162.75 142.50 143.39 201.61 64.97 152.24 138.24 195.80 145.97 194.37Mar 249.43 164.82 151.81 167.73 142.76 143.39 201.61 64.97 152.36 138.24 195.80 146.33 198.16Apr 252.98 164.75 151.98 170.27 144.18 143.39 201.61 64.97 152.36 138.24 197.08 146.64 200.32May 256.98 164.47 152.12 170.45 144.22 143.45 201.61 64.97 152.99 138.24 197.39 146.89 202.10Jun 252.17 164.09 152.35 170.92 144.17 143.54 201.62 64.97 153.00 138.24 197.39 147.06 200.15Jul 245.62 164.78 152.40 170.88 144.29 143.73 201.62 64.97 152.92 138.24 197.39 147.11 197.39Aug 239.83 167.83 152.70 174.23 144.38 143.73 201.85 64.97 153.04 138.24 198.57 147.54 195.70Sep 239.60 169.88 153.14 175.10 145.00 143.98 209.80 64.97 153.56 138.24 199.57 148.02 196.50Oct 232.98 171.87 153.36 175.91 144.98 144.08 209.80 67.20 153.72 138.24 199.81 148.37 193.99Nov 232.86 173.37 153.59 175.70 144.97 144.15 211.62 67.20 153.92 138.93 199.49 148.58 194.06Dec 235.23 173.37 153.79 175.91 145.27 144.44 212.90 67.20 154.29 139.21 200.93 148.74 195.332019Jan 238.88 174.15 153.76 176.20 145.61 146.18 213.02 67.06 154.32 140.03 201.42 149.41 197.09Feb 244.60 175.56 153.76 176.14 145.92 146.22 213.04 67.06 154.66 140.03 202.29 150.24 199.65Mar 255.61 176.38 153.86 176.12 146.10 146.33 213.04 67.06 154.63 140.03 202.42 151.19 204.40Apr 275.47 177.70 154.73 177.13 146.11 146.33 213.05 67.06 154.70 140.87 204.33 151.81 213.25May 270.82 177.52 154.83 177.33 146.17 146.45 213.05 67.06 154.89 140.87 204.59 152.00 211.34Jun 267.39 178.93 155.04 176.87 146.41 146.46 213.05 67.06 155.04 141.23 204.59 152.40 209.87
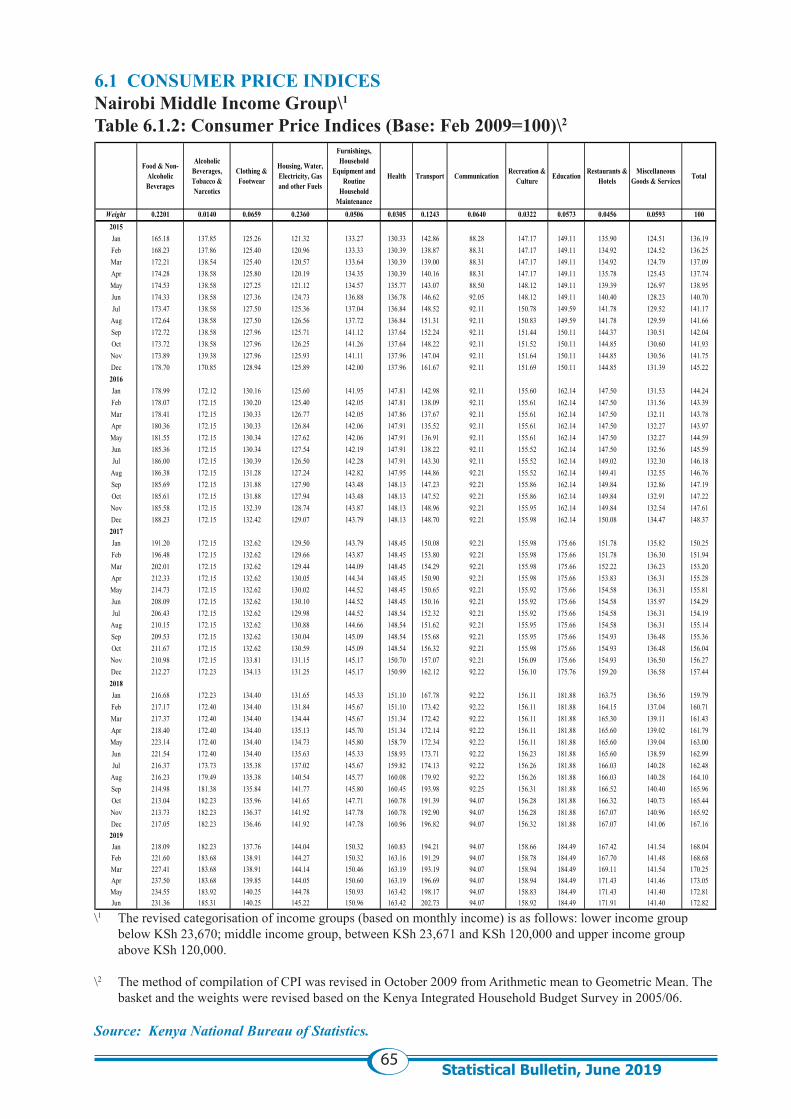
65Statistical Bulletin, June 2019
6.1 CONSUMER PRICE INDICESNairobi Middle Income Group\1
Table 6.1.2: Consumer Price Indices (Base: Feb 2009=100)\2
\1 The revised categorisation of income groups (based on monthly income) is as follows: lower income group below KSh 23,670; middle income group, between KSh 23,671 and KSh 120,000 and upper income group above KSh 120,000.
\2 The method of compilation of CPI was revised in October 2009 from Arithmetic mean to Geometric Mean. The basket and the weights were revised based on the Kenya Integrated Household Budget Survey in 2005/06.
Source: Kenya National Bureau of Statistics.
Food & Non-Alcoholic Beverages
Alcoholic Beverages, Tobacco & Narcotics
Clothing & Footwear
Housing, Water, Electricity, Gas and other Fuels
Furnishings, Household
Equipment and Routine
Household Maintenance
Health Transport Communication Recreation & Culture Education Restaurants &
HotelsMiscellaneous
Goods & Services Total
Weight 0.2201 0.0140 0.0659 0.2360 0.0506 0.0305 0.1243 0.0640 0.0322 0.0573 0.0456 0.0593 1002015Jan 165.18 137.85 125.26 121.32 133.27 130.33 142.86 88.28 147.17 149.11 135.90 124.51 136.19Feb 168.23 137.86 125.40 120.96 133.33 130.39 138.87 88.31 147.17 149.11 134.92 124.52 136.25Mar 172.21 138.54 125.40 120.57 133.64 130.39 139.00 88.31 147.17 149.11 134.92 124.79 137.09Apr 174.28 138.58 125.80 120.19 134.35 130.39 140.16 88.31 147.17 149.11 135.78 125.43 137.74May 174.53 138.58 127.25 121.12 134.57 135.77 143.07 88.50 148.12 149.11 139.39 126.97 138.95Jun 174.33 138.58 127.36 124.73 136.88 136.78 146.62 92.05 148.12 149.11 140.40 128.23 140.70Jul 173.47 138.58 127.50 125.36 137.04 136.84 148.52 92.11 150.78 149.59 141.78 129.52 141.17
Aug 172.64 138.58 127.50 126.56 137.72 136.84 151.31 92.11 150.83 149.59 141.78 129.59 141.66Sep 172.72 138.58 127.96 125.71 141.12 137.64 152.24 92.11 151.44 150.11 144.37 130.51 142.04Oct 173.72 138.58 127.96 126.25 141.26 137.64 148.22 92.11 151.52 150.11 144.85 130.60 141.93Nov 173.89 139.38 127.96 125.93 141.11 137.96 147.04 92.11 151.64 150.11 144.85 130.56 141.75Dec 178.70 170.85 128.94 125.89 142.00 137.96 161.67 92.11 151.69 150.11 144.85 131.39 145.222016Jan 178.99 172.12 130.16 125.60 141.95 147.81 142.98 92.11 155.60 162.14 147.50 131.53 144.24Feb 178.07 172.15 130.20 125.40 142.05 147.81 138.09 92.11 155.61 162.14 147.50 131.56 143.39Mar 178.41 172.15 130.33 126.77 142.05 147.86 137.67 92.11 155.61 162.14 147.50 132.11 143.78Apr 180.36 172.15 130.33 126.84 142.06 147.91 135.52 92.11 155.61 162.14 147.50 132.27 143.97May 181.55 172.15 130.34 127.62 142.06 147.91 136.91 92.11 155.61 162.14 147.50 132.27 144.59Jun 185.36 172.15 130.34 127.54 142.19 147.91 138.22 92.11 155.52 162.14 147.50 132.56 145.59Jul 186.00 172.15 130.39 126.50 142.28 147.91 143.30 92.11 155.52 162.14 149.02 132.30 146.18
Aug 186.38 172.15 131.28 127.24 142.82 147.95 144.86 92.21 155.52 162.14 149.41 132.55 146.76Sep 185.69 172.15 131.88 127.90 143.48 148.13 147.23 92.21 155.86 162.14 149.84 132.86 147.19Oct 185.61 172.15 131.88 127.94 143.48 148.13 147.52 92.21 155.86 162.14 149.84 132.91 147.22Nov 185.58 172.15 132.39 128.74 143.87 148.13 148.96 92.21 155.95 162.14 149.84 132.54 147.61Dec 188.23 172.15 132.42 129.07 143.79 148.13 148.70 92.21 155.98 162.14 150.08 134.47 148.372017Jan 191.20 172.15 132.62 129.50 143.79 148.45 150.08 92.21 155.98 175.66 151.78 135.82 150.25Feb 196.48 172.15 132.62 129.66 143.87 148.45 153.80 92.21 155.98 175.66 151.78 136.30 151.94Mar 202.01 172.15 132.62 129.44 144.09 148.45 154.29 92.21 155.98 175.66 152.22 136.23 153.20Apr 212.33 172.15 132.62 130.05 144.34 148.45 150.90 92.21 155.98 175.66 153.83 136.31 155.28May 214.73 172.15 132.62 130.02 144.52 148.45 150.65 92.21 155.92 175.66 154.58 136.31 155.81Jun 208.09 172.15 132.62 130.10 144.52 148.45 150.16 92.21 155.92 175.66 154.58 135.97 154.29Jul 206.43 172.15 132.62 129.98 144.52 148.54 152.32 92.21 155.92 175.66 154.58 136.31 154.19
Aug 210.15 172.15 132.62 130.88 144.66 148.54 151.62 92.21 155.95 175.66 154.58 136.31 155.14Sep 209.53 172.15 132.62 130.04 145.09 148.54 155.68 92.21 155.95 175.66 154.93 136.48 155.36Oct 211.67 172.15 132.62 130.59 145.09 148.54 156.32 92.21 155.98 175.66 154.93 136.48 156.04Nov 210.98 172.15 133.81 131.15 145.17 150.70 157.07 92.21 156.09 175.66 154.93 136.50 156.27Dec 212.27 172.23 134.13 131.25 145.17 150.99 162.12 92.22 156.10 175.76 159.20 136.58 157.442018Jan 216.68 172.23 134.40 131.65 145.33 151.10 167.78 92.22 156.11 181.88 163.75 136.56 159.79Feb 217.17 172.40 134.40 131.84 145.67 151.10 173.42 92.22 156.11 181.88 164.15 137.04 160.71Mar 217.37 172.40 134.40 134.44 145.67 151.34 172.42 92.22 156.11 181.88 165.30 139.11 161.43Apr 218.40 172.40 134.40 135.13 145.70 151.34 172.14 92.22 156.11 181.88 165.60 139.02 161.79May 223.14 172.40 134.40 134.73 145.80 158.79 172.34 92.22 156.11 181.88 165.60 139.04 163.00Jun 221.54 172.40 134.40 135.63 145.33 158.93 173.71 92.22 156.23 181.88 165.60 138.59 162.99Jul 216.37 173.73 135.38 137.02 145.67 159.82 174.13 92.22 156.26 181.88 166.03 140.28 162.48
Aug 216.23 179.49 135.38 140.54 145.77 160.08 179.92 92.22 156.26 181.88 166.03 140.28 164.10Sep 214.98 181.38 135.84 141.77 145.80 160.45 193.98 92.25 156.31 181.88 166.52 140.40 165.96Oct 213.04 182.23 135.96 141.65 147.71 160.78 191.39 94.07 156.28 181.88 166.32 140.73 165.44Nov 213.73 182.23 136.37 141.92 147.78 160.78 192.90 94.07 156.28 181.88 167.07 140.96 165.92Dec 217.05 182.23 136.46 141.92 147.78 160.96 196.82 94.07 156.32 181.88 167.07 141.06 167.162019Jan 218.09 182.23 137.76 144.04 150.32 160.83 194.21 94.07 158.66 184.49 167.42 141.54 168.04Feb 221.60 183.68 138.91 144.27 150.32 163.16 191.29 94.07 158.78 184.49 167.70 141.48 168.68Mar 227.41 183.68 138.91 144.14 150.46 163.19 193.19 94.07 158.94 184.49 169.11 141.54 170.25Apr 237.50 183.68 139.85 144.05 150.60 163.19 196.69 94.07 158.94 184.49 171.43 141.46 173.05May 234.55 183.92 140.25 144.78 150.93 163.42 198.17 94.07 158.83 184.49 171.43 141.40 172.81Jun 231.36 185.31 140.25 145.22 150.96 163.42 202.73 94.07 158.92 184.49 171.91 141.40 172.82
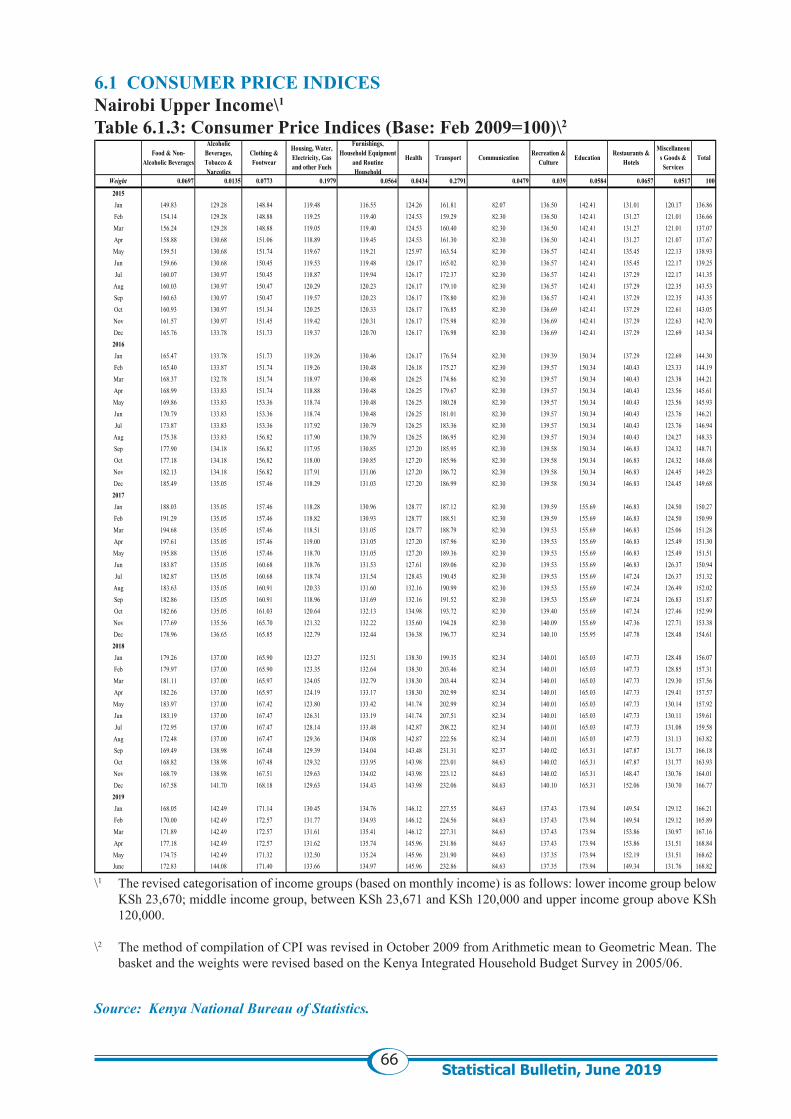
66Statistical Bulletin, June 2019
6.1 CONSUMER PRICE INDICESNairobi Upper Income\1
Table 6.1.3: Consumer Price Indices (Base: Feb 2009=100)\2
Source: Kenya National Bureau of Statistics.
\1 The revised categorisation of income groups (based on monthly income) is as follows: lower income group below KSh 23,670; middle income group, between KSh 23,671 and KSh 120,000 and upper income group above KSh 120,000.
\2 The method of compilation of CPI was revised in October 2009 from Arithmetic mean to Geometric Mean. The basket and the weights were revised based on the Kenya Integrated Household Budget Survey in 2005/06.
Food & Non-Alcoholic Beverages
Alcoholic Beverages, Tobacco & Narcotics
Clothing & Footwear
Housing, Water, Electricity, Gas and other Fuels
Furnishings, Household Equipment
and Routine Household
Health Transport Communication Recreation & Culture Education Restaurants &
Hotels
Miscellaneous Goods & Services
Total
Weight 0.0697 0.0135 0.0773 0.1979 0.0564 0.0434 0.2791 0.0479 0.039 0.0584 0.0657 0.0517 100
2015Jan 149.83 129.28 148.84 119.48 116.55 124.26 161.81 82.07 136.50 142.41 131.01 120.17 136.86Feb 154.14 129.28 148.88 119.25 119.40 124.53 159.29 82.30 136.50 142.41 131.27 121.01 136.66Mar 156.24 129.28 148.88 119.05 119.40 124.53 160.40 82.30 136.50 142.41 131.27 121.01 137.07Apr 158.88 130.68 151.06 118.89 119.45 124.53 161.30 82.30 136.50 142.41 131.27 121.07 137.67May 159.51 130.68 151.74 119.67 119.21 125.97 163.54 82.30 136.57 142.41 135.45 122.13 138.93Jun 159.66 130.68 150.45 119.53 119.48 126.17 165.02 82.30 136.57 142.41 135.45 122.17 139.25Jul 160.07 130.97 150.45 118.87 119.94 126.17 172.37 82.30 136.57 142.41 137.29 122.17 141.35
Aug 160.03 130.97 150.47 120.29 120.23 126.17 179.10 82.30 136.57 142.41 137.29 122.35 143.53Sep 160.63 130.97 150.47 119.57 120.23 126.17 178.80 82.30 136.57 142.41 137.29 122.35 143.35Oct 160.93 130.97 151.34 120.25 120.33 126.17 176.85 82.30 136.69 142.41 137.29 122.61 143.05Nov 161.57 130.97 151.45 119.42 120.31 126.17 175.98 82.30 136.69 142.41 137.29 122.63 142.70Dec 165.76 133.78 151.73 119.37 120.70 126.17 176.98 82.30 136.69 142.41 137.29 122.69 143.342016Jan 165.47 133.78 151.73 119.26 130.46 126.17 176.54 82.30 139.39 150.34 137.29 122.69 144.30Feb 165.40 133.87 151.74 119.26 130.48 126.18 175.27 82.30 139.57 150.34 140.43 123.33 144.19Mar 168.37 132.78 151.74 118.97 130.48 126.25 174.86 82.30 139.57 150.34 140.43 123.38 144.21Apr 168.99 133.83 151.74 118.88 130.48 126.25 179.67 82.30 139.57 150.34 140.43 123.56 145.61May 169.86 133.83 153.36 118.74 130.48 126.25 180.28 82.30 139.57 150.34 140.43 123.56 145.93Jun 170.79 133.83 153.36 118.74 130.48 126.25 181.01 82.30 139.57 150.34 140.43 123.76 146.21Jul 173.87 133.83 153.36 117.92 130.79 126.25 183.36 82.30 139.57 150.34 140.43 123.76 146.94
Aug 175.38 133.83 156.82 117.90 130.79 126.25 186.95 82.30 139.57 150.34 140.43 124.27 148.33Sep 177.90 134.18 156.82 117.95 130.85 127.20 185.95 82.30 139.58 150.34 146.83 124.32 148.71Oct 177.18 134.18 156.82 118.00 130.85 127.20 185.96 82.30 139.58 150.34 146.83 124.32 148.68Nov 182.13 134.18 156.82 117.91 131.06 127.20 186.72 82.30 139.58 150.34 146.83 124.45 149.23Dec 185.49 135.05 157.46 118.29 131.03 127.20 186.99 82.30 139.58 150.34 146.83 124.45 149.682017Jan 188.03 135.05 157.46 118.28 130.96 128.77 187.12 82.30 139.59 155.69 146.83 124.50 150.27Feb 191.29 135.05 157.46 118.82 130.93 128.77 188.51 82.30 139.59 155.69 146.83 124.50 150.99Mar 194.68 135.05 157.46 118.51 131.05 128.77 188.79 82.30 139.53 155.69 146.83 125.06 151.28Apr 197.61 135.05 157.46 119.00 131.05 127.20 187.96 82.30 139.53 155.69 146.83 125.49 151.30May 195.88 135.05 157.46 118.70 131.05 127.20 189.36 82.30 139.53 155.69 146.83 125.49 151.51Jun 183.87 135.05 160.68 118.76 131.53 127.61 189.06 82.30 139.53 155.69 146.83 126.37 150.94Jul 182.87 135.05 160.68 118.74 131.54 128.43 190.45 82.30 139.53 155.69 147.24 126.37 151.32
Aug 183.63 135.05 160.91 120.33 131.60 132.16 190.99 82.30 139.53 155.69 147.24 126.49 152.02Sep 182.86 135.05 160.91 118.96 131.69 132.16 191.52 82.30 139.53 155.69 147.24 126.83 151.87Oct 182.66 135.05 161.03 120.64 132.13 134.98 193.72 82.30 139.40 155.69 147.24 127.46 152.99Nov 177.69 135.56 165.70 121.32 132.22 135.60 194.28 82.30 140.09 155.69 147.36 127.71 153.38Dec 178.96 136.65 165.85 122.79 132.44 136.38 196.77 82.34 140.10 155.95 147.78 128.48 154.612018Jan 179.26 137.00 165.90 123.27 132.51 138.30 199.35 82.34 140.01 165.03 147.73 128.48 156.07Feb 179.97 137.00 165.90 123.35 132.64 138.30 203.46 82.34 140.01 165.03 147.73 128.85 157.31Mar 181.11 137.00 165.97 124.05 132.79 138.30 203.44 82.34 140.01 165.03 147.73 129.30 157.56Apr 182.26 137.00 165.97 124.19 133.17 138.30 202.99 82.34 140.01 165.03 147.73 129.41 157.57May 183.97 137.00 167.42 123.80 133.42 141.74 202.99 82.34 140.01 165.03 147.73 130.14 157.92Jun 183.19 137.00 167.47 126.31 133.19 141.74 207.51 82.34 140.01 165.03 147.73 130.11 159.61Jul 172.95 137.00 167.47 128.14 133.48 142.87 208.22 82.34 140.01 165.03 147.73 131.08 159.58
Aug 172.48 137.00 167.47 129.36 134.08 142.87 222.56 82.34 140.01 165.03 147.73 131.13 163.82Sep 169.49 138.98 167.48 129.39 134.04 143.48 231.31 82.37 140.02 165.31 147.87 131.77 166.18Oct 168.82 138.98 167.48 129.32 133.95 143.98 223.01 84.63 140.02 165.31 147.87 131.77 163.93Nov 168.79 138.98 167.51 129.63 134.02 143.98 223.12 84.63 140.02 165.31 148.47 130.76 164.01Dec 167.58 141.70 168.18 129.63 134.43 143.98 232.06 84.63 140.10 165.31 152.06 130.70 166.772019Jan 168.05 142.49 171.14 130.45 134.76 146.12 227.55 84.63 137.43 173.94 149.54 129.12 166.21Feb 170.00 142.49 172.57 131.77 134.93 146.12 224.56 84.63 137.43 173.94 149.54 129.12 165.89Mar 171.89 142.49 172.57 131.61 135.41 146.12 227.31 84.63 137.43 173.94 153.86 130.97 167.16Apr 177.18 142.49 172.57 131.62 135.74 145.96 231.86 84.63 137.43 173.94 153.86 131.51 168.84May 174.75 142.49 171.32 132.50 135.24 145.96 231.90 84.63 137.35 173.94 152.19 131.51 168.62June 172.83 144.08 171.40 133.66 134.97 145.96 232.86 84.63 137.35 173.94 149.34 131.76 168.82
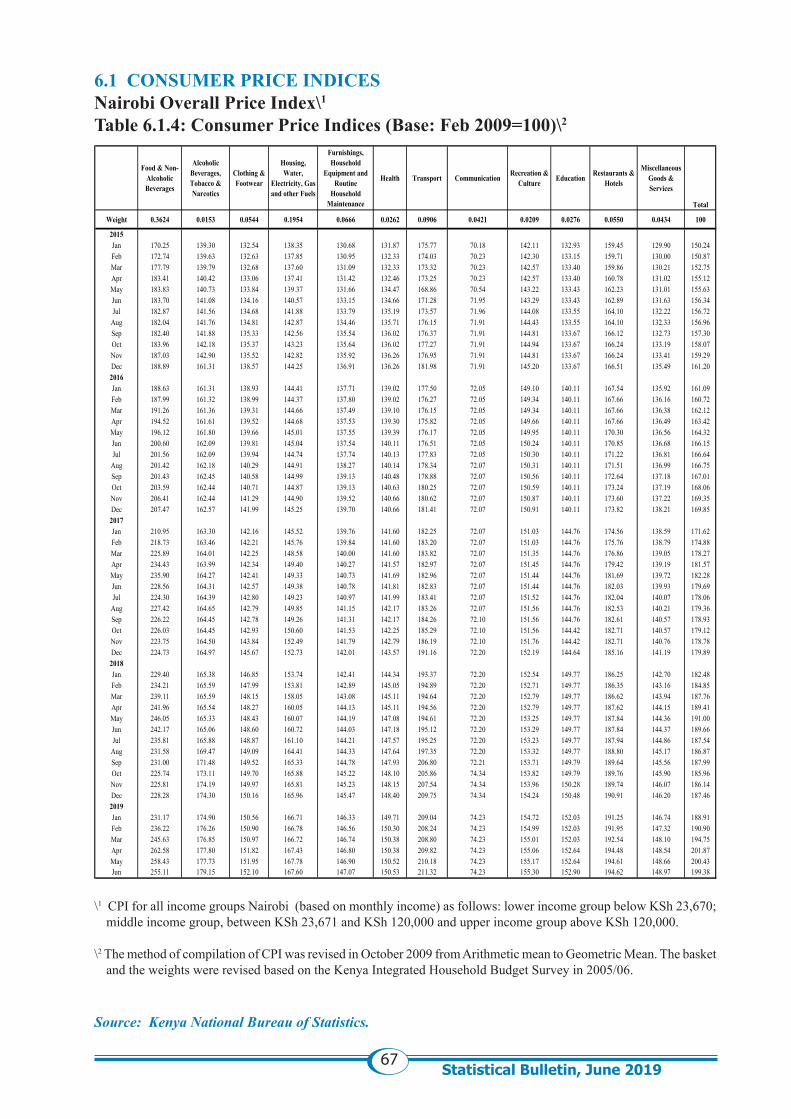
67Statistical Bulletin, June 2019
6.1 CONSUMER PRICE INDICESNairobi Overall Price Index\1 Table 6.1.4: Consumer Price Indices (Base: Feb 2009=100)\2
\1 CPI for all income groups Nairobi (based on monthly income) as follows: lower income group below KSh 23,670; middle income group, between KSh 23,671 and KSh 120,000 and upper income group above KSh 120,000.
\2 The method of compilation of CPI was revised in October 2009 from Arithmetic mean to Geometric Mean. The basket and the weights were revised based on the Kenya Integrated Household Budget Survey in 2005/06.
Source: Kenya National Bureau of Statistics.
Food & Non-Alcoholic Beverages
Alcoholic Beverages, Tobacco & Narcotics
Clothing & Footwear
Housing, Water,
Electricity, Gas and other Fuels
Furnishings, Household
Equipment and Routine
Household Maintenance
Health Transport Communication Recreation & Culture Education Restaurants &
Hotels
Miscellaneous Goods & Services
Total
Weight 0.3624 0.0153 0.0544 0.1954 0.0666 0.0262 0.0906 0.0421 0.0209 0.0276 0.0550 0.0434 100
2015Jan 170.25 139.30 132.54 138.35 130.68 131.87 175.77 70.18 142.11 132.93 159.45 129.90 150.24Feb 172.74 139.63 132.63 137.85 130.95 132.33 174.03 70.23 142.30 133.15 159.71 130.00 150.87Mar 177.79 139.79 132.68 137.60 131.09 132.33 173.32 70.23 142.57 133.40 159.86 130.21 152.75Apr 183.41 140.42 133.06 137.41 131.42 132.46 173.25 70.23 142.57 133.40 160.78 131.02 155.12May 183.83 140.73 133.84 139.37 131.66 134.47 168.86 70.54 143.22 133.43 162.23 131.01 155.63Jun 183.70 141.08 134.16 140.57 133.15 134.66 171.28 71.95 143.29 133.43 162.89 131.63 156.34Jul 182.87 141.56 134.68 141.88 133.79 135.19 173.57 71.96 144.08 133.55 164.10 132.22 156.72
Aug 182.04 141.76 134.81 142.87 134.46 135.71 176.15 71.91 144.43 133.55 164.10 132.33 156.96Sep 182.40 141.88 135.33 142.56 135.54 136.02 176.37 71.91 144.81 133.67 166.12 132.73 157.30Oct 183.96 142.18 135.37 143.23 135.64 136.02 177.27 71.91 144.94 133.67 166.24 133.19 158.07Nov 187.03 142.90 135.52 142.82 135.92 136.26 176.95 71.91 144.81 133.67 166.24 133.41 159.29Dec 188.89 161.31 138.57 144.25 136.91 136.26 181.98 71.91 145.20 133.67 166.51 135.49 161.202016Jan 188.63 161.31 138.93 144.41 137.71 139.02 177.50 72.05 149.10 140.11 167.54 135.92 161.09Feb 187.99 161.32 138.99 144.37 137.80 139.02 176.27 72.05 149.34 140.11 167.66 136.16 160.72Mar 191.26 161.36 139.31 144.66 137.49 139.10 176.15 72.05 149.34 140.11 167.66 136.38 162.12Apr 194.52 161.61 139.52 144.68 137.53 139.30 175.82 72.05 149.66 140.11 167.66 136.49 163.42May 196.12 161.80 139.66 145.01 137.55 139.39 176.17 72.05 149.95 140.11 170.30 136.56 164.32Jun 200.60 162.09 139.81 145.04 137.54 140.11 176.51 72.05 150.24 140.11 170.85 136.68 166.15Jul 201.56 162.09 139.94 144.74 137.74 140.13 177.83 72.05 150.30 140.11 171.22 136.81 166.64
Aug 201.42 162.18 140.29 144.91 138.27 140.14 178.34 72.07 150.31 140.11 171.51 136.99 166.75Sep 201.43 162.45 140.58 144.99 139.13 140.48 178.88 72.07 150.56 140.11 172.64 137.18 167.01Oct 203.59 162.44 140.71 144.87 139.13 140.63 180.25 72.07 150.59 140.11 173.24 137.19 168.06Nov 206.41 162.44 141.29 144.90 139.52 140.66 180.62 72.07 150.87 140.11 173.60 137.22 169.35Dec 207.47 162.57 141.99 145.25 139.70 140.66 181.41 72.07 150.91 140.11 173.82 138.21 169.852017Jan 210.95 163.30 142.16 145.52 139.76 141.60 182.25 72.07 151.03 144.76 174.56 138.59 171.62Feb 218.73 163.46 142.21 145.76 139.84 141.60 183.20 72.07 151.03 144.76 175.76 138.79 174.88Mar 225.89 164.01 142.25 148.58 140.00 141.60 183.82 72.07 151.35 144.76 176.86 139.05 178.27Apr 234.43 163.99 142.34 149.40 140.27 141.57 182.97 72.07 151.45 144.76 179.42 139.19 181.57May 235.90 164.27 142.41 149.33 140.73 141.69 182.96 72.07 151.44 144.76 181.69 139.72 182.28Jun 228.56 164.31 142.57 149.38 140.78 141.81 182.83 72.07 151.44 144.76 182.03 139.93 179.69Jul 224.30 164.39 142.80 149.23 140.97 141.99 183.41 72.07 151.52 144.76 182.04 140.07 178.06
Aug 227.42 164.65 142.79 149.85 141.15 142.17 183.26 72.07 151.56 144.76 182.53 140.21 179.36Sep 226.22 164.45 142.78 149.26 141.31 142.17 184.26 72.10 151.56 144.76 182.61 140.57 178.93Oct 226.03 164.45 142.93 150.60 141.53 142.25 185.29 72.10 151.56 144.42 182.71 140.57 179.12Nov 223.75 164.50 143.84 152.49 141.79 142.79 186.19 72.10 151.76 144.42 182.71 140.76 178.78Dec 224.73 164.97 145.67 152.73 142.01 143.57 191.16 72.20 152.19 144.64 185.16 141.19 179.892018Jan 229.40 165.38 146.85 153.74 142.41 144.34 193.37 72.20 152.54 149.77 186.25 142.70 182.48Feb 234.21 165.59 147.99 153.81 142.89 145.05 194.89 72.20 152.71 149.77 186.35 143.16 184.85Mar 239.11 165.59 148.15 158.05 143.08 145.11 194.64 72.20 152.79 149.77 186.62 143.94 187.76Apr 241.96 165.54 148.27 160.05 144.13 145.11 194.56 72.20 152.79 149.77 187.62 144.15 189.41May 246.05 165.33 148.43 160.07 144.19 147.08 194.61 72.20 153.25 149.77 187.84 144.36 191.00Jun 242.17 165.06 148.60 160.72 144.03 147.18 195.12 72.20 153.29 149.77 187.84 144.37 189.66Jul 235.81 165.88 148.87 161.10 144.21 147.57 195.25 72.20 153.23 149.77 187.94 144.86 187.54
Aug 231.58 169.47 149.09 164.41 144.33 147.64 197.35 72.20 153.32 149.77 188.80 145.17 186.87Sep 231.00 171.48 149.52 165.33 144.78 147.93 206.80 72.21 153.71 149.79 189.64 145.56 187.99Oct 225.74 173.11 149.70 165.88 145.22 148.10 205.86 74.34 153.82 149.79 189.76 145.90 185.96Nov 225.81 174.19 149.97 165.81 145.23 148.15 207.54 74.34 153.96 150.28 189.74 146.07 186.14Dec 228.28 174.30 150.16 165.96 145.47 148.40 209.75 74.34 154.24 150.48 190.91 146.20 187.462019Jan 231.17 174.90 150.56 166.71 146.33 149.71 209.04 74.23 154.72 152.03 191.25 146.74 188.91Feb 236.22 176.26 150.90 166.78 146.56 150.30 208.24 74.23 154.99 152.03 191.95 147.32 190.90Mar 245.63 176.85 150.97 166.72 146.74 150.38 208.80 74.23 155.01 152.03 192.54 148.10 194.75Apr 262.58 177.80 151.82 167.43 146.80 150.38 209.82 74.23 155.06 152.64 194.48 148.54 201.87May 258.43 177.73 151.95 167.78 146.90 150.52 210.18 74.23 155.17 152.64 194.61 148.66 200.43Jun 255.11 179.15 152.10 167.60 147.07 150.53 211.32 74.23 155.30 152.90 194.62 148.97 199.38
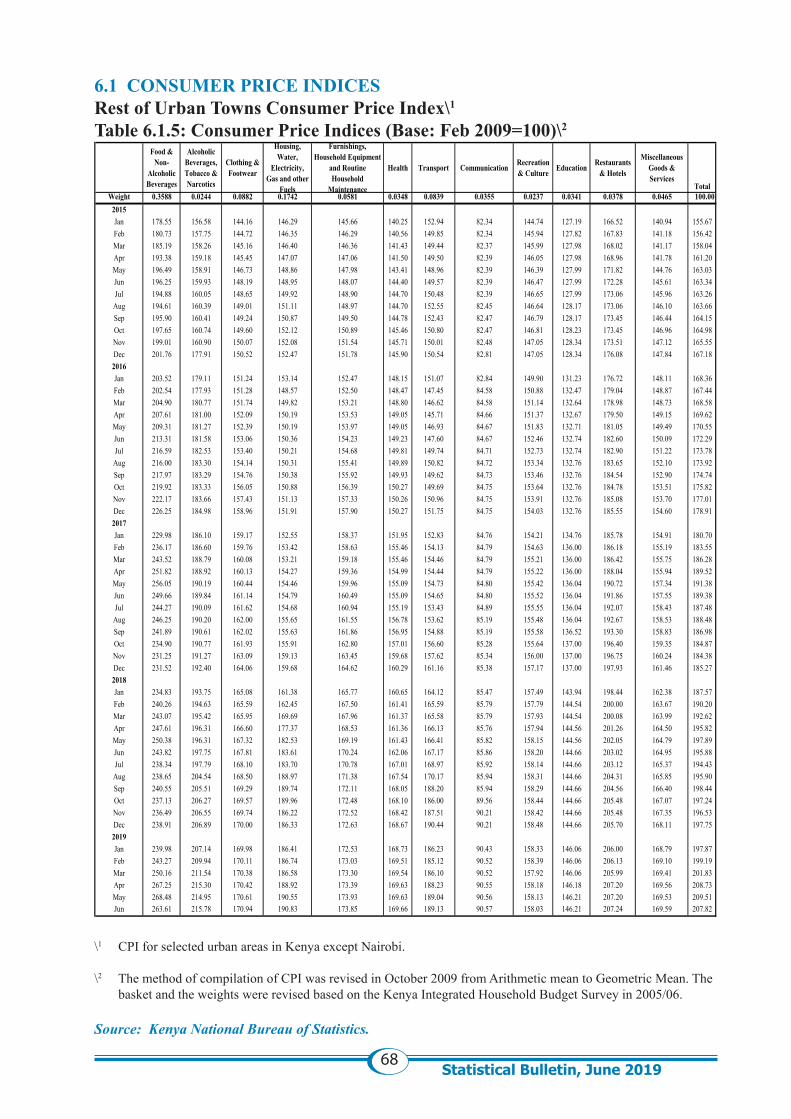
68Statistical Bulletin, June 2019
6.1 CONSUMER PRICE INDICESRest of Urban Towns Consumer Price Index\1 Table 6.1.5: Consumer Price Indices (Base: Feb 2009=100)\2
\1 CPI for selected urban areas in Kenya except Nairobi.
\2 The method of compilation of CPI was revised in October 2009 from Arithmetic mean to Geometric Mean. The basket and the weights were revised based on the Kenya Integrated Household Budget Survey in 2005/06.
Source: Kenya National Bureau of Statistics.
Food & Non-
Alcoholic Beverages
Alcoholic Beverages, Tobacco & Narcotics
Clothing & Footwear
Housing, Water,
Electricity, Gas and other
Fuels
Furnishings, Household Equipment
and Routine Household
Maintenance
Health Transport Communication Recreation & Culture Education Restaurants
& Hotels
Miscellaneous Goods & Services
TotalWeight 0.3588 0.0244 0.0882 0.1742 0.0581 0.0348 0.0839 0.0355 0.0237 0.0341 0.0378 0.0465 100.00
2015Jan 178.55 156.58 144.16 146.29 145.66 140.25 152.94 82.34 144.74 127.19 166.52 140.94 155.67Feb 180.73 157.75 144.72 146.35 146.29 140.56 149.85 82.34 145.94 127.82 167.83 141.18 156.42Mar 185.19 158.26 145.16 146.40 146.36 141.43 149.44 82.37 145.99 127.98 168.02 141.17 158.04Apr 193.38 159.18 145.45 147.07 147.06 141.50 149.50 82.39 146.05 127.98 168.96 141.78 161.20May 196.49 158.91 146.73 148.86 147.98 143.41 148.96 82.39 146.39 127.99 171.82 144.76 163.03Jun 196.25 159.93 148.19 148.95 148.07 144.40 149.57 82.39 146.47 127.99 172.28 145.61 163.34Jul 194.88 160.05 148.65 149.92 148.90 144.70 150.48 82.39 146.65 127.99 173.06 145.96 163.26
Aug 194.61 160.39 149.01 151.11 148.97 144.70 152.55 82.45 146.64 128.17 173.06 146.10 163.66Sep 195.90 160.41 149.24 150.87 149.50 144.78 152.43 82.47 146.79 128.17 173.45 146.44 164.15Oct 197.65 160.74 149.60 152.12 150.89 145.46 150.80 82.47 146.81 128.23 173.45 146.96 164.98Nov 199.01 160.90 150.07 152.08 151.54 145.71 150.01 82.48 147.05 128.34 173.51 147.12 165.55Dec 201.76 177.91 150.52 152.47 151.78 145.90 150.54 82.81 147.05 128.34 176.08 147.84 167.182016Jan 203.52 179.11 151.24 153.14 152.47 148.15 151.07 82.84 149.90 131.23 176.72 148.11 168.36Feb 202.54 177.93 151.28 148.57 152.50 148.47 147.45 84.58 150.88 132.47 179.04 148.87 167.44Mar 204.90 180.77 151.74 149.82 153.21 148.80 146.62 84.58 151.14 132.64 178.98 148.73 168.58Apr 207.61 181.00 152.09 150.19 153.53 149.05 145.71 84.66 151.37 132.67 179.50 149.15 169.62May 209.31 181.27 152.39 150.19 153.97 149.05 146.93 84.67 151.83 132.71 181.05 149.49 170.55Jun 213.31 181.58 153.06 150.36 154.23 149.23 147.60 84.67 152.46 132.74 182.60 150.09 172.29Jul 216.59 182.53 153.40 150.21 154.68 149.81 149.74 84.71 152.73 132.74 182.90 151.22 173.78
Aug 216.00 183.30 154.14 150.31 155.41 149.89 150.82 84.72 153.34 132.76 183.65 152.10 173.92Sep 217.97 183.29 154.76 150.38 155.92 149.93 149.62 84.73 153.46 132.76 184.54 152.90 174.74Oct 219.92 183.33 156.05 150.88 156.39 150.27 149.69 84.75 153.64 132.76 184.78 153.51 175.82Nov 222.17 183.66 157.43 151.13 157.33 150.26 150.96 84.75 153.91 132.76 185.08 153.70 177.01Dec 226.25 184.98 158.96 151.91 157.90 150.27 151.75 84.75 154.03 132.76 185.55 154.60 178.912017Jan 229.98 186.10 159.17 152.55 158.37 151.95 152.83 84.76 154.21 134.76 185.78 154.91 180.70Feb 236.17 186.60 159.76 153.42 158.63 155.46 154.13 84.79 154.63 136.00 186.18 155.19 183.55Mar 243.52 188.79 160.08 153.21 159.18 155.46 154.46 84.79 155.21 136.00 186.42 155.75 186.28Apr 251.82 188.92 160.13 154.27 159.36 154.99 154.44 84.79 155.22 136.00 188.04 155.94 189.52May 256.05 190.19 160.44 154.46 159.96 155.09 154.73 84.80 155.42 136.04 190.72 157.34 191.38Jun 249.66 189.84 161.14 154.79 160.49 155.09 154.65 84.80 155.52 136.04 191.86 157.55 189.38Jul 244.27 190.09 161.62 154.68 160.94 155.19 153.43 84.89 155.55 136.04 192.07 158.43 187.48
Aug 246.25 190.20 162.00 155.65 161.55 156.78 153.62 85.19 155.48 136.04 192.67 158.53 188.48Sep 241.89 190.61 162.02 155.63 161.86 156.95 154.88 85.19 155.58 136.52 193.30 158.83 186.98Oct 234.90 190.77 161.93 155.91 162.80 157.01 156.60 85.28 155.64 137.00 196.40 159.35 184.87Nov 231.25 191.27 163.09 159.13 163.45 159.68 157.62 85.34 156.00 137.00 196.75 160.24 184.38Dec 231.52 192.40 164.06 159.68 164.62 160.29 161.16 85.38 157.17 137.00 197.93 161.46 185.272018Jan 234.83 193.75 165.08 161.38 165.77 160.65 164.12 85.47 157.49 143.94 198.44 162.38 187.57Feb 240.26 194.63 165.59 162.45 167.50 161.41 165.59 85.79 157.79 144.54 200.00 163.67 190.20Mar 243.07 195.42 165.95 169.69 167.96 161.37 165.58 85.79 157.93 144.54 200.08 163.99 192.62Apr 247.61 196.31 166.60 177.37 168.53 161.36 166.13 85.76 157.94 144.56 201.26 164.50 195.82May 250.38 196.31 167.32 182.53 169.19 161.43 166.41 85.82 158.15 144.56 202.05 164.79 197.89Jun 243.82 197.75 167.81 183.61 170.24 162.06 167.17 85.86 158.20 144.66 203.02 164.95 195.88Jul 238.34 197.79 168.10 183.70 170.78 167.01 168.97 85.92 158.14 144.66 203.12 165.37 194.43
Aug 238.65 204.54 168.50 188.97 171.38 167.54 170.17 85.94 158.31 144.66 204.31 165.85 195.90Sep 240.55 205.51 169.29 189.74 172.11 168.05 188.20 85.94 158.29 144.66 204.56 166.40 198.44Oct 237.13 206.27 169.57 189.96 172.48 168.10 186.00 89.56 158.44 144.66 205.48 167.07 197.24Nov 236.49 206.55 169.74 186.22 172.52 168.42 187.51 90.21 158.42 144.66 205.48 167.35 196.53Dec 238.91 206.89 170.00 186.33 172.63 168.67 190.44 90.21 158.48 144.66 205.70 168.11 197.752019Jan 239.98 207.14 169.98 186.41 172.53 168.73 186.23 90.43 158.33 146.06 206.00 168.79 197.87Feb 243.27 209.94 170.11 186.74 173.03 169.51 185.12 90.52 158.39 146.06 206.13 169.10 199.19Mar 250.16 211.54 170.38 186.58 173.30 169.54 186.10 90.52 157.92 146.06 205.99 169.41 201.83Apr 267.25 215.30 170.42 188.92 173.39 169.63 188.23 90.55 158.18 146.18 207.20 169.56 208.73May 268.48 214.95 170.61 190.55 173.93 169.63 189.04 90.56 158.13 146.21 207.20 169.53 209.51Jun 263.61 215.78 170.94 190.83 173.85 169.66 189.13 90.57 158.03 146.21 207.24 169.59 207.82
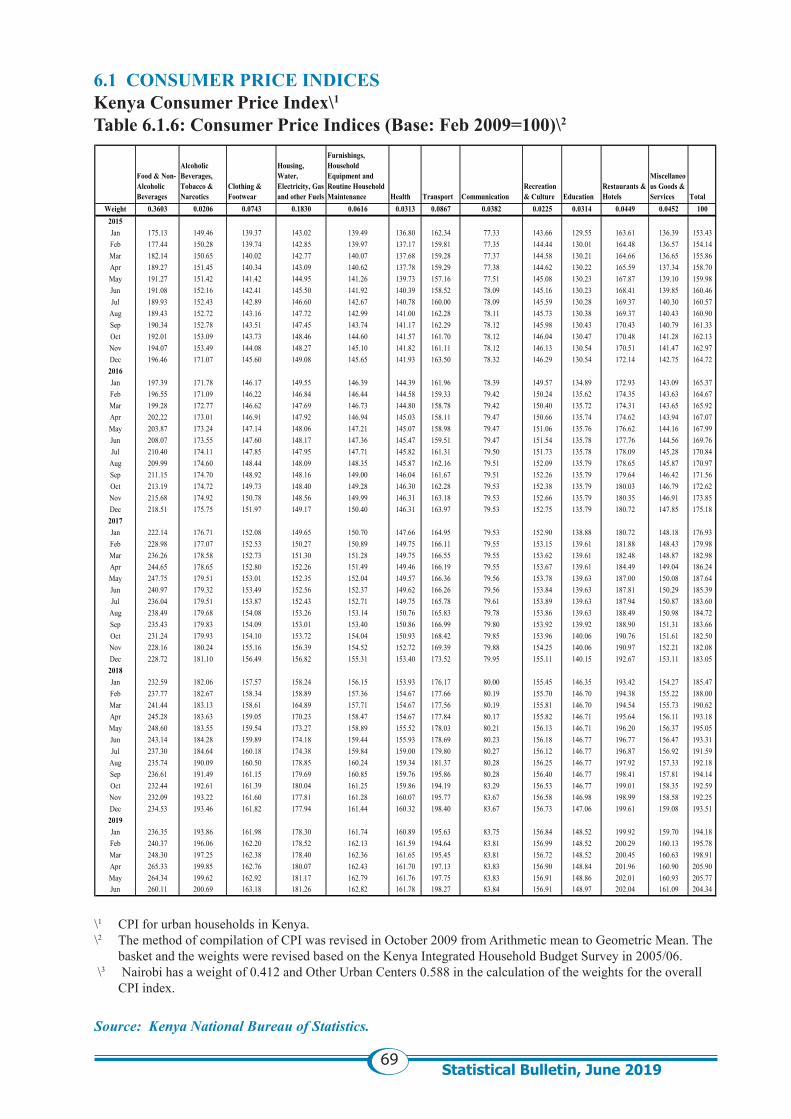
69Statistical Bulletin, June 2019
6.1 CONSUMER PRICE INDICESKenya Consumer Price Index\1 Table 6.1.6: Consumer Price Indices (Base: Feb 2009=100)\2
Source: Kenya National Bureau of Statistics.
\1 CPI for urban households in Kenya. \2 The method of compilation of CPI was revised in October 2009 from Arithmetic mean to Geometric Mean. The
basket and the weights were revised based on the Kenya Integrated Household Budget Survey in 2005/06. \3 Nairobi has a weight of 0.412 and Other Urban Centers 0.588 in the calculation of the weights for the overall
CPI index.
Food & Non-Alcoholic Beverages
Alcoholic Beverages, Tobacco & Narcotics
Clothing & Footwear
Housing, Water, Electricity, Gas and other Fuels
Furnishings, Household Equipment and Routine Household Maintenance Health Transport Communication
Recreation & Culture Education
Restaurants & Hotels
Miscellaneous Goods & Services Total
Weight 0.3603 0.0206 0.0743 0.1830 0.0616 0.0313 0.0867 0.0382 0.0225 0.0314 0.0449 0.0452 1002015Jan 175.13 149.46 139.37 143.02 139.49 136.80 162.34 77.33 143.66 129.55 163.61 136.39 153.43Feb 177.44 150.28 139.74 142.85 139.97 137.17 159.81 77.35 144.44 130.01 164.48 136.57 154.14Mar 182.14 150.65 140.02 142.77 140.07 137.68 159.28 77.37 144.58 130.21 164.66 136.65 155.86Apr 189.27 151.45 140.34 143.09 140.62 137.78 159.29 77.38 144.62 130.22 165.59 137.34 158.70May 191.27 151.42 141.42 144.95 141.26 139.73 157.16 77.51 145.08 130.23 167.87 139.10 159.98Jun 191.08 152.16 142.41 145.50 141.92 140.39 158.52 78.09 145.16 130.23 168.41 139.85 160.46Jul 189.93 152.43 142.89 146.60 142.67 140.78 160.00 78.09 145.59 130.28 169.37 140.30 160.57
Aug 189.43 152.72 143.16 147.72 142.99 141.00 162.28 78.11 145.73 130.38 169.37 140.43 160.90Sep 190.34 152.78 143.51 147.45 143.74 141.17 162.29 78.12 145.98 130.43 170.43 140.79 161.33Oct 192.01 153.09 143.73 148.46 144.60 141.57 161.70 78.12 146.04 130.47 170.48 141.28 162.13Nov 194.07 153.49 144.08 148.27 145.10 141.82 161.11 78.12 146.13 130.54 170.51 141.47 162.97Dec 196.46 171.07 145.60 149.08 145.65 141.93 163.50 78.32 146.29 130.54 172.14 142.75 164.722016Jan 197.39 171.78 146.17 149.55 146.39 144.39 161.96 78.39 149.57 134.89 172.93 143.09 165.37Feb 196.55 171.09 146.22 146.84 146.44 144.58 159.33 79.42 150.24 135.62 174.35 143.63 164.67Mar 199.28 172.77 146.62 147.69 146.73 144.80 158.78 79.42 150.40 135.72 174.31 143.65 165.92Apr 202.22 173.01 146.91 147.92 146.94 145.03 158.11 79.47 150.66 135.74 174.62 143.94 167.07May 203.87 173.24 147.14 148.06 147.21 145.07 158.98 79.47 151.06 135.76 176.62 144.16 167.99Jun 208.07 173.55 147.60 148.17 147.36 145.47 159.51 79.47 151.54 135.78 177.76 144.56 169.76Jul 210.40 174.11 147.85 147.95 147.71 145.82 161.31 79.50 151.73 135.78 178.09 145.28 170.84
Aug 209.99 174.60 148.44 148.09 148.35 145.87 162.16 79.51 152.09 135.79 178.65 145.87 170.97Sep 211.15 174.70 148.92 148.16 149.00 146.04 161.67 79.51 152.26 135.79 179.64 146.42 171.56Oct 213.19 174.72 149.73 148.40 149.28 146.30 162.28 79.53 152.38 135.79 180.03 146.79 172.62Nov 215.68 174.92 150.78 148.56 149.99 146.31 163.18 79.53 152.66 135.79 180.35 146.91 173.85Dec 218.51 175.75 151.97 149.17 150.40 146.31 163.97 79.53 152.75 135.79 180.72 147.85 175.182017Jan 222.14 176.71 152.08 149.65 150.70 147.66 164.95 79.53 152.90 138.88 180.72 148.18 176.93Feb 228.98 177.07 152.53 150.27 150.89 149.75 166.11 79.55 153.15 139.61 181.88 148.43 179.98Mar 236.26 178.58 152.73 151.30 151.28 149.75 166.55 79.55 153.62 139.61 182.48 148.87 182.98Apr 244.65 178.65 152.80 152.26 151.49 149.46 166.19 79.55 153.67 139.61 184.49 149.04 186.24May 247.75 179.51 153.01 152.35 152.04 149.57 166.36 79.56 153.78 139.63 187.00 150.08 187.64Jun 240.97 179.32 153.49 152.56 152.37 149.62 166.26 79.56 153.84 139.63 187.81 150.29 185.39Jul 236.04 179.51 153.87 152.43 152.71 149.75 165.78 79.61 153.89 139.63 187.94 150.87 183.60
Aug 238.49 179.68 154.08 153.26 153.14 150.76 165.83 79.78 153.86 139.63 188.49 150.98 184.72Sep 235.43 179.83 154.09 153.01 153.40 150.86 166.99 79.80 153.92 139.92 188.90 151.31 183.66Oct 231.24 179.93 154.10 153.72 154.04 150.93 168.42 79.85 153.96 140.06 190.76 151.61 182.50Nov 228.16 180.24 155.16 156.39 154.52 152.72 169.39 79.88 154.25 140.06 190.97 152.21 182.08Dec 228.72 181.10 156.49 156.82 155.31 153.40 173.52 79.95 155.11 140.15 192.67 153.11 183.052018Jan 232.59 182.06 157.57 158.24 156.15 153.93 176.17 80.00 155.45 146.35 193.42 154.27 185.47Feb 237.77 182.67 158.34 158.89 157.36 154.67 177.66 80.19 155.70 146.70 194.38 155.22 188.00Mar 241.44 183.13 158.61 164.89 157.71 154.67 177.56 80.19 155.81 146.70 194.54 155.73 190.62Apr 245.28 183.63 159.05 170.23 158.47 154.67 177.84 80.17 155.82 146.71 195.64 156.11 193.18May 248.60 183.55 159.54 173.27 158.89 155.52 178.03 80.21 156.13 146.71 196.20 156.37 195.05Jun 243.14 184.28 159.89 174.18 159.44 155.93 178.69 80.23 156.18 146.77 196.77 156.47 193.31Jul 237.30 184.64 160.18 174.38 159.84 159.00 179.80 80.27 156.12 146.77 196.87 156.92 191.59
Aug 235.74 190.09 160.50 178.85 160.24 159.34 181.37 80.28 156.25 146.77 197.92 157.33 192.18Sep 236.61 191.49 161.15 179.69 160.85 159.76 195.86 80.28 156.40 146.77 198.41 157.81 194.14Oct 232.44 192.61 161.39 180.04 161.25 159.86 194.19 83.29 156.53 146.77 199.01 158.35 192.59Nov 232.09 193.22 161.60 177.81 161.28 160.07 195.77 83.67 156.58 146.98 198.99 158.58 192.25Dec 234.53 193.46 161.82 177.94 161.44 160.32 198.40 83.67 156.73 147.06 199.61 159.08 193.512019Jan 236.35 193.86 161.98 178.30 161.74 160.89 195.63 83.75 156.84 148.52 199.92 159.70 194.18Feb 240.37 196.06 162.20 178.52 162.13 161.59 194.64 83.81 156.99 148.52 200.29 160.13 195.78Mar 248.30 197.25 162.38 178.40 162.36 161.65 195.45 83.81 156.72 148.52 200.45 160.63 198.91Apr 265.33 199.85 162.76 180.07 162.43 161.70 197.13 83.83 156.90 148.84 201.96 160.90 205.90May 264.34 199.62 162.92 181.17 162.79 161.76 197.75 83.83 156.91 148.86 202.01 160.93 205.77Jun 260.11 200.69 163.18 181.26 162.82 161.78 198.27 83.84 156.91 148.97 202.04 161.09 204.34
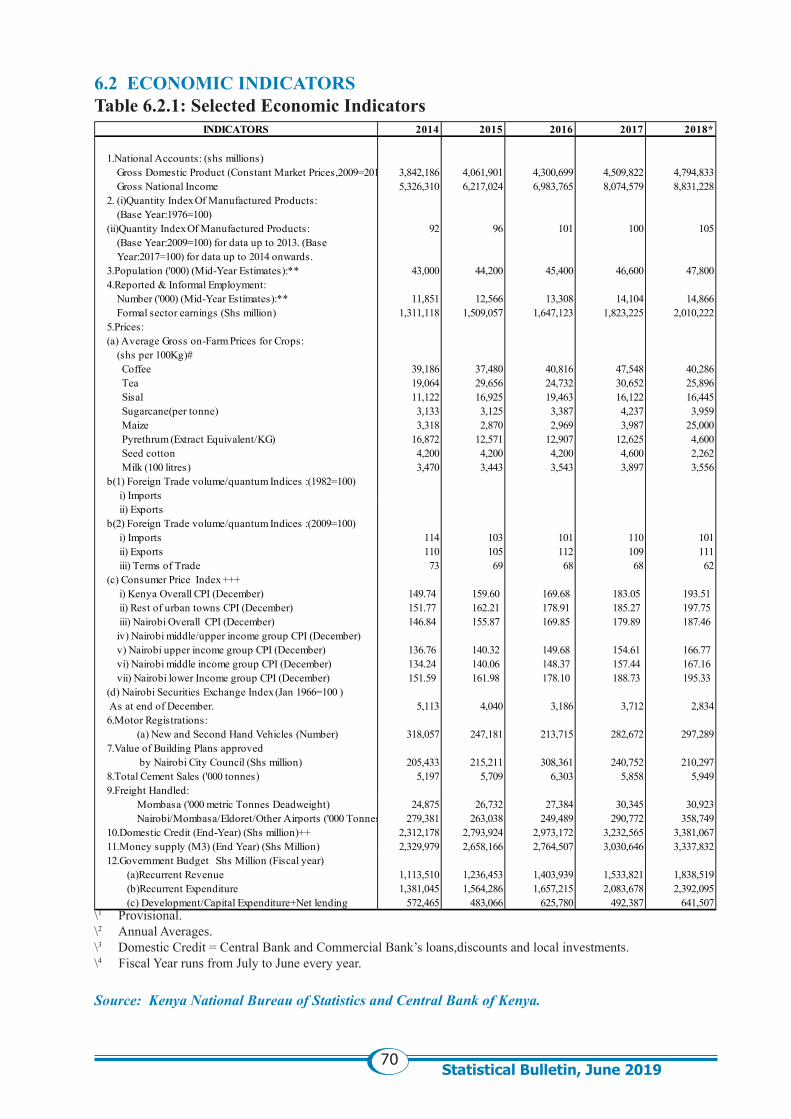
70Statistical Bulletin, June 2019
6.2 ECONOMIC INDICATORSTable 6.2.1: Selected Economic Indicators
\1 Provisional.\2 Annual Averages.\3 Domestic Credit = Central Bank and Commercial Bank’s loans,discounts and local investments.\4 Fiscal Year runs from July to June every year. Source: Kenya National Bureau of Statistics and Central Bank of Kenya.
INDICATORS 2014 2015 2016 2017 2018*
1.National Accounts: (shs millions)Gross Domestic Product (Constant Market Prices,2009=2010) 3,842,186 4,061,901 4,300,699 4,509,822 4,794,833Gross National Income 5,326,310 6,217,024 6,983,765 8,074,579 8,831,228
2. (i)Quantity Index Of Manufactured Products:(Base Year:1976=100)
(ii)Quantity Index Of Manufactured Products: 92 96 101 100 105(Base Year:2009=100) for data up to 2013. (Base Year:2017=100) for data up to 2014 onwards.
3.Population ('000) (Mid-Year Estimates):** 43,000 44,200 45,400 46,600 47,8004.Reported & Informal Employment:
Number ('000) (Mid-Year Estimates):** 11,851 12,566 13,308 14,104 14,866Formal sector earnings (Shs million) 1,311,118 1,509,057 1,647,123 1,823,225 2,010,222
5.Prices:(a) Average Gross on-Farm Prices for Crops:
(shs per 100Kg)# Coffee 39,186 37,480 40,816 47,548 40,286 Tea 19,064 29,656 24,732 30,652 25,896 Sisal 11,122 16,925 19,463 16,122 16,445 Sugarcane(per tonne) 3,133 3,125 3,387 4,237 3,959 Maize 3,318 2,870 2,969 3,987 25,000 Pyrethrum (Extract Equivalent/KG) 16,872 12,571 12,907 12,625 4,600 Seed cotton 4,200 4,200 4,200 4,600 2,262 Milk (100 litres) 3,470 3,443 3,543 3,897 3,556
b(1) Foreign Trade volume/quantum Indices :(1982=100) i) Imports ii) Exports
b(2) Foreign Trade volume/quantum Indices :(2009=100) i) Imports 114 103 101 110 101 ii) Exports 110 105 112 109 111 iii) Terms of Trade 73 69 68 68 62
(c) Consumer Price Index +++ i) Kenya Overall CPI (December) 149.74 159.60 169.68 183.05 193.51 ii) Rest of urban towns CPI (December) 151.77 162.21 178.91 185.27 197.75 iii) Nairobi Overall CPI (December) 146.84 155.87 169.85 179.89 187.46 iv) Nairobi middle/upper income group CPI (December)v) Nairobi upper income group CPI (December) 136.76 140.32 149.68 154.61 166.77 vi) Nairobi middle income group CPI (December) 134.24 140.06 148.37 157.44 167.16 vii) Nairobi lower Income group CPI (December) 151.59 161.98 178.10 188.73 195.33
(d) Nairobi Securities Exchange Index (Jan 1966=100 ) As at end of December. 5,113 4,040 3,186 3,712 2,8346.Motor Registrations:
(a) New and Second Hand Vehicles (Number) 318,057 247,181 213,715 282,672 297,2897.Value of Building Plans approved
by Nairobi City Council (Shs million) 205,433 215,211 308,361 240,752 210,2978.Total Cement Sales ('000 tonnes) 5,197 5,709 6,303 5,858 5,9499.Freight Handled:
Mombasa ('000 metric Tonnes Deadweight) 24,875 26,732 27,384 30,345 30,923Nairobi/Mombasa/Eldoret/Other Airports ('000 Tonnes) 279,381 263,038 249,489 290,772 358,749
10.Domestic Credit (End-Year) (Shs million)++ 2,312,178 2,793,924 2,973,172 3,232,565 3,381,06711.Money supply (M3) (End Year) (Shs Million) 2,329,979 2,658,166 2,764,507 3,030,646 3,337,83212.Government Budget Shs Million (Fiscal year)
(a)Recurrent Revenue 1,113,510 1,236,453 1,403,939 1,533,821 1,838,519(b)Recurrent Expenditure 1,381,045 1,564,286 1,657,215 2,083,678 2,392,095(c) Development/Capital Expenditure+Net lending 572,465 483,066 625,780 492,387 641,507