Table 1: Day Trading by Investor Categories - eScholarship.org
44
The Cross-Section of Speculator Skill: Evidence from Day Trading Brad M. Barber Graduate School of Management University of California, Davis Yi-Tsung Lee Guanghua School of Management Peking University Yu-Jane Liu Guanghua School of Management Peking University Terrance Odean Haas School of Business University of California, Berkeley April 2013 _________________________________ We are grateful to the Taiwan Stock Exchange for providing the data used in this study. Barber appreciates the National Science Council of Taiwan for underwriting a visit to Taipei, where Timothy Lin (Yuanta Core Pacific Securities) and Keh Hsiao Lin (Taiwan Securities) organized excellent overviews of their trading operations. We have benefited from the comments of seminar participants at Oregon, Utah, Virginia, Santa Clara, Texas, Texas A&M, Washington University, Peking University, and HKUST.
-
Upload
khangminh22 -
Category
Documents
-
view
2 -
download
0
Transcript of Table 1: Day Trading by Investor Categories - eScholarship.org

The Cross-Section of Speculator Skill:
Evidence from Day Trading
Brad M. Barber Graduate School of Management University of California, Davis
Yi-Tsung Lee Guanghua School of Management
Peking University
Yu-Jane Liu Guanghua School of Management
Peking University
Terrance Odean Haas School of Business
University of California, Berkeley
April 2013
_________________________________
We are grateful to the Taiwan Stock Exchange for providing the data used in this study. Barber appreciates the National Science Council of Taiwan for underwriting a visit to Taipei, where Timothy Lin (Yuanta Core Pacific Securities) and Keh Hsiao Lin (Taiwan Securities) organized excellent overviews of their trading operations. We have benefited from the comments of seminar participants at Oregon, Utah, Virginia, Santa Clara, Texas, Texas A&M, Washington University, Peking University, and HKUST.

The Cross-Section of Speculator Skill:
Evidence from Day Trading
Abstract
We document economically large cross-sectional differences in the before- and after-fee
returns earned by speculative traders. We establish this result by focusing on day traders
in Taiwan from 1992 to 2006. We argue that these traders are almost certainly
speculative traders given their short holding period. We sort day traders based on their
returns in year y and analyze their subsequent day trading performance in year y+1; the
500 top-ranked day traders go on to earn daily before-fee (after-fee) returns of 61.3 (37.9)
basis points (bps) per day; bottom-ranked day traders go on to earn daily before-fee
(after-fee) returns of -11.5 (-28.9) bps per day. The spread in returns between top-ranked
and bottom-ranked speculators exceeds 70 bps per day. However, less than 1% of the
total population of day traders is able to predictably and reliably earn positive abnormal
returns net of fees. Our results contribute to the evidence that cross-sectional variation in
investor skill is an important feature of financial markets.

1
On average, individual investors lose money from trading. Barber and Odean
(2000) document that the majority of losses incurred at one large discount broker in the
United States can be traced to trading costs. However, trading costs are not the whole
story. On average, individual investors have perverse security selection abilities; they buy
stocks that earn subpar returns and sell stocks that earn strong returns (Odean (1999)). In
aggregate, the losses of individuals are material. Barber, Lee, Liu, and Odean (2009),
using complete transaction data for the Taiwan market from 1995 to 1999, document that
the aggregate losses of individual investors exceed two percent of annual Gross Domestic
Product in Taiwan.
Recent research documents that a host of variables (e.g., IQ, cognitive abilities,
geography, portfolio concentration, age, and past performance) reliably predict cross-
sectional variation in performance. 1 But even the most skilled stock pickers in these
studies are unable to deliver a return that covers a reasonable accounting for transaction
costs. Thus, it remains an open question whether some individual investors can profit
from speculative trading.
Prior studies almost certainly underestimate the economic significance of cross-
sectional variation in the skill of individual investors. Virtually all prior studies of ability
have analyzed the general population of individual investors, who tend to be infrequent
traders. This underestimates the variation in cross-sectional ability of investors, since a
large proportion of trades by infrequent traders will have non-speculative motives (e.g.,
diversification, rebalancing, tax, or liquidity motivations). In addition, many prior studies
of cross-sectional variation in skill have relied on data from a single broker (see footnote
one).
1 See Coval, Hirshleifer, and Shumway (2008), Grinblatt, Keloharju, and Linnainmaa (2012), Korniotis and Kumar (2011, 2012), Kumar (2009), Ivkovic and Weisbenner (2005), and Ivkovic, Sialm, and Weisbenner (2008). Korniotis and Kumar (2012) document that smart individual investors reliably outperform dumb individual investors; however, smart investors are unable to beat passive benchmarks after accounting for transactions costs. All of these studies use data from a large discount broker with the exception of Grinblatt et al. Grinblatt and Keloharju (2000) also document poor performance by individual investors. See Barber and Odean (2012) for a comprehensive review of the performance of retail traders.

2
We are able to enrich this prior evidence by analyzing the returns earned by all
speculators in an entire market over a 15-year period. As in Barber, Lee, Liu, and Odean
(2009), we use complete transaction data for the Taiwan Stock Market, but use a much
longer sample period of 1992 to 2006. Barber et al. (2009) analyze the aggregate
performance of individual investors and document that individual investors incur
systematic and economically large trading losses. In contrast, we focus on the variation in
performance across traders.
To analyze the cross-sectional of investor performance, we focus on day trading
for three reasons. First, as we discuss in detail, day traders are an important equilibrium
feature in Taiwan and account for 17% of all volume on the Taiwan Stock Exchange
(TSE) during our sample period. Second, we are interested in analyzing the cross-section
of speculator skill, and day traders, given their short holding period, are almost certainly
speculators. Third, the signal-to-noise ratio regarding investor skill arguably is greater for
day traders than for investors with longer holding periods. Several prior studies document
that the lion’s share of abnormal returns earned around an informed trade occurs
immediately following the trade (e.g., Coval, Hirshleifer and Shumway (2005); Grinblatt,
Keloharju, and Linnainmaa (2012); Barber, Lee, Liu, and Odean (2009)). If so, returns on
the day of trade may better separate skilled and unskilled investors than long-run returns.
Furthermore, because day traders trade frequently, we observe outcomes of many trading
decisions for each investor, which is likely to lead to a more precise estimate of the
investor’s skill.
We define day trading as the purchase and sale of the same stock by the same
investor on the same day. We analyze the performance of day traders in two parts: (1) the
intraday returns earned on trades (i.e., the day trading return), and (2) the return on the
open positions for the five days following a trade. The day trading return includes both
round-trip and one-sided trades (i.e., trades that result in an open position at the close of
trading). The open positions capture the returns to all positions that remain open after the
day of trade.

3
Consistent with prior work on the performance of individual investors, the vast
majority of day traders lose money. In the average year during our 1992 to 2006 sample
period, about 450,000 Taiwanese individuals engage in day trading. Among thousands of
occasional day traders in the average year, 277,000 individuals engage in day trades in
excess of $NT 600,000 per year (about $US 20,000)2 and about 20% of these day traders
earn positive abnormal returns net of fees (commissions and transaction taxes). 3 Of
course, some outperformance would be expected by sheer luck.
But luck is not the whole story. Our main result documents the presence of
statistically and economically large cross-sectional variation in trader ability. In the
average year, about 4,000 day traders are able to predictably profit net of a reasonable
accounting for transactions costs. Specifically, we sort investors into groups based on
their day trading returns in year y and analyze the performance of each group in the year
y+1. We document that only the 4,000 most profitable day traders (less than 1% of the
total population of day traders) from the prior year go on to earn reliably positive
abnormal returns net of trading costs in the subsequent year. But, the stock picking ability
of these investors is remarkable. The top 500 day traders (based on prior year ranking)
earn gross (net) abnormal returns of 61.3 (37.9) basis points (bps) per day on their day
trading portfolio, while the tens of thousands of day traders with a history of losses in the
prior year go on to earn gross (net) abnormal returns of -11.5 (-28.9) bps per day.
Two points are worth emphasizing in these results. First, the spread in gross
returns between the top and bottom performing investors at 73 bps per day is enormous
when compared to most other studies of cross-sectional ability in investor performance.
For example, using data from Finland, Grinblatt, Keloharju, and Linnainmaa (2012)
document that the buys of high IQ investors outperform those of low IQ investors by 4.4
bps per day in the days immediately following the purchase. Using data from a large U.S.
discount broker, Coval, Hirshleifer, and Shumway (2005) document that a strategy long 2 The mean TWD/USD exchange rate from 1992 to 2006 was 30.54 with a low of 24.65 and a high of 35.01. 3 The percentage of day traders who earn positive intraday returns net of transaction costs in a year varies between 17 and 20% depending on how we define the population of day traders (e.g., requiring minimum number of days of trading or minimum value of trading).

4
firms purchased by previously successful investors and short firms purchased by
previously unsuccessful investors earns a daily abnormal return of 5 bps before trading
costs (assuming a holding period of 1 day). We believe that the much larger returns that
we document are a result of our focus on frequent traders, who are almost certainly
speculators and among whom we are better able to identify skilled investors.
Second, to our knowledge, we provide the only study of individual investor
performance that documents that savvy investors are able to cover a reasonable estimate
of trading costs. The top 500 day traders (based on prior year ranking) are able to cover
rather large transaction costs (on top of commissions and spreads, Taiwan charges a 30
bps tax on sales) and earn an impressive net return ranging from 24.1 bps (assuming a
statutory maximum commission of 14.25 bps one way) to 37.9 bps per day (assuming
heavily discounted commissions of 5 bps one way) on the day of trade.
In auxiliary analyses, we explore factors that might explain the remarkable
profitability of a select group of day traders. We find some evidence that profitable day
traders either use private information (or respond early to public information).
Specifically, the returns of profitable day traders are higher in hard-to-value stocks (e.g.,
small or volatile stocks) and in periods around earnings announcements. In contrast, day
traders with systematic losses also incur losses in hard-to-value stocks and around
earnings announcements. In combination, these results suggest that day traders forecast
short-term price movements in stocks or periods with high levels of information
asymmetry.
We also test the hypothesis that day traders profit by serving as liquidity providers
on the Taiwan Stock Exchange, which is a pure electronic limit order market. If so, day
traders would be compensated for serving as the counterparty to uninformed traders who
demand immediacy. Using the orders underlying executed trades, we document that day
traders tend to place aggressive orders that demand immediacy; the most profitable day
traders tend to lean somewhat more on passive orders, but even for this select group of
profitable day traders nearly two thirds of trades emanate from aggressive orders.

5
Furthermore, the aggressiveness of orders underlying trades is an economically weak
predictor of future day trader profitability. These empirical observations are not
consistent with the hypothesis that liquidity provision is the main driver of the strong
returns earned by a select group of successful day traders.
Finally, we investigate the characteristics of profitable day traders. Past
performance (either returns or dollar profits) is, by a large margin, the best predictor of
future performance. Aside from past performance, the most important predictor of future
performance is the concentration of trading in a few stocks, which is consistent with the
hypothesis that successful day traders focus on a few stocks in an attempt to garner an
information advantage in those stocks.
In addition to providing insights on the cross-sectional variation in investor
performance, ours also is among the first studies of day trading in financial markets. In
Taiwan, 17% of all trading volume can be traced to round-trip day trades made by
individual investors. This trading activity is remarkably stable over the 15-year period
that we analyze, despite the poor performance profile of day traders. Day trading is
clearly an equilibrium feature of the Taiwan stock exchange.
The rest of this paper is organized as follows. We survey related research in
section I. We discuss Taiwan market rules, our dataset, and methods in Section II. We
present results in Section III, followed by a discussion and concluding remarks.
I. Background and Related Research Our study is the first large-scale study of day trading for an entire market.
However, we are not the first to study day trading. Four small-scale academic studies of
day trading provide evidence that day trading can be profitable. Harris and Schultz (1998)
analyze the day trading of Small Order Execution System (SOES) bandits using trading
records from two brokers. To do so, they analyze roughly 20,000 trades over a three-
week period. Though the SOES traders lose money almost as frequently as they make
money, they earn a small average profit per trade. Similarly, Garvey and Murphy (2005a)
analyze the trading of 96,000 trades made by fifteen proprietary day traders—traders who

6
use a firm’s capital, pay no commissions, and profit share with the firm—at a direct
access broker during three months in 2000. They too find these 15 day traders are able to
make money on their day trading activities primarily by placing limit orders on electronic
crossing networks (ECNs) that are inside the current best quotes offered by NASDAQ
dealers. Garvey and Murphy (2005b) find similar results in a follow-up study of 1,386
day traders over two months. Both of the studies by Garvey and Murphy analyze only
round-trip trades, which is likely to bias performance measurement positively as traders
are more likely to close out winning positions. Seasholes and Wu (2007) examine the
trades of ten extremely active traders on the Shanghai Stock Exchange. These traders
earn substantial profits through buying shares on days that stocks hit their upper price
limits and quickly selling those shares the following day.
Linnainmaa (2003) analyzes 7,686 investors who complete at least one roundtrip
intraday transaction. These investors are far less active than those studied by Harris and
Schultz (1998) and Garvey and Murphy (2005a). The majority of these investors day
trade on only one or two occasions and, in aggregate, these investors complete only
185,000 day trading related trades over a two-and-a-half year period (November 1998
through May 2000). In a closely related paper, Linnainmaa (2005) analyzes the
disposition effect in day traders and its effect on performance. Linnainmaa (2003 and
2005) reports that the net returns of these investors are similar to those of a control
sample, but neither paper analyzes the cross-sectional variation in day trader performance
(the focus of our analysis). In a follow-up paper, Linnainmaa (2011) uses a sample of
frequent traders in Finland to test learning models of speculative trading. He concludes
“… investors trade to learn even if they are pessimistic about their ability.” Barber, Lee,
Liu, and Odean (2011) examine learning among Taiwanese day traders and conclude that,
while learning takes place, it is slow, suboptimal, and costly. In our analysis, we focus on
cross-sectional differences in ability and do not address the question of whether investors
rationally learn.
In contrast to the small-scale studies of day trading, we provide a comprehensive
analysis of the profitability of all day trading in Taiwan over a 15-year period. To do so,

7
we use a unique and remarkably complete dataset that contains the entire transaction data,
underlying order data, and the identity of each trader on the Taiwan Stock Exchange
(TSE). In total, the dataset contains 3.7 billion two-sided transactions with a value of
$NT 310 trillion (approximately $10 trillion US). With these data, we provide a
comprehensive accounting of the profitability of day traders during the period 1992
through 2006.
Taiwan provides a particularly appropriate setting to analyze the profitability of
day trading. By most accounts, day trading has been a fixture on the TSE for decades. In
the average year of our sample, 450,000 individual investors engage in day trading, and
their day trading accounts for 17% of all volume on the Taiwan Stock Exchange (see
Figure 1). Virtually all day trading can be traced to individual investors in Taiwan. In a
typical month, 15% of individual investors who trade on the TSE engage in at least one
day trade.
II. The Taiwan Market, Data, and Methods
II.A. Taiwan Market Rules Before proceeding, it is useful to describe the Taiwan Stock Exchange (TSE). The
TSE operates in a consolidated limit order book environment in which only limit orders
are accepted. During the regular trading session, from 9 a.m. to noon (or 1:30 after 2001),
buy and sell orders can interact to determine the executed price subject to applicable
automatching rules.4 Minimum tick sizes are set by the TSE and vary depending on the
price of the security. Generally, orders are cleared using automatching rules one or two
times every 90 seconds throughout the trading day. Orders are executed in strict price and
time priority. An order entered into the system at an earlier time must be executed in full
before an order at the same price entered at a later time is executed. Although market
orders are not permitted, traders can submit aggressive price-limit orders to obtain
matching priority. Prior to 2002, there is a daily price limit of seven percent in each
4 Trading also occurred on Saturdays during most of our sample period. Before December 1997, Saturday trading occurred from 9 a.m. –11 a.m. From January to March, 1998, stocks were traded only on the first and the third Saturday in each month. From April 1998 to December 2000, Saturday trading occurred from 9 a.m. to noon. From 2001 on, there has been no trading on Saturday.

8
direction and a trade-by-trade intraday price limit of two ticks from the previous trade
price.5 After 2002, there is a temporary trading halt when the current price deviates by
more than 3.5% from the last traded price.
Since our analysis focuses on day trading, an important consideration is
transaction costs. Taiwan imposes a transaction tax on stock sales of 0.3%. When
calculating net returns, we apply the 30 bps transaction tax to all sales.
Unfortunately, we do not know the commission paid on each trade, but from
discussions with TSE officials, we know that commissions range from a low of about 5
bps to a maximum of 14.25 bps (one way). The TSE caps commissions at 0.1425% of the
value of a trade, and this cap was the same throughout our sample period (1992 to 2006).
Some brokers offer lower commissions for larger traders. Preferred traders can get heavy
discounts on commissions—as low as 5 bps. We interviewed officials at brokerage firms
and the TSE, who indicated that the trade-weighted average commission paid by all
market participants is approximately 10 bps. These estimates are confirmed in press
reports discussing commissions on the TSE. We present results based on the most heavily
discounted commissions (5 bps).6 Obviously, this overestimates the actual returns earned
by some investors who face higher commissions. For most investors, we document
negative net returns and the 5 bps commission assumption underestimates their losses.
These investors certainly lose money regardless of the commission assumption. For the
small group of investors who earn positive abnormal returns net of fees, we test the
sensitivity of our results by also assuming commissions of 14.25 bps (the statutory
maximum).
5 From 2002 on, intraday price limit has been replaced by a temporarily trading interruption when the current price falls out of a specified range (+/-3.5%) of the last traded price 6According to the United Night Daily Journal (http://www.haixiainfo.com.tw/56439.html), commissions ranged from 6.25 bps to 12.25 bps. According to the Apple Daily (http://tw.nextmedia.com/applenews/article/art_id/3183148/IssueID/20070116) commission rates were 4.25 bps before 2007 for high volume traders. Bloggers provide similar accounts of heavily discounted commissions (http://blog.udn.com/ines0819/3122885 and http://cutiemaggie.pixnet.net/blog/post/26673014). Brokerage and exchange officials indicate discounting practices were common and consistent during our sample period.

9
II.B. Trades Data and Descriptive Statistics We have acquired the complete transaction history of all traders on the TSE from
1992 to 2006. The trade data include the date and time of the transaction, a stock
identifier, order type (buy or sell—cash or margin), transaction price, number of shares, a
broker code, and the identity of the trader. The trader code allows us to categorize traders
broadly as individuals, corporations, dealers, foreign investors, and mutual funds. The
majority of investors (by value and number) are individual investors. Corporations
include Taiwanese corporations and government-owned firms (e.g., the government-
owned post, banking, and insurance services). Dealers include Taiwanese financial
institutions such as Fubon Securities, Yuanta Core Pacific Securities, and Polaris
Securities. Foreign investors are primarily foreign banks, insurance
companies, securities firms, and mutual funds. During our sample period, the largest
foreign investors are Fidelity Investments, Scudder Kemper, and Schroder Investment
Management. Mutual funds are domestic mutual funds, the largest of which is ING Asset
Management with $NT 163 billion invested in Taiwanese stocks in December 2006.
We define day trading as the purchase and sale, in any order, of the same stock on
the same day by an investor. Specifically, if an investor buys and sells the same stock on
the same day, we calculate the number of shares bought (Sb), the number of shares sold
(Ss), the average purchase price (Pb), and the average sales price (Ps). The value of day
trading is defined as half of the total value of sales and purchases (½*Pb*min(Sb,Ss)+
½*Ps*min(Sb,Ss)). Over our sample period, day trading accounted for more than 17% of
the total dollar value of trading volume. Most day trading (about two-thirds) involves the
purchase and sale of the same number of shares in a stock over the course of one day
(i.e., most day trades yield no net change in ownership at the close of the day). In some
cases (about a third of all day trading), investors purchase (or short) a stock and later the
same day sell (or buy to cover) only part of their initial position.
In Figure 1, Panel A, we plot day trading (black) and other trading (grey). There is
clear variation in the volume of day trading and other trading over time, though the two
are correlated (91% correlation at the monthly level). In Figure 1, Panel B, we plot the

10
percentage of total volume that can be attributed to day trading. Over the full sample
period, day trading represents 17% of total volume and the percentage is fairly stable
over the last decade of our sample period. Though not the focus of our investigation, it is
natural to wonder whether wide fluctuations in day trading (and total volume) can be
explained by past market performance. Perhaps surprisingly, this does not appear to be
the case; we regress changes in day trading on past returns (alternatively at monthly,
quarterly, or annual horizons) and find past returns have no ability to predict changes in
day trading.
Virtually all day trading can be traced to individual investors. In the average
month, individual investors account for 95% of day trading. Individuals and corporations
are free to short sell, though dealers, mutual funds, and foreigners are prohibited from
doing so on the TSE. These short sale restrictions might partially explain the tendency for
day trading to concentrate among individual investors and corporations. In contrast to
U.S. dealers, dealers in Taiwan are not active providers of liquidity. Though dealers are
required to adjust the demand and supply in the market efficiently depending on the
market situation and ensure that the formation of fair price and its sound operation are not
harmed, dealers face no specific penalties for failing to meet this requirement. Dealer
trades emanate from their proprietary trading activity. Based on our discussions with
dealers in the TSE, the majority of this proprietary trading is not necessarily intended to
provide liquidity. Chae and Wang (2009) also report that TSE dealers are not net
providers of liquidity. In the remainder of the paper, we restrict our analysis to individual
investors.
II.C. Performance Measurement Our performance measurement focuses primarily on the intraday profits of all
trades made by day traders and on trade-weighted intraday returns. Our return
calculations assume that the value of trades represents the trader’s capital at risk. This
assumption yields returns that are of the correct sign, but are understated in absolute
value for two reasons. First, investors who make sequential round-trip trades (e.g., a
round-trip in stock A followed by a round-trip in stock B) do not need the total capital
required to initiate positions in each stock. Second, investors may borrow to trade in

11
margin accounts. We separately analyze the long-run (interday) profitability of positions
generated by these trades to ensure the inferences we draw from the analysis of intraday
profits are accurate.
We first calculate the intraday returns to day trading. To do so, we identify all
trades made by day traders. We define a day trader as an investor who buys and sells the
same stock on the same day during year y. We then analyze the performance of day
traders in year y+1. To measure performance in year y+1, we calculate the profits on
round-trip day trades and other trades that remain open at the close of the trading day.
The other trades are either purchases to open a long position or sales to open a short
position. The profits for trades that lead to an open position are calculated relative to
closing prices on the date of the trade (i.e., mark-to-market at the day’s closing price). To
calculate the daily return earned by a day trader, we sum the proceeds from stocks sold to
close long positions and bought to close short positions (or their mark-to-market
equivalent at the close of the trading day) and divide by the cost of initiating the position
(i.e., the value of stocks bought or sold short at the time of the purchase or sale). We refer
to this return as the gross return from day trading. To calculate the net return to day
trading, we assume a 5 bps one-way commission and a 30 bps transaction tax on sales.
Since we use realized transaction prices, we capture any price impact from trade. Based
on our discussion of trading costs with TSE officials, our assumption regarding one-way
commissions of 5 bps is likely lower than what many traders pay. Our qualitative results
are similar if we run our analysis using the commission maximum of 14.25 bps. (See
appendix for details regarding our return calculations.)
It is important to include both round-trip and one-sided trades to measure the
performance of day trading. Focusing only on round-trip trades would yield a biased
measure of performance if investors sell winners and hold losers (i.e., exhibit the
disposition effect). For example, assume some day traders randomly buy and sell
(random traders), while others close only winning investments while riding losers
(disposition traders). Were we to analyze only the profits of round-trip trades, it is clear
that the disposition traders would have better round-trip returns than the random traders

12
merely because they have a rule regarding when to close a position. Since the disposition
effect is prevalent among Taiwanese investors and among day traders elsewhere,7 it is
important to include both round-trip and other trades when analyzing performance.
To test the robustness of our results, we also analyze the performance of trades
that result in open positions. We begin by using trades data to build end-of-day positions
for each investor.8 If an investor buys a stock that creates a new end-of-day position in
that stock (or increases an existing position), we track the performance of the position
from the close of the trade date to five days following the trade date. If the stock is sold
within the five-day window, we calculate the return on the position on the sale date using
the sales price net of any transaction costs. We calculate the returns on short position
similarly. Our main results use a five-day window, but the general tenor of the results is
similar if we consider a one- or 10-day window.
In Figure 2, we present an example of four trades by a day trader. The red lines
represent short positions, while the black lines represent long positions. The solid lines
correspond to our intraday returns, while the dashed lines correspond to the returns
earned on open positions in the five-day window following trade.
To evaluate the performance of day traders, we estimate alphas relative to a
market index. To calculate the alphas of intraday returns, we regress the day trading
return on the market excess return (market return less risk-free rate) and report the
intercept (alpha) from these regressions.9 To calculate the alpha of the returns earned on
open positions during the five-day post-trade window, we regress the position excess
return (position return less risk-free rate) on the market excess return and report the
intercept (alpha) from these regressions. We construct our own market index using
7 Barber, Lee, Liu, and Odean (2007) and Linnainmaa (2005) document, respectively, that individual Taiwanese investors and Finnish day traders exhibit the disposition effect. 8 Some errors inevitably occur in building positions since we do not know positions at the beginning of the dataset (in January 1992). While short sales are identified by their order type, buys to cover short positions are not. Thus, we may erroneously build a long position for purchases early on in the dataset. 9 Because day traders are not charged margin interest on intraday trades, we do not subtract the risk-free rate from the day trading return. Our results are unaffected by doing so as the risk-free rate during our sample period is 2.4 bps per day, which is small relative to the estimated alphas for intraday returns.

13
market capitalization from the Taiwan Economic Journal (TEJ) and individual stock
returns calculated from the TSE data. The risk-free rate is the one-year time deposit
interest rate offered by the First Commercial Bank of Taiwan. The intercepts from these
regressions are our measure of abnormal returns.
III. Results In our main results, we sort day traders into groups based on a characteristic in
year y and analyze the aggregate performance of each group in year y+1. We first
consider sorts based on past day trading activity and then sort on past performance.
III.A. Active Day Traders
In Table 1, we present the gross and net performance of day traders sorted on
prior day trading activity. We analyze the day trades and other trades of these investors in
the months in which they day trade. In each year from 1992 to 2005, we rank day traders
based on the dollar volume of day trading. We create nine groups based on prior
activity—starting with the top 500 day traders and going down to those with no prior day
trading experience. We analyze the performance of each group in the year subsequent to
ranking.
Consider the top 500 day traders (first row of Table 1). In aggregate, they earn
positive gross returns on their day trading of 14.4 bps per day (t=21.08), but these profits
do not survive costs because these active day traders lose 7.4 bps per day net of fees (t=-
10.85). The returns to open positions in the five-day post-trade window are reliably
positive, but not sufficiently large to offset the negative returns earned on intraday
trading. In combination, these results suggest that the most active day traders incur losses.
The net returns assume a heavy commission discount, so the net losses from day trading
grow when we assume commissions of 14.25 bps. For example, the net alpha earned by
the 500 most active day traders is -7.4 bps assuming a 5 bps commission and -20.9 bps
assuming a 14.25 bps commission. In untabulated results, we estimate that almost 10% of
all day trading can be traced to these 500 very active day traders and approximately half
of all of their trades are round-trip day trades.

14
It is clear from Table 1 that active day traders, despite failing to make money net
of costs, earn higher returns than occasional day traders. The alphas on intraday returns is
nearly monotonically decreasing as one moves from the most active day traders (top row
of Table 1) to the least active day traders (bottom row of Table 1). In their analysis of the
performance of individual and institutional investors in Taiwan from 1995 to 1999,
Barber, Lee, Liu, and Odean (2009) document that, in aggregate, the trades of all
individual investors lose money before transaction costs and that these losses grow at
longer horizons. Thus, before transaction costs, the trades of both less active day traders
and individual investors in aggregate lose money, while the trades of heavy day traders
earn gross profits.
In summary, active traders perform better than occasional day traders but are still
unable to cover trading costs. Nonetheless, the security selection ability of active day
traders, which generates gross daily alphas of 14.4 bps, is impressive.
III.B. Performance Persistence In Table 2, we present the performance of day traders sorted on the basis of prior
profitability. We rank past profitability based solely on day trading returns. To measure
profitability, we use the Sharpe ratio of past daily returns net of transaction costs (i.e., the
mean net day trading return divided by the standard deviation of day trading returns). We
require a minimum of 10 days of day trading within the ranking year to rank an investor.
Most of the gains (and losses) from trade tend to occur immediately following a trade
(see Barber, Lee, Liu, and Odean (2009), Coval, Hirshleifer, and Shumway (2005),
Grinblatt, Keloharju, and Linnainmaa (2012)). So, by focusing on frequent traders and
the returns earned on the day of trade, we likely obtain a more precise measure of
investor skill.
We create eight groups based on prior day trading profitability—starting with the
top 500 day traders and going down to those ranked below 10,000. We include a ninth
group of unranked traders who day traded on at least one day but fewer than 10 days in
the ranking year. During the ranking period, the top 500 traders have a mean Sharpe ratio

15
of 0.66. Each of the top six groups (through 8,000 traders) has a mean Sharpe ratio
greater than zero in each ranking year.
There is clear performance persistence. The top-ranked profit group (1 to 500)
earns impressive alphas from day trading. The top five groups (or 6,000 traders) earn
reliably positive alphas on their day trading portfolio net of fees. In contrast, poor
performers from prior years or those with insufficient history to be ranked earn reliably
negative returns on their day trading and total portfolio—both before and after fees.
For the top four profit groups (through 4,000 traders), the returns on open
positions are not reliably different from zero and do not affect our conclusions regarding
the profitability of these four groups. These results are qualitatively similar when we
analyze the returns to open position for one or 10 days following the trade date. For the
fifth profit group (4,001 to 6,000 traders), the returns on open positions are -1.3 bps per
day and marginally significant (t=-1.63). When these returns are combined with the
modest intraday profits (2.2 bps per day, t=3.27), we cannot conclude that this group
earns reliably positive returns net of fees. Thus, the number of day traders who
predictably profit from their day trading, assuming a 5 bps commission, is about 4,000
individuals. In untabulated analyses, we test the robustness of the conclusion that some
day traders earn positive returns net of transaction costs by varying our assumptions
regarding commissions paid by day traders. Assuming a 14.25 bps commission (the
statutory maximum), the top three groups earn net alphas of 24.1 bps (t=39.0), 7.6 bps
(t=10.9), and 1.1 bps (t=1.6). Thus, the number of predictably profitable day traders
ranges from a low of 1,000 to a high of 4,000.
In the average year, about 450,000 individuals engage in day trading. While
approximately 20% earn profits net of fees in the typical year, the results of our analysis
suggest that less than 1% of day traders (4,000 out of 450,000) are able to outperform
consistently. It is worth emphasizing the outsized alphas earned by the top 500 day
traders. They pick up 61.3 bps on their day trading portfolio before costs and 37.9 bps
after costs per day.

16
III.C. The Probability of Success If outcomes are governed by luck, rather than skill, we expect success in one year
to be independent of the probability of success in the next year. The preceding analysis
suggests that the most successful investors indeed continue to earn strong returns. A
related question is the following: Is the probability of being a winner in consecutive years
greater than what we would expect by chance?
To answer this question, we define a day trader as a winner (loser) if the net
profits on a trader’s day trading portfolio are positive (zero or negative) in year y. We
then construct a 2x2 contingency table and test the null hypothesis that winner-loser
categorization in year y is independent of winner-loser categorization in year y+1 (i.e.,
outcomes are governed by luck). The results of this analysis are presented in Table 3. In
Panel A, we present results for all traders who day trade in year y and y+1, while in Panel
B we present results for traders with a minimum of $NT 600,000 in years y and y+1. In
both samples, we comfortably reject the null hypothesis that winner-loser categorization
is independent across years (p<.01). For example, in Panel A, we expect 3.9% (20.0% x
19.6%) of traders to be repeat winners by chance, but we observe 6.6% of traders are
repeat winners. In panel B, we expect 3.1% (17.8% x 17.2%)10 to be repeat winners by
chance, but we observe 6.2% are repeat winners. These results reinforce our prior
conclusion that some day traders are skilled.
IV. Sources of Profits How are successful day traders able to earn such strong returns before fees?
Obviously, day traders are able to profit from short-term price movements. What is
unclear is how they are able to forecast these movements. On the one hand, day traders
could earn gross profits by placing aggressive orders in anticipation of future price
movements. This strategy would be profitable if day traders possessed superior 10 The probability of earning positive abnormal returns net of transaction costs decreases when we require a minimum trade level of $NT 600,000 in consecutive years. This is to be expected if the mean net abnormal return for a trader is negative, which is the case for the vast majority of day traders. As a day trader engages in more trading, his average performance will be more precisely estimated and the probability of observing a positive mean abnormal return for all but the select group of skilled day traders will decrease.

17
information (or superior ability to process publicly available information) or were able to
otherwise identify short-term trends in prices. On the other hand, day traders may provide
liquidity to market participants by placing passive limit orders that provide depth to an
otherwise thin market. This strategy would be profitable as long as uninformed traders
are willing to pay for this liquidity and the providers of liquidity are able to avoid
excessive trading with investors who possess superior information. In this section, we
consider both possibilities.
To preview the results of this section, we find some evidence that day traders
possess private information or react quickly to public information. Specifically, profitable
day traders earn particularly strong returns in small, volatile stocks and around earnings
announcement. In contrast, we find weak evidence that liquidity provision is the main
source of day trading profits. Profitable day traders tend to place aggressive orders, and
day traders who follow passive order strategies fail to earn positive returns net of
transaction costs.
IV.A. Are Day Traders Informed?
A. 1. Earnings Announcements Are the strong returns of profitable day traders a result of better information about
a firm’s fundamentals? This is a difficult question to address definitively, but we attempt
to provide some insight on this issue by analyzing the returns to day trading around
earnings announcements. Earnings announcements are economically important and
closely watched; as a result, earnings announcements are a logical place to look to
determine if day traders are capitalizing on superior (or perhaps inside) information.
Using the TSE databank, we identify all earnings announcements for TSE stocks.
We then identify trades that occur within a five-day window that begins three days prior
to the announcement and ends the day after the announcement. We separately analyze the
returns of day traders sorted on the basis of their past profitability as in Table 2; however,
we now separately analyze the returns of stocks that are within the five-day
announcement window and stocks that are outside the announcement window (non-

18
announcement stocks). If day traders have superior information, we expect the returns on
day trading during earnings announcements to be higher than returns during other periods
since information asymmetry is arguably greater during announcement periods.
The results of this analysis are presented in Table 4. The first two columns in this
table present the alphas for stocks traded during the five-day earnings announcement
window, while the next two columns present the alphas during non-announcement
periods, and the last two columns present the difference in alphas between the
announcement and non-announcement periods. The gross alphas for the most profitable
traders around earnings announcements are higher than those earned during non-
announcement periods. For example, the top profit group earns 65.5 bps on trades made
during announcement periods and 58.9 bps on trades during non-announcement periods;
the spread of 6.6 bps is reliably positive. We observe similar results for traders ranked
among the top 10,000 based on prior year performance. However, less profitable day
traders and those with insufficient activity to be ranked (the last two rows of Table 3)
incur losses of equal magnitude during announcement and non-announcement periods.
These results are generally consistent with the hypothesis that the best day traders earn
strong returns during periods of high information asymmetry.
A. 2. Hard-to-Value Stocks If successful day traders profit from identifying temporary mispricings (perhaps
prior to or quickly following information that would correct the mispricing), we would
expect the profits of successful day traders to be concentrated in hard-to-value stocks,
where mispricings are more likely to occur and are more likely to be large. To test this
conjecture, in the spirit of Baker and Wurgler (2006), we sort stocks by size (small,
medium, and big) and volatility (low, medium, and high). In June of year y, we rank
stocks based on size or volatility. Firm size is measured as market cap (price times shares
outstanding). Stocks ranked in the bottom third of market cap are small stocks, those in
the top third are big stocks, and the rest are medium size stocks. Volatility is measured
using the standard deviation of daily returns from July of year y-1 to June of year y,
where we require a minimum of 50 daily return observations. Stocks ranked in the

19
bottom third of daily return standard deviation are low volatility stocks, those in the top
third are high volatility stocks, and the rest are medium volatility stocks.
We estimate the returns to day trading for each of the profit groups of Table 2 for
small/medium/big stocks and low/medium/high volatility stocks. For parsimony, we
present results only for gross intraday returns; the patterns for net intraday returns are
similar. We conjecture that successful day traders will earn strong returns in small or
volatile stocks.
The results of this analysis are presented in Table 5. In Panel A, we present results
for sorts based on firm size. For each profitability group, day traders earn stronger returns
in small stocks than they do in big stocks. The difference (small-big) is particularly
pronounced for the most successful day traders. These patterns are generally consistent
with the notion that successful day traders earn strong returns in small stocks, which are
hard to value.
In Panel B, we present results for sorts based on stock volatility. With the
exception of relatively inexperienced day traders, each profitability group earns stronger
returns in high-volatility stocks. The difference in returns earned between high versus
low-volatility stocks is not as pronounced as the difference in returns earned on small
versus big stocks. Nonetheless, the general tenor of the results is similar. With the
exception of the very top performance group, which earns strong returns in both high-
and low-volatility stocks, successful day traders appear to earn stronger returns in high-
volatility stocks.
IV.B. Are Day Traders Suppliers or Demanders of Liquidity? A natural place to look for profitable day trading is in the provision of liquidity.
Perhaps day traders provide liquidity to uninformed traders by placing passive limit
orders. As groundwork for this analysis, we calculate the closing effective percentage
spread for stocks trading on the TSE. This analysis gives us a sense for the size of the
spread and potential profits from liquidity provision in Taiwan. Each year, we use daily
closing prices (P) and the midpoint of the last unfilled buy and sell orders (M) and

20
calculate the effective percentage spread for each stock-day combination as .
We then calculate the average spread across stocks on a particular day and then average
across days within a year to generate an annual estimate of the percentage effective
spread for 1992 to 2006. Across the 15 years, the average percentage effective spread for
stocks trading on the TSE is 64 bps, with no particularly strong time trend in the average
spread; it ranges from a low of 52 bps in 1996 to a high of 78 bps in 2002. The size of
these spreads makes it plausible that, even with a 30 bps transaction tax, liquidity
provision by day traders could be a profitable trading strategy.
To determine whether day traders are earning gross profits by providing liquidity,
we analyze orders underlying their trades. In addition to trade data, we have all orders
(both filled and unfilled) that underlie these trades. Using these order data, we categorize
each trade as aggressive or passive based on the order underlying the trade. This
categorization involves three steps. First, for each stock, we construct a time series of
clearing prices, the lowest unfilled sell limit order price, and the highest unfilled buy limit
order price. These data are compiled by the TSE (the market display data) and are
presented to market participants in real time. Second, we categorize all orders as
aggressive or passive by comparing order prices to the most recent unfilled limit order
prices at the time of the order. Orders to buy with prices at or in excess of the most recent
unfilled sell limit order we categorize as aggressive; those with prices at, or below, the
most recent unfilled buy limit order we categorize as passive; those with an order price
between the two unfilled limit order prices we categorize as indeterminate. Our algorithm
for sells is analogous. Third, we match all orders to trades. This matching allows us to
determine whether a trade emanated from a passive or aggressive order. Using this
algorithm, we are able to categorize over 90% of all trades as passive or aggressive.11
Overall, about 70% of individual investors’ trades can be traced to aggressive
limit orders. (These proportions are calculated as the total number of aggressive trades 11 The indeterminate category also includes trades that we are unable to match to an order. We discussed this issue with the TSE, and they suspect data entry errors in the order records are the source of the problem. Though annoying, this type of data error should not introduce any bias into our results.

21
divided by the sum of passive and aggressive trades.) The proportion is similar for
institutional investors, though corporations tend to be less aggressive than foreigners and
dealers. Even if investors placed similar numbers of aggressive and passive limit orders,
we would expect a higher percent of trades to originate from aggressive limit orders,
since aggressive limit orders are more likely to be executed.
In Figure 3, we present the proportion of trades that emanate from aggressive
limit orders for trader groups formed on the basis of past profitability, where profit
groups are formed as described in Table 2. We rank traders based on profitability in year
y and analyze the aggressiveness of their trades in year y+1. We sum the total value of
aggressive and passive trades for each profit group and then calculate the proportion of
aggressive trades on each day. The figure presents the mean proportion across all days for
a particular profit group.
In general, day traders place orders that are in the same ballpark as the
aggressiveness we observe for the average individuals. Among day traders, the
proportion of trades that originate from aggressive orders ranges from 64 to 78%, while
the proportion for all individual investors is 70%. The 500 most profitable day traders are
somewhat less aggressive than other day traders (64% of their trades emanate from
aggressive orders). While there is some variation in order aggressiveness suggesting the
most profitable day traders make greater use of passive orders, the variation is
economically modest and is unlikely to explain the strong returns of the most profitable
day traders as the majority of their trades emanate from aggressive orders.
We further explore this issue by ranking day traders by the aggressiveness of their
orders in year y and analyzing their performance in year y+1. We create 10
“aggressiveness” deciles ranging from one (most passive) to 10 (most aggressive) based
on the proportion of an investor’s trades that emanate from aggressive limit orders. We
further partition the top and bottom deciles in half to analyze the extremes more closely.
We require that an investor make 100 trades that we can classify as passive or aggressive
to be included in the rankings, so the traders we analyze are fairly active relative to the

22
population of individual investors. The most passive group (1a) has only 16% aggressive
trades in the ranking year (and 20% in the following year), while the most aggressive
group (10a) has 97% aggressive trades in the ranking year (and 94% in the following
year).
In Table 6, we present the profitability of day trading based on the aggressiveness
partitions. While passive day traders earn profits before costs, the returns are modest (3.8
bps per day) and fail to survive transaction costs. All partitions lose money after costs.
The losses tend to be higher for the most aggressive partitions. Thus, the use of passive
orders does seem to predict cross-sectional variation in day trader performance (a result
we confirm in a multivariate analysis in the next section). However, day traders who
focus on passive strategies fail to earn positive net alphas.
In summary, providing liquidity does not appear to be the major source of day
trading profits. Day traders, even the most profitable day traders, place orders that are
usually aggressive. Furthermore, day traders who rely most heavily on passive orders do
not, on average, earn positive gross trading profits. While the savvy use of passive orders
likely boosts the profits earned by some day traders, it does not completely explain the
outsized returns that they earn.
IV.C. Forecasting Profitability Our analysis indicates that several crude univariate sorts are able to forecast
differences in the profitability of day traders. In this section, we employ a richer model to
forecast the probability that a particular investor will be profitable. We would like to
better understand the characteristics of profitable day traders.
We estimate a logistic regression in which the dependent variable is a dummy
variable that takes on a value of one if the net profits on a trader’s day trading portfolio
are positive in year y. We choose to use the dummy variable as a dependent variable in
lieu of a trader’s return or Sharpe ratio for two reasons. First, the estimation strategy
allows us to say something about the probability of earning a positive net return. Indeed,
we will find it takes a truly remarkable profile to garner an even 50-50 chance of being

23
profitable. Second, we are interested in identifying the characteristics of profitable day
traders rather than (for example) characteristics that predict variation in the losses of day
traders. The logistic regression is well suited to this task. Nonetheless, our results are
qualitatively similar when we use the Sharpe ratio of returns as the dependent variable in
our analyses.
To reduce the impact of occasional day trading, which may be motivated by social
or entertainment values of trading, we require that an investor engage in a minimum of
$NT 600,000 in day trading during the year. (We explore the use of higher and lower
cutoff values and find generally similar results to those reported here.) We include a
range of independent variables designed to capture the experience, sophistication, and
skill of day traders. All independent variables are measured cumulatively through year y-
1, while the dummy variable for profits is based on profitability net of fees on an
investor’s day trading portfolio in year y.
We include two measures of past success (profits): Sharpe Profit and Sharpe
Return. These Sharpe ratios are calculated as the mean net daily return (or dollar profit)
from day trading divided by the daily standard deviation, where we require a minimum of
10 days of day trading to be included in the analysis. We include dollar profits to capture
investors who might consistently earn low returns on a large dollar value of trades.
We also test for any gains from specialization on two dimensions. We include the
concentration of an investor’s trades in the five most traded stocks (Percent Top Five
Stocks). This variable is designed to capture any gains from specializing in the trading of
a small group of stocks. To capture whether there are gains to specializing in day trading,
we measure the fraction of an investor's trades that are round-trip day trades (Fraction
Day Trades).
Short selling is a reasonable proxy for investor sophistication. Thus, we include
the proportion of a day trader’s round-trip day trades that were short sales, including buys
to cover a short position (Percent Short). The proportion of trades that emanate from

24
aggressive orders measures whether a day trader is a liquidity demander or provider
(Fraction Agg. Trades).
Finally, we include two measures of experience: Log Experience is the log of the
number of days since the trader began day trading as of the beginning of year y, while
Log Volume is the log of the dollar volume of prior trading.
We estimate logistic regressions for each year from 1994 to 2006. We begin in
1994 so as to allow some build-up in the history for the more experienced day traders. In
Table 6, we present the annual coefficient estimates, the mean coefficient estimate across
the year, and the standard error of the mean.
In the first two rows of the table, we present the mean for each variable in the
regression and the probability impact of each variable. The mean values are calculated
weighting each year equally (i.e., calculate a mean for each year and then average across
years). The probability impact is the change in the probability of being profitable that
results when one moves from 25th to 75th percentile of the distribution of the
independent variable under consideration while all remaining variables are set to their
mean.
As we discuss these results, it’s useful to note the baseline probabilities of earning
an intraday profit for the set of day traders that meet the above data requirements is
18.6% (i.e., 81.4% of day traders lose money unconditionally). Consistent with our
univariate results, profitability measures are strong predictors of trading success. Both
Sharpe ratios on returns and profits predict future success. Moving from the 25th to the
75th percentile on the profit variable improves the chances of being profitable by 2.8
percentage points for profits and 7.3 percentage points for returns. By a large margin,
these profitability measures are the best predictors of the probability of future
profitability.

25
Measures of sophistication and specialization predict success. Traders who short
and those who concentrate in a few stocks are more likely to be successful. These effects,
though statistically significant, are economically modest. Consistent with our prior
results, we find that order aggressiveness is able to reliably forecast profitability; the
negative relation between order aggressiveness and the probability of success suggests
day traders who employ a larger fraction of passive orders perform better. However, the
predictive power is quite small relative to the importance of past profits or returns.
Experienced and heavy day traders are more likely to be successful. Consistent
with our prior results, the log of volume is a reliable predictor of success; heavy day
traders perform better than occasional day traders. Experience is a less reliable predictor
of success. Both volume and experience are economically weak predictors relative to past
profits.
Overall, the results indicate that heavy traders with past success and experience,
who are willing to short sell, employ passive trading strategies, and concentrate in a few
stocks have the greatest probability of turning a profit. However, only day traders with
extremely rare characteristics would have even odds of turning a profit net of fees. For
example, relative to a baseline probability of being profitable, consider a day trader who
is at the 75th (25th) percentile for independent variables that positively (negatively) predict
profitability. Such a trader would improve his chances of profitability from the baseline
of 18.6% to 31.4%. Thus, only day traders with truly remarkable characteristics can
reasonably expect to earn profits net of fees.
V. Discussion Though the vast majority of day traders lose money, we find that the trades of
heavy day traders are profitable before deducting transactions costs and that the trades of
previously successful traders are profitable even after accounting for costs. How do day
traders identify profitable trades and who is on the other side of these trades? The likely
counterparties to profitable trades by heavy and previously successful day traders are less
active day traders (see Tables 1 and 2) and individual investors in general (see Barber,

26
Lee, Liu, and Odean (2009)). The trades of both of these groups earn losses even before
deducting transaction costs.
One way in which day traders could be earning profits is by supplying liquidity
through passive limit orders to uninformed investors who are too eager to pay for quick
execution. While day traders who employ passive limit orders are somewhat more
profitable than others, the economic significance of order aggressiveness in predicting
profitability is economically weak. Moreover, day traders who focus on passive limit
order strategies fail to earn returns net of fees and more than 64% of the trades executed
by the most successful day traders emanate from aggressive limit orders. Aggressive limit
orders will lead to day trading profits when traders are able to anticipate short-term price
changes.
Successful day traders appear to profit predominantly from forecasting short-term
price movements in periods when information asymmetry is high (e.g., around earnings
announcement) or in hard-to-value stocks (e.g., small or volatile stocks). This evidence
suggests that day traders either possess private information or react more quickly to
public information signals in their trading strategies. Harris and Schultz (1998) document
that SOES bandits are able to profit from trading with market makers who ostensibly are
better informed and better financed. Harris and Schultz write that SOES bandits appear to
profit by paying close attention to the market and reacting more quickly than most market
makers to changing market conditions. The day traders studied by Garvey and Murphy
(2005a) also appear to profit from reacting to market changes more quickly than most
market makers. We speculate that the successful day traders who we observe profit by
reacting more quickly than other investors to changing market conditions, just as SOES
bandits and the 15 day traders studied by Garvey and Murphy profit from vigilance and
quick reactions.
It is also possible that day traders possess private (inside) information. Insider
trading laws in Taiwan are similar to those in the United States. For example, directors
and officers of a firm cannot trade on the basis of material private information; anyone

27
acquiring private information also is precluded from trading. Penalties include fines and
jail time. During our sample period, 35 cases were brought (about two to three per year)
and about half (17) resulted in guilty verdict (11 resulted in jail time). While we cannot
completely rule out the possibility that insider trading drives the profitability of
successful day traders, the consistent profitability of successful day traders in periods
outside of earnings announcement windows and in large and less volatile stocks suggests
that insider trading is not the whole story.
VI. Conclusion Day trading is an equilibrium feature of trading on the Taiwan Stock Exchange—
accounting for almost 17% of total trading volume during our sample period. Individual
investors account for virtually all day trading (over 99% of day traders and 95% of day
trading volume). In an average year, 450,000 individual investors day trade. Of these
277,000 engage in day trades that exceed $NT 600,000 ($US 20,000), but only about
20% of this population is able to profit after a reasonable accounting for trading costs.
Most of successful day traders are merely lucky, but a small group of day traders
are skilled, earning predictably high returns. We document strongly persistent cross-
sectional variation in day trading skill. The 500 most successful day traders from year y
go on to outperform the least successful day traders by over 60 bps per day in year y+1.
The top day traders earn gross returns of 37.9 bps per day—more than enough to cover
commissions and a hefty transaction tax on sales of 30 bps. Our auxiliary analyses
indicate that the most profitable day traders are not primarily liquidity providers, as they
tend to place aggressive orders in anticipation of price moves. The most successful are
heavy day traders with a history of profits who are willing to short and who concentrate
in a few stocks.
Cross-sectional variation in investor ability is statistically and economically large.
This observation runs counter to the classic efficient markets view (e.g., Fama (1991)) in
which private information is rare and investors are protected by market prices that fully
reflect all information.

28
In aggregate and on average, trading is hazardous to one’s wealth. However, the
performance penalty associated with trading is not borne equally by all and is not
confined to trading costs. Some traders are consistently dismal stock pickers; for a select
few, trading proves to be a profitable endeavor.
29
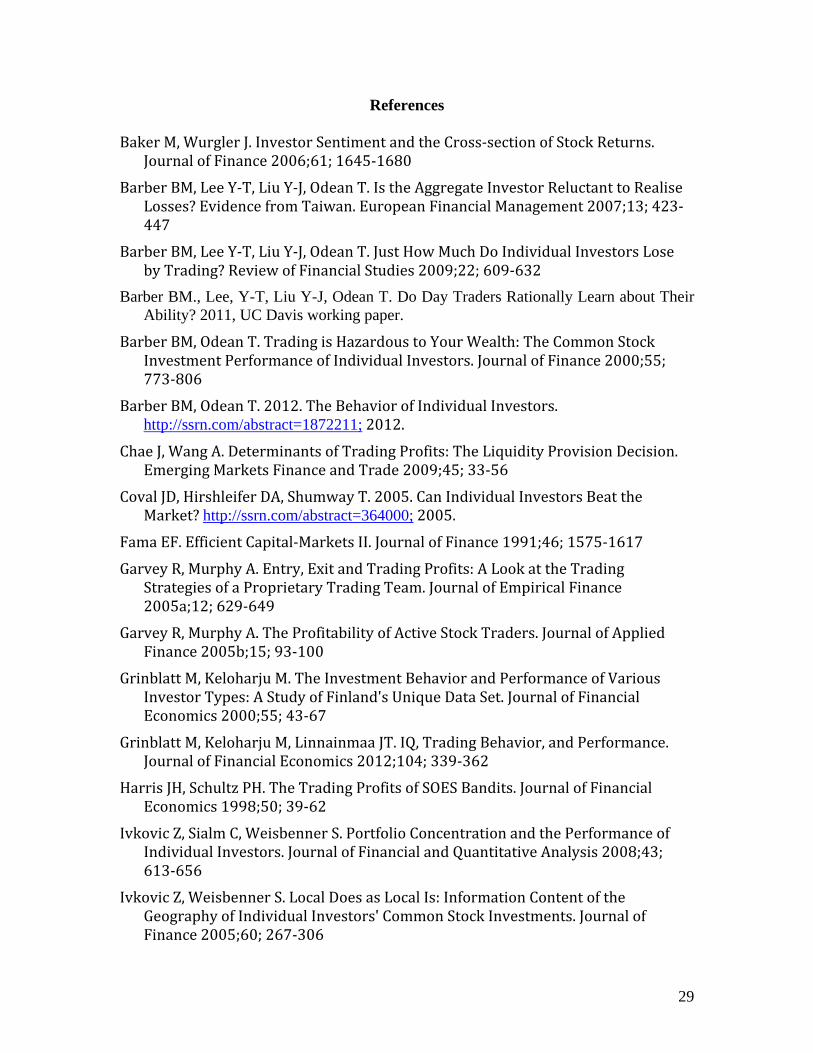
References Baker M, Wurgler J. Investor Sentiment and the Cross-section of Stock Returns.
Journal of Finance 2006;61; 1645-1680
Barber BM, Lee Y-T, Liu Y-J, Odean T. Is the Aggregate Investor Reluctant to Realise Losses? Evidence from Taiwan. European Financial Management 2007;13; 423-447
Barber BM, Lee Y-T, Liu Y-J, Odean T. Just How Much Do Individual Investors Lose by Trading? Review of Financial Studies 2009;22; 609-632
Barber BM., Lee, Y-T, Liu Y-J, Odean T. Do Day Traders Rationally Learn about Their Ability? 2011, UC Davis working paper.
Barber BM, Odean T. Trading is Hazardous to Your Wealth: The Common Stock Investment Performance of Individual Investors. Journal of Finance 2000;55; 773-806
Barber BM, Odean T. 2012. The Behavior of Individual Investors. http://ssrn.com/abstract=1872211; 2012.
Chae J, Wang A. Determinants of Trading Profits: The Liquidity Provision Decision. Emerging Markets Finance and Trade 2009;45; 33-56
Coval JD, Hirshleifer DA, Shumway T. 2005. Can Individual Investors Beat the Market? http://ssrn.com/abstract=364000; 2005.
Fama EF. Efficient Capital-Markets II. Journal of Finance 1991;46; 1575-1617
Garvey R, Murphy A. Entry, Exit and Trading Profits: A Look at the Trading Strategies of a Proprietary Trading Team. Journal of Empirical Finance 2005a;12; 629-649
Garvey R, Murphy A. The Profitability of Active Stock Traders. Journal of Applied Finance 2005b;15; 93-100
Grinblatt M, Keloharju M. The Investment Behavior and Performance of Various Investor Types: A Study of Finland's Unique Data Set. Journal of Financial Economics 2000;55; 43-67
Grinblatt M, Keloharju M, Linnainmaa JT. IQ, Trading Behavior, and Performance. Journal of Financial Economics 2012;104; 339-362
Harris JH, Schultz PH. The Trading Profits of SOES Bandits. Journal of Financial Economics 1998;50; 39-62
Ivkovic Z, Sialm C, Weisbenner S. Portfolio Concentration and the Performance of Individual Investors. Journal of Financial and Quantitative Analysis 2008;43; 613-656
Ivkovic Z, Weisbenner S. Local Does as Local Is: Information Content of the Geography of Individual Investors' Common Stock Investments. Journal of Finance 2005;60; 267-306

30
Korniotis GM, Kumar A. Do Older Investors Make Better Investment Decisions? Review of Economics and Statistics 2011;93; 244-265
Korniotis GM, Kumar A. Do Portfolio Distortions Reflect Superior Information or Psychological Biases? Journal of Financial and Quantitative Analysis 2012;forthcoming.
Kumar A. Who Gambles in the Stock Market ? Journal of Finance 2009;64; 1889-1933
Linnainmaa J. 2003. The Anatomy of Day Traders. http://ssrn.com/abstract=472182; 2003.
Linnainmaa J. 2005. The Individual Day Trader. UCLA Working Paper; 2005.
Linnainmaa JT. Why Do (Some) Households Trade So Much? Review of Financial Studies 2011;24; 1630-1666
Odean T. Do Investors Trade Too Much? American Economic Review 1999;89; 1279-1298
Seasholes MS, Wu G. Predictable Behavior, Profits, and Attention. Journal of Empirical Finance 2007;14; 590-610

31
APPENDIX: Details of Return Calculations
We calculate the intraday return from day trading on day t for a particular group
(g) of investors weighted by the value of investors’ trades:
(A1)
where B and S denote the value of buys and sells (with superscripts L and S for long and
short transactions, respectively) on day t in stock i by investor j. For long positions, the
sales price is the actual transaction price or the closing price if the long position is
not closed out prior to the end of trading. For short positions, the purchase price is
the actual transaction price or the closing price if the short position is not closed out prior
to the end of trading.
Consider a concrete example where an investor buys a stock for $100 and sells
later in the day for $102. On the same day, the investor shorts a stock (the same stock or a
different stock) for $100 and later covers the short with a purchase at $97. The investor
makes profits of $5 = (102-100) + (100-97). We scale the dollar profits by the total value
of the opening positions, $200 = $100 + $100. Thus, we assume the investor put $200 of
capital at risk and earned an intraday return of $5/$200 = 2.5%. This is an accurate
representation of the returns if the investor trades in parallel (i.e., both positions are open
at the same time). For investors who trade sequentially, we correctly calculate dollar
profits of $5, but the capital at risk would be $100 rather than $200 as the $100 would be
deployed sequentially. Thus, we always estimate the correct sign of returns, but for day
traders who trade sequentially our return estimates are biased toward zero. In addition,
we do not know the extent to which traders use leverage, which would increase the
magnitude of returns for both gains and losses, but again the sign of the gains and losses
would be the same as those in our calculations. In summary, the sign of the day trading
returns that we calculate is accurate, though the magnitudes may differ because of
sequential trading or the use of leverage.

32
When we calculate net returns, we deduct a 5 bps commission for all trades (10
bps round-trip commission) and a 30 bps transaction tax for sales. Put differently, buys
cost 5 bps (Cb) and sells cost 35 bps (Cs). We also increase the capital requirements to
reflect the total cost of the opening positions:
(A2)
Continuing our example from above, the net return for the trader would be:
. Note the net return (2.09%) is roughly 40 bps (the total round-trip trading costs of 10bps
in commissions and 30 bps in transaction tax) less than the gross return (2.50%). The
shortfall is slightly greater than 50 bps because we also increase the capital required to
open the positions.
There is an analogous calculation for the return on the remaining portfolio. Define
V as the value of the end-of-day open position in a stock with superscripts for L and S for
long and short positions, respectively. We calculate the return to the remaining portfolio
(rp) as the daily profits to long and short positions scaled by the position value entering
the day:
(A3)
Stocks still held at the end of day t are marked to market at the end-of-day closing price
for the stock. For long positions, stocks sold on day t are valued at the sales price less an
assumed transaction cost of 35 bps. For short positions, stocks bought to cover shorts on
day are valued at the purchase price less an assumed transaction cost of 5 bps.

33
Table 1: Performance for Sorts based on Prior Year Day Trading Activity: 1993 to 2006 Day traders are grouped based on prior year trading activity (e.g., "1 to 500" are the most active 500 day traders from year y). The table presents the aggregate performance for each group in the year following ranking (y+1). The day trading alphas are estimated using the following regression of daily returns: Rpt=αp+βp(Rmt-Rft)+εpt, where Rpt, Rmt, and Rft are the portfolio return, market return, and risk-free return (respectively). For intraday returns, we do not subtract the risk-free rate since interest is not charged for intraday trading. For position returns, the dependent variable is Rpt-Rft. The gross day trading return is calculated from daily round-trip trades plus the intraday returns on open trades; an open trade is a trade made during the day that results in an outstanding position at the close of the day. The net day trading return assumes a 5 bps one-way commission and a 30 bps transaction tax on sales. The returns to open positions are calculated on outstanding positions on the day of trade and are tracked through day t+5 (either marked to market or closed by an offsetting trade).

34
Table 2: Performance for Sorts based on Past Day Trading Profits: 1993 to 2006 Day Traders are grouped based on prior year daily Sharpe ratio for day trading only (e.g., "1 to 500" are the 500 day traders from year y with highest daily Sharpe ratio). See Table 1 for a description of return calculations.

35
Table 3: Tests of Day Trader Winner-Loser Independence across Years A day trader is defined as a winner (loser) if the net profits on a trader’s day trading portfolio are positive (zero or negative) in year y. The table presents a 2x2 contingency table of being classified as a winner in year y and y+1. Panel A considers all traders with positive day trading in years y and y+1. Panel B considers all traders with day trading greater than $NT 600,000 in years y and y+1.

36
Table 4: Day Trading Performance Around Earnings Announcements for Day Traders Sorted on Past Day Trading Profits: 1993 to 2006 The table presents mean daily abnormal returns (α) to day trading only for stocks that are trading in an event window from t=-3,+1 relative to an earnings announcement day (t=0). Day traders are grouped based on prior year daily Sharpe ratio based on day trading returns (e.g., "1 to 500" are the top 500 day traders from year y). See Table 1 for a description of return calculations.
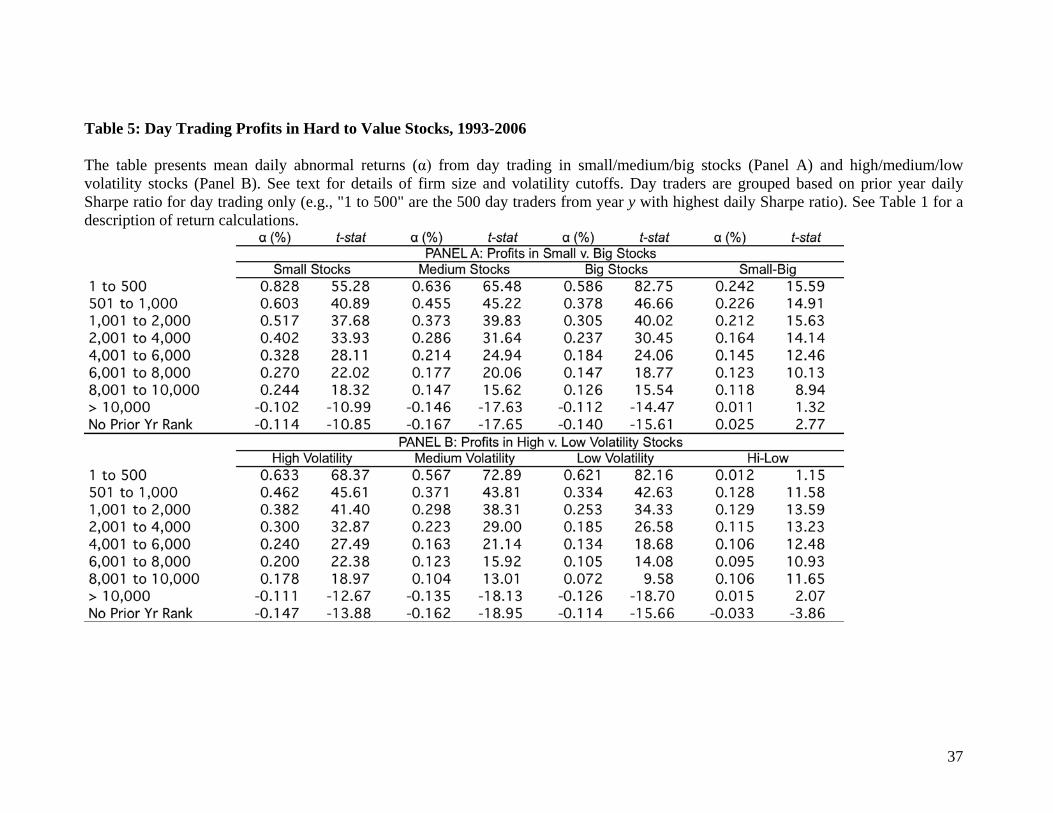
37
Table 5: Day Trading Profits in Hard to Value Stocks, 1993-2006 The table presents mean daily abnormal returns (α) from day trading in small/medium/big stocks (Panel A) and high/medium/low volatility stocks (Panel B). See text for details of firm size and volatility cutoffs. Day traders are grouped based on prior year daily Sharpe ratio for day trading only (e.g., "1 to 500" are the 500 day traders from year y with highest daily Sharpe ratio). See Table 1 for a description of return calculations.

38
Table 6: Performance for Sorts based on Prior Year Order Type: 1993 to 2006 Day traders are grouped into deciles based on the aggressiveness of prior year orders. The extreme deciles are further split in two. The table presents mean abnormal return (α) based on the aggregate performance for each group in the year following ranking (y+1). See Table 1 for a description of return calculations.

39
Table 7: Logistic Regressions of Positive Profit Probability A profit dummy takes a value of one if the net profits from day trading for an investor are positive in year y. The probability of a positive profit is estimated using a logistic regression in which the dependent variable is the profit dummy. Independent variables for each investor include the Sharpe ratio of past day trading profits (Sharpe Profit) and day trading returns (Sharpe Return), the percent of trading concentrated in the top five stocks (Percent Top Five Stocks), the percent of trades that were short sales (Percent Short), the percent of trading devoted to day trading (Percent Day Trade), the log of the number of days since a trader's first day trade as of the beginning of year y (Log Experience), and the log of the dollar volume of prior trading (Log Volume). The regression is limited to day traders with a minimum total value of trade $NT 600,000 in the year that profitability is measured. The probability impact is based on the change in the probability of being profitable when the independent variable under consideration is changed from the 25th to 75th percentile of the distribution of the independent variable while remaining variables are set to their mean values.

40
Panel A: Day Trading Volume and Total Volume
Panel B: Percent of Volume by Day Traders
Figure 1: Day Trading in Taiwan: 1992 to 2006 Day trading is defined as the purchase and sale of the same stock on the same day by the same investor.
0
1,000
2,000
3,000
4,000
5,000
6,000
1992
01
1993
01
1994
01
1995
01
1996
01
1997
01
1998
01
1999
01
2000
01
2001
01
2002
01
2003
01
2004
01
2005
01
2006
01
$NT
Billio
n
Other Trades
Day Trades

41
Figure 2: Example of Trading Activity for a Day Trader
Monday Wednesday Tuesday
♦ Buy
● Sell
▬ Day Trading (Intraday) Returns
--- Long-Run (Interday) Returns
▬ Long
▬ Short

42
Figure 3: Order Aggressiveness for Profit Groups Profit groups are formed in year y; aggressiveness of trades is analyzed in year y+1. The figure presents the mean daily percentage of trades that emanate from aggressive orders for each profit group.
0% 10% 20% 30% 40% 50% 60% 70% 80% 90%
1 to 500
501 to 1,000
1,001 to 2,000
2,001 to 4,000
4,001 to 6,000
6,001 to 8,000
8,001 to 10,000
> 10,000
No Prior Yr Rank
All Individuals
Prof
it G
roup