t Y#/Y' 7)
88
t Y#/Y' 7) AN ASSESSMENT OF THE MARKET FOR SWAZI NATION LAND FARMERS SWAZILAND Ronco Consulting Corporation Prepared By: 1629 K Street, N.W. Suite 401 Mohamed Cassam Washington, D.C. 20006 (Agricultural Economist/ Marketing Specialist) Contract No. PDC- 1406- I- 17-1138 -00O
-
Upload
khangminh22 -
Category
Documents
-
view
0 -
download
0
Transcript of t Y#/Y' 7)
t Y#/Y' 7)
AN ASSESSMENT OF THE MARKET FOR SWAZI NATION LAND FARMERS
SWAZILAND
Ronco Consulting Corporation Prepared By: 1629 K Street, N.W. Suite 401 Mohamed Cassam Washington, D.C. 20006 (Agricultural Economist/
Marketing Specialist)
Contract No. PDC- 1406- I-17-1138 -00O

TABLE OF CONTENTS
I. EXECUTIVE SUMMARY .................. 1
II. ALN ASSESSMENT OF THE MARKET FOR VEGETABLES PRODUCED BY SNL FARMERS ..... ................. 6
Present Supply and Demand for Vegetables ... ....... 6
Production........ ....................... 8
Demand ......... ........................ ... 14
The Effect of the Ban ...... ................ ... 18
Future Demand and Supply ..... ............... ... 19
Projected Demand ....... ................... ... 19
Projected Supply ....... ................... ... 20
Conclusion ...... ...................... 28
The Role of Extension ..... ................. .. 28
The Small-Scale Dairying Option ......... .. 29
III. MARKETING ........ ....................... 32
Market Outlets ........ ................... .. 32
Effects of the Ban...... .................. ... 38
Vegetable Sales by Farmers ...... ............. ... 39
The Wholesale Trade ....... ................ .. 41
The Retail Trade....... .................. ... 42
Institutions ........ ..................... ... 44
Pricing ......... ....................... ... 44
Canning and Processing ...... ................ ... 49
The Proposed Wholesale Market .... ............ . 51
Control of Imports and Exports .... ............ ... 53
Controls on Local Marketing .... .............. 54

PAGE
Market Information ...... ................. ... 55
Credi.t....................... . 55
Jummary and Conclusions .... ................... 56
ANNEX . . . . . . . . . . . . . . . . . . . . . . . . . . . 60
1. SIZE OF CURRENT PRODUCTION .... ............. ... 60
62Dryland and Irrigated Farming .... ...............
2. CROP AND LIVESTOCK PRODUCTION.... ............... 65
65Maize......... ........................ ...
66.....................
Citrus ........... ....................... 67
Fruits .......... . . ................. 69
Pineapples ........ ..................... . 70
Oilseeds ......... ...................... .. 71
Tobacco........... ....................... 72
Livestock........ ......................... 73
Other Grains .......
3. THE IFAD MARKETING PROJECT ............ ....... 74
BIBLIOGRAPHY ........ ........................... 80
LIST OF PERSONS MET........ ....................... 82

ABBREVIATIONS
ha hectares
km kilometers
SNL Swazi National Land
TDL Title Deed Land
RDA Rural Development Areas
RSA Republic of South Africa
i

EXCHANGE RATE
US$1.0 " 1.05 Emalengeni (E)
E1.0 = R1.0 1 US$0.95
ii
I. EXECUTIVE SUMMARY
Present Supply and Demand for Vegetables
Vegetable production in Swaziland depends on a very small number
of farmers: only 25 TDL and perhaps up to 400 SNL farmers are
estimated to be full-time commercial horticulturalists. TDL
farmers grow 600 ha. of vegetables, in total, averaging 30 ha.
each, and produced 59% of the total output in 1982. SNL farmers
had 749 ha. in total, and most grew just a hectare. TDL farmers
concentrated mostly on three veg cables: potatoes, tomatoes and
cabbages. On SNL farms, green mealies, tomatoes, cabbages, and
potatoes accounted for 92% of zhe area under vegetables, with
green mealies alone covering 45% of this area.
TDL vegetable farms are concentrated in the central area between
Mbabane and Siphofanei. Of the SNL farms, 35% of the vegetable
area is in the Vuvulane Irrigation Scheme, and 20% in the NRDA,
with the rest scattered throughout the country. Two-thirds of
the SNL vegetable area are in the RDAs, and a third is on pri
vate schemes outside the RDAs.
Four vegetables, potatoes, cabbages, tomatoes and green mealies,
account for 80% of the 1982 national vegetable production esti
mate of about 18,100 tons. A brief description of these four main
vegetables is given below:
-1

* Potatoes: are mainly grown in the lowveld under
irrigation. TDL growers produce 75% of the crop, while
Vuvulane farmers grow much of the rest. Potatoes are
Swaziland's major vegetable export; in 1978, 2,000 tons
were exported, over half the production, all from
TDL. Potatoes can be grown year-round in the middleveld,
and in the winter under irrigation in the lowveld. In
1982, production was 3,580 tons.
" Tomatoes: are the main vegetable, accounting for 36% of
all vegetables produced. With irrigation, they can be
grown year-round in the iiddleveld and in the winter in
the lowvelV. The bulk of the production occurs in July-
November, and Swaziland has a good market in South Africa
in October-November, when the land there under winter
tomatoes is ploughed for cotton. In 1982, production
was 6,500 tons, of which 55% came from TDL farmers and
33% from NRDA. Exports accounted for under 5% of the
production.
" Cabbages: are grown throughout the country, and are in
over-supply between August and December, but short at
other times. Varieties are now available that grow well
in the summer, when humidity increases production risks.
Production in 1982 was estimated at 4,000 tons, with 75%
from TDL and 11% from Vuvulane.
" Green Mealies: are the most popular vegetables among
SNL farmers, since maize is the one crop they are most
-2

familiar with. They are in demand year-round, but in
January-March, when rainfed cobs are available, the
market is in over-supply. Green mealies can be planted
in the lowveld with irrigation from April to September,
and f-om July to December elsewhere. In 1982, produc
tion was 1,500-1,700 tons, with SNL farmers producing
73%; Vuvulane farmers, with 60% of their vegetable.area
under mealies, supplied 27% of all mealies. Most of
the mealies are currently consumed domestically, but in
1978, a year of no drought and relatively more abundant
supplies, 30% of the production was exported.
According to FAO estimates, current demand for vegetables should
be about 35 kgs. per capita, for a total of 20,300 tons. Total
1982 production was 18,000 tons, and the net available after
exports was 16,000 tons. With illicit imports at about 1,000
tons, supply, and thus total consumption, was 17,000 tons, 3,300
tons short of the potential demand. This deficit could have been
covered by imports, but since October, 1980, there has been a ban
on imports of all fruits and vegetables, and thus shortages and
the resultant high prices constrained consumption to the level of
domestic supply.
Future Supply and Demand
Production increased 31% from 1978/80 to 1982, as a result of
the incentives (high prices and no competition) flowing out of
the ban. Given the levels of on-farm technology, vegetable
-3
farmers are now producing at their optimum levels of capacity.
Allowing for yield increases, new areas and the IFAD project
(rehabilitation of 267 hectares of RDA vegetable areas), the
projected 1990 production level is eutimated at 25,200 tons on
1,503 ha. Demand, however, is projected to be 31,400 tons in
1990, leaving a shortfall of 9,400 tons. To meet this deficit
would require an incremental vegetable area of at least 670 ha.,
assuming a level of yields currently attained by the above
average SNL farmers.
This 9,400 tons deficit in 1990 assumes that the ban would be
maintained and that Swazi farmers would supply juWt the domestic
market. However, building or extrapolating on the momentum of
existing production and marketing trends offers better future
perspectives. Good extension can enable SNL farmers to produce
cabbages and potatoes at times when previously these came only
from across the border. This along represents an extension of
the local market for 4,000 tons of cabbages and 5,000 tons of
potatoes. Swazi green mealie consumption is just 2 kgs. per
capita, against8 kgs. in South Africa. This difference represents
a potential extra demand of 6,400 tons. For tomatoes, there is
an immediate demand in South Africa for about 4,000 tons in the
October-November pe-iod, when fresh tomatoes are scarce there.
There are also good opportunities for expanding existing exports
of potatoes and mealies; South African production of both these
vegetables has been stagnant in the past decade, while demand
has been rising.
-4

Building on the momentum of current production and marketing
trends indicates a need for 900-1,000 hectares of additional
Lrrigated vegetable areas, assuming good yield levels. This in
turn presupposes good extension and research, and that the IFAD
narketing project would be implemented.
The small-scale irrigation projects that USAID proposes to
finance would mainly benefit SNL farmers who have limited or no
previous experience in commercial vegetable production or even
irrigated agriculture. They kniow that irrigation provides better
incomes per unit of labor or area of land and their basic inten
tion is to grow cotton in the summer and vegetables in the winter.
For these farmers, the first priority is to teach them the correct
techniques pertaining to irrigation practice, on crops they are
already familiar with. This implies heavy extension, and concen
tration on cotton and basic vegetables, such as green mealies,
tomatoes and cabbages.
-5

II. AN ASSESSMENT OF THE MARKET FOR VEGETABLES PRODUCED BY SNL FARMERS
A. PRESENT SUPPLY AND DEMAND FOR VEGETABLES
Vegetable production in Swaziland depends on a very few
farmers: cnly 25 TDL farmers and perhaps up to 400 SNL farmers
are estimated to be full-time horticulturalists.- TDL farmers
are large-scale producers, averaging 30 ha of vegetables, and
were responsible for 59% of the total output in 1982. Of the
estimated 600 ha that TDL farmers have under vegetables, three
crops dominate: potatoes, tomatoes and cabbages, each occupying
about a quarter of the area under vegetables. Among SNL farmers,
about 45% of the area is under green mealies, followed by toma
toes (21%), cabbages (14%), potatoes (12%), and :thers (8%).
Of the 25 TDL farmers growing vegetables (one in 14 of all
operational TDL farmers), themajority are located in the central
corridor between Mbabane and Siphofaneni, within the watershed
of the Usutu River and its tributaries. Of the 400 SNL vegetable
growers (one in 135 homesteads), 35% of their area is in just one
block, the Vuvulane Irrigation Scheme (VIF), while another 20% of
their area is in the Northern Rural Development Area, in the
Lomati River Valley. The other SNL farmers are scattered through
out the country, most of them in the other RDAs. About a third
of the SNL farmers outside Vuvulane are on private schemes, where
1/ Originally estimated by B. Hanson, Horticulture in Swaziland
1978, pp. 2 & 4, and updated by Market Advisory Unit, MOAC.
-6

farmers, individually or more commonly in cooperatives, have
initiated irrigation, and contribute towards the schemes' costs.
The other two-thirds of SNL vegetable growers are on RDA schemes,
where the water is free. Table 1 gives the estimated 1981 areas
of vegetable producers.
TABLE 1
ESTIMATED AREA UNDER VEGETABLES IN 1982 (Ha)
SNL: 749
RDAs 339 Private Schemes 150 Vuvulane 260
TDL 600
Total 1,349
Source: MOAC Irrigation Section
Swaziland's vegetable growers, as described above, are a
highly specialized group, only a very small percentage of local
farmers actually grow vegetables, and this is true elsewhere in
the world: vegetable growing is an option practiced by the small
minority, often the very best of the farmers. It requires the
highest level of skill, plus considerable capital and business
or marketing acumen. Furthermore, Swaziland's vegetable produ
cers are also concentrated spacially, with half of them in the
Usutu valley, and'important concentrations in the north, at VIF
and Lomati Valley (NRDA).
-7

Production
Concentration is also evident in the range of vegetables
which these farmers produce. No more than four vegetables- cab
bages, potatoes, tomatoes and green mealies- account for 80% of
the area under vegetables and close to 90% c! the total produc
tion. This concentration on such a small number of vegetables
is not unusual in commercial horticulture; in South Africa, for
example, just three crops- potatoes. onions and tomatoes - account
for 80% of the fresh vegetables traded, with potatoes along being
48%Y
Table 2 gives the estimates of vegetable production in 1978
and 1982, broken doqn by type of grower as well as type of vege
table. TDL farmers produced 50% of all vegetables, down from 64%
in 1978. The best increase has come from private farmers on SNL
land, who have almost doubled their share from 4% to 7%. A brief
description of the main vegetables is given below, and their
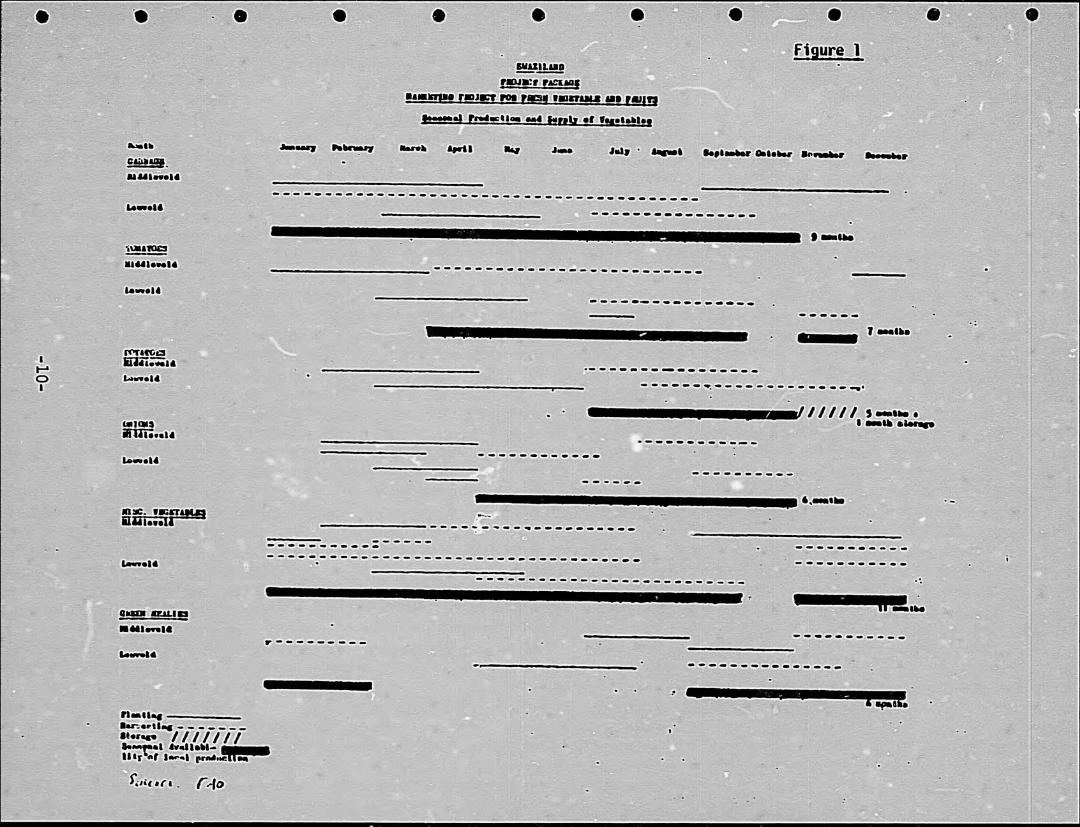
seasonal availability is shown in Figure 1.
Potatoes are mainly grown under irrigation in the lowveld
during the winter months, on land that is used for cotton in the
summer. TDL farmers produce 75% of all potatoes, while Vuvulane
farmers dominate amongst the SNL producers. Potatoes are
available between August and November and local production at
that time is in excess of local demand, leading to large potato
exports to Durban and Johannesburg markets and to the Simba Chip
2/ Crops and Market, Dec. 1982, Vol. 61, issued by Division of
Economic Services, Department of Agriculture, Pretoria.
-8

TABLE 2
Estimated Production of Vegetables 1978 and 1982 (tons)
RDA Private SNL Vuvulane T.D.L. TOTAL
.978 1982 1978 1982 1978 1982 1978 1982 1978 1982
Cabbage 498 554 135 151 385 429 2,680 2,979 3.598 4,000
Tomatoes 1,295 2,135 130 325 240 400 2.860 3.575 4,505 6.500
Potatoes 84 85 80 450 588 735 2,310 2,310 3,062 3,580
Green Maize 440 440 95 95 680 680 455 455 1.670 1,670
Beans 21 34 5 8 - - 100 162 126 200
Onions 240 500 20 200 - - 180 400 440 1,000
Pumpkin 7 14 5 10 - - 100 326 172 350
Carrots 40 120 8 25 - - 75 250 123 400
Beetroot 30 32 8 8 - - 30 30 68 70
Other 6 17 2 6 - - 50 155 58 180
TOTAL 2,641 3,933 488 1,278 1,793 2,244 8,900 10,642 13,822 18,097
SOURCE: Ministry of Agriculture and Cooperatives, Mbabane
~;2~
'~y
~
2' ~
'
-~
* N
" c'~'~ ~i 2 i< ~
~
.~.
~,'
* A' v~"~'~
'~
"
~''"
'
jJ f
i S
.I
S
~
*~4~
'*'<'
"'ix"'. I 4
U
I "~
'
I %
U
I I .
.
* A
-U
I 2.
'
'<''6
I~
I' I
'~v'' I
'I
'~
I ,"''~
' ''
'~K
'' ~
*2"' S
~
.m~
m
U
I'
, ,,
I ~ ' aS
I'
''~ I
<
I~~ ,*
'' ~
"
~ 5
' 1
S
V
, ~
*
"'~
"2~~
~'~
<
2s""''
~
" '~
*'*"'"
~
' 1
hf
*1
gil:
I
, ~
, ~
*
-
S
a S
"~
-
'I'-' g.,
I ~
V
*
I S
-:: I I
6' ~
'
I~ "''''
'-'-v'
" ~
'
Ar
* a
52
1 I I
I I
I I
IS
SI
--
* .5 S
-'
I''I ''
''
It5,
Is,62IIIIs
,
I
'-I-'" 4'"
2
I
a ~I
*1
0' "" '2
"'
III -'
2 -" I
b
'2
1 2
a
2' 2
2'2 "
2 ~
'~'2"~
2~'
"~'
* ~
-"' 2K
,,~t
~
24 &
' P
" 1
jil ,I,
t'A--
'~ A
-
)
2 ''
-"' I,'<
~
22I'
'~tI
2 ~
-~
-"
~
I -
''~ I
"
22
22 ''''~
-~
~7""'~"~ '
~0-. '2~
~~
~
4' --
-
' '"'2
-P
t 2A
i~'2~
~"j
4' '"2
'IP"2
~-t"2
2
22
4
'--'
r2,~
-,I. ~
Q"2
-",-~~
~
'~
22~'N
' ~
'i2
~ 1
~ r~-
2 ~ < 1
~
>~
--
p0'<
t'2<
>
.1
-'
---
~ 2 2'""2P
'2~~
'p(222A~
'2'
iAi 2 ' 2 ' 227 'A7 ' 27 '" 2 ',~ 2~
~24" j-
2 ~2"-7
21t
2~
~J~
~3'~ *
~
2 '
2 "Y
'2
2'2
~~,-
42~
p2I2
~, 2 4
~ ''p~
t~
-'-'2 A
--P
'2
~~
''~
~
-
,2 -'~
~
,2'2
,~
4 ~
2~
4~
4' r
'
'(5
--'-t'2
-
'
,2 ~
'~>
'~~
-g~
-,
-,4
''2'j?
~
~'
2''
processing plant in South Africa. Potato production is possible
year-round in the middleveld and under irrigation in the lowveld
during the winter. The cedara variety in particular is very suit
able for small farmers, because of its climatic adaptability and
hardiness, which permits an extended harvesting period. Before
the cholera ban in October, 1980, TDL farmers would be exporting
to contract buyers in the Johannesburg area, while simultaneously
farmers from Eastern Transvaal would truck in their undergrade
potatoes into Swaziland. Potatoes are Swaziland's biggest vegeta
ble export, because the buoyant market in South Africa has
encouraged TDL farmers to specialize in this crop. TDL farmers
export up to 80% of their production, and almost 50% of the total
production is exported. There is also a large potential in Mozam
bique, providing official channels are developed. In 1978, potato
production was estimated at 3,100 tons, and in 1982, 3600 tons.
Tomatoes are one of the most profitable crops. They are
especially suitable for winter production in the lowveld under
irrigation, while middleveld production uneer irrigation is possi
ble year-round, although costs and disease risks are higher in the
summer. Most tomatoes are marketed from July to November, which
means that Swaziland enjoys a particular niche in October-November,
when production ceases in the Transvaal and Natal as the farmers
there clear their tomato fields to prepare for summer cotton. The
tomato cannery in Malelane in the Transvaal is anxious to purchase
3,000 tons of Roma tomatoes in October and November, when Trans
vaal supplies stop. This is quite a large market, given that
-11

the total Swaziland production of tomatoes in all of 1982 was
about 6500 tons, almost a third of all vegetable production. In
Natal, fresh tomatoes are also scarce during October-November,
and traders come from Durban up to the NRDA schemes to buy toma
toes, even the Roma canning varieties, going from farm to farm
in their 10-ton trucks. This is an extremely expensive system
of produce procurement, considering that it involves committing
a truck for a 1200 km round trip, implying a minimum transport
cash outlay of R1000-1200. It is, though, indicative of a very
under-supplied Durban market for that time of the year. Of the
1982 tomato production of 6,500 tons, 55% came from TDL farms
and 33% from NRDA farms. Exports were about 200 tons to Durban
buyers, and 100 tons to Malelane.
Cabbages from domestic growers are in over-supply between
August and December, when winter cabbages are available. Supply
cannot meet demand in summer, between January and July. Al
though varieties (K-K) are available that can grow in the sum
mer, high humidity and temperatures increase the costs of dis
ease and pest control measure. Production in 1982 was estimated
at 4000 tons, with TDL producing 75% and VIF 11%.
Green Mealies are the most popiular vegetables with SNL
farmers. They are in demand throughout the year, although the
market is saturated from January to March when the rainfed
mealies are available. Green mealies can be planted in -he low
veld with irrigation from April to September, and in the high
-12

and middlevelds from July to December, and be available from July
to February. Green mealies are popular with SNL farmers, since
maize is the one crop they are most familiar with, and its mar
keting is very easy; if there is no market, the mealies can be
ripened for grain. Apparently over half of the green mealies pro
duced are consumed within the rural areas where they are grown,
and compared to the cabbages, potatoes and tomatoes, very little
(15%) enters the central area market. Production in 1978 was
estimated at 1,600-1,700 tons, and about the same in 1982 because
of the drought. SNL farmers produce 73% of all green mealies (re
verse the ratio'for the other major vegetables), with VIF farmers
the most important suppliers, producing 27% of all mealies. In
fact, over 60% of the VIF vegetable area is given to green mealies,
and in the RDAs, the ratio is one-third.
Other vegetables are onions, leeks, green beans, lettuce,
pumpkins, peppers, chillies, Swiss chard (spinach), cucumbers,
beetroots, cauliflower and carrots. In volume terms, onions are
the most important of this group, and 70% are produced and sold
by farmers on SNL. The estimated production of onions in 1978
was 440 tons, and 1,000 tons in 1982. All other vegetables
totalled 550 tons in 1973, and 1,200 tons in 1982, faster than
growth in production of the major vegetables. But all these
vegetables account for only 15% of total local vegetable produc
tion. TDL farmers produce over 60% of these vegetables.
-13

Table 3 gives the areas and quantities of vegetables pro
duced in 1980. The total area given, 1144, was under-estimated
by 150 ha; it should have been 1294 ha. By 1982, the total area
had increased by 4%, 55 ha, all on SNL, but production had risen
31% from 13,822 tons to 18,097 tons. This increase is attributed
to greater intensity of production by all vegetable farmers in
response to the ban on imports imposed in October 1980. This ban
was imposed on imports of all fresh vegetables and fruit coming
from South Africa, and was precipitated by an outbreak of chol
era in the Transvaal. It pushed up local prices by more than
150% in the first six months of operation, and created the in
centives for farmers to increase production through greater ef
fort and input use.
Demand
Table 4 gives the breakdown of per caput consumption of the
principal vegetables as calculated by the FAO for 1979/80. Per
capita consumption of all vegetables was 33.3 kgs, with the four
main vegetables accounting for 29.5 kgs, 88% of the consumption.
Of the total consumption of 18,377 tons, no less than 8,598 tons
or 47%, was imported produce, down from 1978, when 57% of all
consumption was on imports.
- 14

TABLE 3
SWAZILAND
MARKETING PROJECT PACKAGE
PROJECT FOR FRESH VEGETABLES AND FRUITS
1980 Estimated Area and Production of Vegetables
Cabbage
Tomatoes
Area X47
55
99
RDA/SNL % ProductionY
(Lons)
17 633
31 1,405
Area (ha)
19
16
VIF % Production
(tons)
8.6 385
7.2 240
Area (ha)
134
143
TDL
% Production (tons)
22 2.680
24 2,860
Area (ha)
208
257.4
TOTAL
%
18
23
Production (tons)
3.598
4.505
Potatoes
Green Mealies
Others
15
107
45
5
33
14
164
535
392
49
136
-.
22.2
62.0
-
588
680
154
91
81
26
15
13
2,310
455
595
218
334
126
19
29
11
3,062
1,670
987
i-A In
TOTAL
SOURCE:
321 100.0 3,129 220
Horticulture in Swaziland - Hansen (1978)
100.0 1,793 603 100.0 8.900 1.144 100.0 13.822
RDA SHL VIF TDL
= Rural Development Area - Swazi Nation Land - Vuvulane Irrigatcd Farms - Title Deed Land
I/Reported Estimated Actual Production

TABLE 4
ESTIMATED PER CAPITA CONSUMPTION OF MAIN VEGETABLES 1979/80
Cabbages Potatoes Tomatoes Onions Green Others Total Maize
Total .......................... Tons ...........................
Production 3,598 3,062 4,505 440 1,670 547 13,822
Exports 456 1,971 1,199 - 417 - 4,043
Domestic Consumption from lo'al supply 3,142 1,091 3,306 440 1,253 547 9,779
Imports 927 3,883 2,496 1,292 - - 8,598
Total Supply 4,069 4,974 5,802 1,732 1,253 547 18,377
Average Per capitE consumption (kg) 7.4 9.0 10.5 1.1 2.3 1.0 33.3
SOURCE: Swaziland Project Package Preparation Mission FAO Investment Center, Rome, Jan. 16, 1980 Annex 2 p. 13.
Table 5 gives the breakdown in 1979/80 consumption between
the local, central area, exports and imports, as calculated by
FAO.3/
3/ Project Package Preparation Report. Annex 2, page 16.
-16
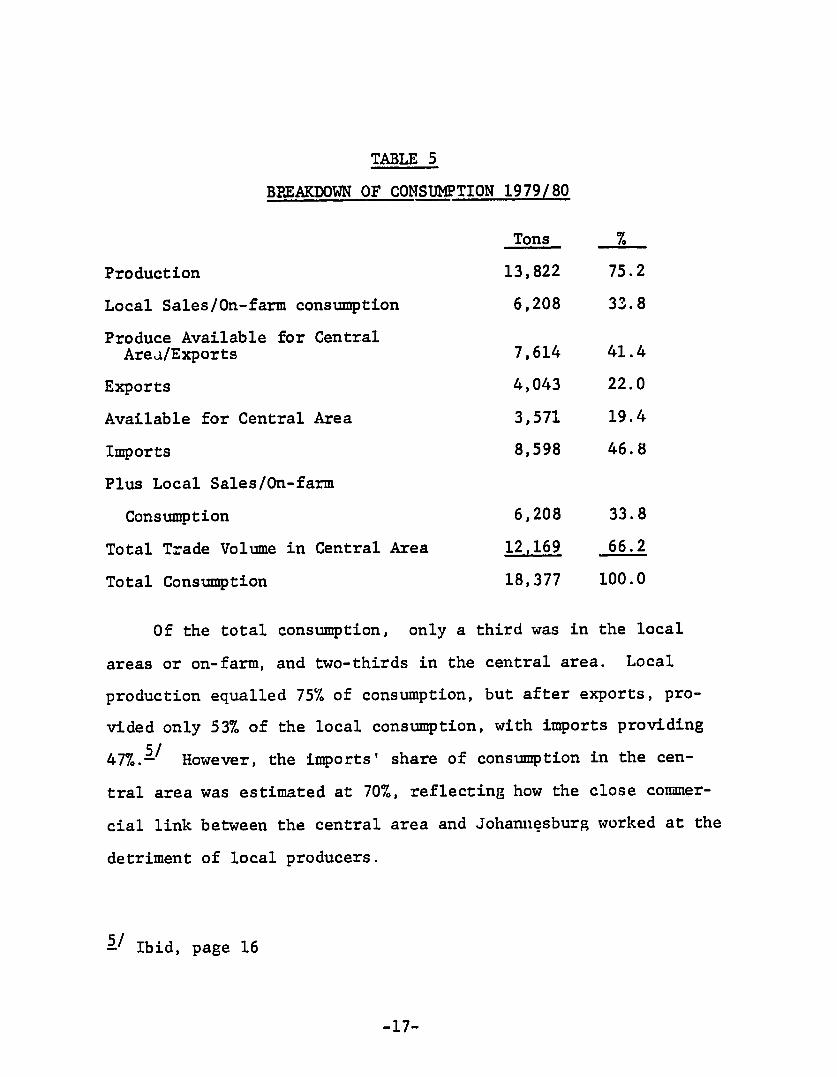
TABLE 5
BEEAKDOWN OF CONSUMPTION 1979/80
Tons %
Production 13,822 75.2
Local Sales/On-farm consumption 6,208 33.8
Produce Available for Central Area/Exports 7,614 41.4
Exports 4,043 22.0
Available for Central Area 3,571 19.4
Imports 8,598 46.8
Plus Local Sales/On-farm
Consumption 6,208 33.8
Total Trade Volume in Central Area 12,169 66.2
Total Consumption 18,377 100.0
Of the total consumption, only a third was in the local
areas or on-farm, and two-thirds in the central area. Local
production equalled 75% of consumption, but after exports, pro
vided only 53% of the local consumption, with imports providing
47%.A-/ However, the imports' share of consumption in the cen
tral area was estimated at 70%, reflecting how the close commer
cial link between the central area and Johannesburg worked at the
detriment of local producers.
Ibid, page 16
-17

The Effect of the Ban
The ban in October 1980 shut-out imports, but there is an
illicit flow, estimated at about 1,000 tens. Although produc
tion has increased, shortages and high prices cut consumption in
1981 and 1982 to levels below those of 1979/80. Table 6 gives
the estimates for 1980, 1981 and 1982, as prepared by the
Marketing Advisor to the Ministry of Agriculture and Cooperative
(figures rounded).
TABLE 6
ESTIMATED COMPOSITION OF VEGETABLE SUPPLY 1979 - 1983
1979/80 1982 1983x
Total Production, tons 13,800 18,100 18,000
Export,, 4,000 2,100 2,000
Domestic Consumption from local supply 9,800 16,000 16,000
Imports 8,600 1,000 1,000
TOTAL CONSUMPTION 18,400 17,000 17,000
x = projected
The ban created the incentives for expanding local produc
tion, which in two years increased 31%, from 13,800 tons in
1979/80 to 18,100 tons in 1982. As already mentioned,
most of this increase came from greater intensity of production
and thus higher yields, rather than from expanded area. Local
production now accounts-for 94% of fresh vegetable consumption
and this is about as high as is possible. Swazi consumers are
restricted to a very narrow range of vegetables produced by
-18

local farmers, and only during the season. In the off-season,
they just do without, or increasingly substitute processed or
frozen vegetables imported from South Africa for the previously
fresh produce, also-imported from South Africa. The ban has
benefited local growers and South African processors and freezers,
while penalizing local consumers and South African farmers who
previously supplied the fresh vegetables.
B. FUTURE DEMAND AND SUPPLY
Projected Demand
Table 7 gives the 1979-85 demand projection made by FAO. It
assumed consumption would rise 28% over the period, from 18,377
tons to 23,450 tons, based on annual rates of growth in population
and per capita income of 2.8% and 3% respectively.
TABLE 7
ESTIMATED CURRENT AND PROJECTED VEGETABLE DEMAND 1981-85
Vegetable 1979/80 1981 1982 1983 1984 1985
Cabbages 4,069 4,272 4,486 4,710 4,946 5,192 Potatoes 4,974 5,223 5,484 5,758 6,046 6,347 Tomatoes 4,082 6,092 6,397 6,716 7,052 7,403 Onions 1,732 1,819 1,910 2,005 2,105 2,210 Other Vegetables 547 573 603 633 665 698
Green Maize 1,263 1,316 1,381 1,450 1,523 1,599
Total 18,377 19,295 20,261 21,272 22,337 23,450
Population 550,000 566,000 582,000 598,000 615,000 632,000
Per Capita Consumption (kg/year) 33.3 34.0 34.9 35.6 36.3 37.0
SOURCE: Swaziland Project Package Preparation Mission FAO Investment Center, Rome, January 16, 1980 - Annex 2, page 14.
-19

The demand projections for 1982, 1982 and 1983 exceeded the
actual estimated consumption. In 1981, demand was cut by the
ban on imports, and in 1982 and 1983, although local production
has increased substantially, supplies are still below demand. In
1982, the market was under-supplied by over 3,000 tons, with
supplies at 17,000 tons (Table 6) against a demand, in the absence
of a ban, of 20,261 tons. Projecting the FAO series at 6%
p.a. to 1990 gives a total demand of about 31,400 tons, 75%
above the 1983 production forecast of 18,000 tons. It should be
noted from Table 7 that in 1985, the four main vegetables would
account for 20,541 tons, 38% of the total projected consumption
of vegetables, the same ratio as in 1979/80.
Projected Supply
Table 8 gives the projected production of vegetables for 1979
85, made by FAO. For 1982, the projection was 15,020 tons against
the actual estimate of 18,100 tons, while for 1983, the projection
was 16,441 tons, against the most recent projection of 18,000
tons. The FAO projections for 1982 and 1983 were exceeded in
actuality because the ban created incentives for local producers
to intensify production.
-20

TABLE 8
ESTIMATED PRESENT AND FUTURE ANNUAL PRODUCTION OF VEGETABLES BY TYPE
Pre-Project ..... ..... Project Year ...... 0 1 2 3 4 5
1979/80 1981 1982 1983 1984 1985
Tomatoes 4,505 4,620 5,096 5,761 8,393 10,150 Cabbages 3,589 2,556 2,664 3,033 4,113 4,518 Potatoes 3,062 3,762 3,810 3,894 4,992 5,172 Onions 440 858 906 1,050 1,728 2,112 Green Maize 1,670 1,206 1,206 1,152 1,212 1,343 Miscellaneous 547 _1,331 1,338 1,551 1,793 1,969
Total 13,822 14,333 15,020 16,441 22,231 25,264
SOURCE: FAO Project Package Preparation Mission., January 16, 1980, Annex 2.
These projections were based on an increase in the total vege
table area of about 700 ha by 1985. They also include production
expected from the IFAD project, which will rehabilitate 267 ha of
vegetable areas in six RDAs, for an incremental production of 2,780
tons by 1987/88,- / given the necessary extension and other institu
tional support. The FAO projection is reproduced in Table 9,
together with the more recent estimate from the Ministry of Agri
culture's Irrigation Section.
./Appraisal Report. Smallholder Credit and Marketing Project,
Swaziland, ADB/IFAD Joint Program, September 1982, pp 19 and 38.
-21

TABLE 9
PROJECTED AND ACTUAL AREA UNDER VEGETABLES (HA)
1982 1985 Forecast
FAO1ProJected Actual MOAC2
RDAs 251 339 701 339
Umtilane 20 0 274 0
Private Schemes 50 150 80 210
Vuvulane 260 260 260 260
TDL 600 600 600 694
TOTAL 1,181 1,349 1,815 1,503
i/Projection of FAO mission, 1980.
!/Projection of MOAC's Irrigation Section, assuming no further external assistance.
The FAO's projection was made on the 1981 base estimate of
1,116 ha, and underestimated the then-extent of RDA and private
schemes by about 150 ha, while including 20 ha at Umtilane which
did not materialize. With these 1982 modifications, the FAO 1982
projection should read 1,311 ha, instead of 1,181 ha, close to the
actual 1,349 ha, and the 1985 target would be reduced by 312 ha,
for an increase of 150 ha from 1,349 ha to 1,503 ha. Thus the
original projection of 1,815 ha will not be achieved, since there
are no funds for further expansion in the RDAs, and because the
Umtilane scheme has been dropped.
Thus the FAO projections of total domestic production for
1982 and 1983 were within 85-95% of the most recent estimates.
Although the base area was underestimated by 150 ha, or 13%, the
increase in yields in the past two years more than made up for
-22

this underestimation. However, for 1982-85, the FAO projection
of increased production was based on an assumption that by 1985,
the area of irrigated vegetables would total 1,815 ha; it is now
estimated that the increase in 1983 and 1984 would be only 154
ha, for a 1981 total of 1,503 ha, a shortfall of 312 ha on the
FAO projection. Also, experts now consider that the country's
vegetable growing capacity is generating at full capacity, given
the existing levels of on-farm technology. Without additional
areas coming into irrigation, production can only increase by
improvements in yields, at best 4% per year. The 1983 production
estimate is 18,000 tons, and for 1984, assuming normal rains, the
projection is 20,000 tons. With no increase in area, and produc
tion augmented by 4% per year through yield improvements, total
vegetable output would reach 25,200 tons in 1990.
Taking the 1984 production projection of 20,000 tons and
assuming exports are maintained at the 1982-83 level of 2,000
tons, the amount available for the local markets is 18,000 tons.
However, demand for 1984 is estimated at 22,331 tons, and if the
import ban is maintained, the shortfall will be 4,337 tons. For
1990, the projected production is 25,200 tons, and if exports
regain the 1980/82 average of 3,200 tons, the local supply will be
22,000 tons, against a demand of 31,400 tons, leaving a short
fall of 9,400 tons, if there are no imports.
This 9,400 ton shortfall indicates that there is a need to
increase the area under vegetables. Taking the 1985 FAO break
down of the major vegetables (Table 8) in total demand, and
-23

applying the full development yields used in the FAO Preparation
Mission report, gives the following areas required to meet the
9,400 ton deficit:
TABLE 10
AREA REQUIRED TO PRODUCE 9,400 TONS
Vegetable % Demand!/ Tons Yield=/ Area
Cabbage 22 2,068 17 122 Potatoes 27 2,538 15 169 Tomatoes 32 3,008 18 167 Green Maize 7 658 5 132 Onions 8 752 18 42 Other 4 376 10 38
TOTAL 100 9,400 670
1/ Table 8
2/ Project Package Preparation Mission. Annex 2, Table 4. Yield in tons per hectare at full development on SNL farms. These levels are considered rather optimistic.
To meet the 1990 demand for the major vegetables requires
about 670 ha of additional irrigated land, if one looks at the
market strictly from the input substitution bias, and assumes
that the present ban will continue, despite the Customs Union
rules. Another more realistic perspective is to look at what the
Swazi vegetable producers have been doing, and to expand thereon.
Taking each of the four major vegetables, the following conclu
sions can be made:
Cabbages: Before the ban, 83% of the cabbages were consumed
locally, and 13% exported, with all the latter coming from TDL
farms. Cabbages are available nine months a year, but the peak
supply is in August-November. However, half the overall market
-24
is in April-July when traditionally RSA supplied 80% of the
cabbages required. Cabbages are popularwith small Swazi farmers,
and technically it is possible to grow them adequately for the
April-July market, provided that extension is available. Being
able to harvest in April-July doubles the local market by sub
stituting the former South African supplies. This implies an
increment of 4,000 tons, which at 17 tons per ha, would require
235 ha.
Green Mealies: This is the most popular crop with small
farmers, accounting for 45% of their vegetable area, and the one
with no marketing problems. In 1978, when production was estimated
at 1,387 tons, 30% of it was exported. Vuvulane farmers exported
50% of their production and accounted for 84% of all mealie exports.
In 1978, Swazi consumption of green mealies was 2kg per caput against
the South African figure of 8 kgs. Given that the per capita in
come of black South Africans is equal to that of Swaziland, the
potential market scope locally is therefore very large. Green
mealies can be grown eight months a year with irrigation, and supply
is particularly short in September-October and March-April. Green
andmealies are one vegetable which are never imported from RSA,
1
the main vegetable of least interest to TDL farmers, since they clash
with cotton, which is more profitable for TDL farmers. For the small
Swazi farmer, though, it should offer good prospects, both in terms of
local and RSA markets, and as an adjunct to the staple food, maize
The 1982 Abstract of Agricultural Statistics issued by Pretoria shows that green mealies production has stagnated at around 200-210 thousand tons since 1976.
-25

flour. A doubling of production would imply an increment of 1,670
tons on the 1982 production level, which at five tons per ha,
would require an additional 334 ha.
Tomatoes can be grown seven months a year, but the peak
production is August-December. In October-November, Swaziland
has a particular niche in the South African market, when tomatoes
of both the canning and round varieties are very short. The
reason for this is that South African farmers like to get their
tomato fields clear by October in preparation for planting summer
cotton. In 1978, 1,200 tons, 27% of the production, was exported,
with supplies coming equally from TDL and SNL farmers. There is
a market for 3,000 tons in October-November at the Malelane Can
nery, and at least another 1,000 tons to the Durban fresh market;
this 4,000 tons is equal to 62% of the 1982 crop. Local consump
tion of domestic production can be increased if farmers could
produce earlier, for marketing in May-July. The key requirements
are extension and research, to help farmers grow earlier, and
introduce varieties that withstand bacterial wilt, a major prob
lem during heat waves, in October-November. An increase of 4,000
tons, at 18 tons per ha, would require an additional 222 ha.
Potatoes: This crop is Swaziland's major vegetable export.
In 1978, 2,000 tons of potatoes were exported, representing 50%
of all vegetable exports. TDL farmers provided nearly all these
potatoes, and in fact 81% of their potato sales were to RSA.
Local sales were only about 930 tons, and the supply
-26

evenly split between TDL and SNL producers. Hansen estimated that
in 1978, domestic demand was 5,000 tons, with 83% of the supply met
by imports. Swazi farmers conld supply much of this demand with
cedara varieties from the lowveld from July to November, and from
the middleveld from November to February. SNL producers can also
follow TDL farmers and concentrate on exporting to RSA. In 1982,
exports were estimated at 1,000 tons, as local prices were higher
than in South Africa. In future, extra supplies destined for ex
port would make hardly a dent in the total South African produc
tion of 700,000 tons. South African demand, especially for
processed potatoes, is rising, while water shortages there have
already limited any increase in winter potato hectarages. Future
RSA production increases than will have to come from increases in
yields and imports. / For SNL farmers, problems with this market
are quality (processors are particular about grades) and timing,
both of which require good extension. Another important factor is
transport, and farmers will need to work together to get both the
harvest and trucking coordinated. An increase in production of
3,000 tons, with 2,000 tons for RSA and 1,000 tons sold locally,
would requirean additional area of 200 ha, at a yield of 15 tons
per ha.
From the above, it can be seen that to maintain and enhance
the ongoing momentum for just the four main vegetables requires an
additional area of 991 ha to produce 12,670 tons of fresh vegetables
8/ South African production has fluctuated between 684 and 762
thousand tons in 1975-01 with no trend discernible. Johannesburg buyers say that, provided the quality standards are met, they would buy any incremental production from Swaziland.
-27

for both the local and South African -market. This area could
be brought into production over the next five years, and the
production to build up to 12,570 tons would take three to five
years more, as farmers require this tue to develop skills that
would enable them to attain the optimal yield levels, given the
necessary extension.
Conclusion
To summarize, there is a requirement of 600-700 ha of
additional irrigated vegetable land to meet the demand for the
major vegetables in 1990, as projected by FAO. From the per3pec
tive of maintaining ongoing trends in production, with the output
going to both domestic markets and to South Africa, 900-1,000 ha
would be required in the next five years, just for growing the
four main vegetables. To include the other vegetables, another
20% more land, 180-200 ha, would be required. The area increases
even more if one assumes that SNL farmers are mostly interested
in green mealies, since these account for 45% of their vegetable
lands. To achieve 8 kg per capita, a level of consumption pre
vailing in South Africa, where it is consumed mainly by blacks,
would require a production of 5,600 tons. At five tons per ha,
this implies an irrigated area of 1,120 ha.
The Role of Extension
The type of farmer who may be expected to benefit from a
small-scale irrigation scheme backed by USAID will need the right
kind of extension if he/she is to succeed in the long run. These
-28

potential beneficiaries are the same people who have come to the
MOAC's Irrigation Section for help in vegetable growing because
of the high profits in the past two years consequent to the import
ban. Only a few of them may currently be growing vegetables,
and, in common with SNL farmers, with the exception of perhaps
a dozen or two, they have very poor techniques of growing vegeta
bles. Lack of technology, despite their keenness and commitment
to hard work, increases costs, reduces yields and unnecessarily
frustrates endeavour. These farmers require persistent and good
quality extension to ensure that yields and profits are attained,
so that the heavy investment, in both irrigation facilities and
effort, is not wasted. Farmers, even the wealthiest TDL growers,
need continuous advice on financing of operations, irrigation
techniques, pests and diseases, fertilization, optimum planting
and cultivating techniques, etc. It is urged that any irrigation
project that USAID backs include a generous funding for extension,
and that this extension concentrate on teaching farmers to improve
yields on the crops they are currently growing.
The Small-Scale Dairying Option
If irrigation is available, vegetable production is not the
only, or the most profitable, option. In Swaziland, small-scale
dairying, based on irrigated pastures, should be considered a
viable option. Swazis, being a pastoral people, have a high
demand for milk, particularly fermented milk known as emasi.
-29

Fresh milk in the rural areas fetches 50-60 cents per liter, which
is about the highest free-market price for fresh milk in Africa.
This price makes milk production very profitable, particularly if
the feed is mostly home-grown pastures.
There are presently a small number of RDA village dairy units,
backed by the Dairy Board. The Board sells farmers cull cows,
from its herd of Canadian Holsteins, for E600. Farmers have to
put down pastures, fencing and a shed, for about E50 for two ha
and two cows. However, none of these farmers have been helped
with irrigation, so the basic forage in the dry season is hay
supplemented by purchased feeds costing 32 cents per kg. This
is an unnecessarily expensive method of feeding when irrigation
is available. Even so, farmers report yields of 2,000 liters per
lactation on average, implying a gross return of El,000-El,200
per cow. Two hectares of irrigated lucerne could support two
milkers and one follower, with very little cost for purchased
feed.
The investment costs for three cows would be E1,800, and
for two ha pastures, fencing, cowshed and equipment, about E1,000.
This E2,800 would be on top of the investment in irrigation,
about E3,000 per ha, which would be common for both dairy and
vegetables. It is higher than the working capital needed for
vegetables, E700-El,200 per ha depending on the crop, but it is
long-term, giving daily cash for a little labor. The gross
income at 50 cents per liter and 4,000 liters per year minimum
-30

would be E2,000. Operating costs annually would be E500 for
irrigation,-1 plus about E120 per cow, for feed and veterinary
services, for a total of E860, giving a net of E1,140 per year.
The market for milk would initially be local, for emasi, and
given a reasonable local population, there would be no need to
have a Dairy Board pick-up, which would paya lower price, 35-40
cents per liter.
The existing daizcy units are extremely popular, but
constrained by shortage of cows from the Dairy Board. Their popu
larity must be seen in the light of regular income, no marketing
problems, and a pastoral people's basic affinity for cows and the
milk they produce. Pure Holsteins are not suitable for the hardy
environment of a small farmer; a Holstein-Sahiwal cross, availa
ble from Zimbabwe, would be better. Alternatively, A Jersey-
Nguni cross could be tried.
9/Appraisal Report, Annex 15.
-31

III. MARKETING
Market Outlets
In Table 5 (page 9) there is a break down of consumption in
1979/80, the year preceding the ban. The shares of the various
markets of domestic production were as follows:
Tons %
Local Sales/On-farm Consumption 6,208 44.9 Exports 4,043 29.1 Sales to Central Area 3,571 25.8
Total Production 13,822 100.0
Local sales outside the central area and on-farm consumption
accounted for 44.9%, or the major share of domestic production.
The major markets outoide the central area are the mines, pulp
mills, sugar and citrus estates. Exports were the next most
important, taking 29.1% of local production, while the central
area took only 25.8% of local produce. The central area, that
is the Mbabane-Manzini corridor, is, however, the major market
in Swaziland, since it has 85% of the urban population. It
accounted for two-thirds the national consumption of vegetables
in 1979/80 and 80% of the consumption of imported produce, i.e.,
54% of total consumption.
In 1978, two thirds of the local production of the four main
vegetables was consumed in Swaziland, and one-third exported,
as shown in Table 11.
-32

TABLE 11
Market Outlets for Vegetables Produced on TDL, Vuvulane, NRDA, SRDA - 1978
(tons)
Local Export Central Sales (RSA) Area Total %
Potatoes 490 2,081 473 2,898 24.3
Cabbages 1,467 456 1,473 3,396 28.4
Tomatoes 1,724 1,199 1,344 4,267 35.7
Green Maize 753 417 217 1,387 11.6
Total 4,434 4,153 3,471 11,948
Percentage 37.1 33.9 29.0
Source: Sterkenburg, et al. (1978), the Production and Marketing of Vegetables in Swaziland.
Table 12 gives the break down of sales, by product and producer,
to the central area. TDL farmers supplied 68% of the main vege
tables, followed by those in Vuvulane with 21%. Cabbages were
the main vegetable, 42% of the sales, followed by tomatoes with
39%.
TABLE 12
Estimated Vegetable Sales to the Central Area (1978)
(tons)
Green Potatoes Cabbage Tomatoes Maize Total
Title Deed Farmers 208 1,126 1,001 23 2,358
Vuvulane 229 270 79 156 734
NRDA - 52 259 17 328
SRDA and MRDA - 25 5 21 52
Total 437 1,473 1,344 217 3,471
-33

Table 13 gives the break down of local sales outside the central
area. TDL farmers were again the dominant suppliers, with 67% of
the supplies, followed by the Vuvulane and NRDA farmers, each
supplying about 15%. Tomatoes were the main vegetable, 39% of the
sales, followed by cabbages, with 33%, and the green maize at 17%
TABLE 13
Estimated Local Sales of Vegetables (Not to Central Area) (1978)
(tons)
Green Potatoes Cabbage Tomatoes Maize Total
Title Deed Farmers 231 1,099 1,258 368 2,956
Vuvulane 259 115 113 170 657
NRDA - 140 315 193 648
SRDA and MRDA - 113 38 22 173
Total 490 1,467 1,724 753 4,434
Table 14 gives the break down for exports. TDL farmers provided
72% of the exports, with the Vuvulane and NRDA farmers sharing
the balance equally. Potatoes were the most important vegetable
exported, with half the sales, and 95% of these came from TDL.
Tomatoes were next, with 29%, supplied equally by TDL and SNL
producers. Of the latter, NRDA farmers provided 90%.
TABLE 14
Estimated Exports of Vegetables to South Africa (1978)
(tons)
Green Potatoes Cabbages Tomatoes Maize Total
Title Deed Farms 1,981 456 600 64 2,991
Vuvulane 100 - 48 353 501
NRDA - - 551 - 551
Total 2,081 456 1,199 417 4,153
Source: Sterkenburg, et al., (1978) - The Production and Marketing of Vegetables in Swaziland.
-34

TDL farmers clearly dominated, and still do, the sale of produce
internally and to South Africa. They have the linkages to the
central area, and about a third sell much of their produce through
their own retail stalls. They also know the big buyers in Johannes
burg, whom they supply on contract. They are able to organize
transport on a large scile, and ship to the requirements of such
major buyers as the mines and Simba Chips, the potato processor.
Vuvulane farmers, who constitute the biggest block of SNL farmers,
specialize in green mealies, and half of this output was exported,
mostly to itinerant traders coming from Durban. Other crops they
are able to sell locally and to the central area. NRDA farmers
specialize in tomatoes, and half their tomato production was
exported to the itinerant traders from Durban and to the Malelane
cannery.
Of the SNL farmers, only a few private farmers, with their own
transport, and possessing business acumen, are able to directly
market their produce in the central market or in South Africa.
The vast majority, lacking both the resources and ability, are
passive participants in the marketing system. They rely entirely
on the traders coming to them at harvest. Before the ban, this
tended to be a haphazard affair, giving rise to incidents of
crops rotting because the trader-producer interests failed to
coincide at the same time.
The SNL farmers suffered because the central area, before the
ban, had better linkages with the South African produce marketing
-35

system than with its own hinterland. This is a reflection of
Swaziland's satellite status within the South African economy,
and although the 1980 ban on fresh produce imports modified it a
bit, this relationship totally holds true for all the other
economic sectors. The central area became dependent on imported
supplies because the buyers in Mbabane and Manzini found it more
convenient to order from Johannesburg brokers, who have the range
of quality vegetables, plus the credit and traIisport arrangements.
They also got supplies delivered to them by vegetable farmers
coming across the border from Eastern Transvaal. These farmers
would bring under-grade vegetables that were not saleable at good
prices to the middle men in Johannesburg and Pretoria wholesale
markets. They could, however, sell to retailers in the Mbabane-
Manzini corridor, where quality standards are not as high. Such
sales were made for cash, and probably escaped income tax. How
ever, they disrupted the market for the local producers, since
the arrival of three or four loads of vegetables from the Trans
vaal in one day would satisfy the immediate needs in the central
area, and dissuade dealers from going to rural areas to pick up
local produce.
Given this scale and operation of the South African sellers and
producers, the small Swazi farmer couldn't compete in the central
area. Central area buyers were so tightly linked to the South
African sources that they had little incentive to develop strong
and permanent linkages with small farmers scattered throughout
the hinterland. The consequent weak linkages in turn became
-36

another set of constraints to production and marketing of more
vegetables by small farmers. The TDL farmers though, because
of their skills, economic and cultural affinities, and scale of
operation, did not suffer so, since they are able to operate the
system, selling locally and to South Africa.
The key weakness in the system for the SNL farmers and the dealers
dependent on them was the lack of a central wholesale market.
Without it, there is no locus for small farmers and traders to
bring in produce; they instead have to hawk their wares to indi
vidual retailers. Lack of a central market also excludes general
transporters, who have a crucial role in vegetable marketing,
from participating in the transporting of local produce. In
Swaziland, there is a flow of goods via general transporters into
the countryside from the central area or even South Africa. How
ever, since the countryside exports bulk commodities such as sugar,
minerals, pulp and timber, by specialized trucks or by rail, these
transporters have no loads to back-haul. A central market would
provide both a destination and a service for these general trans
porters to engage in trucking vegetables into the central area.
They would provide the crucial contract transport service, and
the essential truck capacity, to those actually involved in buy
ing and marketing produce to domestic and South African markets.
-37

Effects of the Ban
The ban definitely forced a rapid strengthening in the linkages
between the central area and the producing centers. With half
the supplies previously imported suddenly shut off, buyers had to
turn quickly to local growers, who responded by increasing produc
tion 31% between 1980 and 1982, and shifting half their expozts
into the local market. The ban, though, was unexpected, and
farmers could not respond by increasing production immediately.
Consequently, prices in the central area shot up 150% between
October 1980 and April 1981. By October 1981, fruit and vegeta
ble prices were 43.8% above the level a year before, against a
16.6% rise in the Index "B" (low income cost of living) prices
series. From October 1981 to July 1982, fruit and vegetable
prices rose another 50%, but then dropped 30% between July 1982
and October 1982, for a twelve months rise of 16.4%, very close
to the overall Index "B" rise of 14.1%. However, from October
1982 to April 1983, the fruit and vegetable price index has risen
26.3%, against the Index "B" rise of .4.8%.
These price trends clearly show that by October 1982, two years
from the imposition of the ban, farmers had been able to increase
production to minimally satisfy the local, but now reduced, fruit
and vegetable demand. Consumers suffered from the ban, particu
larly in the first six months, as well as in April and May of
both 1981 and 1982, when local supplies are seasonally low, and
when traditionally imports from RSA supplied up to 86% of the
central area demand, as opposed to the August-September periods,
-38

when local vegetables supplied 65% of the demand. The 26.3%
increase in fruit and vegetable prices since October 1982 can be
attributed to the prevailing drought, the worst in memory, which
is affecting the whole region. At the Johannesburg wholesale
market, for the period October 1982-February 1983, the increase
in prices has been even worse: 36% for potatoes, 55% for onions,
37% for tomatoes, and these three vegetables account for 80% of
the vegetable index. Except for potatoes and carrots though,
Swaziland retail prices are still higher than those in Johannesbura
or Durban for the first six months of 1983.
Vegetable Sales by Farmers
All TDL farmers assemble their produce in standard packs, after
basic grading, i.e., eliminating the obviously bad items. TDL
farmers who sell to South Africa have to grade according to the
market requirements there. The sales packs in Swaziland for the
most common vegetables are:
cabbage: net bags, 18-25 heads, approx. 25 kg.
tomatoes: 7.5 kg. boxes
green maize: no standard pack
potatoes: 15 kg. pockets
onions: 10 kg. pockets
Except for two or three onion growers, farmers do not store any
vegetables on the farm. Farmers try to space out their harvesting,
within the confines of the market and their labor availability,
and sell without storing.
-39

SNL farmers generally follow the same practices as TDL farmers.
Their major problem, before the ban, was in organizing sales at
harvest. Sales in local areas were easily disposed of, but sales
to the central areas and to South Africa lacked systematic coordi
nation. At NRDA, where tomatoes are the main crop, farmers
generally arranged their transport (just 10 truck loads in 1982)
to the Malelane cannery, at the same time when the Durban traders
would come. The latter offered better prices, and paid cash at
the farm. These Durban traders also went to Vuvulane, where they
bought the green maize. However, since the ban, they have largely
been preempted by the local buyers coming from the central area,
where prices are higher than in Durban, distances shorter, and
alternative supplies of vegetables not available.
Direct selling by farmers to final consumers in the central area
is done oLly by a few TDL farmers. Some of them have set up
roadside retail outlets near their farms, and generate a consider
able proportion of their revenue through these outlets. TDL farmers
also sell directly to institutional buyers, namely hotels and
restaurants. In 1978, institutions purchased a quarter of their
requirements directly from TDL producers; 39% in the case of
restaurants and 20% in the case of hotels. Direct sales by other
farmers do occur, but these sales are within their communities
generally, and generate but a small proportion of their gross
income from vegetables.
-40

The Wholesale Trade
In 1978, the participants in the central area vegetable marketing
system were organized as follows:
Initial Sales Type of Traders No. Per Week (Tons)
1. Full-time Specialist Trader 23 180 2. Part-time Trader 13 .40 3. Specialized Wholesaler 2 13 4. Shops (excluding roadside stalls) 6 7.8 5. Market Traders 73 21
Since 1978, there has been a doubling of the number of traders,
while only one specialized wholesaler and three grocery shops are
still in business.
Prior to the import ban, there were three wholesalers operating
and importing produce into Swaziland. Of these three, two were
operating from Swaziland and the other was of South African ori
gin. Currently, the wholesalers of Mbabane market are relatively
small, and since they can stay at the Mbabane market until 9 a.m.
only, are buying from producers and selling to the market retailers
or to shop owners who buy early in the morning. In addition, a few
growers offer produce on this market, some coming from as far away
as Vuvulane (some 160 km) to offer produce. The market authori
ties in Mbabane recon that about 30 local wholesalers frequent
the market and prior to the ban about six wholesalers came from
the RSA regularly.
At Manzini, wholesalers may remain all day and two wholesalers
offer a range of procude, but mainly concentrating on cabbages,
-41

potatoes, tomatoes and oranges. Each wholesaler has two lorries,
one of which remains at the market whilst the other goes to
collect produce from growers. In addition to these firms, there
are a number of other traders offering a single product, tomatoes
mainly. They remain in the market, in some cases for several days,
until their produce is sold, when they go off for further supplies.
Manzini market also supports a third class of semi-wholesalers who
have stands adjacent to the retail market and who supply the stall
holders there with further supplies as they need them. There is
no long-term storage capacity in either market center.
Currently, two wholesalers resident in Swaziland pursue other
businesses, as they consider wholesaling fruit and vegetables
internally is no longer profitable. The chief reason for this
opinion is the lack of a central point of assembly due to the
fragmented nature of the production process. It was also for
these reasons that one of the wholesalers who, prior to the ban,
was supplying some of the main retail shop outlets in Mbabane and
Manzini, as well as the markets of these two towns and Mahlanya,
bought 90% of his supplies in Johannesburg wholesale market.
Mbabane is 390 km from Johannesburg.
The Retail Trade
The Swaziland Central Statistical Office undertook a survey of
markets in Swaziland. The survey covered all known markets in
Swaziland, these being defined as both those for which licenses
for stalls were issued (e.g., Mbabane, Piggs Peak, Mahlanya) and
-42

those which exist for the selling of produce but for which no
locenses for stalls are issued e.g., Big Bend and Oshoek. Iso
lated roadside stalls, of which a good many exist in the central
Mbabane-Manzini corridor, were excluded. Table 15 below shows
that the total number of stalls in the three central area markets
of Mbabane, Manzini and Mahlanya was 378.
TABLE 15
Number of Stalls and Sellers in Central Area Markets
Covered Stalls Uncovered Stalls
No. No. No. No. Market Stalls Sellers Stalls Sellers
Mbabane 93 130 ....
Manzini 129 129 8 8
Mahlanya 133 133 14 14
Source: Ministry of Agriculture & Cooperatives, Market Advisor
Since that time, other markets have been established in Manzini
and Mbabane as well as at Kwaluseni aid a small market at Malkerns.
There are also plans for further retail markets and roadside
stalls in Manzini and Mbabane in order to satisfy a demonstrated
need which is currently satisfied by illegal streetside retailing.
In total, then, the number of stalls in the central area is some
thing over 500, of which at least 90% are fruit and vegetable
outlets. In addition to the market stalls, there are retail
shops and supermarkets in both Manzini and Mbabane which include
fruit and vegetables Ln their wares and whose turnover in these
commodities must be considerable in some cases. Unfortunately,
no survey data are available on the actual quantities handled.
-43

The main retailers are market women who buy produce brought to
them by producers and hawkers in their pick-ups. These women buy
the produce and repack them in small plastic bags, and by general
agreement, always charge the same price for similar produce.
Institutions
In 1978, there were 52 institutions in the central area, made up
of schools, restaurants, hotels and hospitals. Most important
were the hotels and restaurants, which accounted for over 70% of
the purchases. Half of their purchases were made through whole
salers, and a quarter from producers, mostly TDL potato growers.
Institutions prefer to deal with the wholesalers, who can assemble
the produce in the quantity, quality, and range desired. Before
the ban, the wholesaler preferred to buy from South Africa, but
they now provide some locally grown fresh lettuce, carrots, toma
toes and beans, in competition with a dozen or so TDL farmers who
have developed relations with the restaurants and hotels over the
years. However, in general, because of the high prices, variable
suppiies and limited choice of local vegetables, institutions are
now increasingly dependent on frozen vegetables, all imported
from South Africa.
Pricing
Prior to the ban, local prices were determined by the wholesale
markets in South Africa, particularly Johannesburg. With the ban,
and in the absence of a local wholesale market or a system of
administered prices, the price of vegetables is set by the
-44

retailers in the Mbabane and Manzini markets. This method assures
that retail prices would be set at the highest level. Retail
sellers prefer a higher price and the maximum margin per kg to
lower prices on higher volumes. Retailers can maintain this prac
tice under current conditions, since in the short or even medium
term, with the ban shutting out additional supplies, the volume
traded is fixed, and the retailer's position impregnable.
The situation in 1981, the first year after the ban, is summed up
in the Annual Review of Vegetable Prices and Marketing Trends,
1981, put out by the Marketing Advisory Unit. The overall summary
is quoted below, with the underline added to emphasize the domi
nant role of the retailers in price-fixing.
"In general the same seasonal patterns of supply experience
in 1980 prevailed in 1981, namely that produce was generally
readily available in reasonable quantities from May to
November (winter production) but was in limited or very
short supply from December to April, with March being a
particular lean month.
"Prices followed the availability of supplies, with the
highest prices generally experienced in March and April.
The annual average increase in prices in 1981 over 1980
was 44 percent at the Trader or Wholesale level and 71
percent at the retail level. Onions, cabbages and
tomatoes registered an average annual increase of over
100 percent in 1981 over their 1980 retail levels. At
-45

the wholesale level, only onions registered an increase
of over 100 percent in 1981 over their 1980 price level.
"Average vegetable prices rose sharply in 1981 over 1980
reflecting the often limited availability of produce
especially in the first half of the year, the margins
taken at the retail level have been somewhat exhorbitant
having increased from an average 66 percent in 1980 to
110 percent in 1981. The average wholesale or trader
margin has,, however, registered a downward trend,
dropping from an average 57 percent to 36 percent. It
would appear that the high prices registered at the
retail leval are not finding their way back to the pro
ducer but are retained by the intermediaries. Prices
in the major supermarkets receiving supplies directly
from producers or traders are often considerably below
those found in the town retail fruit and vegetable
markets.
"Local vegetable production has certainly increased in
the wake of the ban on imports due to cholera, but sup
plies are still concentrated in the winter months, with
summer vegetable production, although increasing, still
failing to meet local demand and thereby leading to high
vegetable prices."
-46

In the first half of 1982, the average unweighted retail price
of the main vegetables (tomatoes, potatoes and cabbages) was
EO.70 per kg. The margin breakdown calculated in early 1983 was
as follows:
Retail margin 30c/kg
Traders' margin 6c/kg
Poor Producers' margin 7c/kg (Cost = 27c/kg)
Good Producers' margin 23c/kg (Cost - 4c/kg)
Although the producers' margin is less than 50% of the retail
price, for vegetables this ratio is not out of line, Compared to
other countries, it is in fact rather good. In South Africa, for
example, where the system is more complex and transport costs
greater, the producers receive 27-33% of the retail (consumer)
price. Table 16 gives the average producer and retail prices for
each of the four main vegetables for 1980 (pre-ban), 1981 and
1982, plus the ratio of the producer price to the retail price.
-47

TABLE 16
Average Producer and Retail Prices at Mbabane for Cabbages, Tomatoes, Potatoes and Green Maize
(Cents/kg)
1980 1981 1982
Cabbages: Producer Price 10 13 15 Retail Price 25 53 57 Ratio % 40 25 27
Tomatoes: Producer Price 21 38 50 Retail Price 35 52 81 Ratio % 60 73 62
Potatoes: Producer Price 19 29 30 Retail Price 41 63 62 Ratio 46 46 62
Green Maize: Producer Price 22 45 51 Retail Price 64 85 109 Ratio % 34 53 47
Source: Ministry of Agriculture and Cooperatives, Marketing Advisory Unit. Annual Review of Vegetable Prices and Marketing Trends, 1981-1982.
The producers' share of the final price over the three years varied
according to the vegetable. The share remained constant for toma
toes and potatoes, which together accounted for over 55% of all
sales. However, for cabbages, the producers' share halved after
the ban, to a rather low 22-25%, but for green maize, which is more
storable, the producers' margin went up nearly 50% after the ban,
to half the retail price. The obvious conclusion to draw is that
since the ban, contrary to the general view, most producers have
-48

either held their own or even improved their relative share of
the final price. The winners have been those farmers, mainly
TDL, who are able to market their production directly to the final
consumer. The losers have been the cabbage growers, and of course
the consumers.
Canning and Processing
There is no canning or processing of vegetables in Swaziland, but
growers do depend on processing.plants in South Africa. Prior to
the drought, nearly half of the potato exports accounted for
10-12% of the total vegetable production of Swaziland, was trucked
to the Simba Chip plant in Johannesburg. For tomatoes, the
cannery in Malelane used to be an outlet for growers in Piggs
Peak (NRDA), but at the most it took 452 tons in 1977, about 10%
of total tomato production. In 1982, it took 100 tons, 10% of just
NRDA production.
The Libby cannery at Malkerns is one of the country's major
industries, exporting E18 milliorn worth of canned products in
1982. However, these consisted entirely of pineapples and citrus,
not vegetables. The only major vegetable produced in Swaziland
that can be considered for canning is tomatoes. However, for
the Malkerns factory to have a viable cannery line, it would
require a minimum input of 100 tons per day of good quality
tomatoes for 100 days, i.e., 10,000 tons per year, more than
twice Swaziland's current production, and leaving aside the
issues of transport costs and markets for processed tomatoes. A
-49

similar problem confronts plans to set up a dehydration plant; the
adequate supply and range of quality produce just isn't available
to support a viable plant. NIDC has a proposal to produce 1,500
tons of dehydrafted vegetables per year that would require an in
put of 18,000 tons a year of fresh vegetables, equal to the current
national production of all vegetables. This is supposed to be a
minimum-size plant, but the total supply of vegetables other than
potatoes, tomatoes and green maize, which generally are not de
hydrated, is only 6,000 tons, all of which havea ready fresh market,
where prices are always higher than any processor can pay. Similar
ly for freezing; tomatoes are the only candidate in terms of volume
available in excess of fresh demand, but frozen tomatoes do not exist.
-50

The Proposed Wholesale Market
Institutional buyers and retailers in the central area complain
that there is not one single market center in Swaziland where they
can be sure of buying supplies of the full range of fruits and
vegetables which should be available from regional production
centers. From their point of view, supply services offered by
traders are often uncertain and unreliable, and many found ii.
easier to import from South Africa, when it was permitted.. The
situation would be much improved by the creation of a more effec
tive link between producers and buyers. The proposed project
would establish a central wholesale market to provide the link
between producers and wholesalers/retailers. There is a need for
a central wholesale market where quantities of all types of pro
duce could be brought together to be bought and sold. There is
an allied need for a communications link between the market and
major centers of fruit and vegetable production. A central market
would give producers and traders a central focus of activities,
which would improve efficiency, reduce costs, and attract more
resources into this sector. By contrast, the previous system of
uncoordinated production and marketing, with traders going from
farm to farm on speculation and then hawking their produce along
the Manzini-Mbabane corridor, was extremely inefficient and costly,
and totally uncometitive with the central area-Johannesburg
connection. The ban has provided the one opportunity to create
an organized and formal marketing system that would benefit all
producers.
-51

There is no question that a central wholesale market, with its
market intelligence appendage, is needed for Swaziland. It is a
prerequisite condition for expanding smallholder vegetable produc
tion. Not only will it give the smallholder producei direct
access to the central market, but it will also provide the neces
sary volumes of smallholder potatoes, tomatoes and other produce
for specialist traders to assemble for shipment to Johannesburg
and Durban, and perhaps Maputo. Its existence will prevent a
complete return to the status quo ex-ante when the ban is removed.
Government, with the help of the International Fund for Agricul
tural Development (IFAD), is planning to establish a National
Agricultural Marketing Board, which by the end of 1984 will build
a wholesale market at Mahlanya, midway between Manzini and Mbabane, 2
and a Market Intelligence Office. The market will have 1,200 m
of covered space within a compound of 4 ha. It will have store,
covered parking bays and two small cold rooms. The Market Intel
ligence Office will be sited at this market, and be responsible
for collection and analysis of pertinent data for dissemination
to farmers. The IFAD project will also provide small packing
sheds of 80 m2 at 14 irrigation schemes, plus UHF transceivers
at the seven main producing centers, so that they could receive
daily information put out by the Market Intelligence Office.
According to the agreement with IFAD, Government will operate
the facility for the benefit of piiducers and traders; it will
not be involved in any buying, selling or transporting of produce.
-52

Wholesalers using space will be charged a rent, and if the import
ban is lifted, all imports would have to be brought to the market
for sale. Importers would have to buy licenses, the issuance of
which can be manipulated to ensure local protection. It is pro
posed to charge a small levy, perhaps 5%, on imported produce to
help generate income to pay for the facility. The packing sta
tions in che produc-ag areas will be operated by the growers, and
it is expected that extension officers will use these stations to
help farmers improve their grading and packing. These stations
will also be the loci for buyers, and those equipped with the UHF
transceivers will be able to inform the central buyers of the
forthcoming harvests.
Control of Imports and Exports
Swaziland, as a member of the South African Customs Union, cannot
place any restrictions on the importation of fruits and vegetables
from the Republic of South Africa or other member states of the
Customs Union. In order for Swaziland to introduce a system of
import licensing of fruits and vegetables, negotiations need to
be carried out with other member states of the Customs Union
under the auspices of the Customs Union Commission which meets
quarterly to discuss operations and modification to the Customs
Union Agreement. The Republic of South Africa has a number of
Marketing and Control Boards which regulate the marketing of
agricultural produce, and the Citrus Board of Swaziland exercises
control over the local and export marketing of citrus products in
conjunction with the South African Cooperative Citrus Exchange.
The October, 1980 ban did not violate the rules of the Customs
Union because it was ostensibly imposed for health reasons, being
-53

precipitated by a cholera outbreak in Eastern Transvaal. The ban,
still in force, applies to all imports of fresh fruits and vege
tables from South Africa, even affecting areas with no record of
cholera. There is a considerable smugglitig in of produce, most
notably apples, and given the relatively free flow of traffic
through the border with South Africa, many a passenger car and an
occasional pick-up manage to return to Swaziland with a load of
vegetables. Nevertheless, this leakage of imports probabl-r 4id
not exceed 1,000 tons in 1982, equal to 10% of the volume of
imports in the year preceding the ban.
Controls on Local Marketing
The production and sale of vegetables within Swaziland is subject
to the minimum of controls. The government has minimal regulations
concerning the internal trade in vegetables, the most important
being a requirement that anyone selling produce must have either
a retail or a wholesale license, which are issued by the local
district officer, and are easy to obtain. Hawkers selling vege
tables without a license can have their produce confiscated by
the police. These licenses are needed to enter the major markets
in Mbabane and Manzini. At the former, wholesalers and farmers
bringing in supplies can only stay until 9 a.m. This is to
prevent traffic congestion, as the market is sited between two
of the city's principal road junczions. At Manzini, wholesalers
can trade all day, but only from the wholesale section of the
market.
-54

Market Information
There is a lack of basic information about the market amongst
producers, traders, consumers and government officials. Very
little is knowuL abont the actual area of vegetables planted at
any one time, the expected volumes that may be harvested, or the
amount coming into the market in the near ruture. Small growers
have no idea of the magnitude of the market for their vegetables,
and traders do not keep in regular touch with growers, except
with the TDL farmers located on the main roads. The Ministry of
Agriculture and Cooperatives, through the Market Advisory Unit's
Market Reporters, collects data each weekday morning at tLe
Mbabane and Manzini markets, and twice a week broadcasts prices
on the local radio. The unit publishes a monthly bulletin on
prices and volumes of different produce sold at the Mbabane and
Manzini markets. It has no capacity yet to estimate and dissemi
nate production and demand information on a regular basis in a
manner that would help growers and traders to operate more
efficiently.
Credit
Credit plays an insignificant role overall in vegetable production.
As 60% to 80% of SNL production is by women, the small Swazi pro
ducer is in fact outside of the credit system, since she cannot
pledge land, her husband won't pledge his cattle, and there is no
system of crop loans. A few Swazi men farmers at Vuvulane or in
the RDA schemes have been able to purchase pick-ups on normal bank
credit or hire purchase, and this has been the single most valuable
-55

factor in the marketing of their produce. TDL vegetable growers,
being fully integrated into the modern commercial world, have
access to banks as a matter of course, and in fact finance their
vegetable operations on such credit. This is particularly true
for potatoes, the growing of which is very capital intensive;
currently the cash outlay bef'-s harvest is estimated at E3,500
4,000 per ha. This high cost is the main reason why SNL farmers
don't grow more potatoes. The proposed USAID irrigation project
should provide adequate funds for on-lending as working capital
to project participants so that cash shortages do not constrain
optimal production.
Wholesalers and retailers use credit, in direct relation to their
volume of business: the hawkers and market women deal in cash
only, while the large establishments rely on bank loans. The
current rate of interest charged by banks is 19-20%.
Summary and Conclusions
Before the ban, domestic production outlets were 45% to local
sales and on-farm consumption, 29% to exports, and only 26% sales
to the central area. Of the four main vegetables produced in
Swaziland, two-thirds were sold within Swaziland, and one-third
were exported, with potatoes accounting for half of these exports.
TDL farmers were the dominant suppliers, providing 72% of the
exports, 68% of sales to the central area, and 67% of local
supplies. For Vuvulane farmers, the central area took 39%, local
sales 35%, and exports (mainly green maize) 26%. For other SNL
farmers, the local market was most important, taking 47%,
-56

followed by exports (mainly tomatoes from NRDA), 31%, and last,
the central area, which took 22% of their sales.
The central area, with 85% of Swaziland's urban population, is
the most important market, and in 1978, accounted for 66% of the
domestic vegetable trade. However, 46% of its supplies came from
South Africa. The central area was totally linked into the
Johannesburg grocery trade, and buyers found it easier to purchase
produce coming from there rather than from local Swazi growers.
The exception to these were the 25 or so TDL vegetable growers,
who are part of the commercial system, and able to play the
system to their advantage.
The SNL farmers, however, with the exception of a dozen or so
private growers, do not have the resources or skill to market
their produce in competition with the highly organized Johannes
burg suppliers or growers across the border in Eastern Transvaal.
Being passive participants in the marketing syscem, then tended
to lose out in the interplay of marketing force.s. Dealers pre
ferred to buy from regular suppliers located in the central area,
which meant TDL farmers or importers; they went to the RDA
schemes or Vuvulane only on those days when the TDL farmers or
importers were unable to supply their requirements.
The import ban has definitely improved the marketing position of
local producers. Although the main beneficiaries have been the
TDL farmers, SNL growers have also benefitted. Shut off from their
previous main source of vegetables, buyers and dealers in the
-57

central area have been forced to go out into the countryside to
obtain the necessary supplies. Thus, linkages between the produ
cers and the central area have strengthened immensely. The ban,
and later the drought, pushed up retail prices enormously, and
created a sellers' market for vegetables. Producers have bene
fited in this as much as the market women; in effect, producers'
share of the final price on average has increased over the past
two years.
The proposed wholesale market that Government, with IFAD help,
intends to establish would definitely improve the marketing of
local vegetables. It is axiomatic that buyers and producers need
a central locus to ship to and from, and a center for trade and
information. A central market, with its attendant market intel
ligence component, will be an improvement over the present system
of dispersed production and marketing, and no system of informa
tion to guide producers and buyers. It is also essential to con
trol imports, by licensing importers and requiring all imports to
sell through the market.
There is no processing of vegetables in Swaziland. The Malelane
cannery in Transvaal has been taking 100-400 tons of tomatoes
annually, about 2-6% of local production. For potatoes, the
Simba Chips plant near Johannesburg is an important buyer, taking
about half the amount exported, about 1,000 tons. The Malelane
cannery can take up to 3,000 tons of tomatoes from Swaziland in
October-November, but this clashes with demand for fresh tomatoes
from itinerant Durban traders, who offer a higher price than the
cannery, and pay cash at farm-gate. The Simba Chips factory can

take any amount of potatoes from Swaziland, provided they are the
right grade, sin.e demand for processed potatoes is increasing
faster than the growth in South African potato supplies, which
averaged less than 1.5% per annum over the past decade.
Processing of vegetables, through canning, dehydration or freezing,
on an industrial scale is not possible in Swaziland for the fore
seeable future. Local production consists basically of four
vegetables, but all have a ready fresh market, and in the case of
potatoes, a large processor in Simba Chips. The demand for local
processing has 'Lenbased on regular accounts of vegetables
rotting in some RDA scheme for want of buyers and competition
from South Africa farmers selling in the central area, not because
there is a supply of quality produce sufficient to justify a plant.
The old marketing problem has been solved by the strengthening of
market links between the center and the producers brought about by
the 1980 import ban. It will be improved further in 1984 with the
construction of the wholesale market, an essential keystone in an
efficient marketing system. Unless there is a drastic return to
the status quo which prevailed before the ban, future stories of
rotting vegetables awaiting buyers would herald the presence of
incompetent farmers and/or lack of extension to help farmers grow
their vegetables to the needs of the market.
-59

ANNEX
AGRICULTURE IN SWAZILAND
1. SIZE OF CURRENT PRODUCTION
Agriculture and forestry accounted for 25% of gross domestic
product in 1981, and the agricultural sector provides employment
for 75% of the indigenous work force. National production data
for selected crops are shown in Table 1. Exports of sugar, wood
pulp, citrus fruit, canned fruit and meat products contributed
72.2% of visible exports in 1980. Dualism characterizes this
sector markedly, with the modern sub-sector, covering 447. of all
rural land, primarily concerned with the capital intensive pro
duction of export crops on a plantation basis. Such production
takes place on freehold title deed land (TDL) owned by individuals,
partnerships and companies. In 1981, some 38,000 ha of such lands
were under irrigation. Production is concentrated on sugar cane,
citrus fruit, pineapples and timber. The most important item is
sugar, and the combined capacity of the sugar industry is 400,000
tons per year in three mills. Of this capacity local consumption
of sugar accounts for 20,000 tons per year, and 120,000 tons per
year have a secured market under an EEC quota system. The
remaining 260,000 tons are for sale on the world market. Exports
of wood pulp have stagnated in recent years, but now show signs
of recovery. Exports of citrus and canned fruit have risen
steadily over the past five years.
The subsistence or traditional sub-sector occupies 56% of all
rural land. Such Swazi National Land (SNL) is held by the King
-60

in trust for the nation. The Government has recognized the need
for development in this sub-sector and seeks to rapidly transform
it from traditional to commercial agricultural production. This
is being accomplished through a Rural Developmert Areas Programme,
inaugurated in 1970. It concentrates in 18 rural areas of Swazi
land, providing an improved supply system for farm inputs,
increased availability of rural credit, better agricultural ad
visory services, construction of rural roads and small-scale
irrigation schemes, livestock improvements, and for more rural
crop storage facilities. It is estimated that 2,330 ha of Swazi
National Land are now under irrigation.
The staple food of the Swazi people is maize, which is grown
on an estimated two-thirds of the utilized arable land area.
Sorghum, pulses, potatoes and vegetables are also produced (Table
1). In 1981, the cattle population was 656,000, whilst sheep and
goats together totalled 335,000 head. Swazi National Land areas
suffer from overstocking and low off-take (10%), fostered by
traditional attitudes towards animal husbandry and range manage
ment. To alleviate this problem, the Rural Development Areas
Programme is fencing grazing land, introducing rotational grazing
of natural pastures, and encouraging livestock improvement via
artificial insemination. Dip tanks have also been constructed,
and regular cattle dipping now takes place. Small dairy units
have also been established in some areas.
-61

TABLE 1
Area and Production of Main Crops in Swaziland
Area Production
TDL SNL TDL SNL
'000 ha '000 t
Beans Nil 3.7 Nil 1.1
Cotton 10.5 11.6 6.2 4.5
Citrus 2.5 n/a 62.0 n/a
Groundnuts Nil 1.7 Nil .48
Maize 3.5 58.9 4.2 52.3
Pineapple 1.7 n/a 29.3 n/a
Potatoes .19 .14 3.0 1.7
Sorghum .05 2.2 .8 .7
Sugarcane 31.7 n/a 2,175.8 n/a
Tobacco Nil 0.4
TDL = Title Deed Farms, 1980/81 SNL = Swazi Nation Land, 1981/82
SOURCE: Central Statistics Office, Mbabane
Dryland and Irrigated Farming
The estimated area or crop land in 1979/801 / was 189,363 ha,
of which 187,924 ha, or 72.7%, were on SNL. Fallow land was
estimated at 35,389 ha, 18.7% of the total area, but 21.2% of SNL.
Only 2,339 ha, 1.2% of SNL crop land, had irrigation. By contrast,
38,000 ha, or 73.9%, of TDL crop lands were irrigated. Of these
irrigated lands, 83.3%, or 31,697 ha, were under sugar cane,
i/The 1980 Annual Statistical Bulletin is the latest official source of statistics.
-62

1,568 ha under annual crops, mainly cotton, and 4,762 ha under
citrus.2/
The TDL irrigated lands are large-scale ventures that take
full advantage of good management and modern technology. The
majority of Swazi farmers who practice irrigation do so on a
number of SNL irrigation schemes. These schemes are mostly spon
sored and developed by the Government and handed over to farmers
who are selected by the local chiefs of the areas in which the
schemes are situated. Private irrigation schemes also exist on
SNL, and though not sponsored by the Government, they do get tech
nical advice from the Government through the crop production sec
tion of the Ministry of Agriculture and Cooperatives. There are
a total of 300 irrigation schemes, both large ane small, on both
TDL and SNL farms. Of these, 17 are at present small-scale
schemes, either Government-sponsored within the existing RDAs or
Government-assisted ones, all producing vegetables on Swazi Nation
Land. There is also Vuvulane irrigation Scheme, sponsored by the
Commonwealth Development Corporation. Settlers have been
established on former crown land, now SNL, and are committed to
produce sugar cane on two-thirds of the 660 ha irrigated land.
On the balance 220 ha, they grow cotton followed by vegetables in
the dry season.
Most of the farmers with irrigation grow non-vegetable
crops such as cotton and maize in the summer. Cotton is much the
-/Census of Individual Tenure Farms 1980-81, Central Statistics Office, P.O. Box 456, Mbabane
-63

preferred crop, since it gives much higher returns than maize.
Only 25 TDL farmers with about 600 hectares of irrigated farm
land produce vegetables. Of this area, 50% is devoted to pota
toes, and 25% to cabbages, tomatoes and green maize in almost
equal proportions. On the other hand, farmers in the irrigation
schemes under the supervision of the Taiwanese Agricultural Mis
sion have 30 ha of paddy rice as their principal summer crop,
while vegetable growing is practiced outside the summer season.
Other Government-sponsored schemes, both within and outside the
existing RDAs, are principally involved in vegetable production.
As a matter of policy, the Government insists on having at
least one irrigation scheme in each RDA in order to promote
higher incomes for the farmers involved and improve the nutri
tional level of the rural people. One of the major policy
objectives of the Swaziland Government is to develop the water
resources in the Kingdom. A consi-derable expansion in the total
area under irrigation is envisaged over the next few years. Many
studies have been and are being undertaken to make a quantitative
assessment of the irrigation potential of some river basins.
Most recently, Tate and Lyle Consultants have conducted a compre
hensive feasibility study of the Usutu and Ngwavuma River Basins
for irrigating 30-35,000 ha, on a basic cotton-wheat rotation,
supplemented by maize, vegetables and dried beans. However, the
project would require lifting irrigation water some 210 m,
resulting in a scheme that would be both energy- as well as
capital-intensive, and generating a very low projected economic
rate of return of under 11%.
-64

2. CROP AND LIVESTOCK PRODUCTION
Maize
Maize is the principal food crop grown in Swaziland. Local
production in 1980 and 1981 reached 105,000 tons and 95,000 tons,
respectively, but the following two years have been drought
stricken. Production fell to 60,000 tons in 1982, and is estima
ted to drop to as low as 45,000 tons in 1983.
Even in the normal years of 1980 and 1981, production fell
short of demand. Only 5% of the locil production entered the
formal market, and imports totalled 45,000 tons in 1981. Of this
import volume, 40% was whole maize, 51% mealie meal, and 6% animal
feeds. Imports, which averaged 16-18,000 tons per year in 1963
66, have climbed steadily, reaching 49,700 tons in 1982, and
probably touching 70,000 tons in 1983.
Table 2 gives the production, area and yield of maize from
TDL and SNL farms for 1980 and 1981.
TABLE 2
Maize Production in Swaziland
Area 000 ha Production 1000 t Yield t/ha
TDL SNL TDL SNL TDL SNL
1980 3.6 71.1 3.8 96.7 2.4 1.4
1981 4.4 56.1 8.0 95.8 1.8 1.7
SOURCE: Economic Review, 1972/81, Dept. of Economic Planning and Statistics
-65

Almost all maize is grown on dryland during the summer rainy
season. Virtually all SNL homesteads grow maize, either in pure
stands (40%) or mixed (60%) with cucurbits and occasionally
legumes. On TDL farms, only 7.2% of the cropped area was given
to maize in 1981, as opposed to 26.2% of the cropped area under
cotton. TDL farmers are net sellers of maize, but nearly all SNL
homesteads buy maize or maize meal to meet requirements even in
good years; the 1981 FAO Food Security Mission estimated that the
average purchase was 4.4 bags per homestead.
With the average SNL farm generally cultivating about 2 ha of
dryland maize, it needs to increase yields by 2.2 bags per ha to
reach self-sufficiency. This is possible, since ecological con
ditions are generaly suitable for maize in the high and middle
velds. Technical packages are available, but the critical bottle
neck is the lack of an effective extension service, and lack of
power for land preparation in October-November. This is further
complicated by the fact that at least two-thirds of the farmers
in the country are women, who receive only partial assistance
from their men-folk in their maize operations, and are generally
bypassed by government programs.
3/ Other Grains
The production of sorghum in Swaziland is at a very low level.
The 1979 Survey and Census recorded a total of 1,600 tons sorghum
3/Information on the following draws from the "Reconnaissance Study - Usutu and Ngwavuma River Basins," Tate and Lyle Technical Services, Ltd. and IWLPU Consultants, December, 1982.
-66

produced on SNL from 2,300 ha, chiefly for home brewing. All rice
grown in Swaziland is irrigated, and yields vary from three to six
tons of paddy per ha. The Swaziland Irrigation Scheme (SIS) was
the only large-scale rice grower in Swaziland, and their withdrawal
from production in 1979, because of increased acidity, bird and
weed problems, reduced the area of rice grown on TDL from 1,300
to nearly 70 ha.
Beans and Pulses
Pulses (beans, cowpeas, jugobeans) are grown predominantly on
SNL. Production levels in recent years have remained relatively
constant, and in 1979/80 were estimated at:
Land rop Area (ha Production t)
SNL Beans Jugobeans Cowpeas
1,138 2,582 1,768
322 1,407
908
TDL Field Beans 177 84
5,665 2,720
No imports or exports of pulses are recorded as such in the
Customs and Excise returns. The FAO Food Security Mission esti-
Tated total demand for pulses in Swaziland in 1978 at 963 tons,
all of which were domestically produced.
Citrus
Citrus was first planted commercially in Swaziland in the
early 1950s, and registered growers once numbered 42. This total
has fallen to eight, although the area has increased. All
-67

commercial plantings are on Title Deed Land (TDL). The estates
are located at Ngonini in the northwest, SIS and Tambankulu in
the northeast, and Tambuti, just north of Mapobeni, and there
are four other growers in the Big Bend/Nsoko corridor. Only
very small areas of citrus are grown on Swazi Nation Land (SNL)
for household or local consumption. The total productive area
-was identified in the 1979/80 ITF4 Census as:
Oranges 1,250 Grapefruit 1,071 Naartjies 71 Lemons 10 Limes 63
2:465 ha
An expansion of 250-300 ha has recently been undertaken, com
prising new plantings of Marsh grapefruit in SIS, and the estab
lishment of more modern varieties, such as Star Ruby grapefruit,
and the new oranges - Tambours, Minneolas and Shamoutis. The
latter are intended to replace late season Valencia oranges to
some extent. Almost all the commercial area is irrigated.
Total production for 1981 was just over 63,000 tons, of which
66 percent was exported. The composition of output was as follows:
4/Individual Tenure Farm
-68

Fruit Tons
Grapefruit: Export - in 15 kg carton equivalents Marsh White 1,223,000 Rose 244,500 Star Ruby 2,625 22,052
South Africa, in 8.6 kg packets 147,200 1,266 Libby's, in 8.g kg packet equivalents 852,400 7,330
Total production: 30,648
Oranges: Export - in 15 kg carton equivalents Valencia 939,500 Tambour 124,160 Minneola 98,400 Tomango 95,848 Protea 22,560 Shamouti 26,400 19,603
South Africa, in 10 kg packets. 141,526 1,415 Libby's, in 10 kg packet equivalents 1,144,000 11,440
Total Production: 32,458:L
The proportions of each variety will alter as the new plantings
reach productive age. There are no firm plans for sizeable
expansion.
Fruits
Many SNL smallholders grow some fruit for homestead or local
consumption, and some fruit tree plantings have taken place within
the RDA schemes. Quantitative data are not available for SNL
areas, but the 1979/80 Census of ITFs recorded the following pro
duction:
Area Production Location %
Crop (ha) (t) HV MV LV
Avocados 95 27 68 32 --
Bananas 24 2 -- 100 --
Pecan Nuts 63 5 -- 78 22 Mangoesa/ 160 55 4 69 29 Others - 86 15 -- n.a. -
/Apples, guavas, lychees, macadamia nuts, pawpaw,
peaches
5/Source: Swaziland Citrus Board
-69

Pineapples
The canning factory ai: Malkerns constitutes the major market
outlet for pineapples in Swaziland, although some fruit is also
sold on the local fresh market. The factory started operations
in 1956, and was taken over by Libby's in 1969. The Swaziland
Government and CDC are both minority shareholders, each with a
10% stockholding. The tonnage of pineapple processed per year
has risen steadily from 9,900 in 1971 to 20,000 in 1976, and
30,700 in 1980. The 1981 crop is estimated at around 40,000 t.
The total area harvested in 1980 was 1,650 ha, and the to:al
planted area is just over 4,000 ha. Libby's themselves farm soma
1,300 ha, 400 ha of which they own. The balance of production
comes from outgrowers, including a settlement scheme of 200 ha.
Factory management has expressed concern over an expected
reducti -i in productive area in the near future. The factory is
equipped to handle some 40,000 t/year, and the anticipated crop
from the 1982 area is on the order of 37,000 t. Part of Libby's
pineapple plantings will be sequestered and ploughed out as the
land lies in the path of the airport extension at Matsapha.
Another lease which Libby's now holds is not expected to be
renewed. These two circumstances combined would reduce the
annual crop to 30,000 t, thus adversely affecting the economics
of the processing operation. However, it is believed that a new
leasing agreement has been negotiated with Tibiyo whereby 200 ha
will be made available during the next few years, allowing a
total crop in Swaziland of 36,500 tons.
-70

There is little opportunity for any other compensatory
expansion in the Malkerns valley. This land, lying between
Manzini/Matsapha and Mbabane, is considered as having high
development potential, and land offered for sale fetches a very
high price. There is an apparent trend to hold such land as an
inflation proof asset, using it in the interim for ranching
rather than cash cropping.
Pineapples are increasingly regarded as an uncompetitive crop
by local outgrowers; their annual plantings fell from 130 to 40
ha between 1971 and 1981, whereas in the same years Libby's
planted 80 and 320 ha respectively.
No disporportionate increase in world demand or prices is
anticipated, and faced with a reduction in supply and increasing
operating costs, doubts exist as to the continued viability of
the factory. The company employs 1,500 people.
Oilseeds
Of the three major southern African oilseed crops - ground
nuts, sunflower and soyabeans - the production of sunflower and
soyabeans in Swaziland is currently negligible. Groundnut pro
duction, which is almost entirely on SNL, has dropped from 2,500
t shelled in 1974/5 to an estimated 1,270 tons in 1979/80. 5,800
ha were planted in 1974/5, but only 2,740 l a in 1979/80, mainly
in the middle and lowveld. No reason has been established for
the decline in area; groundnuts could be a useful source of
income to the Swazi farmers.
71

Tobacco
Tobacco production in Swaziland is concentrated in the high
veld and middleveld, particularly in the south of the country
where the major producers' cooperative is located at Nhlangano.
Nearly 90% of production comes from SNL. Dark air cured pipe
tobacco is the main type produced, with small areas of burley
and flue cured.
Production levels have fluctuated during the last ten years,
and are currently running between 150 and 200 t, as shown below.
During the current market difficulties encountered by the RSA
producers, sales of tobacco from Swaziland to RSA have been
restricted to 200 t/year.
Year Production (t) Year Production (t)
1970 130 1976 201 1971 182 1977 172 1972 144 1978 198 1973 164 1979 170 1974 258 1980 246 1975 214 1981 150
Cotton
Production of seed cotton in Swaziland has trebled in the
last 15 years. This has been due primarily to good prices and a
buoyant market in South Africa. However, with the bulk of the
crop grown under rainfed conditions, production is susceptible
to drought, and the effects of dry years in 1975/76 and 1978/79
are evident. Latest estimates for the 1981/82 crop have fallen
to 12,000 tons, this being due almost entirely to the drought
prevailing in early 1982.
-72

Seed production is the responsibility of the Swaziland Cotton
Board. Their selling prices are:
Acid delinted: E450/ton Machine delinted: E270/ton
The selling agents, whether a ginnery or cooperative, usually add
about 10% to the seed price for their markup, plus E1.00 per bag
(50 kg) for credit facilities and E1.50 per bag for transport.
Agricultural chemicals and fertilizers are purchased from normal
commercial channels or cooperatives.
Transport is usually provided by the ginnery. Trucks are
sent free of charge, provided 30 bales (6,000 kg) are available
at one point. Farmers who bring cotton to the ginnery may be
reimbursed at between El and E4 per bale, depending on the
ginnery to which they deliver, and whether or not they ask for
reimbursement.
Livestock
The livestock population in Swaziland has grown steadily
during the past few years. In 1981 there were 656,000 cattle and
304,000 goats, as compared with 634,000 cattle and 258,000 goats
in 1977; the sheep population has remained constant over the same
period. The cattle offtake rate from the national herd is 10%
per annum, derived from recorded slaughter and live exports.
This figure includes both non-commercial offtake from herds
running on Swazi Nation Land (SNL) and offtake from commercial
beef ranches.
-73

In 1980, Swaziland's Gross Domestic Product (GDP) was E340
million, of which agriculture contributed E79.8 million, or 23%.
Within agriculture, livestock production accounted for E13.8
million, or 4% of national GDP.
Swaziland can be divided into Swazi Nation Laid (SNL) and
Title Deed Land (TDL), according to the prevailing system of land
tenure. Very broadly, and with exceptions, minimal input live
stock husbandry prevails on SNL as compared with holdings on TDL,
which are used for commercial production. On SNL, livestock
graze on communal, natural pastures which show signs of over
grazing and soil erosion; the stocking rate is about twice that
on TDL.
Swazis are generally reluctant to sell cattle because they
are the only store for wealth since Swazis are unable to invest
in farm ownership. For this reason, animals sold for slaughter
from SNL tend to be mature in contrast with the younger, heavier
cattle sold from commercial farms on TDL. Breeds include the in
digenous Nguni, Brahman, Afrikaner, Drakensberger and Simmentaler.
Nguni cattle are milked for home consumption and sale in the
immediate neighborhood. Commercial dairying has shown encouraging
increases in productivity since 1976 under a successful Government
program assisted by the Canadian International Development Agency
(CIDA). There are now seven herds with more than 40 cows of
Holstein, Friesian or Jersey breeding, but there are also 38
small-scale producers who market their milk through the Swaziland
Dairy Board (SDB).
-74

Goats are grazed almost exclusively on SNL. Goat meat does
not pass through commercial channels but is consumed locally.
Poultry production is small-scale; most broiler and layer flocks
are in the range of 100-400 birds, but there is one producer
whose output is 4,500 live broilcrs weekly. Government-supported
poultry distribution centers are currently supplying about 1,000
four-week-old broilers weekly. A few households keep one or two
pigs, but there is one herd of fifty breeding sows. Fundamentalist
christian churches, which are very strong in Swaziland, frown on pork.
3. THE IFAD MARKETING PROJECT
This project is expected to be operational by the end of 1984,
although the Government of Swaziland has still to formally sign
the agreement with IFAD. The relevant sections of the project, as
described in the Appraisal Report, are reproduced below.
Marketing
The project will create or strengthen some marketing institu
tions and provide facilities to improve fruit and vegetable, as
well as maize marketing in the country. It will provide the link
between the producer and the final buyer. Project actions in the
improvement of fruit and vegetable and maize marketing will
include the following:
* National Agricultural Marketing Board: A National
Agricultural Marketing Board (NAMB) will be created under
the project to promote, coordinate and monitor the pro
duction of fr 4ts and vegetables and regulate the marketing
and importation of such and some other selected commodities.
-75

e Central Wholesale Market: The NAMB will construct, own
ant operate a Central Wholesale Market with funds provided
by the project. The Central Wholesale Market will serve
as the focal point for the assembly of the fruits and
vegetables produced by project smallholders and other
interested producers, and the meeting place of sellers and
buyers (wholesalers/retailers, etc.). The Market will be
constructed at Mahlanya where there is an existing, thriving
retail market. Mahlanya is located between Mbabane and
Manzini: 25 km from Mbabane and 15 km from Manzini. It
is also about 6-7 km from Matsapa - a potential urban
growth point. To allow ample space for vehicle parking
and future expansion, the Market complex will cover a com
pound of at least four ha. The area will be fenced and a
gate-house installed. The market building would measure
1,200 m2 and it will have brick walls, concrete floor and
metal roof.
The Central Wholesale Market complex will comprise whole
salers' section, farmers' (producers) and traders' section,
cold storage section, and offices/canteen. The whole
salers' section will contain 10 rental unit cubicles of
70 m2 each. The cubicles will be erected on raised plat
forms and enclosed by wire mesh to afford ventilation and
security. They will have loading access at each side of
the Market and a buyer's walk in the middle. The farmers'
and traders' section will consist of 20 covered parking
-76

bays. Both the wholesalers' and fe'mers'/traders' section
of the Market complex will be constructed on a modular
basis to permit future expansion of either as the need
arises. Adjacent to the wholesalers' section will be two
cold stores of 90 m2 each. The cold storage facilities
will also be rented out to wholesalers for short-term
storage of fruits and vegetaules. The capacity of the
cold stores would be about 24 tons each, depending on the
type of produce and the stacking containers used. Office
and canteen facilities will be provided between the whole
salers' and farmers'/traders' sections. The offices will
accommodate the staff of the Central Wholesale Market Unit
and an MOAC Market Intelligence Unit for fruits and vege
tables to be established under the project. The facilities
will be rented out to interested parties. Designs and
drawings for the Central Market are available. Other
facilities to be provided under the project for the Central
Wholesale Market Unit will include: two B3A Type staff
houses, office and bungalow furniture and equipment, two
staff vehicles (station wagon and pick-up), technical
assistance (Market Manager) and training. Funds will also
be provided as incremental working capital in the first
two years.
9 Transceivers: The RDAs are soon to be equipped with a new
Ultra High Frequency (UHF) communications network with four
frequency channels. The NAMB would be included in this
-77

network. The project will therefore procure and install
eight transceivers to establish communication links between
the Central Wholesale Market and seven fruit and vegetable
producing centers: the five project irrigation extension
centers and the two irrigation schemes at Vuvulane and
Magwanyane. Through this network, information on market
prices and conditions will be transmitted from the Central
Wholesale Market to the extension centers for onward com
munication to the farmers. The extension centers 1l
also feed back information on production and produce
availability to the Market authorities and through them to
the wholesalers/traders.
e Packing/Assembly Sheds - Irrigation Schemes: The project
irrigation schemes have no depots at which farmers could
assemble, sort and pack their vegetable produce for nego
tiated prices with traders either on individual or group
basis. Furthermore, the few itinerant traders who
presently buy vegetables from the production areas provide
their own different-sized containers; sales are, therefore,
conducted on volume basis, thus creating a non-uniform
pricing mechanism. Produce are sometimes negotiated and
transported loose in bulk, thus affecting the quality of
tender items such as tomatoes. The project will, there
fore, construct 14 packing/assembly sheds (measuring8Om2),
one at each of the 12 project smallholder-group irrigation
schemes, as well as the schemes at Vuvulane and Magwanyane.
-78

In addition, each shed will be provided with a grading
table, weighing scale and 100 crates for packing vegetables.
Such equipment willbe used by the extension staff to edu
cate the farmers on the benefits in developing a uniform
pricing mechanism through uniform packing, grading and
weight sales. As the vegetable market is in the big towns,
quality preference exists; this system will improve that.
* Market Intelligence Office: The project will establish a
Market Intelligence Office (MIO) at the Central Wholesale
Market. The Office will mainly be responsible for the
collection of fruit and vegetable market information,
including supply, demand and price data, and the presenta
tion of such data in a form suitable for dissemination by the
Central Wholesale Market Unit management. The system will
also be responsible for the identification of target groups,
other than those directly participating in the project,
which are likely to benefit from the act4 itiesof the Office.
The MIO will operate under the supervision of the MOAC
Marketing Advisory Unit. The project will provide funds
for the MIO staff salaries and training, and for the pro
curement, running and maintenance of four 125-cc motorcy
cles as staff vehicles. The MIO staff will include a
Marketing Information Officer, Marketing Assistant, Market
Reporters, and a Statistical Clerk.-!
Z/Appraisal Report: Smallholder Credit and Marketing Project. Swaziland ADO/IFAD Joint Programme, September, 1982, pp 20, 21.
-79

BIBLIOGRAPRY
Cohen, N.P., Economic Sections to Socio-Economic Profile. Monograph, USAID, Mbabane, April 21, 1983.
Department of Agriculture and Fisheries, Division of Agricultural Marketing Research, Pretoria. 1982 Abstract of Agricultural Statistics.
- Division of Economic Services, Statistics on Fresh Produce Marketing, 1 January to 31 December, 1981.
- Division of Economic Services, Crops and Markets, December, 1982, Volume 61.
FAO: Food Security Assistance Scheme. Report of the Food Security Policy Formulation and Project Identification Mission to Swaziland, March, 1981.
FAO: Report of the Swaziland Project Package Preparation Mission. FAO/AFDB Cooperative Programme, Report No. 1/80 DDC SWA-7, Dabe 16.1.1980.
IFAD: Appraisal Report Smallholder Credit and Marketing Project.
Swaziland ADB/IFAD Joint Programme, September, 1982.
Hansen, B., Horticulture in Swaziland 1978. Final Report.
Ministry of Agriculture and Cooperatives, Marketing Advisory Unit. - Marketing Facilities and Problems in Swaziland's Rural Development Areas, RS/80, July 1980.
- Annual Review of Vegetable Prices and Market Trends, 1981, 1982.
Sibisi, Harriet the Response to Increased Marketing Opportunities among Swazi Nation Lard Potato Growers in Ekupheleni(Motshane/Siphocosini, RDA), Monograph, Febr,.ary, 1982.
Sterkenberg, J.J., DiDhoorn, A.J., Spaarman, K.P., The Production and ?arketing of Vegetables in Swaziland. Department of Geography of Development Countries, University of Utrecht, The Netherlands, 1978.
Swaziland Government, Central Statistics Office. - Census of Individual Tenant Farms, 1980-81
- Annual Survey of Swazi Nation Land, 1981-82
Swaziland Government, Prime Minister's Office. - Department of Economic Planming and Statistics, Economic Review, 1978-82.
-80

Tate & Lyle Technical Services, Ltd., and WLPU Consultant, Reconnaissance Study, Usutu and Ngwavuma River Basins, October, 1982.
The Central Bank of Swaziland, Quarterly Review, December, 1982
World Bank - Agro-Industry Sector Memorandum, Swaziland, March,.19R9. Draft.
- Economic Memorandum on Swaziland, April 20, 1981, Eastern Africa Program.
-81

List of Persons Met
Ministry of Agriculture and Cooperatives
Mr. A.R.V. Khoza, Principal Secretary Mr. Victor Pungwayo, Director of Agriculture Mr. Robert Mthwala, Senior Agriculture Officer Dr. Harriet Sibisi, Sociologist Mr. E.S. Seidler, Marketing Advisor Mr. N. Portch, Irrigation Officer Mr. P. Lukhale, Coordinator of Projects, RDA IMr. D. Mangoma, Project Manager, SRDA Mr. Manama, Proj ect b1anager, ahlangatsha RDA Mr. D. Dlamini, Project Manager, CRDA
Ministry of Finance
Dr. N. Campbell, Chief Economist
Central Statistics Office
Mr. C. Lukhele, Director
Dairy Board
Dr. Austin Khoja, Chairman Dr. R. S. Thwala, Manager
National Industrial Development Corporation
Mr. Mayson Dlamini, Project Officer
Tinkabi Tractors
Mr. Alan Catterick, Manager
Hunting Technical Services, Ltd.
Mr. Brian Duncan, Team Leader Mr. Raymond Green Mr. David Johnia Mr. Tom Boyd
Agricultural Development and Advisory Services (Pty.), Ltd.
Mr. J. A. Wetherson, Director Mr. L. Martin. Director
-82

Penn State University
Dr. T. King, Team Leader Dr. R. Freund Dr. D. Grenoble Mr. ". Dunn Mr. G. Easter
Commonwealth Development Corporation (VIF)
Mr. Patrick Tobin, Agricultural Advisor
Private Sector
Mr. D. Jelley, Managing Director, Libby's Mr. R.M. Fowler, Manager, Farm Chemicals, Ltd. Mrs. R. Schlapobersky, Director, General Export Import Mr. M. Ward, Proprietor, Swazi Inn Mr. L. Green, Food & Beverage Manager, Holiday Inn Mr. D. T. Donkin, Dairy Specialist, Loxton, Venn &
Genote Associates, Bramley, RSA Mr. M. Tomlinsor Proprietor, Mbovane Farms
Unnamed but Not Nameless
the ladies and traders at the Mbabane and Manzini varket the farmers met at the RDA
-83